UNITED STATES
SECURITIES AND EXCHANGE COMMISSION
Washington, D.C. 20549
FORM N-CSR
CERTIFIED SHAREHOLDER REPORT
OF
REGISTERED MANAGEMENT INVESTMENT COMPANIES
Investment Company Act file number: 811-03599
Name of Registrant: The Royce Fund
Address of Registrant: 745 Fifth Avenue
New York, NY 10151
| Name and address of agent for service: | John E. Denneen, Esq. | |
| 745 Fifth Avenue | ||
| New York, NY 10151 |
Registrant’s telephone number, including area code: (212) 508-4500
Date of fiscal year end: December 31, 2017
Date of reporting period: January 1, 2017 – June 30, 2017
Item 1. Reports to Shareholders.
 |
| JUNE 30, 2017 | ||
| 2017 Semiannual | ||
| Review and Report to Shareholders | ||
| Royce Dividend Value Fund | |||
| Royce Global Financial Services Fund | |||
| Royce International Micro-Cap Fund | |||
| Royce International Premier Fund | |||
| Royce Low-Priced Stock Fund | |||
| Royce Micro-Cap Fund | |||
| Royce Micro-Cap Opportunity Fund | |||
| Royce Opportunity Fund | |||
| Royce Pennsylvania Mutual Fund | |||
| Royce Premier Fund | |||
| Royce Small-Cap Leaders Fund | |||
| Royce Small-Cap Value Fund | |||
| Royce Small/Mid-Cap Premier Fund | |||
| Royce Smaller-Companies Growth Fund | |||
| Royce Special Equity Fund | |||
| Royce Special Equity Multi-Cap Fund | |||
| Royce Total Return Fund | |||
| roycefunds.com |  | ||
| Table of Contents | |||
| Semiannual Review | |||
| Letter to Our Shareholders | 2 | ||
| Performance and Expenses | 8 | ||
| The Royce Funds and Rolling Returns | 9 | ||
| Semiannual Report to Shareholders | |||
| Managers’ Discussions of Fund Performance | |||
Royce Dividend Value Fund | 10 | ||
Royce Global Financial Services Fund | 12 | ||
Royce International Micro-Cap Fund | 14 | ||
Royce International Premier Fund | 16 | ||
Royce Low-Priced Stock Fund | 18 | ||
Royce Micro-Cap Fund | 20 | ||
Royce Micro-Cap Opportunity Fund | 22 | ||
Royce Opportunity Fund | 24 | ||
Royce Pennsylvania Mutual Fund | 26 | ||
Royce Premier Fund | 28 | ||
Royce Small-Cap Leaders Fund | 30 | ||
Royce Small-Cap Value Fund | 32 | ||
Royce Small/Mid-Cap Premier Fund | 34 | ||
Royce Smaller-Companies Growth Fund | 36 | ||
Royce Special Equity Fund | 38 | ||
Royce Special Equity Multi-Cap Fund | 40 | ||
Royce Total Return Fund | 42 | ||
| Schedules of Investments and Financial Statements | 44 | ||
| Notes to Financial Statements | 110 | ||
| Understanding Your Fund’s Expenses | 125 | ||
| Trustees and Officers | 127 | ||
| Board Approval of Investment Advisory Agreements | 128 | ||
| Notes to Performance and Other Important Information | 131 |

| This page is not part of the 2017 Semiannual Report to Shareholders | 1 |
Letter to Our Shareholders
some key reversals
| In a solid first half for small-cap stocks, the Russell 2000 Index gained 5.0% for the year-to-date period ended June 30, 2017. This followed a terrific 2016, in which the small-cap index advanced 21.3%. From our perspective as small-cap specialists, however, the big news in small-cap last year was the occurrence of three key reversals: leadership for value, improved results for cyclicals, and higher overall returns for small-caps than for large-caps. Perhaps because we had been waiting for so long—and based on history, we endured an inordinately protracted wait for value to resume leadership over growth—we were convinced as we entered 2017 that these reversals would remain in place. Yet the first half saw leadership shifting yet again, as large-caps, growth, and non-cyclicals (especially healthcare) all took the lead after lagging, some significantly, in 2016. (In addition, non-U.S. equities surged, though this came after several years of underperformance). The result was a small-cap market with narrow leadership for growth through most of the first six months. |
| Recent rotations in small-cap style leadership could be seen clearly in the one-year results for the period ended June 30, 2017. The two style indexes finished the 12-month period in remarkably similar places—the Russell 2000 Value Index climbed 24.9% versus a gain of 24.4% for the Russell 2000 Growth Index—though their respective paths were strikingly divergent. |
| A Tale of Two Halves 1-Year Return Russell 2000 Value and Russell 2000 Growth |
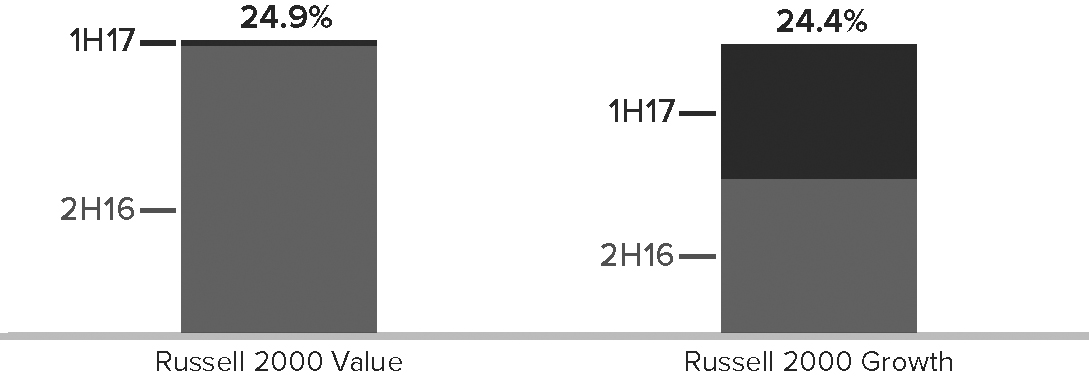
| In the second half of 2016, the small-cap value index rose 24.2% versus 13.1% for growth, while in the first half of 2017, value rose only 0.5% compared to a 10.0% increase for its growth sibling—A Tale of Two Halves. Our interpretation of these actions is that the first half of 2017 marked a catch-up phase for last year’s laggards and a pause for 2016’s leaders. |
| 2 | This page is not part of the 2017 Semiannual Report to Shareholders |
LETTER TO OUR SHAREHOLDERS
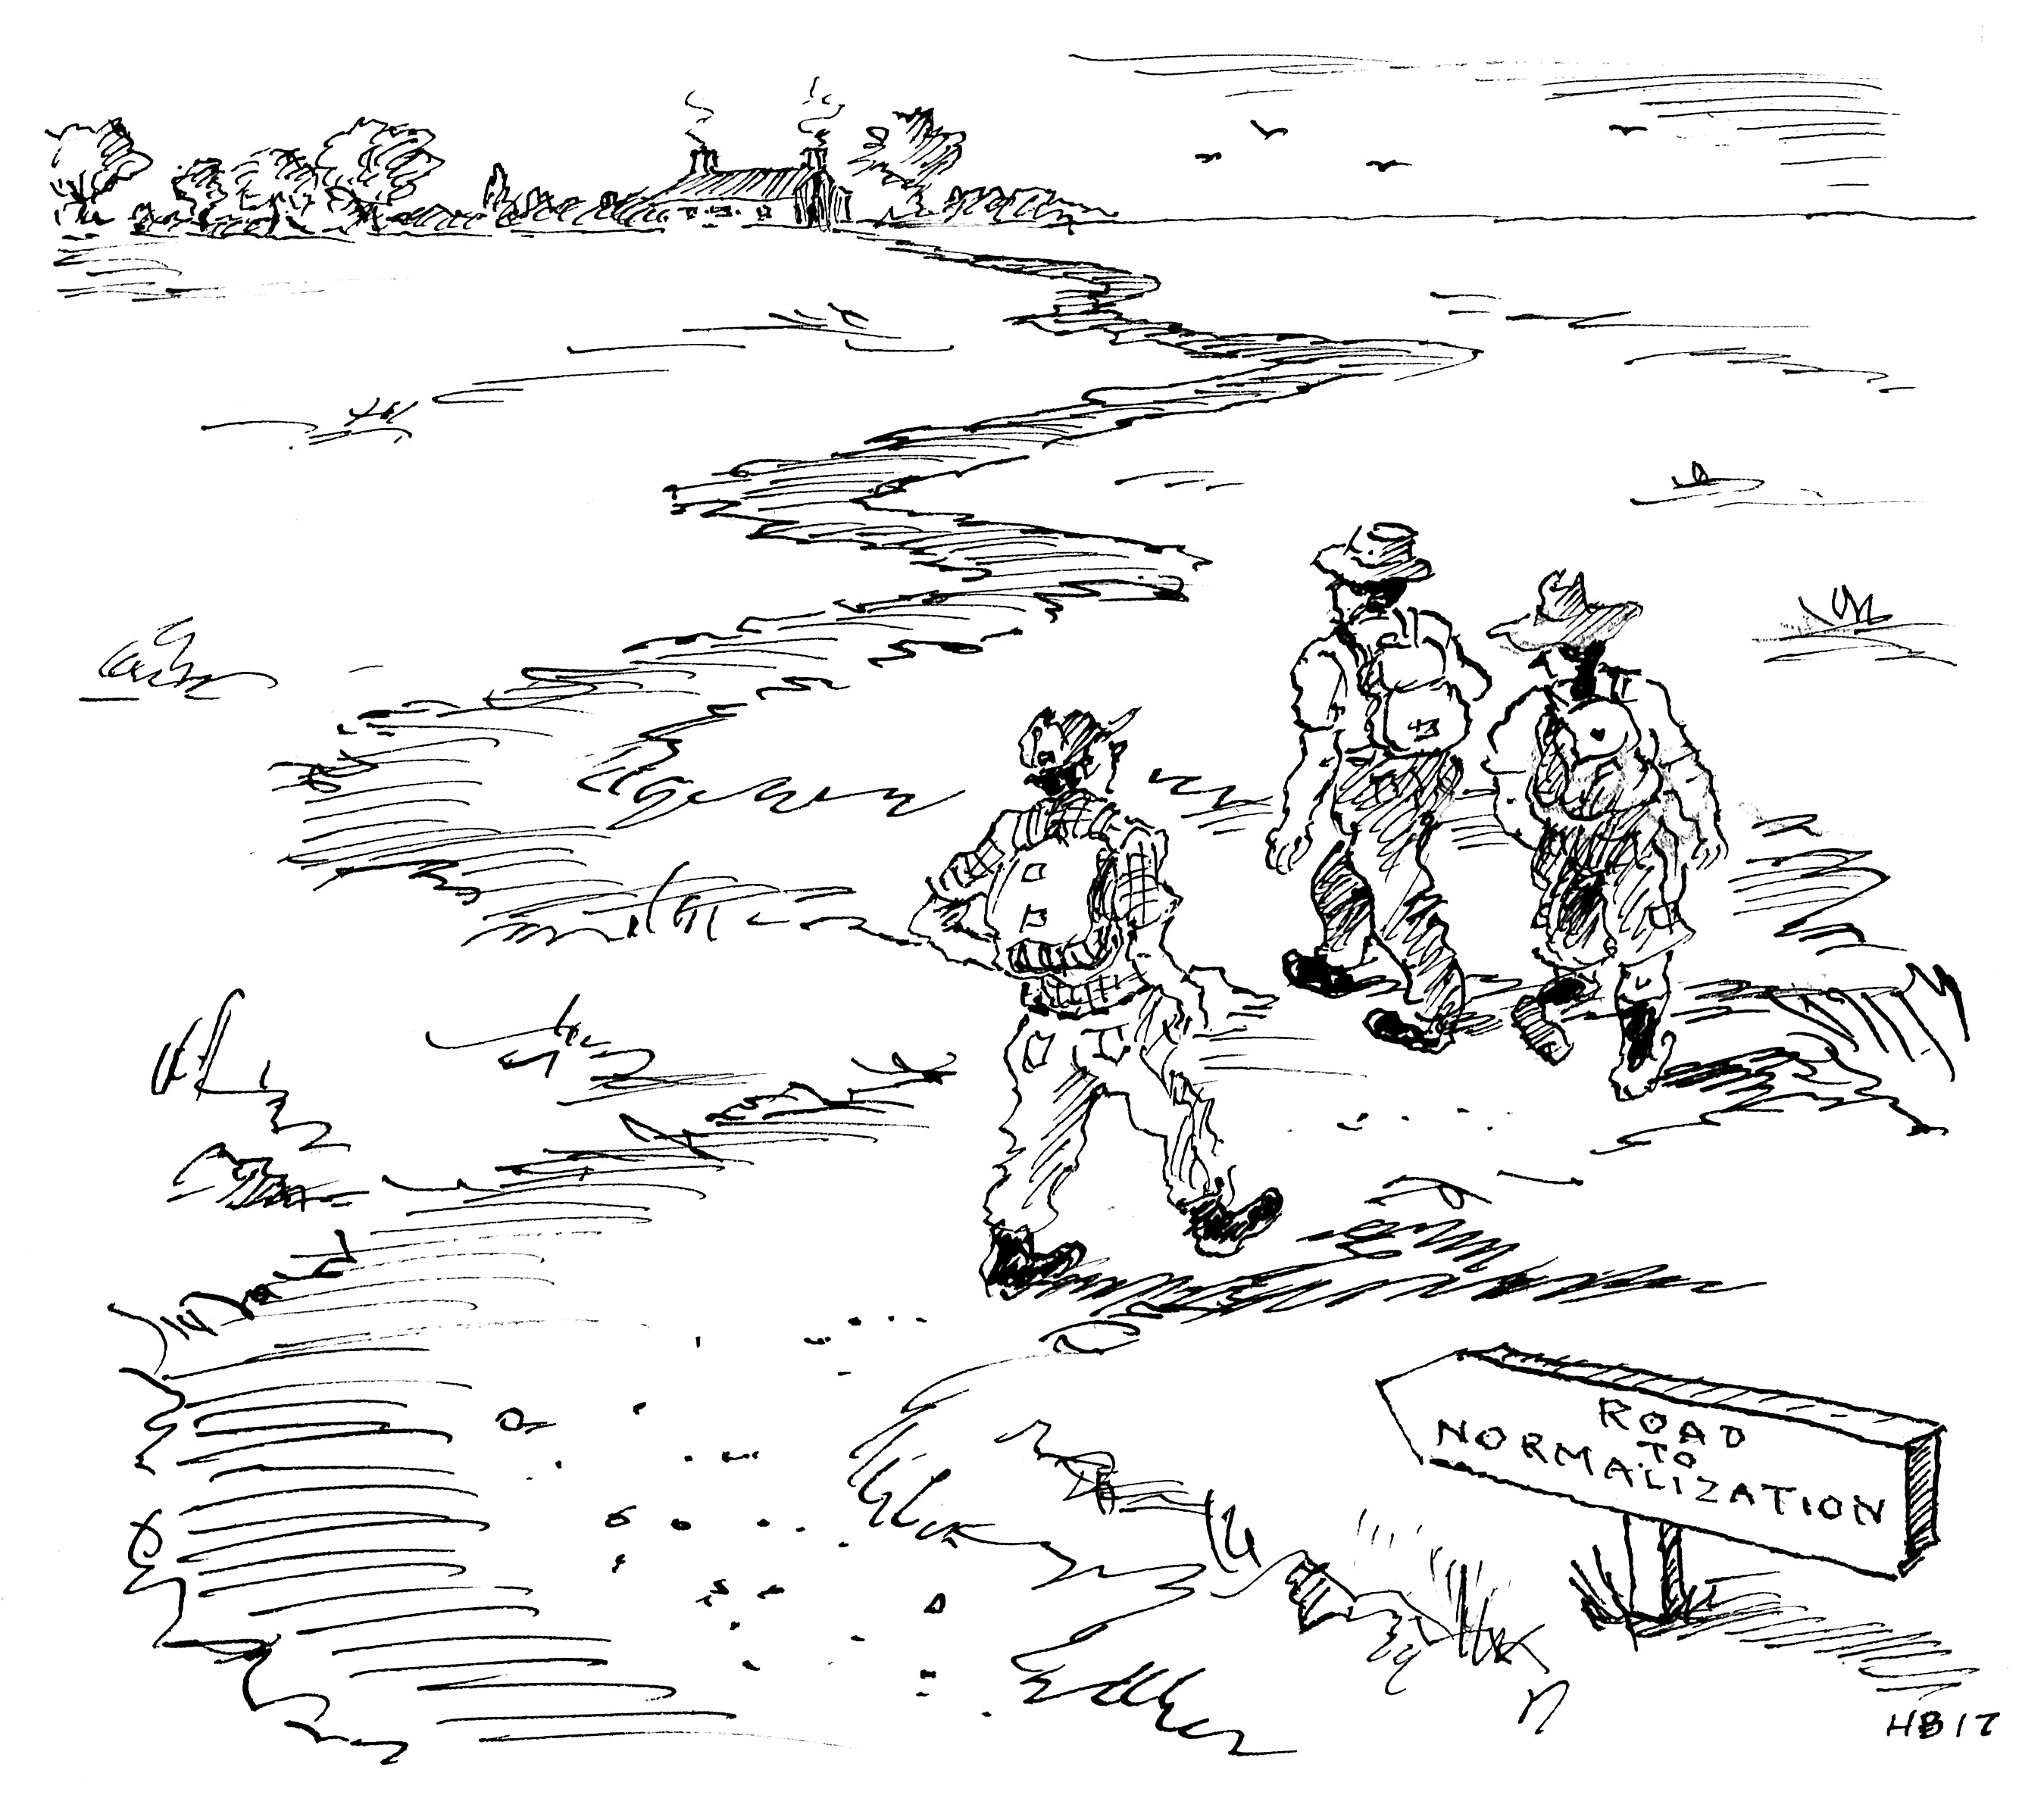
| It’s important to remember that we are still walking the road back to normalization. This is not a straight road—and it was never going to be. If 2017’s first half showed us anything, it was that the path back to normalization (and away from zero interest rates and abundant financial liquidity) will be a winding one with a few sharp twists and turns. |
| Given leadership for growth and non-cyclicals in a period of lackluster economic growth, some market commentators have compared the first half of 2017 to 2015, a year in which growth stocks shined while cyclicals suffered. Growth’s recent leadership notwithstanding, however, 2017 looks nothing like 2015. Today’s environment features rising interest rates, quantitative easing is unwinding in the U.S. (with signs that Europe will soon follow suit), and an increasing amount of data shows a global economy that’s beginning to heat up. In our view, this environment seems significantly different than it did during growth’s last period of extended leadership, which featured anemic global growth and the looming threat of renewed recessions. It’s important to remember that we are still walking the road back to normalization. This is not a straight road—and it was never going to be. If 2017’s first half showed us anything, it was that the path back to normalization (and away from zero interest rates and abundant financial liquidity) will be a winding one with a few sharp twists and turns. We think that we are far from a new regime for growth. In fact, the environment still looks very conducive, at least to us, for value’s leadership to resume and continue—driven by cyclical industries positioned to benefit from global growth. |
| Attractive returns for small-caps in the low-return world we anticipate Our cautious optimism is tempered by an important caveat—the likelihood of lower returns for small-cap stocks than we experienced over the past five years. We make no secret of our belief in reversion to the mean—and the Russell 2000’s 13.7% average annual total return for the five-year period ended June 30, 2017 was higher |
| Rolling 5-Year Returns vs. Latest 5-Year Avg. Annual Total Return Russell 2000 Average Monthly Rolling Average Annual Total Return for 5-Year Periods Through 6/30/17 |
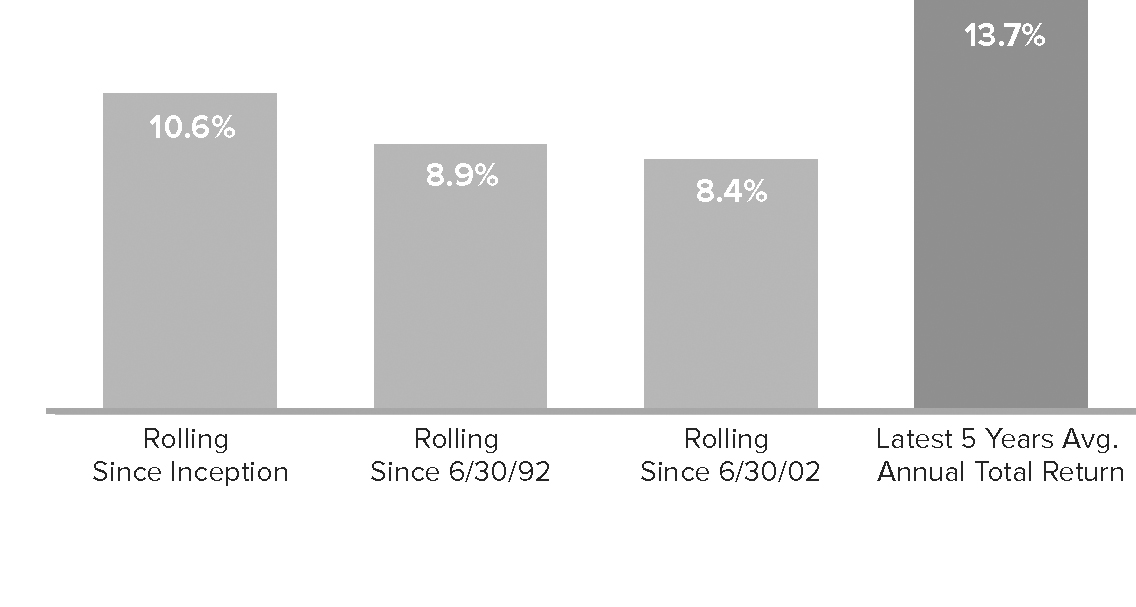
| than its rolling monthly five-year average since the inception of the small-cap index on 12/31/78—a gain of 10.6%. In addition, the chart above shows that small-cap’s rolling five-year returns over the past 15- and 25-year periods are also lower than the current five-year average for the Russell 2000. This explains why we see a high probability of lower small-cap returns over the next few years—our take is based on reversion to the mean. That said, we still see positive, and quite likely very competitive, returns for small-caps ahead, with an argument that rests on two primary factors—the reasonable state of current valuations and the prospect for earnings strength and/or improvement. |
| Equity Indexes as of June 30, 2017 (%) |
| YTD1 | 1-YR | 3-YR | 5-YR | 10-YR | ||||||||
| Russell 2000 | 4.99 | 24.60 | 7.36 | 13.70 | 6.92 | |||||||
| Russell 2000 Value | 0.54 | 24.86 | 7.02 | 13.39 | 5.92 | |||||||
| Russell 2000 Growth | 9.97 | 24.40 | 7.64 | 13.98 | 7.82 | |||||||
| S&P 500 | 9.34 | 17.90 | 9.61 | 14.63 | 7.18 | |||||||
| Russell 1000 | 9.27 | 18.03 | 9.26 | 14.67 | 7.29 | |||||||
| Nasdaq Composite | 14.07 | 26.80 | 11.68 | 15.91 | 8.96 | |||||||
| Russell Midcap | 7.99 | 16.48 | 7.69 | 14.72 | 7.67 | |||||||
| Russell Microcap | 4.23 | 27.60 | 6.69 | 13.73 | 5.47 | |||||||
| Russell Global ex-U.S. Small Cap | 15.01 | 19.59 | 2.85 | 9.24 | 2.47 | |||||||
| Russell Global ex-U.S. Large Cap | 14.30 | 20.61 | 1.05 | 7.63 | 1.40 | |||||||
| 1 Not annualized |
| For details on The Royce Funds’ performance in the period, please turn to the Managers’ Discussions that begin on page 10. |
| Past performance is no guarantee of future results. |
| This page is not part of the 2017 Semiannual Report to Shareholders | 3 |
LETTER TO OUR SHAREHOLDERS
We see positive, and quite likely very competitive, returns for small-caps ahead. Our argument rests on two primary factors—the reasonable state of current valuations and the prospect for earnings strength and/or improvement.
| While it is true that current small-cap valuations are elevated compared with history, it is also true that within a context of low bond yields, small-caps appear cheap versus bonds. |
| Two Perspectives on Small-Cap Market Valuation Through 6/30/17 |
EV/EBIT > Long-term Average Suggests small-caps are more than fully valued Equity Risk Premium > Long-term Average Suggests small-caps are undervalued |  |
Enterprise Value (EV) is calculated by adding a company’s market capitalization, long-term debt, preferred stock, and minority interest, then subtracting cash. EBIT is earnings before interest and tax. EV/EBIT is a harmonic weighted average. Cap Rate is a simple weighted average. Equity Risk Premium is the excess return that an equity investment provides over a risk-free rate, generally defined as the return from U.S. Treasury bonds.
| In addition, valuations actually became more attractive for small-cap companies as a whole in the first half of 2017, as earnings advanced at a faster rate than stock prices. At the end of 2016, the average P/E ratio for the Russell 2000 was 22.9x while at the end of June 2017 it had fallen to 21.7x. During this same period, the yield on the 10-year Treasury yield dropped from 2.4% to 2.3%, further increasing small-cap’s attractiveness versus bonds. Regarding the earnings outlook, our own analyses, our regular discussions with company management teams, and research from our friends at Strategas all reveal a quietly optimistic sales and earnings outlook for many small-cap businesses over the next |
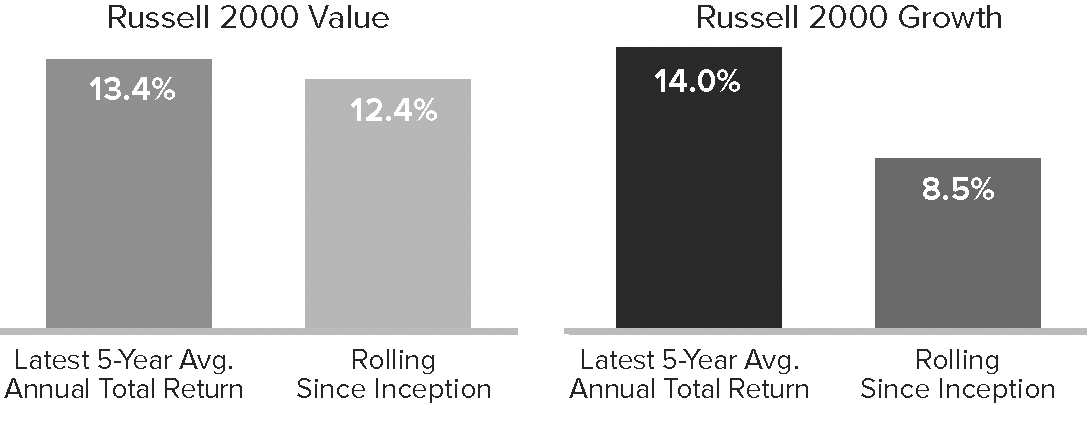
| couple of years, especially if global growth continues to heat up. Small-cap earnings announcements in July 2017 offered some initial, if anecdotal, support for this thesis. We contend that if inflation stays below its historical average, then valuations can stay above their historical levels. We believe valuations do not need to increase from this point for small-caps to advance, and if small-caps can track earnings growth, then an expectation of mid- to high-single-digit returns over the next several years seems reasonable to us. In the low-return world we are anticipating, that could be a very competitive return. TWO ROADS DIVERGING IN THE SMALL-CAP WORLD Why mean reversion and history favor small-cap value Of course, active small-cap managers do not buy the whole market—at least they shouldn’t. If we have sketched a reasonably accurate roadmap for this journey to normalization (of which higher interest rates are a crucial feature), it would have significant implications for investment approaches. Seeing in essence a mirror image of the 2011-2015 period, we think the road to normalization will continue to have divergent paths, with outperformance for value, cyclical, and active management and underperformance for growth, defensive, and passive strategies. Our favorable view of value is rooted in three observations: value’s long-term historical outperformance record versus growth, mean reversion for growth’s performance, and the interest-rate sensitivity of growth stock valuations. Below is a chart showing the most recent five-year returns for the small-cap value and growth indexes |
| Latest 5-Year Average Annual Total Returns vs. Average Monthly Rolling Average Annual Total 5-Year Returns Through 6/30/17 |
| 4 | This page is not part of the 2017 Semiannual Report to Shareholders |
| compared with the average five-year returns over all monthly rolling periods since inception (12/31/78). While the most recent five-year period may be seen as highly supportive for financial assets, small-cap value exceeded its historical five-year average return by only about 100 basis points, while its growth equivalent exceeded its historical average by approximately 550 basis points. Reversion to the mean strongly suggests a very challenging road ahead for small-cap growth stocks. |
| In addition, valuations for cyclicals within small-cap look attractive versus defensives. The metric we prefer to use when examining valuations is the median relative enterprise value (“EV”) over earnings before interest and taxes (“EBIT”). We calculated it over the last 12 months ended June 30, 2017, excluding the companies in the Russell 2000 with negative EBIT. We think this gives a clear picture of the relative attractiveness of cyclicals versus defensive stocks. The results can be seen in the chart above, which shows that valuations for cyclical versus defensive sectors were below their long-term average at the end of June. We feel good about small-cap valuations for our preferred companies and see the greatest earnings potential for small-caps in cyclical areas of the market. Indeed, one of the underappreciated aspects of small-cap cyclicals is the degree to which many look poised to participate in global economic expansion. |
| In fact, we would offer a qualified dissent to the idea that small-caps would be in a relatively unfavorable position if international economies outpace the rate of growth in the U.S. To be sure, this notion is sound enough when applied to the small-cap universe as a whole—the average company in the Russell 2000 derived only 19.8% of its sales from outside the U.S. at the end of June, compared to about 40% for the S&P 500. However, the level of foreign sales varies considerably by sector and industry in the Russell 2000, with Information Technology (44.1%) and Materials (33.4%) having the highest percentages of revenue derived from non-U.S. sources by sector. |
| Valuations for Cyclical Sectors Look Cheap vs. Defensives Cyclical vs. Defensive Stocks Within the Russell 2000 Median Relative LTM EV/EBIT1 Ex. Negative EBIT Through 6/30/17 |

| 1 | Last Twelve Months Enterprise Value/Earnings Before Interest and Taxes Cyclical Definition: Consumer Discretionary, Energy, Financials, Industrials, Information Technology, Materials. Defensive Definition: Consumer Staples, Health Care, Real Estate, Telecommunication Services, Utilities Source: Factset |
| There are also certain other cyclical industries, including auto components (47.2%) and machinery (35.9%), that boast significant international exposure and therefore appear well positioned to benefit from global expansion. Additionally, with the dollar weakening, we expect to see heightened demand for U.S. exports. As experienced small-cap specialists, we see a rebounding global economy as being a potential advantage for active managers who, like us, carry more of a cyclical tilt in their portfolios. Granted, our earnings-centric outlook pivots on there being not simply the tailwind of solid earnings and relatively attractive valuations for select cyclicals but also headwinds for growth and defensive companies. Rising interest rates, for example, are more likely to benefit companies with EPS growth and mute multiple expansion. In this Goldilocks, “not too fast, not too slow” economic environment, we expect higher-quality companies (as measured by |
| Information Technology & Materials Had Highest Percentage of Foreign Revenue for the 12 Months Ended 6/30/17 Russell 2000 GICS Sectors |
 |
Source: Factset |
| This page is not part of the 2017 Semiannual Report to Shareholders | 5 |
We feel good about small-cap valuations for our preferred companies and see the greatest earnings potential for small-caps in cyclical areas of the market. Indeed, one of the underappreciated aspects of small-cap cyclicals is the degree to which many look poised to participate in global economic expansion.
| high returns on invested capital) to have an advantage. Companies that are able to make steady progress and fund their growth from internal cash flow rather than relying on increasingly pricey external sources of capital should be in a superior position to their financially less stable competitors. | |
| SMALL-CAP’S SILK ROAD | |
| The current opportunity in international small-cap | Additionally, there are timely opportunities in international small-cap stocks. As shown below, the trailing 10-year return for international small-caps is significantly lower than its long-term average. A regression to the mean of historical returns would result in more favorable performance. Prior to 2017, the Russell Global ex-U.S. Small Cap had underperformed the Russell 2000 by the widest spread since the inception of the non-U.S. small-cap index in July 1996. As of June 30, 2017, the performance spread between the two indexes was just shy of this lowest point. So while there is no guarantee of the course of future returns, we think the long-term performance history of the two small-cap indexes suggests that a multi-year run for international small-caps is possible. In our view, this is especially relevant when evaluating the opportunity in these companies. |
| Recent Returns for non-U.S. Small-Caps are at Low End of History Russell Global ex-U.S. Small Cap Index Quarterly Rolling 10-Year Returns as of 6/30/17 |  |
| All of this adds up to an environment that appears supportive for active management. Three market environments have historically provided opportunities for many active managers—when value leads, when volatility rises, and when overall market returns are low. All three look more likely than not to us. To the last point, it’s interesting to note what’s shown in the following chart: active managers, with | |
| the Morningstar Small Cap Blend Category Average serving as a proxy, had their widest outperformance spread in the five-year periods when the Russell 2000 returned between 5-10%. This is exactly the environment that we think is most likely. |
| Monthly Rolling 5-Year U.S. Small Blend1 Average Excess Returns During Russell 2000 Return Ranges From 12/31/73 through 6/30/17 |
| GO WITH THE FLOW |
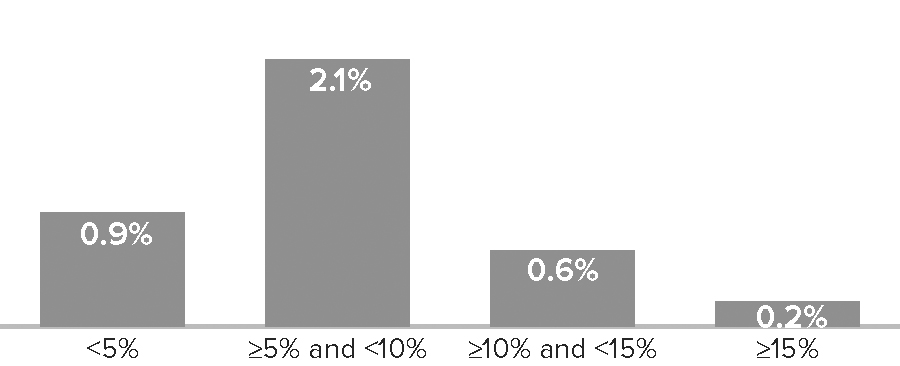
| Corrections are historically typical within small-cap |
| Of course, the road to a lower-return environment likely entails a correction. We do not see this as chilling or discouraging news. Within small-cap, some kind of realignment of stock prices is common. In 18 of the last 20 calendar years, the Russell 2000 had an intra-year decline of at least 10% (and a downturn of 9.6% occurred in one of the two years that escaped the 10%-plus fall). Over the last 20 calendar years, the median intra-year correction was 14.2% while so far in 2017, the Russell 2000’s biggest decline was 4.7%. So we lean toward the likelihood of a pullback in the 8-12% range. We do not see it going much deeper than that because, at least currently, we see none of the signs of a major market top or a recession. |
| Additionally, many market watchers were expecting a correction toward the end of the first quarter, and as of this writing we |
| 6 | This page is not part of the 2017 Semiannual Report to Shareholders |
LETTER TO OUR SHAREHOLDERS
Year-to-Date vs. Median Intra-Year Decline Largest Russell 2000 Intra-Year Declines Through 6/30/17 | 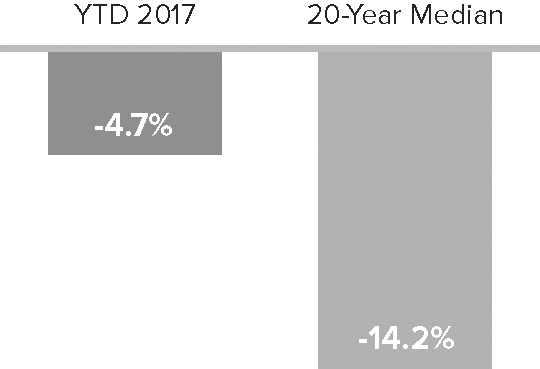 |
still have not seen one even in the midst of ample economic and political uncertainty. When this 20-year history is linked with the fact that we have still not experienced anything like a real correction since the February 2016 small-cap trough, then a downturn looks more than probable to us. So while we are confident that many small-cap companies are in fundamentally solid, even strong, shape, we have also seen over the years that markets simply do not keep ascending for this long without a little air being let out of them. | |
THE ROAD LESS TRAVELED A challenging path worth taking | |
| To be sure, the current environment offers a number of challenges for small-cap investors. Yet we believe it also looks favorable for those who walk the road less traveled—those with disciplined small-cap active management approaches that are geared more globally. Current uncertainty should sooner or later result in higher levels of volatility. (Indeed, perhaps the oddest feature of 2017’s first half was its bullish placidity in the face of so much uncertainty—the 10-year Treasury showed as much, if not more, volatility in the year’s first six months as the stock market.) And we see increased volatility as potentially working to the advantage of the disciplined active manager. | |
| There is also the possibility of fiscal or regulatory support from Washington, which could of course help small-caps. Our view, however, is that investors place undue emphasis on this. We take issue with the common assumption that small-caps cannot continue to advance without a cocktail combining corporate tax cuts, deregulation, and infrastructure spending. Our outlook of measured optimism is not grounded on which policies emerge (or do not emerge) from Washington. Ultimately, of course, the success of what we do hinges on the companies in which we invest. On that score, we are encouraged. The ongoing optimism we have been hearing every day from management teams, for example, contradicts the expectation of an economic slowdown. Order books are continuing to fill up, and the majority of the companies we have been meeting with remain confident about their business. That in turn gives us ample confidence in what we do. We are convinced that small-cap active management approaches can remain successful as long as there is a reasonable amount of economic growth, whether here at home or overseas. Simply put, we see modest global economic growth leading to decent earnings growth which should result in moderate advances for small-caps as a group and greater advances for companies in cyclical businesses. Our advice? “Stay active, my friends.” |
| Sincerely, |
 |  |  | ||
| Charles M. Royce | Christopher D. Clark | Francis D. Gannon | ||
| Chairman, | Chief Executive Officer, and | Co-Chief Investment Officer, | ||
| Royce & Associates, LP | Co-Chief Investment Officer, | Royce & Associates, LP | ||
| Royce & Associates, LP | ||||
| July 31, 2017 |
| This page is not part of the 2017 Semiannual Report to Shareholders | 7 |
Performance and Expenses
| Performance and Expenses | |||||||||||||||||||||
| AVERAGE ANNUAL TOTAL RETURNS (%) | ANNUAL OPERATING EXPENSES (%) | ||||||||||||||||||||
| YTD1 | 1-YR | 5-YR | 10-YR | 15-YR | 20-YR | 40-YR/SINCE INCEPTION | INCEPTION DATE | GROSS | NET | ||||||||||||
| Royce Dividend Value Fund | 7.72 | 20.07 | 11.02 | 6.85 | N/A | N/A | 8.74 | 5/3/04 | 1.34 | 1.34 | |||||||||||
| Royce Global Financial Services Fund | 9.83 | 23.41 | 14.13 | 5.85 | N/A | N/A | 8.17 | 12/31/03 | 1.78 | 1.60 | |||||||||||
| Royce International Micro-Cap Fund | 15.23 | 22.27 | 8.97 | N/A | N/A | N/A | 3.57 | 12/31/10 | 3.35 | 1.64 | |||||||||||
| Royce International Premier Fund | 22.33 | 20.11 | 11.66 | N/A | N/A | N/A | 7.18 | 12/31/10 | 1.84 | 1.44 | |||||||||||
| Royce Low-Priced Stock Fund | 0.97 | 20.17 | 3.88 | 2.09 | 6.21 | 8.94 | 9.91 | 12/15/93 | 1.53 | 1.50 | |||||||||||
| Royce Micro-Cap Fund | 2.01 | 23.04 | 5.32 | 3.11 | 7.61 | 8.98 | 10.91 | 12/31/91 | 1.48 | 1.48 | |||||||||||
| Royce Micro-Cap Opportunity Fund | 9.77 | 31.77 | 12.69 | N/A | N/A | N/A | 12.85 | 8/31/10 | 1.30 | 1.24 | |||||||||||
| Royce Opportunity Fund | 8.17 | 36.10 | 13.83 | 6.59 | 10.25 | 11.95 | 12.39 | 11/19/96 | 1.19 | 1.19 | |||||||||||
| Royce Pennsylvania Mutual Fund | 4.81 | 23.17 | 11.68 | 5.93 | 9.19 | 9.91 | 13.09 | N/A | 0.93 | 0.93 | |||||||||||
| Royce Premier Fund | 8.70 | 25.54 | 10.62 | 7.20 | 10.78 | 10.42 | 11.61 | 12/31/91 | 1.16 | 1.16 | |||||||||||
| Royce Small-Cap Leaders Fund | 1.14 | 19.80 | 9.04 | 5.72 | N/A | N/A | 9.43 | 6/30/03 | 1.58 | 1.49 | |||||||||||
| Royce Small-Cap Value Fund | -4.21 | 12.22 | 7.87 | 3.75 | 10.00 | N/A | 9.26 | 6/14/01 | 1.49 | 1.49 | |||||||||||
| Royce Small/Mid-Cap Premier Fund | 5.68 | 18.27 | 10.11 | 5.73 | 9.04 | 11.39 | 12.33 | 12/27/95 | 1.30 | 1.30 | |||||||||||
| Royce Smaller-Companies Growth Fund | 11.26 | 26.08 | 12.35 | 4.53 | 10.98 | N/A | 11.42 | 6/14/01 | 1.51 | 1.49 | |||||||||||
| Royce Special Equity Fund | -0.36 | 21.63 | 10.45 | 7.31 | 8.85 | N/A | 9.26 | 5/1/98 | 1.17 | 1.17 | |||||||||||
| Royce Special Equity Multi-Cap Fund | 5.95 | 21.04 | 10.14 | N/A | N/A | N/A | 9.96 | 12/31/10 | 1.34 | 1.24 | |||||||||||
| Royce Total Return Fund | 2.78 | 19.09 | 12.15 | 6.24 | 8.76 | 9.33 | 10.82 | 12/15/93 | 1.21 | 1.21 | |||||||||||
| INDEX | |||||||||||||||||||||
| Russell 2000 Index | 4.99 | 24.60 | 13.70 | 6.92 | 9.19 | 7.98 | N/A | N/A | N/A | N/A | |||||||||||
| Russell Microcap Index | 4.23 | 27.60 | 13.73 | 5.47 | 8.44 | N/A | N/A | N/A | N/A | N/A | |||||||||||
| Russell 2500 Index | 5.97 | 19.84 | 14.04 | 7.42 | 9.98 | 9.19 | N/A | N/A | N/A | N/A | |||||||||||
| Russell 1000 Index | 9.27 | 18.03 | 14.67 | 7.29 | 8.62 | 7.42 | N/A | N/A | N/A | N/A | |||||||||||
| Russell Global ex-U.S. Small Cap Index | 15.01 | 19.59 | 9.24 | 2.47 | 9.92 | 6.37 | N/A | N/A | N/A | N/A | |||||||||||
Important Performance, Expense, and Risk Information
All performance information in this Review and Report reflects past performance, is presented on a total return basis, reflects the reinvestment of distributions, and does not reflect the deduction of taxes a shareholder would pay on fund distributions or the redemption of fund shares. Past performance is no guarantee of future results. Investment return and principal value of an investment will fluctuate, so that shares may be worth more or less than their original cost when redeemed. Investment and Service Class shares redeemed within 30 days of purchase may be subject to a 1% redemption fee payable to the Fund (2% for Royce International Micro-Cap and International Premier Funds). Redemption fees are not reflected in the performance shown above; if they were, performance would be lower. Current performance may be higher or lower than performance quoted. Current month-end performance may be obtained at www.roycefunds.com. All performance and expense information reflects results of the Funds’ oldest share Class (Investment Class or Service Class, as the case may be). Price and total return information is based on net asset values calculated for shareholder transactions. Gross annual operating expenses reflect the Fund’s gross total annual operating expenses and include management fees, any 12b-1 distribution and service fees, other expenses, and any applicable acquired fund fees and expenses. Net annual operating expenses reflect contractual fee waivers and/or reimbursements. All expense information is reported as of the Fund’s most current prospectus. Royce & Associates has contractually agreed to waive fees and/or reimburse operating expenses, excluding brokerage commissions, taxes, interest litigation expenses, acquired fund fees and expenses, and other expenses not borne in the ordinary course of business, to the extent necessary to maintain net operating expenses at or below: 1.49% for Royce Global Financial Services, Low-Priced Stock, Small-Cap Leaders, and Smaller-Companies Growth Funds; 1.64% for Royce International Micro-Cap Fund; 1.44% for Royce International Premier Fund; 1.24% for Royce Micro-Cap Opportunity and Special Equity Multi-Cap Funds through April 30, 2018; at or below: 1.99% for Royce International Micro-Cap Fund through April 30, 2027. Acquired fund fees and expenses reflect the estimated amount of fees and expenses incurred indirectly by the Fund through its investments in mutual funds, hedge funds, private equity funds, and other investment companies.
Service Class shares bear an annual distribution expense that is not borne by the Funds’ Investment Class. If such distribution expenses had been reflected for Funds showing Investment Class performance, returns would have been lower. Investments in securities of micro-cap, small-cap, and/or mid-cap companies may involve considerably more risk than investments in securities of larger-cap companies. (Please see “Primary Risks for Fund Investors” in the prospectus.) Certain Funds invest a significant portion of their respective assets in foreign companies that may be subject to different risks than investments in securities of U.S. companies, including adverse political, social, economic, or other developments that are unique to a particular country or region. (Please see “Investing in Foreign Securities” in the prospectus.) Therefore, the prices of securities of foreign companies in particular countries or regions may, at times, move in a different direction than those of securities of U.S. companies. (Please see “Primary Risk of Fund Investors” in the prospectus.) Certain Funds generally invest a significant portion of their assets in a limited number of stocks, which may involve considerably more risk than a more broadly diversified portfolio because a decline in the value of any of these stocks would cause their overall value to decline to a greater degree. A broadly diversified portfolio, however, does not ensure a profit or guarantee against loss. This Review and Report must be preceded or accompanied by a prospectus. Please read the prospectus carefully before investing or sending money. Russell Investment Group is the source and owner of the trademarks, service marks, and copyrights related to the Russell Indexes. Russell® is a trademark of Russell Investment Group. The Russell 2000 Index is an unmanaged, capitalization-weighted index of domestic small-cap stocks. It measures the performance of the 2,000 smallest publicly traded U.S. companies in the Russell 3000 Index. The Russell Microcap Index includes 1,000 of the smallest securities in the small-cap Russell 2000 Index along with the next smallest eligible securities as determined by Russell. The Russell 2500 is an unmanaged, capitalization-weighted index of the 2,500 smallest publicly traded U.S. companies in the Russell 3000 index. The Russell 1000 is an unmanaged, capitalization-weighted index of domestic large-cap stocks. It measures the performance of the 1,000 largest publicly traded U.S. companies in the Russell 3,000 Index. The Russell Global ex-U.S. Small Cap Index is an index of global small-cap stocks, excluding the United States. The performance of an index does not represent exactly any particular investment as you cannot invest directly in an index. Distributor: Royce Fund Services, LLC.
| 8 | This page is not part of the 2017 Semiannual Report to Shareholders |
The Royce Funds and Rolling Returns
We believe strongly in the idea that a long-term perspective is crucial for determining the success of an investment approach. Flourishing in an up market is wonderful, but surviving a bear market by losing less (or not at all) is equally desirable. In any case, the true tests of a portfolio’s mettle are results over bull and bear periods. This is why we prefer to examine results that include up and down market phases—primarily by looking at rolling return periods.
| When evaluating fund performance, it is common practice to review results for the most recent year (often the calendar year) along with its related longer-term trailing periods. However, a calendar-year return is not necessarily any more or less important to consider than any other 12-month period (or related trailing period) during a manager’s tenure. It is also true that few investors buy mutual funds on New Year’s Eve and then sell exactly five or 10 years later. Of course, the reality is that trailing returns ending last month or last quarter are the most commonly available and easily comparable results, so these otherwise arbitrary periods often drive investor decisions and flows. |
| Keeping in mind that investors will buy and sell at any time throughout any given year, we think it makes sense to examine performance over a larger series of dates. We believe rolling returns offer a more effective measure because they provide a more accurate and in-depth picture of a portfolio’s performance. Rather than “point-in-time” results anchored by the end of the month or quarter, |
| rolling returns account for the fact that investors typically do not invest at the beginning of the current five- or 10-year period but instead are in fact investing over many periods. |
| So instead of assuming that an investment was made on January 1, rolling returns calculate all of the periods starting not only in January, but also in February, March, April, etc. For example, a monthly five-year rolling return accounts for all of the five-year returns beginning at a given inception date and advancing one month sequentially. This method allows an investor to evaluate the consistency of a fund’s performance over time—including the ups and downs of market cycles, which are an important test of a manager’s skill. |
| We believe that rolling returns provide a particularly robust analytical tool for evaluating manager performance, especially during volatile periods when simply shifting the performance date range one or two months in either direction can paint a very different picture. |
| Royce Funds1 vs. The Benchmark2 |
| Monthly Rolling Average Annual Return Periods and Relative Results Since Fund Inception or Most Recent 20 Years through 6/30/17 |
| Average Annual 10-Year Rolling Return | Average Annual 5-Year Rolling Return | |||||||||||||||||||||||||||||||||||||||||||
| FUND | PERIODS BEATING THE INDEX | FUND AVG (%)3 | INDEX AVG (%)3 | PERIODS BEATING THE INDEX | FUND AVG (%)3 | INDEX AVG (%)3 | ||||||||||||||||||||||||||||||||||||||
| U.S. EQUITY | ||||||||||||||||||||||||||||||||||||||||||||
| Dividend Value | 29/38 | 76% | 7.8 | 7.3 | 57/98 | 58% | 8.8 | 8.2 | ||||||||||||||||||||||||||||||||||||
| Low-Priced Stock | 66/121 | 55% | 8.2 | 6.7 | 119/181 | 66% | 8.7 | 7.7 | ||||||||||||||||||||||||||||||||||||
| Micro-Cap | 60/85 | 71% | 7.9 | 6.2 | 92/145 | 63% | 8.5 | 7.9 | ||||||||||||||||||||||||||||||||||||
| Opportunity | 97/121 | 80% | 9.6 | 6.7 | 133/181 | 73% | 11.4 | 7.7 | ||||||||||||||||||||||||||||||||||||
| Pennsylvania Mutual | 91/121 | 75% | 8.9 | 6.7 | 127/181 | 70% | 10.0 | 7.7 | ||||||||||||||||||||||||||||||||||||
| Premier | 120/121 | 99% | 10.5 | 6.7 | 131/181 | 72% | 10.9 | 7.7 | ||||||||||||||||||||||||||||||||||||
| Small-Cap Leaders | 25/49 | 51% | 8.1 | 7.7 | 61/109 | 56% | 7.9 | 7.6 | ||||||||||||||||||||||||||||||||||||
| Small-Cap Value | 44/73 | 60% | 9.0 | 7.8 | 76/133 | 57% | 9.7 | 8.7 | ||||||||||||||||||||||||||||||||||||
| Small/Mid-Cap Premier | 99/121 | 82% | 9.4 | 6.7 | 139/181 | 77% | 10.3 | 7.7 | ||||||||||||||||||||||||||||||||||||
| Smaller-Companies Growth | 37/73 | 51% | 8.5 | 7.8 | 54/133 | 41% | 9.7 | 8.7 | ||||||||||||||||||||||||||||||||||||
| Special Equity | 96/110 | 87% | 9.3 | 6.7 | 106/170 | 62% | 10.7 | 8.3 | ||||||||||||||||||||||||||||||||||||
| Total Return | 72/121 | 60% | 8.1 | 6.7 | 115/181 | 64% | 9.4 | 7.7 | ||||||||||||||||||||||||||||||||||||
| GLOBAL/INTERNATIONAL EQUITY | ||||||||||||||||||||||||||||||||||||||||||||
| Global Financial Services | 19/43 | 44% | 7.1 | 7.5 | 32/103 | 31% | 7.1 | 7.7 | ||||||||||||||||||||||||||||||||||||
| 1 Included are all Royce Funds with at least 12 years of history. |
| 2 The Russell 2000 Index is the benchmark for most funds. Royce Micro-Cap Fund is compared to the Russell Microcap Index from the inception of that index on 6/30/00. |
| 3 Average return shown is the average of all month-end trailing five- and 10-year total returns. |
| Past performance is no guarantee of future results. For more information on performance please see page 8. |
| This page is not part of the 2017 Semiannual Report to Shareholders | 9 |
| MANAGERS’ DISCUSSION |
| Royce Dividend Value Fund (RDV) |
 |
| Chuck Royce Jay Kaplan, CFA |
| FUND PERFORMANCE |
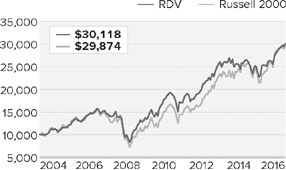
| Royce Dividend Value Fund increased 7.7% for the year-to-date period ended June 30, 2017, outpacing its small-cap benchmark, the Russell 2000 Index, which was up 5.0% for the same period. The first half of 2017 saw a number of reversals in market leadership from 2016, and three factors that hurt relative performance in 2016 became positives in the first half of 2017. Mid-cap stocks, in which a large percentage of the Fund’s assets are invested, outpaced their small-cap peers (the Russell Midcap Index rose 8.0% in the first half); the Fund also benefited from its investments in international stocks, as non-U.S. equities meaningfully outperformed their domestic counterparts; and investments in capital markets companies, by far the portfolio’s largest industry group weighting and the home of several of its non-U.S. holdings, which substantially beat both the small-cap index as a whole and the capital markets companies in the Russell 2000 for the first half. Altogether, it was an impressive performance in a period when most U.S. small- and mid-cap dividend payers lagged. |
| Dividend Value was up 4.3% for the first quarter versus a 2.5% gain for its benchmark. The Fund then enjoyed a solid second quarter, advancing 3.3% while the Russell 2000 again rose 2.5%. Dividend Value also outperformed the small-cap index for the since inception (5/3/04) period ended June 30, 2017. |
| WHAT WORKED... AND WHAT DIDN’T |
| Seven of the portfolio’s 11 equity sectors finished the first half with net gains. Financials and Industrials led by significant margins, followed by Materials. Results for each of the two top sectors were dominated by a single industry group—capital markets for Financials and machinery for Industrials. Interestingly, the Fund’s two top contributing positions came from other industries. Recordati is an Italian pharmaceuticals company. This industry has been one of the few high-growth areas in an otherwise sluggish Italian economy, with drug companies increasing output and exports over the last seven years, which has helped to draw investors to Recordati’s shares. Global staffing and services company—and top-10 holding—ManpowerGroup saw its stock benefit from improved topline growth and a strong bottom line in 2016, solid fiscal first-quarter 2017 earnings, and a brightening global employment picture. |
| Another top-10 position, alternative asset manager KKR & Co. L.P. was helped by strong investment performance, growth in its balance sheet investments, and improved fee-related earnings. IDEX Corporation, also a top-10 holding, is a Norwegian machinery company specializing in fingerprint, imaging, and recognition technology. Its shares were somewhat volatile during the first half, but we were pleased to see a strong increase in revenues as the firm progressed toward the commercialization of its sensor solution for biometric credit cards. Of the four sectors that detracted from first-half performance—Energy, Consumer Discretionary, Consumer Staples, and Telecommunication Services—none made a significant negative impact. The only industry to do so was specialty retail (Consumer Discretionary), where secular shifts in shopping and spending habits, driven in large part by the deep discounts offered by Amazon, have been wreaking havoc on sales and margins over the last few years. We sold our shares of footwear, headwear, and sports apparel retailer Genesco as first-quarter results and revised full-year guidance fell well below expectations due to intensified competition and management’s overconfidence that it could rebalance inventory to compensate for a key fashion shift it missed last year in its Journeys footwear chain. Ongoing net losses from declining sales also led us to sell our shares in value-priced fashion retailer The Cato Corporation. Retail was not the only industry undergoing problems in the first half. Tumbling oil prices created formidable challenges for companies involved in energy, and land and platform rig operator (and long-time Royce holding) Helmerich & Payne was no exception, as sales were adversely affected. We retain our high regard for its innovative approach to its core business, which included the early adoption of flexible rigs, and like the way it has been executing through this latest round of challenges for its industry. |
| Relative to the Russell 2000, the Fund benefited most from stock selection in its two top-performing industries—capital markets and machinery. Hurting relative results were our significantly lower weighting in Health Care, specifically surging biotechnology stocks. Dividends are scarce throughout Health Care in the Russell 2000, where less than 8% of the companies in the sector were dividend payers at the end of June 2017, which accounts for the sector’s perennial underweight in the portfolio. A combination of our underweight and ineffective stock picks also hampered results in Information Technology. |
| Top Contributors to Performance | |||
| Year-to-Date Through 6/30/17 (%)1 | |||
| Recordati | 0.50 | ||
| ManpowerGroup | 0.50 | ||
| KKR & Co. L.P. | 0.48 | ||
| IDEX Corporation | 0.44 | ||
| Hunter Douglas | 0.42 | ||
| 1 Includes dividends | |||
| Top Detractors from Performance | |||
| Year-to-Date Through 6/30/17 (%)2 | |||
| Helmerich & Payne | -0.28 | ||
| Genesco | -0.22 | ||
| Compass Minerals International | -0.22 | ||
| Western Union | -0.19 | ||
| Cato Corporation (The) Cl. A | -0.18 | ||
| 2 Net of dividends | |||
| CURRENT POSITIONING AND OUTLOOK |
| The most notable change we made in the first half was a reduction in both exposure and the number of names in the struggling specialty retail group, where we parted ways with The Buckle, Shoe Carnival, and Stein Mart. We are satisfied with our relatively large international weighting as we expect continued improvement in the global growth picture during the second half of 2017. At the end of June, the Fund’s three largest sectors—Financials, Industrials, and Materials—were also our three biggest overweights, consistent with our belief that cyclical companies with growing earnings look likely to lead over the next few years. |
| 10 | The Royce Funds 2017 Semiannual Report to Shareholders |
| PERFORMANCE AND PORTFOLIO REVIEW | TICKER SYMBOLS RYDVX RDVIX RDIIX RDVCX |
| Performance and Expenses Average Annual Total Return (%) Through 6/30/17 | ||||||||||||
| JAN-JUN 20171 | 1-YR | 3-YR | 5-YR | 10-YR | SINCE INCEPTION (5/3/04) | |||||||
| RDV | 7.72 | 20.07 | 3.82 | 11.02 | 6.85 | 8.74 | ||||||
| Annual Operating Expenses: 1.34% | ||||||||||||
| 1 Not annualized | ||||||||||||
| Relative Risk Adjusted Returns: Monthly Rolling Sharpe Ratios Since Inception Through 6/30/17 On a monthly rolling risk-adjusted basis, the Fund outperformed the Russell 2000 in 100% of all 10-year periods and 66% of all 5-year periods. | ||||||||||||
| PERIODS BEATING THE INDEX | FUND AVG (%)1 | INDEX AVG (%)1 | ||||||||||||
| 10-year | 38/38 | 100% | 0.46 | 0.40 | ||||||||||
| 5-year | 65/98 | 66% | 0.55 | 0.49 | ||||||||||

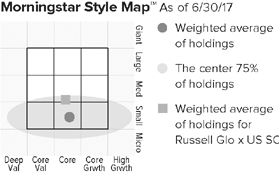
The Morningstar Style Map is the Morningstar Style Box™ with the center 75% of fund holdings plotted as the Morningstar Ownership Zone™. The Morningstar Style Box is designed to reveal a fund’s investment strategy. The Morningstar Ownership Zone provides detail about a portfolio’s investment style by showing the range of stock sizes and styles. The Ownership Zone is derived by plotting each stock in the portfolio within the proprietary Morningstar Style Box. Over time, the shape and location of a fund’s ownership zone may vary. See page 131 for additional information. |
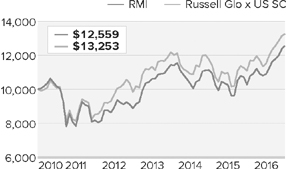
Value of $10,000
| Top 10 Positions | ||
| % of Net Assets | ||
| Dentsply Sirona | 2.6 | |
| KKR & Co. L.P. | 2.3 | |
| ManpowerGroup | 2.3 | |
| First Republic Bank | 2.1 | |
| IDEX Corporation | 2.1 | |
| Quaker Chemical | 2.0 | |
| Donaldson Company | 1.9 | |
| Reliance Steel & Aluminum | 1.9 | |
| Expeditors International of Washington | 1.9 | |
| FLIR Systems | 1.8 | |
| Portfolio Sector Breakdown | ||
| % of Net Assets | ||
| Financials | 29.8 | |
| Industrials | 28.1 | |
| Materials | 13.3 | |
| Consumer Discretionary | 9.2 | |
| Information Technology | 7.5 | |
| Health Care | 4.7 | |
| Energy | 2.7 | |
| Utilities | 1.4 | |
| Consumer Staples | 1.2 | |
| Telecommunication Services | 0.5 | |
| Real Estate | 0.2 | |
| Miscellaneous | 1.1 | |
| Cash and Cash Equivalents | 0.3 | |
| Calendar Year Total Returns (%) | ||
| YEAR | RDV | |
| 2016 | 16.4 | |
| 2015 | -5.7 | |
| 2014 | -2.1 | |
| 2013 | 30.7 | |
| 2012 | 16.9 | |
| 2011 | -4.5 | |
| 2010 | 30.1 | |
| 2009 | 37.7 | |
| 2008 | -31.5 | |
| 2007 | -0.0 | |
| 2006 | 19.9 | |
| 2005 | 7.3 | |
| Upside/Downside Capture Ratios | |||
| Periods Ended 6/30/17 (%) | |||
| UPSIDE | DOWNSIDE | |||
| 10-Year | 86 | 81 | ||
| From 6/30/04 (Start of Fund’s First Full Quarter) | 87 | 76 | ||
| Portfolio Diagnostics | |||
| Fund Net Assets | $198 million | ||
| Number of Holdings | 106 | ||
| Turnover Rate | 11% | ||
| Average Market Capitalization1 | $4,263 million | ||
| Weighted Average P/E Ratio2,3 | 20.2x | ||
| Weighted Average P/B Ratio2 | 2.8x | ||
| Active Share4 | 97% | ||
| U.S. Investments (% of Net Assets) | 72.8% | ||
| Non-U.S. Investments (% of Net Assets) | 26.9% | ||
| 1 | Geometric Average. This weighted calculation uses each portfolio holding’s market cap in a way designed to not skew the effect of very large or small holdings; instead, it aims to better identify the portfolio’s center, which Royce believes offers a more accurate measure of average market cap than a simple mean or median. |
| 2 | Harmonic Average. This weighted calculation evaluates a portfolio as if it were a single stock and measures it overall. It compares the total market value of the portfolio to the portfolio’s share in the earnings or book value, as the case may be, of its underlying stocks. |
| 3 | The Fund’s P/E ratio calculation excludes companies with zero or negative earnings (6% of portfolio holdings as of 6/30/17). |
| 4 | Active Share is the sum of the absolute values of the different weightings of each holding in the Fund versus each holding in the benchmark, divided by two. |
| Important Performance and Expense Information |
All performance information in this Report reflects past performance, is presented on a total return basis, reflects the reinvestment of distributions, and does not reflect the deduction of taxes that a shareholder would pay on fund distributions or the redemption of fund shares. Past performance is no guarantee of future results. Investment return and principal value of an investment will fluctuate, so that shares may be worth more or less than their original cost when redeemed. Shares redeemed within 30 days of purchase may be subject to a 1% redemption fee payable to the Fund, which is not reflected in the performance shown above; if it were, performance would be lower. Current month-end performance may be higher or lower than performance quoted and may be obtained at www.roycefunds.com. All performance and risk information reflects results of the Service Class (its oldest class). Certain immaterial adjustments were made to the net assets of Royce Dividend Value Fund at 6/30/15 for financial reporting purposes, and as a result the net asset values for shareholder transactions on that date and the calendar year Total Returns (%) based on those net asset values differ from the adjusted net asset values and calendar year total returns reported in the Financial Highlights. Operating expenses reflect the Fund’s gross total annual operating expenses for the Service Class as of the Fund’s most current prospectus and include management fees, 12b-1 distribution and service fees, and other expenses. Regarding the “Top Contributors” and “Top Detractors” tables shown above, the sum of all contributors to, and all detractors from, performance for all securities in the portfolio would approximate the Fund’s year-to-date performance for 2017. The Sharpe Ratio is calculated for a specified period by dividing a fund’s annualized excess returns by its annualized standard deviation. The higher the Sharpe ratio, the better the fund’s historical risk-adjusted performance. Upside Capture Ratio measures a manager’s performance in up markets relative to the Fund’s benchmark. It is calculated by measuring the Fund’s performance in quarters when the benchmark went up and dividing it by the benchmark’s return in those quarters. Downside Capture Ratio measures a manager’s performance in down markets relative to the Fund’s benchmark (Russell 2000). It is calculated by measuring the Fund’s performance in quarters when the benchmark goes down and dividing it by the benchmark’s return in those quarters. |
| The Royce Funds 2017 Semiannual Report to Shareholders | 11 |
| MANAGERS’ DISCUSSION |
| Royce Global Financial Services (RFS) |
 |
| Chuck Royce Chris Flynn |
| FUND PERFORMANCE |
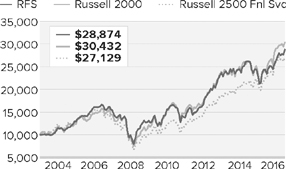
| Royce Global Financial Services Fund advanced an impressive 9.8% for the year-to-date period ended June 30, 2017, well ahead of both its small-cap benchmark, the Russell 2000 Index, and the Russell 2500 Financial Services Index, which advanced 5.0% and 3.3%, respectively, for the same period. As we detail below, it was a particularly strong period for our intentionally unconventional approach to financial companies. It was also an opportune time in which to take a global approach to equities, virtually regardless of sector. The first half of 2017 was the best for stocks on a global basis since 2009. |
| The Fund’s strength was consistent on both an absolute and relative basis throughout the first half. During the first quarter, Global Financial Services rose 4.5% versus respective gains of 2.5% and 1.3% for the small-cap index and the financial services component of the Russell 2500 Index. The second quarter saw more of the same as the Fund increased 5.1% versus 2.5% for the Russell 2000 and 2.0% for the Russell 2500 Financial Services Index. Second-quarter strength came from robust results for subindustries such as asset management & custody banks (within capital markets) and regional banks. Given the Fund’s somewhat unconventional sector fund approach, longer-term relative results were less consistent, though satisfying to us on an absolute basis. Global Financial Services outpaced the financial services companies in the Russell 2500 Index for the one-year and since inception periods (12/31/03) ended June 30, 2017. The bookend nature of this short- and long-term outperformance suggests to us that, with interest rates on the rise, the portfolio can continue to benefit from more historically typical conditions. The Fund also beat the Russell 2000 for the five-year period ended June 30, 2017 while trailing narrowly for the since inception period. |
| WHAT WORKED... AND WHAT DIDN’T |
| Our approach to the financial sector is non-traditional in that we have typically been underweight in banks and significantly overweight in capital markets, in large part because our position as a small-cap asset manager makes companies in this industry easier for us to understand at a deep level. Over the last couple of years, we have been increasingly drawn to non-traditional asset managers, specifically in the alternative asset management space, which we think is an undervalued zone in an asset-light business that is not well understood by other investors. U.K.-based emerging market bond specialist Ashmore Group was the best performer in the group as it benefited from increased net inflows and a rebound in emerging market bond performance. Alternative asset manager Fortress Investment Group, LLC was a strong contributor due to its takeover by Japan’s SoftBank. Financial exchanges & data was another standout subindustry, thanks in large part to MarketAxess Holdings, which manages the leading electronic bond trading platform. Its shares soared early in the year, lifted by significant increases in total trading volume, which included records for U.S. high-grade, Eurobond, and emerging market bond average daily volumes. It was a top-20 position at the end of the semiannual period. The portfolio’s top contributor in the first half was FirstService Corporation, a Toronto-based provider of real estate property management services. Its shares rose throughout the year’s first six months thanks to strong revenue and profit growth that exceeded expectations. |
| Toronto-based Dundee Corporation, which is involved in wealth management, real estate, and natural resources, was the largest detractor in the first half as mounting losses in mining and resource based activities put downward pressure on its shares. BofI Holding is the holding company for Bank of Internet USA, a consumer-focused nationwide savings bank. Its previously rapid growth was slowed after the firm reported disappointing earnings and a deceleration in loan growth. MBIA provides financial guarantee insurance and has significant exposure to Puerto Rican bonds. Investors became increasingly concerned that losses on these bonds might have a meaningfully negative impact on MBIA’s balance sheet and credit rating. |
| Top Contributors to Performance | |||
| Year-to-Date Through 6/30/17 (%)1 | |||
| FirstService Corporation | 1.05 | ||
| Ashmore Group | 0.67 | ||
| Fortress Investment Group LLC Cl. A | 0.65 | ||
| Live Oak Bancshares | 0.55 | ||
| MarketAxess Holdings | 0.52 | ||
| 1 Includes dividends | |||
| Top Detractors from Performance | |||
| Year-to-Date Through 6/30/17 (%)2 | |||
| Dundee Corporation Cl. A | -0.41 | ||
| BofI Holding | -0.26 | ||
| MBIA | -0.23 | ||
| JSE | -0.23 | ||
| Medley Management Cl. A | -0.19 | ||
| 2 Net of dividends | |||
| CURRENT POSITIONING AND OUTLOOK |
| The Fund’s long-term holdings continue to satisfy three criteria: business models that are highly profitable and preferably asset-light; industries where we believe our asset management experience yields relevant insights; and subsectors across financial services that appear positioned for above-average revenue growth. Areas where we see attractive growth prospects currently include specialized traditional asset management, private equity and private debt alternative asset management, wealth management, boutique M&A advisory firms, non-traditional providers of transaction platforms, and financial service providers in emerging economies. In addition, the Fund aims for opportunistic purchases in companies and industries that we believe are heading for improved conditions. The recent increased weighting in banks falls into this category. We anticipate that an economic environment with a steeper yield curve, a moderate pick-up in economic growth, and lighter regulation will support faster loan growth with expanding margins for many small-cap banks. The outlook we have developed from meeting with companies is one of increasing cyclical growth, particularly outside the U.S., though at a “just right” Goldilocks pace, and not so fast as to lead to an aggressive central bank response. |
| 12 | The Royce Funds 2017 Semiannual Report to Shareholders |
| PERFORMANCE AND PORTFOLIO REVIEW | TICKER SYMBOLS RYFSX RGFIX |
| Performance and Expenses | ||||||||||||||
| Average Annual Total Return (%) Through 6/30/17 | ||||||||||||||
| JAN-JUN 20171 | 1-YR | 3-YR | 5-YR | 10-YR | SINCE INCEPTION (12/31/03) | |||||||||
| RFS | 9.83 | 23.41 | 5.67 | 14.13 | 5.85 | 8.17 | ||||||||
| Annual Gross Operating Expenses: 1.78% Annual Net Operating Expenses: 1.60% | ||||||||||||||
| 1 Not annualized | ||||||||||||||

The Morningstar Style Map is the Morningstar Style Box™ with the center 75% of fund holdings plotted as the Morningstar Ownership Zone™. The Morningstar Style Box is designed to reveal a fund’s investment strategy. The Morningstar Ownership Zone provides detail about a portfolio’s investment style by showing the range of stock sizes and styles. The Ownership Zone is derived by plotting each stock in the portfolio within the proprietary Morningstar Style Box. Over time, the shape and location of a fund’s ownership zone may vary. See page 131 for additional information. |
Value of $10,000
| Top 10 Positions | ||
| % of Net Assets | ||
| E-L Financial | 3.0 | |
| FirstService Corporation | 2.9 | |
| Ashmore Group | 2.5 | |
| First Citizens BancShares Cl. A | 2.5 | |
| Popular | 2.3 | |
| Sprott | 2.3 | |
| Northern Trust | 2.2 | |
| Live Oak Bancshares | 2.1 | |
| Franco-Nevada Corporation | 2.1 | |
| Virtu Financial Cl. A | 2.1 | |
| Portfolio Industry Breakdown | ||
| % of Net Assets (Subject to Change) | ||
| Capital Markets | 48.8 | |
| Banks | 17.2 | |
| Real Estate Management & Development | 7.2 | |
| Insurance | 6.8 | |
| IT Services | 3.0 | |
| Software | 2.5 | |
| Metals & Mining | 2.1 | |
| Professional Services | 1.7 | |
| Marine | 1.4 | |
| Thrifts & Mortgage Finance | 1.2 | |
| Investment Companies | 1.0 | |
| Equity Real Estate Investment Trusts (REITs) | 0.9 | |
| Diversified Financial Services | 0.3 | |
| Hotels, Restaurants & Leisure | 0.2 | |
| Diversified Consumer Services | 0.1 | |
| Internet Software & Services | 0.1 | |
| Miscellaneous | 3.0 | |
| Cash and Cash Equivalents | 2.5 | |
| Upside/Downside Capture Ratios | ||||
| Periods Ended 6/30/17 (%) | ||||
| UPSIDE | DOWNSIDE | |||
| 10-Year | 87 | 90 | ||
| Fund’s First Full Quarter (12/31/03) | 87 | 81 | ||
| Calendar Year Total Returns (%) | ||
| YEAR | RFS | |
| 2016 | 12.9 | |
| 2015 | -4.7 | |
| 2014 | 3.5 | |
| 2013 | 42.0 | |
| 2012 | 20.7 | |
| 2011 | -11.3 | |
| 2010 | 18.5 | |
| 2009 | 32.1 | |
| 2008 | -35.4 | |
| 2007 | -4.7 | |
| 2006 | 24.8 | |
| 2005 | 12.2 | |
| 2004 | 15.1 | |
| Portfolio Country Breakdown1,2 | ||
| % of Net Assets | ||
| United States | 56.2 | |
| Canada | 15.3 | |
| United Kingdom | 8.8 | |
| Switzerland | 2.6 | |
| India | 1.9 | |
| France | 1.7 | |
| Hong Kong | 1.6 | |
| South Africa | 1.6 | |
| Brazil | 1.6 | |
| 1 | Represents countries that are 1.5% or more of net assets. |
| 2 | Securities are categorized by the country of their headquarters. |
| Portfolio Diagnostics | ||
| Fund Net Assets | $52 million | |
| Number of Holdings | 92 | |
| Turnover Rate | 10% | |
| Average Market Capitalization1 | $2,206 million | |
| Weighted Average P/E Ratio2,3 | 19.4x | |
| Weighted Average P/B Ratio2 | 2.1x | |
| Active Share4 | 99% | |
| 1 | Geometric Average. This weighted calculation uses each portfolio holding’s market cap in a way designed to not skew the effect of very large or small holdings; instead, it aims to better identify the portfolio’s center, which Royce believes offers a more accurate measure of average market cap than a simple mean or median. |
| 2 | Harmonic Average. This weighted calculation evaluates a portfolio as if it were a single stock and measures it overall. It compares the total market value of the portfolio to the portfolio’s share in the earnings or book value, as the case may be, of its underlying stocks. |
| 3 | The Fund’s P/E ratio calculation excludes companies with zero or negative earnings (8% of portfolio holdings as of 6/30/17). |
| 4 | Active Share is the sum of the absolute values of the different weightings of each holding in the Fund versus each holding in the benchmark, divided by two. |
| Important Performance and Expense Information All performance information in this Report reflects past performance, is presented on a total return basis, reflects the reinvestment of distributions, and does not reflect the deduction of taxes that a shareholder would pay on fund distributions or the redemption of fund shares. Past performance is no guarantee of future results. Investment return and principal value of an investment will fluctuate, so that shares may be worth more or less than their original cost when redeemed. Shares redeemed within 30 days of purchase may be subject to a 1% redemption fee payable to the Fund, which is not reflected in the performance shown above; if it were, performance would be lower. Current month-end performance may be higher or lower than performance quoted and may be obtained at www.roycefunds.com. Gross operating expenses reflect the Fund’s gross total annual operating expenses for the Service Class and include management fees, 12b-1 distribution and service fees, other expenses and acquired fund fees and expenses. Net operating expenses reflect contractual fee waivers and/or expense reimbursements. All expense information is reported as of the Fund’s most current prospectus. Royce & Associates has contractually agreed to waive fees and/or reimburse expenses to the extent necessary to maintain the Fund’s net annual operating expenses, (excluding brokerage commissions, taxes, interest, litigation expenses, acquired fund fees and expenses, and other expenses not borne in the ordinary course of business), at or below 1.49% through April 30, 2018. Acquired fund fees and expenses reflect the estimated amount of the fees and expenses incurred indirectly by the Fund through its investments in mutual funds, hedge funds, private equity funds, and other investment companies. Regarding the “Top Contributors” and “Top Detractors” tables shown above, the sum of all contributors to, and all detractors from, performance for all securities in the portfolio would approximate the Fund’s year-to-date performance for 2017. Upside Capture Ratio measures a manager’s performance in up markets relative to the Fund’s benchmark. It is calculated by measuring the Fund’s performance in quarters when the benchmark went up and dividing it by the benchmark’s return in those quarters. Downside Capture Ratio measures a manager’s performance in down markets relative to the Fund’s benchmark (Russell 2000). It is calculated by measuring the Fund’s performance in quarters when the benchmark goes down and dividing it by the benchmark’s return in those quarters. |
| The Royce Funds 2017 Semiannual Report to Shareholders | 13 |
| MANAGERS’ DISCUSSION | ||
| Royce International Micro-Cap Fund (RMI) |
 |
| Jim Harvey, CFA Dilip Badlani, CFA |
| FUND PERFORMANCE The first half of 2017 saw an impressive rebound for international equities, and Royce International Micro-Cap Fund fully participated. For the year-to-date period ended June 30, 2017, the Fund advanced 15.2%, just ahead of the 15.0% gain for its benchmark, the Russell Global ex-U.S. Small Cap Index, for the same period. After several years in which international small- and micro-cap stocks languished, the current resurgence has been more than welcome. The Fund got off to a strong start on an absolute basis in 2017, climbing 8.1% in the first quarter compared to 9.0% for its international small-cap benchmark. In the second quarter, the Fund improved on a relative basis, gaining 6.6% versus 5.5% for the benchmark. We were also pleased that International Micro-Cap beat the Russell Global ex-U.S. Small Cap for the one- and three-year periods ended June 30, 2017. |
| WHAT WORKED... AND WHAT DIDN’T |
| Nine of the Fund’s 10 equity sectors made positive contributions to first-half performance, with the most substantial positive impacts coming from its three largest—Information Technology, Industrials, and Consumer Discretionary. At the industry level, three technology industries led by a wide margin—IT services, semiconductors & semiconductor equipment, and electronic equipment, instruments & components. Energy was the only sector that detracted. It did so with comparatively minor losses. Net losses at the industry level were similarly modest, with oil, gas & consumable fuels (Energy) and distributors (Consumer Discretionary) detracting most. |
| The Fund’s top contributing position for the semiannual period was South Korea’s Modetour Network. One of that nation’s largest travel agencies, the company provides a wide range of services that include overseas bookings, package tours, air courier services, and discounted airline tickets. Modetour has benefited from South Korea’s growing GDP per capita, which has led to increased spending on travel. Seeing ongoing potential, we held a decent-sized position at the end of June. Conviviality is the largest distributor of liquor in the United Kingdom and also operates franchised off-license and convenience chain stores in the U.K. The company was formed through a series of acquisitions that were completed in 2015-16. The anticipated synergies from the combination have recently begun to bear fruit, lifting its stock price. |
| Canada’s AGT Food and Ingredients made the biggest negative impact among the portfolio’s holdings. The company exports pulses—edible seeds—as well as rice, wheat, and other staples. It experienced a major headwind as its key market of India had higher-than-anticipated pulse output of its own, thus curtailing demand for imports. There has also been heightened uncertainty surrounding a possible policy shift by the Indian government for imported pulses. Liking its core business and long-term prospects, we held shares at the end of June. We felt less confident about Quintis, an Australian firm that manages and cultivates sandalwood forests to produce sandalwood oil products. The resignation of its CEO and co-founder in March created uncertainty over the pricing of its Chinese contracts, which exerted substantial downward pressure on its shares. We chose to exit the position over concerns about the company’s uncertain future, including what we deemed to be growing corporate governance risk. |
| Relative to the Russell Global ex-U.S. Small Cap, the Fund benefited most from savvy stock selection in Consumer Discretionary names, our larger weighting in Information Technology, and our significantly lower exposure to the Energy sector, in which share prices mostly followed the downward trajectory of oil prices. Conversely, the portfolio’s cash position had the largest negative effect while stock selection in Health Care and Financials also impeded relative results. Based on geography, positions in Japan and the U.K. contributed most while those in the U.S. and Greece topped the list of countries that detracted. |
| Top Contributors to Performance Year-to-Date Through 6/30/17 (%)1 | |||
| Modetour Network | 0.62 | ||
| Conviviality | 0.61 | ||
| Nova Measuring Instruments | 0.59 | ||
| Integrated Micro-Electronics | 0.54 | ||
| Proact IT Group | 0.40 | ||
| 1 Includes dividends | |||
| Top Detractors from Performance Year-to-Date Through 6/30/17 (%)2 | |||
| AGT Food and Ingredients | -0.37 | ||
| Quintis | -0.37 | ||
| Aegean Marine Petroleum Network | -0.19 | ||
| AURELIUS Equity Opportunities | -0.18 | ||
| Handsome | -0.18 | ||
| 2 Net of dividends | |||
| CURRENT POSITIONING AND OUTLOOK |
| Even after the strong start to 2017, we continue to find attractive opportunities in international micro-cap companies. Valuations in many parts of the world still looked attractive to us at the end of June, especially in the context of expanding global growth. Recent data showed that the second quarter of 2017 was the eurozone’s best in more than six years, boosted by strong manufacturing numbers, job growth, and elevated business confidence. Additionally, in mid-July China reported surprisingly strong GDP growth for the second quarter, driven by increased retail sales, investment, and industry output—all of which exceeded estimates. We also think the historical performance pattern of international small-caps relative to their large-cap peers is relevant. For example, the Russell Global ex-U.S. Small Cap outperformed the Russell Global ex-U.S. Large Cap in both rising and falling rate interest rate environments, but enjoyed a wider edge when rates were moving up. In fact, U.S. dollar investors received the best results when German Bund Yields were rising. This is arguably due to three overlapping factors: bond yields usually rise when economies are improving, international small-caps have more cyclical exposure than international large-caps, and Bund Yields have often risen during periods of U.S. dollar weakness, resulting in enhanced gains for U.S. dollar investors. |
| 14 | The Royce Funds 2017 Semiannual Report to Shareholders |
| PERFORMANCE AND PORTFOLIO REVIEW | TICKER SYMBOLS ROIMX |
| Performance and Expenses | ||||||||||||
| Average Annual Total Return (%) Through 6/30/17 | ||||||||||||
| JAN-JUN 20171 | 1-YR | 3-YR | 5-YR | SINCE INCEPTION (12/31/10) | ||||||||
| RMI | 15.23 | 22.27 | 3.16 | 8.97 | 3.57 | |||||||
| Annual Gross Operating Expenses: 3.35% Annual Net Operating Expenses: 1.64% | ||||||||||||
| 1 Not annualized | ||||||||||||
The Morningstar Style Map is the Morningstar Style Box™ with the center 75% of fund holdings plotted as the Morningstar Ownership Zone™. The Morningstar Style Box is designed to reveal a fund’s investment strategy. The Morningstar Ownership Zone provides detail about a portfolio’s investment style by showing the range of stock sizes and styles. The Ownership Zone is derived by plotting each stock in the portfolio within the proprietary Morningstar Style Box. Over time, the shape and location of a fund’s ownership zone may vary. See page 131 for additional information. |
Value of $10,000
| Top 10 Positions | ||
| % of Net Assets | ||
| Mantra Group | 1.3 | |
| Atento | 1.3 | |
| Huchems Fine Chemical | 1.3 | |
| Minerva | 1.3 | |
| Western Forest Products | 1.2 | |
| Exco Technologies | 1.2 | |
| IDOM | 1.1 | |
| I.T | 1.1 | |
| Eugene Technology | 1.1 | |
| Sitronix Technology | 1.1 | |
| Portfolio Sector Breakdown | ||
| % of Net Assets | ||
| Industrials | 21.6 | |
| Consumer Discretionary | 21.3 | |
| Information Technology | 17.3 | |
| Consumer Staples | 9.5 | |
| Financials | 7.1 | |
| Real Estate | 6.4 | |
| Materials | 6.1 | |
| Health Care | 4.6 | |
| Energy | 1.2 | |
| Cash and Cash Equivalents | 4.9 | |
| Calendar Year Total Returns (%) | ||
| YEAR | RMI | |
| 2016 | 6.3 | |
| 2015 | -1.0 | |
| 2014 | -2.4 | |
| 2013 | 18.9 | |
| 2012 | 13.6 | |
| 2011 | -21.5 | |
| Portfolio Country Breakdown1,2 | ||
| % of Net Assets | ||
| Japan | 19.5 | |
| United Kingdom | 9.6 | |
| Canada | 8.2 | |
| Taiwan | 8.0 | |
| South Korea | 6.3 | |
| Hong Kong | 4.9 | |
| Australia | 4.1 | |
| India | 3.1 | |
| Sweden | 3.1 | |
| Germany | 3.0 | |
| 1 | Represents countries that are 3% or more of net assets. |
| 2 | Securities are categorized by the country of their headquarters. |
| Portfolio Diagnostics | ||
| Fund Net Assets | $7 million | |
| Number of Holdings | 131 | |
| Turnover Rate | 48% | |
| Average Market Capitalization1 | $492 million | |
| Weighted Average P/E Ratio2,3 | 15.9x | |
| Weighted Average P/B Ratio2 | 2.0x | |
| Active Share4 | 99% | |
| 1 | Geometric Average. This weighted calculation uses each portfolio holding’s market cap in a way designed to not skew the effect of very large or small holdings; instead, it aims to better identify the portfolio’s center, which Royce believes offers a more accurate measure of average market cap than a simple mean or median. |
| 2 | Harmonic Average. This weighted calculation evaluates a portfolio as if it were a single stock and measures it overall. It compares the total market value of the portfolio to the portfolio’s share in the earnings or book value, as the case may be, of its underlying stocks. |
| 3 | The Fund’s P/E ratio calculation excludes companies with zero or negative earnings (4% of portfolio holdings as of 6/30/17). |
| 4 | Active Share is the sum of the absolute values of the different weightings of each holding in the Fund versus each holding in the benchmark, divided by two. |
| Important Performance and Expense Information |
All performance information in this Report reflects past performance, is presented on a total return basis, reflects the reinvestment of distributions, and does not reflect the deduction of taxes that a shareholder would pay on fund distributions or the redemption of fund shares. Past performance is no guarantee of future results. Investment return and principal value of an investment will fluctuate, so that shares may be worth more or less than their original cost when redeemed. Shares redeemed within 30 days of purchase may be subject to a 2% redemption fee payable to the Fund, which is not reflected in the performance shown above; if it were, performance would be lower. Current month-end performance may be higher or lower than performance quoted and may be obtained at www.roycefunds.com. Gross operating expenses reflect total gross annual operating expenses and include management fees, 12b-1 distribution and service fees, and other expenses. Net operating expenses reflect contractual fee waivers and/or expense reimbursements. All expense information is reported as of the Fund’s most current prospectus. Royce & Associates has contractually agreed to waive its fees and/or reimburse operating expenses, to the extent necessary to maintain the Fund’s net annual operating expenses, (excluding brokerage commissions, taxes, interest, litigation expenses, acquired fund fees and expenses, and other expenses not borne in the ordinary course of business), at or below 1.64% through April 30, 2018 and at or below 1.99% through April 30, 2027. Regarding the “Top Contributors” and “Top Detractors” tables shown above, the sum of all contributors to, and all detractors from, performance for all securities in the portfolio would approximate the Fund’s year-to-date performance for 2017. |
| The Royce Funds 2017 Semiannual Report to Shareholders | 15 |
| MANAGERS’ DISCUSSION | ||
| Royce International Premier Fund (RIP) |
 |
| David Nadel Mark Rayner, CA |
| FUND PERFORMANCE The first half of 2017 saw an impressive rebound for international equities, and the high-quality approach we use in Royce International Premier Fund more than fully participated. For the year-to-date period ended June 30, 2017, the Fund advanced 22.3%, well ahead of the 15.0% gain for its benchmark, the Russell Global ex-U.S. Small Cap Index, for the same period. After several years in which international small-caps languished, the current resurgence has been more than welcome. The Fund got off to a strong start in 2017, climbing 9.3% in the first quarter compared to 9.0% for its international small-cap benchmark. In the second quarter, the Fund did even better on both an absolute and relative basis, gaining 11.9% versus 5.5% for the index. We were also pleased that International Premier beat the Russell Global ex-U.S. Small Cap for the one-, three-, five-year, and since inception (12/31/10) periods ended June 30, 2017. The Fund’s average annual total return since inception was 7.2%. |
| WHAT WORKED... AND WHAT DIDN’T |
| All of the Fund’s nine equity sectors made positive contributions to first-half results. Industrials led by a sizable margin while Information Technology also made an impressive contribution, as did Financials and Health Care. By making the smallest contribution to first-half results, the Energy sector finished last. |
| Health care equipment & supplies (Health Care) enjoyed a substantial advantage over the portfolio’s other industry groups in the first half of 2017. Its high positive impact was driven by a trio of holdings—Fisher & Paykel Healthcare, a New Zealand company that makes products which treat sleep apnea, STRATEC Biomedical, a German firm that provides automated equipment and systems that analyze chemical and biological compounds, and Germany’s Carl Zeiss Meditec, which makes screening, diagnostic, and therapeutic systems that treat cataracts, glaucoma, and other vision problems. Showing the diversity of both the sector and geographies, Health Care was also home to the Fund’s two largest detractors at the position level. Shares of French veterinary medicine provider Virbac rallied late in 2016 after the U.S. Food & Drug Administration rescinded the warning letter on its St. Louis facility, only to take another hit in mid-March 2017 when an otherwise solid earnings announcement was accompanied by tepid guidance, including an anticipated decline in fiscal first-quarter revenues. We began to add shares in May. We also built our position in Brazilian dental benefits provider OdontoPrev after first-quarter results revealed some margin erosion and less robust growth than its competitors. We viewed this as a temporary setback and believe that OdontoPrev will remain a market leader. |
| Two financial companies contributed most overall to first-half results. Shares of Indian consumer finance business Bajaj Finance rebounded off a relatively weak fourth quarter of 2016 that resulted from the government’s surprising decision to demonetize in November. During the first half of 2017, however, fiscal third-quarter results (released in January) revealed margin improvement and high asset quality while fiscal fourth-quarter results released in May showed the strength of Bajaj’s 320-city presence in its consumer and commercial lending operations. We believe the company can continue to benefit from its strong position in India’s nascent credit markets. Swiss financial advisory firm Partners Group Holding saw its stock climb on the back of results reported in January that included higher-than-expected assets under management and improved profitability, as well as the market’s growing realization that much of the firm’s performance-fee stream recurs more frequently than is the industry’s norm. Japan’s Relo Group, which specializes in corporate benefits and overseas relocation support, enjoyed a terrific first half as the firm experienced better-than-anticipated growth in its property management business. |
| The Fund’s relative advantage over its benchmark in the first half was mostly the result of strong stock selection in three of its four largest sectors—Information Technology, Industrials, and Financials. By contrast, stock selection in Materials and our cash position created modest drags on first-half results. On a geographic basis, the portfolio’s large weightings in the U.K. and Japan helped performance while Brazil caused a minor drag. |
| Top Contributors to Performance Year-to-Date Through 6/30/17 (%)1 | |||
| Bajaj Finance | 1.60 | ||
| Partners Group Holding | 0.99 | ||
| Relo Group | 0.87 | ||
| XP Power | 0.84 | ||
| Mayr-Melnhof Karton | 0.76 | ||
| 1 Includes dividends | |||
| Top Detractors from Performance Year-to-Date Through 6/30/17 (%)2 | |||
| Virbac | -0.24 | ||
| OdontoPrev | -0.19 | ||
| SH Kelkar & Company | -0.16 | ||
| Spotless Group Holdings | -0.01 | ||
| Fidessa Group | 0.00 | ||
| 2 Net of dividends | |||
| CURRENT POSITIONING AND OUTLOOK |
| We were encouraged by the recent victories for more moderate parties in France, Austria, and the Netherlands. We are also hopeful that Theresa May’s shaky win may stimulate productive debate about the details of the Brexit. More important, we see the emerging data supporting strong growth in the eurozone as a significantly positive development. This year’s second quarter was the eurozone’s best in more than six years, buoyed by strong manufacturing numbers, job growth, and elevated business confidence. Moreover, we continue to see improving profitability from many holdings. Prior to 2017, profit margins appeared spring-loaded for several companies because their respective recoveries from the 2008-09 Financial Crisis were slow and often fitful. We have therefore been pleased to see that recent margin improvement for several holdings has been driven by ROIC-oriented key performance indicators. For disciplined quality-centric investors, then, the investment opportunities in high-quality international small-caps remain attractive from our perspective. |
| 16 | The Royce Funds 2017 Semiannual Report to Shareholders |
| PERFORMANCE AND PORTFOLIO REVIEW | TICKER SYMBOLS RYIPX RIPNX RINRX RINPX |
| Performance and Expenses | ||||||||||
| Average Annual Total Return (%) Through 6/30/17 | ||||||||||
| JAN-JUN 20171 | 1-YR | 3-YR | 5-YR | SINCE INCEPTION (12/31/10) | ||||||
| RIP | 22.33 | 20.11 | 7.73 | 11.66 | 7.18 | |||||
| Annual Gross Operating Expenses: 1.84% Annual Net Operating Expenses: 1.44% | ||||||||||
| 1 Not annualized | ||||||||||
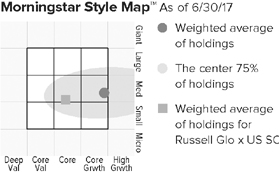
The Morningstar Style Map is the Morningstar Style Box™ with the center 75% of fund holdings plotted as the Morningstar Ownership Zone™. The Morningstar Style Box is designed to reveal a fund’s investment strategy. The Morningstar Ownership Zone provides detail about a portfolio’s investment style by showing the range of stock sizes and styles. The Ownership Zone is derived by plotting each stock in the portfolio within the proprietary Morningstar Style Box. Over time, the shape and location of a fund’s ownership zone may vary. See page 131 for additional information. |
Value of $10,000

| Top 10 Positions | ||
| % of Net Assets | ||
| VZ Holding | 3.2 | |
| Mayr-Melnhof Karton | 3.0 | |
| Partners Group Holding | 2.9 | |
| Meitec Corporation | 2.5 | |
| USS | 2.5 | |
| Santen Pharmaceutical | 2.5 | |
| Relo Group | 2.3 | |
| Vakrangee | 2.3 | |
| Thermador Groupe | 2.3 | |
| Bajaj Finance | 2.2 | |
| Portfolio Sector Breakdown | ||
| % of Net Assets | ||
| Industrials | 24.6 | |
| Health Care | 19.2 | |
| Information Technology | 17.9 | |
| Financials | 10.7 | |
| Materials | 10.3 | |
| Consumer Discretionary | 5.6 | |
| Consumer Staples | 3.4 | |
| Real Estate | 2.3 | |
| Energy | 1.4 | |
| Cash and Cash Equivalents | 4.6 | |
| Upside/Downside Capture Ratios | ||||||||||||||
| Periods Ended 6/30/17 (%) | ||||||||||||||
| UPSIDE | DOWNSIDE | |||||||||||||
| Fund’s First Full Quarter (12/31/10) | 107 | 83 | ||||||||||||
| Calendar Year Total Returns (%) | ||
| YEAR | RIP | |
| 2016 | -1.1 | |
| 2015 | 16.2 | |
| 2014 | -8.2 | |
| 2013 | 18.3 | |
| 2012 | 23.4 | |
| 2011 | -16.8 | |
| Portfolio Country Breakdown1,2 | ||
| % of Net Assets | ||
| Japan | 18.7 | |
| United Kingdom | 13.3 | |
| Switzerland | 11.6 | |
| Australia | 9.0 | |
| Germany | 6.8 | |
| India | 6.2 | |
| France | 5.5 | |
| Brazil | 4.2 | |
| Canada | 3.7 | |
| Sweden | 3.3 | |
| Austria | 3.0 | |
| 1 | Represents countries that are 3% or more of net assets. |
| 2 | Securities are categorized by the country of their headquarters. |
| Portfolio Diagnostics | ||
| Fund Net Assets | $94 million | |
| Number of Holdings | 53 | |
| Turnover Rate | 23% | |
| Average Market Capitalization1 | $2,193 million | |
| Weighted Average P/E Ratio2,3 | 27.4x | |
| Weighted Average P/B Ratio2 | 3.8x | |
| Active Share4 | 99% | |
| 1 | Geometric Average. This weighted calculation uses each portfolio holding’s market cap in a way designed to not skew the effect of very large or small holdings; instead, it aims to better identify the portfolio’s center, which Royce believes offers a more accurate measure of average market cap than a simple mean or median. |
| 2 | Harmonic Average. This weighted calculation evaluates a portfolio as if it were a single stock and measures it overall. It compares the total market value of the portfolio to the portfolio’s share in the earnings or book value, as the case may be, of its underlying stocks. |
| 3 | The Fund’s P/E ratio calculation excludes companies with zero or negative earnings (2% of portfolio holdings as of 6/30/17). |
| 4 | Active Share is the sum of the absolute values of the different weightings of each holding in the Fund versus each holding in the benchmark, divided by two. |
| Important Performance and Expense Information All performance information in this Report reflects past performance, is presented on a total return basis, reflects the reinvestment of distributions, and does not reflect the deduction of taxes that a shareholder would pay on fund distributions or the redemption of fund shares. Past performance is no guarantee of future results. Investment return and principal value of an investment will fluctuate, so that shares may be worth more or less than their original cost when redeemed. Shares redeemed within 30 days of purchase may be subject to a 2% redemption fee payable to the Fund, which is not reflected in the performance shown above; if it were, performance would be lower. Current month-end performance may be higher or lower than performance quoted and may be obtained at www.roycefunds.com. All performance and risk information reflects results of the Service Class (its oldest class). Price and total return information is based on net asset values for shareholder transactions. Certain immaterial adjustments were made to the net assets of Royce International Premier Fund at 6/30/14 for financial reporting purposes, and as a result the net asset values for shareholder transactions and the calendar year total returns based on those net assets values differ from the adjusted net values and calendar year total returns reported in the Financial Highlights. Gross operating expenses reflect total gross annual operating expenses and include management fees, 12b-1 distribution and service fees, and other expenses. Net operating expenses reflect contractual fee waivers and/or expense reimbursements. All expense information is reported as of the Fund’s most current prospectus. Royce & Associates has contractually agreed to waive its fees and/or reimburse operating expenses to the extent necessary to maintain the Fund’s net annual operating expenses, (excluding brokerage commissions, taxes, interest, litigation expenses, acquired fund fees and expenses, and other expenses not borne in the ordinary course of business), at or below 1.44% through April 30, 2018. Regarding the “Top Contributors” and “Top Detractors” tables shown above, the sum of all contributors to, and all detractors from, performance for all securities in the portfolio would approximate the Fund’s year-to-date performance for 2017. Upside Capture Ratio measures a manager’s performance in up markets relative to the Fund’s benchmark. It is calculated by measuring the Fund’s performance in quarters when the benchmark went up and dividing it by the benchmark’s return in those quarters. Downside Capture Ratio measures a manager’s performance in down markets relative to the Fund’s benchmark (Russell Global ex-U.S. Small Cap). It is calculated by measuring the Fund’s performance in quarters when the benchmark goes down and dividing it by the benchmark’s return in those quarters. |
| The Royce Funds 2017 Semiannual Report to Shareholders | 17 |
| MANAGER’S DISCUSSION | ||
| Royce Low-Priced Stock Fund (RLP) |
 |
| Jim Stoeffel |
| FUND PERFORMANCE Royce Low-Priced Stock Fund was up 1.0% for the year-to-date period ended June 30, 2017, trailing its small-cap benchmark, the Russell 2000 Index, which gained 5.0% for the same period. The leadership shifts that characterized the first quarter of 2017 remained in place for most of the second quarter as well, as growth stocks, large-caps, healthcare, and non-U.S. equities all stayed in the lead after lagging in 2016. The Fund was flat in the first quarter, returning 0.0% while the Russell 2000 was up 2.5%. There was some improvement on an absolute basis in the second quarter, with the Fund advancing 1.0% versus a 2.5% gain for the small-cap benchmark. Low-Priced Stock outperformed the Russell 2000 for the 20-year and since inception (12/15/93) periods ended June 30, 2017. The Fund’s average annual total return since inception was 9.9%. |
| WHAT WORKED... AND WHAT DIDN’T |
| Five of the portfolio’s 11 equity sectors made positive contributions to first-half performance. Information Technology led by a sizable margin, followed by notable net gains for Health Care and Industrials. Of the six sectors that detracted from results, only Consumer Discretionary and Energy made appreciable negative impacts. At the industry level, health care equipment & supplies (Health Care) made the biggest contribution, followed by two groups in Information Technology—semiconductors & semiconductor equipment and electronic equipment, instruments & components. Energy equipment & services (Energy), where tumbling oil prices impacted the shares of tech-based energy product maker Tesco Corporation, and chemicals (Materials) were among the industries that detracted most. No industry group, however, had a bigger negative effect than specialty retail (Consumer Discretionary), which continues to struggle with shifts in consumer spending and shopping habits, along with the ensuing margin contraction, developments keyed to a large degree by the omnipresence of Amazon. Two holdings from this industry detracted most from the Fund’s first-half results at the position level. Value-priced department store operator Stein Mart suffered from ongoing sales pressure associated with the shift to online shopping. This formidable challenge was exacerbated by a series of internal merchandising miscues. Despite our concern about the long-term shift to online, we held a small position at the end of the first half based on our view that correcting the internal miscues should provide a better exit point. We chose to sell our position in Ascena Retail Group, which is a holding company for several national chains of women’s and girls’ clothing stores, including Ann Taylor, Lane Bryant, and Justice, in the face of declining sales. The Fund’s top contributor at the position level was Canadian medical device maker Novadaq Technologies. The company provides a unique solution in the rapidly growing intraoperative fluorescent imaging market. The company’s products, which are used primarily to treat vascular and ophthalmic diseases and conditions, allow clinicians to make better informed decisions during surgery and have very good safety profiles. Reflecting the strength of its technology, Novadaq was the subject of a proposed acquisition by industry leader Stryker Corporation, prompting us to sell our position in June at an attractive premium. Top-20 holding Kratos Defense & Security Solutions is a defense contractor offering services in weapons systems lifecycle support, military weapon range, and security and surveillance systems. Increased revenue and earnings were driven by ongoing high demand for its satellite communications, cybersecurity, and technology and training divisions. Relative to the Russell 2000, stock selection woes in Consumer Discretionary, mostly in specialty retail, hurt first-half results most. Our much lower weighting in Health Care—where biotechnology led the small-cap index—and stock picks in Materials also affected relative results, but made a comparatively smaller negative impact. Conversely, stock selection was a strength in Industrials and in the struggling Energy sector, while our lower weighting in banks—as well as stock picking in that industry and in capital markets—gave us a relative edge in Financials. |
| Top Contributors to Performance Year-to-Date Through 6/30/17 (%)1 | ||||
| Novadaq Technologies | 0.43 | |||
| Kratos Defense & Security Solutions | 0.37 | |||
| Novanta | 0.36 | |||
| Kirkland Lake Gold | 0.34 | |||
| Zealand Pharma | 0.28 | |||
| 1 Includes dividends | ||||
| Top Detractors from Performance Year-to-Date Through 6/30/17 (%)2 | ||||
| Stein Mart | -0.48 | |||
| Ascena Retail Group | -0.45 | |||
| Tesco Corporation | -0.32 | |||
| BioAmber | -0.32 | |||
| Inventure Foods | -0.28 | |||
| 2 Net of dividends | ||||
| CURRENT POSITIONING AND OUTLOOK |
| We made no significant changes to the portfolio during the first half. At the end of June, we remained overweight in the Fund’s three largest sectors: Information Technology, Industrials, and Consumer Discretionary while also having more exposure to Energy. Consumer stocks across several industries provide some of the most intriguing valuations among low-priced stocks, although these must be balanced against the significant challenges retailers face as market share continues its inexorable march to online shopping and, at least for the foreseeable future, reduced margins. We view both industrial and energy stocks as well positioned to benefit from a more relaxed U.S. regulatory environment and also continue to see a number of secular trends such as the Internet of Things and mobile computing that carry positive implications for small-cap technology companies with attractive niche businesses. Finally, while we remained substantially underweight in Health Care, we have been selectively adding to positions in later-stage, niche medical device companies that we believe have created defensible competitive positions. |
| 18 | The Royce Funds 2017 Semiannual Report to Shareholders |
| PERFORMANCE AND PORTFOLIO REVIEW | TICKER SYMBOLS RYLPX RLPHX RLPIX RLPRX |
| Performance and Expenses | ||||||||||||||||
| Average Annual Total Return (%) Through 6/30/17 | ||||||||||||||||
| JAN-JUN 20171 | 1-YR | 3-YR | 5-YR | 10-YR | 15-YR | 20-YR | SINCE INCEPTION (12/15/93) | |||||||||
| RLP | 0.97 | 20.17 | -2.37 | 3.88 | 2.09 | 6.21 | 8.94 | 9.91 | ||||||||
| Annual Operating Expenses: 1.53% Annual Net Operating Expenses: 1.50% | ||||||||||||||||
| 1 Not annualized | ||||||||||||||||

The Morningstar Style Map is the Morningstar Style Box™ with the center 75% of fund holdings plotted as the Morningstar Ownership Zone™. The Morningstar Style Box is designed to reveal a fund’s investment strategy. The Morningstar Ownership Zone provides detail about a portfolio’s investment style by showing the range of stock sizes and styles. The Ownership Zone is derived by plotting each stock in the portfolio within the proprietary Morningstar Style Box. Over time, the shape and location of a fund’s ownership zone may vary. See page 131 for additional information. |
Value of $10,000

| Top 10 Positions | ||
| % of Net Assets | ||
| Zealand Pharma | 1.1 | |
| CryoLife | 1.0 | |
| AV Homes | 1.0 | |
| American Outdoor Brands | 0.9 | |
| Ardmore Shipping | 0.9 | |
| CPI Aerostructures | 0.9 | |
| AtriCure | 0.9 | |
| Nautilus | 0.9 | |
| LSI Industries | 0.9 | |
| Clarkson | 0.8 | |
| Portfolio Sector Breakdown | ||
| % of Net Assets | ||
| Information Technology | 23.0 | |
| Industrials | 19.7 | |
| Consumer Discretionary | 17.6 | |
| Financials | 13.0 | |
| Energy | 7.1 | |
| Health Care | 6.5 | |
| Materials | 4.6 | |
| Consumer Staples | 1.2 | |
| Telecommunication Services | 0.8 | |
| Real Estate | 0.5 | |
| Miscellaneous | 4.0 | |
| Cash and Cash Equivalents | 2.0 | |
| Calendar Year Total Returns (%) | ||
| YEAR | RLP | |
| 2016 | 16.1 | |
| 2015 | -10.4 | |
| 2014 | -3.4 | |
| 2013 | 12.9 | |
| 2012 | 4.5 | |
| 2011 | -14.6 | |
| 2010 | 31.5 | |
| 2009 | 53.6 | |
| 2008 | -36.0 | |
| 2007 | 2.3 | |
| 2006 | 19.0 | |
| 2005 | 9.7 | |
| 2004 | 13.6 | |
| 2003 | 44.0 | |
| 2002 | -16.3 | |
| Upside/Downside Capture Ratios | ||||
| Periods Ended 6/30/17 (%) | ||||
| UPSIDE | DOWNSIDE | |||
| 10-Year | 83 | 111 | ||
| From 12/31/93 (Start of the Fund’s First Full Quarter) | 101 | 94 | ||
| Portfolio Diagnostics | ||
| Fund Net Assets | $284 million | |
| Number of Holdings | 165 | |
| Turnover Rate | 17% | |
| Average Market Capitalization1 | $702 million | |
| Weighted Average P/B Ratio2 | 1.8x | |
| Active Share3 | 95% | |
| U.S. Investments (% of Net Assets) | 82.1% | |
| Non-U.S. Investments (% of Net Assets) | 15.9% | |
| 1 | Geometric Average. This weighted calculation uses each portfolio holding’s market cap in a way designed to not skew the effect of very large or small holdings; instead, it aims to better identify the portfolio’s center, which Royce believes offers a more accurate measure of average market cap than a simple mean or median. |
| 2 | Harmonic Average. This weighted calculation evaluates a portfolio as if it were a single stock and measures it overall. It compares the total market value of the portfolio to the portfolio’s share in the earnings or book value, as the case may be, of its underlying stocks. |
| 3 | Active Share is the sum of the absolute values of the different weightings of each holding in the Fund versus each holding in the benchmark, divided by two. |
| Important Performance and Expense Information All performance information in this Report reflects past performance, is presented on a total return basis, reflects the reinvestment of distributions, and does not reflect the deduction of taxes that a shareholder would pay on fund distributions or the redemption of fund shares. Past performance is no guarantee of future results. Investment return and principal value of an investment will fluctuate, so that shares may be worth more or less than their original cost when redeemed. Shares redeemed within 30 days of purchase may be subject to a 1% redemption fee payable to the Fund, which is not reflected in the performance shown above; if it were, performance would be lower. Current month-end performance may be higher or lower than performance quoted and may be obtained at www.roycefunds.com. All performance and risk information reflects results of the Service Class (its oldest class). Price and total return information is based on net asset values for shareholder transactions. Certain immaterial adjustments were made to the net assets of Royce Low-Priced Stock Fund at 6/30/13 for financial reporting purposes, and as a result the net asset values for shareholder transactions and the calendar year total returns based on those net asset values differ from the adjusted net asset values and calendar year total returns reported in the Financial Highlights. Gross operating expenses reflect the Fund’s total gross annual operating expenses and include management fees, 12b-1 distribution and service fees, other expenses, and acquired fund fees and expenses. Net operating expenses reflect contractual fee waivers and/or expense reimbursements. All expense information is reported as of the Fund’s most current prospectus. Royce & Associates has contractually agreed to waive fees and/or reimburse operating expenses to the extent necessary to maintain the Fund’s net annual operating expenses (excluding brokerage commissions, taxes, interest, litigation expenses, acquired fund fees and expenses, and other expenses not borne in the ordinary course of business) at or below 1.49% through April 30, 2018. Acquired fund fees and expenses reflect the estimated amount of the fees and expenses incurred indirectly by the Fund through its investments in mutual funds, hedge funds, private equity funds, and other investment companies. Regarding the “Top Contributors” and “Top Detractors” tables shown above, the sum of all contributors to, and all detractors from, performance for all securities in the portfolio would approximate the Fund’s year-to-date performance for 2017. Upside Capture Ratio measures a manager’s performance in up markets relative to the Fund’s benchmark. It is calculated by measuring the Fund’s performance in quarters when the benchmark went up and dividing it by the benchmark’s return in those quarters. Downside Capture Ratio measures a manager’s performance in down markets relative to the Fund’s benchmark (Russell 2000). It is calculated by measuring the Fund’s performance in quarters when the benchmark goes down and dividing it by the benchmark’s return in those quarters. |
| The Royce Funds 2017 Semiannual Report to Shareholders | 19 |
| MANAGERS’ DISCUSSION | ||
| Royce Micro-Cap Fund (RMC) |
 |
| Jim Stoeffel Brendan Hartman |
| FUND PERFORMANCE Royce Micro-Cap Fund gained 2.0% for the year-to-date period ended June 30, 2017, falling short of both its benchmarks, the Russell Microcap Index, which was up 4.2%, and the small-cap Russell 2000 Index, which advanced 5.0% for the same period. During the first half of 2017, there was both a reversal in small-cap leadership from value to growth stocks and some inconsistency in relative results for micro-cap companies vis-à-vis their small-cap siblings. The first quarter proved the most challenging period for the Fund on a relative basis. Micro-Cap was down 0.7% for the quarter compared to respective gains of 0.4% and 2.5% for the micro-cap and small-cap indexes. The Fund then enjoyed solidly positive results on an absolute basis, up 2.7% in the second quarter marginally outpacing the Russell 2000 (+2.5%) while trailing the Russell Microcap (+3.8%) in this same period. In addition, the Fund outperformed the Russell 2000 for the 20-, 25-year, and since inception (12/31/91) periods ended June 30, 2017. (Data for the Russell Microcap only goes back to June 30, 2000.) The Fund’s average annual total return since inception was 10.9%. |
| WHAT WORKED... AND WHAT DIDN’T |
| Seven of the Fund’s 10 equity sectors finished the semiannual period in the black, with Health Care and Information Technology leading, followed by Industrials. Consumer Discretionary and, to a lesser degree, Energy made the biggest negative impacts while net losses for Consumer Staples were modest. At the industry level, the top contributor for the first half was health care equipment & supplies (Health Care), with the bulk of its contribution coming in the second quarter from two medical device makers, Novadaq Technologies, which was acquired, and Tactile Systems Technology. Machinery (Industrials) came next, with several companies contributing, including Kornit Digital, Alimak Group, and Kadant. It was followed by semiconductors & semiconductor equipment (Information Technology). Detractors at the industry level included the specialty retail group (Consumer Discretionary), where companies continued to struggle with secular shifts in consumer spending and behavior, and energy equipment & services (Energy), where tumbling oil prices impacted the shares of tech-based energy product maker Tesco Corporation. |
| Capital equipment subsystem provider Ultra Clean Holdings was the Fund’s top contributor at the position level in the first half. The company has been gaining market share with key OEM customers in a vibrant environment for semiconductor capital equipment spending. We held shares at the end of June because the rise in its shares has been driven primarily by earnings growth rather than multiple expansion and because we think Ultra Clean is positioned to grow faster than its underlying industry. Corium International manufactures transdermal patches that range from drug delivery to consumer products. While historically a contract manufacturer, Corium has been developing its own generic drugs over the past several years to leverage its delivery expertise. Constructive results in early clinical trials helped to push its shares higher. |
| Value-priced department store operator Stein Mart detracted most from first-half results. Like many retailers, it suffered from ongoing sales pressure associated with the shift to online shopping. This challenge was exacerbated by a series of internal merchandising miscues. We held a small position at the end of the first half based on our view that correcting the internal miscues should provide a better exit point. CUI Global offers a unique solution for measuring pipeline gas quality that’s quicker, cheaper, and more accurate than other existing technologies. While orders were respectable and the sales pipeline looks solid, the delivery schedule proved longer than expected. This exerted downward pressure on its shares, especially given CUI Global’s relatively small size and resources. Proceeding cautiously, we added shares in the first half because we believe its technology can ultimately be monetized successfully. Relative to the Russell Microcap, the Fund was disadvantaged most in the first half by poor stock selection in Consumer Discretionary, particularly in specialty retail, and Information Technology in the electronic equipment, instruments & components group. Conversely, we benefited from our underweight and better stock picking in Financials while enjoying a smaller advantage from stock selection in the Energy sector. |
| Top Contributors to Performance Year-to-Date Through 6/30/17 (%)1 | ||||
| Ultra Clean Holdings | 0.59 | |||
| Corium International | 0.50 | |||
| Novadaq Technologies | 0.39 | |||
| Everspin Technologies | 0.39 | |||
| Novanta | 0.34 | |||
| 1 Includes dividends | ||||
| Top Detractors from Performance Year-to-Date Through 6/30/17 (%)2 | ||||
| Stein Mart | -0.49 | |||
| CUI Global | -0.35 | |||
| Tesco Corporation | -0.33 | |||
| BioAmber | -0.31 | |||
| Kirkland’s | -0.31 | |||
| 2 Net of dividends | ||||
| CURRENT POSITIONING AND OUTLOOK |
| We did not make significant changes during the first half. We continued to build positions in financial stocks, particularly in banks where we believe micro-cap names can benefit from a more relaxed regulatory environment. Financials remained, however, among our largest sector underweights at the end of June. We also maintained our lower exposure to Health Care, although we have been selectively adding to positions in medical device companies that we believe have created defensible competitive positions. Our largest weightings at the end of June remained Industrials, Information Technology, and Consumer Discretionary, with the first of these also reflecting our largest overweight. We continue to find value in all three of these sectors and view them as areas in which select companies have the potential to benefit from the relative strength of the U.S. economy. |
| 20 | The Royce Funds 2017 Semiannual Report to Shareholders |
| PERFORMANCE AND PORTFOLIO REVIEW | TICKER SYMBOLS RYOTX RMCFX RYMCX |
| Performance and Expenses | ||||||||||||||||||
| Average Annual Total Return (%) Through 6/30/17 | ||||||||||||||||||
| JAN-JUN 20171 | 1-YR | 3-YR | 5-YR | 10-YR | 15-YR | 20-YR | 25-YR | SINCE INCEPTION (12/31/91) | ||||||||||
| RMC | 2.01 | 23.04 | 0.16 | 5.32 | 3.11 | 7.61 | 8.98 | 10.84 | 10.91 | |||||||||
| Annual Operating Expenses: 1.48% | ||||||||||||||||||
| 1 Not annualized | ||||||||||||||||||
Relative Returns: Monthly Rolling Average Annual Return Periods
| On a monthly rolling basis, the Fund outperformed the Russell Microcap in 71% of all 10-year periods; 63% of all 5-year periods; and 53% of all 1-year periods. |
| PERIODS BEATING THE INDEX | FUND AVG (%)1 | INDEX AVG (%)1 | ||||||||||||
| 10-year | 60/85 | 71% | 7.9 | 6.2 | ||||||||||
| 5-year | 92/145 | 63% | 8.5 | 7.9 | ||||||||||
| 1-year | 102/193 | 53% | 10.5 | 10.3 | ||||||||||

The Morningstar Style Map is the Morningstar Style Box™ with the center 75% of fund holdings plotted as the Morningstar Ownership Zone™. The Morningstar Style Box is designed to reveal a fund’s investment strategy. The Morningstar Ownership Zone provides detail about a portfolio’s investment style by showing the range of stock sizes and styles. The Ownership Zone is derived by plotting each stock in the portfolio within the proprietary Morningstar Style Box. Over time, the shape and location of a fund’s ownership zone may vary. See page 131 for additional information. |
Value of $10,000
Inception) as of 6/30/17 ($)
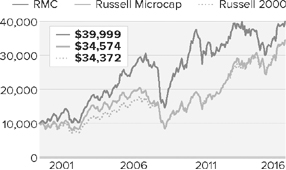
| Top 10 Positions | ||
| % of Net Assets | ||
| Zealand Pharma | 1.1 | |
| CryoLife | 1.0 | |
| AV Homes | 1.0 | |
| Citi Trends | 0.9 | |
| QAD Cl. A | 0.9 | |
| CPI Aerostructures | 0.9 | |
| AtriCure | 0.9 | |
| Ardmore Shipping | 0.9 | |
| Silicon Motion Technology ADR | 0.9 | |
| PC Connection | 0.8 | |
| Portfolio Sector Breakdown | ||
| % of Net Assets | ||
| Industrials | 21.6 | |
| Information Technology | 19.5 | |
| Consumer Discretionary | 15.2 | |
| Financials | 12.7 | |
| Health Care | 8.0 | |
| Energy | 5.7 | |
| Materials | 5.5 | |
| Real Estate | 1.8 | |
| Consumer Staples | 1.2 | |
| Telecommunication Services | 0.8 | |
| Miscellaneous | 4.6 | |
| Cash and Cash Equivalents | 3.4 | |
| Calendar Year Total Returns (%) | ||
| YEAR | RMC | |
| 2016 | 19.7 | |
| 2015 | -13.3 | |
| 2014 | -4.1 | |
| 2013 | 21.3 | |
| 2012 | 8.0 | |
| 2011 | -12.1 | |
| 2010 | 30.1 | |
| 2009 | 55.7 | |
| 2008 | -40.9 | |
| 2007 | 7.1 | |
| 2006 | 22.3 | |
| 2005 | 11.5 | |
| 2004 | 15.8 | |
| 2003 | 52.6 | |
| 2002 | -13.4 | |
| Upside/Downside Capture Ratios | ||||||||||||||
| Periods Ended 6/30/17 (%) | ||||||||||||||
| UPSIDE | DOWNSIDE | |||||||||||||
| 10-Year | 77 | 85 | ||||||||||||
| From 6/30/00 (Russell Microcap Index Inception) | 91 | 81 | ||||||||||||
| Portfolio Diagnostics | ||
| Fund Net Assets | $222 million | |
| Number of Holdings | 164 | |
| Turnover Rate | 17% | |
| Average Market Capitalization1 | $450 million | |
| Weighted Average P/E Ratio2,3 | 21.2x | |
| Weighted Average P/B Ratio2 | 1.9x | |
| Active Share4 | 90% | |
| U.S. Investments (% of Net Assets) | 83.3% | |
| Non-U.S. Investments (% of Net Assets) | 13.3% | |
| 1 | Geometric Average. This weighted calculation uses each portfolio holding’s market cap in a way designed to not skew the effect of very large or small holdings; instead, it aims to better identify the portfolio’s center, which Royce believes offers a more accurate measure of average market cap than a simple mean or median. |
| 2 | Harmonic Average. This weighted calculation evaluates a portfolio as if it were a single stock and measures it overall. It compares the total market value of the portfolio to the portfolio’s share in the earnings or book value, as the case may be, of its underlying stocks. |
| 3 | The Fund’s P/E ratio calculation excludes companies with zero or negative earnings (23% of portfolio holdings as of 6/30/17). |
| 4 | Active Share is the sum of the absolute values of the different weightings of each holding in the Fund versus each holding in the benchmark, divided by two. |
| Important Performance and Expense Information |
All performance information in this Report reflects past performance, is presented on a total return basis, reflects the reinvestment of distributions, and does not reflect the deduction of taxes that a shareholder would pay on fund distributions or the redemption of fund shares. Past performance is no guarantee of future results. Investment return and principal value of an investment will fluctuate, so that shares may be worth more or less than their original cost when redeemed. Shares redeemed within 30 days of purchase may be subject to a 1% redemption fee payable to the Fund, which is not reflected in the performance shown above; if it were, performance would be lower. Current month-end performance may be higher or lower than performance quoted and may be obtained at www.roycefunds.com. All performance and risk information reflects results of the Investment Class (its oldest class). Price and total return information is based on net asset values calculated for shareholder transactions. Operating expenses reflect the Fund’s total annual operating expenses for the Investment Class as of the Fund’s most current prospectus and include management fees and other expenses. Regarding the “Top Contributors” and “Top Detractors” tables shown above, the sum of all contributors to, and all detractors from, performance for all securities in the portfolio would approximate the Fund’s year-to-date performance for 2017. Upside Capture Ratio measures a manager’s performance in up markets relative to the Fund’s benchmark. It is calculated by measuring the Fund’s performance in quarters when the benchmark went up and dividing it by the benchmark’s return in those quarters. Downside Capture Ratio measures a manager’s performance in down markets relative to the Fund’s benchmark (Russell Microcap Index). It is calculated by measuring the Fund’s performance in quarters when the benchmark goes down and dividing it by the benchmark’s return in those quarters. |
| The Royce Funds 2017 Semiannual Report to Shareholders | 21 |
| MANAGERS’ DISCUSSION | ||
| Royce Micro-Cap Opportunity Fund (ROS) |
 |
| Bill Hench Buzz Zaino, CFA |
| FUND PERFORMANCE Royce Micro-Cap Opportunity Fund advanced 9.8% for the year-to-date period ended June 30, 2017, outperforming its benchmark, the Russell Microcap Index, which was up 4.2% for the same period. We were especially pleased with the success of our deep value approach because it came in a period that was otherwise highly challenging for value stocks. The Russell Microcap Value Index was up 1.9% in 2017’s first half versus 8.1% for the Russell Microcap Growth. Micro-Cap Opportunity outpaced the Russell Microcap in the first quarter, up 4.5% versus a 0.4% gain while in the second quarter it increased 5.0% compared to 3.8% for the benchmark. We were also happy that the Fund outperformed the Russell Microcap for the one-year period ended June 30, 2017, up 31.8% versus 27.6%. Micro-Cap Opportunity’s average annual total return since inception (8/31/10) was 12.8%. |
| WHAT WORKED... AND WHAT DIDN’T |
| Six of the Fund’s 10 equity sectors made contributions to first-half performance, with the most impressive result coming from Information Technology. We did much of the seed work in tech stocks 18-24 months ago, when a slow business cycle lowered share prices in many industries in which we have a perennial interest, such as semiconductors and electronic components. In fact, much of the appeal of technology stocks is that the business cycle tends to go to extremes on both the up and the down side, which often creates attractive opportunities as long as one has the patience to wait and the discipline to endure falling prices. In addition, other value investors tend to avoid or underinvest in these companies, which in our view often enhances the attractiveness of the valuations. |
| The recovery we’ve seen in many technology companies over the last several months has been keyed by one of the largest buildouts since the early days of the Internet. It has been benefiting companies in a number of industries because the expansion encompasses multiple developments and innovations, including the move from 4G to 5G, artificial intelligence, autonomous driving, public and private cloud storage, and the expansion of the semiconductor industry in China. Prices in many cases began to exceed our sell targets in the spring, leading us to trim our overall exposure to the sector. However, we are confident that the buildout is in its early stages, so we will be watching carefully (as we always do) for opportunities to materialize. |
| Four industry groups from the sector helped to drive first-half results—electronic equipment, instruments & components, communications equipment, technology hardware storage & peripherals, and semiconductors & semiconductor equipment. The health care providers & services group also made a notable contribution to performance. KEMET Corporation, a solid tantalum and multilayer ceramic capacitor manufacturer that was also the top contributor in 2016’s fourth quarter, was the Fund’s top performer at the position level. Strong sales and earnings combined with margin expansion to fuel the rise of its shares. Nimble Storage is a leader in predictive flash storage solutions, a niche with growing importance in cloud storage, which helps to explain why Hewlett-Packard announced that it would buy Nimble for about a 45% premium in March. |
| Of the four sectors that detracted from first-half results, only Energy made a significant negative impact—net losses for Real Estate, Telecommunication Services, and Consumer Discretionary were modest. Detracting most at the industry level were road & rail (Industrials) and energy equipment & services (Energy), where declining oil prices led to disappointing results. The former industry is home to Celadon Group, which provides long-haul, full-truckload freight services as well as supply chain management solutions. The company had accounting issues in which the financing of its assets was questioned. We think the combination of its very cheap valuation and the value of its trucking assets make a turnaround possible. CareDx specializes in diagnostic testing for transplant recipients. It’s endured some reimbursement issues that have hurt results, but we anticipate favorable resolutions and like the commercial potential of its technologies. |
| The Fund’s biggest relative advantage in the first half came overwhelmingly from stock selection in Information Technology, where our larger weighting also helped. Stock selection in Industrials and a lower exposure to Financials provided an additional relative edge. Conversely, our low weighting and ineffective stock picks in biotechnology (Health Care) hurt relative performance, as did stock selection in Telecommunication Services. |
| Top Contributors to Performance Year-to-Date Through 6/30/17 (%)1 | ||||
| KEMET Corporation | 1.83 | |||
| Nimble Storage | 1.12 | |||
| Community Health Systems | 0.83 | |||
| Ichor Holdings | 0.75 | |||
| Kratos Defense & Security Solutions | 0.75 | |||
| 1 Includes dividends | ||||
| Top Detractors from Performance Year-to-Date Through 6/30/17 (%)2 | ||||
| Celadon Group | -0.66 | |||
| CareDx | -0.50 | |||
| Pengrowth Energy | -0.48 | |||
| Sucampo Pharmaceuticals Cl. A | -0.48 | |||
| TravelCenters of America LLC | -0.45 | |||
| 2 Net of dividends | ||||
| CURRENT POSITIONING AND OUTLOOK |
| We remain encouraged by the pace of global economic growth, which should have a positive impact on the capital goods sector. We began to reduce some positions in Information Technology prior to June’s sell-off based on their lofty valuations, while we maintained most of our holdings in Industrials. We have also been looking to take advantage of improved consumer income by adding select names in Consumer Discretionary. In addition, we reduced the portfolio’s exposure to Financials as valuations for many holdings appeared full relative to where we began to buy three to five years ago. Finally, we benefited from a number of takeovers, which are running at a pace similar to last year. |
| 22 | The Royce Funds 2017 Semiannual Report to Shareholders |
| PERFORMANCE AND PORTFOLIO REVIEW | TICKER SYMBOLS ROSFX ROSSX |
| Performance and Expenses | ||||||||||
| Average Annual Total Return (%) Through 6/30/17 | ||||||||||
| JAN-JUN 20171 | 1-YR | 3-YR | 5-YR | SINCE INCEPTION (8/31/10) | ||||||
| ROS | 9.77 | 31.77 | 1.67 | 12.69 | 12.85 | |||||
| Annual Gross Operating Expenses: 1.30% Annual Net Operating Expenses: 1.24% | ||||||||||
| 1 Not annualized | ||||||||||
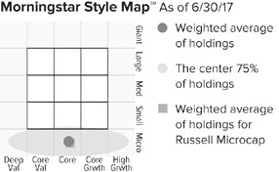
The Morningstar Style Map is the Morningstar Style Box™ with the center 75% of fund holdings plotted as the Morningstar Ownership Zone™. The Morningstar Style Box is designed to reveal a fund’s investment strategy. The Morningstar Ownership Zone provides detail about a portfolio’s investment style by showing the range of stock sizes and styles. The Ownership Zone is derived by plotting each stock in the portfolio within the proprietary Morningstar Style Box. Over time, the shape and location of a fund’s ownership zone may vary. See page 131 for additional information. |
Value of $10,000

| Top 10 Positions | ||
| % of Net Assets | ||
| FreightCar America | 1.9 | |
| Gencor Industries | 1.8 | |
| Surgery Partners | 1.8 | |
| Ducommun | 1.7 | |
| Beazer Homes USA | 1.7 | |
| Alpha & Omega Semiconductor | 1.7 | |
| Ethan Allen Interiors | 1.7 | |
| Old Line Bancshares | 1.7 | |
| Albany Molecular Research | 1.6 | |
| New Home | 1.6 | |
| Portfolio Sector Breakdown | ||
| % of Net Assets | ||
| Industrials | 24.2 | |
| Information Technology | 18.4 | |
| Health Care | 18.3 | |
| Materials | 9.2 | |
| Financials | 8.2 | |
| Consumer Discretionary | 7.3 | |
| Energy | 3.1 | |
| Consumer Staples | 2.6 | |
| Telecommunication Services | 0.7 | |
| Real Estate | 0.5 | |
| Miscellaneous | 3.7 | |
| Cash and Cash Equivalents | 3.8 | |
| Calendar Year Total Returns (%) | ||
| YEAR | ROS | |
| 2016 | 23.8 | |
| 2015 | -16.0 | |
| 2014 | -5.0 | |
| 2013 | 44.6 | |
| 2012 | 35.1 | |
| 2011 | -17.1 | |
| Portfolio Diagnostics | ||
| Fund Net Assets | $50 million | |
| Number of Holdings | 95 | |
| Turnover Rate | 38% | |
| Average Market Capitalization1 | $460 million | |
| Weighted Average P/B Ratio2 | 1.8x | |
| Weighted Average P/S Ratio3 | 0.9x | |
| Active Share4 | 95% | |
| U.S. Investments (% of Net Assets) | 93.5% | |
| Non-U.S. Investments (% of Net Assets) | 2.7% | |
| 1 | Geometric Average. This weighted calculation uses each portfolio holding’s market cap in a way designed to not skew the effect of very large or small holdings; instead, it aims to better identify the portfolio’s center, which Royce believes offers a more accurate measure of average market cap than a simple mean or median. |
| 2 | Harmonic Average. This weighted calculation evaluates a portfolio as if it were a single stock and measures it overall. It compares the total market value of the portfolio to the portfolio’s share in the earnings or book value, as the case may be, of its underlying stocks. |
| 3 | Price to Sales is calculated by dividing the company’s market cap by the revenue in the most recent year. |
| 4 | Active Share is the sum of the absolute values of the different weightings of each holding in the Fund versus each holding in the benchmark, divided by two. |
| Important Performance and Expense Information All performance information in this Report reflects past performance, is presented on a total return basis, reflects the reinvestment of distributions, and does not reflect the deduction of taxes that a shareholder would pay on fund distributions or the redemption of fund shares. Past performance is no guarantee of future results. Investment return and principal value of an investment will fluctuate, so that shares may be worth more or less than their original cost when redeemed. Shares redeemed within 30 days of purchase may be subject to a 1% redemption fee, payable to the Fund, which is not reflected in the performance shown above; if it were, performance would be lower. Current month-end performance may be higher or lower than performance quoted and may be obtained at www.roycefunds.com. Gross operating expenses reflect the Fund’s total gross annual operating expenses and include management fees and other expenses. Net operating expenses reflect contractual fee waivers and/or expense reimbursements. All expense information is reported as of the Funds most current prospectus. Royce & Associates has contractually agreed to waive fees and/or reimburse operating expenses to the extent necessary to maintain the Fund’s net annual operating expenses, (excluding dividend and interest expenses relating to short sale activities, brokerage commissions, taxes, interest, litigation expenses, acquired fund fees and expenses, and other expenses not borne in the ordinary course of business), at or below 1.24% through April 30, 2018. Regarding the “Top Contributors” and “Top Detractors” tables shown above, the sum of all contributors to, and all detractors from, performance for all securities in the portfolio would approximate the Fund’s year-to-date performance for 2017. |
| The Royce Funds 2017 Semiannual Report to Shareholders | 23 |
| MANAGERS’ DISCUSSION | ||
| Royce Opportunity Fund (ROF) |
 |
| Buzz Zaino, CFA Bill Hench |
| FUND PERFORMANCE Royce Opportunity Fund advanced 8.2% for the year-to-date period ended June 30, 2017, outperforming its small-cap benchmark, the Russell 2000 Index, which was up 5.0% for the same period. We were especially pleased with the success of our deep value approach because it came in a period that was otherwise highly challenging for value stocks. The Russell 2000 Value Index was up 0.5% in 2017’s first half versus 10.0% for the Russell 2000 Growth. Opportunity outpaced the Russell 2000 in the first quarter, up 5.2% versus a 2.5% gain, while in the second quarter, the Fund increased 2.8% compared to 2.5% for the benchmark. We were also happy with longer-term results on both an absolute and relative basis. The Fund outperformed the Russell 2000 for the one-, five, 15-, 20-year, and since inception (11/19/96) periods ended June 30, 2017. Opportunity’s average annual total return since inception was 12.4%. |
| WHAT WORKED... AND WHAT DIDN’T |
| Seven of the Fund’s 11 equity sectors made contributions to first-half results, with the most impressive result coming from Information Technology. We did much of the seed work in tech stocks 18-24 months ago, when a slow business cycle lowered share prices in many industries in which we have a perennial interest, such as semiconductors and electronic components. In fact, much of the appeal of technology stocks is that the business cycle tends to go to extremes on both the up and the down side, which often creates attractive opportunities as long as one has the patience to wait and the discipline to endure falling prices. In addition, other value investors tend to avoid or underinvest in these companies, which in our view often enhances the attractiveness of the valuations. |
| The recovery we’ve seen in many technology companies over the last several months has been keyed by one of the largest buildouts since the early days of the Internet. The expansion encompasses multiple developments and innovations, including the move from 4G to 5G, artificial intelligence, autonomous driving, public and private cloud storage, and the expansion of the semiconductor industry in China. Prices in many cases began to exceed our sell targets in the spring, leading us to trim our overall exposure to the sector. However, we are confident that the buildout is in its early stages, so we will be watching carefully (as we always do) for opportunities to materialize. |
| Three industry groups from the sector drove first-half results for the Fund as a whole—semiconductors & semiconductor equipment, electronic equipment, instruments & components, and communications equipment. KEMET Corporation, a solid tantalum and multilayer ceramic capacitor manufacturer that was also one of the top contributors in 2016’s fourth quarter was the Fund’s top performer at the position level. Strong sales and earnings combined with margin expansion to fuel the rise of its shares. Both Brooks Automation, which offers automation-oriented software and hardware for semiconductors, and capital equipment subsystem provider Ultra Clean Holdings benefited from high demand for semiconductor equipment while environmental, engineering, and construction business TRC Companies (from the Industrials sector) proved a profitable acquisition target. |
| Of the four sectors that detracted from first-half results, only Energy had a significant negative impact—net losses for Telecommunication Services, Consumer Staples, and Real Estate were comparatively minor. This carried over to the industry level, where declining oil prices led to disappointing results for energy equipment & services and oil, gas & consumable fuels. The former industry is home to Matrix Service, a contractor to the energy, power, and industrial markets. Ongoing delays in new project awards and starts, depressed maintenance spending, and increased cost estimates on an electrical infrastructure project all discouraged investors. We chose to build our position based on a cautiously optimistic longer-term outlook. We received shares of Windstream Holdings after it bought a former portfolio holding and combined the two companies’ businesses. Fiscal first-quarter losses discouraged investors, notwithstanding management’s more optimistic full-year guidance for service revenue, free cash flow, and adjusted income. Our view was that its participation in growing markets and attractive assets made it worth holding. |
| The Fund’s biggest relative advantage in the first half came from stock selection in Information Technology, where our larger weighting also helped. Stock selection in Industrials and a lower exposure to Financials also provided a relative edge. Conversely, our lack of exposure to biotechnology (Health Care) hurt relative performance as did our cash position and stock selection in Telecommunication Services. |
| Top Contributors to Performance Year-to-Date Through 6/30/17 (%)1 | ||||
| KEMET Corporation | 0.83 | |||
| TRC Companies | 0.59 | |||
| Brooks Automation | 0.51 | |||
| Ultra Clean Holdings | 0.50 | |||
| Kratos Defense & Security Solutions | 0.49 | |||
| 1 Includes dividends | ||||
| Top Detractors from Performance Year-to-Date Through 6/30/17 (%)2 | ||||
| Matrix Service | -0.34 | |||
| Windstream Holdings | -0.27 | |||
| Tower International | -0.24 | |||
| Wesco Aircraft Holdings | -0.24 | |||
| Unisys Corporation | -0.24 | |||
| 2 Net of dividends | ||||
| CURRENT POSITIONING AND OUTLOOK |
| We remain encouraged by the pace of global economic growth, which should have a positive impact on the capital goods sector. We began to reduce some positions in Information Technology prior to June’s sell-off based on their lofty valuations, while we maintained most of our holdings in Industrials. We have also been looking to take advantage of improved consumer income by adding select names in Consumer Discretionary. In addition, we reduced the portfolio’s exposure to Financials as valuations for many holdings appeared full relative to where we began to buy three to five years ago. Finally, we benefited from a number of takeovers. |
| 24 | The Royce Funds 2017 Semiannual Report to Shareholders |
| PERFORMANCE AND PORTFOLIO REVIEW | TICKER SYMBOLS RYPNX RYOFX ROFCX ROFIX ROFRX ROFKX |
| Performance and Expenses | ||||||||||||||||
| Average Annual Total Return (%) Through 6/30/17 | ||||||||||||||||
| JAN-JUN 20171 | 1-YR | 3-YR | 5-YR | 10-YR | 15-YR | 20-YR | SINCE INCEPTION (11/19/96) | |||||||||
| ROF | 8.17 | 36.10 | 5.46 | 13.83 | 6.59 | 10.25 | 11.95 | 12.39 | ||||||||
| Annual Operating Expenses: 1.19% | ||||||||||||||||
| 1 Not annualized | ||||||||||||||||
Relative Returns: Monthly Rolling Average Annual Return Periods
| On a monthly rolling basis, the Fund outperformed the Russell 2000 in 80% of all 10-year periods; 73% of all 5-year periods; and 68% of all 1-year periods. |
| PERIODS BEATING THE INDEX | FUND AVG (%)1 | INDEX AVG (%)1 | |||||||||
| 10-year | 97/121 | 80% | 9.6 | 6.7 | |||||||
| 5-year | 133/181 | 73% | 11.4 | 7.7 | |||||||
| 1-year | 155/229 | 68% | 14.6 | 9.2 | |||||||

The Morningstar Style Map is the Morningstar Style Box™ with the center 75% of fund holdings plotted as the Morningstar Ownership Zone™. The Morningstar Style Box is designed to reveal a fund’s investment strategy. The Morningstar Ownership Zone provides detail about a portfolio’s investment style by showing the range of stock sizes and styles. The Ownership Zone is derived by plotting each stock in the portfolio within the proprietary Morningstar Style Box. Over time, the shape and location of a fund’s ownership zone may vary. See page 131 for additional information. |
Value of $10,000
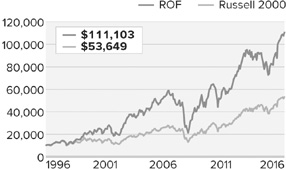
| Top 10 Positions | ||
| % of Net Assets | ||
| Kratos Defense & Security Solutions | 1.2 | |
| Dana | 1.1 | |
| Comtech Telecommunications | 1.0 | |
| Tower International | 1.0 | |
| General Cable | 1.0 | |
| Commercial Metals | 0.9 | |
| IXYS Corporation | 0.9 | |
| Ferro Corporation | 0.9 | |
| NCI Building Systems | 0.9 | |
| Interface | 0.8 | |
| Portfolio Sector Breakdown | ||
| % of Net Assets | ||
| Industrials | 24.7 | |
| Information Technology | 23.0 | |
| Consumer Discretionary | 15.5 | |
| Materials | 9.0 | |
| Financials | 5.6 | |
| Health Care | 5.6 | |
| Energy | 4.0 | |
| Consumer Staples | 1.7 | |
| Telecommunication Services | 0.4 | |
| Real Estate | 0.4 | |
| Utilities | 0.2 | |
| Miscellaneous | 2.5 | |
| Cash and Cash Equivalents | 7.4 | |
| Calendar Year Total Returns (%) | ||
| YEAR | ROF | |
| 2016 | 29.9 | |
| 2015 | -13.6 | |
| 2014 | -0.5 | |
| 2013 | 43.5 | |
| 2012 | 22.6 | |
| 2011 | -13.0 | |
| 2010 | 33.8 | |
| 2009 | 62.1 | |
| 2008 | -45.7 | |
| 2007 | -2.0 | |
| 2006 | 18.8 | |
| 2005 | 4.8 | |
| 2004 | 17.5 | |
| 2003 | 72.9 | |
| 2002 | -17.0 | |
| Upside/Downside Capture Ratios | ||||
| Periods Ended 6/30/17 (%) | ||||
| UPSIDE | DOWNSIDE | |||
| 10-Year | 119 | 128 | ||
| From 12/31/96 (Start of Fund’s First Full Quarter) | 124 | 110 | ||
| Portfolio Diagnostics | ||
| Fund Net Assets | $1,501 million | |
| Number of Holdings | 257 | |
| Turnover Rate | 20% | |
| Average Market Capitalization1 | $816 million | |
| Weighted Average P/B Ratio2 | 1.7x | |
| Weighted Average P/S Ratio3 | 0.8x | |
| Active Share4 | 91% | |
| U.S. Investments (% of Net Assets) | 88.5% | |
| Non-U.S. Investments (% of Net Assets) | 4.1% | |
| 1 | Geometric Average. This weighted calculation uses each portfolio holding’s market cap in a way designed to not skew the effect of very large or small holdings; instead, it aims to better identify the portfolio’s center, which Royce believes offers a more accurate measure of average market cap than a simple mean or median. |
| 2 | Harmonic Average. This weighted calculation evaluates a portfolio as if it were a single stock and measures it overall. It compares the total market value of the portfolio to the portfolio’s share in the earnings or book value, as the case may be, of its underlying stocks. |
| 3 | Price to Sales is calculated by dividing the company’s market cap by the revenue in the most recent year. |
| 4 | Active Share is the sum of the absolute values of the different weightings of each holding in the Fund versus each holding in the benchmark, divided by two. |
| Important Performance and Expense Information All performance information in this Report reflects past performance, is presented on a total return basis, reflects the reinvestment of distributions, and does not reflect the deduction of taxes that a shareholder would pay on fund distributions or the redemption of fund shares. Past performance is no guarantee of future results. Investment return and principal value of an investment will fluctuate, so that shares may be worth more or less than their original cost when redeemed. Shares redeemed within 30 days of purchase may be subject to a 1% redemption fee payable to the Fund, which is not reflected in the performance shown above; if it were, performance would be lower. Current month-end performance may be higher or lower than performance quoted and may be obtained at www.roycefunds.com. All performance and risk information reflects results of the Investment Class (its oldest class). Operating expenses reflect the Fund’s total annual operating expenses for the Investment Class as of the Fund’s most current prospectus and include management fees and other expenses. Regarding the “Top Contributors” and “Top Detractors” tables shown above, the sum of all contributors to, and all detractors from, performance for all securities in the portfolio would approximate the Fund’s year-to-date performance for 2017. Upside Capture Ratio measures a manager’s performance in up markets relative to the Fund’s benchmark. It is calculated by measuring the Fund’s performance in quarters when the benchmark went up and dividing it by the benchmark’s return in those quarters. Downside Capture Ratio measures a manager’s performance in down markets relative to the Fund’s benchmark (Russell 2000). It is calculated by measuring the Fund’s performance in quarters when the benchmark goes down and dividing it by the benchmark’s return in those quarters. |
| The Royce Funds 2017 Semiannual Report to Shareholders | 25 |
| MANAGERS’ DISCUSSION | ||
| Royce Pennsylvania Mutual Fund® (PMF) |
 |
| Chuck Royce Lauren Romeo, CFA Jay Kaplan, CFA |
| FUND PERFORMANCE Royce Pennsylvania Mutual Fund advanced 4.8% for the year-to-date period ended June 30, 2017, slightly trailing its small-cap benchmark, the Russell 2000 Index, which rose 5.0% for the same period. After a terrific absolute and relative showing in 2016—our flagship Fund’s fourth-best return in the last 25 years—some pullback was not surprising, especially in a period that showed more favor to high growth and low quality than the kind of companies we seek using Penn’s diversified, multi-theme core approach. In this more challenging environment, the Fund posted a modest first-quarter return (+1.5%) while lagging the benchmark (+2.5%). Several healthcare names from outside the resurgent biotechnology industry keyed Penn’s strong second-quarter results, up 3.2% versus 2.5% for the small-cap index. Looking at longer-term periods, we were pleased that Penn outpaced the Russell 2000 for the 15-, 20-, 25-, 30-, and 35-year periods ended June 30, 2017. The Fund’s average annual total return for the 40-year period ended June 30, 2017 was 13.1%, all under the management of Chuck Royce. |
| WHAT WORKED... AND WHAT DIDN’T |
| Eight of the Fund’s 11 equity sectors finished the semiannual period in the black (a ninth, Telecommunication Services, was essentially flat). Consumer Discretionary and Energy detracted, the first hurt by secular shifts in consumer spending and behavior, the second by falling oil prices. The most notable positive impacts came from Information Technology, Industrials (the Fund’s two largest sectors), and Health Care. The last is an area in which we have been active in 2017, increasing the Fund’s exposure to 10.2% at the end of June from 6.8% at the end of 2016. Consistent with our usual practice, we have mostly avoided the more speculative environs of the sector and instead have been concentrating on cash-flow generating companies with earnings in industries that have been historically less volatile than those in the bio-pharma complex. The result at the end of June was a comparatively larger weighting within the portfolio in equipment makers and suppliers, service providers, and life sciences tool manufacturers, many of which, including Merit Medical Systems, helped drive second-quarter results. Electronic equipment, instruments & components made the largest contribution at the industry level during 2017’s first half, led by the Fund’s three best performing positions for the period. Laser diode and equipment maker Coherent took the top spot, as it did in 2016, galvanized by ongoing sales and earnings growth driven by vibrant demand for ramped up OLED (organic light-emitting diode) capacity. IPG Photonics, which produces high-power fiber lasers and amplifiers, also saw earnings growth push its shares higher as the company continued to benefit from the accelerated pace with which its fiber lasers are replacing conventional lasers and non-laser technology on a global scale. Cognex Corporation is the market leader in machine vision technology, which captures and analyzes visual information to automate tasks that previously relied on human eyesight and is thus a major driver of industrial and process automation. The trend toward automation continues to improve order strength for its machine vision systems. Only two industries made sizable negative impacts on first-half results—specialty retail and energy equipment & services. The Fund’s leading detractor overall, however, was Core-Mark Holding Company, which comes from the distributors industry within Consumer Discretionary. The company specializes in supply and distribution services to convenience stores in the U.S. and Canada. Although profitable, Core-Mark reported lower-than-expected fiscal first-quarter earnings in May, which helped to send its shares lower. We reduced our stake in the first half prior to the announcement. Matrix Service is a contractor to the energy, power, and industrial markets. Its close association with the reeling energy industry, ongoing delays in new project awards and starts, depressed maintenance spending, and increased cost estimates on an electrical infrastructure project all discouraged investors, including us. We sold the last of our shares in Penn’s portfolio in June. Relative to the Russell 2000, poor stock selection in Consumer Discretionary—most impactfully in that sector’s specialty retail group—hurt most while our underweight in biotechnology also created a relative disadvantage. In contrast, Financials were strong relative contributors, aided by savvy stock selection and an underweight in banks, while effective stock picking in machinery stocks gave us an edge in Industrials. |
| Top Contributors to Performance Year-to-Date Through 6/30/17 (%)1 | ||||
| Coherent | 0.55 | |||
| IPG Photonics | 0.33 | |||
| Cognex Corporation | 0.32 | |||
| Merit Medical Systems | 0.31 | |||
| Raven Industries | 0.28 | |||
| 1 Includes dividends | ||||
| Top Detractors from Performance Year-to-Date Through 6/30/17 (%)2 | ||||
| Core-Mark Holding Company | -0.21 | |||
| Matrix Service | -0.20 | |||
| Team | -0.20 | |||
| SEACOR Holdings | -0.17 | |||
| Tejon Ranch | -0.14 | |||
| 2 Net of dividends | ||||
| CURRENT POSITIONING AND OUTLOOK |
| In addition to increasing our weighting in select healthcare companies, we made a number of other changes to the portfolio. After an extended period of disappointing results, we have been reducing our weighting in retailers as we see an industry with substantial challenges ahead of it. On the brighter side, we trimmed several long-term winners in Information Technology and Industrials where valuations no longer merited high weightings in the portfolio. Along with healthcare, we have been redeploying some of these assets in banks, where we have sought to take advantage of relatively weak first-half performance. |
| 26 | The Royce Funds 2017 Semiannual Report to Shareholders |
| PERFORMANCE AND PORTFOLIO REVIEW | TICKER SYMBOLS PENNX RYPFX RPMIX RYPCX RPMRX RPMKX |
| Performance and Expenses | ||||||||||||||||||||||
| Average Annual Total Return (%) Through 6/30/17 | ||||||||||||||||||||||
| JAN-JUN 20171 | 1-YR | 3-YR | 5-YR | 10-YR | 15-YR | 20-YR | 25-YR | 30-YR | 35-YR | 40-YR | ||||||||||||
| PMF | 4.81 | 23.17 | 4.54 | 11.68 | 5.93 | 9.19 | 9.91 | 10.55 | 10.32 | 12.66 | 13.09 | |||||||||||
| Annual Operating Expenses: 0.93% | ||||||||||||||||||||||
| 1 Not annualized | ||||||||||||||||||||||
Relative Returns: Monthly Rolling Average Annual Return Periods
20 Years Through 6/30/17
| On a monthly rolling basis, the Fund outperformed the Russell 2000 in 75% of all 10-year periods; 70% of all 5-year periods; and 55% of all 1-year periods. |
| PERIODS BEATING THE INDEX | FUND AVG (%)1 | INDEX AVG (%)1 | |||||||||
| 10-year | 91/121 | 75% | 8.9 | 6.7 | |||||||
| 5-year | 127/181 | 70% | 10.0 | 7.7 | |||||||
| 1-year | 125/229 | 55% | 10.9 | 9.2 | |||||||

The Morningstar Style Map is the Morningstar Style Box™ with the center 75% of fund holdings plotted as the Morningstar Ownership Zone™. The Morningstar Style Box is designed to reveal a fund’s investment strategy. The Morningstar Ownership Zone provides detail about a portfolio’s investment style by showing the range of stock sizes and styles. The Ownership Zone is derived by plotting each stock in the portfolio within the proprietary Morningstar Style Box. Over time, the shape and location of a fund’s ownership zone may vary. See page 131 for additional information. |
Value of $10,000
as of 6/30/17 ($)
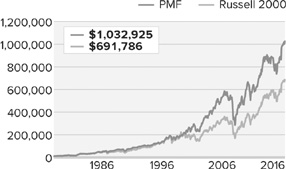
| Top 10 Positions | ||
| % of Net Assets | ||
| Tennant Company | 1.4 | |
| Quaker Chemical | 1.4 | |
| HEICO Corporation | 1.3 | |
| First Citizens BancShares Cl. A | 1.3 | |
| Sun Hydraulics | 1.3 | |
| E-L Financial | 1.1 | |
| Bio-Techne | 1.1 | |
| Valmont Industries | 1.1 | |
| Raven Industries | 1.1 | |
| Landstar System | 1.1 | |
| Portfolio Sector Breakdown | ||
| % of Net Assets | ||
| Industrials | 27.1 | |
| Information Technology | 18.1 | |
| Financials | 13.4 | |
| Consumer Discretionary | 11.3 | |
| Health Care | 10.2 | |
| Materials | 8.6 | |
| Energy | 3.9 | |
| Real Estate | 2.4 | |
| Consumer Staples | 2.0 | |
| Telecommunication Services | 0.2 | |
| Utilities | 0.1 | |
| Miscellaneous | 2.1 | |
| Cash and Cash Equivalents | 0.6 | |
| Calendar Year Total Returns (%) | ||
| YEAR | PMF | |
| 2016 | 26.5 | |
| 2015 | -11.4 | |
| 2014 | -0.7 | |
| 2013 | 35.3 | |
| 2012 | 14.6 | |
| 2011 | -4.2 | |
| 2010 | 23.9 | |
| 2009 | 36.3 | |
| 2008 | -34.8 | |
| 2007 | 2.8 | |
| 2006 | 14.8 | |
| 2005 | 12.5 | |
| 2004 | 20.2 | |
| 2003 | 40.3 | |
| 2002 | -9.2 | |
| Upside/Downside Capture Ratios | ||||
| Periods Ended 6/30/17 (%) | ||||
| UPSIDE | DOWNSIDE | |||
| 10-Year | 92 | 95 | ||
| From 12/31/78 (Russell 2000 Inception) | 89 | 71 | ||
| Portfolio Diagnostics | ||
| Fund Net Assets | $2,329 million | |
| Number of Holdings | 327 | |
| Turnover Rate | 16% | |
| Average Market Capitalization1 | $1,816 million | |
| Weighted Average P/E Ratio2,3 | 22.1x | |
| Weighted Average P/B Ratio2 | 2.4x | |
| Active Share4 | 87% | |
| U.S. Investments (% of Net Assets) | 87.6% | |
| Non-U.S. Investments (% of Net Assets) | 11.8% | |
| 1 | Geometric Average. This weighted calculation uses each portfolio holding’s market cap in a way designed to not skew the effect of very large or small holdings; instead, it aims to better identify the portfolio’s center, which Royce believes offers a more accurate measure of average market cap than a simple mean or median. |
| 2 | Harmonic Average. This weighted calculation evaluates a portfolio as if it were a single stock and measures it overall. It compares the total market value of the portfolio to the portfolio’s share in the earnings or book value, as the case may be, of its underlying stocks. |
| 3 | The Fund’s P/E ratio calculation excludes companies with zero or negative earnings (7% of portfolio holdings as of 6/30/17). |
| 4 | Active Share is the sum of the absolute values of the different weightings of each holding in the Fund versus each holding in the benchmark, divided by two. |
| Important Performance and Expense Information All performance information in this Report reflects past performance, is presented on a total return basis, reflects the reinvestment of distributions, and does not reflect the deduction of taxes that a shareholder would pay on fund distributions or the redemption of fund shares. Past performance is no guarantee of future results. Investment return and principal value of an investment will fluctuate, so that shares may be worth more or less than their original cost when redeemed. Shares redeemed within 30 days of purchase may be subject to a 1% redemption fee payable to the Fund, which is not reflected in the performance shown above; if it were, performance would be lower. Current month-end performance may be higher or lower than performance quoted and may be obtained at www.roycefunds.com. All performance and risk information reflects results of the Investment Class (its oldest class). Operating expenses reflect the Fund’s total annual operating expenses for the Investment Class as of the Fund’s most current prospectus and include management fees, other expenses, and acquired fund fees and expenses. Acquired fund fees and expenses reflect the estimated amount of the fees and expenses incurred indirectly by the Fund through its investment in mutual funds, hedge funds, private equity funds, and other investment companies. Regarding the “Top Contributors” and “Top Detractors” tables shown above, the sum of all contributors to, and all detractors from, performance for all securities in the portfolio would approximate the Fund’s year-to-date performance for 2017. Upside Capture Ratio measures a manager’s performance in up markets relative to the Fund’s benchmark. It is calculated by measuring the Fund’s performance in quarters when the benchmark went up and dividing it by the benchmark’s return in those quarters. Downside Capture Ratio measures a manager’s performance in down markets relative to the Fund’s benchmark (Russell 2000). It is calculated by measuring the Fund’s performance in quarters when the benchmark goes down and dividing it by the benchmark’s return in those quarters. |
| The Royce Funds 2017 Semiannual Report to Shareholders | 27 |
| MANAGERS’ DISCUSSION | ||
| Royce Premier Fund (RPR) |
 |
| Chuck Royce Lauren Romeo, CFA Steven McBoyle, CPA, CA |
| FUND PERFORMANCE During the year’s first half, Royce Premier Fund performed impressively on both an absolute and relative basis, despite value stocks lagging growth stocks. The Fund returned 8.7% for the year-to-date period ended June 30, 2017 compared with 5.0% for its small-cap benchmark, the Russell 2000 Index. This was a strong vote of confidence for the kind of high-quality companies that we seek for the portfolio, those with discernible competitive advantages, high returns on capital, and a sustainable, moat-like franchise. For the first quarter, the Fund gained 6.7% versus 2.5% for the Russell 2000. This strong relative return was all the more notable as the quarter generally favored growth and low-quality stocks, neither of which fit the Fund’s quality approach. Value stocks continued to lag their growth counterparts in the second quarter, when the Fund delivered a respectable return of 1.9% compared with 2.5% for the small-cap index. Long-term results were strong on both an absolute and relative basis as Premier bested its benchmark for the one-, 10-, 15-, 20-, 25-year, and since inception (12/31/91) periods ended June 30, 2017. The Fund’s average annual total return since inception was 11.6%. |
| WHAT WORKED... AND WHAT DIDN’T |
| Eight of Premier’s nine equity sectors finished the semiannual period in the black. Information Technology was the top contributor by a sizable amount, with electronic equipment, instruments & components and semiconductors & semiconductor equipment companies doing best. Industrials made the second-biggest contribution, led by machinery stocks. The Fund’s only sector with negative performance for the first half was Energy, where share prices fell along with the price of oil. Detractions at the industry level were similarly modest, led by energy equipment & services (Energy), specialty retail (Consumer Discretionary), and metals & mining (Materials). The Fund’s two top contributing positions were also top-10 holdings at the end of June. Cognex Corporation is the market leader in machine vision technology, which captures and analyzes visual information to automate tasks that previously relied on human eyesight and is thus a major driver of industrial and process automation. The trend toward automation continues to drive broad order strength for its machine vision systems. Cognex also supplemented its robust technology portfolio with three small acquisitions that should enhance its capabilities in emerging areas such as 3D and adaptive learning. National Instruments supplies computer-based instrumentation hardware and software products for engineers and scientists. The company saw healthier order growth coincident with both improved global industrial activity and new products that should broaden its addressable markets in key growth areas such as semiconductor testing and the Internet of Things. The impact of detractors was far more modest. SEACOR Holdings provides marine transportation equipment and logistics services mostly for the energy and agricultural markets. Its earnings remained pressured by ongoing weakness in the offshore marine vessel business, which was exacerbated by the decline in oil prices in the first half, as well as overcapacity in its inland river barge and tow business. Weak volumes persisted through most of the first half for industrial equipment auctioneer Ritchie Bros. Auctioneers. This was primarily the result of tight supply in consigned heavy equipment for auction as well as uncertainty about the near-term growth trajectory for Iron Planet, a recent acquisition that conducts online equipment auctions. Relative to the Russell 2000, Information Technology provided the largest advantage in the first half. Our performance edge in this sector was driven by savvy stock picking, particularly in the electronic equipment, instruments & components industry. Financials was the second-biggest relative contributor. Both the Fund’s underweight in lagging banks and savvy stock picking among capital markets firms, notably Ashmore Group, the emerging market debt asset manager, helped relative returns. Conversely, our lower exposure to Health Care detracted most from relative performance. A perennial underweight in Premier’s portfolio, it was the top-contributing sector in the Russell 2000 for the first half. Materials also made a minor relative detraction. Shares of our largest holding in the sector, metals distributor and processor Reliance Steel & Aluminum, declined after the company reduced earnings guidance. |
| Top Contributors to Performance Year-to-Date Through 6/30/17 (%)1 | ||||
| Cognex Corporation | 1.06 | |||
| National Instruments | 0.80 | |||
| IDEXX Laboratories | 0.70 | |||
| Lincoln Electric Holdings | 0.68 | |||
| IPG Photonics | 0.66 | |||
| 1 Includes dividends | ||||
| Top Detractors from Performance Year-to-Date Through 6/30/17 (%)2 | ||||
| SEACOR Holdings | -0.35 | |||
| Ritchie Bros. Auctioneers | -0.27 | |||
| Monro Muffler Brake | -0.16 | |||
| CIRCOR International | -0.14 | |||
| Reliance Steel & Aluminum | -0.14 | |||
| 2 Net of dividends | ||||
| CURRENT POSITIONING AND OUTLOOK |
| We slightly narrowed the number of portfolio holdings in the first half of 2017, adding three, including one spin-off, while eliminating four. We also actively trimmed some of our largest contributors, most notably in Information Technology and Industrials, where both valuations and portfolio weightings had become elevated. These actions led to the accumulation of a meaningful cash position of close to 8% at the end of June, as we wait for better opportunities to put this money to work. Until then, we are prepared to be patient. We are comfortable that the long and winding road to normalization that we see for equities will continue to be rewarding for the kind of high-quality companies and long-term compounders that we seek to hold in the Fund. |
| 28 | The Royce Funds 2017 Semiannual Report to Shareholders |
| PERFORMANCE AND PORTFOLIO REVIEW | TICKER SYMBOLS RYPRX RPFFX RPFIX RPRCX RPRRX RPRWX |
| Performance and Expenses | ||||||||||||||||||
| Average Annual Total Return (%) Through 6/30/17 | ||||||||||||||||||
| JAN-JUN 20171 | 1-YR | 3-YR | 5-YR | 10-YR | 15-YR | 20-YR | 25-YR | SINCE INCEPTION (12/31/91) | ||||||||||
| RPR | 8.70 | 25.54 | 3.63 | 10.62 | 7.20 | 10.78 | 10.42 | 11.80 | 11.61 | |||||||||
| Annual Operating Expenses: 1.16% | ||||||||||||||||||
| 1 Not annualized | ||||||||||||||||||
Relative Returns: Monthly Rolling Average Annual Return Periods
| On a monthly rolling basis, the Fund outperformed the Russell 2000 in 99% of all 10-year periods; 72% of all 5-year periods; and 63% of all 1-year periods. |
| PERIODS BEATING THE INDEX | FUND AVG (%)1 | INDEX AVG (%)1 | |||||||||
| 10-year | 120/121 | 99% | 10.5 | 6.7 | |||||||
| 5-year | 131/181 | 72% | 10.9 | 7.7 | |||||||
| 1-year | 144/229 | 63% | 11.4 | 9.2 | |||||||

The Morningstar Style Map is the Morningstar Style Box™ with the center 75% of fund holdings plotted as the Morningstar Ownership Zone™. The Morningstar Style Box is designed to reveal a fund’s investment strategy. The Morningstar Ownership Zone provides detail about a portfolio’s investment style by showing the range of stock sizes and styles. The Ownership Zone is derived by plotting each stock in the portfolio within the proprietary Morningstar Style Box. Over time, the shape and location of a fund’s ownership zone may vary. See page 131 for additional information. |
Value of $10,000
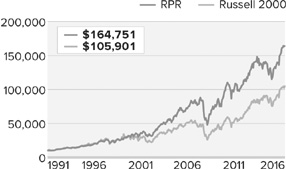
| Top 10 Positions | ||
| % of Net Assets | ||
| Lincoln Electric Holdings | 3.6 | |
| Cognex Corporation | 3.6 | |
| Copart | 3.3 | |
| National Instruments | 3.2 | |
| MKS Instruments | 3.0 | |
| Woodward | 2.8 | |
| Landstar System | 2.8 | |
| Kirby Corporation | 2.7 | |
| Valmont Industries | 2.6 | |
| Alleghany Corporation | 2.6 | |
| Portfolio Sector Breakdown | ||
| % of Net Assets | ||
| Industrials | 33.2 | |
| Information Technology | 19.6 | |
| Financials | 12.1 | |
| Consumer Discretionary | 9.3 | |
| Materials | 7.0 | |
| Health Care | 4.0 | |
| Energy | 3.3 | |
| Consumer Staples | 2.2 | |
| Real Estate | 0.9 | |
| Miscellaneous | 0.6 | |
| Cash and Cash Equivalents | 7.8 | |
| Calendar Year Total Returns (%) | ||
| YEAR | RPR | |
| 2016 | 23.0 | |
| 2015 | -9.9 | |
| 2014 | -0.9 | |
| 2013 | 27.7 | |
| 2012 | 11.4 | |
| 2011 | -0.9 | |
| 2010 | 26.5 | |
| 2009 | 33.3 | |
| 2008 | -28.3 | |
| 2007 | 12.7 | |
| 2006 | 8.8 | |
| 2005 | 17.1 | |
| 2004 | 22.8 | |
| 2003 | 38.7 | |
| 2002 | -7.8 | |
| Upside/Downside Capture Ratios | ||||
| Periods Ended 6/30/16 (%) | ||||
| UPSIDE | DOWNSIDE | |||
| 10-Year | 92 | 87 | ||
| From 12/31/91 (Start of Fund’s First Full Quarter) | 92 | 72 | ||
| Portfolio Diagnostics | ||
| Fund Net Assets | $2,282 million | |
| Number of Holdings | 55 | |
| Turnover Rate | 3% | |
| Average Market Capitalization1 | $3,577 million | |
| Weighted Average P/E Ratio2,3 | 23.7x | |
| Weighted Average P/B Ratio2 | 2.8x | |
| Active Share4 | 97% | |
| U.S. Investments (% of Net Assets) | 81.6% | |
| Non-U.S. Investments (% of Net Assets) | 10.6% | |
| 1 | Geometric Average. This weighted calculation uses each portfolio holding’s market cap in a way designed to not skew the effect of very large or small holdings; instead, it aims to better identify the portfolio’s center, which Royce believes offers a more accurate measure of average market cap than a simple mean or median. |
| 2 | Harmonic Average. This weighted calculation evaluates a portfolio as if it were a single stock and measures it overall. It compares the total market value of the portfolio to the portfolio’s share in the earnings or book value, as the case may be, of its underlying stocks. |
| 3 | The Fund’s P/E ratio calculation excludes companies with zero or negative earnings (4% of portfolio holdings as of 6/30/17). |
| 4 | Active Share is the sum of the absolute values of the different weightings of each holding in the Fund versus each holding in the benchmark, divided by two. |
| Important Performance and Expense Information All performance information in this Report reflects past performance, is presented on a total return basis, reflects the reinvestment of distributions, and does not reflect the deduction of taxes that a shareholder would pay on fund distributions or the redemption of fund shares. Past performance is no guarantee of future results. Investment return and principal value of an investment will fluctuate, so that shares may be worth more or less than their original cost when redeemed. Shares redeemed within 30 days of purchase may be subject to a 1% redemption fee payable to the Fund, which is not reflected in the performance shown above; if it were, performance would be lower. Current month-end performance may be higher or lower than performance quoted and may be obtained at www.roycefunds.com. All performance and risk information reflects results of the Investment Class (its oldest class). Operating expenses reflect the Fund’s total annual operating expenses for the Investment Class as of the Fund’s most current prospectus and include management fees and other expenses. Regarding the “Top Contributors” and “Top Detractors” tables shown above, the sum of all contributors to, and all detractors from, performance for all securities in the portfolio would approximate the Fund’s year-to-date performance for 2017. Upside Capture Ratio measures a manager’s performance in up markets relative to the Fund’s benchmark. It is calculated by measuring the Fund’s performance in quarters when the benchmark went up and dividing it by the benchmark’s return in those quarters. Downside Capture Ratio measures a manager’s performance in down markets relative to the Fund’s benchmark (Russell 2000). It is calculated by measuring the Fund’s performance in quarters when the benchmark goes down and dividing it by the benchmark’s return in those quarters. |
| The Royce Funds 2017 Semiannual Report to Shareholders | 29 |
| MANAGER’S DISCUSSION | ||
| Royce Small-Cap Leaders Fund (ROH) |
 |
| Lauren Romeo, CFA |
| FUND PERFORMANCE After benefiting in 2016 from a combination of strong stock-picking and the resumption of leadership for value and cyclical stocks, Royce Small-Cap Leaders Fund took a relative step back in 2017’s first half. The Fund was up 1.1% for the year-to-date period ended June 30, 2017, trailing its small-cap benchmark, the Russell 2000 Index, which gained 5.0% for the same period. The first half of 2017 featured a few reversals that affected relative performance for the kind of high-quality stocks that we seek, most notably a pronounced advantage for growth stocks, particularly in biotechnology. This pattern began early in the year. For the first quarter, Small-Cap Leaders rose 0.9% versus 2.5% for the Russell 2000 while the second quarter saw more of the same, with the Fund gaining 0.3% while the small-cap index was up 2.5%. Small-Cap Leaders’ average annual total return since inception (6/30/03) was 9.4%. |
| WHAT WORKED... AND WHAT DIDN’T |
| Of the Fund’s nine equity sectors, three detracted from first-half results, and a fourth was flat, while six made positive contributions, led by Financials and Information Technology. The largest negative impacts came from Consumer Discretionary, where specialty retail was the Fund’s worst-performing industry group, and Energy, where energy equipment & services finished second among the portfolio’s detractors at the industry level. Retailers have been under siege over the last few years as they attempt to cope with secular changes in consumer spending habits and the related margin-contracting specter of Amazon. As a result of these challenges—and the resulting downward pressure on stock prices—we reduced the Fund’s exposure to the industry in the first half. We sold our shares of footwear, headwear, and sports apparel retailer Genesco as first-quarter results and revised full-year guidance fell well below expectations due to intensified competition and management’s overconfidence that it could rebalance inventory to compensate for a key fashion shift it missed last year in its Journeys footwear chain. We also significantly reduced our exposure to The Buckle in the second quarter as business for this clothing retailer continued to deteriorate in part due to heightened online competition. We felt more confident about the long-term prospects for footwear wholesaler and retailer Caleres. Recent sales and earnings growth has been solid, but early 2017 results fell short of investors’ optimistic expectations—and even minor disappointments in the industry are severely punished in the current highly challenging environment. We netted out a modest increase in our position during the first half. Despite high employment and solid business confidence, revenue growth for office furniture manufacturer Steelcase remained constrained as North American customers were still cautious about spending. Additionally, while the company is introducing new product to address the “resi-mercial” office style trend, this growth has yet to offset sales declines from legacy office products. We were content to stay patient and held a good-sized stake at the end of June. Xperi was formed when Tessera Holding acquired DTS. The company, which licenses audio and semiconductor technologies, offered disappointing earnings guidance on the formation of the new company. The outlook is clouded by the pending resolution of a patent dispute with one large company and the signing of a licensing renewal by a second, which led us to reduce our position in the first half. Top-10 holding Genworth MI Canada, that country’s leading residential mortgage insurance provider, was the Fund’s top-contributing position in the first half. Its stock extended its strong run from 2016 based on expectations that loss ratios have bottomed in oil-rich provinces where it has residential mortgage insurance in force, combined with a premium increase that offset new, higher capital requirements. Lazard, another top-10 position, continued to gain market share in its global mergers & acquisitions advisory business, particularly in Europe where activity is rebounding. It also saw healthy inflows in its asset management segment that were driven by its global and quantitative offerings. Relative to the Russell 2000, the portfolio’s substantial underweight in Health Care, including a lack of exposure to biotechnology, hurt most. Also having a large negative impact was ineffective stock selection in Consumer Discretionary, mostly in specialty retail. Conversely, savvy stock picks provided a relative advantage in Financials and, to a lesser extent, Consumer Staples. |
| Top Contributors to Performance Year-to-Date Through 6/30/17 (%)1 | ||||
| Genworth MI Canada | 0.44 | |||
| Lazard CI. A | 0.40 | |||
| Fabrinet | 0.33 | |||
| Bio-Rad Laboratories CI. A | 0.33 | |||
| Industrias Bachoco ADR | 0.32 | |||
| 1 Includes dividends | ||||
| Top Detractors from Performance Year-to-Date Through 6/30/17 (%)2 | ||||
| Steelcase CI. A | -0.48 | |||
| Xperi | -0.41 | |||
| Genesco | -0.41 | |||
| Oil States International | -0.39 | |||
| Caleres | -0.38 | |||
| 2 Net of dividends | ||||
| CURRENT POSITIONING AND OUTLOOK |
| Thus far in 2017, small-cap performance has reverted back to that of years such as 2015 – narrow leadership by growth-oriented sectors populated by unprofitable companies. During 2017’s first half, for example, Health Care and Information Technology accounted for approximately 90% of the Russell 2000’s return. However, we believe this is only a temporary pause in the long overdue reversion to the mean of small-cap value and quality outperformance that began in 2016. Fiscal rather than monetary policy will increasingly be the top-down focus of investors as the catalyst to a sustained breakout of U.S. GDP growth beyond the 1-2% range. Many of our more cyclical companies have become even more attractively valued after lagging in first-half stock price performance despite posting in-line financial results and guidance. |
| 30 | The Royce Funds 2017 Semiannual Report to Shareholders |
| PERFORMANCE AND PORTFOLIO REVIEW | TICKER SYMBOLS RYOHX ROHHX ROHRX |
| Performance and Expenses | ||||||||||||
| Average Annual Total Return (%) Through 6/30/17 | ||||||||||||
| JAN-JUN 20171 | 1-YR | 3-YR | 5-YR | 10-YR | SINCE INCEPTION (6/30/03) | |||||||
| ROH | 1.14 | 19.80 | 1.49 | 9.04 | 5.72 | 9.43 | ||||||
| Annual Gross Operating Expenses: 1.58% Annual Net Operating Expenses: 1.49% | ||||||||||||
| 1 Not annualized | ||||||||||||

The Morningstar Style Map is the Morningstar Style Box™ with the center 75% of fund holdings plotted as the Morningstar Ownership Zone™. The Morningstar Style Box is designed to reveal a fund’s investment strategy. The Morningstar Ownership Zone provides detail about a portfolio’s investment style by showing the range of stock sizes and styles. The Ownership Zone is derived by plotting each stock in the portfolio within the proprietary Morningstar Style Box. Over time, the shape and location of a fund’s ownership zone may vary. See page 131 for additional information. |
Value of $10,000
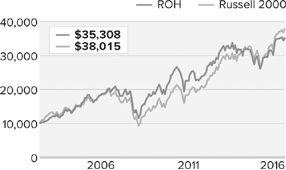
| Top 10 Positions | ||
| % of Net Assets | ||
| Minerals Technologies | 3.0 | |
| Marcus & Millichap | 3.0 | |
| Genworth MI Canada | 2.9 | |
| Artisan Partners Asset Management Cl. A | 2.8 | |
| Lazard Cl. A | 2.6 | |
| Caleres | 2.4 | |
| Pason Systems | 2.3 | |
| Cal-Maine Foods | 2.2 | |
| Bio-Techne | 2.1 | |
| Houlihan Lokey Cl. A | 2.1 | |
| Portfolio Sector Breakdown | ||
| % of Net Assets | ||
| Industrials | 23.3 | |
| Financials | 14.8 | |
| Consumer Discretionary | 14.4 | |
| Information Technology | 13.6 | |
| Consumer Staples | 7.5 | |
| Health Care | 5.9 | |
| Energy | 5.2 | |
| Materials | 4.6 | |
| Real Estate | 3.0 | |
| Miscellaneous | 1.2 | |
| Cash and Cash Equivalents | 6.5 | |
| Calendar Year Total Returns (%) | ||
| YEAR | ROH | |
| 2016 | 25.5 | |
| 2015 | -12.5 | |
| 2014 | -3.3 | |
| 2013 | 30.9 | |
| 2012 | 11.5 | |
| 2011 | -6.5 | |
| 2010 | 24.8 | |
| 2009 | 38.0 | |
| 2008 | -29.2 | |
| 2007 | 7.3 | |
| 2006 | 13.7 | |
| 2005 | 14.9 | |
| 2004 | 27.2 | |
| Upside/Downside Capture Ratios | ||||
| Periods Ended 6/30/17 (%) | ||||
| UPSIDE | DOWNSIDE | |||
| 10-Year | 89 | 93 | ||
| From 6/30/03 (Start of Fund’s First Full Quarter) | 93 | 93 | ||
| Portfolio Diagnostics | ||
| Fund Net Assets | $90 million | |
| Number of Holdings | 73 | |
| Turnover Rate | 32% | |
| Average Market Capitalization1 | $1,763 million | |
| Weighted Average P/E Ratio2,3 | 18.5x | |
| Weighted Average P/B Ratio2 | 2.5x | |
| Active Share4 | 96% | |
| U.S. Investments (% of Net Assets) | 74.9% | |
| Non-U.S. Investments (% of Net Assets) | 18.6% | |
| 1 | Geometric Average. This weighted calculation uses each portfolio holding’s market cap in a way designed to not skew the effect of very large or small holdings; instead, it aims to better identify the portfolio’s center, which Royce believes offers a more accurate measure of average market cap than a simple mean or median. |
| 2 | Harmonic Average. This weighted calculation evaluates a portfolio as if it were a single stock and measures it overall. It compares the total market value of the portfolio to the portfolio’s share in the earnings or book value, as the case may be, of its underlying stocks. |
| 3 | The Fund’s P/E ratio calculation excludes companies with zero or negative earnings (6% of portfolio holdings as of 6/30/17). |
| 4 | Active Share is the sum of the absolute values of the different weightings of each holding in the Fund versus each holding in the benchmark, divided by two. |
| Important Performance and Expense Information All performance information in this Report reflects past performance, is presented on a total return basis, reflects the reinvestment of distributions, and does not reflect the deduction of taxes that a shareholder would pay on fund distributions or the redemption of fund shares. Past performance is no guarantee of future results. Investment return and principal value of an investment will fluctuate, so that shares may be worth more or less than their original cost when redeemed. Shares redeemed within 30 days of purchase may be subject to a 1% redemption fee payable to the Fund, which is not reflected in the performance shown above; if it were, performance would be lower. Current month-end performance may be higher or lower than performance quoted and may be obtained at www.roycefunds.com. All performance and risk information reflects results of the Service Class (its oldest class). Gross operating expenses reflect the Fund’s gross total annual operating expenses for the Service Class and include management fees, 12b-1 distribution and service fees, and other expenses. Net operating expenses reflect contractual fee waivers and/or expense reimbursements. All expense information is reported as of the Fund’s most current prospectus. Royce & Associates has contractually agreed to waive fees and/or reimburse operating expenses to the extent necessary to maintain the Service Class’s net annual operating expenses, (excluding brokerage commissions, taxes, interest, litigation expenses, acquired fund fees and expenses, and other expenses not borne in the ordinary course of business), at or below 1.49% through April 30, 2018. Regarding the “Top Contributors” and “Top Detractors” tables shown above, the sum of all contributors to, and all detractors from, performance for all securities in the portfolio would approximate the Fund’s year-to-date performance for 2017. Upside Capture Ratio measures a manager’s performance in up markets relative to the Fund’s benchmark. It is calculated by measuring the Fund’s performance in quarters when the benchmark went up and dividing it by the benchmark’s return in those quarters. Downside Capture Ratio measures a manager’s performance in down markets relative to the Fund’s benchmark (Russell 2000). It is calculated by measuring the Fund’s performance in quarters when the benchmark goes down and dividing it by the benchmark’s return in those quarters. |
| The Royce Funds 2017 Semiannual Report to Shareholders | 31 |
| MANAGER’S DISCUSSION | ||
| Royce Small-Cap Value Fund (RVV) |
 |
| Jay Kaplan, CFA |
| FUND PERFORMANCE For the year-to-date period ended June 30, 2017, Royce Small-Cap Value Fund was down 4.2%, significantly lagging its small-cap benchmark, the Russell 2000 Index, which gained 5.0% for the same period. It was a difficult first half for value stocks and a disappointing one for our contrarian value approach. The Fund slipped 1.5% in the first quarter versus a 2.5% advance for the small-cap index. Value stocks began to fall behind their growth counterparts early in the year, spurred in large part by strong results for biotechnology companies and less stellar performance for many of the cyclical areas that did so well in 2016. This pattern held sway in the second quarter, when Small-Cap Value was down 2.7% compared to another 2.5% increase for the Russell 2000. The leadership that began early in the year thus remained in place for most of the first half, as large-caps, growth, healthcare, and non-U.S. equities all stayed in the lead after lagging in 2016. Longer-term results were better as the Fund outperformed its benchmark for the 15-year and since inception (6/14/01) periods ended June 30, 2017. Small-Cap Value’s average annual total return since inception was 9.3%. |
| WHAT WORKED... AND WHAT DIDN’T |
| Consumer Discretionary made by far the largest negative impact at the sector level, detracting more than twice as much as Energy, the Fund’s second-biggest detractor for the semiannual period. The specialty retail industry disproportionately drove negative results, with seven of the Fund’s eight biggest first-half detractors coming from the group. Brick and mortar retailers continue to struggle with shifts in consumer spending and shopping habits, along with the ensuing margin contraction, developments keyed to a large degree by the omnipresence of Amazon. We sold our shares of footwear, headwear, and sports apparel retailer Genesco in June and reduced our stake in each of the Fund’s other positions in specialty retail during the first half, including sporting goods company Hibbett Sports, women’s fashion and accessories retailer The Cato Corporation, and footwear specialist Shoe Carnival. The energy equipment & services group also had a substantial negative impact, led by Matrix Service, the Fund’s top detractor at the position level in the first half. The company is a contractor to the energy, power, and industrial markets. Ongoing delays in new project awards and starts, depressed maintenance spending, and increased cost estimates on an electrical infrastructure project all discouraged investors, including us. We sold the last of our shares in the portfolio in May. Industrials, Information Technology, and Financials made the biggest sector-based contributions to 2017’s first-half results, while at the industry level, building products (Industrials), IT services (Information Technology), and capital markets (Financials) made notable positive impacts. Kitchen cabinet and vanity manufacturer American Woodmark led the building products group, and the Fund overall, thanks to impressive sales growth in both its new construction and remodeling products. We trimmed our stake as its share price climbed. We chose to add shares of truck trailer manufacturer (and top-10 holding) Wabash National in the first half. Investors seemed to respond positively to its raised earnings guidance for the rest of 2017 as well the company’s efforts to emphasize its diverse line of transportation products. NCI offers network engineering, information assurance, systems development, and integration for government agencies. Fiscal first-quarter revenues exceeded the midpoint of management’s guidance range given earlier in the year, driven in part by margin improvements resulting from higher contributions from fixed-price contracts. Relative to the Russell 2000, the Fund’s first-half results were affected most by both our overweight and ineffective stock picking in Consumer Discretionary, where the previously mentioned specialty retail group detracted most. Both our lower exposure to Health Care and ineffective stock picks in Information Technology also notably hurt relative results. Bright spots included better stock selection in Financials—most notably in capital markets stocks such as Moelis & Company—and Industrials, where American Woodmark helped the building products group to shine. |
| Top Contributors to Performance Year-to-Date Through 6/30/17 (%)1 | ||||
| American Woodmark | 0.54 | |||
| Wabash National | 0.54 | |||
| NCI Cl. A | 0.50 | |||
| Genworth MI Canada | 0.38 | |||
| Moelis & Company Cl. A | 0.38 | |||
| 1 Includes dividends | ||||
| Top Detractors from Performance Year-to-Date Through 6/30/17 (%)2 | ||||
| Matrix Service | -1.10 | |||
| Hibbett Sports | -0.72 | |||
| Genesco | -0.59 | |||
| Shoe Carnival | -0.49 | |||
| Kirkland’s | -0.46 | |||
| 2 Net of dividends | ||||
| CURRENT POSITIONING AND OUTLOOK |
| Our outlook has not changed appreciably since the end of 2016. Our valuation-sensitive contrarian approach has made finding new ideas difficult because most of the cheap stocks we have been investigating look priced that way for very good reasons that look likely to persist—classic value traps. Patience, therefore, remains key. We still expect that more interesting opportunities will materialize when some of the current widespread optimism dissipates, and we are prepared to wait. In the event of a correction, we will act opportunistically as we always have when the market trends down. During the first half, in addition to reducing the specialty retail group, we made discrete purchases in both residential and non-residential construction companies, as well as in distribution and networking technology businesses—consistent with our ‘low-tech tech’ ethos and including top-10 holdings Fabrinet and PC Connection. We also purchased shares in a small number of boutique investment banks that look well positioned to benefit from ongoing global uncertainty as well as what we think will be a more robust M&A market in the months to come. |
| 32 | The Royce Funds 2017 Semiannual Report to Shareholders |
| PERFORMANCE AND PORTFOLIO REVIEW | TICKER SYMBOLS RYVFX RVVHX RVFIX RVFCX RVVRX RVFKX |
| Performance and Expenses | ||||||||||||||
| Average Annual Total Return (%) Through 6/30/17 | ||||||||||||||
| JAN-JUN 20171 | 1-YR | 3-YR | 5-YR | 10-YR | 15-YR | SINCE INCEPTION (6/14/01) | ||||||||
| RVV | -4.21 | 12.22 | -0.26 | 7.87 | 3.75 | 10.00 | 9.26 | |||||||
| Annual Operating Expenses: 1.49% | ||||||||||||||
| 1 Not annualized | ||||||||||||||
Relative Returns: Monthly Rolling Average Annual Return Periods
| On a monthly rolling basis, the Fund outperformed the Russell 2000 in 60% of all 10-year periods; 57% of all 5-year periods; and 54% of all 1-year periods. |
| PERIODS BEATING THE INDEX | FUND AVG (%)1 | INDEX AVG (%)1 | |||||||||
| 10-year | 44/73 | 60% | 9.0 | 7.8 | |||||||
| 5-year | 76/133 | 57% | 9.7 | 8.7 | |||||||
| 1-year | 98/181 | 54% | 11.5 | 10.5 | |||||||
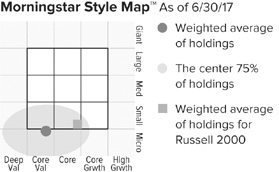
The Morningstar Style Map is the Morningstar Style Box™ with the center 75% of fund holdings plotted as the Morningstar Ownership Zone™. The Morningstar Style Box is designed to reveal a fund’s investment strategy. The Morningstar Ownership Zone provides detail about a portfolio’s investment style by showing the range of stock sizes and styles. The Ownership Zone is derived by plotting each stock in the portfolio within the proprietary Morningstar Style Box. Over time, the shape and location of a fund’s ownership zone may vary. See page 131 for additional information. |
Value of $10,000
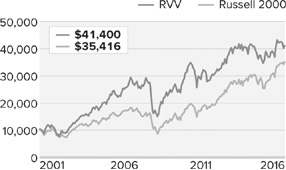
| Top 10 Positions | ||
| % of Net Assets | ||
| Genworth MI Canada | 2.3 | |
| Fabrinet | 2.3 | |
| AMN Healthcare Services | 2.1 | |
| PC Connection | 2.1 | |
| Federated Investors Cl. B | 2.1 | |
| Wabash National | 2.1 | |
| Celestica | 2.0 | |
| Gentex Corporation | 2.0 | |
| Marcus & Millichap | 2.0 | |
| Village Super Market Cl. A | 2.0 | |
| Portfolio Sector Breakdown | ||
| % of Net Assets | ||
| Financials | 21.9 | |
| Industrials | 21.5 | |
| Information Technology | 20.0 | |
| Consumer Discretionary | 14.8 | |
| Health Care | 2.6 | |
| Energy | 2.4 | |
| Real Estate | 2.0 | |
| Consumer Staples | 2.0 | |
| Utilities | 1.0 | |
| Miscellaneous | 1.0 | |
| Cash and Cash Equivalents | 10.8 | |
| Calendar Year Total Returns (%) | ||
| YEAR | RVV | |
| 2016 | 21.1 | |
| 2015 | -11.5 | |
| 2014 | -0.0 | |
| 2013 | 27.8 | |
| 2012 | 9.6 | |
| 2011 | -7.4 | |
| 2010 | 25.0 | |
| 2009 | 44.7 | |
| 2008 | -34.2 | |
| 2007 | 3.8 | |
| 2006 | 16.8 | |
| 2005 | 17.2 | |
| 2004 | 30.9 | |
| 2003 | 54.3 | |
| Upside/Downside Capture Ratios | ||||
| Periods Ended 6/30/17 (%) | ||||
| UPSIDE | DOWNSIDE | |||
| 10-Year | 81 | 95 | ||
| From 6/30/01 (Start of Fund’s First Full Quarter) | 99 | 91 | ||
| Portfolio Diagnostics | ||
| Fund Net Assets | $365 million | |
| Number of Holdings | 74 | |
| Turnover Rate | 33% | |
| Average Market Capitalization1 | $1,064 million | |
| Weighted Average P/E Ratio2,3 | 16.5x | |
| Weighted Average P/B Ratio2 | 1.9x | |
| Active Share4 | 97% | |
| U.S. Investments (% of Net Assets) | 81.3% | |
| Non-U.S. Investments (% of Net Assets) | 7.9% | |
| 1 | Geometric Average. This weighted calculation uses each portfolio holding’s market cap in a way designed to not skew the effect of very large or small holdings; instead, it aims to better identify the portfolio’s center, which Royce believes offers a more accurate measure of average market cap than a simple mean or median. |
| 2 | Harmonic Average. This weighted calculation evaluates a portfolio as if it were a single stock and measures it overall. It compares the total market value of the portfolio to the portfolio’s share in the earnings or book value, as the case may be, of its underlying stocks. |
| 3 | The Fund’s P/E ratio calculation excludes companies with zero or negative earnings (4% of portfolio holdings as of 6/30/17). |
| 4 | Active Share is the sum of the absolute values of the different weightings of each holding in the Fund versus each holding in the benchmark, divided by two. |
| Important Performance and Expense Information All performance information in this Report reflects past performance, is presented on a total return basis, reflects the reinvestment of distributions, and does not reflect the deduction of taxes that a shareholder would pay on fund distributions or the redemption of fund shares. Past performance is no guarantee of future results. Investment return and principal value of an investment will fluctuate, so that shares may be worth more or less than their original cost when redeemed. Shares redeemed within 30 days of purchase may be subject to a 1% redemption fee payable to the Fund, which is not reflected in the performance shown above; if it were, performance would be lower. Current month-end performance may be higher or lower than performance quoted and may be obtained at www.roycefunds.com. All performance and risk information reflects results of the Service Class (its oldest class). Certain immaterial adjustments were made to the net assets of Royce Small-Cap Value Fund at 6/30/16 for financial reporting purposes, and as a result the net asset values for shareholder transactions on that date and the calendar year Total Returns (%) based on those net asset values differ from the adjusted net asset values and calendar year total returns reported in the Financial Highlights. Operating expenses reflect the Fund’s total annual operating expenses for the Service Class as of the Fund’s most current prospectus and include management fees, 12b-1 distribution and service fees, and other expenses. Regarding the “Top Contributors” and “Top Detractors” tables shown above, the sum of all contributors to, and all detractors from, performance for all securities in the portfolio would approximate the Fund’s year-to-date performance for 2017. Upside Capture Ratio measures a manager’s performance in up markets relative to the Fund’s benchmark. It is calculated by measuring the Fund’s performance in quarters when the benchmark went up and dividing it by the benchmark’s return in those quarters. Downside Capture Ratio measures a manager’s performance in down markets relative to the Fund’s benchmark (Russell 2000). It is calculated by measuring the Fund’s performance in quarters when the benchmark goes down and dividing it by the benchmark’s return in those quarters. |
| The Royce Funds 2017 Semiannual Report to Shareholders | 33 |
| MANAGER’S DISCUSSION |
| Royce Small/Mid-Cap Premier Fund (RHF) (Formerly Royce Heritage Fund) |
 |
| Steven McBoyle, CPA, CA |
| FUND PERFORMANCE |
| Royce Small/Mid-Cap Premier Fund (formerly Royce Heritage Fund) climbed 5.7% for the year-to-date period ended June 30, 2017, slightly trailing the 6.0% gain for its new small- and mid-cap benchmark, the Russell 2500 Index, while outpacing the 5.0% increase for the small-cap Russell 2000 Index for the same period. We changed the Fund’s name and shifted its benchmark from the Russell 2000 to the Russell 2500 to better reflect the portfolio’s small- and mid-cap selection universe, which Royce defines as those with market capitalizations up to $15 billion. The Fund’s investment approach, however, remained unchanged—we continue to seek companies that we consider “premier”—those that we believe have sustainable, moat-like franchises, discernible competitive advantages, a history of prudent capital allocation, and opportunities to profitably reinvest excess cash flow. |
| The Fund outpaced both indexes in the first quarter, up 4.4% versus respective gains of 3.8% and 2.5% for the Russell 2500 and Russell 2000 Indexes. This was especially notable during a period in which growth stocks led and approaches similar to the Fund’s valuation-sensitive, high-quality approach were out of favor. Second-quarter results were more pedestrian, with the Fund gaining 1.2% versus 2.1% for the Russell 2500 and 2.5% for the Russell 2000. We were pleased that the Fund outpaced both benchmarks for the 20-year and since inception (12/27/95) periods ended June 30, 2017. Small/Mid-Cap Premier’s average annual total return since inception was 12.3%. |
| WHAT WORKED... AND WHAT DIDN’T |
| Eight of the Fund’s nine equity sectors finished the semiannual period in the black with Information Technology and Industrials leading by impressive margins. Two industries—one from each of the two leading sectors—made by far the biggest positive impacts on first-half performance: electronic equipment, instruments & components and professional services. Results for the first group were primarily driven by two positions. Top-10 position IPG Photonics, which produces high-power fiber lasers and amplifiers, saw earnings growth push its shares higher as the company continued to benefit from the accelerated pace at which its fiber lasers are replacing conventional lasers and non-laser technology on a global scale. The stock price of laser diode and equipment maker Coherent was galvanized by ongoing sales and earnings growth. |
| The top contributing position in professional services, and second in the Fund as a whole, was global staffing and services company—and top-10 holding—ManpowerGroup. The company saw its stock benefit from improved topline growth and a strong bottom line in 2016, solid fiscal first-quarter 2017 earnings, and a brightening global employment picture. From the Consumer Discretionary sector, NVR builds homes and engages in mortgage banking activities. Its shares benefited from ongoing strength in the U.S. housing market, which helped the company post respective first-quarter increases in net income and diluted earnings per share of 58% and 59%. Consumer Discretionary was the only sector to detract from performance in the first half, though its impact was decidedly modest. While the sector offered an interesting mix of contributing and detracting industries and positions, its specialty retail group had a significant negative effect. Some of this is attributable to the “Amazon Effect,” a broadly used term that describes the significant shifts that are adversely affecting brick and mortar retailers. The growing popularity of e-commerce is introducing price transparency and algorithmic-based pricing strategies that are threatening profits across many industries, making it arguably the greatest deflationary force in the economy today. This has resulted in a regular reexamination of our holdings in the retail space. Speaking of which, two retailers topped the portfolio’s list of detractors. We substantially reduced our stake in Dicks Sporting Goods in the first half as the company, which has been cutting costs and streamlining operations, nonetheless reported disappointing fiscal first-quarter earnings due to poor sales. We opted to exit our position in Signet Jewelers, the company that operates Zales, Jared, and Kay Jewelers, due to our discomfort with the company’s reliance on in-house financing to spur sales and sluggish earnings. Relative to the Russell 2500, the Fund was disadvantaged by stock selection in Consumer Discretionary, a much lower weighting in Health Care, and the portfolio’s cash position. By contrast, our lack of exposure to Energy helped as did both our lower weightings and stock selection in Financials and Real Estate were also a plus. Effective stock selection in Information Technology and Industrials. |
| Top Contributors to Performance | |||
| Year-to-Date Through 6/30/17 (%)1 | |||
| IPG Photonics | 0.73 | ||
| ManpowerGroup | 0.55 | ||
| NVR | 0.50 | ||
| Coherent | 0.50 | ||
| Westlake Chemical | 0.50 | ||
| 1 Includes dividends | |||
| Top Detractors from Performance | |||
| Year-to-Date Through 6/30/17 (%)2 | |||
| Dicks Sporting Goods | -0.53 | ||
| Signet Jewelers | -0.53 | ||
| Monro Muffler Brake | -0.25 | ||
| Carlisle Companies | -0.19 | ||
| Dollar Tree | -0.16 | ||
| 2 Net of dividends | |||
| CURRENT POSITIONING AND OUTLOOK |
| We continue to anticipate lower returns, higher volatility, and lower correlation levels. Evidence continues to mount that a normalization in the markets is taking place, which should make them far more discriminating. For these reasons, we believe our bottom-up, quality-oriented process has the potential to do well. Other than reducing our retail exposure, portfolio positioning has remained largely unchanged. The largest sectors at the end of June were Industrials, Consumer Discretionary, and Information Technology. Along with Materials, the first two were also our largest overweights versus the Russell 2500 at the end of the semiannual period. |
| 34 | The Royce Funds 2017 Semiannual Report to Shareholders |
| PERFORMANCE AND PORTFOLIO REVIEW | TICKER SYMBOLS RGFAX RHFHX RYGCX RHFRX |
| Performance and Expenses Average Annual Total Return (%) Through 6/30/17 | ||||||||||||||||
| JAN-JUN 20171 | 1-YR | 3-YR | 5-YR | 10-YR | 15-YR | 20-YR | SINCE INCEPTION (12/27/95) | |||||||||
| RHF | 5.68 | 18.27 | 3.80 | 10.11 | 5.73 | 9.04 | 11.39 | 12.33 | ||||||||
| Annual Operating Expenses: 1.30% | ||||||||||||||||
| 1 Not annualized | ||||||||||||||||
| Relative Returns: Monthly Rolling Average Annual Return Periods 20 Years Through 6/30/17 On a monthly rolling basis, the Fund outperformed the Russell 2000 in 82% of all 10-year periods; 77% of all 5-year periods; and 59% of all 1-year periods. | ||||||||||||
| PERIODS BEATING THE INDEX | FUND AVG (%)1 | INDEX AVG (%)1 | ||||||||||||
| 10-year | 99/121 | 82% | 9.4 | 6.7 | ||||||||||
| 5-year | 139/181 | 77% | 10.3 | 7.7 | ||||||||||
| 1-year | 136/229 | 59% | 12.9 | 9.2 | ||||||||||

The Morningstar Style Map is the Morningstar Style Box™ with the center 75% of fund holdings plotted as the Morningstar Ownership Zone™. The Morningstar Style Box is designed to reveal a fund’s investment strategy. The Morningstar Ownership Zone provides detail about a portfolio’s investment style by showing the range of stock sizes and styles. The Ownership Zone is derived by plotting each stock in the portfolio within the proprietary Morningstar Style Box. Over time, the shape and location of a fund’s ownership zone may vary. See page 131 for additional information. |
Value of $10,000

| Top 10 Positions | |||
| % of Net Assets | |||
| Copart | 3.2 | ||
| Alleghany Corporation | 3.0 | ||
| ManpowerGroup | 2.6 | ||
| LKQ Corporation | 2.6 | ||
| Westlake Chemical | 2.6 | ||
| Valmont Industries | 2.4 | ||
| IPG Photonics | 2.3 | ||
| Thor Industries | 2.3 | ||
| Standard Motor Products | 2.2 | ||
| Minerals Technologies | 2.1 | ||
| Portfolio Sector Breakdown | |||
| % of Net Assets | |||
| Industrials | 27.2 | ||
| Consumer Discretionary | 24.7 | ||
| Information Technology | 11.5 | ||
| Financials | 8.8 | ||
| Materials | 8.2 | ||
| Real Estate | 4.4 | ||
| Health Care | 3.4 | ||
| Consumer Staples | 2.4 | ||
| Utilities | 1.4 | ||
| Miscellaneous | 0.7 | ||
| Cash and Cash Equivalents | 7.3 | ||
| Calendar Year Total Returns (%) | |||
| YEAR | RHF | ||
| 2016 | 17.8 | ||
| 2015 | -6.5 | ||
| 2014 | -1.1 | ||
| 2013 | 26.0 | ||
| 2012 | 14.3 | ||
| 2011 | -9.3 | ||
| 2010 | 27.5 | ||
| 2009 | 51.8 | ||
| 2008 | -36.2 | ||
| 2007 | 1.2 | ||
| 2006 | 22.6 | ||
| 2005 | 8.7 | ||
| 2004 | 20.4 | ||
| 2003 | 38.1 | ||
| 2002 | -18.9 | ||
| Upside/Downside Capture Ratios | |||
| Periods Ended 6/30/17 (%) | |||
| UPSIDE | DOWNSIDE | |||
| 10-Year | 89 | 93 | ||
| From 12/31/95 (Start of Fund’s First Full Quarter) | 108 | 87 | ||
| Portfolio Diagnostics | |||
| Fund Net Assets | $220 million | ||
| Number of Holdings | 82 | ||
| Turnover Rate | 31% | ||
| Average Market Capitalization1 | $5,022 million | ||
| Weighted Average P/E Ratio2,3 | 21.8x | ||
| Weighted Average P/B Ratio2 | 2.9x | ||
| Active Share4 | 98% | ||
| U.S. Investments (% of Net Assets) | 84.5% | ||
| Non-U.S. Investments (% of Net Assets) | 8.2% | ||
| 1 | Geometric Average. This weighted calculation uses each portfolio holding’s market cap in a way designed to not skew the effect of very large or small holdings; instead, it aims to better identify the portfolio’s center, which Royce believes offers a more accurate measure of average market cap than a simple mean or median. |
| 2 | Harmonic Average. This weighted calculation evaluates a portfolio as if it were a single stock and measures it overall. It compares the total market value of the portfolio to the portfolio’s share in the earnings or book value, as the case may be, of its underlying stocks. |
| 3 | The Fund’s P/E ratio calculation excludes companies with zero or negative earnings (0% of portfolio holdings as of 6/30/17). |
| 4 | Active Share is the sum of the absolute values of the different weightings of each holding in the Fund versus each holding in the benchmark, divided by two. |
| Important Performance and Expense Information |
All performance information in this Report reflects past performance, is presented on a total return basis, reflects the reinvestment of distributions, and does not reflect the deduction of taxes that a shareholder would pay on fund distributions or the redemption of fund shares. Past performance is no guarantee of future results. Investment return and principal value of an investment will fluctuate, so that shares may be worth more or less than their original cost when redeemed. Shares redeemed within 30 days of purchase may be subject to a 1% redemption fee payable to the Fund, which is not reflected in the performance shown above; if it were, performance would be lower. Current month-end performance may be higher or lower than performance quoted and may be obtained at www.roycefunds.com. All performance and risk information reflects results of the Service Class (its oldest class). Price and total return information is based on net asset values calculated for shareholder transactions. Operating expenses reflect the Fund’s total annual operating expenses for the Service Class as of the Fund’s most current prospectus and include management fees, 12b-1 distribution and service fees, and other expenses. Regarding the “Top Contributors” and “Top Detractors” tables shown above, the sum of all contributors to, and all detractors from, performance for all securities in the portfolio would approximate the Fund’s year-to-date performance for 2017. Upside Capture Ratio measures a manager’s performance in up markets relative to the Fund’s benchmark. It is calculated by measuring the Fund’s performance in quarters when the benchmark went up and dividing it by the benchmark’s return in those quarters. Downside Capture Ratio measures a manager’s performance in down markets relative to the Fund’s benchmark (Russell 2000). It is calculated by measuring the Fund’s performance in quarters when the benchmark goes down and dividing it by the benchmark’s return in those quarters. |
| The Royce Funds 2017 Semiannual Report to Shareholders | 35 |
| MANAGER’S DISCUSSION |
| Royce Smaller-Companies Growth Fund (RVP) |
 |
| Chip Skinner, CFA |
| FUND PERFORMANCE |
| Royce Smaller-Companies Growth Fund came back strong and turned in an impressive absolute and relative performance in the first half. The Fund advanced 11.3% for the year-to-date period ended June 30, 2017, well ahead of its small-cap benchmark, the Russell 2000 Index, which was up 5.0% for the same period. We were also pleased that the Fund, which uses a valuation-aware, ‘growth-at-a-reasonable-price’ (GARP) strategy, outpaced the Russell 2000 Growth Index (+10.0%) in the first half. |
| The first half of 2017 reversed most of the equity market leadership from 2016, including a rotation from value back to growth. This reversal, along with the related resurgence of biotechnology, was a factor in first-half performance. The Fund enjoyed a strong first quarter, gaining 5.1% versus 2.5% for the Russell 2000. It then slightly improved on that result with a 5.9% advance in the second quarter when the small-cap index once again climbed 2.5%. Smaller-Companies Growth also outpaced the Russell 2000 for the one-year, 15-year, and since inception (6/14/01) periods ended June 30, 2017. The Fund’s average annual total return since inception was 11.4%. |
| WHAT WORKED... AND WHAT DIDN’T |
| Eight of the Fund’s 10 equity sectors finished the semiannual period in the black. Perhaps unsurprisingly for a GARP strategy in a growth-driven market, Information Technology and Health Care made the biggest contributions to first-half results. The degree to which they dominated performance, however, was notable—at least to us. Three groups in tech, for example, were the portfolio’s leaders at the industry level—electronic equipment, instruments & components, software, and internet software & services. These were followed by pharmaceuticals, biotechnology, health care equipment & supplies, and health care providers & services—all from the Health Care sector. Top contributor and top-10 holding Clovis Oncology develops and acquires treatments that target specific subsets of cancer. It bypassed a competitor on the road to FDA approval for one product and went on to experience better-than-expected trial results. At the end of June, we thought both its existing product line and those in its pipeline made its business look highly attractive. Shopify is a Canadian company that provides a cloud-based, omni-channel commerce platform, mostly for smaller businesses. Fiscal first-quarter revenues soared by more than 75%, easily beating Wall Street’s consensus. We saw our investment as a toehold in a business with a long runway for growth, especially with growing demand for the company’s newer services. It was the Fund’s twelfth-largest holding at the end of June. Energy was the only portfolio sector to make a significant detraction in the first half as net losses for Consumer Staples were minor. After increasing our exposure to Energy in 2016, we cut back in 2017 in the face of tumbling oil prices and our contention that drilling innovations are disrupting the industry’s business cycle. Unit Corporation went from finishing 2016 as the portfolio’s top contributor to its second-biggest detractor in the first half. The company operates as a contract driller and exploration & production company while also offering energy-related services. Oil and gas production declined while its rig business suffered margin contraction due to long-term contract repricing and additional expenses from rig relocations and startups. We chose to sell our shares in June. We acted similarly with the Fund’s top detracting position, western and work gear retailer Boot Barn Holdings, whose business was hit with something of a double whammy, hurt by both the travails affecting many retailers and declining energy prices that slowed its previously strong business in oil-rich states. Relative to the Russell 2000, the Fund benefited most in the first half from savvy stock selection in Information Technology, Health Care, and Industrials. Conversely, our previously higher exposure to Energy, ineffective stock picks in Consumer Discretionary, and the Fund’s cash position all produced a relative detraction, although to a much lower degree. |
| Top Contributors to Performance | |||
| Year-to-Date Through 6/30/17 (%)1 | |||
| Clovis Oncology | 0.97 | ||
| Shopify Cl. A | 0.93 | ||
| Universal Display | 0.92 | ||
| Paylocity Holding Corporation | 0.82 | ||
| Coherent | 0.81 | ||
| 1 Includes dividends | |||
| Top Detractors from Performance | |||
| Year-to-Date Through 6/30/17 (%)2 | |||
| Boot Barn Holdings | -0.62 | ||
| Unit Corporation | -0.43 | ||
| CyberOptics Corporation | -0.30 | ||
| RSP Permian | -0.26 | ||
| Progenics Pharmaceuticals | -0.24 | ||
| 2 Net of dividends | |||
| CURRENT POSITIONING AND OUTLOOK |
| After a strong first half, we have seen fewer businesses that fully satisfy the key criteria of our GARP approach. In addition, we have been trimming holdings that exceeded our sell targets and/or sported valuations that looked unsustainable and therefore too risky. The result was a higher-than-usual cash position of 7.0% at the end of June that we are eager to reduce as opportunities are hopefully uncovered in the year’s second half. We also remain cautiously optimistic that policies affecting corporate tax rates, regulation, and healthcare can be implemented over the next six to 12 months that could boost GDP growth. Moreover, we are still bullish on the themes that have guided much of our stock picking over the last 12-18 months: companies involved in cloud software and solutions, automation, robotics, and industrial technology, healthcare innovators (with a focus on device and drug discovery companies), and likely beneficiaries of increased spending on infrastructure and defense. At the end of the first half, we were overweight our two largest sectors, Information Technology and Health Care. Our exposure to both increased in the first half, mostly due to share price appreciation, as was the case with Financials and Industrials. We also actively reduced our weightings in Consumer Discretionary, Consumer Staples, and Energy due to our uncertainty about the near-term prospects for these underperforming areas. |
| 36 | The Royce Funds 2017 Semiannual Report to Shareholders |
| PERFORMANCE AND PORTFOLIO REVIEW | TICKER SYMBOLS RYVPX RVPHX RVPCX RVPIX RVPRX |
| Performance and Expenses | ||||||||||||||||
| Average Annual Total Return (%) Through 6/30/17 | ||||||||||||||||
| JAN-JUN 20171 | 1-YR | 3-YR | 5-YR | 10-YR | 15-YR | SINCE INCEPTION (6/14/01) | ||||||||||
| RVP | 11.26 | 26.08 | 6.05 | 12.35 | 4.53 | 10.98 | 11.42 | |||||||||
| Annual Operating Expenses: 1.51% Annual Net Operating Expenses: 1.49% | ||||||||||||||||
| 1 Not annualized | ||||||||||||||||

The Morningstar Style Map is the Morningstar Style Box™ with the center 75% of fund holdings plotted as the Morningstar Ownership Zone™. The Morningstar Style Box is designed to reveal a fund’s investment strategy. The Morningstar Ownership Zone provides detail about a portfolio’s investment style by showing the range of stock sizes and styles. The Ownership Zone is derived by plotting each stock in the portfolio within the proprietary Morningstar Style Box. Over time, the shape and location of a fund’s ownership zone may vary. See page 131 for additional information. |
Value of $10,000

| Top 10 Positions | ||
| % of Net Assets | ||
| Unisys Corporation | 2.0 | |
| TriState Capital Holdings | 1.8 | |
| Supernus Pharmaceuticals | 1.7 | |
| QAD Cl. A | 1.7 | |
| Zealand Pharma | 1.7 | |
| comScore | 1.7 | |
| DIRTT Environmental Solutions | 1.6 | |
| Clovis Oncology | 1.6 | |
| IPG Photonics | 1.5 | |
| ePlus | 1.5 | |
| Portfolio Sector Breakdown | ||
| % of Net Assets | ||
| Information Technology | 33.6 | |
| Health Care | 16.0 | |
| Industrials | 11.5 | |
| Financials | 11.4 | |
| Consumer Discretionary | 5.9 | |
| Materials | 5.9 | |
| Real Estate | 1.9 | |
| Energy | 1.7 | |
| Telecommunication Services | 0.9 | |
| Miscellaneous | 4.2 | |
| Cash and Cash Equivalents | 7.0 | |
| Calendar Year Total Returns (%) | ||
| YEAR | RVP | |
| 2016 | 9.4 | |
| 2015 | -1.8 | |
| 2014 | 3.9 | |
| 2013 | 32.5 | |
| 2012 | 15.3 | |
| 2011 | -10.0 | |
| 2010 | 19.7 | |
| 2009 | 41.4 | |
| 2008 | -41.1 | |
| 2007 | 3.2 | |
| 2006 | 19.3 | |
| 2005 | 13.2 | |
| 2004 | 28.2 | |
| 2003 | 79.9 | |
| Upside/Downside Capture Ratios | ||||
| Periods Ended 6/30/17 (%) | ||||
| UPSIDE | DOWNSIDE | |||
| 10-Year | 93 | 107 | ||
| From 6/30/01 (Start of Fund’s First Full Quarter) | 114 | 100 | ||
| Portfolio Diagnostics | ||
| Fund Net Assets | $396 million | |
| Number of Holdings | 108 | |
| Turnover Rate | 30% | |
| Average Market Capitalization1 | $1,521 million | |
| Weighted Average P/E Ratio2 | 3.5x | |
| 3-5 Year EPS Growth (est.)3 | 19.4% | |
| Active Share4 | 95% | |
| U.S. Investments (% of Net Assets) | 81.8% | |
| Non-U.S. Investments (% of Net Assets) | 11.2% | |
| 1 | Geometric Average. This weighted calculation uses each portfolio holding’s market cap in a way designed to not skew the effect of very large or small holdings; instead, it aims to better identify the portfolio’s center, which Royce believes offers a more accurate measure of average market cap than a simple mean or median. |
| 2 | Harmonic Average. This weighted calculation evaluates a portfolio as if it were a single stock and measures it overall. It compares the total market value of the portfolio to the portfolio’s share in the earnings or book value, as the case may be, of its underlying stocks. |
| 3 | The 3-5 Year EPS Growth (est.) is calculated as a simple weighted average of the pre-calculated mean long-term EPS growth rate estimates by brokerage analysts. Long Term Growth (LTG) is the annual EPS growth that the company can sustain over the next 3 or 5 years. Source: Factset |
| 4 | Active Share is the sum of the absolute values of the different weightings of each holding in the Fund versus each holding in the benchmark, divided by two. |
| Important Performance and Expense Information All performance information in this Report reflects past performance, is presented on a total return basis, reflects the reinvestment of distributions, and does not reflect the deduction of taxes that a shareholder would pay on fund distributions or the redemption of fund shares. Past performance is no guarantee of future results. Investment return and principal value of an investment will fluctuate, so that shares may be worth more or less than their original cost when redeemed. Shares redeemed within 30 days of purchase may be subject to a 1% redemption fee payable to the Fund, which is not reflected in the performance shown above; if it were, performance would be lower. Current month-end performance may be higher or lower than performance quoted and may be obtained at www.roycefunds.com. All performance and risk information reflects results of the Service Class (its oldest class). Gross operating expenses reflect the Fund’s total gross annual operating expenses and include management fees, 12b-1 distribution and service fees, and other expenses. Net operating expenses reflect contractual fee waivers and/or expense reimbursements. All expense information is reported as of the Fund’s most current prospectus. Royce & Associates has contractually agreed to waive fees and/or reimburse operating expenses to the extent necessary to maintain the Fund’s net annual operating expenses (excluding brokerage commissions, taxes, interest, litigation expenses, acquired fund fees and expenses, and other expenses not borne in the ordinary course of business) at or below 1.49% through April 30, 2018. Regarding the “Top Contributors” and “Top Detractors” tables shown above, the sum of all contributors to, and all detractors from, performance for all securities in the portfolio would approximate the Fund’s year-to-date performance for 2017. Upside Capture Ratio measures a manager’s performance in up markets relative to the Fund’s benchmark. It is calculated by measuring the Fund’s performance in quarters when the benchmark went up and dividing it by the benchmark’s return in those quarters. Downside Capture Ratio measures a manager’s performance in down markets relative to the Fund’s benchmark (Russell 2000). It is calculated by measuring the Fund’s performance in quarters when the benchmark goes down and dividing it by the benchmark’s return in those quarters. |
| The Royce Funds 2017 Semiannual Report to Shareholders | 37 |
| MANAGERS’ DISCUSSION | ||
| Royce Special Equity Fund (RSE) |
 |
| Charlie Dreifus, CFA Steven McBoyle, CPA, CA |
| FUND PERFORMANCE Royce Special Equity Fund fell 0.4% for the year-to-date period ended June 30, 2017, trailing its small-cap benchmark, the Russell 2000 Index, which rose 5.0% for the same period. After posting the best calendar-year return in its history in 2016, an increase of 32.2%, the Fund was susceptible to some adjustment in results. Further, there was a rotation in the first half of 2017 away from what worked last year—small-cap, value, many cyclical sectors—into what lagged, such as growth stocks and more defensive areas, neither of which suits our classic value approach. So while disappointing, first-half performance was not surprising in this inhospitable context. The return pattern was established in the first quarter, when small-cap results were dominated by the lowest return on equity, non-earners, non-dividend payers, fastest sales growth, and highest beta companies. Special Equity was down 0.3% for the quarter while the Russell 2000 was up 2.5%. The Fund fared only marginally better in the second quarter, which again saw leadership from more speculative businesses. Special Equity fell 0.05% versus a 2.5% increase for the small-cap benchmark. Longer-term results were better on both an absolute and relative basis, and we were pleased that the Fund outperformed the Russell 2000 for the 10-year and since inception (5/1/98) periods ended June 30, 2017. Special Equity’s average annual total return since inception was 9.3%. |
| WHAT WORKED... AND WHAT DIDN’T |
| Two of the Fund’s six equity sectors detracted from first-half performance, though only Consumer Staples made a significant negative impact—net losses for Real Estate were de minimis. Most of the net losses in Consumer Staples came from a disappointing performance for supermarket chain operator Weis Markets. The portfolio’s sole holding in the food & staples retailing group and its biggest overall detractor for the semiannual period, Weis was also a top-10 position at the end of June. While we finished the semiannual period with fewer shares than we owned at the end of 2016, we made small share purchases in April and June of this year as its stock price fell. Also detracting in the first half was multinational business consulting firm Resources Connection. We acted in a similar fashion with its stock by adding shares in the second quarter after trimming in the first. Children’s publishing, education, and media company Scholastic Corporation is another top-10 holding that fared poorly. We built our stake modestly in March. We also added to positions in two top-20 holdings. Flexsteel Industries manufactures residential and contract upholstered and wooden furniture while John B. Sanfilippo & Son, a second holding in Consumer Staples, distributes a diverse product line of mostly nut-based snack items. Of the four sectors that made positive contributions to first-half results, Information Technology made by far the most substantial impact, boosted by strong results for three industry groups—semiconductors & semiconductor equipment, electronic equipment, instruments & components, and IT services. The Fund’s top-performing industry, however, was machinery, which is in the Industrials sector. Automatic test equipment maker—and top-10 holding—Teradyne was the Fund’s best performer at the position level and in the semiconductors & semiconductor equipment group. Machinery company Wabash National, which manufactures truck trailers, made a notable contribution to first-half results, while manufacturer Bassett Furniture Industries turned around a difficult first quarter to make the list of top first-half contributors. Computer Services, which provides financial technology solutions and regulatory compliance software to banks, financial institutions, and other businesses, also contributed to results. Results relative to the Russell 2000 were affected most by both our overweight and ineffective stock picking in the Consumer Staples and Consumer Discretionary sectors, especially in the latter’s household durables group, where first-quarter losses outweighed the second-quarter rebound. Our lack of exposure to Health Care also detracted. Conversely, the Fund’s lack of exposure to both Financials and Energy was a strength relative to the benchmark in the first half. |
| Top Contributors to Performance Year-to-Date Through 6/30/17 (%)1 | |||
| Teradyne | 0.66 | ||
| Wabash National | 0.43 | ||
| Bassett Furniture Industries | 0.41 | ||
| Computer Services | 0.38 | ||
| Kaiser Aluminum | 0.36 | ||
| 1 Includes dividends | |||
| Top Detractors from Performance Year-to-Date Through 6/30/17 (%)2 | |||
| Weis Markets | -1.18 | ||
| Resources Connection | -0.48 | ||
| Scholastic Corporation | -0.39 | ||
| Flexsteel Industries | -0.25 | ||
| John B. Sanfilippo & Son | -0.24 | ||
| 2 Net of dividends | |||
| CURRENT POSITIONING AND OUTLOOK |
| The market looks too complacent to us. Stocks advancing on the prospect of economic growth is inconsistent with declining bond yields that suggest a weaker outlook. Only one of these views can be right. Investors thus far seem willing to pay up for the shares of companies that they believe can continue to do well even if the overall outlook may be saying otherwise. The favored issues this year have had perceived growth at rates much more vibrant than the tepid outlook for the economy. A more refined approach— and dare we say a potentially more rewarding one?—might be companies that have the capacity and willingness to grow their dividends. We continue to believe that the world is both yield conscious and yield undernourished and think that an aging population with expectations of a longer retirement period will exert downward pressure on yields. We also suspect that this hunger, coupled with likely low absolute rates for the foreseeable future, portends a likely revolution of companies that will be raising their dividends. This remains a key component of our search. We think growing income scarcity is just as important as scarcity in revenue and earnings growth, perhaps even more so. |
| 38 | The Royce Funds 2017 Semiannual Report to Shareholders |
| PERFORMANCE AND PORTFOLIO REVIEW | TICKER SYMBOLS RYSEX RSEFX RSEIX RSQCX |
| Performance and Expenses | ||||||||||||||||
| Average Annual Total Return (%) Through 6/30/17 | ||||||||||||||||
| JAN-JUN 20171 | 1-YR | 3-YR | 5-YR | 10-YR | 15-YR | SINCE INCEPTION (5/1/98) | ||||||||||
| RSE | -0.36 | 21.63 | 5.23 | 10.45 | 7.31 | 8.85 | 9.26 | |||||||||
| Annual Operating Expenses: 1.17% | ||||||||||||||||
| 1 Not annualized | ||||||||||||||||
Relative Risk Adjusted Returns: Monthly Rolling Sharpe Ratios
| On a monthly rolling risk-adjusted basis, the Fund outperformed the Russell 2000 in 100% of all 10-year periods and 74% of all 5-year periods. |
| PERIODS BEATING THE INDEX | FUND AVG (%)1 | INDEX AVG (%)1 | ||||||||||||
| 10-year | 110/110 | 100% | 0.55 | 0.33 | ||||||||||
| 5-year | 126/170 | 74% | 0.68 | 0.45 | ||||||||||
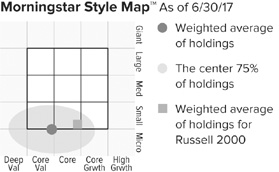
The Morningstar Style Map is the Morningstar Style Box™ with the center 75% of fund holdings plotted as the Morningstar Ownership Zone™. The Morningstar Style Box is designed to reveal a fund’s investment strategy. The Morningstar Ownership Zone provides detail about a portfolio’s investment style by showing the range of stock sizes and styles. The Ownership Zone is derived by plotting each stock in the portfolio within the proprietary Morningstar Style Box. Over time, the shape and location of a fund’s ownership zone may vary. See page 131 for additional information. |
Invested on 5/1/98 as of 6/30/17 ($)

| Top 10 Positions | ||
| % of Net Assets | ||
| AVX Corporation | 5.3 | |
| Children’s Place | 5.3 | |
| UniFirst Corporation | 4.9 | |
| Scholastic Corporation | 4.6 | |
| Standard Motor Products | 4.4 | |
| Hubbell Cl. B | 3.9 | |
| Meredith Corporation | 3.5 | |
| Cooper Tire & Rubber | 3.4 | |
| Weis Markets | 3.4 | |
| Teradyne | 3.4 | |
| Portfolio Sector Breakdown | ||
| % of Net Assets | ||
| Consumer Discretionary | 38.2 | |
| Industrials | 21.0 | |
| Information Technology | 17.3 | |
| Materials | 6.3 | |
| Consumer Staples | 6.2 | |
| Real Estate | 2.0 | |
| Cash and Cash Equivalents | 9.0 | |
| Calendar Year Total Returns (%) | ||
| YEAR | RSE | |
| 2016 | 32.2 | |
| 2015 | -12.4 | |
| 2014 | 1.1 | |
| 2013 | 29.4 | |
| 2012 | 15.4 | |
| 2011 | 0.1 | |
| 2010 | 19.6 | |
| 2009 | 28.4 | |
| 2008 | -19.6 | |
| 2007 | 4.7 | |
| 2006 | 14.0 | |
| 2005 | -1.0 | |
| 2004 | 13.9 | |
| 2003 | 27.6 | |
| 2002 | 15.3 | |
| Upside/Downside Capture Ratios | ||||||||||||||
| Periods Ended 6/30/17 (%) | ||||||||||||||
| UPSIDE | DOWNSIDE | |||||||||||||
| 10-Year | 77 | 64 | ||||||||||||
| From 6/30/98 (Start of Fund’s First Full Quarter) | 73 | 48 | ||||||||||||
| Portfolio Diagnostics | ||
| Fund Net Assets | $1,532 million | |
| Number of Holdings | 41 | |
| Turnover Rate | 11% | |
| Average Market Capitalization1 | $1,298 million | |
| Weighted Average P/E Ratio2,3 | 19.1x | |
| Weighted Average P/B Ratio2 | 2.1x | |
| Active Share4 | 98% | |
| U.S. Investments (% of Net Assets) | 90.0% | |
| Non-U.S. Investments (% of Net Assets) | 1.0% | |
| 1 | Geometric Average. This weighted calculation uses each portfolio holding’s market cap in a way designed to not skew the effect of very large or small holdings; instead, it aims to better identify the portfolio’s center, which Royce believes offers a more accurate measure of average market cap than a simple mean or median. |
| 2 | Harmonic Average. This weighted calculation evaluates a portfolio as if it were a single stock and measures it overall. It compares the total market value of the portfolio to the portfolio’s share in the earnings or book value, as the case may be, of its underlying stocks. |
| 3 | The Fund’s P/E ratio calculation excludes companies with zero or negative earnings (4% of portfolio holdings as of 6/30/17). |
| 4 | Active Share is the sum of the absolute values of the different weightings of each holding in the Fund versus each holding in the benchmark, divided by two. |
| Important Performance and Expense Information |
All performance information in this Report reflects past performance, is presented on a total return basis, reflects the reinvestment of distributions, and does not reflect the deduction of taxes that a shareholder would pay on fund distributions or the redemption of fund shares. Past performance is no guarantee of future results. Investment return and principal value of an investment will fluctuate, so that shares may be worth more or less than their original cost when redeemed. Shares redeemed within 30 days of purchase may be subject to a 1% redemption fee payable to the Fund, which is not reflected in the performance shown above; if it were, performance would be lower. Current month-end performance may be higher or lower than performance quoted and may be obtained at www.roycefunds.com. All performance and risk information reflects results of the Investment Class (its oldest class). Operating expenses reflect the Fund’s total annual operating expenses for the Investment Class as of the Fund’s most current prospectus and include management fees and other expenses. The Sharpe Ratio is calculated for a specified period by dividing a fund’s annualized excess returns by its annualized standard deviation. The higher the Sharpe ratio, the better the fund’s historical risk-adjusted performance. Regarding the “Top Contributors” and “Top Detractors” tables shown above, the sum of all contributors to, and all detractors from, performance for all securities in the portfolio would approximate the Fund’s year-to-date performance for 2017. Upside Capture Ratio measures a manager’s performance in up markets relative to the Fund’s benchmark. It is calculated by measuring the Fund’s performance in quarters when the benchmark went up and dividing it by the benchmark’s return in those quarters. Downside Capture Ratio measures a manager’s performance in down markets relative to the Fund’s benchmark (Russell 2000). It is calculated by measuring the Fund’s performance in quarters when the benchmark goes down and dividing it by the benchmark’s return in those quarters. |
| The Royce Funds 2017 Semiannual Report to Shareholders | 39 |
| MANAGERS’ DISCUSSION | ||
| Royce Special Equity Multi-Cap Fund (RSM) |
 |
| Charlie Dreifus, CFA Steven McBoyle, CPA, CA |
| FUND PERFORMANCE Royce Special Equity Multi-Cap Fund posted a solid absolute performance in the first half while trailing on a relative basis. The Fund increased 5.9% for the year-to-date period ended June 30, 2017 versus a 9.3% gain for its large-cap benchmark, the Russell 1000 Index, for the same period. The portfolio embodied A Tale of Two Quarters, at least when compared to its benchmark. For the first quarter, the Fund experienced the same lofty returns as most large-cap stocks—even more so, actually—and outpaced the Russell 1000, advancing 7.0% compared to 6.0% for the benchmark. Considering the strength in the first quarter of Information Technology, where we were underweighted, and Health Care, where we had no exposure, this was an especially gratifying outcome. Helping most were terrific results from Apple (the Fund’s top contributor in the first half) and, to a lesser extent, motion control products maker Parker Hannifin. There were also mostly minor losses from detractors, the largest of which was retailer Dicks Sporting Goods, 2016’s top contributor. The second quarter, on the other hand, saw less stellar results from contributors accompanied by further share price declines for Dicks and an impactful loss for industrial supplies distributor W.W. Grainger. The result was a loss of 0.9% for the Fund in the second quarter while the Russell 1000 climbed 3.1%. We were pleased, however, that Special Equity Multi-Cap outperformed the large-cap index for the one-year period ended June 30, 2017. The Fund’s average annual total return since inception (12/31/10) was 10.0%. |
| WHAT WORKED... AND WHAT DIDN’T |
| Four of the Fund’s six equity sectors finished the first half in the black, with Industrials leading by a substantial margin and Information Technology also making a notable contribution. Of the two sectors that detracted, Consumer Discretionary made the largest negative impact, thanks to disappointing results from Dicks Sporting Goods. While we are all too aware of the challenges facing retailers in the age of Amazon, we thought highly enough of the company’s long-term prospects to hold a large stake at the end of June. The last 12 years were characterized by central banks providing ample liquidity and keeping rates low. Barron’s recently referenced some compelling data on the period compiled by the University of Chicago’s Eugene Fama and Dartmouth College’s Kenneth French: For the 12 years ended April 30, 2017, value stocks underperformed growth by an annualized average of 0.7%. This was contrasted with the prior eight decades, going back to 1926, in which value outperformed growth by an average of 4.8% a year. The only other 12-year span since 1926 when value underperformed growth was the 12-year period ended March 31, 2000. We suspect that those who ignore this history, and its related force of mean reversion, invest in expensive growth at their peril. Much has been written about the low volatility in the current market. What has not received as much attention is its impact on drawdowns. We have seen a quiet market with a clear upside bias. The maximum drawdown for the S&P 500 in the first half of 2017 topped out at 2.8%, the second-smallest first-half in 89 years. Investors are simply far too comfortable in our view. We would ask whether the macro picture is currently so inviting as to justify this placidly positive mood. We certainly don’t believe it is and would hasten to add that complacency usually engenders negative outcomes. The Nasdaq 100 Index posted a larger number of higher daily closes only once before other than 2017—in 1999. This is not a good history in our estimation. Relative to the Russell 1000, the Fund suffered most in the first half from stock selection in Consumer Discretionary (thanks again to Dicks Sporting Goods). Our lack of exposure to the rebounding Health Care sector as well as the portfolio’s cash position were also drags on relative results. Conversely, the Fund’s lack of exposure to both correcting Energy stocks and Telecommunication Services companies was a plus, as was stock selection in Industrials, where global staffing and services company ManpowerGroup stood out. |
| Top Contributors to Performance Year-to-Date Through 6/30/17 (%)1 | |||
| Apple | 2.33 | ||
| Illinois Tool Works | 1.32 | ||
| Parker Hannifin | 0.97 | ||
| ManpowerGroup | 0.85 | ||
| McDonald’s | 0.63 | ||
| 1 Includes dividends | |||
| Top Detractors from Performance Year-to-Date Through 6/30/17 (%)2 | |||
| Dicks Sporting Goods | -1.72 | ||
| Grainger (W.W.) | -0.74 | ||
| Avnet | -0.34 | ||
| Carlisle Companies | -0.26 | ||
| Snap-on | -0.22 | ||
| 2 Net of dividends | |||
| CURRENT POSITIONING AND OUTLOOK |
| Stocks advancing on the prospect of economic growth is inconsistent with declining bond yields that suggest a weaker outlook. Only one of these views can be right. Investors thus far seem willing to pay up for the shares of companies that they believe can continue to do well even if the overall outlook may be saying otherwise. The favored issues this year have had perceived growth at rates much more vibrant than the tepid outlook for the economy. A more refined approach—and dare we say a potentially more rewarding one?—might be companies that have the capacity and willingness to grow their dividends. We continue to believe that the world is both yield conscious and yield undernourished and think that an aging population with expectations of a longer retirement period will exert downward pressure on yields. We also suspect that this hunger, coupled with likely low absolute rates for the foreseeable future, portends a likely revolution of companies that will be raising their dividends. This remains a key component of our search. We think growing income scarcity is just as important as scarcity in revenue and earnings growth, perhaps even more so. |
| 40 | The Royce Funds 2017 Semiannual Report to Shareholders |
| PERFORMANCE AND PORTFOLIO REVIEW | TICKER SYMBOL RSEMX RSMCX RMUIX RSMLX |
| Performance and Expenses | ||||||||||||
| Average Annual Total Return (%) Through 6/30/17 | ||||||||||||
| JAN-JUN 20171 | 1-YR | 3-YR | 5-YR | SINCE INCEPTION (12/31/10) | ||||||||
| RSM | 5.95 | 21.04 | 2.57 | 10.14 | 9.96 | |||||||
| Annual Gross Operating Expenses: 1.34% Annual Net Operating Expenses: 1.24% | ||||||||||||
| 1 Not annualized | ||||||||||||

The Morningstar Style Map is the Morningstar Style Box™ with the center 75% of fund holdings plotted as the Morningstar Ownership Zone™. The Morningstar Style Box is designed to reveal a fund’s investment strategy. The Morningstar Ownership Zone provides detail about a portfolio’s investment style by showing the range of stock sizes and styles. The Ownership Zone is derived by plotting each stock in the portfolio within the proprietary Morningstar Style Box. Over time, the shape and location of a fund’s ownership zone may vary. See page 131 for additional information. |
Value of $10,000
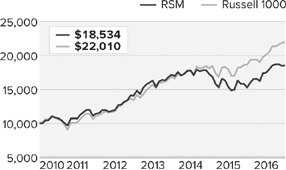
| Top 10 Positions | ||
| % of Net Assets | ||
| Apple | 10.1 | |
| Illinois Tool Works | 7.3 | |
| Genuine Parts | 7.1 | |
| Dicks Sporting Goods | 5.6 | |
| Parker Hannifin | 5.1 | |
| Cisco Systems | 4.0 | |
| VF Corporation | 3.8 | |
| Snap-on | 3.7 | |
| Grainger (W.W.) | 3.1 | |
| Lowe’s Companies | 3.0 | |
| Portfolio Sector Breakdown | ||
| % of Net Assets | ||
| Industrials | 37.5 | |
| Consumer Discretionary | 26.2 | |
| Information Technology | 16.2 | |
| Consumer Staples | 7.5 | |
| Materials | 2.7 | |
| Financials | 1.0 | |
| Cash and Cash Equivalents | 8.9 | |
| Calendar Year Total Returns (%) | ||
| YEAR | RSM | |
| 2016 | 13.7 | |
| 2015 | -13.6 | |
| 2014 | 9.3 | |
| 2013 | 36.3 | |
| 2012 | 11.6 | |
| 2011 | 7.2 | |
| Portfolio Diagnostics | ||
| Fund Net Assets | $110 million | |
| Number of Holdings | 28 | |
| Turnover Rate | 14% | |
| Average Market Capitalization1 | $33,365 million | |
| Weighted Average P/E Ratio2,3 | 19.7x | |
| Weighted Average P/B Ratio2 | 4.0x | |
| Active Share4 | 92% | |
| U.S. Investments (% of Net Assets) | 91.1% | |
| Non-U.S. Investments (% of Net Assets) | 0.0% | |
| 1 | Geometric Average. This weighted calculation uses each portfolio holding’s market cap in a way designed to not skew the effect of very large or small holdings; instead, it aims to better identify the portfolio’s center, which Royce believes offers a more accurate measure of average market cap than a simple mean or median. |
| 2 | Harmonic Average. This weighted calculation evaluates a portfolio as if it were a single stock and measures it overall. It compares the total market value of the portfolio to the portfolio’s share in the earnings or book value, as the case may be, of its underlying stocks. |
| 3 | The Fund’s P/E ratio calculation excludes companies with zero or negative earnings (1% of portfolio holdings as of 6/30/17). |
| 4 | Active Share is the sum of the absolute values of the different weightings of each holding in the Fund versus each holding in the benchmark, divided by two. |
| Important Performance and Expense Information |
All performance information in this Report reflects past performance, is presented on a total return basis, reflects the reinvestment of distributions, and does not reflect the deduction of taxes that a shareholder would pay on fund distributions or the redemption of fund shares. Past performance is no guarantee of future results. Investment return and principal value of an investment will fluctuate, so that shares may be worth more or less than their original cost when redeemed. Shares redeemed within 30 days of purchase may be subject to a 1% redemption fee payable to the Fund, which is not reflected in the performance shown above; if it were, performance would be lower. Current month-end performance may be higher or lower than performance quoted and may be obtained at www.roycefunds.com. All performance and risk information reflects results of the Service Class (its oldest class). Gross operating expenses reflect gross total annual operating expenses for the Service Class and include management fees, 12b-1 distribution and service fees and other expenses. Net operating expenses reflect contractual fee waivers and/or reimbursements. All expense information is reported as of the Fund’s most current prospectus. Royce & Associates has contractually agreed to waive fees and/or reimburse operating expenses to the extent necessary to maintain the Service Classes’s net annual operating expenses, (excluding brokerage commissions, taxes, interest litigation expenses, acquired fund fees and expenses, and other expenses not borne in the ordinary course of business), at or below 1.24% through April 30, 2018. Regarding the “Top Contributors” and “Top Detractors” tables shown above, the sum of all contributors to, and all detractors from, performance for all securities in the portfolio would approximate the Fund’s year-to-date performance for 2017. |
| The Royce Funds 2017 Semiannual Report to Shareholders | 41 |
| MANAGERS’ DISCUSSION | ||
| Royce Total Return Fund (RTR) |
 |
| Chuck Royce Jay Kaplan, CFA |
| FUND PERFORMANCE Royce Total Return Fund gained 2.8% for the year-to-date period ended June 30, 2017, behind its small-cap benchmark, the Russell 2000 Index, which was up 5.0% for the same period. Unlike 2016, a year in which both small-cap dividend payers and value stocks enjoyed higher relative returns, the first half of 2017 offered a narrower, growth-driven market that also featured very low levels of volatility. Against this backdrop, results for our dividend-focused value approach were not surprising. The Fund rose 2.2% in the first quarter versus 2.5% for the Russell 2000, a respectable result in light of the generally underwhelming results for value stocks. The second quarter proved difficult for several holdings in both consumer sectors as well as certain positions in the industrial space, while the portfolio’s substantially lower exposure to resurgent Health Care stocks was also a factor. The Fund was up 0.5% in the second quarter versus 2.5% for the small-cap index. Longer-term results were stronger on both an absolute and relative basis. Total Return outperformed the Russell 2000 for the 20-year and since inception (12/15/93) periods ended June 30, 2017. The Fund’s average annual total return since inception was 10.8%. |
| WHAT WORKED... AND WHAT DIDN’T |
| Seven of the Fund’s 11 equity sectors made positive contributions to first-half results. Driven by strength in the capital markets and insurance industries, Financials led by a wide margin. For many years one of the Fund’s largest sectors, financial companies offer great diversity in terms of business models, and many stocks in the sector also boast long dividend-paying histories. The sector’s top contributor in the first half of 2017 was Canadian investment and insurance business E-L Financial, which benefited from increases in net investment income, assets under management, and profits from wealth management. Other industries that did well in the first half included chemicals (Materials) and professional services (Industrials). The top-contributing holding was global staffing and services company ManpowerGroup, whose stock was helped by improved topline growth and a strong bottom line in 2016, solid fiscal first-quarter 2017 earnings, and a brightening global employment picture. Teleflex provides medical technology and devices used for critical care and surgical applications. Two consecutive quarters of better-than-expected earnings helped to draw investors. We initially liked its niche business, solid cash flow, and dividend. It’s a good example of our conservative, risk-conscious approach to the Health Care sector, where dividends are scarce. Less than 8% of the small-cap companies in the sector paid a dividend at the end of June 2017, which accounts for the sector’s perennial underweight in the portfolio. Four sectors detracted from first-half results, with Energy and Consumer Discretionary making the biggest negative impacts. The latter sector’s specialty retail group hurt performance most as the industry continues to struggle with secular shifts in consumer spending and behavior. We reduced our exposure by nearly half, selling our shares of holdings such as footwear, headwear, and sports apparel retailer Genesco and car repair and tire services business Monro Muffler Brake. The top detractor at the position level was SEACOR Holdings, which provides marine transportation equipment and logistics services mostly for the energy and agricultural markets. Its earnings remained pressured by ongoing weakness in the offshore marine vessel business, which was exacerbated by the decline in oil prices in the first half, as well as overcapacity in its inland river barge and tow business. HNI Corporation manufactures office furniture and household products. Its shares slumped due to declining revenues and disappointing earnings in the first quarter. Liking its long-term prospects, we built our stake in the first half. First-half relative performance suffered most from our significant underweight in Health Care. Both our larger weighting and disappointing results in specialty retail stocks created a disadvantage in Consumer Discretionary. The brightest spot for first-half relative performance came from Financials, where superior stock selection in capital markets and banks (where our underweight also helped) drove the sector’s results. Effective stock selection in the Materials sector was also a relative positive. |
| Top Contributors to Performance Year-to-Date Through 6/30/17 (%)1 | |||
| ManpowerGroup | 0.33 | ||
| Teleflex | 0.26 | ||
| E-L Financial | 0.26 | ||
| Hill-Rom Holdings | 0.26 | ||
| Quaker Chemical | 0.25 | ||
| 1 Includes dividends | |||
| Top Detractors from Performance Year-to-Date Through 6/30/17 (%)2 | |||
| SEACOR Holdings | -0.23 | ||
| HNI Corporation | -0.22 | ||
| Cato Corporation (The) Cl. A | -0.21 | ||
| Genesco | -0.19 | ||
| Ritchie Bros. Auctioneers | -0.13 | ||
| 2 Net of dividends | |||
| CURRENT POSITIONING AND OUTLOOK |
| We reduced our exposure to Consumer Discretionary, not just in the specialty retail group but also in textile, apparel & luxury goods as the ongoing negative effects of e-commerce show no signs of abating. Additionally, we somewhat repositioned the Fund’s weightings in Financials by trimming property & casualty insurers and traditional asset managers in favor of banks and alterative asset managers. Over the last couple of years, we have been increasingly drawn to non-traditional asset managers, specifically in the alternative asset management space, which we think is an undervalued zone in an asset-light business that is not well understood by other investors. Overall, the portfolio is positioned to benefit from any cyclical upswing, with approximately two-thirds of its assets in Financials, Industrials, and Materials. We also think that its dividend-paying approach may help it to hold up relatively well if the long-awaited small-cap correction occurs in the second half. |
| 42 | The Royce Funds 2017 Semiannual Report to Shareholders |
| PERFORMANCE AND PORTFOLIO REVIEW | TICKER SYMBOLS RYTRX RYTFX RTRIX RYTCX RTRRX RTRKX RTRWX |
| Performance and Expenses | ||||||||||||||||
| Average Annual Total Return (%) Through 6/30/17 | ||||||||||||||||
| JAN-JUN 20171 | 1-YR | 3-YR | 5-YR | 10-YR | 15-YR | 20-YR | SINCE INCEPTION (12/15/93) | |||||||||
| RTR | 2.78 | 19.09 | 5.80 | 12.15 | 6.24 | 8.76 | 9.33 | 10.82 | ||||||||
| Annual Operating Expenses: 1.21% | ||||||||||||||||
| 1Not Annualized | ||||||||||||||||
Relative Risk Adjusted Returns: Monthly Rolling Sharpe Ratios
| On a monthly rolling risk-adjusted basis, the Fund outperformed the Russell 2000 in 98% of all 10-year periods and 92% of all 5-year periods. |
| PERIODS BEATING THE INDEX | FUND AVG (%)1 | INDEX AVG (%)1 | ||||||||||||
| 10-year | 118/121 | 98% | 0.46 | 0.32 | ||||||||||
| 5-year | 167/181 | 92% | 0.61 | 0.42 | ||||||||||
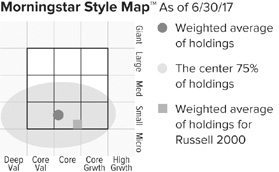
The Morningstar Style Map is the Morningstar Style Box™ with the center 75% of fund holdings plotted as the Morningstar Ownership Zone™. The Morningstar Style Box is designed to reveal a fund’s investment strategy. The Morningstar Ownership Zone provides detail about a portfolio’s investment style by showing the range of stock sizes and styles. The Ownership Zone is derived by plotting each stock in the portfolio within the proprietary Morningstar Style Box. Over time, the shape and location of a fund’s ownership zone may vary. See page 131 for additional information. |
Value of $10,000

| Top 10 Positions | ||
| % of Net Assets | ||
| Quaker Chemical | 1.9 | |
| E-L Financial | 1.7 | |
| Erie Indemnity Cl. A | 1.7 | |
| ManpowerGroup | 1.6 | |
| Tennant Company | 1.4 | |
| Albemarle Corporation | 1.3 | |
| Thor Industries | 1.2 | |
| Woodward | 1.2 | |
| Teleflex | 1.1 | |
| Alleghany Corporation | 1.1 | |
| Portfolio Sector Breakdown | ||
| % of Net Assets | ||
| Financials | 27.4 | |
| Industrials | 24.9 | |
| Materials | 13.7 | |
| Consumer Discretionary | 9.8 | |
| Information Technology | 6.0 | |
| Health Care | 4.9 | |
| Consumer Staples | 3.1 | |
| Energy | 2.6 | |
| Utilities | 2.3 | |
| Telecommunication Services | 1.1 | |
| Real Estate | 0.1 | |
| Miscellaneous | 1.2 | |
| Corporate Bond | 0.2 | |
| Cash and Cash Equivalents | 2.7 | |
| Calendar Year Total Returns (%) | ||
| YEAR | RTR | |
| 2016 | 25.9 | |
| 2015 | -7.2 | |
| 2014 | 1.3 | |
| 2013 | 32.8 | |
| 2012 | 14.4 | |
| 2011 | -1.7 | |
| 2010 | 23.5 | |
| 2009 | 26.2 | |
| 2008 | -31.2 | |
| 2007 | 2.4 | |
| 2006 | 14.5 | |
| 2005 | 8.2 | |
| 2004 | 17.5 | |
| 2003 | 30.0 | |
| 2002 | -1.6 | |
| Upside/Downside Capture Ratios | ||||||||||||||
| Periods Ended 6/30/17 (%) | ||||||||||||||
| UPSIDE | DOWNSIDE | |||||||||||||
| 10-Year | 82 | 79 | ||||||||||||
| From 12/31/93 (Start of Fund’s First Full Quarter) | 81 | 55 | ||||||||||||
| Portfolio Diagnostics | ||
| Fund Net Assets | $2,608 million | |
| Number of Holdings | 286 | |
| Turnover Rate | 6% | |
| Average Market Capitalization1 | $2,119 million | |
| Weighted Average P/E Ratio2,3 | 18.9x | |
| Weighted Average P/B Ratio2 | 2.1x | |
| Active Share4 | 90% | |
| U.S. Investments (% of Net Assets) | 85.5% | |
| Non-U.S. Investments (% of Net Assets) | 11.6% | |
| 1 | Geometric Average. This weighted calculation uses each portfolio holding’s market cap in a way designed to not skew the effect of very large or small holdings; instead, it aims to better identify the portfolio’s center, which Royce believes offers a more accurate measure of average market cap than a simple mean or median. |
| 2 | Harmonic Average. This weighted calculation evaluates a portfolio as if it were a single stock and measures it overall. It compares the total market value of the portfolio to the portfolio’s share in the earnings or book value, as the case may be, of its underlying stocks. |
| 3 | The Fund’s P/E ratio calculation excludes companies with zero or negative earnings (5% of portfolio holdings as of 6/30/17). |
| 4 | Active Share is the sum of the absolute values of the different weightings of each holding in the Fund versus each holding in the benchmark, divided by two. |
| Important Performance and Expense Information All performance information in this Report reflects past performance, is presented on a total return basis, reflects the reinvestment of distributions, and does not reflect the deduction of taxes that a shareholder would pay on fund distributions or the redemption of fund shares. Past performance is no guarantee of future results. Investment return and principal value of an investment will fluctuate, so that shares may be worth more or less than their original cost when redeemed. Shares redeemed within 30 days of purchase may be subject to a 1% redemption fee payable to the Fund, which is not reflected in the performance shown above; if it were, performance would be lower. Current month-end performance may be higher or lower than performance quoted and may be obtained at www.roycefunds.com. All performance and risk information reflects results of the Investment Class (its oldest class). Certain immaterial adjustments were made to the net assets of Royce Total Return Fund at 6/30/17 for financial reporting purposes, and as a result the net asset values for shareholder transactions on that date and the calendar year Total Returns (%) based on those net asset values differ from the adjusted net asset values and calendar year total returns reported in the Financial Highlights. Operating expenses reflect the Fund’s total annual operating expenses for the Investment Class as of the Fund’s most current prospectus and include management fees, other expenses, and acquired fund fees and expenses. Acquired fund fees and expenses reflect the estimated amount of the fees and expenses incurred indirectly by the Fund through its investments in mutual funds, hedge funds, private equity funds, and other investment companies. Regarding the “Top Contributors” and “Top Detractors” tables shown above, the sum of all contributors to, and all detractors from, performance for all securities in the portfolio would approximate the Fund’s year-to-date performance for 2017. The Sharpe Ratio is calculated for a specified period by dividing a fund’s annualized excess returns by its annualized standard deviation. The higher the Sharpe ratio, the better the fund’s historical risk-adjusted performance. Upside Capture Ratio measures a manager’s performance in up markets relative to the Fund’s benchmark. It is calculated by measuring the Fund’s performance in quarters when the benchmark went up and dividing it by the benchmark’s return in those quarters. Downside Capture Ratio measures a manager’s performance in down markets relative to the Fund’s benchmark (Russell 2000). It is calculated by measuring the Fund’s performance in quarters when the benchmark goes down and dividing it by the benchmark’s return in those quarters. |
| The Royce Funds 2017 Semiannual Report to Shareholders | 43 |
Schedules of Investments
| Royce Dividend Value Fund | |||||||
| Common Stocks – 99.7% | |||||||
| SHARES | VALUE | ||||||
| CONSUMER DISCRETIONARY – 9.2% | |||||||
| AUTO COMPONENTS - 2.6% | |||||||
Autoliv | 9,600 | $ | 1,054,080 | ||||
Gentex Corporation | 110,496 | 2,096,109 | |||||
Nokian Renkaat | 47,000 | 1,945,401 | |||||
| 5,095,590 | |||||||
| AUTOMOBILES - 0.8% | |||||||
Thor Industries | 14,940 | 1,561,529 | |||||
| HOUSEHOLD DURABLES - 1.2% | |||||||
Hunter Douglas | 27,600 | 2,350,064 | |||||
| MULTILINE RETAIL - 0.3% | |||||||
Dillard’s Cl. A | 11,400 | 657,666 | |||||
| SPECIALTY RETAIL - 3.0% | |||||||
American Eagle Outfitters | 173,800 | 2,094,290 | |||||
DSW Cl. A | 115,049 | 2,036,367 | |||||
Fielmann | 6,400 | 493,701 | |||||
USS | 70,000 | 1,389,731 | |||||
| 6,014,089 | |||||||
| TEXTILES, APPAREL & LUXURY GOODS - 1.3% | |||||||
HUGO BOSS | 13,000 | 910,179 | |||||
Stella International Holdings | 100,000 | 179,316 | |||||
Steven Madden 1 | 35,008 | 1,398,570 | |||||
| 2,488,065 | |||||||
| Total (Cost $13,939,884) | 18,167,003 | ||||||
| CONSUMER STAPLES – 1.2% | |||||||
| FOOD & STAPLES RETAILING - 0.2% | |||||||
FamilyMart UNY Holdings | 6,000 | 343,010 | |||||
| FOOD PRODUCTS - 1.0% | |||||||
Hormel Foods | 47,900 | 1,633,869 | |||||
Industrias Bachoco ADR | 6,100 | 353,678 | |||||
| 1,987,547 | |||||||
| Total (Cost $945,621) | 2,330,557 | ||||||
| ENERGY – 2.7% | |||||||
| ENERGY EQUIPMENT & SERVICES - 2.3% | |||||||
Helmerich & Payne | 44,654 | 2,426,498 | |||||
TGS-NOPEC Geophysical | 100,900 | 2,067,853 | |||||
| 4,494,351 | |||||||
| OIL, GAS & CONSUMABLE FUELS - 0.4% | |||||||
Gaztransport Et Technigaz | 22,700 | 906,790 | |||||
| Total (Cost $6,095,175) | 5,401,141 | ||||||
| FINANCIALS – 29.8% | |||||||
| BANKS - 5.1% | |||||||
BGEO Group | 58,000 | 2,639,440 | |||||
BLOM Bank GDR | 63,000 | 762,300 | |||||
BOK Financial | 22,114 | 1,860,451 | |||||
City Holding Company | 8,689 | 572,345 | |||||
First Republic Bank | 42,500 | 4,254,250 | |||||
| 10,088,786 | |||||||
| CAPITAL MARKETS - 22.4% | |||||||
Ashmore Group | 624,000 | 2,870,557 | |||||
AURELIUS Equity Opportunities | 9,000 | 483,489 | |||||
BM&FBOVESPA | 322,000 | 1,919,617 | |||||
Bolsa Mexicana de Valores | 1,443,000 | 2,534,766 | |||||
Carlyle Group L.P. | 141,000 | 2,784,750 | |||||
Coronation Fund Managers | 213,000 | 1,061,378 | |||||
Federated Investors Cl. B | 73,700 | 2,082,025 | |||||
Gluskin Sheff + Associates | 51,700 | 667,778 | |||||
Houlihan Lokey Cl. A | 17,500 | 610,750 | |||||
Interactive Brokers Group Cl. A | 22,600 | 845,692 | |||||
Jupiter Fund Management | 408,000 | 2,683,567 | |||||
KKR & Co. L.P. | 246,200 | 4,579,320 | |||||
Lazard Cl. A | 40,100 | 1,857,833 | |||||
Moelis & Company Cl. A | 43,220 | 1,679,097 | |||||
Northern Trust | 25,000 | 2,430,250 | |||||
Oaktree Capital Group LLC Cl. A | 59,500 | 2,772,700 | |||||
SEI Investments | 53,000 | 2,850,340 | |||||
Singapore Exchange | 70,000 | 373,198 | |||||
Sprott | 735,700 | 1,293,489 | |||||
State Street | 27,900 | 2,503,467 | |||||
TD Ameritrade Holding Corporation | 74,100 | 3,185,559 | |||||
Value Partners Group | 2,527,200 | 2,301,442 | |||||
| 44,371,064 | |||||||
| DIVERSIFIED FINANCIAL SERVICES - 1.0% | |||||||
Leucadia National | 76,900 | 2,011,704 | |||||
| INSURANCE - 0.6% | |||||||
Reinsurance Group of America | 9,655 | 1,239,605 | |||||
| THRIFTS & MORTGAGE FINANCE - 0.7% | |||||||
Genworth MI Canada | 47,748 | 1,313,733 | |||||
| Total (Cost $43,230,624) | 59,024,892 | ||||||
| HEALTH CARE – 4.7% | |||||||
| HEALTH CARE EQUIPMENT & SUPPLIES - 2.6% | |||||||
Dentsply Sirona | 80,000 | 5,187,200 | |||||
| HEALTH CARE PROVIDERS & SERVICES - 0.2% | |||||||
Ensign Group (The) | 16,600 | 361,382 | |||||
| HEALTH CARE TECHNOLOGY - 0.2% | |||||||
CompuGroup Medical | 7,300 | 409,631 | |||||
| PHARMACEUTICALS - 1.7% | |||||||
Recordati | 66,000 | 2,677,564 | |||||
Santen Pharmaceutical | 52,000 | 704,583 | |||||
| 3,382,147 | |||||||
| Total (Cost $5,453,789) | 9,340,360 | ||||||
| INDUSTRIALS – 28.1% | |||||||
| AEROSPACE & DEFENSE - 1.4% | |||||||
HEICO Corporation Cl. A | 45,165 | 2,802,488 | |||||
| AIR FREIGHT & LOGISTICS - 1.9% | |||||||
Expeditors International of Washington | 65,200 | 3,682,496 | |||||
| BUILDING PRODUCTS - 1.5% | |||||||
Apogee Enterprises | 18,600 | 1,057,224 | |||||
Geberit | 1,000 | 466,368 | |||||
TOTO | 37,000 | 1,411,247 | |||||
| 2,934,839 | |||||||
| COMMERCIAL SERVICES & SUPPLIES - 0.3% | |||||||
Societe BIC | 5,600 | 664,548 | |||||
| CONSTRUCTION & ENGINEERING - 1.6% | |||||||
Comfort Systems USA | 16,700 | 619,570 | |||||
Jacobs Engineering Group | 10,000 | 543,900 | |||||
KBR | 136,900 | 2,083,618 | |||||
| 3,247,088 | |||||||
| ELECTRICAL EQUIPMENT - 1.1% | |||||||
Hubbell Cl. B | 18,200 | 2,059,694 | |||||
| MACHINERY - 11.7% | |||||||
Alamo Group | 3,708 | 336,724 | |||||
Donaldson Company | 83,900 | 3,820,806 | |||||
Federal Signal | 11,829 | 205,351 | |||||
Flowserve Corporation | 20,100 | 933,243 | |||||
| 44 | The Royce Funds 2017 Semiannual Report to Shareholders | THE ACCOMPANYING NOTES ARE AN INTEGRAL PART OF THESE FINANCIAL STATEMENTS |
| June 30, 2017 (unaudited) |
| Royce Dividend Value Fund (continued) | |||||||
| SHARES | VALUE | ||||||
| INDUSTRIALS (continued) | |||||||
| MACHINERY (continued) | |||||||
Graco | 23,500 | $ | 2,568,080 | ||||
IDEX Corporation | 37,300 | 4,215,273 | |||||
Lincoln Electric Holdings | 27,050 | 2,491,035 | |||||
Lindsay Corporation | 27,500 | 2,454,375 | |||||
Pfeiffer Vacuum Technology | 13,500 | 1,975,947 | |||||
Spirax-Sarco Engineering | 30,492 | 2,124,715 | |||||
Wabash National | 96,500 | 2,121,070 | |||||
| 23,246,619 | |||||||
| MARINE - 1.1% | |||||||
Clarkson | 67,400 | 2,217,452 | |||||
| PROFESSIONAL SERVICES - 3.9% | |||||||
Korn/Ferry International | 53,200 | 1,836,996 | |||||
ManpowerGroup | 40,200 | 4,488,330 | |||||
Robert Half International | 29,100 | 1,394,763 | |||||
| 7,720,089 | |||||||
| ROAD & RAIL - 2.0% | |||||||
Amerco | 8,442 | 3,090,278 | |||||
Werner Enterprises | 29,500 | 865,825 | |||||
| 3,956,103 | |||||||
| TRADING COMPANIES & DISTRIBUTORS - 1.6% | |||||||
Applied Industrial Technologies | 53,700 | 3,170,985 | |||||
| Total (Cost $33,791,857) | 55,702,401 | ||||||
| INFORMATION TECHNOLOGY – 7.5% | |||||||
| ELECTRONIC EQUIPMENT, INSTRUMENTS & COMPONENTS - 3.4% | |||||||
FLIR Systems | 104,800 | 3,632,368 | |||||
Methode Electronics | 24,600 | 1,013,520 | |||||
Vishay Intertechnology | 123,188 | 2,044,921 | |||||
| 6,690,809 | |||||||
| IT SERVICES - 1.2% | |||||||
Convergys Corporation | 17,000 | 404,260 | |||||
Western Union | 109,100 | 2,078,355 | |||||
| 2,482,615 | |||||||
| SEMICONDUCTORS & SEMICONDUCTOR EQUIPMENT - 0.3% | |||||||
MKS Instruments | 8,908 | 599,508 | |||||
| SOFTWARE - 0.8% | |||||||
Computer Modelling Group | 140,000 | 1,099,013 | |||||
SimCorp | 7,000 | 424,063 | |||||
| 1,523,076 | |||||||
| TECHNOLOGY HARDWARE, STORAGE & PERIPHERALS - 1.8% | |||||||
Diebold Nixdorf | 128,000 | 3,584,000 | |||||
| Total (Cost $13,220,032) | 14,880,008 | ||||||
| MATERIALS – 13.3% | |||||||
| CHEMICALS - 2.1% | |||||||
Quaker Chemical | 26,800 | 3,892,164 | |||||
Victrex | 10,000 | 244,340 | |||||
| 4,136,504 | |||||||
| CONTAINERS & PACKAGING - 3.1% | |||||||
AptarGroup | 41,200 | 3,578,632 | |||||
Greif Cl. A | 46,300 | 2,582,614 | |||||
| 6,161,246 | |||||||
| METALS & MINING - 8.1% | |||||||
Carpenter Technology | 69,300 | 2,593,899 | |||||
Compass Minerals International | 38,100 | 2,487,930 | |||||
Franco-Nevada Corporation | 36,000 | 2,597,760 | |||||
Reliance Steel & Aluminum | 50,900 | 3,706,029 | |||||
Royal Gold | 19,900 | 1,555,583 | |||||
Worthington Industries | 62,200 | 3,123,684 | |||||
| 16,064,885 | |||||||
| Total (Cost $18,423,598) | 26,362,635 | ||||||
| REAL ESTATE – 0.2% | |||||||
| REAL ESTATE MANAGEMENT & DEVELOPMENT - 0.2% | |||||||
Relo Group | 23,000 | 447,219 | |||||
| Total (Cost $107,244) | 447,219 | ||||||
| TELECOMMUNICATION SERVICES – 0.5% | |||||||
| DIVERSIFIED TELECOMMUNICATION SERVICES - 0.5% | |||||||
Inmarsat | 105,000 | 1,052,347 | |||||
| Total (Cost $1,165,014) | 1,052,347 | ||||||
| UTILITIES – 1.4% | |||||||
| WATER UTILITIES - 1.4% | |||||||
Aqua America | 84,000 | 2,797,200 | |||||
| Total (Cost $2,013,787) | 2,797,200 | ||||||
| MISCELLANEOUS2 – 1.1% | |||||||
| Total (Cost $2,143,744) | 2,067,324 | ||||||
| TOTAL COMMON STOCKS | |||||||
| (Cost $140,530,369) | 197,573,087 | ||||||
| REPURCHASE AGREEMENT– 0.9% | |||||||
| Fixed Income Clearing Corporation, 0.12% dated 6/30/17, due 7/3/17, maturity value $1,678,017 (collateralized by obligations of various U.S. Government Agencies, 2.375% due 8/15/24, valued at $1,714,544) | |||||||
| (Cost $1,678,000) | 1,678,000 | ||||||
| TOTAL INVESTMENTS – 100.6% | |||||||
| (Cost $142,208,369) | 199,251,087 | ||||||
| LIABILITIES LESS CASH AND OTHER ASSETS – (0.6)% | (1,090,982 | ) | |||||
| NET ASSETS – 100.0% | $ | 198,160,105 | |||||
| THE ACCOMPANYING NOTES ARE AN INTEGRAL PART OF THESE FINANCIAL STATEMENTS | The Royce Funds 2017 Semiannual Report to Shareholders | 45 |
| Schedules of Investments |
| Royce Global Financial Services Fund | |||||||
| Common Stocks – 97.5% | |||||||
| SHARES | VALUE | ||||||
| BANKS - 17.2% | |||||||
BankUnited | 4,100 | $ | 138,211 | ||||
BLOM Bank GDR | 8,000 | 96,800 | |||||
BOK Financial | 12,200 | 1,026,386 | |||||
Capital City Bank Group | 29,822 | 608,965 | |||||
Chemung Financial | 14,512 | 593,251 | |||||
First Citizens BancShares Cl. A | 3,465 | 1,291,405 | |||||
First Republic Bank | 10,400 | 1,041,040 | |||||
Investors Bancorp | 25,300 | 338,008 | |||||
Live Oak Bancshares | 45,000 | 1,089,000 | |||||
Popular | 28,900 | 1,205,419 | |||||
State Bank Financial | 12,500 | 339,000 | |||||
Umpqua Holdings | 17,400 | 319,464 | |||||
†Webster Financial | 14,600 | 762,412 | |||||
| Total (Cost $6,372,501) | 8,849,361 | ||||||
| CAPITAL MARKETS - 48.8% | |||||||
Ares Management L.P. | 51,700 | 930,600 | |||||
Ashmore Group | 285,000 | 1,311,072 | |||||
Associated Capital Group Cl. A | 14,084 | 478,856 | |||||
BM&FBOVESPA | 136,000 | 810,770 | |||||
Canaccord Genuity Group | 88,000 | 361,690 | |||||
Carlyle Group L.P. | 41,700 | 823,575 | |||||
Charles Schwab (The) Corporation | 20,900 | 897,864 | |||||
Citadel Capital 1 | 150,000 | 6,623 | |||||
Coronation Fund Managers | 68,000 | 338,843 | |||||
CRISIL | 14,000 | 423,438 | |||||
Dundee Corporation Cl. A 1 | 90,000 | 197,795 | |||||
†Edelweiss Financial Services | 155,000 | 458,495 | |||||
Edmond de Rothschild (Suisse) | 20 | 341,016 | |||||
Egyptian Financial Group-Hermes Holding | |||||||
Company | 246,390 | 328,384 | |||||
Financial Engines | 14,820 | 542,412 | |||||
Gluskin Sheff + Associates | 70,500 | 910,607 | |||||
GMP Capital 1 | 108,000 | 264,837 | |||||
Hellenic Exchanges - Athens Stock Exchange | 50,000 | 324,370 | |||||
Intermediate Capital Group | 39,111 | 424,076 | |||||
INTL FCStone 1 | 12,100 | 456,896 | |||||
IOOF Holdings | 20,000 | 150,646 | |||||
JSE | 51,000 | 477,585 | |||||
Jupiter Fund Management | 118,800 | 781,392 | |||||
KKR & Co. L.P. | 23,900 | 444,540 | |||||
Lazard Cl. A | 7,500 | 347,475 | |||||
MarketAxess Holdings | 4,600 | 925,060 | |||||
Medley Management Cl. A | 31,302 | 203,463 | |||||
MVC Capital | 47,100 | 464,406 | |||||
Northern Trust | 11,600 | 1,127,636 | |||||
NZX | 440,000 | 361,124 | |||||
Oaktree Capital Group LLC Cl. A | 12,730 | 593,218 | |||||
Partners Group Holding | 670 | 415,387 | |||||
Reinet Investments | 7,200 | 176,723 | |||||
Rothschild & Co | 23,500 | 857,823 | |||||
SEI Investments | 19,900 | 1,070,222 | |||||
Silvercrest Asset Management Group Cl. A | 41,600 | 559,520 | |||||
Singapore Exchange | 105,000 | 559,797 | |||||
Sprott | 680,000 | 1,195,558 | |||||
TD Ameritrade Holding Corporation | 12,715 | 546,618 | |||||
Tokai Tokyo Financial Holdings | 9,400 | 52,067 | |||||
U.S. Global Investors Cl. A | 359,200 | 549,576 | |||||
UOB-Kay Hian Holdings | 129,000 | 126,494 | |||||
Value Partners Group | 672,000 | 611,969 | |||||
Virtu Financial Cl. A | 61,000 | 1,076,650 | |||||
VZ Holding | 1,850 | 593,740 | |||||
Warsaw Stock Exchange | 19,000 | 250,315 | |||||
| Total (Cost $21,448,738) | 25,151,223 | ||||||
| DIVERSIFIED CONSUMER SERVICES - 0.1% | |||||||
H&R Block | 2,000 | 61,820 | |||||
| Total (Cost $44,290) | 61,820 | ||||||
| DIVERSIFIED FINANCIAL SERVICES - 0.3% | |||||||
SHUAA Capital 1 | 580,000 | 170,542 | |||||
| Total (Cost $308,882) | 170,542 | ||||||
| EQUITY REAL ESTATE INVESTMENT TRUSTS (REITS) - 0.9% | |||||||
†Colony NorthStar Cl. A | 31,500 | 443,835 | |||||
| Total (Cost $383,891) | 443,835 | ||||||
| HOTELS, RESTAURANTS & LEISURE - 0.2% | |||||||
Thomas Cook (India) | 30,600 | 116,269 | |||||
| Total (Cost $28,633) | 116,269 | ||||||
| INSURANCE - 6.8% | |||||||
E-L Financial | 2,400 | 1,563,849 | |||||
Jardine Lloyd Thompson Group | 11,900 | 185,990 | |||||
MBIA 1 | 95,300 | 898,679 | |||||
National Western Life Group Cl. A | 2,750 | 878,955 | |||||
| Total (Cost $2,992,178) | 3,527,473 | ||||||
| INTERNET SOFTWARE & SERVICES - 0.1% | |||||||
| 223,459 | 28,759 | ||||||
| Total (Cost $101,010) | 28,759 | ||||||
| INVESTMENT COMPANIES - 1.0% | |||||||
RIT Capital Partners | 20,000 | 495,192 | |||||
| Total (Cost $394,542) | 495,192 | ||||||
| IT SERVICES - 3.0% | |||||||
Cass Information Systems | 3,800 | 249,432 | |||||
DST Systems | 5,800 | 357,860 | |||||
GBST Holdings | 105,000 | 239,688 | |||||
PayPal Holdings 1 | 12,800 | 686,976 | |||||
| Total (Cost $1,351,561) | 1,533,956 | ||||||
| MARINE - 1.4% | |||||||
Clarkson | 22,000 | 723,797 | |||||
| Total (Cost $774,855) | 723,797 | ||||||
| METALS & MINING - 2.1% | |||||||
Franco-Nevada Corporation | 15,000 | 1,082,400 | |||||
| Total (Cost $782,045) | 1,082,400 | ||||||
| PROFESSIONAL SERVICES - 1.7% | |||||||
IHS Markit 1 | 14,000 | 616,560 | |||||
Verisk Analytics 1 | 3,200 | 269,984 | |||||
| Total (Cost $436,359) | 886,544 | ||||||
| REAL ESTATE MANAGEMENT & DEVELOPMENT - 7.2% | |||||||
Altus Group | 32,000 | 691,672 | |||||
FirstService Corporation | 23,200 | 1,484,336 | |||||
| 18,100 | 835,315 | ||||||
| 46 | The Royce Funds 2017 Semiannual Report to Shareholders | THE ACCOMPANYING NOTES ARE AN INTEGRAL PART OF THESE FINANCIAL STATEMENTS |
| June 30, 2017 (unaudited) |
| Royce Global Financial Services Fund (continued) | |||||||
| SHARES | VALUE | ||||||
| REAL ESTATE MANAGEMENT & DEVELOPMENT (continued) | |||||||
Midland Holdings 1 | 800,000 | $ | 216,204 | ||||
Midland IC&I 1 | 400,000 | 21,261 | |||||
RMR Group Cl. A | 10,000 | 486,500 | |||||
| Total (Cost $2,966,337) | 3,735,288 | ||||||
| SOFTWARE - 2.5% | |||||||
Bottomline Technologies 1 | 13,600 | 349,384 | |||||
Fair Isaac | 6,660 | 928,471 | |||||
| Total (Cost $546,845) | 1,277,855 | ||||||
| THRIFTS & MORTGAGE FINANCE - 1.2% | |||||||
BofI Holding 1 | 25,700 | 609,604 | |||||
| Total (Cost $466,954) | 609,604 | ||||||
| MISCELLANEOUS2 - 3.0% | |||||||
| Total (Cost $1,374,565) | 1,532,648 | ||||||
| TOTAL COMMON STOCKS | |||||||
| (Cost $40,774,186) | 50,226,566 | ||||||
| REPURCHASE AGREEMENT– 1.9% | |||||||
| Fixed Income Clearing Corporation, 0.12% dated 6/30/17, due 7/3/17, maturity value $999,010 (collateralized by obligations of various U.S. Government Agencies, 2.375% due 8/15/24, valued at $1,021,540) | |||||||
| (Cost $999,000) | 999,000 | ||||||
| TOTAL INVESTMENTS – 99.4% | |||||||
| (Cost $41,773,186) | 51,225,566 | ||||||
| CASH AND OTHER ASSETS LESS LIABILITIES – 0.6% | 304,975 | ||||||
| NET ASSETS – 100.0% | $ | 51,530,541 | |||||
| Royce International Micro-Cap Fund | |||||||
| Common Stocks – 95.1% | |||||||
| SHARES | VALUE | ||||||
| AUSTRALIA – 4.1% | |||||||
Austal | 35,900 | $ | 50,495 | ||||
| 25,000 | 13,451 | ||||||
†Mantra Group | 41,100 | 96,348 | |||||
NetComm Wireless 1 | 23,300 | 30,802 | |||||
Programmed Maintenance Services | 36,400 | 52,177 | |||||
Seeing Machines 1 | 445,200 | 22,469 | |||||
†Tassal Group | 12,600 | 36,897 | |||||
| Total (Cost $310,220) | 302,639 | ||||||
| BELGIUM – 0.7% | |||||||
†Greenyard | 2,300 | 54,483 | |||||
| Total (Cost $43,335) | 54,483 | ||||||
| BRAZIL – 2.2% | |||||||
Minerva | 24,900 | 92,523 | |||||
T4F Entretenimento | 35,400 | 65,716 | |||||
| Total (Cost $156,557) | 158,239 | ||||||
| CANADA – 8.2% | |||||||
AGT Food and Ingredients | 3,200 | 57,446 | |||||
Altus Group | 2,900 | 62,683 | |||||
| 119,200 | 66,182 | ||||||
Exco Technologies | 10,300 | 84,827 | |||||
| 11,000 | 55,899 | ||||||
Magellan Aerospace | 5,100 | 79,599 | |||||
Sandstorm Gold 1 | 11,200 | 43,344 | |||||
Solium Capital 1 | 8,600 | 65,057 | |||||
Western Forest Products | 49,300 | 88,959 | |||||
| Total (Cost $580,286) | 603,996 | ||||||
| CHINA – 1.2% | |||||||
Xingda International Holdings | 145,100 | 58,728 | |||||
Xtep International Holdings | 76,000 | 29,300 | |||||
| Total (Cost $91,831) | 88,028 | ||||||
| FRANCE – 2.0% | |||||||
Bigben Interactive 1 | 4,600 | 50,753 | |||||
HighCo | 7,500 | 53,538 | |||||
Manutan International | 400 | 39,523 | |||||
| Total (Cost $90,002) | 143,814 | ||||||
| GERMANY – 3.0% | |||||||
Amadeus Fire | 300 | 26,349 | |||||
CANCOM | 1,000 | 60,797 | |||||
HolidayCheck Group 1 | 8,600 | 30,145 | |||||
mutares | 1,800 | 27,919 | |||||
†Surteco | 1,400 | 37,945 | |||||
VIB Vermoegen | 1,600 | 37,791 | |||||
| Total (Cost $212,758) | 220,946 | ||||||
| GREECE – 0.3% | |||||||
Aegean Marine Petroleum Network | 3,200 | 18,720 | |||||
| Total (Cost $42,831) | 18,720 | ||||||
| HONG KONG – 4.9% | |||||||
China Metal International Holdings | 187,400 | 69,848 | |||||
†CSI Properties | 1,146,900 | 55,087 | |||||
I.T | 167,100 | 82,400 | |||||
Oriental Watch Holdings | 181,500 | 39,520 | |||||
Pico Far East Holdings | 102,200 | 42,804 | |||||
Value Partners Group | 29,700 | 27,047 | |||||
| THE ACCOMPANYING NOTES ARE AN INTEGRAL PART OF THESE FINANCIAL STATEMENTS | The Royce Funds 2017 Semiannual Report to Shareholders | 47 |
| Schedules of Investments |
| Royce International Micro-Cap Fund (continued) | |||||||
| SHARES | VALUE | ||||||
| HONG KONG (continued) | |||||||
†Wasion Group Holdings | 100,400 | $ | 46,294 | ||||
| Total (Cost $329,917) | 363,000 | ||||||
| INDIA – 3.1% | |||||||
| 18,000 | 47,689 | ||||||
eClerx Services | 3,100 | 63,163 | |||||
| 17,700 | 50,167 | ||||||
†Multi Commodity Exchange of India | 4,100 | 69,139 | |||||
| Total (Cost $236,487) | 230,158 | ||||||
| INDONESIA – 0.6% | |||||||
Selamat Sempurna | 462,600 | 41,826 | |||||
| Total (Cost $38,548) | 41,826 | ||||||
| IRELAND – 2.4% | |||||||
Ardmore Shipping | 5,200 | 42,380 | |||||
Irish Continental Group | 11,000 | 63,823 | |||||
Irish Residential Properties REIT | 47,057 | 73,095 | |||||
| Total (Cost $172,639) | 179,298 | ||||||
| ISRAEL – 0.8% | |||||||
Nova Measuring Instruments 1 | 1,300 | 28,717 | |||||
Sarine Technologies | 29,100 | 32,551 | |||||
| Total (Cost $50,058) | 61,268 | ||||||
| ITALY – 0.7% | |||||||
| 4,300 | 51,666 | ||||||
| Total (Cost $46,212) | 51,666 | ||||||
| JAPAN – 19.5% | |||||||
†Asia Pile Holdings | 6,600 | 44,010 | |||||
†Ateam | 2,600 | 68,886 | |||||
C. Uyemura & Co. | 1,000 | 51,389 | |||||
†Digital Garage | 2,700 | 50,627 | |||||
†eGuarantee | 3,400 | 79,835 | |||||
GCA | 5,100 | 45,434 | |||||
G-Tekt | 3,100 | 57,659 | |||||
†IDOM | 12,200 | 84,063 | |||||
Inabata & Co. | 4,400 | 58,249 | |||||
†Information Services International-Dentsu | 2,200 | 51,501 | |||||
†Investors Cloud | 1,400 | 68,211 | |||||
Kenedix | 6,700 | 31,572 | |||||
Kenko Mayonnaise | 2,400 | 69,135 | |||||
Leopalace21 | 4,200 | 26,065 | |||||
Mandom Corporation | 500 | 27,073 | |||||
Maruwa Unyu Kikan | 1,500 | 55,946 | |||||
Meitec Corporation | 500 | 21,271 | |||||
NS Solutions | 1,500 | 35,608 | |||||
Open House | 1,100 | 33,839 | |||||
Outsourcing | 1,100 | 53,594 | |||||
Pressance | 4,200 | 55,340 | |||||
Relia | 4,800 | 52,150 | |||||
Ryobi | 15,200 | 61,760 | |||||
SPARX Group | 28,300 | 54,348 | |||||
Sun Frontier Fudousan | 6,200 | 62,179 | |||||
Tokai Corporation | 1,500 | 59,347 | |||||
†Yumeshin Holdings | 11,000 | 73,056 | |||||
| Total (Cost $1,315,919) | 1,432,147 | ||||||
| MALAYSIA – 1.4% | |||||||
†AEON Credit Service | 11,500 | 51,276 | |||||
CB Industrial Product Holding | 101,500 | 47,999 | |||||
| Total (Cost $90,568) | 99,275 | ||||||
| MEXICO – 0.9% | |||||||
Rassini 1 | 13,900 | 68,547 | |||||
| Total (Cost $63,344) | 68,547 | ||||||
| NETHERLANDS – 1.2% | |||||||
AMG Advanced Metallurgical Group | 1,300 | 37,974 | |||||
Constellium Cl. A 1 | 7,800 | 53,820 | |||||
| Total (Cost $77,844) | 91,794 | ||||||
| NEW ZEALAND – 0.2% | |||||||
New Zealand Refining | 8,900 | 15,913 | |||||
| Total (Cost $20,748) | 15,913 | ||||||
| NORWAY – 2.1% | |||||||
Nordic Semiconductor 1 | 12,900 | 51,299 | |||||
NRC Group | 4,800 | 32,196 | |||||
†Protector Forsikring | 8,400 | 70,430 | |||||
| Total (Cost $158,545) | 153,925 | ||||||
| PHILIPPINES – 0.4% | |||||||
Integrated Micro-Electronics | 103,600 | 27,306 | |||||
| Total (Cost $12,633) | 27,306 | ||||||
| SINGAPORE – 1.3% | |||||||
CSE Global | 147,400 | 46,038 | |||||
†Duty Free International | 259,300 | 47,897 | |||||
| Total (Cost $104,657) | 93,935 | ||||||
| SOUTH AFRICA – 1.4% | |||||||
†Adcock Ingram Holdings | 9,800 | 44,271 | |||||
Raubex Group | 29,900 | 54,921 | |||||
| Total (Cost $86,326) | 99,192 | ||||||
| SOUTH KOREA – 6.3% | |||||||
Eugene Technology | 5,100 | 81,126 | |||||
†Huchems Fine Chemical | 4,000 | 93,519 | |||||
Koh Young Technology | 1,400 | 73,417 | |||||
KT Skylife | 5,600 | 80,024 | |||||
Modetour Network | 2,394 | 66,224 | |||||
Samjin Pharmaceutical | 2,400 | 69,222 | |||||
| Total (Cost $398,006) | 463,532 | ||||||
| SPAIN – 1.7% | |||||||
Atento 1 | 8,400 | 93,660 | |||||
Papeles y Cartones de Europa | 3,800 | 32,551 | |||||
| Total (Cost $98,880) | 126,211 | ||||||
| SWEDEN – 3.1% | |||||||
Byggmax Group | 9,800 | 71,249 | |||||
Dustin Group | 6,500 | 54,008 | |||||
Knowit | 2,900 | 44,663 | |||||
Proact IT Group | 2,300 | 55,830 | |||||
| Total (Cost $173,086) | 225,750 | ||||||
| TAIWAN – 8.0% | |||||||
Egis Technology 1 | 9,300 | 63,590 | |||||
Flytech Technology | 22,024 | 71,821 | |||||
†Formosa Laboratories | 21,800 | 62,562 | |||||
Posiflex Technology | 11,900 | 64,546 | |||||
Sinmag Equipment | 7,400 | 43,301 | |||||
| 48 | The Royce Funds 2017 Semiannual Report to Shareholders | THE ACCOMPANYING NOTES ARE AN INTEGRAL PART OF THESE FINANCIAL STATEMENTS |
| June 30, 2017 (unaudited) |
| Royce International Micro-Cap Fund (continued) | |||||||
| SHARES | VALUE | ||||||
| TAIWAN (continued) | |||||||
Sitronix Technology | 26,000 | $ | 80,171 | ||||
Sporton International | 14,383 | 72,813 | |||||
Taiwan Paiho | 18,800 | 70,763 | |||||
TCI | 8,900 | 56,612 | |||||
| Total (Cost $555,937) | 586,179 | ||||||
| THAILAND – 0.8% | |||||||
†Krungthai Card | 16,000 | 56,520 | |||||
| Total (Cost $60,475) | 56,520 | ||||||
| TURKEY – 0.9% | |||||||
Tat Gida Sanayi | 31,400 | 63,631 | |||||
| Total (Cost $62,353) | 63,631 | ||||||
| UNITED ARAB EMIRATES – 0.9% | |||||||
Aramex | 47,500 | 66,989 | |||||
| Total (Cost $23,304) | 66,989 | ||||||
| UNITED KINGDOM – 9.6% | |||||||
Avon Rubber | 3,800 | 50,483 | |||||
Character Group | 3,400 | 21,367 | |||||
Connect Group | 31,300 | 45,964 | |||||
Consort Medical | 3,500 | 47,637 | |||||
Conviviality | 13,300 | 53,353 | |||||
dotdigital group | 60,600 | 53,277 | |||||
EMIS Group | 4,800 | 57,610 | |||||
Epwin Group | 37,700 | 54,013 | |||||
Finsbury Food Group | 42,900 | 64,815 | |||||
Hilton Food Group | 6,000 | 57,672 | |||||
Inspired Energy | 156,600 | 35,694 | |||||
Norcros | 17,470 | 41,412 | |||||
Pendragon | 128,000 | 51,681 | |||||
Rank Group | 17,000 | 52,520 | |||||
Real Estate Investors | 27,700 | 21,827 | |||||
| Total (Cost $717,969) | 709,325 | ||||||
| UNITED STATES – 1.2% | |||||||
Century Casinos 1 | 6,900 | 50,853 | |||||
Currency Exchange International 1 | 2,000 | 40,561 | |||||
| Total (Cost $85,587) | 91,414 | ||||||
| TOTAL COMMON STOCKS | |||||||
| (Cost $6,507,862) | 6,989,666 | ||||||
| REPURCHASE AGREEMENT– 5.6% | |||||||
| Fixed Income Clearing Corporation, 0.12% dated 6/30/17, due 7/3/17, maturity value $413,004 (collateralized by obligations of various U.S. Government Agencies, 2.375% due 8/15/24, valued at $426,069) | |||||||
| (Cost $413,000) | 413,000 | ||||||
| TOTAL INVESTMENTS – 100.7% | |||||||
| (Cost $6,920,862) | 7,402,666 | ||||||
| LIABILITIES LESS CASH AND OTHER ASSETS – (0.7)% | (50,505 | ) | |||||
| NET ASSETS – 100.0% | $ | 7,352,161 | |||||
| Royce International Premier Fund | |||||||
| Common Stocks – 95.4% | |||||||
| SHARES | VALUE | ||||||
| AUSTRALIA – 9.0% | |||||||
ALS | 340,000 | $ | 1,946,864 | ||||
| 825,000 | 1,014,552 | ||||||
Cochlear | 13,500 | 1,612,964 | |||||
†Hansen Technologies | 600,000 | 1,863,086 | |||||
IPH | 550,000 | 2,029,104 | |||||
| Total (Cost $7,252,125) | 8,466,570 | ||||||
| AUSTRIA – 3.0% | |||||||
Mayr-Melnhof Karton | 21,476 | 2,808,548 | |||||
| Total (Cost $2,560,020) | 2,808,548 | ||||||
| BRAZIL – 4.2% | |||||||
OdontoPrev | 577,500 | 2,030,811 | |||||
TOTVS | 206,000 | 1,875,384 | |||||
| Total (Cost $3,600,972) | 3,906,195 | ||||||
| CANADA – 3.7% | |||||||
Morneau Shepell | 110,000 | 1,767,736 | |||||
Winpak | 37,000 | 1,661,120 | |||||
| Total (Cost $2,900,794) | 3,428,856 | ||||||
| CHINA – 1.6% | |||||||
TravelSky Technology | 500,000 | 1,472,952 | |||||
| Total (Cost $804,192) | 1,472,952 | ||||||
| FRANCE – 5.5% | |||||||
†Neurones | 32,000 | 983,893 | |||||
Thermador Groupe | 20,000 | 2,128,967 | |||||
Virbac 1 | 12,600 | 2,021,948 | |||||
| Total (Cost $5,283,500) | 5,134,808 | ||||||
| GERMANY – 6.8% | |||||||
Carl Zeiss Meditec | 37,000 | 1,920,273 | |||||
Fielmann | 17,900 | 1,380,820 | |||||
KWS Saat | 4,000 | 1,573,654 | |||||
STRATEC Biomedical | 22,000 | 1,442,307 | |||||
| Total (Cost $4,726,047) | 6,317,054 | ||||||
| HONG KONG – 1.3% | |||||||
Value Partners Group | 1,375,000 | 1,252,169 | |||||
| Total (Cost $1,380,516) | 1,252,169 | ||||||
| INDIA – 6.2% | |||||||
Bajaj Finance | 98,000 | 2,082,505 | |||||
SH Kelkar & Company 1 | 390,000 | 1,587,151 | |||||
†Vakrangee | 320,000 | 2,129,043 | |||||
| Total (Cost $4,093,515) | 5,798,699 | ||||||
| ISRAEL – 1.1% | |||||||
†Frutarom Industries | 15,000 | 1,049,637 | |||||
| Total (Cost $1,022,533) | 1,049,637 | ||||||
| ITALY – 1.6% | |||||||
DiaSorin | 19,500 | 1,497,786 | |||||
| Total (Cost $876,927) | 1,497,786 | ||||||
| JAPAN – 18.7% | |||||||
Ai Holdings | 70,000 | 1,882,641 | |||||
Horiba | 20,500 | 1,244,854 | |||||
Meitec Corporation | 55,000 | 2,339,853 | |||||
MISUMI Group | 77,500 | 1,768,082 | |||||
Nihon Kohden | 82,500 | 1,902,690 | |||||
Relo Group | 110,000 | 2,138,875 | |||||
| THE ACCOMPANYING NOTES ARE AN INTEGRAL PART OF THESE FINANCIAL STATEMENTS | The Royce Funds 2017 Semiannual Report to Shareholders | 49 |
| Schedules of Investments |
| Royce International Premier Fund (continued) | |||||||
| SHARES | VALUE | ||||||
| JAPAN (continued) | |||||||
Santen Pharmaceutical | 170,000 | $ | 2,303,445 | ||||
Sugi Holdings | 30,000 | 1,605,690 | |||||
USS | 117,000 | 2,322,836 | |||||
| Total (Cost $14,005,224) | 17,508,966 | ||||||
| NEW ZEALAND – 2.0% | |||||||
Fisher & Paykel Healthcare | 220,000 | 1,845,923 | |||||
| Total (Cost $1,245,990) | 1,845,923 | ||||||
| NORWAY – 1.4% | |||||||
TGS-NOPEC Geophysical | 65,000 | 1,332,116 | |||||
| Total (Cost $1,321,253) | 1,332,116 | ||||||
| SINGAPORE – 1.1% | |||||||
XP Power | 33,000 | 1,044,005 | |||||
| Total (Cost $758,356) | 1,044,005 | ||||||
| SWEDEN – 3.3% | |||||||
Addtech Cl. B | 85,000 | 1,619,346 | |||||
Bravida Holding | 205,000 | 1,497,709 | |||||
| Total (Cost $2,550,958) | 3,117,055 | ||||||
| SWITZERLAND – 11.6% | |||||||
Burckhardt Compression Holding | 5,000 | 1,433,935 | |||||
dormakaba Holding | 2,200 | 1,911,148 | |||||
LEM Holding | 1,400 | 1,810,408 | |||||
Partners Group Holding | 4,300 | 2,665,919 | |||||
VZ Holding | 9,300 | 2,984,748 | |||||
| Total (Cost $7,806,378) | 10,806,158 | ||||||
| UNITED KINGDOM – 13.3% | |||||||
Ashmore Group | 220,000 | 1,012,056 | |||||
AVEVA Group | 45,000 | 1,137,039 | |||||
Clarkson | 30,000 | 986,996 | |||||
Consort Medical | 100,000 | 1,361,060 | |||||
Elementis | 250,000 | 957,626 | |||||
Equiniti Group | 400,000 | 1,301,147 | |||||
ITE Group | 750,000 | 1,504,329 | |||||
Rotork | 325,000 | 996,439 | |||||
Spirax-Sarco Engineering | 22,600 | 1,574,792 | |||||
Victrex | 65,000 | 1,588,207 | |||||
| Total (Cost $11,781,179) | 12,419,691 | ||||||
| TOTAL COMMON STOCKS | |||||||
| (Cost $73,970,479) | 89,207,188 | ||||||
| REPURCHASE AGREEMENT– 5.3% | |||||||
| Fixed Income Clearing Corporation, 0.12% dated 6/30/17, due 7/3/17, maturity value $4,994,050 (collateralized by obligations of various U.S. Government Agencies, 2.375% due 8/15/24, valued at $5,097,431) | |||||||
| (Cost $4,994,000) | 4,994,000 | ||||||
| TOTAL INVESTMENTS – 100.7% | |||||||
| (Cost $78,964,479) | 94,201,188 | ||||||
| LIABILITIES LESS CASH AND OTHER ASSETS – (0.7)% | (693,232 | ) | |||||
| NET ASSETS – 100.0% | $ | 93,507,956 | |||||
| Royce Low-Priced Stock Fund | |||||||
| Common Stocks – 98.0% | |||||||
| SHARES | VALUE | ||||||
| CONSUMER DISCRETIONARY – 17.6% | |||||||
| AUTO COMPONENTS - 2.6% | |||||||
Fox Factory Holding 1 | 56,900 | $ | 2,025,640 | ||||
| 106,300 | 1,759,265 | ||||||
Stoneridge 1 | 121,400 | 1,870,774 | |||||
Unique Fabricating | 195,989 | 1,865,815 | |||||
| 7,521,494 | |||||||
| AUTOMOBILES - 0.6% | |||||||
Thor Industries | 15,803 | 1,651,730 | |||||
| HOTELS, RESTAURANTS & LEISURE - 0.7% | |||||||
Century Casinos 1 | 251,400 | 1,852,818 | |||||
| HOUSEHOLD DURABLES - 1.6% | |||||||
AV Homes 1 | 135,800 | 2,722,790 | |||||
TRI Pointe Group 1 | 143,700 | 1,895,403 | |||||
| 4,618,193 | |||||||
| LEISURE PRODUCTS - 3.1% | |||||||
Acushnet Holdings | 86,000 | 1,706,240 | |||||
| 120,300 | 2,665,848 | ||||||
MCBC Holdings 1 | 103,800 | 2,029,290 | |||||
Nautilus 1 | 129,213 | 2,474,429 | |||||
| 8,875,807 | |||||||
| MEDIA - 0.9% | |||||||
Harte-Hanks 1 | 653,400 | 673,002 | |||||
New Media Investment Group | 140,300 | 1,891,244 | |||||
| 2,564,246 | |||||||
| MULTILINE RETAIL - 0.4% | |||||||
| 240,000 | 1,116,000 | ||||||
| SPECIALTY RETAIL - 7.2% | |||||||
American Eagle Outfitters | 168,100 | 2,025,605 | |||||
Buckle (The) | 107,075 | 1,905,935 | |||||
Build-A-Bear Workshop 1 | 174,100 | 1,819,345 | |||||
Cato Corporation (The) Cl. A | 76,150 | 1,339,478 | |||||
Chico’s FAS | 166,300 | 1,566,546 | |||||
DSW Cl. A | 50,000 | 885,000 | |||||
Finish Line (The) Cl. A | 102,500 | 1,452,425 | |||||
Guess? | 150,000 | 1,917,000 | |||||
Kirkland’s 1 | 93,700 | 963,236 | |||||
Shoe Carnival | 92,700 | 1,935,576 | |||||
Stein Mart | 389,100 | 657,579 | |||||
TravelCenters of America LLC 1 | 136,900 | 561,290 | |||||
| 85,000 | 1,575,900 | ||||||
West Marine | 137,300 | 1,764,305 | |||||
| 20,369,220 | |||||||
| TEXTILES, APPAREL & LUXURY GOODS - 0.5% | |||||||
Vera Bradley 1 | 147,100 | 1,438,638 | |||||
| Total (Cost $49,304,406) | 50,008,146 | ||||||
| CONSUMER STAPLES – 1.2% | |||||||
| FOOD PRODUCTS - 1.2% | |||||||
| 260,000 | 1,120,600 | ||||||
Landec Corporation 1 | 143,000 | 2,123,550 | |||||
| Total (Cost $3,442,029) | 3,244,150 | ||||||
| ENERGY – 7.1% | |||||||
| ENERGY EQUIPMENT & SERVICES - 4.9% | |||||||
Gulf Island Fabrication | 160,100 | �� | 1,857,160 | ||||
Newpark Resources 1 | 288,100 | 2,117,535 | |||||
Pason Systems | 128,150 | 1,911,182 | |||||
Profire Energy 1 | 1,180,800 | 1,535,040 | |||||
Tesco Corporation 1 | 323,416 | 1,439,201 | |||||
TGS-NOPEC Geophysical | 72,000 | 1,475,574 | |||||
| 50 | The Royce Funds 2017 Semiannual Report to Shareholders | THE ACCOMPANYING NOTES ARE AN INTEGRAL PART OF THESE FINANCIAL STATEMENTS |
| June 30, 2017 (unaudited) |
| Royce Low-Priced Stock Fund (continued) | |||||||
| SHARES | VALUE | ||||||
| ENERGY (continued) | |||||||
| ENERGY EQUIPMENT & SERVICES (continued) | |||||||
Total Energy Services | 203,100 | $ | 2,082,997 | ||||
Unit Corporation 1 | 78,800 | 1,475,924 | |||||
| 13,894,613 | |||||||
| OIL, GAS & CONSUMABLE FUELS - 2.2% | |||||||
Ardmore Shipping | 312,000 | 2,542,800 | |||||
Panhandle Oil and Gas Cl. A | 82,000 | 1,894,200 | |||||
SRC Energy 1 | 278,500 | 1,874,305 | |||||
| 6,311,305 | |||||||
| Total (Cost $16,609,824) | 20,205,918 | ||||||
| FINANCIALS – 13.0% | |||||||
| BANKS - 2.8% | |||||||
Blue Hills Bancorp | 114,900 | 2,056,710 | |||||
Boston Private Financial Holdings | 100,500 | 1,542,675 | |||||
Brookline Bancorp | 122,400 | 1,787,040 | |||||
HarborOne Bancorp 1 | 93,800 | 1,872,248 | |||||
| 37,643 | 654,988 | ||||||
| 7,913,661 | |||||||
| CAPITAL MARKETS - 5.9% | |||||||
Ares Management L.P. | 95,000 | 1,710,000 | |||||
Ashmore Group | 475,363 | 2,186,790 | |||||
Dundee Corporation Cl. A 1 | 492,800 | 1,083,035 | |||||
Federated Investors Cl. B | 71,900 | 2,031,175 | |||||
Jupiter Fund Management | 205,349 | 1,350,657 | |||||
Newtek Business Services | 85,800 | 1,397,682 | |||||
Silvercrest Asset Management Group Cl. A | 157,500 | 2,118,375 | |||||
Sprott | 1,254,400 | 2,205,453 | |||||
Value Partners Group | 2,270,100 | 2,067,309 | |||||
| 215,800 | 502,814 | ||||||
| 16,653,290 | |||||||
| DIVERSIFIED FINANCIAL SERVICES - 0.4% | |||||||
GTY Technology Holdings 1 | 100,000 | 1,046,000 | |||||
| INSURANCE - 0.7% | |||||||
MBIA 1 | 222,000 | 2,093,460 | |||||
| THRIFTS & MORTGAGE FINANCE - 3.2% | |||||||
Beneficial Bancorp | 108,000 | 1,620,000 | |||||
Clifton Bancorp | 119,000 | 1,967,070 | |||||
Genworth MI Canada | 72,500 | 1,994,756 | |||||
Kearny Financial | 135,800 | 2,016,630 | |||||
Meridian Bancorp | 96,100 | 1,624,090 | |||||
| 9,222,546 | |||||||
| Total (Cost $33,587,928) | 36,928,957 | ||||||
| HEALTH CARE – 6.5% | |||||||
| BIOTECHNOLOGY - 2.0% | |||||||
| 57,500 | 796,375 | ||||||
Progenics Pharmaceuticals 1 | 224,274 | 1,522,820 | |||||
| 161,200 | 3,231,255 | ||||||
| 5,550,450 | |||||||
| HEALTH CARE EQUIPMENT & SUPPLIES - 1.9% | |||||||
AtriCure 1 | 103,200 | 2,502,600 | |||||
CryoLife 1 | 138,500 | 2,763,075 | |||||
| 5,265,675 | |||||||
| HEALTH CARE TECHNOLOGY - 0.8% | |||||||
Allscripts Healthcare Solutions 1 | 170,300 | 2,173,028 | |||||
| LIFE SCIENCES TOOLS & SERVICES - 0.5% | |||||||
Harvard Bioscience 1 | 595,600 | 1,518,780 | |||||
| PHARMACEUTICALS - 1.3% | |||||||
| 368,900 | 1,383,375 | ||||||
Lipocine 1 | 334,500 | 1,344,690 | |||||
Medicines Company (The) 1 | 27,432 | 1,042,691 | |||||
| 3,770,756 | |||||||
| Total (Cost $13,471,222) | 18,278,689 | ||||||
| INDUSTRIALS – 19.7% | |||||||
| AEROSPACE & DEFENSE - 2.3% | |||||||
CPI Aerostructures 1 | 268,866 | 2,527,340 | |||||
Kratos Defense & Security Solutions 1 | 184,300 | 2,187,641 | |||||
Wesco Aircraft Holdings 1 | 156,600 | 1,699,110 | |||||
| 6,414,091 | |||||||
| COMMERCIAL SERVICES & SUPPLIES - 2.8% | |||||||
Atento 1 | 180,600 | 2,013,690 | |||||
Heritage-Crystal Clean 1 | 96,800 | 1,539,120 | |||||
Hudson Technologies 1 | 271,813 | 2,296,820 | |||||
Steelcase Cl. A | 141,700 | 1,983,800 | |||||
| 7,833,430 | |||||||
| CONSTRUCTION & ENGINEERING - 2.0% | |||||||
Ameresco Cl. A 1 | 299,500 | 2,306,150 | |||||
| 79,800 | 1,448,370 | ||||||
KBR | 135,800 | 2,066,876 | |||||
| 5,821,396 | |||||||
| ELECTRICAL EQUIPMENT - 1.3% | |||||||
LSI Industries | 271,800 | 2,459,790 | |||||
| 141,000 | 1,177,350 | ||||||
| 3,637,140 | |||||||
| INDUSTRIAL CONGLOMERATES - 0.6% | |||||||
Raven Industries | 49,400 | 1,645,020 | |||||
| MACHINERY - 4.4% | |||||||
FreightCar America | 95,000 | 1,652,050 | |||||
Harsco Corporation 1 | 121,300 | 1,952,930 | |||||
Mueller Water Products Cl. A | 172,500 | 2,014,800 | |||||
Porvair | 272,000 | 1,964,407 | |||||
| 63,500 | 1,476,375 | ||||||
Trinity Industries | 53,200 | 1,491,196 | |||||
Wabash National | 94,000 | 2,066,120 | |||||
| 12,617,878 | |||||||
| MARINE - 0.8% | |||||||
Clarkson | 70,531 | 2,320,461 | |||||
| PROFESSIONAL SERVICES - 4.8% | |||||||
Acacia Research 1 | 204,405 | 838,061 | |||||
Heidrick & Struggles International | 90,140 | 1,960,545 | |||||
Kforce | 88,374 | 1,732,130 | |||||
Korn/Ferry International | 63,240 | 2,183,677 | |||||
Navigant Consulting 1 | 86,023 | 1,699,815 | |||||
Resources Connection | 133,600 | 1,830,320 | |||||
RPX Corporation 1 | 137,400 | 1,916,730 | |||||
TrueBlue 1 | 57,472 | 1,523,008 | |||||
| 13,684,286 | |||||||
| ROAD & RAIL - 0.7% | |||||||
Werner Enterprises | 68,000 | 1,995,800 | |||||
| Total (Cost $45,007,227) | 55,969,502 | ||||||
| INFORMATION TECHNOLOGY – 23.0% | |||||||
| COMMUNICATIONS EQUIPMENT - 3.1% | |||||||
| 57,500 | 1,493,850 | ||||||
Harmonic 1 | 275,000 | 1,443,750 | |||||
| 162,200 | 1,730,674 | ||||||
Oclaro 1 | 242,100 | 2,261,214 | |||||
| THE ACCOMPANYING NOTES ARE AN INTEGRAL PART OF THESE FINANCIAL STATEMENTS | The Royce Funds 2017 Semiannual Report to Shareholders | 51 |
| Schedules of Investments |
| Royce Low-Priced Stock Fund (continued) | |||||||
| SHARES | VALUE | ||||||
| INFORMATION TECHNOLOGY (continued) | |||||||
| COMMUNICATIONS EQUIPMENT (continued) | |||||||
| 185,000 | $ | 1,948,050 | |||||
| 8,877,538 | |||||||
| ELECTRONIC EQUIPMENT, INSTRUMENTS & COMPONENTS - 6.2% | |||||||
AVX Corporation | 121,378 | 1,983,316 | |||||
Electro Scientific Industries 1 | 185,000 | 1,524,400 | |||||
| 675,000 | 1,822,500 | ||||||
Neonode 1 | 631,100 | 681,588 | |||||
Novanta 1 | 55,500 | 1,998,000 | |||||
Orbotech 1 | 58,900 | 1,921,318 | |||||
PC Connection | 69,100 | 1,869,846 | |||||
TTM Technologies 1 | 118,958 | 2,065,111 | |||||
Vishay Intertechnology | 119,150 | 1,977,890 | |||||
Vishay Precision Group 1 | 105,000 | 1,816,500 | |||||
| 17,660,469 | |||||||
| INTERNET SOFTWARE & SERVICES - 2.4% | |||||||
Amber Road 1 | 212,000 | 1,816,840 | |||||
Carbonite 1 | 93,400 | 2,036,120 | |||||
iPass 1 | 801,900 | 1,058,508 | |||||
QuinStreet 1 | 460,942 | 1,922,128 | |||||
| 6,833,596 | |||||||
| IT SERVICES - 0.7% | |||||||
Convergys Corporation | 85,000 | 2,021,300 | |||||
| SEMICONDUCTORS & SEMICONDUCTOR EQUIPMENT - 8.7% | |||||||
| 285,000 | 1,068,750 | ||||||
Brooks Automation | 63,482 | 1,376,925 | |||||
Cirrus Logic 1 | 31,600 | 1,981,952 | |||||
Cypress Semiconductor | 103,000 | 1,405,950 | |||||
FormFactor 1 | 156,500 | 1,940,600 | |||||
Inphi Corporation 1 | 40,900 | 1,402,870 | |||||
IXYS Corporation 1 | 123,500 | 2,031,575 | |||||
Lam Research | 13,300 | 1,881,019 | |||||
MKS Instruments | 25,927 | 1,744,887 | |||||
Nanometrics 1 | 83,392 | 2,108,984 | |||||
NeoPhotonics Corporation 1 | 189,600 | 1,463,712 | |||||
PDF Solutions 1 | 76,800 | 1,263,360 | |||||
Photronics 1 | 188,000 | 1,767,200 | |||||
Rudolph Technologies 1 | 81,500 | 1,862,275 | |||||
Teradyne | 48,275 | 1,449,698 | |||||
| 24,749,757 | |||||||
| SOFTWARE - 1.1% | |||||||
Computer Modelling Group | 210,900 | 1,655,585 | |||||
SeaChange International 1 | 481,575 | 1,280,989 | |||||
| 2,936,574 | |||||||
| TECHNOLOGY HARDWARE, STORAGE & PERIPHERALS - 0.8% | |||||||
Super Micro Computer 1 | 92,100 | 2,270,265 | |||||
| Total (Cost $46,167,704) | 65,349,499 | ||||||
| MATERIALS – 4.6% | |||||||
| CHEMICALS - 1.5% | |||||||
| 328,200 | 843,474 | ||||||
Trecora Resources 1 | 167,400 | 1,883,250 | |||||
Victrex | 60,000 | 1,466,037 | |||||
| 4,192,761 | |||||||
| METALS & MINING - 3.1% | |||||||
Alamos Gold Cl. A | 192,800 | 1,367,798 | |||||
Commercial Metals | 77,900 | 1,513,597 | |||||
| 205,763 | 0 | ||||||
Kirkland Lake Gold | 235,004 | 2,223,550 | |||||
Orocobre 1 | 500,000 | 1,333,521 | |||||
Pretium Resources 1 | 134,100 | 1,288,468 | |||||
Schnitzer Steel Industries Cl. A | 39,600 | 997,920 | |||||
| 8,724,854 | |||||||
| Total (Cost $12,170,075) | 12,917,615 | ||||||
| REAL ESTATE – 0.5% | |||||||
| REAL ESTATE MANAGEMENT & DEVELOPMENT - 0.5% | |||||||
Kennedy-Wilson Holdings | 75,460 | 1,437,513 | |||||
| Total (Cost $741,998) | 1,437,513 | ||||||
| TELECOMMUNICATION SERVICES – 0.8% | |||||||
| DIVERSIFIED TELECOMMUNICATION SERVICES - 0.8% | |||||||
ORBCOMM 1 | 186,800 | 2,110,840 | |||||
| Total (Cost $1,173,979) | 2,110,840 | ||||||
| MISCELLANEOUS2 – 4.0% | |||||||
| Total (Cost $10,107,689) | 11,452,298 | ||||||
| TOTAL COMMON STOCKS | |||||||
| (Cost $231,784,081) | 277,903,127 | ||||||
| REPURCHASE AGREEMENT– 2.3% | |||||||
| Fixed Income Clearing Corporation, 0.12% dated 6/30/17, due 7/3/17, maturity value $6,579,066 (collateralized by obligations of various U.S. Government Agencies, 2.375% due 8/15/24, valued at $6,714,441) | |||||||
| (Cost $6,579,000) | 6,579,000 | ||||||
| PRINCIPAL | |||||||
| AMOUNT | |||||||
| COLLATERAL RECEIVED FOR SECURITIES LOANED – 6.3% | |||||||
| U.S. Treasury Bills | |||||||
due 7/6/17-3/1/18 | $ | 901,482 | 901,452 | ||||
| U.S. Treasury Bonds | |||||||
2.25%-7.625% | |||||||
due 2/15/25-2/15/47 | 1,100,280 | 1,114,492 | |||||
| U.S. Treasury Notes | |||||||
0.625%-3.625% | |||||||
due 8/31/17-2/15/27 | 7,058,540 | 7,089,940 | |||||
| U.S. Treasury Notes - Floating Rate | |||||||
due 7/31/17-1/31/19 | 202,226 | 202,226 | |||||
| U.S. Treasury Strips - Interest | |||||||
due 11/15/25-2/15/40 | 22,873 | 22,944 | |||||
| U.S. Treasury TIPS | |||||||
0.125%-2.50% | |||||||
due 4/15/18-2/15/46 | 1,324,840 | 1,326,890 | |||||
| Money Market Funds | |||||||
Federated Government Obligations Fund (7 day yield-0.8114%) | 7,311,563 | ||||||
| TOTAL COLLATERAL RECEIVED FOR SECURITIES LOANED | |||||||
| (Cost $17,969,507) | 17,969,507 | ||||||
| TOTAL INVESTMENTS – 106.6% | |||||||
| (Cost $256,332,588) | 302,451,634 | ||||||
| LIABILITIES LESS CASH AND OTHER ASSETS – (6.6)% | (18,820,768 | ) | |||||
| NET ASSETS – 100.0% | $ | 283,630,866 | |||||
| 52 | The Royce Funds 2017 Semiannual Report to Shareholders | THE ACCOMPANYING NOTES ARE AN INTEGRAL PART OF THESE FINANCIAL STATEMENTS |
| June 30, 2017 (unaudited) |
| Royce Micro-Cap Fund | |||||||
| Common Stocks – 96.6% | |||||||
| SHARES | VALUE | ||||||
| CONSUMER DISCRETIONARY – 15.2% | |||||||
| AUTO COMPONENTS - 2.8% | |||||||
| 47,800 | $ | 1,701,680 | |||||
Standard Motor Products | 29,500 | 1,540,490 | |||||
Stoneridge 1 | 95,100 | 1,465,491 | |||||
Unique Fabricating | 151,900 | 1,446,088 | |||||
| 6,153,749 | |||||||
| DIVERSIFIED CONSUMER SERVICES - 0.5% | |||||||
Capella Education | 14,051 | 1,202,766 | |||||
| HOTELS, RESTAURANTS & LEISURE - 1.1% | |||||||
Del Taco Restaurants 1 | 98,800 | 1,358,500 | |||||
Red Lion Hotels 1 | 150,100 | 1,103,235 | |||||
| 2,461,735 | |||||||
| HOUSEHOLD DURABLES - 2.2% | |||||||
AV Homes 1 | 109,050 | 2,186,453 | |||||
Cavco Industries 1 | 10,210 | 1,323,727 | |||||
ZAGG 1 | 146,800 | 1,269,820 | |||||
| 4,780,000 | |||||||
| LEISURE PRODUCTS - 2.1% | |||||||
| 51,165 | 1,133,816 | ||||||
MCBC Holdings 1 | 87,000 | 1,700,850 | |||||
| 94,400 | 1,807,760 | ||||||
| 4,642,426 | |||||||
| MEDIA - 0.6% | |||||||
New Media Investment Group | 106,500 | 1,435,620 | |||||
| SPECIALTY RETAIL - 4.5% | |||||||
Buckle (The) | 68,675 | 1,222,415 | |||||
Build-A-Bear Workshop 1 | 137,600 | 1,437,920 | |||||
Cato Corporation (The) Cl. A | 58,250 | 1,024,618 | |||||
Citi Trends | 94,424 | 2,003,677 | |||||
Haverty Furniture | 64,100 | 1,608,910 | |||||
Kirkland’s 1 | 73,240 | 752,907 | |||||
Shoe Carnival | 71,811 | 1,499,414 | |||||
Stein Mart | 295,934 | 500,128 | |||||
| 10,049,989 | |||||||
| TEXTILES, APPAREL & LUXURY GOODS - 1.4% | |||||||
Cherokee 1 | 130,600 | 907,670 | |||||
Culp | 34,174 | 1,110,655 | |||||
Vera Bradley 1 | 111,800 | 1,093,404 | |||||
| 3,111,729 | |||||||
| Total (Cost $28,445,465) | 33,838,014 | ||||||
| CONSUMER STAPLES – 1.2% | |||||||
| BEVERAGES - 0.6% | |||||||
| 96,400 | 1,224,280 | ||||||
| FOOD PRODUCTS - 0.6% | |||||||
John B. Sanfilippo & Son | 22,000 | 1,388,420 | |||||
| Total (Cost $2,367,430) | 2,612,700 | ||||||
| ENERGY – 5.7% | |||||||
| ENERGY EQUIPMENT & SERVICES - 4.2% | |||||||
Gulf Island Fabrication | 102,718 | 1,191,529 | |||||
Independence Contract Drilling 1 | 314,686 | 1,224,128 | |||||
Natural Gas Services Group 1 | 61,687 | 1,532,922 | |||||
Newpark Resources 1 | 225,600 | 1,658,160 | |||||
Profire Energy 1 | 852,412 | 1,108,136 | |||||
Tesco Corporation 1 | 254,000 | 1,130,300 | |||||
Total Energy Services | 155,400 | 1,593,785 | |||||
| 9,438,960 | |||||||
| OIL, GAS & CONSUMABLE FUELS - 1.5% | |||||||
Ardmore Shipping | 239,375 | 1,950,906 | |||||
Panhandle Oil and Gas Cl. A | 58,300 | 1,346,730 | |||||
| 3,297,636 | |||||||
| Total (Cost $12,138,399) | 12,736,596 | ||||||
| FINANCIALS – 12.7% | |||||||
| BANKS - 3.7% | |||||||
Blue Hills Bancorp | 85,600 | 1,532,240 | |||||
Brookline Bancorp | 73,900 | 1,078,940 | |||||
Caribbean Investment Holdings 1 | 1,858,170 | 320,673 | |||||
County Bancorp | 50,900 | 1,221,600 | |||||
| 31,700 | 1,307,625 | ||||||
HarborOne Bancorp 1 | 68,600 | 1,369,256 | |||||
| 1,858,170 | 0 | ||||||
TriState Capital Holdings 1 | 53,157 | 1,339,556 | |||||
| 8,169,890 | |||||||
| CAPITAL MARKETS - 4.0% | |||||||
Canaccord Genuity Group | 444,500 | 1,826,947 | |||||
GAIN Capital Holdings | 200,300 | 1,247,869 | |||||
Gluskin Sheff + Associates | 122,400 | 1,580,969 | |||||
Newtek Business Services | 65,449 | 1,066,164 | |||||
Silvercrest Asset Management Group Cl. A | 118,800 | 1,597,860 | |||||
Westwood Holdings Group | 27,572 | 1,563,057 | |||||
| 8,882,866 | |||||||
| DIVERSIFIED FINANCIAL SERVICES - 0.4% | |||||||
| 2,760,860 | 828,258 | ||||||
| INSURANCE - 1.2% | |||||||
Atlas Financial Holdings 1 | 108,695 | 1,619,555 | |||||
Blue Capital Reinsurance Holdings | 60,000 | 1,098,000 | |||||
| 2,717,555 | |||||||
| THRIFTS & MORTGAGE FINANCE - 3.4% | |||||||
Beneficial Bancorp | 66,900 | 1,003,500 | |||||
Clifton Bancorp | 101,200 | 1,672,836 | |||||
Federal Agricultural Mortgage | 20,000 | 1,294,000 | |||||
Meridian Bancorp | 73,600 | 1,243,840 | |||||
| 56,000 | 955,360 | ||||||
Western New England Bancorp | 140,900 | 1,430,135 | |||||
| 7,599,671 | |||||||
| Total (Cost $24,273,981) | 28,198,240 | ||||||
| HEALTH CARE – 8.0% | |||||||
| BIOTECHNOLOGY - 2.1% | |||||||
BioSpecifics Technologies 1 | 21,000 | 1,039,710 | |||||
Progenics Pharmaceuticals 1 | 174,600 | 1,185,534 | |||||
| 122,600 | 2,457,518 | ||||||
| 4,682,762 | |||||||
| HEALTH CARE EQUIPMENT & SUPPLIES - 3.1% | |||||||
AtriCure 1 | 80,700 | 1,956,975 | |||||
CryoLife 1 | 111,855 | 2,231,507 | |||||
Surmodics 1 | 42,522 | 1,196,995 | |||||
| 53,500 | 1,529,030 | ||||||
| 6,914,507 | |||||||
| HEALTH CARE PROVIDERS & SERVICES - 0.5% | |||||||
Landauer | 21,200 | 1,108,760 | |||||
| LIFE SCIENCES TOOLS & SERVICES - 0.6% | |||||||
Harvard Bioscience 1 | 505,079 | 1,287,951 | |||||
| PHARMACEUTICALS - 1.7% | |||||||
Agile Therapeutics 1 | 283,982 | 1,064,933 | |||||
| 213,764 | 1,594,679 | ||||||
Lipocine 1 | 255,300 | 1,026,306 | |||||
| THE ACCOMPANYING NOTES ARE AN INTEGRAL PART OF THESE FINANCIAL STATEMENTS | The Royce Funds 2017 Semiannual Report to Shareholders | 53 |
| Schedules of Investments |
| Royce Micro-Cap Fund (continued) | |||||||
| SHARES | VALUE | ||||||
| HEALTH CARE (continued) | |||||||
| PHARMACEUTICALS (continued) | |||||||
| 196,684 | $ | 37,370 | |||||
| 3,723,288 | |||||||
| Total (Cost $13,502,452) | 17,717,268 | ||||||
| INDUSTRIALS – 21.6% | |||||||
| AEROSPACE & DEFENSE - 1.5% | |||||||
Astronics Corporation 1 | 42,100 | 1,282,787 | |||||
| 5,640 | 170,610 | ||||||
CPI Aerostructures 1 | 208,318 | 1,958,189 | |||||
| 3,411,586 | |||||||
| COMMERCIAL SERVICES & SUPPLIES - 2.6% | |||||||
Acme United | 41,100 | 1,175,460 | |||||
Heritage-Crystal Clean 1 | 72,374 | 1,150,746 | |||||
Hudson Technologies 1 | 215,604 | 1,821,854 | |||||
Viad Corporation | 32,800 | 1,549,800 | |||||
| 5,697,860 | |||||||
| CONSTRUCTION & ENGINEERING - 0.7% | |||||||
Northwest Pipe 1 | 103,200 | 1,678,032 | |||||
| ELECTRICAL EQUIPMENT - 2.4% | |||||||
| 188,600 | 871,332 | ||||||
Encore Wire | 34,200 | 1,460,340 | |||||
LSI Industries | 192,936 | 1,746,071 | |||||
| 189,000 | 1,245,510 | ||||||
| 5,323,253 | |||||||
| INDUSTRIAL CONGLOMERATES - 0.6% | |||||||
Raven Industries | 37,600 | 1,252,080 | |||||
| MACHINERY - 8.6% | |||||||
Alimak Group | 103,400 | 1,718,281 | |||||
CIRCOR International | 26,759 | 1,588,949 | |||||
FreightCar America | 89,009 | 1,547,867 | |||||
Global Brass and Copper Holdings | 44,400 | 1,356,420 | |||||
Graham Corporation | 49,588 | 974,900 | |||||
Greenbrier Companies (The) | 24,800 | 1,147,000 | |||||
Harsco Corporation 1 | 91,100 | 1,466,710 | |||||
Kadant | 21,776 | 1,637,555 | |||||
Kornit Digital 1 | 81,100 | 1,569,285 | |||||
Lindsay Corporation | 19,500 | 1,740,375 | |||||
Lydall 1 | 31,000 | 1,602,700 | |||||
RBC Bearings 1 | 11,169 | 1,136,558 | |||||
Sun Hydraulics | 37,100 | 1,583,057 | |||||
| 19,069,657 | |||||||
| MARINE - 0.8% | |||||||
Clarkson | 52,400 | 1,723,954 | |||||
| PROFESSIONAL SERVICES - 3.7% | |||||||
CRA International | 31,683 | 1,150,727 | |||||
GP Strategies 1 | 57,618 | 1,521,115 | |||||
Heidrick & Struggles International | 72,200 | 1,570,350 | |||||
Kforce | 68,658 | 1,345,697 | |||||
Navigant Consulting 1 | 58,400 | 1,153,984 | |||||
Resources Connection | 101,852 | 1,395,372 | |||||
| 8,137,245 | |||||||
| ROAD & RAIL - 0.7% | |||||||
Marten Transport | 57,033 | 1,562,704 | |||||
| Total (Cost $33,768,708) | 47,856,371 | ||||||
| INFORMATION TECHNOLOGY – 19.5% | |||||||
| COMMUNICATIONS EQUIPMENT - 0.9% | |||||||
EMCORE Corporation | 122,400 | 1,303,560 | |||||
Oclaro 1 | 66,400 | 620,176 | |||||
| 1,923,736 | |||||||
| ELECTRONIC EQUIPMENT, INSTRUMENTS & COMPONENTS - 7.2% | |||||||
| 88,100 | 1,249,258 | ||||||
CUI Global 1 | 242,874 | 932,636 | |||||
ePlus 1 | 21,634 | 1,603,079 | |||||
Fabrinet 1 | 37,749 | 1,610,372 | |||||
Mesa Laboratories | 9,700 | 1,390,107 | |||||
| 775,396 | 837,428 | ||||||
| 606,800 | 618,936 | ||||||
Novanta 1 | 39,942 | 1,437,912 | |||||
Orbotech 1 | 45,300 | 1,477,686 | |||||
PC Connection | 67,700 | 1,831,962 | |||||
Rogers Corporation 1 | 13,900 | 1,509,818 | |||||
Vishay Precision Group 1 | 91,400 | 1,581,220 | |||||
| 16,080,414 | |||||||
| INTERNET SOFTWARE & SERVICES - 0.7% | |||||||
QuinStreet 1 | 375,004 | 1,563,767 | |||||
| IT SERVICES - 1.7% | |||||||
Cass Information Systems | 23,800 | 1,562,232 | |||||
Computer Task Group 1 | 194,810 | 1,088,988 | |||||
Unisys Corporation 1 | 82,500 | 1,056,000 | |||||
| 3,707,220 | |||||||
| SEMICONDUCTORS & SEMICONDUCTOR EQUIPMENT - 6.0% | |||||||
Brooks Automation | 48,500 | 1,051,965 | |||||
| 14,800 | 305,620 | ||||||
| 72,400 | 1,446,552 | ||||||
Nanometrics 1 | 65,400 | 1,653,966 | |||||
NeoPhotonics Corporation 1 | 179,400 | 1,384,968 | |||||
PDF Solutions 1 | 59,000 | 970,550 | |||||
Photronics 1 | 163,700 | 1,538,780 | |||||
Rudolph Technologies 1 | 73,551 | 1,680,640 | |||||
Silicon Motion Technology ADR | 39,200 | 1,890,616 | |||||
Ultra Clean Holdings 1 | 74,900 | 1,404,375 | |||||
| 13,328,032 | |||||||
| SOFTWARE - 2.4% | |||||||
Attunity 1 | 185,565 | 1,334,212 | |||||
Computer Modelling Group | 149,400 | 1,172,804 | |||||
QAD Cl. A | 62,200 | 1,993,510 | |||||
SeaChange International 1 | 309,107 | 822,225 | |||||
| 5,322,751 | |||||||
| TECHNOLOGY HARDWARE, STORAGE & PERIPHERALS - 0.6% | |||||||
Super Micro Computer 1 | 51,246 | 1,263,214 | |||||
| Total (Cost $36,395,784) | 43,189,134 | ||||||
| MATERIALS – 5.5% | |||||||
| CHEMICALS - 2.0% | |||||||
| 235,012 | 603,981 | ||||||
FutureFuel Corporation | 81,000 | 1,222,290 | |||||
Quaker Chemical | 8,660 | 1,257,691 | |||||
Trecora Resources 1 | 127,600 | 1,435,500 | |||||
| 4,519,462 | |||||||
| CONSTRUCTION MATERIALS - 0.8% | |||||||
U.S. Concrete 1 | 21,400 | 1,680,970 | |||||
| METALS & MINING - 2.7% | |||||||
Haynes International | 43,830 | 1,591,467 | |||||
Kirkland Lake Gold | 121,742 | 1,151,893 | |||||
McEwen Mining | 247,704 | 651,462 | |||||
Pretium Resources 1 | 58,700 | 564,005 | |||||
| 54 | The Royce Funds 2017 Semiannual Report to Shareholders | THE ACCOMPANYING NOTES ARE AN INTEGRAL PART OF THESE FINANCIAL STATEMENTS |
| June 30, 2017 (unaudited) |
| Royce Micro-Cap Fund (continued) | |||||||
| SHARES | VALUE | ||||||
| MATERIALS (continued) | |||||||
| METALS & MINING (continued) | |||||||
Richmont Mines 1 | 156,300 | $ | 1,219,140 | ||||
Schnitzer Steel Industries Cl. A | 30,900 | 778,680 | |||||
| 5,956,647 | |||||||
| Total (Cost $10,792,712) | 12,157,079 | ||||||
| REAL ESTATE – 1.8% | |||||||
| EQUITY REAL ESTATE INVESTMENT TRUSTS (REITS) - 0.7% | |||||||
Community Healthcare Trust | 63,600 | 1,627,524 | |||||
| REAL ESTATE MANAGEMENT & DEVELOPMENT - 1.1% | |||||||
FRP Holdings 1 | 20,575 | 949,536 | |||||
Marcus & Millichap 1 | 57,300 | 1,510,428 | |||||
| 2,459,964 | |||||||
| Total (Cost $3,048,574) | 4,087,488 | ||||||
| TELECOMMUNICATION SERVICES – 0.8% | |||||||
| DIVERSIFIED TELECOMMUNICATION SERVICES - 0.8% | |||||||
ORBCOMM 1 | 156,200 | 1,765,060 | |||||
| Total (Cost $1,012,252) | 1,765,060 | ||||||
| MISCELLANEOUS2 – 4.6% | |||||||
| Total (Cost $9,696,441) | 10,194,484 | ||||||
| TOTAL COMMON STOCKS | |||||||
| (Cost $175,442,198) | 214,352,434 | ||||||
| REPURCHASE AGREEMENT– 3.6% | |||||||
| Fixed Income Clearing Corporation, 0.12% dated 6/30/17, due 7/3/17, maturity value $7,888,079 (collateralized by obligations of various U.S. Government Agencies, 2.375% due 8/15/24, valued at $8,049,116) | |||||||
| (Cost $7,888,000) | 7,888,000 | ||||||
| PRINCIPAL | |||||||
| AMOUNT | |||||||
| COLLATERAL RECEIVED FOR SECURITIES LOANED – 4.7% | |||||||
| U.S. Treasury Bills | |||||||
due 7/20/17-3/1/18 | $ | 223,414 | 223,406 | ||||
| U.S. Treasury Bonds | |||||||
2.25%-5.50% | |||||||
due 8/15/28-2/15/47 | 73,422 | 74,220 | |||||
| U.S. Treasury Notes | |||||||
0.625%-3.625% | |||||||
due 9/30/17-2/15/27 | 1,247,306 | 1,253,313 | |||||
| U.S. Treasury Notes - Floating Rate | |||||||
due 7/31/17-1/31/19 | 30,103 | 30,103 | |||||
| U.S. Treasury TIPS | |||||||
0.125%-2.50% | |||||||
due 4/15/18-2/15/46 | 189,475 | 189,672 | |||||
| Money Market Funds | |||||||
Federated Government Obligations Fund (7 day yield-0.8114%) | 8,746,148 | ||||||
| TOTAL COLLATERAL RECEIVED FOR SECURITIES LOANED | |||||||
| (Cost $10,516,862) | 10,516,862 | ||||||
| TOTAL INVESTMENTS – 104.9% | |||||||
| (Cost $193,847,060) | 232,757,296 | ||||||
| LIABILITIES LESS CASH AND OTHER ASSETS – (4.9)% | (10,859,023 | ) | |||||
| NET ASSETS – 100.0% | $ | 221,898,273 | |||||
| Royce Micro-Cap Opportunity Fund | |||||||
| Common Stocks – 96.2% | |||||||
| SHARES | VALUE | ||||||
| CONSUMER DISCRETIONARY – 7.3% | |||||||
| HOTELS, RESTAURANTS & LEISURE - 0.6% | |||||||
Belmond Cl. A 1 | 23,500 | $ | 312,550 | ||||
| HOUSEHOLD DURABLES - 6.1% | |||||||
Beazer Homes USA 1 | 62,000 | 850,640 | |||||
Ethan Allen Interiors | 25,500 | 823,650 | |||||
M.D.C. Holdings | 15,050 | 531,716 | |||||
New Home 1 | 70,663 | 810,505 | |||||
| 3,016,511 | |||||||
| MEDIA - 0.1% | |||||||
Harte-Hanks 1 | 40,072 | 41,274 | |||||
| SPECIALTY RETAIL - 0.5% | |||||||
TravelCenters of America LLC 1 | 65,088 | 266,861 | |||||
| Total (Cost $3,446,348) | 3,637,196 | ||||||
| CONSUMER STAPLES – 2.6% | |||||||
| FOOD PRODUCTS - 2.6% | |||||||
| 19,000 | 574,750 | ||||||
Landec Corporation 1 | 48,828 | 725,096 | |||||
| Total (Cost $1,207,915) | 1,299,846 | ||||||
| ENERGY – 3.1% | |||||||
| ENERGY EQUIPMENT & SERVICES - 2.5% | |||||||
Aspen Aerogels 1 | 42,108 | 187,381 | |||||
Basic Energy Services 1 | 14,500 | 361,050 | |||||
Helix Energy Solutions Group 1 | 40,083 | 226,068 | |||||
Newpark Resources 1 | 65,000 | 477,750 | |||||
| 1,252,249 | |||||||
| OIL, GAS & CONSUMABLE FUELS - 0.6% | |||||||
Pengrowth Energy 1 | 200,000 | 158,080 | |||||
StealthGas 1 | 42,500 | 138,125 | |||||
| 296,205 | |||||||
| Total (Cost $1,575,255) | 1,548,454 | ||||||
| FINANCIALS – 8.2% | |||||||
| BANKS - 3.6% | |||||||
| Old Line Bancshares | 29,022 | 817,840 | |||||
State Bank Financial | 25,000 | 678,000 | |||||
TriState Capital Holdings 1 | 12,041 | 303,433 | |||||
| 1,799,273 | |||||||
| CAPITAL MARKETS - 1.4% | |||||||
†Hamilton Lane Cl. A | 30,028 | 660,316 | |||||
| INSURANCE - 0.7% | |||||||
James River Group Holdings | 9,106 | 361,781 | |||||
| THRIFTS & MORTGAGE FINANCE - 2.5% | |||||||
BofI Holding 1 | 18,500 | 438,820 | |||||
NMI Holdings Cl. A 1 | 69,150 | 791,768 | |||||
| 1,230,588 | |||||||
| Total (Cost $2,862,161) | 4,051,958 | ||||||
| HEALTH CARE – 18.3% | |||||||
| BIOTECHNOLOGY - 0.5% | |||||||
CareDx 1 | 207,431 | 230,248 | |||||
| HEALTH CARE EQUIPMENT & SUPPLIES - 4.5% | |||||||
Accuray 1 | 125,000 | 593,750 | |||||
Exactech 1 | 25,225 | 751,705 | |||||
Invuity 1 | 98,939 | 717,308 | |||||
Trinity Biotech ADR Cl. A 1 | 27,612 | 165,672 | |||||
| 2,228,435 | |||||||
| HEALTH CARE PROVIDERS & SERVICES - 8.6% | |||||||
Alliance HealthCare Services 1 | 26,974 | 358,754 | |||||
Civitas Solutions 1 | 42,388 | 741,790 | |||||
| THE ACCOMPANYING NOTES ARE AN INTEGRAL PART OF THESE FINANCIAL STATEMENTS | The Royce Funds 2017 Semiannual Report to Shareholders | 55 |
| Schedules of Investments |
| Royce Micro-Cap Opportunity Fund (continued) | |||||||
| SHARES | VALUE | ||||||
| HEALTH CARE (continued) | |||||||
| HEALTH CARE PROVIDERS & SERVICES (continued) | |||||||
Community Health Systems 1 | 80,000 | $ | 796,800 | ||||
Cross Country Healthcare 1 | 56,000 | 722,960 | |||||
Kindred Healthcare | 67,500 | 786,375 | |||||
Surgery Partners 1 | 38,200 | 869,050 | |||||
| 4,275,729 | |||||||
| HEALTH CARE TECHNOLOGY - 1.6% | |||||||
Castlight Health Cl. B 1 | 189,209 | 785,217 | |||||
| LIFE SCIENCES TOOLS & SERVICES - 1.6% | |||||||
Albany Molecular Research 1 | 37,500 | 813,750 | |||||
| PHARMACEUTICALS - 1.5% | |||||||
Sucampo Pharmaceuticals Cl. A 1 | 70,069 | 735,725 | |||||
| Total (Cost $8,437,658) | 9,069,104 | ||||||
| INDUSTRIALS – 24.2% | |||||||
| AEROSPACE & DEFENSE - 5.1% | |||||||
Aerojet Rocketdyne Holdings 1 | 11,546 | 240,157 | |||||
Ducommun 1 | 27,013 | 853,070 | |||||
KEYW Holding Corporation 1 | 80,345 | 751,226 | |||||
Kratos Defense & Security Solutions 1 | 60,011 | 712,331 | |||||
| 2,556,784 | |||||||
| AIR FREIGHT & LOGISTICS - 1.3% | |||||||
Atlas Air Worldwide Holdings 1 | 12,000 | 625,800 | |||||
| BUILDING PRODUCTS - 1.0% | |||||||
Builders FirstSource 1 | 11,000 | 168,520 | |||||
PGT Innovations 1 | 26,000 | 332,800 | |||||
| 501,320 | |||||||
| CONSTRUCTION & ENGINEERING - 3.8% | |||||||
Ameresco Cl. A 1 | 60,349 | 464,688 | |||||
Great Lakes Dredge & Dock 1 | 91,674 | 394,198 | |||||
Layne Christensen 1 | 57,500 | 505,425 | |||||
Northwest Pipe 1 | 31,000 | 504,060 | |||||
| 1,868,371 | |||||||
| ELECTRICAL EQUIPMENT - 3.2% | |||||||
Encore Wire | 11,500 | 491,050 | |||||
General Cable | 44,000 | 719,400 | |||||
| 45,034 | 376,034 | ||||||
| 1,586,484 | |||||||
| MACHINERY - 7.1% | |||||||
Commercial Vehicle Group 1 | 91,824 | 775,913 | |||||
FreightCar America | 53,000 | 921,670 | |||||
Gencor Industries 1 | 56,031 | 907,702 | |||||
Hyster-Yale Materials Handling Cl. A | 3,800 | 266,950 | |||||
Spartan Motors | 72,331 | 640,129 | |||||
| 3,512,364 | |||||||
| MARINE - 0.5% | |||||||
Diana Shipping 1 | 57,500 | 233,450 | |||||
| PROFESSIONAL SERVICES - 1.6% | |||||||
| 30,006 | 792,158 | ||||||
| ROAD & RAIL - 0.6% | |||||||
Celadon Group | 100,000 | 315,000 | |||||
| Total (Cost $9,787,562) | 11,991,731 | ||||||
| INFORMATION TECHNOLOGY – 18.4% | |||||||
| COMMUNICATIONS EQUIPMENT - 3.0% | |||||||
Aviat Networks 1 | 5,025 | 87,435 | |||||
Comtech Telecommunications | 39,015 | 740,114 | |||||
EMCORE Corporation | 52,000 | 553,800 | |||||
Oclaro 1 | 12,000 | 112,080 | |||||
| 1,493,429 | |||||||
| ELECTRONIC EQUIPMENT, INSTRUMENTS & COMPONENTS - 1.9% | |||||||
KEMET Corporation 1 | 52,882 | 676,890 | |||||
TTM Technologies 1 | 15,000 | 260,400 | |||||
| 937,290 | |||||||
| INTERNET SOFTWARE & SERVICES - 2.1% | |||||||
Amber Road 1 | 86,046 | 737,414 | |||||
Limelight Networks 1 | 60,066 | 173,591 | |||||
Tremor Video 1 | 52,035 | 129,567 | |||||
| 1,040,572 | |||||||
| SEMICONDUCTORS & SEMICONDUCTOR EQUIPMENT - 8.0% | |||||||
Alpha & Omega Semiconductor 1 | 50,594 | 843,402 | |||||
AXT 1 | 73,323 | 465,601 | |||||
FormFactor 1 | 50,540 | 626,696 | |||||
Ichor Holdings 1 | 36,575 | 737,352 | |||||
Kopin Corporation 1 | 95,055 | 352,654 | |||||
Nanometrics 1 | 15,038 | 380,311 | |||||
Rubicon Technology 1 | 12,980 | 120,195 | |||||
Rudolph Technologies 1 | 19,503 | 445,643 | |||||
| 3,971,854 | |||||||
| SOFTWARE - 3.0% | |||||||
A10 Networks 1 | 29,197 | 246,423 | |||||
Bottomline Technologies 1 | 22,064 | 566,824 | |||||
Datawatch Corporation 1 | 71,503 | 664,978 | |||||
| 1,478,225 | |||||||
| TECHNOLOGY HARDWARE, STORAGE & PERIPHERALS - 0.4% | |||||||
Intevac 1 | 17,520 | 194,472 | |||||
| Total (Cost $6,062,614) | 9,115,842 | ||||||
| MATERIALS – 9.2% | |||||||
| CHEMICALS - 4.5% | |||||||
Calgon Carbon | 33,000 | 498,300 | |||||
Intrepid Potash 1 | 110,000 | 248,600 | |||||
Kraton Corporation 1 | 20,000 | 688,800 | |||||
Schulman (A.) | 24,500 | 784,000 | |||||
| 2,219,700 | |||||||
| CONSTRUCTION MATERIALS - 0.7% | |||||||
U.S. Concrete 1 | 4,500 | 353,475 | |||||
| METALS & MINING - 2.9% | |||||||
Haynes International | 18,452 | 669,992 | |||||
Universal Stainless & Alloy Products 1 | 39,780 | 775,710 | |||||
| 1,445,702 | |||||||
| PAPER & FOREST PRODUCTS - 1.1% | |||||||
Boise Cascade 1 | 18,000 | 547,200 | |||||
| Total (Cost $3,762,044) | 4,566,077 | ||||||
| REAL ESTATE – 0.5% | |||||||
| EQUITY REAL ESTATE INVESTMENT TRUSTS (REITS) - 0.5% | |||||||
RAIT Financial Trust | 110,102 | 241,123 | |||||
| Total (Cost $349,963) | 241,123 | ||||||
| TELECOMMUNICATION SERVICES – 0.7% | |||||||
| DIVERSIFIED TELECOMMUNICATION SERVICES - 0.7% | |||||||
| 43,200 | 345,600 | ||||||
| Total (Cost $416,859) | 345,600 | ||||||
| MISCELLANEOUS2 – 3.7% | |||||||
| Total (Cost $1,877,662) | 1,811,148 | ||||||
| TOTAL COMMON STOCKS | |||||||
| (Cost $39,786,041) | 47,678,079 | ||||||
| 56 | The Royce Funds 2017 Semiannual Report to Shareholders | THE ACCOMPANYING NOTES ARE AN INTEGRAL PART OF THESE FINANCIAL STATEMENTS |
| June 30, 2017 (unaudited) |
| Royce Micro-Cap Opportunity Fund (continued) | |||||||
| VALUE | |||||||
| REPURCHASE AGREEMENT– 5.4% | |||||||
| Fixed Income Clearing Corporation, 0.12% dated 6/30/17, due 7/3/17, maturity value $2,662,027 (collateralized by obligations of various U.S. Government Agencies, 2.375% due 8/15/24, valued at $2,715,550) | |||||||
| (Cost $2,662,000) | $ | 2,662,000 | |||||
| TOTAL INVESTMENTS – 101.6% | |||||||
| (Cost $42,448,041) | 50,340,079 | ||||||
| LIABILITIES LESS CASH AND OTHER ASSETS – (1.6)% | (810,963 | ) | |||||
| NET ASSETS – 100.0% | $ | 49,529,116 | |||||
| Royce Opportunity Fund | |||||||
| Common Stocks – 92.6% | |||||||
| SHARES | VALUE | ||||||
| CONSUMER DISCRETIONARY – 15.5% | |||||||
| AUTO COMPONENTS - 4.3% | |||||||
| 511,345 | $ | 7,976,982 | |||||
Cooper Tire & Rubber | 199,400 | 7,198,340 | |||||
Dana | 728,336 | 16,263,743 | |||||
| 538,700 | 8,915,485 | ||||||
Tower International | 657,161 | 14,753,264 | |||||
| 1,227,178 | 10,062,860 | ||||||
| 65,170,674 | |||||||
| AUTOMOBILES - 0.6% | |||||||
Winnebago Industries | 251,022 | 8,785,770 | |||||
| DIVERSIFIED CONSUMER SERVICES - 0.9% | |||||||
| 736,600 | 9,060,180 | ||||||
K12 1 | 229,100 | 4,105,472 | |||||
| 13,165,652 | |||||||
| HOTELS, RESTAURANTS & LEISURE - 1.1% | |||||||
Belmond Cl. A 1 | 624,419 | 8,304,773 | |||||
Carrols Restaurant Group 1 | 269,105 | 3,296,536 | |||||
| 357,125 | 2,782,004 | ||||||
Ruby Tuesday 1 | 791,492 | 1,590,899 | |||||
| 15,974,212 | |||||||
| HOUSEHOLD DURABLES - 2.8% | |||||||
Beazer Homes USA 1 | 751,879 | 10,315,780 | |||||
| 847,735 | 3,814,807 | ||||||
Ethan Allen Interiors | 140,892 | 4,550,812 | |||||
M.D.C. Holdings | 137,132 | 4,844,873 | |||||
M/I Homes 1 | 296,100 | 8,453,655 | |||||
TRI Pointe Group 1 | 238,572 | 3,146,765 | |||||
William Lyon Homes Cl. A 1 | 281,341 | 6,791,572 | |||||
ZAGG 1 | 84,354 | 729,662 | |||||
| 42,647,926 | |||||||
| INTERNET & DIRECT MARKETING RETAIL - 0.0% | |||||||
EVINE Live 1 | 547,143 | 547,143 | |||||
| LEISURE PRODUCTS - 0.2% | |||||||
Black Diamond 1 | 480,582 | 3,195,870 | |||||
| MEDIA - 0.6% | |||||||
Ballantyne Strong 1 | 144,720 | 969,624 | |||||
Entravision Communications Cl. A | 202,200 | 1,334,520 | |||||
| 326,205 | 3,046,755 | ||||||
New York Times Cl. A | 221,599 | 3,922,302 | |||||
| 9,273,201 | |||||||
| MULTILINE RETAIL - 0.3% | |||||||
| 934,741 | 4,346,546 | ||||||
| SPECIALTY RETAIL - 3.5% | |||||||
American Eagle Outfitters | 376,400 | 4,535,620 | |||||
Ascena Retail Group 1 | 503,018 | 1,081,489 | |||||
Barnes & Noble | 630,624 | 4,792,742 | |||||
| 158,905 | 943,896 | ||||||
Caleres | 79,700 | 2,214,066 | |||||
Chico’s FAS | 164,300 | 1,547,706 | |||||
| 217,936 | 4,162,578 | ||||||
DSW Cl. A | 340,200 | 6,021,540 | |||||
Guess? | 346,000 | 4,421,880 | |||||
| 261,264 | 6,547,276 | ||||||
New York & Company 1 | 202,917 | 280,025 | |||||
Rent-A-Center | 308,618 | 3,617,003 | |||||
| 262,700 | 5,319,675 | ||||||
| 19,897 | 53,722 | ||||||
Stage Stores | 720,646 | 1,498,944 | |||||
TravelCenters of America LLC 1 | 478,514 | 1,961,907 | |||||
| THE ACCOMPANYING NOTES ARE AN INTEGRAL PART OF THESE FINANCIAL STATEMENTS | The Royce Funds 2017 Semiannual Report to Shareholders | 57 |
| Schedules of Investments |
| Royce Opportunity Fund (continued) | |||||||
| SHARES | VALUE | ||||||
| CONSUMER DISCRETIONARY (continued) | |||||||
| SPECIALTY RETAIL (continued) | |||||||
West Marine | 294,217 | $ | 3,780,688 | ||||
| 52,780,757 | |||||||
| TEXTILES, APPAREL & LUXURY GOODS - 1.2% | |||||||
| 331,564 | 9,781,138 | ||||||
Unifi 1 | 236,467 | 7,283,183 | |||||
Vince Holding 1 | 524,797 | 247,022 | |||||
| 17,311,343 | |||||||
| Total (Cost $221,131,387) | 233,199,094 | ||||||
| CONSUMER STAPLES – 1.7% | |||||||
| FOOD & STAPLES RETAILING - 0.7% | |||||||
Natural Grocers by Vitamin Cottage 1 | 574,894 | 4,754,374 | |||||
SUPERVALU 1 | 833,100 | 2,740,899 | |||||
| 101,600 | 3,728,720 | ||||||
| 11,223,993 | |||||||
| FOOD PRODUCTS - 1.0% | |||||||
| 500,451 | 2,156,944 | ||||||
Landec Corporation 1 | 503,583 | 7,478,207 | |||||
SunOpta 1 | 466,490 | 4,758,198 | |||||
| 14,393,349 | |||||||
| Total (Cost $26,607,058) | 25,617,342 | ||||||
| ENERGY – 4.0% | |||||||
| ENERGY EQUIPMENT & SERVICES - 2.2% | |||||||
Aspen Aerogels 1 | 316,891 | 1,410,165 | |||||
| 295,710 | 7,363,179 | ||||||
| 690,200 | 2,684,878 | ||||||
Matrix Service 1 | 565,704 | 5,289,332 | |||||
Newpark Resources 1 | 1,233,531 | 9,066,453 | |||||
Patterson-UTI Energy | 227,200 | 4,587,168 | |||||
Willbros Group 1 | 1,028,909 | 2,541,405 | |||||
| 32,942,580 | |||||||
| OIL, GAS & CONSUMABLE FUELS - 1.8% | |||||||
Ardmore Shipping | 415,700 | 3,387,955 | |||||
| 493,200 | 1,514,124 | ||||||
| 497,297 | 4,067,890 | ||||||
| 513,300 | 2,920,677 | ||||||
Matador Resources 1 | 211,700 | 4,524,029 | |||||
Pengrowth Energy 1 | 1,906,900 | 1,507,214 | |||||
Scorpio Tankers | 782,726 | 3,107,422 | |||||
StealthGas 1 | 1,003,621 | 3,261,768 | |||||
Stone Energy 1 | 133,000 | 2,444,540 | |||||
| 26,735,619 | |||||||
| Total (Cost $87,001,425) | 59,678,199 | ||||||
| FINANCIALS – 5.6% | |||||||
| BANKS - 2.4% | |||||||
Boston Private Financial Holdings | 404,446 | 6,208,246 | |||||
CenterState Banks | 207,641 | 5,161,955 | |||||
Guaranty Bancorp | 175,760 | 4,780,672 | |||||
Southern National Bancorp of Virginia | 167,115 | 2,941,224 | |||||
State Bank Financial | 400,059 | 10,849,600 | |||||
Umpqua Holdings | 310,000 | 5,691,600 | |||||
| 35,633,297 | |||||||
| CONSUMER FINANCE - 0.7% | |||||||
Enova International 1 | 703,695 | 10,449,871 | |||||
| INSURANCE - 1.2% | |||||||
Ambac Financial Group 1 | 50,446 | 875,238 | |||||
Aspen Insurance Holdings | 83,900 | 4,182,415 | |||||
Heritage Insurance Holdings | 338,700 | 4,409,874 | |||||
MBIA 1 | 956,476 | 9,019,569 | |||||
| 18,487,096 | |||||||
| INVESTMENT COMPANIES - 0.1% | |||||||
BlackRock Resources & Commodities Strategy | |||||||
Trust | 262,600 | 2,103,426 | |||||
| THRIFTS & MORTGAGE FINANCE - 1.2% | |||||||
| 112,300 | 2,663,756 | ||||||
MGIC Investment 1 | 332,585 | 3,724,952 | |||||
| 290,400 | 3,998,808 | ||||||
Radian Group | 183,400 | 2,998,590 | |||||
Walker & Dunlop 1 | 92,137 | 4,499,049 | |||||
| 17,885,155 | |||||||
| Total (Cost $59,037,839) | 84,558,845 | ||||||
| HEALTH CARE – 5.6% | |||||||
| HEALTH CARE EQUIPMENT & SUPPLIES - 2.0% | |||||||
Accuray 1 | 651,300 | 3,093,675 | |||||
Analogic Corporation | 108,138 | 7,856,226 | |||||
AngioDynamics 1 | 490,041 | 7,943,564 | |||||
Invacare Corporation | 713,307 | 9,415,652 | |||||
RTI Surgical 1 | 386,455 | 2,260,762 | |||||
| 30,569,879 | |||||||
| HEALTH CARE PROVIDERS & SERVICES - 2.3% | |||||||
Brookdale Senior Living 1 | 518,460 | 7,626,547 | |||||
Community Health Systems 1 | 674,300 | 6,716,028 | |||||
| 264,261 | 3,411,610 | ||||||
Kindred Healthcare 4 | 449,050 | 5,231,432 | |||||
PharMerica Corporation 1 | 212,700 | 5,583,375 | |||||
| 76,399 | 1,738,077 | ||||||
Tivity Health 1 | 90,234 | 3,595,825 | |||||
| 33,902,894 | |||||||
| HEALTH CARE TECHNOLOGY - 0.8% | |||||||
Allscripts Healthcare Solutions 1 | 886,936 | 11,317,303 | |||||
| LIFE SCIENCES TOOLS & SERVICES - 0.2% | |||||||
| 124,244 | 2,696,095 | ||||||
| PHARMACEUTICALS - 0.3% | |||||||
| 464,397 | 4,876,169 | ||||||
| Total (Cost $71,966,178) | 83,362,340 | ||||||
| INDUSTRIALS – 24.7% | |||||||
| AEROSPACE & DEFENSE - 3.6% | |||||||
| 433,140 | 9,009,312 | ||||||
Engility Holdings 1 | 173,347 | 4,923,055 | |||||
KEYW Holding Corporation 1 | 546,235 | 5,107,297 | |||||
Kratos Defense & Security Solutions 1 | 1,486,524 | 17,645,040 | |||||
Mercury Systems 1 | 177,895 | 7,487,600 | |||||
Wesco Aircraft Holdings 1 | 923,929 | 10,024,630 | |||||
| 54,196,934 | |||||||
| AIR FREIGHT & LOGISTICS - 0.6% | |||||||
| 180,000 | 9,387,000 | ||||||
| BUILDING PRODUCTS - 3.6% | |||||||
| 306,794 | 4,700,084 | ||||||
Griffon Corporation | 351,800 | 7,722,010 | |||||
Insteel Industries | 199,568 | 6,579,757 | |||||
NCI Building Systems 1 | 774,200 | 12,929,140 | |||||
PGT Innovations 1 | 674,783 | 8,637,223 | |||||
Ply Gem Holdings 1 | 208,792 | 3,747,816 | |||||
| 58 | The Royce Funds 2017 Semiannual Report to Shareholders | THE ACCOMPANYING NOTES ARE AN INTEGRAL PART OF THESE FINANCIAL STATEMENTS |
| June 30, 2017 (unaudited) |
| Royce Opportunity Fund (continued) | |||||||
| SHARES | VALUE | ||||||
| INDUSTRIALS (continued) | |||||||
| BUILDING PRODUCTS (continued) | |||||||
Quanex Building Products | 421,686 | $ | 8,918,659 | ||||
| 53,234,689 | |||||||
| COMMERCIAL SERVICES & SUPPLIES - 2.7% | |||||||
ABM Industries | 90,000 | 3,736,800 | |||||
Herman Miller | 279,479 | 8,496,162 | |||||
Interface | 642,564 | 12,626,383 | |||||
Kimball International Cl. B | 102,150 | 1,704,883 | |||||
Steelcase Cl. A | 397,942 | 5,571,188 | |||||
Team 1 | 328,216 | 7,696,665 | |||||
| 39,832,081 | |||||||
| CONSTRUCTION & ENGINEERING - 1.9% | |||||||
Aegion Corporation 1 | 461,736 | 10,102,784 | |||||
| 476,400 | 2,048,520 | ||||||
Layne Christensen 1 | 981,712 | 8,629,248 | |||||
| 489,326 | 7,956,441 | ||||||
| 28,736,993 | |||||||
| ELECTRICAL EQUIPMENT - 1.9% | |||||||
Encore Wire | 228,806 | 9,770,016 | |||||
General Cable | 879,574 | 14,381,035 | |||||
| 203,905 | 1,702,607 | ||||||
| 489,323 | 3,224,638 | ||||||
| 29,078,296 | |||||||
| MACHINERY - 7.8% | |||||||
Astec Industries | 118,461 | 6,575,770 | |||||
Commercial Vehicle Group 1 | 907,168 | 7,665,570 | |||||
DMC Global | 337,662 | 4,423,372 | |||||
Federal Signal | 372,832 | 6,472,364 | |||||
FreightCar America | 464,220 | 8,072,786 | |||||
Hardinge | 600,997 | 7,464,383 | |||||
Hurco Companies | 202,073 | 7,022,037 | |||||
Hyster-Yale Materials Handling Cl. A | 150,174 | 10,549,723 | |||||
Meritor 1 | 683,232 | 11,348,484 | |||||
Mueller Industries | 378,321 | 11,519,874 | |||||
Mueller Water Products Cl. A | 955,276 | 11,157,624 | |||||
NN | 362,107 | 9,939,837 | |||||
Spartan Motors | 680,105 | 6,018,929 | |||||
Westport Fuel Systems 1 | 3,395,490 | 7,979,401 | |||||
| 116,210,154 | |||||||
| MARINE - 0.4% | |||||||
Diana Shipping 1 | 531,380 | 2,157,403 | |||||
Navios Maritime Holdings 1 | 1,052,049 | 1,441,307 | |||||
Scorpio Bulkers 1 | 375,990 | 2,669,529 | |||||
| 6,268,239 | |||||||
| PROFESSIONAL SERVICES - 0.3% | |||||||
Korn/Ferry International | 136,100 | 4,699,533 | |||||
| ROAD & RAIL - 0.4% | |||||||
| 532,000 | 6,118,000 | ||||||
| TRADING COMPANIES & DISTRIBUTORS - 1.5% | |||||||
| 201,566 | 7,925,575 | ||||||
| 446,200 | 6,469,900 | ||||||
Univar 1 | 269,139 | 7,858,859 | |||||
| 22,254,334 | |||||||
| Total (Cost $289,694,807) | 370,016,253 | ||||||
| INFORMATION TECHNOLOGY – 23.0% | |||||||
| COMMUNICATIONS EQUIPMENT - 3.6% | |||||||
ARRIS International 1 | 309,960 | 8,685,079 | |||||
Aviat Networks 1 | 254,029 | 4,420,105 | |||||
Ciena Corporation 1 | 424,817 | 10,628,921 | |||||
Comtech Telecommunications | 806,752 | 15,304,085 | |||||
EMCORE Corporation | 459,468 | 4,893,334 | |||||
Extreme Networks 1 | 456,056 | 4,204,836 | |||||
Harmonic 1 | 517,319 | 2,715,925 | |||||
Oclaro 1 | 210,675 | 1,967,705 | |||||
Westell Technologies Cl. A 1 | 177,698 | 556,195 | |||||
| 53,376,185 | |||||||
| ELECTRONIC EQUIPMENT, INSTRUMENTS & COMPONENTS - 6.7% | |||||||
Benchmark Electronics 1 | 161,500 | 5,216,450 | |||||
Daktronics | 289,225 | 2,785,237 | |||||
| 230,152 | 1,203,695 | ||||||
Electro Scientific Industries 1 | 254,438 | 2,096,569 | |||||
Frequency Electronics 1 | 226,979 | 2,165,380 | |||||
Identiv 1 | 619,897 | 3,254,459 | |||||
II-VI 1 | 256,678 | 8,804,055 | |||||
KEMET Corporation 1 | 956,434 | 12,242,355 | |||||
Knowles Corporation 1 | 441,877 | 7,476,559 | |||||
Maxwell Technologies 1 | 855,142 | 5,122,301 | |||||
Novanta 1 | 127,434 | 4,587,624 | |||||
Park Electrochemical | 203,034 | 3,739,886 | |||||
PCM 1 | 164,033 | 3,075,619 | |||||
Perceptron 1 | 413,026 | 3,006,829 | |||||
RadiSys Corporation 1 | 488,978 | 1,838,557 | |||||
Sanmina Corporation 1 | 254,123 | 9,682,086 | |||||
| 337,947 | 2,223,691 | ||||||
Systemax | 55,000 | 1,034,000 | |||||
TTM Technologies 1 | 396,725 | 6,887,146 | |||||
Vishay Intertechnology | 685,923 | 11,386,322 | |||||
Vishay Precision Group 1 | 190,342 | 3,292,917 | |||||
| 101,121,737 | |||||||
| INTERNET SOFTWARE & SERVICES - 1.6% | |||||||
Amber Road 1 | 216,771 | 1,857,728 | |||||
| 239,300 | 1,184,535 | ||||||
Blucora 1 | 304,240 | 6,449,888 | |||||
Care.com 1 | 64,057 | 967,261 | |||||
Leaf Group 1 | 496,757 | 3,874,705 | |||||
Limelight Networks 1 | 657,669 | 1,900,663 | |||||
Marin Software 1 | 841,343 | 1,093,746 | |||||
QuinStreet 1 | 798,831 | 3,331,125 | |||||
Tremor Video 1 | 954,282 | 2,376,162 | |||||
YuMe | 165,980 | 780,106 | |||||
| 23,815,919 | |||||||
| IT SERVICES - 1.2% | |||||||
Computer Task Group 1 | 703,363 | 3,931,799 | |||||
Perficient 1 | 117,100 | 2,182,744 | |||||
Unisys Corporation 1 | 749,424 | 9,592,627 | |||||
| 97,300 | 2,860,620 | ||||||
| 18,567,790 | |||||||
| SEMICONDUCTORS & SEMICONDUCTOR EQUIPMENT - 9.0% | |||||||
Advanced Energy Industries 1 | 30,271 | 1,958,231 | |||||
Alpha & Omega Semiconductor 1 | 408,184 | 6,804,427 | |||||
Amtech Systems 1 | 608,540 | 5,136,078 | |||||
AXT 1 | 448,892 | 2,850,464 | |||||
Brooks Automation | 337,955 | 7,330,244 | |||||
Cohu | 315,806 | 4,970,786 | |||||
| 426,414 | 10,511,105 | ||||||
Cypress Semiconductor | 692,700 | 9,455,355 | |||||
FormFactor 1 | 432,638 | 5,364,711 | |||||
IXYS Corporation 1 | 856,615 | 14,091,317 | |||||
| THE ACCOMPANYING NOTES ARE AN INTEGRAL PART OF THESE FINANCIAL STATEMENTS | The Royce Funds 2017 Semiannual Report to Shareholders | 59 |
| Schedules of Investments |
| Royce Opportunity Fund (continued) | |||||||
| SHARES | VALUE | ||||||
| INFORMATION TECHNOLOGY (continued) | |||||||
| SEMICONDUCTORS & SEMICONDUCTOR EQUIPMENT (continued) | |||||||
Kopin Corporation 1 | 1,055,122 | $ | 3,914,503 | ||||
Kulicke & Soffa Industries 1 | 611,388 | 11,628,600 | |||||
MaxLinear Cl. A 1 | 266,222 | 7,424,931 | |||||
Microsemi Corporation 1 | 265,754 | 12,437,287 | |||||
Nanometrics 1 | 166,602 | 4,213,365 | |||||
NeoPhotonics Corporation 1 | 646,296 | 4,989,405 | |||||
| 56,945 | 527,311 | ||||||
Rudolph Technologies 1 | 192,699 | 4,403,172 | |||||
Sigma Designs 1 | 367,707 | 2,151,086 | |||||
Ultra Clean Holdings 1 | 339,338 | 6,362,587 | |||||
Veeco Instruments 1 | 146,100 | 4,068,885 | |||||
Xcerra Corporation 1 | 419,554 | 4,099,043 | |||||
| 134,692,893 | |||||||
| SOFTWARE - 0.1% | |||||||
A10 Networks 1 | 260,699 | 2,200,300 | |||||
| TECHNOLOGY HARDWARE, STORAGE & PERIPHERALS - 0.8% | |||||||
Avid Technology 1 | 275,098 | 1,447,016 | |||||
| 264,392 | 4,864,813 | ||||||
Intevac 1 | 481,123 | 5,340,465 | |||||
| 11,652,294 | |||||||
| Total (Cost $263,940,164) | 345,427,118 | ||||||
| MATERIALS – 9.0% | |||||||
| CHEMICALS - 3.1% | |||||||
Calgon Carbon | 506,360 | 7,646,036 | |||||
Ferro Corporation 1 | 748,611 | 13,692,095 | |||||
Huntsman Corporation | 299,660 | 7,743,215 | |||||
Kraton Corporation 1 | 140,418 | 4,835,996 | |||||
Olin Corporation | 124,800 | 3,778,944 | |||||
Schulman (A.) | 279,219 | 8,935,008 | |||||
| 46,631,294 | |||||||
| METALS & MINING - 5.5% | |||||||
| 927,700 | 6,094,989 | ||||||
| 698,722 | 11,885,261 | ||||||
Carpenter Technology | 301,241 | 11,275,451 | |||||
Century Aluminum 1 | 675,503 | 10,524,337 | |||||
Commercial Metals | 725,561 | 14,097,650 | |||||
Constellium Cl. A 1 | 316,400 | 2,183,160 | |||||
Haynes International | 276,250 | 10,030,637 | |||||
| 593,726 | 13,062 | ||||||
Synalloy Corporation 1 | 379,552 | 4,307,915 | |||||
| 582,813 | 8,957,836 | ||||||
Universal Stainless & Alloy Products 1 | 125,402 | 2,445,339 | |||||
| 81,815,637 | |||||||
| PAPER & FOREST PRODUCTS - 0.4% | |||||||
Louisiana-Pacific Corporation 1 | 273,300 | 6,589,263 | |||||
| Total (Cost $98,243,539) | 135,036,194 | ||||||
| REAL ESTATE – 0.4% | |||||||
| EQUITY REAL ESTATE INVESTMENT TRUSTS (REITS) - 0.1% | |||||||
BRT Apartments 1 | 144,787 | 1,138,026 | |||||
RAIT Financial Trust | 163,766 | 358,647 | |||||
| 1,496,673 | |||||||
| REAL ESTATE MANAGEMENT & DEVELOPMENT - 0.3% | |||||||
Tejon Ranch 1 | 208,610 | 4,305,711 | |||||
| Total (Cost $6,552,479) | 5,802,384 | ||||||
| TELECOMMUNICATION SERVICES – 0.4% | |||||||
| DIVERSIFIED TELECOMMUNICATION SERVICES - 0.4% | |||||||
| 591,213 | 6,532,903 | ||||||
| Total (Cost $3,907,687) | 6,532,903 | ||||||
| UTILITIES – 0.2% | |||||||
| WATER UTILITIES - 0.2% | |||||||
Pure Cycle 1 | 418,790 | 3,245,622 | |||||
| Total (Cost $1,750,542) | 3,245,622 | ||||||
| MISCELLANEOUS 2 – 2.5% | |||||||
| Total (Cost $36,690,947) | 37,094,550 | ||||||
| TOTAL COMMON STOCKS | |||||||
| (Cost $1,166,524,052) | 1,389,570,844 | ||||||
| REPURCHASE AGREEMENT– 7.3% | |||||||
| Fixed Income Clearing Corporation, 0.12% dated 6/30/17, due 7/3/17, maturity value $109,896,099 (collateralized by obligations of various U.S. Government Agencies, 2.375% due 8/15/24, valued at $112,097,292) | |||||||
| (Cost $109,895,000) | 109,895,000 | ||||||
| PRINCIPAL | |||||||
| AMOUNT | |||||||
| COLLATERAL RECEIVED FOR SECURITIES LOANED – 6.2% | |||||||
| U.S. Treasury Bills | |||||||
due 7/6/17-3/1/18 | $ | 4,900,525 | 4,900,353 | ||||
| U.S. Treasury Bonds | |||||||
2.25%-7.625% | |||||||
due 2/15/25-2/15/47 | 4,509,937 | 4,562,767 | |||||
| U.S. Treasury Notes | |||||||
0.625%-3.625% | |||||||
due 8/31/17-2/15/27 | 34,837,587 | 35,006,244 | |||||
| U.S. Treasury Notes - Floating Rate | |||||||
due 7/31/17-1/31/19 | 947,374 | 947,366 | |||||
| U.S. Treasury Strips - Interest | |||||||
due 11/15/25-2/15/40 | 82,160 | 82,417 | |||||
| U.S. Treasury TIPS | |||||||
0.125%-2.50% | |||||||
due 4/15/18-2/15/46 | 8,284,650 | 8,297,623 | |||||
| Money Market Funds | |||||||
Federated Government Obligations Fund (7 day yield-0.8114%) | 39,196,090 | ||||||
| TOTAL COLLATERAL RECEIVED FOR SECURITIES LOANED | |||||||
| (Cost $92,992,860) | 92,992,860 | ||||||
| TOTAL INVESTMENTS – 106.1% | |||||||
| (Cost $1,369,411,912) | 1,592,458,704 | ||||||
| LIABILITIES LESS CASH AND OTHER ASSETS – (6.1)% | (91,955,394 | ) | |||||
| NET ASSETS – 100.0% | $ | 1,500,503,310 | |||||
| 60 | The Royce Funds 2017 Semiannual Report to Shareholders | THE ACCOMPANYING NOTES ARE AN INTEGRAL PART OF THESE FINANCIAL STATEMENTS |
| June 30, 2017 (unaudited) |
| Royce Pennsylvania Mutual Fund | |||||||
| Common Stocks – 99.4% | |||||||
| SHARES | VALUE | ||||||
| CONSUMER DISCRETIONARY – 11.3% | |||||||
| AUTO COMPONENTS - 3.2% | |||||||
Cooper Tire & Rubber | 152,400 | $ | 5,501,640 | ||||
Dorman Products 1 | 219,000 | 18,126,630 | |||||
Gentex Corporation | 594,334 | 11,274,516 | |||||
LCI Industries | 167,065 | 17,107,456 | |||||
| 75,000 | 2,118,000 | ||||||
Standard Motor Products | 88,651 | 4,629,355 | |||||
STRATTEC SECURITY 6 | 242,747 | 8,593,244 | |||||
Superior Industries International | 422,900 | 8,690,595 | |||||
| 76,041,436 | |||||||
| AUTOMOBILES - 1.1% | |||||||
Thor Industries | 67,981 | 7,105,374 | |||||
Winnebago Industries | 525,162 | 18,380,670 | |||||
| 25,486,044 | |||||||
| DISTRIBUTORS - 1.1% | |||||||
Core-Mark Holding Company | 330,660 | 10,931,620 | |||||
Weyco Group | 504,800 | 14,073,824 | |||||
| 25,005,444 | |||||||
| HOTELS, RESTAURANTS & LEISURE - 0.2% | |||||||
Lindblad Expeditions Holdings 1 | 370,700 | 3,892,350 | |||||
| HOUSEHOLD DURABLES - 1.7% | |||||||
AV Homes 1 | 80,800 | 1,620,040 | |||||
Bassett Furniture Industries | 23,400 | 888,030 | |||||
Ethan Allen Interiors | 682,169 | 22,034,059 | |||||
Flexsteel Industries | 91,500 | 4,951,065 | |||||
PICO Holdings 1 | 605,341 | 10,593,467 | |||||
| 40,086,661 | |||||||
| INTERNET & DIRECT MARKETING RETAIL - 0.1% | |||||||
Etsy 1 | 225,500 | 3,382,500 | |||||
| LEISURE PRODUCTS - 0.4% | |||||||
| 58,500 | 1,296,360 | ||||||
MCBC Holdings 1 | 140,500 | 2,746,775 | |||||
Nautilus 1 | 276,700 | 5,298,805 | |||||
| 9,341,940 | |||||||
| MEDIA - 0.5% | |||||||
E.W. Scripps Company Cl. A 1 | 128,267 | 2,284,435 | |||||
| 119,600 | 2,560,636 | ||||||
Saga Communications Cl. A | 137,734 | 6,301,331 | |||||
| 11,146,402 | |||||||
| MULTILINE RETAIL - 0.0% | |||||||
Dillard’s Cl. A | 14,448 | 833,505 | |||||
| SPECIALTY RETAIL - 2.5% | |||||||
American Eagle Outfitters | 537,391 | 6,475,562 | |||||
America’s Car-Mart 1 | 375,100 | 14,591,390 | |||||
AutoCanada | 150,000 | 2,206,971 | |||||
Barnes & Noble | 86,000 | 653,600 | |||||
Buckle (The) | 97,713 | 1,739,291 | |||||
Caleres | 229,613 | 6,378,649 | |||||
Cato Corporation (The) Cl. A | 35,276 | 620,505 | |||||
DSW Cl. A | 265,529 | 4,699,863 | |||||
Hibbett Sports 1 | 84,700 | 1,757,525 | |||||
Kirkland’s 1 | 190,403 | 1,957,343 | |||||
Monro Muffler Brake | 182,600 | 7,623,550 | |||||
| 30,000 | 2,223,300 | ||||||
Shoe Carnival | 313,840 | 6,552,979 | |||||
| 57,480,528 | |||||||
| TEXTILES, APPAREL & LUXURY GOODS - 0.5% | |||||||
Deckers Outdoor 1 | 68,730 | 4,691,510 | |||||
Movado Group | 112,126 | 2,831,181 | |||||
Steven Madden 1 | 113,344 | 4,528,093 | |||||
| 12,050,784 | |||||||
| Total (Cost $167,576,723) | 264,747,594 | ||||||
| CONSUMER STAPLES – 2.0% | |||||||
| FOOD & STAPLES RETAILING - 0.3% | |||||||
Village Super Market Cl. A | 250,711 | 6,498,429 | |||||
| FOOD PRODUCTS - 1.0% | |||||||
| 165,146 | 6,539,782 | ||||||
| 47,777 | 1,445,254 | ||||||
Industrias Bachoco ADR | 62,760 | 3,638,825 | |||||
John B. Sanfilippo & Son | 19,300 | 1,218,023 | |||||
Lancaster Colony | 15,200 | 1,863,824 | |||||
Sanderson Farms | 25,900 | 2,995,335 | |||||
Seneca Foods Cl. A 1 | 85,369 | 2,650,707 | |||||
Seneca Foods Cl. B 1 | 7,197 | 259,092 | |||||
Tootsie Roll Industries | 76,774 | 2,675,574 | |||||
| 23,286,416 | |||||||
| PERSONAL PRODUCTS - 0.7% | |||||||
Inter Parfums | 302,600 | 11,090,290 | |||||
Nutraceutical International | 118,700 | 4,943,855 | |||||
| 16,034,145 | |||||||
| Total (Cost $30,753,989) | 45,818,990 | ||||||
| ENERGY – 3.9% | |||||||
| ENERGY EQUIPMENT & SERVICES - 3.4% | |||||||
Era Group 1 | 389,840 | 3,687,886 | |||||
| 90,665 | 1,414,374 | ||||||
Frank’s International | 231,800 | 1,921,622 | |||||
Helmerich & Payne | 77,246 | 4,197,548 | |||||
| 46,000 | 855,600 | ||||||
Newpark Resources 1 | 99,000 | 727,650 | |||||
| 92,173 | 2,502,497 | ||||||
Pason Systems | 1,199,920 | 17,895,167 | |||||
RPC | 337,775 | 6,826,433 | |||||
SEACOR Holdings 1 | 271,509 | 9,312,759 | |||||
| 394,978 | 8,041,752 | ||||||
TGS-NOPEC Geophysical | 800,585 | 16,407,258 | |||||
Unit Corporation 1 | 286,984 | 5,375,210 | |||||
| 79,165,756 | |||||||
| OIL, GAS & CONSUMABLE FUELS - 0.5% | |||||||
Centennial Resource Development Cl. A 1 | 12,545 | 198,462 | |||||
San Juan Basin Royalty Trust | 207,033 | 1,409,895 | |||||
World Fuel Services | 277,000 | 10,650,650 | |||||
| 12,259,007 | |||||||
| Total (Cost $73,843,641) | 91,424,763 | ||||||
| FINANCIALS – 13.4% | |||||||
| BANKS - 3.4% | |||||||
Ames National | 25,433 | 778,250 | |||||
Blue Hills Bancorp | 96,590 | 1,728,961 | |||||
BOK Financial | 96,100 | 8,084,893 | |||||
Camden National | 117,982 | 5,062,608 | |||||
City Holding Company | 52,170 | 3,436,438 | |||||
CNB Financial | 152,105 | 3,645,957 | |||||
Codorus Valley Bancorp | 27,079 | 769,044 | |||||
| 23,900 | 1,141,225 | ||||||
First Citizens BancShares Cl. A | 78,876 | 29,397,085 | |||||
Landmark Bancorp | 7,950 | 244,860 | |||||
| THE ACCOMPANYING NOTES ARE AN INTEGRAL PART OF THESE FINANCIAL STATEMENTS | The Royce Funds 2017 Semiannual Report to Shareholders | 61 |
Schedules of Investments
| Royce Pennsylvania Mutual Fund (continued) | |||||||
| SHARES | VALUE | ||||||
| FINANCIALS (continued) | |||||||
| BANKS (continued) | |||||||
MidWestOne Financial Group | 128,535 | $ | 4,356,051 | ||||
National Bankshares | 85,600 | 3,492,480 | |||||
Northrim BanCorp | 99,206 | 3,015,862 | |||||
Popular | 181,300 | 7,562,023 | |||||
Unity Bancorp | 42,822 | 736,538 | |||||
Webster Financial | 111,800 | 5,838,196 | |||||
| 79,290,471 | |||||||
| CAPITAL MARKETS - 6.3% | |||||||
Ares Management L.P. | 340,756 | 6,133,608 | |||||
Artisan Partners Asset Management Cl. A | 254,170 | 7,803,019 | |||||
Bolsa Mexicana de Valores | 3,780,000 | 6,639,928 | |||||
Cohen & Steers | 48,000 | 1,945,920 | |||||
Diamond Hill Investment Group | 71,200 | 14,197,280 | |||||
Federated Investors Cl. B | 413,472 | 11,680,584 | |||||
Greenhill & Co. | 200,000 | 4,020,000 | |||||
Houlihan Lokey Cl. A | 270,286 | 9,432,981 | |||||
Lazard Cl. A | 153,457 | 7,109,663 | |||||
Moelis & Company Cl. A | 136,290 | 5,294,866 | |||||
Morningstar | 117,304 | 9,189,595 | |||||
Oaktree Capital Group LLC Cl. A | 27,500 | 1,281,500 | |||||
Reinet Investments | 238,550 | 5,855,161 | |||||
Reinet Investments DR | 1,300,000 | 2,929,410 | |||||
Rothschild & Co | 328,346 | 11,985,648 | |||||
SEI Investments | 332,650 | 17,889,917 | |||||
Sprott | 2,788,700 | 4,903,020 | |||||
Virtu Financial Cl. A | 297,000 | 5,242,050 | |||||
Virtus Investment Partners | 8,270 | 917,557 | |||||
Westwood Holdings Group | 232,700 | 13,191,763 | |||||
| 147,643,470 | |||||||
| INSURANCE - 2.0% | |||||||
Alleghany Corporation 1 | 1,190 | 707,812 | |||||
E-L Financial | 41,100 | 26,780,922 | |||||
MBIA 1 | 721,577 | 6,804,471 | |||||
ProAssurance Corporation | 30,000 | 1,824,000 | |||||
Reinsurance Group of America | 41,628 | 5,344,619 | |||||
RLI Corp. | 84,400 | 4,609,928 | |||||
| 46,071,752 | |||||||
| INVESTMENT COMPANIES - 0.3% | |||||||
RIT Capital Partners | 275,300 | 6,816,309 | |||||
| THRIFTS & MORTGAGE FINANCE - 1.4% | |||||||
| 201,300 | 4,774,836 | ||||||
Genworth MI Canada | 710,057 | 19,536,423 | |||||
Southern Missouri Bancorp | 11,100 | 358,086 | |||||
Timberland Bancorp | 41,900 | 1,058,813 | |||||
TrustCo Bank Corp. NY | 840,194 | 6,511,504 | |||||
| 32,239,662 | |||||||
| Total (Cost $225,515,724) | 312,061,664 | ||||||
| HEALTH CARE – 10.2% | |||||||
| BIOTECHNOLOGY - 0.3% | |||||||
| 50,000 | 1,011,000 | ||||||
Progenics Pharmaceuticals 1 | 304,800 | 2,069,592 | |||||
Zealand Pharma 1 | 166,250 | 3,332,482 | |||||
| 6,413,074 | |||||||
| HEALTH CARE EQUIPMENT & SUPPLIES - 3.0% | |||||||
Analogic Corporation | 155,400 | 11,289,810 | |||||
Atrion Corporation | 9,500 | 6,111,350 | |||||
CryoLife 1 | 77,900 | 1,554,105 | |||||
Hill-Rom Holdings | 52,400 | 4,171,564 | |||||
| 47,400 | 8,176,500 | ||||||
Masimo Corporation 1 | 67,600 | 6,163,768 | |||||
Merit Medical Systems 1 | 627,786 | 23,950,036 | |||||
| 134,500 | 9,295,295 | ||||||
| 70,712,428 | |||||||
| HEALTH CARE PROVIDERS & SERVICES - 3.0% | |||||||
| 100,000 | 693,000 | ||||||
| 311,800 | 12,175,790 | ||||||
Ensign Group (The) | 77,000 | 1,676,290 | |||||
| 77,200 | 3,846,876 | ||||||
HealthSouth Corporation | 183,713 | 8,891,709 | |||||
Landauer | 399,400 | 20,888,620 | |||||
LHC Group 1 | 15,000 | 1,018,350 | |||||
| 90,200 | 3,594,470 | ||||||
U.S. Physical Therapy | 290,500 | 17,546,200 | |||||
| 70,331,305 | |||||||
| HEALTH CARE TECHNOLOGY - 1.6% | |||||||
| 125,900 | 17,695,245 | ||||||
| 235,665 | 18,429,003 | ||||||
| 36,124,248 | |||||||
| LIFE SCIENCES TOOLS & SERVICES - 2.3% | |||||||
Bio-Rad Laboratories Cl. A 1 | 57,222 | 12,949,911 | |||||
Bio-Techne | 226,840 | 26,653,700 | |||||
| 143,700 | 14,052,423 | ||||||
| 53,656,034 | |||||||
| Total (Cost $156,307,198) | 237,237,089 | ||||||
| INDUSTRIALS – 27.1% | |||||||
| AEROSPACE & DEFENSE - 1.9% | |||||||
HEICO Corporation | 315,518 | 22,666,813 | |||||
HEICO Corporation Cl. A | 137,575 | 8,536,529 | |||||
Teledyne Technologies 1 | 70,100 | 8,948,265 | |||||
Wesco Aircraft Holdings 1 | 504,473 | 5,473,532 | |||||
| 45,625,139 | |||||||
| AIR FREIGHT & LOGISTICS - 1.1% | |||||||
Forward Air | 352,800 | 18,797,184 | |||||
Hub Group Cl. A 1 | 165,500 | 6,346,925 | |||||
| 25,144,109 | |||||||
| AIRLINES - 0.3% | |||||||
Spirit Airlines 1 | 149,469 | 7,720,074 | |||||
| �� | |||||||
| BUILDING PRODUCTS - 1.2% | |||||||
American Woodmark 1 | 74,718 | 7,139,305 | |||||
Apogee Enterprises | 160,100 | 9,100,084 | |||||
Gibraltar Industries 1 | 257,420 | 9,177,023 | |||||
Insteel Industries | 98,759 | 3,256,084 | |||||
| 28,672,496 | |||||||
| COMMERCIAL SERVICES & SUPPLIES - 2.9% | |||||||
| 531,700 | 16,902,743 | ||||||
Healthcare Services Group | 235,900 | 11,047,197 | |||||
Heritage-Crystal Clean 1 | 242,158 | 3,850,312 | |||||
Herman Miller | 137,900 | 4,192,160 | |||||
HNI Corporation | 97,400 | 3,883,338 | |||||
Kimball International Cl. B | 288,614 | 4,816,968 | |||||
Mobile Mini | 207,000 | 6,178,950 | |||||
Steelcase Cl. A | 385,470 | 5,396,580 | |||||
Team 1 | 286,082 | 6,708,623 | |||||
UniFirst Corporation | 24,468 | 3,442,647 | |||||
Viad Corporation | 12,700 | 600,075 | |||||
| 67,019,593 | |||||||
| 62 | The Royce Funds 2017 Semiannual Report to Shareholders | THE ACCOMPANYING NOTES ARE AN INTEGRAL PART OF THESE FINANCIAL STATEMENTS |
| June 30, 2017 (unaudited) |
| Royce Pennsylvania Mutual Fund (continued) | |||||||
| SHARES | VALUE | ||||||
| INDUSTRIALS (continued) | |||||||
| CONSTRUCTION & ENGINEERING - 1.9% | |||||||
Comfort Systems USA | 162,500 | $ | 6,028,750 | ||||
Jacobs Engineering Group | 54,000 | 2,937,060 | |||||
KBR | 575,100 | 8,753,022 | |||||
Valmont Industries | 176,375 | 26,385,700 | |||||
| 44,104,532 | |||||||
| ELECTRICAL EQUIPMENT - 0.9% | |||||||
Encore Wire | 181,218 | 7,738,008 | |||||
Preformed Line Products 6 | 290,278 | 13,474,705 | |||||
| 21,212,713 | |||||||
| INDUSTRIAL CONGLOMERATES - 1.1% | |||||||
Raven Industries | 777,945 | 25,905,569 | |||||
| MACHINERY - 10.1% | |||||||
Alamo Group | 18,262 | 1,658,372 | |||||
CIRCOR International | 417,879 | 24,813,655 | |||||
Colfax Corporation 1 | 74,543 | 2,934,758 | |||||
Federal Signal | 96,624 | 1,677,393 | |||||
Flowserve Corporation | 28,800 | 1,337,184 | |||||
Franklin Electric | 325,748 | 13,485,967 | |||||
Graco | 137,549 | 15,031,355 | |||||
Graham Corporation | 25,000 | 491,500 | |||||
Greenbrier Companies (The) | 85,400 | 3,949,750 | |||||
John Bean Technologies | 239,783 | 23,498,734 | |||||
Kadant | 92,100 | 6,925,920 | |||||
Lincoln Electric Holdings | 167,619 | 15,436,034 | |||||
Lindsay Corporation | 121,500 | 10,843,875 | |||||
Lydall 1 | 95,493 | 4,936,988 | |||||
Miller Industries | 270,732 | 6,727,690 | |||||
Mueller Water Products Cl. A | 62,500 | 730,000 | |||||
Nordson Corporation | 121,300 | 14,716,116 | |||||
| 15,000 | 1,008,750 | ||||||
RBC Bearings 1 | 116,806 | 11,886,179 | |||||
Sun Hydraulics | 688,787 | 29,390,541 | |||||
Tennant Company | 454,900 | 33,571,620 | |||||
Wabash National | 372,849 | 8,195,221 | |||||
Westinghouse Air Brake Technologies | 16,157 | 1,478,365 | |||||
| 234,725,967 | |||||||
| MARINE - 0.8% | |||||||
Clarkson | 277,700 | 9,136,296 | |||||
Diana Shipping 1 | 201,900 | 819,714 | |||||
Kirby Corporation 1 | 121,100 | 8,095,535 | |||||
| 18,051,545 | |||||||
| PROFESSIONAL SERVICES - 2.2% | |||||||
Exponent | 196,178 | 11,437,177 | |||||
GP Strategies 1 | 44,900 | 1,185,360 | |||||
Heidrick & Struggles International | 232,352 | 5,053,656 | |||||
ICF International 1 | 8,770 | 413,067 | |||||
Korn/Ferry International | 158,822 | 5,484,124 | |||||
ManpowerGroup | 130,305 | 14,548,553 | |||||
Robert Half International | 184,562 | 8,846,057 | |||||
TrueBlue 1 | 158,249 | 4,193,599 | |||||
| 51,161,593 | |||||||
| ROAD & RAIL - 1.8% | |||||||
Landstar System | 301,360 | 25,796,416 | |||||
Marten Transport | 38,600 | 1,057,640 | |||||
Old Dominion Freight Line | 12,290 | 1,170,500 | |||||
Saia 1 | 63,777 | 3,271,760 | |||||
Universal Logistics Holdings | 586,484 | 8,797,260 | |||||
Werner Enterprises | 31,000 | 909,850 | |||||
| 41,003,426 | |||||||
| TRADING COMPANIES & DISTRIBUTORS - 0.9% | |||||||
Air Lease Cl. A | 48,840 | 1,824,662 | |||||
Applied Industrial Technologies | 208,100 | 12,288,305 | |||||
MSC Industrial Direct Cl. A | 9,950 | 855,302 | |||||
Richelieu Hardware | 292,800 | 6,784,886 | |||||
| 21,753,155 | |||||||
| Total (Cost $330,714,821) | 632,099,911 | ||||||
| INFORMATION TECHNOLOGY – 18.1% | |||||||
| COMMUNICATIONS EQUIPMENT - 0.5% | |||||||
ADTRAN | 79,700 | 1,645,805 | |||||
Digi International 1 | 354,544 | 3,598,621 | |||||
| 83,900 | 3,616,090 | ||||||
| 58,600 | 2,015,840 | ||||||
TESSCO Technologies | 123,189 | 1,638,414 | |||||
| 12,514,770 | |||||||
| ELECTRONIC EQUIPMENT, INSTRUMENTS & COMPONENTS - 9.5% | |||||||
Badger Meter | 455,028 | 18,132,866 | |||||
Benchmark Electronics 1 | 147,944 | 4,778,591 | |||||
| 732,295 | 9,944,566 | ||||||
Cognex Corporation | 195,485 | 16,596,677 | |||||
Coherent 1 | 89,800 | 20,204,102 | |||||
Dolby Laboratories Cl. A | 167,976 | 8,224,105 | |||||
ePlus 1 | 8,000 | 592,800 | |||||
Fabrinet 1 | 305,200 | 13,019,832 | |||||
FARO Technologies 1 | 378,793 | 14,318,375 | |||||
FLIR Systems | 739,900 | 25,644,934 | |||||
HollySys Automation Technologies | 85,700 | 1,423,477 | |||||
Insight Enterprises 1 | 148,400 | 5,934,516 | |||||
IPG Photonics 1 | 125,600 | 18,224,560 | |||||
| 307,600 | 830,520 | ||||||
Mesa Laboratories | 24,630 | 3,529,725 | |||||
Methode Electronics | 135,860 | 5,597,432 | |||||
MTS Systems | 68,774 | 3,562,493 | |||||
National Instruments | 480,990 | 19,345,418 | |||||
Orbotech 1 | 203,400 | 6,634,908 | |||||
PC Connection | 366,465 | 9,916,543 | |||||
Plexus Corporation 1 | 138,102 | 7,260,022 | |||||
Richardson Electronics | 157,551 | 940,580 | |||||
Vishay Intertechnology | 399,089 | 6,624,877 | |||||
| 221,281,919 | |||||||
| INTERNET SOFTWARE & SERVICES - 0.8% | |||||||
| 50,000 | 1,817,500 | ||||||
| 20,000 | 532,600 | ||||||
| 275,709 | 7,223,576 | ||||||
j2 Global | 50,750 | 4,318,317 | |||||
Stamps.com 1 | 10,200 | 1,579,725 | |||||
| 31,800 | 1,865,070 | ||||||
| 17,336,788 | |||||||
| IT SERVICES - 0.3% | |||||||
Convergys Corporation | 136,339 | 3,242,141 | |||||
Genpact | 42,000 | 1,168,860 | |||||
NCI Cl. A 1 | 119,216 | 2,515,458 | |||||
| 6,926,459 | |||||||
| SEMICONDUCTORS & SEMICONDUCTOR EQUIPMENT - 3.7% | |||||||
Advanced Energy Industries 1 | 296,514 | 19,181,491 | |||||
Brooks Automation | 164,200 | 3,561,498 | |||||
Cabot Microelectronics | 148,330 | 10,951,204 | |||||
| 133,688 | 8,384,911 | ||||||
Diodes 1 | 315,300 | 7,576,659 | |||||
| THE ACCOMPANYING NOTES ARE AN INTEGRAL PART OF THESE FINANCIAL STATEMENTS | The Royce Funds 2017 Semiannual Report to Shareholders | 63 |
Schedules of Investments
| Royce Pennsylvania Mutual Fund (continued) | |||||||
| SHARES | VALUE | ||||||
| INFORMATION TECHNOLOGY (continued) | |||||||
| SEMICONDUCTORS & SEMICONDUCTOR EQUIPMENT (continued) | |||||||
FormFactor 1 | 55,200 | $ | 684,480 | ||||
IXYS Corporation 1 | 284,900 | 4,686,605 | |||||
Kulicke & Soffa Industries 1 | 65,400 | 1,243,908 | |||||
| 34,500 | 1,924,065 | ||||||
MKS Instruments | 215,135 | 14,478,586 | |||||
Nanometrics 1 | 154,581 | 3,909,353 | |||||
| 55,000 | 904,750 | ||||||
Photronics 1 | 149,560 | 1,405,864 | |||||
Rudolph Technologies 1 | 98,800 | 2,257,580 | |||||
Silicon Motion Technology ADR | 82,100 | 3,959,683 | |||||
Xperi | 46,330 | 1,380,634 | |||||
| 86,491,271 | |||||||
| SOFTWARE - 2.5% | |||||||
ACI Worldwide 1 | 622,383 | 13,922,708 | |||||
Blackbaud | 123,643 | 10,602,387 | |||||
Computer Modelling Group | 700,200 | 5,496,635 | |||||
Fair Isaac | 87,300 | 12,170,493 | |||||
| 24,000 | 1,649,040 | ||||||
| 15,000 | 720,900 | ||||||
Monotype Imaging Holdings | 556,000 | 10,174,800 | |||||
PTC 1 | 45,700 | 2,518,984 | |||||
| 57,255,947 | |||||||
| TECHNOLOGY HARDWARE, STORAGE & PERIPHERALS - 0.8% | |||||||
Cray 1 | 35,650 | 655,960 | |||||
Diebold Nixdorf | 470,132 | 13,163,696 | |||||
Stratasys 1 | 67,500 | 1,573,425 | |||||
| 158,966 | 3,918,512 | ||||||
| 19,311,593 | |||||||
| Total (Cost $237,088,520) | 421,118,747 | ||||||
| MATERIALS – 8.6% | |||||||
| CHEMICALS - 3.7% | |||||||
Balchem Corporation | 258,200 | 20,064,722 | |||||
FutureFuel Corporation | 686,556 | 10,360,130 | |||||
| 20,000 | 1,148,000 | ||||||
Innospec | 112,578 | 7,379,488 | |||||
Minerals Technologies | 141,702 | 10,372,586 | |||||
| 96,000 | 1,217,280 | ||||||
Quaker Chemical | 230,940 | 33,539,416 | |||||
Umicore | 47,000 | 3,269,175 | |||||
| 87,350,797 | |||||||
| CONTAINERS & PACKAGING - 0.8% | |||||||
AptarGroup | 204,000 | 17,719,440 | |||||
| METALS & MINING - 3.1% | |||||||
Compass Minerals International | 123,326 | 8,053,188 | |||||
Franco-Nevada Corporation | 271,000 | 19,555,360 | |||||
Haynes International | 23,493 | 853,031 | |||||
Hecla Mining | 173,300 | 883,830 | |||||
Major Drilling Group International 1 | 1,546,250 | 10,123,121 | |||||
Pretium Resources 1 | 102,600 | 985,808 | |||||
Reliance Steel & Aluminum | 210,714 | 15,342,086 | |||||
Schnitzer Steel Industries Cl. A | 58,200 | 1,466,640 | |||||
Worthington Industries | 276,733 | 13,897,531 | |||||
| 71,160,595 | |||||||
| PAPER & FOREST PRODUCTS - 1.0% | |||||||
Stella-Jones | 695,400 | 23,734,118 | |||||
| Total (Cost $100,774,514) | 199,964,950 | ||||||
| REAL ESTATE – 2.4% | |||||||
| REAL ESTATE MANAGEMENT & DEVELOPMENT - 2.4% | |||||||
FirstService Corporation | 52,800 | 3,378,144 | |||||
FRP Holdings 1 | 444,276 | 20,503,338 | |||||
Marcus & Millichap 1 | 576,135 | 15,186,919 | |||||
| 105,000 | 1,968,750 | ||||||
Tejon Ranch 1 | 689,385 | 14,228,906 | |||||
| Total (Cost $47,869,403) | 55,266,057 | ||||||
| TELECOMMUNICATION SERVICES – 0.2% | |||||||
| WIRELESS TELECOMMUNICATION SERVICES - 0.2% | |||||||
Telephone and Data Systems | 162,000 | 4,495,500 | |||||
| Total (Cost $4,308,624) | 4,495,500 | ||||||
| UTILITIES – 0.1% | |||||||
| GAS UTILITIES - 0.1% | |||||||
Star Gas Partners L.P. | 218,445 | 2,367,944 | |||||
| Total (Cost $2,209,201) | 2,367,944 | ||||||
| MISCELLANEOUS 2 – 2.1% | |||||||
| Total (Cost $46,725,261) | 48,310,871 | ||||||
| TOTAL COMMON STOCKS | |||||||
| (Cost $1,423,687,619) | 2,314,914,080 | ||||||
| REPURCHASE AGREEMENT– 1.3% | |||||||
| Fixed Income Clearing Corporation, 0.12% dated 6/30/17, due 7/3/17, maturity value $29,850,299 (collateralized by obligations of various U.S. Government Agencies, 0.25% due 1/15/25, valued at $30,449,104) | |||||||
| (Cost $29,850,000) | 29,850,000 | ||||||
| PRINCIPAL | |||||||
| AMOUNT | |||||||
| COLLATERAL RECEIVED FOR SECURITIES LOANED – 3.8% | |||||||
| U.S. Treasury Bills | |||||||
due 7/6/17-3/1/18 | $ | 6,110,579 | 6,110,362 | ||||
| U.S. Treasury Bonds | |||||||
2.25%-7.625% | |||||||
due 2/15/25-2/15/47 | 2,815,027 | 2,846,607 | |||||
| U.S. Treasury Notes | |||||||
0.625%-3.625% | |||||||
due 8/31/17-2/15/27 | 60,872,715 | 61,125,316 | |||||
| U.S. Treasury Notes - Floating Rate | |||||||
due 7/31/17-1/31/19 | 861,354 | 861,334 | |||||
| U.S. Treasury Strips - Interest | |||||||
due 11/15/25-2/15/40 | 12,964 | 13,005 | |||||
| U.S. Treasury TIPS | |||||||
0.125%-2.50% | |||||||
due 4/15/18-2/15/46 | 6,219,875 | 6,227,552 | |||||
| Money Market Funds | |||||||
Federated Government Obligations Fund (7 day yield-0.8114%) | 12,317,236 | ||||||
| TOTAL COLLATERAL RECEIVED FOR SECURITIES LOANED | |||||||
| (Cost $89,501,412) | 89,501,412 | ||||||
| TOTAL INVESTMENTS – 104.5% | |||||||
| (Cost $1,543,039,031) | 2,434,265,492 | ||||||
| LIABILITIES LESS CASH AND OTHER ASSETS – (4.5)% | (105,178,899 | ) | |||||
| NET ASSETS – 100.0% | $ | 2,329,086,593 | |||||
| 64 | The Royce Funds 2017 Semiannual Report to Shareholders | THE ACCOMPANYING NOTES ARE AN INTEGRAL PART OF THESE FINANCIAL STATEMENTS |
| June 30, 2017 (unaudited) |
| Royce Premier Fund | |||||||
| Common Stocks – 92.2% | |||||||
| SHARES | VALUE | ||||||
| CONSUMER DISCRETIONARY – 9.3% | |||||||
| AUTO COMPONENTS - 2.3% | |||||||
Dorman Products 1 | 636,300 | $ | 52,666,551 | ||||
| AUTOMOBILES - 1.5% | |||||||
Thor Industries | 326,900 | 34,167,588 | |||||
| DISTRIBUTORS - 1.7% | |||||||
Core-Mark Holding Company | 127,962 | 4,230,424 | |||||
Pool Corporation | 281,900 | 33,142,983 | |||||
| 37,373,407 | |||||||
| DIVERSIFIED CONSUMER SERVICES - 0.7% | |||||||
Sotheby’s 1 | 287,000 | 15,403,290 | |||||
| SPECIALTY RETAIL - 0.6% | |||||||
Camping World Holdings Cl. A | 469,883 | 14,495,890 | |||||
| TEXTILES, APPAREL & LUXURY GOODS - 2.5% | |||||||
Columbia Sportswear | 531,072 | 30,834,040 | |||||
Wolverine World Wide | 954,464 | 26,734,537 | |||||
| 57,568,577 | |||||||
| Total (Cost $88,396,316) | 211,675,303 | ||||||
| CONSUMER STAPLES – 2.2% | |||||||
| FOOD PRODUCTS - 2.2% | |||||||
| 345,100 | 13,665,960 | ||||||
Sanderson Farms | 308,042 | 35,625,057 | |||||
| Total (Cost $17,137,163) | 49,291,017 | ||||||
| ENERGY – 3.3% | |||||||
| ENERGY EQUIPMENT & SERVICES - 3.3% | |||||||
Pason Systems | 2,573,600 | 38,381,727 | |||||
SEACOR Holdings 1 | 571,002 | 19,585,369 | |||||
†SEACOR Marine Holdings 1 | 853,984 | 17,387,114 | |||||
| Total (Cost $73,043,637) | 75,354,210 | ||||||
| FINANCIALS – 12.1% | |||||||
| CAPITAL MARKETS - 8.1% | |||||||
Ares Management L.P. | 2,463,476 | 44,342,568 | |||||
Ashmore Group | 10,815,000 | 49,751,727 | |||||
Federated Investors Cl. B | 733,400 | 20,718,550 | |||||
Lazard Cl. A | 575,800 | 26,676,814 | |||||
Morningstar | 404,000 | 31,649,360 | |||||
TMX Group | 217,700 | 11,845,244 | |||||
| 184,984,263 | |||||||
| INSURANCE - 2.6% | |||||||
Alleghany Corporation 1 | 98,260 | 58,445,048 | |||||
| THRIFTS & MORTGAGE FINANCE - 1.4% | |||||||
Genworth MI Canada | 1,164,500 | 32,039,914 | |||||
| Total (Cost $179,105,059) | 275,469,225 | ||||||
| HEALTH CARE – 4.0% | |||||||
| HEALTH CARE EQUIPMENT & SUPPLIES - 2.3% | |||||||
IDEXX Laboratories 1 | 316,300 | 51,057,146 | |||||
| LIFE SCIENCES TOOLS & SERVICES - 1.7% | |||||||
Bio-Techne | 336,800 | 39,574,000 | |||||
| Total (Cost $33,861,889) | 90,631,146 | ||||||
| INDUSTRIALS – 33.2% | |||||||
| AIR FREIGHT & LOGISTICS - 1.8% | |||||||
Forward Air | 791,828 | 42,188,596 | |||||
| BUILDING PRODUCTS - 1.3% | |||||||
Simpson Manufacturing | 680,833 | 29,759,210 | |||||
| COMMERCIAL SERVICES & SUPPLIES - 4.6% | |||||||
| 2,355,600 | 74,884,524 | ||||||
Ritchie Bros. Auctioneers | 1,029,100 | 29,576,334 | |||||
| 104,460,858 | |||||||
| CONSTRUCTION & ENGINEERING - 3.2% | |||||||
EMCOR Group | 220,800 | 14,435,904 | |||||
Valmont Industries | 399,700 | 59,795,120 | |||||
| 74,231,024 | |||||||
| MACHINERY - 12.4% | |||||||
CIRCOR International | 711,832 | 42,268,584 | |||||
Lincoln Electric Holdings | 900,300 | 82,908,627 | |||||
Lindsay Corporation | 492,675 | 43,971,244 | |||||
RBC Bearings 1 | 170,900 | 17,390,784 | |||||
Sun Hydraulics | 763,827 | 32,592,498 | |||||
Woodward | 941,101 | 63,599,605 | |||||
| 282,731,342 | |||||||
| MARINE - 3.7% | |||||||
Clarkson | 675,000 | 22,207,418 | |||||
Kirby Corporation 1 | 933,400 | 62,397,790 | |||||
| 84,605,208 | |||||||
| ROAD & RAIL - 2.8% | |||||||
Landstar System | 739,300 | 63,284,080 | |||||
| TRADING COMPANIES & DISTRIBUTORS - 3.4% | |||||||
Air Lease Cl. A | 1,198,260 | 44,766,994 | |||||
MSC Industrial Direct Cl. A | 381,400 | 32,785,144 | |||||
| 77,552,138 | |||||||
| Total (Cost $353,156,299) | 758,812,456 | ||||||
| INFORMATION TECHNOLOGY – 19.6% | |||||||
| ELECTRONIC EQUIPMENT, INSTRUMENTS & COMPONENTS - 9.8% | |||||||
Anixter International 1 | 335,383 | 26,226,950 | |||||
Cognex Corporation | 961,100 | 81,597,390 | |||||
IPG Photonics 1 | 303,100 | 43,979,810 | |||||
National Instruments | 1,801,944 | 72,474,188 | |||||
| 224,278,338 | |||||||
| IT SERVICES - 3.5% | |||||||
Gartner 1 | 258,000 | 31,865,580 | |||||
Jack Henry & Associates | 453,700 | 47,125,819 | |||||
| 78,991,399 | |||||||
| SEMICONDUCTORS & SEMICONDUCTOR EQUIPMENT - 4.2% | |||||||
Cabot Microelectronics | 382,774 | 28,260,205 | |||||
MKS Instruments | 1,000,900 | 67,360,570 | |||||
| 95,620,775 | |||||||
| SOFTWARE - 2.1% | |||||||
Fair Isaac | 349,600 | 48,737,736 | |||||
| Total (Cost $128,952,351) | 447,628,248 | ||||||
| MATERIALS – 7.0% | |||||||
| CHEMICALS - 3.7% | |||||||
Minerals Technologies | 554,900 | 40,618,680 | |||||
Westlake Chemical | 655,800 | 43,420,518 | |||||
| 84,039,198 | |||||||
| METALS & MINING - 1.9% | |||||||
Reliance Steel & Aluminum | 597,700 | 43,518,537 | |||||
| PAPER & FOREST PRODUCTS - 1.4% | |||||||
Stella-Jones | 932,012 | 31,809,725 | |||||
| Total (Cost $76,407,488) | 159,367,460 | ||||||
| THE ACCOMPANYING NOTES ARE AN INTEGRAL PART OF THESE FINANCIAL STATEMENTS | The Royce Funds 2017 Semiannual Report to Shareholders | 65 |
| Schedules of Investments |
| Royce Premier Fund (continued) | |||||||
| SHARES | VALUE | ||||||
| REAL ESTATE – 0.9% | |||||||
| REAL ESTATE MANAGEMENT & DEVELOPMENT - 0.9% | |||||||
Jones Lang LaSalle | 167,600 | $ | 20,950,000 | ||||
| Total (Cost $4,731,391) | 20,950,000 | ||||||
| MISCELLANEOUS 2 – 0.6% | |||||||
| Total (Cost $14,988,276) | 14,490,000 | ||||||
| TOTAL COMMON STOCKS | |||||||
| (Cost $969,779,869) | 2,103,669,065 | ||||||
| REPURCHASE AGREEMENT– 7.3% | |||||||
| Fixed Income Clearing Corporation, 0.12% dated 6/30/17, due 7/3/17, maturity value $167,267,673 (collateralized by obligations of various U.S. Government Agencies, 2.25% due 11/15/24, valued at $170,616,278) | |||||||
| (Cost $167,266,000) | 167,266,000 | ||||||
| PRINCIPAL | |||||||
| AMOUNT | |||||||
| COLLATERAL RECEIVED FOR SECURITIES LOANED – 0.6% | |||||||
| U.S. Treasury Bills | |||||||
due 7/20/17-3/1/18 | $ | 436,743 | 436,727 | ||||
| U.S. Treasury Bonds | |||||||
2.50%-4.25% | |||||||
due 8/15/40-2/15/46 | 111,279 | 112,443 | |||||
| U.S. Treasury Notes | |||||||
0.75%-3.50% | |||||||
due 10/31/17-2/15/27 | 2,383,058 | 2,394,504 | |||||
| U.S. Treasury Notes - Floating Rate | |||||||
due 7/31/17-1/31/19 | 59,523 | 59,521 | |||||
| U.S. Treasury TIPS | |||||||
0.125%-1.875% | |||||||
due 4/15/18-2/15/46 | 338,665 | 338,975 | |||||
| Money Market Funds | |||||||
Federated Government Obligations Fund (7 day yield-0.8114%) | 10,332,000 | ||||||
| TOTAL COLLATERAL RECEIVED FOR SECURITIES LOANED | |||||||
| (Cost $13,674,170) | 13,674,170 | ||||||
| TOTAL INVESTMENTS – 100.1% | |||||||
| (Cost $1,150,720,039) | 2,284,609,235 | ||||||
| LIABILITIES LESS CASH AND OTHER ASSETS – (0.1)% | (2,547,929 | ) | |||||
| NET ASSETS – 100.0% | $ | 2,282,061,306 | |||||
| Royce Small-Cap Leaders Fund | |||||||
| Common Stocks – 93.5% | |||||||
| SHARES | VALUE | ||||||
| CONSUMER DISCRETIONARY – 14.4% | |||||||
| AUTO COMPONENTS - 5.7% | |||||||
Cooper Tire & Rubber | 51,200 | $ | 1,848,320 | ||||
Gentex Corporation | 95,734 | 1,816,074 | |||||
LCI Industries | 14,132 | 1,447,117 | |||||
| 5,111,511 | |||||||
| AUTOMOBILES - 0.2% | |||||||
Thor Industries | 2,005 | 209,563 | |||||
| HOUSEHOLD DURABLES - 0.7% | |||||||
PICO Holdings 1 | 39,000 | 682,500 | |||||
| LEISURE PRODUCTS - 2.4% | |||||||
MCBC Holdings 1 | 50,600 | 989,230 | |||||
| 60,500 | 1,158,575 | ||||||
| 2,147,805 | |||||||
| MEDIA - 0.8% | |||||||
E.W. Scripps Company Cl. A 1 | 39,490 | 703,317 | |||||
| SPECIALTY RETAIL - 2.8% | |||||||
Buckle (The) | 21,700 | 386,260 | |||||
Caleres | 77,600 | 2,155,728 | |||||
| 2,541,988 | |||||||
| TEXTILES, APPAREL & LUXURY GOODS - 1.8% | |||||||
Deckers Outdoor 1 | 8,720 | 595,227 | |||||
Movado Group | 41,000 | 1,035,250 | |||||
| 1,630,477 | |||||||
| Total (Cost $10,691,974) | 13,027,161 | ||||||
| CONSUMER STAPLES – 7.5% | |||||||
| FOOD PRODUCTS - 6.0% | |||||||
Cal-Maine Foods 1 | 49,658 | 1,966,457 | |||||
Industrias Bachoco ADR | 24,690 | 1,431,526 | |||||
Sanderson Farms | 8,690 | 1,004,998 | |||||
Tootsie Roll Industries | 28,869 | 1,006,085 | |||||
| 5,409,066 | |||||||
| PERSONAL PRODUCTS - 1.5% | |||||||
Inter Parfums | 38,270 | 1,402,596 | |||||
| Total (Cost $5,423,995) | 6,811,662 | ||||||
| ENERGY – 5.2% | |||||||
| ENERGY EQUIPMENT & SERVICES - 5.2% | |||||||
| 32,640 | 886,176 | ||||||
Pason Systems | 136,340 | 2,033,325 | |||||
TGS-NOPEC Geophysical | 88,750 | 1,818,850 | |||||
| Total (Cost $3,721,794) | 4,738,351 | ||||||
| FINANCIALS – 14.8% | |||||||
| CAPITAL MARKETS - 10.2% | |||||||
Artisan Partners Asset Management Cl. A | 81,920 | 2,514,944 | |||||
Federated Investors Cl. B | 65,260 | 1,843,595 | |||||
Houlihan Lokey Cl. A | 54,200 | 1,891,580 | |||||
Lazard Cl. A | 50,270 | 2,329,009 | |||||
Virtus Investment Partners | 2,200 | 244,090 | |||||
Westwood Holdings Group | 6,000 | 340,140 | |||||
| 9,163,358 | |||||||
| INSURANCE - 1.7% | |||||||
†RLI Corp. | 27,800 | 1,518,436 | |||||
| THRIFTS & MORTGAGE FINANCE - 2.9% | |||||||
Genworth MI Canada | 96,260 | 2,648,486 | |||||
| Total (Cost $10,488,838) | 13,330,280 | ||||||
| 66 | The Royce Funds 2017 Semiannual Report to Shareholders | THE ACCOMPANYING NOTES ARE AN INTEGRAL PART OF THESE FINANCIAL STATEMENTS |
| June 30, 2017 (unaudited) |
| Royce Small-Cap Leaders Fund (continued) | |||||||
| SHARES | VALUE | ||||||
| HEALTH CARE – 5.9% | |||||||
| BIOTECHNOLOGY - 0.9% | |||||||
| 40,340 | $ | 808,615 | |||||
| HEALTH CARE PROVIDERS & SERVICES - 1.9% | |||||||
AMN Healthcare Services 1 | 43,500 | 1,698,675 | |||||
| LIFE SCIENCES TOOLS & SERVICES - 3.1% | |||||||
Bio-Rad Laboratories Cl. A 1 | 4,125 | 933,529 | |||||
Bio-Techne | 16,144 | 1,896,920 | |||||
| 2,830,449 | |||||||
| Total (Cost $3,952,025) | 5,337,739 | ||||||
| INDUSTRIALS – 23.3% | |||||||
| BUILDING PRODUCTS - 3.7% | |||||||
American Woodmark 1 | 10,000 | 955,500 | |||||
Apogee Enterprises | 28,100 | 1,597,204 | |||||
Insteel Industries | 24,900 | 820,953 | |||||
| 3,373,657 | |||||||
| COMMERCIAL SERVICES & SUPPLIES - 3.2% | |||||||
Steelcase Cl. A | 127,120 | 1,779,680 | |||||
UniFirst Corporation | 8,100 | 1,139,670 | |||||
| 2,919,350 | |||||||
| CONSTRUCTION & ENGINEERING - 2.8% | |||||||
Comfort Systems USA | 27,700 | 1,027,670 | |||||
Valmont Industries | 9,895 | 1,480,292 | |||||
| 2,507,962 | |||||||
| MACHINERY - 9.8% | |||||||
CIRCOR International | 31,070 | 1,844,936 | |||||
Greenbrier Companies (The) | 28,200 | 1,304,250 | |||||
John Bean Technologies | 2,109 | 206,682 | |||||
Kadant | 12,160 | 914,432 | |||||
Lydall 1 | 33,960 | 1,755,732 | |||||
RBC Bearings 1 | 8,480 | 862,925 | |||||
†Supreme Industries Cl. A | 85,900 | 1,413,055 | |||||
Westinghouse Air Brake Technologies | 5,588 | 511,302 | |||||
| 8,813,314 | |||||||
| PROFESSIONAL SERVICES - 1.3% | |||||||
ICF International 1 | 3,743 | 176,295 | |||||
Robert Half International | 13,003 | 623,234 | |||||
TrueBlue 1 | 15,200 | 402,800 | |||||
| 1,202,329 | |||||||
| ROAD & RAIL - 2.2% | |||||||
Landstar System | 15,420 | 1,319,952 | |||||
Saia 1 | 12,220 | 626,886 | |||||
| 1,946,838 | |||||||
| TRADING COMPANIES & DISTRIBUTORS - 0.3% | |||||||
MSC Industrial Direct Cl. A | 3,177 | 273,095 | |||||
| Total (Cost $15,875,255) | 21,036,545 | ||||||
| INFORMATION TECHNOLOGY – 13.6% | |||||||
| COMMUNICATIONS EQUIPMENT - 0.7% | |||||||
NetScout Systems 1 | 19,000 | 653,600 | |||||
| ELECTRONIC EQUIPMENT, INSTRUMENTS & COMPONENTS - 5.5% | |||||||
| 102,500 | 1,391,950 | ||||||
Cognex Corporation | 1,540 | 130,746 | |||||
Fabrinet 1 | 35,500 | 1,514,430 | |||||
FARO Technologies 1 | 12,760 | 482,328 | |||||
Methode Electronics | 17,850 | 735,420 | |||||
Orbotech 1 | 20,590 | 671,646 | |||||
| 4,926,520 | |||||||
| INTERNET SOFTWARE & SERVICES - 1.7% | |||||||
j2 Global | 18,524 | 1,576,207 | |||||
| SEMICONDUCTORS & SEMICONDUCTOR EQUIPMENT - 5.7% | |||||||
Cabot Microelectronics | 8,636 | 637,596 | |||||
MKS Instruments | 13,145 | 884,658 | |||||
Nanometrics 1 | 38,648 | 977,408 | |||||
Rudolph Technologies 1 | 35,500 | 811,175 | |||||
†Silicon Motion Technology ADR | 27,200 | 1,311,856 | |||||
Xperi | 17,330 | 516,434 | |||||
| 5,139,127 | |||||||
| Total (Cost $9,032,486) | 12,295,454 | ||||||
| MATERIALS – 4.6% | |||||||
| CHEMICALS - 3.1% | |||||||
Minerals Technologies | 37,556 | 2,749,099 | |||||
| METALS & MINING - 0.6% | |||||||
Compass Minerals International | 8,300 | 541,990 | |||||
| PAPER & FOREST PRODUCTS - 0.9% | |||||||
†Stella-Jones | 24,700 | 843,015 | |||||
| Total (Cost $3,449,677) | 4,134,104 | ||||||
| REAL ESTATE – 3.0% | |||||||
| REAL ESTATE MANAGEMENT & DEVELOPMENT - 3.0% | |||||||
Marcus & Millichap 1 | 104,210 | 2,746,976 | |||||
| Total (Cost $2,331,048) | 2,746,976 | ||||||
| MISCELLANEOUS 2– 1.2% | |||||||
| Total (Cost $989,793) | 1,059,787 | ||||||
| TOTAL COMMON STOCKS | |||||||
| (Cost $65,956,885) | 84,518,059 | ||||||
| REPURCHASE AGREEMENT– 6.5% | |||||||
| Fixed Income Clearing Corporation, 0.12% dated 6/30/17, due 7/3/17, maturity value $5,869,059 (collateralized by obligations of various U.S. Government Agencies, 2.375% due 8/15/24, valued at $5,990,637) | |||||||
| (Cost $5,869,000) | 5,869,000 | ||||||
| PRINCIPAL | |||||||
| AMOUNT | |||||||
| COLLATERAL RECEIVED FOR SECURITIES LOANED – 1.1% | |||||||
| U.S. Treasury Bills | |||||||
due 7/20/17-3/1/18 | $ | 61,590 | 61,587 | ||||
| U.S. Treasury Bonds | |||||||
2.50%-4.25% | |||||||
due 8/15/40-2/15/46 | 15,693 | 15,857 | |||||
| U.S. Treasury Notes | |||||||
0.75%-3.50% | |||||||
due 10/31/17-2/15/27 | 336,060 | 337,674 | |||||
| U.S. Treasury Notes - Floating Rate | |||||||
due 7/31/17-1/31/19 | 8,394 | 8,394 | |||||
| U.S. Treasury TIPS | |||||||
0.125%-1.875% | |||||||
due 4/15/18-2/15/46 | 47,759 | 47,802 | |||||
| Money Market Funds | |||||||
Federated Government Obligations Fund (7 day yield-0.8114%) | 520,552 | ||||||
| TOTAL COLLATERAL RECEIVED FOR SECURITIES LOANED | |||||||
| (Cost $991,866) | 991,866 | ||||||
| THE ACCOMPANYING NOTES ARE AN INTEGRAL PART OF THESE FINANCIAL STATEMENTS | The Royce Funds 2017 Semiannual Report to Shareholders | 67 |
| Schedules of Investments |
| Royce Small-Cap Leaders Fund (continued) | |||||||
| VALUE | |||||||
| TOTAL INVESTMENTS – 101.1% | |||||||
| (Cost $72,817,751) | $ | 91,378,925 | |||||
| LIABILITIES LESS CASH AND OTHER ASSETS – (1.1)% | (1,032,545 | ) | |||||
| NET ASSETS – 100.0% | $ | 90,346,380 | |||||
| Royce Small-Cap Value Fund | |||||||
| Common Stocks – 89.2% | |||||||
| SHARES | VALUE | ||||||
| CONSUMER DISCRETIONARY – 14.8% | |||||||
| AUTO COMPONENTS - 3.1% | |||||||
Gentex Corporation | 384,556 | $ | 7,295,027 | ||||
| 251,500 | 3,875,615 | ||||||
| 11,170,642 | |||||||
| AUTOMOBILES - 0.1% | |||||||
Thor Industries | 3,900 | 407,628 | |||||
| HOUSEHOLD DURABLES - 1.4% | |||||||
Flexsteel Industries | 94,400 | 5,107,984 | |||||
| MEDIA - 1.6% | |||||||
Saga Communications Cl. A | 129,077 | 5,905,273 | |||||
| SPECIALTY RETAIL - 6.3% | |||||||
American Eagle Outfitters | 544,188 | 6,557,466 | |||||
Buckle (The) | 38,751 | 689,768 | |||||
Cato Corporation (The) Cl. A | 34,590 | 608,438 | |||||
DSW Cl. A | 289,102 | 5,117,105 | |||||
Hibbett Sports 1 | 87,000 | 1,805,250 | |||||
Kirkland’s 1 | 205,830 | 2,115,932 | |||||
Shoe Carnival | 295,141 | 6,162,544 | |||||
| 23,056,503 | |||||||
| TEXTILES, APPAREL & LUXURY GOODS - 2.3% | |||||||
Deckers Outdoor 1 | 51,385 | 3,507,540 | |||||
Steven Madden 1 | 123,895 | 4,949,605 | |||||
| 8,457,145 | |||||||
| Total (Cost $54,431,991) | 54,105,175 | ||||||
| CONSUMER STAPLES – 2.0% | |||||||
| FOOD & STAPLES RETAILING - 2.0% | |||||||
Village Super Market Cl. A | 279,903 | 7,255,086 | |||||
| Total (Cost $8,268,750) | 7,255,086 | ||||||
| ENERGY – 2.4% | |||||||
| ENERGY EQUIPMENT & SERVICES - 2.4% | |||||||
Helmerich & Payne | 74,499 | 4,048,275 | |||||
Unit Corporation 1 | 261,178 | 4,891,864 | |||||
| Total (Cost $8,926,611) | 8,940,139 | ||||||
| FINANCIALS – 21.9% | |||||||
| BANKS - 9.3% | |||||||
Ames National | 115,348 | 3,529,649 | |||||
Camden National | 126,304 | 5,419,705 | |||||
City Holding Company | 56,740 | 3,737,464 | |||||
CNB Financial | 127,860 | 3,064,804 | |||||
Codorus Valley Bancorp | 32,904 | 934,474 | |||||
Landmark Bancorp | 11,600 | 357,280 | |||||
MidWestOne Financial Group | 142,560 | 4,831,358 | |||||
National Bankshares | 142,193 | 5,801,474 | |||||
Northrim BanCorp | 171,543 | 5,214,907 | |||||
Unity Bancorp | 63,110 | 1,085,492 | |||||
| 33,976,607 | |||||||
| CAPITAL MARKETS - 6.3% | |||||||
Federated Investors Cl. B | 265,949 | 7,513,059 | |||||
Greenhill & Co. | 236,700 | 4,757,670 | |||||
Houlihan Lokey Cl. A | 152,396 | 5,318,620 | |||||
Moelis & Company Cl. A | 140,750 | 5,468,138 | |||||
| 23,057,487 | |||||||
| INSURANCE - 1.5% | |||||||
Reinsurance Group of America | 40,735 | 5,229,967 | |||||
| THRIFTS & MORTGAGE FINANCE - 4.8% | |||||||
Genworth MI Canada | 308,200 | 8,479,778 | |||||
Southern Missouri Bancorp | 24,985 | 806,016 | |||||
| 68 | The Royce Funds 2017 Semiannual Report to Shareholders | THE ACCOMPANYING NOTES ARE AN INTEGRAL PART OF THESE FINANCIAL STATEMENTS |
| June 30, 2017 (unaudited) |
| Royce Small-Cap Value Fund (continued) | |||||||
| SHARES | VALUE | ||||||
| FINANCIALS (continued) | |||||||
| THRIFTS & MORTGAGE FINANCE (continued) | |||||||
Timberland Bancorp | 50,500 | $ | 1,276,135 | ||||
TrustCo Bank Corp. NY | 912,064 | 7,068,496 | |||||
| 17,630,425 | |||||||
| Total (Cost $61,158,635) | 79,894,486 | ||||||
| HEALTH CARE – 2.6% | |||||||
| HEALTH CARE PROVIDERS & SERVICES - 2.6% | |||||||
| 194,620 | 7,599,911 | ||||||
Ensign Group (The) | 81,393 | 1,771,926 | |||||
| Total (Cost $9,444,804) | 9,371,837 | ||||||
| INDUSTRIALS – 21.5% | |||||||
| AIRLINES - 1.9% | |||||||
Spirit Airlines 1 | 131,262 | 6,779,682 | |||||
| BUILDING PRODUCTS - 3.0% | |||||||
American Woodmark 1 | 57,276 | 5,472,722 | |||||
Apogee Enterprises | 97,503 | 5,542,070 | |||||
| 11,014,792 | |||||||
| COMMERCIAL SERVICES & SUPPLIES - 3.9% | |||||||
†Herman Miller | 148,800 | 4,523,520 | |||||
HNI Corporation | 106,400 | 4,242,168 | |||||
Kimball International Cl. B | 318,030 | 5,307,921 | |||||
| 14,073,609 | |||||||
| CONSTRUCTION & ENGINEERING - 0.9% | |||||||
Comfort Systems USA | 91,311 | 3,387,638 | |||||
| MACHINERY - 6.4% | |||||||
Alamo Group | 19,691 | 1,788,140 | |||||
Federal Signal | 104,293 | 1,810,526 | |||||
Miller Industries | 282,041 | 7,008,719 | |||||
†Supreme Industries Cl. A | 323,700 | 5,324,865 | |||||
Wabash National | 340,900 | 7,492,982 | |||||
| 23,425,232 | |||||||
| PROFESSIONAL SERVICES - 4.2% | |||||||
Heidrick & Struggles International | 254,083 | 5,526,305 | |||||
Korn/Ferry International | 169,009 | 5,835,881 | |||||
Robert Half International | 8,000 | 383,440 | |||||
TrueBlue 1 | 133,210 | 3,530,065 | |||||
| 15,275,691 | |||||||
| ROAD & RAIL - 1.2% | |||||||
Old Dominion Freight Line | 17,700 | 1,685,748 | |||||
Saia 1 | 36,023 | 1,847,980 | |||||
Werner Enterprises | 33,402 | 980,349 | |||||
| 4,514,077 | |||||||
| Total (Cost $63,822,363) | 78,470,721 | ||||||
| INFORMATION TECHNOLOGY – 20.0% | |||||||
| COMMUNICATIONS EQUIPMENT - 1.1% | |||||||
NETGEAR 1 | 92,000 | 3,965,200 | |||||
| ELECTRONIC EQUIPMENT, INSTRUMENTS & COMPONENTS - 14.3% | |||||||
Benchmark Electronics 1 | 162,068 | 5,234,797 | |||||
| 539,700 | 7,329,126 | ||||||
Fabrinet 1 | 197,100 | 8,408,286 | |||||
Insight Enterprises 1 | 165,371 | 6,613,186 | |||||
Methode Electronics | 128,500 | 5,294,200 | |||||
| 146,100 | 4,765,782 | ||||||
PC Connection | 279,754 | 7,570,143 | |||||
Vishay Intertechnology | 431,868 | 7,169,009 | |||||
| 52,384,529 | |||||||
| IT SERVICES - 2.5% | |||||||
Convergys Corporation | 147,000 | 3,495,660 | |||||
| 261,489 | 5,517,418 | ||||||
| 9,013,078 | |||||||
| SEMICONDUCTORS & SEMICONDUCTOR EQUIPMENT - 0.9% | |||||||
MKS Instruments | 46,447 | 3,125,883 | |||||
| TECHNOLOGY HARDWARE, STORAGE & PERIPHERALS - 1.2% | |||||||
Super Micro Computer 1 | 177,706 | 4,380,453 | |||||
| Total (Cost $61,757,342) | 72,869,143 | ||||||
| REAL ESTATE – 2.0% | |||||||
| REAL ESTATE MANAGEMENT & DEVELOPMENT - 2.0% | |||||||
| 276,100 | 7,277,996 | ||||||
| Total (Cost $7,138,312) | 7,277,996 | ||||||
| UTILITIES – 1.0% | |||||||
| GAS UTILITIES - 1.0% | |||||||
Star Gas Partners L.P. | 357,758 | 3,878,097 | |||||
| Total (Cost $3,504,997) | 3,878,097 | ||||||
| MISCELLANEOUS 2 – 1.0% | |||||||
| Total (Cost $2,808,457) | 3,519,240 | ||||||
| TOTAL COMMON STOCKS | |||||||
| (Cost $281,262,262) | 325,581,920 | ||||||
| REPURCHASE AGREEMENT – 10.9% | |||||||
| Fixed Income Clearing Corporation, 0.12% dated 6/30/17, due 7/3/17, maturity value $39,850,399 (collateralized by obligations of various U.S. Government Agencies, 2.25% due 11/15/24, valued at $40,651,561) | |||||||
| (Cost $39,850,000) | 39,850,000 | ||||||
| PRINCIPAL | |||||||
| AMOUNT | |||||||
| COLLATERAL RECEIVED FOR SECURITIES LOANED – 1.8% | |||||||
| U.S. Treasury Bills | |||||||
due 7/20/17-3/1/18 | $ | 856,377 | 856,347 | ||||
| U.S. Treasury Bonds | |||||||
2.50%-4.25% | |||||||
due 8/15/40-2/15/46 | 218,198 | 220,481 | |||||
| U.S. Treasury Notes | |||||||
0.75%-3.50% | |||||||
due 10/31/17-2/15/27 | 4,672,769 | 4,695,213 | |||||
| U.S. Treasury Notes - Floating Rate | |||||||
due 7/31/17-1/31/19 | 116,714 | 116,711 | |||||
| U.S. Treasury TIPS | |||||||
0.125%-1.875% | |||||||
due 4/15/18-2/15/46 | 664,065 | 664,673 | |||||
| TOTAL COLLATERAL RECEIVED FOR SECURITIES LOANED | |||||||
| (Cost $6,553,425) | 6,553,425 | ||||||
| TOTAL INVESTMENTS – 101.9% | |||||||
| (Cost $327,665,687) | 371,985,345 | ||||||
| LIABILITIES LESS CASH AND OTHER ASSETS – (1.9)% | (7,080,875 | ) | |||||
| NET ASSETS – 100.0% | $ | 364,904,470 | |||||
| THE ACCOMPANYING NOTES ARE AN INTEGRAL PART OF THESE FINANCIAL STATEMENTS | The Royce Funds 2017 Semiannual Report to Shareholders | 69 |
| Schedules of Investments |
| Royce Small/Mid-Cap Premier Fund | |||||||
| Common Stocks – 92.7% | |||||||
| SHARES | VALUE | ||||||
| CONSUMER DISCRETIONARY – 24.7% | |||||||
| AUTO COMPONENTS - 5.8% | |||||||
Cooper Tire & Rubber | 54,202 | $ | 1,956,692 | ||||
Dorman Products 1 | 7,800 | 645,606 | |||||
Gentex Corporation | 105,200 | 1,995,644 | |||||
LCI Industries | 32,500 | 3,328,000 | |||||
Standard Motor Products | 94,422 | 4,930,717 | |||||
| 12,856,659 | |||||||
| AUTOMOBILES - 2.3% | |||||||
Thor Industries | 48,400 | 5,058,768 | |||||
| DISTRIBUTORS - 3.6% | |||||||
Genuine Parts | 9,969 | 924,724 | |||||
LKQ Corporation 1 | 172,691 | 5,690,169 | |||||
Pool Corporation | 12,000 | 1,410,840 | |||||
| 8,025,733 | |||||||
| HOUSEHOLD DURABLES - 2.3% | |||||||
Forbo Holding | 335 | 548,842 | |||||
Hooker Furniture | 32,125 | 1,321,944 | |||||
NVR 1 | 1,290 | 3,109,687 | |||||
| 4,980,473 | |||||||
| MEDIA - 2.2% | |||||||
| 102,272 | 194,317 | ||||||
Meredith Corporation | 49,841 | 2,963,047 | |||||
†Nexstar Media Group Cl. A | 26,373 | 1,577,105 | |||||
| 4,734,469 | |||||||
| MULTILINE RETAIL - 1.5% | |||||||
Dollar Tree 1 | 46,675 | 3,263,516 | |||||
| SPECIALTY RETAIL - 5.3% | |||||||
Camping World Holdings Cl. A | 78,570 | 2,423,884 | |||||
CarMax 1 | 18,275 | 1,152,422 | |||||
Children’s Place | 33,250 | 3,394,825 | |||||
Dicks Sporting Goods | 49,964 | 1,990,066 | |||||
Monro Muffler Brake | 46,150 | 1,926,763 | |||||
USS | 36,100 | 716,704 | |||||
| 11,604,664 | |||||||
| TEXTILES, APPAREL & LUXURY GOODS - 1.7% | |||||||
Coach | 14,900 | 705,366 | |||||
Wolverine World Wide | 109,300 | 3,061,493 | |||||
| 3,766,859 | |||||||
| Total (Cost $41,870,376) | 54,291,141 | ||||||
| CONSUMER STAPLES – 2.4% | |||||||
| FOOD & STAPLES RETAILING - 0.7% | |||||||
Casey’s General Stores | 14,800 | 1,585,228 | |||||
| FOOD PRODUCTS - 1.7% | |||||||
Cal-Maine Foods 1 | 32,900 | 1,302,840 | |||||
†Hormel Foods | 70,257 | 2,396,466 | |||||
| 3,699,306 | |||||||
| Total (Cost $5,511,073) | 5,284,534 | ||||||
| FINANCIALS – 8.8% | |||||||
| CAPITAL MARKETS - 5.7% | |||||||
Affiliated Managers Group | 27,080 | 4,491,489 | |||||
Lazard Cl. A | 92,033 | 4,263,889 | |||||
Oaktree Capital Group LLC Cl. A | 52,587 | 2,450,554 | |||||
SEI Investments | 22,700 | 1,220,806 | |||||
| 12,426,738 | |||||||
| INSURANCE - 3.1% | |||||||
Alleghany Corporation 1 | 11,164 | 6,640,347 | |||||
Brown & Brown | 4,700 | 202,429 | |||||
| 6,842,776 | |||||||
| Total (Cost $16,055,036) | 19,269,514 | ||||||
| HEALTH CARE – 3.4% | |||||||
| HEALTH CARE EQUIPMENT & SUPPLIES - 2.6% | |||||||
Dentsply Sirona | 46,650 | 3,024,786 | |||||
Hill-Rom Holdings | 34,751 | 2,766,527 | |||||
| 5,791,313 | |||||||
| LIFE SCIENCES TOOLS & SERVICES - 0.8% | |||||||
Bio-Techne | 14,500 | 1,703,750 | |||||
| Total (Cost $6,393,497) | 7,495,063 | ||||||
| INDUSTRIALS – 27.2% | |||||||
| AEROSPACE & DEFENSE - 1.7% | |||||||
HEICO Corporation | 9,000 | 646,560 | |||||
Teledyne Technologies 1 | 23,319 | 2,976,670 | |||||
| 3,623,230 | |||||||
| AIR FREIGHT & LOGISTICS - 0.5% | |||||||
Expeditors International of Washington | 20,900 | 1,180,432 | |||||
| BUILDING PRODUCTS - 1.2% | |||||||
Simpson Manufacturing | 61,412 | 2,684,319 | |||||
| COMMERCIAL SERVICES & SUPPLIES - 3.7% | |||||||
Cintas Corporation | 8,700 | 1,096,548 | |||||
Copart 1 | 221,750 | 7,049,433 | |||||
| 8,145,981 | |||||||
| CONSTRUCTION & ENGINEERING - 2.4% | |||||||
Valmont Industries | 35,694 | 5,339,822 | |||||
| ELECTRICAL EQUIPMENT - 2.4% | |||||||
Generac Holdings 1 | 27,100 | 979,123 | |||||
Hubbell Cl. B | 37,722 | 4,268,999 | |||||
| 5,248,122 | |||||||
| INDUSTRIAL CONGLOMERATES - 1.4% | |||||||
Carlisle Companies | 31,017 | 2,959,022 | |||||
| MACHINERY - 4.4% | |||||||
Franklin Electric | 24,000 | 993,600 | |||||
Lincoln Electric Holdings | 29,000 | 2,670,610 | |||||
| 20,603 | 1,385,552 | ||||||
Sun Hydraulics | 53,000 | 2,261,510 | |||||
Westinghouse Air Brake Technologies | 25,305 | 2,315,407 | |||||
| 9,626,679 | |||||||
| MARINE - 1.9% | |||||||
Kirby Corporation 1 | 63,000 | 4,211,550 | |||||
| PROFESSIONAL SERVICES - 5.8% | |||||||
Equifax | 18,025 | 2,476,995 | |||||
IHS Markit 1 | 85,468 | 3,764,011 | |||||
ManpowerGroup | 51,175 | 5,713,689 | |||||
| 10,000 | 843,700 | ||||||
| 12,798,395 | |||||||
| ROAD & RAIL - 1.0% | |||||||
Landstar System | 26,400 | 2,259,840 | |||||
| TRADING COMPANIES & DISTRIBUTORS - 0.8% | |||||||
Diploma | 114,300 | 1,645,013 | |||||
| Total (Cost $45,247,648) | 59,722,405 | ||||||
| INFORMATION TECHNOLOGY – 11.5% | |||||||
| ELECTRONIC EQUIPMENT, INSTRUMENTS & COMPONENTS - 6.0% | |||||||
AVX Corporation | 224,713 | 3,671,811 | |||||
Coherent 1 | 6,500 | 1,462,435 | |||||
| 70 | The Royce Funds 2017 Semiannual Report to Shareholders | THE ACCOMPANYING NOTES ARE AN INTEGRAL PART OF THESE FINANCIAL STATEMENTS |
| June 30, 2017 (unaudited) |
| Royce Small/Mid-Cap Premier Fund (continued) | |||||||
| SHARES | VALUE | ||||||
| INFORMATION TECHNOLOGY (continued) | |||||||
| ELECTRONIC EQUIPMENT, INSTRUMENTS & COMPONENTS (continued) | |||||||
II-VI 1 | 38,800 | $ | 1,330,840 | ||||
IPG Photonics 1 | 35,500 | 5,151,050 | |||||
Littelfuse | 9,300 | 1,534,500 | |||||
| 13,150,636 | |||||||
| IT SERVICES - 1.8% | |||||||
DST Systems | 65,812 | 4,060,600 | |||||
| SEMICONDUCTORS & SEMICONDUCTOR EQUIPMENT - 2.5% | |||||||
Cabot Microelectronics | 22,080 | 1,630,166 | |||||
Lam Research | 26,900 | 3,804,467 | |||||
| 5,434,633 | |||||||
| SOFTWARE - 1.2% | |||||||
| 25,235 | 2,752,634 | ||||||
| Total (Cost $18,891,403) | 25,398,503 | ||||||
| MATERIALS – 8.2% | |||||||
| CHEMICALS - 6.8% | |||||||
Minerals Technologies | 62,880 | 4,602,816 | |||||
†NewMarket Corporation | 5,325 | 2,452,056 | |||||
RPM International | 11,000 | 600,050 | |||||
Sensient Technologies | 19,109 | 1,538,848 | |||||
Westlake Chemical | 84,900 | 5,621,229 | |||||
| 14,814,999 | |||||||
| METALS & MINING - 0.8% | |||||||
Reliance Steel & Aluminum | 24,650 | 1,794,766 | |||||
| PAPER & FOREST PRODUCTS - 0.6% | |||||||
Stella-Jones | 39,400 | 1,344,729 | |||||
| Total (Cost $14,620,729) | 17,954,494 | ||||||
| REAL ESTATE – 4.4% | |||||||
| REAL ESTATE MANAGEMENT & DEVELOPMENT - 4.4% | |||||||
Jones Lang LaSalle | 26,540 | 3,317,500 | |||||
Kennedy Wilson Europe Real Estate | 145,500 | 2,103,521 | |||||
Kennedy-Wilson Holdings | 45,595 | 868,585 | |||||
Realogy Holdings | 104,600 | 3,394,270 | |||||
| Total (Cost $8,695,544) | 9,683,876 | ||||||
| UTILITIES – 1.4% | |||||||
| GAS UTILITIES - 1.4% | |||||||
UGI Corporation | 61,794 | 2,991,448 | |||||
| Total (Cost $1,831,399) | 2,991,448 | ||||||
| MISCELLANEOUS 2 – 0.7% | |||||||
| Total (Cost $1,622,613) | 1,654,041 | ||||||
| TOTAL COMMON STOCKS | |||||||
| (Cost $160,739,318) | 203,745,019 | ||||||
| REPURCHASE AGREEMENT – 9.2% | |||||||
| Fixed Income Clearing Corporation, 0.12% dated 6/30/17, due 7/3/17, maturity value $20,316,203 (collateralized by obligations of various U.S. Government Agencies, 2.375% due 8/15/24, valued at $20,723,395) | |||||||
| (Cost $20,316,000) | $ | 20,316,000 | |||||
| PRINCIPAL | |||||||
| AMOUNT | |||||||
| COLLATERAL RECEIVED FOR SECURITIES LOANED – 1.9% | |||||||
| U.S. Treasury Bills | |||||||
due 7/6/17-3/1/18 | $ | 415,724 | 415,709 | ||||
| U.S. Treasury Bonds | |||||||
2.25%-7.625% | |||||||
due 2/15/25-2/15/47 | 311,542 | 314,948 | |||||
| U.S. Treasury Notes | |||||||
0.625%-3.625% | |||||||
due 8/31/17-2/15/27 | 2,750,961 | 2,764,709 | |||||
| U.S. Treasury Notes - Floating Rate | |||||||
due 7/31/17-1/31/19 | 60,066 | 60,065 | |||||
| U.S. Treasury Strips - Interest | |||||||
due 11/15/25-2/15/40 | 1,848 | 1,854 | |||||
| U.S. Treasury TIPS | |||||||
0.125%-2.50% | |||||||
due 4/15/18-2/15/46 | 658,948 | 659,976 | |||||
| TOTAL COLLATERAL RECEIVED FOR SECURITIES LOANED | |||||||
| (Cost $4,217,261) | 4,217,261 | ||||||
| TOTAL INVESTMENTS – 103.8% | |||||||
| (Cost $185,272,579) | 228,278,280 | ||||||
| LIABILITIES LESS CASH AND OTHER ASSETS – (3.8)% | (8,395,383 | ) | |||||
| NET ASSETS – 100.0% | $ | 219,882,897 | |||||
| THE ACCOMPANYING NOTES ARE AN INTEGRAL PART OF THESE FINANCIAL STATEMENTS | The Royce Funds 2017 Semiannual Report to Shareholders | 71 |
| Schedules of Investments |
| Royce Smaller-Companies Growth Fund | |||||||
| Common Stocks – 93.0% | |||||||
| SHARES | VALUE | ||||||
| CONSUMER DISCRETIONARY – 5.9% | |||||||
| AUTO COMPONENTS - 0.2% | |||||||
LCI Industries | 9,000 | $ | 921,600 | ||||
| HOTELS, RESTAURANTS & LEISURE - 3.0% | |||||||
Dave & Busters Entertainment 1 | 60,000 | 3,990,600 | |||||
Del Taco Restaurants 1 | 217,700 | 2,993,375 | |||||
Texas Roadhouse | 98,000 | 4,993,100 | |||||
| 11,977,075 | |||||||
| HOUSEHOLD DURABLES - 0.5% | |||||||
iRobot Corporation 1 | 22,000 | 1,851,080 | |||||
| LEISURE PRODUCTS - 1.0% | |||||||
Callaway Golf | 302,000 | 3,859,560 | |||||
| TEXTILES, APPAREL & LUXURY GOODS - 1.2% | |||||||
Carter’s | 9,900 | 880,605 | |||||
Cherokee 1 | 230,000 | 1,598,500 | |||||
Columbia Sportswear | 15,000 | 870,900 | |||||
Gildan Activewear | 47,666 | 1,464,776 | |||||
| 4,814,781 | |||||||
| Total (Cost $15,000,220) | 23,424,096 | ||||||
| ENERGY – 1.7% | |||||||
| ENERGY EQUIPMENT & SERVICES - 0.8% | |||||||
Pason Systems | 205,000 | 3,057,295 | |||||
| OIL, GAS & CONSUMABLE FUELS - 0.9% | |||||||
Centennial Resource Development Cl. A 1 | 111,000 | 1,756,020 | |||||
RSP Permian 1 | 56,000 | 1,807,120 | |||||
| 3,563,140 | |||||||
| Total (Cost $3,962,369) | 6,620,435 | ||||||
| FINANCIALS – 11.4% | |||||||
| BANKS - 6.4% | |||||||
Ameris Bancorp | 60,000 | 2,892,000 | |||||
†Banc of California | 142,000 | 3,053,000 | |||||
Enterprise Financial Services | 138,500 | 5,650,800 | |||||
Live Oak Bancshares | 60,700 | 1,468,940 | |||||
ServisFirst Bancshares | 85,000 | 3,135,650 | |||||
State Bank Financial | 79,500 | 2,156,040 | |||||
TriState Capital Holdings 1 | 279,057 | 7,032,236 | |||||
| 25,388,666 | |||||||
| CAPITAL MARKETS - 4.4% | |||||||
Financial Engines | 157,800 | 5,775,480 | |||||
Northern Trust | 51,000 | 4,957,710 | |||||
Oaktree Capital Group LLC Cl. A | 55,800 | 2,600,280 | |||||
WisdomTree Investments | 383,200 | 3,897,144 | |||||
| 17,230,614 | |||||||
| THRIFTS & MORTGAGE FINANCE - 0.6% | |||||||
OceanFirst Financial | 86,000 | 2,332,320 | |||||
| Total (Cost $31,504,623) | 44,951,600 | ||||||
| HEALTH CARE – 16.0% | |||||||
| BIOTECHNOLOGY - 4.8% | |||||||
Clovis Oncology 1 | 66,000 | 6,179,580 | |||||
Progenics Pharmaceuticals 1 | 468,200 | 3,179,078 | |||||
| 70,000 | 2,900,800 | ||||||
| 335,799 | 6,731,093 | ||||||
| 18,990,551 | |||||||
| HEALTH CARE EQUIPMENT & SUPPLIES - 3.0% | |||||||
| 20,000 | 2,866,000 | ||||||
Entellus Medical 1 | 134,526 | 2,227,751 | |||||
Inogen 1 | 37,755 | 3,602,582 | |||||
Penumbra 1 | 10,000 | 877,500 | |||||
West Pharmaceutical Services | 23,000 | 2,173,960 | |||||
| 11,747,793 | |||||||
| HEALTH CARE PROVIDERS & SERVICES - 1.9% | |||||||
BioTelemetry 1 | 127,709 | 4,271,866 | |||||
HealthEquity 1 | 62,000 | 3,089,460 | |||||
| 7,361,326 | |||||||
| HEALTH CARE TECHNOLOGY - 0.5% | |||||||
| 84,000 | 2,210,880 | ||||||
| LIFE SCIENCES TOOLS & SERVICES - 2.0% | |||||||
Cambrex Corporation 1 | 43,500 | 2,599,125 | |||||
| 582,000 | 5,214,720 | ||||||
| 7,813,845 | |||||||
| PHARMACEUTICALS - 3.8% | |||||||
†Axsome Therapeutics 1 | 656,000 | 3,608,000 | |||||
| 21,000 | 2,143,470 | ||||||
Intersect ENT 1 | 94,000 | 2,627,300 | |||||
| 159,000 | 6,852,900 | ||||||
| 15,231,670 | |||||||
| Total (Cost $38,765,522) | 63,356,065 | ||||||
| INDUSTRIALS – 11.5% | |||||||
| AEROSPACE & DEFENSE - 0.5% | |||||||
Mercury Systems 1 | 49,749 | 2,093,935 | |||||
| AIR FREIGHT & LOGISTICS - 1.8% | |||||||
Atlas Air Worldwide Holdings 1 | 74,000 | 3,859,100 | |||||
Forward Air | 63,000 | 3,356,640 | |||||
| 7,215,740 | |||||||
| BUILDING PRODUCTS - 1.6% | |||||||
DIRTT Environmental Solutions 1 | 1,214,000 | 6,412,631 | |||||
| CONSTRUCTION & ENGINEERING - 0.8% | |||||||
NV5 Global 1 | 69,585 | 2,957,363 | |||||
| MACHINERY - 2.5% | |||||||
Astec Industries | 36,000 | 1,998,360 | |||||
| 16,000 | 1,076,000 | ||||||
Tennant Company | 44,937 | 3,316,351 | |||||
Woodward | 50,000 | 3,379,000 | |||||
| 9,769,711 | |||||||
| MARINE - 2.1% | |||||||
Clarkson | 179,976 | 5,921,188 | |||||
| 335,000 | 2,378,500 | ||||||
| 8,299,688 | |||||||
| PROFESSIONAL SERVICES - 1.1% | |||||||
| 77,000 | 4,169,550 | ||||||
| TRADING COMPANIES & DISTRIBUTORS - 1.1% | |||||||
| 87,000 | 4,529,220 | ||||||
| Total (Cost $36,012,037) | 45,447,838 | ||||||
| INFORMATION TECHNOLOGY – 33.6% | |||||||
| ELECTRONIC EQUIPMENT, INSTRUMENTS & COMPONENTS - 8.7% | |||||||
| 185,623 | 2,632,134 | ||||||
Cognex Corporation | 20,000 | 1,698,000 | |||||
Coherent 1 | 16,000 | 3,599,840 | |||||
ePlus 1 | 81,000 | 6,002,100 | |||||
FLIR Systems | 93,600 | 3,244,176 | |||||
IPG Photonics 1 | 41,444 | 6,013,525 | |||||
| 526,000 | 3,271,720 | ||||||
| 154,000 | 2,605,680 | ||||||
†Universal Display | 49,000 | 5,353,250 | |||||
| 34,420,425 | |||||||
| 72 | The Royce Funds 2017 Semiannual Report to Shareholders | THE ACCOMPANYING NOTES ARE AN INTEGRAL PART OF THESE FINANCIAL STATEMENTS |
| June 30, 2017 (unaudited) |
| Royce Smaller-Companies Growth Fund (continued) | |||||||
| SHARES | VALUE | ||||||
| INFORMATION TECHNOLOGY (continued) | |||||||
| INTERNET SOFTWARE & SERVICES - 8.0% | |||||||
Amber Road 1 | 367,000 | $ | 3,145,190 | ||||
Carbonite 1 | 162,000 | 3,531,600 | |||||
| 256,071 | 6,709,060 | ||||||
| 139,000 | 5,136,050 | ||||||
Shopify Cl. A 1 | 56,000 | 4,866,400 | |||||
Stamps.com 1 | 32,000 | 4,956,000 | |||||
2U 1 | 68,348 | 3,206,888 | |||||
| 31,551,188 | |||||||
| IT SERVICES - 3.6% | |||||||
Planet Payment 1 | 277,000 | 914,100 | |||||
†Square Cl. A 1 | 235,000 | 5,513,100 | |||||
Unisys Corporation 1 | 629,000 | 8,051,200 | |||||
| 14,478,400 | |||||||
| SEMICONDUCTORS & SEMICONDUCTOR EQUIPMENT - 4.6% | |||||||
†Ambarella 1 | 34,000 | 1,650,700 | |||||
| 25,000 | 1,136,250 | ||||||
| 277,000 | 5,720,050 | ||||||
| 100,000 | 2,016,000 | ||||||
Inphi Corporation 1 | 50,000 | 1,715,000 | |||||
| 76,100 | 1,962,619 | ||||||
| 69,000 | 3,848,130 | ||||||
| 18,048,749 | |||||||
| SOFTWARE - 8.7% | |||||||
| 82,000 | 2,884,760 | ||||||
†Callidus Software 1 | 132,000 | 3,194,400 | |||||
| 169,000 | 2,458,950 | ||||||
HubSpot 1 | 53,000 | 3,484,750 | |||||
| 453,577 | 5,383,959 | ||||||
Paylocity Holding Corporation 1 | 130,786 | 5,908,911 | |||||
QAD Cl. A | 213,000 | 6,826,650 | |||||
RingCentral Cl. A 1 | 123,000 | 4,495,650 | |||||
| 34,638,030 | |||||||
| Total (Cost $95,058,345) | 133,136,792 | ||||||
| MATERIALS – 5.9% | |||||||
| CHEMICALS - 2.0% | |||||||
Albemarle Corporation | 47,000 | 4,960,380 | |||||
Kraton Corporation 1 | 91,000 | 3,134,040 | |||||
| 8,094,420 | |||||||
| CONSTRUCTION MATERIALS - 2.4% | |||||||
Eagle Materials | 53,000 | 4,898,260 | |||||
| 154,780 | 4,468,499 | ||||||
| 9,366,759 | |||||||
| METALS & MINING - 1.5% | |||||||
Orocobre 1 | 2,150,000 | 5,734,140 | |||||
| Total (Cost $17,005,968) | 23,195,319 | ||||||
| REAL ESTATE – 1.9% | |||||||
| EQUITY REAL ESTATE INVESTMENT TRUSTS (REITS) - 1.9% | |||||||
Community Healthcare Trust | 128,000 | 3,275,520 | |||||
CyrusOne | 78,000 | 4,348,500 | |||||
| Total (Cost $5,135,970) | 7,624,020 | ||||||
| TELECOMMUNICATION SERVICES – 0.9% | |||||||
| DIVERSIFIED TELECOMMUNICATION SERVICES - 0.9% | |||||||
ORBCOMM 1 | 325,000 | 3,672,500 | |||||
| Total (Cost $1,909,714) | 3,672,500 | ||||||
| MISCELLANEOUS 2 – 4.2% | |||||||
| Total (Cost $16,148,866) | 16,791,440 | ||||||
| TOTAL COMMON STOCKS | |||||||
| (Cost $260,503,634) | 368,220,105 | ||||||
| REPURCHASE AGREEMENT – 6.9% | |||||||
| Fixed Income Clearing Corporation, 0.12% dated 6/30/17, due 7/3/17, maturity value $27,192,272 (collateralized by obligations of various U.S. Government Agencies, 2.375% due 8/15/24, valued at $27,740,704) | |||||||
| (Cost $27,192,000) | 27,192,000 | ||||||
| PRINCIPAL | |||||||
| AMOUNT | |||||||
| COLLATERAL RECEIVED FOR SECURITIES LOANED – 10.4% | |||||||
| U.S. Treasury Bills | |||||||
due 7/6/17-3/1/18 | $ | 2,047,479 | 2,047,406 | ||||
| U.S. Treasury Bonds | |||||||
2.25%-7.625% | |||||||
due 2/15/25-2/15/47 | 1,404,641 | 1,421,507 | |||||
| U.S. Treasury Notes | |||||||
0.625%-3.625% | |||||||
due 8/31/17-2/15/27 | 20,243,196 | 20,327,810 | |||||
| U.S. Treasury Notes - Floating Rate | |||||||
due 7/31/17-1/31/19 | 331,529 | 331,524 | |||||
| U.S. Treasury Strips - Interest | |||||||
due 11/15/25-2/15/40 | 16,664 | 16,716 | |||||
| U.S. Treasury TIPS | |||||||
0.125%-2.50% | |||||||
due 4/15/18-2/15/46 | 2,406,212 | 2,409,511 | |||||
| Money Market Funds | |||||||
Federated Government Obligations Fund (7 day yield-0.8114%) | 14,584,266 | ||||||
| TOTAL COLLATERAL RECEIVED FOR SECURITIES LOANED | |||||||
| (Cost $41,138,740) | 41,138,740 | ||||||
| TOTAL INVESTMENTS – 110.3% | |||||||
| (Cost $328,834,374) | 436,550,845 | ||||||
| LIABILITIES LESS CASH AND OTHER ASSETS – (10.3)% | (40,615,048 | ) | |||||
| NET ASSETS – 100.0% | $ | 395,935,797 | |||||
| THE ACCOMPANYING NOTES ARE AN INTEGRAL PART OF THESE FINANCIAL STATEMENTS | The Royce Funds 2017 Semiannual Report to Shareholders | 73 |
| Schedules of Investments |
| Royce Special Equity Fund | |||||||
| Common Stocks – 91.0% | |||||||
| SHARES | VALUE | ||||||
| CONSUMER DISCRETIONARY – 38.2% | |||||||
| AUTO COMPONENTS - 8.7% | |||||||
Cooper Tire & Rubber | 1,435,000 | $ | 51,803,500 | ||||
Gentex Corporation | 820,000 | 15,555,400 | |||||
Standard Motor Products 6 | 1,280,000 | 66,841,600 | |||||
| 134,200,500 | |||||||
| AUTOMOBILES - 2.0% | |||||||
Winnebago Industries | 865,000 | 30,275,000 | |||||
| DIVERSIFIED CONSUMER SERVICES - 3.3% | |||||||
Capella Education 6 | 585,000 | 50,076,000 | |||||
| HOTELS, RESTAURANTS & LEISURE - 0.3% | |||||||
Bowl America Cl. A 6 | 343,000 | 4,970,070 | |||||
| HOUSEHOLD DURABLES - 9.3% | |||||||
Bassett Furniture Industries 6 | 800,000 | 30,360,000 | |||||
CSS Industries 6 | 885,000 | 23,151,600 | |||||
Ethan Allen Interiors | 392,500 | 12,677,750 | |||||
Flexsteel Industries 6 | 562,000 | 30,409,820 | |||||
Hooker Furniture 6 | 1,110,000 | 45,676,500 | |||||
| 142,275,670 | |||||||
| MEDIA - 8.1% | |||||||
Meredith Corporation | 896,000 | 53,267,200 | |||||
Scholastic Corporation | 1,620,000 | 70,615,800 | |||||
| 123,883,000 | |||||||
| SPECIALTY RETAIL - 6.5% | |||||||
Children’s Place | 797,500 | 81,424,750 | |||||
Haverty Furniture | 740,000 | 18,574,000 | |||||
| 99,998,750 | |||||||
| Total (Cost $392,630,269) | 585,678,990 | ||||||
| CONSUMER STAPLES – 6.2% | |||||||
| FOOD & STAPLES RETAILING - 3.4% | |||||||
Weis Markets | 1,061,000 | 51,691,920 | |||||
| FOOD PRODUCTS - 2.8% | |||||||
John B. Sanfilippo & Son 6 | 680,000 | 42,914,800 | |||||
| Total (Cost $78,099,865) | 94,606,720 | ||||||
| INDUSTRIALS – 21.0% | |||||||
| AEROSPACE & DEFENSE - 3.3% | |||||||
National Presto Industries 6 | 464,000 | 51,272,000 | |||||
| BUILDING PRODUCTS - 1.6% | |||||||
Insteel Industries | 730,000 | 24,068,100 | |||||
| COMMERCIAL SERVICES & SUPPLIES - 6.9% | |||||||
Ennis | 72,367 | 1,382,210 | |||||
Herman Miller | 955,000 | 29,032,000 | |||||
UniFirst Corporation | 533,000 | 74,993,100 | |||||
| 105,407,310 | |||||||
| ELECTRICAL EQUIPMENT - 3.9% | |||||||
Hubbell Cl. B | 525,000 | 59,414,250 | |||||
| MACHINERY - 3.6% | |||||||
†Gencor Industries 1 | 268,440 | 4,348,728 | |||||
Hurco Companies 6 | 525,000 | 18,243,750 | |||||
Kadant | 130,000 | 9,776,000 | |||||
Wabash National | 1,050,000 | 23,079,000 | |||||
| 55,447,478 | |||||||
| PROFESSIONAL SERVICES - 1.5% | |||||||
Kelly Services Cl. A | 110,000 | 2,469,500 | |||||
Resources Connection 6 | 1,505,000 | 20,618,500 | |||||
| 23,088,000 | |||||||
| TRADING COMPANIES & DISTRIBUTORS - 0.2% | |||||||
Central Steel & Wire 3 | 6,500 | 3,575,000 | |||||
| Total (Cost $191,132,052) | 322,272,138 | ||||||
| INFORMATION TECHNOLOGY – 17.3% | |||||||
| COMMUNICATIONS EQUIPMENT - 1.1% | |||||||
†NETGEAR 1 | 365,000 | 15,731,500 | |||||
| ELECTRONIC EQUIPMENT, INSTRUMENTS & COMPONENTS - 9.6% | |||||||
AVX Corporation | 5,000,000 | 81,700,000 | |||||
Park Electrochemical 6 | 1,955,000 | 36,011,100 | |||||
Vishay Intertechnology | 1,760,000 | 29,216,000 | |||||
| 146,927,100 | |||||||
| IT SERVICES - 2.3% | |||||||
| 755,500 | 35,508,500 | ||||||
| SEMICONDUCTORS & SEMICONDUCTOR EQUIPMENT - 4.3% | |||||||
†Kulicke & Soffa Industries 1 | 770,400 | 14,653,008 | |||||
Teradyne | 1,716,000 | 51,531,480 | |||||
| 66,184,488 | |||||||
| Total (Cost $209,799,724) | 264,351,588 | ||||||
| MATERIALS – 6.3% | |||||||
| CHEMICALS - 0.4% | |||||||
Hawkins | 145,000 | 6,720,750 | |||||
| METALS & MINING - 2.8% | |||||||
Kaiser Aluminum | 475,000 | 42,047,000 | |||||
| PAPER & FOREST PRODUCTS - 3.1% | |||||||
Neenah Paper | 600,000 | 48,150,000 | |||||
| Total (Cost $68,679,689) | 96,917,750 | ||||||
| REAL ESTATE – 2.0% | |||||||
| REAL ESTATE MANAGEMENT & DEVELOPMENT - 2.0% | |||||||
Marcus & Millichap 1 | 1,138,500 | 30,010,860 | |||||
| Total (Cost $29,926,649) | 30,010,860 | ||||||
| TOTAL COMMON STOCKS | |||||||
| (Cost $970,268,248) | 1,393,838,046 | ||||||
| REPURCHASE AGREEMENT– 9.1% | |||||||
| Fixed Income Clearing Corporation, 0.12% dated 6/30/17, due 7/3/17, maturity value $138,964,390 (collateralized by obligations of various U.S. Government Agencies, 0.25%- 2.25% due 11/15/24-1/15/25, valued at $141,744,273) | |||||||
| (Cost $138,963,000) | 138,963,000 | ||||||
| TOTAL INVESTMENTS – 100.1% | |||||||
| (Cost $1,109,231,248) | 1,532,801,046 | ||||||
| LIABILITIES LESS CASH AND OTHER ASSETS – (0.1)% | (894,440 | ) | |||||
| NET ASSETS – 100.0% | $ | 1,531,906,606 | |||||
| 74 | The Royce Funds 2017 Semiannual Report to Shareholders | THE ACCOMPANYING NOTES ARE AN INTEGRAL PART OF THESE FINANCIAL STATEMENTS |
| June 30, 2017 (unaudited) |
| Royce Special Equity Multi-Cap Fund | |||||||
| Common Stocks – 91.1% | |||||||
| SHARES | VALUE | ||||||
| CONSUMER DISCRETIONARY – 26.2% | |||||||
| DISTRIBUTORS - 7.2% | |||||||
Genuine Parts | 85,000 | $ | 7,884,600 | ||||
| HOTELS, RESTAURANTS & LEISURE - 3.0% | |||||||
McDonald’s | 21,500 | 3,292,940 | |||||
| HOUSEHOLD DURABLES - 2.3% | |||||||
Leggett & Platt | 49,000 | 2,573,970 | |||||
| SPECIALTY RETAIL - 8.6% | |||||||
Dicks Sporting Goods | 154,000 | 6,133,820 | |||||
Lowe’s Companies | 43,000 | 3,333,790 | |||||
| 9,467,610 | |||||||
| TEXTILES, APPAREL & LUXURY GOODS - 5.1% | |||||||
Ralph Lauren Cl. A | 19,100 | 1,409,580 | |||||
VF Corporation | 73,500 | 4,233,600 | |||||
| 5,643,180 | |||||||
| Total (Cost $26,630,402) | 28,862,300 | ||||||
| CONSUMER STAPLES – 7.5% | |||||||
| FOOD PRODUCTS - 2.3% | |||||||
Hormel Foods | 73,000 | 2,490,030 | |||||
| HOUSEHOLD PRODUCTS - 5.2% | |||||||
Kimberly-Clark | 24,000 | 3,098,640 | |||||
Procter & Gamble | 30,000 | 2,614,500 | |||||
| 5,713,140 | |||||||
| Total (Cost $8,108,635) | 8,203,170 | ||||||
| FINANCIALS – 1.0% | |||||||
| INSURANCE - 1.0% | |||||||
Brown & Brown | 26,000 | 1,119,820 | |||||
| Total (Cost $1,135,306) | 1,119,820 | ||||||
| INDUSTRIALS – 37.5% | |||||||
| AEROSPACE & DEFENSE - 5.6% | |||||||
General Dynamics | 16,500 | 3,268,650 | |||||
United Technologies | 23,500 | 2,869,585 | |||||
| 6,138,235 | |||||||
| AIR FREIGHT & LOGISTICS - 1.1% | |||||||
Expeditors International of Washington | 21,000 | 1,186,080 | |||||
| ELECTRICAL EQUIPMENT - 1.1% | |||||||
Emerson Electric | 21,500 | 1,281,830 | |||||
| INDUSTRIAL CONGLOMERATES - 3.9% | |||||||
Carlisle Companies | 28,000 | 2,671,200 | |||||
3M | 7,700 | 1,603,063 | |||||
| 4,274,263 | |||||||
| MACHINERY - 20.4% | |||||||
Cummins | 10,000 | 1,622,200 | |||||
Illinois Tool Works | 56,000 | 8,022,000 | |||||
Parker Hannifin | 35,000 | 5,593,700 | |||||
Snap-on | 26,000 | 4,108,000 | |||||
Stanley Black & Decker | 22,300 | 3,138,279 | |||||
| 22,484,179 | |||||||
| PROFESSIONAL SERVICES - 2.3% | |||||||
ManpowerGroup | 23,000 | 2,567,950 | |||||
| TRADING COMPANIES & DISTRIBUTORS - 3.1% | |||||||
Grainger (W.W.) | 19,200 | 3,466,176 | |||||
| Total (Cost $30,193,863) | 41,398,713 | ||||||
| INFORMATION TECHNOLOGY – 16.2% | |||||||
| COMMUNICATIONS EQUIPMENT - 4.0% | |||||||
Cisco Systems | 141,000 | 4,413,300 | |||||
| ELECTRONIC EQUIPMENT, INSTRUMENTS & COMPONENTS - 2.2% | |||||||
Avnet | 61,500 | 2,391,120 | |||||
| TECHNOLOGY HARDWARE, STORAGE & PERIPHERALS - 10.0% | |||||||
Apple | 77,000 | 11,089,540 | |||||
| Total (Cost $12,286,863) | 17,893,960 | ||||||
| MATERIALS – 2.7% | |||||||
| CHEMICALS - 2.7% | |||||||
NewMarket Corporation | 6,500 | 2,993,120 | |||||
| Total (Cost $2,739,778) | 2,993,120 | ||||||
| TOTAL COMMON STOCKS | |||||||
| (Cost $81,094,847) | 100,471,083 | ||||||
| REPURCHASE AGREEMENT– 9.3% | |||||||
| Fixed Income Clearing Corporation, 0.12% dated 6/30/17, due 7/3/17, maturity value $10,308,103 (collateralized by obligations of various U.S. Government Agencies, 2.375% due 8/15/24, valued at $10,518,265) | |||||||
| (Cost $10,308,000) | 10,308,000 | ||||||
| TOTAL INVESTMENTS – 100.4% | |||||||
| (Cost $91,402,847) | 110,779,083 | ||||||
| LIABILITIES LESS CASH AND OTHER ASSETS – (0.4)% | (457,446 | ) | |||||
| NET ASSETS – 100.0% | $ | 110,321,637 | |||||
| THE ACCOMPANYING NOTES ARE AN INTEGRAL PART OF THESE FINANCIAL STATEMENTS | The Royce Funds 2017 Semiannual Report to Shareholders | 75 |
Schedules of Investments
| Royce Total Return Fund | |||||||
| Common Stocks – 97.1% | |||||||
| SHARES | VALUE | ||||||
| CONSUMER DISCRETIONARY – 9.8% | |||||||
| AUTO COMPONENTS - 1.6% | |||||||
Cooper Tire & Rubber | 52,180 | $ | 1,883,698 | ||||
Gentex Corporation | 1,280,184 | 24,285,091 | |||||
Nokian Renkaat | 161,284 | 6,675,787 | |||||
Standard Motor Products | 91,445 | 4,775,258 | |||||
STRATTEC SECURITY | 99,881 | 3,535,787 | |||||
| 41,155,621 | |||||||
| AUTOMOBILES - 1.2% | |||||||
Thor Industries | 302,364 | 31,603,085 | |||||
| DISTRIBUTORS - 0.3% | |||||||
Weyco Group | 264,397 | 7,371,388 | |||||
| DIVERSIFIED CONSUMER SERVICES - 0.3% | |||||||
Capella Education | 33,464 | 2,864,518 | |||||
Liberty Tax Cl. A | 454,430 | 5,884,869 | |||||
| 8,749,387 | |||||||
| HOTELS, RESTAURANTS & LEISURE - 0.1% | |||||||
Brinker International | 39,520 | 1,505,712 | |||||
Cheesecake Factory | 32,527 | 1,636,108 | |||||
Imvescor Restaurant Group | 18,774 | 53,131 | |||||
| 3,194,951 | |||||||
| HOUSEHOLD DURABLES - 1.3% | |||||||
Bassett Furniture Industries | 48,994 | 1,859,322 | |||||
Ethan Allen Interiors | 712,935 | 23,027,801 | |||||
Flexsteel Industries | 109,638 | 5,932,512 | |||||
La-Z-Boy | 100,864 | 3,278,080 | |||||
| 34,097,715 | |||||||
| INTERNET & DIRECT MARKETING RETAIL - 0.6% | |||||||
HSN | 56,149 | 1,791,153 | |||||
PetMed Express | 301,167 | 12,227,380 | |||||
| 14,018,533 | |||||||
| MEDIA - 1.3% | |||||||
Gannett Company | 303,941 | 2,650,366 | |||||
Meredith Corporation | 260,018 | 15,458,070 | |||||
Saga Communications Cl. A | 194,831 | 8,913,518 | |||||
Wiley (John) & Sons Cl. A | 120,855 | 6,375,101 | |||||
| 33,397,055 | |||||||
| MULTILINE RETAIL - 0.3% | |||||||
Big Lots | 37,155 | 1,794,587 | |||||
Dillard’s Cl. A | 110,538 | 6,376,937 | |||||
| 8,171,524 | |||||||
| SPECIALTY RETAIL - 2.1% | |||||||
Aaron’s | 37,776 | 1,469,486 | |||||
American Eagle Outfitters | 1,179,768 | 14,216,204 | |||||
Buckle (The) | 254,320 | 4,526,896 | |||||
Caleres | 59,593 | 1,655,494 | |||||
Cato Corporation (The) Cl. A | 295,451 | 5,196,983 | |||||
Children’s Place | 37,725 | 3,851,723 | |||||
DSW Cl. A | 613,277 | 10,855,003 | |||||
GameStop Corporation Cl. A | 84,533 | 1,826,758 | |||||
Shoe Carnival | 554,079 | 11,569,170 | |||||
| 55,167,717 | |||||||
| TEXTILES, APPAREL & LUXURY GOODS - 0.7% | |||||||
Columbia Sportswear | 101,515 | 5,893,961 | |||||
J.G. Boswell Company 3 | 1,138 | 747,666 | |||||
Movado Group | 79,583 | 2,009,471 | |||||
Steven Madden 1 | 242,374 | 9,682,841 | |||||
| 18,333,939 | |||||||
| Total (Cost $189,220,146) | 255,260,915 | ||||||
| CONSUMER STAPLES – 3.1% | |||||||
| BEVERAGES - 0.2% | |||||||
Compania Cervecerias Unidas ADR | 209,046 | 5,485,367 | |||||
| FOOD & STAPLES RETAILING - 0.6% | |||||||
PriceSmart | 11,724 | 1,027,022 | |||||
Village Super Market Cl. A | 562,140 | 14,570,669 | |||||
| 15,597,691 | |||||||
| FOOD PRODUCTS - 2.1% | |||||||
Flowers Foods | 314,688 | 5,447,249 | |||||
Fresh Del Monte Produce | 219,747 | 11,187,320 | |||||
Hershey Creamery 3 | 784 | 2,352,000 | |||||
Lancaster Colony | 118,190 | 14,492,458 | |||||
Sanderson Farms | 9,084 | 1,050,564 | |||||
Tootsie Roll Industries | 605,248 | 21,092,893 | |||||
| 55,622,484 | |||||||
| HOUSEHOLD PRODUCTS - 0.1% | |||||||
WD-40 Company | 17,877 | 1,972,727 | |||||
| PERSONAL PRODUCTS - 0.1% | |||||||
Nu Skin Enterprises Cl. A | 34,144 | 2,145,609 | |||||
| Total (Cost $55,615,694) | 80,823,878 | ||||||
| ENERGY – 2.6% | |||||||
| ENERGY EQUIPMENT & SERVICES - 2.0% | |||||||
CARBO Ceramics 1 | 81,615 | 559,063 | |||||
| 172,192 | 1,864,839 | ||||||
Helmerich & Payne | 182,373 | 9,910,149 | |||||
Oceaneering International | 71,945 | 1,643,224 | |||||
Pason Systems | 1,006,222 | 15,006,426 | |||||
| 49,423 | 506,092 | ||||||
SEACOR Holdings 1 | 432,284 | 14,827,341 | |||||
TGS-NOPEC Geophysical | 383,160 | 7,852,514 | |||||
| 52,169,648 | |||||||
| OIL, GAS & CONSUMABLE FUELS - 0.6% | |||||||
Boardwalk Pipeline Partners L.P. | 179,085 | 3,225,321 | |||||
Dorchester Minerals L.P. | 244,571 | 3,534,051 | |||||
Permian Basin Royalty Trust | 742,065 | 6,455,965 | |||||
Sabine Royalty Trust | 9,745 | 377,619 | |||||
San Juan Basin Royalty Trust | 397,109 | 2,704,312 | |||||
| 16,297,268 | |||||||
| Total (Cost $70,969,932) | 68,466,916 | ||||||
| FINANCIALS – 27.4% | |||||||
| BANKS - 7.6% | |||||||
Ames National | 340,668 | 10,424,441 | |||||
Associated Banc-Corp | 462,839 | 11,663,543 | |||||
Bank of Hawaii | 303,502 | 25,181,561 | |||||
Bank of the Ozarks | 48,638 | 2,279,663 | |||||
BLOM Bank GDR | 245,135 | 2,966,133 | |||||
BOK Financial | 325,552 | 27,388,690 | |||||
Camden National | 290,215 | 12,453,126 | |||||
Canadian Western Bank | 609,434 | 12,867,291 | |||||
City Holding Company | 135,994 | 8,957,925 | |||||
CNB Financial | 304,443 | 7,297,499 | |||||
Codorus Valley Bancorp | 39,226 | 1,114,018 | |||||
Farmers & Merchants Bank of Long Beach 3 | 467 | 3,572,550 | |||||
First Citizens BancShares Cl. A | 70,454 | 26,258,206 | |||||
First National Bank Alaska 3 | 2,928 | 4,772,640 | |||||
Landmark Bancorp | 17,358 | 534,626 | |||||
MidWestOne Financial Group | 220,248 | 7,464,205 | |||||
National Bankshares | 188,844 | 7,704,835 | |||||
Northrim BanCorp | 227,159 | 6,905,634 | |||||
| 76 | The Royce Funds 2017 Semiannual Report to Shareholders | THE ACCOMPANYING NOTES ARE AN INTEGRAL PART OF THESE FINANCIAL STATEMENTS |
| June 30, 2017 (unaudited) |
| Royce Total Return Fund (continued) | |||||||
| SHARES | VALUE | ||||||
| FINANCIALS (continued) | |||||||
| BANKS (continued) | |||||||
Peapack-Gladstone Financial | 519,218 | $ | 16,246,331 | ||||
Unity Bancorp | 64,286 | 1,105,719 | |||||
| 197,158,636 | |||||||
| CAPITAL MARKETS - 9.0% | |||||||
AllianceBernstein Holding L.P. | 406,030 | 9,602,609 | |||||
Apollo Global Management LLC Cl. A | 415,076 | 10,978,760 | |||||
Ares Management L.P. | 414,924 | 7,468,632 | |||||
Artisan Partners Asset Management Cl. A | 144,941 | 4,449,689 | |||||
Ashmore Group | 2,901,450 | 13,347,402 | |||||
Associated Capital Group Cl. A | 191,597 | 6,514,298 | |||||
Bolsa Mexicana de Valores | 5,466,910 | 9,603,146 | |||||
Cohen & Steers | 314,432 | 12,747,073 | |||||
Coronation Fund Managers | 511,672 | 2,549,658 | |||||
Edmond de Rothschild (Suisse) | 238 | 4,058,087 | |||||
Egyptian Financial Group-Hermes Holding Company | 1,182,708 | 1,576,291 | |||||
Federated Investors Cl. B | 745,266 | 21,053,765 | |||||
Fifth Street Finance | 281,225 | 1,366,754 | |||||
GAMCO Investors Cl. A | 252,777 | 7,482,199 | |||||
Greenhill & Co. | 267,742 | 5,381,614 | |||||
Houlihan Lokey Cl. A | 198,694 | 6,934,421 | |||||
KKR & Co. L.P. | 1,346,883 | 25,052,024 | |||||
Moelis & Company Cl. A | 295,939 | 11,497,230 | |||||
Morningstar | 32,589 | 2,553,022 | |||||
MVC Capital | 445,330 | 4,390,954 | |||||
Oaktree Capital Group LLC Cl. A | 103,696 | 4,832,234 | |||||
Och-Ziff Capital Management Group LLC Cl. A | 637,547 | 1,632,120 | |||||
Oppenheimer Holdings Cl. A | 117,218 | 1,922,375 | |||||
Rothschild & Co | 545,304 | 19,905,288 | |||||
Teton Advisors Cl. A 3 | 1,264 | 44,240 | |||||
TMX Group | 328,112 | 17,852,855 | |||||
Value Partners Group | 10,902,206 | 9,928,297 | |||||
Vontobel Holding | 70,622 | 4,588,331 | |||||
Waddell & Reed Financial Cl. A | 99,494 | 1,878,447 | |||||
Westwood Holdings Group | 80,767 | 4,578,681 | |||||
| 235,770,496 | |||||||
| CONSUMER FINANCE - 0.1% | |||||||
Nelnet Cl. A | 45,249 | 2,127,156 | |||||
| DIVERSIFIED FINANCIAL SERVICES - 0.1% | |||||||
First Pacific | 693,772 | 511,835 | |||||
Leucadia National | 132,839 | 3,475,068 | |||||
| 3,986,903 | |||||||
| INSURANCE - 9.2% | |||||||
Alleghany Corporation 1 | 48,930 | 29,103,564 | |||||
American Financial Group | 105,447 | 10,478,268 | |||||
Assured Guaranty | 291,341 | 12,160,573 | |||||
Baldwin & Lyons Cl. B | 260,834 | 6,390,433 | |||||
Cincinnati Financial | 132,392 | 9,591,800 | |||||
E-L Financial | 67,498 | 43,981,963 | |||||
Employers Holdings | 76,237 | 3,224,825 | |||||
Erie Indemnity Cl. A | 345,427 | 43,202,555 | |||||
First American Financial | 79,572 | 3,556,073 | |||||
Gallagher (Arthur J.) & Co. | 242,314 | 13,872,477 | |||||
HCI Group | 57,016 | 2,678,612 | |||||
Horace Mann Educators | 18,774 | 709,657 | |||||
Infinity Property & Casualty | 11,833 | 1,112,302 | |||||
Mercury General | 113,423 | 6,124,842 | |||||
National Western Life Group Cl. A | 8,478 | 2,709,738 | |||||
Old Republic International | 552,236 | 10,785,169 | |||||
ProAssurance Corporation | 180,349 | 10,965,219 | |||||
Reinsurance Group of America | 74,480 | 9,562,487 | |||||
RLI Corp. | 132,568 | 7,240,864 | |||||
Selective Insurance Group | 26,341 | 1,318,367 | |||||
State Auto Financial | 175,294 | 4,510,315 | |||||
United Fire Group | 27,643 | 1,217,951 | |||||
Universal Insurance Holdings | 94,844 | 2,390,069 | |||||
White Mountains Insurance Group | 2,368 | 2,056,916 | |||||
| 238,945,039 | |||||||
| INVESTMENT COMPANIES - 0.1% | |||||||
RIT Capital Partners | 89,494 | 2,215,833 | |||||
| THRIFTS & MORTGAGE FINANCE - 1.3% | |||||||
Genworth MI Canada | 762,224 | 20,971,740 | |||||
Southern Missouri Bancorp | 20,618 | 665,137 | |||||
Timberland Bancorp | 63,211 | 1,597,342 | |||||
TrustCo Bank Corp. NY | 1,574,507 | 12,202,429 | |||||
| 35,436,648 | |||||||
| Total (Cost $435,546,483) | 715,640,711 | ||||||
| HEALTH CARE – 4.9% | |||||||
HEALTH CARE EQUIPMENT & SUPPLIES - 2.7% | |||||||
Analogic Corporation | 142,315 | 10,339,185 | |||||
Atrion Corporation | 9,031 | 5,809,642 | |||||
Hill-Rom Holdings | 293,774 | 23,387,348 | |||||
Meridian Bioscience | 153,593 | 2,419,090 | |||||
Teleflex | 144,007 | 29,918,894 | |||||
| 71,874,159 | |||||||
| HEALTH CARE PROVIDERS & SERVICES - 2.0% | |||||||
Aceto Corporation | 46,887 | 724,404 | |||||
Chemed Corporation | 20,284 | 4,148,687 | |||||
Ensign Group (The) | 114,553 | 2,493,819 | |||||
Landauer | 473,442 | 24,761,017 | |||||
Owens & Minor | 592,022 | 19,057,188 | |||||
U.S. Physical Therapy | 16,853 | 1,017,921 | |||||
| 52,203,036 | |||||||
| PHARMACEUTICALS - 0.2% | |||||||
Recordati | 103,113 | 4,183,207 | |||||
| Total (Cost $55,958,480) | 128,260,402 | ||||||
| INDUSTRIALS – 24.9% | |||||||
| AEROSPACE & DEFENSE - 0.7% | |||||||
HEICO Corporation | 264,156 | 18,976,967 | |||||
| AIR FREIGHT & LOGISTICS - 0.9% | |||||||
Expeditors International of Washington | 394,746 | 22,295,254 | |||||
| BUILDING PRODUCTS - 1.1% | |||||||
A. O. Smith Corporation | 394,065 | 22,197,681 | |||||
Apogee Enterprises | 129,020 | 7,333,497 | |||||
| 29,531,178 | |||||||
| COMMERCIAL SERVICES & SUPPLIES - 4.6% | |||||||
ABM Industries | 479,376 | 19,903,692 | |||||
Deluxe Corporation | 33,548 | 2,322,193 | |||||
Ennis | 177,801 | 3,395,999 | |||||
Herman Miller | 225,592 | 6,857,997 | |||||
HNI Corporation | 510,450 | 20,351,641 | |||||
Kimball International Cl. B | 1,116,102 | 18,627,742 | |||||
McGrath RentCorp | 300,388 | 10,402,436 | |||||
MSA Safety | 160,615 | 13,037,120 | |||||
Ritchie Bros. Auctioneers | 697,974 | 20,059,773 | |||||
Tetra Tech | 22,271 | 1,018,898 | |||||
| THE ACCOMPANYING NOTES ARE AN INTEGRAL PART OF THESE FINANCIAL STATEMENTS | The Royce Funds 2017 Semiannual Report to Shareholders | 77 |
Schedules of Investments
| Royce Total Return Fund (continued) | |||||||
| SHARES | VALUE | ||||||
| INDUSTRIALS (continued) | |||||||
COMMERCIAL SERVICES & SUPPLIES (continued) | |||||||
UniFirst Corporation | 20,929 | $ | 2,944,710 | ||||
| 118,922,201 | |||||||
| CONSTRUCTION & ENGINEERING - 0.9% | |||||||
Comfort Systems USA | 301,436 | 11,183,276 | |||||
EMCOR Group | 55,805 | 3,648,531 | |||||
KBR | 412,548 | 6,278,980 | |||||
Valmont Industries | 14,105 | 2,110,108 | |||||
| 23,220,895 | |||||||
| ELECTRICAL EQUIPMENT - 1.7% | |||||||
Hubbell Cl. B | 227,723 | 25,771,412 | |||||
LSI Industries | 936,964 | 8,479,524 | |||||
Preformed Line Products | 220,018 | 10,213,236 | |||||
| 44,464,172 | |||||||
| INDUSTRIAL CONGLOMERATES - 0.7% | |||||||
Raven Industries | 524,245 | 17,457,359 | |||||
| MACHINERY - 9.7% | |||||||
Alamo Group | 32,906 | 2,988,194 | |||||
American Railcar Industries | 219,952 | 8,424,162 | |||||
Federal Signal | 188,413 | 3,270,850 | |||||
Franklin Electric | 640,659 | 26,523,283 | |||||
Gorman-Rupp Company (The) | 446,886 | 11,382,186 | |||||
Greenbrier Companies (The) | 50,410 | 2,331,462 | |||||
Hillenbrand | 26,148 | 943,943 | |||||
Kadant | 24,611 | 1,850,747 | |||||
Lincoln Electric Holdings | 153,988 | 14,180,755 | |||||
Lindsay Corporation | 156,273 | 13,947,365 | |||||
Miller Industries | 466,563 | 11,594,091 | |||||
| 109,436 | 3,121,115 | ||||||
Mueller Industries | 363,275 | 11,061,724 | |||||
Nordson Corporation | 190,161 | 23,070,333 | |||||
Standex International | 43,799 | 3,972,569 | |||||
Starrett (L.S.) Company (The) Cl. A 6 | 477,625 | 4,107,575 | |||||
Sun Hydraulics | 158,742 | 6,773,521 | |||||
Tennant Company | 494,259 | 36,476,314 | |||||
Timken Company (The) | 26,800 | 1,239,500 | |||||
Trinity Industries | 589,650 | 16,527,889 | |||||
Wabash National | 748,885 | 16,460,492 | |||||
Woodward | 459,556 | 31,056,794 | |||||
| 251,304,864 | |||||||
| MARINE - 0.9% | |||||||
Clarkson | 735,601 | 24,201,183 | |||||
| PROFESSIONAL SERVICES - 3.3% | |||||||
Exponent | 61,626 | 3,592,796 | |||||
Heidrick & Struggles International | 411,793 | 8,956,498 | |||||
Insperity | 28,443 | 2,019,453 | |||||
Kelly Services Cl. A | 407,100 | 9,139,395 | |||||
Korn/Ferry International | 364,318 | 12,579,900 | |||||
ManpowerGroup | 366,391 | 40,907,555 | |||||
Resources Connection | 5,447 | 74,624 | |||||
Robert Half International | 201,512 | 9,658,470 | |||||
| 86,928,691 | |||||||
| ROAD & RAIL - 0.2% | |||||||
Werner Enterprises | 195,804 | 5,746,848 | |||||
| TRADING COMPANIES & DISTRIBUTORS - 0.2% | |||||||
Applied Industrial Technologies | 46,887 | 2,768,677 | |||||
Houston Wire & Cable 1 | 585,647 | 3,074,647 | |||||
| 5,843,324 | |||||||
| Total (Cost $310,071,601) | 648,892,936 | ||||||
| INFORMATION TECHNOLOGY – 6.0% | |||||||
| COMMUNICATIONS EQUIPMENT - 0.2% | |||||||
ADTRAN | 137,869 | 2,846,995 | |||||
TESSCO Technologies | 231,380 | 3,077,354 | |||||
| 5,924,349 | |||||||
| ELECTRONIC EQUIPMENT, INSTRUMENTS & COMPONENTS - 3.3% | |||||||
AVX Corporation | 880,926 | 14,394,331 | |||||
Bel Fuse Cl. A | 20,963 | 437,078 | |||||
Methode Electronics | 624,003 | 25,708,924 | |||||
National Instruments | 259,993 | 10,456,918 | |||||
PC Connection | 470,526 | 12,732,434 | |||||
Systemax | 212,256 | 3,990,413 | |||||
Vishay Intertechnology | 1,106,872 | 18,374,075 | |||||
| 86,094,173 | |||||||
| IT SERVICES - 0.4% | |||||||
Convergys Corporation | 190,949 | 4,540,767 | |||||
Forrester Research | 40,179 | 1,573,008 | |||||
MAXIMUS | 51,551 | 3,228,639 | |||||
| 9,342,414 | |||||||
| SEMICONDUCTORS & SEMICONDUCTOR EQUIPMENT - 0.9% | |||||||
MKS Instruments | 325,327 | 21,894,507 | |||||
Xperi | 60,593 | 1,805,672 | |||||
| 23,700,179 | |||||||
| SOFTWARE - 0.4% | |||||||
Ebix | 50,716 | 2,733,592 | |||||
Fair Isaac | 45,716 | 6,373,268 | |||||
| 9,106,860 | |||||||
| TECHNOLOGY HARDWARE, STORAGE & PERIPHERALS - 0.8% | |||||||
| Diebold Nixdorf | 773,167 | 21,648,676 | |||||
| Total (Cost $110,599,121) | 155,816,651 | ||||||
| MATERIALS – 13.7% | |||||||
| CHEMICALS - 6.6% | |||||||
Albemarle Corporation | 330,933 | 34,926,669 | |||||
Balchem Corporation | 333,140 | 25,888,309 | |||||
Cabot Corporation | 340,855 | 18,211,883 | |||||
Chase Corporation | 256,499 | 27,368,443 | |||||
FutureFuel Corporation | 219,287 | 3,309,041 | |||||
Innospec | 30,557 | 2,003,011 | |||||
Quaker Chemical | 349,614 | 50,774,441 | |||||
Trinseo | 34,455 | 2,367,059 | |||||
Umicore | 101,750 | 7,077,416 | |||||
| 171,926,272 | |||||||
| CONSTRUCTION MATERIALS - 0.4% | |||||||
Ash Grove Cement 3 | 37,169 | 9,850,157 | |||||
| CONTAINERS & PACKAGING - 2.8% | |||||||
AptarGroup | 108,268 | 9,404,159 | |||||
Bemis Company | 343,968 | 15,908,520 | |||||
Greif Cl. A | 443,719 | 24,750,646 | |||||
Mayr-Melnhof Karton | 56,225 | 7,352,888 | |||||
Sonoco Products | 307,079 | 15,790,002 | |||||
| 73,206,215 | |||||||
| METALS & MINING - 3.1% | |||||||
Agnico Eagle Mines | 61,868 | 2,791,484 | |||||
Alamos Gold Cl. A | 224,999 | 1,596,230 | |||||
| 228,060 | 3,879,301 | ||||||
Ampco-Pittsburgh | 140,959 | 2,079,145 | |||||
Carpenter Technology | 130,466 | 4,883,342 | |||||
Commercial Metals | 145,259 | 2,822,382 | |||||
Compass Minerals International | 161,482 | 10,544,775 | |||||
Ferroglobe | 534,242 | 6,384,192 | |||||
| 78 | The Royce Funds 2017 Semiannual Report to Shareholders | THE ACCOMPANYING NOTES ARE AN INTEGRAL PART OF THESE FINANCIAL STATEMENTS |
| June 30, 2017 (unaudited) |
| Royce Total Return Fund (continued) | |||||||
| SHARES | VALUE | ||||||
| MATERIALS (continued) | |||||||
| METALS & MINING (continued) | |||||||
| 569,803 | $ | 0 | |||||
Franco-Nevada Corporation | 82,490 | 5,952,478 | |||||
Gold Fields ADR | 1,394,785 | 4,853,852 | |||||
Haynes International | 278,405 | 10,108,885 | |||||
Reliance Steel & Aluminum | 28,502 | 2,075,231 | |||||
Royal Gold | 18,774 | 1,467,564 | |||||
Schnitzer Steel Industries Cl. A | 157,250 | 3,962,700 | |||||
Worthington Industries | 351,264 | 17,640,478 | |||||
| 81,042,039 | |||||||
| PAPER & FOREST PRODUCTS - 0.8% | |||||||
Deltic Timber | 151,848 | 11,336,972 | |||||
Domtar Corporation | 110,213 | 4,234,383 | |||||
Neenah Paper | 36,770 | 2,950,792 | |||||
Pope Resources L.P. | 13,035 | 964,590 | |||||
Resolute Forest Products 1 | 93,774 | 412,606 | |||||
Schweitzer-Mauduit International | 37,840 | 1,408,783 | |||||
| 21,308,126 | |||||||
| Total (Cost $166,497,840) | 357,332,809 | ||||||
| REAL ESTATE – 0.1% | |||||||
| EQUITY REAL ESTATE INVESTMENT TRUSTS (REITS) - 0.1% | |||||||
Lexington Realty Trust | 343,488 | 3,403,966 | |||||
| Total (Cost $1,918,553) | 3,403,966 | ||||||
| TELECOMMUNICATION SERVICES – 1.1% | |||||||
| DIVERSIFIED TELECOMMUNICATION SERVICES - 0.5% | |||||||
ATN International | 195,355 | 13,370,096 | |||||
| WIRELESS TELECOMMUNICATION SERVICES - 0.6% | |||||||
Telephone and Data Systems | 496,098 | 13,766,720 | |||||
| Total (Cost $16,448,096) | 27,136,816 | ||||||
| UTILITIES – 2.3% | |||||||
| ELECTRIC UTILITIES - 0.6% | |||||||
ALLETE | 155,220 | 11,126,170 | |||||
Fortis | 120,101 | 4,221,317 | |||||
| 15,347,487 | |||||||
| GAS UTILITIES - 0.2% | |||||||
Star Gas Partners L.P. | 447,092 | 4,846,477 | |||||
| WATER UTILITIES - 1.5% | |||||||
Aqua America | 471,892 | 15,714,003 | |||||
SJW | 367,898 | 18,093,224 | |||||
York Water | 156,255 | 5,445,487 | |||||
| 39,252,714 | |||||||
| Total (Cost $27,926,461) | 59,446,678 | ||||||
| MISCELLANEOUS2 – 1.2% | |||||||
| Total (Cost $31,242,916) | 30,571,793 | ||||||
| TOTAL COMMON STOCKS | |||||||
| (Cost $1,472,015,323) | 2,531,054,471 | ||||||
| PRINCIPAL | |||||||
| AMOUNT | |||||||
| CORPORATE BOND– 0.2% | |||||||
Unit Corporation 6.625% | |||||||
due 5/15/21 | |||||||
| (Cost $3,759,874) | $ | 4,411,900 | 4,224,394 | ||||
| REPURCHASE AGREEMENT – 2.6% | |||||||
| Fixed Income Clearing Corporation, 0.12% dated 6/30/17, due 7/3/17, maturity value $67,993,680 (collateralized by obligations of various U.S. Government Agencies, 2.375% due 8/15/24, valued at $69,356,895) | |||||||
| (Cost $67,993,000) | 67,993,000 | ||||||
| COLLATERAL RECEIVED FOR SECURITIES LOANED – 0.2% | |||||||
| U.S. Treasury Bills | |||||||
due 7/6/17-3/1/18 | 120,884 | 120,879 | |||||
| U.S. Treasury Bonds | |||||||
2.25%-5.50% | |||||||
due 8/15/28-2/15/47 | 333,605 | 337,613 | |||||
| U.S. Treasury Notes | |||||||
0.625%-3.625% | |||||||
due 9/30/17-2/15/27 | 1,197,489 | 1,203,581 | |||||
| U.S. Treasury Notes - Floating Rate | |||||||
due 7/31/17-1/31/19 | 9,420 | 9,419 | |||||
| U.S. Treasury TIPS | |||||||
0.125%-2.50% | |||||||
due 4/15/18-2/15/46 | 412,439 | 413,283 | |||||
| Money Market Funds | |||||||
Federated Government Obligations Fund (7 day yield-0.8114%) | 4,335,210 | ||||||
| TOTAL COLLATERAL RECEIVED FOR SECURITIES LOANED | |||||||
| (Cost $6,419,985) | 6,419,985 | ||||||
| TOTAL INVESTMENTS – 100.1% | |||||||
| (Cost $1,550,188,182) | 2,609,691,850 | ||||||
| LIABILITIES LESS CASH AND OTHER ASSETS – (0.1)% | (1,656,253 | ) | |||||
| NET ASSETS – 100.0% | $ | 2,608,035,597 | |||||
| † | New additions in 2017. |
| 1 | Non-income producing. |
| 2 | Includes securities first acquired in 2017 and less than 1% of net assets. |
| 3 | These securities are defined as Level 2 securities due to fair value being based on quoted prices for similar securities. See Notes to Financial Statements. |
| 4 | All or a portion of these securities were on loan at June 30, 2017. |
| 5 | Securities for which market quotations are not readily available represent 0.0%, 0.4%, 0.1% and 0.0% of net assets for Royce Low-Priced Stock Fund, Royce Micro-Cap Fund, Royce Small/Mid-Cap Premier Fund and Royce Total Return Fund. These securities have been valued at their fair value under procedures approved by the Fund’s Board of Trustees. These securities are defined as Level 3 securities due to the use of significant unobservable inputs in the determination of fair value. See Notes to Financial Statements. |
| 6 | At June 30, 2017, the Fund owned 5% or more of the Company’s outstanding voting securities thereby making the Company an Affiliated Company as that term is defined in the Investment Company Act of 1940. See Notes to Financial Statements. |
| Securities of International Funds are categorized by the country of their headquarters, with the exception of exchange-traded funds. | |
| Bold indicates a Fund’s 20 largest equity holdings in terms of June 30, 2017, market value. |
| THE ACCOMPANYING NOTES ARE AN INTEGRAL PART OF THESE FINANCIAL STATEMENTS | The Royce Funds 2017 Semiannual Report to Shareholders | 79 |
Statements of Assets and Liabilities
| Royce Global | ||||||||||||||||
| Royce Dividend | Financial Services | Royce International | Royce International | |||||||||||||
| Value Fund | Fund | Micro-Cap Fund | Premier Fund | |||||||||||||
| ASSETS: | ||||||||||||||||
| Investments at value | ||||||||||||||||
Non-Affiliated Companies | $ | 197,573,087 | $ | 50,226,566 | $ | 6,989,666 | $ | 89,207,188 | ||||||||
| Repurchase agreements (at cost and value) | 1,678,000 | 999,000 | 413,000 | 4,994,000 | ||||||||||||
| Cash and foreign currency | 2,013 | 1,089 | 3,496 | 6,708 | ||||||||||||
| Receivable for investments sold | 21,962 | – | 17,816 | – | ||||||||||||
| Receivable for capital shares sold | 251,708 | 374,430 | 110 | 703,709 | ||||||||||||
| Receivable for dividends and interest | 273,383 | 86,480 | 12,096 | 370,149 | ||||||||||||
| Prepaid expenses and other assets | 3,574 | 1,119 | 123 | 1,126 | ||||||||||||
| Total Assets | 199,803,727 | 51,688,684 | 7,436,307 | 95,282,880 | ||||||||||||
| LIABILITIES: | ||||||||||||||||
| Payable for investments purchased | 836,690 | – | 61,659 | 1,224,402 | ||||||||||||
| Payable for capital shares redeemed | 492,088 | 32,536 | 987 | 51,340 | ||||||||||||
| Payable for investment advisory fees | 125,915 | 35,502 | 791 | 74,964 | ||||||||||||
| Payable for trustees’ fees | 6,871 | 1,431 | 175 | 3,233 | ||||||||||||
| Accrued expenses | 182,058 | 57,178 | 20,534 | 146,121 | ||||||||||||
| Deferred capital gains tax | – | 31,496 | – | 274,864 | ||||||||||||
| Total Liabilities | 1,643,622 | 158,143 | 84,146 | 1,774,924 | ||||||||||||
| Net Assets | $ | 198,160,105 | $ | 51,530,541 | $ | 7,352,161 | $ | 93,507,956 | ||||||||
| ANALYSIS OF NET ASSETS: | ||||||||||||||||
| Paid-in capital | $ | 124,337,285 | $ | 41,294,264 | $ | 7,128,451 | $ | 149,474,635 | ||||||||
| Undistributed net investment income (loss) | 855,292 | 283,969 | 26,024 | (581,151 | ) | |||||||||||
Accumulated net realized gain (loss) on investments and foreign currency | 15,924,987 | 531,752 | (284,246 | ) | (70,329,867 | ) | ||||||||||
Net unrealized appreciation (depreciation) on investments and foreign currency | 57,042,541 | 9,420,556 | 481,932 | 14,944,339 | ||||||||||||
| Net Assets | $ | 198,160,105 | $ | 51,530,541 | $ | 7,352,161 | $ | 93,507,956 | ||||||||
Investment Class | $ | 97,796,756 | $ | 38,320,676 | ||||||||||||
Service Class | 97,796,734 | $ | 44,323,783 | $ | 7,352,161 | 48,779,921 | ||||||||||
Consultant Class | 1,574,236 | 6,344,139 | ||||||||||||||
Institutional Class | 992,379 | 7,206,758 | ||||||||||||||
R Class | 63,220 | |||||||||||||||
| SHARES OUTSTANDING (unlimited number of $.001 par value): | ||||||||||||||||
Investment Class | 12,712,801 | 3,314,507 | ||||||||||||||
Service Class | 12,435,375 | 4,507,286 | 639,471 | 3,546,785 | ||||||||||||
Consultant Class | 175,064 | 424,360 | ||||||||||||||
Institutional Class | 130,424 | 572,448 | ||||||||||||||
R Class | 5,715 | |||||||||||||||
| NET ASSET VALUES (Net Assets ÷ Shares Outstanding): | ||||||||||||||||
Investment Class1 | $ | 7.69 | $ | 11.56 | ||||||||||||
Service Class1 | 7.86 | $ | 9.83 | $ | 11.50 | 13.75 | ||||||||||
Consultant Class2 | 8.99 | 14.95 | ||||||||||||||
Institutional Class3 | 7.61 | 12.59 | ||||||||||||||
R Class3 | 11.06 | |||||||||||||||
| Investments at identified cost | $ | 140,530,369 | $ | 40,774,186 | $ | 6,507,862 | $ | 73,970,479 | ||||||||
| 1 | Offering and redemption price per share; shares held less than 30 days may be subject to a 1% redemption fee, or a 2% redemption fee (Royce International Micro-Cap Fund and Royce International Premier Fund), payable to the Fund. |
| 2 | Offering and redemption price per share; shares held less than 365 days may be subject to a 1% contingent deferred sales charge, payable to Royce Fund Services, LLC. |
| 3 | Offering and redemption price per share. |
| 80 | The Royce Funds 2017 Semiannual Report to Shareholders | THE ACCOMPANYING NOTES ARE AN INTEGRAL PART OF THESE FINANCIAL STATEMENTS |
| June 30, 2017 (unaudited) |
| Royce Low-Priced | Royce Micro-Cap | Royce Micro-Cap | Royce Opportunity | |||||||||||||
| Stock Fund | Fund | Opportunity Fund | Fund | |||||||||||||
| ASSETS: | ||||||||||||||||
| Investments at value (including collateral on loaned securities) | ||||||||||||||||
Non-Affiliated Companies | $ | 295,872,634 | $ | 224,869,296 | $ | 47,678,079 | $ | 1,457,289,148 | ||||||||
Affiliated Companies | – | – | – | 25,274,556 | ||||||||||||
| Repurchase agreements (at cost and value) | 6,579,000 | 7,888,000 | 2,662,000 | 109,895,000 | ||||||||||||
| Cash and foreign currency | 9,657 | 6,936 | 17 | 600 | ||||||||||||
| Receivable for investments sold | 815,156 | 1,674,287 | 319,301 | 7,425,954 | ||||||||||||
| Receivable for capital shares sold | 32,840 | 73,188 | 666 | 1,067,448 | ||||||||||||
| Receivable for dividends and interest | 187,898 | 235,304 | 13,239 | 724,262 | ||||||||||||
| Prepaid expenses and other assets | – | 304 | 1,080 | 22,513 | ||||||||||||
| Total Assets | 303,497,185 | 234,747,315 | 50,674,382 | 1,601,699,481 | ||||||||||||
| LIABILITIES: | ||||||||||||||||
| Payable for collateral on loaned securities | 17,969,507 | 10,516,862 | – | 92,992,860 | ||||||||||||
| Payable for investments purchased | 630,777 | 1,436,243 | 1,069,146 | 4,437,138 | ||||||||||||
| Payable for capital shares redeemed | 367,895 | 478,916 | 15,797 | 1,916,658 | ||||||||||||
| Payable for investment advisory fees | 232,414 | 227,281 | 40,071 | 1,226,048 | ||||||||||||
| Payable for trustees’ fees | 8,267 | 6,990 | 1,180 | 41,152 | ||||||||||||
| Accrued expenses | 657,459 | 182,750 | 19,072 | 582,315 | ||||||||||||
| Total Liabilities | 19,866,319 | 12,849,042 | 1,145,266 | 101,196,171 | ||||||||||||
| Net Assets | $ | 283,630,866 | $ | 221,898,273 | $ | 49,529,116 | $ | 1,500,503,310 | ||||||||
| ANALYSIS OF NET ASSETS: | ||||||||||||||||
| Paid-in capital | $ | 220,602,860 | $ | 167,859,079 | $ | 39,605,818 | $ | 1,154,509,187 | ||||||||
| Undistributed net investment income (loss) | (582,740 | ) | (1,396,824 | ) | (165,484 | ) | (1,283,286 | ) | ||||||||
Accumulated net realized gain (loss) on investments and foreign currency | 17,491,656 | 16,533,439 | 2,196,743 | 124,230,616 | ||||||||||||
Net unrealized appreciation (depreciation) on investments and foreign currency | 46,119,090 | 38,902,579 | 7,892,039 | 223,046,793 | ||||||||||||
| Net Assets | $ | 283,630,866 | $ | 221,898,273 | $ | 49,529,116 | $ | 1,500,503,310 | ||||||||
Investment Class | $ | 20,997,834 | $ | 176,671,662 | $ | 48,486,929 | $ | 755,381,146 | ||||||||
Service Class | 251,575,257 | 17,230,589 | 1,042,187 | 95,269,685 | ||||||||||||
Consultant Class | 27,996,022 | 20,134,171 | ||||||||||||||
Institutional Class | 10,085,882 | 584,358,000 | ||||||||||||||
R Class | 971,893 | 38,706,180 | ||||||||||||||
K Class | 6,654,128 | |||||||||||||||
| SHARES OUTSTANDING (unlimited number of $.001 par value): | ||||||||||||||||
Investment Class | 2,514,225 | 14,534,317 | 2,570,012 | 54,330,892 | ||||||||||||
Service Class | 30,266,482 | 1,446,594 | 109,758 | 7,339,098 | ||||||||||||
Consultant Class | 2,934,128 | 1,747,584 | ||||||||||||||
Institutional Class | 1,206,019 | 41,255,134 | ||||||||||||||
R Class | 123,532 | 3,075,574 | ||||||||||||||
K Class | 581,938 | |||||||||||||||
| NET ASSET VALUES (Net Assets ÷ Shares Outstanding): | ||||||||||||||||
Investment Class1 | $ | 8.35 | $ | 12.16 | $ | 18.87 | $ | 13.90 | ||||||||
Service Class1 | 8.31 | 11.91 | 9.50 | 12.98 | ||||||||||||
Consultant Class2 | 9.54 | 11.52 | ||||||||||||||
Institutional Class3 | 8.36 | 14.16 | ||||||||||||||
R Class3 | 7.87 | 12.59 | ||||||||||||||
K Class3 | 11.43 | |||||||||||||||
| Investments at identified cost | $ | 249,753,588 | $ | 185,959,060 | $ | 39,786,041 | $ | 1,259,516,912 | ||||||||
| Market value of loaned securities | 17,102,776 | 9,889,001 | – | 90,713,276 | ||||||||||||
| 1 | Offering and redemption price per share; shares held less than 30 days may be subject to a 1% redemption fee, payable to the Fund. |
| 2 | Offering and redemption price per share; shares held less than 365 days may be subject to a 1% contingent deferred sales charge, payable to Royce Fund Services, LLC. |
| 3 | Offering and redemption price per share. |
| THE ACCOMPANYING NOTES ARE AN INTEGRAL PART OF THESE FINANCIAL STATEMENTS | The Royce Funds 2017 Semiannual Report to Shareholders | 81 |
Statements of Assets and Liabilities
| Royce Pennsylvania | Royce Premier | Royce Small-Cap | Royce Small-Cap | |||||||||||||
| Mutual Fund | Fund | Leaders Fund | Value Fund | |||||||||||||
| ASSETS: | ||||||||||||||||
| Investments at value (including collateral on loaned securities) | ||||||||||||||||
Non-Affiliated Companies | $ | 2,382,347,543 | $ | 2,117,343,235 | $ | 85,509,925 | $ | 332,135,345 | ||||||||
Affiliated Companies | 22,067,949 | – | – | – | ||||||||||||
| Repurchase agreements (at cost and value) | 29,850,000 | 167,266,000 | 5,869,000 | 39,850,000 | ||||||||||||
| Cash and foreign currency | 87 | 34,442 | 447 | 540 | ||||||||||||
| Receivable for investments sold | 1,908,482 | 13,403,930 | 342,815 | 2,275,606 | ||||||||||||
| Receivable for capital shares sold | 906,701 | 1,532,923 | 20,631 | 109,012 | ||||||||||||
| Receivable for dividends and interest | 1,520,391 | 2,566,737 | 51,001 | 343,268 | ||||||||||||
| Prepaid expenses and other assets | 2,637,442 | 8,873 | 33 | 869 | ||||||||||||
| Total Assets | 2,441,238,595 | 2,302,156,140 | 91,793,852 | 374,714,640 | ||||||||||||
| LIABILITIES: | ||||||||||||||||
| Payable for collateral on loaned securities | 89,501,412 | 13,674,170 | 991,866 | 6,553,425 | ||||||||||||
| Payable for investments purchased | 17,052,796 | – | 202,114 | 1,338,662 | ||||||||||||
| Payable for capital shares redeemed | 2,758,265 | 2,840,252 | 73,672 | 1,302,133 | ||||||||||||
| Payable for investment advisory fees | 1,454,441 | 1,886,708 | 75,334 | 302,128 | ||||||||||||
| Payable for trustees’ fees | 74,116 | 65,234 | 3,169 | 13,528 | ||||||||||||
| Accrued expenses | 1,310,972 | 1,628,470 | 101,317 | 300,294 | ||||||||||||
| Total Liabilities | 112,152,002 | 20,094,834 | 1,447,472 | 9,810,170 | ||||||||||||
| Net Assets | $ | 2,329,086,593 | $ | 2,282,061,306 | $ | 90,346,380 | $ | 364,904,470 | ||||||||
| ANALYSIS OF NET ASSETS: | ||||||||||||||||
| Paid-in capital | $ | 1,148,800,268 | $ | 881,409,812 | $ | 61,176,473 | $ | 314,568,683 | ||||||||
| Undistributed net investment income (loss) | 209,133 | (622,783 | ) | 184,940 | 669,888 | |||||||||||
Accumulated net realized gain (loss) on investments and foreign currency | 288,851,004 | 267,483,031 | 10,423,793 | 5,345,755 | ||||||||||||
Net unrealized appreciation (depreciation) on investments and foreign currency | 891,226,188 | 1,133,791,246 | 18,561,174 | 44,320,144 | ||||||||||||
| Net Assets | $ | 2,329,086,593 | $ | 2,282,061,306 | $ | 90,346,380 | $ | 364,904,470 | ||||||||
Investment Class | $ | 1,622,522,033 | $ | 1,768,984,546 | $ | 42,866,112 | $ | 60,223,418 | ||||||||
Service Class | 78,286,752 | 51,848,296 | 45,448,596 | 171,076,571 | ||||||||||||
Consultant Class | 370,697,010 | 31,081,325 | 13,916,981 | |||||||||||||
Institutional Class | 238,644,018 | 269,806,399 | 102,372,977 | |||||||||||||
W Class | 147,282,802 | |||||||||||||||
R Class | 16,215,199 | 13,057,938 | 2,031,672 | 15,260,998 | ||||||||||||
K Class | 2,721,581 | 2,053,525 | ||||||||||||||
| SHARES OUTSTANDING (unlimited number of $.001 par value): | ||||||||||||||||
Investment Class | 140,523,497 | 104,934,721 | 5,943,920 | 6,265,240 | ||||||||||||
Service Class | 6,784,199 | 3,159,004 | 6,390,578 | 17,902,507 | ||||||||||||
Consultant Class | 39,974,733 | 2,308,098 | 1,624,977 | |||||||||||||
Institutional Class | 20,632,234 | 15,786,868 | 10,643,891 | |||||||||||||
W Class | 8,708,005 | |||||||||||||||
R Class | 1,488,580 | 833,074 | 206,758 | 1,658,931 | ||||||||||||
K Class | 286,521 | 310,314 | ||||||||||||||
| NET ASSET VALUES (Net Assets ÷ Shares Outstanding): | ||||||||||||||||
Investment Class1 | $ | 11.55 | $ | 16.86 | $ | 7.21 | $ | 9.61 | ||||||||
Service Class1 | 11.54 | 16.41 | 7.11 | 9.56 | ||||||||||||
Consultant Class2 | 9.27 | 13.47 | 8.56 | |||||||||||||
Institutional Class3 | 11.57 | 17.09 | 9.62 | |||||||||||||
W Class3 | 16.91 | |||||||||||||||
R Class3 | 10.89 | 15.67 | 9.83 | 9.20 | ||||||||||||
K Class3 | 9.50 | 6.62 | ||||||||||||||
| Investments at identified cost | $ | 1,513,189,031 | $ | 983,454,039 | $ | 66,948,751 | $ | 287,815,687 | ||||||||
| Market value of loaned securities | 87,354,679 | 13,545,585 | 976,862 | 6,459,221 | ||||||||||||
| 1 | Offering and redemption price per share; shares held less than 30 days may be subject to a 1% redemption fee, payable to the Fund. |
| 2 | Offering and redemption price per share; shares held less than 365 days may be subject to a 1% contingent deferred sales charge, payable to Royce Fund Services, LLC. |
| 3 | Offering and redemption price per share. |
| 82 | The Royce Funds 2017 Semiannual Report to Shareholders | THE ACCOMPANYING NOTES ARE AN INTEGRAL PART OF THESE FINANCIAL STATEMENTS |
| June 30, 2017 (unaudited) |
| Royce Smaller- | ||||||||||||
| Royce Small/Mid-Cap | Companies Growth | Royce Special Equity | ||||||||||
| Premier Fund | Fund | Fund | ||||||||||
| ASSETS: | ||||||||||||
| Investments at value (including collateral on loaned securities) | ||||||||||||
Non-Affiliated Companies | $ | 207,962,280 | $ | 409,358,845 | $ | 937,783,806 | ||||||
Affiliated Companies | – | – | 456,054,240 | |||||||||
| Repurchase agreements (at cost and value) | 20,316,000 | 27,192,000 | 138,963,000 | |||||||||
| Cash and foreign currency | 5,518 | 904 | 630 | |||||||||
| Receivable for investments sold | 589,925 | 7,317,611 | 786,801 | |||||||||
| Receivable for capital shares sold | 74,981 | 239,090 | 1,984,054 | |||||||||
| Receivable for dividends and interest | 138,402 | 126,494 | 1,080,263 | |||||||||
| Prepaid expenses and other assets | 3,647 | 612 | 22,747 | |||||||||
| Total Assets | 229,090,753 | 444,235,556 | 1,536,675,541 | |||||||||
| LIABILITIES: | ||||||||||||
| Payable for collateral on loaned securities | 4,217,261 | 41,138,740 | – | |||||||||
| Payable for investments purchased | 1,323,398 | 5,500,051 | 1,196,529 | |||||||||
| Payable for capital shares redeemed | 3,415,522 | 920,018 | 1,504,004 | |||||||||
| Payable for investment advisory fees | 157,484 | 330,434 | 1,286,020 | |||||||||
| Payable for trustees’ fees | 6,482 | 13,573 | 42,910 | |||||||||
| Accrued expenses | 87,709 | 396,943 | 739,472 | |||||||||
| Total Liabilities | 9,207,856 | 48,299,759 | 4,768,935 | |||||||||
| Net Assets | $ | 219,882,897 | $ | 395,935,797 | $ | 1,531,906,606 | ||||||
| ANALYSIS OF NET ASSETS: | ||||||||||||
| Paid-in capital | $ | 160,537,669 | $ | 224,157,414 | $ | 1,004,310,086 | ||||||
| Undistributed net investment income (loss) | 158,711 | (1,528,934 | ) | 4,057,335 | ||||||||
| Accumulated net realized gain (loss) on investments and foreign currency | 16,182,219 | 65,590,742 | 99,969,387 | |||||||||
| Net unrealized appreciation (depreciation) on investments and foreign currency | 43,004,298 | 107,716,575 | 423,569,798 | |||||||||
| Net Assets | $ | 219,882,897 | $ | 395,935,797 | $ | 1,531,906,606 | ||||||
Investment Class | $ | 85,044,942 | $ | 97,657,769 | $ | 1,134,092,606 | ||||||
Service Class | 122,446,311 | 274,267,499 | 108,087,650 | |||||||||
Consultant Class | 10,455,887 | 10,952,993 | 47,245,452 | |||||||||
Institutional Class | 12,401,791 | 242,480,898 | ||||||||||
R Class | 1,935,757 | 655,745 | ||||||||||
| SHARES OUTSTANDING (unlimited number of $.001 par value): | ||||||||||||
Investment Class | 5,492,169 | 7,811,219 | 51,694,007 | |||||||||
Service Class | 7,937,596 | 22,396,862 | 4,941,256 | |||||||||
Consultant Class | 952,464 | 1,026,586 | 2,364,652 | |||||||||
Institutional Class | 980,199 | 11,138,864 | ||||||||||
R Class | 192,551 | 57,444 | ||||||||||
| NET ASSET VALUES (Net Assets ÷ Shares Outstanding): | ||||||||||||
Investment Class1 | $ | 15.48 | $ | 12.50 | $ | 21.94 | ||||||
Service Class1 | 15.43 | 12.25 | 21.87 | |||||||||
Consultant Class2 | 10.98 | 10.67 | 19.98 | |||||||||
Institutional Class3 | 12.65 | 21.77 | ||||||||||
R Class3 | 10.05 | 11.42 | ||||||||||
| Investments at identified cost | $ | 164,956,579 | $ | 301,642,374 | $ | 970,268,248 | ||||||
| Market value of loaned securities | 4,137,574 | 39,964,689 | – | |||||||||
| 1 | Offering and redemption price per share; shares held less than 30 days may be subject to a 1% redemption fee, payable to the Fund. |
| 2 | Offering and redemption price per share; shares held less than 365 days may be subject to a 1% contingent deferred sales charge, payable to Royce Fund Services, LLC. |
| 3 | Offering and redemption price per share. |
| THE ACCOMPANYING NOTES ARE AN INTEGRAL PART OF THESE FINANCIAL STATEMENTS | The Royce Funds 2017 Semiannual Report to Shareholders | 83 |
| Statements of Assets and Liabilities | June 30, 2017 (unaudited) |
| Royce Special Equity | Royce Total Return | |||||||
| Multi-Cap Fund | Fund | |||||||
| ASSETS: | ||||||||
| Investments at value (including collateral on loaned securities) | ||||||||
Non-Affiliated Companies | $ | 100,471,083 | $ | 2,534,470,160 | ||||
Affiliated Companies | – | 7,228,690 | ||||||
| Repurchase agreements (at cost and value) | 10,308,000 | 67,993,000 | ||||||
| Cash and foreign currency | 591 | 95,092 | ||||||
| Receivable for investments sold | – | 70,605,878 | ||||||
| Receivable for capital shares sold | 21,927 | 2,814,272 | ||||||
| Receivable for dividends and interest | 153,714 | 2,604,022 | ||||||
| Prepaid expenses and other assets | 2,398 | 39,481 | ||||||
| Total Assets | 110,957,713 | 2,685,850,595 | ||||||
| LIABILITIES: | ||||||||
| Payable for collateral on loaned securities | – | 6,419,985 | ||||||
| Payable for investments purchased | 535,234 | 226,867 | ||||||
| Payable for capital shares redeemed | 1,250 | 67,294,219 | ||||||
| Payable for investment advisory fees | 73,195 | 2,180,333 | ||||||
| Payable for trustees’ fees | 3,443 | 80,493 | ||||||
| Accrued expenses | 22,954 | 1,613,101 | ||||||
| Total Liabilities | 636,076 | 77,814,998 | ||||||
| Net Assets | $ | 110,321,637 | $ | 2,608,035,597 | ||||
| ANALYSIS OF NET ASSETS: | ||||||||
| Paid-in capital | $ | 84,816,254 | $ | 1,303,052,113 | ||||
| Undistributed net investment income (loss) | 499,704 | 555,161 | ||||||
| Accumulated net realized gain (loss) on investments and foreign currency | 5,629,444 | 244,931,790 | ||||||
| Net unrealized appreciation (depreciation) on investments and foreign currency | 19,376,235 | 1,059,496,533 | ||||||
| Net Assets | $ | 110,321,637 | $ | 2,608,035,597 | ||||
Investment Class | $ | 37,209,569 | $ | 1,728,995,819 | ||||
Service Class | 29,091,789 | 112,300,929 | ||||||
Consultant Class | 4,333,743 | 248,059,856 | ||||||
Institutional Class | 39,686,536 | 344,933,332 | ||||||
W Class | 85,375,969 | |||||||
R Class | 52,169,809 | |||||||
K Class | 36,199,883 | |||||||
| SHARES OUTSTANDING (unlimited number of $.001 par value): | ||||||||
Investment Class | 2,522,634 | 123,637,341 | ||||||
Service Class | 1,968,516 | 7,863,253 | ||||||
Consultant Class | 450,317 | 17,248,115 | ||||||
Institutional Class | 2,691,632 | 24,963,388 | ||||||
W Class | 6,111,873 | |||||||
R Class | 3,622,031 | |||||||
K Class | 3,902,671 | |||||||
| NET ASSET VALUES (Net Assets ÷ Shares Outstanding): | ||||||||
Investment Class1 | $ | 14.75 | $ | 13.98 | ||||
Service Class1 | 14.78 | 14.28 | ||||||
Consultant Class2 | 9.62 | 14.38 | ||||||
Institutional Class3 | 14.74 | 13.82 | ||||||
W Class3 | 13.97 | |||||||
R Class3 | 14.40 | |||||||
K Class3 | 9.28 | |||||||
| Investments at identified cost | $ | 81,094,847 | $ | 1,482,195,182 | ||||
| Market value of loaned securities | – | 6,187,714 | ||||||
| 1 | Offering and redemption price per share; shares held less than 30 days may be subject to a 1% redemption fee, payable to the Fund. |
| 2 | Offering and redemption price per share; shares held less than 365 days may be subject to a 1% contingent deferred sales charge, payable to Royce Fund Services, LLC. |
| 3 | Offering and redemption price per share. |
| 84 | The Royce Funds 2017 Semiannual Report to Shareholders | THE ACCOMPANYING NOTES ARE AN INTEGRAL PART OF THESE FINANCIAL STATEMENTS |
Statements of Changes in Net Assets
| Royce Global Financial | Royce International | |||||||||||||||||||||||
| Royce Dividend Value Fund | Services Fund | Micro-Cap Fund | ||||||||||||||||||||||
| Six Months Ended | Six Months Ended | Six Months Ended | ||||||||||||||||||||||
| 6/30/17 (unaudited) | Year Ended 12/31/16 | 6/30/17 (unaudited) | Year Ended 12/31/16 | 6/30/17 (unaudited) | Year Ended 12/31/16 | |||||||||||||||||||
| INVESTMENT OPERATIONS: | ||||||||||||||||||||||||
| Net investment income (loss) | $ | 1,511,306 | $ | 3,671,006 | $ | 259,824 | $ | 632,883 | $ | 41,566 | $ | 40,959 | ||||||||||||
Net realized gain (loss) on investments and foreign currency | 7,509,944 | 23,693,288 | 1,159,952 | (622,546 | ) | 200,539 | 84,177 | |||||||||||||||||
Net change in unrealized appreciation (depreciation) on investments and foreign currency | 6,850,906 | 8,045,266 | 3,383,547 | 5,831,058 | 699,579 | 243,967 | ||||||||||||||||||
Net increase (decrease) in net assets from investment operations | 15,872,156 | 35,409,560 | 4,803,323 | 5,841,395 | 941,684 | 369,103 | ||||||||||||||||||
| DISTRIBUTIONS: | ||||||||||||||||||||||||
| Net investment income | ||||||||||||||||||||||||
Investment Class | (652,563 | ) | (1,603,952 | ) | ||||||||||||||||||||
Service Class | (487,951 | ) | (1,483,597 | ) | – | (227,361 | ) | – | (94,073 | ) | ||||||||||||||
Consultant Class | (2,614 | ) | (6,858 | ) | ||||||||||||||||||||
Institutional Class | (6,248 | ) | (12,914 | ) | – | (48,466 | ) | |||||||||||||||||
Net realized gain on investments and foreign currency | ||||||||||||||||||||||||
Investment Class | – | (9,347,539 | ) | |||||||||||||||||||||
Service Class | – | (10,322,532 | ) | – | (113,915 | ) | – | – | ||||||||||||||||
Consultant Class | – | (118,406 | ) | |||||||||||||||||||||
Institutional Class | – | (73,032 | ) | – | (13,575 | ) | ||||||||||||||||||
| Return of capital | ||||||||||||||||||||||||
Investment Class | – | – | ||||||||||||||||||||||
Service Class | – | – | – | – | – | (3,148 | ) | |||||||||||||||||
Consultant Class | – | – | ||||||||||||||||||||||
Institutional Class | – | – | – | – | ||||||||||||||||||||
| Total distributions | (1,149,376 | ) | (22,968,830 | ) | – | (403,317 | ) | – | (97,221 | ) | ||||||||||||||
| CAPITAL SHARE TRANSACTIONS: | ||||||||||||||||||||||||
| Net capital share transactions | ||||||||||||||||||||||||
Investment Class | (8,577,077 | ) | (21,449,693 | ) | ||||||||||||||||||||
Service Class | (25,389,973 | ) | (59,138,290 | ) | (3,455,188 | ) | (12,648,330 | ) | 350,785 | (314,555 | ) | |||||||||||||
Consultant Class | (107,778 | ) | (345,496 | ) | ||||||||||||||||||||
Institutional Class | 107,695 | 134,631 | 79,295 | 5,299,129 | ||||||||||||||||||||
| Shareholder redemption fees | ||||||||||||||||||||||||
Investment Class | 108 | 149 | ||||||||||||||||||||||
Service Class | 3 | 306 | 328 | 1,391 | – | 3 | ||||||||||||||||||
Net increase (decrease) in net assets from | (33,967,022 | ) | (80,798,393 | ) | (3,375,565 | ) | (7,347,810 | ) | 350,785 | (314,552 | ) | |||||||||||||
| Net Increase (Decrease) In Net Assets | (19,244,242 | ) | (68,357,663 | ) | 1,427,758 | (1,909,732 | ) | 1,292,469 | (42,670 | ) | ||||||||||||||
| NET ASSETS: | ||||||||||||||||||||||||
| Beginning of period | 217,404,347 | 285,762,010 | 50,102,783 | 52,012,515 | 6,059,692 | 6,102,362 | ||||||||||||||||||
| End of period | $ | 198,160,105 | $ | 217,404,347 | $ | 51,530,541 | $ | 50,102,783 | $ | 7,352,161 | $ | 6,059,692 | ||||||||||||
Undistributed Net Investment Income (Loss) at End | $ | 855,292 | $ | 493,362 | $ | 283,969 | $ | 24,145 | $ | 26,024 | $ | (15,542 | ) | |||||||||||
| THE ACCOMPANYING NOTES ARE AN INTEGRAL PART OF THESE FINANCIAL STATEMENTS | The Royce Funds 2017 Semiannual Report to Shareholders | 85 |
Statements of Changes in Net Assets
| Royce International Premier Fund | Royce Low-Priced Stock Fund | Royce Micro-Cap Fund | ||||||||||||||||||||||
| Six Months Ended | Six Months Ended | Six Months Ended | ||||||||||||||||||||||
| 6/30/17 (unaudited) | Year Ended 12/31/16 | 6/30/17 (unaudited) | Year Ended 12/31/16 | 6/30/17 (unaudited) | Year Ended 12/31/16 | |||||||||||||||||||
| INVESTMENT OPERATIONS: | ||||||||||||||||||||||||
| Net investment income (loss) | $ | 338,843 | $ | 440,469 | $ | (64,937 | ) | $ | 563,098 | $ | (508,401 | ) | $ | (315,442 | ) | |||||||||
Net realized gain (loss) on investments and foreign currency | 1,552,099 | 2,017,787 | 11,506,968 | 24,229,523 | 8,330,545 | 24,722,058 | ||||||||||||||||||
Net change in unrealized appreciation (depreciation) on investments and foreign currency | 13,248,725 | 2,859,167 | (8,930,498 | ) | 18,925,368 | (3,974,302 | ) | 16,232,069 | ||||||||||||||||
Net increase (decrease) in net assets from investment operations | 15,139,667 | 5,317,423 | 2,511,533 | 43,717,989 | 3,847,842 | 40,638,685 | ||||||||||||||||||
| DISTRIBUTIONS: | ||||||||||||||||||||||||
| Net investment income | ||||||||||||||||||||||||
Investment Class | – | (578,473 | ) | – | (153,381 | ) | (86 | ) | (860,802 | ) | ||||||||||||||
Service Class | – | (884,559 | ) | – | (1,280,579 | ) | – | (58,138 | ) | |||||||||||||||
Consultant Class | – | (74,632 | ) | – | – | |||||||||||||||||||
Institutional Class | – | (77,571 | ) | |||||||||||||||||||||
R Class | – | (1,365 | ) | – | (1,471 | ) | ||||||||||||||||||
K Class | – | (643 | ) | – | (34,411 | ) | ||||||||||||||||||
Net realized gain on investments and foreign currency | ||||||||||||||||||||||||
Investment Class | – | (22,488 | ) | – | (1,891,699 | ) | (1,945 | ) | (19,361,347 | ) | ||||||||||||||
Service Class | – | (37,565 | ) | – | (23,339,027 | ) | – | (1,732,575 | ) | |||||||||||||||
Consultant Class | – | (4,771 | ) | – | (4,361,373 | ) | ||||||||||||||||||
Institutional Class | – | (1,002,506 | ) | |||||||||||||||||||||
R Class | – | (61 | ) | – | (92,435 | ) | ||||||||||||||||||
K Class | – | (27 | ) | – | (400,675 | ) | ||||||||||||||||||
| Return of capital | ||||||||||||||||||||||||
Investment Class | – | (2,096 | ) | – | – | – | – | |||||||||||||||||
Service Class | – | (3,224 | ) | – | – | – | – | |||||||||||||||||
Consultant Class | – | (282 | ) | – | – | |||||||||||||||||||
Institutional Class | – | – | ||||||||||||||||||||||
R Class | – | (5 | ) | – | – | |||||||||||||||||||
K Class | – | (2 | ) | – | – | |||||||||||||||||||
| Total distributions | – | (1,610,193 | ) | – | (28,273,755 | ) | (2,031 | ) | (26,374,235 | ) | ||||||||||||||
| CAPITAL SHARE TRANSACTIONS: | ||||||||||||||||||||||||
| Net capital share transactions | ||||||||||||||||||||||||
Investment Class | 13,307,240 | (7,619,217 | ) | (2,067,963 | ) | (7,100,958 | ) | (19,284,546 | ) | (38,591,832 | ) | |||||||||||||
Service Class | 1,332,901 | (6,346,690 | ) | (32,494,097 | ) | (50,040,199 | ) | (423,305 | ) | (4,084,325 | ) | |||||||||||||
Consultant Class | 151,306 | (1,615,137 | ) | (5,935,379 | ) | (8,726,715 | ) | |||||||||||||||||
Institutional Class | (2,338,893 | ) | (25,653,966 | ) | ||||||||||||||||||||
R Class | 581 | 11,570 | (70,933 | ) | (159,633 | ) | ||||||||||||||||||
K Class | (24,050 | ) | 672 | (1,100,085 | ) | (145,351 | ) | |||||||||||||||||
Value of shares issued in connection with the merger of Royce European Small-Cap Fund and Royce Global Value Fund | 62,822,434 | |||||||||||||||||||||||
| Shareholder redemption fees | ||||||||||||||||||||||||
Investment Class | – | 758 | – | – | 56 | 70 | ||||||||||||||||||
Service Class | 174 | 268 | 1,305 | 69 | – | – | ||||||||||||||||||
Net increase (decrease) in net assets from capital share transactions | 14,768,152 | 47,254,658 | (38,070,666 | ) | (83,100,038 | ) | (25,643,174 | ) | (51,402,802 | ) | ||||||||||||||
| Net Increase (Decrease) In Net Assets | 29,907,819 | 50,961,888 | (35,559,133 | ) | (67,655,804 | ) | (21,797,363 | ) | (37,138,352 | ) | ||||||||||||||
| NET ASSETS: | ||||||||||||||||||||||||
| Beginning of period | 63,600,137 | 12,638,249 | 319,189,999 | 386,845,803 | 243,695,636 | 280,833,988 | ||||||||||||||||||
| End of period | $ | 93,507,956 | $ | 63,600,137 | $ | 283,630,866 | $ | 319,189,999 | $ | 221,898,273 | $ | 243,695,636 | ||||||||||||
Undistributed Net Investment Income (Loss) at End | $ | (581,151 | ) | $ | (919,994 | ) | $ | (582,740 | ) | $ | (517,803 | ) | $ | (1,396,824 | ) | $ | (888,336 | ) | ||||||
| 86 | The Royce Funds 2017 Semiannual Report to Shareholders | THE ACCOMPANYING NOTES ARE AN INTEGRAL PART OF THESE FINANCIAL STATEMENTS |
| Royce Micro-Cap Opportunity Fund | Royce Opportunity Fund | Royce Pennsylvania Mutual Fund | ||||||||||||||||||||||
| Six Months Ended | Six Months Ended | Six Months Ended | ||||||||||||||||||||||
| 6/30/17 (unaudited) | Year Ended 12/31/16 | 6/30/17 (unaudited) | Year Ended 12/31/16 | 6/30/17 (unaudited) | Year Ended 12/31/16 | |||||||||||||||||||
| INVESTMENT OPERATIONS: | ||||||||||||||||||||||||
| Net investment income (loss) | $ | (165,484 | ) | $ | (220,205 | ) | $ | (839,584 | ) | $ | (2,560,355 | ) | $ | 1,937,184 | $ | 11,458,260 | ||||||||
Net realized gain (loss) on investments and foreign currency | 3,649,697 | (446,685 | ) | 113,543,069 | 81,399,272 | 216,455,618 | 382,217,946 | |||||||||||||||||
Net change in unrealized appreciation (depreciation) on investments and foreign currency | 929,627 | 9,869,805 | 4,031,076 | 286,652,783 | (111,172,760 | ) | 196,021,249 | |||||||||||||||||
Net increase (decrease) in net assets from investment operations | 4,413,840 | 9,202,915 | 116,734,561 | 365,491,700 | 107,220,042 | 589,697,455 | ||||||||||||||||||
| DISTRIBUTIONS: | ||||||||||||||||||||||||
| Net investment income | ||||||||||||||||||||||||
Investment Class | – | – | – | – | – | (5,686,548 | ) | |||||||||||||||||
Service Class | – | – | – | – | – | (89,747 | ) | |||||||||||||||||
Consultant Class | – | – | – | – | ||||||||||||||||||||
Institutional Class | – | – | – | (1,114,871 | ) | |||||||||||||||||||
R Class | – | – | – | – | ||||||||||||||||||||
K Class | – | – | – | – | ||||||||||||||||||||
Net realized gain on investments and foreign currency | ||||||||||||||||||||||||
Investment Class | – | – | – | (49,065,228 | ) | – | (107,426,917 | ) | ||||||||||||||||
Service Class | – | – | – | (5,193,491 | ) | – | (6,455,759 | ) | ||||||||||||||||
Consultant Class | – | (1,647,105 | ) | – | (31,772,229 | ) | ||||||||||||||||||
Institutional Class | – | (37,279,779 | ) | – | (16,986,455 | ) | ||||||||||||||||||
R Class | – | (2,795,339 | ) | – | (1,169,369 | ) | ||||||||||||||||||
K Class | – | (525,822 | ) | – | (247,212 | ) | ||||||||||||||||||
| Total distributions | – | – | – | (96,506,764 | ) | – | (170,949,107 | ) | ||||||||||||||||
| CAPITAL SHARE TRANSACTIONS: | ||||||||||||||||||||||||
| Net capital share transactions | ||||||||||||||||||||||||
Investment Class | (969,851 | ) | 1,678,178 | (55,576,397 | ) | (130,921,772 | ) | (125,044,385 | ) | (525,830,125 | ) | |||||||||||||
Service Class | (44,781 | ) | (400,240 | ) | 15,736,511 | (40,726,682 | ) | (26,358,470 | ) | (14,214,408 | ) | |||||||||||||
Consultant Class | (2,488,386 | ) | (1,846,769 | ) | (47,042,838 | ) | (70,571,044 | ) | ||||||||||||||||
Institutional Class | (45,609,197 | ) | (125,523,167 | ) | (17,366,839 | ) | (328,652,837 | ) | ||||||||||||||||
R Class | (3,123,135 | ) | (127,892 | ) | (1,560,670 | ) | (4,149,765 | ) | ||||||||||||||||
K Class | (563,387 | ) | (4,132,187 | ) | (594,845 | ) | (1,338,061 | ) | ||||||||||||||||
| Shareholder redemption fees | ||||||||||||||||||||||||
Investment Class | – | 412 | 417 | 1,530 | 3,259 | 22,510 | ||||||||||||||||||
Service Class | 99 | 24 | 387 | 124 | 2,907 | 2,869 | ||||||||||||||||||
Net increase (decrease) in net assets from capital share transactions | (1,014,533 | ) | 1,278,374 | (91,623,187 | ) | (303,276,815 | ) | (217,961,881 | ) | (944,730,861 | ) | |||||||||||||
| Net Increase (Decrease) In Net Assets | 3,399,307 | 10,481,289 | 25,111,374 | (34,291,879 | ) | (110,741,839 | ) | (525,982,513 | ) | |||||||||||||||
| NET ASSETS: | ||||||||||||||||||||||||
| Beginning of period | 46,129,809 | 35,648,520 | 1,475,391,936 | 1,509,683,815 | 2,439,828,432 | 2,965,810,945 | ||||||||||||||||||
| End of period | $ | 49,529,116 | $ | 46,129,809 | $ | 1,500,503,310 | $ | 1,475,391,936 | $ | 2,329,086,593 | $ | 2,439,828,432 | ||||||||||||
Undistributed Net Investment Income (Loss) at End | $ | (165,484 | ) | $ | – | $ | (1,283,286 | ) | $ | (443,702 | ) | $ | 209,133 | $ | (1,728,050 | ) | ||||||||
| THE ACCOMPANYING NOTES ARE AN INTEGRAL PART OF THESE FINANCIAL STATEMENTS | The Royce Funds 2017 Semiannual Report to Shareholders | 87 |
Statements of Changes in Net Assets
| Royce Premier Fund | Royce Small-Cap Leaders Fund | Royce Small-Cap Value Fund | ||||||||||||||||||||||
| Six Months Ended | Six Months Ended | Six Months Ended | ||||||||||||||||||||||
| 6/30/17 (unaudited) | Year Ended 12/31/16 | 6/30/17 (unaudited) | Year Ended 12/31/16 | 6/30/17 (unaudited) | Year Ended 12/31/16 | |||||||||||||||||||
| INVESTMENT OPERATIONS: | ||||||||||||||||||||||||
| Net investment income (loss) | $ | (837,717 | ) | $ | 7,651,793 | $ | 186,090 | $ | 479,509 | $ | 551,464 | $ | 2,821,887 | |||||||||||
Net realized gain (loss) on investments and foreign currency | 193,790,812 | 268,086,942 | 8,689,012 | 6,469,616 | 4,085,348 | 10,075,800 | ||||||||||||||||||
Net change in unrealized appreciation | (9,876,082 | ) | 183,886,343 | (7,716,519 | ) | 15,358,937 | (23,071,560 | ) | 77,277,716 | |||||||||||||||
Net increase (decrease) in net assets from investment operations | 183,077,013 | 459,625,078 | 1,158,583 | 22,308,062 | (18,434,748 | ) | 90,175,403 | |||||||||||||||||
| DISTRIBUTIONS: | ||||||||||||||||||||||||
| Net investment income | ||||||||||||||||||||||||
Investment Class | (62 | ) | (4,446,718 | ) | – | (365,134 | ) | – | (574,909 | ) | ||||||||||||||
Service Class | – | – | – | (263,257 | ) | – | (1,164,815 | ) | ||||||||||||||||
Consultant Class | – | – | – | – | ||||||||||||||||||||
Institutional Class | – | (816,383 | ) | – | (1,204,138 | ) | ||||||||||||||||||
W Class | – | (358,070 | ) | |||||||||||||||||||||
R Class | – | – | – | (1,756 | ) | – | (50,816 | ) | ||||||||||||||||
K Class | (36,010 | ) | – | (1,370 | ) | – | (4,294 | ) | ||||||||||||||||
Net realized gain on investments and foreign currency | ||||||||||||||||||||||||
Investment Class | (2,941 | ) | (211,537,353 | ) | – | (4,574,543 | ) | – | (3,534,812 | ) | ||||||||||||||
Service Class | – | (5,326,941 | ) | – | (4,826,822 | ) | – | (10,330,776 | ) | |||||||||||||||
Consultant Class | – | (4,519,182 | ) | – | (880,547 | ) | ||||||||||||||||||
Institutional Class | – | (28,846,485 | ) | – | (6,259,269 | ) | ||||||||||||||||||
W Class | – | (18,160,148 | ) | |||||||||||||||||||||
R Class | – | (1,735,767 | ) | – | (130,446 | ) | – | (902,982 | ) | |||||||||||||||
K Class | (1,812,751 | ) | – | (34,032 | ) | – | (206,890 | ) | ||||||||||||||||
| Total distributions | (3,003 | ) | (277,595,808 | ) | – | (10,197,360 | ) | – | (25,114,248 | ) | ||||||||||||||
| CAPITAL SHARE TRANSACTIONS: | ||||||||||||||||||||||||
| Net capital share transactions | ||||||||||||||||||||||||
Investment Class | (149,200,605 | ) | (386,079,798 | ) | (5,852,906 | ) | (7,875,386 | ) | (9,684,319 | ) | (14,802,713 | ) | ||||||||||||
Service Class | 1,288,664 | (19,076,174 | ) | (5,619,237 | ) | (13,442,897 | ) | (33,312,756 | ) | (68,631,289 | ) | |||||||||||||
Consultant Class | (2,739,029 | ) | (3,272,047 | ) | (1,816,308 | ) | (4,054,963 | ) | ||||||||||||||||
Institutional Class | 5,463,711 | (67,646,777 | ) | (20,184,194 | ) | (42,386,309 | ) | |||||||||||||||||
W Class | (13,044,672 | ) | (59,256,198 | ) | ||||||||||||||||||||
R Class | (1,917,191 | ) | (3,305,881 | ) | 143,191 | (27,116 | ) | (2,038,454 | ) | (3,390,856 | ) | |||||||||||||
K Class | (1,330,635 | ) | (507,282 | ) | 98,793 | (805,335 | ) | (3,533,475 | ) | |||||||||||||||
| Shareholder redemption fees | ||||||||||||||||||||||||
Investment Class | 1,231 | 7,363 | – | – | – | 1,133 | ||||||||||||||||||
Service Class | 210 | – | 9 | 72 | 116 | 559 | ||||||||||||||||||
Net increase (decrease) in net assets from | (160,147,681 | ) | (539,960,147 | ) | (11,836,225 | ) | (21,246,534 | ) | (67,841,250 | ) | (136,797,913 | ) | ||||||||||||
| Net Increase (Decrease) In Net Assets | 22,926,329 | (357,930,877 | ) | (10,677,642 | ) | (9,135,832 | ) | (86,275,998 | ) | (71,736,758 | ) | |||||||||||||
| NET ASSETS: | ||||||||||||||||||||||||
| Beginning of period | 2,259,134,977 | 2,617,065,854 | 101,024,022 | 110,159,854 | 451,180,468 | 522,917,226 | ||||||||||||||||||
| End of period | $ | 2,282,061,306 | $ | 2,259,134,977 | $ | 90,346,380 | $ | 101,024,022 | $ | 364,904,470 | $ | 451,180,468 | ||||||||||||
Undistributed Net Investment Income (Loss) at End | $ | (622,783 | ) | $ | 214,996 | $ | 184,940 | $ | (1,150 | ) | $ | 669,888 | $ | 118,424 | ||||||||||
| 88 | The Royce Funds 2017 Semiannual Report to Shareholders | THE ACCOMPANYING NOTES ARE AN INTEGRAL PART OF THESE FINANCIAL STATEMENTS |
| Royce Smaller-Companies | ||||||||||||||||||||||||
| Royce Small/Mid-Cap Premier Fund | Growth Fund | Royce Special Equity Fund | ||||||||||||||||||||||
| Six Months Ended | Six Months Ended | Six Months Ended | ||||||||||||||||||||||
| 6/30/17 (unaudited) | Year Ended 12/31/16 | 6/30/17 (unaudited) | Year Ended 12/31/16 | 6/30/17 (unaudited) | Year Ended 12/31/16 | |||||||||||||||||||
| INVESTMENT OPERATIONS: | ||||||||||||||||||||||||
| Net investment income (loss) | $ | 171,680 | $ | 80,363 | $ | (1,708,963 | ) | $ | (3,233,602 | ) | $ | 4,017,324 | $ | 14,034,085 | ||||||||||
Net realized gain (loss) on investments and foreign currency | 7,874,594 | 17,403,296 | 44,594,884 | 43,532,996 | 61,597,188 | 144,372,440 | ||||||||||||||||||
Net change in unrealized appreciation (depreciation) | 4,501,253 | 20,044,069 | 638,265 | (8,118,296 | ) | (73,042,533 | ) | 258,157,824 | ||||||||||||||||
Net increase (decrease) in net assets from investment operations | 12,547,527 | 37,527,728 | 43,524,186 | 32,181,098 | (7,428,021 | ) | 416,564,349 | |||||||||||||||||
| DISTRIBUTIONS: | ||||||||||||||||||||||||
| Net investment income | ||||||||||||||||||||||||
Investment Class | – | (349,595 | ) | – | – | – | (10,976,670 | ) | ||||||||||||||||
Service Class | – | (225,517 | ) | – | – | – | (927,113 | ) | ||||||||||||||||
Consultant Class | – | – | – | – | – | (98,531 | ) | |||||||||||||||||
Institutional Class | – | – | – | (2,208,722 | ) | |||||||||||||||||||
R Class | – | – | – | – | ||||||||||||||||||||
K Class | – | (8,467 | ) | – | – | |||||||||||||||||||
Net realized gain on investments and foreign currency | ||||||||||||||||||||||||
Investment Class | – | (2,986,270 | ) | – | (10,605,399 | ) | – | (77,675,819 | ) | |||||||||||||||
Service Class | – | (4,072,137 | ) | – | (30,194,249 | ) | – | (8,070,542 | ) | |||||||||||||||
Consultant Class | – | (538,174 | ) | – | (1,333,802 | ) | – | (3,479,624 | ) | |||||||||||||||
Institutional Class | – | (2,047,317 | ) | – | (14,305,337 | ) | ||||||||||||||||||
R Class | – | (97,583 | ) | – | (89,046 | ) | ||||||||||||||||||
K Class | – | (203,617 | ) | – | (38,133 | ) | ||||||||||||||||||
| Total distributions | – | (8,481,360 | ) | – | (44,307,946 | ) | – | (117,742,358 | ) | |||||||||||||||
| CAPITAL SHARE TRANSACTIONS: | ||||||||||||||||||||||||
| Net capital share transactions | ||||||||||||||||||||||||
Investment Class | (8,297,156 | ) | (13,714,678 | ) | (11,858,703 | ) | (38,505,792 | ) | (85,306,093 | ) | (99,953,704 | ) | ||||||||||||
Service Class | (4,523,220 | ) | (15,044,344 | ) | (40,034,301 | ) | (116,353,750 | ) | (19,179,564 | ) | (6,665,803 | ) | ||||||||||||
Consultant Class | (1,766,543 | ) | (901,650 | ) | (750,182 | ) | (3,295,302 | ) | (2,804,582 | ) | (281,055 | ) | ||||||||||||
Institutional Class | (10,234,193 | ) | (17,982,903 | ) | 36,639,634 | (43,764,912 | ) | |||||||||||||||||
R Class | (113,810 | ) | (613,184 | ) | (216,405 | ) | (63,492 | ) | ||||||||||||||||
K Class | (4,272,121 | ) | (235,717 | ) | (210,263 | ) | (78,318 | ) | ||||||||||||||||
| Shareholder redemption fees | ||||||||||||||||||||||||
Investment Class | 57 | 2 | – | 30,251 | 3,619 | 22,992 | ||||||||||||||||||
Service Class | 8 | 8 | 1,045 | 268 | 874 | 1,222 | ||||||||||||||||||
Net increase (decrease) in net assets from capital share transactions | (18,972,785 | ) | (30,509,563 | ) | (63,303,002 | ) | (176,249,038 | ) | (70,646,112 | ) | (150,641,260 | ) | ||||||||||||
| Net Increase (Decrease) In Net Assets | (6,425,258 | ) | (1,463,195 | ) | (19,778,816 | ) | (188,375,886 | ) | (78,074,133 | ) | 148,180,731 | |||||||||||||
| NET ASSETS: | ||||||||||||||||||||||||
| Beginning of period | 226,308,155 | 227,771,350 | 415,714,613 | 604,090,499 | 1,609,980,739 | 1,461,800,008 | ||||||||||||||||||
| End of period | $ | 219,882,897 | $ | 226,308,155 | $ | 395,935,797 | $ | 415,714,613 | $ | 1,531,906,606 | $ | 1,609,980,739 | ||||||||||||
Undistributed Net Investment Income (Loss) at End of Period | $ | 158,711 | $ | (12,969 | ) | $ | (1,528,934 | ) | $ | 180,029 | $ | 4,057,335 | $ | 40,011 | ||||||||||
| THE ACCOMPANYING NOTES ARE AN INTEGRAL PART OF THESE FINANCIAL STATEMENTS | The Royce Funds 2017 Semiannual Report to Shareholders | 89 |
Statements of Changes in Net Assets
| Royce Special Equity | ||||||||||||||||
| Multi-Cap Fund | Royce Total Return Fund | |||||||||||||||
| Six Months Ended | Six Months Ended | |||||||||||||||
| 6/30/17 (unaudited) | Year Ended 12/31/16 | 6/30/17 (unaudited) | Year Ended 12/31/16 | |||||||||||||
| INVESTMENT OPERATIONS: | ||||||||||||||||
| Net investment income (loss) | $ | 491,447 | $ | 1,281,579 | $ | 13,353,161 | $ | 27,331,086 | ||||||||
| Net realized gain (loss) on investments and foreign currency | 6,229,397 | 4,070,033 | 201,326,157 | 283,268,348 | ||||||||||||
| Net change in unrealized appreciation (depreciation) on investments and foreign currency | (187,526 | ) | 9,868,313 | (141,816,933 | ) | 329,870,012 | ||||||||||
| Net increase (decrease) in net assets from investment operations | 6,533,318 | 15,219,925 | 72,862,385 | 640,469,446 | ||||||||||||
| DISTRIBUTIONS: | ||||||||||||||||
| Net investment income | ||||||||||||||||
Investment Class | – | (444,817 | ) | (9,056,749 | ) | (28,673,118 | ) | |||||||||
Service Class | – | (339,957 | ) | (520,420 | ) | (1,495,071 | ) | |||||||||
Consultant Class | – | (44,532 | ) | – | (99,265 | ) | ||||||||||
Institutional Class | – | (461,530 | ) | (2,452,583 | ) | (7,497,123 | ) | |||||||||
W Class | (387,636 | ) | (1,459,406 | ) | ||||||||||||
R Class | (110,652 | ) | (302,414 | ) | ||||||||||||
K Class | (101,525 | ) | (564,903 | ) | ||||||||||||
| Net realized gain on investments and foreign currency | ||||||||||||||||
Investment Class | – | – | – | (138,580,935 | ) | |||||||||||
Service Class | – | – | – | (10,479,295 | ) | |||||||||||
Consultant Class | – | – | – | (19,570,898 | ) | |||||||||||
Institutional Class | – | – | – | (31,762,325 | ) | |||||||||||
W Class | – | (6,018,247 | ) | |||||||||||||
R Class | – | (3,941,629 | ) | |||||||||||||
K Class | – | (4,383,947 | ) | |||||||||||||
| Total distributions | – | (1,290,836 | ) | (12,629,565 | ) | (254,828,576 | ) | |||||||||
| CAPITAL SHARE TRANSACTIONS: | ||||||||||||||||
| Net capital share transactions | ||||||||||||||||
Investment Class | 250,806 | (13,753,944 | ) | (145,652,994 | ) | (250,310,152 | ) | |||||||||
Service Class | (10,259,313 | ) | (14,795,597 | ) | (33,179,175 | ) | (11,414,322 | ) | ||||||||
Consultant Class | (929,661 | ) | (2,264,766 | ) | (24,693,172 | ) | (32,394,591 | ) | ||||||||
Institutional Class | 48,606 | (3,754,867 | ) | (84,606,645 | ) | (21,328,585 | ) | |||||||||
W Class | 3,885,140 | (53,411,042 | ) | |||||||||||||
R Class | (2,907,685 | ) | (3,978,781 | ) | ||||||||||||
K Class | (5,587,767 | ) | (28,303,584 | ) | ||||||||||||
| Shareholder redemption fees | ||||||||||||||||
Investment Class | 195 | 30 | 692 | 3,889 | ||||||||||||
Service Class | 2 | 84 | 2,970 | 614 | ||||||||||||
| Net increase (decrease) in net assets from capital share transactions | (10,889,365 | ) | (34,569,060 | ) | (292,738,636 | ) | (401,136,554 | ) | ||||||||
| Net Increase (Decrease) In Net Assets | (4,356,047 | ) | (20,639,971 | ) | (232,505,816 | ) | (15,495,684 | ) | ||||||||
| NET ASSETS: | ||||||||||||||||
| Beginning of period | 114,677,684 | 135,317,655 | 2,840,541,413 | 2,856,037,097 | ||||||||||||
| End of period | $ | 110,321,637 | $ | 114,677,684 | $ | 2,608,035,597 | $ | 2,840,541,413 | ||||||||
| Undistributed Net Investment Income (Loss) at End of Period | $ | 499,704 | $ | 8,257 | $ | 555,161 | $ | (168,435 | ) | |||||||
| 90 | The Royce Funds 2017 Semiannual Report to Shareholders | THE ACCOMPANYING NOTES ARE AN INTEGRAL PART OF THESE FINANCIAL STATEMENTS |
| Statements of Operations | Six Months Ended June 30, 2017 (unaudited) |
| Royce Global | ||||||||||||||||
| Royce Dividend | Financial Services | Royce International | Royce International | |||||||||||||
| Value Fund | Fund | Micro-Cap Fund | Premier Fund | |||||||||||||
| INVESTMENT INCOME: | ||||||||||||||||
| INCOME: | ||||||||||||||||
| Dividends | $ | 2,864,800 | $ | 652,530 | $ | 101,968 | $ | 922,538 | ||||||||
| Foreign withholding tax | (105,587 | ) | (30,750 | ) | (6,228 | ) | (59,937 | ) | ||||||||
| Interest | 22,267 | 306 | 207 | 4,379 | ||||||||||||
| Securities lending | 129 | – | – | – | ||||||||||||
| Total income | 2,781,609 | 622,086 | 95,947 | 866,980 | ||||||||||||
| EXPENSES: | ||||||||||||||||
| Investment advisory fees | 888,923 | 253,356 | 41,449 | 375,637 | ||||||||||||
| Distribution fees | 142,547 | 54,876 | 8,290 | 81,129 | ||||||||||||
| Shareholder servicing | 151,517 | 35,910 | 6,558 | 53,823 | ||||||||||||
| Shareholder reports | 44,397 | 7,391 | 2,173 | 9,511 | ||||||||||||
| Administrative and office facilities | 31,810 | 6,800 | 831 | 9,660 | ||||||||||||
| Custody | 30,380 | 16,755 | 19,157 | 27,236 | ||||||||||||
| Registration | 26,947 | 19,302 | 8,788 | 24,213 | ||||||||||||
| Audit | 25,450 | 16,176 | 13,139 | 29,778 | ||||||||||||
| Trustees’ fees | 11,617 | 2,618 | 319 | 3,604 | ||||||||||||
| Legal | 2,743 | 596 | 73 | 832 | ||||||||||||
| Other expenses | 7,253 | 1,764 | 472 | 2,839 | ||||||||||||
| Total expenses | 1,363,584 | 415,544 | 101,249 | 618,262 | ||||||||||||
| Compensating balance credits | (1,213 | ) | (65 | ) | (11 | ) | (300 | ) | ||||||||
| Fees waived by investment adviser and distributor | (74,417 | ) | (36,965 | ) | (44,433 | ) | (24,790 | ) | ||||||||
| Expenses reimbursed by investment adviser | (17,651 | ) | (16,252 | ) | (2,424 | ) | (65,035 | ) | ||||||||
| Net expenses | 1,270,303 | 362,262 | 54,381 | 528,137 | ||||||||||||
| Net investment income (loss) | 1,511,306 | 259,824 | 41,566 | 338,843 | ||||||||||||
| REALIZED AND UNREALIZED GAIN (LOSS) ON INVESTMENTS AND FOREIGN CURRENCY: | ||||||||||||||||
| NET REALIZED GAIN (LOSS): | ||||||||||||||||
| Investments | 7,467,171 | 1,155,735 | 203,227 | 1,526,741 | ||||||||||||
| Foreign currency transactions | 42,773 | 4,217 | (2,688 | ) | 25,358 | |||||||||||
| NET CHANGE IN UNREALIZED APPRECIATION (DEPRECIATION): | ||||||||||||||||
| Investments and foreign currency translations | 6,846,535 | 3,412,932 | 699,427 | 13,440,162 | ||||||||||||
| Other assets and liabilities denominated in foreign currency | 4,371 | (29,385 | ) | 152 | (191,437 | ) | ||||||||||
Net realized and unrealized gain (loss) on investments and foreign currency | 14,360,850 | 4,543,499 | 900,118 | 14,800,824 | ||||||||||||
NET INCREASE (DECREASE) IN NET ASSETS FROM INVESTMENT OPERATIONS | $ | 15,872,156 | $ | 4,803,323 | $ | 941,684 | $ | 15,139,667 | ||||||||
| THE ACCOMPANYING NOTES ARE AN INTEGRAL PART OF THESE FINANCIAL STATEMENTS | The Royce Funds 2017 Semiannual Report to Shareholders | 91 |
Statements of Operations
| Royce Low-Priced | Royce Micro-Cap | Royce Micro-Cap | Royce Opportunity | |||||||||||||
| Stock Fund | Fund | Opportunity Fund | Fund | |||||||||||||
| INVESTMENT INCOME: | ||||||||||||||||
| INCOME: | ||||||||||||||||
| Dividends | $ | 1,841,806 | $ | 1,197,694 | $ | 124,736 | $ | 7,334,256 | ||||||||
| Foreign withholding tax | 56,131 | (21,694 | ) | – | – | |||||||||||
| Interest | 18,016 | 10,352 | 900 | 49,672 | ||||||||||||
| Securities lending | 184,609 | 165,356 | – | 458,772 | ||||||||||||
| Total income | 2,100,562 | 1,351,708 | 125,636 | 7,842,700 | ||||||||||||
| EXPENSES: | ||||||||||||||||
| Investment advisory fees | 1,477,143 | 1,413,631 | 233,753 | 7,321,859 | ||||||||||||
| Distribution fees | 330,088 | 171,372 | 1,266 | 299,287 | ||||||||||||
| Shareholder servicing | 229,469 | 140,096 | 22,776 | 521,410 | ||||||||||||
| Shareholder reports | 54,572 | 56,106 | 2,348 | 103,573 | ||||||||||||
| Administrative and office facilities | 43,525 | 32,567 | 5,760 | 196,020 | ||||||||||||
| Custody | 28,656 | 16,944 | 7,882 | 72,249 | ||||||||||||
| Registration | 24,918 | 20,486 | 14,609 | 40,977 | ||||||||||||
| Audit | 18,242 | 34,488 | 12,417 | 19,797 | ||||||||||||
| Trustees’ fees | 16,220 | 12,201 | 2,271 | 74,956 | ||||||||||||
| Legal | 3,765 | 2,821 | 504 | 19,334 | ||||||||||||
| Other expenses | 9,437 | 6,776 | 1,494 | 36,608 | ||||||||||||
| Total expenses | 2,236,035 | 1,907,488 | 305,080 | 8,706,070 | ||||||||||||
| Compensating balance credits | (1,003 | ) | (854 | ) | (20 | ) | (1,685 | ) | ||||||||
| Fees waived by distributor | (26,180 | ) | – | – | – | |||||||||||
| Expenses reimbursed by investment adviser | (43,353 | ) | (46,525 | ) | (13,940 | ) | (22,101 | ) | ||||||||
| Net expenses | 2,165,499 | 1,860,109 | 291,120 | 8,682,284 | ||||||||||||
| Net investment income (loss) | (64,937 | ) | (508,401 | ) | (165,484 | ) | (839,584 | ) | ||||||||
REALIZED AND UNREALIZED GAIN (LOSS) ON INVESTMENTS AND FOREIGN CURRENCY: | ||||||||||||||||
| NET REALIZED GAIN (LOSS): | ||||||||||||||||
| Investments in Non-Affiliated Companies | 11,534,945 | 8,331,900 | 3,649,697 | 118,199,503 | ||||||||||||
| Investments in Affiliated Companies | – | – | – | (4,656,434 | ) | |||||||||||
| Foreign currency transactions | (27,977 | ) | (1,355 | ) | – | – | ||||||||||
NET CHANGE IN UNREALIZED APPRECIATION (DEPRECIATION): | ||||||||||||||||
Investments in Non-Affiliated Companies and foreign currency translations | (8,930,618 | ) | (3,983,716 | ) | 929,627 | (11,206,936 | ) | |||||||||
| Investments in Affiliated Companies | – | – | – | 15,238,012 | ||||||||||||
| Other assets and liabilities denominated in foreign currency | 120 | 9,414 | – | – | ||||||||||||
Net realized and unrealized gain (loss) on investments and foreign currency | 2,576,470 | 4,356,243 | 4,579,324 | 117,574,145 | ||||||||||||
NET INCREASE (DECREASE) IN NET ASSETS FROM INVESTMENT OPERATIONS | $ | 2,511,533 | $ | 3,847,842 | $ | 4,413,840 | $ | 116,734,561 | ||||||||
| 92 | The Royce Funds 2017 Semiannual Report to Shareholders | THE ACCOMPANYING NOTES ARE AN INTEGRAL PART OF THESE FINANCIAL STATEMENTS |
| Six Months Ended June 30, 2017 (unaudited) |
| Royce | ||||||||||||||||
| Pennsylvania | Royce Premier | Royce Small-Cap | Royce Small-Cap | |||||||||||||
| Mutual Fund | Fund | Leaders Fund | Value Fund | |||||||||||||
| INVESTMENT INCOME: | ||||||||||||||||
| INCOME: | ||||||||||||||||
| Dividends | ||||||||||||||||
Non-Affiliated Companies | $ | 14,618,829 | $ | 12,539,020 | $ | 849,053 | $ | 3,374,756 | ||||||||
Affiliated Companies | 184,528 | – | – | – | ||||||||||||
| Foreign withholding tax | (318,815 | ) | (310,991 | ) | (23,700 | ) | (37,886 | ) | ||||||||
| Interest | 382,444 | 81,383 | 2,241 | 16,976 | ||||||||||||
| Securities lending | 90,125 | 89,602 | 14,974 | 7,494 | ||||||||||||
| Total income | 14,957,111 | 12,399,014 | 842,568 | 3,361,340 | ||||||||||||
| EXPENSES: | ||||||||||||||||
| Investment advisory fees | 8,945,342 | 11,141,528 | 478,016 | 2,031,607 | ||||||||||||
| Distribution fees | 2,072,321 | 253,705 | 64,891 | 355,228 | ||||||||||||
| Shareholder servicing | 1,007,823 | 898,013 | 61,873 | 237,361 | ||||||||||||
| Shareholder reports | 243,305 | 258,428 | 17,368 | 45,765 | ||||||||||||
| Administrative and office facilities | 345,976 | 304,878 | 13,520 | 62,929 | ||||||||||||
| Custody | 115,951 | 93,624 | 11,749 | 27,550 | ||||||||||||
| Registration | 43,208 | 40,012 | 19,167 | 34,033 | ||||||||||||
| Audit | 26,226 | 39,300 | 13,728 | 16,332 | ||||||||||||
| Trustees’ fees | 127,699 | 114,478 | 5,113 | 23,039 | ||||||||||||
| Legal | 29,878 | 39,335 | 1,171 | 5,426 | ||||||||||||
| Other expenses | 67,449 | 59,923 | 3,854 | 13,122 | ||||||||||||
| Total expenses | 13,025,178 | 13,243,224 | 690,450 | 2,852,392 | ||||||||||||
| Compensating balance credits | (5,251 | ) | (3,002 | ) | (269 | ) | (778 | ) | ||||||||
| Fees waived by distributor | – | – | (4,770 | ) | (9,440 | ) | ||||||||||
| Expenses reimbursed by investment adviser | – | (3,491 | ) | (28,933 | ) | (32,298 | ) | |||||||||
| Net expenses | 13,019,927 | 13,236,731 | 656,478 | 2,809,876 | ||||||||||||
| Net investment income (loss) | 1,937,184 | (837,717 | ) | 186,090 | 551,464 | |||||||||||
REALIZED AND UNREALIZED GAIN (LOSS) ON INVESTMENTS AND FOREIGN CURRENCY: | ||||||||||||||||
| NET REALIZED GAIN (LOSS): | ||||||||||||||||
| Investments in Non-Affiliated Companies | 216,555,530 | 193,755,609 | 8,687,765 | 4,078,919 | ||||||||||||
| Investments in Affiliated Companies | (110,352 | ) | – | – | – | |||||||||||
| Foreign currency transactions | 10,440 | 35,203 | 1,247 | 6,429 | ||||||||||||
NET CHANGE IN UNREALIZED APPRECIATION (DEPRECIATION): | ||||||||||||||||
| Investments in Non-Affiliated Companies and foreign currency translations | (106,683,498 | ) | (10,002,478 | ) | (7,716,439 | ) | (23,072,044 | ) | ||||||||
| Investments in Affiliated Companies | (4,492,728 | ) | – | – | – | |||||||||||
| Other assets and liabilities denominated in foreign currency | 3,466 | 126,396 | (80 | ) | 484 | |||||||||||
Net realized and unrealized gain (loss) on investments and foreign currency | 105,282,858 | 183,914,730 | 972,493 | (18,986,212 | ) | |||||||||||
NET INCREASE (DECREASE) IN NET ASSETS FROM INVESTMENT OPERATIONS | $ | 107,220,042 | $ | 183,077,013 | $ | 1,158,583 | $ | (18,434,748 | ) | |||||||
| THE ACCOMPANYING NOTES ARE AN INTEGRAL PART OF THESE FINANCIAL STATEMENTS | The Royce Funds 2017 Semiannual Report to Shareholders | 93 |
Statements of Operations
| Royce Smaller- | ||||||||||||
| Royce Small/Mid- | Companies Growth | Royce Special | ||||||||||
| Cap Premier Fund | Fund | Equity Fund | ||||||||||
| INVESTMENT INCOME: | ||||||||||||
| INCOME: | ||||||||||||
| Dividends | ||||||||||||
Non-Affiliated Companies | $ | 1,470,816 | $ | 1,006,131 | $ | 7,509,591 | ||||||
Affiliated Companies | – | – | 5,761,978 | |||||||||
| Foreign withholding tax | 2,010 | (12,369 | ) | – | ||||||||
| Interest | 9,477 | 7,921 | 73,258 | |||||||||
| Securities lending | 1,611 | 174,756 | – | |||||||||
| Total income | 1,483,914 | 1,176,439 | 13,344,827 | |||||||||
| EXPENSES: | ||||||||||||
| Investment advisory fees | 957,361 | 2,013,224 | 7,793,411 | |||||||||
| Distribution fees | 216,434 | 399,664 | 385,184 | |||||||||
| Shareholder servicing | 71,462 | 293,879 | 626,456 | |||||||||
| Shareholder reports | 28,556 | 75,537 | 128,067 | |||||||||
| Administrative and office facilities | 30,890 | 61,873 | 203,986 | |||||||||
| Custody | 20,750 | 24,700 | 64,869 | |||||||||
| Registration | 24,824 | 31,993 | 33,205 | |||||||||
| Audit | 25,421 | 16,313 | 18,869 | |||||||||
| Trustees’ fees | 11,676 | 22,386 | 78,657 | |||||||||
| Legal | 2,678 | 5,318 | 17,771 | |||||||||
| Other expenses | 7,018 | 13,715 | 38,272 | |||||||||
| Total expenses | 1,397,070 | 2,958,602 | 9,388,747 | |||||||||
| Compensating balance credits | (923 | ) | (980 | ) | (2,331 | ) | ||||||
| Fees waived by distributor | (67,908 | ) | (27,548 | ) | – | |||||||
| Expenses reimbursed by investment adviser | (16,005 | ) | (44,672 | ) | (58,913 | ) | ||||||
| Net expenses | 1,312,234 | 2,885,402 | 9,327,503 | |||||||||
| Net investment income (loss) | 171,680 | (1,708,963 | ) | 4,017,324 | ||||||||
| REALIZED AND UNREALIZED GAIN (LOSS) ON INVESTMENTS AND FOREIGN CURRENCY: | ||||||||||||
| NET REALIZED GAIN (LOSS): | ||||||||||||
| Investments in Non-Affiliated Companies | 7,881,441 | 44,525,080 | 58,186,103 | |||||||||
| Investments in Affiliated Companies | – | – | 3,411,085 | |||||||||
| Foreign currency transactions | (6,847 | ) | 69,804 | – | ||||||||
| NET CHANGE IN UNREALIZED APPRECIATION (DEPRECIATION): | ||||||||||||
| Investments in Non-Affiliated Companies and foreign currency translations | 4,498,715 | 638,136 | (67,855,698 | ) | ||||||||
| Investments in Affiliated Companies | – | – | (5,186,835 | ) | ||||||||
| Other assets and liabilities denominated in foreign currency | 2,538 | 129 | – | |||||||||
| Net realized and unrealized gain (loss) on investments and foreign currency | 12,375,847 | 45,233,149 | (11,445,345 | ) | ||||||||
| NET INCREASE (DECREASE) IN NET ASSETS FROM INVESTMENT OPERATIONS | $ | 12,547,527 | $ | 43,524,186 | $ | (7,428,021 | ) | |||||
| 94 | The Royce Funds 2017 Semiannual Report to Shareholders | THE ACCOMPANYING NOTES ARE AN INTEGRAL PART OF THESE FINANCIAL STATEMENTS |
| Six Months Ended June 30, 2017 (unaudited) |
| Royce Special | ||||||||
| Equity Multi-Cap | Royce Total Return | |||||||
| Fund | Fund | |||||||
| INVESTMENT INCOME: | ||||||||
| INCOME: | ||||||||
| Dividends | ||||||||
Non-Affiliated Companies | $ | 1,081,519 | $ | 31,243,543 | ||||
Affiliated Companies | – | 368,288 | ||||||
| Foreign withholding tax | – | (543,648 | ) | |||||
| Interest | 3,427 | 248,327 | ||||||
| Securities lending | – | 23,466 | ||||||
| Total income | 1,084,946 | 31,339,976 | ||||||
| EXPENSES: | ||||||||
| Investment advisory fees | 472,639 | 13,719,259 | ||||||
| Distribution fees | 62,331 | 1,630,970 | ||||||
| Shareholder servicing | 38,564 | 1,451,963 | ||||||
| Shareholder reports | 5,263 | 301,213 | ||||||
| Administrative and office facilities | 15,984 | 383,133 | ||||||
| Custody | 8,945 | 143,953 | ||||||
| Registration | 25,932 | 53,260 | ||||||
| Audit | 13,577 | 36,874 | ||||||
| Trustees’ fees | 5,921 | 145,840 | ||||||
| Legal | 1,381 | 50,359 | ||||||
| Other expenses | 4,258 | 73,525 | ||||||
| Total expenses | 654,795 | 17,990,349 | ||||||
| Compensating balance credits | (128 | ) | (3,534 | ) | ||||
| Fees waived by investment adviser and distributor | (37,592 | ) | – | |||||
| Expenses reimbursed by investment adviser | (23,576 | ) | – | |||||
| Net expenses | 593,499 | 17,986,815 | ||||||
| Net investment income (loss) | 491,447 | 13,353,161 | ||||||
| REALIZED AND UNREALIZED GAIN (LOSS) ON INVESTMENTS AND FOREIGN CURRENCY: | ||||||||
| NET REALIZED GAIN (LOSS): | ||||||||
| Investments in Non-Affiliated Companies | 6,229,397 | 200,920,966 | ||||||
| Investments in Affiliated Companies | – | 392,025 | ||||||
| Foreign currency transactions | – | 13,166 | ||||||
| NET CHANGE IN UNREALIZED APPRECIATION (DEPRECIATION): | ||||||||
| Investments in Non-Affiliated Companies and foreign currency translations | (187,526 | ) | (143,264,567 | ) | ||||
| Investments in Affiliated Companies | – | 1,422,977 | ||||||
| Other assets and liabilities denominated in foreign currency | – | 24,657 | ||||||
| Net realized and unrealized gain (loss) on investments and foreign currency | 6,041,871 | 59,509,224 | ||||||
| NET INCREASE (DECREASE) IN NET ASSETS FROM INVESTMENT OPERATIONS | $ | 6,533,318 | $ | 72,862,385 | ||||
| THE ACCOMPANYING NOTES ARE AN INTEGRAL PART OF THESE FINANCIAL STATEMENTS | The Royce Funds 2017 Semiannual Report to Shareholders | 95 |
Financial Highlights
This table is presented to show selected data for a share outstanding throughout each year or other indicated period and to assist shareholders in evaluating a Fund’s performance for the periods presented. Per share amounts have been determined on the basis of the weighted average number of shares outstanding during the period.
| Ratio of Expenses to Average Net Assets | Ratio of Net | ||||||||||||||||||||||||||||||||||||||||||||||||||||||||||||||
| Net Asset Value, Beginning of Period | Net Investment Income (Loss) | Net Realized and Unrealized Gain (Loss) on Investments and Foreign Currency | Total from Investment Operations | Distributions from Net Investment Income | Distributions from Net Realized Gain on Investments and Foreign Currency | Total Distributions | Shareholder Redemption Fees | Net Asset Value, End of Period | Total Return | Net Assets, End of Period (in thousands) | Prior to Fee Waivers and Balance Credits | Prior to Fee Waivers | Net of Fee Waivers | Investment Income (Loss) to Average Net Assets | Portfolio Turnover Rate | ||||||||||||||||||||||||||||||||||||||||||||||||
| Royce Dividend Value Fund–Investment Class | |||||||||||||||||||||||||||||||||||||||||||||||||||||||||||||||
| 2017† | $ | 7.18 | $ | 0.06 | $ | 0.50 | $ | 0.56 | $ | (0.05 | ) | $ | – | $ | (0.05 | ) | $ | – | $ | 7.69 | 7.81 | %1 | $ | 97,797 | 1.13 | %2 | 1.13 | %2 | 1.07 | %2 | 1.60 | %2 | 11 | % | |||||||||||||||||||||||||||||
| 2016 | 6.84 | 0.12 | 1.02 | 1.14 | (0.11 | ) | (0.69 | ) | (0.80 | ) | – | 7.18 | 16.75 | 99,462 | 1.16 | 1.16 | 1.11 | 1.64 | 21 | ||||||||||||||||||||||||||||||||||||||||||||
| 2015 | 8.12 | 0.12 | (0.57 | ) | (0.45 | ) | (0.13 | ) | (0.70 | ) | (0.83 | ) | – | 6.84 | (5.54 | ) | 116,053 | 1.24 | 1.24 | 1.22 | 1.49 | 14 | |||||||||||||||||||||||||||||||||||||||||
| 2014 | 8.90 | 0.11 | (0.29 | ) | (0.18 | ) | (0.10 | ) | (0.50 | ) | (0.60 | ) | – | 8.12 | (1.90 | ) | 176,002 | 1.21 | 1.21 | 1.19 | 1.25 | 22 | |||||||||||||||||||||||||||||||||||||||||
| 2013 | 7.29 | 0.09 | 2.15 | 2.24 | (0.10 | ) | (0.53 | ) | (0.63 | ) | – | 8.90 | 31.23 | 211,589 | 1.21 | 1.21 | 1.21 | 1.13 | 36 | ||||||||||||||||||||||||||||||||||||||||||||
| 2012 | 6.34 | 0.14 | 0.95 | 1.09 | (0.12 | ) | (0.02 | ) | (0.14 | ) | – | 7.29 | 17.26 | 118,820 | 1.19 | 1.19 | 1.19 | 1.99 | 28 | ||||||||||||||||||||||||||||||||||||||||||||
| Royce Dividend Value Fund–Service Class | |||||||||||||||||||||||||||||||||||||||||||||||||||||||||||||||
| 2017† | $ | 7.33 | $ | 0.05 | $ | 0.52 | $ | 0.57 | $ | (0.04 | ) | $ | – | $ | (0.04 | ) | $ | – | $ | 7.86 | 7.72 | %1 | $ | 97,797 | 1.42 | %2 | 1.42 | %2 | 1.34 | %2 | 1.32 | %2 | 11 | % | |||||||||||||||||||||||||||||
| 2016 | 6.96 | 0.10 | 1.04 | 1.14 | (0.08 | ) | (0.69 | ) | (0.77 | ) | – | 7.33 | 16.36 | 115,547 | 1.43 | 1.43 | 1.37 | 1.39 | 21 | ||||||||||||||||||||||||||||||||||||||||||||
| 2015 | 8.22 | 0.10 | (0.57 | ) | (0.47 | ) | (0.09 | ) | (0.70 | ) | (0.79 | ) | – | 6.96 | (5.72 | ) | 167,165 | 1.49 | 1.49 | 1.47 | 1.25 | 14 | |||||||||||||||||||||||||||||||||||||||||
| 2014 | 8.98 | 0.09 | (0.29 | ) | (0.20 | ) | (0.06 | ) | (0.50 | ) | (0.56 | ) | – | 8.22 | (2.14 | ) | 295,560 | 1.47 | 1.47 | 1.44 | 0.98 | 22 | |||||||||||||||||||||||||||||||||||||||||
| 2013 | 7.35 | 0.07 | 2.16 | 2.23 | (0.07 | ) | (0.53 | ) | (0.60 | ) | – | 8.98 | 30.74 | 407,599 | 1.48 | 1.48 | 1.46 | 0.87 | 36 | ||||||||||||||||||||||||||||||||||||||||||||
| 2012 | 6.38 | 0.12 | 0.95 | 1.07 | (0.08 | ) | (0.02 | ) | (0.10 | ) | – | 7.35 | 16.95 | 252,443 | 1.48 | 1.48 | 1.46 | 1.74 | 28 | ||||||||||||||||||||||||||||||||||||||||||||
| Royce Dividend Value Fund–Consultant Class a | |||||||||||||||||||||||||||||||||||||||||||||||||||||||||||||||
| 2017† | $ | 8.39 | $ | 0.03 | $ | 0.59 | $ | 0.62 | $ | (0.02 | ) | $ | – | $ | (0.02 | ) | $ | – | $ | 8.99 | 7.33 | %1 | $ | 1,574 | 3.18 | %2 | 3.18 | %2 | 2.09 | %2 | 0.59 | %2 | 11 | % | |||||||||||||||||||||||||||||
| 2016 | 7.90 | 0.05 | 1.17 | 1.22 | (0.04 | ) | (0.69 | ) | (0.73 | ) | – | 8.39 | 15.44 | 1,572 | 3.26 | 3.26 | 2.14 | 0.58 | 21 | ||||||||||||||||||||||||||||||||||||||||||||
| 2015 | 9.22 | 0.04 | (0.63 | ) | (0.59 | ) | (0.03 | ) | (0.70 | ) | (0.73 | ) | – | 7.90 | (6.39 | ) | 1,886 | 3.78 | 3.78 | 2.24 | 0.46 | 14 | |||||||||||||||||||||||||||||||||||||||||
| 2014 | 10.00 | 0.01 | (0.27 | ) | (0.26 | ) | (0.02 | ) | (0.50 | ) | (0.52 | ) | – | 9.22 | (2.43 | )1 | 912 | 9.25 | 2 | 9.25 | 2 | 2.24 | 2 | 0.45 | 2 | 22 | |||||||||||||||||||||||||||||||||||||
| Royce Dividend Value Fund–Institutional Class b | |||||||||||||||||||||||||||||||||||||||||||||||||||||||||||||||
| 2017† | $ | 7.09 | $ | 0.07 | $ | 0.50 | $ | 0.57 | $ | (0.05 | ) | $ | – | $ | (0.05 | ) | $ | – | $ | 7.61 | 8.05 | %1 | $ | 992 | 2.79 | %2 | 2.79 | %2 | 0.89 | %2 | 1.84 | %2 | 11 | % | |||||||||||||||||||||||||||||
| 2016 | 6.78 | 0.13 | 1.00 | 1.13 | (0.13 | ) | (0.69 | ) | (0.82 | ) | – | 7.09 | 16.70 | 823 | 3.30 | 3.30 | 0.93 | 1.81 | 21 | ||||||||||||||||||||||||||||||||||||||||||||
| 2015 | 8.09 | 0.17 | (0.62 | ) | (0.45 | ) | (0.16 | ) | (0.70 | ) | (0.86 | ) | – | 6.78 | (5.61 | ) | 658 | 1.11 | 1.11 | 1.04 | 1.60 | 14 | |||||||||||||||||||||||||||||||||||||||||
| 2014 | 8.88 | 0.12 | (0.29 | ) | (0.17 | ) | (0.12 | ) | (0.50 | ) | (0.62 | ) | – | 8.09 | (1.76 | ) | 40,942 | 1.10 | 1.10 | 1.04 | 1.42 | 22 | |||||||||||||||||||||||||||||||||||||||||
| 2013 | 7.28 | 0.11 | 2.14 | 2.25 | (0.12 | ) | (0.53 | ) | (0.65 | ) | – | 8.88 | 31.46 | 31,236 | 1.11 | 1.11 | 1.04 | 1.29 | 36 | ||||||||||||||||||||||||||||||||||||||||||||
| 2012 | 6.80 | 0.08 | 0.50 | 0.58 | (0.08 | ) | (0.02 | ) | (0.10 | ) | – | 7.28 | 8.51 | 1 | 23,460 | 1.33 | 2 | 1.33 | 2 | 1.04 | 2 | 3.48 | 2 | 28 | |||||||||||||||||||||||||||||||||||||||
| Royce Global Financial Services Fund–Service Class | |||||||||||||||||||||||||||||||||||||||||||||||||||||||||||||||
| 2017† | $ | 8.95 | $ | 0.05 | $ | 0.83 | $ | 0.88 | $ | – | $ | – | $ | – | $ | – | $ | 9.83 | 9.83 | %1 | $ | 44,324 | 1.65 | %2 | 1.65 | %2 | 1.49 | %2 | 0.97 | %2 | 10 | % | |||||||||||||||||||||||||||||||
| 2016 | 7.99 | 0.11 | 0.92 | 1.03 | (0.05 | ) | (0.02 | ) | (0.07 | ) | – | 8.95 | 12.93 | 43,629 | 1.67 | 1.67 | 1.49 | 1.25 | 37 | ||||||||||||||||||||||||||||||||||||||||||||
| 2015 | 9.28 | 0.11 | (0.55 | ) | (0.44 | ) | (0.11 | ) | (0.74 | ) | (0.85 | ) | – | 7.99 | (4.71 | ) | 52,013 | 1.65 | 1.65 | 1.49 | 1.19 | 46 | |||||||||||||||||||||||||||||||||||||||||
| 2014 | 9.68 | 0.09 | 0.22 | 0.31 | (0.06 | ) | (0.65 | ) | (0.71 | ) | – | 9.28 | 3.45 | 53,707 | 1.68 | 1.68 | 1.49 | 0.91 | 41 | ||||||||||||||||||||||||||||||||||||||||||||
| 2013 | 6.83 | 0.04 | 2.82 | 2.86 | (0.02 | ) | – | (0.02 | ) | 0.01 | 9.68 | 42.00 | 47,593 | 1.89 | 1.89 | 1.49 | 0.59 | 23 | |||||||||||||||||||||||||||||||||||||||||||||
| 2012 | 5.71 | 0.10 | 1.08 | 1.18 | (0.06 | ) | – | (0.06 | ) | – | 6.83 | 20.72 | 16,888 | 1.87 | 1.87 | 1.49 | 1.53 | 26 | |||||||||||||||||||||||||||||||||||||||||||||
| Royce Global Financial Services Fund–Institutional Class c | |||||||||||||||||||||||||||||||||||||||||||||||||||||||||||||||
| 2017† | $ | 11.43 | $ | 0.08 | $ | 1.08 | $ | 1.16 | $ | – | $ | – | $ | – | $ | – | $ | 12.59 | 10.15 | %1 | $ | 7,207 | 1.57 | %2 | 1.57 | %2 | 1.04 | %2 | 1.42 | %2 | 10 | % | |||||||||||||||||||||||||||||||
| 2016 | 10.00 | 0.18 | 1.36 | 1.54 | (0.09 | ) | (0.02 | ) | (0.11 | ) | – | 11.43 | 15.41 | 1 | 6,474 | 1.85 | 2 | 1.85 | 2 | 1.04 | 2 | 1.82 | 2 | 37 | |||||||||||||||||||||||||||||||||||||||
| 96 | The Royce Funds 2017 Semiannual Report to Shareholders | THE ACCOMPANYING NOTES ARE AN INTEGRAL PART OF THESE FINANCIAL STATEMENTS |
Financial Highlights
This table is presented to show selected data for a share outstanding throughout each year or other indicated period and to assist shareholders in evaluating a Fund’s performance for the periods presented. Per share amounts have been determined on the basis of the weighted average number of shares outstanding during the period.
| Ratio of Expenses to Average Net Assets | Ratio of Net | ||||||||||||||||||||||||||||||||||||||||||||||||||||||||||||||
| Net Asset Value, Beginning of Period | Net Investment Income (Loss) | Net Realized and Unrealized Gain (Loss) on Investments and Foreign Currency | Total from Investment Operations | Distributions from Net Investment Income | Distributions from Net Realized Gain on Investments and Foreign Currency | Total Distributions | Shareholder Redemption Fees | Net Asset Value, End of Period | Total Return | Net Assets, End of Period (in thousands) | Prior to Fee Waivers and Balance Credits | Prior to Fee Waivers | Net of Fee Waivers | Investment Income (Loss) to Average Net Assets | Portfolio Turnover Rate | ||||||||||||||||||||||||||||||||||||||||||||||||
| Royce International Micro-Cap Fund–Service Class | |||||||||||||||||||||||||||||||||||||||||||||||||||||||||||||||
| 2017† | $ | 9.98 | $ | 0.07 | $ | 1.45 | $ | 1.52 | $ | – | $ | – | $ | – | $ | – | $ | 11.50 | 15.23 | %1 | $ | 7,352 | 3.05 | %2 | 3.05 | %2 | 1.64 | %2 | 1.25 | %2 | 48 | % | |||||||||||||||||||||||||||||||
| 2016 | 9.54 | 0.07 | 0.53 | 0.60 | (0.16 | ) | – | (0.16 | ) | – | 9.98 | 6.33 | 6,060 | 3.35 | 3.35 | 1.64 | 0.68 | 113 | |||||||||||||||||||||||||||||||||||||||||||||
| 2015 | 9.66 | 0.04 | (0.14 | ) | (0.10 | ) | (0.02 | ) | – | (0.02 | ) | – | 9.54 | (0.99 | ) | 6,102 | 3.14 | 3.14 | 1.67 | 0.44 | 94 | ||||||||||||||||||||||||||||||||||||||||||
| 2014 | 10.04 | 0.06 | (0.30 | ) | (0.24 | ) | (0.14 | ) | – | (0.14 | ) | – | 9.66 | (2.37 | ) | 6,410 | 3.51 | 3.51 | 1.69 | 0.82 | 91 | ||||||||||||||||||||||||||||||||||||||||||
| 2013 | 8.61 | 0.11 | 1.51 | 1.62 | (0.20 | ) | – | (0.20 | ) | 0.01 | 10.04 | 18.95 | 5,209 | 3.86 | 3.86 | 1.69 | 1.22 | 103 | |||||||||||||||||||||||||||||||||||||||||||||
| 2012 | 7.72 | 0.13 | 0.92 | 1.05 | (0.16 | ) | – | (0.16 | ) | – | 8.61 | 13.59 | 4,603 | 3.90 | 3.90 | 1.69 | 1.63 | 62 | |||||||||||||||||||||||||||||||||||||||||||||
| Royce International Premier Fund–Investment Class d | |||||||||||||||||||||||||||||||||||||||||||||||||||||||||||||||
| 2017† | $ | 9.44 | $ | 0.06 | $ | 2.06 | $ | 2.12 | $ | – | $ | – | $ | – | $ | – | $ | 11.56 | 22.46 | %1 | $ | 38,321 | 1.37 | %2 | 1.37 | %2 | 1.19 | %2 | 1.21 | %2 | 23 | % | |||||||||||||||||||||||||||||||
| 2016 | 9.82 | 0.10 | (0.19 | ) | (0.09 | ) | (0.28 | ) | (0.01 | ) | (0.29 | ) | – | 9.44 | (0.79 | ) | 19,556 | 1.59 | 1.59 | 1.19 | 0.96 | 67 | |||||||||||||||||||||||||||||||||||||||||
| 2015 | 8.71 | 0.16 | 1.27 | 1.43 | (0.32 | ) | – | (0.32 | ) | – | 9.82 | 16.42 | 3,623 | 2.80 | 2.80 | 1.38 | 1.72 | 67 | |||||||||||||||||||||||||||||||||||||||||||||
| 2014 | 10.00 | 0.03 | (0.85 | ) | (0.82 | ) | (0.16 | ) | (0.31 | ) | (0.47 | ) | – | 8.71 | (8.16 | )1 | 3,481 | 3.17 | 2 | 3.17 | 2 | 1.44 | 2 | 1.00 | 2 | 62 | |||||||||||||||||||||||||||||||||||||
| Royce International Premier Fund–Service Class | |||||||||||||||||||||||||||||||||||||||||||||||||||||||||||||||
| 2017† | $ | 11.24 | $ | 0.05 | $ | 2.46 | $ | 2.51 | $ | – | $ | – | $ | – | $ | – | $ | 13.75 | 22.33 | %1 | $ | 48,780 | 1.65 | %2 | 1.65 | %2 | 1.44 | %2 | 0.82 | %2 | 23 | % | |||||||||||||||||||||||||||||||
| 2016 | 11.64 | 0.06 | (0.19 | ) | (0.13 | ) | (0.26 | ) | (0.01 | ) | (0.27 | ) | – | 11.24 | (1.06 | ) | 38,884 | 1.84 | 1.84 | 1.44 | 0.66 | 67 | |||||||||||||||||||||||||||||||||||||||||
| 2015 | 10.28 | (0.00 | ) | 1.66 | 1.66 | (0.30 | ) | – | (0.30 | ) | – | 11.64 | 16.22 | 9,015 | 2.65 | 2.65 | 1.60 | 1.10 | 67 | ||||||||||||||||||||||||||||||||||||||||||||
| 2014 | 11.67 | 0.17 | (1.13 | ) | (0.96 | ) | (0.12 | ) | (0.31 | ) | (0.43 | ) | – | 10.28 | (8.22 | ) | 4,045 | 2.45 | 2.45 | 1.69 | 1.26 | 62 | |||||||||||||||||||||||||||||||||||||||||
| 2013 | 10.01 | 0.10 | 1.73 | 1.83 | (0.17 | ) | – | (0.17 | ) | – | 11.67 | 18.31 | 9,470 | 2.82 | 2.82 | 1.69 | 1.09 | 51 | |||||||||||||||||||||||||||||||||||||||||||||
| 2012 | 8.26 | 0.12 | 1.81 | 1.93 | (0.18 | ) | – | (0.18 | ) | – | 10.01 | 23.40 | 6,444 | 3.54 | 3.54 | 1.69 | 1.18 | 103 | |||||||||||||||||||||||||||||||||||||||||||||
| Royce International Premier Fund–Consultant Class e | |||||||||||||||||||||||||||||||||||||||||||||||||||||||||||||||
| 2017† | $ | 12.27 | $ | 0.00 | $ | 2.68 | $ | 2.68 | $ | – | $ | – | $ | – | $ | – | $ | 14.95 | 21.84 | %1 | $ | 6,344 | 2.70 | %2 | 2.70 | %2 | 2.19 | %2 | 0.07 | %2 | 23 | % | |||||||||||||||||||||||||||||||
| 2016 | 11.59 | 0.01 | 0.85 | 0.86 | (0.17 | ) | (0.01 | ) | (0.18 | ) | – | 12.27 | 7.49 | 1 | 5,086 | 2.70 | 2 | 2.70 | 2 | 2.19 | 2 | (0.04 | )2 | 67 | |||||||||||||||||||||||||||||||||||||||
| Royce International Premier Fund–R Class e | |||||||||||||||||||||||||||||||||||||||||||||||||||||||||||||||
| 2017† | $ | 9.06 | $ | 0.03 | $ | 1.97 | $ | 2.00 | $ | – | $ | – | $ | – | $ | – | $ | 11.06 | 22.08 | %1 | $ | 63 | 18.34 | %2 | 18.34 | %2 | 1.74 | %2 | 0.53 | %2 | 23 | % | |||||||||||||||||||||||||||||||
| 2016 | 8.64 | (0.02 | ) | 0.70 | 0.68 | (0.25 | ) | (0.01 | ) | (0.26 | ) | – | 9.06 | 7.96 | 1 | 51 | 28.36 | 2 | 28.35 | 2 | 1.74 | 2 | 0.31 | 2 | 67 | ||||||||||||||||||||||||||||||||||||||
| Royce Low-Priced Stock Fund–Investment Class | |||||||||||||||||||||||||||||||||||||||||||||||||||||||||||||||
| 2017† | $ | 8.26 | $ | 0.01 | $ | 0.08 | $ | 0.09 | $ | – | $ | – | $ | – | $ | – | $ | 8.35 | 1.09 | %1 | $ | 20,998 | 1.34 | %2 | 1.34 | %2 | 1.24 | %2 | 0.19 | %2 | 17 | % | |||||||||||||||||||||||||||||||
| 2016 | 7.77 | 0.04 | 1.24 | 1.28 | (0.06 | ) | (0.73 | ) | (0.79 | ) | – | 8.26 | 16.42 | 22,852 | 1.31 | 1.31 | 1.24 | 0.39 | 34 | ||||||||||||||||||||||||||||||||||||||||||||
| 2015 | 9.46 | 0.00 | (0.97 | ) | (0.97 | ) | – | (0.72 | ) | (0.72 | ) | – | 7.77 | (10.21 | ) | 28,732 | 1.28 | 1.28 | 1.24 | 0.03 | 53 | ||||||||||||||||||||||||||||||||||||||||||
| 2014 | 13.60 | 0.06 | (0.58 | ) | (0.52 | ) | (0.01 | ) | (3.61 | ) | (3.62 | ) | – | 9.46 | (3.15 | ) | 50,371 | 1.25 | 1.25 | 1.24 | 0.46 | 29 | |||||||||||||||||||||||||||||||||||||||||
| 2013 | 13.83 | 0.05 | 1.71 | 1.76 | (0.05 | ) | (1.94 | ) | (1.99 | ) | – | 13.60 | 13.17 | 88,568 | 1.37 | 1.37 | 1.24 | 0.18 | 16 | ||||||||||||||||||||||||||||||||||||||||||||
| 2012 | 14.34 | 0.15 | 0.50 | 0.65 | (0.25 | ) | (0.91 | ) | (1.16 | ) | – | 13.83 | 4.79 | 255,335 | 1.26 | 1.26 | 1.24 | 0.86 | 8 | ||||||||||||||||||||||||||||||||||||||||||||
| THE ACCOMPANYING NOTES ARE AN INTEGRAL PART OF THESE FINANCIAL STATEMENTS | The Royce Funds 2017 Semiannual Report to Shareholders | 97 |
Financial Highlights
This table is presented to show selected data for a share outstanding throughout each year or other indicated period and to assist shareholders in evaluating a Fund’s performance for the periods presented. Per share amounts have been determined on the basis of the weighted average number of shares outstanding during the period.
| Ratio of Expenses to Average Net Assets | Ratio of Net | ||||||||||||||||||||||||||||||||||||||||||||||||||||||||||||||
| Net Asset Value, Beginning of Period | Net Investment Income (Loss) | Net Realized and Unrealized Gain (Loss) on Investments and Foreign Currency | Total from Investment Operations | Distributions from Net Investment Income | Distributions from Net Realized Gain on Investments and Foreign Currency | Total Distributions | Shareholder Redemption Fees | Net Asset Value, End of Period | Total Return | Net Assets, End of Period (in thousands) | Prior to Fee Waivers and Balance Credits | Prior to Fee Waivers | Net of Fee Waivers | Investment Income (Loss) to Average Net Assets | Portfolio Turnover Rate | ||||||||||||||||||||||||||||||||||||||||||||||||
| Royce Low-Priced Stock Fund–Service Class | |||||||||||||||||||||||||||||||||||||||||||||||||||||||||||||||
| 2017† | $ | 8.23 | $ | (0.00 | ) | $ | 0.08 | $ | 0.08 | $ | – | $ | – | $ | – | $ | – | $ | 8.31 | 0.97 | %1 | $ | 251,575 | 1.53 | %2 | 1.53 | %2 | 1.49 | %2 | (0.07 | )%2 | 17 | % | ||||||||||||||||||||||||||||||
| 2016 | 7.75 | 0.02 | 1.23 | 1.25 | (0.04 | ) | (0.73 | ) | (0.77 | ) | – | 8.23 | 16.09 | 281,873 | 1.52 | 1.52 | 1.49 | 0.14 | 34 | ||||||||||||||||||||||||||||||||||||||||||||
| 2015 | 9.46 | (0.02 | ) | (0.97 | ) | (0.99 | ) | – | (0.72 | ) | (0.72 | ) | – | 7.75 | (10.42 | ) | 316,475 | 1.49 | 1.49 | 1.47 | (0.20 | ) | 53 | ||||||||||||||||||||||||||||||||||||||||
| 2014 | 13.62 | 0.03 | (0.58 | ) | (0.55 | ) | – | (3.61 | ) | (3.61 | ) | – | 9.46 | (3.37 | ) | 520,905 | 1.55 | 1.55 | 1.49 | 0.21 | 29 | ||||||||||||||||||||||||||||||||||||||||||
| 2013 | 13.84 | (0.00 | ) | 1.72 | 1.72 | (0.00 | ) | (1.94 | ) | (1.94 | ) | – | 13.62 | 12.91 | 1,008,207 | 1.65 | 1.65 | 1.49 | (0.02 | ) | 16 | ||||||||||||||||||||||||||||||||||||||||||
| 2012 | 14.31 | 0.11 | 0.49 | 0.60 | (0.16 | ) | (0.91 | ) | (1.07 | ) | – | 13.84 | 4.48 | 1,800,089 | 1.57 | 1.57 | 1.49 | 0.54 | 8 | ||||||||||||||||||||||||||||||||||||||||||||
| Royce Low-Priced Stock Fund–Institutional Class | |||||||||||||||||||||||||||||||||||||||||||||||||||||||||||||||
| 2017† | $ | 8.28 | $ | 0.00 | $ | 0.08 | $ | 0.08 | $ | – | $ | – | $ | – | $ | – | $ | 8.36 | 0.97 | %1 | $ | 10,086 | 1.30 | %2 | 1.30 | %2 | 1.30 | %2 | 0.11 | %2 | 17 | % | |||||||||||||||||||||||||||||||
| 2016 | 7.78 | 0.06 | 1.23 | 1.29 | (0.06 | ) | (0.73 | ) | (0.79 | ) | – | 8.28 | 16.50 | 12,336 | 1.21 | 1.21 | 1.21 | 0.41 | 34 | ||||||||||||||||||||||||||||||||||||||||||||
| 2015 | 9.46 | 0.01 | (0.97 | ) | (0.96 | ) | (0.00 | ) | (0.72 | ) | (0.72 | ) | – | 7.78 | (10.05 | ) | 39,004 | 1.11 | 1.11 | 1.11 | 0.14 | 53 | |||||||||||||||||||||||||||||||||||||||||
| 2014 | 13.61 | 0.08 | (0.58 | ) | (0.50 | ) | (0.04 | ) | (3.61 | ) | (3.65 | ) | – | 9.46 | (3.01 | ) | 101,473 | 1.16 | 1.16 | 1.16 | 0.47 | 29 | |||||||||||||||||||||||||||||||||||||||||
| 2013 | 13.84 | 0.05 | 1.71 | 1.76 | (0.05 | ) | (1.94 | ) | (1.99 | ) | – | 13.61 | 13.20 | 345,983 | 1.22 | 1.22 | 1.22 | 0.26 | 16 | ||||||||||||||||||||||||||||||||||||||||||||
| 2012 | 14.36 | 0.16 | 0.49 | 0.65 | (0.26 | ) | (0.91 | ) | (1.17 | ) | – | 13.84 | 4.81 | 969,664 | 1.20 | 1.20 | 1.20 | 0.92 | 8 | ||||||||||||||||||||||||||||||||||||||||||||
| Royce Low-Priced Stock Fund–R Class | |||||||||||||||||||||||||||||||||||||||||||||||||||||||||||||||
| 2017† | $ | 7.81 | $ | (0.02 | ) | $ | 0.08 | $ | 0.06 | $ | – | $ | – | $ | – | $ | – | $ | 7.87 | 0.77 | %1 | $ | 972 | 2.98 | %2 | 2.98 | %2 | 1.84 | %2 | (0.42 | )%2 | 17 | % | ||||||||||||||||||||||||||||||
| 2016 | 7.38 | (0.01 | ) | 1.18 | 1.17 | (0.01 | ) | (0.73 | ) | (0.74 | ) | – | 7.81 | 15.83 | 1,036 | 2.82 | 2.82 | 1.84 | (0.21 | ) | 34 | ||||||||||||||||||||||||||||||||||||||||||
| 2015 | 9.08 | (0.05 | ) | (0.93 | ) | (0.98 | ) | – | (0.72 | ) | (0.72 | ) | – | 7.38 | (10.74 | ) | 1,132 | 2.78 | 2.78 | 1.84 | (0.58 | ) | 53 | ||||||||||||||||||||||||||||||||||||||||
| 2014 | 13.27 | (0.02 | ) | (0.56 | ) | (0.58 | ) | – | (3.61 | ) | (3.61 | ) | – | 9.08 | (3.72 | ) | 1,892 | 2.21 | 2.21 | 1.84 | (0.15 | ) | 29 | ||||||||||||||||||||||||||||||||||||||||
| 2013 | 13.58 | (0.05 | ) | 1.68 | 1.63 | – | (1.94 | ) | (1.94 | ) | – | 13.27 | 12.44 | 3,130 | 2.21 | 2.21 | 1.84 | (0.37 | ) | 16 | |||||||||||||||||||||||||||||||||||||||||||
| 2012 | 14.05 | 0.04 | 0.50 | 0.54 | (0.10 | ) | (0.91 | ) | (1.01 | ) | – | 13.58 | 4.10 | 5,823 | 2.05 | 2.05 | 1.84 | 0.22 | 8 | ||||||||||||||||||||||||||||||||||||||||||||
| Royce Micro-Cap Fund–Investment Class | |||||||||||||||||||||||||||||||||||||||||||||||||||||||||||||||
| 2017† | $ | 11.92 | $ | (0.02 | ) | $ | 0.26 | $ | 0.24 | $ | – | $ | – | $ | – | $ | – | $ | 12.16 | 2.01 | %1 | $ | 176,672 | 1.52 | %2 | 1.52 | %2 | 1.49 | %2 | (0.29 | )%2 | 17 | % | ||||||||||||||||||||||||||||||
| 2016 | 11.09 | 0.01 | 2.18 | 2.19 | (0.06 | ) | (1.30 | ) | (1.36 | ) | – | 11.92 | 19.74 | 192,731 | 1.48 | 1.48 | 1.48 | 0.03 | 38 | ||||||||||||||||||||||||||||||||||||||||||||
| 2015 | 14.47 | 0.02 | (1.96 | ) | (1.94 | ) | – | (1.44 | ) | (1.44 | ) | – | 11.09 | (13.32 | ) | 219,272 | 1.51 | 1.51 | 1.51 | 0.15 | 41 | ||||||||||||||||||||||||||||||||||||||||||
| 2014 | 16.68 | (0.08 | ) | (0.65 | ) | (0.73 | ) | – | (1.48 | ) | (1.48 | ) | – | 14.47 | (4.13 | ) | 414,120 | 1.52 | 1.52 | 1.52 | (0.49 | ) | 18 | ||||||||||||||||||||||||||||||||||||||||
| 2013 | 14.78 | (0.08 | ) | 3.19 | 3.11 | (0.02 | ) | (1.19 | ) | (1.21 | ) | – | 16.68 | 21.29 | 650,773 | 1.53 | 1.53 | 1.53 | (0.52 | ) | 22 | ||||||||||||||||||||||||||||||||||||||||||
| 2012 | 14.55 | 0.05 | 1.07 | 1.12 | (0.01 | ) | (0.88 | ) | (0.89 | ) | – | 14.78 | 7.93 | 740,364 | 1.47 | 1.47 | 1.47 | 0.29 | 15 | ||||||||||||||||||||||||||||||||||||||||||||
| Royce Micro-Cap Fund–Service Class | |||||||||||||||||||||||||||||||||||||||||||||||||||||||||||||||
| 2017† | $ | 11.69 | $ | (0.02 | ) | $ | 0.24 | $ | 0.22 | $ | – | $ | – | $ | – | $ | – | $ | 11.91 | 1.88 | %1 | $ | 17,230 | 1.85 | %2 | 1.85 | %2 | 1.61 | %2 | (0.41 | )%2 | 17 | % | ||||||||||||||||||||||||||||||
| 2016 | 10.90 | (0.01 | ) | 2.15 | 2.14 | (0.05 | ) | (1.30 | ) | (1.35 | ) | – | 11.69 | 19.59 | 17,343 | 1.83 | 1.83 | 1.61 | (0.11 | ) | 38 | ||||||||||||||||||||||||||||||||||||||||||
| 2015 | 14.26 | 0.00 | (1.92 | ) | (1.92 | ) | – | (1.44 | ) | (1.44 | ) | – | 10.90 | (13.37 | ) | 20,538 | 1.80 | 1.80 | 1.63 | 0.01 | 41 | ||||||||||||||||||||||||||||||||||||||||||
| 2014 | 16.48 | (0.10 | ) | (0.65 | ) | (0.75 | ) | – | (1.48 | ) | (1.48 | ) | 0.01 | 14.26 | (4.24 | ) | 38,645 | 1.77 | 1.77 | 1.66 | (0.63 | ) | 18 | ||||||||||||||||||||||||||||||||||||||||
| 2013 | 14.61 | (0.10 | ) | 3.16 | 3.06 | – | (1.19 | ) | (1.19 | ) | – | 16.48 | 21.20 | 79,890 | 1.74 | 1.74 | 1.66 | (0.66 | ) | 22 | |||||||||||||||||||||||||||||||||||||||||||
| 2012 | 14.41 | 0.02 | 1.06 | 1.08 | – | (0.88 | ) | (0.88 | ) | – | 14.61 | 7.76 | 109,457 | 1.74 | 1.74 | 1.66 | 0.14 | 15 | |||||||||||||||||||||||||||||||||||||||||||||
| 98 | The Royce Funds 2017 Semiannual Report to Shareholders | THE ACCOMPANYING NOTES ARE AN INTEGRAL PART OF THESE FINANCIAL STATEMENTS |
Financial Highlights
This table is presented to show selected data for a share outstanding throughout each year or other indicated period and to assist shareholders in evaluating a Fund’s performance for the periods presented. Per share amounts have been determined on the basis of the weighted average number of shares outstanding during the period.
| Ratio of Expenses to Average Net Assets | Ratio of Net | ||||||||||||||||||||||||||||||||||||||||||||||||||||||||||||||
| Net Asset Value, Beginning of Period | Net Investment Income (Loss) | Net Realized and Unrealized Gain (Loss) on Investments and Foreign Currency | Total from Investment Operations | Distributions from Net Investment Income | Distributions from Net Realized Gain on Investments and Foreign Currency | Total Distributions | Shareholder Redemption Fees | Net Asset Value, End of Period | Total Return | Net Assets, End of Period (in thousands) | Prior to Fee Waivers and Balance Credits | Prior to Fee Waivers | Net of Fee Waivers | Investment Income (Loss) to Average Net Assets | Portfolio Turnover Rate | ||||||||||||||||||||||||||||||||||||||||||||||||
| Royce Micro-Cap Fund–Consultant Class | |||||||||||||||||||||||||||||||||||||||||||||||||||||||||||||||
| 2017† | $ | 9.41 | $ | (0.06 | ) | $ | 0.19 | $ | 0.13 | $ | – | $ | – | $ | – | $ | – | $ | 9.54 | 1.38 | %1 | $ | 27,996 | 2.59 | %2 | 2.59 | %2 | 2.59 | %2 | (1.40 | )%2 | 17 | % | ||||||||||||||||||||||||||||||
| 2016 | 9.04 | (0.09 | ) | 1.76 | 1.67 | – | (1.30 | ) | (1.30 | ) | – | 9.41 | 18.48 | 33,622 | 2.53 | 2.53 | 2.53 | (1.02 | ) | 38 | |||||||||||||||||||||||||||||||||||||||||||
| 2015 | 12.23 | (0.10 | ) | (1.65 | ) | (1.75 | ) | – | (1.44 | ) | (1.44 | ) | – | 9.04 | (14.21 | ) | 41,024 | 2.54 | 2.54 | 2.54 | (0.90 | ) | 41 | ||||||||||||||||||||||||||||||||||||||||
| 2014 | 14.48 | (0.20 | ) | (0.57 | ) | (0.77 | ) | – | (1.48 | ) | (1.48 | ) | – | 12.23 | (5.03 | ) | 75,868 | 2.48 | 2.48 | 2.48 | (1.45 | ) | 18 | ||||||||||||||||||||||||||||||||||||||||
| 2013 | 13.08 | (0.21 | ) | 2.80 | 2.59 | – | (1.19 | ) | (1.19 | ) | – | 14.48 | 20.08 | 117,538 | 2.52 | 2.52 | 2.52 | (1.51 | ) | 22 | |||||||||||||||||||||||||||||||||||||||||||
| 2012 | 13.11 | (0.10 | ) | 0.95 | 0.85 | – | (0.88 | ) | (0.88 | ) | – | 13.08 | 6.77 | 120,871 | 2.55 | 2.55 | 2.55 | (0.77 | ) | 15 | |||||||||||||||||||||||||||||||||||||||||||
| Royce Micro-Cap Opportunity Fund–Investment Class | |||||||||||||||||||||||||||||||||||||||||||||||||||||||||||||||
| 2017† | $ | 17.19 | $ | (0.06 | ) | $ | 1.74 | $ | 1.68 | $ | – | $ | – | $ | – | $ | – | $ | 18.87 | 9.77 | %1 | $ | 48,487 | 1.26 | %2 | 1.26 | %2 | 1.24 | %2 | (0.70 | )%2 | 38 | % | ||||||||||||||||||||||||||||||
| 2016 | 13.88 | (0.08 | ) | 3.39 | 3.31 | – | – | – | – | 17.19 | 23.85 | 45,135 | 1.30 | 1.30 | 1.24 | (0.55 | ) | 83 | |||||||||||||||||||||||||||||||||||||||||||||
| 2015 | 16.52 | (0.09 | ) | (2.55 | ) | (2.64 | ) | – | (0.00 | ) | (0.00 | ) | – | 13.88 | (15.98 | ) | 34,437 | 1.39 | 1.39 | 1.25 | (0.58 | ) | 105 | ||||||||||||||||||||||||||||||||||||||||
| 2014 | 17.93 | (0.11 | ) | (0.81 | ) | (0.92 | ) | – | (0.51 | ) | (0.51 | ) | 0.02 | 16.52 | (4.97 | ) | 18,221 | 1.56 | 1.56 | 1.28 | (0.60 | ) | 131 | ||||||||||||||||||||||||||||||||||||||||
| 2013 | 12.81 | (0.13 | ) | 5.79 | 5.66 | – | (0.55 | ) | (0.55 | ) | 0.01 | 17.93 | 44.61 | 17,461 | 1.78 | 1.78 | 1.29 | (0.80 | ) | 129 | |||||||||||||||||||||||||||||||||||||||||||
| 2012 | 10.33 | 0.07 | 3.50 | 3.57 | (0.13 | ) | (0.96 | ) | (1.09 | ) | – | 12.81 | 35.14 | 3,198 | 0.29 | 2 | 0.29 | 2 | 0.25 | 2 | 0.64 | 2 | 196 | ||||||||||||||||||||||||||||||||||||||||
| Royce Micro-Cap Opportunity Fund–Service Class a | |||||||||||||||||||||||||||||||||||||||||||||||||||||||||||||||
| 2017† | $ | 8.66 | $ | (0.04 | ) | $ | 0.88 | $ | 0.84 | $ | – | $ | – | $ | – | $ | – | $ | 9.50 | 9.70 | %1 | $ | 1,042 | 3.36 | %2 | 3.36 | %2 | 1.49 | %2 | (0.95 | )%2 | 38 | % | ||||||||||||||||||||||||||||||
| 2016 | 7.01 | (0.06 | ) | 1.71 | 1.65 | – | – | – | – | 8.66 | 23.54 | 995 | 3.37 | 3.37 | 1.49 | (0.81 | ) | 83 | |||||||||||||||||||||||||||||||||||||||||||||
| 2015 | 8.37 | (0.07 | ) | (1.29 | ) | (1.36 | ) | – | (0.00 | ) | (0.00 | ) | – | 7.01 | (16.24 | ) | 1,212 | 3.22 | 3.22 | 1.51 | (0.86 | ) | 105 | ||||||||||||||||||||||||||||||||||||||||
| 2014 | 10.00 | (0.04 | ) | (1.11 | ) | (1.15 | ) | – | (0.51 | ) | (0.51 | ) | 0.03 | 8.37 | (11.11 | )1 | 939 | 10.50 | 2 | 10.50 | 2 | 1.53 | 2 | (0.65 | )2 | 131 | |||||||||||||||||||||||||||||||||||||
| Royce Opportunity Fund–Investment Class | |||||||||||||||||||||||||||||||||||||||||||||||||||||||||||||||
| 2017† | $ | 12.85 | $ | (0.01 | ) | $ | 1.06 | $ | 1.05 | $ | – | $ | – | $ | – | $ | – | $ | 13.90 | 8.17 | %1 | $ | 755,381 | 1.18 | %2 | 1.18 | %2 | 1.18 | %2 | (0.11 | )%2 | 20 | % | ||||||||||||||||||||||||||||||
| 2016 | 10.57 | (0.02 | ) | 3.19 | 3.17 | – | (0.89 | ) | (0.89 | ) | – | 12.85 | 29.86 | 751,184 | 1.19 | 1.19 | 1.19 | (0.18 | ) | 26 | |||||||||||||||||||||||||||||||||||||||||||
| 2015 | 13.46 | (0.03 | ) | (1.80 | ) | (1.83 | ) | – | (1.06 | ) | (1.06 | ) | – | 10.57 | (13.57 | ) | 746,052 | 1.17 | 1.17 | 1.17 | (0.27 | ) | 27 | ||||||||||||||||||||||||||||||||||||||||
| 2014 | 15.54 | (0.05 | ) | (0.09 | ) | (0.14 | ) | – | (1.94 | ) | (1.94 | ) | – | 13.46 | (0.48 | ) | 1,284,044 | 1.14 | 1.14 | 1.14 | (0.30 | ) | 36 | ||||||||||||||||||||||||||||||||||||||||
| 2013 | 11.95 | (0.05 | ) | 5.18 | 5.13 | – | (1.54 | ) | (1.54 | ) | – | 15.54 | 43.50 | 1,426,214 | 1.16 | 1.16 | 1.16 | (0.36 | ) | 39 | |||||||||||||||||||||||||||||||||||||||||||
| 2012 | 10.32 | 0.00 | 2.30 | 2.30 | – | (0.67 | ) | (0.67 | ) | – | 11.95 | 22.59 | 921,473 | 1.13 | 1.13 | 1.13 | 0.02 | 34 | |||||||||||||||||||||||||||||||||||||||||||||
| Royce Opportunity Fund–Service Class | |||||||||||||||||||||||||||||||||||||||||||||||||||||||||||||||
| 2017† | $ | 12.02 | $ | (0.03 | ) | $ | 0.99 | $ | 0.96 | $ | – | $ | – | $ | – | $ | – | $ | 12.98 | 7.99 | %1 | $ | 95,270 | 1.55 | %2 | 1.55 | %2 | 1.49 | %2 | (0.41 | )%2 | 20 | % | ||||||||||||||||||||||||||||||
| 2016 | 9.95 | (0.05 | ) | 3.01 | 2.96 | – | (0.89 | ) | (0.89 | ) | – | 12.02 | 29.61 | 73,517 | 1.53 | 1.53 | 1.49 | (0.48 | ) | 26 | |||||||||||||||||||||||||||||||||||||||||||
| 2015 | 12.80 | (0.07 | ) | (1.72 | ) | (1.79 | ) | – | (1.06 | ) | (1.06 | ) | – | 9.95 | (13.96 | ) | 100,918 | 1.49 | 1.49 | 1.49 | (0.59 | ) | 27 | ||||||||||||||||||||||||||||||||||||||||
| 2014 | 14.92 | (0.09 | ) | (0.09 | ) | (0.18 | ) | – | (1.94 | ) | (1.94 | ) | – | 12.80 | (0.74 | ) | 155,085 | 1.47 | 1.47 | 1.47 | (0.64 | ) | 36 | ||||||||||||||||||||||||||||||||||||||||
| 2013 | 11.55 | (0.09 | ) | 5.00 | 4.91 | – | (1.54 | ) | (1.54 | ) | – | 14.92 | 43.10 | 208,237 | 1.47 | 1.47 | 1.47 | (0.67 | ) | 39 | |||||||||||||||||||||||||||||||||||||||||||
| 2012 | 10.03 | (0.04 | ) | 2.23 | 2.19 | – | (0.67 | ) | (0.67 | ) | – | 11.55 | 22.14 | 205,084 | 1.46 | 1.46 | 1.46 | (0.32 | ) | 34 | |||||||||||||||||||||||||||||||||||||||||||
| THE ACCOMPANYING NOTES ARE AN INTEGRAL PART OF THESE FINANCIAL STATEMENTS | The Royce Funds 2017 Semiannual Report to Shareholders | 99 |
Financial Highlights
This table is presented to show selected data for a share outstanding throughout each year or other indicated period and to assist shareholders in evaluating a Fund’s performance for the periods presented. Per share amounts have been determined on the basis of the weighted average number of shares outstanding during the period.
| Ratio of Expenses to Average Net Assets | Ratio of Net | ||||||||||||||||||||||||||||||||||||||||||||||||||||||||||||||
| Net Asset Value, Beginning of Period | Net Investment Income (Loss) | Net Realized and Unrealized Gain (Loss) on Investments and Foreign Currency | Total from Investment Operations | Distributions from Net Investment Income | Distributions from Net Realized Gain on Investments and Foreign Currency | Total Distributions | Shareholder Redemption Fees | Net Asset Value, End of Period | Total Return | Net Assets, End of Period (in thousands) | Prior to Fee Waivers and Balance Credits | Prior to Fee Waivers | Net of Fee Waivers | Investment Income (Loss) to Average Net Assets | Portfolio Turnover Rate | ||||||||||||||||||||||||||||||||||||||||||||||||
| Royce Opportunity Fund–Consultant Class | |||||||||||||||||||||||||||||||||||||||||||||||||||||||||||||||
| 2017† | $ | 10.71 | $ | (0.07 | ) | $ | 0.88 | $ | 0.81 | $ | - | $ | - | $ | - | $ | - | $ | 11.52 | 7.56 | %1 | $ | 20,134 | 2.27 | %2 | 2.27 | %2 | 2.27 | %2 | (1.20 | )%2 | 20 | % | ||||||||||||||||||||||||||||||
| 2016 | 9.01 | (0.12 | ) | 2.71 | 2.59 | - | (0.89 | ) | (0.89 | ) | - | 10.71 | 28.59 | 21,116 | 2.28 | 2.28 | 2.28 | (1.27 | ) | 26 | |||||||||||||||||||||||||||||||||||||||||||
| 2015 | 11.79 | (0.15 | ) | (1.57 | ) | (1.72 | ) | – | (1.06 | ) | (1.06 | ) | – | 9.01 | (14.56 | ) | 19,464 | 2.26 | 2.26 | 2.26 | (1.34 | ) | 27 | ||||||||||||||||||||||||||||||||||||||||
| 2014 | 14.02 | (0.19 | ) | (0.10 | ) | (0.29 | ) | – | (1.94 | ) | (1.94 | ) | – | 11.79 | (1.61 | ) | 20,518 | 2.24 | 2.24 | 2.24 | (1.40 | ) | 36 | ||||||||||||||||||||||||||||||||||||||||
| 2013 | 11.01 | (0.20 | ) | 4.75 | 4.55 | – | (1.54 | ) | (1.54 | ) | – | 14.02 | 41.93 | 18,643 | 2.31 | 2.31 | 2.31 | (1.51 | ) | 39 | |||||||||||||||||||||||||||||||||||||||||||
| 2012 | 9.67 | (0.13 | ) | 2.14 | 2.01 | – | (0.67 | ) | (0.67 | ) | – | 11.01 | 21.09 | 11,930 | 2.36 | 2.36 | 2.36 | (1.22 | ) | 34 | |||||||||||||||||||||||||||||||||||||||||||
| Royce Opportunity Fund–Institutional Class | |||||||||||||||||||||||||||||||||||||||||||||||||||||||||||||||
| 2017† | $ | 13.08 | $ | 0.00 | $ | 1.08 | $ | 1.08 | $ | - | $ | - | $ | - | $ | - | $ | 14.16 | 8.26 | %1 | $ | 584,358 | 1.07 | %2 | 1.07 | %2 | 1.07 | %2 | 0.00 | %2 | 20 | % | |||||||||||||||||||||||||||||||
| 2016 | 10.74 | (0.01 | ) | 3.24 | 3.23 | - | (0.89 | ) | (0.89 | ) | - | 13.08 | 29.94 | 583,975 | 1.07 | 1.07 | 1.07 | (0.06 | ) | 26 | |||||||||||||||||||||||||||||||||||||||||||
| 2015 | 13.64 | (0.02 | ) | (1.82 | ) | (1.84 | ) | – | (1.06 | ) | (1.06 | ) | – | 10.74 | (13.46 | ) | 600,945 | 1.05 | 1.05 | 1.05 | (0.15 | ) | 27 | ||||||||||||||||||||||||||||||||||||||||
| 2014 | 15.71 | (0.03 | ) | (0.10 | ) | (0.13 | ) | – | (1.94 | ) | (1.94 | ) | – | 13.64 | (0.41 | ) | 799,131 | 1.03 | 1.03 | 1.03 | (0.20 | ) | 36 | ||||||||||||||||||||||||||||||||||||||||
| 2013 | 12.06 | (0.03 | ) | 5.23 | 5.20 | (0.01 | ) | (1.54 | ) | (1.55 | ) | – | 15.71 | 43.69 | 853,886 | 1.03 | 1.03 | 1.03 | (0.23 | ) | 39 | ||||||||||||||||||||||||||||||||||||||||||
| 2012 | 10.40 | 0.01 | 2.32 | 2.33 | – | (0.67 | ) | (0.67 | ) | – | 12.06 | 22.70 | 689,939 | 1.04 | 1.04 | 1.04 | 0.11 | 34 | |||||||||||||||||||||||||||||||||||||||||||||
| Royce Opportunity Fund–R Class | |||||||||||||||||||||||||||||||||||||||||||||||||||||||||||||||
| 2017† | $ | 11.67 | $ | (0.04 | ) | $ | 0.96 | $ | 0.92 | $ | - | $ | - | $ | - | $ | - | $ | 12.59 | 7.88 | %1 | $ | 38,706 | 1.80 | %2 | 1.80 | %2 | 1.80 | %2 | (0.74 | )%2 | 20 | % | ||||||||||||||||||||||||||||||
| 2016 | 9.72 | (0.08 | ) | 2.92 | 2.84 | - | (0.89 | ) | (0.89 | ) | - | 11.67 | 29.08 | 38,902 | 1.82 | 1.82 | 1.82 | (0.81 | ) | 26 | |||||||||||||||||||||||||||||||||||||||||||
| 2015 | 12.56 | (0.11 | ) | (1.67 | ) | (1.78 | ) | – | (1.06 | ) | (1.06 | ) | – | 9.72 | (14.15 | ) | 32,599 | 1.82 | 1.82 | 1.82 | (0.90 | ) | 27 | ||||||||||||||||||||||||||||||||||||||||
| 2014 | 14.73 | (0.13 | ) | (0.10 | ) | (0.23 | ) | – | (1.94 | ) | (1.94 | ) | – | 12.56 | (1.12 | ) | 33,699 | 1.78 | 1.78 | 1.78 | (0.93 | ) | 36 | ||||||||||||||||||||||||||||||||||||||||
| 2013 | 11.46 | (0.14 | ) | 4.95 | 4.81 | – | (1.54 | ) | (1.54 | ) | – | 14.73 | 42.56 | 22,730 | 1.82 | 1.82 | 1.82 | (1.02 | ) | 39 | |||||||||||||||||||||||||||||||||||||||||||
| 2012 | 9.98 | (0.07 | ) | 2.22 | 2.15 | – | (0.67 | ) | (0.67 | ) | – | 11.46 | 21.85 | 6,612 | 2.01 | 2.01 | 1.84 | (0.62 | ) | 34 | |||||||||||||||||||||||||||||||||||||||||||
| Royce Opportunity Fund–K Class | |||||||||||||||||||||||||||||||||||||||||||||||||||||||||||||||
| 2017† | $ | 10.60 | $ | (0.04 | ) | $ | 0.87 | $ | 0.83 | $ | - | $ | - | $ | - | $ | - | $ | 11.43 | 7.83 | %1 | $ | 6,654 | 1.76 | %2 | 1.76 | %2 | 1.76 | %2 | (0.70 | %2 | 20 | % | ||||||||||||||||||||||||||||||
| 2016 | 8.88 | (0.07 | ) | 2.68 | 2.61 | - | (0.89 | ) | (0.89 | ) | - | 10.60 | 29.24 | 6,698 | 1.75 | 1.75 | 1.75 | (0.74 | ) | 26 | |||||||||||||||||||||||||||||||||||||||||||
| 2015 | 11.57 | (0.08 | ) | (1.55 | ) | (1.63 | ) | – | (1.06 | ) | (1.06 | ) | – | 8.88 | (14.06 | ) | 9,706 | 1.62 | 1.62 | 1.62 | (0.73 | ) | 27 | ||||||||||||||||||||||||||||||||||||||||
| 2014 | 13.70 | (0.10 | ) | (0.09 | ) | (0.19 | ) | – | (1.94 | ) | (1.94 | ) | – | 11.57 | (0.90 | ) | 22,892 | 1.59 | 1.59 | 1.59 | (0.75 | ) | 36 | ||||||||||||||||||||||||||||||||||||||||
| 2013 | 10.70 | (0.08 | ) | 4.62 | 4.54 | – | (1.54 | ) | (1.54 | ) | – | 13.70 | 43.07 | 17,927 | 1.46 | 1.46 | 1.46 | (0.65 | ) | 39 | |||||||||||||||||||||||||||||||||||||||||||
| 2012 | 9.33 | (0.04 | ) | 2.08 | 2.04 | – | (0.67 | ) | (0.67 | ) | – | 10.70 | 22.19 | 8,828 | 1.52 | 1.52 | 1.52 | (0.36 | ) | 34 | |||||||||||||||||||||||||||||||||||||||||||
| Royce Pennsylvania Mutual Fund–Investment Class | |||||||||||||||||||||||||||||||||||||||||||||||||||||||||||||||
| 2017† | $ | 11.02 | $ | 0.02 | $ | 0.51 | $ | 0.53 | $ | - | $ | - | $ | - | $ | - | $ | 11.55 | 4.81 | %1 | $ | 1,622,522 | 0.93 | %2 | 0.93 | %2 | 0.93 | %2 | 0.34 | %2 | 16 | % | |||||||||||||||||||||||||||||||
| 2016 | 9.33 | 0.07 | 2.41 | 2 .48 | (0.04 | ) | (0.75 | ) | (0.79 | ) | - | 11.02 | 26.47 | 1,671,848 | 0.92 | 0.92 | 0.92 | 0.60 | 18 | ||||||||||||||||||||||||||||||||||||||||||||
| 2015 | 13.00 | 0.09 | (1.58 | ) | (1.49 | ) | (0.10 | ) | (2.08 | ) | (2.18 | ) | – | 9.33 | (11.43 | ) | 1,925,419 | 0.92 | 0.92 | 0.92 | 0.58 | 21 | |||||||||||||||||||||||||||||||||||||||||
| 2014 | 14.73 | 0.06 | (0.21 | ) | (0.15 | ) | (0.04 | ) | (1.54 | ) | (1.58 | ) | – | 13.00 | (0.70 | ) | 3,869,579 | 0.91 | 0.91 | 0.91 | 0.35 | 21 | |||||||||||||||||||||||||||||||||||||||||
| 2013 | 11.50 | 0.03 | 3.99 | 4.02 | (0.00 | ) | (0.79 | ) | (0.79 | ) | – | 14.73 | 35.25 | 5,033,318 | 0.92 | 0.92 | 0.92 | 0.24 | 26 | ||||||||||||||||||||||||||||||||||||||||||||
| 2012 | 10.76 | 0.15 | 1.39 | 1.54 | (0.15 | ) | (0.65 | ) | (0.80 | ) | – | 11.50 | 14.58 | 4,232,988 | 0.89 | 0.89 | 0.89 | 1.19 | 22 | ||||||||||||||||||||||||||||||||||||||||||||
| 100 | The Royce Funds 2017 Semiannual Report to Shareholders | THE ACCOMPANYING NOTES ARE AN INTEGRAL PART OF THESE FINANCIAL STATEMENTS |
Financial Highlights
This table is presented to show selected data for a share outstanding throughout each year or other indicated period and to assist shareholders in evaluating a Fund’s performance for the periods presented. Per share amounts have been determined on the basis of the weighted average number of shares outstanding during the period.
| Ratio of Expenses to Average Net Assets | Ratio of Net | ||||||||||||||||||||||||||||||||||||||||||||||||||||||||||||||
| Net Asset Value, Beginning of Period | Net Investment Income (Loss) | Net Realized and Unrealized Gain (Loss) on Investments and Foreign Currency | Total from Investment Operations | Distributions from Net Investment Income | Distributions from Net Realized Gain on Investments and Foreign Currency | Total Distributions | Shareholder Redemption Fees | Net Asset Value, End of Period | Total Return | Net Assets, End of Period (in thousands) | Prior to Fee Waivers and Balance Credits | Prior to Fee Waivers | Net of Fee Waivers | Investment Income (Loss) to Average Net Assets | Portfolio Turnover Rate | ||||||||||||||||||||||||||||||||||||||||||||||||
| Royce Pennsylvania Mutual Fund–Service Class | |||||||||||||||||||||||||||||||||||||||||||||||||||||||||||||||
| 2017† | $ | 11.03 | $ | (0.00 | ) | $ | 0.51 | $ | 0.51 | $ | - | $ | - | $ | - | $ | - | $ | 11.54 | 4.62 | %1 | $ | 78,287 | 1.26 | %2 | 1.26 | %2 | 1.26 | %2 | (0.00 | )%2 | 16 | % | ||||||||||||||||||||||||||||||
| 2016 | 9.35 | 0.03 | 2.41 | 2.44 | (0.01 | ) | (0.75 | ) | (0.76 | ) | - | 11.03 | 25.99 | 100,598 | 1.26 | 1.26 | 1.26 | 0.27 | 18 | ||||||||||||||||||||||||||||||||||||||||||||
| 2015 | 12.96 | 0.05 | (1.56 | ) | (1.51 | ) | (0.02 | ) | (2.08 | ) | (2.10 | ) | - | 9.35 | (11.57 | ) | 102,341 | 1.23 | 1.23 | 1.23 | 0.29 | 21 | |||||||||||||||||||||||||||||||||||||||||
| 2014 | 14.69 | 0.00 | (0.19 | ) | (0.19 | ) | - | (1.54 | ) | (1.54 | ) | - | 12.96 | (1.04 | ) | 333,548 | 1.23 | 1.23 | 1.23 | 0.03 | 21 | ||||||||||||||||||||||||||||||||||||||||||
| 2013 | 11.51 | (0.01 | ) | 3.98 | 3.97 | - | (0.79 | ) | (0.79 | ) | - | 14.69 | 34.77 | 591,534 | 1.25 | 1.25 | 1.25 | (0.08 | ) | 26 | |||||||||||||||||||||||||||||||||||||||||||
| 2012 | 10.75 | 0.10 | 1.40 | 1.50 | (0.09 | ) | (0.65 | ) | (0.74 | ) | - | 11.51 | 14.15 | 473,624 | 1.24 | 1.24 | 1.24 | 0.90 | 22 | ||||||||||||||||||||||||||||||||||||||||||||
| Royce Pennsylvania Mutual Fund–Consultant Class | |||||||||||||||||||||||||||||||||||||||||||||||||||||||||||||||
| 2017† | $ | 8.90 | $ | (0.03 | ) | $ | 0.40 | $ | 0.37 | $ | - | $ | - | $ | - | $ | - | $ | 9.27 | 4.16 | %1 | $ | 370,697 | 1.95 | %2 | 1.95 | %2 | 1.95 | %2 | (0.68 | )%2 | 16 | % | ||||||||||||||||||||||||||||||
| 2016 | 7.70 | (0.03 | ) | 1.98 | 1.95 | - | (0.75 | ) | (0.75 | ) | - | 8.90 | 25.20 | 402,114 | 1.94 | 1.94 | 1.94 | (0.42 | ) | 18 | |||||||||||||||||||||||||||||||||||||||||||
| 2015 | 11.16 | (0.05 | ) | (1.33 | ) | (1.38 | ) | - | (2.08 | ) | (2.08 | ) | - | 7.70 | (12.31 | ) | 416,862 | 1.94 | 1.94 | 1.94 | (0.44 | ) | 21 | ||||||||||||||||||||||||||||||||||||||||
| 2014 | 12.96 | (0.08 | ) | (0.18 | ) | (0.26 | ) | - | (1.54 | ) | (1.54 | ) | - | 11.16 | (1.72 | ) | 676,347 | 1.91 | 1.91 | 1.91 | (0.64 | ) | 21 | ||||||||||||||||||||||||||||||||||||||||
| 2013 | 10.29 | (0.09 | ) | 3.55 | 3.46 | - | (0.79 | ) | (0.79 | ) | - | 12.96 | 33.94 | 788,017 | 1.94 | 1.94 | 1.94 | (0.78 | ) | 26 | |||||||||||||||||||||||||||||||||||||||||||
| 2012 | 9.69 | 0.01 | 1.25 | 1.26 | (0.01 | ) | (0.65 | ) | (0.66 | ) | - | 10.29 | 13.27 | 654,642 | 1.97 | 1.97 | 1.97 | 0.12 | 22 | ||||||||||||||||||||||||||||||||||||||||||||
| Royce Pennsylvania Mutual Fund–Institutional Class | |||||||||||||||||||||||||||||||||||||||||||||||||||||||||||||||
| 2017† | $ | 11.04 | $ | 0.02 | $ | 0.51 | $ | 0.53 | $ | - | $ | - | $ | - | $ | - | $ | 11.57 | 4.80 | %1 | $ | 238,644 | 0.84 | %2 | 0.84 | %2 | 0.84 | %2 | 0.43 | %2 | 16 | % | |||||||||||||||||||||||||||||||
| 2016 | 9.34 | 0.09 | 2.41 | 2.50 | (0.05 | ) | (0.75 | ) | (0.80 | ) | - | 11.04 | 26.65 | 245,009 | 0.83 | 0.83 | 0.83 | 0.63 | 18 | ||||||||||||||||||||||||||||||||||||||||||||
| 2015 | 13.02 | 0.11 | (1.60 | ) | (1.49 | ) | (0.11 | ) | (2.08 | ) | (2.19 | ) | - | 9.34 | (11.34 | ) | 498,374 | 0.81 | 0.81 | 0.81 | 0.68 | 21 | |||||||||||||||||||||||||||||||||||||||||
| 2014 | 14.75 | 0.07 | (0.20 | ) | (0.13 | ) | (0.06 | ) | (1.54 | ) | (1.60 | ) | - | 13.02 | (0.58 | ) | 802,517 | 0.79 | 0.79 | 0.79 | 0.48 | 21 | |||||||||||||||||||||||||||||||||||||||||
| 2013 | 11.52 | 0.05 | 3.99 | 4.04 | (0.02 | ) | (0.79 | ) | (0.81 | ) | - | 14.75 | 35.34 | 818,212 | 0.79 | 0.79 | 0.79 | 0.40 | 26 | ||||||||||||||||||||||||||||||||||||||||||||
| 2012 | 10.79 | 0.13 | 1.43 | 1.56 | (0.18 | ) | (0.65 | ) | (0.83 | ) | - | 11.52 | 14.72 | 488,052 | 0.80 | 0.80 | 0.80 | 1.53 | 22 | ||||||||||||||||||||||||||||||||||||||||||||
| Royce Pennsylvania Mutual Fund–R Class | |||||||||||||||||||||||||||||||||||||||||||||||||||||||||||||||
| 2017† | $ | 10.44 | $ | (0.02 | ) | $ | 0.47 | $ | 0.45 | $ | - | $ | - | $ | - | $ | - | $ | 10.89 | 4.31 | %1 | $ | 16,215 | 1.64 | %2 | 1.64 | %2 | 1.64 | %2 | (0.38 | )%2 | 16 | % | ||||||||||||||||||||||||||||||
| 2016 | 8.90 | (0.01 | ) | 2.30 | 2.29 | - | (0.75 | ) | (0.75 | ) | - | 10.44 | 25.62 | 17,059 | 1.63 | 1.63 | 1.63 | (0.11 | ) | 18 | |||||||||||||||||||||||||||||||||||||||||||
| 2015 | 12.50 | (0.02 | ) | (1.50 | ) | (1.52 | ) | - | (2.08 | ) | (2.08 | ) | - | 8.90 | (12.10 | ) | 18,675 | 1.65 | 1.65 | 1.65 | (0.15 | ) | 21 | ||||||||||||||||||||||||||||||||||||||||
| 2014 | 14.26 | (0.03 | ) | (0.19 | ) | (0.22 | ) | - | (1.54 | ) | (1.54 | ) | - | 12.50 | (1.28 | ) | 36,622 | 1.48 | 1.48 | 1.48 | (0.21 | ) | 21 | ||||||||||||||||||||||||||||||||||||||||
| 2013 | 11.22 | (0.05 | ) | 3.88 | 3.83 | - | (0.79 | ) | (0.79 | ) | - | 14.26 | 34.42 | 44,094 | 1.56 | 1.56 | 1.56 | (0.39 | ) | 26 | |||||||||||||||||||||||||||||||||||||||||||
| 2012 | 10.50 | 0.07 | 1.35 | 1.42 | (0.05 | ) | (0.65 | ) | (0.70 | ) | - | 11.22 | 13.79 | 32,977 | 1.50 | 1.50 | 1.50 | 0.70 | 22 | ||||||||||||||||||||||||||||||||||||||||||||
| Royce Pennsylvania Mutual Fund–K Class | |||||||||||||||||||||||||||||||||||||||||||||||||||||||||||||||
| 2017† | $ | 9.11 | $ | (0.03 | ) | $ | 0.42 | $ | 0.39 | $ | - | $ | - | $ | - | $ | - | $ | 9.50 | 4.28 | %1 | $ | 2,722 | 1.94 | %2 | 1.94 | %2 | 1.94 | %2 | (0.67 | )%2 | 16 | % | ||||||||||||||||||||||||||||||
| 2016 | 7.86 | (0.02 | ) | 2.02 | 2.00 | - | (0.75 | ) | (0.75 | ) | - | 9.11 | 25.32 | 3,200 | 1.81 | 1.81 | 1.81 | (0.28 | ) | 18 | |||||||||||||||||||||||||||||||||||||||||||
| 2015 | 11.30 | (0.00 | ) | (1.36 | ) | (1.36 | ) | - | (2.08 | ) | (2.08 | ) | - | 7.86 | (11.95 | ) | 4,140 | 1.51 | 1.51 | 1.51 | (0.01 | ) | 21 | ||||||||||||||||||||||||||||||||||||||||
| 2014 | 13.04 | (0.02 | ) | (0.18 | ) | (0.20 | ) | - | (1.54 | ) | (1.54 | ) | - | 11.30 | (1.24 | ) | 10,707 | 1.42 | 1.42 | 1.42 | (0.15 | ) | 21 | ||||||||||||||||||||||||||||||||||||||||
| 2013 | 10.29 | (0.02 | ) | 3.56 | 3.54 | - | (0.79 | ) | (0.79 | ) | - | 13.04 | 34.72 | 11,685 | 1.37 | 1.37 | 1.37 | (0.19 | ) | 26 | |||||||||||||||||||||||||||||||||||||||||||
| 2012 | 9.68 | 0.09 | 1.24 | 1.33 | (0.07 | ) | (0.65 | ) | (0.72 | ) | - | 10.29 | 14.04 | 8,849 | 1.26 | 1.26 | 1.26 | 0.94 | 22 | ||||||||||||||||||||||||||||||||||||||||||||
| THE ACCOMPANYING NOTES ARE AN INTEGRAL PART OF THESE FINANCIAL STATEMENTS | The Royce Funds 2017 Semiannual Report to Shareholders | 101 |
Financial Highlights
This table is presented to show selected data for a share outstanding throughout each year or other indicated period and to assist shareholders in evaluating a Fund’s performance for the periods presented. Per share amounts have been determined on the basis of the weighted average number of shares outstanding during the period.
| Ratio of Expenses to Average Net Assets | Ratio of Net | ||||||||||||||||||||||||||||||||||||||||||||||||||||||||||||||
| Net Asset Value, Beginning of Period | Net Investment Income (Loss) | Net Realized and Unrealized Gain (Loss) on Investments and Foreign Currency | Total from Investment Operations | Distributions from Net Investment Income | Distributions from Net Realized Gain on Investments and Foreign Currency | Total Distributions | Shareholder Redemption Fees | Net Asset Value, End of Period | Total Return | Net Assets, End of Period (in thousands) | Prior to Fee Waivers and Balance Credits | Prior to Fee Waivers | Net of Fee Waivers | Investment Income (Loss) to Average Net Assets | Portfolio Turnover Rate | ||||||||||||||||||||||||||||||||||||||||||||||||
| Royce Premier Fund–Investment Class | |||||||||||||||||||||||||||||||||||||||||||||||||||||||||||||||
| 2017† | $ | 15.51 | $ | (0.00 | ) | $ | 1.35 | $ | 1.35 | $ | - | $ | - | $ | - | $ | - | $ | 16.86 | 8.70 | %1 | $ | 1,768,985 | 1.16 | %2 | 1.16 | %2 | 1.16 | %2 | (0.06 | )%2 | 3 | % | ||||||||||||||||||||||||||||||
| 2016 | 14.28 | 0.06 | 3.25 | 3.31 | (0.04 | ) | (2.04 | ) | (2.08 | ) | - | 15.51 | 23.00 | 1,768,580 | 1.16 | 1.16 | 1.16 | 0.35 | 15 | ||||||||||||||||||||||||||||||||||||||||||||
| 2015 | 19.72 | 0.13 | (2.11 | ) | (1.98 | ) | (0.13 | ) | (3.33 | ) | (3.46 | ) | - | 14.28 | (9.90 | ) | 2,015,905 | 1.13 | 1.13 | 1.13 | 0.49 | 13 | |||||||||||||||||||||||||||||||||||||||||
| 2014 | 22.11 | 0.08 | (0.32 | ) | (0.24 | ) | (0.08 | ) | (2.07 | ) | (2.15 | ) | - | 19.72 | (0.86 | ) | 4,097,961 | 1.10 | 1.10 | 1.10 | 0.34 | 9 | |||||||||||||||||||||||||||||||||||||||||
| 2013 | 19.16 | 0.00 | 5.22 | 5.22 | - | (2.27 | ) | (2.27 | ) | - | 22.11 | 27.73 | 5,096,793 | 1.09 | 1.09 | 1.09 | 0.02 | 11 | |||||||||||||||||||||||||||||||||||||||||||||
| 2012 | 18.52 | 0.24 | 1.85 | 2.09 | (0.24 | ) | (1.21 | ) | (1.45 | ) | - | 19.16 | 11.45 | 4,629,272 | 1.06 | 1.06 | 1.06 | 1.19 | 7 | ||||||||||||||||||||||||||||||||||||||||||||
| Royce Premier Fund–Service Class | |||||||||||||||||||||||||||||||||||||||||||||||||||||||||||||||
| 2017† | $ | 15.13 | $ | (0.03 | ) | $ | 1.31 | $ | 1.28 | $ | - | $ | - | $ | - | $ | - | $ | 16.41 | 8.46 | %1 | $ | 51,848 | 1.50 | %2 | 1.50 | %2 | 1.49 | %2 | (0.38 | )%2 | 3 | % | ||||||||||||||||||||||||||||||
| 2016 | 13.98 | 0.00 | 3.19 | 3.19 | - | (2.04 | ) | (2.04 | ) | - | 15.13 | 22.63 | 46,550 | 1.50 | 1.50 | 1.49 | 0.02 | 15 | |||||||||||||||||||||||||||||||||||||||||||||
| 2015 | 19.33 | 0.06 | (2.04 | ) | (1.98 | ) | (0.04 | ) | (3.33 | ) | (3.37 | ) | - | 13.98 | (10.13 | ) | 61,969 | 1.44 | 1.43 | 1.43 | 0.23 | 13 | |||||||||||||||||||||||||||||||||||||||||
| 2014 | 21.70 | 0.01 | (0.31 | ) | (0.30 | ) | - | (2.07 | ) | (2.07 | ) | - | 19.33 | (1.16 | ) | 172,810 | 1.38 | 1.38 | 1.38 | 0.05 | 9 | ||||||||||||||||||||||||||||||||||||||||||
| 2013 | 18.89 | (0.07 | ) | 5.15 | 5.08 | - | (2.27 | ) | (2.27 | ) | - | 21.70 | 27.39 | 318,860 | 1.38 | 1.38 | 1.38 | (0.33 | ) | 11 | |||||||||||||||||||||||||||||||||||||||||||
| 2012 | 18.23 | 0.19 | 1.81 | 2.00 | (0.13 | ) | (1.21 | ) | (1.34 | ) | - | 18.89 | 11.14 | 560,553 | 1.33 | 1.33 | 1.32 | 0.92 | 7 | ||||||||||||||||||||||||||||||||||||||||||||
| Royce Premier Fund–Consultant Class | |||||||||||||||||||||||||||||||||||||||||||||||||||||||||||||||
| 2017† | $ | 12.46 | $ | (0.07 | ) | $ | 1.08 | $ | 1.01 | $ | - | $ | - | $ | - | $ | - | $ | 13.47 | 8.11 | %1 | $ | 31,081 | 2.22 | %2 | 2.22 | %2 | 2.22 | %2 | (1.12 | )%2 | 3 | % | ||||||||||||||||||||||||||||||
| 2016 | 11.89 | (0.09 | ) | 2.70 | 2.61 | - | (2.04 | ) | (2.04 | ) | - | 12.46 | 21.72 | 31,353 | 2.22 | 2.22 | 2.22 | (0.72 | ) | 15 | |||||||||||||||||||||||||||||||||||||||||||
| 2015 | 17.09 | (0.09 | ) | (1.78 | ) | (1.87 | ) | - | (3.33 | ) | (3.33 | ) | - | 11.89 | (10.80 | ) | 32,982 | 2.17 | 2.17 | 2.17 | (0.55 | ) | 13 | ||||||||||||||||||||||||||||||||||||||||
| 2014 | 19.58 | (0.13 | ) | (0.29 | ) | (0.42 | ) | - | (2.07 | ) | (2.07 | ) | - | 17.09 | (1.92 | ) | 56,884 | 2.10 | 2.10 | 2.10 | (0.66 | ) | 9 | ||||||||||||||||||||||||||||||||||||||||
| 2013 | 17.35 | (0.20 | ) | 4.70 | 4.50 | - | (2.27 | ) | (2.27 | ) | - | 19.58 | 26.47 | 66,712 | 2.13 | 2.13 | 2.13 | (1.02 | ) | 11 | |||||||||||||||||||||||||||||||||||||||||||
| 2012 | 16.87 | 0.02 | 1.69 | 1.71 | (0.02 | ) | (1.21 | ) | (1.23 | ) | - | 17.35 | 10.24 | 60,568 | 2.12 | 2.12 | 2.12 | 0.13 | 7 | ||||||||||||||||||||||||||||||||||||||||||||
| Royce Premier Fund–Institutional Class | |||||||||||||||||||||||||||||||||||||||||||||||||||||||||||||||
| 2017† | $ | 15.72 | $ | 0.01 | $ | 1.36 | $ | 1.37 | $ | - | $ | - | $ | - | $ | - | $ | 17.09 | 8.72 | %1 | $ | 269,806 | 1.07 | %2 | 1.07 | %2 | 1.07 | %2 | 0.07 | %2 | 3 | % | |||||||||||||||||||||||||||||||
| 2016 | 14.44 | 0.08 | 3.30 | 3.38 | (0.06 | ) | (2.04 | ) | (2.10 | ) | - | 15.72 | 23.20 | 250,826 | 1.07 | 1.07 | 1.07 | 0.44 | 15 | ||||||||||||||||||||||||||||||||||||||||||||
| 2015 | 19.91 | 0.16 | (2.14 | ) | (1.98 | ) | (0.16 | ) | (3.33 | ) | (3.49 | ) | - | 14.44 | (9.82 | ) | 294,477 | 1.02 | 1.02 | 1.02 | 0.60 | 13 | |||||||||||||||||||||||||||||||||||||||||
| 2014 | 22.31 | 0.12 | (0.34 | ) | (0.22 | ) | (0.11 | ) | (2.07 | ) | (2.18 | ) | - | 19.91 | (0.79 | ) | 594,463 | 0.98 | 0.98 | 0.98 | 0.45 | 9 | |||||||||||||||||||||||||||||||||||||||||
| 2013 | 19.30 | 0.03 | 5.25 | 5.28 | - | (2.27 | ) | (2.27 | ) | - | 22.31 | 27.85 | 989,100 | 0.98 | 0.98 | 0.98 | 0.13 | 11 | |||||||||||||||||||||||||||||||||||||||||||||
| 2012 | 18.66 | 0.26 | 1.87 | 2.13 | (0.28 | ) | (1.21 | ) | (1.49 | ) | - | 19.30 | 11.57 | 866,277 | 0.98 | 0.98 | 0.98 | 1.30 | 7 | ||||||||||||||||||||||||||||||||||||||||||||
| Royce Premier Fund–W Class | |||||||||||||||||||||||||||||||||||||||||||||||||||||||||||||||
| 2017† | $ | 15.57 | $ | (0.01 | ) | $ | 1.35 | $ | 1 .34 | $ | - | $ | - | $ | - | $ | - | $ | 16.91 | 8.61 | %1 | $ | 147,283 | 1.19 | %2 | 1.19 | %2 | 1.19 | %2 | (0.08 | )%2 | 3 | % | ||||||||||||||||||||||||||||||
| 2016 | 14.32 | 0.06 | 3.27 | 3.33 | (0.04 | ) | (2.04 | ) | (2.08 | ) | - | 15.57 | 23.06 | 147,937 | 1.17 | 1.17 | 1.17 | 0.34 | 15 | ||||||||||||||||||||||||||||||||||||||||||||
| 2015 | 19.76 | 0.14 | (2.12 | ) | (1.98 | ) | (0.13 | ) | (3.33 | ) | (3.46 | ) | - | 14.32 | (9.88 | ) | 192,785 | 1.12 | 1.12 | 1.12 | 0.51 | 13 | |||||||||||||||||||||||||||||||||||||||||
| 2014 | 22.16 | 0.09 | (0.33 | ) | (0.24 | ) | (0.09 | ) | (2.07 | ) | (2.16 | ) | - | 19.76 | (0.89 | ) | 446,380 | 1.07 | 1.07 | 1.07 | 0.36 | 9 | |||||||||||||||||||||||||||||||||||||||||
| 2013 | 19.20 | 0.00 | 5.23 | 5.23 | - | (2.27 | ) | (2.27 | ) | - | 22.16 | 27.73 | 552,732 | 1.09 | 1.09 | 1.09 | 0.01 | 11 | |||||||||||||||||||||||||||||||||||||||||||||
| 2012 | 18.57 | 0.25 | 1.85 | 2.10 | (0.26 | ) | (1.21 | ) | (1.47 | ) | - | 19.20 | 11.46 | 533,763 | 1.05 | 1.05 | 1.05 | 1.19 | 7 | ||||||||||||||||||||||||||||||||||||||||||||
| 102 | The Royce Funds 2017 Semiannual Report to Shareholders | THE ACCOMPANYING NOTES ARE AN INTEGRAL PART OF THESE FINANCIAL STATEMENTS |
Financial Highlights
This table is presented to show selected data for a share outstanding throughout each year or other indicated period and to assist shareholders in evaluating a Fund’s performance for the periods presented. Per share amounts have been determined on the basis of the weighted average number of shares outstanding during the period.
| Ratio of Expenses to Average Net Assets | Ratio of Net | ||||||||||||||||||||||||||||||||||||||||||||||||||||||||||||||
| Net Asset Value, Beginning of Period | Net Investment Income (Loss) | Net Realized and Unrealized Gain (Loss) on Investments and Foreign Currency | Total from Investment Operations | Distributions from Net Investment Income | Distributions from Net Realized Gain on Investments and Foreign Currency | Total Distributions | Shareholder Redemption Fees | Net Asset Value, End of Period | Total Return | Net Assets, End of Period (in thousands) | Prior to Fee Waivers and Balance Credits | Prior to Fee Waivers | Net of Fee Waivers | Investment Income (Loss) to Average Net Assets | Portfolio Turnover Rate | ||||||||||||||||||||||||||||||||||||||||||||||||
| Royce Premier Fund–R Class | |||||||||||||||||||||||||||||||||||||||||||||||||||||||||||||||
| 2017† | $ | 14.47 | $ | (0.06 | ) | $ | 1.26 | $ | 1 .20 | $ | - | $ | - | $ | - | $ | - | $ | 15.67 | 8.29 | %1 | $ | 13,058 | 1.85 | %2 | 1.85 | %2 | 1.85 | %2 | (0.75 | )%2 | 3 | % | ||||||||||||||||||||||||||||||
| 2016 | 13.49 | (0.05 | ) | 3.07 | 3.02 | - | (2.04 | ) | (2.04 | ) | - | 14.47 | 22.18 | 13,889 | 1.84 | 1.84 | 1.84 | (0.33 | ) | 15 | |||||||||||||||||||||||||||||||||||||||||||
| 2015 | 18.82 | (0.03 | ) | (1.97 | ) | (2.00 | ) | - | (3.33 | ) | (3.33 | ) | - | 13.49 | (10.50 | ) | 16,129 | 1.78 | 1.78 | 1.78 | (0.16 | ) | 13 | ||||||||||||||||||||||||||||||||||||||||
| 2014 | 21.25 | (0.06 | ) | (0.30 | ) | (0.36 | ) | - | (2.07 | ) | (2.07 | ) | - | 18.82 | (1.48 | ) | 27,355 | 1.71 | 1.71 | 1.71 | (0.28 | ) | 9 | ||||||||||||||||||||||||||||||||||||||||
| 2013 | 18.61 | (0.13 | ) | 5.04 | 4.91 | - | (2.27 | ) | (2.27 | ) | - | 21.25 | 26.88 | 32,577 | 1.74 | 1.74 | 1.74 | (0.63 | ) | 11 | |||||||||||||||||||||||||||||||||||||||||||
| 2012 | 17.99 | 0.11 | 1.80 | 1.91 | (0.08 | ) | (1.21 | ) | (1.29 | ) | - | 18.61 | 10.75 | 28,632 | 1.68 | 1.68 | 1.68 | 0.57 | 7 | ||||||||||||||||||||||||||||||||||||||||||||
| Royce Small-Cap Leaders Fund–Investment Class | |||||||||||||||||||||||||||||||||||||||||||||||||||||||||||||||
| 2017† | $ | 7.12 | $ | 0.02 | $ | 0.07 | $ | 0.09 | $ | - | $ | - | $ | - | $ | - | $ | 7.21 | 1.26 | %1 | $ | 42,866 | 1.23 | %2 | 1.23 | %2 | 1.23 | %2 | 0.53 | %2 | 32 | % | |||||||||||||||||||||||||||||||
| 2016 | 6.28 | 0.05 | 1.58 | 1.63 | (0.06 | ) | (0.73 | ) | (0.79 | ) | - | 7.12 | 25.84 | 48,128 | 1.23 | 1.23 | 1.23 | 0.62 | 65 | ||||||||||||||||||||||||||||||||||||||||||||
| 2015 | 8.74 | 0.03 | (1.09 | ) | (1.06 | ) | (0.04 | ) | (1.36 | ) | (1.40 | ) | - | 6.28 | (12.21 | ) | 50,410 | 1.24 | 1.24 | 1.24 | 0.40 | 64 | |||||||||||||||||||||||||||||||||||||||||
| 2014 | 10.11 | (0.00 | ) | (0.32 | ) | (0.32 | ) | - | (1.05 | ) | (1.05 | ) | - | 8.74 | (2.95 | ) | 68,898 | 1.22 | 1.22 | 1.22 | (0.03 | ) | 39 | ||||||||||||||||||||||||||||||||||||||||
| 2013 | 8.85 | (0.00 | ) | 2.71 | 2.71 | (0.03 | ) | (1.42 | ) | (1.45 | ) | - | 10.11 | 31.24 | 60,156 | 1.20 | 1.20 | 1.20 | (0.07 | ) | 31 | ||||||||||||||||||||||||||||||||||||||||||
| 2012 | 8.74 | 0.12 | 0.88 | 1.00 | (0.15 | ) | (0.74 | ) | (0.89 | ) | - | 8.85 | 11.78 | 68,395 | 1.19 | 1.19 | 1.19 | 1.31 | 13 | ||||||||||||||||||||||||||||||||||||||||||||
| Royce Small-Cap Leaders Fund–Service Class | |||||||||||||||||||||||||||||||||||||||||||||||||||||||||||||||
| 2017† | $ | 7.03 | $ | 0.01 | $ | 0.07 | $ | 0.08 | $ | - | $ | - | $ | - | $ | - | $ | 7.11 | 1.14 | %1 | $ | 45,448 | 1.59 | %2 | 1.59 | %2 | 1.49 | %2 | 0.27 | %2 | 32 | % | |||||||||||||||||||||||||||||||
| 2016 | 6.21 | 0.03 | 1.56 | 1.59 | (0.04 | ) | (0.73 | ) | (0.77 | ) | - | 7.03 | 25.51 | 50,523 | 1.58 | 1.58 | 1.49 | 0.37 | 65 | ||||||||||||||||||||||||||||||||||||||||||||
| 2015 | 8.65 | 0.02 | (1.09 | ) | (1.07 | ) | (0.01 | ) | (1.36 | ) | (1.37 | ) | - | 6.21 | (12.50 | ) | 57,729 | 1.54 | 1.54 | 1.49 | 0.18 | 64 | |||||||||||||||||||||||||||||||||||||||||
| 2014 | 10.05 | (0.04 | ) | (0.31 | ) | (0.35 | ) | - | (1.05 | ) | (1.05 | ) | - | 8.65 | (3.26 | ) | 149,736 | 1.52 | 1.52 | 1.50 | (0.39 | ) | 39 | ||||||||||||||||||||||||||||||||||||||||
| 2013 | 8.81 | (0.04 | ) | 2.70 | 2.66 | (0.00 | ) | (1.42 | ) | (1.42 | ) | - | 10.05 | 30.85 | 231,879 | 1.50 | 1.50 | 1.48 | (0.36 | ) | 31 | ||||||||||||||||||||||||||||||||||||||||||
| 2012 | 8.67 | 0.11 | 0.86 | 0.97 | (0.09 | ) | (0.74 | ) | (0.83 | ) | - | 8.81 | 11.52 | 220,674 | 1.46 | 1.46 | 1.42 | 1.03 | 13 | ||||||||||||||||||||||||||||||||||||||||||||
| Royce Small-Cap Leaders Fund–R Class | |||||||||||||||||||||||||||||||||||||||||||||||||||||||||||||||
| 2017† | $ | 9.73 | $ | (0.00 | ) | $ | 0.10 | $ | 0.10 | $ | - | $ | - | $ | - | $ | - | $ | 9.83 | 1.03 | %1 | $ | 2,032 | 2.49 | %2 | 2.48 | %2 | 1.84 | %2 | (0.08 | )%2 | 32 | % | ||||||||||||||||||||||||||||||
| 2016 | 8.36 | (0.00 | ) | 2.11 | 2.11 | (0.01 | ) | (0.73 | ) | (0.74 | ) | - | 9.73 | 25.18 | 1,871 | 2.74 | 2.74 | 1.84 | (0.01 | ) | 65 | ||||||||||||||||||||||||||||||||||||||||||
| 2015 | 11.14 | (0.02 | ) | (1.40 | ) | (1.42 | ) | - | (1.36 | ) | (1.36 | ) | - | 8.36 | (12.84 | ) | 1,681 | 2.75 | 2.75 | 1.84 | (0.22 | ) | 64 | ||||||||||||||||||||||||||||||||||||||||
| 2014 | 12.67 | (0.09 | ) | (0.39 | ) | (0.48 | ) | - | (1.05 | ) | (1.05 | ) | - | 11.14 | (3.61 | ) | 1,983 | 2.23 | 2.23 | 1.84 | (0.73 | ) | 39 | ||||||||||||||||||||||||||||||||||||||||
| 2013 | 10.84 | (0.09 | ) | 3.34 | 3.25 | - | (1.42 | ) | (1.42 | ) | - | 12.67 | 30.45 | 2,807 | 2.28 | 2.28 | 1.84 | (0.72 | ) | 31 | |||||||||||||||||||||||||||||||||||||||||||
| 2012 | 10.46 | 0.05 | 1.07 | 1.12 | - | (0.74 | ) | (0.74 | ) | - | 10.84 | 10.95 | 2,554 | 2.57 | 2.57 | 1.84 | 0.46 | 13 | |||||||||||||||||||||||||||||||||||||||||||||
| Royce Small-Cap Value Fund–Investment Class | |||||||||||||||||||||||||||||||||||||||||||||||||||||||||||||||
| 2017† | $ | 10.03 | $ | 0.02 | $ | (0.44 | ) | $ | (0.42 | ) | $ | - | $ | - | $ | - | $ | - | $ | 9.61 | (4.19 | )%1 | $ | 60,223 | 1.26 | %2 | 1.26 | %2 | 1.24 | %2 | 0.42 | %2 | 33 | % | |||||||||||||||||||||||||||||
| 2016 | 8.74 | 0.08 | 1.79 | 1.87 | (0.08 | ) | (0.50 | ) | (0.58 | ) | - | 10.03 | 21.37 | 72,863 | 1.24 | 1.24 | 1.24 | 0.72 | 56 | ||||||||||||||||||||||||||||||||||||||||||||
| 2015 | 11.81 | 0.10 | (1.43 | ) | (1.33 | ) | (0.09 | ) | (1.65 | ) | (1.74 | ) | - | 8.74 | (11.25 | ) | 77,821 | 1.23 | 1.23 | 1.23 | 0.69 | 60 | |||||||||||||||||||||||||||||||||||||||||
| 2014 | 13.52 | 0.04 | (0.05 | ) | (0.01 | ) | (0.03 | ) | (1.67 | ) | (1.70 | ) | - | 11.81 | 0.27 | 140,163 | 1.18 | 1.18 | 1.18 | 0.32 | 38 | ||||||||||||||||||||||||||||||||||||||||||
| 2013 | 11.37 | 0.02 | 3.13 | 3.15 | (0.03 | ) | (0.97 | ) | (1.00 | ) | - | 13.52 | 28.06 | 196,854 | 1.21 | 1.21 | 1.21 | 0.11 | 51 | ||||||||||||||||||||||||||||||||||||||||||||
| 2012 | 10.97 | 0.15 | 0.92 | 1.07 | (0.14 | ) | (0.53 | ) | (0.67 | ) | - | 11.37 | 9.88 | 206,316 | 1.19 | 1.19 | 1.19 | 1.22 | 25 | ||||||||||||||||||||||||||||||||||||||||||||
| THE ACCOMPANYING NOTES ARE AN INTEGRAL PART OF THESE FINANCIAL STATEMENTS | The Royce Funds 2017 Semiannual Report to Shareholders | 103 |
Financial Highlights
This table is presented to show selected data for a share outstanding throughout each year or other indicated period and to assist shareholders in evaluating a Fund’s performance for the periods presented. Per share amounts have been determined on the basis of the weighted average number of shares outstanding during the period.
| Ratio of Expenses to Average Net Assets | Ratio of Net | ||||||||||||||||||||||||||||||||||||||||||||||||||||||||||||||
| Net Asset Value, Beginning of Period | Net Investment Income (Loss) | Net Realized and Unrealized Gain (Loss) on Investments and Foreign Currency | Total from Investment Operations | Distributions from Net Investment Income | Distributions from Net Realized Gain on Investments and Foreign Currency | Total Distributions | Shareholder Redemption Fees | Net Asset Value, End of Period | Total Return | Net Assets, End of Period (in thousands) | Prior to Fee Waivers and Balance Credits | Prior to Fee Waivers | Net of Fee Waivers | Investment Income (Loss) to Average Net Assets | Portfolio Turnover Rate | ||||||||||||||||||||||||||||||||||||||||||||||||
| Royce Small-Cap Value Fund–Service Class | |||||||||||||||||||||||||||||||||||||||||||||||||||||||||||||||
| 2017† | $ | 9.98 | $ | 0.01 | $ | (0.43 | ) | $ | (0.42 | ) | $ | - | $ | - | $ | - | $ | - | $ | 9.56 | (4.21 | )%1 | $ | 171,077 | 1.52 | %2 | 1.52 | %2 | 1.49 | %2 | 0.17 | %2 | 33 | % | |||||||||||||||||||||||||||||
| 2016 | 8.70 | 0.05 | 1.79 | 1.84 | (0.06 | ) | (0.50 | ) | (0.56 | ) | - | 9.98 | 21.06 | 213,067 | 1.49 | 1.49 | 1.48 | 0.48 | 56 | ||||||||||||||||||||||||||||||||||||||||||||
| 2015 | 11.76 | 0.06 | (1.41 | ) | (1.35 | ) | (0.06 | ) | (1.65 | ) | (1.71 | ) | - | 8.70 | (11.51 | ) | 252,814 | 1.48 | 1.48 | 1.48 | 0.45 | 60 | |||||||||||||||||||||||||||||||||||||||||
| 2014 | 13.48 | 0.01 | (0.06 | ) | (0.05 | ) | - | (1.67 | ) | (1.67 | ) | - | 11.76 | (0.02 | ) | 477,999 | 1.45 | 1.45 | 1.45 | 0.04 | 38 | ||||||||||||||||||||||||||||||||||||||||||
| 2013 | 11.34 | (0.02 | ) | 3.13 | 3.11 | - | (0.97 | ) | (0.97 | ) | - | 13.48 | 27.76 | 680,674 | 1.48 | 1.48 | 1.48 | (0.17 | ) | 51 | |||||||||||||||||||||||||||||||||||||||||||
| 2012 | 10.94 | 0.12 | 0.91 | 1.03 | (0.10 | ) | (0.53 | ) | (0.63 | ) | - | 11.34 | 9.56 | 831,673 | 1.45 | 1.45 | 1.45 | 0.90 | 25 | ||||||||||||||||||||||||||||||||||||||||||||
| Royce Small-Cap Value Fund–Consultant Class | |||||||||||||||||||||||||||||||||||||||||||||||||||||||||||||||
| 2017† | $ | 8.98 | $ | (0.03 | ) | $ | (0.39 | ) | $ | (0.42 | ) | $ | - | $ | - | $ | - | $ | - | $ | 8.56 | (4.68 | )%1 | $ | 13,917 | 2.32 | %2 | 2.32 | %2 | 2.32 | %2 | (0.66 | )%2 | 33 | % | ||||||||||||||||||||||||||||
| 2016 | 7.89 | (0.03 | ) | 1.62 | 1.59 | - | (0.50 | ) | (0.50 | ) | - | 8.98 | 20.10 | 16,484 | 2.28 | 2.28 | 2.28 | (0.33 | ) | 56 | |||||||||||||||||||||||||||||||||||||||||||
| 2015 | 10.87 | (0.04 | ) | (1.29 | ) | (1.33 | ) | - | (1.65 | ) | (1.65 | ) | - | 7.89 | (12.24 | ) | 18,404 | 2.27 | 2.27 | 2.27 | (0.36 | ) | 60 | ||||||||||||||||||||||||||||||||||||||||
| 2014 | 12.68 | (0.09 | ) | (0.05 | ) | (0.14 | ) | - | (1.67 | ) | (1.67 | ) | - | 10.87 | (0.74 | ) | 26,716 | 2.21 | 2.21 | 2.21 | (0.71 | ) | 38 | ||||||||||||||||||||||||||||||||||||||||
| 2013 | 10.81 | (0.12 | ) | 2.96 | 2.84 | - | (0.97 | ) | (0.97 | ) | - | 12.68 | 26.61 | 31,604 | 2.29 | 2.29 | 2.29 | (0.97 | ) | 51 | |||||||||||||||||||||||||||||||||||||||||||
| 2012 | 10.46 | 0.02 | 0.89 | 0.91 | (0.03 | ) | (0.53 | ) | (0.56 | ) | - | 10.81 | 8.77 | 33,480 | 2.26 | 2.26 | 2.26 | 0.15 | 25 | ||||||||||||||||||||||||||||||||||||||||||||
| Royce Small-Cap Value Fund–Institutional Class | |||||||||||||||||||||||||||||||||||||||||||||||||||||||||||||||
| 2017† | $ | 10.03 | $ | 0.03 | $ | (0.44 | ) | $ | (0.41 | ) | $ | - | $ | - | $ | - | $ | - | $ | 9.62 | (4.09 | )%1 | $ | 102,373 | 1.09 | %2 | 1.09 | %2 | 1.09 | %2 | 0.56 | %2 | 33 | % | |||||||||||||||||||||||||||||
| 2016 | 8.74 | 0.10 | 1.79 | 1.89 | (0.10 | ) | (0.50 | ) | (0.60 | ) | - | 10.03 | 21.54 | 127,741 | 1.08 | 1.08 | 1.08 | 0.86 | 56 | ||||||||||||||||||||||||||||||||||||||||||||
| 2015 | 11.81 | 0.10 | (1.40 | ) | (1.30 | ) | (0.12 | ) | (1.65 | ) | (1.77 | ) | - | 8.74 | (11.05 | ) | 148,652 | 1.06 | 1.06 | 1.06 | 0.83 | 60 | |||||||||||||||||||||||||||||||||||||||||
| 2014 | 13.53 | 0.06 | (0.06 | ) | 0.00 | (0.05 | ) | (1.67 | ) | (1.72 | ) | - | 11.81 | 0.35 | 196,543 | 1.05 | 1.05 | 1.05 | 0.46 | 38 | |||||||||||||||||||||||||||||||||||||||||||
| 2013 | 11.38 | 0.04 | 3.13 | 3.17 | (0.05 | ) | (0.97 | ) | (1.02 | ) | - | 13.53 | 28.22 | 219,667 | 1.05 | 1.05 | 1.05 | 0.27 | 51 | ||||||||||||||||||||||||||||||||||||||||||||
| 2012 | 10.98 | 0.17 | 0.92 | 1.09 | (0.16 | ) | (0.53 | ) | (0.69 | ) | - | 11.38 | 10.04 | 202,643 | 1.05 | 1.05 | 1.05 | 1.41 | 25 | ||||||||||||||||||||||||||||||||||||||||||||
| Royce Small-Cap Value Fund–R Class | |||||||||||||||||||||||||||||||||||||||||||||||||||||||||||||||
| 2017† | $ | 9.63 | $ | (0.01 | ) | $ | (0.42 | ) | $ | (0.43 | ) | $ | - | $ | - | $ | - | $ | - | $ | 9.20 | (4.47 | )%1 | $ | 15,261 | 1.87 | %2 | 1.87 | %2 | 1.87 | %2 | (0.22 | )%2 | 33 | % | ||||||||||||||||||||||||||||
| 2016 | 8.42 | 0.01 | 1.73 | 1.74 | (0.03 | ) | (0.50 | ) | (0.53 | ) | - | 9.63 | 20.60 | 18,059 | 1.85 | 1.85 | 1.85 | 0.11 | 56 | ||||||||||||||||||||||||||||||||||||||||||||
| 2015 | 11.43 | 0.01 | (1.35 | ) | (1.34 | ) | (0.02 | ) | (1.65 | ) | (1.67 | ) | - | 8.42 | (11.71 | ) | 19,200 | 1.83 | 1.83 | 1.83 | 0.09 | 60 | |||||||||||||||||||||||||||||||||||||||||
| 2014 | 13.19 | (0.03 | ) | (0.06 | ) | (0.09 | ) | - | (1.67 | ) | (1.67 | ) | - | 11.43 | (0.34 | ) | 31,043 | 1.77 | 1.77 | 1.77 | (0.26 | ) | 38 | ||||||||||||||||||||||||||||||||||||||||
| 2013 | 11.16 | (0.06 | ) | 3.06 | 3.00 | - | (0.97 | ) | (0.97 | ) | - | 13.19 | 27.21 | 37,409 | 1.83 | 1.83 | 1.83 | (0.52 | ) | 51 | |||||||||||||||||||||||||||||||||||||||||||
| 2012 | 10.78 | 0.07 | 0.91 | 0.98 | (0.07 | ) | (0.53 | ) | (0.60 | ) | - | 11.16 | 9.18 | 37,679 | 1.85 | 1.85 | 1.85 | 0.59 | 25 | ||||||||||||||||||||||||||||||||||||||||||||
| Royce Small-Cap Value Fund–K Class | |||||||||||||||||||||||||||||||||||||||||||||||||||||||||||||||
| 2017† | $ | 6.93 | $ | (0.01 | ) | $ | (0.30 | ) | $ | (0.31 | ) | $ | - | $ | - | $ | - | $ | - | $ | 6.62 | (4.47 | )%1 | $ | 2,053 | 2.49 | %2 | 2.49 | %2 | 1.99 | %2 | (0.33 | )%2 | 33 | % | ||||||||||||||||||||||||||||
| 2016 | 6.17 | 0.00 | 1.27 | 1.27 | (0.01 | ) | (0.50 | ) | (0.51 | ) | - | 6.93 | 20.52 | 2,966 | 1.95 | 1.95 | 1.95 | (0.04 | ) | 56 | |||||||||||||||||||||||||||||||||||||||||||
| 2015 | 8.90 | 0.02 | (1.06 | ) | (1.04 | ) | (0.04 | ) | (1.65 | ) | (1.69 | ) | - | 6.17 | (11.69 | ) | 6,026 | 1.80 | 1.80 | 1.80 | 0.11 | 60 | |||||||||||||||||||||||||||||||||||||||||
| 2014 | 10.65 | (0.02 | ) | (0.06 | ) | (0.08 | ) | - | (1.67 | ) | (1.67 | ) | - | 8.90 | (0.32 | ) | 9,363 | 1.67 | 1.67 | 1.67 | (0.18 | ) | 38 | ||||||||||||||||||||||||||||||||||||||||
| 2013 | 9.14 | (0.03 | ) | 2.51 | 2.48 | - | (0.97 | ) | (0.97 | ) | - | 10.65 | 27.55 | 16,285 | 1.62 | 1.62 | 1.62 | (0.30 | ) | 51 | |||||||||||||||||||||||||||||||||||||||||||
| 2012 | 8.95 | 0.09 | 0.75 | 0.84 | (0.12 | ) | (0.53 | ) | (0.65 | ) | - | 9.14 | 9.49 | 18,209 | 1.53 | 1.53 | 1.53 | 0.98 | 25 | ||||||||||||||||||||||||||||||||||||||||||||
| 104 | The Royce Funds 2017 Semiannual Report to Shareholders | THE ACCOMPANYING NOTES ARE AN INTEGRAL PART OF THESE FINANCIAL STATEMENTS |
Financial Highlights
This table is presented to show selected data for a share outstanding throughout each year or other indicated period and to assist shareholders in evaluating a Fund’s performance for the periods presented. Per share amounts have been determined on the basis of the weighted average number of shares outstanding during the period.
| Ratio of Expenses to Average Net Assets | Ratio of Net | ||||||||||||||||||||||||||||||||||||||||||||||||||||||||||||||
| �� | |||||||||||||||||||||||||||||||||||||||||||||||||||||||||||||||
| Net Asset Value, Beginning of Period | Net Investment Income (Loss) | Net Realized and Unrealized Gain (Loss) on Investments and Foreign Currency | Total from Investment Operations | Distributions from Net Investment Income | Distributions from Net Realized Gain on Investments and Foreign Currency | Total Distributions | Shareholder Redemption Fees | Net Asset Value, End of Period | Total Return | Net Assets, End of Period (in thousands) | Prior to Fee Waivers and Balance Credits | Prior to Fee Waivers | Net of Fee Waivers | Investment Income (Loss) to Average Net Assets | Portfolio Turnover Rate | ||||||||||||||||||||||||||||||||||||||||||||||||
| Royce Small/Mid-Cap Premier Fund–Investment Class | |||||||||||||||||||||||||||||||||||||||||||||||||||||||||||||||
| 2017† | $ | 14.64 | $ | 0.03 | $ | 0.81 | $ | 0.84 | $ | - | $ | - | $ | - | $ | - | $ | 15.48 | 5.74 | %1 | $ | 85,045 | 0.98 | %2 | 0.98 | %2 | 0.98 | %2 | 0.34 | %2 | 31 | % | |||||||||||||||||||||||||||||||
| 2016 | 12.87 | 0.04 | 2.30 | 2.34 | (0.06 | ) | (0.51 | ) | (0.57 | ) | - | 14.64 | 18.12 | 88,378 | 1.02 | 1.02 | 1.02 | 0.22 | 67 | ||||||||||||||||||||||||||||||||||||||||||||
| 2015 | 15.21 | 0.12 | (1.09 | ) | (0.97 | ) | (0.11 | ) | (1.26 | ) | (1.37 | ) | - | 12.87 | (6.33 | ) | 89,766 | 1.10 | 1.10 | 1.10 | 0.54 | 66 | |||||||||||||||||||||||||||||||||||||||||
| 2014 | 16.24 | 0.10 | (0.25 | ) | (0.15 | ) | (0.05 | ) | (0.83 | ) | (0.88 | ) | - | 15.21 | (0.81 | ) | 160,558 | 1.09 | 1.09 | 1.09 | 0.66 | 35 | |||||||||||||||||||||||||||||||||||||||||
| 2013 | 14.48 | 0.03 | 3.71 | 3.74 | (0.05 | ) | (1.93 | ) | (1.98 | ) | - | 16.24 | 26.37 | 117,306 | 1.13 | 1.13 | 1.13 | 0.36 | 79 | ||||||||||||||||||||||||||||||||||||||||||||
| 2012 | 13.07 | 0.10 | 1.80 | 1.90 | (0.13 | ) | (0.36 | ) | (0.49 | ) | - | 14.48 | 14.70 | 40,374 | 1.20 | 1.20 | 1.20 | 0.94 | 39 | ||||||||||||||||||||||||||||||||||||||||||||
| Royce Small/Mid-Cap Premier Fund–Service Class | |||||||||||||||||||||||||||||||||||||||||||||||||||||||||||||||
| 2017† | $ | 14.60 | $ | 0.01 | $ | 0.82 | $ | 0.83 | $ | - | $ | - | $ | - | $ | - | $ | 15.43 | 5.68 | %1 | $ | 122,446 | 1.32 | %2 | 1.31 | %2 | 1.20 | %2 | 0.12 | %2 | 31 | % | |||||||||||||||||||||||||||||||
| 2016 | 12.84 | 0.00 | 2.30 | 2.30 | (0.03 | ) | (0.51 | ) | (0.54 | ) | - | 14.60 | 17.84 | 120,254 | 1.36 | 1.36 | 1.25 | (0.01 | ) | 67 | |||||||||||||||||||||||||||||||||||||||||||
| 2015 | 15.17 | 0.05 | (1.05 | ) | (1.00 | ) | (0.07 | ) | (1.26 | ) | (1.33 | ) | - | 12.84 | (6.53 | ) | 120,381 | 1.46 | 1.46 | 1.35 | 0.31 | 66 | |||||||||||||||||||||||||||||||||||||||||
| 2014 | 16.20 | 0.05 | (0.25 | ) | (0.20 | ) | - | (0.83 | ) | (0.83 | ) | - | 15.17 | (1.14 | ) | 175,433 | 1.43 | 1.43 | 1.40 | 0.32 | 35 | ||||||||||||||||||||||||||||||||||||||||||
| 2013 | 14.45 | 0.00 | 3.68 | 3.68 | (0.00 | ) | (1.93 | ) | (1.93 | ) | - | 16.20 | 25.99 | 223,533 | 1.45 | 1.45 | 1.42 | 0.02 | 79 | ||||||||||||||||||||||||||||||||||||||||||||
| 2012 | 13.00 | 0.08 | 1.78 | 1.86 | (0.05 | ) | (0.36 | ) | (0.41 | ) | - | 14.45 | 14.39 | 203,112 | 1.46 | 1.46 | 1.45 | 0.56 | 39 | ||||||||||||||||||||||||||||||||||||||||||||
| Royce Small/Mid-Cap Premier Fund–Consultant Class | |||||||||||||||||||||||||||||||||||||||||||||||||||||||||||||||
| 2017† | $ | 10.44 | $ | (0.04 | ) | $ | 0.58 | $ | 0.54 | $ | - | $ | - | $ | - | $ | - | $ | 10.98 | 5.17 | %1 | $ | 10,456 | 2.24 | %2 | 2.24 | %2 | 2.09 | %2 | (0.78 | )%2 | 31 | % | ||||||||||||||||||||||||||||||
| 2016 | 9.37 | (0.09 | ) | 1.67 | 1.58 | - | (0.51 | ) | (0.51 | ) | - | 10.44 | 16.78 | 11,643 | 2.28 | 2.28 | 2.14 | (0.89 | ) | 67 | |||||||||||||||||||||||||||||||||||||||||||
| 2015 | 11.47 | (0.06 | ) | (0.78 | ) | (0.84 | ) | - | (1.26 | ) | (1.26 | ) | - | 9.37 | (7.31 | ) | 11,369 | 2.41 | 2.41 | 2.24 | (0.58 | ) | 66 | ||||||||||||||||||||||||||||||||||||||||
| 2014 | 12.57 | (0.07 | ) | (0.20 | ) | (0.27 | ) | - | (0.83 | ) | (0.83 | ) | - | 11.47 | (2.02 | ) | 13,338 | 2.31 | 2.31 | 2.31 | (0.59 | ) | 35 | ||||||||||||||||||||||||||||||||||||||||
| 2013 | 11.68 | (0.12 | ) | 2.94 | 2.82 | - | (1.93 | ) | (1.93 | ) | - | 12.57 | 24.73 | 15,942 | 2.37 | 2.37 | 2.37 | (0.93 | ) | 79 | |||||||||||||||||||||||||||||||||||||||||||
| 2012 | 10.64 | (0.04 | ) | 1.44 | 1.40 | - | (0.36 | ) | (0.36 | ) | - | 11.68 | 13.30 | 13,909 | 2.41 | 2.41 | 2.41 | (0.39 | ) | 39 | |||||||||||||||||||||||||||||||||||||||||||
| Royce Small/Mid-Cap Premier Fund–R Class | |||||||||||||||||||||||||||||||||||||||||||||||||||||||||||||||
| 2017† | $ | 9.54 | $ | (0.02 | ) | $ | 0.53 | $ | 0.51 | $ | - | $ | - | $ | - | $ | - | $ | 10.05 | 5.35 | %1 | $ | 1,936 | 2.24 | %2 | 2.24 | %2 | 1.69 | %2 | (0.38 | )%2 | 31 | % | ||||||||||||||||||||||||||||||
| 2016 | 8.56 | (0.05 | ) | 1.54 | 1.49 | - | (0.51 | ) | (0.51 | ) | - | 9.54 | 17.32 | 1,945 | 2.27 | 2.27 | 1.74 | (0.51 | ) | 67 | |||||||||||||||||||||||||||||||||||||||||||
| 2015 | 10.60 | (0.02 | ) | (0.73 | ) | (0.75 | ) | (0.03 | ) | (1.26 | ) | (1.29 | ) | - | 8.56 | (7.00 | ) | 2,339 | 2.20 | 2.20 | 1.84 | (0.19 | ) | 66 | |||||||||||||||||||||||||||||||||||||||
| 2014 | 11.63 | (0.02 | ) | (0.18 | ) | (0.20 | ) | - | (0.83 | ) | (0.83 | ) | - | 10.60 | (1.59 | ) | 3,727 | 1.89 | 1.89 | 1.84 | (0.14 | ) | 35 | ||||||||||||||||||||||||||||||||||||||||
| 2013 | 10.86 | (0.05 | ) | 2.75 | 2.70 | - | (1.93 | ) | (1.93 | ) | - | 11.63 | 25.51 | 6,805 | 1.90 | 1.90 | 1.84 | (0.39 | ) | 79 | |||||||||||||||||||||||||||||||||||||||||||
| 2012 | 9.87 | 0.02 | 1.34 | 1.36 | (0.01 | ) | (0.36 | ) | (0.37 | ) | - | 10.86 | 13.88 | 4,832 | 1.95 | 1.95 | 1.84 | 0.17 | 39 | ||||||||||||||||||||||||||||||||||||||||||||
| Royce Smaller-Companies Growth Fund–Investment Class | |||||||||||||||||||||||||||||||||||||||||||||||||||||||||||||||
| 2017† | $ | 11.22 | $ | (0.04 | ) | $ | 1.32 | $ | 1.28 | $ | - | $ | - | $ | - | $ | - | $ | 12.50 | 11.41 | %1 | $ | 97,658 | 1.23 | %2 | 1.23 | %2 | 1.23 | %2 | (0.64 | )%2 | 30 | % | ||||||||||||||||||||||||||||||
| 2016 | 11.36 | (0.05 | ) | 1.17 | 1.12 | - | (1.26 | ) | (1.26 | ) | - | 11.22 | 9.67 | 98,962 | 1.15 | 1.15 | 1.15 | (0.41 | ) | 59 | |||||||||||||||||||||||||||||||||||||||||||
| 2015 | 14.36 | (0.06 | ) | (0.19 | ) | (0.25 | ) | - | (2.75 | ) | (2.75 | ) | - | 11.36 | (1.59 | ) | 139,979 | 1.32 | 1.32 | 1.24 | (0.38 | ) | 45 | ||||||||||||||||||||||||||||||||||||||||
| 2014 | 17.03 | (0.07 | ) | 0.68 | 0.61 | - | (3.28 | ) | (3.28 | ) | - | 14.36 | 4.04 | 295,412 | 1.33 | 1.33 | 1.33 | (0.40 | ) | 52 | |||||||||||||||||||||||||||||||||||||||||||
| 2013 | 13.90 | (0.09 | ) | 4.57 | 4.48 | (0.00 | ) | (1.35 | ) | (1.35 | ) | - | 17.03 | 32.59 | 244,269 | 1.37 | 1.37 | 1.37 | (0.59 | ) | 45 | ||||||||||||||||||||||||||||||||||||||||||
| 2012 | 12.04 | (0.02 | ) | 1.88 | 1.86 | - | - | - | - | 13.90 | 15.45 | 228,016 | 1.27 | 1.27 | 1.27 | (0.14 | ) | 32 | |||||||||||||||||||||||||||||||||||||||||||||
| THE ACCOMPANYING NOTES ARE AN INTEGRAL PART OF THESE FINANCIAL STATEMENTS | The Royce Funds 2017 Semiannual Report to Shareholders | 105 |
Financial Highlights
This table is presented to show selected data for a share outstanding throughout each year or other indicated period and to assist shareholders in evaluating a Fund’s performance for the periods presented. Per share amounts have been determined on the basis of the weighted average number of shares outstanding during the period.
| Ratio of Expenses to Average Net Assets | Ratio of Net | ||||||||||||||||||||||||||||||||||||||||||||||||||||||||||||||
| Net Asset Value, Beginning of Period | Net Investment Income (Loss) | Net Realized and Unrealized Gain (Loss) on Investments and Foreign Currency | Total from Investment Operations | Distributions from Net Investment Income | Distributions from Net Realized Gain on Investments and Foreign Currency | Total Distributions | Shareholder Redemption Fees | Net Asset Value, End of Period | Total Return | Net Assets, End of Period (in thousands) | Prior to Fee Waivers and Balance Credits | Prior to Fee Waivers | Net of Fee Waivers | Investment Income (Loss) to Average Net Assets | Portfolio Turnover Rate | ||||||||||||||||||||||||||||||||||||||||||||||||
| Royce Smaller-Companies Growth Fund–Service Class | |||||||||||||||||||||||||||||||||||||||||||||||||||||||||||||||
| 2017† | $ | 11.01 | $ | (0.05 | ) | $ | 1.29 | $ | 1.24 | $ | - | $ | - | $ | - | $ | - | $ | 12.25 | 11.26 | %1 | $ | 274,267 | 1.53 | %2 | 1.53 | %2 | 1.49 | %2 | (0.91 | )%2 | 30 | % | ||||||||||||||||||||||||||||||
| 2016 | 11.20 | (0.08 | ) | 1.15 | 1.07 | - | (1.26 | ) | (1.26 | ) | - | 11.01 | 9.37 | 284,640 | 1.51 | 1.51 | 1.49 | (0.74 | ) | 59 | |||||||||||||||||||||||||||||||||||||||||||
| 2015 | 14.23 | (0.08 | ) | (0.20 | ) | (0.28 | ) | - | (2.75 | ) | (2.75 | ) | - | 11.20 | (1.82 | ) | 408,744 | 1.47 | 1.47 | 1.45 | (0.58 | ) | 45 | ||||||||||||||||||||||||||||||||||||||||
| 2014 | 16.93 | (0.09 | ) | 0.67 | 0.58 | - | (3.28 | ) | (3.28 | ) | - | 14.23 | 3.89 | 572,899 | 1.44 | 1.44 | 1.42 | (0.51 | ) | 52 | |||||||||||||||||||||||||||||||||||||||||||
| 2013 | 13.83 | (0.11 | ) | 4.56 | 4.45 | - | (1.35 | ) | (1.35 | ) | - | 16.93 | 32.52 | 835,379 | 1.48 | 1.48 | 1.46 | (0.69 | ) | 45 | |||||||||||||||||||||||||||||||||||||||||||
| 2012 | 12.00 | (0.04 | ) | 1.87 | 1.83 | - | - | - | - | 13.83 | 15.25 | 966,735 | 1.45 | 1.45 | 1.44 | (0.33 | ) | 32 | |||||||||||||||||||||||||||||||||||||||||||||
| Royce Smaller-Companies Growth Fund–Consultant Class | |||||||||||||||||||||||||||||||||||||||||||||||||||||||||||||||
| 2017† | $ | 9.63 | $ | (0.08 | ) | $ | 1.12 | $ | 1.04 | $ | - | $ | - | $ | - | $ | - | $ | 10.67 | 10.80 | %1 | $ | 10,953 | 2.41 | %2 | 2.41 | %2 | 2.24 | %2 | (1.65 | )%2 | 30 | % | ||||||||||||||||||||||||||||||
| 2016 | 10.01 | (0.14 | ) | 1.02 | 0.88 | - | (1.26 | ) | (1.26 | ) | - | 9.63 | 8.58 | 10,593 | 2.35 | 2.35 | 2.24 | (1.50 | ) | 59 | |||||||||||||||||||||||||||||||||||||||||||
| 2015 | 13.12 | (0.18 | ) | (0.18 | ) | (0.36 | ) | - | (2.75 | ) | (2.75 | ) | - | 10.01 | (2.61 | ) | 14,411 | 2.32 | 2.32 | 2.24 | (1.36 | ) | 45 | ||||||||||||||||||||||||||||||||||||||||
| 2014 | 15.99 | (0.22 | ) | 0.63 | 0.41 | - | (3.28 | ) | (3.28 | ) | - | 13.12 | 3.05 | 17,158 | 2.29 | 2.29 | 2.29 | (1.37 | ) | 52 | |||||||||||||||||||||||||||||||||||||||||||
| 2013 | 13.24 | (0.24 | ) | 4.34 | 4.10 | - | (1.35 | ) | (1.35 | ) | - | 15.99 | 31.31 | 22,614 | 2.36 | 2.36 | 2.36 | (1.58 | ) | 45 | |||||||||||||||||||||||||||||||||||||||||||
| 2012 | 11.60 | (0.15 | ) | 1.79 | 1.64 | - | - | - | - | 13.24 | 14.14 | 19,618 | 2.37 | 2.37 | 2.37 | (1.21 | ) | 32 | |||||||||||||||||||||||||||||||||||||||||||||
| Royce Smaller-Companies Growth Fund–Institutional Class | |||||||||||||||||||||||||||||||||||||||||||||||||||||||||||||||
| 2017† | $ | 11.35 | $ | (0.04 | ) | $ | 1.34 | $ | 1.30 | $ | - | $ | - | $ | - | $ | - | $ | 12.65 | 11.45 | %1 | $ | 12,402 | 1.18 | %2 | 1.18 | %2 | 1.18 | %2 | (0.60 | )%2 | 30 | % | ||||||||||||||||||||||||||||||
| 2016 | 11.48 | (0.05 | ) | 1.18 | 1.13 | - | (1.26 | ) | (1.26 | ) | - | 11.35 | 9.66 | 20,523 | 1.15 | 1.15 | 1.15 | (0.41 | ) | 59 | |||||||||||||||||||||||||||||||||||||||||||
| 2015 | 14.46 | (0.03 | ) | (0.20 | ) | (0.23 | ) | - | (2.75 | ) | (2.75 | ) | - | 11.48 | (1.45 | ) | 39,763 | 1.10 | 1.10 | 1.10 | (0.22 | ) | 45 | ||||||||||||||||||||||||||||||||||||||||
| 2014 | 17.09 | (0.03 | ) | 0.68 | 0.65 | - | (3.28 | ) | (3.28 | ) | - | 14.46 | 4.26 | 38,718 | 1.06 | 1.06 | 1.06 | (0.16 | ) | 52 | |||||||||||||||||||||||||||||||||||||||||||
| 2013 | 13.94 | (0.03 | ) | 4.57 | 4.54 | (0.04 | ) | (1.35 | ) | (1.39 | ) | - | 17.09 | 32.99 | 142,923 | 1.07 | 1.07 | 1.07 | (0.30 | ) | 45 | ||||||||||||||||||||||||||||||||||||||||||
| 2012 | 12.05 | 0.01 | 1.88 | 1.89 | - | - | - | - | 13.94 | 15.68 | 216,572 | 1.06 | 1.06 | 1.06 | 0.08 | 32 | |||||||||||||||||||||||||||||||||||||||||||||||
| Royce Smaller-Companies Growth Fund–R Class | |||||||||||||||||||||||||||||||||||||||||||||||||||||||||||||||
| 2017† | $ | 10.28 | $ | (0.07 | ) | $ | 1.21 | $ | 1.14 | $ | - | $ | - | $ | - | $ | - | $ | 11.42 | 11.09 | %1 | $ | 656 | 3.38 | %2 | 3.38 | %2 | 1.84 | %2 | (1.27 | )%2 | 30 | % | ||||||||||||||||||||||||||||||
| 2016 | 10.57 | (0.11 | ) | 1.08 | 0.97 | - | (1.26 | ) | (1.26 | ) | - | 10.28 | 8.97 | 793 | 3.33 | 3.33 | 1.84 | (1.10 | ) | 59 | |||||||||||||||||||||||||||||||||||||||||||
| 2015 | 13.64 | (0.14 | ) | (0.18 | ) | (0.32 | ) | - | (2.75 | ) | (2.75 | ) | - | 10.57 | (2.20 | ) | 886 | 2.99 | 2.99 | 1.84 | (0.97 | ) | 45 | ||||||||||||||||||||||||||||||||||||||||
| 2014 | 16.43 | (0.15 | ) | 0.64 | 0.49 | - | (3.28 | ) | (3.28 | ) | - | 13.64 | 3.45 | 1,360 | 2.35 | 2.35 | 1.84 | (0.93 | ) | 52 | |||||||||||||||||||||||||||||||||||||||||||
| 2013 | 13.51 | (0.16 | ) | 4.43 | 4.27 | - | (1.35 | ) | (1.35 | ) | - | 16.43 | 31.95 | 1,605 | 2.41 | 2.41 | 1.84 | (1.06 | ) | 45 | |||||||||||||||||||||||||||||||||||||||||||
| 2012 | 11.77 | (0.09 | ) | 1.83 | 1.74 | - | - | - | - | 13.51 | 14.78 | 1,221 | 2.35 | 2.35 | 1.84 | (0.66 | ) | 32 | |||||||||||||||||||||||||||||||||||||||||||||
| Royce Special Equity Fund–Investment Class | |||||||||||||||||||||||||||||||||||||||||||||||||||||||||||||||
| 2017† | $ | 22.02 | $ | 0.06 | $ | (0.14 | ) | $ | (0.08 | ) | $ | - | $ | - | $ | - | $ | - | $ | 21.94 | (0.36 | )%1 | $ | 1,134,093 | 1.16 | %2 | 1.16 | %2 | 1.16 | %2 | 0.55 | %2 | 11 | % | |||||||||||||||||||||||||||||
| 2016 | 17.94 | 0.21 | 5.57 | 5.78 | (0.21 | ) | (1.49 | ) | (1.70 | ) | - | 22.02 | 32.21 | 1,225,095 | 1.17 | 1.17 | 1.17 | 0.99 | 29 | ||||||||||||||||||||||||||||||||||||||||||||
| 2015 | 22.86 | 0.22 | (3.04 | ) | (2.82 | ) | (0.24 | ) | (1.86 | ) | (2.10 | ) | - | 17.94 | (12.36 | ) | 1,098,106 | 1.15 | 1.15 | 1.15 | 0.80 | 15 | |||||||||||||||||||||||||||||||||||||||||
| 2014 | 25.02 | 0.13 | 0.09 | 0.22 | (0.12 | ) | (2.26 | ) | (2.38 | ) | - | 22.86 | 1.09 | 1,950,211 | 1.12 | 1.12 | 1.12 | 0.47 | 21 | ||||||||||||||||||||||||||||||||||||||||||||
| 2013 | 21.13 | 0.03 | 6.09 | 6.12 | (0.03 | ) | (2.20 | ) | (2.23 | ) | - | 25.02 | 29.36 | 2,510,346 | 1.13 | 1.13 | 1.13 | 0.13 | 28 | ||||||||||||||||||||||||||||||||||||||||||||
| 2012 | 19.70 | 0.46 | 2.53 | 2.99 | (0.46 | ) | (1.10 | ) | (1.56 | ) | - | 21.13 | 15.36 | 2,048,091 | 1.13 | 1.13 | 1.13 | 2.20 | 31 | ||||||||||||||||||||||||||||||||||||||||||||
| 106 | The Royce Funds 2017 Semiannual Report to Shareholders | THE ACCOMPANYING NOTES ARE AN INTEGRAL PART OF THESE FINANCIAL STATEMENTS |
Financial Highlights
This table is presented to show selected data for a share outstanding throughout each year or other indicated period and to assist shareholders in evaluating a Fund’s performance for the periods presented. Per share amounts have been determined on the basis of the weighted average number of shares outstanding during the period.
| Ratio of Expenses to Average Net Assets | Ratio of Net | ||||||||||||||||||||||||||||||||||||||||||||||||||||||||||||||
| Net Asset Value, Beginning of Period | Net Investment Income (Loss) | Net Realized and Unrealized Gain (Loss) on Investments and Foreign Currency | Total from Investment Operations | Distributions from Net Investment Income | Distributions from Net Realized Gain on Investments and Foreign Currency | Total Distributions | Shareholder Redemption Fees | Net Asset Value, End of Period | Total Return | Net Assets, End of Period (in thousands) | Prior to Fee Waivers and Balance Credits | Prior to Fee Waivers | Net of Fee Waivers | Investment Income (Loss) to Average Net Assets | Portfolio Turnover Rate | ||||||||||||||||||||||||||||||||||||||||||||||||
| Royce Special Equity Fund–Service Class | |||||||||||||||||||||||||||||||||||||||||||||||||||||||||||||||
| 2017† | $ | 21.98 | $ | 0.04 | $ | (0.15 | ) | $ | (0.11 | ) | $ | - | $ | - | $ | - | $ | - | $ | 21.87 | (0.50 | )%1 | $ | 108,088 | 1.49 | %2 | 1.49 | %2 | 1.39 | %2 | 0.33 | %2 | 11 | % | |||||||||||||||||||||||||||||
| 2016 | 17.92 | 0.16 | 5.56 | 5.72 | (0.17 | ) | (1.49 | ) | (1.66 | ) | - | 21.98 | 31.92 | 128,102 | 1.50 | 1.50 | 1.39 | 0.77 | 29 | ||||||||||||||||||||||||||||||||||||||||||||
| 2015 | 22.81 | 0.17 | (3.03 | ) | (2.86 | ) | (0.17 | ) | (1.86 | ) | (2.03 | ) | - | 17.92 | (12.55 | ) | 112,315 | 1.47 | 1.47 | 1.39 | 0.57 | 15 | |||||||||||||||||||||||||||||||||||||||||
| 2014 | 24.97 | 0.06 | 0.09 | 0.15 | (0.05 | ) | (2.26 | ) | (2.31 | ) | - | 22.81 | 0.80 | 233,791 | 1.44 | 1.44 | 1.39 | 0.20 | 21 | ||||||||||||||||||||||||||||||||||||||||||||
| 2013 | 21.12 | (0.03 | ) | 6.08 | 6.05 | - | (2.20 | ) | (2.20 | ) | - | 24.97 | 29.04 | 335,952 | 1.45 | 1.45 | 1.39 | (0.13 | ) | 28 | |||||||||||||||||||||||||||||||||||||||||||
| 2012 | 19.66 | 0.42 | 2.52 | 2.94 | (0.38 | ) | (1.10 | ) | (1.48 | ) | - | 21.12 | 15.10 | 250,915 | 1.43 | 1.43 | 1.39 | 1.90 | 31 | ||||||||||||||||||||||||||||||||||||||||||||
| Royce Special Equity Fund–Consultant Class | |||||||||||||||||||||||||||||||||||||||||||||||||||||||||||||||
| 2017† | $ | 20.16 | $ | (0.05 | ) | $ | (0.13 | ) | $ | (0.18 | ) | $ | - | $ | - | $ | - | $ | - | $ | 19.98 | (0.89 | )%1 | $ | 47,245 | 2.18 | %2 | 2.18 | %2 | 2.18 | %2 | (0.46 | )%2 | 11 | % | ||||||||||||||||||||||||||||
| 2016 | 16.57 | (0.01 | ) | 5.13 | 5.12 | (0.04 | ) | (1.49 | ) | (1.53 | ) | - | 20.16 | 30.91 | 50,514 | 2.20 | 2.20 | 2.20 | (0.04 | ) | 29 | ||||||||||||||||||||||||||||||||||||||||||
| 2015 | 21.27 | (0.05 | ) | (2.76 | ) | (2.81 | ) | (0.03 | ) | (1.86 | ) | (1.89 | ) | - | 16.57 | (13.23 | ) | 42,427 | 2.18 | 2.18 | 2.18 | (0.24 | ) | 15 | |||||||||||||||||||||||||||||||||||||||
| 2014 | 23.57 | (0.13 | ) | 0.09 | (0.04 | ) | - | (2.26 | ) | (2.26 | ) | - | 21.27 | 0.04 | 63,981 | 2.14 | 2.14 | 2.14 | (0.56 | ) | 21 | ||||||||||||||||||||||||||||||||||||||||||
| 2013 | 20.20 | (0.21 | ) | 5.78 | 5.57 | - | (2.20 | ) | (2.20 | ) | - | 23.57 | 27.97 | 71,333 | 2.17 | 2.17 | 2.17 | (0.90 | ) | 28 | |||||||||||||||||||||||||||||||||||||||||||
| 2012 | 18.88 | 0.23 | 2.42 | 2.65 | (0.23 | ) | (1.10 | ) | (1.33 | ) | - | 20.20 | 14.20 | 57,755 | 2.18 | 2.18 | 2.18 | 1.13 | 31 | ||||||||||||||||||||||||||||||||||||||||||||
| Royce Special Equity Fund–Institutional Class | |||||||||||||||||||||||||||||||||||||||||||||||||||||||||||||||
| 2017† | $ | 21.84 | $ | 0.07 | $ | (0.14 | ) | $ | (0.07 | ) | $ | - | $ | - | $ | - | $ | - | $ | 21.77 | (0.32 | )%1 | $ | 242,481 | 1.07 | %2 | 1.07 | %2 | 1.07 | %2 | 0.62 | %2 | 11 | % | |||||||||||||||||||||||||||||
| 2016 | 17.80 | 0.23 | 5.53 | 5.76 | (0.23 | ) | (1.49 | ) | (1.72 | ) | - | 21.84 | 32.35 | 206,270 | 1.07 | 1.07 | 1.07 | 1.10 | 29 | ||||||||||||||||||||||||||||||||||||||||||||
| 2015 | 22.71 | 0.33 | (3.12 | ) | (2.79 | ) | (0.26 | ) | (1.86 | ) | (2.12 | ) | - | 17.80 | (12.27 | ) | 208,952 | 1.04 | 1.04 | 1.04 | 1.02 | 15 | |||||||||||||||||||||||||||||||||||||||||
| 2014 | 24.88 | 0.14 | 0.10 | 0.24 | (0.15 | ) | (2.26 | ) | (2.41 | ) | - | 22.71 | 1.17 | 639,723 | 1.02 | 1.02 | 1.02 | 0.56 | 21 | ||||||||||||||||||||||||||||||||||||||||||||
| 2013 | 21.02 | 0.06 | 6.06 | 6.12 | (0.06 | ) | (2.20 | ) | (2.26 | ) | - | 24.88 | 29.51 | 700,200 | 1.01 | 1.01 | 1.01 | 0.26 | 28 | ||||||||||||||||||||||||||||||||||||||||||||
| 2012 | 19.63 | 0.49 | 2.51 | 3.00 | (0.51 | ) | (1.10 | ) | (1.61 | ) | - | 21.02 | 15.46 | 571,388 | 1.02 | 1.02 | 1.02 | 2.28 | 31 | ||||||||||||||||||||||||||||||||||||||||||||
| Royce Special Equity Multi-Cap Fund–Investment Class f | |||||||||||||||||||||||||||||||||||||||||||||||||||||||||||||||
| 2017† | $ | 13.90 | $ | 0.07 | $ | 0.78 | $ | 0.85 | $ | - | $ | - | $ | - | $ | - | $ | 14.75 | 6.12 | %1 | $ | 37,210 | 1.04 | %2 | 1.04 | %2 | 0.99 | %2 | 0.97 | %2 | 14 | % | |||||||||||||||||||||||||||||||
| 2016 | 12.34 | 0.17 | 1.55 | 1.72 | (0.16 | ) | - | (0.16 | ) | - | 13.90 | 13.92 | 34,858 | 1.02 | 1.02 | 0.97 | 1.15 | 50 | |||||||||||||||||||||||||||||||||||||||||||||
| 2015 | 15.55 | 0.40 | (2.48 | ) | (2.08 | ) | (0.35 | ) | (0.78 | ) | (1.13 | ) | - | 12.34 | (13.40 | ) | 43,999 | 1.01 | 1.01 | 0.99 | 1.49 | 31 | |||||||||||||||||||||||||||||||||||||||||
| 2014 | 14.92 | 0.10 | 1.30 | 1.40 | (0.11 | ) | (0.66 | ) | (0.77 | ) | - | 15.55 | 9.53 | 123,545 | 0.97 | 0.97 | 0.96 | 0.95 | 39 | ||||||||||||||||||||||||||||||||||||||||||||
| 2013 | 11.64 | 0.12 | 4.11 | 4.23 | (0.12 | ) | (0.83 | ) | (0.95 | ) | - | 14.92 | 36.62 | 62,387 | 1.16 | 1.16 | 1.15 | 0.93 | 44 | ||||||||||||||||||||||||||||||||||||||||||||
| 2012 | 11.54 | 0.12 | 0.22 | 0.34 | (0.14 | ) | (0.10 | ) | (0.24 | ) | - | 11.64 | 3.00 | 1 | 34,375 | 1.19 | 2 | 1.19 | 2 | 1.16 | 2 | 1.55 | 2 | 14 | |||||||||||||||||||||||||||||||||||||||
| Royce Special Equity Multi-Cap Fund–Service Class | |||||||||||||||||||||||||||||||||||||||||||||||||||||||||||||||
| 2017† | $ | 13.95 | $ | 0.05 | $ | 0.78 | $ | 0.83 | $ | - | $ | - | $ | - | $ | - | $ | 14.78 | 5.95 | %1 | $ | 29,092 | 1.39 | %2 | 1.39 | %2 | 1.24 | %2 | 0.70 | %2 | 14 | % | |||||||||||||||||||||||||||||||
| 2016 | 12.38 | 0.13 | 1.57 | 1.70 | (0.13 | ) | - | (0.13 | ) | - | 13.95 | 13.69 | 37,495 | 1.34 | 1.34 | 1.23 | 0.89 | 50 | |||||||||||||||||||||||||||||||||||||||||||||
| 2015 | 15.60 | 0.26 | (2.39 | ) | (2.13 | ) | (0.31 | ) | (0.78 | ) | (1.09 | ) | - | 12.38 | (13.64 | ) | 47,630 | 1.29 | 1.29 | 1.23 | 1.21 | 31 | |||||||||||||||||||||||||||||||||||||||||
| 2014 | 14.96 | 0.10 | 1.27 | 1.37 | (0.07 | ) | (0.66 | ) | (0.73 | ) | - | 15.60 | 9.28 | 94,878 | 1.34 | 1.34 | 1.24 | 0.66 | 39 | ||||||||||||||||||||||||||||||||||||||||||||
| 2013 | 11.68 | 0.09 | 4.12 | 4.21 | (0.10 | ) | (0.83 | ) | (0.93 | ) | - | 14.96 | 36.26 | 78,233 | 1.61 | 1.61 | 1.38 | 0.69 | 44 | ||||||||||||||||||||||||||||||||||||||||||||
| 2012 | 10.64 | 0.13 | 1.10 | 1.23 | (0.09 | ) | (0.10 | ) | (0.19 | ) | - | 11.68 | 11.62 | 43,690 | 1.51 | 1.51 | 1.36 | 1.15 | 14 | ||||||||||||||||||||||||||||||||||||||||||||
| THE ACCOMPANYING NOTES ARE AN INTEGRAL PART OF THESE FINANCIAL STATEMENTS | The Royce Funds 2017 Semiannual Report to Shareholders | 107 |
Financial Highlights
This table is presented to show selected data for a share outstanding throughout each year or other indicated period and to assist shareholders in evaluating a Fund’s performance for the periods presented. Per share amounts have been determined on the basis of the weighted average number of shares outstanding during the period.
| Ratio of Expenses to Average Net Assets | Ratio of Net | ||||||||||||||||||||||||||||||||||||||||||||||||||||||||||||||
| Net Asset Value, Beginning of Period | Net Investment Income (Loss) | Net Realized and Unrealized Gain (Loss) on Investments and Foreign Currency | Total from Investment Operations | Distributions from Net Investment Income | Distributions from Net Realized Gain on Investments and Foreign Currency | Total Distributions | Shareholder Redemption Fees | Net Asset Value, End of Period | Total Return | Net Assets, End of Period (in thousands) | Prior to Fee Waivers and Balance Credits | Prior to Fee Waivers | Net of Fee Waivers | Investment Income (Loss) to Average Net Assets | Portfolio Turnover Rate | ||||||||||||||||||||||||||||||||||||||||||||||||
| Royce Special Equity Multi-Cap Fund–Consultant Class g | |||||||||||||||||||||||||||||||||||||||||||||||||||||||||||||||
| 2017† | $ | 9.12 | $ | (0.00 | ) | $ | 0.50 | $ | 0.50 | $ | - | $ | - | $ | - | $ | - | $ | 9.62 | 5.48 | %1 | $ | 4,334 | 2.40 | %2 | 2.40 | %2 | 1.99 | %2 | (0.05 | )%2 | 14 | % | ||||||||||||||||||||||||||||||
| 2016 | 8.15 | 0.02 | 1.03 | 1.05 | (0.08 | ) | - | (0.08 | ) | - | 9.12 | 12.89 | 4,986 | 2.38 | 2.38 | 1.99 | 0.12 | 50 | |||||||||||||||||||||||||||||||||||||||||||||
| 2015 | 10.72 | 0.09 | (1.63 | ) | (1.54 | ) | (0.25 | ) | (0.78 | ) | (1.03 | ) | - | 8.15 | (14.35 | ) | 6,825 | 2.19 | 2.19 | 1.99 | 0.50 | 31 | |||||||||||||||||||||||||||||||||||||||||
| 2014 | 10.00 | (0.04 | ) | 1.48 | 1.44 | (0.06 | ) | (0.66 | ) | (0.72 | ) | - | 10.72 | 14.57 | 1 | 9,223 | 2.54 | 2 | 2.54 | 2 | 1.99 | 2 | (0.05 | )2 | 39 | ||||||||||||||||||||||||||||||||||||||
| Royce Special Equity Multi-Cap Fund–Institutional Class h | |||||||||||||||||||||||||||||||||||||||||||||||||||||||||||||||
| 2017† | $ | 13.89 | $ | 0.08 | $ | 0.77 | $ | 0.85 | $ | - | $ | - | $ | - | $ | - | $ | 14.74 | 6.12 | %1 | $ | 39,686 | 0.99 | %2 | 0.99 | %2 | 0.89 | %2 | 1.07 | %2 | 14 | % | |||||||||||||||||||||||||||||||
| 2016 | 12.33 | 0.16 | 1.57 | 1.73 | (0.17 | ) | - | (0.17 | ) | - | 13.89 | 14.04 | 37,339 | 0.99 | 0.99 | 0.89 | 1.22 | 50 | |||||||||||||||||||||||||||||||||||||||||||||
| 2015 | 15.56 | 0.34 | (2.41 | ) | (2.07 | ) | (0.38 | ) | (0.78 | ) | (1.16 | ) | - | 12.33 | (13.32 | ) | 36,864 | 0.94 | 0.94 | 0.89 | 1.56 | 31 | |||||||||||||||||||||||||||||||||||||||||
| 2014 | 14.92 | 0.12 | 1.30 | 1.42 | (0.12 | ) | (0.66 | ) | (0.78 | ) | - | 15.56 | 9.64 | 75,941 | 0.93 | 0.93 | 0.89 | 1.01 | 39 | ||||||||||||||||||||||||||||||||||||||||||||
| 2013 | 11.64 | 0.15 | 4.10 | 4.25 | (0.14 | ) | (0.83 | ) | (0.97 | ) | - | 14.92 | 36.73 | 48,063 | 1.10 | 1.10 | 1.04 | 1.02 | 44 | ||||||||||||||||||||||||||||||||||||||||||||
| 2012 | 11.83 | 0.10 | (0.03 | ) | 0.07 | (0.16 | ) | (0.10 | ) | (0.26 | ) | - | 11.64 | 0.61 | 1 | 30,905 | 1.21 | 2 | 1.21 | 2 | 1.04 | 2 | 1.76 | 2 | 14 | ||||||||||||||||||||||||||||||||||||||
| Royce Total Return Fund–Investment Class | |||||||||||||||||||||||||||||||||||||||||||||||||||||||||||||||
| 2017† | $ | 13.68 | $ | 0.07 | $ | 0.30 | $ | 0.37 | $ | (0.07 | ) | $ | - | $ | (0.07 | ) | $ | - | $ | 13.98 | 2.71 | %1 | $ | 1,728,996 | 1.19 | %2 | 1.19 | %2 | 1.19 | %2 | 1.06 | %2 | 6 | % | |||||||||||||||||||||||||||||
| 2016 | 11.91 | 0.15 | 2.93 | 3.08 | (0.22 | ) | (1.09 | ) | (1.31 | ) | - | 13.68 | 25.86 | 1,835,927 | 1.19 | 1.19 | 1.19 | 1.08 | 16 | ||||||||||||||||||||||||||||||||||||||||||||
| 2015 | 14.74 | 0.17 | (1.23 | ) | (1.06 | ) | (0.12 | ) | (1.65 | ) | (1.77 | ) | - | 11.91 | (7.19 | ) | 1,850,309 | 1.15 | 1.15 | 1.15 | 1.18 | 11 | |||||||||||||||||||||||||||||||||||||||||
| 2014 | 16.47 | 0.17 | 0.00 | 0.17 | (0.28 | ) | (1.62 | ) | (1.90 | ) | - | 14.74 | 1.34 | 3,077,951 | 1.13 | 1.13 | 1.13 | 0.95 | 18 | ||||||||||||||||||||||||||||||||||||||||||||
| 2013 | 13.63 | 0.16 | 4.24 | 4.40 | (0.14 | ) | (1.42 | ) | (1.56 | ) | - | 16.47 | 32.76 | 3,657,904 | 1.13 | 1.13 | 1.13 | 1.00 | 21 | ||||||||||||||||||||||||||||||||||||||||||||
| 2012 | 12.68 | 0.26 | 1.54 | 1.80 | (0.23 | ) | (0.62 | ) | (0.85 | ) | - | 13.63 | 14.42 | 3,044,664 | 1.10 | 1.10 | 1.10 | 1.89 | 17 | ||||||||||||||||||||||||||||||||||||||||||||
| Royce Total Return Fund–Service Class | |||||||||||||||||||||||||||||||||||||||||||||||||||||||||||||||
| 2017† | $ | 13.98 | $ | 0.06 | $ | 0.30 | $ | 0.36 | $ | (0.06 | ) | $ | - | $ | (0.06 | ) | $ | - | $ | 14.28 | 2.54 | %1 | $ | 112,301 | 1.46 | %2 | 1.46 | %2 | 1.46 | %2 | 0.79 | %2 | 6 | % | |||||||||||||||||||||||||||||
| 2016 | 12.12 | 0.11 | 3.00 | 3.11 | (0.16 | ) | (1.09 | ) | (1.25 | ) | - | 13.98 | 25.60 | 142,606 | 1.46 | 1.46 | 1.46 | 0.80 | 16 | ||||||||||||||||||||||||||||||||||||||||||||
| 2015 | 14.98 | 0.13 | (1.25 | ) | (1.12 | ) | (0.09 | ) | (1.65 | ) | (1.74 | ) | - | 12.12 | (7.48 | ) | 137,594 | 1.43 | 1.43 | 1.43 | 0.90 | 11 | |||||||||||||||||||||||||||||||||||||||||
| 2014 | 16.61 | 0.12 | 0.01 | 0.13 | (0.14 | ) | (1.62 | ) | (1.76 | ) | - | 14.98 | 1.08 | 232,814 | 1.42 | 1.42 | 1.42 | 0.60 | 18 | ||||||||||||||||||||||||||||||||||||||||||||
| 2013 | 13.72 | 0.11 | 4.27 | 4.38 | (0.07 | ) | (1.42 | ) | (1.49 | ) | - | 16.61 | 32.38 | 493,111 | 1.48 | 1.48 | 1.48 | 0.68 | 21 | ||||||||||||||||||||||||||||||||||||||||||||
| 2012 | 12.71 | 0.22 | 1.55 | 1.77 | (0.14 | ) | (0.62 | ) | (0.76 | ) | - | 13.72 | 14.11 | 264,528 | 1.39 | 1.39 | 1.39 | 1.58 | 17 | ||||||||||||||||||||||||||||||||||||||||||||
| Royce Total Return Fund–Consultant Class | |||||||||||||||||||||||||||||||||||||||||||||||||||||||||||||||
| 2017† | $ | 14.07 | $ | 0.01 | $ | 0.30 | $ | 0.31 | $ | - | $ | - | $ | - | $ | - | $ | 14.38 | 2.20 | %1 | $ | 248,060 | 2.17 | %2 | 2.17 | %2 | 2.17 | %2 | 0.08 | %2 | 6 | % | |||||||||||||||||||||||||||||||
| 2016 | 12.15 | 0.01 | 3.01 | 3.02 | (0.01 | ) | (1.09 | ) | (1.10 | ) | - | 14.07 | 24.73 | 267,083 | 2.16 | 2.16 | 2.16 | 0.11 | 16 | ||||||||||||||||||||||||||||||||||||||||||||
| 2015 | 15.05 | 0.03 | (1.26 | ) | (1.23 | ) | (0.02 | ) | (1.65 | ) | (1.67 | ) | - | 12.15 | (8.15 | ) | 262,131 | 2.16 | 2.16 | 2.16 | 0.18 | 11 | |||||||||||||||||||||||||||||||||||||||||
| 2014 | 16.68 | (0.00 | ) | 0.02 | 0.02 | (0.03 | ) | (1.62 | ) | (1.65 | ) | - | 15.05 | 0.37 | 356,731 | 2.12 | 2.12 | 2.12 | (0.04 | ) | 18 | ||||||||||||||||||||||||||||||||||||||||||
| 2013 | 13.81 | (0.00 | ) | 4.29 | 4.29 | - | (1.42 | ) | (1.42 | ) | - | 16.68 | 31.38 | 404,498 | 2.15 | 2.15 | 2.15 | (0.02 | ) | 21 | |||||||||||||||||||||||||||||||||||||||||||
| 2012 | 12.77 | 0.11 | 1.56 | 1.67 | (0.01 | ) | (0.62 | ) | (0.63 | ) | - | 13.81 | 13.19 | 331,116 | 2.20 | 2.20 | 2.20 | 0.80 | 17 | ||||||||||||||||||||||||||||||||||||||||||||
| 108 | The Royce Funds 2017 Semiannual Report to Shareholders | THE ACCOMPANYING NOTES ARE AN INTEGRAL PART OF THESE FINANCIAL STATEMENTS |
Financial Highlights
This table is presented to show selected data for a share outstanding throughout each year or other indicated period and to assist shareholders in evaluating a Fund’s performance for the periods presented. Per share amounts have been determined on the basis of the weighted average number of shares outstanding during the period.
| Ratio of Expenses to Average Net Assets | Ratio of Net | ||||||||||||||||||||||||||||||||||||||||||||||||||||||||||||||
| Net Asset Value, Beginning of Period | Net Investment Income (Loss) | Net Realized and Unrealized Gain (Loss) on Investments and Foreign Currency | Total from Investment Operations | Distributions from Net Investment Income | Distributions from Net Realized Gain on Investments and Foreign Currency | Total Distributions | Shareholder Redemption Fees | Net Asset Value, End of Period | Total Return | Net Assets, End of Period (in thousands) | Prior to Fee Waivers and Balance Credits | Prior to Fee Waivers | Net of Fee Waivers | Investment Income (Loss) to Average Net Assets | Portfolio Turnover Rate | ||||||||||||||||||||||||||||||||||||||||||||||||
| Royce Total Return Fund–Institutional Class | |||||||||||||||||||||||||||||||||||||||||||||||||||||||||||||||
| 2017† | $ | 13.52 | $ | 0.08 | $ | 0.30 | $ | 0.38 | $ | (0.08 | ) | $ | - | $ | (0.08 | ) | $ | - | $ | 13.82 | 2.81 | %1 | $ | 344,933 | 1.06 | %2 | 1.06 | %2 | 1.06 | %2 | 1.20 | %2 | 6 | % | |||||||||||||||||||||||||||||
| 2016 | 11.78 | 0.18 | 2.90 | 3.08 | (0.25 | ) | (1.09 | ) | (1.34 | ) | - | 13.52 | 26.13 | 420,375 | 1.05 | 1.05 | 1.05 | 1.22 | 16 | ||||||||||||||||||||||||||||||||||||||||||||
| 2015 | 14.61 | 0.18 | (1.22 | ) | (1.04 | ) | (0.14 | ) | (1.65 | ) | (1.79 | ) | - | 11.78 | (7.17 | ) | 374,555 | 1.03 | 1.03 | 1.03 | 1.28 | 11 | |||||||||||||||||||||||||||||||||||||||||
| 2014 | 16.35 | 0.18 | 0.02 | 0.20 | (0.32 | ) | (1.62 | ) | (1.94 | ) | - | 14.61 | 1.51 | 572,662 | 1.00 | 1.00 | 1.00 | 1.09 | 18 | ||||||||||||||||||||||||||||||||||||||||||||
| 2013 | 13.55 | 0.18 | 4.21 | 4.39 | (0.17 | ) | (1.42 | ) | (1.59 | ) | - | 16.35 | 32.93 | 621,447 | 1.00 | 1.00 | 1.00 | 1.15 | 21 | ||||||||||||||||||||||||||||||||||||||||||||
| 2012 | 12.64 | 0.27 | 1.54 | 1.81 | (0.28 | ) | (0.62 | ) | (0.90 | ) | - | 13.55 | 14.48 | 408,551 | 1.02 | 1.02 | 1.02 | 2.02 | 17 | ||||||||||||||||||||||||||||||||||||||||||||
| Royce Total Return Fund–W Class | |||||||||||||||||||||||||||||||||||||||||||||||||||||||||||||||
| 2017† | $ | 13.67 | $ | 0.07 | $ | 0.30 | $ | 0.37 | $ | (0.07 | ) | $ | - | $ | (0.07 | ) | $ | - | $ | 13.97 | 2.67 | %1 | $ | 85,376 | 1.25 | %2 | 1.25 | %2 | 1.25 | %2 | 1.01 | %2 | 6 | % | |||||||||||||||||||||||||||||
| 2016 | 11.88 | 0.17 | 2.91 | 3.08 | (0.20 | ) | (1.09 | ) | (1.29 | ) | - | 13.67 | 25.96 | 79,702 | 1.20 | 1.20 | 1.20 | 1.03 | 16 | ||||||||||||||||||||||||||||||||||||||||||||
| 2015 | 14.72 | 0.16 | (1.23 | ) | (1.07 | ) | (0.12 | ) | (1.65 | ) | (1.77 | ) | - | 11.88 | (7.28 | ) | 118,167 | 1.18 | 1.18 | 1.18 | 1.17 | 11 | |||||||||||||||||||||||||||||||||||||||||
| 2014 | 16.45 | 0.15 | 0.03 | 0.18 | (0.29 | ) | (1.62 | ) | (1.91 | ) | - | 14.72 | 1.35 | 261,829 | 1.13 | 1.13 | 1.13 | 0.97 | 18 | ||||||||||||||||||||||||||||||||||||||||||||
| 2013 | 13.62 | 0.16 | 4.23 | 4.39 | (0.14 | ) | (1.42 | ) | (1.56 | ) | - | 16.45 | 32.71 | 249,035 | 1.15 | 1.15 | 1.15 | 0.99 | 21 | ||||||||||||||||||||||||||||||||||||||||||||
| 2012 | 12.69 | 0.26 | 1.54 | 1.80 | (0.25 | ) | (0.62 | ) | (0.87 | ) | - | 13.62 | 14.41 | 171,603 | 1.12 | 1.12 | 1.12 | 1.97 | 17 | ||||||||||||||||||||||||||||||||||||||||||||
| Royce Total Return Fund–R Class | |||||||||||||||||||||||||||||||||||||||||||||||||||||||||||||||
| 2017† | $ | 14.09 | $ | 0.03 | $ | 0.31 | $ | 0.34 | $ | (0.03 | ) | $ | - | $ | (0.03 | ) | $ | - | $ | 14.40 | 2.41 | %1 | $ | 52,170 | 1.78 | %2 | 1.78 | %2 | 1.78 | %2 | 0.47 | %2 | 6 | % | |||||||||||||||||||||||||||||
| 2016 | 12.19 | 0.07 | 3.00 | 3.07 | (0.08 | ) | (1.09 | ) | (1.17 | ) | - | 14.09 | 25.14 | 53,896 | 1.78 | 1.78 | 1.78 | 0.49 | 16 | ||||||||||||||||||||||||||||||||||||||||||||
| 2015 | 15.07 | 0.08 | (1.25 | ) | (1.17 | ) | (0.06 | ) | (1.65 | ) | (1.71 | ) | - | 12.19 | (7.79 | ) | 50,684 | 1.77 | 1.77 | 1.77 | 0.56 | 11 | |||||||||||||||||||||||||||||||||||||||||
| 2014 | 16.73 | 0.07 | 0.01 | 0.08 | (0.12 | ) | (1.62 | ) | (1.74 | ) | - | 15.07 | 0.73 | 65,501 | 1.72 | 1.72 | 1.72 | 0.37 | 18 | ||||||||||||||||||||||||||||||||||||||||||||
| 2013 | 13.82 | 0.06 | 4.30 | 4.36 | (0.03 | ) | (1.42 | ) | (1.45 | ) | - | 16.73 | 31.95 | 72,541 | 1.75 | 1.75 | 1.75 | 0.39 | 21 | ||||||||||||||||||||||||||||||||||||||||||||
| 2012 | 12.79 | 0.18 | 1.55 | 1.73 | (0.08 | ) | (0.62 | ) | (0.70 | ) | - | 13.82 | 13.66 | 48,797 | 1.74 | 1.74 | 1.74 | 1.36 | 17 | ||||||||||||||||||||||||||||||||||||||||||||
| Royce Total Return Fund–K Class | |||||||||||||||||||||||||||||||||||||||||||||||||||||||||||||||
| 2017† | $ | 9.07 | $ | 0.03 | $ | 0.21 | $ | 0.24 | $ | (0.03 | ) | $ | - | $ | (0.03 | ) | $ | - | $ | 9.28 | 2.59 | %1 | $ | 36,200 | 1.62 | %2 | 1.62 | %2 | 1.62 | %2 | 0.63 | %2 | 6 | % | |||||||||||||||||||||||||||||
| 2016 | 8.19 | 0.08 | 2.01 | 2.09 | (0.12 | ) | (1.09 | ) | (1.21 | ) | - | 9.07 | 25.41 | 40,952 | 1.55 | 1.55 | 1.55 | 0.67 | 16 | ||||||||||||||||||||||||||||||||||||||||||||
| 2015 | 10.71 | 0.09 | (0.90 | ) | (0.81 | ) | (0.06 | ) | (1.65 | ) | (1.71 | ) | - | 8.19 | (7.54 | ) | 62,597 | 1.49 | 1.49 | 1.49 | 0.85 | 11 | |||||||||||||||||||||||||||||||||||||||||
| 2014 | 12.40 | 0.11 | (0.03 | ) | 0.08 | (0.15 | ) | (1.62 | ) | (1.77 | ) | - | 10.71 | 1.01 | 91,271 | 1.47 | 1.47 | 1.47 | 0.55 | 18 | |||||||||||||||||||||||||||||||||||||||||||
| 2013 | 10.53 | 0.07 | 3.27 | 3.34 | (0.05 | ) | (1.42 | ) | (1.47 | ) | - | 12.40 | 32.20 | 196,344 | 1.50 | 1.50 | 1.50 | 0.62 | 21 | ||||||||||||||||||||||||||||||||||||||||||||
| 2012 | 9.90 | 0.17 | 1.21 | 1.38 | (0.13 | ) | (0.62 | ) | (0.75 | ) | - | 10.53 | 14.08 | 163,412 | 1.43 | 1.43 | 1.43 | 1.51 | 17 | ||||||||||||||||||||||||||||||||||||||||||||
| †Six months ended June 30, 2017 (unaudited). |
| 1Not annualized |
| 2Annualized |
| aThe Class commenced operations on March 21, 2014. |
| bThe Class commenced operations on September 4, 2012. |
| cThe Class commenced operations on January 5, 2016. |
| dThe Class commenced operations on January 22, 2014. |
| eThe Class commenced operations on February 26, 2016. |
| fThe Class commenced operations on March 1, 2012. |
| gThe Class commenced operations on January 27, 2014. |
| hThe Class commenced operations on April 18, 2012. |
| THE ACCOMPANYING NOTES ARE AN INTEGRAL PART OF THESE FINANCIAL STATEMENTS | The Royce Funds 2017 Semiannual Report to Shareholders | 109 |
Notes to Financial Statements (unaudited)
Royce Dividend Value Fund, Royce Global Financial Services Fund, Royce International Micro-Cap Fund, Royce International Premier Fund, Royce Low-Priced Stock Fund, Royce Micro-Cap Fund, Royce Micro-Cap Opportunity Fund, Royce Opportunity Fund, Royce Pennsylvania Mutual Fund, Royce Premier Fund, Royce Small-Cap Leaders Fund, Royce Small-Cap Value Fund, Royce Small/Mid-Cap Premier Fund, Royce Smaller-Companies Growth Fund, Royce Special Equity Fund, Royce Special Equity Multi-Cap Fund and Royce Total Return Fund (the “Fund” or “Funds”), are the seventeen series of The Royce Fund (the “Trust”), a diversified open-end management investment company organized as a Delaware statutory trust. Effective May 1, 2017, Royce Heritage Fund became Royce Small/Mid-Cap Premier Fund.
| Royce International Micro-Cap Fund | 50% | ||
| Royce Micro-Cap Opportunity Fund | 15% |
Securities are valued as of the close of trading on the New York Stock Exchange (NYSE) (generally 4:00 p.m. Eastern time) on the valuation date. Securities that trade on an exchange, and securities traded on Nasdaq’s Electronic Bulletin Board, are valued at their last reported sales price or Nasdaq official closing price taken from the primary market in which each security trades or, if no sale is reported for such day, at their highest bid price. Other over-the-counter securities for which market quotations are readily available are valued at their highest bid price, except in the case of some bonds and other fixed income securities which may be valued by reference to other securities with comparable ratings, interest rates and maturities, using established independent pricing services. The Funds value their non-U.S. dollar denominated securities in U.S. dollars daily at the prevailing foreign currency exchange rates as quoted by a major bank. Securities for which market quotations are not readily available are valued at their fair value in accordance with the provisions of the 1940 Act, under procedures approved by the Trust’s Board of Trustees, and are reported as Level 3 securities. As a general principle, the fair value of a security is the amount which the Fund might reasonably expect to receive for the security upon its current sale. However, in light of the judgment involved in fair valuations, there can be no assurance that a fair value assigned to a particular security will be the amount which the Fund might be able to receive upon its current sale. In addition, if, between the time trading ends on a particular security and the close of the customary trading session on the NYSE, events occur that are significant and may make the closing price unreliable, a Fund may fair value the security. The Funds use an independent pricing service to provide fair value estimates for relevant non-U.S. equity securities on days when the U.S. market volatility exceeds a certain threshold. This pricing service uses proprietary correlations it has developed between the movement of prices of non-U.S. equity securities and indices of U.S.-traded securities, futures contracts and other indications to estimate the fair value of relevant non-U.S. securities. When fair value pricing is employed, the prices of securities used by a Fund may differ from quoted or published prices for the same security. Investments in money market funds are valued at net asset value per share.
| Level 1 | – | quoted prices in active markets for identical securities. | ||
| Level 2 | – | other significant observable inputs (including quoted prices for similar securities, foreign securities that may be fair valued and repurchase agreements). The table below includes all Level 2 securities. Level 2 securities with values based on quoted prices for similar securities are noted in the Schedules of Investments. | ||
| Level 3 | – | significant unobservable inputs (including last trade price before trading was suspended, or at a discount thereto for lack of marketability or otherwise, market price information regarding other securities, information received from the company and/or published documents, including SEC filings and financial statements, or other publicly available information). |
| 110 | The Royce Funds 2017 Semiannual Report to Shareholders |
VALUATION OF INVESTMENTS (continued):
The following is a summary of the inputs used to value each Fund’s investments as of June 30, 2017. For a detailed breakout of common stocks by sector classification or country, please refer to the Schedules of Investments.
| LEVEL 1 | LEVEL 2 | LEVEL 3 | TOTAL | |||||||||||||||
| Royce Dividend Value Fund | ||||||||||||||||||
| Common Stocks | $ | 197,573,087 | $ | – | $ | – | $ | 197,573,087 | ||||||||||
| Cash Equivalents | – | 1,678,000 | – | 1,678,000 | ||||||||||||||
| Royce Global Financial Services Fund | ||||||||||||||||||
| Common Stocks | 50,197,807 | 28,759 | – | 50,226,566 | ||||||||||||||
| Cash Equivalents | – | 999,000 | – | 999,000 | ||||||||||||||
| Royce International Micro-Cap Fund | ||||||||||||||||||
| Common Stocks | 6,989,666 | – | – | 6,989,666 | ||||||||||||||
| Cash Equivalents | – | 413,000 | – | 413,000 | ||||||||||||||
| Royce International Premier Fund | ||||||||||||||||||
| Common Stocks | 89,207,188 | – | – | 89,207,188 | ||||||||||||||
| Cash Equivalents | – | 4,994,000 | – | 4,994,000 | ||||||||||||||
| Royce Low-Priced Stock Fund | ||||||||||||||||||
| Common Stocks | 276,070,789 | 1,832,338 | 0 | 277,903,127 | ||||||||||||||
| Cash Equivalents | 17,969,507 | 6,579,000 | – | 24,548,507 | ||||||||||||||
| Royce Micro-Cap Fund | ||||||||||||||||||
| Common Stocks | 213,316,196 | 170,610 | 865,628 | 214,352,434 | ||||||||||||||
| Cash Equivalents | 10,516,862 | 7,888,000 | – | 18,404,862 | ||||||||||||||
| Royce Micro-Cap Opportunity Fund | ||||||||||||||||||
| Common Stocks | 47,302,045 | 376,034 | – | 47,678,079 | ||||||||||||||
| Cash Equivalents | – | 2,662,000 | – | 2,662,000 | ||||||||||||||
| Royce Opportunity Fund | ||||||||||||||||||
| Common Stocks | 1,387,855,176 | 1,715,668 | – | 1,389,570,844 | ||||||||||||||
| Cash Equivalents | 92,992,860 | 109,895,000 | – | 202,887,860 | ||||||||||||||
| Royce Pennsylvania Mutual Fund | ||||||||||||||||||
| Common Stocks | 2,307,690,504 | 7,223,576 | – | 2,314,914,080 | ||||||||||||||
| Cash Equivalents | 89,501,412 | 29,850,000 | – | 119,351,412 | ||||||||||||||
| Royce Premier Fund | ||||||||||||||||||
| Common Stocks | 2,103,669,065 | – | – | 2,103,669,065 | ||||||||||||||
| Cash Equivalents | 13,674,170 | 167,266,000 | – | 180,940,170 | ||||||||||||||
| Royce Small-Cap Leaders Fund | ||||||||||||||||||
| Common Stocks | 84,518,059 | – | – | 84,518,059 | ||||||||||||||
| Cash Equivalents | 991,866 | 5,869,000 | – | 6,860,866 | ||||||||||||||
| Royce Small-Cap Value Fund | ||||||||||||||||||
| Common Stocks | 325,581,920 | – | – | 325,581,920 | ||||||||||||||
| Cash Equivalents | 6,553,425 | 39,850,000 | – | 46,403,425 | ||||||||||||||
| Royce Small/Mid-Cap Premier Fund | ||||||||||||||||||
| Common Stocks | 203,550,702 | – | 194,317 | 203,745,019 | ||||||||||||||
| Cash Equivalents | 4,217,261 | 20,316,000 | – | 24,533,261 | ||||||||||||||
| Royce Smaller-Companies Growth Fund | ||||||||||||||||||
| Common Stocks | 361,511,045 | 6,709,060 | – | 368,220,105 | ||||||||||||||
| Cash Equivalents | 41,138,740 | 27,192,000 | – | 68,330,740 | ||||||||||||||
| Royce Special Equity Fund | ||||||||||||||||||
| Common Stocks | 1,354,754,546 | 39,083,500 | – | 1,393,838,046 | ||||||||||||||
| Cash Equivalents | – | 138,963,000 | – | 138,963,000 | ||||||||||||||
| Royce Special Equity Multi-Cap Fund | ||||||||||||||||||
| Common Stocks | 100,471,083 | – | – | 100,471,083 | ||||||||||||||
| Cash Equivalents | – | 10,308,000 | – | 10,308,000 | ||||||||||||||
| Royce Total Return Fund | ||||||||||||||||||
| Common Stocks | 2,506,594,104 | 24,460,367 | 0 | 2,531,054,471 | ||||||||||||||
| Corporate Bond | – | 4,224,394 | – | 4,224,394 | ||||||||||||||
| Cash Equivalents | 6,419,985 | 67,993,000 | – | 74,412,985 | ||||||||||||||
| The Royce Funds 2017 Semiannual Report to Shareholders | 111 |
Notes to Financial Statements (unaudited) (continued)
| TRANSFERS FROM | TRANSFERS FROM | |||||||
| LEVEL 1 TO LEVEL 2 | LEVEL 2 TO LEVEL 1 | |||||||
| Royce Dividend Value Fund | $ | – | $ | 39,738,757 | ||||
| Royce Global Financial Services Fund | – | 11,871,335 | ||||||
| Royce International Micro-Cap Fund | – | 3,958,368 | ||||||
| Royce International Premier Fund | – | 75,530,622 | ||||||
| Royce Low-Priced Stock Fund | – | 17,396,010 | ||||||
| Royce Micro-Cap Fund | – | 5,899,752 | ||||||
| Royce Micro-Cap Opportunity Fund | 376,034 | – | ||||||
| Royce Opportunity Fund | 1,702,607 | – | ||||||
| Royce Pennsylvania Mutual Fund | 7,223,576 | 59,731,739 | ||||||
| Royce Premier Fund | – | 49,751,727 | ||||||
| Royce Small-Cap Leaders Fund | – | 2,627,466 | ||||||
| Royce Small/Mid-Cap Premier Fund | – | 5,014,081 | ||||||
| Royce Total Return Fund | – | 116,024,019 | ||||||
Level 3 Reconciliation:
| REALIZED AND | ||||||||||||||||||||||||
| UNREALIZED | ||||||||||||||||||||||||
| BALANCE AS OF 12/31/16 | PURCHASES | SALES | TRANSFERS IN | GAIN (LOSS)1 | BALANCE AS OF 6/30/17 | |||||||||||||||||||
| Royce Low-Priced Stock Fund | ||||||||||||||||||||||||
| Common Stocks | $ | 0 | $ | – | $ | – | $ | – | $ | – | $ | 0 | ||||||||||||
| Royce Micro-Cap Fund | ||||||||||||||||||||||||
| Common Stocks | 865,628 | 0 | – | – | – | 865,628 | ||||||||||||||||||
| Royce Small/Mid-Cap Premier Fund | ||||||||||||||||||||||||
| Common Stocks | – | 0 | – | – | 194,317 | 194,317 | ||||||||||||||||||
| Royce Total Return Fund | ||||||||||||||||||||||||
| Common Stocks | 0 | – | – | – | – | 0 | ||||||||||||||||||
| 1 | The net change in unrealized appreciation (depreciation) is included in the accompanying Statement of Operations. Change in unrealized appreciation (depreciation) includes net unrealized appreciation (depreciation) resulting from changes in investment values during the reporting period and the reversal of previously recorded unrealized appreciation (depreciation) when gains or losses are realized. Net realized gain (loss) from investments and foreign currency transactions is included in the accompanying Statement of Operations. |
The following table summarizes the valuation techniques used and unobservable inputs approved by the Valuation Committee to determine the fair value of certain, material Level 3 investments. The table does not include Level 3 investments with values derived utilizing prices from prior transactions or third party pricing information with adjustments (e.g. broker quotes, pricing services, net asset values).
| FAIR VALUE AT | IMPACT TO VALUATION FROM | |||||||||||||||||||
| 6/30/17 | VALUATION TECHNIQUE(S) | UNOBSERVABLE INPUT(S) | RANGE AVERAGE | AN INCREASE IN INPUT1 | ||||||||||||||||
| Royce Micro-Cap Fund | ||||||||||||||||||||
| Discounted Present Value | ||||||||||||||||||||
| Common Stocks | $ | 865,628 | Balance Sheet Analysis | Liquidity Discount | 30%-40% | Decrease | ||||||||||||||
| Royce Small/Mid-Cap Premier Fund | ||||||||||||||||||||
| Estimated Net Proceeds | Corporate Estimate | |||||||||||||||||||
| Common Stocks | 194,317 | from Asset Auction | Contained in 8K Filing | N/A | Increase | |||||||||||||||
| 1 | This column represents the directional change in the fair value of the Level 3 investments that would result in an increase from the corresponding unobservable input. A decrease to the unobservable input would have the opposite effect. Significant increases and decreases in these unobservable inputs in isolation could result in significantly higher or lower fair value measurements. |
REPURCHASE AGREEMENTS:
The Funds may enter into repurchase agreements with institutions that the Funds’ investment adviser has determined are creditworthy. Each Fund restricts repurchase agreements to maturities of no more than seven days. Securities pledged as collateral for repurchase agreements, which are held until maturity of the repurchase agreements, are marked-to-market daily and maintained at a value at least equal to the principal amount of the repurchase agreement (including accrued interest). Repurchase agreements could involve certain risks in the event of default or insolvency of the counter-party, including possible delays or restrictions upon the ability of each Fund to dispose of its underlying securities. The remaining contractual maturities of repurchase agreements held by the Funds at June 30, 2017 are overnight and continuous.
112 | The Royce Funds 2017 Semiannual Report to Shareholders
FOREIGN CURRENCY:
Net realized foreign exchange gains or losses arise from sales and maturities of short-term securities, sales of foreign currencies, expiration of currency forward contracts, currency gains or losses realized between the trade and settlement dates on securities transactions, and the difference between the amounts of dividends, interest, and foreign withholding taxes recorded on each Fund’s books and the U.S. dollar equivalent of the amounts actually received or paid. Net unrealized foreign exchange gains and losses arise from changes in the value of assets and liabilities, including investments in securities at the end of the reporting period, as a result of changes in foreign currency exchange rates.
SECURITIES LENDING:
The Funds loan securities through a lending agent to qualified institutional investors for the purpose of realizing additional income. Collateral for the Funds on all securities loaned is accepted in cash and cash equivalents and invested temporarily by the custodian. The collateral maintained is at least 100% of the current market value of the loaned securities. The market value of the loaned securities is determined at the close of business of the Funds and any additional required collateral is delivered to the Funds on the next business day. The Funds retain the risk of any loss on the securities on loan as well as incurring the potential loss on investments purchased with cash collateral received for securities lending. Loans of securities generally do not have stated maturity dates, and the Funds may recall a security at any time. The Funds’ securities lending income consists of the income earned on investing cash collateral, plus any premium payments received for lending certain securities, less any rebates paid to borrowers and lending agent fees associated with the loan. The lending agent is not affiliated with Royce.
The following table presents by financial instrument, a Fund’s assets and liabilities net of related collateral held by the Fund at and June 30, 2017:
| GROSS AMOUNT OF ASSETS AND | ||||||||||||
| LIABILITIES IN THE STATEMENTS OF | ||||||||||||
| ASSETS AND LIABILITIES1 | SECURITIES ON LOAN | NET AMOUNT | ||||||||||
| Royce Low-Priced Stock Fund | ||||||||||||
| Collateral on Loaned Securities/Securities on Loan | $ | 17,969,507 | $ | (17,102,776) | $ | 866,731 | ||||||
| Royce Micro-Cap Fund | ||||||||||||
| Collateral on Loaned Securities/Securities on Loan | 10,516,862 | (9,889,001) | 627,861 | |||||||||
| Royce Opportunity Fund | ||||||||||||
| Collateral on Loaned Securities/Securities on Loan | 92,992,860 | (90,713,276) | 2,279,584 | |||||||||
| Royce Pennsylvania Mutual Fund | ||||||||||||
| Collateral on Loaned Securities/Securities on Loan | 89,501,412 | (87,354,679) | 2,146,733 | |||||||||
| Royce Premier Fund | ||||||||||||
| Collateral on Loaned Securities/Securities on Loan | 13,674,170 | (13,545,585) | 128,585 | |||||||||
| Royce Small-Cap Leaders Fund | ||||||||||||
| Collateral on Loaned Securities/Securities on Loan | 991,866 | (976,862) | 15,004 | |||||||||
| Royce Small-Cap Value Fund | ||||||||||||
| Collateral on Loaned Securities/Securities on Loan | 6,553,425 | (6,459,221) | 94,204 | |||||||||
| Royce Small/Mid-Cap Premier Fund | ||||||||||||
| Collateral on Loaned Securities/Securities on Loan | 4,217,261 | (4,137,574) | 79,687 | |||||||||
| Royce Smaller-Companies Growth Fund | ||||||||||||
| Collateral on Loaned Securities/Securities on Loan | 41,138,740 | (39,964,689) | 1,174,051 | |||||||||
| Royce Total Return Fund | ||||||||||||
| Collateral on Loaned Securities/Securities on Loan | 6,419,985 | (6,187,714) | 232,271 | |||||||||
| 1 | Absent an event of default, assets and liabilities are presented gross and not offset in the Statements of Assets and Liabilities. |
As qualified regulated investment companies under Subchapter M of the Internal Revenue Code, the Funds are not subject to income taxes to the extent that each Fund distributes substantially all of its taxable income for its fiscal year.
The Royce Funds 2017 Semiannual Report to Shareholders | 113
Notes to Financial Statements (unaudited) (continued)
Capital Share Transactions (in dollars):
| SHARES ISSUED FOR REINVESTMENT | NET INCREASE (DECREASE) FROM | ||||||||||||||||||||||||||||||||
| SHARES SOLD | OF DISTRIBUTIONS | SHARES REDEEMED | CAPITAL SHARE TRANSACTIONS | ||||||||||||||||||||||||||||||
| Six Months Ended | Six Months Ended | Six Months Ended | Six Months Ended | ||||||||||||||||||||||||||||||
| 6/30/17 | Period Ended | 6/30/17 | Period Ended | 6/30/17 | Period Ended | 6/30/17 | Period Ended | ||||||||||||||||||||||||||
| (unaudited) | 12/31/16 | (unaudited) | 12/31/16 | (unaudited) | 12/31/16 | (unaudited) | 12/31/16 | ||||||||||||||||||||||||||
| Royce Dividend Value Fund | |||||||||||||||||||||||||||||||||
Investment Class | $ | 12,234,505 | $ | 18,958,290 | $ | 530,292 | $ | 9,175,565 | $ | (21,341,874 | ) | $ | (49,583,548 | ) | $ | (8,577,077 | ) | $ | (21,449,693 | ) | |||||||||||||
Service Class | 3,138,534 | 7,065,296 | 393,908 | 9,959,042 | (28,922,415 | ) | (76,162,628 | ) | (25,389,973 | ) | (59,138,290 | ) | |||||||||||||||||||||
Consultant Class | 21,246 | 145,757 | 2,252 | 121,151 | (131,276 | ) | (612,404 | ) | (107,778 | ) | (345,496 | ) | |||||||||||||||||||||
Institutional Class | 117,445 | 73,405 | 6,248 | 85,945 | (15,998 | ) | (24,719 | ) | 107,695 | 134,631 | |||||||||||||||||||||||
| Royce Global Financial Services Fund | |||||||||||||||||||||||||||||||||
Service Class | 8,798,524 | 10,004,674 | – | 314,467 | (12,253,712 | ) | (22,967,471 | ) | (3,455,188 | ) | (12,648,330 | ) | |||||||||||||||||||||
Institutional Class | 485,900 | 5,237,088 | – | 62,041 | (406,605 | ) | – | 79,295 | 5,299,129 | ||||||||||||||||||||||||
| Royce International Micro-Cap Fund | |||||||||||||||||||||||||||||||||
Service Class | 536,809 | 187,420 | – | 92,479 | (186,024 | ) | (594,454 | ) | 350,785 | (314,555 | ) | ||||||||||||||||||||||
| Royce International Premier Fund | |||||||||||||||||||||||||||||||||
Investment Class | 16,524,771 | 6,174,749 | – | 405,500 | (3,217,531 | ) | (14,199,466 | ) | 13,307,240 | (7,619,217 | ) | ||||||||||||||||||||||
Service Class | 7,246,244 | 4,838,193 | – | 841,078 | (5,913,343 | ) | (12,025,961 | ) | 1,332,901 | (6,346,690 | ) | ||||||||||||||||||||||
Consultant Class | 626,083 | 378,145 | – | 69,250 | (474,777 | ) | (2,062,532 | ) | 151,306 | (1,615,137 | ) | ||||||||||||||||||||||
R Class | 581 | 10,139 | – | 1,431 | – | – | 581 | 11,570 | |||||||||||||||||||||||||
K Class | – | – | – | 672 | (24,050 | ) | – | (24,050 | ) | 672 | |||||||||||||||||||||||
| Royce Low-Priced Stock Fund | |||||||||||||||||||||||||||||||||
Investment Class | 2,130,876 | 1,971,123 | – | 1,820,228 | (4,198,839 | ) | (10,892,309 | ) | (2,067,963 | ) | (7,100,958 | ) | |||||||||||||||||||||
Service Class | 3,837,574 | 7,067,276 | – | 23,428,229 | (36,331,671 | ) | (80,535,704 | ) | (32,494,097 | ) | (50,040,199 | ) | |||||||||||||||||||||
Institutional Class | 200,515 | 583,934 | – | 1,067,221 | (2,539,408 | ) | (27,305,121 | ) | (2,338,893 | ) | (25,653,966 | ) | |||||||||||||||||||||
R Class | 38,226 | 162,573 | – | 89,653 | (109,159 | ) | (411,859 | ) | (70,933 | ) | (159,633 | ) | |||||||||||||||||||||
K Class | 13,656 | 107,931 | – | 434,240 | (1,113,741 | ) | (687,522 | ) | (1,100,085 | ) | (145,351 | ) | |||||||||||||||||||||
114 | The Royce Funds 2017 Semiannual Report to Shareholders
Capital Share Transactions (in dollars) (continued):
| SHARES ISSUED FOR REINVESTMENT | NET INCREASE (DECREASE) FROM | |||||||||||||||||||||||||||||||||
| SHARES SOLD | OF DISTRIBUTIONS | SHARES REDEEMED | CAPITAL SHARE TRANSACTIONS | |||||||||||||||||||||||||||||||
| Six Months Ended | Six Months Ended | Six Months Ended | Six Months Ended | |||||||||||||||||||||||||||||||
| 6/30/17 | Period Ended | 6/30/17 | Period Ended | 6/30/17 | Period Ended | 6/30/17 | Period Ended | |||||||||||||||||||||||||||
| (unaudited) | 12/31/16 | (unaudited) | 12/31/16 | (unaudited) | 12/31/16 | (unaudited) | 12/31/16 | |||||||||||||||||||||||||||
| Royce Micro-Cap Fund | ||||||||||||||||||||||||||||||||||
Investment Class | $ | 2,793,225 | $ | 9,466,655 | $ | 2,031 | $ | 18,015,282 | $ | (22,079,802 | ) | $ | (66,073,769 | ) | $ | (19,284,546 | ) | $ | (38,591,832 | ) | ||||||||||||||
Service Class | 2,874,886 | 4,842,797 | – | 1,576,589 | (3,298,191 | ) | (10,503,711 | ) | (423,305 | ) | (4,084,325 | ) | ||||||||||||||||||||||
Consultant Class | 291,950 | 1,293,781 | – | 4,079,826 | (6,227,329 | ) | (14,100,322 | ) | (5,935,379 | ) | (8,726,715 | ) | ||||||||||||||||||||||
| Royce Micro-Cap Opportunity Fund | ||||||||||||||||||||||||||||||||||
Investment Class | 1,328,362 | 6,820,847 | – | – | (2,298,213 | ) | (5,142,669 | ) | (969,851 | ) | 1,678,178 | |||||||||||||||||||||||
Service Class | 169,617 | 291,194 | – | – | (214,398 | ) | (691,434 | ) | (44,781 | ) | (400,240 | ) | ||||||||||||||||||||||
| Royce Opportunity Fund | ||||||||||||||||||||||||||||||||||
Investment Class | 42,593,198 | 81,034,611 | – | 41,705,217 | (98,169,595 | ) | (253,661,600 | ) | (55,576,397 | ) | (130,921,772 | ) | ||||||||||||||||||||||
Service Class | 32,281,334 | 16,933,706 | – | 4,661,818 | (16,544,823 | ) | (62,322,206 | ) | 15,736,511 | (40,726,682 | ) | |||||||||||||||||||||||
Consultant Class | 469,970 | 2,287,388 | – | 1,568,020 | (2,958,356 | ) | (5,702,177 | ) | (2,488,386 | ) | (1,846,769 | ) | ||||||||||||||||||||||
Institutional Class | 37,353,624 | 58,740,553 | – | 35,837,134 | (82,962,821 | ) | (220,100,854 | ) | (45,609,197 | ) | (125,523,167 | ) | ||||||||||||||||||||||
R Class | 3,461,997 | 5,262,774 | – | 2,794,912 | (6,585,132 | ) | (8,185,578 | ) | (3,123,135 | ) | (127,892 | ) | ||||||||||||||||||||||
K Class | 1,365,085 | 2,688,304 | – | 525,822 | (1,928,472 | ) | (7,346,313 | ) | (563,387 | ) | (4,132,187 | ) | ||||||||||||||||||||||
| Royce Pennsylvania Mutual Fund | ||||||||||||||||||||||||||||||||||
Investment Class | 53,943,154 | 101,656,002 | – | 98,152,740 | (178,987,539 | ) | (725,638,867 | ) | (125,044,385 | ) | (525,830,125 | ) | ||||||||||||||||||||||
Service Class | 17,178,366 | 27,866,036 | – | 5,127,006 | (43,536,836 | ) | (47,207,450 | ) | (26,358,470 | ) | (14,214,408 | ) | ||||||||||||||||||||||
Consultant Class | 4,543,399 | 9,509,567 | – | 29,743,347 | (51,586,237 | ) | (109,823,958 | ) | (47,042,838 | ) | (70,571,044 | ) | ||||||||||||||||||||||
Institutional Class | 21,373,994 | 135,118,511 | – | 18,093,080 | (38,740,833 | ) | (481,864,428 | ) | (17,366,839 | ) | (328,652,837 | ) | ||||||||||||||||||||||
R Class | 2,096,336 | 2,588,691 | – | 1,140,459 | (3,657,006 | ) | (7,878,915 | ) | (1,560,670 | ) | (4,149,765 | ) | ||||||||||||||||||||||
K Class | 229,735 | 507,920 | – | 247,212 | (824,580 | ) | (2,093,193 | ) | (594,845 | ) | (1,338,061 | ) | ||||||||||||||||||||||
| Royce Premier Fund | ||||||||||||||||||||||||||||||||||
Investment Class | 62,655,944 | 132,149,740 | 3,003 | 179,639,115 | (211,859,552 | ) | (697,868,653 | ) | (149,200,605 | ) | (386,079,798 | ) | ||||||||||||||||||||||
Service Class | 8,153,742 | 12,022,129 | – | 5,025,159 | (6,865,078 | ) | (36,123,462 | ) | 1,288,664 | (19,076,174 | ) | |||||||||||||||||||||||
Consultant Class | 1,562,901 | 1,657,648 | – | 4,316,806 | (4,301,930 | ) | (9,246,501 | ) | (2,739,029 | ) | (3,272,047 | ) | ||||||||||||||||||||||
Institutional Class | 190,614,950 | 80,363,260 | – | 29,595,890 | (185,151,239 | ) | (177,605,927 | ) | 5,463,711 | (67,646,777 | ) | |||||||||||||||||||||||
W Class | 8,837,011 | 11,616,780 | – | 14,836,924 | (21,881,683 | ) | (85,709,902 | ) | (13,044,672 | ) | (59,256,198 | ) | ||||||||||||||||||||||
R Class | 473,729 | 452,451 | – | 1,728,030 | (2,390,920 | ) | (5,486,362 | ) | (1,917,191 | ) | (3,305,881 | ) | ||||||||||||||||||||||
K Class | 1,217,490 | 1,845,074 | (4,393,199 | ) | (1,330,635 | ) | ||||||||||||||||||||||||||||
| Royce Small-Cap Leaders Fund | ||||||||||||||||||||||||||||||||||
Investment Class | 2,336,572 | 2,943,260 | – | 4,254,065 | (8,189,478 | ) | (15,072,711 | ) | (5,852,906 | ) | (7,875,386 | ) | ||||||||||||||||||||||
Service Class | 1,867,295 | 2,746,867 | – | 4,672,613 | (7,486,532 | ) | (20,862,377 | ) | (5,619,237 | ) | (13,442,897 | ) | ||||||||||||||||||||||
R Class | 515,281 | 390,342 | – | 132,202 | (372,090 | ) | (549,660 | ) | 143,191 | (27,116 | ) | |||||||||||||||||||||||
K Class | 8,625 | 124,715 | – | 35,143 | (515,907 | ) | (61,065 | ) | (507,282 | ) | 98,793 | |||||||||||||||||||||||
| Royce Small-Cap Value Fund | ||||||||||||||||||||||||||||||||||
Investment Class | 4,683,978 | 15,238,437 | – | 3,520,923 | (14,368,297 | ) | (33,562,073 | ) | (9,684,319 | ) | (14,802,713 | ) | ||||||||||||||||||||||
Service Class | 2,018,599 | 8,438,818 | – | 10,369,371 | (35,331,355 | ) | (87,439,478 | ) | (33,312,756 | ) | (68,631,289 | ) | ||||||||||||||||||||||
Consultant Class | 360,273 | 923,536 | – | 835,891 | (2,176,581 | ) | (5,814,390 | ) | (1,816,308 | ) | (4,054,963 | ) | ||||||||||||||||||||||
Institutional Class | 5,596,291 | 51,211,150 | – | 7,164,497 | (25,780,485 | ) | (100,761,956 | ) | (20,184,194 | ) | (42,386,309 | ) | ||||||||||||||||||||||
R Class | 1,382,376 | 2,883,464 | – | 953,798 | (3,420,830 | ) | (7,228,118 | ) | (2,038,454 | ) | (3,390,856 | ) | ||||||||||||||||||||||
K Class | 254,270 | 1,184,756 | – | 211,184 | (1,059,605 | ) | (4,929,415 | ) | (805,335 | ) | (3,533,475 | ) | ||||||||||||||||||||||
| Royce Small/Mid-Cap Premier Fund | ||||||||||||||||||||||||||||||||||
Investment Class | 1,985,017 | 3,678,000 | – | 3,292,053 | (10,282,173 | ) | (20,684,731 | ) | (8,297,156 | ) | (13,714,678 | ) | ||||||||||||||||||||||
Service Class | 6,101,811 | 1,980,974 | – | 4,133,928 | (10,625,031 | ) | (21,159,246 | ) | (4,523,220 | ) | (15,044,344 | ) | ||||||||||||||||||||||
Consultant Class | 155,860 | 550,259 | – | 519,489 | (1,922,403 | ) | (1,971,398 | ) | (1,766,543 | ) | (901,650 | ) | ||||||||||||||||||||||
R Class | 151,692 | 240,334 | – | 97,399 | (265,502 | ) | (950,917 | ) | (113,810 | ) | (613,184 | ) | ||||||||||||||||||||||
K Class | 73,214 | 524,089 | – | 212,068 | (4,345,335 | ) | (971,874 | ) | (4,272,121 | ) | (235,717 | ) | ||||||||||||||||||||||
| Royce Smaller-Companies Growth Fund | ||||||||||||||||||||||||||||||||||
Investment Class | 5,232,375 | 9,036,660 | – | 8,163,119 | (17,091,078 | ) | (55,705,571 | ) | (11,858,703 | ) | (38,505,792 | ) | ||||||||||||||||||||||
Service Class | 3,977,761 | 14,663,751 | – | 28,201,863 | (44,012,062 | ) | (159,219,364 | ) | (40,034,301 | ) | (116,353,750 | ) | ||||||||||||||||||||||
Consultant Class | 386,076 | 170,036 | – | 1,256,839 | (1,136,258 | ) | (4,722,177 | ) | (750,182 | ) | (3,295,302 | ) | ||||||||||||||||||||||
Institutional Class | 1,677,611 | 4,456,412 | – | 1,910,324 | (11,911,804 | ) | (24,349,639 | ) | (10,234,193 | ) | (17,982,903 | ) | ||||||||||||||||||||||
R Class | 47,488 | 212,289 | – | 89,046 | (263,893 | ) | (364,827 | ) | (216,405 | ) | (63,492 | ) | ||||||||||||||||||||||
K Class | 10,337 | 24,433 | – | 38,133 | (220,600 | ) | (140,884 | ) | (210,263 | ) | (78,318 | ) | ||||||||||||||||||||||
The Royce Funds 2017 Semiannual Report to Shareholders | 115
Notes to Financial Statements (unaudited) (continued)
Capital Share Transactions (in dollars) (continued):
| SHARES ISSUED FOR REINVESTMENT | NET INCREASE (DECREASE) FROM | |||||||||||||||||||||||||||||||
| SHARES SOLD | OF DISTRIBUTIONS | SHARES REDEEMED | CAPITAL SHARE TRANSACTIONS | |||||||||||||||||||||||||||||
| Six Months Ended | Six Months Ended | Six Months Ended | Six Months Ended | |||||||||||||||||||||||||||||
| 6/30/17 | Period Ended | 6/30/17 | Period Ended | 6/30/17 | Period Ended | 6/30/17 | Period Ended | |||||||||||||||||||||||||
| (unaudited) | 12/31/16 | (unaudited) | 12/31/16 | (unaudited) | 12/31/16 | (unaudited) | 12/31/16 | |||||||||||||||||||||||||
| Royce Special Equity Fund | ||||||||||||||||||||||||||||||||
Investment Class | $ | 85,543,791 | $ | 179,392,659 | $ | – | $ | 75,160,317 | $ | (170,849,884 | ) | $ | (354,506,680 | ) | $ | (85,306,093 | ) | $ | (99,953,704 | ) | ||||||||||||
Service Class | 9,983,159 | 30,335,347 | – | 6,662,481 | (29,162,723 | ) | (43,663,631 | ) | (19,179,564 | ) | (6,665,803 | ) | ||||||||||||||||||||
Consultant Class | 2,859,948 | 5,012,148 | – | 3,309,705 | (5,664,530 | ) | (8,602,908 | ) | (2,804,582 | ) | (281,055 | ) | ||||||||||||||||||||
Institutional Class | 104,884,931 | 45,055,283 | – | 15,454,797 | (68,245,297 | ) | (104,274,992 | ) | 36,639,634 | (43,764,912 | ) | |||||||||||||||||||||
| Royce Special Equity Multi-Cap Fund | ||||||||||||||||||||||||||||||||
Investment Class | 2,119,365 | 9,065,075 | – | 361,721 | (1,868,559 | ) | (23,180,740 | ) | 250,806 | (13,753,944 | ) | |||||||||||||||||||||
Service Class | 1,826,570 | 1,179,738 | – | 291,900 | (12,085,883 | ) | (16,267,235 | ) | (10,259,313 | ) | (14,795,597 | ) | ||||||||||||||||||||
Consultant Class | 218,161 | 563,388 | – | 37,877 | (1,147,822 | ) | (2,866,031 | ) | (929,661 | ) | (2,264,766 | ) | ||||||||||||||||||||
Institutional Class | 180,913 | 175,067 | – | 461,530 | (132,307 | ) | (4,391,464 | ) | 48,606 | (3,754,867 | ) | |||||||||||||||||||||
| Royce Total Return Fund | ||||||||||||||||||||||||||||||||
Investment Class | 110,357,620 | 294,955,069 | 7,259,661 | 136,990,355 | (263,270,275 | ) | (682,255,576 | ) | (145,652,994 | ) | (250,310,152 | ) | ||||||||||||||||||||
Service Class | 30,856,362 | 36,092,000 | 454,711 | 10,591,744 | (64,490,248 | ) | (58,098,066 | ) | (33,179,175 | ) | (11,414,322 | ) | ||||||||||||||||||||
Consultant Class | 4,610,884 | 10,401,986 | – | 17,832,355 | (29,304,056 | ) | (60,628,932 | ) | (24,693,172 | ) | (32,394,591 | ) | ||||||||||||||||||||
Institutional Class | 33,234,302 | 293,147,555 | 2,127,457 | 34,001,932 | (119,968,404 | ) | (348,478,072 | ) | (84,606,645 | ) | (21,328,585 | ) | ||||||||||||||||||||
W Class | 11,722,277 | 25,598,918 | 119,409 | 5,366,667 | (7,956,546 | ) | (84,376,627 | ) | 3,885,140 | (53,411,042 | ) | |||||||||||||||||||||
R Class | 8,919,550 | 7,424,801 | 110,573 | 4,240,875 | (11,937,808 | ) | (15,644,457 | ) | (2,907,685 | ) | (3,978,781 | ) | ||||||||||||||||||||
K Class | 6,609,786 | 22,509,661 | 101,525 | 4,948,018 | (12,299,078 | ) | (55,761,263 | ) | (5,587,767 | ) | (28,303,584 | ) | ||||||||||||||||||||
Capital Share Transactions (in shares):
| SHARES ISSUED FOR REINVESTMENT | NET INCREASE (DECREASE) IN | ||||||||||||||||||||||||||||||||||
| SHARES SOLD | OF DISTRIBUTIONS | SHARES REDEEMED | SHARES OUTSTANDING | ||||||||||||||||||||||||||||||||
| Six Months Ended | Six Months Ended | Six Months Ended | Six Months Ended | ||||||||||||||||||||||||||||||||
| 6/30/17 | Period Ended | 6/30/17 | Period Ended | 6/30/17 | Period Ended | 6/30/17 | Period Ended | ||||||||||||||||||||||||||||
| (unaudited) | 12/31/16 | (unaudited) | 12/31/16 | (unaudited) | 12/31/16 | (unaudited) | 12/31/16 | ||||||||||||||||||||||||||||
| Royce Dividend Value Fund | |||||||||||||||||||||||||||||||||||
Investment Class | 1,647,244 | 2,660,858 | 70,304 | 1,266,523 | (2,863,353 | ) | (7,026,219 | ) | (1,145,805 | ) | (3,098,838 | ) | |||||||||||||||||||||||
Service Class | 413,811 | 982,932 | 51,149 | 1,347,129 | (3,788,748 | ) | (10,577,464 | ) | (3,323,788 | ) | (8,247,403 | ) | |||||||||||||||||||||||
Consultant Class | 2,468 | 18,781 | 253 | 14,300 | (15,067 | ) | (84,343 | ) | (12,346 | ) | (51,262 | ) | |||||||||||||||||||||||
Institutional Class | 15,776 | 10,503 | 837 | 11,998 | (2,174 | ) | (3,669 | ) | 14,439 | 18,832 | |||||||||||||||||||||||||
| Royce Global Financial Services Fund | |||||||||||||||||||||||||||||||||||
Service Class | 940,983 | 1,190,188 | – | 35,333 | (1,309,648 | ) | (2,858,179 | ) | (368,665 | ) | (1,632,658 | ) | |||||||||||||||||||||||
Institutional Class | 39,591 | 560,952 | – | 5,461 | (33,556 | ) | – | 6,035 | 566,413 | ||||||||||||||||||||||||||
| Royce International Micro-Cap Fund | |||||||||||||||||||||||||||||||||||
Service Class | 49,533 | 20,043 | – | 9,360 | (17,394 | ) | (61,674 | ) | 32,139 | (32,271 | ) | ||||||||||||||||||||||||
| Royce International Premier Fund | |||||||||||||||||||||||||||||||||||
Investment Class1 | 1,547,410 | 3,108,605 | – | 44,220 | (304,762 | ) | (1,449,841 | ) | 1,242,648 | 1,702,984 | |||||||||||||||||||||||||
Service Class1 | 558,047 | 3,645,178 | – | 77,022 | (470,094 | ) | (1,037,673 | ) | 87,953 | 2,684,527 | |||||||||||||||||||||||||
Consultant Class1 | 45,496 | 572,065 | – | 5,809 | (35,745 | ) | (163,265 | ) | 9,751 | 414,609 | |||||||||||||||||||||||||
R Class1 | 58 | 5,494 | – | 163 | – | – | 58 | 5,657 | |||||||||||||||||||||||||||
K Class1 | – | 2,473 | – | 78 | (2,551 | ) | – | (2,551 | ) | 2,551 | |||||||||||||||||||||||||
| Royce Low-Priced Stock Fund | |||||||||||||||||||||||||||||||||||
Investment Class | 259,005 | 256,929 | – | 219,834 | (510,393 | ) | (1,408,310 | ) | (251,388 | ) | (931,547 | ) | |||||||||||||||||||||||
Service Class | 466,374 | 908,878 | – | 2,839,785 | (4,433,161 | ) | (10,354,471 | ) | (3,966,787 | ) | (6,605,808 | ) | |||||||||||||||||||||||
Institutional Class | 24,342 | 75,466 | – | 128,581 | (308,779 | ) | (3,729,447 | ) | (284,437 | ) | (3,525,400 | ) | |||||||||||||||||||||||
R Class | 4,920 | 22,201 | – | 11,450 | (14,050 | ) | (54,355 | ) | (9,130 | ) | (20,704 | ) | |||||||||||||||||||||||
K Class | 9,447 | 57,659 | – | 301,555 | (770,346 | ) | (381,680 | ) | (760,899 | ) | (22,466 | ) | |||||||||||||||||||||||
| Royce Micro-Cap Fund | |||||||||||||||||||||||||||||||||||
Investment Class | 236,827 | 849,276 | 170 | 1,510,082 | (1,866,429 | ) | (5,962,181 | ) | (1,629,432 | ) | (3,602,823 | ) | |||||||||||||||||||||||
Service Class | 248,075 | 435,709 | – | 134,751 | (284,943 | ) | (971,095 | ) | (36,868 | ) | (400,635 | ) | |||||||||||||||||||||||
Consultant Class | 31,173 | 148,907 | – | 433,103 | (669,721 | ) | (1,547,295 | ) | (638,548 | ) | (965,285 | ) | |||||||||||||||||||||||
| Royce Micro-Cap Opportunity Fund | |||||||||||||||||||||||||||||||||||
Investment Class | 74,705 | 499,875 | – | – | (130,448 | ) | (354,864 | ) | (55,743 | ) | 145,011 | ||||||||||||||||||||||||
Service Class | 18,536 | 40,382 | – | – | (23,629 | ) | (98,358 | ) | (5,093 | ) | (57,976 | ) | |||||||||||||||||||||||
| 1 | Includes shares issued in connection with the merger of Royce European Small-Cap Fund and Royce Global Value Fund (2,460,873 for Investment Class, 3,226,058 for Service Class, 542,120 for Consultant Class, 4,452 for R Class and 2,473 for K Class, for the period ended 12/31/16). |
116 | The Royce Funds 2017 Semiannual Report to Shareholders
Capital Share Transactions (in shares) (continued):
| SHARES ISSUED FOR REINVESTMENT | NET INCREASE (DECREASE) IN | ||||||||||||||||||||||||||||||||||
| SHARES SOLD | OF DISTRIBUTIONS | SHARES REDEEMED | SHARES OUTSTANDING | ||||||||||||||||||||||||||||||||
| Six Months Ended | Six Months Ended | Six Months Ended | Six Months Ended | ||||||||||||||||||||||||||||||||
| 6/30/17 | Period Ended | 6/30/17 | Period Ended | 6/30/17 | Period Ended | 6/30/17 | Period Ended | ||||||||||||||||||||||||||||
| (unaudited) | 12/31/16 | (unaudited) | 12/31/16 | (unaudited) | 12/31/16 | (unaudited) | 12/31/16 | ||||||||||||||||||||||||||||
| Royce Opportunity Fund | |||||||||||||||||||||||||||||||||||
Investment Class | 3,202,738 | 7,169,819 | – | 3,210,563 | (7,327,098 | ) | (22,519,005 | ) | (4,124,360 | ) | (12,138,623 | ) | |||||||||||||||||||||||
Service Class | 2,545,889 | 1,582,515 | – | 383,689 | (1,325,226 | ) | (5,985,363 | ) | 1,220,663 | (4,019,159 | ) | ||||||||||||||||||||||||
Consultant Class | 42,419 | 254,530 | – | 144,785 | (267,107 | ) | (586,237 | ) | (224,688 | ) | (186,922 | ) | |||||||||||||||||||||||
Institutional Class | 2,745,958 | 5,099,929 | – | 2,708,778 | (6,121,517 | ) | (19,157,014 | ) | (3,375,559 | ) | (11,348,307 | ) | |||||||||||||||||||||||
R Class | 287,976 | 525,049 | – | 236,853 | (546,543 | ) | (781,985 | ) | (258,567 | ) | (20,083 | ) | |||||||||||||||||||||||
K Class | 125,675 | 280,506 | – | 49,097 | (175,832 | ) | (790,088 | ) | (50,157 | ) | (460,485 | ) | |||||||||||||||||||||||
| Royce Pennsylvania Mutual Fund | |||||||||||||||||||||||||||||||||||
Investment Class | 4,817,419 | 10,226,806 | – | 8,810,839 | (15,977,805 | ) | (73,784,191 | ) | (11,160,386 | ) | (54,746,546 | ) | |||||||||||||||||||||||
Service Class | 1,551,715 | 2,531,009 | – | 459,821 | (3,884,985 | ) | (4,824,673 | ) | (2,333,270 | ) | (1,833,843 | ) | |||||||||||||||||||||||
Consultant Class | 505,544 | 1,165,040 | – | 3,308,492 | (5,726,085 | ) | (13,450,271 | ) | (5,220,541 | ) | (8,976,739 | ) | |||||||||||||||||||||||
Institutional Class | 1,901,697 | 13,478,552 | – | 1,622,698 | (3,469,677 | ) | (46,263,535 | ) | (1,567,980 | ) | (31,162,285 | ) | |||||||||||||||||||||||
R Class | 198,672 | 265,258 | – | 108,100 | (344,854 | ) | (837,492 | ) | (146,182 | ) | (464,134 | ) | |||||||||||||||||||||||
K Class | 24,937 | 59,680 | – | 26,841 | (89,595 | ) | (262,303 | ) | (64,658 | ) | (175,782 | ) | |||||||||||||||||||||||
| Royce Premier Fund | |||||||||||||||||||||||||||||||||||
Investment Class | 3,827,435 | 8,812,203 | 191 | 11,434,739 | (12,890,567 | ) | (47,449,896 | ) | (9,062,941 | ) | (27,202,954 | ) | |||||||||||||||||||||||
Service Class | 511,822 | 805,849 | – | 328,013 | (429,680 | ) | (2,490,902 | ) | 82,142 | (1,357,040 | ) | ||||||||||||||||||||||||
Consultant Class | 120,213 | 132,228 | – | 342,061 | (328,467 | ) | (732,856 | ) | (208,254 | ) | (258,567 | ) | |||||||||||||||||||||||
Institutional Class | 11,386,378 | 4,672,420 | – | 1,859,039 | (11,556,791 | ) | (10,964,670 | ) | (170,413 | ) | (4,433,211 | ) | |||||||||||||||||||||||
W Class | 536,527 | 769,454 | – | 940,832 | (1,331,641 | ) | (5,671,662 | ) | (795,114 | ) | (3,961,376 | ) | |||||||||||||||||||||||
R Class | 31,194 | 31,848 | – | 117,873 | (157,687 | ) | (385,875 | ) | (126,493 | ) | (236,154 | ) | |||||||||||||||||||||||
K Class | 766,591 | 61,502,453 | (63,925,467 | ) | (1,656,423 | ) | |||||||||||||||||||||||||||||
| Royce Small-Cap Leaders Fund | |||||||||||||||||||||||||||||||||||
Investment Class | 328,231 | 429,323 | – | 594,974 | (1,147,697 | ) | (2,292,098 | ) | (819,466 | ) | (1,267,801 | ) | |||||||||||||||||||||||
Service Class | 264,988 | 411,724 | – | 661,844 | (1,065,153 | ) | (3,183,253 | ) | (800,165 | ) | (2,109,685 | ) | |||||||||||||||||||||||
R Class | 52,911 | 42,261 | – | 13,532 | (38,563 | ) | (64,382 | ) | 14,348 | (8,589 | ) | ||||||||||||||||||||||||
K Class | 860 | 13,532 | – | 3,507 | (51,156 | ) | (6,453 | ) | (50,296 | ) | 10,586 | ||||||||||||||||||||||||
| Royce Small-Cap Value Fund | |||||||||||||||||||||||||||||||||||
Investment Class | 483,346 | 1,706,503 | – | 347,918 | (1,483,652 | ) | (3,693,241 | ) | (1,000,306 | ) | (1,638,820 | ) | |||||||||||||||||||||||
Service Class | 208,063 | 918,639 | – | 1,028,707 | (3,649,888 | ) | (9,655,060 | ) | (3,441,825 | ) | (7,707,714 | ) | |||||||||||||||||||||||
Consultant Class | 40,944 | 112,192 | – | 92,160 | (250,855 | ) | (700,893 | ) | (209,911 | ) | (496,541 | ) | |||||||||||||||||||||||
Institutional Class | 568,753 | 6,021,934 | – | 707,954 | (2,663,494 | ) | (11,003,947 | ) | (2,094,741 | ) | (4,274,059 | ) | |||||||||||||||||||||||
R Class | 147,773 | 319,737 | – | 98,127 | (364,575 | ) | (823,181 | ) | (216,802 | ) | (405,317 | ) | |||||||||||||||||||||||
K Class | 37,862 | 173,952 | – | 30,169 | (155,576 | ) | (752,641 | ) | (117,714 | ) | (548,520 | ) | |||||||||||||||||||||||
| Royce Small/Mid-Cap Premier Fund | |||||||||||||||||||||||||||||||||||
Investment Class | 130,725 | 281,846 | – | 222,737 | (675,581 | ) | (1,440,664 | ) | (544,856 | ) | (936,081 | ) | |||||||||||||||||||||||
Service Class | 401,379 | 149,122 | – | 280,456 | (700,106 | ) | (1,565,689 | ) | (298,727 | ) | (1,136,111 | ) | |||||||||||||||||||||||
Consultant Class | 14,499 | 55,903 | – | 49,287 | (177,734 | ) | (203,096 | ) | (163,235 | ) | (97,906 | ) | |||||||||||||||||||||||
R Class | 15,524 | 27,042 | – | 10,114 | (26,870 | ) | (106,425 | ) | (11,346 | ) | (69,269 | ) | |||||||||||||||||||||||
K Class | 7,418 | 56,896 | – | 21,750 | (431,031 | ) | (107,350 | ) | (423,613 | ) | (28,704 | ) | |||||||||||||||||||||||
| Royce Smaller-Companies Growth Fund | |||||||||||||||||||||||||||||||||||
Investment Class | 445,606 | 847,388 | – | 717,953 | (1,451,969 | ) | (5,074,410 | ) | (1,006,363 | ) | (3,509,069 | ) | |||||||||||||||||||||||
Service Class | 344,051 | 1,409,846 | – | 2,529,315 | (3,806,343 | ) | (14,572,615 | ) | (3,462,292 | ) | (10,633,454 | ) | |||||||||||||||||||||||
Consultant Class | 38,264 | 18,168 | – | 128,775 | (112,096 | ) | (486,078 | ) | (73,832 | ) | (339,135 | ) | |||||||||||||||||||||||
Institutional Class | 139,358 | 412,595 | – | 166,115 | (966,662 | ) | (2,234,312 | ) | (827,304 | ) | (1,655,602 | ) | |||||||||||||||||||||||
R Class | 4,434 | 20,463 | – | 8,546 | (24,141 | ) | (35,661 | ) | (19,707 | ) | (6,652 | ) | |||||||||||||||||||||||
K Class | 1,824 | 4,217 | – | 6,933 | (39,316 | ) | (23,979 | ) | (37,492 | ) | (12,829 | ) | |||||||||||||||||||||||
| Royce Special Equity Fund | |||||||||||||||||||||||||||||||||||
Investment Class | 3,943,565 | 9,260,512 | – | 3,410,178 | (7,881,190 | ) | (18,239,504 | ) | (3,937,625 | ) | (5,568,814 | ) | |||||||||||||||||||||||
Service Class | 461,285 | 1,557,578 | – | 302,840 | (1,347,658 | ) | (2,299,540 | ) | (886,373 | ) | (439,122 | ) | |||||||||||||||||||||||
Consultant Class | 145,073 | 271,702 | – | 164,009 | (286,410 | ) | (489,570 | ) | (141,337 | ) | (53,859 | ) | |||||||||||||||||||||||
Institutional Class | 4,879,532 | 2,367,916 | – | 706,990 | (3,184,626 | ) | (5,367,357 | ) | 1,694,906 | (2,292,451 | ) | ||||||||||||||||||||||||
| Royce Special Equity Multi-Cap Fund | |||||||||||||||||||||||||||||||||||
Investment Class | 142,903 | 704,106 | – | 25,618 | (127,345 | ) | (1,787,819 | ) | 15,558 | (1,058,095 | ) | ||||||||||||||||||||||||
Service Class | 124,946 | 92,500 | – | 20,600 | (844,796 | ) | (1,271,369 | ) | (719,850 | ) | (1,158,269 | ) | |||||||||||||||||||||||
Consultant Class | 22,919 | 64,759 | – | 4,086 | (119,533 | ) | (358,839 | ) | (96,614 | ) | (289,994 | ) | |||||||||||||||||||||||
Institutional Class | 12,667 | 14,101 | – | 32,709 | (9,001 | ) | (348,109 | ) | 3,666 | (301,299 | ) | ||||||||||||||||||||||||
The Royce Funds 2017 Semiannual Report to Shareholders | 117
Notes to Financial Statements (unaudited) (continued)
Capital Share Transactions (in shares) (continued):
| SHARES ISSUED FOR REINVESTMENT | NET INCREASE (DECREASE) IN | ||||||||||||||||||||||||||||||||||
| SHARES SOLD | OF DISTRIBUTIONS | SHARES REDEEMED | SHARES OUTSTANDING | ||||||||||||||||||||||||||||||||
| Six Months Ended | Six Months Ended | Six Months Ended | Six Months Ended | ||||||||||||||||||||||||||||||||
| 6/30/17 | Period Ended | 6/30/17 | Period Ended | 6/30/17 | Period Ended | 6/30/17 | Period Ended | ||||||||||||||||||||||||||||
| (unaudited) | 12/31/16 | (unaudited) | 12/31/16 | (unaudited) | 12/31/16 | (unaudited) | 12/31/16 | ||||||||||||||||||||||||||||
| Royce Total Return Fund | |||||||||||||||||||||||||||||||||||
Investment Class | 7,989,965 | 23,095,630 | 519,573 | 9,965,626 | (19,037,673 | ) | (54,300,006 | ) | (10,528,135 | ) | (21,238,750 | ) | |||||||||||||||||||||||
Service Class | 2,187,949 | 2,651,956 | 31,853 | 752,701 | (4,558,596 | ) | (4,555,567 | ) | (2,338,794 | ) | (1,150,910 | ) | |||||||||||||||||||||||
Consultant Class | 323,762 | 809,896 | – | 1,253,650 | (2,057,427 | ) | (4,654,549 | ) | (1,733,665 | ) | (2,591,003 | ) | |||||||||||||||||||||||
Institutional Class | 2,427,540 | 22,240,210 | 154,151 | 2,503,885 | (8,704,110 | ) | (25,442,830 | ) | (6,122,419 | ) | (698,735 | ) | |||||||||||||||||||||||
W Class | 847,632 | 2,022,318 | 8,564 | 391,422 | (575,591 | ) | (6,527,081 | ) | 280,605 | (4,113,341 | ) | ||||||||||||||||||||||||
R Class | 626,162 | 561,428 | 7,684 | 298,296 | (835,711 | ) | (1,194,084 | ) | (201,865 | ) | (334,360 | ) | |||||||||||||||||||||||
K Class | 716,292 | 2,544,929 | 10,967 | 540,978 | (1,337,414 | ) | (6,214,250 | ) | (610,155 | ) | (3,128,343 | ) | |||||||||||||||||||||||
Under the Trust’s investment advisory agreements with Royce, Royce is entitled to receive investment advisory fees in respect of each Fund that are computed daily and payable monthly. Royce’s commitment to waive its fees and reimburse class-specific expenses to the extent necessary to maintain certain Funds’ net annual operating expense ratios at specified levels through April 30, 2018, is shown below to the extent that it impacted net expenses for the six months ended June 30, 2017. See the Prospectus for contractual waiver expiration dates.
| COMMITTED NET ANNUAL OPERATING EXPENSE RATIO CAP3 | SIX MONTHS ENDED JUNE 30, 2017 | ||||||||||||||||||||||||||||||||||||||||
| ANNUAL CONTRACTUAL ADVISORY FEE AS A PERCENTAGE OF AVERAGE NET ASSETS 1 | Investment Class | Service Class | Consultant Class | Institutional Class | W Class | R Class | K Class | Net advisory fees | Advisory fees waived | ||||||||||||||||||||||||||||||||
| Royce Dividend Value Fund | 0.85% | 1.09% | 1.34% | 2.09% | 0.89% | N/A | N/A | N/A | $ | 819,900 | $ | 69,023 | |||||||||||||||||||||||||||||
| Royce Global Financial Services Fund | 1.00% | N/A | 1.49% | N/A | 1.04% | N/A | N/A | N/A | 218,586 | 34,770 | |||||||||||||||||||||||||||||||
| Royce International Micro-Cap Fund | 1.25% | N/A | 1.64% | N/A | N/A | N/A | N/A | N/A | – | 41,449 | |||||||||||||||||||||||||||||||
| Royce International Premier Fund | 1.00% | 1.19% | 1.44% | 2.19% | N/A | N/A | 1.74% | 1.49% | 372,084 | 3,553 | |||||||||||||||||||||||||||||||
| Royce Low-Priced Stock Fund | 1.00% | 1.24% | 1.49% | N/A | N/A | N/A | 1.84% | 1.59% | 1,477,143 | – | |||||||||||||||||||||||||||||||
| Royce Micro-Cap Fund | 1.25% | 1.49% | 1.61% | N/A | N/A | N/A | N/A | N/A | 1,413,631 | – | |||||||||||||||||||||||||||||||
| Royce Micro-Cap Opportunity Fund | 1.00% | 1.24% | 1.49% | N/A | N/A | N/A | N/A | N/A | 233,753 | – | |||||||||||||||||||||||||||||||
| Royce Opportunity Fund | 1.00% | N/A | 1.49% | N/A | N/A | N/A | N/A | N/A | 7,321,859 | – | |||||||||||||||||||||||||||||||
| Royce Pennsylvania Mutual Fund | 0.76% 2 | N/A | N/A | N/A | N/A | N/A | N/A | N/A | 8,945,342 | – | |||||||||||||||||||||||||||||||
| Royce Premier Fund | 0.99% | N/A | 1.49% | N/A | N/A | N/A | N/A | N/A | 11,141,528 | – | |||||||||||||||||||||||||||||||
| Royce Small-Cap Leaders Fund | 1.00% | N/A | 1.49% | N/A | N/A | N/A | 1.84% | 1.59% | 478,016 | – | |||||||||||||||||||||||||||||||
| Royce Small-Cap Value Fund | 1.00% | 1.24% | 1.49% | N/A | N/A | N/A | N/A | 1.99% | 2,031,607 | – | |||||||||||||||||||||||||||||||
| Royce Small/Mid-Cap Premier Fund | 0.85% | N/A | N/A | 2.09% | N/A | N/A | 1.69% | 1.44% | 957,361 | – | |||||||||||||||||||||||||||||||
| Royce Smaller-Companies Growth Fund | 1.00% | N/A | 1.49% | 2.24% | N/A | N/A | 1.84% | 1.59% | 2,013,224 | – | |||||||||||||||||||||||||||||||
| Royce Special Equity Fund | 1.00% | N/A | 1.39% | N/A | N/A | N/A | N/A | N/A | 7,793,411 | – | |||||||||||||||||||||||||||||||
| Royce Special Equity Multi-Cap Fund | 0.85% | N/A | 1.24% | 1.99% | 0.89% | N/A | N/A | N/A | 444,272 | 28,367 | |||||||||||||||||||||||||||||||
| Royce Total Return Fund | 0.99% | N/A | N/A | N/A | N/A | N/A | N/A | N/A | 13,719,259 | – | |||||||||||||||||||||||||||||||
| 1 | From a base annual rate of 1.00% (0.85% for Royce Dividend Value Fund, Royce Small/Mid-Cap Premier Fund and Royce Special Equity Multi-Cap Fund and 1.25% for Royce International Micro-Cap Fund and Royce Micro-Cap Fund), the annual rates of investment advisory fees payable by each of the Funds, other than Royce Pennsylvania Mutual Fund, are reduced by the indicated amount at the following breakpoints applicable to a Fund’s net assets in excess of $2 billion: more than $2 billion to $4 billion – .05% per annum; more than $4 billion to $6 billion – .10% per annum; over $6 billion – .15% per annum. Effective July 1, 2017, the breakpoints changed to more than $2 billion to $3 billion – .05% per annum; more than $3 billion to $4 billion – .10% per annum; over $4 billion – .15% per annum. |
| 2 | Royce Pennsylvania Mutual Fund’s fees are calculated at the annual rate of 1.00% of the first $50 million of the Fund’s average net assets, 0.875% of the next $50 million of average net assets and 0.75% of average net assets in excess of $100 million. |
| 3 | Committed net annual operating expense ratio cap excludes acquired fund fees and expenses. |
DISTRIBUTOR:
Royce Fund Services, LLC (“RFS”), the distributor of the Trust’s shares, is a wholly owned subsidiary of Royce. RFS is entitled to receive a distribution fees that are computed daily and payable monthly.
| ANNUAL CONTRACTUAL DISTRIBUTION FEE AS A | SIX MONTHS ENDED JUNE 30, 2017 | |||||||||||||||||||||||||||||||||||||||
| PERCENTAGE OF AVERAGE NET ASSETS | Net distribution fees | Distribution fees waived | ||||||||||||||||||||||||||||||||||||||
| Royce Dividend Value Fund – Service Class | 0.25% | $ | 129,450 | $ | 5,394 | |||||||||||||||||||||||||||||||||||
| Royce Dividend Value Fund – Consultant Class | 1.00% | 7,703 | – | |||||||||||||||||||||||||||||||||||||
| Royce Global Financial Services Fund – Service Class | 0.25% | 52,681 | 2,195 | |||||||||||||||||||||||||||||||||||||
| Royce International Micro-Cap Fund – Service Class | 0.25% | 5,306 | 2,984 | |||||||||||||||||||||||||||||||||||||
118 | The Royce Funds 2017 Semiannual Report to Shareholders
DISTRIBUTOR (continued):
| ANNUAL CONTRACTUAL DISTRIBUTION FEE AS A | SIX MONTHS ENDED JUNE 30, 2017 | |||||||||||||||||||||||||||||||||||||||
| PERCENTAGE OF AVERAGE NET ASSETS | Net distribution fees | Distribution fees waived | ||||||||||||||||||||||||||||||||||||||
| Royce International Premier Fund – Service Class | 0.25% | $ | 31,856 | $ | 21,237 | |||||||||||||||||||||||||||||||||||
| Royce International Premier Fund – Consultant Class | 1.00% | 27,888 | – | |||||||||||||||||||||||||||||||||||||
| Royce International Premier Fund – R Class | 0.50% | 142 | – | |||||||||||||||||||||||||||||||||||||
| Royce International Premier Fund – K Class | 0.25% | 6 | – | |||||||||||||||||||||||||||||||||||||
| Royce Low-Priced Stock Fund – Service Class | 0.25% | 301,067 | 26,180 | |||||||||||||||||||||||||||||||||||||
| Royce Low-Priced Stock Fund – R Class | 0.50% | 2,432 | – | |||||||||||||||||||||||||||||||||||||
| Royce Low-Priced Stock Fund – K Class | 0.25% | 409 | – | |||||||||||||||||||||||||||||||||||||
| Royce Micro-Cap Fund – Service Class | 0.25% | 21,256 | – | |||||||||||||||||||||||||||||||||||||
| Royce Micro-Cap Fund – Consultant Class | 1.00% | 150,116 | – | |||||||||||||||||||||||||||||||||||||
| Royce Micro-Cap Opportunity Fund – Service Class | 0.25% | 1,266 | – | |||||||||||||||||||||||||||||||||||||
| Royce Opportunity Fund – Service Class | 0.25% | 93,806 | – | |||||||||||||||||||||||||||||||||||||
| Royce Opportunity Fund – Consultant Class | 1.00% | 101,421 | – | |||||||||||||||||||||||||||||||||||||
| Royce Opportunity Fund – R Class | 0.50% | 95,540 | – | |||||||||||||||||||||||||||||||||||||
| Royce Opportunity Fund – K Class | 0.25% | 8,520 | – | |||||||||||||||||||||||||||||||||||||
| Royce Pennsylvania Mutual Fund – Service Class | 0.25% | 117,211 | – | |||||||||||||||||||||||||||||||||||||
| Royce Pennsylvania Mutual Fund – Consultant Class | 1.00% | 1,910,938 | – | |||||||||||||||||||||||||||||||||||||
| Royce Pennsylvania Mutual Fund – R Class | 0.50% | 40,837 | – | |||||||||||||||||||||||||||||||||||||
| Royce Pennsylvania Mutual Fund – K Class | 0.25% | 3,335 | – | |||||||||||||||||||||||||||||||||||||
| Royce Premier Fund – Service Class | 0.25% | 62,300 | – | |||||||||||||||||||||||||||||||||||||
| Royce Premier Fund – Consultant Class | 1.00% | 157,919 | – | |||||||||||||||||||||||||||||||||||||
| Royce Premier Fund – R Class | 0.50% | 33,486 | – | |||||||||||||||||||||||||||||||||||||
| Royce Small-Cap Leaders Fund – Service Class | 0.25% | 54,850 | 4,770 | |||||||||||||||||||||||||||||||||||||
| Royce Small-Cap Leaders Fund – R Class | 0.50% | 5,082 | – | |||||||||||||||||||||||||||||||||||||
| Royce Small-Cap Leaders Fund – K Class | 0.25% | 189 | – | |||||||||||||||||||||||||||||||||||||
| Royce Small-Cap Value Fund – Service Class | 0.25% | 226,557 | 9,440 | |||||||||||||||||||||||||||||||||||||
| Royce Small-Cap Value Fund – Consultant Class | 1.00% | 75,769 | – | |||||||||||||||||||||||||||||||||||||
| Royce Small-Cap Value Fund – R Class | 0.50% | 40,738 | – | |||||||||||||||||||||||||||||||||||||
| Royce Small-Cap Value Fund – K Class | 0.25% | 2,724 | – | |||||||||||||||||||||||||||||||||||||
| Royce Small/Mid-Cap Premier Fund – Service Class | 0.25% | 86,428 | 67,908 | |||||||||||||||||||||||||||||||||||||
| Royce Small/Mid-Cap Premier Fund – Consultant Class | 1.00% | 55,694 | – | |||||||||||||||||||||||||||||||||||||
| Royce Small/Mid-Cap Premier Fund – R Class | 0.50% | 4,845 | – | |||||||||||||||||||||||||||||||||||||
| Royce Small/Mid-Cap Premier Fund – K Class | 0.25% | 1,559 | – | |||||||||||||||||||||||||||||||||||||
| Royce Smaller-Companies Growth Fund – Service Class | 0.25% | 316,804 | 27,548 | |||||||||||||||||||||||||||||||||||||
| Royce Smaller-Companies Growth Fund – Consultant Class | 1.00% | 53,385 | – | |||||||||||||||||||||||||||||||||||||
| Royce Smaller-Companies Growth Fund – R Class | 0.50% | 1,873 | – | |||||||||||||||||||||||||||||||||||||
| Royce Smaller-Companies Growth Fund – K Class | 0.25% | 54 | – | |||||||||||||||||||||||||||||||||||||
| Royce Special Equity Fund – Service Class | 0.25% | 143,968 | – | |||||||||||||||||||||||||||||||||||||
| Royce Special Equity Fund – Consultant Class | 1.00% | 241,216 | – | |||||||||||||||||||||||||||||||||||||
| Royce Special Equity Multi-Cap Fund – Service Class | 0.25% | 29,211 | 9,225 | |||||||||||||||||||||||||||||||||||||
| Royce Special Equity Multi-Cap Fund – Consultant Class | 1.00% | 23,895 | – | |||||||||||||||||||||||||||||||||||||
| Royce Total Return Fund – Service Class | 0.25% | 175,968 | – | |||||||||||||||||||||||||||||||||||||
| Royce Total Return Fund – Consultant Class | 1.00% | 1,276,639 | – | |||||||||||||||||||||||||||||||||||||
| Royce Total Return Fund – R Class | 0.50% | 131,181 | – | |||||||||||||||||||||||||||||||||||||
| Royce Total Return Fund – K Class | 0.25% | 47,182 | – | |||||||||||||||||||||||||||||||||||||
Purchases and Sales of Investment Securities:
For the six months ended June 30, 2017, the costs of purchases and the proceeds from sales of investment securities, other than short-term securities and collateral received for securities loaned, were as follows:
| PURCHASES | SALES1 | ||||||||
| Royce Dividend Value Fund | $ | 22,907,495 | $ | 51,286,192 | |||||
| Royce Global Financial Services Fund | 4,768,701 | 6,054,689 | |||||||
| Royce International Micro-Cap Fund | 3,431,134 | 2,936,402 | |||||||
| Royce International Premier Fund | 29,071,739 | 16,449,906 | |||||||
| Royce Low-Priced Stock Fund | 48,050,290 | 79,836,489 | |||||||
| Royce Micro-Cap Fund | 36,236,124 | 50,209,784 | |||||||
| Royce Micro-Cap Opportunity Fund | 17,220,337 | 17,863,055 | |||||||
| Royce Opportunity Fund | 277,469,328 | 380,031,955 | |||||||
| Royce Pennsylvania Mutual Fund | 369,098,207 | 569,741,205 | |||||||
| Royce Premier Fund | 69,840,269 | 247,779,395 | |||||||
The Royce Funds 2017 Semiannual Report to Shareholders | 119
Notes to Financial Statements (unaudited) (continued)
Purchases and Sales of Investment Securities (continued):
| PURCHASES | SALES1 | |||||||
| Royce Small-Cap Leaders Fund | $ | 28,267,241 | $ | 40,914,735 | ||||
| Royce Small-Cap Value Fund | 117,189,900 | 175,130,699 | ||||||
| Royce Small/Mid-Cap Premier Fund | 72,247,495 | 60,956,724 | ||||||
| Royce Smaller-Companies Growth Fund | 116,113,322 | 194,869,364 | ||||||
| Royce Special Equity Fund | 150,035,734 | 171,187,721 | ||||||
| Royce Special Equity Multi-Cap Fund | 14,110,423 | 23,417,946 | ||||||
| Royce Total Return Fund | 169,084,861 | 416,398,833 | ||||||
| 1 | Excludes the value of securities delivered as a result of redemptions-in-kind. |
Cross trades were executed by the Funds pursuant to Rule 17a-7 under the 1940 Act. Cross trading is the buying or selling of portfolio securities between funds to which Royce serves as investment adviser. At its regularly scheduled quarterly meetings, the Board reviews such transactions as of the most recent calendar quarter for compliance with the requirements and restrictions set forth by Rule 17a-7. Cross trades for the six months ended June 30, 2017, were as follows:
| COST OF PURCHASES | PROCEEDS FROM SALES | REALIZED GAIN (LOSS) | |||||||||||
| Royce Dividend Value Fund | $ | – | $ | 13,763,919 | $ | 486,027 | |||||||
| Royce Low-Priced Stock Fund | – | 79,237 | 25,944 | ||||||||||
| Royce Micro-Cap Fund | – | 174,983 | 6,301 | ||||||||||
| Royce Opportunity Fund | 1,439,990 | 552,500 | 307,921 | ||||||||||
| Royce Pennsylvania Mutual Fund | 552,500 | 4,521,828 | 1,089,055 | ||||||||||
| Royce Premier Fund | 1,142,289 | – | – | ||||||||||
| Royce Smaller-Companies Growth Fund | – | 2,116,329 | (2,174,137 | ) | |||||||||
| Royce Total Return Fund | 13,763,919 | – | – | ||||||||||
Redemptions-In-Kind:
The Funds may make payment for Fund shares redeemed wholly or in part by distributing portfolio securities to shareholders. The net realized gain will not be realized for tax purposes. For the six months ended June 30, 2017, the following funds had redemptions in kind:
| PROCEEDS | REALIZED GAIN (LOSS) | |||||||
| Royce Premier Fund | $ | 140,719,649 | $ | 80,482,308 | ||||
| Royce Total Return Fund | 71,247,386 | 37,568,359 | ||||||
Class Specific Expenses:
Class specific expenses, for Funds with multiple classes, were as follows for the six months ended June 30, 2017:
| CLASS LEVEL | |||||||||||||||||||||||||||
| EXPENSES | |||||||||||||||||||||||||||
| REIMBURSED BY | |||||||||||||||||||||||||||
| NET DISTRIBUTION | SHAREHOLDER | SHAREHOLDER | TRANSFER AGENT | INVESTMENT | |||||||||||||||||||||||
| FEES | SERVICING | REPORTS | REGISTRATION | BALANCE CREDITS | TOTAL | ADVISER | |||||||||||||||||||||
| Royce Dividend Value Fund – | |||||||||||||||||||||||||||
Investment Class | $ | – | $ | 64,169 | $ | 16,078 | $ | 8,106 | $ | (74 | ) | $ | 88,279 | $ | – | ||||||||||||
| Royce Dividend Value Fund – Service Class | 129,450 | 80,775 | 27,971 | 8,204 | (1,126 | ) | 245,274 | 1,650 | |||||||||||||||||||
| Royce Dividend Value Fund – | |||||||||||||||||||||||||||
Consultant Class | 7,703 | 3,546 | 339 | 5,528 | (11 | ) | 17,105 | 7,858 | |||||||||||||||||||
| Royce Dividend Value Fund – | |||||||||||||||||||||||||||
Institutional Class | – | 3,027 | 9 | 5,109 | (2 | ) | 8,143 | 8,143 | |||||||||||||||||||
| 137,153 | 151,517 | 44,397 | 26,947 | (1,213 | ) | 17,651 | |||||||||||||||||||||
| Royce Global Financial Services Fund – | |||||||||||||||||||||||||||
Service Class | 52,681 | 32,845 | 7,373 | 9,248 | (63 | ) | 102,084 | 3,117 | |||||||||||||||||||
| Royce Global Financial Services Fund – | |||||||||||||||||||||||||||
Institutional Class | – | 3,065 | 18 | 10,054 | (2 | ) | 13,135 | 13,135 | |||||||||||||||||||
| 52,681 | 35,910 | 7,391 | 19,302 | (65 | ) | 16,252 | |||||||||||||||||||||
| Royce International Premier Fund – | |||||||||||||||||||||||||||
Investment Class | – | 13,381 | 2,329 | 6,794 | (20 | ) | 22,484 | 22,484 | |||||||||||||||||||
| Royce International Premier Fund – | |||||||||||||||||||||||||||
Service Class | 31,856 | 30,093 | 5,974 | 7,599 | (226 | ) | 75,296 | 21,341 | |||||||||||||||||||
| Royce International Premier Fund – | |||||||||||||||||||||||||||
Consultant Class | 27,888 | 6,613 | 1,207 | 6,199 | (49 | ) | 41,858 | 13,872 | |||||||||||||||||||
| Royce International Premier Fund – R Class | 142 | 3,050 | 1 | 1,682 | (1 | ) | 4,874 | 4,715 | |||||||||||||||||||
| Royce International Premier Fund – K Class | 6 | 686 | – | 1,939 | – | 2,631 | 2,623 | ||||||||||||||||||||
| 59,892 | 53,823 | 9,511 | 24,213 | (296 | ) | 65,035 | |||||||||||||||||||||
120 | The Royce Funds 2017 Semiannual Report to Shareholders
Class Specific Expenses (continued):
| CLASS LEVEL | ||||||||||||||||||||||||||||
| EXPENSES | ||||||||||||||||||||||||||||
| REIMBURSED BY | ||||||||||||||||||||||||||||
| NET DISTRIBUTION | SHAREHOLDER | SHAREHOLDER | TRANSFER AGENT | INVESTMENT | ||||||||||||||||||||||||
| FEES | SERVICING | REPORTS | REGISTRATION | BALANCE CREDITS | TOTAL | ADVISER | ||||||||||||||||||||||
| Royce Low-Priced Stock Fund – | ||||||||||||||||||||||||||||
Investment Class | $ | – | $ | 17,983 | $ | 4,020 | $ | 5,651 | $ | (32 | ) | $ | 27,622 | $ | 10,520 | |||||||||||||
| Royce Low-Priced Stock Fund – Service Class | 301,067 | 202,755 | 47,170 | 9,904 | (913 | ) | 559,983 | 24,881 | ||||||||||||||||||||
| Royce Low-Priced Stock Fund – | ||||||||||||||||||||||||||||
Institutional Class | – | 3,222 | 2,901 | 5,709 | (4 | ) | 11,828 | – | ||||||||||||||||||||
| Royce Low-Priced Stock Fund – R Class | 2,432 | 4,238 | 417 | 2,134 | (7 | ) | 9,214 | 5,527 | ||||||||||||||||||||
| Royce Low-Priced Stock Fund – K Class | 409 | 1,271 | 64 | 1,520 | (1 | ) | 3,263 | 2,425 | ||||||||||||||||||||
| 303,908 | 229,469 | 54,572 | 24,918 | (957 | ) | 43,353 | ||||||||||||||||||||||
| Royce Micro-Cap Fund – Investment Class | – | 102,468 | 47,269 | 8,591 | (730 | ) | 157,598 | 26,512 | ||||||||||||||||||||
| Royce Micro-Cap Fund – Service Class | 21,256 | 12,585 | 3,011 | 5,736 | (19 | ) | 42,569 | 20,013 | ||||||||||||||||||||
| Royce Micro-Cap Fund – Consultant Class | 150,116 | 25,043 | 5,826 | 6,159 | (82 | ) | 187,062 | – | ||||||||||||||||||||
| 171,372 | 140,096 | 56,106 | 20,486 | (831 | ) | 46,525 | ||||||||||||||||||||||
| Royce Micro-Cap Opportunity Fund – | ||||||||||||||||||||||||||||
Investment Class | – | 18,473 | 2,042 | 9,172 | (15 | ) | 29,672 | 4,454 | ||||||||||||||||||||
| Royce Micro-Cap Opportunity Fund – | ||||||||||||||||||||||||||||
Service Class | 1,266 | 4,303 | 306 | 5,437 | (2 | ) | 11,310 | 9,486 | ||||||||||||||||||||
| 1,266 | 22,776 | 2,348 | 14,609 | (17 | ) | 13,940 | ||||||||||||||||||||||
| Royce Opportunity Fund – Investment Class | – | 392,998 | 60,520 | 10,163 | (1,327 | ) | 462,354 | – | ||||||||||||||||||||
| Royce Opportunity Fund – Service Class | 93,806 | 61,080 | 21,850 | 6,697 | (59 | ) | 183,374 | 22,101 | ||||||||||||||||||||
| Royce Opportunity Fund – Consultant Class | 101,421 | 13,567 | 2,783 | 5,466 | (89 | ) | 123,148 | – | ||||||||||||||||||||
| Royce Opportunity Fund – Institutional Class | – | 3,842 | 15,759 | 8,778 | (27 | ) | 28,352 | – | ||||||||||||||||||||
| Royce Opportunity Fund – R Class | 95,540 | 40,098 | 1,980 | 4,818 | (36 | ) | 142,400 | – | ||||||||||||||||||||
| Royce Opportunity Fund – K Class | 8,520 | 9,825 | 681 | 5,055 | (22 | ) | 24,059 | – | ||||||||||||||||||||
| 299,287 | 521,410 | 103,573 | 40,977 | (1,560 | ) | 22,101 | ||||||||||||||||||||||
| Royce Pennsylvania Mutual Fund – | ||||||||||||||||||||||||||||
Investment Class | – | 707,804 | 165,601 | 11,486 | (4,054 | ) | 880,837 | – | ||||||||||||||||||||
| Royce Pennsylvania Mutual Fund – | ||||||||||||||||||||||||||||
Service Class | 117,211 | 72,762 | 11,907 | 7,672 | (114 | ) | 209,438 | – | ||||||||||||||||||||
| Royce Pennsylvania Mutual Fund – | ||||||||||||||||||||||||||||
Consultant Class | 1,910,938 | 196,328 | 49,956 | 7,532 | (966 | ) | 2,163,788 | – | ||||||||||||||||||||
| Royce Pennsylvania Mutual Fund – | ||||||||||||||||||||||||||||
Institutional Class | – | 4,223 | 13,372 | 7,434 | (49 | ) | 24,980 | – | ||||||||||||||||||||
| Royce Pennsylvania Mutual Fund – R Class | 40,837 | 20,684 | 1,922 | 3,986 | (59 | ) | 67,370 | – | ||||||||||||||||||||
| Royce Pennsylvania Mutual Fund – K Class | 3,335 | 6,022 | 547 | 5,098 | (9 | ) | 14,993 | – | ||||||||||||||||||||
| 2,072,321 | 1,007,823 | 243,305 | 43,208 | (5,251 | ) | – | ||||||||||||||||||||||
| Royce Premier Fund – Investment Class | – | 753,069 | 212,671 | 12,732 | (2,315 | ) | 976,157 | – | ||||||||||||||||||||
| Royce Premier Fund – Service Class | 62,300 | 37,902 | 6,450 | 5,827 | (141 | ) | 112,338 | 3,491 | ||||||||||||||||||||
| Royce Premier Fund – Consultant Class | 157,919 | 17,278 | 3,777 | 5,441 | (81 | ) | 184,334 | – | ||||||||||||||||||||
| Royce Premier Fund – Institutional Class | – | 3,852 | 11,785 | 6,998 | (16 | ) | 22,619 | – | ||||||||||||||||||||
| Royce Premier Fund – W Class | – | 68,505 | 23,201 | 6,809 | (229 | ) | 98,286 | – | ||||||||||||||||||||
| Royce Premier Fund – R Class | 33,486 | 17,407 | 544 | 2,205 | (15 | ) | 53,627 | – | ||||||||||||||||||||
| 253,705 | 898,013 | 258,428 | 40,012 | (2,797 | ) | 3,491 | ||||||||||||||||||||||
| Royce Small-Cap Leaders Fund – | ||||||||||||||||||||||||||||
Investment Class | – | 15,293 | 6,477 | 7,485 | (42 | ) | 29,213 | – | ||||||||||||||||||||
| Royce Small-Cap Leaders Fund – | ||||||||||||||||||||||||||||
Service Class | 54,850 | 40,214 | 9,723 | 7,388 | (163 | ) | 112,012 | 19,721 | ||||||||||||||||||||
| Royce Small-Cap Leaders Fund – R Class | 5,082 | 5,303 | 858 | 2,806 | (39 | ) | 14,010 | 6,533 | ||||||||||||||||||||
| Royce Small-Cap Leaders Fund – K Class | 189 | 1,063 | 310 | 1,488 | (1 | ) | 3,049 | 2,679 | ||||||||||||||||||||
| 60,121 | 61,873 | 17,368 | 19,167 | (245 | ) | 28,933 | ||||||||||||||||||||||
The Royce Funds 2017 Semiannual Report to Shareholders | 121
Notes to Financial Statements (unaudited) (continued)
Class Specific Expenses (continued):
| CLASS LEVEL | |||||||||||||||||||||||||||
| EXPENSES | |||||||||||||||||||||||||||
| REIMBURSED BY | |||||||||||||||||||||||||||
| NET DISTRIBUTION | SHAREHOLDER | SHAREHOLDER | TRANSFER AGENT | INVESTMENT | |||||||||||||||||||||||
| FEES | SERVICING | REPORTS | REGISTRATION | BALANCE CREDITS | TOTAL | ADVISER | |||||||||||||||||||||
| Royce Small-Cap Value Fund – | |||||||||||||||||||||||||||
Investment Class | $ | – | $ | 47,138 | $ | 8,451 | $ | 6,155 | $ | (55 | ) | $ | 61,689 | $ | 6,462 | ||||||||||||
| Royce Small-Cap Value Fund – Service Class | 226,557 | 148,789 | 31,556 | 7,554 | (579 | ) | 413,877 | 20,405 | |||||||||||||||||||
| Royce Small-Cap Value Fund – | |||||||||||||||||||||||||||
Consultant Class | 75,769 | 11,107 | 2,139 | 5,536 | (43 | ) | 94,508 | – | |||||||||||||||||||
| Royce Small-Cap Value Fund – | |||||||||||||||||||||||||||
Institutional Class | – | 3,302 | 1,317 | 7,116 | (10 | ) | 11,725 | – | |||||||||||||||||||
| Royce Small-Cap Value Fund – R Class | 40,738 | 20,620 | 1,061 | 2,603 | (36 | ) | 64,986 | – | |||||||||||||||||||
| Royce Small-Cap Value Fund – K Class | 2,724 | 6,405 | 1,241 | 5,069 | (7 | ) | 15,432 | 5,431 | |||||||||||||||||||
| 345,788 | 237,361 | 45,765 | 34,033 | (730 | ) | 32,298 | |||||||||||||||||||||
| Royce Small/Mid-Cap Premier Fund – | |||||||||||||||||||||||||||
Investment Class | – | 9,021 | 1,302 | 6,980 | (24 | ) | 17,279 | – | |||||||||||||||||||
| Royce Small/Mid-Cap Premier Fund – | |||||||||||||||||||||||||||
Service Class | 86,428 | 46,785 | 23,845 | 8,203 | (741 | ) | 164,520 | – | |||||||||||||||||||
| Royce Small/Mid-Cap Premier Fund – | |||||||||||||||||||||||||||
Consultant Class | 55,694 | 8,430 | 2,867 | 5,724 | (73 | ) | 72,642 | 8,408 | |||||||||||||||||||
| Royce Small/Mid-Cap Premier Fund – R Class | 4,845 | 5,154 | 359 | 2,292 | (12 | ) | 12,638 | 5,343 | |||||||||||||||||||
| Royce Small/Mid-Cap Premier Fund – K Class | 1,559 | 2,072 | 183 | 1,625 | – | 5,439 | 2,254 | ||||||||||||||||||||
| 148,526 | 71,462 | 28,556 | 24,824 | (850 | ) | 16,005 | |||||||||||||||||||||
| Royce Smaller-Companies Growth Fund – | |||||||||||||||||||||||||||
Investment Class | – | 49,417 | 19,640 | 6,784 | (77 | ) | 75,764 | – | |||||||||||||||||||
| Royce Smaller-Companies Growth Fund – | |||||||||||||||||||||||||||
Service Class | 316,804 | 225,857 | 52,113 | 9,815 | (771 | ) | 603,818 | 27,619 | |||||||||||||||||||
| Royce Smaller-Companies Growth Fund – | |||||||||||||||||||||||||||
Consultant Class | 53,385 | 10,228 | 2,029 | 5,596 | (42 | ) | 71,196 | 8,854 | |||||||||||||||||||
| Royce Smaller-Companies Growth Fund – | |||||||||||||||||||||||||||
Institutional Class | – | 3,450 | 1,401 | 5,807 | (6 | ) | 10,652 | – | |||||||||||||||||||
| Royce Smaller-Companies Growth Fund – | |||||||||||||||||||||||||||
R Class | 1,873 | 3,925 | 338 | 2,503 | (8 | ) | 8,631 | 5,753 | |||||||||||||||||||
| Royce Smaller-Companies Growth Fund – | |||||||||||||||||||||||||||
K Class | 54 | 1,002 | 16 | 1,488 | – | 2,560 | 2,446 | ||||||||||||||||||||
| 372,116 | 293,879 | 75,537 | 31,993 | (904 | ) | 44,672 | |||||||||||||||||||||
Royce Special Equity Fund – Investment Class | – | 518,031 | 97,811 | 14,740 | (1,344 | ) | 629,238 | – | |||||||||||||||||||
| Royce Special Equity Fund – Service Class | 143,968 | 82,624 | 20,992 | 5,966 | (762 | ) | 252,788 | 58,913 | |||||||||||||||||||
| Royce Special Equity Fund – Consultant Class | 241,216 | 20,792 | 4,613 | 5,486 | (109 | ) | 271,998 | – | |||||||||||||||||||
| Royce Special Equity Fund – | |||||||||||||||||||||||||||
Institutional Class | – | 5,009 | 4,651 | 7,013 | (55 | ) | 16,618 | – | |||||||||||||||||||
| 385,184 | 626,456 | 128,067 | 33,205 | (2,270 | ) | 58,913 | |||||||||||||||||||||
| Royce Special Equity Multi-Cap Fund – | |||||||||||||||||||||||||||
Investment Class | – | 10,350 | 1,566 | 6,892 | (34 | ) | 18,774 | – | |||||||||||||||||||
| Royce Special Equity Multi-Cap Fund – | |||||||||||||||||||||||||||
Service Class | 29,211 | 20,571 | 3,166 | 6,689 | (79 | ) | 59,558 | 5,472 | |||||||||||||||||||
| Royce Special Equity Multi-Cap Fund – | |||||||||||||||||||||||||||
Consultant Class | 23,895 | 4,558 | 512 | 5,866 | (11 | ) | 34,820 | 8,517 | |||||||||||||||||||
| Royce Special Equity Multi-Cap Fund – | |||||||||||||||||||||||||||
Institutional Class | – | 3,085 | 19 | 6,485 | (2 | ) | 9,587 | 9,587 | |||||||||||||||||||
| 53,106 | 38,564 | 5,263 | 25,932 | (126 | ) | 23,576 | |||||||||||||||||||||
| Royce Total Return Fund – Investment Class | – | 1,067,604 | 220,799 | 17,031 | (2,504 | ) | 1,302,930 | – | |||||||||||||||||||
| Royce Total Return Fund – Service Class | 175,968 | 97,384 | 13,299 | 6,744 | (80 | ) | 293,315 | – | |||||||||||||||||||
| Royce Total Return Fund – Consultant Class | 1,276,639 | 118,978 | 28,978 | 7,186 | (585 | ) | 1,431,196 | – | |||||||||||||||||||
| Royce Total Return Fund – Institutional Class | – | 5,299 | 10,039 | 6,870 | (63 | ) | 22,145 | – | |||||||||||||||||||
| Royce Total Return Fund – W Class | – | 54,969 | 20,860 | 7,280 | (42 | ) | 83,067 | – | |||||||||||||||||||
| Royce Total Return Fund – R Class | 131,181 | 56,024 | 3,649 | 2,769 | (117 | ) | 193,506 | – | |||||||||||||||||||
| Royce Total Return Fund – K Class | 47,182 | 51,705 | 3,589 | 5,380 | (39 | ) | 107,817 | – | |||||||||||||||||||
| 1,630,970 | 1,451,963 | 301,213 | 53,260 | (3,430 | ) | – | |||||||||||||||||||||
122 | The Royce Funds 2017 Semiannual Report to Shareholders
Tax Information:
At June 30, 2017, net unrealized appreciation (depreciation) based on identified cost for tax purposes was as follows:
| NET UNREALIZED | GROSS UNREALIZED | ||||||||||||||
| TAX BASIS COST | APPRECIATION (DEPRECIATION) | Appreciation | Depreciation | ||||||||||||
| Royce Dividend Value Fund | $ | 142,387,862 | $ | 56,863,225 | $ | 64,592,880 | $ | 7,729,655 | |||||||
| Royce Global Financial Services Fund | 41,779,413 | 9,446,153 | 11,876,853 | 2,430,700 | |||||||||||
| Royce International Micro-Cap Fund | 6,933,651 | 469,015 | 762,878 | 293,863 | |||||||||||
| Royce International Premier Fund | 79,094,541 | 15,106,647 | 16,950,056 | 1,843,409 | |||||||||||
| Royce Low-Priced Stock Fund | 256,509,342 | 45,942,292 | 68,881,442 | 22,939,150 | |||||||||||
| Royce Micro-Cap Fund | 194,500,509 | 38,256,787 | 55,994,612 | 17,737,825 | |||||||||||
| Royce Micro-Cap Opportunity Fund | 42,673,477 | 7,666,602 | 10,084,740 | 2,418,138 | |||||||||||
| Royce Opportunity Fund | 1,378,230,639 | 214,228,065 | 373,230,484 | 159,002,419 | |||||||||||
| Royce Pennsylvania Mutual Fund | 1,545,712,509 | 888,552,983 | 941,482,772 | 52,929,789 | |||||||||||
| Royce Premier Fund | 1,151,917,633 | 1,132,691,602 | 1,136,096,860 | 3,405,258 | |||||||||||
| Royce Small-Cap Leaders Fund | 73,045,118 | 18,333,807 | 19,329,261 | 995,454 | |||||||||||
| Royce Small-Cap Value Fund | 328,468,118 | 43,517,227 | 57,227,426 | 13,710,199 | |||||||||||
| Royce Small/Mid-Cap Premier Fund | 185,462,012 | 42,816,268 | 45,130,389 | 2,314,121 | |||||||||||
| Royce Smaller-Companies Growth Fund | 329,863,623 | 106,687,222 | 112,306,245 | 5,619,023 | |||||||||||
| Royce Special Equity Fund | 1,109,289,383 | 423,511,663 | 440,952,642 | 17,440,979 | |||||||||||
| Royce Special Equity Multi-Cap Fund | 91,402,847 | 19,376,236 | 22,254,900 | 2,878,664 | |||||||||||
| Royce Total Return Fund | 1,551,178,990 | 1,058,512,860 | 1,123,340,656 | 64,827,796 | |||||||||||
Transactions in Affiliated Companies:
An “Affiliated Company,” as defined in the Investment Company Act of 1940, is a company in which a fund owns 5% or more of the company’s outstanding voting securities at any time during the period. The following transactions were effected in shares of such companies for the six months ended June 30, 2017:
| CHANGE IN NET | ||||||||||||||||||||||||||||||||||||
| UNREALIZED | ||||||||||||||||||||||||||||||||||||
| SHARES | MARKET VALUE | COST OF | PROCEEDS | APPRECIATION | REALIZED GAIN | DIVIDEND | SHARES | MARKET VALUE | ||||||||||||||||||||||||||||
| AFFILIATED COMPANY | 12/31/16 | 12/31/16 | PURCHASES | FROM SALES | (DEPRECIATION) | (LOSS) | INCOME | 6/30/17 | 6/30/17 | |||||||||||||||||||||||||||
| Royce Opportunity Fund | ||||||||||||||||||||||||||||||||||||
| Amtech Systems1 | 697,399 | $ | 2,963,946 | $ | – | $ | 640,195 | $ | 4,657,280 | $ | (1,844,953 | ) | $ | – | ||||||||||||||||||||||
| Dixie Group | 839,935 | 3,023,766 | 29,231 | – | 761,810 | – | – | 847,735 | $ | 3,814,807 | ||||||||||||||||||||||||||
| Echelon Corporation | 230,152 | 1,081,714 | – | – | 121,981 | – | – | 230,152 | 1,203,695 | |||||||||||||||||||||||||||
| Layne Christensen1 | 978,512 | 10,636,425 | 312,397 | 237,978 | (2,083,689 | ) | 2,093 | – | ||||||||||||||||||||||||||||
| LMI Aerospace1 | 831,730 | 7,169,513 | – | 11,369,995 | 6,890,852 | (2,690,370 | ) | – | ||||||||||||||||||||||||||||
| Noranda Aluminum Holding Corporation | 593,726 | 14,131 | – | – | (1,069 | ) | – | – | 593,726 | 13,062 | ||||||||||||||||||||||||||
| Northwest Pipe | 461,994 | 7,955,537 | 469,114 | 28,255 | (426,824 | ) | (13,131 | ) | – | 489,326 | 7,956,441 | |||||||||||||||||||||||||
| SigmaTron International | 344,772 | 1,630,772 | – | 30,304 | 689,191 | (65,968 | ) | – | 337,947 | 2,223,691 | ||||||||||||||||||||||||||
| VOXX International Cl. A | 1,283,078 | 6,030,467 | 139,915 | 691,897 | 4,628,480 | (44,105 | ) | – | 1,227,178 | 10,062,860 | ||||||||||||||||||||||||||
| 40,506,271 | 15,238,012 | (4,656,434 | ) | – | 25,274,556 | |||||||||||||||||||||||||||||||
| Royce Pennsylvania Mutual Fund | ||||||||||||||||||||||||||||||||||||
| Preformed Line Products | 290,278 | 16,870,957 | – | – | (3,396,252 | ) | – | 116,111 | 290,278 | 13,474,705 | ||||||||||||||||||||||||||
| STRATTEC SECURITY | 245,247 | 9,883,454 | – | 83,382 | (1,096,476 | ) | (110,352 | ) | 68,417 | 242,747 | 8,593,244 | |||||||||||||||||||||||||
| 26,754,411 | (4,492,728 | ) | (110,352 | ) | 184,528 | 22,067,949 | ||||||||||||||||||||||||||||||
| Royce Special Equity Fund | ||||||||||||||||||||||||||||||||||||
| Bassett Furniture Industries | 735,000 | 22,344,000 | 1,695,330 | – | 6,320,670 | – | 153,500 | 800,000 | 30,360,000 | |||||||||||||||||||||||||||
| Bowl America Cl. A | 343,000 | 5,916,750 | – | – | (946,680 | ) | – | 116,620 | 343,000 | 4,970,070 | ||||||||||||||||||||||||||
| Capella Education | 577,700 | 50,722,060 | 3,325,770 | 2,784,875 | (2,318,995 | ) | 1,132,040 | 463,382 | 585,000 | 50,076,000 | ||||||||||||||||||||||||||
| Computer Services | 739,862 | 28,743,639 | 669,308 | – | 6,095,553 | – | 419,786 | 755,500 | 35,508,500 | |||||||||||||||||||||||||||
| CSS Industries | 885,000 | 23,956,950 | – | – | (805,350 | ) | – | 354,000 | 885,000 | 23,151,600 | ||||||||||||||||||||||||||
| Flexsteel Industries | 536,000 | 33,055,120 | 1,294,491 | – | (3,939,791 | ) | – | 224,508 | 562,000 | 30,409,820 | ||||||||||||||||||||||||||
| Hooker Furniture | 1,110,000 | 42,124,500 | – | – | 3,552,000 | – | 266,400 | 1,110,000 | 45,676,500 | |||||||||||||||||||||||||||
| Hurco Companies | 525,000 | 17,377,500 | – | – | 866,250 | – | 105,000 | 525,000 | 18,243,750 | |||||||||||||||||||||||||||
| John B. Sanfilippo & Son | 507,500 | 35,722,925 | 11,508,718 | – | (4,316,843 | ) | – | – | 680,000 | 42,914,800 | ||||||||||||||||||||||||||
| National Presto Industries | 450,000 | 47,880,000 | 1,369,728 | – | 2,022,272 | – | 2,475,000 | 464,000 | 51,272,000 | |||||||||||||||||||||||||||
| Park Electrochemical | 1,950,000 | 36,367,500 | 84,004 | – | (440,404 | ) | – | 390,500 | 1,955,000 | 36,011,100 | ||||||||||||||||||||||||||
| Resources Connection | 1,580,000 | 30,415,000 | 2,904,295 | 4,826,120 | (8,507,959 | ) | 633,284 | 316,382 | 1,505,000 | 20,618,500 | ||||||||||||||||||||||||||
| Standard Motor Products | 1,295,000 | 68,919,900 | 3,126,665 | 4,083,168 | (2,767,558 | ) | 1,645,761 | 476,900 | 1,280,000 | 66,841,600 | ||||||||||||||||||||||||||
| 443,545,844 | (5,186,835 | ) | 3,411,085 | 5,761,978 | 456,054,240 | |||||||||||||||||||||||||||||||
The Royce Funds 2017 Semiannual Report to Shareholders | 123
Notes to Financial Statements (unaudited) (continued)
Transactions in Affiliated Companies (continued):
| CHANGE IN NET | ||||||||||||||||||||||||||||||||||||
| UNREALIZED | ||||||||||||||||||||||||||||||||||||
| SHARES | MARKET VALUE | COST OF | PROCEEDS | APPRECIATION | REALIZED GAIN | DIVIDEND | SHARES | MARKET VALUE | ||||||||||||||||||||||||||||
| AFFILIATED COMPANY | 12/31/16 | 12/31/16 | PURCHASES | FROM SALES | (DEPRECIATION) | (LOSS) | INCOME | 6/30/17 | 6/30/17 | |||||||||||||||||||||||||||
| Royce Total Return Fund | ||||||||||||||||||||||||||||||||||||
| Landauer 1 | 496,600 | $ | 23,886,460 | $ | – | $ | 1,206,307 | $ | 1,607,613 | $ | 473,251 | $ | 270,174 | |||||||||||||||||||||||
| Mueller (Paul) Company | 112,500 | 3,127,500 | – | 87,481 | 86,546 | (5,450 | ) | – | 109,436 | $ | 3,121,115 | |||||||||||||||||||||||||
| Starrett (L.S.) Company (The) Cl. A | 491,000 | 4,566,300 | – | 111,767 | (271,182 | ) | (75,776 | ) | 98,114 | 477,625 | 4,107,575 | |||||||||||||||||||||||||
| 31,580,260 | 1,422,977 | 392,025 | 368,288 | 7,228,690 | ||||||||||||||||||||||||||||||||
| 1 | Not an Affiliated Company at June 30, 2017. |
Merger Information:
On February 26, 2016, Royce International Premier Fund acquired all of the assets and assumed all of the liabilities of Royce European Small-Cap Fund and Royce Global Value Fund. Based on the opinion of counsel delivered to Royce International Premier Fund, the acquisition, which was approved by shareholders of Royce European Small-Cap Fund and Royce Global Value Fund on January 21, 2016, qualified as a tax-free reorganization for federal income tax purposes with no gain or loss recognized to the Funds or their shareholders. Royce European Small-Cap Fund’s net assets of $19,629,421, including $131,656 of unrealized depreciation and Royce Global Value Fund’s net assets of $43,193,013, including $2,001,574 of unrealized depreciation, were combined with Royce International Premier Fund for total net assets after the acquisition of $74,526,547.
124 | The Royce Funds 2017 Semiannual Report to Shareholders
Understanding Your Fund’s Expenses (unaudited)
As a shareholder of a mutual fund, you pay ongoing expenses, including management fees and other Fund expenses including, for some funds, distribution and/or service (12b-1) fees. Using the information below, you can estimate how these ongoing expenses (in dollars) affect your investment and compare them with the ongoing expenses of other funds. You may also incur one-time transaction expenses, including redemption fees, which are not shown in this section and would result in higher total costs. The example is based on an investment of $1,000 invested at January 1, 2017, and held for the entire six-month period ended June 30, 2017. Service, Consultant, R and K Class shares are generally available only through certain brokers or retirement plan administrators who receive distribution and/or service fees from the Fund for services that they perform. Institutional and W Class shares are generally available only to institutions or intermediaries with a minimum account size of $1 million.
Actual Expenses
The first part of the table below provides information about actual account values and actual expenses. You may use the information in this section, together with the amount you invested, to estimate the expenses that you paid over the period. Simply divide your account value at June 30, 2017, by $1,000 (for example, an $8,600 account value divided by $1,000 = 8.6), then multiply the result by the number under the heading entitled “Expenses Paid During the Period” to estimate the expenses you paid on your account during this period.
Hypothetical Example for Comparison Purposes
The second part of the table below provides information about hypothetical account values and hypothetical expenses based on the Fund’s actual expense ratio and an assumed rate of return of 5% per year before expenses, which is not the Fund’s actual return. The hypothetical account values and expenses may not be used to estimate the actual ending account balance or expenses you paid for the period. You may use this information to compare the ongoing costs of investing in the Fund and other funds. To do so, compare this 5% hypothetical example with the 5% hypothetical examples that appear in the shareholder reports of the other funds.
Please note that the expenses shown in the table are meant to highlight your ongoing costs only and do not reflect any transactional costs, such as sales charges (loads), redemption fees, or exchange fees. Therefore, this section is useful in comparing ongoing costs only, and will not help you determine the relative total costs of owning different funds. In addition, if these transactional costs were included, your costs would have been higher.
| ACTUAL | HYPOTHETICAL (5% PER YEAR RETURN BEFORE EXPENSES) | ||||||||||||||||||||||||||||
| Beginning Account | Ending Account | Expenses Paid | Beginning Account | Ending Account | Expenses Paid | Annualized Expense | |||||||||||||||||||||||
| Value 1/1/17 | Value 6/30/17 | During the Period1 | Value 1/1/17 | Value 6/30/17 | During the Period1 | Ratio2 | |||||||||||||||||||||||
| Investment Class | |||||||||||||||||||||||||||||
| Royce Dividend Value Fund | $ | 1,000.00 | $ | 1,078.14 | $ | 5.51 | $ | 1,000.00 | $ | 1,019.49 | $ | 5.36 | 1.07 | % | |||||||||||||||
| Royce International Premier Fund | 1,000.00 | 1,224.58 | 6.56 | 1,000.00 | 1,018.89 | 5.96 | 1.19 | % | |||||||||||||||||||||
| Royce Low-Priced Stock Fund | 1,000.00 | 1,010.90 | 6.18 | 1,000.00 | 1,018.65 | 6.21 | 1.24 | % | |||||||||||||||||||||
| Royce Micro-Cap Fund | 1,000.00 | 1,020.13 | 7.46 | 1,000.00 | 1,017.41 | 7.45 | 1.49 | % | |||||||||||||||||||||
| Royce Micro-Cap Opportunity Fund | 1,000.00 | 1,097.73 | 6.45 | 1,000.00 | 1,018.65 | 6.21 | 1.24 | % | |||||||||||||||||||||
| Royce Opportunity Fund | 1,000.00 | 1,081.71 | 6.09 | 1,000.00 | 1,018.94 | 5.91 | 1.18 | % | |||||||||||||||||||||
| Royce Pennsylvania Mutual Fund | 1,000.00 | 1,048.09 | 4.72 | 1,000.00 | 1,020.18 | 4.66 | 0.93 | % | |||||||||||||||||||||
| Royce Premier Fund | 1,000.00 | 1,087.04 | 6.00 | 1,000.00 | 1,019.04 | 5.81 | 1.16 | % | |||||||||||||||||||||
| Royce Small-Cap Leaders Fund | 1,000.00 | 1,012.64 | 6.14 | 1,000.00 | 1,018.70 | 6.16 | 1.23 | % | |||||||||||||||||||||
| Royce Small-Cap Value Fund | 1,000.00 | 958.13 | 6.02 | 1,000.00 | 1,018.65 | 6.21 | 1.24 | % | |||||||||||||||||||||
| Royce Small/Mid-Cap Premier Fund3 | 1,000.00 | 1,057.38 | 5.00 | 1,000.00 | 1,019.93 | 4.91 | 0.98 | % | |||||||||||||||||||||
| Royce Smaller-Companies Growth Fund | 1,000.00 | 1,114.08 | 6.45 | 1,000.00 | 1,018.70 | 6.16 | 1.23 | % | |||||||||||||||||||||
| Royce Special Equity Fund | 1,000.00 | 996.37 | 5.74 | 1,000.00 | 1,019.04 | 5.81 | 1.16 | % | |||||||||||||||||||||
| Royce Special Equity Multi-Cap Fund | 1,000.00 | 1,061.15 | 5.06 | 1,000.00 | 1,019.89 | 4.96 | 0.99 | % | |||||||||||||||||||||
| Royce Total Return Fund | 1,000.00 | 1,027.06 | 5.98 | 1,000.00 | 1,018.89 | 5.96 | 1.19 | % | |||||||||||||||||||||
| Service Class | |||||||||||||||||||||||||||||
| Royce Dividend Value Fund | 1,000.00 | 1,077.18 | 6.90 | 1,000.00 | 1,018.15 | 6.71 | 1.34 | % | |||||||||||||||||||||
| Royce Global Financial Services Fund | 1,000.00 | 1,098.32 | 7.75 | 1,000.00 | 1,017.41 | 7.45 | 1.49 | % | |||||||||||||||||||||
| Royce International Micro-Cap Fund | 1,000.00 | 1,152.30 | 8.75 | 1,000.00 | 1,016.66 | 8.20 | 1.64 | % | |||||||||||||||||||||
| Royce International Premier Fund | 1,000.00 | 1,223.31 | 7.94 | 1,000.00 | 1,017.65 | 7.20 | 1.44 | % | |||||||||||||||||||||
| Royce Low-Priced Stock Fund | 1,000.00 | 1,009.72 | 7.42 | 1,000.00 | 1,017.41 | 7.45 | 1.49 | % | |||||||||||||||||||||
| Royce Micro-Cap Fund | 1,000.00 | 1,018.82 | 8.06 | 1,000.00 | 1,016.81 | 8.05 | 1.61 | % | |||||||||||||||||||||
| Royce Micro-Cap Opportunity Fund | 1,000.00 | 1,097.00 | 7.75 | 1,000.00 | 1,017.41 | 7.45 | 1.49 | % | |||||||||||||||||||||
| Royce Opportunity Fund | 1,000.00 | 1,079.87 | 7.68 | 1,000.00 | 1,017.41 | 7.45 | 1.49 | % | |||||||||||||||||||||
| Royce Pennsylvania Mutual Fund | 1,000.00 | 1,046.24 | 6.39 | 1,000.00 | 1,018.55 | 6.31 | 1.26 | % | |||||||||||||||||||||
| Royce Premier Fund | 1,000.00 | 1,084.60 | 7.70 | 1,000.00 | 1,017.41 | 7.45 | 1.49 | % | |||||||||||||||||||||
| Royce Small-Cap Leaders Fund | 1,000.00 | 1,011.38 | 7.43 | 1,000.00 | 1,017.41 | 7.45 | 1.49 | % | |||||||||||||||||||||
| Royce Small-Cap Value Fund | 1,000.00 | 957.92 | 7.23 | 1,000.00 | 1,017.41 | 7.45 | 1.49 | % | |||||||||||||||||||||
| Royce Small/Mid-Cap Premier Fund3 | 1,000.00 | 1,056.85 | 6.12 | 1,000.00 | 1,018.84 | 6.01 | 1.20 | % | |||||||||||||||||||||
| Royce Smaller-Companies Growth Fund | 1,000.00 | 1,112.62 | 7.80 | 1,000.00 | 1,017.41 | 7.45 | 1.49 | % | |||||||||||||||||||||
| Royce Special Equity Fund | 1,000.00 | 995.00 | 6.88 | 1,000.00 | 1,017.90 | 6.95 | 1.39 | % | |||||||||||||||||||||
| Royce Special Equity Multi-Cap Fund | 1,000.00 | 1,059.50 | 6.33 | 1,000.00 | 1,018.65 | 6.21 | 1.24 | % | |||||||||||||||||||||
| Royce Total Return Fund | 1,000.00 | 1,025.40 | 7.33 | 1,000.00 | 1,017.55 | 7.30 | 1.46 | % | |||||||||||||||||||||
The Royce Funds 2017 Semiannual Report to Shareholders | 125
Understanding Your Fund’s Expenses (unaudited) (continued)
| ACTUAL | HYPOTHETICAL (5% PER YEAR RETURN BEFORE EXPENSES) | ||||||||||||||||||||||||||||
| Beginning Account | Ending Account | Expenses Paid | Beginning Account | Ending Account | Expenses Paid | Annualized Expense | |||||||||||||||||||||||
| Value 1/1/17 | Value 6/30/17 | During the Period1 | Value 1/1/17 | Value 6/30/17 | During the Period1 | Ratio2 | |||||||||||||||||||||||
| Consultant Class | |||||||||||||||||||||||||||||
| Royce Dividend Value Fund | $ | 1,000.00 | $ | 1,073.32 | $ | 10.74 | $ | 1,000.00 | $ | 1,014.43 | $ | 10.44 | 2.09 | % | |||||||||||||||
| Royce International Premier Fund | 1,000.00 | 1,218.42 | 12.05 | 1,000.00 | 1,013.93 | 10.94 | 2.19 | % | |||||||||||||||||||||
| Royce Micro-Cap Fund | 1,000.00 | 1,013.82 | 12.93 | 1,000.00 | 1,011.95 | 12.92 | 2.59 | % | |||||||||||||||||||||
| Royce Opportunity Fund | 1,000.00 | 1,075.63 | 11.68 | 1,000.00 | 1,013.54 | 11.33 | 2.27 | % | |||||||||||||||||||||
| Royce Pennsylvania Mutual Fund | 1,000.00 | 1,041.57 | 9.87 | 1,000.00 | 1,015.12 | 9.74 | 1.95 | % | |||||||||||||||||||||
| Royce Premier Fund | 1,000.00 | 1,081.06 | 11.46 | 1,000.00 | 1,013.79 | 11.08 | 2.22 | % | |||||||||||||||||||||
| Royce Small-Cap Value Fund | 1,000.00 | 953.23 | 11.24 | 1,000.00 | 1,013.29 | 11.58 | 2.32 | % | |||||||||||||||||||||
| Royce Small/Mid-Cap Premier Fund3 | 1,000.00 | 1,051.72 | 10.63 | 1,000.00 | 1,014.43 | 10.44 | 2.09 | % | |||||||||||||||||||||
| Royce Smaller-Companies Growth Fund | 1,000.00 | 1,108.00 | 11.71 | 1,000.00 | 1,013.69 | 11.18 | 2.24 | % | |||||||||||||||||||||
| Royce Special Equity Fund | 1,000.00 | 991.07 | 10.76 | 1,000.00 | 1,013.98 | 10.89 | 2.18 | % | |||||||||||||||||||||
| Royce Special Equity Multi-Cap Fund | 1,000.00 | 1,054.82 | 10.14 | 1,000.00 | 1,014.93 | 9.94 | 1.99 | % | |||||||||||||||||||||
| Royce Total Return Fund | 1,000.00 | 1,022.03 | 10.88 | 1,000.00 | 1,014.03 | 10.84 | 2.17 | % | |||||||||||||||||||||
| Institutional Class | |||||||||||||||||||||||||||||
| Royce Dividend Value Fund | 1,000.00 | 1,080.55 | 4.59 | 1,000.00 | 1,020.38 | 4.46 | 0.89 | % | |||||||||||||||||||||
| Royce Global Financial Services Fund | 1,000.00 | 1,101.49 | 5.42 | 1,000.00 | 1,019.64 | 5.21 | 1.04 | % | |||||||||||||||||||||
| Royce Low-Priced Stock Fund | 1,000.00 | 1,009.66 | 6.48 | 1,000.00 | 1,018.35 | 6.51 | 1.30 | % | |||||||||||||||||||||
| Royce Opportunity Fund | 1,000.00 | 1,082.57 | 5.53 | 1,000.00 | 1,019.49 | 5.36 | 1.07 | % | |||||||||||||||||||||
| Royce Pennsylvania Mutual Fund | 1,000.00 | 1,048.01 | 4.27 | 1,000.00 | 1,020.63 | 4.21 | 0.84 | % | |||||||||||||||||||||
| Royce Premier Fund | 1,000.00 | 1,087.15 | 5.54 | 1,000.00 | 1,019.49 | 5.36 | 1.07 | % | |||||||||||||||||||||
| Royce Small-Cap Value Fund | 1,000.00 | 959.12 | 5.29 | 1,000.00 | 1,019.39 | 5.46 | 1.09 | % | |||||||||||||||||||||
| Royce Smaller-Companies Growth Fund | 1,000.00 | 1,114.54 | 6.19 | 1,000.00 | 1,018.94 | 5.91 | 1.18 | % | |||||||||||||||||||||
| Royce Special Equity Fund | 1,000.00 | 996.79 | 5.30 | 1,000.00 | 1,019.49 | 5.36 | 1.07 | % | |||||||||||||||||||||
| Royce Special Equity Multi-Cap Fund | 1,000.00 | 1,061.20 | 4.55 | 1,000.00 | 1,020.38 | 4.46 | 0.89 | % | |||||||||||||||||||||
| Royce Total Return Fund | 1,000.00 | 1,028.12 | 5.33 | 1,000.00 | 1,019.54 | 5.31 | 1.06 | % | |||||||||||||||||||||
| W Class | |||||||||||||||||||||||||||||
| Royce Premier Fund | 1,000.00 | 1,086.06 | 6.16 | 1,000.00 | 1,018.89 | 5.96 | 1.19 | % | |||||||||||||||||||||
| Royce Total Return Fund | 1,000.00 | 1,026.72 | 6.28 | 1,000.00 | 1,018.60 | 6.26 | 1.25 | % | |||||||||||||||||||||
| R Class | |||||||||||||||||||||||||||||
| Royce International Premier Fund | 1,000.00 | 1,220.75 | 9.58 | 1,000.00 | 1,016.17 | 8.70 | 1.74 | % | |||||||||||||||||||||
| Royce Low-Priced Stock Fund | 1,000.00 | 1,007.68 | 9.16 | 1,000.00 | 1,015.67 | 9.20 | 1.84 | % | |||||||||||||||||||||
| Royce Opportunity Fund | 1,000.00 | 1,078.83 | 9.28 | 1,000.00 | 1,015.87 | 9.00 | 1.80 | % | |||||||||||||||||||||
| Royce Pennsylvania Mutual Fund | 1,000.00 | 1,043.10 | 8.31 | 1,000.00 | 1,016.66 | 8.20 | 1.64 | % | |||||||||||||||||||||
| Royce Premier Fund | 1,000.00 | 1,082.93 | 9.55 | 1,000.00 | 1,015.62 | 9.25 | 1.85 | % | |||||||||||||||||||||
| Royce Small-Cap Leaders Fund | 1,000.00 | 1,010.28 | 9.17 | 1,000.00 | 1,015.67 | 9.20 | 1.84 | % | |||||||||||||||||||||
| Royce Small-Cap Value Fund | 1,000.00 | 955.35 | 9.07 | 1,000.00 | 1,015.52 | 9.35 | 1.87 | % | |||||||||||||||||||||
| Royce Small/Mid-Cap Premier Fund | 1,000.00 | 1,053.46 | 8.60 | 1,000.00 | 1,016.41 | 8.45 | 1.69 | % | |||||||||||||||||||||
| Royce Smaller-Companies Growth Fund | 1,000.00 | 1,110.89 | 9.63 | 1,000.00 | 1,015.67 | 9.20 | 1.84 | % | |||||||||||||||||||||
| Royce Total Return Fund | 1,000.00 | 1,024.13 | 8.93 | 1,000.00 | 1,015.97 | 8.90 | 1.78 | % | |||||||||||||||||||||
| K Class | |||||||||||||||||||||||||||||
| Royce Opportunity Fund | 1,000.00 | 1,078.30 | 9.07 | 1,000.00 | 1,016.07 | 8.80 | 1.76 | % | |||||||||||||||||||||
| Royce Pennsylvania Mutual Fund | 1,000.00 | 1,042.81 | 9.83 | 1,000.00 | 1,015.17 | 9.69 | 1.94 | % | |||||||||||||||||||||
| Royce Small-Cap Value Fund | 1,000.00 | 955.27 | 9.65 | 1,000.00 | 1,014.93 | 9.94 | 1.99 | % | |||||||||||||||||||||
| Royce Total Return Fund | 1,000.00 | 1,025.92 | 8.14 | 1,000.00 | 1,016.76 | 8.10 | 1.62 | % | |||||||||||||||||||||
| 1 | Expenses are equal to the Fund’s annualized expense ratio multiplied by the average account value for the period, multiplied by 181 days in the most recent fiscal half-year divided by 365 days (to reflect the half-year period). |
| 2 | Annualized expense ratio used to derive figures in the table is based on the most recent fiscal half-year. |
| 3 | GiftShare accounts pay an annual $50 trustee fee to Alliance Trust Company, as trustee. If these fees were included above, your costs would be higher. |
126 | The Royce Funds 2017 Semiannual Report to Shareholders
Trustees and Officers
All Trustees and Officers may be reached c/o The Royce Funds, 745 Fifth Avenue, New York, NY 10151
Charles M. Royce, Trustee1
Age: 77 | Number of Funds Overseen: 22 | Tenure: Since 1982
Non-Royce Directorships: Director of TICC Capital Corp.
Principal Occupation(s) During Past Five Years: Chairman of the Board of Managers of Royce & Associates, LP (“Royce”), the Trust’s investment adviser; Chief Executive Officer (1972-June 2017), President (1972-July 2014) of Royce.
Christopher D. Clark, Trustee1, President
Age: 52 | Number of Funds Overseen: 22 | Tenure: Since 2014
Principal Occupation(s) During Past Five Years: Chief Executive Officer (since July 2017), President (since July 2014), Co-Chief Investment Officer (Since January 2014), Managing Director and, since June 2015, a Member of the Board of Managers of Royce, having been employed by Royce since May 2007.
Patricia W. Chadwick, Trustee
Age: 68 | Number of Funds Overseen: 22 | Tenure: Since 2009
Non-Royce Directorships: Trustee of ING Mutual Funds and Director of Wisconsin Energy Corp.
Principal Occupation(s) During Past 5 Years: Consultant and President of Ravengate Partners LLC (since 2000).
Stephen L. Isaacs, Trustee
Age: 77 | Number of Funds Overseen: 22 | Tenure: Since 1989
Non-Royce Directorships: None
Principal Occupation(s) During Past Five Years: Attorney and President of Health Policy Associates, Inc., consultants. Mr. Isaacs’s prior business experience includes having served as President of the Center for Health and Social Policy (from 1996 to 2012); Director of Columbia University Development Law and Policy Program and Professor at Columbia University (until August 1996).
Arthur S. Mehlman, Trustee
Age: 75 | Number of Funds Overseen: 40 | Tenure: Since 2004
Non-Royce Directorships: Director/Trustee of registered investment companies constituting the 18 Legg Mason Funds.
Principal Occupation(s) During Past Five Years: Director of The League for People with Disabilities, Inc.; Director of University of Maryland Foundation (non-profits). Formerly: Director of Municipal Mortgage & Equity, LLC (from October 2004 to April 1, 2011); Director of University of Maryland College Park Foundation (non-profit) (from 1998 to 2005); Partner, KPMG LLP (international accounting firm) (from 1972 to 2002); Director of Maryland Business Roundtable for Education (from July 1984 to June 2002).
David L. Meister, Trustee
Age: 77 | Number of Funds Overseen: 22 | Tenure: Since 1982
Non-Royce Directorships: None
Principal Occupation(s) During Past Five Years: Consultant. Chairman and Chief Executive Officer of The Tennis Channel (from June 2000 to March 2005). Mr. Meister’s prior business experience includes having served as Chief Executive Officer of Seniorlife.com, a consultant to the communications industry, President of Financial News Network, Senior Vice President of HBO, President of Time-Life Films, and Head of Broadcasting for Major League Baseball.
G. Peter O’Brien, Trustee
Age: 71 | Number of Funds Overseen: 40 | Tenure: Since 2001
Non-Royce Directorships: Director/Trustee of registered investment companies constituting the 18 Legg Mason Funds; Director of TICC Capital Corp.
Principal Occupation(s) During Past Five Years: Trustee Emeritus of Colgate University (since 2005); Board Member of Hill House, Inc. (since 1999); Formerly: Trustee of Colgate University (from 1996 to 2005), President of Hill House, Inc. (from 2001 to 2005) and Managing Director/Equity Capital Markets Group of Merrill Lynch & Co. (from 1971 to 1999).
Michael K. Shields, Trustee
Age: 59 | Number of Funds Overseen: 22 | Tenure: Since 2015
Principal Occupation(s) During Past Five Years: President and Chief Executive Officer of Piedmont Trust Company, a private North Carolina trust company (since May 2012). Mr. Shields’s prior business experience includes owning Shields Advisors, an investment consulting firm (from April 2010 to June 2012).
Francis D. Gannon, Vice President
Age: 49 | Tenure: Since 2014
Principal Occupation(s) During Past Five Years: Co-Chief Investment Officer (since January 2014) and Managing Director of Royce, having been employed by Royce since September 2006.
Daniel A. O’Byrne, Vice President
Age: 55 | Tenure: Since 1994
Principal Occupation(s) During Past Five Years: Principal and Vice President of Royce, having been employed by Royce since October 1986.
Peter K. Hoglund, Treasurer
Age: 51 | Tenure: Since 2015
Principal Occupation(s) During Past Five Years: Chief Financial Officer, Chief Administrative Officer, and Managing Director of Royce, having been employed by Royce since December 2014. Prior to joining Royce, Mr. Hoglund spent more than 20 years with Munder Capital Management in Birmingham, MI, serving as Managing Director and Chief Financial Officer and overseeing all financial aspects of the firm. He began his career at Munder as a portfolio manager.
John E. Denneen, Secretary and Chief Legal Officer
Age: 50 | Tenure: 1996-2001 and Since 2002
Principal Occupation(s) During Past Five Years: General Counsel, Managing Director, and, since June 2015, a Member of the Board of Managers of Royce. Chief Legal and Compliance Officer and Secretary of Royce.
Lisa Curcio, Chief Compliance Officer
Age: 57 | Tenure: Since 2004
Principal Occupation(s) During Past Five Years: Chief Compliance Officer of The Royce Funds (since October 2004) and Compliance Officer of Royce (since June 2004).
| The Royce Funds 2017 Semiannual Report to Shareholders | 127 |
Board Approval of Investment Advisory Agreements
At meetings held on June 5-6, 2017, the Board of Trustees of The Royce Fund (the “Board”), including all of the non-interested trustees, approved: (i) the continuation of an investment advisory agreement between Royce & Associates, LP (“R&A”) and The Royce Fund (“TRF”) relating to Royce Pennsylvania Mutual Fund; and (ii) amended and restated investment advisory agreements between R&A and TRF relating to each of Royce Micro-Cap Fund, Royce Premier Fund, Royce Low-Priced Stock Fund, Royce Total Return Fund, Royce Small/Mid-Cap Premier Fund (formerly Royce Heritage Fund), Royce Opportunity Fund, Royce Special Equity Fund, Royce Small-Cap Value Fund, Royce Smaller-Companies Growth Fund, Royce Small-Cap Leaders Fund, Royce Dividend Value Fund, Royce Micro-Cap Opportunity Fund, Royce Special Equity Multi-Cap Fund, Royce Global Financial Services Fund, Royce International Micro-Cap Fund, and Royce International Premier Fund (each, an “Investment Advisory Agreement” and collectively, the “Investment Advisory Agreements”). The Investment Advisory Agreements for each series of TRF other than Royce Pennsylvania Mutual Fund (“PMF”) were amended and restated to reflect new lower asset breakpoints; such amended and restated agreements are otherwise substantially identical to the previously existing agreements. In reaching these decisions, the Board reviewed, among other things, information prepared internally by R&A and independently by Morningstar Associates, LLC (“Morningstar”) containing detailed investment advisory fee, expense ratio, and investment performance comparisons for each series of TRF (each, a “Fund” and collectively, the “Funds”) with other mutual funds in its “peer group” and “category”, information regarding the past performance of the Funds and other registered investment companies managed by R&A and a memorandum outlining the legal duties of the Board prepared by independent counsel to the non-interested trustees. R&A also provided the trustees with an analysis of its profitability with respect to providing investment advisory services to each Fund. In addition, the Board took into account information furnished throughout the year at regular Board meetings, including reports on investment performance, shareholder services, distribution fees and expenses, regulatory compliance, brokerage commissions and research, brokerage and other execution products and services provided to the Funds. The Board also considered other matters it deemed important to the approval process, such as allocation of Fund brokerage commissions, “soft dollar” research services R&A receives, payments made to affiliates of R&A, as well as payments made by R&A relating to distribution of Fund shares and other direct and indirect benefits to R&A and its affiliates from their relationship with the Funds. The trustees also met throughout the year with investment advisory personnel from R&A. The Board, in its deliberations, recognized that, for many of the Funds’ shareholders, the decision to purchase Fund shares included a decision to select R&A as the investment adviser and that there was a strong association in the minds of Fund shareholders between R&A and each of the Funds. In considering factors relating to the approval of the continuance of the existing Investment Advisory Agreement for PMF and the approval of each amended and restated Investment Advisory Agreement for each Fund other than PMF, the non-interested trustees received assistance and advice from, and met separately with, their independent legal counsel. While continuation of the investment advisory and administrative arrangements for each Fund was considered at the same Board meeting, the trustees dealt with each Fund separately. Among other factors, the trustees considered the following:
The nature, extent and quality of services provided by R&A:
The Board considered the following factors to be of fundamental importance to its consideration of whether to approve the continuance of the existing Investment Advisory Agreement for PMF and to approve each amended and restated Investment Advisory Agreement for each Fund other than PMF: (i) R&A’s more than 40 years of value investing experience and track record; (ii) the history of long-tenured R&A portfolio managers managing many of the Funds; (iii) R&A’s focus on mid-cap, small-cap and micro-cap value investing; (iv) the consistency of R&A’s approach to managing each Fund, other open-end mutual funds, and closed-end funds over more than 40 years; (v) the integrity and high ethical standards adhered to at R&A; (vi) R&A’s specialized experience in the area of trading small- and micro-cap securities; (vii) R&A’s historical ability to attract and retain portfolio management talent; and (viii) R&A’s focus on shareholder interests as exemplified by capping expenses on smaller funds, closing funds to new investors when R&A believed such closings were in the best interests of existing shareholders, establishing breakpoints for a number of funds and providing expansive shareholder reporting and communications. The Board also noted that R&A’s compensation policy arrangements strongly encourage portfolio manager investment in each Fund that they manage. The Board also reviewed the services that R&A provides to each Fund, including, but not limited to, managing each Fund’s investments in accordance with the stated policies of each Fund. The Board considered the fact that R&A provided certain administrative services to the Funds at cost pursuant to the Administration Agreement between TRF and R&A. The Board determined that the services to be provided to the Funds by R&A would be the same as those that it previously provided to the Funds. The Board also took into consideration the histories, reputations and backgrounds of R&A’s portfolio managers for each Fund, finding that these would likely have an impact on the continued success of such Fund. The Board also noted R&A’s ability to attract and retain qualified and experienced personnel. Lastly, the Board noted that R&A officers, employees, and their families had substantial amounts invested in various Funds. The Board concluded that the investment advisory services provided by R&A to each Fund compared favorably to services provided by R&A to other R&A client accounts, including other funds, in both nature and quality, and that the scope of services provided by R&A would continue to be suitable for each Fund.
In light of R&A’s risk-averse approach to investing, the trustees believe that risk-adjusted performance continues to be the most appropriate measure of each Fund’s investment performance. One measure of risk-adjusted performance the trustees have historically used in their review of each Fund’s performance is the Sharpe Ratio. The Sharpe Ratio is a risk-adjusted measure of performance developed by Nobel Laureate William Sharpe. It is calculated by dividing a Fund’s annualized excess returns by its annualized standard deviation to determine reward per unit of risk. The higher the Sharpe Ratio, the better a Fund’s historical risk-adjusted performance. The Board attaches primary importance to risk-adjusted performance over relatively long periods of time, typically 3 to 10 years.
| 128 | The Royce Funds 2017 Semiannual Report to Shareholders |
Board Approval of Investment Advisory Agreements (continued)
Cost of the services provided and profits realized by R&A from its relationship with each Fund:
The Board considered the cost of the services provided by R&A and the profits realized by R&A from its relationship with each Fund. As part of the analysis, the Board discussed with R&A its methodology in allocating its costs to each Fund and concluded that its allocations were reasonable. The Board noted that at times in the past R&A had closed certain of the Funds to new investors because of the rate of growth in Fund assets. The Board also noted that certain Funds were not profitable to R&A during the year ended December 31, 2016. The Board concluded that R&A’s profits with respect to each Fund that was profitable were reasonable in relation to the nature and quality of services provided.
The extent to which economies of scale would be realized as the Funds grow and whether fee levels would reflect such economies of scale:
The Board considered whether there have been economies of scale in respect of the management of each Fund, whether each Fund has appropriately benefited from any economies of scale and whether
| The Royce Funds 2017 Semiannual Report to Shareholders | 129 |
Board Approval of Investment Advisory Agreements (concluded)
there is potential for realization of any further economies of scale. The Board noted the time and effort involved in managing portfolios of small- and micro-cap stocks and that they did not involve the same efficiencies as do portfolios of large-cap stocks. The Board noted that in 2004 breakpoints were added to the investment advisory fees for all of the then-existing Funds except PMF (PMF’s fee schedule already had breakpoints) and that the investment advisory fees for all Funds organized since 2004 included breakpoints. The Board also noted the new proposed lower asset breakpoints for each Fund other than PMF. The Board concluded that the current fee structure for PMF and the new proposed fee structure for each Fund other than PMF were reasonable and that the relevant shareholders sufficiently participated in economies of scale.
The Board reviewed the investment advisory fee paid by each Fund and compared both the services to be rendered and the fees to be paid under the Investment Advisory Agreements to other contracts of R&A and to contracts of other investment advisers to registered investment companies investing in micro-, small-, and mid-cap stocks, as provided by Morningstar. The Board noted the importance of the net expense ratio in measuring a fund’s efficiency, particularly in light of the variations in the mutual fund industry as to which entity is responsible for particular types of expenses. The Board noted that the net expense ratio for ROS ranked within the 1st quintile among its Morningstar peers while the net expense ratios for PMF and RIP fell within the 2nd quintile among their respective Morningstar peers. The Board further noted that the net expense ratios for RHF, RDV, and RFS ranked within the middle quintile among their respective Morningstar peers.
| 130 | The Royce Funds 2017 Semiannual Report to Shareholders |
Notes to Performance and Other Important Information
This material contains forward-looking statements within the meaning of the Securities Exchange Act of 1934, as amended (the “Exchange Act”), that involve risks and uncertainties, including, among others, statements as to:
| • | the Funds’ future operating results, |
| • | the prospects of the Funds’ portfolio companies, |
| • | the impact of investments that the Funds have made or may make, the dependence of the Funds’ future success on the general economy and its impact on the companies and industries in which the Funds invest, and |
| • | the ability of the Funds’ portfolio companies to achieve their objectives. |
| The Royce Funds 2017 Semiannual Report to Shareholders | 131 |
Notes to Performance and Other Important Information (continued)
Proxy Voting
A copy of the policies and procedures that The Royce Funds use to determine how to vote proxies relating to portfolio securities and information regarding how each of The Royce Funds voted proxies relating to portfolio securities during the most recent 12-month period ended June 30 is available, without charge, on The Royce Funds’ website at www.roycefunds.com, by calling (800) 221-4268 (toll-free) and on the website of the Securities and Exchange Commission (“SEC”) at www.sec.gov.
Form N-Q Filing
The Funds file their complete schedules of investments with the SEC for the first and third quarters of each fiscal year on Form N-Q. The Funds’ Forms N-Q are available on the SEC’s website at www. sec.gov. The Royce Funds’ holdings are also on the Funds’ website approximately 15 to 20 days after each calendar quarter end and remain available until the next quarter’s holdings are posted. The Funds’ Forms N-Q may also be reviewed and copied at the SEC’s Public Reference Room in Washington, D.C. To find out more about this public service, call the SEC at (202) 942-8090. The Funds’ complete schedules of investments are updated quarterly and are available at www.roycefunds.com.
| This page is not part of the 2017 Semiannual Report to Shareholders |
| roycefunds.com |
| GET THE LATEST INSIGHTS AND NEWS ON THE ROYCE FUNDS |

| eDELIVERY SAVES! SIGN UP NOW. | STAY INFORMED | ||
| eDelivery saves paper, time, and fund expenses.1 Sign up now to view statements, prospectuses, financial reports, and tax forms online. roycefunds.com/edelivery | Connect with us on LinkedIn, follow us on Twitter, watch us on YouTube and subscribe to our RSS feed. Visit roycefunds.com/subscribe to sign up for our monthly eWord newsletter to stay up to date on the latest from Royce. | ||
 www.twitter.com/roycefunds www.twitter.com/roycefunds |  www.linkedin.com/roycefunds www.linkedin.com/roycefunds |  www.youtube.com/roycefunds www.youtube.com/roycefunds | www.roycefunds.com/subscribe |
1 Any direct Royce Funds IRA investor who chooses eDelivery of prospectuses, financial reports, and Royce Review will be exempt from the $15 annual IRA maintenance fee. (We will continue to also waive the fee for investors with more than $20,000 invested in Royce IRAs at the time the fee is charged, and for new transfer and rollover accounts in their first year.) | |||
| This page is not part of the 2017 Semiannual Report to Shareholders |
 | |||||
| About The Royce Funds | Contact Us | ||||
Unparalleled Knowledge + Experience Pioneers in small-cap investing, with 40+ years of experience, depth of knowledge, and focus. Independent Thinking The confidence to go against consensus, the insight to uncover opportunities others might miss, and the tenacity to stay the course through market cycles. | GENERAL INFORMATION General Royce Funds information including: • How to open an account • An overview of our firm and Funds • Ordering literature including Prospectuses (800) 221-4268 | ||||
Specialized Approaches Strategies that use value, core, or growth investment approaches to select micro-cap, small-cap, and mid-cap companies. | ACCOUNT INFORMATION Speak with a representative about: • Your account, transactions, and forms (800) 841-1180 | ||||
| Unwavering Commitment | |||||
Our team of 17 portfolio managers have significant personal investments in the strategies they manage. | FINANCIAL ADVISORS, CONSULTANTS, AND INSTITUTIONS Speak with your regional Royce contact regarding: • Scheduling a meeting or call • Information about our firm, strategies, and funds • Resources for financial professionals, such as portfolio attribution reports (800) 337-6923 | ||||
| AUTOMATED ACCOUNT INFORMATION 24-hour Automated Telephone Service (800) 878-6923 | |||||
 |  |  | |||
Item 2. Code(s) of Ethics. Not applicable to this semi-annual report.
Item 3. Audit Committee Financial Expert. Not applicable to this semi-annual report.
Item 4. Principal Accountant Fees and Services. Not applicable to this semi-annual report.
Item 5. Audit Committee of Listed Registrants. Not Applicable.
Item 6. Investments.
(a) See Item 1.
(b) Not Applicable
Item 7. Disclosure of Proxy Voting Policies and Procedures for Closed-End Management Investment Companies. Not Applicable.
Item 8. Portfolio Managers of Closed-End Management Investment Companies. Not Applicable.
Item 9. Purchases of Equity Securities by Closed-End Management Investment Company and Affiliated Purchasers. Not Applicable
Item 10. Submission of Matters to a Vote of Security Holders. Not Applicable.
Item 11. Controls and Procedures.
(a) Disclosure Controls and Procedures. The Principal Executive and Financial Officers concluded that the Registrant’s Disclosure Controls and Procedures are effective based on their evaluation of the Disclosure Controls and Procedures as of a date within 90 days of the filing date of this report.
(b) Internal Control over Financial Reporting. There were no significant changes in Registrant’s internal control over financial reporting or in other factors that could significantly affect this control subsequent to the date of the evaluation, including any corrective actions with regard to significant deficiencies and material weaknesses during the second fiscal quarter of the period covered by this report.
Item 12. Exhibits. Attached hereto.
(a)(1) Not applicable to this semi-annual report.
(a)(2) Separate certifications by the Registrant’s Principal Executive Officer and Principal Financial Officer as required by Rule 30a-2(a) under the Investment Company Act of 1940.
(a)(3) Not Applicable
(b) Separate certifications by the Registrant’s Principal Executive Officer and Principal Financial Officer, pursuant to Section 906 of the Sarbanes-Oxley Act of 2002 and required by Rule 30a-2(b) under the Investment Company Act of 1940.
Pursuant to the requirements of the Securities Exchange Act of 1934 and the Investment Company Act of 1940, the registrant has duly caused this report to be signed on its behalf by the undersigned, thereunto duly authorized.
THE ROYCE FUND
| BY: | /c/ Christopher D. Clark | |
| Christopher D. Clark | ||
| President |
Date: August 29, 2017
Pursuant to the requirements of the Securities Exchange Act of 1934 and the Investment Company Act of 1940, this report has been signed below by the following persons on behalf of the registrant and in the capacities and on the dates indicated.
| THE ROYCE FUND | THE ROYCE FUND | ||||
| BY: | /c/ Christopher D. Clark | BY: | /s/ Peter K. Hoglund | ||
| Christopher D. Clark | Peter K. Hoglund | ||||
| President | Chief Financial Officer | ||||
| Date: August 29, 2017 | Date: August 29, 2017 | ||||