UNITED STATES
SECURITIES AND EXCHANGE COMMISSION
Washington, D.C. 20549
FORM N-CSR
CERTIFIED SHAREHOLDER REPORT
OF
REGISTERED MANAGEMENT INVESTMENT COMPANIES
Investment Company Act file number: 811-03599
Name of Registrant: The Royce Fund
Address of Registrant: 745 Fifth Avenue
New York, NY 10151
| Name and address of agent for service: | John E. Denneen, Esq. 745 Fifth Avenue New York, NY 10151 |
Registrant’s telephone number, including area code: (212) 508-4500
Date of fiscal year end: December 31, 2014
Date of reporting period: January 1, 2015 – June 30, 2015
Item 1. Reports to Shareholders.
 |
| JUNE 30, 2015 | ||
| 2015 Semiannual | ||
| Review and Report to Shareholders | ||
| Royce Pennsylvania Mutual Fund | |||
| Royce Micro-Cap Fund | |||
| Royce Premier Fund | |||
| Royce Low-Priced Stock Fund | |||
| Royce Total Return Fund | |||
| Royce Heritage Fund | |||
| Royce Opportunity Fund | |||
| Royce Special Equity Fund | |||
| Royce Select Fund I | |||
| Royce Small-Cap Value Fund (formerly Royce Value Fund) | |||
| Royce Smaller-Companies Growth Fund (formerly Royce Value Plus Fund) | |||
| Royce 100 Fund | |||
| Royce Micro-Cap Discovery Fund | |||
| Royce Dividend Value Fund | |||
| Royce Micro-Cap Opportunity Fund (formerly Royce Opportunity Select Fund) | |||
| Royce Special Equity Multi-Cap Fund | |||
| roycefunds.com |  | ||
| Table of Contents | |||
| Semiannual Review | |||
| Letter to Our Shareholders | 2 | ||
| Performance and Expenses | 6 | ||
| U.S. Small-Cap Market Cycle and Risk Adjusted Performance | 7 | ||
| Semiannual Report to Shareholders | |||
| Managers’ Discussions of Fund Performance | |||
Royce Pennsylvania Mutual Fund | 8 | ||
Royce Micro-Cap Fund | 10 | ||
Royce Premier Fund | 12 | ||
Royce Low-Priced Stock Fund | 14 | ||
Royce Total Return Fund | 16 | ||
Royce Heritage Fund | 18 | ||
Royce Opportunity Fund | 20 | ||
Royce Special Equity Fund | 22 | ||
Royce Select Fund I | 24 | ||
Royce Small-Cap Value Fund (formerly Royce Value Fund) | 26 | ||
Royce Smaller-Companies Growth Fund (formerly Royce Value Plus Fund) | 28 | ||
Royce 100 Fund | 30 | ||
Royce Micro-Cap Discovery Fund | 32 | ||
Royce Dividend Value Fund | 34 | ||
Royce Micro-Cap Opportunity Fund (formerly Royce Opportunity Select Fund) | 36 | ||
Royce Special Equity Multi-Cap Fund | 38 | ||
| Schedules of Investments and Financial Statements | 40 | ||
| Notes to Financial Statements | 106 | ||
| Understanding Your Fund’s Expenses | 120 | ||
| Trustees and Officers | 122 | ||
| Board Approval of Investment Advisory Agreements | 123 | ||
| Notes to Performance and Other Important Information | 126 | ||
| Results of Shareholders Meeting | 127 |

| This page is not part of the 2015 Semiannual Report to Shareholders | 1 |
Letter to Our Shareholders

“THE TIME IS OUT OF JOINT”
| Anyone reestablishing contact with the wider world at the end of June would no doubt be pleased by the numbers that guide the financial and economic parts of our lives. The economy, following a first-quarter stumble in which GDP is estimated to have grown by 0.6%, appears once again to be growing at a faster clip. One could argue that its pace could be livelier, but healthy employment numbers, improving wages, and robust housing and auto markets would seem to promise a quickening in the coming months. Inflation is, for now, not a matter of great concern. Interest rates remain low—and will remain that way on an absolute basis, even with an increase (or two) in short-term rates likely before the end of 2015. And a Fed-led increase in short rates may cause long-term rates to back up as well, which would be bad news for the bond markets, though perhaps not for stocks. One could find positive developments in the equity markets through the first half of the year—or so it would seem. Returns for each of the major domestic indexes were in the black through the end of June, while a welcome recovery finally arrived for many non-U.S. stocks in the year’s first six months. Three- and five-year average annualized returns for the small-cap Russell 2000 |
| Index, the Nasdaq Composite, and the large-cap Russell 1000 and S&P 500 Indexes all topped 17%, well above the rolling three- and five-year historical averages for each index. It would appear that we are living through good times for the economy and possibly great ones for equities. Why, then, have we purloined a line from Hamlet to introduce our own take on stocks in the first half, one in which the titular protagonist warns of a troubling dislocation in the world around him? Some of the reasons are clear enough: Positive results for the first half notwithstanding, global equities were rocked by the highly publicized Greek default late in June. On the second-to-last trading day of the first half, many stocks gave away most, if not all, of their second-quarter gains. Markets in China faced arguably even more significant problems, considering how much larger and more important that nation’s economy is to the world compared to that of Greece. Chinese stocks plummeted 30% in the three weeks leading up to our Independence Day, making what seemed like a typical correction in June far more worrisome. A cut in interest rates and more relaxed rules for margin trading—both hastily put in place late in June—did little to stem the tide of selling. |
| 2 | This page is not part of the 2015 Semiannual Report to Shareholders |
LETTER TO OUR SHAREHOLDERS
| The small-cap market has thus moved from the tightly correlated markets of 2011-2013 into a new phase of wide divergence and constricted leadership. From our perspective, then, the market is indeed out of joint. Closer to home, there is the matter of how thoroughly disjointed results were for domestic equities. Large-cap returns, for example, were paltry—as can be seen from the table below—brought even lower by the Greek drama that ushered out the month of June. Performance for small-caps and the Nasdaq looked appreciably better, but in each case looks are almost assuredly deceiving. Health Care was by far the dominant sector in every market cap range, from micro to large, that Russell Investments tracks. Yet the rule in the first half seemed to be the smaller—and more growth-driven—the company, the loftier the results, especially if it was involved in biotech, the industry that has reigned supreme within the Russell 2000 over much of the last two years. This has had the effect of creating decidedly narrow market leadership within the small-cap space. Outside of biotech, strong first-half performances were mostly limited to a handful of other Health Care industries, software companies, and a few outliers such as construction materials and tobacco. The small-cap market has thus moved from the tightly correlated markets of 2011-2013 into a new phase of wide divergence and constricted leadership. From our perspective, then, the market is indeed out of joint. |
| “MORE THINGS IN HEAVEN AND EARTH...” We have actually been arguing that the market has been disjointed for some time now. Fed policies designed to keep the economy and capital markets above water, which included multiple rounds of QE and keeping interest rates at or near zero, had other, unintended consequences that had an outsized effect on the small-cap market. For example, it became both easy and affordable for businesses to add debt, essentially eroding the risk differential between lower-and higher-quality businesses. Lower-quality and more highly levered companies then began a historically atypical period of outperformance in which our funds mostly did not participate. The Fed’s zero-interest-rate policy (“ZIRP”) also stoked an intense hunger for yield, which drove up values for bond-proxy equities such as REITs and Utilities, regardless of their underlying quality or profitability, that have only recently begun to correct. These actions also boosted stock correlations and reduced volatility, making it harder to find the kind of mispriced opportunities that have always been our stock in trade. Finally, there were significant runs for high-growth, non-earning, and more speculative businesses, many with negative EBIT. This continues into the present day with the recent contraction of small-cap leadership, which represents more of a bet on long-duration assets than current profitability. In each of these cases, our more qualitative, risk-conscious approaches have |
| Equity Indexes | ||
| As of June 30, 2015 (%) | ||
| • | Greek Drama Creates Underwhelming Results—The Greek default late in June eroded gains—giving equities second-quarter results that more closely hugged the flat line. The tech-oriented Nasdaq Composite was the leader, up 1.8%, followed by the small-cap Russell 2000 Index, which finished the quarter with a gain of 0.4%. The large-cap S&P 500 and Russell 1000 Indexes rose 0.3% and 0.1%, respectively. | |
| • | Long-Term Returns in Excess—Both large-cap and small-cap indexes’ three- and five-year average annual total returns for the periods ended 6/30/15 were above 17%, well in excess of each index’s historical average. | |
| • | Healthy and Informed—Health Care and Information Technology were the best performing sectors in the Russell 2000 year-to-date through 6/30/15—the former led by a wide margin—while Utilities and Materials were the worst performers in the year’s first half. | |
| YTD1 | 1-YR | 3-YR | 5-YR | 10-YR | |||||||||
| Russell 2000 | 4.75 | 6.49 | 17.81 | 17.08 | 8.40 | ||||||||
| S&P 500 | 1.23 | 7.42 | 17.31 | 17.34 | 7.89 | ||||||||
| Russell 1000 | 1.71 | 7.37 | 17.73 | 17.58 | 8.13 | ||||||||
| Nasdaq Composite | 5.30 | 13.13 | 19.33 | 18.78 | 9.26 | ||||||||
| Russell Midcap | 2.35 | 6.63 | 19.26 | 18.23 | 9.40 | ||||||||
| Russell Microcap | 6.03 | 8.21 | 19.25 | 17.48 | 7.07 | ||||||||
| Russell Global ex-U.S. Small Cap | 7.74 | -3.46 | 11.35 | 8.99 | 7.07 | ||||||||
| Russell Global ex-U.S. Large Cap | 4.23 | -5.02 | 9.96 | 8.13 | 5.80 | ||||||||
| 1 Not annualized |
| For details on The Royce Funds’ performance in the period, please turn to the Managers’ Discussions that begin on page 8. |
| This page is not part of the 2015 Semiannual Report to Shareholders | 3 |
LETTER TO OUR SHAREHOLDERS
| in general kept us away from these areas. While we are confident that this trend will fade and that speculative bubbles will burst, we also understand the frustrations that have built over the last few years as active managers such as ourselves have continued to lag our respective benchmarks. We have seen enough signs, both economically and in the market, which suggest that stocks are slowly moving back to what we would call their historical norm—lower overall returns, higher volatility, and long-term advantages for companies with consistent profits and high returns on invested capital. So do these challenges mean that something is rotten in the state of small-cap, if only in some of its actively managed precincts? That is the question, more or less, that we have been wrestling with of late. To be sure, we ran the gamut in the first half from disappointment to optimism to frustration as investor preferences moved around. They first showed favor to long-duration assets, then looked, if only briefly, toward consistently profitable and/or conservatively capitalized companies before shifting back again. However, we have seen enough signs, both economically and in the market, which suggest that stocks are slowly moving back to what we would call their historical norm—lower overall returns, higher volatility, and long-term advantages for companies with consistent profits and high returns on invested capital. Most notably, there was a positive directional trend dating from the first-half low for the 10-year Treasury on January 30 through the end of the first half. During this period, which included the bearish month of April, we were pleased with the way many of our portfolios either outperformed their benchmarks or began to narrow the gap. This was very clear during the growth scare engendered by (at the time) negative first-quarter GDP numbers, which led many companies to begin revising their earnings expectations downward. Of course, when it became clear that much of what put a drag on first-quarter numbers was temporary, including such factors as the awful winter weather, the West Coast port strike, and the plunge in oil prices, things began to pick up again fairly quickly, at least for the |
| more speculative areas within Health Care and a few other narrow equity locales. “THE READINESS IS ALL” Yet this period also offered a potential preview of how the landscape for stocks will look when short-term interest rates begin to rise—which is likely to be later this year. We see higher rates breeding more uncertainty, be it about inflation, the cost of capital, or a number of other issues. This in turn typically leads to more mispricing in the short run, which creates precisely the opportunities that we crave as risk-conscious bargain hunters. To us, high rates are synonymous with higher risk. A higher-risk environment also tends to benefit quality companies (by which we mean conservatively capitalized, profitable businesses with high returns on invested capital and effective, shareholder-friendly management). So we have no worries about rising rates or greater volatility in the markets. In fact, we welcome both. High rates are synonymous with higher risk. A higher-risk environment also tends to benefit quality companies (by which we mean conservatively capitalized, profitable businesses with high returns on invested capital and effective, shareholder-friendly management). So we have no worries about rising rates or greater volatility in the markets. In fact, we welcome both. We see quality differentiating itself when risk premiums rise because quality businesses are better businesses—as profitable, financially sound enterprises, they are purpose-built and run to survive periods of higher risk and/or greater uncertainty, which helps to explain why the market of the last several years has seen many of these companies disadvantaged in the easy-money, ZIRP environment. In a phase in which few if any of the traditional penalties were paid for larding leverage onto corporate balance sheets, there were also scant advantages that have historically accrued to higher-quality, more conservatively capitalized companies. We feel confident that this era is over. Our expectation is for lower returns for stocks as a whole, but relatively better returns for both high-quality companies and more cyclical, |
| 4 | This page is not part of the 2015 Semiannual Report to Shareholders |
LETTER TO OUR SHAREHOLDERS

| less defensive sectors. We suspect that in a few years market observers will look back at 2015—and perhaps the longer span covering 2013-2015—as a hinge period in which the gradual sun-setting of interventionist Fed policies, coupled with the steady growth of the economy, restored the capital markets to something closer to more familiar historical patterns of performance and volatility. This is why we have been patiently holding so many companies in cyclical sectors, such as Industrials, Materials, and, more recently, Energy—they boast many attractive characteristics that the market has not yet fully recognized, a phenomenon we expect will change as the economy heats up. In our estimation their profitability, growth prospects, and reasonable to attractive valuations make them coiled springs. Until then, we wait. |
| To be sure, it has been a cycle of, at times, seemingly endless challenges for our active and risk-conscious approaches. Our collective patience has been sorely tested as we have waited (and waited) for many of our highest-confidence holdings to turn around. Of course, transitions are never easy, and the turn we have been anticipating has taken longer, after a few false starts, than any of us initially anticipated. Change, however, can take time—and we are often aware that a dramatic turn has occurred only in retrospect. We are content, then, to continue investing in the same way that we have for more than four decades—with a close eye on risk as we look for the intersection of attractive valuation and organic growth potential. |
| Sincerely, |
 |  |  | ||
| Charles M. Royce | Christopher D. Clark | Francis D. Gannon | ||
| Chief Executive Officer, | President and Co-Chief Investment Officer, | Co-Chief Investment Officer, | ||
| Royce & Associates, LLC | Royce & Associates, LLC | Royce & Associates, LLC | ||
| July 31, 2015 |
| This page is not part of the 2015 Semiannual Report to Shareholders | 5 |
Performance and Expenses
| Performance and Expenses |
| AVERAGE ANNUAL TOTAL RETURNS (%) | ANNUAL OPERATING EXPENSES (%) | |||||||||||||||||||
| YTD1 | 1-YR | 5-YR | 10-YR | 20-YR | 40-YR/SINCE INCEPTION | INCEPTION DATE | GROSS | NET | ||||||||||||
| Royce Pennsylvania Mutual Fund | 0.08 | -2.61 | 13.40 | 7.71 | 10.75 | 13.83 | n.a. | 0.92 | 0.92 | |||||||||||
| Royce Micro-Cap Fund | -1.38 | -6.40 | 7.49 | 7.00 | 10.27 | 11.55 | 12/31/91 | 1.48 | 1.48 | |||||||||||
| Royce Premier Fund | 1.67 | -6.09 | 13.09 | 9.48 | 11.38 | 11.85 | 12/31/91 | 1.10 | 1.10 | |||||||||||
| Royce Low-Priced Stock Fund | 2.64 | -9.03 | 6.59 | 6.04 | 10.56 | 10.76 | 12/15/93 | 1.47 | 1.47 | |||||||||||
| Royce Total Return Fund | 0.74 | -0.63 | 13.70 | 7.42 | 10.85 | 10.97 | 12/15/93 | 1.19 | 1.19 | |||||||||||
| Royce Heritage Fund | 1.12 | -2.85 | 11.57 | 8.64 | n.a. | 12.86 | 12/27/95 | 1.51 | 1.51 | |||||||||||
| Royce Opportunity Fund | 0.67 | -2.75 | 15.62 | 8.58 | n.a. | 12.67 | 11/19/96 | 1.15 | 1.15 | |||||||||||
| Royce Special Equity Fund | -0.52 | 0.40 | 13.11 | 8.41 | n.a. | 9.44 | 5/1/98 | 1.12 | 1.12 | |||||||||||
| Royce Select Fund I | 0.23 | -5.77 | 11.37 | 9.43 | n.a. | 12.85 | 11/18/98 | 1.23 | 1.23 | |||||||||||
| Royce Small-Cap Value Fund (formerly Royce Value Fund) | 1.02 | -2.33 | 11.17 | 8.05 | n.a. | 10.52 | 6/14/01 | 1.45 | 1.45 | |||||||||||
| Royce Smaller-Companies Growth Fund (formerly Royce Value Plus Fund) | 8.92 | 8.73 | 13.98 | 8.63 | n.a. | 12.41 | 6/14/01 | 1.45 | 1.45 | |||||||||||
| Royce 100 Fund | -0.12 | -5.99 | 11.14 | 8.44 | n.a. | 10.11 | 6/30/03 | 1.52 | 1.49 | |||||||||||
| Royce Micro-Cap Discovery Fund | 0.67 | 1.64 | 11.16 | 4.81 | n.a. | 6.25 | 10/3/03 | 2.27 | 1.49 | |||||||||||
| Royce Dividend Value Fund | 2.55 | -2.89 | 13.45 | 8.88 | n.a. | 8.99 | 5/3/04 | 1.55 | 1.55 | |||||||||||
| Royce Micro-Cap Opportunity Fund (formerly Royce Opportunity Select Fund) | 4.30 | -4.04 | n.a. | n.a. | n.a. | 16.43 | 8/31/10 | 1.56 | 1.28 | |||||||||||
| Royce Special Equity Multi-Cap Fund | -3.14 | 0.48 | n.a. | n.a. | n.a. | 12.90 | 12/31/10 | 1.34 | 1.24 | |||||||||||
INDEX | ||||||||||||||||||||
| Russell 2000 Index | 4.75 | 6.49 | 17.08 | 8.40 | 9.15 | n.a. | n.a. | n.a. | n.a. | |||||||||||
| Russell Microcap Index | 6.03 | 8.21 | 17.48 | 7.07 | n.a. | n.a. | n.a. | n.a. | n.a. | |||||||||||
| Russell 1000 Index | 1.71 | 7.37 | 17.58 | 8.13 | 9.14 | n.a. | n.a. | n.a. | n.a. | |||||||||||
Shares of the Funds’ Service, Consultant, R, and K Classes bear an annual distribution expense that is not borne by the Funds’ Investment Class. Investments in securities of micro-cap, small-cap, and/or mid-cap companies may involve considerably more risk than investments in securities of larger-cap companies. (Please see “Primary Risks for Fund Investors” in the prospectus.) Certain Funds generally invest a significant portion of their assets in a limited number of stocks, which may involve considerably more risk than a more broadly diversified portfolio because a decline in the value of any of these stocks would cause their overall value to decline to a greater degree. A broadly diversified portfolio, however, does not ensure a profit or guarantee against loss. Please read the prospectus carefully before investing or sending money. Russell Investment Group is the source and owner of the trademarks, service marks, and copyrights related to the Russell Indexes. Russell® is a trademark of Russell Investment Group. The Russell 2000 Index is an unmanaged, capitalization-weighted index of domestic small-cap stocks. It measures the performance of the 2,000 smallest publicly traded U.S. companies in the Russell 3000 Index. The Russell Microcap Index includes 1,000 of the smallest securities in the small-cap Russell 2000 Index along with the next smallest eligible securities as determined by Russell. The Russell 1000 is an unmanaged, capitalization-weighted index of domestic large-cap stocks. It measures the performance of the 1,000 largest publicly traded U.S. companies in the Russell 3,000 Index. The performance of an index does not represent exactly any particular investment as you cannot invest directly in an index. Distributor: Royce Fund Services, Inc.
6 | This page is not part of the 2015 Semiannual Report to Shareholders
U.S. Small-Cap Market Cycle and Risk-Adjusted Performance
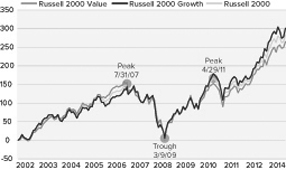
| We believe strongly in the idea that a long-term perspective is crucial for determining the success of an investment approach. Flourishing in an up market is wonderful, but surviving a bear market by losing less (or not at all) is equally desirable. In any case, the true tests of a portfolio’s mettle are results over bull and bear periods. This is why we prefer to examine results that include up and down market phases—primarily by looking at both full market cycles and rolling return periods. We have seen 10 full market cycles since the inception of the Russell 2000 Index on December 31, 1978, with the most recent peaking on April 29, 2011. (Royce defines market cycles as those that have retreated at least 15% from a previous market peak and have rebounded to establish a new peak above the previous one.) Each market cycle contains a peak-to-trough and a trough-to-peak period. When evaluating fund performance, it is common practice to review results for the most recent year (often the calendar year) along with its related longer-term trailing periods. However, we think full market cycle results offer an equally, if not more important measure of performance. Interestingly, over the small-cap index’s more-than-30-year history, each style index—the Russell 2000 Value Index and the Russell 2000 Growth Index—outperformed in five of the 10 full market cycles. In fact, leadership has alternated between growth and value over the last six cycles. |
Royce U.S. Small-Cap Equity Funds vs. Russell 2000 Index:
Market Cycle Results (%)
| FUND | PEAK-TO-PEAK 3/9/00–7/13/07 | PEAK-TO-PEAK 7/13/07–4/29/11 | PEAK-TO-CURRENT 4/29/11–6/30/15 | |||
| Royce Pennsylvania Mutual Fund | 207.1 | 11.6 | 32.3 | |||
| Royce Micro-Cap Fund | 197.4 | 24.9 | -0.9 | |||
| Royce Premier Fund | 198.1 | 29.9 | 26.1 | |||
| Royce Low-Priced Stock Fund | 198.9 | 27.2 | -8.4 | |||
| Royce Total Return Fund | 193.9 | 6.8 | 40.4 | |||
| Royce Heritage Fund | 150.4 | 25.3 | 18.2 | |||
| Royce Opportunity Fund | 191.8 | 6.9 | 42.2 | |||
| Royce Special Equity Fund | 227.4 | 20.8 | 40.0 | |||
| Royce Small-Cap Value Fund1 | n.a. | 17.4 | 17.0 | |||
| Royce Smaller-Companies Growth Fund1 | n.a. | -3.0 | 41.8 | |||
| Royce 100 Fund | n.a. | 27.6 | 19.4 | |||
| Royce Dividend Value Fund | n.a. | 21.6 | 35.3 | |||
| INDEX | ||||||
| Russell 2000 | 54.8 | 6.6 | 53.5 | |||
| Russell 2000 Value | 189.4 | -1.4 | 45.5 | |||
| Russell 2000 Growth | -14.8 | 14.3 | 61.8 | |||
Small-Cap Market Cycle: Russell 2000 Indexes Total Returns (%)
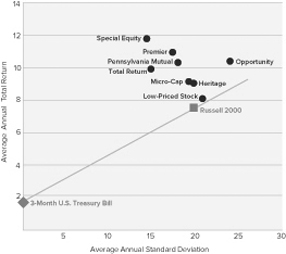
Risk/Return Profile
For the 15-Year Period Ended June 30, 2015 (%)
This page is not part of the 2015 Semiannual Report to Shareholders | 7
| MANAGER’S DISCUSSION | |
| Royce Pennsylvania Mutual Fund® (PMF) |
 |
Chuck Royce |
| FUND PERFORMANCE Royce Pennsylvania Mutual Fund gained 0.1% for the year-to-date period ended June 30, 2015 versus a gain of 4.8% for its small-cap benchmark, the Russell 2000 Index, for the same period. The Fund began 2015 with a historically uncharacteristic underperformance during a bearish January, which helped to seal up a relative disadvantage for the first quarter (+1.2% versus +4.3%). The Fund then beat the small-cap index in the April downturn before trailing in May and June. The second-to-last day of June was particularly harrowing, as the Fund saw a quarterly gain morph into a loss. For the second quarter, Penn Mutual fell 1.1% compared to a 0.4% advance for the Russell 2000. Recent relative performance challenges have served to mask somewhat the fact that the Fund’s five-year average annual total return for the period ended June 30, 2015 was 13.4%, a mark that was higher than both its own and its benchmark’s respective five-year historical rolling averages of 10.7% and 7.4%. This says something to us about the historically atypical market of the last five years. Still, we remain committed to our risk-conscious, fundamentally rooted approaches and remain confident about the Fund’s long-term prospects. Penn Mutual outperformed the Russell 2000 for the 15-, 20-, 25-, 30-, and 35-year periods ended June 30, 2015. The Fund’s average annual total return for the 40-year period—all under the management of Chuck Royce—was 13.8%. |
| WHAT WORKED... AND WHAT DIDN’T |
| The Fund was underweight Health Care at the end of June, though this sector was Penn Mutual’s top performer in the first half. However, the portfolio’s net gains were paltry compared to those for Health Care businesses in the Russell 2000, which were led by biotech stocks. Net contributions for Penn Mutual came instead from companies clustered mostly in two industry groups—health care providers & services and life sciences tools & services. Other sectors in the black at the end of June included Financials, Consumer Staples, and Consumer Discretionary. Although four sectors—Energy, Materials, Industrials, and Information Technology—posted net losses for the first half, only the first of these registered more than a modest decline. The Energy sector’s largest detractor was Unit Corporation, which we have held in the portfolio for more than 10 years. Unit operates as a contract driller and exploration and production company, among other energy-related businesses. Last year’s significant decline in commodity prices drove its share price down. While a nascent recovery for oil prices and its own ongoing effective operations were helping its shares to come back a bit earlier in 2015, a first-quarter loss announced in May brought its stock back down. We held a decent-sized position at the end of the first half. The Fund’s largest detractor was MBIA, which provides financial guarantee insurance to public finance markets in the U.S. and internationally. Its position as an insurer of municipal bonds issued by Puerto Rico led its shares to drop significantly in late June as the island commonwealth’s precarious financial condition grew more troubling. We held a small position at the end of June. Top-10 position Genesco also detracted. The company is a specialty retailer that sells footwear, headwear, sports apparel, and accessories. While we like its core businesses, execution has been an issue of late, particularly the yet-to-materialize turnaround for Lids hat and Lids Locker Room shops, which exerted enough pressure on margins to help create an earnings miss announced late in May. |
| In contrast, two companies from the Financials sector made the largest positive contribution to first-half performance. Shares of Ohio-based investment management firm Diamond Hill Investment Group climbed over much of the last few years, boosted most recently by strong earnings and growing revenues. SEI Investments, the Fund’s eleventh-largest holding at June 30, is another asset manager that also provides technology solutions. The firm enjoyed double-digit growth in assets under management and administration, the result of both capital market appreciation and new client wins. We have always liked asset management businesses and think that more widespread economic growth coupled with an expanding global need for expertise in wealth management bode well for the industry as a whole. |
| Top Contributors to Performance Year-to-Date Through 6/30/15 (%)1 | ||||
| Diamond Hill Investment Group | 0.19 | |||
| SEI Investments | 0.15 | |||
| Blackbaud | 0.14 | |||
| ManpowerGroup | 0.13 | |||
| Drew Industries | 0.12 | |||
| 1 Includes dividends | ||||
| Top Detractors from Performance Year-to-Date Through 6/30/15 (%)2 | ||||
| MBIA | -0.18 | |||
| Unit Corporation | -0.13 | |||
| Genesco | -0.13 | |||
| Balchem Corporation | -0.12 | |||
| PICO Holdings | -0.12 | |||
| 2Net of dividends | ||||
| CURRENT POSITIONING AND OUTLOOK |
| In the context of a small-cap market recently led by biotech stocks and at other times dominated by similarly fast-growing, non-earning companies, the Fund’s results in the first half were not entirely surprising. Due to the considerable potential earnings power we believe many of our holdings in more cyclical, less defensive sectors possess, our primary focus remained with Industrials, Information Technology, Consumer Discretionary, Energy, and Materials. If the U.S. economy continues to accelerate—and we believe it will—the inherent operating leverage in these positions should propel earnings, especially in the event of increased CAPEX spending. And while the demand for profitable and fundamentally sound small-cap companies has not yet materialized to the degree that we had anticipated, we have seen signs of a shift—one that we expect will look more dramatic as the economy picks up its pace. |
| 8 | The Royce Funds 2015 Semiannual Report to Shareholders |
| PERFORMANCE AND PORTFOLIO REVIEW | TICKER SYMBOLS PENNX RYPFX RPMIX RYPCX RPMRX RPMKX |
| Performance and Expenses | ||||||||||||||||||||||
| Average Annual Total Return (%) Through 6/30/15 | ||||||||||||||||||||||
| JAN-JUN 2015* | 1-YR | 3-YR | 5-YR | 10-YR | 15-YR | 20-YR | 25-YR | 30-YR | 35-YR | 40-YR | ||||||||||||
| PMF | 0.08 | -2.61 | 13.98 | 13.40 | 7.71 | 10.28 | 10.75 | 10.63 | 11.06 | 12.77 | 13.83 | |||||||||||
| Annual Operating Expenses: 0.92% | ||||||||||||||||||||||
| *Not Annualized | ||||||||||||||||||||||
Relative Returns: Monthly Rolling Average Annual Return Periods
| On a monthly rolling basis, the Fund outperformed the Russell 2000 in 95% of all 10-year periods; 81% of all 5-year periods; and 55% of all 1-year periods. |
| PERIODS BEATING THE INDEX | FUND AVG (%)* | INDEX AVG (%)* | |||||||||
| 10-year | 115/121 | 95% | 10.6 | 7.3 | |||||||
| 5-year | 147/181 | 81% | 10.7 | 7.4 | |||||||
| 1-year | 125/229 | 55% | 12.4 | 10.5 | |||||||
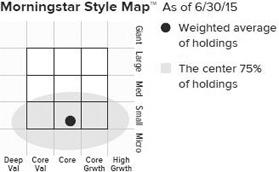
The Morningstar Style Map is the Morningstar Style BoxTM with the center 75% of fund holdings plotted as the Morningstar Ownership ZoneTM. The Morningstar Style Box is designed to reveal a fund’s investment strategy. The Morningstar Ownership Zone provides detail about a portfolio’s investment style by showing the range of stock sizes and styles. The Ownership Zone is derived by plotting each stock in the portfolio within the proprietary Morningstar Style Box. Over time, the shape and location of a fund's ownership zone may vary. See page 126 for additional information. |
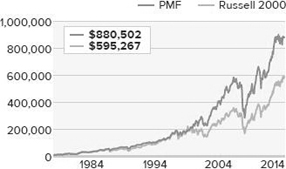
Value of $10,000
| Top 10 Positions | ||
| % of Net Assets | ||
| Ritchie Bros. Auctioneers | 1.0 | |
| Quaker Chemical | 0.8 | |
| Genworth MI Canada | 0.8 | |
| HEICO Corporation | 0.8 | |
| Genesco | 0.8 | |
| Buckle (The) | 0.8 | |
| Reliance Steel & Aluminum | 0.8 | |
| MKS Instruments | 0.8 | |
| SEACOR Holdings | 0.7 | |
| Thor Industries | 0.7 | |
| Portfolio Sector Breakdown | ||
| % of Net Assets | ||
| Industrials | 25.1 | |
| Information Technology | 20.0 | |
| Consumer Discretionary | 16.0 | |
| Financials | 13.2 | |
| Materials | 9.7 | |
| Health Care | 6.6 | |
| Energy | 4.7 | |
| Consumer Staples | 2.3 | |
| Telecommunication Services | 0.3 | |
| Utilities | 0.0 | |
| Miscellaneous | 1.0 | |
| Cash and Cash Equivalents | 1.1 | |
| Calendar Year Total Returns (%) | ||
| YEAR | PMF | |
| 2014 | -0.7 | |
| 2013 | 35.3 | |
| 2012 | 14.6 | |
| 2011 | -4.2 | |
| 2010 | 23.9 | |
| 2009 | 36.3 | |
| 2008 | -34.8 | |
| 2007 | 2.8 | |
| 2006 | 14.8 | |
| 2005 | 12.5 | |
| 2004 | 20.2 | |
| 2003 | 40.3 | |
| 2002 | -9.2 | |
| 2001 | 18.4 | |
| 2000 | 18.3 | |
| Upside/Downside Capture Ratios | ||||
| Periods Ended 6/30/15 (%) | ||||
| UPSIDE | DOWNSIDE | |||
| 10-Year | 97 | 100 | ||
| From 12/31/78 (Russell 2000 Inception) | 89 | 71 | ||
| Portfolio Diagnostics | ||
| Fund Net Assets | $4,484 million | |
| Number of Holdings | 387 | |
| Turnover Rate | 12% | |
| Average Market Capitalization1 | $1,619 million | |
| Weighted Average P/E Ratio2,3 | 18.9x | |
| Weighted Average P/B Ratio2 | 2.6x | |
| Holdings ≥ 75% of Total Investments | 153 | |
| Active Share4 | 86% | |
| U.S. Investments (% of Net Assets) | 88.8% | |
| Non-U.S. Investments (% of Net Assets) | 10.1% | |
| Important Performance and Expense Information All performance information in this Report reflects past performance, is presented on a total return basis, reflects the reinvestment of distributions, and does not reflect the deduction of taxes that a shareholder would pay on fund distributions or the redemption of fund shares. Past performance is no guarantee of future results. Investment return and principal value of an investment will fluctuate, so that shares may be worth more or less than their original cost when redeemed. Shares redeemed within 30 days of purchase may be subject to a 1% redemption fee payable to the Fund, which is not reflected in the performance shown above; if it were, performance would be lower. Current month-end performance may be higher or lower than performance quoted and may be obtained at www.roycefunds.com. All performance and risk information reflects results of the Investment Class (its oldest class). Operating expenses reflect the Fund’s total annual operating expenses for the Investment Class as of the Fund’s most current prospectus and include management fees, other expenses, and acquired fund fees and expenses. Acquired fund fees and expenses reflect the estimated amount of the fees and expenses incurred indirectly by the Fund through its investment in mutual funds, hedge funds, private equity funds, and other investment companies. Shares of PMF’s Service, Consultant, R, and K Classes bear an annual distribution expense that is not borne by the Investment Class. Regarding the “Top Contributors” and “Top Detractors” tables shown above, the sum of all contributors to, and all detractors from, performance for all securities in the portfolio would approximate the Fund’s year-to-date performance for 2015. Upside Capture Ratio measures a manager’s performance in up markets relative to the Fund’s benchmark. It is calculated by measuring the Fund’s performance in quarters when the benchmark went up and dividing it by the benchmark’s return in those quarters. Downside Capture Ratio measures a Managers’ performance in down markets relative to the Fund’s benchmark (Russell 2000). It is calculated by measuring the Fund’s performance in quarters when the benchmark goes down and dividing it by the benchmark’s return in those quarters. |
| The Royce Funds 2015 Semiannual Report to Shareholders | 9 |
| MANAGERS’ DISCUSSION | ||
| Royce Micro-Cap Fund (RMC) |
 |
Jenifer Taylor Jim Stoeffel |
| FUND PERFORMANCE Royce Micro-Cap Fund was down 1.4% for the year-to-date period ended June 30, 2015, lagging both its benchmark, the Russell Microcap Index, and the small-cap Russell 2000 Index, which advanced 6.0% and 4.8%, respectively, for the same period. The Fund was again challenged by its lack of participation in a bullish period for both micro-cap and small-cap stocks. However, it should be noted that returns within each asset class were narrower than year-to-date results for the respective indexes might suggest, with biotech remaining a primary driver of returns during the first half of 2015. |
In the first quarter, Royce Micro-Cap fell 0.3% as a bearish January outdid positive returns in both February and March. By contrast, the Russell Microcap gained 3.1% for the first quarter while the Russell 2000 rose 4.3% for the same period. The Fund’s performance worsened in the second quarter, especially hurt by the wave of volatility that the Greek default sent through the markets at the end of June. The Fund lost 1.1% for the second quarter while the micro-cap index and small-cap index increased 2.8% and 0.4%, respectively. Longer-term relative results were better. Royce Micro-Cap outperformed the Russell Microcap for the 15-year period ended June 30, 2015 and beat the Russell 2000 for the 15-, 20-year, and since inception (12/31/91) periods ended June 30, 2015. (Data for the Russell Microcap only goes back to June 30, 2000.) The Fund’s average annual total return since inception was 11.6%. We are very proud of the Fund’s long-term performance history. |
| WHAT WORKED... AND WHAT DIDN’T |
| Health Care was something of a double-edged sword for the portfolio. The sector comfortably led both the Fund and the Russell Microcap in the first half. Returns for the index, however, were dominated by biotech stocks. Most of these businesses lack either the conservative capitalization or earnings profile that we look for when building our portfolio. The Fund was therefore significantly underweight in Health Care during the first half and had little exposure to biotech. Net gains came primarily from companies in the health care equipment & supplies and the health care providers & services industries. So while the sector was by far the portfolio’s top contributor in the first half, its net gains were not as vigorous as were those for the sector within the Russell Microcap. |
| Firearms maker Smith & Wesson Holding Corporation was the Fund’s best-performing position in the first half. The company continued to gain market share while recent sizable investments in R&D have been driving significant product innovation. Its shares also benefited from effective cash flow allocation into strategic acquisitions that are providing vertical manufacturing integration as well as adjacent product offerings. The stock of financial services business INTL FCStone began to climb in February. It has a growing niche in automated international currency settlements and was thus rewarded in an increasingly volatile global currency market. |
| Of the Fund’s five sectors that finished the semiannual period in the red, only Energy and Materials posted sizable net losses. Gulf Island Fabrication fabricates offshore drilling and production platforms, as well as other steel structures for the oil and gas and marine industries. Recent results have been hurt by the decline in commodity prices, which has led to a slowdown in its business. Still, we like how this low-debt, asset-rich firm has been executing through a highly challenging phase for its industry. We held a good-sized position at the end of June. Exposure to the energy industry also played a role in dismal results for Global Power Equipment Group, which makes gas turbine generation equipment. Also contributing to the decline in its stock price were the resignation of its CEO in March and the announcement in May that it would need to restate financial statements. While this was a clearly disappointing turn of events, we chose to hold our position, at least for the short term. The company’s highly attractive valuation and strong balance sheet offered enough interest for us to allow the dust to settle around a business that we like for the long-term. Two for-profit education businesses were also among the portfolio’s top detractors in the first half—American Public Education and Capella Education. The industry has been under fire of late and is enduring a round of new, more stringent federal regulations. We think each of these companies has the management talent and fundamental strength to survive these challenges. |
| Top Contributors to Performance Year-to-Date Through 6/30/15 (%)1 | ||||
| Smith & Wesson Holding Corporation | 0.55 | |||
| INTL FCStone | 0.46 | |||
| LSI Industries | 0.39 | |||
| Culp | 0.32 | |||
| Ennis | 0.29 | |||
| 1 Includes dividends | ||||
| Top Detractors from Performance Year-to-Date Through 6/30/15 (%)2 | ||||
| Gulf Island Fabrication | -0.51 | |||
| American Public Education | -0.36 | |||
| Global Power Equipment Group | -0.35 | |||
| Capella Education | -0.32 | |||
| Graham Corporation | -0.31 | |||
| 2 Net of dividends | ||||
| CURRENT POSITIONING AND OUTLOOK |
| Sector weightings at the end of June were relatively unchanged from where they have stood over the last 18-24 months. This is due to our ongoing preference for more economically sensitive sectors, such as the Fund’s three largest at the end of the period—Industrials, Information Technology, and Consumer Discretionary. We maintain the belief that many portfolio holdings in these (and other) sectors should benefit from a faster-growing economy that also could reward disciplined approaches that focus on fundamentals. So while the Fund’s recent performances have fallen below our expectations, we remain confident about its prospects going forward. We are also pleased to announce that on May 1, 2015, Royce veteran Jim Stoeffel joined Jenifer Taylor as the Fund’s co-portfolio manager. Jen has been involved in the Fund’s management for more than 11 years while Jim joined Royce in 2007 as portfolio manager. |
| 10 | The Royce Funds 2015 Semiannual Report to Shareholders |
| PERFORMANCE AND PORTFOLIO REVIEW | TICKER SYMBOLS RYOTX RMCFX RYMCX |
| Performance and Expenses | ||||||||||||||||
| Average Annual Total Return (%) Through 6/30/15 | ||||||||||||||||
| JAN-JUN 2015* | 1-YR | 3-YR | 5-YR | 10-YR | 15-YR | 20-YR | SINCE INCEPTION (12/31/91) | |||||||||
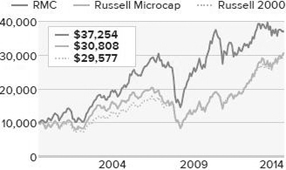
| RMC | -1.38 | -6.40 | 6.48 | 7.49 | 7.00 | 9.16 | 10.27 | 11.55 | ||||||||
| Annual Operating Expenses: 1.48% | ||||||||||||||||
| * Not Annualized | ||||||||||||||||
Relative Returns: Monthly Rolling Average Annual Return Periods
| On a monthly rolling basis, the Fund outperformed the Russell Microcap in 98% of all 10-year periods; 76% of all 5-year periods; and 58% of all 1-year periods. |
| PERIODS BEATING THE INDEX | FUND AVG (%)* | INDEX AVG (%)* | ||||||||||
| 10-year | 60/61 | 98% | 9.6 | 6.7 | ||||||||
| 5-year | 92/121 | 76% | 9.9 | 7.1 | ||||||||
| 1-year | 98/169 | 58% | 11.8 | 10.9 | ||||||||
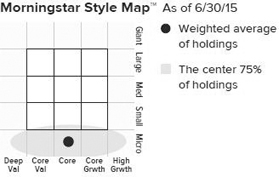
| The Morningstar Style Map is the Morningstar Style BoxTM with the center 75% of fund holdings plotted as the Morningstar Ownership ZoneTM. The Morningstar Style Box is designed to reveal a fund’s investment strategy. The Morningstar Ownership Zone provides detail about a portfolio’s investment style by showing the range of stock sizes and styles. The Ownership Zone is derived by plotting each stock in the portfolio within the proprietary Morningstar Style Box. Over time, the shape and location of a fund’s ownership zone may vary. See page 126 for additional information. |
Value of $10,000
| Top 10 Positions | ||
| % of Net Assets | ||
| Shoe Carnival | 1.1 | |
| Total Energy Services | 1.1 | |
| Resources Connection | 1.0 | |
| Haynes International | 1.0 | |
| ORBCOMM | 1.0 | |
| Key Technology | 1.0 | |
| Kirkland’s | 1.0 | |
| Graham Corporation | 0.9 | |
| Photronics | 0.9 | |
| U.S. Physical Therapy | 0.9 | |
| Portfolio Sector Breakdown | ||
| % of Net Assets | ||
| Industrials | 22.7 | |
| Information Technology | 18.8 | |
| Consumer Discretionary | 14.1 | |
| Health Care | 11.6 | |
| Financials | 10.0 | |
| Materials | 6.4 | |
| Energy | 5.6 | |
| Consumer Staples | 1.6 | |
| Telecommunication Services | 1.3 | |
| Miscellaneous | 4.7 | |
| Cash and Cash Equivalents | 3.2 | |
| Calendar Year Total Returns (%) | ||
| YEAR | RMC | |
| 2014 | -4.1 | |
| 2013 | 21.3 | |
| 2012 | 8.0 | |
| 2011 | -12.1 | |
| 2010 | 30.1 | |
| 2009 | 55.7 | |
| 2008 | -40.9 | |
| 2007 | 7.1 | |
| 2006 | 22.3 | |
| 2005 | 11.5 | |
| 2004 | 15.8 | |
| 2003 | 52.6 | |
| 2002 | -13.4 | |
| 2001 | 23.1 | |
| 2000 | 16.7 | |
| Upside/Downside Capture Ratios | ||||
| Periods Ended 6/30/15 (%) | ||||
| UPSIDE | DOWNSIDE | |||
| 10-Year | 88 | 84 | ||
| From 6/30/00 (Russell | 92 | 80 | ||
| Microcap Index Inception) | ||||
| Portfolio Diagnostics | ||
| Fund Net Assets | $396 million | |
| Number of Holdings | 217 | |
| Turnover Rate | 21% | |
| Average Market Capitalization1 | $409 million | |
| Weighted Average P/E Ratio2,3 | 22.6x | |
| Weighted Average P/B Ratio2 | 2.1x | |
| Holdings ≥ 75% of Total Investments | 116 | |
| Active Share4 | 89% | |
| U.S. Investments (% of Net Assets) | 83.0% | |
| Non-U.S. Investments (% of Net Assets) | 13.8% | |
| Important Performance and Expense Information All performance information in this Report reflects past performance, is presented on a total return basis, reflects the reinvestment of distributions, and does not reflect the deduction of taxes that a shareholder would pay on fund distributions or the redemption of fund shares. Past performance is no guarantee of future results. Investment return and principal value of an investment will fluctuate, so that shares may be worth more or less than their original cost when redeemed. Shares redeemed within 30 days of purchase may be subject to a 1% redemption fee payable to the Fund, which is not reflected in the performance shown above; if it were, performance would be lower. Current month-end performance may be higher or lower than performance quoted and may be obtained at www.roycefunds.com. All performance and risk information reflects results of the Investment Class (its oldest class). Price and total return information is based on net asset values calculated for shareholder transactions. Certain immaterial adjustments were made to the net assets of Royce Micro-Cap Fund at 12/30/11 for financial reporting purposes, and as a result the net asset values for shareholder transactions on that date and the calendar year Total Returns (%) based on those net asset values differ from the adjusted net asset values and calendar year total returns reported in the Financial Highlights. Operating expenses reflect the Fund’s total annual operating expenses for the Investment Class as of the Fund’s most current prospectus and include management fees, other expenses, and acquired fund fees and expenses. Acquired fund fees and expenses reflect the estimated amount of the fees and expenses incurred indirectly by the fund through its investments in mutual funds, hedge funds, private equity funds, and other investment companies. Shares of RMC’s Service and Consultant Classes bear an annual distribution expense that is not borne by the Investment Class. Regarding the “Top Contributors” and “Top Detractors” tables shown above, the sum of all contributors to, and all detractors from, performance for all securities in the portfolio would approximate the Fund’s year-to-date performance for 2015. Upside Capture Ratio measures a manager’s performance in up markets relative to the Fund’s benchmark. It is calculated by measuring the Fund’s performance in quarters when the benchmark went up and dividing it by the benchmark’s return in those quarters. Downside Capture Ratio measures a Managers’ performance in down markets relative to the Fund’s benchmark (Russell Microcap Index). It is calculated by measuring the Fund’s performance in quarters when the benchmark goes down and dividing it by the benchmark’s return in those quarters. |
| The Royce Funds 2015 Semiannual Report to Shareholders | 11 |
| MANAGER’S DISCUSSION | ||
| Royce Premier Fund (RPR) |
 |
| Chuck Royce |
| FUND PERFORMANCE For the year-to-date period ended June 30, 2015, Royce Premier Fund gained 1.7% versus a 4.8% increase for its small-cap benchmark, the Russell 2000 Index, for the same period. The Fund got off to a slow start in 2015, uncharacteristically losing more than its benchmark in January. While the Fund then made a solid recovery in February, it again trailed the small-cap index slightly in March. Premier advanced 2.6% for the first quarter versus an increase of 4.3% for the Russell 2000. |
| The second quarter was less robust and less volatile. Or at least it was prior to an eventful—and, for the Fund, unfortunate—end to June courtesy of Greece’s default and a dramatic plunge for Chinese stocks. Premier’s net gain for the quarter reversed itself during the second-to-last trading day of June. For the second quarter, Premier was down 0.9% versus a 0.4% gain for the benchmark. |
Longer-term results offered a more encouraging view. The Fund once again posted a strong absolute average annual total return for the five-year period ended June 30, 2015, up 13.1%. This result was higher than both the portfolio’s own historical five-year monthly rolling average for the period ended June 30, 2015, up 11.7%, and its benchmark’s average of 7.4% over the same period. Premier outperformed the Russell 2000 for the 10-, 15-, 20-year, and since inception (12/31/91) periods ended June 30, 2015. The Fund’s average annual total return for the since inception period was 11.9%. We take great pride in this long-term record. |
| WHAT WORKED... AND WHAT DIDN’T Six of the portfolio’s eight equity sectors posted net gains for the semiannual period. Consumer Discretionary, the Fund’s third largest at the end of June, led by a comfortable margin, helped by strong turns from holdings in the textiles, apparel & luxury goods group. Columbia Sportswear was the top performer in that group and in the sector as a whole. The company makes active outerwear, apparel, and footwear under the Columbia, Sorel, Mountain Hardwear, and other brand names. The long cold winter and robust product innovation helped to drive share gains. Along with a promising fall order book and improvements in its European business, these results showed the benefit of a multi-year infrastructure improvement effort, demand creation initiatives, management changes in underperforming geographies, and the repositioning of certain brands. We were pleased to see the firm experiencing revitalized revenues and margin expansion. |
| The Fund’s top contributor in the first half was Cal-Maine Foods, the largest producer of eggs in the U.S. Egg prices have more than doubled in anticipation of supply constraints caused by a serious outbreak of avian flu in the Midwest, which led to the loss of approximately 11% of egg-laying hens. This came in the context of a favorable environment for egg producers, driven by the high price of competing proteins such as beef, quick-service restaurants broadening their breakfast offerings, and the popularity of high-protein diets. In addition, the price of grain, the main input for egg producers, remains low. |
| Although Information Technology was in the black during the first half, it was also home to Premier’s most significant detractor—Anixter International, which makes specialized wiring systems and distributes cables and electrical and electronic wire products. The company reduced the organic growth outlook for fiscal 2015 for two of its core distribution businesses—enterprise cabling and security solutions and electronic wire and cable—primarily due to mounting competition in cabling and security and slower U.S. industrial production keyed by the stronger dollar and lower energy-related capital spending. Lower energy prices also continued to hurt results for many energy services companies, and long-time holding Unit Corporation was no exception. Unit explores for oil and natural gas, acquires oil and gas properties, does contract drilling of onshore oil and natural gas wells, and performs gathering and processing of natural gas. In the midst of a struggling industry, the company has continued to operate effectively by reducing costs and improving efficiency. Its newly introduced drilling rig has also gained an encouraging amount of market acceptance, increasing that business segment’s competitiveness. Looking at Premier’s first-half sector results in relation to the Russell 2000, the Fund’s underweight in Health Care had a negative effect, as did overweights in Industrials and Energy, each of which detracted from performance for the semiannual period. |
| Top Contributors to Performance Year-to-Date Through 6/30/15 (%)1 | ||||
| Cal-Maine Foods | 0.66 | |||
| Columbia Sportswear | 0.53 | |||
| Fair Isaac | 0.46 | |||
| Zebra Technologies Cl. A | 0.46 | |||
| Cognex Corporation | 0.36 | |||
| 1 Includes dividends | ||||
| Top Detractors from Performance Year-to-Date Through 6/30/15 (%)2 | ||||
| Anixter International | -0.52 | |||
| Unit Corporation | -0.33 | |||
| Trican Well Service | -0.32 | |||
| Lincoln Electric Holdings | -0.30 | |||
| Acacia Research | -0.28 | |||
| 2 Net of dividends | ||||
| CURRENT POSITIONING AND OUTLOOK After stalling briefly in the first quarter, the economy appears to have resumed its steady pace of growth. This should benefit small-caps as a whole, particularly those in more economically sensitive areas of the market such as Industrials and Materials—two sectors in which the Fund was overweight at the end of June. As such, our focus remains on companies that are poised for profit margin expansion as their revenue growth normalizes in concert with a faster-moving U.S. economy. |
| 12 | The Royce Funds 2015 Semiannual Report to Shareholders |
| PERFORMANCE AND PORTFOLIO REVIEW | TICKER SYMBOLS RYPRX RPFFX RPFIX RPRCX RPRRX RPRKX RPRWX |
| Performance and Expenses | ||||||||||||||||
| Average Annual Total Return (%) Through 6/30/15 | ||||||||||||||||
| JAN-JUN 2015* | 1-YR | 3-YR | 5-YR | 10-YR | 15-YR | 20-YR | SINCE INCEPTION (12/31/91) | |||||||||
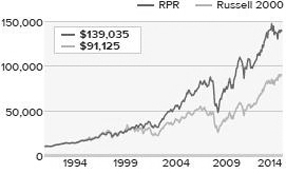
| RPR | 1.67 | -6.09 | 11.81 | 13.09 | 9.48 | 10.98 | 11.38 | 11.85 | ||||||||
| Annual Operating Expenses: 1.10% | ||||||||||||||||
| *Not Annualized | ||||||||||||||||
Relative Returns: Monthly Rolling Average Annual Return Periods
| On a monthly rolling basis, the Fund outperformed the Russell 2000 in 100% of all 10-year periods; 85% of all 5-year periods; and 63% of all 1-year periods. |
| PERIODS BEATING THE INDEX | FUND AVG (%)* | INDEX AVG (%)* | |||||||||
| 10-year | 121/121 | 100% | 11.9 | 7.3 | |||||||
| 5-year | 154/181 | 85% | 11.7 | 7.4 | |||||||
| 1-year | 144/229 | 63% | 12.9 | 10.5 | |||||||
Morningstar Style MapTM As of 6/30/15
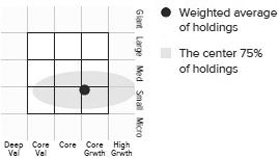
| The Morningstar Style Map is the Morningstar Style BoxTM with the center 75% of fund holdings plotted as the Morningstar Ownership ZoneTM. The Morningstar Style Box is designed to reveal a fund’s investment strategy. The Morningstar Ownership Zone provides detail about a portfolio’s investment style by showing the range of stock sizes and styles. The Ownership Zone is derived by plotting each stock in the portfolio within the proprietary Morningstar Style Box. Over time, the shape and location of a fund's ownership zone may vary. See page 126 for additional information. |
Value of $10,000
| Top 10 Positions | ||
| % of Net Assets | ||
| Ritchie Bros. Auctioneers | 2.7 | |
| Woodward | 2.6 | |
| Alleghany Corporation | 2.4 | |
| Lincoln Electric Holdings | 2.4 | |
| Federated Investors Cl. B | 2.4 | |
| MKS Instruments | 2.3 | |
| Thor Industries | 2.3 | |
| Copart | 2.3 | |
| National Instruments | 2.2 | |
| Kennedy-Wilson Holdings | 2.2 | |
| Portfolio Sector Breakdown | ||
| % of Net Assets | ||
| Industrials | 27.1 | |
| Information Technology | 17.7 | |
| Consumer Discretionary | 12.7 | |
| Financials | 12.4 | |
| Materials | 6.3 | |
| Energy | 5.8 | |
| Health Care | 4.8 | |
| Consumer Staples | 3.4 | |
| Miscellaneous | 1.6 | |
| Cash and Cash Equivalents | 8.2 | |
| Calendar Year Total Returns (%) | ||
| YEAR | RPR | |
| 2014 | -0.9 | |
| 2013 | 27.7 | |
| 2012 | 11.4 | |
| 2011 | -0.9 | |
| 2010 | 26.5 | |
| 2009 | 33.3 | |
| 2008 | -28.3 | |
| 2007 | 12.7 | |
| 2006 | 8.8 | |
| 2005 | 17.1 | |
| 2004 | 22.8 | |
| 2003 | 38.7 | |
| 2002 | -7.8 | |
| 2001 | 9.6 | |
| 2000 | 17.1 | |
| Upside/Downside Capture Ratios | ||||
| Periods Ended 6/30/15 (%) | ||||
| UPSIDE | DOWNSIDE | |||
| 10-Year | 99 | 90 | ||
| From 12/31/91 (Start of Fund’s | 92 | 72 | ||
| First Full Quarter) | ||||
| Portfolio Diagnostics | ||
| Fund Net Assets | $4,383 million | |
| Number of Holdings | 61 | |
| Turnover Rate | 4% | |
| Average Market Capitalization1 | $3,035 million | |
| Weighted Average P/E Ratio2,3 | 20.2x | |
| Weighted Average P/B Ratio2 | 2.9x | |
| Holdings ≥ 75% of Total Investments | 37 | |
| Active Share4 | 97% | |
| U.S. Investments (% of Net Assets) | 83.7% | |
| Non-U.S. Investments (% of Net Assets) | 8.1% | |
| Important Performance and Expense Information All performance information in this Report reflects past performance, is presented on a total return basis, reflects the reinvestment of distributions, and does not reflect the deduction of taxes that a shareholder would pay on fund distributions or the redemption of fund shares. Past performance is no guarantee of future results. Investment return and principal value of an investment will fluctuate, so that shares may be worth more or less than their original cost when redeemed. Shares redeemed within 30 days of purchase may be subject to a 1% redemption fee payable to the Fund, which is not reflected in the performance shown above; if it were, performance would be lower. Current month-end performance may be higher or lower than performance quoted and may be obtained at www.roycefunds.com. All performance and risk information reflects results of the Investment Class (its oldest class). Operating expenses reflect the Fund’s total annual operating expenses for the Investment Class as of the Fund’s most current prospectus and include management fees and other expenses. Shares of RPR’s Service, Consultant, R, and K Classes bear an annual distribution expense that is not borne by the Investment Class. Regarding the “Top Contributors” and “Top Detractors” tables shown above, the sum of all contributors to, and all detractors from, performance for all securities in the portfolio would approximate the Fund’s year-to-date performance for 2015. Upside Capture Ratio measures a manager’s performance in up markets relative to the Fund’s benchmark. It is calculated by measuring the Fund’s performance in quarters when the benchmark went up and dividing it by the benchmark’s return in those quarters. Downside Capture Ratio measures a Managers’ performance in down markets relative to the Fund’s benchmark (Russell 2000). It is calculated by measuring the Fund’s performance in quarters when the benchmark goes down and dividing it by the benchmark’s return in those quarters. |
| The Royce Funds 2015 Semiannual Report to Shareholders | 13 |
| MANAGER’S DISCUSSION | ||
| Royce Low-Priced Stock Fund (RLP) |
 |
| Jim Stoeffel |
| FUND PERFORMANCE Royce Low-Priced Stock Fund gained 2.6% for the year-to-date period ended June 30, 2015, trailing its small-cap benchmark, the Russell 2000 Index, which was up 4.8% for the same period. While the Fund’s relative results for the first half left something to be desired, we were pleased with the portfolio’s absolute return, particularly in a market that continued to present challenges for active, risk-conscious approaches. |
The year began on a down note, with most stocks in negative territory in January. The rebound for many small-caps through the remainder of the first quarter, however, was less bullish for Low-Priced Stock than for the Russell 2000. For the first quarter Low-Priced Stock was up 0.5% compared to a 4.3% gain for the small-cap index. While April saw a round of mostly falling small-cap prices, the Fund was able to resist the trend and showed a solid gain for the month. This set the stage for a strong second quarter in which Low-Priced Stock advanced 2.1% while its benchmark was up 0.4%. Without wanting to put too much emphasis on a short-term result, we were encouraged nonetheless, just as we were by longer-term relative and absolute returns. The Fund outperformed the Russell 2000 for the 15-, 20-year, and since inception (12/15/93) periods ended June 30, 2015. Low-Priced Stock’s average annual total return since inception was 10.8%, a long-term record in which we take great pride. |
| WHAT WORKED... AND WHAT DIDN’T The Energy and Materials sectors remained in the red for the first half following turns as the Fund’s most significant detractors in 2014. Each was hurt by the combination of a strong dollar, weakness in China, and a related softness in many commodity prices. We meaningfully trimmed positions in both sectors in the second half of 2014, so while net losses were broad based, no individual names stood out as significant detractors. As long-term valuations look compelling, we have remained overweight in each, believing that the strong balance sheets of many holdings should allow them to take advantage of current industry disruptions to build stronger franchises for themselves. |
| Information Technology posted a net gain for the semiannual period, though a portion of that was due to the Fund’s substantial overweight throughout the first half—it was actually a source of underperformance versus the sector within the Russell 2000. We have been slowly trimming certain tech-based holdings while remaining significantly overweight in the sector as we see a number of trends in the data center and mobile computing areas that should drive opportunities for several years. One of the portfolio’s top detractors in the sector, Silicon Graphics International provides computing and storage technology for big data applications. Its shares were hurt in the near term over the concern for privacy-driven slowdown in sales to the NSA. We held our shares pending greater visibility into the company’s backlog of new products that target more commercially based applications. One of the portfolio’s top contributors, Cirrus Logic has established itself as the dominant provider of end-to-end, semiconductor-based audio and voice solutions for the mobile industry. During the first half the company was in the early stages of monetizing large R&D investments geared toward supporting Apple, its largest customer, while its recent acquisition of Wolfson made it the dominant provider in the Android ecosystem as well. We see the firm’s high-end audio and voice solutions as being in the very early stages of secular growth. |
| Acacia Research, the portfolio’s largest detractor, is a leading patent assertion company known as a Non Practicing Entity (NPE). The company has amassed a formidable portfolio of patents across industries that it is in the early stages of asserting against infringing parties. However, Acacia has not been as successful in monetizing these assets as we had anticipated, in part due to a slightly unfavorable regulatory environment. As a risk control measure, we reduced our position in the first half, though we are prepared to reevaluate if monetization becomes more visible. |
| The portfolio’s top contributor by a wide margin, Value Partners Group is one of the world’s largest asset managers focused on Hong Kong and China, with its share price closely tied to movements in those markets. Those markets rose significantly through most of the first half, with positive implications for the firm’s assets under management and fees. We meaningfully trimmed our position during the second quarter, though we held some shares given the long-term opportunities we see in Asia. Firearms manufacturer Smith & Wesson Holding Corporation continued to take market share while recent heavy investments in R&D led to significant product innovation. The company also effectively deployed cash to make some strategic acquisitions that provided vertical manufacturing integration as well as adjacent product offerings. |
| Top Contributors to Performance Year-to-Date Through 6/30/15 (%)1 | ||||
| Value Partners Group | 0.93 | |||
| Smith & Wesson Holding Corporation | 0.48 | |||
| Cirrus Logic | 0.46 | |||
| Silicon Image | 0.36 | |||
| II-VI | 0.36 | |||
| 1 Includes dividends | ||||
| Top Detractors from Performance Year-to-Date Through 6/30/15 (%)2 | ||||
| Acacia Research | -0.57 | |||
| Silicon Graphics International | -0.39 | |||
| MBIA | -0.32 | |||
| Global Power Equipment Group | -0.31 | |||
| Amber Road | -0.23 | |||
| 2 Net of dividends | ||||
| CURRENT POSITIONING AND OUTLOOK We remain optimistic about the long-term prospects for well-placed companies in Energy, Materials, and certain areas of Information Technology. We are also upbeat about the outlook for the U.S. consumer, as the gradually improving employment outlook and the benefits of lower energy prices provide a strong tailwind for the group. We had a slight underweight in Consumer Discretionary and a marginal overweight in Consumer Staples at the end of June. |
| 14 | The Royce Funds 2015 Semiannual Report to Shareholders |
| PERFORMANCE AND PORTFOLIO REVIEW | TICKER SYMBOLS RYLPX RLPHX RLPIX RLPRX RLPKX |
| Performance and Expenses | ||||||||||||||||
| Average Annual Total Return (%) Through 6/30/15 | ||||||||||||||||
| JAN-JUN 2015* | 1-YR | 3-YR | 5-YR | 10-YR | 15-YR | 20-YR | SINCE INCEPTION (12/15/93) | |||||||||
| RLP | 2.64 | -9.03 | 5.74 | 6.59 | 6.04 | 8.10 | 10.56 | 10.76 | ||||||||
| Annual Operating Expenses: 1.47% | ||||||||||||||||
| * Not Annualized | ||||||||||||||||
Relative Returns: Monthly Rolling Average Annual Return Periods
| On a monthly rolling basis, the Fund outperformed the Russell 2000 in 74% of all 10-year periods; 79% of all 5-year periods; and 59% of all 1-year periods. |
| PERIODS BEATING THE INDEX | FUND AVG (%)* | INDEX AVG (%)* | |||||||||
| 10-year | 90/121 | 74% | 10.9 | 7.3 | |||||||
| 5-year | 143/181 | 79% | 11.3 | 7.4 | |||||||
| 1-year | 136/229 | 59% | 12.8 | 10.5 | |||||||
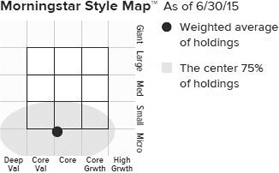
| The Morningstar Style Map is the Morningstar Style BoxTM with the center 75% of fund holdings plotted as the Morningstar Ownership ZoneTM. The Morningstar Style Box is designed to reveal a fund’s investment strategy. The Morningstar Ownership Zone provides detail about a portfolio’s investment style by showing the range of stock sizes and styles. The Ownership Zone is derived by plotting each stock in the portfolio within the proprietary Morningstar Style Box. Over time, the shape and location of a fund's ownership zone may vary. See page 126 for additional information. |
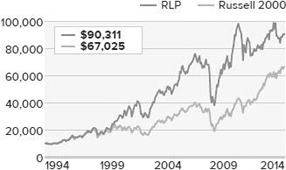
Value of $10,000
| Top 10 Positions | ||
| % of Net Assets | ||
| Resources Connection | 1.2 | |
| Navigant Consulting | 1.2 | |
| Cascade Microtech | 1.2 | |
| Orbotech | 1.1 | |
| Dundee Corporation Cl. A | 1.1 | |
| II-VI | 1.1 | |
| QuinStreet | 1.0 | |
| SeaChange International | 1.0 | |
| Jupiter Fund Management | 0.9 | |
| Ashmore Group | 0.9 | |
| Portfolio Sector Breakdown | ||
| % of Net Assets | ||
| Information Technology | 29.3 | |
| Industrials | 14.9 | |
| Consumer Discretionary | 12.6 | |
| Financials | 10.2 | |
| Energy | 6.4 | |
| Health Care | 5.0 | |
| Materials | 4.7 | |
| Consumer Staples | 3.1 | |
| Telecommunication Services | 1.3 | |
| Miscellaneous | 4.6 | |
| Cash and Cash Equivalents | 7.9 | |
| Calendar Year Total Returns (%) | ||
| YEAR | RLP | |
| 2014 | -3.4 | |
| 2013 | 12.9 | |
| 2012 | 4.5 | |
| 2011 | -14.6 | |
| 2010 | 31.5 | |
| 2009 | 53.6 | |
| 2008 | -36.0 | |
| 2007 | 2.3 | |
| 2006 | 19.0 | |
| 2005 | 9.7 | |
| 2004 | 13.6 | |
| 2003 | 44.0 | |
| 2002 | -16.3 | |
| 2001 | 25.1 | |
| 2000 | 24.0 | |
| Upside/Downside Capture Ratios | ||||
| Periods Ended 6/30/15 (%) | ||||
| UPSIDE | DOWNSIDE | |||
| 10-Year | 94 | 109 | ||
| From 12/31/93 (Start of the | 103 | 92 | ||
| Fund’s First Full Quarter) | ||||
| Portfolio Diagnostics | ||
| Fund Net Assets | $537 million | |
| Number of Holdings | 144 | |
| Turnover Rate | 28% | |
| Average Market Capitalization1 | $757 million | |
| Weighted Average P/B Ratio2 | 2.0x | |
| Holdings ≥ 75% of Total Investments | 92 | |
| Active Share3 | 96% | |
| U.S. Investments (% of Net Assets) | 77.5% | |
| Non-U.S. Investments (% of Net Assets) | 14.6% | |
| Important Performance and Expense Information All performance information in this Report reflects past performance, is presented on a total return basis, reflects the reinvestment of distributions, and does not reflect the deduction of taxes that a shareholder would pay on fund distributions or the redemption of fund shares. Past performance is no guarantee of future results. Investment return and principal value of an investment will fluctuate, so that shares may be worth more or less than their original cost when redeemed. Shares redeemed within 30 days of purchase may be subject to a 1% redemption fee payable to the Fund, which is not reflected in the performance shown above; if it were, performance would be lower. Current month-end performance may be higher or lower than performance quoted and may be obtained at www.roycefunds.com. All performance and risk information reflects results of the Service Class (its oldest class). Price and total return information is based on net asset values for shareholder transactions. Certain immaterial adjustments were made to the net assets of Royce Low-Priced Stock Fund at 6/30/13 for financial reporting purposes, and as a result the net asset values for shareholder transactions and the calendar year total returns based on those net asset values differ from the adjusted net asset values and calendar year total returns reported in the Financial Highlights. Operating expenses reflect the Fund’s gross total annual operating expenses for the Service Class as of the Fund’s most current prospectus, including management fees, 12b-1 distribution and service fees, and other expenses. Shares of RLP’s R Class bear an annual distribution expense that is higher than that of the Service Class. Regarding the “Top Contributors” and “Top Detractors” tables shown above, the sum of all contributors to, and all detractors from, performance for all securities in the portfolio would approximate the Fund’s year-to-date performance for 2015. Upside Capture Ratio measures a manager’s performance in up markets relative to the Fund’s benchmark. It is calculated by measuring the Fund’s performance in quarters when the benchmark went up and dividing it by the benchmark’s return in those quarters. Downside Capture Ratio measures a Managers’ performance in down markets relative to the Fund’s benchmark (Russell 2000). It is calculated by measuring the Fund’s performance in quarters when the benchmark goes down and dividing it by the benchmark’s return in those quarters. |
| The Royce Funds 2015 Semiannual Report to Shareholders | 15 |
| MANAGERS’ DISCUSSION | ||
| Royce Total Return Fund (RTR) |
 |
| Chuck Royce Jay Kaplan, CFA |
| FUND PERFORMANCE We were once again left with mixed feelings about the performance of Royce Total Return Fund. For the year-to-date period ended June 30, 2015, the Fund advanced a modest 0.7%, lagging its small-cap benchmark, the Russell 2000 Index, which gained 4.8% for the same period. The Fund trailed its benchmark during both the first quarter, when it was up 1.8% compared to 4.3%, and the second, when it slipped 1.0% versus a 0.4% gain for the small-cap index. |
| This was all unquestionably disappointing, but not entirely unexpected in the context of the current small-cap market cycle. Year-to-date returns for the Russell 2000 were the result of what looked to us like a seriously disjointed small-cap marketplace. First-half performance for the index came overwhelmingly from the Health Care sector, led by biotech stocks. This sort of narrow, growth-driven environment is not conducive to strong relative results for a portfolio populated with dividend-paying small-caps chosen primarily for their sterling fundamentals, solid profitability, and attractive valuations. When lower overall levels of volatility are factored in, recent results become even easier to understand. |
Which is not to say that we are happy with recent relative performance, only that these results make sense considering the dynamics of the current small-cap market, one in which Total Return has achieved solid absolute returns even as it has trailed the Russell 2000. We have been anticipating a shift away from this environment and toward one in which interest rates are rising, overall equity returns are lower, and volatility is higher, which should benefit the sort of conservatively capitalized dividend payers that we prefer. We remain proud of the Fund’s longer-term relative advantages and its strong absolute performance. Total Return outperformed the Russell 2000 for the 15-, 20-year, and since inception (12/15/93) periods ended June 30, 2015. The Fund’s average annual total return since inception was 11.0%. |
| WHAT WORKED... AND WHAT DIDN’T Portfolio net gains and losses at the level of sector, industry, and position tended to be moderate. The Fund paid a relatively steep price for its underweight in Health Care and, to a lesser degree, Information Technology. The first of these sectors led the equity markets as a whole, including small-cap. Biotech companies, which do not fit the Fund’s valuation or fundamental criteria, were by far the dominant industry. Financials, the Fund’s largest sector at the end of the first half, was also its top contributor. Three of the portfolio’s best four performing industry groups came from the sector—capital markets, insurance (its two largest), and banks. The first of these groups had an appreciably larger net gain than its counterparts, driven by strong results for two asset management businesses we think very highly of. Value Partners Group is a Hong Kong-based firm that has focused on Asian markets for more than two decades. Increased performance and management fees helped to boost net profits. When the Chinese equity markets plummeted in June, we were pleased that the firm’s stock held up well. The share price of AllianceBernstein Holding—Total Return’s second-largest position at the end of June—also cooled off a bit near the end of the first half, but held on to most of its net gain from earlier in the year. |
| Long-time holding and top-10 position ManpowerGroup was the Fund’s top net gainer for the first half. The company has a global business providing staffing and other workforce solutions. Two consecutive quarters of better-than-expected earnings, fueled by an improved labor market, pushed up its shares. The Fund’s largest position at the end of June—and another long-term holding—was specialty insurer Markel Corporation. Robust underwriting and investment operations led to steady earnings improvement and a consistently rising share price in the first half. |
| As for positions that detracted from performance, Tidewater provides marine service vessels to offshore energy companies. Its stock fell with the decline in energy prices and bottomed out in April of this year following a fiscal third-quarter loss reported in February that was nonetheless not as severe as most analysts had been expecting. We have been pleased with the way Tidewater has executed during a highly challenging period for energy companies. Balchem Corporation specializes in making performance ingredients for the food, feed, and medical sterilization industries. Its price fell in late June as insider sales seemed to shift Wall Street’s opinion. The Energy, Materials, and Utilities sectors posted net losses in the first half while those that finished in the black included Health Care, Consumer Staples, Consumer Discretionary, and Industrials. |
| Top Contributors to Performance Year-to-Date Through 6/30/15 (%)1 | ||||
| ManpowerGroup | 0.22 | |||
| Value Partners Group | 0.20 | |||
| Markel Corporation | 0.17 | |||
| AllianceBernstein Holding L.P. | 0.17 | |||
| GameStop Corporation Cl. A | 0.17 | |||
| 1 Includes dividends | ||||
| Top Detractors from Performance Year-to-Date Through 6/30/15 (%)2 | ||||
| Tidewater | -0.18 | |||
| Balchem Corporation | -0.16 | |||
| Greif Cl. A | -0.16 | |||
| E-L Financial | -0.13 | |||
| Vishay Intertechnology | -0.12 | |||
| 2 Net of dividends | ||||
| CURRENT POSITIONING AND OUTLOOK We continue to believe consistent dividend-paying small-cap companies can offer long-term advantages. At the end of the first half, the Fund’s sector weightings remained close to the range they have been in since the end of 2013. Our belief that we will see both continued economic expansion in the U.S. and an earnings-led rally for small-caps has led us over the past few years to favor more cyclical sectors such as Industrials, Consumer Discretionary, and Materials. We were overweight in the first and third of these sectors at the end of June while also being overweight in Financials. |
| 16 | The Royce Funds 2015 Semiannual Report to Shareholders |
| PERFORMANCE AND PORTFOLIO REVIEW | TICKER SYMBOLS RYTRX RYTFX RTRIX RYTCX RTRRX RTRKX RTRWX |
| Performance and Expenses | ||||||||||||||||
| Average Annual Total Return (%) Through 6/30/15 | ||||||||||||||||
| JAN-JUN 2015* | 1-YR | 3-YR | 5-YR | 10-YR | 15-YR | 20-YR | SINCE INCEPTION (12/15/93) | |||||||||
| RTR | 0.74 | -0.63 | 14.18 | 13.70 | 7.42 | 9.94 | 10.85 | 10.97 | ||||||||
| Annual Operating Expenses: 1.19% | ||||||||||||||||
| * Not Annualized | ||||||||||||||||
Relative Risk Adjusted Returns: Monthly Rolling Sharpe Ratios
| On a monthly rolling risk-adjusted basis, the Fund outperformed the Russell 2000 in 100% of all 10-year periods and 96% of all 5-year periods. |
| PERIODS BEATING THE INDEX | FUND AVG (%)* | INDEX AVG (%)* | |||||||||
| 10-year | 121/121 | 100% | 0.55 | 0.32 | |||||||
| 5-year | 173/181 | 96% | 0.61 | 0.35 | |||||||
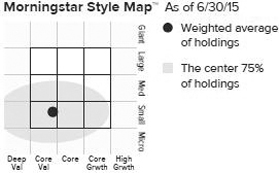
The Morningstar Style Map is the Morningstar Style BoxTM with the center 75% of fund holdings plotted as the Morningstar Ownership ZoneTM. The Morningstar Style Box is designed to reveal a fund’s investment strategy. The Morningstar Ownership Zone provides detail about a portfolio’s investment style by showing the range of stock sizes and styles. The Ownership Zone is derived by plotting each stock in the portfolio within the proprietary Morningstar Style Box. Over time, the shape and location of a fund's ownership zone may vary. See page 126 for additional information. |
Value of $10,000
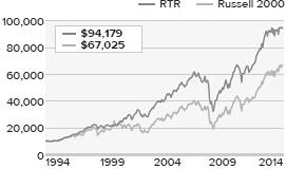
| Top 10 Positions | ||
| % of Net Assets | ||
| Markel Corporation | 1.2 | |
| AllianceBernstein Holding L.P. | 1.2 | |
| E-L Financial | 1.0 | |
| Erie Indemnity Cl. A | 1.0 | |
| Alleghany Corporation | 1.0 | |
| Teleflex | 1.0 | |
| Ritchie Bros. Auctioneers | 0.9 | |
| HEICO Corporation | 0.9 | |
| Gentex Corporation | 0.9 | |
| ManpowerGroup | 0.9 | |
| Portfolio Sector Breakdown | ||
| % of Net Assets | ||
| Financials | 26.6 | |
| Industrials | 21.0 | |
| Consumer Discretionary | 12.8 | |
| Materials | 10.7 | |
| Information Technology | 8.9 | |
| Health Care | 7.2 | |
| Energy | 4.5 | |
| Consumer Staples | 3.6 | |
| Utilities | 2.0 | |
| Telecommunication Services | 0.9 | |
| Miscellaneous | 0.3 | |
| Cash and Cash Equivalents | 1.5 | |
| Calendar Year Total Returns (%) | ||
| YEAR | RTR | |
| 2014 | 1.3 | |
| 2013 | 32.8 | |
| 2012 | 14.4 | |
| 2011 | -1.7 | |
| 2010 | 23.5 | |
| 2009 | 26.2 | |
| 2008 | -31.2 | |
| 2007 | 2.4 | |
| 2006 | 14.5 | |
| 2005 | 8.2 | |
| 2004 | 17.5 | |
| 2003 | 30.0 | |
| 2002 | -1.6 | |
| 2001 | 14.8 | |
| 2000 | 19.4 | |
| Upside/Downside Capture Ratios | ||||
| Periods Ended 6/30/15 (%) | ||||
| UPSIDE | DOWNSIDE | |||
| 10-Year | 85 | 83 | ||
| From 12/31/93 (Start of Fund’s | 82 | 56 | ||
| First Full Quarter) | ||||
| Portfolio Diagnostics | ||
| Fund Net Assets | $3,981 million | |
| Number of Holdings | 339 | |
| Turnover Rate | 4% | |
| Average Market Capitalization1 | $2,173 million | |
| Weighted Average P/E Ratio2,3 | 17.6x | |
| Weighted Average P/B Ratio2 | 2.3x | |
| Holdings ≥ 75% of Total Investments | 134 | |
| Active Share4 | 90% | |
| U.S. Investments (% of Net Assets) | 85.8% | |
| Non-U.S. Investments (% of Net Assets) | 12.7% | |
| Important Performance and Expense Information All performance information in this Report reflects past performance, is presented on a total return basis, reflects the reinvestment of distributions, and does not reflect the deduction of taxes that a shareholder would pay on fund distributions or the redemption of fund shares. Past performance is no guarantee of future results. Investment return and principal value of an investment will fluctuate, so that shares may be worth more or less than their original cost when redeemed. Shares redeemed within 30 days of purchase may be subject to a 1% redemption fee payable to the Fund, which is not reflected in the performance shown above; if it were, performance would be lower. Current month-end performance may be higher or lower than performance quoted and may be obtained at www.roycefunds.com. All performance and risk information reflects results of the Investment Class (its oldest class). Operating expenses reflect the Fund’s total annual operating expenses for the Investment Class as of the Fund’s most current prospectus and include management fees, other expenses, and acquired fund fees and expenses. Acquired fund fees and expenses reflect the estimated amount of the fees and expenses incurred indirectly by the Fund through its investments in mutual funds, hedge funds, private equity funds, and other investment companies. Shares of RTR’s Service, Consultant, R, and K Classes bear an annual distribution expense that is not borne by the Investment Class. Regarding the “Top Contributors” and “Top Detractors” tables shown above, the sum of all contributors to, and all detractors from, performance for all securities in the portfolio would approximate the Fund’s year-to-date performance for 2015. The Sharpe Ratio is calculated for a specified period by dividing a fund’s annualized excess returns by its annualized standard deviation. The higher the Sharpe ratio, the better the fund’s historical risk-adjusted performance. Upside Capture Ratio measures a manager’s performance in up markets relative to the Fund’s benchmark. It is calculated by measuring the Fund’s performance in quarters when the benchmark went up and dividing it by the benchmark’s return in those quarters. Downside Capture Ratio measures a Managers’ performance in down markets relative to the Fund’s benchmark (Russell 2000). It is calculated by measuring the Fund’s performance in quarters when the benchmark goes down and dividing it by the benchmark’s return in those quarters. |
| The Royce Funds 2015 Semiannual Report to Shareholders | 17 |
| MANAGERS’ DISCUSSION | ||
| Royce Heritage Fund (RHF) |
 |
| Chuck Royce Steven McBoyle, CPA, CA Jim Harvey, CFA |
| FUND PERFORMANCE Royce Heritage Fund was up 1.1% for the year-to-date period ended June 30, 2015, trailing its small-cap benchmark, the Russell 2000 Index, which gained 4.8% for the same period. The year began on a difficult note for most equities, with the major indexes all trending downward during January. It was tougher on small-caps than on mid- and large-cap issues, though losses were mitigated in large part by a stronger rebound for the Russell 2000 during the recovery for share prices during February and March. |
The Fund performed in line with this pattern, struggling in January before coming back in the next two months, though its results were not as strong. For the first quarter, Heritage gained 1.2% versus a gain of 4.3% for the small-cap index. The second quarter had a pattern that was similar to that of the first—a bearish April was followed by mostly rising stock prices in May and June—but results were generally more muted. There was also the uncertainty, and resulting volatility, surrounding Greek debt that rocked the global equity markets at the very end of June and substantially tamped down second-quarter gains. Heritage defied the bearish trend in April but was unable to keep pace in the more growth-driven May and more tumultuous June. The Fund fell 0.1% for the second quarter compared to a 0.4% gain for the Russell 2000. Longer-term results were better on both an absolute and relative basis. Heritage beat the Russell 2000 for the 10-, 15-year, and since inception (12/27/95) periods ended June 30, 2015. The Fund’s average annual total return since inception was 12.9%. We remain proud of the Fund’s nearly 20-year record. |
| WHAT WORKED... AND WHAT DIDN’T On a relative basis, two sectors had a significant negative impact for the semiannual period. Health Care was the clear leader within the small-cap market as a whole, driven by highly impressive results for biotech stocks. The Fund was significantly underweight this sector and had very limited exposure to biotech companies, which hurt relative performance. While Heritage was substantially overweight in Information Technology during the first half, it was also significantly underweight in software companies, which dominated overall technology returns in a fashion similar to what biotech did in Health Care. |
| Seven of the Fund’s nine equity sectors posted net gains for the semiannual period, with Financials leading by a sizable margin. The portfolio was underweight in Financials compared to its benchmark, but easily compensated with effective stock selection—its sector holdings posted an overall better return than did those in the Russell 2000. The sector’s results in the portfolio were propelled primarily by excellent results from holdings in the capital markets industry, which was home to five of Heritage’s top-10 contributors in the first half. Value Partners Group is a Hong Kong-based asset manager with a value orientation that naturally appeals to us. Its stock often closely parallels movements in Hong Kong’s and China’s markets, which climbed precipitously into May before cooling off in June with the decline in Chinese stocks. We were pleased to see growth in its assets under management and improved performance and management fees, all of which helped its earnings. Shares of ManpowerGroup, which is in the Industrials sector, rose as demand for temporary staffing recovered in Europe, the company’s largest revenue geography. It also experienced sturdy growth from its permanent placement segment, a high-margin end of its business. Finally, the firm announced two staffing acquisitions that expanded or solidified its status in Europe and the Australasia region and gave a hefty 63% boost to its dividend. |
| The Fund’s largest detractor by a wide margin, Anixter International provides security systems and solutions, enterprise cabling, and also distributes electrical and electronic wire. The company’s stock was hurt when Anixter reduced its organic growth outlook for the year in two of its core distribution businesses—the enterprise cabling and security solutions line and its electronic wire and cable segment. Other disadvantages included competitive pressures in cabling and security, slower U.S. industrial production due to the stronger dollar, and lower energy-related capital spending. Lower copper prices also remained a sales drag. Genesee & Wyoming owns and operates short line and regional freight railroads and provides related rail services through its subsidiaries. A newer position, its business was slowed primarily by a number of factors related to lower shipping traffic for steam coal, agricultural products, oil and frac sand, and metals. |
| Top Contributors to Performance Year-to-Date Through 6/30/15 (%)1 | ||||
| Value Partners Group | 0.58 | |||
| ManpowerGroup | 0.39 | |||
| Cal-Maine Foods | 0.30 | |||
| SEI Investments | 0.25 | |||
| Clarkson | 0.25 | |||
| 1 Includes dividends | ||||
| Top Detractors from Performance Year-to-Date Through 6/30/15 (%)2 | ||||
| Anixter International | -0.33 | |||
| Genesee & Wyoming Cl. A | -0.19 | |||
| Standard Motor Products | -0.19 | |||
| Medley Management Cl. A | -0.17 | |||
| Coronation Fund Managers | -0.15 | |||
| 2 Net of dividends | ||||
| CURRENT POSITIONING AND OUTLOOK After stalling briefly in the first quarter, the economy appears to have resumed a steady pace of growth that should benefit small-caps as a whole, particularly those in more economically sensitive areas of the market such as Industrials and Materials—two sectors in which the Fund was significantly overweight at the end of June. As such, our focus remains on companies that are poised for profit margin expansion as their revenue growth normalizes in concert with a faster-moving U.S. economy. |
| 18 | The Royce Funds 2015 Semiannual Report to Shareholders |
| PERFORMANCE AND PORTFOLIO REVIEW | TICKER SYMBOLS RGFAX RHFHX RYGCX RHFRX RHFKX |
| Performance and Expenses | ||||||||||||||
| Average Annual Total Return (%) Through 6/30/15 | ||||||||||||||
| JAN-JUN 2015* | 1-YR | 3-YR | 5-YR | 10-YR | 15-YR | SINCE INCEPTION (12/27/95) | ||||||||
| RHF | 1.12 | -2.85 | 12.03 | 11.57 | 8.64 | 9.05 | 12.86 | |||||||
| Annual Operating Expenses: 1.51% | ||||||||||||||
| * Not Annualized | ||||||||||||||
Relative Returns: Monthly Rolling Average Annual Return Periods
| On a monthly rolling basis, the Fund outperformed the Russell 2000 in 100% of all 10-year periods; 90% of all 5-year periods; and 64% of all 1-year periods. |
| PERIODS BEATING THE INDEX | FUND AVG (%)* | INDEX AVG (%)* | |||||||||
| 10-year | 115/115 | 100% | 11.5 | 7.2 | |||||||
| 5-year | 157/175 | 90% | 12.1 | 7.3 | |||||||
| 1-year | 143/223 | 64% | 15.0 | 10.4 | |||||||
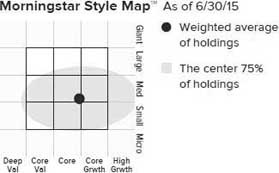
| The Morningstar Style Map is the Morningstar Style BoxTM with the center 75% of fund holdings plotted as the Morningstar Ownership ZoneTM. The Morningstar Style Box is designed to reveal a fund’s investment strategy. The Morningstar Ownership Zone provides detail about a portfolio’s investment style by showing the range of stock sizes and styles. The Ownership Zone is derived by plotting each stock in the portfolio within the proprietary Morningstar Style Box. Over time, the shape and location of a fund's ownership zone may vary. See page 126 for additional information. |
Value of $10,000
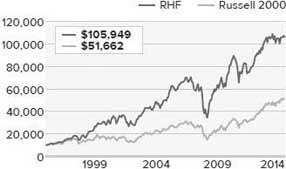
| Top 10 Positions | ||
| % of Net Assets | ||
| Minerals Technologies | 2.0 | |
| ManpowerGroup | 1.7 | |
| Ritchie Bros. Auctioneers | 1.7 | |
| Westlake Chemical | 1.6 | |
| Copart | 1.6 | |
| Reliance Steel & Aluminum | 1.6 | |
| Standard Motor Products | 1.4 | |
| Towers Watson & Co. Cl. A | 1.4 | |
| KKR & Co. L.P. | 1.4 | |
| SEI Investments | 1.4 | |
| Portfolio Sector Breakdown | ||
| % of Net Assets | ||
| Financials | 21.7 | |
| Industrials | 20.7 | |
| Information Technology | 12.2 | |
| Consumer Discretionary | 11.9 | |
| Materials | 9.0 | |
| Health Care | 2.8 | |
| Consumer Staples | 1.9 | |
| Energy | 1.3 | |
| Utilities | 1.2 | |
| Miscellaneous | 3.2 | |
| Cash and Cash Equivalents | 14.1 | |
| Calendar Year Total Returns (%) | ||
| YEAR | RHF | |
| 2014 | -1.1 | |
| 2013 | 26.0 | |
| 2012 | 14.3 | |
| 2011 | -9.3 | |
| 2010 | 27.5 | |
| 2009 | 51.8 | |
| 2008 | -36.2 | |
| 2007 | 1.2 | |
| 2006 | 22.6 | |
| 2005 | 8.7 | |
| 2004 | 20.4 | |
| 2003 | 38.1 | |
| 2002 | -18.9 | |
| 2001 | 20.5 | |
| 2000 | 11.7 | |
| Upside/Downside Capture Ratios | ||||
| Periods Ended 6/30/15 (%) | ||||
| UPSIDE | DOWNSIDE | |||
| 10-Year | 100 | 98 | ||
| From 12/31/95 (Start of Fund’s | 111 | 89 | ||
| First Full Quarter) | ||||
| Portfolio Diagnostics | ||
| Fund Net Assets | $342 million | |
| Number of Holdings | 154 | |
| Turnover Rate | 34% | |
| Average Market Capitalization1 | $3,466 million | |
| Weighted Average P/E Ratio2,3 | 19.5x | |
| Weighted Average P/B Ratio2 | 2.9x | |
| Holdings ≥ 75% of Total Investments | 75 | |
| Active Share4 | 97% | |
| U.S. Investments (% of Net Assets) | 66.3% | |
| Non-U.S. Investments (% of Net Assets) | 19.6% | |
| Important Performance and Expense Information All performance information in this Report reflects past performance, is presented on a total return basis, reflects the reinvestment of distributions, and does not reflect the deduction of taxes that a shareholder would pay on fund distributions or the redemption of fund shares. Past performance is no guarantee of future results. Investment return and principal value of an investment will fluctuate, so that shares may be worth more or less than their original cost when redeemed. Shares redeemed within 30 days of purchase may be subject to a 1% redemption fee payable to the Fund, which is not reflected in the performance shown above; if it were, performance would be lower. Current month-end performance may be higher or lower than performance quoted and may be obtained at www.roycefunds.com. All performance and risk information reflects results of the Service Class (its oldest class). Price and total return information is based on net asset values calculated for shareholder transactions. Certain immaterial adjustments were made to the net assets of Royce Heritage Fund at 12/30/11 for financial reporting purposes, and as a result the net asset values for shareholder transactions on that date and the calendar year total returns based on those net asset values differ from the adjusted net asset values and calendar year total returns reported in the Financial Highlights. Operating expenses reflect the Fund’s total annual operating expenses for the Service Class as of the Fund’s most current prospectus and include management fees, 12b-1 distribution and service fees, other expenses, and acquired fund fees and expenses. Shares of RHF’s Consultant and R Classes bear an annual distribution expense that is higher than that of the Service Class. Acquired fund fees and expenses reflect the estimated amount of the fees and expenses incurred indirectly by the Fund through its investments in mutual funds, hedge funds, private equity funds, and other investment companies. Regarding the “Top Contributors” and “Top Detractors” tables shown above, the sum of all contributors to, and all detractors from, performance for all securities in the portfolio would approximate the Fund’s year-to-date performance for 2015. Upside Capture Ratio measures a manager’s performance in up markets relative to the Fund’s benchmark. It is calculated by measuring the Fund’s performance in quarters when the benchmark went up and dividing it by the benchmark’s return in those quarters. Downside Capture Ratio measures a Managers’ performance in down markets relative to the Fund’s benchmark (Russell 2000). It is calculated by measuring the Fund’s performance in quarters when the benchmark goes down and dividing it by the benchmark’s return in those quarters. |
| The Royce Funds 2015 Semiannual Report to Shareholders | 19 |
| MANAGERS’ DISCUSSION | ||
| Royce Opportunity Fund (ROF) |
 |
| Buzz Zaino, CFA Bill Hench |
| FUND PERFORMANCE Royce Opportunity Fund finished the year-to-date period ended June 30, 2015 with a gain of 0.7% versus an increase of 4.8% for its small-cap benchmark, the Russell 2000, for the same period. |
The Fund first lost a chunk of ground to its benchmark during a bearish January, which hurt its early results. For the first quarter, Opportunity rose 1.1% compared to 4.3% for the Russell 2000. The second quarter saw another relative disadvantage, made worse by a very difficult June. On the second-to-last day of the month, news of the Greek default wreaked havoc on stock prices and the Fund lost more than the Russell 2000. For the second quarter the Fund was down 0.4% while the small-cap index was up 0.4%. 2015’s first-half results notwithstanding, Opportunity maintained longer-term advantages over its benchmark. The Fund outpaced the Russell 2000 for the 10-, 15-year, and since inception (11/19/96) periods ended June 30, 2015. ROF’s average annual total return since inception was 12.7%. We take great pride in the Fund’s nearly two decades of strong long-term results. |
| WHAT WORKED... AND WHAT DIDN’T Typically a strong performer in any bull market, Opportunity was hurt by the very narrow leadership within small-cap over the last 12 months, a period in which biotech dominated returns for both the asset class and domestic equities as a whole. Hewing to the time-tested idea that broad diversity across industries and positions works best in the Fund, we were not too surprised by the portfolio’s first-half performance results. Our theme-driven, opportunistic value approach emphasizes very inexpensive stocks—as determined by low price-to-book and price-to-sales ratios—so we had no exposure to biotech or pharmaceuticals companies, which sport very rich valuations. This lack of exposure was the most significant factor in the Fund’s relative disadvantage in the semiannual period. So while Health Care finished the first half as the portfolio’s second-best contributing sector, its net gains were modest on an absolute level as well as compared to the benchmark and came mostly from companies in the life sciences tools & services group and health care equipment & supplies industry. |
| The Fund’s largest sector at the end of June was Information Technology. The size and diversity of this sector have for many years made it a regular source of investment opportunity for us. In the first half, its diversity could perhaps best be seen by the starkly different results for its industry groups within the portfolio (this could also be seen within the Russell 2000). Two of the Fund’s best-performing industries came from IT. Net gains for the semiconductors & semiconductor equipment group were strong enough to not only lead on an industry basis by a wide margin, but were also appreciably higher than those for each of the Fund’s equity sectors. Conversely, three of the portfolio’s four largest-detracting industry groups also came from Information Technology—electronic equipment, instruments & components stocks (where net losses nearly rivalled the gains achieved by the semiconductor industry), IT services companies, and the technology hardware storage & peripherals group. |
| Within Materials, the metals & mining group was home to the Fund’s biggest contributor and two of its most significant detractors. Fading aluminum prices stymied results for both Century Aluminum and Noranda Aluminum Holding Corporation, though the latter company put shares on sale at a sizable discount prior to the commodity price decline, exacerbating its losses. Our confidence in an eventual rebound for industrial metals led us to increase our stake in both companies. RTI International Metals specializes in titanium and other metals and sells primarily to the aerospace industry. Its shares shot up quickly in March when Alcoa announced an agreement to buy the company. |
| TRC Companies is an engineering, environmental consulting, and construction management firm. In spite of having virtually no Wall Street coverage, its improved earnings and expanding margins drew enough attention to its stock for it to advance significantly in the first half. We trimmed our position as its price rose. Interface produces modular carpet tiles for a variety of industries. It is one of many companies we own in the non-residential construction space, though it is also involved in the residential area running Flor, which sells carpet squares. Improved results in its corporate, hospitality, and retail flooring businesses, as well as its status as an environmentally conscious business, keyed an increase for its shares. |
| Top Contributors to Performance Year-to-Date Through 6/30/15 (%)1 | ||||
| RTI International Metals | 0.42 | |||
| TRC Companies | 0.31 | |||
| Interface | 0.31 | |||
| EarthLink Holdings. | 0.30 | |||
| NeoPhotonics Corporation | 0.26 | |||
| 1 Includes dividends | ||||
| Top Detractors from Performance Year-to-Date Through 6/30/15 (%)2 | ||||
| Century Aluminum | -0.42 | |||
| Silicon Graphics International | -0.29 | |||
| McClatchy Company (The) Cl. A | -0.27 | |||
| Noranda Aluminum Holding Corporation | -0.24 | |||
| Identiv | -0.23 | |||
| 2 Net of dividends | ||||
| CURRENT POSITIONING AND OUTLOOK We have been pleased by the number of bargains that we have found within several industries, including a number of positions in Information Technology, Industrials, and Consumer Discretionary. At the end of June we were substantially overweight in the first two sectors and overweight in the third. Many holdings that we built or first began to buy in the first half fall under our Turnarounds investment theme, an area that we think should generally do well as the pace of economic growth picks up, as we suspect it will. Non-residential construction remains an area of focus, as the industry is beginning to enjoy what we anticipate should be a long-term recovery. |
| 20 | The Royce Funds 2015 Semiannual Report to Shareholders |
| PERFORMANCE AND PORTFOLIO REVIEW | TICKER SYMBOLS RYPNX RYOFX ROFCX ROFIX ROFRX ROFKX |
| Performance and Expenses | ||||||||||||||
| Average Annual Total Return (%) Through 6/30/15 | ||||||||||||||
| JAN-JUN 2015* | 1-YR | 3-YR | 5-YR | 10-YR | 15-YR | SINCE INCEPTION (11/19/96) | ||||||||
| ROF | 0.67 | -2.75 | 16.58 | 15.62 | 8.58 | 10.40 | 12.67 | |||||||
| Annual Operating Expenses: 1.15% | ||||||||||||||
| * Not Annualized | ||||||||||||||
Relative Returns: Monthly Rolling Average Annual Return Periods
| On a monthly rolling basis, the Fund outperformed the Russell 2000 in 99% of all 10-year periods; 84% of all 5-year periods; and 69% of all 1-year periods. |
| PERIODS BEATING THE INDEX | FUND AVG (%)* | INDEX AVG (%)* | |||||||||
| 10-year | 103/104 | 99% | 10.9 | 7.0 | |||||||
| 5-year | 137/164 | 84% | 11.9 | 7.2 | |||||||
| 1-year | 146/212 | 69% | 15.9 | 10.0 | |||||||
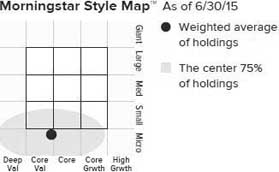
| The Morningstar Style Map is the Morningstar Style BoxTM with the center 75% of fund holdings plotted as the Morningstar Ownership ZoneTM. The Morningstar Style Box is designed to reveal a fund’s investment strategy. The Morningstar Ownership Zone provides detail about a portfolio’s investment style by showing the range of stock sizes and styles. The Ownership Zone is derived by plotting each stock in the portfolio within the proprietary Morningstar Style Box. Over time, the shape and location of a fund's ownership zone may vary. See page 126 for additional information. |
Value of $10,000
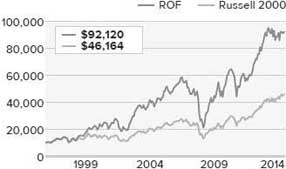
| Top 10 Positions | ||
| % of Net Assets | ||
| Microsemi Corporation | 0.9 | |
| Commercial Metals | 0.9 | |
| General Cable | 0.9 | |
| Advanced Energy Industries | 0.9 | |
| Interface | 0.8 | |
| Encore Wire | 0.8 | |
| Mueller Industries | 0.8 | |
| Astec Industries | 0.8 | |
| TRC Companies | 0.8 | |
| Invacare Corporation | 0.8 | |
| Portfolio Sector Breakdown | ||
| % of Net Assets | ||
| Information Technology | 30.1 | |
| Industrials | 21.5 | |
| Consumer Discretionary | 15.7 | |
| Financials | 10.9 | |
| Materials | 8.0 | |
| Health Care | 3.7 | |
| Energy | 2.0 | |
| Consumer Staples | 2.0 | |
| Telecommunication Services | 0.6 | |
| Utilities | 0.2 | |
| Miscellaneous | 1.5 | |
| Cash and Cash Equivalents | 3.8 | |
| Calendar Year Total Returns (%) | ||
| YEAR | ROF | |
| 2014 | -0.5 | |
| 2013 | 43.5 | |
| 2012 | 22.6 | |
| 2011 | -13.0 | |
| 2010 | 33.8 | |
| 2009 | 62.1 | |
| 2008 | -45.7 | |
| 2007 | -2.0 | |
| 2006 | 18.8 | |
| 2005 | 4.8 | |
| 2004 | 17.5 | |
| 2003 | 72.9 | |
| 2002 | -17.0 | |
| 2001 | 17.3 | |
| 2000 | 19.8 | |
| Upside/Downside Capture Ratios | ||||
| Periods Ended 6/30/15 (%) | ||||
| UPSIDE | DOWNSIDE | |||
| 10-Year | 121 | 130 | ||
| From 12/31/96 (Start of Fund’s | 125 | 110 | ||
| First Full Quarter) | ||||
| Portfolio Diagnostics | ||
| Fund Net Assets | $2,010 million | |
| Number of Holdings | 279 | |
| Turnover Rate | 12% | |
| Average Market Capitalization1 | $750 million | |
| Weighted Average P/B Ratio2 | 1.8x | |
| Holdings ≥ 75% of Total Investments | 142 | |
| Active Share3 | 90% | |
| U.S. Investments (% of Net Assets) | 92.3% | |
| Non-U.S. Investments (% of Net Assets) | 3.9% | |
| Important Performance and Expense Information All performance information in this Report reflects past performance, is presented on a total return basis, reflects the reinvestment of distributions, and does not reflect the deduction of taxes that a shareholder would pay on fund distributions or the redemption of fund shares. Past performance is no guarantee of future results. Investment return and principal value of an investment will fluctuate, so that shares may be worth more or less than their original cost when redeemed. Shares redeemed within 30 days of purchase may be subject to a 1% redemption fee payable to the Fund, which is not reflected in the performance shown above; if it were, performance would be lower. Current month-end performance may be higher or lower than performance quoted and may be obtained at www.roycefunds.com. All performance and risk information reflects results of the Investment Class (its oldest class). Operating expenses reflect the Fund’s total annual operating expenses for the Investment Class as of the Fund’s most current prospectus and include management fees, other expenses, and acquired fund fees and expenses. Acquired fund fees and expenses reflect the estimated amount of the fees and expenses incurred indirectly by the Fund through its investments in mutual funds, hedge funds, private equity funds, and other investment companies. Shares of ROF’s Service, Consultant, R, and K Classes bear an annual distribution expense that is not borne by the Investment Class. Regarding the “Top Contributors” and “Top Detractors” tables shown above, the sum of all contributors to, and all detractors from, performance for all securities in the portfolio would approximate the Fund’s year-to-date performance for 2015. Upside Capture Ratio measures a manager’s performance in up markets relative to the Fund’s benchmark. It is calculated by measuring the Fund’s performance in quarters when the benchmark went up and dividing it by the benchmark’s return in those quarters. Downside Capture Ratio measures a Managers’ performance in down markets relative to the Fund’s benchmark (Russell 2000). It is calculated by measuring the Fund’s performance in quarters when the benchmark goes down and dividing it by the benchmark’s return in those quarters. |
| The Royce Funds 2015 Semiannual Report to Shareholders | 21 |
| MANAGER’S DISCUSSION | ||
| Royce Special Equity Fund (RSE) |
 |
| Charlie Dreifus, CFA |
| FUND PERFORMANCE Royce Special Equity Fund was down 0.5% for the year-to-date period ended June 30, 2015 versus a 4.8% gain for its small-cap benchmark, the Russell 2000 Index, for the same period. Most stocks staggered into the new year, losing value in January before recovering through February and March. The Fund had an atypical underperformance versus the small-cap index as stock prices fell in January. This set the stage for a relatively rough first quarter, in which the Fund gained 2.4% versus 4.3% for the Russell 2000. This pattern repeated itself in the second quarter. Special Equity trailed in the brief April downturn—despite the fact that late March saw signs of a shift back to the kind of quality names we own—and lagged as small-caps rallied in May. The last few trading days in June were particularly difficult. The Fund saw a modest second-quarter gain wiped out near the very end of the month, mostly the result of volatility from the Greek default. Special Equity fell 2.9% in the second quarter while its benchmark advanced 0.4%. In general, the benchmark’s first-half performance was propelled by Health Care (led by biotech), which in the second quarter was joined by Financials (led by banks). The portfolio was significantly underweight both sectors throughout the first half. Positive results within the benchmark for the semiannual period also came disproportionately from non-earning, lowest ROE quintile, and non-yielding companies, which was not a good lineup for our classic value approach to be competing with. |
Longer-term results were better on both an absolute and relative basis. The Fund essentially tied the Russell 2000 for the 10-year period and outpaced the small-cap index for the 15-year and since inception (5/1/98) periods ended June 30, 2015. Special Equity’s average annual total return for the since inception period was 9.4%. |
| WHAT WORKED... AND WHAT DIDN’T In the first half Consumer Discretionary led all of the Fund’s equity sectors by a sizable margin, boosted by strong results from three of the portfolio’s top-five contributors. The Children’s Place retails value-priced apparel and accessories for newborn to 12-year old children primarily in the eastern U.S. Scholastic Corporation is a global children’s publishing, education, and media company that produces and distributes educational materials for use in school and at home. The Finish Line is a specialty retailer of athletic shoes and sports apparel. The company’s stock began a gradual ascent late in the first quarter. In the Industrials sector, long-time holding National Presto Industries also enjoyed a strong first half. The company makes defense products, housewares and small appliances, and absorbent products. |
| The Information Technology, Industrials, and Materials sectors each ended the semiannual period with net losses, with the first group having by far the biggest negative impact. This was the case on both an absolute and relative basis, as the portfolio’s lack of exposure to software companies—the sector’s leaders within the Russell 2000— hurt relative results. The Fund’s largest detractor at the position level was 2014’s top performer and Special Equity’s top position at the end of June 2015—UniFirst Corporation, which provides workplace uniforms and protective work wear clothing. Bed Bath & Beyond, the portfolio’s second-largest position, was a rare first-half miss in the otherwise robust Consumer Discretionary group. The company operates a nationwide chain of retail stores that sell domestics merchandise, home furnishings, and other goods. Another detractor, L.B. Foster Company manufactures, fabricates, and distributes rail and trackwork piling, highway products, earth wall systems, and tubular products. We held a good-sized stake at the end of the first half. |
| Top Contributors to Performance Year-to-Date Through 6/30/15 (%)1 | ||||
| Children’s Place | 0.72 | |||
| Scholastic Corporation | 0.68 | |||
| National Presto Industries | 0.67 | |||
| Finish Line (The) Cl. A | 0.56 | |||
| Universal Corporation | 0.55 | |||
| 1 Includes dividends | ||||
| Top Detractors from Performance Year-to-Date Through 6/30/15 (%)2 | ||||
| UniFirst Corporation | -0.55 | |||
| Bed Bath & Beyond | -0.53 | |||
| Foster (L.B.) Company | -0.51 | |||
| Applied Industrial Technologies | -0.42 | |||
| Anixter International | -0.39 | |||
| 2 Net of dividends | ||||
| CURRENT POSITIONING AND OUTLOOK The Russell 2000’s average annual total return for the five-year period ended June 30, 2015 was 17.1%. We believe the regularly required disclosure when speaking of performance, “Past performance is no guarantee of future results,” is especially relevant when looking at that figure—in our view this is not the kind of return that investors should expect going forward. In such a market, which has been almost devoid of any meaningful correction, passive strategies have obviously prevailed. If, as we expect, the market becomes more challenging and quality minded, not only will returns be lower, but we will also see down markets. In that kind of environment, we expect to do better. Owning what we believe are great companies bought at reasonable valuations—many of which have increased dividends annually— continues to excite us. It’s important to note that in low-growth periods such as the 1940s and 1970s dividends accounted for as much as 75% of the total return for stocks. |
| Perhaps the best signal that many of the globe’s potential trouble spots at the end of June—China, Greece, Puerto Rico, and the seemingly ever-present possibility of terror attacks, to name four examples—seem unlikely to cause harm to the U.S. economy is that consumer confidence remained elevated in sharp contrast to investor sentiment. We believe investors will become more bullish. Taking a full market cycle view, particularly from this level, we feel very comfortable with the portfolio. At the end of the first half, the Fund was substantially overweight in Consumer Discretionary, Consumer Staples, Industrials, and Materials. |
| 22 | The Royce Funds 2015 Semiannual Report to Shareholders |
| PERFORMANCE AND PORTFOLIO REVIEW | TICKER SYMBOLS RYSEX RSEFX RSEIX RSQCX |
| Performance and Expenses | ||||||||||||||
| Average Annual Total Return (%) Through 6/30/15 | ||||||||||||||
| JAN-JUN 2015* | 1-YR | 3-YR | 5-YR | 10-YR | 15-YR | SINCE INCEPTION (5/1/98) | ||||||||
| RSE | -0.52 | 0.40 | 12.29 | 13.11 | 8.41 | 11.75 | 9.44 | |||||||
| Annual Operating Expenses: 1.12% | ||||||||||||||
| *Not Annualized | ||||||||||||||
| Relative Risk Adjusted Returns: Monthly Rolling Sharpe Ratios |
| Since Inception Through 6/30/15 |
| On a monthly rolling risk-adjusted basis, the Fund outperformed the Russell 2000 in 100% of all 10-year periods and 86% of all 5-year periods. |
| PERIODS BEATING THE INDEX | FUND AVG (%)* | INDEX AVG (%)* | |||||||||
| 10-year | 86/86 | 100% | 0.57 | 0.32 | |||||||
| 5-year | 126/146 | 86% | 0.69 | 0.40 | |||||||
| *Average of monthly rolling Sharpe Ratios over the specified periods. | |||||||||||
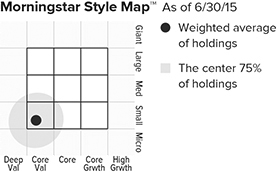
The Morningstar Style Map is the Morningstar Style Box™ with the center 75% of fund holdings plotted as the Morningstar Ownership Zone™. The Morningstar Style Box is designed to reveal a fund’s investment strategy. The Morningstar Ownership Zone™ provides detail about a portfolio’s investment style by showing the range of stock sizes and styles. The Ownership Zone is derived by plotting each stock in the portfolio within the proprietary Morningstar Style Box. Over time, the shape and location of a fund's ownership zone may vary. See page 126 for additional information. |
| Value of $10,000 |
| Invested on 6/30/98 as of 6/30/15 ($) |
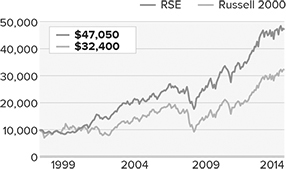
| Top 10 Positions | |
| % of Net Assets | |
| UniFirst Corporation | 7.1 |
| Bed Bath & Beyond | 5.6 |
| AVX Corporation | 5.4 |
| Children’s Place | 4.7 |
| Meredith Corporation | 4.4 |
| Finish Line (The) Cl. A | 4.3 |
| Standard Motor Products | 3.4 |
| Neenah Paper | 3.4 |
| Applied Industrial Technologies | 3.3 |
| Buckle (The) | 3.2 |
| Portfolio Sector Breakdown | |
| % of Net Assets | |
| Consumer Discretionary | 35.2 |
| Industrials | 24.1 |
| Information Technology | 13.3 |
| Materials | 11.5 |
| Consumer Staples | 5.6 |
| Financials | 2.9 |
| Health Care | 0.3 |
| Cash and Cash Equivalents | 7.1 |
| Calendar Year Total Returns (%) | ||
| YEAR | RSE | |
| 2014 | 1.1 | |
| 2013 | 29.4 | |
| 2012 | 15.4 | |
| 2011 | 0.1 | |
| 2010 | 19.6 | |
| 2009 | 28.4 | |
| 2008 | -19.6 | |
| 2007 | 4.7 | |
| 2006 | 14.0 | |
| 2005 | -1.0 | |
| 2004 | 13.9 | |
| 2003 | 27.6 | |
| 2002 | 15.3 | |
| 2001 | 30.7 | |
| 2000 | 16.3 |
| Upside/Downside Capture Ratios | ||
| Periods Ended 6/30/15 (%) | ||
| UPSIDE | DOWNSIDE | |
| 10-year | 79 | 66 |
| From 6/30/98 (Start of Fund’s First Full Quarter) | 73 | 48 |
| Portfolio Diagnostics | ||
| Fund Net Assets | $2,150 million | |
| Number of Holdings | 44 | |
| Turnover Rate | 8% | |
| Average Market Capitalization1 | $1,766 million | |
| Weighted Average P/E Ratio2, 3 | 16.8x | |
| Weighted Average P/B Ratio2 | 2.1x | |
| Holdings ≥ 75% of Total Investments | 20 | |
| Active Share4 | 98% | |
| U.S. Investments (% of Net Assets) | 92.9% | |
| Non-U.S. Investments (% of Net Assets) | 0.0% |
Geometric Average. This weighted calculation uses each portfolio holding’s market cap in a way designed to not skew the effect of very large or small holdings; instead, it aims to better identify the portfolio’s center, which Royce believes offers a more accurate measure of average market cap than a simple mean or median. | |
Harmonic Average. This weighted calculation evaluates a portfolio as if it were a single stock and measures it overall. It compares the total market value of the portfolio to the portfolio’s share in the earnings or book value, as the case may be, of its underlying stocks. | |
The Fund’s P/E ratio calculation excludes companies with zero or negative earnings (0% of portfolio holdings as of 6/30/15). | |
Active Share is the sum of the absolute values of the different weightings of each holding in the Fund versus each holding in the benchmark, divided by two. |
| Important Performance and Expense Information All performance information in this Report reflects past performance, is presented on a total return basis, reflects the reinvestment of distributions, and does not reflect the deduction of taxes that a shareholder would pay on fund distributions or the redemption of fund shares. Past performance is no guarantee of future results. Investment return and principal value of an investment will fluctuate, so that shares may be worth more or less than their original cost when redeemed. Shares redeemed within 30 days of purchase may be subject to a 1% redemption fee payable to the Fund, which is not reflected in the performance shown above; if it were, performance would be lower. Current month-end performance may be higher or lower than performance quoted and may be obtained at www.roycefunds.com. All performance and risk information reflects results of the Investment Class (its oldest class). Operating expenses reflect the Fund’s total annual operating expenses for the Investment Class as of the Fund’s most current prospectus and include management fees and other expenses. Shares of RSE’s Service and Consultant Classes bear an annual distribution expense that is not borne by the Investment Class. The Sharpe Ratio is calculated for a specified period by dividing a fund’s annualized excess returns by its annualized standard deviation. The higher the Sharpe ratio, the better the fund’s historical risk-adjusted performance. Regarding the “Top Contributors” and “Top Detractors” tables shown above, the sum of all contributors to, and all detractors from, performance for all securities in the portfolio would approximate the Fund’s year-to-date performance for 2015. Upside Capture Ratio measures a manager’s performance in up markets relative to the Fund’s benchmark. It is calculated by measuring the Fund’s performance in quarters when the benchmark went up and dividing it by the benchmark’s return in those quarters. Downside Capture Ratio measures a Managers’ performance in down markets relative to the Fund’s benchmark (Russell 2000). It is calculated by measuring the Fund’s performance in quarters when the benchmark goes down and dividing it by the benchmark’s return in those quarters. |
| The Royce Funds 2015 Semiannual Report to Shareholders | 23 |
MANAGER’S DISCUSSION
| Royce Select Fund I (RS1) |
 |
| Lauren Romeo, CFA |
| FUND PERFORMANCE |
| For the year-to-date period ended June 30, 2015 Royce Select Fund I was up 0.2% versus a gain of 4.8% for its small-cap benchmark, the Russell 2000 Index, for the same period. This was a disappointing outcome, though it was not entirely surprising in the context of a market that saw the bulk of its leadership in 2015’s first half come from high-growth industries, such as biotech, while more economically sensitive sectors had not yet revved up by the end of June. |
| Stocks as a whole began the year with losses, with January being a decidedly bearish month across asset classes. Most stocks went on to recover through the rest of the first quarter and pushed past their earlier losses. In the first three months, Select Fund I managed a small gain of 0.2% compared to the 4.3% advance for the Russell 2000. When the markets reversed again in April, we were pleased to see the Fund post a small gain for that otherwise dismal month. Growth issues again emerged with momentum, however, through most of May and June. For the second quarter, the Fund was flat while its benchmark gained 0.4%. We were pleased that Select Fund I outpaced the Russell 2000 for the 10-, 15-year, and since inception (11/18/98) periods ended June 30, 2015. The Fund’s average annual total return since inception was 12.9%. |
| WHAT WORKED… AND WHAT DIDN’T |
| The portfolio’s underweight in the Health Care sector was the primary driver of its underperformance. The sector ruled the market roost in the first half, which held true for equities as a whole, for small-cap as an asset class, and for the portfolio—with one important difference. The Fund had very limited exposure to biotech issues—the leader within small-cap by a quite sizable margin. This meant the sector was something of a double-edged sword to the portfolio in the semiannual period—its net gain was critical but its impact was negative compared to the lofty returns achieved in the benchmark. The Fund’s successes in Health Care came largely from one holding in the pharmaceuticals industry and a second in the life sciences tools & services group. Lannett Company manufactures generic drugs. The firm was aggressive with pricing and took advantage of limited competition in certain drugs to exceed Wall Street expectations. We like its growing pipeline of generics awaiting approval, which are critical to its future growth once Lannett begins to anniversary the price increases on its core medications. Bio-Rad Laboratories provides life science research products, clinical diagnostics, and analytical instrumentation. Its shares grew healthier on margin improvement in the first quarter in spite of ongoing modest organic growth. The company saw a payoff from consolidating facilities, reducing costs, and exiting some unprofitable lines over the past couple of years. These efforts should set the stage for material operating leverage when the headwinds of pricing pressure in Europe eventually abate. We also think its planned product rollouts for the second half of 2015 should also help to reaccelerate top-line growth. |
| Cal-Maine Foods is the country’s largest producer and distributor of eggs. Prices have more than doubled in anticipation of constricted supply resulting from a major outbreak of avian flu in the Midwest, which led to the loss of approximately 11% of egg-laying hens, while greater demand has been keyed by higher prices for competing proteins such as beef, quick-service restaurants expanding their breakfast menus, and the popularity of high-protein diets. Additionally, the price of grain, the main input for egg producers, remains low. SEI Investments provides technology solutions and asset management to a range of institutional clients. Double-digit growth in assets under management and administration, which came from both capital market appreciation and gaining new clients, led its stock upward. While initially slow, we think the gradual adoption of the company’s Wealth Platform within the U.S. banking sector offers significant margin expansion potential. |
| Silicon Graphics International detracted most from first-half results at the position level. The company runs a global business producing data storage, computing servers, and infrastructure software. It reported strong bookings but also reduced guidance, with revenues being pushed out to future quarters. In addition, the company discouraged investors with a short-term debt-financing deal earlier this year. We sold our position in ADTRAN, which makes high-speed digital transmission products. We simply lost patience after waiting several quarters for sales of telecom equipment to AT&T to begin producing revenue for ADTRAN. Specialty athletic and footwear retailer Genesco ran into difficulties trying to turn things around at its Lids licensed sports cap and Lids Locker Room licensed sports apparel businesses, which hampered results for the company as a whole. |
| Top Contributors to Performance Year-to-Date Through 6/30/15 (%)1 | |
| Cal-Maine Foods | 0.57 |
| Lannett Company | 0.43 |
| Bio-Rad Laboratories Cl. A | 0.41 |
| SEI Investments | 0.39 |
| John Bean Technologies | 0.36 |
| 1 Includes dividends | |
| Top Detractors from Performance | |
| Year-to-Date Through 6/30/15 (%)2 | |
| Silicon Graphics International | -0.47 |
| ADTRAN | -0.42 |
| Genesco | -0.41 |
| Unit Corporation | -0.34 |
| Oil States International | -0.32 |
| 2 Net of dividends | |
| IMPORTANT INFORMATION |
| The shareholders of Royce Select Fund I recently approved a reorganization that would combine that Fund with Royce 100 Fund. It is currently expected that the reorganization will be completed in August of 2015. Upon completion, shareholders of Royce Select Fund I will become shareholders of Royce 100 Fund and Royce Select Fund I will cease operations. You may review the proxy statement or go to www.roycefunds.com for more information. |
| 24 | The Royce Funds 2015 Semiannual Report to Shareholders |
| PERFORMANCE AND PORTFOLIO REVIEW | TICKER SYMBOL RYSFX |
| Performance and Expenses | ||||||||||||||
| Average Annual Total Return (%) Through 6/30/15 | ||||||||||||||
| JAN-JUN 2015* | 1-YR | 3-YR | 5-YR | 10-YR | 15-YR | SINCE INCEPTION (11/18/98) | ||||||||
| RS1 | 0.23 | -5.77 | 11.87 | 11.37 | 9.43 | 10.91 | 12.85 | |||||||
| Annual Operating Expenses: 1.23% | ||||||||||||||
| *Not Annualized | ||||||||||||||
| Relative Returns: Monthly Rolling Average Annual Return Periods |
| Since Inception Through 6/30/15 |
| On a monthly rolling basis, the Fund outperformed the Russell 2000 in 100% of all 10-year periods; 81% of all 5-year periods; and 62% of all 1-year periods. |
| PERIODS BEATING THE INDEX | FUND AVG (%)* | INDEX AVG (%)* | |||||||
| 10-year | 80/80 | 100% | 11.2 | 6.7 | |||||
| 5-year | 114/140 | 81% | 12.0 | 7.9 | |||||
| 1-year | 116/188 | 62% | 13.9 | 10.2 | |||||
| *Average of monthly rolling average annual total returns over the specified periods. | |||||||||

The Morningstar Style Map is the Morningstar Style Box™ with the center 75% of fund holdings plotted as the Morningstar Ownership Zone™. The Morningstar Style Box is designed to reveal a fund’s investment strategy. The Morningstar Ownership Zone provides detail about a portfolio’s investment style by showing the range of stock sizes and styles. The Ownership Zone is derived by plotting each stock in the portfolio within the proprietary Morningstar Style Box. Over time, the shape and location of a fund's ownership zone may vary. See page 126 for additional information. |
| Value of $10,000 |
| Invested on 12/31/98 as of 6/30/15 ($) |
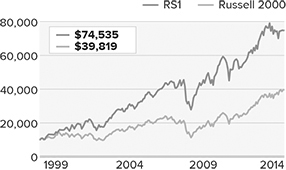
| Top 10 Positions | |
| % of Net Assets | |
| Buckle (The) | 3.4 |
| MKS Instruments | 3.2 |
| Genworth MI Canada | 3.1 |
| Minerals Technologies | 3.0 |
| Genesco | 2.7 |
| John Bean Technologies | 2.7 |
| Lazard Cl. A | 2.5 |
| Artisan Partners Asset Management Cl. A | 2.5 |
| Bio-Rad Laboratories Cl. A | 2.3 |
| Virtus Investment Partners | 2.3 |
| Portfolio Sector Breakdown | |
| % of Net Assets | |
| Industrials | 19.9 |
| Information Technology | 17.7 |
| Financials | 17.5 |
| Consumer Discretionary | 16.4 |
| Energy | 6.7 |
| Health Care | 6.4 |
| Materials | 5.9 |
| Consumer Staples | 2.3 |
| Cash and Cash Equivalents | 7.2 |
| Calendar Year Total Returns (%) | |
| YEAR | RS1 |
| 2014 | 0.2 |
| 2013 | 26.0 |
| 2012 | 13.7 |
| 2011 | -3.6 |
| 2010 | 18.2 |
| 2009 | 39.6 |
| 2008 | -25.9 |
| 2007 | 10.7 |
| 2006 | 15.0 |
| 2005 | 10.9 |
| 2004 | 19.1 |
| 2003 | 48.7 |
| 2002 | -15.8 |
| 2001 | 24.5 |
| 2000 | 15.0 |
| Upside/Downside Capture Ratios | |||
| Periods Ended 6/30/15 (%) | |||
| UPSIDE | DOWNSIDE | ||
| 10-Year | 93 | 81 | |
| From 12/31/98 (Start of the Fund’s First Full Quarter) | 102 | 75 | |
| Portfolio Diagnostics | |||
| Fund Net Assets | $23 million | ||
| Number of Holdings | 70 | ||
| Turnover Rate | 21% | ||
| Average Market Capitalization1 | $2,094 million | ||
| Weighted Average P/E Ratio2,3 | 17.8x | ||
| Weighted Average P/B Ratio2 | 2.5x | ||
| Holdings ≥ 75% of Total Investments | 37 | ||
| Active Share4 | 97% | ||
| U.S. Investments (% of Net Assets) | 82.1% | ||
| Non-U.S. Investments (% of Net Assets) | 10.7% | ||
| Important Performance and Expense Information |
All performance information in this Report reflects past performance, is presented on a total return basis, reflects the reinvestment of distributions, and does not reflect the deduction of taxes that a shareholder would pay on fund distributions or the redemption of fund shares. Past performance is no guarantee of future results. Investment return and principal value of an investment will fluctuate, so that shares may be worth more or less than their original cost when redeemed. Shares redeemed within 30 days of purchase may be subject to a 1% redemption fee payable to the Fund, which is not reflected in performance shown above. Current month-end performance may be higher or lower than performance quoted and may be obtained at www.roycefunds.com. Operating expenses reflect the Fund’s total annual operating expenses for the Investment Class as of the Fund’s most current prospectus and include management fees, and other expenses. Regarding the “Top Contributors” and “Top Detractors” tables shown above, the sum of all contributors to, and all detractors from, performance for all securities in the portfolio would approximate the Fund’s year-to-date performance for 2015. Upside Capture Ratio measures a manager’s performance in up markets relative to the Fund’s benchmark. It is calculated by measuring the Fund’s performance in quarters when the benchmark went up and dividing it by the benchmark’s return in those quarters. Downside Capture Ratio measures a Managers’ performance in down markets relative to the Fund’s benchmark (Russell 2000). It is calculated by measuring the Fund’s performance in quarters when the benchmark goes down and dividing it by the benchmark’s return in those quarters. |
| The Royce Funds 2015 Semiannual Report to Shareholders | 25 |
| MANAGER’S DISCUSSION |
| Royce Small-Cap Value Fund (RVV) (formerly Royce Value Fund) |
 |
| Jay Kaplan, CFA |
| FUND PERFORMANCE |
| Royce Small-Cap Value Fund (formerly Royce Value Fund) advanced 1.0% for the year-to-date period ended June 30, 2015 compared to a gain of 4.8% for its small-cap benchmark, the Russell 2000 Index, for the same period. Small-cap share prices began the year trending downward, and Small-Cap Value felt the brunt of the bearish move in January more than the small-cap index. While the Fund outpaced its benchmark in both February and March as the market rebounded, it could not overtake its index through the year’s first three months. For the first quarter as a whole, Small-Cap Value gained 3.3% versus 4.3% for the Russell 2000. |
| Small-Cap Value beat the Russell 2000 in the bearish climate of April only to lag when small-cap stocks recovered in May. June was another matter altogether—the Fund was showing a respectable gain prior to June 29, when the Greek default sent shockwaves through the global markets and undid four weeks’ worth of positive performance for the portfolio. For the second quarter, the Fund was down 2.2% while its benchmark was up 0.4%. There was more to be encouraged by in the Fund’s longer-term results. Small-Cap Value Fund outperformed the Russell 2000 for the since inception (6/14/01) period ended June 30, 2015. The Fund’s average annual total return since inception was 10.5%. |
| WHAT WORKED… AND WHAT DIDN’T |
| A portion of Small-Cap Value’s relative disadvantage in the first half can be explained by noting where we were not invested—which would be in red-hot biotech stocks—and where we had a less costly but still detrimental overweight—which would be in Energy, which posted the largest net losses in the first half (as it did in 2014), followed by Industrials. The Information Technology sector was an interesting mix of the good and the bad and showed a very modest net loss at the end of June. |
| Consumer Discretionary led on the positive side by an impressive margin, more than tripling the respective gain of each of the portfolio’s next three top contributors—Consumer Staples, Materials, and Financials—which posted nearly identical net contributions. The Fund’s top performer in the first half was Steve Madden, a designer and seller of name brand and private label footwear for women, men, and children. This is a cyclical business that we have liked for many years. Its shares often move as investors try to predict consumer cravings for fashionables wares, and a decidedly positive estimate was firmly in evidence during 2015’s first half. Ascena Retail Group saw its recovering shares get richer when the firm announced in May that it was buying Ann Taylor, thus adding another name to its large lineup of women and tween girl fashion retailers. Shares of GameStop Corporation rallied, helped in part by a strong new cycle for gaming consoles. This retailer of new and used video game hardware, software, and accessories has also seen profit growth running Simply Mac, an authorized retailer and repairer of Apple products located in small markets. |
| Vishay Intertechnology, the Fund’s fourth-largest position and largest detractor, makes semiconductors and components. A conservatively capitalized, cash-rich business with a long history of successful and profitable execution, its shares began to slip in March in the context of a somewhat unsettled and more volatile market for many tech issues. The firm’s good-sized exposure to an equally uncertain Europe may have also been a factor. The announcement in May that Vishay beat first-quarter profit expectations did little to garner investor interest. After last year’s catastrophic drop in commodity prices, our long-term outlook for Energy is positive, and we were happy to hold a good-sized position in Unit Corporation at the end of June. Unit is primarily a contract driller that explores for and produces oil and natural gas while also being involved in midstream activities. In May the company announced a first-quarter loss that drove its shares down while our attention was more focused on its record oil production, improved dayrates, and other positive developments. Top-10 position Genesco sells specialty footwear, licensed and branded headwear, and licensed sports apparel. Its shares fell out of fashion after the company lowered its fiscal year earnings outlook late in May, as it continued to struggle with the turnaround for its two Lids businesses. Shares of residential mortgage insurer Genworth MI Canada began to recover in early April after beating first-quarter profit forecasts. Its shares were under water during the first quarter as lower energy prices fueled concerns about mortgage losses in the energy-dominated areas of western Canada earlier in the year. |
| Top Contributors to Performance Year-to-Date Through 6/30/15 (%)1 | |
| Steven Madden | 0.73 |
| Ascena Retail Group | 0.65 |
| GameStop Corporation Cl. A | 0.64 |
| Convergys Corporation | 0.53 |
| Nu Skin Enterprises Cl. A | 0.51 |
| 1 Includes dividends | |
| Top Detractors from Performance | |
| Year-to-Date Through 6/30/15 (%)2 | |
| Vishay Intertechnology | -0.54 |
| Unit Corporation | -0.48 |
| Genesco | -0.45 |
| Genworth MI Canada | -0.43 |
| NETGEAR | -0.42 |
| 2 Net of dividends | |
| CURRENT POSITIONING AND OUTLOOK |
| At the end of June, the portfolio remained overweight in Consumer Discretionary, Information Technology, Materials, and Energy. These weightings reflected our expectation for slow but mostly steady economic growth. We also anticipate a possible increase in interest rates. However, even in the event of an increase, rates will remain historically low. The portfolio is positioned for a market that more consistently rewards quality companies with low leverage and high returns on invested capital. |
| 26 | The Royce Funds 2015 Semiannual Report to Shareholders |
| PERFORMANCE AND PORTFOLIO REVIEW | TICKER SYMBOLS RYVFX RVVHX RVFIX RVFCX RVVRX RVFKX |
| Performance and Expenses | ||||||||||||||
| Average Annual Total Return (%) Through 6/30/15 | ||||||||||||||
| JAN-JUN 2015* | 1-YR | 3-YR | 5-YR | 10-YR | SINCE INCEPTION (6/14/01) | |||||||||
| RVV | 1.02 | -2.33 | 12.86 | 11.17 | 8.05 | 10.52 | ||||||||
| Annual Operating Expenses: 1.45% | ||||||||||||||
| *Not Annualized | ||||||||||||||
| Relative Returns: Monthly Rolling Average Annual Return Periods |
| Since Inception Through 6/30/15 |
| On a monthly rolling basis, the Fund outperformed the Russell 2000 in 90% of all 10-year periods; 70% of all 5-year periods; and 61% of all 1-year periods. |
| PERIODS BEATING THE INDEX | FUND AVG (%)* | INDEX AVG (%)* | ||||||||||||
| 10-year | 44/49 | 90% | 10.9 | 8.4 | ||||||||||
| 5-year | 76/109 | 70% | 10.6 | 8.0 | ||||||||||
| 1-year | 95/157 | 61% | 13.1 | 10.9 | ||||||||||
| *Average of monthly rolling average annual total returns over the specified periods. | ||||||||||||||
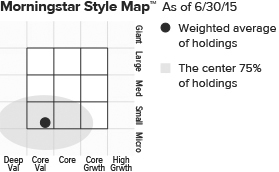
The Morningstar Style Map is the Morningstar Style Box™ with the center 75% of fund holdings plotted as the Morningstar Ownership Zone™. The Morningstar Style Box is designed to reveal a fund’s investment strategy. The Morningstar Ownership Zone provides detail about a portfolio’s investment style by showing the range of stock sizes and styles. The Ownership Zone is derived by plotting each stock in the portfolio within the proprietary Morningstar Style Box. Over time, the shape and location of a fund's ownership zone may vary. See page 126 for additional information. |
| Value of $10,000 | ||
| Invested on 6/30/01 as of 6/30/15 ($) | ||
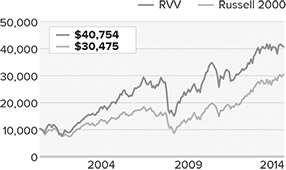
| Top 10 Positions | |
| % of Net Assets | |
| Buckle (The) | 3.1 |
| MKS Instruments | 3.0 |
| Fabrinet | 3.0 |
| Vishay Intertechnology | 3.0 |
| Genesco | 2.9 |
| Reinsurance Group of America | 2.9 |
| Genworth MI Canada | 2.9 |
| PC Connection | 2.9 |
| MYR Group | 2.6 |
| Benchmark Electronics | 2.5 |
| Portfolio Sector Breakdown | |
| % of Net Assets | |
| Consumer Discretionary | 29.5 |
| Information Technology | 25.8 |
| Industrials | 15.7 |
| Financials | 9.8 |
| Energy | 8.1 |
| Materials | 4.2 |
| Health Care | 2.7 |
| Consumer Staples | 2.6 |
| Miscellaneous | 0.7 |
| Cash and Cash Equivalents | 0.9 |
| Calendar Year Total Returns (%) | |
| YEAR | RVV |
| 2014 | -0.0 |
| 2013 | 27.8 |
| 2012 | 9.6 |
| 2011 | -7.4 |
| 2010 | 25.0 |
| 2009 | 44.7 |
| 2008 | -34.2 |
| 2007 | 3.8 |
| 2006 | 16.8 |
| 2005 | 17.2 |
| 2004 | 30.9 |
| 2003 | 54.3 |
| 2002 | -23.5 |
| Upside/Downside Capture Ratios | ||
| Periods Ended 6/30/15 (%) | ||
| UPSIDE | DOWNSIDE | |
| 10-year | 101 | 105 |
| From 6/30/01 (Start of Fund’s | 107 | 96 |
| First Full Quarter) | ||
| Portfolio Diagnostics | ||
| Fund Net Assets | $751 million | |
| Number of Holdings | 66 | |
| Turnover Rate | 30% | |
| Average Market Capitalization1 | $1,540 million | |
| Weighted Average P/E Ratio2,3 | 15.3x | |
| Weighted Average P/B Ratio2 | 2.1x | |
| Holdings ≥ 75% of Total Investments | 33 | |
| Active Share4 | 97% | |
| U.S. Investments (% of Net Assets) | 92.6% | |
| Non-U.S. Investments (% of Net Assets) | 6.5% |
| Important Performance and Expense Information |
All performance information in this Report reflects past performance, is presented on a total return basis, reflects the reinvestment of distributions, and does not reflect the deduction of taxes that a shareholder would pay on fund distributions or the redemption of fund shares. Past performance is no guarantee of future results. Investment return and principal value of an investment will fluctuate, so that shares may be worth more or less than their original cost when redeemed. Shares redeemed within 30 days of purchase may be subject to a 1% redemption fee payable to the Fund, which is not reflected in the performance shown above; if it were, performance would be lower. Current month-end performance may be higher or lower than performance quoted and may be obtained at www.roycefunds.com. All performance and risk information reflects results of the Service Class (its oldest class). Operating expenses reflect the Fund’s total annual operating expenses for the Service Class as of the Fund’s most current prospectus and include management fees, 12b-1 distribution and service fees, and other expenses. Shares of RVV’s Consultant and R Classes bear an annual distribution expense that is higher than that of the Service Class. Regarding the “Top Contributors” and “Top Detractors” tables shown above, the sum of all contributors to, and all detractors from, performance for all securities in the portfolio would approximate the Fund’s year-to-date performance for 2015. Upside Capture Ratio measures a manager’s performance in up markets relative to the Fund’s benchmark. It is calculated by measuring the Fund’s performance in quarters when the benchmark went up and dividing it by the benchmark’s return in those quarters. Downside Capture Ratio measures a Managers’ performance in down markets relative to the Fund’s benchmark (Russell 2000). It is calculated by measuring the Fund’s performance in quarters when the benchmark goes down and dividing it by the benchmark’s return in those quarters. |
| The Royce Funds 2015 Semiannual Report to Shareholders | 27 |
| MANAGER’S DISCUSSION |
| Royce Smaller-Companies Growth Fund (RVP) (formerly Royce Value Plus Fund) |
 |
| Chip Skinner, CFA |
| FUND PERFORMANCE |
| It was a terrific first-half result for the Growth-at-a-Reasonable-Price approach we use in Royce Smaller- Companies Growth Fund (formerly Royce Value Plus Fund). The Fund increased 8.9% for the year-to-date period ended June 30, 2015, ahead of its small-cap benchmark, the Russell 2000 Index, which rose 4.8% for the same period. |
| Along with much of the rest of the small-cap market, the Fund stumbled a bit out of the gate, enduring a bearish January. Its rebound in February was impressive, however, as it finished the month well ahead of its benchmark. For the first quarter Smaller-Companies Growth advanced 4.8%, edging ahead of the Russell 2000, which climbed 4.3% for the same period. The Fund’s relative advantage was both more decisive and more evenly spread out in the second quarter— it beat the small-cap index in the slightly bearish April, the more bullish May, and volatile June. The Fund finished the quarter with a 4.0% gain compared to a 0.4% increase for the Russell 2000. The portfolio’s strong first half helped long-term results on both an absolute and relative basis. Smaller-Companies Growth outperformed the Russell 2000 for the one-, 10-year, and since inception (6/14/01) periods ended June 30, 2015. The Fund’s average annual total return since inception was 12.4%. |
| WHAT WORKED… AND WHAT DIDN’T |
| The portfolio was slightly overweight in Health Care during the first half, when overall market leadership came overwhelmingly from biotech stocks. Within the Russell 2000, pharmaceuticals and health care providers & services also posted notable net gains. We were very pleased, then, that stock selection and the Fund’s overweight, which included greater average exposure to both biotech and pharmaceuticals, made positive impacts on first-half returns vis-à-vis the small-cap index. Shares of Anacor Pharmaceuticals appreciated steadily based on the ongoing successful launch of its first commercial product, Kerydin, a topical antifungal medication. The market was also anticipating positive clinical results for its lead development compound, Crisaborole, a topical treatment for atopic dermatitis. We took advantage of its rising stock price to reduce our position somewhat. However, we remain optimistic about the prospects for both products, and Anacor remained a core holding in the Fund at the end of June. Cambrex Corporation is a life sciences company that provides active pharmaceutical ingredients (“APIs”) for the pharmaceuticals industry. We think very highly of this business— pharmaceuticals companies typically outsource around 50% of their API business, and Cambrex has one of the best reputations in this attractive niche. Its shares grew particularly healthy in February after the company reported terrific results for the fourth quarter and fiscal 2015. Among other developments, investors especially liked its expanded partnership with Gilead Science to provide APIs for the Big Pharma firm’s hepatitis C drug, Harvoni, which was approved for use in the U.S. and Europe late in 2014. |
| Four other sectors posted strong-to-solid net gains in the semiannual period, including Consumer Discretionary and Information Technology—the Fund’s two largest at the end of June. Gentherm hails from the first of these sectors and is a leader in the manufacture of variable temperature climate control devices primarily for the automotive markets. We like the ways the firm is positioning itself for future growth: First, it has been penetrating further into the automotive markets by offering cooling seats, as well as heated and cooling steering wheels, back seats, and cup holders, in addition to cooling compartments. Second, it is moving into other industries, such as mattresses. Shares of Paylocity Holding Corporation rallied after the company reported strong revenue growth for the first quarter and raised guidance for the full year. We continue to see ample growth potential for this cloud-based software provider specializing in payroll and human resources. |
| Net losses for the semiannual period were comparatively modest at the sector, industry, and position levels. The Materials, Energy, and Consumer Staples sectors detracted from returns, as did one of 2014’s top contributors, Sierra Wireless, which provides wireless data communications equipment for M2M (machine-to-machine) communications and mobile components. Its shares fell due to a slowdown in its wireless solutions business—which typically acts as a key driver of sales for its components. We see this as a temporary issue and view Sierra as a well-managed, quality business with a long runway for future growth. We reduced our position in retailer Zumiez, which sells sports-related apparel, footwear, and other equipment, after tiring of recent losses. |
| Top Contributors to Performance Year-to-Date Through 6/30/15 (%)1 | |
| Anacor Pharmaceuticals | 1.39 |
| Cambrex Corporation | 1.24 |
| Gentherm | 0.78 |
| Paylocity Holding Corporation | 0.77 |
| Boot Barn Holdings | 0.77 |
| 1 Includes dividends | |
| Top Detractors from Performance | |
| Year-to-Date Through 6/30/15 (%)2 | |
| Sierra Wireless | -0.67 |
| Zumiez | -0.46 |
| Horsehead Holding Corporation | -0.37 |
| Rogers Corporation | -0.32 |
| Container Store Group (The) | -0.28 |
| 2 Net of dividends | |
| CURRENT POSITIONING AND OUTLOOK |
| We continue to selectively build positions in Health Care, focusing on areas such as biotech, pharmaceuticals, and behavioral health services, which we continue to see as a vibrant theme. The portfolio was also substantially overweight in Consumer Discretionary at the end of June, which reflects our confidence in the ongoing health of consumer spending against a backdrop of higher employment and lower energy prices. |
| 28 | The Royce Funds 2015 Semiannual Report to Shareholders |
| PERFORMANCE AND PORTFOLIO REVIEW | TICKER SYMBOLS RYVPX RVPHX RVPCX RVPIX RVPRX RVPKX |
| Performance and Expenses | ||||||||||||||
| Average Annual Total Return (%) Through 6/30/15 | ||||||||||||||
| JAN-JUN 2015* | 1-YR | 3-YR | 5-YR | 10-YR | SINCE INCEPTION (6/14/01) | |||||||||
| RVP | 8.92 | 8.73 | 17.73 | 13.98 | 8.63 | 12.41 | ||||||||
| Annual Operating Expenses: 1.45% | ||||||||||||||
| * Not Annualized | ||||||||||||||
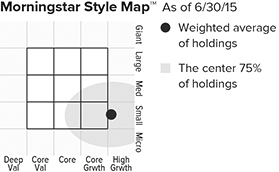
The Morningstar Style Map is the Morningstar Style Box™ with the center 75% of fund holdings plotted as the Morningstar Ownership Zone™. The Morningstar Style Box is designed to reveal a fund’s investment strategy. The Morningstar Ownership Zone provides detail about a portfolio’s investment style by showing the range of stock sizes and styles. The Ownership Zone is derived by plotting each stock in the portfolio within the proprietary Morningstar Style Box. Over time, the shape and location of a fund's ownership zone may vary. See page 126 for additional information. |
| Value of $10,000 |
| Invested on 6/30/01 as of 6/30/15 ($) |
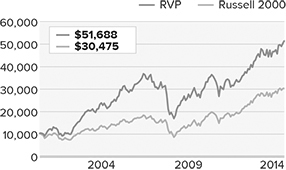
| Top 10 Positions | |
| % of Net Assets | |
| Container Store Group (The) | 3.0 |
| Carter’s | 2.7 |
| Paylocity Holding Corporation | 2.1 |
| Cambrex Corporation | 2.1 |
| Mobile Mini | 2.0 |
| Wabtec Corporation | 1.9 |
| Boot Barn Holdings | 1.9 |
| Gildan Activewear | 1.8 |
| Mercury Systems | 1.8 |
| Gentherm | 1.8 |
| Portfolio Sector Breakdown | |
| % of Net Assets | |
| Consumer Discretionary | 21.7 |
| Health Care | 19.0 |
| Information Technology | 18.0 |
| Industrials | 11.6 |
| Financials | 10.9 |
| Consumer Staples | 3.9 |
| Energy | 3.4 |
| Materials | 1.6 |
| Telecommunication Services | 1.4 |
| Miscellaneous | 2.7 |
| Cash and Cash Equivalents | 5.8 |
| Calendar Year Total Returns (%) | |
| YEAR | RVP |
| 2014 | 3.9 |
| 2013 | 32.5 |
| 2012 | 15.3 |
| 2011 | -10.0 |
| 2010 | 19.7 |
| 2009 | 41.4 |
| 2008 | -41.1 |
| 2007 | 3.2 |
| 2006 | 19.3 |
| 2005 | 13.2 |
| 2004 | 28.2 |
| 2003 | 79.9 |
| 2002 | -14.7 |
| Upside/Downside Capture Ratios | ||
| Periods Ended 6/30/15 (%) | ||
| UPSIDE | DOWNSIDE | |
| 10-year | 106 | 107 |
| From 6/30/01 (Start of Fund's | 117 | 99 |
| First Full Quarter) | ||
| Portfolio Diagnostics | ||
| Fund Net Assets | $888 million | |
| Number of Holdings | 94 | |
| Turnover Rate | 17% | |
| Average Market Capitalization1 | $1,787 million | |
| Weighted Average P/E Ratio2, 3 | 30.8x | |
| Weighted Average P/B Ratio2 | 3.5x | |
| Holdings ≥ 75% of Total Investments | 50 | |
| Active Share4 | 96% | |
| U.S. Investments (% of Net Assets) | 78.8% | |
| Non-U.S. Investments (% of Net Assets) | 15.4% |
| Important Performance and Expense Information |
All performance information in this Report reflects past performance, is presented on a total return basis, reflects the reinvestment of distributions, and does not reflect the deduction of taxes that a shareholder would pay on fund distributions or the redemption of fund shares. Past performance is no guarantee of future results. Investment return and principal value of an investment will fluctuate, so that shares may be worth more or less than their original cost when redeemed. Shares redeemed within 30 days of purchase may be subject to a 1% redemption fee payable to the Fund, which is not reflected in the performance shown above; if it were, performance would be lower. Current month-end performance may be higher or lower than performance quoted and may be obtained at www.roycefunds.com. All performance and risk information reflects results of the Service Class (its oldest class). Operating expenses reflect the Fund’s total annual operating expenses for the Service Class as of the Fund’s most current prospectus and include management fees, 12b-1 distribution and service fees, other expenses, and acquired fund fees and expenses. Acquired fund fees and expenses reflect the estimated amount of fees and expenses incurred indirectly by the Fund through its investments in mutual funds, hedge funds, private equity funds, and other investment companies. Shares of RVP’s Consultant and R Classes bear an annual distribution expense that is higher than that of the Service Class. Regarding the “Top Contributors” and “Top Detractors” tables shown above, the sum of all contributors to, and all detractors from, performance for all securities in the portfolio would approximate the Fund’s year-to-date performance for 2015. Upside Capture Ratio measures a manager’s performance in up markets relative to the Fund’s benchmark. It is calculated by measuring the Fund’s performance in quarters when the benchmark went up and dividing it by the benchmark’s return in those quarters. Downside Capture Ratio measures a Managers’ performance in down markets relative to the Fund’s benchmark (Russell 2000). It is calculated by measuring the Fund’s performance in quarters when the benchmark goes down and dividing it by the benchmark’s return in those quarters. |
| The Royce Funds 2015 Semiannual Report to Shareholders | 29 |
| MANAGERS’ DISCUSSION | |
| Royce 100 Fund (ROH) |
 |
| Lauren Romeo, CFA Chuck Royce |
| FUND PERFORMANCE |
| Royce 100 Fund was down 0.1% for the year-to-date period ended June 30, 2015, trailing its small-cap benchmark, the Russell 2000 Index, which gained 4.8% for the same period. The Fund’s difficulties began with the new year—it uncharacteristically lost more than its benchmark during the bearish January. As the first quarter moved on and share prices began to recover, the Fund was unable to keep pace with the small-cap index in large part because of the more growth-oriented nature of small-cap leadership. For the first quarter 100 Fund was up 0.5% compared to a 4.3% gain for the Russell 2000. |
| Small-cap share prices then retreated somewhat in April, and we were pleased to see the Fund hold its value more effectively than the small-cap index, if only briefly. When the markets rebounded, however, the Fund fell back. Royce 100 Fund was down 0.6% for the second quarter while the Russell 2000 gained 0.4%. It took only one day—the second-to-last of June—for the Fund’s quarterly gain to disappear into negative territory. Needless to say, it was a frustrating quarter. Royce 100 Fund outperformed the Russell 2000 for the 10-year period ended June 30, 2015. The Fund’s average annual total return since inception (6/30/03) was 10.1%. |
| WHAT WORKED… AND WHAT DIDN’T |
| While Health Care led all of the portfolio’s sectors by a wide margin in the first half, it did so within small-cap to an even larger degree. This was the primary factor in the Fund’s first-half underperformance versus the Russell 2000. Results for the small-cap index were driven overwhelmingly by biotech stocks, an area to which the portfolio had no exposure (and has had little if any historically). These businesses, attractive as they have been to other investors over the last couple of years, generally lack the solid fundamentals and sturdy earnings profiles that we seek for our holdings. Two of the sector’s names were among the portfolio’s best performers. Bio-Rad Laboratories, which provides life science research products, clinical diagnostics, and analytical instrumentation, experienced margin improvement, which aided its profitability. Lannett Company is a generic drug manufacturer that continued to exceed expectations in large part due to aggressive pricing and limited competition on certain key drugs. |
| ManpowerGroup was the Fund’s top contributor. Its shares climbed on signs of a pickup in demand for temporary staffing in Europe, its largest revenue geography, coupled with solid growth from its high-margin permanent placement activities. The firm also signaled optimism by raising its dividend by 63% and announced two staffing acquisitions that expanded or solidified its status in Europe and the Australasia region. Cal-Maine Foods, the nation’s largest producer and distributor of eggs, benefited from a robust market for lower-cost proteins, greater numbers of quick-service restaurants serving breakfast, and low grain prices, a key input for egg production. In addition, supply was meaningfully limited by an outbreak of bird flu in the Midwest, which led to a sharp increase in price. |
| The Consumer Discretionary sector detracted most from first-half results, with modest net losses also coming from Energy and Materials. Within the first of these, the most significant declines came from the specialty retail and diversified consumer services groups. Tax preparation business Liberty Tax disappointed investors, including ourselves, as the firm failed to open as many new offices as had been expected and overestimated the amount of incremental volume the Affordable Care Act and its associated tax filings would add to its business. We finished selling our shares in June. Specialty retailer Genesco struggled to turn things around for its Lids licensed sports cap and Lids Locker Room licensed sports apparel businesses, which depressed profitability and overshadowed excellent results from one of its other brands, teen retailer Journey. Ongoing margin pressure from both Lids franchises makes it unlikely that Genesco gets out of the penalty box in the near term, but we like its longer-term potential to get back in the game. |
| The stock of long-time holding Unit Corporation first began to suffer in the second half of last year when oil prices plummeted. Unit, which is involved in several energy businesses, including oil and natural gas exploration, oil and gas property acquisition, contract drilling services, and natural gas processing, saw its shares fall further in the first half of 2015 as the energy industry has not yet recovered. The company has executed effectively through this difficult period, primarily by cutting costs and boosting efficiency. In addition, its newly introduced drilling rig received a warm welcome from the market, which should enhance the firm’s competitiveness in that end of its business. |
| Top Contributors to Performance Year-to-Date Through 6/30/15 (%)1 | |
| ManpowerGroup | 0.72 |
| Cal-Maine Foods | 0.52 |
| Orbotech | 0.41 |
| Bio-Rad Laboratories Cl. A | 0.37 |
| Lannett Company | 0.35 |
| 1Includes dividends | |
| Top Detractors from Performance | |
| Year-to-Date Through 6/30/15 (%)2 | |
| Unit Corporation | -0.36 |
| Liberty Tax | -0.35 |
| Genesco | -0.32 |
| Oil States International | -0.29 |
| Greif Cl. A | -0.27 |
| 2Net of dividends | |
| CURRENT POSITIONING AND OUTLOOK |
| After stalling briefly in the first quarter, the economy appears to have resumed its steady pace of growth. This should benefit small-caps as a whole, particularly those in more economically sensitive areas of the market such as Industrials and Materials—the Fund was overweight in both at the end of June. Against this backdrop, our focus remains on companies that we believe are poised for profit margin expansion as their revenue growth normalizes in concert with a faster-moving U.S. economy. |
| 30 | The Royce Funds 2015 Semiannual Report to Shareholders |
| PERFORMANCE AND PORTFOLIO REVIEW | TICKER SYMBOLS RYOHX ROHHX ROHRX ROHKX |
| Performance and Expenses | ||||||||||||||
| Average Annual Total Return (%) Through 6/30/15 | ||||||||||||||
| JAN-JUN 2015* | 1-YR | 3-YR | 5-YR | 10-YR | SINCE INCEPTION (6/30/03) | |||||||||
| ROH | -0.12 | -5.99 | 11.50 | 11.14 | 8.44 | 10.11 | ||||||||
| Annual Gross Operating Expenses: 1.52% Annual Net Operating Expenses: 1.49% | ||||||||||||||
| *Not Annualized | ||||||||||||||
Relative Returns: Monthly Rolling Average Annual Return Periods
| On a monthly rolling basis, the Fund outperformed the Russell 2000 in 100% of all 10-year periods; 72% of all 5-year periods; and 47% of all 1-year periods. |
| PERIODS BEATING THE INDEX | FUND AVG (%)* | INDEX AVG (%)* | |||||||||
| 10-year | 25/25 | 100% | 10.1 | 8.7 | |||||||
| 5-year | 61/85 | 72% | 8.4 | 6.5 | |||||||
| 1-year | 63/133 | 47% | 11.5 | 10.8 | |||||||

The Morningstar Style Map is the Morningstar Style BoxTM with the center 75% of fund holdings plotted as the Morningstar Ownership ZoneTM. The Morningstar Style Box is designed to reveal a fund’s investment strategy. The Morningstar Ownership Zone provides detail about a portfolio’s investment style by showing the range of stock sizes and styles. The Ownership Zone is derived by plotting each stock in the portfolio within the proprietary Morningstar Style Box. Over time, the shape and location of a fund’s ownership zone may vary. See page 126 for additional information. |
Value of $10,000
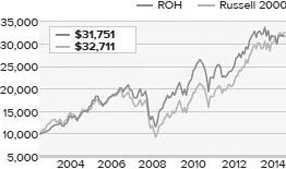
| Top 10 Positions | ||
| % of Net Assets | ||
| Buckle (The) | 3.2 | |
| MKS Instruments | 3.1 | |
| Genworth MI Canada | 3.0 | |
| Minerals Technologies | 3.0 | |
| Genesco | 2.7 | |
| John Bean Technologies | 2.6 | |
| ManpowerGroup | 2.5 | |
| Lazard Cl. A | 2.4 | |
| Artisan Partners Asset Management Cl. A | 2.4 | |
| Bio-Rad Laboratories Cl. A | 2.4 | |
| Portfolio Sector Breakdown | ||
| % of Net Assets | ||
| Industrials | 24.3 | |
| Information Technology | 20.5 | |
| Financials | 16.1 | |
| Consumer Discretionary | 13.5 | |
| Materials | 7.0 | |
| Energy | 6.7 | |
| Health Care | 6.6 | |
| Consumer Staples | 2.3 | |
| Miscellaneous | 0.9 | |
| Cash and Cash Equivalents | 2.1 | |
| Calendar Year Total Returns (%) | ||
| YEAR | ROH | |
| 2014 | -3.3 | |
| 2013 | 30.9 | |
| 2012 | 11.5 | |
| 2011 | -6.5 | |
| 2010 | 24.8 | |
| 2009 | 38.0 | |
| 2008 | -29.2 | |
| 2007 | 7.3 | |
| 2006 | 13.7 | |
| 2005 | 14.9 | |
| 2004 | 27.2 | |
| Upside/Downside Capture Ratios | ||||
| Periods Ended 6/30/15 (%) | ||||
| UPSIDE | DOWNSIDE | |||
| 10-Year | 99 | 98 | ||
| From 6/30/03 (Start of Fund’s First Full Quarter) | 96 | 96 | ||
| Portfolio Diagnostics | ||
| Fund Net Assets | $148 million | |
| Number of Holdings | 81 | |
| Turnover Rate | 32% | |
| Average Market Capitalization1 | $1,919 million | |
| Weighted Average P/E Ratio2,3 | 17.7x | |
| Weighted Average P/B Ratio2 | 2.6x | |
| Holdings ≥ 75% of Total Investments | 41 | |
| Active Share4 | 97% | |
| U.S. Investments (% of Net Assets) | 87.3% | |
| Non-U.S. Investments (% of Net Assets) | 10.6% | |
| Important Performance and Expense Information All performance information in this Report reflects past performance, is presented on a total return basis, reflects the reinvestment of distributions, and does not reflect the deduction of taxes that a shareholder would pay on fund distributions or the redemption of fund shares. Past performance is no guarantee of future results. Investment return and principal value of an investment will fluctuate, so that shares may be worth more or less than their original cost when redeemed. Shares redeemed within 30 days of purchase may be subject to a 1% redemption fee payable to the Fund, which is not reflected in the performance shown above; if it were, performance would be lower. Current month-end performance may be higher or lower than performance quoted and may be obtained at www.roycefunds.com. All performance and risk information reflects results of the Service Class (its oldest class). Gross operating expenses reflect the Fund’s gross total annual operating expenses for the Service Class and include management fees, 12b-1 distribution and service fees, and other expenses. Net operating expenses reflect contractual fee waivers and/or expense reimbursements. All expense information is reported as of the Fund’s most current prospectus. Royce & Associates has contractually agreed to waive fees and/or reimburse operating expenses to the extent necessary to maintain the Service Class’s net annual operating expenses, (excluding brokerage commissions, taxes, interest, litigation expenses, acquired fund fees and expenses, and other expenses not borne in the ordinary course of business), at or below 1.49% through April 30, 2016. Shares of ROH’s R Class bear an annual distribution expense that is higher than that of the Service Class. Regarding the “Top Contributors” and “Top Detractors” tables shown above, the sum of all contributors to, and all detractors from, performance for all securities in the portfolio would approximate the Fund’s year-to-date performance for 2015. Upside Capture Ratio measures a manager’s performance in up markets relative to the Fund’s benchmark. It is calculated by measuring the Fund’s performance in quarters when the benchmark went up and dividing it by the benchmark’s return in those quarters. Downside Capture Ratio measures a Managers’ performance in down markets relative to the Fund’s benchmark (Russell 2000). It is calculated by measuring the Fund’s performance in quarters when the benchmark goes down and dividing it by the benchmark’s return in those quarters. |
| The Royce Funds 2015 Semiannual Report to Shareholders | 31 |
| MANAGERS’ DISCUSSION | ||
| Royce Micro-Cap Discovery Fund (RDF) |
 |
| George Necakov, CFA Jim Harvey, CFA |
| FUND PERFORMANCE Royce Micro-Cap Discovery Fund was up 0.7% for the year-to-date period ended June 30, 2015, lagging its benchmark, the Russell Microcap Index, which advanced 6.0% for the same period. The Fund was again challenged by its lack of participation in a mostly bullish period for both micro-cap and small-cap stocks. It is also worth pointing out, however, that returns for each asset class were extremely narrow, led by biotech stocks and concentrated beyond that industry among a small handful of groups during the first half of 2015. |
| In the first quarter, Royce Micro-Cap Discovery got off to a promising start on an absolute basis. The Fund gained 2.8% versus a 3.1% advance for its benchmark. Though disappointing from a relative standpoint, Micro-Cap Discovery performed largely as we would expect. The Fund lost less than its benchmark during the bearish January before falling behind the micro-cap index when stock prices recovered in February and March. Unfortunately, the Fund ceded more ground to the Russell Microcap in the second quarter, underperforming in each of its three months. Although it stayed close to the benchmark in April when share prices again tumbled, the portfolio also fell in May, when most micro-cap shares were rallying. Micro-Cap Discovery was down 2.1% in the second quarter while the Russell Microcap increased 2.8%. The Fund underperformed its benchmark for the one-, three-, five-, 10-year, and since inception (10/3/03) periods ended June 30, 2015, though the Fund’s average annual total returns for the three- and five-year periods remained strong on an absolute basis. |
| WHAT WORKED... AND WHAT DIDN’T |
| Health Care was something of a double-edged sword for the portfolio. The sector led both the Fund and the Russell Microcap in the first half, though results for the index were (as mentioned) dominated by stratospheric performance for biotech stocks as well as healthy returns for pharmaceuticals. These businesses generally lack the attributes sought by the portfolio’s quantitative model, which looks for what it determines are undervalued micro-cap businesses with strong fundamentals. Not only was the Fund significantly underweight in Health Care during the first half, but it also had no exposure to biotech and very little exposure to pharmaceuticals. Net gains came mostly from holdings in the health care equipment & supplies industry. So even as the sector was the portfolio’s top contributor in the first half, its net gains were not nearly as strong as were those for Health Care within the Russell Microcap. |
| Ebix made the largest contribution to first-half performance by a sizable margin. The company supplies software and e-commerce solutions to the insurance industry and experienced solid growth in its business. We sold our shares in the second quarter as its stock rose. Seeing more room for potential growth, we chose to hold our shares of Culp, which supplies upholstery fabrics and mattress tickings to the furniture and bedding industries. Its shares took flight in March after the firm announced strong fiscal third-quarter results and a positive outlook for the rest of fiscal 2015. |
| Of the Fund’s three sectors that finished the semiannual period in the red, only Energy and Materials posted sizable net losses. The first of those sectors was home to Gulf Island Fabrication, which fabricates offshore drilling and production platforms, as well as other steel structures for the oil and gas and marine industries. Recent results have been hurt by the decline in commodity prices, which has led to a slowdown in its business. We held shares at the end of June. We also added to the portfolio’s position in TESSCO Technologies, which distributes equipment used to equip cell phone towers. One of its larger customers curtailed spending, which has hurt recent earnings. We sold our shares of United States Lime & Minerals, which supplies lime and limestone products to a number of industries, including energy. A slowdown in several of the industries it serves depressed earnings markedly. |
| Top Contributors to Performance Year-to-Date Through 6/30/15 (%)1 | ||||
| Ebix | 0.88 | |||
| Culp | 0.62 | |||
| Invacare Corporation | 0.54 | |||
| Village Super Market Cl. A | 0.39 | |||
| Journal Communications Cl. A | 0.38 | |||
| 1 Includes dividends | ||||
| Top Detractors from Performance Year-to-Date Through 6/30/15 (%)2 | ||||
| TESSCO Technologies | -0.40 | |||
| United States Lime & Minerals | -0.38 | |||
| Gulf Island Fabrication | -0.30 | |||
| UFP Technologies | -0.27 | |||
| Computer Task Group | -0.26 | |||
| 2 Net of dividends | ||||
| CURRENT POSITIONING AND OUTLOOK |
| To cull potential portfolio candidates, we combine a proprietary quantitative screening model with traditional fundamental analysis to help find companies that exhibit certain value-based characteristics. Several key elements comprise this proprietary model. |
| At the end of June Micro-Cap Discovery was significantly underweight versus its benchmark in Health Care and Financials and had no exposure to Utilities and Telecommunications Services. The portfolio was overweight in Consumer Discretionary, Energy, Industrials, and Information Technology, while it had substantial overweights in Consumer Staples and Materials. |
| 32 | The Royce Funds 2015 Semiannual Report to Shareholders |
| PERFORMANCE AND PORTFOLIO REVIEW | TICKER SYMBOL RYDFX |
| Performance and Expenses | ||||||||||||||
| Average Annual Total Return (%) Through 6/30/15 | ||||||||||||||
| JAN-JUN 2015* | 1-YR | 3-YR | 5-YR | 10-YR | SINCE INCEPTION(10/3/03) | |||||||||
| RDF | 0.67 | 1.64 | 12.34 | 11.16 | 4.81 | 6.25 | ||||||||
| Annual Gross Operating Expenses: 2.27% Annual Net Operating Expenses: 1.49% | ||||||||||||||
| *Not Annualized | ||||||||||||||
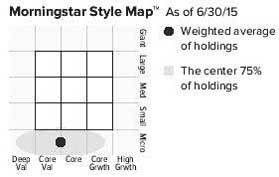
The Morningstar Style Map is the Morningstar Style BoxTM with the center 75% of fund holdings plotted as the Morningstar Ownership ZoneTM. The Morningstar Style Box is designed to reveal a fund’s investment strategy. The Morningstar Ownership Zone provides detail about a portfolio’s investment style by showing the range of stock sizes and styles. The Ownership Zone is derived by plotting each stock in the portfolio within the proprietary Morningstar Style Box. Over time, the shape and location of a fund’s ownership zone may vary. See page 126 for additional information. |
Value of $10,000
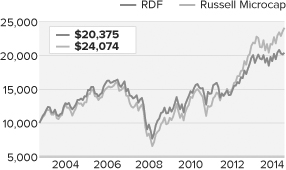
| Top 10 Positions | ||
| % of Net Assets | ||
| Village Super Market Cl. A | 2.6 | |
| MYR Group | 2.2 | |
| Utah Medical Products | 2.1 | |
| Invacare Corporation | 2.1 | |
| Miller Industries | 2.1 | |
| Culp | 1.9 | |
| PC Connection | 1.5 | |
| Computer Task Group | 1.5 | |
| UFP Technologies | 1.5 | |
| Comtech Telecommunications | 1.5 | |
| Portfolio Sector Breakdown | ||
| % of Net Assets | ||
| Information Technology | 18.4 | |
| Health Care | 17.2 | |
| Consumer Discretionary | 14.7 | |
| Industrials | 12.1 | |
| Materials | 9.3 | |
| Financials | 7.3 | |
| Consumer Staples | 5.2 | |
| Energy | 3.8 | |
| Miscellaneous | 4.4 | |
| Cash and Cash Equivalents | 7.6 | |
| Calendar Year Total Returns (%) | ||
| YEAR | RDF | |
| 2014 | 1.0 | |
| 2013 | 35.3 | |
| 2012 | 3.1 | |
| 2011 | -2.2 | |
| 2010 | 19.6 | |
| 2009 | 25.9 | |
| 2008 | -35.1 | |
| 2007 | -7.4 | |
| 2006 | 16.8 | |
| 2005 | 7.6 | |
| 2004 | 13.3 | |
| Portfolio Diagnostics | ||
| Fund Net Assets | $6 million | |
| Number of Holdings | 99 | |
| Turnover Rate | 41% | |
| Average Market Capitalization1 | $393 million | |
| Weighted Average P/E Ratio2,3 | 17.6x | |
| Weighted Average P/B Ratio2 | 1.7x | |
| Holdings ≥ 75% of Total Investments | 60 | |
| Active Share4 | 93% | |
| U.S. Investments (% of Net Assets) | 86.6% | |
| Non-U.S. Investments (% of Net Assets) | 5.8% | |
| Important Performance and Expense Information All performance information in this Report reflects past performance, is presented on a total return basis, reflects the reinvestment of distributions, and does not reflect the deduction of taxes that a shareholder would pay on fund distributions or the redemption of fund shares. Past performance is no guarantee of future results. Investment return and principal value of an investment will fluctuate, so that shares may be worth more or less than their original cost when redeemed. Shares redeemed within 30 days of purchase may be subject to a 1% redemption fee payable to the Fund, which is not reflected in the performance shown above; if it were, performance would be lower. Current month-end performance may be higher or lower than performance quoted and may be obtained at www.roycefunds.com. Price and total return information is based on net asset values calculated for shareholder transactions. Certain immaterial adjustments were made to the net assets of Royce Micro-Cap Discovery Fund at 6/29/12 for financial reporting purposes, and as a result the net asset values for shareholder transactions on that date and calendar-year total returns based on those net asset values differ from the adjusted net asset values and calendar-year total returns reported in the Financial Highlights. Gross operating expenses reflect the Fund’s gross total annual operating expenses for the Service Class and include management fees, 12b-1 distribution and service fees, and other expenses. Net operating expenses reflect contractual fee waivers and/or expense reimbursements. All expense information is reported as of the Fund’s most current prospectus. Royce & Associates has contractually agreed to waive fees and/or reimburse operating expenses to the extent necessary to maintain the Service Class’s net annual operating expenses, (excluding brokerage commissions, taxes, interest, litigation expenses, acquired fund fees and expenses, and other expenses not borne in the ordinary course of business), at or below 1.49% through April 30, 2016 and at or below 1.99% through April 30, 2025. Regarding the “Top Contributors” and “Top Detractors” tables shown above, the sum of all contributors to, and all detractors from, performance for all securities in the portfolio would approximate the Fund’s year-to-date performance for 2015. |
| The Royce Funds 2015 Semiannual Report to Shareholders | 33 |
| MANAGERS’ DISCUSSION | |
| Royce Dividend Value Fund (RDV) |
 |
| Chuck Royce Jay Kaplan, CFA |
| FUND PERFORMANCE Royce Dividend Value Fund advanced 2.6% for the year-to-date period ended June 30, 2015 compared to a 4.8% gain for its small-cap benchmark, the Russell 2000 Index, for the same period. In terms of relative performance, the first half was a tale of two quarters for the portfolio. Dividend Value was up 1.1% for the first quarter while the Russell 2000 gained 4.3%. For the second quarter, however, Dividend Value gained 1.4% versus 0.4% for the small-cap index. Although recent results have been underwhelming, compared to those for the Russell 2000, they have not been unexpected. The small-cap market over the last five years has been dominated at times by high-yield, bond-like REITs and Utilities or by fast-growing, more speculative stocks that typically have no earnings. There has been only short-term, inconsistent favor shown to the kind of steadily profitable, conservatively capitalized small- and mid-cap dividend payers that we prefer. We were pleased with the Fund’s long-term results on both an absolute and relative basis. Dividend Value outpaced the Russell 2000 for the 10-year and since inception (5/3/04) periods ended June 30, 2015. The Fund’s average annual total return since inception was 9.0%. WHAT WORKED... AND WHAT DIDN’T The portfolio’s underweight in Health Care—in particular its lack of exposure to biotech stocks—played the leading role in its first-half relative disadvantage. There was better news from other areas. Financials led all of the Fund’s sectors by a comfortable margin, followed by respectable net gains for Industrials and Consumer Discretionary. In all, seven of the Fund’s 10 equity sectors finished the semiannual period with net gains. Three sectors—Materials, Energy, and Utilities—were in the red at the end of June, though their net losses were relatively modest, especially for the third group. Three of the Fund’s top-seven industry groups came from Financials—capital markets, insurance, and banks. Holdings headquartered in the U.K. and Japan also notably boosted results. Two of the portfolio’s four largest holdings at the end of June were also among its top contributors to first-half results. Columbus, OH-based asset manager Diamond Hill Investment Group rode a wave of strong earnings and growing revenues to a more than 40% increase in the value of its shares. We like the firm’s emphasis on disciplined approaches and long-term investment results. Another asset manager, SEI Investments also runs a business creating technology solutions for its clients. Although its overall gain was not quite as heady, it saw a rising share price along with improved earnings and revenues keyed by double-digit growth in assets under management and administration. We have held shares of SEI in the portfolio for more than 10 years. In our view, it’s a very well-run business, and we see its global presence, focus on active management, technology niche, and close attention to risk as significant attributes. In general, we have a marked preference for investment management firms, especially as part of a portfolio of dividend-paying companies. From our perspective, the industry’s better firms are global growth businesses that should continue to benefit from expanding economic strength and the correspondent need for expertise in wealth management. GameStop Corporation, the Fund’s thirteenth-largest holding at the end of June, was one of a handful of retailers that enjoyed success in the first half. The company sells new and used video game hardware, software, and accessories. We like its core business, which rallied in the first half as a new gaming console cycle took off. The development of video game digital downloads, which many analysts predict will ultimately consign GameStop to the same fate as Blockbuster Video, has also been slow to catch fire. We like GameStop’s innovative ways of cultivating customer loyalty as well as its expansion into running other businesses, such as Simply Mac—an authorized seller and repairer of Apple products in smaller cities and towns. Industrial packaging products manufacturer Greif led all of the portfolio’s detractors in the first half, hurt by earnings disappointments and revised guidance for fiscal 2015. We think its global business can eventually right itself. Long-time holding Carpenter Technology has a global business fabricating and distributing specialty metals. Recent results have been hampered by the firm’s exposure to the energy markets as well as by increased operating costs and the price of reducing inventory. The firm has been taking steps to both reduce costs and improve margins in the face of a slumping market for industrial metals. Vishay Intertechnology, which makes semiconductors and components, has a low-debt balance sheet and a history of successful and profitable execution. Its stock began to fall in March in the context of an uncertain market for many tech businesses. |
| Top Contributors to Performance Year-to-Date Through 6/30/15 (%)1 | ||
| Diamond Hill Investment Group | 0.36 | |
| GameStop Corporation Cl. A | 0.26 | |
| SEI Investments | 0.25 | |
| Steven Madden | 0.23 | |
| ManpowerGroup | 0.22 | |
| 1 Includes dividends | ||
| Top Detractors from Performance Year-to-Date Through 6/30/15 (%)2 | ||
| Greif Cl. A | -0.24 | |
| Carpenter Technology | -0.24 | |
| Vishay Intertechnology | -0.20 | |
| Coronation Fund Managers | -0.19 | |
| Genesco | -0.17 | |
| 2 Net of dividends | ||
| CURRENT POSITIONING AND OUTLOOK Our focus remains on what we believe are well-run dividend-paying businesses, particularly in Financials and the more cyclical sectors of the market. The ongoing expansion of the U.S. economy has been the primary driver of our portfolio positioning over the past two years, as has our anticipation of a more earnings-led small-cap market. As a result, the portfolio was significantly overweight in Industrials and Materials, overweight in Energy and Financials, and close to the Russell 2000’s weighting in Consumer Discretionary at the end of June. Health Care remained a significant underweight. |
| 34 | The Royce Funds 2015 Semiannual Report to Shareholders |
| PERFORMANCE AND PORTFOLIO REVIEW | TICKER SYMBOLS RYDVX RDVIX RDIIX RDVCX |
| Performance and Expenses | ||||||||||||||
| Average Annual Total Return (%) Through 6/30/15 | ||||||||||||||
| JAN-JUN 2015* | 1-YR | 3-YR | 5-YR | 10-YR | SINCE INCEPTION (5/3/04) | |||||||||
| RDV | 2.55 | -2.89 | 13.53 | 13.45 | 8.88 | 8.99 | ||||||||
| Annual Operating Expenses: 1.55% | ||||||||||||||
| *Not Annualized | ||||||||||||||
Relative Risk Adjusted Returns: Monthly Rolling Sharpe Ratios
| On a monthly rolling risk-adjusted basis, the Fund outperformed the Russell 2000 in 100% of all 10-year periods and 88% of all 5-year periods. |
| PERIODS BEATING THE INDEX | FUND AVG (%)* | INDEX AVG (%)* | |||||||||
| 10-year | 14/14 | 100% | 0.53 | 0.44 | |||||||
| 5-year | 65/74 | 88% | 0.50 | 0.39 | |||||||
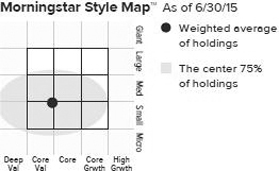
The Morningstar Style Map is the Morningstar Style BoxTM with the center 75% of fund holdings plotted as the Morningstar Ownership ZoneTM. The Morningstar Style Box is designed to reveal a fund’s investment strategy. The Morningstar Ownership Zone provides detail about a portfolio’s investment style by showing the range of stock sizes and styles. The Ownership Zone is derived by plotting each stock in the portfolio within the proprietary Morningstar Style Box. Over time, the shape and location of a fund’s ownership zone may vary. See page 126 for additional information. |
Value of $10,000
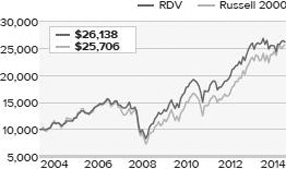
| Top 10 Positions | ||
| % of Net Assets | ||
| Expeditors International of Washington | 1.3 | |
| SEI Investments | 1.3 | |
| Reliance Steel & Aluminum | 1.3 | |
| Diamond Hill Investment Group | 1.2 | |
| Helmerich & Payne | 1.2 | |
| Reinsurance Group of America | 1.1 | |
| FLIR Systems | 1.1 | |
| KKR & Co. L.P. | 1.1 | |
| Diebold | 1.0 | |
| AptarGroup | 1.0 | |
| Portfolio Sector Breakdown | ||
| % of Net Assets | ||
| Financials | 25.7 | |
| Industrials | 22.2 | |
| Information Technology | 12.0 | |
| Consumer Discretionary | 11.4 | |
| Materials | 9.6 | |
| Energy | 4.1 | |
| Health Care | 4.1 | |
| Consumer Staples | 2.5 | |
| Telecommunication Services | 1.0 | |
| Utilities | 0.7 | |
| Miscellaneous | 1.9 | |
| Cash and Cash Equivalents | 4.8 | |
| Calendar Year Total Returns (%) | ||
| YEAR | RDV | |
| 2014 | -2.1 | |
| 2013 | 30.7 | |
| 2012 | 16.9 | |
| 2011 | -4.5 | |
| 2010 | 30.1 | |
| 2009 | 37.7 | |
| 2008 | -31.5 | |
| 2007 | -0.0 | |
| 2006 | 19.9 | |
| 2005 | 7.3 | |
| Upside/Downside Capture Ratios | ||||
| Periods Ended 6/30/15 (%) | ||||
| UPSIDE | DOWNSIDE | |||
| 10-Year | 93 | 85 | ||
| From 6/30/04 (Start of Fund’s First Full Quarter) | 90 | 80 | ||
| Portfolio Diagnostics | ||
| Fund Net Assets | $427 million | |
| Number of Holdings | 229 | |
| Turnover Rate | 7% | |
| Average Market Capitalization1 | $2,771 million | |
| Weighted Average P/E Ratio2,3 | 18.3x | |
| Weighted Average P/B Ratio2 | 2.8x | |
| Holdings ≥ 75% of Total Investments | 94 | |
| Active Share4 | 96% | |
| U.S. Investments (% of Net Assets) | 72.2% | |
| Non-U.S. Investments (% of Net Assets) | 23.0% | |
| Important Performance and Expense Information All performance information in this Report reflects past performance, is presented on a total return basis, reflects the reinvestment of distributions, and does not reflect the deduction of taxes that a shareholder would pay on fund distributions or the redemption of fund shares. Past performance is no guarantee of future results. Investment return and principal value of an investment will fluctuate, so that shares may be worth more or less than their original cost when redeemed. Shares redeemed within 30 days of purchase may be subject to a 1% redemption fee payable to the Fund, which is not reflected in the performance shown above; if it were, performance would be lower. Current month-end performance may be higher or lower than performance quoted and may be obtained at www.roycefunds.com. All performance and risk information reflects results of the Service Class (its oldest class). Certain immaterial adjustments were made to the net assets of Royce Dividend Value Fund at 6/30/15 for financial reporting purposes, and as a result the net asset values for shareholder transactions on that date and the calendar year Total Returns (%) based on those net asset values differ from the adjusted net asset values and calendar year total returns reported in the Financial Highlights. Operating expenses reflect the Fund’s gross total annual operating expenses for the Service Class as of the Fund’s most current prospectus and include management fees, 12b-1 distribution and service fees, other expenses, and acquired fund fees and expenses. Acquired fund fees and expenses reflect the estimated amount of the fees and expenses incurred indirectly by the Fund through its investments in mutual funds, hedge funds, private equity funds, and other investment companies. Regarding the “Top Contributors” and “Top Detractors” tables shown above, the sum of all contributors to, and all detractors from, performance for all securities in the portfolio would approximate the Fund’s year-to-date performance for 2015. The Sharpe Ratio is calculated for a specified period by dividing a fund’s annualized excess returns by its annualized standard deviation. The higher the Sharpe ratio, the better the fund’s historical risk-adjusted performance. Upside Capture Ratio measures a manager’s performance in up markets relative to the Fund’s benchmark. It is calculated by measuring the Fund’s performance in quarters when the benchmark went up and dividing it by the benchmark’s return in those quarters. Downside Capture Ratio measures a Managers’ performance in down markets relative to the Fund’s benchmark (Russell 2000). It is calculated by measuring the Fund’s performance in quarters when the benchmark goes down and dividing it by the benchmark’s return in those quarters. |
| The Royce Funds 2015 Semiannual Report to Shareholders | 35 |
| MANAGER’S DISCUSSION | ||
| Royce Micro-Cap Opportunity Fund (ROS) (formerly Royce Opportunity Select Fund) | ||
 |
| Bill Hench |
| FUND PERFORMANCE Royce Micro-Cap Opportunity Fund (formerly Royce Opportunity Select Fund) gained 4.3% for the year-to-date period ended June 30, 2015, trailing both its new benchmark, the Russell Microcap Index, which rose 6.0%, and its former yardstick, the small-cap Russell 2000 Index, which was up 4.8% for the same period. (We are using the Russell Microcap as the Fund’s new benchmark because it better reflects the Fund’s selection universe, part of changes that became effective on May 1, 2015.) Through much of the first half—as late as early June, in fact—Micro-Cap Opportunity led both indexes. While it began to cede a bit of ground as June rolled on, it took only one very volatile day—June 29 to be exact—for the Fund to slip well behind the indexes in the first half. |
We were otherwise pleased with first-half results. Although stocks endured a downturn in January, Micro-Cap Opportunity climbed 5.1% in the first quarter versus respective gains of 3.1% and 4.3% for the Russell Microcap and Russell 2000. The second quarter began in a similarly bearish fashion, though losses were generally less severe in April than earlier in the year. For the second quarter the Fund lost 0.7% versus a gain of 2.8% for the Russell Microcap and 0.4% for the Russell 2000. Micro-Cap Opportunity Fund’s average annual total return since inception was 16.4%. |
| The Fund’s name change became effective on May 1, 2015 when it also began to operate under a new non-fundamental investment policy requiring 80% of its assets to be invested in stocks with market caps up to $1 billion. The Fund is being run closely to the way in which it has been since its inception, investing primarily in a limited number (generally less than 100) of mostly micro-cap stocks. |
| WHAT WORKED... AND WHAT DIDN’T |
| Five of the portfolio’s nine equity sectors posted net losses in the first half, though for three—Financials, Energy, and Consumer Discretionary—the declines were modest and for the remaining two they were even smaller. One of these was Health Care, which made an outsized contribution to performance for both the Russell Microcap and Russell 2000. The sector was led by red-hot biotech stocks, and the Fund’s significant underweight in both the sector and that industry loomed large in its first-half underperformance. The portfolio’s largest detractor at the position level was The McClatchy Company, which publishes newspapers and provides original media content to digital sources. Its shares grew appreciably cheaper (and more attractive to us) during the first half as the firm continued to adjust to the radically altered media landscape, which has not been kind to newsprint. However, with approximately two-thirds of its revenue now coming from non-print sources, we think the company is responding effectively to new media realities. We added shares in the first quarter. We also built our position in OraSure Technologies as its stock stumbled. The company develops saliva-based disease-testing products, many for more sensitive healthcare situations. Its stock was up in 2014 on news of new product releases. We suspect that expectations may have raced ahead of reality, which resulted in nervous investors when OraSure then reported a fourth-quarter loss in February, even though the loss was lower than had been estimated. We like its niche and its revenue growth potential. |
| Information Technology easily led all of the Fund’s sector groups, with net gains nearly triple those posted by Industrials, the second-best performing sector in the first half. Four of its industry groups made particularly notable contributions—semiconductors & semiconductor equipment, internet software & services, communications equipment, and software. One of the Fund’s top contributors was EarthLink Holdings, which has made the transition from being a general internet services provider to more business-oriented managed services. We initially viewed it as an asset play and liked its new management’s plans to better focus the business and their ability to cut costs in a flat-growth environment. The company’s steady progress toward profitability attracted more investors, though we believe it still has room to grow and held a large position at the end of June. |
| Top contributor Builders FirstSource, which makes building products for residential construction, saw its shares hit the roof when it announced the acquisition of a competitor in mid-April. RTI International Metals benefited from a similar condition for micro-cap companies—its profitability in producing titanium for the aerospace industry drew the interest of a larger firm in the same business. Alcoa announced an agreement to buy the company in March, prompting us to sell our position. |
| Top Contributors to Performance Year-to-Date Through 6/30/15 (%)1 | ||||
| Builders FirstSource | 1.29 | |||
| EarthLink Holdings | 1.28 | |||
| RTI International Metals | 1.05 | |||
| Cambrex Corporation | 0.69 | |||
| RF Micro Devices | 0.59 | |||
| 1 Includes dividends | ||||
| Top Detractors from Performance Year-to-Date Through 6/30/15 (%)2 | ||||
| McClatchy Company (The) Cl. A | -0.83 | |||
| OraSure Technologies | -0.75 | |||
| Noranda Aluminum Holding Corporation | -0.65 | |||
| Zumiez | -0.61 | |||
| Amber Road | -0.59 | |||
| 2 Net of dividends | ||||
| CURRENT POSITIONING AND OUTLOOK |
| Our overall outlook is very positive. We think the market has had the time it needed to fully digest the first quarter’s slowdown in economic growth and the likelihood of increased interest rates in the short run. Our expectation, then, is that the economy will keep growing, which should help a number of micro-cap companies, especially those that have been flat or down over the last couple of years. In particular we believe that we will see more robust earnings recovery in 2016. At the end June the portfolio held large overweights in Information Technology, Consumer Discretionary, and Materials while also being underweight in Industrials. |
| 36 | The Royce Funds 2015 Semiannual Report to Shareholders |
| PERFORMANCE AND PORTFOLIO REVIEW | TICKER SYMBOLS ROSFX ROSSX |
| Performance and Expenses | ||||||||||||||
| Average Annual Total Return (%) Through 6/30/15 | ||||||||||||||
| JAN-JUN 2015* | 1-YR | 3-YR | SINCE INCEPTION (8/31/10) | |||||||||||
| ROS | 4.30 | -4.04 | 18.39 | 16.43 | ||||||||||
| Annual Gross Operating Expenses: 1.56% Annual Net Operating Expenses: 1.28% | ||||||||||||||
| *Not Annualized | ||||||||||||||
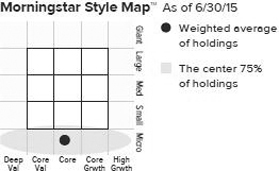
The Morningstar Style Map is the Morningstar Style BoxTM with the center 75% of fund holdings plotted as the Morningstar Ownership ZoneTM. The Morningstar Style Box is designed to reveal a fund’s investment strategy. The Morningstar Ownership Zone provides detail about a portfolio’s investment style by showing the range of stock sizes and styles. The Ownership Zone is derived by plotting each stock in the portfolio within the proprietary Morningstar Style Box. Over time, the shape and location of a fund’s ownership zone may vary. See page 126 for additional information. |
Value of $10,000
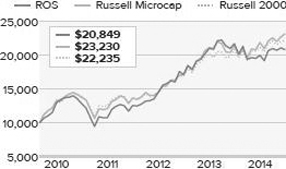
| Top 10 Positions | ||
| % of Net Assets | ||
| General Cable | 2.7 | |
| Applied Optoelectronics | 2.5 | |
| Power Solutions International | 2.4 | |
| U.S. Concrete | 2.4 | |
| Exar Corporation | 2.3 | |
| EarthLink Holdings | 2.3 | |
| Trinity Biotech ADR Cl. A | 2.2 | |
| Zumiez | 2.1 | |
| Carbonite | 2.0 | |
| Installed Building Products | 2.0 | |
| Portfolio Sector Breakdown | ||
| % of Net Assets | ||
| Information Technology | 40.4 | |
| Consumer Discretionary | 17.9 | |
| Industrials | 13.0 | |
| Health Care | 9.9 | |
| Materials | 6.3 | |
| Energy | 2.0 | |
| Consumer Staples | 1.7 | |
| Financials | 1.7 | |
| Telecommunication Services | 1.2 | |
| Miscellaneous | 4.0 | |
| Cash and Cash Equivalents | 1.9 | |
| Calendar Year Total Returns (%) | ||||
| YEAR | ROS | |||
| 2014 | -5.0 | |||
| 2013 | 44.6 | |||
| 2012 | 35.1 | |||
| 2011 | -17.1 | |||
| Portfolio Diagnostics | ||
| Fund Net Assets | $21 million | |
| Number of Holdings | 79 | |
| Turnover Rate | 69% | |
| Average Market Capitalization1 | $454 million | |
| Weighted Average P/B Ratio2 | 2.2x | |
| Holdings ≥ 75% of Total Investments | 44 | |
| Active Share3 | 96% | |
| U.S. Investments (% of Net Assets) | 94.3% | |
| Non-U.S. Investments (% of Net Assets) | 3.8% | |
| Important Performance and Expense Information All performance information in this Report reflects past performance, is presented on a total return basis, reflects the reinvestment of distributions, and does not reflect the deduction of taxes that a shareholder would pay on fund distributions or the redemption of fund shares. Past performance is no guarantee of future results. Investment return and principal value of an investment will fluctuate, so that shares may be worth more or less than their original cost when redeemed. Shares redeemed within 30 days of purchase may be subject to a 1% redemption fee, payable to the Fund, which is not reflected in the performance shown above; if it were, performance would be lower. Current month-end performance may be higher or lower than performance quoted and may be obtained at www.roycefunds.com. Gross operating expenses reflect the Fund’s total gross annual operating expenses and include management fees and other expenses. Net operating expenses reflect contractual fee waivers and/or expense reimbursements. All expense information is reported as of the Funds most current prospectus. Royce & Associates has contractually agreed to waive fees and/or reimburse operating expenses to the extent necessary to maintain the Fund’s net annual operating expenses, (excluding dividend and interest expenses relating to short sale activities, brokerage commissions, taxes, interest, litigation expenses, acquired fund fees and expenses, and other expenses not borne in the ordinary course of business), at or below 1.24% through April 30, 2016 and at or below 1.99% through April 30, 2025. Regarding the “Top Contributors” and “Top Detractors” tables shown above, the sum of all contributors to, and all detractors from, performance for all securities in the portfolio would approximate the Fund’s year-to-date performance for 2015. |
| The Royce Funds 2015 Semiannual Report to Shareholders | 37 |
| MANAGER’S DISCUSSION | ||
| Royce Special Equity Multi-Cap Fund (RSM) |
 |
| Charlie Dreifus, CFA |
| FUND PERFORMANCE For the year-to-date period ended June 30, 2015, Royce Special Equity Multi-Cap Fund was down 3.1% versus a 1.7% increase for its benchmark, the Russell 1000 Index, for the same period. Most equities floundered into the new year, and we were disappointed to see the portfolio lose more than its benchmark in January, when prices were tumbling. The Fund was then unable to narrow the gap when share prices improved in February and March. For the first quarter, Special Equity Multi-Cap fell 0.6% while the Russell 1000 gained 1.6%. The quarter that followed offered little better on a relative basis, with June particularly difficult. A modest net loss for the Fund grew more severe with the impact that the Greek default had on the second-to-last day of the month. The end result was a second-quarter loss of 2.6% for the Fund compared to a modest increase of 0.1% for the Russell 1000. |
In general, the benchmark’s first-half performance was propelled by Health Care (led by biotech). More generally, the broader market’s positive results for the semiannual period came disproportionately from non-earning, lowest ROE quintile, and non-yielding companies, which was not a good lineup for our classic value approach to be competing with. As of June 30, 2015, it had been more 1,350 days since the S&P 500 had experienced a drop of 10% or more. Since our investment approach is designed to seek a relative performance advantage during extended down markets, this has certainly been a strong headwind for the portfolio.The Fund’s average annual total return since inception (12/31/10) was 12.9%. |
| WHAT WORKED... AND WHAT DIDN’T |
| Holdings in the Consumer Discretionary sector had an outsized negative effect on first-half performance—on both a relative and absolute basis. Five of the portfolio’s 10 most significant detractors came from the sector, including media companies—a particular trouble spot in the first half—Viacom and Scripps Networks Interactive, household goods retailer Bed Bath & Beyond, and auto parts distributor Genuine Parts. The portfolio’s underweights in Health Care and Financials also detracted from results vis-à-vis the Russell 1000, as did certain holdings in Information Technology. The Fund’s largest net loss at the position level came from Franklin Resources, which does business as Franklin Templeton Investments. The firm provides investment advisory services to mutual fund, retirement, institutional, and separate accounts. |
| ManpowerGroup was a bright spot in the first half. Several positive developments have helped the company of late: Demand has spiked for temporary staffing in Europe, its largest revenue geography, and its high-margin permanent placement segment has grown. The firm also raised its dividend by 63% and announced two staffing acquisitions that expanded or solidified its status in Europe and the Australasia region. We were also pleased to see solid growth from auto parts maker Lear Corporation, diagnostic testing, information, and services business Quest Diagnostics (which we sold in the first half), and Apple. |
| Top Contributors to Performance Year-to-Date Through 6/30/15 (%)1 | ||||
| ManpowerGroup | 1.34 | |||
| Lear Corporation | 0.78 | |||
| Quest Diagnostics | 0.57 | |||
| Apple | 0.46 | |||
| Rockwell Automation | 0.07 | |||
| 1 Includes dividends | ||||
| Top Detractors from Performance Year-to-Date Through 6/30/15 (%)2 | ||||
| Franklin Resources | -0.53 | |||
| Viacom Cl. B | -0.53 | |||
| Bed Bath & Beyond | -0.49 | |||
| Scripps Networks Interactive Cl. A | -0.48 | |||
| Genuine Parts | -0.48 | |||
| 2 Net of dividends | ||||
| CURRENT POSITIONING AND OUTLOOK |
| Much has been written about the widely held belief that profit levels and/or rates are unsustainable. One such argument looks to corporate profits as a percentage of GDP. In our opinion this is not an appropriate measure as that ratio has many non-operating factors included, such as taxes, interest expense, etc. When one looks deeper one can see, as we do in our accounting work, significant improvement in operating margins despite tepid sales advances. This suggests to us latent higher profit levels when revenues advance enough to kick in. American businesses have become a lot leaner and meaner. Breakeven points have been lowered. Even in an economy with only modest but continued progress, we will indeed reach a level of production that will allow those incremental margins to manifest themselves. We do not see any imminent collapse in profitability as long as the “Goldilocks” model of the economy being “just right” is operative. |
| If, as we expect, the market becomes more challenging and quality minded, not only will returns be lower, but we will also see down markets. In that kind of environment, we expect to do better. Owning what we believe are great companies bought at reasonable valuations—most of which have increased dividends annually— continues to excite us. It’s important to note that in low-growth periods such as the 1940s and 1970s dividends accounted for as much as 75% of the total return for stocks. |
| Perhaps the best signal that many of the globe’s potential trouble spots at the end of June—China, Greece, Puerto Rico, and the seemingly ever-present possibility of terror attacks, to name four examples—seem unlikely to cause harm to the U.S. economy is that consumer confidence remained elevated in sharp contrast to investor sentiment. We believe investors will become more bullish. Taking a full market cycle view, particularly from this level, we feel very comfortable with the portfolio. At the end of the first half, the Fund was substantially overweight in the Consumer Discretionary and Industrials sectors and slightly overweight in Information Technology. |
| 38 | The Royce Funds 2015 Semiannual Report to Shareholders |
| PERFORMANCE AND PORTFOLIO REVIEW | TICKER SYMBOLS RSEMX RSMCX RMUIX RSMLX |
| Performance and Expenses | ||||||||||||||
| Average Annual Total Return (%) Through 6/30/15 | ||||||||||||||
| JAN-JUN 2015* | 1-YR | 3-YR | SINCE INCEPTION (12/31/10) | |||||||||||
| RSM | -3.14 | 0.48 | 14.71 | 12.90 | ||||||||||
| Annual Gross Operating Expenses: 1.34% Annual Net Operating Expenses: 1.24% | ||||||||||||||
| * Not Annualized | ||||||||||||||
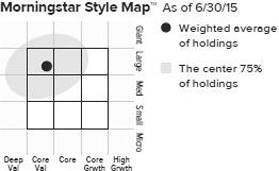
The Morningstar Style Map is the Morningstar Style BoxTM with the center 75% of fund holdings plotted as the Morningstar Ownership ZoneTM. The Morningstar Style Box is designed to reveal a fund’s investment strategy. The Morningstar Ownership Zone provides detail about a portfolio’s investment style by showing the range of stock sizes and styles. The Ownership Zone is derived by plotting each stock in the portfolio within the proprietary Morningstar Style Box. Over time, the shape and location of a fund’s ownership zone may vary. See page 126 for additional information. |
Value of $10,000
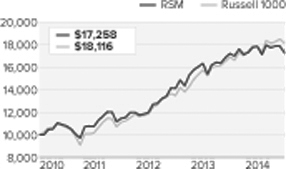
| Top 10 Positions | ||
| % of Net Assets | ||
| ManpowerGroup | 6.2 | |
| Lear Corporation | 5.6 | |
| Nordstrom | 5.5 | |
| Bed Bath & Beyond | 5.3 | |
| Cisco Systems | 5.3 | |
| Emerson Electric | 5.3 | |
| Gap (The) | 5.0 | |
| Microsoft Corporation | 4.9 | |
| Apple | 4.8 | |
| T. Rowe Price Group | 4.8 | |
| Portfolio Sector Breakdown | ||
| % of Net Assets | ||
| Consumer Discretionary | 33.4 | |
| Industrials | 26.4 | |
| Information Technology | 23.8 | |
| Financials | 9.5 | |
| Materials | 2.0 | |
| Cash and Cash Equivalents | 4.9 | |
| Calendar Year Total Returns (%) | ||||
| YEAR | RSM | |||
| 2014 | 9.3 | |||
| 2013 | 36.3 | |||
| 2012 | 11.6 | |||
| 2011 | 7.2 | |||
| Upside/Downside Capture Ratios | ||||
| Periods Ended 6/30/15 (%) | ||||
| UPSIDE | DOWNSIDE | |||
| From 12/31/10 (Start of Fund’s First Full Quarter) | 89 | 82 | ||
| Portfolio Diagnostics | ||
| Fund Net Assets | $258 million | |
| Number of Holdings | 26 | |
| Turnover Rate | 16% | |
| Average Market Capitalization1 | $27,030 million | |
| Weighted Average P/E Ratio2,3 | 15.5x | |
| Weighted Average P/B Ratio2 | 3.6x | |
| Holdings ≥ 75% of Total Investments | 15 | |
| Active Share4 | 92% | |
| U.S. Investments (% of Net Assets) | 95.1% | |
| Non-U.S. Investments (% of Net Assets) | 0.0% | |
| Important Performance and Expense Information All performance information in this Report reflects past performance, is presented on a total return basis, reflects the reinvestment of distributions, and does not reflect the deduction of taxes that a shareholder would pay on fund distributions or the redemption of fund shares. Past performance is no guarantee of future results. Investment return and principal value of an investment will fluctuate, so that shares may be worth more or less than their original cost when redeemed. Shares redeemed within 30 days of purchase may be subject to a 1% redemption fee payable to the Fund, which is not reflected in the performance shown above; if it were, performance would be lower. Current month-end performance may be higher or lower than performance quoted and may be obtained at www.roycefunds.com. All performance and risk information reflects results of the Service Class (its oldest class). Gross operating expenses reflect gross total annual operating expenses for the Service Class and include management fees, 12b-1 distribution and service fees, other expenses, and acquired fund fees and expenses. Acquired fund fees and expenses reflect the estimated amount of the fees and expenses incurred indirectly by the Fund through its investments in mutual funds, hedge funds, private equity funds, and other investment companies. Net operating expenses reflect contractual fee waivers and/or reimbursements. All expense information is reported as of the Fund’s most current prospectus. Royce & Associates has contractually agreed to waive fees and/or reimburse operating expenses to the extent necessary to maintain the Service Classes’s net annual operating expenses, (excluding brokerage commissions, taxes, interest litigation expenses, acquired fund fees and expenses, and other expenses not borne in the ordinary course of business), at or below 1.24% through April 30, 2016. Regarding the “Top Contributors” and “Top Detractors” tables shown above, the sum of all contributors to, and all detractors from, performance for all securities in the portfolio would approximate the Fund’s year-to-date performance for 2015. Upside Capture Ratio measures a manager’s performance in up markets relative to the Fund’s benchmark. It is calculated by measuring the Fund’s performance in quarters when the benchmark went up and dividing it by the benchmark’s return in those quarters. Downside Capture Ratio measures a Managers’ performance in down markets relative to the Fund’s benchmark (Russell 1000). It is calculated by measuring the Fund’s performance in quarters when the benchmark goes down and dividing it by the benchmark’s return in those quarters. |
| The Royce Funds 2015 Semiannual Report to Shareholders | 39 |
Schedules of Investments
Royce Pennsylvania Mutual Fund
Common Stocks – 98.9%
| SHARES | VALUE | |||||
| CONSUMER DISCRETIONARY – 16.0% | ||||||
| AUTO COMPONENTS - 2.2% | ||||||
Dorman Products 1 | 395,921 | $ | 18,869,595 | |||
Drew Industries | 548,273 | 31,810,799 | ||||
Gentex Corporation | 1,136,194 | 18,656,305 | ||||
Motorcar Parts of America 1 | 20,250 | 609,323 | ||||
Standard Motor Products | 85,951 | 3,018,599 | ||||
STRATTEC SECURITY 2 | 253,050 | 17,384,535 | ||||
Superior Industries International | 513,600 | 9,404,016 | ||||
| 99,753,172 | ||||||
| AUTOMOBILES - 1.2% | ||||||
Thor Industries | 586,545 | 33,010,753 | ||||
Winnebago Industries | 846,500 | 19,968,935 | ||||
| 52,979,688 | ||||||
| DISTRIBUTORS - 1.2% | ||||||
Core-Mark Holding Company | 539,684 | 31,976,277 | ||||
| 306,000 | 3,066,120 | |||||
Weyco Group 2 | 566,900 | 16,904,958 | ||||
| 51,947,355 | ||||||
| DIVERSIFIED CONSUMER SERVICES - 1.0% | ||||||
Capella Education | 3,700 | 198,579 | ||||
| 200,000 | 1,568,000 | |||||
Liberty Tax Cl. A | 599,504 | 14,837,724 | ||||
Sotheby’s | 441,600 | 19,977,984 | ||||
Universal Technical Institute | 753,700 | 6,481,820 | ||||
| 43,064,107 | ||||||
| HOTELS, RESTAURANTS & LEISURE - 0.0% | ||||||
MTY Food Group | 66,200 | 1,755,440 | ||||
| HOUSEHOLD DURABLES - 1.4% | ||||||
Cavco Industries 1 | 16,600 | 1,252,304 | ||||
Ethan Allen Interiors | 1,072,388 | 28,246,700 | ||||
La-Z-Boy | 375,600 | 9,893,304 | ||||
NVR 1 | 17,757 | 23,794,380 | ||||
| 63,186,688 | ||||||
| INTERNET & CATALOG RETAIL - 0.2% | ||||||
Blue Nile 1 | 130,768 | 3,974,040 | ||||
FTD Companies 1 | 197,200 | 5,559,068 | ||||
| 9,533,108 | ||||||
| LEISURE PRODUCTS - 0.2% | ||||||
Nautilus 1 | 482,000 | 10,367,820 | ||||
Smith & Wesson Holding Corporation 1 | 39,800 | 660,282 | ||||
| 11,028,102 | ||||||
| MEDIA - 1.7% | ||||||
E.W. Scripps Company Cl. A | 200,030 | 4,570,686 | ||||
Harte-Hanks | 276,640 | 1,648,774 | ||||
Morningstar | 352,695 | 28,056,887 | ||||
| 273,265 | 19,073,897 | |||||
Saga Communications Cl. A | 142,034 | 5,375,987 | ||||
Wiley (John) & Sons Cl. A | 362,793 | 19,725,055 | ||||
| 78,451,286 | ||||||
| MULTILINE RETAIL - 0.1% | ||||||
Tuesday Morning 1 | 370,000 | 4,168,050 | ||||
| SPECIALTY RETAIL - 5.3% | ||||||
American Eagle Outfitters | 814,291 | 14,022,091 | ||||
America’s Car-Mart 1 | 411,200 | 20,280,384 | ||||
Ascena Retail Group 1 | 657,932 | 10,957,857 | ||||
Buckle (The) | 787,170 | 36,028,771 | ||||
Cato Corporation (The) Cl. A | 517,696 | 20,065,897 | ||||
Destination Maternity | 679,367 | 7,921,419 | ||||
DSW Cl. A | 402,400 | 13,428,088 | ||||
Finish Line (The) Cl. A | 52,800 | 1,468,896 | ||||
GameStop Corporation Cl. A | 477,200 | 20,500,512 | ||||
Genesco 1 | 554,153 | 36,590,723 | ||||
Monro Muffler Brake | 259,800 | 16,149,168 | ||||
Penske Automotive Group | 159,400 | 8,306,334 | ||||
Shoe Carnival | 737,481 | 21,283,702 | ||||
Stein Mart | 865,518 | 9,061,973 | ||||
| 236,065,815 | ||||||
| TEXTILES, APPAREL & LUXURY GOODS - 1.5% | ||||||
Carter’s | 3,500 | 372,050 | ||||
Deckers Outdoor 1 | 219,990 | 15,832,680 | ||||
G-III Apparel Group 1 | 45,262 | 3,184,182 | ||||
Gildan Activewear | 14,000 | 465,360 | ||||
Movado Group | 585,506 | 15,902,343 | ||||
Steven Madden 1 | 262,646 | 11,235,996 | ||||
Wolverine World Wide | 650,800 | 18,534,784 | ||||
| 65,527,395 | ||||||
| Total (Cost $446,838,426) | 717,460,206 | |||||
| CONSUMER STAPLES – 2.3% | ||||||
| FOOD & STAPLES RETAILING - 0.2% | ||||||
United Natural Foods 1 | 5,000 | 318,400 | ||||
Village Super Market Cl. A | 193,197 | 6,122,413 | ||||
| 6,440,813 | ||||||
| FOOD PRODUCTS - 1.0% | ||||||
Cal-Maine Foods | 209,620 | 10,942,164 | ||||
Farmer Bros. 1 | 74,277 | 1,745,509 | ||||
Industrias Bachoco ADR | 133,060 | 7,199,877 | ||||
John B. Sanfilippo & Son | 26,400 | 1,370,160 | ||||
Sanderson Farms | 216,100 | 16,242,076 | ||||
Seneca Foods Cl. A 1 | 239,389 | 6,647,832 | ||||
Seneca Foods Cl. B 1 | 7,197 | 214,183 | ||||
SunOpta 1 | 165,019 | 1,770,654 | ||||
| 46,132,455 | ||||||
| HOUSEHOLD PRODUCTS - 0.1% | ||||||
HRG Group 1 | 484,600 | 6,299,800 | ||||
| PERSONAL PRODUCTS - 1.0% | ||||||
Inter Parfums | 381,500 | 12,944,295 | ||||
Nu Skin Enterprises Cl. A | 480,305 | 22,636,775 | ||||
Nutraceutical International 1 | 312,500 | 7,731,250 | ||||
| 43,312,320 | ||||||
| Total (Cost $75,121,849) | 102,185,388 | |||||
| ENERGY – 4.7% | ||||||
| ENERGY EQUIPMENT & SERVICES - 4.5% | ||||||
Atwood Oceanics | 540,421 | 14,288,731 | ||||
CARBO Ceramics | 155,900 | 6,490,117 | ||||
Ensign Energy Services | 739,100 | 7,243,062 | ||||
Era Group 1 | 669,040 | 13,701,939 | ||||
Helmerich & Payne | 305,210 | 21,492,888 | ||||
Matrix Service 1 | 595,274 | 10,881,609 | ||||
Oil States International 1 | 248,363 | 9,246,554 | ||||
Pason Systems | 1,469,820 | 26,301,423 | ||||
RPC | 861,775 | 11,918,348 | ||||
SEACOR Holdings 1 | 472,835 | 33,542,915 | ||||
TGS-NOPEC Geophysical | 239,885 | 5,602,095 | ||||
Tidewater | 457,514 | 10,399,293 | ||||
Total Energy Services | 103,400 | 1,262,490 | ||||
| 40 | The Royce Funds 2015 Semiannual Report to Shareholders | THE ACCOMPANYING NOTES ARE AN INTEGRAL PART OF THESE FINANCIAL STATEMENTS |
| June 30, 2015 (unaudited) |
Royce Pennsylvania Mutual Fund (continued)
| SHARES | VALUE | |||||
| ENERGY (continued) | ||||||
| ENERGY EQUIPMENT & SERVICES (continued) | ||||||
Trican Well Service | 1,183,000 | $ | 3,930,705 | |||
Unit Corporation 1 | 825,459 | 22,386,448 | ||||
| 198,688,617 | ||||||
| OIL, GAS & CONSUMABLE FUELS - 0.2% | ||||||
Cimarex Energy | 61,200 | 6,750,972 | ||||
Sprott Resource 1 | 2,510,000 | 1,889,031 | ||||
World Fuel Services | 6,000 | 287,700 | ||||
WPX Energy 1 | 66,000 | 810,480 | ||||
| 9,738,183 | ||||||
| Total (Cost $180,368,367) | 208,426,800 | |||||
| FINANCIALS – 13.2% | ||||||
| BANKS - 1.2% | ||||||
Ames National | 21,998 | 552,150 | ||||
Blue Hills Bancorp 1 | 274,990 | 3,849,860 | ||||
BOK Financial | 107,100 | 7,452,018 | ||||
Camden National | 154,788 | 5,990,296 | ||||
City Holding Company | 209,070 | 10,296,697 | ||||
First Citizens BancShares Cl. A | 94,726 | 24,916,727 | ||||
| 53,057,748 | ||||||
| CAPITAL MARKETS - 5.4% | ||||||
AllianceBernstein Holding L.P. | 874,160 | 25,813,945 | ||||
Artisan Partners Asset Management Cl. A | 341,320 | 15,857,727 | ||||
ASA Gold and Precious Metals | 98,100 | 952,551 | ||||
Citadel Capital 1 | 6,165,715 | 1,608,086 | ||||
| 1,310,214 | 0 | |||||
Cowen Group 1 | 2,114,177 | 13,530,733 | ||||
Diamond Hill Investment Group | 148,717 | 29,692,836 | ||||
Dundee Corporation Cl. A 1 | 1,171,000 | 11,756,877 | ||||
Evercore Partners Cl. A | 2,500 | 134,900 | ||||
Federated Investors Cl. B | 855,022 | 28,634,687 | ||||
Lazard Cl. A | 219,767 | 12,359,696 | ||||
Manning & Napier Cl. A | 677,292 | 6,752,601 | ||||
Paris Orleans | 328,346 | 10,489,346 | ||||
| 89,500 | 685,570 | |||||
Reinet Investments | 238,550 | 4,966,567 | ||||
Reinet Investments DR | 1,300,000 | 2,686,339 | ||||
SEI Investments | 655,565 | 32,142,352 | ||||
Sprott | 4,325,100 | 8,553,240 | ||||
Stifel Financial 1 | 54,500 | 3,146,830 | ||||
Virtus Investment Partners | 70,370 | 9,306,433 | ||||
Waddell & Reed Financial Cl. A | 25,400 | 1,201,674 | ||||
Westwood Holdings Group | 391,735 | 23,335,654 | ||||
| 243,608,644 | ||||||
| DIVERSIFIED FINANCIAL SERVICES - 1.5% | ||||||
Bolsa Mexicana de Valores | 6,745,500 | 11,673,460 | ||||
| 1,259,124 | 18,534,305 | |||||
Sofina | 185,800 | 20,734,619 | ||||
TMX Group | 395,100 | 16,813,102 | ||||
| 67,755,486 | ||||||
| INSURANCE - 2.5% | ||||||
Alleghany Corporation 1 | 11,650 | 5,461,054 | ||||
Allied World Assurance Company Holdings | 92,458 | 3,996,035 | ||||
Aspen Insurance Holdings | 86,055 | 4,122,034 | ||||
E-L Financial | 43,700 | 22,940,051 | ||||
Greenlight Capital Re Cl. A 1 | 694,004 | 20,244,097 | ||||
MBIA 1 | 2,529,777 | 15,203,960 | ||||
ProAssurance Corporation | 41,500 | 1,917,715 | ||||
Reinsurance Group of America | 214,421 | 20,342,120 | ||||
RLI Corp. | 284,581 | 14,624,617 | ||||
Validus Holdings | 73,970 | 3,253,940 | ||||
| 112,105,623 | ||||||
| INVESTMENT COMPANIES - 0.5% | ||||||
British Empire Securities and General Trust | 183,727 | 1,444,849 | ||||
RIT Capital Partners | 834,900 | 20,294,111 | ||||
| 21,738,960 | ||||||
| REAL ESTATE MANAGEMENT & DEVELOPMENT - 0.9% | ||||||
AV Homes 1 | 68,700 | 987,219 | ||||
| 568,912 | 18,449,816 | |||||
Jones Lang LaSalle | 5,500 | 940,500 | ||||
Kennedy-Wilson Holdings | 89,600 | 2,203,264 | ||||
| 105,000 | 1,630,650 | |||||
Tejon Ranch 1 | 695,615 | 17,884,262 | ||||
| 42,095,711 | ||||||
| THRIFTS & MORTGAGE FINANCE - 1.2% | ||||||
Genworth MI Canada | 1,427,807 | 37,495,652 | ||||
TrustCo Bank Corp. NY | 2,119,751 | 14,901,850 | ||||
| 52,397,502 | ||||||
| Total (Cost $489,832,306) | 592,759,674 | |||||
| HEALTH CARE – 6.6% | ||||||
| BIOTECHNOLOGY - 0.3% | ||||||
| 121,250 | 1,002,738 | |||||
| 217,485 | 1,750,754 | |||||
Myriad Genetics 1 | 242,430 | 8,240,196 | ||||
| 290,100 | 2,164,146 | |||||
| 13,157,834 | ||||||
| HEALTH CARE EQUIPMENT & SUPPLIES - 1.7% | ||||||
Analogic Corporation | 252,900 | 19,953,810 | ||||
Atrion Corporation | 3,603 | 1,413,493 | ||||
| 213,000 | 13,661,820 | |||||
Merit Medical Systems 1 | 534,586 | 11,514,982 | ||||
STERIS Corporation | 242,200 | 15,607,368 | ||||
SurModics 1 | 346,900 | 8,124,398 | ||||
Teleflex | 42,300 | 5,729,535 | ||||
Trinity Biotech ADR Cl. A | 81,500 | 1,471,890 | ||||
| 77,477,296 | ||||||
| HEALTH CARE PROVIDERS & SERVICES - 1.9% | ||||||
Aceto Corporation | 362,136 | 8,919,410 | ||||
| 146,200 | 6,030,750 | |||||
Chemed Corporation | 87,948 | 11,529,983 | ||||
HealthSouth Corporation | 447,813 | 20,626,267 | ||||
Landauer | 437,900 | 15,606,756 | ||||
MEDNAX 1 | 43,384 | 3,215,188 | ||||
U.S. Physical Therapy | 376,385 | 20,610,842 | ||||
| 86,539,196 | ||||||
| LIFE SCIENCES TOOLS & SERVICES - 2.3% | ||||||
Bio-Rad Laboratories Cl. A 1 | 161,692 | 24,352,432 | ||||
Bio-Techne | 285,520 | 28,115,155 | ||||
ICON 1 | 156,600 | 10,539,180 | ||||
Mettler-Toledo International 1 | 63,600 | 21,716,856 | ||||
PAREXEL International 1 | 273,600 | 17,595,216 | ||||
| 102,318,839 | ||||||
| PHARMACEUTICALS - 0.4% | ||||||
| 303,066 | 18,014,243 | |||||
| Total (Cost $196,067,094) | 297,507,408 | |||||
| THE ACCOMPANYING NOTES ARE AN INTEGRAL PART OF THESE FINANCIAL STATEMENTS | The Royce Funds 2015 Semiannual Report to Shareholders | 41 |
Schedules of Investments
Royce Pennsylvania Mutual Fund (continued)
| SHARES | VALUE | |||||
| INDUSTRIALS – 25.1% | ||||||
| AEROSPACE & DEFENSE - 1.5% | ||||||
Curtiss-Wright | 149,820 | $ | 10,852,961 | |||
HEICO Corporation | 505,635 | 29,478,520 | ||||
HEICO Corporation Cl. A | 147,840 | 7,505,837 | ||||
Kratos Defense & Security Solutions 1 | 95,578 | 602,141 | ||||
Teledyne Technologies 1 | 175,700 | 18,538,107 | ||||
| 66,977,566 | ||||||
| AIR FREIGHT & LOGISTICS - 1.6% | ||||||
Echo Global Logistics 1 | 252,004 | 8,230,451 | ||||
Forward Air | 606,100 | 31,674,786 | ||||
Hub Group Cl. A 1 | 202,800 | 8,180,952 | ||||
UTi Worldwide 1 | 2,157,900 | 21,557,421 | ||||
| 69,643,610 | ||||||
| BUILDING PRODUCTS - 1.3% | ||||||
AAON | 1,007,162 | 22,681,288 | ||||
Gibraltar Industries 1 | 615,120 | 12,529,994 | ||||
Insteel Industries | 307,267 | 5,745,893 | ||||
Simpson Manufacturing | 494,700 | 16,819,800 | ||||
| 57,776,975 | ||||||
| COMMERCIAL SERVICES & SUPPLIES - 3.5% | ||||||
Copart 1 | 815,252 | 28,925,141 | ||||
Healthcare Services Group | 481,475 | 15,912,749 | ||||
Heritage-Crystal Clean 1 | 250,058 | 3,675,853 | ||||
Mobile Mini | 366,700 | 15,416,068 | ||||
MSA Safety | 121,800 | 5,908,518 | ||||
Ritchie Bros. Auctioneers | 1,598,430 | 44,628,166 | ||||
Steelcase Cl. A | 278,740 | 5,270,973 | ||||
Team 1 | 512,498 | 20,628,044 | ||||
UniFirst Corporation | 98,626 | 11,031,318 | ||||
US Ecology | 90,300 | 4,399,416 | ||||
Waste Connections | 19,000 | 895,280 | ||||
| 156,691,526 | ||||||
| CONSTRUCTION & ENGINEERING - 1.6% | ||||||
Comfort Systems USA | 553,491 | 12,702,618 | ||||
EMCOR Group | 359,800 | 17,187,646 | ||||
Jacobs Engineering Group 1 | 49,000 | 1,990,380 | ||||
KBR | 1,381,072 | 26,903,283 | ||||
MYR Group 1 | 480,984 | 14,891,265 | ||||
| 73,675,192 | ||||||
| ELECTRICAL EQUIPMENT - 1.5% | ||||||
AZZ | 166,152 | 8,606,674 | ||||
Encore Wire | 283,679 | 12,564,143 | ||||
EnerSys | 10,000 | 702,900 | ||||
Franklin Electric | 549,600 | 17,768,568 | ||||
Global Power Equipment Group | 490,020 | 3,802,555 | ||||
Powell Industries | 322,500 | 11,342,325 | ||||
Preformed Line Products 2 | 333,978 | 12,597,650 | ||||
| 67,384,815 | ||||||
| INDUSTRIAL CONGLOMERATES - 0.4% | ||||||
Carlisle Companies | 34,115 | 3,415,594 | ||||
Raven Industries | 758,245 | 15,415,121 | ||||
| 18,830,715 | ||||||
| MACHINERY - 8.2% | ||||||
AGCO Corporation | 3,600 | 204,408 | ||||
Alamo Group | 217,612 | 11,890,320 | ||||
Chart Industries 1 | 18,900 | 675,675 | ||||
CIRCOR International | 466,409 | 25,433,283 | ||||
CLARCOR | 301,000 | 18,734,240 | ||||
Columbus McKinnon | 296,879 | 7,421,975 | ||||
Donaldson Company | 372,200 | 13,324,760 | ||||
Federal Signal | 625,010 | 9,318,899 | ||||
Foster (L.B.) Company | 171,798 | 5,945,929 | ||||
Gorman-Rupp Company (The) | 62,166 | 1,745,621 | ||||
Graco | 258,749 | 18,378,941 | ||||
Graham Corporation | 34,000 | 696,660 | ||||
Hyster-Yale Materials Handling Cl. A | 40,070 | 2,776,050 | ||||
IDEX Corporation | 22,700 | 1,783,766 | ||||
John Bean Technologies | 681,353 | 25,612,059 | ||||
Kadant | 44,500 | 2,100,400 | ||||
Kennametal | 890,093 | 30,369,973 | ||||
Lincoln Electric Holdings | 267,560 | 16,291,728 | ||||
Lindsay Corporation | 134,700 | 11,841,477 | ||||
Lydall 1 | 158,533 | 4,686,236 | ||||
Miller Industries | 242,125 | 4,830,394 | ||||
Mueller Industries | 55,600 | 1,930,432 | ||||
Nordson Corporation | 198,200 | 15,437,798 | ||||
RBC Bearings 1 | 401,300 | 28,797,288 | ||||
Sun Hydraulics | 743,710 | 28,342,788 | ||||
Tennant Company | 478,800 | 31,284,792 | ||||
Valmont Industries | 236,725 | 28,139,501 | ||||
Wabash National 1 | 81,000 | 1,015,740 | ||||
Wabtec Corporation | 207,077 | 19,514,936 | ||||
| 368,526,069 | ||||||
| PROFESSIONAL SERVICES - 2.6% | ||||||
Advisory Board (The) 1 | 508,623 | 27,806,419 | ||||
CEB | 84,200 | 7,330,452 | ||||
CRA International 1 | 345,861 | 9,639,146 | ||||
Dun & Bradstreet | 2,900 | 353,800 | ||||
Exponent | 519,878 | 23,280,137 | ||||
Franklin Covey 1 | 85,500 | 1,734,795 | ||||
Heidrick & Struggles International | 32,800 | 855,424 | ||||
ICF International 1 | 111,070 | 3,871,900 | ||||
ManpowerGroup | 229,505 | 20,513,157 | ||||
Robert Half International | 74,550 | 4,137,525 | ||||
RPX Corporation 1 | 313,400 | 5,296,460 | ||||
Towers Watson & Co. Cl. A | 36,150 | 4,547,670 | ||||
TrueBlue 1 | 229,200 | 6,853,080 | ||||
| 116,219,965 | ||||||
| ROAD & RAIL - 1.2% | ||||||
Knight Transportation | 16,500 | 441,210 | ||||
Landstar System | 378,500 | 25,310,295 | ||||
| 111,304 | 2,743,643 | |||||
Universal Truckload Services | 752,084 | 16,515,765 | ||||
Werner Enterprises | 238,700 | 6,265,875 | ||||
| 51,276,788 | ||||||
| TRADING COMPANIES & DISTRIBUTORS - 1.4% | ||||||
Air Lease Cl. A | 20,400 | 691,560 | ||||
Applied Industrial Technologies | 737,901 | 29,257,775 | ||||
GATX Corporation | 5,600 | 297,640 | ||||
MSC Industrial Direct Cl. A | 411,430 | 28,705,471 | ||||
Richelieu Hardware | 107,000 | 5,382,554 | ||||
| 64,335,000 | ||||||
| TRANSPORTATION INFRASTRUCTURE - 0.3% | ||||||
Wesco Aircraft Holdings 1 | 995,587 | 15,083,143 | ||||
| Total (Cost $650,586,777) | 1,126,421,364 | |||||
| 42 | The Royce Funds 2015 Semiannual Report to Shareholders | THE ACCOMPANYING NOTES ARE AN INTEGRAL PART OF THESE FINANCIAL STATEMENTS |
| June 30, 2015 (unaudited) |
Royce Pennsylvania Mutual Fund (continued)
| SHARES | VALUE | |||||
| INFORMATION TECHNOLOGY – 20.0% | ||||||
| COMMUNICATIONS EQUIPMENT - 1.1% | ||||||
ADTRAN | 100,000 | $ | 1,625,000 | |||
Brocade Communications Systems | 1,134,850 | 13,482,018 | ||||
Digi International 1 | 388,644 | 3,711,550 | ||||
| 21,100 | 377,057 | |||||
NETGEAR 1 | 707,318 | 21,233,686 | ||||
Plantronics | 70,402 | 3,964,337 | ||||
Polycom 1 | 95,000 | 1,086,800 | ||||
TESSCO Technologies | 234,973 | 4,654,815 | ||||
| 50,135,263 | ||||||
| ELECTRONIC EQUIPMENT, INSTRUMENTS & COMPONENTS - 10.6% | ||||||
Anixter International 1 | 268,100 | 17,466,715 | ||||
Avnet | 15,900 | 653,649 | ||||
AVX Corporation | 1,065,121 | 14,336,529 | ||||
Badger Meter | 262,614 | 16,673,363 | ||||
Benchmark Electronics 1 | 1,288,914 | 28,072,547 | ||||
Cognex Corporation | 412,790 | 19,855,199 | ||||
Coherent 1 | 427,590 | 27,143,413 | ||||
Dolby Laboratories Cl. A | 404,126 | 16,035,720 | ||||
| 992,329 | 30,256,111 | |||||
Fabrinet 1 | 1,188,489 | 22,260,399 | ||||
FARO Technologies 1 | 364,000 | 16,998,800 | ||||
FLIR Systems | 812,300 | 25,035,086 | ||||
HollySys Automation Technologies | 370,400 | 8,900,712 | ||||
IPG Photonics 1 | 235,145 | 20,028,475 | ||||
| 681,935 | 7,412,634 | |||||
MTS Systems | 422,974 | 29,164,057 | ||||
National Instruments | 881,300 | 25,963,098 | ||||
Newport Corporation 1 | 1,605,122 | 30,433,113 | ||||
PC Connection | 947,445 | 23,439,789 | ||||
Plexus Corporation 1 | 401,300 | 17,609,044 | ||||
Richardson Electronics | 157,551 | 1,273,012 | ||||
Rofin-Sinar Technologies 1 | 1,069,291 | 29,512,432 | ||||
Rogers Corporation 1 | 248,271 | 16,420,644 | ||||
ScanSource 1 | 202,087 | 7,691,431 | ||||
Vishay Intertechnology | 1,769,941 | 20,672,911 | ||||
| 473,308,883 | ||||||
| INTERNET SOFTWARE & SERVICES - 0.5% | ||||||
Envestnet 1 | 198,901 | 8,041,568 | ||||
j2 Global | 105,710 | 7,181,937 | ||||
Stamps.com 1 | 9,000 | 662,130 | ||||
| 184,800 | 5,142,984 | |||||
| 21,028,619 | ||||||
| IT SERVICES - 1.5% | ||||||
Calian Technologies | 19,700 | 291,793 | ||||
Computer Task Group | 399,372 | 3,083,152 | ||||
Convergys Corporation | 371,793 | 9,477,004 | ||||
DST Systems | 6,800 | 856,664 | ||||
Forrester Research | 286,300 | 10,312,526 | ||||
ManTech International Cl. A | 391,963 | 11,366,927 | ||||
MAXIMUS | 315,100 | 20,711,523 | ||||
MoneyGram International 1 | 293,113 | 2,693,708 | ||||
Net 1 UEPS Technologies 1 | 26,000 | 475,280 | ||||
Sykes Enterprises 1 | 340,012 | 8,245,291 | ||||
| 67,513,868 | ||||||
| SEMICONDUCTORS & SEMICONDUCTOR EQUIPMENT - 3.3% | ||||||
Advanced Energy Industries 1 | 563,114 | 15,480,004 | ||||
Brooks Automation | 241,900 | 2,769,755 | ||||
Cabot Microelectronics 1 | 421,680 | 19,865,345 | ||||
Cascade Microtech 1 | 43,800 | 666,855 | ||||
Cirrus Logic 1 | 284,888 | 9,694,739 | ||||
Diodes 1 | 815,600 | 19,664,116 | ||||
Exar Corporation 1 | 824,441 | 8,063,033 | ||||
Fairchild Semiconductor International 1 | 308,000 | 5,353,040 | ||||
Integrated Silicon Solution | 38,080 | 843,091 | ||||
IXYS Corporation | 312,400 | 4,779,720 | ||||
Kulicke & Soffa Industries 1 | 79,000 | 925,090 | ||||
MKS Instruments | 892,485 | 33,860,881 | ||||
Nanometrics 1 | 450,411 | 7,260,625 | ||||
Photronics 1 | 226,260 | 2,151,733 | ||||
Teradyne | 53,100 | 1,024,299 | ||||
Tessera Technologies | 20,640 | 783,907 | ||||
Veeco Instruments 1 | 464,380 | 13,346,281 | ||||
| 146,532,514 | ||||||
| SOFTWARE - 2.3% | ||||||
ACI Worldwide 1 | 976,200 | 23,985,234 | ||||
ANSYS 1 | 6,700 | 611,308 | ||||
Blackbaud | 414,691 | 23,616,652 | ||||
Computer Modelling Group | 47,500 | 481,465 | ||||
Ellie Mae 1 | 15,000 | 1,046,850 | ||||
ePlus 1 | 27,600 | 2,115,540 | ||||
Fair Isaac | 173,000 | 15,704,940 | ||||
Manhattan Associates 1 | 179,696 | 10,718,866 | ||||
Mentor Graphics | 258,560 | 6,833,741 | ||||
Monotype Imaging Holdings | 821,386 | 19,803,617 | ||||
| 104,918,213 | ||||||
| TECHNOLOGY HARDWARE, STORAGE & PERIPHERALS - 0.7% | ||||||
Avid Technology 1 | 48,900 | 652,326 | ||||
Diebold | 798,532 | 27,948,620 | ||||
Silicon Graphics International 1 | 365,136 | 2,362,430 | ||||
| 77,100 | 2,693,103 | |||||
| 33,656,479 | ||||||
| Total (Cost $615,925,829) | 897,093,839 | |||||
| MATERIALS – 9.7% | ||||||
| CHEMICALS - 3.9% | ||||||
Balchem Corporation | 436,100 | 24,299,492 | ||||
FutureFuel Corporation | 780,756 | 10,048,330 | ||||
Innospec | 315,030 | 14,188,951 | ||||
Minerals Technologies | 391,797 | 26,693,130 | ||||
OM Group | 22,700 | 762,720 | ||||
Quaker Chemical | 428,988 | 38,111,294 | ||||
Schulman (A.) | 269,690 | 11,790,847 | ||||
Sensient Technologies | 6,600 | 451,044 | ||||
Stepan Company | 217,714 | 11,780,504 | ||||
Umicore | 276,000 | 13,086,416 | ||||
Valspar Corporation (The) | 1,800 | 147,276 | ||||
Westlake Chemical | 324,700 | 22,271,173 | ||||
| 173,631,177 | ||||||
| CONSTRUCTION MATERIALS - 0.2% | ||||||
Ash Grove Cement 5 | 42,118 | 8,465,718 | ||||
| CONTAINERS & PACKAGING - 0.7% | ||||||
AptarGroup | 343,300 | 21,892,241 | ||||
Greif Cl. A | 352,868 | 12,650,318 | ||||
| 34,542,559 | ||||||
| METALS & MINING - 4.0% | ||||||
Allegheny Technologies | 383,646 | 11,586,109 | ||||
| THE ACCOMPANYING NOTES ARE AN INTEGRAL PART OF THESE FINANCIAL STATEMENTS | The Royce Funds 2015 Semiannual Report to Shareholders | 43 |
Schedules of Investments
Royce Pennsylvania Mutual Fund (continued)
| SHARES | VALUE | |||||
| MATERIALS (continued) | ||||||
| METALS & MINING (continued) | ||||||
Commercial Metals | 784,100 | $ | 12,608,328 | |||
Compass Minerals International | 130,426 | 10,713,192 | ||||
Franco-Nevada Corporation | 50,200 | 2,392,030 | ||||
Globe Specialty Metals | 739,903 | 13,096,283 | ||||
Gold Fields ADR | 520,000 | 1,679,600 | ||||
Haynes International | 514,295 | 25,365,029 | ||||
Hecla Mining | 228,300 | 600,429 | ||||
| 488,700 | 5,727,564 | |||||
Kaiser Aluminum | 1,100 | 91,388 | ||||
Major Drilling Group International | 2,304,510 | 11,531,775 | ||||
Pan American Silver | 875,100 | 7,517,109 | ||||
Pretium Resources 1 | 1,237,187 | 6,696,064 | ||||
Reliance Steel & Aluminum | 585,065 | 35,384,731 | ||||
Schnitzer Steel Industries Cl. A | 431,710 | 7,541,974 | ||||
Seabridge Gold 1 | 829,604 | 5,068,881 | ||||
Steel Dynamics | 325,821 | 6,749,382 | ||||
Worthington Industries | 474,233 | 14,255,444 | ||||
| 178,605,312 | ||||||
| PAPER & FOREST PRODUCTS - 0.9% | ||||||
Glatfelter | 8,300 | 182,517 | ||||
Schweitzer-Mauduit International | 274,567 | 10,949,732 | ||||
Stella-Jones | 886,100 | 29,456,263 | ||||
| 40,588,512 | ||||||
| Total (Cost $338,167,568) | 435,833,278 | |||||
| TELECOMMUNICATION SERVICES – 0.3% | ||||||
| DIVERSIFIED TELECOMMUNICATION SERVICES - 0.2% | ||||||
Premiere Global Services 1 | 601,500 | 6,189,435 | ||||
| WIRELESS TELECOMMUNICATION SERVICES - 0.1% | ||||||
Telephone and Data Systems | 162,000 | 4,762,800 | ||||
| Total (Cost $9,335,115) | 10,952,235 | |||||
| UTILITIES – 0.0% | ||||||
| GAS UTILITIES - 0.0% | ||||||
UGI Corporation | 24,900 | 857,805 | ||||
| Total (Cost $757,763) | 857,805 | |||||
| MISCELLANEOUS6 – 1.0% | ||||||
| Total (Cost $44,565,906) | 45,726,056 | |||||
| TOTAL COMMON STOCKS | ||||||
| (Cost $3,047,567,000) | 4,435,224,053 | |||||
| REPURCHASE AGREEMENT– 2.8% | ||||||
| Fixed Income Clearing Corporation, 0.00% dated 6/30/15, due 7/1/15, maturity value $125,906,000 (collateralized by obligations of various U.S. Government Agencies, 2.125% due 1/31/21, valued at $128,427,902) | ||||||
| (Cost $125,906,000) | 125,906,000 | |||||
| COLLATERAL RECEIVED FOR SECURITIES LOANED – 0.6% | ||||||
| Money Market Funds | ||||||
Federated Government Obligations Fund (7 day yield-0.0099%) | ||||||
| (Cost $27,188,580) | 27,188,580 | |||||
| TOTAL INVESTMENTS – 102.3% | ||||||
| (Cost $3,200,661,580) | 4,588,318,633 | |||||
| LIABILITIES LESS CASH AND OTHER ASSETS – (2.3)% | (103,914,895) | |||||
| NET ASSETS – 100.0% | $ | 4,484,403,738 | ||||
| 44 | The Royce Funds 2015 Semiannual Report to Shareholders | THE ACCOMPANYING NOTES ARE AN INTEGRAL PART OF THESE FINANCIAL STATEMENTS |
| June 30, 2015 (unaudited) |
Royce Micro-Cap Fund
Common Stocks – 96.8%
| SHARES | VALUE | |||||
| CONSUMER DISCRETIONARY – 14.1% | ||||||
| AUTO COMPONENTS - 0.8% | ||||||
Drew Industries | 30,478 | $ | 1,768,334 | |||
†Superior Industries International | 72,800 | 1,332,968 | ||||
| 3,101,302 | ||||||
| DISTRIBUTORS - 0.4% | ||||||
| 140,200 | 1,404,804 | |||||
| DIVERSIFIED CONSUMER SERVICES - 2.5% | ||||||
American Public Education 1 | 115,230 | 2,963,716 | ||||
Capella Education | 63,651 | 3,416,149 | ||||
Liberty Tax Cl. A | 78,376 | 1,939,806 | ||||
Lincoln Educational Services 1 | 834,343 | 1,685,373 | ||||
| 10,005,044 | ||||||
| HOUSEHOLD DURABLES - 0.8% | ||||||
Cavco Industries 1 | 42,810 | 3,229,586 | ||||
| INTERNET & CATALOG RETAIL - 0.6% | ||||||
FTD Companies 1 | 30,542 | 860,979 | ||||
Gaiam Cl. A 1 | 229,762 | 1,502,643 | ||||
| 2,363,622 | ||||||
| LEISURE PRODUCTS - 1.6% | ||||||
Malibu Boats Cl. A 1 | 140,800 | 2,828,672 | ||||
Smith & Wesson Holding Corporation 1 | 205,265 | 3,405,346 | ||||
| 6,234,018 | ||||||
| MEDIA - 0.9% | ||||||
| 44,500 | 579,390 | |||||
†New Media Investment Group | 92,500 | 1,658,525 | ||||
| 20,900 | 1,458,820 | |||||
| 3,696,735 | ||||||
| SPECIALTY RETAIL - 5.6% | ||||||
Boot Barn Holdings 1 | 31,000 | 992,000 | ||||
Buckle (The) | 63,275 | 2,896,097 | ||||
Build-A-Bear Workshop 1 | 38,800 | 620,412 | ||||
Cato Corporation (The) Cl. A | 41,650 | 1,614,354 | ||||
Citi Trends 1 | 78,524 | 1,900,281 | ||||
| 35,800 | 603,946 | |||||
Destination Maternity | 178,092 | 2,076,552 | ||||
Kirkland’s | 135,740 | 3,783,074 | ||||
Shoe Carnival | 154,514 | 4,459,274 | ||||
Stein Mart | 238,234 | 2,494,310 | ||||
Zumiez 1 | 31,800 | 846,834 | ||||
| 22,287,134 | ||||||
| TEXTILES, APPAREL & LUXURY GOODS - 0.9% | ||||||
Culp | 112,074 | 3,474,294 | ||||
| Total (Cost $46,913,482) | 55,796,539 | |||||
| CONSUMER STAPLES – 1.6% | ||||||
| FOOD PRODUCTS - 1.6% | ||||||
Limoneira Company | 100,630 | 2,237,005 | ||||
Sipef | 24,648 | 1,313,899 | ||||
| 176,600 | 1,894,918 | |||||
| 2,760,860 | 1,049,127 | |||||
| Total (Cost $5,801,336) | 6,494,949 | |||||
| ENERGY – 5.6% | ||||||
| ENERGY EQUIPMENT & SERVICES - 4.5% | ||||||
Canadian Energy Services & Technology | 164,700 | 949,432 | ||||
Dawson Geophysical 1 | 379,034 | 1,781,460 | ||||
Geospace Technologies 1 | 99,716 | 2,298,454 | ||||
Gulf Island Fabrication | 276,118 | 3,084,238 | ||||
Natural Gas Services Group 1 | 135,987 | 3,103,223 | ||||
| 416,812 | 466,829 | |||||
Tesco Corporation | 195,700 | 2,133,130 | ||||
Total Energy Services | 341,600 | 4,170,857 | ||||
| 17,987,623 | ||||||
| OIL, GAS & CONSUMABLE FUELS - 1.1% | ||||||
Ardmore Shipping | 115,575 | 1,399,613 | ||||
Sprott Resource 1 | 1,220,800 | 918,777 | ||||
Synergy Resources 1 | 172,100 | 1,967,103 | ||||
| 4,285,493 | ||||||
| Total (Cost $23,786,330) | 22,273,116 | |||||
| FINANCIALS – 10.0% | ||||||
| BANKS - 0.9% | ||||||
BCB Holdings 1 | 2,078,260 | 277,565 | ||||
| 61,140 | 978,851 | |||||
TriState Capital Holdings 1 | 165,857 | 2,144,531 | ||||
| 3,400,947 | ||||||
| CAPITAL MARKETS - 4.4% | ||||||
ASA Gold and Precious Metals | 42,400 | 411,704 | ||||
FBR & Co. 1 | 111,542 | 2,581,082 | ||||
Gluskin Sheff + Associates | 66,900 | 1,344,428 | ||||
GMP Capital | 343,800 | 1,412,085 | ||||
INTL FCStone 1 | 90,655 | 3,013,372 | ||||
JMP Group | 262,749 | 2,049,442 | ||||
Silvercrest Asset Management Group Cl. A | 203,600 | 2,862,616 | ||||
U.S. Global Investors Cl. A | 225,049 | 625,636 | ||||
Westwood Holdings Group | 49,972 | 2,976,832 | ||||
| 17,277,197 | ||||||
| DIVERSIFIED FINANCIAL SERVICES - 0.5% | ||||||
GAIN Capital Holdings | 215,900 | 2,064,004 | ||||
| INSURANCE - 0.9% | ||||||
Blue Capital Reinsurance Holdings | 80,900 | 1,453,773 | ||||
eHealth 1 | 76,200 | 966,978 | ||||
Navigators Group 1 | 13,664 | 1,059,780 | ||||
| 3,480,531 | ||||||
| REAL ESTATE MANAGEMENT & DEVELOPMENT - 2.3% | ||||||
AV Homes 1 | 146,250 | 2,101,613 | ||||
FRP Holdings 1 | 69,675 | 2,259,560 | ||||
Kennedy-Wilson Holdings | 118,285 | 2,908,628 | ||||
Midland Holdings 1 | 4,450,400 | 2,015,197 | ||||
| 9,284,998 | ||||||
| THRIFTS & MORTGAGE FINANCE - 1.0% | ||||||
| 101,400 | 1,266,486 | |||||
| 95,600 | 1,281,996 | |||||
†Westfield Financial | 208,900 | 1,527,059 | ||||
| 4,075,541 | ||||||
| Total (Cost $31,662,058) | 39,583,218 | |||||
| HEALTH CARE – 11.6% | ||||||
| BIOTECHNOLOGY - 1.4% | ||||||
BioSpecifics Technologies 1 | 19,900 | 1,026,840 | ||||
Dyax Corporation 1 | 30,619 | 811,403 | ||||
| 69,310 | 557,946 | |||||
| 423,000 | 3,155,580 | |||||
| 5,551,769 | ||||||
| HEALTH CARE EQUIPMENT & SUPPLIES - 5.8% | ||||||
| 66,800 | 862,388 | |||||
| 378,961 | 1,966,808 | |||||
| THE ACCOMPANYING NOTES ARE AN INTEGRAL PART OF THESE FINANCIAL STATEMENTS | The Royce Funds 2015 Semiannual Report to Shareholders | 45 |
Schedules of Investments
Royce Micro-Cap Fund (continued)
| SHARES | VALUE | |||||
| HEALTH CARE (continued) | ||||||
| HEALTH CARE EQUIPMENT & SUPPLIES (continued) | ||||||
CryoLife | 206,555 | $ | 2,329,940 | |||
Cynosure Cl. A 1 | 46,269 | 1,785,058 | ||||
| 91,800 | 657,288 | |||||
Exactech 1 | 44,090 | 918,395 | ||||
Neovasc 1 | 138,000 | 896,061 | ||||
| 74,321 | 900,027 | |||||
Orthofix International 1 | 49,800 | 1,649,376 | ||||
RTI Surgical 1 | 282,800 | 1,826,888 | ||||
SurModics 1 | 111,722 | 2,616,529 | ||||
Synergetics USA 1 | 356,862 | 1,677,251 | ||||
Syneron Medical 1 | 166,090 | 1,763,876 | ||||
Trinity Biotech ADR Cl. A | 79,576 | 1,437,143 | ||||
Vascular Solutions 1 | 50,612 | 1,757,249 | ||||
| 23,044,277 | ||||||
| HEALTH CARE PROVIDERS & SERVICES - 1.7% | ||||||
Bio-Reference Laboratories 1 | 25,800 | 1,064,250 | ||||
CorVel Corporation 1 | 69,865 | 2,237,077 | ||||
U.S. Physical Therapy | 64,040 | 3,506,831 | ||||
| 6,808,158 | ||||||
| HEALTH CARE TECHNOLOGY - 0.8% | ||||||
| 161,400 | 1,313,796 | |||||
Computer Programs and Systems | 2,200 | 117,524 | ||||
Vocera Communications 1 | 129,300 | 1,480,485 | ||||
| 2,911,805 | ||||||
| LIFE SCIENCES TOOLS & SERVICES - 0.6% | ||||||
Harvard Bioscience 1 | 405,479 | 2,311,230 | ||||
| PHARMACEUTICALS - 1.3% | ||||||
Agile Therapeutics 1 | 99,682 | 856,268 | ||||
| 46,900 | 1,342,747 | |||||
| 157,500 | 2,050,650 | |||||
Vetoquinol | 23,132 | 959,340 | ||||
| 5,209,005 | ||||||
| Total (Cost $30,169,207) | 45,836,244 | |||||
| INDUSTRIALS – 22.7% | ||||||
| AEROSPACE & DEFENSE - 1.5% | ||||||
AeroVironment 1 | 63,144 | 1,646,795 | ||||
American Science and Engineering | 15,918 | 697,368 | ||||
CPI Aerostructures 1 | 144,618 | 1,447,626 | ||||
| 84,900 | 2,111,463 | |||||
| 5,903,252 | ||||||
| BUILDING PRODUCTS - 0.5% | ||||||
AAON | 96,199 | 2,166,401 | ||||
| COMMERCIAL SERVICES & SUPPLIES - 3.2% | ||||||
Black Diamond Group | 228,900 | 3,208,999 | ||||
Ennis | 154,851 | 2,878,680 | ||||
Heritage-Crystal Clean 1 | 98,174 | 1,443,158 | ||||
Horizon North Logistics | 581,100 | 1,791,221 | ||||
| 358,004 | 1,249,434 | |||||
| 283,614 | 918,909 | |||||
US Ecology | 26,700 | 1,300,824 | ||||
| 12,791,225 | ||||||
| CONSTRUCTION & ENGINEERING - 1.2% | ||||||
MYR Group 1 | 97,200 | 3,009,312 | ||||
| 68,200 | 1,389,234 | |||||
Severfield 1 | 213,408 | 229,692 | ||||
| 4,628,238 | ||||||
| ELECTRICAL EQUIPMENT - 2.4% | ||||||
Global Power Equipment Group | 241,412 | 1,873,357 | ||||
Graphite India | 1,325,191 | 1,730,365 | ||||
LSI Industries | 363,636 | 3,396,360 | ||||
Powell Industries | 47,500 | 1,670,575 | ||||
| 11,700 | 632,034 | |||||
| 9,302,691 | ||||||
| MACHINERY - 7.1% | ||||||
CIRCOR International | 62,459 | 3,405,889 | ||||
FreightCar America | 71,909 | 1,501,460 | ||||
Gorman-Rupp Company (The) | 51,913 | 1,457,717 | ||||
Graham Corporation | 174,988 | 3,585,504 | ||||
Kadant | 52,376 | 2,472,147 | ||||
Key Technology 1 | 287,814 | 3,799,145 | ||||
†Lindsay Corporation | 18,000 | 1,582,380 | ||||
| 75,300 | 2,225,868 | |||||
NN | 108,400 | 2,766,368 | ||||
RBC Bearings 1 | 34,269 | 2,459,144 | ||||
Semperit AG Holding | 55,978 | 2,309,061 | ||||
Sun Hydraulics | 16,800 | 640,248 | ||||
| 28,204,931 | ||||||
| MARINE - 0.5% | ||||||
Clarkson | 45,700 | 1,965,334 | ||||
| PROFESSIONAL SERVICES - 4.6% | ||||||
CRA International 1 | 114,683 | 3,196,215 | ||||
Exponent | 46,270 | 2,071,971 | ||||
GP Strategies 1 | 64,918 | 2,157,874 | ||||
Heidrick & Struggles International | 99,300 | 2,589,744 | ||||
Kforce | 119,558 | 2,734,291 | ||||
| 87,700 | 1,304,099 | |||||
Resources Connection | 255,952 | 4,118,268 | ||||
| 18,172,462 | ||||||
| ROAD & RAIL - 1.3% | ||||||
Marten Transport | 145,833 | 3,164,576 | ||||
| 77,258 | 1,904,410 | |||||
| 5,068,986 | ||||||
| TRADING COMPANIES & DISTRIBUTORS - 0.4% | ||||||
Houston Wire & Cable | 176,700 | 1,752,864 | ||||
| Total (Cost $69,342,197) | 89,956,384 | |||||
| INFORMATION TECHNOLOGY – 18.8% | ||||||
| COMMUNICATIONS EQUIPMENT - 3.1% | ||||||
| 119,600 | 2,183,896 | |||||
COM DEV International | 377,700 | 1,744,859 | ||||
Digi International 1 | 302,383 | 2,887,758 | ||||
| 273,500 | 1,868,005 | |||||
KVH Industries 1 | 222,800 | 2,996,660 | ||||
| 76,082 | 649,740 | |||||
| 12,330,918 | ||||||
| ELECTRONIC EQUIPMENT, INSTRUMENTS & COMPONENTS - 3.6% | ||||||
| 274,474 | 1,388,838 | |||||
DTS 1 | 64,500 | 1,966,605 | ||||
Fabrinet 1 | 160,749 | 3,010,829 | ||||
GSI Group 1 | 175,042 | 2,630,881 | ||||
| 430,996 | 1,271,438 | |||||
Newport Corporation 1 | 57,100 | 1,082,616 | ||||
Pure Technologies | 107,400 | 623,419 | ||||
Vishay Precision Group 1 | 145,200 | 2,186,712 | ||||
| 14,161,338 | ||||||
| 46 | The Royce Funds 2015 Semiannual Report to Shareholders | THE ACCOMPANYING NOTES ARE AN INTEGRAL PART OF THESE FINANCIAL STATEMENTS |
| June 30, 2015 (unaudited) |
Royce Micro-Cap Fund (continued)
| SHARES | VALUE | |||||
| INFORMATION TECHNOLOGY (continued) | ||||||
| INTERNET SOFTWARE & SERVICES - 1.0% | ||||||
| 137,600 | $ | 814,592 | ||||
QuinStreet 1 | 318,904 | 2,056,931 | ||||
Stamps.com 1 | 8,900 | 654,773 | ||||
United Online 1 | 29,200 | 457,564 | ||||
| 3,983,860 | ||||||
| IT SERVICES - 0.6% | ||||||
Computer Task Group | 277,710 | 2,143,921 | ||||
| SEMICONDUCTORS & SEMICONDUCTOR EQUIPMENT - 5.8% | ||||||
Amtech Systems 1 | 128,027 | 1,330,201 | ||||
Brooks Automation | 246,400 | 2,821,280 | ||||
Cascade Microtech 1 | 165,184 | 2,514,926 | ||||
GSI Technology 1 | 300,682 | 1,566,553 | ||||
PDF Solutions 1 | 106,200 | 1,699,200 | ||||
Photronics 1 | 376,800 | 3,583,368 | ||||
Rudolph Technologies 1 | 163,351 | 1,961,846 | ||||
Ultra Clean Holdings 1 | 252,000 | 1,569,960 | ||||
Ultratech 1 | 128,600 | 2,386,816 | ||||
Xcerra Corporation 1 | 453,961 | 3,436,485 | ||||
| 22,870,635 | ||||||
| SOFTWARE - 3.6% | ||||||
ePlus 1 | 38,367 | 2,940,830 | ||||
Monotype Imaging Holdings | 100,587 | 2,425,153 | ||||
†QAD | 47,800 | 1,263,354 | ||||
Rubicon Project 1 | 136,900 | 2,048,024 | ||||
SeaChange International 1 | 359,007 | 2,516,639 | ||||
TeleNav 1 | 189,000 | 1,521,450 | ||||
Zix Corporation 1 | 305,200 | 1,577,884 | ||||
| 14,293,334 | ||||||
| TECHNOLOGY HARDWARE, STORAGE & PERIPHERALS - 1.1% | ||||||
| 135,443 | 1,806,809 | |||||
Super Micro Computer 1 | 88,046 | 2,604,401 | ||||
| 4,411,210 | ||||||
| Total (Cost $66,817,954) | 74,195,216 | |||||
| MATERIALS – 6.4% | ||||||
| CHEMICALS - 2.1% | ||||||
| 256,912 | 2,209,443 | |||||
FutureFuel Corporation | 231,000 | 2,972,970 | ||||
Quaker Chemical | 27,660 | 2,457,315 | ||||
Societe Internationale de Plantations d’Heveas 1 | 18,392 | 697,967 | ||||
| 8,337,695 | ||||||
| METALS & MINING - 4.3% | ||||||
Argonaut Gold 1 | 337,200 | 453,560 | ||||
| 398,200 | 792,418 | |||||
Geodrill 1 | 1,597,000 | 958,967 | ||||
| 773,700 | 366,734 | |||||
Haynes International | 78,830 | 3,887,895 | ||||
| 219,071 | 2,567,512 | |||||
Imdex 1 | 2,167,665 | 501,739 | ||||
| 998,904 | 957,849 | |||||
Olympic Steel | 155,573 | 2,713,193 | ||||
Pilot Gold 1 | 1,477,600 | 733,476 | ||||
Universal Stainless & Alloy Products 1 | 155,852 | 3,062,492 | ||||
| 16,995,835 | ||||||
| Total (Cost $31,191,395) | 25,333,530 | |||||
| TELECOMMUNICATION SERVICES – 1.3% | ||||||
| DIVERSIFIED TELECOMMUNICATION SERVICES - 1.0% | ||||||
ORBCOMM 1 | 569,600 | 3,844,800 | ||||
| WIRELESS TELECOMMUNICATION SERVICES - 0.3% | ||||||
Spok Holdings | 80,067 | 1,348,328 | ||||
| Total (Cost $4,702,859) | 5,193,128 | |||||
| MISCELLANEOUS6 – 4.7% | ||||||
| Total (Cost $18,630,901) | 18,531,090 | |||||
| TOTAL COMMON STOCKS | ||||||
| (Cost $329,017,719) | 383,193,414 | |||||
| REPURCHASE AGREEMENT– 3.3% | ||||||
| Fixed Income Clearing Corporation, 0.00% dated 6/30/15, due 7/1/15, maturity value $13,158,000 (collateralized by obligations of various U.S. Government Agencies, 2.125% due 1/31/21, valued at $13,423,111) | ||||||
| (Cost $13,158,000) | 13,158,000 | |||||
| COLLATERAL RECEIVED FOR SECURITIES LOANED – 3.2% | ||||||
Money Market Funds | ||||||
| (Cost $12,625,181) | 12,625,181 | |||||
| TOTAL INVESTMENTS – 103.3% | ||||||
| (Cost $354,800,900) | 408,976,595 | |||||
| LIABILITIES LESS CASH AND OTHER ASSETS – (3.3)% | (13,188,749) | |||||
| NET ASSETS – 100.0% | $ | 395,787,846 | ||||
| THE ACCOMPANYING NOTES ARE AN INTEGRAL PART OF THESE FINANCIAL STATEMENTS | The Royce Funds 2015 Semiannual Report to Shareholders | 47 |
Schedules of Investments
Royce Premier Fund
Common Stocks – 91.8%
| SHARES | VALUE | |||||
| CONSUMER DISCRETIONARY – 12.7% | ||||||
| AUTO COMPONENTS - 0.8% | ||||||
Dorman Products 1 | 725,800 | $ | 34,591,628 | |||
| AUTOMOBILES - 2.3% | ||||||
Thor Industries | 1,788,600 | 100,662,408 | ||||
| DISTRIBUTORS - 1.7% | ||||||
Pool Corporation | 1,051,800 | 73,815,324 | ||||
| DIVERSIFIED CONSUMER SERVICES - 1.8% | ||||||
Sotheby’s | 1,734,667 | 78,476,335 | ||||
| MEDIA - 1.9% | ||||||
Morningstar | 1,068,300 | 84,983,265 | ||||
| SPECIALTY RETAIL - 1.5% | ||||||
Buckle (The) | 1,440,336 | 65,924,179 | ||||
| TEXTILES, APPAREL & LUXURY GOODS - 2.7% | ||||||
Columbia Sportswear | 1,062,272 | 64,224,965 | ||||
Wolverine World Wide | 1,857,974 | 52,915,099 | ||||
| 117,140,064 | ||||||
| Total (Cost $275,750,274) | 555,593,203 | |||||
| CONSUMER STAPLES – 3.4% | ||||||
| FOOD PRODUCTS - 3.4% | ||||||
Cal-Maine Foods | 1,828,429 | 95,443,994 | ||||
Sanderson Farms | 723,785 | 54,399,680 | ||||
| Total (Cost $48,639,496) | 149,843,674 | |||||
| ENERGY – 5.8% | ||||||
| ENERGY EQUIPMENT & SERVICES - 5.8% | ||||||
Pason Systems 2 | 4,234,900 | 75,780,637 | ||||
| 1,030,827 | 73,126,867 | |||||
TGS-NOPEC Geophysical | 2,167,010 | 50,606,729 | ||||
Unit Corporation 1 | 2,025,573 | 54,933,540 | ||||
| Total (Cost $228,893,659) | 254,447,773 | |||||
| FINANCIALS – 12.4% | ||||||
| CAPITAL MARKETS - 6.3% | ||||||
Artisan Partners Asset Management Cl. A | 1,228,246 | 57,064,309 | ||||
Federated Investors Cl. B | 3,097,100 | 103,721,879 | ||||
Sprott | 1,000,000 | 1,977,582 | ||||
Stifel Financial 1 | 1,327,454 | 76,647,194 | ||||
WisdomTree Investments | 1,634,400 | 35,899,596 | ||||
| 275,310,560 | ||||||
| INSURANCE - 2.4% | ||||||
Alleghany Corporation 1 | 226,135 | 106,003,043 | ||||
| REAL ESTATE MANAGEMENT & DEVELOPMENT - 3.7% | ||||||
Jones Lang LaSalle | 397,785 | 68,021,235 | ||||
Kennedy-Wilson Holdings | 3,901,614 | 95,940,688 | ||||
| 163,961,923 | ||||||
| Total (Cost $329,540,818) | 545,275,526 | |||||
| HEALTH CARE – 4.8% | ||||||
| BIOTECHNOLOGY - 1.4% | ||||||
| 1,866,250 | 63,433,838 | |||||
| HEALTH CARE EQUIPMENT & SUPPLIES - 1.5% | ||||||
IDEXX Laboratories 1 | 990,800 | 63,549,912 | ||||
| LIFE SCIENCES TOOLS & SERVICES - 1.9% | ||||||
PerkinElmer | 1,567,100 | 82,492,144 | ||||
| Total (Cost $76,112,366) | 209,475,894 | |||||
| INDUSTRIALS – 27.1% | ||||||
| AIR FREIGHT & LOGISTICS - 1.5% | ||||||
Forward Air | 1,215,828 | 63,539,171 | ||||
| BUILDING PRODUCTS - 1.2% | ||||||
Simpson Manufacturing | 1,610,233 | 54,747,922 | ||||
| COMMERCIAL SERVICES & SUPPLIES - 4.9% | ||||||
Copart 1 | 2,791,900 | 99,056,612 | ||||
Ritchie Bros. Auctioneers | 4,215,114 | 117,685,983 | ||||
| 216,742,595 | ||||||
| CONSTRUCTION & ENGINEERING - 1.7% | ||||||
EMCOR Group | 1,534,600 | 73,307,842 | ||||
| MACHINERY - 11.5% | ||||||
Kennametal | 1,618,400 | 55,219,808 | ||||
Lincoln Electric Holdings | 1,718,570 | 104,643,727 | ||||
Lindsay Corporation | 389,975 | 34,282,702 | ||||
Semperit AG Holding 2 | 1,205,461 | 49,724,584 | ||||
Sun Hydraulics 2 | 1,691,433 | 64,460,512 | ||||
Valmont Industries | 704,200 | 83,708,254 | ||||
Woodward | 2,044,124 | 112,406,379 | ||||
| 504,445,966 | ||||||
| PROFESSIONAL SERVICES - 1.9% | ||||||
Advisory Board (The) 1 | 453,200 | 24,776,444 | ||||
Towers Watson & Co. Cl. A | 451,521 | 56,801,342 | ||||
| 81,577,786 | ||||||
| ROAD & RAIL - 1.8% | ||||||
Landstar System | 1,189,300 | 79,528,491 | ||||
| TRADING COMPANIES & DISTRIBUTORS - 2.6% | ||||||
Air Lease Cl. A | 1,180,160 | 40,007,424 | ||||
MSC Industrial Direct Cl. A | 1,056,284 | 73,696,935 | ||||
| 113,704,359 | ||||||
| Total (Cost $613,036,499) | 1,187,594,132 | |||||
| INFORMATION TECHNOLOGY – 17.7% | ||||||
| COMMUNICATIONS EQUIPMENT - 0.3% | ||||||
ADTRAN | 914,106 | 14,854,222 | ||||
| ELECTRONIC EQUIPMENT, INSTRUMENTS & COMPONENTS - 8.6% | ||||||
Anixter International 1 | 1,061,835 | 69,178,550 | ||||
Benchmark Electronics 1 | 2,415,300 | 52,605,234 | ||||
Cognex Corporation | 1,867,914 | 89,846,663 | ||||
National Instruments | 3,325,501 | 97,969,260 | ||||
Zebra Technologies Cl. A 1 | 615,994 | 68,406,134 | ||||
| 378,005,841 | ||||||
| IT SERVICES - 2.7% | ||||||
Gartner 1 | 735,200 | 63,065,456 | ||||
Jack Henry & Associates | 871,940 | 56,414,518 | ||||
| 119,479,974 | ||||||
| SEMICONDUCTORS & SEMICONDUCTOR EQUIPMENT - 4.1% | ||||||
Cabot Microelectronics 1 | 1,048,474 | 49,393,610 | ||||
MKS Instruments 2 | 2,707,410 | 102,719,136 | ||||
Veeco Instruments 1 | 961,815 | 27,642,563 | ||||
| 179,755,309 | ||||||
| SOFTWARE - 2.0% | ||||||
Fair Isaac | 949,500 | 86,195,610 | ||||
| Total (Cost $394,929,985) | 778,290,956 | |||||
| MATERIALS – 6.3% | ||||||
| CHEMICALS - 2.8% | ||||||
†Minerals Technologies | 762,900 | 51,976,377 | ||||
Westlake Chemical | 1,031,110 | 70,723,835 | ||||
| 122,700,212 | ||||||
| METALS & MINING - 2.1% | ||||||
Reliance Steel & Aluminum | 1,503,500 | 90,931,680 | ||||
| 48 | The Royce Funds 2015 Semiannual Report to Shareholders | THE ACCOMPANYING NOTES ARE AN INTEGRAL PART OF THESE FINANCIAL STATEMENTS |
| June 30, 2015 (unaudited) |
Royce Premier Fund (continued)
| SHARES | VALUE | |||||
| MATERIALS (continued) | ||||||
| PAPER & FOREST PRODUCTS - 1.4% | ||||||
Stella-Jones | 1,828,712 | $ | 60,791,131 | |||
| Total (Cost $144,441,480) | 274,423,023 | |||||
| MISCELLANEOUS6 – 1.6% | ||||||
| Total (Cost $70,997,437) | 69,033,409 | |||||
| TOTAL COMMON STOCKS | ||||||
| (Cost $2,182,342,014) | 4,023,977,590 | |||||
| REPURCHASE AGREEMENT– 8.1% | ||||||
| Fixed Income Clearing Corporation, 0.00% dated 6/30/15, due 7/1/15, maturity value $352,403,000 (collateralized by obligations of various U.S. Government Agencies, 2.125%- 2.625% due 8/15/20-1/31/21, valued at $359,453,285) | ||||||
| (Cost $352,403,000) | 352,403,000 | |||||
| COLLATERAL RECEIVED FOR SECURITIES LOANED – 1.0% | ||||||
Money Market Funds | ||||||
| (Cost $44,759,784) | 44,759,784 | |||||
| TOTAL INVESTMENTS – 100.9% | ||||||
| (Cost $2,579,504,798) | 4,421,140,374 | |||||
| LIABILITIES LESS CASH AND OTHER ASSETS – (0.9)% | (37,909,572) | |||||
| NET ASSETS – 100.0% | $ | 4,383,230,802 | ||||
Royce Low-Priced Stock Fund
Common Stocks – 92.1%
| SHARES | VALUE | |||||
| CONSUMER DISCRETIONARY – 12.6% | ||||||
| AUTOMOBILES - 0.5% | ||||||
Thor Industries | 46,303 | $ | 2,605,933 | |||
| DISTRIBUTORS - 0.3% | ||||||
| 184,500 | 1,848,690 | |||||
| DIVERSIFIED CONSUMER SERVICES - 0.6% | ||||||
Universal Technical Institute | 372,651 | 3,204,798 | ||||
| HOTELS, RESTAURANTS & LEISURE - 1.4% | ||||||
Belmond Cl. A 1 | 309,200 | 3,861,908 | ||||
| 550,000 | 3,465,000 | |||||
| 7,326,908 | ||||||
| HOUSEHOLD DURABLES - 0.8% | ||||||
TRI Pointe Homes 1 | 298,700 | 4,570,110 | ||||
| INTERNET & CATALOG RETAIL - 0.5% | ||||||
Gaiam Cl. A 1 | 440,000 | 2,877,600 | ||||
| LEISURE PRODUCTS - 0.9% | ||||||
| 284,800 | 4,724,832 | |||||
| MEDIA - 0.6% | ||||||
Harte-Hanks | 511,300 | 3,047,348 | ||||
| MULTILINE RETAIL - 0.6% | ||||||
| 355,000 | 3,006,850 | |||||
| SPECIALTY RETAIL - 6.2% | ||||||
American Eagle Outfitters | 264,600 | 4,556,412 | ||||
Ascena Retail Group 1 | 224,000 | 3,730,720 | ||||
Buckle (The) | 69,275 | 3,170,717 | ||||
Cato Corporation (The) Cl. A | 73,550 | 2,850,798 | ||||
Chico’s FAS | 259,300 | 4,312,159 | ||||
Finish Line (The) Cl. A | 123,700 | 3,441,334 | ||||
GameStop Corporation Cl. A | 74,800 | 3,213,408 | ||||
Stein Mart | 130,600 | 1,367,382 | ||||
TravelCenters of America LLC 1 | 251,900 | 3,740,715 | ||||
West Marine 1 | 298,300 | 2,875,612 | ||||
| 33,259,257 | ||||||
| TEXTILES, APPAREL & LUXURY GOODS - 0.2% | ||||||
| 116,800 | 1,316,336 | |||||
| Total (Cost $55,850,823) | 67,788,662 | |||||
| CONSUMER STAPLES – 3.1% | ||||||
| FOOD PRODUCTS - 2.5% | ||||||
Industrias Bachoco ADR | 52,139 | 2,821,241 | ||||
Inventure Foods 1 | 263,600 | 2,675,540 | ||||
Landec Corporation 1 | 291,000 | 4,199,130 | ||||
| 338,800 | 3,635,324 | |||||
| 13,331,235 | ||||||
| PERSONAL PRODUCTS - 0.6% | ||||||
Nu Skin Enterprises Cl. A | 68,529 | 3,229,772 | ||||
| Total (Cost $12,398,118) | 16,561,007 | |||||
| ENERGY – 6.4% | ||||||
| ENERGY EQUIPMENT & SERVICES - 5.1% | ||||||
C&J Energy Services 1 | 266,346 | 3,515,767 | ||||
Newpark Resources 1 | 565,475 | 4,597,312 | ||||
Pason Systems | 238,150 | 4,261,531 | ||||
Tesco Corporation | 364,016 | 3,967,775 | ||||
TGS-NOPEC Geophysical | 150,200 | 3,507,658 | ||||
Total Energy Services | 321,100 | 3,920,557 | ||||
Unit Corporation 1 | 125,500 | 3,403,560 | ||||
| 27,174,160 | ||||||
| OIL, GAS & CONSUMABLE FUELS - 1.3% | ||||||
Approach Resources 1 | 342,400 | 2,345,440 | ||||
| THE ACCOMPANYING NOTES ARE AN INTEGRAL PART OF THESE FINANCIAL STATEMENTS | The Royce Funds 2015 Semiannual Report to Shareholders | 49 |
Schedules of Investments
Royce Low-Priced Stock Fund (continued)
| SHARES | VALUE | |||||
| ENERGY (continued) | ||||||
| OIL, GAS & CONSUMABLE FUELS (continued) | ||||||
Synergy Resources 1 | 405,200 | $ | 4,631,436 | |||
| 6,976,876 | ||||||
| Total (Cost $26,157,161) | 34,151,036 | |||||
| FINANCIALS – 10.2% | ||||||
| BANKS - 1.4% | ||||||
| 212,500 | 2,975,000 | |||||
†Boston Private Financial Holdings | 318,000 | 4,264,380 | ||||
| 7,239,380 | ||||||
| CAPITAL MARKETS - 7.1% | ||||||
Ashmore Group 3 | 1,096,163 | 4,981,024 | ||||
| 597,100 | 5,994,903 | |||||
Federated Investors Cl. B | 111,900 | 3,747,531 | ||||
INTL FCStone 1 | 119,900 | 3,985,476 | ||||
Jupiter Fund Management | 719,049 | 5,035,544 | ||||
†Medley Management Cl. A | 262,598 | 3,109,160 | ||||
Sprott | 2,113,800 | 4,180,213 | ||||
Value Partners Group | 2,940,100 | 4,642,533 | ||||
ZAIS Group Holdings Cl. A 1 | 245,800 | 2,679,220 | ||||
| 38,355,604 | ||||||
| INSURANCE - 0.5% | ||||||
MBIA 1 | 484,500 | 2,911,845 | ||||
| REAL ESTATE MANAGEMENT & DEVELOPMENT - 0.7% | ||||||
Kennedy-Wilson Holdings | 145,030 | 3,566,288 | ||||
| THRIFTS & MORTGAGE FINANCE - 0.5% | ||||||
| 235,000 | 2,935,150 | |||||
| Total (Cost $43,269,615) | 55,008,267 | |||||
| HEALTH CARE – 5.0% | ||||||
| BIOTECHNOLOGY - 2.4% | ||||||
Myriad Genetics 1 | 110,869 | 3,768,438 | ||||
| 574,250 | 4,283,905 | |||||
Zealand Pharma 1 | 282,900 | 4,671,386 | ||||
| 12,723,729 | ||||||
| HEALTH CARE EQUIPMENT & SUPPLIES - 0.6% | ||||||
| 485,000 | 3,268,900 | |||||
| HEALTH CARE TECHNOLOGY - 1.2% | ||||||
| 275,000 | 3,762,000 | |||||
| 160,000 | 2,747,200 | |||||
| 6,509,200 | ||||||
| PHARMACEUTICALS - 0.8% | ||||||
Medicines Company (The) 1 | 144,932 | 4,146,504 | ||||
| Total (Cost $19,482,179) | 26,648,333 | |||||
| INDUSTRIALS – 14.9% | ||||||
| AEROSPACE & DEFENSE - 1.1% | ||||||
CPI Aerostructures 1 | 215,566 | 2,157,816 | ||||
Kratos Defense & Security Solutions 1 | 565,200 | 3,560,760 | ||||
| 5,718,576 | ||||||
| CONSTRUCTION & ENGINEERING - 1.7% | ||||||
Ameresco Cl. A 1 | 450,500 | 3,446,325 | ||||
Integrated Electrical Services 1 | 285,800 | 2,029,180 | ||||
†KBR | 195,000 | 3,798,600 | ||||
| 9,274,105 | ||||||
| ELECTRICAL EQUIPMENT - 1.7% | ||||||
General Cable | 198,400 | 3,914,432 | ||||
Global Power Equipment Group | 295,900 | 2,296,184 | ||||
†LSI Industries | 317,500 | 2,965,450 | ||||
| 9,176,066 | ||||||
| MACHINERY - 2.2% | ||||||
Mueller Water Products Cl. A | 532,200 | 4,843,020 | ||||
| 1,207,365 | 2,982,191 | |||||
Wabash National 1 | 330,000 | 4,138,200 | ||||
| 11,963,411 | ||||||
| MARINE - 0.8% | ||||||
Clarkson | 101,031 | 4,344,849 | ||||
| PROFESSIONAL SERVICES - 6.8% | ||||||
Acacia Research | 395,805 | 3,471,210 | ||||
Heidrick & Struggles International | 144,640 | 3,772,211 | ||||
Kforce | 161,674 | 3,697,484 | ||||
Korn/Ferry International | 113,240 | 3,937,355 | ||||
| 313,800 | 910,020 | |||||
Navigant Consulting 1 | 423,523 | 6,297,787 | ||||
Resources Connection | 395,000 | 6,355,550 | ||||
RPX Corporation 1 | 273,900 | 4,628,910 | ||||
TrueBlue 1 | 119,294 | 3,566,891 | ||||
| 36,637,418 | ||||||
| TRADING COMPANIES & DISTRIBUTORS - 0.6% | ||||||
Houston Wire & Cable | 314,000 | 3,114,880 | ||||
| Total (Cost $74,537,516) | 80,229,305 | |||||
| INFORMATION TECHNOLOGY – 29.3% | ||||||
| COMMUNICATIONS EQUIPMENT - 3.3% | ||||||
Brocade Communications Systems | 383,600 | 4,557,168 | ||||
Harmonic 1 | 481,300 | 3,287,279 | ||||
Infinera Corporation 1 | 149,700 | 3,140,706 | ||||
KVH Industries 1 | 304,015 | 4,089,002 | ||||
NETGEAR 1 | 95,500 | 2,866,910 | ||||
| 17,941,065 | ||||||
| ELECTRONIC EQUIPMENT, INSTRUMENTS & COMPONENTS - 5.3% | ||||||
AVX Corporation | 312,378 | 4,204,608 | ||||
Checkpoint Systems | 245,000 | 2,494,100 | ||||
GSI Group 1 | 195,000 | 2,930,850 | ||||
II-VI 1 | 312,200 | 5,925,556 | ||||
| 293,000 | 6,094,400 | |||||
TTM Technologies 1 | 348,358 | 3,480,096 | ||||
Vishay Intertechnology | 259,150 | 3,026,872 | ||||
| 28,156,482 | ||||||
| INTERNET SOFTWARE & SERVICES - 4.0% | ||||||
Amber Road 1 | 456,300 | 3,203,226 | ||||
Carbonite 1 | 208,100 | 2,457,661 | ||||
EarthLink Holdings | 602,700 | 4,514,223 | ||||
Intralinks Holdings 1 | 360,200 | 4,289,982 | ||||
QuinStreet 1 | 808,200 | 5,212,890 | ||||
| 142,600 | 1,709,774 | |||||
| 21,387,756 | ||||||
| IT SERVICES - 1.8% | ||||||
Computer Task Group | 310,000 | 2,393,200 | ||||
Convergys Corporation | 170,111 | 4,336,129 | ||||
Datalink Corporation 1 | 327,200 | 2,925,168 | ||||
| 9,654,497 | ||||||
| SEMICONDUCTORS & SEMICONDUCTOR EQUIPMENT - 11.6% | ||||||
Advanced Energy Industries 1 | 116,183 | 3,193,871 | ||||
Brooks Automation | 423,982 | 4,854,594 | ||||
Cascade Microtech 1 | 412,300 | 6,277,267 | ||||
| 50 | The Royce Funds 2015 Semiannual Report to Shareholders | THE ACCOMPANYING NOTES ARE AN INTEGRAL PART OF THESE FINANCIAL STATEMENTS |
| June 30, 2015 (unaudited) |
| Royce Low-Priced Stock Fund (continued) | ||||||
| SHARES | VALUE | |||||
| INFORMATION TECHNOLOGY (continued) | ||||||
| SEMICONDUCTORS & SEMICONDUCTOR EQUIPMENT (continued) | ||||||
Cirrus Logic 1 | 135,600 | $ | 4,614,468 | |||
Exar Corporation 1 | 387,000 | 3,784,860 | ||||
Fairchild Semiconductor International 1 | 206,739 | 3,593,124 | ||||
Inphi Corporation 1 | 156,900 | 3,586,734 | ||||
IXYS Corporation | 315,000 | 4,819,500 | ||||
Lam Research | 48,300 | 3,929,205 | ||||
MKS Instruments | 117,927 | 4,474,150 | ||||
Nanometrics 1 | 293,000 | 4,723,160 | ||||
Photronics 1 | 454,500 | 4,322,295 | ||||
Rudolph Technologies 1 | 329,900 | 3,962,099 | ||||
Teradyne | 173,275 | 3,342,475 | ||||
Xcerra Corporation 1 | 372,100 | 2,816,797 | ||||
| 62,294,599 | ||||||
| SOFTWARE - 1.6% | ||||||
Rubicon Project 1 | 218,500 | 3,268,760 | ||||
SeaChange International 1 | 739,875 | 5,186,524 | ||||
| 8,455,284 | ||||||
| TECHNOLOGY HARDWARE, STORAGE & PERIPHERALS - 1.7% | ||||||
| 228,100 | 3,042,854 | |||||
| 492,800 | 3,188,416 | |||||
Super Micro Computer 1 | 100,600 | 2,975,748 | ||||
| 9,207,018 | ||||||
| Total (Cost $124,392,895) | 157,096,701 | |||||
| MATERIALS – 4.7% | ||||||
| CHEMICALS - 1.1% | ||||||
| 387,000 | 3,328,200 | |||||
| 185,400 | 2,799,540 | |||||
| 6,127,740 | ||||||
| METALS & MINING - 3.6% | ||||||
Alamos Gold | 457,800 | 2,591,390 | ||||
Globe Specialty Metals | 140,963 | 2,495,045 | ||||
Horsehead Holding Corporation 1 | 278,335 | 3,262,086 | ||||
Major Drilling Group International | 537,300 | 2,688,651 | ||||
Pretium Resources 1 | 497,400 | 2,692,093 | ||||
Schnitzer Steel Industries Cl. A | 164,900 | 2,880,803 | ||||
Seabridge Gold 1 | 423,470 | 2,587,402 | ||||
| 19,197,470 | ||||||
| Total (Cost $22,895,241) | 25,325,210 | |||||
| TELECOMMUNICATION SERVICES – 1.3% | ||||||
| DIVERSIFIED TELECOMMUNICATION SERVICES - 1.3% | ||||||
| 258,600 | 2,350,674 | |||||
ORBCOMM 1 | 689,800 | 4,656,150 | ||||
| Total (Cost $6,746,120) | 7,006,824 | |||||
| MISCELLANEOUS6 – 4.6% | ||||||
| Total (Cost $25,310,608) | 24,922,261 | |||||
| TOTAL COMMON STOCKS | ||||||
| (Cost $411,040,276) | 494,737,606 | |||||
| REPURCHASE AGREEMENT– 7.3% | ||||||
| Fixed Income Clearing Corporation, 0.00% dated 6/30/15, due 7/1/15, maturity value $39,523,000 (collateralized by obligations of various U.S. Government Agencies, 2.125% due 1/31/21, valued at $40,315,389) | ||||||
| (Cost $39,523,000) | $ | 39,523,000 | ||||
| COLLATERAL RECEIVED FOR SECURITIES LOANED – 3.0% | ||||||
| Money Market Funds | ||||||
Federated Government Obligations Fund (7 day yield-0.0099%) | ||||||
| (Cost $16,161,325) | 16,161,325 | |||||
| TOTAL INVESTMENTS – 102.4% | ||||||
| (Cost $466,724,601) | 550,421,931 | |||||
| LIABILITIES LESS CASH AND OTHER ASSETS – (2.4)% | (13,138,817) | |||||
| NET ASSETS – 100.0% | $ | 537,283,114 | ||||
| THE ACCOMPANYING NOTES ARE AN INTEGRAL PART OF THESE FINANCIAL STATEMENTS | The Royce Funds 2015 Semiannual Report to Shareholders | 51 |
| Schedules of Investments |
| Royce Total Return Fund | ||||||
| Common Stocks – 98.5% | ||||||
| SHARES | VALUE | |||||
| CONSUMER DISCRETIONARY – 12.8% | ||||||
| AUTO COMPONENTS - 1.3% | ||||||
Gentex Corporation | 2,205,248 | $ | 36,210,172 | |||
Nokian Renkaat | 172,000 | 5,390,208 | ||||
Standard Motor Products | 97,506 | 3,424,411 | ||||
STRATTEC SECURITY | 71,505 | 4,912,394 | ||||
| 49,937,185 | ||||||
| AUTOMOBILES - 0.7% | ||||||
Thor Industries | 515,874 | 29,033,389 | ||||
| DISTRIBUTORS - 0.2% | ||||||
Weyco Group | 282,000 | 8,409,240 | ||||
| DIVERSIFIED CONSUMER SERVICES - 0.4% | ||||||
Capella Education | 35,701 | 1,916,073 | ||||
Regis Corporation 1 | 809,100 | 12,751,416 | ||||
| 14,667,489 | ||||||
| HOTELS, RESTAURANTS & LEISURE - 0.7% | ||||||
Abu Dhabi National Hotels | 1,200,000 | 947,480 | ||||
Bob Evans Farms | 400,873 | 20,464,566 | ||||
DineEquity | 50,430 | 4,997,109 | ||||
| 26,409,155 | ||||||
| HOUSEHOLD DURABLES - 0.8% | ||||||
Ethan Allen Interiors | 1,105,850 | 29,128,089 | ||||
La-Z-Boy | 77,820 | 2,049,779 | ||||
| 31,177,868 | ||||||
| INTERNET & CATALOG RETAIL - 0.1% | ||||||
PetMed Express | 351,500 | 6,070,405 | ||||
| LEISURE PRODUCTS - 0.3% | ||||||
Arctic Cat | 122,984 | 4,084,299 | ||||
Callaway Golf | 962,900 | 8,608,326 | ||||
| 12,692,625 | ||||||
| MEDIA - 1.0% | ||||||
Harte-Hanks | 618,563 | 3,686,636 | ||||
Meredith Corporation | 309,094 | 16,119,252 | ||||
Morningstar | 34,801 | 2,768,420 | ||||
Saga Communications Cl. A | 190,758 | 7,220,190 | ||||
Wiley (John) & Sons Cl. A | 180,739 | 9,826,779 | ||||
| 39,621,277 | ||||||
| SPECIALTY RETAIL - 6.2% | ||||||
American Eagle Outfitters | 1,418,137 | 24,420,319 | ||||
Ascena Retail Group 1 | 1,229,207 | 20,472,443 | ||||
Buckle (The) | 568,741 | 26,031,276 | ||||
Caleres | 12,900 | 409,962 | ||||
Cato Corporation (The) Cl. A | 788,400 | 30,558,384 | ||||
Children’s Place | 71,243 | 4,660,005 | ||||
DSW Cl. A | 693,650 | 23,147,100 | ||||
GameStop Corporation Cl. A | 650,325 | 27,937,962 | ||||
Genesco 1 | 364,146 | 24,044,560 | ||||
Monro Muffler Brake | 400,400 | 24,888,864 | ||||
Rent-A-Center | 353,729 | 10,028,217 | ||||
Shoe Carnival | 662,671 | 19,124,685 | ||||
Stein Mart | 869,024 | 9,098,681 | ||||
Systemax 1 | 248,580 | 2,147,731 | ||||
| 246,970,189 | ||||||
| TEXTILES, APPAREL & LUXURY GOODS - 1.1% | ||||||
Columbia Sportswear | 159,764 | 9,659,331 | ||||
G-III Apparel Group 1 | 89,479 | 6,294,848 | ||||
Movado Group | 397,479 | 10,795,529 | ||||
Steven Madden 1 | 340,487 | 14,566,034 | ||||
Vera Bradley 1 | 184,192 | 2,075,844 | ||||
Wolverine World Wide | 18,375 | 523,320 | ||||
| 43,914,906 | ||||||
| Total (Cost $366,714,467) | 508,903,728 | |||||
| CONSUMER STAPLES – 3.6% | ||||||
| BEVERAGES - 0.2% | ||||||
Compania Cervecerias Unidas ADR | 355,877 | 7,537,475 | ||||
| FOOD & STAPLES RETAILING - 0.5% | ||||||
Village Super Market Cl. A | 654,037 | 20,726,432 | ||||
| FOOD PRODUCTS - 2.1% | ||||||
Cal-Maine Foods | 111,496 | 5,820,091 | ||||
Farmer Bros. 1 | 366,000 | 8,601,000 | ||||
Flowers Foods | 936,800 | 19,813,320 | ||||
Fresh Del Monte Produce | 241,700 | 9,344,122 | ||||
Hershey Creamery 5 | 882 | 2,491,650 | ||||
Lancaster Colony | 126,100 | 11,456,185 | ||||
Sanderson Farms | 54,800 | 4,118,768 | ||||
Tootsie Roll Industries | 655,756 | 21,187,477 | ||||
| 82,832,613 | ||||||
| HOUSEHOLD PRODUCTS - 0.0% | ||||||
WD-40 Company | 10,211 | 889,991 | ||||
| PERSONAL PRODUCTS - 0.8% | ||||||
Nu Skin Enterprises Cl. A | 639,776 | 30,152,643 | ||||
| Total (Cost $119,335,391) | 142,139,154 | |||||
| ENERGY – 4.5% | ||||||
| ENERGY EQUIPMENT & SERVICES - 3.9% | ||||||
Atwood Oceanics | 575,241 | 15,209,372 | ||||
CARBO Ceramics | 299,446 | 12,465,937 | ||||
Diamond Offshore Drilling | 293,614 | 7,578,177 | ||||
Ensign Energy Services | 226,800 | 2,222,604 | ||||
Era Group 1 | 158,100 | 3,237,888 | ||||
Exterran Partners L.P. | 715,600 | 16,101,000 | ||||
Helmerich & Payne | 232,142 | 16,347,440 | ||||
Pason Systems | 1,048,200 | 18,756,821 | ||||
Precision Drilling | 563,450 | 3,786,384 | ||||
RPC | 69,388 | 959,636 | ||||
SEACOR Holdings 1 | 480,690 | 34,100,149 | ||||
Superior Energy Services | 40,300 | 847,912 | ||||
Tesco Corporation | 73,000 | 795,700 | ||||
TGS-NOPEC Geophysical | 212,300 | 4,957,895 | ||||
Tidewater | 804,913 | 18,295,672 | ||||
Total Energy Services | 84,823 | 1,035,669 | ||||
Trican Well Service | 200,000 | 664,532 | ||||
| 157,362,788 | ||||||
| OIL, GAS & CONSUMABLE FUELS - 0.6% | ||||||
Cimarex Energy | 156,790 | 17,295,505 | ||||
Green Plains | 29,900 | 823,745 | ||||
| 633,760 | 2,775,869 | |||||
San Juan Basin Royalty Trust | 236,945 | 2,544,789 | ||||
| 23,439,908 | ||||||
| Total (Cost $188,655,329) | 180,802,696 | |||||
| FINANCIALS – 26.6% | ||||||
| BANKS - 4.5% | ||||||
Ames National | 423,068 | 10,619,007 | ||||
Associated Banc-Corp | 493,700 | 10,007,299 | ||||
Bank of Hawaii | 323,701 | 21,584,383 | ||||
BLOM Bank GDR | 684,500 | 6,845,000 | ||||
| 52 | The Royce Funds 2015 Semiannual Report to Shareholders | THE ACCOMPANYING NOTES ARE AN INTEGRAL PART OF THESE FINANCIAL STATEMENTS |
| June 30, 2015 (unaudited) |
| Royce Total Return Fund (continued) | ||||||
| SHARES | VALUE | |||||
| FINANCIALS (continued) | ||||||
| BANKS (continued) | ||||||
BOK Financial | 430,768 | $ | 29,972,837 | |||
Camden National | 194,540 | 7,528,698 | ||||
Canadian Western Bank | 929,500 | 21,410,500 | ||||
City Holding Company | 436,400 | 21,492,700 | ||||
Farmers & Merchants Bank of Long Beach 5 | 479 | 2,864,420 | ||||
First Citizens BancShares Cl. A | 97,026 | 25,521,719 | ||||
First National Bank Alaska 5 | 3,110 | 4,820,500 | ||||
National Bankshares | 25,285 | 739,839 | ||||
Northrim BanCorp | 48,717 | 1,248,617 | ||||
Peapack-Gladstone Financial | 604,692 | 13,436,256 | ||||
| 178,091,775 | ||||||
| CAPITAL MARKETS - 8.0% | ||||||
AllianceBernstein Holding L.P. | 1,587,100 | 46,867,063 | ||||
Apollo Global Management LLC Cl. A | 575,500 | 12,747,325 | ||||
Apollo Investment | 1,161,400 | 8,222,712 | ||||
ASA Gold and Precious Metals | 564,692 | 5,483,159 | ||||
Ashmore Group 3 | 2,554,000 | 11,605,516 | ||||
Banca Generali | 86,000 | 3,027,798 | ||||
Citadel Capital 1 | 19,355,000 | 5,047,994 | ||||
| 4,112,937 | 0 | |||||
Cohen & Steers | 285,337 | 9,724,285 | ||||
Coronation Fund Managers | 1,315,000 | 8,907,542 | ||||
Diamond Hill Investment Group | 1,000 | 199,660 | ||||
Edmond de Rothschild (Suisse) | 234 | 4,830,419 | ||||
Egyptian Financial Group-Hermes Holding | ||||||
Company 1 | 1,032,032 | 1,870,630 | ||||
Federated Investors Cl. B | 725,823 | 24,307,812 | ||||
Fortress Investment Group LLC Cl. A | 292,580 | 2,135,834 | ||||
GAMCO Investors Cl. A | 228,500 | 15,700,235 | ||||
KKR & Co. L.P. | 1,202,600 | 27,479,410 | ||||
Lazard Cl. A | 33,090 | 1,860,982 | ||||
MVC Capital | 475,000 | 4,845,000 | ||||
Oppenheimer Holdings Cl. A | 221,512 | 5,821,335 | ||||
Paris Orleans | 581,675 | 18,582,198 | ||||
Raymond James Financial | 389,725 | 23,219,816 | ||||
Schroders | 111,100 | 5,544,212 | ||||
SEI Investments | 520,270 | 25,508,838 | ||||
Teton Advisors Cl. A 5 | 1,297 | 62,230 | ||||
Value Partners Group | 11,628,400 | 18,361,697 | ||||
Vontobel Holding | 150,400 | 6,973,464 | ||||
Waddell & Reed Financial Cl. A | 350,900 | 16,601,079 | ||||
Westwood Holdings Group | 45,895 | 2,733,965 | ||||
| 318,272,210 | ||||||
| CONSUMER FINANCE - 0.1% | ||||||
Nelnet Cl. A | 48,216 | 2,088,235 | ||||
| DIVERSIFIED FINANCIAL SERVICES - 1.5% | ||||||
Bolsa Mexicana de Valores | 6,479,000 | 11,212,267 | ||||
Fidelity National Financial Ventures 1 | 326,869 | 5,027,245 | ||||
First Pacific | 440,000 | 370,661 | ||||
Leucadia National | 141,659 | 3,439,480 | ||||
Sofina | 279,572 | 31,199,241 | ||||
TMX Group | 184,000 | 7,829,944 | ||||
| 59,078,838 | ||||||
| INSURANCE - 9.9% | ||||||
Alleghany Corporation 1 | 87,122 | 40,839,309 | ||||
Allied World Assurance Company Holdings | 314,440 | 13,590,097 | ||||
American Financial Group | 121,586 | 7,907,953 | ||||
American National Insurance | 148,593 | 15,204,036 | ||||
AmTrust Financial Services | 46,238 | 3,029,051 | ||||
Argo Group International Holdings | 18,260 | 1,017,082 | ||||
Aspen Insurance Holdings | 261,418 | 12,521,922 | ||||
Assurant | 38,612 | 2,587,004 | ||||
Assured Guaranty | 430,392 | 10,325,104 | ||||
Baldwin & Lyons Cl. B | 311,743 | 7,176,324 | ||||
Cincinnati Financial | 260,700 | 13,081,926 | ||||
E-L Financial | 78,788 | 41,359,284 | ||||
Employers Holdings | 168,139 | 3,830,206 | ||||
Erie Indemnity Cl. A | 500,600 | 41,084,242 | ||||
Fidelity National Financial | 16,203 | 599,349 | ||||
First American Financial | 93,961 | 3,496,289 | ||||
Gallagher (Arthur J.) & Co. | 595,800 | 28,181,340 | ||||
HCI Group | 39,500 | 1,746,295 | ||||
Infinity Property & Casualty | 121,443 | 9,210,237 | ||||
Markel Corporation 1 | 59,500 | 47,640,460 | ||||
Mercury General | 175,500 | 9,766,575 | ||||
National Western Life Insurance Cl. A | 5,900 | 1,412,991 | ||||
Old Republic International | 799,820 | 12,501,187 | ||||
ProAssurance Corporation | 182,000 | 8,410,220 | ||||
Reinsurance Group of America | 265,256 | 25,164,837 | ||||
RenaissanceRe Holdings | 25,709 | 2,609,721 | ||||
RLI Corp. | 162,870 | 8,369,889 | ||||
Selective Insurance Group | 8,800 | 246,840 | ||||
State Auto Financial | 392,000 | 9,388,400 | ||||
Symetra Financial | 170,600 | 4,123,402 | ||||
United Fire Group | 103,091 | 3,377,261 | ||||
Universal Insurance Holdings | 101,200 | 2,449,040 | ||||
White Mountains Insurance Group | 5,634 | 3,689,932 | ||||
| 395,937,805 | ||||||
| INVESTMENT COMPANIES - 0.2% | ||||||
British Empire Securities and General Trust | 601,182 | 4,727,759 | ||||
RIT Capital Partners | 100,000 | 2,430,724 | ||||
| 7,158,483 | ||||||
| REAL ESTATE INVESTMENT TRUSTS (REITS) - 1.2% | ||||||
Alexander’s | 41,762 | 17,122,420 | ||||
Cousins Properties | 421,710 | 4,377,350 | ||||
DCT Industrial Trust | 280,400 | 8,815,776 | ||||
Lexington Realty Trust | 707,006 | 5,995,411 | ||||
MFA Financial | 692,000 | 5,113,880 | ||||
Rayonier | 315,000 | 8,048,250 | ||||
| 49,473,087 | ||||||
| THRIFTS & MORTGAGE FINANCE - 1.2% | ||||||
Genworth MI Canada | 936,370 | 24,590,021 | ||||
TrustCo Bank Corp. NY | 3,567,544 | 25,079,834 | ||||
| 49,669,855 | ||||||
| Total (Cost $704,655,270) | 1,059,770,288 | |||||
| HEALTH CARE – 7.2% | ||||||
| HEALTH CARE EQUIPMENT & SUPPLIES - 3.6% | ||||||
Analogic Corporation | 231,000 | 18,225,900 | ||||
Atrion Corporation | 9,684 | 3,799,130 | ||||
Hill-Rom Holdings | 504,270 | 27,396,989 | ||||
IDEXX Laboratories 1 | 274,400 | 17,600,016 | ||||
Meridian Bioscience | 48,300 | 900,312 | ||||
STERIS Corporation | 559,641 | 36,063,266 | ||||
Teleflex | 288,400 | 39,063,780 | ||||
| 143,049,393 | ||||||
| THE ACCOMPANYING NOTES ARE AN INTEGRAL PART OF THESE FINANCIAL STATEMENTS | The Royce Funds 2015 Semiannual Report to Shareholders | 53 |
| Schedules of Investments |
| Royce Total Return Fund (continued) | ||||||
| SHARES | VALUE | |||||
| HEALTH CARE (continued) | ||||||
| HEALTH CARE PROVIDERS & SERVICES - 2.6% | ||||||
Aceto Corporation | 382,415 | $ | 9,418,881 | |||
Chemed Corporation | 124,066 | 16,265,053 | ||||
Landauer 2 | 515,300 | 18,365,292 | ||||
MEDNAX 1 | 128,651 | 9,534,326 | ||||
Owens & Minor | 1,057,550 | 35,956,700 | ||||
U.S. Physical Therapy | 250,064 | 13,693,505 | ||||
| 103,233,757 | ||||||
| HEALTH CARE TECHNOLOGY - 0.1% | ||||||
Computer Programs and Systems | 97,000 | 5,181,740 | ||||
| LIFE SCIENCES TOOLS & SERVICES - 0.9% | ||||||
PerkinElmer | 663,600 | 34,931,904 | ||||
| PHARMACEUTICALS - 0.0% | ||||||
Recordati | 110,000 | 2,306,735 | ||||
| Total (Cost $135,814,562) | 288,703,529 | |||||
| INDUSTRIALS – 21.0% | ||||||
| AEROSPACE & DEFENSE - 1.3% | ||||||
American Science and Engineering | 207,834 | 9,105,208 | ||||
Cubic Corporation | 9,923 | 472,136 | ||||
HEICO Corporation | 225,443 | 13,143,327 | ||||
HEICO Corporation Cl. A | 454,966 | 23,098,624 | ||||
National Presto Industries | 46,526 | 3,736,968 | ||||
| 49,556,263 | ||||||
| AIR FREIGHT & LOGISTICS - 1.0% | ||||||
C. H. Robinson Worldwide | 238,400 | 14,873,776 | ||||
Expeditors International of Washington | 479,700 | 22,116,568 | ||||
UTi Worldwide 1 | 328,400 | 3,280,716 | ||||
| 40,271,060 | ||||||
| BUILDING PRODUCTS - 0.7% | ||||||
A. O. Smith Corporation | 411,488 | 29,618,906 | ||||
| COMMERCIAL SERVICES & SUPPLIES - 4.0% | ||||||
ABM Industries | 594,700 | 19,547,789 | ||||
Brady Corporation Cl. A | 671,935 | 16,623,672 | ||||
Ennis | 377,444 | 7,016,684 | ||||
Healthcare Services Group | 180,264 | 5,957,725 | ||||
HNI Corporation | 421,173 | 21,542,999 | ||||
Kimball International Cl. B | 724,600 | 8,811,136 | ||||
McGrath RentCorp | 291,300 | 8,864,259 | ||||
MSA Safety | 220,812 | 10,711,590 | ||||
Ritchie Bros. Auctioneers | 1,299,020 | 36,268,639 | ||||
UniFirst Corporation | 163,204 | 18,254,367 | ||||
Viad Corporation | 208,306 | 5,647,176 | ||||
| 159,246,036 | ||||||
| CONSTRUCTION & ENGINEERING - 0.7% | ||||||
Comfort Systems USA | 200,031 | 4,590,711 | ||||
EMCOR Group | 96,989 | 4,633,165 | ||||
Granite Construction | 176,975 | 6,284,382 | ||||
KBR | 594,172 | 11,574,471 | ||||
| 27,082,729 | ||||||
| ELECTRICAL EQUIPMENT - 1.8% | ||||||
EnerSys | 21,800 | 1,532,322 | ||||
Franklin Electric | 683,300 | 22,091,089 | ||||
Hubbell Cl. B | 268,021 | 29,021,314 | ||||
LSI Industries | 1,035,251 | 9,669,245 | ||||
Preformed Line Products | 247,724 | 9,344,149 | ||||
| 71,658,119 | ||||||
| INDUSTRIAL CONGLOMERATES - 0.2% | ||||||
Raven Industries | 448,828 | 9,124,673 | ||||
| MACHINERY - 7.5% | ||||||
Alamo Group | 329,352 | 17,995,793 | ||||
American Railcar Industries | 215,509 | 10,482,358 | ||||
Briggs & Stratton | 663,040 | 12,770,150 | ||||
CIRCOR International | 35,400 | 1,930,362 | ||||
CLARCOR | 229,000 | 14,252,960 | ||||
Douglas Dynamics | 18,700 | 401,676 | ||||
Federal Signal | 606,680 | 9,045,599 | ||||
Gorman-Rupp Company (The) | 671,191 | 18,847,043 | ||||
Hillenbrand | 243,625 | 7,479,287 | ||||
Hyster-Yale Materials Handling Cl. A | 29,392 | 2,036,278 | ||||
Joy Global | 37,100 | 1,343,020 | ||||
Kadant | 26,300 | 1,241,360 | ||||
Kennametal | 156,075 | 5,325,279 | ||||
Lincoln Electric Holdings | 193,899 | 11,806,510 | ||||
Lindsay Corporation | 219,082 | 19,259,499 | ||||
Miller Industries | 420,166 | 8,382,312 | ||||
| 116,700 | 3,705,225 | |||||
Mueller Industries | 366,524 | 12,725,713 | ||||
Nordson Corporation | 258,800 | 20,157,932 | ||||
RBC Bearings 1 | 35,200 | 2,525,952 | ||||
Standex International | 49,531 | 3,959,013 | ||||
Starrett (L.S.) Company (The) Cl. A 2 | 529,400 | 7,941,000 | ||||
Sun Hydraulics | 28,449 | 1,084,191 | ||||
Tennant Company | 544,396 | 35,570,835 | ||||
Timken Company (The) | 6,832 | 249,846 | ||||
Toro Company (The) | 229,864 | 15,580,182 | ||||
Trinity Industries | 796,474 | 21,050,808 | ||||
Valmont Industries | 12,600 | 1,497,762 | ||||
Woodward | 567,300 | 31,195,827 | ||||
| 299,843,772 | ||||||
| MARINE - 0.4% | ||||||
Clarkson | 343,900 | 14,789,457 | ||||
| PROFESSIONAL SERVICES - 2.2% | ||||||
CEB | 219,700 | 19,127,082 | ||||
Exponent | 74,792 | 3,349,185 | ||||
Heidrick & Struggles International | 137,998 | 3,598,988 | ||||
Kelly Services Cl. A | 634,200 | 9,734,970 | ||||
ManpowerGroup | 404,852 | 36,185,672 | ||||
Resources Connection | 84,133 | 1,353,700 | ||||
Towers Watson & Co. Cl. A | 107,800 | 13,561,240 | ||||
| 86,910,837 | ||||||
| ROAD & RAIL - 0.4% | ||||||
ArcBest Corporation | 220,781 | 7,020,836 | ||||
Knight Transportation | 19,529 | 522,206 | ||||
Werner Enterprises | 282,805 | 7,423,631 | ||||
| 14,966,673 | ||||||
| TRADING COMPANIES & DISTRIBUTORS - 0.8% | ||||||
Applied Industrial Technologies | 454,945 | 18,038,569 | ||||
Houston Wire & Cable 2 | 1,328,225 | 13,175,992 | ||||
| 31,214,561 | ||||||
| Total (Cost $438,715,825) | 834,283,086 | |||||
| INFORMATION TECHNOLOGY – 8.9% | ||||||
| COMMUNICATIONS EQUIPMENT - 1.9% | ||||||
ADTRAN | 402,429 | 6,539,471 | ||||
Bel Fuse Cl. A | 22,350 | 461,751 | ||||
Bel Fuse Cl. B | 74,000 | 1,518,480 | ||||
Black Box | 432,202 | 8,644,040 | ||||
| 54 | The Royce Funds 2015 Semiannual Report to Shareholders | THE ACCOMPANYING NOTES ARE AN INTEGRAL PART OF THESE FINANCIAL STATEMENTS |
| June 30, 2015 (unaudited) |
| Royce Total Return Fund (continued) | ||||||
| SHARES | VALUE | |||||
| INFORMATION TECHNOLOGY (continued) | ||||||
| COMMUNICATIONS EQUIPMENT (continued) | ||||||
Brocade Communications Systems | 2,084,123 | $ | 24,759,381 | |||
NETGEAR 1 | 534,032 | 16,031,641 | ||||
Plantronics | 226,320 | 12,744,079 | ||||
TESSCO Technologies | 333,159 | 6,599,880 | ||||
| 77,298,723 | ||||||
| ELECTRONIC EQUIPMENT, INSTRUMENTS & COMPONENTS - 2.7% | ||||||
AVX Corporation | 1,573,910 | 21,184,829 | ||||
Cognex Corporation | 331,000 | 15,921,100 | ||||
Electro Rent | 348,647 | 3,786,306 | ||||
FLIR Systems | 218,775 | 6,742,646 | ||||
Kimball Electronics 1 | 543,450 | 7,928,936 | ||||
Littelfuse | 52,023 | 4,936,462 | ||||
Methode Electronics | 485,496 | 13,326,865 | ||||
National Instruments | 277,274 | 8,168,492 | ||||
Vishay Intertechnology | 2,259,938 | 26,396,076 | ||||
| 108,391,712 | ||||||
| IT SERVICES - 1.8% | ||||||
Broadridge Financial Solutions | 554,900 | 27,750,549 | ||||
Calian Technologies | 274,004 | 4,058,506 | ||||
Convergys Corporation | 630,496 | 16,071,343 | ||||
Forrester Research | 42,804 | 1,541,800 | ||||
ManTech International Cl. A | 510,863 | 14,815,027 | ||||
MAXIMUS | 104,420 | 6,863,527 | ||||
| 71,100,752 | ||||||
| SEMICONDUCTORS & SEMICONDUCTOR EQUIPMENT - 1.1% | ||||||
Brooks Automation | 80,381 | 920,362 | ||||
MKS Instruments | 937,720 | 35,577,097 | ||||
Power Integrations | 22,204 | 1,003,177 | ||||
Teradyne | 228,446 | 4,406,723 | ||||
| 41,907,359 | ||||||
| SOFTWARE - 0.7% | ||||||
Ebix | 162,245 | 5,290,809 | ||||
Fair Isaac | 164,657 | 14,947,562 | ||||
Monotype Imaging Holdings | 29,007 | 699,359 | ||||
Pegasystems | 208,713 | 4,777,441 | ||||
| 25,715,171 | ||||||
| TECHNOLOGY HARDWARE, STORAGE & PERIPHERALS - 0.7% | ||||||
Diebold | 827,518 | 28,963,130 | ||||
| 37,700 | 552,682 | |||||
| 29,515,812 | ||||||
| Total (Cost $282,003,820) | 353,929,529 | |||||
| MATERIALS – 10.7% | ||||||
| CHEMICALS - 4.7% | ||||||
Albemarle Corporation | 447,300 | 24,722,271 | ||||
Balchem Corporation | 600,649 | 33,468,162 | ||||
Cabot Corporation | 363,600 | 13,558,644 | ||||
Chase Corporation 2 | 684,674 | 27,215,792 | ||||
FutureFuel Corporation | 188,959 | 2,431,902 | ||||
Innophos Holdings | 13,785 | 725,642 | ||||
Innospec | 196,661 | 8,857,612 | ||||
Methanex Corporation | 289,310 | 16,102,995 | ||||
Minerals Technologies | 49,993 | 3,406,023 | ||||
Olin Corporation | 56,400 | 1,519,980 | ||||
Quaker Chemical | 406,129 | 36,080,500 | ||||
Umicore | 305,000 | 14,461,439 | ||||
Victrex | 70,000 | 2,122,759 | ||||
Westlake Chemical | 12,399 | 850,447 | ||||
| 185,524,168 | ||||||
| CONSTRUCTION MATERIALS - 0.2% | ||||||
Ash Grove Cement 5 | 39,610 | 7,961,610 | ||||
| CONTAINERS & PACKAGING - 1.7% | ||||||
AptarGroup | 118,600 | 7,563,122 | ||||
Bemis Company | 433,200 | 19,498,332 | ||||
Greif Cl. A | 614,001 | 22,011,936 | ||||
Mayr-Melnhof Karton | 60,000 | 6,779,400 | ||||
Sonoco Products | 327,578 | 14,039,993 | ||||
| 69,892,783 | ||||||
| METALS & MINING - 2.8% | ||||||
Agnico Eagle Mines | 742,300 | 21,059,051 | ||||
Ampco-Pittsburgh | 180,306 | 2,726,227 | ||||
Carpenter Technology | 303,275 | 11,730,677 | ||||
Centerra Gold | 201,500 | 1,145,436 | ||||
Franco-Nevada Corporation | 173,500 | 8,267,275 | ||||
Gold Fields ADR | 3,102,643 | 10,021,537 | ||||
| 1,056,620 | 2,113,240 | |||||
Pan American Silver | 1,530,000 | 13,142,700 | ||||
Reliance Steel & Aluminum | 337,082 | 20,386,719 | ||||
Sims Metal Management | 1,000,000 | 8,039,553 | ||||
Worthington Industries | 424,700 | 12,766,482 | ||||
| 111,398,897 | ||||||
| PAPER & FOREST PRODUCTS - 1.3% | ||||||
Deltic Timber | 172,000 | 11,634,080 | ||||
Domtar Corporation | 489,900 | 20,281,860 | ||||
Neenah Paper | 39,200 | 2,311,232 | ||||
Pope Resources L.P. | 13,900 | 974,390 | ||||
Schweitzer-Mauduit International | 446,475 | 17,805,423 | ||||
| 53,006,985 | ||||||
| Total (Cost $302,710,535) | 427,784,443 | |||||
| TELECOMMUNICATION SERVICES – 0.9% | ||||||
| DIVERSIFIED TELECOMMUNICATION SERVICES - 0.5% | ||||||
Atlantic Tele-Network | 255,103 | 17,622,515 | ||||
| WIRELESS TELECOMMUNICATION SERVICES - 0.4% | ||||||
Spok Holdings | 78,416 | 1,320,526 | ||||
Telephone and Data Systems | 529,190 | 15,558,186 | ||||
| 16,878,712 | ||||||
| Total (Cost $19,252,569) | 34,501,227 | |||||
| UTILITIES – 2.0% | ||||||
| ELECTRIC UTILITIES - 0.5% | ||||||
ALLETE | 170,647 | 7,916,314 | ||||
ITC Holdings | 349,200 | 11,237,256 | ||||
| 19,153,570 | ||||||
| GAS UTILITIES - 0.6% | ||||||
AGL Resources | 291,058 | 13,551,661 | ||||
Piedmont Natural Gas | 256,300 | 9,049,953 | ||||
| 22,601,614 | ||||||
| WATER UTILITIES - 0.9% | ||||||
Aqua America | 906,507 | 22,200,356 | ||||
SJW | 400,400 | 12,288,276 | ||||
York Water | 166,630 | 3,475,902 | ||||
| 37,964,534 | ||||||
| Total (Cost $46,971,599) | 79,719,718 | |||||
| THE ACCOMPANYING NOTES ARE AN INTEGRAL PART OF THESE FINANCIAL STATEMENTS | The Royce Funds 2015 Semiannual Report to Shareholders | 55 |
| Schedules of Investments |
| Royce Total Return Fund (continued) | |||||||
| VALUE | |||||||
| MISCELLANEOUS6 – 0.3% | |||||||
| Total (Cost $10,816,331) | $ | 10,432,683 | |||||
| TOTAL COMMON STOCKS | |||||||
| (Cost $2,615,645,698) | 3,920,970,081 | ||||||
| REPURCHASE AGREEMENT– 1.7% | |||||||
| Fixed Income Clearing Corporation, 0.00% dated 6/30/15, due 7/1/15, maturity value $68,412,000 (collateralized by obligations of various U.S. Government Agencies, 2.125% due 1/31/21, valued at $69,781,753) | |||||||
| (Cost $68,412,000) | 68,412,000 | ||||||
| PRINCIPAL | |||||||
| AMOUNT | |||||||
| COLLATERAL RECEIVED FOR SECURITIES LOANED – 0.3% | |||||||
| U.S. Treasury Bonds | |||||||
3.00%-8.875% | |||||||
due 2/15/19-11/15/43 | $ | 644,582 | 656,779 | ||||
| U.S. Treasury Notes | |||||||
0.125%-2.75% | |||||||
due 4/15/16-2/15/24 | 6,676,696 | 6,695,719 | |||||
| Money Market Funds | |||||||
Federated Government Obligations Fund (7 day yield-0.0099%) | 4,894,285 | ||||||
| TOTAL COLLATERAL RECEIVED FOR SECURITIES LOANED | |||||||
| (Cost $12,246,783) | 12,246,783 | ||||||
| TOTAL INVESTMENTS – 100.5% | |||||||
| (Cost $2,696,304,481) | 4,001,628,864 | ||||||
| LIABILITIES LESS CASH AND OTHER ASSETS – (0.5)% | (20,534,277) | ||||||
| NET ASSETS – 100.0% | $ | 3,981,094,587 | |||||
| Royce Heritage Fund | ||||||
| Common Stocks – 85.9% | ||||||
| SHARES | VALUE | |||||
| CONSUMER DISCRETIONARY – 11.9% | ||||||
| AUTO COMPONENTS - 4.9% | ||||||
BorgWarner | 48,300 | $ | 2,745,372 | |||
Dorman Products 1 | 8,200 | 390,812 | ||||
Drew Industries | 74,200 | 4,305,084 | ||||
Gentex Corporation | 128,400 | 2,108,328 | ||||
Nokian Renkaat | 28,000 | 877,476 | ||||
Selamat Sempurna | 4,253,800 | 1,472,438 | ||||
Standard Motor Products | 141,183 | 4,958,347 | ||||
| 16,857,857 | ||||||
| AUTOMOBILES - 1.0% | ||||||
Thor Industries | 61,350 | 3,452,778 | ||||
| DISTRIBUTORS - 0.5% | ||||||
Core-Mark Holding Company | 30,000 | 1,777,500 | ||||
| DIVERSIFIED CONSUMER SERVICES - 0.5% | ||||||
Sotheby’s | 33,900 | 1,533,636 | ||||
| HOUSEHOLD DURABLES - 1.8% | ||||||
Ethan Allen Interiors | 28,700 | 755,958 | ||||
Forbo Holding | 800 | 951,495 | ||||
Garmin | 30,200 | 1,326,686 | ||||
Mohawk Industries 1 | 4,600 | 878,140 | ||||
NVR 1 | 1,625 | 2,177,500 | ||||
| 6,089,779 | ||||||
| MULTILINE RETAIL - 0.5% | ||||||
Dollar Tree 1 | 22,300 | 1,761,477 | ||||
| SPECIALTY RETAIL - 1.4% | ||||||
Advance Auto Parts | 3,061 | 487,587 | ||||
Bed Bath & Beyond 1 | 19,600 | 1,352,008 | ||||
Matas | 30,000 | 638,832 | ||||
Monro Muffler Brake | 9,400 | 584,304 | ||||
USS | 86,300 | 1,558,385 | ||||
| 4,621,116 | ||||||
| TEXTILES, APPAREL & LUXURY GOODS - 1.3% | ||||||
Carter’s | 16,400 | 1,743,320 | ||||
Gildan Activewear | 69,600 | 2,313,504 | ||||
Wolverine World Wide | 19,500 | 555,360 | ||||
| 4,612,184 | ||||||
| Total (Cost $33,066,925) | 40,706,327 | |||||
| CONSUMER STAPLES – 1.9% | ||||||
| FOOD PRODUCTS - 1.9% | ||||||
Cal-Maine Foods | 75,600 | 3,946,320 | ||||
Sanderson Farms | 33,700 | 2,532,892 | ||||
| Total (Cost $5,643,525) | 6,479,212 | |||||
| ENERGY – 1.3% | ||||||
| ENERGY EQUIPMENT & SERVICES - 1.1% | ||||||
Core Laboratories | 5,000 | 570,200 | ||||
Pason Systems | 123,500 | 2,209,948 | ||||
TGS-NOPEC Geophysical | 48,000 | 1,120,956 | ||||
| 3,901,104 | ||||||
| OIL, GAS & CONSUMABLE FUELS - 0.2% | ||||||
World Fuel Services | 14,800 | 709,660 | ||||
| Total (Cost $4,037,201) | 4,610,764 | |||||
| FINANCIALS – 21.7% | ||||||
| CAPITAL MARKETS - 15.9% | ||||||
AllianceBernstein Holding L.P. | 131,141 | 3,872,594 | ||||
ARA Asset Management | 955,000 | 1,240,858 | ||||
Artisan Partners Asset Management Cl. A | 51,860 | 2,409,416 | ||||
| 56 | The Royce Funds 2015 Semiannual Report to Shareholders | THE ACCOMPANYING NOTES ARE AN INTEGRAL PART OF THESE FINANCIAL STATEMENTS |
| June 30, 2015 (unaudited) |
| Royce Heritage Fund (continued) | ||||||
| SHARES | VALUE | |||||
| FINANCIALS (continued) | ||||||
| CAPITAL MARKETS (continued) | ||||||
Ashmore Group | 325,400 | $ | 1,478,635 | |||
Blackstone Group L.P. | 52,600 | 2,149,762 | ||||
CETIP - Mercados Organizados | 162,000 | 1,775,742 | ||||
Charles Schwab | 75,700 | 2,471,605 | ||||
Coronation Fund Managers | 160,000 | 1,083,807 | ||||
Dundee Corporation Cl. A 1 | 89,700 | 900,591 | ||||
E*TRADE Financial 1 | 76,800 | 2,300,160 | ||||
Evercore Partners Cl. A | 30,400 | 1,640,384 | ||||
Federated Investors Cl. B | 89,000 | 2,980,610 | ||||
Invesco | 32,400 | 1,214,676 | ||||
Jupiter Fund Management | 312,300 | 2,187,056 | ||||
KKR & Co. L.P. | 211,000 | 4,821,350 | ||||
Lazard Cl. A | 39,500 | 2,221,480 | ||||
Medley Management Cl. A | 202,700 | 2,399,968 | ||||
Partners Group Holding | 1,700 | 508,209 | ||||
SEI Investments | 94,900 | 4,652,947 | ||||
Sprott | 508,500 | 1,005,601 | ||||
State Street | 45,900 | 3,534,300 | ||||
TD Ameritrade Holding Corporation | 50,600 | 1,863,092 | ||||
Value Partners Group | 1,078,100 | 1,702,362 | ||||
VZ Holding | 4,000 | 962,618 | ||||
Westwood Holdings Group | 50,400 | 3,002,328 | ||||
| 54,380,151 | ||||||
| CONSUMER FINANCE - 0.3% | ||||||
Shriram Transport Finance | 92,000 | 1,229,676 | ||||
| DIVERSIFIED FINANCIAL SERVICES - 1.6% | ||||||
Bolsa Mexicana de Valores | 935,000 | 1,618,069 | ||||
JSE | 74,000 | 781,544 | ||||
TMX Group | 50,500 | 2,148,979 | ||||
Warsaw Stock Exchange | 70,000 | 881,330 | ||||
| 5,429,922 | ||||||
| INSURANCE - 1.9% | ||||||
Alleghany Corporation 1 | 7,750 | 3,632,890 | ||||
Marsh & McLennan | 53,900 | 3,056,130 | ||||
| 6,689,020 | ||||||
| REAL ESTATE MANAGEMENT & DEVELOPMENT - 2.0% | ||||||
Jones Lang LaSalle | 13,100 | 2,240,100 | ||||
Kennedy-Wilson Holdings | 182,800 | 4,495,052 | ||||
| 6,735,152 | ||||||
| Total (Cost $58,283,365) | 74,463,921 | |||||
| HEALTH CARE – 2.8% | ||||||
| BIOTECHNOLOGY - 0.2% | ||||||
Abcam | 75,000 | 610,431 | ||||
| HEALTH CARE EQUIPMENT & SUPPLIES - 0.9% | ||||||
Analogic Corporation | 16,660 | 1,314,474 | ||||
Vascular Solutions 1 | 52,000 | 1,805,440 | ||||
| 3,119,914 | ||||||
| LIFE SCIENCES TOOLS & SERVICES - 1.3% | ||||||
Mettler-Toledo International 1 | 8,200 | 2,799,972 | ||||
Waters Corporation 1 | 14,150 | 1,816,577 | ||||
| 4,616,549 | ||||||
| PHARMACEUTICALS - 0.4% | ||||||
Recordati | 60,000 | 1,258,219 | ||||
| Total (Cost $6,306,405) | 9,605,113 | |||||
| INDUSTRIALS – 20.7% | ||||||
| AEROSPACE & DEFENSE - 0.6% | ||||||
HEICO Corporation | 34,178 | 1,992,577 | ||||
| AIR FREIGHT & LOGISTICS - 0.8% | ||||||
Expeditors International of Washington | 57,800 | 2,664,869 | ||||
| COMMERCIAL SERVICES & SUPPLIES - 5.3% | ||||||
Cintas Corporation | 22,600 | 1,911,734 | ||||
Copart 1 | 153,380 | 5,441,923 | ||||
Heritage-Crystal Clean 1 | 62,527 | 919,147 | ||||
Kaba Holding | 1,900 | 1,130,916 | ||||
Ritchie Bros. Auctioneers | 208,508 | 5,821,543 | ||||
Tomra Systems | 85,900 | 786,093 | ||||
Waste Connections | 46,100 | 2,172,232 | ||||
| 18,183,588 | ||||||
| CONSTRUCTION & ENGINEERING - 0.1% | ||||||
KBR | 22,100 | 430,508 | ||||
| INDUSTRIAL CONGLOMERATES - 0.7% | ||||||
Carlisle Companies | 22,600 | 2,262,712 | ||||
| MACHINERY - 5.2% | ||||||
AGCO Corporation | 10,300 | 584,834 | ||||
Burckhardt Compression Holding | 2,000 | 757,795 | ||||
CIRCOR International | 37,000 | 2,017,610 | ||||
Foster (L.B.) Company | 33,700 | 1,166,357 | ||||
Graco | 26,500 | 1,882,295 | ||||
Kennametal | 29,940 | 1,021,553 | ||||
Mueller Industries | 82,000 | 2,847,040 | ||||
Obara Group | 10,000 | 537,648 | ||||
Pfeiffer Vacuum Technology | 12,000 | 1,069,185 | ||||
RBC Bearings 1 | 1,981 | 142,157 | ||||
Rotork | 200,000 | 730,945 | ||||
Sun Hydraulics | 62,885 | 2,396,547 | ||||
Valmont Industries | 22,870 | 2,718,557 | ||||
| 17,872,523 | ||||||
| MARINE - 0.7% | ||||||
Clarkson | 57,700 | 2,481,395 | ||||
| PROFESSIONAL SERVICES - 5.4% | ||||||
Dun & Bradstreet | 7,100 | 866,200 | ||||
Equifax | 24,150 | 2,344,723 | ||||
Exponent | 11,400 | 510,492 | ||||
IHS Cl. A 1 | 17,600 | 2,263,888 | ||||
ManpowerGroup | 66,891 | 5,978,718 | ||||
Towers Watson & Co. Cl. A | 38,900 | 4,893,620 | ||||
Verisk Analytics Cl. A 1 | 23,700 | 1,724,412 | ||||
| 18,582,053 | ||||||
| ROAD & RAIL - 1.5% | ||||||
| 27,600 | 2,102,568 | |||||
Landstar System | 42,000 | 2,808,540 | ||||
| 4,911,108 | ||||||
| TRADING COMPANIES & DISTRIBUTORS - 0.4% | ||||||
Applied Industrial Technologies | 35,062 | 1,390,208 | ||||
| Total (Cost $56,458,858) | 70,771,541 | |||||
| INFORMATION TECHNOLOGY – 12.2% | ||||||
| ELECTRONIC EQUIPMENT, INSTRUMENTS & COMPONENTS - 5.6% | ||||||
Anixter International 1 | 48,800 | 3,179,320 | ||||
Avnet | 32,400 | 1,331,964 | ||||
AVX Corporation | 103,063 | 1,387,228 | ||||
Coherent 1 | 61,900 | 3,929,412 | ||||
e2v technologies | 309,600 | 1,221,012 | ||||
FEI Company | 16,100 | 1,335,173 | ||||
| THE ACCOMPANYING NOTES ARE AN INTEGRAL PART OF THESE FINANCIAL STATEMENTS | The Royce Funds 2015 Semiannual Report to Shareholders | 57 |
| Schedules of Investments |
| Royce Heritage Fund (continued) | ||||||
| SHARES | VALUE | |||||
| INFORMATION TECHNOLOGY (continued) | ||||||
| ELECTRONIC EQUIPMENT, INSTRUMENTS & COMPONENTS (continued) | ||||||
FLIR Systems | 92,800 | $ | 2,860,096 | |||
LPKF Laser & Electronics | 72,000 | 618,072 | ||||
National Instruments | 63,900 | 1,882,494 | ||||
Rogers Corporation 1 | 20,900 | 1,382,326 | ||||
| 19,127,097 | ||||||
| INTERNET SOFTWARE & SERVICES - 0.2% | ||||||
| 3,000 | 492,150 | |||||
| IT SERVICES - 3.6% | ||||||
DST Systems | 33,600 | 4,232,928 | ||||
eClerx Services | 36,000 | 846,859 | ||||
Fiserv 1 | 39,760 | 3,293,321 | ||||
MAXIMUS | 52,200 | 3,431,106 | ||||
Metrofile Holdings | 1,786,000 | 666,484 | ||||
| 12,470,698 | ||||||
| SEMICONDUCTORS & SEMICONDUCTOR EQUIPMENT - 0.6% | ||||||
Diodes 1 | 44,300 | 1,068,073 | ||||
Lam Research | 12,700 | 1,033,145 | ||||
| 2,101,218 | ||||||
| SOFTWARE - 1.8% | ||||||
ANSYS 1 | 28,700 | 2,618,588 | ||||
Computer Modelling Group | 150,000 | 1,520,416 | ||||
ePlus 1 | 5,300 | 406,245 | ||||
Silverlake Axis | 881,520 | 641,415 | ||||
Totvs | 73,900 | 926,989 | ||||
| 6,113,653 | ||||||
| TECHNOLOGY HARDWARE, STORAGE & PERIPHERALS - 0.4% | ||||||
Diebold | 39,912 | 1,396,920 | ||||
| Total (Cost $33,031,621) | 41,701,736 | |||||
| MATERIALS – 9.0% | ||||||
| CHEMICALS - 6.0% | ||||||
Airgas | 9,200 | 973,176 | ||||
Innospec | 53,465 | 2,408,064 | ||||
Minerals Technologies | 102,300 | 6,969,699 | ||||
Quaker Chemical | 7,500 | 666,300 | ||||
Sensient Technologies | 29,300 | 2,002,362 | ||||
Valspar Corporation (The) | 8,800 | 720,016 | ||||
Victrex | 45,700 | 1,385,858 | ||||
Westlake Chemical | 80,890 | 5,548,245 | ||||
| 20,673,720 | ||||||
| METALS & MINING - 1.6% | ||||||
Reliance Steel & Aluminum | 88,869 | 5,374,797 | ||||
| PAPER & FOREST PRODUCTS - 1.4% | ||||||
Glatfelter | 51,758 | 1,138,158 | ||||
Stella-Jones | 107,000 | 3,556,958 | ||||
| 4,695,116 | ||||||
| Total (Cost $26,184,428) | 30,743,633 | |||||
| UTILITIES – 1.2% | ||||||
| GAS UTILITIES - 1.2% | ||||||
UGI Corporation | 123,100 | 4,240,795 | ||||
| Total (Cost $3,881,905) | 4,240,795 | |||||
| MISCELLANEOUS6 – 3.2% | ||||||
| Total (Cost $10,926,006) | 10,912,994 | |||||
| TOTAL COMMON STOCKS | ||||||
| (Cost $237,820,239) | 294,236,036 | |||||
| REPURCHASE AGREEMENT– 14.4% | ||||||
| Fixed Income Clearing Corporation, 0.00% dated 6/30/15, due 7/1/15, maturity value $49,361,000 (collateralized by obligations of various U.S. Government Agencies, 2.125% due 1/31/21, valued at $50,350,738) | ||||||
| (Cost $49,361,000) | $ | 49,361,000 | ||||
| TOTAL INVESTMENTS – 100.3% | ||||||
| (Cost $287,181,239) | 343,597,036 | |||||
| LIABILITIES LESS CASH AND OTHER ASSETS – (0.3)% | (1,196,820) | |||||
| NET ASSETS – 100.0% | $ | 342,400,216 | ||||
| 58 | The Royce Funds 2015 Semiannual Report to Shareholders | THE ACCOMPANYING NOTES ARE AN INTEGRAL PART OF THESE FINANCIAL STATEMENTS |
| June 30, 2015 (unaudited) |
| Royce Opportunity Fund | ||||||
| Common Stocks – 96.2% | ||||||
| SHARES | VALUE | |||||
| CONSUMER DISCRETIONARY – 15.7% | ||||||
| AUTO COMPONENTS - 1.6% | ||||||
Cooper Tire & Rubber | 155,700 | $ | 5,267,331 | |||
Dana Holding Corporation | 497,736 | 10,243,407 | ||||
| 644,800 | 4,823,104 | |||||
Spartan Motors | 861,836 | 3,947,209 | ||||
Tower International 1 | 287,954 | 7,501,201 | ||||
| 31,782,252 | ||||||
| AUTOMOBILES - 0.4% | ||||||
Winnebago Industries | 343,877 | 8,112,058 | ||||
| DISTRIBUTORS - 0.3% | ||||||
VOXX International Cl. A 1 | 664,413 | 5,501,340 | ||||
| DIVERSIFIED CONSUMER SERVICES - 0.2% | ||||||
Houghton Mifflin Harcourt 1 | 172,359 | 4,343,447 | ||||
| HOTELS, RESTAURANTS & LEISURE - 2.0% | ||||||
Belmond Cl. A 1 | 866,019 | 10,816,577 | ||||
Carrols Restaurant Group 1 | 995,305 | 10,351,172 | ||||
| 427,516 | 2,103,379 | |||||
Krispy Kreme Doughnuts 1 | 452,561 | 8,716,325 | ||||
Ruby Tuesday 1 | 1,212,031 | 7,599,434 | ||||
| 39,586,887 | ||||||
| HOUSEHOLD DURABLES - 4.8% | ||||||
| 388,475 | 7,750,076 | |||||
| 864,035 | 9,072,367 | |||||
Ethan Allen Interiors | 182,700 | 4,812,318 | ||||
Installed Building Products 1 | 460,728 | 11,278,621 | ||||
M.D.C. Holdings | 431,250 | 12,924,563 | ||||
M/I Homes 1 | 429,100 | 10,585,897 | ||||
New Home 1 | 405,705 | 6,990,297 | ||||
Standard Pacific 1 | 1,106,000 | 9,854,460 | ||||
TRI Pointe Homes 1 | 512,272 | 7,837,762 | ||||
William Lyon Homes Cl. A 1 | 446,441 | 11,460,140 | ||||
| 512,981 | 4,062,810 | |||||
| 96,629,311 | ||||||
| INTERNET & CATALOG RETAIL - 0.4% | ||||||
EVINE Live 1 | 810,406 | 2,179,992 | ||||
Gaiam Cl. A 1 | 829,962 | 5,427,952 | ||||
| 7,607,944 | ||||||
| LEISURE PRODUCTS - 0.2% | ||||||
Black Diamond 1 | 458,139 | 4,233,204 | ||||
| MEDIA - 1.8% | ||||||
Ballantyne Strong 1 | 667,237 | 3,129,342 | ||||
| 213,186 | 150,275 | |||||
Entravision Communications Cl. A | 988,800 | 8,137,824 | ||||
Martha Stewart Living Omnimedia Cl. A 1 | 849,531 | 5,301,074 | ||||
McClatchy Company (The) Cl. A 1 | 2,860,167 | 3,088,980 | ||||
| 442,700 | 7,313,404 | |||||
New York Times Cl. A | 456,799 | 6,235,306 | ||||
Sizmek 1 | 495,050 | 3,514,855 | ||||
| 36,871,060 | ||||||
| MULTILINE RETAIL - 0.4% | ||||||
Bon-Ton Stores (The) | 462,501 | 2,136,755 | ||||
| 794,241 | 6,727,221 | |||||
| 8,863,976 | ||||||
| SPECIALTY RETAIL - 2.9% | ||||||
American Eagle Outfitters | 451,000 | 7,766,220 | ||||
Ascena Retail Group 1 | 676,092 | 11,260,312 | ||||
bebe stores 3 | 1,678,562 | 3,357,124 | ||||
Chico’s FAS | 313,000 | 5,205,190 | ||||
Destination Maternity | 232,237 | 2,707,883 | ||||
| 1,211,217 | 3,246,062 | |||||
| 731,947 | 834,420 | |||||
Pier 1 Imports | 82,900 | 1,047,027 | ||||
Rent-A-Center | 299,306 | 8,485,325 | ||||
Sears Hometown and Outlet Stores 1 | 306,945 | 2,915,978 | ||||
TravelCenters of America LLC 1 | 294,200 | 4,368,870 | ||||
West Marine 1 | 820,977 | 7,914,218 | ||||
| 59,108,629 | ||||||
| TEXTILES, APPAREL & LUXURY GOODS - 0.7% | ||||||
| 1,449,182 | 960,518 | |||||
Unifi 1 | 366,867 | 12,290,044 | ||||
| 13,250,562 | ||||||
| Total (Cost $280,430,654) | 315,890,670 | |||||
| CONSUMER STAPLES – 2.0% | ||||||
| FOOD & STAPLES RETAILING - 0.3% | ||||||
SUPERVALU 1 | 799,800 | 6,470,382 | ||||
| FOOD PRODUCTS - 0.7% | ||||||
Landec Corporation 1 | 443,602 | 6,401,177 | ||||
SunOpta 1 | 705,091 | 7,565,626 | ||||
| 13,966,803 | ||||||
| HOUSEHOLD PRODUCTS - 0.5% | ||||||
| 897,664 | 9,479,332 | |||||
Central Garden & Pet Cl. A 1 | 102,200 | 1,166,102 | ||||
| 10,645,434 | ||||||
| PERSONAL PRODUCTS - 0.5% | ||||||
| 644,605 | 9,192,068 | |||||
| Total (Cost $40,203,768) | 40,274,687 | |||||
| ENERGY – 2.0% | ||||||
| ENERGY EQUIPMENT & SERVICES - 0.9% | ||||||
Key Energy Services 1 | 1,008,900 | 1,816,020 | ||||
Matrix Service 1 | 337,608 | 6,171,474 | ||||
Newpark Resources 1 | 978,231 | 7,953,018 | ||||
Parker Drilling 1 | 492,200 | 1,634,104 | ||||
| 17,574,616 | ||||||
| OIL, GAS & CONSUMABLE FUELS - 1.1% | ||||||
| 462,100 | 1,538,793 | |||||
| 267,000 | 496,620 | |||||
Pengrowth Energy | 1,910,100 | 4,756,149 | ||||
Scorpio Tankers | 907,526 | 9,156,937 | ||||
StealthGas 1 | 985,421 | 6,651,592 | ||||
| 451,051 | 915,634 | |||||
| 23,515,725 | ||||||
| Total (Cost $62,795,385) | 41,090,341 | |||||
| FINANCIALS – 10.9% | ||||||
| BANKS - 5.5% | ||||||
BancorpSouth | 233,700 | 6,020,112 | ||||
BankUnited | 339,498 | 12,198,163 | ||||
Berkshire Hills Bancorp | 175,400 | 4,995,392 | ||||
Boston Private Financial Holdings | 940,446 | 12,611,381 | ||||
Capital Bank Financial Cl. A 1 | 238,100 | 6,921,567 | ||||
CenterState Banks | 351,441 | 4,747,968 | ||||
Fidelity Southern | 157,440 | 2,745,754 | ||||
First Bancorp | 172,408 | 2,875,765 | ||||
First Internet Bancorp | 120,200 | 2,944,900 | ||||
Guaranty Bancorp | 234,458 | 3,870,902 | ||||
Hilltop Holdings 1 | 253,876 | 6,115,873 | ||||
| THE ACCOMPANYING NOTES ARE AN INTEGRAL PART OF THESE FINANCIAL STATEMENTS | The Royce Funds 2015 Semiannual Report to Shareholders | 59 |
| Schedules of Investments |
| Royce Opportunity Fund (continued) | ||||||
| SHARES | VALUE | |||||
| FINANCIALS (continued) | ||||||
| BANKS (continued) | ||||||
Independent Bank Group | 35,800 | $ | 1,535,820 | |||
South State | 97,326 | 7,395,803 | ||||
Southern National Bancorp of Virginia | 218,015 | 2,415,606 | ||||
State Bank Financial | 382,059 | 8,290,680 | ||||
Trustmark Corporation | 220,300 | 5,503,094 | ||||
Umpqua Holdings | 536,400 | 9,649,836 | ||||
United Bankshares | 236,239 | 9,503,895 | ||||
| 110,342,511 | ||||||
| CAPITAL MARKETS - 0.1% | ||||||
Harris & Harris Group 1 | 414,396 | 1,139,589 | ||||
| CONSUMER FINANCE - 0.6% | ||||||
Enova International 1 | 596,110 | 11,135,335 | ||||
EZCORP Cl. A 1 | 174,306 | 1,295,093 | ||||
| 12,430,428 | ||||||
| INSURANCE - 1.6% | ||||||
Ambac Financial Group 1 | 373,446 | 6,214,141 | ||||
Assured Guaranty | 391,300 | 9,387,287 | ||||
MBIA 1 | 1,114,076 | 6,695,597 | ||||
Old Republic International | 567,538 | 8,870,619 | ||||
| 31,167,644 | ||||||
| REAL ESTATE INVESTMENT TRUSTS (REITS) - 0.9% | ||||||
BRT Realty Trust 1 | 98,309 | 691,112 | ||||
Mack-Cali Realty | 451,550 | 8,322,066 | ||||
RAIT Financial Trust | 58,400 | 356,824 | ||||
Rouse Properties | 575,233 | 9,405,060 | ||||
| 18,775,062 | ||||||
| REAL ESTATE MANAGEMENT & DEVELOPMENT - 0.4% | ||||||
Tejon Ranch 1 | 342,056 | 8,794,260 | ||||
| THRIFTS & MORTGAGE FINANCE - 1.8% | ||||||
Brookline Bancorp | 242,200 | 2,734,438 | ||||
MGIC Investment 1 | 539,785 | 6,142,753 | ||||
Radian Group | 585,385 | 10,981,823 | ||||
Walker & Dunlop 1 | 264,512 | 7,073,051 | ||||
Washington Federal | 378,800 | 8,844,980 | ||||
| 35,777,045 | ||||||
| Total (Cost $170,613,374) | 218,426,539 | |||||
| HEALTH CARE – 3.7% | ||||||
| HEALTH CARE EQUIPMENT & SUPPLIES - 2.0% | ||||||
| 703,800 | 4,743,612 | |||||
AngioDynamics 1 | 405,040 | 6,642,656 | ||||
Exactech 1 | 284,283 | 5,921,615 | ||||
Invacare Corporation | 733,285 | 15,860,955 | ||||
Merit Medical Systems 1 | 250,328 | 5,392,065 | ||||
RTI Surgical 1 | 399,174 | 2,578,664 | ||||
| 41,139,567 | ||||||
| HEALTH CARE PROVIDERS & SERVICES - 0.3% | ||||||
Owens & Minor | 177,200 | 6,024,800 | ||||
| HEALTH CARE TECHNOLOGY - 0.6% | ||||||
Allscripts Healthcare Solutions 1 | 887,936 | 12,146,964 | ||||
| LIFE SCIENCES TOOLS & SERVICES - 0.8% | ||||||
| 770,810 | 15,585,778 | |||||
| Total (Cost $50,832,429) | 74,897,109 | |||||
| INDUSTRIALS – 21.5% | ||||||
| AEROSPACE & DEFENSE - 1.3% | ||||||
Aerojet Rocketdyne Holdings 1 | 464,240 | 9,567,987 | ||||
Kratos Defense & Security Solutions 1 | 1,435,124 | 9,041,281 | ||||
| 816,430 | 8,172,464 | |||||
| 26,781,732 | ||||||
| AIR FREIGHT & LOGISTICS - 0.9% | ||||||
Atlas Air Worldwide Holdings 1 | 136,662 | 7,510,944 | ||||
| 230,500 | 10,413,990 | |||||
| 17,924,934 | ||||||
| AIRLINES - 0.4% | ||||||
| 284,200 | 7,809,816 | |||||
| BUILDING PRODUCTS - 3.7% | ||||||
Builders FirstSource 1 | 329,294 | 4,228,135 | ||||
Gibraltar Industries 1 | 421,987 | 8,595,875 | ||||
Griffon Corporation | 522,400 | 8,316,608 | ||||
Insteel Industries | 440,427 | 8,235,985 | ||||
NCI Building Systems 1 | 934,600 | 14,084,422 | ||||
PGT 1 | 675,208 | 9,797,268 | ||||
Ply Gem Holdings 1 | 541,292 | 6,381,833 | ||||
Quanex Building Products | 713,386 | 15,287,862 | ||||
| 74,927,988 | ||||||
| COMMERCIAL SERVICES & SUPPLIES - 2.6% | ||||||
ABM Industries | 295,000 | 9,696,650 | ||||
Interface | 670,316 | 16,791,416 | ||||
Steelcase Cl. A | 509,700 | 9,638,427 | ||||
| 1,563,629 | 15,870,834 | |||||
| 51,997,327 | ||||||
| CONSTRUCTION & ENGINEERING - 2.2% | ||||||
Aegion Corporation 1 | 689,289 | 13,055,133 | ||||
Furmanite Corporation 1 | 872,641 | 7,085,845 | ||||
| 845,804 | 7,569,946 | |||||
MasTec 1 | 367,200 | 7,296,264 | ||||
Northwest Pipe 1 | 415,256 | 8,458,765 | ||||
| 43,465,953 | ||||||
| ELECTRICAL EQUIPMENT - 2.3% | ||||||
Encore Wire | 378,140 | 16,747,821 | ||||
| 630,780 | 4,800,236 | |||||
General Cable | 916,043 | 18,073,528 | ||||
Magnetek 1 | 164,495 | 5,660,273 | ||||
| 45,281,858 | ||||||
| MACHINERY - 6.2% | ||||||
Accuride Corporation 1 | 375,100 | 1,444,135 | ||||
Albany International Cl. A | 318,150 | 12,662,370 | ||||
Astec Industries | 381,128 | 15,938,773 | ||||
Commercial Vehicle Group 1 | 1,154,540 | 8,324,233 | ||||
Dynamic Materials | 412,939 | 4,542,329 | ||||
Federal Signal | 862,932 | 12,866,316 | ||||
Hardinge | 590,497 | 5,816,396 | ||||
Hurco Companies | 204,591 | 7,082,941 | ||||
Lydall 1 | 101,997 | 3,015,031 | ||||
Meritor 1 | 545,719 | 7,159,833 | ||||
Mueller Industries | 477,221 | 16,569,113 | ||||
Mueller Water Products Cl. A | 1,680,376 | 15,291,422 | ||||
NN | 518,983 | 13,244,446 | ||||
| 123,957,338 | ||||||
| MARINE - 0.7% | ||||||
Baltic Trading 3 | 1,395,937 | 2,233,499 | ||||
Diana Shipping 1 | 982,000 | 6,923,100 | ||||
Navios Maritime Holdings | 1,190,149 | 4,427,354 | ||||
| 795,300 | 1,296,339 | |||||
| 14,880,292 | ||||||
| 60 | The Royce Funds 2015 Semiannual Report to Shareholders | THE ACCOMPANYING NOTES ARE AN INTEGRAL PART OF THESE FINANCIAL STATEMENTS |
| June 30, 2015 (unaudited) |
| Royce Opportunity Fund (continued) |
| SHARES | VALUE | ||||
| INDUSTRIALS (continued) | |||||
| ROAD & RAIL - 0.2% | |||||
Swift Transportation Cl. A 1 | 218,844 | $ | 4,961,193 | ||
| TRADING COMPANIES & DISTRIBUTORS - 0.5% | |||||
Kaman Corporation | 248,831 | 10,435,972 | |||
| TRANSPORTATION INFRASTRUCTURE - 0.5% | |||||
Wesco Aircraft Holdings 1 | 603,300 | 9,139,995 | |||
| Total (Cost $336,775,627) | 431,564,398 | ||||
| INFORMATION TECHNOLOGY – 30.1% | |||||
| COMMUNICATIONS EQUIPMENT - 2.0% | |||||
ARRIS Group 1 | 221,460 | 6,776,676 | |||
Aviat Networks 1 | 2,414,108 | 3,041,776 | |||
| 124,200 | 2,941,056 | ||||
ClearOne | 290,034 | 3,742,889 | |||
Comtech Telecommunications | 379,311 | 11,018,984 | |||
EMCORE Corporation 1 | 175,346 | 1,055,583 | |||
Extreme Networks 1 | 1,138,776 | 3,063,307 | |||
Harmonic 1 | 758,577 | 5,181,081 | |||
Interphase Corporation 1 | 277,743 | 213,862 | |||
| 1,290,977 | 2,917,608 | ||||
| 944,845 | 935,397 | ||||
| 40,888,219 | |||||
| ELECTRONIC EQUIPMENT, INSTRUMENTS & COMPONENTS - 8.7% | |||||
Benchmark Electronics 1 | 498,400 | 10,855,152 | |||
Checkpoint Systems | 741,831 | 7,551,839 | |||
CTS Corporation | 325,780 | 6,277,781 | |||
Daktronics | 610,225 | 7,237,268 | |||
| 1,438,886 | 1,151,109 | ||||
Frequency Electronics 1 | 224,263 | 2,529,687 | |||
GSI Group 1 | 499,225 | 7,503,352 | |||
| 582,839 | 3,432,922 | ||||
II-VI 1 | 738,814 | 14,022,690 | |||
Ingram Micro Cl. A 1 | 487,314 | 12,197,469 | |||
| 2,065,707 | 5,949,236 | ||||
| 151,700 | 2,745,770 | ||||
Maxwell Technologies 1 | 1,013,360 | 6,049,759 | |||
Mercury Systems 1 | 873,478 | 12,787,718 | |||
Newport Corporation 1 | 751,984 | 14,257,617 | |||
Park Electrochemical | 320,934 | 6,149,095 | |||
PCM 1 | 522,736 | 5,243,042 | |||
Perceptron 1 | 334,531 | 3,532,647 | |||
| 1,221,075 | 5,323,887 | ||||
RadiSys Corporation 1 | 609,078 | 1,559,240 | |||
Sanmina Corporation 1 | 604,823 | 12,193,232 | |||
| 345,772 | 3,146,525 | ||||
TTM Technologies 1 | 864,925 | 8,640,601 | |||
Vishay Intertechnology | 986,723 | 11,524,925 | |||
Vishay Precision Group 1 | 206,742 | 3,113,534 | |||
| 174,976,097 | |||||
| INTERNET SOFTWARE & SERVICES - 2.6% | |||||
Bankrate 1 | 476,408 | 4,997,520 | |||
Blucora 1 | 246,530 | 3,981,459 | |||
| 485,938 | 2,876,753 | ||||
EarthLink Holdings | 1,926,458 | 14,429,170 | |||
Limelight Networks 1 | 738,469 | 2,909,568 | |||
Monster Worldwide 1 | 1,526,100 | 9,980,694 | |||
QuinStreet 1 | 1,293,539 | 8,343,327 | |||
Support.com 1 | 1,210,097 | 1,706,237 | |||
| 858,956 | 2,499,562 | ||||
| 47,200 | 255,824 | ||||
| 51,980,114 | |||||
| IT SERVICES - 1.4% | |||||
CIBER 1 | 1,766,873 | 6,095,712 | |||
Computer Task Group | 678,910 | 5,241,185 | |||
Datalink Corporation 1 | 727,909 | 6,507,506 | |||
Perficient 1 | 49,883 | 959,749 | |||
Unisys Corporation 1 | 494,700 | 9,889,053 | |||
| 28,693,205 | |||||
| SEMICONDUCTORS & SEMICONDUCTOR EQUIPMENT - 11.4% | |||||
Advanced Energy Industries 1 | 646,771 | 17,779,735 | |||
| 902,342 | 7,886,469 | ||||
| 631,939 | 6,565,846 | ||||
| 2,131,745 | 1,556,174 | ||||
Axcelis Technologies 1 | 1,185,194 | 3,508,174 | |||
AXT 1 | 621,392 | 1,565,908 | |||
Brooks Automation | 1,312,700 | 15,030,415 | |||
Cohu | 575,426 | 7,612,886 | |||
Exar Corporation 1 | 1,021,094 | 9,986,299 | |||
Fairchild Semiconductor International 1 | 542,120 | 9,422,046 | |||
FormFactor 1 | 755,761 | 6,953,001 | |||
Intersil Corporation Cl. A | 711,499 | 8,900,852 | |||
IXYS Corporation | 607,550 | 9,295,515 | |||
Kopin Corporation 1 | 886,674 | 3,059,025 | |||
Kulicke & Soffa Industries 1 | 740,400 | 8,670,084 | |||
Mattson Technology 1 | 769,400 | 2,577,490 | |||
MaxLinear Cl. A 1 | 980,122 | 11,859,476 | |||
Microsemi Corporation 1 | 544,954 | 19,046,142 | |||
Nanometrics 1 | 679,039 | 10,946,109 | |||
| 886,358 | 8,092,449 | ||||
OmniVision Technologies 1 | 333,411 | 8,733,701 | |||
Pericom Semiconductor | 868,095 | 11,415,449 | |||
| 922,106 | 2,240,718 | ||||
Rudolph Technologies 1 | 618,011 | 7,422,312 | |||
SemiLEDs Corporation 1 | 973,905 | 555,126 | |||
| 662,700 | 73,560 | ||||
| 282,978 | 8,463,872 | ||||
| 482,229 | 8,328,095 | ||||
Ultra Clean Holdings 1 | 704,038 | 4,386,157 | |||
Xcerra Corporation 1 | 894,954 | 6,774,802 | |||
| 228,707,887 | |||||
| SOFTWARE - 1.5% | |||||
| 923,499 | 5,947,334 | ||||
Mentor Graphics | 376,819 | 9,959,326 | |||
Rovi Corporation 1 | 338,300 | 5,395,885 | |||
SeaChange International 1 | 555,600 | 3,894,756 | |||
| 805,722 | 926,580 | ||||
TeleCommunication Systems Cl. A 1 | 828,717 | 2,743,053 | |||
| 28,866,934 | |||||
| TECHNOLOGY HARDWARE, STORAGE & PERIPHERALS - 2.5% | |||||
Avid Technology 1 | 790,580 | 10,546,337 | |||
Cray 1 | 389,567 | 11,496,122 | |||
Dot Hill Systems 1 | 995,571 | 6,092,895 | |||
| 870,591 | 5,092,958 | ||||
QLogic Corporation 1 | 627,200 | 8,899,968 | |||
| 1,313,473 | 8,498,170 | ||||
| 50,626,450 | |||||
| Total (Cost $535,247,471) | 604,738,906 | ||||
| THE ACCOMPANYING NOTES ARE AN INTEGRAL PART OF THESE FINANCIAL STATEMENTS | The Royce Funds 2015 Semiannual Report to Shareholders | 61 |
Schedules of Investments
| Royce Opportunity Fund (continued) |
| SHARES | VALUE | ||||
| MATERIALS – 8.0% | |||||
| CHEMICALS - 1.9% | |||||
Ferro Corporation 1 | 819,711 | $ | 13,754,751 | ||
Kraton Performance Polymers 1 | 663,100 | 15,834,828 | |||
OM Group | 107,035 | 3,596,376 | |||
Schulman (A.) | 129,082 | 5,643,465 | |||
| 38,829,420 | |||||
| CONSTRUCTION MATERIALS - 0.5% | |||||
U.S. Concrete 1 | 261,815 | 9,920,170 | |||
| METALS & MINING - 5.0% | |||||
| 1,107,034 | 6,830,400 | ||||
| 1,098,600 | 4,251,582 | ||||
Carpenter Technology | 106,741 | 4,128,742 | |||
| 1,012,403 | 10,559,363 | ||||
Coeur Mining 1 | 475,200 | 2,713,392 | |||
Commercial Metals | 1,179,761 | 18,970,557 | |||
Haynes International | 273,291 | 13,478,712 | |||
Hecla Mining | 1,189,800 | 3,129,174 | |||
Kaiser Aluminum | 180,000 | 14,954,400 | |||
Noranda Aluminum Holding Corporation 3 | 2,115,039 | 1,797,783 | |||
Pan American Silver | 1,025,100 | 8,805,609 | |||
Synalloy Corporation | 333,195 | 4,564,771 | |||
TimkenSteel Corporation | 219,538 | 5,925,331 | |||
| 100,109,816 | |||||
| PAPER & FOREST PRODUCTS - 0.6% | |||||
Louisiana-Pacific Corporation 1 | 636,400 | 10,837,892 | |||
| Total (Cost $140,928,628) | 159,697,298 | ||||
| TELECOMMUNICATION SERVICES – 0.6% | |||||
| DIVERSIFIED TELECOMMUNICATION SERVICES - 0.6% | |||||
| 1,341,706 | 12,196,108 | ||||
| Total (Cost $9,917,746) | 12,196,108 | ||||
| UTILITIES – 0.2% | |||||
| WATER UTILITIES - 0.2% | |||||
| 107,200 | 931,568 | ||||
| 525,799 | 2,734,155 | ||||
| Total (Cost $3,145,294) | 3,665,723 | ||||
| MISCELLANEOUS6 – 1.5% | |||||
| Total (Cost $32,027,567) | 30,667,510 | ||||
| TOTAL COMMON STOCKS | |||||
| (Cost $1,662,917,943) | 1,933,109,289 | ||||
| REPURCHASE AGREEMENT– 3.6% | ||||||||
| Fixed Income Clearing Corporation, 0.00% dated 6/30/15, due 7/1/15, maturity value $72,563,000 (collateralized by obligations of various U.S. Government Agencies, 1.875% due 6/30/20, valued at $74,017,850) | ||||||||
| (Cost $72,563,000) | 72,563,000 | |||||||
| PRINCIPAL | ||||||||
| AMOUNT | ||||||||
| COLLATERAL RECEIVED FOR SECURITIES LOANED – 5.9% | ||||||||
| U.S. Treasury Bills | ||||||||
due 12/3/15 | $ | 1,455 | 1,455 | |||||
| U.S. Treasury Bonds | ||||||||
0.75%-6.00% | ||||||||
due 1/15/25-5/15/45 | 7,904 | 7,990 | ||||||
| U.S. Treasury Notes | ||||||||
0.125%-4.25% | ||||||||
due 7/15/15-1/15/25 | 21,031 | 21,102 | ||||||
| U.S. Treasury Strips-Interest | ||||||||
due 8/15/18-5/15/25 | 1,562 | 1,562 | ||||||
| Money Market Funds | ||||||||
Federated Government Obligations Fund (7 day yield-0.0099%) | 117,825,189 | |||||||
| TOTAL COLLATERAL RECEIVED FOR SECURITIES LOANED | ||||||||
| (Cost $117,857,298) | 117,857,298 | |||||||
| TOTAL INVESTMENTS – 105.7% | ||||||||
| (Cost $1,853,338,241) | 2,123,529,587 | |||||||
| LIABILITIES LESS CASH AND OTHER ASSETS – (5.7)% | (113,996,137) | |||||||
| NET ASSETS – 100.0% | $ | 2,009,533,450 | ||||||
| 62 | The Royce Funds 2015 Semiannual Report to Shareholders | THE ACCOMPANYING NOTES ARE AN INTEGRAL PART OF THESE FINANCIAL STATEMENTS |
| June 30, 2015 (unaudited) |
| Royce Special Equity Fund |
| Common Stocks – 92.9% |
| SHARES | VALUE | ||||
| CONSUMER DISCRETIONARY – 35.2% | |||||
| AUTO COMPONENTS - 5.1% | |||||
Dana Holding Corporation | 1,722,000 | $ | 35,438,760 | ||
Standard Motor Products 2 | 2,089,000 | 73,365,680 | |||
| 108,804,440 | |||||
| AUTOMOBILES - 0.9% | |||||
Winnebago Industries | 843,700 | 19,902,883 | |||
| DIVERSIFIED CONSUMER SERVICES - 0.3% | |||||
†Capella Education | 120,000 | 6,440,400 | |||
| HOTELS, RESTAURANTS & LEISURE - 0.9% | |||||
Bowl America Cl. A 2 | 315,948 | 4,511,737 | |||
Frisch’s Restaurants 2 | 465,200 | 15,616,764 | |||
| 20,128,501 | |||||
| HOUSEHOLD DURABLES - 1.7% | |||||
CSS Industries 2 | 880,000 | 26,620,000 | |||
Ethan Allen Interiors | 100,000 | 2,634,000 | |||
Hooker Furniture | 254,900 | 6,400,539 | |||
| 35,654,539 | |||||
| MEDIA - 7.5% | |||||
Meredith Corporation | 1,820,000 | 94,913,000 | |||
Scholastic Corporation | 1,515,000 | 66,856,950 | |||
| 161,769,950 | |||||
| SPECIALTY RETAIL - 18.8% | |||||
Bed Bath & Beyond 1 | 1,750,000 | 120,715,000 | |||
Buckle (The) | 1,485,400 | 67,986,758 | |||
Children’s Place 2 | 1,540,000 | 100,731,400 | |||
Finish Line (The) Cl. A 2 | 3,295,000 | 91,666,900 | |||
Haverty Furniture | 1,105,683 | 23,904,867 | |||
| 405,004,925 | |||||
| Total (Cost $583,854,425) | 757,705,638 | ||||
| CONSUMER STAPLES – 5.6% | |||||
| FOOD & STAPLES RETAILING - 2.6% | |||||
Weis Markets | 1,337,500 | 56,375,625 | |||
| FOOD PRODUCTS - 2.4% | |||||
†Cal-Maine Foods | 773,652 | 40,384,634 | |||
Lancaster Colony | 120,000 | 10,902,000 | |||
| 51,286,634 | |||||
| TOBACCO - 0.6% | |||||
Universal Corporation | 240,000 | 13,756,800 | |||
| Total (Cost $102,741,344) | 121,419,059 | ||||
| FINANCIALS – 2.9% | |||||
| CAPITAL MARKETS - 2.9% | |||||
Waddell & Reed Financial Cl. A | 1,315,200 | 62,222,112 | |||
| Total (Cost $63,704,249) | 62,222,112 | ||||
| HEALTH CARE – 0.3% | |||||
| LIFE SCIENCES TOOLS & SERVICES - 0.3% | |||||
Bio-Rad Laboratories Cl. A 1 | 40,000 | 6,024,400 | |||
| Total (Cost $2,020,969) | 6,024,400 | ||||
| INDUSTRIALS – 24.1% | |||||
| AEROSPACE & DEFENSE - 2.2% | |||||
National Presto Industries 2 | 600,000 | 48,192,000 | |||
| COMMERCIAL SERVICES & SUPPLIES - 7.1% | |||||
UniFirst Corporation 2 | 1,370,000 | 153,234,500 | |||
| ELECTRICAL EQUIPMENT - 6.4% | |||||
EnerSys | 725,000 | 50,960,250 | |||
Hubbell Cl. B | 557,300 | 60,344,444 | |||
Regal Beloit | 347,300 | 25,210,507 | |||
| 136,515,201 | |||||
| INDUSTRIAL CONGLOMERATES - 0.7% | |||||
Carlisle Companies | 140,000 | 14,016,800 | |||
| MACHINERY - 4.4% | |||||
Foster (L.B.) Company 2 | 885,000 | 30,629,850 | |||
Hurco Companies 2 | 476,200 | 16,486,044 | |||
Valmont Industries | 400,000 | 47,548,000 | |||
| 94,663,894 | |||||
| PROFESSIONAL SERVICES - 0.0% | |||||
†Kelly Services Cl. A | 28,920 | 443,922 | |||
| TRADING COMPANIES & DISTRIBUTORS - 3.3% | |||||
Applied Industrial Technologies | 1,800,000 | 71,370,000 | |||
| Total (Cost $342,069,747) | 518,436,317 | ||||
| INFORMATION TECHNOLOGY – 13.3% | |||||
| ELECTRONIC EQUIPMENT, INSTRUMENTS & COMPONENTS - 11.0% | |||||
Anixter International 1 | 513,300 | 33,441,495 | |||
AVX Corporation 2 | 8,700,000 | 117,102,000 | |||
Park Electrochemical 2 | 1,475,000 | 28,261,000 | |||
| 1,480,000 | 56,328,800 | ||||
| 235,133,295 | |||||
| SEMICONDUCTORS & SEMICONDUCTOR EQUIPMENT - 2.3% | |||||
Teradyne | 2,585,000 | 49,864,650 | |||
| Total (Cost $278,318,700) | 284,997,945 | ||||
| MATERIALS – 11.5% | |||||
| CHEMICALS - 4.2% | |||||
Hawkins 2 | 900,000 | 36,351,000 | |||
Minerals Technologies | 800,000 | 54,504,000 | |||
| 90,855,000 | |||||
| METALS & MINING - 1.2% | |||||
Central Steel & Wire 5 | 6,421 | 3,981,020 | |||
†Kaiser Aluminum | 259,900 | 21,592,492 | |||
| 25,573,512 | |||||
| PAPER & FOREST PRODUCTS - 6.1% | |||||
Neenah Paper 2 | 1,227,800 | 72,391,088 | |||
Schweitzer-Mauduit International | 1,450,000 | 57,826,000 | |||
| 130,217,088 | |||||
| Total (Cost $194,608,890) | 246,645,600 | ||||
| TOTAL COMMON STOCKS | |||||
| (Cost $1,567,318,324) | 1,997,451,071 | ||||
| REPURCHASE AGREEMENT– 9.2% | |||||
| Fixed Income Clearing Corporation, 0.00% dated 6/30/15, due 7/1/15, maturity value $198,730,000 (collateralized by obligations of various U.S. Government Agencies, 1.875%- 2.625% due 6/30/20-8/15/20, valued at $202,707,950) | |||||
| (Cost $198,730,000) | 198,730,000 | ||||
| TOTAL INVESTMENTS – 102.1% | |||||
| (Cost $1,766,048,324) | 2,196,181,071 | ||||
| LIABILITIES LESS CASH AND OTHER ASSETS – (2.1)% | (45,975,000) | ||||
| NET ASSETS – 100.0% | $ | 2,150,206,071 | |||
| THE ACCOMPANYING NOTES ARE AN INTEGRAL PART OF THESE FINANCIAL STATEMENTS | The Royce Funds 2015 Semiannual Report to Shareholders | 63 |
Schedules of Investments
| Royce Select Fund I | |||||
| Common Stocks – 92.8% | |||||
| SHARES | VALUE | ||||
| CONSUMER DISCRETIONARY – 16.4% | |||||
| AUTO COMPONENTS - 2.0% | |||||
Drew Industries | 2,606 | $ | 151,200 | ||
Gentex Corporation | 18,350 | 301,307 | |||
| 452,507 | |||||
| AUTOMOBILES - 1.9% | |||||
Thor Industries | 7,745 | 435,889 | |||
| HOUSEHOLD DURABLES - 1.6% | |||||
NVR 1 | 280 | 375,200 | |||
| MEDIA - 1.9% | |||||
E.W. Scripps Company Cl. A | 11,750 | 268,488 | |||
Wiley (John) & Sons Cl. A | 3,020 | 164,197 | |||
| 432,685 | |||||
| SPECIALTY RETAIL - 6.2% | |||||
Buckle (The) | 17,205 | 787,473 | |||
Genesco 1 | 9,545 | 630,256 | |||
| 1,417,729 | |||||
| TEXTILES, APPAREL & LUXURY GOODS - 2.8% | |||||
| 3,030 | 218,069 | ||||
Movado Group | 15,933 | 432,740 | |||
| 650,809 | |||||
| Total (Cost $3,185,705) | 3,764,819 | ||||
| CONSUMER STAPLES – 2.3% | |||||
| FOOD PRODUCTS - 1.7% | |||||
Cal-Maine Foods | 7,358 | 384,088 | |||
| PERSONAL PRODUCTS - 0.6% | |||||
Nu Skin Enterprises Cl. A | 2,830 | 133,378 | |||
| Total (Cost $262,480) | 517,466 | ||||
| ENERGY – 6.7% | |||||
| ENERGY EQUIPMENT & SERVICES - 6.7% | |||||
Helmerich & Payne | 3,740 | 263,371 | |||
Oil States International 1 | 4,950 | 184,289 | |||
Pason Systems | 19,800 | 354,307 | |||
SEACOR Holdings 1 | 2,989 | 212,040 | |||
TGS-NOPEC Geophysical | 11,740 | 274,167 | |||
Unit Corporation 1 | 9,595 | 260,216 | |||
| Total (Cost $1,223,238) | 1,548,390 | ||||
| FINANCIALS – 17.5% | |||||
| BANKS - 1.1% | |||||
Blue Hills Bancorp 1 | 18,000 | 252,000 | |||
| CAPITAL MARKETS - 10.6% | |||||
Artisan Partners Asset Management Cl. A | 12,230 | 568,206 | |||
Federated Investors Cl. B | 11,500 | 385,135 | |||
Lazard Cl. A | 10,340 | 581,522 | |||
SEI Investments | 7,865 | 385,621 | |||
Virtus Investment Partners | 3,970 | 525,032 | |||
| 2,445,516 | |||||
| INSURANCE - 2.7% | |||||
Alleghany Corporation 1 | 900 | 421,884 | |||
Validus Holdings | 4,300 | 189,157 | |||
| 611,041 | |||||
| THRIFTS & MORTGAGE FINANCE - 3.1% | |||||
Genworth MI Canada | 26,747 | 702,403 | |||
| Total (Cost $3,224,552) | 4,010,960 | ||||
| HEALTH CARE – 6.4% | |||||
| BIOTECHNOLOGY - 0.4% | |||||
Myriad Genetics 1 | 2,865 | 97,381 | |||
| HEALTH CARE PROVIDERS & SERVICES - 0.6% | |||||
Aceto Corporation | 5,867 | 144,504 | |||
| LIFE SCIENCES TOOLS & SERVICES - 4.5% | |||||
Bio-Rad Laboratories Cl. A 1 | 3,585 | 539,937 | |||
Bio-Techne | 4,934 | 485,851 | |||
| 1,025,788 | |||||
| PHARMACEUTICALS - 0.9% | |||||
Lannett Company 1 | 3,415 | 202,988 | |||
| Total (Cost $1,009,105) | 1,470,661 | ||||
| INDUSTRIALS – 19.9% | |||||
| COMMERCIAL SERVICES & SUPPLIES - 2.9% | |||||
Ritchie Bros. Auctioneers | 12,770 | 356,538 | |||
†Steelcase Cl. A | 16,760 | 316,932 | |||
| 673,470 | |||||
| ELECTRICAL EQUIPMENT - 0.0% | |||||
Global Power Equipment Group | 190 | 1,474 | |||
| INDUSTRIAL CONGLOMERATES - 0.6% | |||||
Carlisle Companies | 1,310 | 131,157 | |||
| MACHINERY - 12.0% | |||||
CIRCOR International | 7,032 | 383,455 | |||
Columbus McKinnon | 15,575 | 389,375 | |||
†Federal Signal | 14,790 | 220,519 | |||
Hyster-Yale Materials Handling Cl. A | 2,325 | 161,076 | |||
John Bean Technologies | 16,709 | 628,091 | |||
Kennametal | 5,500 | 187,660 | |||
Lydall 1 | 8,630 | 255,103 | |||
Valmont Industries | 3,105 | 369,091 | |||
Wabtec Corporation | 1,798 | 169,444 | |||
| 2,763,814 | |||||
| PROFESSIONAL SERVICES - 1.9% | |||||
ICF International 1 | 4,683 | 163,249 | |||
Robert Half International | 2,283 | 126,707 | |||
Towers Watson & Co. Cl. A | 1,200 | 150,960 | |||
| 440,916 | |||||
| ROAD & RAIL - 0.8% | |||||
| 4,920 | 193,307 | ||||
| TRADING COMPANIES & DISTRIBUTORS - 1.7% | |||||
MSC Industrial Direct Cl. A | 5,427 | 378,642 | |||
| Total (Cost $3,664,834) | 4,582,780 | ||||
| INFORMATION TECHNOLOGY – 17.7% | |||||
| COMMUNICATIONS EQUIPMENT - 0.0% | |||||
ADTRAN | 1 | 16 | |||
| ELECTRONIC EQUIPMENT, INSTRUMENTS & COMPONENTS - 3.4% | |||||
Coherent 1 | 2,386 | 151,463 | |||
Dolby Laboratories Cl. A | 4,615 | 183,123 | |||
IPG Photonics 1 | 1,690 | 143,946 | |||
Rofin-Sinar Technologies 1 | 11,282 | 311,383 | |||
| 789,915 | |||||
| INTERNET SOFTWARE & SERVICES - 1.5% | |||||
j2 Global | 4,965 | 337,322 | |||
| IT SERVICES - 2.1% | |||||
Sykes Enterprises 1 | 19,415 | 470,814 | |||
| SEMICONDUCTORS & SEMICONDUCTOR EQUIPMENT - 7.9% | |||||
Cabot Microelectronics 1 | 2,966 | 139,728 | |||
Integrated Silicon Solution | 2,864 | 63,409 | |||
| 64 | The Royce Funds 2015 Semiannual Report to Shareholders | THE ACCOMPANYING NOTES ARE AN INTEGRAL PART OF THESE FINANCIAL STATEMENTS |
| June 30, 2015 (unaudited) |
| Royce Select Fund I (continued) |
| SHARES | VALUE | ||||
| INFORMATION TECHNOLOGY (continued) | |||||
| SEMICONDUCTORS & SEMICONDUCTOR EQUIPMENT (continued) | |||||
MKS Instruments | 19,105 | $ | 724,844 | ||
Nanometrics 1 | 24,818 | 400,066 | |||
Tessera Technologies | 2,255 | 85,645 | |||
Veeco Instruments 1 | 14,230 | 408,970 | |||
| 1,822,662 | |||||
| SOFTWARE - 2.2% | |||||
Mentor Graphics | 9,730 | 257,164 | |||
Monotype Imaging Holdings | 10,460 | 252,191 | |||
| 509,355 | |||||
| TECHNOLOGY HARDWARE, STORAGE & PERIPHERALS - 0.6% | |||||
Silicon Graphics International 1 | 22,260 | 144,022 | |||
| Total (Cost $3,233,723) | 4,074,106 | ||||
| MATERIALS – 5.9% | |||||
| CHEMICALS - 3.6% | |||||
Innospec | 3,057 | 137,688 | |||
Minerals Technologies | 10,256 | 698,741 | |||
| 836,429 | |||||
| METALS & MINING - 1.6% | |||||
Reliance Steel & Aluminum | 5,930 | 358,646 | |||
| PAPER & FOREST PRODUCTS - 0.7% | |||||
Schweitzer-Mauduit International | 3,895 | 155,333 | |||
| Total (Cost $852,560) | 1,350,408 | ||||
| TOTAL COMMON STOCKS | |||||
| (Cost $16,656,197) | 21,319,590 | ||||
| REPURCHASE AGREEMENT– 7.4% | |||||
| Fixed Income Clearing Corporation, 0.00% dated 6/30/15, due 7/1/15, maturity value $1,709,000 (collateralized by obligations of various U.S. Government Agencies, 1.875% due 6/30/20, valued at $1,747,300) | |||||
| (Cost $1,709,000) | 1,709,000 | ||||
| TOTAL INVESTMENTS – 100.2% | |||||
| (Cost $18,365,197) | 23,028,590 | ||||
| LIABILITIES LESS CASH AND OTHER ASSETS – (0.2)% | (41,875) | ||||
| NET ASSETS – 100.0% | $ | 22,986,715 | |||
| Royce Small-Cap Value Fund | |||||
| Common Stocks – 99.1% | |||||
| SHARES | VALUE | ||||
| CONSUMER DISCRETIONARY – 29.5% | |||||
| AUTO COMPONENTS - 3.8% | |||||
Dorman Products 1 | 308,253 | $ | 14,691,338 | ||
Gentex Corporation | 499,956 | 8,209,278 | |||
STRATTEC SECURITY | 79,430 | 5,456,841 | |||
| 28,357,457 | |||||
| HOUSEHOLD DURABLES - 0.6% | |||||
NVR 1 | 3,478 | 4,660,520 | |||
| MEDIA - 0.3% | |||||
Saga Communications Cl. A | 62,557 | 2,367,782 | |||
| SPECIALTY RETAIL - 17.8% | |||||
American Eagle Outfitters | 644,486 | 11,098,049 | |||
Ascena Retail Group 1 | 1,010,264 | 16,825,947 | |||
Buckle (The) | 500,864 | 22,924,545 | |||
Cato Corporation (The) Cl. A | 407,260 | 15,785,398 | |||
DSW Cl. A | 396,855 | 13,243,051 | |||
GameStop Corporation Cl. A | 261,807 | 11,247,229 | |||
Genesco 1 | 334,814 | 22,107,769 | |||
†Shoe Carnival | 420,897 | 12,147,087 | |||
Stein Mart | 778,798 | 8,154,015 | |||
| 133,533,090 | |||||
| TEXTILES, APPAREL & LUXURY GOODS - 7.0% | |||||
Deckers Outdoor 1 | 259,585 | 18,682,333 | |||
G-III Apparel Group 1 | 89,504 | 6,296,606 | |||
Movado Group | 537,505 | 14,598,636 | |||
Steven Madden 1 | 307,195 | 13,141,802 | |||
Vera Bradley 1 | 9,153 | 103,154 | |||
| 52,822,531 | |||||
| Total (Cost $180,981,832) | 221,741,380 | ||||
| CONSUMER STAPLES – 2.6% | |||||
| FOOD & STAPLES RETAILING - 0.2% | |||||
Village Super Market Cl. A | 43,722 | 1,385,550 | |||
| PERSONAL PRODUCTS - 2.4% | |||||
Nu Skin Enterprises Cl. A | 382,618 | 18,032,787 | |||
| Total (Cost $25,634,282) | 19,418,337 | ||||
| ENERGY – 8.1% | |||||
| ENERGY EQUIPMENT & SERVICES - 7.6% | |||||
Atwood Oceanics | 584,728 | 15,460,208 | |||
Helmerich & Payne | 146,899 | 10,344,628 | |||
Matrix Service 1 | 882,925 | 16,139,869 | |||
Unit Corporation 1 | 547,226 | 14,840,769 | |||
| 56,785,474 | |||||
| OIL, GAS & CONSUMABLE FUELS - 0.5% | |||||
Cimarex Energy | 36,435 | 4,019,145 | |||
| Total (Cost $75,183,691) | 60,804,619 | ||||
| FINANCIALS – 9.8% | |||||
| BANKS - 2.4% | |||||
Ames National | 121,148 | 3,040,815 | |||
City Holding Company | 311,818 | 15,357,036 | |||
| 18,397,851 | |||||
| CAPITAL MARKETS - 0.2% | |||||
Federated Investors Cl. B | 48,026 | 1,608,391 | |||
| INSURANCE - 3.6% | |||||
Allied World Assurance Company Holdings | 55,623 | 2,404,026 | |||
Aspen Insurance Holdings | 47,767 | 2,288,039 | |||
Reinsurance Group of America | 232,335 | 22,041,622 | |||
| 26,733,687 | |||||
| THE ACCOMPANYING NOTES ARE AN INTEGRAL PART OF THESE FINANCIAL STATEMENTS | The Royce Funds 2015 Semiannual Report to Shareholders | 65 |
| Schedules of Investments |
| Royce Small-Cap Value Fund (continued) | ||||||
| SHARES | VALUE | |||||
| FINANCIALS (continued) | ||||||
| THRIFTS & MORTGAGE FINANCE - 3.6% | ||||||
Genworth MI Canada | 830,900 | $ | 21,820,272 | |||
TrustCo Bank Corp. NY | 702,148 | 4,936,100 | ||||
| 26,756,372 | ||||||
| Total (Cost $56,334,617) | 73,496,301 | |||||
| HEALTH CARE – 2.7% | ||||||
| HEALTH CARE PROVIDERS & SERVICES - 2.7% | ||||||
Aceto Corporation | 290,333 | 7,150,902 | ||||
Chemed Corporation | 48,179 | 6,316,267 | ||||
MEDNAX 1 | 95,128 | 7,049,936 | ||||
| Total (Cost $9,490,140) | 20,517,105 | |||||
| INDUSTRIALS – 15.7% | ||||||
| COMMERCIAL SERVICES & SUPPLIES - 2.0% | ||||||
UniFirst Corporation | 134,685 | 15,064,517 | ||||
| CONSTRUCTION & ENGINEERING - 2.7% | ||||||
MYR Group 1 | 641,182 | 19,850,995 | ||||
| MACHINERY - 5.3% | ||||||
Alamo Group | 294,479 | 16,090,332 | ||||
Federal Signal | 970,824 | 14,474,986 | ||||
Kennametal | 149,493 | 5,100,701 | ||||
Miller Industries | 210,601 | 4,201,490 | ||||
| 39,867,509 | ||||||
| ROAD & RAIL - 3.4% | ||||||
Knight Transportation | 58,062 | 1,552,578 | ||||
| 408,845 | 16,063,520 | |||||
†Werner Enterprises | 313,600 | 8,232,000 | ||||
| 25,848,098 | ||||||
| TRADING COMPANIES & DISTRIBUTORS - 2.3% | ||||||
Applied Industrial Technologies | 435,195 | 17,255,482 | ||||
| Total (Cost $112,162,390) | 117,886,601 | |||||
| INFORMATION TECHNOLOGY – 25.8% | ||||||
| COMMUNICATIONS EQUIPMENT - 5.0% | ||||||
Brocade Communications Systems | 1,393,211 | 16,551,347 | ||||
NETGEAR 1 | 510,603 | 15,328,302 | ||||
Plantronics | 103,826 | 5,846,442 | ||||
TESSCO Technologies | 9,832 | 194,772 | ||||
| 37,920,863 | ||||||
| ELECTRONIC EQUIPMENT, INSTRUMENTS & COMPONENTS - 14.1% | ||||||
Benchmark Electronics 1 | 863,286 | 18,802,369 | ||||
Fabrinet 1 | 1,184,754 | 22,190,442 | ||||
PC Connection | 876,748 | 21,690,746 | ||||
Rofin-Sinar Technologies 1 | 342,325 | 9,448,170 | ||||
ScanSource 1 | 299,432 | 11,396,382 | ||||
Vishay Intertechnology | 1,899,286 | 22,183,660 | ||||
| 105,711,769 | ||||||
| IT SERVICES - 3.7% | ||||||
Convergys Corporation | 567,005 | 14,452,957 | ||||
ManTech International Cl. A | 476,468 | 13,817,572 | ||||
| 28,270,529 | ||||||
| SEMICONDUCTORS & SEMICONDUCTOR EQUIPMENT - 3.0% | ||||||
MKS Instruments | 587,523 | 22,290,623 | ||||
| Total (Cost $177,105,991) | 194,193,784 | |||||
| MATERIALS – 4.2% | ||||||
| CHEMICALS - 1.4% | ||||||
Innospec | 238,319 | 10,733,888 | ||||
| METALS & MINING - 1.2% | ||||||
Reliance Steel & Aluminum | 145,747 | 8,814,778 | ||||
| PAPER & FOREST PRODUCTS - 1.6% | ||||||
Schweitzer-Mauduit International | 305,000 | 12,163,400 | ||||
| Total (Cost $30,758,269) | 31,712,066 | |||||
| MISCELLANEOUS6 – 0.7% | ||||||
| Total (Cost $5,055,817) | 5,129,698 | |||||
| TOTAL COMMON STOCKS | ||||||
| (Cost $672,707,029) | 744,899,891 | |||||
| REPURCHASE AGREEMENT– 1.4% | ||||||
| Fixed Income Clearing Corporation, 0.00% dated 6/30/15, due 7/1/15, maturity value $10,197,000 (collateralized by obligations of various U.S. Government Agencies, 2.625% due 8/15/20, valued at $10,402,300) | ||||||
| (Cost $10,197,000) | 10,197,000 | |||||
| TOTAL INVESTMENTS – 100.5% | ||||||
| (Cost $682,904,029) | 755,096,891 | |||||
| LIABILITIES LESS CASH AND OTHER ASSETS – (0.5)% | (3,732,875) | |||||
| NET ASSETS – 100.0% | $ | 751,364,016 | ||||
| 66 | The Royce Funds 2015 Semiannual Report to Shareholders | THE ACCOMPANYING NOTES ARE AN INTEGRAL PART OF THESE FINANCIAL STATEMENTS |
| June 30, 2015 (unaudited) |
| Royce Smaller-Companies Growth Fund | ||||||
| Common Stocks – 94.2% | ||||||
| SHARES | VALUE | |||||
| CONSUMER DISCRETIONARY – 21.7% | ||||||
| AUTO COMPONENTS - 3.0% | ||||||
Dorman Products 1 | 236,000 | $ | 11,247,760 | |||
Gentherm 1 | 286,650 | 15,739,951 | ||||
| 26,987,711 | ||||||
| HOTELS, RESTAURANTS & LEISURE - 1.9% | ||||||
Buffalo Wild Wings 1 | 61,900 | 9,699,111 | ||||
Texas Roadhouse | 181,000 | 6,774,830 | ||||
| 16,473,941 | ||||||
| HOUSEHOLD DURABLES - 0.9% | ||||||
| 171,000 | 5,451,480 | |||||
| 100,000 | 2,113,000 | |||||
| 7,564,480 | ||||||
| MEDIA - 2.2% | ||||||
IMAX Corporation 1 | 273,000 | 10,993,710 | ||||
Rentrak Corporation 1 | 117,345 | 8,190,681 | ||||
| 19,184,391 | ||||||
| SPECIALTY RETAIL - 7.5% | ||||||
| 533,656 | 17,076,992 | |||||
| 1,569,077 | 26,470,329 | |||||
Monro Muffler Brake | 117,000 | 7,272,720 | ||||
Tractor Supply | 161,000 | 14,480,340 | ||||
Zumiez 1 | 47,800 | 1,272,914 | ||||
| 66,573,295 | ||||||
| TEXTILES, APPAREL & LUXURY GOODS - 6.2% | ||||||
Carter’s | 221,300 | 23,524,190 | ||||
Columbia Sportswear | 257,000 | 15,538,220 | ||||
Gildan Activewear | 491,666 | 16,342,978 | ||||
| 55,405,388 | ||||||
| Total (Cost $127,042,762) | 192,189,206 | |||||
| CONSUMER STAPLES – 3.9% | ||||||
| FOOD & STAPLES RETAILING - 1.4% | ||||||
Natural Grocers by Vitamin Cottage 1 | 129,500 | 3,188,290 | ||||
United Natural Foods 1 | 143,617 | 9,145,531 | ||||
| 12,333,821 | ||||||
| FOOD PRODUCTS - 2.5% | ||||||
Snyder’s-Lance | 300,000 | 9,681,000 | ||||
SunOpta 1 | 1,156,000 | 12,403,880 | ||||
| 22,084,880 | ||||||
| PERSONAL PRODUCTS - 0.0% | ||||||
Female Health 1 | 81,000 | 145,800 | ||||
| Total (Cost $27,648,933) | 34,564,501 | |||||
| ENERGY – 3.4% | ||||||
| ENERGY EQUIPMENT & SERVICES - 1.8% | ||||||
Canadian Energy Services & Technology | 956,000 | 5,510,969 | ||||
Helmerich & Payne | 14,000 | 985,880 | ||||
Pason Systems | 474,000 | 8,481,905 | ||||
Unit Corporation 1 | 29,200 | 791,904 | ||||
| 15,770,658 | ||||||
| OIL, GAS & CONSUMABLE FUELS - 1.6% | ||||||
Navigator Holdings 1 | 456,000 | 8,636,640 | ||||
Sprott Resource 1 | 1,475,000 | 1,110,088 | ||||
| 1,008,600 | 5,063,172 | |||||
| 14,809,900 | ||||||
| Total (Cost $41,646,186) | 30,580,558 | |||||
| FINANCIALS – 10.9% | ||||||
| BANKS - 5.6% | ||||||
Associated Banc-Corp | 521,900 | 10,578,913 | ||||
Columbia Banking System | 287,500 | 9,355,250 | ||||
Enterprise Financial Services | 441,500 | 10,052,955 | ||||
ServisFirst Bancshares | 244,000 | 9,167,080 | ||||
Umpqua Holdings | 582,800 | 10,484,572 | ||||
| 49,638,770 | ||||||
| CAPITAL MARKETS - 3.1% | ||||||
Financial Engines | 206,800 | 8,784,864 | ||||
Northern Trust | 167,000 | 12,768,820 | ||||
Oaktree Capital Group LLC Cl. A | 112,800 | 5,998,704 | ||||
| 27,552,388 | ||||||
| DIVERSIFIED FINANCIAL SERVICES - 0.3% | ||||||
PICO Holdings 1 | 163,222 | 2,402,628 | ||||
| REAL ESTATE MANAGEMENT & DEVELOPMENT - 1.9% | ||||||
Jones Lang LaSalle | 91,000 | 15,561,000 | ||||
Marcus & Millichap 1 | 41,500 | 1,914,810 | ||||
| 17,475,810 | ||||||
| Total (Cost $66,425,083) | 97,069,596 | |||||
| HEALTH CARE – 19.0% | ||||||
| BIOTECHNOLOGY - 7.5% | ||||||
Actelion | 66,800 | 9,774,041 | ||||
Anacor Pharmaceuticals 1 | 159,500 | 12,350,085 | ||||
| 207,000 | 4,848,975 | |||||
| 462,240 | 15,711,538 | |||||
| 1,432,000 | 10,682,720 | |||||
Zealand Pharma 1 | 800,000 | 13,210,000 | ||||
| 66,577,359 | ||||||
| HEALTH CARE EQUIPMENT & SUPPLIES - 5.0% | ||||||
| 404,000 | 9,954,560 | |||||
| 311,000 | 4,015,010 | |||||
| 1,629,500 | 8,457,105 | |||||
Inogen 1 | 251,755 | 11,228,273 | ||||
| 271,000 | 10,498,540 | |||||
| 44,153,488 | ||||||
| HEALTH CARE PROVIDERS & SERVICES - 0.9% | ||||||
| 187,900 | 8,184,924 | |||||
| LIFE SCIENCES TOOLS & SERVICES - 2.1% | ||||||
Cambrex Corporation 1 | 424,500 | 18,652,530 | ||||
| PHARMACEUTICALS - 3.5% | ||||||
| 86,000 | 1,517,900 | |||||
| 337,000 | 2,682,520 | |||||
Intersect ENT 1 | 325,000 | 9,304,750 | ||||
Relypsa 1 | 250,000 | 8,272,500 | ||||
UCB | 124,000 | 8,901,360 | ||||
| 30,679,030 | ||||||
| Total (Cost $107,216,259) | 168,247,331 | |||||
| INDUSTRIALS – 11.6% | ||||||
| BUILDING PRODUCTS - 0.9% | ||||||
Apogee Enterprises | 146,415 | 7,707,285 | ||||
| COMMERCIAL SERVICES & SUPPLIES - 2.0% | ||||||
Mobile Mini | 432,500 | 18,182,300 | ||||
| CONSTRUCTION & ENGINEERING - 0.8% | ||||||
| 274,885 | 6,668,710 | |||||
| ELECTRICAL EQUIPMENT - 2.2% | ||||||
Acuity Brands | 85,095 | 15,315,398 | ||||
| 3,035,000 | 1,246,475 | |||||
| THE ACCOMPANYING NOTES ARE AN INTEGRAL PART OF THESE FINANCIAL STATEMENTS | The Royce Funds 2015 Semiannual Report to Shareholders | 67 |
| Schedules of Investments |
| Royce Smaller-Companies Growth Fund (continued) | ||||||
| SHARES | VALUE | |||||
| INDUSTRIALS (continued) | ||||||
| ELECTRICAL EQUIPMENT (continued) | ||||||
| 302,295 | $ | 3,074,340 | ||||
| 19,636,213 | ||||||
| MACHINERY - 5.7% | ||||||
KUKA | 151,900 | 12,653,507 | ||||
Middleby Corporation 1 | 89,000 | 9,988,470 | ||||
Tennant Company | 162,937 | 10,646,304 | ||||
Wabtec Corporation | 181,464 | 17,101,167 | ||||
| 50,389,448 | ||||||
| Total (Cost $66,097,473) | 102,583,956 | |||||
| INFORMATION TECHNOLOGY – 18.0% | ||||||
| COMMUNICATIONS EQUIPMENT - 1.4% | ||||||
Infinera Corporation 1 | 358,233 | 7,515,728 | ||||
| 199,500 | 4,959,570 | |||||
| 12,475,298 | ||||||
| ELECTRONIC EQUIPMENT, INSTRUMENTS & COMPONENTS - 5.8% | ||||||
FARO Technologies 1 | 119,000 | 5,557,300 | ||||
FLIR Systems | 292,600 | 9,017,932 | ||||
IPG Photonics 1 | 114,444 | 9,747,768 | ||||
Littelfuse | 77,744 | 7,377,128 | ||||
Mercury Systems 1 | 1,101,749 | 16,129,605 | ||||
Rogers Corporation 1 | 54,893 | 3,630,623 | ||||
| 51,460,356 | ||||||
| INTERNET SOFTWARE & SERVICES - 1.8% | ||||||
HomeAway 1 | 232,500 | 7,235,400 | ||||
SPS Commerce 1 | 133,600 | 8,790,880 | ||||
| 16,026,280 | ||||||
| SEMICONDUCTORS & SEMICONDUCTOR EQUIPMENT - 2.6% | ||||||
Cavium 1 | 134,000 | 9,220,540 | ||||
| 644,000 | 13,974,800 | |||||
| 23,195,340 | ||||||
| SOFTWARE - 5.3% | ||||||
Absolute Software | 1,295,200 | 9,322,537 | ||||
Manhattan Associates 1 | 165,000 | 9,842,250 | ||||
| 4,000 | 212,680 | |||||
| 526,786 | 18,885,278 | |||||
| 213,000 | 8,594,550 | |||||
| 46,857,295 | ||||||
| TECHNOLOGY HARDWARE, STORAGE & PERIPHERALS - 1.1% | ||||||
Immersion Corporation 1 | 805,595 | 10,206,889 | ||||
| Total (Cost $97,792,733) | 160,221,458 | |||||
| MATERIALS – 1.6% | ||||||
| METALS & MINING - 1.6% | ||||||
| 492,853 | 5,776,237 | |||||
Orocobre 1 | 2,250,000 | 3,645,575 | ||||
Worthington Industries | 161,166 | 4,844,650 | ||||
| Total (Cost $12,012,457) | 14,266,462 | |||||
| TELECOMMUNICATION SERVICES – 1.4% | ||||||
| DIVERSIFIED TELECOMMUNICATION SERVICES - 1.4% | ||||||
ORBCOMM 1 | 1,844,000 | 12,447,000 | ||||
| Total (Cost $11,690,628) | 12,447,000 | |||||
| MISCELLANEOUS6 – 2.7% | ||||||
| Total (Cost $21,004,355) | 23,715,674 | |||||
| TOTAL COMMON STOCKS | ||||||
| (Cost $578,576,869) | 835,885,742 | |||||
| REPURCHASE AGREEMENT– 5.3% | ||||||
| Fixed Income Clearing Corporation, 0.00% dated 6/30/15, due 7/1/15, maturity value $47,393,000 (collateralized by obligations of various U.S. Government Agencies, 2.625% due 8/15/20, valued at $48,345,375) | ||||||
| (Cost $47,393,000) | $ | 47,393,000 | ||||
| PRINCIPAL | ||||||
| AMOUNT | ||||||
| COLLATERAL RECEIVED FOR SECURITIES LOANED – 8.6% | ||||||
| U.S. Treasury Notes | ||||||
1.50%-2.375% | ||||||
due 2/28/19-8/15/24 | $ | 122,540 | 123,180 | |||
| Money Market Funds | ||||||
Federated Government Obligations Fund (7 day yield-0.0099%) | 75,672,358 | |||||
| TOTAL COLLATERAL RECEIVED FOR SECURITIES LOANED | ||||||
| (Cost $75,795,538) | 75,795,538 | |||||
| TOTAL INVESTMENTS – 108.1% | ||||||
| (Cost $701,765,407) | 959,074,280 | |||||
| LIABILITIES LESS CASH AND OTHER ASSETS – (8.1)% | (71,517,030) | |||||
| NET ASSETS – 100.0% | $ | 887,557,250 | ||||
| 68 | The Royce Funds 2015 Semiannual Report to Shareholders | THE ACCOMPANYING NOTES ARE AN INTEGRAL PART OF THESE FINANCIAL STATEMENTS |
| June 30, 2015 (unaudited) |
| Royce 100 Fund | ||||||
| Common Stocks – 97.9% | ||||||
| SHARES | VALUE | |||||
| CONSUMER DISCRETIONARY – 13.5% | ||||||
| AUTO COMPONENTS - 1.9% | ||||||
Dorman Products 1 | 15,230 | $ | 725,862 | |||
Drew Industries | 16,886 | 979,726 | ||||
Gentex Corporation | 68,704 | 1,128,119 | ||||
| 2,833,707 | ||||||
| AUTOMOBILES - 2.0% | ||||||
Thor Industries | 52,530 | 2,956,389 | ||||
| MEDIA - 1.0% | ||||||
Morningstar | 9,002 | 716,109 | ||||
Wiley (John) & Sons Cl. A | 14,370 | 781,297 | ||||
| 1,497,406 | ||||||
| SPECIALTY RETAIL - 5.9% | ||||||
Buckle (The) | 103,090 | 4,718,429 | ||||
Genesco 1 | 60,800 | 4,014,624 | ||||
| 8,733,053 | ||||||
| TEXTILES, APPAREL & LUXURY GOODS - 2.7% | ||||||
| 18,930 | 1,362,392 | |||||
Movado Group | 96,030 | 2,608,175 | ||||
| 3,970,567 | ||||||
| Total (Cost $19,886,233) | 19,991,122 | |||||
| CONSUMER STAPLES – 2.3% | ||||||
| FOOD PRODUCTS - 2.3% | ||||||
Cal-Maine Foods | 50,020 | 2,611,044 | ||||
Sanderson Farms | 10,990 | 826,008 | ||||
| Total (Cost $2,225,535) | 3,437,052 | |||||
| ENERGY – 6.7% | ||||||
| ENERGY EQUIPMENT & SERVICES - 6.7% | ||||||
Helmerich & Payne | 24,285 | 1,710,150 | ||||
Oil States International 1 | 28,000 | 1,042,440 | ||||
Pason Systems | 115,500 | 2,066,793 | ||||
SEACOR Holdings 1 | 19,205 | 1,362,403 | ||||
TGS-NOPEC Geophysical | 76,030 | 1,775,547 | ||||
Unit Corporation 1 | 71,390 | 1,936,097 | ||||
| Total (Cost $7,431,650) | 9,893,430 | |||||
| FINANCIALS – 16.1% | ||||||
| CAPITAL MARKETS - 12.6% | ||||||
Artisan Partners Asset Management Cl. A | 76,780 | 3,567,199 | ||||
Federated Investors Cl. B | 76,240 | 2,553,278 | ||||
Lazard Cl. A | 64,590 | 3,632,541 | ||||
SEI Investments | 51,400 | 2,520,142 | ||||
Silvercrest Asset Management Group Cl. A | 118,250 | 1,662,595 | ||||
Virtus Investment Partners | 24,060 | 3,181,935 | ||||
Westwood Holdings Group | 26,010 | 1,549,416 | ||||
| 18,667,106 | ||||||
| REAL ESTATE MANAGEMENT & DEVELOPMENT - 0.5% | ||||||
Marcus & Millichap 1 | 16,840 | 776,997 | ||||
| THRIFTS & MORTGAGE FINANCE - 3.0% | ||||||
Genworth MI Canada | 168,514 | 4,425,348 | ||||
| Total (Cost $19,600,557) | 23,869,451 | |||||
| HEALTH CARE – 6.6% | ||||||
| HEALTH CARE EQUIPMENT & SUPPLIES - 0.7% | ||||||
Atrion Corporation | 2,440 | 957,237 | ||||
| LIFE SCIENCES TOOLS & SERVICES - 5.2% | ||||||
Bio-Rad Laboratories Cl. A 1 | 23,230 | 3,498,670 | ||||
Bio-Techne | 35,170 | 3,463,190 | ||||
PerkinElmer | 13,630 | 717,483 | ||||
| 7,679,343 | ||||||
| PHARMACEUTICALS - 0.7% | ||||||
| 17,720 | 1,053,277 | |||||
| Total (Cost $6,924,435) | 9,689,857 | |||||
| INDUSTRIALS – 24.3% | ||||||
| BUILDING PRODUCTS - 0.3% | ||||||
Simpson Manufacturing | 11,530 | 392,020 | ||||
| COMMERCIAL SERVICES & SUPPLIES - 2.6% | ||||||
Ritchie Bros. Auctioneers | 71,894 | 2,007,281 | ||||
†Steelcase Cl. A | 101,630 | 1,921,823 | ||||
| 3,929,104 | ||||||
| ELECTRICAL EQUIPMENT - 0.0% | ||||||
Global Power Equipment Group | 1,393 | 10,809 | ||||
| MACHINERY - 13.9% | ||||||
CIRCOR International | 43,938 | 2,395,939 | ||||
†Columbus McKinnon | 99,300 | 2,482,500 | ||||
†Federal Signal | 78,580 | 1,171,628 | ||||
Hyster-Yale Materials Handling Cl. A | 15,080 | 1,044,742 | ||||
John Bean Technologies | 101,470 | 3,814,257 | ||||
Kadant | 34,260 | 1,617,072 | ||||
Kennametal | 33,710 | 1,150,185 | ||||
Lydall 1 | 53,760 | 1,589,146 | ||||
RBC Bearings 1 | 15,880 | 1,139,549 | ||||
Sun Hydraulics | 26,110 | 995,052 | ||||
Valmont Industries | 20,110 | 2,390,476 | ||||
Wabtec Corporation | 7,720 | 727,533 | ||||
| 20,518,079 | ||||||
| PROFESSIONAL SERVICES - 4.3% | ||||||
ICF International 1 | 28,060 | 978,171 | ||||
ManpowerGroup | 41,286 | 3,690,143 | ||||
Robert Half International | 14,450 | 801,975 | ||||
Towers Watson & Co. Cl. A | 7,750 | 974,950 | ||||
| 6,445,239 | ||||||
| ROAD & RAIL - 0.8% | ||||||
| 30,030 | 1,179,879 | |||||
| TRADING COMPANIES & DISTRIBUTORS - 2.4% | ||||||
Applied Industrial Technologies | 28,450 | 1,128,043 | ||||
MSC Industrial Direct Cl. A | 34,090 | 2,378,459 | ||||
| 3,506,502 | ||||||
| Total (Cost $27,242,787) | 35,981,632 | |||||
| INFORMATION TECHNOLOGY – 20.5% | ||||||
| ELECTRONIC EQUIPMENT, INSTRUMENTS & COMPONENTS - 5.2% | ||||||
Coherent 1 | 15,350 | 974,418 | ||||
Dolby Laboratories Cl. A | 28,810 | 1,143,181 | ||||
IPG Photonics 1 | 10,250 | 873,044 | ||||
Littelfuse | 6,990 | 663,281 | ||||
National Instruments | 22,110 | 651,360 | ||||
Orbotech 1 | 60,670 | 1,261,936 | ||||
Rofin-Sinar Technologies 1 | 75,128 | 2,073,533 | ||||
| 7,640,753 | ||||||
| INTERNET SOFTWARE & SERVICES - 1.5% | ||||||
j2 Global | 32,789 | 2,227,685 | ||||
| IT SERVICES - 2.0% | ||||||
| 119,720 | 2,903,210 | |||||
| THE ACCOMPANYING NOTES ARE AN INTEGRAL PART OF THESE FINANCIAL STATEMENTS | The Royce Funds 2015 Semiannual Report to Shareholders | 69 |
| Schedules of Investments |
| Royce 100 Fund (continued) | ||||||
| SHARES | VALUE | |||||
| INFORMATION TECHNOLOGY (continued) | ||||||
| SEMICONDUCTORS & SEMICONDUCTOR EQUIPMENT - 7.4% | ||||||
Brooks Automation | 65,690 | $ | 752,151 | |||
Cabot Microelectronics 1 | 17,520 | 825,367 | ||||
MKS Instruments | 121,000 | 4,590,740 | ||||
Nanometrics 1 | 151,730 | 2,445,888 | ||||
Veeco Instruments 1 | 83,060 | 2,387,144 | ||||
| 11,001,290 | ||||||
| SOFTWARE - 4.4% | ||||||
ANSYS 1 | 9,020 | 822,985 | ||||
ePlus 1 | 32,177 | 2,466,367 | ||||
Mentor Graphics | 61,710 | 1,630,995 | ||||
Monotype Imaging Holdings | 67,430 | 1,625,737 | ||||
| 6,546,084 | ||||||
| Total (Cost $24,393,974) | 30,319,022 | |||||
| MATERIALS – 7.0% | ||||||
| CHEMICALS - 4.3% | ||||||
Innospec | 15,500 | 698,120 | ||||
†Minerals Technologies | 64,430 | 4,389,616 | ||||
Quaker Chemical | 13,080 | 1,162,027 | ||||
| 6,249,763 | ||||||
| METALS & MINING - 2.7% | ||||||
Compass Minerals International | 13,910 | 1,142,567 | ||||
Haynes International | 11,393 | 561,903 | ||||
Reliance Steel & Aluminum | 38,420 | 2,323,642 | ||||
| 4,028,112 | ||||||
| Total (Cost $8,619,924) | 10,277,875 | |||||
| MISCELLANEOUS6 – 0.9% | ||||||
| Total (Cost $1,546,952) | 1,390,005 | |||||
| TOTAL COMMON STOCKS | ||||||
| (Cost $117,872,047) | 144,849,446 | |||||
| REPURCHASE AGREEMENT– 2.3% | ||||||
| Fixed Income Clearing Corporation, 0.00% dated 6/30/15, due 7/1/15, maturity value $3,463,000 (collateralized by obligations of various U.S. Government Agencies, 2.625% due 8/15/20, valued at $3,534,250) | ||||||
| (Cost $3,463,000) | 3,463,000 | |||||
| COLLATERAL RECEIVED FOR SECURITIES LOANED – 0.7% | ||||||
| Money Market Funds | ||||||
Federated Government Obligations Fund (7 day yield-0.0099%) | ||||||
| (Cost $1,034,978) | 1,034,978 | |||||
| TOTAL INVESTMENTS – 100.9% | ||||||
| (Cost $122,370,025) | 149,347,424 | |||||
| LIABILITIES LESS CASH AND OTHER ASSETS – (0.9)% | (1,302,385) | |||||
| NET ASSETS – 100.0% | $ | 148,045,039 | ||||
| Royce Micro-Cap Discovery Fund | ||||||
| Common Stocks – 92.4% | ||||||
| SHARES | VALUE | |||||
| CONSUMER DISCRETIONARY – 14.7% | ||||||
| AUTO COMPONENTS - 2.1% | ||||||
| 6,500 | $ | 54,730 | ||||
Standard Motor Products | 1,800 | 63,216 | ||||
| 117,946 | ||||||
| DISTRIBUTORS - 0.5% | ||||||
VOXX International Cl. A 1 | 3,100 | 25,668 | ||||
| DIVERSIFIED CONSUMER SERVICES - 0.5% | ||||||
Bridgepoint Education 1 | 3,000 | 28,680 | ||||
| HOTELS, RESTAURANTS & LEISURE - 1.6% | ||||||
Famous Dave’s of America 1 | 1,600 | 32,080 | ||||
Monarch Casino & Resort 1 | 2,700 | 55,512 | ||||
| 87,592 | ||||||
| HOUSEHOLD DURABLES - 3.1% | ||||||
| 900 | 67,896 | |||||
Flexsteel Industries | 1,400 | 60,326 | ||||
Hooker Furniture | 1,800 | 45,198 | ||||
| 173,420 | ||||||
| LEISURE PRODUCTS - 1.0% | ||||||
Arctic Cat | 743 | 24,675 | ||||
Johnson Outdoors Cl. A | 1,200 | 28,260 | ||||
| 52,935 | ||||||
| MEDIA - 0.9% | ||||||
Harte-Hanks | 8,800 | 52,448 | ||||
| SPECIALTY RETAIL - 2.2% | ||||||
Big 5 Sporting Goods | 2,800 | 39,788 | ||||
Haverty Furniture | 2,800 | 60,536 | ||||
Stage Stores | 1,400 | 24,542 | ||||
| 124,866 | ||||||
| TEXTILES, APPAREL & LUXURY GOODS - 2.8% | ||||||
Culp | 3,400 | 105,400 | ||||
Perry Ellis International 1 | 2,100 | 49,917 | ||||
| 155,317 | ||||||
| Total (Cost $753,983) | 818,872 | |||||
| CONSUMER STAPLES – 5.2% | ||||||
| FOOD & STAPLES RETAILING - 2.6% | ||||||
Village Super Market Cl. A | 4,500 | 142,605 | ||||
| FOOD PRODUCTS - 2.6% | ||||||
John B. Sanfilippo & Son | 1,300 | 67,470 | ||||
SunOpta 1 | 7,500 | 80,475 | ||||
| 147,945 | ||||||
| Total (Cost $253,700) | 290,550 | |||||
| ENERGY – 3.8% | ||||||
| ENERGY EQUIPMENT & SERVICES - 1.4% | ||||||
Gulf Island Fabrication | 2,000 | 22,340 | ||||
Matrix Service 1 | 1,300 | 23,764 | ||||
Tesco Corporation | 2,900 | 31,610 | ||||
| 77,714 | ||||||
| OIL, GAS & CONSUMABLE FUELS - 2.4% | ||||||
Pacific Ethanol 1 | 3,900 | 40,248 | ||||
REX American Resources 1 | 900 | 57,276 | ||||
TransGlobe Energy | 9,000 | 35,910 | ||||
| 133,434 | ||||||
| Total (Cost $284,340) | 211,148 | |||||
| FINANCIALS – 7.3% | ||||||
| CAPITAL MARKETS - 0.6% | ||||||
Oppenheimer Holdings Cl. A | 1,200 | 31,536 | ||||
| 70 | The Royce Funds 2015 Semiannual Report to Shareholders | THE ACCOMPANYING NOTES ARE AN INTEGRAL PART OF THESE FINANCIAL STATEMENTS |
| June 30, 2015 (unaudited) |
| Royce Micro-Cap Discovery Fund (continued) | ||||||
| SHARES | VALUE | |||||
| FINANCIALS (continued) | ||||||
| CONSUMER FINANCE - 1.7% | ||||||
Regional Management 1 | 3,400 | $ | 60,724 | |||
World Acceptance 1 | 600 | 36,906 | ||||
| 97,630 | ||||||
| INSURANCE - 5.0% | ||||||
Employers Holdings | 2,100 | 47,838 | ||||
Hallmark Financial Services 1 | 2,800 | 31,864 | ||||
Infinity Property & Casualty | 600 | 45,504 | ||||
Investors Title Company | 800 | 56,712 | ||||
United Fire Group | 1,400 | 45,864 | ||||
Universal Insurance Holdings | 2,000 | 48,400 | ||||
| 276,182 | ||||||
| Total (Cost $364,316) | 405,348 | |||||
| HEALTH CARE – 17.2% | ||||||
| HEALTH CARE EQUIPMENT & SUPPLIES - 11.1% | ||||||
Atrion Corporation | 200 | 78,462 | ||||
CryoLife | 4,500 | 50,760 | ||||
Cynosure Cl. A 1 | 600 | 23,148 | ||||
Exactech 1 | 3,800 | 79,154 | ||||
Invacare Corporation | 5,500 | 118,965 | ||||
†LeMaitre Vascular | 3,600 | 43,416 | ||||
Meridian Bioscience | 3,400 | 63,376 | ||||
Merit Medical Systems 1 | 2,000 | 43,080 | ||||
Utah Medical Products | 2,000 | 119,260 | ||||
| 619,621 | ||||||
| HEALTH CARE PROVIDERS & SERVICES - 1.8% | ||||||
| 1,000 | 55,390 | |||||
LHC Group 1 | 1,100 | 42,075 | ||||
| 97,465 | ||||||
| HEALTH CARE TECHNOLOGY - 0.8% | ||||||
†Quality Systems | 2,800 | 46,396 | ||||
| LIFE SCIENCES TOOLS & SERVICES - 2.6% | ||||||
Affymetrix 1 | 4,000 | 43,680 | ||||
Harvard Bioscience 1 | 8,100 | 46,170 | ||||
| 3,200 | 55,232 | |||||
| 145,082 | ||||||
| PHARMACEUTICALS - 0.9% | ||||||
| 7,000 | 50,050 | |||||
| Total (Cost $849,213) | 958,614 | |||||
| INDUSTRIALS – 12.1% | ||||||
| CONSTRUCTION & ENGINEERING - 3.0% | ||||||
Aegion Corporation 1 | 2,200 | 41,668 | ||||
MYR Group 1 | 4,000 | 123,840 | ||||
| 165,508 | ||||||
| ELECTRICAL EQUIPMENT - 1.1% | ||||||
SL Industries 1 | 1,500 | 57,915 | ||||
| MACHINERY - 2.8% | ||||||
Lydall 1 | 1,300 | 38,428 | ||||
Miller Industries | 5,920 | 118,104 | ||||
| 156,532 | ||||||
| PROFESSIONAL SERVICES - 3.5% | ||||||
CDI Corporation | 3,500 | 45,500 | ||||
GP Strategies 1 | 1,300 | 43,212 | ||||
Heidrick & Struggles International | 2,400 | 62,592 | ||||
Resources Connection | 2,800 | 45,052 | ||||
| 196,356 | ||||||
| TRADING COMPANIES & DISTRIBUTORS - 1.7% | ||||||
CAI International 1 | 2,000 | 41,180 | ||||
Willis Lease Finance 1 | 3,000 | 55,110 | ||||
| 96,290 | ||||||
| Total (Cost $592,564) | 672,601 | |||||
| INFORMATION TECHNOLOGY – 18.4% | ||||||
| COMMUNICATIONS EQUIPMENT - 4.4% | ||||||
Comtech Telecommunications | 2,800 | 81,340 | ||||
Digi International 1 | 3,700 | 35,335 | ||||
Harmonic 1 | 4,300 | 29,369 | ||||
PCTEL | 6,300 | 45,234 | ||||
TESSCO Technologies | 2,600 | 51,506 | ||||
| 242,784 | ||||||
| ELECTRONIC EQUIPMENT, INSTRUMENTS & COMPONENTS - 5.9% | ||||||
†Checkpoint Systems | 5,300 | 53,954 | ||||
CTS Corporation | 3,400 | 65,518 | ||||
Daktronics | 5,300 | 62,858 | ||||
PC Connection | 3,400 | 84,116 | ||||
Vishay Precision Group 1 | 4,200 | 63,252 | ||||
| 329,698 | ||||||
| INTERNET SOFTWARE & SERVICES - 1.4% | ||||||
DHI Group 1 | 3,200 | 28,448 | ||||
Liquidity Services 1 | 5,000 | 48,150 | ||||
| 76,598 | ||||||
| IT SERVICES - 1.5% | ||||||
Computer Task Group | 10,700 | 82,604 | ||||
| SEMICONDUCTORS & SEMICONDUCTOR EQUIPMENT - 2.8% | ||||||
Alpha & Omega Semiconductor 1 | 5,900 | 51,566 | ||||
Kulicke & Soffa Industries 1 | 4,600 | 53,866 | ||||
Ultra Clean Holdings 1 | 8,000 | 49,840 | ||||
| 155,272 | ||||||
| SOFTWARE - 2.4% | ||||||
American Software Cl. A | 5,342 | 50,749 | ||||
EnerNOC 1 | 3,700 | 35,890 | ||||
†Epiq Systems | 2,800 | 47,264 | ||||
| 133,903 | ||||||
| Total (Cost $1,087,657) | 1,020,859 | |||||
| MATERIALS – 9.3% | ||||||
| CHEMICALS - 3.5% | ||||||
Chase Corporation | 800 | 31,800 | ||||
FutureFuel Corporation | 4,900 | 63,063 | ||||
KMG Chemicals | 900 | 22,896 | ||||
Trecora Resources 1 | 5,300 | 80,030 | ||||
| 197,789 | ||||||
| CONTAINERS & PACKAGING - 1.5% | ||||||
UFP Technologies 1 | 3,940 | 82,425 | ||||
| METALS & MINING - 4.3% | ||||||
| 4,300 | 44,849 | |||||
Haynes International | 1,400 | 69,048 | ||||
Materion Corporation | 1,100 | 38,775 | ||||
†Schnitzer Steel Industries Cl. A | 3,200 | 55,904 | ||||
Universal Stainless & Alloy Products 1 | 1,500 | 29,475 | ||||
| 238,051 | ||||||
| Total (Cost $482,939) | 518,265 | |||||
| THE ACCOMPANYING NOTES ARE AN INTEGRAL PART OF THESE FINANCIAL STATEMENTS | The Royce Funds 2015 Semiannual Report to Shareholders | 71 |
| Schedules of Investments |
| Royce Micro-Cap Discovery Fund (continued) | ||||||
| VALUE | ||||||
| MISCELLANEOUS6 – 4.4% | ||||||
| Total (Cost $269,655) | $ | 243,180 | ||||
| TOTAL COMMON STOCKS | ||||||
| (Cost $4,938,367) | 5,139,437 | |||||
| REPURCHASE AGREEMENT– 7.9% | ||||||
| Fixed Income Clearing Corporation, 0.00% dated 6/30/15, due 7/1/15, maturity value $442,000 (collateralized by obligations of various U.S. Government Agencies, 1.875% due 6/30/20, valued at $454,500) | ||||||
| (Cost $442,000) | 442,000 | |||||
| TOTAL INVESTMENTS – 100.3% | ||||||
| (Cost $5,380,367) | 5,581,437 | |||||
| LIABILITIES LESS CASH AND OTHER ASSETS – (0.3)% | (16,950) | |||||
| NET ASSETS – 100.0% | $ | 5,564,487 | ||||
| Royce Dividend Value Fund | ||||||
| Common Stocks – 95.2% | ||||||
| SHARES | VALUE | |||||
| CONSUMER DISCRETIONARY – 11.4% | ||||||
| AUTO COMPONENTS - 2.0% | ||||||
Autoliv | 28,600 | $ | 3,339,050 | |||
Gentex Corporation | 182,896 | 3,003,153 | ||||
Nokian Renkaat | 35,000 | 1,096,845 | ||||
Selamat Sempurna | 1,382,400 | 478,513 | ||||
STRATTEC SECURITY | 8,029 | 551,592 | ||||
| 8,469,153 | ||||||
| AUTOMOBILES - 0.2% | ||||||
Thor Industries | 16,740 | 942,127 | ||||
| HOTELS, RESTAURANTS & LEISURE - 0.2% | ||||||
Abu Dhabi National Hotels | 642,000 | 506,902 | ||||
MTY Food Group | 9,500 | 251,913 | ||||
| 758,815 | ||||||
| HOUSEHOLD DURABLES - 0.3% | ||||||
Forbo Holding | 50 | 59,469 | ||||
Hunter Douglas | 27,600 | 1,230,640 | ||||
| 1,290,109 | ||||||
| MEDIA - 0.4% | ||||||
Media Chinese International | 322,600 | 51,729 | ||||
Media Prima | 155,000 | 59,979 | ||||
Pico Far East Holdings | 1,014,100 | 324,447 | ||||
Saga Communications Cl. A | 21,966 | 831,413 | ||||
T4F Entretenimento 1 | 134,800 | 158,251 | ||||
Television Broadcasts | 26,600 | 157,681 | ||||
| 1,583,500 | ||||||
| MULTILINE RETAIL - 0.1% | ||||||
New World Department Store China | 667,000 | 178,978 | ||||
Parkson Retail Asia | 268,000 | 94,517 | ||||
| 273,495 | ||||||
| SPECIALTY RETAIL - 7.3% | ||||||
American Eagle Outfitters | 167,000 | 2,875,740 | ||||
Ascena Retail Group 1 | 144,484 | 2,406,381 | ||||
Buckle (The) | 94,779 | 4,338,035 | ||||
Cato Corporation (The) Cl. A | 73,910 | 2,864,752 | ||||
DSW Cl. A | 77,749 | 2,594,484 | ||||
Fielmann | 6,400 | 435,023 | ||||
GameStop Corporation Cl. A | 96,430 | 4,142,633 | ||||
Genesco 1 | 61,949 | 4,090,492 | ||||
Lewis Group | 196,000 | 1,588,331 | ||||
Luk Fook Holdings (International) | 472,200 | 1,391,950 | ||||
Oriental Watch Holdings | 807,800 | 137,559 | ||||
Shoe Carnival | 72,668 | 2,097,199 | ||||
Stein Mart | 104,396 | 1,093,026 | ||||
USS | 70,000 | 1,264,044 | ||||
| 31,319,649 | ||||||
| TEXTILES, APPAREL & LUXURY GOODS - 0.9% | ||||||
Huvis Corporation | 19,700 | 191,622 | ||||
Le Saunda Holdings | 346,100 | 166,988 | ||||
Luen Thai Holdings | 627,200 | 136,743 | ||||
Movado Group | 40,100 | 1,089,116 | ||||
Stella International Holdings | 100,000 | 238,662 | ||||
Steven Madden 1 | 41,608 | 1,779,990 | ||||
Vera Bradley 1 | 38,240 | 430,965 | ||||
| 4,034,086 | ||||||
| Total (Cost $41,414,054) | 48,670,934 | |||||
| CONSUMER STAPLES – 2.5% | ||||||
| BEVERAGES - 0.0% | ||||||
Compania Cervecerias Unidas ADR | 10,500 | 222,390 | ||||
| 72 | The Royce Funds 2015 Semiannual Report to Shareholders | THE ACCOMPANYING NOTES ARE AN INTEGRAL PART OF THESE FINANCIAL STATEMENTS |
| June 30, 2015 (unaudited) |
| Royce Dividend Value Fund (continued) | ||||||
| SHARES | VALUE | |||||
| CONSUMER STAPLES (continued) | ||||||
| FOOD & STAPLES RETAILING - 0.5% | ||||||
FamilyMart | 6,000 | $ | 276,014 | |||
Village Super Market Cl. A | 55,167 | 1,748,242 | ||||
| 2,024,256 | ||||||
| FOOD PRODUCTS - 1.1% | ||||||
Hormel Foods | 56,000 | 3,156,720 | ||||
Industrias Bachoco ADR | 6,100 | 330,071 | ||||
J&J Snack Foods | 10,300 | 1,139,901 | ||||
| 4,626,692 | ||||||
| PERSONAL PRODUCTS - 0.9% | ||||||
Nu Skin Enterprises Cl. A | 83,745 | 3,946,902 | ||||
| Total (Cost $9,383,559) | 10,820,240 | |||||
| ENERGY – 4.1% | ||||||
| ENERGY EQUIPMENT & SERVICES - 3.5% | ||||||
Atwood Oceanics | 61,400 | 1,623,416 | ||||
Helmerich & Payne | 69,854 | 4,919,119 | ||||
Oil States International 1 | 21,700 | 807,891 | ||||
Pason Systems | 44,000 | 787,350 | ||||
TGS-NOPEC Geophysical | 100,900 | 2,356,343 | ||||
Tidewater | 76,500 | 1,738,845 | ||||
Total Energy Services | 9,379 | 114,515 | ||||
Transocean | 175,000 | 2,821,000 | ||||
| 15,168,479 | ||||||
| OIL, GAS & CONSUMABLE FUELS - 0.6% | ||||||
Cimarex Energy | 8,500 | 937,635 | ||||
Gaztransport Et Technigaz | 22,700 | 1,435,924 | ||||
| 2,373,559 | ||||||
| Total (Cost $24,068,031) | 17,542,038 | |||||
| FINANCIALS – 25.7% | ||||||
| BANKS - 2.1% | ||||||
Ames National | 33,739 | 846,849 | ||||
BLOM Bank GDR | 63,000 | 630,000 | ||||
BOK Financial | 22,114 | 1,538,692 | ||||
Camden National | 15,422 | 596,832 | ||||
City Holding Company | 47,901 | 2,359,124 | ||||
First Republic Bank | 44,700 | 2,817,441 | ||||
National Bankshares | 3,200 | 93,632 | ||||
| 8,882,570 | ||||||
| CAPITAL MARKETS - 16.2% | ||||||
Alaris Royalty | 33,000 | 805,580 | ||||
AllianceBernstein Holding L.P. | 123,500 | 3,646,955 | ||||
Apollo Global Management LLC Cl. A | 157,300 | 3,484,195 | ||||
ARA Asset Management | 1,108,200 | 1,439,915 | ||||
Artisan Partners Asset Management Cl. A | 84,600 | 3,930,516 | ||||
Ashmore Group | 424,250 | 1,927,815 | ||||
Aurelius | 6,400 | 273,593 | ||||
CETIP - Mercados Organizados | 202,000 | 2,214,197 | ||||
Close Brothers Group | 18,000 | 432,157 | ||||
Coronation Fund Managers | 266,000 | 1,801,830 | ||||
Diamond Hill Investment Group | 25,900 | 5,171,194 | ||||
Federated Investors Cl. B | 119,000 | 3,985,310 | ||||
GCA Savvian | 11,400 | 141,586 | ||||
Gluskin Sheff + Associates | 51,700 | 1,038,967 | ||||
GMP Capital | 296,000 | 1,215,757 | ||||
Invesco | 39,800 | 1,492,102 | ||||
Investec | 20,000 | 179,751 | ||||
Jupiter Fund Management | 509,500 | 3,568,059 | ||||
KKR & Co. L.P. | 200,258 | 4,575,895 | ||||
Oaktree Capital Group LLC Cl. A | 32,900 | 1,749,622 | ||||
Och-Ziff Capital Management Group LLC Cl. A | 108,100 | 1,320,982 | ||||
SEI Investments | 116,700 | 5,721,801 | ||||
Sprott | 735,700 | 1,454,907 | ||||
State Street | 55,900 | 4,304,300 | ||||
Value Partners Group | 2,527,200 | 3,990,547 | ||||
VZ Holding | 10,800 | 2,599,070 | ||||
Waddell & Reed Financial Cl. A | 61,105 | 2,890,878 | ||||
Westwood Holdings Group | 62,473 | 3,721,517 | ||||
| 69,078,998 | ||||||
| DIVERSIFIED FINANCIAL SERVICES - 1.4% | ||||||
Bolsa Mexicana de Valores | 1,443,000 | 2,497,191 | ||||
Hellenic Exchanges - Athens Stock Exchange | 158,000 | 817,318 | ||||
Singapore Exchange | 140,000 | 813,899 | ||||
Warsaw Stock Exchange | 135,400 | 1,704,744 | ||||
| 5,833,152 | ||||||
| INSURANCE - 4.5% | ||||||
Allied World Assurance Company Holdings | 18,194 | 786,345 | ||||
Cincinnati Financial | 43,500 | 2,182,830 | ||||
E-L Financial | 4,400 | 2,309,753 | ||||
Erie Indemnity Cl. A | 24,200 | 1,986,094 | ||||
Marsh & McLennan | 68,400 | 3,878,280 | ||||
Reinsurance Group of America | 49,955 | 4,739,231 | ||||
Symetra Financial | 144,100 | 3,482,897 | ||||
| 19,365,430 | ||||||
| REAL ESTATE MANAGEMENT & DEVELOPMENT - 0.1% | ||||||
Brasil Brokers Participacoes | 69,200 | 47,853 | ||||
E-House (China) Holdings ADR | 19,200 | 129,024 | ||||
Relo Holdings | 2,300 | 227,397 | ||||
Sun Frontier Fudousan | 10,000 | 81,056 | ||||
| 485,330 | ||||||
| THRIFTS & MORTGAGE FINANCE - 1.4% | ||||||
Genworth MI Canada | 156,848 | 4,118,986 | ||||
TrustCo Bank Corp. NY | 301,560 | 2,119,967 | ||||
| 6,238,953 | ||||||
| Total (Cost $79,087,606) | 109,884,433 | |||||
| HEALTH CARE – 4.1% | ||||||
| HEALTH CARE EQUIPMENT & SUPPLIES - 1.9% | ||||||
Atrion Corporation | 10,500 | 4,119,255 | ||||
DENTSPLY International | 73,600 | 3,794,080 | ||||
| 7,913,335 | ||||||
| HEALTH CARE PROVIDERS & SERVICES - 1.4% | ||||||
Aceto Corporation | 11,000 | 270,930 | ||||
Chemed Corporation | 6,408 | 840,089 | ||||
MEDNAX 1 | 10,700 | 792,977 | ||||
Owens & Minor | 120,100 | 4,083,400 | ||||
| 5,987,396 | ||||||
| HEALTH CARE TECHNOLOGY - 0.1% | ||||||
CompuGroup Medical | 7,300 | 255,424 | ||||
EMIS Group | 9,000 | 130,382 | ||||
| 385,806 | ||||||
| PHARMACEUTICALS - 0.7% | ||||||
Recordati | 82,300 | 1,725,857 | ||||
Santen Pharmaceutical | 104,000 | 1,472,664 | ||||
| 3,198,521 | ||||||
| Total (Cost $11,608,608) | 17,485,058 | |||||
| THE ACCOMPANYING NOTES ARE AN INTEGRAL PART OF THESE FINANCIAL STATEMENTS | The Royce Funds 2015 Semiannual Report to Shareholders | 73 |
| Schedules of Investments |
| Royce Dividend Value Fund (continued) |
| SHARES | VALUE | |||||
| INDUSTRIALS – 22.2% | ||||||
| AEROSPACE & DEFENSE - 1.0% | ||||||
American Science and Engineering | 46,145 | $ | 2,021,613 | |||
HEICO Corporation Cl. A | 36,132 | 1,834,422 | ||||
Magellan Aerospace | 25,700 | 351,034 | ||||
| 4,207,069 | ||||||
| AIR FREIGHT & LOGISTICS - 1.8% | ||||||
C. H. Robinson Worldwide | 33,500 | 2,090,065 | ||||
Expeditors International of Washington | 124,600 | 5,744,683 | ||||
| 7,834,748 | ||||||
| BUILDING PRODUCTS - 0.7% | ||||||
AAON | 58,187 | 1,310,371 | ||||
Geberit | 1,000 | 333,387 | ||||
TOTO | 74,000 | 1,333,856 | ||||
| 2,977,614 | ||||||
| COMMERCIAL SERVICES & SUPPLIES - 2.7% | ||||||
Cintas Corporation | 41,100 | 3,476,649 | ||||
Collection House | 62,514 | 107,559 | ||||
Itoki Corporation | 47,100 | 269,011 | ||||
Kaba Holding | 2,100 | 1,249,960 | ||||
MSA Safety | 35,000 | 1,697,850 | ||||
Ritchie Bros. Auctioneers | 90,092 | 2,515,368 | ||||
Societe BIC | 6,600 | 1,052,195 | ||||
UniFirst Corporation | 12,155 | 1,359,537 | ||||
| 11,728,129 | ||||||
| CONSTRUCTION & ENGINEERING - 0.6% | ||||||
KBR | 136,900 | 2,666,812 | ||||
| ELECTRICAL EQUIPMENT - 2.2% | ||||||
AZZ | 53,700 | 2,781,660 | ||||
Hubbell Cl. B | 36,400 | 3,941,392 | ||||
Regal Beloit | 30,200 | 2,192,218 | ||||
Zumtobel Group | 8,700 | 258,532 | ||||
| 9,173,802 | ||||||
| MACHINERY - 8.1% | ||||||
Alamo Group | 38,309 | 2,093,204 | ||||
CB Industrial Product Holding | 258,200 | 136,867 | ||||
China Metal International Holdings | 352,000 | 113,980 | ||||
CLARCOR | 59,800 | 3,721,952 | ||||
Donaldson Company | 88,300 | 3,161,140 | ||||
Federal Signal | 66,400 | 990,024 | ||||
Flowserve Corporation | 20,100 | 1,058,466 | ||||
Freund Corporation | 11,700 | 141,392 | ||||
Graco | 52,100 | 3,700,663 | ||||
IDEX Corporation | 37,300 | 2,931,034 | ||||
John Bean Technologies | 81,556 | 3,065,690 | ||||
Kennametal | 32,314 | 1,102,554 | ||||
Lincoln Electric Holdings | 30,050 | 1,829,744 | ||||
Lindsay Corporation | 27,500 | 2,417,525 | ||||
Luxfer Holdings ADR | 6,000 | 78,000 | ||||
Miller Industries | 41,314 | 824,214 | ||||
Nitto Kohki | 5,800 | 131,369 | ||||
Obara Group | 5,400 | 290,330 | ||||
Pfeiffer Vacuum Technology | 13,500 | 1,202,833 | ||||
Spirax-Sarco Engineering | 33,892 | 1,806,868 | ||||
Tennant Company | 18,400 | 1,202,256 | ||||
Valmont Industries | 20,600 | 2,448,722 | ||||
Zuiko Corporation | 5,800 | 199,992 | ||||
| 34,648,819 | ||||||
| MARINE - 0.7% | ||||||
Clarkson | 67,400 | 2,898,545 | ||||
| PROFESSIONAL SERVICES - 1.7% | ||||||
ManpowerGroup | 41,700 | 3,727,146 | ||||
Towers Watson & Co. Cl. A | 29,000 | 3,648,200 | ||||
| 7,375,346 | ||||||
| ROAD & RAIL - 1.7% | ||||||
Amerco | 10,442 | 3,413,594 | ||||
Globaltrans Investment GDR 1 | 10,400 | 49,400 | ||||
Knight Transportation | 2,300 | 61,502 | ||||
Landstar System | 55,400 | 3,704,598 | ||||
| 7,229,094 | ||||||
| TRADING COMPANIES & DISTRIBUTORS - 1.0% | ||||||
Applied Industrial Technologies | 102,427 | 4,061,230 | ||||
Brammer | 41,000 | 198,901 | ||||
| 4,260,131 | ||||||
| Total (Cost $65,617,072) | 95,000,109 | |||||
| INFORMATION TECHNOLOGY – 12.0% | ||||||
| COMMUNICATIONS EQUIPMENT - 1.0% | ||||||
Brocade Communications Systems | 242,306 | 2,878,595 | ||||
Plantronics | 18,308 | 1,030,923 | ||||
TESSCO Technologies | 25,949 | 514,050 | ||||
| 4,423,568 | ||||||
| ELECTRONIC EQUIPMENT, INSTRUMENTS & COMPONENTS - 5.7% | ||||||
Amphenol Corporation Cl. A | 52,600 | 3,049,222 | ||||
AVX Corporation | 142,300 | 1,915,358 | ||||
FLIR Systems | 149,700 | 4,613,754 | ||||
Littelfuse | 30,263 | 2,871,656 | ||||
MTS Systems | 42,193 | 2,909,208 | ||||
National Instruments | 123,500 | 3,638,310 | ||||
Vaisala Cl. A | 48,000 | 1,257,550 | ||||
Vishay Intertechnology | 344,288 | 4,021,284 | ||||
| 24,276,342 | ||||||
| IT SERVICES - 2.6% | ||||||
Broadridge Financial Solutions | 55,200 | 2,760,552 | ||||
Calian Technologies | 23,296 | 345,057 | ||||
Convergys Corporation | 75,315 | 1,919,779 | ||||
eClerx Services | 116,700 | 2,745,236 | ||||
ManTech International Cl. A | 9,036 | 262,044 | ||||
Metrofile Holdings | 1,987,700 | 741,752 | ||||
Western Union | 119,700 | 2,433,501 | ||||
| 11,207,921 | ||||||
| SEMICONDUCTORS & SEMICONDUCTOR EQUIPMENT - 0.7% | ||||||
Eugene Technology | 11,665 | 167,323 | ||||
MKS Instruments | 69,608 | 2,640,927 | ||||
| 2,808,250 | ||||||
| SOFTWARE - 1.0% | ||||||
Computer Modelling Group | 140,000 | 1,419,055 | ||||
Lectra | 16,500 | 235,456 | ||||
Silverlake Axis | 105,360 | 76,662 | ||||
SimCorp | 14,000 | 557,540 | ||||
Totvs | 150,000 | 1,881,574 | ||||
| 4,170,287 | ||||||
| TECHNOLOGY HARDWARE, STORAGE & PERIPHERALS - 1.0% | ||||||
Diebold | 127,000 | 4,445,000 | ||||
| Total (Cost $41,258,830) | 51,331,368 | |||||
| MATERIALS – 9.6% | ||||||
| CHEMICALS - 2.0% | ||||||
Balchem Corporation | 25,050 | 1,395,786 | ||||
| 74 | The Royce Funds 2015 Semiannual Report to Shareholders | THE ACCOMPANYING NOTES ARE AN INTEGRAL PART OF THESE FINANCIAL STATEMENTS |
| June 30, 2015 (unaudited) |
| Royce Dividend Value Fund (continued) | ||||||
| SHARES | VALUE | |||||
| MATERIALS (continued) | ||||||
| CHEMICALS (continued) | ||||||
Fujimori Kogyo | 2,900 | $ | 87,674 | |||
Innospec | 23,400 | 1,053,936 | ||||
Quaker Chemical | 26,800 | 2,380,912 | ||||
Stepan Company | 60,600 | 3,279,066 | ||||
Victrex | 7,500 | 227,438 | ||||
| 8,424,812 | ||||||
| CONTAINERS & PACKAGING - 1.8% | ||||||
AptarGroup | 68,600 | 4,374,622 | ||||
Greif Cl. A | 92,700 | 3,323,295 | ||||
| 7,697,917 | ||||||
| METALS & MINING - 5.4% | ||||||
Allegheny Technologies | 106,900 | 3,228,380 | ||||
Carpenter Technology | 92,400 | 3,574,032 | ||||
Compass Minerals International | 38,100 | 3,129,534 | ||||
Franco-Nevada Corporation | 42,000 | 2,001,300 | ||||
Randgold Resources ADR | 20,000 | 1,339,000 | ||||
Reliance Steel & Aluminum | 93,906 | 5,679,435 | ||||
Royal Gold | 19,900 | 1,225,641 | ||||
Worthington Industries | 97,900 | 2,942,874 | ||||
| 23,120,196 | ||||||
| PAPER & FOREST PRODUCTS - 0.4% | ||||||
Schweitzer-Mauduit International | 36,400 | 1,451,632 | ||||
Stella-Jones | 3,840 | 127,652 | ||||
| 1,579,284 | ||||||
| Total (Cost $38,935,220) | 40,822,209 | |||||
| TELECOMMUNICATION SERVICES – 1.0% | ||||||
| DIVERSIFIED TELECOMMUNICATION SERVICES - 0.4% | ||||||
Inmarsat | 105,000 | 1,510,403 | ||||
| WIRELESS TELECOMMUNICATION SERVICES - 0.6% | ||||||
Telephone and Data Systems | 91,500 | 2,690,100 | ||||
| Total (Cost $3,264,045) | 4,200,503 | |||||
| UTILITIES – 0.7% | ||||||
| WATER UTILITIES - 0.7% | ||||||
Aqua America | 116,400 | 2,850,636 | ||||
| Total (Cost $2,797,782) | 2,850,636 | |||||
| MISCELLANEOUS6 – 1.9% | ||||||
| Total (Cost $8,205,265) | 8,001,112 | |||||
| TOTAL COMMON STOCKS | ||||||
| (Cost $325,640,072) | 406,608,640 | |||||
| REPURCHASE AGREEMENT– 3.8% | ||||||
| Fixed Income Clearing Corporation, 0.00% dated 6/30/15, due 7/1/15, maturity value $16,497,000 (collateralized by obligations of various U.S. Government Agencies, 1.875% due 6/30/20, valued at $16,831,650) | ||||||
| (Cost $16,497,000) | 16,497,000 | |||||
| TOTAL INVESTMENTS – 99.0% | ||||||
| (Cost $342,137,072) | 423,105,640 | |||||
| CASH AND OTHER ASSETS LESS LIABILITIES – 1.0% | 4,130,297 | |||||
| NET ASSETS – 100.0% | $ | 427,235,937 | ||||
| Royce Micro-Cap Opportunity Fund |
| Common Stocks – 98.1% |
| SHARES | VALUE | |||||
| CONSUMER DISCRETIONARY – 17.9% | ||||||
| AUTO COMPONENTS - 1.2% | ||||||
Shiloh Industries 1 | 19,200 | $ | 248,640 | |||
| AUTOMOBILES - 1.6% | ||||||
†Winnebago Industries | 15,000 | 353,850 | ||||
| HOTELS, RESTAURANTS & LEISURE - 0.7% | ||||||
Belmond Cl. A 1 | 12,000 | 149,880 | ||||
| HOUSEHOLD DURABLES - 8.4% | ||||||
| 18,500 | 369,075 | |||||
Dixie Group 1 | 31,000 | 325,500 | ||||
Installed Building Products 1 | 17,800 | 435,744 | ||||
M.D.C. Holdings | 9,000 | 269,730 | ||||
New Home 1 | 23,000 | 396,290 | ||||
| 1,796,339 | ||||||
| MEDIA - 0.9% | ||||||
Ballantyne Strong 1 | 25,000 | 117,250 | ||||
McClatchy Company (The) Cl. A 1 | 80,000 | 86,400 | ||||
| 203,650 | ||||||
| SPECIALTY RETAIL - 4.9% | ||||||
bebe stores | 69,450 | 138,900 | ||||
Guess? | 11,200 | 214,704 | ||||
TravelCenters of America LLC 1 | 17,000 | 252,450 | ||||
Zumiez 1 | 16,800 | 447,384 | ||||
| 1,053,438 | ||||||
| TEXTILES, APPAREL & LUXURY GOODS - 0.2% | ||||||
Quiksilver 1 | 67,700 | 44,872 | ||||
| Total (Cost $3,936,209) | 3,850,669 | |||||
| CONSUMER STAPLES – 1.7% | ||||||
| FOOD PRODUCTS - 1.7% | ||||||
Landec Corporation 1 | 25,500 | 367,965 | ||||
| Total (Cost $323,537) | 367,965 | |||||
| ENERGY – 2.0% | ||||||
| ENERGY EQUIPMENT & SERVICES - 1.3% | ||||||
Basic Energy Services 1 | 24,000 | 181,200 | ||||
Key Energy Services 1 | 56,000 | 100,800 | ||||
| 282,000 | ||||||
| OIL, GAS & CONSUMABLE FUELS - 0.7% | ||||||
Pengrowth Energy | 60,000 | 149,400 | ||||
| Total (Cost $644,828) | 431,400 | |||||
| FINANCIALS – 1.7% | ||||||
| BANKS - 1.2% | ||||||
TriState Capital Holdings 1 | 19,641 | 253,958 | ||||
| INSURANCE - 0.5% | ||||||
James River Group Holdings | 2,000 | 51,740 | ||||
MBIA 1 | 9,000 | 54,090 | ||||
| 105,830 | ||||||
| Total (Cost $389,493) | 359,788 | |||||
| HEALTH CARE – 9.9% | ||||||
| BIOTECHNOLOGY - 1.0% | ||||||
CareDx 1 | 31,049 | 201,818 | ||||
| HEALTH CARE EQUIPMENT & SUPPLIES - 7.7% | ||||||
Accuray 1 | 48,000 | 323,520 | ||||
Exactech 1 | 10,649 | 221,819 | ||||
†Invacare Corporation | 18,000 | 389,340 | ||||
OraSure Technologies 1 | 47,000 | 253,330 | ||||
Trinity Biotech ADR Cl. A | 26,000 | 469,560 | ||||
| 1,657,569 | ||||||
| THE ACCOMPANYING NOTES ARE AN INTEGRAL PART OF THESE FINANCIAL STATEMENTS | The Royce Funds 2015 Semiannual Report to Shareholders | 75 |
| Schedules of Investments |
| Royce Micro-Cap Opportunity Fund (continued) |
| SHARES | VALUE | |||||
| HEALTH CARE (continued) | ||||||
| HEALTH CARE PROVIDERS & SERVICES - 1.2% | ||||||
| 12,200 | $ | 260,226 | ||||
| Total (Cost $2,117,364) | 2,119,613 | |||||
| INDUSTRIALS – 13.0% | ||||||
| AEROSPACE & DEFENSE - 1.2% | ||||||
Kratos Defense & Security Solutions 1 | 40,000 | 252,000 | ||||
| AIR FREIGHT & LOGISTICS - 1.3% | ||||||
Atlas Air Worldwide Holdings 1 | 5,000 | 274,800 | ||||
| BUILDING PRODUCTS - 1.7% | ||||||
Builders FirstSource 1 | 28,000 | 359,520 | ||||
| CONSTRUCTION & ENGINEERING - 0.6% | ||||||
Northwest Pipe 1 | 6,200 | 126,294 | ||||
| ELECTRICAL EQUIPMENT - 6.2% | ||||||
†Encore Wire | 5,200 | 230,308 | ||||
General Cable | 29,000 | 572,170 | ||||
| 9,700 | 523,994 | |||||
| 1,326,472 | ||||||
| MACHINERY - 0.6% | ||||||
Mueller Water Products Cl. A | 15,000 | 136,500 | ||||
| MARINE - 0.3% | ||||||
Baltic Trading | 50,000 | 80,000 | ||||
| ROAD & RAIL - 1.1% | ||||||
Covenant Transport Group Cl. A 1 | 10,000 | 250,600 | ||||
| Total (Cost $2,685,424) | 2,806,186 | |||||
| INFORMATION TECHNOLOGY – 40.4% | ||||||
| COMMUNICATIONS EQUIPMENT - 5.6% | ||||||
Aerohive Networks 1 | 60,000 | 418,800 | ||||
| 31,000 | 538,160 | |||||
Oclaro 1 | 112,500 | 254,250 | ||||
| 1,211,210 | ||||||
| ELECTRONIC EQUIPMENT, INSTRUMENTS & COMPONENTS - 5.4% | ||||||
II-VI 1 | 13,500 | 256,230 | ||||
Newport Corporation 1 | 19,000 | 360,240 | ||||
| 54,000 | 235,440 | |||||
| 30,500 | 304,695 | |||||
| 1,156,605 | ||||||
| INTERNET SOFTWARE & SERVICES - 12.9% | ||||||
Amber Road 1 | 49,000 | 343,980 | ||||
| 48,000 | 295,680 | |||||
Carbonite 1 | 37,000 | 436,970 | ||||
EarthLink Holdings | 65,000 | 486,850 | ||||
Limelight Networks 1 | 106,000 | 417,640 | ||||
| 28,000 | 387,240 | |||||
Monster Worldwide 1 | 26,500 | 173,310 | ||||
| 77,452 | 225,386 | |||||
| 2,767,056 | ||||||
| SEMICONDUCTORS & SEMICONDUCTOR EQUIPMENT - 11.5% | ||||||
| 21,652 | 224,964 | |||||
Brooks Automation | 8,503 | 97,359 | ||||
Exar Corporation 1 | 51,000 | 498,780 | ||||
| 16,000 | 365,760 | |||||
Kopin Corporation 1 | 55,000 | 189,750 | ||||
Mattson Technology 1 | 100,000 | 335,000 | ||||
NeoPhotonics Corporation 1 | 7,766 | 70,904 | ||||
OmniVision Technologies 1 | 8,000 | 209,560 | ||||
Rudolph Technologies 1 | 19,903 | 239,035 | ||||
SunEdison Semiconductor 1 | 14,014 | 242,022 | ||||
| 2,473,134 | ||||||
| SOFTWARE - 5.0% | ||||||
A10 Networks 1 | 60,000 | 386,400 | ||||
| 38,000 | 265,240 | |||||
| 33,735 | 424,386 | |||||
| 1,076,026 | ||||||
| Total (Cost $7,915,238) | 8,684,031 | |||||
| MATERIALS – 6.3% | ||||||
| CHEMICALS - 1.0% | ||||||
Kraton Performance Polymers 1 | 9,000 | 214,920 | ||||
| CONSTRUCTION MATERIALS - 2.4% | ||||||
U.S. Concrete 1 | 13,500 | 511,515 | ||||
| METALS & MINING - 2.9% | ||||||
Century Aluminum 1 | 18,800 | 196,084 | ||||
Haynes International | 8,000 | 394,560 | ||||
Noranda Aluminum Holding Corporation | 56,700 | 48,195 | ||||
| 638,839 | ||||||
| Total (Cost $1,365,799) | 1,365,274 | |||||
| TELECOMMUNICATION SERVICES – 1.2% | ||||||
| DIVERSIFIED TELECOMMUNICATION SERVICES - 1.2% | ||||||
Iridium Communications 1 | 27,500 | 249,975 | ||||
| Total (Cost $262,996) | 249,975 | |||||
| MISCELLANEOUS6 – 4.0% | ||||||
| Total (Cost $915,530) | 850,991 | |||||
| TOTAL COMMON STOCKS | ||||||
| (Cost $20,556,418) | 21,085,892 | |||||
| REPURCHASE AGREEMENT– 1.6% | ||||||
| Fixed Income Clearing Corporation, 0.00% dated 6/30/15, due 7/1/15, maturity value $330,000 (collateralized by obligations of various U.S. Government Agencies, 1.875% due 6/30/20, valued at $338,350) | ||||||
| (Cost $330,000) | 330,000 | |||||
| TOTAL INVESTMENTS – 99.7% | ||||||
| (Cost $20,886,418) | 21,415,892 | |||||
| CASH AND OTHER ASSETS LESS LIABILITIES – 0.3% | 72,329 | |||||
| NET ASSETS – 100.0% | $ | 21,488,221 | ||||
| 76 | The Royce Funds 2015 Semiannual Report to Shareholders | THE ACCOMPANYING NOTES ARE AN INTEGRAL PART OF THESE FINANCIAL STATEMENTS |
| June 30, 2015 (unaudited) |
| Royce Special Equity Multi-Cap Fund |
| Common Stocks – 95.1% |
| SHARES | VALUE | |||||
| CONSUMER DISCRETIONARY – 33.4% | ||||||
| AUTO COMPONENTS - 5.6% | ||||||
Lear Corporation | 130,000 | $ | 14,593,800 | |||
| DISTRIBUTORS - 3.3% | ||||||
Genuine Parts | 95,000 | 8,505,350 | ||||
| MEDIA - 8.7% | ||||||
Scripps Networks Interactive Cl. A | 160,000 | 10,459,200 | ||||
Viacom Cl. B | 185,000 | 11,958,400 | ||||
| 22,417,600 | ||||||
| MULTILINE RETAIL - 5.5% | ||||||
Nordstrom | 190,000 | 14,155,000 | ||||
| SPECIALTY RETAIL - 10.3% | ||||||
Bed Bath & Beyond 1 | 200,000 | 13,796,000 | ||||
Gap (The) | 340,000 | 12,977,800 | ||||
| 26,773,800 | ||||||
| Total (Cost $76,575,870) | 86,445,550 | |||||
| FINANCIALS – 9.5% | ||||||
| CAPITAL MARKETS - 9.5% | ||||||
Franklin Resources | 245,000 | 12,012,350 | ||||
T. Rowe Price Group | 160,000 | 12,436,800 | ||||
| Total (Cost $25,374,815) | 24,449,150 | |||||
| INDUSTRIALS – 26.4% | ||||||
| AEROSPACE & DEFENSE - 1.9% | ||||||
Raytheon Company | 52,700 | 5,042,336 | ||||
| ELECTRICAL EQUIPMENT - 6.3% | ||||||
Emerson Electric | 245,000 | 13,580,350 | ||||
†Rockwell Automation | 21,000 | 2,617,440 | ||||
| 16,197,790 | ||||||
| INDUSTRIAL CONGLOMERATES - 1.3% | ||||||
3M | 21,500 | 3,317,450 | ||||
| MACHINERY - 9.7% | ||||||
Dover Corporation | 110,000 | 7,719,800 | ||||
Illinois Tool Works | 69,500 | 6,379,405 | ||||
†Lincoln Electric Holdings | 31,000 | 1,887,590 | ||||
Parker Hannifin | 77,000 | 8,957,410 | ||||
| 24,944,205 | ||||||
| PROFESSIONAL SERVICES - 6.2% | ||||||
ManpowerGroup | 180,000 | 16,088,400 | ||||
| TRADING COMPANIES & DISTRIBUTORS - 1.0% | ||||||
Grainger (W.W.) | 11,200 | 2,650,480 | ||||
| Total (Cost $58,051,770) | 68,240,661 | |||||
| INFORMATION TECHNOLOGY – 23.8% | ||||||
| COMMUNICATIONS EQUIPMENT - 5.3% | ||||||
Cisco Systems | 500,000 | 13,730,000 | ||||
| ELECTRONIC EQUIPMENT, INSTRUMENTS & COMPONENTS - 1.4% | ||||||
Avnet | 88,000 | 3,617,680 | ||||
| SEMICONDUCTORS & SEMICONDUCTOR EQUIPMENT - 2.8% | ||||||
Intel Corporation | 240,000 | 7,299,600 | ||||
| SOFTWARE - 9.5% | ||||||
Microsoft Corporation | 285,000 | 12,582,750 | ||||
Symantec Corporation | 510,000 | 11,857,500 | ||||
| 24,440,250 | ||||||
| TECHNOLOGY HARDWARE, STORAGE & PERIPHERALS - 4.8% | ||||||
Apple | 99,800 | 12,517,415 | ||||
| Total (Cost $50,800,297) | 61,604,945 | |||||
| MATERIALS – 2.0% | ||||||
| METALS & MINING - 2.0% | ||||||
†Nucor Corporation | 115,000 | 5,068,050 | ||||
| Total (Cost $5,344,776) | 5,068,050 | |||||
| TOTAL COMMON STOCKS | ||||||
| (Cost $216,147,528) | 245,808,356 | |||||
| REPURCHASE AGREEMENT– 4.9% | ||||||
| Fixed Income Clearing Corporation, 0.00% dated 6/30/15, due 7/1/15, maturity value $12,660,000 (collateralized by obligations of various U.S. Government Agencies, 2.625% due 8/15/20, valued at $12,913,200) | ||||||
| (Cost $12,660,000) | 12,660,000 | |||||
| TOTAL INVESTMENTS – 100.0% | ||||||
| (Cost $228,807,528) | 258,468,356 | |||||
| LIABILITIES LESS CASH AND OTHER ASSETS – (0.0)% | (117,889) | |||||
| NET ASSETS – 100.0% | $ | 258,350,467 | ||||
| THE ACCOMPANYING NOTES ARE AN INTEGRAL PART OF THESE FINANCIAL STATEMENTS | The Royce Funds 2015 Semiannual Report to Shareholders | 77 |
| Statements of Assets and Liabilities |
| Royce | ||||||||||||||||
| Pennsylvania | Royce Micro-Cap | Royce Premier | Royce Low-Priced | |||||||||||||
| Mutual Fund | Fund | Fund | Stock Fund | |||||||||||||
| ASSETS: | ||||||||||||||||
Investments at value (including collateral on loaned securities) | ||||||||||||||||
Non-Affiliated Companies | $ | 4,340,872,624 | $ | 395,818,595 | $ | 3,702,925,638 | $ | 507,916,740 | ||||||||
Affiliated Companies | 121,540,009 | – | 365,811,736 | 2,982,191 | ||||||||||||
| Repurchase agreements (at cost and value) | 125,906,000 | 13,158,000 | 352,403,000 | 39,523,000 | ||||||||||||
| Cash and foreign currency | 716 | 22,467 | 451 | 437 | ||||||||||||
| Receivable for investments sold | 84,178,567 | 3,388,725 | 21,720,098 | 5,842,242 | ||||||||||||
| Receivable for capital shares sold | 1,830,856 | 110,958 | 2,509,120 | 153,373 | ||||||||||||
| Receivable for dividends and interest | 2,381,507 | 445,487 | 4,263,006 | 233,505 | ||||||||||||
| Prepaid expenses and other assets | 2,369,490 | 1,428 | 54,056 | 433 | ||||||||||||
| Total Assets | 4,679,079,769 | 412,945,660 | 4,449,687,105 | 556,651,921 | ||||||||||||
| LIABILITIES: | ||||||||||||||||
| Payable for collateral on loaned securities | 27,188,580 | 12,625,181 | 44,759,784 | 16,161,325 | ||||||||||||
| Payable for investments purchased | 146,953,182 | 3,289,644 | 1,878,983 | 1,108,267 | ||||||||||||
| Payable for capital shares redeemed | 14,798,205 | 424,779 | 13,121,946 | 605,436 | ||||||||||||
| Payable for investment advisory fees | 2,887,058 | 420,004 | 3,601,816 | 459,918 | ||||||||||||
| Payable for trustees’ fees | 87,944 | 10,871 | 88,668 | 17,000 | ||||||||||||
| Accrued expenses | 2,761,062 | 387,335 | 3,005,106 | 1,016,861 | ||||||||||||
| Total Liabilities | 194,676,031 | 17,157,814 | 66,456,303 | 19,368,807 | ||||||||||||
| Net Assets | $ | 4,484,403,738 | $ | 395,787,846 | $ | 4,383,230,802 | $ | 537,283,114 | ||||||||
| ANALYSIS OF NET ASSETS: | ||||||||||||||||
| Paid-in capital | $ | 2,472,152,451 | $ | 276,587,800 | $ | 2,122,087,140 | $ | 393,462,796 | ||||||||
| Undistributed net investment income (loss) | 7,316,378 | 482,333 | 17,228,554 | (431,438 | ) | |||||||||||
| Accumulated net realized gain (loss) on investments and foreign currency | 617,252,035 | 64,565,606 | 402,459,309 | 60,554,597 | ||||||||||||
Net unrealized appreciation (depreciation) on investments and foreign | 1,387,682,874 | 54,152,107 | 1,841,455,799 | 83,697,159 | ||||||||||||
| Net Assets | $ | 4,484,403,738 | $ | 395,787,846 | $ | 4,383,230,802 | $ | 537,283,114 | ||||||||
Investment Class | $ | 2,940,218,991 | $ | 302,866,325 | $ | 3,333,630,412 | $ | 41,378,525 | ||||||||
Service Class | 201,945,866 | 34,170,715 | 101,779,997 | 433,396,711 | ||||||||||||
Consultant Class | 600,924,389 | 58,750,806 | 50,828,230 | |||||||||||||
Institutional Class | 703,284,081 | 498,654,080 | 59,245,722 | |||||||||||||
W Class | 370,597,456 | |||||||||||||||
R Class | 29,171,200 | 23,018,264 | 1,365,383 | |||||||||||||
K Class | 8,859,211 | 4,722,363 | 1,896,773 | |||||||||||||
| SHARES OUTSTANDING (unlimited number of $.001 par value): | ||||||||||||||||
Investment Class | 226,043,818 | 21,217,306 | 166,242,807 | 4,254,207 | ||||||||||||
Service Class | 15,603,341 | 2,429,498 | 5,186,431 | 44,629,610 | ||||||||||||
Consultant Class | 54,076,467 | 4,895,149 | 2,938,476 | |||||||||||||
Institutional Class | 53,940,099 | 24,609,219 | 6,089,661 | |||||||||||||
W Class | 18,438,491 | |||||||||||||||
R Class | 2,338,653 | 1,206,593 | 146,655 | |||||||||||||
K Class | 785,543 | 808,528 | 625,826 | |||||||||||||
| NET ASSET VALUES (Net Assets ÷ Shares Outstanding): | ||||||||||||||||
Investment Class1 | $13.01 | $14.27 | $20.05 | $9.73 | ||||||||||||
Service Class1 | 12.94 | 14.06 | 19.62 | 9.71 | ||||||||||||
Consultant Class2 | 11.11 | 12.00 | 17.30 | |||||||||||||
Institutional Class3 | 13.04 | 20.26 | 9.73 | |||||||||||||
W Class3 | 20.10 | |||||||||||||||
R Class3 | 12.47 | 19.08 | 9.31 | |||||||||||||
K Class3 | 11.28 | 5.84 | 3.03 | |||||||||||||
| Investments at identified cost | $ | 3,074,755,580 | $ | 341,642,900 | $ | 2,227,101,798 | $ | 427,201,601 | ||||||||
| Market value of loaned securities | 23,302,461 | 12,121,274 | 44,420,001 | 15,789,510 | ||||||||||||
| 1 | Offering and redemption price per share; shares held less than 30 days may be subject to a 1% redemption fee, payable to the Fund. From January 1-31, 2015, the same redemption fee was applied to shares held less than 180 days. |
| 2 | Offering and redemption price per share; shares held less than 365 days may be subject to a 1% contingent deferred sales charge, payable to Royce Fund Services, Inc. |
| 3 | Offering and redemption price per share. |
| 78 | The Royce Funds 2015 Semiannual Report to Shareholders | THE ACCOMPANYING NOTES ARE AN INTEGRAL PART OF THESE FINANCIAL STATEMENTS |
| June 30, 2015 (unaudited) |
| Royce Total Return | Royce Heritage | Royce Opportunity | Royce Special Equity | |||||||||||||
| Fund | Fund | Fund | Fund | |||||||||||||
| ASSETS: | ||||||||||||||||
Investments at value (including collateral on loaned securities) | ||||||||||||||||
Non-Affiliated Companies | $ | 3,862,813,563 | $ | 294,236,036 | $ | 2,005,874,028 | $ | 1,125,962,308 | ||||||||
Affiliated Companies | 70,403,301 | – | 45,092,559 | 871,488,763 | ||||||||||||
| Repurchase agreements (at cost and value) | 68,412,000 | 49,361,000 | 72,563,000 | 198,730,000 | ||||||||||||
| Cash and foreign currency | 1,594,454 | 8,850 | 914 | 11 | ||||||||||||
| Receivable for investments sold | 5,110,255 | 169,528 | 12,233,318 | 21,986,734 | ||||||||||||
| Receivable for capital shares sold | 2,713,022 | 25,384 | 960,215 | 1,701,173 | ||||||||||||
| Receivable for dividends and interest | 4,276,436 | 211,624 | 848,817 | 858,978 | ||||||||||||
| Prepaid expenses and other assets | 54,361 | 4,570 | 28,291 | 36,825 | ||||||||||||
| Total Assets | 4,015,377,392 | 344,016,992 | 2,137,601,142 | 2,220,764,792 | ||||||||||||
| LIABILITIES: | ||||||||||||||||
| Payable for collateral on loaned securities | 12,246,783 | – | 117,857,298 | – | ||||||||||||
| Payable for investments purchased | 9,220,368 | 903,097 | 5,437,903 | 2,137,269 | ||||||||||||
| Payable for capital shares redeemed | 7,393,219 | 277,619 | 2,411,352 | 65,450,295 | ||||||||||||
| Payable for investment advisory fees | 3,269,595 | 286,195 | 1,698,715 | 1,928,113 | ||||||||||||
| Payable for trustees’ fees | 63,910 | 3,973 | 29,916 | 41,810 | ||||||||||||
| Accrued expenses | 2,088,930 | 145,892 | 632,508 | 1,001,234 | ||||||||||||
| Total Liabilities | 34,282,805 | 1,616,776 | 128,067,692 | 70,558,721 | ||||||||||||
| Net Assets | $ | 3,981,094,587 | $ | 342,400,216 | $ | 2,009,533,450 | $ | 2,150,206,071 | ||||||||
| ANALYSIS OF NET ASSETS: | ||||||||||||||||
| Paid-in capital | $ | 2,309,258,523 | $ | 276,718,412 | $ | 1,639,271,692 | $ | 1,402,626,308 | ||||||||
| Undistributed net investment income (loss) | (1,883,887 | ) | 1,550,907 | (3,518,704 | ) | 13,455,352 | ||||||||||
| Accumulated net realized gain (loss) on investments and foreign currency | 368,410,434 | 7,716,255 | 103,589,660 | 303,991,663 | ||||||||||||
Net unrealized appreciation (depreciation) on investments and foreign currency | 1,305,309,517 | 56,414,642 | 270,190,802 | 430,132,748 | ||||||||||||
| Net Assets | $ | 3,981,094,587 | $ | 342,400,216 | $ | 2,009,533,450 | $ | 2,150,206,071 | ||||||||
Investment Class | $ | 2,618,703,602 | $ | 178,123,915 | $ | 1,040,355,642 | $ | 1,618,767,496 | ||||||||
Service Class | 195,257,809 | 143,789,527 | 136,216,684 | 179,409,390 | ||||||||||||
Consultant Class | 326,199,088 | 12,659,572 | 22,565,753 | 55,950,167 | ||||||||||||
Institutional Class | 547,264,085 | 757,991,884 | 296,079,018 | |||||||||||||
W Class | 148,060,564 | |||||||||||||||
R Class | 62,601,173 | 2,903,336 | 35,669,403 | |||||||||||||
K Class | 83,008,266 | 4,923,866 | 16,734,084 | |||||||||||||
| SHARES OUTSTANDING (unlimited number of $.001 par value): | ||||||||||||||||
Investment Class | 177,393,656 | 11,565,912 | 76,772,353 | 71,180,846 | ||||||||||||
Service Class | 13,013,065 | 9,376,412 | 10,595,103 | 7,914,477 | ||||||||||||
Consultant Class | 21,642,063 | 1,096,040 | 1,911,111 | 2,656,402 | ||||||||||||
Institutional Class | 37,415,950 | 55,177,479 | 13,097,776 | |||||||||||||
W Class | 10,046,028 | |||||||||||||||
R Class | 4,147,925 | 271,448 | 2,829,539 | |||||||||||||
K Class | 7,738,117 | 455,458 | 1,441,185 | |||||||||||||
| NET ASSET VALUES (Net Assets ÷ Shares Outstanding): | ||||||||||||||||
Investment Class1 | $14.76 | $15.40 | $13.55 | $22.74 | ||||||||||||
Service Class1 | 15.00 | 15.34 | 12.86 | 22.67 | ||||||||||||
Consultant Class2 | 15.07 | 11.55 | 11.81 | 21.06 | ||||||||||||
Institutional Class3 | 14.63 | 13.74 | 22.61 | |||||||||||||
W Class3 | 14.74 | |||||||||||||||
R Class3 | 15.09 | 10.70 | 12.61 | |||||||||||||
K Class3 | 10.73 | 10.81 | 11.61 | |||||||||||||
| Investments at identified cost | $ | 2,627,892,481 | $ | 237,820,239 | $ | 1,780,775,241 | $ | 1,567,318,324 | ||||||||
| Market value of loaned securities | 11,140,364 | – | 113,392,474 | – | ||||||||||||
| 1 | Offering and redemption price per share; shares held less than 30 days may be subject to a 1% redemption fee, payable to the Fund. From January 1-31, 2015, the same redemption fee was applied to shares held less than 180 days. |
| 2 | Offering and redemption price per share; shares held less than 365 days may be subject to a 1% contingent deferred sales charge, payable to Royce Fund Services, Inc. |
| 3 | Offering and redemption price per share. |
| THE ACCOMPANYING NOTES ARE AN INTEGRAL PART OF THESE FINANCIAL STATEMENTS | The Royce Funds 2015 Semiannual Report to Shareholders | 79 |
| Statements of Assets and Liabilities |
| Royce Smaller- | ||||||||||||||||
| Royce | Royce Small-Cap | Companies Growth | Royce | |||||||||||||
| Select Fund I | Value Fund | Fund | 100 Fund | |||||||||||||
| ASSETS: | ||||||||||||||||
Investments at value (including collateral on loaned securities) | ||||||||||||||||
Non-Affiliated Companies | $ | 21,319,590 | $ | 744,899,891 | $ | 911,681,280 | $ | 145,884,424 | ||||||||
| Repurchase agreements (at cost and value) | 1,709,000 | 10,197,000 | 47,393,000 | 3,463,000 | ||||||||||||
| Cash and foreign currency | 992 | 666 | 934 | 386 | ||||||||||||
| Receivable for investments sold | 41,341 | 5,161,305 | 8,589,652 | 239,001 | ||||||||||||
| Receivable for capital shares sold | – | 184,160 | 397,050 | 21,817 | ||||||||||||
| Receivable for dividends and interest | 5,278 | 383,260 | 233,036 | 46,830 | ||||||||||||
| Prepaid expenses and other assets | 606 | 4,790 | 922 | 1,272 | ||||||||||||
| Total Assets | 23,076,807 | 760,831,072 | 968,295,874 | 149,656,730 | ||||||||||||
| LIABILITIES: | ||||||||||||||||
| Payable for collateral on loaned securities | – | – | 75,795,538 | 1,034,978 | ||||||||||||
| Payable for investments purchased | 34,957 | 7,471,132 | 1,680,647 | – | ||||||||||||
| Payable for capital shares redeemed | 12,340 | 815,931 | 1,831,356 | 247,330 | ||||||||||||
| Payable for investment advisory fees | 15,238 | 637,705 | 738,071 | 125,744 | ||||||||||||
| Payable for trustees’ fees | 625 | 13,934 | 14,651 | 3,801 | ||||||||||||
| Accrued expenses | 26,932 | 528,354 | 678,361 | 199,838 | ||||||||||||
| Total Liabilities | 90,092 | 9,467,056 | 80,738,624 | 1,611,691 | ||||||||||||
| Net Assets | $ | 22,986,715 | $ | 751,364,016 | $ | 887,557,250 | $ | 148,045,039 | ||||||||
| ANALYSIS OF NET ASSETS: | ||||||||||||||||
| Paid-in capital | $ | 15,067,155 | $ | 553,224,879 | $ | 547,728,250 | $ | 90,127,393 | ||||||||
| Undistributed net investment income (loss) | 86,647 | 3,452,339 | (2,595,452 | ) | 348,061 | |||||||||||
Accumulated net realized gain (loss) on investments and foreign currency | 3,169,548 | 122,493,936 | 85,115,881 | 30,592,284 | ||||||||||||
Net unrealized appreciation (depreciation) on investments and foreign currency | 4,663,365 | 72,192,862 | 257,308,571 | 26,977,301 | ||||||||||||
| Net Assets | $ | 22,986,715 | $ | 751,364,016 | $ | 887,557,250 | $ | 148,045,039 | ||||||||
Investment Class | $ | 22,986,715 | $ | 118,068,570 | $ | 289,769,335 | $ | 53,856,109 | ||||||||
Service Class | 373,436,449 | 543,707,584 | 91,720,173 | |||||||||||||
Consultant Class | 24,282,269 | 16,698,993 | ||||||||||||||
Institutional Class | 200,478,932 | 35,692,479 | ||||||||||||||
R Class | 26,534,675 | 1,234,044 | 1,993,426 | |||||||||||||
K Class | 8,563,121 | 454,815 | 475,331 | |||||||||||||
| SHARES OUTSTANDING (unlimited number of $.001 par value): | ||||||||||||||||
Investment Class | 1,327,970 | 9,880,928 | 18,504,071 | 6,160,047 | ||||||||||||
Service Class | 31,433,187 | 35,073,766 | 10,618,961 | |||||||||||||
Consultant Class | 2,219,912 | 1,172,983 | ||||||||||||||
Institutional Class | 16,759,287 | 2,261,257 | ||||||||||||||
R Class | 2,300,518 | 83,198 | 179,440 | |||||||||||||
K Class | 953,059 | 46,168 | 42,002 | |||||||||||||
| NET ASSET VALUES (Net Assets ÷ Shares Outstanding): | ||||||||||||||||
Investment Class1 | $17.31 | $11.95 | $15.66 | $8.74 | ||||||||||||
Service Class1 | 11.88 | 15.50 | 8.64 | |||||||||||||
Consultant Class2 | 10.94 | 14.24 | ||||||||||||||
Institutional Class3 | 11.96 | 15.78 | ||||||||||||||
R Class3 | 11.53 | 14.83 | 11.11 | |||||||||||||
K Class3 | 8.98 | 9.85 | 11.32 | |||||||||||||
| Investments at identified cost | $ | 16,656,197 | $ | 672,707,029 | $ | 654,372,407 | $ | 118,907,025 | ||||||||
| Market value of loaned securities | – | – | 73,107,248 | 1,042,696 | ||||||||||||
| 1 | Offering and redemption price per share; shares held less than 30 days may be subject to a 1% redemption fee, payable to the Fund. From January 1-31, 2015, the same redemption fee was applied to shares held less than 180 days. |
| 2 | Offering and redemption price per share; shares held less than 365 days may be subject to a 1% contingent deferred sales charge, payable to Royce Fund Services, Inc. |
| 3 | Offering and redemption price per share. |
| 80 | The Royce Funds 2015 Semiannual Report to Shareholders | THE ACCOMPANYING NOTES ARE AN INTEGRAL PART OF THESE FINANCIAL STATEMENTS |
| June 30, 2015 (unaudited) |
| Royce Micro-Cap | Royce Dividend | Royce Micro-Cap | Royce Special Equity | |||||||||||||
| Discovery Fund | Value Fund | Opportunity Fund | Multi-Cap Fund | |||||||||||||
| ASSETS: | ||||||||||||||||
| Investments at value | ||||||||||||||||
Non-Affiliated Companies | $ | 5,139,437 | $ | 406,608,640 | $ | 21,085,892 | $ | 245,808,356 | ||||||||
| Repurchase agreements (at cost and value) | 442,000 | 16,497,000 | 330,000 | 12,660,000 | ||||||||||||
| Cash and foreign currency | 95 | 481,348 | 23 | 288 | ||||||||||||
| Receivable for investments sold | – | 4,596,899 | 128,914 | – | ||||||||||||
| Receivable for capital shares sold | 1,102 | 376,404 | 211,909 | 201,948 | ||||||||||||
| Receivable for dividends and interest | 5,352 | 488,989 | 14,622 | 289,833 | ||||||||||||
| Prepaid expenses and other assets | 76 | 7,561 | 295 | 5,088 | ||||||||||||
| Total Assets | 5,588,062 | 429,056,841 | 21,771,655 | 258,965,513 | ||||||||||||
| LIABILITIES: | ||||||||||||||||
| Payable for investments purchased | 1,606 | 441,597 | 246,098 | 23,300 | ||||||||||||
| Payable for capital shares redeemed | 6,050 | 683,683 | – | 344,661 | ||||||||||||
| Payable for investment advisory fees | 845 | 352,861 | 17,904 | 187,952 | ||||||||||||
| Payable for trustees’ fees | 58 | 7,946 | 236 | 1,242 | ||||||||||||
| Accrued expenses | 15,016 | 334,817 | 19,196 | 57,891 | ||||||||||||
| Total Liabilities | 23,575 | 1,820,904 | 283,434 | 615,046 | ||||||||||||
| Net Assets | $ | 5,564,487 | $ | 427,235,937 | $ | 21,488,221 | $ | 258,350,467 | ||||||||
| ANALYSIS OF NET ASSETS: | ||||||||||||||||
| Paid-in capital | $ | 5,026,277 | $ | 320,536,857 | $ | 19,615,096 | $ | 217,858,939 | ||||||||
| Undistributed net investment income (loss) | (5,858 | ) | 2,180,273 | (64,651 | ) | 1,849,391 | ||||||||||
Accumulated net realized gain (loss) on investments and foreign currency | 342,998 | 23,552,159 | 1,408,319 | 8,981,309 | ||||||||||||
Net unrealized appreciation (depreciation) on investments and foreign currency | 201,070 | 80,966,648 | 529,457 | 29,660,828 | ||||||||||||
| Net Assets | $ | 5,564,487 | $ | 427,235,937 | $ | 21,488,221 | $ | 258,350,467 | ||||||||
Investment Class | $ | 149,310,264 | $ | 20,098,630 | $ | 121,614,526 | ||||||||||
Service Class | $ | 5,564,487 | 235,242,511 | 1,389,591 | 77,523,765 | |||||||||||
Consultant Class | 1,095,426 | 9,274,138 | ||||||||||||||
Institutional Class | 41,587,736 | 49,938,038 | ||||||||||||||
SHARES OUTSTANDING (unlimited number of $.001 par value): | ||||||||||||||||
Investment Class | 18,055,066 | 1,166,236 | 8,063,191 | |||||||||||||
Service Class | 920,506 | 28,087,682 | 159,460 | 5,131,798 | ||||||||||||
Consultant Class | 116,681 | 896,920 | ||||||||||||||
Institutional Class | 5,045,433 | 3,307,433 | ||||||||||||||
| NET ASSET VALUES (Net Assets ÷ Shares Outstanding): | ||||||||||||||||
Investment Class1 | $8.27 | $17.23 | $15.08 | |||||||||||||
Service Class1 | $6.05 | 8.38 | 8.71 | 15.11 | ||||||||||||
Consultant Class2 | 9.39 | 10.34 | ||||||||||||||
Institutional Class3 | 8.24 | 15.10 | ||||||||||||||
| Investments at identified cost | $ | 4,938,367 | $ | 325,640,072 | $ | 20,556,418 | $ | 216,147,528 | ||||||||
| 1 | Offering and redemption price per share; shares held less than 30 days may be subject to a 1% redemption fee, payable to the Fund. From January 1-31, 2015, the same redemption fee was applied to shares held less than 180 days. |
| 2 | Offering and redemption price per share; shares held less than 365 days may be subject to a 1% contingent deferred sales charge, payable to Royce Fund Services, Inc. |
| 3 | Offering and redemption price per share. |
| THE ACCOMPANYING NOTES ARE AN INTEGRAL PART OF THESE FINANCIAL STATEMENTS | The Royce Funds 2015 Semiannual Report to Shareholders | 81 |
| Statements of Changes in Net Assets |
| Royce Pennsylvania Mutual Fund | Royce Micro-Cap Fund | Royce Premier Fund | ||||||||||||||||||||||
| Six Months Ended | Six Months Ended | Six Months Ended | ||||||||||||||||||||||
| 6/30/15 (unaudited) | Year Ended 12/31/14 | 6/30/15 (unaudited) | Year Ended 12/31/14 | 6/30/15 (unaudited) | Year Ended 12/31/14 | |||||||||||||||||||
| INVESTMENT OPERATIONS: | ||||||||||||||||||||||||
| Net investment income (loss) | $ | 13,013,384 | $ | 15,158,466 | $ | 631,454 | $ | (4,483,168 | ) | $ | 16,572,690 | $ | 21,471,509 | |||||||||||
Net realized gain (loss) on investments and foreign | 392,747,673 | 850,882,031 | 46,244,798 | 67,181,821 | 387,316,093 | 509,484,795 | ||||||||||||||||||
Net change in unrealized appreciation (depreciation) | (404,280,621 | ) | (941,232,232 | ) | (52,835,331 | ) | (98,379,469 | ) | (322,036,807 | ) | (571,494,932 | ) | ||||||||||||
Net increase (decrease) in net assets from | 1,480,436 | (75,191,735 | ) | (5,959,079 | ) | (35,680,816 | ) | 81,851,976 | (40,538,628 | ) | ||||||||||||||
| DISTRIBUTIONS: | ||||||||||||||||||||||||
| Net investment income | ||||||||||||||||||||||||
Investment Class | – | (12,703,277 | ) | – | – | – | (15,697,641 | ) | ||||||||||||||||
Service Class | – | – | – | – | – | – | ||||||||||||||||||
Consultant Class | – | – | – | – | – | – | ||||||||||||||||||
Institutional Class | – | (3,678,635 | ) | – | (3,363,878 | ) | ||||||||||||||||||
W Class | – | (1,812,923 | ) | |||||||||||||||||||||
R Class | – | – | – | – | ||||||||||||||||||||
K Class | – | – | – | (36,229 | ) | |||||||||||||||||||
Net realized gain on investments and foreign | ||||||||||||||||||||||||
Investment Class | – | (417,000,811 | ) | – | (39,701,168 | ) | – | (398,730,083 | ) | |||||||||||||||
Service Class | – | (49,712,548 | ) | – | (3,907,041 | ) | – | (17,256,962 | ) | |||||||||||||||
Consultant Class | – | (82,823,610 | ) | – | (8,779,199 | ) | – | (6,231,891 | ) | |||||||||||||||
Institutional Class | – | (86,408,552 | ) | – | (65,714,517 | ) | ||||||||||||||||||
W Class | – | (44,052,112 | ) | |||||||||||||||||||||
R Class | – | (4,018,570 | ) | – | (2,717,731 | ) | ||||||||||||||||||
K Class | – | (1,293,456 | ) | – | (1,653,995 | ) | ||||||||||||||||||
| Total distributions | – | (657,639,459 | ) | – | (52,387,408 | ) | – | (557,267,962 | ) | |||||||||||||||
| CAPITAL SHARE TRANSACTIONS: | ||||||||||||||||||||||||
| Net capital share transactions | ||||||||||||||||||||||||
Investment Class | (930,476,530 | ) | (689,872,693 | ) | (107,133,971 | ) | (170,862,529 | ) | (825,863,094 | ) | (547,373,395 | ) | ||||||||||||
Service Class | (132,189,485 | ) | (199,343,245 | ) | (3,963,967 | ) | (33,847,817 | ) | (73,000,939 | ) | (129,533,114 | ) | ||||||||||||
Consultant Class | (73,014,667 | ) | (14,396,432 | ) | (15,789,336 | ) | (26,840,854 | ) | (6,694,552 | ) | (2,535,012 | ) | ||||||||||||
Institutional Class | (101,510,300 | ) | 81,146,529 | (106,057,836 | ) | (326,676,517 | ) | |||||||||||||||||
W Class | (82,862,972 | ) | (56,736,703 | ) | ||||||||||||||||||||
R Class | (7,364,335 | ) | (2,792,539 | ) | (4,652,623 | ) | (2,140,060 | ) | ||||||||||||||||
K Class | (1,862,661 | ) | 439,120 | (1,664,910 | ) | (526,085 | ) | |||||||||||||||||
| Shareholder redemption fees | ||||||||||||||||||||||||
Investment Class | 18,296 | 66,223 | 857 | 6,501 | 14,330 | 68,382 | ||||||||||||||||||
Service Class | 3,242 | 44,289 | 110 | 45,360 | 2,429 | 3,900 | ||||||||||||||||||
Net increase (decrease) in net assets from capital | (1,246,396,440 | ) | (824,708,748 | ) | (126,886,307 | ) | (231,499,339 | ) | (1,100,780,167 | ) | (1,065,448,604 | ) | ||||||||||||
Net Increase (Decrease) In Net Assets | (1,244,916,004 | ) | (1,557,539,942 | ) | (132,845,386 | ) | (319,567,563 | ) | (1,018,928,191 | ) | (1,663,255,194 | ) | ||||||||||||
| NET ASSETS: | ||||||||||||||||||||||||
| Beginning of period | 5,729,319,742 | 7,286,859,684 | 528,633,232 | 848,200,795 | 5,402,158,993 | 7,065,414,187 | ||||||||||||||||||
| End of period | $ | 4,484,403,738 | $ | 5,729,319,742 | $ | 395,787,846 | $ | 528,633,232 | $ | 4,383,230,802 | $ | 5,402,158,993 | ||||||||||||
Undistributed Net Investment Income (Loss) at End | $ | 7,316,378 | $ | (5,697,006 | ) | $ | 482,333 | $ | (149,122 | ) | $ | 17,228,554 | $ | 655,864 | ||||||||||
| 82 | The Royce Funds 2015 Semiannual Report to Shareholders | THE ACCOMPANYING NOTES ARE AN INTEGRAL PART OF THESE FINANCIAL STATEMENTS |
| Royce Low-Priced Stock Fund | Royce Total Return Fund | Royce Heritage Fund | ||||||||||||||||||||||
| Six Months Ended | Six Months Ended | Six Months Ended | ||||||||||||||||||||||
| 6/30/15 (unaudited) | Year Ended 12/31/14 | 6/30/15 (unaudited) | Year Ended 12/31/14 | 6/30/15 (unaudited) | Year Ended 12/31/14 | |||||||||||||||||||
| INVESTMENT OPERATIONS: | ||||||||||||||||||||||||
| Net investment income (loss) | $ | (225,936 | ) | $ | 2,857,398 | $ | 24,805,933 | $ | 43,476,286 | $ | 648,229 | $ | 1,470,971 | |||||||||||
Net realized gain (loss) on investments and foreign | 67,325,911 | 178,888,358 | 222,761,364 | 599,509,277 | 6,526,620 | 16,802,002 | ||||||||||||||||||
Net change in unrealized appreciation (depreciation) | (51,152,169 | ) | (201,991,166 | ) | (210,903,480 | ) | (593,275,861 | ) | (2,860,025 | ) | (21,766,741 | ) | ||||||||||||
Net increase (decrease) in net assets from | 15,947,806 | (20,245,410 | ) | 36,663,817 | 49,709,702 | 4,314,824 | (3,493,768 | ) | ||||||||||||||||
| DISTRIBUTIONS: | ||||||||||||||||||||||||
| Net investment income | ||||||||||||||||||||||||
Investment Class | – | (39,705 | ) | (17,093,495 | ) | (56,476,197 | ) | – | (508,210 | ) | ||||||||||||||
Service Class | – | – | (908,760 | ) | (2,393,470 | ) | – | – | ||||||||||||||||
Consultant Class | (449,082 | ) | (759,635 | ) | – | – | ||||||||||||||||||
Institutional Class | – | (298,806 | ) | (3,764,630 | ) | (11,453,242 | ) | |||||||||||||||||
W Class | (1,276,054 | ) | (4,594,582 | ) | ||||||||||||||||||||
R Class | – | – | (213,891 | ) | (488,326 | ) | – | – | ||||||||||||||||
K Class | – | – | (388,611 | ) | (1,252,049 | ) | – | – | ||||||||||||||||
Net realized gain on investments and foreign | ||||||||||||||||||||||||
Investment Class | – | (14,919,772 | ) | – | (307,872,630 | ) | – | (8,225,023 | ) | |||||||||||||||
Service Class | – | (167,025,408 | ) | – | (22,938,230 | ) | – | (9,172,987 | ) | |||||||||||||||
Consultant Class | – | (34,858,344 | ) | – | (903,116 | ) | ||||||||||||||||||
Institutional Class | – | (27,925,196 | ) | – | (56,439,291 | ) | ||||||||||||||||||
W Class | – | (25,890,733 | ) | |||||||||||||||||||||
R Class | – | (532,869 | ) | – | (6,318,710 | ) | – | (284,436 | ) | |||||||||||||||
K Class | – | (1,092,324 | ) | – | (11,933,090 | ) | – | (396,761 | ) | |||||||||||||||
| Total distributions | – | (211,834,080 | ) | (24,094,523 | ) | (543,668,529 | ) | – | (19,490,533 | ) | ||||||||||||||
| CAPITAL SHARE TRANSACTIONS: | ||||||||||||||||||||||||
| Net capital share transactions | ||||||||||||||||||||||||
Investment Class | (10,268,408 | ) | (21,276,371 | ) | (466,019,393 | ) | (252,019,403 | ) | 15,410,196 | 52,478,285 | ||||||||||||||
Service Class | (100,071,496 | ) | (299,833,853 | ) | (38,028,983 | ) | (234,371,808 | ) | (33,618,308 | ) | (36,442,055 | ) | ||||||||||||
Consultant Class | (31,117,101 | ) | (13,001,945 | ) | (765,267 | ) | (1,382,087 | ) | ||||||||||||||||
Institutional Class | (44,254,312 | ) | (218,563,474 | ) | (26,862,067 | ) | 10,261,846 | |||||||||||||||||
W Class | (116,621,058 | ) | 39,625,519 | |||||||||||||||||||||
R Class | (560,401 | ) | (638,616 | ) | (3,008,421 | ) | (821,115 | ) | (852,555 | ) | (2,676,572 | ) | ||||||||||||
K Class | (167,409 | ) | (694,975 | ) | (8,602,779 | ) | (91,917,398 | ) | (607,209 | ) | (483,726 | ) | ||||||||||||
| Shareholder redemption fees | ||||||||||||||||||||||||
Investment Class | – | 2,035 | 26,012 | 62,578 | 13 | 411 | ||||||||||||||||||
Service Class | 4,909 | 7,803 | 530 | 19,546 | 404 | 2,709 | ||||||||||||||||||
Net increase (decrease) in net assets from capital | (155,317,117 | ) | (540,997,451 | ) | (690,233,260 | ) | (542,162,180 | ) | (20,432,726 | ) | 11,496,965 | |||||||||||||
| Net Increase (Decrease) In Net Assets | (139,369,311 | ) | (773,076,941 | ) | (677,663,966 | ) | (1,036,121,007 | ) | (16,117,902 | ) | (11,487,336 | ) | ||||||||||||
| NET ASSETS: | ||||||||||||||||||||||||
| Beginning of period | 676,652,425 | 1,449,729,366 | 4,658,758,553 | 5,694,879,560 | 358,518,118 | 370,005,454 | ||||||||||||||||||
| End of period | $ | 537,283,114 | $ | 676,652,425 | $ | 3,981,094,587 | $ | 4,658,758,553 | $ | 342,400,216 | $ | 358,518,118 | ||||||||||||
Undistributed Net Investment Income (Loss) at End | $ | (431,438 | ) | $ | (205,502 | ) | $ | (1,883,887 | ) | $ | (2,595,297 | ) | $ | 1,550,907 | $ | 902,677 | ||||||||
| THE ACCOMPANYING NOTES ARE AN INTEGRAL PART OF THESE FINANCIAL STATEMENTS | The Royce Funds 2015 Semiannual Report to Shareholders | 83 |
| Statements of Changes in Net Assets |
| Royce Opportunity Fund | Royce Special Equity Fund | Royce Select Fund I | ||||||||||||||||||||||
| Six Months Ended | Six Months Ended | Six Months Ended | ||||||||||||||||||||||
| 6/30/15 (unaudited) | Year Ended 12/31/14 | 6/30/15 (unaudited) | Year Ended 12/31/14 | 6/30/15 (unaudited) | Year Ended 12/31/14 | |||||||||||||||||||
| INVESTMENT OPERATIONS: | ||||||||||||||||||||||||
| Net investment income (loss) | $ | (3,496,861 | ) | $ | (7,726,211 | ) | $ | 13,049,528 | $ | 14,181,577 | $ | 86,647 | $ | (66,508 | ) | |||||||||
Net realized gain (loss) on investments and foreign | 97,863,165 | 270,749,921 | 253,712,168 | 282,154,386 | 2,588,528 | 5,543,536 | ||||||||||||||||||
Net change in unrealized appreciation (depreciation) | (78,600,000 | ) | (282,435,370 | ) | (275,853,189 | ) | (285,557,513 | ) | (2,722,503 | ) | (5,445,016 | ) | ||||||||||||
Net increase (decrease) in net assets from | 15,766,304 | (19,411,660 | ) | (9,091,493 | ) | 10,778,450 | (47,328 | ) | 32,012 | |||||||||||||||
| DISTRIBUTIONS: | ||||||||||||||||||||||||
| Net investment income | ||||||||||||||||||||||||
Investment Class | – | – | – | (9,502,532 | ) | – | – | |||||||||||||||||
Service Class | – | – | – | (460,707 | ) | |||||||||||||||||||
Consultant Class | – | – | – | – | ||||||||||||||||||||
Institutional Class | – | – | – | (3,812,516 | ) | |||||||||||||||||||
R Class | – | – | ||||||||||||||||||||||
K Class | – | – | ||||||||||||||||||||||
Net realized gain on investments and foreign | ||||||||||||||||||||||||
Investment Class | – | (163,669,872 | ) | – | (179,944,282 | ) | – | (5,238,043 | ) | |||||||||||||||
Service Class | – | (20,590,649 | ) | – | (22,106,099 | ) | ||||||||||||||||||
Consultant Class | – | (2,830,608 | ) | – | (6,200,641 | ) | ||||||||||||||||||
Institutional Class | – | (101,200,321 | ) | – | (58,145,358 | ) | ||||||||||||||||||
R Class | – | (4,511,800 | ) | |||||||||||||||||||||
K Class | – | (3,319,400 | ) | |||||||||||||||||||||
| Total distributions | – | (296,122,650 | ) | – | (280,172,135 | ) | – | (5,238,043 | ) | |||||||||||||||
| CAPITAL SHARE TRANSACTIONS: | ||||||||||||||||||||||||
| Net capital share transactions | ||||||||||||||||||||||||
Investment Class | (252,269,328 | ) | 31,743,029 | (322,349,687 | ) | (376,370,344 | ) | (16,188,261 | ) | (2,812,871 | ) | |||||||||||||
Service Class | (19,457,660 | ) | (31,618,193 | ) | (52,879,903 | ) | (78,674,569 | ) | ||||||||||||||||
Consultant Class | 1,972,598 | 4,875,799 | (7,417,744 | ) | (949,433 | ) | ||||||||||||||||||
Institutional Class | (47,441,714 | ) | 53,771,758 | (345,774,638 | ) | (4,835,990 | ) | |||||||||||||||||
R Class | 1,853,705 | 15,752,508 | ||||||||||||||||||||||
K Class | (6,275,539 | ) | 8,646,557 | |||||||||||||||||||||
| Shareholder redemption fees | ||||||||||||||||||||||||
Investment Class | 15,366 | 44,101 | 5,473 | 89,514 | 1,954 | 1,411 | ||||||||||||||||||
Service Class | 428 | 51,186 | 7,667 | 9,825 | ||||||||||||||||||||
Net increase (decrease) in net assets from capital | (321,602,144 | ) | 83,266,745 | (728,408,832 | ) | (460,730,997 | ) | (16,186,307 | ) | (2,811,460 | ) | |||||||||||||
| Net Increase (Decrease) In Net Assets | (305,835,840 | ) | (232,267,565 | ) | (737,500,325 | ) | (730,124,682 | ) | (16,233,635 | ) | (8,017,491 | ) | ||||||||||||
| NET ASSETS: | ||||||||||||||||||||||||
| Beginning of period | 2,315,369,290 | 2,547,636,855 | 2,887,706,396 | 3,617,831,078 | 39,220,350 | 47,237,841 | ||||||||||||||||||
| End of period | $ | 2,009,533,450 | $ | 2,315,369,290 | $ | 2,150,206,071 | $ | 2,887,706,396 | $ | 22,986,715 | $ | 39,220,350 | ||||||||||||
Undistributed Net Investment Income (Loss) at End | $ | (3,518,704 | ) | $ | (21,843 | ) | $ | 13,455,352 | $ | 405,823 | $ | 86,647 | $ | – | ||||||||||
| 84 | The Royce Funds 2015 Semiannual Report to Shareholders | THE ACCOMPANYING NOTES ARE AN INTEGRAL PART OF THESE FINANCIAL STATEMENTS |
| Royce Smaller-Companies | ||||||||||||||||||||||||
| Royce Small-Cap Value Fund | Growth Fund | Royce 100 Fund | ||||||||||||||||||||||
| Six Months Ended | Six Months Ended | Six Months Ended | ||||||||||||||||||||||
| 6/30/15 (unaudited) | Year Ended 12/31/14 | 6/30/15 (unaudited) | Year Ended 12/31/14 | 6/30/15 (unaudited) | Year Ended 12/31/14 | |||||||||||||||||||
| INVESTMENT OPERATIONS: | ||||||||||||||||||||||||
Net investment income (loss) | $ | 3,149,742 | $ | 1,379,609 | $ | (2,595,451 | ) | $ | (5,084,731 | ) | $ | 357,939 | $ | (807,160 | ) | |||||||||
Net realized gain (loss) on investments and foreign | 101,017,224 | 127,638,267 | 49,755,448 | 185,659,073 | 22,601,910 | 34,836,525 | ||||||||||||||||||
Net change in unrealized appreciation (depreciation) | (94,138,920 | ) | (130,516,990 | ) | 30,352,526 | (144,652,002 | ) | (22,822,450 | ) | (43,017,230 | ) | |||||||||||||
Net increase (decrease) in net assets from | 10,028,046 | (1,499,114 | ) | 77,512,523 | 35,922,340 | 137,399 | (8,987,865 | ) | ||||||||||||||||
| DISTRIBUTIONS: | ||||||||||||||||||||||||
| Net investment income | ||||||||||||||||||||||||
Investment Class | – | (331,391 | ) | – | – | – | – | |||||||||||||||||
Service Class | – | – | – | – | – | – | ||||||||||||||||||
Consultant Class | – | – | – | – | ||||||||||||||||||||
Institutional Class | – | (739,829 | ) | – | – | |||||||||||||||||||
R Class | – | – | – | – | – | – | ||||||||||||||||||
K Class | – | – | – | – | – | – | ||||||||||||||||||
Net realized gain on investments and foreign | ||||||||||||||||||||||||
Investment Class | – | (18,283,548 | ) | – | (56,823,564 | ) | – | (7,631,746 | ) | |||||||||||||||
Service Class | – | (60,973,556 | ) | – | (111,290,311 | ) | – | (16,718,190 | ) | |||||||||||||||
Consultant Class | – | (3,553,425 | ) | – | (3,522,779 | ) | ||||||||||||||||||
Institutional Class | – | (24,265,825 | ) | – | (7,260,689 | ) | ||||||||||||||||||
R Class | – | (4,166,100 | ) | – | (271,992 | ) | – | (168,762 | ) | |||||||||||||||
K Class | – | (1,486,852 | ) | – | (242,326 | ) | – | (64,553 | ) | |||||||||||||||
| Total distributions | – | (113,800,526 | ) | – | (179,411,661 | ) | – | (24,583,251 | ) | |||||||||||||||
| CAPITAL SHARE TRANSACTIONS: | ||||||||||||||||||||||||
| Net capital share transactions | ||||||||||||||||||||||||
Investment Class | (23,728,137 | ) | (37,927,661 | ) | (31,159,032 | ) | 97,261,344 | (15,028,856 | ) | 18,982,373 | ||||||||||||||
Service Class | (109,891,318 | ) | (140,511,862 | ) | (76,313,571 | ) | (172,358,399 | ) | (58,171,378 | ) | (59,224,113 | ) | ||||||||||||
Consultant Class | (2,624,510 | ) | (1,050,038 | ) | (1,834,863 | ) | (2,449,406 | ) | ||||||||||||||||
Institutional Class | 1,362,453 | 1,519,448 | (6,374,984 | ) | (100,411,469 | ) | ||||||||||||||||||
R Class | (4,743,506 | ) | (2,055,524 | ) | (234,611 | ) | (21,676 | ) | 16,312 | (558,911 | ) | |||||||||||||
K Class | (868,697 | ) | (5,355,597 | ) | (82,989 | ) | (256,776 | ) | (198,225 | ) | (1,510,299 | ) | ||||||||||||
| Shareholder redemption fees | ||||||||||||||||||||||||
Investment Class | 154 | 3,778 | – | 2,387 | – | 1,028 | ||||||||||||||||||
Service Class | 2,560 | 11,345 | 763 | 9,262 | 1,073 | 7,417 | ||||||||||||||||||
Net increase (decrease) in net assets from capital | (140,491,001 | ) | (185,366,111 | ) | (115,999,287 | ) | (178,224,733 | ) | (73,381,074 | ) | (42,302,505 | ) | ||||||||||||
| Net Increase (Decrease) In Net Assets | (130,462,955 | ) | (300,665,751 | ) | (38,486,764 | ) | (321,714,054 | ) | (73,243,675 | ) | (75,873,621 | ) | ||||||||||||
| NET ASSETS: | ||||||||||||||||||||||||
| Beginning of period | 881,826,971 | 1,182,492,722 | 926,044,014 | 1,247,758,068 | 221,288,714 | 297,162,335 | ||||||||||||||||||
| End of period | $ | 751,364,016 | $ | 881,826,971 | $ | 887,557,250 | $ | 926,044,014 | $ | 148,045,039 | $ | 221,288,714 | ||||||||||||
Undistributed Net Investment Income (Loss) at End | $ | 3,452,339 | $ | 302,597 | $ | (2,595,452 | ) | $ | – | $ | 348,061 | $ | (9,879 | ) | ||||||||||
| THE ACCOMPANYING NOTES ARE AN INTEGRAL PART OF THESE FINANCIAL STATEMENTS | The Royce Funds 2015 Semiannual Report to Shareholders | 85 |
| Statements of Changes in Net Assets |
| Royce Micro-Cap Discovery Fund | Royce Dividend Value Fund | |||||||||||||||
| Six Months Ended | Six Months Ended | |||||||||||||||
| 6/30/15 (unaudited) | Year Ended 12/31/14 | 6/30/15 (unaudited) | Year Ended 12/31/14 | |||||||||||||
| INVESTMENT OPERATIONS: | ||||||||||||||||
| Net investment income (loss) | $ | (5,942 | ) | $ | (2,759 | ) | $ | 3,615,899 | $ | 6,568,248 | ||||||
| Net realized gain (loss) on investments and foreign currency | 278,178 | 646,262 | 16,252,957 | 31,074,320 | ||||||||||||
Net change in unrealized appreciation (depreciation) on investments and foreign currency | (243,184 | ) | (593,485 | ) | (7,907,261 | ) | (51,255,088 | ) | ||||||||
Net increase (decrease) in net assets from investment operations | 29,052 | 50,018 | 11,961,595 | (13,612,520 | ) | |||||||||||
| DISTRIBUTIONS: | ||||||||||||||||
| Net investment income | ||||||||||||||||
Investment Class | (1,326,577 | ) | (2,211,322 | ) | ||||||||||||
Service Class | – | – | (1,824,771 | ) | (2,404,931 | ) | ||||||||||
Consultant Class | (4,641 | ) | (2,223 | ) | ||||||||||||
Institutional Class | (378,023 | ) | (561,238 | ) | ||||||||||||
| Net realized gain on investments and foreign currency | ||||||||||||||||
Investment Class | – | (10,463,314 | ) | |||||||||||||
Service Class | – | (725,446 | ) | – | (17,175,104 | ) | ||||||||||
Consultant Class | – | (47,672 | ) | |||||||||||||
Institutional Class | – | (2,354,384 | ) | |||||||||||||
| Total distributions | – | (725,446 | ) | (3,534,012 | ) | (35,220,188 | ) | |||||||||
| CAPITAL SHARE TRANSACTIONS: | ||||||||||||||||
| Net capital share transactions | ||||||||||||||||
Investment Class | (29,621,473 | ) | (18,740,722 | ) | ||||||||||||
Service Class | (39,713 | ) | 433,264 | (65,014,227 | ) | (83,630,839 | ) | |||||||||
Consultant Class | 166,025 | 984,157 | ||||||||||||||
Institutional Class | (139,943 | ) | 13,199,508 | |||||||||||||
| Shareholder redemption fees | ||||||||||||||||
Investment Class | 316 | 2,284 | ||||||||||||||
Service Class | – | 1,114 | 1,591 | 10,514 | ||||||||||||
Net increase (decrease) in net assets from capital share transactions | (39,713 | ) | 434,378 | (94,607,711 | ) | (88,175,098 | ) | |||||||||
| Net Increase (Decrease) In Net Assets | (10,661 | ) | (241,050 | ) | (86,180,128 | ) | (137,007,806 | ) | ||||||||
| NET ASSETS: | ||||||||||||||||
| Beginning of period | 5,575,148 | 5,816,198 | 513,416,065 | 650,423,871 | ||||||||||||
| End of period | $ | 5,564,487 | $ | 5,575,148 | $ | 427,235,937 | $ | 513,416,065 | ||||||||
| Undistributed Net Investment Income (Loss) at End of Period | $ | (5,858 | ) | $ | 84 | $ | 2,180,273 | $ | 2,098,387 | |||||||
| 86 | The Royce Funds 2015 Semiannual Report to Shareholders | THE ACCOMPANYING NOTES ARE AN INTEGRAL PART OF THESE FINANCIAL STATEMENTS |
| Royce Micro-Cap Opportunity Fund | Royce Special Equity Multi-Cap Fund | |||||||||||||||
| Six Months Ended | Six Months Ended | |||||||||||||||
| 6/30/15 (unaudited) | Year Ended 12/31/14 | 6/30/15 (unaudited) | Year Ended 12/31/14 | |||||||||||||
| INVESTMENT OPERATIONS: | ||||||||||||||||
| Net investment income (loss) | $ | (64,604 | ) | $ | (126,420 | ) | $ | 1,744,931 | $ | 1,918,432 | ||||||
Net realized gain (loss) on investments and foreign currency | 1,596,138 | 217,534 | 681,547 | 17,012,232 | ||||||||||||
Net change in unrealized appreciation (depreciation) on investments and foreign currency | (753,050 | ) | (1,518,331 | ) | (10,587,083 | ) | 3,829,046 | |||||||||
Net increase (decrease) in net assets from investment operations | 778,484 | (1,427,217 | ) | (8,160,605 | ) | 22,759,710 | ||||||||||
| DISTRIBUTIONS: | ||||||||||||||||
| Net investment income | ||||||||||||||||
Investment Class | – | – | – | (802,271 | ) | |||||||||||
Service Class | – | – | – | (404,109 | ) | |||||||||||
Consultant Class | – | (44,315 | ) | |||||||||||||
Institutional Class | – | (566,069 | ) | |||||||||||||
Net realized gain on investments and foreign currency | ||||||||||||||||
Investment Class | – | (557,908 | ) | – | (4,729,740 | ) | ||||||||||
Service Class | – | (46,594 | ) | – | (3,852,466 | ) | ||||||||||
Consultant Class | – | (504,045 | ) | |||||||||||||
Institutional Class | – | (3,159,353 | ) | |||||||||||||
| Total distributions | – | (604,502 | ) | – | (14,062,368 | ) | ||||||||||
| CAPITAL SHARE TRANSACTIONS: | ||||||||||||||||
| Net capital share transactions | ||||||||||||||||
Investment Class | 1,154,310 | 2,700,474 | 1,873,570 | 59,033,956 | ||||||||||||
Service Class | 394,716 | 1,008,378 | (14,799,873 | ) | 12,637,616 | |||||||||||
Consultant Class | 381,488 | 9,200,567 | ||||||||||||||
Institutional Class | (24,533,856 | ) | 25,321,547 | |||||||||||||
| Shareholder redemption fees | ||||||||||||||||
Investment Class | 282 | 20,852 | 945 | 2,402 | ||||||||||||
Service Class | 90 | 1,239 | 1,546 | 10,760 | ||||||||||||
Net increase (decrease) in net assets from capital share transactions | 1,549,398 | 3,730,943 | (37,076,180 | ) | 106,206,848 | |||||||||||
| Net Increase (Decrease) In Net Assets | 2,327,882 | 1,699,224 | (45,236,785 | ) | 114,904,190 | |||||||||||
| NET ASSETS: | ||||||||||||||||
| Beginning of period | 19,160,339 | 17,461,115 | 303,587,252 | 188,683,062 | ||||||||||||
| End of period | $ | 21,488,221 | $ | 19,160,339 | $ | 258,350,467 | $ | 303,587,252 | ||||||||
Undistributed Net Investment Income (Loss) at End of Period | $ | (64,651 | ) | $ | (46 | ) | $ | 1,849,391 | $ | 104,459 | ||||||
| THE ACCOMPANYING NOTES ARE AN INTEGRAL PART OF THESE FINANCIAL STATEMENTS | The Royce Funds 2015 Semiannual Report to Shareholders | 87 |
| Statements of Operations |
| Royce | ||||||||||||||||
| Pennsylvania | Royce Micro-Cap | Royce Premier | Royce Low-Priced | |||||||||||||
| Mutual Fund | Fund | Fund | Stock Fund | |||||||||||||
| INVESTMENT INCOME: | ||||||||||||||||
| INCOME: | ||||||||||||||||
| Dividends | ||||||||||||||||
Non-Affiliated Companies | $ | 39,625,447 | $ | 4,391,647 | $ | 28,986,588 | $ | 3,850,698 | ||||||||
Affiliated Companies | 556,267 | – | 16,076,340 | – | ||||||||||||
| Foreign withholding tax | (610,798 | ) | (118,980 | ) | (2,381,427 | ) | (114,559 | ) | ||||||||
| Interest | 216,963 | – | – | – | ||||||||||||
| Securities lending | 424,943 | 210,123 | 1,607,390 | 274,963 | ||||||||||||
| Total income | 40,212,822 | 4,482,790 | 44,288,891 | 4,011,102 | ||||||||||||
| EXPENSES: | ||||||||||||||||
| Investment advisory fees | 19,092,231 | 2,947,953 | 23,194,951 | 2,962,474 | ||||||||||||
| Distribution fees | 3,601,545 | 371,211 | 508,046 | 595,677 | ||||||||||||
| Shareholder servicing | 2,854,324 | 351,895 | 2,423,626 | 616,302 | ||||||||||||
| Shareholder reports | 555,136 | 116,600 | 594,816 | 117,215 | ||||||||||||
| Administrative and office facilities | 426,305 | 43,248 | 408,143 | 62,247 | ||||||||||||
| Custody | 258,412 | 46,331 | 230,785 | 79,993 | ||||||||||||
| Trustees’ fees | 153,095 | 16,512 | 148,884 | 25,112 | ||||||||||||
| Registration | 71,839 | 23,160 | 58,795 | 32,545 | ||||||||||||
| Audit | 44,535 | 19,123 | 44,495 | 17,342 | ||||||||||||
| Legal | 33,260 | 3,199 | 30,624 | 4,529 | ||||||||||||
| Other expenses | 109,495 | 11,967 | 103,283 | 16,663 | ||||||||||||
| Total expenses | 27,200,177 | 3,951,199 | 27,746,448 | 4,530,099 | ||||||||||||
| Compensating balance credits | (739 | ) | (184 | ) | (1,324 | ) | (145 | ) | ||||||||
| Fees waived by distributor | – | – | – | (23,579 | ) | |||||||||||
| Expenses reimbursed by investment adviser | – | (99,679 | ) | (28,923 | ) | (269,337 | ) | |||||||||
| Net expenses | 27,199,438 | 3,851,336 | 27,716,201 | 4,237,038 | ||||||||||||
| Net investment income (loss) | 13,013,384 | 631,454 | 16,572,690 | (225,936 | ) | |||||||||||
| REALIZED AND UNREALIZED GAIN (LOSS) ON INVESTMENTS AND FOREIGN CURRENCY: | ||||||||||||||||
| NET REALIZED GAIN (LOSS): | ||||||||||||||||
| Investments in Non-Affiliated Companies | 392,462,350 | 46,916,268 | 411,589,133 | 67,271,323 | ||||||||||||
| Investments in Affiliated Companies | 422,258 | (677,696 | ) | (24,149,549 | ) | – | ||||||||||
| Foreign currency transactions | (136,935 | ) | 6,226 | (123,491 | ) | 54,588 | ||||||||||
NET CHANGE IN UNREALIZED APPRECIATION (DEPRECIATION): | ||||||||||||||||
Investments and foreign currency translations | (404,309,044 | ) | (52,828,417 | ) | (321,986,296 | ) | (51,151,240 | ) | ||||||||
Other assets and liabilities denominated in foreign currency | 28,423 | (6,914 | ) | (50,511 | ) | (929 | ) | |||||||||
Net realized and unrealized gain (loss) on investments and foreign currency | (11,532,948 | ) | (6,590,533 | ) | 65,279,286 | 16,173,742 | ||||||||||
NET INCREASE (DECREASE) IN NET ASSETS FROM INVESTMENT OPERATIONS | $ | 1,480,436 | $ | (5,959,079 | ) | $ | 81,851,976 | $ | 15,947,806 | |||||||
| 88 | The Royce Funds 2015 Semiannual Report to Shareholders | THE ACCOMPANYING NOTES ARE AN INTEGRAL PART OF THESE FINANCIAL STATEMENTS |
| Six Months Ended June 30, 2015 (unaudited) |
| Royce Total Return | Royce Heritage | Royce Opportunity | Royce Special | |||||||||||||
| Fund | Fund | Fund | Equity Fund | |||||||||||||
| INVESTMENT INCOME: | ||||||||||||||||
| INCOME: | ||||||||||||||||
| Dividends | ||||||||||||||||
Non-Affiliated Companies | $ | 51,744,847 | $ | 3,000,686 | $ | 8,397,862 | $ | 10,171,227 | ||||||||
Affiliated Companies | 718,614 | – | 124,613 | 17,992,356 | ||||||||||||
| Foreign withholding tax | (875,789 | ) | (93,990 | ) | (55,896 | ) | – | |||||||||
| Securities lending | 132,094 | 10,313 | 691,782 | – | ||||||||||||
| Total income | 51,719,766 | 2,917,009 | 9,158,361 | 28,163,583 | ||||||||||||
| EXPENSES: | ||||||||||||||||
| Investment advisory fees | 20,931,624 | 1,748,685 | 10,832,580 | 12,835,735 | ||||||||||||
| Distribution fees | 2,245,431 | 278,497 | 401,953 | 549,509 | ||||||||||||
| Shareholder servicing | 2,334,883 | 118,789 | 823,366 | 1,071,091 | ||||||||||||
| Shareholder reports | 468,288 | 34,423 | 150,733 | 231,745 | ||||||||||||
| Administrative and office facilities | 338,567 | 24,863 | 165,624 | 210,933 | ||||||||||||
| Custody | 240,458 | 45,489 | 106,752 | 111,660 | ||||||||||||
| Trustees’ fees | 118,492 | 8,330 | 57,397 | 74,788 | ||||||||||||
| Registration | 84,886 | 28,086 | 51,939 | 43,113 | ||||||||||||
| Audit | 39,708 | 16,267 | 21,243 | 26,588 | ||||||||||||
| Legal | 25,610 | 1,901 | 12,821 | 15,826 | ||||||||||||
| Other expenses | 86,542 | 7,152 | 41,841 | 53,552 | ||||||||||||
| Total expenses | 26,914,489 | 2,312,482 | 12,666,249 | 15,224,540 | ||||||||||||
| Compensating balance credits | (656 | ) | (134 | ) | (339 | ) | (373 | ) | ||||||||
| Fees waived by distributor | – | (23,935 | ) | – | – | |||||||||||
| Expenses reimbursed by investment adviser | – | (19,633 | ) | (10,688 | ) | (110,112 | ) | |||||||||
| Net expenses | 26,913,833 | 2,268,780 | 12,655,222 | 15,114,055 | ||||||||||||
| Net investment income (loss) | 24,805,933 | 648,229 | (3,496,861 | ) | 13,049,528 | |||||||||||
| REALIZED AND UNREALIZED GAIN (LOSS) ON INVESTMENTS AND FOREIGN CURRENCY: | ||||||||||||||||
| NET REALIZED GAIN (LOSS): | ||||||||||||||||
| Investments in Non-Affiliated Companies | 221,535,260 | 6,559,320 | 97,266,349 | 171,261,079 | ||||||||||||
| Investments in Affiliated Companies | 1,196,798 | – | 595,779 | 82,451,089 | ||||||||||||
| Foreign currency transactions | 29,306 | (32,700 | ) | 1,037 | – | |||||||||||
| NET CHANGE IN UNREALIZED APPRECIATION (DEPRECIATION): | ||||||||||||||||
Investments and foreign currency translations | (210,897,448 | ) | (2,862,399 | ) | (78,599,516 | ) | (275,853,189 | ) | ||||||||
Other assets and liabilities denominated in foreign currency | (6,032 | ) | 2,374 | (484 | ) | – | ||||||||||
Net realized and unrealized gain (loss) on investments and foreign currency | 11,857,884 | 3,666,595 | 19,263,165 | (22,141,021 | ) | |||||||||||
NET INCREASE (DECREASE) IN NET ASSETS FROM INVESTMENT OPERATIONS | $ | 36,663,817 | $ | 4,314,824 | $ | 15,766,304 | $ | (9,091,493 | ) | |||||||
| THE ACCOMPANYING NOTES ARE AN INTEGRAL PART OF THESE FINANCIAL STATEMENTS | The Royce Funds 2015 Semiannual Report to Shareholders | 89 |
| Statements of Operations |
| Royce | Royce Small-Cap | Royce Smaller- Companies | Royce | |||||||||||||
| Select Fund I | Value Fund | Growth Fund | 100 Fund | |||||||||||||
| INVESTMENT INCOME: | ||||||||||||||||
| INCOME: | ||||||||||||||||
| Dividends | $ | 266,936 | $ | 8,806,413 | $ | 2,679,750 | $ | 1,729,013 | ||||||||
| Foreign withholding tax | (7,665 | ) | (80,279 | ) | (106,833 | ) | (50,087 | ) | ||||||||
| Securities lending | – | 370 | 1,064,745 | 28 | ||||||||||||
| Total income | 259,271 | 8,726,504 | 3,637,662 | 1,678,954 | ||||||||||||
| EXPENSES: | ||||||||||||||||
| Investment advisory fees | 139,213 | 4,035,905 | 4,470,199 | 935,137 | ||||||||||||
| Distribution fees | – | 737,745 | 772,821 | 160,147 | ||||||||||||
| Shareholder servicing | 14,271 | 531,347 | 772,618 | 178,121 | ||||||||||||
| Shareholder reports | 4,170 | 95,953 | 178,869 | 74,647 | ||||||||||||
| Administrative and office facilities | 2,799 | 65,842 | 70,356 | 16,864 | ||||||||||||
| Custody | 7,346 | 47,185 | 52,422 | 14,854 | ||||||||||||
| Trustees’ fees | 1,014 | 23,800 | 25,366 | 6,219 | ||||||||||||
| Registration | 8,589 | 38,683 | 38,808 | 23,961 | ||||||||||||
| Audit | 12,766 | 15,548 | 15,581 | 13,102 | ||||||||||||
| Legal | 211 | 4,893 | 5,282 | 1,261 | ||||||||||||
| Other expenses | 961 | 18,036 | 22,039 | 5,142 | ||||||||||||
| Total expenses | 191,340 | 5,614,937 | 6,424,361 | 1,429,455 | ||||||||||||
| Compensating balance credits | (3 | ) | (219 | ) | (182 | ) | (64 | ) | ||||||||
| Fees waived by investment adviser and distributor | (18,713 | ) | – | (54,886 | ) | (12,354 | ) | |||||||||
| Expenses reimbursed by investment adviser | – | (37,956 | ) | (136,180 | ) | (96,022 | ) | |||||||||
| Net expenses | 172,624 | 5,576,762 | 6,233,113 | 1,321,015 | ||||||||||||
| Net investment income (loss) | 86,647 | 3,149,742 | (2,595,451 | ) | 357,939 | |||||||||||
| REALIZED AND UNREALIZED GAIN (LOSS) ON INVESTMENTS AND FOREIGN CURRENCY: | ||||||||||||||||
| NET REALIZED GAIN (LOSS): | ||||||||||||||||
| Investments | 2,589,147 | 101,018,845 | 49,777,075 | 22,625,802 | ||||||||||||
| Foreign currency transactions | (619 | ) | (1,621 | ) | (21,627 | ) | (23,892 | ) | ||||||||
NET CHANGE IN UNREALIZED APPRECIATION (DEPRECIATION): | ||||||||||||||||
Investments and foreign currency translations | (2,722,475 | ) | (94,138,920 | ) | 30,352,906 | (22,823,110 | ) | |||||||||
Other assets and liabilities denominated in foreign currency | (28 | ) | – | (380 | ) | 660 | ||||||||||
Net realized and unrealized gain (loss) on investments and foreign currency | (133,975 | ) | 6,878,304 | 80,107,974 | (220,540 | ) | ||||||||||
NET INCREASE (DECREASE) IN NET ASSETS FROM INVESTMENT OPERATIONS | $ | (47,328 | ) | $ | 10,028,046 | $ | 77,512,523 | $ | 137,399 | |||||||
| 90 | The Royce Funds 2015 Semiannual Report to Shareholders | THE ACCOMPANYING NOTES ARE AN INTEGRAL PART OF THESE FINANCIAL STATEMENTS |
| Six Months Ended June 30, 2015 (unaudited) |
| Royce Special | ||||||||||||||||
| Royce Micro-Cap | Royce Dividend | Royce Micro-Cap | Equity Multi-Cap | |||||||||||||
| Discovery Fund | Value Fund | Opportunity Fund | Fund | |||||||||||||
| INVESTMENT INCOME: | ||||||||||||||||
| INCOME: | ||||||||||||||||
| Dividends | $ | 35,296 | $ | 6,805,818 | $ | 67,037 | $ | 3,291,612 | ||||||||
| Foreign withholding tax | (179 | ) | (173,311 | ) | (513 | ) | – | |||||||||
| Securities lending | – | 104,228 | – | – | ||||||||||||
| Total income | 35,117 | 6,736,735 | 66,524 | 3,291,612 | ||||||||||||
| EXPENSES: | ||||||||||||||||
| Investment advisory fees | 27,557 | 2,303,317 | 101,398 | 1,244,178 | ||||||||||||
| Distribution fees | 6,889 | 329,312 | 1,420 | 157,234 | ||||||||||||
| Shareholder servicing | 6,135 | 311,833 | 14,232 | 81,482 | ||||||||||||
| Shareholder reports | 1,957 | 90,202 | 4,878 | 12,894 | ||||||||||||
| Administrative and office facilities | 381 | 38,306 | 1,428 | 17,867 | ||||||||||||
| Custody | 4,407 | 60,624 | 7,520 | 16,316 | ||||||||||||
| Trustees’ fees | 126 | 13,738 | 478 | 5,149 | ||||||||||||
| Registration | 7,525 | 35,245 | 19,027 | 43,325 | ||||||||||||
| Audit | 7,922 | 17,995 | 12,913 | 13,003 | ||||||||||||
| Legal | 29 | 2,886 | 111 | 2,166 | ||||||||||||
| Dividends on securities sold short | – | – | 1,660 | – | ||||||||||||
| Interest expense | – | – | 2,088 | – | ||||||||||||
| Other expenses | 354 | 10,835 | 4,331 | 5,129 | ||||||||||||
| Total expenses | 63,282 | 3,214,293 | 171,484 | 1,598,743 | ||||||||||||
| Compensating balance credits | (6 | ) | (361 | ) | (8 | ) | (14 | ) | ||||||||
| Fees waived by investment adviser and distributor | (22,217 | ) | (73,595 | ) | (2,176 | ) | (8,751 | ) | ||||||||
| Expenses reimbursed by investment adviser | – | (19,501 | ) | (38,172 | ) | (43,297 | ) | |||||||||
| Net expenses | 41,059 | 3,120,836 | 131,128 | 1,546,681 | ||||||||||||
| Net investment income (loss) | (5,942 | ) | 3,615,899 | (64,604 | ) | 1,744,931 | ||||||||||
| REALIZED AND UNREALIZED GAIN (LOSS) ON INVESTMENTS AND FOREIGN CURRENCY: | ||||||||||||||||
| NET REALIZED GAIN (LOSS): | ||||||||||||||||
| Investments | 278,178 | 16,276,793 | 1,596,173 | 681,547 | ||||||||||||
| Foreign currency transactions | – | (23,836 | ) | (35 | ) | – | ||||||||||
NET CHANGE IN UNREALIZED APPRECIATION (DEPRECIATION): | ||||||||||||||||
Investments and foreign currency translations | (243,184 | ) | (7,908,862 | ) | (753,034 | ) | (10,587,083 | ) | ||||||||
Other assets and liabilities denominated in foreign currency | – | 1,601 | (16 | ) | – | |||||||||||
Net realized and unrealized gain (loss) on investments and foreign currency | 34,994 | 8,345,696 | 843,088 | (9,905,536 | ) | |||||||||||
NET INCREASE (DECREASE) IN NET ASSETS FROM INVESTMENT OPERATIONS | $ | 29,052 | $ | 11,961,595 | $ | 778,484 | $ | (8,160,605 | ) | |||||||
| THE ACCOMPANYING NOTES ARE AN INTEGRAL PART OF THESE FINANCIAL STATEMENTS | The Royce Funds 2015 Semiannual Report to Shareholders | 91 |
Financial Highlights
This table is presented to show selected data for a share outstanding throughout each period and to assist shareholders in evaluating a Fund’s performance for the periods presented. Per share amounts have been determined on the basis of the weighted average number of shares outstanding during the period.
| Ratio of Expenses to Average Net Assets | |||||||||||||||||||||||||||||||||||
| Net Asset Value, Beginning of Period | Net Investment Income (Loss) | Net Realized and Unrealized Gain (Loss) on Investments and Foreign Currency | Total from Investment Operations | Distributions from Net Investment Income | Distributions from Net Realized Gain on Investments and Foreign Currency | Total Distributions | Shareholder Redemption Fees | Net Asset Value, End of Period | Total Return | Net Assets, End of Period (in thousands) | Prior to Fee Waivers and Balance Credits | Prior to Fee Waivers | Net of Fee Waivers | Ratio of Net Investment Income (Loss) to Average Net Assets | Portfolio Turnover Rate | ||||||||||||||||||||
| Royce Pennsylvania Mutual Fund–Investment Class | |||||||||||||||||||||||||||||||||||
| 2015 | † | $ | 13.00 | $ | 0.04 | $ | (0.03 | ) | $ | 0.01 | $ – | $ – | $ – | $ – | $ | 13.01 | 0.08 | % 1 | $ | 2,940,219 | 0.94 | % 2 | 0.94 | % 2 | 0.94 | % 2 | 0.64 | % 2 | 12 | % | |||||
| 2014 | 14.73 | 0.06 | (0.21 | ) | (0.15 | ) | (0.04 | ) | (1.54 | ) | (1.58 | ) | – | 13.00 | (0.70 | ) | 3,869,579 | 0.91 | 0.91 | 0.91 | 0.35 | 21 | |||||||||||||
| 2013 | 11.50 | 0.03 | 3.99 | 4.02 | (0.00 | ) | (0.79 | ) | (0.79 | ) | – | 14.73 | 35.25 | 5,033,318 | 0.92 | 0.92 | 0.92 | 0.24 | 26 | ||||||||||||||||
| 2012 | 10.76 | 0.15 | 1.39 | 1.54 | (0.15 | ) | (0.65 | ) | (0.80 | ) | – | 11.50 | 14.58 | 4,232,988 | 0.89 | 0.89 | 0.89 | 1.19 | 22 | ||||||||||||||||
| 2011 | 11.65 | 0.01 | (0.50 | ) | (0.49 | ) | (0.02 | ) | (0.38 | ) | (0.40 | ) | – | 10.76 | (4.17 | ) | 4,266,754 | 0.90 | 0.90 | 0.90 | 0.11 | 20 | |||||||||||||
| 2010 | 9.45 | 0.06 | 2.19 | 2.25 | (0.05 | ) | – | (0.05 | ) | – | 11.65 | 23.86 | 4,735,403 | 0.90 | 0.90 | 0.90 | 0.63 | 25 | |||||||||||||||||
| Royce Pennsylvania Mutual Fund–Service Class | |||||||||||||||||||||||||||||||||||
| 2015 | † | $ | 12.96 | $ | 0.01 | $ | (0.03 | ) | $ | (0.02 | ) | $ – | $ – | $ – | $ – | $ | 12.94 | (0.15 | )% 1 | $ | 201,946 | 1.39 | % 2 | 1.39 | % 2 | 1.39 | % 2 | 0.21 | % 2 | 12 | % | ||||
| 2014 | 14.69 | 0.00 | (0.19 | ) | (0.19 | ) | – | (1.54 | ) | (1.54 | ) | – | 12.96 | (1.04 | ) | 333,548 | 1.23 | 1.23 | 1.23 | 0.03 | 21 | ||||||||||||||
| 2013 | 11.51 | (0.01 | ) | 3.98 | 3.97 | – | (0.79 | ) | (0.79 | ) | – | 14.69 | 34.77 | 591,534 | 1.25 | 1.25 | 1.25 | (0.08 | ) | 26 | |||||||||||||||
| 2012 | 10.75 | 0.10 | 1.40 | 1.50 | (0.09 | ) | (0.65 | ) | (0.74 | ) | – | 11.51 | 14.15 | 473,624 | 1.24 | 1.24 | 1.24 | 0.90 | 22 | ||||||||||||||||
| 2011 | 11.65 | (0.02 | ) | (0.50 | ) | (0.52 | ) | – | (0.38 | ) | (0.38 | ) | – | 10.75 | (4.42 | ) | 406,052 | 1.19 | 1.19 | 1.19 | (0.18 | ) | 20 | ||||||||||||
| 2010 | 9.41 | 0.02 | 2.20 | 2.22 | – | – | – | 0.02 | 11.65 | 23.80 | 448,784 | 1.27 | 1.27 | 1.25 | 0.18 | 25 | |||||||||||||||||||
| Royce Pennsylvania Mutual Fund–Consultant Class | |||||||||||||||||||||||||||||||||||
| 2015 | † | $ | 11.16 | $ | (0.02 | ) | $ | (0.03 | ) | $ | (0.05 | ) | $ – | $ – | $ – | $ – | $ | 11.11 | (0.45 | )% 1 | $ | 600,925 | 1.92 | % 2 | 1.92 | % 2 | 1.92 | % 2 | (0.34 | )% 2 | 12 | % | |||
| 2014 | 12.96 | (0.08 | ) | (0.18 | ) | (0.26 | ) | – | (1.54 | ) | (1.54 | ) | – | 11.16 | (1.72 | ) | 676,347 | 1.91 | 1.91 | 1.91 | (0.64 | ) | 21 | ||||||||||||
| 2013 | 10.29 | (0.09 | ) | 3.55 | 3.46 | – | (0.79 | ) | (0.79 | ) | – | 12.96 | 33.94 | 788,017 | 1.94 | 1.94 | 1.94 | (0.78 | ) | 26 | |||||||||||||||
| 2012 | 9.69 | 0.01 | 1.25 | 1.26 | (0.01 | ) | (0.65 | ) | (0.66 | ) | – | 10.29 | 13.27 | 654,642 | 1.97 | 1.97 | 1.97 | 0.12 | 22 | ||||||||||||||||
| 2011 | 10.61 | (0.09 | ) | (0.45 | ) | (0.54 | ) | – | (0.38 | ) | (0.38 | ) | – | 9.69 | (5.05 | ) | 664,778 | 1.85 | 1.85 | 1.85 | (0.85 | ) | 20 | ||||||||||||
| 2010 | 8.65 | (0.03 | ) | 1.99 | 1.96 | – | – | – | – | 10.61 | 22.66 | 841,525 | 1.87 | 1.87 | 1.87 | (0.36 | ) | 25 | |||||||||||||||||
| Royce Pennsylvania Mutual Fund–Institutional Class a | |||||||||||||||||||||||||||||||||||
| 2015 | † | $ | 13.02 | $ | 0.05 | $ | (0.03 | ) | $ | 0.02 | $ – | $ – | $ – | $ – | $ | 13.04 | 0.15 | % 1 | $ | 703,284 | 0.81 | % 2 | 0.81 | % 2 | 0.81 | % 2 | 0.78 | % 2 | 12 | % | |||||
| 2014 | 14.75 | 0.07 | (0.20 | ) | (0.13 | ) | (0.06 | ) | (1.54 | ) | (1.60 | ) | – | 13.02 | (0.58 | ) | 802,517 | 0.79 | 0.79 | 0.79 | 0.48 | 21 | |||||||||||||
| 2013 | 11.52 | 0.05 | 3.99 | 4.04 | (0.02 | ) | (0.79 | ) | (0.81 | ) | – | 14.75 | 35.34 | 818,212 | 0.79 | 0.79 | 0.79 | 0.40 | 26 | ||||||||||||||||
| 2012 | 10.79 | 0.13 | 1.43 | 1.56 | (0.18 | ) | (0.65 | ) | (0.83 | ) | – | 11.52 | 14.72 | 488,052 | 0.80 | 0.80 | 0.80 | 1.53 | 22 | ||||||||||||||||
| 2011 | 12.19 | 0.03 | (1.05 | ) | (1.02 | ) | – | (0.38 | ) | (0.38 | ) | – | 10.79 | (8.33 | ) 1 | 241,951 | 0.78 | 2 | 0.78 | 2 | 0.78 | 2 | 0.46 | 2 | 20 | ||||||||||
| Royce Pennsylvania Mutual Fund–R Class | |||||||||||||||||||||||||||||||||||
| 2015 | † | $ | 12.50 | $ | 0.00 | $ | (0.03 | ) | $ | (0.03 | ) | $ – | $ – | $ – | $ – | $ | 12.47 | (0.24 | )% 1 | $ | 29,171 | 1.52 | % 2 | 1.52 | % 2 | 1.52 | % 2 | 0.07 | % 2 | 12 | % | ||||
| 2014 | 14.26 | (0.03 | ) | (0.19 | ) | (0.22 | ) | – | (1.54 | ) | (1.54 | ) | – | 12.50 | (1.28 | ) | 36,622 | 1.48 | 1.48 | 1.48 | (0.21 | ) | 21 | ||||||||||||
| 2013 | 11.22 | (0.05 | ) | 3.88 | 3.83 | – | (0.79 | ) | (0.79 | ) | – | 14.26 | 34.42 | 44,094 | 1.56 | 1.56 | 1.56 | (0.39 | ) | 26 | |||||||||||||||
| 2012 | 10.50 | 0.07 | 1.35 | 1.42 | (0.05 | ) | (0.65 | ) | (0.70 | ) | – | 11.22 | 13.79 | 32,977 | 1.50 | 1.50 | 1.50 | 0.70 | 22 | ||||||||||||||||
| 2011 | 11.43 | (0.05 | ) | (0.50 | ) | (0.55 | ) | – | (0.38 | ) | (0.38 | ) | – | 10.50 | (4.77 | ) | 22,542 | 1.51 | 1.51 | 1.51 | (0.47 | ) | 20 | ||||||||||||
| 2010 | 9.28 | 0.01 | 2.14 | 2.15 | (0.00 | ) | – | (0.00 | ) | – | 11.43 | 23.21 | 17,868 | 1.51 | 1.51 | 1.51 | 0.06 | 25 | |||||||||||||||||
| 92 | The Royce Funds 2015 Semiannual Report to Shareholders | THE ACCOMPANYING NOTES ARE AN INTEGRAL PART OF THESE FINANCIAL STATEMENTS |
Financial Highlights
This table is presented to show selected data for a share outstanding throughout each period and to assist shareholders in evaluating a Fund’s performance for the periods presented. Per share amounts have been determined on the basis of the weighted average number of shares outstanding during the period.
| Ratio of Expenses to Average Net Assets | |||||||||||||||||||||||||||||||||||
| Net Asset Value, Beginning of Period | Net Investment Income (Loss) | Net Realized and Unrealized Gain (Loss) on Investments and Foreign Currency | Total from Investment Operations | Distributions from Net Investment Income | Distributions from Net Realized Gain on Investments and Foreign Currency | Total Distributions | Shareholder Redemption Fees | Net Asset Value, End of Period | Total Return | Net Assets, End of Period (in thousands) | Prior to Fee Waivers and Balance Credits | Prior to Fee Waivers | Net of Fee Waivers | Ratio of Net Investment Income (Loss) to Average Net Assets | Portfolio Turnover Rate | ||||||||||||||||||||
| Royce Pennsylvania Mutual Fund–K Class | |||||||||||||||||||||||||||||||||||
| 2015 | † | $ | 11.30 | $ | 0.01 | $ | (0.03 | ) | $ | (0.02 | ) | $ – | $ – | $ – | $ – | $ | 11.28 | (0.18 | )% 1 | $ | 8,859 | 1.45 | % 2 | 1.45 | % 2 | 1.45 | % 2 | 0.14 | % 2 | 12 | % | ||||
| 2014 | 13.04 | (0.02 | ) | (0.18 | ) | (0.20 | ) | – | (1.54 | ) | (1.54 | ) | – | 11.30 | (1.24 | ) | 10,707 | 1.42 | 1.42 | 1.42 | (0.15 | ) | 21 | ||||||||||||
| 2013 | 10.29 | (0.02 | ) | 3.56 | 3.54 | – | (0.79 | ) | (0.79 | ) | – | 13.04 | 34.72 | 11,685 | 1.37 | 1.37 | 1.37 | (0.19 | ) | 26 | |||||||||||||||
| 2012 | 9.68 | 0.09 | 1.24 | 1.33 | (0.07 | ) | (0.65 | ) | (0.72 | ) | – | 10.29 | 14.04 | 8,849 | 1.26 | 1.26 | 1.26 | 0.94 | 22 | ||||||||||||||||
| 2011 | 10.57 | (0.05 | ) | (0.46 | ) | (0.51 | ) | – | (0.38 | ) | (0.38 | ) | – | 9.68 | (4.78 | ) | 5,800 | 1.55 | 1.55 | 1.55 | (0.49 | ) | 20 | ||||||||||||
| 2010 | 8.59 | 0.00 | 1.98 | 1.98 | (0.00 | ) | – | (0.00 | ) | – | 10.57 | 23.11 | 3,760 | 1.61 | 1.61 | 1.59 | 0.01 | 25 | |||||||||||||||||
| Royce Micro-Cap Fund–Investment Class | |||||||||||||||||||||||||||||||||||
| 2015 | † | $ | 14.47 | $ | 0.03 | $ | (0.23 | ) | $ | (0.20 | ) | $ – | $ – | $ – | $ – | $ | 14.27 | (1.38 | )% 1 | $ | 302,866 | 1.56 | % 2 | 1.56 | % 2 | 1.53 | % 2 | 0.43 | % 2 | 21 | % | ||||
| 2014 | 16.68 | (0.08 | ) | (0.65 | ) | (0.73 | ) | – | (1.48 | ) | (1.48 | ) | – | 14.47 | (4.13 | ) | 414,120 | 1.52 | 1.52 | 1.52 | (0.49 | ) | 18 | ||||||||||||
| 2013 | 14.78 | (0.08 | ) | 3.19 | 3.11 | (0.02 | ) | (1.19 | ) | (1.21 | ) | – | 16.68 | 21.29 | 650,773 | 1.53 | 1.53 | 1.53 | (0.52 | ) | 22 | ||||||||||||||
| 2012 | 14.55 | 0.05 | 1.07 | 1.12 | (0.01 | ) | (0.88 | ) | (0.89 | ) | – | 14.78 | 7.93 | 740,364 | 1.47 | 1.47 | 1.47 | 0.29 | 15 | ||||||||||||||||
| 2011 | 17.57 | (0.07 | ) | (2.05 | ) | (2.12 | ) | (0.20 | ) | (0.70 | ) | (0.90 | ) | – | 14.55 | (12.04 | ) | 904,168 | 1.50 | 1.50 | 1.50 | (0.50 | ) | 35 | |||||||||||
| 2010 | 13.71 | (0.03 | ) | 4.14 | 4.11 | (0.25 | ) | – | (0.25 | ) | – | 17.57 | 30.06 | 1,085,782 | 1.50 | 1.50 | 1.50 | (0.27 | ) | 36 | |||||||||||||||
| Royce Micro-Cap Fund–Service Class | |||||||||||||||||||||||||||||||||||
| 2015 | † | $ | 14.26 | $ | 0.02 | $ | (0.22 | ) | $ | (0.20 | ) | $ – | $ – | $ – | $ – | $ | 14.06 | (1.40 | )% 1 | $ | 34,171 | 1.80 | % 2 | 1.80 | % 2 | 1.64 | % 2 | 0.30 | % 2 | 21 | % | ||||
| 2014 | 16.48 | (0.10 | ) | (0.65 | ) | (0.75 | ) | – | (1.48 | ) | (1.48 | ) | 0.01 | 14.26 | (4.24 | ) | 38,645 | 1.77 | 1.77 | 1.66 | (0.63 | ) | 18 | ||||||||||||
| 2013 | 14.61 | (0.10 | ) | 3.16 | 3.06 | – | (1.19 | ) | (1.19 | ) | – | 16.48 | 21.20 | 79,890 | 1.74 | 1.74 | 1.66 | (0.66 | ) | 22 | |||||||||||||||
| 2012 | 14.41 | 0.02 | 1.06 | 1.08 | – | (0.88 | ) | (0.88 | ) | – | 14.61 | 7.76 | 109,457 | 1.74 | 1.74 | 1.66 | 0.14 | 15 | |||||||||||||||||
| 2011 | 17.43 | (0.10 | ) | (2.04 | ) | (2.14 | ) | (0.18 | ) | (0.70 | ) | (0.88 | ) | – | 14.41 | (12.23 | ) | 122,479 | 1.76 | 1.76 | 1.66 | (0.65 | ) | 35 | |||||||||||
| 2010 | 13.61 | (0.08 | ) | 4.14 | 4.06 | (0.24 | ) | – | (0.24 | ) | – | 17.43 | 29.85 | 139,911 | 1.78 | 1.78 | 1.66 | (0.41 | ) | 36 | |||||||||||||||
| Royce Micro-Cap Fund–Consultant Class | |||||||||||||||||||||||||||||||||||
| 2015 | † | $ | 12.23 | $ | (0.04 | ) | $ | (0.19 | ) | $ | (0.23 | ) | $ – | $ – | $ – | $ – | $ | 12.00 | (1.88 | )% 1 | $ | 58,751 | 2.54 | % 2 | 2.54 | % 2 | 2.54 | % 2 | (0.60 | )% 2 | 21 | % | |||
| 2014 | 14.48 | (0.20 | ) | (0.57 | ) | (0.77 | ) | – | (1.48 | ) | (1.48 | ) | – | 12.23 | (5.03 | ) | 75,868 | 2.48 | 2.48 | 2.48 | (1.45 | ) | 18 | ||||||||||||
| 2013 | 13.08 | (0.21 | ) | 2.80 | 2.59 | – | (1.19 | ) | (1.19 | ) | – | 14.48 | 20.08 | 117,538 | 2.52 | 2.52 | 2.52 | (1.51 | ) | 22 | |||||||||||||||
| 2012 | 13.11 | (0.10 | ) | 0.95 | 0.85 | – | (0.88 | ) | (0.88 | ) | – | 13.08 | 6.77 | 120,871 | 2.55 | 2.55 | 2.55 | (0.77 | ) | 15 | |||||||||||||||
| 2011 | 15.91 | (0.21 | ) | (1.84 | ) | (2.05 | ) | (0.05 | ) | (0.70 | ) | (0.75 | ) | – | 13.11 | (12.86 | ) | 134,752 | 2.42 | 2.42 | 2.42 | (1.41 | ) | 35 | |||||||||||
| 2010 | 12.45 | (0.15 | ) | 3.74 | 3.59 | (0.13 | ) | – | (0.13 | ) | – | 15.91 | 28.85 | 181,746 | 2.43 | 2.43 | 2.43 | (1.20 | ) | 36 | |||||||||||||||
| Royce Premier Fund–Investment Class | |||||||||||||||||||||||||||||||||||
| 2015 | † | $ | 19.72 | $ | 0.07 | $ | 0.26 | $ | 0.33 | $ – | $ – | $ – | $ – | $ | 20.05 | 1.67 | % 1 | $ | 3,333,631 | 1.14 | % 2 | 1.14 | % 2 | 1.14 | % 2 | 0.70 | % 2 | 4 | % | ||||||
| 2014 | 22.11 | 0.08 | (0.32 | ) | (0.24 | ) | (0.08 | ) | (2.07 | ) | (2.15 | ) | – | 19.72 | (0.86 | ) | 4,097,961 | 1.10 | 1.10 | 1.10 | 0.34 | 9 | |||||||||||||
| 2013 | 19.16 | 0.00 | 5.22 | 5.22 | – | (2.27 | ) | (2.27 | ) | – | 22.11 | 27.73 | 5,096,793 | 1.09 | 1.09 | 1.09 | 0.02 | 11 | |||||||||||||||||
| 2012 | 18.52 | 0.24 | 1.85 | 2.09 | (0.24 | ) | (1.21 | ) | (1.45 | ) | – | 19.16 | 11.45 | 4,629,272 | 1.06 | 1.06 | 1.06 | 1.19 | 7 | ||||||||||||||||
| 2011 | 20.35 | (0.02 | ) | (0.17 | ) | (0.19 | ) | (0.05 | ) | (1.59 | ) | (1.64 | ) | – | 18.52 | (0.86 | ) | 4,539,127 | 1.09 | 1.09 | 1.09 | (0.11 | ) | 18 | |||||||||||
| 2010 | 16.31 | (0.01 | ) | 4.32 | 4.31 | – | (0.27 | ) | (0.27 | ) | – | 20.35 | 26.46 | 4,961,891 | 1.12 | 1.12 | 1.12 | (0.07 | ) | 10 | |||||||||||||||
| THE ACCOMPANYING NOTES ARE AN INTEGRAL PART OF THESE FINANCIAL STATEMENTS | The Royce Funds 2015 Semiannual Report to Shareholders | 93 |
Financial Highlights
This table is presented to show selected data for a share outstanding throughout each period and to assist shareholders in evaluating a Fund’s performance for the periods presented. Per share amounts have been determined on the basis of the weighted average number of shares outstanding during the period.
| Ratio of Expenses to Average Net Assets | |||||||||||||||||||||||||||||||||||
| Net Asset Value, Beginning of Period | Net Investment Income (Loss) | Net Realized and Unrealized Gain (Loss) on Investments and Foreign Currency | Total from Investment Operations | Distributions from Net Investment Income | Distributions from Net Realized Gain on Investments and Foreign Currency | Total Distributions | Shareholder Redemption Fees | Net Asset Value, End of Period | Total Return | Net Assets, End of Period (in thousands) | Prior to Fee Waivers and Balance Credits | Prior to Fee Waivers | Net of Fee Waivers | Ratio of Net Investment Income (Loss) to Average Net Assets | Portfolio Turnover Rate | ||||||||||||||||||||
| Royce Premier Fund–Service Class | |||||||||||||||||||||||||||||||||||
| 2015 | † | $ | 19.33 | $ | 0.04 | $ | 0.25 | $ | 0.29 | $ – | $ – | $ – | $ – | $ | 19.62 | 1.50 | % 1 | $ | 101,780 | 1.53 | % 2 | 1.53 | % 2 | 1.49 | % 2 | 0.38 | % 2 | 4 | % | ||||||
| 2014 | 21.70 | 0.01 | (0.31 | ) | (0.30 | ) | – | (2.07 | ) | (2.07 | ) | – | 19.33 | (1.16 | ) | 172,810 | 1.38 | 1.38 | 1.38 | 0.05 | 9 | ||||||||||||||
| 2013 | 18.89 | (0.07 | ) | 5.15 | 5.08 | – | (2.27 | ) | (2.27 | ) | – | 21.70 | 27.39 | 318,860 | 1.38 | 1.38 | 1.38 | (0.33 | ) | 11 | |||||||||||||||
| 2012 | 18.23 | 0.19 | 1.81 | 2.00 | (0.13 | ) | (1.21 | ) | (1.34 | ) | – | 18.89 | 11.14 | 560,553 | 1.33 | 1.33 | 1.32 | 0.92 | 7 | ||||||||||||||||
| 2011 | 20.07 | (0.07 | ) | (0.16 | ) | (0.23 | ) | (0.02 | ) | (1.59 | ) | (1.61 | ) | – | 18.23 | (1.07 | ) | 628,824 | 1.34 | 1.34 | 1.32 | (0.33 | ) | 18 | |||||||||||
| 2010 | 16.12 | (0.05 | ) | 4.27 | 4.22 | – | (0.27 | ) | (0.27 | ) | – | 20.07 | 26.22 | 584,817 | 1.39 | 1.39 | 1.37 | (0.30 | ) | 10 | |||||||||||||||
| Royce Premier Fund–Consultant Class | |||||||||||||||||||||||||||||||||||
| 2015 | † | $ | 17.09 | $ | (0.03 | ) | $ | 0.24 | $ | 0.21 | $ – | $ – | $ – | $ – | $ | 17.30 | 1.23 | % 1 | $ | 50,828 | 2.14 | % 2 | 2.14 | % 2 | 2.14 | % 2 | (0.31 | )% 2 | 4 | % | |||||
| 2014 | 19.58 | (0.13 | ) | (0.29 | ) | (0.42 | ) | – | (2.07 | ) | (2.07 | ) | – | 17.09 | (1.92 | ) | 56,884 | 2.10 | 2.10 | 2.10 | (0.66 | ) | 9 | ||||||||||||
| 2013 | 17.35 | (0.20 | ) | 4.70 | 4.50 | – | (2.27 | ) | (2.27 | ) | – | 19.58 | 26.47 | 66,712 | 2.13 | 2.13 | 2.13 | (1.02 | ) | 11 | |||||||||||||||
| 2012 | 16.87 | 0.02 | 1.69 | 1.71 | (0.02 | ) | (1.21 | ) | (1.23 | ) | – | 17.35 | 10.24 | 60,568 | 2.12 | 2.12 | 2.12 | 0.13 | 7 | ||||||||||||||||
| 2011 | 18.81 | (0.21 | ) | (0.14 | ) | (0.35 | ) | – | (1.59 | ) | (1.59 | ) | – | 16.87 | (1.80 | ) | 59,766 | 2.05 | 2.05 | 2.05 | (1.07 | ) | 18 | ||||||||||||
| 2010 | 15.24 | (0.17 | ) | 4.01 | 3.84 | – | (0.27 | ) | (0.27 | ) | – | 18.81 | 25.24 | 71,686 | 2.08 | 2.08 | 2.08 | (1.04 | ) | 10 | |||||||||||||||
| Royce Premier Fund–Institutional Class | |||||||||||||||||||||||||||||||||||
| 2015 | † | $ | 19.91 | $ | 0.08 | $ | 0.27 | $ | 0.35 | $ – | $ – | $ – | $ – | $ | 20.26 | 1.76 | % 1 | $ | 498,654 | 1.01 | % 2 | 1.01 | % 2 | 1.01 | % 2 | 0.81 | % 2 | 4 | % | ||||||
| 2014 | 22.31 | 0.12 | (0.34 | ) | (0.22 | ) | (0.11 | ) | (2.07 | ) | (2.18 | ) | – | 19.91 | (0.79 | ) | 594,463 | 0.98 | 0.98 | 0.98 | 0.45 | 9 | |||||||||||||
| 2013 | 19.30 | 0.03 | 5.25 | 5.28 | – | (2.27 | ) | (2.27 | ) | – | 22.31 | 27.85 | 989,100 | 0.98 | 0.98 | 0.98 | 0.13 | 11 | |||||||||||||||||
| 2012 | 18.66 | 0.26 | 1.87 | 2.13 | (0.28 | ) | (1.21 | ) | (1.49 | ) | – | 19.30 | 11.57 | 866,277 | 0.98 | 0.98 | 0.98 | 1.30 | 7 | ||||||||||||||||
| 2011 | 20.49 | 0.00 | (0.16 | ) | (0.16 | ) | (0.08 | ) | (1.59 | ) | (1.67 | ) | – | 18.66 | (0.73 | ) | 813,837 | 0.97 | 0.97 | 0.97 | 0.02 | 18 | |||||||||||||
| 2010 | 16.40 | 0.01 | 4.35 | 4.36 | – | (0.27 | ) | (0.27 | ) | – | 20.49 | 26.62 | 706,870 | 0.99 | 0.99 | 0.99 | 0.07 | 10 | |||||||||||||||||
| Royce Premier Fund–W Class | |||||||||||||||||||||||||||||||||||
| 2015 | † | $ | 19.76 | $ | 0.07 | $ | 0.27 | $ | 0.34 | $ – | $ – | $ – | $ – | $ | 20.10 | 1.72 | % 1 | $ | 370,598 | 1.12 | % 2 | 1.12 | % 2 | 1.12 | % 2 | 0.72 | % 2 | 4 | % | ||||||
| 2014 | 22.16 | 0.09 | (0.33 | ) | (0.24 | ) | (0.09 | ) | (2.07 | ) | (2.16 | ) | – | 19.76 | (0.89 | ) | 446,380 | 1.07 | 1.07 | 1.07 | 0.36 | 9 | |||||||||||||
| 2013 | 19.20 | 0.00 | 5.23 | 5.23 | – | (2.27 | ) | (2.27 | ) | – | 22.16 | 27.73 | 552,732 | 1.09 | 1.09 | 1.09 | 0.01 | 11 | |||||||||||||||||
| 2012 | 18.57 | 0.25 | 1.85 | 2.10 | (0.26 | ) | (1.21 | ) | (1.47 | ) | – | 19.20 | 11.46 | 533,763 | 1.05 | 1.05 | 1.05 | 1.19 | 7 | ||||||||||||||||
| 2011 | 20.40 | (0.01 | ) | (0.15 | ) | (0.16 | ) | (0.08 | ) | (1.59 | ) | (1.67 | ) | – | 18.57 | (0.75 | ) | 549,648 | 1.00 | 1.00 | 1.00 | (0.01 | ) | 18 | |||||||||||
| 2010 | 16.33 | 0.01 | 4.33 | 4.34 | – | (0.27 | ) | (0.27 | ) | – | 20.40 | 26.61 | 425,397 | 1.02 | 1.02 | 1.02 | 0.04 | 10 | |||||||||||||||||
| Royce Premier Fund–R Class | |||||||||||||||||||||||||||||||||||
| 2015 | † | $ | 18.82 | $ | 0.01 | $ | 0.25 | $ | 0.26 | $ – | $ – | $ – | $ – | $ | 19.08 | 1.38 | % 1 | $ | 23,018 | 1.77 | % 2 | 1.77 | % 2 | 1.77 | % 2 | 0.06 | % 2 | 4 | % | ||||||
| 2014 | 21.25 | (0.06 | ) | (0.30 | ) | (0.36 | ) | – | (2.07 | ) | (2.07 | ) | – | 18.82 | (1.48 | ) | 27,355 | 1.71 | 1.71 | 1.71 | (0.28 | ) | 9 | ||||||||||||
| 2013 | 18.61 | (0.13 | ) | 5.04 | 4.91 | – | (2.27 | ) | (2.27 | ) | – | 21.25 | 26.88 | 32,577 | 1.74 | 1.74 | 1.74 | (0.63 | ) | 11 | |||||||||||||||
| 2012 | 17.99 | 0.11 | 1.80 | 1.91 | (0.08 | ) | (1.21 | ) | (1.29 | ) | – | 18.61 | 10.75 | 28,632 | 1.68 | 1.68 | 1.68 | 0.57 | 7 | ||||||||||||||||
| 2011 | 19.91 | (0.14 | ) | (0.15 | ) | (0.29 | ) | (0.04 | ) | (1.59 | ) | (1.63 | ) | – | 17.99 | (1.38 | ) | 23,653 | 1.66 | 1.66 | 1.66 | (0.63 | ) | 18 | |||||||||||
| 2010 | 16.07 | (0.11 | ) | 4.22 | 4.11 | – | (0.27 | ) | (0.27 | ) | – | 19.91 | 25.61 | 10,185 | 1.78 | 1.78 | 1.78 | (0.64 | ) | 10 | |||||||||||||||
| 94 | The Royce Funds 2015 Semiannual Report to Shareholders | THE ACCOMPANYING NOTES ARE AN INTEGRAL PART OF THESE FINANCIAL STATEMENTS |
Financial Highlights
This table is presented to show selected data for a share outstanding throughout each period and to assist shareholders in evaluating a Fund’s performance for the periods presented. Per share amounts have been determined on the basis of the weighted average number of shares outstanding during the period.
| Ratio of Expenses to Average Net Assets | |||||||||||||||||||||||||||||||||||
| Net Asset Value, Beginning of Period | Net Investment Income (Loss) | Net Realized and Unrealized Gain (Loss) on Investments and Foreign Currency | Total from Investment Operations | Distributions from Net Investment Income | Distributions from Net Realized Gain on Investments and Foreign Currency | Total Distributions | Shareholder Redemption Fees | Net Asset Value, End of Period | Total Return | Net Assets, End of Period (in thousands) | Prior to Fee Waivers and Balance Credits | Prior to Fee Waivers | Net of Fee Waivers | Ratio of Net Investment Income (Loss) to Average Net Assets | Portfolio Turnover Rate | ||||||||||||||||||||
| Royce Premier Fund–K Class | |||||||||||||||||||||||||||||||||||
| 2015 | † | $ | 5.76 | $ | (0.00 | ) | $ | 0.08 | $ | 0.08 | $ – | $ – | $ – | $ – | $ | 5.84 | 1.39 | % 1 | $ | 4,722 | 1.86 | % 2 | 1.86 | % 2 | 1.86 | % 2 | (0.03 | )% 2 | 4 | % | |||||
| 2014 | 8.04 | (0.01 | ) | (0.15 | ) | (0.16 | ) | (0.05 | ) | (2.07 | ) | (2.12 | ) | – | 5.76 | (1.50 | ) | 6,306 | 1.69 | 1.69 | 1.69 | (0.25 | ) | 9 | |||||||||||
| 2013 | 8.19 | (0.04 | ) | 2.16 | 2.12 | – | (2.27 | ) | (2.27 | ) | – | 8.04 | 27.01 | 8,640 | 1.59 | 1.59 | 1.59 | (0.50 | ) | 11 | |||||||||||||||
| 2012 | 8.67 | 0.08 | 0.85 | 0.93 | (0.20 | ) | (1.21 | ) | (1.41 | ) | – | 8.19 | 11.00 | 9,707 | 1.47 | 1.47 | 1.47 | 0.79 | 7 | ||||||||||||||||
| 2011 | 10.46 | (0.05 | ) | (0.09 | ) | (0.14 | ) | (0.06 | ) | (1.59 | ) | (1.65 | ) | – | 8.67 | (1.20 | ) | 8,776 | 1.49 | 1.49 | 1.49 | (0.46 | ) | 18 | |||||||||||
| 2010 | 8.53 | (0.04 | ) | 2.24 | 2.20 | – | (0.27 | ) | (0.27 | ) | – | 10.46 | 25.86 | 3,845 | 1.63 | 1.63 | 1.59 | (0.47 | ) | 10 | |||||||||||||||
| Royce Low-Priced Stock Fund–Investment Class | |||||||||||||||||||||||||||||||||||
| 2015 | † | $ | 9.46 | $ | 0.01 | $ | 0.26 | $ | 0.27 | $ – | $ – | $ – | $ – | $ | 9.73 | 2.85 | % 1 | $ | 41,378 | 1.26 | % 2 | 1.26 | % 2 | 1.24 | % 2 | 0.12 | % 2 | 28 | % | ||||||
| 2014 | 13.60 | 0.06 | (0.58 | ) | (0.52 | ) | (0.01 | ) | (3.61 | ) | (3.62 | ) | – | 9.46 | (3.15 | ) | 50,371 | 1.25 | 1.25 | 1.24 | 0.46 | 29 | |||||||||||||
| 2013 | 13.83 | 0.05 | 1.71 | 1.76 | (0.05 | ) | (1.94 | ) | (1.99 | ) | – | 13.60 | 13.17 | 88,568 | 1.37 | 1.37 | 1.24 | 0.18 | 16 | ||||||||||||||||
| 2012 | 14.34 | 0.15 | 0.50 | 0.65 | (0.25 | ) | (0.91 | ) | (1.16 | ) | – | 13.83 | 4.79 | 255,335 | 1.26 | 1.26 | 1.24 | 0.86 | 8 | ||||||||||||||||
| 2011 | 18.31 | (0.06 | ) | (2.57 | ) | (2.63 | ) | (0.14 | ) | (1.20 | ) | (1.34 | ) | – | 14.34 | (14.37 | ) | 276,247 | 1.26 | 1.26 | 1.24 | (0.15 | ) | 22 | |||||||||||
| 2010 | 14.08 | (0.03 | ) | 4.50 | 4.47 | (0.10 | ) | (0.14 | ) | (0.24 | ) | – | 18.31 | 31.77 | 148,144 | 1.26 | 1.26 | 1.24 | (0.10 | ) | 24 | ||||||||||||||
| Royce Low-Priced Stock Fund–Service Class | |||||||||||||||||||||||||||||||||||
| 2015 | † | $ | 9.46 | $ | (0.01 | ) | $ | 0.26 | $ | 0.25 | $ – | $ – | $ – | $ – | $ | 9.71 | 2.64 | % 1 | $ | 433,397 | 1.61 | % 2 | 1.61 | % 2 | 1.49 | % 2 | (0.13 | )% 2 | 28 | % | |||||
| 2014 | 13.62 | 0.03 | (0.58 | ) | (0.55 | ) | – | (3.61 | ) | (3.61 | ) | – | 9.46 | (3.37 | ) | 520,905 | 1.55 | 1.55 | 1.49 | 0.21 | 29 | ||||||||||||||
| 2013 | 13.84 | (0.00 | ) | 1.72 | 1.72 | (0.00 | ) | (1.94 | ) | (1.94 | ) | – | 13.62 | 12.91 | 1,008,207 | 1.65 | 1.65 | 1.49 | (0.02 | ) | 16 | ||||||||||||||
| 2012 | 14.31 | 0.11 | 0.49 | 0.60 | (0.16 | ) | (0.91 | ) | (1.07 | ) | – | 13.84 | 4.48 | 1,800,089 | 1.57 | 1.57 | 1.49 | 0.54 | 8 | ||||||||||||||||
| 2011 | 18.26 | (0.06 | ) | (2.60 | ) | (2.66 | ) | (0.09 | ) | (1.20 | ) | (1.29 | ) | – | 14.31 | (14.58 | ) | 2,489,189 | 1.56 | 1.56 | 1.49 | (0.39 | ) | 22 | |||||||||||
| 2010 | 14.05 | (0.05 | ) | 4.47 | 4.42 | (0.07 | ) | (0.14 | ) | (0.21 | ) | – | 18.26 | 31.49 | 3,456,142 | 1.60 | 1.60 | 1.49 | (0.37 | ) | 24 | ||||||||||||||
| Royce Low-Priced Stock Fund–Institutional Class | |||||||||||||||||||||||||||||||||||
| 2015 | † | $ | 9.46 | $ | 0.01 | $ | 0.26 | $ | 0.27 | $ – | $ – | $ – | $ – | $ | 9.73 | 2.85 | % 1 | $ | 59,246 | 1.15 | % 2 | 1.15 | % 2 | 1.15 | % 2 | 0.17 | % 2 | 28 | % | ||||||
| 2014 | 13.61 | 0.08 | (0.58 | ) | (0.50 | ) | (0.04 | ) | (3.61 | ) | (3.65 | ) | – | 9.46 | (3.01 | ) | 101,473 | 1.16 | 1.16 | 1.16 | 0.47 | 29 | |||||||||||||
| 2013 | 13.84 | 0.05 | 1.71 | 1.76 | (0.05 | ) | (1.94 | ) | (1.99 | ) | – | 13.61 | 13.20 | 345,983 | 1.22 | 1.22 | 1.22 | 0.26 | 16 | ||||||||||||||||
| 2012 | 14.36 | 0.16 | 0.49 | 0.65 | (0.26 | ) | (0.91 | ) | (1.17 | ) | – | 13.84 | 4.81 | 969,664 | 1.20 | 1.20 | 1.20 | 0.92 | 8 | ||||||||||||||||
| 2011 | 18.33 | (0.01 | ) | (2.61 | ) | (2.62 | ) | (0.15 | ) | (1.20 | ) | (1.35 | ) | – | 14.36 | (14.35 | ) | 991,706 | 1.17 | 1.17 | 1.17 | (0.07 | ) | 22 | |||||||||||
| 2010 | 14.09 | (0.02 | ) | 4.50 | 4.48 | (0.10 | ) | (0.14 | ) | (0.24 | ) | – | 18.33 | 31.82 | 1,077,659 | 1.18 | 1.18 | 1.18 | (0.04 | ) | 24 | ||||||||||||||
| Royce Low-Priced Stock Fund–R Class | |||||||||||||||||||||||||||||||||||
| 2015 | † | $ | 9.08 | $ | (0.02 | ) | $ | 0.25 | $ | 0.23 | $ – | $ – | $ – | $ – | $ | 9.31 | 2.53 | % 1 | $ | 1,365 | 2.47 | % 2 | 2.47 | % 2 | 1.84 | % 2 | (0.49 | )% 2 | 28 | % | |||||
| 2014 | 13.27 | (0.02 | ) | (0.56 | ) | (0.58 | ) | – | (3.61 | ) | (3.61 | ) | – | 9.08 | (3.72 | ) | 1,892 | 2.21 | 2.21 | 1.84 | (0.15 | ) | 29 | ||||||||||||
| 2013 | 13.58 | (0.05 | ) | 1.68 | 1.63 | – | (1.94 | ) | (1.94 | ) | – | 13.27 | 12.44 | 3,130 | 2.21 | 2.21 | 1.84 | (0.37 | ) | 16 | |||||||||||||||
| 2012 | 14.05 | 0.04 | 0.50 | 0.54 | (0.10 | ) | (0.91 | ) | (1.01 | ) | – | 13.58 | 4.10 | 5,823 | 2.05 | 2.05 | 1.84 | 0.22 | 8 | ||||||||||||||||
| 2011 | 18.05 | (0.19 | ) | (2.49 | ) | (2.68 | ) | (0.12 | ) | (1.20 | ) | (1.32 | ) | – | 14.05 | (14.86 | ) | 7,337 | 1.95 | 1.95 | 1.84 | (0.72 | ) | 22 | |||||||||||
| 2010 | 13.95 | (0.12 | ) | 4.44 | 4.32 | (0.08 | ) | (0.14 | ) | (0.22 | ) | – | 18.05 | 31.00 | 2,925 | 2.21 | 2.21 | 1.84 | (0.67 | ) | 24 | ||||||||||||||
| THE ACCOMPANYING NOTES ARE AN INTEGRAL PART OF THESE FINANCIAL STATEMENTS | The Royce Funds 2015 Semiannual Report to Shareholders | 95 |
Financial Highlights
This table is presented to show selected data for a share outstanding throughout each period and to assist shareholders in evaluating a Fund’s performance for the periods presented. Per share amounts have been determined on the basis of the weighted average number of shares outstanding during the period.
| Ratio of Expenses to Average Net Assets | |||||||||||||||||||||||||||||||||||
| Net Asset Value, Beginning of Period | Net Investment Income (Loss) | Net Realized and Unrealized Gain (Loss) on Investments and Foreign Currency | Total from Investment Operations | Distributions from Net Investment Income | Distributions from Net Realized Gain on Investments and Foreign Currency | Total Distributions | Shareholder Redemption Fees | Net Asset Value, End of Period | Total Return | Net Assets, End of Period (in thousands) | Prior to Fee Waivers and Balance Credits | Prior to Fee Waivers | Net of Fee Waivers | Ratio of Net Investment Income (Loss) to Average Net Assets | Portfolio Turnover Rate | ||||||||||||||||||||
| Royce Low-Priced Stock Fund–K Class | |||||||||||||||||||||||||||||||||||
| 2015 | † | $ | 2.95 | $ | (0.00 | ) | $ | 0.08 | $ | 0.08 | $ – | $ – | $ – | $ – | $ | 3.03 | 2.71 | % 1 | $ | 1,897 | 2.62 | % 2 | 2.62 | % 2 | 1.59 | % 2 | (0.23 | )% 2 | 28 | % | |||||
| 2014 | 6.89 | 0.01 | (0.34 | ) | (0.33 | ) | – | (3.61 | ) | (3.61 | ) | – | 2.95 | (3.55 | ) | 2,011 | 2.33 | 2.33 | 1.59 | 0.11 | 29 | ||||||||||||||
| 2013 | 7.90 | (0.00 | ) | 0.94 | 0.94 | (0.01 | ) | (1.94 | ) | (1.95 | ) | – | 6.89 | 12.74 | 3,841 | 1.92 | 1.92 | 1.59 | (0.12 | ) | 16 | ||||||||||||||
| 2012 | 8.65 | 0.07 | 0.27 | 0.34 | (0.18 | ) | (0.91 | ) | (1.09 | ) | – | 7.90 | 4.42 | 6,253 | 1.71 | 1.71 | 1.59 | 0.40 | 8 | ||||||||||||||||
| 2011 | 11.70 | (0.08 | ) | (1.63 | ) | (1.71 | ) | (0.14 | ) | (1.20 | ) | (1.34 | ) | – | 8.65 | (14.71 | ) | 8,719 | 1.68 | 1.68 | 1.59 | (0.48 | ) | 22 | |||||||||||
| 2010 | 9.09 | (0.08 | ) | 2.93 | 2.85 | (0.10 | ) | (0.14 | ) | (0.24 | ) | – | 11.70 | 31.44 | 4,782 | 1.78 | 1.78 | 1.59 | (0.40 | ) | 24 | ||||||||||||||
| Royce Total Return Fund–Investment Class | |||||||||||||||||||||||||||||||||||
| 2015 | † | $ | 14.74 | $ | 0.09 | $ | 0.02 | $ | 0.11 | $ (0.09 | ) | $ – | $ (0.09 | ) | $ – | $ | 14.76 | 0.74 | % 1 | $ | 2,618,704 | 1.15 | % 2 | 1.15 | % 2 | 1.15 | % 2 | 1.24 | % 2 | 4 | % | ||||
| 2014 | 16.47 | 0.17 | 0.00 | 0.17 | (0.28 | ) | (1.62 | ) | (1.90 | ) | – | 14.74 | 1.34 | 3,077,951 | 1.13 | 1.13 | 1.13 | 0.95 | 18 | ||||||||||||||||
| 2013 | 13.63 | 0.16 | 4.24 | 4.40 | (0.14 | ) | (1.42 | ) | (1.56 | ) | – | 16.47 | 32.76 | 3,657,904 | 1.13 | 1.13 | 1.13 | 1.00 | 21 | ||||||||||||||||
| 2012 | 12.68 | 0.26 | 1.54 | 1.80 | (0.23 | ) | (0.62 | ) | (0.85 | ) | – | 13.63 | 14.42 | 3,044,664 | 1.10 | 1.10 | 1.10 | 1.89 | 17 | ||||||||||||||||
| 2011 | 13.17 | 0.15 | (0.37 | ) | (0.22 | ) | (0.12 | ) | (0.15 | ) | (0.27 | ) | – | 12.68 | (1.68 | ) | 3,106,208 | 1.12 | 1.12 | 1.12 | 1.10 | 21 | |||||||||||||
| 2010 | 10.81 | 0.19 | 2.32 | 2.51 | (0.15 | ) | – | (0.15 | ) | – | 13.17 | 23.47 | 3,562,002 | 1.14 | 1.14 | 1.14 | 1.64 | 15 | |||||||||||||||||
| Royce Total Return Fund–Service Class | |||||||||||||||||||||||||||||||||||
| 2015 | † | $ | 14.98 | $ | 0.07 | $ | 0.02 | $ | 0.09 | $ (0.07 | ) | $ – | $ (0.07 | ) | $ – | $ | 15.00 | 0.57 | % 1 | $ | 195,258 | 1.47 | % 2 | 1.47 | % 2 | 1.47 | % 2 | 0.92 | % 2 | 4 | % | ||||
| 2014 | 16.61 | 0.12 | 0.01 | 0.13 | (0.14 | ) | (1.62 | ) | (1.76 | ) | – | 14.98 | 1.08 | 232,814 | 1.42 | 1.42 | 1.42 | 0.60 | 18 | ||||||||||||||||
| 2013 | 13.72 | 0.11 | 4.27 | 4.38 | (0.07 | ) | (1.42 | ) | (1.49 | ) | – | 16.61 | 32.38 | 493,111 | 1.48 | 1.48 | 1.48 | 0.68 | 21 | ||||||||||||||||
| 2012 | 12.71 | 0.22 | 1.55 | 1.77 | (0.14 | ) | (0.62 | ) | (0.76 | ) | – | 13.72 | 14.11 | 264,528 | 1.39 | 1.39 | 1.39 | 1.58 | 17 | ||||||||||||||||
| 2011 | 13.19 | 0.11 | (0.38 | ) | (0.27 | ) | (0.06 | ) | (0.15 | ) | (0.21 | ) | – | 12.71 | (2.01 | ) | 282,704 | 1.41 | 1.41 | 1.41 | 0.82 | 21 | |||||||||||||
| 2010 | 10.81 | 0.16 | 2.32 | 2.48 | (0.10 | ) | – | (0.10 | ) | – | 13.19 | 23.11 | 295,656 | 1.42 | 1.42 | 1.42 | 1.39 | 15 | |||||||||||||||||
| Royce Total Return Fund–Consultant Class | |||||||||||||||||||||||||||||||||||
| 2015 | † | $ | 15.05 | $ | 0.02 | $ | 0.02 | $ | 0.04 | $ (0.02 | ) | $ – | $ (0.02 | ) | $ – | $ | 15.07 | 0.26 | % 1 | $ | 326,199 | 2.13 | % 2 | 2.13 | % 2 | 2.13 | % 2 | 0.26 | % 2 | 4 | % | ||||
| 2014 | 16.68 | (0.00 | ) | 0.02 | 0.02 | (0.03 | ) | (1.62 | ) | (1.65 | ) | – | 15.05 | 0.37 | 356,731 | 2.12 | 2.12 | 2.12 | (0.04 | ) | 18 | ||||||||||||||
| 2013 | 13.81 | (0.00 | ) | 4.29 | 4.29 | – | (1.42 | ) | (1.42 | ) | – | 16.68 | 31.38 | 404,498 | 2.15 | 2.15 | 2.15 | (0.02 | ) | 21 | |||||||||||||||
| 2012 | 12.77 | 0.11 | 1.56 | 1.67 | (0.01 | ) | (0.62 | ) | (0.63 | ) | – | 13.81 | 13.19 | 331,116 | 2.20 | 2.20 | 2.20 | 0.80 | 17 | ||||||||||||||||
| 2011 | 13.27 | 0.02 | (0.37 | ) | (0.35 | ) | – | (0.15 | ) | (0.15 | ) | – | 12.77 | (2.64 | ) | 328,610 | 2.07 | 2.07 | 2.07 | 0.15 | 21 | ||||||||||||||
| 2010 | 10.90 | 0.08 | 2.33 | 2.41 | (0.04 | ) | – | (0.04 | ) | – | 13.27 | 22.18 | 391,886 | 2.09 | 2.09 | 2.09 | 0.68 | 15 | |||||||||||||||||
| Royce Total Return Fund–Institutional Class | |||||||||||||||||||||||||||||||||||
| 2015 | † | $ | 14.61 | $ | 0.10 | $ | 0.02 | $ | 0.12 | $ (0.10 | ) | $ – | $ (0.10 | ) | $ – | $ | 14.63 | 0.82 | % 1 | $ | 547,264 | 1.02 | % 2 | 1.02 | % 2 | 1.02 | % 2 | 1.37 | % 2 | 4 | % | ||||
| 2014 | 16.35 | 0.18 | 0.02 | 0.20 | (0.32 | ) | (1.62 | ) | (1.94 | ) | – | 14.61 | 1.51 | 572,662 | 1.00 | 1.00 | 1.00 | 1.09 | 18 | ||||||||||||||||
| 2013 | 13.55 | 0.18 | 4.21 | 4.39 | (0.17 | ) | (1.42 | ) | (1.59 | ) | – | 16.35 | 32.93 | 621,447 | 1.00 | 1.00 | 1.00 | 1.15 | 21 | ||||||||||||||||
| 2012 | 12.64 | 0.27 | 1.54 | 1.81 | (0.28 | ) | (0.62 | ) | (0.90 | ) | – | 13.55 | 14.48 | 408,551 | 1.02 | 1.02 | 1.02 | 2.02 | 17 | ||||||||||||||||
| 2011 | 13.14 | 0.16 | (0.37 | ) | (0.21 | ) | (0.14 | ) | (0.15 | ) | (0.29 | ) | – | 12.64 | (1.55 | ) | 390,277 | 1.00 | 1.00 | 1.00 | 1.26 | 21 | |||||||||||||
| 2010 | 10.80 | 0.21 | 2.31 | 2.52 | (0.18 | ) | – | (0.18 | ) | – | 13.14 | 23.56 | 356,038 | 1.01 | 1.01 | 1.01 | 1.79 | 15 | |||||||||||||||||
| 96 | The Royce Funds 2015 Semiannual Report to Shareholders | THE ACCOMPANYING NOTES ARE AN INTEGRAL PART OF THESE FINANCIAL STATEMENTS |
Financial Highlights
This table is presented to show selected data for a share outstanding throughout each period and to assist shareholders in evaluating a Fund’s performance for the periods presented. Per share amounts have been determined on the basis of the weighted average number of shares outstanding during the period.
| Ratio of Expenses to Average Net Assets | |||||||||||||||||||||||||||||||||||
| Net Asset Value, Beginning of Period | Net Investment Income (Loss) | Net Realized and Unrealized Gain (Loss) on Investments and Foreign Currency | Total from Investment Operations | Distributions from Net Investment Income | Distributions from Net Realized Gain on Investments and Foreign Currency | Total Distributions | Shareholder Redemption Fees | Net Asset Value, End of Period | Total Return | Net Assets, End of Period (in thousands) | Prior to Fee Waivers and Balance Credits | Prior to Fee Waivers | Net of Fee Waivers | Ratio of Net Investment Income (Loss) to Average Net Assets | Portfolio Turnover Rate | ||||||||||||||||||||
| Royce Total Return Fund–W Class | |||||||||||||||||||||||||||||||||||
| 2015 | † | $ | 14.72 | $ | 0.09 | $ | 0.02 | $ | 0.11 | $ (0.09 | ) | $ – | $ (0.09 | ) | $ – | $ | 14.74 | 0.74 | % 1 | $ | 148,061 | 1.17 | % 2 | 1.17 | % 2 | 1.17 | % 2 | 1.23 | % 2 | 4 | % | ||||
| 2014 | 16.45 | 0.15 | 0.03 | 0.18 | (0.29 | ) | (1.62 | ) | (1.91 | ) | – | 14.72 | 1.35 | 261,829 | 1.13 | 1.13 | 1.13 | 0.97 | 18 | ||||||||||||||||
| 2013 | 13.62 | 0.16 | 4.23 | 4.39 | (0.14 | ) | (1.42 | ) | (1.56 | ) | – | 16.45 | 32.71 | 249,035 | 1.15 | 1.15 | 1.15 | 0.99 | 21 | ||||||||||||||||
| 2012 | 12.69 | 0.26 | 1.54 | 1.80 | (0.25 | ) | (0.62 | ) | (0.87 | ) | – | 13.62 | 14.41 | 171,603 | 1.12 | 1.12 | 1.12 | 1.97 | 17 | ||||||||||||||||
| 2011 | 13.19 | 0.16 | (0.37 | ) | (0.21 | ) | (0.14 | ) | (0.15 | ) | (0.29 | ) | – | 12.69 | (1.58 | ) | 132,488 | 1.05 | 1.05 | 1.05 | 1.27 | 21 | |||||||||||||
| 2010 | 10.83 | 0.20 | 2.32 | 2.52 | (0.16 | ) | – | (0.16 | ) | – | 13.19 | 23.44 | 75,063 | 1.09 | 1.09 | 1.09 | 1.74 | 15 | |||||||||||||||||
| Royce Total Return Fund–R Class | |||||||||||||||||||||||||||||||||||
| 2015 | † | $ | 15.07 | $ | 0.05 | $ | 0.02 | $ | 0.07 | $ (0.05 | ) | $ – | $ (0.05 | ) | $ – | $ | 15.09 | 0.46 | % 1 | $ | 62,601 | 1.73 | % 2 | 1.73 | % 2 | 1.73 | % 2 | 0.67 | % 2 | 4 | % | ||||
| 2014 | 16.73 | 0.07 | 0.01 | 0.08 | (0.12 | ) | (1.62 | ) | (1.74 | ) | – | 15.07 | 0.73 | 65,501 | 1.72 | 1.72 | 1.72 | 0.37 | 18 | ||||||||||||||||
| 2013 | 13.82 | 0.06 | 4.30 | 4.36 | (0.03 | ) | (1.42 | ) | (1.45 | ) | – | 16.73 | 31.95 | 72,541 | 1.75 | 1.75 | 1.75 | 0.39 | 21 | ||||||||||||||||
| 2012 | 12.79 | 0.18 | 1.55 | 1.73 | (0.08 | ) | (0.62 | ) | (0.70 | ) | – | 13.82 | 13.66 | 48,797 | 1.74 | 1.74 | 1.74 | 1.36 | 17 | ||||||||||||||||
| 2011 | 13.28 | 0.08 | (0.38 | ) | (0.30 | ) | (0.04 | ) | (0.15 | ) | (0.19 | ) | – | 12.79 | (2.23 | ) | 34,695 | 1.68 | 1.68 | 1.68 | 0.62 | 21 | |||||||||||||
| 2010 | 10.88 | 0.15 | 2.32 | 2.47 | (0.07 | ) | – | (0.07 | ) | – | 13.28 | 22.76 | 20,011 | 1.71 | 1.71 | 1.71 | 1.20 | 15 | |||||||||||||||||
| Royce Total Return Fund–K Class | |||||||||||||||||||||||||||||||||||
| 2015 | † | $ | 10.71 | $ | 0.05 | $ | 0.02 | $ | 0.07 | $ (0.05 | ) | $ – | $ (0.05 | ) | $ – | $ | 10.73 | 0.61 | % 1 | $ | 83,008 | 1.54 | % 2 | 1.54 | % 2 | 1.54 | % 2 | 0.86 | % 2 | 4 | % | ||||
| 2014 | 12.40 | 0.11 | (0.03 | ) | 0.08 | (0.15 | ) | (1.62 | ) | (1.77 | ) | – | 10.71 | 1.01 | 91,271 | 1.47 | 1.47 | 1.47 | 0.55 | 18 | |||||||||||||||
| 2013 | 10.53 | 0.07 | 3.27 | 3.34 | (0.05 | ) | (1.42 | ) | (1.47 | ) | – | 12.40 | 32.20 | 196,344 | 1.50 | 1.50 | 1.50 | 0.62 | 21 | ||||||||||||||||
| 2012 | 9.90 | 0.17 | 1.21 | 1.38 | (0.13 | ) | (0.62 | ) | (0.75 | ) | – | 10.53 | 14.08 | 163,412 | 1.43 | 1.43 | 1.43 | 1.51 | 17 | ||||||||||||||||
| 2011 | 10.31 | 0.09 | (0.30 | ) | (0.21 | ) | (0.05 | ) | (0.15 | ) | (0.20 | ) | – | 9.90 | (1.97 | ) | 177,812 | 1.44 | 1.44 | 1.44 | 0.90 | 21 | |||||||||||||
| 2010 | 8.47 | 0.13 | 1.81 | 1.94 | (0.10 | ) | – | (0.10 | ) | – | 10.31 | 23.08 | 95,319 | 1.43 | 1.43 | 1.43 | 1.46 | 15 | |||||||||||||||||
| Royce Heritage Fund–Investment Class | |||||||||||||||||||||||||||||||||||
| 2015 | † | $ | 15.21 | $ | 0.05 | $ | 0.14 | $ | 0.19 | $ – | $ – | $ – | $ – | $ | 15.40 | 1.25 | % 1 | $ | 178,124 | 1.08 | % 2 | 1.08 | % 2 | 1.08 | % 2 | 0.59 | % 2 | 34 | % | ||||||
| 2014 | 16.24 | 0.10 | (0.25 | ) | (0.15 | ) | (0.05 | ) | (0.83 | ) | (0.88 | ) | – | 15.21 | (0.81 | ) | 160,558 | 1.09 | 1.09 | 1.09 | 0.66 | 35 | |||||||||||||
| 2013 | 14.48 | 0.03 | 3.71 | 3.74 | (0.05 | ) | (1.93 | ) | (1.98 | ) | – | 16.24 | 26.37 | 117,306 | 1.13 | 1.13 | 1.13 | 0.36 | 79 | ||||||||||||||||
| 2012 | 13.07 | 0.10 | 1.80 | 1.90 | (0.13 | ) | (0.36 | ) | (0.49 | ) | – | 14.48 | 14.70 | 40,374 | 1.20 | 1.20 | 1.20 | 0.94 | 39 | ||||||||||||||||
| 2011 | 15.10 | 0.01 | (1.41 | ) | (1.40 | ) | (0.05 | ) | (0.59 | ) | (0.64 | ) | 0.01 | 13.07 | (9.16 | ) | 21,088 | 1.22 | 1.22 | 1.22 | 0.15 | 51 | |||||||||||||
| 2010 | 12.12 | 0.04 | 3.31 | 3.35 | (0.08 | ) | (0.29 | ) | (0.37 | ) | – | 15.10 | 27.71 | 13,313 | 1.25 | 1.25 | 1.24 | 0.35 | 66 | ||||||||||||||||
| Royce Heritage Fund–Service Class | |||||||||||||||||||||||||||||||||||
| 2015 | † | $ | 15.17 | $ | 0.02 | $ | 0.15 | $ | 0.17 | $ – | $ – | $ – | $ – | $ | 15.34 | 1.12 | % 1 | $ | 143,789 | 1.46 | % 2 | 1.46 | % 2 | 1.43 | % 2 | 0.23 | % 2 | 34 | % | ||||||
| 2014 | 16.20 | 0.05 | (0.25 | ) | (0.20 | ) | – | (0.83 | ) | (0.83 | ) | – | 15.17 | (1.14 | ) | 175,433 | 1.43 | 1.43 | 1.40 | 0.32 | 35 | ||||||||||||||
| 2013 | 14.45 | 0.00 | 3.68 | 3.68 | (0.00 | ) | (1.93 | ) | (1.93 | ) | – | 16.20 | 25.99 | 223,533 | 1.45 | 1.45 | 1.42 | 0.02 | 79 | ||||||||||||||||
| 2012 | 13.00 | 0.08 | 1.78 | 1.86 | (0.05 | ) | (0.36 | ) | (0.41 | ) | – | 14.45 | 14.39 | 203,112 | 1.46 | 1.46 | 1.45 | 0.56 | 39 | ||||||||||||||||
| 2011 | 15.03 | (0.01 | ) | (1.40 | ) | (1.41 | ) | (0.03 | ) | (0.59 | ) | (0.62 | ) | – | 13.00 | (9.39 | ) | 218,770 | 1.47 | 1.47 | 1.44 | (0.07 | ) | 51 | |||||||||||
| 2010 | 12.07 | 0.03 | 3.28 | 3.31 | (0.06 | ) | (0.29 | ) | (0.35 | ) | – | 15.03 | 27.50 | 243,822 | 1.47 | 1.47 | 1.38 | 0.21 | 66 | ||||||||||||||||
| THE ACCOMPANYING NOTES ARE AN INTEGRAL PART OF THESE FINANCIAL STATEMENTS | The Royce Funds 2015 Semiannual Report to Shareholders | 97 |
Financial Highlights
This table is presented to show selected data for a share outstanding throughout each period and to assist shareholders in evaluating a Fund’s performance for the periods presented. Per share amounts have been determined on the basis of the weighted average number of shares outstanding during the period.
| Ratio of Expenses to Average Net Assets | |||||||||||||||||||||||||||||||||||
| Net Asset Value, Beginning of Period | Net Investment Income (Loss) | Net Realized and Unrealized Gain (Loss) on Investments and Foreign Currency | Total from Investment Operations | Distributions from Net Investment Income | Distributions from Net Realized Gain on Investments and Foreign Currency | Total Distributions | Shareholder Redemption Fees | Net Asset Value, End of Period | Total Return | Net Assets, End of Period (in thousands) | Prior to Fee Waivers and Balance Credits | Prior to Fee Waivers | Net of Fee Waivers | Ratio of Net Investment Income (Loss) to Average Net Assets | Portfolio Turnover Rate | ||||||||||||||||||||
| Royce Heritage Fund–Consultant Class | |||||||||||||||||||||||||||||||||||
| 2015 | † | $ | 11.47 | $ | (0.03 | ) | $ | 0.11 | $ | 0.08 | $ – | $ – | $ – | $ – | $ | 11.55 | 0.70 | % 1 | $ | 12,660 | 2.35 | % 2 | 2.35 | % 2 | 2.24 | % 2 | (0.57 | )% 2 | 34 | % | |||||
| 2014 | 12.57 | (0.07 | ) | (0.20 | ) | (0.27 | ) | – | (0.83 | ) | (0.83 | ) | – | 11.47 | (2.02 | ) | 13,338 | 2.31 | 2.31 | 2.31 | (0.59 | ) | 35 | ||||||||||||
| 2013 | 11.68 | (0.12 | ) | 2.94 | 2.82 | – | (1.93 | ) | (1.93 | ) | – | 12.57 | 24.73 | 15,942 | 2.37 | 2.37 | 2.37 | (0.93 | ) | 79 | |||||||||||||||
| 2012 | 10.64 | (0.04 | ) | 1.44 | 1.40 | – | (0.36 | ) | (0.36 | ) | – | 11.68 | 13.30 | 13,909 | 2.41 | 2.41 | 2.41 | (0.39 | ) | 39 | |||||||||||||||
| 2011 | 12.50 | (0.11 | ) | (1.16 | ) | (1.27 | ) | – | (0.59 | ) | (0.59 | ) | – | 10.64 | (10.14 | ) | 13,850 | 2.28 | 2.28 | 2.28 | (0.91 | ) | 51 | ||||||||||||
| 2010 | 10.14 | (0.08 | ) | 2.73 | 2.65 | – | (0.29 | ) | (0.29 | ) | – | 12.50 | 26.22 | 12,801 | 2.36 | 2.36 | 2.36 | (0.77 | ) | 66 | |||||||||||||||
| Royce Heritage Fund–R Class | |||||||||||||||||||||||||||||||||||
| 2015 | † | $ | 10.60 | $ | (0.01 | ) | $ | 0.11 | $ | 0.10 | $ – | $ – | $ – | $ – | $ | 10.70 | 0.94 | % 1 | $ | 2,903 | 2.06 | % 2 | 2.05 | % 2 | 1.84 | % 2 | (0.19 | )% 2 | 34 | % | |||||
| 2014 | 11.63 | (0.02 | ) | (0.18 | ) | (0.20 | ) | – | (0.83 | ) | (0.83 | ) | – | 10.60 | (1.59 | ) | 3,727 | 1.89 | 1.89 | 1.84 | (0.14 | ) | 35 | ||||||||||||
| 2013 | 10.86 | (0.05 | ) | 2.75 | 2.70 | – | (1.93 | ) | (1.93 | ) | – | 11.63 | 25.51 | 6,805 | 1.90 | 1.90 | 1.84 | (0.39 | ) | 79 | |||||||||||||||
| 2012 | 9.87 | 0.02 | 1.34 | 1.36 | (0.01 | ) | (0.36 | ) | (0.37 | ) | – | 10.86 | 13.88 | 4,832 | 1.95 | 1.95 | 1.84 | 0.17 | 39 | ||||||||||||||||
| 2011 | 11.63 | (0.06 | ) | (1.07 | ) | (1.13 | ) | (0.04 | ) | (0.59 | ) | (0.63 | ) | – | 9.87 | (9.73 | ) | 4,081 | 1.90 | 1.90 | 1.84 | (0.45 | ) | 51 | |||||||||||
| 2010 | 9.43 | (0.03 | ) | 2.55 | 2.52 | (0.03 | ) | (0.29 | ) | (0.32 | ) | – | 11.63 | 26.84 | 1,909 | 2.22 | 2.22 | 1.84 | (0.25 | ) | 66 | ||||||||||||||
| Royce Heritage Fund–K Class | |||||||||||||||||||||||||||||||||||
| 2015 | † | $ | 10.70 | $ | 0.00 | $ | 0.11 | $ | 0.11 | $ – | $ – | $ – | $ – | $ | 10.81 | 1.03 | % 1 | $ | 4,924 | 1.92 | % 2 | 1.92 | % 2 | 1.59 | % 2 | 0.08 | % 2 | 34 | % | ||||||
| 2014 | 11.70 | 0.02 | (0.19 | ) | (0.17 | ) | – | (0.83 | ) | (0.83 | ) | – | 10.70 | (1.32 | ) | 5,462 | 1.87 | 1.87 | 1.59 | 0.14 | 35 | ||||||||||||||
| 2013 | 10.90 | (0.02 | ) | 2.75 | 2.73 | – | (1.93 | ) | (1.93 | ) | – | 11.70 | 25.69 | 6,419 | 1.70 | 1.70 | 1.59 | (0.15 | ) | 79 | |||||||||||||||
| 2012 | 9.93 | 0.04 | 1.36 | 1.40 | (0.07 | ) | (0.36 | ) | (0.43 | ) | – | 10.90 | 14.22 | 7,077 | 1.61 | 1.61 | 1.59 | 0.42 | 39 | ||||||||||||||||
| 2011 | 11.68 | (0.04 | ) | (1.08 | ) | (1.12 | ) | (0.04 | ) | (0.59 | ) | (0.63 | ) | – | 9.93 | (9.53 | ) | 7,787 | 1.66 | 1.66 | 1.59 | (0.24 | ) | 51 | |||||||||||
| 2010 | 9.46 | (0.03 | ) | 2.60 | 2.57 | (0.06 | ) | (0.29 | ) | (0.35 | ) | – | 11.68 | 27.29 | 5,214 | 1.67 | 1.67 | 1.59 | (0.00 | ) | 66 | ||||||||||||||
| Royce Opportunity Fund–Investment Class | |||||||||||||||||||||||||||||||||||
| 2015 | † | $ | 13.46 | $ | (0.02 | ) | $ | 0.11 | $ | 0.09 | $ – | $ – | $ – | $ – | $ | 13.55 | 0.67 | % 1 | $ | 1,040,355 | 1.16 | % 2 | 1.16 | % 2 | 1.16 | % 2 | (0.32 | )% 2 | 12 | % | |||||
| 2014 | 15.54 | (0.05 | ) | (0.09 | ) | (0.14 | ) | – | (1.94 | ) | (1.94 | ) | – | 13.46 | (0.48 | ) | 1,284,044 | 1.14 | 1.14 | 1.14 | (0.30 | ) | 36 | ||||||||||||
| 2013 | 11.95 | (0.05 | ) | 5.18 | 5.13 | – | (1.54 | ) | (1.54 | ) | – | 15.54 | 43.50 | 1,426,214 | 1.16 | 1.16 | 1.16 | (0.36 | ) | 39 | |||||||||||||||
| 2012 | 10.32 | 0.00 | 2.30 | 2.30 | – | (0.67 | ) | (0.67 | ) | – | 11.95 | 22.59 | 921,473 | 1.13 | 1.13 | 1.13 | 0.02 | 34 | |||||||||||||||||
| 2011 | 12.08 | (0.04 | ) | (1.53 | ) | (1.57 | ) | – | (0.19 | ) | (0.19 | ) | – | 10.32 | (12.95 | ) | 878,824 | 1.16 | 1.16 | 1.16 | (0.38 | ) | 35 | ||||||||||||
| 2010 | 9.03 | (0.04 | ) | 3.09 | 3.05 | – | – | – | – | 12.08 | 33.78 | 1,170,607 | 1.17 | 1.17 | 1.17 | (0.44 | ) | 47 | |||||||||||||||||
| Royce Opportunity Fund–Service Class | |||||||||||||||||||||||||||||||||||
| 2015 | † | $ | 12.80 | $ | (0.04 | ) | $ | 0.10 | $ | 0.06 | $ – | $ – | $ – | $ – | $ | 12.86 | 0.47 | % 1 | $ | 136,217 | 1.50 | % 2 | 1.50 | % 2 | 1.49 | % 2 | (0.65 | )% 2 | 12 | % | |||||
| 2014 | 14.92 | (0.09 | ) | (0.09 | ) | (0.18 | ) | – | (1.94 | ) | (1.94 | ) | – | 12.80 | (0.74 | ) | 155,085 | 1.47 | 1.47 | 1.47 | (0.64 | ) | 36 | ||||||||||||
| 2013 | 11.55 | (0.09 | ) | 5.00 | 4.91 | – | (1.54 | ) | (1.54 | ) | – | 14.92 | 43.10 | 208,237 | 1.47 | 1.47 | 1.47 | (0.67 | ) | 39 | |||||||||||||||
| 2012 | 10.03 | (0.04 | ) | 2.23 | 2.19 | – | (0.67 | ) | (0.67 | ) | – | 11.55 | 22.14 | 205,084 | 1.46 | 1.46 | 1.46 | (0.32 | ) | 34 | |||||||||||||||
| 2011 | 11.78 | (0.08 | ) | (1.49 | ) | (1.57 | ) | – | (0.19 | ) | (0.19 | ) | 0.01 | 10.03 | (13.20 | ) | 160,496 | 1.48 | 1.48 | 1.48 | (0.73 | ) | 35 | ||||||||||||
| 2010 | 8.83 | (0.08 | ) | 3.03 | 2.95 | – | – | – | – | 11.78 | 33.41 | 312,728 | 1.46 | 1.46 | 1.46 | (0.78 | ) | 47 | |||||||||||||||||
| 98 | The Royce Funds 2015 Semiannual Report to Shareholders | THE ACCOMPANYING NOTES ARE AN INTEGRAL PART OF THESE FINANCIAL STATEMENTS |
Financial Highlights
This table is presented to show selected data for a share outstanding throughout each period and to assist shareholders in evaluating a Fund’s performance for the periods presented. Per share amounts have been determined on the basis of the weighted average number of shares outstanding during the period.
| Ratio of Expenses to Average Net Assets | |||||||||||||||||||||||||||||||||||
| Net Asset Value, Beginning of Period | Net Investment Income (Loss) | Net Realized and Unrealized Gain (Loss) on Investments and Foreign Currency | Total from Investment Operations | Distributions from Net Investment Income | Distributions from Net Realized Gain on Investments and Foreign Currency | Total Distributions | Shareholder Redemption Fees | Net Asset Value, End of Period | Total Return | Net Assets, End of Period (in thousands) | Prior to Fee Waivers and Balance Credits | Prior to Fee Waivers | Net of Fee Waivers | Ratio of Net Investment Income (Loss) to Average Net Assets | Portfolio Turnover Rate | ||||||||||||||||||||
| Royce Opportunity Fund–Consultant Class | |||||||||||||||||||||||||||||||||||
| 2015 | † | $ | 11.79 | $ | (0.08 | ) | $ | 0.10 | $ | 0.02 | $ – | $ – | $ – | $ – | $ | 11.81 | 0.17 | % 1 | $ | 22,566 | 2.22 | % 2 | 2.22 | % 2 | 2.22 | % 2 | (1.37 | )% 2 | 12 | % | |||||
| 2014 | 14.02 | (0.19 | ) | (0.10 | ) | (0.29 | ) | – | (1.94 | ) | (1.94 | ) | – | 11.79 | (1.61 | ) | 20,518 | 2.24 | 2.24 | 2.24 | (1.40 | ) | 36 | ||||||||||||
| 2013 | 11.01 | (0.20 | ) | 4.75 | 4.55 | – | (1.54 | ) | (1.54 | ) | – | 14.02 | 41.93 | 18,643 | 2.31 | 2.31 | 2.31 | (1.51 | ) | 39 | |||||||||||||||
| 2012 | 9.67 | (0.13 | ) | 2.14 | 2.01 | – | (0.67 | ) | (0.67 | ) | – | 11.01 | 21.09 | 11,930 | 2.36 | 2.36 | 2.36 | (1.22 | ) | 34 | |||||||||||||||
| 2011 | 11.46 | (0.15 | ) | (1.45 | ) | (1.60 | ) | – | (0.19 | ) | (0.19 | ) | – | 9.67 | (13.91 | ) | 11,884 | 2.24 | 2.24 | 2.24 | (1.44 | ) | 35 | ||||||||||||
| 2010 | 8.66 | (0.15 | ) | 2.95 | 2.80 | – | – | – | – | 11.46 | 32.33 | 13,126 | 2.29 | 2.29 | 2.29 | (1.56 | ) | 47 | |||||||||||||||||
| Royce Opportunity Fund–Institutional Class | |||||||||||||||||||||||||||||||||||
| 2015 | † | $ | 13.64 | $ | (0.01 | ) | $ | 0.11 | $ | 0.10 | $ – | $ – | $ – | $ – | $ | 13.74 | 0.73 | % 1 | $ | 757,992 | 1.04 | % 2 | 1.04 | % 2 | 1.04 | % 2 | (0.20 | )% 2 | 12 | % | |||||
| 2014 | 15.71 | (0.03 | ) | (0.10 | ) | (0.13 | ) | – | (1.94 | ) | (1.94 | ) | – | 13.64 | (0.41 | ) | 799,131 | 1.03 | 1.03 | 1.03 | (0.20 | ) | 36 | ||||||||||||
| 2013 | 12.06 | (0.03 | ) | 5.23 | 5.20 | (0.01 | ) | (1.54 | ) | (1.55 | ) | – | 15.71 | 43.69 | 853,886 | 1.03 | 1.03 | 1.03 | (0.23 | ) | 39 | ||||||||||||||
| 2012 | 10.40 | 0.01 | 2.32 | 2.33 | – | (0.67 | ) | (0.67 | ) | – | 12.06 | 22.70 | 689,939 | 1.04 | 1.04 | 1.04 | 0.11 | 34 | |||||||||||||||||
| 2011 | 12.16 | (0.03 | ) | (1.54 | ) | (1.57 | ) | – | (0.19 | ) | (0.19 | ) | – | 10.40 | (12.86 | ) | 574,826 | 1.03 | 1.03 | 1.03 | (0.24 | ) | 35 | ||||||||||||
| 2010 | 9.07 | (0.03 | ) | 3.12 | 3.09 | – | – | – | – | 12.16 | 34.07 | 702,220 | 1.04 | 1.04 | 1.04 | (0.32 | ) | 47 | |||||||||||||||||
| Royce Opportunity Fund–R Class | |||||||||||||||||||||||||||||||||||
| 2015 | † | $ | 12.56 | $ | (0.06 | ) | $ | 0.11 | $ | 0.05 | $ – | $ – | $ – | $ – | $ | 12.61 | 0.40 | % 1 | $ | 35,669 | 1.74 | % 2 | 1.74 | % 2 | 1.74 | % 2 | (0.90 | )% 2 | 12 | % | |||||
| 2014 | 14.73 | (0.13 | ) | (0.10 | ) | (0.23 | ) | – | (1.94 | ) | (1.94 | ) | – | 12.56 | (1.12 | ) | 33,699 | 1.78 | 1.78 | 1.78 | (0.93 | ) | 36 | ||||||||||||
| 2013 | 11.46 | (0.14 | ) | 4.95 | 4.81 | – | (1.54 | ) | (1.54 | ) | – | 14.73 | 42.56 | 22,730 | 1.82 | 1.82 | 1.82 | (1.02 | ) | 39 | |||||||||||||||
| 2012 | 9.98 | (0.07 | ) | 2.22 | 2.15 | – | (0.67 | ) | (0.67 | ) | – | 11.46 | 21.85 | 6,612 | 2.01 | 2.01 | 1.84 | (0.62 | ) | 34 | |||||||||||||||
| 2011 | 11.78 | (0.10 | ) | (1.51 | ) | (1.61 | ) | – | (0.19 | ) | (0.19 | ) | – | 9.98 | (13.62 | ) | 3,088 | 2.03 | 2.03 | 1.84 | (0.98 | ) | 35 | ||||||||||||
| 2010 | 8.86 | (0.11 | ) | 3.03 | 2.92 | – | – | – | – | 11.78 | 32.96 | 1,407 | 2.88 | 2.88 | 1.84 | (1.06 | ) | 47 | |||||||||||||||||
| Royce Opportunity Fund–K Class | |||||||||||||||||||||||||||||||||||
| 2015 | † | $ | 11.57 | $ | (0.05 | ) | $ | 0.09 | $ | 0.04 | $ – | $ – | $ – | $ – | $ | 11.61 | 0.35 | % 1 | $ | 16,734 | 1.63 | % 2 | 1.63 | % 2 | 1.63 | % 2 | (0.79 | )% 2 | 12 | % | |||||
| 2014 | 13.70 | (0.10 | ) | (0.09 | ) | (0.19 | ) | – | (1.94 | ) | (1.94 | ) | – | 11.57 | (0.90 | ) | 22,892 | 1.59 | 1.59 | 1.59 | (0.75 | ) | 36 | ||||||||||||
| 2013 | 10.70 | (0.08 | ) | 4.62 | 4.54 | – | (1.54 | ) | (1.54 | ) | – | 13.70 | 43.07 | 17,927 | 1.46 | 1.46 | 1.46 | (0.65 | ) | 39 | |||||||||||||||
| 2012 | 9.33 | (0.04 | ) | 2.08 | 2.04 | – | (0.67 | ) | (0.67 | ) | – | 10.70 | 22.19 | 8,828 | 1.52 | 1.52 | 1.52 | (0.36 | ) | 34 | |||||||||||||||
| 2011 | 10.98 | (0.07 | ) | (1.39 | ) | (1.46 | ) | – | (0.19 | ) | (0.19 | ) | – | 9.33 | (13.25 | ) | 6,484 | 1.46 | 1.46 | 1.46 | (0.68 | ) | 35 | ||||||||||||
| 2010 | 8.24 | (0.07 | ) | 2.81 | 2.74 | – | – | – | – | 10.98 | 33.25 | 6,657 | 1.63 | 1.63 | 1.59 | (0.76 | ) | 47 | |||||||||||||||||
| Royce Special Equity Fund–Investment Class | |||||||||||||||||||||||||||||||||||
| 2015 | † | $ | 22.86 | $ | 0.11 | $ | (0.23 | ) | $ | (0.12 | ) | $ – | $ – | $ – | $ – | $ | 22.74 | (0.52 | )% 1 | $ | 1,618,768 | 1.15 | % 2 | 1.15 | % 2 | 1.15 | % 2 | 1.01 | % 2 | 8 | % | ||||
| 2014 | 25.02 | 0.13 | 0.09 | 0.22 | (0.12 | ) | (2.26 | ) | (2.38 | ) | – | 22.86 | 1.09 | 1,950,211 | 1.12 | 1.12 | 1.12 | 0.47 | 21 | ||||||||||||||||
| 2013 | 21.13 | 0.03 | 6.09 | 6.12 | (0.03 | ) | (2.20 | ) | (2.23 | ) | – | 25.02 | 29.36 | 2,510,346 | 1.13 | 1.13 | 1.13 | 0.13 | 28 | ||||||||||||||||
| 2012 | 19.70 | 0.46 | 2.53 | 2.99 | (0.46 | ) | (1.10 | ) | (1.56 | ) | – | 21.13 | 15.36 | 2,048,091 | 1.13 | 1.13 | 1.13 | 2.20 | 31 | ||||||||||||||||
| 2011 | 20.87 | 0.05 | (0.05 | ) | 0.00 | (0.09 | ) | (1.08 | ) | (1.17 | ) | – | 19.70 | 0.08 | 1,677,393 | 1.15 | 1.15 | 1.15 | 0.23 | 23 | |||||||||||||||
| 2010 | 17.50 | 0.14 | 3.29 | 3.43 | (0.06 | ) | – | (0.06 | ) | – | 20.87 | 19.61 | 1,487,632 | 1.17 | 1.16 | 1.16 | 0.78 | 21 | |||||||||||||||||
| THE ACCOMPANYING NOTES ARE AN INTEGRAL PART OF THESE FINANCIAL STATEMENTS | The Royce Funds 2015 Semiannual Report to Shareholders | 99 |
Financial Highlights
This table is presented to show selected data for a share outstanding throughout each period and to assist shareholders in evaluating a Fund’s performance for the periods presented. Per share amounts have been determined on the basis of the weighted average number of shares outstanding during the period.
| Ratio of Expenses to Average Net Assets | |||||||||||||||||||||||||||||||||||
| Net Asset Value, Beginning of Period | Net Investment Income (Loss) | Net Realized and Unrealized Gain (Loss) on Investments and Foreign Currency | Total from Investment Operations | Distributions from Net Investment Income | Distributions from Net Realized Gain on Investments and Foreign Currency | Total Distributions | Shareholder Redemption Fees | Net Asset Value, End of Period | Total Return | Net Assets, End of Period (in thousands) | Prior to Fee Waivers and Balance Credits | Prior to Fee Waivers | Net of Fee Waivers | Ratio of Net Investment Income (Loss) to Average Net Assets | Portfolio Turnover Rate | ||||||||||||||||||||
| Royce Special Equity Fund–Service Class | |||||||||||||||||||||||||||||||||||
| 2015 | † | $ | 22.81 | $ | 0.09 | $ | (0.23 | ) | $ | (0.14 | ) | $ – | $ – | $ – | $ – | $ | 22.67 | (0.61 | )% 1 | $ | 179,409 | 1.50 | % 2 | 1.50 | % 2 | 1.39 | % 2 | 0.78 | % 2 | 8 | % | ||||
| 2014 | 24.97 | 0.06 | 0.09 | 0.15 | (0.05 | ) | (2.26 | ) | (2.31 | ) | – | 22.81 | 0.80 | 233,791 | 1.44 | 1.44 | 1.39 | 0.20 | 21 | ||||||||||||||||
| 2013 | 21.12 | (0.03 | ) | 6.08 | 6.05 | – | (2.20 | ) | (2.20 | ) | – | 24.97 | 29.04 | 335,952 | 1.45 | 1.45 | 1.39 | (0.13 | ) | 28 | |||||||||||||||
| 2012 | 19.66 | 0.42 | 2.52 | 2.94 | (0.38 | ) | (1.10 | ) | (1.48 | ) | – | 21.12 | 15.10 | 250,915 | 1.43 | 1.43 | 1.39 | 1.90 | 31 | ||||||||||||||||
| 2011 | 20.83 | 0.00 | (0.05 | ) | (0.05 | ) | (0.05 | ) | (1.08 | ) | (1.13 | ) | 0.01 | 19.66 | (0.12 | ) | 216,143 | 1.45 | 1.45 | 1.39 | 0.00 | 23 | |||||||||||||
| 2010 | 17.48 | 0.10 | 3.27 | 3.37 | (0.03 | ) | – | (0.03 | ) | 0.01 | 20.83 | 19.33 | 160,870 | 1.48 | 1.48 | 1.39 | 0.56 | 21 | |||||||||||||||||
| Royce Special Equity Fund–Consultant Class | |||||||||||||||||||||||||||||||||||
| 2015 | † | $ | 21.27 | $ | (0.00 | ) | $ | (0.21 | ) | $ | (0.21 | ) | $ – | $ – | $ – | $ – | $ | 21.06 | (0.99 | )% 1 | $ | 55,950 | 2.16 | % 2 | 2.16 | % 2 | 2.16 | % 2 | (0.01 | )% 2 | 8 | % | |||
| 2014 | 23.57 | (0.13 | ) | 0.09 | (0.04 | ) | – | (2.26 | ) | (2.26 | ) | – | 21.27 | 0.04 | 63,981 | 2.14 | 2.14 | 2.14 | (0.56 | ) | 21 | ||||||||||||||
| 2013 | 20.20 | (0.21 | ) | 5.78 | 5.57 | – | (2.20 | ) | (2.20 | ) | – | 23.57 | 27.97 | 71,333 | 2.17 | 2.17 | 2.17 | (0.90 | ) | 28 | |||||||||||||||
| 2012 | 18.88 | 0.23 | 2.42 | 2.65 | (0.23 | ) | (1.10 | ) | (1.33 | ) | – | 20.20 | 14.20 | 57,755 | 2.18 | 2.18 | 2.18 | 1.13 | 31 | ||||||||||||||||
| 2011 | 20.16 | (0.15 | ) | (0.05 | ) | (0.20 | ) | – | (1.08 | ) | (1.08 | ) | – | 18.88 | (0.93 | ) | 50,253 | 2.16 | 2.16 | 2.16 | (0.77 | ) | 23 | ||||||||||||
| 2010 | 17.03 | (0.04 | ) | 3.17 | 3.13 | – | – | – | – | 20.16 | 18.38 | 38,497 | 2.17 | 2.17 | 2.17 | (0.22 | ) | 21 | |||||||||||||||||
| Royce Special Equity Fund–Institutional Class | |||||||||||||||||||||||||||||||||||
| 2015 | † | $ | 22.71 | $ | 0.13 | $ | (0.23 | ) | $ | (0.10 | ) | $ – | $ – | $ – | $ – | $ | 22.61 | (0.44 | )% 1 | $ | 296,079 | 1.03 | % 2 | 1.03 | % 2 | 1.03 | % 2 | 1.18 | % 2 | 8 | % | ||||
| 2014 | 24.88 | 0.14 | 0.10 | 0.24 | (0.15 | ) | (2.26 | ) | (2.41 | ) | – | 22.71 | 1.17 | 639,723 | 1.02 | 1.02 | 1.02 | 0.56 | 21 | ||||||||||||||||
| 2013 | 21.02 | 0.06 | 6.06 | 6.12 | (0.06 | ) | (2.20 | ) | (2.26 | ) | – | 24.88 | 29.51 | 700,200 | 1.01 | 1.01 | 1.01 | 0.26 | 28 | ||||||||||||||||
| 2012 | 19.63 | 0.49 | 2.51 | 3.00 | (0.51 | ) | (1.10 | ) | (1.61 | ) | – | 21.02 | 15.46 | 571,388 | 1.02 | 1.02 | 1.02 | 2.28 | 31 | ||||||||||||||||
| 2011 | 20.79 | 0.07 | (0.03 | ) | 0.04 | (0.12 | ) | (1.08 | ) | (1.20 | ) | – | 19.63 | 0.25 | 481,855 | 1.03 | 1.03 | 1.03 | 0.36 | 23 | |||||||||||||||
| 2010 | 17.44 | 0.16 | 3.27 | 3.43 | (0.08 | ) | – | (0.08 | ) | – | 20.79 | 19.69 | 445,168 | 1.04 | 1.04 | 1.04 | 0.91 | 21 | |||||||||||||||||
| Royce Select Fund I–Investment Class | |||||||||||||||||||||||||||||||||||
| 2015 | † | $ | 17.27 | $ | 0.05 | $ | (0.01 | ) | $ | 0.04 | $ – | $ – | $ – | $ – | $ | 17.31 | 0.23 | % 2 | $ | 22,987 | 1.37 | % 2 | 1.37 | % 2 | 1.24 | % 2 | 0.62 | % 2 | 21 | % | |||||
| 2014 | 19.66 | (0.03 | ) | 0.02 | (0.01 | ) | – | (2.38 | ) | (2.38 | ) | – | 17.27 | 0.23 | 39,220 | 1.23 | 1.23 | 1.23 | (0.15 | ) | 40 | ||||||||||||||
| 2013 | 17.40 | (0.07 | ) | 4.48 | 4.41 | (0.00 | ) | (2.15 | ) | (2.15 | ) | – | 19.66 | 25.99 | 47,238 | 1.20 | 1.20 | 1.20 | (0.36 | ) | 56 | ||||||||||||||
| 2012 | 16.93 | 0.31 | 1.95 | 2.26 | (0.30 | ) | (1.49 | ) | (1.79 | ) | – | 17.40 | 13.68 | 49,856 | 0.00 | 0.00 | 0.00 | 1.68 | 54 | ||||||||||||||||
| 2011 | 20.32 | (0.16 | ) | (0.67 | ) | (0.83 | ) | – | (2.56 | ) | (2.56 | ) | – | 16.93 | (3.61 | ) | 47,345 | 1.45 | 1.45 | 1.45 | (0.78 | ) | 63 | ||||||||||||
| 2010 | 17.42 | (0.23 | ) | 3.39 | 3.16 | – | (0.26 | ) | (0.26 | ) | – | 20.32 | 18.15 | 58,788 | 2.37 | 2.37 | 2.37 | (1.26 | ) | 49 | |||||||||||||||
| Royce Small-Cap Value Fund–Investment Class | |||||||||||||||||||||||||||||||||||
| 2015 | † | $ | 11.81 | $ | 0.06 | $ | 0.08 | $ | 0.14 | $ – | $ – | $ – | $ – | $ | 11.95 | 1.19 | % 1 | $ | 118,069 | 1.21 | % 2 | 1.21 | % 2 | 1.21 | % 2 | 0.95 | % 2 | 30 | % | ||||||
| 2014 | 13.52 | 0.04 | (0.05 | ) | (0.01 | ) | (0.03 | ) | (1.67 | ) | (1.70 | ) | – | 11.81 | 0.27 | 140,163 | 1.18 | 1.18 | 1.18 | 0.32 | 38 | ||||||||||||||
| 2013 | 11.37 | 0.02 | 3.13 | 3.15 | (0.03 | ) | (0.97 | ) | (1.00 | ) | – | 13.52 | 28.06 | 196,854 | 1.21 | 1.21 | 1.21 | 0.11 | 51 | ||||||||||||||||
| 2012 | 10.97 | 0.15 | 0.92 | 1.07 | (0.14 | ) | (0.53 | ) | (0.67 | ) | – | 11.37 | 9.88 | 206,316 | 1.19 | 1.19 | 1.19 | 1.22 | 25 | ||||||||||||||||
| 2011 | 12.70 | 0.00 | (0.92 | ) | (0.92 | ) | (0.07 | ) | (0.75 | ) | (0.82 | ) | 0.01 | 10.97 | (7.17 | ) | 218,126 | 1.17 | 1.17 | 1.17 | 0.09 | 35 | |||||||||||||
| 2010 | 10.16 | 0.03 | 2.55 | 2.58 | (0.04 | ) | – | (0.04 | ) | – | 12.70 | 25.42 | 115,007 | 1.16 | 1.16 | 1.16 | 0.32 | 35 | |||||||||||||||||
| 100 | The Royce Funds 2015 Semiannual Report to Shareholders | THE ACCOMPANYING NOTES ARE AN INTEGRAL PART OF THESE FINANCIAL STATEMENTS |
Financial Highlights
This table is presented to show selected data for a share outstanding throughout each period and to assist shareholders in evaluating a Fund’s performance for the periods presented. Per share amounts have been determined on the basis of the weighted average number of shares outstanding during the period.
| Ratio of Expenses to Average Net Assets | |||||||||||||||||||||||||||||||||||
| Net Asset Value, Beginning of Period | Net Investment Income (Loss) | Net Realized and Unrealized Gain (Loss) on Investments and Foreign Currency | Total from Investment Operations | Distributions from Net Investment Income | Distributions from Net Realized Gain on Investments and Foreign Currency | Total Distributions | Shareholder Redemption Fees | Net Asset Value, End of Period | Total Return | Net Assets, End of Period (in thousands) | Prior to Fee Waivers and Balance Credits | Prior to Fee Waivers | Net of Fee Waivers | Ratio of Net Investment Income (Loss) to Average Net Assets | Portfolio Turnover Rate | ||||||||||||||||||||
| Royce Small-Cap Value Fund–Service Class | |||||||||||||||||||||||||||||||||||
| 2015 | † | $ | 11.76 | $ | 0.04 | $ | 0.08 | $ | 0.12 | $ – | $ – | $ – | $ – | $ | 11.88 | 1.02 | % 1 | $ | 373,436 | 1.51 | % 2 | 1.51 | % 2 | 1.49 | % 2 | 0.68 | % 2 | 30 | % | ||||||
| 2014 | 13.48 | 0.01 | (0.06 | ) | (0.05 | ) | – | (1.67 | ) | (1.67 | ) | – | 11.76 | (0.02 | ) | 477,999 | 1.45 | 1.45 | 1.45 | 0.04 | 38 | ||||||||||||||
| 2013 | 11.34 | (0.02 | ) | 3.13 | 3.11 | – | (0.97 | ) | (0.97 | ) | – | 13.48 | 27.76 | 680,674 | 1.48 | 1.48 | 1.48 | (0.17 | ) | 51 | |||||||||||||||
| 2012 | 10.94 | 0.12 | 0.91 | 1.03 | (0.10 | ) | (0.53 | ) | (0.63 | ) | – | 11.34 | 9.56 | 831,673 | 1.45 | 1.45 | 1.45 | 0.90 | 25 | ||||||||||||||||
| 2011 | 12.65 | (0.03 | ) | (0.92 | ) | (0.95 | ) | (0.02 | ) | (0.75 | ) | (0.77 | ) | 0.01 | 10.94 | (7.41 | ) | 1,083,903 | 1.45 | 1.45 | 1.44 | (0.23 | ) | 35 | |||||||||||
| 2010 | 10.13 | 0.00 | 2.53 | 2.53 | (0.01 | ) | – | (0.01 | ) | – | 12.65 | 24.97 | 1,415,766 | 1.46 | 1.46 | 1.44 | 0.04 | 35 | |||||||||||||||||
| Royce Small-Cap Value Fund–Consultant Class | |||||||||||||||||||||||||||||||||||
| 2015 | † | $ | 10.87 | $ | (0.01 | ) | $ | 0.08 | $ | 0.07 | $ – | $ – | $ – | $ – | $ | 10.94 | 0.64 | % 1 | $ | 24,282 | 2.25 | % 2 | 2.25 | % 2 | 2.25 | % 2 | (0.09 | )% 2 | 30 | % | |||||
| 2014 | 12.68 | (0.09 | ) | (0.05 | ) | (0.14 | ) | – | (1.67 | ) | (1.67 | ) | – | 10.87 | (0.74 | ) | 26,716 | 2.21 | 2.21 | 2.21 | (0.71 | ) | 38 | ||||||||||||
| 2013 | 10.81 | (0.12 | ) | 2.96 | 2.84 | – | (0.97 | ) | (0.97 | ) | – | 12.68 | 26.61 | 31,604 | 2.29 | 2.29 | 2.29 | (0.97 | ) | 51 | |||||||||||||||
| 2012 | 10.46 | 0.02 | 0.89 | 0.91 | (0.03 | ) | (0.53 | ) | (0.56 | ) | – | 10.81 | 8.77 | 33,480 | 2.26 | 2.26 | 2.26 | 0.15 | 25 | ||||||||||||||||
| 2011 | 12.21 | (0.11 | ) | (0.89 | ) | (1.00 | ) | – | (0.75 | ) | (0.75 | ) | – | 10.46 | (8.20 | ) | 36,104 | 2.17 | 2.17 | 2.17 | (0.94 | ) | 35 | ||||||||||||
| 2010 | 9.84 | (0.07 | ) | 2.44 | 2.37 | – | – | – | – | 12.21 | 24.09 | 35,167 | 2.18 | 2.18 | 2.18 | (0.69 | ) | 35 | |||||||||||||||||
| Royce Small-Cap Value Fund–Institutional Class | |||||||||||||||||||||||||||||||||||
| 2015 | † | $ | 11.81 | $ | 0.06 | $ | 0.09 | $ | 0.15 | $ – | $ – | $ – | $ – | $ | 11.96 | 1.27 | % 1 | $ | 200,479 | 1.06 | % 2 | 1.06 | % 2 | 1.06 | % 2 | 1.08 | % 2 | 30 | % | ||||||
| 2014 | 13.53 | 0.06 | (0.06 | ) | 0.00 | (0.05 | ) | (1.67 | ) | (1.72 | ) | – | 11.81 | 0.35 | 196,543 | 1.05 | 1.05 | 1.05 | 0.46 | 38 | |||||||||||||||
| 2013 | 11.38 | 0.04 | 3.13 | 3.17 | (0.05 | ) | (0.97 | ) | (1.02 | ) | – | 13.53 | 28.22 | 219,667 | 1.05 | 1.05 | 1.05 | 0.27 | 51 | ||||||||||||||||
| 2012 | 10.98 | 0.17 | 0.92 | 1.09 | (0.16 | ) | (0.53 | ) | (0.69 | ) | – | 11.38 | 10.04 | 202,643 | 1.05 | 1.05 | 1.05 | 1.41 | 25 | ||||||||||||||||
| 2011 | 12.71 | 0.03 | (0.94 | ) | (0.91 | ) | (0.07 | ) | (0.75 | ) | (0.82 | ) | – | 10.98 | (7.12 | ) | 190,591 | 1.04 | 1.04 | 1.04 | 0.19 | 35 | |||||||||||||
| 2010 | 10.17 | 0.05 | 2.54 | 2.59 | (0.05 | ) | – | (0.05 | ) | – | 12.71 | 25.52 | 219,111 | 1.04 | 1.04 | 1.04 | 0.45 | 35 | |||||||||||||||||
| Royce Small-Cap Value Fund–R Class | |||||||||||||||||||||||||||||||||||
| 2015 | † | $ | 11.43 | $ | 0.02 | $ | 0.08 | $ | 0.10 | $ – | $ – | $ – | $ – | $ | 11.53 | 0.87 | % 1 | $ | 26,535 | 1.83 | % 2 | 1.83 | % 2 | 1.83 | % 2 | 0.33 | % 2 | 30 | % | ||||||
| 2014 | 13.19 | (0.03 | ) | (0.06 | ) | (0.09 | ) | – | (1.67 | ) | (1.67 | ) | – | 11.43 | (0.34 | ) | 31,043 | 1.77 | 1.77 | 1.77 | (0.26 | ) | 38 | ||||||||||||
| 2013 | 11.16 | (0.06 | ) | 3.06 | 3.00 | – | (0.97 | ) | (0.97 | ) | – | 13.19 | 27.21 | 37,409 | 1.83 | 1.83 | 1.83 | (0.52 | ) | 51 | |||||||||||||||
| 2012 | 10.78 | 0.07 | 0.91 | 0.98 | (0.07 | ) | (0.53 | ) | (0.60 | ) | – | 11.16 | 9.18 | 37,679 | 1.85 | 1.85 | 1.85 | 0.59 | 25 | ||||||||||||||||
| 2011 | 12.54 | (0.06 | ) | (0.91 | ) | (0.97 | ) | (0.04 | ) | (0.75 | ) | (0.79 | ) | – | 10.78 | (7.75 | ) | 34,151 | 1.68 | 1.68 | 1.68 | (0.44 | ) | 35 | |||||||||||
| 2010 | 10.05 | (0.02 | ) | 2.51 | 2.49 | (0.00 | ) | – | (0.00 | ) | – | 12.54 | 24.81 | 26,524 | 1.68 | 1.67 | 1.67 | (0.16 | ) | 35 | |||||||||||||||
| Royce Small-Cap Value Fund–K Class | |||||||||||||||||||||||||||||||||||
| 2015 | † | $ | 8.90 | $ | 0.02 | $ | 0.06 | $ | 0.08 | $ – | $ – | $ – | $ – | $ | 8.98 | 0.90 | % 1 | $ | 8,563 | 1.81 | % 2 | 1.81 | % 2 | 1.81 | % 2 | 0.34 | % 2 | 30 | % | ||||||
| 2014 | 10.65 | (0.02 | ) | (0.06 | ) | (0.08 | ) | – | (1.67 | ) | (1.67 | ) | – | 8.90 | (0.32 | ) | 9,363 | 1.67 | 1.67 | 1.67 | (0.18 | ) | 38 | ||||||||||||
| 2013 | 9.14 | (0.03 | ) | 2.51 | 2.48 | – | (0.97 | ) | (0.97 | ) | – | 10.65 | 27.55 | 16,285 | 1.62 | 1.62 | 1.62 | (0.30 | ) | 51 | |||||||||||||||
| 2012 | 8.95 | 0.09 | 0.75 | 0.84 | (0.12 | ) | (0.53 | ) | (0.65 | ) | – | 9.14 | 9.49 | 18,209 | 1.53 | 1.53 | 1.53 | 0.98 | 25 | ||||||||||||||||
| 2011 | 10.54 | (0.03 | ) | (0.77 | ) | (0.80 | ) | (0.04 | ) | (0.75 | ) | (0.79 | ) | – | 8.95 | (7.54 | ) | 14,079 | 1.54 | 1.54 | 1.54 | (0.33 | ) | 35 | |||||||||||
| 2010 | 8.46 | (0.00 | ) | 2.10 | 2.10 | (0.02 | ) | – | (0.02 | ) | – | 10.54 | 24.82 | 13,195 | 1.50 | 1.50 | 1.50 | 0.01 | 35 | ||||||||||||||||
| THE ACCOMPANYING NOTES ARE AN INTEGRAL PART OF THESE FINANCIAL STATEMENTS | The Royce Funds 2015 Semiannual Report to Shareholders | 101 |
Financial Highlights
This table is presented to show selected data for a share outstanding throughout each period and to assist shareholders in evaluating a Fund’s performance for the periods presented. Per share amounts have been determined on the basis of the weighted average number of shares outstanding during the period.
| Net Asset Value, Beginning of Period | Net Investment Income (Loss) | Net Realized and Unrealized Gain (Loss) on Investments and Foreign Currency | Total from Investment Operations | Distributions from Net Investment Income | Distributions from Net Realized Gain on Investments and Foreign Currency | Total Distributions | Shareholder Redemption Fees | Net Asset Value, End of Period | Total Return | Net Assets, End of Period (in thousands) | Ratio of Expenses to Average Net Assets | Ratio of Net Investment Income (Loss) to Average Net Assets | Portfolio Turnover Rate | |||||||||||||||||||||||
Prior to Fee Waivers and Balance Credits | Prior to Fee Waivers | Net of Fee Waivers | ||||||||||||||||||||||||||||||||||
| Royce Smaller-Companies Growth Fund–Investment Class | ||||||||||||||||||||||||||||||||||||
| 2015 | † | $ | 14.36 | $ | (0.03 | ) | $ | 1.33 | $ | 1.30 | $ – | $ | – | $ – | $ – | $ | 15.66 | 9.05 | % 1 | $ | 289,769 | 1.32 | % 2 | 1.32 | % 2 | 1.24 | % 2 | (0.42 | )% 2 | 17 | % | |||||
| 2014 | 17.03 | (0.07 | ) | 0.68 | 0.61 | – | (3.28 | ) | (3.28 | ) | – | 14.36 | 4.04 | 295,412 | 1.33 | 1.33 | 1.33 | (0.40 | ) | 52 | ||||||||||||||||
| 2013 | 13.90 | (0.09 | ) | 4.57 | 4.48 | (0.00 | ) | (1.35 | ) | (1.35 | ) | – | 17.03 | 32.59 | 244,269 | 1.37 | 1.37 | 1.37 | (0.59 | ) | 45 | |||||||||||||||
| 2012 | 12.04 | (0.02 | ) | 1.88 | 1.86 | – | – | – | – | 13.90 | 15.45 | 228,016 | 1.27 | 1.27 | 1.27 | (0.14 | ) | 32 | ||||||||||||||||||
| 2011 | 13.52 | (0.06 | ) | (1.27 | ) | (1.33 | ) | (0.15 | ) | – | (0.15 | ) | – | 12.04 | (9.79 | ) | 298,073 | 1.13 | 1.13 | 1.13 | (0.42 | ) | 49 | |||||||||||||
| 2010 | 11.31 | (0.02 | ) | 2.31 | 2.29 | (0.08 | ) | – | (0.08 | ) | – | 13.52 | 20.25 | 305,161 | 1.08 | 1.08 | 1.08 | (0.14 | ) | 48 | ||||||||||||||||
| Royce Smaller-Companies Growth Fund–Service Class | ||||||||||||||||||||||||||||||||||||
| 2015 | † | $ | 14.23 | $ | (0.05 | ) | $ | 1.32 | $ | 1.27 | $ – | $ | – | $ – | $ – | $ | 15.50 | 8.92 | % 1 | $ | 543,708 | 1.49 | % 2 | 1.49 | % 2 | 1.47 | % 2 | (0.65 | )% 2 | 17 | % | |||||
| 2014 | 16.93 | (0.09 | ) | 0.67 | 0.58 | – | (3.28 | ) | (3.28 | ) | – | 14.23 | 3.89 | 572,899 | 1.44 | 1.44 | 1.42 | (0.51 | ) | 52 | ||||||||||||||||
| 2013 | 13.83 | (0.11 | ) | 4.56 | 4.45 | – | (1.35 | ) | (1.35 | ) | – | 16.93 | 32.52 | 835,379 | 1.48 | 1.48 | 1.46 | (0.69 | ) | 45 | ||||||||||||||||
| 2012 | 12.00 | (0.04 | ) | 1.87 | 1.83 | – | – | – | – | 13.83 | 15.25 | 966,735 | 1.45 | 1.45 | 1.44 | (0.33 | ) | 32 | ||||||||||||||||||
| 2011 | 13.42 | (0.08 | ) | (1.26 | ) | (1.34 | ) | (0.08 | ) | – | (0.08 | ) | – | 12.00 | (9.98 | ) | 1,417,973 | 1.44 | 1.44 | 1.42 | (0.74 | ) | 49 | |||||||||||||
| 2010 | 11.24 | (0.06 | ) | 2.27 | 2.21 | (0.03 | ) | – | (0.03 | ) | – | 13.42 | 19.70 | 2,454,325 | 1.44 | 1.44 | 1.42 | (0.53 | ) | 48 | ||||||||||||||||
| Royce Smaller-Companies Growth Fund–Consultant Class | ||||||||||||||||||||||||||||||||||||
| 2015 | † | $ | 13.12 | $ | (0.10 | ) | $ | 1.22 | $ | 1.12 | $ – | $ | – | $ – | $ – | $ | 14.24 | 8.54 | % 1 | $ | 16,699 | 2.32 | % 2 | 2.32 | % 2 | 2.24 | % 2 | (1.42 | )% 2 | 17 | % | |||||
| 2014 | 15.99 | (0.22 | ) | 0.63 | 0.41 | – | (3.28 | ) | (3.28 | ) | – | 13.12 | 3.05 | 17,158 | 2.29 | 2.29 | 2.29 | (1.37 | ) | 52 | ||||||||||||||||
| 2013 | 13.24 | (0.24 | ) | 4.34 | 4.10 | – | (1.35 | ) | (1.35 | ) | – | 15.99 | 31.31 | 22,614 | 2.36 | 2.36 | 2.36 | (1.58 | ) | 45 | ||||||||||||||||
| 2012 | 11.60 | (0.15 | ) | 1.79 | 1.64 | – | – | – | – | 13.24 | 14.14 | 19,618 | 2.37 | 2.37 | 2.37 | (1.21 | ) | 32 | ||||||||||||||||||
| 2011 | 12.99 | (0.19 | ) | (1.20 | ) | (1.39 | ) | – | – | – | – | 11.60 | (10.70 | ) | 20,245 | 2.19 | 2.19 | 2.19 | (1.50 | ) | 49 | |||||||||||||||
| 2010 | 10.93 | (0.14 | ) | 2.20 | 2.06 | – | – | – | – | 12.99 | 18.85 | 30,279 | 2.16 | 2.16 | 2.16 | (1.26 | ) | 48 | ||||||||||||||||||
| Royce Smaller-Companies Growth Fund–Institutional Class | ||||||||||||||||||||||||||||||||||||
| 2015 | † | $ | 14.46 | $ | (0.02 | ) | $ | 1.34 | $ | 1.32 | $ – | $ | – | $ – | $ – | $ | 15.78 | 9.13 | % 1 | $ | 35,692 | 1.11 | % 2 | 1.11 | % 2 | 1.11 | % 2 | (0.30 | )% 2 | 17 | % | |||||
| 2014 | 17.09 | (0.03 | ) | 0.68 | 0.65 | – | (3.28 | ) | (3.28 | ) | – | 14.46 | 4.26 | 38,718 | 1.06 | 1.06 | 1.06 | (0.16 | ) | 52 | ||||||||||||||||
| 2013 | 13.94 | (0.03 | ) | 4.57 | 4.54 | (0.04 | ) | (1.35 | ) | (1.39 | ) | – | 17.09 | 32.99 | 142,923 | 1.07 | 1.07 | 1.07 | (0.30 | ) | 45 | |||||||||||||||
| 2012 | 12.05 | 0.01 | 1.88 | 1.89 | – | – | – | – | 13.94 | 15.68 | 216,572 | 1.06 | 1.06 | 1.06 | 0.08 | 32 | ||||||||||||||||||||
| 2011 | 13.52 | (0.01 | ) | (1.30 | ) | (1.31 | ) | (0.16 | ) | – | (0.16 | ) | – | 12.05 | (9.70 | ) | 261,425 | 1.05 | 1.05 | 1.05 | (0.36 | ) | 49 | |||||||||||||
| 2010 | 11.31 | (0.01 | ) | 2.30 | 2.29 | (0.08 | ) | – | (0.08 | ) | – | 13.52 | 20.25 | 425,911 | 1.04 | 1.04 | 1.04 | (0.12 | ) | 48 | ||||||||||||||||
| Royce Smaller-Companies Growth Fund–R Class | ||||||||||||||||||||||||||||||||||||
| 2015 | † | $ | 13.64 | $ | (0.07 | ) | $ | 1.26 | $ | 1.19 | $ – | $ | – | $ – | $ – | $ | 14.83 | 8.72 | % 1 | $ | 1,234 | 2.39 | % 2 | 2.39 | % 2 | 1.84 | % 2 | (1.03 | )% 2 | 17 | % | |||||
| 2014 | 16.43 | (0.15 | ) | 0.64 | 0.49 | – | (3.28 | ) | (3.28 | ) | – | 13.64 | 3.45 | 1,360 | 2.35 | 2.35 | 1.84 | (0.93 | ) | 52 | ||||||||||||||||
| 2013 | 13.51 | (0.16 | ) | 4.43 | 4.27 | – | (1.35 | ) | (1.35 | ) | – | 16.43 | 31.95 | 1,605 | 2.41 | 2.41 | 1.84 | (1.06 | ) | 45 | ||||||||||||||||
| 2012 | 11.77 | (0.09 | ) | 1.83 | 1.74 | – | – | – | – | 13.51 | 14.78 | 1,221 | 2.35 | 2.35 | 1.84 | (0.66 | ) | 32 | ||||||||||||||||||
| 2011 | 13.24 | (0.15 | ) | (1.23 | ) | (1.38 | ) | (0.09 | ) | – | (0.09 | ) | – | 11.77 | (10.40 | ) | 1,079 | 2.45 | 2.45 | 1.84 | (1.12 | ) | 49 | |||||||||||||
| 2010 | 11.13 | (0.11 | ) | 2.26 | 2.15 | (0.04 | ) | – | (0.04 | ) | – | 13.24 | 19.34 | 942 | 2.75 | 2.75 | 1.84 | (0.90 | ) | 48 | ||||||||||||||||
| 102 | The Royce Funds 2015 Semiannual Report to Shareholders | THE ACCOMPANYING NOTES ARE AN INTEGRAL PART OF THESE FINANCIAL STATEMENTS |
Financial Highlights
This table is presented to show selected data for a share outstanding throughout each period and to assist shareholders in evaluating a Fund’s performance for the periods presented. Per share amounts have been determined on the basis of the weighted average number of shares outstanding during the period.
| Net Asset Value, Beginning of Period | Net Investment Income (Loss) | Net Realized and Unrealized Gain (Loss) on Investments and Foreign Currency | Total from Investment Operations | Distributions from Net Investment Income | Distributions from Net Realized Gain on Investments and Foreign Currency | Total Distributions | Shareholder Redemption Fees | Net Asset Value, End of Period | Total Return | Net Assets, End of Period (in thousands) | Ratio of Expenses to Average Net Assets | Ratio of Net Investment Income (Loss) to Average Net Assets | Portfolio Turnover Rate | ||||||||||||||||||||||||||||||
Prior to Fee Waivers and Balance Credits | Prior to Fee Waivers | Net of Fee Waivers | |||||||||||||||||||||||||||||||||||||||||
| Royce Smaller-Companies Growth Fund–K Class | |||||||||||||||||||||||||||||||||||||||||||
| 2015 | † | $ | 9.05 | $ | (0.04 | ) | $ | 0.84 | $ | 0.80 | $ – | $ | – | $ – | $ – | $ | 9.85 | 8.84 | % 1 | $ | 455 | 5.76 | % 2 | 5.76 | % 2 | 1.59 | % 2 | (0.78 | )% 2 | 17 | % | ||||||||||||
| 2014 | 11.96 | (0.08 | ) | 0.45 | 0.37 | – | (3.28 | ) | (3.28 | ) | – | 9.05 | 3.75 | 497 | 3.63 | 3.63 | 1.59 | (0.67 | ) | 52 | |||||||||||||||||||||||
| 2013 | 10.10 | (0.10 | ) | 3.31 | 3.21 | (0.00 | ) | (1.35 | ) | (1.35 | ) | – | 11.96 | 32.31 | 968 | 2.62 | 2.62 | 1.59 | (0.82 | ) | 45 | ||||||||||||||||||||||
| 2012 | 8.78 | (0.04 | ) | 1.36 | 1.32 | – | – | – | – | 10.10 | 15.03 | 486 | 2.96 | 2.96 | 1.59 | (0.45 | ) | 32 | |||||||||||||||||||||||||
| 2011 | 9.77 | (0.08 | ) | (0.91 | ) | (0.99 | ) | – | – | – | – | 8.78 | (10.13 | ) | 501 | 1.86 | 1.86 | 1.59 | (0.86 | ) | 49 | ||||||||||||||||||||||
| 2010 | 8.22 | (0.06 | ) | 1.67 | 1.61 | (0.06 | ) | – | (0.06 | ) | – | 9.77 | 19.55 | 1,851 | 1.88 | 1.88 | 1.59 | (0.67 | ) | 48 | |||||||||||||||||||||||
| Royce 100 Fund–Investment Class | |||||||||||||||||||||||||||||||||||||||||||
| 2015 | † | $ | 8.74 | $ | 0.02 | $ | (0.02 | ) | $ | 0.00 | $ – | $ | – | $ – | $ – | $ | 8.74 | 0.00 | % 1 | $ | 53,856 | 1.28 | % 2 | 1.28 | % 2 | 1.24 | % 2 | 0.55 | % 2 | 32 | % | ||||||||||||
| 2014 | 10.11 | (0.00 | ) | (0.32 | ) | (0.32 | ) | – | (1.05 | ) | (1.05 | ) | – | 8.74 | (2.95 | ) | 68,898 | 1.22 | 1.22 | 1.22 | (0.03 | ) | 39 | ||||||||||||||||||||
| 2013 | 8.85 | (0.00 | ) | 2.71 | 2.71 | (0.03 | ) | (1.42 | ) | (1.45 | ) | – | 10.11 | 31.24 | 60,156 | 1.20 | 1.20 | 1.20 | (0.07 | ) | 31 | ||||||||||||||||||||||
| 2012 | 8.74 | 0.12 | 0.88 | 1.00 | (0.15 | ) | (0.74 | ) | (0.89 | ) | – | 8.85 | 11.78 | 68,395 | 1.19 | 1.19 | 1.19 | 1.31 | 13 | ||||||||||||||||||||||||
| 2011 | 9.82 | (0.03 | ) | (0.60 | ) | (0.63 | ) | (0.00 | ) | (0.45 | ) | (0.45 | ) | – | 8.74 | (6.31 | ) | 63,012 | 1.17 | 1.17 | 1.17 | (0.27 | ) | 27 | |||||||||||||||||||
| 2010 | 7.94 | 0.03 | 1.96 | 1.99 | – | (0.11 | ) | (0.11 | ) | – | 9.82 | 25.06 | 66,011 | 1.17 | 1.17 | 1.17 | 0.33 | 27 | |||||||||||||||||||||||||
| Royce 100 Fund–Service Class | |||||||||||||||||||||||||||||||||||||||||||
| 2015 | † | $ | 8.65 | $ | 0.01 | $ | (0.02 | ) | $ | (0.01 | ) | $ – | $ | – | $ – | $ – | $ | 8.64 | (0.12 | )% 1 | $ | 91,720 | 1.62 | % 2 | 1.62 | % 2 | 1.49 | % 2 | 0.31 | % 2 | 32 | % | |||||||||||
| 2014 | 10.05 | (0.04 | ) | (0.31 | ) | (0.35 | ) | – | (1.05 | ) | (1.05 | ) | – | 8.65 | (3.26 | ) | 149,736 | 1.52 | 1.52 | 1.50 | (0.39 | ) | 39 | ||||||||||||||||||||
| 2013 | 8.81 | (0.04 | ) | 2.70 | 2.66 | (0.00 | ) | (1.42 | ) | (1.42 | ) | – | 10.05 | 30.85 | 231,879 | 1.50 | 1.50 | 1.48 | (0.36 | ) | 31 | ||||||||||||||||||||||
| 2012 | 8.67 | 0.11 | 0.86 | 0.97 | (0.09 | ) | (0.74 | ) | (0.83 | ) | – | 8.81 | 11.52 | 220,674 | 1.46 | 1.46 | 1.42 | 1.03 | 13 | ||||||||||||||||||||||||
| 2011 | 9.76 | (0.05 | ) | (0.59 | ) | (0.64 | ) | – | (0.45 | ) | (0.45 | ) | – | 8.67 | (6.52 | ) | 310,825 | 1.47 | 1.47 | 1.42 | (0.53 | ) | 27 | ||||||||||||||||||||
| 2010 | 7.91 | 0.00 | 1.96 | 1.96 | – | (0.11 | ) | (0.11 | ) | – | 9.76 | 24.77 | 366,184 | 1.50 | 1.50 | 1.46 | 0.03 | 27 | |||||||||||||||||||||||||
| Royce 100 Fund–R Class | |||||||||||||||||||||||||||||||||||||||||||
| 2015 | † | $ | 11.14 | $ | (0.00 | ) | $ | (0.03 | ) | $ | (0.03 | ) | $ – | $ | – | $ – | $ – | $ | 11.11 | (0.27 | )% 1 | $ | 1,994 | 2.35 | % 2 | 2.35 | % 2 | 1.84 | % 2 | (0.07 | )% 2 | 32 | % | ||||||||||
| 2014 | 12.67 | (0.09 | ) | (0.39 | ) | (0.48 | ) | – | (1.05 | ) | (1.05 | ) | – | 11.14 | (3.61 | ) | 1,983 | 2.23 | 2.23 | 1.84 | (0.73 | ) | 39 | ||||||||||||||||||||
| 2013 | 10.84 | (0.09 | ) | 3.34 | 3.25 | – | (1.42 | ) | (1.42 | ) | – | 12.67 | 30.45 | 2,807 | 2.28 | 2.28 | 1.84 | (0.72 | ) | 31 | |||||||||||||||||||||||
| 2012 | 10.46 | 0.05 | 1.07 | 1.12 | – | (0.74 | ) | (0.74 | ) | – | 10.84 | 10.95 | 2,554 | 2.57 | 2.57 | 1.84 | 0.46 | 13 | |||||||||||||||||||||||||
| 2011 | 11.72 | (0.10 | ) | (0.71 | ) | (0.81 | ) | – | (0.45 | ) | (0.45 | ) | – | 10.46 | (6.88 | ) | 3,469 | 2.70 | 2.69 | 1.84 | (0.88 | ) | 27 | ||||||||||||||||||||
| 2010 | 9.52 | (0.03 | ) | 2.34 | 2.31 | – | (0.11 | ) | (0.11 | ) | – | 11.72 | 24.26 | 1,358 | 2.22 | 2.21 | 1.84 | (0.29 | ) | 27 | |||||||||||||||||||||||
| Royce 100 Fund–K Class | |||||||||||||||||||||||||||||||||||||||||||
| 2015 | † | $ | 11.34 | $ | 0.01 | $ | (0.03 | ) | $ | (0.02 | ) | $ – | $ | – | $ – | $ – | $ | 11.32 | (0.18 | )% 1 | $ | 475 | 4.94 | % 2 | 4.94 | % 2 | 1.59 | % 2 | 0.19 | % 2 | 32 | % | |||||||||||
| 2014 | 12.84 | (0.07 | ) | (0.38 | ) | (0.45 | ) | – | (1.05 | ) | (1.05 | ) | – | 11.34 | (3.33 | ) | 672 | 2.98 | 2.98 | 1.59 | (0.53 | ) | 39 | ||||||||||||||||||||
| 2013 | 10.95 | (0.06 | ) | 3.37 | 3.31 | – | (1.42 | ) | (1.42 | ) | – | 12.84 | 30.69 | 2,320 | 1.78 | 1.78 | 1.59 | (0.50 | ) | 31 | |||||||||||||||||||||||
| 2012 | 10.56 | 0.11 | 1.06 | 1.17 | (0.04 | ) | (0.74 | ) | (0.78 | ) | – | 10.95 | 11.37 | 3,554 | 1.68 | 1.68 | 1.59 | 0.88 | 13 | ||||||||||||||||||||||||
| 2011 | 11.81 | (0.08 | ) | (0.72 | ) | (0.80 | ) | – | (0.45 | ) | (0.45 | ) | – | 10.56 | (6.75 | ) | 4,447 | 1.66 | 1.66 | 1.59 | (0.68 | ) | 27 | ||||||||||||||||||||
| 2010 | 9.57 | 0.02 | 2.33 | 2.35 | – | (0.11 | ) | (0.11 | ) | – | 11.81 | 24.55 | 2,915 | 1.89 | 1.89 | 1.59 | 0.20 | 27 | |||||||||||||||||||||||||
| THE ACCOMPANYING NOTES ARE AN INTEGRAL PART OF THESE FINANCIAL STATEMENTS | The Royce Funds 2015 Semiannual Report to Shareholders | 103 | ||
Financial Highlights
This table is presented to show selected data for a share outstanding throughout each period and to assist shareholders in evaluating a Fund’s performance for the periods presented. Per share amounts have been determined on the basis of the weighted average number of shares outstanding during the period.
| Net Asset Value, Beginning of Period | Net Investment Income (Loss) | Net Realized and Unrealized Gain (Loss) on Investments and Foreign Currency | Total from Investment Operations | Distributions from Net Investment Income | Distributions from Net Realized Gain on Investments and Foreign Currency | Total Distributions | Shareholder Redemption Fees | Net Asset Value, End of Period | Total Return | Net Assets, End of Period (in thousands) | Ratio of Expenses to Average Net Assets | Ratio of Net Investment Income (Loss) to Average Net Assets | Portfolio Turnover Rate | |||||||||||||||||||||||||||
Prior to Fee Waivers and Balance Credits | Prior to Fee Waivers | Net of Fee Waivers | ||||||||||||||||||||||||||||||||||||||
| Royce Micro-Cap Discovery Fund–Service Class | ||||||||||||||||||||||||||||||||||||||||
| 2015 | † | $ | 6.01 | $ | (0.01 | ) | $ | 0.05 | $ | 0.04 | $ | – | $ | – | $ | – | $ – | $ | 6.05 | 0.67 | % 1 | $ | 5,564 | 2.30 | % 2 | 2.30 | % 2 | 1.49 | % 2 | (0.22 | )% 2 | 41 | % | |||||||
| 2014 | 6.87 | (0.00 | ) | 0.04 | 0.04 | – | (0.90 | ) | (0.90 | ) | – | 6.01 | 0.97 | 5,575 | 2.27 | 2.27 | 1.49 | (0.05 | ) | 85 | ||||||||||||||||||||
| 2013 | 5.23 | (0.02 | ) | 1.86 | 1.84 | – | (0.20 | ) | (0.20 | ) | – | 6.87 | 35.29 | 5,816 | 2.50 | 2.50 | 1.49 | (0.33 | ) | 81 | ||||||||||||||||||||
| 2012 | 5.12 | 0.04 | 0.12 | 0.16 | (0.05 | ) | – | (0.05 | ) | – | 5.23 | 3.10 | 4,468 | 2.94 | 2.94 | 1.49 | 0.85 | 87 | ||||||||||||||||||||||
| 2011 | 5.24 | (0.04 | ) | (0.09 | ) | (0.13 | ) | (0.00 | ) | – | (0.00 | ) | 0.01 | 5.12 | (2.24 | ) | 3,621 | 2.99 | 2.99 | 1.49 | (0.71 | ) | 72 | |||||||||||||||||
| 2010 | 4.38 | (0.01 | ) | 0.87 | 0.86 | – | – | – | – | 5.24 | 19.63 | 3,637 | 3.04 | 3.04 | 1.49 | (0.19 | ) | 105 | ||||||||||||||||||||||
| Royce Dividend Value Fund–Investment Class | ||||||||||||||||||||||||||||||||||||||||
| 2015 | † | $ | 8.12 | $ | 0.07 | $ | 0.15 | $ | 0.22 | $ | (0.07 | ) | $ | – | $ | (0.07 | ) | $ – | $ | 8.27 | 2.71 | % 1 | $ | 149,310 | 1.24 | % 2 | 1.24 | % 2 | 1.22 | % 2 | 1.71 | % 2 | 7 | % | ||||||
| 2014 | 8.90 | 0.11 | (0.29 | ) | (0.18 | ) | (0.10 | ) | (0.50 | ) | (0.60 | ) | – | 8.12 | (1.90 | ) | 176,002 | 1.21 | 1.21 | 1.19 | 1.25 | 22 | ||||||||||||||||||
| 2013 | 7.29 | 0.09 | 2.15 | 2.24 | (0.10 | ) | (0.53 | ) | (0.63 | ) | – | 8.90 | 31.23 | 211,589 | 1.21 | 1.21 | 1.21 | 1.13 | 36 | |||||||||||||||||||||
| 2012 | 6.34 | 0.14 | 0.95 | 1.09 | (0.12 | ) | (0.02 | ) | (0.14 | ) | – | 7.29 | 17.26 | 118,820 | 1.19 | 1.19 | 1.19 | 1.99 | 28 | |||||||||||||||||||||
| 2011 | 6.80 | 0.07 | (0.37 | ) | (0.30 | ) | (0.07 | ) | (0.09 | ) | (0.16 | ) | – | 6.34 | (4.46 | ) | 85,188 | 1.20 | 1.20 | 1.20 | 1.14 | 14 | ||||||||||||||||||
| 2010 | 5.31 | 0.09 | 1.51 | 1.60 | (0.08 | ) | (0.03 | ) | (0.11 | ) | – | 6.80 | 30.46 | 35,626 | 1.38 | 1.38 | 1.24 | 1.56 | 21 | |||||||||||||||||||||
| Royce Dividend Value Fund–Service Class | ||||||||||||||||||||||||||||||||||||||||
| 2015 | † | $ | 8.22 | $ | 0.06 | $ | 0.16 | $ | 0.22 | $ | (0.06 | ) | $ | – | $ | (0.06 | ) | $ – | $ | 8.38 | 2.68 | % 1 | $ | 235,243 | 1.52 | % 2 | 1.52 | % 2 | 1.49 | % 2 | 1.44 | % 2 | 7 | % | ||||||
| 2014 | 8.98 | 0.09 | (0.29 | ) | (0.20 | ) | (0.06 | ) | (0.50 | ) | (0.56 | ) | – | 8.22 | (2.14 | ) | 295,560 | 1.47 | 1.47 | 1.44 | 0.98 | 22 | ||||||||||||||||||
| 2013 | 7.35 | 0.07 | 2.16 | 2.23 | (0.07 | ) | (0.53 | ) | (0.60 | ) | – | 8.98 | 30.74 | 407,599 | 1.48 | 1.48 | 1.46 | 0.87 | 36 | |||||||||||||||||||||
| 2012 | 6.38 | 0.12 | 0.95 | 1.07 | (0.08 | ) | (0.02 | ) | (0.10 | ) | – | 7.35 | 16.95 | 252,443 | 1.48 | 1.48 | 1.46 | 1.74 | 28 | |||||||||||||||||||||
| 2011 | 6.82 | 0.05 | (0.36 | ) | (0.31 | ) | (0.04 | ) | (0.09 | ) | (0.13 | ) | – | 6.38 | (4.55 | ) | 201,634 | 1.48 | 1.48 | 1.46 | 0.84 | 14 | ||||||||||||||||||
| 2010 | 5.33 | 0.08 | 1.51 | 1.59 | (0.07 | ) | (0.03 | ) | (0.10 | ) | – | 6.82 | 30.11 | 117,304 | 1.56 | 1.56 | 1.49 | 1.32 | 21 | |||||||||||||||||||||
| Royce Dividend Value Fund–Consultant Class b | ||||||||||||||||||||||||||||||||||||||||
| 2015 | † | $ | 9.22 | $ | 0.02 | $ | 0.19 | $ | 0.21 | $ | (0.04 | ) | $ | – | $ | (0.04 | ) | $ – | $ | 9.39 | 2.22 | % 1 | $ | 1,095 | 4.47 | % 2 | 4.47 | % 2 | 2.24 | % 2 | 0.69 | % 2 | 7 | % | ||||||
| 2014 | 10.00 | 0.01 | (0.27 | ) | (0.26 | ) | (0.02 | ) | (0.50 | ) | (0.52 | ) | – | 9.22 | (2.43 | ) 1 | 912 | 9.25 | 2 | 9.25 | 2 | 2.24 | 2 | 0.45 | 2 | 22 | ||||||||||||||
| Royce Dividend Value Fund–Institutional Class c | ||||||||||||||||||||||||||||||||||||||||
| 2015 | † | $ | 8.09 | $ | 0.08 | $ | 0.15 | $ | 0.23 | $ | (0.08 | ) | $ | – | $ | (0.08 | ) | $ – | $ | 8.24 | 2.78 | % 1 | $ | 41,588 | 1.11 | % 2 | 1.11 | % 2 | 1.04 | % 2 | 1.90 | % 2 | 7 | % | ||||||
| 2014 | 8.88 | 0.12 | (0.29 | ) | (0.17 | ) | (0.12 | ) | (0.50 | ) | (0.62 | ) | – | 8.09 | (1.76 | ) | 40,942 | 1.10 | 1.10 | 1.04 | 1.42 | 22 | ||||||||||||||||||
| 2013 | 7.28 | 0.11 | 2.14 | 2.25 | (0.12 | ) | (0.53 | ) | (0.65 | ) | – | 8.88 | 31.46 | 31,236 | 1.11 | 1.11 | 1.04 | 1.29 | 36 | |||||||||||||||||||||
| 2012 | 6.80 | 0.08 | 0.50 | 0.58 | (0.08 | ) | (0.02 | ) | (0.10 | ) | – | 7.28 | 8.51 1 | 23,460 | 1.33 | 2 | 1.33 | 2 | 1.04 | 2 | 3.48 | 2 | 28 | |||||||||||||||||
| Royce Micro-Cap Opportunity Fund–Investment Class d | ||||||||||||||||||||||||||||||||||||||||
| 2015 | † | $ | 16.52 | $ | (0.05 | ) | $ | 0.76 | $ | 0.71 | $ | – | $ | – | $ | – | $ – | $ | 17.23 | 4.30 | % 1 | $ | 20,099 | 1.54 | % 2 | 1.54 | % 2 | 1.28 | % 2 | (0.62 | )% 2 | 69 | % | |||||||
| 2014 | 17.93 | (0.11 | ) | (0.81 | ) | (0.92 | ) | – | (0.51 | ) | (0.51 | ) | 0.02 | 16.52 | (4.97 | ) | 18,221 | 1.56 | 1.56 | 1.28 | (0.60 | ) | 131 | |||||||||||||||||
| 2013 | 12.81 | (0.13 | ) | 5.79 | 5.66 | – | (0.55 | ) | (0.55 | ) | 0.01 | 17.93 | 44.61 | 17,461 | 1.78 | 1.78 | 1.29 | (0.80 | ) | 129 | ||||||||||||||||||||
| 2012 | 10.33 | 0.07 | 3.50 | 3.57 | (0.13 | ) | (0.96 | ) | (1.09 | ) | – | 12.81 | 35.14 | 3,198 | 0.29 | 2 | 0.29 | 2 | 0.25 | 2 | 0.64 | 2 | 196 | |||||||||||||||||
| 2011 | 12.99 | 0.01 | (2.26 | ) | (2.25 | ) | (0.02 | ) | (0.39 | ) | (0.41 | ) | – | 10.33 | (17.14 | ) | 2,102 | 1.14 | 1.14 | 1.14 | 0.08 | 299 | ||||||||||||||||||
| 2010 | 10.00 | (0.43 | ) | 3.42 | 2.99 | – | – | – | – | 12.99 | 29.90 | 1 | 1,913 | 4.01 | 1 | 4.01 | 1 | 4.01 | 1 | (3.79 | ) 1 | 95 | ||||||||||||||||||
| 104 | The Royce Funds 2015 Semiannual Report to Shareholders | THE ACCOMPANYING NOTES ARE AN INTEGRAL PART OF THESE FINANCIAL STATEMENTS |
Financial Highlights
This table is presented to show selected data for a share outstanding throughout each period and to assist shareholders in evaluating a Fund’s performance for the periods presented. Per share amounts have been determined on the basis of the weighted average number of shares outstanding during the period.
| Net Asset Value, Beginning of Period | Net Investment Income (Loss) | Net Realized and Unrealized Gain (Loss) on Investments and Foreign Currency | Total from Investment Operations | Distributions from Net Investment Income | Distributions from Net Realized Gain on Investments and Foreign Currency | Total Distributions | Shareholder Redemption Fees | Net Asset Value, End of Period | Total Return | Net Assets, End of Period (in thousands) | Ratio of Expenses to Average Net Assets | Ratio of Net Investment Income (Loss) to Average Net Assets | Portfolio Turnover Rate | |||||||||||||||||||||||||||||
Prior to Fee Waivers and Balance Credits | Prior to Fee Waivers | Net of Fee Waivers | ||||||||||||||||||||||||||||||||||||||||
| Royce Micro-Cap Opportunity Fund–Service Class b | ||||||||||||||||||||||||||||||||||||||||||
| 2015 | † | $ | 8.37 | $ | (0.04 | ) | $ | 0.38 | $ | 0.34 | $ – | $ | – | $ – | $ – | $ | 8.71 | 4.06 | % 1 | $ | 1,389 | 4.25 | % 2 | 4.25 | % 2 | 1.53 | % 2 | (0.86 | )% 2 | 69 | % | |||||||||||
| 2014 | 10.00 | (0.04 | ) | (1.11 | ) | (1.15 | ) | – | (0.51 | ) | (0.51) | 0.03 | 8.37 | (11.11 | ) 1 | 939 | 10.50 | 2 | 10.50 | 2 | 1.53 | 2 | (0.65 | ) 2 | 131 | |||||||||||||||||
| Royce Special Equity Multi-Cap Fund–Investment Class e | ||||||||||||||||||||||||||||||||||||||||||
| 2015 | † | $ | 15.55 | $ | 0.10 | $ | (0.57 | ) | $ | (0.47 | ) | $ – | $ | – | $ – | $ – | $ | 15.08 | (3.02 | )% 1 | $ | 121,614 | 0.95 | % 2 | 0.95 | % 2 | 0.95 | % 2 | 1.30 | % 2 | 16 | % | ||||||||||
| 2014 | 14.92 | 0.10 | 1.30 | 1.40 | (0.11 | ) | (0.66 | ) | (0.77) | – | 15.55 | 9.53 | 123,545 | 0.97 | 0.97 | 0.96 | 0.95 | 39 | ||||||||||||||||||||||||
| 2013 | 11.64 | 0.12 | 4.11 | 4.23 | (0.12 | ) | (0.83 | ) | (0.95) | – | 14.92 | 36.62 | 62,387 | 1.16 | 1.16 | 1.15 | 0.93 | 44 | ||||||||||||||||||||||||
| 2012 | 11.54 | 0.12 | 0.22 | 0.34 | (0.14 | ) | (0.10 | ) | (0.24) | – | 11.64 | 3.00 | 1 | 34,375 | 1.19 | 2 | 1.19 | 2 | 1.16 | 2 | 1.55 | 2 | 14 | |||||||||||||||||||
| Royce Special Equity Multi-Cap Fund–Service Class f | ||||||||||||||||||||||||||||||||||||||||||
| 2015 | † | $ | 15.60 | $ | 0.08 | $ | (0.57 | ) | $ | (0.49 | ) | $ – | $ | – | $ – | $ – | $ | 15.11 | (3.14 | )% 1 | $ | 77,524 | 1.31 | % 2 | 1.31 | % 2 | 1.24 | % 2 | 1.01 | % 2 | 16 | % | ||||||||||
| 2014 | 14.96 | 0.10 | 1.27 | 1.37 | (0.07 | ) | (0.66 | ) | (0.73) | – | 15.60 | 9.28 | 94,878 | 1.34 | 1.34 | 1.24 | 0.66 | 39 | ||||||||||||||||||||||||
| 2013 | 11.68 | 0.09 | 4.12 | 4.21 | (0.10 | ) | (0.83 | ) | (0.93) | – | 14.96 | 36.26 | 78,233 | 1.61 | 1.61 | 1.38 | 0.69 | 44 | ||||||||||||||||||||||||
| 2012 | 10.64 | 0.13 | 1.10 | 1.23 | (0.09 | ) | (0.10 | ) | (0.19) | – | 11.68 | 11.62 | 43,690 | 1.51 | 1.51 | 1.36 | 1.15 | 14 | ||||||||||||||||||||||||
| 2011 | 10.00 | 0.06 | 0.65 | 0.71 | (0.06 | ) | (0.02 | ) | (0.08) | 0.01 | 10.64 | 7.20 | 1 | 36,811 | 1.97 | 2 | 1.97 | 2 | 1.39 | 2 | 1.45 | 2 | 5 | |||||||||||||||||||
| Royce Special Equity Multi-Cap Fund–Consultant Class g | ||||||||||||||||||||||||||||||||||||||||||
| 2015 | † | $ | 10.72 | $ | 0.01 | $ | (0.39 | ) | $ | (0.38 | ) | $ – | $ | – | $ – | $ – | $ | 10.34 | (3.54 | )% 1 | $ | 9,274 | 2.20 | % 2 | 2.20 | % 2 | 1.99 | % 2 | 0.26 | % 2 | 16 | % | ||||||||||
| 2014 | 10.00 | (0.04 | ) | 1.48 | 1.44 | (0.06 | ) | (0.66 | ) | (0.72) | – | 10.72 | 14.57 | 1 | 9,223 | 2.54 | 2 | 2.54 | 2 | 1.99 | 2 | (0.05 | ) 2 | 39 | ||||||||||||||||||
| Royce Special Equity Multi-Cap Fund–Institutional Class h | ||||||||||||||||||||||||||||||||||||||||||
| 2015 | † | $ | 15.56 | $ | 0.11 | $ | (0.57 | ) | $ | (0.46 | ) | $ – | $ | – | $ – | $ – | $ | 15.10 | (2.96 | )% 1 | $ | 49,938 | 0.92 | % 2 | 0.92 | % 2 | 0.89 | % 2 | 1.36 | % 2 | 16 | % | ||||||||||
| 2014 | 14.92 | 0.12 | 1.30 | 1.42 | (0.12 | ) | (0.66 | ) | (0.78) | – | 15.56 | 9.64 | 75,941 | 0.93 | 0.93 | 0.89 | 1.01 | 39 | ||||||||||||||||||||||||
| 2013 | 11.64 | 0.15 | 4.10 | 4.25 | (0.14 | ) | (0.83 | ) | (0.97) | – | 14.92 | 36.73 | 48,063 | 1.10 | 1.10 | 1.04 | 1.02 | 44 | ||||||||||||||||||||||||
| 2012 | 11.83 | 0.10 | (0.03 | ) | 0.07 | (0.16 | ) | (0.10 | ) | (0.26) | – | 11.64 | 0.61 | 1 | 30,905 | 1.21 | 2 | 1.21 | 2 | 1.04 | 2 | 1.76 | 2 | 14 | ||||||||||||||||||
| THE ACCOMPANYING NOTES ARE AN INTEGRAL PART OF THESE FINANCIAL STATEMENTS | The Royce Funds 2015 Semiannual Report to Shareholders | 105 |
| Notes to Financial Statements (unaudited) |
Summary of Significant Accounting Policies:
Royce Pennsylvania Mutual Fund, Royce Micro-Cap Fund, Royce Premier Fund, Royce Low-Priced Stock Fund, Royce Total Return Fund, Royce Heritage Fund, Royce Opportunity Fund, Royce Special Equity Fund, Royce Select Fund I, Royce Small-Cap Value Fund, Royce Smaller-Companies Growth Fund, Royce 100 Fund, Royce Micro-Cap Discovery Fund, Royce Dividend Value Fund, Royce Micro-Cap Opportunity Fund and Royce Special Equity Multi-Cap Fund (the “Fund” or “Funds”), are sixteen series of The Royce Fund (the “Trust”), a diversified open-end management investment company organized as a Delaware statutory trust. Effective May 1, 2015, Royce Value Fund became Royce Small-Cap Value Fund, Royce Value Plus Fund became Royce Smaller-Companies Growth Fund and Royce Opportunity Select Fund became Royce Micro-Cap Opportunity Fund.
Classes of shares have equal rights as to earnings and assets, except that each class may bear different fees and expenses for distribution, shareholder servicing, registration and shareholder reports, and receive different compensating balance credits and expense reimbursements. Investment income, realized and unrealized capital gains or losses on investments and foreign currency, and expenses other than those attributable to a specific class are allocated to each class of shares based on its relative net assets.
The preparation of financial statements in conformity with accounting principles generally accepted in the United States requires management to make estimates and assumptions that affect the reported amounts of assets and liabilities and the disclosure of contingent assets and liabilities at the date of the financial statements and the reported amounts of income and expenses during the reporting period. Actual results could differ from those estimates.
The Fund is an investment company and accordingly follows the investment company accounting and reporting guidance of the Financial Accounting Standards Board (FASB) Accounting Standard Codification Topic 946 “Financial Services-Investment Companies”.
At June 30, 2015, officers, employees of Royce & Associates, LLC (“Royce”), Fund trustees, the Royce retirement plans and other affiliates owned more than 10% of the following Funds:
| Royce Select Fund I | 21 | % | |
| Royce Micro-Cap Discovery Fund | 71 | % | |
| Royce Micro-Cap Opportunity Fund | 28 | % |
Securities are valued as of the close of trading on the New York Stock Exchange (NYSE) (generally 4:00 p.m. Eastern time) on the valuation date. Securities that trade on an exchange, and securities traded on Nasdaq’s Electronic Bulletin Board, are valued at their last reported sales price or Nasdaq official closing price taken from the primary market in which each security trades or, if no sale is reported for such day, at their highest bid price. Other over-the-counter securities for which market quotations are readily available are valued at their highest bid price, except in the case of some bonds and other fixed income securities which may be valued by reference to other securities with comparable ratings, interest rates and maturities, using established independent pricing services. The Funds value their non-U.S. dollar denominated securities in U.S. dollars daily at the prevailing foreign currency exchange rates as quoted by a major bank. Securities for which market quotations are not readily available are valued at their fair value in accordance with the provisions of the 1940 Act, under procedures approved by the Fund’s Board of Trustees, and are reported as Level 3 securities. As a general principle, the fair value of a security is the amount which the Fund might reasonably expect to receive for the security upon its current sale. However, in light of the judgment involved in fair valuations, there can be no assurance that a fair value assigned to a particular security will be the amount which the Fund might be able to receive upon its current sale. In addition, if, between the time trading ends on a particular security and the close of the customary trading session on the NYSE, events occur that are significant and may make the closing price unreliable, a Fund may fair value the security. The Funds use an independent pricing service to provide fair value estimates for relevant non-U.S. equity securities on days when the U.S. market volatility exceeds a certain threshold. This pricing service uses proprietary correlations it has developed between the movement of prices of non-U.S. equity securities and indices of U.S.-traded securities, futures contracts and other indications to estimate the fair value of relevant non-U.S. securities. When fair value pricing is employed, the prices of securities used by a Fund may differ from quoted or published prices for the same security. Investments in money market funds are valued at net asset value per share.
Various inputs are used in determining the value of each Fund’s investments, as noted above. These inputs are summarized in the three broad levels below:
Level 1 | – | quoted prices in active markets for identical securities. | ||
Level 2 | – | other significant observable inputs (including quoted prices for similar securities, foreign securities that may be fair valued and repurchase agreements). The table below includes all Level 2 securities. Level 2 securities with values based on quoted prices for similar securities are noted in the Schedules of Investments. | ||
Level 3 | – | significant unobservable inputs (including last trade price before trading was suspended, or at a discount thereto for lack of marketability or otherwise, market price information regarding other securities, information received from the company and/or published documents, including SEC filings and financial statements, or other publicly available information). |
106 | The Royce Funds 2015 Semiannual Report to Shareholders
VALUATION OF INVESTMENTS (continued):
The following is a summary of the inputs used to value each Fund’s investments as of June 30, 2015. For a detailed breakout of common stocks by sector classification, please refer to the Schedules of Investments.
| LEVEL 1 | LEVEL 2 | LEVEL 3 | TOTAL | |||||||
| Royce Pennsylvania Mutual Fund | ||||||||||
| Common Stocks | $4,426,758,335 | $ 8,465,718 | $ | 0 | $4,435,224,053 | |||||
| Cash Equivalents | 27,188,580 | 125,906,000 | - | 153,094,580 | ||||||
| Royce Micro-Cap Fund | ||||||||||
| Common Stocks | 381,165,436 | 978,851 | 1,049,127 | 383,193,414 | ||||||
| Cash Equivalents | 12,625,181 | 13,158,000 | - | 25,783,181 | ||||||
| Royce Premier Fund | ||||||||||
| Common Stocks | 4,023,977,590 | - | - | 4,023,977,590 | ||||||
| Cash Equivalents | 44,759,784 | 352,403,000 | - | 397,162,784 | ||||||
| Royce Low-Priced Stock Fund | ||||||||||
| Common Stocks | 494,737,606 | - | - | 494,737,606 | ||||||
| Cash Equivalents | 16,161,325 | 39,523,000 | - | 55,684,325 | ||||||
| Royce Total Return Fund | ||||||||||
| Common Stocks | 3,899,064,446 | 21,905,635 | 0 | 3,920,970,081 | ||||||
| Cash Equivalents | 12,246,783 | 68,412,000 | - | 80,658,783 | ||||||
| Royce Heritage Fund | ||||||||||
| Common Stocks | 294,236,036 | - | - | 294,236,036 | ||||||
| Cash Equivalents | - | 49,361,000 | - | 49,361,000 | ||||||
| Royce Opportunity Fund | ||||||||||
| Common Stocks | 1,933,035,729 | 73,560 | - | 1,933,109,289 | ||||||
| Cash Equivalents | 117,857,298 | 72,563,000 | - | 190,420,298 | ||||||
| Royce Special Equity Fund | ||||||||||
| Common Stocks | 1,993,470,051 | 3,981,020 | - | 1,997,451,071 | ||||||
| Cash Equivalents | - | 198,730,000 | - | 198,730,000 | ||||||
| Royce Select Fund I | ||||||||||
| Common Stocks | 21,319,590 | - | - | 21,319,590 | ||||||
| Cash Equivalents | - | 1,709,000 | - | 1,709,000 | ||||||
| Royce Small-Cap Value Fund | ||||||||||
| Common Stocks | 744,899,891 | - | - | 744,899,891 | ||||||
| Cash Equivalents | - | 10,197,000 | - | 10,197,000 | ||||||
| Royce Smaller-Companies Growth Fund | ||||||||||
| Common Stocks | 835,885,742 | - | - | 835,885,742 | ||||||
| Cash Equivalents | 75,795,538 | 47,393,000 | - | 123,188,538 | ||||||
| Royce 100 Fund | ||||||||||
| Common Stocks | 144,849,446 | - | - | 144,849,446 | ||||||
| Cash Equivalents | 1,034,978 | 3,463,000 | - | 4,497,978 | ||||||
| Royce Micro-Cap Discovery Fund | ||||||||||
| Common Stocks | 5,139,437 | - | - | 5,139,437 | ||||||
| Cash Equivalents | - | 442,000 | - | 442,000 | ||||||
| Royce Dividend Value Fund | ||||||||||
| Common Stocks | 406,608,640 | - | - | 406,608,640 | ||||||
| Cash Equivalents | - | 16,497,000 | - | 16,497,000 | ||||||
| Royce Micro-Cap Opportunity Fund | ||||||||||
| Common Stocks | 21,085,892 | - | - | 21,085,892 | ||||||
| Cash Equivalents | - | 330,000 | - | 330,000 | ||||||
| Royce Special Equity Multi-Cap Fund | ||||||||||
| Common Stocks | 245,808,356 | - | - | 245,808,356 | ||||||
| Cash Equivalents | - | 12,660,000 | - | 12,660,000 | ||||||
The Royce Funds 2015 Semiannual Report to Shareholders | 107
Notes to Financial Statements (unaudited) (continued)
| TRANSFERS FROM LEVEL 2 TO LEVEL 1 | TRANSFERS FROM LEVEL 2 TO LEVEL 1 | ||||||||||
| Royce Pennsylvania Mutual Fund | $ | 80,912,428 | Royce Heritage Fund | $ | 34,919,323 | ||||||
| Royce Micro-Cap Fund | 11,722,594 | Royce Select Fund I | 274,167 | ||||||||
| Royce Premier Fund | 100,331,314 | Royce Smaller-Companies Growth Fund | 48,184,483 | ||||||||
| Royce Low-Priced Stock Fund | 27,182,995 | Royce 100 Fund | 1,775,548 | ||||||||
| Royce Total Return Fund | 177,496,881 | Royce Dividend Value Fund | 58,160,027 | ||||||||
Level 3 Reconciliation:
| BALANCE AS OF 12/31/14 | PURCHASES | UNREALIZED GAIN (LOSS)1 | BALANCE AS OF 6/30/15 | ||||||||||||||
| Royce Pennsylvania Mutual Fund | |||||||||||||||||
| Common Stocks | $ | – | $ | 0 | $ | – | $ | 0 | |||||||||
| Royce Micro-Cap Fund | |||||||||||||||||
| Common Stocks | 1,049,127 | – | – | 1,049,127 | |||||||||||||
| Royce Total Return Fund | |||||||||||||||||
| Common Stocks | – | 0 | – | 0 | |||||||||||||
The following table summarizes the valuation techniques used and unobservable inputs approved by the Valuation Committee to determine the fair value of certain, material Level 3 investments. The table does not include Level 3 investments with values derived utilizing prices from prior transactions or third party pricing information with adjustments (e.g. broker quotes, pricing services, net asset values).
| FAIR VALUE AT | IMPACT TO VALUATION FROM | ||||||||||||||||
| 6/30/15 | VALUATION TECHNIQUE(S) | UNOBSERVABLE INPUT(S) | RANGE AVERAGE | AN INCREASE IN INPUT1 | |||||||||||||
| Royce Micro-Cap Fund | |||||||||||||||||
| Common Stocks | $ | 1,049,127 | Market Approach | Liquidity Discount | 30 | % | Decrease | ||||||||||
| 108 | The Royce Funds 2015 Semiannual Report to Shareholders |
SECURITIES LENDING:
The Funds loan securities through a lending agent to qualified institutional investors for the purpose of realizing additional income. Collateral for the Funds on all securities loaned is accepted in cash and cash equivalents and invested temporarily by the custodian. The collateral maintained is at least 100% of the current market value of the loaned securities. The market value of the loaned securities is determined at the close of business of the Funds and any additional required collateral is delivered to the Funds on the next business day. The Funds retain the risk of any loss on the securities on loan as well as incurring the potential loss on investments purchased with cash collateral received for securities lending. The Funds’ securities lending income consists of the income earned on investing cash collateral, plus any premium payments received for lending certain securities, less any rebates paid to borrowers and lending agent fees associated with the loan. The lending agent is not affiliated with Royce.
The following table presents by financial instrument, each Fund’s assets and liabilities net of related collateral held by each Fund at June 30, 2015:
| GROSS AMOUNT OF ASSETS AND LIABILITIES IN THE STATEMENTS OF ASSETS AND LIABILITIES1 | COLLATERAL RECEIVED AND PLEDGED | NET AMOUNT | |||||||||||
| Royce Pennsylvania Mutual Fund | |||||||||||||
| Securities on Loan/Collateral on Loaned Securities | $ | 27,188,580 | $ | (27,188,580) | $ | – | |||||||
| Royce Micro-Cap Fund | |||||||||||||
| Securities on Loan/Collateral on Loaned Securities | 12,625,181 | (12,625,181) | – | ||||||||||
| Royce Premier Fund | |||||||||||||
| Securities on Loan/Collateral on Loaned Securities | 44,759,784 | (44,759,784) | – | ||||||||||
| Royce Low-Priced Stock Fund | |||||||||||||
| Securities on Loan/Collateral on Loaned Securities | 16,161,325 | (16,161,325) | – | ||||||||||
| Royce Total Return Fund | |||||||||||||
| Securities on Loan/Collateral on Loaned Securities | 12,246,783 | (12,246,783) | – | ||||||||||
| Royce Opportunity Fund | |||||||||||||
| Securities on Loan/Collateral on Loaned Securities | 117,857,298 | (117,857,298) | – | ||||||||||
| Royce Smaller-Companies Growth Fund | |||||||||||||
| Securities on Loan/Collateral on Loaned Securities | 75,795,538 | (75,795,538) | – | ||||||||||
| Royce 100 Fund | |||||||||||||
| Securities on Loan/Collateral on Loaned Securities | 1,034,978 | (1,034,978) | – | ||||||||||
| 1Absent an event of default, assets and liabilities are presented gross and not offset in the Statements of Assets and Liabilities. | |||||||||||||
DISTRIBUTIONS AND TAXES:
As qualified regulated investment companies under Subchapter M of the Internal Revenue Code, the Funds are not subject to income taxes to the extent that each Fund distributes substantially all of its taxable income for its fiscal year.
Royce Total Return Fund and Royce Dividend Value Fund pay any dividends from net investment income quarterly and make any distributions from net realized gains annually in December. The other Funds pay any dividends and capital gain distributions annually in December. Dividends from net investment income are determined at a class level and distributions from capital gains are determined at a Fund level. Because federal income tax regulations differ from generally accepted accounting principles, income and capital gain distributions determined in accordance with tax regulations may differ from net investment income and realized gains recognized for financial reporting purposes. Accordingly, the character of distributions and composition of net assets for tax purposes differ from those reflected in the accompanying financial statements.
INVESTMENT TRANSACTIONS AND RELATED INVESTMENT INCOME:
Investment transactions are accounted for on the trade date. Dividend income is recorded on the ex-dividend date. Non-cash dividend income is recorded at the fair market value of the securities received. Interest income is recorded on an accrual basis. Premium and discounts on debt securities are amortized using the effective yield-to-maturity method. Realized gains and losses from investment transactions are determined on the basis of identified cost for book and tax purposes.
EXPENSES:
The Funds incur direct and indirect expenses. Expenses directly attributable to a Fund are charged to the Fund’s operations, while expenses applicable to more than one of the Royce Funds are allocated equitably. Certain personnel, occupancy costs and other administrative expenses related to the Funds are allocated by Royce under an administration agreement and are included in administrative and office facilities and legal expenses. The Trust has adopted a deferred fee agreement that allows the Trustees to defer the receipt of all or a portion of trustees’ fees otherwise payable. The deferred fees are invested in certain Royce Funds until distributed in accordance with the agreement.
The Royce Funds 2015 Semiannual Report to Shareholders | 109
Notes to Financial Statements (unaudited) (continued)
COMPENSATING BALANCE CREDITS:
The Funds have arrangements with their custodian bank and transfer agent, whereby a portion of the custodian’s fee and transfer agent’s fee is paid indirectly by credits earned on a Fund’s cash on deposit with the bank and transfer agent. These deposit arrangements are an alternative to purchasing overnight investments. Conversely, a Fund pays interest to the custodian on any cash overdrafts, to the extent they are not offset by credits earned on positive cash balances.
LINE OF CREDIT:
The Funds, along with certain other Royce Funds, participate in a $75 million line of credit (“Credit Agreement”) to be used for temporary or emergency purposes. This revolving Credit Agreement expires on October 16, 2015. Pursuant to the Credit Agreement, each participating Fund is liable only for principal and interest payments related to borrowings made by that Fund. Borrowings under the Credit Agreement bear interest at a rate equal to the higher of the federal funds rate + 1.25% or overnight LIBOR + 1.25%. The Funds did not utilize the line of credit during the six months ended June 30, 2015.
| Capital Share Transactions (in dollars): | ||||||||||||||||||||||
| SHARES SOLD | SHARES ISSUED FOR REINVESTMENT OF DISTRIBUTIONS | SHARES REDEEMED | NET INCREASE (DECREASE) FROM CAPITAL SHARE TRANSACTIONS | |||||||||||||||||||
| Six Months Ended 6/30/15 (unaudited) | Period Ended 12/31/14 | Six Months Ended 6/30/15 (unaudited) | Period Ended 12/31/14 | Six Months Ended 6/30/15 (unaudited) | Period Ended 12/31/14 | Six Months Ended 6/30/15 (unaudited) | Period Ended 12/31/14 | |||||||||||||||
| Royce Pennsylvania Mutual Fund | ||||||||||||||||||||||
| Investment Class | $115,621,519 | $506,526,617 | $ | – | $370,880,440 | $(1,046,098,049) | $(1,567,279,750) | $(930,476,530) | $(689,872,693) | |||||||||||||
| Service Class | 14,589,573 | 99,828,552 | – | 28,968,181 | (146,779,058) | (328,139,978) | (132,189,485) | (199,343,245) | ||||||||||||||
| Consultant Class | 8,886,819 | 25,211,845 | – | 76,735,320 | (81,901,486) | (116,343,597) | (73,014,667) | (14,396,432) | ||||||||||||||
| Institutional Class | 58,612,862 | 343,125,813 | – | 89,605,015 | (160,123,162) | (351,584,299) | (101,510,300) | 81,146,529 | ||||||||||||||
| R Class | 2,584,998 | 8,053,228 | – | 4,003,806 | (9,949,333) | (14,849,573) | (7,364,335) | (2,792,539) | ||||||||||||||
| K Class | 1,150,749 | 2,508,960 | – | 1,293,444 | (3,013,410) | (3,363,284) | (1,862,661) | 439,120 | ||||||||||||||
| Royce Micro-Cap Fund | ||||||||||||||||||||||
| Investment Class | 8,223,043 | 33,996,859 | – | 34,181,364 | (115,357,014) | (239,040,752) | (107,133,971) | (170,862,529) | ||||||||||||||
| Service Class | 4,755,333 | 11,050,878 | – | 3,280,443 | (8,719,300) | (48,179,138) | (3,963,967) | (33,847,817) | ||||||||||||||
| Consultant Class | 648,948 | 2,107,865 | – | 8,255,066 | (16,438,284) | (37,203,785) | (15,789,336) | (26,840,854) | ||||||||||||||
| Royce Premier Fund | ||||||||||||||||||||||
| Investment Class | 99,073,327 | 382,768,920 | – | 342,058,115 | (924,936,421) | (1,272,200,430) | (825,863,094) | (547,373,395) | ||||||||||||||
| Service Class | 10,282,924 | 37,616,729 | – | 16,483,596 | (83,283,863) | (183,633,439) | (73,000,939) | (129,533,114) | ||||||||||||||
| Consultant Class | 827,057 | 2,338,877 | – | 5,704,199 | (7,521,609) | (10,578,088) | (6,694,552) | (2,535,012) | ||||||||||||||
| Institutional Class | 40,870,824 | 111,264,468 | – | 67,113,888 | (146,928,660) | (505,054,873) | (106,057,836) | (326,676,517) | ||||||||||||||
| W Class | 18,501,963 | 48,647,645 | – | 33,267,513 | (101,364,935) | (138,651,861) | (82,862,972) | (56,736,703) | ||||||||||||||
| R Class | 861,685 | 4,881,491 | – | 2,707,987 | (5,514,308) | (9,729,538) | (4,652,623) | (2,140,060) | ||||||||||||||
| K Class | 286,941 | 1,286,179 | – | 1,673,519 | (1,951,851) | (3,485,783) | (1,664,910) | (526,085) | ||||||||||||||
| Royce Low-Priced Stock Fund | ||||||||||||||||||||||
| Investment Class | 1,417,652 | 26,094,517 | – | 13,502,147 | (11,686,060) | (60,873,035) | (10,268,408) | (21,276,371) | ||||||||||||||
| Service Class | 6,429,161 | 44,977,684 | – | 155,283,260 | (106,500,657) | (500,094,797) | (100,071,496) | (299,833,853) | ||||||||||||||
| Institutional Class | 2,187,150 | 17,984,583 | – | 28,211,899 | (46,441,462) | (264,759,956) | (44,254,312) | (218,563,474) | ||||||||||||||
| R Class | 50,273 | 345,884 | – | 532,842 | (610,674) | (1,517,342) | (560,401) | (638,616) | ||||||||||||||
| K Class | 107,237 | 311,506 | – | 1,081,444 | (274,646) | (2,087,925) | (167,409) | (694,975) | ||||||||||||||
| Royce Total Return Fund | ||||||||||||||||||||||
| Investment Class | 127,603,081 | 362,137,881 | 13,886,938 | 302,662,051 | (607,509,412) | (916,819,335) | (466,019,393) | (252,019,403) | ||||||||||||||
| Service Class | 13,194,701 | 64,225,061 | 817,900 | 22,994,953 | (52,041,584) | (321,591,822) | (38,028,983) | (234,371,808) | ||||||||||||||
| Consultant Class | 6,755,082 | 17,101,346 | 396,223 | 32,433,723 | (38,268,406) | (62,537,014) | (31,117,101) | (13,001,945) | ||||||||||||||
| Institutional Class | 70,355,851 | 140,092,526 | 3,540,434 | 63,750,942 | (100,758,352) | (193,581,622) | (26,862,067) | 10,261,846 | ||||||||||||||
| W Class | 21,262,858 | 64,397,705 | 941,832 | 26,931,314 | (138,825,748) | (51,703,500) | (116,621,058) | 39,625,519 | ||||||||||||||
| R Class | 4,947,859 | 13,541,789 | 213,810 | 6,802,388 | (8,170,090) | (21,165,292) | (3,008,421) | (821,115) | ||||||||||||||
| K Class | 27,407,863 | 47,764,450 | 385,621 | 13,185,125 | (36,396,263) | (152,866,973) | (8,602,779) | (91,917,398) | ||||||||||||||
110 | The Royce Funds 2015 Semiannual Report to Shareholders
| Capital Share Transactions (in dollars) (continued): | ||||||||||||||||||||||||||||||||
| SHARES ISSUED FOR REINVESTMENT OF | NET INCREASE (DECREASE) IN SHARES | |||||||||||||||||||||||||||||||
| SHARES SOLD | DISTRIBUTIONS | SHARES REDEEMED | OUTSTANDING | |||||||||||||||||||||||||||||
| Six Months Ended | Six Months Ended | Six Months Ended | Six Months Ended | |||||||||||||||||||||||||||||
| 6/30/15 | Period ended | 6/30/15 | Period ended | 6/30/15 | Period ended | 6/30/15 | Period ended | |||||||||||||||||||||||||
| (unaudited) | 12/31/14 | (unaudited) | 12/31/14 | (unaudited) | 12/31/14 | (unaudited) | 12/31/14 | |||||||||||||||||||||||||
| Royce Heritage Fund | ||||||||||||||||||||||||||||||||
Investment Class | $ | 18,824,886 | $ | 50,189,428 | $ | – | $ | 8,592,153 | $ | (3,414,690 | ) | $ | (6,303,296 | ) | $ | 15,410,196 | $ | 52,478,285 | ||||||||||||||
Service Class | 2,144,266 | 9,893,864 | – | 8,633,861 | (35,762,574 | ) | (54,969,780 | ) | (33,618,308 | ) | (36,442,055 | ) | ||||||||||||||||||||
Consultant Class | 228,789 | 682,067 | – | 844,425 | (994,056 | ) | (2,908,579 | ) | (765,267 | ) | (1,382,087 | ) | ||||||||||||||||||||
R Class | 144,295 | 627,816 | – | 218,815 | (996,850 | ) | (3,523,203 | ) | (852,555 | ) | (2,676,572 | ) | ||||||||||||||||||||
K Class | 809,279 | 809,955 | – | 396,754 | (1,416,488 | ) | (1,690,435 | ) | (607,209 | ) | (483,726 | ) | ||||||||||||||||||||
| Royce Opportunity Fund | ||||||||||||||||||||||||||||||||
Investment Class | 51,248,298 | 193,304,142 | – | 146,112,723 | (303,517,626 | ) | (307,673,836 | ) | (252,269,328 | ) | 31,743,029 | |||||||||||||||||||||
Service Class | 11,305,015 | 44,181,047 | – | 19,076,365 | (30,762,675 | ) | (94,875,605 | ) | (19,457,660 | ) | (31,618,193 | ) | ||||||||||||||||||||
Consultant Class | 3,953,069 | 6,846,175 | – | 2,726,295 | (1,980,471 | ) | (4,696,671 | ) | 1,972,598 | 4,875,799 | ||||||||||||||||||||||
Institutional Class | 55,579,276 | 141,310,734 | – | 95,518,937 | (103,020,990 | ) | (183,057,913 | ) | (47,441,714 | ) | 53,771,758 | |||||||||||||||||||||
R Class | 4,747,583 | 16,193,270 | – | 4,486,685 | (2,893,878 | ) | (4,927,447 | ) | 1,853,705 | 15,752,508 | ||||||||||||||||||||||
K Class | 2,120,907 | 16,734,919 | – | 3,319,386 | (8,396,446 | ) | (11,407,748 | ) | (6,275,539 | ) | 8,646,557 | |||||||||||||||||||||
| Royce Special Equity Fund | ||||||||||||||||||||||||||||||||
Investment Class | 84,342,043 | 251,091,597 | – | 155,219,704 | (406,691,730 | ) | (782,681,645 | ) | (322,349,687 | ) | (376,370,344 | ) | ||||||||||||||||||||
Service Class | 12,579,398 | 39,990,897 | – | 17,667,281 | (65,459,301 | ) | (136,332,747 | ) | (52,879,903 | ) | (78,674,569 | ) | ||||||||||||||||||||
Consultant Class | 1,963,475 | 3,371,625 | – | 5,815,732 | (9,381,219 | ) | (10,136,790 | ) | (7,417,744 | ) | (949,433 | ) | ||||||||||||||||||||
Institutional Class | 35,241,082 | 71,641,743 | – | 59,595,359 | (381,015,720 | ) | (136,073,092 | ) | (345,774,638 | ) | (4,835,990 | ) | ||||||||||||||||||||
| Royce Select Fund I | ||||||||||||||||||||||||||||||||
Investment Class | 162,276 | 3,917,901 | – | 3,322,753 | (16,350,537 | ) | (10,053,525 | ) | (16,188,261 | ) | (2,812,871 | ) | ||||||||||||||||||||
| Royce Small-Cap Value Fund | ||||||||||||||||||||||||||||||||
Investment Class | 5,675,473 | 40,123,987 | – | 16,598,054 | (29,403,610 | ) | (94,649,702 | ) | (23,728,137 | ) | (37,927,661 | ) | ||||||||||||||||||||
Service Class | 10,742,499 | 32,791,478 | – | 54,561,485 | (120,633,817 | ) | (227,864,825 | ) | (109,891,318 | ) | (140,511,862 | ) | ||||||||||||||||||||
Consultant Class | 829,493 | 3,022,082 | – | 3,337,468 | (3,454,003 | ) | (7,409,588 | ) | (2,624,510 | ) | (1,050,038 | ) | ||||||||||||||||||||
Institutional Class | 30,834,045 | 18,404,265 | – | 24,538,922 | (29,471,592 | ) | (41,423,739 | ) | 1,362,453 | 1,519,448 | ||||||||||||||||||||||
R Class | 1,687,952 | 5,066,775 | – | 4,166,100 | (6,431,458 | ) | (11,288,399 | ) | (4,743,506 | ) | (2,055,524 | ) | ||||||||||||||||||||
K Class | 774,810 | 2,640,410 | – | 1,486,836 | (1,643,507 | ) | (9,482,843 | ) | (868,697 | ) | (5,355,597 | ) | ||||||||||||||||||||
| Royce Smaller-Companies Growth Fund | ||||||||||||||||||||||||||||||||
Investment Class | 17,525,433 | 130,967,883 | – | 46,641,316 | (48,684,465 | ) | (80,347,855 | ) | (31,159,032 | ) | 97,261,344 | |||||||||||||||||||||
Service Class | 12,365,916 | 53,871,837 | – | 95,079,165 | (88,679,487 | ) | (321,309,401 | ) | (76,313,571 | ) | (172,358,399 | ) | ||||||||||||||||||||
Consultant Class | 294,835 | 591,354 | – | 3,226,909 | (2,129,698 | ) | (6,267,669 | ) | (1,834,863 | ) | (2,449,406 | ) | ||||||||||||||||||||
Institutional Class | 2,382,541 | 17,848,303 | – | 6,945,468 | (8,757,525 | ) | (125,205,240 | ) | (6,374,984 | ) | (100,411,469 | ) | ||||||||||||||||||||
R Class | 64,759 | 331,566 | – | 271,992 | (299,370 | ) | (625,234 | ) | (234,611 | ) | (21,676 | ) | ||||||||||||||||||||
K Class | 30,923 | 157,920 | – | 238,115 | (113,912 | ) | (652,811 | ) | (82,989 | ) | (256,776 | ) | ||||||||||||||||||||
| Royce 100 Fund | ||||||||||||||||||||||||||||||||
Investment Class | 2,699,001 | 48,981,013 | – | 6,419,484 | (17,727,857 | ) | (36,418,124 | ) | (15,028,856 | ) | 18,982,373 | |||||||||||||||||||||
Service Class | 4,921,667 | 24,824,949 | – | 13,631,471 | (63,093,045 | ) | (97,680,533 | ) | (58,171,378 | ) | (59,224,113 | ) | ||||||||||||||||||||
R Class | 397,143 | 959,574 | – | 168,762 | (380,831 | ) | (1,687,247 | ) | 16,312 | (558,911 | ) | |||||||||||||||||||||
K Class | 62,690 | 287,289 | – | 64,074 | (260,915 | ) | (1,861,662 | ) | (198,225 | ) | (1,510,299 | ) | ||||||||||||||||||||
| Royce Micro-Cap Discovery Fund | ||||||||||||||||||||||||||||||||
Service Class | 130,982 | 140,729 | – | 690,513 | (170,695 | ) | (397,978 | ) | (39,713 | ) | 433,264 | |||||||||||||||||||||
| Royce Dividend Value Fund | ||||||||||||||||||||||||||||||||
Investment Class | 10,773,849 | 53,534,161 | 1,108,678 | 10,979,129 | (41,504,000 | ) | (83,254,012 | ) | (29,621,473 | ) | (18,740,722 | ) | ||||||||||||||||||||
Service Class | 10,947,439 | 44,423,724 | 1,430,813 | 16,719,515 | (77,392,479 | ) | (144,774,078 | ) | (65,014,227 | ) | (83,630,839 | ) | ||||||||||||||||||||
Consultant Class | 176,516 | 965,582 | 4,453 | 47,956 | (14,944 | ) | (29,381 | ) | 166,025 | 984,157 | ||||||||||||||||||||||
Institutional Class | 1,094,850 | 12,840,709 | 378,023 | 2,915,622 | (1,612,816 | ) | (2,556,823 | ) | (139,943 | ) | 13,199,508 | |||||||||||||||||||||
| Royce Micro-Cap Opportunity Fund | ||||||||||||||||||||||||||||||||
Investment Class | 3,511,880 | 9,262,133 | – | 511,788 | (2,357,570 | ) | (7,073,447 | ) | 1,154,310 | 2,700,474 | ||||||||||||||||||||||
Service Class | 706,251 | 1,177,953 | – | 46,594 | (311,535 | ) | (216,169 | ) | 394,716 | 1,008,378 | ||||||||||||||||||||||
| Royce Special Equity Multi-Cap Fund | ||||||||||||||||||||||||||||||||
Investment Class | 10,753,048 | 66,548,135 | – | 5,358,537 | (8,879,478 | ) | (12,872,716 | ) | 1,873,570 | 59,033,956 | ||||||||||||||||||||||
Service Class | 2,857,415 | 27,303,035 | – | 3,891,504 | (17,657,288 | ) | (18,556,923 | ) | (14,799,873 | ) | 12,637,616 | |||||||||||||||||||||
Consultant Class | 822,611 | 8,880,332 | – | 397,636 | (441,123 | ) | (77,401 | ) | 381,488 | 9,200,567 | ||||||||||||||||||||||
Institutional Class | 5,363,108 | 35,830,108 | – | 3,725,422 | (29,896,964 | ) | (14,233,983 | ) | (24,533,856 | ) | 25,321,547 | |||||||||||||||||||||
The Royce Funds 2015 Semiannual Report to Shareholders | 111
Notes to Financial Statements (unaudited) (continued)
Capital Share Transactions (in shares):
| SHARES ISSUED FOR REINVESTMENT OF | NET INCREASE (DECREASE) IN SHARES | |||||||||||||||||||||||||||||||
| SHARES SOLD | DISTRIBUTIONS | SHARES REDEEMED | OUTSTANDING | |||||||||||||||||||||||||||||
| Six Months Ended | Six Months Ended | Six Months Ended | Six Months Ended | |||||||||||||||||||||||||||||
| 6/30/15 | Period ended | 6/30/15 | Period ended | 6/30/15 | Period ended | 6/30/15 | Period ended | |||||||||||||||||||||||||
| (unaudited) | 12/31/14 | (unaudited) | 12/31/14 | (unaudited) | 12/31/14 | (unaudited) | 12/31/14 | |||||||||||||||||||||||||
| Royce Pennsylvania Mutual Fund | ||||||||||||||||||||||||||||||||
Investment Class | 8,982,111 | 36,206,076 | – | 30,489,187 | (80,694,234 | ) | (110,659,655 | ) | (71,712,123 | ) | (43,964,392 | ) | ||||||||||||||||||||
Service Class | 1,137,104 | 6,949,807 | – | 2,824,174 | (11,268,017 | ) | (24,303,578 | ) | (10,130,913 | ) | (14,529,597 | ) | ||||||||||||||||||||
Consultant Class | 804,161 | 2,003,148 | – | 7,059,367 | (7,352,668 | ) | (9,263,663 | ) | (6,548,507 | ) | (201,148 | ) | ||||||||||||||||||||
Institutional Class | 4,528,703 | 23,994,962 | – | 7,066,642 | (12,236,232 | ) | (24,871,748 | ) | (7,707,529 | ) | 6,189,856 | |||||||||||||||||||||
R Class | 208,143 | 574,241 | – | 330,114 | (799,550 | ) | (1,066,363 | ) | (591,407 | ) | (162,008 | ) | ||||||||||||||||||||
K Class | 103,217 | 200,117 | – | 117,586 | (265,571 | ) | (266,187 | ) | (162,354 | ) | 51,516 | |||||||||||||||||||||
| Royce Micro-Cap Fund | ||||||||||||||||||||||||||||||||
Investment Class | 578,968 | 2,121,398 | – | 2,528,680 | (7,983,848 | ) | (15,045,118 | ) | (7,404,880 | ) | (10,395,040 | ) | ||||||||||||||||||||
Service Class | 337,341 | 700,023 | – | 242,995 | (617,156 | ) | (3,082,010 | ) | (279,815 | ) | (2,138,992 | ) | ||||||||||||||||||||
Consultant Class | 53,975 | 153,824 | – | 692,539 | (1,364,168 | ) | (2,758,901 | ) | (1,310,193 | ) | (1,912,538 | ) | ||||||||||||||||||||
| Royce Premier Fund | ||||||||||||||||||||||||||||||||
Investment Class | 5,000,584 | 17,298,122 | – | 19,065,823 | (46,566,609 | ) | (59,032,600 | ) | (41,566,025 | ) | (22,668,655 | ) | ||||||||||||||||||||
Service Class | 526,551 | 1,730,643 | – | 893,882 | (4,278,768 | ) | (8,380,293 | ) | (3,752,217 | ) | (5,755,768 | ) | ||||||||||||||||||||
Consultant Class | 47,669 | 119,767 | – | 340,548 | (436,765 | ) | (540,506 | ) | (389,096 | ) | (80,191 | ) | ||||||||||||||||||||
Institutional Class | 2,011,750 | 4,948,769 | – | 3,442,603 | (7,253,625 | ) | (22,872,894 | ) | (5,241,875 | ) | (14,481,522 | ) | ||||||||||||||||||||
W Class | 940,688 | 2,184,841 | – | 1,723,220 | (5,088,068 | ) | (6,268,848 | ) | (4,147,380 | ) | (2,360,787 | ) | ||||||||||||||||||||
R Class | 45,204 | 229,555 | – | 147,382 | (292,244 | ) | (456,270 | ) | (247,040 | ) | (79,333 | ) | ||||||||||||||||||||
K Class | 49,842 | 160,529 | – | 296,199 | (335,244 | ) | (436,832 | ) | (285,402 | ) | 19,896 | |||||||||||||||||||||
| Royce Low-Priced Stock Fund | ||||||||||||||||||||||||||||||||
Investment Class | 148,125 | 1,823,350 | – | 1,499,869 | (1,218,700 | ) | (4,511,651 | ) | (1,070,575 | ) | (1,188,432 | ) | ||||||||||||||||||||
Service Class | 673,165 | 3,328,649 | – | 17,589,337 | (11,127,023 | ) | (39,870,593 | ) | (10,453,858 | ) | (18,952,607 | ) | ||||||||||||||||||||
Institutional Class | 231,241 | 1,320,098 | – | 3,059,858 | (4,871,024 | ) | (19,078,377 | ) | (4,639,783 | ) | (14,698,421 | ) | ||||||||||||||||||||
R Class | 5,476 | 26,112 | – | 60,140 | (67,091 | ) | (113,771 | ) | (61,615 | ) | (27,519 | ) | ||||||||||||||||||||
K Class | 35,787 | 46,361 | – | 378,649 | (91,065 | ) | (301,233 | ) | (55,278 | ) | 123,777 | |||||||||||||||||||||
| Royce Total Return Fund | ||||||||||||||||||||||||||||||||
Investment Class | 8,637,994 | 22,372,344 | 969,116 | 22,430,864 | (41,000,098 | ) | (58,160,964 | ) | (31,392,988 | ) | (13,357,756 | ) | ||||||||||||||||||||
Service Class | 877,594 | 3,926,950 | 56,380 | 1,702,788 | (3,460,778 | ) | (19,785,781 | ) | (2,526,804 | ) | (14,156,043 | ) | ||||||||||||||||||||
Consultant Class | 449,519 | 1,048,627 | 26,107 | 2,209,382 | (2,530,187 | ) | (3,805,888 | ) | (2,054,561 | ) | (547,879 | ) | ||||||||||||||||||||
Institutional Class | 4,851,907 | 8,770,274 | 241,432 | 4,474,278 | (6,878,999 | ) | (12,053,533 | ) | (1,785,660 | ) | 1,191,019 | |||||||||||||||||||||
W Class | 1,443,321 | 3,975,782 | 63,659 | 1,864,392 | (9,249,356 | ) | (3,193,929 | ) | (7,742,376 | ) | 2,646,245 | |||||||||||||||||||||
R Class | 327,736 | 822,089 | 14,092 | 462,360 | (539,446 | ) | (1,275,828 | ) | (197,618 | ) | 8,621 | |||||||||||||||||||||
K Class | 2,553,214 | 3,906,869 | 35,828 | 1,258,739 | (3,370,611 | ) | (12,482,664 | ) | (781,569 | ) | (7,317,056 | ) | ||||||||||||||||||||
| Royce Heritage Fund | ||||||||||||||||||||||||||||||||
Investment Class | 1,232,172 | 3,146,637 | – | 583,366 | (225,330 | ) | (395,548 | ) | 1,006,842 | 3,334,455 | ||||||||||||||||||||||
Service Class | 141,749 | 617,610 | – | 605,064 | (2,332,316 | ) | (3,457,889 | ) | (2,190,567 | ) | (2,235,215 | ) | ||||||||||||||||||||
Consultant Class | 19,696 | 55,109 | – | 75,463 | (86,590 | ) | (235,654 | ) | (66,894 | ) | (105,082 | ) | ||||||||||||||||||||
R Class | 13,527 | 55,045 | – | 27,482 | (93,675 | ) | (316,179 | ) | (80,148 | ) | (233,652 | ) | ||||||||||||||||||||
K Class | 75,609 | 70,201 | – | 38,003 | (130,620 | ) | (146,342 | ) | (55,011 | ) | (38,138 | ) | ||||||||||||||||||||
| Royce Opportunity Fund | ||||||||||||||||||||||||||||||||
Investment Class | 3,820,216 | 12,687,041 | – | 11,528,908 | (22,418,824 | ) | (20,605,360 | ) | (18,598,608 | ) | 3,610,589 | |||||||||||||||||||||
Service Class | 883,312 | 3,006,071 | – | 1,657,147 | (2,407,973 | ) | (6,502,632 | ) | (1,524,661 | ) | (1,839,414 | ) | ||||||||||||||||||||
Consultant Class | 338,132 | 515,572 | – | 239,149 | (166,622 | ) | (344,991 | ) | 171,510 | 409,730 | ||||||||||||||||||||||
Institutional Class | 4,141,214 | 8,987,079 | – | 7,247,263 | (7,532,730 | ) | (12,024,838 | ) | (3,391,516 | ) | 4,209,504 | |||||||||||||||||||||
R Class | 377,810 | 1,116,193 | – | 371,647 | (230,843 | ) | (348,481 | ) | 146,967 | 1,139,359 | ||||||||||||||||||||||
K Class | 184,074 | 1,233,120 | – | 296,904 | (722,324 | ) | (859,545 | ) | (538,250 | ) | 670,479 | |||||||||||||||||||||
| Royce Special Equity Fund | ||||||||||||||||||||||||||||||||
Investment Class | 3,702,834 | 10,375,790 | – | 7,392,246 | (17,847,704 | ) | (32,780,612 | ) | (14,144,870 | ) | (15,012,576 | ) | ||||||||||||||||||||
Service Class | 552,271 | 1,657,860 | – | 891,296 | (2,887,686 | ) | (5,755,208 | ) | (2,335,415 | ) | (3,206,052 | ) | ||||||||||||||||||||
Consultant Class | 92,221 | 148,400 | – | 278,799 | (443,203 | ) | (445,924 | ) | (350,982 | ) | (18,725 | ) | ||||||||||||||||||||
Institutional Class | 1,566,013 | 2,968,109 | – | 2,677,947 | (16,639,012 | ) | (5,620,871 | ) | (15,072,999 | ) | 25,185 | |||||||||||||||||||||
| Royce Select Fund I | ||||||||||||||||||||||||||||||||
Investment Class | 9,419 | 194,816 | – | 290,480 | (952,237 | ) | (616,828 | ) | (942,818 | ) | (131,532 | ) | ||||||||||||||||||||
112 | The Royce Funds 2015 Semiannual Report to Shareholders
Capital Share Transactions (in shares) (continued):
| SHARES ISSUED FOR REINVESTMENT OF | NET INCREASE (DECREASE) IN SHARES | |||||||||||||||||||||||||||||||
| SHARES SOLD | DISTRIBUTIONS | SHARES REDEEMED | OUTSTANDING | |||||||||||||||||||||||||||||
| Six Months Ended | Six Months Ended | Six Months Ended | Six Months Ended | |||||||||||||||||||||||||||||
| 6/30/15 | Period ended | 6/30/15 | Period ended | 6/30/15 | Period ended | 6/30/15 | Period ended | |||||||||||||||||||||||||
| (unaudited) | 12/31/14 | (unaudited) | 12/31/14 | (unaudited) | 12/31/14 | (unaudited) | 12/31/14 | |||||||||||||||||||||||||
| Royce Small-Cap Value Fund | ||||||||||||||||||||||||||||||||
Investment Class | 476,335 | 2,962,049 | – | 1,489,706 | (2,465,396 | ) | (7,141,129 | ) | (1,989,061 | ) | (2,689,374 | ) | ||||||||||||||||||||
Service Class | 902,628 | 2,464,793 | – | 5,106,063 | (10,127,193 | ) | (17,413,782 | ) | (9,224,565 | ) | (9,842,926 | ) | ||||||||||||||||||||
Consultant Class | 77,042 | 245,055 | – | 316,348 | (316,003 | ) | (594,530 | ) | (238,961 | ) | (33,127 | ) | ||||||||||||||||||||
Institutional Class | 2,566,552 | 1,363,836 | – | 2,139,400 | (2,446,125 | ) | (3,098,649 | ) | 120,427 | 404,587 | ||||||||||||||||||||||
R Class | 145,101 | 390,274 | – | 375,324 | (559,876 | ) | (885,453 | ) | (414,775 | ) | (119,855 | ) | ||||||||||||||||||||
K Class | 85,083 | 250,607 | – | 172,087 | (183,479 | ) | (900,345 | ) | (98,396 | ) | (477,651 | ) | ||||||||||||||||||||
| Royce Smaller-Companies Growth Fund | ||||||||||||||||||||||||||||||||
Investment Class | 1,185,237 | 7,656,782 | – | 3,404,492 | (3,255,860 | ) | (4,828,693 | ) | (2,070,623 | ) | 6,232,581 | |||||||||||||||||||||
Service Class | 834,252 | 3,129,248 | – | 7,488,175 | (6,022,099 | ) | (19,711,434 | ) | (5,187,847 | ) | (9,094,011 | ) | ||||||||||||||||||||
Consultant Class | 21,469 | 38,547 | – | 251,709 | (156,444 | ) | (396,344 | ) | (134,975 | ) | (106,088 | ) | ||||||||||||||||||||
Institutional Class | 158,000 | 1,030,329 | – | 491,639 | (573,682 | ) | (7,208,614 | ) | (415,682 | ) | (5,686,646 | ) | ||||||||||||||||||||
R Class | 4,559 | 20,086 | – | 20,404 | (21,088 | ) | (38,468 | ) | (16,529 | ) | 2,022 | |||||||||||||||||||||
K Class | 3,232 | 12,887 | – | 26,936 | (12,004 | ) | (65,796 | ) | (8,772 | ) | (25,973 | ) | ||||||||||||||||||||
| Royce 100 Fund | ||||||||||||||||||||||||||||||||
Investment Class | 314,229 | 4,896,139 | – | 765,609 | (2,035,547 | ) | (3,728,666 | ) | (1,721,318 | ) | 1,933,082 | |||||||||||||||||||||
Service Class | 575,721 | 2,533,436 | – | 1,899,069 | (7,271,580 | ) | (10,198,107 | ) | (6,695,859 | ) | (5,765,602 | ) | ||||||||||||||||||||
R Class | 35,880 | 77,893 | – | 15,511 | (34,406 | ) | (137,046 | ) | 1,474 | (43,642 | ) | |||||||||||||||||||||
K Class | 5,604 | 22,709 | – | 5,788 | (22,881 | ) | (149,939 | ) | (17,277 | ) | (121,442 | ) | ||||||||||||||||||||
| Royce Micro-Cap Discovery Fund | ||||||||||||||||||||||||||||||||
Service Class | 21,635 | 21,073 | – | 119,500 | (28,159 | ) | (60,104 | ) | (6,524 | ) | 80,469 | |||||||||||||||||||||
| Royce Dividend Value Fund | ||||||||||||||||||||||||||||||||
Investment Class | 1,316,416 | 6,107,891 | 138,149 | 1,432,854 | (5,078,662 | ) | (9,643,658 | ) | (3,624,097 | ) | (2,102,913 | ) | ||||||||||||||||||||
Service Class | 1,326,274 | 5,033,545 | 174,758 | 2,128,903 | (9,359,737 | ) | (16,596,059 | ) | (7,858,705 | ) | (9,433,611 | ) | ||||||||||||||||||||
Consultant Class | 18,931 | 96,722 | 475 | 5,327 | (1,586 | ) | (3,188 | ) | 17,820 | 98,861 | ||||||||||||||||||||||
Institutional Class | 135,055 | 1,472,932 | 45,877 | 365,097 | (196,486 | ) | (295,202 | ) | (15,554 | ) | 1,542,827 | |||||||||||||||||||||
| Royce Micro-Cap Opportunity Fund | ||||||||||||||||||||||||||||||||
Investment Class | 203,024 | 512,765 | – | 33,180 | (139,475 | ) | (417,105 | ) | 63,549 | 128,840 | ||||||||||||||||||||||
Service Class | 82,951 | 131,427 | – | 5,703 | (35,744 | ) | (24,877 | ) | 47,207 | 112,253 | ||||||||||||||||||||||
| Royce Special Equity Multi-Cap Fund | ||||||||||||||||||||||||||||||||
Investment Class | 693,841 | 4,256,073 | – | 356,996 | (573,871 | ) | (852,315 | ) | 119,970 | 3,760,754 | ||||||||||||||||||||||
Service Class | 184,543 | 1,800,024 | – | 267,339 | (1,134,482 | ) | (1,215,439 | ) | (949,939 | ) | 851,924 | |||||||||||||||||||||
Consultant Class | 77,839 | 829,645 | – | 38,088 | (41,494 | ) | (7,158 | ) | 36,345 | 860,575 | ||||||||||||||||||||||
Institutional Class | 346,421 | 2,353,132 | – | 245,902 | (1,918,313 | ) | (941,028 | ) | (1,571,892 | ) | 1,658,006 | |||||||||||||||||||||
The Royce Funds 2015 Semiannual Report to Shareholders | 113
Notes to Financial Statements (unaudited) (continued)
INVESTMENT ADVISER:
| ANNUAL CONTRACTUAL | SIX MONTHS ENDED | |||||||||||||||||||||||||||||||||||||||
| ADVISORY FEE AS A | COMMITTED NET ANNUAL OPERATING EXPENSE RATIO CAP | JUNE 30, 2015 | ||||||||||||||||||||||||||||||||||||||
| PERCENTAGE OF AVERAGE | Investment | Service | Consultant | Institutional | Advisory fees | |||||||||||||||||||||||||||||||||||
| NET ASSETS1 | Class4 | Class4 | Class4 | Class4 | W Class4 | R Class4 | K Class4 | Net advisory fees | waived | |||||||||||||||||||||||||||||||
| Royce Pennsylvania Mutual Fund | 0.75 | %2 | N/A | N/A | N/A | N/A | N/A | N/A | N/A | $ | 19,092,231 | $ | – | |||||||||||||||||||||||||||
| Royce Micro-Cap Fund | 1.25 | %3 | 1.49%5 | 1.61%5 | N/A | N/A | N/A | N/A | N/A | 2,947,953 | – | |||||||||||||||||||||||||||||
| Royce Premier Fund | 0.96 | % | N/A | 1.49% | N/A | N/A | N/A | N/A | N/A | 23,194,951 | – | |||||||||||||||||||||||||||||
| Royce Low-Priced Stock Fund | 1.00 | % | 1.24% | 1.49% | N/A | N/A | N/A | 1.84% | 1.59% | 2,962,474 | – | |||||||||||||||||||||||||||||
| Royce Total Return Fund | 0.97 | % | N/A | N/A | N/A | N/A | N/A | N/A | N/A | 20,931,624 | – | |||||||||||||||||||||||||||||
| Royce Heritage Fund | 1.00 | % | N/A | N/A | 2.24% | N/A | N/A | 1.84% | 1.59% | 1,748,685 | – | |||||||||||||||||||||||||||||
| Royce Opportunity Fund | 1.00 | % | N/A | 1.49% | N/A | N/A | N/A | N/A | N/A | 10,832,580 | – | |||||||||||||||||||||||||||||
| Royce Special Equity Fund | 0.99 | % | N/A | 1.39% | N/A | N/A | N/A | N/A | N/A | 12,835,735 | – | |||||||||||||||||||||||||||||
| Royce Select Fund I | 1.00 | % | 1.24% | N/A | N/A | N/A | N/A | N/A | N/A | 120,500 | 18,713 | |||||||||||||||||||||||||||||
| Royce Small-Cap Value Fund | 1.00 | % | N/A | 1.49% | N/A | N/A | N/A | N/A | N/A | 4,035,905 | – | |||||||||||||||||||||||||||||
| Royce Smaller-Companies Growth Fund | 1.00 | % | 1.24% | N/A | 2.24% | N/A | N/A | 1.84% | 1.59% | 4,470,199 | – | |||||||||||||||||||||||||||||
| Royce 100 Fund | 1.00 | % | 1.24% | 1.49% | N/A | N/A | N/A | 1.84% | 1.59% | 935,137 | – | |||||||||||||||||||||||||||||
| Royce Micro-Cap Discovery Fund | 1.00 | % | N/A | 1.49% | N/A | N/A | N/A | N/A | N/A | 5,340 | 22,217 | |||||||||||||||||||||||||||||
| Royce Dividend Value Fund | 1.00 | % | N/A | 1.49% | 2.24% | 1.04% | N/A | N/A | N/A | 2,242,693 | 60,624 | |||||||||||||||||||||||||||||
| Royce Micro-Cap Opportunity Fund | 1.00 | % | 1.24% | 1.49% | N/A | N/A | N/A | N/A | N/A | 99,222 | 2,176 | |||||||||||||||||||||||||||||
| Royce Special Equity Multi-Cap Fund | 0.85 | % | N/A | 1.24% | 1.99% | 0.89% | N/A | N/A | N/A | 1,244,178 | – | |||||||||||||||||||||||||||||
| 1 | From a base annual rate of 1.00% (1.25% for Royce Micro-Cap Fund and 0.85% for Royce Special Equity Multi-Cap Fund), the annual rates of investment advisory fees payable by each of the Funds, other than Royce Pennsylvania Mutual Fund, are reduced by the indicated amount at the following breakpoints applicable to a Fund’s net assets in excess of $2 billion: more than $2 billion to $4 billion – .05% per annum; more than $4 billion to $6 billion – .10% per annum; over $6 billion – .15% per annum. | 2 | Royce Pennsylvania Mutual Fund’s fees are calculated at the annual rate of 1.00% of the first $50 million of the Fund’s average net assets, 0.875% of the next $50 million of average net assets and 0.75% of average net assets in excess of $100 million. |
| 3 | Royce Micro-Cap Fund’s base annual contractual advisory fee was reduced from 1.30% to 1.25% effective May 1, 2015. |
| 4 | Committed net annual operating expense ratio cap excludes acquired fund fees and expenses, dividends on securities sold short and other expenses related to short sales. |
| 5 | Royce Micro-Cap Fund’s committed net annual operating expense ratio cap was reduced from 1.54% to 1.49% for Investment Class and from 1.66% to 1.61% for Service Class effective May 1, 2015. |
| ANNUAL CONTRACTUAL DISTRIBUTION FEE AS A | SIX MONTHS ENDED JUNE 30, 2015 | ||||||||||||
| PERCENTAGE OF AVERAGE NET ASSETS | Net distribution fees | Distribution fees waived | |||||||||||
| Royce Pennsylvania Mutual Fund – Service Class | 0.25 | % | $ | 330,707 | $ | – | |||||||
| Royce Pennsylvania Mutual Fund – Consultant Class | 1.00 | % | 3,176,629 | – | |||||||||
| Royce Pennsylvania Mutual Fund – R Class | 0.50 | % | 81,868 | – | |||||||||
| Royce Pennsylvania Mutual Fund – K Class | 0.25 | % | 12,341 | – | |||||||||
| Royce Micro-Cap Fund – Service Class | 0.25 | % | 45,028 | – | |||||||||
| Royce Micro-Cap Fund – Consultant Class | 1.00 | % | 326,183 | – | |||||||||
| Royce Premier Fund – Service Class | 0.25 | % | 171,925 | – | |||||||||
| Royce Premier Fund – Consultant Class | 1.00 | % | 267,254 | – | |||||||||
| Royce Premier Fund – R Class | 0.50 | % | 61,986 | – | |||||||||
| Royce Premier Fund – K Class | 0.25 | % | 6,881 | – | |||||||||
| Royce Low-Priced Stock Fund – Service Class | 0.25 | % | 565,908 | 23,579 | |||||||||
| Royce Low-Priced Stock Fund – R Class | 0.50 | % | 3,735 | – | |||||||||
| Royce Low-Priced Stock Fund – K Class | 0.25 | % | 2,455 | – | |||||||||
| Royce Total Return Fund – Service Class | 0.25 | % | 265,268 | – | |||||||||
| Royce Total Return Fund – Consultant Class | 1.00 | % | 1,702,419 | – | |||||||||
| Royce Total Return Fund – R Class | 0.50 | % | 161,427 | – | |||||||||
| Royce Total Return Fund – K Class | 0.25 | % | 116,317 | – | |||||||||
| Royce Heritage Fund – Service Class | 0.25 | % | 175,523 | 23,935 | |||||||||
| Royce Heritage Fund – Consultant Class | 1.00 | % | 64,085 | – | |||||||||
| Royce Heritage Fund – R Class | 0.50 | % | 8,166 | – | |||||||||
| Royce Heritage Fund – K Class | 0.25 | % | 6,788 | – | |||||||||
114 | The Royce Funds 2015 Semiannual Report to Shareholders
DISTRIBUTOR (continued):
| ANNUAL CONTRACTUAL DISTRIBUTION FEE AS A | SIX MONTHS ENDED JUNE 30, 2015 | ||||||||||||
| PERCENTAGE OF AVERAGE NET ASSETS | Net distribution fees | Distribution fees waived | |||||||||||
| Royce Opportunity Fund – Service Class | 0.25 | % | $ | 180,149 | $ | – | |||||||
| Royce Opportunity Fund – Consultant Class | 1.00 | % | 110,979 | – | |||||||||
| Royce Opportunity Fund – R Class | 0.50 | % | 85,679 | – | |||||||||
| Royce Opportunity Fund – K Class | 0.25 | % | 25,146 | – | |||||||||
| Royce Special Equity Fund – Service Class | 0.25 | % | 251,449 | – | |||||||||
| Royce Special Equity Fund – Consultant Class | 1.00 | % | 298,060 | – | |||||||||
| Royce Small-Cap Value Fund – Service Class | 0.25 | % | 528,219 | – | |||||||||
| Royce Small-Cap Value Fund – Consultant Class | 1.00 | % | 127,814 | – | |||||||||
| Royce Small-Cap Value Fund – R Class | 0.50 | % | 70,460 | – | |||||||||
| Royce Small-Cap Value Fund – K Class | 0.25 | % | 11,252 | – | |||||||||
| Royce Smaller-Companies Growth Fund – Service Class | 0.25 | % | 631,191 | 54,886 | |||||||||
| Royce Smaller-Companies Growth Fund – Consultant Class | 1.00 | % | 82,901 | – | |||||||||
| Royce Smaller-Companies Growth Fund – R Class | 0.50 | % | 3,244 | – | |||||||||
| Royce Smaller-Companies Growth Fund – K Class | 0.25 | % | 599 | – | |||||||||
| Royce 100 Fund – Service Class | 0.25 | % | 142,075 | 12,354 | |||||||||
| Royce 100 Fund – R Class | 0.50 | % | 4,948 | – | |||||||||
| Royce 100 Fund – K Class | 0.25 | % | 770 | – | |||||||||
| Royce Micro-Cap Discovery Fund – Service Class | 0.25 | % | 6,889 | – | |||||||||
| Royce Dividend Value Fund – Service Class | 0.25 | % | 311,293 | 12,971 | |||||||||
| Royce Dividend Value Fund – Consultant Class | 1.00 | % | 5,048 | – | |||||||||
| Royce Micro-Cap Opportunity Fund – Service Class | 0.25 | % | 1,420 | – | |||||||||
| Royce Special Equity Multi-Cap Fund – Service Class | 0.25 | % | 100,634 | 8,751 | |||||||||
| Royce Special Equity Multi-Cap Fund – Consultant Class | 1.00 | % | 47,849 | – | |||||||||
| PURCHASES TO COVER | ||||||||||||||||
| PURCHASES | SALES | SHORT SALES | SHORT SALES | |||||||||||||
| Royce Pennsylvania Mutual Fund | $ | 584,992,953 | $ | 1,804,512,533 | $ | – | $ | – | ||||||||
| Royce Micro-Cap Fund | 92,434,781 | 210,791,886 | – | – | ||||||||||||
| Royce Premier Fund | 188,990,411 | 1,517,707,944 | – | – | ||||||||||||
| Royce Low-Priced Stock Fund | 159,357,758 | 319,197,011 | – | – | ||||||||||||
| Royce Total Return Fund | 169,583,588 | 780,877,253 | – | – | ||||||||||||
| Royce Heritage Fund | 104,009,411 | 160,298,707 | – | – | ||||||||||||
| Royce Opportunity Fund | 247,527,209 | 485,984,390 | – | – | ||||||||||||
| Royce Special Equity Fund | 185,672,519 | 897,438,045 | – | – | ||||||||||||
| Royce Select Fund I | 5,371,480 | 20,459,467 | – | – | ||||||||||||
| Royce Small-Cap Value Fund | 236,459,019 | 367,803,202 | – | – | ||||||||||||
| Royce Smaller-Companies Growth Fund | 141,848,899 | 294,133,633 | – | – | ||||||||||||
| Royce 100 Fund | 56,715,349 | 122,275,010 | – | – | ||||||||||||
| Royce Micro-Cap Discovery Fund | 2,171,662 | 2,305,280 | – | – | ||||||||||||
| Royce Dividend Value Fund | 30,999,520 | 143,903,321 | – | – | ||||||||||||
| Royce Micro-Cap Opportunity Fund | 13,460,727 | 12,129,521 | 1,283,203 | 2,217,912 | ||||||||||||
| Royce Special Equity Multi-Cap Fund | 43,822,814 | 65,593,134 | – | – | ||||||||||||
The Royce Funds 2015 Semiannual Report to Shareholders | 115
Notes to Financial Statements (unaudited) (continued)
| CLASS LEVEL | |||||||||||||||||||||||
| EXPENSES | |||||||||||||||||||||||
| REIMBURSED BY | |||||||||||||||||||||||
| NET DISTRIBUTION | SHAREHOLDER | SHAREHOLDER | TRANSFER AGENT | INVESTMENT | |||||||||||||||||||
| FEES | SERVICING | REPORTS | REGISTRATION | BALANCE CREDITS | TOTAL | ADVISER | |||||||||||||||||
| Royce Pennsylvania Mutual Fund – Investment Class | $ | – | $ | 2,113,999 | $ | 377,563 | $ | 29,399 | $ | (579 | ) | $ | 2,520,382 | $ | – | ||||||||
| Royce Pennsylvania Mutual Fund – Service Class | 330,707 | 386,614 | 64,752 | 10,835 | (17 | ) | 792,891 | – | |||||||||||||||
| Royce Pennsylvania Mutual Fund – Consultant Class | 3,176,629 | 304,006 | 78,481 | 8,015 | (131 | ) | 3,567,000 | – | |||||||||||||||
| Royce Pennsylvania Mutual Fund – Institutional Class | – | 3,585 | 30,929 | 16,117 | (2 | ) | 50,629 | – | |||||||||||||||
| Royce Pennsylvania Mutual Fund – R Class | 81,868 | 33,563 | 2,493 | 839 | (8 | ) | 118,755 | – | |||||||||||||||
| Royce Pennsylvania Mutual Fund – K Class | 12,341 | 12,557 | 918 | 6,634 | (2 | ) | 32,448 | – | |||||||||||||||
| 3,601,545 | 2,854,324 | 555,136 | 71,839 | (739 | ) | ||||||||||||||||||
| Royce Micro-Cap Fund – Investment Class | – | 284,360 | 96,045 | 10,793 | (141 | ) | 391,057 | 70,974 | |||||||||||||||
| Royce Micro-Cap Fund – Service Class | 45,028 | 22,078 | 9,355 | 5,737 | (10 | ) | 82,188 | 28,705 | |||||||||||||||
| Royce Micro-Cap Fund – Consultant Class | 326,183 | 45,457 | 11,200 | 6,630 | (27 | ) | 389,443 | – | |||||||||||||||
| 371,211 | 351,895 | 116,600 | 23,160 | (178 | ) | 99,679 | |||||||||||||||||
| Royce Premier Fund – Investment Class | – | 2,016,394 | 477,462 | 19,380 | (493 | ) | 2,512,743 | – | |||||||||||||||
| Royce Premier Fund – Service Class | 171,925 | 162,946 | 24,929 | 6,536 | (39 | ) | 366,297 | 28,923 | |||||||||||||||
| Royce Premier Fund – Consultant Class | 267,254 | 24,959 | 6,262 | 5,648 | (17 | ) | 304,106 | – | |||||||||||||||
| Royce Premier Fund – Institutional Class | – | 4,755 | 26,781 | 8,407 | (4 | ) | 39,939 | – | |||||||||||||||
| Royce Premier Fund – W Class | – | 173,185 | 57,826 | 11,341 | (80 | ) | 242,272 | – | |||||||||||||||
| Royce Premier Fund – R Class | 61,986 | 31,461 | 1,329 | 840 | (3 | ) | 95,613 | – | |||||||||||||||
| Royce Premier Fund – K Class | 6,881 | 9,926 | 227 | 6,643 | (1 | ) | 23,676 | – | |||||||||||||||
| 508,046 | 2,423,626 | 594,816 | 58,795 | (637 | ) | 28,923 | |||||||||||||||||
| Royce Low-Priced Stock Fund – Investment Class | – | 29,578 | 7,932 | 5,920 | (3 | ) | 43,427 | 4,973 | |||||||||||||||
| Royce Low-Priced Stock Fund – Service Class | 565,908 | 572,391 | 90,108 | 11,938 | (139 | ) | 1,240,206 | 249,587 | |||||||||||||||
| Royce Low-Priced Stock Fund – Institutional Class | – | 3,343 | 18,329 | 7,073 | (1 | ) | 28,744 | – | |||||||||||||||
| Royce Low-Priced Stock Fund – R Class | 3,735 | 5,445 | 459 | 839 | (1 | ) | 10,477 | 4,710 | |||||||||||||||
| Royce Low-Priced Stock Fund – K Class | 2,455 | 5,545 | 387 | 6,775 | (1 | ) | 15,161 | 10,067 | |||||||||||||||
| 572,098 | 616,302 | 117,215 | 32,545 | (145 | ) | 269,337 | |||||||||||||||||
| Royce Total Return Fund – Investment Class | – | 1,674,337 | 333,605 | 26,361 | (457 | ) | 2,033,846 | – | |||||||||||||||
| Royce Total Return Fund – Service Class | 265,268 | 183,771 | 33,049 | 9,086 | (17 | ) | 491,157 | – | |||||||||||||||
| Royce Total Return Fund – Consultant Class | 1,702,419 | 164,579 | 41,147 | 7,225 | (84 | ) | 1,915,286 | – | |||||||||||||||
| Royce Total Return Fund – Institutional Class | – | 5,509 | 12,981 | 23,485 | (6 | ) | 41,969 | – | |||||||||||||||
| Royce Total Return Fund – W Class | – | 121,514 | 40,835 | 10,857 | (4 | ) | 173,202 | – | |||||||||||||||
| Royce Total Return Fund – R Class | 161,427 | 66,132 | 3,498 | 844 | (12 | ) | 231,889 | – | |||||||||||||||
| Royce Total Return Fund – K Class | 116,317 | 119,041 | 3,173 | 7,028 | (4 | ) | 245,555 | – | |||||||||||||||
| 2,245,431 | 2,334,883 | 468,288 | 84,886 | (584 | ) | ||||||||||||||||||
| Royce Heritage Fund – Investment Class | – | 10,880 | 1,869 | 7,256 | (3 | ) | 20,002 | – | |||||||||||||||
| Royce Heritage Fund – Service Class | 175,523 | 82,069 | 27,710 | 8,062 | (98 | ) | 293,266 | – | |||||||||||||||
| Royce Heritage Fund – Consultant Class | 64,085 | 10,060 | 3,393 | 5,167 | (10 | ) | 82,695 | 7,037 | |||||||||||||||
| Royce Heritage Fund – R Class | 8,166 | 6,690 | 601 | 839 | (2 | ) | 16,294 | 3,510 | |||||||||||||||
| Royce Heritage Fund – K Class | 6,788 | 9,090 | 850 | 6,762 | (1 | ) | 23,489 | 9,086 | |||||||||||||||
| 254,562 | 118,789 | 34,423 | 28,086 | (114 | ) | 19,633 | |||||||||||||||||
| Royce Opportunity Fund – Investment Class | – | 622,917 | 94,541 | 17,595 | (248 | ) | 734,805 | – | |||||||||||||||
| Royce Opportunity Fund – Service Class | 180,149 | 125,868 | 27,630 | 6,399 | (9 | ) | 340,037 | 10,688 | |||||||||||||||
| Royce Opportunity Fund – Consultant Class | 110,979 | 11,656 | 3,012 | 6,084 | (8 | ) | 131,723 | – | |||||||||||||||
| Royce Opportunity Fund – Institutional Class | – | 3,829 | 21,677 | 13,941 | (3 | ) | 39,444 | – | |||||||||||||||
| Royce Opportunity Fund – R Class | 85,679 | 33,218 | 2,062 | 839 | (5 | ) | 121,793 | – | |||||||||||||||
| Royce Opportunity Fund – K Class | 25,146 | 25,878 | 1,811 | 7,081 | (3 | ) | 59,913 | – | |||||||||||||||
| 401,953 | 823,366 | 150,733 | 51,939 | (276 | ) | 10,688 | |||||||||||||||||
116 | The Royce Funds 2015 Semiannual Report to Shareholders
| CLASS LEVEL | |||||||||||||||||||||||
| EXPENSES | |||||||||||||||||||||||
| REIMBURSED BY | |||||||||||||||||||||||
| NET DISTRIBUTION | SHAREHOLDER | SHAREHOLDER | TRANSFER AGENT | INVESTMENT | |||||||||||||||||||
| FEES | SERVICING | REPORTS | REGISTRATION | BALANCE CREDITS | TOTAL | ADVISER | |||||||||||||||||
| Royce Special Equity Fund – Investment Class | $ | – | $ | 866,337 | $ | 178,042 | $ | 21,218 | $ | (196 | ) | $ | 1,065,401 | $ | – | ||||||||
| Royce Special Equity Fund – Service Class | 251,449 | 174,361 | 41,669 | 8,799 | (120 | ) | 476,158 | 110,112 | |||||||||||||||
| Royce Special Equity Fund – Consultant Class | 298,060 | 26,114 | 6,658 | 5,535 | (13 | ) | 336,354 | – | |||||||||||||||
| Royce Special Equity Fund – Institutional Class | – | 4,279 | 5,376 | 7,561 | (3 | ) | 17,213 | – | |||||||||||||||
| 549,509 | 1,071,091 | 231,745 | 43,113 | (332 | ) | 110,112 | |||||||||||||||||
| Royce Small-Cap Value Fund – Investment Class | – | 82,323 | 19,218 | 6,387 | (29 | ) | 107,899 | – | |||||||||||||||
| Royce Small-Cap Value Fund – Service Class | 528,219 | 377,771 | 66,396 | 10,650 | (146 | ) | 982,890 | 37,956 | |||||||||||||||
| Royce Small-Cap Value Fund – Consultant Class | 127,814 | 16,520 | 3,453 | 5,875 | (5 | ) | 153,657 | – | |||||||||||||||
| Royce Small-Cap Value Fund – Institutional Class | – | 3,286 | 3,183 | 8,081 | (1 | ) | 14,549 | – | |||||||||||||||
| Royce Small-Cap Value Fund – R Class | 70,460 | 37,363 | 1,582 | 857 | (3 | ) | 110,259 | – | |||||||||||||||
| Royce Small-Cap Value Fund – K Class | 11,252 | 14,084 | 2,121 | 6,833 | (1 | ) | 34,289 | – | |||||||||||||||
| 737,745 | 531,347 | 95,953 | 38,683 | (185 | ) | 37,956 | |||||||||||||||||
| Royce Smaller-Companies Growth Fund – Investment Class | – | 315,985 | 76,668 | 8,590 | (7 | ) | 401,236 | 115,717 | |||||||||||||||
| Royce Smaller-Companies Growth Fund – Service Class | 631,191 | 429,956 | 94,957 | 11,373 | (150 | ) | 1,167,327 | – | |||||||||||||||
| Royce Smaller-Companies Growth Fund – Consultant Class | 82,901 | 14,870 | 3,027 | 5,366 | (6 | ) | 106,158 | 6,911 | |||||||||||||||
| Royce Smaller-Companies Growth Fund – Institutional Class | – | 3,637 | 3,794 | 5,876 | (1 | ) | 13,306 | – | |||||||||||||||
| Royce Smaller-Companies Growth Fund – R Class | 3,244 | 4,337 | 314 | 851 | (1 | ) | 8,745 | 3,571 | |||||||||||||||
| Royce Smaller-Companies Growth Fund – K Class | 599 | 3,833 | 109 | 6,752 | – | 11,293 | 9,981 | ||||||||||||||||
| 717,935 | 772,618 | 178,869 | 38,808 | (165 | ) | 136,180 | |||||||||||||||||
| Royce 100 Fund – Investment Class | – | 48,244 | 11,807 | 6,602 | (2 | ) | 66,651 | 12,686 | |||||||||||||||
| Royce 100 Fund – Service Class | 142,075 | 119,812 | 61,598 | 9,734 | (55 | ) | 333,164 | 67,982 | |||||||||||||||
| Royce 100 Fund – R Class | 4,948 | 5,920 | 1,001 | 846 | (6 | ) | 12,709 | 5,047 | |||||||||||||||
| Royce 100 Fund – K Class | 770 | 4,145 | 241 | 6,779 | – | 11,935 | 10,307 | ||||||||||||||||
| 147,793 | 178,121 | 74,647 | 23,961 | (63 | ) | 96,022 | |||||||||||||||||
| Royce Dividend Value Fund – Investment Class | – | 108,085 | 27,039 | 8,803 | (7 | ) | 143,920 | – | |||||||||||||||
| Royce Dividend Value Fund – Service Class | 311,293 | 197,303 | 62,988 | 12,521 | (352 | ) | 583,753 | – | |||||||||||||||
| Royce Dividend Value Fund – Consultant Class | 5,048 | 3,469 | 121 | 8,573 | (1 | ) | 17,210 | 11,123 | |||||||||||||||
| Royce Dividend Value Fund – Institutional Class | – | 2,976 | 54 | 5,348 | – | 8,378 | 8,378 | ||||||||||||||||
| 316,341 | 311,833 | 90,202 | 35,245 | (360 | ) | 19,501 | |||||||||||||||||
| Royce Micro-Cap Opportunity Fund – Investment Class | – | 9,989 | 4,494 | 8,379 | (4 | ) | 22,858 | 22,858 | |||||||||||||||
| Royce Micro-Cap Opportunity Fund – Service Class | 1,420 | 4,243 | 384 | 10,648 | – | 16,695 | 15,314 | ||||||||||||||||
| 1,420 | 14,232 | 4,878 | 19,027 | (4 | ) | 38,172 | |||||||||||||||||
| Royce Special Equity Multi-Cap Fund – Investment Class | – | 18,047 | 3,362 | 15,594 | (3 | ) | 37,000 | – | |||||||||||||||
| Royce Special Equity Multi-Cap Fund – Service Class | 100,634 | 56,994 | 7,901 | 9,916 | (11 | ) | 175,434 | 22,400 | |||||||||||||||
| Royce Special Equity Multi-Cap Fund – Consultant Class | 47,849 | 3,439 | 354 | 10,804 | – | 62,446 | 9,902 | ||||||||||||||||
| Royce Special Equity Multi-Cap Fund – Institutional Class | – | 3,002 | 1,277 | 7,011 | – | 11,290 | 10,995 | ||||||||||||||||
| 148,483 | 81,482 | 12,894 | 43,325 | (14 | ) | 43,297 | |||||||||||||||||
The Royce Funds 2015 Semiannual Report to Shareholders | 117
Notes to Financial Statements (unaudited) (continued)
| NET UNREALIZED | GROSS UNREALIZED | |||||||||||||||||||||
| TAX BASIS COST | APPRECIATION (DEPRECIATION) | Appreciation | Depreciation | |||||||||||||||||||
| Royce Pennsylvania Mutual Fund | $3,211,608,167 | $1,376,710,466 | $1,574,015,035 | $197,304,569 | ||||||||||||||||||
| Royce Micro-Cap Fund | 355,453,322 | 53,523,273 | 99,034,885 | 45,511,612 | ||||||||||||||||||
| Royce Premier Fund | 2,579,504,798 | 1,841,635,576 | 1,870,789,355 | 29,153,779 | ||||||||||||||||||
| Royce Low-Priced Stock Fund | 466,901,255 | 83,520,676 | 113,200,683 | 29,680,007 | ||||||||||||||||||
| Royce Total Return Fund | 2,699,748,240 | 1,301,880,624 | 1,487,190,371 | 185,309,747 | ||||||||||||||||||
| Royce Heritage Fund | 288,111,763 | 55,485,273 | 64,035,721 | 8,550,448 | ||||||||||||||||||
| Royce Opportunity Fund | 1,861,454,029 | 262,075,558 | 492,210,771 | 230,135,213 | ||||||||||||||||||
| Royce Special Equity Fund | 1,766,119,638 | 430,061,433 | 461,312,501 | 31,251,068 | ||||||||||||||||||
| Royce Select Fund I | 18,408,718 | 4,619,872 | 5,225,202 | 605,330 | ||||||||||||||||||
| Royce Small-Cap Value Fund | 684,307,992 | 70,788,899 | 122,429,313 | 51,640,414 | ||||||||||||||||||
| Royce Smaller-Companies Growth Fund | 701,826,103 | 257,248,177 | 289,428,960 | 32,180,783 | ||||||||||||||||||
| Royce 100 Fund | 122,491,480 | 26,855,944 | 30,572,648 | 3,716,704 | ||||||||||||||||||
| Royce Micro-Cap Discovery Fund | 5,380,367 | 201,070 | 606,688 | 405,618 | ||||||||||||||||||
| Royce Dividend Value Fund | 342,392,915 | 80,712,725 | 104,592,597 | 23,879,872 | ||||||||||||||||||
| Royce Micro-Cap Opportunity Fund | 20,914,768 | 501,124 | 2,383,986 | 1,882,862 | ||||||||||||||||||
| Royce Special Equity Multi-Cap Fund | 228,817,081 | 29,651,275 | 33,531,538 | 3,880,263 | ||||||||||||||||||
The primary difference between book and tax basis cost is the timing of the recognition of losses on securities sold.
| AFFILIATED COMPANY | SHARES 12/31/14 | MARKET VALUE 12/31/14 | COST OF PURCHASES | COST OF SALES | REALIZED GAIN (LOSS) | DIVIDEND INCOME | SHARES 6/30/15 | MARKET VALUE 6/30/15 | ||||||||||||||||||||||||
| Royce Pennsylvania Mutual Fund | ||||||||||||||||||||||||||||||||
| America’s Car-Mart 1 | 500,900 | $ | 26,738,042 | $ | – | $ | 2,815,200 | $ | 1,969,291 | $ | – | |||||||||||||||||||||
| Destination Maternity 1 | 648,466 | 10,343,033 | 793,983 | 527,736 | (234,705 | ) | 139,905 | |||||||||||||||||||||||||
| DTS | 1,007,929 | 30,993,817 | 891,968 | 1,354,778 | 55,494 | – | 992,329 | $ | 30,256,111 | |||||||||||||||||||||||
| Fabrinet 1 | 1,790,355 | 31,760,898 | 367,716 | 10,588,169 | 867,728 | – | ||||||||||||||||||||||||||
| FRP Holdings | 254,400 | 9,975,024 | 11,154,081 | – | – | – | 568,912 | 18,449,816 | ||||||||||||||||||||||||
| Key Tronic | 681,935 | 5,414,564 | – | – | – | – | 681,935 | 7,412,634 | ||||||||||||||||||||||||
| PICO Holdings | 1,319,011 | 24,863,357 | 2,063,566 | 4,379,209 | (1,534,242 | ) | – | 1,259,124 | 18,534,305 | |||||||||||||||||||||||
| Preformed Line Products | 352,478 | 19,255,873 | – | 1,618,822 | (735,607 | ) | 133,591 | 333,978 | 12,597,650 | |||||||||||||||||||||||
| STRATTEC SECURITY | 263,950 | 21,796,991 | 26,189 | 972,829 | (142,596 | ) | 61,680 | 253,050 | 17,384,535 | |||||||||||||||||||||||
| Weyco Group | 590,500 | 17,520,135 | – | 472,000 | 176,895 | 221,091 | 566,900 | 16,904,958 | ||||||||||||||||||||||||
| 198,661,734 | 422,258 | 556,267 | 121,540,009 | |||||||||||||||||||||||||||||
| Royce Micro-Cap Fund | ||||||||||||||||||||||||||||||||
| Key Technology 1 | 339,814 | 4,349,619 | – | 613,845 | 53,755 | – | ||||||||||||||||||||||||||
| Truett-Hurst Cl. A 1 | 191,900 | 758,005 | – | 1,148,176 | (731,451 | ) | – | |||||||||||||||||||||||||
| 5,107,624 | (677,696 | ) | – | |||||||||||||||||||||||||||||
| Royce Premier Fund | ||||||||||||||||||||||||||||||||
| Acacia Research 1 | 3,075,472 | 52,098,496 | – | 67,134,113 | (28,531,187 | ) | 167,904 | |||||||||||||||||||||||||
| Benchmark Electronics 1 | 2,702,100 | 68,741,424 | – | 6,629,165 | 364,846 | – | ||||||||||||||||||||||||||
| Cabot Microelectronics 1 | 1,321,074 | 62,513,222 | – | 7,832,375 | 6,012,691 | – | ||||||||||||||||||||||||||
| Globe Specialty Metals 1 | 5,094,972 | 87,786,367 | – | 73,194,473 | 18,399,483 | 289,206 | ||||||||||||||||||||||||||
| Kennedy-Wilson Holdings 1 | 5,318,014 | 134,545,754 | – | 34,463,467 | 1,876,428 | 1,106,355 | ||||||||||||||||||||||||||
| MKS Instruments | 3,028,910 | 110,858,106 | – | 9,537,051 | 1,914,959 | 959,260 | 2,707,410 | 102,719,136 | ||||||||||||||||||||||||
| Pason Systems | 3,981,100 | 75,009,708 | 3,726,683 | – | – | 1,151,673 | 4,234,900 | 75,780,637 | ||||||||||||||||||||||||
| Ritchie Bros. Auctioneers 1 | 5,442,714 | 146,354,580 | – | 28,605,032 | 3,572,853 | 1,370,352 | ||||||||||||||||||||||||||
| Schnitzer Steel Industries Cl. A 1 | 1,795,805 | 40,513,361 | – | 56,990,886 | (26,764,674 | ) | 327,695 | |||||||||||||||||||||||||
| SEACOR Holdings | 982,527 | 72,520,318 | 3,366,527 | – | – | – | 1,030,827 | 73,126,867 | ||||||||||||||||||||||||
| Semperit AG Holding | 1,927,361 | 93,265,167 | – | 38,484,699 | (6,050,825 | ) | 8,095,993 | 1,205,461 | 49,724,584 | |||||||||||||||||||||||
| Simpson Manufacturing 1 | 2,630,933 | 91,030,282 | – | 23,387,311 | 12,296,651 | 935,681 | ||||||||||||||||||||||||||
| Sun Hydraulics | 1,252,333 | 49,316,874 | 17,012,584 | – | – | 433,218 | 1,691,433 | 64,460,512 | ||||||||||||||||||||||||
| Thor Industries 1 | 3,761,457 | 210,152,602 | – | 61,162,990 | 52,402,713 | 1,239,003 | ||||||||||||||||||||||||||
118 | The Royce Funds 2015 Semiannual Report to Shareholders
Transactions in Affiliated Companies (continued):
| AFFILIATED COMPANY | SHARES 12/31/14 | MARKET VALUE 12/31/14 | COST OF PURCHASES | COST OF SALES | REALIZED GAIN (LOSS) | DIVIDEND INCOME | SHARES 6/30/15 | MARKET VALUE 6/30/15 | ||||||||||||||||||||||||
| Royce Premier Fund (continued) | ||||||||||||||||||||||||||||||||
| Trican Well Service 1 | 8,450,100 | $ | 40,512,186 | $ | – | $ | 74,979,907 | $ | (49,934,405 | ) | $ | – | ||||||||||||||||||||
| Unit Corporation 1 | 2,586,073 | 88,185,089 | – | 26,964,630 | (9,709,082 | ) | – | |||||||||||||||||||||||||
| 1,423,403,536 | (24,149,549 | ) | 16,076,340 | 365,811,736 | ||||||||||||||||||||||||||||
| Royce Low-Priced Stock Fund | ||||||||||||||||||||||||||||||||
| Tecumseh Products | 1,207,365 | 3,730,758 | – | – | – | – | 1,207,365 | 2,982,191 | ||||||||||||||||||||||||
| 3,730,758 | – | – | 2,982,191 | |||||||||||||||||||||||||||||
| Royce Total Return Fund | ||||||||||||||||||||||||||||||||
| Chase Corporation | 773,974 | 27,855,324 | – | 1,413,454 | 2,003,829 | – | 684,674 | 27,215,792 | ||||||||||||||||||||||||
| Houston Wire & Cable | 1,378,225 | 16,469,789 | – | 709,000 | (176,903 | ) | 323,406 | 1,328,225 | 13,175,992 | |||||||||||||||||||||||
| Landauer | 553,400 | 18,893,076 | – | 1,920,217 | (630,128 | ) | 289,328 | 515,300 | 18,365,292 | |||||||||||||||||||||||
| Mueller (Paul) Company | 116,700 | 5,391,540 | – | – | – | – | 116,700 | 3,705,225 | ||||||||||||||||||||||||
| Starrett (L.S.) Company (The) Cl. A | 529,400 | 10,550,942 | – | – | – | 105,880 | 529,400 | 7,941,000 | ||||||||||||||||||||||||
| 79,160,671 | 1,196,798 | 718,614 | 70,403,301 | |||||||||||||||||||||||||||||
| Royce Opportunity Fund | ||||||||||||||||||||||||||||||||
| BTU International 1 | 806,549 | 2,653,546 | – | – | – | – | ||||||||||||||||||||||||||
| Dixie Group | 845,735 | 7,755,390 | 172,964 | 19,162 | 245 | – | 864,035 | 9,072,367 | ||||||||||||||||||||||||
| Identiv | 526,268 | 7,309,863 | 1,279,916 | 313,510 | 9,003 | – | 582,839 | 3,432,922 | ||||||||||||||||||||||||
| LMI Aerospace | 702,037 | 9,898,722 | 1,410,606 | 137,119 | (50,256 | ) | – | 816,430 | 8,172,464 | |||||||||||||||||||||||
| Pericom Semiconductor 1 | 1,221,199 | 16,535,034 | – | 3,250,914 | 1,958,208 | 124,613 | ||||||||||||||||||||||||||
| Planar Systems | 1,079,499 | 9,035,407 | 1,053,770 | 181,951 | 33,347 | – | 1,221,075 | 5,323,887 | ||||||||||||||||||||||||
| SigmaTron International | 345,772 | 2,309,757 | – | – | – | – | 345,772 | 3,146,525 | ||||||||||||||||||||||||
| Spire Corporation | 675,600 | 172,278 | 3,599 | 15,751 | (12,396 | ) | – | 662,700 | 73,560 | |||||||||||||||||||||||
| TRC Companies | 1,740,430 | 11,034,326 | – | 3,041,662 | (1,342,372 | ) | – | 1,563,629 | 15,870,834 | |||||||||||||||||||||||
| 66,704,323 | 595,779 | 124,613 | 45,092,559 | |||||||||||||||||||||||||||||
| Royce Special Equity Fund | ||||||||||||||||||||||||||||||||
| Atrion Corporation 1 | 115,000 | 39,101,150 | – | 8,331,780 | 30,159,230 | 36,000 | ||||||||||||||||||||||||||
| AVX Corporation | 9,900,000 | 138,600,000 | – | 13,742,351 | 3,253,281 | 2,047,500 | 8,700,000 | 117,102,000 | ||||||||||||||||||||||||
| Bowl America Cl. A | 343,048 | 4,912,447 | – | 262,801 | 147,764 | 116,636 | 315,948 | 4,511,737 | ||||||||||||||||||||||||
| Children’s Place | 2,170,000 | 123,690,000 | – | 32,566,839 | 8,328,555 | 565,290 | 1,540,000 | 100,731,400 | ||||||||||||||||||||||||
| CSS Industries | 972,385 | 26,876,721 | – | 1,650,753 | 983,992 | 347,829 | 880,000 | 26,620,000 | ||||||||||||||||||||||||
| Finish Line (The) Cl. A | 4,775,000 | 116,080,250 | – | 31,733,011 | 5,873,064 | 766,872 | 3,295,000 | 91,666,900 | ||||||||||||||||||||||||
| Foster (L.B.) Company | 1,000,000 | 48,570,000 | – | 3,721,265 | 802,523 | 78,800 | 885,000 | 30,629,850 | ||||||||||||||||||||||||
| Frisch’s Restaurants | 505,100 | 13,536,680 | – | 603,915 | 745,902 | 194,060 | 465,200 | 15,616,764 | ||||||||||||||||||||||||
| Haverty Furniture 1 | 985,163 | 21,683,438 | 4,748,709 | 1,975,694 | 128,540 | 172,654 | ||||||||||||||||||||||||||
| Hawkins | 955,432 | 41,398,869 | 1,706,901 | 1,487,920 | 2,614,039 | 367,834 | 900,000 | 36,351,000 | ||||||||||||||||||||||||
| Hurco Companies | 479,319 | 16,339,985 | 1,250,660 | 480,149 | 913,171 | 76,837 | 476,200 | 16,486,044 | ||||||||||||||||||||||||
| Meredith Corporation 1 | 2,375,000 | 129,010,000 | – | 20,107,547 | 9,689,540 | 1,927,265 | ||||||||||||||||||||||||||
| National Presto Industries | 656,500 | 38,103,260 | – | 1,961,640 | 2,170,287 | 2,658,825 | 600,000 | 48,192,000 | ||||||||||||||||||||||||
| Neenah Paper | 1,272,808 | 76,712,138 | 3,598,098 | 4,464,183 | 1,897,767 | 781,352 | 1,227,800 | 72,391,088 | ||||||||||||||||||||||||
| Park Electrochemical | 1,458,382 | 36,357,463 | 2,962,826 | 1,996,600 | 694,640 | 2,487,023 | 1,475,000 | 28,261,000 | ||||||||||||||||||||||||
| ScanSource | 2,400,000 | 96,384,000 | – | 36,909,365 | (1,386,154 | ) | – | 1,480,000 | 56,328,800 | |||||||||||||||||||||||
| Scholastic Corporation 1 | 2,725,000 | 99,244,500 | – | 39,093,076 | 9,963,657 | 639,750 | ||||||||||||||||||||||||||
| Schweitzer-Mauduit International 1 | 2,300,000 | 97,290,000 | – | 41,764,892 | (5,807,598 | ) | 1,417,400 | |||||||||||||||||||||||||
| Standard Motor Products | 2,268,000 | 86,456,160 | – | 4,032,594 | 2,608,306 | 680,400 | �� | 2,089,000 | 73,365,680 | |||||||||||||||||||||||
| UniFirst Corporation | 1,542,278 | 187,309,663 | – | 10,605,622 | 9,434,598 | 115,671 | 1,370,000 | 153,234,500 | ||||||||||||||||||||||||
| Universal Corporation 1 | 1,900,000 | 83,562,000 | – | 83,994,124 | (1,868,398 | ) | 1,633,528 | |||||||||||||||||||||||||
| Weis Markets 1 | 1,486,100 | 71,065,302 | 63,176 | 5,627,016 | 1,104,383 | 880,830 | ||||||||||||||||||||||||||
| 1,592,284,026 | 82,451,089 | 17,992,356 | 871,488,763 | |||||||||||||||||||||||||||||
The Royce Funds 2015 Semiannual Report to Shareholders | 119
Understanding Your Fund’s Expenses (unaudited)
As a shareholder of a mutual fund, you pay ongoing expenses, including management fees and other Fund expenses including, for some funds, distribution and/or service (12b-1) fees. Using the information below, you can estimate how these ongoing expenses (in dollars) affect your investment and compare them with the ongoing expenses of other funds. You may also incur one-time transaction expenses, including redemption fees, which are not shown in this section and would result in higher total costs. The example is based on an investment of $1,000 invested at January 1, 2015, and held for the entire six-month period ended June 30, 2015. Service, Consultant, R and K Class shares are generally available only through certain brokers or retirement plan administrators who receive distribution and/or service fees from the Fund for services that they perform. Institutional and W Class shares are generally available only to institutions or intermediaries with a minimum account size of $1 million.
Actual Expenses
The first part of the table below provides information about actual account values and actual expenses. You may use the information in this section, together with the amount you invested, to estimate the expenses that you paid over the period. Simply divide your account value at June 30, 2015, by $1,000 (for example, an $8,600 account value divided by $1,000 = 8.6), then multiply the result by the number under the heading entitled “Expenses Paid During the Period” to estimate the expenses you paid on your account during this period.
Hypothetical Example for Comparison Purposes
The second part of the table below provides information about hypothetical account values and hypothetical expenses based on the Fund’s actual expense ratio and an assumed rate of return of 5% per year before expenses, which is not the Fund’s actual return. The hypothetical account values and expenses may not be used to estimate the actual ending account balance or expenses you paid for the period. You may use this information to compare the ongoing costs of investing in the Fund and other funds. To do so, compare this 5% hypothetical example with the 5% hypothetical examples that appear in the shareholder reports of the other funds.
Please note that the expenses shown in the table are meant to highlight your ongoing costs only and do not reflect any transactional costs, such as sales charges (loads), redemption fees, or exchange fees. Therefore, this section is useful in comparing ongoing costs only, and will not help you determine the relative total costs of owning different funds. In addition, if these transactional costs were included, your costs would have been higher.
| ACTUAL | HYPOTHETICAL (5% PER YEAR RETURN BEFORE EXPENSES) | |||||||||||||||||||||
| Beginning Account Value 1/1/15 | Ending Account Value 6/30/15 | Expenses Paid During the Period1 | Beginning Account Value 1/1/15 | Ending Account Value 6/30/15 | Expenses Paid During the Period1 | Annualized Expense Ratio2 | ||||||||||||||||
| Investment Class | ||||||||||||||||||||||
| Royce Pennsylvania Mutual Fund | $ | 1,000.00 | $ | 1,000.77 | $ | 4.66 | $ | 1,000.00 | $ | 1,020.13 | $ | 4.71 | 0.94 | % | ||||||||
| Royce Micro-Cap Fund | 1,000.00 | 986.18 | 7.53 | 1,000.00 | 1,017.21 | 7.65 | 1.53 | % | ||||||||||||||
| Royce Premier Fund | 1,000.00 | 1,016.73 | 5.70 | 1,000.00 | 1,019.14 | 5.71 | 1.14 | % | ||||||||||||||
| Royce Low-Priced Stock Fund | 1,000.00 | 1,028.54 | 6.24 | 1,000.00 | 1,018.65 | 6.21 | 1.24 | % | ||||||||||||||
| Royce Total Return Fund | 1,000.00 | 1,007.44 | 5.72 | 1,000.00 | 1,019.09 | 5.76 | 1.15 | % | ||||||||||||||
| Royce Heritage Fund3 | 1,000.00 | 1,012.49 | 5.39 | 1,000.00 | 1,019.44 | 5.41 | 1.08 | % | ||||||||||||||
| Royce Opportunity Fund | 1,000.00 | 1,006.69 | 5.77 | 1,000.00 | 1,019.04 | 5.81 | 1.16 | % | ||||||||||||||
| Royce Special Equity Fund | 1,000.00 | 994.75 | 5.69 | 1,000.00 | 1,019.09 | 5.76 | 1.15 | % | ||||||||||||||
| Royce Select Fund I | 1,000.00 | 1,002.32 | 6.16 | 1,000.00 | 1,018.65 | 6.21 | 1.24 | % | ||||||||||||||
| Royce Small-Cap Value Fund | 1,000.00 | 1,011.85 | 6.04 | 1,000.00 | 1,018.79 | 6.06 | 1.21 | % | ||||||||||||||
| Royce Smaller-Companies Growth Fund | 1,000.00 | 1,090.53 | 6.43 | 1,000.00 | 1,018.65 | 6.21 | 1.24 | % | ||||||||||||||
| Royce 100 Fund | 1,000.00 | 1,000.00 | 6.15 | 1,000.00 | 1,018.65 | 6.21 | 1.24 | % | ||||||||||||||
| Royce Dividend Value Fund | 1,000.00 | 1,027.10 | 6.13 | 1,000.00 | 1,018.74 | 6.11 | 1.22 | % | ||||||||||||||
| Royce Micro-Cap Opportunity Fund | 1,000.00 | 1,042.98 | 6.48 | 1,000.00 | 1,018.45 | 6.41 | 1.28 | % | ||||||||||||||
| Royce Special Equity Multi-Cap Fund | 1,000.00 | 969.77 | 4.64 | 1,000.00 | 1,020.08 | 4.76 | 0.95 | % | ||||||||||||||
| Service Class Royce Pennsylvania Mutual Fund | 1,000.00 | 998.46 | 6.89 | 1,000.00 | 1,017.90 | 6.95 | 1.39 | % | ||||||||||||||
| Royce Micro-Cap Fund | 1,000.00 | 985.97 | 8.08 | 1,000.00 | 1,016.66 | 8.20 | 1.64 | % | ||||||||||||||
| Royce Premier Fund | 1,000.00 | 1,015.00 | 7.44 | 1,000.00 | 1,017.41 | 7.45 | 1.49 | % | ||||||||||||||
| Royce Low-Priced Stock Fund | 1,000.00 | 1,026.43 | 7.49 | 1,000.00 | 1,017.41 | 7.45 | 1.49 | % | ||||||||||||||
| Royce Total Return Fund | 1,000.00 | 1,005.65 | 7.31 | 1,000.00 | 1,017.50 | 7.35 | 1.47 | % | ||||||||||||||
| Royce Heritage Fund3 | 1,000.00 | 1,011.21 | 7.13 | 1,000.00 | 1,017.70 | 7.15 | 1.43 | % | ||||||||||||||
| Royce Opportunity Fund | 1,000.00 | 1,004.69 | 7.41 | 1,000.00 | 1,017.41 | 7.45 | 1.49 | % | ||||||||||||||
| Royce Special Equity Fund | 1,000.00 | 993.86 | 6.87 | 1,000.00 | 1,017.90 | 6.95 | 1.39 | % | ||||||||||||||
| Royce Small-Cap Value Fund | 1,000.00 | 1,010.20 | 7.43 | 1,000.00 | 1,017.41 | 7.45 | 1.49 | % | ||||||||||||||
| Royce Smaller-Companies Growth Fund | 1,000.00 | 1,089.25 | 7.61 | 1,000.00 | 1,017.50 | 7.35 | 1.47 | % | ||||||||||||||
| Royce 100 Fund | 1,000.00 | 998.84 | 7.38 | 1,000.00 | 1,017.41 | 7.45 | 1.49 | % | ||||||||||||||
| Royce Micro-Cap Discovery Fund | 1,000.00 | 1,006.66 | 7.41 | 1,000.00 | 1,017.41 | 7.45 | 1.49 | % | ||||||||||||||
| Royce Dividend Value Fund | 1,000.00 | 1,026.77 | 7.49 | 1,000.00 | 1,017.41 | 7.45 | 1.49 | % | ||||||||||||||
| Royce Micro-Cap Opportunity Fund | 1,000.00 | 1,040.62 | 7.74 | 1,000.00 | 1,017.21 | 7.65 | 1.53 | % | ||||||||||||||
| Royce Special Equity Multi-Cap Fund | 1,000.00 | 968.59 | 6.05 | 1,000.00 | 1,018.65 | 6.21 | 1.24 | % | ||||||||||||||
| 120 | | The Royce Funds 2015 Semiannual Report to Shareholders |
| ACTUAL | HYPOTHETICAL (5% PER YEAR RETURN BEFORE EXPENSES) | |||||||||||||||||||||
| Beginning Account Value 1/1/15 | Ending Account Value 6/30/15 | Expenses Paid During the Period1 | Beginning Account Value 1/1/15 | Ending Account Value 6/30/15 | Expenses Paid During the Period1 | Annualized Expense Ratio2 | ||||||||||||||||
| Consultant Class | ||||||||||||||||||||||
| Royce Pennsylvania Mutual Fund | $ | 1,000.00 | $ | 995.52 | $ | 9.50 | $ | 1,000.00 | $ | 1,015.27 | $ | 9.59 | 1.92 | % | ||||||||
| Royce Micro-Cap Fund | 1,000.00 | 981.19 | 12.48 | 1,000.00 | 1,012.20 | 12.67 | 2.54 | % | ||||||||||||||
| Royce Premier Fund | 1,000.00 | 1,012.29 | 10.68 | 1,000.00 | 1,014.18 | 10.69 | 2.14 | % | ||||||||||||||
| Royce Total Return Fund | 1,000.00 | 1,002.65 | 10.58 | 1,000.00 | 1,014.23 | 10.64 | 2.13 | % | ||||||||||||||
| Royce Heritage Fund3 | 1,000.00 | 1,006.97 | 11.15 | 1,000.00 | 1,013.69 | 11.18 | 2.24 | % | ||||||||||||||
| Royce Opportunity Fund | 1,000.00 | 1,001.70 | 11.02 | 1,000.00 | 1,013.79 | 11.08 | 2.22 | % | ||||||||||||||
| Royce Special Equity Fund | 1,000.00 | 990.13 | 10.66 | 1,000.00 | 1,014.08 | 10.79 | 2.16 | % | ||||||||||||||
| Royce Small-Cap Value Fund | 1,000.00 | 1,006.44 | 11.19 | 1,000.00 | 1,013.64 | 11.23 | 2.25 | % | ||||||||||||||
| Royce Smaller-Companies Growth Fund | 1,000.00 | 1,085.37 | 11.58 | 1,000.00 | 1,013.69 | 11.18 | 2.24 | % | ||||||||||||||
| Royce Dividend Value Fund | 1,000.00 | 1,022.22 | 11.23 | 1,000.00 | 1,013.69 | 11.18 | 2.24 | % | ||||||||||||||
| Royce Special Equity Multi-Cap Fund | 1,000.00 | 964.55 | 9.69 | 1,000.00 | 1,014.93 | 9.94 | 1.99 | % | ||||||||||||||
| Institutional Class Royce Pennsylvania Mutual Fund | 1,000.00 | 1,001.54 | 4.02 | 1,000.00 | 1,020.78 | 4.06 | 0.81 | % | ||||||||||||||
| Royce Premier Fund | 1,000.00 | 1,017.58 | 5.05 | 1,000.00 | 1,019.79 | 5.06 | 1.01 | % | ||||||||||||||
| Royce Low-Priced Stock Fund | 1,000.00 | 1,028.54 | 5.78 | 1,000.00 | 1,019.09 | 5.76 | 1.15 | % | ||||||||||||||
| Royce Total Return Fund | 1,000.00 | 1,008.19 | 5.08 | 1,000.00 | 1,019.74 | 5.11 | 1.02 | % | ||||||||||||||
| Royce Opportunity Fund | 1,000.00 | 1,007.33 | 5.18 | 1,000.00 | 1,019.64 | 5.21 | 1.04 | % | ||||||||||||||
| Royce Special Equity Fund | 1,000.00 | 995.60 | 5.10 | 1,000.00 | 1,019.69 | 5.16 | 1.03 | % | ||||||||||||||
| Royce Small-Cap Value Fund | 1,000.00 | 1,012.70 | 5.29 | 1,000.00 | 1,019.54 | 5.31 | 1.06 | % | ||||||||||||||
| Royce Smaller-Companies Growth Fund | 1,000.00 | 1,091.29 | 5.76 | 1,000.00 | 1,019.29 | 5.56 | 1.11 | % | ||||||||||||||
| Royce Dividend Value Fund | 1,000.00 | 1,027.83 | 5.23 | 1,000.00 | 1,019.64 | 5.21 | 1.04 | % | ||||||||||||||
| Royce Special Equity Multi-Cap Fund | 1,000.00 | 970.44 | 4.35 | 1,000.00 | 1,020.38 | 4.46 | 0.89 | % | ||||||||||||||
| W Class Royce Premier Fund | 1,000.00 | 1,017.21 | 5.60 | 1,000.00 | 1,019.24 | 5.61 | 1.12 | % | ||||||||||||||
| Royce Total Return Fund | 1,000.00 | 1,007.45 | 5.82 | 1,000.00 | 1,018.99 | 5.86 | 1.17 | % | ||||||||||||||
| R Class Royce Pennsylvania Mutual Fund | 1,000.00 | 997.60 | 7.53 | 1,000.00 | 1,017.26 | 7.60 | 1.52 | % | ||||||||||||||
| Royce Premier Fund | 1,000.00 | 1,013.82 | 8.84 | 1,000.00 | 1,016.02 | 8.85 | 1.77 | % | ||||||||||||||
| Royce Low-Priced Stock Fund | 1,000.00 | 1,025.33 | 9.24 | 1,000.00 | 1,015.67 | 9.20 | 1.84 | % | ||||||||||||||
| Royce Total Return Fund | 1,000.00 | 1,004.63 | 8.60 | 1,000.00 | 1,016.22 | 8.65 | 1.73 | % | ||||||||||||||
| Royce Heritage Fund | 1,000.00 | 1,009.43 | 9.17 | 1,000.00 | 1,015.67 | 9.20 | 1.84 | % | ||||||||||||||
| Royce Opportunity Fund | 1,000.00 | 1,003.98 | 8.65 | 1,000.00 | 1,016.17 | 8.70 | 1.74 | % | ||||||||||||||
| Royce Small-Cap Value Fund | 1,000.00 | 1,008.75 | 9.11 | 1,000.00 | 1,015.72 | 9.15 | 1.83 | % | ||||||||||||||
| Royce Smaller-Companies Growth Fund | 1,000.00 | 1,087.24 | 9.52 | 1,000.00 | 1,015.67 | 9.20 | 1.84 | % | ||||||||||||||
| Royce 100 Fund | 1,000.00 | 997.31 | 9.11 | 1,000.00 | 1,015.67 | 9.20 | 1.84 | % | ||||||||||||||
| K Class Royce Pennsylvania Mutual Fund | 1,000.00 | 998.23 | 7.18 | 1,000.00 | 1,017.60 | 7.25 | 1.45 | % | ||||||||||||||
| Royce Premier Fund | 1,000.00 | 1,013.89 | 9.29 | 1,000.00 | 1,015.57 | 9.30 | 1.86 | % | ||||||||||||||
| Royce Low-Priced Stock Fund | 1,000.00 | 1,027.12 | 7.99 | 1,000.00 | 1,016.91 | 7.95 | 1.59 | % | ||||||||||||||
| Royce Total Return Fund | 1,000.00 | 1,006.05 | 7.66 | 1,000.00 | 1,017.16 | 7.70 | 1.54 | % | ||||||||||||||
| Royce Heritage Fund | 1,000.00 | 1,010.28 | 7.93 | 1,000.00 | 1,016.91 | 7.95 | 1.59 | % | ||||||||||||||
| Royce Opportunity Fund | 1,000.00 | 1,003.46 | 8.10 | 1,000.00 | 1,016.71 | 8.15 | 1.63 | % | ||||||||||||||
| Royce Small-Cap Value Fund | 1,000.00 | 1,008.99 | 9.02 | 1,000.00 | 1,015.82 | 9.05 | 1.81 | % | ||||||||||||||
| Royce Smaller-Companies Growth Fund | 1,000.00 | 1,088.40 | 8.23 | 1,000.00 | 1,016.91 | 7.95 | 1.59 | % | ||||||||||||||
| Royce 100 Fund | 1,000.00 | 998.24 | 7.88 | 1,000.00 | 1,016.91 | 7.95 | 1.59 | % | ||||||||||||||
| 1 | Expenses are equal to the Fund’s annualized expense ratio multiplied by the average account value for the period, multiplied by 181 days in the most recent fiscal half-year divided by 365 days (to reflect the half-year period). |
| 2 | Annualized expense ratio used to derive figures in the table is based on the most recent fiscal half-year. |
| 3 | GiftShare accounts pay an annual $50 trustee fee to State Street Bank, NA, as trustee. If these fees were included above, your costs would be higher. |
The Royce Funds 2015 Semiannual Report to Shareholders | 121
Trustees and Officers
All Trustees and Officers may be reached c/o The Royce Funds, 745 Fifth Avenue, New York, NY 10151
Non-Royce Directorships: Director of TICC Capital Corp.
Principal Occupation(s) During Past Five Years: Chief Executive Officer and a Member of the Board of Managers of Royce & Associates, LLC (“Royce”), the Trust’s investment adviser.
Principal Occupation(s) During Past Five Years: President (since July 2014), Co-Chief Investment Officer (since January 2014), Managing Director and, since June 2015, a Member of the Board of Managers of Royce having been employed by Royce since May 2007.
Non-Royce Directorships: Trustee of ING Mutual Funds and Director of Wisconsin Energy Corp.
Principal Occupation(s) During Past 5 Years: Consultant and President of Ravengate Partners LLC (since 2000).
Non-Royce Directorships: None
Non-Royce Directorships: None
Principal Occupation(s) During Past Five Years: Attorney and President of Health Policy Associates, Inc., consultants. Mr. Isaacs’s prior business experience includes having served as President of the Center for Health and Social Policy (from 1996 to 2012); Director of Columbia University Development Law and Policy Program and Professor at Columbia University (until August 1996).
Non-Royce Directorships: Director/Trustee of registered investment companies constituting the 18 Legg Mason Funds.
Principal Occupation(s) During Past Five Years: Director of The League for People with Disabilities, Inc.; Director of University of Maryland Foundation (non-profits). Formerly: Director of Municipal Mortgage & Equity, LLC (from October 2004 to April 1, 2011); Director of University of Maryland College Park Foundation (non-profit) (from 1998 to 2005); Partner, KPMG LLP (international accounting firm) (from 1972 to 2002); Director of Maryland Business Roundtable for Education (from July 1984 to June 2002).
Non-Royce Directorships: None
Principal Occupation(s) During Past Five Years: Consultant. Chairman and Chief Executive Officer of The Tennis Channel (from June 2000 to March 2005). Mr. Meister’s prior business experience includes having served as Chief Executive Officer of Seniorlife.com, a consultant to the communications industry, President of Financial News Network, Senior Vice President of HBO, President of Time-Life Films, and Head of Broadcasting for Major League Baseball.
Age: 69 | Number of Funds Overseen: 45 | Tenure: Since 2001
Non-Royce Directorships: Director/Trustee of registered investment companies constituting the 18 Legg Mason Funds; Director of TICC Capital Corp.
Principal Occupation(s) During Past Five Years: Trustee Emeritus of Colgate University (since 2005); Board Member of Hill House, Inc. (since 1999); Formerly: Trustee of Colgate University (from 1996 to 2005), President of Hill House, Inc. (from 2001 to 2005) and Managing Director/Equity Capital Markets Group of Merrill Lynch & Co. (from 1971 to 1999).
Age: 57 | Number of Funds Overseen: 27 | Tenure: Since 2015
Principal Occupation(s) During Past Five Years: President and Chief Executive Officer of Piedmont Trust Company, a private North Carolina trust company (since May 2012). Mr. Shields’s prior business experience includes owning Shields Advisors, an investment consulting firm (from April 2010 to June 2012).
Age: 47 | Tenure: Since 2014
Principal Occupation(s) During Past Five Years: Co-Chief Investment Officer (since January 2014) and Managing Director of Royce, having been employed by Royce since September 2006.
Age: 53 | Tenure: Since 1994
Principal Occupation(s) During Past Five Years: Principal and Vice President of Royce, having been employed by Royce since October 1986.
Age: 49 | Tenure: Since 2015
Principal Occupation(s) During Past Five Years: Principal, Chief Financial Officer, and Chief Administrative Officer of Royce, having been employed by Royce since December 2014. Prior to joining Royce, Mr. Hoglund spent more than 20 years with Munder Capital Management in Birmingham, MI, serving as Managing Director and Chief Financial Officer and overseeing all financial aspects of the firm. He began his career at Munder as a portfolio manager.
Age: 48 | Tenure: 1996-2001 and Since 2002
Principal Occupation(s) During Past Five Years: General Counsel and, since June 2015, a Member of the Board of Managers of Royce; Chief Legal and Compliance Officer and Secretary of Royce; Secretary and Chief Legal Officer of The Royce Funds.
Age: 55 | Tenure: Since 2004
Principal Occupation(s) During Past Five Years: Chief Compliance Officer of The Royce Funds (since October 2004) and Compliance Officer of Royce (since June 2004).
| 1 | Interested Trustee. |
| Trustees will hold office until their successors have been duly elected and qualified or until their earlier resignation or removal. The Statement of Additional Information, which contains additional information about the Trust’s trustees and officers, is available and can be obtained without charge at www.roycefunds.com or by calling (800) 221-4268. |
| 122 | The Royce Funds 2015 Semiannual Report to Shareholders |
Board Approval of Investment Advisory Agreements
At meetings held on June 3-4, 2015, the Board of Trustees of The Royce Fund (the “Board”), including all of the non-interested trustees, approved the continuance of the Investment Advisory Agreements between Royce & Associates, LLC (“R&A”) and The Royce Fund (“TRF”) relating to each of Royce Pennsylvania Mutual Fund, Royce Micro-Cap Fund, Royce Premier Fund, Royce Low-Priced Stock Fund, Royce Total Return Fund, Royce Heritage Fund, Royce Opportunity Fund, Royce Special Equity Fund, Royce Small-Cap Value Fund (formerly Royce Value Fund), Royce Smaller-Companies Growth Fund (formerly Royce Value Plus Fund), Royce 100 Fund, Royce Micro-Cap Discovery Fund, Royce Dividend Value Fund, Royce Micro-Cap Opportunity Fund (formerly Royce Opportunity Select Fund), Royce Special Equity Multi-Cap Fund, and Royce Select Fund I (each, a “Fund” and collectively, the “Funds”). In reaching these decisions, the Board reviewed, among other things, information prepared internally by R&A and independently by Morningstar Associates, LLC (“Morningstar”) containing detailed expense ratio and investment performance comparisons for each Fund with other mutual funds in its “peer group” and “category”, information regarding the past performance of the Funds and other registered investment companies managed by R&A and a memorandum outlining the legal duties of the Board prepared by independent counsel to the non-interested trustees. R&A also provided the trustees with an analysis of its profitability with respect to providing investment advisory services to each Fund. In addition, the Board took into account information furnished throughout the year at regular Board meetings, including reports on investment performance, shareholder services, distribution fees and expenses, regulatory compliance, brokerage commissions and research, brokerage and other execution products and services provided to the Funds. The Board also considered other matters it deemed important to the approval process, such as allocation of Fund brokerage commissions, “soft dollar” research services R&A receives, payments made to affiliates of R&A, as well as payments made by R&A relating to distribution of Fund shares and other direct and indirect benefits to R&A and its affiliates from their relationship with the Funds. The trustees also met throughout the year with investment advisory personnel from R&A. The Board, in its deliberations, recognized that, for many of the Funds’ shareholders, the decision to purchase Fund shares included a decision to select R&A as the investment adviser and that there was a strong association in the minds of Fund shareholders between R&A and each of the Funds. In considering factors relating to the approval of the continuance of the Investment Advisory Agreements, the non-interested trustees received assistance and advice from, and met separately with, their independent counsel. While the Investment Advisory Agreements for the Funds were considered at the same Board meeting, the trustees dealt with each agreement separately. Among other factors, the trustees considered the following:
Investment performance of the Funds and R&A: In light of R&A’s risk-averse approach to investing, the trustees believe that risk-adjusted performance continues to be the most appropriate measure of each Fund’s investment performance. One measure of risk-adjusted performance the trustees have historically used in their review of each Fund’s performance is the Sharpe Ratio. The Sharpe Ratio is a risk-adjusted measure of performance developed by Nobel Laureate William Sharpe. It is calculated by dividing a Fund’s annualized excess returns by its annualized standard deviation to determine reward per unit of risk. The higher the Sharpe Ratio, the better a Fund’s historical risk-adjusted performance. The Board attaches primary importance to risk-adjusted performance over relatively long periods of time, typically 3 to 10 years.
Overall, although the Funds generally achieved strong absolute performance during the 3-year and 5-year periods ended December 31, 2014, the Board noted that the Funds also generally underperformed their peers, as evidenced by their respective Sharpe Ratios, during those periods. The trustees noted that, as explained by R&A, the extraordinary monetary stimulus programs implemented by the Federal Reserve in the aftermath of the 2008 financial crisis (e.g., near zero interest rate policy, quantitative easing, “Operation Twist”, etc.) have produced significant relative performance headwinds for R&A’s value approach. These relative performance headwinds include: (i) small-cap equity returns well above historical averages; (ii) low equity market volatility; and (iii) historically low costs of capital for corporate issuers. As a result, companies with little-to-no earnings, high leverage, and high income yields generally have been the market leaders during the relevant 3-year and 5-year periods, not the higher quality companies generally favored by R&A (i.e., those with solid balance sheets, low leverage, the ability to generate and effectively allocate free cash flow, and strong returns on invested capital). The Board also noted that the relative performance for many Funds for the 10-year period ended December 31, 2014, which includes a portion of the more historically customary market cycle that preceded the 2008 financial crisis, was quite strong.
This trend of weaker relative performance over the applicable 3-year and 5-year periods and stronger relative performance over the relevant 10-year period manifested itself for several Funds. For example, the Sharpe Ratios for Royce Special Equity Fund (“RSE”), Royce Select Fund I (“RS1”), and Royce Dividend Value Fund (“RDV”) ranked in the top quartile within their respective Morningstar categories for the 10-year period ended December 31, 2014. The relative performance for the 3-year and 5-year periods ended December 31, 2014 was not, however, as strong for these Funds
| The Royce Funds 2015 Semiannual Report to Shareholders | 123 |
Board Approval of Investment Advisory Agreements (continued)
(RSE: 4th and 3rd quartiles; RS1: 4th quartile for both periods; and RDV: 4th and 3rd quartiles). Similarly, although the Sharpe Ratio for Royce Total Return Fund (“RTR”) placed in the third quartile within the Small Blend Morningstar category for the 3-year period ended December 31, 2014, it ranked in the second quartile for the relevant 5-year and 10-year periods. Royce Pennsylvania Mutual Fund (“PMF”) also exemplified this trend, with its Sharpe Ratio ranking in the third, fourth, and second quartiles within the Small Growth Morningstar category for the 3-year, 5-year, and 10-year periods, respectively, ended December 31, 2014. In addition, the Sharpe Ratios for Royce Premier Fund (“RPR”), Royce Small-Cap Value Fund (“RVV”), and Royce 100 Fund (“ROH”) ranked in the fourth quartile within their respective Morningstar categories for the 3-year and 5-year periods ended December 31, 2014. However, each of RPR, RVV, and ROH achieved better relative performance during the applicable 10-year period by placing in the second quartile within its Morningstar category.
The above-described trend did not manifest itself for all of the Funds that have been in existence for at least 10 years. The Sharpe Ratios for Royce Low-Priced Stock Fund (“RLP”) and Royce Micro-Cap Fund (“RMC”) ranked in the fourth quartile within the Small Blend Morningstar category for the 3-year and 5-year periods ended December 31, 2014 and in the fourth quartile (RLP) and third quartile (RMC) for the relevant 10-year period. In recent years, RLP and RMC had over-weightings in materials companies, particularly Canadian gold and silver mining companies, while RMC also maintained significant positions in international companies. These holdings contributed, in part, to the relative underperformance of RLP and RMC during the applicable periods. Royce Heritage Fund (“RHF”) achieved similar relative performance, with its Sharpe Ratio placing in the fourth, fourth, and third quartile within the Small Growth Morningstar category for the 3-year, 5-year, and 10-year periods, respectively, ended December 31, 2014. Likewise, the Sharpe Ratios for Royce Smaller-Companies Growth Fund (“RVP”) and Royce Opportunity Fund (“ROF”) placed in the third, fourth, and third quartiles within the applicable category assigned by Morningstar for the 3-year, 5-year, and 10-year periods, respectively, ended December 31, 2014. The Board noted that RVP has struggled during the recent market cycle as its portfolio manager had taken a more defensive portfolio approach going into the strong up-market beginning with the March 2009 market low. The Sharpe Ratio for Royce Micro-Cap Discovery Fund (“DSC”) fell in the 4th quartile within the Small Blend Morningstar category for the 3-year, 5-year, and 10-year periods ended December 31, 2014. In addition to the relative performance headwinds described above, the Board noted that the addition of an active management component layered onto DSC’s quantitative structure in August 2010 and its recent overweight to micro-cap value stocks adversely affected its relative performance during recent periods. The Board further noted that, other than a net 31 basis point advisory fee in 2007 and a net 22 basis point advisory fee in 2014, R&A has not otherwise received an advisory fee in respect of DSC since its 2003 inception.
Although Royce Micro-Cap Opportunity Fund (“ROS”) and Royce Special Equity Multi-Cap Fund (“RSM”) are among the newer open-end funds managed by R&A, the Board noted that these funds now have more than 3 years of performance. R&A’s general process of investing net inflows over longer periods of time led to larger cash positions and market lagging performance for most of these newer funds in their initial periods of operation. The Board noted that ROS placed in the middle quintile and RSM placed in the fourth quartile within their respective Morningstar categories on the basis of their Sharpe Ratios for the 3-year period ended December 31, 2014.
The Board also noted that the peer groups included in the Morningstar materials for a number of Funds may not be appropriate for performance comparisons and that R&A had augmented the Morningstar data provided to the Board throughout the years by including performance information for other funds that R&A believes are comparable to those Funds.
In addition to the risk–adjusted performance of each Fund, the Board also reviewed and considered the absolute total returns for each Fund, down market performance and, for Funds in existence for such periods, long-term performance records over periods of 10 years or longer. The Board also considered it important to look beyond the current snapshot of performance as of December 31, 2014 and therefore examined extended performance histories for each Fund using monthly rolling average return periods through March 31, 2015.
The Board noted that R&A manages a number of funds that invest in micro-cap, small-cap, and mid-cap issuers, many of which had outperformed their benchmark indices and their competitors during preceding periods. Although the Board recognized that past performance is not necessarily an indicator of future results, it found that R&A had the necessary qualifications, experience and track record in managing equity mutual funds to manage each Fund. The Board determined that R&A continued to be an appropriate investment adviser for each Fund and concluded that each Fund’s performance supported the continuation of its Investment Advisory Agreement.
Cost of the services provided and profits realized by R&A from its relationship with each Fund: The Board considered the cost of the services provided by R&A and the profits realized by R&A from its relationship with each Fund. As part of the analysis, the Board discussed with R&A its methodology in allocating its costs to each Fund and concluded that its allocations were reasonable. The Board noted that at times R&A had closed certain of the Funds to new investors because of the rate of growth in Fund assets. The Board concluded that R&A’s profits were reasonable in relation to the nature and quality of services provided.
The extent to which economies of scale would be realized as the Funds grow and whether fee levels would reflect such economies of scale: The Board considered whether there have been economies of scale in respect of the management of each Fund, whether each Fund has appropriately benefited from any economies of scale and whether there is potential for realization of any further economies of scale. The Board noted the time and effort involved in managing portfolios of small-and micro-cap stocks and that they did not involve the same efficiencies as do portfolios of large-cap stocks. The Board noted that in 2004 breakpoints were added to the investment advisory fees for all of the then-existing Funds except PMF (PMF’s fee schedule already had breakpoints) and that the investment advisory fees for all Funds organized since 2004 included breakpoints. The Board concluded that the current fee structure for each Fund was reasonable and that the relevant shareholders sufficiently participated in economies of scale.
Comparison of services to be rendered and fees to be paid to those under other investment advisory contracts, such as contracts of the same and other investment advisers or other clients: The Board reviewed the investment advisory fee paid by each Fund and compared both the services to be rendered and the fees to be paid under the Investment Advisory Agreements to other contracts of R&A and to contracts of other investment advisers to registered investment companies investing in micro-, small-, and mid-cap stocks, as provided by Morningstar. The Board noted the importance of the net expense ratio in measuring a fund’s efficiency, particularly in light of the variations in the mutual fund industry as to which entity is
| 124 | The Royce Funds 2015 Semiannual Report to Shareholders |
Board Approval of Investment Advisory Agreements (continued)
responsible for particular types of expenses. The Board noted that the net expense ratio for PMF ranked within the top quartile among its Morningstar peers, while the net expense ratios for RTR, ROF, DSC, ROS, RSM, and RS1 ranked within the middle quintile among their Morningstar peers.
Although the net expense ratios for RPR, RHF, and RSE, ranked within the fourth quintile among their Morningstar peers, the Board noted that such expense ratios were not significantly higher than their peer medians. RPR’s net expense ratio was 1.10%, 17 basis points higher than its peer median, while RHF’s net expense ratio of 1.40% was 9 basis points higher than its peer median. The Board further noted that RSE had a relatively small peer group, with RSE’s net expense ratio of 1.12% being only 2 basis points higher than its peer median.
The Board noted that the remaining Funds had fifth quintile net expense ratios. With respect to RMC, the Board noted that its contractual investment advisory fee rates were reduced by 5 basis points as of May 1, 2015, which would have lowered its reported net expense ratio of 1.52% to 1.47%, and that the average net expense ratio for the 65 non-institutional, non-ETF, domestic stock funds in the Morningstar database that invest primarily in issuers with market caps below $1 billion and 12b-1 fees of 0.25% is 1.45%. With respect to RLP, the Board noted that its reported net expense ratio of 1.49% was 14 basis points higher than its peer group median. The Board further noted that RLP’s contractual investment advisory fee rates were reduced as of July 1, 2014. Had that fee reduction been in place for all of 2014, RLP’s net expense ratio would have been 6 basis points higher than its peer group median.
With respect to RVP and RVV, the Board noted that RVP’s net expense ratio of 1.42% was 16 basis points higher than its peer group median and 7 basis points higher than its category median, while RVV’s net expense ratio of 1.45% was 20 basis points higher than its peer group median and 10 basis points higher than its category median. The investment advisory fees for RVP and RVV, which are both 25 and 15 basis points higher than their peer group medians and category medians, respectively, account for much of these differentials. The Board further noted, however, that the investment advisory fees for RVP and RVV are consistent with other Royce open-end funds and that the net expense ratios for RVP and RVV are 4 and 7 basis points, respectively, higher than the 1.38% mean for all 185 small-cap category funds (non-institutional, non-index, non-ETF) with 12b-1 fees of 25 basis points.
The Board also noted that the net expense ratios of ROH (1.50%) and RDV (1.44%) were 14 and 10 basis points higher than their peer group medians, respectively. The investment advisory fees for ROH and RDV, which are 12 and 12.5 basis points, respectively, higher than their peer group medians, account for much of these differentials. The Board further noted, however, that the investment advisory fees for ROH and RDV are consistent with other Royce open-end funds and that the net expense ratios for ROH and RDV are 12 and 6 basis points, respectively, higher than the 1.38% mean for all 185 small-cap category funds (non-institutional, non-index, non-ETF) with 12b-1 fees of 25 basis points.
The Board also noted that R&A manages the Funds in an active fashion. The industry accepted metric for measuring how actively an equity portfolio is managed is called “active share.” In particular, active share measures how much the holdings of an equity portfolio differ from the holdings of its appropriate passive benchmark index. At the extremes, a portfolio with no holdings in common with the benchmark would have 100% active share, while a portfolio that is identical to the benchmark would have 0% active share. R&A presented a chart to the Board which demonstrated that mutual funds with high active share scores had higher expense ratios than mutual funds with lower active share scores due to the resources required for the active management of those funds.
The Board further noted that R&A has waived investment advisory fees for numerous Funds in order to maintain expense ratios at competitive levels and acknowledged R&A’s intention to continue this expense limitation practice. The Board also considered fees charged by R&A to institutional and other clients and noted that, given the greater levels of services that R&A provides to registered investment companies such as the Funds as compared to other accounts, each Fund’s advisory fees compared favorably to these other accounts.
It was noted that no single factor was cited as determinative to the decision of the trustees. Rather, after weighing all of the considerations and conclusions discussed above, the entire Board, including all of the non-interested trustees, determined to approve the continuance of the existing Investment Advisory Agreements for all of the Funds, concluding that contract continuations on the existing terms for all of the Funds were in the best interest of the shareholders of the respective Funds and that each investment advisory fee rate was reasonable in relation to the services provided.
| The Royce Funds 2015 Semiannual Report to Shareholders | 125 |
Notes to Performance and Other Important Information
The thoughts expressed in this report concerning recent market movements and future prospects for small company stocks are solely the opinion of Royce at June 30, 2015, and, of course, historical market trends are not necessarily indicative of future market movements. Statements regarding the future prospects for particular securities held in the Funds’ portfolios and Royce’s investment intentions with respect to those securities reflect Royce’s opinions as of June 30, 2015 and are subject to change at any time without notice. There can be no assurance that securities mentioned in this report will be included in any Royce-managed portfolio in the future.
Sector weightings are determined using the Global Industry Classification Standard (“GICS”). GICS was developed by, and is the exclusive property of, Standard & Poor’s Financial Services LLC (“S&P”) and MSCI Inc. (“MSCI”). GICS is the trademark of S&P and MSCI. “Global Industry Classification Standard (GICS)” and “GICS Direct” are service marks of S&P and MSCI.
All indexes referred to are unmanaged and capitalization weighted. Each index’s returns include net reinvested dividends and/or interest income. Russell Investment Group is the source and owner of the trademarks, service marks, and copyrights related to the Russell Indexes. Russell® is a trademark of Russell Investment Group. The Russell 2000 is an index of domestic small-cap stocks. It measures the performance of the 2,000 smallest publicly traded U.S. companies in the Russell 3000 Index. The Russell 1000 Index is an index of domestic large-cap stocks. It measures the performance of the 1,000 largest publicly traded U.S. companies in the Russell 3000 Index. The Russell Microcap Index includes 1,000 of the smallest securities in the Russell 2000 Index, along with the next smallest eligible securities as determined by Russell. The Russell Midcap Index measures the performance of the mid-cap segment of the U.S. equity universe. It includes approximately 800 of the smallest securities in the Russell 1000 Index. The Russell Global ex-U.S. Small Cap Index is an index of global small-cap stocks, excluding the United States. The Russell Global ex-U.S. Large Cap Index is an index of global large-cap stocks, excluding the United States. The S&P 500 is an index of U.S. large-cap stocks, selected by Standard & Poor’s based on market size, liquidity, and industry grouping, among other factors. The Nasdaq Composite is an index of the more than 3,000 common equities listed on the Nasdaq stock exchange. The performance of an index does not represent exactly any particular investment, as you cannot invest directly in an index. Returns for the market indexes used in this report were based on information supplied to Royce by Russell Investments. Royce has not independently verified the above described information.
The Price-Earnings, or P/E, Ratio is calculated by dividing a company’s share price by its trailing 12-month earnings-per share (EPS). The Price-to-Book, or P/B, Ratio is calculated by dividing a company’s share price by its book value per share. Standard deviation is a statistical measure within which a fund’s total returns have varied over time. The greater the standard deviation, the greater a fund’s volatility. The Morningstar Style Map uses proprietary scores of a stock’s value and growth characteristics to determine its placement in one of the five categories listed on the horizontal axis. These characteristics are then compared to those of other stocks within the same market capitalization band. Each is scored from zero to 100 for both value and growth attributes. The value score is subtracted from the growth score to determine the overall style score. For the vertical, market cap axis, Morningstar subdivides into size groups. Giant-cap stocks are defined as those that account for the top 40% of the capitalization of each style zone; large-cap stocks represent the next 30%; mid-cap stocks the next 20%; small-cap stocks the next 7%; micro-cap stocks the smallest 3%. Investments in securities of micro-cap, small-cap, and/or mid-cap companies may involve considerably more risk than investments in securities of larger-cap companies. (Please see “Primary Risks for Fund Investors” in the prospectus.) Investments in foreign securities, which generally may involve political, economic, currency, and other risks not encountered in U.S. investments. (Please see “Investing in Foreign Securities” in the prospectus.) A Fund that invests a significant portion of its assets in a limited number of stocks may be subject to considerably more risk than a more broadly diversified Fund because a decline in the value of any of these stocks would cause that Fund’s overall value to decline to a greater degree. A broadly diversified portfolio does not, however, ensure a profit for a Fund or guarantee against loss. Please read the prospectus carefully before investing or sending money. A copy of the Funds’ current prospectus and Statement of Additional Information may be obtained by calling (800) 221-4268 or by visiting www.roycefunds.com. All publicly released material Fund information is disclosed by the Funds on their website at www.roycefunds.com. The Royce Funds is a service mark of The Royce Funds. Distributor: Royce Fund Services, Inc.
| • | the Funds’ future operating results, |
| • | the prospects of the Funds’ portfolio companies, |
| • | the impact of investments that the Funds have made or may make, the dependence of the Funds’ future success on the general economy and its impact on the companies and industries in which the Funds invest, and |
| • | the ability of the Funds’ portfolio companies to achieve their objectives. |
This review and report use words such as “anticipates,” “believes,” “expects,” “future,” “intends,” and similar expressions to identify forward-looking statements. Actual results may differ materially from those projected in the forward-looking statements for any reason.
The Royce Funds have based the forward-looking statements included in this review and report on information available to us on the date of the report, and we assume no obligation to update any such forward-looking statements. Although The Royce Funds undertake no obligation to revise or update any forward-looking statements, whether as a result of new information, future events, or otherwise, you are advised to consult any additional disclosures that we may make through future shareholder communications or reports.
Proxy Voting
A copy of the policies and procedures that The Royce Funds use to determine how to vote proxies relating to portfolio securities and information regarding how each of The Royce Funds voted proxies relating to portfolio securities during the most recent 12-month period ended June 30 is available, without charge, on The Royce Funds’ website at www.roycefunds.com, by calling (800) 221-4268 (toll-free) and on the website of the Securities and Exchange Commission (“SEC”) at www.sec.gov.
Form N-Q Filing
The Funds file their complete schedules of investments with the SEC for the first and third quarters of each fiscal year on Form N-Q. The Funds’ Forms N-Q are available on the SEC’s website at www.sec.gov. The Royce Funds’ holdings are also on the Funds’ website approximately 15 to 20 days after each calendar quarter end and remain available until the next quarter’s holdings are posted. The Funds’ Forms N-Q may also be reviewed and copied at the SEC’s Public Reference Room in Washington, D.C. To find out more about this public service, call the SEC at (202) 942-8090. The Funds’ complete schedules of investments are updated quarterly and are available at www.roycefunds.com.
| 126 | The Royce Funds 2015 Semiannual Report to Shareholders |
Results of Shareholders Meeting
Royce Select Fund I
| PROPOSAL | VOTES FOR | VOTES WITHHELD | ABSTAIN | ||||
| to approve a Plan of Reorganization of The Royce Fund, on behalf of Royce Select Fund I (“Select Fund I”) and Royce 100 Fund (“100 Fund”), whereby all of the assets of Select Fund I would be transferred to 100 Fund in exchange for 100 Fund’s assumption of all of the liabilities of Select Fund I and 100 Fund’s issuance to Select Fund I of Investment Class shares of beneficial interest of 100 Fund. | 629,580 | 83,605 | 2,221 | ||||
The Royce Funds 2015 Semiannual Report to Shareholders | 127

| 128 | This page is not part of the 2015 Semiannual Report to Shareholders |
 | ||||
| About The Royce Funds | Contact Us | |||
Wealth of Experience With approximately $27 billion in total assets under management, Royce & Associates is committed to the same investment principles that have served us well for more than 40 years. Chuck Royce, our Chief Executive Officer, enjoys one of the longest tenures of any active mutual fund manager. Royce’s investment staff also includes 23 portfolio managers and analysts and eight traders. Multiple Funds, Common Focus Our goal is to offer both individual and institutional investors the best available micro-cap, small-cap, and/or mid-cap portfolios. We have chosen to concentrate on smaller-company investing by providing investors with a range of funds that take full advantage of this large and diverse sector. Consistent Discipline Our approach emphasizes paying close attention to risk and maintaining the same discipline, regardless of market movements and trends. The price we pay for a security must be below our appraisal of its current worth. This requires a thorough analysis of the financial and business dynamics of an enterprise, as though we were purchasing the entire company. Co-Ownership of Funds It is important that our employees and shareholders share a common financial goal. Our officers, employees, and their families currently have more than $127 million invested in The Royce Funds and are often among the largest individual shareholders. | GENERAL INFORMATION General Royce Funds information including: • How to open an account • An overview of our firm and Funds • Ordering literature including Prospectuses (800) 221-4268 | |||
ACCOUNT INFORMATION Speak with a representative about: • Your account, transactions, and forms (800) 841-1180 | ||||
| FINANCIAL ADVISORS, CONSULTANTS, AND INSTITUTIONS Speak with your regional Royce contact regarding: • Scheduling a meeting or call • Information about our firm, strategies, and funds • Resources for financial professionals, such as portfolio attribution reports (800) 337-6923 | ||||
| AUTOMATED ACCOUNT INFORMATION 24-hour Automated Telephone Service (800) 878-6923 | ||||
 |  |  | ||
 |
| JUNE 30, 2015 | ||
| 2015 Semiannual | ||
| Review and Report to Shareholders | ||
| Royce Global Financial Services Fund (formerly Royce Financial Services Fund) | |||
| Royce European Small-Cap Fund (formerly Royce European Smaller-Companies Fund) | |||
| Royce Global Value Fund | |||
| Royce International Small-Cap Fund (formerly Royce International Smaller-Companies Fund) | |||
| Royce International Micro-Cap Fund | |||
| Royce International Premier Fund | |||
| roycefunds.com |  | ||
| Table of Contents | |||
| Semiannual Review | |||
| Letter to Our Shareholders | 1 | ||
| Performance and Expenses | 5 | ||
| Semiannual Report to Shareholders | |||
| Managers’ Discussions of Fund Performance | |||
Royce Global Financial Services Fund (formerly Royce Financial Services Fund) | 6 | ||
Royce European Small-Cap Fund (formerly Royce European Smaller-Companies Fund) | 8 | ||
Royce Global Value Fund | 10 | ||
Royce International Small-Cap Fund (formerly Royce International Smaller-Companies Fund) | 12 | ||
Royce International Micro-Cap Fund | 14 | ||
Royce International Premier Fund | 16 | ||
| Schedules of Investments and Financial Statements | 18 | ||
| Notes to Financial Statements | 38 | ||
| Understanding Your Fund’s Expenses | 44 | ||
| Trustees and Officers | 45 | ||
| Board Approval of Investment Advisory Agreements | 46 | ||
| Notes to Performance and Other Important Information | 48 |

| This page is not part of the 2015 Semiannual Report to Shareholders |
| Letter to Our Shareholders |

| “THE TIME IS OUT OF JOINT” |
| Anyone reestablishing contact with the wider world at the end of June would no doubt be pleased by the numbers that guide the financial and economic parts of our lives. The U.S. economy, following a first-quarter stumble in which GDP is estimated to have grown by 0.6%, appears once again to be growing at a faster clip. One could argue that its pace could be livelier, but healthy employment numbers, improving wages, and robust housing and auto markets would seem to promise a quickening in the coming months. Inflation is, for now, not a matter of great concern. Interest rates remain low—and will remain that way on an absolute basis, even with an increase (or two) in short-term rates likely before the end of 2015. And a Fed-led increase in short rates may cause long-term rates to back up as well, which would be bad news for the bond markets, though perhaps not for stocks. Similarly, Europe showed signs of recovery in the first half, even as Greece’s finances lurched dangerously toward collapse. |
| Indeed, one could find many positive developments in the globe’s equity markets through the first half of the year—or so it would seem. Returns for each of the major domestic indexes were in the black through the end of June, while a welcome recovery finally |
| arrived for many non-U.S. stocks in the year’s first six months. Three- and five-year average annualized returns for the small-cap Russell 2000 Index, the Nasdaq Composite, and the large-cap Russell 1000 and S&P 500 Indexes all topped 17%, well above the rolling three- and five-year historical averages for each index. Non-U.S. indexes, while not as robust over the three- and five-year periods, showed encouraging signs of revival in the year’s first half. It would appear that we are living through good times for the economy and possibly great ones for equities. |
| Why, then, have we purloined a line from Hamlet to introduce our own take on stocks in the first half, one in which the titular protagonist warns of a troubling dislocation in the world around him? Some of the reasons are clear enough: Positive results for the first half notwithstanding, global equities were rocked by the highly publicized Greek default late in June. On the second-to-last trading day of the first half, many stocks gave away most, if not all, of their second-quarter gains. Markets in China faced arguably even more significant problems, considering how much larger and more important that nation’s economy is to the world compared to that of Greece. Chinese stocks plummeted 30% in the three weeks leading up to our Independence Day, |
| This page is not part of the 2015 Semiannual Report to Shareholders | 1 |
| LETTER TO OUR SHAREHOLDERS |
| making what seemed like a typical correction in June far more worrisome. A cut in interest rates and more relaxed rules for margin trading—both hastily put in place late in June—did little to stem the tide of selling. |
| The small-cap market has thus moved from the tightly correlated markets of 2011-2013 into a new phase of wide divergence and constricted leadership. From our perspective, then, the market is indeed out of joint. |
| Closer to home, there is the matter of how thoroughly disjointed results were for domestic equities. Large-cap returns, for example, were paltry—as can be seen from the table below—brought even lower by the Greek drama that ushered out the month of June. Performance for small-caps and the Nasdaq looked appreciably better, but in each case looks are almost assuredly deceiving. Health Care was by far the dominant sector in every market cap range, from micro to large, that Russell Investments tracks. Yet the rule in the first half seemed to be the smaller—and more growth-driven—the company, the loftier the results, especially if it was involved in biotech, the industry that has reigned supreme within the Russell 2000 over much of the last two years. This has had the effect of creating decidedly narrow market leadership within the small-cap space. Outside of biotech, strong first-half performances |
| were mostly limited to a handful of other Health Care industries, software companies, and a few outliers such as construction materials and tobacco. The small-cap market has thus moved from the tightly correlated markets of 2011-2013 into a new phase of wide divergence and constricted leadership. From our perspective, then, the market is indeed out of joint. |
| “MORE THINGS IN HEAVEN AND EARTH...” |
| We have actually been arguing that the market has been disjointed for some time now. Fed policies designed to keep the economy and capital markets above water, which included multiple rounds of QE and keeping interest rates at or near zero, had other, unintended consequences that had an outsized effect on the small-cap market. For example, it became both easy and affordable for businesses to add debt, essentially eroding the risk differential between lower- and higher-quality businesses. Lower-quality and more highly levered companies then began a historically atypical period of outperformance in which our funds mostly did not participate. The Fed’s zero-interest-rate policy (“ZIRP”) also stoked an intense hunger for yield, which drove up values for bond-proxy equities such as REITs and Utilities, regardless of their underlying quality or profitability, that have only recently begun to correct. These actions also boosted stock correlations and reduced volatility, making it |
| Equity Indexes | |
| As of June 30, 2015 (%) | |
| • | Greek Drama Creates Underwhelming Results—The Greek default late in June eroded gains—giving equities second-quarter results that more closely hugged the flat line. The tech-oriented Nasdaq Composite was the leader, up 1.8%, followed by the small-cap Russell 2000 Index, which finished the quarter with a gain of 0.4%. The large-cap S&P 500 and Russell 1000 Indexes rose 0.3% and 0.1%, respectively. |
| • | A Global Bull Encounters a Greek Drama—Late in June, equity investors had to address the potential consequences of an economic Greek tragedy. Investors’ concerns about a Greek default stalled what was otherwise a robust recovery in non-US equities. The Russell Global ex-U.S. Small Cap Index returned 3.9% versus a gain of 0.7% for the Russell Global ex-U.S. Large Cap Index for the second quarter. Year-to-date results remained quite solid—the small-cap index led the way with a gain of 7.7% while the Russell Global ex-U.S. Large Cap Index rose 4.2%. |
| • | Healthy and Informed—Health Care and Information Technology were the best performing sectors in the Russell 2000 year-to-date through 6/30/15—the former led by a wide margin—while Utilities and Materials were the worst performers in the year’s first half. |
| YTD1 | 1-YR | 3-YR | 5-YR | 10-YR | ||||||
| Russell 2000 | 4.75 | 6.49 | 17.81 | 17.08 | 8.40 | |||||
| S&P 500 | 1.23 | 7.42 | 17.31 | 17.34 | 7.89 | |||||
| Russell 1000 | 1.71 | 7.37 | 17.73 | 17.58 | 8.13 | |||||
| Nasdaq Composite | 5.30 | 13.13 | 19.33 | 18.78 | 9.26 | |||||
| Russell Midcap | 2.35 | 6.63 | 19.26 | 18.23 | 9.40 | |||||
| Russell Microcap | 6.03 | 8.21 | 19.25 | 17.48 | 7.07 | |||||
| Russell Global ex-U.S. Small Cap | 7.74 | -3.46 | 11.35 | 8.99 | 7.07 | |||||
| Russell Global ex-U.S. Large Cap | 4.23 | -5.02 | 9.96 | 8.13 | 5.80 | |||||
| 1 Not annualized | ||||||||||
| For details on The Royce Funds’ performance in the period, please turn to the Managers’ Discussions that begin on page 6. | ||||||||||
| 2 | This page is not part of the 2015 Semiannual Report to Shareholders |
| LETTER TO OUR SHAREHOLDERS |
| harder to find the kind of mispriced opportunities that have always been our stock in trade. |
| Finally, there were significant runs for high-growth, non-earning, and more speculative businesses, many with negative EBIT. This continues into the present day with the recent contraction of small-cap leadership, which represents more of a bet on long-duration assets than current profitability. In each of these cases, our more qualitative, risk-conscious approaches have in general kept us away from these areas. While we are confident that this trend will fade and that speculative bubbles will burst, we also understand the frustrations that have built over the last few years as active managers such as ourselves have continued to lag our respective benchmarks. |
| We have seen enough signs, both economically and in the market, which suggest that stocks are slowly moving back to what we would call their historical norm—lower overall returns, higher volatility, and long-term advantages for companies with consistent profits and high returns on invested capital. |
| So do these challenges mean that something is rotten in the state of small-cap, if only in some of its actively managed precincts? That is the question, more or less, that we have been wrestling with of late. To be sure, we ran the gamut in the first half from disappointment to optimism to frustration as investor preferences moved around. They first showed favor to long-duration assets, then looked, if only briefly, toward consistently profitable and/or conservatively capitalized companies before shifting back again. However, we have seen enough signs, both economically and in the market, which suggest that stocks are slowly moving back to what we would call their historical norm—lower overall returns, higher volatility, and long-term advantages for companies with consistent profits and high returns on invested capital. |
| Most notably, there was a positive directional trend dating from the first-half low for the 10-year Treasury on January 30 through the end of the first half. During this period, which included the bearish month of April, we were pleased with |
| the way many of our portfolios either outperformed their benchmarks or began to narrow the gap. This was very clear during the growth scare engendered by (at the time) negative first-quarter GDP numbers, which led many companies to begin revising their earnings expectations downward. Of course, when it became clear that much of what put a drag on first-quarter numbers was temporary, including such factors as the awful winter weather, the West Coast port strike, and the plunge in oil prices, things began to pick up again fairly quickly, at least for the more speculative areas within Health Care and a few other narrow equity locales. |
| “THE READINESS IS ALL” |
| Yet this period also offered a potential preview of how the landscape, at least for U.S. stocks, will look when short-term interest rates begin to rise—which is likely to be later this year. We see higher rates breeding more uncertainty, be it about inflation, the cost of capital, or a number of other issues. This in turn typically leads to more mispricing in the short run, which creates precisely the opportunities that we crave as risk-conscious bargain hunters. To us, high rates are synonymous with higher risk. A higher-risk environment also tends to benefit quality companies (by which we mean conservatively capitalized, profitable businesses with high returns on invested capital and effective, shareholder-friendly management). So we have no worries about rising rates or greater volatility in the markets. In fact, we welcome both. |
| High rates are synonymous with higher risk. A higher-risk environment also tends to benefit quality companies (by which we mean conservatively capitalized, profitable businesses with high returns on invested capital and effective, shareholder-friendly management). So we have no worries about rising rates or greater volatility in the markets. In fact, we welcome both. |
| Regardless of location, we see quality differentiating itself when risk premiums rise because quality businesses are better businesses—as profitable, financially sound enterprises, they are purpose-built and run to survive periods of higher risk |
| This page is not part of the 2015 Semiannual Report to Shareholders | 3 |
LETTER TO OUR SHAREHOLDERS
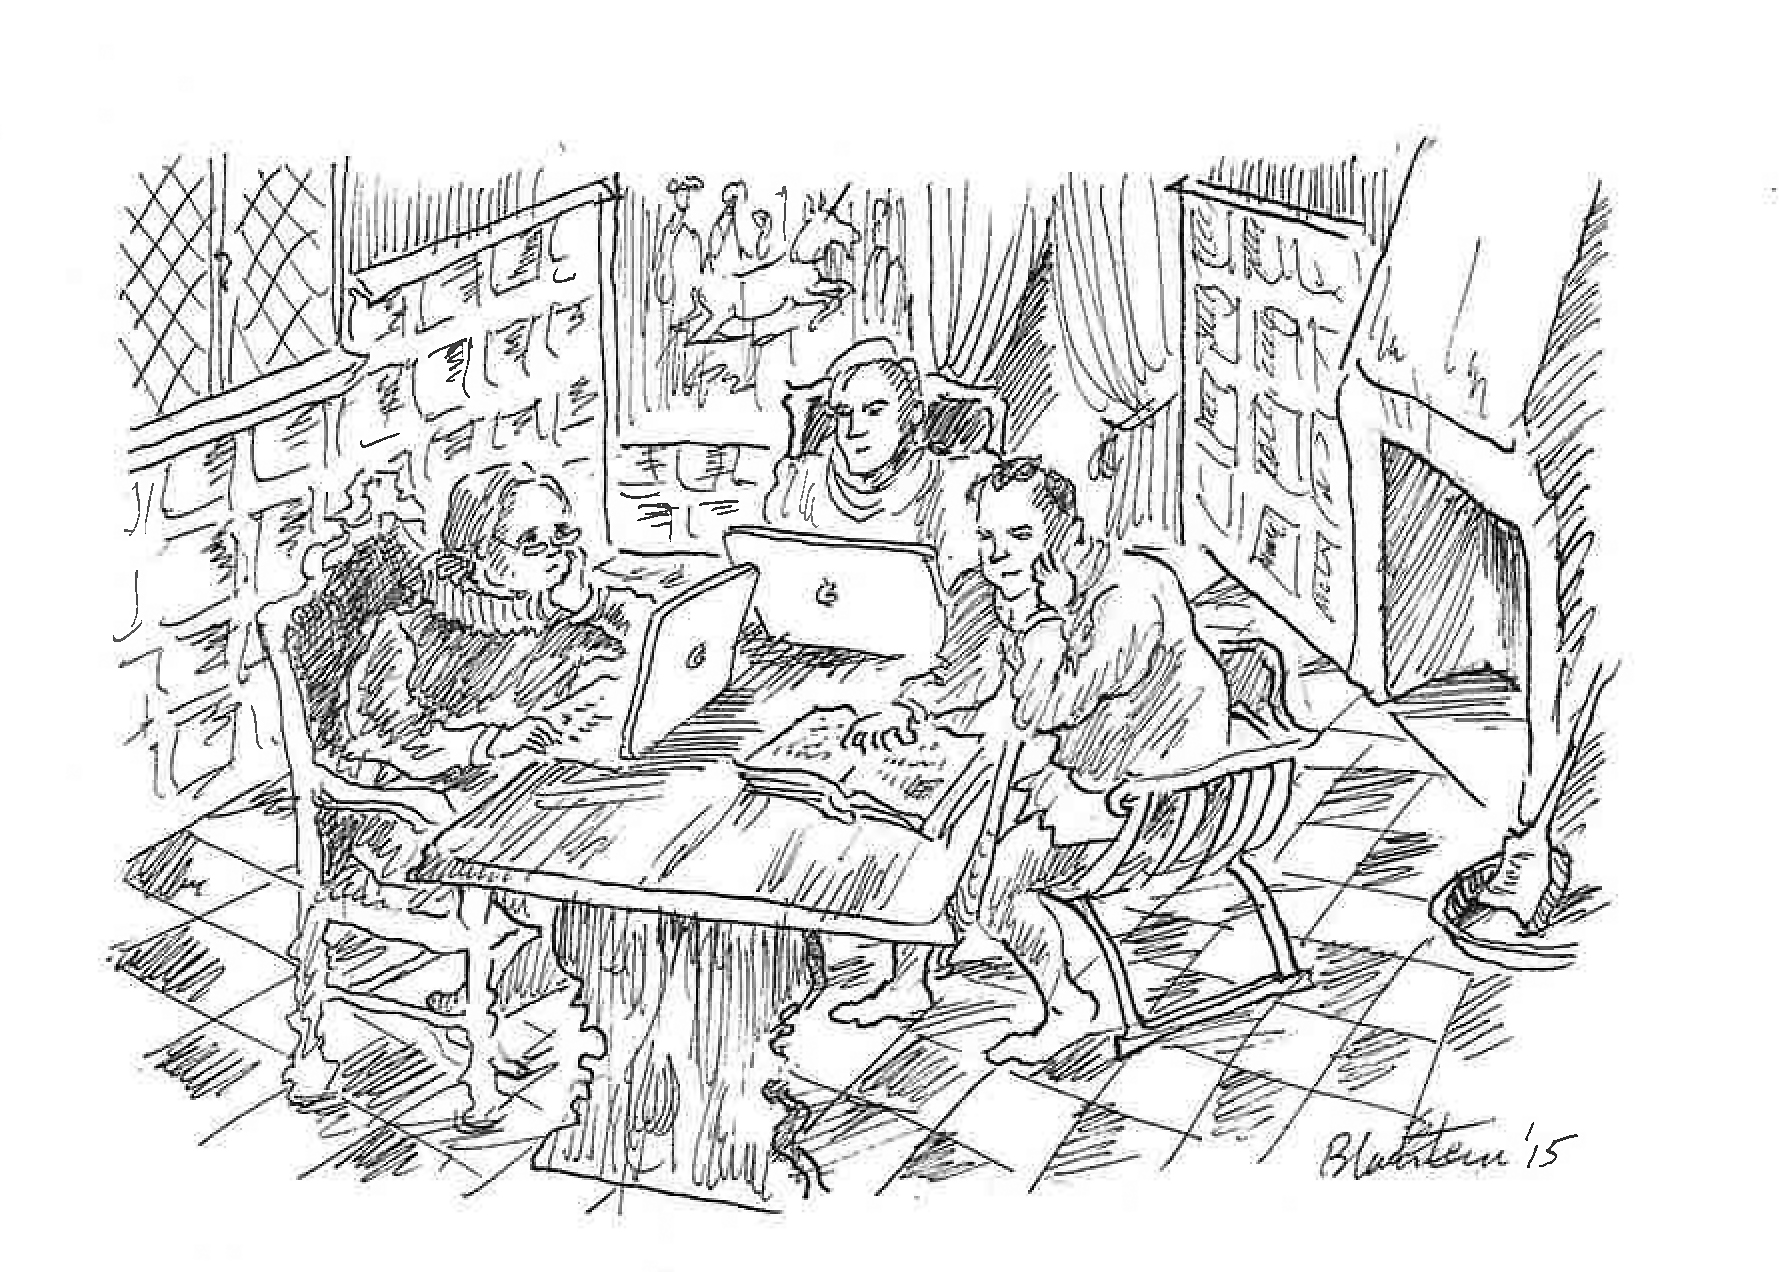
| and/or greater uncertainty, which helps to explain why the market of the last several years has seen many of these companies disadvantaged in the easy-money, ZIRP environment. In a phase in which few if any of the traditional penalties were paid for larding leverage onto corporate balance sheets, there were also scant advantages that have historically accrued to higher-quality, more conservatively capitalized companies. |
| We feel confident that this era is over. Our expectation is for lower returns for stocks as a whole, but relatively better returns for both high-quality companies and more cyclical, less defensive sectors. We suspect that in a few years market observers will look back at 2015—and perhaps the longer span covering 2013-2015 —as a hinge period in which the gradual sun-setting of interventionist Fed policies, coupled with the steady growth of the economy, restored the capital markets to something closer to more familiar historical patterns of performance and volatility. This is why we have been patiently holding so many companies in sectors such as Industrials and |
| Materials—they boast many attractive characteristics that the market has not yet fully recognized, a phenomenon we expect will change as the economy heats up. In our estimation their profitability, growth prospects, and reasonable to attractive valuations make them coiled springs. Until then, we wait. |
| To be sure, it has been a cycle of, at times, seemingly endless challenges for our active and risk-conscious approaches. Our collective patience has been sorely tested as we have waited (and waited) for many of our highest-confidence holdings to turn around. Of course, transitions are never easy, and the turn we have been anticipating has taken longer, after a few false starts, than any of us initially anticipated. Change, however, can take time—and we are often aware that a dramatic turn has occurred only in retrospect. We are content, then, to continue investing in the same way that we have for more than four decades—with a close eye on risk as we look for the intersection of attractive valuation and organic growth potential. |
| Sincerely, |
 |  |  | ||
| Charles M. Royce | Christopher D. Clark | Francis D. Gannon | ||
| Chief Executive Officer, | President and Co-Chief Investment Officer, | Co-Chief Investment Officer, | ||
| Royce & Associates, LLC | Royce & Associates, LLC | Royce & Associates, LLC | ||
| July 31, 2015 |
| 4 | This page is not part of the 2015 Semiannual Report to Shareholders |
| Performance and Expenses |
| Performance and Expenses | ||||||||||||||||||
| As of June 30, 2015 | ||||||||||||||||||
| AVERAGE ANNUAL TOTAL RETURNS (%) | ANNUAL OPERATING EXPENSES (%) | |||||||||||||||||
| YTD1 | 1-YR | 3-YR | 5-YR | 10-YR | SINCE INCEPTION | INCEPTION DATE | GROSS | NET | ||||||||||
| Royce Global Financial Services Fund | 7.22 | 7.05 | 20.66 | 17.07 | 8.71 | 8.74 | 12/31/03 | 1.93 | 1.74 | |||||||||
| (formerly Royce Financial Services Fund) | ||||||||||||||||||
| Royce European Small-Cap Fund | 11.52 | -9.22 | 10.46 | 9.52 | n.a. | 3.25 | 12/29/06 | 1.962 | 1.542 | |||||||||
| (formerly Royce European Smaller-Companies Fund) | ||||||||||||||||||
| Royce Global Value Fund | 7.67 | -8.62 | 6.34 | 6.49 | n.a. | 4.62 | 12/29/06 | 1.652 | 1.542 | |||||||||
| Royce International Small-Cap Fund | 4.49 | -9.11 | 7.66 | 6.94 | n.a. | 5.00 | 6/30/08 | 1.842 | 1.542 | |||||||||
| (formerly Royce International Smaller-Companies Fund) | ||||||||||||||||||
| Royce International Micro-Cap Fund | 7.45 | -2.75 | 10.82 | n.a. | n.a. | 2.40 | 12/31/10 | 3.472 | 1.652 | |||||||||
| Royce International Premier Fund | 13.72 | 1.08 | 11.95 | n.a. | n.a. | 5.43 | 12/31/10 | 2.302 | 1.542 | |||||||||
| INDEX | ||||||||||||||||||
| Russell 2000 Index | 4.75 | 6.49 | 17.81 | 17.08 | 8.40 | n.a. | n.a. | n.a. | n.a. | |||||||||
| Russell Global Small Cap Index | 6.37 | 0.34 | 13.69 | 11.77 | 7.36 | n.a. | n.a. | n.a. | n.a. | |||||||||
| Russell Global ex-U.S. Small Cap Index | 7.74 | -3.46 | 11.35 | 8.99 | 7.07 | n.a. | n.a. | n.a. | n.a. | |||||||||
| Russell Europe Small Cap Index | 10.01 | -4.56 | 17.85 | 13.09 | 7.33 | n.a. | n.a. | n.a. | n.a. | |||||||||
| 1 Not annualized | ||||||||||||||||||
| 2 Restated to reflect the Fund’s revised contractual investment advisory fee rate as of July 1, 2015. | ||||||||||||||||||
| Important Performance, Expense, and Risk Information All performance information in this Review and Report reflects past performance, is presented on a total return basis, reflects the reinvestment of distributions, and does not reflect the deduction of taxes a shareholder would pay on fund distributions or the redemption of fund shares. Past performance is no guarantee of future results. Investment return and principal value of an investment will fluctuate, so that shares may be worth more or less than their original cost when redeemed. Shares redeemed within 30 days of purchase may be subject to a 2% redemption fee payable to the Fund (1% for Royce Global Financial Services Fund). Redemption fees are not reflected in the performance shown above; if they were, performance would be lower. Current performance may be higher or lower than performance quoted. Current month-end performance may be obtained at www.roycefunds.com. All performance and expense information reflects results of the Fund’s Service Class shares. Price and total return information is based on net asset values calculated for shareholder transactions. Gross annual operating expenses reflect the Fund’s gross total annual operating expenses and include management fees, any 12b-1 distribution and service fees, other expenses, and any applicable acquired fund fees and expenses. Net annual operating expenses reflect contractual fee waivers and/or reimbursements. All expense information is reported as of the Fund’s most current prospectus. Royce & Associates has contractually agreed to waive fees and/or reimburse operating expenses (excluding brokerage commissions, taxes, interest, litigation expenses, acquired fund fees and expenses, and other expenses not borne in the ordinary course of business) to the extent necessary to maintain net operating expenses at or below: 1.49% for Royce Global Financial Services Fund; 1.54% for Royce European Small-Cap, Global Value, International Small-Cap, and International Premier Funds through April 30, 2016, at or below: 1.64% for Royce International Micro-Cap Fund through April 30, 2016, and at or below: 1.99% for Royce International Micro-Cap Fund, and International Premier Fund through April 30, 2025. Acquired fund fees and expenses reflect the estimated amount of fees and expenses incurred indirectly by the Fund through its investments in mutual funds, hedge funds, private equity funds, and other investment companies. |
| Shares of the Funds’ Service Class bear an annual distribution expense that is not borne by the Funds’ Investment Class. Investments in securities of micro-cap, small-cap, and/or mid-cap companies may involve considerably more risk than investments in securities of larger-cap companies. (Please see “Primary Risks for Fund Investors” in the prospectus.) The Funds invest a significant portion of their respective assets in foreign companies that may be subject to different risks than investments in securities of U.S. companies, including adverse political, social, economic, or other developments that are unique to a particular country or region. (Please see “Investing in Foreign Securities” in the prospectus.) Therefore, the prices of securities of foreign companies in particular countries or regions may, at times, move in a different direction than those of securities of U.S. companies. (Please see “Primary Risk of Fund Investors” in the prospectus.) Please read the prospectus carefully before investing or sending money. The Russell 2000 Index is an unmanaged, capitalization-weighted index of domestic small-cap stocks that measures the performance of the 2,000 smallest publicly traded U.S. companies in the Russell 3000 Index. The Russell Global Small Cap Index is an unmanaged, capitalization-weighted index of global small-cap stocks. The Russell Europe Small Cap Index is an unmanaged, capitalization-weighted index of European small-cap stocks. Index returns include net reinvested dividends and/or interest income. The Russell Global ex-U.S. Small Cap Index is an index of global small-cap stocks, excluding the United States. All index returns include net reinvested dividends and/or interest income. The performance of an index does not represent exactly any particular investment as you cannot invest directly in an index. Distributor: Royce Fund Services, Inc. |
| This page is not part of the 2015 Semiannual Report to Shareholders | 5 |
| MANAGER’S DISCUSSION |
| Royce Global Financial Services (RFS) (formerly Royce Financial Services Fund) |
 |
Chuck Royce |
| FUND PERFORMANCE |
| We were very pleased with both absolute and relative first-half results for Royce Global Financial Services Fund (formerly Royce Financial Services Fund). For the year-to-date period ended June 30, 2015, the Fund advanced 7.2%, easily outperforming both its small-cap benchmark, the Russell 2000 Index, which was up 4.8%, and the Russell 2500 Financial Services Index, which was up 3.1% for the same period. The Fund underperformed both indexes during the slightly volatile first quarter, increasing 2.7% compared to 4.3% for the Russell 2000 and 3.7% for the financial services companies in the Russell 2500. Much of this relative disadvantage was due to a positive but relatively underwhelming performance from capital markets, the portfolio’s largest industry group. |
| The second quarter saw the Fund rebound on a relative basis thanks to a very strong performance in April, an otherwise bearish month for most stocks. For the second quarter as a whole, the Fund gained 4.4% compared to gains of 0.4% for the Russell 2000 and a loss of 0.5% for the financial services companies in the Russell 2500. Long-term results remained impressive on both and absolute and relative scale. The Fund beat the Russell 2000 for the one-, three-, and 10-year periods ended June 30, 2015 while it was essentially even with the small-cap index for the five-year and since inception (12/31/03) time spans. It outperformed the Russell 2500 Financial Services companies for the three-, five-, 10-year, and since inception periods ended June 30, 2015. The Fund’s average annual total return since inception was 8.7%. |
| WHAT WORKED... AND WHAT DIDN’T |
| As mentioned above, the capital markets group dominated the portfolio’s performance in the first half. The industry is home to several asset management companies, a business we believe we know well and in which we have many years of investment experience. So while six of the portfolio’s 10 most significant detractors came from that industry, eight of its 10 largest contributors did as well. Needless to say, net gains for contributors had a far more meaningful impact on performance than those whose shares were in decline for the first half. |
| The Fund’s top-two performers made particularly notable contributions to results for the semiannual period. First was WisdomTree Investments, an asset management company that primarily sponsors ETFs (exchange traded funds).The company enjoyed record inflows and revenues in the first quarter of 2015, which prompted us to reduce our position during the first half, though we still held a good-sized stake at the end of June. A rising share price inspired a similar reduction for Diamond Hill Investment Group, which saw strong earnings and growing revenues draw investors. Though not quite as lofty, Jupiter Fund Management also posted a noteworthy net gain. This London-based business manages open-end funds with an active management approach. The firm also offers investment services to institutional and other private clients. Its shares were helped by healthy inflows and increased assets under management, and we were pleased to hold a large position at the end of June. |
| In January we chose to sell our shares of automotive financial services company Ally Financial, formerly GMAC, the financing arm of General Motors. Steady losses dating back to late 2014—primarily the result of a growing number of missed auto loan payments—convinced us that better opportunities could be found elsewhere in the market. We were more confident in the long-term prospects for South African investment firm Coronation Fund Managers. Although we trimmed our shares in January, we held onto a sizable position. Its shares were challenged throughout the first half, falling especially hard in April after the firm announced that earnings were likely to drop anywhere from 5% to 15% for its fiscal semiannual period. |
| Top Contributors to Performance Year-to-Date Through 6/30/15 (%)1 | ||||
| WisdomTree Investments | 0.83 | |||
| Diamond Hill Investment Group | 0.80 | |||
| Jupiter Fund Management | 0.50 | |||
| Value Partners Group | 0.47 | |||
| MarketAxess Holdings | 0.40 | |||
| 1 Includes dividends | ||||
| Top Detractors from Performance Year-to-Date Through 6/30/15 (%)2 | ||||
| Ally Financial | -0.36 | |||
| Coronation Fund Managers | -0.33 | |||
| Medley Management, Cl. A | -0.31 | |||
| Piper Jaffray | -0.31 | |||
| GMP Capital | -0.30 | |||
| 2 Net of dividends | ||||
| CURRENT POSITIONING AND OUTLOOK |
| Effective June 15, 2015, we renamed the Fund while simultaneously expanding its ability to invest in non-U.S. financial services companies, which have become an area of increasing interest and opportunity for us over the last several years. The Fund may now invest up to 50% of its net assets in foreign companies, where 33.7% of its net assets were invested in at the end June, slightly less than half of which were headquartered in Western Europe. |
| In terms of individual companies, we continue to lean more toward financial services businesses with little or very low leverage and sterling fundamentals, which typically encompasses asset managers, insurance companies, investment or insurance brokers, and technology firms with financial expertise or specialization. While historically we have invested comparatively little in banks, we have been looking at them more closely of late. Looking forward, we like the growing global reach of some of the best-managed asset management firms and anticipate that these businesses will continue to remain a focal point of the portfolio. Considering this emphasis, we would expect the Fund to remain periodically out of sync with the financial services companies in the Russell 2500 and to often move in a different direction than the Russell 2000. |
| 6 | The Royce Funds 2015 Semiannual Report to Shareholders |
| PERFORMANCE AND PORTFOLIO REVIEW | TICKER SYMBOL RYFSX |
| Performance and Expenses | ||||||||||||
| Average Annual Total Return (%) Through 6/30/15 | ||||||||||||
| JAN-JUN 2015* | 1-YR | 3-YR | 5-YR | 10-YR | SINCE INCEPTION (12/31/03) | |||||||
| RFS | 7.22 | 7.05 | 20.66 | 17.07 | 8.71 | 8.74 | ||||||
| Annual Gross Operating Expenses: 1.93% Annual Net Operating Expenses: 1.74% | ||||||||||||
| *Not Annualized | ||||||||||||
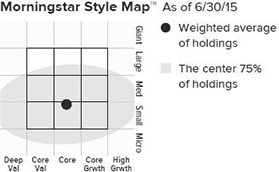
The Morningstar Style Map is the Morningstar Style BoxTM with the center 75% of fund holdings plotted as the Morningstar Ownership ZoneTM. The Morningstar Style Box is designed to reveal a fund’s investment strategy. The Morningstar Ownership Zone provides detail about a portfolio’s investment style by showing the range of stock sizes and styles. The Ownership Zone is derived by plotting each stock in the portfolio within the proprietary Morningstar Style Box. Over time, the shape and location of a fund’s ownership zone may vary. See page 48 for additional information. |
Value of $10,000
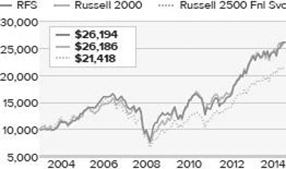
| Top 10 Positions | ||
| % of Net Assets | ||
| Federated Investors Cl. B | 2.0 | |
| CIT Group | 1.8 | |
| TMX Group | 1.8 | |
| Jupiter Fund Management | 1.8 | |
| Ashmore Group | 1.7 | |
| First Citizens BancShares Cl. A | 1.6 | |
| First Republic Bank | 1.6 | |
| Artisan Partners Asset Management Cl. A | 1.6 | |
| Westwood Holdings Group | 1.6 | |
| Value Partners Group | 1.5 | |
| Portfolio Industry Breakdown | ||
| % of Net Assets | ||
| Capital Markets | 51.7 | |
| Diversified Financial Services | 11.0 | |
| Banks | 8.1 | |
| Insurance | 5.1 | |
| Software | 2.2 | |
| IT Services | 1.8 | |
| Internet Software & Services | 1.8 | |
| Consumer Finance | 1.8 | |
| Media | 1.5 | |
| Investment Companies | 1.4 | |
| Marine | 1.0 | |
| Trading Companies & Distributors | 1.0 | |
| Professional Services | 0.8 | |
| Real Estate Management & Development | 0.6 | |
| Hotels, Restaurants & Leisure | 0.2 | |
| Miscellaneous | 3.1 | |
| Cash and Cash Equivalents | 6.9 | |
| Upside/Downside Capture Ratios | ||||||||||||
| Periods Ended 6/30/15 (%) | ||||||||||||
| UPSIDE | DOWNSIDE | |||||||||||
| 10-Year | 94 | 88 | ||||||||||
| Fund’s First Full Quarter (12/31/03) | 90 | 84 | ||||||||||
| Calendar Year Total Returns (%) | ||
| YEAR | RFS | |
| 2014 | 3.5 | |
| 2013 | 42.0 | |
| 2012 | 20.7 | |
| 2011 | -11.3 | |
| 2010 | 18.5 | |
| 2009 | 32.1 | |
| 2008 | -35.4 | |
| 2007 | -4.7 | |
| 2006 | 24.8 | |
| 2005 | 12.2 | |
| 2004 | 15.1 | |
| Portfolio Country Breakdown1,2 % of Net Assets | ||
| United States | 59.4 | |
| United Kingdom | 7.0 | |
| Canada | 5.7 | |
| Switzerland | 4.0 | |
| 1 Represents countries that are 3% or more of net assets. | ||
| 2 Securities are categorized by the country of their headquarters. | ||
| Portfolio Diagnostics | ||
| Fund Net Assets | $57 million | |
| Number of Holdings | 100 | |
| Turnover Rate | 24% | |
| Average Market Capitalization1 | $2,350 million | |
| Weighted Average P/E Ratio2,3 | 18.4x | |
| Weighted Average P/B Ratio2 | 2.8x | |
| Holdings ≥ 75% of Total Investments | 56 | |
| Active Share4 | 98% | |
| 1 | Geometric Average. This weighted calculation uses each portfolio holding’s market cap in a way designed to not skew the effect of very large or small holdings; instead, it aims to better identify the portfolio’s center, which Royce believes offers a more accurate measure of average market cap than a simple mean or median. |
| 2 | Harmonic Average. This weighted calculation evaluates a portfolio as if it were a single stock and measures it overall. It compares the total market value of the portfolio to the portfolio’s share in the earnings or book value, as the case may be, of its underlying stocks. |
| 3 | The Fund’s P/E ratio calculation excludes companies with zero or negative earnings (6% of portfolio holdings as of 6/30/15). |
| 4 | Active Share is the sum of the absolute values of the different weightings of each holding in the Fund versus each holding in the benchmark, divided by two. |
| Important Performance and Expense Information All performance information in this Report reflects past performance, is presented on a total return basis, reflects the reinvestment of distributions, and does not reflect the deduction of taxes that a shareholder would pay on fund distributions or the redemption of fund shares. Past performance is no guarantee of future results. Investment return and principal value of an investment will fluctuate, so that shares may be worth more or less than their original cost when redeemed. Shares redeemed within 30 days of purchase may be subject to a 1% redemption fee payable to the Fund, which is not reflected in the performance shown above; if it were, performance would be lower. Current month-end performance may be higher or lower than performance quoted and may be obtained at www.roycefunds.com. Gross operating expenses reflect the Fund’s gross total annual operating expenses for the Service Class and include management fees, 12b-1 distribution and service fees, other expenses and acquired fund fees and expenses. Net operating expenses reflect contractual fee waivers and/or expense reimbursements. All expense information is reported as of the Fund’s most current prospectus. Royce & Associates has contractually agreed to waive fees and/or reimburse expenses to the extent necessary to maintain the Fund’s net annual operating expenses, (excluding brokerage commissions, taxes, interest, litigation expenses, acquired fund fees and expenses, and other expenses not borne in the ordinary course of business), at or below 1.49% through April 30, 2016. Acquired fund fees and expenses reflect the estimated amount of the fees and expenses incurred indirectly by the Fund through its investments in mutual funds, hedge funds, private equity funds, and other investment companies. Regarding the “Top Contributors” and “Top Detractors” tables shown above, the sum of all contributors to, and all detractors from, performance for all securities in the portfolio would approximate the Fund’s year-to-date performance for 2015. Upside Capture Ratio measures a manager’s performance in up markets relative to the Fund’s benchmark. It is calculated by measuring the Fund’s performance in quarters when the benchmark went up and dividing it by the benchmark’s return in those quarters. Downside Capture Ratio measures a Managers’ performance in down markets relative to the Fund’s benchmark (Russell 2000). It is calculated by measuring the Fund’s performance in quarters when the benchmark goes down and dividing it by the benchmark’s return in those quarters. |
| The Royce Funds 2015 Semiannual Report to Shareholders | 7 |
| MANAGERS’ DISCUSSION |
| Royce European Small-Cap Fund (RES) (formerly Royce European Smaller-Companies Fund) |
 |
David Nadel Mark Rayner, CA |
| FUND PERFORMANCE |
| Royce European Small-Cap Fund (formerly Royce European Smaller-Companies Fund) put up a terrific showing in the first half. For the year-to-date period ended June 30, 2015 the Fund increased 11.5%, outpacing its benchmark, the Russell Europe Small Cap Index, which gained 10.0% for the same period. Following a difficult 2014 (and a similarly bearish January 2015), the Fund’s fortunes began to reverse in February when it outpaced the European small-cap index’s impressive 8.0% gain with an 8.8% advance for the month. The Fund then held its value relatively better than the benchmark when European small-caps briefly corrected in March. For the first quarter European Small-Cap was up 4.7% compared to its benchmark’s 3.6% advance. |
| Unlike most domestic equities, non-U.S. stocks, particularly European small-caps, roared back in April, and we were again pleased to see the Fund outpace its benchmark during another dynamic, short-term rally. The pace of returns slackened in May and into June before news of the Greek default on the second-to-last trading day of the quarter wreaked havoc on stock prices. Despite the last-minute headwind, European Small-Cap gained 6.5% in the second quarter versus a return of 6.2% for the Russell Europe Small Cap. On a more intermediate- and long-term basis, the Fund still has some ground to make up, though the Fund outperformed the Russell Europe Small Cap for the since inception (12/29/06) period ended June 30, 2015. |
| WHAT WORKED... AND WHAT DIDN’T |
| During the semiannual period all of the Fund’s eight equity sectors posted net gains, most notably Industrials, Information Technology, Consumer Discretionary, Health Care, and Financials. Only the first of these five groups did not also have a positive impact vis-à-vis the benchmark. Net losses at the industry and position level were comparatively modest. The leading detractor among the portfolio’s industries was the building products group. It’s slotted in the Industrials sector and was one of the few industries in which the Fund significantly lagged its benchmark in the first half. |
| On a country level, the top contributor was by far the U.K., where the Fund has historically had substantial exposure, followed by France, Italy, and Switzerland. Germany was the lone sizable detractor, followed by slight net losses for Cyprus and Spain. |
| Based in Switzerland and the Fund’s largest position at the end of June, VZ Holding provides financial services to both individual and corporate clients in Switzerland and Germany, including financial planning, insurance, mortgages, and other wealth management services. The Swiss National Bank’s surprise decision in mid-January to delink from the euro resulted in rapid appreciation for the Swiss franc, which in turn led VZ Holding’s stock to decline as the Swiss market as a whole reacted negatively to the currency inflation. We took this opportunity to add shares, as we believe this is a high-quality company with a domestic business that has historically been largely unaffected by currency movements. When the company subsequently reported sterling 2014 results in March, its stock marched to new highs, which led us to sell some shares. London-based Clarkson is an investment holding company whose subsidiaries provide integrated shipping services worldwide. Its stock began to rise in February shortly after the announcement that it had completed the acquisition of international shipbroking company RS Platou ASA. Its stock continued to do well through the rest of 2015’s first half, reaching new highs at the end of June. Strong results for fiscal 2014, which were well ahead of market expectations, and a double-digit growth outlook were additional factors that helped drive performance. Clarkson’s entrance into the FTSE 250 index on the London Stock Exchange in mid-April, a move that required U.K. index funds to invest in the stock, also played a part. |
| A German business topped the list of the Fund’s detractors at the position level for the semiannual period. LPKF Laser & Electronics develops specialized mechanical engineering products for electronics production, the automotive industry, and in the manufacture of solar cells. After a disappointing 2014, its shares rallied briefly in February only to begin falling again in March after a disappointing first-quarter report led to a wave of selling. We decided to sell our shares in June. Headquartered in China and listed on the Frankfurt Stock Exchange, Joyou designs and retails sanitary fixtures including bathroom faucets, kitchen products, and ceramics. An announcement late in April that the company’s supervisory board would be conducting an audit to review business transactions by its subsidiaries led to a precipitous drop in Joyou’s stock price. We exited our position immediately following the announcement. |
| Top Contributors to Performance Year-to-Date Through 6/30/15 (%)1 | ||||
| VZ Holding | 0.93 | |||
| Clarkson | 0.89 | |||
| Nokian Renkaat | 0.88 | |||
| Elektrobudowa | 0.85 | |||
| AVEVA Group | 0.80 | |||
| 1Includes dividends | ||||
| Top Detractors from Performance Year-to-Date Through 6/30/15 (%)2 | |||||
| LPKF Laser & Electronics | -0.55 | ||||
| Joyou | -0.55 | ||||
| Aixtron | -0.38 | ||||
| Societe Internationale de Plantations d’Heveas | -0.18 | ||||
| Schaffner Holding | -0.18 | ||||
| 2 Net of dividends | |||||
| CURRENT POSITIONING AND OUTLOOK |
| At the end June, the portfolio remained overweight in Industrials, Information Technology, Materials, and Energy. The largest exposure by country was to the U.K., France, and Switzerland. We continue to look for conservatively capitalized companies that earn high returns on invested capital and demonstrate the ability to compound wealth over the long term. |
| 8 | The Royce Funds 2015 Semiannual Report to Shareholders |
| PERFORMANCE AND PORTFOLIO REVIEW | TICKER SYMBOLS RISCX RESNX |
| Performance and Expenses | ||||||||||
| Average Annual Total Return (%) Through 6/30/15 | ||||||||||
| JAN-JUN 2015* | 1-YR | 3-YR | 5-YR | SINCE INCEPTION (12/29/06) | ||||||
| RES | 11.52 | -9.22 | 10.46 | 9.52 | 3.25 | |||||
| Annual Gross Operating Expenses: 1.96%** Annual Net Operating Expenses: 1.54%** | ||||||||||
| * Not Annualized | ||||||||||
| ** Restated to reflect the Fund’s revised contractual investment advisory fee rate as of July 1, 2015. | ||||||||||
The Morningstar Style Map is the Morningstar Style BoxTM with the center 75% of fund holdings plotted as the Morningstar Ownership ZoneTM. The Morningstar Style Box is designed to reveal a fund’s investment strategy. The Morningstar Ownership Zone provides detail about a portfolio’s investment style by showing the range of stock sizes and styles. The Ownership Zone is derived by plotting each stock in the portfolio within the proprietary Morningstar Style Box. Over time, the shape and location of a fund’s ownership zone may vary. See page 48 for additional information. |
Invested on 12/31/06 as of 6/30/15 ($)
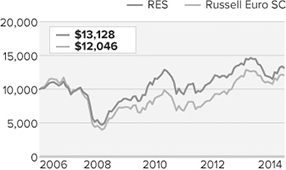
| Top 10 Positions | ||
| % of Net Assets | ||
| VZ Holding | 3.0 | |
| Clarkson | 2.6 | |
| HellermannTyton Group | 2.4 | |
| Mayr-Melnhof Karton | 2.3 | |
| e2v technologies | 2.1 | |
| Consort Medical | 2.0 | |
| Ashmore Group | 1.9 | |
| AVEVA Group | 1.9 | |
| Addtech Cl. B | 1.9 | |
| Polypipe Group | 1.9 | |
| Portfolio Sector Breakdown | ||
| % of Net Assets | ||
| Industrials | 34.0 | |
| Information Technology | 12.9 | |
| Health Care | 12.2 | |
| Consumer Discretionary | 10.6 | |
| Financials | 10.3 | |
| Materials | 8.6 | |
| Energy | 4.3 | |
| Consumer Staples | 2.9 | |
| Cash and Cash Equivalents | 4.2 | |
| Upside/Downside Capture Ratios | ||||
| Periods Ended 6/30/15 (%) | ||||
| UPSIDE | DOWNSIDE | |||
| Fund’s First Full Quarter (12/31/06) | 90 | 85 | ||
| Calendar Year Total Returns (%) | ||
| YEAR | RES | |
| 2014 | -14.9 | |
| 2013 | 20.8 | |
| 2012 | 23.8 | |
| 2011 | -20.3 | |
| 2010 | 35.2 | |
| 2009 | 57.7 | |
| 2008 | -46.4 | |
| 2007 | 1.4 | |
| Portfolio Country Breakdown1,2 | ||
| % of Net Assets | ||
| United Kingdom | 37.1 | |
| France | 19.7 | |
| Switzerland | 8.9 | |
| Italy | 6.7 | |
| Germany | 6.7 | |
| Austria | 4.4 | |
| Norway | 3.3 | |
| 1 Represents countries that are 3% or more of net assets. | ||
| 2 Securities are categorized by the country of their headquarters. | ||
| Portfolio Diagnostics | ||
| Fund Net Assets | $22 million | |
| Number of Holdings | 75 | |
| Turnover Rate | 46% | |
| Average Market Capitalization1 | $986 million | |
| Weighted Average P/E Ratio2,3 | 18.8x | |
| Weighted Average P/B Ratio2 | 2.8x | |
| Holdings ≥ 75% of Total Investments | 46 | |
| Active Share4 | 95% | |
| 1 | Geometric Average. This weighted calculation uses each portfolio holding’s market cap in a way designed to not skew the effect of very large or small holdings; instead, it aims to better identify the portfolio’s center, which Royce believes offers a more accurate measure of average market cap than a simple mean or median. | |
Harmonic Average. This weighted calculation evaluates a portfolio as if it were a single stock and measures it overall. It compares the total market value of the portfolio to the portfolio’s share in the earnings or book value, as the case may be, of its underlying stocks. | ||
| 3 | The Fund’s P/E ratio calculation excludes companies with zero or negative earnings (4% of portfolio holdings as of 6/30/15). | |
| 4 | Active Share is the sum of the absolute values of the different weightings of each holding in the Fund versus each holding in the benchmark, divided by two. |
Important Performance and Expense Information All performance information in this Report reflects past performance, is presented on a total return basis, reflects the reinvestment of distributions, and does not reflect the deduction of taxes that a shareholder would pay on fund distributions or the redemption of fund shares. Past performance is no guarantee of future results. Investment return and principal value of an investment will fluctuate, so that shares may be worth more or less than their original cost when redeemed. Shares redeemed within 30 days of purchase may be subject to a 2% redemption fee payable to the Fund, which is not reflected in the performance shown above; if it were, performance would be lower. Current month end performance may be higher or lower than performance quoted and may be obtained at www.roycefunds.com. Gross operating expenses reflect total gross annual operating expenses and include management fees, 12b-1 distribution and service fees, and other expenses. Net operating expenses reflect contractual fee waivers and/or expense reimbursements. All expense information is reported as of the Fund’s most current prospectus. Royce & Associates has contractually agreed to waive its fees and/or reimburse operating expenses to the extent necessary to maintain the Fund’s net annual operating expenses, (excluding brokerage commissions, taxes, interest, litigation expenses, acquired fund fees and expenses, and other expenses not borne in the ordinary course of business), at or below 1.54% through April 30, 2016. Regarding the “Top Contributors” and “Top Detractors” tables shown above, the sum of all contributors to, and all detractors from, performance for all securities in the portfolio would approximate the Fund’s year-to-date performance for 2015. Upside Capture Ratio measures a manager’s performance in up markets relative to the Fund’s benchmark. It is calculated by measuring the Fund’s performance in quarters when the benchmark went up and dividing it by the benchmark’s return in those quarters. Downside Capture Ratio measures a Managers’ performance in down markets relative to the Fund’s benchmark (Russell Europe Small Cap). It is calculated by measuring the Fund’s performance in quarters when the benchmark goes down and dividing it by the benchmark’s return in those quarters. |
| The Royce Funds 2015 Semiannual Report to Shareholders | 9 |
| MANAGERS’ DISCUSSION |
| Royce Global Value Fund (RGV) |
 |
David Nadel Dilip Badlani, CFA Steven McBoyle, CPA, CA Jim Harvey, CFA |
| FUND PERFORMANCE |
| We were pleased to see Royce Global Value Fund mount a comeback of sorts in the first half with a strong absolute and relative performance. The Fund gained 7.7% for the year-to-date period ended June 30, 2015, outpacing its benchmark, the Russell Global Small Cap Index, which gained 6.4% for the same period. While domestic equities began the year with a downturn in January, their non-U.S. counterparts had more varied results. We were pleased to see the Fund lose less than its benchmark during this challenging month (-1.0% versus -1.5%). The rest of the first quarter was similarly mixed, but along more varied lines. Most stocks across the globe did well in February, with the U.S. and Europe showing the most strength regionally. March then saw some interestingly selective pullbacks in U.S. large-caps (the S&P 500, Russell 1000, and Nasdaq were each underwater for the month) and a number of European small-caps. The upshot was a solidly positive opening quarter for the Fund, in which it advanced 2.4%, lagging the index’s 3.9% return. |
| While domestic small-caps struggled in April, signs of an economic recovery in Europe were a boon to many non-U.S. small-caps. Their stateside cousins then rallied in May, which was more globally bullish though less robust outside the U.S. The overall pace of returns continued to cool globally in June, especially later in the month when the Greek default and China’s precipitously plummeting stock market made markets more volatile and, in some cases, downright bearish. Despite these headwinds, Global Value increased 5.2% for the quarter, well ahead of its benchmark’s 2.4% advance. The Fund also owned a slight performance advantage over the Russell Global Small Cap for the since inception (12/29/06) period ended June 30, 2015. |
| WHAT WORKED... AND WHAT DIDN’T |
| All of the Fund’s nine equity sectors contributed to performance in the first half, with particularly strong net gains coming from Industrials and Financials. We were also pleased that these two sectors outpaced the net gains from these areas within the benchmark. As was the case with many of Royce’s domestic portfolios, Health Care contributed within the portfolio while also having a negative impact versus the benchmark. This was almost entirely a result of the Fund’s very low exposure to U.S. market-leading biotech stocks and, to a lesser degree, pharmaceuticals companies. At the country level the largest contributors were the U.K., Hong Kong, and Japan. Net losses at the country level were far more modest, with Brazil, Singapore, and Sweden detracting most from the Fund’s first-half results. |
| Leading all of the portfolio’s positions by an impressive margin was top-10 holding Value Partners Group. A Hong Kong-based asset manager with a value orientation that naturally appeals to us, its shares often closely parallel movements in the Hong Kong and Shanghai markets. Each climbed precipitously into May before cooling off with the bear market for Chinese stocks. We were pleased to see growth in its assets under management and improved performance and management fees, all of which helped its earnings. London-based Clarkson was the Fund’s second-biggest position at the end of June and second-largest contributor to performance in the first six months of 2015. Clarkson is an investment holding company whose subsidiaries provide integrated shipping services worldwide. Its stock began to rise in February and did well through the remainder of 2015’s first half, reaching new highs at the end of June. Strong results for fiscal 2014, which were well ahead of market expectations, and a double-digit growth outlook helped drive performance. Clarkson’s entrance into the FTSE 250 index on the London Stock Exchange in mid-April, a move that required U.K. index funds to invest in the stock, also played a part. |
| The Fund’s most significant detractor was retailer New World Department Store China, which is headquartered in Hong Kong and runs stores on the mainland. Its stock plunged late in June, hurt by the bear market in China and the decision by Chinese authorities to tighten restrictions on margin lending. Liking the company’s management, generous dividend policy, and position as a major retail presence in a vital and growing consumer market, we held onto a sizable position at the end of June. Anixter International, which makes specialized wiring systems and distributes cables and electrical and electronic wire products, reduced the organic growth outlook for fiscal 2015 for two of its core distribution businesses—enterprise cabling and security solutions and electronic wire and cable—primarily due to mounting competition in cabling and security and slower U.S. industrial production keyed by the stronger dollar and lower energy-related capital spending. Slumping copper prices have also hurt its business. We held shares at the end of June. |
| Top Contributors to Performance Year-to-Date Through 6/30/15 (%)1 | ||||
| Value Partners Group | 1.62 | |||
| Clarkson | 0.68 | |||
| Taiwan Paiho | 0.54 | |||
| Obara Group | 0.50 | |||
| AVEVA Group | 0.42 | |||
| 1 Includes dividends | ||||
| Top Detractors from Performance Year-to-Date Through 6/30/15 (%)2 | ||||
| New World Department Store China | -0.42 | |||
| Anixter International | -0.32 | |||
| Luk Fook Holdings (International) | -0.23 | |||
| Zuiko Corporation | -0.23 | |||
| Western Forest Products | -0.19 | |||
| 2 Net of dividends | ||||
| CURRENT POSITIONING AND OUTLOOK |
| The portfolio’s largest weightings by country at the end of the first half were the U.S., Japan, and the U.K. As the global economy continues to recover, we are looking for opportunities in several sectors. At the end of June, the Fund was overweight in Consumer Discretionary and Industrials, positioned for a market that more consistently rewards profitable businesses. |
| 10 | The Royce Funds 2015 Semiannual Report to Shareholders |
| PERFORMANCE AND PORTFOLIO REVIEW | TICKER SYMBOLS RIVFX RGVIX RGVHX RGVRX RGVKX |
| Performance and Expenses | ||||||||||
| Average Annual Total Return (%) Through 6/30/15 | ||||||||||
| JAN-JUN 2015* | 1-YR | 3-YR | 5-YR | SINCE INCEPTION (12/29/06) | ||||||
| RGV | 7.67 | -8.62 | 6.34 | 6.49 | 4.62 | |||||
| Annual Gross Operating Expenses: 1.65%** Annual Net Operating Expenses: 1.54%** | ||||||||||
| * Not Annualized. | ||||||||||
| ** Restated to reflect the Fund’s revised contractual investment advisory fee rate as of July 1, 2015. | ||||||||||

The Morningstar Style Map is the Morningstar Style BoxTM with the center 75% of fund holdings plotted as the Morningstar Ownership ZoneTM. The Morningstar Style Box is designed to reveal a fund’s investment strategy. The Morningstar Ownership Zone provides detail about a portfolio’s investment style by showing the range of stock sizes and styles. The Ownership Zone is derived by plotting each stock in the portfolio within the proprietary Morningstar Style Box. Over time, the shape and location of a fund’s ownership zone may vary. See page 48 for additional information. |
Invested on 12/31/06 as of 6/30/15 ($)
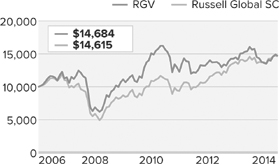
| Top 10 Positions | ||
| % of Net Assets | ||
| Magellan Aerospace | 2.1 | |
| Clarkson | 1.9 | |
| VZ Holding | 1.5 | |
| New World Department Store China | 1.5 | |
| Totvs | 1.4 | |
| CETIP - Mercados Organizados | 1.4 | |
| Obara Group | 1.4 | |
| Value Partners Group | 1.4 | |
| ManpowerGroup | 1.3 | |
| Valmont Industries | 1.2 | |
| Portfolio Sector Breakdown | ||
| % of Net Assets | ||
| Industrials | 24.1 | |
| Consumer Discretionary | 20.9 | |
| Financials | 16.9 | |
| Information Technology | 10.9 | |
| Materials | 7.3 | |
| Health Care | 6.2 | |
| Consumer Staples | 2.4 | |
| Energy | 1.4 | |
| Utilities | 0.5 | |
| Cash and Cash Equivalents | 9.4 | |
| Upside/Downside Capture Ratios | ||||
| Periods Ended 6/30/15 (%) | ||||
| UPSIDE | DOWNSIDE | |||
| From 12/31/06 (Start of Fund’s First Full Quarter) | 98 | 97 | ||
| Calendar Year Total Returns (%) | ||
| YEAR | RGV | |
| 2014 | -5.8 | |
| 2013 | 6.3 | |
| 2012 | 11.0 | |
| 2011 | -18.7 | |
| 2010 | 35.7 | |
| 2009 | 61.9 | |
| 2008 | -39.9 | |
| 2007 | 14.3 | |
| Portfolio Country Breakdown1,2 | ||
| % of Net Assets | ||
| United States | 25.1 | |
| Japan | 12.1 | |
| United Kingdom | 11.4 | |
| Hong Kong | 5.4 | |
| Canada | 4.6 | |
| Switzerland | 4.2 | |
| Germany | 3.7 | |
| Brazil | 3.6 | |
| France | 3.1 | |
| 1 Represents countries that are 3% or more of net assets. | ||
| 2 Securities are categorized by the country of their headquarters. | ||
| Portfolio Diagnostics | ||
| Fund Net Assets | $71 million | |
| Number of Holdings | 175 | |
| Turnover Rate | 30% | |
| Average Market Capitalization1 | $1,826 million | |
| Weighted Average P/E Ratio2,3 | 17.5x | |
| Weighted Average P/B Ratio2 | 2.8x | |
| Holdings ≥ 75% of Total Investments | 84 | |
| Active Share4 | 98% | |
Important Performance and Expense Information All performance information in this Report reflects past performance, is presented on a total return basis, reflects the reinvestment of distributions, and does not reflect the deduction of taxes that a shareholder would pay on fund distributions or the redemption of fund shares. Past performance is no guarantee of future results. Investment return and principal value of an investment will fluctuate, so that shares may be worth more or less than their original cost when redeemed. Shares redeemed within 30 days of purchase may be subject to a 2% redemption fee payable to the Fund, which is not reflected in the performance shown above; if it were, performance would be lower. Current month-end performance may be higher or lower than performance quoted and may be obtained at www.roycefunds.com. All performance and risk information reflects results of the Service Class (its oldest class). Price and total return information is based on net asset values calculated for shareholder transactions. Certain immaterial adjustments were made to the net assets of Royce Global Value Fund at 12/31/13 for financial reporting purposes, and as a result the net asset values for shareholder transactions on that date and the total returns based on those net asset values differ from the adjusted net asset values and total returns reported in the Financial Highlights. Gross operating expenses reflect gross total annual operating expenses for the Service Class and include management fees, 12b-1 distribution and service fees, and other expenses. Net operating expenses reflect contractual fee waivers and/or reimbursements. All expense information is reported as of the Fund’s most current prospectus. Royce & Associates has contractually agreed to waive fees and/or reimburse operating expenses to the extent necessary to maintain the Fund’s net annual operating expenses, (excluding brokerage commissions, taxes, interest litigation expenses, acquired fund fees and expenses, and other expenses not borne in the ordinary course of business), at or below 1.54% through April 30, 2016. Regarding the “Top Contributors” and “Top Detractors” tables shown above, the sum of all contributors to, and all detractors from, performance for all securities in the portfolio would approximate the Fund’s year-to-date performance for 2015. Upside Capture Ratio measures a manager’s performance in up markets relative to the Fund’s benchmark. It is calculated by measuring the Fund’s performance in quarters when the benchmark went up and dividing it by the benchmark’s return in those quarters. Downside Capture Ratio measures a Managers’ performance in down markets relative to the Fund’s benchmark (Russell Global Small Cap). It is calculated by measuring the Fund’s performance in quarters when the benchmark goes down and dividing it by the benchmark’s return in those quarters. |
| The Royce Funds 2015 Semiannual Report to Shareholders | 11 |
| MANAGERS’ DISCUSSION |
| Royce International Small-Cap Fund (RIS) (formerly Royce International Smaller-Companies Fund) |
 |
Dilip Badlani, CFA Jim Harvey, CFA |
| FUND PERFORMANCE |
| Royce International Small-Cap Fund (formerly Royce International Smaller-Companies Fund) enjoyed a strong first half on an absolute basis even as it came up short on a relative scale. For the year-to-date period ended June 30, 2015, the Fund advanced 4.5% compared to a 7.7% increase for its benchmark, the Russell Global ex-U.S. Small Cap Index, for the same period. After a bearish finish to 2014, fortunes for many non-U.S. equity markets reversed in 2015’s first quarter. During these volatile first three months, the Fund was unable to gain an advantage over its benchmark, falling 0.5% in the first quarter versus a 3.7% gain for the index. |
| The Fund found its footing in the second quarter, improving on both an absolute and relative basis. We were pleased to see International Small-Cap outperform the Russell Global ex-U.S. Small Cap in the bullish April and relatively more muted May. The Fund was even with the benchmark in the markedly bearish June, when markets were rocked largely by the Greek default and anxiety over China’s plunging stock market. The Fund thus outpaced the index in the second quarter, climbing 5.0% compared to the non-U.S. small-cap index’s 3.9% gain. The Fund outperformed the Russell Global ex-U.S. Small Cap for the since inception (6/30/08) period ended June 30, 2015. |
| WHAT WORKED... AND WHAT DIDN’T |
| Six of the Fund’s eight equity sectors contributed to performance in the first half, with net gains from Financials making the largest positive impact, followed by Industrials and Health Care. When sector impacts are compared to the Fund’s benchmark, only the first of the three made a positive impact. Based on country exposure, the top contributors were the U.K., Japan, and Hong Kong while the largest detractors from results were Brazil (by a wide margin), India, and Germany. |
| The portfolio’s strength in the Financials sector came primarily from two of its top performers, each of which was a top-10 holding at the end of June. Value Partners Group is a Hong Kong-based firm that has focused on Asian markets for more than two decades. Its shares often closely parallel movements in the Hong Kong and Shanghai markets. Each climbed precipitously into May before cooling off with the bear market for Chinese stocks. Its value orientation having an understandable appeal to us, the company saw growth in its assets under management and improved performance and management fees, all of which helped its earnings. VZ Holding provides financial services to individual and corporate clients in Switzerland and Germany. The Swiss National Bank’s surprise decision in mid-January to delink from the euro resulted in rapid appreciation for the Swiss franc, which in turn led VZ Holding’s stock to decline as the Swiss market as a whole reacted negatively to the currency inflation. We took this opportunity to add shares, as we believe this is a high-quality company with a domestic business that has historically been largely unaffected by currency movements. When the company subsequently reported sterling 2014 results in March, its stock marched to new highs. Another top contributor and top-10 holding, e2v Technologies makes high-tech electronic components including radio frequency, microwave, and sensing components. While recent revenue growth was modest, the company continued to offer optimistic full-year guidance. Along with an earlier assurance that it planned on doubling EBIT by 2020, the news kept investors very interested in the stock through the end of June. |
| Industrials was a mixed bag on two levels—the sector did well in the portfolio but had a modest negative impact vis-à-vis the benchmark. In addition, while eight companies from the sector were among the Fund’s top-20 contributors in the first half, it was also home to a pair of its largest detractors, including the top detractor for the first half, Brazil’s Kepler Weber. The company manufactures food storage equipment including grain silos, conveyors, and animal feed mills. Ongoing weakness in the Brazilian economy, combined with a global commodity price decline, led to a sell off. Execution issues continued to hurt results for India’s KPIT Technologies, which provides product engineering and application and consulting services to a number of industries. Its shares tanked after the company reported disappointing earnings for its fiscal fourth quarter as revenues fell and margins contracted. Seeing what we thought were better opportunities elsewhere, we exited both positions in April. One of 2014’s top contributors, India’s Shriram Transport Finance lends to the used truck market and was a significant detractor in the first half as it experienced a steep decline in profits based on increased costs associated with bad loans. |
| Top Contributors to Performance Year-to-Date Through 6/30/15 (%)1 | ||||
| Value Partners Group | 1.64 | |||
| e2v technologies | 0.61 | |||
| VZ Holding | 0.60 | |||
| Biosensors International Group | 0.47 | |||
| Norbert Dentressangle | 0.41 | |||
| 1 Includes dividends | ||||
| Top Detractors from Performance Year-to-Date Through 6/30/15 (%)2 | ||||
| Kepler Weber | -0.48 | |||
| KPIT Technologies | -0.40 | |||
| Shriram Transport Finance | -0.36 | |||
| Apollo Tyres | -0.31 | |||
| Zuiko Corporation | -0.29 | |||
| 2 Net of dividends | ||||
| CURRENT POSITIONING AND OUTLOOK |
| Effective May 1, 2015, Dilip Badlani and Jim Harvey became the Fund’s portfolio managers (Dilip having served previously as assistant portfolio manager since 2013). Mark Rayner continues to serve as assistant portfolio manager. Our portfolio holdings emphasize our preference for high-quality, wealth-compounding businesses, particularly in sectors such as Industrials and Consumer Discretionary—two areas in which we were overweight versus the benchmark at the end of June. |
| 12 | The Royce Funds 2015 Semiannual Report to Shareholders |
| PERFORMANCE AND PORTFOLIO REVIEW | TICKER SYMBOLS RYGSX RISNX RISIX |
| Performance and Expenses Average Annual Total Return (%) Through 6/30/15 | |||||||||||
| JAN-JUN 2015* | 1-YR | 3-YR | 5-YR | SINCE INCEPTION (6/30/08) | |||||||
| RIS | 4.49 | -9.11 | 7.66 | 6.94 | 5.00 | ||||||
| Annual Gross Operating Expenses: 1.84%** Annual Net Operating Expenses: 1.54%** | |||||||||||
| * Not Annualized | |||||||||||
| ** Restated to reflect the Fund’s revised contractual investment advisory fee rate as of July 1, 2015. | |||||||||||
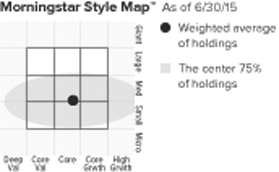
The Morningstar Style Map is the Morningstar Style BoxTM with the center 75% of fund holdings plotted as the Morningstar Ownership ZoneTM. The Morningstar Style Box is designed to reveal a fund’s investment strategy. The Morningstar Ownership Zone provides detail about a portfolio’s investment style by showing the range of stock sizes and styles. The Ownership Zone is derived by plotting each stock in the portfolio within the proprietary Morningstar Style Box. Over time, the shape and location of a fund’s ownership zone may vary. See page 48 for additional information. |
| Value of $10,000 |
| Invested on 6/30/08 as of 6/30/15 ($) |
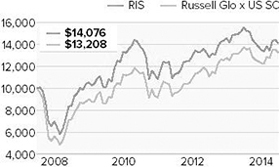
| Top 10 Positions | ||
| % of Net Assets | ||
| VZ Holding | 2.2 | |
| Television Broadcasts | 1.8 | |
| Industrias Bachoco ADR | 1.8 | |
| Magellan Aerospace | 1.7 | |
| Leopalace21 Corporation | 1.7 | |
| E-House (China) Holdings ADR | 1.7 | |
| e2v technologies | 1.6 | |
| Value Partners Group | 1.6 | |
| EMIS Group | 1.5 | |
| ADLER Real Estate | 1.5 | |
| Portfolio Sector Breakdown | ||
| % of Net Assets | ||
| Industrials | 24.2 | |
| Consumer Discretionary | 22.7 | |
| Financials | 21.7 | |
| Information Technology | 12.0 | |
| Health Care | 7.0 | |
| Materials | 4.0 | |
| Consumer Staples | 2.7 | |
| Energy | 1.1 | |
| Cash and Cash Equivalents | 4.6 | |
| Upside/Downside Capture Ratios | ||||
| Periods Ended 6/30/15 (%) | ||||
| UPSIDE | DOWNSIDE | |||
| From 6/30/08 (Start of Fund’s First Full Quarter) | 94 | 89 | ||
| Calendar Year Total Returns (%) | ||
| YEAR | RIS | |
| 2014 | -7.3 | |
| 2013 | 12.7 | |
| 2012 | 19.4 | |
| 2011 | -18.7 | |
| 2010 | 26.5 | |
| 2009 | 50.3 | |
| Portfolio Country Breakdown1,2 | ||
| % of Net Assets | ||
| Japan | 17.7 | |
| United Kingdom | 11.9 | |
| �� | ||
| Hong Kong | 11.6 | |
| Germany | 7.5 | |
| Canada | 5.8 | |
| China | 5.7 | |
| France | 3.9 | |
| Switzerland | 3.5 | |
| 1 Represents countries that are 3% or more of net assets. | ||
| 2 Securities are categorized by the country of their headquarters. | ||
| Portfolio Diagnostics | ||
| Fund Net Assets | $31 million | |
| Number of Holdings | 98 | |
| Turnover Rate | 64% | |
| Average Market Capitalization1 | $1,340 million | |
| Weighted Average P/E Ratio2,3 | 16.9x | |
| Weighted Average P/B Ratio2 | 2.5x | |
| Holdings ≥ 75% of Total Investments | 61 | |
| Active Share4 | 97% | |
| 1 | Geometric Average. This weighted calculation uses each portfolio holding’s market cap in a way designed to not skew the effect of very large or small holdings; instead, it aims to better identify the portfolio’s center, which Royce believes offers a more accurate measure of average market cap than a simple mean or median. | |
| 2 | Harmonic Average. This weighted calculation evaluates a portfolio as if it were a single stock and measures it overall. It compares the total market value of the portfolio to the portfolio’s share in the earnings or book value, as the case may be, of its underlying stocks. | |
| 3 | The Fund’s P/E ratio calculation excludes companies with zero or negative earnings (2% of portfolio holdings as of 6/30/15). | |
| 4 | Active Share is the sum of the absolute values of the different weightings of each holding in the Fund versus each holding in the benchmark, divided by two. |
Important Performance and Expense Information All performance information in this Report reflects past performance, is presented on a total return basis, reflects the reinvestment of distributions, and does not reflect the deduction of taxes that a shareholder would pay on fund distributions or the redemption of fund shares. Past performance is no guarantee of future results. Investment return and principal value of an investment will fluctuate, so that shares may be worth more or less than their original cost when redeemed. Shares redeemed within 30 days of purchase may be subject to a 2% redemption fee payable to the Fund, which is not reflected in the performance shown above; if it were, performance would be lower. Current month-end performance may be higher or lower than performance quoted and may be obtained at www.roycefunds.com. All performance and risk information reflects results of the Service Class (its oldest class). Gross operating expenses reflect total gross annual operating expenses and include management fees, 12b-1 distribution and service fees, and other expenses. Net operating expenses reflect contractual fee waivers and/or expense reimbursements. All expense information is reported as of the Fund’s most current prospectus. Royce & Associates has contractually agreed to waive its fees and/or reimburse operating expenses to the extent necessary to maintain the Fund’s net annual operating expenses, (excluding brokerage commissions, taxes, interest litigation expenses, acquired fund fees and expenses, and other expenses not borne in the ordinary course of business), at or below 1.54% through April 30, 2016. Regarding the “Top Contributors” and “Top Detractors” tables shown above, the sum of all contributors to, and all detractors from, performance for all securities in the portfolio would approximate the Fund’s year-to-date performance for 2015. Upside Capture Ratio measures a manager’s performance in up markets relative to the Fund’s benchmark. It is calculated by measuring the Fund’s performance in quarters when the benchmark went up and dividing it by the benchmark’s return in those quarters. Downside Capture Ratio measures a Managers’ performance in down markets relative to the Fund’s benchmark (Russell Global ex-U.S. Small Cap). It is calculated by measuring the Fund’s performance in quarters when the benchmark goes down and dividing it by the benchmark’s return in those quarters. |
| The Royce Funds 2015 Semiannual Report to Shareholders | 13 |
| MANAGERS’ DISCUSSION | ||
| Royce International Micro-Cap Fund (RMI) |
 |
Jim Harvey, CFA Dilip Badlani, CFA |
| FUND PERFORMANCE |
| For the year-to-date period ended June 30, 2015 Royce International Micro-Cap Fund was up 7.5%, trailing its benchmark, the Russell Global ex-U.S. Small Cap, which advanced 7.7% for the same period. While we were pleased with the Fund’s absolute result, its relative showing was disappointing. |
| After finishing 2014 in the red (and behind their domestic counterparts), non-U.S. equities continued the downward trend in the first month of 2015, this time joined by most U.S. stocks. There was, however, a spirited global rally in February before many non-U.S. issues corrected again in March. This made for a volatile opening period that, thanks to the strength of returns in February, left most non-U.S. stocks in the black. For the first quarter International Micro-Cap was up 1.8%, lagging the benchmark, which gained 3.7% for the same period. The upward trend for non-U.S. stocks continued into the second quarter, with April having the most pronounced positive effect. Although the Fund trailed the benchmark in the opening month of the second quarter, its 4.9% return was more than respectable. The Fund outperformed its benchmark in the quieter May and more volatile and bearish June. For the second quarter, International Micro-Cap advanced 5.6% compared to the Russell Global ex-U.S. Small Cap’s 3.9% gain. The Fund also outperformed its benchmark for the one-year period ended June 30, 2015. |
| WHAT WORKED... AND WHAT DIDN’T |
| Industrials was the Fund’s largest contributor at the sector level during the first half—more than doubling the respective net gains from Consumer Discretionary, Information Technology, and Health Care, International Micro-Cap’s second-, third-, and fourth-largest contributors. We were also pleased that net gains for this sector were strong relative to those for the sector in its benchmark as well. Eight of the portfolio’s top-20 (and two of its top-five) contributors at the position level came from this group, including its biggest position at the end of June, Trancom, one of the largest distribution and logistics companies in Japan. The company continued to take market share in the first half while its stock participated in the rally for Japanese equities. Its shares received an additional boost in the second quarter after Trancom reported better-than-expected earnings. Along with growing annual operating profits, we thought we had a number of good reasons to hold a large position at the end of June. At the country level, the largest positive impacts came from Japan, which led by a wide margin, and Taiwan and Germany. Net losses aggregated to country were far more modest, with Australia, Brazil, Malaysia, and Singapore detracting most. |
| Three portfolio sectors that finished the semiannual period in the black—Consumer Discretionary, Consumer Staples, and Information Technology—nonetheless had a negative impact compared to sector results within the Russell Global ex-U.S. Small Cap. Still, the Fund’s top contributor to first-half performance came from the first of these groups. Taiwan Paiho is in the arguably pedestrian business of manufacturing fasteners for shoes, supplying customers such as Nike and Adidas. Introducing new products at higher price points helped lead to margin expansion, which seemed to send investors running to the stock. Liking both its management and recent product innovations, we held on to our stake. |
| Holdings more sensitive to commodity-price pressure, especially in the energy and metals & mining industries, tended to struggle in the first half—Energy was the Fund’s only sector with a sizable net loss. Imdex, a Western Australian business that provides drilling fluids and downhole instrumentation, saw its shares hurt by the ongoing difficulties faced by businesses exposed to mining as well as oil and gas. Malaysia’s Parkson Retail Asia has been hit by a slowdown in consumer spending in Southeast Asia and an expansion into Vietnam that encountered setbacks with local partners. Liking the respective long-term prospects for each business, we held a sizable position in both companies at the end of June. Weakness in lumber prices, which has not been offset by a decline in the value of the Canadian dollar, hurt results for Western Forest Products, leading us to exit the position in March. |
| Top Contributors to Performance Year-to-Date Through 6/30/15 (%)1 | ||||
| Taiwan Paiho | 1.02 | |||
| Trancom | 0.92 | |||
| I.T | 0.68 | |||
| Magellan Aerospace | 0.54 | |||
| AirBoss of America | 0.53 | |||
| 1 Includes dividends | ||||
| Top Detractors from Performance Year-to-Date Through 6/30/15 (%)2 | ||||
| Imdex | -0.59 | |||
| Parkson Retail Asia | -0.50 | |||
| Western Forest Products | -0.33 | |||
| Zuiko Corporation | -0.32 | |||
| Bufab Holding | -0.27 | |||
| 2 Net of dividends | ||||
| CURRENT POSITIONING AND OUTLOOK |
| At the end of June we maintained substantial overweights in Industrials, Consumer Discretionary, and Information Technology. At the country level, we had the greatest exposure to Japan, Canada, and Germany. We anticipate an ongoing expansion in the global economy while we continue to seek profitable, conservatively capitalized companies capable of compounding their wealth, ideally even when faced with economic headwinds. |
| 14 | The Royce Funds 2015 Semiannual Report to Shareholders |
| PERFORMANCE AND PORTFOLIO REVIEW | TICKER SYMBOL ROIMX | ||
| Performance and Expenses Average Annual Total Return (%) Through 6/30/15 | |||||||||||
| JAN-JUN 2015* | 1-YR | 3-YR | SINCE INCEPTION (12/31/10) | ||||||||
| RMI | 7.45 | -2.75 | 10.82 | 2.40 | |||||||
| Annual Gross Operating Expenses: 3.47%** Annual Net Operating Expenses: 1.65%** | |||||||||||
| * Not Annualized | |||||||||||
| ** Restated to reflect the Fund’s revised contractual investment advisory fee rate as of July 1, 2015. | |||||||||||
The Morningstar Style Map is the Morningstar Style BoxTM with the center 75% of fund holdings plotted as the Morningstar Ownership ZoneTM. The Morningstar Style Box is designed to reveal a fund’s investment strategy. The Morningstar Ownership Zone provides detail about a portfolio’s investment style by showing the range of stock sizes and styles. The Ownership Zone is derived by plotting each stock in the portfolio within the proprietary Morningstar Style Box. Over time, the shape and location of a fund’s ownership zone may vary. See page 48 for additional information. |
| Value of $10,000 |
| Invested on 12/31/10 as of 6/30/15 ($) |
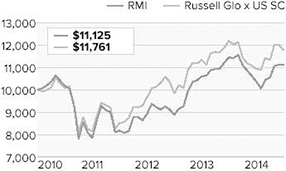
| Top 10 Positions | ||
| % of Net Assets | ||
| Trancom | 3.0 | |
| Magellan Aerospace | 2.8 | |
| I.T | 1.9 | |
| ADLER Real Estate | 1.8 | |
| Pico Far East Holdings | 1.5 | |
| T4F Entretenimento | 1.4 | |
| Collection House | 1.4 | |
| MTY Food Group | 1.4 | |
| Tomorrow Focus | 1.3 | |
| Obara Group | 1.3 | |
| Portfolio Sector Breakdown | ||
| % of Net Assets | ||
| Industrials | 28.4 | |
| Consumer Discretionary | 23.4 | |
| Information Technology | 20.4 | |
| Financials | 10.8 | |
| Materials | 4.9 | |
| Health Care | 4.6 | |
| Consumer Staples | 2.1 | |
| Energy | 1.3 | |
| Cash and Cash Equivalents | 4.1 | |
| Calendar Year Total Returns (%) | ||
| YEAR | RMI | |
| 2014 | -2.4 | |
| 2013 | 18.9 | |
| 2012 | 13.6 | |
| 2011 | -21.5 | |
| Portfolio Country Breakdown1,2 | ||
| % of Net Assets | ||
| Japan | 19.2 | |
| Canada | 10.9 | |
| Germany | 7.5 | |
| Hong Kong | 6.9 | |
| Taiwan | 6.2 | |
| United Kingdom | 5.8 | |
| France | 3.9 | |
| Australia | 3.8 | |
| South Korea | 3.3 | |
| 1 Represents countries that are 3% or more of net assets. | ||
| 2 Securities are categorized by the country of their headquarters. | ||
| Portfolio Diagnostics | ||
| Fund Net Assets | $7 million | |
| Number of Holdings | 123 | |
| Turnover Rate | 46% | |
| Average Market Capitalization1 | $392 million | |
| Weighted Average P/E Ratio2,3 | 14.1x | |
| Weighted Average P/B Ratio2 | 2.3x | |
| Holdings ≥ 75% of Total Investments | 69 | |
| Active Share4 | 99% | |
| 1 | Geometric Average. This weighted calculation uses each portfolio holding’s market cap in a way designed to not skew the effect of very large or small holdings; instead, it aims to better identify the portfolio’s center, which Royce believes offers a more accurate measure of average market cap than a simple mean or median. | |
| 2 | Harmonic Average. This weighted calculation evaluates a portfolio as if it were a single stock and measures it overall. It compares the total market value of the portfolio to the portfolio’s share in the earnings or book value, as the case may be, of its underlying stocks. | |
| 3 | The Fund’s P/E ratio calculation excludes companies with zero or negative earnings (6% of portfolio holdings as of 6/30/15). | |
| 4 | Active Share is the sum of the absolute values of the different weightings of each holding in the Fund versus each holding in the benchmark, divided by two. |
Important Performance and Expense Information All performance information in this Report reflects past performance, is presented on a total return basis, reflects the reinvestment of distributions, and does not reflect the deduction of taxes that a shareholder would pay on fund distributions or the redemption of fund shares. Past performance is no guarantee of future results. Investment return and principal value of an investment will fluctuate, so that shares may be worth more or less than their original cost when redeemed. Shares redeemed within 30 days of purchase may be subject to a 2% redemption fee payable to the Fund, which is not reflected in the performance shown above; if it were, performance would be lower. Current month-end performance may be higher or lower than performance quoted and may be obtained at www.roycefunds.com. Gross operating expenses reflect total gross annual operating expenses and include management fees, 12b-1 distribution and service fees, other expenses, and acquired fund fees and expenses. Net operating expenses reflect contractual fee waivers and/or expense reimbursements. All expense information is reported as of the Fund’s most current prospectus. Royce & Associates has contractually agreed to waive its fees and/or reimburse operating expenses, to the extent necessary to maintain the Fund’s net annual operating expenses, (excluding brokerage commissions, taxes, interest, litigation expenses, acquired fund fees and expenses, and other expenses not borne in the ordinary course of business), at or below 1.64% through April 30, 2016 and at or below 1.99% though April 30, 2025. Acquired fund fees and expenses reflect the estimated amount of the fees and expenses incurred indirectly by the Fund through its investments in mutual funds, hedge funds, private equity funds, and other investment companies. Regarding the “Top Contributors” and “Top Detractors” tables shown above, the sum of all contributors to, and all detractors from, performance for all securities in the portfolio would approximate the Fund’s year-to-date performance for 2015. |
| The Royce Funds 2015 Semiannual Report to Shareholders | 15 |
| MANAGER’S DISCUSSION | ||
| Royce International Premier Fund (RIP) |
 |
David Nadel |
| FUND PERFORMANCE |
| We were very pleased with Royce International Premier Fund’s absolute and relative performance in the first half. For the year- to-date period ended June 30, 2015 the Fund gained 13.7%, outperforming its benchmark, the Russell Global ex-U.S. Small Cap Index, which advanced 7.7% for the same period. While U.S. stocks kicked off 2015 on a decidedly bearish note, results for non-U.S. equities were more mixed. International Premier finished January with a small gain before increasing its edge over the benchmark when shares rallied in February. Though the Fund’s fortunes reversed in March, its underperformance during this period did little to deter its first-quarter relative advantage (+5.4% versus +3.7% for the index). |
| International Premier also enjoyed a strong second quarter, outpacing the Russell Global ex-U.S. Small Cap in all three months. This included a solid advantage in June, in which equities were rocked both by the Greek default and China’s rapidly declining stock market. For the second quarter, International Premier was up 7.9% compared to the index’s 3.9% advance. In addition to its strong first-half showing, the Fund outperformed its benchmark in the one-, three-year, and since inception (12/31/10) periods ended June 30, 2015. |
| WHAT WORKED... AND WHAT DIDN’T |
| All of the Fund’s eight equity sectors contributed to performance in the first half, with Industrials nearly doubling the net gain of Consumer Discretionary, the Fund’s second-largest contributor. Notable contributions also came from Information Technology and Financials. It’s important to point out that most of these sectors also fared very well compared to the Fund’s non-U.S. small-cap benchmark. The portfolio’s strongest industries in the first half included electronic equipment, instruments & components stocks, consumer finance companies, and capital markets. Net losses at the industry level were comparatively modest and limited to two groups—real estate management & development stocks and diversified financial services companies. At the country level, the healthiest overall contributions came from holdings headquartered in the U.K., Switzerland, Japan, and India, while Brazil, Malaysia, Chile, Sweden, and Germany detracted, albeit on a relatively smaller scale. |
| The Fund’s two largest positions at the end of June were also its two top contributors to first-half performance. India’s Bajaj Finance offers an array of services including wealth management, commercial lending, and consumer finance. Its shares have been rising more or less steadily for more than a year. The company continued to experience profitable growth in the first half, largely in its consumer finance segment. London-based Clarkson is an investment holding company whose subsidiaries provide integrated shipping services worldwide. Its stock began to rise in February and did well through the remainder of 2015’s first half, reaching new highs at the end of June. Strong results for fiscal 2014, which were well ahead of market expectations, and a double-digit growth outlook helped drive performance. Clarkson’s entrance into the FTSE 250 index on the London Stock Exchange in mid-April, a move that required U.K. index funds to invest in the stock, also played a part. Japan’s TOTO also made a strong contribution to performance. The world’s largest toilet manufacturer, TOTO saw its shares rise when it announced an increase to its dividend in April. |
| Conversely, LPS Brasil Consultoria de Imoveis—Brazil’s leading real estate brokerage firm—detracted from performance in the first half. Brazil’s troubled economy continued to weigh on real estate sales as a combination of government scandals and painfully slow reforms has hurt consumer confidence. LPS’s secondary sales (pre-existing properties) have also been weak. Another detractor was Singapore-based Silverlake Axis—a top contributor in 2014. The company, which provides customized software to banks and insurance companies, found itself in the curious position of seeing its shares decline when a financial blogger questioned its accounting practices. After a disappointing 2014, the stock price of LPKF Laser & Electronics briefly rallied in early 2015 before falling again in March. A disappointing fiscal first quarter accelerated the decline. Seeing what we deemed were more promising long-term opportunities elsewhere, we sold our shares in all three companies during the first half. |
| Top Contributors to Performance Year-to-Date Through 6/30/15 (%)1 | ||||
| Bajaj Finance | 1.45 | |||
| Clarkson | 1.10 | |||
| TOTO | 0.95 | |||
| VZ Holding | 0.91 | |||
| AVEVA Group | 0.87 | |||
| 1Includes dividends | ||||
| Top Detractors from Performance Year-to-Date Through 6/30/15 (%)2 | ||||
| LPS Brasil Consultoria de Imoveis | -0.43 | |||
| Silverlake Axis | -0.24 | |||
| LPKF Laser & Electronics | -0.21 | |||
| Media Prima | -0.21 | |||
| CETIP-Mercados Organizados | -0.18 | |||
| 2 Net of dividends | ||||
| CURRENT POSITIONING AND OUTLOOK |
| At the end of June the portfolio was slightly overweight in Consumer Discretionary, comfortably overweight in Industrials, and had substantially more exposure than its benchmark in Information Technology and Health Care. Holdings headquartered in the U.K. and Switzerland comprised slightly less than half of net assets. Our highest conviction is, as always, reserved for conservatively capitalized companies that earn high returns on invested capital and demonstrate the ability to compound wealth over the long term. We believe corporate profit margins for many non-U.S. companies that fit this profile were trading well below their historic peaks during the first half. |
| 16 | The Royce Funds 2015 Semiannual Report to Shareholders |
| PERFORMANCE AND PORTFOLIO REVIEW | TICKER SYMBOLS RYIPX RIPNX |
| Performance and Expenses | |||||||||||||||||||||||||||
| Average Annual Total Return (%) Through 6/30/15 | |||||||||||||||||||||||||||
| JAN-JUN 2015* | 1-YR | 3-YR | SINCE INCEPTION (12/31/10) | ||||||||||||||||||||||||
| RIP | 13.72 | 1.08 | 11.95 | 5.43 | |||||||||||||||||||||||
| Annual Gross Operating Expenses: 2.30%** Annual Net Operating Expenses: 1.54%** | |||||||||||||||||||||||||||
| * Not Annualized | |||||||||||||||||||||||||||
| ** Restated to reflect the Fund’s revised contractual investment advisory fee rate as of July 1, 2015. | |||||||||||||||||||||||||||
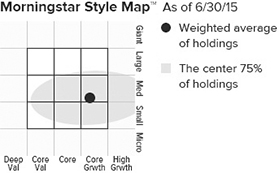
The Morningstar Style Map is the Morningstar Style BoxTM with the center 75% of fund holdings plotted as the Morningstar Ownership ZoneTM. The Morningstar Style Box is designed to reveal a fund’s investment strategy. The Morningstar Ownership Zone provides detail about a portfolio’s investment style by showing the range of stock sizes and styles. The Ownership Zone is derived by plotting each stock in the portfolio within the proprietary Morningstar Style Box. Over time, the shape and location of a fund’s ownership zone may vary. See page 48 for additional information. |
Value of $10,000
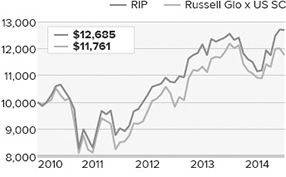
| Top 10 Positions | ||
| % of Net Assets | ||
| Bajaj Finance | 3.4 | |
| Clarkson | 3.0 | |
| VZ Holding | 2.9 | |
| Partners Group Holding | 2.7 | |
| Carl Zeiss Meditec | 2.4 | |
| Abcam | 2.4 | |
| Mayr-Melnhof Karton | 2.4 | |
| LEM Holding | 2.4 | |
| Latchways | 2.4 | |
| Motherson Sumi Systems | 2.3 | |
| Portfolio Sector Breakdown | ||
| % of Net Assets | ||
| Industrials | 28.1 | |
| Information Technology | 17.5 | |
| Financials | 15.8 | |
| Health Care | 14.3 | |
| Consumer Discretionary | 12.0 | |
| Materials | 6.2 | |
| Energy | 2.1 | |
| Consumer Staples | 2.0 | |
| Cash and Cash Equivalents | 2.0 | |
| Upside/Downside Capture Ratios | ||||
| Periods Ended 6/30/15 (%) | ||||
| UPSIDE | DOWNSIDE | |||
| Fund’s First Full Quarter (12/31/10) | 99 | 83 | ||
| Calendar Year Total Returns (%) | ||
| YEAR | RIP | |
| 2014 | -8.2 | |
| 2013 | 18.3 | |
| 2012 | 23.4 | |
| 2011 | -16.8 | |
| Portfolio Country Breakdown1,2 % of Net Assets | ||
| United Kingdom | 26.5 | |
| Switzerland | 19.1 | |
| Japan | 12.4 | |
| Germany | 9.0 | |
| India | 7.3 | |
| Italy | 5.2 | |
| Brazil | 4.5 | |
| France | 3.6 | |
| 1 | Represents countries that are 3% or more of net assets. |
| 2 | Securities are categorized by the country of their headquarters. |
| Portfolio Diagnostics | ||
| Fund Net Assets | $8 million | |
| Number of Holdings | 50 | |
| Turnover Rate | 34% | |
| Average Market Capitalization1 | $1,878 million | |
| Weighted Average P/E Ratio2,3 | 22.0x | |
| Weighted Average P/B Ratio2 | 3.7x | |
| Holdings ≥ 75% of Total Investments | 33 | |
| Active Share4 | 99% | |
| 1 | Geometric Average. This weighted calculation uses each portfolio holding’s market cap in a way designed to not skew the effect of very large or small holdings; instead, it aims to better identify the portfolio’s center, which Royce believes offers a more accurate measure of average market cap than a simple mean or median. |
| 2 | Harmonic Average. This weighted calculation evaluates a portfolio as if it were a single stock and measures it overall. It compares the total market value of the portfolio to the portfolio’s share in the earnings or book value, as the case may be, of its underlying stocks. |
| 3 | The Fund’s P/E ratio calculation excludes companies with zero or negative earnings (0% of portfolio holdings as of 6/30/15). |
| 4 | Active Share is the sum of the absolute values of the different weightings of each holding in the Fund versus each holding in the benchmark, divided by two. |
| Important Performance and Expense Information All performance information in this Report reflects past performance, is presented on a total return basis, reflects the reinvestment of distributions, and does not reflect the deduction of taxes that a shareholder would pay on fund distributions or the redemption of fund shares. Past performance is no guarantee of future results. Investment return and principal value of an investment will fluctuate, so that shares may be worth more or less than their original cost when redeemed. Shares redeemed within 30 days of purchase may be subject to a 2% redemption fee payable to the Fund, which is not reflected in the performance shown above; if it were, performance would be lower. Current month-end performance may be higher or lower than performance quoted and may be obtained at www.roycefunds.com. All performance and risk information reflects results of the Service Class (its oldest class). Price and total return information is based on net asset values for shareholder transactions. Certain immaterial adjustments were made to the net assets of Royce International Premier Fund at 6/30/14 for financial reporting purposes, and as a result the net asset values for shareholder transactions and the calendar year total returns based on those net assets values differ from the adjusted net values and calendar year total returns reported in the Financial Highlights. Gross operating expenses reflect total gross annual operating expenses and include management fees, 12b-1 distribution and service fees, and other expenses. Net operating expenses reflect contractual fee waivers and/or expense reimbursements. All expense information is reported as of the Fund’s most current prospectus. Royce & Associates has contractually agreed to waive its fees and/or reimburse operating expenses to the extent necessary to maintain the Fund’s net annual operating expenses, (excluding brokerage commissions, taxes, interest, litigation expenses, acquired fund fees and expenses, and other expenses not borne in the ordinary course of business), at or below 1.54% through April 30, 2016 and at or below 1.99% through April 30, 2025. Regarding the “Top Contributors” and “Top Detractors” tables shown above, the sum of all contributors to, and all detractors from, performance for all securities in the portfolio would approximate the Fund’s year-to-date performance for 2015. Upside Capture Ratio measures a manager’s performance in up markets relative to the Fund’s benchmark. It is calculated by measuring the Fund’s performance in quarters when the benchmark went up and dividing it by the benchmark’s return in those quarters. Downside Capture Ratio measures a Managers’ performance in down markets relative to the Fund’s benchmark (Russell Global ex-U.S. Small Cap). It is calculated by measuring the Fund’s performance in quarters when the benchmark goes down and dividing it by the benchmark’s return in those quarters. |
| The Royce Funds 2015 Semiannual Report to Shareholders | 17 |
Schedules of Investments
| Royce Global Financial Services Fund | |||||
| Common Stocks – 93.1% | |||||
| SHARES | VALUE | ||||
| BANKS - 8.1% | |||||
BLOM Bank GDR | 8,000 | $ | 80,000 | ||
BOK Financial | 12,300 | 855,834 | |||
Capital City Bank Group | 29,822 | 455,382 | |||
Chemung Financial | 14,512 | 384,278 | |||
CIT Group | 22,400 | 1,041,376 | |||
First Citizens BancShares Cl. A | 3,500 | 920,640 | |||
First Republic Bank | 14,400 | 907,632 | |||
| Total (Cost $4,263,019) | 4,645,142 | ||||
CAPITAL MARKETS - 51.7% | |||||
AllianceBernstein Holding L.P. | 16,500 | 487,245 | |||
Apollo Global Management LLC Cl. A | 32,700 | 724,305 | |||
ARA Asset Management | 564,000 | 732,821 | |||
†Ares Management L.P. | 28,000 | 518,000 | |||
Artisan Partners Asset Management Cl. A | 19,500 | 905,970 | |||
Ashmore Group | 210,000 | 954,251 | |||
BHF Kleinwort Benson Group 1 | 105,000 | 513,890 | |||
CETIP - Mercados Organizados | 78,000 | 854,987 | |||
Charles Schwab | 24,500 | 799,925 | |||
Citadel Capital 1 | 150,000 | 39,122 | |||
| 31,875 | 0 | ||||
Coronation Fund Managers | 52,000 | 352,237 | |||
Cowen Group 1 | 99,800 | 638,720 | |||
Diamond Hill Investment Group | 3,675 | 733,750 | |||
Dundee Corporation Cl. A 1 | 59,400 | 596,378 | |||
Edmond de Rothschild (Suisse) | 20 | 412,856 | |||
Egyptian Financial Group-Hermes Holding | |||||
Company 1 | 215,000 | 389,703 | |||
Federated Investors Cl. B | 33,800 | 1,131,962 | |||
†Fifth Street Asset Management CI. A | 71,034 | 730,230 | |||
Financial Engines | 18,400 | 781,632 | |||
GMP Capital | 108,000 | 443,587 | |||
Interactive Brokers Group Cl. A | 6,400 | 265,984 | |||
INTL FCStone 1 | 15,000 | 498,600 | |||
Invesco | 8,000 | 299,920 | |||
IOOF Holdings | 11,528 | 79,961 | |||
Jupiter Fund Management | 147,000 | 1,029,450 | |||
Manning & Napier Cl. A | 15,800 | 157,526 | |||
Medley Management Cl. A | 65,702 | 777,912 | |||
Monroe Capital | 58,050 | 864,945 | |||
MVC Capital | 47,100 | 480,420 | |||
Northern Trust | 11,400 | 871,644 | |||
Oaktree Capital Group LLC Cl. A | 4,700 | 249,946 | |||
Och-Ziff Capital Management Group LLC Cl. A | 66,000 | 806,520 | |||
Oppenheimer Holdings Cl. A | 10,000 | 262,800 | |||
†Paris Orleans | 16,522 | 527,812 | |||
Partners Group Holding | 1,339 | 400,289 | |||
Raymond James Financial | 7,300 | 434,934 | |||
Reinet Investments | 5,500 | 114,509 | |||
SEI Investments | 13,200 | 647,196 | |||
Silvercrest Asset Management Group Cl. A | 41,600 | 584,896 | |||
SPARX Group | 220,000 | 461,985 | |||
Sprott | 391,500 | 774,223 | |||
State Street | 9,135 | 703,395 | |||
Stifel Financial 1 | 7,150 | 412,841 | |||
TD Ameritrade Holding Corporation | 9,650 | 355,313 | |||
Tokai Tokyo Financial Holdings | 9,400 | 68,435 | |||
U.S. Global Investors Cl. A | 225,200 | 626,056 | |||
UOB-Kay Hian Holdings | 99,122 | 110,393 | |||
Value Partners Group | 560,000 | 884,262 | |||
Vontobel Holding | 16,500 | 765,041 | |||
VZ Holding | 3,000 | 721,964 | |||
Westwood Holdings Group | 15,000 | 893,550 | |||
WisdomTree Investments | 36,000 | 790,740 | |||
| Total (Cost $25,192,030) | 29,665,033 | ||||
| CONSUMER FINANCE - 1.8% | |||||
Credit Acceptance 1 | 848 | 208,761 | |||
†Discover Financial Services | 13,900 | 800,918 | |||
| Total (Cost $832,525) | 1,009,679 | ||||
| DIVERSIFIED FINANCIAL SERVICES - 11.0% | |||||
Bolsa Mexicana de Valores | 248,000 | 429,178 | |||
Bolsas y Mercados Espanoles | 10,500 | 424,691 | |||
Bursa Malaysia | 160,000 | 345,189 | |||
CRISIL | 14,000 | 427,057 | |||
Hellenic Exchanges - Athens Stock Exchange | 50,000 | 258,645 | |||
JSE | 51,000 | 538,631 | |||
Leucadia National | 31,000 | 752,680 | |||
MarketAxess Holdings | 9,200 | 853,484 | |||
MSCI | 8,700 | 535,485 | |||
SHUAA Capital 1 | 580,000 | 95,695 | |||
Singapore Exchange | 63,000 | 366,255 | |||
†TMX Group | 24,250 | 1,031,936 | |||
Warsaw Stock Exchange | 19,000 | 239,218 | |||
| Total (Cost $5,620,321) | 6,298,144 | ||||
| HOTELS, RESTAURANTS & LEISURE - 0.2% | |||||
Thomas Cook (India) | 30,600 | 107,278 | |||
| Total (Cost $28,633) | 107,278 | ||||
| INSURANCE - 5.1% | |||||
E-L Financial | 800 | 419,955 | |||
Greenlight Capital Re Cl. A 1 | 18,600 | 542,562 | |||
Jardine Lloyd Thompson Group | 11,900 | 195,206 | |||
Marsh & McLennan | 8,000 | 453,600 | |||
RLI Corp. | 10,300 | 529,317 | |||
State Auto Financial | 33,800 | 809,510 | |||
| Total (Cost $2,386,906) | 2,950,150 | ||||
| INTERNET SOFTWARE & SERVICES - 1.8% | |||||
Envestnet 1 | 7,600 | 307,268 | |||
| 223,459 | 63,686 | ||||
Xoom Corporation 1 | 30,900 | 650,599 | |||
| Total (Cost $1,071,931) | 1,021,553 | ||||
| INVESTMENT COMPANIES - 1.4% | |||||
RIT Capital Partners | 33,500 | 814,292 | |||
| Total (Cost $682,554) | 814,292 | ||||
| IT SERVICES - 1.8% | |||||
Broadridge Financial Solutions | 13,100 | 655,131 | |||
Vantiv Cl. A 1 | 10,000 | 381,900 | |||
| Total (Cost $522,012) | 1,037,031 | ||||
| 18 | The Royce Funds 2015 Semiannual Report to Shareholders | THE ACCOMPANYING NOTES ARE AN INTEGRAL PART OF THESE FINANCIAL STATEMENTS |
| June 30, 2015 (unaudited) |
| Royce Global Financial Services Fund (continued) | |||||||
| SHARES | VALUE | ||||||
| MARINE - 1.0% | |||||||
†Clarkson | 14,000 | $ | 602,071 | ||||
| Total (Cost $522,555) | 602,071 | ||||||
| MEDIA - 1.5% | |||||||
Markit 1 | 16,000 | 409,120 | |||||
Morningstar | 6,000 | 477,300 | |||||
| Total (Cost $676,857) | 886,420 | ||||||
| PROFESSIONAL SERVICES - 0.8% | |||||||
Verisk Analytics Cl. A 1 | 6,400 | 465,664 | |||||
| Total (Cost $237,159) | 465,664 | ||||||
| REAL ESTATE MANAGEMENT & DEVELOPMENT - 0.6% | |||||||
Midland Holdings 1 | 800,000 | 362,250 | |||||
| Total (Cost $321,572) | 362,250 | ||||||
| SOFTWARE - 2.2% | |||||||
Fair Isaac | 7,400 | 671,772 | |||||
SS&C Technologies Holdings | 9,500 | 593,750 | |||||
| Total (Cost $575,241) | 1,265,522 | ||||||
| TRADING COMPANIES & DISTRIBUTORS - 1.0% | |||||||
Air Lease Cl. A | 16,300 | 552,570 | |||||
| Total (Cost $644,258) | 552,570 | ||||||
| MISCELLANEOUS4 - 3.1% | |||||||
| Total (Cost $1,760,174) | 1,760,424 | ||||||
| TOTAL COMMON STOCKS | |||||||
| (Cost $45,337,747) | 53,443,223 | ||||||
| REPURCHASE AGREEMENT– 6.6% | |||||||
| Fixed Income Clearing Corporation, 0.00% dated 6/30/15, due 7/1/15, maturity value $3,801,000 (collateralized by obligations of various U.S. Government Agencies, 2.625% due 8/15/20, valued at $3,877,125) | |||||||
| (Cost $3,801,000) | 3,801,000 | ||||||
| TOTAL INVESTMENTS – 99.7% | |||||||
| (Cost $49,138,747) | 57,244,223 | ||||||
| CASH AND OTHER ASSETS LESS LIABILITIES – 0.3% | 173,314 | ||||||
| NET ASSETS – 100.0% | $ | 57,417,537 | |||||
| Royce European Small-Cap Fund | |||||
| Common Stocks – 95.8% | |||||
| SHARES | VALUE | ||||
| AUSTRIA – 4.4% | |||||
Mayr-Melnhof Karton | 4,500 | $ | 508,455 | ||
†Schoeller-Bleckmann Oilfield Equipment | 3,500 | 211,604 | |||
Semperit AG Holding | 6,500 | 268,121 | |||
| Total (Cost $1,079,938) | 988,180 | ||||
| CYPRUS – 1.5% | |||||
Globaltrans Investment GDR 1 | 72,200 | 342,950 | |||
| Total (Cost $843,741) | 342,950 | ||||
| DENMARK – 1.8% | |||||
Coloplast Cl. B | 3,000 | 196,850 | |||
Zealand Pharma 1 | 12,000 | 198,150 | |||
| Total (Cost $383,832) | 395,000 | ||||
| FINLAND – 1.8% | |||||
Nokian Renkaat | 12,500 | 391,730 | |||
| Total (Cost $515,849) | 391,730 | ||||
| FRANCE – 19.7% | |||||
Altamir | 20,000 | 232,781 | |||
Alten | 6,000 | 278,701 | |||
Boiron | 1,500 | 147,160 | |||
Gaztransport Et Technigaz | 3,900 | 246,701 | |||
†Interparfums | 11,500 | 313,468 | |||
Lectra | 20,000 | 285,402 | |||
| 9,000 | 266,694 | ||||
Manutan International | 8,500 | 403,971 | |||
Neurones | 15,000 | 249,503 | |||
Nexity | 5,000 | 196,214 | |||
Parrot 1 | 3,000 | 134,551 | |||
†Robertet | 700 | 159,201 | |||
SEB | 3,000 | 279,604 | |||
†Tarkett | 9,000 | 194,151 | |||
†Thermador Groupe | 4,953 | 414,194 | |||
Vetoquinol | 9,200 | 381,546 | |||
Virbac | 1,000 | 214,051 | |||
| Total (Cost $4,296,828) | 4,397,893 | ||||
| GERMANY – 6.7% | |||||
Amadeus Fire | 2,500 | 222,970 | |||
Bertrandt | 2,500 | 328,184 | |||
Fielmann | 2,750 | 186,924 | |||
Gerry Weber International | 8,500 | 194,926 | |||
KWS Saat | 1,000 | 332,783 | |||
Takkt | 12,000 | 219,536 | |||
| Total (Cost $1,356,221) | 1,485,323 | ||||
| ITALY – 6.7% | |||||
Azimut Holding | 9,600 | 280,835 | |||
†B&C Speakers | 30,000 | 227,429 | |||
De’Longhi | 8,000 | 183,371 | |||
DiaSorin | 7,400 | 337,833 | |||
Recordati | 12,500 | 262,129 | |||
†Reply | 2,000 | 204,352 | |||
| Total (Cost $1,063,038) | 1,495,949 | ||||
| NETHERLANDS – 1.1% | |||||
Brunel International | 12,500 | 247,984 | |||
| Total (Cost $308,184) | 247,984 | ||||
| THE ACCOMPANYING NOTES ARE AN INTEGRAL PART OF THESE FINANCIAL STATEMENTS | The Royce Funds 2015 Semiannual Report to Shareholders | 19 |
Schedules of Investments
| Royce European Small-Cap Fund (continued) | |||||
| SHARES | VALUE | ||||
| NORWAY – 3.3% | |||||
Borregaard | 35,000 | $ | 247,754 | ||
Spectrum | 35,000 | 142,402 | |||
TGS-NOPEC Geophysical | 14,800 | 345,628 | |||
| Total (Cost $728,265) | 735,784 | ||||
| SPAIN – 0.9% | |||||
†Laboratorios Farmaceuticos Rovi | 12,000 | 187,429 | |||
| Total (Cost $201,011) | 187,429 | ||||
| SWEDEN – 1.9% | |||||
† Addtech Cl. B | 27,500 | 418,810 | |||
| Total (Cost $388,105) | 418,810 | ||||
| SWITZERLAND – 8.9% | |||||
†Burkhalter Holding | 2,000 | 233,167 | |||
Carlo Gavazzi Holding | 1,400 | 343,954 | |||
†Kardex | 3,000 | 180,170 | |||
†Schaffner Holding | 1,100 | 262,367 | |||
VZ Holding | 2,800 | 673,833 | |||
Zehnder Group | 8,000 | 298,626 | |||
| Total (Cost $1,700,759) | 1,992,117 | ||||
| UNITED KINGDOM – 37.1% | |||||
Ashmore Group | 95,000 | 431,685 | |||
AVEVA Group | 15,000 | 426,123 | |||
†Brammer | 70,000 | 339,586 | |||
| 20,000 | 92,075 | ||||
Clarkson | 13,400 | 576,268 | |||
Consort Medical | 31,700 | 453,258 | |||
Diploma | 20,000 | 253,914 | |||
e2v technologies | 120,300 | 474,444 | |||
Elementis | 91,400 | 368,509 | |||
†Genus | 11,500 | 257,850 | |||
†HellermannTyton Group | 100,000 | 540,196 | |||
| 60,000 | 126,800 | ||||
†ITE Group | 100,000 | 268,684 | |||
Jupiter Fund Management | 25,000 | 175,077 | |||
Kennedy Wilson Europe Real Estate | 17,170 | 306,474 | |||
| 80,000 | 119,415 | ||||
Latchways | 33,700 | 415,666 | |||
†Mears Group | 40,000 | 264,441 | |||
†Polypipe Group | 97,900 | 417,636 | |||
†Porvair | 55,000 | 267,898 | |||
Rotork | 50,000 | 182,736 | |||
Senior | 70,000 | 315,664 | |||
Spirax-Sarco Engineering | 3,000 | 159,938 | |||
Synthomer | 85,000 | 416,161 | |||
†Treatt | 85,000 | 219,032 | |||
†Trifast | 58,200 | 112,480 | |||
Xaar | 40,000 | 292,253 | |||
| Total (Cost $7,837,240) | 8,274,263 | ||||
| TOTAL COMMON STOCKS | |||||
| (Cost $20,703,011) | 21,353,412 | ||||
| REPURCHASE AGREEMENT– 5.7% | |||||
| Fixed Income Clearing Corporation, 0.00% dated 6/30/15, due 7/1/15, maturity value $1,273,000 (collateralized by obligations of various U.S. Government Agencies, 1.875% due 6/30/20, valued at $1,302,900) | |||||
| (Cost $1,273,000) | $ | 1,273,000 | |||
| TOTAL INVESTMENTS – 101.5% | |||||
| (Cost $21,976,011) | 22,626,412 | ||||
| LIABILITIES LESS CASH AND OTHER ASSETS – (1.5)% | (340,841) | ||||
| NET ASSETS – 100.0% | $ | 22,285,571 | |||
| 20 | The Royce Funds 2015 Semiannual Report to Shareholders | THE ACCOMPANYING NOTES ARE AN INTEGRAL PART OF THESE FINANCIAL STATEMENTS |
| June 30, 2015 (unaudited) |
| Royce Global Value Fund | |||||
| Common Stocks – 90.6% | |||||
| SHARES | VALUE | ||||
| AUSTRALIA – 0.7% | |||||
TFS Corporation | 395,400 | $ | 489,639 | ||
| Total (Cost $475,256) | 489,639 | ||||
| AUSTRIA – 1.1% | |||||
Mayr-Melnhof Karton | 7,000 | 790,930 | |||
| Total (Cost $831,620) | 790,930 | ||||
| BERMUDA – 0.3% | |||||
†Lazard Cl. A | 3,200 | 179,968 | |||
| Total (Cost $179,554) | 179,968 | ||||
| BRAZIL – 3.6% | |||||
CETIP - Mercados Organizados | 90,000 | 986,523 | |||
MAHLE Metal Leve | 83,700 | 576,109 | |||
Totvs | 80,100 | 1,004,760 | |||
| Total (Cost $2,748,015) | 2,567,392 | ||||
| CANADA – 4.6% | |||||
†Absolute Software | 16,200 | 116,604 | |||
†Gildan Activewear | 5,500 | 182,820 | |||
Magellan Aerospace | 109,100 | 1,490,189 | |||
MTY Food Group | 15,100 | 400,410 | |||
Richelieu Hardware | 9,800 | 492,981 | |||
Ritchie Bros. Auctioneers | 19,900 | 555,608 | |||
| Total (Cost $3,059,744) | 3,238,612 | ||||
| CHILE – 1.4% | |||||
Inversiones La Construccion | 60,100 | 673,131 | |||
Sonda | 155,400 | 325,495 | |||
| Total (Cost $1,245,020) | 998,626 | ||||
| CHINA – 2.2% | |||||
†AAC Technologies Holdings | 30,000 | 169,708 | |||
E-House (China) Holdings ADR | 77,500 | 520,800 | |||
Haitian International Holdings | 167,000 | 384,346 | |||
Xtep International Holdings | 1,358,800 | 494,329 | |||
| Total (Cost $1,994,562) | 1,569,183 | ||||
| CYPRUS – 0.8% | |||||
Globaltrans Investment GDR 1 | 115,800 | 550,050 | |||
| Total (Cost $835,033) | 550,050 | ||||
| FINLAND – 0.7% | |||||
Nokian Renkaat | 15,000 | 470,076 | |||
| Total (Cost $409,334) | 470,076 | ||||
| FRANCE – 3.1% | |||||
Alten | 11,100 | 515,598 | |||
Lectra | 21,310 | 304,095 | |||
†Nexity | 7,700 | 302,169 | |||
†Technicolor | 81,400 | 530,880 | |||
†Thermador Groupe | 3,100 | 259,237 | |||
Virbac | 1,350 | 288,969 | |||
| Total (Cost $2,184,693) | 2,200,948 | ||||
| GERMANY – 3.7% | |||||
Aurelius | 8,561 | 365,973 | |||
†Bertrandt | 950 | 124,710 | |||
Carl Zeiss Meditec | 29,000 | 739,402 | |||
CompuGroup Medical | 7,300 | 255,424 | |||
†Fielmann | 2,450 | 166,532 | |||
†GFT Technologies | 9,300 | 191,913 | |||
†KWS Saat | 1,100 | 366,061 | |||
Nemetschek | 8,000 | 257,486 | |||
†STRATEC Biomedical | 2,000 | 110,158 | |||
| Total (Cost $2,383,046) | 2,577,659 | ||||
| HONG KONG – 5.4% | |||||
I.T | 1,531,000 | 576,726 | |||
New World Department Store China | 3,843,400 | 1,031,313 | |||
Pacific Textiles Holdings | 295,000 | 471,906 | |||
Television Broadcasts | 98,100 | 581,522 | |||
†Texwinca Holdings | 208,000 | 220,838 | |||
Value Partners Group | 612,600 | 967,319 | |||
| Total (Cost $4,378,294) | 3,849,624 | ||||
| INDIA – 1.5% | |||||
Apollo Tyres | 100,000 | 266,960 | |||
†Bajaj Finance | 7,500 | 641,645 | |||
†Motherson Sumi Systems | 22,500 | 182,954 | |||
| Total (Cost $1,042,234) | 1,091,559 | ||||
| INDONESIA – 0.4% | |||||
Selamat Sempurna | 792,700 | 274,390 | |||
| Total (Cost $290,824) | 274,390 | ||||
| ITALY – 0.6% | |||||
†Azimut Holding | 4,000 | 117,015 | |||
†DiaSorin | 2,700 | 123,263 | |||
Recordati | 9,000 | 188,733 | |||
| Total (Cost $432,978) | 429,011 | ||||
| JAPAN – 12.1% | |||||
EPS Holdings | 45,100 | 547,236 | |||
GCA Savvian | 50,000 | 620,991 | |||
†Horiba | 7,500 | 305,184 | |||
Itoki Corporation | 52,700 | 300,995 | |||
Leopalace21 Corporation 1 | 82,400 | 505,637 | |||
†Meitec Corporation | 12,500 | 465,743 | |||
†Miraca Holdings | 5,400 | 270,033 | |||
MISUMI Group | 41,000 | 582,245 | |||
Namura Shipbuilding | 35,300 | 302,856 | |||
†Nihon Kohden | 2,600 | 64,371 | |||
Nishikawa Rubber | 17,000 | 275,034 | |||
Obara Group | 18,000 | 967,766 | |||
SPARX Group | 226,300 | 475,214 | |||
Sun Frontier Fudousan | 34,400 | 278,832 | |||
Tokai Tokyo Financial Holdings | 56,400 | 410,609 | |||
TOTO | 30,200 | 544,358 | |||
Trancom | 6,600 | 360,779 | |||
†Trend Micro | 9,000 | 308,126 | |||
USS | 40,000 | 722,311 | |||
Zuiko Corporation | 7,500 | 258,610 | |||
| Total (Cost $7,499,547) | 8,566,930 | ||||
| MALAYSIA – 0.3% | |||||
CB Industrial Product Holding | 400,000 | 212,033 | |||
| Total (Cost $269,837) | 212,033 | ||||
| MEXICO – 0.7% | |||||
Industrias Bachoco ADR | 9,700 | 524,867 | |||
| Total (Cost $148,233) | 524,867 | ||||
| THE ACCOMPANYING NOTES ARE AN INTEGRAL PART OF THESE FINANCIAL STATEMENTS | The Royce Funds 2015 Semiannual Report to Shareholders | 21 |
Schedules of Investments
| Royce Global Value Fund (continued) | |||||
| SHARES | VALUE | ||||
| NETHERLANDS – 0.3% | |||||
Lucas Bols Holding 1 | 11,937 | $ | 230,161 | ||
| Total (Cost $214,169) | 230,161 | ||||
| NORWAY – 2.0% | |||||
Borregaard | 34,000 | 240,675 | |||
TGS-NOPEC Geophysical | 35,000 | 817,364 | |||
Tomra Systems | 37,400 | 342,257 | |||
| Total (Cost $1,496,092) | 1,400,296 | ||||
| SOUTH AFRICA – 1.1% | |||||
Lewis Group | 87,500 | 709,077 | |||
Nampak | 28,200 | 78,323 | |||
| Total (Cost $772,538) | 787,400 | ||||
| SOUTH KOREA – 0.4% | |||||
Huvis Corporation | 27,200 | 264,575 | |||
| Total (Cost $305,907) | 264,575 | ||||
| SPAIN – 0.8% | |||||
Atento 1 | 38,400 | 552,192 | |||
| Total (Cost $398,651) | 552,192 | ||||
| SWITZERLAND – 4.2% | |||||
†Belimo Holding | 95 | 226,590 | |||
Burckhardt Compression Holding | 500 | 189,449 | |||
†Burkhalter Holding | 1,400 | 163,217 | |||
†Forbo Holding | 250 | 297,342 | |||
Garmin | 11,400 | 500,802 | |||
†Inficon Holding | 400 | 136,692 | |||
†LEM Holding | 190 | 146,013 | |||
Partners Group Holding | 1,000 | 298,946 | |||
VZ Holding | 4,300 | 1,034,815 | |||
| Total (Cost $2,911,532) | 2,993,866 | ||||
| TAIWAN – 2.1% | |||||
†Flytech Technology | 95,600 | 381,105 | |||
Kinik Company | 147,100 | 280,331 | |||
Makalot Industrial | 35,100 | 302,032 | |||
†Parade Technologies | 17,300 | 201,851 | |||
Taiwan Paiho | 117,100 | 330,185 | |||
| Total (Cost $1,192,334) | 1,495,504 | ||||
| UNITED KINGDOM – 11.4% | |||||
Abcam | 85,000 | 691,821 | |||
Ashmore Group | 150,000 | 681,608 | |||
AVEVA Group | 20,500 | 582,368 | |||
Brammer | 26,000 | 126,132 | |||
Clarkson | 31,500 | 1,354,661 | |||
†Consort Medical | 20,000 | 285,968 | |||
†e2v technologies | 75,000 | 295,788 | |||
†Elementis | 50,000 | 201,591 | |||
†EMIS Group | 39,200 | 567,887 | |||
†Fidessa Group | 10,000 | 357,459 | |||
HellermannTyton Group | 149,000 | 804,892 | |||
†Kennedy Wilson Europe Real Estate | 8,865 | 158,235 | |||
Rotork | 180,000 | 657,851 | |||
Spirax-Sarco Engineering | 3,000 | 159,938 | |||
Synthomer | 135,000 | 660,962 | |||
Victrex | 7,500 | 227,438 | |||
†Zeal Network | 4,500 | 211,108 | |||
| Total (Cost $7,519,352) | 8,025,707 | ||||
| UNITED STATES – 25.1% | |||||
Advance Auto Parts | 800 | 127,432 | |||
AGCO Corporation | 5,700 | 323,646 | |||
| 775 | 363,289 | ||||
Anixter International 1 | 9,100 | 592,865 | |||
| 2,600 | 237,224 | ||||
†Applied Industrial Technologies | 3,300 | 130,845 | |||
Artisan Partners Asset Management Cl. A | 11,200 | 520,352 | |||
†Badger Meter | 1,000 | 63,490 | |||
Bed Bath & Beyond 1 | 4,800 | 331,104 | |||
†Blackstone Group L.P. | 4,000 | 163,480 | |||
†BorgWarner | 5,300 | 301,252 | |||
†Cal-Maine Foods | 6,100 | 318,420 | |||
†Capella Education | 1,400 | 75,138 | |||
Carlisle Companies | 6,500 | 650,780 | |||
†Carter’s | 1,400 | 148,820 | |||
| 4,800 | 304,704 | ||||
| 5,100 | 180,948 | ||||
Core-Mark Holding Company | 2,200 | 130,350 | |||
Diodes 1 | 3,500 | 84,385 | |||
Dollar Tree 1 | 8,200 | 647,718 | |||
Dorman Products 1 | 700 | 33,362 | |||
Drew Industries | 11,000 | 638,220 | |||
†DST Systems | 2,700 | 340,146 | |||
†Dun & Bradstreet | 500 | 61,000 | |||
| 6,900 | 206,655 | ||||
†Equifax | 1,200 | 116,508 | |||
†Evercore Partners Cl. A | 1,000 | 53,960 | |||
| 8,500 | 85,170 | ||||
†GATX Corporation | 2,100 | 111,615 | |||
| 2,500 | 190,450 | ||||
†Gentex Corporation | 10,000 | 164,200 | |||
| 1,300 | 167,219 | ||||
†Jones Lang LaSalle | 1,600 | 273,600 | |||
†Kaiser Aluminum | 400 | 33,232 | |||
Kennedy-Wilson Holdings | 23,800 | 585,242 | |||
Lam Research | 1,100 | 89,485 | |||
ManpowerGroup | 10,100 | 902,738 | |||
| 2,600 | 42,952 | ||||
Mentor Graphics | 4,700 | 124,221 | |||
Minerals Technologies | 10,900 | 742,617 | |||
Mohawk Industries 1 | 1,800 | 343,620 | |||
Monro Muffler Brake | 700 | 43,512 | |||
†Mueller Industries | 3,200 | 111,104 | |||
†National Instruments | 5,200 | 153,192 | |||
| 100 | 134,000 | ||||
| 2,800 | 107,688 | ||||
Quaker Chemical | 2,500 | 222,100 | |||
RBC Bearings 1 | 300 | 21,528 | |||
Reliance Steel & Aluminum | 8,900 | 538,272 | |||
Rogers Corporation 1 | 1,600 | 105,824 | |||
Sanderson Farms | 3,100 | 232,996 | |||
SEI Investments | 6,700 | 328,501 | |||
†Sensient Technologies | 3,800 | 259,692 | |||
| 22 | The Royce Funds 2015 Semiannual Report to Shareholders | THE ACCOMPANYING NOTES ARE AN INTEGRAL PART OF THESE FINANCIAL STATEMENTS |
| June 30, 2015 (unaudited) |
| Royce Global Value Fund (continued) | |||||
| SHARES | VALUE | ||||
| UNITED STATES (continued) | |||||
†Sotheby’s | 4,700 | $ | 212,628 | ||
Standard Motor Products | 14,263 | 500,917 | |||
Sun Hydraulics | 3,700 | 141,007 | |||
Thor Industries | 13,700 | 771,036 | |||
†Towers Watson & Co. Cl. A | 2,100 | 264,180 | |||
†UGI Corporation | 9,500 | 327,275 | |||
Valmont Industries | 7,000 | 832,090 | |||
†Valspar Corporation (The) | 700 | 57,274 | |||
†Waste Connections | 3,500 | 164,920 | |||
| 1,300 | 166,894 | ||||
Westlake Chemical | 9,000 | 617,310 | |||
†Westwood Holdings Group | 4,200 | 250,194 | |||
World Fuel Services | 3,500 | 167,825 | |||
| Total (Cost $17,327,726) | 17,734,413 | ||||
| TOTAL COMMON STOCKS | |||||
| (Cost $62,546,125) | 64,065,611 | ||||
| REPURCHASE AGREEMENT– 8.3% | |||||
| Fixed Income Clearing Corporation, 0.00% dated 6/30/15, due 7/1/15, maturity value $5,874,000 (collateralized by obligations of various U.S. Government Agencies, 1.875% due 6/30/20, valued at $5,994,350) | |||||
| (Cost $5,874,000) | 5,874,000 | ||||
| TOTAL INVESTMENTS – 98.9% | |||||
| (Cost $68,420,125) | 69,939,611 | ||||
| CASH AND OTHER ASSETS LESS LIABILITIES – 1.1% | 755,529 | ||||
| NET ASSETS – 100.0% | $ | 70,695,140 | |||
| Royce International Small-Cap Fund | |||||
| Common Stocks – 95.4% | |||||
| SHARES | VALUE | ||||
| AUSTRALIA – 0.7% | |||||
†Magellan Financial Group | 15,394 | $ | 206,664 | ||
| Total (Cost $260,065) | 206,664 | ||||
| AUSTRIA – 1.7% | |||||
Mayr-Melnhof Karton | 2,200 | 248,578 | |||
Semperit AG Holding | 7,227 | 298,110 | |||
| Total (Cost $536,525) | 546,688 | ||||
| BRAZIL – 2.0% | |||||
CETIP - Mercados Organizados | 17,800 | 195,112 | |||
Grendene | 54,000 | 290,573 | |||
| 130,500 | 153,204 | ||||
| Total (Cost $688,863) | 638,889 | ||||
| CANADA – 5.8% | |||||
†Altus Group | 22,811 | 325,089 | |||
Magellan Aerospace | 40,000 | 546,357 | |||
†Morneau Shepell | 22,465 | 298,934 | |||
†Richelieu Hardware | 6,198 | 311,785 | |||
†Stella-Jones | 9,943 | 330,531 | |||
| Total (Cost $1,679,504) | 1,812,696 | ||||
| CHILE – 0.8% | |||||
†Sonda | 121,438 | 254,359 | |||
| Total (Cost $292,536) | 254,359 | ||||
| CHINA – 5.7% | |||||
E-House (China) Holdings ADR | 78,944 | 530,504 | |||
Haitian International Holdings | 142,905 | 328,892 | |||
Minth Group | 129,353 | 289,359 | |||
Pacific Online | 840,300 | 370,742 | |||
Xtep International Holdings | 726,800 | 264,409 | |||
| Total (Cost $1,957,956) | 1,783,906 | ||||
| FINLAND – 1.2% | |||||
†BasWare | 8,100 | 361,211 | |||
| Total (Cost $379,103) | 361,211 | ||||
| FRANCE – 3.9% | |||||
Gaztransport Et Technigaz | 5,500 | 347,911 | |||
Nexity | 9,935 | 389,876 | |||
†Technicolor | 39,618 | 258,383 | |||
†Teleperformance | 3,200 | 226,074 | |||
| Total (Cost $1,283,931) | 1,222,244 | ||||
| GERMANY – 7.5% | |||||
| 32,332 | 463,543 | ||||
†Aurelius | 5,201 | 222,337 | |||
†CompuGroup Medical | 3,873 | 135,514 | |||
†Deutz | 28,400 | 162,741 | |||
| 7,137 | 344,047 | ||||
†Norma Group SE | 4,891 | 247,254 | |||
Rational | 500 | 183,644 | |||
Takkt | 18,500 | 338,452 | |||
| 1,600 | 262,480 | ||||
| Total (Cost $2,408,153) | 2,360,012 | ||||
| HONG KONG – 11.6% | |||||
I.T | 1,016,600 | 382,952 | |||
Luk Fook Holdings (International) | 100,000 | 294,780 | |||
†Man Wah Holdings | 312,325 | 305,816 | |||
| THE ACCOMPANYING NOTES ARE AN INTEGRAL PART OF THESE FINANCIAL STATEMENTS | The Royce Funds 2015 Semiannual Report to Shareholders | 23 |
Schedules of Investments
| Royce International Small-Cap Fund (continued) | |||||
| SHARES | VALUE | ||||
| HONG KONG (continued) | |||||
New World Department Store China | 1,362,700 | $ | 365,658 | ||
Pacific Textiles Holdings | 189,635 | 303,355 | |||
Stella International Holdings | 96,476 | 230,252 | |||
Television Broadcasts | 96,000 | 569,073 | |||
Texwinca Holdings | 426,841 | 453,187 | |||
Value Partners Group | 311,734 | 492,240 | |||
†Wasion Group Holdings | 145,700 | 224,051 | |||
| Total (Cost $3,605,764) | 3,621,364 | ||||
| INDIA – 2.7% | |||||
Apollo Tyres | 118,100 | 315,280 | |||
Bajaj Holdings & Investment | 10,000 | 228,800 | |||
Grasim Industries | 24 | 1,302 | |||
Thomas Cook (India) | 90,000 | 315,523 | |||
| Total (Cost $712,327) | 860,905 | ||||
| INDONESIA – 0.9% | |||||
Selamat Sempurna | 850,500 | 294,398 | |||
| Total (Cost $243,711) | 294,398 | ||||
| ITALY – 2.1% | |||||
†Cerved Information Solutions | 36,228 | 278,682 | |||
DiaSorin | 8,300 | 378,921 | |||
| Total (Cost $506,969) | 657,603 | ||||
| JAPAN – 17.7% | |||||
†Horiba | 10,100 | 410,982 | |||
†Iriso Electronics | 4,800 | 340,434 | |||
†Japan Aviation Electronics Industry | 7,000 | 190,465 | |||
kabu.com Securities | 73,256 | 245,414 | |||
Kenedix | 44,800 | 172,413 | |||
| 86,500 | 530,796 | ||||
Meitec Corporation | 5,500 | 204,927 | |||
Milbon | 8,500 | 270,519 | |||
MISUMI Group | 14,100 | 200,235 | |||
Nifco | 7,000 | 303,714 | |||
Obara Group | 8,000 | 430,118 | |||
†Pasona Group | 29,300 | 269,574 | |||
Relo Holdings | 3,400 | 336,152 | |||
Santen Pharmaceutical | 30,000 | 424,807 | |||
†Square Enix Holdings | 8,500 | 188,148 | |||
†Tokai Tokyo Financial Holdings | 29,000 | 211,129 | |||
Trancom | 8,000 | 437,308 | |||
USS | 21,000 | 379,213 | |||
| Total (Cost $4,801,995) | 5,546,348 | ||||
| MALAYSIA – 1.1% | |||||
†Kossan Rubber Industries | 112,638 | 194,049 | |||
Media Prima | 400,000 | 154,784 | |||
| Total (Cost $464,395) | 348,833 | ||||
| MEXICO – 2.5% | |||||
Grupo SIMEC Ser. B 1 | 72,700 | 213,232 | |||
Industrias Bachoco ADR | 10,483 | 567,235 | |||
| Total (Cost $718,813) | 780,467 | ||||
| NETHERLANDS – 1.2% | |||||
Brunel International | 19,000 | 376,936 | |||
| Total (Cost $393,367) | 376,936 | ||||
| NORWAY – 2.8% | |||||
†Borregaard | 63,190 | 447,301 | |||
Kongsberg Gruppen | 10,200 | 190,589 | |||
†Tomra Systems | 24,677 | 225,826 | |||
| Total (Cost $916,463) | 863,716 | ||||
| SINGAPORE – 1.2% | |||||
ARA Asset Management | 299,800 | 389,539 | |||
| Total (Cost $348,224) | 389,539 | ||||
| SLOVENIA – 0.6% | |||||
Krka d.d., Novo mesto | 2,593 | 187,902 | |||
| Total (Cost $243,277) | 187,902 | ||||
| SOUTH KOREA – 1.5% | |||||
| 900 | 156,529 | ||||
Handsome | 4,800 | 153,624 | |||
†Koh Young Technology | 4,100 | 151,069 | |||
| Total (Cost $474,208) | 461,222 | ||||
| SPAIN – 2.0% | |||||
Atento 1 | 25,424 | 365,597 | |||
†Axiare Patrimonio | 19,700 | 264,429 | |||
| Total (Cost $585,407) | 630,026 | ||||
| SWITZERLAND – 3.5% | |||||
Kaba Holding | 650 | 386,893 | |||
VZ Holding | 2,900 | 697,898 | |||
| Total (Cost $615,060) | 1,084,791 | ||||
| TAIWAN – 2.0% | |||||
†Makalot Industrial | 40,000 | 344,196 | |||
†Siliconware Precision Industries ADR | 39,000 | 290,550 | |||
| Total (Cost $673,134) | 634,746 | ||||
| UNITED ARAB EMIRATES – 0.8% | |||||
Aramex | 268,585 | 254,479 | |||
| Total (Cost $221,066) | 254,479 | ||||
| UNITED KINGDOM – 11.9% | |||||
†Brammer | 43,505 | 211,053 | |||
†Burford Capital | 99,100 | 239,405 | |||
†Clarkson | 9,599 | 412,806 | |||
Consort Medical | 12,400 | 177,300 | |||
Diploma | 20,528 | 260,617 | |||
e2v technologies | 126,300 | 498,107 | |||
†EMIS Group | 33,109 | 479,648 | |||
†Genus | 9,451 | 211,908 | |||
†Halma | 19,500 | 233,472 | |||
Kennedy Wilson Europe Real Estate | 21,770 | 388,581 | |||
Polypipe Group | 85,000 | 362,605 | |||
Spirax-Sarco Engineering | 4,514 | 240,653 | |||
| Total (Cost $3,323,677) | 3,716,155 | ||||
| TOTAL COMMON STOCKS | |||||
| (Cost $28,334,493) | 29,896,099 | ||||
| 24 | The Royce Funds 2015 Semiannual Report to Shareholders | THE ACCOMPANYING NOTES ARE AN INTEGRAL PART OF THESE FINANCIAL STATEMENTS |
| June 30, 2015 (unaudited) |
| Royce International Small-Cap Fund (continued) | |||||
| VALUE | |||||
| REPURCHASE AGREEMENT– 5.2% | |||||
| Fixed Income Clearing Corporation, 0.00% dated 6/30/15, due 7/1/15, maturity value $1,625,000 (collateralized by obligations of various U.S. Government Agencies, 1.875% due 6/30/20, valued at $1,661,450) | |||||
| (Cost $1,625,000) | $ | 1,625,000 | |||
| TOTAL INVESTMENTS – 100.6% | |||||
| (Cost $29,959,493) | 31,521,099 | ||||
| LIABILITIES LESS CASH AND OTHER ASSETS – (0.6)% | (173,885) | ||||
| NET ASSETS – 100.0% | $ | 31,347,214 | |||
| Royce International Micro-Cap Fund | |||||||||
| Common Stocks – 95.9% | |||||||||
| SHARES | VALUE | ||||||||
| AUSTRALIA – 3.8% | |||||||||
Collection House | 53,970 | $ | 92,858 | ||||||
Imdex 1 | 114,300 | 26,457 | |||||||
Medusa Mining 1 | 32,800 | 21,131 | |||||||
TFS Corporation | 60,351 | 74,735 | |||||||
Webjet | 16,850 | 38,872 | |||||||
| Total (Cost $300,076) | 254,053 | ||||||||
| BELGIUM – 0.3% | |||||||||
Picanol Group | 350 | 20,056 | |||||||
| Total (Cost $12,599) | 20,056 | ||||||||
| BRAZIL – 1.8% | |||||||||
| 10,400 | 22,579 | ||||||||
T4F Entretenimento 1 | 81,000 | 95,092 | |||||||
| Total (Cost $163,624) | 117,671 | ||||||||
| CANADA – 10.9% | |||||||||
†Absolute Software | 4,400 | 31,670 | |||||||
AirBoss of America | 4,450 | 79,452 | |||||||
†Altus Group | 4,700 | 66,982 | |||||||
COM DEV International | 11,850 | 54,743 | |||||||
†easyhome | 3,600 | 56,205 | |||||||
Exco Technologies | 4,700 | 57,612 | |||||||
FLYHT Aerospace Solutions 1 | 59,050 | 11,110 | |||||||
Magellan Aerospace | 13,800 | 188,493 | |||||||
†Morneau Shepell | 2,800 | 37,259 | |||||||
MTY Food Group | 3,500 | 92,810 | |||||||
†Richelieu Hardware | 700 | 35,213 | |||||||
Solium Capital 1 | 2,600 | 16,424 | |||||||
| Total (Cost $626,704) | 727,973 | ||||||||
| CHINA – 2.7% | |||||||||
Daqo New Energy ADR 1 | 1,100 | 25,905 | |||||||
E-House (China) Holdings ADR | 10,800 | 72,576 | |||||||
Pacific Online | 134,500 | 59,342 | |||||||
Xtep International Holdings | 53,200 | 19,354 | |||||||
| Total (Cost $189,623) | 177,177 | ||||||||
| DENMARK – 0.6% | |||||||||
Zealand Pharma 1 | 2,550 | 42,107 | |||||||
| Total (Cost $34,826) | 42,107 | ||||||||
| FINLAND – 1.1% | |||||||||
BasWare | 1,700 | 75,810 | |||||||
| Total (Cost $81,938) | 75,810 | ||||||||
| FRANCE – 3.9% | |||||||||
aufeminin 1 | 900 | 24,502 | |||||||
| 700 | 29,546 | ||||||||
Lectra | 4,200 | 59,934 | |||||||
Neurones | 2,550 | 42,416 | |||||||
Prodware 1 | 4,550 | 31,145 | |||||||
Tessi | 200 | 19,354 | |||||||
†Thermador Groupe | 650 | 54,356 | |||||||
| Total (Cost $274,659) | 261,253 | ||||||||
| GERMANY – 7.5% | |||||||||
†Adler Modemaerkte | 2,600 | 29,711 | |||||||
| 8,500 | 121,864 | ||||||||
Amadeus Fire | 250 | 22,297 | |||||||
†Deutz | 5,800 | 33,236 | |||||||
| THE ACCOMPANYING NOTES ARE AN INTEGRAL PART OF THESE FINANCIAL STATEMENTS | The Royce Funds 2015 Semiannual Report to Shareholders | 25 |
Schedules of Investments
| Royce International Micro-Cap Fund (continued) | |||||
| SHARES | VALUE | ||||
| GERMANY (continued) | |||||
GFT Technologies | 2,450 | $ | 50,558 | ||
mutares | 250 | 28,707 | |||
†SQS Software Quality Systems | 6,900 | 66,947 | |||
Tomorrow Focus 1 | 17,700 | 85,739 | |||
| 350 | 57,418 | ||||
| Total (Cost $447,849) | 496,477 | ||||
| GREECE – 1.0% | |||||
†Aegean Marine Petroleum Network | 2,800 | 34,608 | |||
StealthGas 1 | 4,800 | 32,400 | |||
| Total (Cost $92,942) | 67,008 | ||||
| HONG KONG – 6.9% | |||||
China Metal International Holdings | 209,800 | 67,935 | |||
I.T | 335,000 | 126,194 | |||
Le Saunda Holdings | 122,600 | 59,153 | |||
New World Department Store China | 84,800 | 22,755 | |||
Oriental Watch Holdings | 384,800 | 65,527 | |||
Pico Far East Holdings | 304,600 | 97,452 | |||
Tse Sui Luen Jewellery (International) | 57,200 | 22,137 | |||
| Total (Cost $479,697) | 461,153 | ||||
| INDIA – 1.3% | |||||
†CCL Products India | 9,000 | 25,581 | |||
eClerx Services | 2,500 | 58,810 | |||
| Total (Cost $70,880) | 84,391 | ||||
| INDONESIA – 0.9% | |||||
Selamat Sempurna | 174,700 | 60,472 | |||
| Total (Cost $66,893) | 60,472 | ||||
| IRELAND – 0.8% | |||||
†Trinity Biotech ADR Cl. A | 3,000 | 54,180 | |||
| Total (Cost $54,534) | 54,180 | ||||
| ISRAEL – 2.8% | |||||
Fox Wizel | 1,100 | 22,181 | |||
| 4,050 | 50,625 | ||||
Sarine Technologies | 34,000 | 57,556 | |||
| 4,500 | 57,060 | ||||
| Total (Cost $173,939) | 187,422 | ||||
| JAPAN – 19.2% | |||||
EPS Holdings | 3,800 | 46,109 | |||
Freund Corporation | 6,700 | 80,968 | |||
Fujimori Kogyo | 800 | 24,186 | |||
GCA Savvian | 3,500 | 43,469 | |||
Itoki Corporation | 13,100 | 74,821 | |||
| 12,000 | 73,637 | ||||
Namura Shipbuilding | 4,000 | 34,318 | |||
Nishikawa Rubber | 3,600 | 58,242 | |||
Nitto Kohki | 3,100 | 70,215 | |||
Obara Group | 1,590 | 85,486 | |||
†Pressance Corporation | 2,000 | 67,083 | |||
Relo Holdings | 600 | 59,321 | |||
SPARX Group | 38,800 | 81,477 | |||
Sun Frontier Fudousan | 5,800 | 47,012 | |||
T Hasegawa | 2,600 | 37,709 | |||
†Tenpos Busters | 1,700 | 24,586 | |||
Tokai Corporation | 2,000 | 72,476 | |||
Trancom | 3,700 | 202,255 | |||
YAMADA Consulting Group | 2,000 | 66,757 | |||
Zuiko Corporation | 900 | 31,033 | |||
| Total (Cost $1,189,211) | 1,281,160 | ||||
| MALAYSIA – 1.5% | |||||
Asia Brands | 30,000 | 14,233 | |||
CB Industrial Product Holding | 60,700 | 32,176 | |||
Media Prima | 84,100 | 32,543 | |||
NTPM Holdings | 100,700 | 18,016 | |||
| Total (Cost $136,006) | 96,968 | ||||
| NETHERLANDS – 1.2% | |||||
| 3,100 | 26,943 | ||||
| 2,900 | 55,916 | ||||
| Total (Cost $84,755) | 82,859 | ||||
| NORWAY – 1.9% | |||||
Borregaard | 5,350 | 37,871 | |||
| 62,600 | 43,514 | ||||
Oslo Bors VPS Holding | 3,700 | 42,944 | |||
| Total (Cost $127,256) | 124,329 | ||||
| POLAND – 0.7% | |||||
Warsaw Stock Exchange | 3,700 | 46,585 | |||
| Total (Cost $51,642) | 46,585 | ||||
| SINGAPORE – 2.4% | |||||
†Asian Pay Television Trust | 64,400 | 40,643 | |||
Hour Glass (The) | 55,200 | 34,427 | |||
Parkson Retail Asia | 117,400 | 41,404 | |||
†Riverstone Holdings | 32,300 | 40,529 | |||
| Total (Cost $181,513) | 157,003 | ||||
| SOUTH AFRICA – 1.9% | |||||
Metrofile Holdings | 132,450 | 49,426 | |||
Net 1 UEPS Technologies 1 | 4,100 | 74,948 | |||
| Total (Cost $131,159) | 124,374 | ||||
| SOUTH KOREA – 3.3% | |||||
Eugene Technology | 5,258 | 75,421 | |||
Handsome | 900 | 28,804 | |||
Huvis Corporation | 1,650 | 16,050 | |||
†ISC | 800 | 27,469 | |||
Koh Young Technology | 900 | 33,161 | |||
Samjin Pharmaceutical | 1,400 | 37,025 | |||
| Total (Cost $205,708) | 217,930 | ||||
| SPAIN – 1.0% | |||||
Atento 1 | 4,700 | 67,586 | |||
| Total (Cost $47,542) | 67,586 | ||||
| SRI LANKA – 0.6% | |||||
Distilleries Company of Sri Lanka | 19,100 | 38,543 | |||
| Total (Cost $24,139) | 38,543 | ||||
| SWEDEN – 2.0% | |||||
Inwido | 6,000 | 65,321 | |||
Nolato Cl. B | 1,850 | 42,290 | |||
Recipharm Cl. B | 1,400 | 26,176 | |||
| Total (Cost $129,770) | 133,787 | ||||
| 26 | The Royce Funds 2015 Semiannual Report to Shareholders | THE ACCOMPANYING NOTES ARE AN INTEGRAL PART OF THESE FINANCIAL STATEMENTS |
| June 30, 2015 (unaudited) |
| Royce International Micro-Cap Fund (continued) | |||||
| SHARES | VALUE | ||||
| TAIWAN – 6.2% | |||||
†Flytech Technology | 18,888 | $ | 75,296 | ||
Kinik Company | 28,000 | 53,360 | |||
Lumax International | 31,800 | 56,582 | |||
Makalot Industrial | 7,660 | 65,914 | |||
†Parade Technologies | 4,600 | 53,671 | |||
Shih Her Technologies | 32,600 | 43,320 | |||
Taiwan Paiho | 24,100 | 67,954 | |||
| Total (Cost $349,143) | 416,097 | ||||
| UNITED ARAB EMIRATES – 0.7% | |||||
Aramex | 48,300 | 45,763 | |||
| Total (Cost $23,700) | 45,763 | ||||
| UNITED KINGDOM – 5.8% | |||||
†Character Group | 4,700 | 35,115 | |||
Clarkson | 1,100 | 47,306 | |||
Hargreaves Services | 3,100 | 16,634 | |||
Mattioli Woods | 4,400 | 35,604 | |||
Norcros | 266,700 | 80,668 | |||
Pendragon | 85,200 | 50,871 | |||
Trifast | 36,300 | 70,155 | |||
†Zeal Network | 1,100 | 51,604 | |||
| Total (Cost $367,573) | 387,957 | ||||
| UNITED STATES – 1.2% | |||||
Century Casinos 1 | 13,000 | 81,900 | |||
| Total (Cost $68,234) | 81,900 | ||||
| TOTAL COMMON STOCKS | |||||
| (Cost $6,188,134) | 6,390,044 | ||||
| REPURCHASE AGREEMENT– 5.0% | |||||
| Fixed Income Clearing Corporation, 0.00% dated 6/30/15, due 7/1/15, maturity value $333,000 (collateralized by obligations of various U.S. Government Agencies, 1.875% due 6/30/20, valued at $343,400) | |||||
| (Cost $333,000) | 333,000 | ||||
| TOTAL INVESTMENTS – 100.9% | |||||
| (Cost $6,521,134) | 6,723,044 | ||||
| LIABILITIES LESS CASH AND OTHER ASSETS – (0.9)% | (59,114) | ||||
| NET ASSETS – 100.0% | $ | 6,663,930 | |||
| Royce International Premier Fund | |||||
| Common Stocks – 98.0% | |||||
| SHARES | VALUE | ||||
| AUSTRIA – 2.4% | |||||
Mayr-Melnhof Karton | 1,800 | $ | 203,382 | ||
| Total (Cost $195,840) | 203,382 | ||||
| BRAZIL – 4.5% | |||||
CETIP - Mercados Organizados | 17,500 | 191,824 | |||
Totvs | 15,000 | 188,157 | |||
| Total (Cost $398,914) | 379,981 | ||||
| CHILE – 1.2% | |||||
†Inversiones La Construccion | 9,000 | 100,802 | |||
| Total (Cost $114,910) | 100,802 | ||||
| DENMARK – 1.2% | |||||
SimCorp | 2,500 | 99,561 | |||
| Total (Cost $93,646) | 99,561 | ||||
| FINLAND – 1.8% | |||||
Nokian Renkaat | 5,000 | 156,692 | |||
| Total (Cost $217,459) | 156,692 | ||||
| FRANCE – 3.6% | |||||
†Thermador Groupe | 1,700 | 142,162 | |||
Virbac | 750 | 160,539 | |||
| Total (Cost $287,062) | 302,701 | ||||
| GERMANY – 9.0% | |||||
†Bertrandt | 1,400 | 183,783 | |||
Carl Zeiss Meditec | 8,000 | 203,973 | |||
Fielmann | 1,300 | 88,364 | |||
KWS Saat | 500 | 166,392 | |||
STRATEC Biomedical | 2,000 | 110,158 | |||
| Total (Cost $759,180) | 752,670 | ||||
| HONG KONG – 1.7% | |||||
Stella International Holdings | 30,000 | 71,598 | |||
Value Partners Group | 45,000 | 71,057 | |||
| Total (Cost $133,920) | 142,655 | ||||
| INDIA – 7.3% | |||||
Bajaj Finance | 3,300 | 282,324 | |||
Kewal Kiran Clothing | 3,980 | 132,562 | |||
Motherson Sumi Systems | 24,000 | 195,151 | |||
| Total (Cost $315,235) | 610,037 | ||||
| ITALY – 5.2% | |||||
†Azimut Holding | 3,500 | 102,388 | |||
DiaSorin | 3,500 | 159,786 | |||
Recordati | 8,200 | 171,956 | |||
| Total (Cost $302,080) | 434,130 | ||||
| JAPAN – 12.4% | |||||
†Horiba | 3,600 | 146,488 | |||
†Meitec Corporation | 5,200 | 193,749 | |||
MISUMI Group | 13,000 | 184,614 | |||
†TOTO | 10,000 | 180,251 | |||
†Trend Micro | 4,500 | 154,063 | |||
USS | 10,000 | 180,578 | |||
| Total (Cost $811,321) | 1,039,743 | ||||
| NORWAY – 2.1% | |||||
TGS-NOPEC Geophysical | 7,500 | 175,149 | |||
| Total (Cost $178,405) | 175,149 | ||||
| THE ACCOMPANYING NOTES ARE AN INTEGRAL PART OF THESE FINANCIAL STATEMENTS | The Royce Funds 2015 Semiannual Report to Shareholders | 27 |
| Schedules of Investments | June 30, 2015 (unaudited) |
| Royce International Premier Fund (continued) | |||||
| SHARES | VALUE | ||||
| SWITZERLAND – 19.1% | |||||
Belimo Holding | 70 | $ | 166,961 | ||
Burckhardt Compression Holding | 425 | 161,031 | |||
†Burkhalter Holding | 1,050 | 122,413 | |||
Forbo Holding | 155 | 184,352 | |||
Inficon Holding | 450 | 153,778 | |||
Kaba Holding | 250 | 148,805 | |||
LEM Holding | 260 | 199,807 | |||
Partners Group Holding | 750 | 224,210 | |||
VZ Holding | 1,000 | 240,655 | |||
| Total (Cost $1,223,037) | 1,602,012 | ||||
| UNITED KINGDOM – 26.5% | |||||
Abcam | 25,000 | 203,477 | |||
Ashmore Group | 25,000 | 113,601 | |||
AVEVA Group | 6,500 | 184,653 | |||
Clarkson | 5,832 | 250,806 | |||
Consort Medical | 13,300 | 190,168 | |||
†e2v technologies | 40,000 | 157,753 | |||
Elementis | 41,500 | 167,321 | |||
Fidessa Group | 5,200 | 185,879 | |||
HellermannTyton Group | 35,000 | 189,069 | |||
Latchways | 16,000 | 197,349 | |||
Rotork | 30,000 | 109,642 | |||
Spirax-Sarco Engineering | 2,300 | 122,619 | |||
Victrex | 5,000 | 151,626 | |||
| Total (Cost $2,070,259) | 2,223,963 | ||||
| TOTAL COMMON STOCKS | |||||
| (Cost $7,101,268) | 8,223,478 | ||||
| REPURCHASE AGREEMENT– 9.3% | |||||
| Fixed Income Clearing Corporation, 0.00% dated 6/30/15, due 7/1/15, maturity value $782,000 (collateralized by obligations of various U.S. Government Agencies, 1.875% due 6/30/20, valued at $797,900) | |||||
| (Cost $782,000) | 782,000 | ||||
| TOTAL INVESTMENTS – 107.3% | |||||
| (Cost $7,883,268) | 9,005,478 | ||||
| LIABILITIES LESS CASH AND OTHER ASSETS – (7.3)% | (614,355) | ||||
| NET ASSETS – 100.0% | $ | 8,391,123 | |||
| 28 | The Royce Funds 2015 Semiannual Report to Shareholders | THE ACCOMPANYING NOTES ARE AN INTEGRAL PART OF THESE FINANCIAL STATEMENTS |
| Statements of Assets and Liabilities | June 30, 2015 (unaudited) |
| Royce Global Financial Services Fund | Royce European Small-Cap Fund | Royce Global Value Fund | Royce International Small-Cap Fund | |||||||||||||
| ASSETS: | ||||||||||||||||
| Investments at value | $ | 53,443,223 | $ | 21,353,412 | $ | 64,065,611 | $ | 29,896,099 | ||||||||
| Repurchase agreements (at cost and value) | 3,801,000 | 1,273,000 | 5,874,000 | 1,625,000 | ||||||||||||
| Cash and foreign currency | 24,863 | 2,309 | 307,193 | 66,280 | ||||||||||||
| Receivable for investments sold | 1,200,634 | – | 722,666 | – | ||||||||||||
| Receivable for capital shares sold | 1,190,093 | 75,015 | 23,173 | 37,048 | ||||||||||||
| Receivable for dividends and interest | 70,120 | 81,034 | 293,926 | 70,217 | ||||||||||||
| Prepaid expenses and other assets | 824 | 278 | 204 | 494 | ||||||||||||
| Total Assets | 59,730,757 | 22,785,048 | 71,286,773 | 31,695,138 | ||||||||||||
| LIABILITIES: | ||||||||||||||||
| Payable for investments purchased | 2,125,621 | 428,216 | 75,042 | 245,078 | ||||||||||||
| Payable for capital shares redeemed | 67,935 | – | 317,222 | 11,800 | ||||||||||||
| Payable for investment advisory fees | 38,772 | 20,062 | 73,658 | 28,619 | ||||||||||||
| Payable for trustees’ fees | 683 | 447 | 3,550 | 696 | ||||||||||||
| Accrued expenses | 80,209 | 50,752 | 122,161 | 61,731 | ||||||||||||
| Total Liabilities | 2,313,220 | 499,477 | 591,633 | 347,924 | ||||||||||||
| Net Assets | $ | 57,417,537 | $ | 22,285,571 | $ | 70,695,140 | $ | 31,347,214 | ||||||||
| ANALYSIS OF NET ASSETS: | ||||||||||||||||
| Paid-in capital | $ | 45,173,787 | $ | 23,851,988 | $ | 141,066,289 | $ | 34,010,634 | ||||||||
| Undistributed net investment income (loss) | 435,074 | 175,917 | 439,301 | 236,331 | ||||||||||||
| Accumulated net realized gain (loss) on investments and foreign currency | 3,701,425 | (2,392,302 | ) | (72,299,373 | ) | (4,457,874 | ) | |||||||||
| Net unrealized appreciation (depreciation) on investments and foreign currency | 8,107,251 | 649,968 | 1,488,923 | 1,558,123 | ||||||||||||
| Net Assets | $ | 57,417,537 | $ | 22,285,571 | $ | 70,695,140 | $ | 31,347,214 | ||||||||
Investment Class | $ | 2,629,734 | $ | 34,188,745 | $ | 441,829 | ||||||||||
Service Class | $ | 57,417,537 | 19,655,837 | 25,054,308 | 28,916,667 | |||||||||||
Consultant Class | 11,302,854 | |||||||||||||||
Institutional Class | 1,988,718 | |||||||||||||||
R Class | 124,902 | |||||||||||||||
K Class | 24,331 | |||||||||||||||
| SHARES OUTSTANDING (unlimited number of $.001 par value): | ||||||||||||||||
Investment Class | 288,558 | 2,522,592 | 53,400 | |||||||||||||
Service Class | 5,769,238 | 1,705,577 | 1,839,859 | 2,823,705 | ||||||||||||
Consultant Class | 842,229 | |||||||||||||||
Institutional Class | 234,132 | |||||||||||||||
R Class | 12,503 | |||||||||||||||
K Class | 2,431 | |||||||||||||||
| NET ASSET VALUES (Net Assets ÷ Shares Outstanding): | ||||||||||||||||
Investment Class1 | $9.11 | $13.55 | $8.27 | |||||||||||||
Service Class1 | $9.95 | 11.52 | 13.62 | 10.24 | ||||||||||||
Consultant Class2 | 13.42 | |||||||||||||||
Institutional Class3 | 8.49 | |||||||||||||||
R Class3 | 9.99 | |||||||||||||||
K Class3 | 10.01 | |||||||||||||||
| Investments at identified cost | $ | 45,337,747 | $ | 20,703,011 | $ | 62,546,125 | $ | 28,334,493 | ||||||||
| 1 | Offering and redemption price per share; shares held less than 30 days may be subject to a 2% redemption fee, or a 1% redemption fee (Royce Global Financial Services Fund), payable to the Fund. From January 1-31, 2015, the same redemption fee was applied to shares held less than 180 days. |
| 2 | Offering and redemption price per share; shares held less than 365 days may be subject to a 1% contingent deferred sales charge, payable to Royce Fund Services, Inc. |
| 3 | Offering and redemption price per share. |
| THE ACCOMPANYING NOTES ARE AN INTEGRAL PART OF THESE FINANCIAL STATEMENTS | The Royce Funds 2015 Semiannual Report to Shareholders | 29 |
| Statements of Assets and Liabilities | June 30, 2015 (unaudited) |
| Royce International Micro-Cap Fund | Royce International Premier Fund | |||||||
| ASSETS: | ||||||||
| Investments at value | $ | 6,390,044 | $ | 8,223,478 | ||||
| Repurchase agreements (at cost and value) | 333,000 | 782,000 | ||||||
| Cash and foreign currency | 5,578 | 2,537 | ||||||
| Receivable for investments sold | 342,558 | 73,703 | ||||||
| Receivable for capital shares sold | 5,288 | 6,599 | ||||||
| Receivable for dividends and interest | 10,320 | 39,071 | ||||||
| Prepaid expenses and other assets | 87 | 126 | ||||||
| Total Assets | 7,086,875 | 9,127,514 | ||||||
| LIABILITIES: | ||||||||
| Payable for investments purchased | 18,270 | 695,888 | ||||||
| Payable for capital shares redeemed | 381,226 | 3,204 | ||||||
| Payable for investment advisory fees | 175 | 4,066 | ||||||
| Payable for trustees’ fees | 47 | 192 | ||||||
| Accrued expenses | 21,845 | 25,864 | ||||||
| Deferred capital gains tax | 1,382 | 7,177 | ||||||
| Total Liabilities | 422,945 | 736,391 | ||||||
| Net Assets | $ | 6,663,930 | $ | 8,391,123 | ||||
| ANALYSIS OF NET ASSETS: | ||||||||
| Paid-in capital | $ | 7,111,015 | $ | 7,892,892 | ||||
| Undistributed net investment income (loss) | (19,371 | ) | 89,282 | |||||
| Accumulated net realized gain (loss) on investments and foreign currency | (628,472 | ) | (708,412 | ) | ||||
| Net unrealized appreciation (depreciation) on investments and foreign currency | 200,758 | 1,117,361 | ||||||
| Net Assets | $ | 6,663,930 | $ | 8,391,123 | ||||
Investment Class | $ | 1,836,254 | ||||||
Service Class | $ | 6,663,930 | 6,554,869 | |||||
| SHARES OUTSTANDING (unlimited number of $.001 par value): | ||||||||
Investment Class | 185,372 | |||||||
Service Class | 641,990 | 560,830 | ||||||
| NET ASSET VALUES (Net Assets ÷ Shares Outstanding): | ||||||||
Investment Class1 | $9.91 | |||||||
Service Class1 | $10.38 | 11.69 | ||||||
| Investments at identified cost | $ | 6,188,134 | $ | 7,101,268 | ||||
| 1 | Offering and redemption price per share; shares held less than 30 days may be subject to a 2% redemption fee, payable to the Fund. From January 1-31, 2015, the same redemption fee was applied to shares held less than 180 days. |
| 30 | The Royce Funds 2015 Semiannual Report to Shareholders | THE ACCOMPANYING NOTES ARE AN INTEGRAL PART OF THESE FINANCIAL STATEMENTS |
Statements of Changes in Net Assets
| Royce Global Financial Services Fund | Royce European Small-Cap Fund | Royce Global Value Fund | ||||||||||||||||||||||
| Six Months Ended 6/30/15 (unaudited) | Year Ended 12/31/14 | Six Months Ended 6/30/15 (unaudited) | Year Ended 12/31/14 | Six Months Ended 6/30/15 (unaudited) | Year Ended 12/31/14 | |||||||||||||||||||
| INVESTMENT OPERATIONS: | ||||||||||||||||||||||||
| Net investment income (loss) | $ | 303,868 | $ | 534,686 | $ | 203,095 | $ | 241,006 | $ | 380,302 | $ | 2,023,823 | ||||||||||||
| Net realized gain (loss) on investments and foreign | ||||||||||||||||||||||||
currency | 2,595,203 | 3,400,962 | (1,984,820 | ) | 1,470,960 | 1,228,026 | (18,859,829 | ) | ||||||||||||||||
| Net change in unrealized appreciation (depreciation) | ||||||||||||||||||||||||
on investments and foreign currency | 559,821 | (1,908,778 | ) | 4,031,408 | (6,684,254 | ) | 4,074,539 | 6,433,800 | ||||||||||||||||
| Net increase (decrease) in net assets from | ||||||||||||||||||||||||
investment operations | 3,458,892 | 2,026,870 | 2,249,683 | (4,972,288 | ) | 5,682,867 | (10,402,206 | ) | ||||||||||||||||
| DISTRIBUTIONS: | ||||||||||||||||||||||||
| Net investment income | ||||||||||||||||||||||||
Investment Class | – | (40,603 | ) | – | (2,001,782 | ) | ||||||||||||||||||
Service Class | – | (368,093 | ) | – | (248,801 | ) | – | (561,587 | ) | |||||||||||||||
Consultant Class | – | (264,812 | ) | |||||||||||||||||||||
R Class | – | (2,886 | ) | |||||||||||||||||||||
K Class | – | (601 | ) | |||||||||||||||||||||
| Net realized gain on investments and foreign | ||||||||||||||||||||||||
currency | ||||||||||||||||||||||||
Investment Class | – | (27,878 | ) | – | – | |||||||||||||||||||
Service Class | – | (3,550,372 | ) | – | (220,072 | ) | – | – | ||||||||||||||||
Consultant Class | – | – | ||||||||||||||||||||||
R Class | – | – | ||||||||||||||||||||||
K Class | – | – | ||||||||||||||||||||||
| Total distributions | – | (3,918,465 | ) | – | (537,354 | ) | – | (2,831,668 | ) | |||||||||||||||
| CAPITAL SHARE TRANSACTIONS: | ||||||||||||||||||||||||
| Net capital share transactions | ||||||||||||||||||||||||
Investment Class | 462,572 | 2,436,957 | (14,064,733 | ) | (104,088,063 | ) | ||||||||||||||||||
Service Class | 250,050 | 7,978,123 | (2,400,221 | ) | (3,017,743 | ) | (6,496,737 | ) | (16,686,150 | ) | ||||||||||||||
Consultant Class | (10,595,719 | ) | (3,254,422 | ) | ||||||||||||||||||||
R Class | – | 28,386 | ||||||||||||||||||||||
K Class | – | (19,399 | ) | |||||||||||||||||||||
| Shareholder redemption fees | ||||||||||||||||||||||||
Investment Class | – | – | (327 | ) | 1,878 | |||||||||||||||||||
Service Class | 1,566 | 27,684 | 961 | 17,034 | 370 | 3,732 | ||||||||||||||||||
| Net increase (decrease) in net assets from capital | ||||||||||||||||||||||||
share transactions | 251,616 | 8,005,807 | (1,936,688 | ) | (563,752 | ) | (31,157,146 | ) | (124,014,038 | ) | ||||||||||||||
| Net Increase (Decrease) In Net Assets | 3,710,508 | 6,114,212 | 312,995 | (6,073,394 | ) | (25,474,279 | ) | (137,247,912 | ) | |||||||||||||||
| NET ASSETS: | ||||||||||||||||||||||||
| Beginning of period | 53,707,029 | 47,592,817 | 21,972,576 | 28,045,970 | 96,169,419 | 233,417,331 | ||||||||||||||||||
| End of period | $ | 57,417,537 | $ | 53,707,029 | $ | 22,285,571 | $ | 21,972,576 | $ | 70,695,140 | $ | 96,169,419 | ||||||||||||
| Undistributed Net Investment Income (Loss) at End | ||||||||||||||||||||||||
of Period | $ | 435,074 | $ | 131,205 | $ | 175,917 | $ | (27,179 | ) | $ | 439,301 | $ | 58,999 | |||||||||||
| THE ACCOMPANYING NOTES ARE AN INTEGRAL PART OF THESE FINANCIAL STATEMENTS | The Royce Funds 2015 Semiannual Report to Shareholders | 31 |
Statements of Changes in Net Assets
| Royce International Small-Cap Fund | Royce International Micro-Cap Fund | Royce International Premier Fund | ||||||||||||||||||||||
| Six Months Ended 6/30/15 (unaudited) | Year Ended 12/31/14 | Six Months Ended 6/30/15 (unaudited) | Year Ended 12/31/14 | Six Months Ended 6/30/15 (unaudited) | Year Ended 12/31/14 | |||||||||||||||||||
| INVESTMENT OPERATIONS: | ||||||||||||||||||||||||
| Net investment income (loss) | $ | 269,153 | $ | 600,768 | $ | 14,493 | $ | 47,007 | $ | 96,274 | $ | 156,675 | ||||||||||||
| Net realized gain (loss) on investments and foreign | ||||||||||||||||||||||||
currency | (1,554,507 | ) | 271,690 | (202,634 | ) | 406,568 | (75,209 | ) | (79,151 | ) | ||||||||||||||
| Net change in unrealized appreciation (depreciation) | ||||||||||||||||||||||||
on investments and foreign currency | 2,711,988 | (4,257,707 | ) | 678,229 | (732,114 | ) | 1,081,419 | (1,127,130 | ) | |||||||||||||||
| Net increase (decrease) in net assets from | ||||||||||||||||||||||||
investment operations | 1,426,634 | (3,385,249 | ) | 490,088 | (278,539 | ) | 1,102,484 | (1,049,606 | ) | |||||||||||||||
| DISTRIBUTIONS: | ||||||||||||||||||||||||
| Net investment income | ||||||||||||||||||||||||
Investment Class | – | (18,814 | ) | – | (64,490 | ) | ||||||||||||||||||
Service Class | – | (574,443 | ) | – | (91,072 | ) | – | (80,804 | ) | |||||||||||||||
Institutional Class | – | (61,462 | ) | |||||||||||||||||||||
| Net realized gain on investments and foreign | ||||||||||||||||||||||||
currency | ||||||||||||||||||||||||
Investment Class | – | (79,823 | ) | – | (126,090 | ) | ||||||||||||||||||
Service Class | – | (2,909,304 | ) | – | – | – | (214,622 | ) | ||||||||||||||||
Institutional Class | – | (260,563 | ) | |||||||||||||||||||||
| Total distributions | – | (3,904,409 | ) | – | (91,072 | ) | – | (486,006 | ) | |||||||||||||||
| CAPITAL SHARE TRANSACTIONS: | ||||||||||||||||||||||||
| Net capital share transactions | ||||||||||||||||||||||||
Investment Class | (728,541 | ) | 1,265,297 | (2,252,897 | ) | 4,170,312 | ||||||||||||||||||
Service Class | (1,940,673 | ) | (1,737,936 | ) | (236,439 | ) | 1,569,954 | 2,014,989 | (4,578,287 | ) | ||||||||||||||
Institutional Class | (492,557 | ) | 2,778,811 | |||||||||||||||||||||
| Shareholder redemption fees | ||||||||||||||||||||||||
Investment Class | – | 723 | 84 | 103 | ||||||||||||||||||||
Service Class | 4 | 5,977 | 331 | 945 | – | 367 | ||||||||||||||||||
| Net increase (decrease) in net assets from capital | ||||||||||||||||||||||||
share transactions | (3,161,767 | ) | 2,312,872 | (236,108 | ) | 1,570,899 | (237,824 | ) | (407,505 | ) | ||||||||||||||
| Net Increase (Decrease) In Net Assets | (1,735,133 | ) | (4,976,786 | ) | 253,980 | 1,201,288 | 864,660 | (1,943,117 | ) | |||||||||||||||
| NET ASSETS: | ||||||||||||||||||||||||
| Beginning of period | 33,082,347 | 38,059,133 | 6,409,950 | 5,208,662 | 7,526,463 | 9,469,580 | ||||||||||||||||||
| End of period | $ | 31,347,214 | $ | 33,082,347 | $ | 6,663,930 | $ | 6,409,950 | $ | 8,391,123 | $ | 7,526,463 | ||||||||||||
| Undistributed Net Investment Income (Loss) at End | ||||||||||||||||||||||||
of Period | $ | 236,331 | $ | (32,823 | ) | $ | (19,371 | ) | $ | (33,864 | ) | $ | 89,282 | $ | (6,992 | ) | ||||||||
| 32 | The Royce Funds 2015 Semiannual Report to Shareholders | THE ACCOMPANYING NOTES ARE AN INTEGRAL PART OF THESE FINANCIAL STATEMENTS |
| Statements of Operations | Six Months Ended June 30, 2015 (unaudited) |
| Royce Global Financial Services Fund | Royce European Small-Cap Fund | Royce Global Value Fund | ||||||||||
| INVESTMENT INCOME: | ||||||||||||
| INCOME: | ||||||||||||
| Dividends | $ | 708,061 | $ | 429,193 | $ | 1,155,091 | ||||||
| Foreign withholding tax | (20,515 | ) | (48,747 | ) | (94,575 | ) | ||||||
| Securities lending | – | – | 71 | |||||||||
| Total income | 687,546 | 380,446 | 1,060,587 | |||||||||
| EXPENSES: | ||||||||||||
| Investment advisory fees | 257,502 | 133,237 | 491,523 | |||||||||
| Distribution fees | 64,375 | 23,909 | 113,588 | |||||||||
| Shareholder servicing | 43,302 | 27,332 | 105,546 | |||||||||
| Shareholder reports | 25,780 | 11,914 | 26,912 | |||||||||
| Custody | 18,105 | 21,364 | 50,626 | |||||||||
| Registration | 10,170 | 20,054 | 35,256 | |||||||||
| Audit | 9,755 | 12,918 | 17,508 | |||||||||
| Administrative and office facilities | 3,828 | 1,837 | 10,095 | |||||||||
| Trustees’ fees | 1,318 | 694 | 4,301 | |||||||||
| Legal | 292 | 137 | 734 | |||||||||
| Other expenses | 1,141 | 887 | 4,039 | |||||||||
| Total expenses | 435,568 | 254,283 | 860,128 | |||||||||
| Compensating balance credits | (19 | ) | (10 | ) | (44 | ) | ||||||
| Fees waived by investment adviser and distributor | (51,871 | ) | (18,159 | ) | (11,696 | ) | ||||||
| Expenses reimbursed by investment adviser | – | (58,763 | ) | (168,103 | ) | |||||||
| Net expenses | 383,678 | 177,351 | 680,285 | |||||||||
| Net investment income (loss) | 303,868 | 203,095 | 380,302 | |||||||||
| REALIZED AND UNREALIZED GAIN (LOSS) ON INVESTMENTS AND FOREIGN CURRENCY: | ||||||||||||
| NET REALIZED GAIN (LOSS): | ||||||||||||
| Investments | 2,608,433 | (1,988,528 | ) | 1,273,580 | ||||||||
| Foreign currency transactions | (13,230 | ) | 3,708 | (45,554 | ) | |||||||
| NET CHANGE IN UNREALIZED APPRECIATION (DEPRECIATION): | ||||||||||||
| Investments and foreign currency translations | 556,774 | 4,028,207 | 4,084,452 | |||||||||
| Other assets and liabilities denominated in foreign currency | 3,047 | 3,201 | (9,913 | ) | ||||||||
| Net realized and unrealized gain (loss) on investments and foreign currency | 3,155,024 | 2,046,588 | 5,302,565 | |||||||||
| NET INCREASE (DECREASE) IN NET ASSETS FROM INVESTMENT OPERATIONS | $ | 3,458,892 | $ | 2,249,683 | $ | 5,682,867 | ||||||
| THE ACCOMPANYING NOTES ARE AN INTEGRAL PART OF THESE FINANCIAL STATEMENTS | The Royce Funds 2015 Semiannual Report to Shareholders | 33 |
| Statements of Operations | Six Months Ended June 30, 2015 (unaudited) |
| Royce International Small-Cap Fund | Royce International Micro-Cap Fund | Royce International Premier Fund | ||||||||||
| INVESTMENT INCOME: | ||||||||||||
| INCOME: | ||||||||||||
| Dividends | $ | 581,370 | $ | 79,028 | $ | 175,645 | ||||||
| Foreign withholding tax | (43,769 | ) | (8,398 | ) | (14,320 | ) | ||||||
| Total income | 537,601 | 70,630 | 161,325 | |||||||||
| EXPENSES: | ||||||||||||
| Investment advisory fees | 201,520 | 43,183 | 51,432 | |||||||||
| Distribution fees | 36,308 | 8,304 | 5,824 | |||||||||
| Shareholder servicing | 36,621 | 6,138 | 13,453 | |||||||||
| Shareholder reports | 4,444 | 1,891 | 1,666 | |||||||||
| Custody | 36,745 | 20,392 | 17,038 | |||||||||
| Registration | 29,218 | 9,680 | 20,443 | |||||||||
| Audit | 18,700 | 11,623 | 14,446 | |||||||||
| Administrative and office facilities | 2,891 | 412 | 745 | |||||||||
| Trustees’ fees | 1,086 | 128 | 288 | |||||||||
| Legal | 216 | 32 | 55 | |||||||||
| Other expenses | 1,313 | 360 | 631 | |||||||||
| Total expenses | 369,062 | 102,143 | 126,021 | |||||||||
| Compensating balance credits | (9 | ) | (5 | ) | (2 | ) | ||||||
| Fees waived by investment adviser and distributor | (30,498 | ) | (43,515 | ) | (25,827 | ) | ||||||
| Expenses reimbursed by investment adviser | (70,107 | ) | (2,486 | ) | (35,141 | ) | ||||||
| Net expenses | 268,448 | 56,137 | 65,051 | |||||||||
| Net investment income (loss) | 269,153 | 14,493 | 96,274 | |||||||||
| REALIZED AND UNREALIZED GAIN (LOSS) ON INVESTMENTS AND FOREIGN CURRENCY: | ||||||||||||
| NET REALIZED GAIN (LOSS): | ||||||||||||
| Investments | (1,489,080 | ) | (197,710 | ) | (68,015 | ) | ||||||
| Foreign currency transactions | (65,427 | ) | (4,924 | ) | (7,194 | ) | ||||||
| NET CHANGE IN UNREALIZED APPRECIATION (DEPRECIATION): | ||||||||||||
| Investments and foreign currency translations | 2,637,232 | 675,135 | 1,063,154 | |||||||||
| Other assets and liabilities denominated in foreign currency | 74,756 | 3,094 | 18,265 | |||||||||
| Net realized and unrealized gain (loss) on investments and foreign currency | 1,157,481 | 475,595 | 1,006,210 | |||||||||
| NET INCREASE (DECREASE) IN NET ASSETS FROM INVESTMENT OPERATIONS | $ | 1,426,634 | $ | 490,088 | $ | 1,102,484 | ||||||
| 34 | The Royce Funds 2015 Semiannual Report to Shareholders | THE ACCOMPANYING NOTES ARE AN INTEGRAL PART OF THESE FINANCIAL STATEMENTS |
| Financial Highlights | ||||||||||||||||||||||||||||||||||||||||||||||||||||||||||||||||||||
| This table is presented to show selected data for a share outstanding throughout each period and to assist shareholders in evaluating a Fund’s performance for the periods presented. Per share amounts have been determined on the basis of the weighted average number of shares outstanding during the period. | ||||||||||||||||||||||||||||||||||||||||||||||||||||||||||||||||||||
| Ratio of Expenses to Average Net Assets | ||||||||||||||||||||||||||||||||||||||||||||||||||||||||||||||||||||
| Net Asset Value, Beginning of Period | Net Investment Income (Loss) | Net Realized and Unrealized Gain (Loss) on Investments and Foreign Currency | Total from Investment Operations | Distributions from Net Investment Income | Distributions from Net Realized Gain on Investments and Foreign Currency | Distributions from Return of Capital | Total Distributions | Shareholder Redemption Fees | Net Asset Value, End of Period | | Total Return | Net Assets, End of Period (in thousands) | Prior to Fee Waivers and Balance Credits | Prior to Fee Waivers | Net of Fee Waivers | Ratio of Net Investment Income (Loss) to Average Net Assets | Portfolio Turnover Rate | |||||||||||||||||||||||||||||||||||||||||||||||||||
| Royce Global Financial Services Fund–Service Class | ||||||||||||||||||||||||||||||||||||||||||||||||||||||||||||||||||||
| 2015 | † | $ | 9.28 | $ | 0.06 | $ | 0.61 | $ | 0.67 | $ | – | $ | – | $ | – | $ | – | $ | – | $ | 9.95 | 7.22 | %1 | $ | 57,418 | 1.69 | %2 | 1.69 | %2 | 1.49 | %2 | 1.18 | %2 | 24 | % | |||||||||||||||||||||||||||||||||
| 2014 | 9.68 | 0.09 | 0.22 | 0.31 | (0.06 | ) | (0.65 | ) | – | (0.71 | ) | – | 9.28 | 3.45 | 53,707 | 1.68 | 1.68 | 1.49 | 0.91 | 41 | ||||||||||||||||||||||||||||||||||||||||||||||||
| 2013 | 6.83 | 0.04 | 2.82 | 2.86 | (0.02 | ) | – | – | (0.02 | ) | 0.01 | 9.68 | 42.00 | 47,593 | 1.89 | 1.89 | 1.49 | 0.59 | 23 | |||||||||||||||||||||||||||||||||||||||||||||||||
| 2012 | 5.71 | 0.10 | 1.08 | 1.18 | (0.06 | ) | – | – | (0.06 | ) | – | 6.83 | 20.72 | 16,888 | 1.87 | 1.87 | 1.49 | 1.53 | 26 | |||||||||||||||||||||||||||||||||||||||||||||||||
| 2011 | 6.50 | 0.05 | (0.78 | ) | (0.73 | ) | (0.06 | ) | – | – | (0.06 | ) | – | 5.71 | (11.29 | ) | 14,096 | 1.84 | 1.84 | 1.49 | 0.73 | 23 | ||||||||||||||||||||||||||||||||||||||||||||||
| 2010 | 5.57 | 0.07 | 0.96 | 1.03 | (0.10 | ) | – | – | (0.10 | ) | – | 6.50 | 18.45 | 14,688 | 1.94 | 1.94 | 1.49 | 1.14 | 16 | |||||||||||||||||||||||||||||||||||||||||||||||||
| Royce European Small-Cap Fund–Investment Class a | ||||||||||||||||||||||||||||||||||||||||||||||||||||||||||||||||||||
| 2015 | † | $ | 8.16 | $ | 0.10 | $ | 0.85 | $ | 0.95 | $ | – | $ | – | $ | – | $ | – | $ | – | $ | 9.11 | 11.64 | %1 | $ | 2,630 | 2.88 | %2 | 2.88 | %2 | 1.44 | %2 | 2.36 | %2 | 46 | % | |||||||||||||||||||||||||||||||||
| 2014 | 10.00 | 0.07 | (1.63 | ) | (1.56 | ) | (0.17 | ) | (0.11 | ) | – | (0.28 | ) | – | 8.16 | (15.58 | )1 | 1,938 | 3.13 | 2 | 3.13 | 2 | 1.44 | 2 | 1.17 | 2 | 65 | |||||||||||||||||||||||||||||||||||||||||
| Royce European Small-Cap Fund–Service Class | ||||||||||||||||||||||||||||||||||||||||||||||||||||||||||||||||||||
| 2015 | † | $ | 10.33 | $ | 0.10 | $ | 1.09 | $ | 1.19 | $ | – | $ | – | $ | – | $ | – | $ | – | $ | 11.52 | 11.52 | %1 | $ | 19,656 | 2.33 | %2 | 2.33 | %2 | 1.69 | %2 | 1.85 | %2 | 46 | % | |||||||||||||||||||||||||||||||||
| 2014 | 12.42 | 0.11 | (1.97 | ) | (1.86 | ) | (0.13 | ) | (0.11 | ) | – | (0.24 | ) | 0.01 | 10.33 | (14.86 | ) | 20,035 | 2.11 | 2.11 | 1.69 | 0.76 | 65 | |||||||||||||||||||||||||||||||||||||||||||||
| 2013 | 10.37 | 0.04 | 2.11 | 2.15 | (0.11 | ) | – | – | (0.11 | ) | 0.01 | 12.42 | 20.83 | 28,046 | 2.26 | 2.26 | 1.69 | 0.58 | 53 | |||||||||||||||||||||||||||||||||||||||||||||||||
| 2012 | 8.50 | 0.14 | 1.88 | 2.02 | (0.15 | ) | – | – | (0.15 | ) | – | 10.37 | 23.83 | 15,854 | 2.13 | 2.13 | 1.69 | 1.29 | 22 | |||||||||||||||||||||||||||||||||||||||||||||||||
| 2011 | 10.79 | 0.10 | (2.31 | ) | (2.21 | ) | (0.10 | ) | – | – | (0.10 | ) | 0.02 | 8.50 | (20.32 | ) | 15,918 | 2.09 | 2.09 | 1.69 | 0.95 | 36 | ||||||||||||||||||||||||||||||||||||||||||||||
| 2010 | 8.06 | 0.03 | 2.79 | 2.82 | (0.10 | ) | – | – | (0.10 | ) | 0.01 | 10.79 | 35.20 | 15,369 | 2.57 | 2.57 | 1.69 | 0.70 | 32 | |||||||||||||||||||||||||||||||||||||||||||||||||
| Royce Global Value Fund–Investment Class b | ||||||||||||||||||||||||||||||||||||||||||||||||||||||||||||||||||||
| 2015 | † | $ | 12.58 | $ | 0.08 | $ | 0.89 | $ | 0.97 | $ | – | $ | – | $ | – | $ | – | $ | – | $ | 13.55 | 7.71 | %1 | $ | 34,189 | 1.98 | %2 | 1.98 | %2 | 1.44 | %2 | 1.27 | %2 | 30 | % | |||||||||||||||||||||||||||||||||
| 2014 | 13.60 | 0.22 | (0.97 | ) | (0.75 | ) | (0.27 | ) | – | – | (0.27 | ) | – | 12.58 | (5.49 | ) | 45,698 | 1.50 | 1.50 | 1.50 | 1.20 | 54 | ||||||||||||||||||||||||||||||||||||||||||||||
| 2013 | 12.91 | 0.16 | 0.68 | 0.84 | (0.16 | ) | – | – | (0.16 | ) | 0.01 | 13.60 | 6.59 | 159,366 | 1.49 | 1.49 | 1.49 | 1.08 | 41 | |||||||||||||||||||||||||||||||||||||||||||||||||
| 2012 | 11.74 | 0.14 | 1.19 | 1.33 | (0.16 | ) | – | – | (0.16 | ) | – | 12.91 | 11.37 | 178,319 | 1.47 | 1.47 | 1.44 | 1.16 | 36 | |||||||||||||||||||||||||||||||||||||||||||||||||
| 2011 | 14.54 | 0.13 | (2.82 | ) | (2.69 | ) | (0.12 | ) | – | – | (0.12 | ) | 0.01 | 11.74 | (18.48 | ) | 141,180 | 1.42 | 1.42 | 1.42 | 0.80 | 77 | ||||||||||||||||||||||||||||||||||||||||||||||
| 2010 | 11.02 | (0.06 | ) | 3.68 | 3.62 | (0.10 | ) | – | – | (0.10 | ) | – | 14.54 | 32.88 | 1 | 6,626 | 2.07 | 2 | 2.07 | 2 | 1.44 | 2 | (0.58 | )2 | 42 | |||||||||||||||||||||||||||||||||||||||||||
| Royce Global Value Fund–Service Class | ||||||||||||||||||||||||||||||||||||||||||||||||||||||||||||||||||||
| 2015 | † | $ | 12.65 | $ | 0.07 | $ | 0.90 | $ | 0.97 | $ | – | $ | – | $ | – | $ | – | $ | – | $ | 13.62 | 7.67 | %1 | $ | 25,054 | 2.04 | %2 | 2.04 | %2 | 1.69 | %2 | 1.06 | %2 | 30 | % | |||||||||||||||||||||||||||||||||
| 2014 | 13.68 | 0.19 | (0.98 | ) | (0.79 | ) | (0.24 | ) | – | – | (0.24 | ) | – | 12.65 | (5.76 | ) | 29,625 | 1.80 | 1.80 | 1.69 | 1.03 | 54 | ||||||||||||||||||||||||||||||||||||||||||||||
| 2013 | 12.98 | 0.15 | 0.66 | 0.81 | (0.11 | ) | – | – | (0.11 | ) | – | 13.68 | 6.28 | 48,244 | 1.83 | 1.83 | 1.69 | 0.84 | 41 | |||||||||||||||||||||||||||||||||||||||||||||||||
| 2012 | 11.77 | 0.12 | 1.18 | 1.30 | (0.09 | ) | – | – | (0.09 | ) | – | 12.98 | 11.03 | 98,274 | 1.80 | 1.80 | 1.69 | 0.88 | 36 | |||||||||||||||||||||||||||||||||||||||||||||||||
| 2011 | 14.56 | 0.07 | (2.80 | ) | (2.73 | ) | (0.07 | ) | – | – | (0.07 | ) | 0.01 | 11.77 | (18.69 | ) | 122,574 | 1.77 | 1.77 | 1.69 | 0.41 | 77 | ||||||||||||||||||||||||||||||||||||||||||||||
| 2010 | 10.79 | (0.03 | ) | 3.87 | 3.84 | (0.08 | ) | – | – | (0.08 | ) | 0.01 | 14.56 | 35.69 | 141,992 | 1.84 | 1.84 | 1.69 | 0.01 | 42 | ||||||||||||||||||||||||||||||||||||||||||||||||
| Royce Global Value Fund–Consultant Class c | ||||||||||||||||||||||||||||||||||||||||||||||||||||||||||||||||||||
| 2015 | † | $ | 12.52 | $ | 0.01 | $ | 0.89 | $ | 0.90 | $ | – | $ | – | $ | – | $ | – | $ | – | $ | 13.42 | 7.19 | %1 | $ | 11,303 | 2.71 | %2 | 2.71 | %2 | 2.44 | %2 | 0.14 | %2 | 30 | % | |||||||||||||||||||||||||||||||||
| 2014 | 13.54 | 0.04 | (0.91 | ) | (0.87 | ) | (0.15 | ) | – | – | (0.15 | ) | – | 12.52 | (6.41 | ) | 20,707 | 2.51 | 2.51 | 2.44 | 0.29 | 54 | ||||||||||||||||||||||||||||||||||||||||||||||
| 2013 | 12.88 | 0.01 | 0.70 | 0.71 | (0.05 | ) | – | – | (0.05 | ) | – | 13.54 | 5.50 | 25,663 | 2.53 | 2.53 | 2.44 | 0.11 | 41 | |||||||||||||||||||||||||||||||||||||||||||||||||
| 2012 | 11.71 | 0.02 | 1.17 | 1.19 | (0.02 | ) | – | – | (0.02 | ) | – | 12.88 | 10.13 | 23,383 | 2.55 | 2.55 | 2.44 | 0.16 | 36 | |||||||||||||||||||||||||||||||||||||||||||||||||
| 2011 | 15.66 | (0.09 | ) | (3.80 | ) | (3.89 | ) | (0.06 | ) | – | – | (0.06 | ) | – | 11.71 | (24.82 | )1 | 18,585 | 2.64 | 2 | 2.64 | 2 | 2.44 | 2 | (0.77 | )2 | 77 | |||||||||||||||||||||||||||||||||||||||||
| THE ACCOMPANYING NOTES ARE AN INTEGRAL PART OF THESE FINANCIAL STATEMENTS | The Royce Funds 2015 Semiannual Report to Shareholders | 35 | ||
| Financial Highlights | ||||||||||||||||||||||||||||||||||||||||||||||||||||||||||||||||||||
| This table is presented to show selected data for a share outstanding throughout each period and to assist shareholders in evaluating a Fund’s performance for the periods presented. Per share amounts have been determined on the basis of the weighted average number of shares outstanding during the period. | ||||||||||||||||||||||||||||||||||||||||||||||||||||||||||||||||||||
| Ratio of Expenses to Average Net Assets | ||||||||||||||||||||||||||||||||||||||||||||||||||||||||||||||||||||
| Net Asset Value, Beginning of Period | Net Investment Income (Loss) | Net Realized and Unrealized Gain (Loss) on Investments and Foreign Currency | Total from Investment Operations | Distributions from Net Investment Income | Distributions from Net Realized Gain on Investments and Foreign Currency | Distributions from Return of Capital | Total Distributions | Shareholder Redemption Fees | Net Asset Value, End of Period | Total Return | Net Assets, End of Period (in thousands) | Prior to Fee Waivers and Balance Credits | Prior to Fee Waivers | Net of Fee Waivers | Ratio of Net Investment Income (Loss) to Average Net Assets | Portfolio Turnover Rate | ||||||||||||||||||||||||||||||||||||||||||||||||||||
| Royce Global Value Fund–R Class d | ||||||||||||||||||||||||||||||||||||||||||||||||||||||||||||||||||||
| 2015 | † | $ | 9.30 | $ | 0.04 | $ | 0.65 | $ | 0.69 | $ | – | $ | – | $ | – | $ | – | $ | – | $ | 9.99 | 7.42 | %1 | $ | 125 | 8.34 | %2 | 8.34 | %2 | 1.99 | %2 | 0.86 | %2 | 30 | % | |||||||||||||||||||||||||||||||||
| 2014 | 10.15 | 0.06 | (0.67 | ) | (0.61 | ) | (0.24 | ) | – | – | (0.24 | ) | – | 9.30 | (6.01 | ) | 116 | 8.36 | 8.36 | 1.99 | 0.75 | 54 | ||||||||||||||||||||||||||||||||||||||||||||||
| 2013 | 9.69 | 0.05 | 0.53 | 0.58 | (0.12 | ) | – | – | (0.12 | ) | – | 10.15 | 5.98 | 100 | 9.50 | 9.50 | 1.99 | 0.48 | 41 | |||||||||||||||||||||||||||||||||||||||||||||||||
| 2012 | 10.00 | 0.02 | (0.21 | ) | (0.19 | ) | (0.12 | ) | – | – | (0.12 | ) | – | 9.69 | (1.90 | )1 | 80 | 19.19 | 2 | 19.19 | 2 | 1.99 | 2 | 0.70 | 2 | 36 | ||||||||||||||||||||||||||||||||||||||||||
| Royce Global Value Fund–K Class d | ||||||||||||||||||||||||||||||||||||||||||||||||||||||||||||||||||||
| 2015 | † | $ | 9.30 | $ | 0.05 | $ | 0.66 | $ | 0.71 | $ | – | $ | – | $ | – | $ | – | $ | – | $ | 10.01 | 7.63 | %1 | $ | 24 | 84.63 | %2 | 84.63 | %2 | 1.74 | %2 | 1.11 | %2 | 30 | % | |||||||||||||||||||||||||||||||||
| 2014 | 10.15 | 0.10 | (0.70 | ) | (0.60 | ) | (0.25 | ) | – | – | (0.25 | ) | – | 9.30 | (5.84 | ) | 23 | 76.41 | 76.41 | 1.74 | 0.88 | 54 | ||||||||||||||||||||||||||||||||||||||||||||||
| 2013 | 9.69 | 0.08 | 0.52 | 0.60 | (0.14 | ) | – | – | (0.14 | ) | – | 10.15 | 6.24 | 44 | 19.21 | 19.21 | 1.74 | 0.80 | 41 | |||||||||||||||||||||||||||||||||||||||||||||||||
| 2012 | 10.00 | 0.09 | (0.27 | ) | (0.18 | ) | (0.13 | ) | – | – | (0.13 | ) | – | 9.69 | (1.74 | )1 | 41 | 29.99 | 2 | 29.98 | 2 | 1.74 | 2 | 1.20 | 2 | 36 | ||||||||||||||||||||||||||||||||||||||||||
| Royce International Small-Cap Fund–Investment Class a | ||||||||||||||||||||||||||||||||||||||||||||||||||||||||||||||||||||
| 2015 | † | $ | 7.91 | $ | 0.05 | $ | 0.31 | �� | $ | 0.36 | $ | – | $ | – | $ | – | $ | – | $ | – | $ | 8.27 | 4.55 | %1 | $ | 442 | 4.50 | %2 | 4.50 | %2 | 1.44 | %2 | 1.14 | %2 | 64 | % | ||||||||||||||||||||||||||||||||
| 2014 | 10.00 | 0.14 | (0.91 | ) | (0.77 | ) | (0.26 | ) | (1.07 | ) | – | (1.33 | ) | 0.01 | 7.91 | (7.31 | )1 | 1,119 | 5.53 | 2 | 5.53 | 2 | 1.44 | 2 | 1.45 | 2 | 78 | |||||||||||||||||||||||||||||||||||||||||
| Royce International Small-Cap Fund–Service Class | ||||||||||||||||||||||||||||||||||||||||||||||||||||||||||||||||||||
| 2015 | † | $ | 9.80 | $ | 0.08 | $ | 0.36 | $ | 0.44 | $ | – | $ | – | $ | – | $ | – | $ | – | $ | 10.24 | 4.49 | %1 | $ | 28,916 | 2.18 | %2 | 2.18 | %2 | 1.69 | %2 | 1.67 | %2 | 64 | % | |||||||||||||||||||||||||||||||||
| 2014 | 11.99 | 0.21 | (1.11 | ) | (0.90 | ) | (0.22 | ) | (1.07 | ) | – | (1.29 | ) | – | 9.80 | (7.29 | ) | 29,610 | 1.99 | 1.99 | 1.69 | 1.20 | 78 | |||||||||||||||||||||||||||||||||||||||||||||
| 2013 | 11.28 | 0.12 | 1.30 | 1.42 | (0.15 | ) | (0.56 | ) | – | (0.71 | ) | – | 11.99 | 12.73 | 38,059 | 2.07 | 2.07 | 1.69 | 1.13 | 64 | ||||||||||||||||||||||||||||||||||||||||||||||||
| 2012 | 9.58 | 0.14 | 1.70 | 1.84 | (0.15 | ) | – | – | (0.15 | ) | 0.01 | 11.28 | 19.39 | 26,371 | 2.13 | 2.13 | 1.69 | 1.29 | 44 | |||||||||||||||||||||||||||||||||||||||||||||||||
| 2011 | 12.85 | 0.10 | (2.51 | ) | (2.41 | ) | (0.08 | ) | (0.78 | ) | (0.01 | ) | (0.87 | ) | 0.01 | 9.58 | (18.75 | ) | 20,103 | 2.15 | 2.15 | 1.69 | 0.88 | 38 | ||||||||||||||||||||||||||||||||||||||||||||
| 2010 | 10.49 | 0.03 | �� | 2.72 | 2.75 | (0.10 | ) | (0.30 | ) | – | (0.40 | ) | 0.01 | 12.85 | 26.45 | 18,297 | 2.35 | 2.35 | 1.69 | 0.45 | 55 | |||||||||||||||||||||||||||||||||||||||||||||||
| Royce International Small-Cap Fund–Institutional Class e | ||||||||||||||||||||||||||||||||||||||||||||||||||||||||||||||||||||
| 2015 | † | $ | 8.12 | $ | 0.08 | $ | 0.29 | $ | 0.37 | $ | – | $ | – | $ | – | $ | – | $ | – | $ | 8.49 | 4.56 | %1 | $ | 1,989 | 2.75 | %2 | 2.75 | %2 | 1.44 | %2 | 1.91 | %2 | 64 | % | |||||||||||||||||||||||||||||||||
| 2014 | 10.00 | 0.17 | (0.72 | ) | (0.55 | ) | (0.26 | ) | (1.07 | ) | – | (1.33 | ) | – | 8.12 | (5.22 | )1 | 2,353 | 2.63 | 2 | 2.63 | 2 | 1.44 | 2 | 1.58 | 2 | 78 | |||||||||||||||||||||||||||||||||||||||||
| Royce International Micro-Cap Fund–Service Class f | ||||||||||||||||||||||||||||||||||||||||||||||||||||||||||||||||||||
| 2015 | † | $ | 9.66 | $ | 0.02 | $ | 0.70 | $ | 0.72 | $ | – | $ | – | $ | – | $ | – | $ | – | $ | 10.38 | 7.45 | %1 | $ | 6,664 | 3.07 | %2 | 3.07 | %2 | 1.69 | %2 | 0.44 | %2 | 46 | % | |||||||||||||||||||||||||||||||||
| 2014 | 10.04 | 0.06 | (0.30 | ) | (0.24 | ) | (0.14 | ) | – | – | (0.14 | ) | – | 9.66 | (2.37 | ) | 6,410 | 3.51 | 3.51 | 1.69 | 0.82 | 91 | ||||||||||||||||||||||||||||||||||||||||||||||
| 2013 | 8.61 | 0.11 | 1.51 | 1.62 | (0.20 | ) | – | – | (0.20 | ) | 0.01 | 10.04 | 18.95 | 5,209 | 3.86 | 3.86 | 1.69 | 1.22 | 103 | |||||||||||||||||||||||||||||||||||||||||||||||||
| 2012 | 7.72 | 0.13 | 0.92 | 1.05 | (0.16 | ) | – | – | (0.16 | ) | – | 8.61 | 13.59 | 4,603 | 3.90 | 3.90 | 1.69 | 1.63 | 62 | |||||||||||||||||||||||||||||||||||||||||||||||||
| 2011 | 10.00 | 0.10 | (2.26 | ) | (2.16 | ) | (0.12 | ) | – | (0.01 | ) | (0.13 | ) | 0.01 | 7.72 | (21.51 | )1 | 3,572 | 3.92 | 2 | 3.92 | 2 | 1.69 | 2 | 1.08 | 2 | 71 | |||||||||||||||||||||||||||||||||||||||||
| 36 | The Royce Funds 2015 Semiannual Report to Shareholders | THE ACCOMPANYING NOTES ARE AN INTEGRAL PART OF THESE FINANCIAL STATEMENTS |
| Financial Highlights | ||||||||||||||||||||||||||||||||||||||||||||||||||||||||||||||||||||
| This table is presented to show selected data for a share outstanding throughout each period and to assist shareholders in evaluating a Fund’s performance for the periods presented. Per share amounts have been determined on the basis of the weighted average number of shares outstanding during the period. | ||||||||||||||||||||||||||||||||||||||||||||||||||||||||||||||||||||
| Ratio of Expenses to Average Net Assets | ||||||||||||||||||||||||||||||||||||||||||||||||||||||||||||||||||||
| Net Asset Value, Beginning of Period | Net Investment Income (Loss) | Net Realized and Unrealized Gain (Loss) on Investments and Foreign Currency | Total from Investment Operations | Distributions from Net Investment Income | Distributions from Net Realized Gain on Investments and Foreign Currency | Distributions from Return of Capital | Total Distributions | Shareholder Redemption Fees | Net Asset Value, End of Period | Total Return | Net Assets, End of Period (in thousands) | Prior to Fee Waivers and Balance Credits | Prior to Fee Waivers | Net of Fee Waivers | Ratio of Net Investment Income (Loss) to Average Net Assets | Portfolio Turnover Rate | ||||||||||||||||||||||||||||||||||||||||||||||||||||
| Royce International Premier Fund–Investment Class a | ||||||||||||||||||||||||||||||||||||||||||||||||||||||||||||||||||||
| 2015 | † | $ | 8.71 | $ | 0.11 | $ | 1.09 | $ | 1.20 | $ | – | $ | – | $ | – | $ | – | $ | – | $ | 9.91 | 13.78 | %1 | $ | 1,836 | 3.00 | %2 | 3.00 | %2 | 1.44 | %2 | 2.35 | %2 | 34 | % | |||||||||||||||||||||||||||||||||
| 2014 | 10.00 | 0.03 | (0.85 | ) | (0.82 | ) | (0.16 | ) | (0.31 | ) | – | (0.47 | ) | – | 8.71 | (8.16 | )1 | 3,481 | 3.17 | 2 | 3.17 | 2 | 1.44 | 2 | 1.00 | 2 | 62 | |||||||||||||||||||||||||||||||||||||||||
| Royce International Premier Fund–Service Class g | ||||||||||||||||||||||||||||||||||||||||||||||||||||||||||||||||||||
| 2015 | † | $ | 10.28 | $ | 0.13 | $ | 1.28 | $ | 1.41 | $ | – | $ | – | $ | – | $ | – | $ | – | $ | 11.69 | 13.72 | %1 | $ | 6,555 | 3.11 | %2 | 3.11 | %2 | 1.69 | %2 | 2.33 | %2 | 34 | % | |||||||||||||||||||||||||||||||||
| 2014 | 11.67 | 0.17 | (1.13 | ) | (0.96 | ) | (0.12 | ) | (0.31 | ) | – | (0.43 | ) | – | 10.28 | (8.22 | ) | 4,045 | 2.45 | 2.45 | 1.69 | 1.26 | 62 | |||||||||||||||||||||||||||||||||||||||||||||
| 2013 | 10.01 | 0.10 | 1.73 | 1.83 | (0.17 | ) | – | – | (0.17 | ) | – | 11.67 | 18.31 | 9,470 | 2.82 | 2.82 | 1.69 | 1.09 | 51 | |||||||||||||||||||||||||||||||||||||||||||||||||
| 2012 | 8.26 | 0.12 | 1.81 | 1.93 | (0.18 | ) | – | – | (0.18 | ) | – | 10.01 | 23.40 | 6,444 | 3.54 | 3.54 | 1.69 | 1.18 | 103 | |||||||||||||||||||||||||||||||||||||||||||||||||
| 2011 | 10.00 | 0.05 | (1.73 | ) | (1.68 | ) | (0.06 | ) | (0.00 | ) | (0.01 | ) | (0.07 | ) | 0.01 | 8.26 | (16.75 | )1 | 4,090 | 3.77 | 2 | 3.77 | 2 | 1.69 | 2 | 0.67 | 2 | 42 | ||||||||||||||||||||||||||||||||||||||||
| † | Six months ended June 30, 2015 (unaudited). |
| 1 | Not annualized |
| 2 | Annualized |
| a | The Class commenced operations on January 22, 2014. |
| b | The Class commenced operations on September 1, 2010. |
| c | The Class commenced operations on May 2, 2011. |
| d | The Class commenced operations on March 21, 2012. |
| e | The Class commenced operations on January 27, 2014. |
| f | The Fund commenced operations on January 3, 2011. |
| g | The Class commenced operations on January 3, 2011. |
| THE ACCOMPANYING NOTES ARE AN INTEGRAL PART OF THESE FINANCIAL STATEMENTS | The Royce Funds 2015 Semiannual Report to Shareholders | 37 | ||
| Royce International Micro-Cap Fund | 49% | |
| Royce International Premier Fund | 32% |
| Level 1 – | quoted prices in active markets for identical securities. | |
| Level 2 – | other significant observable inputs (including quoted prices for similar securities, foreign securities that may be fair valued and repurchase agreements). The table below includes all Level 2 securities. Level 2 securities with values based on quoted prices for similar securities are noted in the Schedules of Investments. | |
| Level 3 – | significant unobservable inputs (including last trade price before trading was suspended, or at a discount thereto for lack of marketability or otherwise, market price information regarding other securities, information received from the company and/or published documents, including SEC filings and financial statements, or other publicly available information). |
| LEVEL 1 | LEVEL 2 | LEVEL 3 | TOTAL | |||||
| Royce Global Financial Services Fund | ||||||||
| Common Stocks | $53,379,537 | $ 63,686 | $0 | $53,443,223 | ||||
| Cash Equivalents | – | 3,801,000 | – | 3,801,000 | ||||
| Royce European Small-Cap Fund | ||||||||
| Common Stocks | 21,353,412 | – | – | 21,353,412 | ||||
| Cash Equivalents | – | 1,273,000 | – | 1,273,000 | ||||
| Royce Global Value Fund | ||||||||
| Common Stocks | 64,065,611 | – | – | 64,065,611 | ||||
| Cash Equivalents | – | 5,874,000 | – | 5,874,000 | ||||
| Royce International Small-Cap Fund | ||||||||
| Common Stocks | 29,896,099 | – | – | 29,896,099 | ||||
| Cash Equivalents | – | 1,625,000 | – | 1,625,000 | ||||
| Royce International Micro-Cap Fund | ||||||||
| Common Stocks | 6,390,044 | – | – | 6,390,044 | ||||
| Cash Equivalents | – | 333,000 | – | 333,000 | ||||
| Royce International Premier Fund | ||||||||
| Common Stocks | 8,223,478 | – | – | 8,223,478 | ||||
| Cash Equivalents | – | 782,000 | – | 782,000 | ||||
| TRANSFERS FROM LEVEL 2 TO LEVEL 1 | TRANSFERS FROM LEVEL 2 TO LEVEL 1 | |||||||||
| Royce Global Financial Services Fund | $11,525,455 | Royce International Small-Cap Fund | $12,387,968 | |||||||
| Royce European Small-Cap Fund | 13,273,317 | Royce International Micro-Cap Fund | 3,773,512 | |||||||
| Royce Global Value Fund | 30,021,085 | Royce International Premier Fund | 5,977,194 | |||||||
| BALANCE AS OF 12/31/14 | PURCHASES | SALES | REALIZED AND UNREALIZED GAIN (LOSS)1 | BALANCE AS OF 6/30/15 | ||||||
| Royce Global Financial Services Fund | ||||||||||
| Common Stocks | $ – | $ 0 | $ – | $ – | $ 0 | |||||
| Royce International Micro-Cap Fund | ||||||||||
| Common Stocks | 529 | – | 0 | (529) | – | |||||
The Funds pay any dividends and capital gain distributions annually in December. Dividends from net investment income are determined at a class level and distributions from capital gains are determined at a Fund level. Because federal income tax regulations differ from generally accepted accounting principles, income and capital gain distributions determined in accordance with tax regulations may differ from net investment income and realized gains recognized for financial reporting purposes. Accordingly, the character of distributions and composition of net assets for tax purposes differ from those reflected in the accompanying financial statements.
| SHARES SOLD | SHARES ISSUED FOR REINVESTMENT OF DISTRIBUTIONS | SHARES REDEEMED | NET INCREASE (DECREASE) FROM CAPITAL SHARE TRANSACTIONS | |||||||||||||||||||||||||||||
| Six Months Ended 6/30/15 (unaudited) | Period ended 12/31/14 | Six Months Ended 6/30/15 (unaudited) | Period ended 12/31/14 | Six Months Ended 6/30/15 (unaudited) | Period ended 12/31/14 | Six Months Ended 6/30/15 (unaudited) | Period ended 12/31/14 | |||||||||||||||||||||||||
| Royce Global Financial Services Fund | ||||||||||||||||||||||||||||||||
| Service Class | $11,677,001 | $27,931,624 | $– | $3,487,173 | $(11,426,951 | ) | $ | (23,440,674 | ) | $ | 250,050 | $ | 7,978,123 | |||||||||||||||||||
| Royce European Small-Cap Fund | ||||||||||||||||||||||||||||||||
| Investment Class | 683,100 | 2,976,525 | – | 23,074 | (220,528 | ) | (562,642 | ) | 462,572 | 2,436,957 | ||||||||||||||||||||||
| Service Class | 2,199,983 | 10,432,098 | – | 418,765 | (4,600,204 | ) | (13,868,606 | ) | (2,400,221 | ) | (3,017,743 | ) | ||||||||||||||||||||
| Royce Global Value Fund | ||||||||||||||||||||||||||||||||
| Investment Class | 3,283,436 | 34,241,857 | – | 1,478,512 | (17,348,169 | ) | (139,808,432 | ) | (14,064,733 | ) | (104,088,063 | ) | ||||||||||||||||||||
| Service Class | 797,544 | 4,434,044 | – | 463,969 | (7,294,281 | ) | (21,584,163 | ) | (6,496,737 | ) | (16,686,150 | ) | ||||||||||||||||||||
| Consultant Class | 340,269 | 2,262,356 | – | 238,875 | (10,935,988 | ) | (5,755,653 | ) | (10,595,719 | ) | (3,254,422 | ) | ||||||||||||||||||||
| R Class | – | 25,500 | – | 2,886 | – | – | – | 28,386 | ||||||||||||||||||||||||
| K Class | – | – | – | 601 | – | (20,000 | ) | – | (19,399 | ) | ||||||||||||||||||||||
| Royce International Small-Cap Fund | ||||||||||||||||||||||||||||||||
| Investment Class | 255,039 | 1,269,960 | – | 98,637 | (983,580 | ) | (103,300 | ) | (728,541 | ) | 1,265,297 | |||||||||||||||||||||
| Service Class | 9,535,265 | 24,538,927 | – | 3,268,187 | (11,475,938 | ) | (29,545,050 | ) | (1,940,673 | ) | (1,737,936 | ) | ||||||||||||||||||||
| Institutional Class | 7,699 | 2,956,787 | – | 322,024 | (500,256 | ) | (500,000 | ) | (492,557 | ) | 2,778,811 | |||||||||||||||||||||
| Royce International Micro-Cap Fund | ||||||||||||||||||||||||||||||||
| Service Class | 455,338 | 3,084,632 | – | 86,844 | (691,777 | ) | (1,601,522 | ) | (236,439 | ) | 1,569,954 | |||||||||||||||||||||
| Royce International Premier Fund | ||||||||||||||||||||||||||||||||
| Investment Class | 875,747 | 5,574,827 | – | 188,340 | (3,128,644 | ) | (1,592,855 | ) | (2,252,897 | ) | 4,170,312 | |||||||||||||||||||||
| Service Class | 2,337,846 | 6,044,190 | – | 286,437 | (322,857 | ) | (10,908,914 | ) | 2,014,989 | (4,578,287 | ) | |||||||||||||||||||||
| Capital Share Transactions (in shares): | ||||||||||||||||||||||||||||||||
| SHARES SOLD | SHARES ISSUED FOR REINVESTMENT OF DISTRIBUTIONS | SHARES REDEEMED | NET INCREASE (DECREASE) IN SHARES OUTSTANDING | |||||||||||||||||||||||||||||
| Six Months Ended 6/30/15 (unaudited) | Period ended 12/31/14 | Six Months Ended 6/30/15 (unaudited) | Period ended 12/31/14 | Six Months Ended 6/30/15 (unaudited) | Period ended 12/31/14 | Six Months Ended 6/30/15 (unaudited) | Period ended 12/31/14 | |||||||||||||||||||||||||
| Royce Global Financial Services Fund | ||||||||||||||||||||||||||||||||
| Service Class | 1,186,652 | 2,899,740 | – | 417,602 | (1,201,956 | ) | (2,448,965 | ) | (15,304 | ) | 868,377 | |||||||||||||||||||||
| Royce European Small-Cap Fund | ||||||||||||||||||||||||||||||||
| Investment Class | 76,610 | 297,124 | – | 2,880 | (25,621 | ) | (62,436 | ) | 50,989 | 237,568 | ||||||||||||||||||||||
| Service Class | 195,251 | 826,782 | – | 43,605 | (429,418 | ) | (1,188,428 | ) | (234,167 | ) | (318,041 | ) | ||||||||||||||||||||
| Royce Global Value Fund | ||||||||||||||||||||||||||||||||
| Investment Class | 250,313 | 2,430,818 | – | 133,403 | (1,360,889 | ) | (10,653,392 | ) | (1,110,576 | ) | (8,089,171 | ) | ||||||||||||||||||||
| Service Class | 61,393 | 314,008 | – | 40,116 | (562,649 | ) | (1,540,282 | ) | (501,256 | ) | (1,186,158 | ) | ||||||||||||||||||||
| Consultant Class | 25,733 | 168,211 | – | 19,342 | (837,585 | ) | (428,708 | ) | (811,852 | ) | (241,155 | ) | ||||||||||||||||||||
| R Class | – | 2,359 | – | 315 | – | – | – | 2,674 | ||||||||||||||||||||||||
| K Class | – | – | – | 66 | – | (1,992 | ) | – | (1,926 | ) | ||||||||||||||||||||||
| Royce International Small-Cap Fund | ||||||||||||||||||||||||||||||||
| Investment Class | 31,114 | 138,719 | – | 12,760 | (119,193 | ) | (10,000 | ) | (88,079 | ) | 141,479 | |||||||||||||||||||||
| Service Class | 954,840 | 2,070,356 | – | 351,297 | (1,153,470 | ) | (2,572,623 | ) | (198,630 | ) | (150,970 | ) | ||||||||||||||||||||
| Institutional Class | 920 | 297,157 | – | 40,557 | (56,655 | ) | (47,847 | ) | (55,735 | ) | 289,867 | |||||||||||||||||||||
| Royce International Micro-Cap Fund | ||||||||||||||||||||||||||||||||
| Service Class | 46,070 | 290,430 | – | 9,432 | (67,471 | ) | (155,454 | ) | (21,401 | ) | 144,408 | |||||||||||||||||||||
| Royce International Premier Fund | ||||||||||||||||||||||||||||||||
| Investment Class | 97,426 | 547,336 | – | 21,875 | (311,859 | ) | (169,405 | ) | (214,433 | ) | 399,806 | |||||||||||||||||||||
| Service Class | 196,379 | 517,826 | – | 28,675 | (28,895 | ) | (964,831 | ) | 167,484 | (418,330 | ) | |||||||||||||||||||||
Notes to Financial Statements (unaudited) (continued)
Investment Adviser and Distributor:
| ANNUAL CONTRACTUAL ADVISORY FEE AS A | COMMITTED NET ANNUAL OPERATING EXPENSE RATIO CAP | SIX MONTHS ENDED JUNE 30, 2015 | ||||||||||||||||||||
| PERCENTAGE OF AVERAGE NET ASSETS1 | Investment Class4 | Service Class4 | Consultant Class4 | Institutional Class4 | R Class4 | K Class4 | Net advisory fees | Advisory fees waived | ||||||||||||||
Royce Global Financial Services Fund | 1.00% | N/A | 1.49% | N/A | N/A | N/A | N/A | $ | 210,781 | $ 46,721 | ||||||||||||
Royce European Small-Cap Fund | 1.25%2 | 1.44%5 | 1.69%6 | N/A | N/A | N/A | N/A | 115,078 | 18,159 | |||||||||||||
Royce Global Value Fund | 1.25%2 | 1.44%5 | 1.69%6 | 2.44%7 | N/A | 1.99%9 | 1.74%10 | 479,827 | 11,696 | |||||||||||||
Royce International Small-Cap Fund | 1.25%2 | 1.44%5 | 1.69%6 | N/A | 1.44%8 | N/A | N/A | 171,022 | 30,498 | |||||||||||||
Royce International Micro-Cap Fund | 1.30%3 | N/A | 1.69%6 | N/A | N/A | N/A | N/A | – | 43,183 | |||||||||||||
Royce International Premier Fund | 1.25%2 | 1.44%5 | 1.69%6 | N/A | N/A | N/A | N/A | 26,304 | 25,128 | |||||||||||||
| ANNUAL CONTRACTUAL DISTRIBUTION FEE AS A | SIX MONTHS ENDED JUNE 30, 2015 | |||||||||||
| PERCENTAGE OF AVERAGE NET ASSETS | Net distribution fees | Distribution fees waived | ||||||||||
Royce Global Financial Services Fund – Service Class | 0.25% | $ | 59,225 | $ | 5,150 | |||||||
Royce European Small-Cap Fund – Service Class | 0.25% | 23,909 | – | |||||||||
Royce Global Value Fund – Service Class | 0.25% | 32,989 | – | |||||||||
Royce Global Value Fund – Consultant Class | 1.00% | 80,269 | – | |||||||||
Royce Global Value Fund – R Class | 0.50% | 301 | – | |||||||||
Royce Global Value Fund – K Class | 0.25% | 29 | – | |||||||||
Royce International Small-Cap Fund – Service Class | 0.25% | 36,308 | – | |||||||||
Royce International Micro-Cap Fund – Service Class | 0.25% | 7,972 | 332 | |||||||||
Royce International Premier Fund – Service Class | 0.25% | 5,125 | 699 | |||||||||
| PURCHASES | SALES | |||||
| Royce Global Financial Services Fund | $ | 11,879,021 | $ | 13,693,505 | ||
| Royce European Small-Cap Fund | 9,594,446 | 11,890,896 | ||||
| Royce Global Value Fund | 21,395,673 | 51,746,526 | ||||
| Royce International Small-Cap Fund | 19,798,009 | 23,546,685 | ||||
| Royce International Micro-Cap Fund | 2,905,772 | 3,249,050 | ||||
| Royce International Premier Fund | 2,726,414 | 3,096,850 | ||||
| 42 | The Royce Funds 2015 Semiannual Report to Shareholders |
| CLASS LEVEL | |||||||||||||||||||||||
| EXPENSES | |||||||||||||||||||||||
| REIMBURSED BY | |||||||||||||||||||||||
| NET DISTRIBUTION | SHAREHOLDER | SHAREHOLDER | TRANSFER AGENT | INVESTMENT | |||||||||||||||||||
| FEES | SERVICING | REPORTS | REGISTRATION | BALANCE CREDITS | TOTAL | ADVISER | |||||||||||||||||
Royce European Small-Cap Fund – | $ | – | $ | 3,847 | $ | 93 | $ | 10,043 | $ | – | $ | 13,983 | $ | 13,983 | |||||||||
Royce European Small-Cap Fund – | 23,909 | 23,485 | 11,821 | 10,011 | (10 | ) | 69,216 | 44,780 | |||||||||||||||
| 23,909 | 27,332 | 11,914 | 20,054 | (10 | ) | 58,763 | |||||||||||||||||
Royce Global Value Fund – Investment Class | – | 61,490 | 16,693 | 14,132 | (3 | ) | 92,312 | 92,312 | |||||||||||||||
Royce Global Value Fund – Service Class | 32,989 | 27,644 | 7,552 | 7,108 | (31 | ) | 75,262 | 42,829 | |||||||||||||||
Royce Global Value Fund – Consultant Class | 80,269 | 10,455 | 2,661 | 6,435 | (10 | ) | 99,810 | 19,453 | |||||||||||||||
Royce Global Value Fund – R Class | 301 | 2,989 | 6 | 836 | – | 4,132 | 3,802 | ||||||||||||||||
Royce Global Value Fund – K Class | 29 | 2,968 | – | 6,745 | – | 9,742 | 9,707 | ||||||||||||||||
| 113,588 | 105,546 | 26,912 | 35,256 | (44 | ) | 168,103 | |||||||||||||||||
Royce International Small-Cap Fund – | – | 3,031 | 30 | 9,738 | – | 12,799 | 12,798 | ||||||||||||||||
Royce International Small-Cap Fund – | 36,308 | 30,612 | 4,394 | 9,595 | (9 | ) | 80,900 | 44,426 | |||||||||||||||
Royce International Small-Cap Fund – | – | 2,978 | 20 | 9,885 | – | 12,883 | 12,883 | ||||||||||||||||
| 36,308 | 36,621 | 4,444 | 29,218 | (9 | ) | 70,107 | |||||||||||||||||
Royce International Premier Fund – | – | 5,724 | 317 | 11,032 | – | 17,073 | 17,073 | ||||||||||||||||
Royce International Premier Fund – | 5,125 | 7,729 | 1,349 | 9,411 | (2 | ) | 23,612 | 18,068 | |||||||||||||||
| 5,125 | 13,453 | 1,666 | 20,443 | (2 | ) | 35,141 | |||||||||||||||||
| NET UNREALIZED | GROSS UNREALIZED | ||||||||
| TAX BASIS COST | APPRECIATION (DEPRECIATION) | Appreciation | Depreciation | ||||||
| Royce Global Financial Services Fund | $49,161,415 | $8,082,808 | $10,656,507 | $2,573,699 | |||||
| Royce European Small-Cap Fund | 21,987,099 | 639,313 | 2,293,870 | 1,654,557 | |||||
| Royce Global Value Fund | 68,468,687 | 1,470,924 | 6,458,923 | 4,987,999 | |||||
| Royce International Small-Cap Fund | 30,009,309 | 1,511,790 | 3,203,889 | 1,692,099 | |||||
| Royce International Micro-Cap Fund | 6,532,553 | 190,491 | 819,242 | 628,751 | |||||
| Royce International Premier Fund | 7,883,847 | 1,121,631 | 1,400,791 | 279,160 | |||||
The primary difference between book and tax basis cost is the timing of the recognition of losses on securities sold.
| The Royce Funds 2015 Semiannual Report to Shareholders | 43 |
Understanding Your Fund’s Expenses (unaudited)
| ACTUAL | HYPOTHETICAL (5% PER YEAR RETURN BEFORE EXPENSES) | ||||||||||||||||||||||||||||
| Beginning Account Value 1/1/15 | Ending Account Value 6/30/15 | Expenses Paid During the Period1 | Beginning Account Value 1/1/15 | Ending Account Value 6/30/15 | Expenses Paid During the Period1 | Annualized Expense Ratio2 | |||||||||||||||||||||||
| Investment Class Royce European Small-Cap Fund | $ | 1,000.00 | $ | 1,116.42 | $ | 7.56 | $ | 1,000.00 | $ | 1,017.65 | $ | 7.20 | 1.44% | ||||||||||||||||
| Royce Global Value Fund | 1,000.00 | 1,077.11 | 7.42 | 1,000.00 | 1,017.65 | 7.20 | 1.44% | ||||||||||||||||||||||
| Royce International Small-Cap Fund | 1,000.00 | 1,045.51 | 7.30 | 1,000.00 | 1,017.65 | 7.20 | 1.44% | ||||||||||||||||||||||
| Royce International Premier Fund | 1,000.00 | 1,137.77 | 7.63 | 1,000.00 | 1,017.65 | 7.20 | 1.44% | ||||||||||||||||||||||
| Service Class Royce Global Financial Services Fund | 1,000.00 | 1,072.20 | 7.66 | 1,000.00 | 1,017.41 | 7.45 | 1.49% | ||||||||||||||||||||||
| Royce European Small-Cap Fund | 1,000.00 | 1,115.20 | 8.86 | 1,000.00 | 1,016.41 | 8.45 | 1.69% | ||||||||||||||||||||||
| Royce Global Value Fund | 1,000.00 | 1,076.68 | 8.70 | 1,000.00 | 1,016.41 | 8.45 | 1.69% | ||||||||||||||||||||||
| Royce International Small-Cap Fund | 1,000.00 | 1,044.90 | 8.57 | 1,000.00 | 1,016.41 | 8.45 | 1.69% | ||||||||||||||||||||||
| Royce International Micro-Cap Fund | 1,000.00 | 1,074.53 | 8.69 | 1,000.00 | 1,016.41 | 8.45 | 1.69% | ||||||||||||||||||||||
| Royce International Premier Fund | 1,000.00 | 1,137.16 | 8.96 | 1,000.00 | 1,016.41 | 8.45 | 1.69% | ||||||||||||||||||||||
| Consultant Class Royce Global Value Fund | 1,000.00 | 1,071.88 | 12.53 | 1,000.00 | 1,012.69 | 12.18 | 2.44% | ||||||||||||||||||||||
| Institutional Class Royce International Small-Cap Fund | 1,000.00 | 1,045.57 | 7.30 | 1,000.00 | 1,017.65 | 7.20 | 1.44% | ||||||||||||||||||||||
| R Class Royce Global Value Fund | 1,000.00 | 1,074.19 | 10.23 | 1,000.00 | 1,014.93 | 9.94 | 1.99% | ||||||||||||||||||||||
| K Class Royce Global Value Fund | 1,000.00 | 1,076.34 | 8.96 | 1,000.00 | 1,016.17 | 8.70 | 1.74% | ||||||||||||||||||||||
| 44 | The Royce Funds 2015 Semiannual Report to Shareholders |
Trustees and Officers
All Trustees and Officers may be reached c/o The Royce Funds, 745 Fifth Avenue, New York, NY 10151
Charles M. Royce, Trustee1
Age: 75 | Number of Funds Overseen: 27 | Tenure: Since 1982
Non-Royce Directorships: Director of TICC Capital Corp.
Principal Occupation(s) During Past Five Years: Chief Executive Officer and a Member of the Board of Managers of Royce & Associates, LLC (“Royce”), the Trust’s investment adviser.
Christopher D. Clark, Trustee1, President
Age: 50 | Number of Funds Overseen: 27 | Tenure: Since 2014
Principal Occupation(s) During Past Five Years: President (since July 2014), Co-Chief Investment Officer (since January 2014), Managing Director and, since June 2015, a Member of the Board of Managers of Royce having been employed by Royce since May 2007.
Patricia W. Chadwick, Trustee
Age: 66 | Number of Funds Overseen: 27 | Tenure: Since 2009
Non-Royce Directorships: Trustee of ING Mutual Funds and Director of Wisconsin Energy Corp.
Principal Occupation(s) During Past 5 Years: Consultant and President of Ravengate Partners LLC (since 2000).
Richard M. Galkin, Trustee
Age: 77 | Number of Funds Overseen: 27 | Tenure: Since 1982
Non-Royce Directorships: None
Principal Occupation(s) During Past Five Years: Private investor. Mr. Galkin’s prior business experience includes having served as President of Richard M. Galkin Associates, Inc., telecommunications consultants, President of Manhattan Cable Television (a subsidiary of Time, Inc.), President of Haverhills Inc. (another Time, Inc. subsidiary), President of Rhode Island Cable Television, and Senior Vice President of Satellite Television Corp. (a subsidiary of Comsat).
Stephen L. Isaacs, Trustee
Age: 75 | Number of Funds Overseen: 27 | Tenure: Since 1989
Non-Royce Directorships: None
Principal Occupation(s) During Past Five Years: Attorney and President of Health Policy Associates, Inc., consultants. Mr. Isaacs’s prior business experience includes having served as President of the Center for Health and Social Policy (from 1996 to 2012); Director of Columbia University Development Law and Policy Program and Professor at Columbia University (until August 1996).
Arthur S. Mehlman, Trustee
Age: 73 | Number of Funds Overseen: 45 | Tenure: Since 2004
Non-Royce Directorships: Director/Trustee of registered investment companies constituting the 18 Legg Mason Funds.
Principal Occupation(s) During Past Five Years: Director of The League for People with Disabilities, Inc.; Director of University of Maryland Foundation (non-profits). Formerly: Director of Municipal Mortgage & Equity, LLC (from October 2004 to April 1, 2011); Director of University of Maryland College Park Foundation (non-profit) (from 1998 to 2005); Partner, KPMG LLP (international accounting firm) (from 1972 to 2002); Director of Maryland Business Roundtable for Education (from July 1984 to June 2002).
David L. Meister, Trustee
Age: 75 | Number of Funds Overseen: 27 | Tenure: Since 1982
Non-Royce Directorships: None
Principal Occupation(s) During Past Five Years: Consultant. Chairman and Chief Executive Officer of The Tennis Channel (from June 2000 to March 2005). Mr. Meister’s prior business experience includes having served as Chief Executive Officer of Seniorlife.com, a consultant to the communications industry, President of Financial News Network, Senior Vice President of HBO, President of Time-Life Films, and Head of Broadcasting for Major League Baseball.
G. Peter O’Brien, Trustee
Age: 69 | Number of Funds Overseen: 45 | Tenure: Since 2001
Non-Royce Directorships: Director/Trustee of registered investment companies constituting the 18 Legg Mason Funds; Director of TICC Capital Corp.
Principal Occupation(s) During Past Five Years: Trustee Emeritus of Colgate University (since 2005); Board Member of Hill House, Inc. (since 1999); Formerly: Trustee of Colgate University (from 1996 to 2005), President of Hill House, Inc. (from 2001 to 2005) and Managing Director/Equity Capital Markets Group of Merrill Lynch & Co. (from 1971 to 1999).
Michael K. Shields, Trustee
Age: 57 | Number of Funds Overseen: 27 | Tenure: Since 2015
Principal Occupation(s) During Past Five Years: President and Chief Executive Officer of Piedmont Trust Company, a private North Carolina trust company (since May 2012). Mr. Shields’s prior business experience includes owning Shields Advisors, an investment consulting firm (from April 2010 to June 2012).
Francis D. Gannon, Vice President
Age: 47 | Tenure: Since 2014
Principal Occupation(s) During Past Five Years: Co-Chief Investment Officer (since January 2014) and Managing Director of Royce, having been employed by Royce since September 2006.
Daniel A. O’Byrne, Vice President
Age: 53 | Tenure: Since 1994
Principal Occupation(s) During Past Five Years: Principal and Vice President of Royce, having been employed by Royce since October 1986.
Peter K. Hoglund, Treasurer
Age: 49 | Tenure: Since 2015
Principal Occupation(s) During Past Five Years: Principal, Chief Financial Officer, and Chief Administrative Officer of Royce, having been employed by Royce since December 2014. Prior to joining Royce, Mr. Hoglund spent more than 20 years with Munder Capital Management in Birmingham, MI, serving as Managing Director and Chief Financial Officer and overseeing all financial aspects of the firm. He began his career at Munder as a portfolio manager.
John E. Denneen, Secretary and Chief Legal Officer
Age: 48 | Tenure: 1996-2001 and Since 2002
Principal Occupation(s) During Past Five Years: General Counsel and, since June 2015, a Member of the Board of Managers of Royce; Chief Legal and Compliance Officer and Secretary of Royce; Secretary and Chief Legal Officer of The Royce Funds.
Lisa Curcio, Chief Compliance Officer
Age: 55 | Tenure: Since 2004
Principal Occupation(s) During Past Five Years: Chief Compliance Officer of The Royce Funds (since October 2004) and Compliance Officer of Royce (since June 2004).
The Royce Funds 2015 Semiannual Report to Shareholders | 45
Board Approval of Investment Advisory Agreements
At meetings held on June 3-4, 2015, the Board of Trustees of The Royce Fund (the “Board”), including all of the non-interested trustees, approved the continuance of the Investment Advisory Agreements between Royce & Associates, LLC (“R&A”) and The Royce Fund (“TRF”) relating to each of Royce Global Financial Services Fund (formerly Royce Financial Services Fund), Royce Global Value Fund, Royce European Small-Cap Fund (formerly Royce European Smaller-Companies Fund), Royce International Small-Cap Fund (formerly Royce International Smaller-Companies Fund), Royce International Micro-Cap Fund, and Royce International Premier Fund (each, a “Fund” and collectively, the “Funds”). In reaching these decisions, the Board reviewed, among other things, information prepared internally by R&A and independently by Morningstar Associates, LLC (“Morningstar”) containing detailed expense ratio and investment performance comparisons for each Fund with other mutual funds in its “peer group” and “category”, information regarding the past performance of the Funds and other registered investment companies managed by R&A and a memorandum outlining the legal duties of the Board prepared by independent counsel to the non-interested trustees. R&A also provided the trustees with an analysis of its profitability with respect to providing investment advisory services to each Fund. In addition, the Board took into account information furnished throughout the year at regular Board meetings, including reports on investment performance, shareholder services, distribution fees and expenses, regulatory compliance, brokerage commissions and research, brokerage and other execution products and services provided to the Funds. The Board also considered other matters it deemed important to the approval process, such as allocation of Fund brokerage commissions, “soft dollar” research services R&A receives, payments made to affiliates of R&A, as well as payments made by R&A relating to distribution of Fund shares and other direct and indirect benefits to R&A and its affiliates from their relationship with the Funds. The trustees also met throughout the year with investment advisory personnel from R&A. The Board, in its deliberations, recognized that, for many of the Funds’ shareholders, the decision to purchase Fund shares included a decision to select R&A as the investment adviser and that there was a strong association in the minds of Fund shareholders between R&A and each of the Funds. In considering factors relating to the approval of the continuance of the Investment Advisory Agreements, the non-interested trustees received assistance and advice from, and met separately with, their independent counsel. While the Investment Advisory Agreements for the Funds were considered at the same Board meeting, the trustees dealt with each agreement separately. Among other factors, the trustees considered the following:
The nature, extent and quality of services provided by R&A: The Board considered the following factors to be of fundamental importance to its consideration of whether to approve the continuance of the Funds’ Investment Advisory Agreements: (i) R&A’s more than 40 years of value investing experience and track record; (ii) the history of long-tenured R&A portfolio managers managing many of the Funds; (iii) R&A’s focus on mid-cap, small-cap and micro-cap value investing; (iv) the consistency of R&A’s approach to managing open-end mutual funds and closed-end funds over more than 40 years; (v) the integrity and high ethical standards adhered to at R&A; (vi) R&A’s specialized experience in the area of trading small- and micro-cap securities; (vii) R&A’s historical ability to attract and retain portfolio management talent; and (viii) R&A’s focus on shareholder interests as exemplified by capping expenses on smaller funds, closing funds to new investors when R&A believed such closings were in the best interests of existing shareholders, establishing breakpoints for a number of funds and providing expansive shareholder reporting and communications. The trustees reviewed the services that R&A provides to each Fund, including, but not limited to, managing each Fund’s investments in accordance with the stated policies of each Fund. The Board considered the fact that R&A provided certain administrative services to the Funds at cost pursuant to the Administration Agreement between TRF and R&A which went into effect on January 1, 2008. The Board determined that the services to be provided to the Funds by R&A would be the same as those that it previously provided to the Funds. The Board also took into consideration the histories, reputations and backgrounds of R&A’s portfolio managers for the Funds, finding that these would likely have an impact on the continued success of the Funds. Lastly, the trustees noted R&A’s ability to attract and retain qualified and experienced personnel. The trustees concluded that the investment advisory services provided by R&A to each Fund compared favorably to services provided by R&A to other R&A client accounts, including other funds, in both nature and quality, and that the scope of services provided by R&A would continue to be suitable for each Fund.
Investment performance of the Funds and R&A: In light of R&A’s risk-averse approach to investing, the trustees believe that risk-adjusted performance continues to be the most appropriate measure of each Fund’s investment performance. One measure of risk-adjusted performance the trustees have historically used in their review of each Fund’s performance is the Sharpe Ratio. The Sharpe Ratio is a risk-adjusted measure of performance developed by Nobel Laureate William Sharpe. It is calculated by dividing a Fund’s annualized excess returns by its annualized standard deviation to determine reward per unit of risk. The higher the Sharpe Ratio, the better a Fund’s historical risk-adjusted performance. The Board attaches primary importance to risk-adjusted performance over relatively long periods of time, typically 3 to 10 years.
Overall, although the Funds generally achieved strong absolute performance during the 3-year and 5-year periods ended December 31, 2014, the Board noted that the Funds also generally underperformed their peers, as evidenced by their respective Sharpe Ratios, during those periods. The trustees noted that, as explained by R&A, the extraordinary monetary stimulus programs implemented by the Federal Reserve in the aftermath of the 2008 financial crisis (e.g., near zero interest rate policy, quantitative easing, “Operation Twist”, etc.) have produced significant relative performance headwinds for R&A’s value approach. These relative performance headwinds include: (i) small-cap equity returns well above historical averages; (ii) low equity market volatility; and (iii) historically low costs of capital for corporate issuers. As a result, companies with little-to-no earnings, high leverage, and high income yields generally have been the market leaders during the relevant 3-year and 5-year periods, not the higher quality companies generally favored by R&A (i.e., those with solid balance sheets, low leverage, the ability to generate and effectively allocate free cash flow, and strong returns on invested capital). The Board also noted that the relative performance for certain open-end funds advised by R&A for the 10-year period ended December 31, 2014, which includes a portion of the more historically customary market cycle that preceded the 2008 financial crisis, was quite strong.
These trends manifested themselves for Royce Global Financial Services Fund (“RFS”). The Sharpe Ratio for RFS ranked in the top quartile within its Morningstar category for the 10-year period ended December 31, 2014. RFS’s relative performance for the 3-year and 5-year periods ended December 31, 2014 was not, however, quite as strong (3rd quartile and 2nd quartile, respectively). Those Funds with more than 5 years but less than 10 years of performance exhibited similar relative performance patterns. Royce International Small-Cap Fund (“RIS”) has struggled in recent periods due, in part, to its overweighting of emerging market equities. This resulted in a 4th quartile Sharpe Ratio within the Foreign Small/Mid Blend Morningstar category for the 3-year and 5-year periods ended December 31, 2014. The Sharpe Ratio for Royce Global Value Fund (“RGV”) also fell in the 4th quartile within the World Stock category assigned by Morningstar for the 3-year and 5-year periods ended December 31, 2014. Similarly, the Sharpe Ratio for Royce European Small-Cap Fund (“RES”) placed in the 4th and 3rd quartiles within the Europe Stock Morningstar category for the 3-year and 5-year periods, respectively, ended December 31, 2014.
46 | The Royce Funds 2015 Semiannual Report to Shareholders
Board Approval of Investment Advisory Agreements (continued)
Although Royce International Micro-Cap Fund (“RMI”) and Royce International Premier Fund (“RIP”) are among the newer open-end funds managed by R&A, the Board noted that these funds now have more than 3 years of performance. R&A’s general process of investing net inflows over longer periods of time led to larger cash positions and market lagging performance for most of these newer funds in their initial periods of operation. The Board noted that RIP ranked in the 3rd quartile and RMI placed in the 4th quartile within their respective Morningstar categories on the basis of their Sharpe Ratios for the 3-year period ended December 31, 2014.
The Board also noted that the peer groups included in the Morningstar materials for a number of Funds may not be appropriate for performance comparisons and that R&A had augmented the Morningstar data provided to the Board throughout the years by including performance information for other funds that R&A believes are comparable to those Funds.
In addition to the risk–adjusted performance of each Fund, the Board also reviewed and considered the absolute total returns for each Fund, down market performance and, for RFS, long-term performance records over periods of 10 years or longer. The Board also considered it important to look beyond the current snapshot of performance as of December 31, 2014 and therefore examined extended performance histories for each Fund using monthly rolling average return periods through March 31, 2015.
The Board noted that R&A manages a number of funds that invest in micro-cap, small-cap, and mid-cap issuers, many of which had outperformed their benchmark indices and their competitors during preceding periods. Although the Board recognized that past performance is not necessarily an indicator of future results, it found that R&A had the necessary qualifications, experience and track record in managing equity mutual funds to manage each Fund. The Board determined that R&A continued to be an appropriate investment adviser for each Fund and concluded that each Fund’s performance supported the continuation of its Investment Advisory Agreement.
Cost of the services provided and profits realized by R&A from its relationship with each Fund: The Board considered the cost of the services provided by R&A and the profits realized by R&A from its relationship with each Fund. As part of the analysis, the Board discussed with R&A its methodology in allocating its costs to each Fund and concluded that its allocations were reasonable. The Board concluded that R&A’s profits were reasonable in relation to the nature and quality of services provided.
The extent to which economies of scale would be realized as the Funds grow and whether fee levels would reflect such economies of scale: The Board considered whether there have been economies of scale in respect of the management of each Fund, whether each Fund has appropriately benefited from any economies of scale and whether there is potential for realization of any further economies of scale. The Board noted the time and effort involved in managing portfolios of small- and micro-cap stocks and that they did not involve the same efficiencies as do portfolios of large-cap stocks. The Board noted that in 2004 breakpoints were added to the investment advisory fee for RFS and that the investment advisory fees for all of the remaining Funds included breakpoints since their respective inceptions. The Board also noted the new proposed lower fee schedule with breakpoints for RES, RGV, RIS, RMI, and RIP. The Board concluded that the current fee structure for RFS, and the new proposed fee structure for RES, RGV, RIS, RMI, and RIP, were reasonable and that shareholders sufficiently participated in economies of scale.
Comparison of services to be rendered and fees to be paid to those under other investment advisory contracts, such as contracts of the same and other investment advisers or other clients: The Board reviewed the investment advisory fee paid by each Fund and compared both the services to be rendered and the fees to be paid under the Investment Advisory Agreements to other contracts of R&A and to contracts of other investment advisers to registered investment companies investing in micro-, small-, and mid-cap stocks, as provided by Morningstar. The Board noted the importance of the net expense ratio in measuring a fund’s efficiency, particularly in light of the variations in the mutual fund industry as to which entity is responsible for particular types of expenses.
Although the net expense ratio for RFS ranked within the 4th quintile among its Morningstar peers, the Board noted that RFS had a relatively small peer group and that its net expense ratio of 1.40% was only 5 basis points higher than its peer median. The Board noted that the remaining Funds had 5th quintile net expense ratios. With respect to those, the Board noted that the net expense ratios of RES and RGV were 31 basis points higher than their peer group medians while those of RIS, RMI, and RIP were 10, 20, and 10 basis points, respectively, higher than their peer group medians. The Board took into account that a significant majority of RES’s and RGV’s peers are identified as large-cap funds by Morningstar, while RIS, RMI, and RIP had lower weighted average market capitalizations than a substantial majority of their peers. After taking into consideration that the level of work necessary to invest in micro- and small-cap international securities is significantly greater than that necessary to invest in larger-cap securities, the Board noted that the basis point differentials in investment advisory fees, which give rise to the generally higher net expense ratios, were appropriate for these Funds. The Board also noted the new proposed lower contractual fee structures for RES, RGV, RIS, RMI, and RIP.
The Board also noted that R&A manages the Funds in an active fashion. The industry accepted metric for measuring how actively an equity portfolio is managed is called “active share.” In particular, active share measures how much the holdings of an equity portfolio differ from the holdings of its appropriate passive benchmark index. At the extremes, a portfolio with no holdings in common with the benchmark would have 100% active share, while a portfolio that is identical to the benchmark would have 0% active share. R&A presented a chart to the Board which demonstrated that mutual funds with high active share scores had higher expense ratios than mutual funds with lower active share scores due to the resources required for the active management of those funds.
The Board further noted that R&A has waived investment advisory fees for numerous Funds in order to maintain expense ratios at competitive levels and acknowledged R&A’s intention to continue this expense limitation practice. The Board also considered fees charged by R&A to institutional and other clients and noted that, given the greater levels of services that R&A provides to registered investment companies such as the Funds as compared to other accounts, each Fund’s advisory fees compared favorably to these other accounts.
It was noted that no single factor was cited as determinative to the decision of the trustees. Rather, after weighing all of the considerations and conclusions discussed above, the entire Board, including all of the non-interested trustees, determined to approve: (i) the continuance of the existing Investment Advisory Agreement for RFS, concluding that a contract continuation on the existing terms for RFS was in the best interest of its shareholders and that the investment advisory fee rate for RFS was reasonable in relation to the services provided, and (ii) the amended Investment Advisory Agreement with the reduced fee schedule for each of RES, RGV, RIS, RMI, and RIP, concluding that a contract continuation on the amended terms for RES, RGV, RIS, RMI, and RIP was in the best interest of the shareholders of each such Fund and that each investment advisory fee rate was reasonable in relation to the services provided.
The Royce Funds 2015 Semiannual Report to Shareholders | 47
Notes to Performance and Other Important Information
The thoughts expressed in this report concerning recent market movements and future prospects for small company stocks are solely the opinion of Royce at June 30, 2015, and, of course, historical market trends are not necessarily indicative of future market movements. Statements regarding the future prospects for particular securities held in the Funds’ portfolios and Royce’s investment intentions with respect to those securities reflect Royce’s opinions as of June 30, 2015 and are subject to change at any time without notice. There can be no assurance that securities mentioned in this report will be included in any Royce-managed portfolio in the future.
Sector weightings are determined using the Global Industry Classification Standard (“GICS”). GICS was developed by, and is the exclusive property of, Standard & Poor’s Financial Services LLC (“S&P”) and MSCI Inc. (“MSCI”). GICS is the trademark of S&P and MSCI. “Global Industry Classification Standard (GICS)” and “GICS Direct” are service marks of S&P and MSCI.
All indexes referred to are unmanaged and capitalization weighted. Each index’s returns include net reinvested dividends and/or interest income. Russell Investment Group is the source and owner of the trademarks, service marks, and copyrights related to the Russell Indexes. Russell(R) is a trademark of Russell Investment Group. The Russell 2000 is an index of domestic small-cap stocks. It measures the performance of the 2,000 smallest publicly traded U.S. companies in the Russell 3000 Index. The Russell 1000 Index is an index of domestic large-cap stocks. It measures the performance of the 1,000 largest publicly traded U.S. companies in the Russell 3000 Index. The Russell Microcap Index includes 1,000 of the smallest securities in the Russell 2000 Index, along with the next smallest eligible securities as determined by Russell. The Russell 2500 is an index of domestic small- to mid-cap stocks. It includes approximately 2,500 of the smallest securities in the Russell 3000 Index. The returns for the Russell 2500—Financial Services Sector represent those of the financial services companies within the Russell 2500 Index. The Russell Midcap Index measures the performance of the mid-cap segment of the U.S. equity universe. It includes approximately 800 of the smallest securities in the Russell 1000 Index. The Russell Global Small Cap Index is an index of global small-cap stocks. The Russell Global ex-U.S. Large Cap Index is an index of global large-cap stocks, excluding the United States. The Russell Global ex-U.S. Small Cap Index is an index of global small-cap stocks, excluding the United States. The Russell Europe Small Cap Index is an index of European small-cap stocks. The S&P 500 is an index of U.S. large-cap stocks, selected by Standard & Poor’s based on market size, liquidity, and industry grouping, among other factors. The Nasdaq Composite is an index of the more than 3,000 common equities listed on the Nasdaq stock exchange. The performance of an index does not represent exactly any particular investment, as you cannot invest directly in an index. Returns for the market indexes used in this report were based on information supplied to Royce by Russell Investments. Royce has not independently verified the above described information.
The Price-Earnings, or P/E, Ratio is calculated by dividing a company’s share price by its trailing 12-month earnings-per share (EPS). The Price-to-Book, or P/B, Ratio is calculated by dividing a company’s share price by its book value per share. The Morningstar Style Map uses proprietary scores of a stock’s value and growth characteristics to determine its placement in one of the five categories listed on the horizontal axis. These characteristics are then compared to those of other stocks within the same market capitalization band. Each is scored from zero to 100 for both value and growth attributes. The value score is subtracted from the growth score to determine the overall style score. For the vertical, market cap axis, Morningstar subdivides into size groups. Giant-cap stocks are defined as those that account for the top 40% of the capitalization of each style zone; large-cap stocks represent the next 30%; mid-cap stocks the next 20%; small-cap stocks the next 7%; micro-cap stocks the smallest 3%.
Investments in securities of micro-cap, small-cap, and/or mid-cap companies may involve considerably more risk than investments in securities of larger-cap companies. (Please see “Primary Risks for Fund Investors” in the prospectus.) Investments in foreign securities, which generally may involve political, economic, currency and other risks not encountered in U.S. investments. (Please see “Investing in Foreign Securities” in the prospectus.) A Fund that invests a significant portion of its assets in a limited number of stocks may be subject to considerably more risk than a more broadly diversified Fund because a decline in the value of any of these stocks would cause that Fund’s overall value to decline to a greater degree. A broadly diversified portfolio does not, however, ensure a profit for a Fund or guarantee against loss. Please read the prospectus carefully before investing or sending money. A copy of the Funds’ current prospectus and Statement of Additional Information may be obtained by calling (800) 221-4268, or by visiting www.roycefunds.com. All publicly released material Fund information is disclosed by the Funds on their website at www.roycefunds.com. The Royce Funds is a service mark of The Royce Funds. Distributor: Royce Fund Services, Inc.
This material contains forward-looking statements within the meaning of the Securities Exchange Act of 1934, as amended (the “Exchange Act”), that involve risks and uncertainties, including, among others, statements as to:
| • | the Funds’ future operating results, |
| • | the prospects of the Funds’ portfolio companies, |
| • | the impact of investments that the Funds have made or may make, |
| • | the dependence of the Funds’ future success on the general economy and its impact on the companies and industries in which the Funds invest, and |
| • | the ability of the Funds’ portfolio companies to achieve their objectives. |
This review and report use words such as “anticipates,” “believes,” “expects,” “future,” “intends,” and similar expressions to identify forward-looking statements. Actual results may differ materially from those projected in the forward-looking statements for any reason.
The Royce Funds have based the forward-looking statements included in this review and report on information available to us on the date of the report, and we assume no obligation to update any such forward-looking statements. Although The Royce Funds undertake no obligation to revise or update any forward-looking statements, whether as a result of new information, future events or otherwise, you are advised to consult any additional disclosures that we may make through future shareholder communications or reports.
Proxy Voting
A copy of the policies and procedures that The Royce Funds use to determine how to vote proxies relating to portfolio securities and information regarding how each of The Royce Funds voted proxies relating to portfolio securities during the most recent 12-month period ended June 30 is available, without charge, on The Royce Funds’ website at www.roycefunds.com, by calling (800) 221-4268 (toll-free) and on the website of the Securities and Exchange Commission (“SEC”), at www.sec.gov.
Form N-Q Filing
The Funds file their complete schedules of investments with the SEC for the first and third quarters of each fiscal year on Form N-Q. The Funds’ Forms N-Q are available on the SEC’s website at www.sec.gov. The Royce Funds’ holdings are also on the Funds’ website approximately 15 to 20 days after each calendar quarter end and remain available until the next quarter’s holdings are posted. The Funds’ Forms N-Q may also be reviewed and copied at the SEC’s Public Reference Room in Washington, D.C. To find out more about this public service, call the SEC at (202) 942-8090. The Funds’ complete schedules of investments are updated quarterly, and are available at www.roycefunds.com.
48 | The Royce Funds 2015 Semiannual Report to Shareholders

| This page is not part of the 2015 Semiannual Report to Shareholders |
| ||||
| About The Royce Funds | Contact Us | |||
Wealth of Experience With approximately $27 billion in total assets under management, Royce & Associates is committed to the same investment principles that have served us well for more than 40 years. Chuck Royce, our Chief Executive Officer, enjoys one of the longest tenures of any active mutual fund manager. Royce’s investment staff also includes 23 portfolio managers and analysts and eight traders. Multiple Funds, Common Focus Our goal is to offer both individual and institutional investors the best available micro-cap, small-cap, and/or mid-cap portfolios. We have chosen to concentrate on smaller-company investing by providing investors with a range of funds that take full advantage of this large and diverse sector. Consistent Discipline Our approach emphasizes paying close attention to risk and maintaining the same discipline, regardless of market movements and trends. The price we pay for a security must be below our appraisal of its current worth. This requires a thorough analysis of the financial and business dynamics of an enterprise, as though we were purchasing the entire company. Co-Ownership of Funds It is important that our employees and shareholders share a common financial goal. Our officers, employees, and their families currently have more than $127 million invested in The Royce Funds and are often among the largest individual shareholders. | GENERAL INFORMATION General Royce Funds information including: • How to open an account • An overview of our firm and Funds • Ordering literature including Prospectuses (800) 221-4268 | |||
ACCOUNT INFORMATION Speak with a representative about: • Your account, transactions, and forms (800) 841-1180 | ||||
| FINANCIAL ADVISORS, CONSULTANTS, AND INSTITUTIONS Speak with your regional Royce contact regarding: • Scheduling a meeting or call • Information about our firm, strategies, and funds • Resources for financial professionals, such as portfolio attribution reports (800) 337-6923 | ||||
| AUTOMATED ACCOUNT INFORMATION 24-hour Automated Telephone Service (800) 878-6923 | ||||
| | | ||
Item 2. Code(s) of Ethics. Not applicable to this semi-annual report.
Item 3. Audit Committee Financial Expert. Not applicable to this semi-annual report.
Item 4. Principal Accountant Fees and Services. Not applicable to this semi-annual report.
Item 5. Audit Committee of Listed Registrants. Not Applicable.
Item 6. Investments.
(a) See Item 1.
(b) Not Applicable
Item 7. Disclosure of Proxy Voting Policies and Procedures for Closed-End Management Investment Companies. Not Applicable.
Item 8. Portfolio Managers of Closed-End Management Investment Companies. Not Applicable.
Item 9. Purchases of Equity Securities by Closed-End Management Investment Company and Affiliated Purchasers. Not Applicable
Item 10. Submission of Matters to a Vote of Security Holders. Not Applicable.
Item 11. Controls and Procedures.
(a) Disclosure Controls and Procedures. The Principal Executive and Financial Officers concluded that the Registrant’s Disclosure Controls and Procedures are effective based on their evaluation of the Disclosure Controls and Procedures as of a date within 90 days of the filing date of this report.
(b) Internal Control over Financial Reporting. There were no significant changes in Registrant’s internal control over financial reporting or in other factors that could significantly affect this control subsequent to the date of the evaluation, including any corrective actions with regard to significant deficiencies and material weaknesses during the second fiscal quarter of the period covered by this report.
Item 12. Exhibits. Attached hereto.
(a)(1) Not applicable to this semi-annual report.
(a)(2) Separate certifications by the Registrant’s Principal Executive Officer and Principal Financial Officer as required by Rule 30a-2(a) under the Investment Company Act of 1940.
(a)(3) Not Applicable
(b) Separate certifications by the Registrant’s Principal Executive Officer and Principal Financial Officer, pursuant to Section 906 of the Sarbanes-Oxley Act of 2002 and required by Rule 30a-2(b) under the Investment Company Act of 1940.
Pursuant to the requirements of the Securities Exchange Act of 1934 and the Investment Company Act of 1940, the registrant has duly caused this report to be signed on its behalf by the undersigned, thereunto duly authorized.
THE ROYCE FUND
| BY: | /s/ Christopher D. Clark |
| Christopher D. Clark | |
| President |
Date: August 28, 2015
Pursuant to the requirements of the Securities Exchange Act of 1934 and the Investment Company Act of 1940, this report has been signed below by the following persons on behalf of the registrant and in the capacities and on the dates indicated.
| THE ROYCE FUND | THE ROYCE FUND | |||
| BY: | /s/ Christopher D. Clark | BY: | /s/ Peter K. Hoglund | |
| Christopher D. Clark | Peter K. Hoglund | |||
| President | Chief Financial Officer | |||
| Date: August 28, 2015 | Date: August 28, 2015 | |||