| UNITED STATES |
| SECURITIES AND EXCHANGE COMMISSION |
| Washington, D.C. 20549 |
| FORM N-CSR |
| CERTIFIED SHAREHOLDER REPORT |
| OF |
| REGISTERED MANAGEMENT INVESTMENT COMPANIES |
| Investment Company Act File Number: 811-03599 |
| Name of Registrant: The Royce Fund |
| Address of Registrant: 745 Fifth Avenue |
| New York, NY 10151 |
| Name and address of agent for service: | John E. Denneen, Esq. | |||
| 745 Fifth Avenue | ||||
| New York, NY 10151 |
| Registrant’s telephone number, including area code: (212) 508-4500 |
| Date of fiscal year end: December 31, 2012 |
| Date of reporting period: January 1, 2013 – June 30, 2013 |
Item 1. Reports to Shareholders.
|

SEMIANNUAL
REVIEW AND REPORT
TO SHAREHOLDERS
SMALL-CAP DIVERSIFIED Royce Pennsylvania Mutual Fund Royce Low-Priced Stock Fund Royce Heritage Fund Royce Value Plus Fund FOCUSED Royce Premier Fund Royce Special Equity Fund Royce Value Fund Royce 100 Fund TOTAL RETURN Royce Total Return Fund Royce Dividend Value Fund MICRO-CAP Royce Micro-Cap Fund Royce Opportunity Fund GLOBAL/INTERNATIONAL Royce Global Value Fund Royce International Smaller-Companies Fund | ||
www.roycefunds.com |  | |
| A Fresh Experience at RoyceFunds.com |
| Welcome to the new RoyceFunds.com! We’ve redesigned the site in order to give you a simpler, more efficient, and user-friendly online experience that’s been optimized for compatibility with any device. |
 | ||
 | ||
 | ||||
 |  | |||
 | ||
 | ||
| ACCESS ALL IN ONE PLACE |
| Fund pages have been enhanced to bring you all the information you need on your investments without leaving the page. | |
| LEARN ABOUT PORTFOLIO MANAGERS |
| Interactive and colorful, our People pages provide professional bios as well as videos, funds managed, commentaries, and news from your favorite Royce managers. | |
| MAKE THE SITE WORK FOR YOU |
| In addition to Shareholder Account Access, you can register for an account and log in to personalize your experience. With the My Funds feature, you’ll be able to organize and check in on your Funds at any time and on any device. | |
eDelivery Saves! Sign Up Now. eDelivery saves paper, time, and fund expenses.1 Sign up now to view statements, prospectuses, financial reports, and tax forms online. > www.roycefunds.com/edelivery 1 Any direct Royce Funds IRA investor who chooses eDelivery of prospectuses, financial reports, and RWord will be exempt from the $15 annual IRA maintenance fee. (We will continue to also waive the fee for investors with more than $20,000 invested in Royce IRAs at the time the fee is charged, and for new transfer and rollover accounts in their first year.) Stay Informed Follow us on Twitter, watch us on YouTube, subscribe to our RSS feed, and sign up for our monthly eWord newsletter to stay up to date on the latest from The Royce Funds.  www.twitter.com/roycefunds www.twitter.com/roycefunds www.youtube.com/roycefunds www.youtube.com/roycefunds www.roycefunds.com/eword www.roycefunds.com/eword |
| This page is not part of the 2013 Semiannual Report to Shareholders |
| Table of Contents | |
| Semiannual Review | |
| Royce Featured Fund Guide | 2 |
| Portfolio Characteristics | 4 |
| Performance and Expenses | 5 |
| Market Cycle and Risk Adjusted Performance | 6 |
| Letter to Our Shareholders | 7 |
| Fund Focus | 14 |
| 2013 In Quotes | 131 |
| Making Headlines | 132 |
| Postscript: Searching for Super Small-Cap Companies Through the Macro Noise | Inside Back Cover |
| Semiannual Report to Shareholders | 15 |
 | |
| This page is not part of the 2013 Semiannual Report to Shareholders | 1 |
| Royce Featured Fund Guide |
| Value-Oriented Small-Cap Offerings Tailored to Specific Investor Needs |
| INVESTMENT UNIVERSE BREAKDOWN1 |
|

The size and diversity of the small-company universe make it a unique and fertile area for investment. For 40 years, it has been our primary area of focus. Over that time, this universe has evolved into an established asset class used by a wide range of investors, including institutions, consultants, advisors, and individuals. Today, there are numerous small-cap and micro-cap indexes and ETFs. Importantly, the continuous regeneration of the asset class, through the entrance of new companies, spin-offs, and IPOs, makes it an evergreen source of investment opportunities. This is why we have elected to focus on the smaller-company universe and believe it is ideally suited for a variety of distinct offerings. Our Featured Funds offer broad exposure to this large and diverse universe. Market Cap The smaller company universe consists of more than 4,0001 publicly traded companies in the U.S. (and more than 21,7001 outside the U.S.). We break it down into two distinct market segments: micro-cap—companies with market caps up to $750 million—and small-cap—companies with market caps between $750 million and $2.5 billion. Sorting the universe into two markets is critical because, in our experience, each requires a portfolio approach based primarily on diversification needs. Our portfolio managers share a common investment approach, one that emphasizes paying attention to risk and buying what each thinks are strong businesses at discounted prices, but our portfolios also possess important differences that make each one unique. Each portfolio falls within the small-cap universe, in terms of constituent names. Portfolio Approach Our portfolio managers possess broad latitude within our investment universe, though in general they seek a combination of quality—measured by the balance sheet and returns on invested capital—and valuation. Portfolios that invest more heavily in micro-caps are, in general, more broadly diversified due to liquidity considerations; those that invest primarily in the upper end of the small-cap universe tend to be more focused. In addition, we seek to take advantage of pockets of opportunity, such as dividend-paying companies, low-priced companies, turnarounds, special situations, etc., within each universe. Broadly Diversified Portfolios  A broadly diversified portfolio at Royce is one that generally holds more than 100 securities and whose top positions generally do not exceed 2% of net assets. Focused Portfolios  A focused portfolio at Royce is one that either (i) generally invests in no more than 100 companies and whose top positions generally exceed 2% of net assets, or (ii) invests primarily in a single sector. |
| The Royce Funds invest primarily in micro-cap, small-cap, and/or mid-cap stocks, which may involve considerably more risk than investing in larger-cap stocks (please see “Primary Risks for Fund Investors” in the prospectus). Each Fund may invest a portion of its net assets in foreign securities, which may involve political, economic, currency, and other risks not encountered in U.S. investments (please see “Investing in Foreign Securities” in the prospectus). Distributor: Royce Fund Services, Inc. |
| 2 | This page is not part of the 2013 Semiannual Report to Shareholders |
| This guide is designed to help investors better understand both the different approaches and the common ground among our portfolios. Looking closely at our Featured Funds allows investors to see other important differences—in levels of volatility, sector orientation, and investment themes—within the context of our two key differentiators, namely, market cap and portfolio approach. We think that understanding these differences can inform asset allocation decisions, especially when investors incorporate more than one Royce offering within their portfolios. Listed below are our Funds arranged by average market cap. For a complete listing of our Funds and their attributes please visit our website at www.roycefunds.com. |
| Fund Tools Go online for more tools to help you better understand our Funds. Compare Funds > www.roycefunds.com/compare Prices & Performance > www.roycefunds.com/prices |
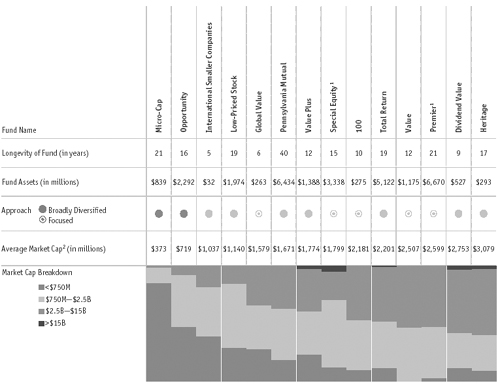 |
1 Only available to existing investors and relationships. |
2 Geometric Average. This weighted calculation uses each portfolio holding’s market cap in a way designed to not skew the effect of very large or small holdings; instead, it aims to better identify the portfolio’s center, which Royce believes offers a more accurate measure of average market cap than a simple mean or median. |
| This page is not part of the 2013 Semiannual Report to Shareholders | 3 |
| Portfolio Characteristics | Through June 30, 2013 |
| Longevity | Average | 2012 | % of | Five-Year | ||||||||||||||||||||||
| of Fund | Market | Number of | Turnover | Non-U.S. | Standard | |||||||||||||||||||||
| Fund | Portfolio Manager(s) | (in years) | Cap1 | Holdings | Rate | Securities | Deviation | |||||||||||||||||||
| SMALL-CAP | ||||||||||||||||||||||||||
| DIVERSIFIED | ||||||||||||||||||||||||||
| Royce Pennsylvania Mutual Fund | Chuck Royce | 40 | $1,671 | 578 | 22 | % | 7.6 | % | 23.51 | |||||||||||||||||
| Royce Low-Priced Stock Fund | Whitney George | 19 | 1,140 | 129 | 8 | 34.0 | 26.29 | |||||||||||||||||||
| Royce Heritage Fund | Chuck Royce, Jim Harvey, Steven McBoyle | 17 | 3,079 | 186 | 39 | 18.4 | 25.18 | |||||||||||||||||||
| Royce Value Plus Fund | Chip Skinner | 12 | 1,774 | 103 | 32 | 9.2 | 23.91 | |||||||||||||||||||
| FOCUSED | ||||||||||||||||||||||||||
| Royce Premier Fund | Chuck Royce, Whitney George | 21 | 2,599 | 78 | 7 | 11.1 | 22.32 | |||||||||||||||||||
| Royce Special Equity Fund | Charlie Dreifus | 15 | 1,799 | 48 | 31 | 0.0 | 17.60 | |||||||||||||||||||
| Royce Value Fund | Jay Kaplan | 12 | 2,507 | 53 | 25 | 6.8 | 24.60 | |||||||||||||||||||
| Royce 100 Fund | Chuck Royce, Lauren Romeo | 10 | 2,181 | 98 | 13 | 7.6 | 23.20 | |||||||||||||||||||
| TOTAL RETURN | ||||||||||||||||||||||||||
| Royce Total Return Fund | Chuck Royce, Jay Kaplan | 19 | 2,201 | 457 | 17 | 9.2 | 19.68 | |||||||||||||||||||
| Royce Dividend Value Fund | Chuck Royce, Jay Kaplan | 9 | 2,753 | 253 | 28 | 22.3 | 21.22 | |||||||||||||||||||
| MICRO-CAP | ||||||||||||||||||||||||||
| Royce Micro-Cap Fund | Jenifer Taylor | 21 | 373 | 194 | 15 | 14.6 | 23.87 | |||||||||||||||||||
| Royce Opportunity Fund | Buzz Zaino | 16 | 719 | 317 | 34 | 3.3 | 31.13 | |||||||||||||||||||
| GLOBAL/INTERNATIONAL | �� | |||||||||||||||||||||||||
| Royce Global Value Fund | Whitney George, David Nadel | 6 | 1,579 | 67 | 36 | 78.9 | 26.10 | |||||||||||||||||||
| Royce International Smaller-Companies Fund | Chuck Royce, David Nadel | 5 | 1,037 | 130 | 44 | 92.2 | 23.03 | |||||||||||||||||||
| 4 | This page is not part of the 2013 Semiannual Report to Shareholders |
| Performance and Expenses | Through June 30, 2013 |
| Average Annual Total Returns | ||||||||||||||||||||||||||||||||||
| Gross Annual | Net Annual | |||||||||||||||||||||||||||||||||
| 40-Year or Since | Inception | Operating | Operating | |||||||||||||||||||||||||||||||
| Fund | Year-to-Date1 | 1-Year | 5-Year | 10-Year | 20-Year | Inception | Date | Expenses | Expenses | |||||||||||||||||||||||||
| SMALL-CAP | ||||||||||||||||||||||||||||||||||
| DIVERSIFIED | ||||||||||||||||||||||||||||||||||
| Royce Pennsylvania Mutual Fund | 11.57 | % | 22.92 | % | 7.23 | % | 10.29 | % | 10.62 | % | 13.86 | % | n.a. | 0.90 | % | 0.90 | % | |||||||||||||||||
| Royce Low-Priced Stock Fund | -1.23 | 4.29 | 3.06 | 7.97 | n.a. | 11.20 | 12/15/93 | 1.58 | 1.50 | |||||||||||||||||||||||||
| Royce Heritage Fund | 9.41 | 22.15 | 9.64 | 10.73 | n.a. | 13.51 | 12/27/95 | 1.51 | 1.51 | |||||||||||||||||||||||||
| Royce Value Plus Fund | 12.36 | 22.27 | 4.75 | 10.91 | n.a. | 11.90 | 6/14/01 | 1.46 | 1.46 | |||||||||||||||||||||||||
| FOCUSED | ||||||||||||||||||||||||||||||||||
| Royce Premier Fund | 7.88 | 17.13 | 6.72 | 11.98 | 11.77 | 12.10 | 12/31/91 | 1.06 | 1.06 | |||||||||||||||||||||||||
| Royce Special Equity Fund | 12.40 | 22.34 | 11.67 | 9.85 | n.a. | 9.69 | 5/1/98 | 1.13 | 1.13 | |||||||||||||||||||||||||
| Royce Value Fund | 8.47 | 20.82 | 3.94 | 11.67 | n.a. | 10.76 | 6/14/01 | 1.45 | 1.45 | |||||||||||||||||||||||||
| Royce 100 Fund | 10.56 | 21.20 | 8.49 | 10.75 | n.a. | 10.75 | 6/30/03 | 1.48 | 1.48 | |||||||||||||||||||||||||
| TOTAL RETURN | ||||||||||||||||||||||||||||||||||
| Royce Total Return Fund | 12.85 | 23.94 | 7.67 | 9.05 | n.a. | 11.11 | 12/15/93 | 1.14 | 1.14 | |||||||||||||||||||||||||
| Royce Dividend Value Fund | 10.89 | 23.67 | 9.76 | n.a. | n.a. | 9.04 | 5/3/04 | 1.52 | 1.52 | |||||||||||||||||||||||||
| MICRO-CAP | ||||||||||||||||||||||||||||||||||
| Royce Micro-Cap Fund | 3.04 | 8.46 | 4.68 | 9.79 | 11.13 | 12.13 | 12/31/91 | 1.49 | 1.49 | |||||||||||||||||||||||||
| Royce Opportunity Fund | 18.49 | 30.58 | 10.90 | 11.52 | n.a. | 12.98 | 11/19/96 | 1.14 | 1.14 | |||||||||||||||||||||||||
| GLOBAL/INTERNATIONAL | ||||||||||||||||||||||||||||||||||
| Royce Global Value Fund | -4.78 | 6.18 | 1.34 | n.a. | n.a. | 4.08 | 12/29/06 | 1.81 | 1.70 | |||||||||||||||||||||||||
| Royce International | ||||||||||||||||||||||||||||||||||
| Smaller-Companies Fund | -0.71 | 13.46 | 5.06 | n.a. | n.a. | 5.06 | 6/30/08 | 2.15 | 1.71 | |||||||||||||||||||||||||
| INDEX | ||||||||||||||||||||||||||||||||||
| Russell 2000 Index | 15.86 | 24.21 | 8.77 | 9.53 | 8.88 | n.a. | n.a. | n.a. | n.a. | |||||||||||||||||||||||||
| Russell Microcap Index | 18.32 | 25.38 | 8.53 | 7.81 | n.a. | n.a. | n.a. | n.a. | n.a. | |||||||||||||||||||||||||
| Russell Global Small Cap Index | 6.72 | 18.48 | 4.16 | 10.33 | n.a. | n.a. | n.a. | n.a. | n.a. | |||||||||||||||||||||||||
| Russell Global ex-U.S. Small Cap Index | 1.76 | 15.45 | 2.01 | 11.32 | n.a. | n.a. | n.a. | n.a. | n.a. | |||||||||||||||||||||||||
| 1 Not annualized | ||||||||||||||||||||||||||||||||||
Important Performance, Expense, and Risk Information
All performance information in this Review and Report reflects past performance, is presented on a total return basis, reflects the reinvestment of distributions, and does not reflect the deduction of taxes a shareholder would pay on fund distributions or the redemption of fund shares. Past performance is no guarantee of future results. Investment return and principal value of an investment will fluctuate, so that shares may be worth more or less than their original cost when redeemed. Shares of Royce Global Value and International Smaller-Companies Funds redeemed within 180 days of purchase may be subject to a 2% redemption fee payable to the Royce Funds. Shares of all other Funds redeemed within 180 days of purchase may be subject to a 1% redemption fee payable to the Fund. Redemption fees are not reflected in the performance shown above; if they were, performance would be lower. Current performance may be higher or lower than performance quoted. Current month-end performance may be obtained at www.roycefunds.com. All performance and expense information reflects results of the Fund’s oldest share Class (Investment Class or Service Class, as the case may be). Price and total return information is based on net asset values calculated for shareholder transactions. Gross annual operating expenses reflect the Fund’s gross total annual operating expenses and include management fees, any 12b-1 distribution and service fees, other expenses, and any applicable acquired fund fees and expenses. Net annual operating expenses reflect contractual fee waivers and/or reimbursements. All expense information is reported as of the Fund’s most current prospectus. Royce & Associates has contractually agreed to waive fees and/or reimburse operating expenses, other than acquired fund fees and expenses, if any, to the extent necessary to maintain net operating expenses at or below: 1.49% for Royce Low-Priced Stock Fund; 1.69% for Royce Global Value and International Smaller-Companies Funds through April 30, 2014; and at or below 1.99% for Royce Global Value and International Smaller-Companies Funds through April 30, 2023. Acquired fund fees and expenses reflect the estimated amount of fees and expenses incurred indirectly by the Fund through its investments in mutual funds, hedge funds, private equity funds, and other investment companies. Shares of the Funds’ Service, Consultant, R, and K Classes bear an annual distribution expense that is not borne by the Funds’ Investment Class. Investments in securities of micro-cap, small-cap, and/or mid-cap companies may involve considerably more risk than investments in securities of larger-cap companies. (Please see “Primary Risks for Fund Investors” in the prospectus.) Royce Global Value and International Smaller-Companies Funds invest a significant portion of their respective assets in foreign companies which may be subject to different risks than investments in securities of U.S. companies, including adverse political, social, economic, or other developments that are unique to a particular country or region. (Please see “Investing in foreign securities” in the prospectus.) Therefore, the prices of securities of foreign companies in particular countries or regions may, at times, move in a different direction than those of securities of U.S. companies. (Please see “Primary Risk of Fund Investors” in the prospectus.) Please read the prospectus carefully before investing or sending money. Russell Investment Group is the source and owner of the trademarks, service marks, and copyrights related to the Russell Indexes. Russell® is a trademark of Russell Investment Group. The Russell 2000 Index is an unmanaged, capitalization-weighted index of domestic small-cap stocks. It measures the performance of the 2,000 smallest publicly traded U.S. companies in the Russell 3000 Index. The Russell Microcap Index includes 1,000 of the smallest securities in the Russell 2000 Index, along with the next smallest eligible securities as determined by Russell. The Russell Global Small Cap Index is an index of global small-cap stocks. The Russell Global ex-U.S. Small Cap Index is an index of global small-cap stocks, excluding the United States. Distributor: Royce Fund Services, Inc. |
| This page is not part of the 2013 Semiannual Report to Shareholders | 5 |
| Market Cycle and Risk Adjusted Performance |
We believe strongly in the idea that a long-term investment perspective is crucial for determining the success of a particular investment approach. While flourishing in an up market is wonderful, surviving a bear market by losing less (or not at all) is at least as good. However, the true test of a portfolio’s mettle is performance over full market cycle periods, which include both an up and down market period. |
| Since the inception of the Russell 2000 index on 12/31/78, there have been 10 full market cycles, with the most recent peaking on 4/29/11. Market cycles are defined as those that have retreated at least 15% from a previous market peak and have rebounded to establish a new peak above the previous one. Each market cycle contains a peak-to-trough and a trough-to-peak period. Interestingly, over the small-cap index’s 30+ year history, each style index—the Russell 2000 Value Index and the Russell 2000 Growth Index—outperformed in five of the 10 full market cycles. In fact, leadership has alternated between growth and value over the last six cycles. If history were to adhere to this pattern, value would lead in the current cycle that began on 4/29/11. |
RISK / RETURN PROFILE 10-YEAR PERIOD ENDED JUNE 30, 2013 |
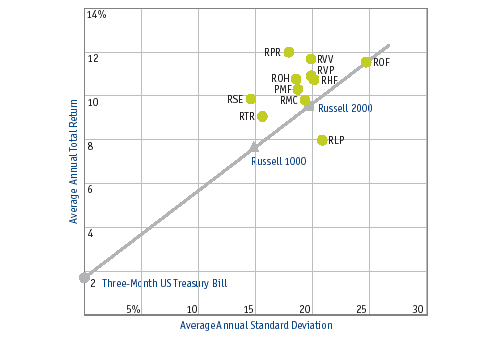 |
 | For the 10-year period ended 6/30/13, nine out of 11 Royce Funds with 10 years of history outperformed the Russell 2000, while 10 of the 11 did so with better risk-adjusted returns and Sharpe ratios. | |
| In addition, for the 10-year period ended 6/30/13, six of the 11 Royce Funds outperformed the Russell 2000 with lower volatility. |
SMALL-CAP MARKET CYCLE: RUSSELL 2000 INDEXES TOTAL RETURNS |
 |
| ROYCE U.S. EQUITY FUNDS VS. RUSSELL 2000 INDEX: | ||||||||||||
| MARKET CYCLE RESULTS | ||||||||||||
| Peak-to- | Peak-to- | Peak-to- | ||||||||||
| Peak | Peak | Current | ||||||||||
| 3/9/00– | 7/13/07– | 4/29/11 | ||||||||||
| Fund | 7/13/07 | 4/29/11 | 6/30/13 | |||||||||
| SMALL-CAP | ||||||||||||
| DIVERSIFIED | ||||||||||||
| Royce Pennsylvania Mutual Fund | 207.1 | % | 11.6 | % | 9.8 | % | ||||||
| Royce Low-Priced Stock Fund | 198.9 | 27.2 | -19.2 | |||||||||
| Royce Heritage Fund | 150.4 | 25.3 | 2.7 | |||||||||
| Royce Value Plus Fund | n.a. | -3.0 | 6.3 | |||||||||
| FOCUSED | ||||||||||||
| Royce Premier Fund | 198.1 | 29.9 | 5.7 | |||||||||
| Royce Special Equity Fund | 227.4 | 20.8 | 21.0 | |||||||||
| Royce Value Fund | n.a. | 17.4 | -1.6 | |||||||||
| Royce 100 Fund | n.a. | 27.6 | 4.4 | |||||||||
| TOTAL RETURN | ||||||||||||
| Royce Total Return Fund | 193.9 | 6.8 | 16.9 | |||||||||
| Royce Dividend Value Fund | n.a. | 21.6 | 14.4 | |||||||||
| MICRO-CAP | ||||||||||||
| Royce Micro-Cap Fund | 197.4 | 24.9 | -10.9 | |||||||||
| Royce Opportunity Fund | 191.8 | 6.9 | 17.2 | |||||||||
| INDEX | ||||||||||||
| Russell 2000 | 54.8 | 6.6 | 16.6 | |||||||||
| Russell 2000 Value | 189.4 | -1.4 | 17.8 | |||||||||
| Russell 2000 Growth | -14.8 | 14.3 | 15.4 | |||||||||
| All performance information above reflects past performance, is presented on a total return basis, reflects the reinvestment of distributions, and does not reflect the deduction of taxes that a shareholder would pay on fund distributions or the redemption of fund shares. Past performance is no guarantee of future results. Investment return and principal value of an investment will fluctuate, so that shares may be worth more or less than their original cost when redeemed. Current performance may be higher or lower than performance quoted. |
| 6 | This page is not part of the 2013 Semiannual Report to Shareholders |
| Letter to Our Shareholders |
 |
Exile on Wall Street | ||
The small-cap market reached peaks in July 2007 and April 2011 before surging to its most recent record highs. Surveying the small-cap landscape from the vantage points of these respective summits shows that each cycle (the second of which is still going on) has presented a difficult environment for active managers such as the parties penning this letter. This has been particularly true of the most recent period, which has seen solid results for the major small-cap indexes, ETFs, and other passive investment vehicles, while the active managers who once routinely outperformed all of them have achieved more muted results. The current phase has favored more defensive sectors and investments with high dividend yields, such as REITs and MLPs. Strong balance sheets and higher quality metrics such as returns on invested capital (ROIC) have also been out of favor in this world of easy money and zero interest rates that tends to be more supportive of lower-quality businesses. And we have not even mentioned the flight to fixed income, which, along with the proliferation of ETFs, has been one of the most significant developments in the investment world during the last three-plus years. | By buying out-of-favor companies and rooting around beaten down sectors and industries, we do things every day that may not look particularly savvy to many on Wall Street, at least in the short run. After 40 years, we are used to doing things according to our own principles and long-term time frame and do not mind being something akin to exiles on Wall Street. |
| This page is not part of the 2013 Semiannual Report to Shareholders | 7 |
 Charles M. Royce, President As it has for the past few years, sentiment once again shifted dramatically in the second quarter and volatility returned to the markets. However, unlike the previous few years, it was the bond market that felt the brunt of the pain as speculation that the Federal Reserve may soon pull back from its unprecedented stimulus efforts fueled a one percentage point jump in 10-year Treasury yields during the final two months of the quarter. After gaining 12.4% in the first quarter of 2013, the Russell 2000 Index advanced 3.1% in the second quarter, finishing the first half of the year with a 15.9% gain. At the same time, the CBOE Volatility Index (VIX), after hitting a fresh 2013 low in March 2013, spiked 33% in the second quarter—the largest quarterly increase since the third quarter of 2011. In the span of one quarter, we have transitioned from a world in which the idea that interest rates would remain indefinitely low to one in which the shift back to a more normalized yield environment is now center stage. Continued on page 10... | Letter to Our Shareholders These events took shape in a market that has featured regular spasms of high volatility and periods of declining stock prices, some of them of a historically extreme nature. These are periods in which fundamentally driven active management approaches such as ours have historically proven their worth. That many of our portfolios struggled to preserve their value as effectively as they have done historically during the market downturns since the pre-crisis peak in July 2007 has been frustrating and humbling, to say the least. Yet investing is a routinely humbling business. This is not the first time (and almost certainly won’t be the last) in which we have endured a prolonged relative slump versus the small-cap market as a whole. But behind every contrarian, especially an out-of-sync one, is a disciplined investor. By buying out-of-favor companies and rooting around beaten down sectors and industries, we do things every day that may not look particularly savvy to many on Wall Street, at least in the short run. After 40 years, we are used to doing things according to our own principles and long-term time frame and do not mind being something akin to exiles on Wall Street. It should come as no surprise, then, that we are not persuaded—or even bothered—by those voices suggesting that active management has perhaps seen its day in the sun. With ETFs and high-frequency trading seemingly making markets that much more efficient, with so many investors disenchanted with equities, and with sustained periods of relative underperformance in the books, perhaps (so the argument runs) active managers should simply switch to indexing or find another line of work. To be sure, the last several years have given us little to crow about (while serving up plenty of crow to eat). However, we remain as enthusiastic as ever about active management in general and value-oriented small-cap investing in particular. To paraphrase Mark Twain, we find reports of the death of active management to be greatly exaggerated. So while lower-quality stocks have dominated the market and outperformed many of our holdings through the current cycle, we are undeterred in our conviction that well-run, cash-rich businesses with high returns on invested capital remain the best route to building long-term wealth. It is also important to remember that many stocks possessing these attributes have done very well on an absolute basis through the current cycle even as they have suffered in comparison to their more defensive or higher-yielding cohorts. Finally, we have already seen signs of a change in which we think the kind of higher-quality companies that we favor can assume a leadership role. There were encouraging signals in May and in the second half of 2012 that investors were giving more thought to fundamentals. In short, we are excited about the days ahead. We are bullish not only on stocks but, more important, on our specific approach to quality and active management. | ||
| 8 | This page is not part of the 2013 Semiannual Report to Shareholders |
Tumbling Dice | ||||
When 2012 drew to a close, we were equally optimistic. The second half of 2012 offered much that was good for what ailed quality-centric investors. The last few months in particular saw a brief resurgence of quality as many companies with strong balance sheets, high ROIC, and strong cash flow characteristics outpaced the rest of the small-cap market. This rally did not last long into 2013, however, as more highly levered and lower ROIC businesses soon resumed leadership. Quality stocks for the most part acquitted themselves well in the bullish first quarter; they simply did not attract as much interest as more defensive areas. The strongest sectors for the small-cap Russell 2000 Index during the first quarter were Health Care, Consumer Discretionary, and Financials, the latter drawing much of its strength from REITs. More cyclical sectors such as Technology and Energy, which we see as featuring some of the most attractively valued, high-quality companies available over the last couple of years, lagged. | ||||
| The result was a strong opening quarter for stocks across the board. Small-caps led, showing positive returns for the third consecutive quarter. The Russell 2000 gained 12.4% compared to respective gains of 11.0% and 10.6% for the large-cap Russell 1000 and S&P 500 Indexes, while the more tech-oriented Nasdaq Composite rose 8.2%. Quality stocks resuming their back seat was not entirely surprising. Stocks as a whole have been on an encouraging roll since the low on June 2, 2012, so some give-back was not entirely unexpected, even if it was somewhat disappointing. | ||||
| Going into the second quarter, we were confident that the rally could last, though we also assumed that a correction would be a natural part of a longer-term bullish trend, as has been the case over the past several years. While share prices all over the globe were more volatile in the second quarter, on the domestic front a rocky market still resulted in positive returns, with strength across all asset classes. The tech-oriented Nasdaq Composite led for the quarter with a 4.2% advance. Small-cap edged out the large-cap indexes, with the Russell 2000 up 3.1% for the quarter compared to respective gains of 2.9% and 2.7% for the S&P 500 and Russell 1000 Indexes. One-year results were also strong for the major indexes, with the Russell 2000 leading (+24.2%), followed by the Russell 1000 (+21.2%), S&P 500 (+20.6%), and Nasdaq (+16.0%). Three-year results were even more closely aligned, offering compelling evidence of just how tightly correlated equity returns have been. Average annual total returns for the three-year period ended June 30, 2013 for the Russell 2000 (+18.7%), the Russell 1000 (+18.6%), and S&P 500 (+18.5%) were within two-tenths of one another while the Nasdaq rose 17.3% over the same span. That stocks continue to perform well could be seen by the fact that trailing one-, five-, and 10-year results for the small-cap and two large-cap indexes were well ahead of their returns for the same periods ended one year prior. Micro-cap returns also continued their ascent. The Russell Microcap Index gained 18.3% year-to-date through June 30, 2013. Its one-year result was also strong, up 25.4%. | We are bullish not only on stocks but, more important, on our specific approach to quality and active management. | |||
| This page is not part of the 2013 Semiannual Report to Shareholders | 9 |
| From our perspective, the end to the easy money bias that has been in place for several years presents an attractive environment for active managers with an absolute orientation like us, as underlying fundamentals and less-leveraged balance sheets should become increasingly more important. We have long thought that the ongoing efforts to reflate the economy through numerous quantitative easings and a zero interest rate policy would have unintended consequences. To be sure, the actions of the Fed have been distorting asset pricing and valuations in the equity market in a number of ways. Many of the fundamental qualities we hold so dear, for example, seem temporarily suspended in an investment world where highly-leveraged businesses are benefiting from the ability to restructure their debt, lower funding costs, and extend maturities. The unintended consequence of leveling the playing field has given lower-quality companies the luxury of time, which in a normal environment they would not have. It would not surprise us to see these trends reverse as tapering is implemented and monetary stimulus is slowly trimmed back and ultimately withdrawn. To be clear, our balance sheet scrutiny is paramount to our process, particularly our focus on risk. To that end, we have always chosen to focus on companies with high operating leverage. Our measure of financial leverage centers on the ratio of assets to stockholders’ equity, looking for a two-to-one ratio for non-financial companies. Continued on page 12... | |||
| Letter to Our Shareholders | ||
The micro-cap index’s trailing three-, five-, and 10-year results were also fine, though it trailed the Russell 2000 in these periods. By contrast, mid-caps narrowly underperformed year-to-date—the Russell Midcap Index rose 15.5% through the end of June—but outpaced their small-cap peers for the one-, three-, 10-, 15-, 20-, and 25-year periods ended June 30, 2013. This impressive long-term record helps to explain why we think of mid-caps as the market’s stealth asset class. Outside the U.S., short- and intermediate-term results were far less bullish. The first quarter saw positive, though lower, returns for the Russell ex-U.S. Small Cap Index, which climbed 6.5% while the Russell ex-U.S. Large Cap Index was up 3.1%. Second-quarter results slipped into the red as the Russell ex-U.S. Small Cap Index fell 4.5% and the Russell Global ex-U.S. Large Cap Index was down 2.9%. This resulted in considerably lower year-to-date results through June 30, 2013: the Russell ex-U.S. Small Cap Index was up 1.8% while its large-cap sibling managed only a 0.1% advance. In this context it was hardly surprising that one-, three-, and five-year results for the non-U.S. indexes were also well behind their U.S. equivalents for the periods ended June 30, 2013. | ||
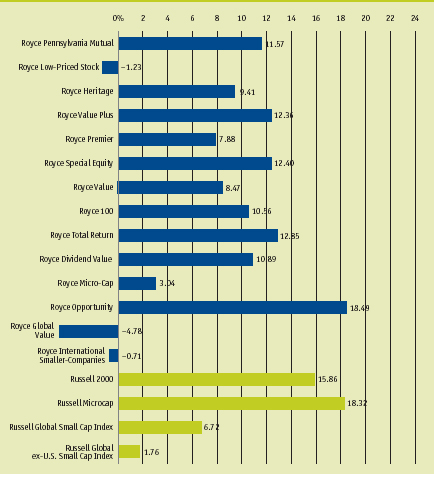
Shine a Light Among The Royce Funds in this Semiannual Review and Report, only Royce Opportunity Fund outperformed its benchmark for the year-to-date period through the end of June, providing a happy exception to what was otherwise a lackluster six months on a relative basis. The remaining 13 portfolios ran the gamut. There were the portfolios that turned in strong absolute results—Royce Pennsylvania Mutual, Value Plus, Special Equity, 100, Total Return, and Dividend Value Funds. Next came three others that were not quite as robust but still posted solid absolute returns—Royce Heritage, Premier, and Value Funds. Last were those that struggled—Royce Low-Priced Stock, Micro-Cap, Global Value, and International Smaller-Companies Funds. As a group, the Funds featured in this Semiannual Review and Report had strong results from several sectors, including Consumer Discretionary, Information Technology, Industrials, and Financials. Those portfolios with anything beyond a modest amount of exposure to the Materials sector generally paid a high price in the form of sizable net losses. These declines came overwhelmingly from the metals & mining industry, especially from precious metals mining companies, a once sterling industry that has recently become a persistent trouble spot for a few Royce-managed portfolios. In the first quarter cyclical companies mostly lagged defensive sectors, but the second quarter offered a more eclectic, and thus encouraging, mix. Within the Russell 2000, both Consumer-oriented sectors remained strong, as did Health Care, Information Technology, and Telecommunication Services. However, the more cyclical Energy, Materials, and | ||
| 10 | This page is not part of the 2013 Semiannual Report to Shareholders |
| 2013 YEAR-TO-DATE TOTAL RETURNS FOR THE ROYCE FUNDS VS. BENCHMARK INDEXES As of 6/30/13 | ||
 | ||
Industrials sectors fell, as did more high-yielding areas such as REITs and Utilities. The S&P 500 showed a similarly scrambled pattern among large-cap sector returns. Although painful in the short term, we see this growing differentiation as a very positive sign that the market is beginning to break out of its correlation groove. Let it Loose During the first half of 2013 the stock market displayed a broadly similar pattern of results to the first halves of 2010, 2011, and 2012. This was a model in which a robustly bullish first quarter gave way to a far more volatile second quarter, with a sudden shift in market sentiment driven primarily by global macro issues. However, this year’s first half also showed some notable differences that suggest a break with the market’s previously unyielding pattern of the last three calendar years—a pattern marked by closely correlated returns and, as a result, relatively uninspired results for many active managers. For example, during the first quarter of 2013 the market was remarkably good at tuning out a great deal of ominous political news. When Congress and the President failed to produce a long-term plan to tackle the deficit, the | Our contention is that the unusual performance pattern spurred by the effects of multiple rounds of QE and zero interest rates has begun to unwind, which will set the stage for more fundamentally based value-oriented approaches to take hold of market leadership. |
| This page is not part of the 2013 Semiannual Report to Shareholders | 11 |
This is an important part of our ongoing search for a company’s “margin of safety.” If a company is carrying too much debt, it impedes its own ability to meet the challenge of out-of-left-field occurrences such as lawsuits, the loss of a major customer, or overseas currency crises. A conservatively capitalized company, especially a smaller company, can better weather these storms because it has the necessary financial reserves to do so, while a company with too much debt on the balance sheet runs a greater risk that stormy weather will turn into a hurricane. We also view financially strong companies as well-positioned to grow. The assets of these companies are derived more from retained earnings than paid-in capital, i.e., they have the ability to self-fund their own success as a business. Of course, transitions are never easy. Shifting back to a more normalized yield environment is likely to be marked by increased volatility and pockets of uncertainty. Stock prices have begun the transition from their reliance on monetary policy to fundamentals, which is a process we believe will stress the importance of companies with strong, less-leveraged balance sheets, excess cash flow generation, and the ability to self-finance. We look forward to a more normalized yield environment that could usher in that long-awaited flight to quality. | Letter to Our Shareholders  market mostly shrugged and continued to climb. When sequestration began to take effect in the aftermath of the stalled budget negotiations, stocks once again paused then resumed moving upward. This stood in stark contrast to what we saw in 2010, 2011, and most of the first half of 2012, when the markets seemed to react to little other than macro headlines that were themselves largely driven by political events. In addition, when macro issues did inspire a sell-off, year-to-date returns were not too adversely affected, with most stocks and domestic indexes escaping the more uncertain second quarter of 2013 in the black despite a 33% second-quarter spike in the CBOE Volatility Index (VIX). This increase was the largest quarterly advance for the VIX, which hit a fresh 2013 low in March before spiking higher, since the third quarter of 2011. Another significant deviation from the pattern of previous years was the pain born by the bond market. Speculation that the Fed would taper its stimulus efforts fueled a full one percentage point jump in 10-year Treasury yields during May and June. We saw an encouraging variation in performance at the stock, industry, and sector levels, which was especially pronounced in these same two months, as signals that the economy was slowly finding its way back to more historically normal—that is, less Fed-dependent—levels of growth and activity. Happy? All of this makes us optimistic. Our contention is that the unusual performance pattern spurred by the effects of multiple rounds of QE and zero interest rates has begun to unwind, which will set the stage for more fundamentally based value-oriented approaches to take hold of market leadership. One sign that the process has already begun is that | ||||||
| 12 | This page is not part of the 2013 Semiannual Report to Shareholders |
in the space of roughly three months we have moved from an environment in which many believed that interest rates would remain low indefinitely to one in which more historically normal yields are inching closer and closer. We have argued that an unintended consequence of QE and zero interest rates has been to make life a little too easy for lower-quality companies. Highly levered businesses have been able to re-finance their obligations at record low rates and thus not pay the usual economic cost for being over-levered. This unnatural and (we believe) temporary advantage reduced the attractiveness of the conservatively capitalized businesses that have been our portfolio mainstays since the early 1970s. However, with Fed policy changing, we are moving closer to a market in which strong fundamentals are likely to be in high demand once more. What Ben Bernanke actually said back in June about the Fed potentially tapering its bond purchases seemed entirely positive. Many of us have been waiting for the economy and the markets to return to more historically normal conditions for some time. We have been especially eager to see interest rates normalize, which would be as sure a sign as any that the economy and markets are operating at something like business as usual (and this period of QE and zero interest rates has been anything but that). We suspect an environment in which the Fed is not as intimately involved in the economy will be a healthy one for stocks. So while many investors saw the Fed’s plans to taper bond purchases as a cause for alarm, we saw it as an affirmation that the economy is healing as it grows. Within the next couple of years, it should grow even stronger. Along with more historically normal—that is, higher—rates, this would be a very welcome development for equities in our view, particularly the kind of attractively valued, well-run, financially strong small-cap businesses that remain our favorites. Guarded optimism may be as close to bliss as we can usually get, but we have seldom felt more confident about our investment approach as we do right now, looking out on the months and years to come. Sincerely, | Guarded optimism may be as close to bliss as we can usually get, but we have seldom felt more confident about our investment approach as we do right now, looking out on the months and years to come. | |||||
 |  |  | ||||
| Charles M. Royce | W. Whitney George | Jack E. Fockler, Jr. | ||||
| President | Vice President | Vice President | ||||
| July 31, 2013 | ||||||
| This page is not part of the 2013 Semiannual Report to Shareholders | 13 |
| Fund Focus |
While in the investment world, an “opportunity” nearly always refers to a possibly positive circumstance or a chance for growth, “opportunistic” often implies an act or attitude more appropriate for speculators or other people with a decidedly short-term mindset and a healthy—perhaps too healthy—appetite for risk. However, in Royce Opportunity Fund (ROF), portfolio manager Buzz Zaino uses an opportunistic approach to small-cap value investing that has achieved long-term results which look anything but negative (see the table below). As a result of the Fund’s success, we have entirely positive associations with both terms.
Buzz joined Royce in January 1998. He shares with our founder and Co-CIO Chuck Royce the experience of having been a young and relatively inexperienced portfolio manager through the rise and fall of the “Nifty Fifty” market of 1973-74, one whose precipitous declines shook the equity world as dramatically as the crisis period of late 2008-09. During the earlier period, Buzz was managing the Lehman Capital Fund, where he developed the theme-based methodology that he has used throughout his career.
Buzz’s security selection process differs from that used by most of our portfolio managers, who begin with the balance sheet and proceed to factors such as returns on invested capital and the ability to generate free cash flow. By contrast, Buzz favors small-cap turnarounds and special situations. He looks for a catalyst for change at the company or industry level, one that he thinks is likely to eventually reverse the firm’s fortunes and drive its stock price upward.
He typically slots purchase candidates into one of four themes: Companies with unrecognized asset values are those selling below probable liquidating value, franchise value, tangible book value, or physical asset value relative to plant or liquid assets. Turnarounds are companies recovering from depressed operating margins due to management changes or industry- and/or sector-specific factors. Undervalued Growth stocks are those that we believe can provide potential growth rates of at least 12%, have strong balance sheets, and whose stock prices are selling at relatively low valuations. Interrupted Earnings are companies with the potential for either a 20% annual growth rate or preeminent market position, accompanied by a price-earnings multiple substantially less than the expected growth rate.
At the same time, these purchase candidates must be, in his words, “statistically valid for a value portfolio.” The primary metrics used to determine this are price-to-book and price-to-sales ratios, as Buzz believes that examining each in concert provides the best estimate of a company’s potential to rebound. He prefers companies with low debt, but is willing to look past a less-than-pristine balance sheet if he believes that the company is otherwise well-positioned to generate positive or improved earnings. He also begins to buy slowly, patiently building positions over time, usually at the first signs of corporate distress. Positions typically begin by accounting for anywhere from 0.25% to 0.50% of net assets. If the company’s stock price rises and it reaches to 1.00% of net assets, he generally begins to pare it back or sell it off entirely.
Since Buzz began to manage the Fund in January 1998, ROF has been characterized by his disciplined and methodical approach, a commitment to broad diversity and an ample number of micro-cap stocks. Bill Hench joined Buzz as the Fund’s assistant portfolio manager in 2004 and together they have built a strong long-term performance record.
| Royce Opportunity Fund vs the Russell 2000: Performance and Expense Information | Through June 30, 2013 | |||||||||||||||||||||||||||||||
| Average Annual Total Returns | ||||||||||||||||||||||||||||||||
| Since | ||||||||||||||||||||||||||||||||
| Inception | Net Operating | |||||||||||||||||||||||||||||||
| Year-to-Date1 | One-Year | Three-Year | Five-Year | 10-Year | 15-Year | (11/19/96) | Expenses | |||||||||||||||||||||||||
| Royce Opportunity Fund | 18.49 | % | 30.58 | % | 19.42 | % | 10.90 | % | 11.52 | % | 12.11 | % | 12.98 | % | 1.14 | % | ||||||||||||||||
| Russell 2000 | 15.86 | 24.21 | 18.67 | 8.77 | 9.53 | 6.60 | 7.85 | n.a. | ||||||||||||||||||||||||
| 1 Not annualized | ||||||||||||||||||||||||||||||||
Important Performance, Expense, and Risk Information
All performance information is for the Fund’s Investment Class, reflects past performance, is presented on a total return basis, reflects the reinvestment of distributions, and does not reflect the deduction of taxes that a shareholder would pay on fund distributions or the redemption of fund shares. Past performance is no guarantee of future results. Investment return and principal value of an investment will fluctuate, so that shares may be worth more or less than their original cost when redeemed. Shares redeemed within 180 days of purchase may be subject to a 1% redemption fee, payable to the Fund, which is not reflected in the performance shown above; if it were, performance would be lower. Current performance may be higher or lower than performance quoted. Current month-end performance information may be obtained at www.roycefunds.com. Operating expenses reflect the Fund’s total annual operating expenses for the Investment Class as of the Fund’s most current prospectus and include management fees, other expenses, and acquired fund fees and expenses. Acquired fund fees and expenses reflect the estimated amount of the fees and expenses incurred indirectly by the Fund through its investments in mutual funds, hedge funds, private equity funds and other investment companies. Shares of ROF’s Service, Consultant, R, and K Classes bear an annual distribution expense that is not borne by the Investment Class.
The Fund invests primarily in small-cap and micro-cap stocks, which may involve considerably more risk than investing in larger-cap stocks. (Please see “Primary Risks for Fund Investors” in the prospectus.) Russell Investment Group is the source and owner of the trademarks, service marks and copyrights related to the Russell Indexes. Russell® is a trademark of Russell Investment Group. The Russell 2000 Index is an unmanaged, capitalization-weighted index of domestic small-cap stocks. It measures the performance of the 2,000 smallest publicly traded U.S. companies in the Russell 3000 Index. Distributor: Royce Fund Services, Inc.
| 14 | This page is not part of the 2013 Semiannual Report to Shareholders |
| Table of Contents | ||
| Semiannual Report to Shareholders | ||
| Managers’ Discussions of Fund Performance | ||
| SMALL-CAP | ||
| DIVERSIFIED | ||
| Royce Pennsylvania Mutual Fund | 16 | |
| Royce Low-Priced Stock Fund | 18 | |
| Royce Heritage Fund | 20 | |
| Royce Value Plus Fund | 22 | |
| FOCUSED | ||
| Royce Premier Fund | 24 | |
| Royce Special Equity Fund | 26 | |
| Royce Value Fund | 28 | |
| Royce 100 Fund | 30 | |
| TOTAL RETURN | ||
| Royce Total Return Fund | 32 | |
| Royce Dividend Value Fund | 34 | |
| MICRO-CAP | ||
| Royce Micro-Cap Fund | 36 | |
| Royce Opportunity Fund | 38 | |
| GLOBAL/INTERNATIONAL | ||
| Royce Global Value Fund | 40 | |
| Royce International Smaller-Companies Fund | 42 | |
| Schedules of Investments and Financial Statements | 44 | |
| Notes to Financial Statements | 111 | |
| Understanding Your Fund’s Expenses | 125 | |
| Trustees and Officers | 127 | |
| Board Approval of Investment Advisory Agreements | 128 | |
| Notes to Performance and Other Important Information | 130 | |
| The Royce Funds 2013 Semiannual Report to Shareholders | 15 |
| Royce Pennsylvania Mutual Fund |
AVERAGE ANNUAL TOTAL RETURNS Through 6/30/13 | |||||||||||
| January–June 20131 | 11.57 | % | |||||||||
| One-Year | 22.92 | ||||||||||
| Three-Year | 15.90 | ||||||||||
| Five-Year | 7.23 | ||||||||||
| 10-Year | 10.29 | ||||||||||
| 15-Year | 9.48 | ||||||||||
| 20-Year | 10.62 | ||||||||||
| 25-Year | 10.69 | ||||||||||
| 30-Year | 11.03 | ||||||||||
| 35-Year | 12.82 | ||||||||||
| 40-Year | 13.86 | ||||||||||
| ANNUAL EXPENSE RATIO | |||||||||||
| Operating Expenses | 0.90 | % | |||||||||
| 1 Not annualized | |||||||||||
| CALENDAR YEAR TOTAL RETURNS | |||||||||||
| Year | PMF | Year | PMF | ||||||||
| 2012 | 14.6 | % | 2004 | 20.2 | % | ||||||
| 2011 | -4.2 | 2003 | 40.3 | ||||||||
| 2010 | 23.9 | 2002 | -9.2 | ||||||||
| 2009 | 36.3 | 2001 | 18.4 | ||||||||
| 2008 | -34.8 | 2000 | 18.3 | ||||||||
| 2007 | 2.8 | 1999 | 6.0 | ||||||||
| 2006 | 14.8 | 1998 | 4.2 | ||||||||
| 2005 | 12.5 | 1997 | 25.0 | ||||||||
| TOP 10 POSITIONS % of Net Assets | |||||||||||
| Oil States International | 1.1 | % | |||||||||
| Federated Investors Cl. B | 1.0 | ||||||||||
| Reliance Steel & Aluminum | 0.9 | ||||||||||
| Helmerich & Payne | 0.9 | ||||||||||
| Unit Corporation | 0.8 | ||||||||||
| HEICO Corporation | 0.8 | ||||||||||
| Lincoln Electric Holdings | 0.8 | ||||||||||
| Applied Industrial Technologies | 0.7 | ||||||||||
| Advisory Board (The) | 0.7 | ||||||||||
| SEI Investments | 0.7 | ||||||||||
| PORTFOLIO SECTOR BREAKDOWN % of Net Assets | |||||||||||
| Industrials | 25.8 | % | |||||||||
| Information Technology | 21.0 | ||||||||||
| Consumer Discretionary | 15.4 | ||||||||||
| Financials | 10.0 | ||||||||||
| Materials | 9.0 | ||||||||||
| Health Care | 7.7 | ||||||||||
| Energy | 7.0 | ||||||||||
| Consumer Staples | 1.9 | ||||||||||
| Telecommunication Services | 0.1 | ||||||||||
| Miscellaneous | 1.4 | ||||||||||
| Cash and Cash Equivalents | 0.7 | ||||||||||
 | |||||||||
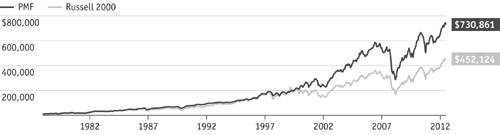
Manager’s Discussion The first half of 2013 featured a robust though increasingly volatile market for equities, particularly here in the U.S. The market was fueled by an economy that continued to grow, albeit far more slowly than anyone would like. Perhaps the most notable development was the Fed’s announcement in mid-June that, while interest rates would remain unchanged at essentially zero, it would begin to taper the pace of bond purchases later in 2013. This sent the global financial markets into a brief tailspin that made an already rocky June that much more unpredictable. In this context, we were pleased with the absolute performance of our flagship, Royce Pennsylvania Mutual Fund (PMF), through the year’s first six months. For the year-to-date period ended June 30, 2013 PMF gained 11.6% versus 15.9% for its small-cap benchmark, the Russell 2000 Index, for the same period. Trailing the benchmark has become an unfortunate trend of late, one that has generated considerable consternation, especially in light of the Fund’s strong second half of 2012 during which PMF outpaced the Russell 2000 (+10.2% versus +7.2%). This was an admittedly short-term advantage that nonetheless offered signs that the long period of closely correlated returns was drawing to a close, with the result that investors were paying more attention to company quality. There were also encouraging signs in the second quarter, which saw not only ample volatility but a fair amount of differentiation, too. Based on this, we believe that the market should begin to show more favor to the kind of companies that we seek—those with low debt, high returns on invested capital, and strong free cash flows. During the first quarter, PMF was up 10.2% compared to 12.4% for its small-cap benchmark. The Fund then rose 1.3% in the more volatile second quarter while its benchmark was up 3.1%. The Fund did maintain an edge over its benchmark, outpacing the Russell 2000 over several longer-term periods. (The Fund’s market cycle results can be found on page 6.) PMF outperformed the small-cap index for the 10- 15-, 20-, 25-, and 30-year periods ended June 30, 2013. The Fund’s average annual total return for the 40-year period ended June 30, 2013 was 13.9%. We remain very proud of PMF’s long-term record. Several old favorites were among the portfolio’s best and worst performers in the first half. Based in Houston, Oil States International provides products and services to oil and gas companies, including connection technology for offshore oil and gas development and production, the distribution of tubular products, hydraulic workover and well control services, and remote site | |||||||||
| 16 | The Royce Funds 2013 Semiannual Report to Shareholders |
Performance and Portfolio Review accommodations, catering, and logistics. Its expertise in a wide variety of energy-related fields helped to fuel our initial interest in the company. Its share price skyrocketed at the end of April on news that activist shareholders were asking the company’s management to create a REIT from its oilfield accommodation business. We liked its other business lines, valuation, and ongoing prospects enough for it to be the Fund’s top holding at the end of June. Our take on asset manager and money market specialist Federated Investors has not changed much over the last year or so. Money market funds are still facing new regulations—the new rules remained under review at the end of June, adding to a process that has been dragging on for a couple of years. We agree with most industry observers who think that the longer this process takes, the less onerous the rules are going to be. Equally important is our confidence that rising interest rates are going help its business. Although we trimmed our position in May, June, and early July, we held a large stake at the end of the period, when it was PMF’s second-largest holding. The rising stock price of Nu Skin Enterprises led us to reduce our position between late March and early July. The company, which develops and distributes personal care skin products worldwide, mounted an impressive comeback in 2013, part of a long rebound that began in early 2009. Earnings have been strong, often surprising on the upside, while its dividend has been growing. It also recently announced a five-year business plan for China. All of these events were factors in the stock’s strong first-half returns. The long-anticipated recovery for GameStop Corporation prompted us to sell shares in the first half. On the sector level, results were solid. The Materials sector posted a small net loss, while Industrials, Information Technology, Consumer Discretionary, and Financials all made notable net contributions to performance. Net losses at the company level were also modest. We built our stake in wireless equipment maker NETGEAR as its price fell through much of the first half. During the first quarter the company had a product execution issue in its storage business, which hurt fiscal first-quarter earnings. In April the company completed the acquisition of select assets of the Sierra Wireless AirCard business, which some investors thought left NETGEAR too exposed to the lower-margin wireless service provider segment. Ever contrarian, we took the long view and saw a company that looks very well-positioned to benefit from ongoing global growth for wireless products. Hoping for an eventual turnaround for mining companies, we chose to hold shares of Eldorado Gold, Agnico Eagles Mines, Seabridge Gold, and Pan American Silver. |
 |
| Includes reinvestment of distributions. | |||
| PORTFOLIO DIAGNOSTICS | |||
| Fund Net Assets | $6,434 million | ||
| Number of Holdings | 578 | ||
| Turnover Rate | 12% | ||
| Average Market Capitalization1 | $1,671 million | ||
| Weighted Average P/E Ratio2,3 | 19.0x | ||
| Weighted Average P/B Ratio2 | 2.1x | ||
| U.S. Investments (% of Net Assets) | 91.7% | ||
| Non-U.S. Investments (% of Net Assets) | 7.6% | ||
| Symbol | |||
| Investment Class | PENNX | ||
| Service Class | RYPFX | ||
| Consultant Class | RYPCX | ||
| Institutional Class | RPMIX | ||
| R Class | RPMRX | ||
| K Class | RPMKX | ||
1 Geometric Average. This weighted calculation uses each portfolio holding’s market cap in a way designed to not skew the effect of very large or small holdings; instead, it aims to better identify the portfolio’s center, which Royce believes offers a more accurate measure of average market cap than a simple mean or median. | |||
1 Harmonic Average.This weighted calculation evaluates a portfolio as if it were a single stock and measures it overall. It compares the total market value of the portfolio to the portfolio’s share in the earnings or book value, as the case may be, of its underlying stocks. | |||
3 The Fund’s P/E ratio calculation excludes companies with zero or negative earnings (9% of portfolio holdings as of 6/30/13). | |||
| MORNINGSTAR STATISTICAL MEASURES1 | |||
| Sharpe Ratio | Standard Deviation | ||
| PMF | 0.41 | 23.51 | |
| Russell 2000 | 0.46 | 24.07 | |
| Category Median | 0.46 | 23.47 | |
| Best Quartile Breakpoint | 0.52 | 22.36 | |
1 Five years ended 6/30/13. Category Median and Best Quartile Breakpoint based on 348 small-cap objective funds (oldest class only) with at least five years of history. | |||
The Fund produced lower volatility than the Russell 2000, as shown by its standard deviation. | |||
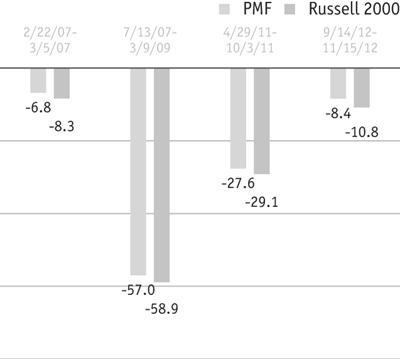
DOWN MARKET PERFORMANCE COMPARISON | |||
 | |||
| The Royce Funds 2013 Semiannual Report to Shareholders | 17 |
| Royce Low-Priced Stock Fund |
AVERAGE ANNUAL TOTAL RETURNS Through 6/30/13 | ||||||||||
| January–June 20131 | -1.23 | % | ||||||||
| One-Year | 4.29 | |||||||||
| Three-Year | 6.66 | |||||||||
| Five-Year | 3.06 | |||||||||
| 10-Year | 7.97 | |||||||||
| 15-Year | 9.16 | |||||||||
| Since Inception (12/15/93) | 11.20 | |||||||||
| ANNUAL EXPENSE RATIOS | ||||||||||
| Gross Operating Expenses | 1.58 | % | ||||||||
| Net Operating Expenses | 1.50 | |||||||||
| 1 Not annualized | ||||||||||
| CALENDAR YEAR TOTAL RETURNS | ||||||||||
| Year | RLP | Year | RLP | |||||||
| 2012 | 4.5 | % | 2004 | 13.6 | % | |||||
| 2011 | -14.6 | 2003 | 44.0 | |||||||
| 2010 | 31.5 | 2002 | -16.3 | |||||||
| 2009 | 53.6 | 2001 | 25.1 | |||||||
| 2008 | -36.0 | 2000 | 24.0 | |||||||
| 2007 | 2.3 | 1999 | 29.8 | |||||||
| 2006 | 19.0 | 1998 | 2.4 | |||||||
| 2005 | 9.7 | 1997 | 19.5 | |||||||
| TOP 10 POSITIONS % of Net Assets | ||||||||||
| Value Partners Group | 2.0 | % | ||||||||
| Fairchild Semiconductor International | 2.0 | |||||||||
| Teradyne | 1.9 | |||||||||
| Globe Specialty Metals | 1.9 | |||||||||
| Federated Investors Cl. B | 1.9 | |||||||||
| Convergys Corporation | 1.9 | |||||||||
| Nu Skin Enterprises Cl. A | 1.9 | |||||||||
| Alamos Gold | 1.9 | |||||||||
| Pason Systems | 1.8 | |||||||||
| Unit Corporation | 1.8 | |||||||||
| PORTFOLIO SECTOR BREAKDOWN % of Net Assets | ||||||||||
| Information Technology | 23.2 | % | ||||||||
| Materials | 15.4 | |||||||||
| Energy | 12.6 | |||||||||
| Industrials | 12.2 | |||||||||
| Financials | 12.2 | |||||||||
| Consumer Discretionary | 10.0 | |||||||||
| Health Care | 5.4 | |||||||||
| Consumer Staples | 4.6 | |||||||||
| Utilities | 0.2 | |||||||||
| Miscellaneous | 2.1 | |||||||||
| Cash and Cash Equivalents | 2.1 | |||||||||
 |
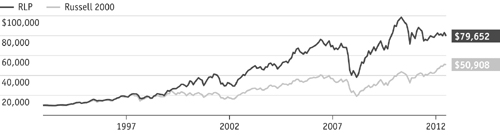
Manager’s Discussion Royce Low-Priced Stock Fund (RLP) had a difficult first half. The Fund was down 1.2% for the year-to-date period ended June 30, 2013, well behind its small-cap benchmark, the Russell 2000 Index, which climbed 15.9% for the same period. These first-half results follow a string of disappointing performances for the Fund dating back to 2011, a period characterized by closely correlated market results, strong performance for defensive stocks, growing popularity of higher-yielding vehicles such as REITs, MLPs (master limited partnerships), and Utilities, and a widespread preference for fixed-income securities over many equities. Needless to say, these are not the kinds of investments that we seek for RLP’s portfolio, choosing instead to focus on low-priced stocks with strong balance sheets and what look to us like compelling valuations. In contrast to the second, the first quarter was pleasantly, smoothly bullish for most stocks. The Russell 2000 rose 12.4% between January and the end of March while the Fund managed a 1.4% return. This made the task of a strong absolute first-half return, as well as the challenge of narrowing the gap with the benchmark, more than a little daunting. The challenge was made more difficult by the fact that markets were markedly more volatile between April and the end of June than they had been earlier in the year. April was slightly bearish, May sunnily bullish, and June volatile. An unsettled month from the start, it grew decidedly more so after Fed Chairman Ben Bernanke’s comments on June 19, in which he hinted that the central bank would taper its purchases of fixed-income securities later this year, provided economic conditions warrant such a slowdown. News of a credit squeeze in China also played a role—arguably a larger one than the Fed announcement—as did protests and declining markets in Turkey and Brazil. In this suddenly uncertain climate RLP fell 2.6% for the second quarter compared to a gain of 3.1% for the Russell 2000. The Fund’s relative returns in recent market cycles and other long-term periods have also suffered through these last two-and-a-half years (market cycle results can be found on page 6), though RLP was ahead of the Russell 2000 for the 15-year and since inception (12/15/93) |
| 18 | The Royce Funds 2013 Semiannual Report to Shareholders |
Performance and Portfolio Review |
periods ended June 30, 2013. The Fund’s average annual total return since inception was 11.2%. We remain proud of RLP’s long-term results through its nearly two decades of history. The Fund’s seventh-largest holding at the end of the period, Nu Skin Enterprises was mostly being ignored by doubtful investors before coming back strong in the first half. A personal care business with a niche in anti-aging products, its revenues are split more or less evenly between personal care and nutritional products. It sells these through a direct marketing strategy, and this convinced many investors over the last few years that Nu Skin was essentially the same kind of company as Herbalife. This was not an enviable association considering that the latter has been facing accusations of being a pyramid scheme. We held on due to our affection for the company’s global reach, quality products, solid earnings and cash flows, and low-debt balance sheet. Recent earnings have been strong, often surprising on the upside, while its dividend has also been growing. In addition, the company also recently announced a five-year business plan for China. TrueBlue provides temporary general labor services in the U.S. and Canada, with heavy exposure to the resurgent home construction industry. That connection helped its stock price to rise, as did its ongoing relationship with Boeing. GameStop Corporation is a video game retailer that sells new and pre-owned gaming products, including hardware and software. Many investors doubted the long-term viability of its business model at a time when tablet applications and downloads predominate. When Microsoft and Sony announced earlier this year that they would be introducing updated consoles, the news helped assure investors that the company’s video game exchange business can continue to grow and quieted fears that GameStop would go the same route as Blockbuster Video. The company should also draw a benefit from selling the consoles themselves. It was a top-30 position at the end of June. The bulk of the Fund’s net losses in the first half came from the metals & mining industry, part of the Materials sector that as a result also posted a sizable net loss. Precious metals miners accounted for nine of the Fund’s ten largest detractors and 12 of its largest 20 for the period. Several factors worked against these holdings in the first half. Gold and silver prices declined significantly, mine operating costs were climbing, and several firms went through management changes. Warren Buffett once said, “Only when the tide goes out do you discover who’s been swimming naked.” For the mining industry, it has often looked as if the tide was never coming back in. In many cases, valuations have reached what we view as rock-bottom levels that have not been seen since the late 2008-early 2009 lows. Still, we have chosen not to build positions but to hold those we think are best positioned for an eventual turnaround. |
 |
| Includes reinvestment of distributions. |
| PORTFOLIO DIAGNOSTICS | |||||
| Fund Net Assets | $1,974 million | ||||
| Number of Holdings | 129 | ||||
| Turnover Rate | 12% | ||||
| Average Market Capitalization1 | $1,140 million | ||||
| Weighted Average P/E Ratio2,3 | 15.8x | ||||
| Weighted Average P/B Ratio2 | 1.5x | ||||
| U.S. Investments (% of Net Assets) | 63.9% | ||||
| Non-U.S. Investments (% of Net Assets) | 34.0% | ||||
| Symbol | |||||
| Investment Class | RLPHX | ||||
| Service Class | RYLPX | ||||
| Institutional Class | RLPIX | ||||
| R Class | RLPRX | ||||
| K Class | RLPKX | ||||
1 Geometric Average. This weighted calculation uses each portfolio holding’s market cap in a way designed to not skew the effect of very large or small holdings; instead, it aims to better identify the portfolio’s center, which Royce believes offers a more accurate measure of average market cap than a simple mean or median. | |||||
2 Harmonic Average. This weighted calculation evaluates a portfolio as if it were a single stock and measures it overall. It compares the total market value of the portfolio to the portfolio’s share in the earnings or book value, as the case may be, of its underlying stocks. | |||||
3 The Fund’s P/E ratio calculation excludes companies with zero or negative earnings (19% of portfolio holdings as of 6/30/13). | |||||
| MORNINGSTAR STATISTICAL MEASURES1 | |||||
| Sharpe Ratio | Standard Deviation | ||||
| RLP | 0.24 | 26.29 | |||
| Russell 2000 | 0.46 | 24.07 | |||
| Category Median | 0.46 | 23.47 | |||
| Best Quartile Breakpoint | 0.52 | 22.36 | |||
1 Five years ended 6/30/13. Category Median and Best Quartile Breakpoint based on 348 small-cap objective funds (oldest class only) with at least five years of history. | |||||
DOWN MARKET PERFORMANCE COMPARISON All Down Periods of 7.5% or Greater Over the Last 7 Years, in Percentages(%)  | |||||
| The Royce Funds 2013 Semiannual Report to Shareholders | 19 |
| Royce Heritage Fund |
AVERAGE ANNUAL TOTAL RETURNS Through 6/30/13 | |||||||||||
| January–June 20131 | 9.41 | % | |||||||||
| One-Year | 22.15 | ||||||||||
| Three-Year | 14.52 | ||||||||||
| Five-Year | 9.64 | ||||||||||
| 10-Year | 10.73 | ||||||||||
| 15-Year | 11.52 | ||||||||||
| Since Inception (12/27/95) | 13.51 | ||||||||||
| ANNUAL EXPENSE RATIO | |||||||||||
| Operating Expenses | 1.51 | % | |||||||||
| 1 Not annualized | |||||||||||
| CALENDAR YEAR TOTAL RETURNS | |||||||||||
| Year | RHF | Year | RHF | ||||||||
| 2012 | 14.3 | % | 2004 | 20.4 | % | ||||||
| 2011 | -9.3 | 2003 | 38.1 | ||||||||
| 2010 | 27.5 | 2002 | -18.9 | ||||||||
| 2009 | 51.8 | 2001 | 20.5 | ||||||||
| 2008 | -36.2 | 2000 | 11.7 | ||||||||
| 2007 | 1.2 | 1999 | 41.7 | ||||||||
| 2006 | 22.6 | 1998 | 19.5 | ||||||||
| 2005 | 8.7 | 1997 | 26.0 | ||||||||
| TOP 10 POSITIONS % of Net Assets | |||||||||||
| Towers Watson & Company Cl. A | 1.6 | % | |||||||||
| Greif Cl. A | 1.3 | ||||||||||
| Jacobs Engineering Group | 1.2 | ||||||||||
| Lazard Cl. A | 1.2 | ||||||||||
| ManpowerGroup | 1.1 | ||||||||||
| Expeditors International of Washington | 1.1 | ||||||||||
| Anixter International | 1.1 | ||||||||||
| FLIR Systems | 1.1 | ||||||||||
| Coherent | 1.0 | ||||||||||
| Helmerich & Payne | 1.0 | ||||||||||
| PORTFOLIO SECTOR BREAKDOWN % of Net Assets | |||||||||||
| Industrials | 22.2 | % | |||||||||
| Information Technology | 17.6 | ||||||||||
| Financials | 15.7 | ||||||||||
| Consumer Discretionary | 11.3 | ||||||||||
| Materials | 9.5 | ||||||||||
| Energy | 4.7 | ||||||||||
| Health Care | 2.8 | ||||||||||
| Consumer Staples | 1.2 | ||||||||||
| Utilities | 0.2 | ||||||||||
| Miscellaneous | 3.0 | ||||||||||
| Cash and Cash Equivalents | 11.8 | ||||||||||
 | |||||||||
Managers’ Discussion First-half results for Royce Heritage Fund (RHF) left us in something of a quandary. We were reasonably pleased with the Fund’s absolute return while we were disappointed by its relative performance. The Fund gained 9.4% for the year-to-date period ended June 30, 2013, behind its small-cap benchmark, the Russell 2000 Index, which advanced 15.9% for the same period. The first quarter was pleasantly bullish overall, though the mostly unimpeded upward move made it easy to miss a shift in market leadership. After lagging the market overall, many cyclical stocks raced ahead in the second half of 2012, a span in which RHF handily beat the Russell 2000 with a gain of 11.6% versus 7.2%. The first quarter saw a return to leadership of more defensive companies, which was a factor in the Fund’s relative disadvantage. RHF was up 9.2% in the first quarter compared to a 12.4% increase for the small-cap index. Worrisome macro news made a comeback of its own in 2013, primarily during the second quarter, a more volatile three months than the preceding three. The developments included credit, banking, and real estate market challenges for China, unrest in developing nations such as Turkey and Brazil, a sharp rise in the 10-year Treasury rate during May and June, and word from the Fed that it would slow the pace of bond purchases at the end of 2013, allowing that the economy keeps growing. In contrast to 2011 and 2012, the domestic equity markets in general handled this news well. For the second quarter, RHF gained 0.2% while the Russell 2000 rose 3.1%. Relative results were better over longer-term time spans. For the periods ended June 30, 2013, the Fund beat the small-cap index from the previous small-cap peak on July 13, 2007, up 28.6% versus 24.3%. (More market cycle results are on page 6.) RHF also outpaced the Russell 2000 for the five-, 10-, 15-year, and since inception (12/27/95) periods ended June 30, 2013. The Fund’s average annual total return since inception was 13.5%. The Fund paid a high price for its overweight exposure to the Materials sector, which was the only one to post a net loss for the first half. The sector’s metals & mining group was particularly ubiquitous among holdings that lost value through the end of June. The industry accounted for RHF’s six largest detractors for the period. Eight of the Fund’s 10, and 11 of its 20, largest net | |||||||||
| 20 | The Royce Funds 2013 Semiannual Report to Shareholders |
Performance and Portfolio Review losses at the company level also came from businesses in this industry. The six largest detractors were precious metals mining businesses while the remaining five were industrial metals producers (Sims Metal Management, Imdex, Globe Specialty Metals, and Carpenter Technology) or companies involved in drilling (Major Drilling Group International). We sold our shares of Globe Specialty Metals and Carpenter Technology and held positions in Major Drilling Group International, Sims Metal Management, and Imdex at the end of the period, confident that a pick-up in related industrial activity could help reverse the downward trend. The precious metals mining industry endured a very difficult first half, with commodity price declines combining with rising operational costs to create a truly awful environment. This had the effect of depressing valuations for several companies to levels comparable or lower to those of the market bottom in early 2009. Our view of the fundamentals and/or long-term prospects for individual businesses guided our actions through these difficult days. We trimmed our position in Hochschild Mining, built our stakes in Gold Fields and Pan American Silver—substantially in the latter’s case—held our positions in Randgold Resources and Fresnillo, and sold our position in Allied Nevada Gold. Financials, Industrials, and Information Technology were RHF’s best-performing sectors in the first half. The capital markets group in the Financials sector led all industries by a sizable margin and accounted for three of the Fund’s five largest contributors, with the other two coming from the professional services group in Industrials. The Fund’s top contributor for the period was WisdomTree Investments, an asset management company that primarily sponsors ETFs (exchange traded funds). Robust inflows and strong product line growth helped to attract investors to its stock. With its price on the rise, we reduced our position with several sales in the first half. Top holding Towers Watson & Company, from the Industrials sector, provides human resource and financial consulting services. It offers employee benefit programs, develops attraction, retention, and reward strategies, and provides other related services. Its price rose more or less steadily through the first half. Earnings have been strong, revenues have grown, and cash flows have been solid. In May the firm’s management also raised adjusted EPS (earnings per share) guidance for fiscal 2013. We have liked its core business and steady earnings for several years. We first bought shares in RHF’s portfolio in 2007 and have held a position since December 2010. That same year saw us initiating a position in KKR & Co., a private equity and venture capital firm that specializes in acquisitions, leveraged buyouts, management buyouts, special situations, and growth equity. We like its core business, industry leadership, pristine balance sheet, and dividend. We took gains during May and June. |
 |
| Includes reinvestment of distributions. | |||
| PORTFOLIO DIAGNOSTICS | |||
| Fund Net Assets | $293 million | ||
| Number of Holdings | 186 | ||
| Turnover Rate | 31% | ||
| Average Market Capitalization1 | $3,079 million | ||
| Weighted Average P/E Ratio2,3 | 19.2x | ||
| Weighted Average P/B Ratio2 | 2.4x | ||
| U.S. Investments (% of Net Assets) | 69.8% | ||
| Non-U.S. Investments (% of Net Assets) | 18.4% | ||
| Symbol | |||
| Investment Class | RHFHX | ||
| Service Class | RGFAX | ||
| Consultant Class | RYGCX | ||
| R Class | RHFRX | ||
| K Class | RHFKX | ||
1 Geometric Average. This weighted calculation uses each portfolio holding’s market cap in a way designed to not skew the effect of very large or small holdings; instead, it aims to better identify the portfolio’s center, which Royce believes offers a more accurate measure of average market cap than a simple mean or median. | |||
2 Harmonic Average. This weighted calculation evaluates a portfolio as if it were a single stock and measures it overall. It compares the total market value of the portfolio to the portfolio’s share in the earnings or book value, as the case may be, of its underlying stocks. | |||
3 The Fund’s P/E ratio calculation excludes companies with zero or negative earnings (3% of portfolio holdings as of 6/30/13). | |||
| MORNINGSTAR STATISTICAL MEASURES1 | |||
| Sharpe Ratio | Standard Deviation | ||
| RHF | 0.49 | 25.18 | |
| Russell 2000 | 0.46 | 24.07 | |
| Category Median | 0.46 | 23.47 | |
| Best Quartile Breakpoint | 0.52 | 22.36 | |
1 Five years ended 6/30/13. Category Median and Best Quartile Breakpoint based on 348 small-cap objective funds (oldest class only) with at least five years of history. | |||
The Fund beat the Russell 2000 and performed within the top 50% of small-cap objective funds on a risk-adjusted basis, as shown by its Sharpe ratio. | |||
DOWN MARKET PERFORMANCE COMPARISON | |||
 | |||
| The Royce Funds 2013 Semiannual Report to Shareholders | 21 |
| Royce Value Plus Fund |
AVERAGE ANNUAL TOTAL RETURNS Through 6/30/13 | ||||||||||
| January–June 20131 | 12.36 | % | ||||||||
| One-Year | 22.27 | |||||||||
| Three-Year | 12.97 | |||||||||
| Five-Year | 4.75 | |||||||||
| 10-Year | 10.91 | |||||||||
| Since Inception (6/14/01) | 11.90 | |||||||||
| ANNUAL EXPENSE RATIO | ||||||||||
| Operating Expenses | 1.46 | % | ||||||||
| 1 Not annualized | ||||||||||
| CALENDAR YEAR TOTAL RETURNS | ||||||||||
| Year | RVP | Year | RVP | |||||||
| 2012 | 15.3 | % | 2006 | 19.3 | % | |||||
| 2011 | -10.0 | 2005 | 13.2 | |||||||
| 2010 | 19.7 | 2004 | 28.2 | |||||||
| 2009 | 41.4 | 2003 | 79.9 | |||||||
| 2008 | -41.1 | 2002 | -14.7 | |||||||
| 2007 | 3.2 | |||||||||
| TOP 10 POSITIONS % of Net Assets | ||||||||||
| Myriad Genetics | 2.0 | % | ||||||||
| Genpact | 2.0 | |||||||||
| LSI Corporation | 1.9 | |||||||||
| Rogers Corporation | 1.9 | |||||||||
| Infinera Corporation | 1.8 | |||||||||
| Carter’s | 1.7 | |||||||||
| Northern Trust | 1.7 | |||||||||
| Worthington Industries | 1.7 | |||||||||
| IPG Photonics | 1.6 | |||||||||
| Eagle Materials | 1.6 | |||||||||
| PORTFOLIO SECTOR BREAKDOWN % of Net Assets | ||||||||||
| Information Technology | 27.1 | % | ||||||||
| Industrials | 18.0 | |||||||||
| Financials | 12.6 | |||||||||
| Health Care | 12.4 | |||||||||
| Consumer Discretionary | 10.9 | |||||||||
| Materials | 5.5 | |||||||||
| Energy | 3.0 | |||||||||
| Consumer Staples | 1.9 | |||||||||
| Miscellaneous | 4.6 | |||||||||
| Cash and Cash Equivalents | 4.0 | |||||||||
 |
Manager’s Discussion A strong absolute performance from Royce Value Plus Fund (RVP) was only slightly diminished by its relative disadvantage in the first half. The Fund gained 12.4% for the year-to-date period ended June 30, 2013, trailing its small-cap benchmark, the Russell 2000 Index, which rose 15.9% for the same period. Over the last two years, we have stressed a more GARP (growth at a reasonable price) approach that focuses on businesses with greater current growth prospects that also possess attractive valuations. While this work has not paid off in terms of better relative performance of late, it has resulted in improved absolute results, which give us confidence in the Fund’s long-term potential going forward. We were encouraged by RVP’s strong second half of 2012, an admittedly short-term span in which the Fund beat its benchmark with a gain of 8.8% versus 7.2%. These results, along with RVP’s highly respectable showing in the first half of 2013, fuel our recent optimism. The first quarter of 2013 saw investors again favoring more defensive areas of the market and showing less interest in the more cyclical stocks that have met our criteria. The Fund underperformed the Russell 2000 in this arguably less discriminating period, gaining 9.4% compared to 12.4% for the small-cap index. Waves of volatility then swept through the markets in the second quarter. April was mostly bearish, May saw a rebound (a notably strong one for many cyclical stocks), and June was unsettled. The rate of the 10-year Treasury spiked 100 basis points between mid-May and mid-June, while the final weeks of the quarter also saw disappointing news out of China, trouble in emerging markets, and the Fed’s announcement that it would probably begin to reduce the amount of its monthly bond purchases later in the year. Considering all the noise, domestic equities weathered these storms rather well. The Fund rose 2.7% for the second quarter while the Russell 2000 advanced 3.1%. RVP outperformed its benchmark for the 10-year and since inception (6/14/01) periods ended June 30, 2013. (Market cycle results can be found on page 6.) The Fund’s average annual total return since inception was 11.9%. Each of the Fund’s equity sectors finished the first half in the black. The largest net contributions came from the Information Technology, Consumer Discretionary, Financials and Health Care sectors. Among the portfolio’s strongest industry groups were commercial banks, capital markets (both in Financials), semiconductors & semiconductor equipment, and specialty retail. Net losses at the industry level were comparatively modest. A resurgent |
| 22 | The Royce Funds 2013 Semiannual Report to Shareholders |
Performance and Portfolio Review housing market, now more than a full year into its recovery, could not help the share price of the Fund’s largest detractor, Quanex Building Products. Disappointing fiscal first-quarter results were announced in early March, which drove down the stock price of this maker of engineered and aluminum sheet products used mostly for doors and windows. While it serves the housing industry, the company typically does best in the more specific areas of renovation and remodeling, which have been slow to catch up with housing overall. We like the recent actions the company has taken, such as reducing costs, but are otherwise cautiously hanging on. During the first half we reduced the portfolio’s overall exposure to Materials companies, which included selling three precious metals miners that posted relatively large net losses for the period—McEwen Mining, Hochschild Mining, and Alamos Gold. Top-five holding Infinera Corporation manufactures digital optical telecommunications equipment, using photonic integrated circuits to create digital optical networks. The firm’s primary customers include carriers, data service providers, and cable operators. We like the company’s unique, chip-based technology and began adding shares in 2009 when it chose to bypass a business cycle in which carriers moved from 10 GB to 40 GB channels, instead choosing to focus on 100 GB channels. Its business has begun to recover as it now appears that its customers are embracing 100 GB channels. After posting impressive growth in the first half, the stock still looked as if it had room to run at the end of June. Immersion Corporation makes patented TouchSense technologies that allow devices to vibrate in correspondence with on-screen events. Profitable settlements with Google and Motorola over patent infringement late in 2012, along with a new long-term agreement with Samsung announced early in March, drove interest in its shares. Many of RVP’s recent GARP successes have come from our decision to focus on investment themes. Hoping to continue this trend, we have been adding to positions in companies involved in genetic testing, including top holding Myriad Genetics, part of an overall effort to increase the portfolio’s exposure to growth opportunities in the Health Care sector. With consumer confidence growing, we have also built positions in consumer-oriented names such as restaurant franchises—and first-half contributors—Red Robin Gourmet Burgers and Buffalo Wild Wings. We have also been actively looking for what we regard as attractively valued companies involved in ‘Big Data,’ which we see as a potential rapid-growth area in the next several years. |
GOOD IDEAS AT THE TIME | |
| Quanex Building Products | -0.30% |
| McEwen Mining | -0.25 |
| Hochschild Mining | -0.24 |
| Alamos Gold | -0.22 |
| Thoratec Corporation | -0.19 |
| 1 Net of dividends | |
| ROYCE VALUE PLUS FUND VS. RUSSELL 2000 Value of $10,000 Invested on 6/14/01 | |
 |
| Includes reinvestment of distributions. | |||
| PORTFOLIO DIAGNOSTICS | |||
| Fund Net Assets | $1,388 million | ||
| Number of Holdings | 103 | ||
| Turnover Rate | 28% | ||
| Average Market Capitalization1 | $1,774 million | ||
| Weighted Average P/E Ratio2,3 | 21.1x | ||
| Weighted Average P/B Ratio2 | 2.4x | ||
| U.S. Investments (% of Net Assets) | 86.8% | ||
| Non-U.S. Investments (% of Net Assets) | 9.2% | ||
| Symbol | |||
| Investment Class | RVPHX | ||
| Service Class | RYVPX | ||
| Consultant Class | RVPCX | ||
| Institutional Class | RVPIX | ||
| R Class | RVPRX | ||
| K Class | RVPKX | ||
1 Geometric Average. This weighted calculation uses each portfolio holding’s market cap in a way designed to not skew the effect of very large or small holdings; instead, it aims to better identify the portfolio’s center, which Royce believes offers a more accurate measure of average market cap than a simple mean or median. | |||
2 Harmonic Average. This weighted calculation evaluates a portfolio as if it were a single stock and measures it overall. It compares the total market value of the portfolio to the portfolio’s share in the earnings or book value, as the case may be, of its underlying stocks. | |||
3 The Fund’s P/E ratio calculation excludes companies with zero or negative earnings (17% of portfolio holdings as of 6/30/13). | |||
| MORNINGSTAR STATISTICAL MEASURES1 | |||
| Sharpe Ratio | Standard Deviation | ||
| RVP | 0.31 | 23.91 | |
| Russell 2000 | 0.46 | 24.07 | |
| Category Median | 0.46 | 23.47 | |
| Best Quartile Breakpoint | 0.52 | 22.36 | |
1 Five years ended 6/30/13. Category Median and Best Quartile Breakpoint based on 348 small-cap objective funds (oldest class only) with at least five years of history. | |||
The Fund produced lower volatility than the Russell 2000, as shown by its standard deviation. | |||
DOWN MARKET PERFORMANCE COMPARISON | |||
 | |||
| The Royce Funds 2013 Semiannual Report to Shareholders | 23 |
| Royce Premier Fund |
AVERAGE ANNUAL TOTAL RETURNS Through 6/30/13 | |||||||||||
| January–June 20131 | 7.88 | % | |||||||||
| One-Year | 17.13 | ||||||||||
| Three-Year | 15.74 | ||||||||||
| Five-Year | 6.72 | ||||||||||
| 10-Year | 11.98 | ||||||||||
| 15-Year | 10.67 | ||||||||||
| 20-Year | 11.77 | ||||||||||
| Since Inception (12/31/91) | 12.10 | ||||||||||
| ANNUAL EXPENSE RATIO | |||||||||||
| Operating Expenses | 1.06 | % | |||||||||
| 1 Not annualized | |||||||||||
| CALENDAR YEAR TOTAL RETURNS | |||||||||||
| Year | RPR | Year | RPR | ||||||||
| 2012 | 11.4 | % | 2004 | 22.8 | % | ||||||
| 2011 | -0.9 | 2003 | 38.7 | ||||||||
| 2010 | 26.5 | 2002 | -7.8 | ||||||||
| 2009 | 33.3 | 2001 | 9.6 | ||||||||
| 2008 | -28.3 | 2000 | 17.1 | ||||||||
| 2007 | 12.7 | 1999 | 11.5 | ||||||||
| 2006 | 8.8 | 1998 | 6.7 | ||||||||
| 2005 | 17.1 | 1997 | 18.4 | ||||||||
| TOP 10 POSITIONS % of Net Assets | |||||||||||
| Lincoln Electric Holdings | 3.8 | % | |||||||||
| Nu Skin Enterprises Cl. A | 3.4 | ||||||||||
| Thor Industries | 3.1 | ||||||||||
| Westlake Chemical | 2.8 | ||||||||||
| Alleghany Corporation | 2.7 | ||||||||||
| Myriad Genetics | 2.5 | ||||||||||
| Reliance Steel & Aluminum | 2.5 | ||||||||||
| Woodward | 2.3 | ||||||||||
| Unit Corporation | 1.8 | ||||||||||
| Towers Watson & Company Cl. A | 1.7 | ||||||||||
| PORTFOLIO SECTOR BREAKDOWN % of Net Assets | |||||||||||
| Industrials | 25.3 | % | |||||||||
| Information Technology | 18.9 | ||||||||||
| Consumer Discretionary | 12.1 | ||||||||||
| Financials | 10.6 | ||||||||||
| Materials | 10.2 | ||||||||||
| Energy | 7.9 | ||||||||||
| Consumer Staples | 6.2 | ||||||||||
| Health Care | 5.8 | ||||||||||
| Miscellaneous | 0.4 | ||||||||||
| Cash and Cash Equivalents | 2.6 | ||||||||||
 | |||||||||
Managers’ Discussion As was the case with 2012’s results, the first-half performance for Royce Premier Fund (RPR) left us with conflicting emotions. On the one hand, we found the Fund’s absolute result satisfying; on the other hand, its relative performance left a great deal to be desired. For the year-to-date period ended June 30, 2013, RPR gained 7.9%, well behind the 15.9% advance for its small-cap benchmark, the Russell 2000, over the same period. In light of the Fund’s strong showing in the second half of 2012, when RPR outpaced the small-cap index with a gain of 8.6% versus 7.2%, we were hoping for more of the same in 2013. That is, we wanted improved absolute and relative results, but also a market that would continue to be less enamored of high yield and instant growth and more attracted to companies with strong fundamentals. So while the first quarter of 2013 was bullish, it seemed to us like a different type of bull run than we saw in last year’s second half. That said, RPR was up 6.7% in the first quarter, trailing the Russell 2000, which climbed 12.4%. The second quarter brought higher volatility, more uncertainty, and enough variation in sector, industry, and company results to rekindle our hopes that the long period of close correlation and higher returns for lower-quality businesses was finally ending. Multiple rounds of QE and zero interest rates have removed much of the stigma of high leverage on corporate balance sheets. This has in turn created a lot of asset value distortion, a development that has hurt results for the kind of conservatively capitalized, well-run businesses we seek for the portfolio. With this in mind, we were cheered by signs in the second quarter, such as the sharp rise in the 10-year Treasury rate between mid-May and mid-June and resulting bond redemptions, that signaled a return to a more historically normal environment in which the Fed’s role is not nearly as large. However, for the second quarter the Fund again trailed its benchmark, up 1.1% versus 3.1%. While underperforming in short- and intermediate-term intervals, RPR did maintain a performance advantage over the Russell 2000 for longer-term periods. (The Fund’s recent market cycle results can be found on page 6.) RPR outpaced the Russell 2000 for the 10-, 15-, 20-year, and since inception (12/31/91) periods ended June 30, 2013. The Fund’s average annual total return since inception was 12.1%, a long-term record in which we take great pride. Holdings in the metals & mining industry created an outsized drag on first-half performance, which gave the Materials sector the unwanted distinction of posting considerably larger net losses than the portfolio’s only other sector to detract from results, Health Care, which finished the | |||||||||
| GOOD IDEAS THAT WORKED Top Contributors to Performance Year-to-Date through 6/30/131 | |||||||||||
| Nu Skin Enterprises Cl. A | 1.46% | ||||||||||
| Thor Industries | 0.77 | ||||||||||
| Lincoln Electric Holdings | 0.67 | ||||||||||
| Westlake Chemical | 0.60 | ||||||||||
| Sanderson Farms | 0.54 | ||||||||||
| 1 Includes dividends | |||||||||||
Important Performance and Expense Information All performance information in this Report reflects past performance, is presented on a total return basis, reflects the reinvestment of distributions, and does not reflect the deduction of taxes that a shareholder would pay on fund distributions or the redemption of fund shares. Past performance is no guarantee of future results. Investment return and principal value of an investment will fluctuate, so that shares may be worth more or less than their original cost when redeemed. Shares redeemed within 180 days of purchase may be subject to a 1% redemption fee payable to the Fund, which is not reflected in the performance shown above; if it were, performance would be lower. Current month-end performance may be higher or lower than performance quoted and may be obtained at www.roycefunds.com. All performance and risk information reflects results of the Investment Class (its oldest class). Operating expenses reflect the Fund’s total annual operating expenses for the Investment Class as of the Fund’s most current prospectus and include management fees and other expenses. Shares of RPR’s Service, Consultant, R, and K Classes bear an annual distribution expense that is not borne by the Investment Class. Regarding the two “Good Ideas” tables shown above, the sum of all contributors to, and all detractors from, performance for all securities in the portfolio would approximate the Fund’s year-to-date performance for 2013. | |||||||||||
| 24 | The Royce Funds 2013 Semiannual Report to Shareholders |
Performance and Portfolio Review period only slightly in the red. The six largest detractors in the first half were all metals businesses, and the top five were gold or silver miners. We sold our positions in Allied Nevada Gold, Pretium Resources, and Seabridge Gold. We chose to add shares of Pan American Silver and held our stake in Silver Standard Resources. The first half was a terrible period for mining companies, which dealt with rapidly falling gold and silver commodity prices, increased operational costs, and in many cases management upheavals. This brought the valuations in some instances down to levels that we have not seen since the worst days of the financial crisis. Pan American Silver saw that kind of steep decline, though we think that its positive earnings and dividend, along with solid mining operations in Mexico and Peru, give it strong turnaround potential when the industry recovers. The Fund’s three largest holdings at the end of June were also its three largest contributors. Each was also a long-term holding. We have owned shares of skin care and nutritional supplement business Nu Skin Enterprises, which made a sizable positive contribution, for more than a decade. The company’s stock suffered in 2012 in large part because its direct marketing distribution model led many investors to think of it along the same lines as Herbalife, which was not a favorable comparison considering that the latter firm was roundly accused of being a pyramid scheme. We never entertained such thoughts about Nu Skin. We knew its history well and maintained our high regard for its strong balance sheet, growing earnings, and increasing dividend. We also saw the company’s global expansion as a key strength, particularly its steadily developing presence in China. The company’s anti-aging products have helped recent earnings to top expectations. We modestly trimmed our position in the first half. One of 2012’s top contributors, Thor Industries remained in the fast lane during the first half of 2013. Our analysis of this RV and small- and mid-size bus maker, which we first bought in the portfolio in 2004, has not shifted. The company emerged in 2012 in what we thought was excellent condition following a five-year period of sluggish sales and intense industry consolidation. The company recently brought on some new faces in upper management, including a CEO who rose through the ranks of the company and has worked to make Thor’s business more focused and efficient just as demand is picking up. We think its stock has the potential to stay in high gear. Lincoln Electric Holdings is one of our longest-tenured holdings firm-wide. Its stock price began to soar in May. The welding and cutting products maker beat quarterly earnings estimates, in part by expanding margins in a lower-volume environment. |
GOOD IDEAS AT THE TIME | |
| Allied Nevada Gold | -0.69% |
| Pan American Silver | -0.54 |
| Silver Standard Resources | -0.53 |
| Pretium Resources | -0.53 |
| Seabridge Gold | -0.40 |
| 1 Net of dividends | |
| ROYCE PREMIER FUND VS. RUSSELL 2000 Value of $10,000 Invested on 12/31/91 | |
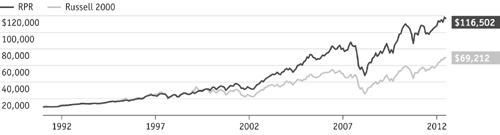 |
| Includes reinvestment of distributions. | |||
| PORTFOLIO DIAGNOSTICS | |||
| Fund Net Assets | $6,670 million | ||
| Number of Holdings | 78 | ||
| Turnover Rate | 7% | ||
| Average Market Capitalization1 | $2,599 million | ||
| Weighted Average P/E Ratio2,3 | 20.4x | ||
| Weighted Average P/B Ratio2 | 2.1x | ||
| U.S. Investments (% of Net Assets) | 86.3% | ||
| Non-U.S. Investments (% of Net Assets) | 11.1% | ||
| Symbol | |||
| Investment Class | RYPRX | ||
| Service Class | RPFFX | ||
| Consultant Class | RPRCX | ||
| Institutional Class | RPFIX | ||
| W Class | RPRWX | ||
| R Class | RPRRX | ||
| K Class | RPRKX | ||
1 Geometric Average. This weighted calculation uses each portfolio holding’s market cap in a way designed to not skew the effect of very large or small holdings; instead, it aims to better identify the portfolio’s center, which Royce believes offers a more accurate measure of average market cap than a simple mean or median. | |||
2 Harmonic Average. This weighted calculation evaluates a portfolio as if it were a single stock and measures it overall. It compares the total market value of the portfolio to the portfolio’s share in the earnings or book value, as the case may be, of its underlying stocks. | |||
3 The Fund’s P/E ratio calculation excludes companies with zero or negative earnings (3% of portfolio holdings as of 6/30/13). | |||
| MORNINGSTAR STATISTICAL MEASURES1 | |||
| Sharpe Ratio | Standard Deviation | ||
| RPR | 0.40 | 22.32 | |
| Russell 2000 | 0.46 | 24.07 | |
| Category Median | 0.46 | 23.47 | |
| Best Quartile Breakpoint | 0.52 | 22.36 | |
1 Five years ended 6/30/13. Category Median and Best Quartile Breakpoint based on 348 small-cap objective funds (lowest expense class only) with at least five years of history. | |||
The Fund produced lower volatility than the Russell 2000 and 75% of small-cap objective funds, as shown by its standard deviation. | |||
DOWN MARKET PERFORMANCE COMPARISON | |||
 | |||
| The Royce Funds 2013 Semiannual Report to Shareholders | 25 |
| Royce Special Equity Fund |
AVERAGE ANNUAL TOTAL RETURNS Through 6/30/13 | ||||||||||
| January–June 20131 | 12.40 | % | ||||||||
| One-Year | 22.34 | |||||||||
| Three-Year | 16.96 | |||||||||
| Five-Year | 11.67 | |||||||||
| 10-Year | 9.85 | |||||||||
| 15-Year | 9.87 | |||||||||
| Since Inception (5/1/98) | 9.69 | |||||||||
| ANNUAL EXPENSE RATIO | ||||||||||
| Operating Expenses | 1.13 | % | ||||||||
| 1 Not annualized | ||||||||||
| CALENDAR YEAR TOTAL RETURNS | ||||||||||
| Year | RSE | Year | RSE | |||||||
| 2012 | 15.4 | % | 2005 | -1.0 | % | |||||
| 2011 | 0.1 | 2004 | 13.9 | |||||||
| 2010 | 19.6 | 2003 | 27.6 | |||||||
| 2009 | 28.4 | 2002 | 15.3 | |||||||
| 2008 | -19.6 | 2001 | 30.7 | |||||||
| 2007 | 4.7 | 2000 | 16.3 | |||||||
| 2006 | 14.0 | 1999 | -9.6 | |||||||
| TOP 10 POSITIONS % of Net Assets | ||||||||||
| Bed Bath & Beyond | 4.2 | % | ||||||||
| Molex Cl. A | 4.1 | |||||||||
| Minerals Technologies | 4.0 | |||||||||
| EnerSys | 4.0 | |||||||||
| UniFirst Corporation | 3.9 | |||||||||
| Teradyne | 3.7 | |||||||||
| Meredith Corporation | 3.4 | |||||||||
| Finish Line (The) Cl. A | 3.2 | |||||||||
| American Eagle Outfitters | 3.1 | |||||||||
| Bio-Rad Laboratories Cl. A | 3.0 | |||||||||
| PORTFOLIO SECTOR BREAKDOWN % of Net Assets | ||||||||||
| Consumer Discretionary | 25.8 | % | ||||||||
| Industrials | 19.9 | |||||||||
| Information Technology | 19.1 | |||||||||
| Materials | 14.4 | |||||||||
| Consumer Staples | 6.0 | |||||||||
| Health Care | 4.8 | |||||||||
| Cash and Cash Equivalents | 10.0 | |||||||||
 |
Manager’s Discussion The first six months of 2013 offered two very different market climates, and we were pleased with the absolute results for Royce Special Equity Fund (RSE) in each of them. The Fund advanced 12.4% for the year-to-date period ended June 30, 2013, trailing its small-cap benchmark, the Russell 2000 Index, which was up 15.9% for the same period. The first quarter was a bullish period that in many ways continued the trend that began following the small-cap low on June 4, 2012. The difference was that RSE outpaced the Russell 2000 through the last six months of 2012, up 8.8% versus 7.2%, but trailed the small-cap index in early 2013. For the first quarter the Fund was up 8.7%, trailing the 12.4% gain for its benchmark. This was not surprising considering that much of small-cap’s first-quarter performance was led by companies that had the lowest returns on equity, high beta, and the smallest market caps. Stocks trading for less than $5 per share and that paid dividends also did very well. These are not the attributes we seek for RSE’s portfolio. In addition, areas such as Health Care and REITs, where we had little to no representation, respectively, saw rising share prices. The more volatile second quarter saw improvement on a relative basis. Although small-cap results were often dominated by many of the same lower-quality issues that led in the first quarter, there was enough differentiation at the company, industry, and sector levels between April 1 and June 30 for the Fund to narrowly outpace the small-cap index with a gain of 3.4% versus 3.1%. Better results in a bullish May (+4.5% versus +4.0%) and more uncertain June (-0.4% versus -0.5%) made the difference. The Fund also outperformed the Russell 2000 for the five-, 10-, 15-year, and since inception (5/1/98) periods ended June 30, 2013. RSE’s average annual total return since inception was 9.7%. We remain bullish and are not alone in this view, as evidenced by an article that appeared on June 16th in the New York Times, “Even Pessimists Feel Optimistic Over Economy.” In the piece, the author says that a number of economists in academia and on Wall Street are now predicting something the United States has not experienced in years—healthier, more lasting growth. This helps to explain why stocks remain in our view the best way to access yield, particularly when focusing, as we do, on those equities that generate substantial free cash flow and have the ability to grow their dividends. The market needed time to recalibrate and digest the Fed’s earlier-than-expected announcement of a potential reduction in QE. An analogy offered by investment research company I.S.I. was that the Fed has its foot on the gas pedal driving 85 mph and is contemplating slowing down to 60 mph. At this point, we think it is too early to jump out of that car. That said, there is no real |
| GOOD IDEAS THAT WORKED Top Contributors to Performance Year-to-Date through 6/30/131 | |||||||||||
| Meredith Corporation | 1.10% | ||||||||||
| Bed Bath & Beyond | 0.95 | ||||||||||
| UniFirst Corporation | 0.91 | ||||||||||
| EnerSys | 0.90 | ||||||||||
| Schweitzer-Mauduit International | 0.57 | ||||||||||
| 1 Includes dividends | |||||||||||
Important Performance and Expense Information All performance information in this Report reflects past performance, is presented on a total return basis, reflects the reinvestment of distributions, and does not reflect the deduction of taxes that a shareholder would pay on fund distributions or the redemption of fund shares. Past performance is no guarantee of future results. Investment return and principal value of an investment will fluctuate, so that shares may be worth more or less than their original cost when redeemed. Shares redeemed within 180 days of purchase may be subject to a 1% redemption fee payable to the Fund, which is not reflected in the performance shown above; if it were, performance would be lower. Current month-end performance may be higher or lower than performance quoted and may be obtained at www.roycefunds.com. All performance and risk information reflects results of the Investment Class (its oldest class). Operating expenses reflect the Fund’s total annual operating expenses for the Investment Class as of the Fund’s most current prospectus and include management fees and other expenses. Shares of RSE’s Service and Consultant Classes bear an annual distribution expense that is not borne by the Investment Class. Regarding the two “Good Ideas” tables shown above, the sum of all contributors to, and all detractors from, performance for all securities in the portfolio would approximate the Fund’s year-to-date performance for 2013. | |||||||||||
| 26 | The Royce Funds 2013 Semiannual Report to Shareholders |
Performance and Portfolio Review |
| precedent for what the Fed is doing. In the end, it will all boil down to the economic outlook. It should be remembered, however, that the stock market has been trending higher as long as the Fed’s balance sheet has been expanding. Even with tapering, it would still be expanding, just not as rapidly. While many were hoping for a correction, we suspect we were among the relatively few who really bought during the June selloff. The rise in rates did not bother us, as the level is too far away to pose a real threat to equities. We think the 10-year Treasury needs to be in the 5% region before it is a problem historically. We also believe further decoupling will occur with the trend in equities up and bonds flat to down. In addition, we suspect the decoupling of the U.S. market with the rest of the world is likely to continue, at least for the time being. We are known for worrying and, despite our bullish stance, we still keep a watchful eye on issues that could cause us to change that view. Among the more notable potential issues are a poorly executed Fed tapering, another euro crisis, a hard landing in China, and unforeseen events such as terrorism, earthquakes, bird flu, and geopolitical risk as a result of unstable or extreme governments. At the same time, we cannot ignore the many domestic positives besides improvements in energy production and manufacturing. This list would include the decline in the budget deficit as a percentage of GDP, our debt to GDP having stabilized at a reasonable figure (70%), and the slowing of healthcare costs, which is reducing Medicare’s unfunded liabilities. We believe that the portfolio remains well-positioned for a market in which dividends and quality matter and that looks as if it is headed higher. However, we also recognize that volatility will be higher as we travel a new, uncharted road. Each of the Fund’s six equity sectors posted net gains in the first half. Consumer Discretionary led by a wide margin, though Industrials, Information Technology, Materials, and Consumer Staples also made strong contributions. The top performers were media and marketing company (and top-ten holding) Meredith Corporation and home merchandise retailer Bed Bath & Beyond, which ended June as the Fund’s second-largest holding. The two top detractors were clothing retailer American Eagle Outfitters, which was a top contributor in 2012, and safety and security products maker Brady Corporation. Net losses in the portfolio overall were modest. |
GOOD IDEAS AT THE TIME | |
| American Eagle Outfitters | -0.34% |
| Brady Corporation Cl. A | -0.03 |
| Ampco-Pittsburgh | -0.03 |
| Carlisle Companies | -0.02 |
| Schulman (A.) | -0.01 |
| 1 Net of dividends | |
| ROYCE SPECIAL EQUITY FUND VS. RUSSELL 2000 Value of $10,000 Invested on 5/1/98 | |
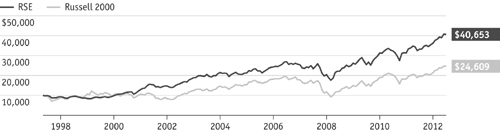 |
| Includes reinvestment of distributions. |
| PORTFOLIO DIAGNOSTICS | |||||
| Fund Net Assets | $3,338 million | ||||
| Number of Holdings | 48 | ||||
| Turnover Rate | 14% | ||||
| Average Market Capitalization1 | $1,799 million | ||||
| Weighted Average P/E Ratio2,3 | 17.3x | ||||
| Weighted Average P/B Ratio2 | 2.1x | ||||
| U.S. Investments (% of Net Assets) | 90.0% | ||||
| Non-U.S. Investments (% of Net Assets) | 0.0% | ||||
| Symbol | |||||
| Investment Class | RYSEX | ||||
| Service Class | RSEFX | ||||
| Consultant Class | RSQCX | ||||
| Institutional Class | RSEIX | ||||
1 Geometric Average. This weighted calculation uses each portfolio holding’s market cap in a way designed to not skew the effect of very large or small holdings; instead, it aims to better identify the portfolio’s center, which Royce believes offers a more accurate measure of average market cap than a simple mean or median. | |||||
2 Harmonic Average. This weighted calculation evaluates a portfolio as if it were a single stock and measures it overall. It compares the total market value of the portfolio to the portfolio’s share in the earnings or book value, as the case may be, of its underlying stocks. | |||||
3 The Fund’s P/E ratio calculation excludes companies with zero or negative earnings (3% of portfolio holdings as of 6/30/13). | |||||
| MORNINGSTAR STATISTICAL MEASURES1 | |||||
| Sharpe Ratio | Standard Deviation | ||||
| RSE | 0.71 | 17.60 | |||
| Russell 2000 | 0.46 | 24.07 | |||
| Category Median | 0.46 | 23.47 | |||
| Best Decile Breakpoint | 0.59 | 21.05 | |||
1 Five years ended 6/30/13 Category Median and Best Decile Breakpoint based on 348 small-cap objective funds (oldest class only) with at least five years of history. | |||||
| |||||
DOWN MARKET PERFORMANCE COMPARISON All Down Periods of 7.5% or Greater Over the Last 7 Years, in Percentages(%) 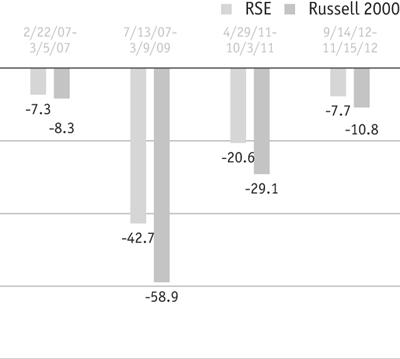 | |||||
| The Royce Funds 2013 Semiannual Report to Shareholders | 27 |
| Royce Value Fund |
AVERAGE ANNUAL TOTAL RETURNS Through 6/30/13 | |||||||||||
| January–June 20131 | 8.47 | % | |||||||||
| One-Year | 20.82 | ||||||||||
| Three-Year | 12.59 | ||||||||||
| Five-Year | 3.94 | ||||||||||
| 10-Year | 11.67 | ||||||||||
| Since Inception (6/14/01) | 10.76 | ||||||||||
| ANNUAL EXPENSE RATIO | |||||||||||
| Operating Expenses | 1.45 | % | |||||||||
| 1 Not annualized | |||||||||||
| CALENDAR YEAR TOTAL RETURNS | |||||||||||
| Year | RVV | Year | RVV | ||||||||
| 2012 | 9.6 | % | 2006 | 16.8 | % | ||||||
| 2011 | -7.4 | 2005 | 17.2 | ||||||||
| 2010 | 25.0 | 2004 | 30.9 | ||||||||
| 2009 | 44.7 | 2003 | 54.3 | ||||||||
| 2008 | -34.2 | 2002 | -23.5 | ||||||||
| 2007 | 3.8 | ||||||||||
| TOP 10 POSITIONS % of Net Assets | |||||||||||
| Reinsurance Group of America | 3.1 | % | |||||||||
| Nu Skin Enterprises Cl. A | 3.0 | ||||||||||
| Federated Investors Cl. B | 3.0 | ||||||||||
| GameStop Corporation Cl. A | 3.0 | ||||||||||
| Unit Corporation | 2.9 | ||||||||||
| Helmerich & Payne | 2.9 | ||||||||||
| American Eagle Outfitters | 2.9 | ||||||||||
| Buckle (The) | 2.9 | ||||||||||
| NETGEAR | 2.8 | ||||||||||
| Genworth MI Canada | 2.7 | ||||||||||
| PORTFOLIO SECTOR BREAKDOWN % of Net Assets | |||||||||||
| Consumer Discretionary | 28.5 | % | |||||||||
| Information Technology | 19.9 | ||||||||||
| Financials | 12.9 | ||||||||||
| Energy | 9.4 | ||||||||||
| Industrials | 8.9 | ||||||||||
| Materials | 7.1 | ||||||||||
| Health Care | 6.6 | ||||||||||
| Consumer Staples | 3.0 | ||||||||||
| Cash and Cash Equivalents | 3.7 | ||||||||||
 | |||||||||
Manager’s Discussion A strong second quarter on both an absolute and relative basis provided Royce Value Fund (RVV) with a solid return on an absolute basis through the end of June, though it was not enough to push first-half results past its benchmark. The Fund gained 8.5% for the year-to-date period ended June 30, 2013 versus a 15.9% advance for its small-cap benchmark, the Russell 2000 Index, for the same period. As was the case through much of 2012’s second half, 2013 began with investors seeming to ignore macro headlines. The result was a bullish first quarter for most stocks. Unfortunately, RVV’s participation in this up phase did not match its sterling results in last year’s final six months. The Fund rose 3.1% in the first quarter compared to a 12.4% gain for the small-cap index. The Fund’s performance over the last two calendar years was simply not as strong as we would have liked. This led us to make changes to the portfolio during the first quarter of 2013. Some of these changes began to bear fruit immediately and were a factor in the Fund’s second-quarter results. RVV outpaced the Russell 2000 in the second quarter, up 5.2% versus 3.1%. However, one strong absolute and relative quarter was not enough to improve relative results over the last one-, three-, and five-year periods. Recent market cycle results through June 30, 2013, which can be found on page 6, were also underwhelming on a relative basis. Over longer-term periods, we remain pleased with RVV’s performance. The Fund outperformed the Russell 2000 for the 10-year and since inception (6/14/01) periods ended June 30, 2013. RVV’s average annual total return since inception was 10.8%. There were three significant changes to the portfolio in the first half. First, Whitney George, who served as co-manager from 2004-2012, became assistant portfolio manager on March 6, 2013. Jay Kaplan now serves as portfolio manager after having served as co-manager from 2003 through 2012. Second, we substantially reduced the Fund’s exposure to the Materials sector, which accounted for 17.9% of net assets at December 31, 2012 but only 7.1% of net assets at the end of June 2013. Finally, we increased the portfolio’s exposure to U.S. stocks, which went from 81.1% of net assets as of December 31, 2012 to 89.4% of net assets at the end of June 2013. This was a fortuitously timed shift as non-U.S. stocks slumped in the second quarter. Many of RVV’s non-U.S. holdings that were sold came from the metals & mining and capital markets industries. The first of these groups was in the Materials sector and has been struggling for a while. However, the decision to sell was based on a diminished emphasis on most commodity-based businesses—energy, steel, and chemicals being the exceptions. The general dependence of commodity-based industries on capital markets and the cash flow characteristics of many of these | |||||||||
| GOOD IDEAS THAT WORKED Top Contributors to Performance Year-to-Date through 6/30/131 | |||||||||||
| GameStop Corporation Cl. A | 1.73% | ||||||||||
| Nu Skin Enterprises Cl. A | 1.43 | ||||||||||
| Federated Investors Cl. B | 0.96 | ||||||||||
| Oil States International | 0.91 | ||||||||||
| Reinsurance Group of America | 0.85 | ||||||||||
| 1 Includes dividends | |||||||||||
Important Performance and Expense Information All performance information in this Report reflects past performance, is presented on a total return basis, reflects the reinvestment of distributions, and does not reflect the deduction of taxes that a shareholder would pay on fund distributions or the redemption of fund shares. Past performance is no guarantee of future results. Investment return and principal value of an investment will fluctuate, so that shares may be worth more or less than their original cost when redeemed. Shares redeemed within 180 days of purchase may be subject to a 1% redemption fee payable to the Fund, which is not reflected in the performance shown above; if it were, performance would be lower. Current month-end performance may be higher or lower than performance quoted and may be obtained at www.roycefunds.com. All performance and risk information reflects results of the Service Class (its oldest class). Operating expenses reflect the Fund’s total annual operating expenses for the Service Class as of the Fund’s most current prospectus and include management fees, 12b-1 distribution and service fees, and other expenses. Shares of RVV’s Consultant and R Classes bear an annual distribution expense that is higher than that of the Service Class. Regarding the two “Good Ideas” tables shown above, the sum of all contributors to, and all detractors from, performance for all securities in the portfolio would approximate the Fund’s year-to-date performance for 2013. | |||||||||||
| 28 | The Royce Funds 2013 Semiannual Report to Shareholders |
Performance and Portfolio Review businesses were a growing source of concern. This led us to part ways with mining companies Allied Nevada Gold, Silver Standard Resources, Hochschild Mining, and Seabridge Gold, among others. Within the Energy sector, where most of the portfolio’s exposure is in services companies, the timeline between drilling and extracting is typically far shorter than for precious metals, making the time and capital commitments less risky and more short-term in nature. This allows energy companies to self-correct more quickly. We also like that energy is a consumable commodity that is in high demand. GameStop Corporation made the largest positive contribution to performance in the first half. The company is a video game retailer that sells new and pre-owned gaming products, including hardware and software. Questions lingered over the last couple of years as to whether its business model was viable in an increasingly app- and download-driven world. The announcement from Microsoft and Sony that they would be introducing updated consoles assured investors that there would be another cycle for the company in the holiday season later this year. More important, the new consoles also helped to ensure that the company’s video game exchange business can continue to thrive, overcoming fears that GameStop would go the same route as Blockbuster Video. In addition, the company does a brisk business selling the consoles themselves. The GameStop story was a situation where what happened to the company was exactly what we hoped would happen, which was a very pleasing outcome. We took some gains in the first half, but it was RVV’s fourth-largest holding at the end of June. The Fund’s second-largest holding at the end of the period, Nu Skin Enterprises also felt the brunt of market skepticism before rebounding soundly in the first half. Nu Skin is a personal care company with a niche in anti-aging products. The company’s revenues are split close to evenly between its personal care line and its nutritional supplements. It sells its products through a direct marketing strategy. This last part convinced many investors over the last few years that Nu Skin was essentially the same kind of company as Herbalife, which was not a desirable association considering that the latter endured accusations of being a pyramid scheme. We held on, liking the company’s global reach, quality products, solid earnings and cash flows, and low-debt balance sheet. Once investors were convinced of Nu Skin’s viability, its shares began to climb, helped by the announcement of a five-year business plan for China. We took some profits in March. We built our position in wireless products maker NETGEAR as its business and stock price have slumped. We think highly of its potential in a world of ever-growing demand for the wireless products that are the company’s specialty. |
GOOD IDEAS AT THE TIME | |
| Allied Nevada Gold | -0.86% |
| NETGEAR | -0.60 |
| Silver Standard Resources | -0.42 |
| Hochschild Mining | -0.42 |
| Seabridge Gold | -0.42 |
| 1 Net of dividends | |
| ROYCE VALUE FUND VS. RUSSELL 2000 Value of $10,000 Invested on 6/14/01 | |
 |
| Includes reinvestment of distributions. | |||
| PORTFOLIO DIAGNOSTICS | |||
| Fund Net Assets | $1,175 million | ||
| Number of Holdings | 53 | ||
| Turnover Rate | 29% | ||
| Average Market Capitalization1 | $2,507 million | ||
| Weighted Average P/E Ratio2,3 | 13.8x | ||
| Weighted Average P/B Ratio2 | 1.7x | ||
| U.S. Investments (% of Net Assets) | 89.5% | ||
| Non-U.S. Investments (% of Net Assets) | 6.8% | ||
| Symbol | |||
| Investment Class | RVVHX | ||
| Service Class | RYVFX | ||
| Consultant Class | RVFCX | ||
| Institutional Class | RVFIX | ||
| R Class | RVVRX | ||
| K Class | RVFKX | ||
1 Geometric Average. This weighted calculation uses each portfolio holding’s market cap in a way designed to not skew the effect of very large or small holdings; instead, it aims to better identify the portfolio’s center, which Royce believes offers a more accurate measure of average market cap than a simple mean or median. | |||
2 Harmonic Average. This weighted calculation evaluates a portfolio as if it were a single stock and measures it overall. It compares the total market value of the portfolio to the portfolio’s share in the earnings or book value, as the case may be, of its underlying stocks. | |||
3 The Fund’s P/E ratio calculation excludes companies with zero or negative earnings (3% of portfolio holdings as of 6/30/13). | |||
| MORNINGSTAR STATISTICAL MEASURES1 | |||
| Sharpe Ratio | Standard Deviation | ||
| RVV | 0.28 | 24.60 | |
| Russell 2000 | 0.46 | 24.07 | |
| Category Median | 0.46 | 23.47 | |
| Best Quartile Breakpoint | 0.52 | 22.36 | |
1 Five years ended 6/30/13. Category Median and Best Quartile Breakpoint based on 348 small-cap objective funds (oldest class only) with at least five years of history. | |||
DOWN MARKET PERFORMANCE COMPARISON | |||
 | |||
| The Royce Funds 2013 Semiannual Report to Shareholders | 29 |
| Royce 100 Fund |
AVERAGE ANNUAL TOTAL RETURNS Through 6/30/13 | |||||||||||
| January–June 20131 | 10.56 | % | |||||||||
| One-Year | 21.20 | ||||||||||
| Three-Year | 14.04 | ||||||||||
| Five-Year | 8.49 | ||||||||||
| 10-Year | 10.75 | ||||||||||
| Since Inception (6/30/03) | 10.75 | ||||||||||
| ANNUAL EXPENSE RATIO | |||||||||||
| Operating Expenses | 1.48 | % | |||||||||
| 1 Not annualized | |||||||||||
| CALENDAR YEAR TOTAL RETURNS | |||||||||||
| Year | ROH | Year | ROH | ||||||||
| 2012 | 11.5 | % | 2007 | 7.3 | % | ||||||
| 2011 | -6.5 | 2006 | 13.7 | ||||||||
| 2010 | 24.8 | 2005 | 14.9 | ||||||||
| 2009 | 38.0 | 2004 | 27.2 | ||||||||
| 2008 | -29.2 | ||||||||||
| TOP 10 POSITIONS % of Net Assets | |||||||||||
| Federated Investors Cl. B | 1.9 | % | |||||||||
| Towers Watson & Company Cl. A | 1.8 | ||||||||||
| Jacobs Engineering Group | 1.8 | ||||||||||
| Forward Air | 1.7 | ||||||||||
| PerkinElmer | 1.7 | ||||||||||
| Pason Systems | 1.7 | ||||||||||
| Helmerich & Payne | 1.6 | ||||||||||
| ADTRAN | 1.6 | ||||||||||
| National Instruments | 1.6 | ||||||||||
| Reliance Steel & Aluminum | 1.5 | ||||||||||
| PORTFOLIO SECTOR BREAKDOWN % of Net Assets | |||||||||||
| Industrials | 30.8 | % | |||||||||
| Information Technology | 22.7 | ||||||||||
| Consumer Discretionary | 9.4 | ||||||||||
| Energy | 9.1 | ||||||||||
| Materials | 8.5 | ||||||||||
| Financials | 7.1 | ||||||||||
| Health Care | 3.4 | ||||||||||
| Consumer Staples | 2.4 | ||||||||||
| Miscellaneous | 4.6 | ||||||||||
| Cash and Cash Equivalents | 2.0 | ||||||||||
 | |||||||||
Managers’ Discussion Royce 100 Fund (ROH) did fine in the first half on an absolute basis, though we were disappointed that it came up short against its benchmark. For the year-to-date period ended June 30, 2013, the Fund rose 10.6% compared to a gain of 15.9% for its small-cap benchmark, the Russell 2000 Index, for the same period. ROH finished 2012 on a high note, outperforming the small-cap index through the last six months of the year with a 9.6% advance compared to a 7.2% gain for the benchmark. However, the Fund could not maintain this pace through the first quarter of 2013. The period was more or less consistently bullish, and though ROH did well on an absolute basis, it lost ground against the Russell 2000, gaining 11.1% versus 12.4% for the small-cap index. The Fund fell further behind in the second quarter, which was unfortunate enough, but we were particularly frustrated that ROH underperformed the benchmark during the more volatile months of the second quarter. In April the Fund fell 3.2% versus a loss of 0.4% for the Russell 2000; in June ROH slipped 2.0% compared to a 0.5% decline of the small-cap index. The Fund did beat the benchmark in May, a bullish month in which ROH was up 4.9% compared to 4.0%. For the second quarter as a whole the Fund was down 0.5% while the Russell 2000 gained 3.1%. Much of this decline came from the portfolio’s holdings in the metals & mining industry and the electronic equipment, instruments & components group. Results over the last full market cycle were strong on a relative basis and respectable on an absolute scale. From the previous small-cap market peak on July 13, 2007 through the small-cap peak on April 29, 2011, ROH was up 27.6% versus 6.6% for the small-cap index. (Please see page 6 for more market cycle results.) The Fund, which marked its first full decade of history at the end of the period, outperformed the Russell 2000 for the 10-year and since inception (6/30/03) periods ended June 30, 2013. ROH’s average annual total return since inception was 10.8%. Seven of the Fund’s eight equity sectors made net contributions to first-half results, with Industrials, Information Technology, and Financials leading. Materials posted a comparatively modest net loss, with the metals & mining group detracting most from year-to-date performance. Precious metals companies faced weaker demand from a slower- | |||||||||
| 30 | The Royce Funds 2013 Semiannual Report to Shareholders |
Performance and Portfolio Review growing China. In addition, higher mining costs worked to reduce margins and cash flows while also depressing overall project economics. Confident in their long-term prospects, we added to our position in Randgold Resources, a Jersey-based gold miner with operations in Africa, and made only a slight trim to Fresnillo, a London-based gold and silver miner with most of its properties in Mexico. We also made a small trim to Major Drilling Group International, a Canadian provider of contract drilling services for miners. The Fund’s top-three contributors were also top-three positions at the end of June. We remain very fond of both the core business and long-term prospects for asset manager and money market specialist Federated Investors. Its shares benefited from the “taper tantrum” pulled by the financial markets—for example, the 50 basis point rise in the 10-year Treasury note and the negative results for equity bond proxies such as REITs and Utilities in the second quarter—as rising rates that ultimately lift short rates should enable the firm to eliminate fee waivers and thus unlock earnings that have been hampered by the Fed’s zero interest rate policy. Although we trimmed our position in the first half, we held a large stake at the end of the period, when it was ROH’s largest holding. We still liked the valuation and growth potential for Towers Watson & Company at the end of June. This company from the Industrials sector provides human resource and financial consulting services. It offers employee benefit programs, develops attraction, retention, and reward strategies, and provides other related services. Its price rose more or less steadily through the first half. The company continues to deliver steady growth in its benefits consulting business, generates strong free cash flow, and showed solid initial enrollments in its exchange solutions business as it gains traction in the early innings of healthcare exchange implementation. Earnings have been strong, revenues have grown, and cash flows have been solid. In May the firm’s management also raised adjusted EPS (earnings per share) guidance for fiscal 2013. We have liked its core business and steady earnings for many years, having initiated our first position in 2003. We have held a position continuously since the summer of 2012. We first bought shares of Jacobs Engineering Group late in 2010. The company provides a range of engineering, construction, and technical services to industrial, commercial, and government clients around the world. As evidenced by recent backlog growth, the company looks well-positioned to benefit from the recovery in capital spending here in the U.S. and the ripple effect (in the form of infrastructure improvements) related to the reviving energy industry. Utilization rates have recently improved, driving margin expansion and revenue growth. |
 |
| Includes reinvestment of distributions. | |||
| PORTFOLIO DIAGNOSTICS | |||
| Fund Net Assets | $275 million | ||
| Number of Holdings | 98 | ||
| Turnover Rate | 14% | ||
| Average Market Capitalization1 | $2,181 million | ||
| Weighted Average P/E Ratio2,3 | 21.7x | ||
| Weighted Average P/B Ratio2 | 2.1x | ||
| U.S. Investments (% of Net Assets) | 90.4% | ||
| Non-U.S. Investments (% of Net Assets) | 7.6% | ||
| Symbol | |||
| Investment Class | ROHHX | ||
| Service Class | RYOHX | ||
| R Class | ROHRX | ||
| K Class | ROHKX | ||
1 Geometric Average. This weighted calculation uses each portfolio holding’s market cap in a way designed to not skew the effect of very large or small holdings; instead, it aims to better identify the portfolio’s center, which Royce believes offers a more accurate measure of average market cap than a simple mean or median. | |||
2 Harmonic Average. This weighted calculation evaluates a portfolio as if it were a single stock and measures it overall. It compares the total market value of the portfolio to the portfolio’s share in the earnings or book value, as the case may be, of its underlying stocks. | |||
3 The Fund’s P/E ratio calculation excludes companies with zero or negative earnings (8% of portfolio holdings as of 6/30/13). | |||
| MORNINGSTAR STATISTICAL MEASURES1 | |||
| Sharpe Ratio | Standard Deviation | ||
| ROH | 0.46 | 23.20 | |
| Russell 2000 | 0.46 | 24.07 | |
| Category Median | 0.46 | 23.47 | |
| Best Quartile Breakpoint | 0.52 | 22.36 | |
1 Five years ended 6/30/13. Category Median and Best Quartile Breakpoint based on 348 small-cap objective funds (oldest class only) with at least five years of history. | |||
The Fund produced lower volatility than the Russell 2000 and 50% of small-cap objective funds, as shown by its standard deviation. | |||
DOWN MARKET PERFORMANCE COMPARISON | |||
 | |||
| The Royce Funds 2013 Semiannual Report to Shareholders | 31 |
| Royce Total Return Fund |
AVERAGE ANNUAL TOTAL RETURNS Through 6/30/13 | ||||||||||
| January–June 20131 | 12.85 | % | ||||||||
| One-Year | 23.94 | |||||||||
| Three-Year | 16.52 | |||||||||
| Five-Year | 7.67 | |||||||||
| 10-Year | 9.05 | |||||||||
| 15-Year | 8.77 | |||||||||
| Since Inception (12/15/93) | 11.11 | |||||||||
| ANNUAL EXPENSE RATIO | ||||||||||
| Operating Expenses | 1.14 | % | ||||||||
| 1 Not annualized | ||||||||||
| CALENDAR YEAR TOTAL RETURNS | ||||||||||
| Year | RTR | Year | RTR | |||||||
| 2012 | 14.4 | % | 2004 | 17.5 | % | |||||
| 2011 | -1.7 | 2003 | 30.0 | |||||||
| 2010 | 23.5 | 2002 | -1.6 | |||||||
| 2009 | 26.2 | 2001 | 14.8 | |||||||
| 2008 | -31.2 | 2000 | 19.4 | |||||||
| 2007 | 2.4 | 1999 | 1.5 | |||||||
| 2006 | 14.5 | 1998 | 4.8 | |||||||
| 2005 | 8.2 | 1997 | 23.7 | |||||||
| TOP 10 POSITIONS % of Net Assets | ||||||||||
| E-L Financial | 1.1 | % | ||||||||
| Erie Indemnity Cl. A | 1.0 | |||||||||
| Balchem Corporation | 0.9 | |||||||||
| Federated Investors Cl. B | 0.9 | |||||||||
| Nordson Corporation | 0.9 | |||||||||
| SEI Investments | 0.8 | |||||||||
| Nu Skin Enterprises Cl. A | 0.8 | |||||||||
| Reinsurance Group of America | 0.8 | |||||||||
| Buckle (The) | 0.8 | |||||||||
| GameStop Corporation Cl. A | 0.8 | |||||||||
| PORTFOLIO SECTOR BREAKDOWN % of Net Assets | ||||||||||
| Financials | 25.8 | % | ||||||||
| Industrials | 19.1 | |||||||||
| Consumer Discretionary | 12.6 | |||||||||
| Information Technology | 7.3 | |||||||||
| Materials | 6.9 | |||||||||
| Health Care | 5.8 | |||||||||
| Energy | 4.9 | |||||||||
| Consumer Staples | 3.3 | |||||||||
| Utilities | 2.8 | |||||||||
| Telecommunication Services | 0.7 | |||||||||
| Diversified Investment Companies | 0.3 | |||||||||
| Miscellaneous | 1.3 | |||||||||
| Corporate Bond | 0.1 | |||||||||
| Cash and Cash Equivalents | 9.1 | |||||||||
 |
Managers’ Discussion Investors’ ongoing hunger for yield did not lead quite enough of them to dividend-paying small-caps during the first half of 2013. Royce Total Return Fund (RTR), which invests primarily in dividend-paying small- and micro-cap companies, rose a more-than-respectable 12.8% for the year-to-date period ended June 30, 2013, trailing the 15.9% advance of its benchmark, the Russell 2000 Index, for the same period. We were satisfied with the Fund’s performance on an absolute level. Although we were hoping for a stronger relative showing, first-half returns were consistent with RTR’s historical results in bull phases. The Fund also displayed absolute and relative strength during the second half of 2012 by outpacing its benchmark (+9.8% versus +7.2%). We took this as a welcome sign that the market was at last freeing itself from the risk-on/risk-off pattern of the past few years, which have not been very kind to disciplined, bottom-up active management approaches such as ours. In fact, these years have shown more favor to highly leveraged and/or high-yielding companies. After deviating from this pattern in the second half of 2012, the first quarter of 2013 saw a resumption of this pattern. RTR climbed 10.6% in the first quarter while the Russell 2000 rose 12.4%. Volatility then returned to the markets with a vengeance in the second quarter. The Fund did well initially, eking out a 0.5% gain in an otherwise bearish April in which the small-cap index slipped 0.4%. May then saw mostly rising prices, with several indexes hitting new highs before the arrival of a more uncertain June. The end result was a second-quarter disadvantage for RTR versus its benchmark, up 2.0% versus 3.1%. Recent underperformance has eroded the Fund’s once-strong relative advantages over certain intermediate-, long-term, and market cycle periods. (Market cycle results can be found on page 6.) RTR outpaced the Russell 2000 for the 15-year and since inception (12/15/93) periods ended June 30, 2013. The Fund’s average annual total return since inception was 11.1%. Within the small-cap index, non-dividend payers outperformed companies that pay them in the first half. This may seem odd in a world of zero interest rates, where one might think that a portfolio comprised of dividend-paying equities could outperform. Yet over the last two-and-a-half years greater numbers of investors have flocked to higher-yielding equities of lower quality, such as REITs, MLPs, (master limited partnerships) and Utilities, and/or to companies that pay no dividends, carry sizable debt, and have low returns on invested capital. The potential for |
| GOOD IDEAS THAT WORKED Top Contributors to Performance Year-to-Date through 6/30/131 | |||||||||||
| Nu Skin Enterprises Cl. A | 0.44% | ||||||||||
| GameStop Corporation Cl. A | 0.41 | ||||||||||
| E-L Financial | 0.32 | ||||||||||
| Federated Investors Cl. B | 0.31 | ||||||||||
| Towers Watson & Company Cl. A | 0.25 | ||||||||||
| 1 Includes dividends | |||||||||||
Important Performance and Expense Information All performance information in this Report reflects past performance, is presented on a total return basis, reflects the reinvestment of distributions, and does not reflect the deduction of taxes that a shareholder would pay on fund distributions or the redemption of fund shares. Past performance is no guarantee of future results. Investment return and principal value of an investment will fluctuate, so that shares may be worth more or less than their original cost when redeemed. Shares redeemed within 180 days of purchase may be subject to a 1% redemption fee payable to the Fund, which is not reflected in the performance shown above; if it were, performance would be lower. Current month-end performance may be higher or lower than performance quoted and may be obtained at www.roycefunds.com. All performance and risk information reflects results of the Investment Class (its oldest class). Operating expenses reflect the Fund’s total annual operating expenses for the Investment Class as of the Fund’s most current prospectus and include management fees, other expenses, and acquired fund fees and expenses. Acquired fund fees and expenses reflect the estimated amount of the fees and expenses incurred indirectly by the Fund through its investments in mutual funds, hedge funds, private equity funds, and other investment companies. Shares of RTR’s Service, Consultant, R, and K Classes bear an annual distribution expense that is not borne by the Investment Class. Regarding the two “Good Ideas” tables shown above, the sum of all contributors to, and all detractors from, performance for all securities in the portfolio would approximate the Fund’s year-to-date performance for 2013. | |||||||||||
| 32 | The Royce Funds 2013 Semiannual Report to Shareholders |
Performance and Portfolio Review |
| high growth and the desire for high yield have outweighed other factors, such as those qualities that we hold dear—strong balance sheets, high returns on invested capital, strong cash flows, and, in many cases, growing dividends. While this has provoked some frustration for us when reviewing the last few years’ worth of relative returns, the situation has also created opportunities for us to find better businesses—those that possess those key quality attributes we just listed. As a result, we think the portfolio is very well positioned for the more historically typical market we anticipate going forward, in which rising interest rates and a growing, less Fed-dependent economy are likely to steer investors to what we regard as better businesses. The Fund’s largest net losses at the individual company level were modest compared to those stocks that made net contributions. The share price of wireless products maker NETGEAR slumped through much of the first half, primarily due to a product execution problem in its storage business. This hurt fiscal first-quarter earnings, and an acquisition in April of select assets of the Sierra Wireless AirCard business gave some investors the idea that NETGEAR was too exposed to the lower-margin wireless service provider segment. Ever contrarian, we built our stake because we think the firm is well positioned to benefit from ongoing global growth for all things wireless. Our confidence in Nam Tai Electronics fell in line with the decline in its share price. The company makes cell phones, palm-sized PCs, and components including LCD (liquid crystal display) modules and panels. Slumping demand for LCD modules had the company ponder a halt in production, which sparked a significant sell-off in late April. We began to reduce our stake shortly afterward. Ten of the Fund’s equity sectors finished the first half in the black—only Diversified Investment Companies posted a net loss, which was quite modest. The Fund’s top contributor was Nu Skin Enterprises, which makes skin care treatments and nutritional supplements with a niche in anti-aging products. It sells using a direct marketing strategy. This last part led many investors in 2012 to doubt the viability of the firm’s business model. We held on, liking the company’s global reach, quality products, solid earnings and cash flows, and low-debt balance sheet. Once investors were convinced of Nu Skin’s viability, its shares began to climb, helped by the announcement of a five-year business plan for China. GameStop Corporation sells new and pre-owned gaming products, including hardware and software. Its business model also came under fire, with investors fearing that its video game exchange business would go the same route as Blockbuster Video. When Microsoft and Sony announced earlier this year that they would be introducing updated gaming consoles, confidence returned and the stock reversed course. |
GOOD IDEAS AT THE TIME | |
| NETGEAR | -0.18% |
| Nam Tai Electronics | -0.17 |
| Central Fund of Canada Cl. A | -0.13 |
| Landauer | -0.09 |
| American Eagle Outfitters | -0.08 |
| 1 Net of dividends | |
| ROYCE TOTAL RETURN FUND VS. RUSSELL 2000 Value of $10,000 Invested on 12/15/93 | |
 |
| Includes reinvestment of distributions. |
| PORTFOLIO DIAGNOSTICS | |||||
| Fund Net Assets | $5,122 million | ||||
| Number of Holdings | 457 | ||||
| Turnover Rate | 10% | ||||
| Average Market Capitalization1 | $2,201 million | ||||
| Weighted Average P/E Ratio2,3 | 16.1x | ||||
| Weighted Average P/B Ratio2 | 1.8x | ||||
| U.S. Investments (% of Net Assets) | 81.7% | ||||
| Non-U.S. Investments (% of Net Assets) | 9.2% | ||||
| Symbol | |||||
| Investment Class | RYTRX | ||||
| Service Class | RYTFX | ||||
| Consultant Class | RYTCX | ||||
| Institutional Class | RTRIX | ||||
| W Class | RTRWX | ||||
| R Class | RTRRX | ||||
| K Class | RTRKX | ||||
1 Geometric Average. This weighted calculation uses each portfolio holding’s market cap in a way designed to not skew the effect of very large or small holdings; instead, it aims to better identify the portfolio’s center, which Royce believes offers a more accurate measure of average market cap than a simple mean or median. | |||||
2 Harmonic Average. This weighted calculation evaluates a portfolio as if it were a single stock and measures it overall. It compares the total market value of the portfolio to the portfolio’s share in the earnings or book value, as the case may be, of its underlying stocks. | |||||
3 The Fund’s P/E ratio calculation excludes companies with zero or negative earnings (4% of portfolio holdings as of 6/30/13). | |||||
| MORNINGSTAR STATISTICAL MEASURES1 | |||||
| Sharpe Ratio | Standard Deviation | ||||
| RTR | 0.47 | 19.68 | |||
| Russell 2000 | 0.46 | 24.07 | |||
| Category Median | 0.46 | 23.47 | |||
| Best Decile Breakpoint | 0.59 | 21.05 | |||
1 Five years ended 6/30/13. Category Median and Best Decile Breakpoint based on 348 small-cap objective funds (oldest class only) with at least five years of history. | |||||
The Fund beat the Russell 2000 and performed within the top 50% of small-cap objective funds on a risk-adjusted basis, as shown by its Sharpe ratio. In addition, the Fund produced lower volatility than the Russell 2000 and 90% of small-cap objective funds, as shown by its standard deviation. DOWN MARKET PERFORMANCE COMPARISON All Down Periods of 7.5% or Greater Over the Last 7 Years, in Percentages(%)  | |||||
| The Royce Funds 2013 Semiannual Report to Shareholders | 33 |
| Royce Dividend Value Fund |
| AVERAGE ANNUAL TOTAL RETURNS Through 6/30/13 | ||||||||||
| January–June 20131 | 10.89 | % | ||||||||
| One-Year | 23.67 | |||||||||
| Three-Year | 16.68 | |||||||||
| Five-Year | 9.76 | |||||||||
| Since Inception (5/3/04) | 9.04 | |||||||||
| ANNUAL EXPENSE RATIO | ||||||||||
| Operating Expenses | 1.52 | % | ||||||||
| 1 Not annualized | ||||||||||
| CALENDAR YEAR TOTAL RETURNS | ||||||||||
| Year | RDV | Year | RDV | |||||||
| 2012 | 16.9 | % | 2008 | -31.5 | % | |||||
| 2011 | -4.5 | 2007 | 0.0 | |||||||
| 2010 | 30.1 | 2006 | 19.9 | |||||||
| 2009 | 37.7 | 2005 | 7.3 | |||||||
| TOP 10 POSITIONS % of Net Assets | ||||||||||
| Federated Investors Cl. B | 1.6 | % | ||||||||
| Towers Watson & Company Cl. A | 1.5 | |||||||||
| Molex | 1.2 | |||||||||
| Reinsurance Group of America | 1.2 | |||||||||
| Nu Skin Enterprises Cl. A | 1.1 | |||||||||
| Reliance Steel & Aluminum | 1.1 | |||||||||
| KKR & Co. L.P. | 1.1 | |||||||||
| Expeditors International of Washington | 1.1 | |||||||||
| Buckle (The) | 1.1 | |||||||||
| Hubbell Cl. B | 1.1 | |||||||||
| PORTFOLIO SECTOR BREAKDOWN % of Net Assets | ||||||||||
| Financials | 27.3 | % | ||||||||
| Industrials | 22.3 | |||||||||
| Materials | 12.1 | |||||||||
| Consumer Discretionary | 11.2 | |||||||||
| Information Technology | 8.7 | |||||||||
| Energy | 3.9 | |||||||||
| Health Care | 3.8 | |||||||||
| Consumer Staples | 3.5 | |||||||||
| Miscellaneous | 4.8 | |||||||||
| Cash and Cash Equivalents | 2.4 | |||||||||
| |||||||||
Managers’ Discussion While satisfied on an absolute basis, we were not equally pleased with the relative performance of Royce Dividend Value Fund (RDV) in the first half of 2013. RDV gained 10.9% for the year-to-date period ended June 30, 2013 versus a 15.9% advance for its small-cap benchmark, the Russell 2000 Index, for the same period. Results for the year’s first months made an unhappy contrast with relative results from the second half of 2012, when the Fund handily outpaced its benchmark, rising 11.5% versus a gain of 7.2% for the small-cap index. Yet despite an ongoing and intense desire for yield, too many investors chose to ignore dividend-paying equities within the small-cap space—within the Russell 2000 companies that pay no dividends actually outperformed those that do in 2013’s opening half. The first quarter was thus a slightly different type of bullish phase than the one that saw out 2012. The Russell 2000 rose an impressive 12.4% between the beginning of January and the end of March while RDV was up 9.5%, a strong absolute performance that was nonetheless behind its benchmark. Higher volatility was already hitting the markets before the Fed announced on June 19 that, while it would leave interest rates unchanged at essentially zero, it would begin to taper the pace of monthly bond purchases later in 2013. Along with lackluster results from China, unrest and uncertainty in emerging markets, and the usual anxieties in the eurozone, the announcement sent the global markets reeling. The sharp spike in the 10-year Treasury between mid-May and mid-June did not add any stability. In this more uncertain climate most domestic stocks managed pretty well. The Fund was up 1.2% in the second quarter while the Russell 2000 advanced 3.1%. The Fund still held on to its longer-term advantage versus the benchmark. Its market cycle results, which can be found on page 6, were more mixed. For the periods ended June 30, 2013, RDV outperformed the Russell 2000 for the five-year and since inception (5/3/04) periods. The Fund’s average annual total return since inception was 9.0%. It may seem odd that non-dividend payers outperformed companies that pay them in the first half. In a world of zero interest rates, one might expect smaller dividend-paying companies to be more consistently in high demand. Yet over the last two-and-a-half years, greater numbers of investors have flocked to higher-yielding equities of lower quality, such as REITs, MLPs (master limited partnerships), and Utilities, and/or to companies that pay no dividends, carry sizable | |||||||||
| GOOD IDEAS THAT WORKED Top Contributors to Performance Year-to-Date through 6/30/131 | |||||||||||
| Nu Skin Enterprises Cl. A | 0.48% | ||||||||||
| Federated Investors Cl. B | 0.45 | ||||||||||
| Pandora | 0.44 | ||||||||||
| GameStop Corporation Cl. A | 0.42 | ||||||||||
| KKR & Co. L.P. | 0.39 | ||||||||||
| 1 Includes dividends | |||||||||||
Important Performance and Expense Information All performance information in this Report reflects past performance, is presented on a total return basis, reflects the reinvestment of distributions, and does not reflect the deduction of taxes that a shareholder would pay on fund distributions or the redemption of fund shares. Past performance is no guarantee of future results. Investment return and principal value of an investment will fluctuate, so that shares may be worth more or less than their original cost when redeemed. Shares redeemed within 180 days of purchase may be subject to a 1% redemption fee payable to the Fund, which is not reflected in the performance shown above; if it were, performance would be lower. Current month-end performance may be higher or lower than performance quoted and may be obtained at www.roycefunds.com. All performance and risk information reflects results of the Service Class (its oldest class). Operating expenses reflect the Fund’s gross total annual operating expenses for the Service Class as of the Fund’s most current prospectus and include management fees, 12b-1 distribution and service fees, other expenses, and acquired fund fees and expenses. Acquired fund fees and expenses reflect the estimated amount of the fees and expenses incurred indirectly by the Fund through its investments in mutual funds, hedge funds, private equity funds, and other investment companies. Regarding the two “Good Ideas” tables shown above, the sum of all contributors to, and all detractors from, performance for all securities in the portfolio would approximate the Fund’s year-to-date performance for 2013. | |||||||||||
| 34 | The Royce Funds 2013 Semiannual Report to Shareholders |
Performance and Portfolio Review debt, and have low returns on invested capital. The potential for high growth and the desire for high yield have outweighed other factors, such as those qualities that we hold dear—strong balance sheets, high returns on invested capital, strong cash flows, and, in many cases, growing dividends. While this has caused some frustration when reviewing the last few years’ worth of relative returns, the situation has also created opportunities for us to find what we think are better businesses—those that possess those key quality attributes previously mentioned. As a result, we think the portfolio is well positioned for the more historically typical market we anticipate going forward, in which rising interest rates and a faster-growing, less Fed-dependent economy are likely to steer investors toward what we regard as quality businesses. RDV’s fifth-largest holding at the end of the period, Nu Skin Enterprises overcame market skepticism about its direct marketing distribution strategy before recovering in the first half. Nu Skin makes skin care and nutritional products with a niche in anti-aging wares. Selling through a direct marketing strategy recently led many investors to think of Nu Skin as the same kind of company as Herbalife, which was not a desirable association considering that the latter endured accusations of being a pyramid scheme. We held on, liking the company’s global reach, quality products, solid earnings and cash flows, and low-debt balance sheet. Once investors were convinced of Nu Skin’s viability, its shares began to climb, helped by the announcement of a five-year business plan for China. We began to take gains in the second quarter. We have not changed our view of money market specialist Federated Investors over the last year. Money market funds are still facing new regulations—the new rules remain under review, extending a process that has been dragging on for a while now. We concur with most industry observers who think that the longer this process takes, the less onerous the rules are going to be. Equally important is our confidence that rising interest rates are going help its business. Although we began to trim our position in mid-May, we held a large stake at the end of the period, when it was the Fund’s largest holding. Some opportune selling in January, February, and April helped to make Pandora A/S a top first-half contributor. A Danish designer, maker, and distributor of hand-finished jewelry, its share price has been mostly rising since we first bought shares in July 2012. Gold and silver mining companies from the precious metals & mining industry detracted most from performance through the end of June. While we liked the very attractive valuations of companies such as Gold Fields, Randgold Resources, Fresnillo, and Pan American Silver, we were carefully reviewing the long-term prospects of these businesses at the end of June. |
GOOD IDEAS AT THE TIME | |
| Gold Fields ADR | -0.49% |
| Randgold Resources ADR | -0.43 |
| Fresnillo | -0.40 |
| Pan American Silver | -0.25 |
| U.S. Global Investors Cl. A | -0.23 |
| 1 Net of dividends | |
| ROYCE DIVIDEND VALUE FUND VS. RUSSELL 2000 Value of $10,000 Invested on 5/3/04 | |
 |
| Includes reinvestment of distributions. | |||
| PORTFOLIO DIAGNOSTICS | |||
| Fund Net Assets | $527 million | ||
| Number of Holdings | 253 | ||
| Turnover Rate | 10% | ||
| Average Market Capitalization1 | $2,753 million | ||
| Weighted Average P/E Ratio2,3 | 15.9x | ||
| Weighted Average P/B Ratio2 | 2.1x | ||
| U.S. Investments (% of Net Assets) | 75.3% | ||
| Non-U.S. Investments (% of Net Assets) | 22.3% | ||
| Symbol | |||
| Investment Class | RDVIX | ||
| Service Class | RYDVX | Institutional Class | RDIIX |
1 Geometric Average. This weighted calculation uses each portfolio holding’s market cap in a way designed to not skew the effect of very large or small holdings; instead, it aims to better identify the portfolio’s center, which Royce believes offers a more accurate measure of average market cap than a simple mean or median. | |||
2 Harmonic Average. This weighted calculation evaluates a portfolio as if it were a single stock and measures it overall. It compares the total market value of the portfolio to the portfolio’s share in the earnings or book value, as the case may be, of its underlying stocks. | |||
3 The Fund’s P/E ratio calculation excludes companies with zero or negative earnings (4% of portfolio holdings as of 6/30/13). | |||
| MORNINGSTAR STATISTICAL MEASURES1 | |||
| Sharpe Ratio | Standard Deviation | ||
| RDV | 0.54 | 21.22 | |
| Russell 2000 | 0.46 | 24.07 | |
| Category Median | 0.46 | 23.47 | |
| Best Quartile Breakpoint | 0.52 | 22.36 | |
1 Five years ended 6/30/13. Category Median and Best Quartile Breakpoint based on 348 small-cap objective funds (oldest class only) with at least five years of history. | |||
The Fund beat the Russell 2000 and performed within the top 25% of small-cap objective funds on a risk-adjusted basis, as shown by its Sharpe ratio. In addition, the Fund produced lower volatility than the Russell 2000 and 75% of small-cap objective funds, as shown by its standard deviation. | |||
DOWN MARKET PERFORMANCE COMPARISON | |||
 | |||
| The Royce Funds 2013 Semiannual Report to Shareholders | 35 |
| Royce Micro-Cap Fund |
AVERAGE ANNUAL TOTAL RETURNS Through 6/30/13 | ||||||||||
| January–June 20131 | 3.04 | % | ||||||||
| One-Year | 8.46 | |||||||||
| Three-Year | 8.84 | |||||||||
| Five-Year | 4.68 | |||||||||
| 10-Year | 9.79 | |||||||||
| 15-Year | 9.46 | |||||||||
| 20-Year | 11.13 | |||||||||
| Since Inception (12/31/91) | 12.13 | |||||||||
| ANNUAL EXPENSE RATIO | ||||||||||
| Operating Expenses | 1.49 | % | ||||||||
| 1 Not annualized | ||||||||||
| CALENDAR YEAR TOTAL RETURNS | ||||||||||
| Year | RMC | Year | RMC | |||||||
| 2012 | 8.0 | % | 2004 | 15.8 | % | |||||
| 2011 | -12.1 | 2003 | 52.6 | |||||||
| 2010 | 30.1 | 2002 | -13.4 | |||||||
| 2009 | 55.7 | 2001 | 23.1 | |||||||
| 2008 | -40.9 | 2000 | 16.7 | |||||||
| 2007 | 7.1 | 1999 | 13.7 | |||||||
| 2006 | 22.3 | 1998 | -3.3 | |||||||
| 2005 | 11.5 | 1997 | 24.7 | |||||||
| TOP 10 POSITIONS % of Net Assets | ||||||||||
| Kirkland’s | 1.4 | % | ||||||||
| GP Strategies | 1.3 | |||||||||
| Graham Corporation | 1.3 | |||||||||
| Marten Transport | 1.3 | |||||||||
| Horsehead Holding Corporation | 1.3 | |||||||||
| Patriot Transportation Holding | 1.3 | |||||||||
| ATMI | 1.3 | |||||||||
| Perry Ellis International | 1.2 | |||||||||
| Shoe Carnival | 1.2 | |||||||||
| Olympic Steel | 1.2 | |||||||||
| PORTFOLIO SECTOR BREAKDOWN % of Net Assets | ||||||||||
| Industrials | 20.9 | % | ||||||||
| Consumer Discretionary | 18.5 | |||||||||
| Information Technology | 13.6 | |||||||||
| Materials | 10.3 | |||||||||
| Health Care | 8.2 | |||||||||
| Energy | 7.8 | |||||||||
| Financials | 5.6 | |||||||||
| Consumer Staples | 0.9 | |||||||||
| Utilities | 0.1 | |||||||||
| Miscellaneous | 4.8 | |||||||||
| Cash and Cash Equivalents | 9.3 | |||||||||
 |
Manager’s Discussion Micro-caps enjoyed generally strong returns in the first six months of 2013, but this did not translate to notable results for Royce Micro-Cap Fund (RMC). The Fund rose 3.0% for the year-to-date period ended June 30, 2013 versus respective gains of 18.3% and 15.9% for its benchmark, the Russell Microcap Index, and the small-cap Russell 2000 Index. The year’s first quarter saw the bulk of underperformance. The first three months of the year were a mostly bullish period that followed a solid third quarter and more volatile fourth quarter in 2012. RMC, however, struggled during the year’s first three months. For the first quarter, the Fund gained 2.4% versus 12.6% for its benchmark and 12.4% for the small-cap index. The second quarter brought considerably more volatility and, unsurprisingly, lower returns for equities across the board. Markets all over the world convulsed late in June following the announcement by Fed Chairman Ben Bernanke that the central bank would consider slowing the pace of monthly bond purchases later in the year. Along with less-than-stellar news out of China, Brazil, Turkey, and Europe, stocks fell precipitously for several sessions before beginning to find their feet again. The upshot was a rougher quarter for stocks, though the U.S. fared better than foreign markets. RMC was up 0.6% for the second quarter versus 5.1% for the micro-cap index and 3.1% for the small-cap index. For the periods ended June 30, 2013, the Fund underperformed both indexes for one-, three-, and five-year spans, while the Fund outpaced both indexes for the 10-year period and beat the Russell 2000 for the 15-, 20-year, and since inception (12/31/91) periods. (The Russell Microcap Index’s inception was June 30, 2000.) RMC’s average annual total return since inception was 12.1%, a long-term record in which we take great pride. The portfolio’s top contributor in the first half was hhgregg, a retailer specializing in consumer electronics, home appliances, and other items. Its share price benefited from growing home sales and improving consumer confidence. We reduced our position in April and May. Clothing retailer Stein Mart also received help from higher levels of consumer activity. It drew an even larger advantage from resolving internal accounting issues that drove investors from its stock late in 2012. The company, which discovered these errors on its own, restated results and then continued to improve its merchandising strategy. Even with the rise in its share price, we liked its valuation at the end of June, when it was RMC’s eleventh-largest holding. Two top-ten positions were also top contributors in the first half. Graham Corporation manufactures custom |
| GOOD IDEAS THAT WORKED Top Contributors to Performance Year-to-Date through 6/30/131 | |||||||||||
| hhgregg | 0.67% | ||||||||||
| Stein Mart | 0.64 | ||||||||||
| Graham Corporation | 0.56 | ||||||||||
| Kirkland’s | 0.54 | ||||||||||
| Monotype Imaging Holdings | 0.45 | ||||||||||
| 1 Includes dividends | |||||||||||
Important Performance and Expense Information All performance information in this Report reflects past performance, is presented on a total return basis, reflects the reinvestment of distributions, and does not reflect the deduction of taxes that a shareholder would pay on fund distributions or the redemption of fund shares. Past performance is no guarantee of future results. Investment return and principal value of an investment will fluctuate, so that shares may be worth more or less than their original cost when redeemed. Shares redeemed within 180 days of purchase may be subject to a 1% redemption fee payable to the Fund, which is not reflected in the performance shown above; if it were, performance would be lower. Current month-end performance may be higher or lower than performance quoted and may be obtained at www.roycefunds.com. All performance and risk information reflects results of the Investment Class (its oldest class). Price and total return information is based on net asset values calculated for shareholder transactions. Certain immaterial adjustments were made to the net assets of Royce Micro-Cap Fund at 12/30/11 for financial reporting purposes, and as a result the net asset values for shareholder transactions on that date and the calendar year total returns based on those net asset values differ from the adjusted net asset values and calendar year total returns reported in the Financial Highlights. Operating expenses reflect the Fund’s total annual operating expenses for the Investment Class as of the Fund’s most current prospectus and include management fees, other expenses, and acquired fund fees and expenses. Acquired fund fees and expenses reflect the estimated amount of the fees and expenses incurred indirectly by the fund through its investments in mutual funds, hedge funds, private equity funds, and other investment companies. Shares of RMC’s Service and Consultant Classes bear an annual distribution expense that is not borne by the Investment Class. Regarding the two “Good Ideas” tables shown above, the sum of all contributors to, and all detractors from, performance for all securities in the portfolio would approximate the Fund’s year-to-date performance for 2013. | |||||||||||
| 36 | The Royce Funds 2013 Semiannual Report to Shareholders |
Performance and Portfolio Review |
| vacuum and heat transfer equipment. We bought shares when its niche business was slow and its valuation looked particularly attractive to us. Growing sales and record revenue in its fiscal fourth quarter helped to draw other investors. Kirkland’s was another company that profited from the resurgence in the housing industry as well as from analytical tools that allowed it to better understand and respond to sales activity at its stores, creating greater efficiency and better inventory management. PDI provides outsourced sales and other commercial services to pharmaceutical, biotechnology, and healthcare companies in the U.S. Its contract sales business has not grown as we initially anticipated, which has hurt results. We began to reduce our position in April. Detracting most from the portfolio’s results in the period were investments in the Materials sector, particularly those in the metals & mining category. Four of the portfolio’s five largest detractors were precious metals miners. We have reduced the Fund’s exposure to this industry, holding positions only in those companies that are well funded and capable in our view of weathering what remained at the end of June a very challenging period for mining businesses. These challenges include rising operating costs and declining commodity prices. We added shares of Endeavour Silver in March and April and trimmed our position in Pilot Gold in the first quarter. Choosing to hold shares of McEwen Mining, we also reduced our stake in Lumina Copper. The lack of exposure to more defensive areas of the market, most notably REITs and MLPs, was also a factor in first-half results (though REITs abruptly reversed course in the second quarter). This was consistent with much of what hampered relative returns in 2012. We take a disciplined approach, looking for bargain-priced companies with strong balance sheets and above-average returns on invested capital. This vintage Royce formula has led us to companies that have not experienced full participation in the last few years’ worth of rallies while they have often been sold off with equal abandon during downturns. Perhaps needless to say, our patience and discipline have been amply tested throughout the last two-and-a-half years, though by no means enough for us to abandon what has been successful for most of the Fund’s more than two decades of history. Indeed, we are highly confident going forward that companies with solid fundamentals and strong managements can ultimately be market leaders. We recently increased the Fund’s exposure to U.S. companies, which stood at 76% of net assets at the end of June. We firmly believe that the portfolio is well positioned for the next market phase, one which we anticipate should be better for the kind of conservatively capitalized micro-cap businesses that we seek for the portfolio. |
GOOD IDEAS AT THE TIME | |
| Endeavour Silver | -0.46% |
| Pilot Gold | -0.45 |
| McEwen Mining | -0.35 |
| PDI | -0.31 |
| Lumina Copper | -0.30 |
| 1 Net of dividends | |
| ROYCE MICRO-CAP FUND VS. RUSSELL MICROCAP AND RUSSELL 2000 Value of $10,000 Invested on 6/30/00 (Russell Microcap Inception) | |
 |
| Includes reinvestment of distributions. |
| PORTFOLIO DIAGNOSTICS | |||||
| Fund Net Assets | $839 million | ||||
| Number of Holdings | 194 | ||||
| Turnover Rate | 12% | ||||
| Average Market Capitalization1 | $373 million | ||||
| Weighted Average P/E Ratio2,3 | 17.4x | ||||
| Weighted Average P/B Ratio2 | 1.5x | ||||
| U.S. Investments (% of Net Assets) | 76.1% | ||||
| Non-U.S. Investments (% of Net Assets) | 14.6% | ||||
| Symbol | |||||
| Investment Class | RYOTX | ||||
| Service Class | RMCFX | ||||
| Consultant Class | RYMCX | ||||
1 Geometric Average. This weighted calculation uses each portfolio holding’s market cap in a way designed to not skew the effect of very large or small holdings; instead, it aims to better identify the portfolio’s center, which Royce believes offers a more accurate measure of average market cap than a simple mean or median. | |||||
2 Harmonic Average. This weighted calculation evaluates a portfolio as if it were a single stock and measures it overall. It compares the total market value of the portfolio to the portfolio’s share in the earnings or book value, as the case may be, of its underlying stocks. | |||||
3 The Fund’s P/E ratio calculation excludes companies with zero or negative earnings (22% of portfolio holdings as of 6/30/13). | |||||
| MORNINGSTAR STATISTICAL MEASURES1 | |||||
| Sharpe Ratio | Standard Deviation | ||||
| RMC | 0.30 | 23.87 | |||
| Russell Microcap | 0.45 | 25.07 | |||
| Category Median | 0.51 | 24.28 | |||
| Best Quartile Breakpoint | 0.55 | 23.77 | |||
1 Five years ended 6/30/13. Category Median and Best Quartile Breakpoint based on 24 micro-cap objective funds (oldest class only) with at least five years of history. | |||||
| |||||
| DOWN MARKET PERFORMANCE COMPARISON All Down Periods of 7.5% or Greater Over the Last 7 Years, in Percentages(%) | |||||
 | |||||
| The Royce Funds 2013 Semiannual Report to Shareholders | 37 |
| Royce Opportunity Fund |
AVERAGE ANNUAL TOTAL RETURNS Through 6/30/13 | ||||||||||
| January–June 20131 | 18.49 | % | ||||||||
| One-Year | 30.58 | |||||||||
| Three-Year | 19.42 | |||||||||
| Five-Year | 10.90 | |||||||||
| 10-Year | 11.52 | |||||||||
| 15-Year | 12.11 | |||||||||
| Since Inception (11/19/96) | 12.98 | |||||||||
| ANNUAL EXPENSE RATIO | ||||||||||
| Operating Expenses | 1.14 | % | ||||||||
| 1 Not annualized | ||||||||||
| CALENDAR YEAR TOTAL RETURNS | ||||||||||
| Year | ROF | Year | ROF | |||||||
| 2012 | 22.6 | % | 2004 | 17.5 | % | |||||
| 2011 | -13.0 | 2003 | 72.9 | |||||||
| 2010 | 33.8 | 2002 | -17.0 | |||||||
| 2009 | 62.1 | 2001 | 17.3 | |||||||
| 2008 | -45.7 | 2000 | 19.8 | |||||||
| 2007 | -2.0 | 1999 | 32.3 | |||||||
| 2006 | 18.8 | 1998 | 4.9 | |||||||
| 2005 | 4.8 | 1997 | 20.8 | |||||||
| TOP 10 POSITIONS % of Net Assets | ||||||||||
| Sanmina Corporation | 0.7 | % | ||||||||
| OM Group | 0.7 | |||||||||
| Unifi | 0.7 | |||||||||
| Jones Group (The) | 0.7 | |||||||||
| NCI Building Systems | 0.7 | |||||||||
| Tower International | 0.6 | |||||||||
| SunEdison | 0.6 | |||||||||
| Commercial Metals | 0.6 | |||||||||
| Kaiser Aluminum | 0.6 | |||||||||
| LaSalle Hotel Properties | 0.6 | |||||||||
| PORTFOLIO SECTOR BREAKDOWN % of Net Assets | ||||||||||
| Information Technology | 22.6 | % | ||||||||
| Industrials | 18.6 | |||||||||
| Consumer Discretionary | 14.5 | |||||||||
| Financials | 12.1 | |||||||||
| Materials | 6.9 | |||||||||
| Energy | 5.0 | |||||||||
| Health Care | 4.0 | |||||||||
| Consumer Staples | 0.5 | |||||||||
| Telecommunication Services | 0.3 | |||||||||
| Miscellaneous | 5.0 | |||||||||
| Preferred Stock | 0.1 | |||||||||
| Cash and Cash Equivalents | 10.4 | |||||||||
 | |||||||||
Manager’s Discussion Royce Opportunity Fund (ROF) easily shrugged off what has otherwise been a difficult market for active managers with a terrific performance in the first half of 2013. The Fund climbed 18.5% for the year-to-date period ended June 30, 2013, outpacing its small-cap benchmark, the Russell 2000 Index, which was up 15.9% for the same period. ROF’s first-half showing was part of a longer-term trend of enviable absolute and relative returns. The first quarter was an almost placidly bullish period, though it did see the return to market leadership of high-yielding and more defensive sectors at the expense of cyclical areas across most asset classes. The Fund coped just fine with the shift, gaining 13.3% versus 12.4% for the small-cap index. Stock prices then began falling, with April a bearish month that gave way to a bullish May. June was already proving to be a volatile month when the Fed announced on the 19th that it would likely begin to taper its bond-buying program later this year. Along with a rapidly rising rate on the 10-year Treasury, underwhelming news out of China, and growing unrest in the developing world, the global markets swooned for several days, though most domestic indexes were showing signs of recovery by the end of the month. The Fund acquitted itself well in this uncertain environment. ROF gained 4.6% for the second quarter, ahead of the Russell 2000, which was up 3.1%. Ongoing strength helped ROF achieve a consistent advantage over its benchmark through recent market cycles. For the periods ended June 30, 2013, the Fund beat the small-cap index from the trough on March 9, 2009 (+307.4% versus +202.3%) and the most recent small-cap peak on April 29, 2011 (+17.2% versus +16.6%), among other periods. (More market cycle results can be found on page 6.) These results were especially noteworthy because ROF had a relative advantage in both bullish and bearish phases. The Fund outperformed the Russell 2000 for the one-, three-, five-,10-, 15-year, and since inception (11/19/96) periods ended June 30, 2013. ROF’s average annual total return for the since inception period was 13.0%. All but one of the Fund’s eight equity sectors finished the period in the black, and the net loss for Diversified Investment Companies was minimal. Consumer Discretionary led by a good-sized margin, followed by notable net gains for the Industrials, Information Technology, and Financials sectors. The leading industry was the semiconductor & semiconductor equipment group. | |||||||||
| GOOD IDEAS THAT WORKED Top Contributors to Performance Year-to-Date through 6/30/131 | |||||||||||
| SunPower Corporation | 0.76% | ||||||||||
| Tower International | 0.53 | ||||||||||
| SunEdison | 0.47 | ||||||||||
| Radian Group | 0.45 | ||||||||||
| Albany Molecular Research | 0.39 | ||||||||||
| 1 Includes dividends | |||||||||||
Important Performance and Expense Information All performance information in this Report reflects past performance, is presented on a total return basis, reflects the reinvestment of distributions, and does not reflect the deduction of taxes that a shareholder would pay on fund distributions or the redemption of fund shares. Past performance is no guarantee of future results. Investment return and principal value of an investment will fluctuate, so that shares may be worth more or less than their original cost when redeemed. Shares redeemed within 180 days of purchase may be subject to a 1% redemption fee payable to the Fund, which is not reflected in the performance shown above; if it were, performance would be lower. Current month-end performance may be higher or lower than performance quoted and may be obtained at www.roycefunds.com. All performance and risk information reflects results of the Investment Class (its oldest class). Operating expenses reflect the Fund’s total annual operating expenses for the Investment Class as of the Fund’s most current prospectus and include management fees, other expenses, and acquired fund fees and expenses. Acquired fund fees and expenses reflect the estimated amount of the fees and expenses incurred indirectly by the Fund through its investments in mutual funds, hedge funds, private equity funds, and other investment companies. Shares of ROF’s Service, Consultant, R, and K Classes bear an annual distribution expense that is not borne by the Investment Class. Regarding the two “Good Ideas” tables shown above, the sum of all contributors to, and all detractors from, performance for all securities in the portfolio would approximate the Fund’s year-to-date performance for 2013. | |||||||||||
| 38 | The Royce Funds 2013 Semiannual Report to Shareholders |
Performance and Portfolio Review Prospects for this industry have been more or less steadily improving for the last year, boosted by growth in the U.S. economy. That European economies look to have hit bottom and other national economies, especially in Asia, did not fall as hard as many had predicted were also factors in the improvement for this highly volume-sensitive business. Inventory levels were reasonable and pricing in the memory market was better than expected, which also helped to attract investors. As their respective share prices soared past our sell targets, we reduced our stake in two of ROF’s top-five contributors that came from the semiconductor group—SunPower Corporation and SunEdison. Each of these companies also benefited from the resurgence of interest in companies involved in solar power, an area that we think has considerable potential. SunPower manufactures high-performance solar electric equipment while SunEdison produces electronic-grade polysilicon used for electronics, solar cells, and film devices while also developing solar power projects. In spite of fears that reduced government subsidies would derail growth, the demand for solar technology has continued to grow. Many lesser-quality players have either exited the business or lost market share. Technological efficiency has improved, which has helped bring down costs, while China recently called for a five-fold increase in installed solar capacity. Tower International, the Fund’s sixth-largest holding at the end of June, has a global business manufacturing metal automotive components for OEMS (original equipment manufacturers). Global demand for auto parts has held up well, attracting interest to its shares. We began to take gains in May as its stock price revved up. Radian Group provides financial guarantee insurance. Its services allow people to buy homes more quickly (often with smaller down payments), protect lenders against loan default, and lower the costs of mortgage origination and servicing. The recovering housing industry and a decline in the number of defaults helped its business to grow. We took gains through most of the first half. We also reduced our stake in Albany Molecular Research, which provides contract manufacturing for the pharmaceutical industry. Higher utilization rates and deft management both helped it to improve its business. Weaker earnings hurt the Fund’s two largest detractors. Walter Energy produces metallurgical coal. Prices fell in the wake of slack demand in China. We sold our shares shortly after the company’s efforts to refinance its debt fell through. We chose to add to our stake in oil and gas driller Layne Christensen during much of the first half based on our belief that its industry niche and efforts to improve operations would eventually lead it to reverse course. |
GOOD IDEAS AT THE TIME | |
| Walter Energy | -0.32% |
| Layne Christensen | -0.11 |
| Quanex Building Products | -0.10 |
| McClatchy Company (The) Cl. A | -0.10 |
| Central Garden & Pet | -0.10 |
| 1 Net of dividends | |
| ROYCE OPPORTUNITY FUND VS. RUSSELL 2000 Value of $10,000 Invested on 11/19/96 | |
 |
| Includes reinvestment of distributions. | |||
| PORTFOLIO DIAGNOSTICS | |||
| Fund Net Assets | $2,292 million | ||
| Number of Holdings | 317 | ||
| Turnover Rate | 23% | ||
| Average Market Capitalization1 | $719 million | ||
| Weighted Average P/E Ratio2,3 | 15.7x | ||
| Weighted Average P/B Ratio3 | 1.4x | ||
| U.S. Investments (% of Net Assets) | 86.3% | ||
| Non-U.S. Investments (% of Net Assets) | 3.3% | ||
| Symbol | |||
| Investment Class | RYPNX | ||
| Service Class | RYOFX | Consultant Class | ROFCX | Institutional Class | ROFIX | R Class | ROFRX | K Class | ROFKX |
1 Geometric Average. This weighted calculation uses each portfolio holding’s market cap in a way designed to not skew the effect of very large or small holdings; instead, it aims to better identify the portfolio’s center, which Royce believes offers a more accurate measure of average market cap than a simple mean or median. | |||
2 Harmonic Average. This weighted calculation evaluates a portfolio as if it were a single stock and measures it overall. It compares the total market value of the portfolio to the portfolio’s share in the earnings or book value, as the case may be, of its underlying stocks. | |||
3 The Fund’s P/E ratio calculation excludes companies with zero or negative earnings (34% of portfolio holdings as of 6/30/13). | |||
| MORNINGSTAR STATISTICAL MEASURES1 | |||
| Sharpe Ratio | Standard Deviation | ||
| ROF | 0.48 | 31.13 | |
| Russell 2000 | 0.46 | 24.07 | |
| Category Median | 0.46 | 23.47 | |
| Best Quartile Breakpoint | 0.52 | 22.36 | |
1 Five years ended 6/30/13 Category Median and Best Quartile Breakpoint based on 348 small-cap objective funds (oldest class only) with at least five years of history. | |||
The Fund beat the Russell 2000 and performed within the top 50% of small-cap objective funds on a risk-adjusted basis, as shown by its Sharpe ratio. | |||
DOWN MARKET PERFORMANCE COMPARISON | |||
 | |||
| The Royce Funds 2013 Semiannual Report to Shareholders | 39 |
| Royce Global Value Fund |
AVERAGE ANNUAL TOTAL RETURNS Through 6/30/13 | ||||||||||
| January–June 20131 | -4.78 | % | ||||||||
| One-Year | 6.18 | |||||||||
| Three-Year | 6.53 | |||||||||
| Five-Year | 1.34 | |||||||||
| Since Inception (12/29/06) | 4.08 | |||||||||
| ANNUAL EXPENSE RATIOS | ||||||||||
| Gross Operating Expenses | 1.81 | % | ||||||||
| Net Operating Expenses | 1.70 | |||||||||
| 1 Not annualized | ||||||||||
| CALENDAR YEAR TOTAL RETURNS | ||||||||||
| Year | RGV | Year | RGV | |||||||
| 2012 | 11.0 | % | 2009 | 61.9 | % | |||||
| 2011 | -18.7 | 2008 | -39.9 | |||||||
| 2010 | 35.7 | 2007 | 14.3 | |||||||
| TOP 10 POSITIONS % of Net Assets | ||||||||||
| Helmerich & Payne | 3.1 | % | ||||||||
| Mayr-Melnhof Karton | 3.1 | |||||||||
| Semperit AG Holding | 3.0 | |||||||||
| Western Digital | 3.0 | |||||||||
| Recordati | 2.9 | |||||||||
| Ashmore Group | 2.7 | |||||||||
| FamilyMart | 2.5 | |||||||||
| Myriad Genetics | 2.3 | |||||||||
| Pason Systems | 2.2 | |||||||||
| Autoliv | 2.1 | |||||||||
| PORTFOLIO SECTOR BREAKDOWN % of Net Assets | ||||||||||
| Consumer Discretionary | 18.0 | % | ||||||||
| Industrials | 17.6 | |||||||||
| Health Care | 12.6 | |||||||||
| Materials | 12.6 | |||||||||
| Energy | 10.6 | |||||||||
| Information Technology | 9.8 | |||||||||
| Financials | 9.2 | |||||||||
| Consumer Staples | 6.4 | |||||||||
| Cash and Cash Equivalents | 3.2 | |||||||||
| PORTFOLIO COUNTRY BREAKDOWN1,2 % of Net Assets | ||||||||||
| United States | 17.9 | % | ||||||||
| Japan | 13.3 | |||||||||
| Canada | 8.4 | |||||||||
| United Kingdom | 7.9 | |||||||||
| Austria | 6.1 | |||||||||
| South Africa | 5.1 | |||||||||
| Hong Kong | 4.6 | |||||||||
| Norway | 4.6 | |||||||||
| France | 3.6 | |||||||||
| Switzerland | 3.4 | |||||||||
| Brazil | 3.0 | |||||||||
| 1 Represents countries that are 3% or more of net assets. | ||||||||||
| 2 Securities are categorized by their country of headquarters. | ||||||||||
 |
Managers’ Discussion The first half of 2013 was often challenging for many equities all over the world. It was also a disappointing period for Royce Global Value Fund (RGV). The Fund fell 4.8% for the year-to-date period ended June 30, 2013 versus a 6.7% gain for its benchmark, the Russell Global Small Cap Index, for the same period. As was the case in 2012, the first quarter was a solidly bullish period for most stocks. Unlike 2012, however, non-U.S. equities generally had lower returns. Also unlike last year, RGV underperformed its benchmark by a considerable margin. The Fund gained 0.8% in the year’s opening quarter while the global small-cap index rose 8.6%. This left the Fund with substantial ground to make up versus the benchmark as temperatures warmed up in the second quarter. The period was far more volatile, and we were unhappy that the portfolio was unable to better hold its value when share prices were falling from April through June. For the quarter as a whole, RGV fell 5.5% versus a decline of 1.7% for the benchmark. The second-quarter correction was a global event, fueled by concerns over an economic slowdown and credit issues in China, emerging markets countries such as Brazil and Turkey facing both social unrest and faltering growth, ongoing concerns over the fiscal health of certain eurozone nations, and the Fed’s talk of tapering the pace of bond purchases later this year. All of these developments combined to help push stock prices lower. None of these problems are new, and all are potentially solvable, yet their surfacing so close to one another in May and June clearly spooked many investors who remain understandably skittish in light of all that has happened since the financial crisis in 2008. After narrowly outpacing the global small-cap index in the second half of 2012 (+11.5% versus +11.0%), the Fund’s underperformance in 2013 eroded some of its longer-term relative advantage. For the period ended June 30, 2013, RGV beat the Russell Global Small Cap Index for the since inception (12/29/06) period. Most of the Fund’s net losses in the first half came from the metals & mining industry—part of the Materials sector, which as a result also posted a sizable net loss. We reduced the portfolio’s overall exposure to the Materials sector primarily by selling shares of several metals & mining companies in May. Companies in this industry accounted for the Fund’s top five (and seven of its ten) largest detractors for the period. Several factors had a negative effect on these businesses in the first half. Gold and silver prices declined significantly, mine operating costs were climbing, |
| GOOD IDEAS THAT WORKED Top Contributors to Performance Year-to-Date through 6/30/131 | |||||||||||
| Western Digital | 0.88% | ||||||||||
| Nihon M&A Center | 0.74 | ||||||||||
| Recordati | 0.50 | ||||||||||
| SimCorp | 0.37 | ||||||||||
| USS | 0.37 | ||||||||||
| 1 Includes dividends | |||||||||||
Important Performance and Expense Information All performance information in this Report reflects past performance, is presented on a total return basis, reflects the reinvestment of distributions, and does not reflect the deduction of taxes that a shareholder would pay on fund distributions or the redemption of fund shares. Past performance is no guarantee of future results. Investment return and principal value of an investment will fluctuate, so that shares may be worth more or less than their original cost when redeemed. Shares redeemed within 180 days of purchase may be subject to a 2% redemption fee payable to the Fund, which is not reflected in the performance shown above; if it were, performance would be lower. Current month-end performance may be higher or lower than performance quoted and may be obtained at www.roycefunds.com. All performance and risk information reflects results of the Service Class (its oldest class). Gross operating expenses reflect gross total annual operating expenses for the Service Class and include management fees, 12b-1 distribution and service fees, other expenses, and acquired fund fees and expenses. Acquired fund fees and expenses reflect the estimated amount of the fees and expenses incurred indirectly by the Fund through its investments in mutual funds, hedge funds, private equity funds, and other investment companies. Net operating expenses reflect contractual fee waivers and/or reimbursements. All expense information is reported as of the Fund’s most current prospectus. Royce & Associates has contractually agreed to waive fees and/or reimburse operating expenses to the extent necessary to maintain the Fund’s net annual operating expenses, other than acquired fund fees and expenses, at or below 1.69% through April 30, 2014. Regarding the two “Good Ideas” tables shown above, the sum of all contributors to, and all detractors from, performance for all securities in the portfolio would approximate the Fund’s year-to-date performance for 2013. | |||||||||||
| 40 | The Royce Funds 2013 Semiannual Report to Shareholders |
Performance and Portfolio Review |
| and several firms went through management changes. Warren Buffett once said, “Only when the tide goes out do you discover who’s been swimming naked.” For too many precious metals mining businesses, it has often looked as if the tide was never coming back in. This drove many companies’ valuations to what we regard as rock-bottom levels that have not been reached since the lows of late 2008-early 2009. Still, we chose to sell some of the Fund’s largest detractors in the industry, such as Allied Nevada Gold, Medusa Mining, and B2Gold, while reducing our stake in Hochschild Mining, one of 2012’s top contributors. We added shares of Pan American Silver as we think it is well positioned for an eventual turnaround for the industry. The Fund’s top contributor could be found relatively close to home in Irvine, CA., the headquarters of hard disk drive maker Western Digital. The company is one of two firms that dominate disk drive production worldwide. As such, its core business, which involves solutions for the collection, storage, management, and protection of digital content, has long interested us. We first bought shares in the fall of 2010 when its valuation reached levels that we found attractive. Many investors seemed to be selling at the time out of concern that the decline in PCs would adversely affect its business while we saw opportunities in the need cloud computing server farms had for its products. Its shares began to rebound in February on solid EPS (earnings per share) growth and again in March on reports that global demand for data storage would remain strong. Although we trimmed our shares in May and early July, it was the Fund’s fourth-largest holding at the end of June. Tokyo-based Nihon M&A Center provides M&A advisory and other related services to small and medium-sized businesses. Growing revenues and earnings helped draw investors to its stock. We were intrigued by its niche in Japan, a country in which approximately 150,000 companies are said to lack succession plans, which represents a great opportunity for Nihon M&A. We reduced our position as its share price soared past our sell targets. Since the mid-point of 2012, we have enjoyed a mostly very positive experience with Recordati, a Milan-based pharmaceutical business with an 80-year history and an expanding global reach, especially in Russia, Turkey, and Eastern Europe, where demand for its products has been growing. The company researches and manufactures prescription pharmaceuticals, including lercanidipine, a treatment for hypertension. Its shares slumped between February and early April 2013 before climbing again on a strong fiscal first quarter and revised guidance for 2013. It was the Fund’s fifth-largest position at the end of June. |
| GOOD IDEAS AT THE TIME Top Detractors from Performance Year-to-Date through 6/30/131 | |||||||||||
| Hochschild Mining | -1.45% | ||||||||||
| Allied Nevada Gold | -1.23 | ||||||||||
| Medusa Mining | -0.78 | ||||||||||
| Pan American Silver | -0.67 | ||||||||||
| B2Gold Corporation | -0.54 | ||||||||||
| 1 Net of dividends | |||||||||||
| ROYCE GLOBAL VALUE FUND VS. RUSSELL GLOBAL SMALL CAP Value of $10,000 Invested on 12/29/06 | |||||||||||
 |
| Includes reinvestment of distributions. |
| PORTFOLIO DIAGNOSTICS | |||||
| Fund Net Assets | $263 million | ||||
| Number of Holdings | 67 | ||||
| Turnover Rate | 24% | ||||
| Average Market Capitalization1 | $1,579 million | ||||
| Weighted Average P/E Ratio2,3 | 13.2x | ||||
| Weighted Average P/B Ratio2 | 1.8x | ||||
| Ticker Symbol | |||||
| Investment Class | RGVIX | ||||
| Service Class | RIVFX | ||||
| Consultant Class | RGVHX | ||||
| R Class | RGVRX | ||||
| K Class | RGVKR | ||||
1 Geometric Average. This weighted calculation uses each portfolio holding’s market cap in a way designed to not skew the effect of very large or small holdings; instead, it aims to better identify the portfolio’s center, which Royce believes offers a more accurate measure of average market cap than a simple mean or median. | |||||
2 Harmonic Average. This weighted calculation evaluates a portfolio as if it were a single stock and measures it overall. It compares the total market value of the portfolio to the portfolio’s share in the earnings or book value, as the case may be, of its underlying stocks. | |||||
3 The Fund’s P/E ratio calculation excludes companies with zero or negative earnings (2% of portfolio holdings as of 6/30/13). | |||||
| MORNINGSTAR STATISTICAL MEASURES1 | |||||
| Sharpe Ratio | Standard Deviation | ||||
| RGV | 0.18 | 26.10 | |||
| Russell Global Small Cap | 0.29 | 23.87 | |||
| Category Median | 0.27 | 23.74 | |||
| Best Quartile Breakpoint | 0.36 | 22.36 | |||
1 Five years ended 6/30/13. Category Median and Best Quartile Breakpoint based on 19 world stock small-cap objective funds (oldest class only) with at least five years of history. | |||||
DOWN MARKET PERFORMANCE COMPARISON All Down Periods of 7.5% or Greater in Percentages(%)  | |||||
| The Royce Funds 2013 Semiannual Report to Shareholders | 41 |
| Royce International Smaller-Companies Fund |
AVERAGE ANNUAL TOTAL RETURNS Through 6/30/13 | ||||||||||
| January–June 20131 | -0.71 | % | ||||||||
| One-Year | 13.46 | |||||||||
| Three-Year | 8.33 | |||||||||
| Five-Year | 5.06 | |||||||||
| Since Inception (6/30/08) | 5.06 | |||||||||
| ANNUAL EXPENSE RATIOS | ||||||||||
| Gross Operating Expenses | 2.15 | % | ||||||||
| Net Operating Expenses | 1.71 | |||||||||
| 1 Not annualized | ||||||||||
| CALENDAR YEAR TOTAL RETURNS | ||||||||||
| Year | RIS | Year | RIS | |||||||
| 2012 | 19.4 | % | 2010 | 26.5 | % | |||||
| 2011 | -18.7 | 2009 | 50.3 | |||||||
| TOP 10 POSITIONS % of Net Assets | ||||||||||
| Recordati | 1.5 | % | ||||||||
| EPS Corporation | 1.4 | |||||||||
| Mayr-Melnhof Karton | 1.4 | |||||||||
| FamilyMart | 1.4 | |||||||||
| Santen Pharmaceutical | 1.3 | |||||||||
| Semperit AG Holding | 1.3 | |||||||||
| Daphne International Holdings | 1.2 | |||||||||
| Moshi Moshi Hotline | 1.2 | |||||||||
| Lewis Group | 1.2 | |||||||||
| Forbo Holding | 1.1 | |||||||||
| PORTFOLIO SECTOR BREAKDOWN % of Net Assets | ||||||||||
| Consumer Discretionary | 23.9 | % | ||||||||
| Health Care | 17.7 | |||||||||
| Industrials | 14.5 | |||||||||
| Financials | 10.6 | |||||||||
| Information Technology | 8.4 | |||||||||
| Materials | 7.9 | |||||||||
| Consumer Staples | 5.8 | |||||||||
| Energy | 3.4 | |||||||||
| Cash and Cash Equivalents | 7.8 | |||||||||
| PORTFOLIO COUNTRY BREAKDOWN1,2 % of Net Assets | ||||||||||
| Japan | 13.6 | % | ||||||||
| Hong Kong | 10.5 | |||||||||
| United Kingdom | 10.4 | |||||||||
| France | 9.4 | |||||||||
| Switzerland | 7.7 | |||||||||
| Italy | 3.6 | |||||||||
| Germany | 3.4 | |||||||||
| South Africa | 3.2 | |||||||||
| India | 3.0 | |||||||||
| 1 Represents countries that are 3% or more of net assets. | ||||||||||
| 2 Securities are categorized by the country of their headquarters. | ||||||||||
  | |||||||||
Managers’ Discussion Stocks outside the U.S. saw substantially lower returns overall than their domestic counterparts in the first half of 2013. For the year-to-date period ended June 30, 2013, Royce International Smaller-Companies Fund (RIS) was down 0.7% versus a gain of 1.8% for its benchmark, the Russell Global ex-U.S. Small Cap Index, for the same period. The first quarter was bullish across much of the globe, though results for non-U.S. companies were generally lower. Further, the Fund participated in this rally only to a limited degree, gaining 3.2% in the year’s opening quarter versus a 6.5% gain for its benchmark. This contrasted with the Fund’s strong absolute and relative results in 2012, which featured a strong second-half advantage for RIS, which advanced 14.3% versus 13.5% for the Russell Global ex-U.S. Small Cap. Markets experienced a significant spike in volatility in the second quarter. April was bearish, May bullish, and June more of a mix. Most U.S. markets finished the quarter slightly in the black while many non-U.S. indexes were negative—some dramatically—over the same period. RIS held investments headquartered in Brazil, which declined by about a third in U.S. dollar terms in the first half, and Turkey, which like Brazil suffered falling markets and was gripped by numerous protests. During the spring and early summer months, China was attempting to cope with a slowing economy, credit and banking issues, and its overheated real estate market, Japan was trying to galvanize its economy with monetary stimulus, uncertainty was prevalent throughout several emerging markets nations, and there were ongoing, still unresolved issues in the eurozone. All of these situations made the pullback unsurprising. RIS slipped 3.8% in the second quarter while its benchmark declined 4.5%. We were pleased to see the Fund better preserve its value during this more volatile period. Recent short-term results notwithstanding, we were also pleased that RIS outpaced the Russell ex-U.S. Global Small Cap Index for the five-year/since inception (6/30/08) period ended June 30, 2013. The bulk of the Fund’s net losses in the first half came from the metals & mining industry, part of the Materials sector that posted a sizable net loss as a result. Companies in this group accounted for four of the Fund’s five, and six of its ten, largest detractors for the period, with the four biggest net losses coming from precious metals mining businesses. Gold, silver, and other commodity prices declined significantly while mine operating costs were increasing, which | |||||||||
| GOOD IDEAS THAT WORKED Top Contributors to Performance Year-to-Date through 6/30/131 | |||||||||||
| Kakaku.com | 0.32% | ||||||||||
| Boiron | 0.32 | ||||||||||
| SimCorp | 0.30 | ||||||||||
| Recordati | 0.29 | ||||||||||
| Nomura Research Institute | 0.26 | ||||||||||
| 1 Includes dividends | |||||||||||
Important Performance and Expense Information All performance information in this Report reflects past performance, is presented on a total return basis, reflects the reinvestment of distributions, and does not reflect the deduction of taxes that a shareholder would pay on fund distributions or the redemption of fund shares. Past performance is no guarantee of future results. Investment return and principal value of an investment will fluctuate, so that shares may be worth more or less than their original cost when redeemed. Shares redeemed within 180 days of purchase may be subject to a 2% redemption fee payable to the Fund, which is not reflected in the performance shown above; if it were, performance would be lower. Current month-end performance may be higher or lower than performance quoted and may be obtained at www.roycefunds.com. Gross operating expenses reflect total gross annual operating expenses and include management fees, 12b-1 distribution and service fees, other expenses, and acquired fund fees and expenses. Acquired fund fees and expenses reflect the estimated amount of the fees and expenses incurred indirectly by any applicable Fund through its investments in mutual funds, hedge funds, private equity funds, and other investment companies. Net operating expenses reflect contractual fee waivers and/or expense reimbursements. All expense information is reported as of the Fund’s most current prospectus. Royce & Associates has contractually agreed to waive its fees and/or reimburse operating expenses to the extent necessary to maintain the Fund’s net annual operating expenses, other than acquired fund fees and expenses, at or below 1.69% through April 30, 2014 and at or below 1.99% through April 30, 2023. Regarding the two “Good Ideas” tables shown above, the sum of all contributors to, and all detractors from, performance for all securities in the portfolio would approximate the Fund’s year-to-date performance for 2013. | |||||||||||
| 42 | The Royce Funds 2013 Semiannual Report to Shareholders |
Performance and Portfolio Review combined to make the first half a nightmarish period for many mining companies. At the same time, these developments dropped valuations in many cases to what we view as rock-bottom levels that have not been seen since the late 2008–early 2009 lows. During the first quarter we added shares of London-based Hochschild Mining, a gold and silver producer that operates primarily in South America. We also chose to hold small positions in Australian gold producer Regis Resources and Turkish gold producer Koza Altin Isletmeleri while selling our positions in Medusa Mining and B2Gold Corporation. On the whole, we reduced the portfolio’s exposure to the Materials sector chiefly by selling shares of metals & mining companies in the first half. We saw the sliding stock price of Daphne International Holdings as an opportunity to build our position in this Chinese footwear maker and retailer, which sells Aerosole shoes in China. Adding shares between April and June, we like the company’s long-term potential based on its strong management and market position, though we recognize that this investment may require patience in the short run. The general slowdown in the Chinese economy has taken its toll on Daphne’s business. Lower levels of consumer spending in particular have caused sales and revenues to slump. It was the Fund’s seventh-largest position at the end of June. Tokyo-based Kakaku.com provides websites that offer price comparison services and product information on restaurants, hotels, and consumer appliances, among other things. Its business grew throughout the first half as increased website traffic helped spark impressive earnings growth. We took gains between February and May. A rising share price also led us to take gains in Boiron, which has a global business manufacturing homeopathic medications. Improved profitability and cash flows were key to its healthy results through the end of June. We also reduced our position in SimCorp during the first half. Based in Copenhagen, the company provides specialized software for investment management businesses all over the world. Its share price rose more or less steadily through the first half. The company instituted a share buyback program in February and completed a 10-for-1 stock split in June, all while showing steady earnings growth. Recordati, RIS’s top holding at the end of June, is a pharmaceutical business based in Milan with a growing global reach. The company produced notable growth over the last two fiscal years that were reported in the first half. Investors seem to appreciate its increasing revenues from Russia, Turkey, and Eastern Europe, markets where demand for pharmaceutical products is growing in the high single-digits. We sold our position in Nomura Research Institute, a Japanese business consultant that offers technology and research to analyze strategy and decision making. |
GOOD IDEAS AT THE TIME | |
| Hochschild Mining | -0.78% |
| Regis Resources | -0.36 |
| Medusa Mining | -0.33 |
| Daphne International Holdings | -0.33 |
| B2Gold Corporation | -0.33 |
| 1 Net of dividends | |
| ROYCE INTERNATIONAL SMALLER-COMPANIES FUND VS. RUSSELL GLOBAL EX-U.S. SMALL CAP Value of $10,000 Invested on 6/30/08 | |
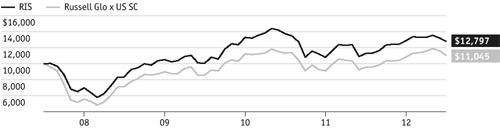 |
| Includes reinvestment of distributions. | |||
| PORTFOLIO DIAGNOSTICS | |||
| Fund Net Assets | $32 million | ||
| Number of Holdings | 130 | ||
| Turnover Rate | 33% | ||
| Average Market Capitalization1 | $1,037 million | ||
| Weighted Average P/E Ratio2,3 | 13.3x | ||
| Weighted Average P/B Ratio2 | 1.9x | ||
| Ticker Symbol | |||
| Service Class | RYGSX | ||
1 Geometric Average. This weighted calculation uses each portfolio holding’s market cap in a way designed to not skew the effect of very large or small holdings; instead, it aims to better identify the portfolio’s center, which Royce believes offers a more accurate measure of average market cap than a simple mean or median. | |||
2 Harmonic Average. This weighted calculation evaluates a portfolio as if it were a single stock and measures it overall. It compares the total market value of the portfolio to the portfolio’s share in the earnings or book value, as the case may be, of its underlying stocks. | |||
3 The Fund’s P/E ratio calculation excludes companies with zero or negative earnings (1% of portfolio holdings as of 6/30/13). | |||
| MORNINGSTAR STATISTICAL MEASURES1 | |||
| Sharpe Ratio | Standard Deviation | ||
| RIS | 0.32 | 23.03 | |
| Russell Global ex-U.S. Small Cap | 0.20 | 25.39 | |
| Category Median | 0.25 | 24.41 | |
| Best Quartile Breakpoint | 0.33 | 23.54 | |
1 Five years ended 6/30/13. Category Median and Best Quartile Breakpoint based on 56 foreign small/mid objective funds (oldest class only) with at least five years of history. | |||
The Fund beat the Russell Global ex-U.S. Small Cap and performed within the top 50% of foreign small/mid objective funds on a risk-adjusted basis, as shown by its Sharpe ratio. In addition, the Fund produced lower volatility than the Russell Global ex-U.S. Small Cap and 75% of foreign small/mid objective funds, as shown by its standard deviation. | |||
| The Royce Funds 2013 Semiannual Report to Shareholders | 43 |
| Schedules of Investments |
| Royce Pennsylvania Mutual Fund |
| SHARES | VALUE | |||||||
| COMMON STOCKS – 99.3% | ||||||||
Consumer Discretionary – 15.4% | ||||||||
Auto Components - 1.3% | ||||||||
| 152,300 | $ | 625,953 | ||||||
Dorman Products | 455,185 | 20,770,092 | ||||||
Drew Industries | 784,088 | 30,830,340 | ||||||
Gentex Corporation | 804,500 | 18,543,725 | ||||||
Spartan Motors | 170,800 | 1,045,296 | ||||||
Strattec Security | 150,000 | 5,604,000 | ||||||
Superior Industries International | 488,000 | 8,398,480 | ||||||
| 85,817,886 | ||||||||
Automobiles - 1.0% | ||||||||
Thor Industries | 736,650 | 36,228,447 | ||||||
| 1,494,450 | 31,368,506 | |||||||
| 67,596,953 | ||||||||
Distributors - 0.4% | ||||||||
Pool Corporation | 261,400 | 13,699,974 | ||||||
Weyco Group 3 | 590,500 | 14,880,600 | ||||||
| 28,580,574 | ||||||||
Diversified Consumer Services - 0.7% | ||||||||
American Public Education 2 | 1,900 | 70,604 | ||||||
Capella Education 2 | 25,926 | 1,079,818 | ||||||
Corinthian Colleges 2 | 100,000 | 224,000 | ||||||
Lincoln Educational Services | 69,500 | 366,265 | ||||||
Sotheby’s | 928,608 | 35,203,529 | ||||||
Universal Technical Institute | 753,700 | 7,785,721 | ||||||
| 44,729,937 | ||||||||
Hotels, Restaurants & Leisure - 0.1% | ||||||||
Bob Evans Farms | 20,000 | 939,600 | ||||||
CEC Entertainment | 140,600 | 5,770,224 | ||||||
| 6,709,824 | ||||||||
Household Durables - 2.6% | ||||||||
Ethan Allen Interiors 3 | 1,523,910 | 43,888,608 | ||||||
Harman International Industries | 458,300 | 24,839,860 | ||||||
Helen of Troy 2 | 35,000 | 1,342,950 | ||||||
La-Z-Boy | 689,500 | 13,976,165 | ||||||
Lifetime Brands | 211,413 | 2,870,989 | ||||||
Mohawk Industries 2 | 318,000 | 35,771,820 | ||||||
Natuzzi ADR 2 | 2,096,300 | 4,548,971 | ||||||
NVR 2 | 36,600 | 33,745,200 | ||||||
Skullcandy 2 | 68,600 | 374,556 | ||||||
Skyline Corporation 2 | 183,400 | 720,762 | ||||||
| 1,002,235 | 4,008,940 | |||||||
| 166,088,821 | ||||||||
Internet & Catalog Retail - 0.0% | ||||||||
| 149,700 | 938,619 | |||||||
Leisure Equipment & Products - 0.0% | ||||||||
Arctic Cat | 18,836 | 847,243 | ||||||
Callaway Golf | 250,000 | 1,645,000 | ||||||
| 73,400 | 722,256 | |||||||
| 3,214,499 | ||||||||
Media - 1.4% | ||||||||
| 746,800 | 19,162,888 | |||||||
Morningstar | 496,300 | 38,502,954 | ||||||
Rentrak Corporation 2 | 286,665 | 5,753,367 | ||||||
Saga Communications Cl. A | 117,951 | 5,415,130 | ||||||
Scholastic Corporation | 443,000 | 12,975,470 | ||||||
Wiley (John) & Sons Cl. A | 65,000 | 2,605,850 | ||||||
World Wrestling Entertainment Cl. A | 259,600 | 2,676,476 | ||||||
| 87,092,135 | ||||||||
Multiline Retail - 0.1% | ||||||||
Tuesday Morning 2 | 370,000 | 3,836,900 | ||||||
Specialty Retail - 5.3% | ||||||||
American Eagle Outfitters | 1,437,091 | 26,241,282 | ||||||
| 556,600 | 24,067,384 | |||||||
Ascena Retail Group 2 | 2,378,549 | 41,505,680 | ||||||
Buckle (The) | 623,604 | 32,439,880 | ||||||
Cato Corporation (The) Cl. A | 1,362,502 | 34,008,050 | ||||||
Christopher & Banks 2 | 135,252 | 911,599 | ||||||
Destination Maternity | 93,000 | 2,287,800 | ||||||
GameStop Corporation Cl. A | 734,400 | 30,866,832 | ||||||
Guess? | 662,014 | 20,542,294 | ||||||
Jos. A. Bank Clothiers 2 | 669,279 | 27,654,608 | ||||||
Kirkland’s 2 | 3,100 | 53,475 | ||||||
| 685,000 | 2,540,173 | |||||||
Monro Muffler Brake | 327,400 | 15,731,570 | ||||||
Penske Automotive Group | 389,200 | 11,886,168 | ||||||
Pier 1 Imports | 1,013,600 | 23,809,464 | ||||||
Shoe Carnival 3 | 1,227,698 | 29,477,029 | ||||||
Stage Stores | 11,300 | 265,550 | ||||||
Stein Mart | 975,916 | 13,321,253 | ||||||
Wet Seal (The) Cl. A 2 | 161,700 | 761,607 | ||||||
| 338,371,698 | ||||||||
Textiles, Apparel & Luxury Goods - 2.5% | ||||||||
Barry (R.G.) | 204,344 | 3,318,546 | ||||||
Columbia Sportswear | 295,117 | 18,489,080 | ||||||
Crocs 2 | 1,315,620 | 21,707,730 | ||||||
Crown Crafts | 322,700 | 1,984,605 | ||||||
Deckers Outdoor 2 | 483,706 | 24,431,990 | ||||||
G-III Apparel Group 2 | 618,157 | 29,745,715 | ||||||
Maidenform Brands 2 | 1,139,532 | 19,748,090 | ||||||
Movado Group | 120,000 | 4,059,600 | ||||||
Steven Madden 2 | 448,896 | 21,717,588 | ||||||
Vera Bradley 2 | 618,354 | 13,393,548 | ||||||
| 158,596,492 | ||||||||
Total (Cost $682,483,702) | 991,574,338 | |||||||
Consumer Staples – 1.9% | ||||||||
Food & Staples Retailing - 0.1% | ||||||||
Village Super Market Cl. A | 120,995 | 4,003,724 | ||||||
Food Products - 0.7% | ||||||||
| 211,116 | 1,773,374 | |||||||
Calavo Growers | 65,277 | 1,774,882 | ||||||
Cal-Maine Foods | 215,121 | 10,005,278 | ||||||
Darling International 2 | 20,000 | 373,200 | ||||||
Farmer Bros. 2 | 50,700 | 712,842 | ||||||
Industrias Bachoco ADR | 112,586 | 3,906,734 | ||||||
Sanderson Farms | 366,900 | 24,369,498 | ||||||
| 44 | The Royce Funds 2013 Semiannual Report to Shareholders | THE ACCOMPANYING NOTES ARE AN INTEGRAL PART OF THESE FINANCIAL STATEMENTS. |
| June 30, 2013 (unaudited) |
| SHARES | VALUE | |||||||
| Consumer Staples (continued) | ||||||||
Food Products (continued) | ||||||||
SunOpta 2 | 206,300 | $ | 1,565,817 | |||||
| 44,481,625 | ||||||||
Household Products - 0.1% | ||||||||
Harbinger Group 2 | 1,009,600 | 7,612,384 | ||||||
Orchids Paper Products | 28,600 | 750,750 | ||||||
| 8,363,134 | ||||||||
Personal Products - 1.0% | ||||||||
Inter Parfums | 826,736 | 23,578,511 | ||||||
Nu Skin Enterprises Cl. A | 537,185 | 32,832,747 | ||||||
Nutraceutical International | 312,500 | 6,387,500 | ||||||
| 62,798,758 | ||||||||
Total (Cost $71,350,676) | 119,647,241 | |||||||
Energy – 7.0% | ||||||||
Energy Equipment & Services - 6.3% | ||||||||
Atwood Oceanics 2 | 18,500 | 962,925 | ||||||
| 121,977 | 2,362,694 | |||||||
CARBO Ceramics | 273,100 | 18,415,133 | ||||||
Ensign Energy Services | 1,710,100 | 26,471,835 | ||||||
Exterran Holdings 2 | 951,700 | 26,761,804 | ||||||
Helmerich & Payne | 931,717 | 58,185,727 | ||||||
| 816,700 | 4,916,534 | |||||||
Matrix Service 2 | 1,201,243 | 18,715,366 | ||||||
Newpark Resources 2 | 130,700 | 1,436,393 | ||||||
Oil States International 2 | 735,226 | 68,111,337 | ||||||
Pason Systems | 2,351,700 | 42,754,115 | ||||||
Patterson-UTI Energy | 419,800 | 8,125,229 | ||||||
Rowan Companies 2 | 9,000 | 306,630 | ||||||
RPC | 1,294,775 | 17,880,843 | ||||||
SEACOR Holdings | 374,836 | 31,130,130 | ||||||
Superior Energy Services 2 | 104,200 | 2,702,948 | ||||||
Tidewater | 82,000 | 4,671,540 | ||||||
Trican Well Service | 1,241,200 | 16,498,979 | ||||||
Unit Corporation 2 | 1,251,637 | 53,294,703 | ||||||
Willbros Group 2 | 90,000 | 552,600 | ||||||
| 404,257,465 | ||||||||
Oil, Gas & Consumable Fuels - 0.7% | ||||||||
Cimarex Energy | 355,500 | 23,103,945 | ||||||
SM Energy | 229,100 | 13,741,418 | ||||||
Sprott Resource | 2,830,200 | 9,445,662 | ||||||
VAALCO Energy 2 | 208,700 | 1,193,764 | ||||||
| 47,484,789 | ||||||||
Total (Cost $267,296,867) | 451,742,254 | |||||||
Financials – 10.0% | ||||||||
Capital Markets - 5.5% | ||||||||
Affiliated Managers Group 2 | 203,700 | 33,394,578 | ||||||
AllianceBernstein Holding L.P. | 1,635,760 | 34,056,523 | ||||||
ASA Gold and Precious Metals | 53,000 | 673,100 | ||||||
Cohen & Steers | 687,663 | 23,366,789 | ||||||
Cowen Group 2 | 2,152,377 | 6,241,893 | ||||||
Diamond Hill Investment Group | 136,350 | 11,596,567 | ||||||
Federated Investors Cl. B | 2,445,082 | 67,019,698 | ||||||
Financial Engines | 97,000 | 4,422,230 | ||||||
GAMCO Investors Cl. A | 85,421 | 4,733,178 | ||||||
GFI Group | 580,000 | 2,267,800 | ||||||
INTL FCStone 2 | 61,217 | 1,068,237 | ||||||
Janus Capital Group | 650,000 | 5,531,500 | ||||||
Lazard Cl. A | 1,076,627 | 34,613,558 | ||||||
Manning & Napier | 677,292 | 12,028,706 | ||||||
MVC Capital | 263,600 | 3,318,724 | ||||||
Oppenheimer Holdings Cl. A | 25,000 | 476,000 | ||||||
SEI Investments | 1,569,100 | 44,609,513 | ||||||
Sprott | 2,637,500 | 7,021,964 | ||||||
Waddell & Reed Financial Cl. A | 648,027 | 28,189,175 | ||||||
Westwood Holdings Group | 369,035 | 15,838,982 | ||||||
WisdomTree Investments 2 | 1,141,911 | 13,211,910 | ||||||
| 353,680,625 | ||||||||
Commercial Banks - 0.2% | ||||||||
City Holding Company | 352,270 | 13,720,916 | ||||||
Diversified Financial Services - 0.3% | ||||||||
Interactive Brokers Group | 588,600 | 9,399,942 | ||||||
PICO Holdings 2 | 487,400 | 10,215,904 | ||||||
| 19,615,846 | ||||||||
Insurance - 3.0% | ||||||||
Alleghany Corporation 2 | 14,200 | 5,443,002 | ||||||
Allied World Assurance Company Holdings | 199,436 | 18,250,388 | ||||||
Aspen Insurance Holdings | 176,039 | 6,529,287 | ||||||
Baldwin & Lyons Cl. B | 306,000 | 7,429,680 | ||||||
Brown & Brown | 755,700 | 24,363,768 | ||||||
E-L Financial | 47,000 | 28,377,865 | ||||||
Enstar Group 2 | 5,000 | 664,900 | ||||||
Erie Indemnity Cl. A | 293,500 | 23,389,015 | ||||||
Gallagher (Arthur J.) & Co. | 495,000 | 21,626,550 | ||||||
Greenlight Capital Re Cl. A 2 | 596,910 | 14,642,202 | ||||||
ProAssurance Corporation | 40,400 | 2,107,264 | ||||||
Reinsurance Group of America | 464,721 | 32,116,868 | ||||||
RLI Corp. | 65,231 | 4,984,301 | ||||||
Stewart Information Services | 191,600 | 5,018,004 | ||||||
| 194,943,094 | ||||||||
Real Estate Management & Development - 0.5% | ||||||||
E-House China Holdings ADR | 328,200 | 1,424,388 | ||||||
Forestar Group 2 | 50,000 | 1,003,000 | ||||||
Jones Lang LaSalle | 301,900 | 27,515,166 | ||||||
Tejon Ranch 2 | 131,624 | 3,749,968 | ||||||
| 33,692,522 | ||||||||
Thrifts & Mortgage Finance - 0.5% | ||||||||
BofI Holding 2 | 47,300 | 2,167,286 | ||||||
Doral Financial 2 | 214,600 | 178,118 | ||||||
Genworth MI Canada | 912,850 | 21,300,123 | ||||||
TrustCo Bank Corp. NY | 1,194,551 | 6,498,357 | ||||||
| 30,143,884 | ||||||||
Total (Cost $521,592,743) | 645,796,887 | |||||||
| THE ACCOMPANYING NOTES ARE AN INTEGRAL PART OF THESE FINANCIAL STATEMENTS. | The Royce Funds 2013 Semiannual Report to Shareholders | 45 |
| Schedules of Investments |
| Royce Pennsylvania Mutual Fund (continued) |
| SHARES | VALUE | |||||||
| Health Care – 7.7% | ||||||||
| Biotechnology - 0.5% | ||||||||
| 152,000 | $ | 354,160 | ||||||
| 150,000 | 541,500 | |||||||
Lexicon Pharmaceuticals 2 | 1,522,400 | 3,303,608 | ||||||
Myriad Genetics 2 | 988,500 | 26,560,995 | ||||||
| 177,100 | 304,612 | |||||||
| 160,000 | 336,000 | |||||||
| 31,400,875 | ||||||||
Health Care Equipment & Supplies - 1.9% | ||||||||
Abaxis | 2,000 | 95,020 | ||||||
Analogic Corporation | 346,300 | 25,221,029 | ||||||
Atrion Corporation | 400 | 87,484 | ||||||
CryoLife | 150,627 | 942,925 | ||||||
Exactech 2 | 59,800 | 1,181,050 | ||||||
Haemonetics 2 | 285,100 | 11,788,885 | ||||||
ICU Medical 2 | 21,800 | 1,570,908 | ||||||
IDEXX Laboratories 2 | 285,800 | 25,659,124 | ||||||
Invacare Corporation | 108,400 | 1,556,624 | ||||||
Medical Action Industries 2 | 304,262 | 2,342,817 | ||||||
Merit Medical Systems 2 | 534,586 | 5,960,634 | ||||||
STERIS Corporation | 577,600 | 24,767,488 | ||||||
SurModics 2 | 346,900 | 6,941,469 | ||||||
| 9,900 | 105,138 | |||||||
Teleflex | 60,000 | 4,649,400 | ||||||
Thoratec Corporation 2 | 348,300 | 10,905,273 | ||||||
Trinity Biotech ADR | 83,600 | 1,408,660 | ||||||
| 125,183,928 | ||||||||
Health Care Providers & Services - 2.4% | ||||||||
| 19,000 | 205,390 | |||||||
Almost Family | 34,147 | 648,793 | ||||||
| 40,200 | 1,155,750 | |||||||
BioScrip 2 | 4,000 | 66,000 | ||||||
Chemed Corporation | 266,260 | 19,285,212 | ||||||
Cross Country Healthcare 2 | 240,700 | 1,242,012 | ||||||
HealthSouth Corporation 2 | 915,000 | 26,352,000 | ||||||
Hooper Holmes 2 | 1,847,477 | 665,091 | ||||||
Landauer | 442,200 | 21,362,682 | ||||||
LHC Group 2 | 17,000 | 332,860 | ||||||
Magellan Health Services 2 | 284,022 | 15,927,954 | ||||||
MEDNAX 2 | 214,317 | 19,627,151 | ||||||
Owens & Minor | 744,000 | 25,169,520 | ||||||
Psychemedics Corporation | 70,200 | 753,948 | ||||||
U.S. Physical Therapy 3 | 685,048 | 18,934,727 | ||||||
VCA Antech 2 | 52,650 | 1,373,638 | ||||||
| 153,102,728 | ||||||||
Health Care Technology - 0.0% | ||||||||
Computer Programs and Systems | 5,000 | 245,700 | ||||||
Life Sciences Tools & Services - 2.3% | ||||||||
Bio-Rad Laboratories Cl. A 2 | 118,612 | 13,308,266 | ||||||
Covance 2 | 323,000 | 24,593,220 | ||||||
Furiex Pharmaceuticals 2 | 43,625 | 1,486,304 | ||||||
ICON 2 | 267,348 | 9,472,140 | ||||||
Mettler-Toledo International 2 | 168,600 | 33,922,320 | ||||||
PAREXEL International 2 | 270,000 | 12,403,800 | ||||||
PerkinElmer | 988,020 | 32,110,650 | ||||||
Techne Corporation | 299,900 | 20,717,092 | ||||||
| 148,013,792 | ||||||||
Pharmaceuticals - 0.6% | ||||||||
Hi-Tech Pharmacal 3 | 1,128,832 | 37,477,223 | ||||||
Total (Cost $376,906,105) | 495,424,246 | |||||||
Industrials – 25.8% | ||||||||
Aerospace & Defense - 1.7% | ||||||||
AeroVironment 2 | 31,900 | 643,742 | ||||||
American Science & Engineering | 57,305 | 3,209,080 | ||||||
Astronics Corporation 2 | 50,220 | 2,052,492 | ||||||
CPI Aerostructures 2 | 67,291 | 730,107 | ||||||
Cubic Corporation | 424,663 | 20,426,290 | ||||||
Curtiss-Wright | 255,620 | 9,473,277 | ||||||
HEICO Corporation | 875,428 | 44,095,308 | ||||||
HEICO Corporation Cl. A | 151,952 | 5,608,548 | ||||||
| 95,578 | 619,346 | |||||||
Orbital Sciences 2 | 100,000 | 1,737,000 | ||||||
Sparton Corporation 2 | 87,208 | 1,503,466 | ||||||
Teledyne Technologies 2 | 277,000 | 21,425,950 | ||||||
| 111,524,606 | ||||||||
Air Freight & Logistics - 1.1% | ||||||||
Forward Air | 869,900 | 33,299,772 | ||||||
Hub Group Cl. A 2 | 247,500 | 9,013,950 | ||||||
Pacer International 2 | 817,040 | 5,155,522 | ||||||
UTi Worldwide | 1,479,700 | 24,370,659 | ||||||
| 71,839,903 | ||||||||
Building Products - 1.8% | ||||||||
AAON | 1,100,650 | 36,409,502 | ||||||
American Woodmark 2 | 410,774 | 14,253,858 | ||||||
Apogee Enterprises | 40,569 | 973,656 | ||||||
Gibraltar Industries 2 | 615,120 | 8,956,147 | ||||||
Insteel Industries | 233,708 | 4,094,564 | ||||||
Owens Corning 2 | 383,800 | 14,998,904 | ||||||
Simpson Manufacturing | 1,064,000 | 31,302,880 | ||||||
WaterFurnace Renewable Energy | 140,400 | 2,743,387 | ||||||
| 113,732,898 | ||||||||
Commercial Services & Supplies - 2.7% | ||||||||
Brink’s Company (The) | 1,018,700 | 25,987,037 | ||||||
Copart 2 | 960,012 | 29,568,370 | ||||||
Healthcare Services Group | 677,275 | 16,606,783 | ||||||
| 221,539 | 3,236,685 | |||||||
| 1,800 | 19,530 | |||||||
Mine Safety Appliances | 332,100 | 15,459,255 | ||||||
Ritchie Bros. Auctioneers | 1,743,900 | 33,517,758 | ||||||
Team 2 | 818,095 | 30,964,896 | ||||||
Tetra Tech 2 | 458,240 | 10,773,222 | ||||||
TMS International Cl. A | 204,500 | 3,032,735 | ||||||
Viad Corporation | 203,666 | 4,993,890 | ||||||
| 174,160,161 | ||||||||
Construction & Engineering - 1.3% | ||||||||
Ameresco Cl. A 2 | 173,700 | 1,565,037 | ||||||
Baker (Michael) | 163,100 | 4,421,641 | ||||||
| 46 | The Royce Funds 2013 Semiannual Report to Shareholders | THE ACCOMPANYING NOTES ARE AN INTEGRAL PART OF THESE FINANCIAL STATEMENTS. |
| June 30, 2013 (unaudited) |
| SHARES | VALUE | |||||||
| Industrials (continued) | ||||||||
| Construction & Engineering (continued) | ||||||||
Chicago Bridge & Iron | 23,000 | $ | 1,372,180 | |||||
Comfort Systems USA | 553,491 | 8,258,086 | ||||||
EMCOR Group | 743,200 | 30,211,080 | ||||||
Foster Wheeler 2 | 15,000 | 325,650 | ||||||
KBR | 1,030,300 | 33,484,750 | ||||||
Layne Christensen 2 | 94,100 | 1,835,891 | ||||||
MYR Group 2 | 39,500 | 768,275 | ||||||
Pike Electric | 79,858 | 982,253 | ||||||
Sterling Construction 2 | 244,671 | 2,216,719 | ||||||
| 85,441,562 | ||||||||
Electrical Equipment - 2.6% | ||||||||
AZZ | 507,492 | 19,568,891 | ||||||
Brady Corporation Cl. A | 674,700 | 20,733,531 | ||||||
| 4,200 | 4,914 | |||||||
Encore Wire | 353,079 | 12,039,994 | ||||||
EnerSys | 97,100 | 4,761,784 | ||||||
Franklin Electric | 1,091,500 | 36,728,975 | ||||||
Global Power Equipment Group | 699,705 | 11,279,245 | ||||||
| 2,360,206 | 17,182,300 | |||||||
Powell Industries 2 | 403,300 | 20,830,445 | ||||||
Preformed Line Products 3 | 311,088 | 20,628,245 | ||||||
| 163,758,324 | ||||||||
Industrial Conglomerates - 0.4% | ||||||||
Raven Industries | 814,270 | 24,411,815 | ||||||
Machinery - 7.7% | ||||||||
Alamo Group | 340,340 | 13,892,679 | ||||||
Astec Industries | 59,512 | 2,040,667 | ||||||
Briggs & Stratton | 252,600 | 5,001,480 | ||||||
Chart Industries 2 | 19,500 | 1,834,755 | ||||||
CIRCOR International | 308,952 | 15,713,299 | ||||||
CLARCOR | 600,400 | 31,346,884 | ||||||
Columbus McKinnon 2 | 187,150 | 3,990,038 | ||||||
Donaldson Company | 783,700 | 27,946,742 | ||||||
Edwards Group ADR 2 | 150,000 | 1,275,000 | ||||||
| 2,500 | 154,300 | |||||||
Flow International 2 | 604,574 | 2,230,878 | ||||||
Foster (L.B.) Company | 126,598 | 5,465,236 | ||||||
Gorman-Rupp Company | 49,733 | 1,583,499 | ||||||
Graco | 605,449 | 38,270,431 | ||||||
Graham Corporation | 108,848 | 3,268,705 | ||||||
Hurco Companies | 30,552 | 878,981 | ||||||
IDEX Corporation | 343,500 | 18,483,735 | ||||||
Kadant | 76,500 | 2,308,005 | ||||||
Kaydon Corporation | 158,400 | 4,363,920 | ||||||
Kennametal | 1,078,751 | 41,887,901 | ||||||
Lincoln Electric Holdings | 852,727 | 48,835,675 | ||||||
Lindsay Corporation | 10,300 | 772,294 | ||||||
Miller Industries | 54,010 | 830,674 | ||||||
Nordson Corporation | 394,400 | 27,335,864 | ||||||
| 75,110 | 4,879,897 | |||||||
RBC Bearings 2 | 666,200 | 34,609,090 | ||||||
Standex International | 21,700 | 1,144,675 | ||||||
Sun Hydraulics | 629,300 | 19,684,504 | ||||||
Tennant Company | 639,181 | 30,853,267 | ||||||
Valmont Industries | 289,000 | 41,353,010 | ||||||
WABCO Holdings 2 | 469,500 | 35,066,955 | ||||||
Wabtec Corporation | 520,522 | 27,811,490 | ||||||
| 495,114,530 | ||||||||
Marine - 0.3% | ||||||||
Kirby Corporation 2 | 213,700 | 16,997,698 | ||||||
Professional Services - 3.2% | ||||||||
Acacia Research-Acacia Technologies | 124,700 | 2,787,045 | ||||||
Advisory Board (The) 2 | 835,800 | 45,676,470 | ||||||
Barrett Business Services | 160,800 | 8,395,368 | ||||||
Corporate Executive Board | 470,800 | 29,763,976 | ||||||
| 592,143 | 10,936,881 | |||||||
Exponent | 405,039 | 23,941,855 | ||||||
GP Strategies 2 | 96,615 | 2,301,370 | ||||||
Heidrick & Struggles International | 31,632 | 528,887 | ||||||
Kforce | 5,000 | 73,000 | ||||||
Korn/Ferry International 2 | 50,000 | 937,000 | ||||||
ManpowerGroup | 429,330 | 23,527,284 | ||||||
On Assignment 2 | 85,000 | 2,271,200 | ||||||
Resources Connection | 6,800 | 78,880 | ||||||
Robert Half International | 375,600 | 12,481,188 | ||||||
Towers Watson & Company Cl. A | 457,800 | 37,512,132 | ||||||
TrueBlue 2 | 285,700 | 6,013,985 | ||||||
| 207,226,521 | ||||||||
Road & Rail - 1.1% | ||||||||
Arkansas Best | 541,600 | 12,429,720 | ||||||
Knight Transportation | 189,000 | 3,178,980 | ||||||
Landstar System | 618,500 | 31,852,750 | ||||||
Marten Transport | 51,750 | 810,923 | ||||||
Patriot Transportation Holding 2 | 254,400 | 7,642,176 | ||||||
Universal Truckload Services 2 | 685,784 | 16,534,252 | ||||||
| 72,448,801 | ||||||||
Trading Companies & Distributors - 1.5% | ||||||||
Air Lease Cl. A | 594,800 | 16,410,532 | ||||||
Applied Industrial Technologies | 969,590 | 46,860,285 | ||||||
Houston Wire & Cable | 22,700 | 314,168 | ||||||
MSC Industrial Direct Cl. A | 430,900 | 33,377,514 | ||||||
| 96,962,499 | ||||||||
Transportation Infrastructure - 0.4% | ||||||||
Wesco Aircraft Holdings 2 | 1,243,787 | 23,097,124 | ||||||
Total (Cost $1,036,319,522) | 1,656,716,442 | |||||||
Information Technology – 21.0% | ||||||||
Communications Equipment - 1.6% | ||||||||
ADTRAN | 1,205,415 | 29,665,263 | ||||||
Bel Fuse Cl. B | 25,937 | 348,853 | ||||||
Black Box | 142,502 | 3,608,150 | ||||||
CalAmp Corporation 2 | 127,000 | 1,854,200 | ||||||
Digi International 2 | 388,644 | 3,641,594 | ||||||
Emulex Corporation 2 | 50,000 | 326,000 | ||||||
Finisar Corporation 2 | 74,000 | 1,254,300 | ||||||
Globecomm Systems 2 | 120,800 | 1,526,912 | ||||||
Harmonic 2 | 150,000 | 952,500 | ||||||
NETGEAR 2 | 1,242,918 | 37,958,716 | ||||||
| THE ACCOMPANYING NOTES ARE AN INTEGRAL PART OF THESE FINANCIAL STATEMENTS. | The Royce Funds 2013 Semiannual Report to Shareholders | 47 |
| Schedules of Investments |
| Royce Pennsylvania Mutual Fund (continued) |
| SHARES | VALUE | |||||||
| Information Technology (continued) | ||||||||
| Communications Equipment (continued) | ||||||||
Oplink Communications 2 | 101,167 | $ | 1,757,271 | |||||
Plantronics | 337,402 | 14,818,696 | ||||||
Polycom 2 | 253,900 | 2,676,106 | ||||||
| 6,600 | 84,480 | |||||||
TESSCO Technologies | 11,800 | 311,520 | ||||||
| 100,784,561 | ||||||||
Computers & Peripherals - 1.1% | ||||||||
Diebold | 701,000 | 23,616,690 | ||||||
Intevac 2 | 20,000 | 113,200 | ||||||
Lexmark International Cl. A | 349,000 | 10,668,930 | ||||||
Logitech International 1 | 1,287,100 | 9,074,055 | ||||||
Rimage Corporation 2 | 153,000 | 1,283,670 | ||||||
STEC 2 | 45,000 | 302,400 | ||||||
| 289,335 | 24,228,913 | |||||||
| 69,287,858 | ||||||||
Electronic Equipment, Instruments & Components - 8.3% | ||||||||
Agilysys 2 | 10,000 | 112,900 | ||||||
Anixter International 2 | 370,564 | 28,092,457 | ||||||
AVX Corporation | 1,545,821 | 18,163,397 | ||||||
Badger Meter | 273,514 | 12,185,049 | ||||||
Benchmark Electronics 2 | 1,009,000 | 20,280,900 | ||||||
Checkpoint Systems 2 | 50,100 | 710,919 | ||||||
Cognex Corporation | 628,435 | 28,417,831 | ||||||
Coherent | 776,700 | 42,772,869 | ||||||
Dolby Laboratories Cl. A | 865,250 | 28,942,612 | ||||||
| 1,068,267 | 21,984,935 | |||||||
Electro Rent | 77,074 | 1,294,072 | ||||||
Fabrinet 2 | 1,614,475 | 22,602,650 | ||||||
FARO Technologies 2 | 440,460 | 14,896,357 | ||||||
FEI Company | 12,750 | 930,623 | ||||||
FLIR Systems | 916,600 | 24,720,702 | ||||||
Frequency Electronics | 60,100 | 640,065 | ||||||
Hollysys Automation Technologies 2 | 195,455 | 2,425,597 | ||||||
IPG Photonics | 709,730 | 43,101,903 | ||||||
| 682,347 | 7,062,291 | |||||||
Littelfuse | 71,222 | 5,313,873 | ||||||
LRAD Corporation 2 | 600,744 | 678,841 | ||||||
Maxwell Technologies 2 | 53,000 | 378,950 | ||||||
Mercury Systems 2 | 7,900 | 72,838 | ||||||
Molex Cl. A | 810,549 | 20,150,248 | ||||||
MTS Systems | 471,275 | 26,674,165 | ||||||
National Instruments | 1,388,700 | 38,800,278 | ||||||
Newport Corporation 2 | 1,536,722 | 21,406,537 | ||||||
Park Electrochemical | 70,200 | 1,685,502 | ||||||
Plexus Corporation 2 | 788,200 | 23,559,298 | ||||||
| 223,173 | 584,713 | |||||||
Richardson Electronics | 98,551 | 1,156,989 | ||||||
Rofin-Sinar Technologies 2 | 1,066,638 | 26,601,952 | ||||||
Rogers Corporation 2 | 51,000 | 2,413,320 | ||||||
Tech Data 2 | 335,900 | 15,817,531 | ||||||
TTM Technologies 2 | 300,000 | 2,520,000 | ||||||
Vishay Intertechnology 2 | 1,722,309 | 23,922,872 | ||||||
Vishay Precision Group 2 | 11,200 | 169,568 | ||||||
Zygo Corporation 2 | 34,900 | 551,769 | ||||||
| 531,797,373 | ||||||||
Internet Software & Services - 0.3% | ||||||||
Active Network 2 | 1,802,700 | 13,646,439 | ||||||
CoStar Group 2 | 25,000 | 3,226,750 | ||||||
Dealertrack Technologies 2 | 1,700 | 60,231 | ||||||
| 7,700 | 134,750 | |||||||
RealNetworks 2 | 93,450 | 706,482 | ||||||
Responsys 2 | 150,000 | 2,146,500 | ||||||
Stamps.com 2 | 39,700 | 1,563,783 | ||||||
Support.com 2 | 160,999 | 735,766 | ||||||
ValueClick 2 | 27,030 | 667,100 | ||||||
| 2,700 | 61,884 | |||||||
| 22,949,685 | ||||||||
IT Services - 2.8% | ||||||||
Computer Task Group | 228,901 | 5,257,856 | ||||||
Convergys Corporation | 974,831 | 16,991,304 | ||||||
CoreLogic 2 | 319,000 | 7,391,230 | ||||||
Forrester Research | 312,400 | 11,461,956 | ||||||
Hackett Group | 320,973 | 1,665,850 | ||||||
ManTech International Cl. A | 967,670 | 25,275,540 | ||||||
MAXIMUS | 366,600 | 27,304,368 | ||||||
MoneyGram International 2 | 1,249,739 | 28,306,588 | ||||||
Sapient Corporation 2 | 1,980,000 | 25,858,800 | ||||||
ServiceSource International 2 | 815,761 | 7,602,893 | ||||||
Sykes Enterprises 2 | 167,802 | 2,644,560 | ||||||
Syntel 2 | 296,600 | 18,647,242 | ||||||
Virtusa Corporation 2 | 4,000 | 88,640 | ||||||
| 178,496,827 | ||||||||
Office Electronics - 0.4% | ||||||||
Zebra Technologies Cl. A 2 | 554,439 | 24,084,830 | ||||||
Semiconductors & Semiconductor Equipment - 3.8% | ||||||||
Advanced Energy Industries 2 | 662,714 | 11,537,851 | ||||||
Aixtron ADR 2 | 569,726 | 9,560,002 | ||||||
Amtech Systems 2 | 149,000 | 947,640 | ||||||
ATMI 2 | 496,368 | 11,739,103 | ||||||
AXT 2 | 148,800 | 401,760 | ||||||
Cabot Microelectronics 2 | 462,200 | 15,257,222 | ||||||
| 375,500 | 6,518,680 | |||||||
Diodes 2 | 1,333,700 | 34,636,189 | ||||||
Entegris 2 | 89,900 | 844,161 | ||||||
Entropic Communications 2 | 121,953 | 520,739 | ||||||
Exar Corporation 2 | 824,441 | 8,879,230 | ||||||
Fairchild Semiconductor International 2 | 1,205,300 | 16,633,140 | ||||||
GSI Technology 2 | 44,862 | 283,528 | ||||||
Integrated Device Technology 2 | 300,000 | 2,382,000 | ||||||
Integrated Silicon Solution 2 | 443,003 | 4,855,313 | ||||||
International Rectifier 2 | 873,600 | 18,293,184 | ||||||
IXYS Corporation | 1,216,917 | 13,459,102 | ||||||
Kulicke & Soffa Industries 2 | 173,900 | 1,923,334 | ||||||
LTX-Credence Corporation 2 | 182,800 | 1,094,972 | ||||||
Micrel | 1,080,800 | 10,678,304 | ||||||
MKS Instruments | 657,200 | 17,442,088 | ||||||
Nanometrics 2 | 320,671 | 4,704,244 | ||||||
| 48 | The Royce Funds 2013 Semiannual Report to Shareholders | THE ACCOMPANYING NOTES ARE AN INTEGRAL PART OF THESE FINANCIAL STATEMENTS. |
| June 30, 2013 (unaudited) |
| SHARES | VALUE | |||||||
| Information Technology (continued) | ||||||||
| Semiconductors & Semiconductor Equipment (continued) | ||||||||
OmniVision Technologies 2 | 301,700 | $ | 5,626,705 | |||||
Photronics 2 | 182,760 | 1,473,046 | ||||||
RDA Microelectronics ADR | 146,933 | 1,628,018 | ||||||
Rudolph Technologies 2 | 89,422 | 1,001,526 | ||||||
Silicon Motion Technology ADR | 145,500 | 1,540,845 | ||||||
STR Holdings 2 | 90,000 | 204,300 | ||||||
Supertex | 334,000 | 7,985,940 | ||||||
Teradyne 2 | 1,423,796 | 25,016,096 | ||||||
TriQuint Semiconductor 2 | 110,066 | 762,757 | ||||||
Ultra Clean Holdings 2 | 36,567 | 221,230 | ||||||
| 280,100 | 9,921,142 | |||||||
| 247,973,391 | ||||||||
Software - 2.7% | ||||||||
ACI Worldwide 2 | 427,600 | 19,874,848 | ||||||
Actuate Corporation 2 | 303,872 | 2,017,710 | ||||||
American Software Cl. A | 243,224 | 2,113,616 | ||||||
ANSYS 2 | 497,000 | 36,330,700 | ||||||
Blackbaud | 692,991 | 22,570,717 | ||||||
| 150,098 | 303,198 | |||||||
FactSet Research Systems | 110,900 | 11,305,146 | ||||||
Fair Isaac | 506,900 | 23,231,227 | ||||||
Manhattan Associates 2 | 455,000 | 35,107,800 | ||||||
Monotype Imaging Holdings | 669,700 | 17,017,077 | ||||||
Rovi Corporation 2 | 123,000 | 2,809,320 | ||||||
| 1,000 | 24,940 | |||||||
| 172,706,299 | ||||||||
Total (Cost $1,084,800,143) | 1,348,080,824 | |||||||
Materials – 9.0% | ||||||||
Chemicals - 2.8% | ||||||||
Balchem Corporation | 305,000 | 13,648,750 | ||||||
Cabot Corporation | 478,300 | 17,897,986 | ||||||
Hawkins | 29,617 | 1,166,614 | ||||||
Innophos Holdings | 246,063 | 11,606,792 | ||||||
Innospec | 726,680 | 29,198,002 | ||||||
Intrepid Potash | 211,400 | 4,027,170 | ||||||
KMG Chemicals | 66,600 | 1,405,260 | ||||||
LSB Industries 2 | 133,839 | 4,070,044 | ||||||
Minerals Technologies | 261,832 | 10,824,135 | ||||||
OM Group 2 | 85,500 | 2,643,660 | ||||||
Quaker Chemical | 433,288 | 26,868,189 | ||||||
Schulman (A.) | 269,690 | 7,233,086 | ||||||
Stepan Company | 349,914 | 19,458,717 | ||||||
Westlake Chemical | 339,800 | 32,760,118 | ||||||
| 182,808,523 | ||||||||
Construction Materials - 0.1% | ||||||||
Ash Grove Cement 4 | 50,018 | 9,393,380 | ||||||
Containers & Packaging - 0.7% | ||||||||
AptarGroup | 221,700 | 12,240,057 | ||||||
Greif Cl. A | 536,468 | 28,255,770 | ||||||
UFP Technologies 2 | 72,198 | 1,413,637 | ||||||
| 41,909,464 | ||||||||
Metals & Mining - 4.9% | ||||||||
Agnico Eagle Mines | 317,700 | 8,749,458 | ||||||
Allegheny Technologies | 690,646 | 18,170,896 | ||||||
Allied Nevada Gold 2 | 905,500 | 5,867,640 | ||||||
Carpenter Technology | 117,500 | 5,295,725 | ||||||
Commercial Metals | 238,700 | 3,525,599 | ||||||
Compass Minerals International | 210,126 | 17,761,951 | ||||||
Eldorado Gold | 1,435,900 | 8,873,862 | ||||||
Franco-Nevada Corporation | 300,000 | 10,731,000 | ||||||
Geodrill 2 | 497,300 | 335,726 | ||||||
Globe Specialty Metals | 1,354,303 | 14,721,274 | ||||||
Haynes International | 387,593 | 18,554,077 | ||||||
Hecla Mining | 2,078,100 | 6,192,738 | ||||||
Hochschild Mining | 134,700 | 318,166 | ||||||
Horsehead Holding Corporation 2 | 630,900 | 8,081,829 | ||||||
Major Drilling Group International | 2,464,000 | 16,774,974 | ||||||
Olympic Steel | 129,000 | 3,160,500 | ||||||
Pan American Silver | 930,700 | 10,833,348 | ||||||
Pretium Resources 2 | 3,399,700 | 22,438,757 | ||||||
Reliance Steel & Aluminum | 930,800 | 61,023,248 | ||||||
Schnitzer Steel Industries Cl. A | 358,410 | 8,379,626 | ||||||
Scorpio Mining 2 | 364,000 | 117,676 | ||||||
| 2,413,004 | 22,754,628 | |||||||
Silver Standard Resources 2 | 689,000 | 4,368,260 | ||||||
Sims Metal Management ADR | 2,006,399 | 15,168,376 | ||||||
Steel Dynamics | 383,521 | 5,718,298 | ||||||
Universal Stainless & Alloy Products 2 | 72,500 | 2,137,300 | ||||||
Worthington Industries | 523,733 | 16,607,573 | ||||||
| 316,662,505 | ||||||||
Paper & Forest Products - 0.5% | ||||||||
Stella-Jones | 330,700 | 30,828,019 | ||||||
Total (Cost $496,435,552) | 581,601,891 | |||||||
Telecommunication Services – 0.1% | ||||||||
Diversified Telecommunication Services - 0.1% | ||||||||
Premiere Global Services 2 | 743,900 | 8,978,873 | ||||||
Total (Cost $6,790,022) | 8,978,873 | |||||||
Miscellaneous5 – 1.4% | ||||||||
Total (Cost $83,614,016) | 90,693,427 | |||||||
| TOTAL COMMON STOCKS | ||||||||
(Cost $4,627,589,348) | 6,390,256,423 | |||||||
| REPURCHASE AGREEMENT – 0.2% | ||||||||
| Fixed Income Clearing Corporation, | ||||||||
0.01% dated 6/28/13, due 7/1/13, | ||||||||
maturity value $9,377,008 (collateralized | ||||||||
by obligations of various U.S. Government | ||||||||
Agencies, 1.50% due 12/11/13-12/31/13, valued at $9,567,650) | ||||||||
(Cost $9,377,000) | 9,377,000 | |||||||
| THE ACCOMPANYING NOTES ARE AN INTEGRAL PART OF THESE FINANCIAL STATEMENTS. | The Royce Funds 2013 Semiannual Report to Shareholders | 49 |
| Schedules of Investments |
| Royce Pennsylvania Mutual Fund (continued) |
| PRINCIPAL | ||||||||
| AMOUNT | VALUE | |||||||
| COLLATERAL RECEIVED FOR SECURITIES | ||||||||
LOANED – 1.1% | ||||||||
| U.S. Treasury Bonds | ||||||||
0.75%-4.375% | ||||||||
due 1/15/25-8/15/42 | $3,724,573 | $ | 3,747,618 | |||||
| U.S. Treasury Notes | ||||||||
0.125%-4.50% | ||||||||
due 11/15/13-1/15/22 | 1,925,377 | 1,934,686 | ||||||
| Money Market Funds | ||||||||
Federated Government Obligations Fund | ||||||||
(7 day yield-0.0099%) | 65,953,483 | |||||||
| TOTAL COLLATERAL RECEIVED FOR | ||||||||
SECURITIES LOANED | ||||||||
(Cost $71,635,787) | 71,635,787 | |||||||
| TOTAL INVESTMENTS – 100.6% | ||||||||
(Cost $4,708,602,135) | 6,471,269,210 | |||||||
LIABILITIES LESS CASH | ||||||||
AND OTHER ASSETS – (0.6)% | (37,516,046 | ) | ||||||
| NET ASSETS – 100.0% | $ | 6,433,753,164 | ||||||
| Royce Micro-Cap Fund |
| SHARES | VALUE | |||||||
| COMMON STOCKS – 90.7% | ||||||||
| Consumer Discretionary – 18.5% | ||||||||
| Auto Components - 1.2% | ||||||||
Drew Industries | 189,778 | $ | 7,462,071 | |||||
Fuel Systems Solutions 2 | 130,671 | 2,337,704 | ||||||
| 9,799,775 | ||||||||
Diversified Consumer Services - 2.5% | ||||||||
| 167,930 | 6,240,279 | |||||||
Capella Education 2 | 158,300 | 6,593,195 | ||||||
Lincoln Educational Services 3 | 1,499,847 | 7,904,193 | ||||||
| 20,737,667 | ||||||||
Household Durables - 1.1% | ||||||||
Cavco Industries 2 | 137,820 | 6,953,019 | ||||||
Skullcandy 2 | 446,500 | 2,437,890 | ||||||
| 9,390,909 | ||||||||
Internet & Catalog Retail - 0.3% | ||||||||
Vitacost.com 2 | 339,400 | 2,867,930 | ||||||
Leisure Equipment & Products - 0.8% | ||||||||
Callaway Golf | 663,654 | 4,366,843 | ||||||
| 221,200 | 2,176,608 | |||||||
| 6,543,451 | ||||||||
Media - 0.3% | ||||||||
Saraiva S/A Livreiros Editores | 156,700 | 2,036,570 | ||||||
Specialty Retail - 9.4% | ||||||||
Buckle (The) | 161,275 | 8,389,525 | ||||||
Cato Corporation (The) Cl. A | 243,250 | 6,071,520 | ||||||
Citi Trends 2 | 508,383 | 7,386,805 | ||||||
†Destination Maternity | 272,456 | 6,702,418 | ||||||
| 500,776 | 7,997,393 | |||||||
Jos. A. Bank Clothiers 2 | 104,180 | 4,304,718 | ||||||
Kirkland’s 2 | 683,834 | 11,796,136 | ||||||
Shoe Carnival | 432,114 | 10,375,057 | ||||||
Stein Mart | 735,684 | 10,042,087 | ||||||
Tilly’s Cl. A 2 | 39,448 | 631,168 | ||||||
Zumiez 2 | 187,600 | 5,393,500 | ||||||
| 79,090,327 | ||||||||
Textiles, Apparel & Luxury Goods - 2.9% | ||||||||
Calida Holding | 99,000 | 2,431,634 | ||||||
Culp | 133,000 | 2,312,870 | ||||||
Maidenform Brands 2 | 261,500 | 4,531,795 | ||||||
Perry Ellis International | 510,948 | 10,377,354 | ||||||
True Religion Apparel 2 | 151,000 | 4,780,660 | ||||||
| 24,434,313 | ||||||||
Total (Cost $123,744,757) | 154,900,942 | |||||||
Consumer Staples – 0.9% | ||||||||
Beverages - 0.1% | ||||||||
| 191,900 | 1,082,316 | |||||||
Food Products - 0.8% | ||||||||
Asian Citrus Holdings | 4,092,900 | 1,467,017 | ||||||
Legumex Walker 2 | 402,000 | 1,716,250 | ||||||
Sipef | 46,948 | 3,154,490 | ||||||
| 50 | The Royce Funds 2013 Semiannual Report to Shareholders | THE ACCOMPANYING NOTES ARE AN INTEGRAL PART OF THESE FINANCIAL STATEMENTS. |
| June 30, 2013 (unaudited) |
| SHARES | VALUE | |||||||
| Consumer Staples (continued) | ||||||||
Food Products (continued) | ||||||||
| 2,760,860 | $ | 377,962 | ||||||
| 6,715,719 | ||||||||
Total (Cost $8,526,096) | 7,798,035 | |||||||
Energy – 7.8% | ||||||||
Energy Equipment & Services - 5.9% | ||||||||
Canadian Energy Services & Technology | 307,900 | 4,780,838 | ||||||
Dawson Geophysical 2 | 132,933 | 4,899,910 | ||||||
Geospace Technologies 2 | 9,116 | 629,733 | ||||||
Gulf Island Fabrication | 335,944 | 6,433,328 | ||||||
Lamprell 2 | 815,056 | 1,738,622 | ||||||
Natural Gas Services Group 2 | 324,697 | 7,627,132 | ||||||
Tesco Corporation 2 | 542,600 | 7,189,450 | ||||||
TGC Industries | 908,872 | 7,470,928 | ||||||
Total Energy Services | 622,800 | 8,616,279 | ||||||
| 49,386,220 | ||||||||
Oil, Gas & Consumable Fuels - 1.9% | ||||||||
Contango Oil & Gas | 61,073 | 2,061,214 | ||||||
Gran Tierra Energy 2 | 269,600 | 1,620,296 | ||||||
Renewable Energy Group 2 | 96,100 | 1,367,503 | ||||||
Sprott Resource | 1,645,800 | 5,492,782 | ||||||
Triangle Petroleum 2 | 683,963 | 4,794,581 | ||||||
| 114,647 | 301,521 | |||||||
| 15,637,897 | ||||||||
Total (Cost $42,158,338) | 65,024,117 | |||||||
Financials – 5.6% | ||||||||
Capital Markets - 2.6% | ||||||||
FBR & Co. 2 | 228,334 | 5,767,717 | ||||||
Gluskin Sheff + Associates | 91,600 | 1,694,909 | ||||||
GMP Capital | 515,600 | 3,039,574 | ||||||
INTL FCStone 2 | 353,455 | 6,167,790 | ||||||
U.S. Global Investors Cl. A | 381,749 | 805,490 | ||||||
Westwood Holdings Group | 99,372 | 4,265,046 | ||||||
| 21,740,526 | ||||||||
Commercial Banks - 0.9% | ||||||||
Bancorp (The) 2 | 179,843 | 2,695,846 | ||||||
BCB Holdings 2 | 2,760,860 | 818,830 | ||||||
Pacific Continental | 326,897 | 3,857,385 | ||||||
| 7,372,061 | ||||||||
Insurance - 0.4% | ||||||||
American Safety Insurance Holdings 2 | 42,937 | 1,243,026 | ||||||
Navigators Group 2 | 34,164 | 1,948,715 | ||||||
| 3,191,741 | ||||||||
Real Estate Management & Development - 1.7% | ||||||||
Brasil Brokers Participacoes | 1,099,600 | 3,227,813 | ||||||
Kennedy-Wilson Holdings | 517,281 | 8,607,556 | ||||||
Midland Holdings | 7,132,400 | 2,666,816 | ||||||
| 14,502,185 | ||||||||
Total (Cost $39,489,115) | 46,806,513 | |||||||
| Health Care – 8.2% | ||||||||
| Biotechnology - 0.9% | ||||||||
Burcon NutraScience 2 | 279,600 | 676,632 | ||||||
Dyax Corporation 2 | 865,484 | 2,994,575 | ||||||
Lexicon Pharmaceuticals 2 | 1,838,871 | 3,990,350 | ||||||
| 7,661,557 | ||||||||
Health Care Equipment & Supplies - 3.6% | ||||||||
Cerus Corporation 2 | 873,754 | 3,861,992 | ||||||
CryoLife | 477,711 | 2,990,471 | ||||||
Exactech 2 | 205,265 | 4,053,984 | ||||||
Merit Medical Systems 2 | 321,965 | 3,589,910 | ||||||
SurModics 2 | 230,722 | 4,616,747 | ||||||
Syneron Medical 2 | 672,374 | 5,849,654 | ||||||
Trinity Biotech ADR | 125,020 | 2,106,587 | ||||||
ZELTIQ Aesthetics 2 | 472,386 | 3,018,546 | ||||||
| 30,087,891 | ||||||||
Health Care Providers & Services - 2.7% | ||||||||
| 69,900 | 2,009,625 | |||||||
CorVel Corporation 2 | 227,240 | 6,651,315 | ||||||
IPC The Hospitalist 2 | 63,509 | 3,261,822 | ||||||
PDI 2 | 626,612 | 2,945,076 | ||||||
U.S. Physical Therapy | 272,440 | 7,530,242 | ||||||
| 22,398,080 | ||||||||
Health Care Technology - 0.1% | ||||||||
| 89,800 | 1,108,132 | |||||||
Pharmaceuticals - 0.9% | ||||||||
Unichem Laboratories | 795,618 | 2,202,426 | ||||||
Vetoquinol | 114,465 | 3,896,175 | ||||||
Zogenix 2 | 928,500 | 1,587,735 | ||||||
| 7,686,336 | ||||||||
Total (Cost $53,692,434) | 68,941,996 | |||||||
Industrials – 20.9% | ||||||||
Aerospace & Defense - 0.5% | ||||||||
AeroVironment 2 | 102,000 | 2,058,360 | ||||||
American Science & Engineering | 42,418 | 2,375,408 | ||||||
| 4,433,768 | ||||||||
Building Products - 1.7% | ||||||||
AAON | 103,444 | 3,421,928 | ||||||
Quanex Building Products | 373,400 | 6,288,056 | ||||||
WaterFurnace Renewable Energy | 241,800 | 4,724,722 | ||||||
| 14,434,706 | ||||||||
Commercial Services & Supplies - 1.8% | ||||||||
Courier Corporation | 236,782 | 3,381,247 | ||||||
Ennis | 474,251 | 8,199,800 | ||||||
Heritage-Crystal Clean 2 | 92,576 | 1,352,535 | ||||||
| 635,800 | 2,028,202 | |||||||
| 14,961,784 | ||||||||
Construction & Engineering - 1.8% | ||||||||
Layne Christensen 2 | 319,360 | 6,230,714 | ||||||
Severfield-Rowen | 5,860,458 | 4,211,610 | ||||||
Sterling Construction 2 | 535,175 | 4,848,685 | ||||||
| 15,291,009 | ||||||||
Electrical Equipment - 2.9% | ||||||||
Global Power Equipment Group | 551,212 | 8,885,537 | ||||||
| THE ACCOMPANYING NOTES ARE AN INTEGRAL PART OF THESE FINANCIAL STATEMENTS. | The Royce Funds 2013 Semiannual Report to Shareholders | 51 |
| Schedules of Investments |
| Royce Micro-Cap Fund (continued) |
| SHARES | VALUE | |||||||
| Industrials (continued) | ||||||||
| Electrical Equipment (continued) | ||||||||
Graphite India | 3,227,991 | $ | 3,992,551 | |||||
LSI Industries | 900,136 | 7,282,100 | ||||||
Powell Industries 2 | 62,300 | 3,217,795 | ||||||
Voltamp Transformers | 144,600 | 973,328 | ||||||
| 24,351,311 | ||||||||
Machinery - 6.2% | ||||||||
AIA Engineering | 309,087 | 1,773,642 | ||||||
Foster (L.B.) Company | 184,856 | 7,980,233 | ||||||
FreightCar America | 354,309 | 6,019,710 | ||||||
Gorman-Rupp Company | 70,971 | 2,259,717 | ||||||
Graham Corporation | 362,187 | 10,876,476 | ||||||
Kadant | 208,916 | 6,302,996 | ||||||
| 403,814 | 5,786,655 | |||||||
RBC Bearings 2 | 99,569 | 5,172,609 | ||||||
Semperit AG Holding | 166,979 | 5,998,808 | ||||||
| 52,170,846 | ||||||||
Professional Services - 2.9% | ||||||||
CRA International 2 | 325,783 | 6,017,212 | ||||||
Exponent | 76,635 | 4,529,895 | ||||||
GP Strategies 2 | 465,882 | 11,097,309 | ||||||
Kforce | 162,200 | 2,368,120 | ||||||
| 24,012,536 | ||||||||
Road & Rail - 2.6% | ||||||||
Marten Transport | 692,879 | 10,857,406 | ||||||
Patriot Transportation Holding 2 | 358,269 | 10,762,401 | ||||||
| 21,619,807 | ||||||||
Trading Companies & Distributors - 0.5% | ||||||||
Houston Wire & Cable | 297,600 | 4,118,784 | ||||||
Total (Cost $149,498,012) | 175,394,551 | |||||||
Information Technology – 13.6% | ||||||||
Communications Equipment - 2.3% | ||||||||
Anaren 2 | 249,999 | 5,734,977 | ||||||
COM DEV International 2 | 472,800 | 1,802,727 | ||||||
Digi International 2 | 486,008 | 4,553,895 | ||||||
KVH Industries 2 | 373,300 | 4,968,623 | ||||||
Parrot 2 | 68,200 | 1,897,956 | ||||||
| 18,958,178 | ||||||||
Computers & Peripherals - 0.7% | ||||||||
Avid Technology 2 | 159,343 | 936,937 | ||||||
Super Micro Computer 2 | 502,931 | 5,351,186 | ||||||
| 6,288,123 | ||||||||
Electronic Equipment, Instruments & Components - 1.0% | ||||||||
Electro Rent | 242,000 | 4,063,180 | ||||||
Fabrinet 2 | 330,945 | 4,633,230 | ||||||
| 8,696,410 | ||||||||
Internet Software & Services - 0.8% | ||||||||
QuinStreet 2 | 505,200 | 4,359,876 | ||||||
| 663,900 | 2,635,683 | |||||||
| 6,995,559 | ||||||||
IT Services - 0.9% | ||||||||
CSE Global | 2,776,500 | 1,861,953 | ||||||
EPAM Systems 2 | 208,717 | 5,672,928 | ||||||
| 7,534,881 | ||||||||
Semiconductors & Semiconductor Equipment - 6.0% | ||||||||
Advanced Energy Industries 2 | 422,836 | 7,361,575 | ||||||
ATMI 2 | 448,300 | 10,602,295 | ||||||
| 1,738,161 | 4,693,034 | |||||||
GSI Technology 2 | 784,480 | 4,957,913 | ||||||
Integrated Silicon Solution 2 | 712,000 | 7,803,520 | ||||||
M/A-COM Technology Solutions Holdings 2 | 246,658 | 3,601,207 | ||||||
Mindspeed Technologies 2 | 473,241 | 1,533,301 | ||||||
Rudolph Technologies 2 | 92,565 | 1,036,728 | ||||||
Sigma Designs 2 | 1,028,335 | 5,193,092 | ||||||
Ultra Clean Holdings 2 | 519,282 | 3,141,656 | ||||||
| 49,924,321 | ||||||||
Software - 1.9% | ||||||||
Monotype Imaging Holdings | 263,970 | 6,707,477 | ||||||
TeleNav 2 | 464,900 | 2,431,427 | ||||||
VASCO Data Security International 2 | 836,009 | 6,947,235 | ||||||
| 16,086,139 | ||||||||
Total (Cost $106,352,620) | 114,483,611 | |||||||
Materials – 10.3% | ||||||||
Chemicals - 2.4% | ||||||||
C. Uyemura & Co. | 54,600 | 2,254,356 | ||||||
FutureFuel Corporation | 308,300 | 4,368,611 | ||||||
LSB Industries 2 | 100,300 | 3,050,123 | ||||||
Quaker Chemical | 118,530 | 7,350,045 | ||||||
Societe Internationale de Plantations d’Heveas | 44,237 | 3,116,863 | ||||||
| 20,139,998 | ||||||||
Metals & Mining - 7.8% | ||||||||
Alamos Gold | 331,000 | 4,009,642 | ||||||
Allied Nevada Gold 2 | 91,300 | 591,624 | ||||||
Argonaut Gold 2 | 187,500 | 1,014,429 | ||||||
Bear Creek Mining 2 | 944,500 | 1,526,719 | ||||||
Endeavour Mining 2 | 1,971,000 | 1,049,501 | ||||||
| 951,100 | 3,262,273 | |||||||
Geodrill 2 | 1,912,300 | 1,290,989 | ||||||
| 1,290,000 | 812,700 | |||||||
Goldgroup Mining 2 | 1,340,000 | 140,154 | ||||||
Haynes International | 116,830 | 5,592,652 | ||||||
Horsehead Holding Corporation 2 | 844,271 | 10,815,111 | ||||||
Imdex | 1,170,165 | 663,508 | ||||||
International Tower Hill Mines 2 | 615,000 | 399,750 | ||||||
| 440,000 | 2,029,096 | |||||||
McEwen Mining 2 | 1,498,804 | 2,517,991 | ||||||
Olympic Steel | 420,159 | 10,293,895 | ||||||
Pilot Gold 2 | 2,864,500 | 2,178,948 | ||||||
Quaterra Resources 2 | 1,885,000 | 169,650 | ||||||
Silvercorp Metals | 730,200 | 2,059,164 | ||||||
Synalloy Corporation | 175,942 | 2,732,379 | ||||||
| 1,388,300 | 3,026,494 | |||||||
Universal Stainless & Alloy Products 2 | 283,352 | 8,353,217 | ||||||
| 52 | The Royce Funds 2013 Semiannual Report to Shareholders | THE ACCOMPANYING NOTES ARE AN INTEGRAL PART OF THESE FINANCIAL STATEMENTS. |
| June 30, 2013 (unaudited) |
| SHARES | VALUE | |||||||
| Materials (continued) | ||||||||
| Metals & Mining (continued) | ||||||||
Village Main Reef | 1,714,000 | $ | 78,027 | |||||
Western Copper and Gold 2 | 1,471,000 | 750,210 | ||||||
| 65,358,123 | ||||||||
| Paper & Forest Products - 0.1% | ||||||||
TFS Corporation 2 | 2,106,000 | 982,282 | ||||||
| Total (Cost $102,570,619) | 86,480,403 | |||||||
| Utilities – 0.1% | ||||||||
| Independent Power Producers & Energy Traders - 0.1% | ||||||||
Alterra Power 2 | 3,498,400 | 1,047,824 | ||||||
| Total (Cost $4,304,472) | 1,047,824 | |||||||
| Miscellaneous5 – 4.8% | ||||||||
| Total (Cost $38,516,505) | 40,224,129 | |||||||
| TOTAL COMMON STOCKS | ||||||||
(Cost $668,852,968) | 761,102,121 | |||||||
| REPURCHASE AGREEMENT – 9.6% | ||||||||
| Fixed Income Clearing Corporation, | ||||||||
0.01% dated 6/28/13, due 7/1/13, | ||||||||
maturity value $80,146,067 (collateralized | ||||||||
by obligations of various U.S. Government | ||||||||
Agencies, 1.375% due 2/25/14, valued at | ||||||||
$81,752,100) | ||||||||
(Cost $80,146,000) | 80,146,000 | |||||||
| PRINCIPAL | ||||||||
| AMOUNT | ||||||||
| COLLATERAL RECEIVED FOR SECURITIES | ||||||||
LOANED – 1.7% | ||||||||
| U.S. Treasury Notes | ||||||||
0.25%-3.125% | ||||||||
due 1/31/14-8/15/22 | $2,837,264 | 2,842,748 | ||||||
| Money Market Funds | ||||||||
Federated Government Obligations Fund | ||||||||
(7 day yield-0.0099%) | 11,443,581 | |||||||
| TOTAL COLLATERAL RECEIVED FOR | ||||||||
SECURITIES LOANED | ||||||||
(Cost $14,286,329) | 14,286,329 | |||||||
| TOTAL INVESTMENTS – 102.0% | ||||||||
(Cost $763,285,297) | 855,534,450 | |||||||
| LIABILITIES LESS CASH | ||||||||
AND OTHER ASSETS – (2.0)% | (16,464,768 | ) | ||||||
| NET ASSETS – 100.0% | $ | 839,069,682 | ||||||
| Royce Premier Fund |
| SHARES | VALUE | |||||||
| COMMON STOCKS – 97.4% | ||||||||
| Consumer Discretionary – 12.1% | ||||||||
| Automobiles - 3.1% | ||||||||
Thor Industries 3 | 4,216,757 | $ | 207,380,109 | |||||
Distributors - 1.4% | ||||||||
Pool Corporation | 1,761,400 | 92,314,974 | ||||||
Diversified Consumer Services - 2.1% | ||||||||
Sotheby’s | 2,378,594 | 90,172,498 | ||||||
| 1,068,485 | 52,174,123 | |||||||
| 142,346,621 | ||||||||
Media - 1.4% | ||||||||
Morningstar | 1,171,500 | 90,884,970 | ||||||
Specialty Retail - 1.4% | ||||||||
Buckle (The) | 1,730,836 | 90,038,089 | ||||||
Textiles, Apparel & Luxury Goods - 2.7% | ||||||||
Carter’s | 894,800 | 66,277,836 | ||||||
Columbia Sportswear | 1,221,813 | 76,546,585 | ||||||
Wolverine World Wide | 729,800 | 39,854,378 | ||||||
| 182,678,799 | ||||||||
Total (Cost $547,301,069) | 805,643,562 | |||||||
Consumer Staples – 6.2% | ||||||||
Food Products - 2.8% | ||||||||
Cal-Maine Foods 3 | 1,721,686 | 80,075,616 | ||||||
Sanderson Farms 3 | 1,606,791 | 106,723,058 | ||||||
| 186,798,674 | ||||||||
Personal Products - 3.4% | ||||||||
Nu Skin Enterprises Cl. A 3 | 3,670,694 | 224,352,817 | ||||||
Total (Cost $166,159,092) | 411,151,491 | |||||||
Energy – 7.9% | ||||||||
Energy Equipment & Services - 7.9% | ||||||||
Ensign Energy Services | 7,128,000 | 110,339,302 | ||||||
Pason Systems | 4,016,300 | 73,016,692 | ||||||
SEACOR Holdings | 735,065 | 61,047,148 | ||||||
Tidewater | 892,800 | 50,862,816 | ||||||
Trican Well Service 3 | 8,077,100 | 107,366,984 | ||||||
| 2,896,073 | 123,314,788 | |||||||
Total (Cost $359,754,202) | 525,947,730 | |||||||
Financials – 10.6% | ||||||||
Capital Markets - 5.2% | ||||||||
Affiliated Managers Group 2 | 401,300 | 65,789,122 | ||||||
| 506,936 | 25,301,176 | |||||||
Federated Investors Cl. B | 3,939,300 | 107,976,213 | ||||||
Partners Group Holding | 171,613 | 46,466,597 | ||||||
Stifel Financial 2 | 2,840,777 | 101,330,516 | ||||||
| 346,863,624 | ||||||||
Insurance - 3.3% | ||||||||
Alleghany Corporation 2 | 464,525 | 178,057,078 | ||||||
ProAssurance Corporation | 873,298 | 45,551,223 | ||||||
| 223,608,301 | ||||||||
Real Estate Management & Development - 2.1% | ||||||||
Jones Lang LaSalle | 1,089,700 | 99,315,258 | ||||||
| THE ACCOMPANYING NOTES ARE AN INTEGRAL PART OF THESE FINANCIAL STATEMENTS. | The Royce Funds 2013 Semiannual Report to Shareholders | 53 |
| Schedules of Investments |
| Royce Premier Fund (continued) |
| SHARES | VALUE | |||||||
| Financials (continued) | ||||||||
| Real Estate Management & Development (continued) | ||||||||
St. Joe Company (The) 2 | 1,874,700 | $ | 39,462,435 | |||||
| 138,777,693 | ||||||||
Total (Cost $451,888,612) | 709,249,618 | |||||||
Health Care – 5.8% | ||||||||
Biotechnology - 2.5% | ||||||||
| 6,284,665 | 168,868,949 | |||||||
Health Care Equipment & Supplies - 1.3% | ||||||||
IDEXX Laboratories 2 | 927,200 | 83,244,016 | ||||||
Life Sciences Tools & Services - 1.0% | ||||||||
PerkinElmer | 1,983,200 | 64,454,000 | ||||||
Pharmaceuticals - 1.0% | ||||||||
| 2,233,525 | 68,703,229 | |||||||
Total (Cost $272,427,524) | 385,270,194 | |||||||
Industrials – 25.3% | ||||||||
Air Freight & Logistics - 1.4% | ||||||||
Forward Air | 1,344,354 | 51,461,871 | ||||||
UTi Worldwide | 2,659,700 | 43,805,259 | ||||||
| 95,267,130 | ||||||||
Building Products - 2.4% | ||||||||
Armstrong World Industries 2 | 1,216,570 | 58,139,881 | ||||||
Simpson Manufacturing 3 | 3,387,886 | 99,671,606 | ||||||
| 157,811,487 | ||||||||
Commercial Services & Supplies - 2.3% | ||||||||
Copart 2 | 2,114,800 | 65,135,840 | ||||||
Ritchie Bros. Auctioneers | 4,475,850 | 86,025,837 | ||||||
| 151,161,677 | ||||||||
Construction & Engineering - 1.4% | ||||||||
EMCOR Group | 2,296,200 | 93,340,530 | ||||||
Electrical Equipment - 1.4% | ||||||||
Brady Corporation Cl. A | 1,516,927 | 46,615,167 | ||||||
| 6,444,076 | 46,912,873 | |||||||
| 93,528,040 | ||||||||
Machinery - 11.1% | ||||||||
Kennametal | 1,563,500 | 60,710,705 | ||||||
Lincoln Electric Holdings 3 | 4,474,994 | 256,282,906 | ||||||
Rational | 129,966 | 43,569,778 | ||||||
Semperit AG Holding 3 | 1,894,996 | 68,078,726 | ||||||
Valmont Industries | 772,800 | 110,579,952 | ||||||
Wabtec Corporation | 896,274 | 47,887,920 | ||||||
Woodward 3 | 3,806,024 | 152,240,960 | ||||||
| 739,350,947 | ||||||||
Marine - 0.7% | ||||||||
Kirby Corporation 2 | 579,835 | 46,120,076 | ||||||
Professional Services - 1.7% | ||||||||
Towers Watson & Company Cl. A | 1,421,111 | 116,445,835 | ||||||
Road & Rail - 1.3% | ||||||||
Landstar System | 1,675,300 | 86,277,950 | ||||||
Trading Companies & Distributors - 1.6% | ||||||||
Air Lease Cl. A | 1,210,357 | 33,393,749 | ||||||
MSC Industrial Direct Cl. A | 952,284 | 73,763,919 | ||||||
| 107,157,668 | ||||||||
Total (Cost $966,212,252) | 1,686,461,340 | |||||||
Information Technology – 18.9% | ||||||||
Communications Equipment - 1.1% | ||||||||
ADTRAN | 3,019,434 | 74,308,271 | ||||||
Electronic Equipment, Instruments & Components - 6.1% | ||||||||
Anixter International 2 | 980,700 | 74,346,867 | ||||||
| 2,843,900 | 57,162,390 | |||||||
Cognex Corporation 3 | 2,552,717 | 115,433,863 | ||||||
FEI Company | 637,344 | 46,519,738 | ||||||
National Instruments | 4,147,101 | 115,870,002 | ||||||
| 409,332,860 | ||||||||
IT Services - 2.7% | ||||||||
Gartner 2 | 1,731,800 | 98,695,282 | ||||||
Jack Henry & Associates | 1,786,640 | 84,204,343 | ||||||
| 182,899,625 | ||||||||
Office Electronics - 1.6% | ||||||||
Zebra Technologies Cl. A 2 | 2,423,325 | 105,269,238 | ||||||
Semiconductors & Semiconductor Equipment - 5.7% | ||||||||
| 2,036,191 | 67,214,665 | |||||||
| 3,751,779 | 65,130,883 | |||||||
| 6,883,112 | 94,986,946 | |||||||
MKS Instruments 3 | 2,971,910 | 78,874,491 | ||||||
| 2,026,512 | 71,779,055 | |||||||
| 377,986,040 | ||||||||
Software - 1.7% | ||||||||
Fair Isaac 3 | 1,832,600 | 83,988,058 | ||||||
SimCorp | 964,700 | 28,620,618 | ||||||
| 112,608,676 | ||||||||
Total (Cost $929,934,695) | 1,262,404,710 | |||||||
Materials – 10.2% | ||||||||
Chemicals - 3.8% | ||||||||
Cabot Corporation | 1,665,800 | 62,334,236 | ||||||
Westlake Chemical | 1,964,785 | 189,424,922 | ||||||
| 251,759,158 | ||||||||
Metals & Mining - 6.0% | ||||||||
Globe Specialty Metals 3 | 4,682,472 | 50,898,471 | ||||||
Pan American Silver 3 | 8,244,097 | 95,961,289 | ||||||
Reliance Steel & Aluminum | 2,519,800 | 165,198,088 | ||||||
Schnitzer Steel Industries Cl. A 3 | 2,108,038 | 49,285,928 | ||||||
| 4,115,069 | 26,089,538 | |||||||
Sims Metal Management ADR | 1,949,304 | 14,736,738 | ||||||
| 402,170,052 | ||||||||
Paper & Forest Products - 0.4% | ||||||||
Stella-Jones | 284,803 | 26,549,478 | ||||||
| Total (Cost $579,605,221) | 680,478,688 | |||||||
| Miscellaneous5 – 0.4% | ||||||||
| Total (Cost $31,400,000) | 27,370,068 | |||||||
| 54 | The Royce Funds 2013 Semiannual Report to Shareholders | THE ACCOMPANYING NOTES ARE AN INTEGRAL PART OF THESE FINANCIAL STATEMENTS. |
| June 30, 2013 (unaudited) |
| VALUE | ||||||||
| TOTAL COMMON STOCKS | ||||||||
(Cost $4,304,682,667) | $ | 6,493,977,401 | ||||||
| REPURCHASE AGREEMENT – 3.0% | ||||||||
| Fixed Income Clearing Corporation, | ||||||||
0.01% dated 6/28/13, due 7/1/13, | ||||||||
maturity value $199,418,166 (collateralized | ||||||||
by obligations of various U.S. Government | ||||||||
Agencies, 0.125%-1.375% due 12/31/13-2/25/14, | ||||||||
valued at $203,408,077) | ||||||||
(Cost $199,418,000) | 199,418,000 | |||||||
| COLLATERAL RECEIVED FOR SECURITIES | ||||||||
LOANED – 0.8% | ||||||||
| Money Market Funds | ||||||||
Federated Government Obligations Fund | ||||||||
(7 day yield-0.0099%) | ||||||||
(Cost $56,194,485) | 56,194,485 | |||||||
| TOTAL INVESTMENTS – 101.2% | ||||||||
(Cost $4,560,295,152) | 6,749,589,886 | |||||||
| LIABILITIES LESS CASH | ||||||||
AND OTHER ASSETS – (1.2)% | (79,666,610 | ) | ||||||
| NET ASSETS – 100.0% | $ | 6,669,923,276 | ||||||
| Royce Low-Priced Stock Fund |
| SHARES | VALUE | |||||||
| COMMON STOCKS – 97.9% | ||||||||
| Consumer Discretionary – 10.0% | ||||||||
| Auto Components - 0.4% | ||||||||
Gentex Corporation | 300,000 | $ | 6,915,000 | |||||
Automobiles - 1.8% | ||||||||
Thor Industries | 728,653 | 35,835,155 | ||||||
Diversified Consumer Services - 1.3% | ||||||||
| 4,041,854 | 9,053,753 | |||||||
Universal Technical Institute 3 | 1,655,679 | 17,103,164 | ||||||
| 26,156,917 | ||||||||
Internet & Catalog Retail - 0.2% | ||||||||
NutriSystem | 235,690 | 2,776,428 | ||||||
Media - 0.5% | ||||||||
Pico Far East Holdings | 30,000,000 | 10,250,063 | ||||||
Specialty Retail - 5.3% | ||||||||
Buckle (The) | 554,575 | 28,848,991 | ||||||
Cato Corporation (The) Cl. A | 452,350 | 11,290,656 | ||||||
Chico’s FAS | 781,000 | 13,323,860 | ||||||
GameStop Corporation Cl. A | 500,000 | 21,015,000 | ||||||
Lewis Group | 1,543,747 | 9,838,702 | ||||||
Luk Fook Holdings (International) 1 | 4,077,800 | 9,463,632 | ||||||
Men’s Wearhouse (The) | 281,700 | 10,662,345 | ||||||
| 104,443,186 | ||||||||
Textiles, Apparel & Luxury Goods - 0.5% | ||||||||
Crocs 2 | 641,300 | 10,581,450 | ||||||
Total (Cost $150,614,540) | 196,958,199 | |||||||
Consumer Staples – 4.6% | ||||||||
Food Products - 2.7% | ||||||||
Asian Citrus Holdings | 30,918,000 | 11,081,935 | ||||||
Darling International 2 | 480,970 | 8,974,900 | ||||||
Industrias Bachoco ADR | 930,622 | 32,292,583 | ||||||
| 52,349,418 | ||||||||
Personal Products - 1.9% | ||||||||
Nu Skin Enterprises Cl. A | 609,729 | 37,266,637 | ||||||
Total (Cost $48,768,122) | 89,616,055 | |||||||
Energy – 12.6% | ||||||||
Energy Equipment & Services - 12.1% | ||||||||
| 816,246 | 15,810,685 | |||||||
Calfrac Well Services | 1,206,100 | 34,759,809 | ||||||
Ensign Energy Services | 954,100 | 14,769,182 | ||||||
Lamprell 2 | 3,604,351 | 7,688,556 | ||||||
Oil States International 2 | 52,343 | 4,849,055 | ||||||
Pason Systems | 2,000,700 | 36,372,904 | ||||||
Tesco Corporation 2 | 1,681,330 | 22,277,622 | ||||||
TGS-NOPEC Geophysical | 385,000 | 11,186,794 | ||||||
Total Energy Services | 1,416,700 | 19,599,682 | ||||||
Trican Well Service | 2,669,800 | 35,489,021 | ||||||
Unit Corporation 2 | 853,400 | 36,337,772 | ||||||
| 239,141,082 | ||||||||
| THE ACCOMPANYING NOTES ARE AN INTEGRAL PART OF THESE FINANCIAL STATEMENTS. | The Royce Funds 2013 Semiannual Report to Shareholders | 55 |
| Schedules of Investments |
| Royce Low-Priced Stock Fund (continued) |
| SHARES | VALUE | |||||||
| Energy (continued) | ||||||||
| Oil, Gas & Consumable Fuels - 0.5% | ||||||||
Sprott Resource | 2,980,100 | $ | 9,945,947 | |||||
Total (Cost $141,749,857) | 249,087,029 | |||||||
Financials – 12.2% | ||||||||
Capital Markets - 8.3% | ||||||||
Ashmore Group | 3,780,363 | 19,761,861 | ||||||
Federated Investors Cl. B | 1,371,900 | 37,603,779 | ||||||
| 604,900 | 10,555,505 | |||||||
Jupiter Fund Management | 3,371,349 | 14,854,807 | ||||||
Sprott | 8,302,400 | 22,103,945 | ||||||
| 470,663 | 16,788,549 | |||||||
U.S. Global Investors Cl. A | 661,751 | 1,396,295 | ||||||
Value Partners Group | 73,869,500 | 39,810,794 | ||||||
| 162,875,535 | ||||||||
Diversified Financial Services - 1.0% | ||||||||
KKR Financial Holdings LLC | 1,013,430 | 10,691,686 | ||||||
PICO Holdings 2 | 432,658 | 9,068,512 | ||||||
| 19,760,198 | ||||||||
Real Estate Management & Development - 2.9% | ||||||||
Brasil Brokers Participacoes | 2,000,000 | 5,870,885 | ||||||
E-House China Holdings ADR | 2,086,204 | 9,054,126 | ||||||
| 501,200 | 8,485,316 | |||||||
Kennedy-Wilson Holdings | 2,050,830 | 34,125,811 | ||||||
| 57,536,138 | ||||||||
Total (Cost $267,033,419) | 240,171,871 | |||||||
Health Care – 5.4% | ||||||||
Biotechnology - 1.6% | ||||||||
| 1,203,437 | 32,336,352 | |||||||
Health Care Equipment & Supplies - 0.6% | ||||||||
Nihon Kohden | 242,000 | 9,247,631 | ||||||
Thoratec Corporation 2 | 100,000 | 3,131,000 | ||||||
| 12,378,631 | ||||||||
Pharmaceuticals - 3.2% | ||||||||
Adcock Ingram Holdings | 1,511,900 | 9,941,629 | ||||||
| 1,155,140 | 35,532,107 | |||||||
Recordati | 974,800 | 10,816,928 | ||||||
| 500,000 | 6,290,000 | |||||||
| 62,580,664 | ||||||||
Total (Cost $73,770,437) | 107,295,647 | |||||||
Industrials – 12.2% | ||||||||
Aerospace & Defense - 1.3% | ||||||||
HEICO Corporation Cl. A | 312,127 | 11,520,608 | ||||||
Orbital Sciences 2 | 852,523 | 14,808,324 | ||||||
| 26,328,932 | ||||||||
Building Products - 1.0% | ||||||||
WaterFurnace Renewable Energy 3 | 970,500 | 18,963,369 | ||||||
Commercial Services & Supplies - 1.7% | ||||||||
Ennis | 865,562 | 14,965,567 | ||||||
Moshi Moshi Hotline | 1,575,600 | 19,667,199 | ||||||
| 34,632,766 | ||||||||
| Construction & Engineering - 1.0% | ||||||||
Raubex Group | 8,640,707 | 19,055,788 | ||||||
Electrical Equipment - 2.3% | ||||||||
| 4,897,800 | 35,655,984 | |||||||
Powell Industries 2 | 194,848 | 10,063,899 | ||||||
| 45,719,883 | ||||||||
Machinery - 0.6% | ||||||||
Kennametal | 129,500 | 5,028,485 | ||||||
Lincoln Electric Holdings | 121,070 | 6,933,679 | ||||||
| 11,962,164 | ||||||||
Professional Services - 3.4% | ||||||||
†Acacia Research-Acacia Technologies | 862,282 | 19,272,003 | ||||||
Kforce | 498,774 | 7,282,100 | ||||||
Korn/Ferry International 2 | 1,220,340 | 22,869,171 | ||||||
Resources Connection | 400,000 | 4,640,000 | ||||||
TrueBlue 2 | 612,494 | 12,892,999 | ||||||
| 66,956,273 | ||||||||
Road & Rail - 0.9% | ||||||||
Heartland Express | 638,366 | 8,854,136 | ||||||
Universal Truckload Services 2 | 188,944 | 4,555,440 | ||||||
Werner Enterprises | 155,093 | 3,748,598 | ||||||
| 17,158,174 | ||||||||
Total (Cost $207,442,043) | 240,777,349 | |||||||
Information Technology – 23.2% | ||||||||
Communications Equipment - 3.2% | ||||||||
ADTRAN | 773,581 | 19,037,828 | ||||||
ARRIS Group 2 | 688,671 | 9,882,429 | ||||||
| 300,000 | 3,201,000 | |||||||
KVH Industries 2 | 727,804 | 9,687,071 | ||||||
NETGEAR 2 | 599,300 | 18,302,622 | ||||||
PC-Tel | 279,660 | 2,371,517 | ||||||
| 62,482,467 | ||||||||
Computers & Peripherals - 0.8% | ||||||||
QLogic Corporation 2 | 359,900 | 3,440,644 | ||||||
Xyratex | 1,227,566 | 12,349,314 | ||||||
| 15,789,958 | ||||||||
Electronic Equipment, Instruments & Components - 3.1% | ||||||||
AVX Corporation | 855,347 | 10,050,327 | ||||||
GSI Group 2 | 1,275,000 | 10,251,000 | ||||||
TTM Technologies 2 | 2,456,735 | 20,636,574 | ||||||
| 1,456,550 | 20,231,480 | |||||||
| 61,169,381 | ||||||||
Internet Software & Services - 0.2% | ||||||||
| 176,900 | 4,365,892 | |||||||
IT Services - 2.8% | ||||||||
Convergys Corporation | 2,155,730 | 37,574,374 | ||||||
TeleTech Holdings 2 | 802,660 | 18,806,324 | ||||||
| 56,380,698 | ||||||||
Semiconductors & Semiconductor Equipment - 13.1% | ||||||||
Advanced Energy Industries 2 | 551,400 | 9,599,874 | ||||||
Aixtron ADR 2 | 568,190 | 9,534,228 | ||||||
ATMI 2 | 925,000 | 21,876,250 | ||||||
Brooks Automation | 2,122,582 | 20,652,723 | ||||||
| 56 | The Royce Funds 2013 Semiannual Report to Shareholders | THE ACCOMPANYING NOTES ARE AN INTEGRAL PART OF THESE FINANCIAL STATEMENTS. |
| June 30, 2013 (unaudited) |
| SHARES | VALUE | |||||||
| Information Technology (continued) | ||||||||
| Semiconductors & Semiconductor Equipment (continued) | ||||||||
| 1,193,300 | $ | 20,715,688 | ||||||
| 2,791,139 | 38,517,718 | |||||||
International Rectifier 2 | 1,312,213 | 27,477,740 | ||||||
Lam Research 2 | 148,800 | 6,597,792 | ||||||
Micrel | 385,744 | 3,811,151 | ||||||
MKS Instruments | 1,301,455 | 34,540,616 | ||||||
OmniVision Technologies 2 | 1,420,191 | 26,486,562 | ||||||
Teradyne 2 | 2,187,975 | 38,442,721 | ||||||
| 258,253,063 | ||||||||
Total (Cost $376,173,586) | 458,441,459 | |||||||
Materials – 15.4% | ||||||||
Chemicals - 1.2% | ||||||||
Intrepid Potash | 804,700 | 15,329,535 | ||||||
Westlake Chemical | 92,500 | 8,917,925 | ||||||
| 24,247,460 | ||||||||
Construction Materials - 0.4% | ||||||||
Mardin Cimento Sanayii | 3,088,100 | 7,044,973 | ||||||
Metals & Mining - 13.8% | ||||||||
Alamos Gold | 3,052,100 | 36,972,288 | ||||||
| 2,463,878 | 15,965,930 | |||||||
AuRico Gold | 1,147,500 | 5,014,575 | ||||||
Centamin 2 | 11,898,400 | 5,600,179 | ||||||
Endeavour Mining 2 | 3,625,000 | 1,930,208 | ||||||
Globe Specialty Metals | 3,476,606 | 37,790,707 | ||||||
Hochschild Mining | 5,858,563 | 13,838,129 | ||||||
Horsehead Holding Corporation 2 | 1,009,535 | 12,932,143 | ||||||
Kirkland Lake Gold 2 | 1,321,100 | 5,552,212 | ||||||
Major Drilling Group International | 2,836,800 | 19,313,005 | ||||||
McEwen Mining 2 | 6,708,918 | 11,270,982 | ||||||
Olympic Steel | 58,132 | 1,424,234 | ||||||
Orbit Garant Drilling 2 | 1,512,500 | 1,668,251 | ||||||
Pan American Silver | 254,776 | 2,965,593 | ||||||
| 5,120,700 | 33,796,620 | |||||||
Reliance Steel & Aluminum | 110,000 | 7,211,600 | ||||||
Schnitzer Steel Industries Cl. A | 177,100 | 4,140,598 | ||||||
| 3,111,783 | 29,344,114 | |||||||
| 1,978,611 | 12,544,394 | |||||||
Silvercorp Metals | 2,076,900 | 5,856,858 | ||||||
Sims Metal Management ADR | 1,060,855 | 8,020,064 | ||||||
| 273,152,684 | ||||||||
Total (Cost $398,174,411) | 304,445,117 | |||||||
Utilities – 0.2% | ||||||||
Independent Power Producers & Energy Traders - 0.2% | ||||||||
Alterra Power 2 | 9,732,900 | 2,915,150 | ||||||
| Total (Cost $12,581,547) | 2,915,150 | |||||||
| Miscellaneous5 – 2.1% | ||||||||
| Total (Cost $40,202,257) | 42,050,791 | |||||||
| VALUE | ||||||||
| TOTAL COMMON STOCKS | ||||||||
(Cost $1,716,510,219) | $ | 1,931,758,667 | ||||||
| REPURCHASE AGREEMENT – 9.3% | ||||||||
| Fixed Income Clearing Corporation, | ||||||||
0.01% dated 6/28/13, due 7/1/13, | ||||||||
maturity value $183,002,153 (collateralized | ||||||||
by obligations of various U.S. Government | ||||||||
Agencies, 0.12% due 3/28/14, valued at | ||||||||
$186,665,000) | ||||||||
(Cost $183,002,000) | 183,002,000 | |||||||
| PRINCIPAL | ||||||||
| AMOUNT | ||||||||
| COLLATERAL RECEIVED FOR SECURITIES | ||||||||
LOANED – 4.5% | ||||||||
| U.S. Treasury Bonds | ||||||||
0.75%-4.375% | ||||||||
due 1/15/25-8/15/42 | $8,018,443 | 8,060,956 | ||||||
| U.S. Treasury Notes | ||||||||
0.875%-4.75% | ||||||||
due 5/15/14-8/15/20 | 1,933,946 | 1,943,788 | ||||||
| Money Market Funds | ||||||||
Federated Government Obligations Fund | ||||||||
(7 day yield-0.0099%) | 79,347,668 | |||||||
| TOTAL COLLATERAL RECEIVED FOR | ||||||||
SECURITIES LOANED | ||||||||
(Cost $89,352,412) | 89,352,412 | |||||||
| TOTAL INVESTMENTS – 111.7% | ||||||||
(Cost $1,988,864,631) | 2,204,113,079 | |||||||
LIABILITIES LESS CASH | ||||||||
AND OTHER ASSETS – (11.7)% | (230,180,050 | ) | ||||||
| NET ASSETS – 100.0% | $ | 1,973,933,029 | ||||||
| THE ACCOMPANYING NOTES ARE AN INTEGRAL PART OF THESE FINANCIAL STATEMENTS. | The Royce Funds 2013 Semiannual Report to Shareholders | 57 |
| Schedules of Investments |
| Royce Total Return Fund |
| SHARES | VALUE | |||||||
| COMMON STOCKS – 90.8% | ||||||||
| Consumer Discretionary – 12.6% | ||||||||
| Auto Components - 0.6% | ||||||||
Autoliv | 29,300 | $ | 2,267,527 | |||||
Gentex Corporation | 1,142,527 | 26,335,247 | ||||||
Spartan Motors | 47,557 | 291,049 | ||||||
Standard Motor Products | 114,806 | 3,942,438 | ||||||
Superior Industries International | 27,101 | 466,408 | ||||||
| 33,302,669 | ||||||||
| �� | ||||||||
Automobiles - 0.5% | ||||||||
Thor Industries | 513,689 | 25,263,225 | ||||||
Distributors - 0.1% | ||||||||
Weyco Group | 282,000 | 7,106,400 | ||||||
Diversified Consumer Services - 0.3% | ||||||||
DeVry | 82,900 | 2,571,558 | ||||||
Hillenbrand | 243,625 | 5,776,349 | ||||||
Regis Corporation | 231,100 | 3,794,662 | ||||||
Sotheby’s | 6,300 | 238,833 | ||||||
Strayer Education 2 | 21,000 | 1,025,430 | ||||||
Universal Technical Institute | 3,500 | 36,155 | ||||||
| 13,442,987 | ||||||||
Hotels, Restaurants & Leisure - 0.6% | ||||||||
Abu Dhabi National Hotels | 1,200,000 | 686,088 | ||||||
Ambassadors Group | 29,970 | 106,393 | ||||||
Bob Evans Farms | 430,673 | 20,233,018 | ||||||
Cheesecake Factory | 61,700 | 2,584,613 | ||||||
Churchill Downs | 21,300 | 1,679,505 | ||||||
DineEquity | 61,030 | 4,203,136 | ||||||
| 29,492,753 | ||||||||
Household Durables - 0.8% | ||||||||
American Greetings Cl. A | 112,800 | 2,055,216 | ||||||
Blyth | 5,638 | 78,707 | ||||||
Ethan Allen Interiors | 1,170,250 | 33,703,200 | ||||||
Harman International Industries | 36,300 | 1,967,460 | ||||||
La-Z-Boy | 4,200 | 85,134 | ||||||
Leggett & Platt | 39,003 | 1,212,603 | ||||||
| 39,102,320 | ||||||||
Internet & Catalog Retail - 0.0% | ||||||||
NutriSystem | 21,760 | 256,333 | ||||||
Leisure Equipment & Products - 0.3% | ||||||||
Arctic Cat | 92,881 | 4,177,787 | ||||||
Callaway Golf | 962,900 | 6,335,882 | ||||||
Hasbro | 12,438 | 557,596 | ||||||
Polaris Industries | 27,400 | 2,603,000 | ||||||
| 13,674,265 | ||||||||
Media - 0.6% | ||||||||
Arbitron | 43,600 | 2,025,220 | ||||||
CTC Media | 163,500 | 1,818,120 | ||||||
Harte-Hanks | 22,788 | 195,977 | ||||||
Meredith Corporation | 99,320 | 4,737,564 | ||||||
Morningstar | 29,301 | 2,273,171 | ||||||
Saga Communications Cl. A | 125,881 | 5,779,197 | ||||||
Scholastic Corporation | 78,799 | 2,308,023 | ||||||
Washington Post (The) Cl. B | 100 | 48,377 | ||||||
Wiley (John) & Sons Cl. A | 100,000 | 4,009,000 | ||||||
World Wrestling Entertainment Cl. A | 972,470 | 10,026,166 | ||||||
| 33,220,815 | ||||||||
Multiline Retail - 0.0% | ||||||||
Dillard’s Cl. A | 30,386 | 2,490,740 | ||||||
Specialty Retail - 6.2% | ||||||||
Aaron’s | 22,000 | 616,220 | ||||||
Abercrombie & Fitch Cl. A | 18,000 | 814,500 | ||||||
American Eagle Outfitters | 2,137,223 | 39,025,692 | ||||||
Ascena Retail Group 2 | 1,819,818 | 31,755,824 | ||||||
Buckle (The) | 788,083 | 40,996,078 | ||||||
Cato Corporation (The) Cl. A | 1,417,608 | 35,383,496 | ||||||
Chico’s FAS | 170,500 | 2,908,730 | ||||||
Finish Line (The) Cl. A | 16,424 | 359,029 | ||||||
Foot Locker | 83,792 | 2,943,613 | ||||||
GameStop Corporation Cl. A | 965,857 | 40,594,970 | ||||||
Guess? | 1,065,313 | 33,056,662 | ||||||
Jos. A. Bank Clothiers 2 | 791,736 | 32,714,531 | ||||||
Men’s Wearhouse (The) | 303,139 | 11,473,811 | ||||||
PetSmart | 3,900 | 261,261 | ||||||
| 159,981 | 505,540 | |||||||
Rent-A-Center | 88,100 | 3,308,155 | ||||||
Shoe Carnival | 255,426 | 6,132,778 | ||||||
Signet Jewelers | 700 | 47,201 | ||||||
Stage Stores | 87,678 | 2,060,433 | ||||||
Systemax | 295,961 | 2,784,993 | ||||||
Tiffany & Co. | 407,500 | 29,682,300 | ||||||
Williams-Sonoma | 4,500 | 251,505 | ||||||
| 317,677,322 | ||||||||
Textiles, Apparel & Luxury Goods - 2.6% | ||||||||
Barry (R.G.) 3 | 1,048,496 | 17,027,575 | ||||||
Columbia Sportswear | 59,582 | 3,732,812 | ||||||
G-III Apparel Group 2 | 814,013 | 39,170,306 | ||||||
Jones Group (The) | 505,523 | 6,950,941 | ||||||
Movado Group | 7,400 | 250,342 | ||||||
Steven Madden 2 | 808,332 | 39,107,102 | ||||||
True Religion Apparel 2 | 64,945 | 2,056,159 | ||||||
Vera Bradley 2 | 901,098 | 19,517,783 | ||||||
Wolverine World Wide | 66,217 | 3,616,110 | ||||||
| 131,429,130 | ||||||||
Total (Cost $477,762,743) | 646,458,959 | |||||||
Consumer Staples – 3.3% | ||||||||
Beverages - 0.0% | ||||||||
| 43,380 | 369,381 | |||||||
Food & Staples Retailing - 0.5% | ||||||||
Village Super Market Cl. A 3 | 731,386 | 24,201,563 | ||||||
Weis Markets | 377 | 16,991 | ||||||
| 24,218,554 | ||||||||
Food Products - 1.7% | ||||||||
Cal-Maine Foods | 21,998 | 1,023,127 | ||||||
Farmer Bros. 2 | 542,300 | 7,624,738 | ||||||
Flowers Foods | 900,225 | 19,849,961 | ||||||
Hershey Creamery 4 | 882 | 1,850,657 | ||||||
| 58 | The Royce Funds 2013 Semiannual Report to Shareholders | THE ACCOMPANYING NOTES ARE AN INTEGRAL PART OF THESE FINANCIAL STATEMENTS. |
| June 30, 2013 (unaudited) |
| SHARES | VALUE | |||||||
| Consumer Staples (continued) | ||||||||
| Food Products (continued) | ||||||||
Lancaster Colony | 3,800 | $ | 296,362 | |||||
Seaboard Corporation | 10,476 | 28,369,008 | ||||||
Tootsie Roll Industries | 830,866 | 26,404,921 | ||||||
| 85,418,774 | ||||||||
Household Products - 0.0% | ||||||||
WD-40 Company | 20,611 | 1,122,887 | ||||||
Personal Products - 1.1% | ||||||||
Inter Parfums | 473,204 | 13,495,778 | ||||||
Nu Skin Enterprises Cl. A | 697,753 | 42,646,664 | ||||||
| 56,142,442 | ||||||||
Tobacco - 0.0% | ||||||||
Universal Corporation | 27,464 | 1,588,792 | ||||||
Total (Cost $103,345,020) | 168,860,830 | |||||||
Diversified Investment Companies – 0.3% | ||||||||
Closed-End Funds - 0.3% | ||||||||
British Empire Securities and General Trust | 440,000 | 3,185,477 | ||||||
Central Fund of Canada Cl. A | 960,500 | 13,062,800 | ||||||
RIT Capital Partners | 100,000 | 1,764,301 | ||||||
Total (Cost $18,881,030) | 18,012,578 | |||||||
Energy – 4.9% | ||||||||
Energy Equipment & Services - 3.1% | ||||||||
CARBO Ceramics | 321,646 | 21,688,590 | ||||||
Core Laboratories | 100 | 15,166 | ||||||
Exterran Partners L.P. | 629,700 | 19,010,643 | ||||||
Helmerich & Payne | 560,944 | 35,030,953 | ||||||
Lufkin Industries | 9,336 | 825,956 | ||||||
Oceaneering International | 9,201 | 664,312 | ||||||
Oil States International 2 | 364,542 | 33,771,171 | ||||||
Patterson-UTI Energy | 58,877 | 1,139,564 | ||||||
Precision Drilling | 611,050 | 5,224,477 | ||||||
RPC | 233,400 | 3,223,254 | ||||||
SEACOR Holdings | 327,477 | 27,196,965 | ||||||
Tidewater | 150,000 | 8,545,500 | ||||||
| 156,336,551 | ||||||||
Oil, Gas & Consumable Fuels - 1.8% | ||||||||
Alliance Holdings GP L.P. | 179,800 | 11,462,250 | ||||||
Alliance Resource Partners L.P. | 129,800 | 9,167,774 | ||||||
Apco Oil and Gas International 2 | 600 | 6,918 | ||||||
Arch Coal | 111,518 | 421,538 | ||||||
Baytex Energy | 44,900 | 1,618,196 | ||||||
Cimarex Energy | 346,590 | 22,524,884 | ||||||
Delek US Holdings | 15,203 | 437,543 | ||||||
Energen Corporation | 10,400 | 543,504 | ||||||
Energy XXI (Bermuda) | 76,200 | 1,690,116 | ||||||
Hugoton Royalty Trust | 558,500 | 4,814,270 | ||||||
Natural Resource Partners L.P. | 225,900 | 4,646,763 | ||||||
NuStar GP Holdings LLC | 369,200 | 9,868,716 | ||||||
Pengrowth Energy | 129,757 | 639,702 | ||||||
| 633,760 | 2,978,672 | |||||||
| 25,500 | 269,790 | |||||||
PVR Partners L.P. | 215,100 | 5,872,230 | ||||||
QEP Resources | 1,291 | 35,864 | ||||||
Sabine Royalty Trust | 700 | 36,393 | ||||||
San Juan Basin Royalty Trust | 920 | 14,766 | ||||||
SM Energy | 18,342 | 1,100,153 | ||||||
Sunoco Logistics Partners L.P. | 224,700 | 14,369,565 | ||||||
W&T Offshore | 77,700 | 1,110,333 | ||||||
| 93,629,940 | ||||||||
Total (Cost $169,855,799) | 249,966,491 | |||||||
Financials – 25.8% | ||||||||
Capital Markets - 7.5% | ||||||||
A.F.P. Provida ADR | 261,700 | 22,323,010 | ||||||
AGF Management Cl. B | 815,600 | 8,677,915 | ||||||
AllianceBernstein Holding L.P. | 1,711,900 | 35,641,758 | ||||||
AP Alternative Assets L.P. 2 | 56,000 | 1,178,800 | ||||||
Apollo Global Management LLC Cl. A | 659,500 | 15,893,950 | ||||||
Apollo Investment | 1,161,400 | 8,989,236 | ||||||
ASA Gold and Precious Metals | 578,892 | 7,351,928 | ||||||
Banca Generali | 86,000 | 1,853,757 | ||||||
Banque Privee Edmond de Rothschild | 205 | 3,568,048 | ||||||
CI Financial | 933,500 | 26,867,971 | ||||||
Cohen & Steers | 335,637 | 11,404,945 | ||||||
Coronation Fund Managers | 1,315,000 | 8,347,580 | ||||||
Egyptian Financial Group-Hermes Holding Company 2 | 860,027 | 907,890 | ||||||
Egyptian Financial Group-Hermes Holding Company GDR 2 | 75,000 | 150,000 | ||||||
Federated Investors Cl. B | 1,698,235 | 46,548,621 | ||||||
GAMCO Investors Cl. A | 278,300 | 15,420,603 | ||||||
Investec | 118,000 | 742,476 | ||||||
Janus Capital Group | 551,309 | 4,691,640 | ||||||
KKR & Co. L.P. | 1,315,600 | 25,864,696 | ||||||
Lazard Cl. A | 292,290 | 9,397,124 | ||||||
MVC Capital | 475,000 | 5,980,250 | ||||||
Oppenheimer Holdings Cl. A | 4,567 | 86,956 | ||||||
Paris Orleans | 249,213 | 5,903,861 | ||||||
Raymond James Financial | 597,925 | 25,698,817 | ||||||
Schroders | 111,100 | 3,688,779 | ||||||
SEI Investments | 1,528,346 | 43,450,877 | ||||||
T. Rowe Price Group | 349,400 | 25,558,610 | ||||||
Teton Advisors Cl. A 4 | 1,297 | 25,292 | ||||||
Vontobel Holding | 75,400 | 2,322,947 | ||||||
Waddell & Reed Financial Cl. A | 277,200 | 12,058,200 | ||||||
Westwood Holdings Group | 45,895 | 1,969,813 | ||||||
| 382,566,350 | ||||||||
Commercial Banks - 3.5% | ||||||||
Ames National | 409,964 | 9,330,781 | ||||||
Banco Latinoamericano de Comercio | ||||||||
Exterior Cl. E | 110,575 | 2,475,774 | ||||||
Bank of Hawaii | 782,001 | 39,350,291 | ||||||
BLOM Bank GDR | 684,500 | 5,818,250 | ||||||
BOK Financial | 521,582 | 33,407,327 | ||||||
Canadian Western Bank | 933,200 | 24,641,023 | ||||||
CapitalSource | 283,100 | 2,655,478 | ||||||
City Holding Company | 625,058 | 24,346,009 | ||||||
| THE ACCOMPANYING NOTES ARE AN INTEGRAL PART OF THESE FINANCIAL STATEMENTS. | The Royce Funds 2013 Semiannual Report to Shareholders | 59 |
| Schedules of Investments |
| Royce Total Return Fund (continued) |
| SHARES | VALUE | |||||||
| Financials (continued) | ||||||||
| Commercial Banks (continued) | ||||||||
Farmers & Merchants Bank of Long Beach | 479 | $ | 2,347,579 | |||||
First Citizens BancShares Cl. A | 89,526 | 17,193,468 | ||||||
First National Bank Alaska | 3,110 | 5,349,200 | ||||||
National Bankshares | 125,549 | 4,460,756 | ||||||
Peapack-Gladstone Financial 3 | 475,350 | 8,318,625 | ||||||
Sun Bancorp 2 | 284,428 | 964,211 | ||||||
| 180,658,772 | ||||||||
Consumer Finance - 0.1% | ||||||||
Cash America International | 41,900 | 1,904,774 | ||||||
Nelnet Cl. A | 29,200 | 1,053,828 | ||||||
| 2,958,602 | ||||||||
Diversified Financial Services - 0.6% | ||||||||
Leucadia National | 433,800 | 11,374,236 | ||||||
NASDAQ OMX Group (The) | 17,900 | 586,941 | ||||||
Sofina | 195,572 | 17,720,352 | ||||||
| 29,681,529 | ||||||||
Insurance - 9.9% | ||||||||
Alleghany Corporation 2 | 102,139 | 39,150,900 | ||||||
Allied World Assurance Company Holdings | 394,687 | 36,117,807 | ||||||
American Financial Group | 158,800 | 7,766,908 | ||||||
American National Insurance | 145,093 | 14,432,401 | ||||||
AmTrust Financial Services | 39,580 | 1,413,006 | ||||||
Argo Group International Holdings | 1,419 | 60,151 | ||||||
Aspen Insurance Holdings | 613,408 | 22,751,303 | ||||||
Assurant | 51,159 | 2,604,505 | ||||||
Assured Guaranty | 202,192 | 4,460,356 | ||||||
Baldwin & Lyons Cl. B | 101,343 | 2,460,608 | ||||||
Cincinnati Financial | 280,000 | 12,852,000 | ||||||
Crawford & Company Cl. B | 31,341 | 176,136 | ||||||
E-L Financial | 92,288 | 55,722,050 | ||||||
EMC Insurance Group | 101,164 | 2,656,567 | ||||||
Employers Holdings | 49,600 | 1,212,720 | ||||||
Erie Indemnity Cl. A | 635,400 | 50,635,026 | ||||||
Everest Re Group | 8,700 | 1,115,862 | ||||||
FBL Financial Group Cl. A | 1,700 | 73,967 | ||||||
Fidelity National Financial | 1,097,852 | 26,139,856 | ||||||
First American Financial | 284,661 | 6,273,929 | ||||||
Gallagher (Arthur J.) & Co. | 880,400 | 38,464,676 | ||||||
Infinity Property & Casualty | 56,762 | 3,392,097 | ||||||
Kansas City Life Insurance | 2,247 | 85,993 | ||||||
Markel Corporation 2 | 67,900 | 35,779,905 | ||||||
Meadowbrook Insurance Group | 17,146 | 137,682 | ||||||
Mercury General | 193,200 | 8,493,072 | ||||||
Montpelier Re Holdings | 195,707 | 4,894,632 | ||||||
National Western Life Insurance Cl. A | 2,100 | 398,685 | ||||||
Old Republic International | 767,000 | 9,871,290 | ||||||
PartnerRe | 295,582 | 26,767,906 | ||||||
Platinum Underwriters Holdings | 213,106 | 12,193,925 | ||||||
Primerica | 30,300 | 1,134,432 | ||||||
Protective Life | 30,929 | 1,187,983 | ||||||
Reinsurance Group of America | 603,465 | 41,705,466 | ||||||
RenaissanceRe Holdings | 9,809 | 851,323 | ||||||
RLI Corp. | 79,435 | 6,069,628 | ||||||
StanCorp Financial Group | 8,800 | 434,808 | ||||||
State Auto Financial | 439,194 | 7,980,155 | ||||||
Stewart Information Services | 83,200 | 2,179,008 | ||||||
Symetra Financial | 659,952 | 10,552,633 | ||||||
Torchmark Corporation | 43,300 | 2,820,562 | ||||||
United Fire Group | 91,774 | 2,278,748 | ||||||
White Mountains Insurance Group | 3,534 | 2,031,838 | ||||||
| 507,782,505 | ||||||||
Real Estate Investment Trusts (REITs) - 2.7% | ||||||||
Annaly Capital Management | 450,500 | 5,662,785 | ||||||
Colony Financial | 1,744,149 | 34,691,124 | ||||||
Cousins Properties | 381,700 | 3,855,170 | ||||||
DCT Industrial Trust | 1,121,600 | 8,019,440 | ||||||
Essex Property Trust | 83,000 | 13,190,360 | ||||||
Lexington Realty Trust | 648,300 | 7,572,144 | ||||||
MFA Financial | 692,000 | 5,847,400 | ||||||
National Health Investors | 159,570 | 9,551,860 | ||||||
National Retail Properties | 650,000 | 22,360,000 | ||||||
PS Business Parks | 168,500 | 12,160,645 | ||||||
Rayonier | 315,000 | 17,447,850 | ||||||
| 140,358,778 | ||||||||
Real Estate Management & Development - 0.5% | ||||||||
Alexander & Baldwin | 694,700 | 27,614,325 | ||||||
Thrifts & Mortgage Finance - 1.0% | ||||||||
Genworth MI Canada | 1,403,900 | 32,758,112 | ||||||
Kearny Financial 2 | 177,659 | 1,863,643 | ||||||
TrustCo Bank Corp. NY | 3,282,549 | 17,857,066 | ||||||
| 52,478,821 | ||||||||
Total (Cost $915,625,450) | 1,324,099,682 | |||||||
Health Care – 5.8% | ||||||||
Health Care Equipment & Supplies - 2.4% | ||||||||
Analogic Corporation | 154,800 | 11,274,084 | ||||||
Atrion Corporation | 700 | 153,097 | ||||||
Cantel Medical | 70,009 | 2,371,205 | ||||||
Hill-Rom Holdings | 514,270 | 17,320,613 | ||||||
| 379,600 | 34,080,488 | |||||||
Invacare Corporation | 96,261 | 1,382,308 | ||||||
ResMed | 47,600 | 2,148,188 | ||||||
STERIS Corporation | 659,508 | 28,279,703 | ||||||
Teleflex | 309,700 | 23,998,653 | ||||||
| 121,008,339 | ||||||||
Health Care Providers & Services - 2.9% | ||||||||
Assisted Living Concepts Cl. A 2 | 200 | 2,392 | ||||||
Chemed Corporation | 466,864 | 33,814,960 | ||||||
Ensign Group | 18,415 | 648,576 | ||||||
Landauer | 403,171 | 19,477,191 | ||||||
Magellan Health Services 2 | 355,366 | 19,928,925 | ||||||
MEDNAX 2 | 355,085 | 32,518,684 | ||||||
Omnicare | 66,899 | 3,191,751 | ||||||
Owens & Minor | 935,750 | 31,656,423 | ||||||
| 60 | The Royce Funds 2013 Semiannual Report to Shareholders | THE ACCOMPANYING NOTES ARE AN INTEGRAL PART OF THESE FINANCIAL STATEMENTS. |
| June 30, 2013 (unaudited) |
| SHARES | VALUE | |||||||
| Health Care (continued) | ||||||||
| Health Care Providers & Services (continued) | ||||||||
U.S. Physical Therapy | 243,164 | $ | 6,721,053 | |||||
| 147,959,955 | ||||||||
Health Care Technology - 0.0% | ||||||||
Computer Programs and Systems | 800 | 39,312 | ||||||
Life Sciences Tools & Services - 0.4% | ||||||||
Nordion 2 | 46,130 | 341,362 | ||||||
PerkinElmer | 712,600 | 23,159,500 | ||||||
| 23,500,862 | ||||||||
Pharmaceuticals - 0.1% | ||||||||
Valeant Pharmaceuticals International 2 | 55,768 | 4,800,510 | ||||||
Total (Cost $174,050,380) | 297,308,978 | |||||||
Industrials – 19.1% | ||||||||
Aerospace & Defense - 1.5% | ||||||||
American Science & Engineering | 142,429 | 7,976,024 | ||||||
Cubic Corporation | 604,612 | 29,081,837 | ||||||
HEICO Corporation | 371,875 | 18,731,344 | ||||||
HEICO Corporation Cl. A | 390,933 | 14,429,337 | ||||||
National Presto Industries | 68,826 | 4,957,537 | ||||||
Triumph Group | 24,376 | 1,929,360 | ||||||
| 77,105,439 | ||||||||
Air Freight & Logistics - 0.8% | ||||||||
Aramex | 1,600,000 | 1,067,247 | ||||||
C. H. Robinson Worldwide | 256,000 | 14,415,360 | ||||||
Expeditors International of Washington | 458,400 | 17,423,784 | ||||||
UTi Worldwide | 588,900 | 9,699,183 | ||||||
| 42,605,574 | ||||||||
Building Products - 0.7% | ||||||||
Smith (A.O.) Corporation | 995,788 | 36,127,189 | ||||||
Commercial Services & Supplies - 2.5% | ||||||||
ABM Industries | 706,400 | 17,313,864 | ||||||
Ennis | 378,529 | 6,544,767 | ||||||
G&K Services Cl. A | 1,955 | 93,058 | ||||||
Healthcare Services Group | 108,764 | 2,666,893 | ||||||
HNI Corporation | 474,573 | 17,117,848 | ||||||
Kimball International Cl. B | 724,600 | 7,035,866 | ||||||
McGrath RentCorp | 291,300 | 9,950,808 | ||||||
Mine Safety Appliances | 196,000 | 9,123,800 | ||||||
Progressive Waste Solutions | 9,000 | 193,590 | ||||||
Ritchie Bros. Auctioneers | 1,700,820 | 32,689,760 | ||||||
Rollins | 833,625 | 21,590,888 | ||||||
UniFirst Corporation | 30,016 | 2,738,960 | ||||||
US Ecology | 49,705 | 1,363,905 | ||||||
Viad Corporation | 27,540 | 675,281 | ||||||
| 129,099,288 | ||||||||
Construction & Engineering - 0.4% | ||||||||
Comfort Systems USA | 258,131 | 3,851,315 | ||||||
EMCOR Group | 69,539 | 2,826,760 | ||||||
Granite Construction | 205,075 | 6,103,032 | ||||||
Great Lakes Dredge & Dock | 4,432 | 34,658 | ||||||
KBR | 79,013 | 2,567,923 | ||||||
URS Corporation | 47,000 | 2,219,340 | ||||||
| 17,603,028 | ||||||||
| Electrical Equipment - 2.3% | ||||||||
Acuity Brands | 11,668 | 881,167 | ||||||
AZZ | 264,083 | 10,183,040 | ||||||
Belden | 18,703 | 933,841 | ||||||
Brady Corporation Cl. A | 558,973 | 17,177,240 | ||||||
Encore Wire | 5,551 | 189,289 | ||||||
Franklin Electric | 733,800 | 24,692,370 | ||||||
Hubbell Cl. B | 304,821 | 30,177,279 | ||||||
LSI Industries | 1,104,161 | 8,932,663 | ||||||
Preformed Line Products | 198,271 | 13,147,350 | ||||||
Regal-Beloit | 1,702 | 110,358 | ||||||
Roper Industries | 76,000 | 9,440,720 | ||||||
| 115,865,317 | ||||||||
Industrial Conglomerates - 0.2% | ||||||||
Raven Industries | 312,402 | 9,365,812 | ||||||
Machinery - 7.3% | ||||||||
Alamo Group | 507,369 | 20,710,803 | ||||||
American Railcar Industries | 269,194 | 9,020,691 | ||||||
Ampco-Pittsburgh | 189,320 | 3,553,536 | ||||||
Briggs & Stratton | 388,230 | 7,686,954 | ||||||
CIRCOR International | 5,400 | 274,644 | ||||||
CLARCOR | 243,800 | 12,728,798 | ||||||
Crane Company | 290,000 | 17,376,800 | ||||||
Donaldson Company | 34,602 | 1,233,907 | ||||||
Foster (L.B.) Company | 2,500 | 107,925 | ||||||
FreightCar America | 10,539 | 179,058 | ||||||
Gardner Denver | 14,500 | 1,090,110 | ||||||
Gorman-Rupp Company | 576,633 | 18,359,995 | ||||||
Kaydon Corporation | 103,300 | 2,845,915 | ||||||
Kennametal | 415,109 | 16,118,683 | ||||||
Lincoln Electric Holdings | 486,672 | 27,871,705 | ||||||
Lindsay Corporation | 225,182 | 16,884,146 | ||||||
Miller Industries | 121,298 | 1,865,563 | ||||||
| 116,700 | 2,392,350 | |||||||
Mueller Industries | 402,262 | 20,286,073 | ||||||
Nordson Corporation | 634,300 | 43,963,333 | ||||||
Standex International | 48,731 | 2,570,560 | ||||||
Starrett (L.S.) Company (The) Cl. A 3 | 529,400 | 5,410,468 | ||||||
Sun Hydraulics | 935,649 | 29,267,101 | ||||||
Tennant Company | 619,498 | 29,903,168 | ||||||
Timken Company (The) | 49,532 | 2,787,661 | ||||||
Toro Company (The) | 656,550 | 29,813,936 | ||||||
Trinity Industries | 645,587 | 24,816,364 | ||||||
Wabtec Corporation | 14,400 | 769,392 | ||||||
Watts Water Technologies Cl. A | 300 | 13,602 | ||||||
Woodward | 609,200 | 24,368,000 | ||||||
| 374,271,241 | ||||||||
Marine - 0.3% | ||||||||
Euroseas | 72,046 | 73,487 | ||||||
Matson | 594,700 | 14,867,500 | ||||||
| 14,940,987 | ||||||||
Professional Services - 1.8% | ||||||||
Corporate Executive Board | 236,000 | 14,919,920 | ||||||
Heidrick & Struggles International | 124,932 | 2,088,863 | ||||||
Kelly Services Cl. A | 595,000 | 10,394,650 | ||||||
| THE ACCOMPANYING NOTES ARE AN INTEGRAL PART OF THESE FINANCIAL STATEMENTS. | The Royce Funds 2013 Semiannual Report to Shareholders | 61 |
| Schedules of Investments |
| Royce Total Return Fund (continued) |
| SHARES | VALUE | |||||||
| Industrials (continued) | ||||||||
| Professional Services (continued) | ||||||||
ManpowerGroup | 462,152 | $ | 25,325,930 | |||||
Resources Connection | 107,222 | 1,243,775 | ||||||
Robert Half International | 26,300 | 873,949 | ||||||
Towers Watson & Company Cl. A | 463,700 | 37,995,578 | ||||||
| 92,842,665 | ||||||||
Road & Rail - 0.2% | ||||||||
Arkansas Best | 246,081 | 5,647,559 | ||||||
Knight Transportation | 287,072 | 4,828,551 | ||||||
| 10,476,110 | ||||||||
Trading Companies & Distributors - 1.1% | ||||||||
Applied Industrial Technologies | 760,870 | 36,772,847 | ||||||
Houston Wire & Cable 3 | 1,193,373 | 16,516,282 | ||||||
MFC Industrial | 16,359 | 132,017 | ||||||
Watsco | 6,402 | 537,512 | ||||||
| 53,958,658 | ||||||||
Transportation Infrastructure - 0.0% | ||||||||
Grupo Aeroportuario del Pacifico ADR | 40,000 | 2,033,200 | ||||||
Total (Cost $516,523,955) | 976,294,508 | |||||||
Information Technology – 7.3% | ||||||||
Communications Equipment - 1.9% | ||||||||
ADTRAN | 443,457 | 10,913,477 | ||||||
Bel Fuse Cl. A | 22,350 | 309,994 | ||||||
Bel Fuse Cl. B | 74,000 | 995,300 | ||||||
Black Box | 317,530 | 8,039,860 | ||||||
Comtech Telecommunications | 112,100 | 3,014,369 | ||||||
NETGEAR 2 | 1,169,837 | 35,726,822 | ||||||
Plantronics | 782,597 | 34,371,660 | ||||||
Tellabs | 741,355 | 1,467,883 | ||||||
| 94,839,365 | ||||||||
Computers & Peripherals - 0.3% | ||||||||
Diebold | 392,500 | 13,223,325 | ||||||
Xyratex | 1,603 | 16,126 | ||||||
| 13,239,451 | ||||||||
Electronic Equipment, Instruments & Components - 2.5% | ||||||||
AVX Corporation | 1,252,192 | 14,713,256 | ||||||
Cognex Corporation | 418,300 | 18,915,526 | ||||||
Daktronics | 12,853 | 131,872 | ||||||
Electro Rent | 51,616 | 866,633 | ||||||
FLIR Systems | 140,200 | 3,781,194 | ||||||
Littelfuse | 303,610 | 22,652,342 | ||||||
Methode Electronics | 1,122,573 | 19,094,967 | ||||||
Molex | 1,667 | 48,910 | ||||||
Molex Cl. A | 1,343,055 | 33,388,347 | ||||||
MTS Systems | 168,722 | 9,549,665 | ||||||
Nam Tai Electronics | 615,197 | 3,445,103 | ||||||
Park Electrochemical | 113,828 | 2,733,010 | ||||||
| 129,320,825 | ||||||||
Internet Software & Services - 0.2% | ||||||||
EarthLink | 275,252 | 1,709,315 | ||||||
IAC/InterActiveCorp | 29,400 | 1,398,264 | ||||||
j2 Global | 70,800 | 3,009,708 | ||||||
United Online | 324,662 | 2,460,938 | ||||||
| 8,578,225 | ||||||||
IT Services - 1.7% | ||||||||
Amdocs | 51,900 | 1,924,971 | ||||||
Broadridge Financial Solutions | 584,500 | 15,536,010 | ||||||
Computer Sciences | 1,900 | 83,163 | ||||||
Convergys Corporation | 1,538,299 | 26,812,551 | ||||||
Forrester Research | 81,026 | 2,972,844 | ||||||
Global Payments | 7,246 | 335,635 | ||||||
Jack Henry & Associates | 5,700 | 268,641 | ||||||
ManTech International Cl. A | 948,348 | 24,770,850 | ||||||
MAXIMUS | 72,360 | 5,389,373 | ||||||
Syntel 2 | 35,500 | 2,231,885 | ||||||
Total System Services | 224,295 | 5,490,741 | ||||||
| 85,816,664 | ||||||||
Semiconductors & Semiconductor Equipment - 0.5% | ||||||||
Brooks Automation | 37,690 | 366,724 | ||||||
Cypress Semiconductor | 81 | 869 | ||||||
Marvell Technology Group | 238,300 | 2,790,493 | ||||||
Micrel | 115,360 | 1,139,757 | ||||||
MKS Instruments | 61,183 | 1,623,797 | ||||||
Teradyne 2 | 1,258,100 | 22,104,817 | ||||||
| 28,026,457 | ||||||||
Software - 0.2% | ||||||||
Ebix | 138,145 | 1,279,223 | ||||||
FactSet Research Systems | 22,400 | 2,283,456 | ||||||
Fair Isaac | 180,257 | 8,261,178 | ||||||
| 11,823,857 | ||||||||
Total (Cost $339,855,108) | 371,644,844 | |||||||
Materials – 6.9% | ||||||||
Chemicals - 4.0% | ||||||||
Agrium | 5,200 | 452,192 | ||||||
Albemarle Corporation | 447,900 | 27,899,691 | ||||||
Balchem Corporation | 1,051,649 | 47,061,293 | ||||||
Cabot Corporation | 781,000 | 29,225,020 | ||||||
Chase Corporation 3 | 773,974 | 17,306,059 | ||||||
FutureFuel Corporation | 188,447 | 2,670,294 | ||||||
H.B. Fuller Company | 9,022 | 341,122 | ||||||
Innophos Holdings | 317,732 | 14,987,418 | ||||||
International Flavors & Fragrances | 255,300 | 19,188,348 | ||||||
Kronos Worldwide | 4,100 | 66,584 | ||||||
Methanex Corporation | 310,710 | 13,295,281 | ||||||
Minerals Technologies | 60,057 | 2,482,756 | ||||||
NewMarket Corporation | 8,626 | 2,264,842 | ||||||
Quaker Chemical | 418,029 | 25,921,978 | ||||||
Stepan Company | 6,070 | 337,553 | ||||||
Westlake Chemical | 38,700 | 3,731,067 | ||||||
| 207,231,498 | ||||||||
Construction Materials - 0.1% | ||||||||
Ash Grove Cement 4 | 39,610 | 7,438,758 | ||||||
Containers & Packaging - 1.3% | ||||||||
AptarGroup | 41,300 | 2,280,173 | ||||||
| 62 | The Royce Funds 2013 Semiannual Report to Shareholders | THE ACCOMPANYING NOTES ARE AN INTEGRAL PART OF THESE FINANCIAL STATEMENTS. |
| June 30, 2013 (unaudited) |
| SHARES | VALUE | |||||||
| Materials (continued) | ||||||||
| Containers & Packaging (continued) | ||||||||
Bemis Company | 464,800 | $ | 18,192,272 | |||||
Greif Cl. A | 586,801 | 30,906,809 | ||||||
Myers Industries | 14,700 | 220,647 | ||||||
Sealed Air | 13 | 311 | ||||||
Sonoco Products | 359,778 | 12,437,526 | ||||||
| 64,037,738 | ||||||||
Metals & Mining - 1.2% | ||||||||
Agnico Eagle Mines | 77,000 | 2,120,580 | ||||||
Carpenter Technology | 312,775 | 14,096,769 | ||||||
Gold Fields ADR | 396,200 | 2,080,050 | ||||||
IAMGOLD Corporation | 846,620 | 3,665,865 | ||||||
Olympic Steel | 39,297 | 962,777 | ||||||
Reliance Steel & Aluminum | 456,513 | 29,928,992 | ||||||
Sims Metal Management ADR | 1,000,000 | 7,560,000 | ||||||
| 60,415,033 | ||||||||
Paper & Forest Products - 0.3% | ||||||||
Buckeye Technologies | 7,000 | 259,280 | ||||||
Deltic Timber | 172,000 | 9,945,040 | ||||||
Domtar Corporation | 7,900 | 525,350 | ||||||
Schweitzer-Mauduit International | 47,800 | 2,384,264 | ||||||
| 13,113,934 | ||||||||
Total (Cost $209,379,350) | 352,236,961 | |||||||
Telecommunication Services – 0.7% | ||||||||
Diversified Telecommunication Services - 0.3% | ||||||||
Atlantic Tele-Network | 284,303 | 14,118,487 | ||||||
Wireless Telecommunication Services - 0.4% | ||||||||
Telephone and Data Systems | 822,190 | 20,266,983 | ||||||
USA Mobility | 143,566 | 1,948,191 | ||||||
| 22,215,174 | ||||||||
Total (Cost $28,847,837) | 36,333,661 | |||||||
Utilities – 2.8% | ||||||||
Electric Utilities - 0.9% | ||||||||
ALLETE | 199,147 | 9,927,478 | ||||||
ITC Holdings | 250,000 | 22,825,000 | ||||||
PNM Resources | 638,900 | 14,177,191 | ||||||
| 46,929,669 | ||||||||
Gas Utilities - 1.2% | ||||||||
AGL Resources | 312,558 | 13,396,236 | ||||||
National Fuel Gas | 61,676 | 3,574,124 | ||||||
Piedmont Natural Gas | 539,500 | 18,202,730 | ||||||
UGI Corporation | 660,076 | 25,815,572 | ||||||
| 60,988,662 | ||||||||
Water Utilities - 0.7% | ||||||||
Aqua America | 819,766 | 25,650,478 | ||||||
Consolidated Water | 25,827 | 295,203 | ||||||
SJW | 400,400 | 10,490,480 | ||||||
| 36,436,161 | ||||||||
| Total (Cost $93,414,655) | 144,354,492 | |||||||
| Miscellaneous5 – 1.3% | ||||||||
| Total (Cost $58,952,632) | 64,149,402 | |||||||
| VALUE | ||||||||
| TOTAL COMMON STOCKS | ||||||||
(Cost $3,106,493,959) | 4,649,721,386 | |||||||
| PRINCIPAL | ||||||||
| AMOUNT | ||||||||
| CORPORATE BOND – 0.1% | ||||||||
Leucadia National 3.75% | ||||||||
Conv. Senior Note due 4/15/14 | ||||||||
(Cost $3,000,000) | $3,000,000 | 3,789,375 | ||||||
| REPURCHASE AGREEMENT – 9.3% | ||||||||
| Fixed Income Clearing Corporation, | ||||||||
0.01% dated 6/28/13, due 7/1/13, | ||||||||
maturity value $478,504,399 (collateralized | ||||||||
by obligations of various U.S. Government | ||||||||
Agencies, 0.12%-1.125% due 2/27/14-3/28/14, | ||||||||
valued at $488,078,588) | ||||||||
(Cost $478,504,000) | 478,504,000 | |||||||
| COLLATERAL RECEIVED FOR SECURITIES | ||||||||
LOANED – 0.1% | ||||||||
| Money Market Funds | ||||||||
Federated Government Obligations Fund | ||||||||
(7 day yield-0.0099%) | ||||||||
(Cost $3,957,333) | 3,957,333 | |||||||
| TOTAL INVESTMENTS – 100.3% | ||||||||
(Cost $3,591,955,292) | 5,135,972,094 | |||||||
LIABILITIES LESS CASH | ||||||||
AND OTHER ASSETS – (0.3)% | (13,899,568 | ) | ||||||
| NET ASSETS – 100.0% | $ | 5,122,072,526 | ||||||
| THE ACCOMPANYING NOTES ARE AN INTEGRAL PART OF THESE FINANCIAL STATEMENTS. | The Royce Funds 2013 Semiannual Report to Shareholders | 63 |
| Schedules of Investments |
| Royce Heritage Fund |
| SHARES | VALUE | |||||||
| COMMON STOCKS – 88.2% | ||||||||
| Consumer Discretionary – 11.3% | ||||||||
| Auto Components - 1.1% | ||||||||
Drew Industries | 47,000 | $ | 1,848,040 | |||||
Minth Group | 122,200 | 192,217 | ||||||
Nokian Renkaat | 28,000 | 1,141,130 | ||||||
| 3,181,387 | ||||||||
Automobiles - 0.9% | ||||||||
Thor Industries | 52,650 | 2,589,327 | ||||||
Distributors - 1.0% | ||||||||
Genuine Parts | 7,420 | 579,280 | ||||||
LKQ Corporation 2 | 95,800 | 2,466,850 | ||||||
| 3,046,130 | ||||||||
Diversified Consumer Services - 0.6% | ||||||||
Sotheby’s | 42,700 | 1,618,757 | ||||||
Household Durables - 3.3% | ||||||||
Ethan Allen Interiors | 55,900 | 1,609,920 | ||||||
Garmin | 40,520 | 1,465,203 | ||||||
Harman International Industries | 46,200 | 2,504,040 | ||||||
Mohawk Industries 2 | 16,500 | 1,856,085 | ||||||
NVR 2 | 2,337 | 2,154,714 | ||||||
| 9,589,962 | ||||||||
Multiline Retail - 0.5% | ||||||||
Dollar Tree 2 | 22,300 | 1,133,732 | ||||||
New World Department Store China | 545,900 | 275,904 | ||||||
| 1,409,636 | ||||||||
Specialty Retail - 2.7% | ||||||||
Advance Auto Parts | 7,261 | 589,375 | ||||||
Ascena Retail Group 2 | 40 | 698 | ||||||
Lewis Group | 77,500 | 493,928 | ||||||
Luk Fook Holdings (International) 1 | 136,600 | 317,017 | ||||||
Ross Stores | 22,800 | 1,477,668 | ||||||
Signet Jewelers | 36,520 | 2,462,544 | ||||||
Tiffany & Co. | 23,600 | 1,719,024 | ||||||
USS | 7,000 | 888,586 | ||||||
| 7,948,840 | ||||||||
Textiles, Apparel & Luxury Goods - 1.2% | ||||||||
Daphne International Holdings | 349,800 | 299,015 | ||||||
Gildan Activewear | 12,600 | 510,426 | ||||||
Stella International Holdings | 423,500 | 1,171,224 | ||||||
Wolverine World Wide | 30,100 | 1,643,761 | ||||||
| 3,624,426 | ||||||||
Total (Cost $23,713,699) | 33,008,465 | |||||||
Consumer Staples – 1.2% | ||||||||
Food & Staples Retailing - 0.2% | ||||||||
FamilyMart | 10,500 | 447,822 | ||||||
Food Products - 1.0% | ||||||||
Darling International 2 | 102,500 | 1,912,650 | ||||||
First Resources | 406,000 | 568,560 | ||||||
Super Group | 136,000 | 477,476 | ||||||
| 2,958,686 | ||||||||
| Total (Cost $2,417,357) | 3,406,508 | |||||||
| Energy – 4.7% | ||||||||
| Energy Equipment & Services - 4.7% | ||||||||
CARBO Ceramics | 16,150 | 1,088,994 | ||||||
Ensign Energy Services | 24,800 | 383,897 | ||||||
Helmerich & Payne | 46,970 | 2,933,277 | ||||||
Oil States International 2 | 26,900 | 2,492,016 | ||||||
Pason Systems | 72,700 | 1,321,692 | ||||||
SEACOR Holdings | 6,600 | 548,130 | ||||||
TGS-NOPEC Geophysical | 45,400 | 1,319,170 | ||||||
Tidewater | 32,900 | 1,874,313 | ||||||
Trican Well Service | 125,600 | 1,669,571 | ||||||
| 13,631,060 | ||||||||
Oil, Gas & Consumable Fuels - 0.0% | ||||||||
Energen Corporation | 1,500 | 78,390 | ||||||
Total (Cost $9,016,679) | 13,709,450 | |||||||
Financials – 15.7% | ||||||||
Capital Markets - 12.4% | ||||||||
Affiliated Managers Group 2 | 10,200 | 1,672,188 | ||||||
AllianceBernstein Holding L.P. | 95,441 | 1,987,082 | ||||||
ARA Asset Management | 682,000 | 936,237 | ||||||
Ashmore Group | 321,300 | 1,679,597 | ||||||
Blackstone Group L.P. | 60,000 | 1,263,600 | ||||||
Coronation Fund Managers | 200,000 | 1,269,594 | ||||||
Egyptian Financial Group-Hermes Holding Company 2 | 248,750 | 262,594 | ||||||
Federated Investors Cl. B | 96,000 | 2,631,360 | ||||||
Invesco | 46,800 | 1,488,240 | ||||||
Jupiter Fund Management | 375,900 | 1,656,287 | ||||||
KKR & Co. L.P. | 140,800 | 2,768,128 | ||||||
Lazard Cl. A | 111,300 | 3,578,295 | ||||||
Schwab (Charles) | 102,500 | 2,176,075 | ||||||
SEI Investments | 92,600 | 2,632,618 | ||||||
Sprott | 600,000 | 1,597,413 | ||||||
State Street | 35,700 | 2,327,997 | ||||||
T. Rowe Price Group | 17,100 | 1,250,865 | ||||||
TD Ameritrade Holding Corporation | 90,300 | 2,193,387 | ||||||
Value Partners Group | 2,672,000 | 1,440,032 | ||||||
| 138,400 | 1,601,288 | |||||||
| 36,412,877 | ||||||||
Diversified Financial Services - 2.1% | ||||||||
Bolsa Mexicana de Valores | 566,800 | 1,409,405 | ||||||
Moody’s Corporation | 38,900 | 2,370,177 | ||||||
Singapore Exchange | 185,000 | 1,026,075 | ||||||
Warsaw Stock Exchange | 100,000 | 1,145,454 | ||||||
| 5,951,111 | ||||||||
Insurance - 0.8% | ||||||||
Alleghany Corporation 2 | 6,190 | 2,372,689 | ||||||
Real Estate Management & Development - 0.4% | ||||||||
Jones Lang LaSalle | 7,430 | 677,170 | ||||||
Midland Holdings | 1,443,300 | 539,652 | ||||||
| 1,216,822 | ||||||||
| Total (Cost $34,513,443) | 45,953,499 | |||||||
| 64 | The Royce Funds 2013 Semiannual Report to Shareholders | THE ACCOMPANYING NOTES ARE AN INTEGRAL PART OF THESE FINANCIAL STATEMENTS. |
| June 30, 2013 (unaudited) |
| SHARES | VALUE | |||||||
| Health Care – 2.8% | ||||||||
| Biotechnology - 0.3% | ||||||||
Myriad Genetics 2 | 30,258 | $ | 813,032 | |||||
Health Care Equipment & Supplies - 1.5% | ||||||||
Analogic Corporation | 25,040 | 1,823,663 | ||||||
Atrion Corporation | 6,325 | 1,383,341 | ||||||
Kossan Rubber Industries | 433,997 | 685,439 | ||||||
West Pharmaceutical Services | 5,900 | 414,534 | ||||||
| 4,306,977 | ||||||||
Life Sciences Tools & Services - 0.7% | ||||||||
Bio-Rad Laboratories Cl. A 2 | 6,400 | 718,080 | ||||||
Waters Corporation 2 | 13,250 | 1,325,663 | ||||||
| 2,043,743 | ||||||||
Pharmaceuticals - 0.3% | ||||||||
Adcock Ingram Holdings | 157,500 | 1,035,655 | ||||||
Total (Cost $7,271,259) | 8,199,407 | |||||||
Industrials – 22.2% | ||||||||
Aerospace & Defense - 0.7% | ||||||||
HEICO Corporation | 27,343 | 1,377,267 | ||||||
Teledyne Technologies 2 | 9,600 | 742,560 | ||||||
| 2,119,827 | ||||||||
Air Freight & Logistics - 2.6% | ||||||||
Expeditors International of Washington | 85,500 | 3,249,855 | ||||||
Forward Air | 67,000 | 2,564,760 | ||||||
UTi Worldwide | 103,000 | 1,696,410 | ||||||
| 7,511,025 | ||||||||
Building Products - 0.5% | ||||||||
AAON | 41,250 | 1,364,550 | ||||||
Commercial Services & Supplies - 1.4% | ||||||||
Cintas Corporation | 31,400 | 1,429,956 | ||||||
Heritage-Crystal Clean 2 | 119,227 | 1,741,906 | ||||||
Kaba Holding | 1,800 | 675,083 | ||||||
Moleskine 2 | 50,000 | 113,569 | ||||||
Team 2 | 7,976 | 301,892 | ||||||
| 4,262,406 | ||||||||
Construction & Engineering - 3.3% | ||||||||
Fluor Corporation | 39,600 | 2,348,676 | ||||||
Jacobs Engineering Group 2 | 65,630 | 3,618,182 | ||||||
KBR | 89,200 | 2,899,000 | ||||||
Raubex Group | 367,500 | 810,466 | ||||||
| 9,676,324 | ||||||||
Electrical Equipment - 0.8% | ||||||||
EnerSys | 4,000 | 196,160 | ||||||
| 39,618 | 2,046,270 | |||||||
| 2,242,430 | ||||||||
Industrial Conglomerates - 0.5% | ||||||||
Raven Industries | 50,400 | 1,510,992 | ||||||
Machinery - 4.3% | ||||||||
Burckhardt Compression Holding | 2,000 | 796,146 | ||||||
Chart Industries 2 | 1,600 | 150,544 | ||||||
Foster (L.B.) Company | 33,700 | 1,454,829 | ||||||
Graco | 30,400 | 1,921,584 | ||||||
Kennametal | 58,500 | 2,271,555 | ||||||
Lincoln Electric Holdings | 30,500 | 1,746,735 | ||||||
Pfeiffer Vacuum Technology | 12,000 | 1,243,336 | ||||||
Semperit AG Holding | 6,500 | 233,516 | ||||||
Sun Hydraulics | 8,700 | 272,136 | ||||||
Valmont Industries | 17,170 | 2,456,855 | ||||||
| 12,547,236 | ||||||||
Marine - 0.8% | ||||||||
Clarkson | 30,600 | 791,663 | ||||||
Kirby Corporation 2 | 19,015 | 1,512,453 | ||||||
| 2,304,116 | ||||||||
Professional Services - 4.9% | ||||||||
Acacia Research-Acacia Technologies | 20,800 | 464,880 | ||||||
Advisory Board (The) 2 | 26,900 | 1,470,085 | ||||||
Equifax | 37,570 | 2,214,000 | ||||||
ManpowerGroup | 60,925 | 3,338,690 | ||||||
Towers Watson & Company Cl. A | 55,750 | 4,568,155 | ||||||
Verisk Analytics Cl. A 2 | 40,800 | 2,435,760 | ||||||
| 14,491,570 | ||||||||
Road & Rail - 1.6% | ||||||||
Landstar System | 44,000 | 2,266,000 | ||||||
Patriot Transportation Holding 2 | 79,512 | 2,388,541 | ||||||
| 4,654,541 | ||||||||
Trading Companies & Distributors - 0.8% | ||||||||
†Applied Industrial Technologies | 48,900 | 2,363,337 | ||||||
Total (Cost $47,250,257) | 65,048,354 | |||||||
Information Technology – 17.6% | ||||||||
Communications Equipment - 0.6% | ||||||||
ADTRAN | 31,950 | 786,290 | ||||||
Plantronics | 22,020 | 967,118 | ||||||
| 1,753,408 | ||||||||
Computers & Peripherals - 0.8% | ||||||||
Western Digital | 38,365 | 2,382,083 | ||||||
Electronic Equipment, Instruments & Components - 7.7% | ||||||||
Amphenol Corporation Cl. A | 29,900 | 2,330,406 | ||||||
Anixter International 2 | 41,800 | 3,168,858 | ||||||
AVX Corporation | 65,763 | 772,715 | ||||||
Coherent | 54,100 | 2,979,287 | ||||||
DTS 2 | 77,527 | 1,595,506 | ||||||
FEI Company | 31,100 | 2,269,989 | ||||||
FLIR Systems | 114,900 | 3,098,853 | ||||||
IPG Photonics | 22,714 | 1,379,421 | ||||||
National Instruments | 104,850 | 2,929,509 | ||||||
Rogers Corporation 2 | 11,900 | 563,108 | ||||||
Trimble Navigation 2 | 44,200 | 1,149,642 | ||||||
Vaisala Cl. A | 19,500 | 501,805 | ||||||
| 22,739,099 | ||||||||
Internet Software & Services - 0.4% | ||||||||
Bankrate 2 | 54,975 | 789,441 | ||||||
Stamps.com 2 | 7,300 | 287,547 | ||||||
| 1,076,988 | ||||||||
IT Services - 2.4% | ||||||||
Computer Task Group | 22,800 | 523,716 | ||||||
| THE ACCOMPANYING NOTES ARE AN INTEGRAL PART OF THESE FINANCIAL STATEMENTS. | The Royce Funds 2013 Semiannual Report to Shareholders | 65 |
| Schedules of Investments |
| Royce Heritage Fund (continued) |
| SHARES | VALUE | |||||||
| Information Technology (continued) | ||||||||
| IT Services (continued) | ||||||||
Fiserv 2 | 27,430 | $ | 2,397,656 | |||||
MAXIMUS | 26,100 | 1,943,928 | ||||||
Sapient Corporation 2 | 119,800 | 1,564,588 | ||||||
Total System Services | 23,300 | 570,384 | ||||||
| 7,000,272 | ||||||||
Office Electronics - 0.5% | ||||||||
Zebra Technologies Cl. A 2 | 32,170 | 1,397,465 | ||||||
Semiconductors & Semiconductor Equipment - 3.0% | ||||||||
Analog Devices | 58,700 | 2,645,022 | ||||||
Diodes 2 | 98,300 | 2,552,851 | ||||||
RDA Microelectronics ADR | 10 | 111 | ||||||
Silicon Motion Technology ADR | 29,300 | 310,287 | ||||||
Teradyne 2 | 122,400 | 2,150,568 | ||||||
Veeco Instruments 2 | 30,400 | 1,076,768 | ||||||
| 8,735,607 | ||||||||
Software - 2.2% | ||||||||
ANSYS 2 | 38,300 | 2,799,730 | ||||||
| 54,500 | 2,351,675 | |||||||
SimCorp | 49,000 | 1,453,727 | ||||||
| 6,605,132 | ||||||||
Total (Cost $38,769,666) | 51,690,054 | |||||||
Materials – 9.5% | ||||||||
Chemicals - 2.9% | ||||||||
Airgas | 15,400 | 1,470,084 | ||||||
Cabot Corporation | 9,600 | 359,232 | ||||||
Innospec | 34,528 | 1,387,335 | ||||||
Intrepid Potash | 33,100 | 630,555 | ||||||
Minerals Technologies | 12,400 | 512,616 | ||||||
Sigma-Aldrich Corporation | 18,040 | 1,449,694 | ||||||
Tronox Cl. A | 39,800 | 801,970 | ||||||
Victrex | 28,000 | 657,537 | ||||||
Westlake Chemical | 14,700 | 1,417,227 | ||||||
| 8,686,250 | ||||||||
Containers & Packaging - 1.2% | ||||||||
Greif Cl. A | 69,800 | 3,676,366 | ||||||
Metals & Mining - 4.7% | ||||||||
Compass Minerals International | 24,400 | 2,062,532 | ||||||
Fresnillo | 48,000 | 643,909 | ||||||
Gold Fields ADR | 280,400 | 1,472,100 | ||||||
Haynes International | 7 | 335 | ||||||
Hochschild Mining | 243,300 | 574,683 | ||||||
Major Drilling Group International | 212,000 | 1,443,301 | ||||||
Pan American Silver | 211,600 | 2,463,024 | ||||||
Randgold Resources ADR | 26,700 | 1,710,135 | ||||||
Reliance Steel & Aluminum | 34,580 | 2,267,065 | ||||||
Sims Metal Management ADR | 137,800 | 1,041,768 | ||||||
| 13,678,852 | ||||||||
Paper & Forest Products - 0.7% | ||||||||
Stella-Jones | 21,000 | 1,957,631 | ||||||
| Total (Cost $28,649,049) | 27,999,099 | |||||||
| Utilities – 0.2% | ||||||||
| Gas Utilities - 0.2% | ||||||||
UGI Corporation | 16,800 | 657,048 | ||||||
| Total (Cost $565,085) | 657,048 | |||||||
| Miscellaneous5 – 3.0% | ||||||||
| Total (Cost $8,532,244) | 8,957,171 | |||||||
| TOTAL COMMON STOCKS | ||||||||
(Cost $200,698,738) | 258,629,055 | |||||||
| REPURCHASE AGREEMENT – 14.4% | ||||||||
| Fixed Income Clearing Corporation, | ||||||||
0.01% dated 6/28/13, due 7/1/13, | ||||||||
maturity value $42,307,035 (collateralized | ||||||||
by obligations of various U.S. Government | ||||||||
Agencies, 1.375% due 2/25/14, valued at | ||||||||
$43,156,927) | ||||||||
(Cost $42,307,000) | 42,307,000 | |||||||
| COLLATERAL RECEIVED FOR SECURITIES | ||||||||
LOANED – 0.4% | ||||||||
| Money Market Funds | ||||||||
Federated Government Obligations Fund | ||||||||
(7 day yield-0.0099%) | ||||||||
(Cost $1,231,565) | 1,231,565 | |||||||
| TOTAL INVESTMENTS – 103.0% | ||||||||
(Cost $244,237,303) | 302,167,620 | |||||||
LIABILITIES LESS CASH | ||||||||
AND OTHER ASSETS – (3.0)% | (8,909,596 | ) | ||||||
| NET ASSETS – 100.0% | $ | 293,258,024 | ||||||
| 66 | The Royce Funds 2013 Semiannual Report to Shareholders | THE ACCOMPANYING NOTES ARE AN INTEGRAL PART OF THESE FINANCIAL STATEMENTS. |
| June 30, 2013 (unaudited) | ||
| Royce Opportunity Fund | ||
| SHARES | VALUE | |||||||
| COMMON STOCKS – 89.5% | ||||||||
| Consumer Discretionary – 14.5% | ||||||||
| Auto Components - 2.0% | ||||||||
Dana Holding Corporation | 553,536 | $ | 10,661,103 | |||||
Fuel Systems Solutions 2 | 428,700 | 7,669,443 | ||||||
Spartan Motors | 608,706 | 3,725,281 | ||||||
Tower International 2 | 740,468 | 14,653,862 | ||||||
Visteon Corporation 2 | 150,100 | 9,474,312 | ||||||
| 46,184,001 | ||||||||
Automobiles - 0.3% | ||||||||
Winnebago Industries 2 | 309,236 | 6,490,864 | ||||||
Distributors - 0.5% | ||||||||
VOXX International Cl. A 2 | 907,194 | 11,131,270 | ||||||
Diversified Consumer Services - 0.3% | ||||||||
†DeVry | 255,600 | 7,928,712 | ||||||
Hotels, Restaurants & Leisure - 1.8% | ||||||||
Carrols Restaurant Group 2 | 915,295 | 5,912,806 | ||||||
Isle of Capri Casinos 2 | 964,336 | 7,232,520 | ||||||
Jamba 2 | 392,150 | 5,854,800 | ||||||
Krispy Kreme Doughnuts 2 | 259,623 | 4,530,421 | ||||||
Orient-Express Hotels Cl. A 2 | 1,003,319 | 12,200,359 | ||||||
Ruby Tuesday 2 | 630,500 | 5,819,515 | ||||||
| 41,550,421 | ||||||||
Household Durables - 1.8% | ||||||||
| 878,590 | 2,433,694 | |||||||
| 834,519 | 6,926,508 | |||||||
Ethan Allen Interiors | 205,900 | 5,929,920 | ||||||
| 231,753 | 927,012 | |||||||
| 1,111,959 | 1,712,417 | |||||||
La-Z-Boy | 533,341 | 10,810,822 | ||||||
M.D.C. Holdings | 159,150 | 5,173,966 | ||||||
| 477,900 | 3,980,907 | |||||||
| 549,500 | 2,939,825 | |||||||
| 40,835,071 | ||||||||
Internet & Catalog Retail - 0.8% | ||||||||
| 1,674,115 | 1,657,374 | |||||||
Gaiam Cl. A 2 | 716,304 | 3,194,716 | ||||||
1-800-FLOWERS.COM Cl. A 2 | 446,227 | 2,762,145 | ||||||
Vitacost.com 2 | 1,166,622 | 9,857,956 | ||||||
| 17,472,191 | ||||||||
Leisure Equipment & Products - 0.8% | ||||||||
Callaway Golf | 1,055,026 | 6,942,071 | ||||||
Steinway Musical Instruments 2 | 357,003 | 10,863,601 | ||||||
| 17,805,672 | ||||||||
Media - 1.4% | ||||||||
Ballantyne Strong 2 | 421,497 | 1,778,717 | ||||||
Harris Interactive 2 | 2,240,035 | 4,054,463 | ||||||
Martha Stewart Living Omnimedia Cl. A 2 | 1,505,757 | 3,628,875 | ||||||
McClatchy Company (The) Cl. A 2 | 2,113,554 | 4,818,903 | ||||||
Media General Cl. A 2 | 633,843 | 6,991,288 | ||||||
New York Times Cl. A 2 | 949,900 | 10,505,894 | ||||||
| 31,778,140 | ||||||||
Multiline Retail - 0.3% | ||||||||
Dillard’s Cl. A | 15,000 | 1,229,550 | ||||||
| 324,131 | 5,536,158 | |||||||
| 6,765,708 | ||||||||
Specialty Retail - 2.1% | ||||||||
bebe stores | 960,621 | 5,389,084 | ||||||
Brown Shoe | 193,559 | 4,167,325 | ||||||
Coldwater Creek 2 | 876,803 | 2,192,007 | ||||||
Destination Maternity | 188,000 | 4,624,800 | ||||||
Haverty Furniture | 124,426 | 2,863,042 | ||||||
MarineMax 2 | 741,750 | 8,404,028 | ||||||
Pacific Sunwear of California 2 | 72,200 | 263,530 | ||||||
Penske Automotive Group | 200,500 | 6,123,270 | ||||||
Sears Hometown and Outlet Stores 2 | 108,600 | 4,747,992 | ||||||
West Marine 2 | 901,547 | 9,917,017 | ||||||
| 48,692,095 | ||||||||
Textiles, Apparel & Luxury Goods - 2.4% | ||||||||
Delta Apparel 2 | 80,476 | 1,134,712 | ||||||
| 429,300 | 704,052 | |||||||
Jones Group (The) | 1,178,171 | 16,199,851 | ||||||
Quiksilver 2 | 1,313,145 | 8,456,654 | ||||||
Skechers U.S.A. Cl. A 2 | 523,658 | 12,573,028 | ||||||
Unifi 2 | 798,734 | 16,509,832 | ||||||
| 55,578,129 | ||||||||
Total (Cost $259,410,022) | 332,212,274 | |||||||
Consumer Staples – 0.5% | ||||||||
Food & Staples Retailing - 0.2% | ||||||||
SUPERVALU 2 | 641,400 | 3,989,508 | ||||||
Food Products - 0.1% | ||||||||
Inventure Foods 2 | 204,212 | 1,707,212 | ||||||
Household Products - 0.2% | ||||||||
Central Garden & Pet 2 | 810,064 | 5,751,455 | ||||||
Total (Cost $11,509,907) | 11,448,175 | |||||||
Energy – 5.0% | ||||||||
Energy Equipment & Services - 2.2% | ||||||||
Basic Energy Services 2 | 523,195 | 6,325,428 | ||||||
Cal Dive International 2 | 1,187,431 | 2,232,370 | ||||||
Hercules Offshore 2 | 871,700 | 6,136,768 | ||||||
Key Energy Services 2 | 938,900 | 5,586,455 | ||||||
Matrix Service 2 | 768,187 | 11,968,353 | ||||||
Newpark Resources 2 | 755,877 | 8,307,088 | ||||||
Patterson-UTI Energy | 384,800 | 7,447,804 | ||||||
Willbros Group 2 | 555,800 | 3,412,612 | ||||||
| 51,416,878 | ||||||||
Oil, Gas & Consumable Fuels - 2.8% | ||||||||
Goodrich Petroleum 2 | 596,600 | 7,636,480 | ||||||
Matador Resources 2 | 371,636 | 4,452,199 | ||||||
PDC Energy 2 | 215,200 | 11,078,496 | ||||||
Pengrowth Energy | 1,143,100 | 5,635,483 | ||||||
Penn Virginia 2 | 880,150 | 4,136,705 | ||||||
REX American Resources 2 | 41,300 | 1,188,201 | ||||||
Scorpio Tankers | 650,026 | 5,837,234 | ||||||
StealthGas 2 | 762,545 | 8,387,995 | ||||||
Stone Energy 2 | 436,035 | 9,605,851 | ||||||
| THE ACCOMPANYING NOTES ARE AN INTEGRAL PART OF THESE FINANCIAL STATEMENTS. | The Royce Funds 2013 Semiannual Report to Shareholders | 67 |
| Schedules of Investments |
| Royce Opportunity Fund (continued) |
| SHARES | VALUE | |||||||
| Energy (continued) | ||||||||
| Oil, Gas & Consumable Fuels (continued) | ||||||||
| 423,700 | $ | 5,080,163 | ||||||
| 63,038,807 | ||||||||
| Total (Cost $102,716,369) | 114,455,685 | |||||||
| Financials – 12.1% | ||||||||
| Capital Markets - 1.5% | ||||||||
Evercore Partners Cl. A | 178,400 | 7,007,552 | ||||||
Harris & Harris Group 2 | 932,997 | 2,836,311 | ||||||
Piper Jaffray 2 | 377,700 | 11,939,097 | ||||||
Stifel Financial 2 | 372,700 | 13,294,209 | ||||||
| 35,077,169 | ||||||||
Commercial Banks - 3.9% | ||||||||
BancorpSouth | 478,500 | 8,469,450 | ||||||
BankUnited | 312,498 | 8,128,073 | ||||||
Boston Private Financial Holdings | 972,546 | 10,347,889 | ||||||
Columbia Banking System | 307,500 | 7,321,575 | ||||||
First Bancorp | 167,408 | 2,360,453 | ||||||
First Financial Holdings | 170,300 | 3,612,063 | ||||||
FirstMerit Corporation | 264,700 | 5,301,941 | ||||||
Guaranty Bancorp | 179,696 | 2,039,550 | ||||||
Old National Bancorp | 370,800 | 5,128,164 | ||||||
State Bank Financial | 239,959 | 3,606,584 | ||||||
†Trustmark Corporation | 412,800 | 10,146,624 | ||||||
Umpqua Holdings | 573,700 | 8,611,237 | ||||||
Valley National Bancorp | 467,468 | 4,426,922 | ||||||
Virginia Commerce Bancorp 2 | 185,667 | 2,591,911 | ||||||
Western Alliance Bancorp 2 | 421,400 | 6,670,762 | ||||||
| 88,763,198 | ||||||||
Insurance - 3.3% | ||||||||
Argo Group International Holdings | 154,650 | 6,555,613 | ||||||
Aspen Insurance Holdings | 148,600 | 5,511,574 | ||||||
†Assured Guaranty | 417,200 | 9,203,432 | ||||||
Fidelity National Financial | 386,000 | 9,190,660 | ||||||
Hilltop Holdings 2 | 556,224 | 9,122,074 | ||||||
Kemper Corporation | 290,400 | 9,946,200 | ||||||
Navigators Group 2 | 123,920 | 7,068,397 | ||||||
Old Republic International | 826,900 | 10,642,203 | ||||||
†Tower Group International | 464,042 | 9,517,501 | ||||||
| 76,757,654 | ||||||||
Real Estate Investment Trusts (REITs) - 1.7% | ||||||||
LaSalle Hotel Properties | 565,200 | 13,960,440 | ||||||
Mack-Cali Realty | 263,350 | 6,449,442 | ||||||
PennyMac Mortgage Investment Trust | 351,100 | 7,390,655 | ||||||
RAIT Financial Trust | 390,500 | 2,936,560 | ||||||
Rouse Properties | 388,233 | 7,617,131 | ||||||
| 38,354,228 | ||||||||
Real Estate Management & Development - 0.0% | ||||||||
Maui Land & Pineapple 2 | 205,561 | 834,578 | ||||||
Thrifts & Mortgage Finance - 1.7% | ||||||||
Berkshire Hills Bancorp | 151,700 | 4,211,192 | ||||||
BofI Holding 2 | 172,038 | 7,882,781 | ||||||
Brookline Bancorp | 298,700 | 2,592,716 | ||||||
| 1,123,785 | 6,821,375 | |||||||
Radian Group | 771,400 | 8,963,668 | ||||||
Washington Federal | 417,400 | 7,880,512 | ||||||
| 38,352,244 | ||||||||
Total (Cost $224,304,186) | 278,139,071 | |||||||
Health Care – 4.0% | ||||||||
Health Care Equipment & Supplies - 2.0% | ||||||||
| 896,300 | 5,144,762 | |||||||
Alere 2 | 413,200 | 10,123,400 | ||||||
AngioDynamics 2 | 531,803 | 5,998,738 | ||||||
Exactech 2 | 317,323 | 6,267,129 | ||||||
Greatbatch 2 | 76,500 | 2,508,435 | ||||||
Invacare Corporation | 645,000 | 9,262,200 | ||||||
Merit Medical Systems 2 | 554,400 | 6,181,560 | ||||||
| 45,486,224 | ||||||||
Health Care Providers & Services - 0.6% | ||||||||
Kindred Healthcare 2 | 528,900 | 6,944,457 | ||||||
Select Medical Holdings | 803,714 | 6,590,455 | ||||||
| 13,534,912 | ||||||||
Health Care Technology - 0.4% | ||||||||
| 601,200 | 7,779,528 | |||||||
Life Sciences Tools & Services - 1.0% | ||||||||
Albany Molecular Research 2 | 840,610 | 9,978,041 | ||||||
Cambrex Corporation 2 | 977,254 | 13,652,238 | ||||||
| 23,630,279 | ||||||||
Total (Cost $71,483,476) | 90,430,943 | |||||||
Industrials – 18.6% | ||||||||
Aerospace & Defense - 1.6% | ||||||||
Curtiss-Wright | 169,300 | 6,274,258 | ||||||
| 273,361 | 4,444,850 | |||||||
| 325,947 | 11,098,495 | |||||||
| 970,502 | 6,288,853 | |||||||
Moog Cl. A 2 | 148,000 | 7,626,440 | ||||||
| 35,732,896 | ||||||||
Air Freight & Logistics - 0.3% | ||||||||
XPO Logistics 2 | 387,600 | 7,011,684 | ||||||
Airlines - 0.2% | ||||||||
Republic Airways Holdings 2 | 438,647 | 4,969,871 | ||||||
Building Products - 2.7% | ||||||||
Apogee Enterprises | 385,641 | 9,255,384 | ||||||
Builders FirstSource 2 | 980,500 | 5,863,390 | ||||||
Griffon Corporation | 489,900 | 5,511,375 | ||||||
Insteel Industries | 354,900 | 6,217,848 | ||||||
NCI Building Systems 2 | 1,014,369 | 15,509,702 | ||||||
PGT 2 | 690,008 | 5,982,369 | ||||||
Quanex Building Products | 728,500 | 12,267,940 | ||||||
Trex Company 2 | 34,140 | 1,621,309 | ||||||
| 62,229,317 | ||||||||
Commercial Services & Supplies - 1.0% | ||||||||
Interface | 610,000 | 10,351,700 | ||||||
| 1,702,926 | 11,920,482 | |||||||
| 22,272,182 | ||||||||
| 68 | The Royce Funds 2013 Semiannual Report to Shareholders | THE ACCOMPANYING NOTES ARE AN INTEGRAL PART OF THESE FINANCIAL STATEMENTS. |
| June 30, 2013 (unaudited) |
| SHARES | VALUE | |||||||
| Industrials (continued) | ||||||||
| Construction & Engineering - 2.6% | ||||||||
Aegion Corporation 2 | 552,953 | $ | 12,446,972 | |||||
Ameresco Cl. A 2 | 474,099 | 4,271,632 | ||||||
Furmanite Corporation 2 | 1,090,330 | 7,294,308 | ||||||
Layne Christensen 2 | 492,387 | 9,606,470 | ||||||
MasTec 2 | 272,495 | 8,965,086 | ||||||
Northwest Pipe 2 | 394,983 | 11,020,026 | ||||||
Pike Electric | 477,521 | 5,873,508 | ||||||
| 59,478,002 | ||||||||
Electrical Equipment - 0.7% | ||||||||
†General Cable | 399,444 | 12,282,903 | ||||||
Magnetek 2 | 156,017 | 2,812,987 | ||||||
| 15,095,890 | ||||||||
Machinery - 6.7% | ||||||||
Albany International Cl. A | 340,000 | 11,213,200 | ||||||
Astec Industries | 368,570 | 12,638,265 | ||||||
Barnes Group | 441,849 | 13,251,052 | ||||||
CIRCOR International | 254,680 | 12,953,025 | ||||||
Commercial Vehicle Group 2 | 1,022,240 | 7,625,910 | ||||||
Dynamic Materials | 296,599 | 4,896,850 | ||||||
Federal Signal 2 | 1,414,679 | 12,378,441 | ||||||
Flow International 2 | 1,688,672 | 6,231,200 | ||||||
Hardinge 3 | 622,791 | 9,204,851 | ||||||
Hurco Companies | 198,595 | 5,713,578 | ||||||
John Bean Technologies | 181,800 | 3,819,618 | ||||||
Lydall 2 | 405,100 | 5,914,460 | ||||||
Meritor 2 | 1,470,421 | 10,366,468 | ||||||
Mueller Industries | 250,714 | 12,643,507 | ||||||
Mueller Water Products Cl. A | 1,862,829 | 12,872,148 | ||||||
NN | 492,083 | 5,614,667 | ||||||
Trinity Industries | 179,850 | 6,913,434 | ||||||
| 154,250,674 | ||||||||
Marine - 0.3% | ||||||||
Diana Shipping 2 | 652,000 | 6,546,080 | ||||||
Professional Services - 0.5% | ||||||||
| 361,360 | 1,582,757 | |||||||
Hill International 2 | 694,207 | 1,902,127 | ||||||
Hudson Global 2 | 739,944 | 1,835,061 | ||||||
Kelly Services Cl. A | 325,700 | 5,689,979 | ||||||
| 11,009,924 | ||||||||
Road & Rail - 0.9% | ||||||||
Arkansas Best | 377,139 | 8,655,340 | ||||||
Swift Transportation 2 | 753,534 | 12,463,452 | ||||||
| 21,118,792 | ||||||||
Trading Companies & Distributors - 0.8% | ||||||||
Aceto Corporation | 625,560 | 8,714,051 | ||||||
Kaman Corporation | 261,231 | 9,028,143 | ||||||
| 17,742,194 | ||||||||
Transportation Infrastructure - 0.3% | ||||||||
Wesco Aircraft Holdings 2 | 402,000 | 7,465,140 | ||||||
Total (Cost $308,327,457) | 424,922,646 | |||||||
Information Technology – 22.6% | ||||||||
Communications Equipment - 2.7% | ||||||||
ARRIS Group 2 | 322,700 | 4,630,745 | ||||||
Aviat Networks 2 | 1,940,984 | 5,085,378 | ||||||
| 646,900 | 12,562,798 | |||||||
ClearOne 2 | 381,634 | 3,247,706 | ||||||
EMCORE Corporation 2 | 158,300 | 569,880 | ||||||
Emulex Corporation 2 | 979,425 | 6,385,851 | ||||||
| 550,755 | 9,335,297 | |||||||
| 1,319,877 | 1,557,455 | |||||||
Oplink Communications 2 | 535,736 | 9,305,734 | ||||||
Symmetricom 2 | 1,276,904 | 5,733,299 | ||||||
| 293,697 | 781,234 | |||||||
Westell Technologies Cl. A 2 | 1,199,531 | 2,866,879 | ||||||
| 62,062,256 | ||||||||
Computers & Peripherals - 1.2% | ||||||||
Avid Technology 2 | 626,962 | 3,686,537 | ||||||
Cray 2 | 466,959 | 9,171,075 | ||||||
Datalink Corporation 2 | 661,633 | 7,039,775 | ||||||
Dot Hill Systems 2 | 1,773,271 | 3,883,463 | ||||||
Interphase Corporation 2 | 329,811 | 880,595 | ||||||
Intevac 2 | 428,094 | 2,423,012 | ||||||
| 27,084,457 | ||||||||
Electronic Equipment, Instruments & Components - 5.9% | ||||||||
Benchmark Electronics 2 | 631,700 | 12,697,170 | ||||||
CTS Corporation | 437,103 | 5,962,085 | ||||||
| 1,145,186 | 2,416,342 | |||||||
FEI Company | 115,575 | 8,435,819 | ||||||
Frequency Electronics | 223,663 | 2,382,011 | ||||||
GSI Group 2 | 152,700 | 1,227,708 | ||||||
Identive Group 2 | 592,075 | 428,070 | ||||||
Ingram Micro Cl. A 2 | 697,300 | 13,241,727 | ||||||
KEMET Corporation 2 | 1,504,654 | 6,184,128 | ||||||
Maxwell Technologies 2 | 367,661 | 2,628,776 | ||||||
Mercury Systems 2 | 572,297 | 5,276,578 | ||||||
Newport Corporation 2 | 795,484 | 11,081,092 | ||||||
Park Electrochemical | 366,034 | 8,788,476 | ||||||
| 1,572,192 | 2,562,673 | |||||||
RadiSys Corporation 2 | 988,643 | 4,755,373 | ||||||
Sanmina Corporation 2 | 1,187,331 | 17,038,200 | ||||||
| 344,172 | 1,459,289 | |||||||
TTM Technologies 2 | 792,900 | 6,660,360 | ||||||
Viasystems Group 2 | 304,717 | 3,513,387 | ||||||
| 845,223 | 11,740,148 | |||||||
Vishay Precision Group 2 | 70,042 | 1,060,436 | ||||||
Zygo Corporation 2 | 339,608 | 5,369,203 | ||||||
| 134,909,051 | ||||||||
Internet Software & Services - 2.2% | ||||||||
Autobytel 2 | 187,982 | 896,674 | ||||||
Bankrate 2 | 293,100 | 4,208,916 | ||||||
Blucora 2 | 404,230 | 7,494,424 | ||||||
EarthLink | 1,541,600 | 9,573,336 | ||||||
Mediabistro 2 | 166,815 | 261,900 | ||||||
| 1,247,500 | 6,125,225 | |||||||
Perficient 2 | 436,026 | 5,816,587 | ||||||
QuinStreet 2 | 864,539 | 7,460,972 | ||||||
Support.com 2 | 1,150,834 | 5,259,311 | ||||||
| THE ACCOMPANYING NOTES ARE AN INTEGRAL PART OF THESE FINANCIAL STATEMENTS. | The Royce Funds 2013 Semiannual Report to Shareholders | 69 |
| Schedules of Investments |
| Royce Opportunity Fund (continued) |
| SHARES | VALUE | |||||||
| Information Technology (continued) | ||||||||
| Internet Software & Services (continued) | ||||||||
ValueClick 2 | 165,091 | $ | 4,074,446 | |||||
| 51,171,791 | ||||||||
IT Services - 0.2% | ||||||||
CIBER 2 | 1,508,273 | 5,037,632 | ||||||
Semiconductors & Semiconductor Equipment - 9.6% | ||||||||
Advanced Energy Industries 2 | 568,688 | 9,900,858 | ||||||
Alpha & Omega Semiconductor 2 | 805,881 | 6,156,931 | ||||||
ANADIGICS 2 | 2,209,614 | 4,861,151 | ||||||
ATMI 2 | 579,807 | 13,712,436 | ||||||
Axcelis Technologies 2 | 1,105,794 | 2,012,545 | ||||||
| 629,230 | 1,698,921 | |||||||
Brooks Automation | 1,127,500 | 10,970,575 | ||||||
| 686,756 | 1,648,214 | |||||||
Cohu | 433,726 | 5,421,575 | ||||||
Exar Corporation 2 | 766,337 | 8,253,449 | ||||||
Fairchild Semiconductor International 2 | 915,120 | 12,628,656 | ||||||
FormFactor 2 | 909,361 | 6,138,187 | ||||||
Integrated Silicon Solution 2 | 290,775 | 3,186,894 | ||||||
International Rectifier 2 | 645,902 | 13,525,188 | ||||||
Kulicke & Soffa Industries 2 | 762,500 | 8,433,250 | ||||||
LTX-Credence Corporation 2 | 1,246,406 | 7,465,972 | ||||||
Microsemi Corporation 2 | 561,004 | 12,762,841 | ||||||
Mindspeed Technologies 2 | 722,300 | 2,340,252 | ||||||
Nanometrics 2 | 767,671 | 11,261,734 | ||||||
NeoPhotonics Corporation 2 | 819,155 | 7,118,457 | ||||||
| 1,375,517 | 9,793,681 | |||||||
| 972,823 | 7,792,312 | |||||||
Rudolph Technologies 2 | 469,511 | 5,258,523 | ||||||
| 1,201,940 | 2,067,337 | |||||||
| 537,420 | 284,833 | |||||||
SunEdison 2 | 1,786,634 | 14,596,800 | ||||||
| 534,153 | 11,056,967 | |||||||
TriQuint Semiconductor 2 | 1,204,114 | 8,344,510 | ||||||
Ultra Clean Holdings 2 | 392,806 | 2,376,476 | ||||||
| 927,978 | 2,440,582 | |||||||
| 513,500 | 7,250,620 | |||||||
| 220,760,727 | ||||||||
Software - 0.8% | ||||||||
Actuate Corporation 2 | 749,783 | 4,978,559 | ||||||
Cinedigm Digital Cinema Cl. A 2 | 1,664,636 | 2,363,783 | ||||||
Mentor Graphics | 422,500 | 8,259,875 | ||||||
Smith Micro Software 2 | 1,696,903 | 1,798,717 | ||||||
| 17,400,934 | ||||||||
Total (Cost $496,233,069) | 518,426,848 | |||||||
Materials – 6.9% | ||||||||
Chemicals - 2.7% | ||||||||
Chemtura Corporation 2 | 229,550 | 4,659,865 | ||||||
Ferro Corporation 2 | 368,711 | 2,562,541 | ||||||
Material Sciences 2 | 488,727 | 4,916,594 | ||||||
OM Group 2 | 548,859 | 16,970,720 | ||||||
PolyOne Corporation | 179,594 | 4,450,339 | ||||||
Quaker Chemical | 100,805 | 6,250,918 | ||||||
†Schulman (A.) | 356,309 | 9,556,207 | ||||||
Zoltek Companies 2 | 1,030,150 | 13,299,237 | ||||||
| 62,666,421 | ||||||||
Construction Materials - 0.5% | ||||||||
| 166,577 | 10,850,826 | |||||||
Metals & Mining - 3.6% | ||||||||
Carpenter Technology | 208,536 | 9,398,718 | ||||||
Century Aluminum 2 | 1,143,300 | 10,609,824 | ||||||
Commercial Metals | 986,661 | 14,572,983 | ||||||
Haynes International | 204,181 | 9,774,144 | ||||||
Kaiser Aluminum | 229,900 | 14,240,006 | ||||||
| 1,186,900 | 7,358,780 | |||||||
RTI International Metals 2 | 397,600 | 11,017,496 | ||||||
US Silica Holdings | 263,200 | 5,469,296 | ||||||
| 82,441,247 | ||||||||
Paper & Forest Products - 0.1% | ||||||||
| 202,400 | 2,993,496 | |||||||
Total (Cost $110,128,995) | 158,951,990 | |||||||
Telecommunication Services – 0.3% | ||||||||
Diversified Telecommunication Services - 0.3% | ||||||||
Iridium Communications 2 | 908,546 | 7,050,317 | ||||||
| Total (Cost $7,247,242) | 7,050,317 | |||||||
| Miscellaneous5 – 5.0% | ||||||||
| Total (Cost $112,680,521) | 113,935,985 | |||||||
| TOTAL COMMON STOCKS | ||||||||
(Cost $1,704,041,244) | 2,049,973,934 | |||||||
| PREFERRED STOCK – 0.1% | ||||||||
Hovnanian Enterprises 7.25% Conv. | ||||||||
(Cost $1,567,998) | 100,400 | 2,863,408 | ||||||
| REPURCHASE AGREEMENT – 10.9% | ||||||||
| Fixed Income Clearing Corporation, | ||||||||
0.01% dated 6/28/13, due 7/1/13, | ||||||||
maturity value $249,540,208 (collateralized | ||||||||
by obligations of various U.S. Government | ||||||||
Agencies, 0.14%-2.375% due 5/22/14-12/6/22, | ||||||||
valued at $254,534,811) | ||||||||
(Cost $249,540,000) | 249,540,000 | |||||||
| PRINCIPAL | ||||||||
| AMOUNT | ||||||||
| COLLATERAL RECEIVED FOR SECURITIES | ||||||||
LOANED – 3.0% | ||||||||
| U.S. Treasury Bonds | ||||||||
0.75%-4.375% | ||||||||
due 1/15/25-8/15/42 | $8,121,301 | 8,172,436 | ||||||
| U.S. Treasury Notes | ||||||||
0.875%-4.75% | ||||||||
due 5/15/14-8/15/20 | 1,683,422 | 1,693,097 | ||||||
| 70 | The Royce Funds 2013 Semiannual Report to Shareholders | THE ACCOMPANYING NOTES ARE AN INTEGRAL PART OF THESE FINANCIAL STATEMENTS. |
June 30, 2013 (unaudited) |
| VALUE | ||||||
| COLLATERAL RECEIVED FOR SECURITIES | ||||||
LOANED (continued) | ||||||
| Money Market Funds | ||||||
Federated Government Obligations Fund | ||||||
(7 day yield-0.0099%) | $ | 59,102,191 | ||||
| TOTAL COLLATERAL RECEIVED FOR | ||||||
SECURITIES LOANED | ||||||
(Cost $68,967,724) | 68,967,724 | |||||
| TOTAL INVESTMENTS – 103.5% | ||||||
(Cost $2,024,116,966) | 2,371,345,066 | |||||
| LIABILITIES LESS CASH | ||||||
AND OTHER ASSETS – (3.5)% | (79,689,820 | ) | ||||
| NET ASSETS – 100.0% | $ | 2,291,655,246 | ||||
| Royce Special Equity Fund | ||||||
| SHARES | VALUE | |||||
| COMMON STOCKS – 90.0% | ||||||
| Consumer Discretionary – 25.8% | ||||||
| Auto Components - 2.9% | ||||||
Dorman Products | 1,144,812 | $ | 52,237,772 | |||
| 1,255,273 | 43,106,075 | |||||
| 95,343,847 | ||||||
| Hotels, Restaurants & Leisure - 0.4% | ||||||
Bowl America Cl. A 3 | 342,575 | 4,367,831 | ||||
Frisch’s Restaurants 3 | 505,100 | 9,425,166 | ||||
| 13,792,997 | ||||||
| Household Durables - 0.7% | ||||||
CSS Industries 3 | 974,100 | 24,284,313 | ||||
| Media - 5.9% | ||||||
Meredith Corporation 3 | 2,397,773 | 114,373,772 | ||||
Scholastic Corporation 3 | 2,835,034 | 83,038,146 | ||||
| 197,411,918 | ||||||
| Specialty Retail - 15.9% | ||||||
American Eagle Outfitters | 5,695,682 | 104,003,153 | ||||
Bed Bath & Beyond 2 | 1,994,000 | 141,374,600 | ||||
Buckle (The) | 1,564,000 | 81,359,280 | ||||
| 1,730,200 | 94,814,960 | |||||
Finish Line (The) Cl. A 3 | 4,958,900 | 108,401,554 | ||||
| 529,953,547 | ||||||
| Total (Cost $658,339,251) | 860,786,622 | |||||
| Consumer Staples – 6.0% | ||||||
| Food & Staples Retailing - 2.4% | ||||||
Arden Group Cl. A 3 | 248,969 | 27,483,688 | ||||
Weis Markets | 1,127,601 | 50,820,977 | ||||
| 78,304,665 | ||||||
| Food Products - 3.6% | ||||||
J&J Snack Foods | 552,171 | 42,958,904 | ||||
Lancaster Colony | 1,008,689 | 78,667,655 | ||||
| 121,626,559 | ||||||
| Total (Cost $131,684,182) | 199,931,224 | |||||
| Health Care – 4.8% | ||||||
| Health Care Equipment & Supplies - 1.8% | ||||||
Atrion Corporation 3 | 185,801 | 40,636,537 | ||||
Hill-Rom Holdings | 634,724 | 21,377,504 | ||||
| 62,014,041 | ||||||
| Life Sciences Tools & Services - 3.0% | ||||||
| 880,941 | 98,841,580 | |||||
| Total (Cost $112,813,690) | 160,855,621 | |||||
| Industrials – 19.9% | ||||||
| Aerospace & Defense - 1.4% | ||||||
National Presto Industries 3 | 656,500 | 47,287,695 | ||||
| Commercial Services & Supplies - 3.9% | ||||||
UniFirst Corporation 3 | 1,420,000 | 129,575,000 | ||||
| Electrical Equipment - 7.8% | ||||||
Brady Corporation Cl. A | 880,188 | 27,048,177 | ||||
EnerSys 3 | 2,689,000 | 131,868,560 | ||||
| THE ACCOMPANYING NOTES ARE AN INTEGRAL PART OF THESE FINANCIAL STATEMENTS. | The Royce Funds 2013 Semiannual Report to Shareholders | 71 |
Schedules of Investments
| Royce Special Equity Fund (continued) |
| SHARES | VALUE | |||||
| Industrials (continued) | ||||||
| Electrical Equipment (continued) | ||||||
Hubbell Cl. B | 805,100 | $ | 79,704,900 | |||
Regal-Beloit | 338,400 | 21,941,856 | ||||
| 260,563,493 | ||||||
| Industrial Conglomerates - 0.9% | ||||||
Carlisle Companies | 451,485 | 28,132,031 | ||||
| Machinery - 3.3% | ||||||
Ampco-Pittsburgh 3 | 987,000 | 18,525,990 | ||||
Foster (L.B.) Company 3 | 994,000 | 42,910,980 | ||||
Hurco Companies 3 | 470,213 | 13,528,028 | ||||
Standex International 3 | 694,000 | 36,608,500 | ||||
| 111,573,498 | ||||||
| Trading Companies & Distributors - 2.6% | ||||||
Applied Industrial Technologies | 1,811,300 | 87,540,129 | ||||
| Total (Cost $441,097,870) | 664,671,846 | |||||
| Information Technology – 19.1% | ||||||
| Communications Equipment - 2.9% | ||||||
Plantronics 3 | 2,178,578 | 95,683,146 | ||||
| Electronic Equipment, Instruments & Components - 10.8% | ||||||
AVX Corporation | 7,880,000 | 92,590,000 | ||||
Littelfuse 3 | 1,121,658 | 83,686,903 | ||||
Molex Cl. A | 5,525,000 | 137,351,500 | ||||
Park Electrochemical 3 | 2,011,012 | 48,284,398 | ||||
| 361,912,801 | ||||||
| IT Services - 0.4% | ||||||
Computer Services 4 | 514,752 | 15,365,347 | ||||
| Semiconductors & Semiconductor Equipment - 5.0% | ||||||
Entegris 2 | 4,686,200 | 44,003,418 | ||||
Teradyne 2 | 6,968,900 | 122,443,573 | ||||
| 166,446,991 | ||||||
| Total (Cost $536,268,524) | 639,408,285 | |||||
| Materials – 14.4% | ||||||
| Chemicals - 9.3% | ||||||
Hawkins 3 | 1,027,510 | 40,473,619 | ||||
Minerals Technologies 3 | 3,250,500 | 134,375,670 | ||||
†NewMarket Corporation | 135,618 | 35,607,862 | ||||
Schulman (A.) | 1,465,222 | 39,297,254 | ||||
Stepan Company | 1,089,487 | 60,586,372 | ||||
| 310,340,777 | ||||||
| Containers & Packaging - 0.8% | ||||||
Sonoco Products | 754,200 | 26,072,694 | ||||
| Metals & Mining - 0.1% | ||||||
Central Steel & Wire 4 | 5,172 | 3,692,808 | ||||
| Paper & Forest Products - 4.2% | ||||||
Clearwater Paper 2 | 1,127,279 | 53,049,750 | ||||
Schweitzer-Mauduit International 3 | 1,745,822 | 87,081,601 | ||||
| 140,131,351 | ||||||
| Total (Cost $364,016,579) | 480,237,630 | |||||
| TOTAL COMMON STOCKS | ||||||
(Cost $2,244,220,096) | 3,005,891,228 | |||||
| VALUE | ||||||
| REPURCHASE AGREEMENT – 9.9% | ||||||
| Fixed Income Clearing Corporation, | ||||||
0.01% dated 6/28/13, due 7/1/13, | ||||||
maturity value $328,681,274 (collateralized | ||||||
by obligations of various U.S. Government | ||||||
Agencies, 0.14%-5.25% due 4/15/14-8/20/14, valued | ||||||
at $335,258,038) | ||||||
(Cost $328,681,000) | 328,681,000 | |||||
| COLLATERAL RECEIVED FOR SECURITIES | ||||||
LOANED – 0.0% | ||||||
| Money Market Funds | ||||||
Federated Government Obligations Fund | ||||||
(7 day yield-0.0099%) | ||||||
(Cost $11,400) | 11,400 | |||||
| TOTAL INVESTMENTS – 99.9% | ||||||
(Cost $2,572,912,496) | 3,334,583,628 | |||||
| CASH AND OTHER ASSETS | ||||||
LESS LIABILITIES – 0.1% | 3,745,856 | |||||
| NET ASSETS – 100.0% | $ | 3,338,329,484 | ||||
| 72 | The Royce Funds 2013 Semiannual Report to Shareholders | THE ACCOMPANYING NOTES ARE AN INTEGRAL PART OF THESE FINANCIAL STATEMENTS. |
June 30, 2013 (unaudited) |
Royce Value Fund
| SHARES | VALUE | |||||
| COMMON STOCKS – 96.3% | ||||||
| Consumer Discretionary – 28.5% | ||||||
| Auto Components - 1.5% | ||||||
†Dorman Products | 94,210 | $ | 4,298,802 | |||
†Gentex Corporation | 556,100 | 12,818,105 | ||||
| 17,116,907 | ||||||
| Automobiles - 2.6% | ||||||
Thor Industries | 626,540 | 30,813,237 | ||||
| Specialty Retail - 15.6% | ||||||
American Eagle Outfitters | 1,888,761 | 34,488,776 | ||||
Ascena Retail Group 2 | 1,606,664 | 28,036,287 | ||||
Buckle (The) | 657,298 | 34,192,642 | ||||
GameStop Corporation Cl. A | 829,137 | 34,848,628 | ||||
Guess? | 665,672 | 20,655,802 | ||||
Jos. A. Bank Clothiers 2 | 749,761 | 30,980,124 | ||||
| 183,202,259 | ||||||
| Textiles, Apparel & Luxury Goods - 8.8% | ||||||
Crocs 2 | 1,798,442 | 29,674,293 | ||||
Deckers Outdoor 2 | 258,053 | 13,034,257 | ||||
| 321,012 | 15,447,098 | |||||
Steven Madden 2 | 616,651 | 29,833,575 | ||||
Vera Bradley 2 | 738,010 | 15,985,297 | ||||
| 103,974,520 | ||||||
| Total (Cost $259,329,086) | 335,106,923 | |||||
| Consumer Staples – 3.0% | ||||||
| Personal Products - 3.0% | ||||||
Nu Skin Enterprises Cl. A | 578,166 | 35,337,506 | ||||
| Total (Cost $23,917,159) | 35,337,506 | |||||
| Energy – 9.4% | ||||||
| Energy Equipment & Services - 9.1% | ||||||
Atwood Oceanics 2 | 114,900 | 5,980,545 | ||||
Helmerich & Payne | 553,534 | 34,568,198 | ||||
Oil States International 2 | 340,023 | 31,499,731 | ||||
RPC | 42,100 | 581,401 | ||||
Unit Corporation 2 | 813,471 | 34,637,595 | ||||
| 107,267,470 | ||||||
| Oil, Gas & Consumable Fuels - 0.3% | ||||||
Cimarex Energy | 54,392 | 3,534,936 | ||||
| Total (Cost $88,423,291) | 110,802,406 | |||||
| Financials – 12.9% | ||||||
Capital Markets - 3.0% | ||||||
Federated Investors Cl. B | 1,282,340 | 35,148,940 | ||||
| Insurance - 7.2% | ||||||
Allied World Assurance Company | ||||||
Holdings | 243,792 | 22,309,406 | ||||
Aspen Insurance Holdings | 206,597 | 7,662,683 | ||||
PartnerRe | 196,889 | 17,830,268 | ||||
Reinsurance Group of America | 532,761 | 36,819,112 | ||||
| 84,621,469 | ||||||
| Thrifts & Mortgage Finance - 2.7% | ||||||
Genworth MI Canada | 1,363,200 | 31,808,432 | ||||
| Total (Cost $124,775,302) | 151,578,841 | |||||
| Health Care – 6.6% | ||||||
| Health Care Providers & Services - 6.6% | ||||||
Chemed Corporation | 372,883 | 27,007,916 | ||||
Magellan Health Services 2 | 375,825 | 21,076,266 | ||||
MEDNAX 2 | 322,264 | 29,512,937 | ||||
| Total (Cost $61,419,496) | 77,597,119 | |||||
| Industrials – 8.9% | ||||||
| Aerospace & Defense - 1.3% | ||||||
Cubic Corporation | 311,258 | 14,971,510 | ||||
| Construction & Engineering - 0.3% | ||||||
Jacobs Engineering Group 2 | 73,850 | 4,071,350 | ||||
| Electrical Equipment - 0.4% | ||||||
GrafTech International 2 | 715,281 | 5,207,246 | ||||
| Machinery - 3.7% | ||||||
Kennametal | 417,169 | 16,198,672 | ||||
Lincoln Electric Holdings | 476,066 | 27,264,300 | ||||
| 43,462,972 | ||||||
| Road & Rail - 0.9% | ||||||
†Knight Transportation | 600,600 | 10,102,092 | ||||
| Trading Companies & Distributors - 2.3% | ||||||
Applied Industrial Technologies | 564,898 | 27,301,520 | ||||
| Total (Cost $82,549,730) | 105,116,690 | |||||
| Information Technology – 19.9% | ||||||
| Communications Equipment - 4.5% | ||||||
NETGEAR 2 | 1,064,254 | 32,502,317 | ||||
Plantronics | 454,140 | 19,945,829 | ||||
| 52,448,146 | ||||||
| Electronic Equipment, Instruments & Components - 6.1% | ||||||
Littelfuse | 88,158 | 6,577,468 | ||||
Molex Cl. A | 971,446 | 24,150,148 | ||||
†MTS Systems | 161,359 | 9,132,919 | ||||
| 2,267,587 | 31,496,784 | |||||
| 71,357,319 | ||||||
| IT Services - 4.5% | ||||||
Convergys Corporation | 1,384,898 | 24,138,772 | ||||
ManTech International Cl. A | 1,078,224 | 28,163,211 | ||||
| 52,301,983 | ||||||
| Office Electronics - 0.3% | ||||||
Zebra Technologies Cl. A 2 | 94,560 | 4,107,686 | ||||
| Semiconductors & Semiconductor Equipment - 4.5% | ||||||
Cabot Microelectronics 2 | 138,550 | 4,573,535 | ||||
MKS Instruments | 644,161 | 17,096,033 | ||||
Teradyne 2 | 1,785,847 | 31,377,332 | ||||
| 53,046,900 | ||||||
| Total (Cost $227,632,950) | 233,262,034 | |||||
| THE ACCOMPANYING NOTES ARE AN INTEGRAL PART OF THESE FINANCIAL STATEMENTS. | The Royce Funds 2013 Semiannual Report to Shareholders | 73 |
Schedules of Investments
Royce Value Fund (continued)
| SHARES | VALUE | |||||
| Materials – 7.1% | ||||||
| Chemicals - 4.6% | ||||||
Innophos Holdings | 304,798 | $ | 14,377,321 | |||
†Innospec | 469,893 | 18,880,301 | ||||
Westlake Chemical | 212,980 | 20,533,402 | ||||
| 53,791,024 | ||||||
| Metals & Mining - 2.5% | ||||||
Reliance Steel & Aluminum | 450,223 | 29,516,621 | ||||
| Total (Cost $62,997,805) | 83,307,645 | |||||
| TOTAL COMMON STOCKS | ||||||
(Cost $931,044,819) | 1,132,109,164 | |||||
| REPURCHASE AGREEMENT – 3.7% | ||||||
| Fixed Income Clearing Corporation, | ||||||
0.01% dated 6/28/13, due 7/1/13, | ||||||
maturity value $43,226,036 (collateralized | ||||||
by obligations of various U.S. Government | ||||||
Agencies, due 12/11/13, valued at $44,095,000) | ||||||
(Cost $43,226,000) | 43,226,000 | |||||
| PRINCIPAL | ||||||
| AMOUNT | ||||||
| COLLATERAL RECEIVED FOR SECURITIES | ||||||
LOANED – 0.1% | ||||||
| U.S. Treasury Bonds | ||||||
0.75%-4.375% | ||||||
due 1/15/25-8/15/42 | $903,048 | 907,700 | ||||
| U.S. Treasury Notes | ||||||
0.625%-4.75% | ||||||
due 5/15/14-8/15/20 | 693,615 | 697,797 | ||||
| TOTAL COLLATERAL RECEIVED FOR | ||||||
SECURITIES LOANED | ||||||
(Cost $1,605,497) | 1,605,497 | |||||
| TOTAL INVESTMENTS – 100.1% | ||||||
(Cost $975,876,316) | 1,176,940,661 | |||||
| LIABILITIES LESS CASH | ||||||
AND OTHER ASSETS – (0.1)% | (1,492,377 | ) | ||||
| NET ASSETS – 100.0% | $ | 1,175,448,284 | ||||
| Royce Value Plus Fund | ||||||
| SHARES | VALUE | |||||
| COMMON STOCKS – 96.0% | ||||||
| Consumer Discretionary – 10.9% | ||||||
| Hotels, Restaurants & Leisure - 2.4% | ||||||
Buffalo Wild Wings 2 | 153,900 | $ | 15,106,824 | |||
| 1,578,441 | 3,472,570 | |||||
Red Robin Gourmet Burgers 2 | 270,000 | 14,898,600 | ||||
| 33,477,994 | ||||||
| Household Durables - 1.0% | ||||||
| 369,000 | 14,675,130 | |||||
| Internet & Catalog Retail - 1.1% | ||||||
| 465,500 | 15,054,270 | |||||
| Leisure Equipment & Products - 0.9% | ||||||
†Arctic Cat | 274,000 | 12,324,520 | ||||
| Specialty Retail - 2.6% | ||||||
Monro Muffler Brake | 127,000 | 6,102,350 | ||||
Tractor Supply | 144,000 | 16,935,840 | ||||
Zumiez 2 | 477,000 | 13,713,750 | ||||
| 36,751,940 | ||||||
| Textiles, Apparel & Luxury Goods - 2.9% | ||||||
Carter’s | 319,200 | 23,643,144 | ||||
Gildan Activewear | 399,342 | 16,177,345 | ||||
| 39,820,489 | ||||||
| Total (Cost $114,168,451) | 152,104,343 | |||||
| Consumer Staples – 1.9% | ||||||
| Food & Staples Retailing - 0.6% | ||||||
United Natural Foods 2 | 140,517 | 7,586,513 | ||||
| Food Products - 0.9% | ||||||
Snyder’s-Lance | 457,000 | 12,983,370 | ||||
| Personal Products - 0.4% | ||||||
Female Health | 556,000 | 5,482,160 | ||||
| Total (Cost $20,860,286) | 26,052,043 | |||||
| Energy – 3.0% | ||||||
| Energy Equipment & Services - 2.0% | ||||||
Helmerich & Payne | 88,000 | 5,495,600 | ||||
Pason Systems | 619,000 | 11,253,475 | ||||
Trican Well Service | 383,800 | 5,101,763 | ||||
Unit Corporation 2 | 127,400 | 5,424,692 | ||||
| 27,275,530 | ||||||
| Oil, Gas & Consumable Fuels - 1.0% | ||||||
EPL Oil & Gas 2 | 306,160 | 8,988,857 | ||||
Sprott Resource | 1,515,000 | 5,056,243 | ||||
| 14,045,100 | ||||||
| Total (Cost $33,189,747) | 41,320,630 | |||||
| Financials – 12.6% | ||||||
| Capital Markets - 5.5% | ||||||
Affiliated Managers Group 2 | 125,000 | 20,492,500 | ||||
Northern Trust | 398,000 | 23,044,200 | ||||
Oaktree Capital Group LLC | 240,600 | 12,643,530 | ||||
Raymond James Financial | 469,000 | 20,157,620 | ||||
| 74 | The Royce Funds 2013 Semiannual Report to Shareholders | THE ACCOMPANYING NOTES ARE AN INTEGRAL PART OF THESE FINANCIAL STATEMENTS. |
June 30, 2013 (unaudited) |
| SHARES | VALUE | |||||
| Financials (continued) | ||||||
| Capital Markets (continued) | ||||||
Value Partners Group | 1,227,500 | $ | 661,542 | |||
| 76,999,392 | ||||||
| Commercial Banks - 4.5% | ||||||
Associated Banc-Corp | 970,000 | 15,083,500 | ||||
Columbia Banking System | 354,500 | 8,440,645 | ||||
Enterprise Financial Services | 765,800 | 12,222,168 | ||||
Fifth Third Bancorp | 772,800 | 13,949,040 | ||||
Umpqua Holdings | 822,300 | 12,342,723 | ||||
| 62,038,076 | ||||||
| Diversified Financial Services - 1.1% | ||||||
PICO Holdings 2 | 716,222 | 15,012,013 | ||||
| Thrifts & Mortgage Finance - 1.5% | ||||||
Berkshire Hills Bancorp | 771,700 | 21,422,392 | ||||
| Total (Cost $135,352,091) | 175,471,873 | |||||
| Health Care – 12.4% | ||||||
| Biotechnology - 4.8% | ||||||
Actelion | 285,000 | 17,168,493 | ||||
| 400,000 | 6,244,000 | |||||
Cubist Pharmaceuticals 2 | 324,000 | 15,649,200 | ||||
Myriad Genetics 2 | 1,055,893 | 28,371,845 | ||||
| 67,433,538 | ||||||
| Health Care Equipment & Supplies - 3.8% | ||||||
Abaxis | 298,000 | 14,157,980 | ||||
Cerus Corporation 2 | 2,629,500 | 11,622,390 | ||||
| 770,677 | 12,993,614 | |||||
Thoratec Corporation 2 | 465,600 | 14,577,936 | ||||
| 53,351,920 | ||||||
| Health Care Providers & Services - 1.1% | ||||||
Healthways 2 | 851,000 | 14,790,380 | ||||
| Life Sciences Tools & Services - 0.4% | ||||||
Sequenom 2 | 1,256,000 | 5,287,760 | ||||
| Pharmaceuticals - 2.3% | ||||||
Medicines Company (The) 2 | 598,000 | 18,394,480 | ||||
UCB | 257,000 | 13,844,272 | ||||
| 32,238,752 | ||||||
| Total (Cost $139,352,751) | 173,102,350 | |||||
| Industrials – 18.0% | ||||||
| Aerospace & Defense - 0.5% | ||||||
AeroVironment 2 | 342,000 | 6,901,560 | ||||
| Building Products - 2.8% | ||||||
Apogee Enterprises | 736,198 | 17,668,752 | ||||
Quanex Building Products | 1,214,533 | 20,452,736 | ||||
| 38,121,488 | ||||||
| Commercial Services & Supplies - 1.2% | ||||||
| 211,842 | 3,095,012 | |||||
UniFirst Corporation | 148,800 | 13,578,000 | ||||
| 16,673,012 | ||||||
| Construction & Engineering - 0.5% | ||||||
MYR Group 2 | 317,608 | 6,177,475 | ||||
| Electrical Equipment - 2.1% | ||||||
Acuity Brands | 208,095 | 15,715,335 | ||||
| 263,462 | 13,607,812 | |||||
| 29,323,147 | ||||||
| Industrial Conglomerates - 1.2% | ||||||
Carlisle Companies | 275,900 | 17,191,329 | ||||
| Machinery - 2.7% | ||||||
Tennant Company | 143,437 | 6,923,704 | ||||
Valmont Industries | 119,400 | 17,084,946 | ||||
Wabtec Corporation | 263,464 | 14,076,881 | ||||
| 38,085,531 | ||||||
| Professional Services - 0.9% | ||||||
| 280,514 | 12,970,967 | |||||
| Road & Rail - 1.4% | ||||||
Celadon Group | 841,600 | 15,359,200 | ||||
Werner Enterprises | 142,000 | 3,432,140 | ||||
| 18,791,340 | ||||||
| Trading Companies & Distributors - 3.7% | ||||||
| 509,000 | 19,280,920 | |||||
Grainger (W.W.) | 64,600 | 16,290,828 | ||||
Watsco | 189,100 | 15,876,836 | ||||
| 51,448,584 | ||||||
| Transportation Infrastructure - 1.0% | ||||||
| 754,000 | 14,001,780 | |||||
| Total (Cost $195,144,561) | 249,686,213 | |||||
| Information Technology – 27.1% | ||||||
| Communications Equipment - 5.5% | ||||||
| 2,017,500 | 8,998,050 | |||||
| 2,378,833 | 25,382,148 | |||||
| 1,173,100 | 13,091,796 | |||||
Plantronics | 323,000 | 14,186,160 | ||||
| 1,141,200 | 14,607,360 | |||||
| 76,265,514 | ||||||
| Computers & Peripherals - 1.1% | ||||||
Immersion Corporation 2 | 1,130,095 | 14,973,759 | ||||
| Electronic Equipment, Instruments & Components - 7.5% | ||||||
FLIR Systems | 560,000 | 15,103,200 | ||||
| 1,134,400 | 17,447,072 | |||||
IPG Photonics | 368,732 | 22,393,094 | ||||
Littelfuse | 172,744 | 12,888,430 | ||||
Mercury Systems 2 | 1,033,749 | 9,531,166 | ||||
Rogers Corporation 2 | 556,414 | 26,329,511 | ||||
| 103,692,473 | ||||||
| Internet Software & Services - 1.1% | ||||||
Bankrate 2 | 133,768 | 1,920,908 | ||||
| 555,877 | 13,924,719 | |||||
| 15,845,627 | ||||||
| IT Services - 2.9% | ||||||
| 553,000 | 12,829,600 | |||||
Genpact | 1,430,000 | 27,513,200 | ||||
| 40,342,800 | ||||||
| Semiconductors & Semiconductor Equipment - 5.3% | ||||||
International Rectifier 2 | 796,048 | 16,669,245 | ||||
LSI Corporation 2 | 3,748,000 | 26,760,720 | ||||
| THE ACCOMPANYING NOTES ARE AN INTEGRAL PART OF THESE FINANCIAL STATEMENTS. | The Royce Funds 2013 Semiannual Report to Shareholders | 75 |
Schedules of Investments
| Royce Value Plus Fund (continued) | ||||||
| SHARES | VALUE | |||||
| Information Technology (continued) | ||||||
| Semiconductors & Semiconductor Equipment (continued) | ||||||
Micrel | 145,901 | $ | 1,441,502 | |||
Teradyne 2 | 768,000 | 13,493,760 | ||||
Ultratech 2 | 407,041 | 14,946,546 | ||||
| 73,311,773 | ||||||
| Software - 3.7% | ||||||
| 383,000 | 13,397,340 | |||||
Manhattan Associates 2 | 100,000 | 7,716,000 | ||||
PTC 2 | 640,000 | 15,699,200 | ||||
Splunk 2 | 315,304 | 14,617,493 | ||||
| 51,430,033 | ||||||
| Total (Cost $308,220,296) | 375,861,979 | |||||
| Materials – 5.5% | ||||||
| Construction Materials - 1.6% | ||||||
Eagle Materials | 329,000 | 21,802,830 | ||||
| Metals & Mining - 3.9% | ||||||
Horsehead Holding Corporation 2 | 1,361,353 | 17,438,932 | ||||
Reliance Steel & Aluminum | 215,100 | 14,101,956 | ||||
Worthington Industries | 723,466 | 22,941,107 | ||||
| 54,481,995 | ||||||
| Total (Cost $48,621,776) | 76,284,825 | |||||
| Miscellaneous5 – 4.6% | ||||||
| Total (Cost $62,017,095) | 63,764,466 | |||||
| TOTAL COMMON STOCKS | ||||||
(Cost $1,056,927,054) | 1,333,648,722 | |||||
| REPURCHASE AGREEMENT – 3.6% | ||||||
| Fixed Income Clearing Corporation, | ||||||
0.01% dated 6/28/13, due 7/1/13, | ||||||
maturity value $49,746,041 (collateralized | ||||||
by obligations of various U.S. Government | ||||||
Agencies, 0.30% due 12/11/13, valued at | ||||||
$50,743,350) | ||||||
(Cost $49,746,000) | 49,746,000 | |||||
| COLLATERAL RECEIVED FOR SECURITIES | ||||||
LOANED – 3.7% | ||||||
| Money Market Funds | ||||||
Federated Government Obligations Fund | ||||||
(7 day yield-0.0099%) | ||||||
(Cost $51,073,622) | 51,073,622 | |||||
| TOTAL INVESTMENTS – 103.3% | ||||||
(Cost $1,157,746,676) | 1,434,468,344 | |||||
| LIABILITIES LESS CASH | ||||||
AND OTHER ASSETS – (3.3)% | (46,240,155 | ) | ||||
| NET ASSETS – 100.0% | $ | 1,388,228,189 | ||||
| Royce 100 Fund | ||||||
| SHARES | VALUE | |||||
| COMMON STOCKS – 98.0% | ||||||
| Consumer Discretionary – 9.4% | ||||||
| Auto Components - 1.6% | ||||||
Drew Industries | 73,156 | $ | 2,876,494 | |||
Gentex Corporation | 65,100 | 1,500,555 | ||||
| 4,377,049 | ||||||
| Distributors - 1.2% | ||||||
LKQ Corporation 2 | 126,200 | 3,249,650 | ||||
| Diversified Consumer Services - 0.5% | ||||||
Sotheby’s | 40,500 | 1,535,355 | ||||
| Household Durables - 4.2% | ||||||
Ethan Allen Interiors | 72,500 | 2,088,000 | ||||
Harman International Industries | 71,500 | 3,875,300 | ||||
Mohawk Industries 2 | 27,315 | 3,072,664 | ||||
NVR 2 | 2,800 | 2,581,600 | ||||
| 11,617,564 | ||||||
| Media - 0.8% | ||||||
Morningstar | 28,572 | 2,216,616 | ||||
| Specialty Retail - 1.1% | ||||||
Ascena Retail Group 2 | 167,300 | 2,919,385 | ||||
| Total (Cost $13,910,877) | 25,915,619 | |||||
| Consumer Staples – 2.4% | ||||||
| Food Products - 2.4% | ||||||
Darling International 2 | 197,500 | 3,685,350 | ||||
Sanderson Farms | 45,700 | 3,035,394 | ||||
| Total (Cost $4,090,580) | 6,720,744 | |||||
| Energy – 9.1% | ||||||
| Energy Equipment & Services - 9.1% | ||||||
Ensign Energy Services | 187,000 | 2,894,704 | ||||
Helmerich & Payne | 72,725 | 4,541,676 | ||||
Oil States International 2 | 39,600 | 3,668,544 | ||||
Pason Systems | 251,000 | 4,563,203 | ||||
SEACOR Holdings | 41,500 | 3,446,575 | ||||
Trican Well Service | 245,000 | 3,256,727 | ||||
Unit Corporation 2 | 63,300 | 2,695,314 | ||||
| Total (Cost $14,970,421) | 25,066,743 | |||||
| Financials – 7.1% | ||||||
| Capital Markets - 7.1% | ||||||
Affiliated Managers Group 2 | 14,197 | 2,327,456 | ||||
AllianceBernstein Holding L.P. | 128,769 | 2,680,971 | ||||
Federated Investors Cl. B | 191,200 | 5,240,792 | ||||
Lazard Cl. A | 129,500 | 4,163,425 | ||||
SEI Investments | 110,200 | 3,132,986 | ||||
Waddell & Reed Financial Cl. A | 48,300 | 2,101,050 | ||||
| Total (Cost $14,003,996) | 19,646,680 | |||||
| Health Care – 3.4% | ||||||
| Biotechnology - 0.8% | ||||||
Myriad Genetics 2 | 82,000 | 2,203,340 | ||||
| Life Sciences Tools & Services - 2.6% | ||||||
Bio-Rad Laboratories Cl. A 2 | 22,700 | 2,546,940 | ||||
| 76 | The Royce Funds 2013 Semiannual Report to Shareholders | THE ACCOMPANYING NOTES ARE AN INTEGRAL PART OF THESE FINANCIAL STATEMENTS. |
June 30, 2013 (unaudited) |
| SHARES | VALUE | |||||
| Health Care (continued) | ||||||
| Life Sciences Tools & Services (continued) | ||||||
PerkinElmer | 140,800 | $ | 4,576,000 | |||
| 7,122,940 | ||||||
| Total (Cost $6,947,594) | 9,326,280 | |||||
| Industrials – 30.8% | ||||||
| Aerospace & Defense - 1.2% | ||||||
HEICO Corporation Cl. A | 88,840 | 3,279,084 | ||||
| Air Freight & Logistics - 4.3% | ||||||
Expeditors International of Washington | 92,300 | 3,508,323 | ||||
Forward Air | 120,500 | 4,612,740 | ||||
UTi Worldwide | 221,800 | 3,653,046 | ||||
| 11,774,109 | ||||||
| Building Products - 0.9% | ||||||
Simpson Manufacturing | 81,200 | 2,388,904 | ||||
| Commercial Services & Supplies - 1.0% | ||||||
| 189,008 | 2,761,407 | |||||
| Construction & Engineering - 3.2% | ||||||
Jacobs Engineering Group 2 | 88,200 | 4,862,466 | ||||
KBR | 118,800 | 3,861,000 | ||||
| 8,723,466 | ||||||
| Electrical Equipment - 3.1% | ||||||
AZZ | 13,600 | 524,416 | ||||
Brady Corporation Cl. A | 43,700 | 1,342,901 | ||||
Global Power Equipment Group | 180,000 | 2,901,600 | ||||
| 315,900 | 2,299,752 | |||||
Regal-Beloit | 23,700 | 1,536,708 | ||||
| 8,605,377 | ||||||
| Industrial Conglomerates - 0.2% | ||||||
Raven Industries | 17,800 | 533,644 | ||||
| Machinery - 7.5% | ||||||
†CIRCOR International | 75,818 | 3,856,104 | ||||
Hyster-Yale Materials Handling Cl. A | 44,000 | 2,762,760 | ||||
Kaydon Corporation | 124,900 | 3,440,995 | ||||
Kennametal | 95,400 | 3,704,382 | ||||
Lincoln Electric Holdings | 37,300 | 2,136,171 | ||||
Valmont Industries | 24,300 | 3,477,087 | ||||
Wabtec Corporation | 26,200 | 1,399,866 | ||||
| 20,777,365 | ||||||
| Professional Services - 6.2% | ||||||
Advisory Board (The) 2 | 31,482 | 1,720,491 | ||||
CRA International 2 | 132,113 | 2,440,127 | ||||
ManpowerGroup | 66,666 | 3,653,297 | ||||
Robert Half International | 49,500 | 1,644,885 | ||||
Towers Watson & Company Cl. A | 61,400 | 5,031,116 | ||||
Verisk Analytics Cl. A 2 | 44,100 | 2,632,770 | ||||
| 17,122,686 | ||||||
| Trading Companies & Distributors - 3.2% | ||||||
Air Lease Cl. A | 94,200 | 2,598,978 | ||||
Applied Industrial Technologies | 87,200 | 4,214,376 | ||||
MSC Industrial Direct Cl. A | 25,800 | 1,998,468 | ||||
| 8,811,822 | ||||||
| Total (Cost $63,967,073) | 84,777,864 | |||||
| Information Technology – 22.7% | ||||||
| Communications Equipment - 1.6% | ||||||
ADTRAN | 179,400 | $ | 4,415,034 | |||
| Computers & Peripherals - 1.0% | ||||||
Diebold | 85,100 | 2,867,019 | ||||
| Electronic Equipment, Instruments & Components - 12.0% | ||||||
Coherent | 48,700 | 2,681,909 | ||||
Dolby Laboratories Cl. A | 65,000 | 2,174,250 | ||||
DTS 2 | 139,800 | 2,877,084 | ||||
FARO Technologies 2 | 87,187 | 2,948,664 | ||||
FLIR Systems | 148,400 | 4,002,348 | ||||
IPG Photonics | 41,886 | 2,543,737 | ||||
Littelfuse | 45,000 | 3,357,450 | ||||
MTS Systems | 30,600 | 1,731,960 | ||||
National Instruments | 156,100 | 4,361,434 | ||||
Plexus Corporation 2 | 105,300 | 3,147,417 | ||||
Rofin-Sinar Technologies 2 | 127,600 | 3,182,344 | ||||
| 33,008,597 | ||||||
| IT Services - 1.5% | ||||||
Sapient Corporation 2 | 305,800 | 3,993,748 | ||||
| Office Electronics - 0.9% | ||||||
Zebra Technologies Cl. A 2 | 57,600 | 2,502,144 | ||||
| Semiconductors & Semiconductor Equipment - 3.8% | ||||||
Cabot Microelectronics 2 | 66,700 | 2,201,767 | ||||
Diodes 2 | 116,000 | 3,012,520 | ||||
International Rectifier 2 | 80,300 | 1,681,482 | ||||
Nanometrics 2 | 118,729 | 1,741,754 | ||||
| 49,800 | 1,763,916 | |||||
| 10,401,439 | ||||||
| Software - 1.9% | ||||||
ANSYS 2 | 47,000 | 3,435,700 | ||||
Blackbaud | 58,900 | 1,918,373 | ||||
| 5,354,073 | ||||||
| Total (Cost $51,506,339) | 62,542,054 | |||||
| Materials – 8.5% | ||||||
| Chemicals - 1.1% | ||||||
Innospec | 74,200 | 2,981,356 | ||||
| Containers & Packaging - 1.5% | ||||||
Greif Cl. A | 78,800 | 4,150,396 | ||||
| Metals & Mining - 5.9% | ||||||
Fresnillo | 127,000 | 1,703,676 | ||||
Globe Specialty Metals | 106,100 | 1,153,307 | ||||
Major Drilling Group International | 317,000 | 2,158,144 | ||||
Randgold Resources ADR | 35,800 | 2,292,990 | ||||
Reliance Steel & Aluminum | 64,900 | 4,254,844 | ||||
Schnitzer Steel Industries Cl. A | 53,500 | 1,250,830 | ||||
Sims Metal Management ADR | 146,667 | 1,108,803 | ||||
Steel Dynamics | 148,200 | 2,209,662 | ||||
| 16,132,256 | ||||||
| Total (Cost $22,574,927) | 23,264,008 | |||||
| Miscellaneous5 – 4.6% | ||||||
| Total (Cost $11,962,316) | 12,572,697 | |||||
| THE ACCOMPANYING NOTES ARE AN INTEGRAL PART OF THESE FINANCIAL STATEMENTS. | The Royce Funds 2013 Semiannual Report to Shareholders | 77 |
Schedules of Investments
| Royce 100 Fund (continued) | ||||||
| VALUE | ||||||
| TOTAL COMMON STOCKS | ||||||
(Cost $203,934,123) | $ | 269,832,689 | ||||
| REPURCHASE AGREEMENT – 2.5% | ||||||
| Fixed Income Clearing Corporation, | ||||||
0.01% dated 6/28/13, due 7/1/13, | ||||||
maturity value $7,001,006 (collateralized | ||||||
by obligations of various U.S. Government | ||||||
Agencies, 0.30% due 12/11/13, valued at | ||||||
$7,143,919) | ||||||
(Cost $7,001,000) | 7,001,000 | |||||
| COLLATERAL RECEIVED FOR SECURITIES | ||||||
LOANED – 0.4% | ||||||
| Money Market Funds | ||||||
Federated Government Obligations Fund | ||||||
(7 day yield-0.0099%) | ||||||
(Cost $1,000,778) | 1,000,778 | |||||
| TOTAL INVESTMENTS – 100.9% | ||||||
(Cost $211,935,901) | 277,834,467 | |||||
| LIABILITIES LESS CASH | ||||||
AND OTHER ASSETS – (0.9)% | (2,572,215 | ) | ||||
| NET ASSETS – 100.0% | $ | 275,262,252 | ||||
| Royce Dividend Value Fund | ||||||
| SHARES | VALUE | |||||
| COMMON STOCKS – 97.6% | ||||||
| Consumer Discretionary – 11.2% | ||||||
| Auto Components - 0.5% | ||||||
Autoliv | 33,300 | $ | 2,577,087 | |||
Tianneng Power International | 324,000 | 130,334 | ||||
Xinyi Glass Holdings | 130,000 | 100,902 | ||||
| 2,808,323 | ||||||
| Automobiles - 0.1% | ||||||
Thor Industries | 9,900 | 486,882 | ||||
| Diversified Consumer Services - 0.6% | ||||||
Benesse Holdings | 4,000 | 144,182 | ||||
Regis Corporation | 127,800 | 2,098,476 | ||||
Weight Watchers International | 23,500 | 1,081,000 | ||||
| 3,323,658 | ||||||
| Hotels, Restaurants & Leisure - 0.1% | ||||||
Abu Dhabi National Hotels | 642,000 | 367,057 | ||||
| Household Durables - 1.4% | ||||||
Ethan Allen Interiors | 49,000 | 1,411,200 | ||||
Garmin | 45,000 | 1,627,200 | ||||
Harman International Industries | 54,400 | 2,948,480 | ||||
Hunter Douglas | 27,600 | 1,102,914 | ||||
| 7,089,794 | ||||||
| Internet & Catalog Retail - 0.1% | ||||||
PetMed Express | 56,000 | 705,600 | ||||
| Media - 0.4% | ||||||
Saga Communications Cl. A | 10,381 | 476,592 | ||||
Value Line | 169,000 | 1,436,500 | ||||
World Wrestling Entertainment Cl. A | 22,731 | 234,356 | ||||
| 2,147,448 | ||||||
| Specialty Retail - 6.4% | ||||||
American Eagle Outfitters | 270,300 | 4,935,678 | ||||
Ascena Retail Group 2 | 215,984 | 3,768,921 | ||||
Buckle (The) | 107,779 | 5,606,664 | ||||
Cato Corporation (The) Cl. A | 35,810 | 893,818 | ||||
Fielmann | 3,200 | 334,472 | ||||
GameStop Corporation Cl. A | 103,000 | 4,329,090 | ||||
Guess? | 102,500 | 3,180,575 | ||||
Jos. A. Bank Clothiers 2 | 85,049 | 3,514,225 | ||||
Lewis Group | 146,000 | 930,496 | ||||
Shoe Carnival | 30,844 | 740,564 | ||||
Signet Jewelers | 14,500 | 977,735 | ||||
Tiffany & Co. | 48,400 | 3,525,456 | ||||
USS | 7,000 | 888,586 | ||||
| 33,626,280 | ||||||
| Textiles, Apparel & Luxury Goods - 1.6% | ||||||
Barry (R.G.) | 13,075 | 212,338 | ||||
Marimekko | 22,500 | 300,193 | ||||
Pandora | 102,000 | 3,456,903 | ||||
Stella International Holdings | 314,000 | 868,393 | ||||
Vera Bradley 2 | 158,900 | 3,441,774 | ||||
| 8,279,601 | ||||||
| Total (Cost $51,700,399) | 58,834,643 | |||||
| 78 | The Royce Funds 2013 Semiannual Report to Shareholders | THE ACCOMPANYING NOTES ARE AN INTEGRAL PART OF THESE FINANCIAL STATEMENTS. |
June 30, 2013 (unaudited) |
| SHARES | VALUE | |||||
| Consumer Staples – 3.5% | ||||||
| Food & Staples Retailing - 0.6% | ||||||
FamilyMart | 16,850 | $ | 718,648 | |||
Village Super Market Cl. A | 66,045 | 2,185,429 | ||||
| 2,904,077 | ||||||
| Food Products - 1.3% | ||||||
Hormel Foods | 115,600 | 4,459,848 | ||||
Industrias Bachoco ADR | 6,100 | 211,670 | ||||
J&J Snack Foods | 10,300 | 801,340 | ||||
Lancaster Colony | 3,000 | 233,970 | ||||
Lindt & Spruengli | 4 | 174,305 | ||||
Super Group | 346,000 | 1,214,754 | ||||
| 7,095,887 | ||||||
| Personal Products - 1.6% | ||||||
| 95,400 | 1,638,972 | |||||
Inter Parfums | 30,113 | 858,823 | ||||
Nu Skin Enterprises Cl. A | 96,545 | 5,900,830 | ||||
| 8,398,625 | ||||||
| Total (Cost $13,548,790) | 18,398,589 | |||||
| Energy – 3.9% | ||||||
| Energy Equipment & Services - 3.6% | ||||||
Ensco Cl. A | 66,600 | 3,870,792 | ||||
Ensign Energy Services | 25,300 | 391,637 | ||||
Helmerich & Payne | 88,854 | 5,548,932 | ||||
Oil States International 2 | 43,300 | 4,011,312 | ||||
RPC | 3,700 | 51,097 | ||||
TGS-NOPEC Geophysical | 18,500 | 537,547 | ||||
Tidewater | 76,500 | 4,358,205 | ||||
| 18,769,522 | ||||||
| Oil, Gas & Consumable Fuels - 0.3% | ||||||
Cimarex Energy | 6,500 | 422,435 | ||||
Golar LNG | 10,700 | 341,223 | ||||
Natural Resource Partners L.P. | 37,500 | 771,375 | ||||
| 1,535,033 | ||||||
| Total (Cost $16,215,992) | 20,304,555 | |||||
| Financials – 27.3% | ||||||
| Capital Markets - 14.3% | ||||||
AllianceBernstein Holding L.P. | 155,100 | 3,229,182 | ||||
Apollo Global Management LLC Cl. A | 163,800 | 3,947,580 | ||||
ARA Asset Management | 1,388,200 | 1,905,695 | ||||
Ashmore Group | 464,250 | 2,426,869 | ||||
Close Brothers Group | 18,000 | 268,706 | ||||
Coronation Fund Managers | 760,000 | 4,824,457 | ||||
Egyptian Financial Group-Hermes Holding | ||||||
Company 2 | 132,500 | 139,874 | ||||
Federated Investors Cl. B | 308,600 | 8,458,726 | ||||
Gluskin Sheff + Associates | 32,200 | 595,809 | ||||
Invesco | 148,200 | 4,712,760 | ||||
Investec | 80,000 | 503,373 | ||||
Jupiter Fund Management | 550,000 | 2,423,405 | ||||
KKR & Co. L.P. | 293,200 | 5,764,312 | ||||
Lazard Cl. A | 134,600 | 4,327,390 | ||||
Manning & Napier | 161,600 | 2,870,016 | ||||
†Oaktree Capital Group LLC | 58,800 | 3,089,940 | ||||
Och-Ziff Capital Management Group LLC Cl. A | 108,100 | 1,128,564 | ||||
Oppenheimer Holdings Cl. A | 121,512 | 2,313,588 | ||||
Partners Group Holding | 500 | 135,382 | ||||
Raymond James Financial | 7,800 | 335,244 | ||||
SEI Investments | 146,600 | 4,167,838 | ||||
Sprott | 525,000 | 1,397,737 | ||||
State Street | 71,100 | 4,636,431 | ||||
T. Rowe Price Group | 42,000 | 3,072,300 | ||||
Value Partners Group | 2,420,000 | 1,304,221 | ||||
VZ Holding | 8,300 | 1,159,917 | ||||
Waddell & Reed Financial Cl. A | 67,510 | 2,936,685 | ||||
Westwood Holdings Group | 78,473 | 3,368,061 | ||||
| 75,444,062 | ||||||
| Commercial Banks - 2.1% | ||||||
Ames National | 34,271 | 780,008 | ||||
Bank of Hawaii | 78,600 | 3,955,152 | ||||
BLOM Bank GDR | 63,000 | 535,500 | ||||
BOK Financial | 30,400 | 1,947,120 | ||||
City Holding Company | 54,865 | 2,136,992 | ||||
First Republic Bank | 48,100 | 1,850,888 | ||||
| 11,205,660 | ||||||
| Diversified Financial Services - 2.3% | ||||||
Bolsa Mexicana de Valores | 674,900 | 1,678,207 | ||||
Hellenic Exchanges | 158,000 | 1,229,850 | ||||
KKR Financial Holdings LLC | 228,350 | 2,409,092 | ||||
Moody’s Corporation | 74,900 | 4,563,657 | ||||
Singapore Exchange | 140,000 | 776,489 | ||||
Warsaw Stock Exchange | 135,400 | 1,550,945 | ||||
| 12,208,240 | ||||||
| Insurance - 6.3% | ||||||
Allied World Assurance Company Holdings | 35,898 | 3,285,026 | ||||
Aspen Insurance Holdings | 24,724 | 917,013 | ||||
Brown & Brown | 13,400 | 432,016 | ||||
Cincinnati Financial | 46,700 | 2,143,530 | ||||
E-L Financial | 7,000 | 4,226,491 | ||||
Erie Indemnity Cl. A | 24,200 | 1,928,498 | ||||
Marsh & McLennan | 85,900 | 3,429,128 | ||||
Montpelier Re Holdings | 11,097 | 277,536 | ||||
PartnerRe | 28,706 | 2,599,615 | ||||
Reinsurance Group of America | 88,519 | 6,117,548 | ||||
†Symetra Financial | 181,100 | 2,895,789 | ||||
United Fire Group | 11,900 | 295,477 | ||||
Willis Group Holdings | 110,700 | 4,514,346 | ||||
| 33,062,013 | ||||||
| Real Estate Investment Trusts (REITs) - 0.8% | ||||||
Cousins Properties | 40,010 | 404,101 | ||||
DCT Industrial Trust | 98,400 | 703,560 | ||||
Essex Property Trust | 8,000 | 1,271,360 | ||||
Lexington Realty Trust | 58,706 | 685,686 | ||||
National Health Investors | 19,300 | 1,155,298 | ||||
| 4,220,005 | ||||||
| THE ACCOMPANYING NOTES ARE AN INTEGRAL PART OF THESE FINANCIAL STATEMENTS. | The Royce Funds 2013 Semiannual Report to Shareholders | 79 |
Schedules of Investments
| Royce Dividend Value Fund (continued) | ||||||
| SHARES | VALUE | |||||
| Financials (continued) | ||||||
| Real Estate Management & Development - 0.3% | ||||||
Kennedy-Wilson Holdings | 98,600 | $ | 1,640,704 | |||
| Thrifts & Mortgage Finance - 1.2% | ||||||
Capitol Federal Financial | 27,000 | 327,780 | ||||
Genworth MI Canada | 189,568 | 4,423,314 | ||||
TrustCo Bank Corp. NY | 228,710 | 1,244,182 | ||||
| 5,995,276 | ||||||
| Total (Cost $116,082,508) | 143,775,960 | |||||
| Health Care – 3.8% | ||||||
| Health Care Equipment & Supplies - 0.6% | ||||||
Atrion Corporation | 13,200 | 2,886,972 | ||||
Carl Zeiss Meditec | 9,500 | 315,324 | ||||
| 3,202,296 | ||||||
| Health Care Providers & Services - 2.7% | ||||||
Chemed Corporation | 51,658 | 3,741,589 | ||||
Landauer | 53,000 | 2,560,430 | ||||
MEDNAX 2 | 30,900 | 2,829,822 | ||||
OdontoPrev | 38,400 | 158,326 | ||||
Owens & Minor | 150,800 | 5,101,564 | ||||
| 14,391,731 | ||||||
| Pharmaceuticals - 0.5% | ||||||
Adcock Ingram Holdings | 98,000 | 644,407 | ||||
Hikma Pharmaceuticals | 11,000 | 159,107 | ||||
Recordati | 93,000 | 1,031,980 | ||||
Santen Pharmaceutical | 18,100 | 779,260 | ||||
| 2,614,754 | ||||||
| Total (Cost $18,163,180) | 20,208,781 | |||||
| Industrials – 22.3% | ||||||
| Aerospace & Defense - 1.2% | ||||||
American Science & Engineering | 49,545 | 2,774,520 | ||||
Cubic Corporation | 48,416 | 2,328,810 | ||||
HEICO Corporation Cl. A | 28,906 | 1,066,920 | ||||
| 6,170,250 | ||||||
| Air Freight & Logistics - 1.8% | ||||||
Expeditors International of | ||||||
Washington | 150,400 | 5,716,704 | ||||
Forward Air | 88,000 | 3,368,640 | ||||
UTi Worldwide | 16,700 | 275,049 | ||||
| 9,360,393 | ||||||
| Building Products - 1.3% | ||||||
AAON | 78,350 | 2,591,818 | ||||
Geberit | 1,000 | 248,055 | ||||
Insteel Industries | 72,000 | 1,261,440 | ||||
Simpson Manufacturing | 57,600 | 1,694,592 | ||||
TOTO | 74,000 | 752,833 | ||||
WaterFurnace Renewable Energy | 6,000 | 117,239 | ||||
| 6,665,977 | ||||||
| Commercial Services & Supplies - 2.3% | ||||||
Brink’s Company (The) | 108,500 | 2,767,835 | ||||
†Cintas Corporation | 115,000 | 5,237,100 | ||||
Kaba Holding | 2,100 | 787,597 | ||||
Mine Safety Appliances | 35,000 | 1,629,250 | ||||
Ritchie Bros. Auctioneers | 48,900 | 939,858 | ||||
Societe BIC | 6,600 | 661,498 | ||||
| 12,023,138 | ||||||
| Construction & Engineering - 0.6% | ||||||
KBR | 75,000 | 2,437,500 | ||||
Raubex Group | 260,000 | 573,391 | ||||
| 3,010,891 | ||||||
| Electrical Equipment - 2.4% | ||||||
AZZ | 85,800 | 3,308,448 | ||||
Brady Corporation Cl. A | 54,300 | 1,668,639 | ||||
Franklin Electric | 12,000 | 403,800 | ||||
Hubbell Cl. B | 56,400 | 5,583,600 | ||||
Preformed Line Products | 13,100 | 868,661 | ||||
Regal-Beloit | 16,400 | 1,063,376 | ||||
| 12,896,524 | ||||||
| Machinery - 8.3% | ||||||
Alamo Group | 31,382 | 1,281,013 | ||||
Burckhardt Compression Holding | 3,600 | 1,433,063 | ||||
CLARCOR | 75,200 | 3,926,192 | ||||
Donaldson Company | 111,000 | 3,958,260 | ||||
Flowserve Corporation | 23,700 | 1,280,037 | ||||
Foster (L.B.) Company | 55,300 | 2,387,301 | ||||
Graco | 80,800 | 5,107,368 | ||||
IDEX Corporation | 44,500 | 2,394,545 | ||||
John Bean Technologies | 97,356 | 2,045,450 | ||||
Kennametal | 66,514 | 2,582,739 | ||||
Lincoln Electric Holdings | 51,400 | 2,943,678 | ||||
Lindsay Corporation | 32,800 | 2,459,344 | ||||
†Luxfer Holdings ADR | 199,714 | 3,165,467 | ||||
Nordson Corporation | 15,400 | 1,067,374 | ||||
Pfeiffer Vacuum Technology | 13,500 | 1,398,752 | ||||
Rational | 1,000 | 335,240 | ||||
Semperit AG Holding | 5,000 | 179,628 | ||||
Spirax-Sarco Engineering | 35,148 | 1,436,425 | ||||
Tennant Company | 18,400 | 888,168 | ||||
Valmont Industries | 23,700 | 3,391,233 | ||||
| 43,661,277 | ||||||
| Professional Services - 2.4% | ||||||
Kelly Services Cl. A | 39,200 | 684,824 | ||||
ManpowerGroup | 66,700 | 3,655,160 | ||||
Michael Page International | 36,000 | 203,138 | ||||
Towers Watson & Company Cl. A | 98,300 | 8,054,702 | ||||
| 12,597,824 | ||||||
| Road & Rail - 0.8% | ||||||
Arkansas Best | 49,600 | 1,138,320 | ||||
Landstar System | 66,300 | 3,414,450 | ||||
| 4,552,770 | ||||||
| Trading Companies & Distributors - 1.2% | ||||||
Applied Industrial Technologies | 113,506 | 5,485,745 | ||||
Houston Wire & Cable | 79,700 | 1,103,048 | ||||
| 6,588,793 | ||||||
| Total (Cost $93,009,975) | 117,527,837 | |||||
| 80 | The Royce Funds 2013 Semiannual Report to Shareholders | THE ACCOMPANYING NOTES ARE AN INTEGRAL PART OF THESE FINANCIAL STATEMENTS. |
June 30, 2013 (unaudited) |
| SHARES | VALUE | |||||
| Information Technology – 8.7% | ||||||
| Communications Equipment - 0.5% | ||||||
Plantronics | 59,008 | $ | 2,591,631 | |||
| Computers & Peripherals - 0.7% | ||||||
Diebold | 23,800 | 801,822 | ||||
†Seagate Technology | 66,000 | 2,958,780 | ||||
| 3,760,602 | ||||||
| Electronic Equipment, Instruments & Components - 5.3% | ||||||
Amphenol Corporation Cl. A | 47,100 | 3,670,974 | ||||
AVX Corporation | 142,300 | 1,672,025 | ||||
Cognex Corporation | 10,000 | 452,200 | ||||
Domino Printing Sciences | 36,000 | 341,666 | ||||
Electro Rent | 15,900 | 266,961 | ||||
FLIR Systems | 142,900 | 3,854,013 | ||||
Littelfuse | 43,658 | 3,257,323 | ||||
Molex | 116,000 | 3,403,440 | ||||
Molex Cl. A | 109,718 | 2,727,590 | ||||
MTS Systems | 54,193 | 3,067,324 | ||||
National Instruments | 145,400 | 4,062,476 | ||||
Vaisala Cl. A | 41,000 | 1,055,078 | ||||
| 27,831,070 | ||||||
| IT Services - 1.9% | ||||||
Convergys Corporation | 163,715 | 2,853,553 | ||||
CoreLogic 2 | 9,300 | 215,481 | ||||
Jack Henry & Associates | 32,300 | 1,522,299 | ||||
ManTech International Cl. A | 69,836 | 1,824,116 | ||||
†Western Union | 207,900 | 3,557,169 | ||||
| 9,972,618 | ||||||
| Semiconductors & Semiconductor Equipment - 0.3% | ||||||
Teradyne 2 | 103,600 | 1,820,252 | ||||
| Total (Cost $38,421,099) | 45,976,173 | |||||
| Materials – 12.1% | ||||||
| Chemicals - 2.7% | ||||||
Balchem Corporation | 50,150 | 2,244,212 | ||||
Cabot Corporation | 46,000 | 1,721,320 | ||||
Innophos Holdings | 18,150 | 856,136 | ||||
International Flavors & Fragrances | 27,100 | 2,036,836 | ||||
Quaker Chemical | 57,600 | 3,571,776 | ||||
Stepan Company | 60,600 | 3,369,966 | ||||
Victrex | 7,500 | 176,126 | ||||
Westlake Chemical | 4,300 | 414,563 | ||||
| 14,390,935 | ||||||
| Containers & Packaging - 1.6% | ||||||
AptarGroup | 71,300 | 3,936,473 | ||||
Greif Cl. A | 84,800 | 4,466,416 | ||||
| 8,402,889 | ||||||
| Metals & Mining - 7.8% | ||||||
Allegheny Technologies | 134,200 | 3,530,802 | ||||
Carpenter Technology | 65,600 | 2,956,592 | ||||
Commercial Metals | 18,700 | 276,199 | ||||
Compass Minerals International | 47,000 | 3,972,910 | ||||
Fresnillo | 212,000 | 2,843,932 | ||||
Gold Fields ADR | 743,200 | 3,901,800 | ||||
Hecla Mining | 270,000 | 804,600 | ||||
Kingsgate Consolidated | 33,000 | 38,178 | ||||
†Major Drilling Group International | 403,000 | 2,743,634 | ||||
Pan American Silver | 284,000 | 3,305,760 | ||||
Randgold Resources ADR | 75,300 | 4,822,965 | ||||
Reliance Steel & Aluminum | 88,806 | 5,822,122 | ||||
Schnitzer Steel Industries Cl. A | 27,600 | 645,288 | ||||
Sims Metal Management ADR | 240,000 | 1,814,400 | ||||
Steel Dynamics | 21,000 | 313,110 | ||||
Worthington Industries | 103,800 | 3,291,498 | ||||
| 41,083,790 | ||||||
| Total (Cost $67,522,576) | 63,877,614 | |||||
| Miscellaneous5 – 4.8% | ||||||
| Total (Cost $23,918,138) | 25,141,312 | |||||
| TOTAL COMMON STOCKS | ||||||
(Cost $438,582,657) | 514,045,464 | |||||
| REPURCHASE AGREEMENT – 1.9% | ||||||
| Fixed Income Clearing Corporation, | ||||||
0.01% dated 6/28/13, due 7/1/13, | ||||||
maturity value $9,646,008 (collateralized | ||||||
by obligations of various U.S. Government | ||||||
Agencies, 0.30% due 12/11/13, valued at | ||||||
$9,843,163) | ||||||
(Cost $9,646,000) | 9,646,000 | |||||
| COLLATERAL RECEIVED FOR SECURITIES | ||||||
LOANED – 0.3% | ||||||
| Money Market Funds | ||||||
Federated Government Obligations Fund | ||||||
(7 day yield-0.0099%) | ||||||
(Cost $1,676,417) | 1,676,417 | |||||
| TOTAL INVESTMENTS – 99.8% | ||||||
(Cost $449,905,074) | 525,367,881 | |||||
| CASH AND OTHER ASSETS | ||||||
LESS LIABILITIES – 0.2% | 1,284,156 | |||||
| NET ASSETS – 100.0% | $ | 526,652,037 | ||||
| THE ACCOMPANYING NOTES ARE AN INTEGRAL PART OF THESE FINANCIAL STATEMENTS. | The Royce Funds 2013 Semiannual Report to Shareholders | 81 |
Schedules of Investments
| Royce Global Value Fund | ||||||
| SHARES | VALUE | |||||
| COMMON STOCKS – 96.8% | ||||||
| Austria – 6.1% | ||||||
Mayr-Melnhof Karton | 75,000 | $ | 8,063,718 | |||
Semperit AG Holding | 221,844 | 7,969,862 | ||||
| Total (Cost $21,028,157) | 16,033,580 | |||||
| Belgium – 1.5% | ||||||
Sipef | 59,000 | 3,964,278 | ||||
| Total (Cost $5,624,238) | 3,964,278 | |||||
| Bermuda – 1.7% | ||||||
†Signet Jewelers | 67,000 | 4,517,810 | ||||
| Total (Cost $4,609,729) | 4,517,810 | |||||
| Brazil – 3.0% | ||||||
Brasil Brokers Participacoes | 1,455,000 | 4,271,069 | ||||
Eternit | 875,000 | 3,705,716 | ||||
| Total (Cost $8,516,297) | 7,976,785 | |||||
| Canada – 8.4% | ||||||
†Alamos Gold | 145,000 | 1,756,489 | ||||
Major Drilling Group International | 464,500 | 3,162,328 | ||||
Pan American Silver | 330,000 | 3,841,200 | ||||
Pason Systems | 315,000 | 5,726,728 | ||||
Sprott | 954,000 | 2,539,888 | ||||
†Sprott Resource Lending | 300,000 | 370,828 | ||||
Trican Well Service | 345,000 | 4,586,004 | ||||
| Total (Cost $37,728,664) | 21,983,465 | |||||
| China – 1.6% | ||||||
Daphne International Holdings | 5,000,000 | 4,274,083 | ||||
| Total (Cost $5,033,366) | 4,274,083 | |||||
| Denmark – 0.7% | ||||||
SimCorp | 65,000 | 1,928,413 | ||||
| Total (Cost $1,076,343) | 1,928,413 | |||||
| France – 3.6% | ||||||
Alten | 85,000 | 2,902,093 | ||||
Societe Internationale de Plantations | ||||||
d’Heveas | 48,000 | 3,381,998 | ||||
†Stallergenes | 43,915 | 3,083,886 | ||||
| Total (Cost $10,938,371) | 9,367,977 | |||||
| Germany – 1.4% | ||||||
Carl Zeiss Meditec | 50,000 | 1,659,603 | ||||
Pfeiffer Vacuum Technology | 18,306 | 1,896,708 | ||||
| Total (Cost $3,253,659) | 3,556,311 | |||||
| Hong Kong – 4.6% | ||||||
Asian Citrus Holdings | 3,500,000 | 1,254,505 | ||||
Luk Fook Holdings (International) 1 | 1,799,600 | 4,176,456 | ||||
†New World Department Store China | 5,750,000 | 2,906,118 | ||||
Value Partners Group | 7,000,000 | 3,772,539 | ||||
Total (Cost $16,859,552) | 12,109,618 | |||||
India – 2.6% | ||||||
Graphite India | 2,650,000 | 3,277,661 | ||||
Maharashtra Seamless | 1,000,000 | 3,449,726 | ||||
Total (Cost $12,080,313) | 6,727,387 | |||||
Italy – 2.9% | ||||||
Recordati | 690,000 | 7,656,628 | ||||
Total (Cost $5,972,296) | 7,656,628 | |||||
Japan – 13.3% | ||||||
Benesse Holdings | 87,500 | 3,153,988 | ||||
EPS Corporation | 4,000 | 4,452,511 | ||||
FamilyMart | 155,000 | 6,610,708 | ||||
MISUMI Group | 104,500 | 2,873,276 | ||||
Moshi Moshi Hotline | 400,000 | 4,992,942 | ||||
Nihon M&A Center | 62,500 | 3,484,825 | ||||
Santen Pharmaceutical | 105,000 | 4,520,569 | ||||
USS | 37,500 | 4,760,284 | ||||
Total (Cost $29,520,093) | 34,849,103 | |||||
Mexico – 1.9% | ||||||
Industrias Bachoco ADR | 145,000 | 5,031,500 | ||||
Total (Cost $3,222,602) | 5,031,500 | |||||
Norway – 4.6% | ||||||
Ekornes | 260,000 | 4,151,884 | ||||
| 2,568,015 | 1,416,259 | |||||
†Spectrum | 442,000 | 3,521,825 | ||||
TGS-NOPEC Geophysical | 100,000 | 2,905,661 | ||||
Total (Cost $11,915,080) | 11,995,629 | |||||
South Africa – 5.1% | ||||||
Adcock Ingram Holdings | 600,000 | 3,945,352 | ||||
Lewis Group | 800,000 | 5,098,608 | ||||
Raubex Group | 2,000,000 | 4,410,701 | ||||
Total (Cost $17,826,035) | 13,454,661 | |||||
South Korea – 1.5% | ||||||
MegaStudy | 75,000 | 4,051,924 | ||||
Total (Cost $9,644,865) | 4,051,924 | |||||
Sweden – 2.1% | ||||||
Autoliv | 71,400 | 5,525,646 | ||||
Total (Cost $5,095,967) | 5,525,646 | |||||
Switzerland – 3.4% | ||||||
Burckhardt Compression Holding | 5,409 | 2,153,178 | ||||
†Garmin | 125,800 | 4,548,928 | ||||
| 82 | The Royce Funds 2013 Semiannual Report to Shareholders | THE ACCOMPANYING NOTES ARE AN INTEGRAL PART OF THESE FINANCIAL STATEMENTS. |
June 30, 2013 (unaudited) |
| SHARES | VALUE | |||||
Switzerland (continued) | ||||||
Partners Group Holding | 8,200 | $ | 2,220,263 | |||
Total (Cost $7,227,753) | 8,922,369 | |||||
Turkey – 1.0% | ||||||
Mardin Cimento Sanayii | 1,151,452 | 2,626,841 | ||||
Total (Cost $5,121,672) | 2,626,841 | |||||
United Kingdom – 7.9% | ||||||
Ashmore Group | 1,350,000 | 7,057,130 | ||||
†Clarkson | 13,100 | 338,915 | ||||
Domino Printing Sciences | 280,000 | 2,657,403 | ||||
| 924,400 | 1,661,851 | |||||
Hochschild Mining | 525,000 | 1,240,068 | ||||
Jupiter Fund Management | 900,000 | 3,965,572 | ||||
Spirax-Sarco Engineering | 47,001 | 1,920,833 | ||||
Victrex | 80,000 | 1,878,677 | ||||
Total (Cost $23,893,350) | 20,720,449 | |||||
United States – 17.9% | ||||||
| 65,000 | 1,128,400 | |||||
†Cubic Corporation | 81,000 | 3,896,100 | ||||
Dolby Laboratories Cl. A | 126,000 | 4,214,700 | ||||
Helmerich & Payne | 130,000 | 8,118,500 | ||||
Kennametal | 100,000 | 3,883,000 | ||||
Lincoln Electric Holdings | 90,000 | 5,154,300 | ||||
| 60,000 | 1,845,600 | |||||
Myriad Genetics 2 | 225,000 | 6,045,750 | ||||
Teradyne 2 | 290,000 | 5,095,300 | ||||
Western Digital | 125,000 | 7,761,250 | ||||
Total (Cost $41,187,293) | 47,142,900 | |||||
TOTAL COMMON STOCKS | ||||||
(Cost $287,375,695) | 254,417,357 | |||||
REPURCHASE AGREEMENT – 3.1% | ||||||
Fixed Income Clearing Corporation, | ||||||
0.01% dated 6/28/13, due 7/1/13, | ||||||
maturity value $8,163,007 (collateralized | ||||||
by obligations of various U.S. Government | ||||||
Agencies, 1.375% due 2/25/14, valued at | ||||||
$8,328,619) | ||||||
(Cost $8,163,000) | 8,163,000 | |||||
| VALUE | ||||||
COLLATERAL RECEIVED FOR SECURITIES | ||||||
LOANED – 1.0% | ||||||
Money Market Funds | ||||||
Federated Government Obligations Fund | ||||||
(7 day yield-0.0099%) | ||||||
(Cost $2,509,644) | 2,509,644 | |||||
TOTAL INVESTMENTS – 100.9% | ||||||
(Cost $298,048,339) | 265,090,001 | |||||
LIABILITIES LESS CASH | ||||||
AND OTHER ASSETS – (0.9)% | (2,302,208 | ) | ||||
NET ASSETS – 100.0% | $ | 262,787,793 | ||||
| THE ACCOMPANYING NOTES ARE AN INTEGRAL PART OF THESE FINANCIAL STATEMENTS. | The Royce Funds 2013 Semiannual Report to Shareholders | 83 |
Schedules of Investments
| Royce International Smaller-Companies Fund | ||||||
| SHARES | VALUE | |||||
| COMMON STOCKS – 92.2% | ||||||
Australia – 0.3% | ||||||
Regis Resources 2 | 40,000 | $ | 105,722 | |||
Total (Cost $126,783) | 105,722 | |||||
Austria – 2.7% | ||||||
Mayr-Melnhof Karton | 4,000 | 430,065 | ||||
Semperit AG Holding | 11,500 | 413,143 | ||||
Total (Cost $891,252) | 843,208 | |||||
Belgium – 1.4% | ||||||
Sipef | 3,400 | 228,450 | ||||
Van de Velde | 4,800 | 209,618 | ||||
Total (Cost $450,541) | 438,068 | |||||
Brazil – 1.9% | ||||||
Brasil Brokers Participacoes | 98,500 | 289,141 | ||||
Eternit | 47,500 | 201,167 | ||||
Fleury | 14,000 | 114,191 | ||||
Total (Cost $750,454) | 604,499 | |||||
Canada – 1.9% | ||||||
Ensign Energy Services | 8,000 | 123,838 | ||||
Gluskin Sheff + Associates | 10,000 | 185,034 | ||||
Major Drilling Group International | 20,000 | 136,160 | ||||
Sprott | 60,000 | 159,741 | ||||
Total (Cost $639,027) | 604,773 | |||||
Cayman Islands – 0.8% | ||||||
Greenlight Capital Re Cl. A 2 | 10,000 | 245,300 | ||||
Total (Cost $194,676) | 245,300 | |||||
China – 2.4% | ||||||
Anta Sports Products | 215,000 | 188,498 | ||||
Daphne International Holdings | 450,000 | 384,667 | ||||
Pacific Online | 449,800 | 197,758 | ||||
Total (Cost $757,924) | 770,923 | |||||
Cyprus – 0.8% | ||||||
Globaltrans Investment GDR | 18,000 | 247,320 | ||||
Total (Cost $259,671) | 247,320 | |||||
Denmark – 1.0% | ||||||
H. Lundbeck | 10,000 | 178,357 | ||||
SimCorp | 4,350 | 129,055 | ||||
Total (Cost $240,954) | 307,412 | |||||
Finland – 0.8% | ||||||
†F-Secure | 93,500 | 258,013 | ||||
Total (Cost $248,202) | 258,013 | |||||
France – 9.4% | ||||||
Altamir | 19,000 | 213,926 | ||||
Alten | 9,300 | 317,523 | ||||
Audika Groupe 2 | 21,352 | 215,950 | ||||
Beneteau 2 | 17,500 | 193,393 | ||||
bioMerieux | 2,000 | 193,790 | ||||
Boiron | 5,200 | 270,743 | ||||
Ipsen | 4,500 | 166,058 | ||||
Manutan International | 5,500 | 235,533 | ||||
Parrot 2 | 7,500 | 208,720 | ||||
Societe Internationale de Plantations | ||||||
d’Heveas | 3,300 | 232,512 | ||||
†Stallergenes | 4,866 | 341,710 | ||||
Vetoquinol | 7,400 | 251,882 | ||||
Virbac | 585 | 121,073 | ||||
Total (Cost $2,934,331) | 2,962,813 | |||||
Germany – 3.4% | ||||||
†Bertrandt | 1,500 | 161,118 | ||||
Carl Zeiss Meditec | 8,000 | 265,536 | ||||
KWS Saat | 500 | 180,897 | ||||
Nemetschek | 2,300 | 148,193 | ||||
Pfeiffer Vacuum Technology | 1,500 | 155,417 | ||||
PUMA | 615 | 173,111 | ||||
Total (Cost $816,138) | 1,084,272 | |||||
Hong Kong – 10.5% | ||||||
Bosideng International Holdings | 500,000 | 104,435 | ||||
†I.T | 550,000 | 197,136 | ||||
Luk Fook Holdings (International) | 100,000 | 232,077 | ||||
Media Chinese International | 675,000 | 245,688 | ||||
Midland Holdings | 850,000 | 317,817 | ||||
New World Department Store China | 563,000 | 284,547 | ||||
Pacific Textiles Holdings | 200,000 | 225,372 | ||||
Pico Far East Holdings | 823,000 | 281,193 | ||||
Stella International Holdings | 110,800 | 306,427 | ||||
Television Broadcasts | 47,500 | 329,179 | ||||
Texwinca Holdings | 359,300 | 334,467 | ||||
Value Partners Group | 450,000 | 242,520 | ||||
Xtep International Holdings | 550,000 | 229,756 | ||||
Total (Cost $3,464,404) | 3,330,614 | |||||
India – 3.0% | ||||||
AIA Engineering | 50,000 | 286,916 | ||||
Graphite India | 176,400 | 218,181 | ||||
Maharashtra Seamless | 67,500 | 232,856 | ||||
Unichem Laboratories | 71,700 | 198,480 | ||||
Total (Cost $1,238,889) | 936,433 | |||||
Italy – 3.6% | ||||||
†De’Longhi | 12,500 | 195,410 | ||||
DiaSorin | 8,000 | 319,373 | ||||
Geox | 60,000 | 149,481 | ||||
| 84 | The Royce Funds 2013 Semiannual Report to Shareholders | THE ACCOMPANYING NOTES ARE AN INTEGRAL PART OF THESE FINANCIAL STATEMENTS. |
June 30, 2013 (unaudited) |
| SHARES | VALUE | |||||
Italy (continued) | ||||||
Recordati | 42,500 | $ | 471,604 | |||
Total (Cost $981,142) | 1,135,868 | |||||
Japan – 13.6% | ||||||
†Asahi Company | 9,500 | 139,655 | ||||
Benesse Holdings | 9,200 | 331,619 | ||||
BML | 10,000 | 253,680 | ||||
C. Uyemura & Co. | 5,500 | 227,087 | ||||
Dr.Ci:Labo | 94 | 249,738 | ||||
EPS Corporation | 400 | 445,251 | ||||
FamilyMart | 10,050 | 428,630 | ||||
Hisamitsu Pharmaceutical | 3,400 | 172,777 | ||||
Hogy Medical | 1,800 | 102,904 | ||||
Kakaku.com | 6,050 | 184,526 | ||||
Mandom Corporation | 6,300 | 209,619 | ||||
Milbon | 3,400 | 119,984 | ||||
Miraial | 15,000 | 235,330 | ||||
MISUMI Group | 6,500 | 178,720 | ||||
Moshi Moshi Hotline | 30,500 | 380,712 | ||||
Santen Pharmaceutical | 9,800 | 421,919 | ||||
USS | 1,750 | 222,147 | ||||
Total (Cost $3,926,516) | 4,304,298 | |||||
Jersey – 0.6% | ||||||
Randgold Resources ADR | 3,200 | 204,960 | ||||
Total (Cost $221,823) | 204,960 | |||||
Luxembourg – 0.3% | ||||||
Reinet Investments 2 | 5,000 | 89,228 | ||||
Total (Cost $82,407) | 89,228 | |||||
Malaysia – 2.0% | ||||||
†CB Industrial Product Holding | 300,000 | 248,774 | ||||
†Media Prima | 250,000 | 221,554 | ||||
Padini Holdings | 250,000 | 149,549 | ||||
Total (Cost $552,060) | 619,877 | |||||
Mexico – 0.9% | ||||||
Industrias Bachoco ADR | 8,000 | 277,600 | ||||
Total (Cost $161,273) | 277,600 | |||||
Netherlands – 0.8% | ||||||
†Beter Bed Holding | 13,500 | 247,418 | ||||
Total (Cost $245,925) | 247,418 | |||||
Norway – 2.1% | ||||||
Ekornes | 14,000 | 223,563 | ||||
| 200,000 | 110,300 | |||||
†Spectrum | 27,000 | 215,134 | ||||
TGS-NOPEC Geophysical | 4,500 | 130,755 | ||||
Total (Cost $654,589) | 679,752 | |||||
| Poland – 0.5% | ||||||
Warsaw Stock Exchange | 15,000 | 171,818 | ||||
Total (Cost $193,819) | 171,818 | |||||
Singapore – 2.3% | ||||||
ARA Asset Management | 141,090 | 193,686 | ||||
Biosensors International Group 2 | 190,500 | 161,568 | ||||
ComfortDelGro Corporation | 165,000 | 238,876 | ||||
†CSE Global | 200,000 | 134,122 | ||||
Total (Cost $676,188) | 728,252 | |||||
South Africa – 3.2% | ||||||
Adcock Ingram Holdings | 35,000 | 230,146 | ||||
AVI | 21,500 | 129,304 | ||||
Lewis Group | 59,000 | 376,022 | ||||
Raubex Group | 122,500 | 270,155 | ||||
Total (Cost $1,165,485) | 1,005,627 | |||||
South Korea – 2.2% | ||||||
Green Cross | 1,260 | 135,152 | ||||
GS Home Shopping | 600 | 124,250 | ||||
Handsome Co. | 8,800 | 223,843 | ||||
MegaStudy | 4,200 | 226,908 | ||||
Total (Cost $910,931) | 710,153 | |||||
Sweden – 0.8% | ||||||
Lundin Petroleum 2 | 12,500 | 247,909 | ||||
Total (Cost $178,327) | 247,909 | |||||
Switzerland – 7.7% | ||||||
Banque Privee Edmond de Rothschild | 10 | 174,051 | ||||
Burckhardt Compression Holding | 460 | 183,114 | ||||
†Forbo Holding | 555 | 354,018 | ||||
Kaba Holding | 880 | 330,041 | ||||
Sika | 68 | 176,092 | ||||
Straumann Holding | 1,000 | 150,124 | ||||
Sulzer | 2,200 | 351,935 | ||||
Vontobel Holding | 4,200 | 129,395 | ||||
VZ Holding | 2,200 | 307,448 | ||||
Zehnder Group | 6,300 | 280,800 | ||||
Total (Cost $2,201,231) | 2,437,018 | |||||
Turkey – 0.9% | ||||||
Koza Altin Isletmeleri | 9,000 | 109,193 | ||||
Mardin Cimento Sanayii | 75,000 | 171,099 | ||||
Total (Cost $490,816) | 280,292 | |||||
United Kingdom – 10.4% | ||||||
Ashmore Group | 62,000 | 324,105 | ||||
Clinigen Group | 40,687 | 185,649 | ||||
†Consort Medical | 18,000 | 227,914 | ||||
Domino Printing Sciences | 28,000 | 265,740 | ||||
†E2V Technologies | 82,200 | 148,464 | ||||
EnQuest 2 | 135,000 | 242,698 | ||||
| THE ACCOMPANYING NOTES ARE AN INTEGRAL PART OF THESE FINANCIAL STATEMENTS. | The Royce Funds 2013 Semiannual Report to Shareholders | 85 |
| Schedules of Investments | June 30, 2013 (unaudited) |
Royce International Smaller-Companies Fund (continued)
| SHARES | VALUE | |||||
United Kingdom (continued) | ||||||
Hochschild Mining | 48,500 | $ | 114,559 | |||
Homeserve | 75,000 | 319,399 | ||||
Jupiter Fund Management | 36,000 | 158,623 | ||||
†Lancashire Holdings | 12,500 | 150,574 | ||||
Oxford Instruments | 10,000 | 183,883 | ||||
†Photo-Me International | 180,000 | 240,234 | ||||
Rotork | 4,000 | 162,438 | ||||
Spirax-Sarco Engineering | 3,851 | 157,382 | ||||
Spirent Communications | 115,000 | 246,097 | ||||
Victrex | 6,500 | 152,642 | ||||
Total (Cost $3,082,590) | 3,280,401 | |||||
TOTAL COMMON STOCKS | ||||||
(Cost $28,738,368) | 29,159,841 | |||||
| VALUE | ||||||
| REPURCHASE AGREEMENT – 13.1% | ||||||
| Fixed Income Clearing Corporation, | ||||||
0.01% dated 6/28/13, due 7/1/13, | ||||||
maturity value $4,154,003 (collateralized | ||||||
by obligations of various U.S. Government | ||||||
Agencies, 0.30% due 12/11/13, valued at | ||||||
$4,240,294) | ||||||
(Cost $4,154,000) | $ | 4,154,000 | ||||
| TOTAL INVESTMENTS – 105.3% | ||||||
(Cost $32,892,368) | 33,313,841 | |||||
| LIABILITIES LESS CASH | ||||||
AND OTHER ASSETS – (5.3)% | (1,676,533 | ) | ||||
| NET ASSETS – 100.0% | $ | 31,637,308 | ||||
| 86 | The Royce Funds 2013 Semiannual Report to Shareholders | THE ACCOMPANYING NOTES ARE AN INTEGRAL PART OF THESE FINANCIAL STATEMENTS. |
| Statements of Assets and Liabilities | June 30, 2013 (unaudited) |
| Royce | Royce | Royce | Royce | |||||||||||||||||
| Pennsylvania | Micro-Cap | Premier | Low-Priced | |||||||||||||||||
| Mutual Fund | Fund | Fund | Stock Fund | |||||||||||||||||
| ASSETS: | ||||||||||||||||||||
| Investments at value (including collateral on loaned securities) | ||||||||||||||||||||
Non-Affiliated Companies | $ | 6,174,422,213 | $ | 753,286,569 | $ | 4,046,835,667 | $ | 1,913,418,496 | ||||||||||||
Affiliated Companies | 287,469,997 | 22,101,881 | 2,503,336,219 | 107,692,583 | ||||||||||||||||
| Repurchase agreements (at cost and value) | 9,377,000 | 80,146,000 | 199,418,000 | 183,002,000 | ||||||||||||||||
| Cash and foreign currency | 1,012,060 | 243,123 | 881 | 687 | ||||||||||||||||
| Receivable for investments sold | 63,981,391 | 2,146,022 | – | 6,006,715 | ||||||||||||||||
| Receivable for capital shares sold | 9,178,806 | 431,647 | 5,876,629 | 1,205,314 | ||||||||||||||||
| Receivable for dividends and interest | 3,341,659 | 528,511 | 5,162,243 | 1,575,496 | ||||||||||||||||
| Prepaid expenses and other assets | 2,039,746 | 4,799 | 37,178 | 14,552 | ||||||||||||||||
Total Assets | 6,550,822,872 | 858,888,552 | 6,760,666,817 | 2,212,915,843 | ||||||||||||||||
| LIABILITIES: | ||||||||||||||||||||
| Payable for collateral on loaned securities | 71,635,787 | 14,286,329 | 56,194,485 | 89,352,412 | ||||||||||||||||
| Payable for investments purchased | 19,236,778 | 2,377,417 | 17,282,005 | 1,161,105 | ||||||||||||||||
| Payable for capital shares redeemed | 18,676,748 | 1,494,270 | 8,670,504 | 144,529,286 | ||||||||||||||||
| Payable for investment advisory fees | 4,030,453 | 916,731 | 5,222,898 | 2,083,599 | ||||||||||||||||
| Accrued expenses | 3,489,942 | 744,123 | 3,373,649 | 1,856,412 | ||||||||||||||||
Total Liabilities | 117,069,708 | 19,818,870 | 90,743,541 | 238,982,814 | ||||||||||||||||
Net Assets | $ | 6,433,753,164 | $ | 839,069,682 | $ | 6,669,923,276 | $ | 1,973,933,029 | ||||||||||||
| ANALYSIS OF NET ASSETS: | ||||||||||||||||||||
| Paid-in capital | $ | 4,531,088,765 | $ | 710,174,181 | $ | 4,228,369,878 | $ | 1,659,229,951 | ||||||||||||
| Undistributed net investment income (loss) | (4,591,267 | ) | (7,230,358 | ) | 4,786,860 | (37,578,825 | ) | |||||||||||||
| Accumulated net realized gain (loss) on investments and | ||||||||||||||||||||
foreign currency | 144,601,630 | 43,888,360 | 247,549,127 | 137,047,649 | ||||||||||||||||
| Net unrealized appreciation (depreciation) on investments and | ||||||||||||||||||||
foreign currency | 1,762,654,036 | 92,237,499 | 2,189,217,411 | 215,234,254 | ||||||||||||||||
Net Assets | $ | 6,433,753,164 | $ | 839,069,682 | $ | 6,669,923,276 | $ | 1,973,933,029 | ||||||||||||
Investment Class | $ | 4,550,074,406 | $ | 653,984,097 | $ | 4,709,035,429 | $ | 133,957,095 | ||||||||||||
Service Class | 551,597,837 | 76,474,794 | 471,429,535 | 1,226,184,947 | ||||||||||||||||
Consultant Class | 681,998,712 | 108,610,791 | 60,311,426 | |||||||||||||||||
Institutional Class | 601,033,016 | 865,066,536 | 604,452,632 | |||||||||||||||||
W Class | 523,517,735 | |||||||||||||||||||
R Class | 39,073,495 | 32,302,325 | 3,958,604 | |||||||||||||||||
K Class | 9,975,698 | 8,260,290 | 5,379,751 | |||||||||||||||||
| SHARES OUTSTANDING (unlimited number of $.001 par value): | ||||||||||||||||||||
Investment Class | 354,713,871 | 42,940,417 | 227,837,485 | 9,796,897 | ||||||||||||||||
Service Class | 43,038,315 | 5,081,058 | 23,166,374 | 89,712,168 | ||||||||||||||||
Consultant Class | 59,702,906 | 8,097,016 | 3,238,524 | |||||||||||||||||
Institutional Class | 46,758,577 | 41,542,312 | 44,170,976 | |||||||||||||||||
W Class | 25,284,055 | |||||||||||||||||||
R Class | 3,130,641 | 1,614,398 | 295,736 | |||||||||||||||||
K Class | 870,870 | 937,308 | 690,079 | |||||||||||||||||
| NET ASSET VALUES (Net Assets ÷ Shares Outstanding): | ||||||||||||||||||||
Investment Class 1 | $12.83 | $15.23 | $20.67 | $13.67 | ||||||||||||||||
Service Class 1 | 12.82 | 15.05 | 20.35 | 13.67 | ||||||||||||||||
Consultant Class 2 | 11.42 | 13.41 | 18.62 | |||||||||||||||||
Institutional Class 3 | 12.85 | 20.82 | 13.68 | |||||||||||||||||
W Class 3 | 20.71 | |||||||||||||||||||
R Class 3 | 12.48 | 20.01 | 13.39 | |||||||||||||||||
K Class 3 | 11.45 | 8.81 | 7.80 | |||||||||||||||||
Investments at identified cost | $ | 4,699,225,135 | $ | 683,139,297 | $ | 4,360,877,152 | $ | 1,805,862,631 | ||||||||||||
Market value of loaned securities | 70,779,979 | 14,291,805 | 55,888,102 | 88,649,870 | ||||||||||||||||
| THE ACCOMPANYING NOTES ARE AN INTEGRAL PART OF THESE FINANCIAL STATEMENTS. | The Royce Funds 2013 Semiannual Report to Shareholders | 87 |
| Statements of Assets and Liabilities |
| Royce | Royce | Royce | Royce | |||||||||||||||||
| Total Return | Heritage | Opportunity | Special Equity | |||||||||||||||||
| Fund | Fund | Fund | Fund | |||||||||||||||||
| ASSETS: | ||||||||||||||||||||
| Investments at value (including collateral on loaned securities) | ||||||||||||||||||||
Non-Affiliated Companies | $ | 4,566,295,172 | $ | 259,860,620 | $ | 2,073,051,987 | $ | 1,546,080,496 | ||||||||||||
Affiliated Companies | 91,172,922 | – | 48,753,079 | 1,459,822,132 | ||||||||||||||||
| Repurchase agreements (at cost and value) | 478,504,000 | 42,307,000 | 249,540,000 | 328,681,000 | ||||||||||||||||
| Cash and foreign currency | 796,392 | – | 918 | 766 | ||||||||||||||||
| Receivable for investments sold | 4,500,130 | 11,251,196 | 4,433,571 | 4,171,188 | ||||||||||||||||
| Receivable for capital shares sold | 6,379,817 | 137,653 | 2,279,754 | 4,923,204 | ||||||||||||||||
| Receivable for dividends and interest | 5,416,367 | 231,256 | 672,072 | 2,524,468 | ||||||||||||||||
| Prepaid expenses and other assets | 23,902 | 1,395 | 8,141 | 17,933 | ||||||||||||||||
Total Assets | 5,153,088,702 | 313,789,120 | 2,378,739,522 | 3,346,221,187 | ||||||||||||||||
| LIABILITIES: | ||||||||||||||||||||
| Payable for collateral on loaned securities | 3,957,333 | 1,231,565 | 68,967,724 | 11,400 | ||||||||||||||||
| Payable for investments purchased | 15,325,875 | 18,476,541 | 14,826,682 | 1,872,948 | ||||||||||||||||
| Payable for capital shares redeemed | 5,078,404 | 96,867 | 702,114 | 2,001,160 | ||||||||||||||||
| Payable to custodian for overdrawn balance | – | 257,952 | – | – | ||||||||||||||||
| Payable for investment advisory fees | 4,050,611 | 243,037 | 1,841,453 | 2,703,028 | ||||||||||||||||
| Accrued expenses | 2,603,953 | 225,134 | 746,303 | 1,303,167 | ||||||||||||||||
Total Liabilities | 31,016,176 | 20,531,096 | 87,084,276 | 7,891,703 | ||||||||||||||||
Net Assets | $ | 5,122,072,526 | $ | 293,258,024 | $ | 2,291,655,246 | $ | 3,338,329,484 | ||||||||||||
| ANALYSIS OF NET ASSETS: | ||||||||||||||||||||
| Paid-in capital | $ | 3,277,678,770 | $ | 213,359,975 | $ | 1,807,114,598 | $ | 2,449,743,446 | ||||||||||||
| Undistributed net investment income (loss) | (4,745,638 | ) | 89,679 | (4,021,671 | ) | 5,503,197 | ||||||||||||||
| Accumulated net realized gain (loss) on investments and | ||||||||||||||||||||
foreign currency | 305,137,090 | 21,884,429 | 141,334,707 | 121,411,709 | ||||||||||||||||
| Net unrealized appreciation (depreciation) on investments and | ||||||||||||||||||||
foreign currency | 1,544,002,304 | 57,923,941 | 347,227,612 | 761,671,132 | ||||||||||||||||
Net Assets | $ | 5,122,072,526 | $ | 293,258,024 | $ | 2,291,655,246 | $ | 3,338,329,484 | ||||||||||||
Investment Class | $ | 3,315,501,930 | $ | 57,115,934 | $ | 1,088,975,801 | $ | 2,314,919,165 | ||||||||||||
Service Class | 454,812,569 | 208,030,745 | 300,860,764 | 296,812,239 | ||||||||||||||||
Consultant Class | 359,091,055 | 14,559,052 | 14,725,060 | 63,473,827 | ||||||||||||||||
Institutional Class | 525,385,562 | 861,500,438 | 663,124,253 | |||||||||||||||||
W Class | 212,957,596 | |||||||||||||||||||
R Class | 59,782,609 | 6,365,931 | 13,493,013 | |||||||||||||||||
K Class | 194,541,205 | 7,186,362 | 12,100,170 | |||||||||||||||||
| SHARES OUTSTANDING (unlimited number of $.001 par value): | ||||||||||||||||||||
Investment Class | 216,514,958 | 3,599,851 | 76,885,023 | 97,487,829 | ||||||||||||||||
Service Class | 29,501,606 | 13,160,322 | 22,003,715 | 12,522,145 | ||||||||||||||||
Consultant Class | 23,147,087 | 1,144,605 | 1,134,510 | 2,811,195 | ||||||||||||||||
Institutional Class | 34,506,984 | 60,247,775 | 28,059,282 | |||||||||||||||||
W Class | 13,920,514 | |||||||||||||||||||
R Class | 3,851,223 | 536,732 | 996,879 | |||||||||||||||||
K Class | 16,453,270 | 603,391 | 955,987 | |||||||||||||||||
| NET ASSET VALUES (Net Assets ÷ Shares Outstanding): | ||||||||||||||||||||
Investment Class 1 | $15.31 | $15.87 | $14.16 | $23.75 | ||||||||||||||||
Service Class 1 | 15.42 | 15.81 | 13.67 | 23.70 | ||||||||||||||||
Consultant Class 2 | 15.51 | 12.72 | 12.98 | 22.58 | ||||||||||||||||
Institutional Class 3 | 15.23 | 14.30 | 23.63 | |||||||||||||||||
W Class 3 | 15.30 | |||||||||||||||||||
R Class 3 | 15.52 | 11.86 | 13.54 | |||||||||||||||||
K Class 3 | 11.82 | 11.91 | 12.66 | |||||||||||||||||
Investments at identified cost | $ | 3,113,451,292 | $ | 201,930,303 | $ | 1,774,576,966 | $ | 2,244,231,496 | ||||||||||||
Market value of loaned securities | 3,780,042 | 1,189,810 | 67,109,925 | 11,220 | ||||||||||||||||
| 88 | The Royce Funds 2013 Semiannual Report to Shareholders | THE ACCOMPANYING NOTES ARE AN INTEGRAL PART OF THESE FINANCIAL STATEMENTS. |
| June 30, 2013 (unaudited) |
| Royce | Royce | Royce | |||||||||
| Value | Value Plus | 100 | |||||||||
| Fund | Fund | Fund | |||||||||
| ASSETS: | |||||||||||
| Investments at value (including collateral on loaned securities) | |||||||||||
Non-Affiliated Companies | $ | 1,133,714,661 | $ | 1,371,630,548 | $ | 270,833,467 | |||||
Affiliated Companies | – | 13,091,796 | – | ||||||||
| Repurchase agreements (at cost and value) | 43,226,000 | 49,746,000 | 7,001,000 | ||||||||
| Cash and foreign currency | 265 | 282 | 627 | ||||||||
| Receivable for investments sold | 1,469,234 | 16,298,690 | 337,393 | ||||||||
| Receivable for capital shares sold | 3,413,775 | 919,869 | 204,553 | ||||||||
| Receivable for dividends and interest | 895,524 | 728,143 | 183,878 | ||||||||
| Prepaid expenses and other assets | 6,250 | 4,031 | 1,423 | ||||||||
Total Assets | 1,182,725,709 | 1,452,419,359 | 278,562,341 | ||||||||
| LIABILITIES: | |||||||||||
| Payable for collateral on loaned securities | 1,605,497 | 51,073,622 | 1,000,778 | ||||||||
| Payable for investments purchased | 8,009 | 8,075,170 | 13,008 | ||||||||
| Payable for capital shares redeemed | 3,671,211 | 2,733,771 | 1,792,575 | ||||||||
| Payable for investment advisory fees | 987,078 | 1,149,887 | 231,475 | ||||||||
| Accrued expenses | 1,005,630 | 1,158,720 | 262,253 | ||||||||
Total Liabilities | 7,277,425 | 64,191,170 | 3,300,089 | ||||||||
Net Assets | $ | 1,175,448,284 | $ | 1,388,228,189 | $ | 275,262,252 | |||||
| ANALYSIS OF NET ASSETS: | |||||||||||
| Paid-in capital | $ | 972,590,357 | $ | 1,107,578,002 | $ | 186,370,486 | |||||
| Undistributed net investment income (loss) | 483,543 | (8,137,999 | ) | 140,924 | |||||||
| Accumulated net realized gain (loss) on investments and | |||||||||||
foreign currency | 1,312,175 | 12,070,925 | 22,853,734 | ||||||||
| Net unrealized appreciation (depreciation) on investments and foreign currency | 201,062,209 | 276,717,261 | 65,897,108 | ||||||||
Net Assets | $ | 1,175,448,284 | $ | 1,388,228,189 | $ | 275,262,252 | |||||
Investment Class | $ | 180,892,629 | $ | 232,226,775 | $ | 55,269,898 | |||||
Service Class | 701,940,270 | 940,440,442 | 213,687,263 | ||||||||
Consultant Class | 29,350,044 | 20,230,255 | |||||||||
Institutional Class | 208,079,877 | 192,878,524 | |||||||||
R Class | 37,291,420 | 1,562,926 | 2,463,737 | ||||||||
K Class | 17,894,044 | 889,267 | 3,841,354 | ||||||||
| SHARES OUTSTANDING (unlimited number of $.001 par value): | |||||||||||
Investment Class | 14,649,138 | 14,862,477 | 5,634,418 | ||||||||
Service Class | 57,057,839 | 60,528,835 | 21,930,562 | ||||||||
Consultant Class | 2,514,136 | 1,365,584 | |||||||||
Institutional Class | 16,827,134 | 12,294,815 | |||||||||
R Class | 3,085,959 | 103,208 | 205,757 | ||||||||
K Class | 1,805,646 | 78,419 | 317,290 | ||||||||
| NET ASSET VALUES (Net Assets ÷ Shares Outstanding): | |||||||||||
Investment Class 1 | $12.35 | $15.63 | $9.81 | ||||||||
Service Class 1 | 12.30 | 15.54 | 9.74 | ||||||||
Consultant Class 2 | 11.67 | 14.81 | |||||||||
Institutional Class 3 | 12.37 | 15.69 | |||||||||
R Class 3 | 12.08 | 15.14 | 11.97 | ||||||||
K Class 3 | 9.91 | 11.34 | 12.11 | ||||||||
Investments at identified cost | $ | 932,650,316 | $ | 1,108,000,676 | $ | 204,934,901 | |||||
Market value of loaned securities | 1,578,626 | 50,092,957 | 1,004,638 | ||||||||
| THE ACCOMPANYING NOTES ARE AN INTEGRAL PART OF THESE FINANCIAL STATEMENTS. | The Royce Funds 2013 Semiannual Report to Shareholders | 89 |
| Statements of Assets and Liabilities | June 30, 2013 (unaudited) |
| Royce | Royce | Royce | |||||||||||
| Dividend | Global | International Smaller- | |||||||||||
| Value Fund | Value Fund | Companies Fund | |||||||||||
| ASSETS: | |||||||||||||
| Investments at value (including collateral on loaned securities) | |||||||||||||
Non-Affiliated Companies | $ | 515,721,881 | $ | 256,927,001 | $ | 29,159,841 | |||||||
| Repurchase agreements (at cost and value) | 9,646,000 | 8,163,000 | 4,154,000 | ||||||||||
| Cash and foreign currency | 20,562 | 565,487 | 151,207 | ||||||||||
| Receivable for investments sold | 3,743,629 | 664,993 | 53,242 | ||||||||||
| Receivable for capital shares sold | 1,883,998 | 562,927 | 85,539 | ||||||||||
| Receivable for dividends and interest | 601,490 | 659,980 | 43,846 | ||||||||||
| Prepaid expenses and other assets | 2,495 | 1,120 | 153 | ||||||||||
Total Assets | 531,620,055 | 267,544,508 | 33,647,828 | ||||||||||
| LIABILITIES: | |||||||||||||
| Payable for collateral on loaned securities | 1,676,417 | 2,509,644 | – | ||||||||||
| Payable for investments purchased | 1,465,917 | 1,445,582 | 1,900,700 | ||||||||||
| Payable for capital shares redeemed | 1,123,425 | 324,260 | 46,142 | ||||||||||
| Payable for investment advisory fees | 433,004 | 278,548 | 25,043 | ||||||||||
| Accrued expenses | 269,255 | 198,681 | 38,635 | ||||||||||
Total Liabilities | 4,968,018 | 4,756,715 | 2,010,520 | ||||||||||
Net Assets | $ | 526,652,037 | $ | 262,787,793 | $ | 31,637,308 | |||||||
| ANALYSIS OF NET ASSETS: | |||||||||||||
| Paid-in capital | $ | 438,468,261 | $ | 350,767,814 | $ | 30,747,553 | |||||||
| Undistributed net investment income (loss) | 1,345,986 | 1,884,543 | 154,120 | ||||||||||
| Accumulated net realized gain (loss) on investments and | |||||||||||||
foreign currency | 11,378,200 | (56,900,704 | ) | 309,335 | |||||||||
| Net unrealized appreciation (depreciation) on investments and foreign currency | 75,459,590 | (32,963,860 | ) | 426,300 | |||||||||
Net Assets | $ | 526,652,037 | $ | 262,787,793 | $ | 31,637,308 | |||||||
Investment Class | $ | 173,693,679 | $ | 173,665,306 | |||||||||
Service Class | 326,603,114 | 65,195,332 | $ | 31,637,308 | |||||||||
Consultant Class | 23,797,969 | ||||||||||||
Institutional Class | 26,355,244 | ||||||||||||
R Class | 89,532 | ||||||||||||
K Class | 39,654 | ||||||||||||
| SHARES OUTSTANDING (unlimited number of $.001 par value): | |||||||||||||
Investment Class | 21,589,379 | 14,106,609 | |||||||||||
Service Class | 40,293,009 | 5,273,655 | 2,823,691 | ||||||||||
Consultant Class | 1,946,314 | ||||||||||||
Institutional Class | 3,279,334 | ||||||||||||
R Class | 9,716 | ||||||||||||
K Class | 4,296 | ||||||||||||
| NET ASSET VALUES (Net Assets ÷ Shares Outstanding): | |||||||||||||
Investment Class 1 | $8.05 | $12.31 | |||||||||||
Service Class 1 | 8.11 | 12.36 | $11.20 | ||||||||||
Consultant Class 2 | 12.23 | ||||||||||||
Institutional Class 3 | 8.04 | ||||||||||||
R Class 3 | 9.22 | ||||||||||||
K Class 3 | 9.23 | ||||||||||||
Investments at identified cost | $ | 440,259,074 | $ | 289,885,339 | $ | 28,738,368 | |||||||
Market value of loaned securities | 1,622,582 | 2,289,034 | |||||||||||
| 90 | The Royce Funds 2013 Semiannual Report to Shareholders | THE ACCOMPANYING NOTES ARE AN INTEGRAL PART OF THESE FINANCIAL STATEMENTS. |
| Statements of Changes in Net Assets |
| Royce Pennsylvania | ||||||||||||||||||||||||||||||||
| Mutual Fund | Royce Micro-Cap Fund | Royce Premier Fund | ||||||||||||||||||||||||||||||
| Six months ended | Six months ended | Six months ended | ||||||||||||||||||||||||||||||
| 6/30/13 | Year ended | 6/30/13 | Year ended | 6/30/13 | Year ended | |||||||||||||||||||||||||||
| (unaudited) | 12/31/12 | (unaudited) | 12/31/12 | (unaudited) | 12/31/12 | |||||||||||||||||||||||||||
| INVESTMENT OPERATIONS: | ||||||||||||||||||||||||||||||||
| Net investment income (loss) | $ | (898,671 | ) | $ | 63,191,199 | $ | (3,013,184 | ) | $ | 1,716,521 | $ | (3,273,638 | ) | $ | 80,158,458 | |||||||||||||||||
| Net realized gain (loss) on investments and | ||||||||||||||||||||||||||||||||
foreign currency | 129,692,429 | 378,839,758 | 52,642,213 | 42,923,758 | 243,210,914 | 279,919,593 | ||||||||||||||||||||||||||
| Net change in unrealized appreciation | ||||||||||||||||||||||||||||||||
(depreciation) on investments and | ||||||||||||||||||||||||||||||||
foreign currency | 544,748,986 | 334,772,475 | (23,060,132 | ) | 35,269,614 | 274,560,770 | 365,993,509 | |||||||||||||||||||||||||
| Net increase (decrease) in net assets from | ||||||||||||||||||||||||||||||||
investment operations | 673,542,744 | 776,803,432 | 26,568,897 | 79,909,893 | 514,498,046 | 726,071,560 | ||||||||||||||||||||||||||
| DISTRIBUTIONS: | ||||||||||||||||||||||||||||||||
| Net investment income | ||||||||||||||||||||||||||||||||
Investment Class | – | (54,629,386 | ) | – | (251,657 | ) | – | (56,492,020 | ) | |||||||||||||||||||||||
Service Class | – | (3,420,121 | ) | – | – | – | (3,868,028 | ) | ||||||||||||||||||||||||
Consultant Class | – | (921,895 | ) | – | – | – | (58,930 | ) | ||||||||||||||||||||||||
Institutional Class | – | (7,313,426 | ) | – | (12,152,037 | ) | ||||||||||||||||||||||||||
W Class | – | (7,061,577 | ) | |||||||||||||||||||||||||||||
R Class | – | (151,956 | ) | – | (116,893 | ) | ||||||||||||||||||||||||||
K Class | – | (58,794 | ) | – | (211,170 | ) | ||||||||||||||||||||||||||
| Net realized gain on investments and | ||||||||||||||||||||||||||||||||
foreign currency | ||||||||||||||||||||||||||||||||
Investment Class | – | (228,773,446 | ) | – | (44,059,505 | ) | – | (277,063,842 | ) | |||||||||||||||||||||||
Service Class | – | (25,136,819 | ) | – | (7,356,916 | ) | – | (34,158,623 | ) | |||||||||||||||||||||||
Consultant Class | – | (39,332,146 | ) | – | (7,779,887 | ) | – | (3,996,638 | ) | |||||||||||||||||||||||
Institutional Class | – | (25,463,721 | ) | – | (51,201,959 | ) | ||||||||||||||||||||||||||
W Class | – | (32,235,493 | ) | |||||||||||||||||||||||||||||
R Class | – | (1,791,694 | ) | – | (1,746,454 | ) | ||||||||||||||||||||||||||
K Class | – | (502,561 | ) | – | (1,257,434 | ) | ||||||||||||||||||||||||||
| Total distributions | – | (387,495,965 | ) | – | (59,447,965 | ) | – | (481,621,098 | ) | |||||||||||||||||||||||
| CAPITAL SHARE TRANSACTIONS: | ||||||||||||||||||||||||||||||||
| Net capital share transactions | ||||||||||||||||||||||||||||||||
Investment Class | (169,061,407 | ) | (335,995,316 | ) | (107,471,648 | ) | (180,722,729 | ) | (278,353,086 | ) | (81,178,362 | ) | ||||||||||||||||||||
Service Class | 23,620,824 | 38,274,164 | (35,442,001 | ) | (15,930,771 | ) | (129,227,250 | ) | (91,558,488 | ) | ||||||||||||||||||||||
Consultant Class | (43,660,048 | ) | (52,892,588 | ) | (15,310,688 | ) | (14,554,956 | ) | (4,580,609 | ) | (1,059,390 | ) | ||||||||||||||||||||
Institutional Class | 55,679,132 | 232,958,907 | (68,887,792 | ) | 25,599,256 | |||||||||||||||||||||||||||
W Class | (51,741,428 | ) | (37,012,083 | ) | ||||||||||||||||||||||||||||
R Class | 2,304,697 | 8,694,966 | 1,482,071 | 4,268,797 | ||||||||||||||||||||||||||||
K Class | 142,570 | 2,702,838 | (2,134,228 | ) | 1,447,345 | |||||||||||||||||||||||||||
| Shareholder redemption fees | ||||||||||||||||||||||||||||||||
Investment Class | 33,681 | 159,022 | 23,841 | 29,714 | 90,324 | 151,679 | ||||||||||||||||||||||||||
Service Class | 18,538 | 45,638 | 9,501 | 9,218 | 5,060 | 32,028 | ||||||||||||||||||||||||||
| Net increase (decrease) in net assets from | ||||||||||||||||||||||||||||||||
capital share transactions | (130,922,013 | ) | (106,052,369 | ) | (158,190,995 | ) | (211,169,524 | ) | (533,346,938 | ) | (179,309,218 | ) | ||||||||||||||||||||
| NET INCREASE (DECREASE) IN NET ASSETS | 542,620,731 | 283,255,098 | (131,622,098 | ) | (190,707,596 | ) | (18,848,892 | ) | 65,141,244 | |||||||||||||||||||||||
| NET ASSETS: | ||||||||||||||||||||||||||||||||
Beginning of period | 5,891,132,433 | 5,607,877,335 | 970,691,780 | 1,161,399,376 | 6,688,772,168 | 6,623,630,924 | ||||||||||||||||||||||||||
End of period | $ | 6,433,753,164 | $ | 5,891,132,433 | $ | 839,069,682 | $ | 970,691,780 | $ | 6,669,923,276 | $ | 6,688,772,168 | ||||||||||||||||||||
| UNDISTRIBUTED NET INVESTMENT INCOME | ||||||||||||||||||||||||||||||||
(LOSS) AT END OF PERIOD | $ | (4,591,267 | ) | $ | (3,692,596 | ) | $ | (7,230,358 | ) | $ | (4,217,174 | ) | $ | 4,786,860 | $ | 8,060,497 | ||||||||||||||||
| THE ACCOMPANYING NOTES ARE AN INTEGRAL PART OF THESE FINANCIAL STATEMENTS. | The Royce Funds 2013 Semiannual Report to Shareholders | 91 |
Statements of Changes in Net Assets
| Royce Low-Priced Stock Fund | Royce Total Return Fund | Royce Heritage Fund | ||||||||||||||||||||||
| Six months ended | Six months ended | Six months ended | ||||||||||||||||||||||
| 6/30/13 | Year ended | 6/30/13 | Year ended | 6/30/13 | Year ended | |||||||||||||||||||
| (unaudited) | 12/31/12 | (unaudited) | 12/31/12 | (unaudited) | 12/31/12 | |||||||||||||||||||
| INVESTMENT OPERATIONS: | ||||||||||||||||||||||||
| Net investment income (loss) | $ | 900,111 | $ | 24,690,528 | $ | 22,890,160 | $ | 81,188,302 | $ | 195,186 | $ | 1,469,368 | ||||||||||||
Net realized gain (loss) on investments and foreign currency | 211,056,271 | 151,259,303 | 226,475,563 | 184,938,882 | 19,362,969 | 11,021,118 | ||||||||||||||||||
Net change in unrealized appreciation (depreciation) on investments and foreign currency | (226,949,449 | ) | (19,676,712 | ) | 329,877,764 | 334,217,094 | 5,739,466 | 23,058,809 | ||||||||||||||||
Net increase (decrease) in net assets from investment operations | (14,993,067 | ) | 156,273,119 | 579,243,487 | 600,344,278 | 25,297,621 | 35,549,295 | |||||||||||||||||
| DISTRIBUTIONS: | ||||||||||||||||||||||||
| Net investment income | ||||||||||||||||||||||||
Investment Class | – | (4,662,575 | ) | (15,168,398 | ) | (53,669,916 | ) | – | (349,590 | ) | ||||||||||||||
Service Class | – | (21,186,960 | ) | (1,604,414 | ) | (3,010,686 | ) | – | (611,643 | ) | ||||||||||||||
Consultant Class | – | (359,919 | ) | – | – | |||||||||||||||||||
Institutional Class | – | (17,457,085 | ) | (2,792,939 | ) | (8,049,250 | ) | |||||||||||||||||
W Class | (941,189 | ) | (2,959,883 | ) | ||||||||||||||||||||
R Class | – | (42,427 | ) | (114,308 | ) | (267,095 | ) | – | (1,807 | ) | ||||||||||||||
K Class | – | (134,605 | ) | (540,793 | ) | (2,164,963 | ) | – | (41,464 | ) | ||||||||||||||
Net realized gain on investments and foreign currency | ||||||||||||||||||||||||
Investment Class | – | (17,157,473 | ) | – | (133,827,796 | ) | – | (918,362 | ) | |||||||||||||||
Service Class | – | (116,022,410 | ) | – | (11,891,556 | ) | – | (5,058,972 | ) | |||||||||||||||
Consultant Class | – | (14,383,518 | ) | – | (427,725 | ) | ||||||||||||||||||
Institutional Class | – | (59,427,238 | ) | – | (17,842,030 | ) | ||||||||||||||||||
W Class | – | (7,371,475 | ) | |||||||||||||||||||||
R Class | – | (371,144 | ) | – | (2,086,921 | ) | – | (155,993 | ) | |||||||||||||||
K Class | – | (647,596 | ) | – | (9,380,378 | ) | – | (230,237 | ) | |||||||||||||||
| Total distributions | – | (237,109,513 | ) | (21,162,041 | ) | (267,265,386 | ) | – | (7,795,793 | ) | ||||||||||||||
| CAPITAL SHARE TRANSACTIONS: | ||||||||||||||||||||||||
| Net capital share transactions | ||||||||||||||||||||||||
Investment Class | (121,323,940 | ) | (10,702,232 | ) | (100,001,396 | ) | (292,787,502 | ) | 12,618,464 | 16,574,511 | ||||||||||||||
Service Class | (563,367,160 | ) | (652,700,848 | ) | 145,923,321 | (40,417,979 | ) | (13,894,048 | ) | (38,109,460 | ) | |||||||||||||
Consultant Class | (12,533,526 | ) | (23,892,297 | ) | (578,870 | ) | (1,264,043 | ) | ||||||||||||||||
Institutional Class | (360,942,903 | ) | 11,456,233 | 61,900,124 | (9,567,656 | ) | ||||||||||||||||||
W Class | 19,570,306 | 29,048,933 | ||||||||||||||||||||||
R Class | (1,838,266 | ) | (1,360,956 | ) | 4,731,684 | 11,084,404 | 1,058,448 | 288,324 | ||||||||||||||||
K Class | (806,695 | ) | (1,987,623 | ) | 11,669,467 | (26,785,638 | ) | (556,757 | ) | (1,534,883 | ) | |||||||||||||
| Shareholder redemption fees | ||||||||||||||||||||||||
Investment Class | 16,362 | 8,999 | 36,158 | 99,541 | 114 | 9,332 | ||||||||||||||||||
Service Class | 24,519 | 89,425 | 23,865 | 16,129 | 8,633 | 11,091 | ||||||||||||||||||
Net increase (decrease) in net assets from capital share transactions | (1,048,238,083 | ) | (655,197,002 | ) | 131,320,003 | (353,202,065 | ) | (1,344,016 | ) | (24,025,128 | ) | |||||||||||||
| NET INCREASE (DECREASE) IN NET ASSETS | (1,063,231,150 | ) | (736,033,396 | ) | 689,401,449 | (20,123,173 | ) | 23,953,605 | 3,728,374 | |||||||||||||||
| NET ASSETS: | ||||||||||||||||||||||||
Beginning of period | 3,037,164,179 | 3,773,197,575 | 4,432,671,077 | 4,452,794,250 | 269,304,419 | 265,576,045 | ||||||||||||||||||
End of period | $ | 1,973,933,029 | $ | 3,037,164,179 | $ | 5,122,072,526 | $ | 4,432,671,077 | $ | 293,258,024 | $ | 269,304,419 | ||||||||||||
UNDISTRIBUTED NET INVESTMENT INCOME (LOSS) AT END OF PERIOD | $ | (37,578,825 | ) | $ | (38,478,936 | ) | $ | (4,745,638 | ) | $ | (6,473,757 | ) | $ | 89,679 | $ | (105,508 | ) | |||||||
| 92 | The Royce Funds 2013 Semiannual Report to Shareholders | THE ACCOMPANYING NOTES ARE AN INTEGRAL PART OF THESE FINANCIAL STATEMENTS. |
| Royce Opportunity Fund | Royce Special Equity Fund | Royce Value Fund | ||||||||||||||||||||||
| Six months ended | Six months ended | Six months ended | ||||||||||||||||||||||
| 6/30/13 | Year ended | 6/30/13 | Year ended | 6/30/13 | Year ended | |||||||||||||||||||
| (unaudited) | 12/31/12 | (unaudited) | 12/31/12 | (unaudited) | 12/31/12 | |||||||||||||||||||
| INVESTMENT OPERATIONS: | ||||||||||||||||||||||||
| Net investment income (loss) | $ | (3,303,326 | ) | $ | 102,039 | $ | 5,398,463 | $ | 60,607,144 | $ | (744,340 | ) | $ | 14,771,880 | ||||||||||
Net realized gain (loss) on investments and foreign currency | 143,167,977 | 109,724,848 | 106,137,857 | 141,201,929 | 6,394,417 | 52,407,833 | ||||||||||||||||||
Net change in unrealized appreciation (depreciation) on investments and foreign currency | 208,431,055 | 244,768,732 | 255,612,121 | 181,861,687 | 96,479,540 | 61,602,303 | ||||||||||||||||||
Net increase (decrease) in net assets from investment operations | 348,295,706 | 354,595,619 | 367,148,441 | 383,670,760 | 102,129,617 | 128,782,016 | ||||||||||||||||||
| DISTRIBUTIONS: | ||||||||||||||||||||||||
| Net investment income | ||||||||||||||||||||||||
Investment Class | – | – | – | (42,635,374 | ) | – | (2,519,414 | ) | ||||||||||||||||
Service Class | – | – | – | (4,207,327 | ) | – | (7,612,610 | ) | ||||||||||||||||
Consultant Class | – | – | – | (638,032 | ) | – | (90,458 | ) | ||||||||||||||||
Institutional Class | – | – | – | (13,115,881 | ) | – | (2,720,021 | ) | ||||||||||||||||
R Class | – | – | – | (226,100 | ) | |||||||||||||||||||
K Class | – | – | – | (231,059 | ) | |||||||||||||||||||
Net realized gain on investments and foreign currency | ||||||||||||||||||||||||
Investment Class | – | (50,051,234 | ) | – | (100,542,375 | ) | – | (9,221,480 | ) | |||||||||||||||
Service Class | – | (9,506,373 | ) | – | (12,209,477 | ) | – | (37,662,892 | ) | |||||||||||||||
Consultant Class | – | (699,843 | ) | – | (2,985,183 | ) | – | (1,611,685 | ) | |||||||||||||||
Institutional Class | – | (36,267,105 | ) | – | (27,981,290 | ) | – | (8,879,772 | ) | |||||||||||||||
R Class | – | (374,879 | ) | – | (1,683,262 | ) | ||||||||||||||||||
K Class | – | (504,189 | ) | – | (1,016,272 | ) | ||||||||||||||||||
| Total distributions | – | (97,403,623 | ) | – | (204,314,939 | ) | – | (73,475,025 | ) | |||||||||||||||
| CAPITAL SHARE TRANSACTIONS: | ||||||||||||||||||||||||
| Net capital share transactions | ||||||||||||||||||||||||
Investment Class | (2,973,981 | ) | (96,250,867 | ) | 11,182,315 | 245,485,021 | (40,805,561 | ) | (20,874,943 | ) | ||||||||||||||
Service Class | 55,070,512 | 18,730,839 | 14,138,139 | 19,208,306 | (192,592,276 | ) | (288,914,041 | ) | ||||||||||||||||
Consultant Class | 667,903 | (1,632,584 | ) | (1,052,448 | ) | 3,989,935 | (6,589,900 | ) | (3,805,405 | ) | ||||||||||||||
Institutional Class | 39,803,692 | 25,874,792 | 18,705,929 | 54,304,122 | (11,597,659 | ) | 4,907,087 | |||||||||||||||||
R Class | 5,385,152 | 2,950,304 | (3,334,834 | ) | 2,483,316 | |||||||||||||||||||
K Class | 1,527,079 | 1,362,780 | (1,783,632 | ) | 3,867,457 | |||||||||||||||||||
| Shareholder redemption fees | ||||||||||||||||||||||||
Investment Class | 9,329 | 34,806 | 47,833 | 131,211 | 2,237 | 11,705 | ||||||||||||||||||
Service Class | 3,660 | 1,830 | 10,629 | 29,902 | 20,371 | 63,509 | ||||||||||||||||||
Net increase (decrease) in net assets from capital share transactions | 99,493,346 | (48,928,100 | ) | 43,032,397 | 323,148,497 | (256,681,254 | ) | (302,261,315 | ) | |||||||||||||||
| NET INCREASE (DECREASE) IN NET ASSETS | 447,789,052 | 208,263,896 | 410,180,838 | 502,504,318 | (154,551,637 | ) | (246,954,324 | ) | ||||||||||||||||
| NET ASSETS: | ||||||||||||||||||||||||
Beginning of period | 1,843,866,194 | 1,635,602,298 | 2,928,148,646 | 2,425,644,328 | 1,329,999,921 | 1,576,954,245 | ||||||||||||||||||
End of period | $ | 2,291,655,246 | $ | 1,843,866,194 | $ | 3,338,329,484 | $ | 2,928,148,646 | $ | 1,175,448,284 | $ | 1,329,999,921 | ||||||||||||
UNDISTRIBUTED NET INVESTMENT INCOME (LOSS) AT END OF PERIOD | $ | (4,021,671 | ) | $ | (718,346 | ) | $ | 5,503,197 | $ | 104,734 | $ | 483,543 | $ | 1,227,883 | ||||||||||
| THE ACCOMPANYING NOTES ARE AN INTEGRAL PART OF THESE FINANCIAL STATEMENTS. | The Royce Funds 2013 Semiannual Report to Shareholders | 93 |
Statements of Changes in Net Assets
| Royce Value Plus Fund | Royce 100 Fund | Royce Dividend Value Fund | ||||||||||||||||||||||
| Six months ended | Six months ended | Six months ended | ||||||||||||||||||||||
| 6/30/13 | Year ended | 6/30/13 | Year ended | 6/30/13 | Year ended | |||||||||||||||||||
| (unaudited) | 12/31/12 | (unaudited) | 12/31/12 | (unaudited) | 12/31/12 | |||||||||||||||||||
| INVESTMENT OPERATIONS: | ||||||||||||||||||||||||
| Net investment income (loss) | $ | (3,993,267 | ) | $ | (4,512,013 | ) | $ | (387,299 | ) | $ | 3,820,129 | $ | 2,526,804 | $ | 6,466,075 | |||||||||
Net realized gain (loss) on investments and foreign currency | 103,078,923 | 73,209,917 | 20,499,133 | 22,129,056 | 6,961,722 | 4,715,713 | ||||||||||||||||||
Net change in unrealized appreciation (depreciation) on investments and foreign currency | 68,192,210 | 200,771,476 | 10,568,506 | 10,234,695 | 35,599,019 | 43,493,780 | ||||||||||||||||||
Net increase (decrease) in net assets from investment operations | 167,277,866 | 269,469,380 | 30,680,340 | 36,183,880 | 45,087,545 | 54,675,568 | ||||||||||||||||||
| DISTRIBUTIONS: | ||||||||||||||||||||||||
| Net investment income | ||||||||||||||||||||||||
Investment Class | – | – | – | (1,109,858 | ) | (990,068 | ) | (1,908,107 | ) | |||||||||||||||
Service Class | – | – | – | (2,171,815 | ) | (1,538,172 | ) | (2,958,083 | ) | |||||||||||||||
Consultant Class | – | – | ||||||||||||||||||||||
Institutional Class | – | – | (180,055 | ) | (249,765 | ) | ||||||||||||||||||
R Class | – | – | – | – | ||||||||||||||||||||
K Class | – | – | – | (13,851 | ) | |||||||||||||||||||
Net realized gain on investments and foreign currency | ||||||||||||||||||||||||
Investment Class | – | – | – | (5,347,166 | ) | – | (281,579 | ) | ||||||||||||||||
Service Class | – | – | – | (17,649,123 | ) | – | (594,951 | ) | ||||||||||||||||
Consultant Class | – | – | ||||||||||||||||||||||
Institutional Class | – | – | – | (55,684 | ) | |||||||||||||||||||
R Class | – | – | – | (157,770 | ) | |||||||||||||||||||
K Class | – | – | – | (235,061 | ) | |||||||||||||||||||
| Total distributions | – | – | – | (26,684,644 | ) | (2,708,295 | ) | (6,048,169 | ) | |||||||||||||||
| CAPITAL SHARE TRANSACTIONS: | ||||||||||||||||||||||||
| Net capital share transactions | ||||||||||||||||||||||||
Investment Class | (22,878,773 | ) | (113,741,824 | ) | (20,240,082 | ) | 4,430,476 | 41,935,560 | 18,217,648 | |||||||||||||||
Service Class | (139,228,631 | ) | (637,273,254 | ) | (29,924,609 | ) | (98,413,720 | ) | 47,138,156 | 19,094,095 | ||||||||||||||
Consultant Class | (1,639,248 | ) | (3,330,475 | ) | ||||||||||||||||||||
Institutional Class | (48,517,923 | ) | (81,721,749 | ) | 451,986 | 21,931,199 | ||||||||||||||||||
R Class | 195,363 | (15,162 | ) | (346,928 | ) | (1,037,720 | ) | |||||||||||||||||
K Class | 347,933 | (84,938 | ) | (90,569 | ) | (1,079,162 | ) | |||||||||||||||||
| Shareholder redemption fees | ||||||||||||||||||||||||
Investment Class | 8,550 | 5,789 | 2,777 | 3,283 | 3,315 | 19,184 | ||||||||||||||||||
Service Class | 15,341 | 43,741 | 3,917 | 22,175 | 20,900 | 11,034 | ||||||||||||||||||
Net increase (decrease) in net assets from capital share transactions | (211,697,388 | ) | (836,117,872 | ) | (50,595,494 | ) | (96,074,668 | ) | 89,549,917 | 59,273,160 | ||||||||||||||
| NET INCREASE (DECREASE) IN NET ASSETS | (44,419,522 | ) | (566,648,492 | ) | (19,915,154 | ) | (86,575,432 | ) | 131,929,167 | 107,900,559 | ||||||||||||||
| NET ASSETS: | ||||||||||||||||||||||||
Beginning of period | 1,432,647,711 | 1,999,296,203 | 295,177,406 | 381,752,838 | 394,722,870 | 286,822,311 | ||||||||||||||||||
End of period | $ | 1,388,228,189 | $ | 1,432,647,711 | $ | 275,262,252 | $ | 295,177,406 | $ | 526,652,037 | $ | 394,722,870 | ||||||||||||
UNDISTRIBUTED NET INVESTMENT INCOME (LOSS) AT END OF PERIOD | $ | (8,137,999 | ) | $ | (4,144,731 | ) | $ | 140,924 | $ | 528,222 | $ | 1,345,986 | $ | 1,527,478 | ||||||||||
| 94 | The Royce Funds 2013 Semiannual Report to Shareholders | THE ACCOMPANYING NOTES ARE AN INTEGRAL PART OF THESE FINANCIAL STATEMENTS. |
| Royce International Smaller- | ||||||||||||||||
| Royce Global Value Fund | Companies Fund | |||||||||||||||
| Six months ended | Six months ended | |||||||||||||||
| 6/30/13 | Year ended | 6/30/13 | Year ended | |||||||||||||
| (unaudited) | 12/31/12 | (unaudited) | 12/31/12 | |||||||||||||
| INVESTMENT OPERATIONS: | ||||||||||||||||
| Net investment income (loss) | $ | 1,910,811 | $ | 3,023,958 | $ | 196,976 | $ | 312,115 | ||||||||
| Net realized gain (loss) on investments and foreign currency | (9,713,575 | ) | (35,393,527 | ) | 1,258,632 | (470,078 | ) | |||||||||
Net change in unrealized appreciation (depreciation) on investments and foreign currency | (4,978,856 | ) | 61,537,989 | (1,829,824 | ) | 4,127,441 | ||||||||||
| Net increase (decrease) in net assets from investment operations | (12,781,620 | ) | 29,168,420 | (374,216 | ) | 3,969,478 | ||||||||||
| DISTRIBUTIONS: | ||||||||||||||||
| Net investment income | ||||||||||||||||
Investment Class | – | (2,257,000 | ) | |||||||||||||
Service Class | – | (672,322 | ) | – | (351,848 | ) | ||||||||||
Consultant Class | – | (28,794 | ) | |||||||||||||
R Class | – | (950 | ) | |||||||||||||
K Class | – | (565 | ) | |||||||||||||
| Net realized gain on investments and foreign currency | ||||||||||||||||
Investment Class | – | – | ||||||||||||||
Service Class | – | – | – | – | ||||||||||||
Consultant Class | – | – | ||||||||||||||
R Class | – | – | ||||||||||||||
K Class | – | – | ||||||||||||||
| Total distributions | – | (2,959,631 | ) | – | (351,848 | ) | ||||||||||
| CAPITAL SHARE TRANSACTIONS: | ||||||||||||||||
| Net capital share transactions | ||||||||||||||||
Investment Class | 3,765,278 | 23,272,708 | ||||||||||||||
Service Class | (30,053,333 | ) | (34,945,055 | ) | 5,636,534 | 2,636,481 | ||||||||||
Consultant Class | 1,719,838 | 3,019,093 | ||||||||||||||
R Class | 15,934 | 76,841 | ||||||||||||||
K Class | – | 42,936 | ||||||||||||||
| Shareholder redemption fees | ||||||||||||||||
Investment Class | 18,961 | 51,565 | ||||||||||||||
Service Class | 5,590 | 31,111 | 4,104 | 13,906 | ||||||||||||
| Net increase (decrease) in net assets from capital share transactions | (24,527,732 | ) | (8,450,801 | ) | 5,640,638 | 2,650,387 | ||||||||||
| NET INCREASE (DECREASE) IN NET ASSETS | (37,309,352 | ) | 17,757,988 | 5,266,422 | 6,268,017 | |||||||||||
| NET ASSETS: | ||||||||||||||||
Beginning of period | 300,097,145 | 282,339,157 | 26,370,886 | 20,102,869 | ||||||||||||
End of period | $ | 262,787,793 | $ | 300,097,145 | $ | 31,637,308 | $ | 26,370,886 | ||||||||
| UNDISTRIBUTED NET INVESTMENT INCOME (LOSS) AT END OF PERIOD | $ | 1,884,543 | $ | (26,269 | ) | $ | 154,120 | $ | (42,855 | ) | ||||||
| THE ACCOMPANYING NOTES ARE AN INTEGRAL PART OF THESE FINANCIAL STATEMENTS. | The Royce Funds 2013 Semiannual Report to Shareholders | 95 |
| Statements of Operations | Six Months Ended June 30, 2013 (unaudited) |
| Royce | Royce | Royce | Royce | Royce | Royce | Royce | ||||||||||||||||||||||
| Pennsylvania | Micro-Cap | Premier | Low-Priced | Total Return | Heritage | Opportunity | ||||||||||||||||||||||
| Mutual Fund | Fund | Fund | Stock Fund | Fund | Fund | Fund | ||||||||||||||||||||||
| INVESTMENT INCOME: | ||||||||||||||||||||||||||||
| Income: | ||||||||||||||||||||||||||||
Dividends | ||||||||||||||||||||||||||||
Non-Affiliated Companies | $ | 30,784,688 | $ | 4,483,430 | $ | 20,984,294 | $ | 17,829,953 | $ | 53,435,907 | $ | 2,347,145 | $ | 8,269,829 | ||||||||||||||
Affiliated Companies | 523,203 | 243,793 | 14,759,028 | 1,868,742 | 625,306 | – | 23,642 | |||||||||||||||||||||
Foreign withholding tax | (674,948 | ) | (363,100 | ) | (1,802,995 | ) | (1,195,526 | ) | (1,284,502 | ) | (93,410 | ) | (35,200 | ) | ||||||||||||||
Interest | 176,280 | 9,906 | 41,869 | 6,740 | 94,921 | 1,181 | 22,288 | |||||||||||||||||||||
Securities lending | 958,865 | 258,453 | 266,673 | 253,575 | 184,627 | 1,579 | 533,099 | |||||||||||||||||||||
| Total income | 31,768,088 | 4,632,482 | 34,248,869 | 18,763,484 | 53,056,259 | 2,256,495 | 8,813,658 | |||||||||||||||||||||
| Expenses: | ||||||||||||||||||||||||||||
Investment advisory fees | 23,707,790 | 5,901,112 | 31,897,784 | 14,696,797 | 23,691,321 | 1,437,081 | 10,473,808 | |||||||||||||||||||||
Distribution fees | 4,169,422 | 685,675 | 1,050,699 | 1,937,486 | 2,652,073 | 359,644 | 413,356 | |||||||||||||||||||||
Shareholder servicing | 3,316,445 | 600,842 | 2,822,186 | 1,621,801 | 2,590,078 | 154,790 | 786,768 | |||||||||||||||||||||
Shareholder reports | 584,793 | 201,345 | 738,438 | 363,179 | 482,282 | 38,584 | 121,945 | |||||||||||||||||||||
Administrative and office facilities | 343,967 | 61,946 | 396,690 | 195,306 | 267,885 | 15,988 | 107,461 | |||||||||||||||||||||
Custody | 241,551 | 146,862 | 270,362 | 236,827 | 210,594 | 36,866 | 92,717 | |||||||||||||||||||||
Trustees’ fees | 102,599 | 19,320 | 118,886 | 61,899 | 78,832 | 4,727 | 31,159 | |||||||||||||||||||||
Registration | 54,543 | 26,780 | 66,679 | 35,068 | 66,957 | 21,853 | 33,138 | |||||||||||||||||||||
Audit | 36,544 | 30,720 | 36,773 | 34,023 | 32,471 | 19,779 | 22,545 | |||||||||||||||||||||
Legal | 32,564 | 5,869 | 37,334 | 18,532 | 25,058 | 1,497 | 10,068 | |||||||||||||||||||||
Other expenses | 78,466 | 15,895 | 88,318 | 49,794 | 70,196 | 4,905 | 24,517 | |||||||||||||||||||||
| Total expenses | 32,668,684 | 7,696,366 | 37,524,149 | 19,250,712 | 30,167,747 | 2,095,714 | 12,117,482 | |||||||||||||||||||||
| Compensating balance credits | (1,925 | ) | (508 | ) | (1,642 | ) | (682 | ) | (1,648 | ) | (231 | ) | (498 | ) | ||||||||||||||
| Fees waived by distributor | – | – | – | (76,698 | ) | – | (31,465 | ) | – | |||||||||||||||||||
| Expenses reimbursed by investment adviser | – | (50,192 | ) | – | (1,309,959 | ) | – | (2,709 | ) | – | ||||||||||||||||||
| Net expenses | 32,666,759 | 7,645,666 | 37,522,507 | 17,863,373 | 30,166,099 | 2,061,309 | 12,116,984 | |||||||||||||||||||||
| Net investment income (loss) | (898,671 | ) | (3,013,184 | ) | (3,273,638 | ) | 900,111 | 22,890,160 | 195,186 | (3,303,326 | ) | |||||||||||||||||
| REALIZED AND UNREALIZED GAIN (LOSS) ON INVESTMENTS AND FOREIGN CURRENCY: | ||||||||||||||||||||||||||||
| Net realized gain (loss): | ||||||||||||||||||||||||||||
Investments in Non-Affiliated Companies | 123,647,282 | 57,517,720 | 266,984,035 | 221,525,729 | 226,499,931 | 19,393,494 | 142,144,285 | |||||||||||||||||||||
Investments in Affiliated Companies | 6,055,361 | (4,692,103 | ) | (23,819,736 | ) | (10,443,159 | ) | – | – | 1,023,724 | ||||||||||||||||||
Foreign currency transactions | (10,214 | ) | (183,404 | ) | 46,615 | (26,299 | ) | (24,368 | ) | (30,525 | ) | (32 | ) | |||||||||||||||
| Net change in unrealized appreciation (depreciation): | ||||||||||||||||||||||||||||
Investments and foreign currency translations | 544,755,563 | (23,048,838 | ) | 274,615,573 | (226,926,025 | ) | 329,889,451 | 5,746,504 | 208,431,351 | |||||||||||||||||||
Other assets and liabilities denominated in foreign currency | (6,577 | ) | (11,294 | ) | (54,803 | ) | (23,424 | ) | (11,687 | ) | (7,038 | ) | (296 | ) | ||||||||||||||
Net realized and unrealized gain (loss) on investments and foreign currency | 674,441,415 | 29,582,081 | 517,771,684 | (15,893,178 | ) | 556,353,327 | 25,102,435 | 351,599,032 | ||||||||||||||||||||
| NET INCREASE (DECREASE) IN NET ASSETS | ||||||||||||||||||||||||||||
| FROM INVESTMENT OPERATIONS | $ | 673,542,744 | $ | 26,568,897 | $ | 514,498,046 | $ | (14,993,067 | ) | $ | 579,243,487 | $ | 25,297,621 | $ | 348,295,706 | |||||||||||||
| 96 | The Royce Funds 2013 Semiannual Report to Shareholders | THE ACCOMPANYING NOTES ARE AN INTEGRAL PART OF THESE FINANCIAL STATEMENTS. |
| Statements of Operations | Six Months Ended June 30, 2013 (unaudited) |
| Royce | Royce | Royce | Royce | Royce | Royce | Royce International | ||||||||||||||||||||||
| Special Equity | Value | Value Plus | 100 | Dividend | Global | Smaller- | ||||||||||||||||||||||
| Fund | Fund | Fund | Fund | Value Fund | Value Fund | Companies Fund | ||||||||||||||||||||||
| INVESTMENT INCOME: | ||||||||||||||||||||||||||||
| Income: | ||||||||||||||||||||||||||||
Dividends | ||||||||||||||||||||||||||||
Non-Affiliated Companies | $ | 9,091,105 | $ | 8,102,968 | $ | 5,656,994 | $ | 1,762,343 | $ | 5,799,523 | $ | 4,704,602 | $ | 481,523 | ||||||||||||||
Affiliated Companies | 14,480,822 | – | – | – | – | – | – | |||||||||||||||||||||
Foreign withholding tax | – | (167,255 | ) | (158,933 | ) | (39,020 | ) | (142,708 | ) | (492,336 | ) | (47,537 | ) | |||||||||||||||
Interest | 52,864 | 5,893 | 6,848 | 1,012 | 2,817 | 1,758 | 159 | |||||||||||||||||||||
Securities lending | 18 | 140,085 | 438,523 | 3,632 | 34,010 | 13,446 | – | |||||||||||||||||||||
| Total income | 23,624,809 | 8,081,691 | 5,943,432 | 1,727,967 | 5,693,642 | 4,227,470 | 434,145 | |||||||||||||||||||||
| Expenses: | ||||||||||||||||||||||||||||
Investment advisory fees | 15,630,269 | 6,276,001 | 7,093,206 | 1,498,338 | 2,377,787 | 1,800,299 | 175,421 | |||||||||||||||||||||
Distribution fees | 653,752 | 1,232,515 | 1,303,771 | 291,724 | 373,666 | 225,559 | 35,084 | |||||||||||||||||||||
Shareholder servicing | 1,253,575 | 870,912 | 1,083,450 | 202,309 | 248,217 | 174,189 | 22,712 | |||||||||||||||||||||
Shareholder reports | 275,753 | 176,510 | 258,765 | 77,187 | 72,013 | 44,518 | 3,751 | |||||||||||||||||||||
Administrative and office facilities | 165,825 | 82,792 | 96,075 | 19,801 | 21,746 | 17,701 | 1,450 | |||||||||||||||||||||
Custody | 114,431 | 78,240 | 83,250 | 17,470 | 39,993 | 79,866 | 23,274 | |||||||||||||||||||||
Trustees’ fees | 48,147 | 25,736 | 30,668 | 6,167 | 6,105 | 5,264 | 417 | |||||||||||||||||||||
Registration | 57,708 | 32,296 | 32,314 | 17,262 | 28,710 | 26,643 | 10,299 | |||||||||||||||||||||
Audit | 29,983 | 22,698 | 22,627 | 14,825 | 16,732 | 17,376 | 10,523 | |||||||||||||||||||||
Legal | 15,518 | 7,840 | 9,206 | 1,878 | 2,018 | 1,643 | 134 | |||||||||||||||||||||
Other expenses | 34,564 | 21,299 | 26,923 | 5,936 | 4,761 | 6,189 | 572 | |||||||||||||||||||||
| Total expenses | 18,279,525 | 8,826,839 | 10,040,255 | 2,152,897 | 3,191,748 | 2,399,247 | 283,637 | |||||||||||||||||||||
| Compensating balance credits | (1,407 | ) | (808 | ) | (471 | ) | (291 | ) | (559 | ) | (134 | ) | (19 | ) | ||||||||||||||
| Fees waived by investment adviser and distributor | – | – | (95,975 | ) | (22,444 | ) | (14,947 | ) | – | (46,449 | ) | |||||||||||||||||
| Expenses reimbursed by investment adviser | (51,772 | ) | – | (7,110 | ) | (14,896 | ) | (9,404 | ) | (82,454 | ) | – | ||||||||||||||||
| Net expenses | 18,226,346 | 8,826,031 | 9,936,699 | 2,115,266 | 3,166,838 | 2,316,659 | 237,169 | |||||||||||||||||||||
| Net investment income (loss) | 5,398,463 | (744,340 | ) | (3,993,267 | ) | (387,299 | ) | 2,526,804 | 1,910,811 | 196,976 | ||||||||||||||||||
| REALIZED AND UNREALIZED GAIN (LOSS) ON INVESTMENTS AND FOREIGN CURRENCY: | ||||||||||||||||||||||||||||
| Net realized gain (loss): | ||||||||||||||||||||||||||||
Investments in Non-Affiliated Companies | 40,412,062 | 6,373,722 | 102,002,651 | 20,500,702 | 6,955,649 | (9,690,311 | ) | 1,277,086 | ||||||||||||||||||||
Investments in Affiliated Companies | 65,725,795 | – | 1,086,121 | – | – | – | – | |||||||||||||||||||||
Foreign currency transactions | – | 20,695 | (9,849 | ) | (1,569 | ) | 6,073 | (23,264 | ) | (18,454 | ) | |||||||||||||||||
| Net change in unrealized appreciation (depreciation): | ||||||||||||||||||||||||||||
Investments and foreign currency translations | 255,612,121 | 96,483,527 | 68,195,471 | 10,569,192 | 35,602,118 | (4,983,229 | ) | (1,834,802 | ) | |||||||||||||||||||
Other assets and liabilities denominated in foreign currency | – | (3,987 | ) | (3,261 | ) | (686 | ) | (3,099 | ) | 4,373 | 4,978 | |||||||||||||||||
Net realized and unrealized gain (loss) on investments and foreign currency | 361,749,978 | 102,873,957 | 171,271,133 | 31,067,639 | 42,560,741 | (14,692,431 | ) | (571,192 | ) | |||||||||||||||||||
| NET INCREASE (DECREASE) IN NET ASSETS | ||||||||||||||||||||||||||||
| FROM INVESTMENT OPERATIONS | $ | 367,148,441 | $ | 102,129,617 | $ | 167,277,866 | $ | 30,680,340 | $ | 45,087,545 | $ | (12,781,620 | ) | $ | (374,216 | ) | ||||||||||||
| THE ACCOMPANYING NOTES ARE AN INTEGRAL PART OF THESE FINANCIAL STATEMENTS. | The Royce Funds 2013 Semiannual Report to Shareholders | 97 |
|
Financial Highlights |
|
| |||||||||||||||||||||||||||||||||||||||||||||||||||||||||
|
| Net Asset |
| Net |
| Net Realized and Unrealized |
|
| Distributions |
| Distributions from Net |
|
|
|
|
|
|
|
|
| Ratio of Expenses to Average Net Assets |
| Ratio of Net Investment |
|
| ||||||||||||||||||||||||||||||||
|
| Value, |
| Investment |
| Gain (Loss) on |
| Total from Investment Operations |
| from Net Investment Income |
| Realized Gain on |
| Distributions |
| Total Distributions |
| Shareholder Redemption Fees |
| Net Asset |
| Total Return |
| Net Assets, |
| Prior to Fee |
| Prior |
| Net of |
| Income (Loss) |
| Portfolio Turnover Rate |
| ||||||||||||||||||||||
|
|
|
|
|
|
|
|
|
|
|
|
|
|
|
|
|
|
|
|
|
|
|
|
|
|
|
|
|
|
|
|
|
|
|
|
|
|
|
|
|
|
|
|
|
|
|
|
|
|
|
|
|
|
|
|
|
|
Royce Pennsylvania Mutual Fund – Investment Class | |||||||||||||||||||||||||||||||||||||||||||||||||||||||||
†2013 |
| $ | 11.50 |
| $ | 0.01 |
| $ | 1.32 |
| $ | 1.33 |
| $ | – |
| $ | – |
| $ | – |
| $ | – |
| $ | – |
| $ | 12.83 |
|
| 11.57 | %1 | $ | 4,550,074 |
|
| 0.91 | %2 |
|
| 0.91 | %2 |
|
| 0.91 | %2 |
|
| 0.10 | %2 |
|
| 12 | % |
|
2012 |
|
| 10.76 |
|
| 0.15 |
|
| 1.39 |
|
| 1.54 |
|
| (0.15 | ) |
| (0.65 | ) |
| – |
|
| (0.80 | ) |
| – |
|
| 11.50 |
|
| 14.58 |
|
| 4,232,988 |
|
| 0.89 |
|
|
| 0.89 |
|
|
| 0.89 |
|
|
| 1.19 |
|
|
| 22 |
|
|
2011 |
|
| 11.65 |
|
| 0.01 |
|
| (0.50 | ) |
| (0.49 | ) |
| (0.02 | ) |
| (0.38 | ) |
| – |
|
| (0.40 | ) |
| – |
|
| 10.76 |
|
| (4.17 | ) |
| 4,266,754 |
|
| 0.90 |
|
|
| 0.90 |
|
|
| 0.90 |
|
|
| 0.11 |
|
|
| 20 |
|
|
2010 |
|
| 9.45 |
|
| 0.06 |
|
| 2.19 |
|
| 2.25 |
|
| (0.05 | ) |
| – |
|
| – |
|
| (0.05 | ) |
| – |
|
| 11.65 |
|
| 23.86 |
|
| 4,735,403 |
|
| 0.90 |
|
|
| 0.90 |
|
|
| 0.90 |
|
|
| 0.63 |
|
|
| 25 |
|
|
2009 |
|
| 6.94 |
|
| 0.02 |
|
| 2.50 |
|
| 2.52 |
|
| (0.01 | ) |
| – |
|
| – |
|
| (0.01 | ) |
| – |
|
| 9.45 |
|
| 36.28 |
|
| 3,555,507 |
|
| 0.92 |
|
|
| 0.92 |
|
|
| 0.92 |
|
|
| 0.33 |
|
|
| 23 |
|
|
2008 |
|
| 10.82 |
|
| 0.05 |
|
| (3.82 | ) |
| (3.77 | ) |
| (0.01 | ) |
| (0.10 | ) |
| – |
|
| (0.11 | ) |
| – |
|
| 6.94 |
|
| (34.78 | ) |
| 2,293,526 |
|
| 0.90 |
|
|
| 0.89 |
|
|
| 0.89 |
|
|
| 0.55 |
|
|
| 36 |
|
|
Royce Pennsylvania Mutual Fund – Service Class | |||||||||||||||||||||||||||||||||||||||||||||||||||||||||
†2013 |
| $ | 11.51 |
| $ | (0.01 | ) | $ | 1.32 |
| $ | 1.31 |
| $ | – |
| $ | – |
| $ | – |
| $ | – |
| $ | – |
| $ | 12.82 |
|
| 11.38 | %1 | $ | 551,598 |
|
| 1.22 | %2 |
|
| 1.22 | %2 |
|
| 1.22 | %2 |
|
| (0.21 | )%2 |
|
| 12 | % |
|
2012 |
|
| 10.75 |
|
| 0.10 |
|
| 1.40 |
|
| 1.50 |
|
| (0.09 | ) |
| (0.65 | ) |
| – |
|
| (0.74 | ) |
| – |
|
| 11.51 |
|
| 14.15 |
| $ | 473,624 |
|
| 1.24 |
|
|
| 1.24 |
|
|
| 1.24 |
|
|
| 0.90 |
|
|
| 22 |
|
|
2011 |
|
| 11.65 |
|
| (0.02 | ) |
| (0.50 | ) |
| (0.52 | ) |
| – |
|
| (0.38 | ) |
| – |
|
| (0.38 | ) |
| – |
|
| 10.75 |
|
| (4.42 | ) |
| 406,052 |
|
| 1.19 |
|
|
| 1.19 |
|
|
| 1.19 |
|
|
| (0.18 | ) |
|
| 20 |
|
|
2010 |
|
| 9.41 |
|
| 0.02 |
|
| 2.20 |
|
| 2.22 |
|
| – |
|
| – |
|
| – |
|
| – |
|
| 0.02 |
|
| 11.65 |
|
| 23.80 |
|
| 448,784 |
|
| 1.27 |
|
|
| 1.27 |
|
|
| 1.25 |
|
|
| 0.18 |
|
|
| 25 |
|
|
2009 |
|
| 6.90 |
|
| (0.00 | ) |
| 2.49 |
|
| 2.49 |
|
| – |
|
| – |
|
| – |
|
| – |
|
| 0.02 |
|
| 9.41 |
|
| 36.38 |
|
| 609,445 |
|
| 1.31 |
|
|
| 1.31 |
|
|
| 1.29 |
|
|
| (0.05 | ) |
|
| 23 |
|
|
2008 |
|
| 10.78 |
|
| 0.04 |
|
| (3.82 | ) |
| (3.78 | ) |
| – |
|
| (0.10 | ) |
| – |
|
| (0.10 | ) |
| – |
|
| 6.90 |
|
| (35.00 | ) |
| 115,959 |
|
| 1.11 |
|
|
| 1.11 |
|
|
| 1.11 |
|
|
| 0.41 |
|
|
| 36 |
|
|
Royce Pennsylvania Mutual Fund – Consultant Class | |||||||||||||||||||||||||||||||||||||||||||||||||||||||||
†2013 |
| $ | 10.29 |
| $ | (0.05 | ) | $ | 1.18 |
| $ | 1.13 |
| $ | – |
| $ | – |
| $ | – |
| $ | – |
| $ | – |
| $ | 11.42 |
|
| 10.98 | %1 | $ | 681,999 |
|
| 1.91 | %2 |
|
| 1.91 | %2 |
|
| 1.91 | %2 |
|
| (0.90 | )%2 |
|
| 12 | % |
|
2012 |
|
| 9.69 |
|
| 0.01 |
|
| 1.25 |
|
| 1.26 |
|
| (0.01 | ) |
| (0.65 | ) |
| – |
|
| (0.66 | ) |
| – |
|
| 10.29 |
|
| 13.27 | % |
| 654,642 |
|
| 1.97 |
|
|
| 1.97 |
|
|
| 1.97 |
|
|
| 0.12 |
|
|
| 22 |
|
|
2011 |
|
| 10.61 |
|
| (0.09 | ) |
| (0.45 | ) |
| (0.54 | ) |
| – |
|
| (0.38 | ) |
| – |
|
| (0.38 | ) |
| – |
|
| 9.69 |
|
| (5.05 | ) |
| 664,778 |
|
| 1.85 |
|
|
| 1.85 |
|
|
| 1.85 |
|
|
| (0.85 | ) |
|
| 20 |
|
|
2010 |
|
| 8.65 |
|
| (0.03 | ) |
| 1.99 |
|
| 1.96 |
|
| – |
|
| – |
|
| – |
|
| – |
|
| – |
|
| 10.61 |
|
| 22.66 |
|
| 841,525 |
|
| 1.87 |
|
|
| 1.87 |
|
|
| 1.87 |
|
|
| (0.36 | ) |
|
| 25 |
|
|
2009 |
|
| 6.40 |
|
| (0.05 | ) |
| 2.30 |
|
| 2.25 |
|
| – |
|
| – |
|
| – |
|
| – |
|
| – |
|
| 8.65 |
|
| 35.16 |
|
| 757,734 |
|
| 1.89 |
|
|
| 1.89 |
|
|
| 1.89 |
|
|
| (0.64 | ) |
|
| 23 |
|
|
2008 |
|
| 10.09 |
|
| (0.04 | ) |
| (3.55 | ) |
| (3.59 | ) |
| – |
|
| (0.10 | ) |
| – |
|
| (0.10 | ) |
| – |
|
| 6.40 |
|
| (35.52 | ) |
| 635,688 |
|
| 1.88 |
|
|
| 1.87 |
|
|
| 1.87 |
|
|
| (0.46 | ) |
|
| 36 |
|
|
Royce Pennsylvania Mutual Fund – Institutional Class a | |||||||||||||||||||||||||||||||||||||||||||||||||||||||||
†2013 |
| $ | 11.52 |
| $ | 0.01 |
| $ | 1.32 |
| $ | 1.33 |
| $ | – |
| $ | – |
| $ | – |
| $ | – |
| $ | – |
| $ | 12.85 |
|
| 11.55 | %1 | $ | 601,033 |
|
| 0.79 | %2 |
|
| 0.79 | %2 |
|
| 0.79 | %2 |
|
| 0.23 | %2 |
|
| 12 | % |
|
2012 |
|
| 10.79 |
|
| 0.13 |
|
| 1.43 |
|
| 1.56 |
|
| (0.18 | ) |
| (0.65 | ) |
| – |
|
| (0.83 | ) |
| – |
|
| 11.52 |
|
| 14.72 |
|
| 488,052 |
|
| 0.80 |
|
|
| 0.80 |
|
|
| 0.80 |
|
|
| 1.53 |
|
|
| 22 | % |
|
2011 |
|
| 12.19 |
|
| 0.03 |
|
| (1.05 | ) |
| (1.02 | ) |
| – |
|
| (0.38 | ) |
| – |
|
| (0.38 | ) |
| – |
|
| 10.79 |
|
| (8.33 | )1 |
| 241,951 |
|
| 0.78 |
|
| 0.78 |
|
| 0.78 |
|
| 0.46 |
|
| 20 |
|
| ||||
Royce Pennsylvania Mutual Fund – R Class | |||||||||||||||||||||||||||||||||||||||||||||||||||||||||
†2013 |
| $ | 11.22 |
| $ | (0.03 | ) | $ | 1.29 |
| $ | 1.26 |
| $ | – |
| $ | – |
| $ | – |
| $ | – |
| $ | – |
| $ | 12.48 |
|
| 11.23 | %1 | $ | 39,073 |
|
| 1.53 | %2 |
|
| 1.53 | %2 |
|
| 1.53 | %2 |
|
| (0.52 | )%2 |
|
| 12 | % |
|
2012 |
|
| 10.50 |
|
| 0.07 |
|
| 1.35 |
|
| 1.42 |
|
| (0.05 | ) |
| (0.65 | ) |
| – |
|
| (0.70 | ) |
| – |
|
| 11.22 |
|
| 13.79 | % |
| 32,977 |
|
| 1.50 |
|
|
| 1.50 |
|
|
| 1.50 |
|
|
| 0.70 |
|
|
| 22 |
|
|
2011 |
|
| 11.43 |
|
| (0.05 | ) |
| (0.50 | ) |
| (0.55 | ) |
| – |
|
| (0.38 | ) |
| – |
|
| (0.38 | ) |
| – |
|
| 10.50 |
|
| (4.77 | ) |
| 22,542 |
|
| 1.51 |
|
|
| 1.51 |
|
|
| 1.51 |
|
|
| (0.47 | ) |
|
| 20 |
|
|
2010 |
|
| 9.28 |
|
| 0.01 |
|
| 2.14 |
|
| 2.15 |
|
| (0.00 | ) |
| – |
|
| – |
|
| (0.00 | ) |
| – |
|
| 11.43 |
|
| 23.21 |
|
| 17,868 |
|
| 1.51 |
|
|
| 1.51 |
|
|
| 1.51 |
|
|
| 0.06 |
|
|
| 25 |
|
|
2009 |
|
| 6.87 |
|
| (0.05 | ) |
| 2.46 |
|
| 2.41 |
|
| – |
|
| – |
|
| – |
|
| – |
|
| – |
|
| 9.28 |
|
| 35.08 |
|
| 9,808 |
|
| 1.95 |
|
|
| 1.95 |
|
|
| 1.84 |
|
|
| (0.61 | ) |
|
| 23 |
|
|
2008 |
|
| 10.78 |
|
| (0.00 | ) |
| (3.81 | ) |
| (3.81 | ) |
| – |
|
| (0.10 | ) |
| – |
|
| (0.10 | ) |
| – |
|
| 6.87 |
|
| (35.28 | ) |
| 5,270 |
|
| 1.58 |
|
|
| 1.57 |
|
|
| 1.57 |
|
|
| (0.03 | ) |
|
| 36 |
|
|
Royce Pennsylvania Mutual Fund – K Class b | |||||||||||||||||||||||||||||||||||||||||||||||||||||||||
†2013 |
| $ | 10.29 |
| $ | (0.02 | ) | $ | 1.18 |
| $ | 1.16 |
| $ | – |
| $ | – |
| $ | – |
| $ | – |
| $ | – |
| $ | 11.45 |
|
| 11.27 | %1 | $ | 9,976 |
|
| 1.35 | %2 |
|
| 1.35 | %2 |
|
| 1.35 | %2 |
|
| (0.34 | )%2 |
|
| 12 | % |
|
2012 |
|
| 9.68 |
|
| 0.09 |
|
| 1.24 |
|
| 1.33 |
|
| (0.07 | ) |
| (0.65 | ) |
| – |
|
| (0.72 | ) |
| – |
|
| 10.29 |
|
| 14.04 |
|
| 8,849 |
|
| 1.26 |
|
|
| 1.26 |
|
|
| 1.26 |
|
|
| 0.94 |
|
|
| 22 |
|
|
2011 |
|
| 10.57 |
|
| (0.05 | ) |
| (0.46 | ) |
| (0.51 | ) |
| – |
|
| (0.38 | ) |
| – |
|
| (0.38 | ) |
| – |
|
| 9.68 |
|
| (4.78 | ) |
| 5,800 |
|
| 1.55 |
|
|
| 1.55 |
|
|
| 1.55 |
|
|
| (0.49 | ) |
|
| 20 |
|
|
2010 |
|
| 8.59 |
|
| 0.00 |
|
| 1.98 |
|
| 1.98 |
|
| (0.00 | ) |
| – |
|
| – |
|
| (0.00 | ) |
| – |
|
| 10.57 |
|
| 23.11 |
|
| 3,760 |
|
| 1.61 |
|
|
| 1.61 |
|
|
| 1.59 |
|
|
| 0.01 |
|
|
| 25 |
|
|
2009 |
|
| 6.34 |
|
| (0.02 | ) |
| 2.27 |
|
| 2.25 |
|
| – |
|
| – |
|
| – |
|
| – |
|
| – |
|
| 8.59 |
|
| 35.49 |
|
| 1,920 |
|
| 1.79 |
|
|
| 1.79 |
|
|
| 1.59 |
|
|
| (0.34 | ) |
|
| 23 |
|
|
2008 |
|
| 10.00 |
|
| 0.01 |
|
| (3.57 | ) |
| (3.56 | ) |
| – |
|
| (0.10 | ) |
| – |
|
| (0.10 | ) |
| – |
|
| 6.34 |
|
| (35.53 | )1 |
| 694 |
|
| 12.12 |
|
| 12.12 |
|
| 1.59 |
|
| 0.13 |
|
| 36 |
|
| ||||
| 98 | The Royce Funds 2013 Semiannual Report to Shareholders | THE ACCOMPANYING NOTES ARE AN INTEGRAL PART OF THESE FINANCIAL STATEMENTS. |
|
Financial Highlights |
|
| |||||||||||||||||||||||||||||||||||||||||||||||||||||||||
|
| Net Asset |
| Net |
| Net Realized and Unrealized |
|
| Distributions |
| Distributions from Net |
|
|
|
|
|
|
|
|
| Ratio of Expenses to Average Net Assets |
| Ratio of Net Investment |
|
| ||||||||||||||||||||||||||||||||
|
| Value, |
| Investment |
| Gain (Loss) on |
| Total from Investment Operations |
| from Net Investment Income |
| Realized Gain on |
| Distributions |
| Total Distributions |
| Shareholder Redemption Fees |
| Net Asset |
| Total Return |
| Net Assets, |
| Prior to Fee |
| Prior |
| Net of |
| Income (Loss) |
| Portfolio Turnover Rate |
| ||||||||||||||||||||||
|
|
|
|
|
|
|
|
|
|
|
|
|
|
|
|
|
|
|
|
|
|
|
|
|
|
|
|
|
|
|
|
|
|
|
|
|
|
|
|
|
|
|
|
|
|
|
|
|
|
|
|
|
|
|
|
|
|
Royce Micro-Cap Fund – Investment Class | |||||||||||||||||||||||||||||||||||||||||||||||||||||||||
†2013 |
| $ | 14.78 |
| $ | (0.04 | ) | $ | 0.49 |
| $ | 0.45 |
| $ | – |
| $ | – |
| $ | – |
| $ | – |
| $ | – |
| $ | 15.23 |
|
| 3.04 | %1 | $ | 653,984 |
|
| 1.56 | %2 |
|
| 1.56 | %2 |
|
| 1.56 | %2 |
|
| (0.53 | )%2 |
|
| 12 | % |
|
2012 |
|
| 14.55 |
|
| 0.05 |
|
| 1.07 |
|
| 1.12 |
|
| (0.01 | ) |
| (0.88 | ) |
| – |
|
| (0.89 | ) |
| – |
|
| 14.78 |
|
| 7.93 |
|
| 740,364 |
|
| 1.47 |
|
|
| 1.47 |
|
|
| 1.47 |
|
|
| 0.29 |
|
|
| 15 |
|
|
2011 |
|
| 17.57 |
|
| (0.07 | ) |
| (2.05 | ) |
| (2.12 | ) |
| (0.20 | ) |
| (0.70 | ) |
| – |
|
| (0.90 | ) |
| – |
|
| 14.55 |
|
| (12.04 | ) |
| 904,168 |
|
| 1.50 |
|
|
| 1.50 |
|
|
| 1.50 |
|
|
| (0.50 | ) |
|
| 35 |
|
|
2010 |
|
| 13.71 |
|
| (0.03 | ) |
| 4.14 |
|
| 4.11 |
|
| (0.25 | ) |
| – |
|
| – |
|
| (0.25 | ) |
| – |
|
| 17.57 |
|
| 30.06 |
|
| 1,085,782 |
|
| 1.50 |
|
|
| 1.50 |
|
|
| 1.50 |
|
|
| (0.27 | ) |
|
| 36 |
|
|
2009 |
|
| 8.93 |
|
| (0.06 | ) |
| 5.02 |
|
| 4.96 |
|
| (0.18 | ) |
| – |
|
| – |
|
| (0.18 | ) |
| – |
|
| 13.71 |
|
| 55.67 |
|
| 844,859 |
|
| 1.54 |
|
|
| 1.54 |
|
|
| 1.54 |
|
|
| (0.41 | ) |
|
| 34 |
|
|
2008 |
|
| 15.72 |
|
| 0.12 |
|
| (6.58 | ) |
| (6.46 | ) |
| – |
|
| (0.33 | ) |
| – |
|
| (0.33 | ) |
| – |
|
| 8.93 |
|
| (40.94 | ) |
| 455,077 |
|
| 1.52 |
|
|
| 1.51 |
|
|
| 1.51 |
|
|
| 0.89 |
|
|
| 43 |
|
|
Royce Micro-Cap Fund – Service Class | |||||||||||||||||||||||||||||||||||||||||||||||||||||||||
†2013 |
| $ | 14.61 |
| $ | (0.05 | ) | $ | 0.49 |
| $ | 0.44 |
| $ | – |
| $ | – |
| $ | – |
| $ | – |
| $ | – |
| $ | 15.05 |
|
| 3.01 | %1 | $ | 76,475 |
|
| 1.77 | %2 |
|
| 1.77 | %2 |
|
| 1.66 | %2 |
|
| (0.66 | )%2 |
|
| 12 | % |
|
2012 |
|
| 14.41 |
|
| 0.02 |
|
| 1.06 |
|
| 1.08 |
|
| – |
|
| (0.88 | ) |
| – |
|
| (0.88 | ) |
| – |
|
| 14.61 |
|
| 7.76 |
|
| 109,457 |
|
| 1.74 |
|
|
| 1.74 |
|
|
| 1.66 |
|
|
| 0.14 |
|
|
| 15 |
|
|
2011 |
|
| 17.43 |
|
| (0.10 | ) |
| (2.04 | ) |
| (2.14 | ) |
| (0.18 | ) |
| (0.70 | ) |
| – |
|
| (0.88 | ) |
| – |
|
| 14.41 |
|
| (12.23 | ) |
| 122,479 |
|
| 1.76 |
|
|
| 1.76 |
|
|
| 1.66 |
|
|
| (0.65 | ) |
|
| 35 |
|
|
2010 |
|
| 13.61 |
|
| (0.08 | ) |
| 4.14 |
|
| 4.06 |
|
| (0.24 | ) |
| – |
|
| – |
|
| (0.24 | ) |
| – |
|
| 17.43 |
|
| 29.85 |
|
| 139,911 |
|
| 1.78 |
|
|
| 1.78 |
|
|
| 1.66 |
|
|
| (0.41 | ) |
|
| 36 |
|
|
2009 |
|
| 8.87 |
|
| (0.10 | ) |
| 5.01 |
|
| 4.91 |
|
| (0.18 | ) |
| – |
|
| – |
|
| (0.18 | ) |
| 0.01 |
|
| 13.61 |
|
| 55.49 |
|
| 84,771 |
|
| 1.77 |
|
|
| 1.77 |
|
|
| 1.66 |
|
|
| (0.53 | ) |
|
| 34 |
|
|
2008 |
|
| 15.63 |
|
| 0.07 |
|
| (6.51 | ) |
| (6.44 | ) |
| – |
|
| (0.33 | ) |
| – |
|
| (0.33 | ) |
| 0.01 |
|
| 8.87 |
|
| (40.98 | ) |
| 28,245 |
|
| 1.79 |
|
|
| 1.78 |
|
|
| 1.66 |
|
|
| 0.58 |
|
|
| 43 |
|
|
Royce Micro-Cap Fund – Consultant Class | |||||||||||||||||||||||||||||||||||||||||||||||||||||||||
†2013 |
| $ | 13.08 |
| $ | (0.10 | ) | $ | 0.43 |
| $ | 0.33 |
| $ | – |
| $ | – |
| $ | – |
| $ | – |
| $ | – |
| $ | 13.41 |
|
| 2.52 | %1 | $ | 108,611 |
|
| 2.50 | %2 |
|
| 2.50 | %2 |
|
| 2.50 | %2 |
|
| (1.48 | )%2 |
|
| 12 | % |
|
2012 |
|
| 13.11 |
|
| (0.10 | ) |
| 0.95 | �� |
| 0.85 |
|
| – |
|
| (0.88 | ) |
| – |
|
| (0.88 | ) |
| – |
|
| 13.08 |
|
| 6.77 |
|
| 120,871 |
|
| 2.55 |
|
|
| 2.55 |
|
|
| 2.55 |
|
|
| (0.77 | ) |
|
| 15 |
|
|
2011 |
|
| 15.91 |
|
| (0.21 | ) |
| (1.84 | ) |
| (2.05 | ) |
| (0.05 | ) |
| (0.70 | ) |
| – |
|
| (0.75 | ) |
| – |
|
| 13.11 |
|
| (12.86 | ) |
| 134,752 |
|
| 2.42 |
|
|
| 2.42 |
|
|
| 2.42 |
|
|
| (1.41 | ) |
|
| 35 |
|
|
2010 |
|
| 12.45 |
|
| (0.15 | ) |
| 3.74 |
|
| 3.59 |
|
| (0.13 | ) |
| – |
|
| – |
|
| (0.13 | ) |
| – |
|
| 15.91 |
|
| 28.85 |
|
| 181,746 |
|
| 2.43 |
|
|
| 2.43 |
|
|
| 2.43 |
|
|
| (1.20 | ) |
|
| 36 |
|
|
2009 |
|
| 8.14 |
|
| (0.13 | ) |
| 4.53 |
|
| 4.40 |
|
| (0.09 | ) |
| – |
|
| – |
|
| (0.09 | ) |
| – |
|
| 12.45 |
|
| 54.14 |
|
| 149,454 |
|
| 2.46 |
|
|
| 2.46 |
|
|
| 2.46 |
|
|
| (1.30 | ) |
|
| 34 |
|
|
2008 |
|
| 14.51 |
|
| 0.00 |
|
| (6.04 | ) |
| (6.04 | ) |
| – |
|
| (0.33 | ) |
| – |
|
| (0.33 | ) |
| – |
|
| 8.14 |
|
| (41.46 | ) |
| 103,038 |
|
| 2.45 |
|
|
| 2.45 |
|
|
| 2.45 |
|
|
| 0.02 |
|
|
| 43 |
|
|
Royce Premier Fund – Investment Class | |||||||||||||||||||||||||||||||||||||||||||||||||||||||||
†2013 |
| $ | 19.16 |
| $ | (0.01 | ) | $ | 1.52 |
| $ | 1.51 |
| $ | – |
| $ | – |
| $ | – |
| $ | – |
| $ | – |
| $ | 20.67 |
|
| 7.88 | %1 | $ | 4,709,035 |
|
| 1.08 | %2 |
|
| 1.08 | %2 |
|
| 1.08 | %2 |
|
| (0.07 | )%2 |
|
| 7 | % |
|
2012 |
|
| 18.52 |
|
| 0.24 |
|
| 1.85 |
|
| 2.09 |
|
| (0.24 | ) |
| (1.21 | ) |
| – |
|
| (1.45 | ) |
| – |
|
| 19.16 |
|
| 11.45 |
|
| 4,629,272 |
|
| 1.06 |
|
|
| 1.06 |
|
|
| 1.06 |
|
|
| 1.19 |
|
|
| 7 |
|
|
2011 |
|
| 20.35 |
|
| (0.02 | ) |
| (0.17 | ) |
| (0.19 | ) |
| (0.05 | ) |
| (1.59 | ) |
| – |
|
| (1.64 | ) |
| – |
|
| 18.52 |
|
| (0.86 | ) |
| 4,539,127 |
|
| 1.09 |
|
|
| 1.09 |
|
|
| 1.09 |
|
|
| (0.11 | ) |
|
| 18 |
|
|
2010 |
|
| 16.31 |
|
| (0.01 | ) |
| 4.32 |
|
| 4.31 |
|
| – |
|
| (0.27 | ) |
| – |
|
| (0.27 | ) |
| – |
|
| 20.35 |
|
| 26.46 |
|
| 4,961,891 |
|
| 1.12 |
|
|
| 1.12 |
|
|
| 1.12 |
|
|
| (0.07 | ) |
|
| 10 |
|
|
2009 |
|
| 12.24 |
|
| (0.02 | ) |
| 4.09 |
|
| 4.07 |
|
| – |
|
| – |
|
| – |
|
| – |
|
| – |
|
| 16.31 |
|
| 33.25 |
|
| 3,911,502 |
|
| 1.15 |
|
|
| 1.15 |
|
|
| 1.15 |
|
|
| (0.14 | ) |
|
| 14 |
|
|
2008 |
|
| 17.36 |
|
| 0.02 |
|
| (4.94 | ) |
| (4.92 | ) |
| – |
|
| (0.20 | ) |
| – |
|
| (0.20 | ) |
| – |
|
| 12.24 |
|
| (28.29 | ) |
| 2,634,045 |
|
| 1.13 |
|
|
| 1.12 |
|
|
| 1.12 |
|
|
| 0.15 |
|
|
| 11 |
|
|
Royce Premier Fund – Service Class | |||||||||||||||||||||||||||||||||||||||||||||||||||||||||
†2013 |
| $ | 18.89 |
| $ | (0.04 | ) | $ | 1.50 |
| $ | 1.46 |
| $ | – |
| $ | – |
| $ | – |
| $ | – |
| $ | – |
| $ | 20.35 |
|
| 7.73 | %1 | $ | 471,430 |
|
| 1.37 | %2 |
|
| 1.37 | %2 |
|
| 1.37 | %2 |
|
| (0.39 | )%2 |
|
| 7 | % |
|
2012 |
|
| 18.23 |
|
| 0.19 |
|
| 1.81 |
|
| 2.00 |
|
| (0.13 | ) |
| (1.21 | ) |
| – |
|
| (1.34 | ) |
| – |
|
| 18.89 |
|
| 11.14 |
|
| 560,553 |
|
| 1.33 |
|
|
| 1.33 |
|
|
| 1.32 |
|
|
| 0.92 |
|
|
| 7 |
|
|
2011 |
|
| 20.07 |
|
| (0.07 | ) |
| (0.16 | ) |
| (0.23 | ) |
| (0.02 | ) |
| (1.59 | ) |
| – |
|
| (1.61 | ) |
| – |
|
| 18.23 |
|
| (1.07 | ) |
| 628,824 |
|
| 1.34 |
|
|
| 1.34 |
|
|
| 1.32 |
|
|
| (0.33 | ) |
|
| 18 |
|
|
2010 |
|
| 16.12 |
|
| (0.05 | ) |
| 4.27 |
|
| 4.22 |
|
| – |
|
| (0.27 | ) |
| – |
|
| (0.27 | ) |
| – |
|
| 20.07 |
|
| 26.22 |
|
| 584,817 |
|
| 1.39 |
|
|
| 1.39 |
|
|
| 1.37 |
|
|
| (0.30 | ) |
|
| 10 |
|
|
2009 |
|
| 12.14 |
|
| (0.06 | ) |
| 4.04 |
|
| 3.98 |
|
| – |
|
| – |
|
| – |
|
| – |
|
| – |
|
| 16.12 |
|
| 32.78 |
|
| 377,079 |
|
| 1.44 |
|
|
| 1.44 |
|
|
| 1.43 |
|
|
| (0.41 | ) |
|
| 14 |
|
|
2008 |
|
| 17.25 |
|
| (0.01 | ) |
| (4.91 | ) |
| (4.92 | ) |
| – |
|
| (0.20 | ) |
| – |
|
| (0.20 | ) |
| 0.01 |
|
| 12.14 |
|
| (28.41 | ) |
| 209,647 |
|
| 1.37 |
|
|
| 1.37 |
|
|
| 1.34 |
|
|
| (0.06 | ) |
|
| 11 |
|
|
| THE ACCOMPANYING NOTES ARE AN INTEGRAL PART OF THESE FINANCIAL STATEMENTS. | The Royce Funds 2013 Semiannual Report to Shareholders | 99 |
|
Financial Highlights |
|
| |||||||||||||||||||||||||||||||||||||||||||||||||||||||||
|
| Net Asset |
| Net |
| Net Realized and Unrealized |
|
| Distributions |
| Distributions from Net |
|
|
|
|
|
|
|
|
| Ratio of Expenses to Average Net Assets |
| Ratio of Net Investment |
|
| ||||||||||||||||||||||||||||||||
|
| Value, |
| Investment |
| Gain (Loss) on |
| Total from Investment Operations |
| from Net Investment Income |
| Realized Gain on |
| Distributions |
| Total Distributions |
| Shareholder Redemption Fees |
| Net Asset |
| Total Return |
| Net Assets, |
| Prior to Fee |
| Prior |
| Net of |
| Income (Loss) |
| Portfolio Turnover Rate |
| ||||||||||||||||||||||
|
|
|
|
|
|
|
|
|
|
|
|
|
|
|
|
|
|
|
|
|
|
|
|
|
|
|
|
|
|
|
|
|
|
|
|
|
|
|
|
|
|
|
|
|
|
|
|
|
|
|
|
|
|
|
|
|
|
Royce Premier Fund – Consultant Class | |||||||||||||||||||||||||||||||||||||||||||||||||||||||||
†2013 |
| $ | 17.35 |
| $ | (0.10 | ) | $ | 1.37 |
| $ | 1.27 |
| $ | – |
| $ | – |
| $ | – |
| $ | – |
| $ | – |
| $ | 18.62 |
|
| 7.32 | %1 | $ | 60,311 |
|
| 2.11 | %2 |
|
| 2.11 | %2 |
|
| 2.11 | %2 |
|
| (1.10 | )%2 |
|
| 7 | % |
|
2012 |
|
| 16.87 |
|
| 0.02 |
|
| 1.69 |
|
| 1.71 |
|
| (0.02 | ) |
| (1.21 | ) |
| – |
|
| (1.23 | ) |
| – |
|
| 17.35 |
|
| 10.24 |
|
| 60,568 |
|
| 2.12 |
|
|
| 2.12 |
|
|
| 2.12 |
|
|
| 0.13 |
|
|
| 7 |
|
|
2011 |
|
| 18.81 |
|
| (0.21 | ) |
| (0.14 | ) |
| (0.35 | ) |
| – |
|
| (1.59 | ) |
| – |
|
| (1.59 | ) |
| – |
|
| 16.87 |
|
| (1.80 | ) |
| 59,766 |
|
| 2.05 |
|
|
| 2.05 |
|
|
| 2.05 |
|
|
| (1.07 | ) |
|
| 18 |
|
|
2010 |
|
| 15.24 |
|
| (0.17 | ) |
| 4.01 |
|
| 3.84 |
|
| – |
|
| (0.27 | ) |
| – |
|
| (0.27 | ) |
| – |
|
| 18.81 |
|
| 25.24 |
|
| 71,686 |
|
| 2.08 |
|
|
| 2.08 |
|
|
| 2.08 |
|
|
| (1.04 | ) |
|
| 10 |
|
|
2009 |
|
| 11.55 |
|
| (0.15 | ) |
| 3.84 |
|
| 3.69 |
|
| – |
|
| – |
|
| – |
|
| – |
|
| – |
|
| 15.24 |
|
| 31.95 |
|
| 58,241 |
|
| 2.14 |
|
|
| 2.14 |
|
|
| 2.14 |
|
|
| (1.13 | ) |
|
| 14 |
|
|
2008 |
|
| 16.57 |
|
| (0.13 | ) |
| (4.69 | ) |
| (4.82 | ) |
| – |
|
| (0.20 | ) |
| – |
|
| (0.20 | ) |
| – |
|
| 11.55 |
|
| (29.04 | ) |
| 28,977 |
|
| 2.12 |
|
|
| 2.11 |
|
|
| 2.11 |
|
|
| (0.84 | ) |
|
| 11 |
|
|
Royce Premier Fund – Institutional Class | |||||||||||||||||||||||||||||||||||||||||||||||||||||||||
†2013 |
| $ | 19.30 |
| $ | 0.00 |
| $ | 1.52 |
| $ | 1.52 |
| $ | – |
| $ | – |
| $ | – |
| $ | – |
| $ | – |
| $ | 20.82 |
|
| 7.88 | %1 | $ | 865,067 |
|
| 0.98 | %2 |
|
| 0.98 | %2 |
|
| 0.98 | %2 |
|
| 0.03 | %2 |
|
| 7 | % |
|
2012 |
|
| 18.66 |
|
| 0.26 |
|
| 1.87 |
|
| 2.13 |
|
| (0.28 | ) |
| (1.21 | ) |
| – |
|
| (1.49 | ) |
| – |
|
| 19.30 |
|
| 11.57 |
|
| 866,277 |
|
| 0.98 |
|
|
| 0.98 |
|
|
| 0.98 |
|
|
| 1.30 |
|
|
| 7 |
|
|
2011 |
|
| 20.49 |
|
| 0.00 |
|
| (0.16 | ) |
| (0.16 | ) |
| (0.08 | ) |
| (1.59 | ) |
| – |
|
| (1.67 | ) |
| – |
|
| 18.66 |
|
| (0.73 | ) |
| 813,837 |
|
| 0.97 |
|
|
| 0.97 |
|
|
| 0.97 |
|
|
| 0.02 |
|
|
| 18 |
|
|
2010 |
|
| 16.40 |
|
| 0.01 |
|
| 4.35 |
|
| 4.36 |
|
| – |
|
| (0.27 | ) |
| – |
|
| (0.27 | ) |
| – |
|
| 20.49 |
|
| 26.62 |
|
| 706,870 |
|
| 0.99 |
|
|
| 0.99 |
|
|
| 0.99 |
|
|
| 0.07 |
|
|
| 10 |
|
|
2009 |
|
| 12.30 |
|
| (0.00 | ) |
| 4.10 |
|
| 4.10 |
|
| – |
|
| – |
|
| – |
|
| – |
|
| – |
|
| 16.40 |
|
| 33.33 |
|
| 516,900 |
|
| 1.03 |
|
|
| 1.03 |
|
|
| 1.03 |
|
|
| (0.01 | ) |
|
| 14 |
|
|
2008 |
|
| 17.42 |
|
| 0.04 |
|
| (4.96 | ) |
| (4.92 | ) |
| – |
|
| (0.20 | ) |
| – |
|
| (0.20 | ) |
| – |
|
| 12.30 |
|
| (28.19 | ) |
| 352,804 |
|
| 1.01 |
|
|
| 1.01 |
|
|
| 1.01 |
|
|
| 0.27 |
|
|
| 11 |
|
|
Royce Premier Fund – W Class | |||||||||||||||||||||||||||||||||||||||||||||||||||||||||
†2013 |
| $ | 19.20 |
| $ | (0.01 | ) | $ | 1.52 |
| $ | 1.51 |
| $ | – |
| $ | – |
| $ | – |
| $ | – |
| $ | – |
| $ | 20.71 |
|
| 7.86 | %1 | $ | 523,518 |
|
| 1.08 | %2 |
|
| 1.08 | %2 |
|
| 1.08 | %2 |
|
| (0.07 | )%2 |
|
| 7 | % |
|
2012 |
|
| 18.57 |
|
| 0.25 |
|
| 1.85 |
|
| 2.10 |
|
| (0.26 | ) |
| (1.21 | ) |
| – |
|
| (1.47 | ) |
| – |
|
| 19.20 |
|
| 11.46 |
|
| 533,763 |
|
| 1.05 |
|
|
| 1.05 |
|
|
| 1.05 |
|
|
| 1.19 |
|
|
| 7 |
|
|
2011 |
|
| 20.40 |
|
| (0.01 | ) |
| (0.15 | ) |
| (0.16 | ) |
| (0.08 | ) |
| (1.59 | ) |
| – |
|
| (1.67 | ) |
| – |
|
| 18.57 |
|
| (0.75 | ) |
| 549,648 |
|
| 1.00 |
|
|
| 1.00 |
|
|
| 1.00 |
|
|
| (0.01 | ) |
|
| 18 |
|
|
2010 |
|
| 16.33 |
|
| 0.01 |
|
| 4.33 |
|
| 4.34 |
|
| – |
|
| (0.27 | ) |
| – |
|
| (0.27 | ) |
| – |
|
| 20.40 |
|
| 26.61 |
|
| 425,397 |
|
| 1.02 |
|
|
| 1.02 |
|
|
| 1.02 |
|
|
| 0.04 |
|
|
| 10 |
|
|
2009 |
|
| 12.25 |
|
| (0.01 | ) |
| 4.09 |
|
| 4.08 |
|
| – |
|
| – |
|
| – |
|
| – |
|
| – |
|
| 16.33 |
|
| 33.31 |
|
| 319,120 |
|
| 1.07 |
|
|
| 1.07 |
|
|
| 1.07 |
|
|
| (0.06 | ) |
|
| 14 |
|
|
2008 |
|
| 17.36 |
|
| 0.04 |
|
| (4.95 | ) |
| (4.91 | ) |
| – |
|
| (0.20 | ) |
| – |
|
| (0.20 | ) |
| – |
|
| 12.25 |
|
| (28.23 | ) |
| 234,618 |
|
| 1.04 |
|
|
| 1.04 |
|
|
| 1.04 |
|
|
| 0.23 |
|
|
| 11 |
|
|
Royce Premier Fund – R Class | |||||||||||||||||||||||||||||||||||||||||||||||||||||||||
†2013 |
| $ | 18.61 |
| $ | (0.07 | ) | $ | 1.47 |
| $ | 1.40 |
| $ | – |
| $ | – |
| $ | – |
| $ | – |
| $ | – |
| $ | 20.01 |
|
| 7.52 | %1 | $ | 32,302 |
|
| 1.70 | %2 |
|
| 1.70 | %2 |
|
| 1.70 | %2 |
|
| (0.68 | )%2 |
|
| 7 | % |
|
2012 |
|
| 17.99 |
|
| 0.11 |
|
| 1.80 |
|
| 1.91 |
|
| (0.08 | ) |
| (1.21 | ) |
| – |
|
| (1.29 | ) |
| – |
|
| 18.61 |
|
| 10.75 |
|
| 28,632 |
|
| 1.68 |
|
|
| 1.68 |
|
|
| 1.68 |
|
|
| 0.57 |
|
|
| 7 |
|
|
2011 |
|
| 19.91 |
|
| (0.14 | ) |
| (0.15 | ) |
| (0.29 | ) |
| (0.04 | ) |
| (1.59 | ) |
| – |
|
| (1.63 | ) |
| – |
|
| 17.99 |
|
| (1.38 | ) |
| 23,653 |
|
| 1.66 |
|
|
| 1.66 |
|
|
| 1.66 |
|
|
| (0.63 | ) |
|
| 18 |
|
|
2010 |
|
| 16.07 |
|
| (0.11 | ) |
| 4.22 |
|
| 4.11 |
|
| – |
|
| (0.27 | ) |
| – |
|
| (0.27 | ) |
| – |
|
| 19.91 |
|
| 25.61 |
|
| 10,185 |
|
| 1.78 |
|
|
| 1.78 |
|
|
| 1.78 |
|
|
| (0.64 | ) |
|
| 10 |
|
|
2009 |
|
| 12.15 |
|
| (0.12 | ) |
| 4.04 |
|
| 3.92 |
|
| – |
|
| – |
|
| – |
|
| – |
|
| – |
|
| 16.07 |
|
| 32.26 |
|
| 2,634 |
|
| 2.26 |
|
|
| 2.26 |
|
|
| 1.84 |
|
|
| (0.83 | ) |
|
| 14 |
|
|
2008 |
|
| 17.36 |
|
| (0.08 | ) |
| (4.93 | ) |
| (5.01 | ) |
| – |
|
| (0.20 | ) |
| – |
|
| (0.20 | ) |
| – |
|
| 12.15 |
|
| (28.81 | ) |
| 396 |
|
| 3.97 |
|
|
| 3.97 |
|
|
| 1.84 |
|
|
| (0.54 | ) |
|
| 11 |
|
|
Royce Premier Fund – K Class b | |||||||||||||||||||||||||||||||||||||||||||||||||||||||||
†2013 |
| $ | 8.19 |
| $ | (0.02 | ) | $ | 0.64 |
| $ | 0.62 |
| $ | – |
| $ | – |
| $ | – |
| $ | – |
| $ | – |
| $ | 8.81 |
|
| 7.57 | %1 | $ | 8,260 |
|
| 1.54 | %2 |
|
| 1.54 | %2 |
|
| 1.54 | %2 |
|
| (0.55 | )%2 |
|
| 7 | % |
|
2012 |
|
| 8.67 |
|
| 0.08 |
|
| 0.85 |
|
| 0.93 |
|
| (0.20 | ) |
| (1.21 | ) |
| – |
|
| (1.41 | ) |
| – |
|
| 8.19 |
|
| 11.00 |
|
| 9,707 |
|
| 1.47 |
|
|
| 1.47 |
|
|
| 1.47 |
|
|
| 0.79 |
|
|
| 7 |
|
|
2011 |
|
| 10.46 |
|
| (0.05 | ) |
| (0.09 | ) |
| (0.14 | ) |
| (0.06 | ) |
| (1.59 | ) |
| – |
|
| (1.65 | ) |
| – |
|
| 8.67 |
|
| (1.20 | ) |
| 8,776 |
|
| 1.49 |
|
|
| 1.49 |
|
|
| 1.49 |
|
|
| (0.46 | ) |
|
| 18 |
|
|
2010 |
|
| 8.53 |
|
| (0.04 | ) |
| 2.24 |
|
| 2.20 |
|
| – |
|
| (0.27 | ) |
| – |
|
| (0.27 | ) |
| – |
|
| 10.46 |
|
| 25.86 |
|
| 3,845 |
|
| 1.63 |
|
|
| 1.63 |
|
|
| 1.59 |
|
|
| (0.47 | ) |
|
| 10 |
|
|
2009 |
|
| 6.44 |
|
| (0.05 | ) |
| 2.14 |
|
| 2.09 |
|
| – |
|
| – |
|
| – |
|
| – |
|
| – |
|
| 8.53 |
|
| 32.45 |
|
| 1,551 |
|
| 2.39 |
|
|
| 2.39 |
|
|
| 1.59 |
|
|
| (0.60 | ) |
|
| 14 |
|
|
2008 |
|
| 10.00 |
|
| (0.02 | ) |
| (3.34 | ) |
| (3.36 | ) |
| – |
|
| (0.20 | ) |
| – |
|
| (0.20 | ) |
| – |
|
| 6.44 |
|
| (33.51 | )1 |
| 35 |
|
| 35.36 |
|
| 35.36 |
|
| 1.59 |
|
| (0.38 | )2 |
|
| 11 |
|
| |||
| 100 | The Royce Funds 2013 Semiannual Report to Shareholders | THE ACCOMPANYING NOTES ARE AN INTEGRAL PART OF THESE FINANCIAL STATEMENTS. |
|
Financial Highlights |
|
| |||||||||||||||||||||||||||||||||||||||||||||||||||||||||
|
| Net Asset |
| Net |
| Net Realized and Unrealized |
|
| Distributions |
| Distributions from Net |
|
|
|
|
|
|
|
|
| Ratio of Expenses to Average Net Assets |
| Ratio of Net Investment |
|
| ||||||||||||||||||||||||||||||||
|
| Value, |
| Investment |
| Gain (Loss) on |
| Total from Investment Operations |
| from Net Investment Income |
| Realized Gain on |
| Distributions |
| Total Distributions |
| Shareholder Redemption Fees |
| Net Asset |
| Total Return |
| Net Assets, |
| Prior to Fee |
| Prior |
| Net of |
| Income (Loss) |
| Portfolio Turnover Rate |
| ||||||||||||||||||||||
|
|
|
|
|
|
|
|
|
|
|
|
|
|
|
|
|
|
|
|
|
|
|
|
|
|
|
|
|
|
|
|
|
|
|
|
|
|
|
|
|
|
|
|
|
|
|
|
|
|
|
|
|
|
|
|
|
|
Royce Low-Priced Stock Fund – Investment Class | |||||||||||||||||||||||||||||||||||||||||||||||||||||||||
†2013 |
| $ | 13.83 |
| $ | 0.01 |
| $ | (0.17 | ) | $ | (0.16 | ) | $ | – |
| $ | – |
| $ | – |
| $ | – |
| $ | – |
| $ | 13.67 |
|
| (1.16 | )%1 | $ | 133,957 |
|
| 1.35 | %2 |
|
| 1.35 | %2 |
|
| 1.24 | %2 |
|
| 0.15 | %2 |
|
| 12 | % |
|
2012 |
|
| 14.34 |
|
| 0.15 |
|
| 0.50 |
|
| 0.65 |
|
| (0.25 | ) |
| (0.91 | ) |
| – |
|
| (1.16 | ) |
| – |
|
| 13.83 |
|
| 4.79 |
|
| 255,335 |
|
| 1.26 |
|
|
| 1.26 |
|
|
| 1.24 |
|
|
| 0.86 |
|
|
| 8 |
|
|
2011 |
|
| 18.31 |
|
| (0.06 | ) |
| (2.57 | ) |
| (2.63 | ) |
| (0.14 | ) |
| (1.20 | ) |
| – |
|
| (1.34 | ) |
| – |
|
| 14.34 |
|
| (14.37 | ) |
| 276,247 |
|
| 1.26 |
|
|
| 1.26 |
|
|
| 1.24 |
|
|
| (0.15 | ) |
|
| 22 |
|
|
2010 |
|
| 14.08 |
|
| (0.03 | ) |
| 4.50 |
|
| 4.47 |
|
| (0.10 | ) |
| (0.14 | ) |
| – |
|
| (0.24 | ) |
| – |
|
| 18.31 |
|
| 31.77 |
|
| 148,144 |
|
| 1.26 |
|
|
| 1.26 |
|
|
| 1.24 |
|
|
| (0.10 | ) |
|
| 24 |
|
|
2009 |
|
| 9.17 |
|
| (0.01 | ) |
| 4.96 |
|
| 4.95 |
|
| (0.04 | ) |
| – |
|
| – |
|
| (0.04 | ) |
| – |
|
| 14.08 |
|
| 54.04 |
|
| 94,966 |
|
| 1.27 |
|
|
| 1.27 |
|
|
| 1.24 |
|
|
| (0.14 | ) |
|
| 22 |
|
|
2008 |
|
| 14.75 |
|
| 0.03 |
|
| (5.35 | ) |
| (5.32 | ) |
| – |
|
| (0.27 | ) |
| – |
|
| (0.27 | ) |
| 0.01 |
|
| 9.17 |
|
| (35.77 | ) |
| 65,004 |
|
| 1.24 |
|
|
| 1.24 |
|
|
| 1.24 |
|
|
| 0.29 |
|
|
| 39 |
|
|
Royce Low-Priced Stock Fund – Service Class | |||||||||||||||||||||||||||||||||||||||||||||||||||||||||
†2013 |
| $ | 13.84 |
| $ | (0.00 | ) | $ | (0.17 | ) | $ | (0.17 | ) | $ | – |
| $ | – |
| $ | – |
| $ | – |
| $ | – |
| $ | 13.67 |
|
| (1.23 | )%1 | $ | 1,226,185 |
|
| 1.65 | %2 |
|
| 1.65 | %2 |
|
| 1.49 | %2 |
|
| (0.04 | )%2 |
|
| 12 | % |
|
2012 |
|
| 14.31 |
|
| 0.11 |
|
| 0.49 |
|
| 0.60 |
|
| (0.16 | ) |
| (0.91 | ) |
| – |
|
| (1.07 | ) |
| – |
|
| 13.84 |
|
| 4.48 |
|
| 1,800,089 |
|
| 1.57 |
|
|
| 1.57 |
|
|
| 1.49 |
|
|
| 0.54 |
|
|
| 8 |
|
|
2011 |
|
| 18.26 |
|
| (0.06 | ) |
| (2.60 | ) |
| (2.66 | ) |
| (0.09 | ) |
| (1.20 | ) |
| – |
|
| (1.29 | ) |
| – |
|
| 14.31 |
|
| (14.58 | ) |
| 2,489,189 |
|
| 1.56 |
|
|
| 1.56 |
|
|
| 1.49 |
|
|
| (0.39 | ) |
|
| 22 |
|
|
2010 |
|
| 14.05 |
|
| (0.05 | ) |
| 4.47 |
|
| 4.42 |
|
| (0.07 | ) |
| (0.14 | ) |
| – |
|
| (0.21 | ) |
| – |
|
| 18.26 |
|
| 31.49 |
|
| 3,456,142 |
|
| 1.60 |
|
|
| 1.60 |
|
|
| 1.49 |
|
|
| (0.37 | ) |
|
| 24 |
|
|
2009 |
|
| 9.16 |
|
| (0.04 | ) |
| 4.95 |
|
| 4.91 |
|
| (0.02 | ) |
| – |
|
| – |
|
| (0.02 | ) |
| – |
|
| 14.05 |
|
| 53.58 |
|
| 2,669,235 |
|
| 1.60 |
|
|
| 1.60 |
|
|
| 1.49 |
|
|
| (0.38 | ) |
|
| 22 |
|
|
2008 |
|
| 14.78 |
|
| (0.01 | ) |
| (5.34 | ) |
| (5.35 | ) |
| – |
|
| (0.27 | ) |
| – |
|
| (0.27 | ) |
| – |
|
| 9.16 |
|
| (35.97 | ) |
| 1,870,016 |
|
| 1.56 |
|
|
| 1.55 |
|
|
| 1.49 |
|
|
| (0.10 | ) |
|
| 39 |
|
|
Royce Low-Priced Stock Fund – Institutional Class | |||||||||||||||||||||||||||||||||||||||||||||||||||||||||
†2013 |
| $ | 13.84 |
| $ | 0.02 |
| $ | (0.18 | ) | $ | (0.16 | ) | $ | – |
| $ | – |
| $ | – |
| $ | – |
| $ | – |
| $ | 13.68 |
|
| (1.16 | )%1 | $ | 604,453 |
|
| 1.22 | %2 |
|
| 1.22 | %2 |
|
| 1.22 | %2 |
|
| 0.26 | %2 |
|
| 12 | % |
|
2012 |
|
| 14.36 |
|
| 0.16 |
|
| 0.49 |
|
| 0.65 |
|
| (0.26 | ) |
| (0.91 | ) |
| – |
|
| (1.17 | ) |
| – |
|
| 13.84 |
|
| 4.81 |
|
| 969,664 |
|
| 1.20 |
|
|
| 1.20 |
|
|
| 1.20 |
|
|
| 0.92 |
|
|
| 8 |
|
|
2011 |
|
| 18.33 |
|
| (0.01 | ) |
| (2.61 | ) |
| (2.62 | ) |
| (0.15 | ) |
| (1.20 | ) |
| – |
|
| (1.35 | ) |
| – |
|
| 14.36 |
|
| (14.35 | ) |
| 991,706 |
|
| 1.17 |
|
|
| 1.17 |
|
|
| 1.17 |
|
|
| (0.07 | ) |
|
| 22 |
|
|
2010 |
|
| 14.09 |
|
| (0.02 | ) |
| 4.50 |
|
| 4.48 |
|
| (0.10 | ) |
| (0.14 | ) |
| – |
|
| (0.24 | ) |
| – |
|
| 18.33 |
|
| 31.82 |
|
| 1,077,659 |
|
| 1.18 |
|
|
| 1.18 |
|
|
| 1.18 |
|
|
| (0.04 | ) |
|
| 24 |
|
|
2009 |
|
| 9.18 |
|
| (0.01 | ) |
| 4.96 |
|
| 4.95 |
|
| (0.04 | ) |
| – |
|
| – |
|
| (0.04 | ) |
| – |
|
| 14.09 |
|
| 53.97 |
|
| 673,846 |
|
| 1.24 |
|
|
| 1.24 |
|
|
| 1.24 |
|
|
| (0.15 | ) |
|
| 22 |
|
|
2008 |
|
| 14.76 |
|
| 0.03 |
|
| (5.34 | ) |
| (5.31 | ) |
| – |
|
| (0.27 | ) |
| – |
|
| (0.27 | ) |
| – |
|
| 9.18 |
|
| (35.75 | ) |
| 553,070 |
|
| 1.18 |
|
|
| 1.18 |
|
|
| 1.18 |
|
|
| 0.22 |
|
|
| 39 |
|
|
| Royce Low-Priced Stock Fund – R Class | |||||||||||||||||||||||||||||||||||||||||||||||||||||||||
| †2013 | $ | 13.58 | $ | (0.03 | ) | $ | (0.16 | ) | $ | (0.19 | ) | $ | – |
| $ | – |
| $ | – | $ | – |
| $ | – | $ | 13.39 | (1.40 | )%1 | $ | 3,958 | 2.11 | %2 | 2.11 | %2 | 1.84 | %2 | (0.38 | )%2 | 12 | % | |||||||||||||||||
| 2012 | 14.05 | 0.04 |
| 0.50 |
| 0.54 |
| (0.10 | ) | (0.91 | ) | – | (1.01 | ) | – | 13.58 | 4.10 | 5,823 | 2.05 | 2.05 | 1.84 | 0.22 | 8 | ||||||||||||||||||||||||||||||||||
| 2011 | 18.05 | (0.19 | ) | (2.49 | ) | (2.68 | ) | (0.12 | ) | (1.20 | ) | – | (1.32 | ) | – | 14.05 | (14.86 | ) | 7,337 | 1.95 | 1.95 | 1.84 | (0.72 | ) | 22 | ||||||||||||||||||||||||||||||||
| 2010 | 13.95 | (0.12 | ) | 4.44 | 4.32 | (0.08 | ) | (0.14 | ) | – | (0.22 | ) | – | 18.05 | 31.00 | 2,925 | 2.21 | 2.21 | 1.84 | (0.67 | ) | 24 | |||||||||||||||||||||||||||||||||||
| 2009 | 9.11 | (0.09 | ) | 4.92 | 4.83 | (0.00 | ) | – | – | (0.00 | ) | 0.01 | 13.95 | 53.13 | 1,134 | 3.02 | 3.02 | 1.84 | (0.76 | ) | 22 | ||||||||||||||||||||||||||||||||||||
| 2008 | 14.76 | (0.05 | ) | (5.33 | ) | (5.38 | ) | – | (0.27 | ) | – | (0.27 | ) | – | 9.11 | (36.22 | ) | 74 | 10.95 | 10.94 | 1.84 | (0.42 | ) | 39 | |||||||||||||||||||||||||||||||||
| Royce Low-Priced Stock Fund – K Class b | |||||||||||||||||||||||||||||||||||||||||||||||||||||||||
| †2013 | $ | 7.90 | $ | (0.00 | ) | $ | (0.10 | ) | $ | (0.10 | ) | $ | – |
| $ | – |
| $ | – | $ | – |
| $ | – | $ | 7.80 | (1.27 | )%1 | $ | 5,380 | 1.83 | %2 | 1.83 | %2 | 1.59 | %2 | (0.10 | )%2 | 12 | % | |||||||||||||||||
| 2012 | 8.65 | 0.07 |
| 0.27 |
| 0.34 |
| (0.18 | ) | (0.91 | ) | – | (1.09 | ) | – | 7.90 | 4.42 | 6,253 | 1.71 | 1.71 | 1.59 | 0.40 | 8 | ||||||||||||||||||||||||||||||||||
| 2011 | 11.70 | (0.08 | ) | (1.63 | ) | (1.71 | ) | (0.14 | ) | (1.20 | ) | – | (1.34 | ) | – | 8.65 | (14.71 | ) | 8,719 | 1.68 | 1.68 | 1.59 | (0.48 | ) | 22 | ||||||||||||||||||||||||||||||||
| 2010 | 9.09 | (0.08 | ) | 2.93 | 2.85 | (0.10 | ) | (0.14 | ) | – | (0.24 | ) | – | 11.70 | 31.44 | 4,782 | 1.78 | 1.78 | 1.59 | (0.40 | ) | 24 | |||||||||||||||||||||||||||||||||||
| 2009 | 5.95 | (0.10 | ) | 3.28 | 3.18 | (0.04 | ) | – | – | (0.04 | ) | – | 9.09 | 53.45 | 676 | 4.75 | 4.75 | 1.59 | (0.44 | ) | 22 | ||||||||||||||||||||||||||||||||||||
| 2008 | 10.00 | (0.01 | ) | (3.77 | ) | (3.78 | ) | – | (0.27 | ) | – | (0.27 | ) | – | 5.95 | (37.47 | )1 | 30 | 40.19 | 2 | 40.19 | 2 | 1.59 | 2 | (0.19 | )2 | 39 | ||||||||||||||||||||||||||||||
| THE ACCOMPANYING NOTES ARE AN INTEGRAL PART OF THESE FINANCIAL STATEMENTS. | The Royce Funds 2013 Semiannual Report to Shareholders | 101 |
|
Financial Highlights |
|
| |||||||||||||||||||||||||||||||||||||||||||||||||||||||||||||||
| Net Asset | Net | Net Realized and Unrealized | Distributions | Distributions from Net | Ratio of Expenses to Average Net Assets | Ratio of Net Investment | |||||||||||||||||||||||||||||||||||||||||||||||||||||||||
| Value, Beginning of Period | Investment Income (Loss) | Gain (Loss) on Investments and Foreign Currency | Total from Investment Operations | from Net Investment Income | Realized Gain on Investments and Foreign Currency | Distributions | Total Distributions | Shareholder Redemption Fees | Net Asset Value, End of Period | Total Return | Net Assets, End of Period (in thousands) | Prior to Fee Waivers and Balance Credits | Prior to Fee Waivers | Net of Fee Waivers | Income (Loss) to Average Net Assets | Portfolio Turnover Rate | |||||||||||||||||||||||||||||||||||||||||||||||
|
|
|
|
|
|
|
|
|
|
|
|
|
|
|
|
|
|
|
|
|
|
|
|
|
|
|
|
|
|
|
|
|
|
|
|
|
|
|
|
|
|
|
|
|
|
|
|
|
|
|
|
|
|
|
|
|
|
|
|
|
|
|
|
| Royce Total Return Fund – Investment Class | |||||||||||||||||||||||||||||||||||||||||||||||||||||||||||||||
| †2013 | $ | 13.63 | $ | 0.08 | $ | 1.67 |
| $ | 1.75 |
| $ | (0.07 | ) | $ | – | $ | – | $ | (0.07 | ) | $ | – | $ | 15.31 | 12.85 | %1 | $ | 3,315,502 | 1.12 | %2 | 1.12 | %2 | 1.12 | %2 | 1.02 | %2 | 10 | % | |||||||||||||||||||||||||
| 2012 | 12.68 | 0.26 | 1.54 |
| 1.80 |
| (0.23 | ) | (0.62 | ) | – | (0.85 | ) | – | 13.63 | 14.42 | 3,044,664 | 1.10 | 1.10 | 1.10 | 1.89 | 17 | |||||||||||||||||||||||||||||||||||||||||
| 2011 | 13.17 | 0.15 | (0.37 | ) | (0.22 | ) | (0.12 | ) | (0.15 | ) | – | (0.27 | ) | – | 12.68 | (1.68 | ) | 3,106,208 | 1.12 | 1.12 | 1.12 | 1.10 | 21 | ||||||||||||||||||||||||||||||||||||||||
| 2010 | 10.81 | 0.19 | 2.32 | 2.51 | (0.15 | ) | – | – | (0.15 | ) | – | 13.17 | 23.47 | 3,562,002 | 1.14 | 1.14 | 1.14 | 1.64 | 15 | ||||||||||||||||||||||||||||||||||||||||||||
| 2009 | 8.70 | 0.16 | 2.09 | 2.25 | (0.14 | ) | – | – | (0.14 | ) | – | 10.81 | 26.22 | 3,077,099 | 1.17 | 1.17 | 1.17 | 1.74 | 20 | ||||||||||||||||||||||||||||||||||||||||||||
| 2008 | 12.93 | 0.20 | (4.20 | ) | (4.00 | ) | (0.23 | ) | (0.00 | ) | – | (0.23 | ) | – | 8.70 | (31.17 | ) | 2,577,031 | 1.12 | 1.12 | 1.12 | 1.69 | 25 | ||||||||||||||||||||||||||||||||||||||||
| Royce Total Return Fund – Service Class | |||||||||||||||||||||||||||||||||||||||||||||||||||||||||||||||
| †2013 | $ | 13.72 | $ | 0.06 | $ | 1.70 | $ | 1.76 | $ | (0.06 | ) | $ | – | $ | – | $ | (0.06 | ) | $ | – | $ | 15.42 | 12.80 | %1 | $ | 454,813 | 1.38 | %2 | 1.38 | %2 | 1.38 | %2 | 0.82 | % | 10 | % | |||||||||||||||||||||||||||
| 2012 | 12.71 | 0.22 | 1.55 | 1.77 | (0.14 | ) | (0.62 | ) | – | (0.76 | ) | – | 13.72 | 14.11 | 264,528 | 1.39 | 1.39 | 1.39 | 1.58 | 17 | |||||||||||||||||||||||||||||||||||||||||||
| 2011 | 13.19 | 0.11 | (0.38 | ) | (0.27 | ) | (0.06 | ) | (0.15 | ) | – | (0.21 | ) | – | 12.71 | (2.01 | ) | 282,704 | 1.41 | 1.41 | 1.41 | 0.82 | 21 | ||||||||||||||||||||||||||||||||||||||||
| 2010 | 10.81 | 0.16 | 2.32 | 2.48 | (0.10 | ) | – | – | (0.10 | ) | – | 13.19 | 23.11 | 295,656 | 1.42 | 1.42 | 1.42 | 1.39 | 15 | ||||||||||||||||||||||||||||||||||||||||||||
| 2009 | 8.67 | 0.14 | 2.09 | 2.23 | (0.10 | ) | – | – | (0.10 | ) | 0.01 | 10.81 | 26.16 | 215,939 | 1.42 | 1.42 | 1.42 | 1.49 | 20 | ||||||||||||||||||||||||||||||||||||||||||||
| 2008 | 12.82 | 0.17 | (4.16 | ) | (3.99 | ) | (0.18 | ) | (0.00 | ) | – | (0.18 | ) | 0.02 | 8.67 | (31.17 | ) | 155,644 | 1.37 | 1.37 | 1.34 | 1.49 | 25 | ||||||||||||||||||||||||||||||||||||||||
| Royce Total Return Fund – Consultant Class | |||||||||||||||||||||||||||||||||||||||||||||||||||||||||||||||
| †2013 | $ | 13.81 | $ | 0.00 | $ | 1.70 | $ | 1.70 | $ | – | $ | – | $ | – | $ | – | $ | – | $ | 15.51 | 12.31 | %1 | $ | 359,091 | 2.12 | %2 | 2.12 | %2 | 2.12 | %2 | 0.03 | %2 | 10 | % | |||||||||||||||||||||||||||||
| 2012 | 12.77 | 0.11 | 1.56 | 1.67 | (0.01 | ) | (0.62 | ) | – | (0.63 | ) | – | 13.81 | 13.19 | 331,116 | 2.20 | 2.20 | 2.20 | 0.80 | 17 | |||||||||||||||||||||||||||||||||||||||||||
| 2011 | 13.27 | 0.02 | (0.37 | ) | (0.35 | ) | – | (0.15 | ) |
| – | (0.15 | ) | – | 12.77 | (2.64 | ) | 328,610 | 2.07 | 2.07 | 2.07 | 0.15 | 21 | ||||||||||||||||||||||||||||||||||||||||
| 2010 | 10.90 | 0.08 | 2.33 | 2.41 | (0.04 | ) | – |
| – | (0.04 | ) | – | 13.27 | 22.18 | 391,886 | 2.09 | 2.09 | 2.09 | 0.68 | 15 | |||||||||||||||||||||||||||||||||||||||||||
| 2009 | 8.76 | 0.07 | 2.12 | 2.19 | (0.05 | ) | – |
| – | (0.05 | ) | – | 10.90 | 25.12 | 366,367 | 2.12 | 2.12 | 2.12 | 0.78 | 20 | |||||||||||||||||||||||||||||||||||||||||||
| 2008 | 12.91 | 0.08 | (4.18 | ) | (4.10 | ) | (0.05 | ) | (0.00 | ) |
| – | (0.05 | ) | – | 8.76 | (31.83 | ) | 354,384 | 2.09 | 2.08 | 2.08 | 0.71 | 25 | |||||||||||||||||||||||||||||||||||||||
| Royce Total Return Fund – Institutional Class | |||||||||||||||||||||||||||||||||||||||||||||||||||||||||||||||
| †2013 | $ | 13.55 | $ | 0.09 | $ | 1.67 | $ | 1.76 | $ | (0.08 | ) | $ | – | $ | – | $ | (0.08 | ) | $ | – | $ | 15.23 | 13.00 | %1 | $ | 525,385 | 1.00 | %2 | 1.00 | %2 | 1.00 | %2 | 1.19 | %2 | 10 | % | |||||||||||||||||||||||||||
| 2012 | 12.64 | 0.27 | 1.54 | 1.81 | (0.28 | ) | (0.62 | ) | – | (0.90 | ) | – | 13.55 | 14.48 | 408,551 | 1.02 | 1.02 | 1.02 | 2.02 | 17 | |||||||||||||||||||||||||||||||||||||||||||
| 2011 | 13.14 | 0.16 | (0.37 | ) | (0.21 | ) | (0.14 | ) | (0.15 | ) |
| – | (0.29 | ) | – | 12.64 | (1.55 | ) | 390,277 | 1.00 | 1.00 | 1.00 | 1.26 | 21 | |||||||||||||||||||||||||||||||||||||||
| 2010 | 10.80 | 0.21 | 2.31 | 2.52 | (0.18 | ) | – |
| – | (0.18 | ) | – | 13.14 | 23.56 | 356,038 | 1.01 | 1.01 | 1.01 | 1.79 | 15 | |||||||||||||||||||||||||||||||||||||||||||
| 2009 | 8.70 | 0.17 | 2.09 | 2.26 | (0.16 | ) | – |
| – | (0.16 | ) | – | 10.80 | 26.41 | 264,041 | 1.04 | 1.04 | 1.04 | 1.87 | 20 | |||||||||||||||||||||||||||||||||||||||||||
| 2008 | 12.95 | 0.20 | (4.19 | ) | (3.99 | ) | (0.26 | ) | (0.00 | ) |
| – | (0.26 | ) | – | 8.70 | (31.09 | ) | 191,014 | 1.00 | 0.99 | 0.99 | 1.82 | 25 | |||||||||||||||||||||||||||||||||||||||
| Royce Total Return Fund – W Class | |||||||||||||||||||||||||||||||||||||||||||||||||||||||||||||||
| †2013 | $ | 13.62 | $ | 0.08 | $ | 1.67 | $ | 1.75 | $ | (0.07 | ) | $ | – | $ | – | $ | (0.07 | ) | $ | – | $ | 15.30 | 12.86 | %1 | $ | 212,958 | 1.12 | %2 | 1.12 | %2 | 1.12 | %2 | 1.04 | %2 | 10 | % | |||||||||||||||||||||||||||
| 2012 | 12.69 | 0.26 | 1.54 | 1.80 | (0.25 | ) | (0.62 | ) | – | (0.87 | ) | – | 13.62 | 14.41 | 171,603 | 1.12 | 1.12 | 1.12 | 1.97 | 17 | |||||||||||||||||||||||||||||||||||||||||||
| 2011 | 13.19 | 0.16 | (0.37 | ) | (0.21 | ) | (0.14 | ) | (0.15 | ) |
| – | (0.29 | ) | – | 12.69 | (1.58 | ) | 132,488 | 1.05 | 1.05 | 1.05 | 1.27 | 21 | |||||||||||||||||||||||||||||||||||||||
| 2010 | 10.83 | 0.20 | 2.32 | 2.52 | (0.16 | ) | – |
| – | (0.16 | ) | – | 13.19 | 23.44 | 75,063 | 1.09 | 1.09 | 1.09 | 1.74 | 15 | |||||||||||||||||||||||||||||||||||||||||||
| 2009 | 8.71 | 0.16 | 2.10 | 2.26 | (0.14 | ) | – |
| – | (0.14 | ) | – | 10.83 | 26.28 | 48,058 | 1.13 | 1.13 | 1.13 | 1.78 | 20 | |||||||||||||||||||||||||||||||||||||||||||
| 2008 | 12.95 | 0.23 | (4.23 | ) | (4.00 | ) | (0.24 | ) | (0.00 | ) |
| – | (0.24 | ) | – | 8.71 | (31.18 | ) | 65,260 | 1.08 | 1.08 | 1.08 | 1.66 | 25 | |||||||||||||||||||||||||||||||||||||||
| 102 | The Royce Funds 2013 Semiannual Report to Shareholders | THE ACCOMPANYING NOTES ARE AN INTEGRAL PART OF THESE FINANCIAL STATEMENTS. |
|
Financial Highlights |
|
| |||||||||||||||||||||||||||||||||||||||||||||||||||||||||||||||
|
| Net Asset |
| Net |
| Net Realized and Unrealized |
|
| Distributions |
| Distributions from Net |
|
|
|
|
|
|
|
|
| Ratio of Expenses to Average Net Assets |
| Ratio of Net Investment |
|
| ||||||||||||||||||||||||||||||||||||||
|
| Value, |
| Investment |
| Gain (Loss) on |
| Total from Investment Operations |
| from Net Investment Income |
| Realized Gain on |
| Distributions |
| Total Distributions |
| Shareholder Redemption Fees |
| Net Asset |
| Total Return |
| Net Assets, |
| Prior to Fee |
| Prior |
| Net of |
| Income (Loss) |
| Portfolio Turnover Rate |
| ||||||||||||||||||||||||||||
|
|
|
|
|
|
|
|
|
|
|
|
|
|
|
|
|
|
|
|
|
|
|
|
|
|
|
|
|
|
|
|
|
|
|
|
|
|
|
|
|
|
|
|
|
|
|
|
|
|
|
|
|
|
|
|
|
| ||||||
| Royce Total Return Fund – R Class | |||||||||||||||||||||||||||||||||||||||||||||||||||||||||||||||
| †2013 | $ | 13.82 | $ | 0.03 | $ | 1.70 | $ | 1.73 | $ | (0.03 | ) | $ | – | $ | – | $ | (0.03 | ) | $ | – | $ | 15.52 | 12.52 | %1 | $ | 59,783 | 1.72 | %2 | 1.72 | %2 | 1.72 | %2 | 0.44 | % | 10 | % | |||||||||||||||||||||||||||
| 2012 | 12.79 | 0.18 | 1.55 | 1.73 | (0.08 | ) | (0.62 | ) | – | (0.70 | ) | – | 13.82 | 13.66 | 48,797 | 1.74 | 1.74 | 1.74 | 1.36 | 17 | |||||||||||||||||||||||||||||||||||||||||||
| 2011 | 13.28 | 0.08 | (0.38 | ) | (0.30 | ) | (0.04 | ) | (0.15 | ) | – | (0.19 | ) | – | 12.79 | (2.23 | ) | 34,695 | 1.68 | 1.68 | 1.68 | 0.62 | 21 | ||||||||||||||||||||||||||||||||||||||||
| 2010 | 10.88 | 0.15 | 2.32 | 2.47 | (0.07 | ) | – | – | (0.07 | ) | – | 13.28 | 22.76 | 20,011 | 1.71 | 1.71 | 1.71 | 1.20 | 15 | ||||||||||||||||||||||||||||||||||||||||||||
| 2009 | 8.74 | 0.10 | 2.10 | 2.20 | (0.06 | ) | – | – | (0.06 | ) | – | 10.88 | 25.43 | 6,450 | 1.85 | 1.85 | 1.84 | 1.05 | 20 | ||||||||||||||||||||||||||||||||||||||||||||
| 2008 | 12.93 | 0.11 | (4.19 | ) | (4.08 | ) | (0.11 | ) | (0.00 | ) | – | (0.11 | ) | – | 8.74 | (31.67 | ) | 2,946 | 2.03 | 2.02 | 1.84 | 1.10 | 25 | ||||||||||||||||||||||||||||||||||||||||
| Royce Total Return Fund – K Class c | |||||||||||||||||||||||||||||||||||||||||||||||||||||||||||||||
| †2013 | $ | 10.53 | $ | 0.04 | $ | 1.29 | $ | 1.33 | $ | (0.04 | ) | $ | – | $ | – | $ | (0.04 | ) | $ | – | $ | 11.82 | 12.59 | %1 | $ | 194,541 | 1.47 | %2 | 1.47 | %2 | 1.47 | %2 | 0.68 | %2 | 10 | % | |||||||||||||||||||||||||||
| 2012 | 9.90 | 0.17 | 1.21 | 1.38 | (0.13 | ) | (0.62 | ) | – | (0.75 | ) | – | 10.53 | 14.08 | 163,412 | 1.43 | 1.43 | 1.43 | 1.51 | 17 | |||||||||||||||||||||||||||||||||||||||||||
| 2011 | 10.31 | 0.09 | (0.30 | ) | (0.21 | ) | (0.05 | ) | (0.15 | ) | – | (0.20 | ) | – | 9.90 | (1.97 | ) | 177,812 | 1.44 | 1.44 | 1.44 | 0.90 | 21 | ||||||||||||||||||||||||||||||||||||||||
| 2010 | 8.47 | 0.13 | 1.81 | 1.94 | (0.10 | ) | – | – | (0.10 | ) | – | 10.31 | 23.08 | 95,319 | 1.43 | 1.43 | 1.43 | 1.46 | 15 | ||||||||||||||||||||||||||||||||||||||||||||
| 2009 | 6.81 | 0.11 | 1.63 | 1.74 | (0.08 | ) | – | – | (0.08 | ) | – | 8.47 | 25.89 | 43,281 | 1.42 | 1.42 | 1.42 | 1.44 | 20 | ||||||||||||||||||||||||||||||||||||||||||||
| 2008 | 10.00 | 0.02 | (3.07 | ) | (3.05 | ) | (0.14 | ) | (0.00 | ) | – | (0.14 | ) | – | 6.81 | (30.56 | )1 | 14,064 | 1.46 | 2 | 1.46 | 2 | 1.46 | 2 | 1.81 | 2 | 25 | ||||||||||||||||||||||||||||||||||||
| Royce Heritage Fund – Investment Class | |||||||||||||||||||||||||||||||||||||||||||||||||||||||||||||||
| †2013 | $ | 14.48 | $ | 0.04 | $ | 1.35 | $ | 1.39 | $ | – | $ | – | $ | – | $ | – | $ | – | $ | 15.87 | 9.60 | %1 | $ | 57,116 | 1.14 | %2 | 1.14 | %2 | 1.14 | %2 | 0.46 | %2 | 31 | % | |||||||||||||||||||||||||||||
| 2012 | 13.07 | 0.10 | 1.80 | 1.90 | (0.13 | ) | (0.36 | ) | – | (0.49 | ) | – | 14.48 | 14.70 | 40,374 | 1.20 | 1.20 | 1.20 | 0.94 | 39 | |||||||||||||||||||||||||||||||||||||||||||
| 2011 | 15.10 | 0.01 | (1.41 | ) | (1.40 | ) | (0.05 | ) | (0.59 | ) | – | (0.64 | ) | 0.01 | 13.07 | (9.16 | ) | 21,088 | 1.22 | 1.22 | 1.22 | 0.15 | 51 | ||||||||||||||||||||||||||||||||||||||||
| 2010 | 12.12 | 0.04 | 3.31 | 3.35 | (0.08 | ) | (0.29 | ) | – | (0.37 | ) | – | 15.10 | 27.71 | 13,313 | 1.25 | 1.25 | 1.24 | 0.35 | 66 | |||||||||||||||||||||||||||||||||||||||||||
| 2009 | 7.97 | 0.02 | 4.13 | 4.15 | – | – | – | – | – | 12.12 | 52.07 | 10,052 | 1.34 | 1.34 | 1.24 | 0.19 | 59 | ||||||||||||||||||||||||||||||||||||||||||||||
| 2008 | 12.88 | 0.04 | (4.70 | ) | (4.66 | ) | – | (0.25 | ) | – | (0.25 | ) | – | 7.97 | (36.07 | ) | 5,522 | 1.39 | 1.38 | 1.24 | 0.40 | 128 | |||||||||||||||||||||||||||||||||||||||||
| Royce Heritage Fund – Service Class | |||||||||||||||||||||||||||||||||||||||||||||||||||||||||||||||
| †2013 | $ | 14.45 | $ | 0.01 | $ | 1.35 | $ | 1.36 | $ | – | $ | – | $ | – | $ | – | $ | – | $ | 15.81 | 9.41 | %1 | $ | 208,031 | 1.45 | %2 | 1.45 | %2 | 1.42 | %2 | 0.14 | %2 | 31 | % | |||||||||||||||||||||||||||||
| 2012 | 13.00 | 0.08 | 1.78 | 1.86 | (0.05 | ) | (0.36 | ) | – | (0.41 | ) | – | 14.45 | 14.39 | 203,112 | 1.46 | 1.46 | 1.45 | 0.56 | 39 | |||||||||||||||||||||||||||||||||||||||||||
| 2011 | 15.03 | (0.01 | ) | (1.40 | ) | (1.41 | ) | (0.03 | ) | (0.59 | ) | – | (0.62 | ) | – | 13.00 | (9.39 | ) | 218,770 | 1.47 | 1.47 | 1.44 | (0.07 | ) | 51 | ||||||||||||||||||||||||||||||||||||||
| 2010 | 12.07 | 0.03 | 3.28 | 3.31 | (0.06 | ) | (0.29 | ) | – | (0.35 | ) | – | 15.03 | 27.50 | 243,822 | 1.47 | 1.47 | 1.38 | 0.21 | 66 | |||||||||||||||||||||||||||||||||||||||||||
| 2009 | 7.95 | (0.00 | ) | 4.12 | 4.12 | – | – | – | – | – | 12.07 | 51.82 | 182,690 | 1.51 | 1.51 | 1.42 | (0.02 | ) | 59 | ||||||||||||||||||||||||||||||||||||||||||||
| 2008 | 12.88 | 0.02 | (4.70 | ) | (4.68 | ) | – | (0.25 | ) | – | (0.25 | ) | – | 7.95 | (36.22 | ) | 78,526 | 1.50 | 1.49 | 1.49 | 0.14 | 128 | |||||||||||||||||||||||||||||||||||||||||
| Royce Heritage Fund – Consultant Class | |||||||||||||||||||||||||||||||||||||||||||||||||||||||||||||||
| †2013 | $ | 11.68 | $ | (0.05 | ) | $ | 1.09 | $ | 1.04 | $ | – | $ | – | $ | – | $ | – | $ | – | $ | 12.72 | 8.90 | %1 | $ | 14,559 | 2.33 | %2 | 2.33 | %2 | 2.33 | %2 | (0.76 | )%2 | 31 | % | ||||||||||||||||||||||||||||
| 2012 | 10.64 | (0.04 | ) | 1.44 | 1.40 | – | (0.36 | ) | – | (0.36 | ) | – | 11.68 | 13.30 | 13,909 | 2.41 | 2.41 | 2.41 | (0.39 | ) | 39 | ||||||||||||||||||||||||||||||||||||||||||
| 2011 | 12.50 | (0.11 | ) | (1.16 | ) | (1.27 | ) | – | (0.59 | ) | – | (0.59 | ) | – | 10.64 | (10.14 | ) | 13,850 | 2.28 | 2.28 | 2.28 | (0.91 | ) | 51 | |||||||||||||||||||||||||||||||||||||||
| 2010 | 10.14 | (0.08 | ) | 2.73 | 2.65 | – | (0.29 | ) | – | (0.29 | ) | – | 12.50 | 26.22 | 12,801 | 2.36 | 2.36 | 2.36 | (0.77 | ) | 66 | ||||||||||||||||||||||||||||||||||||||||||
| 2009 | 6.75 | (0.09 | ) | 3.48 | 3.39 | – | – | – | – | – | 10.14 | 50.22 | 7,485 | 2.55 | 2.55 | 2.49 | (1.05 | ) | 59 | ||||||||||||||||||||||||||||||||||||||||||||
| 2008 | 11.10 | (0.08 | ) | (4.03 | ) | (4.11 | ) | – | (0.25 | ) | – | (0.25 | ) | 0.01 | 6.75 | (36.81 | ) | 4,609 | 2.69 | 2.68 | 2.49 | (0.86 | ) | 128 | |||||||||||||||||||||||||||||||||||||||
| THE ACCOMPANYING NOTES ARE AN INTEGRAL PART OF THESE FINANCIAL STATEMENTS. | The Royce Funds 2013 Semiannual Report to Shareholders | 103 |
|
Financial Highlights |
|
| |||||||||||||||||||||||||||||||||||||||||||||||||||||||||
|
| Net |
| Net |
| Net Realized and Unrealized |
|
| Distributions |
| Distributions from Net |
|
|
|
|
|
|
|
|
| Ratio of Expenses to Average Net Assets |
| Ratio of Net Investment |
|
| ||||||||||||||||||||||||||||||||
|
| Asset Value, |
| Investment |
| Gain (Loss) on |
| Total from Investment Operations |
| from Net Investment Income |
| Realized Gain on |
| Distributions |
| Total Distributions |
| Shareholder Redemption Fees |
| Net Asset |
| Total Return |
| Net Assets, |
| Prior to Fee |
| Prior |
| Net of |
| Income (Loss) |
| Portfolio Turnover Rate |
| ||||||||||||||||||||||
|
|
|
|
|
|
|
|
|
|
|
|
|
|
|
|
|
|
|
|
|
|
|
|
|
|
|
|
|
|
|
|
|
|
|
|
|
|
|
|
|
|
|
|
|
|
|
|
|
|
|
|
|
|
|
|
|
|
| Royce Heritage Fund – R Class b | |||||||||||||||||||||||||||||||||||||||||||||||||||||||||
| †2013 | $ | 10.86 | $ | (0.01 | ) | $ | 1.01 | $ | 1.00 | $ | – |
| $ | – |
| $ | – | $ | – |
| $ | – | $ | 11.86 | 9.21 | %1 | $ | 6,366 | 1.86 | %2 | 1.86 | %2 | 1.84 | %2 | (0.25 | )%2 | 31 | % | |||||||||||||||||||
| 2012 | 9.87 | 0.02 | 1.34 | 1.36 | (0.01 | ) | (0.36 | ) | – | (0.37 | ) | – | 10.86 | 13.88 | 4,832 | 1.95 | 1.95 | 1.84 | 0.17 | 39 | |||||||||||||||||||||||||||||||||||||
| 2011 | 11.63 | (0.06 | ) | (1.07 | ) | (1.13 | ) | (0.04 | ) | (0.59 | ) | – | (0.63 | ) | – | 9.87 | (9.73 | ) | 4,081 | 1.90 | 1.90 | 1.84 | (0.45 | ) | 51 | ||||||||||||||||||||||||||||||||
| 2010 | 9.43 | (0.03 | ) | 2.55 | 2.52 | (0.03 | ) | (0.29 | ) | – | (0.32 | ) | – | 11.63 | 26.84 | 1,909 | 2.22 | 2.22 | 1.84 | (0.25 | ) | 66 | |||||||||||||||||||||||||||||||||||
| 2009 | 6.23 | (0.05 | ) | 3.25 | 3.20 | – | – | – | – | – | 9.43 | 51.36 | 832 | 4.03 | 4.03 | 1.84 | (0.56 | ) | 59 | ||||||||||||||||||||||||||||||||||||||
| 2008 | 10.00 | (0.01 | ) | (3.51 | ) | (3.52 | ) | – | (0.25 | ) | – | (0.25 | ) | – | 6.23 | (35.05 | )1 | 65 | 19.77 | 2 | 19.76 | 2 | 1.84 | 2 | (0.27 | )2 | 128 | ||||||||||||||||||||||||||||||
| Royce Heritage Fund – K Class b | |||||||||||||||||||||||||||||||||||||||||||||||||||||||||
| †2013 | $ | 10.90 | $ | (0.00 | ) | $ | 1.01 | $ | 1.01 | $ | – |
| $ | – |
| $ | – | $ | – |
| $ | – | $ | 11.91 | 9.27 | %1 | $ | 7,186 | 1.65 | %2 | 1.65 | %2 | 1.59 | %2 | (0.03 | )%2 | 31 | % | |||||||||||||||||||
| 2012 | 9.93 | 0.04 | 1.36 | 1.40 | (0.07 | ) | (0.36 | ) | – | (0.43 | ) | – | 10.90 | 14.22 | 7,077 | 1.61 | 1.61 | 1.59 | 0.42 | 39 | |||||||||||||||||||||||||||||||||||||
| 2011 | 11.68 | (0.04 | ) | (1.08 | ) | (1.12 | ) | (0.04 | ) | (0.59 | ) | – | (0.63 | ) | – | 9.93 | (9.53 | ) | 7,787 | 1.66 | 1.66 | 1.59 | (0.24 | ) | 51 | ||||||||||||||||||||||||||||||||
| 2010 | 9.46 | (0.03 | ) | 2.60 | 2.57 | (0.06 | ) | (0.29 | ) | – | (0.35 | ) | – | 11.68 | 27.29 | 5,214 | 1.67 | 1.67 | 1.59 | (0.00 | ) | 66 | |||||||||||||||||||||||||||||||||||
| 2009 | 6.24 | (0.02 | ) | 3.24 | 3.22 | – | – | – | – | – | 9.46 | 51.60 | 287 | 5.82 | 5.82 | 1.59 | (0.26 | ) | 59 | ||||||||||||||||||||||||||||||||||||||
| 2008 | 10.00 | (0.00 | ) | (3.51 | ) | (3.51 | ) | – | (0.25 | ) | – | (0.25 | ) | – | 6.24 | (34.95 | )1 | 65 | 19.53 | 2 | 19.53 | 2 | 1.59 | 2 | (0.02 | )2 | 128 | ||||||||||||||||||||||||||||||
| Royce Opportunity Fund – Investment Class | |||||||||||||||||||||||||||||||||||||||||||||||||||||||||
| †2013 | $ | 11.95 | $ | (0.02 | ) | $ | 2.23 | $ | 2.21 | $ | – |
| $ | – |
| $ | – | $ | – |
| $ | – | $ | 14.16 | 18.49 | %1 | $ | 1,088,976 | 1.16 | %2 | 1.16 | %2 | 1.16 | %2 | (0.32 | )%2 | 23 | % | |||||||||||||||||||
| 2012 | 10.32 | 0.00 | 2.30 | 2.30 | – | (0.67 | ) | – | (0.67 | ) | – | 11.95 | 22.59 | 921,473 | 1.13 | 1.13 | 1.13 | 0.02 | 34 | ||||||||||||||||||||||||||||||||||||||
| 2011 | 12.08 | (0.04 | ) | (1.53 | ) | (1.57 | ) | – | (0.19 | ) | – | (0.19 | ) | – | 10.32 | (12.95 | ) | 878,824 | 1.16 | 1.16 | 1.16 | (0.38 | ) | 35 | |||||||||||||||||||||||||||||||||
| 2010 | 9.03 | (0.04 | ) | 3.09 | 3.05 | – | – | – | – | – | 12.08 | 33.78 | 1,170,607 | 1.17 | 1.17 | 1.17 | (0.44 | ) | 47 | ||||||||||||||||||||||||||||||||||||||
| 2009 | 5.57 | (0.03 | ) | 3.49 | 3.46 | (0.00 | ) | – | – | (0.00 | ) | – | 9.03 | 62.14 | 836,268 | 1.22 | 1.22 | 1.22 | (0.43 | ) | 44 | ||||||||||||||||||||||||||||||||||||
| 2008 | 11.02 | 0.06 | (5.12 | ) | (5.06 | ) | (0.05 | ) | (0.34 | ) | – | (0.39 | ) | – | 5.57 | (45.73 | ) | 581,860 | 1.17 | 1.17 | 1.17 | 0.63 | 52 | ||||||||||||||||||||||||||||||||||
| Royce Opportunity Fund – Service Class | |||||||||||||||||||||||||||||||||||||||||||||||||||||||||
| †2013 | $ | 11.55 | $ | (0.04 | ) | $ | 2.16 | $ | 2.12 | $ | – |
| $ | – |
| $ | – | $ | – |
| $ | – | $ | 13.67 | 18.35 | %1 | $ | 300,861 | 1.43 | %2 | 1.43 | %2 | 1.43 | %2 | (0.59 | )%2 | 23 | % | |||||||||||||||||||
| 2012 | 10.03 | (0.04 | ) | 2.23 | 2.19 | – | (0.67 | ) | – | (0.67 | ) | – | 11.55 | 22.14 | 205,084 | 1.46 | 1.46 | 1.46 | (0.32 | ) | 34 | ||||||||||||||||||||||||||||||||||||
| 2011 | 11.78 | (0.08 | ) | (1.49 | ) | (1.57 | ) | – | (0.19 | ) | – | (0.19 | ) | 0.01 | 10.03 | (13.20 | ) | 160,496 | 1.48 | 1.48 | 1.48 | (0.73 | ) | 35 | |||||||||||||||||||||||||||||||||
| 2010 | 8.83 | (0.08 | ) | 3.03 | 2.95 | – | – | – | – | – | 11.78 | 33.41 | 312,728 | 1.46 | 1.46 | 1.46 | (0.78 | ) | 47 | ||||||||||||||||||||||||||||||||||||||
| 2009 | 5.46 | (0.05 | ) | 3.42 | 3.37 | – | – | – | – | – | 8.83 | 61.72 | 298,410 | 1.47 | 1.47 | 1.47 | (0.69 | ) | 44 | ||||||||||||||||||||||||||||||||||||||
| 2008 | 10.80 | 0.04 | (5.00 | ) | (4.96 | ) | (0.04 | ) | (0.34 | ) | – | (0.38 | ) | – | 5.46 | (45.76 | ) | 162,607 | 1.41 | 1.41 | 1.34 | 0.40 | 52 | ||||||||||||||||||||||||||||||||||
| Royce Opportunity Fund – Consultant Class | |||||||||||||||||||||||||||||||||||||||||||||||||||||||||
| †2013 | $ | 11.01 | $ | (0.09 | ) | $ | 2.06 | $ | 1.97 | $ | – |
| $ | – |
| $ | – | $ | – |
| $ | – | $ | 12.98 | 17.89 | %1 | $ | 14,725 | 2.28 | %2 | 2.28 | %2 | 2.28 | %2 | (1.44 | )%2 | 23 | % | |||||||||||||||||||
| 2012 | 9.67 | (0.13 | ) | 2.14 | 2.01 | – | (0.67 | ) | – | (0.67 | ) | – | 11.01 | 21.09 | 11,930 | 2.36 | 2.36 | 2.36 | (1.22 | ) | 34 | ||||||||||||||||||||||||||||||||||||
| 2011 | 11.46 | (0.15 | ) | (1.45 | ) | (1.60 | ) | – | (0.19 | ) | – | (0.19 | ) | – | 9.67 | (13.91 | ) | 11,884 | 2.24 | 2.24 | 2.24 | (1.44 | ) | 35 | |||||||||||||||||||||||||||||||||
| 2010 | 8.66 | (0.15 | ) | 2.95 | 2.80 | – | – | – | – | – | 11.46 | 32.33 | 13,126 | 2.29 | 2.29 | 2.29 | (1.56 | ) | 47 | ||||||||||||||||||||||||||||||||||||||
| 2009 | 5.42 | (0.11 | ) | 3.35 | 3.24 | – | – | – | – | – | 8.66 | 59.78 | 7,500 | 2.45 | 2.45 | 2.45 | (1.66 | ) | 44 | ||||||||||||||||||||||||||||||||||||||
| 2008 | 10.78 | (0.07 | ) | (4.95 | ) | (5.02 | ) | – | (0.34 | ) | – | (0.34 | ) | – | 5.42 | (46.40 | ) | 4,707 | 2.48 | 2.47 | 2.47 | (0.74 | ) | 52 | |||||||||||||||||||||||||||||||||
| 104 | The Royce Funds 2013 Semiannual Report to Shareholders | THE ACCOMPANYING NOTES ARE AN INTEGRAL PART OF THESE FINANCIAL STATEMENTS. |
|
Financial Highlights |
|
| |||||||||||||||||||||||||||||||||||||||||||||||||||||||||||||||
|
| Net Asset |
| Net |
| Net Realized and Unrealized |
|
| Distributions |
| Distributions from Net |
|
|
|
|
|
|
|
|
| Ratio of Expenses to Average Net Assets |
| Ratio of Net Investment |
|
| ||||||||||||||||||||||||||||||||||||||
|
| Value, |
| Investment |
| Gain (Loss) on |
| Total from Investment Operations |
| from Net Investment Income |
| Realized Gain on |
| Distributions |
| Total Distributions |
| Shareholder Redemption Fees |
| Net Asset |
| Total Return |
| Net Assets, |
| Prior to Fee |
| Prior |
| Net of |
| Income (Loss) |
| Portfolio Turnover Rate |
| ||||||||||||||||||||||||||||
|
|
|
|
|
|
|
|
|
|
|
|
|
|
|
|
|
|
|
|
|
|
|
|
|
|
|
|
|
|
|
|
|
|
|
|
|
|
|
|
|
|
|
|
|
|
|
|
|
|
|
|
|
|
|
|
|
| ||||||
| Royce Opportunity Fund – Institutional Class | |||||||||||||||||||||||||||||||||||||||||||||||||||||||||||||||
| †2013 | $ | 12.06 | $ | (0.01 | ) | $ | 2.25 | $ | 2.24 | $ | – | $ | – |
| $ | – | $ | – |
| $ | – | $ | 14.30 | 18.57 | %1 | $ | 861,500 | 1.03 | %2 | 1.03 | %2 | 1.03 | %2 | (0.19 | )%2 | 23 | % | ||||||||||||||||||||||||||
| 2012 | 10.40 | 0.01 |
| 2.32 | 2.33 | – | (0.67 | ) | –�� | (0.67 | ) | – | 12.06 | 22.70 | 689,939 | 1.04 | 1.04 | 1.04 | 0.11 | 34 | |||||||||||||||||||||||||||||||||||||||||||
| 2011 | 12.16 | (0.03 | ) | (1.54 | ) | (1.57 | ) | – | (0.19 | ) | – | (0.19 | ) | – | 10.40 | (12.86 | ) | 574,826 | 1.03 | 1.03 | 1.03 | (0.24 | ) | 35 | |||||||||||||||||||||||||||||||||||||||
| 2010 | 9.07 | (0.03 | ) | 3.12 | 3.09 | – | – | – | – | – | 12.16 | 34.07 | 702,220 | 1.04 | 1.04 | 1.04 | (0.32 | ) | 47 | ||||||||||||||||||||||||||||||||||||||||||||
| 2009 | 5.60 | (0.02 | ) | 3.50 | 3.48 | (0.01 | ) | – | – | (0.01 | ) | – | 9.07 | 62.23 | 502,300 | 1.04 | 1.04 | 1.04 | (0.26 | ) | 44 | ||||||||||||||||||||||||||||||||||||||||||
| 2008 | 11.09 | 0.05 | (5.13 | ) | (5.08 | ) | (0.07 | ) | (0.34 | ) | – | (0.41 | ) | – | 5.60 | (45.66 | ) | 310,272 | 1.04 | 1.04 | 1.04 | 0.60 | 52 | ||||||||||||||||||||||||||||||||||||||||
Royce Opportunity Fund – R Class | |||||||||||||||||||||||||||||||||||||||||||||||||||||||||||||||
| †2013 | $ | 11.46 | $ | (0.06 | ) | $ | 2.14 | $ | 2.08 | $ | – | $ | – |
| $ | – | $ | – |
| $ | – | $ | 13.54 | 18.15 | %1 | $ | 13,493 | 1.80 | %2 | 1.80 | %2 | 1.80 | %2 | (0.96 | )%2 | 23 | % | ||||||||||||||||||||||||||
2012 |
|
| 9.98 |
|
| (0.07 | ) |
| 2.22 |
|
| 2.15 |
|
| – |
|
| (0.67 | ) |
| – |
|
| (0.67 | ) |
| – |
|
| 11.46 |
|
| 21.85 |
|
| 6,612 |
|
| 2.01 |
|
|
| 2.01 |
|
|
| 1.84 |
|
|
| (0.62 | ) |
|
| 34 |
|
| ||||||
2011 |
|
| 11.78 |
|
| (0.10 | ) |
| (1.51 | ) |
| (1.61 | ) |
| – |
|
| (0.19 | ) |
| – |
|
| (0.19 | ) |
| – |
|
| 9.98 |
|
| (13.62 | ) |
| 3,088 |
|
| 2.03 |
|
|
| 2.03 |
|
|
| 1.84 |
|
|
| (0.98 | ) |
|
| 35 |
|
| ||||||
2010 |
|
| 8.86 |
|
| (0.11 | ) |
| 3.03 |
|
| 2.92 |
|
| – |
|
| – |
|
| – |
|
| – |
|
| – |
|
| 11.78 |
|
| 32.96 |
|
| 1,407 |
|
| 2.88 |
|
|
| 2.88 |
|
|
| 1.84 |
|
|
| (1.06 | ) |
|
| 47 |
|
| ||||||
2009 |
|
| 5.50 |
|
| (0.07 | ) |
| 3.43 |
|
| 3.36 |
|
| – |
|
| – |
|
| – |
|
| – |
|
| – |
|
| 8.86 |
|
| 61.09 |
|
| 341 |
|
| 9.91 |
|
|
| 9.91 |
|
|
| 1.84 |
|
|
| (1.05 | ) |
|
| 44 |
|
| ||||||
2008 |
|
| 11.02 |
|
| (0.06 | ) |
| (5.08 | ) |
| (5.14 | ) |
| (0.04 | ) |
| (0.34 | ) |
| – |
|
| (0.38 | ) |
| – |
|
| 5.50 |
|
| (46.50 | ) |
| 64 |
|
| 18.28 |
|
|
| 18.27 |
|
|
| 1.84 |
|
|
| (0.04 | ) |
|
| 52 |
|
| ||||||
Royce Opportunity Fund – K Class b | |||||||||||||||||||||||||||||||||||||||||||||||||||||||||||||||
| †2013 | $ | 10.70 | $ | (0.04 | ) | $ | 2.00 | $ | 1.96 | $ | – | $ | – |
| $ | – | $ | – |
| $ | – | $ | 12.66 | 18.32 | %1 | $ | 12,100 | 1.44 | %2 | 1.44 | %2 | 1.44 | %2 | (0.60 | )%2 | 23 | % | ||||||||||||||||||||||||||
2012 |
|
| 9.33 |
|
| (0.04 | ) |
| 2.08 |
|
| 2.04 |
|
| – |
|
| (0.67 | ) |
| – |
|
| (0.67 | ) |
| – |
|
| 10.70 |
|
| 22.19 |
|
| 8,828 |
|
| 1.52 |
|
|
| 1.52 |
|
|
| 1.52 |
|
|
| (0.36 | ) |
|
| 34 |
|
| ||||||
2011 |
|
| 10.98 |
|
| (0.07 | ) |
| (1.39 | ) |
| (1.46 | ) |
| – |
|
| (0.19 | ) |
| – |
|
| (0.19 | ) |
| – |
|
| 9.33 |
|
| (13.25 | ) |
| 6,484 |
|
| 1.46 |
|
|
| 1.46 |
|
|
| 1.46 |
|
|
| (0.68 | ) |
|
| 35 |
|
| ||||||
2010 |
|
| 8.24 |
|
| (0.07 | ) |
| 2.81 |
|
| 2.74 |
|
| – |
|
| – |
|
| – |
|
| – |
|
| – |
|
| 10.98 |
|
| 33.25 |
|
| 6,657 |
|
| 1.63 |
|
|
| 1.63 |
|
|
| 1.59 |
|
|
| (0.76 | ) |
|
| 47 |
|
| ||||||
2009 |
|
| 5.11 |
|
| (0.06 | ) |
| 3.19 |
|
| 3.13 |
|
| – |
|
| – |
|
| – |
|
| – |
|
| – |
|
| 8.24 |
|
| 61.25 |
|
| 286 |
|
| 6.85 |
|
|
| 6.85 |
|
|
| 1.59 |
|
|
| (0.86 | ) |
|
| 44 |
|
| ||||||
2008 |
|
| 10.00 |
|
| (0.00 | ) |
| (4.51 | ) |
| (4.51 | ) |
| (0.04 | ) |
| (0.34 | ) |
| – |
|
| (0.38 | ) |
| – |
|
| 5.11 |
|
| (44.92 | )1 |
| 24 |
|
| 44.39 |
|
| 44.39 |
|
| 1.59 |
|
| (0.06 | )2 |
|
| 52 |
|
| |||||||||
Royce Special Equity Fund – Investment Class | |||||||||||||||||||||||||||||||||||||||||||||||||||||||||||||||
| †2013 | $ | 21.13 | $ | 0.04 |
| $ | 2.58 | $ | 2.62 | $ | – | $ | – |
| $ | – | $ | – |
| $ | – | $ | 23.75 | 12.40 | %1 | $ | 2,314,919 | 1.12 | %2 | 1.12 | %2 | 1.12 | %2 | 0.36 | %2 | 14 | % | ||||||||||||||||||||||||||
2012 |
|
| 19.70 |
|
| 0.46 |
|
| 2.53 |
|
| 2.99 |
|
| (0.46 | ) |
| (1.10 | ) |
| – |
|
| (1.56 | ) |
| – |
|
| 21.13 |
|
| 15.36 |
|
| 2,048,091 |
|
| 1.13 |
|
|
| 1.13 |
|
|
| 1.13 |
|
|
| 2.20 |
|
|
| 31 |
|
| ||||||
2011 |
|
| 20.87 |
|
| 0.05 |
|
| (0.05 | ) |
| 0.00 |
|
| (0.09 | ) |
| (1.08 | ) |
| – |
|
| (1.17 | ) |
| – |
|
| 19.70 |
|
| 0.08 |
|
| 1,677,393 |
|
| 1.15 |
|
|
| 1.15 |
|
|
| 1.15 |
|
|
| 0.23 |
|
|
| 23 |
|
| ||||||
2010 |
|
| 17.50 |
|
| 0.14 |
|
| 3.29 |
|
| 3.43 |
|
| (0.06 | ) |
| – |
|
| – |
|
| (0.06 | ) |
| – |
|
| 20.87 |
|
| 19.61 |
|
| 1,487,632 |
|
| 1.17 |
|
|
| 1.16 |
|
|
| 1.16 |
|
|
| 0.78 |
|
|
| 21 |
|
| ||||||
2009 |
|
| 13.69 |
|
| 0.07 |
|
| 3.80 |
|
| 3.87 |
|
| (0.07 | ) |
| – |
|
| – |
|
| (0.07 | ) |
| 0.01 |
|
| 17.50 |
|
| 28.38 |
|
| 842,678 |
|
| 1.17 |
|
|
| 1.17 |
|
|
| 1.17 |
|
|
| 0.62 |
|
|
| 10 |
|
| ||||||
2008 |
|
| 18.27 |
|
| 0.21 |
|
| (3.83 | ) |
| (3.62 | ) |
| (0.21 | ) |
| (0.75 | ) |
| – |
|
| (0.96 | ) |
| – |
|
| 13.69 |
|
| (19.62 | ) |
| 316,558 |
|
| 1.15 |
|
|
| 1.15 |
|
|
| 1.15 |
|
|
| 1.32 |
|
|
| 27 |
|
| ||||||
Royce Special Equity Fund – Service Class | |||||||||||||||||||||||||||||||||||||||||||||||||||||||||||||||
| †2013 | $ | 21.12 | $ | 0.01 |
| $ | 2.57 | $ | 2.58 | $ | – | $ | – |
| $ | – | $ | – |
| $ | – | $ | 23.70 | 12.22 | %1 | $ | 296,812 | 1.43 | %2 | 1.43 | %2 | 1.39 | %2 | 0.09 | %2 | 14 | % | ||||||||||||||||||||||||||
2012 |
|
| 19.66 |
|
| 0.42 |
|
| 2.52 |
|
| 2.94 |
|
| (0.38 | ) |
| (1.10 | ) |
| – |
|
| (1.48 | ) |
| – |
|
| 21.12 |
|
| 15.10 |
|
| 250,915 |
|
| 1.43 |
|
|
| 1.43 |
|
|
| 1.39 |
|
|
| 1.90 |
|
|
| 31 |
|
| ||||||
2011 |
|
| 20.83 |
|
| 0.00 |
|
| (0.05 | ) |
| (0.05 | ) |
| (0.05 | ) |
| (1.08 | ) |
| – |
|
| (1.13 | ) |
| 0.01 |
|
| 19.66 |
|
| (0.12 | ) |
| 216,143 |
|
| 1.45 |
|
|
| 1.45 |
|
|
| 1.39 |
|
|
| 0.00 |
|
|
| 23 |
|
| ||||||
2010 |
|
| 17.48 |
|
| 0.10 |
|
| 3.27 |
|
| 3.37 |
|
| (0.03 | ) |
| – |
|
| – |
|
| (0.03 | ) |
| 0.01 |
|
| 20.83 |
|
| 19.33 |
|
| 160,870 |
|
| 1.48 |
|
|
| 1.48 |
|
|
| 1.39 |
|
|
| 0.56 |
|
|
| 21 |
|
| ||||||
2009 |
|
| 13.69 |
|
| (0.00 | ) |
| 3.84 |
|
| 3.84 |
|
| (0.06 | ) |
| – |
|
| – |
|
| (0.06 | ) |
| 0.01 |
|
| 17.48 |
|
| 28.11 |
|
| 72,360 |
|
| 1.52 |
|
|
| 1.52 |
|
|
| 1.39 |
|
|
| 0.29 |
|
|
| 10 |
|
| ||||||
2008 |
|
| 18.28 |
|
| 0.11 |
|
| (3.77 | ) |
| (3.66 | ) |
| (0.19 | ) |
| (0.75 | ) |
| – |
|
| (0.94 | ) |
| 0.01 |
|
| 13.69 |
|
| (19.74 | ) |
| 9,549 |
|
| 1.83 |
|
|
| 1.82 |
|
|
| 1.35 |
|
|
| 1.27 |
|
|
| 27 |
|
| ||||||
|
|
|
| THE ACCOMPANYING NOTES ARE AN INTEGRAL PART OF THESE FINANCIAL STATEMENTS. | The Royce Funds 2013 Semiannual Report to Shareholders | 105 |
|
Financial Highlights |
|
| |||||||||||||||||||||||||||||||||||||||||||||||||||||||||
|
| Net Asset |
| Net |
| Net Realized and Unrealized |
|
| Distributions |
| Distributions from Net |
|
|
|
|
|
|
|
|
| Ratio of Expenses to Average Net Assets |
| Ratio of Net Investment |
|
| ||||||||||||||||||||||||||||||||
|
| Value, |
| Investment |
| Gain (Loss) on |
| Total from Investment Operations |
| from Net Investment Income |
| Realized Gain on |
| Distributions |
| Total Distributions |
| Shareholder Redemption Fees |
| Net Asset |
| Total Return |
| Net Assets, |
| Prior to Fee |
| Prior |
| Net of |
| Income (Loss) |
| Portfolio Turnover Rate |
| ||||||||||||||||||||||
|
|
|
|
|
|
|
|
|
|
|
|
|
|
|
|
|
|
|
|
|
|
|
|
|
|
|
|
|
|
|
|
|
|
|
|
|
|
|
|
|
|
|
|
|
|
|
|
|
|
|
|
|
|
|
|
|
|
Royce Special Equity Fund – Consultant Class | |||||||||||||||||||||||||||||||||||||||||||||||||||||||||
†2013 |
| $ | 20.20 |
| $ | (0.07 | ) | $ | 2.45 |
| $ | 2.38 |
| $ | – |
| $ | – |
| $ | – |
| $ | – |
| $ | – |
| $ | 22.58 |
|
| 11.78 | %1 | $ | 63,474 |
|
| 2.15 | %2 |
|
| 2.15 | %2 |
|
| 2.15 | %2 |
|
| (0.67 | )%2 |
|
| 14 | % |
|
2012 |
|
| 18.88 |
|
| 0.23 |
|
| 2.42 |
|
| 2.65 |
|
| (0.23 | ) |
| (1.10 | ) |
| – |
|
| (1.33 | ) |
| – |
|
| 20.20 |
|
| 14.20 |
|
| 57,755 |
|
| 2.18 |
|
|
| 2.18 |
|
|
| 2.18 |
|
|
| 1.13 |
|
|
| 31 |
|
|
2011 |
|
| 20.16 |
|
| (0.15 | ) |
| (0.05 | ) |
| (0.20 | ) |
| – |
|
| (1.08 | ) |
| – |
|
| (1.08 | ) |
| – |
|
| 18.88 |
|
| (0.93 | ) |
| 50,253 |
|
| 2.16 |
|
|
| 2.16 |
|
|
| 2.16 |
|
|
| (0.77 | ) |
|
| 23 |
|
|
2010 |
|
| 17.03 |
|
| (0.04 | ) |
| 3.17 |
|
| 3.13 |
|
| – |
|
| – |
|
| – |
|
| – |
|
| – |
|
| 20.16 |
|
| 18.38 |
|
| 38,497 |
|
| 2.17 |
|
|
| 2.17 |
|
|
| 2.17 |
|
|
| (0.22 | ) |
|
| 21 |
|
|
2009 |
|
| 13.42 |
|
| (0.06 | ) |
| 3.67 |
|
| 3.61 |
|
| – |
|
| – |
|
| – |
|
| – |
|
| – |
|
| 17.03 |
|
| 26.90 |
|
| 20,891 |
|
| 2.23 |
|
|
| 2.23 |
|
|
| 2.23 |
|
|
| (0.41 | ) |
|
| 10 |
|
|
2008 |
|
| 17.87 |
|
| 0.03 |
|
| (3.72 | ) |
| (3.69 | ) |
| (0.01 | ) |
| (0.75 | ) |
| – |
|
| (0.76 | ) |
| – |
|
| 13.42 |
|
| (20.46 | ) |
| 11,460 |
|
| 2.26 |
|
|
| 2.26 |
|
|
| 2.26 |
|
|
| 0.18 |
|
|
| 27 |
|
|
Royce Special Equity Fund – Institutional Class | |||||||||||||||||||||||||||||||||||||||||||||||||||||||||
†2013 |
| $ | 21.02 |
| $ | 0.05 |
| $ | 2.56 |
| $ | 2.61 |
| $ | – |
| $ | – |
| $ | – |
| $ | – |
| $ | – |
| $ | 23.63 |
|
| 12.42 | %1 | $ | 663,124 |
|
| 1.01 | %2 |
|
| 1.01 | %2 |
|
| 1.01 | %2 |
|
| 0.47 | %2 |
|
| 14 | % |
|
2012 |
|
| 19.63 |
|
| 0.49 |
|
| 2.51 |
|
| 3.00 |
|
| (0.51 | ) |
| (1.10 | ) |
| – |
|
| (1.61 | ) |
| – |
|
| 21.02 |
|
| 15.46 |
|
| 571,388 |
|
| 1.02 |
|
|
| 1.02 |
|
|
| 1.02 |
|
|
| 2.28 |
|
|
| 31 |
|
|
2011 |
|
| 20.79 |
|
| 0.07 |
|
| (0.03 | ) |
| 0.04 |
|
| (0.12 | ) |
| (1.08 | ) |
| – |
|
| (1.20 | ) |
| – |
|
| 19.63 |
|
| 0.25 |
|
| 481,855 |
|
| 1.03 |
|
|
| 1.03 |
|
|
| 1.03 |
|
|
| 0.36 |
|
|
| 23 |
|
|
2010 |
|
| 17.44 |
|
| 0.16 |
|
| 3.27 |
|
| 3.43 |
|
| (0.08 | ) |
| – |
|
| – |
|
| (0.08 | ) |
| – |
|
| 20.79 |
|
| 19.69 |
|
| 445,168 |
|
| 1.04 |
|
|
| 1.04 |
|
|
| 1.04 |
|
|
| 0.91 |
|
|
| 21 |
|
|
2009 |
|
| 13.65 |
|
| 0.11 |
|
| 3.77 |
|
| 3.88 |
|
| (0.09 | ) |
| – |
|
| – |
|
| (0.09 | ) |
| – |
|
| 17.44 |
|
| 28.42 |
|
| 280,253 |
|
| 1.05 |
|
|
| 1.05 |
|
|
| 1.05 |
|
|
| 0.81 |
|
|
| 10 |
|
|
2008 |
|
| 18.22 |
|
| 0.21 |
|
| (3.80 | ) |
| (3.59 | ) |
| (0.23 | ) |
| (0.75 | ) |
| – |
|
| (0.98 | ) |
| – |
|
| 13.65 |
|
| (19.52 | ) |
| 161,840 |
|
| 1.05 |
|
|
| 1.05 |
|
|
| 1.05 |
|
|
| 1.43 |
|
|
| 27 |
|
|
Royce Value Fund – Investment Class | |||||||||||||||||||||||||||||||||||||||||||||||||||||||||
†2013 |
| $ | 11.37 |
| $ | 0.00 |
| $ | 0.98 |
| $ | 0.98 |
| $ | – |
| $ | – |
| $ | – |
| $ | – |
| $ | – |
| $ | 12.35 |
|
| 8.62 | %1 | $ | 180,893 |
|
| 1.22 | %2 |
|
| 1.21 | %2 |
|
| 1.21 | %2 |
|
| 0.07 | %2 |
|
| 29 | % |
|
2012 |
|
| 10.97 |
|
| 0.15 |
|
| 0.92 |
|
| 1.07 |
|
| (0.14 | ) |
| (0.53 | ) |
| – |
|
| (0.67 | ) |
| – |
|
| 11.37 |
|
| 9.88 |
|
| 206,316 |
|
| 1.19 |
|
|
| 1.19 |
|
|
| 1.19 |
|
|
| 1.22 |
|
|
| 25 |
|
|
2011 |
|
| 12.70 |
|
| 0.00 |
|
| (0.92 | ) |
| (0.92 | ) |
| (0.07 | ) |
| (0.75 | ) |
| – |
|
| (0.82 | ) |
| 0.01 |
|
| 10.97 |
|
| (7.17 | ) |
| 218,126 |
|
| 1.17 |
|
|
| 1.17 |
|
|
| 1.17 |
|
|
| 0.09 |
|
|
| 35 |
|
|
2010 |
|
| 10.16 |
|
| 0.03 |
|
| 2.55 |
|
| 2.58 |
|
| (0.04 | ) |
| – |
|
| – |
|
| (0.04 | ) |
| – |
|
| 12.70 |
|
| 25.42 |
|
| 115,007 |
|
| 1.16 |
|
|
| 1.16 |
|
|
| 1.16 |
|
|
| 0.32 |
|
|
| 35 |
|
|
2009 |
|
| 7.00 |
|
| 0.01 |
|
| 3.15 |
|
| 3.16 |
|
| – |
|
| – |
|
| – |
|
| – |
|
| – |
|
| 10.16 |
|
| 45.14 |
|
| 67,249 |
|
| 1.14 |
|
|
| 1.14 |
|
|
| 1.14 |
|
|
| 0.06 |
|
|
| 49 |
|
|
2008 |
|
| 10.62 |
|
| (0.01 | ) |
| (3.61 | ) |
| (3.62 | ) |
| – |
|
| – |
|
| – |
|
| – |
|
| – |
|
| 7.00 |
|
| (34.09 | ) |
| 18,993 |
|
| 1.16 |
|
|
| 1.16 |
|
|
| 1.16 |
|
|
| (0.06 | ) |
|
| 41 |
|
|
Royce Value Fund – Service Class | |||||||||||||||||||||||||||||||||||||||||||||||||||||||||
†2013 |
| $ | 11.34 |
| $ | (0.01 | ) | $ | 0.97 |
| $ | 0.96 |
| $ | – |
| $ | – |
| $ | – |
| $ | – |
| $ | – |
| $ | 12.30 |
|
| 8.47 | %1 | $ | 701,940 |
|
| 1.49 | %2 |
|
| 1.49 | %2 |
|
| 1.49 | %2 |
|
| (0.21 | )%2 |
|
| 29 | % |
|
2012 |
|
| 10.94 |
|
| 0.12 |
|
| 0.91 |
|
| 1.03 |
|
| (0.10 | ) |
| (0.53 | ) |
| – |
|
| (0.63 | ) |
| – |
|
| 11.34 |
|
| 9.56 |
|
| 831,673 |
|
| 1.45 |
|
|
| 1.45 |
|
|
| 1.45 |
|
|
| 0.90 |
|
|
| 25 |
|
|
2011 |
|
| 12.65 |
|
| (0.03 | ) |
| (0.92 | ) |
| (0.95 | ) |
| (0.02 | ) |
| (0.75 | ) |
| – |
|
| (0.77 | ) |
| 0.01 |
|
| 10.94 |
|
| (7.41 | ) |
| 1,083,903 |
|
| 1.45 |
|
|
| 1.45 |
|
|
| 1.44 |
|
|
| (0.23 | ) |
|
| 35 |
|
|
2010 |
|
| 10.13 |
|
| 0.00 |
|
| 2.53 |
|
| 2.53 |
|
| (0.01 | ) |
| – |
|
| – |
|
| (0.01 | ) |
| – |
|
| 12.65 |
|
| 24.97 |
|
| 1,415,766 |
|
| 1.46 |
|
|
| 1.46 |
|
|
| 1.44 |
|
|
| 0.04 |
|
|
| 35 |
|
|
2009 |
|
| 7.00 |
|
| (0.03 | ) |
| 3.16 |
|
| 3.13 |
|
| – |
|
| – |
|
| – |
|
| – |
|
| – |
|
| 10.13 |
|
| 44.71 |
|
| 1,178,806 |
|
| 1.47 |
|
|
| 1.47 |
|
|
| 1.45 |
|
|
| (0.31 | ) |
|
| 49 |
|
|
2008 |
|
| 10.64 |
|
| (0.03 | ) |
| (3.62 | ) |
| (3.65 | ) |
| – |
|
| – |
|
| – |
|
| – |
|
| 0.01 |
|
| 7.00 |
|
| (34.21 | ) |
| 704,406 |
|
| 1.45 |
|
|
| 1.45 |
|
|
| 1.45 |
|
|
| (0.34 | ) |
|
| 41 |
|
|
Royce Value Fund – Consultant Class | |||||||||||||||||||||||||||||||||||||||||||||||||||||||||
†2013 |
| $ | 10.81 |
| $ | (0.06 | ) | $ | 0.92 |
| $ | 0.86 |
| $ | – |
| $ | – |
| $ | – |
| $ | – |
| $ | – |
| $ | 11.67 |
|
| 7.96 | %1 | $ | 29,350 |
|
| 2.27 | %2 |
|
| 2.27 | %2 |
|
| 2.27 | %2 |
|
| (0.99 | )%2 |
|
| 29 | % |
|
2012 |
|
| 10.46 |
|
| 0.02 |
|
| 0.89 |
|
| 0.91 |
|
| (0.03 | ) |
| (0.53 | ) |
| – |
|
| (0.56 | ) |
| – |
|
| 10.81 |
|
| 8.77 |
|
| 33,480 |
|
| 2.26 |
|
|
| 2.26 |
|
|
| 2.26 |
|
|
| 0.15 |
|
|
| 25 |
|
|
2011 |
|
| 12.21 |
|
| (0.11 | ) |
| (0.89 | ) |
| (1.00 | ) |
| – |
|
| (0.75 | ) |
| – |
|
| (0.75 | ) |
| – |
|
| 10.46 |
|
| (8.20 | ) |
| 36,104 |
|
| 2.17 |
|
|
| 2.17 |
|
|
| 2.17 |
|
|
| (0.94 | ) |
|
| 35 |
|
|
2010 |
|
| 9.84 |
|
| (0.07 | ) |
| 2.44 |
|
| 2.37 |
|
| – |
|
| – |
|
| – |
|
| – |
|
| – |
|
| 12.21 |
|
| 24.09 |
|
| 35,167 |
|
| 2.18 |
|
|
| 2.18 |
|
|
| 2.18 |
|
|
| (0.69 | ) |
|
| 35 |
|
|
2009 |
|
| 6.85 |
|
| (0.09 | ) |
| 3.08 |
|
| 2.99 |
|
| – |
|
| – |
|
| – |
|
| – |
|
| – |
|
| 9.84 |
|
| 43.65 |
|
| 27,625 |
|
| 2.23 |
|
|
| 2.23 |
|
|
| 2.23 |
|
|
| (1.09 | ) |
|
| 49 |
|
|
2008 |
|
| 10.50 |
|
| (0.11 | ) |
| (3.54 | ) |
| (3.65 | ) |
| – |
|
| – |
|
| – |
|
| – |
|
| – |
|
| 6.85 |
|
| (34.76 | ) |
| 15,915 |
|
| 2.29 |
|
|
| 2.28 |
|
|
| 2.28 |
|
|
| (1.18 | ) |
|
| 41 |
|
|
| 106 | The Royce Funds 2013 Semiannual Report to Shareholders | THE ACCOMPANYING NOTES ARE AN INTEGRAL PART OF THESE FINANCIAL STATEMENTS. |
|
Financial Highlights |
|
| |||||||||||||||||||||||||||||||||||||||||||||||||||||||||||||||
|
| Net |
| Net |
| Net Realized and Unrealized |
|
| Distributions |
| Distributions from Net |
|
|
|
|
|
|
|
|
| Ratio of Expenses to Average Net Assets |
| Ratio of Net Investment |
|
| ||||||||||||||||||||||||||||||||||||||
|
| Asset Value, |
| Investment |
| Gain (Loss) on |
| Total from Investment Operations |
| from Net Investment Income |
| Realized Gain on |
| Distributions |
| Total Distributions |
| Shareholder Redemption Fees |
| Net Asset |
| Total Return |
| Net Assets, |
| Prior to Fee |
| Prior |
| Net of |
| Income (Loss) |
| Portfolio Turnover Rate |
| ||||||||||||||||||||||||||||
|
|
|
|
|
|
|
|
|
|
|
|
|
|
|
|
|
|
|
|
|
|
|
|
|
|
|
|
|
|
|
|
|
|
|
|
|
|
|
|
|
|
|
|
|
|
|
|
|
|
|
|
|
|
|
|
|
| ||||||
Royce Value Fund – Institutional Class | |||||||||||||||||||||||||||||||||||||||||||||||||||||||||||||||
†2013 |
| $ | 11.38 |
| $ | 0.01 |
| $ | 0.98 |
| $ | 0.99 |
| $ | – |
| $ | – |
| $ | – |
| $ | – |
| $ | – |
| $ | 12.37 |
|
| 8.70 | %1 | $ | 208,080 |
|
| 1.05 | %2 |
|
| 1.05 | %2 |
|
| 1.05 | %2 |
|
| 0.25 | %2 |
|
| 29 | % |
| ||||||
2012 |
|
| 10.98 |
|
| 0.17 |
|
| 0.92 |
|
| 1.09 |
|
| (0.16 | ) |
| (0.53 | ) |
| – |
|
| (0.69 | ) |
| – |
|
| 11.38 |
|
| 10.04 |
|
| 202,643 |
|
| 1.05 |
|
|
| 1.05 |
|
|
| 1.05 |
|
|
| 1.41 |
|
|
| 25 |
|
| ||||||
2011 |
|
| 12.71 |
|
| 0.03 |
|
| (0.94 | ) |
| (0.91 | ) |
| (0.07 | ) |
| (0.75 | ) |
| – |
|
| (0.82 | ) |
| – |
|
| 10.98 |
|
| (7.12 | ) |
| 190,591 |
|
| 1.04 |
|
|
| 1.04 |
|
|
| 1.04 |
|
|
| 0.19 |
|
|
| 35 |
|
| ||||||
2010 |
|
| 10.17 |
|
| 0.05 |
|
| 2.54 |
|
| 2.59 |
|
| (0.05 | ) |
| – |
|
| – |
|
| (0.05 | ) |
| – |
|
| 12.71 |
|
| 25.52 |
|
| 219,111 |
|
| 1.04 |
|
|
| 1.04 |
|
|
| 1.04 |
|
|
| 0.45 |
|
|
| 35 |
|
| ||||||
2009 |
|
| 7.00 |
|
| 0.01 |
|
| 3.16 |
|
| 3.17 |
|
| – |
|
| – |
|
| – |
|
| – |
|
| – |
|
| 10.17 |
|
| 45.29 |
|
| 167,215 |
|
| 1.04 |
|
|
| 1.04 |
|
|
| 1.04 |
|
|
| 0.10 |
|
|
| 49 |
|
| ||||||
2008 |
|
| 10.61 |
|
| 0.00 |
|
| (3.61 | ) |
| (3.61 | ) |
| – |
|
| – |
|
| – |
|
| – |
|
| – |
|
| 7.00 |
|
| (34.02 | ) |
| 114,244 |
|
| 1.04 |
|
|
| 1.04 |
|
|
| 1.04 |
|
|
| 0.03 |
|
|
| 41 |
|
| ||||||
Royce Value Fund – R Class | |||||||||||||||||||||||||||||||||||||||||||||||||||||||||||||||
†2013 |
| $ | 11.16 |
| $ | (0.03 | ) | $ | 0.95 |
| $ | 0.92 |
| $ | – |
| $ | – |
| $ | – |
| $ | – |
| $ | – |
| $ | 12.08 |
|
| 8.24 | %1 | $ | 37,291 |
|
| 1.80 | %2 |
|
| 1.80 | %2 |
|
| 1.80 | %2 |
|
| (0.50 | )%2 |
|
| 29 | % |
| ||||||
2012 |
|
| 10.78 |
|
| 0.07 |
|
| 0.91 |
|
| 0.98 |
|
| (0.07 | ) |
| (0.53 | ) |
| – |
|
| (0.60 | ) |
| – |
|
| 11.16 |
|
| 9.18 |
|
| 37,679 |
|
| 1.85 |
|
|
| 1.85 |
|
|
| 1.85 |
|
|
| 0.59 |
|
|
| 25 |
|
| ||||||
2011 |
|
| 12.54 |
|
| (0.06 | ) |
| (0.91 | ) |
| (0.97 | ) |
| (0.04 | ) |
| (0.75 | ) |
| – |
|
| (0.79 | ) |
| – |
|
| 10.78 |
|
| (7.75 | ) |
| 34,151 |
|
| 1.68 |
|
|
| 1.68 |
|
|
| 1.68 |
|
|
| (0.44 | ) |
|
| 35 |
|
| ||||||
2010 |
|
| 10.05 |
|
| (0.02 | ) |
| 2.51 |
|
| 2.49 |
|
| (0.00 | ) |
| – |
|
| – |
|
| (0.00 | ) |
| – |
|
| 12.54 |
|
| 24.81 |
|
| 26,524 |
|
| 1.68 |
|
|
| 1.67 |
|
|
| 1.67 |
|
|
| (0.16 | ) |
|
| 35 |
|
| ||||||
2009 |
|
| 6.97 |
|
| (0.06 | ) |
| 3.14 |
|
| 3.08 |
|
| – |
|
| – |
|
| – |
|
| – |
|
| – |
|
| 10.05 |
|
| 44.19 |
|
| 6,114 |
|
| 2.08 |
|
|
| 2.08 |
|
|
| 1.84 |
|
|
| (0.68 | ) |
|
| 49 |
|
| ||||||
2008 |
|
| 10.63 |
|
| (0.06 | ) |
| (3.62 | ) |
| (3.68 | ) |
| – |
|
| – |
|
| – |
|
| – |
|
| 0.02 |
|
| 6.97 |
|
| (34.43 | ) |
| 326 |
|
| 6.72 |
|
|
| 6.71 |
|
|
| 1.84 |
|
|
| (0.68 | ) |
|
| 41 |
|
| ||||||
Royce Value Fund – K Class b | |||||||||||||||||||||||||||||||||||||||||||||||||||||||||||||||
†2013 |
| $ | 9.14 |
| $ | (0.01 | ) | $ | 0.78 |
| $ | 0.77 |
| $ | – |
| $ | – |
| $ | – |
| $ | – |
| $ | – |
| $ | 9.91 |
|
| 8.42 | %1 | $ | 17,894 |
|
| 1.57 | %2 |
|
| 1.57 | %2 |
|
| 1.57 | %2 |
|
| (0.27 | )%2 |
|
| 29 | % |
| ||||||
2012 |
|
| 8.95 |
|
| 0.09 |
|
| 0.75 |
|
| 0.84 |
|
| (0.12 | ) |
| (0.53 | ) |
| – |
|
| (0.65 | ) |
| – |
|
| 9.14 |
|
| 9.49 |
|
| 18,209 |
|
| 1.53 |
|
|
| 1.53 |
|
|
| 1.53 |
|
|
| 0.98 |
|
|
| 25 |
|
| ||||||
2011 |
|
| 10.54 |
|
| (0.03 | ) |
| (0.77 | ) |
| (0.80 | ) |
| (0.04 | ) |
| (0.75 | ) |
| – |
|
| (0.79 | ) |
| – |
|
| 8.95 |
|
| (7.54 | ) |
| 14,079 |
|
| 1.54 |
|
|
| 1.54 |
|
|
| 1.54 |
|
|
| (0.33 | ) |
|
| 35 |
|
| ||||||
2010 |
|
| 8.46 |
|
| (0.00 | ) |
| 2.10 |
|
| 2.10 |
|
| (0.02 | ) |
| – |
|
| – |
|
| (0.02 | ) |
| – |
|
| 10.54 |
|
| 24.82 |
|
| 13,195 |
|
| 1.50 |
|
|
| 1.50 |
|
|
| 1.50 |
|
|
| 0.01 |
|
|
| 35 |
|
| ||||||
2009 |
|
| 5.91 |
|
| (0.03 | ) |
| 2.58 |
|
| 2.55 |
|
| – |
|
| – |
|
| – |
|
| – |
|
| – |
|
| 8.46 |
|
| 43.15 |
|
| 4,721 |
|
| 1.73 |
|
|
| 1.73 |
|
|
| 1.59 |
|
|
| (0.43 | ) |
|
| 49 |
|
| ||||||
2008 |
|
| 10.00 |
|
| (0.01 | ) |
| (4.08 | ) |
| (4.09 | ) |
| – |
|
| – |
|
| – |
|
| – |
|
| – |
|
| 5.91 |
|
| (40.90 | )1 |
| 1,550 |
|
| 9.63 |
|
| 9.63 |
|
| 1.59 |
|
| (0.35 | )2 |
|
| 41 |
|
| |||||||||
Royce Value Plus Fund – Investment Class | |||||||||||||||||||||||||||||||||||||||||||||||||||||||||||||||
†2013 |
| $ | 13.90 |
| $ | (0.04 | ) | $ | 1.77 |
| $ | 1.73 |
| $ | – |
| $ | – |
| $ | – |
| $ | – |
| $ | – |
| $ | 15.63 |
|
| 12.45 | %1 | $ | 232,227 |
|
| 1.34 | %2 |
|
| 1.34 | %2 |
|
| 1.34 | %2 |
|
| (0.50 | )%2 |
|
| 28 | % |
| ||||||
2012 |
|
| 12.04 |
|
| (0.02 | ) |
| 1.88 |
|
| 1.86 |
|
| – |
|
| – |
|
| – |
|
| – |
|
| – |
|
| 13.90 |
|
| 15.45 |
|
| 228,016 |
|
| 1.27 |
|
|
| 1.27 |
|
|
| 1.27 |
|
|
| (0.14 | ) |
|
| 32 |
|
| ||||||
2011 |
|
| 13.52 |
|
| (0.06 | ) |
| (1.27 | ) |
| (1.33 | ) |
| (0.15 | ) |
| – |
|
| – |
|
| (0.15 | ) |
| – |
|
| 12.04 |
|
| (9.79 | ) |
| 298,073 |
|
| 1.13 |
|
|
| 1.13 |
|
|
| 1.13 |
|
|
| (0.42 | ) |
|
| 49 |
|
| ||||||
2010 |
|
| 11.31 |
|
| (0.02 | ) |
| 2.31 |
|
| 2.29 |
|
| (0.08 | ) |
| – |
|
| – |
|
| (0.08 | ) |
| – |
|
| 13.52 |
|
| 20.25 |
|
| 305,161 |
|
| 1.08 |
|
|
| 1.08 |
|
|
| 1.08 |
|
|
| (0.14 | ) |
|
| 48 |
|
| ||||||
2009 |
|
| 7.97 |
|
| 0.01 |
|
| 3.33 |
|
| 3.34 |
|
| – |
|
| – |
|
| – |
|
| – |
|
| – |
|
| 11.31 |
|
| 41.91 |
|
| 261,906 |
|
| 1.06 |
|
|
| 1.06 |
|
|
| 1.06 |
|
|
| 0.13 |
|
|
| 39 |
|
| ||||||
2008 |
|
| 13.80 |
|
| (0.02 | ) |
| (5.63 | ) |
| (5.65 | ) |
| – |
|
| (0.18 | ) |
| – |
|
| (0.18 | ) |
| – |
|
| 7.97 |
|
| (40.88 | ) |
| 122,043 |
|
| 1.07 |
|
|
| 1.07 |
|
|
| 1.07 |
|
|
| (0.15 | ) |
|
| 42 |
|
| ||||||
Royce Value Plus Fund – Service Class | |||||||||||||||||||||||||||||||||||||||||||||||||||||||||||||||
†2013 |
| $ | 13.83 |
| $ | (0.05 | ) | $ | 1.76 |
| $ | 1.71 |
| $ | – |
| $ | – |
| $ | – |
| $ | – |
| $ | – |
| $ | 15.54 |
|
| 12.36 | %1 | $ | 940,440 |
|
| 1.49 | %2 |
|
| 1.49 | %2 |
|
| 1.47 | %2 |
|
| (0.63 | )%2 |
|
| 28 | % |
| ||||||
2012 |
|
| 12.00 |
|
| (0.04 | ) |
| 1.87 |
|
| 1.83 |
|
| – |
|
| – |
|
| – |
|
| – |
|
| – |
|
| 13.83 |
|
| 15.25 |
|
| 966,735 |
|
| 1.45 |
|
|
| 1.45 |
|
|
| 1.44 |
|
|
| (0.33 | ) |
|
| 32 |
|
| ||||||
2011 |
|
| 13.42 |
|
| (0.08 | ) |
| (1.26 | ) |
| (1.34 | ) |
| (0.08 | ) |
| – |
|
| – |
|
| (0.08 | ) |
| – |
|
| 12.00 |
|
| (9.98 | ) |
| 1,417,973 |
|
| 1.44 |
|
|
| 1.44 |
|
|
| 1.42 |
|
|
| (0.74 | ) |
|
| 49 |
|
| ||||||
2010 |
|
| 11.24 |
|
| (0.06 | ) |
| 2.27 |
|
| 2.21 |
|
| (0.03 | ) |
| – |
|
| – |
|
| (0.03 | ) |
| – |
|
| 13.42 |
|
| 19.70 |
|
| 2,454,325 |
|
| 1.44 |
|
|
| 1.44 |
|
|
| 1.42 |
|
|
| (0.53 | ) |
|
| 48 |
|
| ||||||
2009 |
|
| 7.95 |
|
| (0.02 | ) |
| 3.31 |
|
| 3.29 |
|
| – |
|
| – |
|
| – |
|
| – |
|
| – |
|
| 11.24 |
|
| 41.38 |
|
| 2,505,017 |
|
| 1.47 |
|
|
| 1.47 |
|
|
| 1.45 |
|
|
| (0.25 | ) |
|
| 39 |
|
| ||||||
2008 |
|
| 13.81 |
|
| (0.06 | ) |
| (5.62 | ) |
| (5.68 | ) |
| – |
|
| (0.18 | ) |
| – |
|
| (0.18 | ) |
| – |
|
| 7.95 |
|
| (41.07 | ) |
| 1,709,764 |
|
| 1.44 |
|
|
| 1.43 |
|
|
| 1.43 |
|
|
| (0.53 | ) |
|
| 42 |
|
| ||||||
|
|
|
THE ACCOMPANYING NOTES ARE AN INTEGRAL PART OF THESE FINANCIAL STATEMENTS. |
| The Royce Funds 2013 Semiannual Report to Shareholders | 107 |
|
Financial Highlights |
|
| |||||||||||||||||||||||||||||||||||||||||||||||||||||||||||||||
|
| Net |
| Net |
| Net Realized and Unrealized |
|
| Distributions |
| Distributions from Net |
|
|
|
|
|
|
|
|
| Ratio of Expenses to Average Net Assets |
| Ratio of Net Investment |
|
| ||||||||||||||||||||||||||||||||||||||
|
| Asset Value, |
| Investment |
| Gain (Loss) on |
| Total from Investment Operations |
| from Net Investment Income |
| Realized Gain on |
| Distributions |
| Total Distributions |
| Shareholder Redemption Fees |
| Net Asset |
| Total Return |
| Net Assets, |
| Prior to Fee |
| Prior |
| Net of |
| Income (Loss) |
| Portfolio Turnover Rate |
| ||||||||||||||||||||||||||||
|
|
|
|
|
|
|
|
|
|
|
|
|
|
|
|
|
|
|
|
|
|
|
|
|
|
|
|
|
|
|
|
|
|
|
|
|
|
|
|
|
|
|
|
|
|
|
|
|
|
|
|
|
|
|
|
|
| ||||||
Royce Value Plus Fund – Consultant Class | |||||||||||||||||||||||||||||||||||||||||||||||||||||||||||||||
†2013 |
| $ | 13.24 |
| $ | (0.11 | ) | $ | 1.68 |
| $ | 1.57 |
| $ | – |
| $ | – |
| $ | – |
| $ | – |
| $ | – |
| $ | 14.81 |
|
| 11.86 | %1 | $ | 20,230 |
|
| 2.33 | %2 |
|
| 2.33 | %2 |
|
| 2.33 | %2 |
|
| (1.49 | )%2 |
|
| 28 | % |
| ||||||
2012 |
|
| 11.60 |
|
| (0.15 | ) |
| 1.79 |
|
| 1.64 |
|
| – |
|
| – |
|
| – |
|
| – |
|
| – |
|
| 13.24 |
|
| 14.14 |
|
| 19,618 |
|
| 2.37 |
|
|
| 2.37 |
|
|
| 2.37 |
|
|
| (1.21 | ) |
|
| 32 |
|
| ||||||
2011 |
|
| 12.99 |
|
| (0.19 | ) |
| (1.20 | ) |
| (1.39 | ) |
| – |
|
| – |
|
| – |
|
| – | �� |
| – |
|
| 11.60 |
|
| (10.70 | ) |
| 20,245 |
|
| 2.19 |
|
|
| 2.19 |
|
|
| 2.19 |
|
|
| (1.50 | ) |
|
| 49 |
|
| ||||||
2010 |
|
| 10.93 |
|
| (0.14 | ) |
| 2.20 |
|
| 2.06 |
|
| – |
|
| – |
|
| – |
|
| – |
|
| – |
|
| 12.99 |
|
| 18.85 |
|
| 30,279 |
|
| 2.16 |
|
|
| 2.16 |
|
|
| 2.16 |
|
|
| (1.26 | ) |
|
| 48 |
|
| ||||||
2009 |
|
| 7.79 |
|
| (0.09 | ) |
| 3.23 |
|
| 3.14 |
|
| – |
|
| – |
|
| – |
|
| – |
|
| – |
|
| 10.93 |
|
| 40.31 |
|
| 31,154 |
|
| 2.20 |
|
|
| 2.20 |
|
|
| 2.20 |
|
|
| (0.98 | ) |
|
| 39 |
|
| ||||||
2008 |
|
| 13.65 |
|
| (0.15 | ) |
| (5.53 | ) |
| (5.68 | ) |
| – |
|
| (0.18 | ) |
| – |
|
| (0.18 | ) |
| – |
|
| 7.79 |
|
| (41.55 | ) |
| 26,024 |
|
| 2.21 |
|
|
| 2.21 |
|
|
| 2.21 |
|
|
| (1.30 | ) |
|
| 42 |
|
| ||||||
Royce Value Plus Fund – Institutional Class | |||||||||||||||||||||||||||||||||||||||||||||||||||||||||||||||
†2013 |
| $ | 13.94 |
| $ | (0.02 | ) | $ | 1.77 |
| $ | 1.75 |
| $ | – |
| $ | – |
| $ | – |
| $ | – |
| $ | – |
| $ | 15.69 |
|
| 12.55 | %1 | $ | 192,879 |
|
| 1.07 | %2 |
|
| 1.07 | %2 |
|
| 1.07 | %2 |
|
| (0.24 | )%2 |
|
| 28 | % |
| ||||||
2012 |
|
| 12.05 |
|
| 0.01 |
|
| 1.88 |
|
| 1.89 |
|
| – |
|
| – |
|
| – |
|
| – |
|
| – |
|
| 13.94 |
|
| 15.68 |
|
| 216,572 |
|
| 1.06 |
|
|
| 1.06 |
|
|
| 1.06 |
|
|
| 0.08 |
|
|
| 32 |
|
| ||||||
2011 |
|
| 13.52 |
|
| (0.01 | ) |
| (1.30 | ) |
| (1.31 | ) |
| (0.16 | ) |
| – |
|
| – |
|
| (0.16 | ) |
| – |
|
| 12.05 |
|
| (9.70 | ) |
| 261,425 |
|
| 1.05 |
|
|
| 1.05 |
|
|
| 1.05 |
|
|
| (0.36 | ) |
|
| 49 |
|
| ||||||
2010 |
|
| 11.31 |
|
| (0.01 | ) |
| 2.30 |
|
| 2.29 |
|
| (0.08 | ) |
| – |
|
| – |
|
| (0.08 | ) |
| – |
|
| 13.52 |
|
| 20.25 |
|
| 425,911 |
|
| 1.04 |
|
|
| 1.04 |
|
|
| 1.04 |
|
|
| (0.12 | ) |
|
| 48 |
|
| ||||||
2009 |
|
| 7.97 |
|
| 0.01 |
|
| 3.33 |
|
| 3.34 |
|
| – |
|
| – |
|
| – |
|
| – |
|
| – |
|
| 11.31 |
|
| 41.91 |
|
| 357,734 |
|
| 1.06 |
|
|
| 1.06 |
|
|
| 1.06 |
|
|
| 0.08 |
|
|
| 39 |
|
| ||||||
2008 |
|
| 13.80 |
|
| (0.01 | ) |
| (5.64 | ) |
| (5.65 | ) |
| – |
|
| (0.18 | ) |
| – |
|
| (0.18 | ) |
| – |
|
| 7.97 |
|
| (40.88 | ) |
| 143,315 |
|
| 1.04 |
|
|
| 1.04 |
|
|
| 1.04 |
|
|
| (0.13 | ) |
|
| 42 |
|
| ||||||
Royce Value Plus Fund – R Class | |||||||||||||||||||||||||||||||||||||||||||||||||||||||||||||||
†2013 |
| $ | 13.51 |
| $ | (0.07 | ) | $ | 1.70 |
| $ | 1.63 |
| $ | – |
| $ | – |
| $ | – |
| $ | – |
| $ | – |
| $ | 15.14 |
|
| 12.07 | %1 | $ | 1,563 |
|
| 2.42 | %2 |
|
| 2.42 | %2 |
|
| 1.84 | %2 |
|
| (0.99 | )%2 |
|
| 28 | % |
| ||||||
2012 |
|
| 11.77 |
|
| (0.09 | ) |
| 1.83 |
|
| 1.74 |
|
| – |
|
| – |
|
| – |
|
| – |
|
| – |
|
| 13.51 |
|
| 14.78 |
|
| 1,221 |
|
| 2.35 |
|
|
| 2.35 |
|
|
| 1.84 |
|
|
| (0.66 | ) |
|
| 32 |
|
| ||||||
2011 |
|
| 13.24 |
|
| (0.15 | ) |
| (1.23 | ) |
| (1.38 | ) |
| (0.09 | ) |
| – |
|
| – |
|
| (0.09 | ) |
| – |
|
| 11.77 |
|
| (10.40 | ) |
| 1,079 |
|
| 2.45 |
|
|
| 2.45 |
|
|
| 1.84 |
|
|
| (1.12 | ) |
|
| 49 |
|
| ||||||
2010 |
|
| 11.13 |
|
| (0.11 | ) |
| 2.26 |
|
| 2.15 |
|
| (0.04 | ) |
| – |
|
| – |
|
| (0.04 | ) |
| – |
|
| 13.24 |
|
| 19.34 |
|
| 942 |
|
| 2.75 |
|
|
| 2.75 |
|
|
| 1.84 |
|
|
| (0.90 | ) |
|
| 48 |
|
| ||||||
2009 |
|
| 7.91 |
|
| (0.06 | ) |
| 3.28 |
|
| 3.22 |
|
| – |
|
| – |
|
| – |
|
| – |
|
| – |
|
| 11.13 |
|
| 40.71 |
|
| 642 |
|
| 3.76 |
|
|
| 3.76 |
|
|
| 1.84 |
|
|
| (0.70 | ) |
|
| 39 |
|
| ||||||
2008 |
|
| 13.80 |
|
| (0.09 | ) |
| (5.62 | ) |
| (5.71 | ) |
| – |
|
| (0.18 | ) |
| – |
|
| (0.18 | ) |
| – |
|
| 7.91 |
|
| (41.31 | ) |
| 331 |
|
| 6.62 |
|
|
| 6.62 |
|
|
| 1.84 |
|
|
| (0.92 | ) |
|
| 42 |
|
| ||||||
Royce Value Plus Fund – K Class b | |||||||||||||||||||||||||||||||||||||||||||||||||||||||||||||||
†2013 |
| $ | 10.10 |
| $ | (0.04 | ) | $ | 1.28 |
| $ | 1.24 |
| $ | – |
| $ | – |
| $ | – |
| $ | – |
| $ | – |
| $ | 11.34 |
|
| 12.28 | %1 | $ | 889 |
|
| 2.84 | %2 |
|
| 2.84 | %2 |
|
| 1.59 | %2 |
|
| (0.73 | )%2 |
|
| 28 | % |
| ||||||
2012 |
|
| 8.78 |
|
| (0.04 | ) |
| 1.36 |
|
| 1.32 |
|
| – |
|
| – |
|
| – |
|
| – |
|
| – |
|
| 10.10 |
|
| 15.03 |
|
| 486 |
|
| 2.96 |
|
|
| 2.96 |
|
|
| 1.59 |
|
|
| (0.45 | ) |
|
| 32 |
|
| ||||||
2011 |
|
| 9.77 |
|
| (0.08 | ) |
| (0.91 | ) |
| (0.99 | ) |
| – |
|
| – |
|
| – |
|
| – |
|
| – |
|
| 8.78 |
|
| (10.13 | ) |
| 501 |
|
| 1.86 |
|
|
| 1.86 |
|
|
| 1.59 |
|
|
| (0.86 | ) |
|
| 49 |
|
| ||||||
2010 |
|
| 8.22 |
|
| (0.06 | ) |
| 1.67 |
|
| 1.61 |
|
| (0.06 | ) |
| – |
|
| – |
|
| (0.06 | ) |
| – |
|
| 9.77 |
|
| 19.55 |
|
| 1,851 |
|
| 1.88 |
|
|
| 1.88 |
|
|
| 1.59 |
|
|
| (0.67 | ) |
|
| 48 |
|
| ||||||
2009 |
|
| 5.82 |
|
| (0.03 | ) |
| 2.43 |
|
| 2.40 |
|
| – |
|
| – |
|
| – |
|
| – |
|
| – |
|
| 8.22 |
|
| 41.24 |
|
| 1,363 |
|
| 2.46 |
|
|
| 2.45 |
|
|
| 1.59 |
|
|
| (0.38 | ) |
|
| 39 |
|
| ||||||
2008 |
|
| 10.00 |
|
| (0.04 | ) |
| (3.96 | ) |
| (4.00 | ) |
| – |
|
| (0.18 | ) |
| – |
|
| (0.18 | ) |
| – |
|
| 5.82 |
|
| (39.91 | )1 |
| 31 |
|
| 39.36 |
|
| 39.36 |
|
| 1.59 |
|
| (0.75 | )2 |
|
| 42 |
|
| |||||||||
Royce 100 Fund – Investment Class | |||||||||||||||||||||||||||||||||||||||||||||||||||||||||||||||
†2013 |
| $ | 8.85 |
| $ | (0.00 | ) | $ | 0.96 |
| $ | 0.96 |
| $ | – |
| $ | – |
| $ | – |
| $ | – |
| $ | – |
| $ | 9.81 |
|
| 10.85 | %1 | $ | 55,270 |
|
| 1.20 | %2 |
|
| 1.20 | %2 |
|
| 1.20 | %2 |
|
| (0.04 | )%2 |
|
| 14 | % |
| ||||||
2012 |
|
| 8.74 |
|
| 0.12 |
|
| 0.88 |
|
| 1.00 |
|
| (0.15 | ) |
| (0.74 | ) |
| – |
|
| (0.89 | ) |
| – |
|
| 8.85 |
|
| 11.78 |
|
| 68,395 |
|
| 1.19 |
|
|
| 1.19 |
|
|
| 1.19 |
|
|
| 1.31 |
|
|
| 13 |
|
| ||||||
2011 |
|
| 9.82 |
|
| (0.03 | ) |
| (0.60 | ) |
| (0.63 | ) |
| (0.00 | ) |
| (0.45 | ) |
| – |
|
| (0.45 | ) |
| – |
|
| 8.74 |
|
| (6.31 | ) |
| 63,012 |
|
| 1.17 |
|
|
| 1.17 |
|
|
| 1.17 |
|
|
| (0.27 | ) |
|
| 27 |
|
| ||||||
2010 |
|
| 7.94 |
|
| 0.03 |
|
| 1.96 |
|
| 1.99 |
|
| – |
|
| (0.11 | ) |
| – |
|
| (0.11 | ) |
| – |
|
| 9.82 |
|
| 25.06 |
|
| 66,011 |
|
| 1.17 |
|
|
| 1.17 |
|
|
| 1.17 |
|
|
| 0.33 |
|
|
| 27 |
|
| ||||||
2009 |
|
| 5.74 |
|
| 0.00 |
|
| 2.20 |
|
| 2.20 |
|
| – |
|
| – |
|
| – |
|
| – |
|
| – |
|
| 7.94 |
|
| 38.33 |
|
| 35,165 |
|
| 1.22 |
|
|
| 1.22 |
|
|
| 1.22 |
|
|
| 0.03 |
|
|
| 42 |
|
| ||||||
2008 |
|
| 8.23 |
|
| 0.01 |
|
| (2.41 | ) |
| (2.40 | ) |
| – |
|
| (0.09 | ) |
| – |
|
| (0.09 | ) |
| – |
|
| 5.74 |
|
| (29.13 | ) |
| 15,748 |
|
| 1.39 |
|
|
| 1.39 |
|
|
| 1.24 |
|
|
| 0.21 |
|
|
| 72 |
|
| ||||||
| 108 | The Royce Funds 2013 Semiannual Report to Shareholders | THE ACCOMPANYING NOTES ARE AN INTEGRAL PART OF THESE FINANCIAL STATEMENTS. |
Financial Highlights |
|
| |||||||||||||||||||||||||||||||||||||||||||||||||||||||||
|
| Net |
| Net |
| Net Realized and Unrealized |
|
| Distributions |
| Distributions from Net |
|
|
|
|
|
|
|
|
| Ratio of Expenses to Average Net Assets |
| Ratio of Net Investment |
|
| ||||||||||||||||||||||||||||||||
|
| Asset Value, |
| Investment |
| Gain (Loss) on |
| Total from Investment Operations |
| from Net Investment Income |
| Realized Gain on |
| Distributions |
| Total Distributions |
| Shareholder Redemption Fees |
| Net Asset |
| Total Return |
| Net Assets, |
| Prior to Fee |
| Prior |
| Net of |
| Income (Loss) |
| Portfolio Turnover Rate |
| ||||||||||||||||||||||
|
|
|
|
|
|
|
|
|
|
|
|
|
|
|
|
|
|
|
|
|
|
|
|
|
|
|
|
|
|
|
|
|
|
|
|
|
|
|
|
|
|
|
|
|
|
|
|
|
|
|
|
|
|
|
|
|
|
Royce 100 Fund – Service Class | |||||||||||||||||||||||||||||||||||||||||||||||||||||||||
†2013 |
| $ | 8.81 |
| $ | (0.02 | ) | $ | 0.95 |
| $ | 0.93 |
| $ | – |
| $ | – |
| $ | – |
| $ | – |
| $ | – |
| $ | 9.74 |
|
| 10.56 | %1 | $ | 213,687 |
|
| 1.49 | %2 |
|
| 1.49 | %2 |
|
| 1.47 | %2 |
|
| (0.32 | )%2 |
|
| 14 | % |
|
2012 |
|
| 8.67 |
|
| 0.11 |
|
| 0.86 |
|
| 0.97 |
|
| (0.09 | ) |
| (0.74 | ) |
| – |
|
| (0.83 | ) |
| – |
|
| 8.81 |
|
| 11.52 |
|
| 220,674 |
|
| 1.46 |
|
|
| 1.46 |
|
|
| 1.42 |
|
|
| 1.03 |
|
|
| 13 |
|
|
2011 |
|
| 9.76 |
|
| (0.05 | ) |
| (0.59 | ) |
| (0.64 | ) |
| – |
|
| (0.45 | ) |
| – |
|
| (0.45 | ) |
| – |
|
| 8.67 |
|
| (6.52 | ) |
| 310,825 |
|
| 1.47 |
|
|
| 1.47 |
|
|
| 1.42 |
|
|
| (0.53 | ) |
|
| 27 |
|
|
2010 |
|
| 7.91 |
|
| 0.00 |
|
| 1.96 |
|
| 1.96 |
|
| – |
|
| (0.11 | ) |
| – |
|
| (0.11 | ) |
| – |
|
| 9.76 |
|
| 24.77 |
|
| 366,184 |
|
| 1.50 |
|
|
| 1.50 |
|
|
| 1.46 |
|
|
| 0.03 |
|
|
| 27 |
|
|
2009 |
|
| 5.73 |
|
| (0.01 | ) |
| 2.19 |
|
| 2.18 |
|
| – |
|
| – |
|
| – |
|
| – |
|
| – |
|
| 7.91 |
|
| 38.05 |
|
| 197,607 |
|
| 1.54 |
|
|
| 1.54 |
|
|
| 1.49 |
|
|
| (0.19 | ) |
|
| 42 |
|
|
2008 |
|
| 8.22 |
|
| (0.01 | ) |
| (2.40 | ) |
| (2.41 | ) |
| – |
|
| (0.09 | ) |
| – |
|
| (0.09 | ) |
| 0.01 |
|
| 5.73 |
|
| (29.17 | ) |
| 43,882 |
|
| 1.57 |
|
|
| 1.56 |
|
|
| 1.49 |
|
|
| (0.10 | ) |
|
| 72 |
|
|
Royce 100 Fund – R Class b | |||||||||||||||||||||||||||||||||||||||||||||||||||||||||
†2013 |
| $ | 10.84 |
| $ | (0.04 | ) | $ | 1.17 |
| $ | 1.13 |
| $ | – |
| $ | – |
| $ | – |
| $ | – |
| $ | – |
| $ | 11.97 |
|
| 10.42 | %1 | $ | 2,464 |
|
| 2.83 | %2 |
|
| 2.83 | %2 |
|
| 1.84 | %2 |
|
| (0.69 | )%2 |
|
| 14 | % |
|
2012 |
|
| 10.46 |
|
| 0.05 |
|
| 1.07 |
|
| 1.12 |
|
| – |
|
| (0.74 | ) |
| – |
|
| (0.74 | ) |
| – |
|
| 10.84 |
|
| 10.95 |
|
| 2,554 |
|
| 2.57 |
|
|
| 2.57 |
|
|
| 1.84 |
|
|
| 0.46 |
|
|
| 13 |
|
|
2011 |
|
| 11.72 |
|
| (0.10 | ) |
| (0.71 | ) |
| (0.81 | ) |
| – |
|
| (0.45 | ) |
| – |
|
| (0.45 | ) |
| – |
|
| 10.46 |
|
| (6.88 | ) |
| 3,469 |
|
| 2.70 |
|
|
| 2.69 |
|
|
| 1.84 |
|
|
| (0.88 | ) |
|
| 27 |
| |
2010 |
|
| 9.52 |
|
| (0.03 | ) |
| 2.34 |
|
| 2.31 |
|
| – |
|
| (0.11 | ) |
| – |
|
| (0.11 | ) |
| – |
|
| 11.72 |
|
| 24.26 |
|
| 1,358 |
|
| 2.22 |
|
|
| 2.21 |
|
|
| 1.84 |
|
|
| (0.29 | ) |
|
| 27 |
|
|
2009 |
|
| 6.93 |
|
| (0.05 | ) |
| 2.64 |
|
| 2.59 |
|
| – |
|
| – |
|
| – |
|
| – |
|
| – |
|
| 9.52 |
|
| 37.37 |
|
| 296 |
|
| 6.58 |
|
|
| 6.57 |
|
|
| 1.84 |
|
|
| (0.56 | ) |
|
| 42 |
|
|
2008 |
|
| 10.00 |
|
| (0.02 | ) |
| (2.96 | ) |
| (2.98 | ) |
| – |
|
| (0.09 | ) |
| – |
|
| (0.09 | ) |
| – |
|
| 6.93 |
|
| (29.78 | )1 |
| 70 |
|
| 18.97 |
|
| 18.97 |
|
| 1.84 |
|
| (0.44 | )2 |
|
| 72 |
|
| |||
Royce 100 Fund – K Class b | |||||||||||||||||||||||||||||||||||||||||||||||||||||||||
†2013 |
| $ | 10.95 |
| $ | (0.03 | ) | $ | 1.19 |
| $ | 1.16 |
| $ | – |
| $ | – |
| $ | – |
| $ | – |
| $ | – |
| $ | 12.11 |
|
| 10.59 | %1 | $ | 3,841 |
|
| 1.71 | %2 |
|
| 1.71 | %2 |
|
| 1.59 | %2 |
|
| (0.43 | )%2 |
|
| 14 | % |
|
2012 |
| 10.56 |
|
| 0.11 |
|
| 1.06 |
|
| 1.17 |
|
| (0.04 | ) |
| (0.74 | ) |
| – |
|
| (0.78 | ) |
| – |
|
| 10.95 |
|
| 11.37 |
|
| 3,554 |
|
| 1.68 |
|
|
| 1.68 |
|
|
| 1.59 |
|
|
| 0.88 |
|
|
| 13 |
|
| |
2011 |
|
| 11.81 |
|
| (0.08 | ) |
| (0.72 | ) |
| (0.80 | ) |
| – |
|
| (0.45 | ) |
| – |
|
| (0.45 | ) |
| – |
|
| 10.56 |
|
| (6.75 | ) |
| 4,447 |
|
| 1.66 |
|
|
| 1.66 |
|
|
| 1.59 |
|
|
| (0.68 | ) |
|
| 27 |
|
|
2010 |
|
| 9.57 |
|
| 0.02 |
|
| 2.33 |
|
| 2.35 |
|
| – |
|
| (0.11 | ) |
| – |
|
| (0.11 | ) |
| – |
|
| 11.81 |
|
| 24.55 |
|
| 2,915 |
|
| 1.89 |
|
|
| 1.89 |
|
|
| 1.59 |
|
|
| 0.20 |
|
|
| 27 |
|
|
2009 |
|
| 6.94 |
|
| (0.03 | ) |
| 2.66 |
|
| 2.63 |
|
| – |
|
| – |
|
| – |
|
| – |
|
| – |
|
| 9.57 |
|
| 37.90 |
|
| 186 |
|
| 5.78 |
|
|
| 5.78 |
|
|
| 1.59 |
|
|
| (0.41 | ) |
|
| 42 |
|
|
2008 |
|
| 10.00 |
|
| (0.01 | ) |
| (2.96 | ) |
| (2.97 | ) |
| – |
|
| (0.09 | ) |
| – |
|
| (0.09 | ) |
| – |
|
| 6.94 |
|
| (29.68 | )1 |
| 95 |
|
| 17.55 |
|
| 17.55 |
|
| 1.59 |
|
| (0.13 | )2 |
|
| 72 |
|
| |||
| Royce Dividend Value Fund – Investment Class | |||||||||||||||||||||||||||||||||||||||||||||||||||||||||
†2013 |
| $ | 7.29 |
| $ | 0.05 |
| $ | 0.76 |
| $ | 0.81 |
| $ | (0.05 | ) | $ | – |
| $ | – |
| $ | (0.05 | ) | $ | – |
| $ | 8.05 |
|
| 11.11 | %1 | $ | 173,694 |
|
| 1.17 | %2 |
|
| 1.17 | %2 |
|
| 1.17 | %2 |
|
| 1.23 | %2 |
|
| 10 | % |
|
2012 |
|
| 6.34 |
|
| 0.14 |
|
| 0.95 |
|
| 1.09 |
|
| (0.12 | ) |
| (0.02 | ) |
| – |
|
| (0.14 | ) |
| – |
|
| 7.29 |
|
| 17.26 |
|
| 118,820 |
|
| 1.19 |
|
|
| 1.19 |
|
|
| 1.19 |
|
|
| 1.99 |
|
|
| 28 |
|
|
| 2011 | 6.80 | 0.07 | (0.37 | ) | (0.30 | ) | (0.07 | ) | (0.09 | ) |
| – |
| (0.16 | ) | – | 6.34 | (4.46 | ) | 85,188 | 1.20 |
| 1.20 |
| 1.20 |
| 1.14 |
| 14 |
| |||||||||||||||||||||||||||
| 2010 | 5.31 | 0.09 | 1.51 | 1.60 | (0.08 | ) | (0.03 | ) |
| – |
| (0.11 | ) | – | 6.80 | 30.46 | 35,626 | 1.38 |
| 1.38 |
| 1.24 |
| 1.56 |
| 21 |
| ||||||||||||||||||||||||||||||
| 2009 | 3.90 | 0.07 | 1.40 | 1.47 | (0.06 | ) | – |
| – |
| (0.06 | ) | – | 5.31 | 38.22 | 13,208 | 1.69 |
| 1.69 |
| 1.24 |
| 1.70 |
| 43 |
| |||||||||||||||||||||||||||||||
| 2008 | 5.82 | 0.11 | (1.91 | ) | (1.80 | ) | (0.12 | ) | (0.00 | ) |
| – |
| (0.12 | ) | – | 3.90 | (31.38 | ) | 1,881 | 2.84 |
| 2.83 |
| 1.24 |
| 2.13 |
| 61 |
| |||||||||||||||||||||||||||
| Royce Dividend Value Fund – Service Class | |||||||||||||||||||||||||||||||||||||||||||||||||||||||||
†2013 |
| $ | 7.35 |
| $ | 0.04 |
| $ | 0.76 |
| $ | 0.80 |
| $ | (0.04 | ) | $ | – |
| $ | – |
| $ | (0.04 | ) | $ | – |
| $ | 8.11 |
|
| 10.89 | %1 | $ | 326,603 |
|
| 1.45 | %2 |
|
| 1.45 | %2 |
|
| 1.44 | %2 |
|
| 0.95 | %2 |
|
| 10 | % |
|
2012 |
|
| 6.38 |
|
| 0.12 |
|
| 0.95 |
|
| 1.07 |
|
| (0.08 | ) |
| (0.02 | ) |
| – |
|
| (0.10 | ) |
| – |
|
| 7.35 |
|
| 16.95 |
|
| 252,443 |
|
| 1.48 |
|
|
| 1.48 |
|
|
| 1.46 |
|
|
| 1.74 |
|
|
| 28 |
|
|
| 2011 | 6.82 | 0.05 | (0.36 | ) | (0.31 | ) | (0.04 | ) | (0.09 | ) |
| – |
| (0.13 | ) | – | 6.38 | (4.55 | ) | 201,634 | 1.48 |
| 1.48 |
| 1.46 |
| 0.84 |
| 14 |
| |||||||||||||||||||||||||||
| 2010 | 5.33 | 0.08 | 1.51 | 1.59 | (0.07 | ) | (0.03 | ) |
| – |
| (0.10 | ) | – | 6.82 | 30.11 | 117,304 | 1.56 |
| 1.56 |
| 1.49 |
| 1.32 |
| 21 |
| ||||||||||||||||||||||||||||||
| 2009 | 3.92 | 0.07 | 1.39 | 1.46 | (0.05 | ) | – |
| – |
| (0.05 | ) | – | 5.33 | 37.73 | 16,107 | 2.04 |
| 2.04 |
| 1.49 |
| 1.45 |
| 43 |
| |||||||||||||||||||||||||||||||
| 2008 | 5.83 | 0.09 | (1.90 | ) | (1.81 | ) | (0.10 | ) | (0.00 | ) |
| – |
| (0.10 | ) | – | 3.92 | (31.47 | ) | 4,872 | 2.54 |
| 2.54 |
| 1.49 |
| 1.89 |
| 61 |
| |||||||||||||||||||||||||||
| Royce Dividend Value Fund – Institutional Class d | |||||||||||||||||||||||||||||||||||||||||||||||||||||||||
†2013 |
| $ | 7.28 |
| $ | 0.05 |
| $ | 0.77 |
| $ | 0.82 |
| $ | (0.06 | ) | $ | – |
| $ | – |
| $ | (0.06 | ) | $ | – |
| $ | 8.04 |
|
| 11.20 | %1 | $ | 26,355 |
|
| 1.11 | %2 |
|
| 1.11 | %2 |
|
| 1.04 | %2 |
|
| 1.34 | %2 |
|
| 10 | % |
|
2012 |
|
| 6.80 |
|
| 0.08 |
|
| 0.50 |
|
| 0.58 |
|
| (0.08 | ) |
| (0.02 | ) |
| – |
|
| (0.10 | ) |
| – |
|
| 7.28 |
|
| 8.51 |
| 23,460 |
|
| 1.33 |
|
| 1.33 |
|
| 1.04 |
|
| 3.48 |
|
| 28 |
|
| |||||
THE ACCOMPANYING NOTES ARE AN INTEGRAL PART OF THESE FINANCIAL STATEMENTS. |
| The Royce Funds 2013 Semiannual Report to Shareholders | 109 |
Financial Highlights |
|
| ||||||||||||||||||||||||||||||||||||||||||||||||||||||||||||
|
| Net |
| Net |
| Net Realized and Unrealized |
|
| Distributions |
| Distributions from Net |
|
|
|
|
|
|
|
|
| Ratio of Expenses to Average Net Assets |
| Ratio of Net Investment |
|
| |||||||||||||||||||||||||||||||||||
|
| Asset Value, |
| Investment |
| Gain (Loss) on |
| Total from Investment Operations |
| from Net Investment Income |
| Realized Gain on |
| Distributions |
| Total Distributions |
| Shareholder Redemption Fees |
| Net Asset |
| Total Return |
| Net Assets, |
| Prior to Fee |
| Prior |
| Net of |
| Income (Loss) |
| Portfolio Turnover Rate |
| |||||||||||||||||||||||||
|
|
|
|
|
|
|
|
|
|
|
|
|
|
|
|
|
|
|
|
|
|
|
|
|
|
|
|
|
|
|
|
|
|
|
|
|
|
|
|
|
|
|
|
|
|
|
|
|
|
|
|
|
|
|
|
|
| |||
Royce Global Value Fund – Investment Class e | ||||||||||||||||||||||||||||||||||||||||||||||||||||||||||||
†2013 |
| $ | 12.91 |
| $ | 0.10 |
| $ | (0.70 | ) | $ | (0.60 | ) | $ | – |
| $ | – |
| $ | – |
| $ | – |
| $ | – |
| $ | 12.31 |
|
| (4.65 | )%1 | $ | 173,665 |
|
| 1.46 | %2 |
|
| 1.46 | %2 |
|
| 1.46 | %2 |
|
| 1.52 | %2 |
|
| 24 | % |
| |||
2012 |
|
| 11.74 |
|
| 0.14 |
|
| 1.19 |
|
| 1.33 |
|
| (0.16 | ) |
| – |
|
| – |
|
| (0.16 | ) |
| – |
|
| 12.91 |
|
| 11.37 |
|
| 178,319 |
|
| 1.47 |
|
|
| 1.47 |
|
|
| 1.44 |
|
|
| 1.16 |
|
|
| 36 |
|
| |||
2011 |
|
| 14.54 |
|
| 0.13 |
|
| (2.82 | ) |
| (2.69 | ) |
| (0.12 | ) |
| – |
|
| – |
|
| (0.12 | ) |
| 0.01 |
|
| 11.74 |
|
| (18.48 | ) |
| 141,180 |
|
| 1.42 |
|
|
| 1.42 |
|
|
| 1.42 |
|
|
| 0.80 |
|
|
| 77 |
|
| |||
2010 |
|
| 11.02 |
|
| (0.06 | ) |
| 3.68 |
|
| 3.62 |
|
| (0.10 | ) |
| – |
|
| – |
|
| (0.10 | ) |
| – |
|
| 14.54 |
|
| 32.88 |
| 6,626 |
|
| 2.07 |
|
| 2.07 |
|
| 1.44 |
|
| (0.58 | )2 |
|
| 42 |
|
| |||||||
Royce Global Value Fund – Service Class | ||||||||||||||||||||||||||||||||||||||||||||||||||||||||||||
†2013 |
| $ | 12.98 |
| $ | 0.07 |
| $ | (0.69 | ) | $ | (0.62 | ) | $ | – |
| $ | – |
| $ | – |
| $ | – |
| $ | – |
| $ | 12.36 |
|
| (4.78 | )%1 | $ | 65,195 |
|
| 1.85 | %2 |
|
| 1.85 | %2 |
|
| 1.69 | %2 |
|
| 1.13 | %2 |
|
| 24 | % |
| |||
2012 |
|
| 11.77 |
|
| 0.12 |
|
| 1.18 |
|
| 1.30 |
|
| (0.09 | ) |
| – |
|
| – |
|
| (0.09 | ) |
| – |
|
| 12.98 |
|
| 11.03 |
|
| 98,274 |
|
| 1.80 |
|
|
| 1.80 |
|
|
| 1.69 |
|
|
| 0.88 |
|
|
| 36 |
|
| |||
2011 |
|
| 14.56 |
|
| 0.07 |
|
| (2.80 | ) |
| (2.73 | ) |
| (0.07 | ) |
| – |
|
| – |
|
| (0.07 | ) |
| 0.01 |
|
| 11.77 |
|
| (18.69 | ) |
| 122,574 |
|
| 1.77 |
|
|
| 1.77 |
|
|
| 1.69 |
|
|
| 0.41 |
|
|
| 77 |
|
| |||
2010 |
|
| 10.79 |
|
| (0.03 | ) |
| 3.87 |
|
| 3.84 |
|
| (0.08 | ) |
| – |
|
| – |
|
| (0.08 | ) |
| 0.01 |
|
| 14.56 |
|
| 35.69 |
|
| 141,992 |
|
| 1.84 |
|
|
| 1.84 |
|
|
| 1.69 |
|
|
| 0.01 |
|
|
| 42 |
|
| |||
2009 |
|
| 6.70 |
|
| 0.01 |
|
| 4.13 |
|
| 4.14 |
|
| (0.06 | ) |
| – |
|
| – |
|
| (0.06 | ) |
| 0.01 |
|
| 10.79 |
|
| 61.89 |
|
| 50,946 |
|
| 1.88 |
|
|
| 1.88 |
|
|
| 1.69 |
|
|
| 0.11 |
|
|
| 71 |
|
| |||
2008 |
|
| 11.20 |
|
| 0.14 |
|
| (4.65 | ) |
| (4.51 | ) |
| (0.03 | ) |
| (0.00 | ) |
| – |
|
| (0.03 | ) |
| 0.04 |
|
| 6.70 |
|
| (39.92 | ) |
| 31,040 |
|
| 1.91 |
|
|
| 1.90 |
|
|
| 1.69 |
|
|
| 1.64 |
|
|
| 45 |
|
| |||
Royce Global Value Fund – Consultant Class f | ||||||||||||||||||||||||||||||||||||||||||||||||||||||||||||
†2013 |
| $ | 12.88 |
| $ | 0.04 |
| $ | (0.69 | ) | $ | (0.65 | ) | $ | – |
| $ | – |
| $ | – |
| $ | – |
| $ | – |
| $ | 12.23 |
|
| (5.05 | )%1 | $ | 23,798 |
|
| 2.51 | %2 |
|
| 2.51 | %2 |
|
| 2.44 | %2 |
|
| 0.55 | %2 |
|
| 24 | % |
| |||
2012 |
|
| 11.71 |
|
| 0.02 |
|
| 1.17 |
|
| 1.19 |
|
| (0.02 | ) |
| – |
|
| – |
|
| (0.02 | ) |
| – |
|
| 12.88 |
|
| 10.13 |
|
| 23,383 |
|
| 2.55 |
|
|
| 2.55 |
|
|
| 2.44 |
|
|
| 0.16 |
|
|
| 36 |
|
| |||
2011 |
|
| 15.66 |
|
| (0.09 | ) |
| (3.80 | ) |
| (3.89 | ) |
| (0.06 | ) |
| – |
|
| – |
|
| (0.06 | ) |
| – |
|
| 11.71 |
|
| (24.82 | )1 |
| 18,585 |
|
| 2.64 |
|
| 2.64 |
|
| 2.44 |
|
| (0.77 | )2 |
|
| 77 |
| |||||||
Royce Global Value Fund – R Class g | ||||||||||||||||||||||||||||||||||||||||||||||||||||||||||||
†2013 |
| $ | 9.69 |
| $ | 0.04 |
| $ | (0.51 | ) | $ | (0.47 | ) | $ | – |
| $ | – |
| $ | – |
| $ | – |
| $ | – |
| $ | 9.22 |
|
| (4.85 | )%1 | $ | 90 |
|
| 10.02 | %2 |
|
| 10.02 | %2 |
|
| 1.99 | %2 |
|
| 0.82 | %2 |
|
| 24 | % |
| |||
2012 |
|
| 10.00 |
|
| 0.02 |
|
| (0.21 | ) |
| (0.19 | ) |
| (0.12 | ) |
| – |
|
| – |
|
| (0.12 | ) |
| – |
|
| 9.69 |
|
| (1.90 | )1 |
| 80 |
|
| 19.19 |
|
| 19.19 |
|
| 1.99 |
|
| 0.70 |
|
| 36 |
|
| |||||||
| Royce Global Value Fund – K Class g | ||||||||||||||||||||||||||||||||||||||||||||||||||||||||||||
†2013 |
| $ | 9.69 |
| $ | 0.06 |
| $ | (0.52 | ) | $ | (0.46 | ) | $ | – |
| $ | – |
| $ | – |
| $ | – |
| $ | – |
| $ | 9.23 |
|
| (4.75 | )%1 | $ | 40 |
|
| 20.81 | %2 |
|
| 20.81 | %2 |
|
| 1.74 | %2 |
|
| 1.23 | %2 |
|
| 24 | % |
| |||
2012 |
|
| 10.00 |
|
| 0.09 |
|
| (0.27 | ) |
| (0.18 | ) |
| (0.13 | ) |
| – |
|
| – |
|
| (0.13 | ) |
| – |
|
| 9.69 |
|
| (1.74 | )1 |
| 41 |
|
| 29.99 |
|
| 29.98 |
|
| 1.74 |
|
| 1.20 |
|
| 36 |
|
| |||||||
| Royce International Smaller-Companies Fund – Service Class h | ||||||||||||||||||||||||||||||||||||||||||||||||||||||||||||
†2013 |
| $ | 11.28 |
| $ | 0.08 |
| $ | (0.16 | ) | $ | (0.08 | ) | $ | – |
| $ | – |
| $ | – |
| $ | – |
| $ | – |
| $ | 11.20 |
|
| (0.71 | )%1 | $ | 31,637 |
|
| 2.02 | %2 |
|
| 2.02 | %2 |
|
| 1.69 | %2 |
|
| 1.40 | %2 |
|
| 33 | % |
| |||
2012 |
|
| 9.58 |
|
| 0.14 |
|
| 1.70 |
|
| 1.84 |
|
| (0.15 | ) |
| – |
|
| – |
|
| (0.15 | ) |
| 0.01 |
|
| 11.28 |
|
| 19.39 |
|
| 26,371 |
|
| 2.13 |
|
|
| 2.13 |
|
|
| 1.69 |
|
|
| 1.29 |
|
|
| 44 |
|
| |||
| 2011 | 12.85 | 0.10 | (2.51 | ) | (2.41 | ) | (0.08 | ) | (0.78 | ) |
| (0.01 | ) | (0.87 | ) | 0.01 |
| 9.58 | (18.75 | ) | 20,103 | 2.15 |
| 2.15 |
| 1.69 |
| 0.88 |
| 38 |
| |||||||||||||||||||||||||||||
| 2010 | 10.49 | 0.03 | 2.72 | 2.75 | (0.10 | ) | (0.30 | ) |
| – |
| (0.40 | ) | 0.01 |
| 12.85 | 26.45 | 18,297 | 2.35 |
| 2.35 |
| 1.69 |
| 0.45 |
| 55 |
| ||||||||||||||||||||||||||||||||
| 2009 | 6.99 | (0.02 | ) | 3.53 | 3.51 | (0.02 | ) | – |
| – |
| (0.02 | ) | 0.01 |
| 10.49 | 50.31 | 7,871 | 3.01 |
| 3.01 |
| 1.69 |
| (0.18 | ) |
| 38 |
| |||||||||||||||||||||||||||||||
| 2008 | 10.00 | (0.02 | ) | (2.99 | ) | (3.01 | ) | – |
| – |
|
| – |
| – |
| – | 6.99 | (30.10 | )1 | 1,960 | 6.24 |
| 5.98 |
| 1.69 |
| (0.43 | )2 |
| 1 |
| ||||||||||||||||||||||||||||
| 110 | The Royce Funds 2013 Semiannual Report to Shareholders | THE ACCOMPANYING NOTES ARE AN INTEGRAL PART OF THESE FINANCIAL STATEMENTS. |
Royce International Smaller-Companies Fund 11%
| Level 1 | – | quoted prices in active markets for identical securities. |
| Level 2 | – | other significant observable inputs (including quoted prices for similar securities, foreign securities that may be fair valued and repurchase agreements). The table below includes all Level 2 securities. Level 2 securities with values based on quoted prices for similar securities are noted in the Schedules of Investments. |
| Level 3 | – | significant unobservable inputs (including last trade price before trading was suspended, or at a discount thereto for lack of marketability or otherwise, market price information regarding other securities, information received from the company and/or published documents, including SEC filings and financial statements, or other publicly available information). |
| Level 1 | Level 2 | Level 3 | Total | |||||||||||||||||
| Royce Pennsylvania Mutual Fund | ||||||||||||||||||||
| Common Stocks | $ | 6,380,863,043 | $ | 9,393,380 | $ | – | $ | 6,390,256,423 | ||||||||||||
| Cash Equivalents | 71,635,787 | 9,377,000 | – | 81,012,787 | ||||||||||||||||
| Royce Micro-Cap Fund | ||||||||||||||||||||
| Common Stocks | 760,724,159 | – | 377,962 | 761,102,121 | ||||||||||||||||
| Cash Equivalents | 14,286,329 | 80,146,000 | – | 94,432,329 | ||||||||||||||||
| The Royce Funds 2013 Semiannual Report to Shareholders | 111 |
Valuation of Investments (continued):
| Level 1 | Level 2 | Level 3 | Total | |||||||||||||||||
| Royce Premier Fund | ||||||||||||||||||||
| Common Stocks | $ | 6,493,977,401 | $ | – | $ | – | $ | 6,493,977,401 | ||||||||||||
| Cash Equivalents | 56,194,485 | 199,418,000 | – | 255,612,485 | ||||||||||||||||
| Royce Low-Priced Stock Fund | ||||||||||||||||||||
| Common Stocks | 1,931,758,667 | – | – | 1,931,758,667 | ||||||||||||||||
| Cash Equivalents | 89,352,412 | 183,002,000 | – | 272,354,412 | ||||||||||||||||
| Royce Total Return Fund | ||||||||||||||||||||
| Common Stocks | 4,638,014,330 | 11,707,056 | – | 4,649,721,386 | ||||||||||||||||
| Corporate Bonds | – | 3,789,375 | – | 3,789,375 | ||||||||||||||||
| Cash Equivalents | 3,957,333 | 478,504,000 | – | 482,461,333 | ||||||||||||||||
| Royce Heritage Fund | ||||||||||||||||||||
| Common Stocks | 258,629,055 | – | – | 258,629,055 | ||||||||||||||||
| Cash Equivalents | 1,231,565 | 42,307,000 | – | 43,538,565 | ||||||||||||||||
| Royce Opportunity Fund | ||||||||||||||||||||
| Common Stocks | 2,049,973,934 | – | – | 2,049,973,934 | ||||||||||||||||
| Preferred Stocks | 2,863,408 | – | – | 2,863,408 | ||||||||||||||||
| Cash Equivalents | 68,967,724 | 249,540,000 | – | 318,507,724 | ||||||||||||||||
| Royce Special Equity Fund | ||||||||||||||||||||
| Common Stocks | 2,986,833,073 | 19,058,155 | – | 3,005,891,228 | ||||||||||||||||
| Cash Equivalents | 11,400 | 328,681,000 | – | 328,692,400 | ||||||||||||||||
| Royce Value Fund | ||||||||||||||||||||
| Common Stocks | 1,132,109,164 | – | – | 1,132,109,164 | ||||||||||||||||
| Cash Equivalents | 1,605,497 | 43,226,000 | – | 44,831,497 | ||||||||||||||||
| Royce Value Plus Fund | ||||||||||||||||||||
| Common Stocks | 1,333,648,722 | – | – | 1,333,648,722 | ||||||||||||||||
| Cash Equivalents | 51,073,622 | 49,746,000 | – | 100,819,622 | ||||||||||||||||
| Royce 100 Fund | ||||||||||||||||||||
| Common Stocks | 269,832,689 | – | – | 269,832,689 | ||||||||||||||||
| Cash Equivalents | 1,000,778 | 7,001,000 | – | 8,001,778 | ||||||||||||||||
| Royce Dividend Value Fund | ||||||||||||||||||||
| Common Stocks | 514,045,464 | – | – | 514,045,464 | ||||||||||||||||
| Cash Equivalents | 1,676,417 | 9,646,000 | – | 11,322,417 | ||||||||||||||||
| Royce Global Value Fund | ||||||||||||||||||||
| Common Stocks | 254,417,357 | – | – | 254,417,357 | ||||||||||||||||
| Cash Equivalents | 2,509,644 | 8,163,000 | – | 10,672,644 | ||||||||||||||||
| Royce International Smaller-Companies Fund | ||||||||||||||||||||
| Common Stocks | 29,159,841 | – | – | 29,159,841 | ||||||||||||||||
| Cash Equivalents | – | 4,154,000 | – | 4,154,000 | ||||||||||||||||
For the six months ended June 30, 2013, certain securities have transferred in and out of Level 1 and Level 2 measurements as a result of the fair value pricing procedures for international equities. The Funds recognize transfers between levels as of the end of the reporting period.
At June 30, 2013, the following Funds had securities transfer from Level 2 to Level 1 within the fair value hierarchy:
| Transfers from Level 2 | Transfers from Level 2 | |||||||||||
| to Level 1 | to Level 1 | |||||||||||
| Royce Pennsylvania Mutual Fund | $ | 183,892,815 | Royce Value Plus Fund | $ | 53,085,787 | |||||||
| Royce Micro-Cap Fund | 87,967,267 | Royce 100 Fund | 14,576,454 | |||||||||
| Royce Premier Fund | 475,387,557 | Royce Dividend Value Fund | 46,174,111 | |||||||||
| Royce Low-Priced Stock Fund | 518,988,497 | Royce Global Value Fund | 158,847,874 | |||||||||
| Royce Total Return Fund | 116,651,483 | Royce International Smaller-Companies Fund | 23,483,820 | |||||||||
| Royce Heritage Fund | 33,846,589 | |||||||||||
Level 3 Reconciliation:
| Realized and Unrealized | |||||||||||||||
| Balance as of 12/31/12 | Gain (Loss)1 | Balance as of 6/30/13 | |||||||||||||
| Royce Micro-Cap Fund | |||||||||||||||
| Common Stocks | $ | 403,638 | $ | (25,676 | ) | $ | 377,962 | ||||||||
| 112 | The Royce Funds 2013 Semiannual Report to Shareholders |
| Gross Amount of Derivative Assets in the Statements of Assets and Liabilities1 | Collateral Received2 | Net Amount | |||||||||||||
| Royce Pennsylvania Mutual Fund | |||||||||||||||
| Securities on Loan | $ | 71,635,787 | $ | (71,635,787 | ) | $ | – | ||||||||
| Royce Micro-Cap Fund | |||||||||||||||
| Securities on Loan | 14,286,329 | (14,286,329 | ) | – | |||||||||||
| Royce Premier Fund | |||||||||||||||
| Securities on Loan | 56,194,485 | (56,194,485 | ) | – | |||||||||||
| Royce Low-Priced Stock Fund | |||||||||||||||
| Securities on Loan | 89,352,412 | (89,352,412 | ) | – | |||||||||||
| Royce Total Return Fund | |||||||||||||||
| Securities on Loan | 3,957,333 | (3,957,333 | ) | – | |||||||||||
| Royce Heritage Fund | |||||||||||||||
| Securities on Loan | 1,231,565 | (1,231,565 | ) | – | |||||||||||
| Royce Opportunity Fund | |||||||||||||||
| Securities on Loan | 68,967,724 | (68,967,724 | ) | – | |||||||||||
| Royce Special Equity Fund | |||||||||||||||
| Securities on Loan | 11,400 | (11,400 | ) | – | |||||||||||
| Royce Value Fund | |||||||||||||||
| Securities on Loan | 1,605,497 | (1,605,497 | ) | – | |||||||||||
| Royce Value Plus Fund | |||||||||||||||
| Securities on Loan | 51,073,622 | (51,073,622 | ) | – | |||||||||||
| Royce 100 Fund | |||||||||||||||
| Securities on Loan | 1,000,778 | (1,000,778 | ) | – | |||||||||||
| Royce Dividend Value Fund | |||||||||||||||
| Securities on Loan | 1,676,417 | (1,676,417 | ) | – | |||||||||||
| Royce Global Value Fund | |||||||||||||||
| Securities on Loan | 2,509,644 | (2,509,644 | ) | – | |||||||||||
The following table presents by financial instrument, each Fund’s derivative liabilities net of related collateral held by each Fund at June 30, 2013:
| Gross Amount of Derivative | |||||||||||||||
| Liabilities in the Statements of | |||||||||||||||
| Assets and Liabilities1 | Collateral Pledged2 | Net Amount | |||||||||||||
| Royce Pennsylvania Mutual Fund | |||||||||||||||
| Collateral on Loaned Securities | $ | 71,635,787 | $ | (71,635,787 | ) | $ | – | ||||||||
| Royce Micro-Cap Fund | |||||||||||||||
| Collateral on Loaned Securities | 14,286,329 | (14,286,329 | ) | – | |||||||||||
| The Royce Funds 2013 Semiannual Report to Shareholders | 113 |
Securities Lending (continued):
| Gross Amount of Derivative | |||||||||||||||
| Liabilities in the Statements of | |||||||||||||||
| Assets and Liabilities1 | Collateral Pledged2 | Net Amount | |||||||||||||
| Royce Premier Fund | |||||||||||||||
| Collateral on Loaned Securities | $ | 56,194,485 | $ | (56,194,485 | ) | $ | – | ||||||||
| Royce Low-Priced Stock Fund | |||||||||||||||
| Collateral on Loaned Securities | 89,352,412 | (89,352,412 | ) | – | |||||||||||
| Royce Total Return Fund | |||||||||||||||
| Collateral on Loaned Securities | 3,957,333 | (3,957,333 | ) | – | |||||||||||
| Royce Heritage Fund | |||||||||||||||
| Collateral on Loaned Securities | 1,231,565 | (1,231,565 | ) | – | |||||||||||
| Royce Opportunity Fund | |||||||||||||||
| Collateral on Loaned Securities | 68,967,724 | (68,967,724 | ) | – | |||||||||||
| Royce Special Equity Fund | |||||||||||||||
| Collateral on Loaned Securities | 11,400 | (11,400 | ) | – | |||||||||||
| Royce Value Fund | |||||||||||||||
| Collateral on Loaned Securities | 1,605,497 | (1,605,497 | ) | – | |||||||||||
| Royce Value Plus Fund | |||||||||||||||
| Collateral on Loaned Securities | 51,073,622 | (51,073,622 | ) | – | |||||||||||
| Royce 100 Fund | |||||||||||||||
| Collateral on Loaned Securities | 1,000,778 | (1,000,778 | ) | – | |||||||||||
| Royce Dividend Value Fund | |||||||||||||||
| Collateral on Loaned Securities | 1,676,417 | (1,676,417 | ) | – | |||||||||||
| Royce Global Value Fund | |||||||||||||||
| Collateral on Loaned Securities | 2,509,644 | (2,509,644 | ) | – | |||||||||||
| 114 | The Royce Funds 2013 Semiannual Report to Shareholders |
Capital Share Transactions (in dollars):
| Shares issued for | Net increase (decrease) from | |||||||||||||||||||||||||||||||||||||||
| Shares sold | reinvestment of distributions | Shares redeemed | capital share transactions | |||||||||||||||||||||||||||||||||||||
| Period ended | Period ended | Period ended | Period ended | |||||||||||||||||||||||||||||||||||||
| 6/30/13 | Period ended | 6/30/13 | Period ended | 6/30/13 | Period ended | 6/30/13 | Period ended | |||||||||||||||||||||||||||||||||
| (unaudited) | 12/31/12 | (unaudited) | 12/31/12 | (unaudited) | 12/31/12 | (unaudited) | 12/31/12 | |||||||||||||||||||||||||||||||||
| Royce Pennsylvania Mutual Fund | ||||||||||||||||||||||||||||||||||||||||
Investment Class | $ | 344,702,056 | $ | 662,607,895 | $ | – | $ | 257,795,544 | $ | (513,763,463 | ) | $ | (1,256,398,755 | ) | $ | (169,061,407 | ) | $ | (335,995,316 | ) | ||||||||||||||||||||
Service Class | 97,962,246 | 165,003,710 | – | 28,468,833 | (74,341,422 | ) | (155,198,379 | ) | 23,620,824 | 38,274,164 | ||||||||||||||||||||||||||||||
Consultant Class | 19,100,100 | 34,093,194 | – | 39,215,706 | (62,760,148 | ) | (126,201,488 | ) | (43,660,048 | ) | (52,892,588 | ) | ||||||||||||||||||||||||||||
Institutional Class | 86,518,519 | 261,272,296 | – | 32,724,191 | (30,839,387 | ) | (61,037,580 | ) | 55,679,132 | 232,958,907 | ||||||||||||||||||||||||||||||
R Class | 6,814,500 | 15,853,054 | – | 1,943,538 | (4,509,803 | ) | (9,101,626 | ) | 2,304,697 | 8,694,966 | ||||||||||||||||||||||||||||||
K Class | 1,467,470 | 4,442,442 | – | 491,916 | (1,324,900 | ) | (2,231,520 | ) | 142,570 | 2,702,838 | ||||||||||||||||||||||||||||||
| Royce Micro-Cap Fund | ||||||||||||||||||||||||||||||||||||||||
Investment Class | 52,486,500 | 110,135,135 | – | 40,891,444 | (159,958,148 | ) | (331,749,308 | ) | (107,471,648 | ) | (180,722,729 | ) | ||||||||||||||||||||||||||||
Service Class | 10,469,887 | 77,650,222 | – | 7,331,533 | (45,911,888 | ) | (100,912,526 | ) | (35,442,001 | ) | (15,930,771 | ) | ||||||||||||||||||||||||||||
Consultant Class | 2,535,680 | 5,379,491 | – | 7,635,941 | (17,846,368 | ) | (27,570,388 | ) | (15,310,688 | ) | (14,554,956 | ) | ||||||||||||||||||||||||||||
| Royce Premier Fund | ||||||||||||||||||||||||||||||||||||||||
Investment Class | 351,879,527 | 747,646,770 | – | 313,244,907 | (630,232,613 | ) | (1,142,070,039 | ) | (278,353,086 | ) | (81,178,362 | ) | ||||||||||||||||||||||||||||
Service Class | 51,305,210 | 137,054,293 | – | 37,837,318 | (180,532,460 | ) | (266,450,099 | ) | (129,227,250 | ) | (91,558,488 | ) | ||||||||||||||||||||||||||||
Consultant Class | 2,182,076 | 4,914,067 | – | 3,975,657 | (6,762,685 | ) | (9,949,114 | ) | (4,580,609 | ) | (1,059,390 | ) | ||||||||||||||||||||||||||||
Institutional Class | 86,133,159 | 163,632,309 | – | 58,694,049 | (155,020,951 | ) | (196,727,102 | ) | (68,887,792 | ) | 25,599,256 | |||||||||||||||||||||||||||||
W Class | 38,528,412 | 113,845,651 | – | 29,318,980 | (90,269,840 | ) | (180,176,714 | ) | (51,741,428 | ) | (37,012,083 | ) | ||||||||||||||||||||||||||||
R Class | 5,081,298 | 11,096,351 | – | 1,863,347 | (3,599,227 | ) | (8,690,901 | ) | 1,482,071 | 4,268,797 | ||||||||||||||||||||||||||||||
K Class | 1,150,037 | 2,923,140 | – | 1,464,327 | (3,284,265 | ) | (2,940,122 | ) | (2,134,228 | ) | 1,447,345 | |||||||||||||||||||||||||||||
| Royce Low-Priced Stock Fund | ||||||||||||||||||||||||||||||||||||||||
Investment Class | 18,711,747 | 121,523,266 | – | 19,845,684 | (140,035,687 | ) | (152,071,182 | ) | (121,323,940 | ) | (10,702,232 | ) | ||||||||||||||||||||||||||||
Service Class | 66,945,194 | 239,998,652 | – | 135,141,136 | (630,312,354 | ) | (1,027,840,636 | ) | (563,367,160 | ) | (652,700,848 | ) | ||||||||||||||||||||||||||||
Institutional Class | 41,654,797 | 216,954,398 | – | 76,401,516 | (402,597,700 | ) | (281,899,681 | ) | (360,942,903 | ) | 11,456,233 | |||||||||||||||||||||||||||||
R Class | 472,476 | 1,545,216 | – | 413,318 | (2,310,742 | ) | (3,319,490 | ) | (1,838,266 | ) | (1,360,956 | ) | ||||||||||||||||||||||||||||
K Class | 541,407 | 1,898,473 | – | 781,650 | (1,348,102 | ) | (4,667,746 | ) | (806,695 | ) | (1,987,623 | ) | ||||||||||||||||||||||||||||
| Royce Total Return Fund | ||||||||||||||||||||||||||||||||||||||||
Investment Class | 281,251,024 | 419,303,349 | 13,902,723 | 173,830,152 | (395,155,143 | ) | (885,921,003 | ) | (100,001,396 | ) | (292,787,502 | ) | ||||||||||||||||||||||||||||
Service Class | 197,167,491 | 69,272,271 | 1,600,910 | 14,854,646 | (52,845,080 | ) | (124,544,896 | ) | 145,923,321 | (40,417,979 | ) | |||||||||||||||||||||||||||||
Consultant Class | 14,333,684 | 20,173,454 | – | 14,273,391 | (26,867,210 | ) | (58,339,142 | ) | (12,533,526 | ) | (23,892,297 | ) | ||||||||||||||||||||||||||||
Institutional Class | 139,989,828 | 92,895,625 | 2,620,894 | 23,588,680 | (80,710,598 | ) | (126,051,961 | ) | 61,900,124 | (9,567,656 | ) | |||||||||||||||||||||||||||||
W Class | 38,146,130 | 56,620,882 | 937,134 | 10,281,660 | (19,512,958 | ) | (37,853,609 | ) | 19,570,306 | 29,048,933 | ||||||||||||||||||||||||||||||
R Class | 12,311,711 | 19,963,699 | 114,308 | 2,354,016 | (7,694,335 | ) | (11,233,311 | ) | 4,731,684 | 11,084,404 | ||||||||||||||||||||||||||||||
K Class | 63,775,642 | 96,984,981 | 540,793 | 11,545,341 | (52,646,968 | ) | (135,315,960 | ) | 11,669,467 | (26,785,638 | ) | |||||||||||||||||||||||||||||
| Royce Heritage Fund | ||||||||||||||||||||||||||||||||||||||||
Investment Class | 15,203,171 | 25,279,973 | – | 1,251,617 | (2,584,707 | ) | (9,957,079 | ) | 12,618,464 | 16,574,511 | ||||||||||||||||||||||||||||||
Service Class | 8,120,046 | 23,331,563 | – | 5,597,731 | (22,014,094 | ) | (67,038,754 | ) | (13,894,048 | ) | (38,109,460 | ) | ||||||||||||||||||||||||||||
Consultant Class | 549,337 | 1,725,731 | – | 423,298 | (1,128,207 | ) | (3,413,073 | ) | (578,870 | ) | (1,264,043 | ) | ||||||||||||||||||||||||||||
R Class | 1,480,362 | 1,916,645 | – | 157,800 | (421,914 | ) | (1,786,121 | ) | 1,058,448 | 288,324 | ||||||||||||||||||||||||||||||
K Class | 685,371 | 4,681,526 | – | 271,701 | (1,242,128 | ) | (6,488,110 | ) | (556,757 | ) | (1,534,883 | ) | ||||||||||||||||||||||||||||
| Royce Opportunity Fund | ||||||||||||||||||||||||||||||||||||||||
Investment Class | 95,860,728 | 128,158,726 | – | 47,244,802 | (98,834,709 | ) | (271,654,395 | ) | (2,973,981 | ) | (96,250,867 | ) | ||||||||||||||||||||||||||||
Service Class | 78,332,624 | 70,636,968 | – | 9,474,766 | (23,262,112 | ) | (61,380,895 | ) | 55,070,512 | 18,730,839 | ||||||||||||||||||||||||||||||
Consultant Class | 1,909,542 | 1,688,984 | – | 671,947 | (1,241,639 | ) | (3,993,515 | ) | 667,903 | (1,632,584 | ) | |||||||||||||||||||||||||||||
Institutional Class | 96,461,164 | 158,959,803 | – | 34,022,248 | (56,657,472 | ) | (167,107,259 | ) | 39,803,692 | 25,874,792 | ||||||||||||||||||||||||||||||
R Class | 6,301,905 | 4,090,762 | – | 374,879 | (916,753 | ) | (1,515,337 | ) | 5,385,152 | 2,950,304 | ||||||||||||||||||||||||||||||
K Class | 2,777,394 | 2,701,921 | – | 504,189 | (1,250,315 | ) | (1,843,330 | ) | 1,527,079 | 1,362,780 | ||||||||||||||||||||||||||||||
| The Royce Funds 2013 Semiannual Report to Shareholders | 115 |
| Shares issued for | �� | |||||||||||||||||||||||||||||||||||||||
| reinvestment of | Net increase (decrease) from | |||||||||||||||||||||||||||||||||||||||
| Shares sold | distributions | Shares redeemed | capital share transactions | |||||||||||||||||||||||||||||||||||||
| Period ended | Period ended | Period ended | Period ended | |||||||||||||||||||||||||||||||||||||
| 6/30/13 | Period ended | 6/30/13 | Period ended | 6/30/13 | Period ended | 6/30/13 | Period ended | |||||||||||||||||||||||||||||||||
| (unaudited) | 12/31/12 | (unaudited) | 12/31/12 | (unaudited) | 12/31/12 | (unaudited) | 12/31/12 | |||||||||||||||||||||||||||||||||
| Royce Special Equity Fund | ||||||||||||||||||||||||||||||||||||||||
Investment Class | $ | 269,945,105 | $ | 577,591,163 | $ | – | $ | 130,040,727 | $ | (258,762,790 | ) | $ | (462,146,869 | ) | $ | 11,182,315 | $ | 245,485,021 | ||||||||||||||||||||||
Service Class | 46,070,822 | 95,889,522 | – | 15,496,840 | (31,932,683 | ) | (92,178,056 | ) | 14,138,139 | 19,208,306 | ||||||||||||||||||||||||||||||
Consultant Class | 2,960,596 | 8,002,331 | – | 3,566,493 | (4,013,044 | ) | (7,578,889 | ) | (1,052,448 | ) | 3,989,935 | |||||||||||||||||||||||||||||
Institutional Class | 73,578,479 | 142,834,981 | – | 38,652,965 | (54,872,550 | ) | (127,183,824 | ) | 18,705,929 | 54,304,122 | ||||||||||||||||||||||||||||||
| Royce Value Fund | ||||||||||||||||||||||||||||||||||||||||
Investment Class | 21,244,021 | 70,246,479 | – | 10,320,986 | (62,049,582 | ) | (101,442,408 | ) | (40,805,561 | ) | (20,874,943 | ) | ||||||||||||||||||||||||||||
Service Class | 34,385,811 | 109,344,849 | – | 44,267,749 | (226,978,087 | ) | (442,526,639 | ) | (192,592,276 | ) | (288,914,041 | ) | ||||||||||||||||||||||||||||
Consultant Class | 1,274,707 | 3,482,363 | – | 1,631,878 | (7,864,607 | ) | (8,919,646 | ) | (6,589,900 | ) | (3,805,405 | ) | ||||||||||||||||||||||||||||
Institutional Class | 17,917,204 | 45,645,269 | – | 11,504,828 | (29,514,863 | ) | (52,243,010 | ) | (11,597,659 | ) | 4,907,087 | |||||||||||||||||||||||||||||
R Class | 3,601,785 | 12,801,375 | – | 1,909,362 | (6,936,619 | ) | (12,227,421 | ) | (3,334,834 | ) | 2,483,316 | |||||||||||||||||||||||||||||
K Class | 3,225,939 | 9,830,058 | – | 1,247,136 | (5,009,571 | ) | (7,209,737 | ) | (1,783,632 | ) | 3,867,457 | |||||||||||||||||||||||||||||
| Royce Value Plus Fund | ||||||||||||||||||||||||||||||||||||||||
Investment Class | 23,475,521 | 69,004,335 | – | – | (46,354,294 | ) | (182,746,159 | ) | (22,878,773 | ) | (113,741,824 | ) | ||||||||||||||||||||||||||||
Service Class | 41,812,763 | 123,835,229 | – | – | (181,041,394 | ) | (761,108,483 | ) | (139,228,631 | ) | (637,273,254 | ) | ||||||||||||||||||||||||||||
Consultant Class | 518,339 | 1,261,129 | – | – | (2,157,587 | ) | (4,591,604 | ) | (1,639,248 | ) | (3,330,475 | ) | ||||||||||||||||||||||||||||
Institutional Class | 13,268,986 | 50,704,394 | – | – | (61,786,909 | ) | (132,426,143 | ) | (48,517,923 | ) | (81,721,749 | ) | ||||||||||||||||||||||||||||
R Class | 849,853 | 737,783 | – | – | (654,490 | ) | (752,945 | ) | 195,363 | (15,162 | ) | |||||||||||||||||||||||||||||
K Class | 379,929 | 159,051 | – | – | (31,996 | ) | (243,989 | ) | 347,933 | (84,938 | ) | |||||||||||||||||||||||||||||
| Royce 100 Fund | ||||||||||||||||||||||||||||||||||||||||
Investment Class | 13,611,611 | 28,275,102 | – | 5,900,826 | (33,851,693 | ) | (29,745,452 | ) | (20,240,082 | ) | 4,430,476 | |||||||||||||||||||||||||||||
Service Class | 17,695,891 | 31,574,384 | – | 19,484,774 | (47,620,500 | ) | (149,472,878 | ) | (29,924,609 | ) | (98,413,720 | ) | ||||||||||||||||||||||||||||
R Class | 487,148 | 2,369,785 | – | 157,770 | (834,076 | ) | (3,565,275 | ) | (346,928 | ) | (1,037,720 | ) | ||||||||||||||||||||||||||||
K Class | 694,233 | 1,218,557 | – | 248,406 | (784,802 | ) | (2,546,125 | ) | (90,569 | ) | (1,079,162 | ) | ||||||||||||||||||||||||||||
| Royce Dividend Value Fund | ||||||||||||||||||||||||||||||||||||||||
Investment Class | 60,408,490 | 73,458,760 | 974,216 | 2,119,445 | (19,447,146 | ) | (57,360,557 | ) | 41,935,560 | 18,217,648 | ||||||||||||||||||||||||||||||
Service Class | 70,462,601 | 84,975,117 | 1,367,402 | 3,193,010 | (24,691,847 | ) | (69,074,032 | ) | 47,138,156 | 19,094,095 | ||||||||||||||||||||||||||||||
Institutional Class | 1,116,445 | 22,056,597 | 180,054 | 305,449 | (844,513 | ) | (430,847 | ) | 451,986 | 21,931,199 | ||||||||||||||||||||||||||||||
| Royce Global Value Fund | ||||||||||||||||||||||||||||||||||||||||
Investment Class | 32,272,458 | 91,568,654 | – | 2,219,916 | (28,507,180 | ) | (70,515,862 | ) | 3,765,278 | 23,272,708 | ||||||||||||||||||||||||||||||
Service Class | 6,727,550 | 34,284,203 | – | 652,820 | (36,780,883 | ) | (69,882,078 | ) | (30,053,333 | ) | (34,945,055 | ) | ||||||||||||||||||||||||||||
Consultant Class | 3,793,627 | 7,109,366 | – | 28,010 | (2,073,789 | ) | (4,118,283 | ) | 1,719,838 | 3,019,093 | ||||||||||||||||||||||||||||||
R Class | 48,060 | 75,891 | – | 950 | (32,126 | ) | – | 15,934 | 76,841 | |||||||||||||||||||||||||||||||
K Class | – | 42,371 | – | 565 | – | – | – | 42,936 | ||||||||||||||||||||||||||||||||
| Royce International Smaller-Companies Fund | ||||||||||||||||||||||||||||||||||||||||
Service Class | 10,519,923 | 10,558,425 | – | 336,519 | (4,883,389 | ) | (8,258,463 | ) | 5,636,534 | 2,636,481 | ||||||||||||||||||||||||||||||
Capital Share Transactions (in shares):
| Shares issued for | Net increase (decrease) in | |||||||||||||||||||||||||||||||||||||||
| Shares sold | reinvestment of distributions | Shares redeemed | shares outstanding | |||||||||||||||||||||||||||||||||||||
| Period ended | Period ended | Period ended | Period ended | |||||||||||||||||||||||||||||||||||||
| 6/30/13 | Period ended | 6/30/13 | Period ended | 6/30/13 | Period ended | 6/30/13 | Period ended | |||||||||||||||||||||||||||||||||
| (unaudited) | 12/31/12 | (unaudited) | 12/31/12 | (unaudited) | 12/31/12 | (unaudited) | 12/31/12 | |||||||||||||||||||||||||||||||||
| Royce Pennsylvania Mutual Fund | ||||||||||||||||||||||||||||||||||||||||
Investment Class | 27,776,568 | 57,315,522 | – | 23,088,722 | (41,159,068 | ) | (108,721,143 | ) | (13,382,500 | ) | (28,316,899 | ) | ||||||||||||||||||||||||||||
Service Class | 7,845,660 | 14,331,989 | – | 2,555,226 | (5,966,640 | ) | (13,503,390 | ) | 1,879,020 | 3,383,825 | ||||||||||||||||||||||||||||||
Consultant Class | 1,712,199 | 3,295,095 | – | 3,937,320 | (5,619,542 | ) | (12,234,852 | ) | (3,907,343 | ) | (5,002,437 | ) | ||||||||||||||||||||||||||||
Institutional Class | 6,853,220 | 22,317,425 | – | 2,922,651 | (2,472,339 | ) | (5,277,914 | ) | 4,380,881 | 19,962,162 | ||||||||||||||||||||||||||||||
R Class | 564,647 | 1,421,548 | – | 179,128 | (372,352 | ) | (809,427 | ) | 192,295 | 791,249 | ||||||||||||||||||||||||||||||
K Class | 129,616 | 428,087 | – | 49,436 | (118,597 | ) | (217,025 | ) | 11,019 | 260,498 | ||||||||||||||||||||||||||||||
| Royce Micro-Cap Fund | ||||||||||||||||||||||||||||||||||||||||
Investment Class | 3,476,496 | 7,184,519 | – | 2,883,568 | (10,637,906 | ) | (22,127,390 | ) | (7,161,410 | ) | (12,059,303 | ) | ||||||||||||||||||||||||||||
Service Class | 703,213 | 5,290,434 | – | 522,645 | (3,113,777 | ) | (6,819,080 | ) | (2,410,564 | ) | (1,006,001 | ) | ||||||||||||||||||||||||||||
Consultant Class | 190,757 | 390,707 | – | 607,577 | (1,337,163 | ) | (2,035,352 | ) | (1,146,406 | ) | (1,037,068 | ) | ||||||||||||||||||||||||||||
| 116 | The Royce Funds 2013 Semiannual Report to Shareholders |
Capital Share Transactions (in shares) (continued):
| Shares issued for | Net increase (decrease) in | |||||||||||||||||||||||||||||||||||||||
| Shares sold | reinvestment of distributions | Shares redeemed | shares outstanding | |||||||||||||||||||||||||||||||||||||
| Period ended | Period ended | Period ended | Period ended | |||||||||||||||||||||||||||||||||||||
| 6/30/13 | Period ended | 6/30/13 | Period ended | 6/30/13 | Period ended | 6/30/13 | Period ended | |||||||||||||||||||||||||||||||||
| (unaudited) | 12/31/12 | (unaudited) | 12/31/12 | (unaudited) | 12/31/12 | (unaudited) | 12/31/12 | |||||||||||||||||||||||||||||||||
| Royce Premier Fund | ||||||||||||||||||||||||||||||||||||||||
Investment Class | 17,373,077 | 38,100,247 | – | 16,634,759 | (31,118,028 | ) | (58,228,633 | ) | (13,744,951 | ) | (3,493,627 | ) | ||||||||||||||||||||||||||||
Service Class | 2,570,787 | 7,053,893 | – | 2,043,052 | (9,071,297 | ) | (13,922,293 | ) | (6,500,510 | ) | (4,825,348 | ) | ||||||||||||||||||||||||||||
Consultant Class | 119,324 | 274,128 | – | 233,450 | (370,834 | ) | (560,084 | ) | (251,510 | ) | (52,506 | ) | ||||||||||||||||||||||||||||
Institutional Class | 4,221,829 | 8,171,315 | – | 3,090,868 | (7,572,493 | ) | (9,977,508 | ) | (3,350,664 | ) | 1,284,675 | |||||||||||||||||||||||||||||
W Class | 1,903,415 | 5,771,151 | – | 1,552,912 | (4,424,157 | ) | (9,121,752 | ) | (2,520,742 | ) | (1,797,689 | ) | ||||||||||||||||||||||||||||
R Class | 259,013 | 580,289 | – | 102,157 | (183,342 | ) | (458,782 | ) | 75,671 | 223,664 | ||||||||||||||||||||||||||||||
K Class | 132,895 | 318,350 | – | 181,684 | (380,886 | ) | (326,918 | ) | (247,991 | ) | 173,116 | |||||||||||||||||||||||||||||
| Royce Low-Priced Stock Fund | ||||||||||||||||||||||||||||||||||||||||
Investment Class | 1,334,662 | 8,187,882 | – | 1,478,272 | (10,003,889 | ) | (10,464,863 | ) | (8,669,227 | ) | (798,709 | ) | ||||||||||||||||||||||||||||
Service Class | 4,788,611 | 16,082,356 | – | 10,083,981 | (45,130,414 | ) | (70,093,267 | ) | (40,341,803 | ) | (43,926,930 | ) | ||||||||||||||||||||||||||||
Institutional Class | 2,979,038 | 14,658,805 | – | 5,682,348 | (28,868,417 | ) | (19,337,316 | ) | (25,889,379 | ) | 1,003,837 | |||||||||||||||||||||||||||||
R Class | 34,330 | 104,095 | – | 31,455 | (167,375 | ) | (229,127 | ) | (133,045 | ) | (93,577 | ) | ||||||||||||||||||||||||||||
K Class | 68,076 | 207,241 | – | 102,021 | (169,712 | ) | (525,629 | ) | (101,636 | ) | (216,367 | ) | ||||||||||||||||||||||||||||
| Royce Total Return Fund | ||||||||||||||||||||||||||||||||||||||||
Investment Class | 18,915,732 | 31,093,660 | 918,179 | 12,992,846 | (26,700,059 | ) | (65,700,802 | ) | (6,866,148 | ) | (21,614,296 | ) | ||||||||||||||||||||||||||||
Service Class | 13,639,016 | 5,140,212 | 105,090 | 1,104,895 | (3,518,748 | ) | (9,205,687 | ) | 10,225,358 | (2,960,580 | ) | |||||||||||||||||||||||||||||
Consultant Class | 952,038 | 1,485,792 | – | 1,051,103 | (1,777,215 | ) | (4,288,883 | ) | (825,177 | ) | (1,751,988 | ) | ||||||||||||||||||||||||||||
Institutional Class | 9,620,013 | 6,887,862 | 174,214 | 1,770,103 | (5,431,057 | ) | (9,394,490 | ) | 4,363,170 | (736,525 | ) | |||||||||||||||||||||||||||||
W Class | 2,568,025 | 4,191,083 | 62,122 | 768,514 | (1,311,923 | ) | (2,800,377 | ) | 1,318,224 | 2,159,220 | ||||||||||||||||||||||||||||||
R Class | 826,446 | 1,471,260 | 7,413 | 173,782 | (513,489 | ) | (827,928 | ) | 320,370 | 817,114 | ||||||||||||||||||||||||||||||
K Class | 5,492,273 | 9,249,102 | 46,205 | 1,117,868 | (4,610,845 | ) | (12,806,385 | ) | 927,633 | (2,439,415 | ) | |||||||||||||||||||||||||||||
| Royce Heritage Fund | ||||||||||||||||||||||||||||||||||||||||
Investment Class | 977,768 | 1,804,807 | – | 88,973 | (165,781 | ) | (718,974 | ) | 811,987 | 1,174,806 | ||||||||||||||||||||||||||||||
Service Class | 524,293 | 1,676,233 | – | 400,670 | (1,421,856 | ) | (4,845,156 | ) | (897,563 | ) | (2,768,253 | ) | ||||||||||||||||||||||||||||
Consultant Class | 43,931 | 151,913 | – | 37,493 | (90,261 | ) | (299,964 | ) | (46,330 | ) | (110,558 | ) | ||||||||||||||||||||||||||||
R Class | 127,663 | 189,339 | – | 15,043 | (35,760 | ) | (173,028 | ) | 91,903 | 31,354 | ||||||||||||||||||||||||||||||
K Class | 58,490 | 440,847 | – | 25,725 | (104,609 | ) | (601,164 | ) | (46,119 | ) | (134,592 | ) | ||||||||||||||||||||||||||||
| Royce Opportunity Fund | ||||||||||||||||||||||||||||||||||||||||
Investment Class | 7,236,378 | 11,028,382 | – | 4,137,014 | (7,450,552 | ) | (23,238,518 | ) | (214,174 | ) | (8,073,122 | ) | ||||||||||||||||||||||||||||
Service Class | 6,056,561 | 6,304,466 | – | 857,445 | (1,803,266 | ) | (5,418,150 | ) | 4,253,295 | 1,743,761 | ||||||||||||||||||||||||||||||
Consultant Class | 154,305 | 156,945 | – | 63,752 | (103,049 | ) | (366,220 | ) | 51,256 | (145,523 | ) | |||||||||||||||||||||||||||||
Institutional Class | 7,204,163 | 13,339,942 | – | 2,950,759 | (4,171,130 | ) | (14,367,297 | ) | 3,033,033 | 1,923,404 | ||||||||||||||||||||||||||||||
R Class | 492,710 | 368,584 | – | 34,204 | (72,937 | ) | (134,921 | ) | 419,773 | 267,867 | ||||||||||||||||||||||||||||||
K Class | 233,835 | 255,383 | – | 49,285 | (103,208 | ) | (174,304 | ) | 130,627 | 130,364 | ||||||||||||||||||||||||||||||
| Royce Special Equity Fund | ||||||||||||||||||||||||||||||||||||||||
Investment Class | 11,935,134 | 27,211,249 | – | 6,281,951 | (11,366,096 | ) | (21,715,568 | ) | 569,038 | 11,777,632 | ||||||||||||||||||||||||||||||
Service Class | 2,044,369 | 4,525,611 | – | 749,726 | (1,401,856 | ) | (4,387,157 | ) | 642,513 | 888,180 | ||||||||||||||||||||||||||||||
Consultant Class | 136,925 | 393,687 | – | 180,399 | (185,302 | ) | (375,603 | ) | (48,377 | ) | 198,483 | |||||||||||||||||||||||||||||
Institutional Class | 3,276,512 | 6,717,922 | – | 1,874,538 | (2,399,509 | ) | (5,963,143 | ) | 877,003 | 2,629,317 | ||||||||||||||||||||||||||||||
| Royce Value Fund | ||||||||||||||||||||||||||||||||||||||||
Investment Class | 1,786,115 | 6,106,020 | – | 928,146 | (5,280,350 | ) | (8,777,389 | ) | (3,494,235 | ) | (1,743,223 | ) | ||||||||||||||||||||||||||||
Service Class | 2,917,237 | 9,480,588 | – | 3,991,686 | (19,169,525 | ) | (39,259,385 | ) | (16,252,288 | ) | (25,787,111 | ) | ||||||||||||||||||||||||||||
Consultant Class | 114,047 | 315,057 | – | 154,388 | (697,916 | ) | (822,780 | ) | (583,869 | ) | (353,335 | ) | ||||||||||||||||||||||||||||
Institutional Class | 1,501,901 | 3,985,141 | – | 1,034,607 | (2,484,090 | ) | (4,574,089 | ) | (982,189 | ) | 445,659 | |||||||||||||||||||||||||||||
R Class | 309,704 | 1,126,145 | – | 175,010 | (599,708 | ) | (1,092,910 | ) | (290,004 | ) | 208,245 | |||||||||||||||||||||||||||||
K Class | 341,290 | 1,047,488 | – | 139,501 | (527,368 | ) | (768,482 | ) | (186,078 | ) | 418,507 | |||||||||||||||||||||||||||||
| Royce Value Plus Fund | ||||||||||||||||||||||||||||||||||||||||
Investment Class | 1,570,828 | 5,344,485 | – | – | (3,113,463 | ) | (13,687,043 | ) | (1,542,635 | ) | (8,342,558 | ) | ||||||||||||||||||||||||||||
Service Class | 2,814,021 | 9,451,131 | – | – | (12,185,701 | ) | (57,686,001 | ) | (9,371,680 | ) | (48,234,870 | ) | ||||||||||||||||||||||||||||
Consultant Class | 36,477 | 97,660 | – | – | (152,278 | ) | (361,007 | ) | (115,801 | ) | (263,347 | ) | ||||||||||||||||||||||||||||
Institutional Class | 888,080 | 3,813,004 | – | – | (4,132,463 | ) | (9,966,075 | ) | (3,244,383 | ) | (6,153,071 | ) | ||||||||||||||||||||||||||||
R Class | 57,615 | 56,661 | – | – | (44,831 | ) | (57,916 | ) | 12,784 | (1,255 | ) | |||||||||||||||||||||||||||||
K Class | 33,330 | 16,250 | – | – | (2,971 | ) | (25,241 | ) | 30,359 | (8,991 | ) | |||||||||||||||||||||||||||||
| The Royce Funds 2013 Semiannual Report to Shareholders | 117 |
Capital Share Transactions (in shares) (continued):
| Shares issued for | Net increase (decrease) in | |||||||||||||||||||||||||||||||||||||||
| Shares sold | reinvestment of distributions | Shares redeemed | shares outstanding | |||||||||||||||||||||||||||||||||||||
| Period ended | Period ended | Period ended | Period ended | |||||||||||||||||||||||||||||||||||||
| 6/30/13 | Period ended | 6/30/13 | Period ended | 6/30/13 | Period ended | 6/30/13 | Period ended | |||||||||||||||||||||||||||||||||
| (unaudited) | 12/31/12 | (unaudited) | 12/31/12 | (unaudited) | 12/31/12 | (unaudited) | 12/31/12 | |||||||||||||||||||||||||||||||||
| Royce 100 Fund | ||||||||||||||||||||||||||||||||||||||||
Investment Class | 1,412,065 | 3,117,457 | – | 686,458 | (3,501,967 | ) | (3,286,242 | ) | (2,089,902 | ) | 517,673 | |||||||||||||||||||||||||||||
Service Class | 1,851,257 | 3,400,812 | – | 2,288,621 | (4,973,586 | ) | (16,496,087 | ) | (3,122,329 | ) | (10,806,654 | ) | ||||||||||||||||||||||||||||
R Class | 41,489 | 212,108 | – | 15,083 | (71,278 | ) | (323,459 | ) | (29,789 | ) | (96,268 | ) | ||||||||||||||||||||||||||||
K Class | 58,559 | 108,470 | – | 23,523 | (65,809 | ) | (228,464 | ) | (7,250 | ) | (96,471 | ) | ||||||||||||||||||||||||||||
| Royce Dividend Value Fund | ||||||||||||||||||||||||||||||||||||||||
Investment Class | 7,631,038 | 10,955,363 | 121,404 | 306,194 | (2,457,175 | ) | (8,396,697 | ) | 5,295,267 | 2,864,860 | ||||||||||||||||||||||||||||||
Service Class | 8,856,032 | 12,321,600 | 169,195 | 458,132 | (3,092,428 | ) | (10,025,848 | ) | 5,932,799 | 2,753,884 | ||||||||||||||||||||||||||||||
Institutional Class | 142,193 | 3,238,890 | 22,434 | 43,093 | (105,895 | ) | (61,381 | ) | 58,732 | 3,220,602 | ||||||||||||||||||||||||||||||
| Royce Global Value Fund | ||||||||||||||||||||||||||||||||||||||||
Investment Class | 2,494,463 | 7,291,263 | – | 175,061 | (2,202,243 | ) | (5,672,627 | ) | 292,220 | 1,793,697 | ||||||||||||||||||||||||||||||
Service Class | 512,301 | 2,693,567 | – | 51,403 | (2,811,100 | ) | (5,587,200 | ) | (2,298,799 | ) | (2,842,230 | ) | ||||||||||||||||||||||||||||
Consultant Class | 292,042 | 564,189 | – | 2,221 | (160,552 | ) | (338,661 | ) | 131,490 | 227,749 | ||||||||||||||||||||||||||||||
R Class | 4,926 | 8,118 | – | 100 | (3,428 | ) | – | 1,498 | 8,218 | |||||||||||||||||||||||||||||||
K Class | – | 4,237 | – | 59 | – | – | – | 4,296 | ||||||||||||||||||||||||||||||||
| Royce International Smaller-Companies Fund | ||||||||||||||||||||||||||||||||||||||||
Service Class | 906,726 | 1,000,016 | – | 30,648 | (420,500 | ) | (791,871 | ) | 486,226 | 238,793 | ||||||||||||||||||||||||||||||
| Annual contractual advisory fee as a | Committed net annual | Six months ended | |||||||||||||||||||||||||||||||||||||||
| operating expense ratio cap | June 30, 2013 | ||||||||||||||||||||||||||||||||||||||||
| percentage of | Investment | Service | Consultant | Institutional | Net advisory | Advisory | |||||||||||||||||||||||||||||||||||
| average net assets1 | Class3 | Class3 | Class3 | Class3 | W Class3 | R Class3 | K Class3 | fees | fees waived | ||||||||||||||||||||||||||||||||
| Royce Pennsylvania Mutual Fund | 0.75 | %2 | N/A | N/A | N/A | N/A | N/A | N/A | N/A | $ | 23,707,790 | $ | – | ||||||||||||||||||||||||||||
| Royce Micro-Cap Fund | 1.30 | % | N/A | 1.66% | N/A | N/A | N/A | N/A | N/A | 5,901,112 | – | ||||||||||||||||||||||||||||||
| Royce Premier Fund | 0.94 | % | N/A | N/A | N/A | N/A | N/A | N/A | N/A | 31,897,784 | – | ||||||||||||||||||||||||||||||
| Royce Low-Priced Stock Fund | 1.14 | % | 1.24% | 1.49% | N/A | N/A | N/A | 1.84% | 1.59% | 14,696,797 | – | ||||||||||||||||||||||||||||||
| Royce Total Return Fund | 0.96 | % | N/A | N/A | N/A | N/A | N/A | N/A | N/A | 23,691,321 | – | ||||||||||||||||||||||||||||||
| Royce Heritage Fund | 1.00 | % | N/A | N/A | N/A | N/A | N/A | 1.84% | 1.59% | 1,437,081 | – | ||||||||||||||||||||||||||||||
| Royce Opportunity Fund | 1.00 | % | N/A | N/A | N/A | N/A | N/A | N/A | N/A | 10,473,808 | – | ||||||||||||||||||||||||||||||
| Royce Special Equity Fund | 0.98 | % | N/A | 1.39% | N/A | N/A | N/A | N/A | N/A | 15,630,269 | – | ||||||||||||||||||||||||||||||
| Royce Value Fund | 1.00 | % | N/A | N/A | N/A | N/A | N/A | N/A | N/A | 6,276,001 | – | ||||||||||||||||||||||||||||||
| Royce Value Plus Fund | 1.00 | % | N/A | N/A | N/A | N/A | N/A | 1.84% | 1.59% | 7,093,206 | – | ||||||||||||||||||||||||||||||
| Royce 100 Fund | 1.00 | % | N/A | N/A | N/A | N/A | N/A | 1.84% | 1.59% | 1,498,338 | – | ||||||||||||||||||||||||||||||
| Royce Dividend Value Fund | 1.00 | % | N/A | N/A | N/A | 1.04% | N/A | N/A | N/A | 2,377,787 | – | ||||||||||||||||||||||||||||||
| Royce Global Value Fund | 1.25 | % | N/A | 1.69% | 2.44% | N/A | N/A | 1.99% | 1.74% | 1,800,299 | – | ||||||||||||||||||||||||||||||
| Royce International Smaller- | |||||||||||||||||||||||||||||||||||||||||
Companies Fund | 1.25 | % | N/A | 1.69% | N/A | N/A | N/A | N/A | N/A | 128,972 | 46,449 | ||||||||||||||||||||||||||||||
| 118 | The Royce Funds 2013 Semiannual Report to Shareholders |
Distributor: Royce Fund Services, Inc. (“RFS”), the distributor of the Trust’s shares, is a wholly owned subsidiary of Royce. RFS is entitled to receive distribution fees that are computed daily and payable monthly.
| Six months ended June 30, 2013 | ||||||||||||||
| Annual contractual distribution fee as | Net distribution | Distribution fees | ||||||||||||
| a percentage of average net assets | fees | waived | ||||||||||||
| Royce Pennsylvania Mutual Fund – Service Class | 0.25 | % | $ | 652,416 | $ | – | ||||||||
| Royce Pennsylvania Mutual Fund – Consultant Class | 1.00 | % | 3,413,214 | – | ||||||||||
| Royce Pennsylvania Mutual Fund – R Class | 0.50 | % | 91,909 | – | ||||||||||
| Royce Pennsylvania Mutual Fund – K Class | 0.25 | % | 11,883 | – | ||||||||||
| Royce Micro-Cap Fund – Service Class | 0.25 | % | 115,918 | – | ||||||||||
| Royce Micro-Cap Fund – Consultant Class | 1.00 | % | 569,757 | – | ||||||||||
| Royce Premier Fund – Service Class | 0.25 | % | 657,464 | – | ||||||||||
| Royce Premier Fund – Consultant Class | 1.00 | % | 304,842 | – | ||||||||||
| Royce Premier Fund – R Class | 0.50 | % | 77,258 | – | ||||||||||
| Royce Premier Fund – K Class | 0.25 | % | 11,135 | – | ||||||||||
| Royce Low-Priced Stock Fund – Service Class | 0.25 | % | 1,840,746 | 76,698 | ||||||||||
| Royce Low-Priced Stock Fund – R Class | 0.50 | % | 12,679 | – | ||||||||||
| Royce Low-Priced Stock Fund – K Class | 0.25 | % | 7,363 | – | ||||||||||
| Royce Total Return Fund – Service Class | 0.25 | % | 528,384 | – | ||||||||||
| Royce Total Return Fund – Consultant Class | 1.00 | % | 1,765,889 | – | ||||||||||
| Royce Total Return Fund – R Class | 0.50 | % | 140,831 | – | ||||||||||
| Royce Total Return Fund – K Class | 0.25 | % | 216,969 | – | ||||||||||
| Royce Heritage Fund – Service Class | 0.25 | % | 230,740 | 31,465 | ||||||||||
| Royce Heritage Fund – Consultant Class | 1.00 | % | 73,086 | – | ||||||||||
| Royce Heritage Fund – R Class | 0.50 | % | 15,027 | – | ||||||||||
| Royce Heritage Fund – K Class | 0.25 | % | 9,326 | – | ||||||||||
| Royce Opportunity Fund – Service Class | 0.25 | % | 309,445 | – | ||||||||||
| Royce Opportunity Fund – Consultant Class | 1.00 | % | 66,468 | – | ||||||||||
| Royce Opportunity Fund – R Class | 0.50 | % | 24,127 | – | ||||||||||
| Royce Opportunity Fund – K Class | 0.25 | % | 13,316 | – | ||||||||||
| Royce Special Equity Fund – Service Class | 0.25 | % | 348,921 | – | ||||||||||
| Royce Special Equity Fund – Consultant Class | 1.00 | % | 304,831 | – | ||||||||||
| Royce Value Fund – Service Class | 0.25 | % | 960,407 | – | ||||||||||
| Royce Value Fund – Consultant Class | 1.00 | % | 157,105 | – | ||||||||||
| Royce Value Fund – R Class | 0.50 | % | 92,083 | – | ||||||||||
| Royce Value Fund – K Class | 0.25 | % | 22,920 | – | ||||||||||
| Royce Value Plus Fund – Service Class | 0.25 | % | 1,103,719 | 95,975 | ||||||||||
| Royce Value Plus Fund – Consultant Class | 1.00 | % | 100,237 | – | ||||||||||
| Royce Value Plus Fund – R Class | 0.50 | % | 3,150 | – | ||||||||||
| Royce Value Plus Fund – K Class | 0.25 | % | 690 | – | ||||||||||
| Royce 100 Fund – Service Class | 0.25 | % | 258,106 | 22,444 | ||||||||||
| Royce 100 Fund – R Class | 0.50 | % | 6,375 | – | ||||||||||
| Royce 100 Fund – K Class | 0.25 | % | 4,799 | – | ||||||||||
| Royce Dividend Value Fund – Service Class | 0.25 | % | 358,719 | 14,947 | ||||||||||
| Royce Global Value Fund – Service Class | 0.25 | % | 103,617 | – | ||||||||||
| Royce Global Value Fund – Consultant Class | 1.00 | % | 121,643 | – | ||||||||||
| Royce Global Value Fund – R Class | 0.50 | % | 247 | – | ||||||||||
| Royce Global Value Fund – K Class | 0.25 | % | 52 | – | ||||||||||
| Royce International Smaller-Companies Fund – Service Class | 0.25 | % | 35,084 | – | ||||||||||
| Purchases | Sales | Purchases | Sales | |||||||||||
| Royce Pennsylvania Mutual Fund | $ | 774,222,604 | $ | 863,480,974 | Royce Special Equity Fund | $ | 423,203,137 | $ | 396,368,973 | |||||
| Royce Micro-Cap Fund | 97,245,552 | 314,219,219 | Royce Value Fund | 356,561,052 | 641,949,670 | |||||||||
| Royce Premier Fund | 475,819,550 | 915,790,816 | Royce Value Plus Fund | 381,532,795 | 640,491,743 | |||||||||
| Royce Low-Priced Stock Fund | 296,800,592 | 1,336,562,142 | Royce 100 Fund | 42,526,704 | 92,477,581 | |||||||||
| Royce Total Return Fund | 464,468,102 | 693,981,926 | Royce Dividend Value Fund | 134,550,582 | 47,710,116 | |||||||||
| Royce Heritage Fund | 85,003,100 | 111,698,511 | Royce Global Value Fund | 66,016,688 | 84,001,918 | |||||||||
| Royce Opportunity Fund | 450,019,872 | 463,998,094 | Royce International Smaller- | |||||||||||
Companies Fund | 12,921,224 | 8,786,288 | ||||||||||||
| The Royce Funds 2013 Semiannual Report to Shareholders | 119 |
| Class Level | |||||||||||||||||||||||||||||||||||
| Transfer | Expenses | ||||||||||||||||||||||||||||||||||
| Net | Agent | Reimbursed by | |||||||||||||||||||||||||||||||||
| Distribution | Shareholder | Shareholder | Balance | Investment | |||||||||||||||||||||||||||||||
| Fees | Servicing | Reports | Registration | Credits | Total | Adviser | |||||||||||||||||||||||||||||
Royce Pennsylvania Mutual Fund – Investment Class | $ | – | $ | 2,504,689 | $ | 402,614 | $ | 31,602 | $ | (1,450 | ) | $ | 2,937,455 | $ | – | ||||||||||||||||||||
Royce Pennsylvania Mutual Fund – Service Class | 652,416 | 420,050 | 69,698 | 6,532 | (35 | ) | 1,148,661 | – | |||||||||||||||||||||||||||
Royce Pennsylvania Mutual Fund – Consultant Class | 3,413,214 | 331,862 | 98,251 | 7,149 | (415 | ) | 3,850,061 | – | |||||||||||||||||||||||||||
Royce Pennsylvania Mutual Fund – Institutional Class | – | 3,276 | 11,277 | 8,066 | (3 | ) | 22,616 | – | |||||||||||||||||||||||||||
Royce Pennsylvania Mutual Fund – R Class | 91,909 | 42,738 | 2,358 | 598 | (19 | ) | 137,584 | – | |||||||||||||||||||||||||||
Royce Pennsylvania Mutual Fund – K Class | 11,883 | 13,830 | 595 | 596 | (2 | ) | 26,902 | – | |||||||||||||||||||||||||||
| 4,169,422 | 3,316,445 | 584,793 | 54,543 | (1,924 | ) | ||||||||||||||||||||||||||||||
Royce Micro-Cap Fund – Investment Class | – | 494,673 | 166,483 | 15,619 | (309 | ) | 676,466 | – | |||||||||||||||||||||||||||
Royce Micro-Cap Fund – Service Class | 115,918 | 50,335 | 18,227 | 5,410 | (28 | ) | 189,862 | 50,192 | |||||||||||||||||||||||||||
Royce Micro-Cap Fund – Consultant Class | 569,757 | 55,834 | 16,635 | 5,751 | (85 | ) | 647,892 | – | |||||||||||||||||||||||||||
| 685,675 | 600,842 | 201,345 | 26,780 | (422 | ) | 50,192 | |||||||||||||||||||||||||||||
Royce Premier Fund – Investment Class | – | 2,143,280 | 577,260 | 33,634 | (1,112 | ) | 2,753,062 | – | |||||||||||||||||||||||||||
Royce Premier Fund – Service Class | 657,464 | 374,142 | 42,468 | 6,218 | (81 | ) | 1,080,211 | – | |||||||||||||||||||||||||||
Royce Premier Fund – Consultant Class | 304,842 | 31,117 | 7,817 | 5,365 | (36 | ) | 349,105 | – | |||||||||||||||||||||||||||
Royce Premier Fund – Institutional Class | – | 4,842 | 35,968 | 8,341 | (7 | ) | 49,144 | – | |||||||||||||||||||||||||||
Royce Premier Fund – W Class | – | 221,251 | 72,958 | 11,926 | (207 | ) | 305,928 | – | |||||||||||||||||||||||||||
Royce Premier Fund – R Class | 77,258 | 33,932 | 1,630 | 598 | (8 | ) | 113,410 | – | |||||||||||||||||||||||||||
Royce Premier Fund – K Class | 11,135 | 13,622 | 337 | 597 | (2 | ) | 25,689 | – | |||||||||||||||||||||||||||
| 1,050,699 | 2,822,186 | 738,438 | 66,679 | (1,453 | ) | ||||||||||||||||||||||||||||||
Royce Low-Priced Stock Fund – Investment Class | – | 134,914 | 17,703 | 14,377 | (15 | ) | 166,979 | 111,642 | |||||||||||||||||||||||||||
Royce Low-Priced Stock Fund – Service Class | 1,840,746 | 1,462,984 | 213,320 | 11,335 | (606 | ) | 3,527,779 | 1,184,312 | |||||||||||||||||||||||||||
Royce Low-Priced Stock Fund – Institutional Class | – | 4,061 | 130,764 | 8,163 | (4 | ) | 142,984 | – | |||||||||||||||||||||||||||
Royce Low-Priced Stock Fund – R Class | 12,679 | 9,505 | 781 | 596 | (6 | ) | 23,555 | 6,963 | |||||||||||||||||||||||||||
Royce Low-Priced Stock Fund – K Class | 7,363 | 10,337 | 611 | 597 | (2 | ) | 18,906 | 7,042 | |||||||||||||||||||||||||||
| 1,860,788 | 1,621,801 | 363,179 | 35,068 | (633 | ) | 1,309,959 | |||||||||||||||||||||||||||||
Royce Total Return Fund – Investment Class | – | 1,814,181 | 356,358 | 23,078 | (1,194 | ) | 2,192,423 | – | |||||||||||||||||||||||||||
Royce Total Return Fund – Service Class | 528,384 | 244,244 | 30,337 | 17,390 | (32 | ) | 820,323 | – | |||||||||||||||||||||||||||
Royce Total Return Fund – Consultant Class | 1,765,889 | 170,283 | 48,993 | 6,386 | (196 | ) | 1,991,355 | – | |||||||||||||||||||||||||||
Royce Total Return Fund – Institutional Class | – | 7,964 | 12,716 | 8,587 | (22 | ) | 29,245 | – | |||||||||||||||||||||||||||
Royce Total Return Fund – W Class | – | 91,932 | 29,678 | 10,317 | (5 | ) | 131,922 | – | |||||||||||||||||||||||||||
Royce Total Return Fund – R Class | 140,831 | 60,804 | 2,505 | 596 | (19 | ) | 204,717 | – | |||||||||||||||||||||||||||
Royce Total Return Fund – K Class | 216,969 | 200,670 | 1,695 | 603 | (6 | ) | 419,931 | – | |||||||||||||||||||||||||||
| 2,652,073 | 2,590,078 | 482,282 | 66,957 | (1,474 | ) | ||||||||||||||||||||||||||||||
Royce Heritage Fund – Investment Class | – | 12,670 | 1,731 | 6,012 | (5 | ) | 20,408 | – | |||||||||||||||||||||||||||
Royce Heritage Fund – Service Class | 230,740 | 111,768 | 31,881 | 9,819 | (200 | ) | 384,008 | – | |||||||||||||||||||||||||||
Royce Heritage Fund – Consultant Class | 73,086 | 11,248 | 3,610 | 4,790 | (19 | ) | 92,715 | – | |||||||||||||||||||||||||||
Royce Heritage Fund – R Class | 15,027 | 7,833 | 633 | 616 | (5 | ) | 24,104 | 642 | |||||||||||||||||||||||||||
Royce Heritage Fund – K Class | 9,326 | 11,271 | 729 | 616 | (2 | ) | 21,940 | 2,067 | |||||||||||||||||||||||||||
| 328,179 | 154,790 | 38,584 | 21,853 | (231 | ) | 2,709 | |||||||||||||||||||||||||||||
Royce Opportunity Fund – Investment Class | – | 586,185 | 85,574 | 12,484 | (444 | ) | 683,799 | – | |||||||||||||||||||||||||||
Royce Opportunity Fund – Service Class | 309,445 | 168,063 | 21,486 | 5,881 | (14 | ) | 504,861 | – | |||||||||||||||||||||||||||
Royce Opportunity Fund – Consultant Class | 66,468 | 9,963 | 2,177 | 4,884 | (11 | ) | 83,481 | – | |||||||||||||||||||||||||||
Royce Opportunity Fund – Institutional Class | – | 3,604 | 11,360 | 8,658 | (4 | ) | 23,618 | – | |||||||||||||||||||||||||||
Royce Opportunity Fund – R Class | 24,127 | 11,409 | 919 | 615 | (8 | ) | 37,062 | – | |||||||||||||||||||||||||||
Royce Opportunity Fund – K Class | 13,316 | 7,544 | 429 | 616 | (2 | ) | 21,903 | – | |||||||||||||||||||||||||||
| 413,356 | 786,768 | 121,945 | 33,138 | (483 | ) | ||||||||||||||||||||||||||||||
Royce Special Equity Fund – Investment Class | – | 1,031,413 | 220,720 | 36,707 | (867 | ) | 1,287,973 | – | |||||||||||||||||||||||||||
Royce Special Equity Fund – Service Class | 348,921 | 186,478 | 43,090 | 8,032 | (285 | ) | 586,236 | 51,772 | |||||||||||||||||||||||||||
Royce Special Equity Fund – Consultant Class | 304,831 | 31,792 | 7,827 | 5,482 | (41 | ) | 349,891 | – | |||||||||||||||||||||||||||
Royce Special Equity Fund – Institutional Class | – | 3,892 | 4,116 | 7,487 | (5 | ) | 15,490 | – | |||||||||||||||||||||||||||
| 653,752 | 1,253,575 | 275,753 | 57,708 | (1,198 | ) | 51,772 | |||||||||||||||||||||||||||||
| 120 | The Royce Funds 2013 Semiannual Report to Shareholders |
Class Specific Expenses (continued):
| Class Level | |||||||||||||||||||||||||||||||||||
| Transfer | Expenses | ||||||||||||||||||||||||||||||||||
| Net | Agent | Reimbursed by | |||||||||||||||||||||||||||||||||
| Distribution | Shareholder | Shareholder | Balance | Investment | |||||||||||||||||||||||||||||||
| Fees | Servicing | Reports | Registration | Credits | Total | Adviser | |||||||||||||||||||||||||||||
Royce Value Fund – Investment Class | $ | – | $ | 121,561 | $ | 43,649 | $ | 7,393 | $ | (282 | ) | $ | 172,321 | $ | – | ||||||||||||||||||||
Royce Value Fund – Service Class | 960,407 | 652,059 | 121,114 | 11,693 | (458 | ) | 1,744,815 | – | |||||||||||||||||||||||||||
Royce Value Fund – Consultant Class | 157,105 | 24,692 | 6,461 | 5,083 | (28 | ) | 193,313 | – | |||||||||||||||||||||||||||
Royce Value Fund – Institutional Class | – | 3,638 | 1,469 | 6,931 | (4 | ) | 12,034 | – | |||||||||||||||||||||||||||
Royce Value Fund – R Class | 92,083 | 46,059 | 1,817 | 599 | (13 | ) | 140,545 | – | |||||||||||||||||||||||||||
Royce Value Fund – K Class | 22,920 | 22,903 | 2,000 | 597 | (2 | ) | 48,418 | – | |||||||||||||||||||||||||||
| 1,232,515 | 870,912 | 176,510 | 32,296 | (787 | ) | ||||||||||||||||||||||||||||||
Royce Value Plus Fund – Investment Class | – | 277,157 | 60,647 | 7,195 | (43 | ) | 344,956 | – | |||||||||||||||||||||||||||
Royce Value Plus Fund – Service Class | 1,103,719 | 773,576 | 171,524 | 10,627 | (371 | ) | 2,059,075 | – | |||||||||||||||||||||||||||
Royce Value Plus Fund – Consultant Class | 100,237 | 19,924 | 4,598 | 4,860 | (14 | ) | 129,605 | – | |||||||||||||||||||||||||||
Royce Value Plus Fund – Institutional Class | – | 4,584 | 21,562 | 8,438 | (4 | ) | 34,580 | – | |||||||||||||||||||||||||||
Royce Value Plus Fund – R Class | 3,150 | 4,656 | 315 | 596 | (3 | ) | 8,714 | 3,664 | |||||||||||||||||||||||||||
Royce Value Plus Fund – K Class | 690 | 3,553 | 119 | 598 | (1 | ) | 4,959 | 3,446 | |||||||||||||||||||||||||||
| 1,207,796 | 1,083,450 | 258,765 | 32,314 | (436 | ) | 7,110 | |||||||||||||||||||||||||||||
Royce 100 Fund – Investment Class | – | 34,100 | 12,179 | 5,924 | (78 | ) | 52,125 | – | |||||||||||||||||||||||||||
Royce 100 Fund – Service Class | 258,106 | 149,020 | 61,131 | 10,025 | (170 | ) | 478,112 | – | |||||||||||||||||||||||||||
Royce 100 Fund – R Class | 6,375 | 12,248 | 3,492 | 696 | (41 | ) | 22,770 | 12,614 | |||||||||||||||||||||||||||
Royce 100 Fund – K Class | 4,799 | 6,941 | 385 | 617 | (2 | ) | 12,740 | 2,282 | |||||||||||||||||||||||||||
| 269,280 | 202,309 | 77,187 | 17,262 | (291 | ) | 14,896 | |||||||||||||||||||||||||||||
Royce Dividend Value Fund – Investment Class | – | 73,225 | 17,103 | 8,605 | (17 | ) | 98,916 | – | |||||||||||||||||||||||||||
Royce Dividend Value Fund – Service Class | 358,719 | 172,202 | 54,851 | 13,184 | (506 | ) | 598,450 | – | |||||||||||||||||||||||||||
Royce Dividend Value Fund – Institutional Class | – | 2,790 | 59 | 6,921 | – | 9,770 | 9,404 | ||||||||||||||||||||||||||||
| 358,719 | 248,217 | 72,013 | 28,710 | (523 | ) | 9,404 | |||||||||||||||||||||||||||||
Royce Global Value Fund – Investment Class | – | 75,801 | 20,637 | 10,920 | (11 | ) | 107,347 | – | |||||||||||||||||||||||||||
Royce Global Value Fund – Service Class | 103,617 | 80,043 | 20,830 | 8,242 | (103 | ) | 212,629 | 65,855 | |||||||||||||||||||||||||||
Royce Global Value Fund – Consultant Class | 121,643 | 11,953 | 2,996 | 5,905 | (20 | ) | 142,477 | 8,680 | |||||||||||||||||||||||||||
Royce Global Value Fund – R Class | 247 | 3,222 | 29 | 788 | – | 4,286 | 3,963 | ||||||||||||||||||||||||||||
Royce Global Value Fund – K Class | 52 | 3,170 | 26 | 788 | – | 4,036 | 3,956 | ||||||||||||||||||||||||||||
| 225,559 | 174,189 | 44,518 | 26,643 | (134 | ) | 82,454 | |||||||||||||||||||||||||||||
| Net Unrealized | ||||||||||||||||||||
| Appreciation | Gross Unrealized | |||||||||||||||||||
| Tax Basis Cost | (Depreciation) | Appreciation | Depreciation | |||||||||||||||||
| Royce Pennsylvania Mutual Fund | $ | 4,719,062,697 | $ | 1,752,206,513 | $ | 2,045,768,805 | $ | 293,562,292 | ||||||||||||
| Royce Micro-Cap Fund | 763,603,103 | 91,931,347 | 200,244,904 | 108,313,557 | ||||||||||||||||
| Royce Premier Fund | 4,560,940,634 | 2,188,649,252 | 2,527,095,923 | 338,446,671 | ||||||||||||||||
| Royce Low-Priced Stock Fund | 1,988,867,032 | 215,246,047 | 522,723,317 | 307,477,270 | ||||||||||||||||
| Royce Total Return Fund | 3,593,869,708 | 1,542,102,386 | 1,726,010,452 | 183,908,066 | ||||||||||||||||
| Royce Heritage Fund | 245,380,608 | 56,787,012 | 64,320,975 | 7,533,963 | ||||||||||||||||
| Royce Opportunity Fund | 2,035,222,685 | 336,122,381 | 500,424,471 | 164,302,090 | ||||||||||||||||
| Royce Special Equity Fund | 2,572,938,402 | 761,645,226 | 784,763,075 | 23,117,849 | ||||||||||||||||
| Royce Value Fund | 976,236,582 | 200,704,079 | 233,001,752 | 32,297,673 | ||||||||||||||||
| Royce Value Plus Fund | 1,157,770,224 | 276,698,120 | 335,222,567 | 58,524,447 | ||||||||||||||||
| Royce 100 Fund | 212,140,166 | 65,694,301 | 75,546,902 | 9,852,601 | ||||||||||||||||
| Royce Dividend Value Fund | 449,944,390 | 75,423,491 | 96,607,273 | 21,183,782 | ||||||||||||||||
| Royce Global Value Fund | 298,460,399 | (33,370,398 | ) | 24,667,143 | 58,037,541 | |||||||||||||||
| Royce International Smaller-Companies Fund | 32,901,673 | 412,168 | 2,807,807 | 2,395,639 | ||||||||||||||||
The primary difference between book and tax basis cost is the timing of the recognition of losses on securities sold.
| The Royce Funds 2013 Semiannual Report to Shareholders | 121 |
| Market | Realized | Market | ||||||||||||||||||||||||||||||||||||
| Shares | Value | Cost of | Cost of | Gain | Dividend | Shares | Value | |||||||||||||||||||||||||||||||
| Affiliated Company | 12/31/12 | 12/31/12 | Purchases | Sales | (Loss) | Income | 6/30/13 | 6/30/13 | ||||||||||||||||||||||||||||||
| Royce Pennsylvania Mutual Fund | ||||||||||||||||||||||||||||||||||||||
| America’s Car-Mart | 556,600 | $ | 22,553,432 | $ | – | $ | – | $ | – | $ | – | 556,600 | $ | 24,067,384 | ||||||||||||||||||||||||
| CRA International | 592,143 | 11,706,667 | – | – | – | – | 592,143 | 10,936,881 | ||||||||||||||||||||||||||||||
| DTS | 1,167,789 | 19,502,076 | 385,821 | 2,719,864 | (535,956 | ) | – | 1,068,267 | 21,984,935 | |||||||||||||||||||||||||||||
| Ethan Allen Interiors | 1,573,910 | 40,465,226 | – | 1,778,076 | (342,616 | ) | 141,652 | 1,523,910 | 43,888,608 | |||||||||||||||||||||||||||||
| Hi-Tech Pharmacal | 997,731 | 34,900,630 | 5,658,965 | 930,156 | (153,491 | ) | – | 1,128,832 | 37,477,223 | |||||||||||||||||||||||||||||
| Key Tronic | 7,329,668 | – | – | – | 682,347 | 7,062,291 | ||||||||||||||||||||||||||||||||
| Pervasive Software1 | 1,461,500 | 13,021,965 | – | 6,076,523 | 7,369,277 | – | ||||||||||||||||||||||||||||||||
| Preformed Line Products | 311,088 | 18,484,849 | – | – | – | 62,218 | 311,088 | 20,628,245 | ||||||||||||||||||||||||||||||
| Seabridge Gold | 446,200 | 8,018,214 | 22,409,094 | 1,423,740 | (395,098 | ) | – | 2,413,004 | 22,754,628 | |||||||||||||||||||||||||||||
| Shoe Carnival | 1,227,698 | 25,155,532 | – | – | – | 73,662 | 1,227,698 | 29,477,029 | ||||||||||||||||||||||||||||||
| Stanley Furniture | 912,235 | 4,105,058 | 361,594 | – | – | – | 1,002,235 | 4,008,940 | ||||||||||||||||||||||||||||||
| U.S. Physical Therapy | 656,893 | 18,090,833 | 1,515,528 | 688,574 | 222,781 | 139,381 | 685,048 | 18,934,727 | ||||||||||||||||||||||||||||||
| Weyco Group | 590,500 | 13,794,080 | – | – | – | 106,290 | 590,500 | 14,880,600 | ||||||||||||||||||||||||||||||
| Winnebago Industries | 1,504,450 | 25,771,229 | – | 306,056 | (109,536 | ) | – | 1,494,450 | 31,368,506 | |||||||||||||||||||||||||||||
| 255,569,791 | 6,055,361 | 523,203 | 287,469,997 | |||||||||||||||||||||||||||||||||||
| Royce Micro-Cap Fund | ||||||||||||||||||||||||||||||||||||||
| AXT | 1,808,161 | 5,080,932 | – | 563,782 | (364,982 | ) | – | 1,738,161 | 4,693,034 | |||||||||||||||||||||||||||||
| Graham Corporation1 | 601,249 | 11,724,355 | – | 3,858,984 | 2,014,786 | 29,614 | ||||||||||||||||||||||||||||||||
| Key Technology | 421,814 | 4,403,738 | – | 308,389 | (76,369 | ) | – | 403,814 | 5,786,655 | |||||||||||||||||||||||||||||
| Lincoln Educational Services | 1,520,827 | 8,501,423 | 195,692 | 546,992 | (188,792 | ) | 214,179 | 1,499,847 | 7,904,193 | |||||||||||||||||||||||||||||
| Novatel Wireless1 | 2,142,033 | 2,870,325 | – | 6,741,889 | (3,861,821 | ) | – | |||||||||||||||||||||||||||||||
| PDI1 | 982,694 | 7,468,475 | – | 3,456,618 | (1,723,469 | ) | – | |||||||||||||||||||||||||||||||
| Truett-Hurst Cl. A | 1,148,176 | – | – | – | 191,900 | 1,082,316 | ||||||||||||||||||||||||||||||||
| World Energy Solutions | 733,900 | �� | 3,192,465 | – | 777,756 | (491,456 | ) | – | 663,900 | 2,635,683 | ||||||||||||||||||||||||||||
| 43,241,713 | (4,692,103 | ) | 243,793 | 22,101,881 | ||||||||||||||||||||||||||||||||||
| Royce Premier Fund | ||||||||||||||||||||||||||||||||||||||
| ADTRAN1 | 3,245,434 | 63,415,780 | – | 6,114,815 | (943,169 | ) | 584,178 | |||||||||||||||||||||||||||||||
| Benchmark Electronics | 2,843,900 | 47,265,618 | – | – | – | – | 2,843,900 | 57,162,390 | ||||||||||||||||||||||||||||||
| Cabot Microelectronics | 2,086,191 | 74,080,642 | – | 1,745,550 | 39,426 | – | 2,036,191 | 67,214,665 | ||||||||||||||||||||||||||||||
| Cal-Maine Foods | 1,721,686 | 69,246,211 | – | – | – | 1,070,889 | 1,721,686 | 80,075,616 | ||||||||||||||||||||||||||||||
| Cirrus Logic | 71,964,214 | – | – | – | 3,751,779 | 65,130,883 | ||||||||||||||||||||||||||||||||
| Cognex Corporation | 3,052,717 | 112,401,040 | – | 15,832,618 | 4,074,113 | – | 2,552,717 | 115,433,863 | ||||||||||||||||||||||||||||||
| Fair Isaac | 1,832,600 | 77,024,178 | – | – | – | 73,304 | 1,832,600 | 83,988,058 | ||||||||||||||||||||||||||||||
| Fairchild Semiconductor International | 6,508,112 | 93,716,813 | 5,676,910 | 869,615 | (123,529 | ) | – | 6,883,112 | 94,986,946 | |||||||||||||||||||||||||||||
| Globe Specialty Metals | 3,632,763 | 49,950,491 | 13,901,621 | – | – | 519,702 | 4,682,472 | 50,898,471 | ||||||||||||||||||||||||||||||
| Lincoln Electric Holdings | 5,074,994 | 247,050,708 | – | 11,328,061 | 21,513,728 | 1,849,998 | 4,474,994 | 256,282,906 | ||||||||||||||||||||||||||||||
| MKS Instruments | 2,971,910 | 76,615,840 | – | – | – | 951,011 | 2,971,910 | 78,874,491 | ||||||||||||||||||||||||||||||
| Myriad Genetics | 5,114,765 | 139,377,346 | 31,854,198 | – | – | – | 6,284,665 | 168,868,949 | ||||||||||||||||||||||||||||||
| Nu Skin Enterprises Cl. A | 3,816,994 | 141,419,628 | – | 4,313,454 | 4,640,674 | 2,290,196 | 3,670,694 | 224,352,817 | ||||||||||||||||||||||||||||||
| Pan American Silver | 5,188,544 | 97,181,429 | 37,266,105 | – | – | 1,411,281 | 8,244,097 | 95,961,289 | ||||||||||||||||||||||||||||||
| Sanderson Farms | 1,880,191 | 89,403,082 | – | 12,980,062 | 5,270,275 | 629,337 | 1,606,791 | 106,723,058 | ||||||||||||||||||||||||||||||
| Schnitzer Steel Industries Cl. A | 2,108,038 | 63,936,793 | – | – | – | 790,514 | 2,108,038 | 49,285,928 | ||||||||||||||||||||||||||||||
| Seabridge Gold1 | 3,342,400 | 60,062,928 | – | 82,761,348 | (49,170,228 | ) | – | |||||||||||||||||||||||||||||||
| Semperit AG Holding | 1,894,996 | 78,103,926 | – | – | – | 1,487,818 | 1,894,996 | 68,078,726 | ||||||||||||||||||||||||||||||
| Silver Standard Resources | 4,115,069 | 61,273,377 | – | – | – | – | 4,115,069 | 26,089,538 | ||||||||||||||||||||||||||||||
| Simpson Manufacturing | 3,387,886 | 111,088,782 | – | – | – | – | 3,387,886 | 99,671,606 | ||||||||||||||||||||||||||||||
| Strayer Education | 1,068,485 | 60,016,803 | – | – | – | – | 1,068,485 | 52,174,123 | ||||||||||||||||||||||||||||||
| Thor Industries | 4,166,757 | 155,961,714 | 2,064,815 | – | – | 1,509,033 | 4,216,757 | 207,380,109 | ||||||||||||||||||||||||||||||
| Trican Well Service | 8,027,100 | 105,876,702 | 701,110 | – | – | 982,803 | 8,077,100 | 107,366,984 | ||||||||||||||||||||||||||||||
| Unit Corporation | 2,896,073 | 130,468,089 | – | – | – | – | 2,896,073 | 123,314,788 | ||||||||||||||||||||||||||||||
| Veeco Instruments | 2,708,912 | 79,967,082 | – | 37,285,009 | (10,582,745 | ) | – | 2,026,512 | 71,779,055 | |||||||||||||||||||||||||||||
| Woodward | 3,906,024 | 148,936,695 | – | 2,360,425 | 1,461,719 | 608,964 | 3,806,024 | 152,240,960 | ||||||||||||||||||||||||||||||
| 2,433,841,697 | (23,819,736 | ) | 14,759,028 | 2,503,336,219 | ||||||||||||||||||||||||||||||||||
| Royce Low-Priced Stock Fund | ||||||||||||||||||||||||||||||||||||||
| Gladstone Land | 7,514,356 | – | – | 220,468 | 501,200 | 8,485,316 | ||||||||||||||||||||||||||||||||
| Globe Specialty Metals1 | 4,026,606 | 55,365,832 | – | 11,767,098 | (3,822,065 | ) | 453,326 | |||||||||||||||||||||||||||||||
| Houston Wire & Cable1 | 1,591,200 | 19,524,024 | – | 29,133,637 | (7,254,989 | ) | 266,840 | |||||||||||||||||||||||||||||||
| KVH Industries1 | 777,804 | 10,873,700 | – | 663,517 | (10,202 | ) | – | |||||||||||||||||||||||||||||||
| 122 | The Royce Funds 2013 Semiannual Report to Shareholders |
Transactions in Affiliated Companies (continued):
| Market | Realized | Market | ||||||||||||||||||||||||||||||||||||
| Shares | Value | Cost of | Cost of | Gain | Dividend | Shares | Value | |||||||||||||||||||||||||||||||
| Affiliated Company | 12/31/12 | 12/31/12 | Purchases | Sales | (Loss) | Income | 6/30/13 | 6/30/13 | ||||||||||||||||||||||||||||||
| Royce Low-Priced Stock Fund (continued) | ||||||||||||||||||||||||||||||||||||||
| PC-Tel1 | 995,592 | $ | 7,168,262 | $ | – | $ | 4,970,890 | $ | 399,262 | $ | 57,317 | |||||||||||||||||||||||||||
| Pretium Resources | 4,335,000 | 57,265,350 | 9,295,772 | 5,264,152 | 2,142,449 | – | 5,120,700 | $ | 33,796,620 | |||||||||||||||||||||||||||||
| Seabridge Gold | 1,111,783 | 19,978,741 | 20,100,000 | – | – | – | 3,111,783 | 29,344,114 | ||||||||||||||||||||||||||||||
| Sigma Designs1 | 1,720,358 | 8,859,844 | – | 25,559,680 | (17,092,008 | ) | – | |||||||||||||||||||||||||||||||
| Tesco Corporation1 | 2,682,105 | 30,549,176 | – | 12,186,165 | 435,747 | – | ||||||||||||||||||||||||||||||||
| Total Energy Services1 | 1,866,700 | 28,130,926 | – | 4,793,751 | 1,499,795 | 135,442 | ||||||||||||||||||||||||||||||||
| TrueBlue1 | 3,262,691 | 51,387,383 | – | 41,470,770 | 13,258,852 | – | ||||||||||||||||||||||||||||||||
| Universal Technical Institute | 1,655,679 | 16,623,017 | – | – | – | 331,136 | 1,655,679 | 17,103,164 | ||||||||||||||||||||||||||||||
| WaterFurnace Renewable Energy | 970,500 | 14,088,690 | – | – | – | 404,213 | 970,500 | 18,963,369 | ||||||||||||||||||||||||||||||
| 319,814,945 | (10,443,159 | ) | 1,868,742 | 107,692,583 | ||||||||||||||||||||||||||||||||||
| Royce Total Return Fund | ||||||||||||||||||||||||||||||||||||||
| Barry (R.G.) | 1,048,496 | 14,857,188 | – | – | – | 94,365 | 1,048,496 | 17,027,575 | ||||||||||||||||||||||||||||||
| Chase Corporation | 773,974 | 14,395,916 | – | – | – | – | 773,974 | 17,306,059 | ||||||||||||||||||||||||||||||
| Houston Wire & Cable | 59,164 | 725,942 | 16,082,811 | – | – | 11,833 | 1,193,373 | 16,516,282 | ||||||||||||||||||||||||||||||
| Mueller (Paul) Company | 116,700 | 2,520,720 | – | – | – | – | 116,700 | 2,392,350 | ||||||||||||||||||||||||||||||
| Peapack-Gladstone Financial | 475,350 | 6,692,928 | – | – | – | 47,535 | 475,350 | 8,318,625 | ||||||||||||||||||||||||||||||
| Starrett (L.S.) Company (The) Cl. A | 529,400 | 5,135,180 | – | – | – | 105,880 | 529,400 | 5,410,468 | ||||||||||||||||||||||||||||||
| Village Super Market Cl. A | 726,483 | 23,872,231 | 160,871 | – | – | 365,693 | 731,386 | 24,201,563 | ||||||||||||||||||||||||||||||
| 68,200,105 | – | 625,306 | 91,172,922 | |||||||||||||||||||||||||||||||||||
| Royce Opportunity Fund | ||||||||||||||||||||||||||||||||||||||
| BTU International | 686,756 | 1,366,644 | – | – | – | – | 686,756 | 1,648,214 | ||||||||||||||||||||||||||||||
| ClearOne1 | 556,620 | 2,248,745 | – | 680,773 | 812,862 | – | ||||||||||||||||||||||||||||||||
| Comstock Holding Companies Cl. A1 | 1,285,590 | 1,491,285 | – | 461,945 | 548,919 | – | ||||||||||||||||||||||||||||||||
| CTPartners Executive Search | 338,890 | 1,558,894 | 98,933 | – | – | – | 361,360 | 1,582,757 | ||||||||||||||||||||||||||||||
| dELiA*s | 1,602,615 | 1,875,059 | 85,025 | 23,680 | (8,889 | ) | – | 1,674,115 | 1,657,374 | |||||||||||||||||||||||||||||
| Dixie Group | 829,519 | 2,745,708 | 39,478 | – | – | – | 834,519 | 6,926,508 | ||||||||||||||||||||||||||||||
| Hardinge | 569,291 | 5,658,753 | 690,451 | – | – | 23,642 | 622,791 | 9,204,851 | ||||||||||||||||||||||||||||||
| Kid Brands | 953,809 | 1,478,404 | 237,776 | – | – | – | 1,111,959 | 1,712,417 | ||||||||||||||||||||||||||||||
| MarineMax1 | 1,357,850 | 12,139,179 | 402,512 | 7,661,961 | (326,484 | ) | – | |||||||||||||||||||||||||||||||
| Pericom Semiconductor | 1,240,848 | 9,964,009 | 947,452 | – | – | – | 1,375,517 | 9,793,681 | ||||||||||||||||||||||||||||||
| Planar Systems | 1,554,792 | 2,223,352 | 51,864 | 19,919 | (2,684 | ) | – | 1,572,192 | 2,562,673 | |||||||||||||||||||||||||||||
| SigmaTron International | 344,172 | 1,400,780 | – | – | – | – | 344,172 | 1,459,289 | ||||||||||||||||||||||||||||||
| Spire Corporation | 448,074 | 224,485 | 65,880 | – | – | – | 537,420 | 284,833 | ||||||||||||||||||||||||||||||
| TRC Companies | 1,683,765 | 9,799,512 | 113,581 | – | – | – | 1,702,926 | 11,920,482 | ||||||||||||||||||||||||||||||
| 54,174,809 | 1,023,724 | 23,642 | 48,753,079 | |||||||||||||||||||||||||||||||||||
| Royce Special Equity Fund | ||||||||||||||||||||||||||||||||||||||
| Ampco-Pittsburgh | 987,000 | 19,720,260 | – | – | – | 355,320 | 987,000 | 18,525,990 | ||||||||||||||||||||||||||||||
| Applied Industrial Technologies1 | 2,430,400 | 102,101,104 | 1,382,963 | 26,052,417 | 3,409,480 | 1,018,586 | ||||||||||||||||||||||||||||||||
| Arden Group Cl. A | 232,001 | 20,873,130 | 1,684,523 | – | – | 121,848 | 248,969 | 27,483,688 | ||||||||||||||||||||||||||||||
| Atrion Corporation | 165,000 | 32,340,000 | 4,153,108 | 224,463 | 5,429 | 202,148 | 185,801 | 40,636,537 | ||||||||||||||||||||||||||||||
| Bowl America Cl. A | 342,575 | 4,282,187 | – | – | – | 56,525 | 342,575 | 4,367,831 | ||||||||||||||||||||||||||||||
| Children’s Place Retail Stores | 1,318,056 | 58,376,700 | 19,892,328 | – | – | – | 1,730,200 | 94,814,960 | ||||||||||||||||||||||||||||||
| Clearwater Paper1 | 1,956,000 | 76,596,960 | – | 29,502,312 | 9,909,796 | – | ||||||||||||||||||||||||||||||||
| CSS Industries | 974,100 | 21,323,049 | – | – | – | 292,230 | 974,100 | 24,284,313 | ||||||||||||||||||||||||||||||
| Dorman Products1 | 2,306,679 | 81,518,036 | – | 7,724,104 | 37,480,244 | – | ||||||||||||||||||||||||||||||||
| EnerSys | 2,284,700 | 85,973,261 | 19,088,276 | – | – | 321,380 | 2,689,000 | 131,868,560 | ||||||||||||||||||||||||||||||
| Finish Line (The) Cl. A | 4,462,000 | 84,465,660 | 9,064,180 | – | – | 694,246 | 4,958,900 | 108,401,554 | ||||||||||||||||||||||||||||||
| Foster (L.B.) Company | 928,875 | 40,350,330 | 2,854,862 | – | – | 59,640 | 994,000 | 42,910,980 | ||||||||||||||||||||||||||||||
| Frisch’s Restaurants | 505,100 | 9,344,350 | – | – | – | 161,632 | 505,100 | 9,425,166 | ||||||||||||||||||||||||||||||
| Hawkins | 911,020 | 35,201,813 | 4,491,353 | – | – | 348,809 | 1,027,510 | 40,473,619 | ||||||||||||||||||||||||||||||
| Hurco Companies | 435,179 | 10,009,117 | 935,112 | – | – | 23,511 | 470,213 | 13,528,028 | ||||||||||||||||||||||||||||||
| Littelfuse | 1,375,583 | 84,887,227 | – | 15,111,002 | 1,867,206 | 478,584 | 1,121,658 | 83,686,903 | ||||||||||||||||||||||||||||||
| Meredith Corporation | 2,194,450 | 75,598,802 | 17,215,871 | 9,484,551 | 1,870,661 | 1,988,926 | 2,397,773 | 114,373,772 | ||||||||||||||||||||||||||||||
| Minerals Technologies | 2,851,200 | 113,819,904 | 16,411,003 | – | – | 300,405 | 3,250,500 | 134,375,670 | ||||||||||||||||||||||||||||||
| National Presto Industries | 656,500 | 45,364,150 | – | – | – | – | 656,500 | 47,287,695 | ||||||||||||||||||||||||||||||
| Park Electrochemical | 2,011,012 | 51,743,338 | – | – | – | 5,429,732 | 2,011,012 | 48,284,398 | ||||||||||||||||||||||||||||||
| Plantronics | 2,077,278 | 76,589,240 | 4,304,377 | – | – | 424,498 | 2,178,578 | 95,683,146 | ||||||||||||||||||||||||||||||
| Scholastic Corporation | 2,400,207 | 70,950,119 | 12,317,215 | – | – | 644,463 | 2,835,034 | 83,038,146 | ||||||||||||||||||||||||||||||
| Schulman (A.)1 | 1,472,577 | 42,601,652 | 10,512,309 | 9,000,625 | 3,357,216 | 221,645 | ||||||||||||||||||||||||||||||||
| Schweitzer-Mauduit International | 69,143,846 | – | – | 626,876 | 1,745,822 | 87,081,601 | ||||||||||||||||||||||||||||||||
| Standard Motor Products | 33,819,577 | – | – | 135,375 | 1,255,273 | 43,106,075 | ||||||||||||||||||||||||||||||||
| Standex International | 831,990 | 42,672,767 | – | 4,609,364 | 2,939,656 | 115,990 | 694,000 | 36,608,500 | ||||||||||||||||||||||||||||||
| The Royce Funds 2013 Semiannual Report to Shareholders | 123 |
Transactions in Affiliated Companies (continued):
| Market | Realized | Market | ||||||||||||||||||||||||||||||||||||
| Shares | Value | Cost of | Cost of | Gain | Dividend | Shares | Value | |||||||||||||||||||||||||||||||
| Affiliated Company | 12/31/12 | 12/31/12 | Purchases | Sales | (Loss) | Income | 6/30/13 | 6/30/13 | ||||||||||||||||||||||||||||||
| Royce Special Equity Fund (continued) | ||||||||||||||||||||||||||||||||||||||
| Stepan Company1 | 1,252,900 | $ | 69,586,066 | $ | – | $ | 6,205,372 | $ | 3,550,672 | $ | 351,902 | |||||||||||||||||||||||||||
| UniFirst Corporation | 1,469,012 | 107,707,960 | 869,854 | 3,732,750 | 1,335,435 | 106,551 | 1,420,000 | $ | 129,575,000 | |||||||||||||||||||||||||||||
| 1,463,997,182 | 65,725,795 | 14,480,822 | 1,459,822,132 | |||||||||||||||||||||||||||||||||||
| Royce Value Plus Fund | ||||||||||||||||||||||||||||||||||||||
| Cerus Corporation1 | 2,884,500 | 9,115,020 | – | 1,982,035 | (735,590 | ) | – | |||||||||||||||||||||||||||||||
| Cosi1 | 6,833,770 | 5,316,673 | – | 338,004 | (70,150 | ) | – | |||||||||||||||||||||||||||||||
| Immersion Corporation1 | 1,578,109 | 10,841,609 | – | 2,763,885 | 1,891,861 | – | ||||||||||||||||||||||||||||||||
| NumereX Corporation Cl. A | 302,701 | 3,977,491 | 9,814,211 | – | – | – | 1,173,100 | 13,091,796 | ||||||||||||||||||||||||||||||
| 29,250,793 | 1,086,121 | – | 13,091,796 | |||||||||||||||||||||||||||||||||||
1 Not an Affiliated Company at June 30, 2013.
| 124 | The Royce Funds 2013 Semiannual Report to Shareholders |
As a shareholder of a mutual fund, you pay ongoing expenses, including management fees and other Fund expenses including, for some funds, distribution and/or service (12b-1) fees. Using the information below, you can estimate how these ongoing expenses (in dollars) affect your investment and compare them with the ongoing expenses of other funds. You may also incur one-time transaction expenses, including redemption fees, which are not shown in this section and would result in higher total costs. The example is based on an investment of $1,000 invested at January 1, 2013, and held for the entire six-month period ended June 30, 2013. Service, Consultant, R and K Class shares are generally available only through certain brokers or retirement plan administrators who receive distribution and/or service fees from the Fund for services that they perform. Institutional and W Class shares are generally available only to institutions or intermediaries with a minimum account size of $1 million.
| Actual | Hypothetical (5% per year return before expenses) | ||||||||||||||||||||||||||||||||||
| Beginning | Ending | Expenses Paid | Beginning | Ending | Expenses Paid | Annualized | |||||||||||||||||||||||||||||
| Account Value | Account Value | During the | Account Value | Account Value | During the | Expense | |||||||||||||||||||||||||||||
| 1/1/13 | 6/30/13 | Period1 | 1/1/13 | 6/30/13 | Period1 | Ratio2 | |||||||||||||||||||||||||||||
| Investment Class | |||||||||||||||||||||||||||||||||||
| Royce Pennsylvania Mutual Fund | $ | 1,000.00 | $ | 1,115.65 | $ | 4.77 | $ | 1,000.00 | $ | 1,020.28 | $ | 4.56 | 0.91 | % | |||||||||||||||||||||
| Royce Micro-Cap Fund | 1,000.00 | 1,030.45 | 7.85 | 1,000.00 | 1,017.06 | 7.80 | 1.56 | ||||||||||||||||||||||||||||
| Royce Premier Fund | 1,000.00 | 1,078.81 | 5.57 | 1,000.00 | 1,019.44 | 5.41 | 1.08 | ||||||||||||||||||||||||||||
| Royce Low-Priced Stock Fund | 1,000.00 | 988.43 | 6.11 | 1,000.00 | 1,018.65 | 6.21 | 1.24 | ||||||||||||||||||||||||||||
| Royce Total Return Fund | 1,000.00 | 1,128.46 | 5.91 | 1,000.00 | 1,019.24 | 5.61 | 1.12 | ||||||||||||||||||||||||||||
| Royce Heritage Fund3 | 1,000.00 | 1,095.99 | 5.92 | 1,000.00 | 1,019.14 | 5.71 | 1.14 | ||||||||||||||||||||||||||||
| Royce Opportunity Fund | 1,000.00 | 1,184.94 | 6.28 | 1,000.00 | 1,019.04 | 5.81 | 1.16 | ||||||||||||||||||||||||||||
| Royce Special Equity Fund | 1,000.00 | 1,123.99 | 5.90 | 1,000.00 | 1,019.24 | 5.61 | 1.12 | ||||||||||||||||||||||||||||
| Royce Value Fund | 1,000.00 | 1,086.19 | 6.26 | 1,000.00 | 1,018.79 | 6.06 | 1.21 | ||||||||||||||||||||||||||||
| Royce Value Plus Fund | 1,000.00 | 1,124.46 | 7.06 | 1,000.00 | 1,018.15 | 6.71 | 1.34 | ||||||||||||||||||||||||||||
| Royce 100 Fund | 1,000.00 | 1,108.47 | 6.27 | 1,000.00 | 1,018.84 | 6.01 | 1.20 | ||||||||||||||||||||||||||||
| Royce Dividend Value Fund | 1,000.00 | 1,111.15 | 6.12 | 1,000.00 | 1,018.99 | 5.86 | 1.17 | ||||||||||||||||||||||||||||
| Royce Global Value Fund | 1,000.00 | 953.52 | 7.07 | 1,000.00 | 1,017.55 | 7.30 | 1.46 | ||||||||||||||||||||||||||||
| Service Class | |||||||||||||||||||||||||||||||||||
| Royce Pennsylvania Mutual Fund | 1,000.00 | 1,113.81 | 6.39 | 1,000.00 | 1,018.74 | 6.11 | 1.22 | ||||||||||||||||||||||||||||
| Royce Micro-Cap Fund | 1,000.00 | 1,030.12 | 8.36 | 1,000.00 | 1,016.56 | 8.30 | 1.66 | ||||||||||||||||||||||||||||
| Royce Premier Fund | 1,000.00 | 1,077.29 | 7.06 | 1,000.00 | 1,018.00 | 6.85 | 1.37 | ||||||||||||||||||||||||||||
| Royce Low-Priced Stock Fund | 1,000.00 | 987.72 | 7.34 | 1,000.00 | 1,017.41 | 7.45 | 1.49 | ||||||||||||||||||||||||||||
| Royce Total Return Fund | 1,000.00 | 1,127.97 | 7.28 | 1,000.00 | 1,017.95 | 6.90 | 1.38 | ||||||||||||||||||||||||||||
| Royce Heritage Fund3 | 1,000.00 | 1,094.12 | 7.37 | 1,000.00 | 1,017.75 | 7.10 | 1.42 | ||||||||||||||||||||||||||||
| Royce Opportunity Fund | 1,000.00 | 1,183.55 | 7.74 | 1,000.00 | 1,017.70 | 7.15 | 1.43 | ||||||||||||||||||||||||||||
| Royce Special Equity Fund | 1,000.00 | 1,122.16 | 7.31 | 1,000.00 | 1,017.90 | 6.95 | 1.39 | ||||||||||||||||||||||||||||
| Royce Value Fund | 1,000.00 | 1,084.66 | 7.70 | 1,000.00 | 1,017.41 | 7.45 | 1.49 | ||||||||||||||||||||||||||||
| Royce Value Plus Fund | 1,000.00 | 1,123.64 | 7.74 | 1,000.00 | 1,017.50 | 7.35 | 1.47 | ||||||||||||||||||||||||||||
| Royce 100 Fund | 1,000.00 | 1,105.56 | 7.67 | 1,000.00 | 1,017.50 | 7.35 | 1.47 | ||||||||||||||||||||||||||||
| Royce Dividend Value Fund | 1,000.00 | 1,108.87 | 7.53 | 1,000.00 | 1,017.65 | 7.20 | 1.44 | ||||||||||||||||||||||||||||
| Royce Global Value Fund | 1,000.00 | 952.23 | 8.18 | 1,000.00 | 1,016.41 | 8.45 | 1.69 | ||||||||||||||||||||||||||||
| Royce International Smaller- | |||||||||||||||||||||||||||||||||||
Companies Fund | 1,000.00 | 992.91 | 8.35 | 1,000.00 | 1,016.41 | 8.45 | 1.69 | ||||||||||||||||||||||||||||
| The Royce Funds 2013 Semiannual Report to Shareholders | 125 |
| Actual | Hypothetical (5% per year return before expenses) | ||||||||||||||||||||||||||||||||||
| Beginning | Ending | Expenses Paid | Beginning | Ending | Expenses Paid | Annualized | |||||||||||||||||||||||||||||
| Account Value | Account Value | During the | Account Value | Account Value | During the | Expense | |||||||||||||||||||||||||||||
| 1/1/13 | 6/30/13 | Period1 | 1/1/13 | 6/30/13 | Period1 | Ratio2 | |||||||||||||||||||||||||||||
| Consultant Class | |||||||||||||||||||||||||||||||||||
| Royce Pennsylvania Mutual Fund | $ | 1,000.00 | $ | 1,109.82 | $ | 9.99 | $ | 1,000.00 | $ | 1,015.32 | $ | 9.54 | 1.91 | % | |||||||||||||||||||||
| Royce Micro-Cap Fund | 1,000.00 | 1,025.23 | 12.55 | 1,000.00 | 1,012.40 | 12.47 | 2.50 | ||||||||||||||||||||||||||||
| Royce Premier Fund | 1,000.00 | 1,073.20 | 10.85 | 1,000.00 | 1,014.33 | 10.54 | 2.11 | ||||||||||||||||||||||||||||
| Royce Total Return Fund | 1,000.00 | 1,123.10 | 11.16 | 1,000.00 | 1,014.28 | 10.59 | 2.12 | ||||||||||||||||||||||||||||
| Royce Heritage Fund3 | 1,000.00 | 1,089.04 | 12.07 | 1,000.00 | 1,013.24 | 11.63 | 2.33 | ||||||||||||||||||||||||||||
| Royce Opportunity Fund | 1,000.00 | 1,178.93 | 12.32 | 1,000.00 | 1,013.49 | 11.38 | 2.28 | ||||||||||||||||||||||||||||
| Royce Special Equity Fund | 1,000.00 | 1,117.82 | 11.29 | 1,000.00 | 1,014.13 | 10.74 | 2.15 | ||||||||||||||||||||||||||||
| Royce Value Fund | 1,000.00 | 1,079.56 | 11.70 | 1,000.00 | 1,013.54 | 11.33 | 2.27 | ||||||||||||||||||||||||||||
| Royce Value Plus Fund | 1,000.00 | 1,118.58 | 12.24 | 1,000.00 | 1,013.24 | 11.63 | 2.33 | ||||||||||||||||||||||||||||
| Royce Global Value Fund | 1,000.00 | 949.53 | 11.79 | 1,000.00 | 1,012.69 | 12.18 | 2.44 | ||||||||||||||||||||||||||||
| Institutional Class | |||||||||||||||||||||||||||||||||||
| Royce Pennsylvania Mutual Fund | 1,000.00 | 1,115.45 | 4.14 | 1,000.00 | 1,020.88 | 3.96 | 0.79 | ||||||||||||||||||||||||||||
| Royce Premier Fund | 1,000.00 | 1,078.76 | 5.05 | 1,000.00 | 1,019.93 | 4.91 | 0.98 | ||||||||||||||||||||||||||||
| Royce Low-Priced Stock Fund | 1,000.00 | 988.40 | 6.01 | 1,000.00 | 1,018.74 | 6.11 | 1.22 | ||||||||||||||||||||||||||||
| Royce Total Return Fund | 1,000.00 | 1,129.97 | 5.28 | 1,000.00 | 1,019.84 | 5.01 | 1.00 | ||||||||||||||||||||||||||||
| Royce Opportunity Fund | 1,000.00 | 1,185.74 | 5.58 | 1,000.00 | 1,019.69 | 5.16 | 1.03 | ||||||||||||||||||||||||||||
| Royce Special Equity Fund | 1,000.00 | 1,124.17 | 5.32 | 1,000.00 | 1,019.79 | 5.06 | 1.01 | ||||||||||||||||||||||||||||
| Royce Value Fund | 1,000.00 | 1,086.99 | 5.43 | 1,000.00 | 1,019.59 | 5.26 | 1.05 | ||||||||||||||||||||||||||||
| Royce Value Plus Fund | 1,000.00 | 1,125.54 | 5.64 | 1,000.00 | 1,019.49 | 5.36 | 1.07 | ||||||||||||||||||||||||||||
| Royce Dividend Value Fund | 1,000.00 | 1,111.98 | 5.45 | 1,000.00 | 1,019.64 | 5.21 | 1.04 | ||||||||||||||||||||||||||||
| W Class | |||||||||||||||||||||||||||||||||||
| Royce Premier Fund | 1,000.00 | 1,078.65 | 5.57 | 1,000.00 | 1,019.44 | 5.41 | 1.08 | ||||||||||||||||||||||||||||
| Royce Total Return Fund | 1,000.00 | 1,128.57 | 5.91 | 1,000.00 | 1,019.24 | 5.61 | 1.12 | ||||||||||||||||||||||||||||
| R Class | |||||||||||||||||||||||||||||||||||
| Royce Pennsylvania Mutual Fund | 1,000.00 | 1,112.30 | 8.01 | 1,000.00 | 1,017.21 | 7.65 | 1.53 | ||||||||||||||||||||||||||||
| Royce Premier Fund | 1,000.00 | 1,075.23 | 8.75 | 1,000.00 | 1,016.36 | 8.50 | 1.70 | ||||||||||||||||||||||||||||
| Royce Low-Priced Stock Fund | 1,000.00 | 986.01 | 9.06 | 1,000.00 | 1,015.67 | 9.20 | 1.84 | ||||||||||||||||||||||||||||
| Royce Total Return Fund | 1,000.00 | 1,125.20 | 9.06 | 1,000.00 | 1,016.27 | 8.60 | 1.72 | ||||||||||||||||||||||||||||
| Royce Heritage Fund | 1,000.00 | 1,092.08 | 9.54 | 1,000.00 | 1,015.67 | 9.20 | 1.84 | ||||||||||||||||||||||||||||
| Royce Opportunity Fund | 1,000.00 | 1,181.50 | 9.74 | 1,000.00 | 1,015.87 | 9.00 | 1.80 | ||||||||||||||||||||||||||||
| Royce Value Fund | 1,000.00 | 1,082.44 | 9.29 | 1,000.00 | 1,015.87 | 9.00 | 1.80 | ||||||||||||||||||||||||||||
| Royce Value Plus Fund | 1,000.00 | 1,120.65 | 9.67 | 1,000.00 | 1,015.67 | 9.20 | 1.84 | ||||||||||||||||||||||||||||
| Royce 100 Fund | 1,000.00 | 1,104.24 | 9.60 | 1,000.00 | 1,015.67 | 9.20 | 1.84 | ||||||||||||||||||||||||||||
| Royce Global Value Fund | 1,000.00 | 951.50 | 9.63 | 1,000.00 | 1,014.93 | 9.94 | 1.99 | ||||||||||||||||||||||||||||
| K Class | |||||||||||||||||||||||||||||||||||
| Royce Pennsylvania Mutual Fund | 1,000.00 | 1,112.73 | 7.07 | 1,000.00 | 1,018.10 | 6.76 | 1.35 | ||||||||||||||||||||||||||||
| Royce Premier Fund | 1,000.00 | 1,075.70 | 7.93 | 1,000.00 | 1,017.16 | 7.70 | 1.54 | ||||||||||||||||||||||||||||
| Royce Low-Priced Stock Fund | 1,000.00 | 987.34 | 7.83 | 1,000.00 | 1,016.91 | 7.95 | 1.59 | ||||||||||||||||||||||||||||
| Royce Total Return Fund | 1,000.00 | 1,125.87 | 7.75 | 1,000.00 | 1,017.50 | 7.35 | 1.47 | ||||||||||||||||||||||||||||
| Royce Heritage Fund | 1,000.00 | 1,092.66 | 8.25 | 1,000.00 | 1,016.91 | 7.95 | 1.59 | ||||||||||||||||||||||||||||
| Royce Opportunity Fund | 1,000.00 | 1,183.18 | 7.79 | 1,000.00 | 1,017.65 | 7.20 | 1.44 | ||||||||||||||||||||||||||||
| Royce Value Fund | 1,000.00 | 1,084.25 | 8.11 | 1,000.00 | 1,017.01 | 7.85 | 1.57 | ||||||||||||||||||||||||||||
| Royce Value Plus Fund | 1,000.00 | 1,122.77 | 8.37 | 1,000.00 | 1,016.91 | 7.95 | 1.59 | ||||||||||||||||||||||||||||
| Royce 100 Fund | 1,000.00 | 1,105.94 | 8.30 | 1,000.00 | 1,016.91 | 7.95 | 1.59 | ||||||||||||||||||||||||||||
| Royce Global Value Fund | 1,000.00 | 952.53 | 8.42 | 1,000.00 | 1,016.17 | 8.70 | 1.74 | ||||||||||||||||||||||||||||
| 126 | The Royce Funds 2013 Semiannual Report to Shareholders |
| Trustees and Officers |
| All Trustees and Officers may be reached c/o The Royce Funds, 745 Fifth Avenue, New York, NY 10151 |
Charles M. Royce, Trustee1, President
Age: 73 | Number of Funds Overseen: 34 | Tenure: Since 1982
Non-Royce Directorships: Director of TICC Capital Corp.
Principal Occupation(s) During Past Five Years: President, Co-Chief Investment Officer, and Member of Board of Managers of Royce & Associates, LLC (“Royce”), the Trust’s investment adviser.
Patricia W. Chadwick, Trustee
Age: 64 | Number of Funds Overseen: 34 | Tenure: Since 2009
Non-Royce Directorships: Trustee of ING Mutual Funds and Director of Wisconsin Energy Corp.
Principal Occupation(s) During Past 5 Years: Consultant and President of Ravengate Partners LLC (since 2000).
Richard M. Galkin, Trustee
Age: 75 | Number of Funds Overseen: 34 | Tenure: Since 1982
Non-Royce Directorships: None
Principal Occupation(s) During Past Five Years: Private investor. Mr. Galkin’s prior business experience includes having served as President of Richard M. Galkin Associates, Inc., telecommunications consultants, President of Manhattan Cable Television (a subsidiary of Time, Inc.), President of Haverhills Inc. (another Time, Inc. subsidiary), President of Rhode Island Cable Television, and Senior Vice President of Satellite Television Corp. (a subsidiary of Comsat).
Stephen L. Isaacs, Trustee
Age: 73 | Number of Funds Overseen: 34 | Tenure: Since 1989
Non-Royce Directorships: None
Principal Occupation(s) During Past Five Years: Attorney and President of Health Policy Associates, Inc., consultants. Mr. Isaacs’s prior business experience includes having served as President of the Center for Health and Social Policy (from 1996 to 2012); Director of Columbia University Development Law and Policy Program and Professor at Columbia University (until August 1996).
Arthur S. Mehlman, Trustee
Age: 71 | Number of Funds Overseen: 48 | Tenure: Since 2004
Non-Royce Directorships: Director/Trustee of registered investment companies constituting the 14 Legg Mason Funds.
Principal Occupation(s) During Past Five Years: Director of The League for People with Disabilities, Inc.; Director of University of Maryland Foundation (non-profits). Formerly: Director of Municipal Mortgage & Equity, LLC (from October 2004 to April 1, 2011); Director of University of Maryland College Park Foundation (non-profit) (from 1998 to 2005); Partner, KPMG LLP (international accounting firm) (from 1972 to 2002); Director of Maryland Business Roundtable for Education (from July 1984 to June 2002).
David L. Meister, Trustee
Age: 73 | Number of Funds Overseen: 34 | Tenure: Since 1982
Non-Royce Directorships: None
Principal Occupation(s) During Past Five Years: Consultant. Chairman and Chief Executive Officer of The Tennis Channel (from June 2000 to March 2005). Mr. Meister’s prior business experience includes having served as Chief Executive Officer of Seniorlife.com, a consultant to the communications industry, President of Financial News Network, Senior Vice President of HBO, President of Time-Life Films, and Head of Broadcasting for Major League Baseball.
G. Peter O’Brien, Trustee
Age: 67 | Number of Funds Overseen: 48 | Tenure: Since 2001
Non-Royce Directorships: Director/Trustee of registered investment companies constituting the 14 Legg Mason Funds; Director of TICC Capital Corp.
Principal Occupation(s) During Past Five Years: Trustee Emeritus of Colgate University (since 2005); Board Member of Hill House, Inc. (since 1999); Formerly: Trustee of Colgate University (from 1996 to 2005), President of Hill House, Inc. (from 2001 to 2005) and Managing Director/Equity Capital Markets Group of Merrill Lynch & Co. (from 1971 to 1999).
John D. Diederich, Vice President and Treasurer
Age: 61 | Tenure: Since 2001
Principal Occupation(s) During Past Five Years: Chief Operating Officer, Managing Director and member of the Board of Managers of Royce; Chief Financial Officer of Royce; Director of Administration of the Trust; and President of RFS, having been employed by Royce since April 1993.
Jack E. Fockler, Jr., Vice President
Age: 54 | Tenure: Since 1995
Principal Occupation(s) During Past Five Years: Managing Director and Vice President of Royce, and Vice President of RFS, having been employed by Royce since October 1989.
W. Whitney George, Vice President
Age: 55 | Tenure: Since 1995
Principal Occupation(s) During Past Five Years: Co-Chief Investment Officer, Managing Director and Vice President of Royce, having been employed by Royce since October 1991.
Daniel A. O’Byrne, Vice President and Assistant Secretary
Age: 51 | Tenure: Since 1994
Principal Occupation(s) During Past Five Years: Principal and Vice President of Royce, having been employed by Royce since October 1986.
John E. Denneen, Secretary and Chief Legal Officer
Age: 46 | Tenure: 1996-2001 and Since April 2002
Principal Occupation(s) During Past Five Years: General Counsel, Principal, Chief Legal and Compliance Officer, and Secretary of Royce; Secretary and Chief Legal Officer of The Royce Funds.
Lisa Curcio, Chief Compliance Officer
Age: 53 | Tenure: Since 2004
Principal Occupation(s) During Past Five Years: Chief Compliance Officer of The Royce Funds (since October 2004) and Compliance Officer of Royce (since June 2004).
1 Interested Trustee.
Trustees will hold office until their successors have been duly elected and qualified or until their earlier resignation or removal. The Statement of Additional Information, which contains additional information about the Trust’s trustees and officers, is available and can be obtained without charge at www.roycefunds.com or by calling (800) 221-4268.
| The Royce Funds 2013 Semiannual Report to Shareholders | 127 |
| Board Approval of Investment Advisory Agreements |
At meetings held on June 11-12, 2013, the Board of Trustees of The Royce Fund (the “Board”), including all of the non-interested trustees, approved the continuance of the Investment Advisory Agreements between Royce & Associates, LLC (“R&A”) and The Royce Fund (“TRF”) relating to each of Royce Pennsylvania Mutual Fund, Royce Low-Priced Stock Fund, Royce Heritage Fund, Royce Value Plus Fund, Royce Premier Fund, Royce Special Equity Fund, Royce Value Fund, Royce 100 Fund, Royce Total Return Fund, Royce Dividend Value Fund, Royce Micro-Cap Fund, Royce Opportunity Fund, Royce Global Value Fund, and Royce International Smaller-Companies Fund (each, a “Fund” and collectively, the “Funds”). In reaching these decisions, the Board reviewed, among other things, information prepared internally by R&A and independently by Morningstar Associates, LLC (“Morningstar”) containing detailed expense ratio and investment performance comparisons for each Fund with other mutual funds in their “peer group” and “category”, information regarding the past performance of the Funds and other registered investment companies managed by R&A and a memorandum outlining the legal duties of the Board prepared by independent counsel to the non-interested trustees. R&A also provided the trustees with an analysis of its profitability with respect to providing investment advisory services to each Fund. In addition, the Board took into account information furnished throughout the year at regular Board meetings, including reports on investment performance, shareholder services, distribution fees and expenses, regulatory compliance, brokerage commissions and research, brokerage and other execution products and services provided to the Funds. The Board also considered other matters they deemed important to the approval process such as allocation of Fund brokerage commissions, “soft dollar” research services R&A receives, payments made to affiliates of R&A, as well as payments made by R&A, relating to distribution of Fund shares and other direct and indirect benefits to R&A and its affiliates from their relationship with the Funds. The trustees also met throughout the year with investment advisory personnel from R&A. The Board, in its deliberations, recognized that, for many of the Funds’ shareholders, the decision to purchase Fund shares included a decision to select R&A as the investment adviser and that there was a strong association in the minds of Fund shareholders between R&A and each of the Funds. In considering factors relating to the approval of the continuance of the Investment Advisory Agreements, the non-interested trustees received assistance and advice from, and met separately with, their independent counsel. While the Investment Advisory Agreements for the Funds were considered at the same meetings, the trustees dealt with each agreement separately. Among other factors, the trustees considered the following:
Royce Premier Fund (“RPR”) and Royce Global Value Fund (“RGV”) placed in the middle quintile for the 3-year period ended December 31, 2012 within their respective Morningstar category. Royce Low-Priced Stock Fund (“RLP”) and Royce Opportunity Fund (“ROF”) fell in the middle quintile for the 5-year period within their Morningstar categories and RLP’s 10-year ranking fell in the middle quintile of its Morningstar category. Royce Micro-Cap Fund’s (“RMC”) Sharpe Ratio for the 5-year period fell in the 3rd quartile as its risk-adjusted performance in 2012 adversely impacted its longer-term performance. It was noted that as of December 31, 2011 RMC had placed in the first quartile for the 3-year, 5-year and 10-year periods. The Board noted that Royce Value Plus Fund (“RVP”) has struggled during recent market cycles as its portfolio manager had taken a more defensive portfolio approach going into the strong up market beginning with the March 2009 market low, leading to a 3rd quartile total return and Sharpe Ratio performance for the 5-year period and a 4th quartile Sharpe Ratio for the 3-year period. RVP was in the top quartile (4th percentile) for the 10-year period. It was also noted that RVP’s portfolio manager had repositioned the Fund to take it back to its “value plus” growth roots, resulting in a total return in 2012 of 15.2%, slightly trailing the Russell 2000 Index in a strong up market. RLP’s, RMC’s, Royce Heritage Fund’s (“RHF”), and Royce Value Fund’s (“RVV”), Sharpe Ratios fell in the 4th quartile for the 3-year period within each Fund’s Morningstar category. This was attributable in part to RLP’s, RMC’s, and RVV’s significant overweighting in materials, particularly metals and mining companies, and RHF’s focus on companies with low leverage and solid balance sheets, each of which contributed to lagging
| 128 | The Royce Funds 2013 Semiannual Report to Shareholders |
performance. In addition to each Fund’s risk-adjusted performance, the trustees also reviewed and considered each Fund’s absolute total returns, down market performance and, for the Funds in existence for such periods, long-term performance records over periods of 10 years or longer.
The Board also considered it important to look beyond the current snapshot of performance as of December 31, 2012 and therefore examined extended performance histories for each series with 3 years or more since its inception using monthly rolling average return periods through March 31, 2013.
The trustees noted that R&A manages a number of funds that invest in small-cap and micro-cap issuers, many of which had outperformed their benchmark indexes and their competitors over longer-term periods. Although the trustees recognized that past performance is not necessarily an indicator of future results, they found that R&A had the necessary qualifications, experience and track record in managing mid-cap, small-cap and micro-cap securities to manage the Funds. The trustees determined that R&A continued to be an appropriate investment adviser for each Fund and concluded that each of Fund’s performance supported the continuation of its Investment Advisory Agreement.
The trustees noted that R&A has waived advisory fees for numerous series of TRF in order to maintain expense ratios at competitive levels and acknowledged R&A’s intention to continue this expense limitation practice. The trustees also considered fees charged by R&A to institutional and other clients and noted that, given the greater levels of services that R&A provides to registered investment companies such as the Funds as compared to other accounts, each of the Funds’ advisory fees compared favorably to these other accounts. It was noted that no single factor was cited as determinative to the decision of the trustees. Rather, after weighing all of considerations and conclusions discussed above, the entire Board, including all the non-interested trustees, determined to approve the continuation of the existing Investment Advisory Agreements, concluding that a contract continuation on the existing terms was in the best interest of the shareholders of each Fund and that each investment advisory fee rate was reasonable in relation to the services provided.
| The Royce Funds 2013 Semiannual Report to Shareholders | 129 |
| Notes to Performance and Other Important Information |
| • | the Funds’ future operating results, |
| • | the prospects of the Funds’ portfolio companies, |
| • | the impact of investments that the Funds have made or may make, |
| • | the dependence of the Funds’ future success on the general economy and its impact on the companies and industries in which the Funds invest, and |
| • | the ability of the Funds’ portfolio companies to achieve their objectives. |
| 130 | The Royce Funds 2013 Semiannual Report to Shareholders |
| 2013 In Quotes |
Active managers earn their fees building a long-term performance record through time arbitrage... Value investors succeed not by chasing relative returns, but by embracing the fundamentals of value investing, finding the strongest, highest-quality companies at the best possible prices.
| This page is not part of the 2013 Semiannual Report to Shareholders | 131 |
| Making Headlines |
At The Royce Funds, the integrity of our process and the reputation of our people are as important to us as the long-term performance of our portfolios, so it is always gratifying when the results of these three efforts are recognized in the wider world. Through the years, we have been fortunate enough to have a number of positive articles written about The Royce Funds, our firm, and our people, as well as opportunities to share our investment beliefs and approach. Below is a summary of several media mentions we received in the first half of this year.
June 26, 2013
May 23, 2013
May 9, 2013
April 15, 2013
| 132 | This page is not part of the 2013 Semiannual Report to Shareholders |
| Searching for Super Small-Cap Companies Through the Macro Noise |
Portfolio Manager and Principal Chris Clark offers insights into our disciplined, long-term investment process by emphasizing the role that contrarian thinking plays in our portfolios.

| This page is not part of the 2013 Semiannual Report to Shareholders |
 | |||||||||||||||||||
 | |||||||||||||||||||
About The Royce Funds This Review and Report must be accompanied or preceded by a current prospectus for the Funds. Please read the prospectus carefully before investing or sending money. | |||||||||||||||||||
| Contact Us | |||||||||||||||||||
| General Information Additional Report Copies and Prospectus Inquiries (800) 221-4268 | RIA/BD Services Fund Materials and Performance Updates (800) 33-ROYCE (337-6923) | Shareholder Services Transactions and Account Inquiries (800) 841-1180 | Royce InfoLine 24-Hour Automated Telephone Service (800) 78-ROYCE (787-6923) |  | |||||||||||||||
|

SEMIANNUAL
REVIEW AND REPORT
TO SHAREHOLDERS
Royce Select Fund I Royce Select Fund II Royce Global Select Long/Short Fund Royce Enterprise Select Fund Royce Opportunity Select Fund Royce Micro-Cap Discovery Fund Royce Financial Services Fund Royce SMid-Cap Value Fund Royce Focus Value Fund Royce Partners Fund Royce Special Equity Multi-Cap Fund Royce European Smaller-Companies Fund Royce Global Dividend Value Fund Royce International Micro-Cap Fund Royce International Premier Fund | ||
www.roycefunds.com |  | |
| A Fresh Experience at RoyceFunds.com |
| Welcome to the new RoyceFunds.com! We’ve redesigned the site in order to give you a simpler, more efficient, and user-friendly online experience that’s been optimized for compatibility with any device. |
 | ||
 | ||
 | ||||
 | ||||
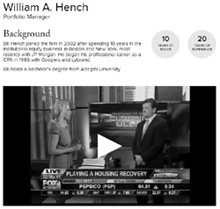
 | ||
 | ||
| ACCESS ALL IN ONE PLACE |
| Fund pages have been enhanced to bring you all the information you need on your investments without leaving the page. | |
| LEARN ABOUT PORTFOLIO MANAGERS |
| Interactive and colorful, our People pages provide professional bios as well as videos, funds managed, commentaries, and news from your favorite Royce managers. | |
| MAKE THE SITE WORK FOR YOU |
| In addition to Shareholder Account Access, you can register for an account and log in to personalize your experience. With the My Funds feature, you’ll be able to organize and check in on your Funds at any time and on any device. | |
eDelivery Saves! Sign Up Now. eDelivery saves paper, time, and fund expenses.1 Sign up now to view statements, prospectuses, financial reports, and tax forms online. > www.roycefunds.com/edelivery 1 Any direct Royce Funds IRA investor who chooses eDelivery of prospectuses, financial reports, and RWord will be exempt from the $15 annual IRA maintenance fee. (We will continue to also waive the fee for investors with more than $20,000 invested in Royce IRAs at the time the fee is charged, and for new transfer and rollover accounts in their first year.) Stay Informed Follow us on Twitter, watch us on YouTube, subscribe to our RSS feed, and sign up for our monthly eWord newsletter to stay up to date on the latest from The Royce Funds.  www.twitter.com/roycefunds www.twitter.com/roycefunds www.youtube.com/roycefunds www.youtube.com/roycefunds www.roycefunds.com/eword www.roycefunds.com/eword |
| This page is not part of the 2013 Semiannual Report to Shareholders |
| Table of Contents | |
| Semiannual Review | |
| Fund Guide | 2 |
| Performance and Expenses | 4 |
| Portfolio Characteristics | 5 |
| Letter to Our Shareholders | 6 |
| 2013 In Quotes | 98 |
| Making Headlines | 99 |
| Postscript: Searching for Super Small-Cap Companies Through the Macro Noise | Inside Back Cover |
| Semiannual Report to Shareholders | 13 |
 | |
| This page is not part of the 2013 Semiannual Report to Shareholders | 1 |
| Royce Fund Guide |
| Value-Oriented Small-Cap Offerings Tailored to Specific Investor Needs |
| INVESTMENT UNIVERSE BREAKDOWN1 |
|

The size and diversity of the small-company universe make it a unique and fertile area for investment. For 40 years, it has been our primary area of focus. Over that time, this universe has evolved into an established asset class, used by a wide range of investors, including institutions, consultants, advisors, and individuals. Today, there are numerous small-cap and micro-cap indexes and ETFs. Importantly, the continuous regeneration of the asset class, through the entrance of new companies, spin-offs, and IPOs, makes it an evergreen source of investment opportunities. This is why we have elected to focus on the smaller-company universe and believe it is ideally suited for a variety of distinct offerings. Market Cap The smaller company universe consists of more than 4,0001 publicly traded companies in the U.S. (and more than 21,0001 outside the U.S.). We break it down into two distinct market segments: micro-cap—companies with market caps up to $750 million—and small-cap—companies with market caps between $750 million and $2.5 billion. Sorting the universe into two markets is critical because, in our experience, each requires a portfolio approach based primarily on diversification needs. Our portfolio managers share a common investment approach, one that emphasizes paying attention to risk and buying what each thinks are strong businesses at discounted prices, but our portfolios also possess important differences that make each one unique. Portfolio Approach Our portfolio managers possess broad latitude within our investment universe, though in general they seek a combination of quality—measured by the balance sheet and returns on invested capital—and valuation. Portfolios that invest more heavily in micro-caps are, in general, more broadly diversified due to liquidity considerations; those that invest primarily in the upper end of small-cap portfolios universe tend to be more focused. In addition, we seek to take advantage of pockets of opportunity, such as dividend-paying companies, low-priced companies, turnarounds, special situations, etc., within each universe. Broadly Diversified Portfolios  A broadly diversified portfolio at Royce is one that generally holds more than 100 securities and whose top positions generally do not exceed 2% of net assets. Focused Portfolios  A focused portfolio at Royce is one that either (i) generally invests in no more than 100 companies and whose top positions generally exceed 2% of net assets, or (ii) invests primarily in a single sector. |
| The Royce Funds, other than Royce Special Equity Multi-Cap Fund, invest primarily in micro-cap, small-cap, and/or mid-cap stocks, which may involve considerably more risk than investing in larger-cap stocks (please see “Primary Risks for Fund Investors” in the prospectus). Each Fund may invest a portion of its net assets in foreign securities, which may involve political, economic, currency, and other risks not encountered in U.S. investments (please see “Investing in Foreign Securities” in the prospectus). Distributor: Royce Fund Services, Inc. |
| 2 | This page is not part of the 2013 Semiannual Report to Shareholders |
This guide is designed to help investors better understand both the different approaches and the common ground among our portfolios. Looking closely at our Fund Guide allows investors to see other important differences—in levels of volatility, sector orientation, and investment themes—within the context of our two key differentiators, namely market cap and portfolio approach. We think that understanding these differences can inform asset allocation decisions, especially when investors incorporate more than one Royce offering within their portfolios. Listed below are the Royce Funds included in this Semiannual Report, arranged by average market cap. For a complete listing of our Funds and their attributes please visit our website at www.roycefunds.com. |
 |
| Fund Tools Go online for more tools to help you better understand our Funds. Compare Funds > www.roycefunds.com/compare Prices & Performance > www.roycefunds.com/prices |
1 Geometric Average. This weighted calculation uses each portfolio holding’s market cap in a way designed to not skew the effect of very large or small holdings; instead, it aims to better identify the portfolio’s center, which Royce believes offers a more accurate measure of average market cap than a simple mean or median. |
| This page is not part of the 2013 Semiannual Report to Shareholders | 3 |
| Performance and Expenses | Through June 30, 2013 |
| Average Annual Total Returns | Gross Annual | Net Annual | ||||||||||||||||||||||||||||||
| Since | Since | Operating | Operating | |||||||||||||||||||||||||||||
| Fund | Year-to-Date1 | 1-Year | 5-Year | 10-Year | Inception | Inception Date | Expenses | Expenses | ||||||||||||||||||||||||
| Royce Select Fund I | 6.72 | % | 18.05 | % | 8.32 | % | 11.72 | % | 13.40 | % | 11/18/98 | 1.15 | % | 1.15 | % | |||||||||||||||||
| Royce Select Fund II | 6.37 | 14.81 | 9.43 | n.a. | 6.80 | 6/30/05 | 3.08 | 1.60 | ||||||||||||||||||||||||
| Royce Global Select Long/Short Fund | -9.15 | 0.20 | 1.45 | n.a. | 8.57 | 6/30/05 | 2.20 | 1.70 | ||||||||||||||||||||||||
| Royce Enterprise Select Fund | 11.49 | 21.93 | 7.37 | n.a. | 6.06 | 9/28/07 | 3.86 | 1.24 | ||||||||||||||||||||||||
| Royce Opportunity Select Fund | 17.88 | 36.45 | n.a. | n.a. | 20.99 | 8/31/10 | 2.67 | 1.38 | ||||||||||||||||||||||||
| Royce Micro-Cap Discovery Fund | 12.24 | 15.72 | 5.04 | n.a. | 5.36 | 10/3/03 | 2.94 | 1.49 | ||||||||||||||||||||||||
| Royce Financial Services Fund | 18.89 | 32.61 | 8.23 | n.a. | 7.44 | 12/31/03 | 1.96 | 1.58 | ||||||||||||||||||||||||
| Royce SMid-Cap Value Fund | 4.80 | 17.84 | 4.25 | n.a. | 3.65 | 9/28/07 | 1.90 | 1.35 | ||||||||||||||||||||||||
| Royce Focus Value Fund | 4.41 | 14.01 | n.a. | n.a. | 13.52 | 2/27/09 | 2.06 | 1.36 | ||||||||||||||||||||||||
| Royce Partners Fund | 12.13 | 26.14 | n.a. | n.a. | 12.60 | 4/27/09 | 4.85 | 1.37 | ||||||||||||||||||||||||
| Royce Special Equity Multi-Cap Fund | 17.81 | 23.27 | n.a. | n.a. | 14.75 | 12/31/10 | 1.51 | 1.39 | ||||||||||||||||||||||||
| Royce European Smaller-Companies Fund | 2.31 | 20.19 | 3.98 | n.a. | 2.45 | 12/29/06 | 2.16 | 1.72 | ||||||||||||||||||||||||
| Royce Global Dividend Value Fund | 1.97 | 18.11 | n.a. | n.a. | 2.26 | 12/31/10 | 2.87 | 1.70 | ||||||||||||||||||||||||
| Royce International Micro-Cap Fund | -0.46 | 8.56 | n.a. | n.a. | -4.67 | 12/31/10 | 3.97 | 1.76 | ||||||||||||||||||||||||
| Royce International Premier Fund | 4.60 | 18.86 | n.a. | n.a. | 2.92 | 12/31/10 | 3.54 | 1.69 | ||||||||||||||||||||||||
| 1 Not annualized | ||||||||||||||||||||||||||||||||
Important Performance, Expense, and Risk Information
All performance information in this Review and Report reflects past performance, is presented on a total return basis, reflects the reinvestment of distributions, and does not reflect the deduction of taxes a shareholder would pay on fund distributions or the redemption of fund shares. Past performance is no guarantee of future results. Investment return and principal value of an investment will fluctuate, so that shares may be worth more or less than their original cost when redeemed. Shares redeemed within 180 days of purchase may be subject to a 1% redemption fee payable to the Fund (2% for Royce Select II, Global Select Long/Short, European Smaller-Companies, Global Dividend Value, International Micro-Cap, and International Premier Funds). Redemption fees are not reflected in the performance shown above; if they were, performance would be lower. Current performance may be higher or lower than performance quoted. Current month-end performance may be obtained at www.roycefunds.com. All performance and expense information reflects results of the Fund’s oldest share Class (Investment Class or Service Class, as the case may be). Price and total return information is based on net asset values calculated for shareholder transactions. Gross annual operating expenses reflect the Fund’s gross total annual operating expenses and include management fees, any 12b-1 distribution and service fees, other expenses, and any applicable acquired fund fees and expenses. Net annual operating expenses reflect contractual fee waivers and/or reimbursements. All expense information is reported as of the Fund’s most current prospectus. Royce & Associates has contractually agreed to waive fees and/or reimburse operating expenses, other than acquired fund fees and expenses, if any, to the extent necessary to maintain net operating expenses at or below: 1.35% for Royce Focus Value and Partners Funds; 1.39% for Royce Special Equity Multi-Cap Fund; 1.49% for Royce Micro-Cap Discovery and Financial Services Funds; and 1.69% for Royce European Smaller-Companies, Global Dividend Value, International Micro-Cap and International Premier Funds through April 30, 2014, at or below: 1.24% for Royce Enterprise Select and Opportunity Select Funds; and 1.49% for Royce Select II and Royce Global Select Long/Short Funds through April 30, 2015, at or below: 1.99% for Royce Select Fund II, Global Select Long/Short, Enterprise Select, Opportunity Select, Micro-Cap Discovery, Focus Value, Partners, European Smaller-Companies, Global Dividend Value, International Micro-Cap and International Premier Funds through April 30, 2023. Acquired fund fees and expenses reflect the estimated amount of fees and expenses incurred indirectly by the Fund through its investments in mutual funds, hedge funds, private equity funds and other investment companies. Shares of the Funds’ Service Class bear an annual distribution expense that is not borne by the Funds’ Investment Class. Investments in securities of micro-cap, small-cap, and/or mid-cap companies may involve considerably more risk than investments in securities of larger-cap companies. (Please see “Primary Risks for Fund Investors” in the prospectus.) Royce Select I, Select II, Global Select Long/Short, Enterprise Select, and Opportunity Select Funds may sell securities short which involves selling a security it does not own in anticipation that the security’s price will decline. Short sales present unlimited risk on an individual stock basis since the Fund may be required to buy security sold short at a time when the security has appreciated in value. Royce Global Select Long/Short, European Smaller-Companies, Global Dividend Value, International Micro-Cap, and International Premier Funds invest a significant portion of their respective assets in foreign companies that may be subject to different risks than investments in securities of U.S. companies, including adverse political, social, economic, or other developments that are unique to a particular country or region. (Please see “Investing in Foreign Securities” in the prospectus.) Therefore, the prices of securities of foreign companies in particular countries or regions may, at times, move in a different direction than those of securities of U.S. companies. (Please see “Primary Risk of Fund Investors” in the prospectus.) Please read the prospectus carefully before investing or sending money. Distributor: Royce Fund Services, Inc. |
| 4 | This page is not part of the 2013 Semiannual Report to Shareholders |
| Portfolio Characteristics | Through June 30, 2013 | ||||||||||||||||||||||||||||
| Longevity | Average | 2012 | % of | Five-Year | |||||||||||||||||||||||||
| of Fund | Market | Number of | Turnover | Non-U.S. | Standard | ||||||||||||||||||||||||
| Fund | Portfolio Manager(s) | (in years) | Cap1 | Holdings | Rate | Securities | Deviation | ||||||||||||||||||||||
| Royce Select Fund I | Lauren Romeo | 14 | $1,884 | 74 | 54 | % | 8.3 | % | 21.50 | ||||||||||||||||||||
| Royce Select Fund II | Jim Harvey | 8 | 889 | 86 | 123 | 34.7 | 2 | 24.10 | |||||||||||||||||||||
| Royce Global Select Long/Short Fund | David Nadel | 8 | 1,299 | 72 | 77 | 108.3 | 2 | 22.43 | |||||||||||||||||||||
| Royce Enterprise Select Fund | Steven McBoyle | 5 | 3,882 | 59 | 127 | 5.4 | 16.63 | ||||||||||||||||||||||
| Royce Opportunity Select Fund | Bill Hench | 2 | 703 | 92 | 196 | 4.5 | 2 | n.a. | |||||||||||||||||||||
| Royce Financial Services Fund | Chuck Royce | 9 | 2,933 | 86 | 26 | 24.4 | 23.38 | ||||||||||||||||||||||
| Royce Micro-Cap Discovery Fund | George Necakov, Jim Harvey | 9 | 416 | 101 | 87 | 4.2 | 23.46 | ||||||||||||||||||||||
| Royce SMid-Cap Value Fund | Steven McBoyle, Whitney George | 5 | 3,493 | 47 | 46 | 26.0 | 22.72 | ||||||||||||||||||||||
| Royce Focus Value Fund | George Wyper | 4 | 4,243 | 52 | 21 | 12.4 | n.a. | ||||||||||||||||||||||
| Royce Partners Fund | Chuck Royce | 4 | 3,624 | 60 | 31 | 29.0 | n.a. | ||||||||||||||||||||||
| Royce Special Equity Multi-Cap Fund | Charlie Dreifus | 2 | 23,858 | 29 | 14 | n.a. | n.a. | ||||||||||||||||||||||
| Royce European Smaller-Companies Fund | David Nadel, Chuck Royce | 6 | 1,081 | 79 | 22 | 96.1 | 25.92 | ||||||||||||||||||||||
| Royce Global Dividend Value Fund | Chuck Royce | 2 | 1,217 | 154 | 36 | 83.4 | n.a. | ||||||||||||||||||||||
| Royce International Micro-Cap Fund | David Nadel | 2 | 346 | 115 | 62 | 94.3 | n.a. | ||||||||||||||||||||||
| Royce International Premier Fund | David Nadel | 2 | 1,664 | 51 | 103 | 99.3 | n.a. | ||||||||||||||||||||||
| 1 | Geometric Average. This weighted calculation uses each portfolio holding’s market cap in a way designed to not skew the effect of very large or small holdings; instead, it aims to better identify the portfolio’s center, which Royce believes offers a more accurate measure of average market cap than a simple mean or median. |
| 2 Long positions only. | |
| This page is not part of the 2013 Semiannual Report to Shareholders | 5 |
 Charles M. Royce, President As it has for the past few years, sentiment once again shifted dramatically in the second quarter and volatility returned to the markets. However, unlike the previous few years, it was the bond market that felt the brunt of the pain as speculation that the Federal Reserve may soon pull back from its unprecedented stimulus efforts fueled a one percentage point jump in 10-year Treasury yields during the final two months of the quarter. After gaining 12.4% in the first quarter of 2013, the Russell 2000 Index advanced 3.1% in the second quarter, finishing the first half of the year with a 15.9% gain. At the same time, the CBOE Volatility Index (VIX), after hitting a fresh 2013 low in March 2013, spiked 33% in the second quarter—the largest quarterly increase since the third quarter of 2011. In the span of one quarter, we have transitioned from a world in which the idea that interest rates would remain indefinitely low to one in which the shift back to a more normalized yield environment is now center stage. Continued on page 8... | Letter to Our Shareholders Exile on Wall Street The small-cap market reached peaks in July 2007 and April 2011 before surging to its most recent record highs. Surveying the small-cap landscape from the vantage points of these respective summits shows that each cycle (the second of which is still going on) has presented a difficult environment for active managers such as the parties penning this letter. This has been particularly true of the most recent period, which has seen solid results for the major small-cap indexes, ETFs, and other passive investment vehicles, while the active managers who once routinely outperformed all of them have achieved more muted results. The current phase has favored more defensive sectors and investments with high dividend yields, such as REITs and MLPs. Strong balance sheets and higher-quality metrics such as returns on invested capital (ROIC) have also been out of favor in this world of easy money and zero interest rates that tends to be more supportive of lower-quality businesses. And we have not even mentioned the flight to fixed income, which, along with the proliferation of ETFs, has been one of the most significant developments in the investment world during the last three-plus years. These events took shape in a market that has featured regular spasms of high volatility and periods of declining stock prices, some of them of a historically extreme nature. These are periods in which fundamentally driven active management approaches such as ours have historically proven their worth. That many of our portfolios struggled to preserve their value as effectively as they have done historically during the market downturns since the pre-crisis peak in July 2007 has been frustrating and humbling, to say the least. Yet investing is a routinely humbling business. This is not the first time (and almost certainly won’t be the last) in which we | ||
| 6 | This page is not part of the 2013 Semiannual Report to Shareholders |
have endured a prolonged relative slump versus the small-cap market as a whole. But behind every contrarian, especially an out-of-sync one, is a disciplined investor. By buying out-of-favor companies and rooting around beaten down sectors and industries, we do things every day that may not look particularly savvy to many on Wall Street, at least in the short run. After 40 years, we are used to doing things according to our own principles and long-term time frame and do not mind being something akin to exiles on Wall Street. It should come as no surprise, then, that we are not persuaded—or even bothered—by those voices suggesting that active management has perhaps seen its day in the sun. With ETFs and high-frequency trading seemingly making markets that much more efficient, with so many investors disenchanted with equities, and with sustained periods of relative underperformance in the books, perhaps (so the argument runs) active managers should simply switch to indexing or find another line of work. To be sure, the last several years have given us little to crow about (while serving up plenty of crow to eat). However, we remain as enthusiastic as ever about active management in general and value-oriented small-cap investing in particular. To paraphrase Mark Twain, we find reports of the death of active management to be greatly exaggerated. So while lower-quality stocks have dominated the market and outperformed many of our holdings through the current cycle, we are undeterred in our conviction that well-run, cash-rich businesses with high returns on invested capital remain the best route to building long-term wealth. It is also important to remember that many stocks possessing these attributes have done very well on an absolute basis through the current cycle even as they have suffered in comparison to their more defensive or higher-yielding cohorts. Finally, we have already seen signs of a change in which we think the kind of higher-quality companies that we favor can assume a leadership role. There were encouraging signals in May and in the second half of 2012 that investors were giving more thought to fundamentals. In short, we are excited about the days ahead. We are bullish not only on stocks but, more important, on our specific approach to quality and active management. Tumbling Dice When 2012 drew to a close, we were equally optimistic. The second half of 2012 offered much that was good for what ailed quality-centric investors. The last few months in particular saw a brief resurgence of quality as many companies with strong balance sheets, high ROIC, and strong cash flow characteristics outpaced the rest of the small-cap market. This rally did not last long into 2013, however, as more highly levered and lower-ROIC businesses soon resumed leadership. Quality stocks for the most part acquitted themselves well in the bullish first quarter; they simply did not attract as much interest as more defensive areas. The strongest sectors for the small-cap Russell 2000 Index during the first quarter were Health Care, | By buying out-of-favor companies and rooting around beaten down sectors and industries, we do things every day that may not look particularly savvy to many on Wall Street, at least in the short run. After 40 years, we are used to doing things according to our own principles and long-term time frame and do not mind being something akin to exiles on Wall Street. | |
| This page is not part of the 2013 Semiannual Report to Shareholders | 7 |
From our perspective, the end to the easy money bias that has been in place for several years presents an attractive environment for active managers with an absolute orientation like us, as underlying fundamentals and less-leveraged balance sheets should become increasingly more important. We have long thought that the ongoing efforts to reflate the economy through numerous quantitative easings and a zero interest rate policy would have unintended consequences. To be sure, the actions of the Fed have been distorting asset pricing and valuations in the equity market in a number of ways. Many of the fundamental qualities we hold so dear, for example, seem temporarily suspended in an investment world where highly-leveraged businesses are benefiting from the ability to restructure their debt, lower funding costs, and extend maturities. The unintended consequence of leveling the playing field has given lower-quality companies the luxury of time, which in a normal environment they would not have. It would not surprise us to see these trends reverse as tapering is implemented and monetary stimulus is slowly trimmed back and ultimately withdrawn. Continued on page 10... | Letter to Our Shareholders Consumer Discretionary, and Financials, the latter drawing much of its strength from REITs. More cyclical sectors such as Technology and Energy, which we see as featuring some of the most attractively valued, high-quality companies available over the last couple of years, lagged. The result was a strong opening quarter for stocks across the board. Small-caps led, showing positive returns for the third consecutive quarter. The Russell 2000 gained 12.4% compared to respective gains of 11.0% and 10.6% for the large-cap Russell 1000 and S&P 500 Indexes, while the more tech-oriented Nasdaq Composite rose 8.2%. Quality stocks resuming their back seat was not entirely surprising. Stocks as a whole have been on an encouraging roll since the low on June 2, 2012, so some give-back was not entirely unexpected, even if it was somewhat disappointing. Going into the second quarter, we were confident that the rally could last, though we also assumed that a correction would be a natural part of a longer-term bullish trend, as has been the case over the past several years. While share prices all over the globe were more volatile in the second quarter, on the domestic front a rocky market still resulted in positive returns, with strength across all asset classes. The tech-oriented Nasdaq Composite led for the quarter with a 4.2% advance. Small-cap edged out the large-cap indexes, with the Russell 2000 up 3.1% for the quarter compared to respective gains of 2.9% and 2.7% for the S&P 500 and Russell 1000 Indexes. One-year results were also strong for the major indexes, with the Russell 2000 leading (+24.2%), followed by the Russell 1000 (+21.2%), S&P 500 (+20.6%), and Nasdaq (+16.0%). Three-year results were even more closely aligned, offering compelling evidence of just how tightly correlated equity returns have been. Average annual total returns for the three-year period ended June 30, 2013 for the Russell 2000 (+18.7%), the Russell 1000 (+18.6%), and S&P 500 (+18.5%) were within two-tenths of one another while the Nasdaq rose 17.3% over the same span. That stocks continue to perform well could be seen by the fact that trailing one-, five-, and 10-year results for the small-cap and two large-cap indexes were well ahead of their returns for the same periods ended one year prior. Micro-cap returns also continued their ascent. The Russell Microcap Index gained 18.3% year-to-date through June 30, 2013. Its one-year result was also strong, up 25.4%. The micro-cap index’s trailing three-, five-, and 10-year results were also fine, though it trailed the Russell 2000 in these periods. By contrast, mid-caps narrowly underperformed year-to-date—the Russell Midcap Index rose 15.5% through the end of June—but outpaced their small-cap peers for the one-, three-, 10-, 15-, 20-, and 25-year periods ended June 30, 2013. This impressive long-term record helps to explain why we think of mid-caps as the market’s stealth asset class. | ||
| 8 | This page is not part of the 2013 Semiannual Report to Shareholders |
Shine a Light Among The Royce Funds in this Semiannual Review and Report, Royce Opportunity Select, Financial Services, Special Equity Multi-Cap, and International Premier Funds outperformed their respective benchmarks for the year-to-date period through the end of June, providing four happy exceptions to what was otherwise a lackluster six months on a relative basis. The other Funds ran the gamut. Three portfolios turned in strong absolute results—Royce Enterprise Select, Micro-Cap Discovery, and Partners Funds. Royce Select Fund I, Select Fund II, SMid-Cap Value, and Focus Value Funds were not as robust, but still posted respectable absolute returns. Those portfolios that fared less well—Royce Global Select Long/Short, European Smaller-Companies, Global Dividend Value, and International Micro-Cap Funds—shared a significant exposure to non-U.S. stocks, many of which struggled in the first half. As a group, the Funds featured in this Semiannual Review and Report had strong results from several sectors, including Financials, Information Technology, Industrials, and Consumer Discretionary. Those portfolios with anything beyond a modest amount of exposure to the Materials sector generally paid a high price in the form of sizable net losses. These declines came overwhelmingly from the metals & mining industry, and especially from precious metals mining companies, a once sterling industry that has recently become a persistent trouble spot for a few Royce-managed portfolios. In the first quarter cyclical companies mostly lagged defensive sectors, but the second quarter offered a more eclectic, and thus encouraging, mix. Within the Russell 2000, both Consumer-oriented sectors remained strong, as did Health Care, Information Technology, and Telecommunications Services. However, the more cyclical Energy, Materials, and Industrials sectors fell, as did more high-yielding areas such as REITs and Utilities. The S&P 500 showed a similarly scrambled pattern among large-cap sector returns. Although painful in the short term, we see this growing differentiation as a very positive sign that the U.S. market is beginning to break out of its correlation groove. | We are bullish not only on stocks but, more important, on our specific approach to quality and active management. | |||
| This page is not part of the 2013 Semiannual Report to Shareholders | 9 |
| To be clear, our balance sheet scrutiny is paramount to our process, particularly our focus on risk. To that end, we have always chosen to focus on companies with high operating leverage. Our measure of financial leverage centers on the ratio of assets to stockholders’ equity, looking for a two-to-one ratio for non-financial companies. This is an important part of our ongoing search for a company’s “margin of safety.” If a company is carrying too much debt, it impedes its own ability to meet the challenge of out-of-left-field occurrences such as lawsuits, the loss of a major customer, or overseas currency crises. A conservatively capitalized company, especially a smaller company, can better weather these storms because it has the necessary financial reserves to do so, while a company with too much debt on the balance sheet runs a greater risk that stormy weather will turn into a hurricane. We also view financially strong companies as well-positioned to grow. The assets of these companies are derived more from retained earnings than paid-in capital, i.e., they have the ability to self-fund their own success as a business. Continued on page 12... | ||||
| Letter to Our Shareholders |
2013 YEAR-TO-DATE TOTAL RETURNS FOR THE ROYCE FUNDS VS. BENCHMARK INDEXES as of 6/30/13 |
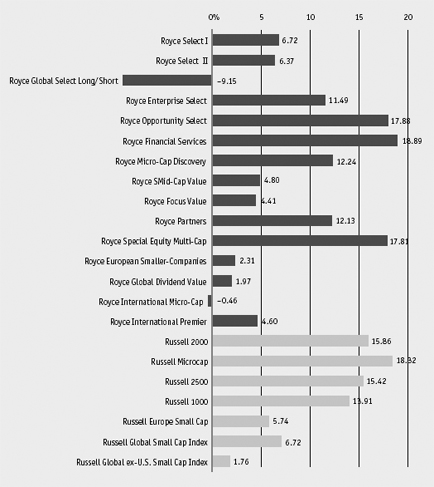 |
Let it Loose During the first half of 2013 the stock market displayed a broadly similar pattern of results to the first halves of 2010, 2011, and 2012. This was a model in which a robustly bullish first quarter gave way to a far more volatile second quarter, with a sudden shift in market sentiment driven primarily by global macro issues. However, this year’s first half also showed some notable differences that suggest a break with the market’s previously unyielding pattern of the last three calendar years—a pattern marked by closely correlated returns and, as a result, relatively uninspired results for many active managers. For example, during the first quarter of 2013 the market was remarkably good at tuning out a great deal of ominous political news. When Congress and the President failed to produce a long-term plan to tackle the deficit, the market mostly shrugged and continued to climb. When sequestration began to take effect in the aftermath of the stalled budget negotiations, stocks once again paused then resumed moving upward. |
| 10 | This page is not part of the 2013 Semiannual Report to Shareholders |
 | ||
This stood in stark contrast to what we saw in 2010, 2011, and most of the first half of 2012, when the markets seemed to react to little other than macro headlines that were themselves largely driven by political events. In addition, when macro issues did inspire a sell-off, year-to-date returns were not too adversely affected, with most stocks and domestic indexes escaping the more uncertain second quarter of 2013 in the black despite a 33% second-quarter spike in the CBOE Volatility Index (VIX). This increase was the largest quarterly advance for the VIX, which hit a fresh 2013 low in March before spiking higher, since the third quarter of 2011. Another significant deviation from the pattern of previous years was the pain born by the bond market. Speculation that the Fed would taper its stimulus efforts fueled a full one percentage point jump in 10-year Treasury yields during May and June. We saw an encouraging variation in performance at the stock, industry, and sector levels, which was especially pronounced in these same two months, as signals that the economy was slowly finding its way back to more historically normal—that is, less Fed-dependent—levels of growth and activity. Happy? All of this makes us optimistic. Our contention is that the unusual performance pattern spurred by the effects of multiple rounds of QE and zero interest rates has begun to unwind, which will set the stage for more fundamentally based value-oriented approaches to take hold of market leadership. One sign that the process has already begun is that in the space of roughly three months we have moved from an environment in which many believed that interest rates would remain low indefinitely to one in which more historically normal | Our contention is that the unusual performance pattern spurred by the effects of multiple rounds of QE and zero interest rates has begun to unwind, which will set the stage for more fundamentally based value- oriented approaches to take hold of market leadership. |
| This page is not part of the 2013 Semiannual Report to Shareholders | 11 |
| Of course, transitions are never easy. Shifting back to a more normalized yield environment is likely to be marked by increased volatility and pockets of uncertainty. Stock prices have begun the transition from their reliance on monetary policy to fundamentals, which is a process we believe will stress the importance of companies with strong, less-leveraged balance sheets, excess cash flow generation, and the ability to self-finance. We look forward to a more normalized yield environment that could usher in that long-awaited flight to quality. | yields are inching closer and closer. We have argued that an unintended consequence of QE and zero interest rates has been to make life a little too easy for lower-quality companies. Highly levered businesses have been able to re-finance their obligations at record low rates and thus not pay the usual economic cost for being over-levered. This unnatural and (we believe) temporary advantage reduced the attractiveness of the conservatively capitalized businesses that have been our portfolio mainstays since the early 1970s. However, with Fed policy changing, we are moving closer to a market in which strong fundamentals are likely to be in high demand once more. What Ben Bernanke actually said back in June about the Fed potentially tapering its bond purchases seemed entirely positive. Many of us have been waiting for the economy and the markets to return to more historically normal conditions for some time. We have been especially eager to see interest rates normalize, which would be as sure a sign as any that the economy and markets are operating at something like business as usual (and this period of QE and zero interest rates has been anything but that). We suspect an environment in which the Fed is not as intimately involved in the economy will be a healthy one for stocks. So while many investors saw the Fed’s plans to taper bond purchases as a cause for alarm, we saw it as an affirmation that the economy is healing as it grows. Within the next couple of years, it should grow even stronger. Along with more historically normal—that is, higher—rates, this would be a very welcome development for equities in our view, particularly the kind of attractively valued, well-run, financially strong small-cap businesses that remain our favorites. Guarded optimism may be as close to bliss as we can usually get, but we have seldom felt more confident about our investment approach than we do right now, looking out on the months and years to come. Sincerely, | |||||
 |  |  | ||||
| Charles M. Royce | W. Whitney George | Jack E. Fockler, Jr. | ||||
| President | Vice President | Vice President | ||||
| July 31, 2013 | ||||||
| 12 | This page is not part of the 2013 Semiannual Report to Shareholders |
| Table of Contents | ||
| Semiannual Report to Shareholders | ||
| Managers’ Discussions of Fund Performance | ||
| Royce Select Fund I | 14 | |
| Royce Select Fund II | 16 | |
| Royce Global Select Long/Short Fund | 18 | |
| Royce Enterprise Select Fund | 20 | |
| Royce Opportunity Select Fund | 22 | |
| Royce Micro-Cap Discovery Fund | 24 | |
| Royce Financial Services Fund | 26 | |
| Royce SMid-Cap Value Fund | 28 | |
| Royce Focus Value Fund | 30 | |
| Royce Partners Fund | 32 | |
| Royce Special Equity Multi-Cap Fund | 34 | |
| Royce European Smaller-Companies Fund | 36 | |
| Royce Global Dividend Value Fund | 38 | |
| Royce International Micro-Cap Fund | 40 | |
| Royce International Premier Fund | 42 | |
| Schedules of Investments and Financial Statements | 44 | |
| Notes to Financial Statements | 86 | |
| Understanding Your Fund’s Expenses | 93 | |
| Trustees and Officers | 94 | |
| Board of Approval Investment Advisory Agreements | 95 | |
| Notes to Performance and Other Important Information | 97 | |
| The Royce Funds 2013 Semiannual Report to Shareholders | 13 |
| Royce Select Fund I |
AVERAGE ANNUAL TOTAL RETURNS Through 6/30/13 | ||||||||||
| January–June 20131 | 6.72 | % | ||||||||
| One-Year | 18.05 | |||||||||
| Three-Year | 13.05 | |||||||||
| Five-Year | 8.32 | |||||||||
| 10-Year | 11.72 | |||||||||
| Since Inception (11/18/98) | 13.40 | |||||||||
| ANNUAL EXPENSE RATIO | ||||||||||
| Operating Expenses | 1.15 | % | ||||||||
| 1 Not annualized | ||||||||||
| CALENDAR YEAR TOTAL RETURNS | ||||||||||
| Year | RS1 | Year | RS1 | |||||||
| 2012 | 13.7 | % | 2005 | 10.9 | % | |||||
| 2011 | -3.6 | 2004 | 19.1 | |||||||
| 2010 | 18.2 | 2003 | 48.7 | |||||||
| 2009 | 39.6 | 2002 | -15.8 | |||||||
| 2008 | -25.9 | 2001 | 24.5 | |||||||
| 2007 | 10.7 | 2000 | 15.0 | |||||||
| 2006 | 15.0 | 1999 | 35.4 | |||||||
| TOP 10 POSITIONS % of Net Assets | ||||||||||
| Reliance Steel & Aluminum | 3.1 | % | ||||||||
| Federated Investors Cl. B | 2.9 | |||||||||
| Helmerich & Payne | 2.9 | |||||||||
| Alleghany Corporation | 2.7 | |||||||||
| Oil States International | 2.3 | |||||||||
| MKS Instruments | 2.1 | |||||||||
| Unit Corporation | 2.1 | |||||||||
| ATMI | 2.0 | |||||||||
| GrafTech International | 2.0 | |||||||||
| Bio-Rad Laboratories Cl. A | 2.0 | |||||||||
| PORTFOLIO SECTOR BREAKDOWN % of Net Assets | ||||||||||
| Industrials | 22.8 | % | ||||||||
| Information Technology | 22.6 | |||||||||
| Energy | 13.4 | |||||||||
| Financials | 8.7 | |||||||||
| Materials | 8.3 | |||||||||
| Consumer Discretionary | 7.9 | |||||||||
| Health Care | 5.9 | |||||||||
| Consumer Staples | 1.4 | |||||||||
| Miscellaneous | 2.9 | |||||||||
| Cash and Cash Equivalents | 6.1 | |||||||||
 | |||||||||
Manager’s Discussion The first-half performance of Royce Select Fund I (RS1) left us a little vexed. On the one hand, we found the Fund’s absolute result satisfactory; on the other hand, its relative performance left a great deal to be desired. For the year-to-date period ended June 30, 2013, RS1 gained 6.7%, well behind the 15.9% advance for its small-cap benchmark, the Russell 2000, over the same period. This was frustrating in light of the Fund’s impressive showing in the second half of 2012 when RS1 outpaced the small-cap index, gaining 10.6% versus 7.2%. We were hoping for improved absolute and relative results as well as a market that would continue to be less enamored of high yield and instant growth and more attracted to companies with strong fundamentals. So while the first quarter of 2013 was bullish, it appeared to be a different sort of bull run than what we saw in last year’s second half. RS1 was up 7.3% in the first quarter, trailing the Russell 2000, which climbed 12.4%. The second quarter brought a wave of volatility, more uncertainty, and enough variation in sector, industry, and company results to rekindle our hopes that the long period of close correlation and higher returns for lower-quality businesses was finally ending. However, the Fund fell further behind the Russell 2000 between the beginning of April and the end of June, a period in which RS1 lost ground to the small-cap index during the more volatile months of the second quarter. In April the Fund fell 3.1% versus a loss of 0.4% for the Russell 2000; in June RS1 slipped 2.7% compared to a 0.5% decline of the small-cap index. The Fund did beat the benchmark in May, a bullish month in which RS1 was up 5.4% compared to 4.0% for the Index. For the second quarter as a whole the Fund finished with a disappointing loss of 0.5% versus a 3.1% gain for the Russell 2000. Much of this decline can be traced to the portfolio’s holdings in four industry groups—metals & mining, electronic equipment, instruments & components, commercial services & supplies, and electrical equipment. RS1 did maintain a performance advantage over its benchmark for longer-term periods, outpacing the Russell 2000 for the 10-year and since inception (11/18/98) periods ended June 30, 2013. The Fund’s average annual total return since inception was 13.4%. Based in Houston, Oil States International provides products and services to oil and gas companies, including connection technology for offshore oil and gas development and production, the distribution of tubular products, hydraulic workover and well control services, and remote site accommodations, catering, and logistics. Its expertise in a wide variety of | |||||||||
| 14 | The Royce Funds 2013 Semiannual Report to Shareholders |
Performance and Portfolio Review energy-related fields helped to fuel our initial interest in the company. Its share price skyrocketed at the end of April on news that activist shareholders were asking the company’s management to create a REIT from its oilfield accommodation business. Its sharp rise notwithstanding, we liked its other business lines, valuation, and ongoing prospects enough for it to be the Fund’s fifth-largest holding at the end of June. We remain very fond of both the core business and long-term prospects for asset manager and money market specialist Federated Investors. Its shares benefited from the “taper tantrum” pulled by the financial markets—for example, the 50 basis point rise in the 10-year Treasury note and the negative results for equity bond proxies such as REITs and Utilities in the second quarter—as rising rates that ultimately lift short rates should enable the firm to eliminate fee waivers and thus unlock earnings that have been hampered by the Fed’s zero interest rate policy. Although we trimmed our position in May and June, we held a large stake at the end of the period, when it was the Fund’s second-largest holding. ADTRAN, which makes networking and communications equipment primarily for telecommunications networks, made the move from 2012’s “Good Ideas at the Time” list to a more favorable status as one of the first half’s top contributors. Its stock price hit a low in early April before rebounding on stronger-than-expected fiscal first quarter earnings. Although we took gains between March and May, it was the Fund’s seventeenth-largest holding at the end of the period. Aixtron is a German business that manufactures metal organic chemical vapor deposition (MOCVD) equipment for the semiconductor industry. Like ADTRAN, its price was volatile during the first half, though it recovered and mostly rose following a late April low. While revenues and margins fell below analysts’ expectations, the company’s even-keeled pre-announcement, improving utilization rates, and efforts to better manage its cost structure seemed to help bring investors back. Top-10 holding GrafTech International manufactures synthetic and natural graphite and carbon-based products that are used to produce steel. We still like its long-term prospects, but stiffer competition and weak demand that hurt pricing led its share price down. Major Drilling Group International provides contract drilling services for the metals industry. Its stock struggled in the face of weak precious and base metals prices and slumping demand that slowed drilling activity and rig utilization while increasing pricing pressure. After buying shares in the first quarter, we reduced our position from 2012 levels in the second quarter. |
 |
| Includes reinvestment of distributions. | |||
| PORTFOLIO DIAGNOSTICS | |||
| Fund Net Assets | $44 million | ||
| Number of Holdings | 74 | ||
| Turnover Rate | 30% | ||
| Average Market Capitalization1 | $1,884 million | ||
| Weighted Average P/E Ratio2,3 | 17.3x | ||
| Weighted Average P/B Ratio2 | 1.8x | ||
| U.S. Investments (% of Net Assets) | 85.6% | ||
| Non-U.S. Investments (% of Net Assets) | 8.3% | ||
| Symbol | RYSFX | ||
1 Geometric Average. This weighted calculation uses each portfolio holding’s market cap in a way designed to not skew the effect of very large or small holdings; instead, it aims to better identify the portfolio’s center, which Royce believes offers a more accurate measure of average market cap than a simple mean or median. | |||
2 Harmonic Average. This weighted calculation evaluates a portfolio as if it were a single stock and measures it overall. It compares the total market value of the portfolio to the portfolio’s share in the earnings or book value, as the case may be, of its underlying stocks. | |||
3 The Fund’s P/E calculation excludes companies with zero or negative earnings (8% of portfolio holdings as of 6/30/13). | |||
| MORNINGSTAR STATISTICAL MEASURES1 | |||
| Sharpe Ratio | Standard Deviation | ||
| RS1 | 0.47 | 21.50 | |
| Russell 2000 | 0.46 | 24.07 | |
| Category Median | 0.46 | 23.47 | |
| Best Quartile Breakpoint | 0.52 | 22.36 | |
1 Five years ended 6/30/13. Category Median and Best Quartile Breakpoint based on 348 small-cap objective funds (oldest class) with at least five years of history. | |||
The Fund beat the Russell 2000 and performed within the top 50% of small-cap objective funds on a risk-adjusted basis, as shown by its Sharpe ratio. In addition, the Fund produced lower volatility than the Russell 2000 and 75% of small-cap objective funds, as shown by its standard deviation. | |||
DOWN MARKET PERFORMANCE COMPARISON | |||
 | |||
| The Royce Funds 2013 Semiannual Report to Shareholders | 15 |
| Royce Select Fund II |
AVERAGE ANNUAL TOTAL RETURNS Through 6/30/13 | ||||||||||
| January–June 20131 | 6.37 | % | ||||||||
| One-Year | 14.81 | |||||||||
| Three-Year | 9.80 | |||||||||
| Five-Year | 9.43 | |||||||||
| Since Inception (6/30/05) | 6.80 | |||||||||
| ANNUAL EXPENSE RATIOS | ||||||||||
| Gross Operating Expenses | 3.08 | % | ||||||||
| Net Operating Expenses | 1.60 | |||||||||
| 1 Not Annualized | ||||||||||
| CALENDAR YEAR TOTAL RETURNS | ||||||||||
| Year | RS2 | Year | RS2 | |||||||
| 2012 | 13.8 | % | 2008 | -33.4 | % | |||||
| 2011 | -14.0 | 2007 | -5.5 | |||||||
| 2010 | 21.0 | 2006 | 19.8 | |||||||
| 2009 | 66.6 | |||||||||
| TOP 10 LONG POSITIONS % of Net Assets | ||||||||||
| Bankrate | 2.6 | % | ||||||||
| Federated Investors Cl. B | 2.2 | |||||||||
| First Resources | 2.2 | |||||||||
| Analogic Corporation | 2.2 | |||||||||
| Teradyne | 2.0 | |||||||||
| Minerals Technologies | 2.0 | |||||||||
| FamilyMart | 1.8 | |||||||||
| Total System Services | 1.8 | |||||||||
| Acacia Research-Acacia Technologies | 1.8 | |||||||||
| Destination Maternity | 1.6 | |||||||||
| SHORT POSITIONS % of Net Assets | ||||||||||
| Direxion Daily Small Cap Bull 3X Shares | -1.2 | % | ||||||||
VelocityShares Daily Inverse VIX Short Term ETN | -1.0 | |||||||||
| iShares 20+ Year Treasury Bond ETF | -0.6 | |||||||||
| Direxion Daily Financial Bear 3X Shares | -0.5 | |||||||||
| PORTFOLIO SECTOR BREAKDOWN1 % of Net Assets | ||||||||||
| Information Technology | 25.0 | % | ||||||||
| Consumer Discretionary | 15.0 | |||||||||
| Industrials | 14.0 | |||||||||
| Financials | 8.2 | |||||||||
| Consumer Staples | 6.4 | |||||||||
| Materials | 5.7 | |||||||||
| Health Care | 4.9 | |||||||||
| Energy | 4.9 | |||||||||
| Telecommunication Services | 1.2 | |||||||||
| Miscellaneous | 4.6 | |||||||||
| Cash and Cash Equivalents | 10.1 | |||||||||
| 1 Long positions only | ||||||||||
 |
Manager’s Discussion Royce Select Fund II (RS2) gained 6.4% for the year-to-date period ended June 30, 2013 versus a 15.9% increase for its domestic small-cap benchmark, the Russell 2000 Index, and a 6.7% gain for its global benchmark, the Russell Global Small Cap Index, for the same period. While the Fund posted a solid result on an absolute basis, its relative performance was disappointing, especially in the context of a highly volatile market in which we would typically expect the Fund to perform better. (It should be noted that since May 1, 2011 the Fund may invest in U.S. and/or non-U.S. securities and there is no limit to the Fund’s foreign exposure. As a result, we introduced the Russell Global Small Cap Index as an additional benchmark for the Fund.) We were hoping for improved absolute and relative results as well as a market that would continue to be less enamored of high yield and instant growth and more attracted to companies with strong fundamentals. So while the first quarter of 2013 was bullish, it was not the sort of bull run that we were hoping for. RS2 was up 5.9% in the first quarter, trailing both the Russell 2000, which climbed 12.4%, and the global small-cap index, which advanced 8.6%. The second quarter brought a wave of volatility, more uncertainty, and enough variation in sector, industry, and company results to rekindle our hopes that the long period of close correlation and higher returns for lower-quality businesses was finally ending. While the Fund fell further behind the Russell 2000 between the beginning of April and the end of June, it outpaced its small-cap global benchmark over the same period. For the second quarter, the Fund finished with a slight gain of 0.4% versus a 3.1% gain for the Russell 2000 and a loss of 1.7% for the Russell Global Small Cap Index. Much of the portfolio’s second-quarter net losses came primarily from holdings in the metals & mining group. The Fund’s longer-term results were somewhat better on a relative basis. RS2 outperformed the Russell Global Small Cap Index for the five-year and since inception (6/30/05) periods ended June 30, 2013. The Fund also narrowly trailed the Russell 2000 for the since inception period, up 6.8% compared to 6.9%. |
| 16 | The Royce Funds 2013 Semiannual Report to Shareholders |
Performance and Portfolio Review |
| At the end of the period, 34.7% of the Fund’s net assets were invested in non-U.S. companies. Only -3.3% of its net assets were in short positions. For the year-to-date period ended June 30, 2013 all but one of the Fund’s nine equity sectors were positive. The Information Technology, Industrials, and Consumer Discretionary sectors were the greatest contributors to performance. At the industry level, internet software & services led the advance, followed by machinery and IT services. Materials was the worst-performing sector for the period, with the metals & mining industry the largest detractor to performance by a wide margin. Also in Materials, chemical companies posted a modest net loss. At the end of the period Information Technology was the largest sector in the Fund, followed by the Consumer Discretionary and Industrials sectors. Astronics Corporation was the top performer for the period. Based in East Aurora, NY, the company provides advanced, high-performance lighting, electrical power, and automated test systems for the global aerospace & defense industries. Its shares surged on record first-quarter earnings, which showed record backlog and cash flow generation. Federated Investors benefited from the volatility in the financial markets—increasing interest rates should allow the company to scale back its fee waivers and thereby unlock earnings that have been hampered by the Fed’s zero interest rate policy. We added to our position in May and June, helping to make it the portfolio’s second-largest holding at the end of the period. We also built our position in Sarin Technologies, an Israeli company that manufactures advanced planning, measurement, and evaluation systems for diamond and gemstone production. Rising revenues and net profits drove up its share price through much of the first half. It was RS2’s eleventh-largest holding at the end of June. Bankrate, which aggregates and distributes personal finance content on the Internet and owns several financial services websites and lead-generation properties, was the largest individual holding at the end of June and was one of the top performers for the period. Improved EPS (earnings per share) and better-than-expected guidance helped to key a rebound for its stock. The top two detractors to performance in the first half were the Market Vectors Junior Gold Miners ETF and Hochschild Mining. Precious metals miners faced a highly challenging environment in the first half. Gold and silver prices declined significantly, mine operating costs were climbing, and demand in China slowed significantly. Seeing opportunities elsewhere in the market, we chose to take our losses in each of these investments and move on. We also trimmed our position in Sprott, a Canadian investment management company with a history dating back to 1981 that saw its share price decline primarily due to its high exposure to the precious metals mining industry. |
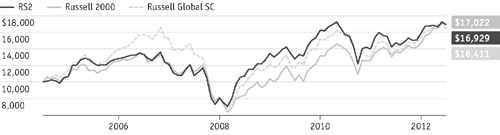 |
| Includes reinvestment of distributions. |

| The Royce Funds 2013 Semiannual Report to Shareholders | 17 |
| Royce Global Select Long/Short Fund |
AVERAGE ANNUAL TOTAL RETURNS Through 6/30/13 | ||||||||||
| January–June 20131 | -9.15 | % | ||||||||
| One-Year | 0.20 | |||||||||
| Three-Year | 4.51 | |||||||||
| Five-Year | 1.45 | |||||||||
| Since Inception (6/30/05) | 8.57 | |||||||||
| ANNUAL EXPENSE RATIOS | ||||||||||
| Gross Operating Expenses | 2.20 | % | ||||||||
| Net Operating Expenses | 1.70 | |||||||||
| 1 Not annualized | ||||||||||
| CALENDAR YEAR TOTAL RETURNS | ||||||||||
| Year | RGS | Year | RGS | |||||||
| 2012 | 14.0 | % | 2008 | -34.4 | % | |||||
| 2011 | -17.8 | 2007 | 18.2 | |||||||
| 2010 | 33.2 | 2006 | 19.4 | |||||||
| 2009 | 56.1 | |||||||||
| TOP 10 LONG POSITIONS % of Net Assets | ||||||||||
| Semperit AG Holding | 4.6 | % | ||||||||
| FamilyMart | 4.0 | |||||||||
| Lewis Group | 3.6 | |||||||||
| Mayr-Melnhof Karton | 3.5 | |||||||||
| Recordati | 3.1 | |||||||||
| USS | 3.1 | |||||||||
| Media Chinese International | 3.1 | |||||||||
| MegaStudy | 3.0 | |||||||||
| Brasil Brokers Participacoes | 3.0 | |||||||||
| Ekornes | 3.0 | |||||||||
| TOP 10 SHORT POSITIONS % of Net Assets | ||||||||||
| Direxion Daily Energy Bull 3X Shares | -2.0 | % | ||||||||
| iShares China Large-Cap ETF | -1.8 | |||||||||
| ProShares Ultra Basic Materials | -1.6 | |||||||||
| NEXT FUNDS Nikkei 225 Leveraged Index ETF | -1.6 | |||||||||
| Monster Beverage | -1.4 | |||||||||
| NCR Corporation | -1.4 | |||||||||
| ProShares Ultra Health Care | -1.1 | |||||||||
| Delta Air Lines | -1.1 | |||||||||
| Orion Cl. B | -0.9 | |||||||||
| Direxion Daily Emerging Markets Bull 3X Shares | -0.9 | |||||||||
| PORTFOLIO SECTOR BREAKDOWN1 % of Net Assets | ||||||||||
| Consumer Discretionary | 27.0 | % | ||||||||
| Materials | 19.8 | |||||||||
| Industrials | 19.7 | |||||||||
| Health Care | 15.8 | |||||||||
| Financials | 11.5 | |||||||||
| Consumer Staples | 10.7 | |||||||||
| Energy | 7.6 | |||||||||
| Information Technology | 5.0 | |||||||||
| Cash and Cash Equivalents | -17.1 | |||||||||
| 1 Long positions only | ||||||||||
 |
Manager’s Discussion The first half of 2013 was at times a challenging period for equities all over the world. It was also a highly disappointing period for Royce Global Select Long/Short Fund (RGS). The Fund fell 9.2% for the year-to-date period ended June 30, 2013 versus a 6.7% advance for its long-only benchmark, the Russell Global Small Cap Index, for the same period. The portfolio ended the period with 117.4% of its net assets invested in common stocks, 3.1% in cash and cash equivalents, and 20.5% in short positions. Short positions, designed in part to provide a measure of downside protection when markets are flat to bearish, had a negative net impact as a group in the first half, though two shorts were also among the portfolio’s top contributors. As was the case in 2012, the first quarter was a solidly bullish period for most equities, though unlike 2012, non-U.S. equities generally had lower returns. Unlike last year, RGS not only underperformed its benchmark by a sizable margin, but fell into the red as well. The Fund was down 1.4% in the year’s opening quarter while the global small-cap index rose 8.6%. This left the Fund with a lot of ground to make up against the benchmark in the second quarter, a much more uncertain period than the first three months of the year. We were once again frustrated that the portfolio could not more effectively preserve its value when non-U.S. stock prices were falling in May and June. For the quarter as a whole, RGS fell 7.9% versus a decline of 1.7% for the benchmark. The second-quarter correction was a global event, fueled by concerns over an economic slowdown and credit issues in China, social unrest and slowing growth in emerging markets countries such as Brazil and Turkey, the by now requisite concerns over the fiscal health of certain eurozone nations, and the Fed’s announcement that it would begin to taper the pace of bond purchases later this year. These developments combined to help push share prices down. None of these are new problems, and all have possible solutions, yet their surfacing so close to one another in May and June clearly spooked many investors who remain understandably skittish in light of all that has happened since the financial crisis in 2008. Along with underperforming the global small-cap index in 2012 (+14.0% versus +17.7%), the Fund’s relative disadvantage in 2013 eroded some of its longer-term relative advantage. For the period ended June 30, 2013, RGS beat the Russell Global Small Cap Index for the since inception (6/30/05) period. The Fund’s average annual total return since inception was 8.6%. |
| 18 | The Royce Funds 2013 Semiannual Report to Shareholders |
Performance and Portfolio Review |
| Aside from the overall impact of the portfolio’s short positions, a large share of its losses in the first half came from the metals & mining industry within the Materials sector, which finished the year’s first six months in the red. Precious metals miners accounted for the Fund’s top three largest detractors for the period. Several factors had a negative effect on these holdings in the first half. Gold and silver prices declined significantly while mine operating costs increased, which pushed valuations in many cases to what we see as levels that have not been reached since the lows in late 2008–early 2009. We chose to sell Medusa Mining, trimmed our stake in Hochschild Mining in early July, and added shares of Fresnillo as we think the London-based gold and silver miner with most of its lower-cost properties in Mexico is well positioned for an eventual turnaround. In what remained a robust period for many Health Care stocks, RGS’s short position in ProShares Ultra Health Care continued to be unprofitable. (The position was a significant detractor in 2012.) We partially covered the short position with buys in March and May. We chose to hold our shares of top-ten holding MegaStudy, a South Korean educational firm that specializes in online tutoring and test preparation. It has spent much of the last 18 months mired in disappointing results for its business based on increased competition. We remain confident in its ability to turn its business around. A short position in an ETF that we used as a hedge against once-robust emerging market growth was the portfolio’s top contributor in the first half—Direxion Daily Emerging Markets Bull 3X Shares. With the declines in many prominent markets in the developing world, this was a profitable strategy in the first half. We made cover buys in June but maintained a short position at the end of the semiannual period. Tokyo-based Nihon M&A Center provides M&A advisory and other related services to small and medium-sized businesses. Growing revenues and earnings helped draw investors to its stock. We were intrigued by its niche in Japan, a country in which approximately 150,000 companies are said to lack succession plans, which represents a great opportunity for Nihon M&A. We reduced our position as its share price soared past our sell targets. Since the mid-point of 2012, we have enjoyed a mostly positive experience with Recordati, a Milan-based pharmaceutical business with an 80-year history and an expanding global reach, especially in Russia, Turkey, and Eastern Europe, where demand for its products has been growing. The company researches and manufactures prescription pharmaceuticals, including lercanidipine, a treatment for hypertension. Its shares slumped between February and early April 2013 before climbing again on a strong fiscal first quarter and revised guidance for 2013. |
 |
| Includes reinvestment of distributions. |
| The Royce Funds 2013 Semiannual Report to Shareholders | 19 |
| Royce Enterprise Select Fund |
AVERAGE ANNUAL TOTAL RETURNS Through 6/30/13 | ||||||||||
| January–June 20131 | 11.49 | % | ||||||||
| One-Year | 21.93 | |||||||||
| Three-Year | 16.47 | |||||||||
| Five-Year | 7.37 | |||||||||
| Since Inception (9/28/07) | 6.06 | |||||||||
| ANNUAL EXPENSE RATIOS | ||||||||||
| Gross Operating Expenses | 3.86 | % | ||||||||
| Net Operating Expenses | 1.24 | |||||||||
| 1 Not annualized | ||||||||||
| CALENDAR YEAR TOTAL RETURNS | ||||||||||
| Year | RSS | Year | RSS | |||||||
| 2012 | 15.7 | % | 2009 | 23.1 | % | |||||
| 2011 | 0.7 | 2008 | -25.5 | |||||||
| 2010 | 17.2 | |||||||||
| TOP 10 POSITIONS % of Net Assets | ||||||||||
| Dollar Tree | 3.2 | % | ||||||||
| Thor Industries | 3.1 | |||||||||
| Towers Watson & Company Cl. A | 2.7 | |||||||||
| Western Digital | 2.6 | |||||||||
| iShares 1-3 Year Treasury Bond ETF | 2.5 | |||||||||
| AVX Corporation | 2.4 | |||||||||
| Expeditors International of Washington | 2.1 | |||||||||
| Methode Electronics | 2.0 | |||||||||
| Myriad Genetics | 2.0 | |||||||||
| Garmin | 2.0 | |||||||||
| PORTFOLIO SECTOR BREAKDOWN % of Net Assets | ||||||||||
| Information Technology | 17.5 | % | ||||||||
| Industrials | 17.2 | |||||||||
| Consumer Discretionary | 16.8 | |||||||||
| Financials | 7.2 | |||||||||
| Materials | 4.7 | |||||||||
| Health Care | 4.2 | |||||||||
| Energy | 2.4 | |||||||||
| Utilities | 1.8 | |||||||||
| Miscellaneous | 1.3 | |||||||||
| Government Bonds | 2.5 | |||||||||
| Cash and Cash Equivalents | 24.4 | |||||||||
 | |||||||||
Manager’s Discussion U.S. Federal Reserve policy once again hopped into the spotlight in 2013’s first half as Fed Chairman Ben Bernanke surprised investors of all kinds with a statement that quantitative easing could be tapered in the not-too-distant future if the U.S. economy continued to grow at a reasonable pace. In place since the depths of the financial crisis in the fall of 2008, the Fed’s asset purchase plan has since taken many forms but has clearly provided a strong foundation for securities prices not only in the U.S. but around the world as well. So the resulting volatility was not unexpected for market participants though it seemed to somewhat surprise its architects as Bernanke and his colleagues worked tirelessly in the following weeks to provide greater clarity as to what they really meant. Their main challenge seemed to be the propensity of investors to extrapolate current trends far into the future, meaning that there were some who believed the Fed’s massive stimulus was designed to go on forever. This obviously not being the case, the underpinnings of their decision were actually rooted in an improving outlook for economic stability as well as growth that is becoming increasingly self-sustaining. The yield on the 10-year Treasury jumped more than 100 basis points on the news, which led to the first significant losses in bond portfolios in years. Equity markets shuddered, but then quickly regained their footing and were propelled to new highs, at least here in the U.S. Royce Enterprise Select Fund (RSS), with its focus on our highest-conviction ideas in the larger end of the smaller company universe, posted strong absolute returns in the year’s first half while underperforming its benchmark. For the year-to-date period ended June 30, 2013, the Fund gained 11.5% compared to its small-cap benchmark, the Russell 2500, which advanced 15.4% for the same period. The first two quarters of 2013 were quite similar to the comparable periods in the three preceding years. During the bullish first quarter, RSS gained 8.3% and fell behind the streaking Russell 2500, which advanced 12.9%. When markets turned more volatile in the second quarter—giving us the year’s first correction of any magnitude—RSS advanced 2.9%, edging out its benchmark, which rose 2.3%. Launched in September 2007, just two months after a historic peak for U.S. small-caps and near the onset of what would become the global financial crisis, the Fund has seen its fair share of market volatility. We were encouraged then that our vigilance with regard to risk and consistent focus on what we think are quality companies with high internal rates of return and strong balance sheets helped RSS to outperform the Russell 2500 since the Fund’s inception on | |||||||||
| 20 | The Royce Funds 2013 Semiannual Report to Shareholders |
Performance and Portfolio Review September 28, 2007. For the period ended June 30, 2013, RSS’s average annual total return for the since inception period was 6.1% versus 5.6% for its benchmark. Industrials led all of the Fund’s sectors during the period, followed by notable net gains for Financials and Consumer Discretionary. Seven of the Fund’s eight equity sectors contributed positively to returns, while Consumer Staples was flat. At the industry level, most groups generated positive net returns. Professional services led all industries, though diversified financial services also showed notable strength. The Fund’s largest contributor came from the Industrials sector—top-three holding Towers Watson & Company Cl. A, which provides human resource and financial consulting services. It offers employee benefit programs, develops attraction, retention, and reward strategies, and provides other related services. Its price rose more or less steadily through the first half of 2013. Earnings have been strong, revenues have grown, and cash flows have been solid. In May the firm’s management also raised adjusted EPS (earnings per share) guidance for fiscal 2013. We were initially drawn to its core business and steady earnings. UGI Corporation distributes energy products and services, operates natural gas and electric utilities in Pennsylvania, and distributes propane. A cold winter helped fuel earnings improvement. A rising share price prompted us to sell our position in Leucadia National during the first half. Leucadia National is a diversified holding company with subsidiaries in several businesses, including beef processing, manufacturing, gaming entertainment, real estate, and medical product development. It also holds significant equity interests in other businesses. It merged with global investment banker Jefferies Group in March, a move that investors seemed to like, along with the firm’s strong fiscal 2012 results. Western Digital, RSS’s fourth-largest holding at the end of the period, is the globe’s largest manufacturer of hard disk drives. While the company was mostly a supplier to the desktop market until 2004, it has successfully expanded into cloud computing server farms and the notebook segment. Its shares began to rebound in February on solid EPS growth and again in March on reports that global demand for data storage would remain strong. As for positions that detracted from returns, Myriad Genetics is engaged in the development of molecular diagnostic products designed to assess an individual’s lifetime risk of disease development. A longtime Royce favorite and top-ten holding at the end of June, Myriad Genetics struggled in the first half from the overhang of a Supreme Court decision challenging the patentability of human genes. The company lost a handful of patents as a result of the ruling, which we believe was more of a temporary problem than a significant setback for what we see as an otherwise strong business. |
 |
| Includes reinvestment of distributions. | |||
| PORTFOLIO DIAGNOSTICS | |||
| Fund Net Assets | $2 million | ||
| Number of Holdings | 59 | ||
| Turnover Rate | 77% | ||
| Average Market Capitalization1 | $3,882 million | ||
| Weighted Average P/E Ratio2,3 | 17.4x | ||
| Weighted Average P/B Ratio2 | 2.3x | ||
| U.S. Investments (% of Net Assets) | 70.2% | ||
| Non-U.S. Investments (% of Net Assets) | 5.4% | ||
| Symbol | RMISX | ||
1 Geometric Average. This weighted calculation uses each portfolio holding’s market cap in a way designed to not skew the effect of very large or small holdings; instead, it aims to better identify the portfolio’s center, which Royce believes offers a more accurate measure of average market cap than a simple mean or median. | |||
2 Harmonic Average. This weighted calculation evaluates a portfolio as if it were a single stock and measures it overall. It compares the total market value of the portfolio to the portfolio’s share in the earnings or book value, as the case may be, of its underlying stocks. | |||
3 The Fund’s P/E calculation excludes companies with zero or negative earnings (4% of portfolio holdings as of 6/30/13). | |||
| MORNINGSTAR STATISTICAL MEASURES1 | |||
| Sharpe Ratio | Standard Deviation | ||
| RSS | 0.50 | 16.63 | |
| Russell 2500 | 0.49 | 23.15 | |
| Category Median | 0.42 | 21.94 | |
| Best Decile Breakpoint | 0.58 | 19.30 | |
1 Five years ended 6/30/13. Category Median and Best Decile Breakpoint based on 348 mid-cap objective funds (oldest class) with at least five years of history. | |||
The Fund beat the Russell 2500 and performed within the top 50% of mid-cap objective funds on a risk-adjusted basis, as shown by its Sharpe ratio. In addition, the Fund produced lower volatility than the Russell 2500 and 90% of mid-cap objective funds, as shown by its standard deviation. | |||
| The Royce Funds 2013 Semiannual Report to Shareholders | 21 |
| Royce Opportunity Select Fund |
AVERAGE ANNUAL TOTAL RETURNS Through 6/30/13 | ||||||||||
| January–June 20131 | 17.88 | % | ||||||||
| One-Year | 36.45 | |||||||||
| Since Inception (8/31/10) | 20.99 | |||||||||
| ANNUAL EXPENSE RATIOS | ||||||||||
| Gross Operating Expenses | 2.67 | % | ||||||||
| Net Operating Expenses | 1.38 | |||||||||
| 1 Not annualized | ||||||||||
| CALENDAR YEAR TOTAL RETURNS | ||||||||||
| Year | ROS | Year | ROS | |||||||
| 2012 | 35.1 | % | 2011 | -17.1 | % | |||||
| TOP 10 LONG POSITIONS % of Net Assets | ||||||||||
| Kennedy-Wilson Holdings | 2.2 | % | ||||||||
| Zumiez | 2.1 | |||||||||
| Kratos Defense & Security Solutions | 2.1 | |||||||||
| Mueller Water Products Cl. A | 2.0 | |||||||||
| Jones Group (The) | 2.0 | |||||||||
| Orient-Express Hotels Cl. A | 2.0 | |||||||||
| Louisiana-Pacific Corporation | 2.0 | |||||||||
| Audience | 1.9 | |||||||||
| Ellie Mae | 1.9 | |||||||||
| Exar Corporation | 1.9 | |||||||||
| TOP 10 SHORT POSITIONS % of Net Assets | ||||||||||
| Lumber Liquidators Holdings | -2.2 | % | ||||||||
| Fleetmatics Group | -1.5 | |||||||||
| Stamps.com | -1.3 | |||||||||
| Fresh Market | -1.2 | |||||||||
| Lithia Motors Cl. A | -1.2 | |||||||||
| Life Time Fitness | -1.1 | |||||||||
| Tile Shop Holdings | -0.6 | |||||||||
| Sonic Automotive Cl. A | -0.3 | |||||||||
| iRobot Corporation | -0.3 | |||||||||
| Bravo Brio Restaurant Group | -0.1 | |||||||||
| PORTFOLIO SECTOR BREAKDOWN1 % of Net Assets | ||||||||||
| Information Technology | 36.4 | % | ||||||||
| Industrials | 18.0 | |||||||||
| Financials | 16.7 | |||||||||
| Consumer Discretionary | 12.7 | |||||||||
| Energy | 7.4 | |||||||||
| Materials | 5.8 | |||||||||
| Health Care | 1.3 | |||||||||
| Miscellaneous | 4.3 | |||||||||
| Cash and Cash Equivalents | -2.6 | |||||||||
| 1 Long positions only | ||||||||||
 | |||||||||
Manager’s Discussion Royce Opportunity Select Fund (ROS) advanced 17.9% for the year-to-date period ended June 30, 2013, outpacing its small-cap benchmark, the Russell 2000 Index, which was up 15.9% for the same period. ROS’s first-half showing was part of a more than year-long trend of enviable absolute and relative returns. The first quarter seemed like an uneventfully bullish period, though it did mark the return to market leadership of more defensive sectors and high-yielding equities at the expense of cyclical areas across most asset classes. The Fund managed the transition well, though it lagged its benchmark, gaining 11.5% versus 12.4% for the small-cap index. Volatility then made a dramatic return to the market. Share prices began falling before a bearish April gave way to a bullish May. June was already looking rocky and unpredictable when the Fed announced on the 19th that it would likely begin to taper its bond-buying program later this year. Along with a rapidly rising rate on the 10-year Treasury, underwhelming news out of China, and growing unrest in the developing world, the global markets nosedived for several days, though most domestic indexes were showing signs of recovery by the end of the month. The Fund fared well in this uncertain environment, rising 5.7% for the second quarter, ahead of the Russell 2000’s 3.1% increase. Performance through recent market cycles was strong. For the periods ended June 30, 2013, ROS beat the small-cap index from the most recent peak on April 29, 2011 (+22.3% versus +16.6%); from the small-cap trough on October 3, 2011 (+92.0% versus +64.5%); from the small-cap high on March 26, 2012 (+32.4% versus +17.7%); and from the small-cap low on June 4, 2012 (+52.8% versus +34.7%). These results were especially noteworthy because the Fund held a performance advantage relative to the benchmark in both bullish and bearish periods. ROS also outperformed the Russell 2000 for the one-year and since inception (8/31/10) periods ended June 30, 2013. The Fund’s average annual total return for the since inception period was 21.0%. The Financials, Information Technology, and Consumer Discretionary sectors made the largest contribution to ROS’s first-half performance. Short positions as a whole detracted from results, mostly in the Consumer Discretionary and Information Technology sectors, where they put a drag on what were still strong net results. Net losses at the level of individual positions were mostly modest. We sold our shares of metallurgical coal mining business | |||||||||
| GOOD IDEAS THAT WORKED Top Contributors to Performance Year-to-Date through 6/30/131 | |||||||||||
| SunEdison | 1.68% | ||||||||||
| Radian Group | 1.61 | ||||||||||
| SunPower Corporation | 1.47 | ||||||||||
| Acquity Group ADR | 1.23 | ||||||||||
| MGIC Investment | 1.09 | ||||||||||
| 1 Includes dividends | |||||||||||
Important Performance and Expense Information All performance information in this Report reflects past performance, is presented on a total return basis, reflects the reinvestment of distributions, and does not reflect the deduction of taxes that a shareholder would pay on fund distributions or the redemption of fund shares. Past performance is no guarantee of future results. Investment return and principal value of an investment will fluctuate, so that shares may be worth more or less than their original cost when redeemed. Shares redeemed within 180 days of purchase may be subject to a 1% redemption fee, payable to the Fund, which is not reflected in the performance shown above; if it were, performance would be lower. Current month-end performance may be higher or lower than performance quoted and may be obtained at www.roycefunds.com. Gross operating expenses reflect the Fund’s total gross annual operating expenses and include management fees and other expenses. Net operating expenses reflect contractual fee waivers and/or expense reimbursements. All expense information is reported as of the Funds most current prospectus. Royce & Associates has contractually agreed to waive fees and/or reimburse operating expenses to the extent necessary to maintain the Fund’s net annual operating expenses, other than dividends on securities sold short, acquired fund fees and expenses, and interest expense on borrowing, at or below 1.24% through April 30, 2015 and at or below 1.99% through April 30, 2023. Regarding the two “Good Ideas” tables shown above, the sum of all contributors to, and all detractors from, performance for all securities in the portfolio would approximate the Fund’s year-to-date performance for 2013. | |||||||||||
| 22 | The Royce Funds 2013 Semiannual Report to Shareholders |
Performance and Portfolio Review Walter Energy in June. Coal prices fell in the first half, mostly due to slumping demand from China. When a refinancing effort fell through in mid-June, we chose to sell our shares and move on. We went 0-for-2 in our estimate of Deckers Outdoor, which makes footwear and accessories. We thought that its sales growth would remain slow and that pricing would not recover. Wrong on both counts, we covered our short sales in March. The Fund’s leading industry was the semiconductor & semiconductor equipment group. Prospects for this industry have been more or less steadily improving for the last year, boosted by growth in the U.S. economy. That European economies look to have hit bottom and other national economies, especially in Asia, did not fall as hard as many had predicted were also factors in the improvement for this highly volume-sensitive business. Inventory levels were reasonable and pricing in the memory market was better than expected, which also helped to attract investors. As their respective share prices soared past our sell targets, we reduced our stake in two of ROS’s top-five contributors that came from the semiconductor group—SunPower Corporation and SunEdison. Each of these companies also benefited from the resurgence of interest in companies involved in solar power, an area that we think has considerable potential. SunPower manufactures high-performance solar electric equipment while SunEdison produces electronic-grade polysilicon used for electronics, solar cells, and film devices while also developing solar power projects. In spite of fears that reduced government subsidies would derail growth, the demand for solar technology has continued to grow. Many lesser-quality players have either exited the business or lost market share. Technological efficiency has improved, which has helped bring down costs, while China recently called for a five-fold increase in installed solar capacity. Two companies in the mortgage financing business benefited from the robust housing recovery to make strong contributions. Radian Group provides financial guarantee insurance. Its services allow people to buy homes more quickly (often with smaller down payments), protect lenders against loan default, and lower the costs of mortgage origination and servicing. MGIC Investment Corporation provides private mortgage insurance coverage. A decline in the number of defaults also helped both businesses to grow. Hong Kong-based digital marketing and e-commerce specialist Acquity Group was acquired in the spring while BofI Holdings saw its web-based banking services in both the consumer and commercial markets in high demand. We thought that its valuation remained attractive at the end of June and like its prospects going forward. |
GOOD IDEAS AT THE TIME | |
| Walter Energy | -1.28% |
| Deckers Outdoor (Short) | -0.64 |
| Mindspeed Technologies | -0.57 |
| Genco Shipping & Trading | -0.55 |
| Stamps.com (Short) | -0.54 |
| 1 Net of dividends | |
| ROYCE OPPORTUNITY SELECT FUND VS. RUSSELL 2000 Value of $10,000 Invested on 8/31/10 | |
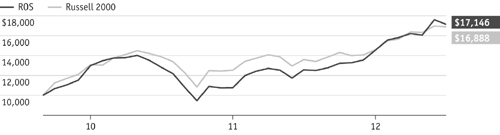 |
| Includes reinvestment of distributions. | |||
| PORTFOLIO DIAGNOSTICS | |||
| Fund Net Assets | $7 million | ||
| Number of Holdings | 92 | ||
| Turnover Rate | 95% | ||
| Average Market Capitalization1,3 | $703 million | ||
| Weighted Average P/B Ratio2,3 | 1.5x | ||
| U.S. Investments3 (% of Net Assets) | 98.1% | ||
| Non-U.S. Investments3 (% of Net Assets) | 4.5% | ||
| Symbol | ROSFX | ||
1 Geometric Average. This weighted calculation uses each portfolio holding’s market cap in a way designed to not skew the effect of very large or small holdings; instead, it aims to better identify the portfolio’s center, which Royce believes offers a more accurate measure of average market cap than a simple mean or median. | |||
2 Harmonic Average. This weighted calculation evaluates a portfolio as if it were a single stock and measures it overall. It compares the total market value of the portfolio to the portfolio’s share in the earnings or book value, as the case may be, of its underlying stocks. | |||
3 Long positions only | |||
| The Royce Funds 2013 Semiannual Report to Shareholders | 23 |
| Royce Micro-Cap Discovery Fund |
AVERAGE ANNUAL TOTAL RETURNS Through 6/30/13 | ||||||||||
| January–June 20131 | 12.24 | % | ||||||||
| One-Year | 15.72 | |||||||||
| Three-Year | 11.47 | |||||||||
| Five-Year | 5.04 | |||||||||
| Since Inception (10/3/03) | 5.36 | |||||||||
| ANNUAL EXPENSE RATIOS | ||||||||||
| Gross Operating Expenses | 2.94 | % | ||||||||
| Net Operating Expenses | 1.49 | |||||||||
| 1 Not annualized | ||||||||||
| CALENDAR YEAR TOTAL RETURNS | ||||||||||
| Year | RDF | Year | RDF | |||||||
| 2012 | 3.1 | % | 2007 | -7.4 | % | |||||
| 2011 | -2.2 | 2006 | 16.8 | |||||||
| 2010 | 19.6 | 2005 | 7.6 | |||||||
| 2009 | 25.9 | 2004 | 13.3 | |||||||
| 2008 | -35.1 | |||||||||
| TOP 10 POSITIONS % of Net Assets | ||||||||||
| TESSCO Technologies | 1.7 | % | ||||||||
| American Software Cl. A | 1.7 | |||||||||
| Computer Task Group | 1.7 | |||||||||
| Globecomm Systems | 1.7 | |||||||||
| Materion Corporation | 1.7 | |||||||||
| Lifetime Brands | 1.6 | |||||||||
| Johnson Outdoors Cl. A | 1.5 | |||||||||
| ePlus | 1.5 | |||||||||
| Alamo Group | 1.5 | |||||||||
| Miller Industries | 1.5 | |||||||||
| PORTFOLIO SECTOR BREAKDOWN % of Net Assets | ||||||||||
| Information Technology | 25.3 | % | ||||||||
| Industrials | 16.0 | |||||||||
| Materials | 11.6 | |||||||||
| Consumer Discretionary | 10.8 | |||||||||
| Health Care | 8.9 | |||||||||
| Financials | 7.9 | |||||||||
| Energy | 5.7 | |||||||||
| Consumer Staples | 4.3 | |||||||||
| Telecommunication Services | 1.2 | |||||||||
| Miscellaneous | 4.8 | |||||||||
| Cash and Cash Equivalents | 3.5 | |||||||||
 | |||||||||
Managers’ Discussion The diversified portfolio of Royce Micro-Cap Discovery Fund (RDF) gained 12.2% for the year-to-date period ended June 30, 2013 compared to gains of 18.3% for its benchmark, the Russell Microcap Index, and 15.9% for the small-cap Russell 2000 Index for the same period. The year’s first quarter saw the bulk of underperformance. The first three months of the year were a mostly bullish period that followed a solid third quarter and more volatile fourth quarter in 2012. While the Fund posted a solid result on an absolute basis, its relative performance fell short. For the first quarter, the Fund gained 8.2% versus 12.6% for its benchmark and 12.4% for the small-cap index. The second quarter brought considerably more volatility and, unsurprisingly, lower returns for equities across the board. Markets all over the world convulsed late in June following the announcement by Fed Chairman Bernanke that the central bank would consider slowing the pace of monthly bond purchases later in the year. Along with less-than-stellar news out of China, Brazil, Turkey, and Europe, stocks fell precipitously for several sessions before beginning to find their feet again. The upshot was a rougher quarter for stocks, though the U.S. fared better on the whole than foreign markets. RDF was up 3.7% for the second quarter. This was a mixed performance on a relative basis, as the Russell Microcap rose 5.1% while the small-cap index advanced 3.1%. The lack of exposure to more defensive areas of the market, most notably REITs and MLPs (master limited partnerships), was also a factor in first-half results (though REITs abruptly reversed course in the second quarter). This was consistent with much of what hampered relative returns in 2012. (It is worth pointing out, however, that the Fund outperformed the Russell Microcap in 74% of all monthly rolling five-year return periods ended June 30, 2013.) As we have mentioned previously, we made important changes to the Fund’s principal investment strategies in August 2010. Primarily, the changes mean that the Fund’s portfolio managers evaluate the purchase and sale recommendations of its proprietary model using both quantitative and qualitative portfolio analysis before investment decisions are implemented. The Fund had heavier weightings in more economically sensitive areas of the micro-cap space. These sectors, including RDF’s three largest—Information Technology, Industrials, and | |||||||||
| GOOD IDEAS THAT WORKED Top Contributors to Performance Year-to-Date through 6/30/131 | |||||||||||
| Obagi Medical Products | 0.83% | ||||||||||
| Standard Motor Products | 0.72 | ||||||||||
| Stein Mart | 0.63 | ||||||||||
| PC Connection | 0.60 | ||||||||||
| Glatfelter | 0.55 | ||||||||||
| 1 Includes dividends | |||||||||||
Important Performance and Expense Information All performance information in this Report reflects past performance, is presented on a total return basis, reflects the reinvestment of distributions, and does not reflect the deduction of taxes that a shareholder would pay on fund distributions or the redemption of fund shares. Past performance is no guarantee of future results. Investment return and principal value of an investment will fluctuate, so that shares may be worth more or less than their original cost when redeemed. Shares redeemed within 180 days of purchase may be subject to a 1% redemption fee payable to the Fund, which is not reflected in the performance shown above; if it were, performance would be lower. Current month-end performance may be higher or lower than performance quoted and may be obtained at www.roycefunds.com. Price and total return information is based on net asset values calculated for shareholder transactions. Certain immaterial adjustments were made to the net assets of Royce Micro-Cap Discovery Fund at 6/29/12 for financial reporting purposes, and as a result the net asset values for shareholder transactions on that date and calendar-year total returns based on those net asset values differ from the adjusted net asset values and calendar-year total returns reported in the Financial Highlights. Gross operating expenses reflect the Fund’s gross total annual operating expenses for the Service Class and include management fees, 12b-1 distribution and service fees, and other expenses. Net operating expenses reflect contractual fee waivers and/or expense reimbursements. All expense information is reported as of the Fund’s most current prospectus. Royce & Associates has contractually agreed to waive fees and/or reimburse operating expenses to the extent necessary to maintain the Service Class’s net annual operating expense ratio at or below 1.49% through April 30, 2014 and at or below 1.99% through April 30, 2023. Regarding the two “Good Ideas” tables shown above, the sum of all contributors to, and all detractors from, performance for all securities in the portfolio would approximate the Fund’s year-to-date performance for 2013. | |||||||||||
| 24 | The Royce Funds 2013 Semiannual Report to Shareholders |
Performance and Portfolio Review Materials—hindered relative performance even as they posted respectable (in the case of Materials) or strong (for Information Technology and Industrials) results during the first half. Indeed, at the end of the period all of the Fund’s nine sectors were in positive territory. Information Technology, Consumer Discretionary, and Industrials were the Fund’s best performers. At the industry level insurance, professional services, chemicals, and energy equipment & services companies all made sizable net contributions. The only significant net losses at the industry level came from the oil, gas & consumable fuels industry. Obagi Medical Products was the top performer in the Fund for the period. The Long Beach, CA-based firm was acquired by Valeant Pharmaceuticals in April at a healthy premium. We sold the last of our shares in April. Automotive parts manufacturer Standard Motor Products benefited from continued growth in the large, historically stable auto aftermarket business. In particular, the company enjoyed revenue growth (primarily via acquisitions) and strong cash flows. Strong earnings also seemed to help attract investors. We took some gains in March. Stein Mart is a clothing retailer that fixed some internal accounting issues. This news initially hurt its stock price, although the company uncovered and resolved these issues on its own. In early May the firm completed its restatement review and released its fiscal 2013 results. Beating Wall Street expectations and boasting strong EPS (earnings per share) growth, the company saw its stock price soar. We made a modest trim to our position in May. We made a larger reduction to our stake in PC Connection in February and May. The company provides a full range of information technology (IT) solutions to business, government, and educational customers. Its growing business and solid earnings, as well as a tech-friendlier market, appeared to give a boost to its share price. Glatfelter manufactures specialty paper and engineered products. The company made an acquisition in March that analysts and investors seemed to love, especially as the deal was thought to provide Glatfelter with a sizable earnings enhancement. We sold some shares in March as its price was moving up. VAALCO Energy was the Fund’s worst performing position for the period. The Texas-based energy producer and explorer stumbled badly with a fiscal fourth-quarter miss, rising costs, and a stalled project in Angola, all of which affected margins and kept its stock price in a slump. Confident in its long-term potential, we increased our position with small buys in February and March. We chose to hold our shares in Canadian silver producer Endeavour Silver. Precious metals miners endured an awful first half of 2013 as commodity prices fell and mine operating costs rose, but we like its potential pending a recovery for its industry. |
GOOD IDEAS AT THE TIME | |
| VAALCO Energy | -0.44% |
| Endeavour Silver | -0.37 |
| Nevsun Resources | -0.29 |
| TeleNav | -0.29 |
| TransGlobe Energy | -0.26 |
| 1 Net of dividends | |
| ROYCE MICRO-CAP DISCOVERY FUND VS. RUSSELL MICROCAP Value of $10,000 Invested on 6/30/00 (Russell Microcap Inception) | |
 |
| Includes reinvestment of distributions. | |||
| PORTFOLIO DIAGNOSTICS | |||
| Fund Net Assets | $5 million | ||
| Number of Holdings | 101 | ||
| Turnover Rate | 34% | ||
| Average Market Capitalization1 | $416 million | ||
| Weighted Average P/E Ratio2,3 | 15.3x | ||
| Weighted Average P/B Ratio2 | 1.4x | ||
| U.S. Investments (% of Net Assets) | 92.3% | ||
| Non-U.S. Investments (% of Net Assets) | 4.2% | ||
| Symbol | RYDFX | ||
1 Geometric Average. This weighted calculation uses each portfolio holding’s market cap in a way designed to not skew the effect of very large or small holdings; instead, it aims to better identify the portfolio’s center, which Royce believes offers a more accurate measure of average market cap than a simple mean or median. | |||
2 Harmonic Average. This weighted calculation evaluates a portfolio as if it were a single stock and measures it overall. It compares the total market value of the portfolio to the portfolio’s share in the earnings or book value, as the case may be, of its underlying stocks. | |||
3 The Fund’s P/E ratio calculation excludes companies with zero or negative earnings (6% of portfolio holdings as of 6/30/13). | |||
| MORNINGSTAR STATISTICAL MEASURES1 | |||
| Sharpe Ratio | Standard Deviation | ||
| RDF | 0.32 | 23.46 | |
| Russell Microcap | 0.45 | 25.07 | |
| Category Median | 0.51 | 24.28 | |
| Best Quartile Breakpoint | 0.55 | 23.77 | |
1 Five years ended 6/30/13. Category Median and Best Quartile Breakpoint based on 24 micro-cap objective funds (oldest class only) with at least five years of history. | |||
The Fund produced lower volatility than the Russell Microcap and 75% of micro-cap objective funds, as shown by its standard deviation. | |||
DOWN MARKET PERFORMANCE COMPARISON | |||
 | |||
| The Royce Funds 2013 Semiannual Report to Shareholders | 25 |
| Royce Financial Services Fund |
AVERAGE ANNUAL TOTAL RETURNS Through 6/30/13 | ||||||||||
| January–June 20131 | 18.89 | % | ||||||||
| One-Year | 32.61 | |||||||||
| Three-Year | 18.41 | |||||||||
| Five-Year | 8.23 | |||||||||
| Since Inception (12/31/03) | 7.44 | |||||||||
| ANNUAL EXPENSE RATIOS | ||||||||||
| Gross Operating Expenses | 1.96 | % | ||||||||
| Net Operating Expenses | 1.58 | |||||||||
| 1 Not annualized | ||||||||||
| CALENDAR YEAR TOTAL RETURNS | ||||||||||
| Year | RFS | Year | RFS | |||||||
| 2012 | 20.7 | % | 2007 | -4.7 | % | |||||
| 2011 | -11.3 | 2006 | 24.8 | |||||||
| 2010 | 18.5 | 2005 | 12.2 | |||||||
| 2009 | 32.1 | 2004 | 15.1 | |||||||
| 2008 | -35.4 | |||||||||
| TOP 10 POSITIONS % of Net Assets | ||||||||||
| Artisan Partners Asset Management | 2.7 | % | ||||||||
| State Street | 2.0 | |||||||||
| Lazard Cl. A | 2.0 | |||||||||
| Towers Watson & Company Cl. A | 1.9 | |||||||||
| WisdomTree Investments | 1.9 | |||||||||
| Apollo Global Management LLC Cl. A | 1.9 | |||||||||
| SEI Investments | 1.9 | |||||||||
| Northern Trust | 1.8 | |||||||||
| Jupiter Fund Management | 1.7 | |||||||||
| Regional Management | 1.7 | |||||||||
| PORTFOLIO INDUSTRY BREAKDOWN % of Net Assets | ||||||||||
| Capital Markets | 48.9 | % | ||||||||
| Diversified Financial Services | 8.5 | |||||||||
| Insurance | 6.5 | |||||||||
| IT Services | 3.7 | |||||||||
| Commercial Banks | 3.3 | |||||||||
| Professional Services | 3.0 | |||||||||
| Consumer Finance | 2.9 | |||||||||
| Software | 2.5 | |||||||||
| Trading Companies & Distributors | 1.6 | |||||||||
| Media | 1.3 | |||||||||
| Real Estate Management & Development | 1.2 | |||||||||
| Closed-End Funds | 0.6 | |||||||||
| Cash and Cash Equivalents | 16.0 | |||||||||
 | |||||||||
Manager’s Discussion Royce Financial Services Fund (RFS) continued its recent run of strong absolute and relative results with a terrific showing in the first half of 2013. The Fund gained 18.9% for the year-to-date period ended June 30, 2013, ahead of its benchmarks, the small-cap Russell 2000 Index, which rose 15.9%, and the Russell 2500 Financial Services Index, which was up 15.5% for the same period. The first quarter was a mostly consistent bull phase, with domestic share prices showing strength across all asset classes in the form of double-digit returns for most major U.S. indexes. The Fund fully participated in the good times, rising 14.2% versus respective gains of 12.4% for the Russell 2000 and 14.0% for the financial services component of the Russell 2500. This marked the third consecutive quarter in which RFS achieved positive quarterly performance and beat both its benchmark and the financial services companies in the Russell 2500. The second quarter saw the Fund go four-for-four. This was a far more volatile period than this year’s first quarter, somewhat similar to 2012’s second and fourth quarters. The period between the beginning of April and the end of June saw underwhelming economic news from China (along with credit issues and the threat of an overheated real estate market), new attempts at fiscal stimulus in Japan, unrest—and plunging markets—in Turkey and Brazil, a spike in the 10-year Treasury note between mid-May and mid-June, and word from the Federal Reserve that it would likely begin to slow the pace of its bond purchase program later this year. All of this was enough to send financial markets into a frenzy of selling, especially outside the U.S. Indeed, the major domestic equity indexes stabilized and finished the quarter in the black. RFS finished the second quarter with a gain of 4.1% compared to respective advances of 3.1% and 1.3% for the Russell 2000 and Russell 2500 Financial Services Index. Results over the last full market cycle were also more mixed. The Fund was up 1.2% from the previous small-cap peak on July 13, 2007 through the most recent peak on April 29, 2011 versus an increase of 6.6% for the Russell 2000 and a loss of 13.5% for the financial services component of the Russell 2500. From that April 2011 small-cap peak through June 30, 2013, RFS gained 18.7% versus 16.6% for its benchmark and 25.0% for the financial services sector of the Russell 2500. The Fund outperformed both indexes for the one-year period ended June 30, 2013 and was also ahead of the Russell 2500 Financial Services Index for the since inception (12/31/03) period ended June 30, 2013 (+7.4% versus 5.4%). In addition, RFS finished only slightly behind the | |||||||||
| GOOD IDEAS THAT WORKED Top Contributors to Performance Year-to-Date through 6/30/131 | |||||||||||
| WisdomTree Investments | 1.53% | ||||||||||
| Apollo Global Management LLC Cl. A | 1.15 | ||||||||||
| State Street | 0.87 | ||||||||||
| Regional Management | 0.74 | ||||||||||
| Artisan Partners Asset Management | 0.63 | ||||||||||
| 1 Includes dividends | |||||||||||
Important Performance and Expense Information All performance information in this Report reflects past performance, is presented on a total return basis, reflects the reinvestment of distributions, and does not reflect the deduction of taxes that a shareholder would pay on fund distributions or the redemption of fund shares. Past performance is no guarantee of future results. Investment return and principal value of an investment will fluctuate, so that shares may be worth more or less than their original cost when redeemed. Shares redeemed within 180 days of purchase may be subject to a 1% redemption fee payable to the Fund, which is not reflected in the performance shown above; if it were, performance would be lower. Current month-end performance may be higher or lower than performance quoted and may be obtained at www.roycefunds.com. Gross operating expenses reflect the Fund’s gross total annual operating expenses for the Service Class and include management fees, 12b-1 distribution and service fees, other expenses, and acquired fund fees and expenses. Net operating expenses reflect contractual fee waivers and/ or expense reimbursements. All expense information is reported as of the Fund’s most current prospectus. Royce & Associates has contractually agreed to waive fees and/or reimburse expenses to the extent necessary to maintain the Fund’s net annual operating expenses, other than acquired fund fees and expenses, at or below 1.49% through April 30, 2014. Acquired fund fees and expenses reflect the estimated amount of the fees and expenses incurred indirectly by the Fund through its investments in mutual funds, hedge funds, private equity funds, and other investment companies. Regarding the two “Good Ideas” tables shown above, the sum of all contributors to, and all detractors from, performance for all securities in the portfolio would approximate the Fund’s year-to-date performance for 2013. | |||||||||||
| 26 | The Royce Funds 2013 Semiannual Report to Shareholders |
Performance and Portfolio Review Russell 2000’s 7.5% increase over the same period. Our disciplined approach to investing in what we believe are fundamentally sound, conservatively capitalized, and attractively valued financial companies has at times put us out of sync both with the benchmark and the index that tracks the performance of micro-cap, small-cap, and mid-cap financial services stocks. With that in mind, we were pleased with the Fund’s 7.4% average annual total return since inception for the period ended June 30, 2013. The portfolio’s substantial overweight in capital markets was a net positive for the period. The industry was more than well-represented among RFS’s top contributors, where it accounted for four of the Fund’s five best performers, as well as eight of its top 10 and 14 of its top 20. However, capital markets was also home to the portfolio’s five largest detractors and eight of its 10 top net losers, though net losses at the company level were generally more modest than net gains. The Fund’s top contributor for the period was WisdomTree Investments, an asset management company that primarily sponsors ETFs (exchange traded funds). Robust inflows and strong product line growth helped to attract investors to its stock. With its price on the rise, we trimmed our position in the first half, though it was the Fund’s fifth-largest holding at the end of the period. New York City-based Apollo Global Management, another top-ten position, offers alternative asset and other investment management services including private equity, credit, and real estate funds. We like its core business, dividend, solid earnings history, and positive cash flows and were content to hold our shares as its earnings remained solid. State Street, the Fund’s second-largest holding at the end of June, is one of the world’s leading providers of financial services to institutional investors, including investment servicing, investment management, and investment research and trading. Its price climbed through much of the first half, boosted by strong fiscal 2012 results, which included strong EPS (earnings per share) growth and a growing dividend. The Fund’s most significant detractor for the period was Sprott, a Canadian investment management company with a history dating back to 1981. The firm saw its share price decline primarily as a result of its significant exposure to the precious metals mining industry, which suffered from declining commodity prices and increased operational costs. We added shares in March. Similar issues plagued U.S. Global Investors, a boutique registered investment advisory firm specializing in natural resources and emerging markets, two poor-performing areas of the market in the first half. We substantially increased our position in June. |
GOOD IDEAS AT THE TIME | |
| Sprott | -0.57% |
| U.S. Global Investors Cl. A | -0.46 |
| Citadel Capital | -0.16 |
| Ashmore Group | -0.14 |
| Egyptian Financial Group-Hermes Holding Company | -0.10 |
| 1 Net of dividends | |
| ROYCE FINANCIAL SERVICES FUND VS. RUSSELL 2000 AND RUSSELL 2500 FINANCIAL SERVICES Value of $10,000 Invested on 12/31/03 | |
 |
| Includes reinvestment of distributions. | |||
| PORTFOLIO DIAGNOSTICS | |||
| Fund Net Assets | $28 million | ||
| Number of Holdings | 86 | ||
| Turnover Rate | 3% | ||
| Average Market Capitalization1 | $2,933 million | ||
| Weighted Average P/E Ratio2,3 | 18.6x | ||
| Weighted Average P/B Ratio2 | 2.2x | ||
| U.S. Investments (% of Net Assets) | 59.6% | ||
| Non-U.S. Investments (% of Net Assets) | 24.4% | ||
| Symbol | RYFSX | ||
1 Geometric Average. This weighted calculation uses each portfolio holding’s market cap in a way designed to not skew the effect of very large or small holdings; instead, it aims to better identify the portfolio’s center, which Royce believes offers a more accurate measure of average market cap than a simple mean or median. | |||
2 Harmonic Average. This weighted calculation evaluates a portfolio as if it were a single stock and measures it overall. It compares the total market value of the portfolio to the portfolio’s share in the earnings or book value, as the case may be, of its underlying stocks. | |||
3 The Fund’s P/E ratio calculation excludes companies with zero or negative earnings (6% of portfolio holdings as of 6/30/13). | |||
| MORNINGSTAR STATISTICAL MEASURES1 | |||
| Sharpe Ratio | Standard Deviation | ||
| RFS | 0.45 | 23.38 | |
| Russell 2000 | 0.49 | 24.07 | |
| Category Median | 0.38 | 24.10 | |
| Best Quartile Breakpoint | 0.45 | 22.11 | |
1 Five years ended 6/30/13. Category Median and Best Quartile Breakpoint based on 29 financial services objective funds (oldest class only) with at least five years of history. | |||
The Fund performed within the top 50% of financial services objective funds on a risk-adjusted basis, as shown by its Sharpe ratio. In addition, the Fund produced lower volatility than the Russell 2000 and 50% of financial services objective funds, as shown by its standard deviation. | |||
DOWN MARKET PERFORMANCE COMPARISON | |||
 | |||
| The Royce Funds 2013 Semiannual Report to Shareholders | 27 |
| Royce SMid-Cap Value Fund |
AVERAGE ANNUAL TOTAL RETURNS Through 6/30/13 | ||||||||||
| January–June 20131 | 4.80 | % | ||||||||
| One-Year | 17.84 | |||||||||
| Three-Year | 11.16 | |||||||||
| Five-Year | 4.25 | |||||||||
| Since Inception (9/28/07) | 3.65 | |||||||||
| ANNUAL EXPENSE RATIOS | ||||||||||
| Gross Operating Expenses | 1.90 | % | ||||||||
| Net Operating Expenses | 1.35 | |||||||||
| 1 Not annualized | ||||||||||
| CALENDAR YEAR TOTAL RETURNS | ||||||||||
| Year | RSV | Year | RSV | |||||||
| 2012 | 15.4 | % | 2009 | 28.7 | % | |||||
| 2011 | -11.6 | 2008 | -29.3 | |||||||
| 2010 | 26.0 | |||||||||
| TOP 10 POSITIONS % of Net Assets | ||||||||||
| Western Digital | 5.1 | % | ||||||||
| Helmerich & Payne | 4.1 | |||||||||
| Jacobs Engineering Group | 3.8 | |||||||||
| Thor Industries | 3.7 | |||||||||
| Reliance Steel & Aluminum | 3.6 | |||||||||
| Pason Systems | 3.0 | |||||||||
| Myriad Genetics | 3.0 | |||||||||
| Teradyne | 3.0 | |||||||||
| Stella-Jones | 2.7 | |||||||||
| Westlake Chemical | 2.6 | |||||||||
| PORTFOLIO SECTOR BREAKDOWN % of Net Assets | ||||||||||
| Information Technology | 19.2 | % | ||||||||
| Industrials | 14.8 | |||||||||
| Materials | 14.8 | |||||||||
| Financials | 13.5 | |||||||||
| Energy | 11.1 | |||||||||
| Consumer Discretionary | 9.9 | |||||||||
| Health Care | 3.0 | |||||||||
| Consumer Staples | 1.1 | |||||||||
| Cash and Cash Equivalents | 12.6 | |||||||||
 | |||||||||
Managers’ Discussion Royce SMid-Cap Value Fund (RSV), with its mandate to explore the larger segment of the smaller company universe, had a challenging first half of 2013. With investor preferences decidedly favoring those areas of the market with more defensive or high-yielding characteristics, the portfolio’s contrarian positioning favored more economically sensitive and cyclical businesses during a time when fears persisted about the general health of the global economy. For the year-to-date period ended June 30, 2013, RSV gained 4.8%, trailing its benchmark index, the Russell 2500, which gained 15.4%. Reminiscent of the first half of the prior three years, 2013’s opening six months began on a strongly bullish note only to be followed by a period of elevated volatility as two main storylines developed to stunt the enthusiasm of investors. Credit tightening in China orchestrated by that country’s central bank to address the excessive speculation in the housing market and unchecked lending in their shadow banking industry once again raised important questions around the sustainability of that nation’s remarkable growth rate. Perhaps more significantly, Fed Chairman Ben Bernanke surprised financial markets in June by signaling that the central bank would taper the pace of asset purchases, long the mainstay of the Fed’s quantitative easing program dating back to the financial crisis in 2008. While logically unsettling to fixed income markets, equity markets also swooned as investors struggled to come to grips with the potential withdrawal of the proverbial punchbowl. RSV got off to a slow start in the year’s ebullient first quarter, managing an increase of only 4.4% compared to the 12.9% advance for its benchmark index. The more challenging second quarter saw the Fund’s return more closely parallel that of the overall market as volatility returned while investors became a bit more selective. RSV gained 0.4% in the second quarter versus a 2.3% increase for the Russell 2500. Launched on September 28, 2007 near the eve of the financial crisis, RSV has seen its fair share of market volatility and a seemingly continuous tension between specific company fundamentals and the constant stream of macroeconomic risks. Throughout this time, the Fund has stayed true to its investment mandate to invest in well-capitalized businesses that we believe possess high quality and are mispriced in the marketplace. Performance in the first half of 2013 was mostly positive from a sector standpoint, with only one of the Fund’s eight equity sectors meaningfully detracting from returns. Leading the list of positive contributors was the Information Technology sector, followed by Industrials and Financials. | |||||||||
| GOOD IDEAS THAT WORKED Top Contributors to Performance Year-to-Date through 6/30/131 | |||||||||||
| Western Digital | 1.65% | ||||||||||
| Thor Industries | 0.77 | ||||||||||
| Jacobs Engineering Group | 0.76 | ||||||||||
| SanDisk Corporation | 0.58 | ||||||||||
| Westlake Chemical | 0.57 | ||||||||||
| 1 Includes dividends | |||||||||||
Important Performance and Expense Information All performance information in this Report reflects past performance, is presented on a total return basis, reflects the reinvestment of distributions, and does not reflect the deduction of taxes that a shareholder would pay on fund distributions or the redemption of fund shares. Past performance is no guarantee of future results. Investment return and principal value of an investment will fluctuate, so that shares may be worth more or less than their original cost when redeemed. Shares redeemed within 180 days of purchase may be subject to a 1% redemption fee payable to the Fund, which is not reflected in the performance shown above; if it were, performance would be lower. Current month-end performance may be higher or lower than performance quoted and may be obtained at www.roycefunds.com. Gross operating expenses reflect gross total annual operating expenses for the Service Class and include management fees, 12b-1 distribution and service fees, and other expenses. Net operating expenses reflect contractual fee waivers and/or expense reimbursements. All expense information is reported as of the Fund’s most current prospectus. Royce & Associates has contractually agreed to waive fees and/or reimburse operating expenses to the extent necessary to maintain the Service Class’s net annual operating expenses at or below 1.35% through April 30, 2014. Regarding the two “Good Ideas” tables shown above, the sum of all contributors to, and all detractors from, performance for all securities in the portfolio would approximate the Fund’s year-to-date performance for 2013. | |||||||||||
| 28 | The Royce Funds 2013 Semiannual Report to Shareholders |
Performance and Portfolio Review Materials, a leadership group in 2010 and in the first half of 2011, was the notable detractor to Fund performance as precious metals prices fell precipitously in the first half, hurting the underlying companies engaged in their extraction. Results were largely consistent at the industry level with metals & mining being the biggest trouble spot. Household durables was the only other notable detractor. On the positive side, computers & peripherals was a bright spot leading all industry groups by a wide margin. Western Digital was the Fund’s top contributor to performance by a healthy margin. Based in Irvine, CA, Western Digital is the globe’s largest manufacturer of hard disk drives. While the company was mostly a supplier to the desktop market until 2004, it has successfully expanded into cloud computing server farms and the notebook segment. First buying shares early in 2010, we took gains in April and early in July. Long-time Royce favorite Thor Industries remained in the fast lane during the first half of 2013. Our analysis of this RV and small- and mid-size bus maker, which we first bought in the portfolio in 2010, has not shifted. The company emerged in 2012 in what we thought was excellent condition following a five-year period of sluggish sales and intense industry consolidation. Thor recently brought on some new faces in upper management, including a CEO who rose through the ranks of the company and has worked to make the business more focused and efficient just as demand is picking up. We think its stock has the potential to stay in high gear. Jacobs Engineering Group provides a range of engineering, construction, and technical services to industrial, commercial, and government clients around the world. As evidenced by recent backlog growth, the company looks well-positioned to benefit from the recovery in capital spending here in the U.S. and the ripple effect (in the form of infrastructure improvements) related to the reviving energy industry. Utilization rates have recently improved, driving margin expansion and revenue growth. As mentioned the bulk of the Fund’s net losses in the first half came from the metals & mining industry. Precious metals miners accounted for five of the Fund’s 10 largest detractors for the period. Several factors worked against these holdings in the first half. Gold and silver prices declined significantly, mine operating costs increased, and several firms went through management changes. Warren Buffett once said, “Only when the tide goes out do you discover who’s been swimming naked.” For the mining industry, it has often looked as if the tide was never coming back in. In many cases, valuations have reached what we view as rock-bottom levels that have not been seen since the late 2008-early 2009 lows. Still, we have chosen not to build positions but to hold those we think best positioned for an eventual turnaround, such as Hochschild Mining and Pan American Silver. |
GOOD IDEAS AT THE TIME | |
| Hochschild Mining | -1.06% |
| Pan American Silver | -0.91 |
| Pretium Resources | -0.66 |
| Globe Specialty Metals | -0.55 |
| Sprott | -0.45 |
| 1 Net of dividends | |
| ROYCE SMID-CAP VALUE FUND VS. RUSSELL 2500 Value of $10,000 Invested on 9/28/07 | |
 |
| Includes reinvestment of distributions. |
| PORTFOLIO DIAGNOSTICS | |||||
| Fund Net Assets | $11 million | ||||
| Number of Holdings | 47 | ||||
| Turnover Rate | 17% | ||||
| Average Market Capitalization1 | $3,493 million | ||||
| Weighted Average P/E Ratio2,3 | 15.5x | ||||
| Weighted Average P/B Ratio2 | 2.0x | ||||
| U.S. Investments (% of Net Assets) | 61.4% | ||||
| Non-U.S. Investments (% of Net Assets) | 26.0% | ||||
| Symbol | RMVSX | ||||
1 Geometric Average. This weighted calculation uses each portfolio holding’s market cap in a way designed to not skew the effect of very large or small holdings; instead, it aims to better identify the portfolio’s center, which Royce believes offers a more accurate measure of average market cap than a simple mean or median. | |||||
2 Harmonic Average. This weighted calculation evaluates a portfolio as if it were a single stock and measures it overall. It compares the total market value of the portfolio to the portfolio’s share in the earnings or book value, as the case may be, of its underlying stocks. | |||||
3 The Fund’s P/E ratio calculation excludes companies with zero or negative earnings (11% of portfolio holdings as of 6/30/13). | |||||
| MORNINGSTAR STATISTICAL MEASURES1 | |||||
| Sharpe Ratio | Standard Deviation | ||||
| RSV | 0.29 | 22.72 | |||
| Russell 2500 | 0.49 | 23.15 | |||
| Category Median | 0.42 | 21.94 | |||
| Best Quartile Breakpoint | 0.50 | 20.58 | |||
1 Five years ended 6/30/13. Category Median and Best Quartile Breakpoint based on 348 mid-cap objective funds (oldest class only) with at least five years of history. | |||||
| |||||
| The Royce Funds 2013 Semiannual Report to Shareholders | 29 |
| Royce Focus Value Fund |
AVERAGE ANNUAL TOTAL RETURNS Through 6/30/13 | ||||||||||
| January–June 20131 | 4.41 | % | ||||||||
| One-Year | 14.01 | |||||||||
| Three-Year | 7.79 | |||||||||
| Since Inception (2/27/09) | 13.52 | |||||||||
| ANNUAL EXPENSE RATIOS | ||||||||||
| Gross Operating Expenses | 2.06 | % | ||||||||
| Net Operating Expenses | 1.36 | |||||||||
| 1 Not annualized | ||||||||||
| CALENDAR YEAR TOTAL RETURNS | ||||||||||
| Year | RFV | Year | RFV | |||||||
| 2012 | 9.2 | % | 2010 | 15.2 | % | |||||
| 2011 | -13.9 | |||||||||
| TOP 10 POSITIONS % of Net Assets | ||||||||||
| Berkshire Hathaway Cl. B | 3.9 | % | ||||||||
| Google Cl. A | 3.5 | |||||||||
| Franklin Resources | 3.4 | |||||||||
| SemGroup Corporation Cl. A | 3.3 | |||||||||
| Western Digital | 3.2 | |||||||||
| Exxon Mobil | 3.2 | |||||||||
| ePlus | 3.0 | |||||||||
| Nautilus | 2.9 | |||||||||
| NutriSystem | 2.6 | |||||||||
| eHealth | 2.5 | |||||||||
| PORTFOLIO SECTOR BREAKDOWN % of Net Assets | ||||||||||
| Financials | 20.1 | % | ||||||||
| Information Technology | 16.0 | |||||||||
| Consumer Discretionary | 13.0 | |||||||||
| Industrials | 12.3 | |||||||||
| Energy | 11.2 | |||||||||
| Health Care | 8.7 | |||||||||
| Materials | 6.1 | |||||||||
| Consumer Staples | 3.8 | |||||||||
| Miscellaneous | 0.7 | |||||||||
| Government Bonds | 1.3 | |||||||||
| Cash and Cash Equivalents | 6.8 | |||||||||
 | |||||||||
Manager’s Discussion Royce Focus Value Fund (RFV) had a difficult first half of 2013. For the year-to-date period, the Fund rose 4.4% compared to a gain of 15.4% for its benchmark, the Russell 2500 Index, for the same period. These first-half results follow a string of disappointing performances for the Fund dating back to 2011, a period characterized by closely correlated market results, strong performance for defensive stocks, the growing popularity of higher-yielding vehicles such as REITs, MLPs (master limited partnerships), and Utilities, and a widespread preference for fixed-income securities over many equities. Needless to say, these are not the kinds of investments that we seek for RFV’s portfolio, choosing instead to focus on small to mid-cap companies with strong balance sheets and what look to us like compelling valuations. In contrast to the second, the first quarter was pleasantly, smoothly bullish for most stocks. The Russell 2500 rose 12.9% between the beginning of January and the end of March while the Fund managed a 2.7% return. This made the task of a strong absolute first-half return, as well as narrowing the gap with the benchmark, more than a little challenging. The Fund fell further behind in the second quarter, which was unfortunate enough, but we were particularly frustrated that RFV underperformed the benchmark during the more volatile months of the second quarter. In April the Fund fell 1.0% versus a gain of 0.3% for the Russell 2500; in June RFV slipped 2.3% compared to a 1.1% decline of the small-to-mid cap index. The Fund did beat the benchmark in May, a bullish month in which RFV was up 5.1% compared to 3.1% for the benchmark. For the second quarter as a whole the Fund gained 1.7% while the Russell 2500 advanced 2.3%. Much of the underperformance came from the portfolio’s holdings in the metals & mining industry. The Fund is one of a select group of Royce offerings with the flexibility to pursue opportunities up and down the market capitalization spectrum. Consistent with our view that leadership in the market will most likely rotate between small- and larger-cap stocks over time, this flexibility is of great value, especially within the context of an asset class—equities—that looks broadly attractive to us versus other asset classes, particularly fixed income. We use the same rigorous criteria of strong balance sheets, high internal rates of return, and compelling valuation combined with a long-term investment horizon that has come to distinguish the Royce approach over the past four decades. So while | |||||||||
| GOOD IDEAS THAT WORKED Top Contributors to Performance Year-to-Date through 6/30/131 | |||||||||||
| Western Digital | 1.68% | ||||||||||
| Berkshire Hathaway Cl. B | 0.87 | ||||||||||
| NutriSystem | 0.64 | ||||||||||
| GameStop Corporation Cl. A | 0.64 | ||||||||||
| Jacobs Engineering Group | 0.54 | ||||||||||
| 1 Includes dividends | |||||||||||
Important Performance and Expense Information All performance information in this Report reflects past performance, is presented on a total return basis, reflects the reinvestment of distributions, and does not reflect the deduction of taxes that a shareholder would pay on fund distributions or the redemption of fund shares. Past performance is no guarantee of future results. Investment return and principal value of an investment will fluctuate, so that shares may be worth more or less than their original cost when redeemed. Shares redeemed within 180 days of purchase may be subject to a 1% redemption fee payable to the Fund, which is not reflected in the performance shown above; if it were, performance would be lower. Current month-end performance may be higher or lower than performance quoted and may be obtained at www.roycefunds.com. Gross operating expenses reflect total gross annual operating expenses and include management fees, 12b-1 distribution and service fees, other expenses, and acquired fund fees and expenses. Net operating expenses reflect contractual fee waivers and/or reimbursements. All expense information is reported as of the Fund’s most current prospectus. Royce & Associates has contractually agreed to waive its fees and/or reimburse operating expenses to the extent necessary to maintain the Fund’s net annual operating expenses, other than acquired fund fees and expenses, at or below 1.35% through April 30, 2014. Acquired fund fees and expenses reflect the estimated amount of the fees and expenses incurred indirectly by the Fund through its investments in mutual funds, hedge funds, private equity funds, and other investment companies. Regarding the two “Good Ideas” tables shown above, the sum of all contributors to, and all detractors from, performance for all securities in the portfolio would approximate the Fund’s year-to-date performance for 2013. | |||||||||||
| 30 | The Royce Funds 2013 Semiannual Report to Shareholders |
Performance and Portfolio Review a meaningful portion of the portfolio will continue to be sourced from our favored segment of smaller companies, the Fund also has the opportunity to apply our strict methodology to companies of all sizes. RFV’s average annual total return since inception was 13.5%. RFV ended the period with 52 holdings, up from 50 at the end of 2012. Two of the Fund’s equity sectors, Materials and Health Care, finished the first half in negative territory, though the Materials sector detracted most and by a wide margin. The Information Technology, Financials, and Consumer Discretionary sectors were the greatest contributors to performance. At the industry level, computers & peripherals led the advance, followed by insurance and capital markets. The bulk of the Fund’s net losses in the first half came from the metals & mining industry, part of the Materials sector. Companies in this industry accounted for seven of the Fund’s ten—and 11 of its 20—largest detractors for the period. Most were precious metals mining companies. Several factors worked against these holdings in the first half. Gold and silver prices declined significantly, mine operating costs were climbing, and several firms went through management changes. As a result, we substantially reduced the portfolio’s exposure to this industry and Materials stocks in general. The sector accounted for 6.1% of net assets at the end of the period. Among the positions we sold were Allied Nevada Gold, Pretium Resources, Newmont Mining, Fresnillo, Seabridge Gold, Pan American Silver, Schnitzer Steel Industries, Agnico Eagles Mines, Alamos Gold, and Major Drilling Group International, each of which was a significant detractor to performance in the first half. Long-time holding Berkshire Hathaway was the Fund’s top holding at the end of the semiannual period, while Western Digital was the Fund’s top contributor to performance by a healthy margin. Based in Irvine, CA, Western Digital is the globe’s largest manufacturer of hard disk drives. While the company was mostly a supplier to the desktop market until 2004, it has successfully expanded into cloud computing server farms and the notebook segment. Another top performer for the period was GameStop Corporation. The Texas-based firm is a video game retailer that sells new and pre-owned gaming products, including hardware and software. Many investors doubted the long-term viability of its business model at a time when tablet applications and downloads predominate. When Microsoft and Sony announced earlier this year that they would be introducing updated consoles, the news helped assure investors that the company’s video game exchange business can continue to grow and quieted fears that GameStop would go the same route as Blockbuster Video. The company should also draw a benefit from selling the consoles themselves. It was a top-30 position for the Fund at the end of June. |
| GOOD IDEAS AT THE TIME Top Detractors from Performance Year-to-Date through 6/30/131 | |||||||||||
| Allied Nevada Gold | -1.32% | ||||||||||
| Pretium Resources | -0.96 | ||||||||||
| Newmont Mining | -0.74 | ||||||||||
| Fresnillo | -0.70 | ||||||||||
| Apple | -0.62 | ||||||||||
| 1 Net of dividends | |||||||||||
| ROYCE FOCUS VALUE FUND VS. RUSSELL 2500 Value of $10,000 Invested on 2/27/09 | |||||||||||
 |
| Includes reinvestment of distributions. | |||
| PORTFOLIO DIAGNOSTICS | |||
| Fund Net Assets | $10 million | ||
| Number of Holdings | 52 | ||
| Turnover Rate | 85% | ||
| Average Market Capitalization1 | $4,243 million | ||
| Weighted Average P/E Ratio2,3 | 18.2x | ||
| Weighted Average P/B Ratio2 | 2.2x | ||
| U.S. Investments (% of Net Assets) | 80.8% | ||
| Non-U.S. Investments (% of Net Assets) | 12.4% | ||
| Symbol | RYFVX | ||
1 Geometric Average. This weighted calculation uses each portfolio holding’s market cap in a way designed to not skew the effect of very large or small holdings; instead, it aims to better identify the portfolio’s center, which Royce believes offers a more accurate measure of average market cap than a simple mean or median. | |||
2 Harmonic Average. This weighted calculation evaluates a portfolio as if it were a single stock and measures it overall. It compares the total market value of the portfolio to the portfolio’s share in the earnings or book value, as the case may be, of its underlying stocks. | |||
3 The Fund’s P/E ratio calculation excludes companies with zero or negative earnings (9% of portfolio holdings as of 6/30/13). | |||
| MORNINGSTAR STATISTICAL MEASURES1 | |||
| Sharpe Ratio | Standard Deviation | ||
| RFV | 0.50 | 18.18 | |
| Russell 2500 | 1.11 | 17.48 | |
| Category Median | 1.05 | 16.85 | |
| Best Quartile Breakpoint | 1.15 | 15.63 | |
1 Three years ended 6/30/13. Category Median and Best Quartile Breakpoint based on 370 mid-cap objective funds (oldest class only) with at least three years of history. | |||
| The Royce Funds 2013 Semiannual Report to Shareholders | 31 |
| Royce Partners Fund |
AVERAGE ANNUAL TOTAL RETURNS Through 6/30/13 | ||||||||||
| January–June 20131 | 12.13 | % | ||||||||
| One-Year | 26.14 | |||||||||
| Three-Year | 15.55 | |||||||||
| Since Inception (4/27/09) | 12.60 | |||||||||
| ANNUAL EXPENSE RATIOS | ||||||||||
| Gross Operating Expenses | 4.85 | % | ||||||||
| Net Operating Expenses | 1.37 | |||||||||
| 1 Not annualized | ||||||||||
| CALENDAR YEAR TOTAL RETURNS | ||||||||||
| Year | PTR | Year | PTR | |||||||
| 2012 | 20.7 | % | 2010 | 18.7 | % | |||||
| 2011 | -11.7 | |||||||||
| TOP 10 POSITIONS % of Net Assets | ||||||||||
| E-L Financial | 3.0 | % | ||||||||
| Towers Watson & Company Cl. A | 2.4 | |||||||||
| MasterCard Cl. A | 2.3 | |||||||||
| Verisk Analytics Cl. A | 2.2 | |||||||||
| Sanofi ADR | 2.1 | |||||||||
| Tidewater | 2.1 | |||||||||
| SEI Investments | 2.1 | |||||||||
| Global Telecom & Technology | 2.1 | |||||||||
| Schwab (Charles) | 2.0 | |||||||||
| Zebra Technologies Cl. A | 2.0 | |||||||||
| PORTFOLIO SECTOR BREAKDOWN % of Net Assets | ||||||||||
| Financials | 25.2 | % | ||||||||
| Industrials | 23.9 | |||||||||
| Information Technology | 14.4 | |||||||||
| Materials | 11.2 | |||||||||
| Consumer Discretionary | 6.2 | |||||||||
| Energy | 4.9 | |||||||||
| Health Care | 4.6 | |||||||||
| Telecommunication Services | 2.1 | |||||||||
| Miscellaneous | 0.9 | |||||||||
| Cash and Cash Equivalents | 6.6 | |||||||||
 | |||||||||
Manager’s Discussion Royce Partners Fund (PTR) did fine in the first half on an absolute basis, though we were disappointed that it came up short against its benchmark. For the year-to-date period ended June 30, 2013, the Fund rose 12.1% compared to a gain of 15.4% for its benchmark, the Russell 2500 Index, for the same period. PTR finished 2012 on a high note, outperforming the small to mid-cap index through the last six months of the year with a 12.5% advance compared to a 8.9% gain for the benchmark. However, the Fund was unable to maintain this pace through the more or less consistently bullish first quarter of 2013. PTR did well on an absolute basis but lost ground against the Russell 2500, gaining 10.7% versus 12.9% for the index. The Fund fell further behind in the second quarter, a far more volatile period than this year’s first quarter and somewhat similar to the second and fourth quarters of 2012, which only served to exacerbate our frustration. The period between the beginning of April and the end of June saw underwhelming economic news from China (along with credit issues and the threat of an overheated real estate market), new attempts at fiscal stimulus in Japan, unrest—and plunging markets—in Turkey and Brazil, a spike in the 10-year Treasury rate between mid-May and mid-June, and word from the Federal Reserve that it would likely begin to reduce its bond purchase program later this year. All of this was enough to send financial markets into a frenzy of selling, especially outside the U.S. Indeed, the major domestic equity indexes stabilized and finished the second quarter in the black. For the second quarter as a whole the Fund gained 1.3% while the Russell 2500 advanced 2.3%. PTR is one of a select group of Royce offerings with the flexibility to pursue opportunities up and down the market capitalization spectrum. Consistent with our view that leadership in the market will most likely rotate between small- and larger-cap stocks over time, this flexibility is of great value, especially within the context of an asset class—equities—that looks broadly attractive to us versus other asset classes, particularly fixed income. We use the same rigorous criteria of strong balance sheets, high internal rates of return, and compelling valuation combined with a long-term investment horizon that has come to distinguish the Royce approach over the past four decades. So while a meaningful portion of the portfolio will continue to be sourced from our favored segment of smaller companies, the Fund also has the opportunity to apply our strict methodology to companies of all sizes. We were | |||||||||
| 32 | The Royce Funds 2013 Semiannual Report to Shareholders |
Performance and Portfolio Review pleased that PTR outperformed the Russell 2500 for the one-year period ended June 30, 2013. The Fund’s average annual total return since inception was 12.6%. PTR ended the period with 60 holdings, up from 58 at the end of 2012. All of the Fund’s eight equity sectors made positive contributions in the first half, with Financials leading by a considerable margin, followed by strong net gains from the Industrials and Information Technology sectors. At the industry level, capital markets—the dominant industry in the Financials sector—led all groups, followed by professional services and machinery. WisdomTree Investments, a New York-based asset management firm sponsoring ETFs (exchange-traded funds) and other financial products to retail and institutional investors, was the top performer for the period. Robust inflows and strong product line growth helped to attract investors to its stock. With its price on the rise, we took some gains in the first half. State Street is one of the world’s leading providers of financial services to institutional investors, including investment servicing, investment management, and investment research and trading. Its price climbed through much of the first half, boosted by strong fiscal 2012 results, which included EPS (earnings per share) growth and a growing dividend. We reduced our position as its stock price climbed in the first half. Asset management business Alliance Bernstein is a longtime Royce favorite. However, we chose to sell our position in PTR as its price soared past our sell target in May. We liked the valuation and growth potential for Towers Watson & Company enough for it to be the Fund’s second-largest holding at the end of June. The company provides human resource and financial consulting services. It offers employee benefit programs, develops attraction, retention, and reward strategies, and provides other related services. Its price rose more or less steadily through the first half of 2013. The company continues to deliver steady growth in its benefits consulting business, generates strong free cash flow, and showed solid initial enrollments in its exchange solutions business as it gains traction in the early innings of healthcare exchange implementation. Earnings have been strong, revenues have grown, and cash flows have been solid. In May the firm’s management also raised adjusted EPS guidance for fiscal 2013. Gold Fields was the largest detractor to performance by a wide margin. Precious metals miners faced the dual challenges of slumping commodity prices and rising operational costs in the first half. We held our shares in the hope of en eventual industry turnaround. We added to our stake in Italian shoemaker and retailer Geox. Declining sales and earnings drove its price down, but we thought that its strong brand could help the stock to step up when eurozone economies in the Mediterranean begin to recover. |
 |
| Includes reinvestment of distributions. | ||||||||||
| PORTFOLIO DIAGNOSTICS | ||||||||||
| Fund Net Assets | $2 million | |||||||||
| Number of Holdings | 60 | |||||||||
| Turnover Rate | 34% | |||||||||
| Average Market Capitalization1 | $3,624 million | |||||||||
| Weighted Average P/E Ratio2,3 | 18.2x | |||||||||
| Weighted Average P/B Ratio2 | 2.1x | |||||||||
| U.S. Investments (% of Net Assets) | 64.4% | |||||||||
| Non-U.S. Investments (% of Net Assets) | 29.0% | |||||||||
| Symbol | RPTRX | |||||||||
1 Geometric Average. This weighted calculation uses each portfolio holding’s market cap in a way designed to not skew the effect of very large or small holdings; instead, it aims to better identify the portfolio’s center, which Royce believes offers a more accurate measure of average market cap than a simple mean or median. | ||||||||||
2 Harmonic Average. This weighted calculation evaluates a portfolio as if it were a single stock and measures it overall. It compares the total market value of the portfolio to the portfolio’s share in the earnings or book value, as the case may be, of its underlying stocks. | ||||||||||
3 The Fund’s P/E ratio calculation excludes companies with zero or negative earnings (5% of portfolio holdings as of 6/30/13). | ||||||||||
| MORNINGSTAR STATISTICAL MEASURES1 | ||||||||||
| Sharpe Ratio | Standard Deviation | |||||||||
| PTR | 0.92 | 17.30 | ||||||||
| Russell 2500 | 1.11 | 17.48 | ||||||||
| Category Median | 1.05 | 16.85 | ||||||||
| Best Quartile Breakpoint | 1.15 | 15.63 | ||||||||
1 Three years ended 6/30/13. Category Median and Best Quartile Breakpoint based on 370 mid-cap objective funds (oldest class only) with at least three years of history. | ||||||||||
| ||||||||||
| The Royce Funds 2013 Semiannual Report to Shareholders | 33 |
| Royce Special Equity Multi-Cap Fund |
AVERAGE ANNUAL TOTAL RETURNS Through 6/30/13 | ||||||||||
| January–June 20131 | 17.81 | % | ||||||||
| One-Year | 23.27 | |||||||||
| Since Inception (12/31/10) | 14.75 | |||||||||
| ANNUAL EXPENSE RATIOS | ||||||||||
| Gross Operating Expenses | 1.51 | % | ||||||||
| Net Operating Expenses | 1.39 | |||||||||
| 1 Not annualized | ||||||||||
| CALENDAR YEAR TOTAL RETURNS | ||||||||||
| Year | RSM | Year | RSM | |||||||
| 2012 | 11.6 | % | 2011 | 7.2 | % | |||||
| TOP 10 POSITIONS % of Net Assets | ||||||||||
| Bed Bath & Beyond | 5.1 | % | ||||||||
| Gap (The) | 5.0 | |||||||||
| Molex Cl. A | 4.9 | |||||||||
| Emerson Electric | 4.8 | |||||||||
| Staples | 4.6 | |||||||||
| Microsoft Corporation | 4.5 | |||||||||
| Nordstrom | 4.4 | |||||||||
| Occidental Petroleum | 4.3 | |||||||||
| Cisco Systems | 4.3 | |||||||||
| Dover Corporation | 4.0 | |||||||||
| PORTFOLIO SECTOR BREAKDOWN % of Net Assets | ||||||||||
| Information Technology | 27.1 | % | ||||||||
| Consumer Discretionary | 24.0 | |||||||||
| Industrials | 23.8 | |||||||||
| Health Care | 14.7 | |||||||||
| Energy | 4.3 | |||||||||
| Consumer Staples | 1.7 | |||||||||
| Financials | 0.8 | |||||||||
| Cash and Cash Equivalents | 3.6 | |||||||||
 |
Manager’s Discussion The first six months of 2013 offered two very different market climates, and we were pleased with the absolute and relative results for Royce Special Equity Multi-Cap Fund (RSM) in each of them. The Fund advanced 17.8% for the year-to-date period ended June 30, 2013, ahead of its benchmark, the Russell 1000 Index, which was up 13.9% for the same period. The first quarter was a bullish period that in many ways continued the trend that began following the market lows in June 2012. RSM trailed the Russell 1000 through the last six months of 2012, up 4.6% versus 6.4%, and began 2013 by remaining slightly behind. For the first quarter the Fund was up 10.3%, trailing the 11.0% gain for its benchmark. The Fund’s early disadvantage was not surprising since lower-quality issues have often dominated the market over the last few years. We were pleased that the more volatile second quarter saw substantial improvement on a relative basis. Markets were sent reeling following the Fed’s announcement that it would likely begin tapering the pace of monthly bond purchases later in the year. In this more uncertain environment,the Fund more than doubled the return of its benchmark with a gain of 6.8% versus 2.7% for the Russell 1000. Strong results from holdings in the Consumer Discretionary sector, which also made a notable contribution in the first quarter, helped make the difference. The Fund also outperformed the Russell 1000 for the one-year and since inception (12/31/10) periods ended June 30, 2013. RSM’s average annual total return since inception was 14.8%. We remain bullish and are not alone in this view, as evidenced by an article that appeared on June 16th in the New York Times, “Even Pessimists Feel Optimistic Over Economy.” In the piece, the author says that a number of economists in academia and on Wall Street are now predicting something the United States has not experienced in years—healthier, more lasting growth. This helps to explain why stocks remain in our view the best way to access yield, particularly when focusing, as we do, on those equities that generate substantial free cash flow and have the ability to grow their dividends. The market needed time to recalibrate and digest the Fed’s earlier-than-expected announcement of a potential reduction in QE. An analogy offered by investment research company I.S.I. was that the Fed has its foot on the gas pedal driving 85 mph and is contemplating slowing down to 60 mph. At this point, we think it is too early to jump out of |
| 34 | The Royce Funds 2013 Semiannual Report to Shareholders |
Performance and Portfolio Review |
| that car. That said, there is no real precedent for what the Fed is doing. In the end, it will all boil down to the economic outlook. It should be remembered, however, that the stock market has been trending higher as long as the Fed’s balance sheet has been expanding. Even with tapering it would still be expanding, just not as rapidly. During the June selloff, the rise in rates did not bother us, as the level is too far away to pose a real threat to equities. We think the 10-year Treasury needs to be in the 5% region before it is a problem historically. We also believe further decoupling will occur with the trend in equities up and bonds flat to down. In addition, we suspect the decoupling of the U.S. market with the rest of the world is likely to continue, at least for the time being. We are known for worrying and, despite our bullish stance, we still keep a watchful eye on issues that could cause us to change that view. Among the more notable potential issues are a poorly executed Fed tapering, another euro crisis, a hard landing in China, and unforeseen events such as terrorism, earthquakes, pandemics, and geopolitical risk as a result of unstable or extreme governments. At the same time, we cannot ignore the many domestic positives including improvements in energy production and manufacturing. This list would also include the decline in the budget deficit as a percentage of GDP, our debt to GDP having stabilized at a reasonable figure (70%), and the slowing of healthcare costs, which is reducing Medicare’s unfunded liabilities. We believe that the portfolio remains well-positioned for a market in which dividends and quality matter and that looks as if it is headed higher. However, we also recognize that volatility will be higher as we travel a new, uncharted road. Six of the Fund’s seven equity sectors posted net gains in the first half. Consumer Discretionary led all sectors by a sizable margin. Specialty retail was the best-performing industry group within the sector and in the Fund overall. The group received a boost from the portfolio’s three largest contributors, Staples (one of 2012’s chief detractors), The Gap (a top performer last year), and Bed Bath & Beyond. Each was also a top-ten holding at the end of June. Information Technology, Industrials, Health Care, and Consumer Staples also made strong-to-solid net contributions to first-half results. RSM’s top detractor was another retailer, Kohl’s Corporation. The company also made that list in 2012. We sold our shares in January 2013. |
 |
| Includes reinvestment of distributions. |
| PORTFOLIO DIAGNOSTICS | ||||
| Fund Net Assets | $159 million | |||
| Number of Holdings | 29 | |||
| Turnover Rate | 20% | |||
| Average Market Capitalization1 | $23,858 million | |||
| Weighted Average P/E Ratio2,3 | 15.6x | |||
| Weighted Average P/B Ratio2 | 2.8x | |||
| U.S. Investments (% of Net Assets) | 96.4% | |||
| Non-U.S. Investments (% of Net Assets) | 0.0% | |||
| Symbol | ||||
| Investment Class | RSMCX | |||
| Service Class | RSEMX | |||
| Institutional Class | RMUIX | |||
1 Geometric Average. This weighted calculation uses each portfolio holding’s market cap in a way designed to not skew the effect of very large or small holdings; instead, it aims to better identify the portfolio’s center, which Royce believes offers a more accurate measure of average market cap than a simple mean or median. | ||||
2 Harmonic Average. This weighted calculation evaluates a portfolio as if it were a single stock and measures it overall. It compares the total market value of the portfolio to the portfolio’s share in the earnings or book value, as the case may be, of its underlying stocks. | ||||
3 The Fund’s P/E ratio calculation excludes companies with zero or negative earnings (5% of portfolio holdings as of 6/30/13). | ||||
| The Royce Funds 2013 Semiannual Report to Shareholders | 35 |
| Royce European Smaller-Companies Fund |
AVERAGE ANNUAL TOTAL RETURNS Through 6/30/13 | ||||||||||
| January–June 20131 | 2.31 | % | ||||||||
| One-Year | 20.19 | |||||||||
| Three-Year | 12.00 | |||||||||
| Five-Year | 3.98 | |||||||||
| Since Inception (12/29/06) | 2.45 | |||||||||
| ANNUAL EXPENSE RATIOS | ||||||||||
| Gross Operating Expenses | 2.16 | % | ||||||||
| Net Operating Expenses | 1.72 | |||||||||
| 1 Not annualized | ||||||||||
| CALENDAR YEAR TOTAL RETURNS | ||||||||||
| Year | RES | Year | RES | |||||||
| 2012 | 23.8 | % | 2009 | 57.7 | % | |||||
| 2011 | -20.3 | 2008 | -46.4 | |||||||
| 2010 | 35.2 | 2007 | 1.4 | |||||||
| TOP 10 POSITIONS % of Net Assets | ||||||||||
| Stallergenes | 2.7 | % | ||||||||
| Recordati | 2.4 | |||||||||
| Semperit AG Holding | 2.4 | |||||||||
| Forbo Holding | 2.1 | |||||||||
| Ashmore Group | 2.0 | |||||||||
| Mayr-Melnhof Karton | 2.0 | |||||||||
| Zehnder Group | �� | 1.9 | ||||||||
| Lewis Group | 1.9 | |||||||||
| Boiron | 1.8 | |||||||||
| Raubex Group | 1.8 | |||||||||
| PORTFOLIO SECTOR BREAKDOWN % of Net Assets | ||||||||||
| Industrials | 21.9 | % | ||||||||
| Health Care | 19.5 | |||||||||
| Consumer Discretionary | 18.9 | |||||||||
| Information Technology | 11.7 | |||||||||
| Financials | 10.6 | |||||||||
| Materials | 5.9 | |||||||||
| Energy | 5.3 | |||||||||
| Consumer Staples | 2.3 | |||||||||
| Cash and Cash Equivalents | 3.9 | |||||||||
| PORTFOLIO COUNTRY BREAKDOWN1,2 % of Net Assets | ||||||||||
| United Kingdom | 21.3 | % | ||||||||
| France | 16.8 | |||||||||
| Switzerland | 12.4 | |||||||||
| Germany | 10.0 | |||||||||
| Italy | 7.9 | |||||||||
| South Africa | 5.6 | |||||||||
| Austria | 4.4 | |||||||||
| Norway | 4.0 | |||||||||
| 1 Represents countries that are 3% or more of net assets. | ||||||||||
| 2 Securities are categorized by the country of their headquarters. | ||||||||||
| | |||||||||
Manager’s Discussion European stocks had trouble keeping up with the blistering pace of returns shown by their U.S. peers. Nonetheless, returns were generally positive as many of the ever-present headlines about the eurozone’s thus-far intractable debt issues were overshadowed by renewed investor concern over the health certain emerging markets economies and the impact of the U.S. Federal Reserve’s signaling a potential roadmap for reducing fixed-income purchases. Royce European Smaller Companies Fund (RES), with its charter to invest in the highest conviction ideas we are finding in our European research efforts, demonstrated mixed results in what was a volatile first half for European small-caps. RES gained 2.3% in the first half of 2013, lagging its benchmark, the Russell Europe Small Cap Index, which advanced 5.7% for the same period. The bullish first quarter saw RES gain a respectable 2.5% while falling behind its European benchmark index, which gained 5.2%. Markets experienced a significant spike in volatility in the second quarter as the fragile eurozone economies came to grips with the potential for a reduction in U.S. monetary stimulus and higher interest rates. April and May were bullish, continuing the positive momentum of the first quarter, while June turned decidedly bearish. RES lost 0.2% in 2013’s second quarter compared to slightly better performance by the benchmark, with the Russell Europe Small Cap Index gaining by 0.5%. Now in its seventh year, RES continued to hold its longer term relative performance advantage over its benchmark. For the period ended June 30, 2013, the Fund’s average annual total return since inception (12/29/06) was 2.5% versus a decline of 1.2% for the Russell Europe Small Cap Index for the same period. Breaking the pattern of the past few years, in which news flow was dominated by fears of global economic weakness and the potential for renewed recessionary activities in the world’s important growth engines, was the potentially positive take on the health of the U.S. economy that motivated Fed Chairman Ben Bernanke to first articulate a potential slowing in the pace of the Fed’s balance sheet expansion by reducing the size of its monthly bond purchases. While we see this as an inherently positive development, the risks around removing the primary support mechanism of the fragile global economy led to a sharp increase in the yield of the 10-year U.S. Treasury and an uptick in equity market volatility, particularly in the latter half of the second quarter. Six of the Fund’s eight equity sectors generated positive performance for the first half of 2013. Health Care led by a considerable margin, more than doubling the contribution of the | |||||||||
| 36 | The Royce Funds 2013 Semiannual Report to Shareholders |
Performance and Portfolio Review next-best performing sector, Information Technology, which also made a strong contribution. With Financials and Industrials also posting solid net gains, the portfolio demonstrated solid performance characteristics from both the cyclical and more traditionally defensive areas of the market. Materials and Energy detracted from first-half performance as natural resource and commodity-based businesses reacted to the growing economic headwinds buffeting the emerging markets, especially China and Brazil. At the industry level, results remained broadly positive. Pharmaceuticals led all industry groups, followed by capital markets and software. The top performer in the period was Boiron, a French developer and manufacturer of homeopathic pharmaceutical products. The company published results for fiscal 2012 and the fiscal first quarter of 2013, both of which showed strong revenue growth and continued high levels of profitability. The share price responded favorably, with the company appearing attractively valued on both an absolute level and compared to its peers. Although we took some gains in the first half, we believed at the end of the period that Boiron remained attractively valued. It was RES’s ninth-largest holding at the end of June. Almirall is a Spanish company that is also in the pharmaceutical industry. It focuses on allergy and respiratory compounds as well as a range of infectious disease drugs. Although during the period the company reported further profit declines for both fiscal 2012 and the fiscal first quarter of 2013, many investors appeared to believe the company was moving close to positive trends in growth and profitability. The most challenging aspects of Spanish healthcare reforms now look to be in the past while news on clinical trials and new drug launches looked increasingly positive. However, based on our belief that many of its improved prospects have been priced in, we finished selling our shares in late June. Unhappy with ongoing share price declines over the past year, we also sold our shares of Hochschild Mining, a standout from 2012’s first half. This U.K.-based gold and silver mining company with operations primarily in South America saw its shares begin to fall sharply in the first quarter, closely tracking the steep losses experienced in the physical gold market. Mining companies also face increased operating costs, creating a nightmarish scenario. We felt better about the future prospects for Paris-based Parrot, which develops software and components for portable voice recognition devices, hands-free telephone kits for cars, and voice-activated personal digital assistants. Its shares suffered from a sharp drop in semiconductor sales in the automotive market that we believe resulted from general weakness in Europe’s automobile market and the timing of Parrot’s new product launches. We continue to believe that Parrot’s prospects for 2014 and beyond are bright and that the stock was attractively priced at the end of the period. |
 |
| Includes reinvestment of distributions. | |||
| PORTFOLIO DIAGNOSTICS | |||
| Fund Net Assets | $19 million | ||
| Number of Holdings | 79 | ||
| Turnover Rate | 27% | ||
| Average Market Capitalization1 | $1,081 million | ||
| Weighted Average P/E Ratio2,3 | 12.8x | ||
| Weighted Average P/B Ratio2 | 2.2x | ||
| Symbol | RISCX | ||
1 Geometric Average. This weighted calculation uses each portfolio holding’s market cap in a way designed to not skew the effect of very large or small holdings; instead, it aims to better identify the portfolio’s center, which Royce believes offers a more accurate measure of average market cap than a simple mean or median. | |||
2 Harmonic Average. This weighted calculation evaluates a portfolio as if it were a single stock and measures it overall. It compares the total market value of the portfolio to the portfolio’s share in the earnings or book value, as the case may be, of its underlying stocks. | |||
3 The Fund’s P/E ratio calculation excludes companies with zero or negative earnings (3% of portfolio holdings as of 6/30/13). | |||
| MORNINGSTAR STATISTICAL MEASURES1 | |||
| Sharpe Ratio | Standard Deviation | ||
| RES | 0.28 | 25.92 | |
| Russell Europe Small Cap | 0.14 | 28.85 | |
| Category Median | 0.09 | 25.73 | |
| Best Quartile Breakpoint | 0.23 | 24.23 | |
1 Five years ended 6/30/13. Category Median and Best Quartile Breakpoint based on 22 European stock objective funds (oldest class only) with at least five years of history. | |||
The Fund beat the Russell Europe Small Cap and performed within the top 25% of European stock objective funds on a risk-adjusted basis, as shown by its Sharpe ratio. In addition, the Fund produced lower volatility than the Russell Europe Small Cap, as shown by its standard deviation. | |||
DOWN MARKET PERFORMANCE COMPARISON | |||
 | |||
| The Royce Funds 2013 Semiannual Report to Shareholders | 37 |
| Royce Global Dividend Value Fund |
AVERAGE ANNUAL TOTAL RETURNS Through 6/30/13 | ||||||||||
| January–June 20131 | 1.97 | % | ||||||||
| One-Year | 18.11 | |||||||||
| Since Inception (12/31/10) | 2.26 | |||||||||
| ANNUAL EXPENSE RATIOS | ||||||||||
| Gross Operating Expenses | 2.87 | % | ||||||||
| Net Operating Expenses | 1.70 | |||||||||
| 1 Not annualized | ||||||||||
| CALENDAR YEAR TOTAL RETURNS | ||||||||||
| Year | RGD | Year | RGD | |||||||
| 2012 | 22.5 | % | 2011 | -15.4 | % | |||||
| TOP 10 POSITIONS % of Net Assets | ||||||||||
| Mayr-Melnhof Karton | 1.2 | % | ||||||||
| Raubex Group | 1.1 | |||||||||
| Lewis Group | 1.0 | |||||||||
| Garmin | 1.0 | |||||||||
| Apollo Global Management LLC Cl. A | 1.0 | |||||||||
| Expeditors International of Washington | 1.0 | |||||||||
| Domino Printing Sciences | 0.9 | |||||||||
| Stella-Jones | 0.9 | |||||||||
| Randgold Resources ADR | 0.9 | |||||||||
| WaterFurnace Renewable Energy | 0.9 | |||||||||
| PORTFOLIO SECTOR BREAKDOWN % of Net Assets | ||||||||||
| Consumer Discretionary | 24.0 | % | ||||||||
| Industrials | 18.5 | |||||||||
| Financials | 17.1 | |||||||||
| Information Technology | 11.2 | |||||||||
| Materials | 11.0 | |||||||||
| Health Care | 6.7 | |||||||||
| Energy | 2.9 | |||||||||
| Consumer Staples | 2.7 | |||||||||
| Diversified Investment Companies | 0.2 | |||||||||
| Cash and Cash Equivalents | 5.7 | |||||||||
 |
Manager’s Discussion The first half of 2013 was often challenging for non-U.S. equities. It was also a disappointing period for Royce Global Dividend Value Fund (RGD), which gained 2.0% for the year-to-date period ended June 30, 2013 versus a 6.7% increase for its small-cap benchmark, the Russell Global Small-Cap Index, for the same period. As was the case in 2012, the first quarter was a solidly bullish period for most stocks. Unlike 2012, however, non-U.S. equities generally had lower returns. Also unlike last year, RGD underperformed its benchmark by a considerable margin. The Fund gained 4.1% in the year’s opening quarter while the global small-cap index rose 8.6%. This left the Fund with substantial ground to make up versus the benchmark in the second quarter. The period was far more volatile, and we were unhappy that the portfolio was unable to better hold its value when share prices were falling from April through June. For the quarter as a whole, RGD fell 2.0% versus a decline of 1.7% for the benchmark. The second-quarter correction affected stocks globally. It was spurred by anxieties about the slowed pace of growth and credit issues in China, declining markets and social unrest in emerging markets countries such as Brazil and Turkey, the by now perennial concerns over the fiscal health of certain eurozone nations, and the U.S. Federal Reserve’s announcement that it would begin to taper the pace of bond purchases later this year. These developments combined to drive stock prices lower, especially outside the U.S. Of course, these issues are not new, and all have solutions, yet their coming so close together between mid-May and mid-June clearly spooked many investors who remain understandably skittish in light of all that has happened since the financial crisis in 2008. After nicely outpacing the global small-cap index in the second half of 2012 (+15.8% versus +11.0%), the Fund’s underperformance in 2013 eroded some of its longer-term relative advantage. From our point of view dividends have always been a marker of quality in the smaller-capitalization space. They also typically can potentially provide a cushion against high volatility. This, however, has not been as evident as we would have liked for RGD since its inception at the end of 2010. It may seem odd that non-dividend payers outperformed companies that pay them in the first half. With U.S. interest rates at zero, one might expect smaller dividend-paying companies to be more consistently in high demand. Yet over the last two-and-a-half years, greater numbers of investors have flocked to higher-yielding equities of lower quality, such as REITs, MLPs (master limited partnerships), and Utilities, and/or to companies that pay no dividends, carry sizable debt, and have low returns on invested capital. The potential for high growth and the desire |
| 38 | The Royce Funds 2013 Semiannual Report to Shareholders |
Performance and Portfolio Review |
| for high yield have outweighed other factors, such as those qualities that we hold dear—strong balance sheets, high returns on invested capital, strong cash flows, and, in many cases, growing dividends. While this has caused some frustration when reviewing recent relative returns, the situation has also created numerous opportunities for us to find better businesses—those that possess those key quality attributes we just listed. As a result, we think the portfolio is very well positioned for the more historically typical market we anticipate going forward, in which rising interest rates and a faster-growing, less Fed-dependent economy are likely to steer investors toward what we regard as better businesses. All but one of the Fund’s eight equity sectors were positive in the first half. Materials was the only sector to finish the period in the red. The lion’s share of its net losses came from the metals & mining industry, which was the largest detractor among all of the Fund’s industry groups. Four of the portfolio’s five—and eight of its ten—largest detractors came from this industry, and most were precious metals mining companies. While we liked the attractive valuations of many miners at the end of June, our estimate of each company’s fundamentals and the likelihood of a strong rebound when the industry recovers from falling commodity prices and rising operations costs guided our decisions. We chose to hold a position in Randgold Resources (a top-ten holding at the end of June), sold our shares of Hochschild Mining and Hecla Mining, and built our stake in Imdex, which provides drilling fluids and downhole survey instruments to the mining, oil and gas, water well, HDD, and civil engineering industries worldwide. We also added to our position in Sprott, a Canadian investment management company that saw its share price decline primarily due to its significant exposure to the precious metals and mining industry. The Information Technology, Industrials, and Health Care sectors were the greatest contributors to performance for the period. At the industry level, capital markets led the advance along with pharmaceutical companies and electronic equipment, instruments & components stocks. Top-ten position Apollo Global Management was also the top performer for the period. The New York City-based company is a leading global asset manager that applies a contrarian, value-oriented investment style in private equity, credit-oriented capital markets, and real estate. Western Digital, headquartered in Lake Forest, CA, is the largest global manufacturer of hard disk drives. While the company was mostly a supplier to the desktop market until 2004, it has successfully expanded into cloud computing server farms and the notebook segment. |
 |
| Includes reinvestment of distributions. |
| PORTFOLIO DIAGNOSTICS | ||||
| Fund Net Assets | $8 million | |||
| Number of Holdings | 154 | |||
| Turnover Rate | 49% | |||
| Average Market Capitalization1 | $1,217 million | |||
| Weighted Average P/E Ratio2,3 | 13.9x | |||
| Weighted Average P/B Ratio2 | 2.0x | |||
| Symbol | RGVDX | |||
1 Geometric Average. This weighted calculation uses each portfolio holding’s market cap in a way designed to not skew the effect of very large or small holdings; instead, it aims to better identify the portfolio’s center, which Royce believes offers a more accurate measure of average market cap than a simple mean or median. | ||||
2 Harmonic Average. This weighted calculation evaluates a portfolio as if it were a single stock and measures it overall. It compares the total market value of the portfolio to the portfolio’s share in the earnings or book value, as the case may be, of its underlying stocks. | ||||
3 The Fund’s P/E ratio calculation excludes companies with zero or negative earnings (1% of portfolio holdings as of 6/30/13). | ||||
| PORTFOLIO COUNTRY BREAKDOWN1,2 % of Net Assets | ||||||||||
| Hong Kong | 11.3 | % | ||||||||
| United States | 10.9 | |||||||||
| United Kingdom | 10.7 | |||||||||
| Switzerland | 8.0 | |||||||||
| Canada | 6.7 | |||||||||
| South Africa | 6.4 | |||||||||
| Japan | 5.2 | |||||||||
| France | 3.4 | |||||||||
| 1 Represents countries that are 3% or more of net assets. | ||||||||||
| 2 Securities are categorized by the country of their headquarters. | ||||||||||
| The Royce Funds 2013 Semiannual Report to Shareholders | 39 |
| Royce International Micro-Cap Fund |
AVERAGE ANNUAL TOTAL RETURNS Through 6/30/13 | ||||||||||
| January–June 20131 | -0.46 | % | ||||||||
| One-Year | 8.56 | |||||||||
| Since Inception (12/31/10) | -4.67 | |||||||||
| ANNUAL EXPENSE RATIOS | ||||||||||
| Gross Operating Expenses | 3.97 | % | ||||||||
| Net Operating Expenses | 1.76 | |||||||||
| 1 Not annualized | ||||||||||
| CALENDAR YEAR TOTAL RETURNS | ||||||||||
| Year | RMI | Year | RMI | |||||||
| 2012 | 13.6 | % | 2011 | -21.5 | % | |||||
| TOP 10 POSITIONS % of Net Assets | ||||||||||
| Manutan International | 1.7 | % | ||||||||
| Latchways | 1.6 | |||||||||
| CB Industrial Product Holding | 1.5 | |||||||||
| Semperit AG Holding | 1.5 | |||||||||
| Makalot Industrial | 1.5 | |||||||||
| Beter Bed Holding | 1.5 | |||||||||
| Stallergenes | 1.4 | |||||||||
| Ekornes | 1.4 | |||||||||
| Clarkson | 1.3 | |||||||||
| Elektrobudowa | 1.3 | |||||||||
| PORTFOLIO SECTOR BREAKDOWN % of Net Assets | ||||||||||
| Consumer Discretionary | 26.2 | % | ||||||||
| Industrials | 22.4 | |||||||||
| Information Technology | 13.0 | |||||||||
| Health Care | 12.8 | |||||||||
| Materials | 10.3 | |||||||||
| Financials | 5.8 | |||||||||
| Energy | 3.2 | |||||||||
| Consumer Staples | 2.6 | |||||||||
| Cash and Cash Equivalents | 3.7 | |||||||||
|
Manager’s Discussion From the standpoint of the international markets, the first half of 2013 exhibited many of the same performance characteristics as comparable periods in 2012 and 2011. Early gains gave way to a more volatile period as investors weighed developing economic risks mostly around events in the emerging world. China was back in the spotlight as growing credit risks around an increasingly overheated real estate market brought swift action by that country’s central bank to improve and gain greater control over lending standards. Volatility in global bond markets also gave investors pause as a potential change to slow the pace of the U.S. Federal Reserve’s monthly bond purchases (quantitative easing) was introduced and reinforced in May and June, sending yields 100 basis points higher on the 10-year Treasury note. In this often topsy-turvy environment, Royce International Micro-Cap Fund (RMI) lost 0.5% for the year-to-date period ended June 30, 2013, trailing its international smallcap benchmark, the Russell Global ex-U.S. Small Cap Index, which was up 1.8% for the same period. RMI’s selection universe is quite large and diverse, incorporating thousands of companies and more than $2.7 trillion in aggregate market capitalization. The characteristics of this evergreen universe have strong intellectual appeal given the inherent inefficiencies and lack of institutional resources dedicated to exploring it, attributes that originally attracted us to this segment of the U.S. equity market more than two decades ago. During the more bullish first quarter, RMI’s eclectic mix of what we deem to be high quality micro-cap companies struggled to keep pace with the solid gains exhibited by its benchmark index, which rose 6.5% over the period versus the Fund’s 2.2% advance. This contrasted with the more volatile second quarter in which international markets diverged meaningfully from the generally positive trends experienced in the U.S. RMI benefited from the margin of safety discipline, a hallmark of the Royce investment approach, by falling a modest 2.6% compared to the relevant Russell index, which lost 4.5%. While not satisfied with the half-year result, we were pleased to see the Fund preserve its value during this challenging period. Five of the Fund’s eight equity sectors generated positive performance for the first half of 2013, led by Industrials, Information Technology, and Health Care. Consumer Discretionary was also a contributor, meaning that the portfolio got solid performance from both cyclical and more traditionally defensive segments of the market. What most hampered performance, then, were |
| 40 | The Royce Funds 2013 Semiannual Report to Shareholders |
Performance and Portfolio Review |
| holdings in Materials, which posted outsized net losses in the first half. The Energy sector also detracted, though far more modestly, as natural resource and commodity-oriented businesses reacted to the growing economic headwinds buffeting emerging markets, especially China and Brazil. At the industry level, results were broadly positive, with professional services, software, and pharmaceuticals the top gainers. Not surprisingly given the sector results, the metals & mining industry led detractors by a sizable margin followed by net losses for diversified consumer services companies and energy equipment & services stocks. Companies in the metals & mining industry accounted for all of the Fund’s five largest detractors for the period as well as seven of its top 10 and 10 of its top 20. Most of the Fund’s net losses in the metals & mining industry came from precious metals miners. Several factors had a negative effect on these businesses in the first half. Gold and silver prices declined significantly and mine operating costs continued to climb, dramatically affecting margins. Warren Buffett once said, “Only when the tide goes out do you discover who’s been swimming naked.” For too many precious metals mining businesses, it has often looked as if the tide was never coming back in. This drove many companies’ valuations to what we regard as rock-bottom levels that have not been reached since the lows of late 2008-early 2009. We built our position in Australian gold producer Evolution Mining, which had an outsized negative effect on first-half results. We also added to our stake in two other Australian businesses—Imdex, which provides drilling fluids and downhole survey instruments to the mining, oil and gas, water well, HDD, and civil engineering industries worldwide, and junior gold producer Troy Resources. We chose to part ways with French drilling services business Foraco International and Australian gold producer Kingsrose Mining. Tokyo-based Nihon M&A Center provides M&A advisory and other related services to small- and medium-sized businesses. Growing revenues and earnings helped draw investors to its stock. We were intrigued by its niche in Japan, a country in which approximately 150,000 companies are said to lack succession plans, which represents a great opportunity for Nihon M&A. We reduced our position as its share price soared past our sell targets. Makalot Industrial is true to its name, making a large variety of garments, including underwear, sleepwear, skirts, dresses, shirts, pants, shorts, etc. and exporting most of its products to the U.S. Based in Taiwan, the company enjoyed strong sales and revenue growth, taking advantage of lower production costs outside of China in Southeast Asia. It also boasts a solid dividend. We took some gains in early July 2013. |
 |
| Includes reinvestment of distributions. |
| PORTFOLIO DIAGNOSTICS | ||||
| Fund Net Assets | $4 million | |||
| Number of Holdings | 115 | |||
| Turnover Rate | 25% | |||
| Average Market Capitalization1 | $346 million | |||
| Weighted Average P/E Ratio2,3 | 11.2x | |||
| Weighted Average P/B Ratio2 | 1.5x | |||
| Symbol | ROIMX | |||
1 Geometric Average. This weighted calculation uses each portfolio holding’s market cap in a way designed to not skew the effect of very large or small holdings; instead, it aims to better identify the portfolio’s center, which Royce believes offers a more accurate measure of average market cap than a simple mean or median. | ||||
2 Harmonic Average. This weighted calculation evaluates a portfolio as if it were a single stock and measures it overall. It compares the total market value of the portfolio to the portfolio’s share in the earnings or book value, as the case may be, of its underlying stocks. | ||||
3 The Fund’s P/E ratio calculation excludes companies with zero or negative earnings (1% of portfolio holdings as of 6/30/13). | ||||
| PORTFOLIO COUNTRY BREAKDOWN1,2 % of Net Assets | ||||||||||
| France | 10.7 | % | ||||||||
| Hong Kong | 9.7 | |||||||||
| United Kingdom | 9.6 | |||||||||
| Japan | 8.3 | |||||||||
| India | 6.0 | |||||||||
| Germany | 4.6 | |||||||||
| Malaysia | 4.4 | |||||||||
| South Africa | 4.2 | |||||||||
| Switzerland | 4.1 | |||||||||
| 1 Represents countries that are 3% or more of net assets. | ||||||||||
| 2 Securities are categorized by the country of their headquarters. | ||||||||||
| The Royce Funds 2013 Semiannual Report to Shareholders | 41 |
| Royce International Premier Fund |
AVERAGE ANNUAL TOTAL RETURNS Through 6/30/13 | ||||||||||
| January–June 20131 | 4.60 | % | ||||||||
| One-Year | 18.86 | |||||||||
| Since Inception (12/31/10) | 2.92 | |||||||||
| ANNUAL EXPENSE RATIOS | ||||||||||
| Gross Operating Expenses | 3.54 | % | ||||||||
| Net Operating Expenses | 1.69 | |||||||||
| 1 Not annualized | ||||||||||
| CALENDAR YEAR TOTAL RETURNS | ||||||||||
| Year | RIP | Year | RIP | |||||||
| 2012 | 23.4 | % | 2011 | -16.8 | % | |||||
| TOP 10 POSITIONS % of Net Assets | ||||||||||
| Daphne International Holdings | 2.9 | % | ||||||||
| Stallergenes | 2.9 | |||||||||
| Mayr-Melnhof Karton | 2.8 | |||||||||
| Lewis Group | 2.7 | |||||||||
| Kaba Holding | 2.7 | |||||||||
| Stella International Holdings | 2.6 | |||||||||
| Domino Printing Sciences | 2.5 | |||||||||
| Forbo Holding | 2.5 | |||||||||
| Santen Pharmaceutical | 2.5 | |||||||||
| FamilyMart | 2.4 | |||||||||
| PORTFOLIO SECTOR BREAKDOWN % of Net Assets | ||||||||||
| Health Care | 27.2 | % | ||||||||
| Consumer Discretionary | 26.4 | |||||||||
| Industrials | 17.9 | |||||||||
| Information Technology | 11.1 | |||||||||
| Financials | 7.2 | |||||||||
| Materials | 5.5 | |||||||||
| Consumer Staples | 4.0 | |||||||||
| Cash and Cash Equivalents | 0.7 | |||||||||
|
Manager’s Discussion With all the negative headlines surrounding the global economy and international markets over the course of the first half of 2013, we were quite pleased with the results of Royce International Premier Fund (RIP). Tasked with uncovering and investing in the highest quality and most durable small-cap businesses we can find outside the United States, RIP invests in a relatively concentrated portfolio of our highest conviction ideas sourced from our global research efforts. The Fund gained 4.6% for the year-to-date period ended June 30, 2013, nicely ahead of its small-cap benchmark, Russell Global ex-US Small Cap Index, which advanced 1.8% for the same period. The volatile first half of 2013 saw a return of the same troubling economic headlines that had plagued the first halves of the preceding three years. An overheated real estate market in China stole many of the headlines as policy makers there sought to cool speculation through surprising credit restrictions that had the unintended consequence of rejuvenating fears of an economic slowdown. Civil unrest in developing nations such as Turkey and Brazil also challenged the underpinnings of the emerging market’s secular growth thesis. The sharp rise in the yield of the 10-year U.S. Treasury note during May and June provided yet another headwind as Ben Bernanke and the U.S. Federal Reserve began to guide financial markets toward a likely reduction in bond purchases—the mainstay of the various quantitative easing programs. During the bullish first quarter, RIP’s portfolio of what we deem to be high-quality companies delivered solid absolute returns—our preferred measure—while lagging on a relative basis. Gaining 4.1% in the first quarter, RIP trailed its benchmark, which rose 6.5%. As the global investment landscape became more volatile in the second quarter, RIP advanced 0.5% compared to a 4.5% decline for the benchmark index, highlighting the defensive and high-quality attributes of the Fund’s positions. We were quite pleased that five of the Fund’s seven equity sectors generated positive performance during the first half, led notably by Health Care, Information Technology, and Industrials. It was also satisfying to see portfolios achieve solid performance from both the cyclical and more traditionally defensive areas of the market. Only the Consumer Discretionary sector had a noticeable negative contribution, with the Materials sector essentially flat for the period. At the industry level results were also broadly positive, with pharmaceuticals, internet software & services, and health care equipment & supplies being the top gainers. Diversified consumer services, textiles, apparel & luxury goods, and specialty retail were the biggest detractors among a short list of industries that posted net losses. |
| 42 | The Royce Funds 2013 Semiannual Report to Shareholders |
Performance and Portfolio Review |
Tokyo-based Kakaku.com had a pleasantly outsized effect on first-half results. The company provides websites that offer price comparison services and product information on restaurants, hotels, and consumer appliances, among other services. Its shares advanced in the first half as an increase in the number of PC and smartphone users, a move into profitability in its travel & real estate segment, and positive momentum in its restaurant segment helped spark impressive earnings growth. We reduced our position as its stock price climbed. Stallergenes develops and markets immunotherapy pharmaceuticals for respiratory allergies. It is the second-largest global player in this market, with a nearly 30% market share. It benefited from a number of positive developments in the period, including the FDA’s announcement that it will examine the company’s application for its Oralair grass pollen tablet (this would be a significant step towards market penetration in the all-important U.S. market), positive corporate developments that will assist in the hoped-for future commercialization of Oralair in the U.S., and the announcement of further profitable growth that took place in fiscal 2012. The company also held a comprehensive and well-attended investor day in France that helped to increase investor awareness of this still under-researched company. Recordati, a pharmaceutical business based in Milan with a growing global reach, was another notable performer during the period. The company produced notable growth over the last two fiscal years that were reported in the first half. Investors seemed to appreciate its increasing revenues from Russia, Turkey, and Eastern Europe, markets where demand for pharmaceutical products is growing in the high single-digits. We used the sliding stock price of Daphne International Holdings as an opportunity to build our position in this Chinese footwear maker and retailer, which sells Aerosole shoes in China. Adding shares between March and June, we like the company’s long-term potential based on its strong management and market position, though we recognize that this investment may require patience in the short run. The general slowdown in the Chinese economy has taken its toll on Daphne’s business. Lower levels of consumer spending in particular have caused sales and revenues to slump. It was the Fund’s largest position at the end of June. MegaStudy, a South Korean educational firm that specializes in online tutoring and test preparation, was the second largest detractor in the first half as high school and middle school online business experienced stagnating enrollment trends. |
 |
| Includes reinvestment of distributions. |
| PORTFOLIO DIAGNOSTICS | ||||
| Fund Net Assets | $7 million | |||
| Number of Holdings | 51 | |||
| Turnover Rate | 16% | |||
| Average Market Capitalization1 | $1,664 million | |||
| Weighted Average P/E Ratio2,3 | 16.4x | |||
| Weighted Average P/B Ratio2 | 2.8x | |||
| Symbol | RYIPX | |||
1 Geometric Average. This weighted calculation uses each portfolio holding’s market cap in a way designed to not skew the effect of very large or small holdings; instead, it aims to better identify the portfolio’s center, which Royce believes offers a more accurate measure of average market cap than a simple mean or median. | ||||
2 Harmonic Average. This weighted calculation evaluates a portfolio as if it were a single stock and measures it overall. It compares the total market value of the portfolio to the portfolio’s share in the earnings or book value, as the case may be, of its underlying stocks. | ||||
3 The Fund’s P/E ratio calculation excludes companies with zero or negative earnings (0% of portfolio holdings as of 6/30/13). | ||||
| PORTFOLIO COUNTRY BREAKDOWN1,2 % of Net Assets | ||||||||||
| United Kingdom | 19.5 | % | ||||||||
| Switzerland | 17.3 | |||||||||
| Japan | 10.8 | |||||||||
| France | 8.8 | |||||||||
| Germany | 7.1 | |||||||||
| Austria | 5.3 | |||||||||
| Italy | 4.7 | |||||||||
| Hong Kong | 4.7 | |||||||||
| South Korea | 3.8 | |||||||||
| 1 Represents countries that are 3% or more of net assets. | ||||||||||
| 2 Securities are categorized by the country of their headquarters. | ||||||||||
| The Royce Funds 2013 Semiannual Report to Shareholders | 43 |
Schedules of Investments
| Royce Select Fund I |
| SHARES | VALUE | ||||
| COMMON STOCKS – 93.9% | |||||
| Consumer Discretionary – 7.9% | |||||
| Auto Components - 2.1% | |||||
Drew Industries | 13,796 | $ | 542,459 | ||
Gentex Corporation | 15,900 | 366,495 | |||
| 908,954 | |||||
| Automobiles - 1.5% | |||||
Thor Industries | 13,100 | 644,258 | |||
| Diversified Consumer Services - 0.5% | |||||
Sotheby’s | 5,792 | 219,575 | |||
| Household Durables - 1.2% | |||||
†Harman International Industries | 10,100 | 547,420 | |||
| Specialty Retail - 2.0% | |||||
Ascena Retail Group 1 | 49,200 | 858,540 | |||
| Textiles, Apparel & Luxury Goods - 0.6% | |||||
Columbia Sportswear | 4,121 | 258,180 | |||
| Total (Cost $2,481,584) | 3,436,927 | ||||
| Consumer Staples – 1.4% | |||||
| Food Products - 1.4% | |||||
Cal-Maine Foods | 12,978 | 603,607 | |||
| Total (Cost $371,741) | 603,607 | ||||
| Energy – 13.4% | |||||
| Energy Equipment & Services - 13.4% | |||||
CARBO Ceramics | 5,400 | 364,122 | |||
Helmerich & Payne | 19,900 | 1,242,755 | |||
Oil States International 1 | 10,900 | 1,009,776 | |||
Pason Systems | 45,400 | 825,376 | |||
†SEACOR Holdings | 5,699 | 473,302 | |||
Superior Energy Services 1 | 18,400 | 477,296 | |||
†TGS-NOPEC Geophysical | 16,400 | 476,528 | |||
Trican Well Service | 4,000 | 53,171 | |||
Unit Corporation 1 | 21,650 | 921,857 | |||
| Total (Cost $4,278,452) | 5,844,183 | ||||
| Financials – 8.7% | |||||
| Capital Markets - 6.0% | |||||
Federated Investors Cl. B | 46,500 | 1,274,565 | |||
Lazard Cl. A | 23,800 | 765,170 | |||
SEI Investments | 21,100 | 599,873 | |||
| 2,639,608 | |||||
| Insurance - 2.7% | |||||
Alleghany Corporation 1 | 3,055 | 1,171,012 | |||
| Total (Cost $2,872,513) | 3,810,620 | ||||
| Health Care – 5.9% | |||||
| Biotechnology - 1.2% | |||||
| 19,700 | 529,339 | ||||
| Health Care Providers & Services - 0.5% | |||||
VCA Antech 1 | 9,110 | 237,680 | |||
| Life Sciences Tools & Services - 3.1% | |||||
Bio-Rad Laboratories Cl. A 1 | 7,700 | 863,940 | |||
Techne Corporation | 6,800 | 469,744 | |||
| 1,333,684 | |||||
| Pharmaceuticals - 1.1% | |||||
| 6,700 | 460,491 | ||||
| Total (Cost $2,281,000) | 2,561,194 | ||||
| Industrials – 22.8% | |||||
| Aerospace & Defense - 1.6% | |||||
†Cubic Corporation | 14,500 | 697,450 | |||
| Commercial Services & Supplies - 1.9% | |||||
Tetra Tech 1 | 36,000 | 846,360 | |||
| Electrical Equipment - 6.3% | |||||
AZZ | 16,910 | 652,050 | |||
†EnerSys | 11,300 | 554,152 | |||
Global Power Equipment Group | 41,518 | 669,270 | |||
GrafTech International 1 | 121,759 | 886,405 | |||
| 2,761,877 | |||||
| Machinery - 7.7% | |||||
Astec Industries | 10,934 | 374,927 | |||
Columbus McKinnon 1 | 16,500 | 351,780 | |||
Kennametal | 16,700 | 648,461 | |||
Lincoln Electric Holdings | 5,450 | 312,122 | |||
†Timken Company (The) | 12,100 | 680,988 | |||
Valmont Industries | 4,900 | 701,141 | |||
Wabtec Corporation | 5,168 | 276,126 | |||
| 3,345,545 | |||||
| Professional Services - 4.4% | |||||
CRA International 1 | 24,279 | 448,433 | |||
| 14,500 | 456,895 | ||||
Robert Half International | 11,728 | 389,722 | |||
Towers Watson & Company Cl. A | 4,900 | 401,506 | |||
TrueBlue 1 | 10,287 | 216,541 | |||
| 1,913,097 | |||||
| Trading Companies & Distributors - 0.9% | |||||
MSC Industrial Direct Cl. A | 4,952 | 383,582 | |||
| Total (Cost $8,608,893) | 9,947,911 | ||||
| Information Technology – 22.6% | |||||
| Communications Equipment - 1.7% | |||||
ADTRAN | 30,300 | 745,683 | |||
| Electronic Equipment, Instruments & Components - 5.7% | |||||
Coherent | 4,281 | 235,755 | |||
Dolby Laboratories Cl. A | 12,600 | 421,470 | |||
FARO Technologies 1 | 11,200 | 378,784 | |||
FEI Company | 2,552 | 186,270 | |||
IPG Photonics | 11,790 | 716,007 | |||
Rofin-Sinar Technologies 1 | 22,164 | 552,770 | |||
| 2,491,056 | |||||
| IT Services - 1.1% | |||||
Sykes Enterprises 1 | 30,500 | 480,680 | |||
| Office Electronics - 0.9% | |||||
Zebra Technologies Cl. A 1 | 8,600 | 373,584 | |||
| 44 | The Royce Funds 2013 Semiannual Report to Shareholders | THE ACCOMPANYING NOTES ARE AN INTEGRAL PART OF THESE FINANCIAL STATEMENTS. |
June 30, 2013 (unaudited) |
| SHARES | VALUE | |||||
| Information Technology (continued) | ||||||
| Semiconductors & Semiconductor Equipment - 13.2% | ||||||
Aixtron ADR 1 | 39,807 | $ | 667,961 | |||
ATMI 1 | 37,500 | 886,875 | ||||
Cabot Microelectronics 1 | 15,791 | 521,261 | ||||
Integrated Silicon Solution 1 | 78,000 | 854,880 | ||||
†MKS Instruments | 34,800 | 923,592 | ||||
Nanometrics 1 | 50,100 | 734,967 | ||||
Teradyne 1 | 39,000 | 685,230 | ||||
Veeco Instruments 1 | 13,300 | 471,086 | ||||
| 5,745,852 | ||||||
| Total (Cost $8,577,076) | 9,836,855 | |||||
| Materials – 8.3% | ||||||
| Chemicals - 4.0% | ||||||
†Innospec | 12,400 | 498,232 | ||||
Intrepid Potash | 11,858 | 225,895 | ||||
LSB Industries 1 | 8,751 | 266,118 | ||||
Minerals Technologies | 18,840 | 778,846 | ||||
| 1,769,091 | ||||||
| Metals & Mining - 4.3% | ||||||
Major Drilling Group International | 51,700 | 351,975 | ||||
Reliance Steel & Aluminum | 20,400 | 1,337,424 | ||||
Sims Metal Management ADR | 22,170 | 167,605 | ||||
| 1,857,004 | ||||||
| Total (Cost $2,983,064) | 3,626,095 | |||||
| Miscellaneous2 – 2.9% | ||||||
| Total (Cost $1,179,615) | 1,238,558 | |||||
| TOTAL COMMON STOCKS | ||||||
(Cost $33,633,938) | 40,905,950 | |||||
| REPURCHASE AGREEMENT – 6.4% | ||||||
| Fixed Income Clearing Corporation, | ||||||
0.01% dated 6/28/13, due 7/1/13, | 2,801,000 | |||||
| TOTAL INVESTMENTS – 100.3% | ||||||
(Cost $36,434,938) | 43,706,950 | |||||
| LIABILITIES LESS CASH | ||||||
AND OTHER ASSETS �� (0.3)% | (111,764 | ) | ||||
| NET ASSETS – 100.0% | $ | 43,595,186 | ||||
| Royce Micro-Cap Discovery Fund |
| SHARES | VALUE | ||||
| COMMON STOCKS – 96.5% | |||||
| Consumer Discretionary – 10.8% | |||||
| Auto Components - 1.5% | |||||
Standard Motor Products | 2,200 | $ | 75,548 | ||
| Diversified Consumer Services - 2.1% | |||||
Capella Education 1 | 1,600 | 66,640 | |||
Corinthian Colleges 1 | 17,800 | 39,872 | |||
| 106,512 | |||||
| Hotels, Restaurants & Leisure - 1.1% | |||||
Ruby Tuesday 1 | 6,000 | 55,380 | |||
| Household Durables - 2.0% | |||||
Hooker Furniture | 1,500 | 24,390 | |||
†Lifetime Brands | 6,000 | 81,480 | |||
| 105,870 | |||||
| Leisure Equipment & Products - 2.1% | |||||
Arctic Cat | 600 | 26,988 | |||
Johnson Outdoors Cl. A 1 | 3,200 | 79,680 | |||
| 106,668 | |||||
| Multiline Retail - 0.7% | |||||
Fred’s Cl. A | 2,500 | 38,725 | |||
| Specialty Retail - 1.3% | |||||
Stein Mart | 4,900 | 66,885 | |||
| Total (Cost $438,357) | 555,588 | ||||
| Consumer Staples – 4.3% | |||||
| Food & Staples Retailing - 1.1% | |||||
Village Super Market Cl. A | 1,700 | 56,253 | |||
| Food Products - 2.3% | |||||
Calavo Growers | 2,200 | 59,818 | |||
John B. Sanfilippo & Son | 3,000 | 60,480 | |||
| 120,298 | |||||
| Household Products - 0.9% | |||||
Oil-Dri Corporation of America | 1,700 | 46,699 | |||
| Total (Cost $217,337) | 223,250 | ||||
| Energy – 5.7% | |||||
| Energy Equipment & Services - 2.9% | |||||
Matrix Service 1 | 2,700 | 42,066 | |||
Natural Gas Services Group 1 | 2,400 | 56,376 | |||
| 4,800 | 52,752 | ||||
| 151,194 | |||||
| Oil, Gas & Consumable Fuels - 2.8% | |||||
Hallador Energy | 3,200 | 25,760 | |||
TransGlobe Energy 1 | 5,000 | 31,000 | |||
VAALCO Energy 1 | 7,600 | 43,472 | |||
Warren Resources 1 | 16,100 | 41,055 | |||
| 141,287 | |||||
| Total (Cost $279,096) | 292,481 | ||||
| Financials – 7.9% | |||||
| Consumer Finance - 1.1% | |||||
Nicholas Financial | 3,700 | 55,944 | |||
| Diversified Financial Services - 0.7% | |||||
Resource America | 4,200 | 35,700 | |||
| THE ACCOMPANYING NOTES ARE AN INTEGRAL PART OF THESE FINANCIAL STATEMENTS. | The Royce Funds 2013 Semiannual Report to Shareholders | 45 |
Schedules of Investments
| Royce Micro-Cap Discovery Fund (continued) |
| SHARES | VALUE | ||||
| Financials (continued) | |||||
| Insurance - 6.1% | |||||
Baldwin & Lyons Cl. B | 2,100 | $ | 50,988 | ||
EMC Insurance Group | 1,500 | 39,390 | |||
†Employers Holdings | 2,000 | 48,900 | |||
Maiden Holdings | 6,100 | 68,442 | |||
National Western Life Insurance Cl. A | 200 | 37,970 | |||
Safety Insurance Group | 700 | 33,957 | |||
United Fire Group | 1,400 | 34,762 | |||
| 314,409 | |||||
| Total (Cost $369,391) | 406,053 | ||||
| Health Care – 8.9% | |||||
| Health Care Equipment & Supplies - 4.2% | |||||
Anika Therapeutics 1 | 1,900 | 32,300 | |||
CryoLife | 8,900 | 55,714 | |||
ICU Medical 1 | 800 | 57,648 | |||
Invacare Corporation | 4,000 | 57,440 | |||
Symmetry Medical 1 | 1,500 | 12,630 | |||
| 215,732 | |||||
| Health Care Providers & Services - 3.4% | |||||
Almost Family | 1,900 | 36,100 | |||
| 2,400 | 69,000 | ||||
National HealthCare | 1,500 | 71,700 | |||
| 176,800 | |||||
| Pharmaceuticals - 1.3% | |||||
Hi-Tech Pharmacal | 960 | 31,872 | |||
SciClone Pharmaceuticals 1 | 6,700 | 33,232 | |||
| 65,104 | |||||
| Total (Cost $418,953) | 457,636 | ||||
| Industrials – 16.0% | |||||
| Aerospace & Defense - 2.4% | |||||
AeroVironment 1 | 1,700 | 34,306 | |||
National Presto Industries | 800 | 57,624 | |||
Sparton Corporation 1 | 2,000 | 34,480 | |||
| 126,410 | |||||
| Commercial Services & Supplies - 1.5% | |||||
| 1,000 | 47,010 | ||||
Intersections | 3,200 | 28,064 | |||
| 75,074 | |||||
| Construction & Engineering - 2.4% | |||||
Baker (Michael) | 1,100 | 29,821 | |||
Comfort Systems USA | 1,589 | 23,708 | |||
MYR Group 1 | 3,600 | 70,020 | |||
| 123,549 | |||||
| Machinery - 5.4% | |||||
Alamo Group | 1,900 | 77,558 | |||
Lydall 1 | 3,700 | 54,020 | |||
Miller Industries | 5,020 | 77,207 | |||
Standex International | 700 | 36,925 | |||
Twin Disc | 1,400 | 33,180 | |||
| 278,890 | |||||
| Professional Services - 4.3% | |||||
†CDI Corporation | 2,600 | 36,816 | |||
ICF International 1 | 2,300 | 72,473 | |||
Korn/Ferry International 1 | 3,000 | 56,220 | |||
TrueBlue 1 | 2,600 | 54,730 | |||
| 220,239 | |||||
| Total (Cost $763,119) | 824,162 | ||||
| Information Technology – 25.3% | |||||
| Communications Equipment - 6.1% | |||||
Bel Fuse Cl. B | 1,000 | 13,450 | |||
Comtech Telecommunications | 2,100 | 56,469 | |||
Globecomm Systems 1 | 6,900 | 87,216 | |||
Oplink Communications 1 | 3,800 | 66,006 | |||
TESSCO Technologies | 3,400 | 89,760 | |||
| 312,901 | |||||
| Computers & Peripherals - 1.6% | |||||
QLogic Corporation 1 | 5,100 | 48,756 | |||
Xyratex | 3,200 | 32,192 | |||
| 80,948 | |||||
| Electronic Equipment, Instruments & Components - 2.5% | |||||
Daktronics | 3,000 | 30,780 | |||
PC Connection | 4,000 | 61,800 | |||
†Richardson Electronics | 3,000 | 35,220 | |||
| 127,800 | |||||
| Internet Software & Services - 2.9% | |||||
Dice Holdings 1 | 5,800 | 53,418 | |||
Digital River 1 | 1,700 | 31,909 | |||
United Online | 8,500 | 64,430 | |||
| 149,757 | |||||
| IT Services - 4.4% | |||||
Computer Task Group | 3,800 | 87,286 | |||
†Forrester Research | 1,000 | 36,690 | |||
Sykes Enterprises 1 | 4,300 | 67,768 | |||
TeleTech Holdings 1 | 1,600 | 37,488 | |||
| 229,232 | |||||
| Semiconductors & Semiconductor Equipment - 3.4% | |||||
IXYS Corporation | 6,600 | 72,996 | |||
Kulicke & Soffa Industries 1 | 5,400 | 59,724 | |||
| 2,900 | 40,948 | ||||
| 173,668 | |||||
| Software - 4.4% | |||||
Actuate Corporation 1 | 9,500 | 63,080 | |||
American Software Cl. A | 10,200 | 88,638 | |||
ePlus | 1,300 | 77,857 | |||
| 229,575 | |||||
| Total (Cost $1,136,150) | 1,303,881 | ||||
| Materials – 11.6% | |||||
| Chemicals - 5.8% | |||||
| 7,300 | 63,510 | ||||
FutureFuel Corporation | 4,900 | 69,433 | |||
Innospec | 900 | 36,162 | |||
| 46 | The Royce Funds 2013 Semiannual Report to Shareholders | THE ACCOMPANYING NOTES ARE AN INTEGRAL PART OF THESE FINANCIAL STATEMENTS. |
June 30, 2013 (unaudited) |
| SHARES | VALUE | ||||
| Materials (continued) | |||||
| Chemicals (continued) | |||||
KMG Chemicals | 3,200 | $ | 67,520 | ||
Schulman (A.) | 1,400 | 37,548 | |||
Stepan Company | 500 | 27,805 | |||
| 301,978 | |||||
| Construction Materials - 0.7% | |||||
United States Lime & Minerals 1 | 700 | 36,575 | |||
| Metals & Mining - 3.8% | |||||
Endeavour Silver 1 | 3,900 | 13,377 | |||
Haynes International | 1,200 | 57,444 | |||
Materion Corporation | 3,200 | 86,688 | |||
Nevsun Resources | 13,500 | 39,825 | |||
| 197,334 | |||||
| Paper & Forest Products - 1.3% | |||||
Glatfelter | 2,600 | 65,260 | |||
| Total (Cost $519,827) | 601,147 | ||||
| Telecommunication Services – 1.2% | |||||
| Diversified Telecommunication Services - 1.2% | |||||
| 5,000 | 60,350 | ||||
| Total (Cost $48,334) | 60,350 | ||||
| Miscellaneous2 – 4.8% | |||||
| Total (Cost $259,863) | 246,885 | ||||
| TOTAL COMMON STOCKS | |||||
(Cost $4,450,427) | 4,971,433 | ||||
| REPURCHASE AGREEMENT – 3.3% | |||||
| Fixed Income Clearing Corporation, | |||||
0.01% dated 6/28/13, due 7/1/13, | 170,000 | ||||
| TOTAL INVESTMENTS – 99.8% | |||||
(Cost $4,620,427) | 5,141,433 | ||||
| CASH AND OTHER ASSETS | |||||
LESS LIABILITIES – 0.2% | 9,652 | ||||
| NET ASSETS – 100.0% | $ | 5,151,085 | |||
| Royce Financial Services Fund |
| SHARES | VALUE | ||||
| COMMON STOCKS – 84.0% | |||||
| Capital Markets - 48.9% | |||||
Affiliated Managers Group 1 | 1,500 | $ | 245,910 | ||
AllianceBernstein Holding L.P. | 14,500 | 301,890 | |||
Apollo Global Management LLC Cl. A | 22,000 | 530,200 | |||
| 15,000 | 748,650 | ||||
Ashmore Group | 70,000 | 365,925 | |||
Banque Privee Edmond de Rothschild | 3 | 52,215 | |||
Blackstone Group L.P. | 16,300 | 343,278 | |||
Citadel Capital 1 | 150,000 | 52,996 | |||
Coronation Fund Managers | 62,000 | 393,574 | |||
Cowen Group 1 | 83,000 | 240,700 | |||
Daewoo Securities | 3,800 | 33,440 | |||
Diamond Hill Investment Group | 2,500 | 212,625 | |||
Egyptian Financial Group-Hermes Holding | |||||
Company 1 | 211,875 | 223,667 | |||
Federated Investors Cl. B | 11,900 | 326,179 | |||
Financial Engines | 6,800 | 310,012 | |||
Invesco | 13,800 | 438,840 | |||
Investec | 8,500 | 53,483 | |||
IOOF Holdings | 11,528 | 77,596 | |||
Jupiter Fund Management | 105,000 | 462,650 | |||
KKR & Co. L.P. | 18,300 | 359,778 | |||
Lazard Cl. A | 17,100 | 549,765 | |||
Manning & Napier | 15,800 | 280,608 | |||
MVC Capital | 3,800 | 47,842 | |||
Northern Trust | 8,400 | 486,360 | |||
Oaktree Capital Group LLC | 4,700 | 246,985 | |||
Och-Ziff Capital Management Group LLC Cl. A | 15,300 | 159,732 | |||
Oppenheimer Holdings Cl. A | 11,500 | 218,960 | |||
Partners Group Holding | 1,000 | 270,764 | |||
Raymond James Financial | 5,100 | 219,198 | |||
Reinet Investments 1 | 5,500 | 98,151 | |||
Samsung Securities | 1,791 | 72,296 | |||
†Schwab (Charles) | 18,800 | 399,124 | |||
SEI Investments | 18,400 | 523,112 | |||
SHUAA Capital 1 | 580,000 | 107,378 | |||
| 24,500 | 294,000 | ||||
Sprott | 117,500 | 312,827 | |||
State Street | 8,500 | 554,285 | |||
Stifel Financial 1 | 6,073 | 216,624 | |||
T. Rowe Price Group | 3,500 | 256,025 | |||
TD Ameritrade Holding Corporation | 15,500 | 376,495 | |||
Tokai Tokyo Financial Holdings | 9,400 | 64,069 | |||
U.S. Global Investors Cl. A | 178,300 | 376,213 | |||
UOB-Kay Hian Holdings | 95,000 | 122,919 | |||
Value Partners Group | 566,000 | 305,037 | |||
Vontobel Holding | 3,000 | 92,425 | |||
Waddell & Reed Financial Cl. A | 5,900 | 256,650 | |||
Westwood Holdings Group | 5,300 | 227,476 | |||
WisdomTree Investments 1 | 46,000 | 532,220 | |||
| Total (Cost $10,986,300) | 13,441,148 | ||||
| THE ACCOMPANYING NOTES ARE AN INTEGRAL PART OF THESE FINANCIAL STATEMENTS. | The Royce Funds 2013 Semiannual Report to Shareholders | 47 |
Schedules of Investments
| Royce Financial Services Fund (continued) |
| SHARES | VALUE | |||||
| Closed-End Funds - 0.6% | ||||||
RIT Capital Partners | 8,500 | $ | 149,965 | |||
| Total (Cost $153,505) | 149,965 | |||||
| Commercial Banks - 3.3% | ||||||
BLOM Bank GDR | 8,000 | 68,000 | ||||
BOK Financial | 4,100 | 262,605 | ||||
First Citizens BancShares Cl. A | 1,900 | 364,895 | ||||
First Republic Bank | 5,600 | 215,488 | ||||
| Total (Cost $753,374) | 910,988 | |||||
| Consumer Finance - 2.9% | ||||||
Credit Acceptance 1 | 848 | 89,082 | ||||
Regional Management 1 | 18,200 | 455,000 | ||||
World Acceptance 1 | 3,000 | 260,820 | ||||
| Total (Cost $414,103) | 804,902 | |||||
| Diversified Financial Services - 8.5% | ||||||
†Bolsa Mexicana de Valores | 110,000 | 273,526 | ||||
Bolsas y Mercados Espanoles | 4,000 | 97,962 | ||||
Hellenic Exchanges | 36,000 | 280,219 | ||||
Interactive Brokers Group | 12,800 | 204,416 | ||||
†Japan Exchange Group | 3,500 | 353,600 | ||||
Leucadia National | 9,801 | 256,982 | ||||
Moody’s Corporation | 6,000 | 365,580 | ||||
MSCI Cl. A 1 | 2,800 | 93,156 | ||||
RHJ International 1 | 10,000 | 47,120 | ||||
Singapore Exchange | 25,000 | 138,659 | ||||
Warsaw Stock Exchange | 19,000 | 217,636 | ||||
| Total (Cost $2,048,866) | 2,328,856 | |||||
| Insurance - 6.5% | ||||||
Brown & Brown | 2,600 | 83,824 | ||||
E-L Financial | 400 | 241,514 | ||||
First American Financial | 5,000 | 110,200 | ||||
Greenlight Capital Re Cl. A 1 | 9,000 | 220,770 | ||||
Marsh & McLennan | 7,400 | 295,408 | ||||
Platinum Underwriters Holdings | 5,500 | 314,710 | ||||
RLI Corp. | 1,100 | 84,051 | ||||
State Auto Financial | 11,000 | 199,870 | ||||
Willis Group Holdings | 6,100 | 248,758 | ||||
| Total (Cost $1,313,031) | 1,799,105 | |||||
| IT Services - 3.7% | ||||||
†Broadridge Financial Solutions | 12,800 | 340,224 | ||||
MasterCard Cl. A | 700 | 402,150 | ||||
Vantiv Cl. A 1 | 10,000 | 276,000 | ||||
| Total (Cost $634,865) | 1,018,374 | |||||
| Media - 1.3% | ||||||
Morningstar | 4,600 | 356,868 | ||||
| Total (Cost $181,189) | 356,868 | |||||
| Professional Services - 3.0% | ||||||
Towers Watson & Company Cl. A | 6,500 | 532,610 | ||||
Verisk Analytics Cl. A 1 | 5,100 | 304,470 | ||||
| Total (Cost $612,812) | 837,080 | |||||
| Real Estate Management & Development - 1.2% | ||||||
Kennedy-Wilson Holdings | 19,676 | 327,409 | ||||
| Total (Cost $186,246) | 327,409 | |||||
| Software - 2.5% | ||||||
Fair Isaac | 7,400 | 339,142 | ||||
†SimCorp | 12,000 | 356,015 | ||||
| Total (Cost $421,695) | 695,157 | |||||
| Trading Companies & Distributors - 1.6% | ||||||
Air Lease Cl. A | 15,700 | 433,163 | ||||
| Total (Cost $356,874) | 433,163 | |||||
| TOTAL COMMON STOCKS | ||||||
(Cost $18,062,860) | 23,103,015 | |||||
| REPURCHASE AGREEMENT – 18.3% | ||||||
| Fixed Income Clearing Corporation, | ||||||
0.01% dated 6/28/13, due 7/1/13, | 5,045,000 | |||||
| TOTAL INVESTMENTS – 102.3% | ||||||
(Cost $23,107,860) | 28,148,015 | |||||
| LIABILITIES LESS CASH | ||||||
AND OTHER ASSETS – (2.3)% | (631,319 | ) | ||||
| NET ASSETS – 100.0% | $ | 27,516,696 | ||||
| 48 | The Royce Funds 2013 Semiannual Report to Shareholders | THE ACCOMPANYING NOTES ARE AN INTEGRAL PART OF THESE FINANCIAL STATEMENTS. |
June 30, 2013 (unaudited) |
| Royce Select Fund II |
| SHARES | VALUE | ||||
| COMMON STOCKS – 89.9% | |||||
| Consumer Discretionary – 15.0% | |||||
| Auto Components - 3.0% | |||||
Drew Industries 3 | 1,201 | $ | 47,223 | ||
Minth Group | 16,900 | 26,583 | |||
†Selamat Sempurna | 221,200 | 59,061 | |||
| 132,867 | |||||
| Distributors - 1.0% | |||||
†Core-Mark Holding Company | 700 | 44,450 | |||
| Household Durables - 1.0% | |||||
†Lifetime Brands | 3,300 | 44,814 | |||
| Media - 1.8% | |||||
IMAX Corporation 1 | 1,400 | 34,804 | |||
†Media Prima | 49,200 | 43,602 | |||
| 78,406 | |||||
| Multiline Retail - 1.1% | |||||
| New World Department Store China | 91,500 | 46,245 | |||
| Specialty Retail - 6.0% | |||||
†Destination Maternity | 2,900 | 71,340 | |||
†Lewis Group | 5,600 | 35,690 | |||
Luk Fook Holdings (International) | 6,400 | 14,853 | |||
†Padini Holdings | 59,700 | 35,713 | |||
Signet Jewelers 3 | 900 | 60,687 | |||
Stage Stores | 300 | 7,050 | |||
†USS | 300 | 38,082 | |||
| 263,415 | |||||
| Textiles, Apparel & Luxury Goods - 1.1% | |||||
Daphne International Holdings | 58,600 | 50,092 | |||
| Total (Cost $603,676) | 660,289 | ||||
| Consumer Staples – 6.4% | |||||
| Food & Staples Retailing - 1.8% | |||||
FamilyMart | 1,900 | 81,034 | |||
| Food Products - 4.6% | |||||
| 7,100 | 59,640 | ||||
First Resources | 68,100 | 95,367 | |||
SunOpta 1 | 6,200 | 47,058 | |||
| 202,065 | |||||
| Total (Cost $275,560) | 283,099 | ||||
| Energy – 4.9% | |||||
| Energy Equipment & Services - 4.9% | |||||
Helmerich & Payne 3 | 890 | 55,580 | |||
RPC 3 | 3,200 | 44,192 | |||
TGS-NOPEC Geophysical | 2,200 | 63,925 | |||
Total Energy Services | 3,800 | 52,572 | |||
| Total (Cost $187,907) | 216,269 | ||||
| Financials – 8.2% | |||||
| Capital Markets - 5.6% | |||||
Ashmore Group | 5,700 | 29,797 | |||
Federated Investors Cl. B 3 | 3,600 | 98,676 | |||
Lazard Cl. A | 600 | 19,290 | |||
Sprott | 13,100 | 34,877 | |||
†Westwood Holdings Group | 1,500 | 64,380 | |||
| 247,020 | |||||
| Real Estate Management & Development - 2.6% | |||||
E-House China Holdings ADR 3 | 10,600 | 46,004 | |||
Midland Holdings | 174,600 | 65,283 | |||
| 111,287 | |||||
| Total (Cost $449,986) | 358,307 | ||||
| Health Care – 4.9% | |||||
| Health Care Equipment & Supplies - 4.3% | |||||
Analogic Corporation 3 | 1,300 | 94,679 | |||
Invacare Corporation | 2,900 | 41,644 | |||
Kossan Rubber Industries | 32,635 | 51,543 | |||
| 187,866 | |||||
| Pharmaceuticals - 0.6% | |||||
Hi-Tech Pharmacal | 861 | 28,585 | |||
| Total (Cost $199,969) | 216,451 | ||||
| Industrials – 14.0% | |||||
| Aerospace & Defense - 1.2% | |||||
Astronics Corporation 1,3 | 1,330 | 54,357 | |||
| Building Products - 1.3% | |||||
WaterFurnace Renewable Energy | 2,800 | 54,712 | |||
| Commercial Services & Supplies - 1.2% | |||||
Team 1,3 | 1,344 | 50,870 | |||
| Electrical Equipment - 1.0% | |||||
Global Power Equipment Group | 2,800 | 45,136 | |||
| Machinery - 4.7% | |||||
Flow International 1 | 16,892 | 62,331 | |||
Sarin Technologies | 54,400 | 66,525 | |||
†Semperit AG Holding | 1,000 | 35,926 | |||
Sun Hydraulics 3 | 1,300 | 40,664 | |||
| 205,446 | |||||
| Marine - 1.5% | |||||
Clarkson | 2,500 | 64,678 | |||
| Professional Services - 3.1% | |||||
Acacia Research-Acacia Technologies | 3,500 | 78,225 | |||
†Exponent | 1,000 | 59,110 | |||
| 137,335 | |||||
| Total (Cost $550,102) | 612,534 | ||||
| Information Technology – 25.0% | |||||
| Communications Equipment - 4.9% | |||||
CalAmp Corporation 1 | 3,100 | 45,260 | |||
Oplink Communications 1 | 3,282 | 57,008 | |||
Plantronics | 1,200 | 52,704 | |||
Polycom 1 | 5,800 | 61,132 | |||
| 216,104 | |||||
| Computers & Peripherals - 0.9% | |||||
Western Digital | 600 | 37,254 | |||
| Electronic Equipment, Instruments & Components - 1.4% | |||||
DTS 1,3 | 1,613 | 33,196 | |||
| THE ACCOMPANYING NOTES ARE AN INTEGRAL PART OF THESE FINANCIAL STATEMENTS. | The Royce Funds 2013 Semiannual Report to Shareholders | 49 |
Schedules of Investments
| Royce Select Fund II (continued) |
| SHARES | VALUE | |||||
| Information Technology (continued) | ||||||
| Electronic Equipment, Instruments & Components (continued) | ||||||
Vishay Intertechnology 1 | 2,100 | $ | 29,169 | |||
| 62,365 | ||||||
| Internet Software & Services - 3.9% | ||||||
Bankrate 1,3 | 7,874 | 113,071 | ||||
Stamps.com 1 | 1,000 | 39,390 | ||||
ValueClick 1,3 | 805 | 19,867 | ||||
| 172,328 | ||||||
| IT Services - 3.3% | ||||||
Computer Task Group 3 | 2,700 | 62,019 | ||||
Total System Services 3 | 3,300 | 80,784 | ||||
| 142,803 | ||||||
| Semiconductors & Semiconductor Equipment - 8.0% | ||||||
Kulicke & Soffa Industries 1 | 5,000 | 55,300 | ||||
MKS Instruments | 2,388 | 63,378 | ||||
Photronics 1,3 | 5,840 | 47,070 | ||||
RDA Microelectronics ADR | 4,200 | 46,536 | ||||
Silicon Motion Technology ADR | 4,900 | 51,891 | ||||
Teradyne 1,3 | 5,050 | 88,729 | ||||
| 352,904 | ||||||
| Software - 2.6% | ||||||
Actuate Corporation 1,3 | 8,200 | 54,448 | ||||
American Software Cl. A 3 | 6,764 | 58,779 | ||||
| 113,227 | ||||||
| Total (Cost $896,589) | 1,096,985 | |||||
| Materials – 5.7% | ||||||
| Chemicals - 3.1% | ||||||
Innophos Holdings | 1,000 | 47,170 | ||||
Minerals Technologies | 2,100 | 86,814 | ||||
| 133,984 | ||||||
| Metals & Mining - 2.6% | ||||||
Haynes International | 799 | 38,248 | ||||
Hochschild Mining | 6,000 | 14,172 | ||||
Horsehead Holding Corporation 1 | 3,400 | 43,554 | ||||
Market Vectors Junior Gold Miners ETF 3 | 2,200 | 20,152 | ||||
| 116,126 | ||||||
| Total (Cost $263,088) | 250,110 | |||||
| Telecommunication Services – 1.2% | ||||||
| Diversified Telecommunication Services - 1.2% | ||||||
| 4,400 | 53,108 | |||||
| Total (Cost $49,099) | 53,108 | |||||
| Miscellaneous2 – 4.6% | ||||||
| Total (Cost $218,241) | 202,089 | |||||
| TOTAL COMMON STOCKS | ||||||
(Cost $3,694,217) | 3,949,241 | |||||
| REPURCHASE AGREEMENT – 14.3% | ||||||
| Fixed Income Clearing Corporation, | ||||||
0.01% dated 6/28/13, due 7/1/13, | 628,000 | |||||
| TOTAL INVESTMENTS – 104.2% | ||||||
(Cost $4,322,217) | 4,577,241 | |||||
| LIABILITIES LESS CASH | ||||||
AND OTHER ASSETS – (4.2)% | (186,015 | ) | ||||
| NET ASSETS – 100.0% | $ | 4,391,226 | ||||
| SECURITIES SOLD SHORT | ||||||
| COMMON STOCKS – 2.7% | ||||||
| Diversified Investment Companies – 2.1% | ||||||
| Exchange Traded Funds - 2.1% | ||||||
Direxion Daily Small Cap Bull 3X Shares | 1,100 | $ | 51,700 | |||
VelocityShares Daily Inverse VIX Short | ||||||
Term ETN | 2,100 | 41,874 | ||||
| Total (Proceeds $89,736) | 93,574 | |||||
| Financials – 0.6% | ||||||
| Commercial Banks - 0.6% | ||||||
Direxion Daily Financial Bear 3X Shares | 700 | 23,520 | ||||
| Total (Proceeds $36,763) | 23,520 | |||||
| FIXED INCOME – 0.6% | ||||||
| Government Bonds – 0.6% | ||||||
iShares 20+ Year Treasury Bond ETF | 250 | 27,610 | ||||
| Total (Proceeds $32,212) | 27,610 | |||||
| TOTAL SECURITIES SOLD SHORT | ||||||
(Proceeds $158,711) | $ | 144,704 | ||||
| 50 | The Royce Funds 2013 Semiannual Report to Shareholders | THE ACCOMPANYING NOTES ARE AN INTEGRAL PART OF THESE FINANCIAL STATEMENTS. |
June 30, 2013 (unaudited) |
| Royce Global Select Long/Short Fund |
| SHARES | VALUE | ||||
| COMMON STOCKS – 117.1% | |||||
| Austria – 8.1% | |||||
Mayr-Melnhof Karton | 3,500 | $ | 376,307 | ||
Semperit AG Holding 3 | 13,500 | 484,994 | |||
| Total (Cost $847,309) | 861,301 | ||||
| Belgium – 2.5% | |||||
Sipef 3 | 4,000 | 268,765 | |||
| Total (Cost $271,698) | 268,765 | ||||
| Bermuda – 2.5% | |||||
| 4,000 | 269,720 | ||||
| Total (Cost $275,329) | 269,720 | ||||
| Brazil – 5.6% | |||||
Brasil Brokers Participacoes 3 | 110,000 | 322,898 | |||
Eternit 3 | 65,000 | 275,282 | |||
| Total (Cost $699,200) | 598,180 | ||||
| China – 2.4% | |||||
Daphne International Holdings | 300,000 | 256,445 | |||
| Total (Cost $320,683) | 256,445 | ||||
| Finland – 2.7% | |||||
Nokian Renkaat 3 | 7,000 | 285,283 | |||
| Total (Cost $266,291) | 285,283 | ||||
| France – 2.3% | |||||
Societe Internationale de Plantations | |||||
d’Heveas 3 | 3,500 | 246,604 | |||
| Total (Cost $284,243) | 246,604 | ||||
| Germany – 1.1% | |||||
Carl Zeiss Meditec 3 | 3,000 | 99,576 | |||
Pfeiffer Vacuum Technology 3 | 181 | 18,754 | |||
| Total (Cost $49,028) | 118,330 | ||||
| Hong Kong – 8.9% | |||||
Luk Fook Holdings (International) | 90,000 | 208,869 | |||
Media Chinese International | 900,000 | 327,584 | |||
†New World Department Store China | 325,000 | 164,259 | |||
Value Partners Group | 450,000 | 242,520 | |||
| Total (Cost $1,062,153) | 943,232 | ||||
| India – 6.7% | |||||
Graphite India | 200,000 | 247,370 | |||
Maharashtra Seamless 3 | 70,000 | 241,481 | |||
| 45,000 | 219,529 | ||||
| Total (Cost $1,148,623) | 708,380 | ||||
| Italy – 3.1% | |||||
Recordati 3 | 30,000 | 332,897 | |||
| Total (Cost $203,669) | 332,897 | ||||
| Japan – 18.8% | |||||
EPS Corporation 3 | 245 | 272,716 | |||
FamilyMart 3 | 10,000 | 426,497 | |||
MISUMI Group 3 | 9,000 | 247,459 | |||
Moshi Moshi Hotline 3 | 22,500 | 280,853 | |||
Nihon M&A Center 3 | 2,500 | 139,393 | |||
Santen Pharmaceutical 3 | 7,000 | 301,371 | |||
USS 3 | 2,600 | 330,047 | |||
| Total (Cost $1,586,001) | 1,998,336 | ||||
| Jersey – 1.8% | |||||
Randgold Resources ADR 3 | 3,000 | 192,150 | |||
| Total (Cost $217,267) | 192,150 | ||||
| Mexico – 5.0% | |||||
Fresnillo 3 | 22,500 | 301,832 | |||
Industrias Bachoco ADR 3 | 6,500 | 225,550 | |||
| Total (Cost $639,170) | 527,382 | ||||
| Norway – 5.5% | |||||
Ekornes 3 | 20,000 | 319,376 | |||
†Spectrum | 12,000 | 95,615 | |||
TGS-NOPEC Geophysical 3 | 6,000 | 174,340 | |||
| Total (Cost $545,579) | 589,331 | ||||
| Singapore – 1.5% | |||||
†ComfortDelGro Corporation | 110,000 | 159,251 | |||
| Total (Cost $168,382) | 159,251 | ||||
| South Africa – 8.5% | |||||
Adcock Ingram Holdings 3 | 45,000 | 295,901 | |||
Lewis Group 3 | 60,000 | 382,396 | |||
Raubex Group | 100,000 | 220,535 | |||
| Total (Cost $1,142,612) | 898,832 | ||||
| South Korea – 3.1% | |||||
MegaStudy 3 | 6,000 | 324,154 | |||
| Total (Cost $737,850) | 324,154 | ||||
| Switzerland – 1.4% | |||||
Partners Group Holding 3 | 550 | 148,920 | |||
| Total (Cost $49,594) | 148,920 | ||||
| Turkey – 2.8% | |||||
Koza Altin Isletmeleri 3 | 6,000 | 72,795 | |||
Mardin Cimento Sanayii 3 | 100,000 | 228,133 | |||
| Total (Cost $571,867) | 300,928 | ||||
| United Kingdom – 14.0% | |||||
Ashmore Group 3 | 60,000 | 313,650 | |||
| THE ACCOMPANYING NOTES ARE AN INTEGRAL PART OF THESE FINANCIAL STATEMENTS. | The Royce Funds 2013 Semiannual Report to Shareholders | 51 |
Schedules of Investments
| Royce Global Select Long/Short Fund (continued) |
| SHARES | VALUE | |||||
| United Kingdom (continued) | ||||||
†Consort Medical | 10,000 | $ | 126,619 | |||
Domino Printing Sciences 3 | 33,500 | 317,939 | ||||
EnQuest 1 | 160,000 | 287,642 | ||||
Hochschild Mining 3 | 70,000 | 165,342 | ||||
Jupiter Fund Management 3 | 45,000 | 198,279 | ||||
Spirax-Sarco Engineering 3 | 2,001 | 81,777 | ||||
| Total (Cost $1,455,098) | 1,491,248 | |||||
| United States – 8.8% | ||||||
| 4,500 | 216,450 | |||||
Dolby Laboratories Cl. A 3 | 6,500 | 217,425 | ||||
Helmerich & Payne 3 | 4,000 | 249,800 | ||||
Myriad Genetics 1,3 | 9,500 | 255,265 | ||||
| Total (Cost $880,269) | 938,940 | |||||
| TOTAL COMMON STOCKS | ||||||
(Cost $13,421,915) | 12,458,609 | |||||
| REPURCHASE AGREEMENT – 3.0% | ||||||
| Fixed Income Clearing Corporation, | ||||||
0.01% dated 6/28/13, due 7/1/13, | 315,000 | |||||
| TOTAL INVESTMENTS – 120.1% | ||||||
(Cost $13,736,915) | 12,773,609 | |||||
| LIABILITIES LESS CASH | ||||||
AND OTHER ASSETS – (20.1)% | (2,137,886 | ) | ||||
| NET ASSETS – 100.0% | $ | 10,635,723 | ||||
| SECURITIES SOLD SHORT | ||||||
| COMMON STOCKS – 20.4% | ||||||
| Cayman Islands – 0.8% | ||||||
Herbalife | 2,000 | $ | 90,280 | |||
| Total (Proceeds $115,219) | 90,280 | |||||
| China – 1.8% | ||||||
iShares China Large-Cap ETF | 6,000 | 195,120 | ||||
| Total (Proceeds $246,864) | 195,120 | |||||
| Finland – 0.9% | ||||||
Orion Cl. B | 4,000 | 93,823 | ||||
| Total (Proceeds $117,278) | 93,823 | |||||
| Germany – 0.6% | ||||||
Deutsche Bank | 1,500 | 62,925 | ||||
| Total (Proceeds $65,217) | 62,925 | |||||
| Japan – 1.6% | ||||||
NEXT FUNDS Nikkei 225 Leveraged Index ETF | 2,000 | 169,792 | ||||
| Total (Proceeds $139,917) | 169,792 | |||||
| United States – 13.8% | ||||||
Brunswick Corporation | 2,000 | 63,900 | ||||
Coca-Cola Company (The) | 1,500 | 60,165 | ||||
Delta Air Lines | 6,000 | 112,260 | ||||
Deluxe Corporation | 1,500 | 51,975 | ||||
Direxion Daily Energy Bull 3X Shares | 3,500 | 218,015 | ||||
General Motors | 2,000 | 66,620 | ||||
Haverty Furniture | 3,700 | 85,137 | ||||
Monster Beverage | 2,500 | 151,925 | ||||
NCR Corporation | 4,500 | 148,455 | ||||
ProShares Ultra Basic Materials | 5,000 | 172,350 | ||||
ProShares Ultra Health Care | 2,000 | 120,600 | ||||
Tempur Sealy International | 1,800 | 79,020 | ||||
Terex Corporation | 700 | 18,410 | ||||
Toll Brothers | 2,000 | 65,260 | ||||
United Rentals | 1,100 | 54,901 | ||||
| Total (Proceeds $1,116,660) | 1,468,993 | |||||
| Non-Country Specific – 0.9% | ||||||
Direxion Daily Emerging Markets Bull 3X | ||||||
Shares | 4,000 | 93,560 | ||||
| Total (Proceeds $115,754) | 93,560 | |||||
| TOTAL SECURITIES SOLD SHORT | ||||||
(Proceeds $1,916,909) | $ | 2,174,493 | ||||
| 52 | The Royce Funds 2013 Semiannual Report to Shareholders | THE ACCOMPANYING NOTES ARE AN INTEGRAL PART OF THESE FINANCIAL STATEMENTS. |
June 30, 2013 (unaudited) |
| Royce European Smaller-Companies Fund |
| SHARES | VALUE | ||||
| COMMON STOCKS – 96.1% | |||||
| Austria – 4.4% | |||||
Mayr-Melnhof Karton | 3,500 | $ | 376,307 | ||
Semperit AG Holding | 12,200 | 438,291 | |||
| Total (Cost $922,131) | 814,598 | ||||
| Belgium – 2.8% | |||||
EVS Broadcast Equipment | 3,850 | 267,306 | |||
Sipef | 3,800 | 255,326 | |||
| Total (Cost $565,037) | 522,632 | ||||
| Cyprus – 1.3% | |||||
†Globaltrans Investment GDR | 17,500 | 240,450 | |||
| Total (Cost $268,876) | 240,450 | ||||
| Denmark – 1.4% | |||||
H. Lundbeck | 14,500 | 258,617 | |||
| Total (Cost $230,483) | 258,617 | ||||
| Finland – 2.1% | |||||
†F-Secure | 44,500 | 122,797 | |||
Nokian Renkaat | 6,550 | 266,943 | |||
| Total (Cost $377,158) | 389,740 | ||||
| France – 16.8% | |||||
Altamir | 15,000 | 168,889 | |||
Alten | 6,300 | 215,096 | |||
Audika Groupe 1 | 22,000 | 222,504 | |||
Beneteau 1 | 20,200 | 223,230 | |||
bioMerieux | 2,700 | 261,616 | |||
Boiron | 6,550 | 341,032 | |||
Manutan International | 6,000 | 256,946 | |||
Parrot 1 | 10,000 | 278,293 | |||
Societe Internationale de Plantations | |||||
d’Heveas | 3,450 | 243,081 | |||
Stallergenes | 7,105 | 498,942 | |||
Vetoquinol | 8,600 | 292,728 | |||
Virbac | 600 | 124,177 | |||
| Total (Cost $3,291,272) | 3,126,534 | ||||
| Germany – 10.0% | |||||
Aixtron 1 | 9,000 | 151,297 | |||
†Bertrandt | 2,400 | 257,789 | |||
Carl Zeiss Meditec | 5,650 | 187,535 | |||
KWS Saat | 450 | 162,807 | |||
Nemetschek | 2,550 | 164,301 | |||
Pfeiffer Vacuum Technology | 1,100 | 113,972 | |||
PUMA | 915 | 257,556 | |||
Rational | 545 | 182,706 | |||
†SMT Scharf | 5,000 | 153,465 | |||
Takkt | 15,000 | 226,487 | |||
| Total (Cost $1,674,173) | 1,857,915 | ||||
| Italy – 7.9% | |||||
Azimut Holding | 17,400 | 316,855 | |||
†De’Longhi | 16,000 | 250,125 | |||
DiaSorin | 7,600 | 303,404 | |||
Geox | 66,000 | 164,430 | |||
Recordati | 39,500 | 438,314 | |||
| Total (Cost $1,179,357) | 1,473,128 | ||||
| Netherlands – 2.9% | |||||
ASM International | 5,100 | 172,134 | |||
Beter Bed Holding | 15,000 | 274,908 | |||
Fugro | 1,800 | 97,585 | |||
| Total (Cost $545,787) | 544,627 | ||||
| Norway – 4.0% | |||||
Ekornes | 19,950 | 318,577 | |||
| 150,392 | 82,941 | ||||
†Spectrum | 25,000 | 199,199 | |||
TGS-NOPEC Geophysical | 4,700 | 136,566 | |||
| Total (Cost $867,134) | 737,283 | ||||
| Poland – 0.7% | |||||
Warsaw Stock Exchange | 12,000 | 137,454 | |||
| Total (Cost $129,779) | 137,454 | ||||
| South Africa – 5.6% | |||||
Adcock Ingram Holdings | 40,650 | 267,298 | |||
†Cashbuild | 6,300 | 84,765 | |||
Lewis Group | 55,000 | 350,529 | |||
Raubex Group | 150,000 | 330,802 | |||
| Total (Cost $1,281,859) | 1,033,394 | ||||
| Sweden – 1.4% | |||||
†Bjoern Borg | 12,500 | 54,987 | |||
Lundin Petroleum 1 | 10,000 | 198,327 | |||
| Total (Cost $306,410) | 253,314 | ||||
| Switzerland – 12.4% | |||||
Banque Privee Edmond de Rothschild | 5 | 87,026 | |||
Burckhardt Compression Holding | 360 | 143,306 | |||
†Calida Holding | 5,000 | 122,810 | |||
†Forbo Holding | 600 | 382,722 | |||
Partners Group Holding | 750 | 203,073 | |||
Sika | 55 | 142,427 | |||
†Straumann Holding | 2,100 | 315,261 | |||
Sulzer | 1,500 | 239,956 | |||
VZ Holding | 2,250 | 314,435 | |||
Zehnder Group | 8,000 | 356,572 | |||
| Total (Cost $1,993,911) | 2,307,588 | ||||
| Turkey – 1.1% | |||||
Mardin Cimento Sanayii | 85,000 | 193,913 | |||
| Total (Cost $360,161) | 193,913 | ||||
| THE ACCOMPANYING NOTES ARE AN INTEGRAL PART OF THESE FINANCIAL STATEMENTS. | The Royce Funds 2013 Semiannual Report to Shareholders | 53 |
Schedules of Investments
| Royce European Smaller-Companies Fund (continued) |
| SHARES | VALUE | ||||
| United Kingdom – 21.3% | |||||
Ashmore Group | 72,500 | $ | 378,994 | ||
Clarkson | 12,000 | 310,456 | |||
†Consort Medical | 8,934 | 113,121 | |||
Diploma | 10,000 | 85,249 | |||
Domino Printing Sciences | 25,000 | 237,268 | |||
†E2V Technologies | 97,000 | 175,195 | |||
EnQuest 1 | 150,000 | 269,664 | |||
†Homeserve | 60,000 | 255,520 | |||
Jupiter Fund Management | 50,500 | 222,513 | |||
†Lancashire Holdings | 12,000 | 144,551 | |||
Latchways | 14,600 | 265,915 | |||
Michael Page International | 20,000 | 112,854 | |||
†Photo-Me International | 200,000 | 266,927 | |||
Rotork | 6,000 | 243,656 | |||
†Sepura | 70,000 | 130,421 | |||
Severfield-Rowen | 300,000 | 215,595 | |||
Spirax-Sarco Engineering | 4,815 | 196,779 | |||
Spirent Communications | 85,000 | 181,898 | |||
Victrex | 6,000 | 140,901 | |||
| Total (Cost $3,574,377) | 3,947,477 | ||||
| TOTAL COMMON STOCKS | |||||
(Cost $17,567,905) | 17,838,664 | ||||
| REPURCHASE AGREEMENT – 1.4% | |||||
| Fixed Income Clearing Corporation, | |||||
0.01% dated 6/28/13, due 7/1/13, | 257,000 | ||||
| TOTAL INVESTMENTS – 97.5% | |||||
(Cost $17,824,905) | 18,095,664 | ||||
| CASH AND OTHER ASSETS | |||||
LESS LIABILITIES – 2.5% | 473,135 | ||||
| NET ASSETS – 100.0% | $ | 18,568,799 | |||
| Royce Enterprise Select Fund |
| SHARES | VALUE | ||||
| COMMON STOCKS – 73.1% | |||||
| Consumer Discretionary – 16.8% | |||||
| Automobiles - 3.1% | |||||
Thor Industries | 1,275 | $ | 62,705 | ||
| Distributors - 1.7% | |||||
Genuine Parts | 430 | 33,570 | |||
| Household Durables - 2.0% | |||||
Garmin | 1,100 | 39,776 | |||
| Leisure Equipment & Products - 0.2% | |||||
†Arctic Cat | 100 | 4,498 | |||
| Multiline Retail - 3.2% | |||||
Dollar Tree 1 | 1,250 | 63,550 | |||
| Specialty Retail - 3.5% | |||||
Advance Auto Parts | 420 | 34,092 | |||
†Ross Stores | 300 | 19,443 | |||
Signet Jewelers | 235 | 15,846 | |||
| 69,381 | |||||
| Textiles, Apparel & Luxury Goods - 3.1% | |||||
Gildan Activewear | 730 | 29,572 | |||
†Wolverine World Wide | 600 | 32,766 | |||
| 62,338 | |||||
| Total (Cost $302,635) | 335,818 | ||||
| Energy – 2.4% | |||||
| Energy Equipment & Services - 2.4% | |||||
CARBO Ceramics | 100 | 6,743 | |||
Helmerich & Payne | 100 | 6,245 | |||
†SEACOR Holdings | 420 | 34,881 | |||
| Total (Cost $45,938) | 47,869 | ||||
| Financials – 7.2% | |||||
| Capital Markets - 2.4% | |||||
| 200 | 9,982 | ||||
Federated Investors Cl. B | 1,400 | 38,374 | |||
| 48,356 | |||||
| Insurance - 2.6% | |||||
Alleghany Corporation 1 | 100 | 38,331 | |||
Berkley (W.R.) | 320 | 13,075 | |||
| 51,406 | |||||
| Real Estate Management & Development - 2.2% | |||||
Jones Lang LaSalle | 390 | 35,545 | |||
Kennedy-Wilson Holdings | 513 | 8,536 | |||
| 44,081 | |||||
| Total (Cost $123,049) | 143,843 | ||||
| Health Care – 4.2% | |||||
| Biotechnology - 2.0% | |||||
Myriad Genetics 1 | 1,500 | 40,305 | |||
| Health Care Equipment & Supplies - 1.7% | |||||
Analogic Corporation | 210 | 15,294 | |||
C.R. Bard | 80 | 8,695 | |||
| 54 | The Royce Funds 2013 Semiannual Report to Shareholders | THE ACCOMPANYING NOTES ARE AN INTEGRAL PART OF THESE FINANCIAL STATEMENTS. |
June 30, 2013 (unaudited) |
| SHARES | VALUE | |||||
| Health Care (continued) | ||||||
| Health Care Equipment & Supplies (continued) | ||||||
IDEXX Laboratories 1 | 100 | $ | 8,978 | |||
| 32,967 | ||||||
| Health Care Providers & Services - 0.5% | ||||||
Schein (Henry) 1 | 110 | 10,532 | ||||
| Total (Cost $84,194) | 83,804 | |||||
| Industrials – 17.2% | ||||||
| Aerospace & Defense - 0.8% | ||||||
Teledyne Technologies 1 | 200 | 15,470 | ||||
| Air Freight & Logistics - 2.1% | ||||||
Expeditors International of | ||||||
Washington | 1,100 | 41,811 | ||||
| Commercial Services & Supplies - 2.0% | ||||||
Cintas Corporation | 500 | 22,770 | ||||
UniFirst Corporation | 190 | 17,337 | ||||
| 40,107 | ||||||
| Construction & Engineering - 1.7% | ||||||
Jacobs Engineering Group 1 | 630 | 34,732 | ||||
| Machinery - 2.5% | ||||||
†AGCO Corporation | 330 | 16,562 | ||||
Valmont Industries | 230 | 32,911 | ||||
| 49,473 | ||||||
| Marine - 1.9% | ||||||
Kirby Corporation 1 | 475 | 37,782 | ||||
| Professional Services - 5.4% | ||||||
Equifax | 400 | 23,572 | ||||
| 200 | 9,248 | |||||
ManpowerGroup | 400 | 21,920 | ||||
Towers Watson & Company Cl. A | 650 | 53,261 | ||||
| 108,001 | ||||||
| Transportation Infrastructure - 0.8% | ||||||
| 800 | 14,856 | |||||
| Total (Cost $307,295) | 342,232 | |||||
| Information Technology – 17.5% | ||||||
| Communications Equipment - 1.9% | ||||||
†Plantronics | 880 | 38,650 | ||||
| Computers & Peripherals - 2.6% | ||||||
Western Digital | 820 | 50,914 | ||||
| Electronic Equipment, Instruments & Components - 9.1% | ||||||
AVX Corporation | 4,160 | 48,880 | ||||
Coherent | 530 | 29,187 | ||||
FLIR Systems | 1,200 | 32,364 | ||||
†Methode Electronics | 2,400 | 40,824 | ||||
Rogers Corporation 1 | 640 | 30,285 | ||||
| 181,540 | ||||||
| IT Services - 0.4% | ||||||
Fiserv 1 | 100 | 8,741 | ||||
| Semiconductors & Semiconductor Equipment - 1.0% | ||||||
Analog Devices | 420 | 18,925 | ||||
| Software - 2.5% | ||||||
MICROS Systems 1 | 850 | 36,677 | ||||
| 600 | 13,704 | |||||
| 50,381 | ||||||
| Total (Cost $324,142) | 349,151 | |||||
| Materials – 4.7% | ||||||
| Chemicals - 2.5% | ||||||
†Innospec | 226 | 9,081 | ||||
Sigma-Aldrich Corporation | 206 | 16,554 | ||||
Westlake Chemical | 250 | 24,102 | ||||
| 49,737 | ||||||
| Metals & Mining - 1.4% | ||||||
| Reliance Steel & Aluminum | 430 | 28,191 | ||||
| Paper & Forest Products - 0.8% | ||||||
Stella-Jones | 170 | 15,848 | ||||
| Total (Cost $80,356) | 93,776 | |||||
| Utilities – 1.8% | ||||||
| Gas Utilities - 1.8% | ||||||
UGI Corporation | 900 | 35,199 | ||||
| Total (Cost $27,729) | 35,199 | |||||
| Miscellaneous2 – 1.3% | ||||||
| Total (Cost $25,846) | 26,738 | |||||
| TOTAL COMMON STOCKS | ||||||
(Cost $1,321,184) | 1,458,430 | |||||
| FIXED INCOME – 2.5% | ||||||
| Government Bonds – 2.5% | ||||||
†iShares 1-3 Year Treasury Bond ETF | 590 | 49,725 | ||||
| TOTAL FIXED INCOME | ||||||
(Cost $49,848) | 49,725 | |||||
| REPURCHASE AGREEMENT – 25.8% | ||||||
| Fixed Income Clearing Corporation, | ||||||
0.01% dated 6/28/13, due 7/1/13, | 516,000 | |||||
| TOTAL INVESTMENTS – 101.4% | ||||||
(Cost $1,887,032) | 2,024,155 | |||||
| LIABILITIES LESS CASH | ||||||
AND OTHER ASSETS – (1.4)% | (28,902 | ) | ||||
| NET ASSETS – 100.0% | $ | 1,995,253 | ||||
| THE ACCOMPANYING NOTES ARE AN INTEGRAL PART OF THESE FINANCIAL STATEMENTS. | The Royce Funds 2013 Semiannual Report to Shareholders | 55 |
Schedules of Investments
| Royce SMid-Cap Value Fund |
| SHARES | VALUE | ||||
| COMMON STOCKS – 87.4% | |||||
| Consumer Discretionary – 9.9% | |||||
| Auto Components - 0.3% | |||||
Autoliv | 370 | $ | 28,634 | ||
| Automobiles - 3.6% | |||||
Thor Industries | 7,900 | 388,522 | |||
| Household Durables - 2.6% | |||||
Garmin | 7,700 | 278,432 | |||
| Multiline Retail - 1.7% | |||||
Dollar Tree 1 | 3,500 | 177,940 | |||
| Specialty Retail - 1.7% | |||||
Signet Jewelers | 2,720 | 183,410 | |||
| Total (Cost $883,429) | 1,056,938 | ||||
| Consumer Staples – 1.1% | �� | ||||
| Food Products - 1.1% | |||||
Sanderson Farms | 1,700 | 112,914 | |||
| Total (Cost $90,213) | 112,914 | ||||
| Energy – 11.1% | |||||
| Energy Equipment & Services - 10.2% | |||||
Helmerich & Payne | 7,000 | 437,150 | |||
Pason Systems | 17,800 | 323,606 | |||
Trican Well Service | 16,000 | 212,684 | |||
Unit Corporation 1 | 2,600 | 110,708 | |||
| 1,084,148 | |||||
| Oil, Gas & Consumable Fuels - 0.9% | |||||
†HollyFrontier Corporation | 2,200 | 94,116 | |||
| Total (Cost $1,160,311) | 1,178,264 | ||||
| Financials – 13.5% | |||||
| Capital Markets - 10.0% | |||||
| 2,600 | 129,766 | ||||
Ashmore Group | 51,600 | 269,739 | |||
Federated Investors Cl. B | 7,900 | 216,539 | |||
Partners Group Holding | 500 | 135,382 | |||
Sprott | 39,700 | 105,695 | |||
Value Partners Group | 384,000 | 206,951 | |||
| 1,064,072 | |||||
| Diversified Financial Services - 0.5% | |||||
Leucadia National | 1,950 | 51,129 | |||
| Real Estate Management & Development - 3.0% | |||||
Jones Lang LaSalle | 1,630 | 148,558 | |||
Kennedy-Wilson Holdings | 10,500 | 174,720 | |||
| 323,278 | |||||
| Total (Cost $1,512,279) | 1,438,479 | ||||
| Health Care – 3.0% | |||||
| Biotechnology - 3.0% | |||||
Myriad Genetics 1 | 12,000 | 322,440 | |||
| Total (Cost $305,909) | 322,440 | ||||
| Industrials – 14.8% | |||||
| Construction & Engineering - 3.8% | |||||
Jacobs Engineering Group 1 | 7,300 | 402,449 | |||
| Machinery - 7.8% | |||||
Kennametal | 3,200 | 124,256 | |||
Lincoln Electric Holdings | 1,900 | 108,813 | |||
Semperit AG Holding | 7,400 | 265,849 | |||
Valmont Industries | 1,925 | 275,448 | |||
Wabtec Corporation | 1,000 | 53,430 | |||
| 827,796 | |||||
| Marine - 0.8% | |||||
Kirby Corporation 1 | 1,100 | 87,494 | |||
| Professional Services - 2.4% | |||||
ManpowerGroup | 2,000 | 109,600 | |||
Towers Watson & Company Cl. A | 1,800 | 147,492 | |||
| 257,092 | |||||
| Total (Cost $1,306,233) | 1,574,831 | ||||
| Information Technology – 19.2% | |||||
| Computers & Peripherals - 7.2% | |||||
SanDisk Corporation 1 | 3,700 | 226,070 | |||
Western Digital | 8,700 | 540,183 | |||
| 766,253 | |||||
| Electronic Equipment, Instruments & Components - 1.4% | |||||
AVX Corporation | 12,200 | 143,350 | |||
| Semiconductors & Semiconductor Equipment - 9.8% | |||||
Analog Devices | 6,100 | 274,866 | |||
| 7,800 | 135,408 | ||||
International Rectifier 1 | 8,142 | 170,493 | |||
LSI Corporation 1 | 18,800 | 134,232 | |||
Teradyne 1 | 18,350 | 322,410 | |||
| 1,037,409 | |||||
| Software - 0.8% | |||||
SimCorp | 3,000 | 89,004 | |||
| Total (Cost $1,688,887) | 2,036,016 | ||||
| Materials – 14.8% | |||||
| Chemicals - 2.6% | |||||
Westlake Chemical | 2,900 | 279,589 | |||
| Metals & Mining - 9.5% | |||||
Alamos Gold | 10,000 | 121,137 | |||
Globe Specialty Metals | 22,100 | 240,227 | |||
Hochschild Mining | 21,300 | 50,312 | |||
Pan American Silver | 14,700 | 171,108 | |||
Pretium Resources 1 | 5,800 | 38,280 | |||
Reliance Steel & Aluminum | 5,900 | 386,804 | |||
| 1,007,868 | |||||
| Paper & Forest Products - 2.7% | |||||
Stella-Jones | 3,025 | 281,992 | |||
| Total (Cost $1,769,106) | 1,569,449 | ||||
| TOTAL COMMON STOCKS | |||||
(Cost $8,716,367) | 9,289,331 | ||||
| 56 | The Royce Funds 2013 Semiannual Report to Shareholders | THE ACCOMPANYING NOTES ARE AN INTEGRAL PART OF THESE FINANCIAL STATEMENTS. |
June 30, 2013 (unaudited) |
| VALUE | ||||||
| REPURCHASE AGREEMENT – 12.6% | ||||||
| Fixed Income Clearing Corporation, | ||||||
0.01% dated 6/28/13, due 7/1/13, | $ | 1,338,000 | ||||
| TOTAL INVESTMENTS – 100.0% | ||||||
(Cost $10,054,367) | 10,627,331 | |||||
| LIABILITIES LESS CASH | ||||||
AND OTHER ASSETS – (0.0)% | (2,377 | ) | ||||
| NET ASSETS – 100.0% | $ | 10,624,954 | ||||
| Royce Focus Value Fund |
| SHARES | VALUE | ||||
| COMMON STOCKS – 91.9% | |||||
| Consumer Discretionary – 13.0% | |||||
| Automobiles - 1.5% | |||||
Thor Industries | 3,000 | $ | 147,540 | ||
| Household Durables - 2.9% | |||||
†Blyth | 8,200 | 114,472 | |||
| 4,400 | 174,988 | ||||
| 289,460 | |||||
| Internet & Catalog Retail - 2.6% | |||||
†NutriSystem | 21,700 | 255,626 | |||
| Leisure Equipment & Products - 2.9% | |||||
| 32,800 | 285,032 | ||||
| Specialty Retail - 3.1% | |||||
Buckle (The) | 3,500 | 182,070 | |||
GameStop Corporation Cl. A | 3,100 | 130,293 | |||
| 312,363 | |||||
| Total (Cost $1,012,274) | 1,290,021 | ||||
| Consumer Staples – 3.8% | |||||
| Food Products - 3.8% | |||||
Cal-Maine Foods | 2,000 | 93,020 | |||
Industrias Bachoco ADR | 4,500 | 156,150 | |||
Sanderson Farms | 2,000 | 132,840 | |||
| Total (Cost $211,314) | 382,010 | ||||
| Energy – 11.2% | |||||
| Energy Equipment & Services - 3.0% | |||||
Helmerich & Payne | 2,400 | 149,880 | |||
Trican Well Service | 11,000 | 146,221 | |||
| 296,101 | |||||
| Oil, Gas & Consumable Fuels - 8.2% | |||||
Africa Oil 1 | 15,000 | 100,552 | |||
Exxon Mobil | 3,500 | 316,225 | |||
| 3,900 | 77,347 | ||||
†SemGroup Corporation Cl. A | 6,100 | 328,546 | |||
| 822,670 | |||||
| Total (Cost $978,727) | 1,118,771 | ||||
| Financials – 20.1% | |||||
| Capital Markets - 9.8% | |||||
Affiliated Managers Group 1 | 600 | 98,364 | |||
Ashmore Group | 30,000 | 156,825 | |||
Federated Investors Cl. B | 5,000 | 137,050 | |||
Franklin Resources | 2,500 | 340,050 | |||
Partners Group Holding | 400 | 108,306 | |||
Value Partners Group | 250,000 | 134,733 | |||
| 975,328 | |||||
| Diversified Financial Services - 1.7% | |||||
†Sprott Resource Lending | 134,100 | 165,760 | |||
| Insurance - 6.4% | |||||
Berkshire Hathaway Cl. B 1 | 3,500 | 391,720 | |||
| 10,950 | 248,784 | ||||
| 640,504 | |||||
| THE ACCOMPANYING NOTES ARE AN INTEGRAL PART OF THESE FINANCIAL STATEMENTS. | The Royce Funds 2013 Semiannual Report to Shareholders | 57 |
Schedules of Investments
| Royce Focus Value Fund (continued) |
| SHARES | VALUE | ||||
| Financials (continued) | |||||
| Real Estate Management & Development - 2.2% | |||||
Kennedy-Wilson Holdings | 13,400 | $ | 222,976 | ||
| Total (Cost $1,442,855) | 2,004,568 | ||||
| Health Care – 8.7% | |||||
| Biotechnology - 4.4% | |||||
| 4,200 | 202,860 | ||||
Myriad Genetics 1 | 8,700 | 233,769 | |||
| 436,629 | |||||
| Health Care Providers & Services - 2.9% | |||||
†Chemed Corporation | 1,300 | 94,159 | |||
| 1,600 | 193,280 | ||||
| 287,439 | |||||
| Pharmaceuticals - 1.4% | |||||
| 4,600 | 141,496 | ||||
| Total (Cost $897,057) | 865,564 | ||||
| Industrials – 12.3% | |||||
| Aerospace & Defense - 2.0% | |||||
†Boeing Company | 1,900 | 194,636 | |||
| Construction & Engineering - 2.2% | |||||
Jacobs Engineering Group 1 | 4,000 | 220,520 | |||
| Machinery - 3.4% | |||||
†CIRCOR International | 4,500 | 228,870 | |||
Lincoln Electric Holdings | 2,000 | 114,540 | |||
| 343,410 | |||||
| Marine - 1.3% | |||||
| 1,600 | 127,264 | ||||
| Professional Services - 1.6% | |||||
†Towers Watson & Company Cl. A | 1,900 | 155,686 | |||
| Road & Rail - 1.8% | |||||
Patriot Transportation Holding 1 | 6,000 | 180,240 | |||
| Total (Cost $1,097,337) | 1,221,756 | ||||
| Information Technology – 16.0% | |||||
| Computers & Peripherals - 4.0% | |||||
Apple | 200 | 79,216 | |||
Western Digital | 5,100 | 316,659 | |||
| 395,875 | |||||
| Internet Software & Services - 3.5% | |||||
| 400 | 352,148 | ||||
| Semiconductors & Semiconductor Equipment - 3.6% | |||||
MKS Instruments | 8,000 | 212,320 | |||
| 7,900 | 147,335 | ||||
| 359,655 | |||||
| Software - 4.9% | |||||
†ePlus | 5,000 | 299,450 | |||
| 4,300 | 185,545 | ||||
| 484,995 | |||||
| Total (Cost $1,444,215) | 1,592,673 | ||||
| Materials – 6.1% | |||||
| Chemicals - 1.0% | |||||
| 1,200 | 100,848 | ||||
| Metals & Mining - 5.1% | |||||
Fresnillo | 4,000 | 53,659 | |||
Randgold Resources ADR | 2,100 | 134,505 | |||
Reliance Steel & Aluminum | 3,500 | 229,460 | |||
†Worthington Industries | 2,800 | 88,788 | |||
| 506,412 | |||||
| Total (Cost $503,254) | 607,260 | ||||
| Miscellaneous2 – 0.7% | |||||
| Total (Cost $66,000) | 72,000 | ||||
| TOTAL COMMON STOCKS | |||||
(Cost $7,653,033) | 9,154,623 | ||||
| FIXED INCOME – 1.3% | |||||
| Government Bonds – 1.3% | |||||
ProShares UltraShort 20+ Year Treasury 1 | 1,750 | 126,752 | |||
| TOTAL FIXED INCOME | |||||
(Cost $185,658) | 126,752 | ||||
| REPURCHASE AGREEMENT – 10.3% | |||||
| Fixed Income Clearing Corporation, | |||||
0.01% dated 6/28/13, due 7/1/13, | 1,033,000 | ||||
| TOTAL INVESTMENTS – 103.5% | |||||
(Cost $8,871,691) | 10,314,375 | ||||
| LIABILITIES LESS CASH | |||||
AND OTHER ASSETS – (3.5)% | (350,122) | ||||
| NET ASSETS – 100.0% | $ | 9,964,253 | |||
| 58 | The Royce Funds 2013 Semiannual Report to Shareholders | THE ACCOMPANYING NOTES ARE AN INTEGRAL PART OF THESE FINANCIAL STATEMENTS. |
June 30, 2013 (unaudited) |
| Royce Partners Fund |
| SHARES | VALUE | ||||
| COMMON STOCKS – 93.4% | |||||
| Consumer Discretionary – 6.2% | |||||
| Household Durables - 2.0% | |||||
Hunter Douglas | 600 | $ | 23,976 | ||
NVR 1 | 25 | 23,050 | |||
| 47,026 | |||||
| Media - 1.9% | |||||
Morningstar | 600 | 46,548 | |||
| Specialty Retail - 1.0% | |||||
Tiffany & Co. | 333 | 24,256 | |||
| Textiles, Apparel & Luxury Goods - 1.3% | |||||
†Geox | 12,600 | 31,391 | |||
| Total (Cost $118,730) | 149,221 | ||||
| Energy – 4.9% | |||||
| Energy Equipment & Services - 4.9% | |||||
Ensco Cl. A | 700 | 40,684 | |||
Schlumberger | 360 | 25,798 | |||
Tidewater | 900 | 51,273 | |||
| Total (Cost $97,788) | 117,755 | ||||
| Financials – 25.2% | |||||
| Capital Markets - 19.7% | |||||
†ASA Gold and Precious Metals | 2,700 | 34,290 | |||
Ashmore Group | 8,000 | 41,820 | |||
Bank of New York Mellon (The) | 1,700 | 47,685 | |||
Coronation Fund Managers | 5,300 | 33,644 | |||
Jupiter Fund Management | 7,300 | 32,165 | |||
KKR & Co. L.P. | 1,300 | 25,558 | |||
Northern Trust | 560 | 32,424 | |||
†Schwab (Charles) | 2,300 | 48,829 | |||
SEI Investments | 1,800 | 51,174 | |||
†Sprott | 10,000 | 26,624 | |||
State Street | 483 | 31,496 | |||
Value Partners Group | 84,000 | 45,271 | |||
WisdomTree Investments 1 | 2,000 | 23,140 | |||
| 474,120 | |||||
| Diversified Financial Services - 1.0% | |||||
Moody’s Corporation | 406 | 24,738 | |||
| Insurance - 3.0% | |||||
E-L Financial | 120 | 72,454 | |||
| Real Estate Management & Development - 1.5% | |||||
Jones Lang LaSalle | 400 | 36,456 | |||
| Total (Cost $510,393) | 607,768 | ||||
| Health Care – 4.6% | |||||
| Biotechnology - 1.2% | |||||
Myriad Genetics 1 | 1,100 | 29,557 | |||
| Pharmaceuticals - 3.4% | |||||
Adcock Ingram Holdings | 4,400 | 28,932 | |||
†Sanofi ADR | 1,000 | 51,510 | |||
| 80,442 | |||||
| Total (Cost $112,222) | 109,999 | ||||
| Industrials – 23.9% | |||||
| Air Freight & Logistics - 1.6% | |||||
Expeditors International of Washington | 1,040 | 39,530 | |||
| Commercial Services & Supplies - 1.5% | |||||
| 2,400 | 35,064 | ||||
| Construction & Engineering - 2.0% | |||||
Fluor Corporation | 800 | 47,448 | |||
| Machinery - 7.9% | |||||
Foster (L.B.) Company | 800 | 34,536 | |||
Graco | 720 | 45,511 | |||
| 700 | 36,365 | ||||
Spirax-Sarco Engineering | 770 | 31,469 | |||
Valmont Industries | 300 | 42,927 | |||
| 190,808 | |||||
| Professional Services - 6.1% | |||||
ManpowerGroup | 700 | 38,360 | |||
Towers Watson & Company Cl. A | 700 | 57,358 | |||
Verisk Analytics Cl. A 1 | 873 | 52,118 | |||
| 147,836 | |||||
| Road & Rail - 3.2% | |||||
Landstar System | 800 | 41,200 | |||
Patriot Transportation Holding 1 | 1,200 | 36,048 | |||
| 77,248 | |||||
| Trading Companies & Distributors - 1.6% | |||||
†Applied Industrial Technologies | 800 | 38,664 | |||
| Total (Cost $430,844) | 576,598 | ||||
| Information Technology – 14.4% | |||||
| Computers & Peripherals - 1.0% | |||||
†Western Digital | 400 | 24,836 | |||
| Electronic Equipment, Instruments & Components - 6.2% | |||||
Amphenol Corporation Cl. A | 300 | 23,382 | |||
Anixter International 1 | 500 | 37,905 | |||
FARO Technologies 1 | 600 | 20,292 | |||
IPG Photonics | 550 | 33,401 | |||
†National Instruments | 1,200 | 33,528 | |||
| 148,508 | |||||
| IT Services - 3.4% | |||||
MasterCard Cl. A | 95 | 54,578 | |||
Western Union | 1,600 | 27,376 | |||
| 81,954 | |||||
| Office Electronics - 2.0% | |||||
Zebra Technologies Cl. A 1 | 1,100 | 47,784 | |||
| Software - 1.8% | |||||
†SimCorp | 1,500 | 44,502 | |||
| Total (Cost $254,157) | 347,584 | ||||
| Materials – 11.2% | |||||
| Chemicals - 1.6% | |||||
Airgas | 400 | 38,184 | |||
| Containers & Packaging - 3.6% | |||||
Greif Cl. A | 880 | 46,350 | |||
Mayr-Melnhof Karton | 375 | 40,318 | |||
| 86,668 | |||||
| THE ACCOMPANYING NOTES ARE AN INTEGRAL PART OF THESE FINANCIAL STATEMENTS. | The Royce Funds 2013 Semiannual Report to Shareholders | 59 |
Schedules of Investments
| Royce Partners Fund (continued) |
| SHARES | VALUE | |||||
| Materials (continued) | ||||||
| Metals & Mining - 4.3% | ||||||
Gold Fields ADR | 3,800 | $ | 19,950 | |||
†Pan American Silver | 3,200 | 37,248 | ||||
Reliance Steel & Aluminum | 700 | 45,892 | ||||
| 103,090 | ||||||
| Paper & Forest Products - 1.7% | ||||||
†Stella-Jones | 440 | 41,017 | ||||
| Total (Cost $266,092) | 268,959 | |||||
| Telecommunication Services – 2.1% | ||||||
| Diversified Telecommunication Services - 2.1% | ||||||
| 11,700 | 50,895 | |||||
| Total (Cost $49,802) | 50,895 | |||||
| Miscellaneous2 – 0.9% | ||||||
| Total (Cost $23,063) | 21,626 | |||||
| TOTAL COMMON STOCKS | ||||||
(Cost $1,863,091) | 2,250,405 | |||||
| REPURCHASE AGREEMENT – 6.7% | ||||||
| Fixed Income Clearing Corporation, | ||||||
0.01% dated 6/28/13, due 7/1/13, | 161,000 | |||||
| TOTAL INVESTMENTS – 100.1% | ||||||
(Cost $2,024,091) | 2,411,405 | |||||
| LIABILITIES LESS CASH | ||||||
AND OTHER ASSETS – (0.1)% | (3,443 | ) | ||||
| NET ASSETS – 100.0% | $ | 2,407,962 | ||||
| Royce Opportunity Select Fund |
| SHARES | VALUE | ||||
| COMMON STOCKS – 102.6% | |||||
| Consumer Discretionary – 12.7% | |||||
| Diversified Consumer Services - 1.3% | |||||
| 4,800 | $ | 85,056 | |||
| Hotels, Restaurants & Leisure - 2.0% | |||||
Orient-Express Hotels Cl. A 1 | 11,000 | 133,760 | |||
| Household Durables - 2.4% | |||||
Hovnanian Enterprises Cl. A 1 | 12,000 | 67,320 | |||
M.D.C. Holdings | 3,000 | 97,530 | |||
| 164,850 | |||||
| Internet & Catalog Retail - 0.7% | |||||
Vitacost.com 1 | 6,000 | 50,700 | |||
| Specialty Retail - 2.1% | |||||
Zumiez 1 | 5,000 | 143,750 | |||
| Textiles, Apparel & Luxury Goods - 4.2% | |||||
Delta Apparel 1,3 | 2,500 | 35,250 | |||
†Jones Group (The) | 10,000 | 137,500 | |||
Quiksilver 1 | 17,000 | 109,480 | |||
| 282,230 | |||||
| Total (Cost $765,813) | 860,346 | ||||
| Energy – 7.4% | |||||
| Energy Equipment & Services - 4.0% | |||||
Hercules Offshore 1 | 10,000 | 70,400 | |||
Key Energy Services 1 | 7,000 | 41,650 | |||
Newpark Resources 1 | 4,000 | 43,960 | |||
Patterson-UTI Energy | 6,000 | 116,130 | |||
| 272,140 | |||||
| Oil, Gas & Consumable Fuels - 3.4% | |||||
Goodrich Petroleum 1 | 5,000 | 64,000 | |||
Scorpio Tankers | 11,000 | 98,780 | |||
| 25,000 | 63,750 | ||||
| 226,530 | |||||
| Total (Cost $444,165) | 498,670 | ||||
| Financials – 16.7% | |||||
| Commercial Banks - 8.0% | |||||
| 5,000 | 122,000 | ||||
†FirstMerit Corporation | 6,200 | 124,186 | |||
| 3,300 | 100,320 | ||||
| 9,000 | 123,750 | ||||
†Trustmark Corporation | 3,000 | 73,740 | |||
| 543,996 | |||||
| Insurance - 0.9% | |||||
†Old Republic International | 5,000 | 64,350 | |||
| Real Estate Investment Trusts (REITs) - 2.4% | |||||
LaSalle Hotel Properties 3 | 5,000 | 123,500 | |||
RAIT Financial Trust | 5,000 | 37,600 | |||
| 161,100 | |||||
| Real Estate Management & Development - 2.2% | |||||
†Kennedy-Wilson Holdings | 9,000 | 149,760 | |||
| Thrifts & Mortgage Finance - 3.2% | |||||
BofI Holding 1 | 1,900 | 87,058 | |||
MGIC Investment 1 | 8,000 | 48,560 | |||
| 60 | The Royce Funds 2013 Semiannual Report to Shareholders | THE ACCOMPANYING NOTES ARE AN INTEGRAL PART OF THESE FINANCIAL STATEMENTS. |
June 30, 2013 (unaudited) |
| SHARES | VALUE | ||||
| Financials (continued) | |||||
| Thrifts & Mortgage Finance (continued) | |||||
Radian Group 3 | 7,000 | $ | 81,340 | ||
| 216,958 | |||||
| Total (Cost $950,291) | 1,136,164 | ||||
| Health Care – 1.3% | |||||
| Health Care Equipment & Supplies - 1.3% | |||||
Accuray 1 | 15,000 | 86,100 | |||
| Total (Cost $71,651) | 86,100 | ||||
| Industrials – 18.0% | |||||
| Aerospace & Defense - 2.1% | |||||
Kratos Defense & Security Solutions 1 | 22,000 | 142,560 | |||
| Air Freight & Logistics - 1.3% | |||||
XPO Logistics 1 | 5,000 | 90,450 | |||
| Airlines - 0.9% | |||||
JetBlue Airways 1 | 10,000 | 63,000 | |||
| Building Products - 2.2% | |||||
Builders FirstSource 1 | 7,000 | 41,860 | |||
†Quanex Building Products | 6,500 | 109,460 | |||
| 151,320 | |||||
| Construction & Engineering - 0.9% | |||||
Ameresco Cl. A 1,3 | 6,600 | 59,466 | |||
| Electrical Equipment - 1.2% | |||||
| 5,000 | 81,300 | ||||
| Machinery - 5.3% | |||||
Commercial Vehicle Group 1,3 | 10,000 | 74,600 | |||
Hardinge | 3,500 | 51,730 | |||
Meritor 1 | 13,000 | 91,650 | |||
Mueller Water Products Cl. A | 20,000 | 138,200 | |||
| 356,180 | |||||
| Road & Rail - 2.3% | |||||
Arkansas Best | 4,300 | 98,685 | |||
Swift Transportation 1,3 | 3,500 | 57,890 | |||
| 156,575 | |||||
| Trading Companies & Distributors - 1.8% | |||||
†Air Lease Cl. A | 4,500 | 124,155 | |||
| Total (Cost $1,080,204) | 1,225,006 | ||||
| Information Technology – 36.4% | |||||
| Communications Equipment - 4.1% | |||||
| 28,000 | 96,600 | ||||
†NETGEAR 1,3 | 4,000 | 122,160 | |||
Westell Technologies Cl. A 1 | 25,000 | 59,750 | |||
| 278,510 | |||||
| Computers & Peripherals - 3.2% | |||||
Datalink Corporation 1 | 9,000 | 95,760 | |||
| 13,000 | 124,280 | ||||
| 220,040 | |||||
| Electronic Equipment, Instruments & Components - 3.3% | |||||
Audience 1 | 10,000 | 132,100 | |||
Newport Corporation 1 | 5,500 | 76,615 | |||
SigmaTron International 1 | 3,500 | 14,840 | |||
| 223,555 | |||||
| IT Services - 0.8% | |||||
| 16,500 | 55,110 | ||||
| Semiconductors & Semiconductor Equipment - 22.6% | |||||
| 3,000 | 22,920 | ||||
| 4,200 | 99,330 | ||||
| 12,000 | 129,240 | ||||
| 6,000 | 82,800 | ||||
FormFactor 1 | 14,000 | 94,500 | |||
| 20,000 | 83,000 | ||||
Inphi Corporation 1,3 | 6,000 | 66,000 | |||
†Intersil Corporation Cl. A | 16,000 | 125,120 | |||
Kulicke & Soffa Industries 1 | 5,000 | 55,300 | |||
| 4,000 | 73,080 | ||||
NeoPhotonics Corporation 1 | 11,000 | 95,590 | |||
OmniVision Technologies 1 | 4,600 | 85,790 | |||
Rubicon Technology 1 | 12,500 | 100,125 | |||
Rudolph Technologies 1,3 | 11,000 | 123,200 | |||
SunEdison 1 | 14,000 | 114,380 | |||
SunPower Corporation 1 | 2,500 | 51,750 | |||
TriQuint Semiconductor 1 | 11,000 | 76,230 | |||
Ultratech 1 | 1,500 | 55,080 | |||
| 1,533,435 | |||||
| Software - 2.4% | |||||
Ellie Mae 1 | 5,600 | 129,248 | |||
Smith Micro Software 1 | 30,000 | 31,800 | |||
| 161,048 | |||||
| Total (Cost $2,158,046) | 2,471,698 | ||||
| Materials – 5.8% | |||||
| Chemicals - 0.9% | |||||
OM Group 1 | 2,000 | 61,840 | |||
| Metals & Mining - 2.9% | |||||
| 17,000 | 105,400 | ||||
US Silica Holdings | 4,500 | 93,510 | |||
| 198,910 | |||||
| Paper & Forest Products - 2.0% | |||||
Louisiana-Pacific Corporation 1 | 9,000 | 133,110 | |||
| Total (Cost $395,431) | 393,860 | ||||
| Miscellaneous2 – 4.3% | |||||
| Total (Cost $291,018) | 294,500 | ||||
| TOTAL COMMON STOCKS | |||||
(Cost $6,156,619) | 6,966,344 | ||||
| REPURCHASE AGREEMENT – 3.9% | |||||
| Fixed Income Clearing Corporation, | |||||
0.01% dated 6/28/13, due 7/1/13, | 269,000 | ||||
| THE ACCOMPANYING NOTES ARE AN INTEGRAL PART OF THESE FINANCIAL STATEMENTS. | The Royce Funds 2013 Semiannual Report to Shareholders | 61 |
Schedules of Investments
| Royce Opportunity Select Fund (continued) |
| SHARES | VALUE | |||||
| TOTAL INVESTMENTS – 106.5% | ||||||
(Cost $6,425,619) | $ | 7,235,344 | ||||
| LIABILITIES LESS CASH | ||||||
AND OTHER ASSETS – (6.5)% | (444,079 | ) | ||||
| NET ASSETS – 100.0% | $ | 6,791,265 | ||||
| SECURITIES SOLD SHORT | ||||||
| COMMON STOCKS – 9.8% | ||||||
| Consumer Discretionary – 5.8% | ||||||
| Hotels, Restaurants & Leisure - 1.2% | ||||||
Bravo Brio Restaurant Group | 500 | $ | 8,910 | |||
Life Time Fitness | 1,500 | 75,165 | ||||
| 84,075 | ||||||
| Household Durables - 0.3% | ||||||
iRobot Corporation | 500 | 19,885 | ||||
| Specialty Retail - 4.3% | ||||||
Lithia Motors Cl. A | 1,500 | 79,965 | ||||
Lumber Liquidators Holdings | 1,900 | 147,953 | ||||
Sonic Automotive Cl. A | 1,000 | 21,140 | ||||
Tile Shop Holdings | 1,500 | 43,440 | ||||
| 292,498 | ||||||
| Total (Proceeds $385,567) | 396,458 | |||||
| Consumer Staples – 1.3% | ||||||
| Food & Staples Retailing - 1.3% | ||||||
Fresh Market | 1,700 | 84,524 | ||||
| Total (Proceeds $81,970) | 84,524 | |||||
| Information Technology – 2.7% | ||||||
| Internet Software & Services - 1.3% | ||||||
Stamps.com | 2,200 | 86,658 | ||||
| Software - 1.4% | ||||||
Fleetmatics Group | 3,000 | 99,690 | ||||
| Total (Proceeds $146,647) | 186,348 | |||||
| TOTAL SECURITIES SOLD SHORT | ||||||
(Proceeds $614,184) | $ | 667,330 | ||||
| Royce Global Dividend Value Fund |
| SHARES | VALUE | ||||
| COMMON STOCKS – 94.3% | |||||
| Australia – 0.7% | |||||
Cochlear | 300 | $ | 16,931 | ||
†Imdex | 65,000 | 36,856 | |||
| Total (Cost $93,828) | 53,787 | ||||
| Austria – 1.9% | |||||
Mayr-Melnhof Karton | 900 | 96,765 | |||
Semperit AG Holding | 1,500 | 53,888 | |||
| Total (Cost $178,885) | 150,653 | ||||
| Belgium – 2.0% | |||||
EVS Broadcast Equipment | 800 | 55,544 | |||
Sipef | 650 | 43,674 | |||
Van de Velde | 1,400 | 61,139 | |||
| Total (Cost $172,595) | 160,357 | ||||
| Bermuda – 0.7% | |||||
Lazard Cl. A | 1,760 | 56,584 | |||
| Total (Cost $51,953) | 56,584 | ||||
| Brazil – 2.6% | |||||
†Brasil Brokers Participacoes | 20,000 | 58,709 | |||
Eternit | 12,500 | 52,939 | |||
Grendene | 4,000 | 36,319 | |||
†MAHLE Metal Leve | 5,000 | 55,504 | |||
| Total (Cost $219,666) | 203,471 | ||||
| Canada – 6.7% | |||||
†Alaris Royalty | 2,000 | 60,626 | |||
Canadian Energy Services & Technology | 1,200 | 18,633 | |||
†Computer Modelling Group | 1,900 | 41,895 | |||
E-L Financial | 70 | 42,265 | |||
†Gluskin Sheff + Associates | 1,800 | 33,306 | |||
Major Drilling Group International | 5,500 | 37,444 | |||
Pan American Silver | 5,700 | 66,348 | |||
Pason Systems | 2,500 | 45,450 | |||
Sprott | 22,500 | 59,903 | |||
Stella-Jones | 760 | 70,848 | |||
Trican Well Service | 4,200 | 55,829 | |||
| Total (Cost $616,498) | 532,547 | ||||
| Chile – 0.6% | |||||
†Inversiones La Construccion | 3,000 | 45,940 | |||
| Total (Cost $57,325) | 45,940 | ||||
| China – 1.9% | |||||
Anta Sports Products | 40,000 | 35,070 | |||
Daphne International Holdings | 77,000 | 65,821 | |||
Pacific Online | 110,000 | 48,362 | |||
| Total (Cost $138,859) | 149,253 | ||||
| 62 | The Royce Funds 2013 Semiannual Report to Shareholders | THE ACCOMPANYING NOTES ARE AN INTEGRAL PART OF THESE FINANCIAL STATEMENTS. |
June 30, 2013 (unaudited) |
| SHARES | VALUE | ||||
| Cyprus – 0.7% | |||||
Globaltrans Investment GDR | 4,000 | $ | 54,960 | ||
| Total (Cost $54,719) | 54,960 | ||||
| Denmark – 1.3% | |||||
H. Lundbeck | 2,000 | 35,671 | |||
Pandora | 800 | 27,113 | |||
SimCorp | 1,300 | 38,568 | |||
| Total (Cost $81,725) | 101,352 | ||||
| Finland – 1.4% | |||||
†F-Secure | 12,500 | 34,494 | |||
Nokian Renkaat | 1,000 | 40,755 | |||
Ponsse | 4,500 | 33,621 | |||
| Total (Cost $128,843) | 108,870 | ||||
| France – 3.4% | |||||
Alten | 1,900 | 64,870 | |||
bioMerieux | 300 | 29,068 | |||
Boiron | 1,000 | 52,066 | |||
Manutan International | 1,600 | 68,519 | |||
Societe Internationale de Plantations | |||||
d’Heveas | 750 | 52,844 | |||
| Total (Cost $280,437) | 267,367 | ||||
| Germany – 2.5% | |||||
†Aurelius | 1,500 | 36,043 | |||
Nemetschek | 700 | 45,102 | |||
Pfeiffer Vacuum Technology | 430 | 44,553 | |||
Rational | 100 | 33,524 | |||
†RIB Software | 7,000 | 36,583 | |||
| Total (Cost $185,144) | 195,805 | ||||
| Hong Kong – 11.3% | |||||
Arts Optical International Holdings | 150,000 | 30,944 | |||
†Bosideng International Holdings | 150,000 | 31,330 | |||
†Dickson Concepts (International) | 105,000 | 58,890 | |||
†Goldlion Holdings | 60,000 | 28,932 | |||
Le Saunda Holdings | 100,000 | 36,746 | |||
Lung Kee (Bermuda) Holdings | 110,000 | 42,547 | |||
Media Chinese International | 160,000 | 58,237 | |||
Midland Holdings | 170,000 | 63,563 | |||
New World Department Store China | 75,000 | 37,906 | |||
Pacific Textiles Holdings | 45,000 | 50,709 | |||
Pico Far East Holdings | 170,000 | 58,083 | |||
Stella International Holdings | 25,000 | 69,140 | |||
Television Broadcasts | 9,500 | 65,836 | |||
Texwinca Holdings | 72,500 | 67,489 | |||
Value Partners Group | 120,000 | 64,672 | |||
VTech Holdings | 3,000 | 45,371 | |||
Win Hanverky Holdings | 276,000 | 27,045 | |||
Xtep International Holdings | 125,000 | 52,217 | |||
| Total (Cost $949,580) | 889,657 | ||||
| India – 0.7% | |||||
†Graphite India | 45,000 | 55,658 | |||
| Total (Cost $64,735) | 55,658 | ||||
| Indonesia – 0.7% | |||||
Selamat Sempurna | 200,000 | 53,401 | |||
| Total (Cost $27,572) | 53,401 | ||||
| Italy – 1.7% | |||||
DiaSorin | 1,000 | 39,922 | |||
†Nice | 12,000 | 37,675 | |||
Recordati | 5,200 | 57,702 | |||
| Total (Cost $137,571) | 135,299 | ||||
| Japan – 5.2% | |||||
Dr.Ci:Labo | 12 | 31,881 | |||
EPS Corporation | 45 | 50,091 | |||
FamilyMart | 1,600 | 68,240 | |||
Hogy Medical | 350 | 20,009 | |||
Miraial | 2,500 | 39,222 | |||
Moshi Moshi Hotline | 5,600 | 69,901 | |||
Santen Pharmaceutical | 1,000 | 43,053 | |||
TOTO | 2,000 | 20,347 | |||
USS | 520 | 66,009 | |||
| Total (Cost $348,544) | 408,753 | ||||
| Jersey – 0.9% | |||||
Randgold Resources ADR | 1,100 | 70,455 | |||
| Total (Cost $88,315) | 70,455 | ||||
| Malaysia – 2.0% | |||||
CB Industrial Product Holding | 75,000 | 62,193 | |||
†Media Prima | 65,000 | 57,604 | |||
Padini Holdings | 65,000 | 38,883 | |||
| Total (Cost $128,321) | 158,680 | ||||
| Mexico – 1.9% | |||||
Bolsa Mexicana de Valores | 21,200 | 52,716 | |||
†Fresnillo | 5,000 | 67,074 | |||
Industrias Bachoco ADR | 800 | 27,760 | |||
| Total (Cost $144,306) | 147,550 | ||||
| Netherlands – 1.1% | |||||
Beter Bed Holding | 2,500 | 45,818 | |||
†Exact Holding | 1,200 | 25,562 | |||
Hunter Douglas | 500 | 19,980 | |||
| Total (Cost $90,532) | 91,360 | ||||
| Norway – 1.9% | |||||
Ekornes | 4,200 | 67,069 | |||
†Oslo Bors VPS Holding | 5,000 | 41,156 | |||
TGS-NOPEC Geophysical | 1,500 | 43,585 | |||
| Total (Cost $170,358) | 151,810 | ||||
| THE ACCOMPANYING NOTES ARE AN INTEGRAL PART OF THESE FINANCIAL STATEMENTS. | The Royce Funds 2013 Semiannual Report to Shareholders | 63 |
Schedules of Investments
| Royce Global Dividend Value Fund (continued) |
| SHARES | VALUE | ||||
| Poland – 0.4% | |||||
Warsaw Stock Exchange | 3,000 | $ | 34,364 | ||
| Total (Cost $44,626) | 34,364 | ||||
| Singapore – 1.7% | |||||
ARA Asset Management | 39,050 | 53,607 | |||
ComfortDelGro Corporation | 40,000 | 57,909 | |||
†CSE Global | 40,000 | 26,825 | |||
| Total (Cost $119,973) | 138,341 | ||||
| South Africa – 6.4% | |||||
Adcock Ingram Holdings | 9,800 | 64,441 | |||
ADvTECH | 51,000 | 36,115 | |||
†AVI | 6,400 | 38,491 | |||
†Cashbuild | 2,400 | 32,291 | |||
Coronation Fund Managers | 9,200 | 58,401 | |||
†Gold Fields ADR | 12,200 | 64,050 | |||
JSE | 6,000 | 43,095 | |||
Lewis Group | 12,500 | 79,666 | |||
Raubex Group | 39,500 | 87,111 | |||
| Total (Cost $556,354) | 503,661 | ||||
| South Korea – 1.0% | |||||
GS Home Shopping | 155 | 32,098 | |||
MegaStudy | 910 | 49,163 | |||
| Total (Cost $116,943) | 81,261 | ||||
| Switzerland – 8.0% | |||||
Belimo Holding | 15 | 33,460 | |||
Burckhardt Compression Holding | 100 | 39,807 | |||
†Forbo Holding | 70 | 44,651 | |||
†Garmin | 2,200 | 79,552 | |||
Kaba Holding | 150 | 56,257 | |||
LEM Holding | 60 | 38,621 | |||
Partners Group Holding | 190 | 51,445 | |||
Sika | 23 | 59,561 | |||
Straumann Holding | 350 | 52,543 | |||
Sulzer | 350 | 55,990 | |||
VZ Holding | 500 | 69,875 | |||
Zehnder Group | 1,100 | 49,029 | |||
| Total (Cost $569,056) | 630,791 | ||||
| Turkey – 0.6% | |||||
Mardin Cimento Sanayii | 22,500 | 51,330 | |||
| Total (Cost $83,722) | 51,330 | ||||
| United Arab Emirates – 0.8% | |||||
†Aramex | 92,000 | 61,367 | |||
| Total (Cost $57,210) | 61,367 | ||||
| United Kingdom – 10.7% | |||||
Ashmore Group | 10,800 | 56,457 | |||
†Aveva Group | 1,400 | 47,995 | |||
Clarkson | 2,100 | 54,330 | |||
Close Brothers Group | 1,200 | 17,914 | |||
†Consort Medical | 3,000 | 37,986 | |||
De La Rue | 2,700 | 39,690 | |||
Diploma | 3,500 | 29,837 | |||
Domino Printing Sciences | 7,800 | 74,028 | |||
†Fidessa Group | 1,800 | 52,783 | |||
†Homeserve | 15,000 | 63,880 | |||
Investec | 5,000 | 31,461 | |||
Jupiter Fund Management | 15,000 | 66,093 | |||
†Lancashire Holdings | 5,000 | 60,230 | |||
Latchways | 1,500 | 27,320 | |||
Michael Page International | 3,500 | 19,749 | |||
†Photo-Me International | 50,000 | 66,732 | |||
Rathbone Brothers | 700 | 16,821 | |||
RIT Capital Partners | 1,000 | 17,643 | |||
Spirax-Sarco Engineering | 950 | 38,824 | |||
†Victrex | 1,000 | 23,483 | |||
| Total (Cost $783,984) | 843,256 | ||||
| United States – 10.9% | |||||
Apollo Global Management LLC Cl. A | 3,200 | 77,120 | |||
†Cabot Corporation | 1,000 | 37,420 | |||
†CIRCOR International | 1,200 | 61,032 | |||
Compass Minerals International | 400 | 33,812 | |||
Expeditors International of | |||||
Washington | 2,000 | 76,020 | |||
FLIR Systems | 1,650 | 44,501 | |||
†Gentex Corporation | 2,300 | 53,015 | |||
Greif Cl. A | 900 | 47,403 | |||
Harman International Industries | 800 | 43,360 | |||
Invesco | 1,900 | 60,420 | |||
†Kennametal | 1,600 | 62,128 | |||
ManpowerGroup | 600 | 32,880 | |||
†National Instruments | 2,000 | 55,880 | |||
†New Mountain Finance | 2,700 | 38,232 | |||
Tidewater | 1,200 | 68,364 | |||
WaterFurnace Renewable Energy | 3,600 | 70,343 | |||
| Total (Cost $755,261) | 861,930 | ||||
| TOTAL COMMON STOCKS | |||||
(Cost $7,497,440) | 7,449,870 | ||||
| REPURCHASE AGREEMENT – 7.9% | |||||
| Fixed Income Clearing Corporation, | |||||
0.01% dated 6/28/13, due 7/1/13, | 627,000 | ||||
| 64 | The Royce Funds 2013 Semiannual Report to Shareholders | THE ACCOMPANYING NOTES ARE AN INTEGRAL PART OF THESE FINANCIAL STATEMENTS. |
June 30, 2013 (unaudited) |
| VALUE | ||||||
| TOTAL INVESTMENTS – 102.2% | ||||||
(Cost $8,124,440) | $ | 8,076,870 | ||||
| LIABILITIES LESS CASH | ||||||
AND OTHER ASSETS – (2.2)% | (173,639 | ) | ||||
| NET ASSETS – 100.0% | $ | 7,903,231 | ||||
| Royce International Micro-Cap Fund |
| SHARES | VALUE | ||||
| COMMON STOCKS – 96.3% | |||||
| Australia – 2.6% | |||||
Evolution Mining 1 | 40,000 | $ | 20,851 | ||
Imdex | 45,000 | 25,516 | |||
TFS Corporation 1 | 90,000 | 41,978 | |||
Troy Resources | 12,500 | 17,491 | |||
| Total (Cost $235,960) | 105,836 | ||||
| Austria – 1.5% | |||||
Semperit AG Holding | 1,700 | 61,074 | |||
| Total (Cost $61,718) | 61,074 | ||||
| Belgium – 0.9% | |||||
EVS Broadcast Equipment | 500 | 34,715 | |||
| Total (Cost $21,744) | 34,715 | ||||
| Bermuda – 0.7% | |||||
Northern Offshore | 20,000 | 28,053 | |||
| Total (Cost $39,962) | 28,053 | ||||
| Brazil – 2.3% | |||||
Brasil Brokers Participacoes | 17,500 | 51,370 | |||
Eternit | 10,000 | 42,351 | |||
| Total (Cost $109,349) | 93,721 | ||||
| Canada – 1.6% | |||||
Major Drilling Group International | 3,500 | 23,828 | |||
Total Energy Services | 3,000 | 41,504 | |||
| Total (Cost $71,153) | 65,332 | ||||
| China – 0.9% | |||||
Pacific Online | 80,000 | 35,172 | |||
Qunxing Paper Holdings 4 | 41,000 | 529 | |||
| Total (Cost $39,284) | 35,701 | ||||
| Denmark – 0.7% | |||||
SimCorp | 1,000 | 29,668 | |||
| Total (Cost $15,920) | 29,668 | ||||
| Finland – 1.4% | |||||
†F-Secure | 9,000 | 24,835 | |||
Ponsse | 4,500 | 33,622 | |||
| Total (Cost $66,076) | 58,457 | ||||
| France – 10.7% | |||||
Altamir | 3,500 | 39,408 | |||
Audika Groupe 1 | 4,000 | 40,455 | |||
Boiron | 600 | 31,240 | |||
Manutan International | 1,600 | 68,519 | |||
Neurones | 4,000 | 46,703 | |||
Parrot 1 | 1,700 | 47,310 | |||
Societe Internationale de Plantations | |||||
d’Heveas | 700 | 49,321 | |||
| THE ACCOMPANYING NOTES ARE AN INTEGRAL PART OF THESE FINANCIAL STATEMENTS. | The Royce Funds 2013 Semiannual Report to Shareholders | 65 |
Schedules of Investments
| Royce International Micro-Cap Fund (continued) |
| SHARES | VALUE | ||||
| France (continued) | |||||
Stallergenes | 815 | $ | 57,232 | ||
Vetoquinol | 1,500 | 51,057 | |||
| Total (Cost $452,324) | 431,245 | ||||
| Germany – 4.6% | |||||
Bertrandt | 200 | 21,483 | |||
Deutsche Beteiligungs | 1,000 | 24,081 | |||
LPKF Laser & Electronics | 1,000 | 15,529 | |||
Mobotix | 700 | 13,940 | |||
Nemetschek | 300 | 19,329 | |||
†RIB Software | 6,500 | 33,970 | |||
SMT Scharf | 1,400 | 42,970 | |||
Takkt | 1,000 | 15,099 | |||
| Total (Cost $166,847) | 186,401 | ||||
| Hong Kong – 9.7% | |||||
Arts Optical International Holdings | 170,000 | 35,069 | |||
Dickson Concepts (International) | 60,000 | 33,651 | |||
Embry Holdings | 35,000 | 20,803 | |||
Goldlion Holdings | 100,000 | 48,221 | |||
†I.T | 75,000 | 26,882 | |||
Le Saunda Holdings | 90,000 | 33,071 | |||
Lung Kee (Bermuda) Holdings | 100,000 | 38,679 | |||
Midland Holdings | 100,000 | 37,390 | |||
Oriental Watch Holdings | 65,000 | 21,203 | |||
Pico Far East Holdings | 100,000 | 34,167 | |||
Tse Sui Luen Jewellery (International) | 61,000 | 27,999 | |||
Win Hanverky Holdings | 350,000 | 34,296 | |||
| Total (Cost $467,052) | 391,431 | ||||
| India – 6.0% | |||||
AIA Engineering | 7,500 | 43,037 | |||
FAG Bearings India | 2,000 | 47,770 | |||
Graphite India | 40,000 | 49,474 | |||
Maharashtra Seamless | 13,416 | 46,281 | |||
†McLeod Russel India | 7,000 | 34,149 | |||
†Solar Industries India | 1,500 | 23,652 | |||
| Total (Cost $295,414) | 244,363 | ||||
| Indonesia – 0.9% | |||||
Selamat Sempurna | 130,000 | 34,710 | |||
| Total (Cost $21,234) | 34,710 | ||||
| Isle of Man – 0.5% | |||||
Geodrill 1 | 27,500 | 18,565 | |||
| Total (Cost $59,209) | 18,565 | ||||
| Italy – 2.9% | |||||
Geox | 9,000 | 22,422 | |||
Interpump Group | 2,500 | 22,291 | |||
Nice | 10,000 | 31,396 | |||
Piquadro | 22,500 | 40,709 | |||
| Total (Cost $151,426) | 116,818 | ||||
| Japan – 8.3% | |||||
Asahi Company | 3,000 | 44,102 | |||
BML | 1,500 | 38,052 | |||
C. Uyemura & Co. | 1,200 | 49,546 | |||
EPS Corporation | 46 | 51,204 | |||
Gurunavi | 1,200 | 12,111 | |||
Hogy Medical | 300 | 17,151 | |||
Mandom Corporation | 740 | 24,622 | |||
Milbon | 750 | 26,467 | |||
Miraial | 1,500 | 23,533 | |||
Moshi Moshi Hotline | 1,700 | 21,220 | |||
Nihon M&A Center | 500 | 27,878 | |||
| Total (Cost $324,875) | 335,886 | ||||
| Malaysia – 4.4% | |||||
CB Industrial Product Holding | 75,000 | 62,193 | |||
Coastal Contracts | 55,000 | 37,601 | |||
Kossan Rubber Industries | 20,000 | 31,587 | |||
Padini Holdings | 75,000 | 44,865 | |||
| Total (Cost $140,979) | 176,246 | ||||
| Mexico – 0.5% | |||||
Medica Sur Ser. B | 8,500 | 20,336 | |||
| Total (Cost $15,744) | 20,336 | ||||
| Netherlands – 1.8% | |||||
Beter Bed Holding | 3,200 | 58,647 | |||
†Exact Holding | 700 | 14,911 | |||
| Total (Cost $74,243) | 73,558 | ||||
| Norway – 2.9% | |||||
Ekornes | 3,500 | 55,891 | |||
| 30,000 | 16,545 | ||||
†Spectrum | 5,500 | 43,823 | |||
| Total (Cost $124,493) | 116,259 | ||||
| Poland – 2.3% | |||||
Elektrobudowa | 1,200 | 51,500 | |||
Warsaw Stock Exchange | 3,500 | 40,091 | |||
| Total (Cost $101,350) | 91,591 | ||||
| Singapore – 1.1% | |||||
CSE Global | 25,000 | 16,765 | |||
Hour Glass (The) | 20,000 | 27,535 | |||
| Total (Cost $47,343) | 44,300 | ||||
| South Africa – 4.2% | |||||
†Cashbuild | 1,500 | 20,182 | |||
†Holdsport | 2,800 | 12,404 | |||
†Lewis Group | 7,500 | 47,799 | |||
| 66 | The Royce Funds 2013 Semiannual Report to Shareholders | THE ACCOMPANYING NOTES ARE AN INTEGRAL PART OF THESE FINANCIAL STATEMENTS. |
June 30, 2013 (unaudited) |
| SHARES | VALUE | ||||
| South Africa (continued) | |||||
Merafe Resources 1 | 300,000 | $ | 21,548 | ||
†MiX Telematics | 70,000 | 24,785 | |||
Raubex Group | 20,000 | 44,107 | |||
| Total (Cost $223,734) | 170,825 | ||||
| South Korea – 2.4% | |||||
GS Home Shopping | 90 | 18,638 | |||
Handsome Co. | 1,200 | 30,524 | |||
MegaStudy | 900 | 48,623 | |||
| Total (Cost $102,062) | 97,785 | ||||
| Spain – 0.6% | |||||
Clinica Baviera | 3,500 | 25,011 | |||
| Total (Cost $32,443) | 25,011 | ||||
| Sri Lanka – 0.5% | |||||
Distilleries Company of Sri Lanka | 12,500 | 18,501 | |||
| Total (Cost $13,750) | 18,501 | ||||
| Sweden – 0.5% | |||||
Bjoern Borg | 5,000 | 21,995 | |||
| Total (Cost $39,378) | 21,995 | ||||
| Switzerland – 4.1% | |||||
Calida Holding | 1,500 | 36,843 | |||
Inficon Holding | 65 | 19,285 | |||
LEM Holding | 40 | 25,748 | |||
VZ Holding | 300 | 41,925 | |||
Zehnder Group | 900 | 40,114 | |||
| Total (Cost $149,732) | 163,915 | ||||
| Taiwan – 1.5% | |||||
Makalot Industrial | 12,500 | 59,641 | |||
| Total (Cost $36,417) | 59,641 | ||||
| Turkey – 0.8% | |||||
Mardin Cimento Sanayii | 15,000 | 34,220 | |||
| Total (Cost $53,878) | 34,220 | ||||
| United Arab Emirates – 0.9% | |||||
Aramex | 52,000 | 34,686 | |||
| Total (Cost $25,530) | 34,686 | ||||
| United Kingdom – 9.6% | |||||
Clarkson | 2,000 | 51,743 | |||
Clinigen Group | 7,500 | 34,221 | |||
†Consort Medical | 3,300 | 41,784 | |||
Diploma | 2,500 | 21,312 | |||
†E2V Technologies | 15,200 | 27,453 | |||
Immunodiagnostic Systems Holdings | 6,000 | 41,522 | |||
Latchways | 3,500 | 63,747 | |||
†Luxfer Holdings ADR | 1,500 | 23,775 | |||
†Photo-Me International | 22,000 | 29,362 | |||
†Sepura | 18,000 | 33,537 | |||
†Veripos | 7,000 | 21,204 | |||
| Total (Cost $336,920) | 389,660 | ||||
| United States – 2.0% | |||||
Century Casinos 1 | 12,000 | 41,520 | |||
WaterFurnace Renewable Energy | 2,000 | 39,080 | |||
| Total (Cost $82,721) | 80,600 | ||||
| TOTAL COMMON STOCKS | |||||
(Cost $4,200,264) | 3,891,105 | ||||
| REPURCHASE AGREEMENT – 3.4% | |||||
| Fixed Income Clearing Corporation, | |||||
0.01% dated 6/28/13, due 7/1/13, | 137,000 | ||||
| TOTAL INVESTMENTS – 99.7% | |||||
(Cost $4,337,264) | 4,028,105 | ||||
| CASH AND OTHER ASSETS | |||||
LESS LIABILITIES – 0.3% | 12,598 | ||||
| NET ASSETS – 100.0% | $ | 4,040,703 | |||
| THE ACCOMPANYING NOTES ARE AN INTEGRAL PART OF THESE FINANCIAL STATEMENTS. | The Royce Funds 2013 Semiannual Report to Shareholders | 67 |
Schedules of Investments
| Royce International Premier Fund |
| SHARES | VALUE | ||||
| COMMON STOCKS – 99.3% | |||||
| Austria – 5.3% | |||||
Mayr-Melnhof Karton | 1,850 | $ | 198,905 | ||
Semperit AG Holding | 4,700 | 168,850 | |||
| Total (Cost $410,931) | 367,755 | ||||
| Belgium – 2.0% | |||||
EVS Broadcast Equipment | 2,000 | 138,860 | |||
| Total (Cost $118,028) | 138,860 | ||||
| Bermuda – 2.4% | |||||
†Signet Jewelers | 2,500 | 168,575 | |||
| Total (Cost $172,979) | 168,575 | ||||
| Brazil – 0.9% | |||||
†Totvs | 4,000 | 62,724 | |||
| Total (Cost $68,843) | 62,724 | ||||
| China – 2.9% | |||||
Daphne International Holdings | 240,000 | 205,156 | |||
| Total (Cost $255,045) | 205,156 | ||||
| Finland – 2.0% | |||||
Nokian Renkaat | 3,500 | 142,641 | |||
| Total (Cost $148,959) | 142,641 | ||||
| France – 8.8% | |||||
bioMerieux | 1,400 | 135,652 | |||
Stallergenes | 2,895 | 203,299 | |||
Vetoquinol | 4,405 | 149,938 | |||
Virbac | 600 | 124,177 | |||
| Total (Cost $545,554) | 613,066 | ||||
| Germany – 7.1% | |||||
Carl Zeiss Meditec | 4,000 | 132,768 | |||
Fielmann | 900 | 94,070 | |||
Fuchs Petrolub | 1,400 | 95,052 | |||
KWS Saat | 300 | 108,538 | |||
Rational | 200 | 67,048 | |||
| Total (Cost $376,873) | 497,476 | ||||
| Hong Kong – 4.7% | |||||
Media Chinese International | 400,000 | 145,592 | |||
Stella International Holdings | 65,000 | 179,763 | |||
| Total (Cost $334,321) | 325,355 | ||||
| Italy – 4.7% | |||||
DiaSorin | 4,100 | 163,679 | |||
Recordati | 14,700 | 163,119 | |||
| Total (Cost $262,951) | 326,798 | ||||
| Japan – 10.8% | |||||
FamilyMart | 4,000 | 170,599 | |||
Kakaku.com | 2,500 | 76,250 | |||
M3 | 50 | 112,321 | |||
MISUMI Group | 4,500 | 123,730 | |||
Santen Pharmaceutical | 4,000 | 172,212 | |||
USS | 800 | 101,553 | |||
| Total (Cost $617,492) | 756,665 | ||||
| Malaysia – 2.3% | |||||
Media Prima | 185,000 | 163,950 | |||
| Total (Cost $135,652) | 163,950 | ||||
| Norway – 2.1% | |||||
Ekornes | 9,000 | 143,719 | |||
| Total (Cost $173,376) | 143,719 | ||||
| South Africa – 2.7% | |||||
Lewis Group | 30,000 | 191,198 | |||
| Total (Cost $244,649) | 191,198 | ||||
| South Korea – 3.8% | |||||
Green Cross | 1,155 | 123,889 | |||
MegaStudy | 2,600 | 140,467 | |||
| Total (Cost $377,262) | 264,356 | ||||
| Switzerland – 17.3% | |||||
Belimo Holding | 60 | 133,842 | |||
Burckhardt Compression Holding | 300 | 119,422 | |||
†Forbo Holding | 270 | 172,225 | |||
Geberit | 300 | 74,416 | |||
Kaba Holding | 500 | 187,523 | |||
LEM Holding | 200 | 128,738 | |||
Partners Group Holding | 400 | 108,306 | |||
Straumann Holding | 1,050 | 157,631 | |||
VZ Holding | 900 | 125,774 | |||
| Total (Cost $1,040,847) | 1,207,877 | ||||
| United Kingdom – 19.5% | |||||
Abcam | 17,500 | 120,706 | |||
Ashmore Group | 32,500 | 169,894 | |||
Aveva Group | 3,000 | 102,847 | |||
†Consort Medical | 11,000 | 139,281 | |||
Domino Printing Sciences | 18,500 | 175,579 | |||
†Lancashire Holdings | 8,000 | 96,367 | |||
†Latchways | 8,500 | 154,814 | |||
Oxford Instruments | 5,000 | 91,941 | |||
Rotork | 3,000 | 121,828 | |||
Spirax-Sarco Engineering | 2,407 | 98,369 | |||
Victrex | 4,000 | 93,934 | |||
| Total (Cost $1,273,695) | 1,365,560 | ||||
| 68 | The Royce Funds 2013 Semiannual Report to Shareholders | THE ACCOMPANYING NOTES ARE AN INTEGRAL PART OF THESE FINANCIAL STATEMENTS. |
June 30, 2013 (unaudited) |
| VALUE | |||||
| TOTAL COMMON STOCKS | |||||
(Cost $6,557,457) | $ | 6,941,731 | |||
| TOTAL INVESTMENTS – 99.3% | |||||
(Cost $6,557,457) | 6,941,731 | ||||
| CASH AND OTHER ASSETS | |||||
LESS LIABILITIES – 0.7% | 48,511 | ||||
| NET ASSETS – 100.0% | $ | 6,990,242 | |||
| Royce Special Equity Multi-Cap Fund |
| SHARES | VALUE | ||||
| COMMON STOCKS – 96.4% | |||||
| Consumer Discretionary – 24.0% | |||||
| Distributors - 3.4% | |||||
Genuine Parts | 69,075 | $ | 5,392,685 | ||
| Media - 1.6% | |||||
Scripps Networks Interactive Cl. A | 37,900 | 2,530,204 | |||
| Multiline Retail - 4.3% | |||||
Nordstrom | 116,000 | 6,953,040 | |||
| Specialty Retail - 14.7% | |||||
Bed Bath & Beyond 1 | 114,500 | 8,118,050 | |||
Gap (The) | 190,600 | 7,953,738 | |||
Staples | 461,000 | 7,311,460 | |||
| 23,383,248 | |||||
| Total (Cost $30,945,708) | 38,259,177 | ||||
| Consumer Staples – 1.7% | |||||
| Food & Staples Retailing - 1.2% | |||||
Walgreen Company | 45,000 | 1,989,000 | |||
| Food Products - 0.5% | |||||
Hormel Foods | 20,500 | 790,890 | |||
| Total (Cost $2,105,092) | 2,779,890 | ||||
| Energy – 4.3% | |||||
| Oil, Gas & Consumable Fuels - 4.3% | |||||
Occidental Petroleum | 76,750 | 6,848,403 | |||
| Total (Cost $6,706,836) | 6,848,403 | ||||
| Financials – 0.8% | |||||
| Capital Markets - 0.8% | |||||
†Franklin Resources | 9,500 | 1,292,190 | |||
| Total (Cost $1,307,336) | 1,292,190 | ||||
| Health Care – 14.7% | |||||
| Health Care Equipment & Supplies - 9.1% | |||||
C.R. Bard | 45,000 | 4,890,600 | |||
Medtronic | 80,000 | 4,117,600 | |||
Stryker Corporation | 84,500 | 5,465,460 | |||
| 14,473,660 | |||||
| Health Care Providers & Services - 3.7% | |||||
Quest Diagnostics | 97,500 | 5,911,425 | |||
| Pharmaceuticals - 1.9% | |||||
Johnson & Johnson | 35,000 | 3,005,100 | |||
| Total (Cost $20,052,390) | 23,390,185 | ||||
| Industrials – 23.8% | |||||
| Aerospace & Defense - 3.2% | |||||
Raytheon Company | 77,000 | 5,091,240 | |||
| Electrical Equipment - 4.8% | |||||
Emerson Electric | 139,000 | 7,581,060 | |||
| Industrial Conglomerates - 2.7% | |||||
3M | 39,150 | 4,281,052 | |||
| Machinery - 13.1% | |||||
Cummins | 36,350 | 3,942,521 | |||
Dover Corporation | 82,800 | 6,430,248 | |||
| THE ACCOMPANYING NOTES ARE AN INTEGRAL PART OF THESE FINANCIAL STATEMENTS. | The Royce Funds 2013 Semiannual Report to Shareholders | 69 |
| Schedules of Investments | June 30, 2013 (unaudited) |
| Royce Special Equity Multi-Cap Fund (continued) |
| SHARES | VALUE | |||||
| Industrials (continued) | ||||||
| Machinery (continued) | ||||||
Illinois Tool Works | 66,675 | $ | 4,611,910 | |||
Parker Hannifin | 61,500 | 5,867,100 | ||||
| 20,851,779 | ||||||
| Total (Cost $32,954,825) | 37,805,131 | |||||
| Information Technology – 27.1% | ||||||
| Communications Equipment - 4.3% | ||||||
Cisco Systems | 280,000 | 6,806,800 | ||||
| Electronic Equipment, Instruments & Components - 7.4% | ||||||
Avnet 1 | 122,400 | 4,112,640 | ||||
Molex Cl. A | 311,000 | 7,731,460 | ||||
| 11,844,100 | ||||||
| Semiconductors & Semiconductor Equipment - 10.9% | ||||||
Analog Devices | 119,050 | 5,364,393 | ||||
Intel Corporation | 249,000 | 6,030,780 | ||||
KLA-Tencor | 106,500 | 5,935,245 | ||||
| 17,330,418 | ||||||
| Software - 4.5% | ||||||
Microsoft Corporation | 207,000 | 7,147,710 | ||||
| Total (Cost $38,368,423) | 43,129,028 | |||||
| TOTAL COMMON STOCKS | ||||||
(Cost $132,440,610) | 153,504,004 | |||||
| VALUE | ||||||
| REPURCHASE AGREEMENT – 4.2% | ||||||
| Fixed Income Clearing Corporation, | ||||||
0.01% dated 6/28/13, due 7/1/13, | $ | 6,610,000 | ||||
| TOTAL INVESTMENTS – 100.6% | ||||||
(Cost $139,050,610) | 160,114,004 | |||||
| LIABILITIES LESS CASH | ||||||
AND OTHER ASSETS – (0.6)% | (934,833 | ) | ||||
| NET ASSETS – 100.0% | $ | 159,179,171 | ||||
| 70 | The Royce Funds 2013 Semiannual Report to Shareholders | THE ACCOMPANYING NOTES ARE AN INTEGRAL PART OF THESE FINANCIAL STATEMENTS. |
| Statements of Assets and Liabilities | June 30, 2013 (unaudited) |
| Royce | Royce Micro-Cap | Royce | Royce | ||||||||||||||||
| Select | Discovery | Financial | Select | ||||||||||||||||
| Fund I | Fund | Services Fund | Fund II | ||||||||||||||||
ASSETS: | |||||||||||||||||||
Investments at value | $ | 40,905,950 | $ | 4,971,433 | $ | 23,103,015 | $ | 3,949,241 | |||||||||||
Repurchase agreements (at cost and value) | 2,801,000 | 170,000 | 5,045,000 | 628,000 | |||||||||||||||
Cash and foreign currency | 625 | 594 | 83 | 2,131 | |||||||||||||||
Receivable for investments sold | 486,980 | – | – | – | |||||||||||||||
Receivable for capital shares sold | 50 | 21,699 | 384,433 | 50 | |||||||||||||||
Receivable for dividends and interest | 11,049 | 2,646 | 20,884 | 2,313 | |||||||||||||||
Prepaid expenses and other assets | 372 | 24 | 81 | – | |||||||||||||||
Total Assets | 44,206,026 | 5,166,396 | 28,553,496 | 4,581,735 | |||||||||||||||
LIABILITIES: | |||||||||||||||||||
Securities sold short, at fair value | – | – | – | 144,704 | |||||||||||||||
Payable for investments purchased | 557,692 | – | 926,506 | – | |||||||||||||||
Payable for capital shares redeemed | – | – | 76,633 | – | |||||||||||||||
Payable for investment advisory fees | 36,445 | – | 13,150 | – | |||||||||||||||
Payable to brokers for securities sold short | – | – | – | 45,805 | |||||||||||||||
Accrued expenses | 16,703 | 15,311 | 20,511 | – | |||||||||||||||
Total Liabilities | 610,840 | 15,311 | 1,036,800 | 190,509 | |||||||||||||||
Net Assets | $ | 43,595,186 | $ | 5,151,085 | $ | 27,516,696 | $ | 4,391,226 | |||||||||||
ANALYSIS OF NET ASSETS: | |||||||||||||||||||
Paid-in capital | $ | 32,843,453 | $ | 4,832,541 | $ | 23,264,580 | $ | 3,873,233 | |||||||||||
Undistributed net investment income (loss) | (86,899 | ) | (15,580 | ) | 164,289 | 28,038 | |||||||||||||
Accumulated net realized gain (loss) on investments and foreign currency | 3,566,542 | (186,883 | ) | (952,196) | 220,926 | ||||||||||||||
Net unrealized appreciation (depreciation) on investments and foreign currency | 7,272,090 | 521,007 | 5,040,023 | 269,029 | |||||||||||||||
Net Assets | $ | 43,595,186 | $ | 5,151,085 | $ | 27,516,696 | $ | 4,391,226 | |||||||||||
Investment Class | $ | 43,595,186 | $ | 4,391,226 | |||||||||||||||
Service Class | $ | 5,151,085 | $ | 27,516,696 | |||||||||||||||
SHARES OUTSTANDING (unlimited number of $.001 par value): | |||||||||||||||||||
Investment Class | 2,347,885 | 386,439 | |||||||||||||||||
Service Class | 876,924 | 3,386,730 | |||||||||||||||||
NET ASSET VALUES (Net Assets ÷ Shares Outstanding): | |||||||||||||||||||
Investment Class1 | $18.57 | $11.36 | |||||||||||||||||
Service Class2 | $5.87 | $8.12 | |||||||||||||||||
Investments at identified cost | $ | 33,633,938 | $ | 4,450,427 | $ | 18,062,860 | $ | 3,694,217 | |||||||||||
Proceeds of short sales | – | – | – | 158,711 | |||||||||||||||
Aggregate value of segregated securities | – | – | – | 854,400 | |||||||||||||||
| 1 | Offering and redemption price per share; shares held less than 180 days may be subject to a 1% redemption fee for Royce Select Fund I, or a 2% redemption fee for Royce Select Fund II, payable to the Fund. From January 1-17, 2013, shares held less than 365 days may have been subject to a 2% redemption fee, payable to the Fund. From January 18 - April 30, 2013, shares held less than 180 days may have been subject to a 1% redemption fee, payable to the Fund. |
| 2 | Offering and redemption price per share; shares held less than 180 days may be subject to a 1% redemption fee, payable to the Fund. |
| THE ACCOMPANYING NOTES ARE AN INTEGRAL PART OF THESE FINANCIAL STATEMENTS. | The Royce Funds 2013 Semiannual Report to Shareholders | 71 |
| Statements of Assets and Liabilities |
| Royce | Royce | Royce | Royce | |||||||||||||||||
| Global Select | European Smaller- | Enterprise Select | SMid-Cap | |||||||||||||||||
| Long/Short Fund | Companies Fund | Fund | Value Fund | |||||||||||||||||
ASSETS: | ||||||||||||||||||||
Investments at value | $ | 12,458,609 | $ | 17,838,664 | $ | 1,508,155 | $ | 9,289,331 | ||||||||||||
Repurchase agreements (at cost and value) | 315,000 | 257,000 | 516,000 | 1,338,000 | ||||||||||||||||
Cash and foreign currency | 15,567 | 127,988 | 1,347 | 4,606 | ||||||||||||||||
Receivable for investments sold | 98,144 | 472,563 | – | – | ||||||||||||||||
Receivable for capital shares sold | 50 | 6,750 | – | 7,297 | ||||||||||||||||
Receivable for dividends and interest | 32,067 | 52,296 | 866 | 13,255 | ||||||||||||||||
Prepaid expenses and other assets | – | 61 | 8 | 63 | ||||||||||||||||
Total Assets | 12,919,437 | 18,755,322 | 2,026,376 | 10,652,552 | ||||||||||||||||
LIABILITIES: | ||||||||||||||||||||
Securities sold short, at fair value | 2,174,493 | – | – | – | ||||||||||||||||
Payable for investments purchased | – | 105,519 | 23,795 | – | ||||||||||||||||
Payable for capital shares redeemed | – | 54,025 | – | 9,220 | ||||||||||||||||
Payable for dividends and interest | 7,364 | – | – | – | ||||||||||||||||
Payable for investment advisory fees | – | 8,975 | – | – | ||||||||||||||||
Payable to brokers for securities sold short | 101,857 | – | – | – | ||||||||||||||||
Accrued expenses | – | 18,004 | 7,328 | 18,378 | ||||||||||||||||
Total Liabilities | 2,283,714 | 186,523 | 31,123 | 27,598 | ||||||||||||||||
Net Assets | $ | 10,635,723 | $ | 18,568,799 | $ | 1,995,253 | $ | 10,624,954 | ||||||||||||
ANALYSIS OF NET ASSETS: | ||||||||||||||||||||
Paid-in capital | $ | 12,609,142 | $ | 20,243,843 | $ | 1,734,420 | $ | 15,795,126 | ||||||||||||
Undistributed net investment income (loss) | 248,585 | 110,791 | (1,617) | 7,672 | ||||||||||||||||
Accumulated net realized gain (loss) on investments and foreign currency | (1,000,253 | ) | (2,053,163 | ) | 125,327 | (5,750,591 | ) | |||||||||||||
Net unrealized appreciation (depreciation) on investments and foreign currency | (1,221,751 | ) | 267,328 | 137,123 | 572,747 | |||||||||||||||
Net Assets | $ | 10,635,723 | $ | 18,568,799 | $ | 1,995,253 | $ | 10,624,954 | ||||||||||||
Investment Class | $ | 10,635,723 | $ | 1,995,253 | ||||||||||||||||
Service Class | $ | 18,568,799 | $ | 10,624,954 | ||||||||||||||||
SHARES OUTSTANDING (unlimited number of $.001 par value): | ||||||||||||||||||||
Investment Class | 687,231 | 172,808 | ||||||||||||||||||
Service Class | 1,749,701 | 869,282 | ||||||||||||||||||
NET ASSET VALUES (Net Assets ÷ Shares Outstanding): | ||||||||||||||||||||
Investment Class1 | $15.48 | $11.55 | ||||||||||||||||||
Service Class2 | $10.61 | $12.22 | ||||||||||||||||||
Investments at identified cost | $ | 13,421,915 | $ | 17,567,905 | $ | 1,371,032 | $ | 8,716,367 | ||||||||||||
Proceeds of short sales | 1,916,909 | – | – | – | ||||||||||||||||
Aggregate value of segregated securities | 9,601,405 | – | – | – | ||||||||||||||||
| 1 | Offering and redemption price per share; shares held less than 180 days may be subject to a 2% redemption fee for Royce Global Select Long/Short Fund, or a 1% redemption fee for Royce Enterprise Select Fund, payable to the Fund. From January 1-17, 2013, shares held less than 365 days may have been subject to a 2% redemption fee, payable to the Fund. From January 18 - April 30, 2013, shares held less than 180 days may have been subject to a 1% redemption fee, payable to the Fund. |
| 2 | Offering and redemption price per share; shares held less than 180 days may be subject to a 2% redemption fee (Royce European Smaller-Companies Fund), or a 1% redemption fee (Royce SMid-Cap Value Fund), payable to the Fund. |
| 72 | The Royce Funds 2013 Semiannual Report to Shareholders | THE ACCOMPANYING NOTES ARE AN INTEGRAL PART OF THESE FINANCIAL STATEMENTS. |
| June 30, 2013 (unaudited) |
| Royce | Royce | Royce | Royce | |||||||||||||||||
| Focus Value | Partners | Opportunity | Global Dividend | |||||||||||||||||
| Fund | Fund | Select Fund | Value Fund | |||||||||||||||||
ASSETS: | ||||||||||||||||||||
Investments at value | $ | 9,281,375 | $ | 2,250,405 | $ | 6,966,344 | $ | 7,449,870 | ||||||||||||
Repurchase agreements (at cost and value) | 1,033,000 | 161,000 | 269,000 | 627,000 | ||||||||||||||||
Deposits with brokers for securities sold short | – | – | 407,223 | – | ||||||||||||||||
Cash and foreign currency | 484 | 367 | 159 | 10,626 | ||||||||||||||||
Receivable for investments sold | 198,734 | – | 176,869 | – | ||||||||||||||||
Receivable for capital shares sold | 1,434 | 37 | – | – | ||||||||||||||||
Receivable for dividends and interest | 7,099 | 3,334 | 1,958 | 12,350 | ||||||||||||||||
Prepaid expenses and other assets | 47 | 11 | – | 46 | ||||||||||||||||
Total Assets | 10,522,173 | 2,415,154 | 7,821,553 | 8,099,892 | ||||||||||||||||
LIABILITIES: | ||||||||||||||||||||
Securities sold short, at fair value | – | – | 667,330 | – | ||||||||||||||||
Payable for investments purchased | 543,296 | – | 354,207 | 187,941 | ||||||||||||||||
Payable for capital shares redeemed | 40 | – | – | – | ||||||||||||||||
Payable for dividends and interest | – | – | 25 | – | ||||||||||||||||
Payable for investment advisory fees | 2,230 | – | 2,366 | – | ||||||||||||||||
Accrued expenses | 12,354 | 7,192 | 6,360 | 8,720 | ||||||||||||||||
Total Liabilities | 557,920 | 7,192 | 1,030,288 | 196,661 | ||||||||||||||||
Net Assets | $ | 9,964,253 | $ | 2,407,962 | $ | 6,791,265 | $ | 7,903,231 | ||||||||||||
ANALYSIS OF NET ASSETS: | ||||||||||||||||||||
Paid-in capital | $ | 8,655,144 | $ | 1,888,044 | $ | 5,706,204 | $ | 8,034,864 | ||||||||||||
Undistributed net investment income (loss) | (58,695 | ) | 13,870 | (20,681) | 35,850 | |||||||||||||||
Accumulated net realized gain (loss) on investments and foreign currency | (74,852 | ) | 118,746 | 349,163 | (120,053 | ) | ||||||||||||||
Net unrealized appreciation (depreciation) on investments and foreign currency | 1,442,656 | 387,302 | 756,579 | (47,430 | ) | |||||||||||||||
Net Assets | $ | 9,964,253 | $ | 2,407,962 | $ | 6,791,265 | $ | 7,903,231 | ||||||||||||
Investment Class | $ | 6,791,265 | ||||||||||||||||||
Service Class | $ | 9,964,253 | $ | 2,407,962 | $ | 7,903,231 | ||||||||||||||
SHARES OUTSTANDING (unlimited number of $.001 par value): | ||||||||||||||||||||
Investment Class | 449,700 | |||||||||||||||||||
Service Class | 647,622 | 178,358 | 772,136 | |||||||||||||||||
NET ASSET VALUES (Net Assets ÷ Shares Outstanding): | ||||||||||||||||||||
Investment Class1 | $15.10 | |||||||||||||||||||
Service Class2 | $15.39 | $13.50 | $10.24 | |||||||||||||||||
Investments at identified cost | $ | 7,838,691 | $ | 1,863,091 | $ | 6,156,619 | $ | 7,497,440 | ||||||||||||
Proceeds of short sales | – | – | 614,184 | – | ||||||||||||||||
Aggregate value of segregated securities | – | – | 765,191 | – | ||||||||||||||||
| 1 | Offering and redemption price per share; shares held less than 180 days may be subject to a 1% redemption fee, payable to the Fund. From January 1-17, 2013, shares held less than 365 days may have been subject to a 2% redemption fee, payable to the Fund. |
| 2 | Offering and redemption price per share; shares held less than 180 days may be subject to a 1% redemption fee, or a 2% redemption fee (Royce Global Dividend Value Fund), payable to the Fund. |
| THE ACCOMPANYING NOTES ARE AN INTEGRAL PART OF THESE FINANCIAL STATEMENTS. | The Royce Funds 2013 Semiannual Report to Shareholders | 73 |
| Statements of Assets and Liabilities | June 30, 2013 (unaudited) |
| Royce | Royce | Royce | |||||||||||||
| International | International | Special Equity | |||||||||||||
| Micro-Cap Fund | Premier Fund | Multi-Cap Fund | |||||||||||||
ASSETS: | |||||||||||||||
Investments at value | $ | 3,891,105 | $ | 6,941,731 | $ | 153,504,004 | |||||||||
Repurchase agreements (at cost and value) | 137,000 | – | 6,610,000 | ||||||||||||
Cash and foreign currency | 5,114 | 49,183 | 238 | ||||||||||||
Receivable for investments sold | 20,035 | 43,099 | 1,024,528 | ||||||||||||
Receivable for capital shares sold | 12,714 | – | 69,566 | ||||||||||||
Receivable for dividends and interest | 3,969 | 14,281 | 287,452 | ||||||||||||
Prepaid expenses and other assets | 22 | 25 | 830 | ||||||||||||
Total Assets | 4,069,959 | 7,048,319 | 161,496,618 | ||||||||||||
LIABILITIES: | |||||||||||||||
Payable for investments purchased | 16,837 | 45,657 | 2,188,363 | ||||||||||||
Payable for capital shares redeemed | – | – | 646 | ||||||||||||
Payable for investment advisory fees | – | 604 | 121,567 | ||||||||||||
Accrued expenses | 12,419 | 11,816 | 6,871 | ||||||||||||
Total Liabilities | 29,256 | 58,077 | 2,317,447 | ||||||||||||
Net Assets | $ | 4,040,703 | $ | 6,990,242 | $ | 159,179,171 | |||||||||
ANALYSIS OF NET ASSETS: | |||||||||||||||
Paid-in capital | $ | 5,321,897 | $ | 6,915,047 | $ | 133,570,913 | |||||||||
Undistributed net investment income (loss) | 24,085 | 33,797 | 641,961 | ||||||||||||
Accumulated net realized gain (loss) on investments and foreign currency | (995,918 | ) | (342,845) | 3,902,903 | |||||||||||
Net unrealized appreciation (depreciation) on investments and foreign currency | (309,361 | ) | 384,243 | 21,063,394 | |||||||||||
Net Assets | $ | 4,040,703 | $ | 6,990,242 | $ | 159,179,171 | |||||||||
Investment Class | $ | 50,209,188 | |||||||||||||
Service Class | $ | 4,040,703 | $ | 6,990,242 | 63,074,022 | ||||||||||
Institutional Class | 45,895,961 | ||||||||||||||
SHARES OUTSTANDING (unlimited number of $.001 par value): | |||||||||||||||
Investment Class | 3,656,067 | ||||||||||||||
Service Class | 471,343 | 667,742 | 4,583,251 | ||||||||||||
Institutional Class | 3,340,489 | ||||||||||||||
NET ASSET VALUES (Net Assets ÷ Shares Outstanding): | |||||||||||||||
Investment Class1 | $13.73 | ||||||||||||||
Service Class2 | $8.57 | $10.47 | 13.76 | ||||||||||||
Institutional Class3 | 13.74 | ||||||||||||||
Investments at identified cost | $ | 4,200,264 | $ | 6,557,457 | $ | 132,440,610 | |||||||||
| 1 | Offering and redemption price per share; shares held less than 180 days may be subject to a 1% redemption fee, payable to the Fund. |
| 2 | Offering and redemption price per share; shares held less than 180 days may be subject to a 2% redemption fee, or a 1% redemption fee (Royce Special Equity Multi-Cap Fund), payable to the Fund. |
| 3 | Offering and redemption price per share. |
| 74 | The Royce Funds 2013 Semiannual Report to Shareholders | THE ACCOMPANYING NOTES ARE AN INTEGRAL PART OF THESE FINANCIAL STATEMENTS. |
| Statements of Changes in Net Assets |
| Royce Micro-Cap | |||||||||||||||||||||||||||||||
| Royce Select Fund I | Discovery Fund | Royce Financial Services Fund | |||||||||||||||||||||||||||||
| Six months ended | Six months ended | Six months ended | |||||||||||||||||||||||||||||
| 6/30/13 | Year ended | 6/30/13 | Year ended | 6/30/13 | Year ended | ||||||||||||||||||||||||||
| (unaudited) | 12/31/12 | (unaudited) | 12/31/12 | (unaudited) | 12/31/12 | ||||||||||||||||||||||||||
INVESTMENT OPERATIONS: | |||||||||||||||||||||||||||||||
Net investment income (loss) | $ | (93,214 | ) | $ | 829,042 | $ | (15,580 | ) | $ | 34,721 | $ | 100,858 | $ | 241,534 | |||||||||||||||||
Net realized gain (loss) on investments and foreign currency | 3,566,873 | 3,357,629 | 241,141 | 583 | (141,324 | ) | 705,504 | ||||||||||||||||||||||||
Net change in unrealized appreciation (depreciation) on investments and foreign currency | (194,739 | ) | 2,098,657 | 337,078 | 125,030 | 3,460,537 | 1,868,205 | ||||||||||||||||||||||||
Net increase (decrease) in net assets from investment operations | 3,278,920 | 6,285,328 | 562,639 | 160,334 | 3,420,071 | 2,815,243 | |||||||||||||||||||||||||
DISTRIBUTIONS: | |||||||||||||||||||||||||||||||
Net investment income | |||||||||||||||||||||||||||||||
Investment Class | – | (805,821 | ) | ||||||||||||||||||||||||||||
Service Class | – | (40,240) | – | (153,360 | ) | ||||||||||||||||||||||||||
Net realized gain on investments and foreign currency | |||||||||||||||||||||||||||||||
Investment Class | – | (4,035,586 | ) | ||||||||||||||||||||||||||||
Service Class | – | – | – | – | |||||||||||||||||||||||||||
Total distributions | – | (4,841,407 | ) | – | (40,240 ) | – | (153,360 | ) | |||||||||||||||||||||||
CAPITAL SHARE TRANSACTIONS: | |||||||||||||||||||||||||||||||
Net capital share transactions | |||||||||||||||||||||||||||||||
Investment Class | (9,540,880 | ) | 1,066,334 | ||||||||||||||||||||||||||||
Service Class | 120,132 | 727,013 | 7,203,245 | 127,677 | |||||||||||||||||||||||||||
Shareholder redemption fees | |||||||||||||||||||||||||||||||
Investment Class | 1,025 | 635 | |||||||||||||||||||||||||||||
Service Class | 88 | 357 | 4,993 | 3,274 | |||||||||||||||||||||||||||
Net increase (decrease) in net assets from capital share transactions | (9,539,855 | ) | 1,066,969 | 120,220 | 727,370 | 7,208,238 | 130,951 | ||||||||||||||||||||||||
NET INCREASE (DECREASE) IN NET ASSETS | (6,260,935 | ) | 2,510,890 | 682,859 | 847,464 | 10,628,309 | 2,792,834 | ||||||||||||||||||||||||
NET ASSETS: | |||||||||||||||||||||||||||||||
Beginning of period | 49,856,121 | 47,345,231 | 4,468,226 | 3,620,762 | 16,888,387 | 14,095,553 | |||||||||||||||||||||||||
End of period | $ | 43,595,186 | $ | 49,856,121 | $ | 5,151,085 | $ | 4,468,226 | $ | 27,516,696 | $ | 16,888,387 | |||||||||||||||||||
UNDISTRIBUTED NET INVESTMENT INCOME (LOSS) AT END OF PERIOD | $ | (86,899 | ) | $ | 6,316 | $ | (15,580 | ) | $ | – | $ | 164,289 | $ | 63,430 | |||||||||||||||||
| THE ACCOMPANYING NOTES ARE AN INTEGRAL PART OF THESE FINANCIAL STATEMENTS. | The Royce Funds 2013 Semiannual Report to Shareholders | 75 |
| Statements of Changes in Net Assets |
| Royce Global Select | Royce European Smaller- | ||||||||||||||||||||||||||||||
| Royce Select Fund II | Long/Short Fund | Companies Fund | |||||||||||||||||||||||||||||
| Six months ended | Six months ended | Six months ended | |||||||||||||||||||||||||||||
| 6/30/13 | Year ended | 6/30/13 | Year ended | 6/30/13 | Year ended | ||||||||||||||||||||||||||
| (unaudited) | 12/31/12 | (unaudited) | 12/31/12 | (unaudited) | 12/31/12 | ||||||||||||||||||||||||||
| INVESTMENT OPERATIONS: | |||||||||||||||||||||||||||||||
| Net investment income (loss) | $ | 29,459 | $ | 66,556 | $ | 248,585 | $ | 581,341 | $ | 179,434 | $ | 201,539 | |||||||||||||||||||
Net realized gain (loss) on investments and foreign currency | 210,614 | 134,060 | 321,664 | (977,654) | 517,211 | (220,323 | ) | ||||||||||||||||||||||||
Net change in unrealized appreciation (depreciation) on investments and foreign currency | (30,295 | ) | 277,321 | (1,915,664 | ) | 3,298,845 | (389,746 | ) | 3,337,255 | ||||||||||||||||||||||
Net increase (decrease) in net assets from investment operations | 209,778 | 477,937 | (1,345,415 | ) | 2,902,532 | 306,899 | 3,318,471 | ||||||||||||||||||||||||
| DISTRIBUTIONS: | |||||||||||||||||||||||||||||||
| Net investment income | |||||||||||||||||||||||||||||||
Investment Class | – | (55,366 | ) | – | (610,348) | ||||||||||||||||||||||||||
Service Class | – | (225,920 | ) | ||||||||||||||||||||||||||||
Net realized gain on investments and foreign currency | |||||||||||||||||||||||||||||||
Investment Class | – | (160,636 | ) | – | – | ||||||||||||||||||||||||||
Service Class | – | – | |||||||||||||||||||||||||||||
| Total distributions | – | (216,002 | ) | – | (610,348) | – | (225,920 | ) | |||||||||||||||||||||||
| CAPITAL SHARE TRANSACTIONS: | |||||||||||||||||||||||||||||||
| Net capital share transactions | |||||||||||||||||||||||||||||||
Investment Class | 561,356 | (61,887 | ) | (8,978,443 | ) | (3,844,018) | |||||||||||||||||||||||||
Service Class | 2,398,001 | (3,163,201 | ) | ||||||||||||||||||||||||||||
| Shareholder redemption fees | |||||||||||||||||||||||||||||||
Investment Class | 34 | – | 596 | 4,038 | |||||||||||||||||||||||||||
Service Class | 9,695 | 6,989 | |||||||||||||||||||||||||||||
Net increase (decrease) in net assets from capital share transactions | 561,390 | (61,887 | ) | (8,977,847 | ) | (3,839,980) | 2,407,696 | (3,156,212 | ) | ||||||||||||||||||||||
NET INCREASE (DECREASE) IN NET ASSETS | 771,168 | 200,048 | (10,323,262 | ) | (1,547,796) | 2,714,595 | (63,661 | ) | |||||||||||||||||||||||
| NET ASSETS: | |||||||||||||||||||||||||||||||
Beginning of period | 3,620,058 | 3,420,010 | 20,958,985 | 22,506,781 | 15,854,204 | 15,917,865 | |||||||||||||||||||||||||
End of period | $ | 4,391,226 | $ | 3,620,058 | $ | 10,635,723 | $ | 20,958,985 | $ | 18,568,799 | $ | 15,854,204 | |||||||||||||||||||
UNDISTRIBUTED NET INVESTMENT INCOME (LOSS) AT END OF PERIOD | $ | 28,038 | $ | (1,421 | ) | $ | 248,585 | $ | – | $ | 110,791 | $ | (68,643 | ) | |||||||||||||||||
| 76 | The Royce Funds 2013 Semiannual Report to Shareholders | THE ACCOMPANYING NOTES ARE AN INTEGRAL PART OF THESE FINANCIAL STATEMENTS. |
| Royce Enterprise Select Fund | Royce SMid-Cap Value Fund | Royce Focus Value Fund | ||||||||||||||||||||||||||||
| Six months ended | Six months ended | Six months ended | ||||||||||||||||||||||||||||
| 6/30/13 | Year ended | 6/30/13 | Year ended | 6/30/13 | Year ended | |||||||||||||||||||||||||
| (unaudited) | 12/31/12 | (unaudited) | 12/31/12 | (unaudited) | 12/31/12 | |||||||||||||||||||||||||
INVESTMENT OPERATIONS: | ||||||||||||||||||||||||||||||
Net investment income (loss) | $ | (3,684 | ) | $ | 2,143 | $ | 7,672 | $ | (3,245 | ) | $ | 9,196 | $ | 31,675 | ||||||||||||||||
Net realized gain (loss) on investments and foreign currency | 122,655 | 127,475 | 194,388 | (206,122 | ) | 93,757 | (105,119 | ) | ||||||||||||||||||||||
Net change in unrealized appreciation (depreciation) on investments and foreign currency | 26,855 | 46,734 | 335,357 | 1,627,478 | 268,492 | 871,968 | ||||||||||||||||||||||||
Net increase (decrease) in net assets from investment operations | 145,826 | 176,352 | 537,417 | 1,418,111 | 371,445 | 798,524 | ||||||||||||||||||||||||
DISTRIBUTIONS: | ||||||||||||||||||||||||||||||
Net investment income | ||||||||||||||||||||||||||||||
Investment Class | – | (80 | ) | |||||||||||||||||||||||||||
Service Class | – | – | – | (155,697 | ) | |||||||||||||||||||||||||
Net realized gain on investments and foreign currency | ||||||||||||||||||||||||||||||
Investment Class | – | (119,739 | ) | |||||||||||||||||||||||||||
Service Class | – | – | – | (1,950 | ) | |||||||||||||||||||||||||
Total distributions | – | (119,819 | ) | – | – | – | (157,647 | ) | ||||||||||||||||||||||
CAPITAL SHARE TRANSACTIONS: | ||||||||||||||||||||||||||||||
Net capital share transactions | ||||||||||||||||||||||||||||||
Investment Class | 550,704 | 119,229 | ||||||||||||||||||||||||||||
Service Class | (1,053,269 | ) | (613,301 | ) | 717,865 | (494,067 | ) | |||||||||||||||||||||||
Shareholder redemption fees | ||||||||||||||||||||||||||||||
Service Class | 365 | 8,222 | – | 664 | ||||||||||||||||||||||||||
Net increase (decrease) in net assets from capital share transactions | 550,704 | 119,229 | (1,052,904 | ) | (605,079 | ) | 717,865 | (493,403 | ) | |||||||||||||||||||||
NET INCREASE (DECREASE) IN NET ASSETS | 696,530 | 175,762 | (515,487 | ) | 813,032 | 1,089,310 | 147,474 | |||||||||||||||||||||||
NET ASSETS: | ||||||||||||||||||||||||||||||
Beginning of period | 1,298,723 | 1,122,961 | 11,140,441 | 10,327,409 | 8,874,943 | 8,727,469 | ||||||||||||||||||||||||
End of period | $ | 1,995,253 | $ | 1,298,723 | $ | 10,624,954 | $ | 11,140,441 | $ | 9,964,253 | $ | 8,874,943 | ||||||||||||||||||
UNDISTRIBUTED NET INVESTMENT INCOME (LOSS) AT END OF PERIOD | $ | (1,617 | ) | $ | 2,068 | $ | 7,672 | $ | – | $ | (58,695 | ) | $ | (67,891 | ) | |||||||||||||||
| THE ACCOMPANYING NOTES ARE AN INTEGRAL PART OF THESE FINANCIAL STATEMENTS. | The Royce Funds 2013 Semiannual Report to Shareholders | 77 |
| Statements of Changes in Net Assets |
| Royce Global Dividend | ||||||||||||||||||||||||||||||
| Royce Partners Fund | Royce Opportunity Select Fund | Value Fund | ||||||||||||||||||||||||||||
| Six months ended | Six months ended | Six months ended | ||||||||||||||||||||||||||||
| 6/30/13 | Year ended | 6/30/13 | Year ended | 6/30/13 | Year ended | |||||||||||||||||||||||||
| (unaudited) | 12/31/12 | (unaudited) | 12/31/12 | (unaudited) | 12/31/12 | |||||||||||||||||||||||||
INVESTMENT OPERATIONS: | ||||||||||||||||||||||||||||||
Net investment income (loss) | $ | 8,378 | $ | 6,241 | $ | (19,091 | ) | $ | 16,146 | $ | 83,741 | $ | 110,305 | |||||||||||||||||
Net realized gain (loss) on investments and foreign currency | 123,001 | 70,836 | 341,985 | 219,405 | 6,960 | (71,639 | ) | |||||||||||||||||||||||
Net change in unrealized appreciation (depreciation) on investments and foreign currency | 122,715 | 274,404 | 350,677 | 522,838 | 9,348 | 1,214,840 | ||||||||||||||||||||||||
Net increase (decrease) in net assets from investment operations | 254,094 | 351,481 | 673,571 | 758,389 | 100,049 | 1,253,506 | ||||||||||||||||||||||||
DISTRIBUTIONS: | ||||||||||||||||||||||||||||||
Net investment income | ||||||||||||||||||||||||||||||
Investment Class | – | (27,185 | ) | |||||||||||||||||||||||||||
Service Class | – | (632 | ) | (45,677 | ) | (109,924 | ) | |||||||||||||||||||||||
Net realized gain on investments and foreign currency | ||||||||||||||||||||||||||||||
Investment Class | – | (205,395 | ) | |||||||||||||||||||||||||||
Service Class | – | (76,810 | ) | – | – | |||||||||||||||||||||||||
Total distributions | – | (77,442 | ) | – | (232,580 | ) | (45,677 | ) | (109,924 | ) | ||||||||||||||||||||
CAPITAL SHARE TRANSACTIONS: | ||||||||||||||||||||||||||||||
Net capital share transactions | ||||||||||||||||||||||||||||||
Investment Class | 2,916,590 | 570,739 | ||||||||||||||||||||||||||||
Service Class | 70,601 | 126,723 | 1,135,742 | (571,143 | ) | |||||||||||||||||||||||||
Shareholder redemption fees | ||||||||||||||||||||||||||||||
Investment Class | 2,701 | – | ||||||||||||||||||||||||||||
Service Class | 218 | 31 | 4,949 | 1,040 | ||||||||||||||||||||||||||
Net increase (decrease) in net assets from capital share transactions | 70,819 | 126,754 | 2,919,291 | 570,739 | 1,140,691 | (570,103 | ) | |||||||||||||||||||||||
NET INCREASE (DECREASE) IN NET ASSETS | 324,913 | 400,793 | 3,592,862 | 1,096,548 | 1,195,063 | 573,479 | ||||||||||||||||||||||||
NET ASSETS: | ||||||||||||||||||||||||||||||
Beginning of period | 2,083,049 | 1,682,256 | 3,198,403 | 2,101,855 | 6,708,168 | 6,134,689 | ||||||||||||||||||||||||
End of period | $ | 2,407,962 | $ | 2,083,049 | $ | 6,791,265 | $ | 3,198,403 | $ | 7,903,231 | $ | 6,708,168 | ||||||||||||||||||
UNDISTRIBUTED NET INVESTMENT INCOME (LOSS) AT END OF PERIOD | $ | 13,870 | $ | 5,492 | $ | (20,681 | ) | $ | (1,590 | ) | $ | 35,850 | $ | (2,214 | ) | |||||||||||||||
| 78 | The Royce Funds 2013 Semiannual Report to Shareholders | THE ACCOMPANYING NOTES ARE AN INTEGRAL PART OF THESE FINANCIAL STATEMENTS. |
| Royce International | Royce International | Royce Special Equity | ||||||||||||||||||||||||||||
| Micro-Cap Fund | Premier Fund | Multi-Cap Fund | ||||||||||||||||||||||||||||
| Six months ended | Six months ended | Six months ended | ||||||||||||||||||||||||||||
| 6/30/13 | Year ended | 6/30/13 | Year ended | 6/30/13 | Year ended | |||||||||||||||||||||||||
| (unaudited) | 12/31/12 | (unaudited) | 12/31/12 | (unaudited) | 12/31/12 | |||||||||||||||||||||||||
INVESTMENT OPERATIONS: | ||||||||||||||||||||||||||||||
Net investment income (loss) | $ | 37,255 | $ | 68,271 | $ | 57,179 | $ | 49,640 | $ | 624,351 | $ | 1,123,620 | ||||||||||||||||||
Net realized gain (loss) on investments and foreign currency | (43,220 | ) | (138,773 | ) | 159,665 | (382,792 | ) | 2,935,665 | 1,858,816 | |||||||||||||||||||||
Net change in unrealized appreciation (depreciation) on investments and foreign currency | (7,937 | ) | 572,117 | 73,979 | 1,268,471 | 17,524,393 | 2,863,481 | |||||||||||||||||||||||
Net increase (decrease) in net assets from investment operations | (13,902 | ) | 501,615 | 290,823 | 935,319 | 21,084,409 | 5,845,917 | |||||||||||||||||||||||
DISTRIBUTIONS: | ||||||||||||||||||||||||||||||
Net investment income | ||||||||||||||||||||||||||||||
Investment Class | – | (375,548 | ) | |||||||||||||||||||||||||||
Service Class | – | (79,547 | ) | – | (76,745 | ) | – | (329,533 | ) | |||||||||||||||||||||
Institutional Class | – | (400,930 | ) | |||||||||||||||||||||||||||
Net realized gain on investments and foreign currency | ||||||||||||||||||||||||||||||
Investment Class | – | (280,238 | ) | |||||||||||||||||||||||||||
Service Class | – | – | – | – | – | (388,479 | ) | |||||||||||||||||||||||
Institutional Class | – | (273,181 | ) | |||||||||||||||||||||||||||
Total distributions | – | (79,547 | ) | – | (76,745 | ) | – | (2,047,909 | ) | |||||||||||||||||||||
CAPITAL SHARE TRANSACTIONS: | ||||||||||||||||||||||||||||||
Net capital share transactions | ||||||||||||||||||||||||||||||
Investment Class | 8,909,844 | 34,833,917 | ||||||||||||||||||||||||||||
Service Class | (551,972 | ) | 608,323 | 253,966 | 1,495,086 | 11,586,974 | 2,291,212 | |||||||||||||||||||||||
Institutional Class | 8,625,101 | 31,218,929 | ||||||||||||||||||||||||||||
Shareholder redemption fees | ||||||||||||||||||||||||||||||
Investment Class | 558 | 2,238 | ||||||||||||||||||||||||||||
Service Class | 3,132 | 1,344 | 1,540 | 462 | 2,446 | 14,274 | ||||||||||||||||||||||||
Net increase (decrease) in net assets from capital share transactions | (548,840 | ) | 609,667 | 255,506 | 1,495,548 | 29,124,923 | 68,360,570 | |||||||||||||||||||||||
NET INCREASE (DECREASE) IN NET ASSETS | (562,742 | ) | 1,031,735 | 546,329 | 2,354,122 | 50,209,332 | 72,158,578 | |||||||||||||||||||||||
NET ASSETS: | ||||||||||||||||||||||||||||||
Beginning of period | 4,603,445 | 3,571,710 | 6,443,913 | 4,089,791 | 108,969,839 | 36,811,261 | ||||||||||||||||||||||||
End of period | $ | 4,040,703 | $ | 4,603,445 | $ | 6,990,242 | $ | 6,443,913 | $ | 159,179,171 | $ | 108,969,839 | ||||||||||||||||||
UNDISTRIBUTED NET INVESTMENT INCOME (LOSS) AT END OF PERIOD | $ | 24,085 | $ | (13,170 | ) | $ | 33,797 | $ | (23,382 | ) | $ | 641,961 | $ | 17,610 | ||||||||||||||||
| THE ACCOMPANYING NOTES ARE AN INTEGRAL PART OF THESE FINANCIAL STATEMENTS. | The Royce Funds 2013 Semiannual Report to Shareholders | 79 |
| Statements of Operations | Six Months Ended June 30, 2013 (unaudited) |
| Royce | Royce Micro-Cap | Royce | Royce | Royce | |||||||||||||||||||||
| Select | Discovery | Financial | Select | Global Select | |||||||||||||||||||||
| Fund I | Fund | Services Fund | Fund II | Long/Short Fund | |||||||||||||||||||||
INVESTMENT INCOME: | |||||||||||||||||||||||||
Income: | |||||||||||||||||||||||||
Dividends | $ | 191,661 | $ | 21,079 | $ | 273,787 | $ | 32,678 | $ | 323,268 | |||||||||||||||
Foreign withholding tax | (10,476 | ) | (271 | ) | (7,804 | ) | (2,171 | ) | (35,859 | ) | |||||||||||||||
Interest | 625 | 41 | 287 | 69 | 593 | ||||||||||||||||||||
Total income | 181,810 | 20,849 | 266,270 | 30,576 | 288,002 | ||||||||||||||||||||
Expenses: | |||||||||||||||||||||||||
Investment advisory fees | 236,846 | 24,449 | 111,015 | – | – | ||||||||||||||||||||
Distribution fees | – | 6,112 | 27,754 | – | – | ||||||||||||||||||||
Audit | 7,339 | 6,993 | 6,996 | – | – | ||||||||||||||||||||
Custody | 7,267 | 3,944 | 10,746 | – | – | ||||||||||||||||||||
Shareholder servicing | 6,620 | 7,480 | 15,304 | – | – | ||||||||||||||||||||
Shareholder reports | 6,601 | 3,032 | 14,862 | – | – | ||||||||||||||||||||
Registration | 5,664 | 7,801 | 9,036 | – | – | ||||||||||||||||||||
Administrative and office facilities | 2,814 | 245 | 981 | – | – | ||||||||||||||||||||
Trustees’ fees | 855 | 71 | 278 | – | – | ||||||||||||||||||||
Legal | 275 | 23 | 92 | – | – | ||||||||||||||||||||
Dividends on securities sold short | – | – | – | 391 | 28,375 | ||||||||||||||||||||
Interest expense | – | – | – | 726 | 11,042 | ||||||||||||||||||||
Other expenses | 752 | 335 | 469 | – | – | ||||||||||||||||||||
Total expenses | 275,033 | 60,485 | 197,533 | 1,117 | 39,417 | ||||||||||||||||||||
Compensating balance credits | (9 | ) | (10 | ) | (25 | ) | – | – | |||||||||||||||||
Fees waived by investment adviser and distributor | – | (24,046 | ) | (32,096 | ) | – | – | ||||||||||||||||||
Expenses reimbursed by investment adviser | – | – | – | – | – | ||||||||||||||||||||
Net expenses | 275,024 | 36,429 | 165,412 | 1,117 | 39,417 | ||||||||||||||||||||
Net investment income (loss) | (93,214 | ) | (15,580 | ) | 100,858 | 29,459 | 248,585 | ||||||||||||||||||
REALIZED AND UNREALIZED GAIN (LOSS) ON INVESTMENTS AND FOREIGN CURRENCY: | |||||||||||||||||||||||||
Net realized gain (loss): | |||||||||||||||||||||||||
Investments | 3,565,945 | 241,141 | (139,574 | ) | 212,262 | 332,617 | |||||||||||||||||||
Foreign currency transactions | 928 | – | (1,750 | ) | (1,648 | ) | (10,953 | ) | |||||||||||||||||
Net change in unrealized appreciation (depreciation): | |||||||||||||||||||||||||
Investments and foreign currency translations | (194,923 | ) | 337,078 | 3,460,674 | (30,294 | ) | (1,916,221 | ) | |||||||||||||||||
Other assets and liabilities denominated in foreign currency | 184 | – | (137 | ) | (1 | ) | 557 | ||||||||||||||||||
Net realized and unrealized gain (loss) on investments and foreign currency | 3,372,134 | 578,219 | 3,319,213 | 180,319 | (1,594,000 | ) | |||||||||||||||||||
NET INCREASE (DECREASE) IN NET ASSETS FROM INVESTMENT OPERATIONS | $ | 3,278,920 | $ | 562,639 | $ | 3,420,071 | $ | 209,778 | $ | (1,345,415 | ) | ||||||||||||||
| 80 | The Royce Funds 2013 Semiannual Report to Shareholders | THE ACCOMPANYING NOTES ARE AN INTEGRAL PART OF THESE FINANCIAL STATEMENTS. |
| Statements of Operations | Six Months Ended June 30, 2013 (unaudited) |
| Royce | Royce | Royce | Royce | Royce | ||||||||||||||||||||
| European Smaller- | Enterprise Select | SMid-Cap | Focus Value | Partners | ||||||||||||||||||||
| Companies Fund | Fund | Value Fund | Fund | Fund | ||||||||||||||||||||
INVESTMENT INCOME: | ||||||||||||||||||||||||
Income: | ||||||||||||||||||||||||
Dividends | $ | 383,834 | $ | 5,610 | $ | 86,940 | $ | 73,953 | $ | 25,394 | ||||||||||||||
Foreign withholding tax | (48,607 | ) | (10 | ) | (4,288 | ) | (1,879 | ) | (1,447 | ) | ||||||||||||||
Interest | 117 | 45 | 159 | 41 | 24 | |||||||||||||||||||
Total income | 335,344 | 5,645 | 82,811 | 72,115 | 23,971 | |||||||||||||||||||
Expenses: | ||||||||||||||||||||||||
Investment advisory fees | 115,318 | 7,524 | 55,659 | 46,606 | 11,550 | |||||||||||||||||||
Distribution fees | 23,064 | – | 13,915 | 11,652 | 2,888 | |||||||||||||||||||
Audit | 6,996 | 7,317 | 6,995 | 7,372 | 7,320 | |||||||||||||||||||
Custody | 14,799 | 4,401 | 9,073 | 8,762 | 8,771 | |||||||||||||||||||
Shareholder servicing | 16,026 | 2,990 | 8,753 | 7,187 | 5,740 | |||||||||||||||||||
Shareholder reports | 10,502 | 99 | 7,971 | 2,478 | 1,182 | |||||||||||||||||||
Registration | 9,312 | 3,483 | 9,089 | 7,367 | 3,875 | |||||||||||||||||||
Administrative and office facilities | 944 | 72 | 643 | 517 | 116 | |||||||||||||||||||
Trustees’ fees | 277 | 22 | 191 | 155 | 33 | |||||||||||||||||||
Legal | 89 | 7 | 60 | 49 | 10 | |||||||||||||||||||
Other expenses | 492 | 277 | 427 | 404 | 317 | |||||||||||||||||||
Total expenses | 197,819 | 26,192 | 112,776 | 92,549 | 41,802 | |||||||||||||||||||
Compensating balance credits | (23 | ) | – | (11 | ) | (6 | ) | (31 | ) | |||||||||||||||
Fees waived by investment adviser and distributor | (41,886 | ) | (7,524 | ) | (37,626 | ) | (29,624 | ) | (11,550 | ) | ||||||||||||||
Expenses reimbursed by investment adviser | – | (9,339 | ) | – | – | (14,628 | ) | |||||||||||||||||
Net expenses | 155,910 | 9,329 | 75,139 | 62,919 | 15,593 | |||||||||||||||||||
Net investment income (loss) | 179,434 | (3,684 | ) | 7,672 | 9,196 | 8,378 | ||||||||||||||||||
REALIZED AND UNREALIZED GAIN (LOSS) ON INVESTMENTS AND FOREIGN CURRENCY: | ||||||||||||||||||||||||
Net realized gain (loss): | ||||||||||||||||||||||||
Investments | 521,083 | 122,656 | 194,299 | 93,017 | 123,400 | |||||||||||||||||||
Foreign currency transactions | (3,872 | ) | (1 | ) | 89 | 740 | (399 | ) | ||||||||||||||||
Net change in unrealized appreciation (depreciation): | ||||||||||||||||||||||||
Investments and foreign currency translations | (386,714 | ) | 26,853 | 335,449 | 268,494 | 122,727 | ||||||||||||||||||
Other assets and liabilities denominated in foreign currency | (3,032 | ) | 2 | (92 | ) | (2 | ) | (12 | ) | |||||||||||||||
Net realized and unrealized gain (loss) on investments and foreign currency | 127,465 | 149,510 | 529,745 | 362,249 | 245,716 | |||||||||||||||||||
NET INCREASE (DECREASE) IN NET ASSETS FROM INVESTMENT OPERATIONS | $ | 306,899 | $ | 145,826 | $ | 537,417 | $ | 371,445 | $ | 254,094 | ||||||||||||||
| THE ACCOMPANYING NOTES ARE AN INTEGRAL PART OF THESE FINANCIAL STATEMENTS. | The Royce Funds 2013 Semiannual Report to Shareholders | 81 |
| Statements of Operations | Six Months Ended June 30, 2013 (unaudited) |
| Royce | Royce | Royce | Royce | Royce | |||||||||||||||||||||
| Opportunity | Global Dividend | International | International | Special Equity | |||||||||||||||||||||
| Select Fund | Value Fund | Micro-Cap Fund | Premier Fund | Multi-Cap Fund | |||||||||||||||||||||
INVESTMENT INCOME: | |||||||||||||||||||||||||
Income: | |||||||||||||||||||||||||
Dividends | $ | 11,147 | $ | 163,986 | $ | 83,636 | $ | 130,019 | $ | 1,426,186 | |||||||||||||||
Foreign withholding tax | – | (15,223 | ) | (7,820 | ) | (14,378 | ) | – | |||||||||||||||||
Interest | 28 | 54 | 28 | 43 | 1,054 | ||||||||||||||||||||
Total income | 11,175 | 148,817 | 75,844 | 115,684 | 1,427,240 | ||||||||||||||||||||
Expenses: | |||||||||||||||||||||||||
Investment advisory fees | 23,769 | 48,133 | 29,684 | 43,273 | 666,978 | ||||||||||||||||||||
Distribution fees | – | 9,627 | 5,708 | 8,655 | 62,905 | ||||||||||||||||||||
Audit | 7,293 | 6,994 | 8,783 | 7,398 | 14,192 | ||||||||||||||||||||
Custody | 5,593 | 13,886 | 15,297 | 13,727 | 11,106 | ||||||||||||||||||||
Shareholder servicing | 3,056 | 8,096 | 6,867 | 7,196 | 42,907 | ||||||||||||||||||||
Shareholder reports | 201 | 5,467 | 2,060 | 2,545 | 29,755 | ||||||||||||||||||||
Registration | 3,028 | 9,650 | 10,043 | 9,657 | 22,263 | ||||||||||||||||||||
Administrative and office facilities | 170 | 391 | 250 | 296 | 5,380 | ||||||||||||||||||||
Trustees’ fees | 46 | 114 | 73 | 79 | 1,400 | ||||||||||||||||||||
Legal | 15 | 37 | 24 | 28 | 492 | ||||||||||||||||||||
Dividends on securities sold short | 405 | – | – | – | – | ||||||||||||||||||||
Interest expense | 387 | – | – | – | – | ||||||||||||||||||||
Other expenses | 1,350 | 367 | 345 | 379 | 1,607 | ||||||||||||||||||||
Total expenses | 45,313 | 102,762 | 79,134 | 93,233 | 858,985 | ||||||||||||||||||||
Compensating balance credits | (1 | ) | (19 | ) | (10 | ) | (4 | ) | (25 | ) | |||||||||||||||
Fees waived by investment adviser and distributor | (15,046 | ) | (37,667 | ) | (29,912 | ) | (34,724 | ) | (10,003 | ) | |||||||||||||||
Expenses reimbursed by investment adviser | – | – | (10,623 | ) | – | (46,068 | ) | ||||||||||||||||||
Net expenses | 30,266 | 65,076 | 38,589 | 58,505 | 802,889 | ||||||||||||||||||||
Net investment income (loss) | (19,091 | ) | 83,741 | 37,255 | 57,179 | 624,351 | |||||||||||||||||||
REALIZED AND UNREALIZED GAIN (LOSS) ON INVESTMENTS AND FOREIGN CURRENCY: | |||||||||||||||||||||||||
Net realized gain (loss): | |||||||||||||||||||||||||
Investments | 341,985 | 8,795 | (41,952 | ) | 160,276 | 2,935,665 | |||||||||||||||||||
Foreign currency transactions | – | (1,835 | ) | (1,268 | ) | (611 | ) | – | |||||||||||||||||
Net change in unrealized appreciation (depreciation): | |||||||||||||||||||||||||
Investments and foreign currency translations | 350,677 | 9,432 | (7,599 | ) | 74,019 | 17,524,393 | |||||||||||||||||||
Other assets and liabilities denominated in foreign currency | – | (84 | ) | (338 | ) | (40 | ) | – | |||||||||||||||||
Net realized and unrealized gain (loss) on investments and foreign currency | 692,662 | 16,308 | (51,157 | ) | 233,644 | 20,460,058 | |||||||||||||||||||
NET INCREASE (DECREASE) IN NET ASSETS FROM INVESTMENT OPERATIONS | $ | 673,571 | $ | 100,049 | $ | (13,902 | ) | $ | 290,823 | $ | 21,084,409 | ||||||||||||||
| 82 | The Royce Funds 2013 Semiannual Report to Shareholders | THE ACCOMPANYING NOTES ARE AN INTEGRAL PART OF THESE FINANCIAL STATEMENTS. |
|
Financial Highlights |
| |||||||||||||||||||||||||||||||||||||||||||||||||||||||||
|
| Net |
| Net |
| Net Realized and Unrealized |
|
| Distributions |
| Distributions from Net |
|
|
|
|
|
|
|
|
| Ratio of Expenses to Average Net Assets |
| Ratio of Net Investment |
|
| ||||||||||||||||||||||||||||||||
|
| Asset Value, |
| Investment |
| Gain (Loss) on |
| Total from Investment Operations |
| from Net Investment Income |
| Realized Gain on |
| Distributions |
| Total Distributions |
| Shareholder Redemption Fees |
| Net Asset |
| Total Return |
| Net Assets, |
| Prior to Fee |
| Prior |
| Net of |
| Income (Loss) |
| Portfolio Turnover Rate |
| ||||||||||||||||||||||
|
|
|
|
|
|
|
|
|
|
|
|
|
|
|
|
|
|
|
|
|
|
|
|
|
|
|
|
|
|
|
|
|
|
|
|
|
|
|
|
|
|
|
|
|
|
|
|
|
|
|
|
|
|
|
|
|
|
Royce Select Fund I – Investment Class | |||||||||||||||||||||||||||||||||||||||||||||||||||||||||
†2013 |
| $ | 17.40 |
| $ | (0.04 | ) | $ | 1.21 |
| $ | 1.17 |
| $ | – |
| $ | – |
| $ | – |
| $ | – |
| $ | – |
| $ | 18.57 |
|
| 6.72 | %1 | $ | 43,595 |
|
| 1.15 | %2 |
|
| 1.15 | %2 |
|
| 1.15 | %2 |
|
| (0.39 | )%2 |
|
| 30 | % |
|
2012 |
|
| 16.93 |
|
| 0.31 |
|
| 1.95 |
|
| 2.26 |
|
| (0.30 | ) |
| (1.49 | ) |
| – |
|
| (1.79 | ) |
| – |
|
| 17.40 |
|
| 13.68 |
|
| 49,856 |
|
| 0.00 |
|
|
| 0.00 |
|
|
| 0.00 |
|
|
| 1.68 |
|
|
| 54 |
|
|
2011 |
|
| 20.32 |
|
| (0.16 | ) |
| (0.67 | ) |
| (0.83 | ) |
| – |
|
| (2.56 | ) |
| – |
|
| (2.56 | ) |
| – |
|
| 16.93 |
|
| (3.61 | ) |
| 47,345 |
|
| 1.45 |
|
|
| 1.45 |
|
|
| 1.45 |
|
|
| (0.78 | ) |
|
| 63 |
|
|
2010 |
|
| 17.42 |
|
| (0.23 | ) |
| 3.39 |
|
| 3.16 |
|
| – |
|
| (0.26 | ) |
| – |
|
| (0.26 | ) |
| – |
|
| 20.32 |
|
| 18.15 |
|
| 58,788 |
|
| 2.37 |
|
|
| 2.37 |
|
|
| 2.37 |
|
|
| (1.26 | ) |
|
| 49 |
|
|
2009 |
|
| 12.59 |
|
| 0.15 |
|
| 4.83 |
|
| 4.98 |
|
| (0.15 | ) |
| – |
|
| – |
|
| (0.15 | ) |
| – |
|
| 17.42 |
|
| 39.59 |
|
| 33,896 |
|
| 0.01 |
|
|
| 0.01 |
|
|
| 0.01 |
|
|
| 1.28 |
|
|
| 80 |
|
|
2008 |
|
| 18.20 |
|
| 0.19 |
|
| (4.93 | ) |
| (4.74 | ) |
| (0.16 | ) |
| (0.71 | ) |
| – |
|
| (0.87 | ) |
| – |
|
| 12.59 |
|
| (25.91 | ) |
| 17,480 |
|
| 0.08 |
|
|
| 0.08 |
|
|
| 0.08 |
|
|
| 1.25 |
|
|
| 116 |
|
|
Royce Micro-Cap Discovery Fund – Service Class | |||||||||||||||||||||||||||||||||||||||||||||||||||||||||
†2013 |
| $ | 5.23 |
| $ | (0.02 | ) | $ | 0.66 |
| $ | 0.64 |
| $ | – |
| $ | – |
| $ | – |
| $ | – |
| $ | – |
| $ | 5.87 |
|
| 12.24 | %1 | $ | 5,151 |
|
| 2.47 | %2 |
|
| 2.47 | %2 |
|
| 1.49 | %2 |
|
| (0.64 | )%2 |
|
| 34 | % |
|
2012 |
|
| 5.12 |
|
| 0.04 |
|
| 0.12 |
|
| 0.16 |
|
| (0.05 | ) |
| – |
|
| – |
|
| (0.05 | ) |
| – |
|
| 5.23 |
|
| 3.10 |
|
| 4,468 |
|
| 2.94 |
|
|
| 2.94 |
|
|
| 1.49 |
|
|
| 0.85 |
|
|
| 87 |
|
|
2011 |
|
| 5.24 |
|
| (0.04 | ) |
| (0.09 | ) |
| (0.13 | ) |
| (0.00 | ) |
| – |
|
| – |
|
| (0.00 | ) |
| 0.01 |
|
| 5.12 |
|
| (2.24 | ) |
| 3,621 |
|
| 2.99 |
|
|
| 2.99 |
|
|
| 1.49 |
|
|
| (0.71 | ) |
|
| 72 |
|
|
2010 |
|
| 4.38 |
|
| (0.01 | ) |
| 0.87 |
|
| 0.86 |
|
| – |
|
| – |
|
| – |
|
| – |
|
| – |
|
| 5.24 |
|
| 19.63 |
|
| 3,637 |
|
| 3.04 |
|
|
| 3.04 |
|
|
| 1.49 |
|
|
| (0.19 | ) |
|
| 105 |
|
|
2009 |
|
| 3.48 |
|
| (0.01 | ) |
| 0.91 |
|
| 0.90 |
|
| – |
|
| – |
|
| – |
|
| – |
|
| – |
|
| 4.38 |
|
| 25.86 |
|
| 2,910 |
|
| 3.56 |
|
|
| 3.56 |
|
|
| 1.49 |
|
|
| (0.30 | ) |
|
| 13 |
|
|
2008 |
|
| 5.85 |
|
| (0.01 | ) |
| (2.06 | ) |
| (2.07 | ) |
| – |
|
| (0.30 | ) |
| – |
|
| (0.30 | ) |
| – |
|
| 3.48 |
|
| (35.07 | ) |
| 2,332 |
|
| 2.77 |
|
|
| 2.77 |
|
|
| 1.49 |
|
|
| (0.22 | ) |
|
| 63 |
|
|
Royce Financial Services Fund – Service Class | |||||||||||||||||||||||||||||||||||||||||||||||||||||||||
†2013 |
| $ | 6.83 |
| $ | 0.04 |
| $ | 1.25 |
| $ | 1.29 |
| $ | – |
| $ | – |
| $ | – |
| $ | – |
| $ | – |
| $ | 8.12 |
|
| 18.89 | %1 | $ | 27,517 |
|
| 1.78 | %2 |
|
| 1.78 | %2 |
|
| 1.49 | %2 |
|
| 0.91 | %2 |
|
| 3 | % |
|
2012 |
|
| 5.71 |
|
| 0.10 |
|
| 1.08 |
|
| 1.18 |
|
| (0.06 | ) |
| – |
|
| – |
|
| (0.06 | ) |
| – |
|
| 6.83 |
|
| 20.72 |
|
| 16,888 |
|
| 1.87 |
|
|
| 1.87 |
|
|
| 1.49 |
|
|
| 1.53 |
|
|
| 26 |
|
|
2011 |
|
| 6.50 |
|
| 0.05 |
|
| (0.78 | ) |
| (0.73 | ) |
| (0.06 | ) |
| – |
|
| – |
|
| (0.06 | ) |
| – |
|
| 5.71 |
|
| (11.29 | ) |
| 14,096 |
|
| 1.84 |
|
|
| 1.84 |
|
|
| 1.49 |
|
|
| 0.73 |
|
|
| 23 |
|
|
2010 |
|
| 5.57 |
|
| 0.07 |
|
| 0.96 |
|
| 1.03 |
|
| (0.10 | ) |
| – |
|
| – |
|
| (0.10 | ) |
| – |
|
| 6.50 |
|
| 18.45 |
|
| 14,688 |
|
| 1.94 |
|
|
| 1.94 |
|
|
| 1.49 |
|
|
| 1.14 |
|
|
| 16 |
|
|
2009 |
|
| 4.25 |
|
| 0.04 |
|
| 1.31 |
|
| 1.35 |
|
| (0.04 | ) |
| – |
|
| – |
|
| (0.04 | ) |
| 0.01 |
|
| 5.57 |
|
| 32.13 |
|
| 13,525 |
|
| 2.06 |
|
|
| 2.06 |
|
|
| 1.49 |
|
|
| 0.90 |
|
|
| 34 |
|
|
2008 |
|
| 6.71 |
|
| 0.07 |
|
| (2.46 | ) |
| (2.39 | ) |
| (0.05 | ) |
| (0.03 | ) |
| – |
|
| (0.08 | ) |
| 0.01 |
|
| 4.25 |
|
| (35.37 | ) |
| 9,553 |
|
| 2.35 |
|
|
| 2.34 |
|
|
| 1.49 |
|
|
| 1.85 |
|
|
| 48 |
|
|
Royce Select Fund II – Investment Class | |||||||||||||||||||||||||||||||||||||||||||||||||||||||||
†2013 |
| $ | 10.68 |
| $ | 0.09 |
| $ | 0.59 |
| $ | 0.68 |
| $ | – |
| $ | – |
| $ | – |
| $ | – |
| $ | – |
| $ | 11.36 |
|
| 6.37 | %1 | $ | 4,391 |
|
| 0.03 | %1 |
|
| 0.03 | %1 |
|
| 0.03 | %1 |
|
| 0.75 | %1 |
|
| 80 | % |
|
2012 |
|
| 9.95 |
|
| 0.20 |
|
| 1.19 |
|
| 1.39 |
|
| (0.17 | ) |
| (0.49 | ) |
| – |
|
| (0.66 | ) |
| – |
|
| 10.68 |
|
| 14.23 |
|
| 3,620 |
|
| 0.19 |
|
|
| 0.19 |
|
|
| 0.19 |
|
|
| 1.86 |
|
|
| 123 |
|
|
2011 |
|
| 13.90 |
|
| (0.01 | ) |
| (2.04 | ) |
| (2.05 | ) |
| – |
|
| (1.90 | ) |
| – |
|
| (1.90 | ) |
| – |
|
| 9.95 |
|
| (14.35 | ) |
| 3,420 |
|
| 1.29 |
|
|
| 1.29 |
|
|
| 1.29 |
|
|
| (0.09 | ) |
|
| 153 |
|
|
2010 |
|
| 11.62 |
|
| (0.18 | ) |
| 2.60 |
|
| 2.42 |
|
| (0.00 | ) |
| (0.15 | ) |
| – |
|
| (0.15 | ) |
| 0.01 |
|
| 13.90 |
|
| 20.96 |
|
| 5,141 |
|
| 2.77 |
|
|
| 2.77 |
|
|
| 2.77 |
|
|
| (1.47 | ) |
|
| 126 |
|
|
2009 |
|
| 7.02 |
|
| 0.03 |
|
| 4.64 |
|
| 4.67 |
|
| (0.07 | ) |
| – |
|
| – |
|
| (0.07 | ) |
| – |
|
| 11.62 |
|
| 66.58 |
|
| 4,109 |
|
| 0.67 |
|
|
| 0.67 |
|
|
| 0.67 |
|
|
| 0.53 |
|
|
| 114 |
|
|
2008 |
|
| 10.66 |
|
| 0.09 |
|
| (3.65 | ) |
| (3.56 | ) |
| (0.08 | ) |
| – |
|
| – |
|
| (0.08 | ) |
| – |
|
| 7.02 |
|
| (33.37 | ) |
| 1,698 |
|
| 0.24 |
|
|
| 0.24 |
|
|
| 0.24 |
|
|
| 0.98 |
|
|
| 268 |
|
|
Royce Global Select Long/Short Fund – Investment Class | |||||||||||||||||||||||||||||||||||||||||||||||||||||||||
†2013 |
| $ | 17.04 |
| $ | 0.23 |
| $ | (1.79 | ) | $ | (1.56 | ) | $ | – |
| $ | – |
| $ | – |
| $ | – |
| $ | – |
| $ | 15.48 |
|
| (9.15 | )%1 | $ | 10,636 |
|
| 0.22 | %1 |
|
| 0.22 | %1 |
|
| 0.22 | %1 |
|
| 1.37 | %1 |
|
| 81 | % |
|
2012 |
|
| 15.38 |
|
| 0.47 |
|
| 1.68 |
|
| 2.15 |
|
| (0.49 | ) |
| – |
|
| – |
|
| (0.49 | ) |
| – |
|
| 17.04 |
|
| 14.02 |
|
| 20,959 |
|
| 0.57 |
|
|
| 0.57 |
|
|
| 0.57 |
|
|
| 2.57 |
|
|
| 77 |
|
|
2011 |
|
| 19.89 |
|
| 0.25 |
|
| (3.83 | ) |
| (3.58 | ) |
| (0.25 | ) |
| (0.70 | ) |
| – |
|
| (0.95 | ) |
| 0.02 |
|
| 15.38 |
|
| (17.77 | ) |
| 22,507 |
|
| 0.98 |
|
|
| 0.98 |
|
|
| 0.98 |
|
|
| 1.46 |
|
|
| 45 |
|
|
2010 |
|
| 14.97 |
|
| (0.26 | ) |
| 5.22 |
|
| 4.96 |
|
| (0.05 | ) |
| – |
|
| – |
|
| (0.05 | ) |
| 0.01 |
|
| 19.89 |
|
| 33.21 |
|
| 16,355 |
|
| 3.48 |
|
|
| 3.48 |
|
|
| 3.48 |
|
|
| (1.55 | ) |
|
| 80 |
|
|
2009 |
|
| 9.76 |
|
| 0.18 |
|
| 5.27 |
|
| 5.45 |
|
| (0.26 | ) |
| – |
|
| – |
|
| (0.26 | ) |
| 0.02 |
|
| 14.97 |
|
| 56.11 |
|
| 9,117 |
|
| 0.00 |
|
|
| 0.00 |
|
|
| 0.00 |
|
|
| 1.55 |
|
|
| 85 |
|
|
2008 |
|
| 15.01 |
|
| 0.23 |
|
| (5.40 | ) |
| (5.17 | ) |
| – |
|
| (0.09 | ) |
| – |
|
| (0.09 | ) |
| 0.01 |
|
| 9.76 |
|
| (34.39 | ) |
| 6,049 |
|
| 0.50 |
|
|
| 0.50 |
|
|
| 0.50 |
|
|
| 1.75 |
|
|
| 41 |
|
|
|
|
|
THE ACCOMPANYING NOTES ARE AN INTEGRAL PART OF THESE FINANCIAL STATEMENTS. | The Royce Funds 2013 Semiannual Report to Shareholders | 83 | |
|
Financial Highlights |
| |||||||||||||||||||||||||||||||||||||||||||||||||||||||||
|
| Net |
| Net |
| Net Realized and Unrealized |
|
| Distributions |
| Distributions from Net |
|
|
|
|
|
|
|
|
| Ratio of Expenses to Average Net Assets |
| Ratio of Net Investment |
|
| ||||||||||||||||||||||||||||||||
|
| Asset Value, |
| Investment |
| Gain (Loss) on |
| Total from Investment Operations |
| from Net Investment Income |
| Realized Gain on |
| Distributions |
| Total Distributions |
| Shareholder Redemption Fees |
| Net Asset |
| Total Return |
| Net Assets, |
| Prior to Fee |
| Prior |
| Net of |
| Income (Loss) |
| Portfolio Turnover Rate |
| ||||||||||||||||||||||
|
|
|
|
|
|
|
|
|
|
|
|
|
|
|
|
|
|
|
|
|
|
|
|
|
|
|
|
|
|
|
|
|
|
|
|
|
|
|
|
|
|
|
|
|
|
|
|
|
|
|
|
|
|
|
|
|
|
Royce European Smaller-Companies Fund – Service Class | |||||||||||||||||||||||||||||||||||||||||||||||||||||||||
†2013 |
| $ | 10.37 |
| $ | 0.10 |
| $ | 0.13 |
| $ | 0.23 |
| $ | – |
| $ | – |
| $ | – |
| $ | – |
| $ | 0.01 |
| $ | 10.61 |
|
| 2.31 | %1 | $ | 18,569 |
|
| 2.14 | %2 |
|
| 2.14 | %2 |
|
| 1.69 | %2 |
|
| 1.94 | %2 |
|
| 27 | % |
|
2012 |
|
| 8.50 |
|
| 0.14 |
|
| 1.88 |
|
| 2.02 |
|
| (0.15 | ) |
| – |
|
| – |
|
| (0.15 | ) |
| – |
|
| 10.37 |
|
| 23.83 |
|
| 15,854 |
|
| 2.13 |
|
|
| 2.13 |
|
|
| 1.69 |
|
|
| 1.29 |
|
|
| 22 |
|
|
2011 |
|
| 10.79 |
|
| 0.10 |
|
| (2.31 | ) |
| (2.21 | ) |
| (0.10 | ) |
| – |
|
| – |
|
| (0.10 | ) |
| 0.02 |
|
| 8.50 |
|
| (20.32 | ) |
| 15,918 |
|
| 2.09 |
|
|
| 2.09 |
|
|
| 1.69 |
|
|
| 0.95 |
|
|
| 36 |
|
|
2010 |
|
| 8.06 |
|
| 0.03 |
|
| 2.79 |
|
| 2.82 |
|
| (0.10 | ) |
| – |
|
| – |
|
| (0.10 | ) |
| 0.01 |
|
| 10.79 |
|
| 35.20 |
|
| 15,369 |
|
| 2.57 |
|
|
| 2.57 |
|
|
| 1.69 |
|
|
| 0.70 |
|
|
| 32 |
|
|
2009 |
|
| 5.19 |
|
| 0.06 |
|
| 2.93 |
|
| 2.99 |
|
| (0.12 | ) |
| – |
|
| – |
|
| (0.12 | ) |
| – |
|
| 8.06 |
|
| 57.69 |
|
| 6,887 |
|
| 3.21 |
|
|
| 3.21 |
|
|
| 1.69 |
|
|
| 1.11 |
|
|
| 51 |
|
|
2008 |
|
| 10.14 |
|
| 0.22 |
|
| (4.95 | ) |
| (4.73 | ) |
| (0.23 | ) |
| – |
|
| – |
|
| (0.23 | ) |
| 0.01 |
|
| 5.19 |
|
| (46.38 | ) |
| 4,044 |
|
| 2.74 |
|
|
| 2.72 |
|
|
| 1.69 |
|
|
| 2.22 |
|
|
| 88 |
|
|
Royce Enterprise Select Fund – Investment Class | |||||||||||||||||||||||||||||||||||||||||||||||||||||||||
†2013 |
| $ | 10.36 |
| $ | (0.03 | ) | $ | 1.22 |
| $ | 1.19 |
| $ | – |
| $ | – |
| $ | – |
| $ | – |
| $ | – |
| $ | 11.55 |
|
| 11.49 | %1 | $ | 1,995 |
|
| 3.48 | %2 |
|
| 3.48 | %2 |
|
| 1.24 | %2 |
|
| (0.49 | )%2 |
|
| 77 | % |
|
2012 |
|
| 9.88 |
|
| 0.02 |
|
| 1.51 |
|
| 1.53 |
|
| (0.00 | ) |
| (1.05 | ) |
| – |
|
| (1.05 | ) |
| – |
|
| 10.36 |
|
| 15.68 |
|
| 1,299 |
|
| 0.98 | 2 |
|
| 0.98 | 2 |
|
| 0.81 | 2 |
|
| 0.18 | 2 |
|
| 127 |
|
|
2011 |
|
| 10.43 |
|
| (0.04 | ) |
| 0.09 |
|
| 0.05 |
|
| – |
|
| (0.60 | ) |
| – |
|
| (0.60 | ) |
| – |
|
| 9.88 |
|
| 0.66 |
|
| 1,123 |
|
| 1.31 |
|
|
| 1.31 |
|
|
| 1.31 |
|
|
| (0.42 | ) |
|
| 136 |
|
|
2010 |
|
| 8.95 |
|
| 0.05 |
|
| 1.49 |
|
| 1.54 |
|
| (0.06 | ) |
| – |
|
| – |
|
| (0.06 | ) |
| – |
|
| 10.43 |
|
| 17.22 |
|
| 1,158 |
|
| 0.70 |
|
|
| 0.70 |
|
|
| 0.70 |
|
|
| 0.50 |
|
|
| 166 |
|
|
2009 |
|
| 7.33 |
|
| 0.07 |
|
| 1.62 |
|
| 1.69 |
|
| (0.07 | ) |
| – |
|
| – |
|
| (0.07 | ) |
| – |
|
| 8.95 |
|
| 23.13 |
|
| 1,150 |
|
| 0.03 |
|
|
| 0.03 |
|
|
| 0.03 |
|
|
| 0.88 |
|
|
| 415 |
|
|
2008 |
|
| 10.04 |
|
| 0.13 |
|
| (2.80 | ) |
| (2.67 | ) |
| (0.12 | ) |
| (0.02 | ) |
| – |
|
| (0.14 | ) |
| 0.10 |
|
| 7.33 |
|
| (25.53 | ) |
| 917 |
|
| 0.28 |
|
|
| 0.28 |
|
|
| 0.28 |
|
|
| 1.48 |
|
|
| 764 |
|
|
Royce SMid-Cap Value Fund – Service Class | |||||||||||||||||||||||||||||||||||||||||||||||||||||||||
†2013 |
| $ | 11.66 |
| $ | 0.01 |
| $ | 0.55 |
| $ | 0.56 |
| $ | – |
| $ | – |
| $ | – |
| $ | – |
| $ | – |
| $ | 12.22 |
|
| 4.80 | %1 | $ | 10,625 |
|
| 2.03 | %2 |
|
| 2.03 | %2 |
|
| 1.35 | %2 |
|
| 0.14 | %2 |
|
| 17 | % |
|
2012 |
|
| 10.10 |
|
| (0.00 | ) |
| 1.55 |
|
| 1.55 |
|
| – |
|
| – |
|
| – |
|
| – |
|
| 0.01 |
|
| 11.66 |
|
| 15.45 |
|
| 11,140 |
|
| 1.90 |
|
|
| 1.90 |
|
|
| 1.35 |
|
|
| (0.03 | ) |
|
| 46 |
|
|
2011 |
|
| 11.44 |
|
| (0.06 | ) |
| (1.27 | ) |
| (1.33 | ) |
| (0.02 | ) |
| – |
|
| – |
|
| (0.02 | ) |
| 0.01 |
|
| 10.10 |
|
| (11.57 | ) |
| 10,327 |
|
| 1.95 |
|
|
| 1.95 |
|
|
| 1.49 |
|
|
| (0.54 | ) |
|
| 54 |
|
|
2010 |
|
| 9.08 |
|
| (0.03 | ) |
| 2.39 |
|
| 2.36 |
|
| – |
|
| – |
|
| – |
|
| – |
|
| – |
|
| 11.44 |
|
| 25.99 |
|
| 6,195 |
|
| 2.40 |
|
|
| 2.40 |
|
|
| 1.49 |
|
|
| (0.26 | ) |
|
| 126 |
|
|
2009 |
|
| 7.06 |
|
| (0.01 | ) |
| 2.03 |
|
| 2.02 |
|
| (0.01 | ) |
| – |
|
| – |
|
| (0.01 | ) |
| 0.01 |
|
| 9.08 |
|
| 28.75 |
|
| 7,365 |
|
| 2.03 |
|
|
| 2.03 |
|
|
| 1.49 |
|
|
| (0.20 | ) |
|
| 216 |
|
|
2008 |
|
| 9.99 |
|
| 0.02 |
|
| (2.96 | ) |
| (2.94 | ) |
| (0.01 | ) |
| – |
|
| – |
|
| (0.01 | ) |
| 0.02 |
|
| 7.06 |
|
| (29.27 | ) |
| 14,059 |
|
| 2.05 |
|
|
| 2.04 |
|
|
| 1.49 |
|
|
| 0.31 |
|
|
| 397 |
|
|
Royce Focus Value Fund – Service Class a | |||||||||||||||||||||||||||||||||||||||||||||||||||||||||
†2013 |
| $ | 14.74 |
| $ | 0.01 |
| $ | 0.64 |
| $ | 0.65 |
| $ | – |
| $ | – |
| $ | – |
| $ | – |
| $ | – |
| $ | 15.39 |
|
| 4.41 | %1 | $ | 9,964 |
|
| 1.99 | %2 |
|
| 1.99 | %2 |
|
| 1.35 | %2 |
|
| 0.20 | %2 |
|
| 85 | % |
|
2012 |
|
| 13.75 |
|
| 0.06 |
|
| 1.20 |
|
| 1.26 |
|
| (0.27 | ) |
| (0.00 | ) |
| – |
|
| (0.27 | ) |
| – |
|
| 14.74 |
|
| 9.20 |
|
| 8,875 |
|
| 2.05 |
|
|
| 2.05 |
|
|
| 1.35 |
|
|
| 0.35 |
|
|
| 21 |
|
|
2011 |
|
| 16.59 |
|
| (0.05 | ) |
| (2.25 | ) |
| (2.30 | ) |
| – |
|
| (0.54 | ) |
| – |
|
| (0.54 | ) |
| – |
|
| 13.75 |
|
| (13.88 | ) |
| 8,727 |
|
| 1.97 |
|
|
| 1.97 |
|
|
| 1.49 |
|
|
| (0.31 | ) |
|
| 25 |
|
|
2010 |
|
| 14.82 |
|
| (0.06 | ) |
| 2.30 |
|
| 2.24 |
|
| (0.06 | ) |
| (0.41 | ) |
| – |
|
| (0.47 | ) |
| – |
|
| 16.59 |
|
| 15.16 |
|
| 8,942 |
|
| 1.95 |
|
|
| 1.95 |
|
|
| 1.49 |
|
|
| (0.32 | ) |
|
| 31 |
|
|
2009 |
|
| 10.00 |
|
| 0.00 |
|
| 5.31 |
|
| 5.31 |
|
| (0.05 | ) |
| (0.44 | ) |
| – |
|
| (0.49 | ) |
| – |
|
| 14.82 |
|
| 53.27 | 1 |
| 4,796 |
|
| 2.97 | 2 |
|
| 2.97 | 2 |
|
| 1.49 | 2 |
|
| 0.17 | 2 |
|
| 21 |
|
|
Royce Partners Fund – Service Class b | |||||||||||||||||||||||||||||||||||||||||||||||||||||||||
†2013 |
| $ | 12.04 |
| $ | 0.05 |
| $ | 1.41 |
| $ | 1.46 |
| $ | – |
| $ | – |
| $ | – |
| $ | – |
| $ | – |
| $ | 13.50 |
|
| 12.13 | %1 | $ | 2,408 |
|
| 3.62 | %2 |
|
| 3.62 | %2 |
|
| 1.35 | %2 |
|
| 0.73 | %2 |
|
| 34 | % |
|
2012 |
|
| 10.37 |
|
| 0.04 |
|
| 2.10 |
|
| 2.14 |
|
| (0.01 | ) |
| (0.46 | ) |
| – |
|
| (0.47 | ) |
| – |
|
| 12.04 |
|
| 20.74 |
|
| 2,083 |
|
| 4.83 |
|
|
| 4.83 |
|
|
| 1.35 |
|
|
| 0.33 |
|
|
| 31 |
|
|
2011 |
|
| 13.15 |
|
| (0.03 | ) |
| (1.52 | ) |
| (1.55 | ) |
| (0.05 | ) |
| (1.18 | ) |
| – |
|
| (1.23 | ) |
| – |
|
| 10.37 |
|
| (11.66 | ) |
| 1,682 |
|
| 4.25 |
|
|
| 4.25 |
|
|
| 1.49 |
|
|
| (0.25 | ) |
|
| 44 |
|
|
2010 |
|
| 11.56 |
|
| 0.01 |
|
| 2.14 |
|
| 2.15 |
|
| (0.16 | ) |
| (0.41 | ) |
| – |
|
| (0.57 | ) |
| 0.01 |
|
| 13.15 |
|
| 18.74 |
|
| 1,771 |
|
| 3.72 |
|
|
| 3.72 |
|
|
| 1.49 |
|
|
| 0.10 |
|
|
| 38 |
|
|
2009 |
|
| 10.00 |
|
| (0.05 | ) |
| 1.61 |
|
| 1.56 |
|
| – |
|
| – |
|
| – |
|
| – |
|
| – |
|
| 11.56 |
|
| 15.60 | 1 |
| 1,501 |
|
| 5.27 | 2 |
|
| 5.27 | 2 |
|
| 1.49 | 2 |
|
| (0.71 | )2 |
|
| 14 |
|
|
Royce Opportunity Select Fund – Investment Class c | |||||||||||||||||||||||||||||||||||||||||||||||||||||||||
†2013 |
| $ | 12.81 |
| $ | (0.06 | ) | $ | 2.34 |
| $ | 2.28 |
| $ | – |
| $ | – |
| $ | – |
| $ | – |
| $ | 0.01 |
| $ | 15.10 |
|
| 17.88 | %1 | $ | 6,791 |
|
| 1.91 | %2 |
|
| 1.91 | %2 |
|
| 1.27 | %2 |
|
| (0.80 | )%2 |
|
| 95 | % |
|
2012 |
|
| 10.33 |
|
| 0.07 |
|
| 3.50 |
|
| 3.57 |
|
| (0.13 | ) |
| (0.96 | ) |
| – |
|
| (1.09 | ) |
| – |
|
| 12.81 |
|
| 35.14 |
|
| 3,198 |
|
| 0.29 | 2 |
|
| 0.29 | 2 |
|
| 0.25 | 2 |
|
| 0.64 | 2 |
|
| 196 |
|
|
2011 |
|
| 12.99 |
|
| 0.01 |
|
| (2.26 | ) |
| (2.25 | ) |
| (0.02 | ) |
| (0.39 | ) |
| – |
|
| (0.41 | ) |
| – |
|
| 10.33 |
|
| (17.14 | ) |
| 2,102 |
|
| 1.14 |
|
|
| 1.14 |
|
|
| 1.14 |
|
|
| 0.08 |
|
|
| 299 |
|
|
2010 |
|
| 10.00 |
|
| (0.43 | ) |
| 3.42 |
|
| 2.99 |
|
| – |
|
| – |
|
| – |
|
| – |
|
| – |
|
| 12.99 |
|
| 29.90 | 1 |
| 1,913 |
|
| 4.01 | 1 |
|
| 4.01 | 1 |
|
| 4.01 | 1 |
|
| (3.79 | )1 |
|
| 95 |
|
|
|
|
|
84 | The Royce Funds 2013 Semiannual Report to Shareholders | THE ACCOMPANYING NOTES ARE AN INTEGRAL PART OF THESE FINANCIAL STATEMENTS. | |
|
Financial Highlights |
| |||||||||||||||||||||||||||||||||||||||||||||||||||||||||
|
| Net |
| Net |
| Net Realized and Unrealized |
|
| Distributions |
| Distributions from Net |
|
|
|
|
|
|
|
|
| Ratio of Expenses to Average Net Assets |
| Ratio of Net Investment |
|
| ||||||||||||||||||||||||||||||||
|
| Asset Value, |
| Investment |
| Gain (Loss) on |
| Total from Investment Operations |
| from Net Investment Income |
| Realized Gain on |
| Distributions |
| Total Distributions |
| Shareholder Redemption Fees |
| Net Asset |
| Total Return |
| Net Assets, |
| Prior to Fee |
| Prior |
| Net of |
| Income (Loss) |
| Portfolio Turnover Rate |
| ||||||||||||||||||||||
|
|
|
|
|
|
|
|
|
|
|
|
|
|
|
|
|
|
|
|
|
|
|
|
|
|
|
|
|
|
|
|
|
|
|
|
|
|
|
|
|
|
|
|
|
|
|
|
|
|
|
|
|
|
|
|
|
|
Royce Global Dividend Value Fund – Service Class d | |||||||||||||||||||||||||||||||||||||||||||||||||||||||||
†2013 |
| $ | 10.10 |
| $ | 0.11 |
| $ | 0.08 |
| $ | 0.19 |
| $ | (0.06 | ) | $ | – |
| $ | – |
| $ | (0.06 | ) | $ | 0.01 |
| $ | 10.24 |
|
| 1.97 | %1 | $ | 7,903 |
|
| 2.67 | %2 |
|
| 2.67 | %2 |
|
| 1.69 | %2 |
|
| 2.17 | %2 |
|
| 49 | % |
|
2012 |
|
| 8.39 |
|
| 0.17 |
|
| 1.71 |
|
| 1.88 |
|
| (0.17 | ) |
| – |
|
| – |
|
| (0.17 | ) |
| – |
|
| 10.10 |
|
| 22.52 |
|
| 6,708 |
|
| 2.86 |
|
|
| 2.86 |
|
|
| 1.69 |
|
|
| 1.72 |
|
|
| 36 |
|
|
2011 |
|
| 10.00 |
|
| 0.08 |
|
| (1.62 | ) |
| (1.54 | ) |
| (0.07 | ) |
| (0.01 | ) |
| – |
|
| (0.08 | ) |
| 0.01 |
|
| 8.39 |
|
| (15.37 | )1 |
| 6,135 |
|
| 3.47 | 2 |
|
| 3.47 | 2 |
|
| 1.69 | 2 |
|
| 1.10 | 2 |
|
| 20 |
|
|
Royce International Micro-Cap Fund – Service Class d | |||||||||||||||||||||||||||||||||||||||||||||||||||||||||
†2013 |
| $ | 8.61 |
| $ | 0.07 |
| $ | (0.12 | ) | $ | (0.05 | ) | $ | – |
| $ | – |
| $ | – |
| $ | – |
| $ | 0.01 |
| $ | 8.57 |
|
| (0.46 | )%1 | $ | 4,041 |
|
| 3.47 | %2 |
|
| 3.47 | %2 |
|
| 1.69 | %2 |
|
| 1.63 | %2 |
|
| 25 | % |
|
2012 |
|
| 7.72 |
|
| 0.13 |
|
| 0.92 |
|
| 1.05 |
|
| (0.16 | ) |
| – |
|
| – |
|
| (0.16 | ) |
| – |
|
| 8.61 |
|
| 13.59 |
|
| 4,603 |
|
| 3.90 |
|
|
| 3.90 |
|
|
| 1.69 |
|
|
| 1.63 |
|
|
| 62 |
|
|
2011 |
|
| 10.00 |
|
| 0.10 |
|
| (2.26 | ) |
| (2.16 | ) |
| (0.12 | ) |
| – |
|
| (0.01 | ) |
| (0.13 | ) |
| 0.01 |
|
| 7.72 |
|
| (21.51 | )1 |
| 3,572 |
|
| 3.92 | 2 |
|
| 3.92 | 2 |
|
| 1.69 | 2 |
|
| 1.08 | 2 |
|
| 71 |
|
|
Royce International Premier Fund – Service Class d | |||||||||||||||||||||||||||||||||||||||||||||||||||||||||
†2013 |
| $ | 10.01 |
| $ | 0.09 |
| $ | 0.37 |
| $ | 0.46 |
| $ | – |
| $ | – |
| $ | – |
| $ | – |
| $ | – |
| $ | 10.47 |
|
| 4.60 | %1 | $ | 6,990 |
|
| 2.69 | %2 |
|
| 2.69 | %2 |
|
| 1.69 | %2 |
|
| 1.65 | %2 |
|
| 16 | % |
|
2012 |
|
| 8.26 |
|
| 0.12 |
|
| 1.81 |
|
| 1.93 |
|
| (0.18 | ) |
| – |
|
| – |
|
| (0.18 | ) |
| – |
|
| 10.01 |
|
| 23.40 |
|
| 6,444 |
|
| 3.54 |
|
|
| 3.54 |
|
|
| 1.69 |
|
|
| 1.18 |
|
|
| 103 |
|
|
2011 |
|
| 10.00 |
|
| 0.05 |
|
| (1.73 | ) |
| (1.68 | ) |
| (0.06 | ) |
| (0.00 | ) |
| (0.01 | ) |
| (0.07 | ) |
| 0.01 |
|
| 8.26 |
|
| (16.75 | )1 |
| 4,090 |
|
| 3.77 | 2 |
|
| 3.77 | 2 |
|
| 1.69 | 2 |
|
| 0.67 | 2 |
|
| 42 |
|
|
Royce Special Equity Multi-Cap Fund – Investment Class e | |||||||||||||||||||||||||||||||||||||||||||||||||||||||||
†2013 |
| $ | 11.64 |
| $ | 0.06 |
| $ | 2.03 |
| $ | 2.09 |
| $ | – |
| $ | – |
| $ | – |
| $ | – |
| $ | – |
| $ | 13.73 |
|
| 17.96 | %1 | $ | 50,209 |
|
| 1.15 | %2 |
|
| 1.15 | %2 |
|
| 1.14 | %2 |
|
| 1.01 | %2 |
|
| 20 | % |
|
2012 |
|
| 11.54 |
|
| 0.12 |
|
| 0.22 |
|
| 0.34 |
|
| (0.14 | ) |
| (0.10 | ) |
| – |
|
| (0.24 | ) |
| – |
|
| 11.64 |
|
| 3.00 | 1 |
| 34,375 |
|
| 1.19 | 2 |
|
| 1.19 | 2 |
|
| 1.16 | 2 |
|
| 1.55 | 2 |
|
| 14 |
|
|
Royce Special Equity Multi-Cap Fund – Service Class f | |||||||||||||||||||||||||||||||||||||||||||||||||||||||||
†2013 |
| $ | 11.68 |
| $ | 0.05 |
| $ | 2.03 |
| $ | 2.08 |
| $ | – |
| $ | – |
| $ | – |
| $ | – |
| $ | – |
| $ | 13.76 |
|
| 17.81 | %1 | $ | 63,074 |
|
| 1.55 | %2 |
|
| 1.55 | %2 |
|
| 1.38 | %2 |
|
| 0.76 | %2 |
|
| 20 | % |
|
2012 |
|
| 10.64 |
|
| 0.13 |
|
| 1.10 |
|
| 1.23 |
|
| (0.09 | ) |
| (0.10 | ) |
| – |
|
| (0.19 | ) |
| – |
|
| 11.68 |
|
| 11.62 |
|
| 43,690 |
|
| 1.51 |
|
|
| 1.51 |
|
|
| 1.36 |
|
|
| 1.15 |
|
|
| 14 |
|
|
| 2011 | 10.00 | 0.06 | 0.65 | 0.71 | (0.06 | ) | (0.02 | ) | – | (0.08 | ) | 0.01 | 10.64 | 7.20 | 1 | 36,811 | 1.97 | 2 | 1.97 | 2 | 1.39 | 2 | 1.45 | 2 | 5 | ||||||||||||||||||||||||||||||||
Royce Special Equity Multi-Cap Fund – Institutional Class g | |||||||||||||||||||||||||||||||||||||||||||||||||||||||||
†2013 |
| $ | 11.64 |
| $ | 0.07 |
| $ | 2.03 |
| $ | 2.10 |
| $ | – |
| $ | – |
| $ | – |
| $ | – |
| $ | – |
| $ | 13.74 |
|
| 18.04 | %1 | $ | 45,896 |
|
| 1.10 | %2 |
|
| 1.10 | %2 |
|
| 1.04 | %2 |
|
| 1.08 | %2 |
|
| 20 | % |
|
2012 |
|
| 11.83 |
|
| 0.10 |
|
| (0.03 | ) |
| 0.07 |
|
| (0.16 | ) |
| (0.10 | ) |
| – |
|
| (0.26 | ) |
| – |
|
| 11.64 |
|
| 0.61 | 1 |
| 30,905 |
|
| 1.21 | 2 |
|
| 1.21 | 2 |
|
| 1.04 | 2 |
|
| 1.76 | 2 |
|
| 14 |
|
|
| † | Six months ended June 30, 2013 (unaudited). |
| 1 | Not annualized |
| 2 | Annualized |
| a | The Fund commenced operations on March 2, 2009. |
| b | The Fund commenced operations on April 28, 2009. |
| c | The Fund commenced operations on September 1, 2010. |
| d | The Fund commenced operations on January 3, 2011. |
| e | The Class commenced operations on March 1, 2012. |
| f | The Class commenced operations on January 3, 2011. |
| g | The Class commenced operations on April 18, 2012. |
|
|
|
THE ACCOMPANYING NOTES ARE AN INTEGRAL PART OF THESE FINANCIAL STATEMENTS. | The Royce Funds 2013 Semiannual Report to Shareholders | 85 | |
| Notes to Financial Statements (unaudited) | |
| Summary of Significant Accounting Policies: |
Royce Select Fund I, Royce Micro-Cap Discovery Fund, Royce Financial Services Fund, Royce Select Fund II, Royce Global Select Long/Short Fund, Royce European Smaller-Companies Fund, Royce Enterprise Select Fund, Royce SMid-Cap Value Fund, Royce Focus Value Fund, Royce Partners Fund, Royce Opportunity Select Fund, Royce Global Dividend Value Fund, Royce International Micro-Cap Fund, Royce International Premier Fund and Royce Special Equity Multi-Cap Fund (the “Fund” or “Funds”), are fifteen series of The Royce Fund (the “Trust”), a diversified open-end management investment company organized as a Delaware statutory trust. |
| Royce Select Fund I | 13 | % | Royce Focus Value Fund | 77 | % | ||||
| Royce Micro-Cap Discovery Fund | 49 | % | Royce Partners Fund | 78 | % | ||||
| Royce Select Fund II | 41 | % | Royce Opportunity Select Fund | 41 | % | ||||
| Royce Global Select Long/Short Fund | 26 | % | Royce Global Dividend Value Fund | 14 | % | ||||
| Royce Enterprise Select Fund | 57 | % | Royce International Micro-Cap Fund | 26 | % | ||||
| Royce SMid-Cap Value Fund | 41 | % | Royce International Premier Fund | 21 | % |
| Valuation of Investments: |
Securities are valued as of the close of trading on the New York Stock Exchange (NYSE) (generally 4:00 p.m. Eastern time) on the valuation date. Securities that trade on an exchange, and securities traded on Nasdaq’s Electronic Bulletin Board, are valued at their last reported sales price or Nasdaq official closing price taken from the primary market in which each security trades or, if no sale is reported for such day, at their highest bid price (in the case of long positions) or at the lowest ask price (in the case of short positions). Other over-the-counter securities for which market quotations are readily available are valued at their highest bid price, except in the case of some bonds and other fixed income securities which may be valued by reference to other securities with comparable ratings, interest rates and maturities, using established independent pricing services. The Funds value their non-U.S. dollar denominated securities in U.S. dollars daily at the prevailing foreign currency exchange rates as quoted by a major bank. Securities for which market quotations are not readily available are valued at their fair value in accordance with the provisions of the 1940 Act, under procedures approved by the Fund's Board of Trustees, and are reported as Level 3 securities. As a general principle, the fair value of a security is the amount which the Fund might reasonably expect to receive for the security upon its current sale. However, in light of the judgment involved in fair valuations, there can be no assurance that a fair value assigned to a particular security will be the amount which the Fund might be able to receive upon its current sale. In addition, if, between the time trading ends on a particular security and the close of the customary trading session on the NYSE, events occur that are significant and may make the closing price unreliable, a Fund may fair value the security. The Funds use an independent pricing service to provide fair value estimates for relevant non-U.S. equity securities on days when the U.S. market volatility exceeds a certain threshold. This pricing service uses proprietary correlations it has developed between the movement of prices of non-U.S. equity securities and indices of U.S.-traded securities, futures contracts and other indications to estimate the fair value of relevant non-U.S. securities. When fair value pricing is employed, the prices of securities used by a Fund may differ from quoted or published prices for the same security. Investments in money market funds are valued at net asset value per share. |
Various inputs are used in determining the value of each Fund’s investments, as noted above. These inputs are summarized in the three broad levels below: | |||
Level 1 – quoted prices in active markets for identical securities. | |||
Level 2 – other significant observable inputs (including quoted prices for similar securities, foreign securities that may be fair valued and repurchase agreements). The table below includes all Level 2 securities. Any Level 2 securities with values based on quoted prices for similar securities would be noted in the Schedules of Investments. | |||
Level 3 – significant unobservable inputs (including last trade price before trading was suspended, or at a discount thereto for lack of marketability or otherwise, market price information regarding other securities, information received from the company and/or published documents, including SEC filings and financial statements, or other publicly available information). | |||
The inputs or methodology used for valuing securities are not necessarily an indication of the risk associated with investing in those securities. | |||
The following is a summary of the inputs used to value each Fund’s investments as of June 30, 2013. For a detailed breakout of common stocks by sector classification or country, please refer to the Schedules of Investments. | |||
| 86 | The Royce Funds 2013 Semiannual Report to Shareholders |
| Level 1 | Level 2 | Level 3 | Total | |||||||||||
| Royce Select Fund I | ||||||||||||||
| Common Stocks | $ | 40,905,950 | $ | – | $ | – | $ | 40,905,950 | ||||||
| Cash Equivalents | – | 2,801,000 | – | 2,801,000 | ||||||||||
| Royce Micro-Cap Discovery Fund | ||||||||||||||
| Common Stocks | 4,971,433 | – | – | 4,971,433 | ||||||||||
| Cash Equivalents | – | 170,000 | – | 170,000 | ||||||||||
| Royce Financial Services Fund | ||||||||||||||
| Common Stocks | 23,103,015 | – | – | 23,103,015 | ||||||||||
| Cash Equivalents | – | 5,045,000 | – | 5,045,000 | ||||||||||
| Royce Select Fund II | ||||||||||||||
| Common Stocks | 3,949,241 | – | – | 3,949,241 | ||||||||||
| Cash Equivalents | – | 628,000 | – | 628,000 | ||||||||||
| Royce Global Select Long/Short Fund | ||||||||||||||
| Common Stocks | 12,458,609 | – | – | 12,458,609 | ||||||||||
| Cash Equivalents | – | 315,000 | – | 315,000 | ||||||||||
| Royce European Smaller-Companies Fund | ||||||||||||||
| Common Stocks | 17,838,664 | – | – | 17,838,664 | ||||||||||
| Cash Equivalents | – | 257,000 | – | 257,000 | ||||||||||
| Royce Enterprise Select Fund | ||||||||||||||
| Common Stocks | 1,458,430 | – | – | 1,458,430 | ||||||||||
| Fixed Income | 49,725 | – | – | 49,725 | ||||||||||
| Cash Equivalents | – | 516,000 | – | 516,000 | ||||||||||
| Royce SMid-Cap Value Fund | ||||||||||||||
| Common Stocks | 9,289,331 | – | – | 9,289,331 | ||||||||||
| Cash Equivalents | – | 1,338,000 | – | 1,338,000 | ||||||||||
| Royce Focus Value Fund | ||||||||||||||
| Common Stocks | 9,154,623 | – | – | 9,154,623 | ||||||||||
| Fixed Income | 126,752 | – | – | 126,752 | ||||||||||
| Cash Equivalents | – | 1,033,000 | – | 1,033,000 | ||||||||||
| Royce Partners Fund | ||||||||||||||
| Common Stocks | 2,250,405 | – | – | 2,250,405 | ||||||||||
| Cash Equivalents | – | 161,000 | – | 161,000 | ||||||||||
| Royce Opportunity Select Fund | ||||||||||||||
| Common Stocks | 6,966,344 | – | – | 6,966,344 | ||||||||||
| Cash Equivalents | – | 269,000 | – | 269,000 | ||||||||||
| Royce Global Dividend Value Fund | ||||||||||||||
| Common Stocks | 7,449,870 | – | – | 7,449,870 | ||||||||||
| Cash Equivalents | – | 627,000 | – | 627,000 | ||||||||||
| Royce International Micro-Cap Fund | ||||||||||||||
| Common Stocks | 3,890,576 | – | 529 | 3,891,105 | ||||||||||
| Cash Equivalents | – | 137,000 | – | 137,000 | ||||||||||
| Royce International Premier Fund | ||||||||||||||
| Common Stocks | 6,941,731 | – | – | 6,941,731 | ||||||||||
| Royce Special Equity Multi-Cap Fund | ||||||||||||||
| Common Stocks | 153,504,004 | – | – | 153,504,004 | ||||||||||
| Cash Equivalents | – | 6,610,000 | – | 6,610,000 | ||||||||||
Short positions: | ||||||||||||||
| Level 1 | Level 2 | Level 3 | Total | |||||||||||
| Royce Select Fund II | ||||||||||||||
| Common Stocks | $ | (117,094 | ) | $ | – | $ | – | $ | (117,094 | ) | ||||
| Fixed Income | (27,610 | ) | – | – | (27,610 | ) | ||||||||
| Royce Global Select Long/Short Fund | ||||||||||||||
| Common Stocks | (2,174,493 | ) | – | – | (2,174,493 | ) | ||||||||
| Royce Opportunity Select Fund | ||||||||||||||
| Common Stocks | (667,330 | ) | – | – | (667,330 | ) | ||||||||
| The Royce Funds 2013 Semiannual Report to Shareholders | 87 |
| Notes to Financial Statements (unaudited) (continued) | |
For the six months ended June 30, 2013, certain securities have transferred in and out of Level 1 and Level 2 measurements as a result of the fair value pricing procedures for international equities. The Funds recognize transfers between levels as of the end of the reporting period. At June 30, 2013, the following Funds had securities transfer from Level 2 to Level 1 within the fair value hierarchy: |
| Transfers from Level 2 | Transfers from Level 2 | ||||||||||||
| to Level 1 | to Level 1 | ||||||||||||
| Royce Select Fund I | $ | 1,230,522 | Royce SMid-Cap Value Fund | $ | 2,011,627 | ||||||||
| Royce Financial Services Fund | 4,334,488 | Royce Focus Value Fund | 700,295 | ||||||||||
| Royce Select Fund II | 676,512 | Royce Partners Fund | 318,582 | ||||||||||
| Royce Global Select Long/Short Fund | 9,985,200 | Royce Global Dividend Value Fund | 4,602,093 | ||||||||||
| Royce European Smaller-Companies Fund | 14,009,358 | Royce International Micro-Cap Fund | 3,179,332 | ||||||||||
| Royce Enterprise Select Fund | 15,847 | Royce International Premier Fund | 6,049,376 | ||||||||||
| Level 3 Reconciliation: | ||||||||||||||||
| Realized and Unrealized | ||||||||||||||||
| Balance as of 12/31/12 | Gain (Loss)1 | Balance as of 6/30/13 | ||||||||||||||
| Royce International Micro-Cap Fund | ||||||||||||||||
| Common Stocks | $2,184 | $(1,655) | $529 | |||||||||||||
| 1 | The net change in unrealized appreciation (depreciation) is included in the accompanying Statement of Operations. Change in unrealized appreciation (depreciation) includes net unrealized appreciation (depreciation) resulting from changes in investment values during the reporting period and the reversal of previously recorded unrealized appreciation (depreciation) when gains or losses are realized. Net realized gain (loss) from investments and foreign currency transactions is included in the accompanying Statement of Operations. |
Repurchase Agreements:
The Funds may enter into repurchase agreements with institutions that the Funds’ investment adviser has determined are creditworthy. Each Fund restricts repurchase agreements to maturities of no more than seven days. Securities pledged as collateral for repurchase agreements, which are held until maturity of the repurchase agreements, are marked-to-market daily and maintained at a value at least equal to the principal amount of the repurchase agreement (including accrued interest). Repurchase agreements could involve certain risks in the event of default or insolvency of the counter-party, including possible delays or restrictions upon the ability of each Fund to dispose of its underlying securities.
Foreign Currency:
Net realized foreign exchange gains or losses arise from sales and maturities of short-term securities, sales of foreign currencies, expiration of currency forward contracts, currency gains or losses realized between the trade and settlement dates on securities transactions, and the difference between the amounts of dividends, interest, and foreign withholding taxes recorded on each Fund’s books and the U.S. dollar equivalent of the amounts actually received or paid. Net unrealized foreign exchange gains and losses arise from changes in the value of assets and liabilities, including investments in securities at the end of the reporting period, as a result of changes in foreign currency exchange rates.
Short Sales:
The Funds may sell securities they do not own in anticipation of a decline in the fair value of that security. When a Fund sells a security short, it must borrow the security sold short and deliver it to the broker-dealer through which it made the short sale. A gain, limited to the price at which the Fund sold the security short, or a loss, unlimited in size, will be recognized upon the termination of a short sale. On ex-dividend date, dividends on short sales are recorded as an expense to the Fund.
Securities Lending:
The Funds loan securities through a lending agent to qualified institutional investors for the purpose of realizing additional income. Collateral for the Funds on all securities loaned is accepted in cash and cash equivalents and invested temporarily by the custodian. The collateral maintained is at least 100% of the current market value of the loaned securities. The market value of the loaned securities is determined at the close of business of the Funds and any additional required collateral is delivered to the Funds on the next business day. The Funds retain the risk of any loss on the securities on loan as well as incurring the potential loss on investments purchased with cash collateral received for securities lending. The Funds’ securities lending income consists of the income earned on investing cash collateral, plus any premium payments received for lending certain securities, less any rebates paid to borrowers and lending agent fees associated with the loan. The lending agent is not affiliated with Royce.
Distributions and Taxes:
As qualified regulated investment companies under Subchapter M of the Internal Revenue Code, the Funds are not subject to income taxes to the extent that each Fund distributes substantially all of its taxable income for its fiscal year.
Royce Global Dividend Value Fund pays any dividends from net investment income quarterly and makes any distributions from net realized gains annually in December. The other Funds pay any dividends and capital gain distributions annually in December. Dividends from net investment income are determined at a class level and distributions from capital gains are determined at a Fund level. Because federal income tax regulations differ from generally accepted accounting principles, income and capital gain distributions determined in accordance with tax regulations may differ from net investment income and realized gains recognized for financial reporting purposes. Accordingly, the character of distributions and composition of net assets for tax purposes differ from those reflected in the accompanying financial statements.
| 88 | The Royce Funds 2013 Semiannual Report to Shareholders |
Investment Transactions and Related Investment Income:
Investment transactions are accounted for on the trade date. Dividend income is recorded on the ex-dividend date. Non-cash dividend income is recorded at the fair market value of the securities received. Interest income is recorded on an accrual basis. Premium and discounts on debt securities are amortized using the effective yield-to-maturity method. Realized gains and losses from investment transactions are determined on the basis of identified cost for book and tax purposes.
Expenses:
The Funds incur direct and indirect expenses. Expenses directly attributable to a Fund are charged to the Fund’s operations, while expenses applicable to more than one of the Royce Funds are allocated equitably. Certain personnel, occupancy costs and other administrative expenses related to the Royce Funds are allocated by Royce under an administration agreement and are included in administrative and office facilities and legal expenses. The Fund has adopted a deferred fee agreement that allows the Trustees to defer the receipt of all or a portion of trustees’ fees otherwise payable. The deferred fees are invested in certain Royce Funds until distributed in accordance with the agreement.
Compensating Balance Credits:
The Funds have arrangements with their custodian bank and transfer agent, whereby a portion of the custodian’s fee and transfer agent’s fee is paid indirectly by credits earned on a Fund’s cash on deposit with the bank and transfer agent. These deposit arrangements are an alternative to purchasing overnight investments. Conversely, a Fund pays interest to the custodian on any cash overdrafts, to the extent they are not offset by credits earned on positive cash balances.
Line of Credit:
The Funds, along with certain other Royce Funds, participate in a $75 million line of credit (“Credit Agreement”) to be used for temporary or emergency purposes. This 364-day revolving Credit Agreement expires on July 11, 2014. Pursuant to the Credit Agreement, each participating Fund is liable only for principal and interest payments related to borrowings made by that Fund. Borrowings under the Credit Agreement bear interest at a rate equal to the higher of the federal funds rate + 1.25% or overnight LIBOR + 1.25%. The Funds did not utilize the line of credit during the six months ended June 30, 2013.
| Shares issued for | Net increase (decrease) from | |||||||||||||||||||||||||||||||
| Shares sold | reinvestment of distributions | Shares redeemed | capital share transactions | |||||||||||||||||||||||||||||
| Period ended | Period ended | Period ended | Period ended | |||||||||||||||||||||||||||||
| 6/30/13 | Period ended | 6/30/13 | Period ended | 6/30/13 | Period ended | 6/30/13 | Period ended | |||||||||||||||||||||||||
| (unaudited) | 12/31/12 | (unaudited) | 12/31/12 | (unaudited) | 12/31/12 | (unaudited) | 12/31/12 | |||||||||||||||||||||||||
| Royce Select Fund I | ||||||||||||||||||||||||||||||||
Investment Class | $ | 3,061,624 | $ | 5,074,208 | $ | – | $ | 4,672,287 | $ | (12,602,504 | ) | $ | (8,680,161 | ) | $ | (9,540,880 | ) | $ | 1,066,334 | |||||||||||||
| Royce Micro-Cap Discovery Fund | ||||||||||||||||||||||||||||||||
Service Class | 540,572 | 1,050,076 | – | 37,994 | (420,440 | ) | (361,057 | ) | 120,132 | 727,013 | ||||||||||||||||||||||
| Royce Financial Services Fund | ||||||||||||||||||||||||||||||||
Service Class | 9,670,740 | 4,612,568 | – | 149,100 | (2,467,495 | ) | (4,633,991 | ) | 7,203,245 | 127,677 | ||||||||||||||||||||||
| Royce Select Fund II | ||||||||||||||||||||||||||||||||
Investment Class | 815,496 | 6,284 | – | 215,961 | (254,140 | ) | (284,132 | ) | 561,356 | (61,887 | ) | |||||||||||||||||||||
| Royce Global Select Long/Short Fund | ||||||||||||||||||||||||||||||||
Investment Class | 415,741 | 748,210 | – | 574,715 | (9,394,184 | ) | (5,166,943 | ) | (8,978,443 | ) | (3,844,018 | ) | ||||||||||||||||||||
| Royce European Smaller-Companies Fund | ||||||||||||||||||||||||||||||||
Service Class | 4,740,601 | 3,702,876 | – | 219,038 | (2,342,600 | ) | (7,085,115 | ) | 2,398,001 | (3,163,201 | ) | |||||||||||||||||||||
| Royce Enterprise Select Fund | ||||||||||||||||||||||||||||||||
Investment Class | 650,704 | – | – | 119,819 | (100,000 | ) | (590 | ) | 550,704 | 119,229 | ||||||||||||||||||||||
| Royce SMid-Cap Value Fund | ||||||||||||||||||||||||||||||||
Service Class | 388,676 | 4,410,001 | – | – | (1,441,945 | ) | (5,023,302 | ) | (1,053,269 | ) | (613,301 | ) | ||||||||||||||||||||
| Royce Focus Value Fund | ||||||||||||||||||||||||||||||||
Service Class | 1,810,268 | 701,475 | – | 157,460 | (1,092,403 | ) | (1,353,002 | ) | 717,865 | (494,067 | ) | |||||||||||||||||||||
| Royce Partners Fund | ||||||||||||||||||||||||||||||||
Service Class | 129,212 | 128,126 | – | 76,833 | (58,611 | ) | (78,236 | ) | 70,601 | 126,723 | ||||||||||||||||||||||
| Royce Opportunity Select Fund | ||||||||||||||||||||||||||||||||
Investment Class | 3,314,076 | 352,527 | – | 227,344 | (397,486 | ) | (9,132 | ) | 2,916,590 | 570,739 | ||||||||||||||||||||||
| Royce Global Dividend Value Fund | ||||||||||||||||||||||||||||||||
Service Class | 1,810,457 | 1,477,197 | 45,287 | 109,376 | (720,002 | ) | (2,157,716 | ) | 1,135,742 | (571,143 | ) | |||||||||||||||||||||
| Royce International Micro-Cap Fund | ||||||||||||||||||||||||||||||||
Service Class | 832,175 | 1,435,544 | – | 78,472 | (1,384,147 | ) | (905,693 | ) | (551,972 | ) | 608,323 | |||||||||||||||||||||
| The Royce Funds 2013 Semiannual Report to Shareholders | 89 |
| Notes to Financial Statements (unaudited) (continued) | |
| Capital Share Transactions (in dollars) (continued): |
| Shares issued for | Net increase (decrease) from | |||||||||||||||||||||||||||||||
| Shares sold | reinvestment of distributions | Shares redeemed | capital share transactions | |||||||||||||||||||||||||||||
| Period ended | Period ended | Period ended | Period ended | |||||||||||||||||||||||||||||
| 6/30/13 | Period ended | 6/30/13 | Period ended | 6/30/13 | Period ended | 6/30/13 | Period ended | |||||||||||||||||||||||||
| (unaudited) | 12/31/12 | (unaudited) | 12/31/12 | (unaudited) | 12/31/12 | (unaudited) | 12/31/12 | |||||||||||||||||||||||||
| Royce International Premier Fund | ||||||||||||||||||||||||||||||||
Service Class | $ | 851,955 | $ | 2,793,388 | $ | – | $ | 76,745 | $ | (597,989 | ) | $ | (1,375,047 | ) | $ | 253,966 | $ | 1,495,086 | ||||||||||||||
| Royce Special Equity Multi-Cap Fund | ||||||||||||||||||||||||||||||||
Investment Class | 11,167,783 | 36,724,835 | – | 653,344 | (2,257,939 | ) | (2,544,262 | ) | 8,909,844 | 34,833,917 | ||||||||||||||||||||||
Service Class | 16,677,552 | 34,106,088 | – | 705,194 | (5,090,578 | ) | (32,520,070 | ) | 11,586,974 | 2,291,212 | ||||||||||||||||||||||
Institutional Class | 9,125,101 | 30,548,000 | – | 674,111 | (500,000 | ) | (3,182 | ) | 8,625,101 | 31,218,929 | ||||||||||||||||||||||
| Capital Share Transactions (in shares): |
| Shares issued for | Net increase (decrease) in | |||||||||||||||||||||||||||||||
| Shares sold | reinvestment of distributions | Shares redeemed | shares outstanding | |||||||||||||||||||||||||||||
| Period ended | Period ended | Period ended | Period ended | |||||||||||||||||||||||||||||
| 6/30/13 | Period ended | 6/30/13 | Period ended | 6/30/13 | Period ended | 6/30/13 | Period ended | |||||||||||||||||||||||||
| (unaudited) | 12/31/12 | (unaudited) | 12/31/12 | (unaudited) | 12/31/12 | (unaudited) | 12/31/12 | |||||||||||||||||||||||||
| Royce Select Fund I | ||||||||||||||||||||||||||||||||
Investment Class | 166,482 | 280,124 | – | 276,467 | (684,201 | ) | (488,288 | ) | (517,719 | ) | 68,303 | |||||||||||||||||||||
| Royce Micro-Cap Discovery Fund | ||||||||||||||||||||||||||||||||
Service Class | 96,831 | 210,468 | – | 7,462 | (74,610 | ) | (70,120 | ) | 22,221 | 147,810 | ||||||||||||||||||||||
| Royce Financial Services Fund | ||||||||||||||||||||||||||||||||
Service Class | 1,229,390 | 713,267 | – | 22,252 | (316,352 | ) | (729,615 | ) | 913,038 | 5,904 | ||||||||||||||||||||||
| Royce Select Fund II | ||||||||||||||||||||||||||||||||
Investment Class | 70,329 | 593 | – | 20,866 | (22,837 | ) | (26,289 | ) | 47,492 | (4,830 | ) | |||||||||||||||||||||
| Royce Global Select Long/Short Fund | ||||||||||||||||||||||||||||||||
Investment Class | 24,358 | 44,803 | – | 33,886 | (566,881 | ) | (312,018 | ) | (542,523 | ) | (233,329 | ) | ||||||||||||||||||||
| Royce European Smaller-Companies Fund | ||||||||||||||||||||||||||||||||
Service Class | 437,264 | 388,293 | – | 21,926 | (217,095 | ) | (752,653 | ) | 220,169 | (342,434 | ) | |||||||||||||||||||||
| Royce Enterprise Select Fund | ||||||||||||||||||||||||||||||||
Investment Class | 56,579 | – | – | 11,724 | (9,099 | ) | (59 | ) | 47,480 | 11,665 | ||||||||||||||||||||||
| Royce SMid-Cap Value Fund | ||||||||||||||||||||||||||||||||
Service Class | 32,045 | 390,512 | – | – | (118,050 | ) | (457,720 | ) | (86,005 | ) | (67,208 | ) | ||||||||||||||||||||
| Royce Focus Value Fund | ||||||||||||||||||||||||||||||||
Service Class | 118,453 | 48,418 | – | 10,988 | (72,959 | ) | (91,922 | ) | 45,494 | (32,516 | ) | |||||||||||||||||||||
| Royce Partners Fund | ||||||||||||||||||||||||||||||||
Service Class | 9,837 | 11,070 | – | 6,589 | (4,497 | ) | (6,930 | ) | 5,340 | 10,729 | ||||||||||||||||||||||
| Royce Opportunity Select Fund | ||||||||||||||||||||||||||||||||
Investment Class | 228,700 | 28,178 | – | 18,773 | (28,638 | ) | (754 | ) | 200,062 | 46,197 | ||||||||||||||||||||||
| Royce Global Dividend Value Fund | ||||||||||||||||||||||||||||||||
Service Class | 172,529 | 156,760 | 4,306 | 11,645 | (68,742 | ) | (235,478 | ) | 108,093 | (67,073 | ) | |||||||||||||||||||||
| Royce International Micro-Cap Fund | ||||||||||||||||||||||||||||||||
Service Class | 93,481 | 170,805 | – | 9,342 | (156,926 | ) | (108,278 | ) | (63,445 | ) | 71,869 | |||||||||||||||||||||
| Royce International Premier Fund | ||||||||||||||||||||||||||||||||
Service Class | 81,922 | 291,121 | – | 7,855 | (57,640 | ) | (150,814 | ) | 24,282 | 148,162 | ||||||||||||||||||||||
| Royce Special Equity Multi-Cap Fund | ||||||||||||||||||||||||||||||||
Investment Class | 875,389 | 3,113,219 | – | 56,659 | (172,680 | ) | (216,520 | ) | 702,709 | 2,953,358 | ||||||||||||||||||||||
Service Class | 1,238,858 | 2,986,622 | – | 61,008 | (396,646 | ) | (2,765,871 | ) | 842,212 | 281,759 | ||||||||||||||||||||||
Institutional Class | 726,100 | 2,597,051 | – | 58,422 | (40,816 | ) | (268 | ) | 685,284 | 2,655,205 | ||||||||||||||||||||||
| 90 | The Royce Funds 2013 Semiannual Report to Shareholders |
Investment Adviser and Distributor:
Investment Adviser: Under the Trust’s investment advisory agreements with Royce, Royce is entitled to receive Investment Advisory fees that are computed daily and payable monthly. Royce’s commitment to waive its fees and reimburse class-specific expenses to the extent necessary to maintain certain Funds’ net annual operating expense ratios at specified levels through April 30, 2014, is shown below to the extent that it impacted net expenses for the six months ended June 30, 2013. See the Prospectus for contractual waiver expiration dates.
Effective September 28, 2012, Royce Select Fund I, Royce Select Fund II and Royce Global Select Long/Short Fund have a traditional management fee structure consistent with the other series of The Royce Fund. Previously, for its services and for paying certain other ordinary expenses, Royce received from each Fund a performance fee of 12.5% of each Fund’s pre-fee total return, subject to a high watermark test. Royce will waive its compensation for services provided by it under the new agreement until a respective Fund’s pre-fee cumulative return exceeds its pre-fee total return as of the day on which a fee was last accrued under its former Investment Advisory Agreement, and agrees to reimburse certain ordinary operating expenses as well. Royce Select Fund I reached its high watermark on January 2, 2013.
| Annual contractual | Committed net annual | Six months ended | ||||||||||||||||||||||
| advisory fee as a | operating expense ratio cap | June 30, 2013 | ||||||||||||||||||||||
| percentage of | Investment | Service | Institutional | Net advisory | Advisory | |||||||||||||||||||
| average net assets1 | Class2 | Class2 | Class2 | fees | fees waived | |||||||||||||||||||
| Royce Select Fund I | 1.00 | % | N/A | N/A | N/A | $ | 236,846 | $ | – | |||||||||||||||
| Royce Micro-Cap Discovery Fund | 1.00 | % | N/A | 1.49 | % | N/A | 403 | 24,046 | ||||||||||||||||
| Royce Financial Services Fund | 1.00 | % | N/A | 1.49 | % | N/A | 81,139 | 29,876 | ||||||||||||||||
| Royce Select Fund II | 1.25 | % | 1.49 | % | N/A | N/A | – | – | ||||||||||||||||
| Royce Global Select Long/Short Fund | 1.25 | % | 1.49 | % | N/A | N/A | – | – | ||||||||||||||||
| Royce European Smaller-Companies Fund | 1.25 | % | N/A | 1.69 | % | N/A | 73,432 | 41,886 | ||||||||||||||||
| Royce Enterprise Select Fund | 1.00 | % | 1.24 | % | N/A | N/A | – | 7,524 | ||||||||||||||||
| Royce SMid-Cap Value Fund | 1.00 | % | N/A | 1.35 | % | N/A | 18,033 | 37,626 | ||||||||||||||||
| Royce Focus Value Fund | 1.00 | % | N/A | 1.35 | % | N/A | 16,982 | 29,624 | ||||||||||||||||
| Royce Partners Fund | 1.00 | % | N/A | 1.35 | % | N/A | – | 11,550 | ||||||||||||||||
| Royce Opportunity Select Fund | 1.00 | % | 1.24 | % | N/A | N/A | 8,723 | 15,046 | ||||||||||||||||
| Royce Global Dividend Value Fund | 1.25 | % | N/A | 1.69 | % | N/A | 10,466 | 37,667 | ||||||||||||||||
| Royce International Micro-Cap Fund | 1.30 | % | N/A | 1.69 | % | N/A | – | 29,684 | ||||||||||||||||
| Royce International Premier Fund | 1.25 | % | N/A | 1.69 | % | N/A | 9,588 | 33,685 | ||||||||||||||||
| Royce Special Equity Multi-Cap Fund | 1.00 | % | N/A | 1.39 | % | 1.04 | % | 662,007 | 4,971 | |||||||||||||||
| 1 | From a base annual rate of 1.00% (1.25% for Royce Select Fund II, Royce Global Select Long/Short Fund, Royce European Smaller-Companies Fund, Royce Global Dividend Value Fund and Royce International Premier Fund; 1.30% for Royce International Micro-Cap Fund), the annual rates of investment advisory fees payable by each of the Funds are reduced by the indicated amount at the following breakpoints applicable to a Fund's net assets in excess of $2 billion: more than $2 billion to $4 billion - .05% per annum; more than $4 billion to $6 billion - .10% per annum; over $6 billion - .15% per annum. |
| 2 | Committed net annual operating expense ratio cap excludes acquired fund fees and expenses, dividends on securities sold short and other expenses related to short sales. |
Distributor: Royce Fund Services, Inc. (“RFS”), the distributor of the Trust’s shares, is a wholly owned subsidiary of Royce. RFS is entitled to receive distribution fees that are computed daily and payable monthly.
| Six months ended June 30, 2013 | ||||||||||||
| Annual contractual distribution fee as | Net distribution | Distribution fees | ||||||||||
| a percentage of average net assets | fees | waived | ||||||||||
| Royce Micro-Cap Discovery Fund – Service Class | 0.25 | % | $ | 6,112 | $ | – | ||||||
| Royce Financial Services Fund – Service Class | 0.25 | % | 25,534 | 2,220 | ||||||||
| Royce European Smaller-Companies Fund – Service Class | 0.25 | % | 23,064 | – | ||||||||
| Royce SMid-Cap Value Fund – Service Class | 0.25 | % | 13,915 | – | ||||||||
| Royce Focus Value Fund – Service Class | 0.25 | % | 11,652 | – | ||||||||
| Royce Partners Fund – Service Class | 0.25 | % | 2,888 | – | ||||||||
| Royce Global Dividend Value Fund – Service Class | 0.25 | % | 9,627 | – | ||||||||
| Royce International Micro-Cap Fund – Service Class | 0.25 | % | 5,480 | 228 | ||||||||
| Royce International Premier Fund – Service Class | 0.25 | % | 7,616 | 1,039 | ||||||||
| Royce Special Equity Multi-Cap Fund – Service Class | 0.25 | % | 57,873 | 5,032 | ||||||||
| The Royce Funds 2013 Semiannual Report to Shareholders | 91 |
| Notes to Financial Statements (unaudited) (continued) | |
Purchases and Sales of Investment Securities:
For the six months ended June 30, 2013, the costs of purchases and the proceeds from sales of investment securities, other than short-term securities, were as follows:
| Short | Purchases to | |||||||||||||||
| Purchases | Sales | Sales | Cover Short Sales | |||||||||||||
| Royce Select Fund I | $ | 13,404,341 | $ | 22,185,462 | $ | – | $ | – | ||||||||
| Royce Micro-Cap Discovery Fund | 1,767,857 | 1,566,255 | – | – | ||||||||||||
| Royce Financial Services Fund | 4,083,658 | 580,571 | – | – | ||||||||||||
| Royce Select Fund II | 2,303,751 | 2,028,646 | 571,710 | 660,257 | ||||||||||||
| Royce Global Select Long/Short Fund | 3,083,802 | 8,697,263 | 1,668,519 | 6,437,936 | ||||||||||||
| Royce European Smaller-Companies Fund | 7,367,738 | 4,750,395 | – | – | ||||||||||||
| Royce Enterprise Select Fund | 1,215,417 | 914,586 | – | – | ||||||||||||
| Royce SMid-Cap Value Fund | 1,660,685 | 3,218,080 | – | – | ||||||||||||
| Royce Focus Value Fund | 8,007,335 | 7,727,916 | – | – | ||||||||||||
| Royce Partners Fund | 741,975 | 768,041 | – | – | ||||||||||||
| Royce Opportunity Select Fund | 5,683,177 | 2,474,952 | 1,608,276 | 1,440,908 | ||||||||||||
| Royce Global Dividend Value Fund | 4,353,881 | 3,496,235 | – | – | ||||||||||||
| Royce International Micro-Cap Fund | 1,079,673 | 1,489,640 | – | – | ||||||||||||
| Royce International Premier Fund | 1,653,687 | 1,049,494 | – | – | ||||||||||||
| Royce Special Equity Multi-Cap Fund | 56,010,314 | 25,647,195 | – | – | ||||||||||||
Class Specific Expenses:
Class specific expenses, for Funds with multiple classes, were as follows for the six months ended June 30, 2013:
| Class Level | ||||||||||||||||||||||||||||
| Transfer | Expenses | |||||||||||||||||||||||||||
| Net | Agent | Reimbursed by | ||||||||||||||||||||||||||
| Distribution | Shareholder | Shareholder | Balance | Investment | ||||||||||||||||||||||||
| Fees | Servicing | Reports | Registration | Credits | Total | Adviser | ||||||||||||||||||||||
| Royce Special Equity Multi-Cap Fund – | ||||||||||||||||||||||||||||
Investment Class | $ | – | $ | 7,680 | $ | 6,364 | $ | 7,487 | $ | (2 | ) | $ | 21,529 | $ | – | |||||||||||||
| Royce Special Equity Multi-Cap Fund – | ||||||||||||||||||||||||||||
Service Class | 57,873 | 32,035 | 23,291 | 7,582 | (20 | ) | 120,761 | 35,582 | ||||||||||||||||||||
| Royce Special Equity Multi-Cap Fund – | ||||||||||||||||||||||||||||
Institutional Class | – | 3,192 | 100 | 7,194 | – | 10,486 | 10,486 | |||||||||||||||||||||
| 57,873 | 42,907 | 29,755 | 22,263 | (22 | ) | 46,068 | ||||||||||||||||||||||
Tax Information:
At June 30, 2013, net unrealized appreciation (depreciation) based on identified cost for tax purposes was as follows:
| Net Unrealized | ||||||||||||||||
| Appreciation | Gross Unrealized | |||||||||||||||
| Tax Basis Cost | (Depreciation) | Appreciation | Depreciation | |||||||||||||
| Royce Select Fund I | $ | 36,443,066 | $ | 7,263,884 | $ | 8,240,090 | $ | 976,206 | ||||||||
| Royce Micro-Cap Discovery Fund | 4,620,517 | 520,916 | 740,384 | 219,468 | ||||||||||||
| Royce Financial Services Fund | 23,107,860 | 5,040,155 | 6,525,501 | 1,485,346 | ||||||||||||
| Royce Select Fund II | 4,168,482 | 264,055 | 507,712 | 243,657 | ||||||||||||
| Royce Global Select Long/Short Fund | 11,823,176 | (1,224,060 | ) | 1,460,264 | 2,684,324 | |||||||||||
| Royce European Smaller-Companies Fund | 17,831,476 | 264,188 | 2,174,671 | 1,910,483 | ||||||||||||
| Royce Enterprise Select Fund | 1,887,948 | 136,207 | 152,283 | 16,076 | ||||||||||||
| Royce SMid-Cap Value Fund | 10,068,136 | 559,195 | 1,693,673 | 1,134,478 | ||||||||||||
| Royce Focus Value Fund | 8,871,691 | 1,442,684 | 1,702,828 | 260,144 | ||||||||||||
| Royce Partners Fund | 2,024,091 | 387,314 | 449,425 | 62,111 | ||||||||||||
| Royce Opportunity Select Fund | 5,831,088 | 736,926 | 985,210 | 248,284 | ||||||||||||
| Royce Global Dividend Value Fund | 8,138,093 | (61,223 | ) | 738,803 | 800,026 | |||||||||||
| Royce International Micro-Cap Fund | 4,340,151 | (312,046 | ) | 370,623 | 682,669 | |||||||||||
| Royce International Premier Fund | 6,558,017 | 383,714 | 741,044 | 357,330 | ||||||||||||
| Royce Special Equity Multi-Cap Fund | 139,050,610 | 21,063,394 | 21,128,328 | 64,934 | ||||||||||||
The primary difference between book and tax basis cost is the timing of the recognition of losses on securities sold.
| 92 | The Royce Funds 2013 Semiannual Report to Shareholders |
| Understanding Your Fund’s Expenses (unaudited) |
As a shareholder of a mutual fund, you pay ongoing expenses, including management fees and other Fund expenses including, for some funds, distribution and/or service (12b-1) fees. Using the information below, you can estimate how these ongoing expenses (in dollars) affect your investment and compare them with the ongoing expenses of other funds. You may also incur one-time transaction expenses, including redemption fees, which are not shown in this section and would result in higher total costs. The example is based on an investment of $1,000 invested at January 1, 2013, and held for the entire six-month period ended June 30, 2013. Service Class shares are generally available only through certain brokers or retirement plan administrators who receive distribution and/or service fees from the Fund for services that they perform. Institutional Class shares are generally available only to institutions or intermediaries with a minimum account size of $1 million.
Actual Expenses
The first part of the table below provides information about actual account values and actual expenses. You may use the information in this section, together with the amount you invested, to estimate the expenses that you paid over the period. Simply divide your account value at June 30, 2013, by $1,000 (for example, an $8,600 account value divided by $1,000 = 8.6), then multiply the result by the number under the heading entitled “Expenses Paid During the Period” to estimate the expenses you paid on your account during this period.
Hypothetical Example for Comparison Purposes
The second part of the table below provides information about hypothetical account values and hypothetical expenses based on the Fund’s actual expense ratio and an assumed rate of return of 5% per year before expenses, which is not the Fund’s actual return. The hypothetical account values and expenses may not be used to estimate the actual ending account balance or expenses you paid for the period. You may use this information to compare the ongoing costs of investing in the Fund and other funds. To do so, compare this 5% hypothetical example with the 5% hypothetical examples that appear in the shareholder reports of the other funds.
Please note that the expenses shown in the table are meant to highlight your ongoing costs only and do not reflect any transactional costs, such as sales charges (loads), redemption fees, or exchange fees. Therefore, this section is useful in comparing ongoing costs only, and will not help you determine the relative total costs of owning different funds. In addition, if these transactional costs were included, your costs would have been higher.
| Actual | Hypothetical (5% per year return before expenses) | |||||||||||||||||||||||||||
| Beginning | Ending | Expenses Paid | Beginning | Ending | Expenses Paid | Annualized | ||||||||||||||||||||||
| Account Value | Account Value | During the | Account Value | Account Value | During the | Expense | ||||||||||||||||||||||
| 1/1/13 | 6/30/13 | Period1 | 1/1/13 | 6/30/13 | Period1 | Ratio2 | ||||||||||||||||||||||
| Investment Class | ||||||||||||||||||||||||||||
| Royce Select Fund I | $ | 1,000.00 | $ | 1,067.24 | $ | 5.89 | $ | 1,000.00 | $ | 1,019.09 | $ | 5.76 | 1.15 | % | ||||||||||||||
| Royce Select Fund II | 1,000.00 | 1,063.67 | 7.62 | 1,000.00 | 1,017.41 | 7.45 | 1.49 | |||||||||||||||||||||
| Royce Global Select | ||||||||||||||||||||||||||||
Long/Short Fund | 1,000.00 | 908.45 | 7.05 | 1,000.00 | 1,017.41 | 7.45 | 1.49 | |||||||||||||||||||||
| Royce Enterprise Select Fund | 1,000.00 | 1,114.86 | 6.50 | 1,000.00 | 1,018.65 | 6.21 | 1.24 | |||||||||||||||||||||
| Royce Opportunity Select Fund | 1,000.00 | 1,178.77 | 6.86 | 1,000.00 | 1,018.50 | 6.36 | 1.27 | |||||||||||||||||||||
| Royce Special Equity | ||||||||||||||||||||||||||||
Multi-Cap Fund | 1,000.00 | 1,179.55 | 6.16 | 1,000.00 | 1,019.14 | 5.71 | 1.14 | |||||||||||||||||||||
| Service Class | ||||||||||||||||||||||||||||
| Royce Micro-Cap Discovery Fund | 1,000.00 | 1,122.37 | 7.84 | 1,000.00 | 1,017.41 | 7.45 | 1.49 | |||||||||||||||||||||
| Royce Financial Services Fund | 1,000.00 | 1,188.87 | 8.09 | 1,000.00 | 1,017.41 | 7.45 | 1.49 | |||||||||||||||||||||
| Royce European Smaller- | ||||||||||||||||||||||||||||
Companies Fund | 1,000.00 | 1,023.14 | 8.48 | 1,000.00 | 1,016.41 | 8.45 | 1.69 | |||||||||||||||||||||
| Royce SMid-Cap Value Fund | 1,000.00 | 1,048.03 | 6.86 | 1,000.00 | 1,018.10 | 6.76 | 1.35 | |||||||||||||||||||||
| Royce Focus Value Fund | 1,000.00 | 1,044.10 | 6.84 | 1,000.00 | 1,018.10 | 6.76 | 1.35 | |||||||||||||||||||||
| Royce Partners Fund | 1,000.00 | 1,121.26 | 7.10 | 1,000.00 | 1,018.10 | 6.76 | 1.35 | |||||||||||||||||||||
| Royce Global Dividend | ||||||||||||||||||||||||||||
Value Fund | 1,000.00 | 1,019.65 | 8.46 | 1,000.00 | 1,016.41 | 8.45 | 1.69 | |||||||||||||||||||||
| Royce International | ||||||||||||||||||||||||||||
Micro-Cap Fund | 1,000.00 | 995.35 | 8.36 | 1,000.00 | 1,016.41 | 8.45 | 1.69 | |||||||||||||||||||||
| Royce International | ||||||||||||||||||||||||||||
Premier Fund | 1,000.00 | 1,045.95 | 8.57 | 1,000.00 | 1,016.41 | 8.45 | 1.69 | |||||||||||||||||||||
| Royce Special Equity | ||||||||||||||||||||||||||||
Multi-Cap Fund | 1,000.00 | 1,178.08 | 7.45 | 1,000.00 | 1,017.95 | 6.90 | 1.38 | |||||||||||||||||||||
| Institutional Class | ||||||||||||||||||||||||||||
| Royce Special Equity | ||||||||||||||||||||||||||||
Multi-Cap Fund | 1,000.00 | 1,180.41 | 5.62 | 1,000.00 | 1,019.64 | 5.21 | 1.04 | |||||||||||||||||||||
| The Royce Funds 2013 Semiannual Report to Shareholders | 93 |
| Trustees and Officers |
| All Trustees and Officers may be reached c/o The Royce Funds, 745 Fifth Avenue, New York, NY 10151 |
Charles M. Royce, Trustee1, President
Age: 73 | Number of Funds Overseen: 34 | Tenure: Since 1982
Non-Royce Directorships: Director of TICC Capital Corp.
Principal Occupation(s) During Past Five Years: President, Co-Chief Investment Officer, and Member of Board of Managers of Royce & Associates, LLC (“Royce”), the Trust’s investment adviser.
Patricia W. Chadwick, Trustee
Age: 64 | Number of Funds Overseen: 34 | Tenure: Since 2009
Non-Royce Directorships: Trustee of ING Mutual Funds and Director of Wisconsin Energy Corp.
Principal Occupation(s) During Past 5 Years: Consultant and President of Ravengate Partners LLC (since 2000).
Richard M. Galkin, Trustee
Age: 75 | Number of Funds Overseen: 34 | Tenure: Since 1982
Non-Royce Directorships: None
Principal Occupation(s) During Past Five Years: Private investor. Mr. Galkin’s prior business experience includes having served as President of Richard M. Galkin Associates, Inc., telecommunications consultants, President of Manhattan Cable Television (a subsidiary of Time, Inc.), President of Haverhills Inc. (another Time, Inc. subsidiary), President of Rhode Island Cable Television, and Senior Vice President of Satellite Television Corp. (a subsidiary of Comsat).
Stephen L. Isaacs, Trustee
Age: 73 | Number of Funds Overseen: 34 | Tenure: Since 1989
Non-Royce Directorships: None
Principal Occupation(s) During Past Five Years: Attorney and President of Health Policy Associates, Inc., consultants. Mr. Isaacs’s prior business experience includes having served as President of the Center for Health and Social Policy (from 1996 to 2012); Director of Columbia University Development Law and Policy Program and Professor at Columbia University (until August 1996).
Arthur S. Mehlman, Trustee
Age: 71 | Number of Funds Overseen: 48 | Tenure: Since 2004
Non-Royce Directorships: Director/Trustee of registered investment companies constituting the 14 Legg Mason Funds.
Principal Occupation(s) During Past Five Years: Director of The League for People with Disabilities, Inc.; Director of University of Maryland Foundation (non-profits). Formerly: Director of Municipal Mortgage & Equity, LLC (from October 2004 to April 1, 2011); Director of University of Maryland College Park Foundation (non-profit) (from 1998 to 2005); Partner, KPMG LLP (international accounting firm) (from 1972 to 2002); Director of Maryland Business Roundtable for Education (from July 1984 to June 2002).
David L. Meister, Trustee
Age: 73 | Number of Funds Overseen: 34 | Tenure: Since 1982
Non-Royce Directorships: None
Principal Occupation(s) During Past Five Years: Consultant. Chairman and Chief Executive Officer of The Tennis Channel (from June 2000 to March 2005). Mr. Meister’s prior business experience includes having served as Chief Executive Officer of Seniorlife.com, a consultant to the communications industry, President of Financial News Network, Senior Vice President of HBO, President of Time-Life Films, and Head of Broadcasting for Major League Baseball.
G. Peter O’Brien, Trustee
Age: 67 | Number of Funds Overseen: 48 | Tenure: Since 2001
Non-Royce Directorships: Director/Trustee of registered investment companies constituting the 14 Legg Mason Funds; Director of TICC Capital Corp.
Principal Occupation(s) During Past Five Years: Trustee Emeritus of Colgate University (since 2005); Board Member of Hill House, Inc. (since 1999); Formerly: Trustee of Colgate University (from 1996 to 2005), President of Hill House, Inc. (from 2001 to 2005) and Managing Director/Equity Capital Markets Group of Merrill Lynch & Co. (from 1971 to 1999).
John D. Diederich, Vice President and Treasurer
Age: 61 | Tenure: Since 2001
Principal Occupation(s) During Past Five Years: Chief Operating Officer, Managing Director and member of the Board of Managers of Royce; Chief Financial Officer of Royce; Director of Administration of the Trust; and President of RFS, having been employed by Royce since April 1993.
Jack E. Fockler, Jr., Vice President
Age: 54 | Tenure: Since 1995
Principal Occupation(s) During Past Five Years: Managing Director and Vice President of Royce, and Vice President of RFS, having been employed by Royce since October 1989.
W. Whitney George, Vice President
Age: 55 | Tenure: Since 1995
Principal Occupation(s) During Past Five Years: Co-Chief Investment Officer, Managing Director and Vice President of Royce, having been employed by Royce since October 1991.
Daniel A. O’Byrne, Vice President and Assistant Secretary
Age: 51 | Tenure: Since 1994
Principal Occupation(s) During Past Five Years: Principal and Vice President of Royce, having been employed by Royce since October 1986.
John E. Denneen, Secretary and Chief Legal Officer
Age: 46 | Tenure: 1996-2001 and Since April 2002
Principal Occupation(s) During Past Five Years: General Counsel, Principal, Chief Legal and Compliance Officer, and Secretary of Royce; Secretary and Chief Legal Officer of The Royce Funds.
Lisa Curcio, Chief Compliance Officer
Age: 53 | Tenure: Since 2004
Principal Occupation(s) During Past Five Years: Chief Compliance Officer of The Royce Funds (since October 2004) and Compliance Officer of Royce (since June 2004).
Trustees will hold office until their successors have been duly elected and qualified or until their earlier resignation or removal. The Statement of Additional Information, which contains additional information about the Trust’s trustees and officers, is available and can be obtained without charge at www.roycefunds.com or by calling (800) 221-4268.
| 94 | The Royce Funds 2013 Semiannual Report to Shareholders |
| Board Approval of Investment Advisory Agreements |
At meetings held on June 11-12, 2013, the Board of Trustees of The Royce Fund (the “Board”), including all of the non-interested trustees, approved the continuance of the Investment Advisory Agreements between Royce & Associates, LLC (“R&A”) and The Royce Fund (“TRF”) relating to each of Royce Select Fund I, Royce Select Fund II, Royce Global Select Long/Short Fund, Royce Enterprise Select Fund, Royce Opportunity Select Fund, Royce Micro-Cap Discovery Fund, Royce Financial Services Fund, Royce SMid-Cap Value Fund, Royce Focus Value Fund, Royce Partners Fund, Royce Special Equity Multi-Cap Fund, Royce European Smaller-Companies Fund, Royce Global Dividend Fund, Royce International Micro-Cap Fund, and Royce International Premier Fund (each, a “Fund” and collectively, the “Funds”). In reaching these decisions, the Board reviewed, among other things, information prepared internally by R&A and independently by Morningstar Associates, LLC (“Morningstar”) containing detailed expense ratio and investment performance comparisons for each Fund with other mutual funds in their “peer group” and “category”, information regarding the past performance of the Funds and other registered investment companies managed by R&A and a memorandum outlining the legal duties of the Board prepared by independent counsel to the non-interested trustees. R&A also provided the trustees with an analysis of its profitability with respect to providing investment advisory services to each Fund. In addition, the Board took into account information furnished throughout the year at regular Board meetings, including reports on investment performance, shareholder services, distribution fees and expenses, regulatory compliance, brokerage commissions and research, brokerage and other execution products and services provided to the Funds. The Board also considered other matters they deemed important to the approval process such as allocation of Fund brokerage commissions, “soft dollar” research services R&A receives, payments made to affiliates of R&A, as well as payments made by R&A, relating to distribution of Fund shares and other direct and indirect benefits to R&A and its affiliates from their relationship with the Funds. The trustees also met throughout the year with investment advisory personnel from R&A. The Board, in its deliberations, recognized that, for many of the Funds’ shareholders, the decision to purchase Fund shares included a decision to select R&A as the investment adviser and that there was a strong association in the minds of Fund shareholders between R&A and each of the Funds. In considering factors relating to the approval of the continuance of the Investment Advisory Agreements, the non-interested trustees received assistance and advice from, and met separately with, their independent counsel. While the Investment Advisory Agreements for the Funds were considered at the same meetings, the trustees dealt with each agreement separately. Among other factors, the trustees considered the following:
The nature, extent and quality of services provided by R&A:
The trustees considered the following factors to be of fundamental importance to their consideration of whether to approve the continuance of the Funds’ Investment Advisory Agreements: (i) R&A’s more than 40 years of value investing experience and track record; (ii) the history of long-tenured R&A portfolio managers managing many of the Funds; (iii) R&A’s focus on mid-cap, small-cap and micro-cap value investing; (iv) the consistency of R&A’s approach to managing the Funds over more than 40 years; (v) the integrity and high ethical standards adhered to at R&A; (vi) R&A’s specialized experience in the area of trading small- and micro-cap securities; (vii) R&A’s historical ability to attract and retain portfolio management talent; and (viii) R&A’s focus on shareholder interests as exemplified by capping expenses on smaller funds, closing funds to new investors when R&A believed such closings were in the best interests of existing shareholders, establishing breakpoints for a number of funds and providing expansive shareholder reporting and communications. The trustees reviewed the services that R&A provides to the Funds, including, but not limited to, managing each Fund’s investments in accordance with the stated policies of each Fund. The Board considered the fact that R&A provided certain administrative services to the Funds pursuant to the Administration Agreement between R&A and RCF which went into effect on January 1, 2008 and the methodology used by R&A in allocating the compensation paid to certain R&A personnel and other administrative expenses to the Funds under that agreement. The trustees determined that the services to be provided to the Funds by R&A would be the same as those that R&A previously provided to the Funds. They also took into consideration the histories, reputations and backgrounds of R&A’s portfolio managers for Funds, finding that these would likely have an impact on the continued success of the Funds. Lastly, the trustees noted R&A’s ability to attract and retain quality and experienced personnel. The trustees concluded that the investment advisory services provided by R&A to each Fund compared favorably to services provided by R&A to other R&A client accounts, including other funds, in both nature and quality, and that the scope of services provided by R&A would continue to be suitable for each Fund.
Investment performance of the Funds and R&A:
In light of R&A’s risk-averse approach to investing, the trustees believe that risk-adjusted performance continues to be an appropriate measure of each Fund’s investment performance. One measure of risk-adjusted performance the trustees have historically used in their review of the Funds’ performance is the Sharpe Ratio. The Sharpe Ratio is a risk-adjusted measure of performance developed by Nobel Laureate William Sharpe. It is calculated by dividing a fund’s annualized excess returns by its annualized standard deviation to determine reward per unit of risk. The higher the Sharpe Ratio, the better a fund’s historical risk-adjusted performance. The Board attaches primary importance to risk-adjusted performance over relatively long periods of time, typically 3 to 10 years. Except as described below, each of the Funds with 3 or more years of performance fell in the 1st or 2nd quartile within its Morningstar category and the small-cap universe for the 3-year, 5-year and 10-year periods ended December 31, 2012.
The Sharpe Ratio for Royce Micro-Cap Discovery Fund (“RDF”) fell in the 4th quartile for the 3-year and 5-year periods as compared with its Small Blend category as selected by Morningstar. The Board noted the impact of the addition of an active management component layered onto RDF’s quantitative structure in August 2010. The Board also noted that, other than a net 31 basis point fee received in 2007, R&A has not received a management fee on RDF since its 2003 inception. Royce SMid-Cap Value Fund’s (“RSV”), Royce Select Fund I’s (“RSI”), Royce Focus Value Fund’s (“RFV”) and Royce Partners Fund’s (“RPF”) Sharpe Ratios fell in the 4th quartile for the 3-year period within each Fund’s Morningstar category. This was attributable in part to RSV’s and RFV’s significant overweighting in materials, particularly metals and mining companies, and RSI’s and RPF’s focus on companies with low leverage and solid balance sheets contributing to lagging performance. In addition to each Fund’s risk-adjusted performance, the trustees also reviewed and considered each Fund’s absolute total returns, down market performance and for the Funds
| The Royce Funds 2013 Semiannual Report to Shareholders | 95 |
in existence for such periods, long-term performance records over periods of 10 years or longer. The Board noted that Royce Opportunity Select Fund (“ROS”), Royce International Micro-Cap (“RMI”), Royce International Premier (“RIP”), Royce Global Dividend Value (“RGD”) and Royce Special Equity Multi-Cap Funds (“RSM”) have less than 3 years of performance. R&A’s general process of investing net inflows over longer periods of time led to larger cash positions and market lagging performance for most of these newer funds in their initial periods of operation.
The Board also considered it important to look beyond the current snapshot of performance as of December 31, 2012 and therefore examined extended performance histories for each series with 3 years or more since its inception using monthly rolling average return periods through March 31, 2013.
The trustees noted that R&A manages a number of funds that invest in small-cap and micro-cap issuers, many of which had outperformed their benchmark indexes and their competitors over longer-term periods. Although the trustees recognized that past performance is not necessarily an indicator of future results, they found that R&A had the necessary qualifications, experience and track record in managing mid-cap, small-cap and micro-cap securities to manage the Funds. The trustees determined that R&A continued to be an appropriate investment adviser for each Fund and concluded that each of Fund’s performance supported the continuation of its Investment Advisory Agreement.
Cost of the services provided and profits realized by R&A from its relationship with each Fund:
The trustees considered the cost of the services provided by R&A and the profits realized by R&A from its relationship with each Fund. As part of the analysis, the Board discussed with R&A its methodology in allocating its costs to each Fund and concluded that its allocations were reasonable. The trustees noted that at times R&A had closed certain of the Funds to new investors because of the rate of growth in Fund assets. The trustees concluded that R&A’s profits were reasonable in relation to the nature and quality of services provided.
The extent to which economies of scale would be realized as the Funds grow and whether fee levels would reflect such economies of scale:
The trustees considered whether there have been economies of scale in respect of the management of the Funds, whether the Funds have appropriately benefited from any economies of scale and whether there is potential for realization of any further economies of scale. The trustees noted the time and effort involved in managing portfolios of small- and micro-cap stocks and that they did not involve the same efficiencies as do portfolios of large-cap stocks. The trustees concluded that the current fee structure for each Fund was reasonable and that shareholders sufficiently participated in economies of scale.
Comparison of services to be rendered and fees to be paid to those under other investment advisory contracts, such as contracts of the same and other investment advisers or other clients:
The trustees reviewed the investment advisory fee paid by each Fund and compared both the services to be rendered and the fees to be paid under the Investment Advisory Agreements to other contracts of R&A and to contracts of other investment advisers to registered investment companies investing in small- and micro-cap stocks, as provided by Morningstar. The trustees also considered each Fund’s administrative, sub-transfer agent, and transfer agent expenses. The net expense ratios for RDF, RSV, RFV, and RPF ranked within the first or second quartile among their peers, as selected by Morningstar. It was noted that most of Royce European Smaller-Companies Fund’s and RGD’s peers are in large-cap style boxes per the Morningstar data. After taking into consideration that the level of work necessary to invest in small-cap international securities is significantly greater than that necessary to invest in larger-cap securities, the trustees noted that the basis point differentials in management fees, which give rise to the generally higher expense ratios, were appropriate for these Funds. It was also noted that 33% of the peers for RMI and RIP, as selected by Morningstar, do not have 12b-1 fees. Despite having no 12b-1 fees, these peers were selected because of their comparable investment market-cap ranges (RMI is, however, the only micro-cap fund in the peer group). The average 12b-1 fees for the peer group is 15 basis points, and the 10 basis point difference between that average and the Funds’ 25 basis point 12b-1 fee accounts for the majority of the differential in net expenses for these Funds. RSM’s expense ratio fell in the 3rd quartile within its peer group as selected by Morningstar, 14 basis points higher than its peer group median. It was noted that RSM’s focus on smaller-cap issuers caused its weighted average market capitalization to be the 4th lowest of its peer group.
The trustees noted that R&A has waived advisory fees for numerous series of TRF in order to maintain expense ratios at competitive levels and acknowledged R&A’s intention to continue this expense limitation practice. The trustees also considered fees charged by R&A to institutional and other clients and noted that, given the greater levels of services that R&A provides to registered investment companies such as the Funds as compared to other accounts, each of the Funds’ advisory fees compared favorably to these other accounts.
It was noted that no single factor was cited as determinative to the decision of the trustees. Rather, after weighing all of considerations and conclusions discussed above, the entire Board, including all the non-interested trustees, determined to approve the continuation of the existing Investment Advisory Agreements, concluding that a contract continuation on the existing terms was in the best interest of the shareholders of each Fund and that each investment advisory fee rate was reasonable in relation to the services provided.
| 96 | The Royce Funds 2013 Semiannual Report to Shareholders |
| Notes to Performance and Other Important Information |
The thoughts expressed in this report concerning recent market movements and future prospects for small company stocks are solely the opinion of Royce at June 30, 2013, and, of course, historical market trends are not necessarily indicative of future market movements. Statements regarding the future prospects for particular securities held in the Funds’ portfolios and Royce’s investment intentions with respect to those securities reflect Royce’s opinions as of June 30, 2013 and are subject to change at any time without notice. There can be no assurance that securities mentioned in this report will be included in any Royce-managed portfolio in the future. Sector weightings are determined using the Global Industry Classification Standard (“GICS”). GICS was developed by, and is the exclusive property of, Standard & Poor’s Financial Services LLC (“S&P”) and MSCI Inc. (“MSCI”). GICS is the trademark of S&P and MSCI. “Global Industry Classification Standard (GICS)” and “GICS Direct” are service marks of S&P and MSCI. All indexes referred to are unmanaged and capitalization weighted. Each index’s returns include net reinvested dividends and/or interest income. Russell Investment Group is the source and owner of the trademarks, service marks, and copyrights related to the Russell Indexes. Russell® is a trademark of Russell Investment Group. The Russell 2000 is an index of domestic small-cap stocks. It measures the performance of the 2,000 smallest publicly traded U.S. companies in the Russell 3000 Index. The Russell 1000 Index is an index of domestic large-cap stocks. It measures the performance of the 1,000 largest publicly traded U.S. companies in the Russell 3000 Index. The Russell Microcap Index includes 1,000 of the smallest securities in the Russell 2000 Index, along with the next smallest eligible securities as determined by Russell. The Russell 2500 is an index of domestic small- to mid-cap stocks. It includes approximately 2,500 of the smallest securities in the Russell 3000 Index. The returns for the Russell 2500—Financial Services Sector represent those of the financial services companies within the Russell 2500 Index. The Russell Midcap Index measures the performance of the mid-cap segment of the U.S. equity universe. It includes approximately 800 of the smallest securities in the Russell 1000 Index. The Russell Global Small Cap Index is an index of global small-cap stocks. The Russell Global ex-U.S. Large Cap Index is an index of global large-cap stocks, excluding the United States. The Russell Global ex-U.S. Small Cap Index is an index of global small-cap stocks, excluding the United States. The S&P 500 is an index of U.S. large-cap stocks, selected by Standard & Poor’s based on market size, liquidity, and industry grouping, among other factors. The Russell Europe Small Cap Index is an index of European small-cap stocks. The CBOE Volatility Index (VIX) measures market expectations of near-term volatility conveyed by S&P 500 Stock Index option prices. The Nasdaq Composite is an index of the more than 3,000 common equities listed on the Nasdaq stock exchange. The performance of an index does not represent exactly any particular investment, as you cannot invest directly in an index. Returns for the market indexes used in this report were based on information supplied to Royce by Russell Investments. Royce has not independently verified the above described information. The Price-Earnings, or P/E, Ratio is calculated by dividing a company’s share price by its trailing 12-month earnings-per share (EPS). The Price-to-Book, or P/B, Ratio is calculated by dividing a company’s share price by its book value per share. The Sharpe Ratio is calculated for a specified period by dividing a fund’s annualized excess returns by its annualized standard deviation. The higher the Sharpe Ratio, the better the fund’s historical risk-adjusted performance. Standard deviation is a statistical measure within which a fund’s total returns have varied over time. The greater the standard deviation, the greater a fund’s volatility. The Royce Funds is a service mark of The Royce Funds. Distributor: Royce Fund Services, Inc. Investments in securities of micro-cap, small-cap and/or mid-cap companies may involve considerably more risk than investments in securities of larger-cap companies. (Please see “Primary Risks for Fund Investors” in the prospectus.) Certain Royce Funds may invest up to 25% (100% for Royce Global Select Long/Short Fund, Select Fund II, European Smaller-Companies, Global Dividend Value, International Micro-Cap, and International Premier Fund, 35% of Focus Value, Partners, Financial Services and SMid-Cap Value Funds, 10% of Select Fund I and 5% of Special Equity Fund) of their respective assets in foreign securities, which generally may involve political, economic, currency and other risks not encountered in U.S. investments. (Please see “Investing in Foreign Securities” in the prospectus.) Royce Select I, Select II, Global Select Long/Short, Enterprise Select, and Opportunity Select Funds may sell securities short which involves selling a security it does not own in anticipation that the security’s price will decline. Short sales present unlimited risk on an individual stock basis since the Fund may be required to buy security sold short at a time when the security has appreciated in value. Please read the prospectus carefully before investing or sending money. A copy of the Funds’ current prospectus and Statement of Additional Information may be obtained by calling (800) 221-4268, or by visiting www.roycefunds.com. All publicly released material Fund information is disclosed by the Funds on their website at www.roycefunds.com. |
| Forward-Looking Statements | |
This material contains forward-looking statements within the meaning of the Securities Exchange Act of 1934, as amended (the “Exchange Act”), that involve risks and uncertainties, including, among others, statements as to: | |
| • | the Funds’ future operating results, |
| • | the prospects of the Funds’ portfolio companies, |
| • | the impact of investments that the Funds have made or may make, |
| • | the dependence of the Funds’ future success on the general economy and its impact on the companies and industries in which the Funds invest, and |
| • | the ability of the Funds’ portfolio companies to achieve their objectives. |
This review and report use words such as “anticipates,” “believes,” “expects,” “future,” “intends,” and similar expressions to identify forward-looking statements. Actual results may differ materially from those projected in the forward-looking statements for any reason. | |
The Royce Funds have based the forward-looking statements included in this review and report on information available to us on the date of the report, and we assume no obligation to update any such forward-looking statements. Although The Royce Funds undertake no obligation to revise or update any forward-looking statements, whether as a result of new information, future events or otherwise, you are advised to consult any additional disclosures that we may make through future shareholder communications or reports. | |
| Proxy Voting |
A copy of the policies and procedures that The Royce Funds use to determine how to vote proxies relating to portfolio securities and information regarding how each of The Royce Funds voted proxies relating to portfolio securities during the most recent 12-month period ended June 30 is available, without charge, on The Royce Funds’ website at www.roycefunds.com, by calling (800) 221-4268 (toll-free) and on the website of the Securities and Exchange Commission (“SEC”), at www.sec.gov. |
| Form N-Q Filing |
The Funds file their complete schedules of investments with the SEC for the first and third quarters of each fiscal year on Form N-Q. The Funds’ Forms N-Q are available on the SEC’s website at www.sec.gov. The Royce Funds’ holdings are also on the Funds’ website approximately 15 to 20 days after each calendar quarter end and remain available until the next quarter’s holdings are posted. The Funds’ Forms N-Q may also be reviewed and copied at the SEC’s Public Reference Room in Washington, D.C. To find out more about this public service, call the SEC at (202) 942-8090. The Funds’ complete schedules of investments are updated quarterly, and are available at www.roycefunds.com. |
| The Royce Funds 2013 Semiannual Report to Shareholders | 97 |
| 2013 In Quotes |
| It’s not during up years that great investment track records are made. – Charles de Vaulx, International Value Advisers, The Art of Value Investing |
Supply will be constrained, and demand will be strong, coming from corporate buyers and individual and institutional investors, who will begin to reallocate funds toward the equity market and out of bonds. There will be a great migration or great rotation, or whatever you want to call it. It will intensify as the year continues.
– Brian Rodgers, Barron’s, January 26, 2013
Active managers earn their fees building a long-term performance record through time arbitrage...Value investors succeed not by chasing relative returns, but by embracing the fundamentals of value investing, finding the strongest, highest-quality companies at the best possible prices.
– Chuck Royce, Barron’s, May 11, 2013
While absolute skill tends to improve, relative skill tends to become more uniform. In plain words, that means that the difference between the best and the average is less than what it used to be. So, the best hitter in baseball is closer to an average player today than was the case 50 years ago.
– Michael Mauboussin, Morningstar Advisor, April/May 2013
With interest rates at all-time lows, stocks continue to offer investors the best prospects.
– Jeremy J. Siegel, Kiplinger’s Personal Finance, June 2013
Throughout the post-World War II era, the average stock-market decline in a bear market is about 25% and lasts about 10 months. So the bear market that ended in March of ’09 was twice as severe as the average. Most bear markets are induced by economic contractions. During the average recession in the postwar period, real gross domestic product goes down 2% from peak to trough. The most recent recession was about twice as severe in magnitude, so you had a bear market twice as severe as the average bear market, and the market discounted twice as severe an economic contraction.
– Leon Cooperman, Barron’s, May 18, 2013
In Absolute Agreement
For any period of less than five years you are evaluating serendipity rather than skill.
– Bill Nygren, Kiplinger’s Personal Finance, March 2013
American business will do fine over time. And stocks will do well just as certainly, since their fate is tied to business performance. Periodic setbacks will occur, yes, but investors and managers are in a game that is heavily stacked in their favor. (The Dow Jones Industrials advanced from 66 to 11,497 in the 20th Century, a staggering 17,320% increase that materialized despite four costly wars, a Great Depression and many recessions. And don’t forget that shareholders received substantial dividends throughout the century as well.)
– Warren Buffett, Berkshire Hathaway 2013 annual report letter, March 1, 2013
Cocktail Conversation
Commodities are not an investment. An investment by definition is either current income or a stream of future income. When you buy a commodity, you have to be assuming that you are going to be able to sell it at a higher price to someone else, because it has no income. Thus, it is not investing—it is speculating.
– Barton Biggs, Diary of a Hedgehog
Many who abandoned equities in the “flight to safety” have begun to slowly migrate from cash and bonds to high dividend, low volatility stocks, and very recently, to more cyclical stocks. The timid move back into equities is in early stages with much money still on the sidelines, but flows could occur sporadically.
– Longleaf Partners Fund, First Quarter 2013 Report
The Dow Jones Industrial Index has risen in 17 of the past 20 months, the longest such streak since 1951.
– Sandra Ward, Barron’s, June 1, 2013
Timeless Tidbits
When all is said and done, more is said than done.
– Lou Holtz
There are more fools among buyers than among sellers.
– Proverb
A creative man is motivated by the desire to achieve, not by the desire to beat others.
– Ayn Rand
Try not to become a man of success, but rather try to become a man of value.
– Albert Einstein
There are no secrets to success. It is the result of preparation, hard work, and learning from failure.
– Colin Powell
| The thoughts expressed above represent solely the opinions of the persons quoted and, of course, there can be no assurance of future market trends or performance. |
| 98 | This page is not part of the 2013 Semiannual Report to Shareholders |
| Making Headlines |
At The Royce Funds, the integrity of our process and the reputation of our people are as important to us as the long-term performance of our portfolios, so it is always gratifying when the results of these three efforts are recognized in the wider world. Through the years, we have been fortunate enough to have a number of positive articles written about The Royce Funds, our firm, and our people, as well as opportunities to share our investment beliefs and approach. Below is a summary of several media mentions we received in the first half of this year.
Jay Kaplan Shares “The Case for Equities” with Investment News and Asset.tv
May 23, 2013
Chuck Royce in Barron’s “Willing to Wait”
“Right now, we’re working our way through a bubble of fear, a mirror to how it was in the 1990s, when we were in a bubble of greed,” said Co-CIO and President of The Royce Funds Chuck Royce in “Willing to Wait,” an article written by Jack Willoughby and published by Barron’s on May 11, 2013. “This market and the wide availability of credit rewards the overleveraged operations that have made excessive use of debt,” said Chuck. “It’s taken us awhile to understand the destructive effects of quantitative easing,” he added. Among the consequences of the Federal Reserve’s quantitative easing program—in addition to distorting stock value—have been investors’ preference for lower-quality companies, fixed-income securities, and passive management vehicles such as exchange-traded funds (ETFs) and index funds. However, while investor confidence can wax and wane quickly, playing a major role in the market’s direction, Chuck remains disciplined and sticks to his path. The article also looked closely at Chuck’s investment methodology, citing three companies that he currently likes.
May 9, 2013
Consuelo Mack WealthTrack:
Exclusive Interview with The Royce Funds’ “Great Investor”
On April 26, 2013, Co-CIO, President, and Portfolio Manager Chuck Royce was welcomed once again as a guest on Consuelo Mack WealthTrack. Introduced as a “small-company stock pioneer,” Chuck answered questions that revolved around his 40 years of experience investing in small-cap stocks, how the market has changed during his tenure, and the most important lessons he’s learned since enduring the bear market of the early- and mid-1970s, which include controlling risk, measuring performance by full market cycles, focusing on absolute returns (not comparisons to indexes), and maintaining a long-term investment discipline. “You have to suspend your fear in the short term in order to capture the long-term performance,” said Chuck. The interview also consisted of Chuck’s thoughts on the current market environment, small-caps as a distinct asset class, where Chuck is currently finding value, and avoiding the bandwagon while betting on quality.
The Wall Street Journal: Royce Special Equity Multi-Cap Among “Promising New Funds From Old Hands”
| This page is not part of the 2013 Semiannual Report to Shareholders | 99 |
This page is intentionally left blank.
| 100 | This page is not part of the 2013 Semiannual Report to Shareholders |
| Searching for Super Small-Cap Companies Through the Macro Noise |
Portfolio Manager and Principal Chris Clark offers insights into our disciplined, long-term investment process by emphasizing the role that contrarian thinking plays in our portfolios.
Watching Man of Steel on its opening weekend, the latest movie based on the iconic Superman comic books, I was struck by the fact that one “tail risk” not regularly appearing on the seemingly endless list of macroeconomic concerns is the possibility, however slight, that a well-armed villain from another galaxy might unexpectedly show up and wreak havoc on our sometimes peaceful and unprepared planet. It may be the one global catastrophe that we have not been warned about by market pundits.
Without giving away the plot, let’s just say that some variation of this unlikely turn of events does indeed occur, and while the film made no reference to the impact this unfriendly visit had on financial markets (sadly for me), it’s no stretch to conclude that there would probably be more sellers than buyers during the initial period of panic and uncertainty.
Not wanting to miss the full effects of this thriller, I convinced my wife and daughters to see the movie in IMAX 3D. In hindsight, this was probably not a great call on my part. To say that the whole experience overwhelmed the senses understates the continuous visual and audio assault that exhausted more than it entertained several moviegoers, my wife and youngest daughter included.
Other viewers had a similar experience, with several congregating outside the theater doors also attempting to regain their lost senses. I was able to make it through to the ending but felt disoriented by the whole experience. It took several hours for the effects to fully wear off.
Clearly the theater’s supersized viewing screen and deafening Dolby Surround Sound, combined with the movie’s exhilarating action and awesome 3-D imagery, had the desired effect of hijacking the senses. However, it also had the unintended consequence of numbing the viewer to the underlying plot.
Although no one will pay hard-earned dollars to watch the action on trading floors or Ben Bernanke’s press conferences, the corollaries to today’s investment climate are otherwise surprisingly close. Systemic risks abound and while clearly different and (perhaps) less fantastic than those depicted in the movie, they are no less unsettling when followed to their potential conclusion.
The most dramatic systemic risks imply the end of civilization due to natural resource exhaustion, civil strife over wealth disparity, wars over unpaid liabilities (people generally like to get paid back), and religious fanaticism. Of course, risks are one thing and outcomes can be entirely different—therein lies the true challenge for today’s would-be heroic investor.
The prognostications from market pundits through the various media outlets are overwhelming and constant. Much like the IMAX 3-D experience, the extreme noise can make the underlying plot tough to discern. And weighing the probabilities of any outcome is another challenge entirely.
One recent favorite of the pundits has been the inherently flawed eurozone currency structure. Another doomsday scenario centers on Japanese Prime Minister Shinzo Abe’s attempt to target inflation through extreme monetary and fiscal policies. A third recent view sees China struggling with demographic and environmental catastrophe while also facing an economic hard landing that will unleash massive social upheaval in the world’s most populous country. And there’s always the old favorite involving the respective pursuits of nuclear weapons by North Korea and Iran, as well as each nation’s stated goals of annihilating their adversaries (a list that often includes the U.S.).

The investment team at Royce is often asked to weigh in on macroeconomic issues and while we oblige, somewhat reluctantly, we always offer the same caveat—our expertise is evaluating and understanding companies, their value, quality, and future prospects, not predicting economic, political, or strategic outcomes, especially those that resemble the plot of a summer blockbuster. For us, the multitude of variables that go into that type of analysis would cause sensory and intellectual overload. Even more importantly, we might miss the underlying story.
This is important because we invest in companies, not headlines or economic statistics. Like the best-drawn movie characters, companies can be resilient and dynamic entities that more often than not self-determine their long-term success or failure. There is no question that macroeconomic factors provide relevant inputs. Yet from our perspective they are often far less important than investors believe.
So whether or not the investment community decides to sell everything because chaos and destruction appear imminent is less of a concern to us than which companies look likely to survive, adapt, and ultimately grow stronger in whatever the aftermath. That is our business, and we are sticking with it. All that loud noise is like Kryptonite to us.
The thoughts in this essay concerning the stock market are solely those of Royce & Associates and, of course, there can be no assurance with regard to future market movements.
| This page is not part of the 2013 Semiannual Report to Shareholders |
 | |||||||||||||||||||
 | |||||||||||||||||||
About The Royce Funds This Review and Report must be accompanied or preceded by a current prospectus for the Funds. Please read the prospectus carefully before investing or sending money. | |||||||||||||||||||
| Contact Us | |||||||||||||||||||
| General Information Additional Report Copies and Prospectus Inquiries (800) 221-4268 | RIA Services Fund Materials and Performance Updates (800) 33-ROYCE (337-6923) | Broker/Dealer Services Fund Materials and Performance Updates (800) 59-ROYCE (597-6923) | Shareholder Services Transactions and Account Inquiries (800) 841-1180 | Royce Infoline 24-Hour Automated Telephone Service (800) 78-ROYCE (787-6923) |  | ||||||||||||||
Item 2. Code(s) of Ethics. Not applicable to this semi-annual report.
Item 3. Audit Committee Financial Expert. Not applicable to this semi-annual report.
Item 4. Principal Accountant Fees and Services. Not applicable to this semi-annual report.
Item 5. Audit Committee of Listed Registrants. Not Applicable.
Item 6. Investments.
(a) See Item 1.
(b) Not Applicable
Item 7. Disclosure of Proxy Voting Policies and Procedures for Closed-End Management Investment Companies. Not Applicable.
Item 8. Portfolio Managers of Closed-End Management Investment Companies. Not Applicable.
Item 9. Purchases of Equity Securities by Closed-End Management Investment Company and Affiliated Purchasers. Not Applicable
Item 10. Submission of Matters to a Vote of Security Holders. Not Applicable.
Item 11. Controls and Procedures.
(a) Disclosure Controls and Procedures. The Principal Executive and Financial Officers concluded that the Registrant’s Disclosure Controls and Procedures are effective based on their evaluation of the Disclosure Controls and Procedures as of a date within 90 days of the filing date of this report.
(b) Internal Control over Financial Reporting. There were no significant changes in Registrant’s internal control over financial reporting or in other factors that could significantly affect this control subsequent to the date of the evaluation, including any corrective actions with regard to significant deficiencies and material weaknesses during the second fiscal quarter of the period covered by this report.
Item 12. Exhibits. Attached hereto.
(a)(1) Not applicable to this semi-annual report.
(a)(2) Separate certifications by the Registrant’s Principal Executive Officer and Principal Financial Officer as required by Rule 30a-2(a) under the Investment Company Act of 1940.
(a)(3) Not Applicable
(b) Separate certifications by the Registrant’s Principal Executive Officer and Principal Financial Officer, pursuant to Section 906 of the Sarbanes-Oxley Act of 2002 and required by Rule 30a-2(b) under the Investment Company Act of 1940.
Pursuant to the requirements of the Securities Exchange Act of 1934 and the Investment Company Act of 1940, the registrant has duly caused this report to be signed on its behalf by the undersigned, thereunto duly authorized.
| THE ROYCE FUND |
| BY: /s/ Charles M. Royce |
Charles M. Royce |
President |
| Date: August 28, 2013 |
Pursuant to the requirements of the Securities Exchange Act of 1934 and the Investment Company Act of 1940, this report has been signed below by the following persons on behalf of the registrant and in the capacities and on the dates indicated.
| THE ROYCE FUND | THE ROYCE FUND | |
| BY: /s/ Charles M. Royce | BY: /s/ John D. Diederich | |
Charles M. Royce | John D. Diederich | |
President | Chief Financial Officer | |
| Date: August 28, 2013 | Date: August 28, 2013 | |