| UNITED STATES |
| SECURITIES AND EXCHANGE COMMISSION |
| Washington, D.C. 20549 |
| FORM N-CSR |
| CERTIFIED SHAREHOLDER REPORT |
| OF |
| REGISTERED MANAGEMENT INVESTMENT COMPANIES |
| Investment Company Act file number: 811-03599 |
| Name of Registrant: The Royce Fund |
| Address of Registrant: 745 Fifth Avenue |
| New York, NY 10151 |
| Name and address of agent for service: | John E. Denneen, Esq. | |||
| 745 Fifth Avenue | ||||
| New York, NY 10151 |
| Registrant’s telephone number, including area code: (212) 508-4500 |
| Date of fiscal year end: December 31, 2012 |
| Date of reporting period: January 1, 2012 – June 30, 2012 |
Item 1. Reports to Shareholders.
|

SEMIANNUAL
REVIEW AND REPORT
TO SHAREHOLDERS
| CORE Royce Pennsylvania Mutual Fund Royce Heritage Fund CORE + DIVIDENDS Royce Total Return Fund Royce Dividend Value Fund FOCUSED Royce Premier Fund Royce Special Equity Fund Royce Value Fund Royce 100 Fund Royce Focus Value Fund Royce Partners Fund Royce Special Equity Multi-Cap Fund OPPORTUNISTIC THEMES Royce Low-Priced Stock Fund Royce Opportunity Fund Royce Value Plus Fund Royce Financial Services Fund MICRO-CAP Royce Micro-Cap Fund Royce Micro-Cap Discovery Fund MID-CAP Royce SMid-Cap Value Fund Royce Mid-Cap Fund | |||
www.roycefunds.com |  | ||
| Online Update |
| Visit www.roycefunds.com for Fund performance information, special messages and commentary from Co-CIOs Chuck Royce, Whitney George and other portfolio managers, news, literature and tools to help you better understand and compare our Funds. |
 |
| eDelivery Saves! Sign Up Now. |
eDelivery saves paper, time and fund expenses.1 Sign up now to view statements, prospectuses, financial reports and tax forms online. |
| > www.roycefunds.com/edelivery |
1 Any direct Royce Funds IRA investor who chooses eDelivery of prospectuses, financial reports, and RWord will be exempt from the $15 annual IRA maintenance fee. (We will continue to also waive the fee for investors with more than $20,000 invested in Royce IRAs at the time the fee is charged, and for new transfer and rollover accounts in their first year.) |
| Stay Informed |
| Follow us on Twitter, watch us on YouTube, subscribe to our RSS feed and sign up for our monthly eWord newsletter to stay up to date on the latest from The Royce Funds. |
 |
| Financial Professionals |
Login to our Financial Professional website to access up-to-date research, insights and whitepapers including: The Valuation Challenge: Inexpensive Quality Remains Plentiful in Small-Cap Quality is not only plentiful within the small-cap universe, but it is also attractively valued right now across the market cap spectrum. Cyclicality Is Our Friend: Market Downturns Can Build Better Future Returns The small-cap downturn in 2011 was no fun, but downturns are neither unusual nor unprecedented. More important, in our view they remain key components in building higher long-term returns. |
| > www.roycefunds.com/research-0612 |
Quarterly Advisor Materials Log into our Financial Professional site and manage your preferences to receive alerts about our: • Quarterly Review Book • Fund Impact and Attribution Reports • Longitudinal Studies • Fact Sheets |
| > www.roycefunds.com/advisors |
| This page is not part of the 2012 Semiannual Report to Shareholders |
| Table of Contents | |
| Semiannual Review | |
| Fund Guide | 2 |
| Performance and Expenses | 4 |
| Portfolio Characteristics | 5 |
| Market Cycle and Risk Adjusted Performance | 6 |
| Letter to Our Shareholders | 7 |
| Fund Focus | 14 |
| Postscript: Is the Business Cycle Dead? | Inside Back Cover |
| Semiannual Report to Shareholders | 15 |

| This page is not part of the 2012 Semiannual Report to Shareholders | 1 |
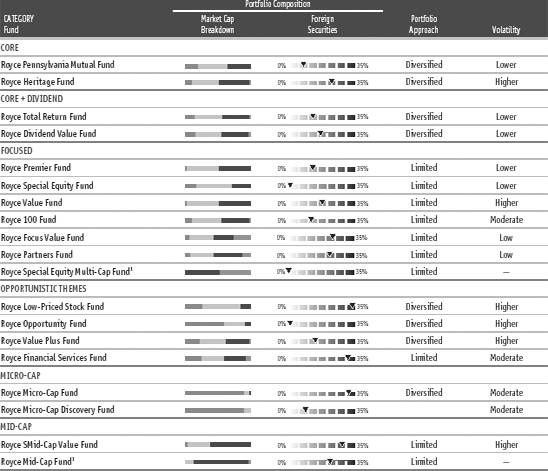
| Fund Guide |
| Understanding How We Think About Our Portfolios |
We are often asked, “If small companies are your primary area of focus, why are there so many Royce Funds?” To answer this question, we first point to the distinctive nature of the small-company universe. Small-cap is significantly larger than large-cap both in terms of names—with more than ten times the number of companies—and potential opportunities. |
The universe has evolved over the last 15 years into a recognized, professional asset class with a high level of institutional acceptance. Today, there are many small-cap and micro-cap indexes, as well as style indexes and sector groupings. This is why we believe the size and diversity of the universe make it ideally suited for multiple offerings. Small-cap and micro-cap securities also require their own particular approach. In addition, within each universe there are significant pockets of opportunity, such as dividend-paying companies, low-priced companies, high quality companies, etc., that go beyond classification by market cap. So while our portfolio managers share a common investment approach—one that emphasizes paying attention to risk and buying what each thinks are strong companies at attractively discounted prices—our portfolios also possess important distinctions that make each one unique.  Our Fund Guide is designed to help investors better understand both the different approaches and the common ground among our portfolios. Each Fund Category provides insight into how the respective portfolios are managed, while a closer look at our materials allows investors to see other important differences—capitalization range, volatility, other investment themes, portfolio diversification—within each category. We think that understanding these differences can be helpful in asset allocation decisions, especially when investors incorporate more than one Royce offering within their portfolios. |
| Investment Universe |
Our universe consists of three primary markets: micro-cap, small-cap and mid-cap companies. The Funds may also invest in foreign securities to varying degrees. |
U.S. Micro-Cap Market Caps up to $750 million1 • More than 3,380 companies • More than $540 billion in total capitalization This area offers many choices, but also features limited trading volumes and higher volatility. U.S. Small-Cap Market Caps between1 $750 million and $2.5 billion • More than 820 companies • More than $1.1 trillion in total capitalization This segment is more efficient, offering greater trading volumes and narrower bid/ask spreads. U.S. Mid-Cap Market Caps between1 $2.5 billion and $15 billion • More than 680 companies • More than $4.0 trillion in total capitalization Mid-cap companies generally possess more established businesses that attract greater institutional interest and thus enjoy greater liquidity. Foreign Securities2 This market consists of more than 15,360 companies in developed countries. Sources: 1 Compustat as of 6/30/12 2 Reuters as of 6/30/12 |
| 2 | This page is not part of the 2012 Semiannual Report to Shareholders |
| Multiple offerings tailored to specific investor needs. | ||
CORE | |
Royce Pennsylvania Mutual Fund | |
Royce Heritage Fund | |
| Generally invest across a wide spectrum of small companies using a diversified approach. We select stocks in these Funds using our core investment approach, which is based on attractive valuation, balance sheet quality and returns on invested capital. We developed this approach during the 1970s and ’80s in our flagship, Royce Pennsylvania Mutual Fund. These Funds may also incorporate ideas used in other portfolios, such as low-priced stocks, dividend-paying stocks, above-average growth companies and international securities. | |
CORE + DIVIDENDS | |
Royce Total Return Fund | |
Royce Dividend Value Fund | |
| Generally invest in a diversified portfolio of dividend-paying smaller companies using our core investment approach. We believe that an investment strategy that seeks both long-term growth and current income has the potential to generate above-average absolute returns over full market cycles with less volatility. These Funds may also invest a portion of the portfolio in preferred stocks and in fixed income securities, such as convertible bonds. | |
FOCUSED | |
Royce Premier Fund | |
Royce Special Equity Fund | |
Royce Value Fund | |
Royce 100 Fund | |
Royce Focus Value Fund | |
Royce Partners Fund | |
Royce Special Equity Multi-Cap Fund | |
| Generally employ a more limited portfolio approach—typically holding no more than 100 positions—and whose holdings possess what we believe are attractive valuations and higher-quality characteristics. These include strong balance sheets, above-average returns on invested capital and the ability to generate free cash flow. | |
OPPORTUNISTIC THEMES | |
Royce Low-Priced Stock Fund | |
Royce Opportunity Fund | |
Royce Value Plus Fund | |
Royce Financial Services Fund | |
| Generally invest in companies considered more opportunistic, with each emphasizing different themes, such as turnarounds, special situations, low-priced stocks and/or companies with high growth prospects. These portfolios are in general highly diversified and have the potential for higher returns, commensurate with each Fund’s higher level of risk. | |
MICRO-CAP | |
Royce Micro-Cap Fund | |
Royce Micro-Cap Discovery Fund | |
| Generally invest in micro-caps, those companies with market capitalizations up to $750 million, using our core investment approach. Due to the sector’s size and limited research coverage, there is more opportunity to find pricing inefficiencies. Therefore, we believe that the potential for higher returns, commensurate with a higher level of risk, is greater than for any other capitalization sector of the domestic equity marketplace. | |
MID-CAP | |
Royce SMid-Cap Value Fund | |
Royce Mid-Cap Fund | |
| Generally invest in mid-caps, those companies with market capitalizations from $2.5 billion to $15 billion, or smid-caps, those companies with market capitalizations from $750 million to $10 billion. While not restricted by number of holdings, we typically employ a more concentrated approach when investing in these companies, holding proportionately larger positions in a relatively limited number of stocks. | |
|
| Investments in securities of micro-cap, small-cap and/or mid-cap companies may involve considerably more risk than investments in securities of larger-cap companies. (Please see “Primary Risks for Fund Investors” in the prospectus.) Each Fund may invest a portion of its net assets in foreign securities, which may involve political, economic, currency, and other risks not encountered in U.S. investments. (Please see “Investing in Foreign Securities” in the prospectus.) |
| This page is not part of the 2012 Semiannual Report to Shareholders | 3 |
| Performance and Expenses | Through June 30, 2012 |
| Average Annual Total Returns | Gross Annual | Net Annual | ||||||||||||||||||||||||||||||
| CATEGORY | Since | Since | Operating | Operating | ||||||||||||||||||||||||||||
| Fund | Year-to-Date1 | 1-Year | 5-Year | 10-Year | Inception | Inception Date | Expenses | Expenses | ||||||||||||||||||||||||
| CORE | ||||||||||||||||||||||||||||||||
| Royce Pennsylvania Mutual Fund | 4.00 | % | -6.97 | % | 0.49 | % | 7.97 | % | n.a. | n.a. | 0.91 | % | 0.91 | % | ||||||||||||||||||
| Royce Heritage Fund | 2.38 | -11.57 | 1.53 | 8.51 | 13.01 | % | 12/27/95 | 1.50 | 1.50 | |||||||||||||||||||||||
| CORE + DIVIDENDS | ||||||||||||||||||||||||||||||||
| Royce Total Return Fund | 4.18 | -2.82 | 0.65 | 7.11 | 10.46 | 12/15/93 | 1.15 | 1.15 | ||||||||||||||||||||||||
| Royce Dividend Value Fund | 4.85 | -4.34 | 2.84 | n.a. | 7.37 | 5/3/04 | 1.50 | 1.50 | ||||||||||||||||||||||||
| FOCUSED | ||||||||||||||||||||||||||||||||
| Royce Premier Fund | 2.65 | -6.54 | 3.89 | 10.85 | 11.86 | 12/31/91 | 1.09 | 1.09 | ||||||||||||||||||||||||
| Royce Special Equity Fund | 5.99 | 2.87 | 4.27 | 8.07 | 8.85 | 5/1/98 | 1.15 | 1.15 | ||||||||||||||||||||||||
| Royce Value Fund | -1.65 | -14.23 | -0.20 | 11.08 | 9.90 | 6/14/01 | 1.45 | 1.45 | ||||||||||||||||||||||||
| Royce 100 Fund | 1.73 | -9.72 | 2.50 | n.a. | 9.65 | 6/30/03 | 1.47 | 1.47 | ||||||||||||||||||||||||
| Royce Focus Value Fund | 0.00 | -14.65 | n.a. | n.a. | 13.37 | 2/27/09 | 1.98 | 1.36 | ||||||||||||||||||||||||
| Royce Partners Fund | 7.33 | -9.19 | n.a. | n.a. | 8.65 | 4/27/09 | 4.28 | 1.38 | ||||||||||||||||||||||||
| Royce Special Equity Multi-Cap Fund | 6.67 | 6.17 | n.a. | n.a. | 9.38 | 12/31/10 | 1.97 | 1.39 | ||||||||||||||||||||||||
| OPPORTUNISTIC THEMES | ||||||||||||||||||||||||||||||||
| Royce Low-Priced Stock Fund | -1.05 | -18.17 | 0.33 | 7.39 | 11.59 | 12/15/93 | 1.58 | 1.51 | ||||||||||||||||||||||||
| Royce Opportunity Fund | 11.24 | -5.59 | -0.18 | 8.51 | 11.94 | 11/19/96 | 1.17 | 1.17 | ||||||||||||||||||||||||
| Royce Value Plus Fund | 5.92 | -8.41 | -2.73 | 10.30 | 11.00 | 6/14/01 | 1.45 | 1.45 | ||||||||||||||||||||||||
| Royce Financial Services Fund | 8.23 | -6.44 | -1.83 | n.a. | 4.81 | 12/31/03 | 1.89 | 1.54 | ||||||||||||||||||||||||
| MICRO-CAP | ||||||||||||||||||||||||||||||||
| Royce Micro-Cap Fund | 2.61 | -12.35 | 0.95 | 8.78 | 12.32 | 12/31/91 | 1.50 | 1.50 | ||||||||||||||||||||||||
| Royce Micro-Cap Discovery Fund | 0.00 | -4.78 | -2.62 | n.a. | 4.24 | 10/3/03 | 2.99 | 1.49 | ||||||||||||||||||||||||
| MID-CAP | ||||||||||||||||||||||||||||||||
| Royce SMid-Cap Value Fund | 2.67 | -13.37 | n.a. | n.a. | 0.90 | 9/28/07 | 1.95 | 1.35 | ||||||||||||||||||||||||
| Royce Mid-Cap Fund | -0.75 | -13.19 | n.a. | n.a. | 3.79 | 12/31/09 | 2.34 | 1.35 | ||||||||||||||||||||||||
| Russell 2000 Index | 8.53 | -2.08 | 0.54 | 7.00 | n.a. | n.a. | n.a. | n.a. | ||||||||||||||||||||||||
Royce Pennsylvania Mutual Fund’s average annual total return for the 35-year period ended 6/30/12 was 13.30%. |
Important Performance, Expense and Risk Information All performance information in this Review and Report reflects past performance, is presented on a total return basis, reflects the reinvestment of distributions and does not reflect the deduction of taxes a shareholder would pay on fund distributions or the redemption of fund shares. Past performance is no guarantee of future results. Investment return and principal value of an investment will fluctuate, so that shares may be worth more or less than their original cost when redeemed. Shares redeemed within 180 days of purchase may be subject to a 1% redemption fee payable to the Fund. Redemption fees are not reflected in the performance shown above; if they were, performance would be lower. Current performance may be higher or lower than performance quoted. Current month-end performance may be obtained at www.roycefunds.com. All performance and expense information reflects results of the Fund’s oldest share Class (Investment Class or Service Class, as the case may be). Price and total return information is based on net asset values calculated for shareholder transactions. Certain immaterial adjustments were made to the net assets of Royce Heritage and Micro-Cap Funds at 12/30/11 and Royce Micro-Cap Discovery Fund at 6/29/12 for financial reporting purposes, and as a result the net asset values for shareholder transactions on those dates and the total returns based on those net asset values differ from the adjusted net asset values and total returns reported in the Financial Highlights. Gross annual operating expenses reflect the Fund’s gross total annual operating expenses and include management fees, any 12b-1 distribution and service fees, other expenses and any applicable acquired fund fees and expenses. Net annual operating expenses reflect contractual fee waivers and/or reimbursements. All expense information is reported as of the Fund’s most current prospectus. Royce & Associates has contractually agreed to waive fees and/or reimburse operating expenses, other than acquired fund fees and expenses, if any, to the extent necessary to maintain net operating expenses at or below: 1.35% for Royce Focus Value, Partners, SMid-Cap Value and Mid-Cap Funds; 1.49% for Royce Low-Priced Stock, Financial Services, and Micro-Cap Discovery Funds through April 30, 2013 and at or below 1.99% for Royce Partners, Micro-Cap Discovery and Mid-Cap Funds through April 30, 2022; and 1.39% for Royce Special Equity Multi-Cap Fund through April 30, 2014. Acquired fund fees and expenses reflect the estimated amount of fees and expenses incurred indirectly by the Fund through its investments in mutual funds, hedge funds, private equity funds and other investment companies. Shares of the Funds’ Service, Consultant, R and K Classes bear an annual distribution expense that is not borne by the Funds’ Investment Class. Investments in securities of micro-cap, small-cap and/or mid-cap companies may involve considerably more risk than investments in securities of larger-cap companies. (Please see “Primary Risks for Fund Investors” in the prospectus.) Please read the prospectus carefully before investing or sending money. Russell Investment Group is the source and owner of the trademarks, service marks and copyrights related to the Russell Indexes. Russell® is a trademark of Russell Investment Group. The Russell 2000 Index is an unmanaged, capitalization-weighted index of domestic small-cap stocks. It measures the performance of the 2,000 smallest publicly traded U.S. companies in the Russell 3000 Index. Distributor: Royce Fund Services, Inc. |
| 4 | This page is not part of the 2012 Semiannual Report to Shareholders |
| Portfolio Characteristics | As of June 30, 2012 |
 | |
Market Cap Breakdown Key:  Micro-Cap Micro-Cap  Small-Cap Small-Cap  Mid-Cap Mid-Cap  Large-Cap Large-Cap |
Investment Universe Micro-Cap: Market Caps up to $750 million Small-Cap: Market Caps between $750 million and $2.5 billion Mid-Cap: Market Caps between $2.5 billion and $15 billion Large-Cap: Market Caps greater than $15 billion Foreign Securities: Non-U.S. securities are those securities that do not trade on a U.S. exchange, trade outside the U.S. and/or are issued by companies that are domiciled outside the U.S. Portfolio Approach Diversified: A diversified portfolio at Royce is one that generally holds more than 100 securities and whose top positions generally do not exceed 2% of net assets. Limited: A limited portfolio at Royce is one that either (i) generally invests in no more than 100 companies, and whose top positions generally exceed 2% of net assets, or (ii) invests primarily in a single sector. Volatility Each Fund’s volatility is measured using Morningstar’s Risk Ratio, which measures variations in a fund’s monthly returns, with an emphasis on downside performance. Each Royce Fund’s overall Risk Ratio is a weighted combination of its three-, five- and 10-year scores, if applicable. Except as noted below, each Fund’s results reflect its score compared with all small-cap objective funds tracked by Morningstar with at least three years of history (367 funds as of 6/30/12). For Royce Financial Services Fund, all financial funds tracked by the Morningstar with at least three years of history (32 funds as of 6/30/12) are included. For Royce SMid-Cap Value Fund, all mid-cap stock funds with weighted average market caps between $750 million and $10 billion tracked by Morningstar with at least three years of history (403 funds as of 6/30/12) are included. We consider funds whose results rank in the top third of the category to have relatively low volatility; those in the middle third to have moderate volatility; and those in the bottom third to have high volatility. |
| This page is not part of the 2012 Semiannual Report to Shareholders | 5 |
| Market Cycle and Risk Adjusted Performance |
We believe strongly in the idea that a long-term investment perspective is crucial for determining the success of a particular investment approach. While flourishing in an up market is wonderful, surviving a bear market by losing less (or not at all) is at least as good. However, the true test of a portfolio’s mettle is performance over full market cycle periods, which include both an up and down market period. |
| Since the inception of the Russell 2000’s index on 12/31/78, there have been 10 full market cycles, with the most recent peaking on 4/29/11. Market cycles are defined as those that have retreated at least 15% from a previous market peak and have rebounded to establish a new peak above the previous one. Each market cycle contains a peak-to-trough and a trough-to-peak period. Interestingly, over the small-cap index’s 30+ year history, each style index—the Russell 2000 Value Index and the Russell 2000 Growth Index—outperformed in five of the 10 full market cycles. In fact, leadership has alternated between growth and value over the last six cycles. If history were to adhere to this pattern, value would lead in the current cycle that began on 4/29/11. |
| RISK/RETURN PROFILE 10-YEAR PERIOD ENDED JUNE 30, 2012 |
 |
• | For the 10-year period ended 6/30/12, all 10 Royce Funds with 10 years of history outperformed the Russell 2000, and all did so with better risk-adjusted returns and Sharpe ratios. |
• | In addition, six of the 10 Royce Funds outperformed the Index with lower volatility. |
| All performance information above reflects past performance, is presented on a total return basis, reflects the reinvestment of distributions and does not reflect the deduction of taxes that a shareholder would pay on fund distributions or the redemption of fund shares. Past performance is no guarantee of future results. Investment return and principal value of an investment will fluctuate, so that shares may be worth more or less than their original cost when redeemed. Current performance may be higher or lower than performance quoted. |
| SMALL-CAP MARKET CYCLE: RUSSELL 2000 INDEXES TOTAL RETURNS | |||||||||||||||
 | |||||||||||||||
| ROYCE U.S. EQUITY FUNDS VS. RUSSELL 2000 INDEX: MARKET CYCLE RESULTS | |||||||||||||||
| Peak-to- Peak 3/9/00- 7/13/07 | Peak-to- Peak 7/13/07- 4/29/11 | Peak-to- Current 4/29/11- 6/30/12 | |||||||||||||
| Russell 2000 | 54.8 | % | 6.6 | % | -6.1 | % | |||||||||
| Russell 2000 Value | 189.4 | -1.4 | -5.6 | ||||||||||||
| Russell 2000 Growth | -14.8 | 14.3 | -6.6 | ||||||||||||
| CORE | |||||||||||||||
| Royce Pennsylvania Mutual | 207.1 | 11.6 | -10.7 | ||||||||||||
| Royce Heritage | 150.4 | 25.3 | -15.9 | ||||||||||||
| CORE + DIVIDENDS | |||||||||||||||
| Royce Total Return | 193.9 | 6.8 | -5.7 | ||||||||||||
| Royce Dividend Value | n.a. | 21.6 | -7.5 | ||||||||||||
| FOCUSED | |||||||||||||||
| Royce Premier | 198.1 | 29.9 | -9.8 | ||||||||||||
| Royce Special Equity | 227.4 | 20.8 | -1.1 | ||||||||||||
| Royce Value | n.a. | 17.4 | -18.6 | ||||||||||||
| Royce 100 | n.a. | 27.6 | -13.8 | ||||||||||||
| Royce Focus Value | n.a. | n.a. | -20.5 | ||||||||||||
| Royce Partners | n.a. | n.a. | -11.9 | ||||||||||||
| Royce Special Equity Multi Cap | n.a. | n.a. | -3.6 | ||||||||||||
| OPPORTUNISTIC THEMES | |||||||||||||||
| Royce Low-Priced Stock | 198.9 | 27.2 | -22.5 | ||||||||||||
| Royce Opportunity | 191.8 | 6.9 | -10.2 | ||||||||||||
| Royce Value Plus | n.a. | -3.0 | -13.1 | ||||||||||||
| Royce Financial Services | n.a. | 1.1 | -10.5 | ||||||||||||
| MICRO-CAP | |||||||||||||||
| Royce Micro-Cap | 197.4 | 24.9 | -17.9 | ||||||||||||
| Royce Micro-Cap Discovery | n.a. | -6.1 | -8.8 | ||||||||||||
| MID-CAP | |||||||||||||||
| Royce SMid-Cap Value | n.a. | n.a. | -16.4 | ||||||||||||
| Royce Mid-Cap | n.a. | n.a. | -17.9 | ||||||||||||
| 6 | This page is not part of the 2012 Semiannual Report to Shareholders |
| Letter to Our Shareholders | ||
 | ||
“I Read the News Today, Oh Boy.” | ||
Another dismal summer has dawned with spring having brought a wave of worries back to the market for the third consecutive year. Karl Marx—as canny an observer of the global scene as he was a checkered prognosticator of its future—wrote in 1852 that all events in history occur twice: the first time as tragedy, the second as farce. Allowing for the accuracy of this observation, what are we then to make of this third round of wobbly recovery, sluggish markets, panic-stuffed headlines, and the by now reflexive anxiety about the potential horrors of European debt for the world economy? What lies beyond farce, other than lousy returns, high correlation, and growing numbers of investors disenchanted with equities? To this kind of question, too many investors have no answer, having lost not only their belief in the viability of investing in stocks, but also in the prospects for the global economy. Indeed, one unfortunate result of the contagion of uncertainty has been the erosion of confidence in the ability of equities to deliver returns that will beat inflation and build wealth over the long term. On May 7, a USA Today headline asked and answered, “Invest in stocks? Forget About It.” It was not quite as damning as the now infamous Business Week cover from August 1979 that proclaimed “The Death of Equities,” but the overall message was not much happier: “Wall Street’s long-running story about how stocks are the best way to build wealth seems tired, dated and less believable to many individual investors.” And the USA Today piece was published early in May, just before the current bear bit down most sharply. The implicit assumption that the best days for the stock market may be (way) behind it seems to us to be the distinguishing feature of this third round of poor results for most equities. Panic has given way to a shrug of resignation. This stance sees equity investing as a mug’s game, even if the alternatives—Treasuries, bonds, money markets, etc.—are not much more attractive or profitable. | Our collective experience tells us that this highly volatile, tightly correlated, range-bound market will be remembered as being as anomalous as it has been painful, one that tends to occur once or twice a century. It does not, in our view, change the fact that stocks remain the single best way of building wealth over the long run. | |
| This page is not part of the 2012 Semiannual Report to Shareholders | 7 |
 Charles M. Royce, President We have often stressed the importance of capital preservation in asset management, arguing that not losing money is as critical as making it grow. Implicit in this belief is the idea that capital preservation is mostly synonymous with preserving purchasing power. However, we now find ourselves in a very non- traditional investment environment, an age marked by near-zero interest rates; regular, short-term bursts of volatility for equities; and relentless money printing on the part of the developed world’s central banks. While this has not altered our view of the significance of risk aversion, it has led us to ask if at this moment in history capital preservation and preservation of purchasing power should be defined differently. The answer approaches what we think is one of the most underappreciated risks to which investors are now subject: the potential for meaningful loss in the future purchasing power of investments. With so much attention being paid to preservation of capital, too little has been placed on what that capital, once returned, will actually be worth. Continued on page 10... | Letter to Our Shareholders Such a belief—as ultimately wrong-headed as we think it is—has the advantage that recent history, as far back as five years, is on its side. With a few exceptions, there is simply not much of a defense for equity investing as a whole since the respective index peaks in 2007. The explanation for why the market has been so troublesome and unprofitable seems simple: The world is still emerging from the most serious economic crisis since the Great Depression. Yet this account may be in equal parts true and unhelpful, at least to anyone who had been looking for a way to safely and effectively grow capital during the last few years, which helps to explain why panic and resignation are symptoms of the same fatalism that has gripped investors since the early days of the mortgage and banking crisis in 2008. We understand the pessimism and the unwillingness to take risks on the part of so many investors today. At the same time, we still see many of the same positive signs that have been inspiring our confidence about stocks and the economy as a whole since the spring of 2010. By taking the long view (a common perspective for us), we can offer, in addition to a Nostra Culpa for much recent fund performance, the benefit of nearly 40 years of small-cap value investing. Our collective experience tells us that this highly volatile, tightly correlated, range-bound market will be remembered as being as anomalous as it has been painful, one that tends to occur once or twice a century. It does not, in our view, change the fact that stocks remain the single best way of building wealth over the long run. We know that in the current environment these words may sound hollow or even self-serving. We are more than willing to assume that risk in the hope that investors will continue to look to equities (and to our portfolios) as effective and ultimately successful ways to invest in the years to come. “They’ve Been Going in and out of Style” The kind of dynamic rally that ushered out the first half of 2012 is always guaranteed to raise a smile, even if it could not completely erase earlier losses in the second quarter, losses that spoiled a promising upswing that lasted through most of the year’s opening quarter. Indeed, lack of direction has arguably been the most distinguishing characteristic of the recent market. Still, the major U.S. indexes finished the year-to-date period ended June 30, 2012 in decent condition, as did their overseas counterparts. Domestic small-caps brought up the rear. The Russell 2000 Index was up 8.5% in the first half, compared to respective gains of 9.4% and 9.5% for the large-cap Russell 1000 and S&P 500 Indexes and an electrifying 12.7% for the Nasdaq Composite. It was an interesting road for each index. The first quarter extended a rally that began following the October 2011 lows. Small-cap trailed, though its 12.4% gain was its best opening quarter since 2006. It was also not far behind its large-cap counterparts. The Russell 1000 rose 12.9%, and the S&P 500 gained 12.6%. The Nasdaq was especially impressive, notching an 18.7% increase for the quarter. We were among | ||
| 8 | This page is not part of the 2012 Semiannual Report to Shareholders |
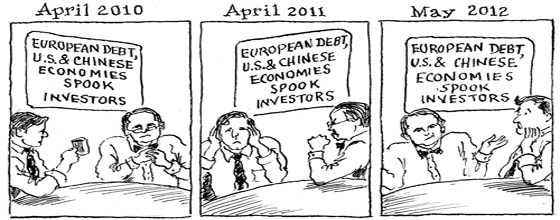
| those hopeful souls who saw a nearly six-month bull run and thought that maybe the market was ready for some consistent recovery. Yet April and May were cruel months, the latter especially so, as the now-traditional spring downturn caused by concerns about European debt and the state of the American and Chinese economies spoiled the party and tamped down returns. (If not for the rally on the final trading day of June, that month would also have been less solidly in the black.) That rally was welcome—they always are—but second-quarter returns were still negative. The Nasdaq led on the downside, falling 5.1%, while the Russell 2000 slipped 3.5%. Large-caps held their value a bit better, with the Russell 1000 losing 3.1% and the S&P 500 declining 2.8%. So the first half concluded with a bang, but still left investors whimpering about the future. | Our expectation is for a less extreme, more historically normal phase, without so many of the stomach-churning drops followed by equally steep upticks that we saw last summer and fall and have seen so far in 2012. It is worth noting that a more historically normal range is one in which we think our funds can generate strong absolute and relative performance over the long run. | |
Looking at longer-term returns, this uncertainty has been well-earned. While three- and 10-year average annual total returns for the major indexes were solid-to-strong, one-, five-, and 12-year results for the periods ended June 30, 2012 were generally poor. The 12-year period—not a period that we, or anyone else, usually discusses—is instructive because it encompasses the Internet Bubble, the subsequent recovery, the recession that was followed by the financial crisis, and the market’s herky-jerky, volatile aftermath. So we think it is worth pointing out that for the 12-year period ended December 31, 2011, the average annual total return for the S&P 500 was its lowest since the end of World War II (beginning with the period from the end of 1945 through the end of 1957). Small-cap returns for that same period ended December 31, 2011 for the Russell 2000 and the CRSP 6-10, a small-cap proxy that dates back to the 1920s, were among the worst for both since the launch of the Russell 2000 on December 31, 1978 and since the end of 1945 for the CRSP 6-10. Recent performance for the two non-U.S. indexes that we track followed patterns similar to their domestic cousins, though with more muted results. This was not entirely surprising considering both Europe’s ongoing travails and worries about the pace of growth in China. Non-U.S. small-caps enjoyed an advantage over their large-cap siblings, with the Russell Global ex-U.S. Small Cap up 4.8% for the year-to-date period ended June 30, 2012 versus a 2.7% gain for the Russell Global ex-U.S. Large Cap Index. Both indexes enjoyed strong first-quarter results. The Russell Global ex-U.S. Small Cap Index rose 14.4%, and the Russell Global ex-U.S. Large Cap Index was up 11.5% in the first three months of 2012. Each index’s second quarter was far more difficult, as Europe’s troubles registered more dramatically outside the U.S. Small-cap lost a bit more in the downturn, with the Russell Global ex-U.S. Small Cap Index falling 8.5%, while the Russell Global ex-U.S. Large Cap Index was down 7.9%. |
| This page is not part of the 2012 Semiannual Report to Shareholders | 9 |
For more than three decades, an investment vehicle provided highly consistent returns with such low volatility that they were nearly devoid of risk—U.S. government bonds, specifically Treasury securities. They were the instruments that possessed that highly desired standard, “the risk-free rate of return.” The currently volatile investment climate has greatly expanded the appeal of this designation. Investors trying to cope with the economic uncertainty and asset-price volatility caused by the bursting credit bubble have grown increasingly sensitive to the possibilities of capital loss. Yet if history is any proxy—and we believe that it is—a healthy degree of skepticism should greet the notion that Treasuries remain risk free or provide an acceptable rate of return. If nothing else, the lens through which we see them needs to be adjusted to include the growing uncertainty of ultimate purchasing power (of real goods and services) of the currency in which they are denominated. This risk, one for which we have a healthy respect over the intermediate term, is the ominous combination of ongoing currency debasement and acceleration in inflationary pressures. These could erode the purchasing power of non- productive assets. Central banks around the world, with the U.S. Federal Reserve a primary contributor, have been pumping liquidity into the capital markets through a combination of historically low interest rates and quantitative easing or, more simply stated, money printing. Continued on page 12... | |||
| Letter to Our Shareholders | ||
U.S. mid-caps performed well on an absolute basis, though they were behind the domestic micro-cap, small-cap, and large-cap indexes in the first half. The Russell Midcap Index gained 8.0% through the end of June. Like the domestic indexes, they enjoyed a strong first quarter, up 12.9%, before slipping in the second quarter with a loss of 4.4%. Considering both the significant volatility and the unpopularity of stocks, the strength of micro-cap stocks was something of a surprise in the first half. Year-to-date through June 30, 2012, the Russell Microcap Index gained an impressive 13.0%. That the index accomplished this feat with stronger and steadier quarterly performances was equally notable: the Russell Microcap climbed 15.3% in the first quarter and fell only 2.0% in the bearish second. | ||
“The Act You’ve Known for all these Years...” If only our own portfolio had done as well. On an absolute basis, most of the Funds’ in this Semiannual Review and Report posted results that ranged from uninspiring to strong in the first half. With the exception of Royce Opportunity Fund, relative performance was a more significant issue. Normally, this does not trouble us. Long ago, we accepted that our disciplined approaches to stock selection would result in out-of-sync moments against our portfolios’ respective benchmarks. Our goal has always been strong absolute performance over long-term periods. If we met that standard, then relative results would most likely not be an issue, at least over long-term time spans. We have also been glad to accept the historical trade-off in which underperformance was more common for our Funds during short-term periods of 18 months or less, while outperformance was more typical over full market cycle and other long-term periods of three years or more. For too many time periods ended June 30, 2012, that history has become too exclusively long-term, even for us, with strong relative and absolute results coming only in periods of 10 years or longer. Three-year results were fine on an absolute basis in most cases, but trailed on a relative score, while the five-year returns were more mixed on a relative basis and underwhelming at best using the absolute standard that we prefer. This was particularly bad news for our newer portfolios, which lack history. With significant investments in all of our Funds, we share our investors’ frustrations with recent results. Those areas of the market in which we have seen both high quality and compelling valuations during the last three-to-five years—energy and mining companies, in particular—were among the worst performers in the first half, with net losses in some cases stretching back even further. Many of these stocks remain in our portfolios, as their attractive valuations and our ongoing high regard have combined to keep | ||
| 10 | This page is not part of the 2012 Semiannual Report to Shareholders |
 | ||
1 Price and total return information is based on net asset values calculated for shareholder transactions. Certain immaterial adjustments were made to the net assets of Royce Heritage and Micro-Cap Funds at 12/30/11 and Royce Micro-Cap Discovery Fund at 6/29/12 for financial reporting purposes, and as a result the net asset values for shareholder transactions on those dates and the total returns based on those net asset values differ from the adjusted net asset values and total returns reported in the Financial Highlights. | ||
| Through all manner of markets—many of which were thought to establish a “New Normal”—we have never wavered in our convictions. We still believe that equities remain the best way—maybe the only way—to beat inflation and build wealth over the long term. |
| This page is not part of the 2012 Semiannual Report to Shareholders | 11 |
| Headline inflation numbers have remained subdued due to the continuing struggles in the labor market and stubbornly weak housing markets, but commodity inflation has been on the rise. With the recent uptick in U.S. leading economic indicators and encouraging signs of stability and improvement in the housing market, it would not take much to see a more broad-based uptick in inflation. So while U.S. government bonds are likely to continue to pay their meager coupons and return principal on schedule, the value of what is being returned to investors will be declining. For the first time in almost 30 years, we think that investors risk meaningful losses in that portion of their investment portfolio they deem to be the safest. Commodities offer one possible way to protect against the loss of purchasing power caused by currency debasement. Unsurprisingly, however, we prefer assets that are inherently productive and flexible and can adjust quickly to changing pricing environments. To us, investments in quality companies that possess embedded pricing power and high returns on their invested capital look to be some of the best investments to protect, and grow, purchasing power. We believe they need much broader representation in investors’ asset allocation. | |
| Letter to Our Shareholders |
 |
Getting Better We do not know how much longer markets and economies will remain so uncertain. The fiscal turmoil that continues to haunt Europe has been hampering equity markets across the globe and contributing to the tight range of returns that have nonetheless demonstrated ample levels of volatility. The fragile recovery here in the U.S. has also played a role, as has the recent deceleration of the Chinese economy. These major macro events, which have been the dominant influence on investors’ behavior over the last three years, largely account for why stocks have struggled to create any direction for longer than a few months. Instead, markets have been mired in a pattern of short-term swings in which they have moved straight up or straight down, and for no longer than a few months at a time. One consequence of this closely correlated, range-bound cycle is that our Funds have not had the time to create the spread that we would usually seek to build through a full market cycle. However, we think that as Europe meets its challenges and as the U.S. begins to get its own fiscal house in order, which is not likely to happen until after the election, we will escape this range and move toward a more lasting upswing. Our expectation is for a less extreme, more historically normal phase, without so many of the stomach-churning drops followed by equally steep upticks that we saw last summer and fall and have seen so far in 2012. It is worth noting that a more historically normal range is one in which we think our Funds can generate strong absolute and relative performance over the long run. We would like to think that long-term history is on our side in this assessment. |
| 12 | This page is not part of the 2012 Semiannual Report to Shareholders |
Good Morning, Good Morning | |||||
Obviously, we would all like to reach a more hospitable market climate soon. As always, patience is critical. Indeed, the ability to be patient is probably the single most important quality that an investor who seeks strong long-term returns can possess. It is easy to talk about the importance of patience and discipline when markets are solid and portfolios are doing well. Yet at some point, these things will change, and both will be tested, as they have been in this market. It has been a very difficult time, but we believe it will pass. When it does, our disciplined approach will remain and, we believe, be effective. As we approach our 40th anniversary as a firm this coming November, we look back at what we have seen—the “Nifty Fifty” market of the ’70s, Black Friday in the ’80s, the first stirrings of the Internet boom in the ’90s, the horrific events of 9/11, our current era of uncertainty, and much, much more. Through all manner of markets—many of which were thought to establish a “New Normal”—we have never wavered in our convictions. We still believe that equities remain the best way—maybe the only way—to beat inflation and build wealth over the long term. (We also think that equities are capable of beating the fixed income markets over the next five years.) Our guess is that stocks can deliver returns in the mid- to upper-single digits, which we think would be respectable on an absolute basis and, equally important, higher than the rate of inflation. When things are working well, the underlying parts of an equity portfolio, the companies themselves, can act as compounding machines—compounding book value. We are confident that we can create portfolios that can grow commendably, especially in the more historically typical market climate that we believe we will eventually see. | |||||
Sincerely, | |||||
 |  |  | |||
| Charles M. Royce | W. Whitney George | Jack E. Fockler, Jr. | |||
| President | Vice President | Vice President | |||
| July 31, 2012 | |||||
It is easy to talk about the importance of patience and discipline when markets are solid and portfolios are doing well. Yet at some point, these things will change, and both will be tested, as they have been in this market. It has been a very difficult time, but we believe it will pass. When it does, our disciplined approach will remain and, we believe, be effective. |
| This page is not part of the 2012 Semiannual Report to Shareholders | 13 |
| Fund Focus |
After enjoying a measure of success as a small-cap portfolio manager in the late ’70s and early ’80s, Buzz Zaino moved to a firm where his new employers were eager to learn more about how he had built his track record. What, they wanted to know, made his portfolio approach successful? The investigation into what had worked best in the past led to the development of the four investment themes he continues to use in Royce Opportunity Fund. Each theme focuses on a catalyst for potential growth in stocks that Buzz and assistant portfolio manager Bill Hench deem significantly discounted to their value as a business. The first theme that Buzz identified was Unrecognized Asset Values, which could be in the form of a valuable franchise, ample cash on the balance sheet, real estate, etc. These companies are generally selling below their probable liquidating value, franchise value, tangible book value or physical asset value relative to plant or liquid assets, an attractive discount to a bargain-conscious investor. Next are Turnarounds, situations that typically entail new management coming to a company and attempting to reverse the fortunes of a business that has fallen on hard times, whether the result of depressed operating margins, poor management or industry-specific factors. The third theme is Undervalued Growth, which covers companies that have been growing in industries that largely have not, so the stocks are often valued with the industry, not necessarily with the company’s own growth. Buzz and Bill look for companies that they believe can provide potential growth rates of at least 12%, possess strong balance sheets and whose stock prices reflect relatively low valuations. The fourth theme is Interrupted Earnings, a category they sometimes refer to as broken IPOs. Companies tend to go public when times are very good, but in the normal course of events, such a company is going to endure a bad quarter or a difficult year, which naturally disappoints shareholders who have grown used to the heady growth. In this area, Buzz and Bill look for companies that they think have the potential for either a 20% annual growth rate or a dominant market position, accompanied by a price-earnings multiple substantially lower than the business’s anticipated growth rate. The Fund’s singular opportunistic value approach has been tested over the last five years, which includes the recession, the previous small-cap peak on July 13, 2007, the financial crisis, and the pattern of high volatility and close correlation that have followed in its wake. The worst days of the bear market in late 2008 and early 2009 were the most challenging, because so many stocks were routinely testing new lows, and there was no way to catch the falling knife. Patience became their mantra during this time, as well as during the shorter bear phases in 2010, 2011, and the first half of 2012. Buzz and Bill believed that they were acquiring solid companies at very attractive prices, but also thought that it could take several years before many bore fruit; in the meantime, near-term performance might suffer. As can be seen in the performance table below, this has mostly been the case. The Fund’s opportunistic bent has served it particularly well during the recent rally, as well as over longer-term periods since Buzz assumed portfolio management duties in 1998. The Fund outperformed the Russell 2000 in 87% of all monthly rolling five-year return periods between July 31, 2002 and June 30, 2012. ROF’s average return for all 120 five-year periods was 10.6% versus 5.4% for the index. (See the table below and pages 6 and 40 for more information.) We think that Royce Opportunity Fund’s unique take on small-cap value investing makes it a viable choice for long-term investors with a reasonable tolerance for risk. |
| ROF vs the Russell 2000: Performance and Expense Information | Through June 30, 2012 | ||||||||||||||||||||
| Average Annual Total Returns | Net | ||||||||||||||||||||
| Since | Operating | ||||||||||||||||||||
One-Year | Three-Year | Five-Year | 10-Year | 15-Year | Inception | Expenses | |||||||||||||||
| Royce Opportunity Fund | -5.59 | % | 20.78 | % | -0.18 | % | 8.51 | % | 11.33 | % | 11.94% (11/19/96) | 1.17 | % | ||||||||
| Russell 2000 | -2.08 | 17.80 | 0.54 | 7.00 | 6.14 | 6.87 | n.a. | ||||||||||||||
| Important Performance, Expense and Risk Information All performance information is for the Fund’s Investment Class, reflects past performance, is presented on a total return basis, reflects the reinvestment of distributions and does not reflect the deduction of taxes that a shareholder would pay on fund distributions or the redemption of fund shares. Past performance is no guarantee of future results. Investment return and principal value of an investment will fluctuate, so that shares may be worth more or less than their original cost when redeemed. Shares redeemed within 180 days of purchase may be subject to a 1% redemption fee, payable to the Fund, which is not reflected in the performance shown above; if it were, performance would be lower. Current performance may be higher or lower than performance quoted. Current month-end performance information may be obtained at www.roycefunds.com. Operating expenses reflect the Fund’s total annual operating expenses for the Investment Class as of the Fund’s most current prospectus and include management fees, other expenses and acquired fund fees and expenses. Acquired fund fees and expenses reflect the estimated amount of the fees and expenses incurred indirectly by the Fund through its investments in mutual funds, hedge funds, private equity funds and other investment companies. The Fund invests primarily in small-cap and micro-cap stocks, which may involve considerably more risk than investing in larger-cap stocks. (Please see “Primary Risks for Fund Investors” in the prospectus.) Russell Investment Group is the source and owner of the trademarks, service marks and copyrights related to the Russell Indexes. Russell® is a trademark of Russell Investment Group. The Russell 2000 Index is an unmanaged, capitalization-weighted index of domestic small-cap stocks. It measures the performance of the 2,000 smallest publicly traded U.S. companies in the Russell 3000 Index. Distributor: Royce Fund Services, Inc. |
| 14 | This page is not part of the 2012 Semiannual Report to Shareholders |
| Table of Contents |
| Semiannual Report to Shareholders | ||||||||||
| Managers’ Discussions of Fund Performance | ||||||||||
| CORE | ||||||||||
| Royce Pennsylvania Mutual Fund | 16 | |||||||||
| Royce Heritage Fund | 18 | |||||||||
| CORE + DIVIDENDS | ||||||||||
| Royce Total Return Fund | 20 | |||||||||
| Royce Dividend Value Fund | 22 | |||||||||
| FOCUSED | ||||||||||
| Royce Premier Fund | 24 | |||||||||
| Royce Special Equity Fund | 26 | |||||||||
| Royce Value Fund | 28 | |||||||||
| Royce 100 Fund | 30 | |||||||||
| Royce Focus Value Fund | 32 | |||||||||
| Royce Partners Fund | 34 | |||||||||
| Royce Special Equity Multi-Cap Fund | 36 | |||||||||
| OPPORTUNISTIC THEMES | ||||||||||
| Royce Low-Priced Stock Fund | 38 | |||||||||
| Royce Opportunity Fund | 40 | |||||||||
| Royce Value Plus Fund | 42 | |||||||||
| Royce Financial Services Fund | 44 | |||||||||
| MICRO-CAP | ||||||||||
| Royce Micro-Cap Fund | 46 | |||||||||
| Royce Micro-Cap Discovery Fund | 48 | |||||||||
| MID-CAP | ||||||||||
| Royce SMid-Cap Value Fund | 50 | |||||||||
| Royce Mid-Cap Fund | 52 | |||||||||
| Schedules of Investments and Financial Statements | 54 | |||||||||
| Notes to Financial Statements | 133 | |||||||||
| Understanding Your Fund’s Expenses | 147 | |||||||||
| Trustees and Officers | 149 | |||||||||
| Notes to Performance and Other Important Information | 150 | |||||||||
| Board Approval of Investment Advisory Agreement | 151 | |||||||||
| The Royce Funds 2012 Semiannual Report to Shareholders | 15 |
| Royce Pennsylvania Mutual Fund |
| CORE | ||||||||||||
Core Funds generally invest across a wide spectrum of smaller companies using a diversified approach. | ||||||||||||
| ||||||||||||
| AVERAGE ANNUAL TOTAL RETURNS Through 6/30/12 | ||||||||||||
| Jan-June 20121 | 4.00 | % | ||||||||||
| One-Year | -6.97 | |||||||||||
| Three-Year | 15.84 | |||||||||||
| Five-Year | 0.49 | |||||||||||
| 10-Year | 7.97 | |||||||||||
| 15-Year | 9.32 | |||||||||||
| 20-Year | 10.27 | |||||||||||
| 25-Year | 10.05 | |||||||||||
| 30-Year | 12.82 | |||||||||||
| 35-Year | 13.30 | |||||||||||
| ANNUAL EXPENSE RATIO | ||||||||||||
| Operating Expenses | 0.91 | % | ||||||||||
| 1 Not annualized | ||||||||||||
| CALENDAR YEAR TOTAL RETURNS | ||||||||||||
| Year | PMF | Year | PMF | |||||||||
| 2011 | -4.2 | % | 2003 | 40.3 | % | |||||||
| 2010 | 23.9 | 2002 | -9.2 | |||||||||
| 2009 | 36.3 | 2001 | 18.4 | |||||||||
| 2008 | -34.8 | 2000 | 18.3 | |||||||||
| 2007 | 2.8 | 1999 | 6.0 | |||||||||
| 2006 | 14.8 | 1998 | 4.2 | |||||||||
| 2005 | 12.5 | 1997 | 25.0 | |||||||||
| 2004 | 20.2 | 1996 | 12.8 | |||||||||
| TOP 10 POSITIONS % of Net Assets | ||||||||||||
| Advisory Board (The) | 1.1 | % | ||||||||||
| Kennametal | 1.0 | |||||||||||
| Helmerich & Payne | 0.9 | |||||||||||
| IDEXX Laboratories | 0.8 | |||||||||||
| Nordson Corporation | 0.8 | |||||||||||
| Oil States International | 0.8 | |||||||||||
| Cirrus Logic | 0.8 | |||||||||||
| Federated Investors Cl. B | 0.7 | |||||||||||
| HEICO Corporation | 0.7 | |||||||||||
| Valmont Industries | 0.7 | |||||||||||
| PORTFOLIO SECTOR BREAKDOWN % of Net Assets | ||||||||||||
| Industrials | 25.5 | % | ||||||||||
| Information Technology | 20.9 | |||||||||||
| Consumer Discretionary | 15.3 | |||||||||||
| Financials | 11.3 | |||||||||||
| Materials | 8.0 | |||||||||||
| Health Care | 7.3 | |||||||||||
| Energy | 7.0 | |||||||||||
| Consumer Staples | 1.7 | |||||||||||
| Telecommunication Services | 0.1 | |||||||||||
| Miscellaneous | 1.0 | |||||||||||
| Bond | 0.0 | |||||||||||
| Cash and Cash Equivalents | 1.9 | |||||||||||
 |
Manager’s Discussion The stock market’s choppy waters led to an underwhelming first-half result for our flagship, Royce Pennsylvania Mutual Fund (PMF). The Fund gained 4.0% for the year-to-date period ended June 30, 2012, compared to an 8.5% gain for its small-cap benchmark, the Russell 2000 Index, for the same period. The year began with a promising rally that lasted almost the entire first quarter, with small-caps reaching their year-to-date high on March 26, 2012. Correlation was again the order of the day, a fact reflected in a comparison of the Fund’s first-quarter return with that of its benchmark—PMF rose 12.1% in the year’s opening quarter versus a 12.4% gain for the Russell 2000. The first quarter’s positive results were an extension of the upswing that began following 2011’s small-cap low on October 3. Considering the volatility that has afflicted the equity markets over the last few years, this nearly six-month bull run was welcome not simply because of its steadily rising stock prices, but also because it ran in parallel with the recovery of the U.S. economy, giving hope to many that both the market and the economy were sailing more confidently forward. Such hopes were gradually dashed, however, as mildly negative returns for most stocks in April gave way to a far more bearish May that was followed by falling share prices into early June. |
Most disappointing about PMF’s second-quarter return was its difficulty in this more bearish and volatile period, in which it fell 7.2% versus a loss of 3.5% for the benchmark. (So much for correlation.) Needless to say, we expect to do relatively better when markets move downward (and have done so historically) and were disappointed that the Fund failed to hold its value, especially in the context of a market that has been so tightly correlated within a relatively narrow range for the past two years. We were pleased, however, that in the most recent peak-to-peak period from July 13, 2007 through April 29, 2011, PMF outpaced the Russell 2000, gaining 11.6% versus 6.6% for the small-cap benchmark. (Please see page 6 for more market cycle results.) The Fund also outperformed the Russell 2000 for the 10-, 15-, 20-, 25-, and 30-year periods ended June 30, 2012, and one challenge going forward is to restore the relative advantage the Fund previously enjoyed in more intermediate-term periods. PMF’s average annual total return for the 35-year period ended June 30, 2012 was 13.3%. As might be expected in a nondescript performance period, few names stood out very positively or negatively at the level of company, industry, or sector. Still, there were definite patterns and |
| GOOD IDEAS THAT WORKED Top Contributors to Performance Year-to-Date through 6/30/121 | ||
| Cirrus Logic | 0.35% | |
| Advisory Board (The) | 0.24 | |
| Federated Investors Cl. B | 0.23 | |
| Valmont Industries | 0.18 | |
| IDEXX Laboratories | 0.17 | |
| 1 Includes dividends | ||
Important Performance and Expense Information All performance information in this Report reflects past performance, is presented on a total return basis, reflects the reinvestment of distributions and does not reflect the deduction of taxes that a shareholder would pay on fund distributions or the redemption of fund shares. Past performance is no guarantee of future results. Investment return and principal value of an investment will fluctuate, so that shares may be worth more or less than their original cost when redeemed. Shares redeemed within 180 days of purchase may be subject to a 1% redemption fee payable to the Fund, which is not reflected in the performance shown above; if it were, performance would be lower. Current month-end performance may be higher or lower than performance quoted and may be obtained at www.roycefunds.com. All performance and risk information reflects results of the Investment Class (its oldest class). Operating expenses reflect the Fund’s total annual operating expenses for the Investment Class as of the Fund’s most current prospectus and include management fees, other expenses and acquired fund fees and expenses. Acquired fund fees and expenses reflect the estimated amount of the fees and expenses incurred indirectly by the Fund through its investment in mutual funds, hedge funds, private equity funds and other investment companies. Shares of PMF’s Service, Consultant, R and K Classes bear an annual distribution expense that is not borne by the Investment Class. Regarding the two “Good Ideas” tables shown above, the sum of all contributors to, and all detractors from, performance for all securities in the portfolio would approximate the Fund’s year-to-date performance for 2012. |
16 | The Royce Funds 2012 Semiannual Report to Shareholders
Performance and Portfolio Review some noteworthy performances, although not necessarily for reasons that we liked. Four sectors made sizable net contributions to first-half results—Consumer Discretionary, Financials, Health Care, and Information Technology—while only the Energy sector, a problem area in the market as a whole, detracted. During the second quarter, three of the aforementioned net-gaining sectors suffered net losses, large ones in the case of the Information Technology and Consumer Discretionary sectors. In fact, only Health Care was able to extend its net gains through the end of the period; it was also the Fund’s only sector in the black from April through June. During that difficult second-quarter slide, Industrials and Energy were also significant detractors. Three of the Fund’s top net losers in the first half came from the Energy sector’s energy equipment & services industry. Each of these companies represents a traditional strategy for us in a volatile, commodity-based industry in which we focus more on conservatively capitalized service companies with strong business fundamentals rather than looking at firms more directly involved with energy production. Oil prices were highly volatile in the year’s first six months, spending most of the second quarter in a tailspin that also drove down share prices for many energy services companies. CARBO Ceramics is an old favorite that we first purchased in PMF’s portfolio in 1996 and have owned continuously since 2006. The company primarily manufactures resin-coated ceramic and sand proppants used in the hydraulic fracturing of natural gas and oil wells. Slumping natural gas prices crimped production, which led to a higher-than-desired inventory of proppants. We like its long-term prospects, especially with ample natural gas reserves still untapped here in the U.S. Another long-term holding, Helmerich & Payne, provides contract drilling for oil and gas wells in the Gulf of Mexico and South America and is one of the largest land drillers in the U.S. Moving from dry gas to wet gas plays caused some margin compression as prices in the latter area came down. However, we like its leading position in an industry that we think is likely to come back strong and, as we did with CARBO, added to our position in the first half. |
| In July, we modestly trimmed our stake in Cirrus Logic, a semiconductor maker that is the sole provider of audio codecs for Apple’s iPhones and iPads, among other products and customers. Its core business continues to show strength and promising new products are being developed, so we were content to hold a good-sized stake in the portfolio. A top gainer in 2011, The Advisory Board offers programs, services, and software focused on best practices research services while also providing management and advisory services. Strong execution and innovative technology appeared to boost the health of its stock price through the first half. |
GOOD IDEAS AT THE TIME | |
| CARBO Ceramics | -0.20% |
| Helmerich & Payne | -0.20 |
| Unit Corporation | -0.15 |
| Kennametal | -0.12 |
| GrafTech International | -0.12 |
| 1 Net of dividends | |
| ROYCE PENNSYLVANIA MUTUAL FUND VS. RUSSELL 2000 Value of $10,000 Invested on 6/30/82 | ||
 | ||
Includes reinvestment of distributions. | ||
| PORTFOLIO DIAGNOSTICS | |||||
| Fund Net Assets | $5,844 million | ||||
| Number of Holdings | 506 | ||||
| Turnover Rate | 12% | ||||
| Average Market Capitalization1 | $1,518 million | ||||
| Weighted Average P/E Ratio2,3 | 14.7x | ||||
| Weighted Average P/B Ratio2 | 1.8x | ||||
| U.S. Investments (% of Net Assets) | 89.9% | ||||
| Non-U.S. Investments (% of Net Assets) | 8.2% | ||||
| Symbol | |||||
| Investment Class | PENNX | ||||
| Service Class | RYPFX | ||||
| Consultant Class | RYPCX | ||||
| Institutional Class | RPMIX | ||||
| R Class | RPMRX | ||||
| K Class | RPMKX | ||||
| 1 Geometric average | |||||
| 2 Harmonic average | |||||
3 The Fund’s P/E ratio calculation excludes companies with zero or negative earnings (6% of portfolio holdings as of 6/30/12). | |||||
| MORNINGSTAR STATISTICAL MEASURES1 | |||||
| PMF | Category Median | Best Quartile Breakpoint | |||
| Sharpe Ratio | 0.11 | 0.11 | 0.16 | ||
| Standard Deviation | 24.01 | 24.37 | 23.17 | ||
1 Five years ended 6/30/12. Category Median and Best Quartile Breakpoint based on 349 small-cap objective funds (oldest class only) with at least five years of history. | |||||
| RISK/RETURN COMPARISON Five-Year Period Ended 6/30/12 | |||||
| Average Annual Total Return | Standard Deviation | Return Efficiency1 | |||
| PMF | 0.49% | 24.01 | 0.02 | ||
| Russell 2000 | 0.54 | 24.90 | 0.02 | ||
1 Return Efficiency is the average annual total return divided by the annualized standard deviation over a designated time period. Please read the prospectus for a more complete discussion of risk. | |||||
| DOWN MARKET PERFORMANCE COMPARISON All Down Periods of 7.5% or Greater Over the Last 7 Years, in Percentages(%) | |||||
 | |||||
The Royce Funds 2012 Semiannual Report to Shareholders | 17
| Royce Heritage Fund |
| CORE | ||||||||||||
Core Funds generally invest across a wide spectrum of smaller companies using a diversified approach. | ||||||||||||
| ||||||||||||
| AVERAGE ANNUAL TOTAL RETURNS Through 6/30/12 | ||||||||||||
| Jan-June 20121 | 2.38 | % | ||||||||||
| One-Year | -11.57 | |||||||||||
| Three-Year | 14.69 | |||||||||||
| Five-Year | 1.53 | |||||||||||
| 10-Year | 8.51 | |||||||||||
| 15-Year | 11.81 | |||||||||||
| Since Inception (12/27/95) | 13.01 | |||||||||||
| ANNUAL EXPENSE RATIO | ||||||||||||
| Operating Expenses | 1.50 | % | ||||||||||
| 1 Not annualized | ||||||||||||
| CALENDAR YEAR TOTAL RETURNS | ||||||||||||
| Year | RHF | Year | RHF | |||||||||
| 2011 | -9.3 | % | 2003 | 38.1 | % | |||||||
| 2010 | 27.5 | 2002 | -18.9 | |||||||||
| 2009 | 51.8 | 2001 | 20.5 | |||||||||
| 2008 | -36.2 | 2000 | 11.7 | |||||||||
| 2007 | 1.2 | 1999 | 41.7 | |||||||||
| 2006 | 22.6 | 1998 | 19.5 | |||||||||
| 2005 | 8.7 | 1997 | 26.0 | |||||||||
| 2004 | 20.4 | 1996 | 25.6 | |||||||||
| TOP 10 POSITIONS % of Net Assets | ||||||||||||
| Alleghany Corporation | 1.9 | % | ||||||||||
| Verisk Analytics Cl. A | 1.7 | |||||||||||
| Advisory Board (The) | 1.5 | |||||||||||
| ANSYS | 1.4 | |||||||||||
| Landstar System | 1.4 | |||||||||||
| Mohawk Industries | 1.4 | |||||||||||
| Ashmore Group | 1.3 | |||||||||||
| Towers Watson & Company Cl. A | 1.3 | |||||||||||
| NVR | 1.3 | |||||||||||
| IPG Photonics | 1.2 | |||||||||||
| PORTFOLIO SECTOR BREAKDOWN % of Net Assets | ||||||||||||
| Industrials | 25.3 | % | ||||||||||
| Financials | 17.7 | |||||||||||
| Information Technology | 17.7 | |||||||||||
| Consumer Discretionary | 12.2 | |||||||||||
| Materials | 9.3 | |||||||||||
| Energy | 4.9 | |||||||||||
| Health Care | 4.0 | |||||||||||
| Consumer Staples | 1.4 | |||||||||||
| Utilities | 0.1 | |||||||||||
| Miscellaneous | 3.6 | |||||||||||
| Cash and Cash Equivalents | 3.8 | |||||||||||
  |
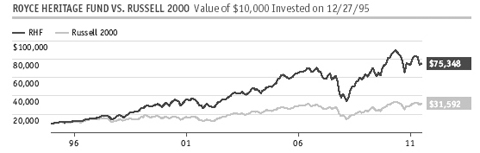
Managers’ Discussion Royce Heritage Fund (RHF) gained 2.4% for the year-to-date period ended June 30, 2012, trailing the Russell 2000 Index, its small-cap benchmark, which rose 8.5% for the same period. Although the markets have been tightly correlated over the last couple of years, those attributes that we seek for portfolio holdings—strong balance sheets, established records of earnings, the ability to generate free cash flow, and high returns on invested capital—have not been in high demand. One consequence of this was that during three of the last four quarters RHF followed a similar pattern to its benchmark, while underperforming in both up and down markets, with the only exception being the bullish first quarter of 2012. The year began on a encouraging note, lengthening the rally that began following 2011’s small-cap market low on October 3. The Fund rose 12.9% in the first quarter of 2012, ahead of the 12.4% rise for the Russell 2000. The bull phase ended, or was at least derailed, on March 26, 2012, just before the end of the first quarter. This made for a markedly bearish second quarter, despite a furious rally on the last day of trading in June. For the third consecutive year, a market rally was rudely interrupted by fears of European defaults and questions about the pace of growth here in the U.S. and China. During the second quarter, RHF fell 9.3% (with most of its losses coming in a particularly brutal May) versus a loss of 3.5% for its small-cap benchmark. This displeased us not only because the Fund underperformed, but also because we take great pride in the portfolio’s historical track record during both down markets and down quarters. Unfortunately, the recent run of risk-on, risk-off behavior has prevented the market from establishing any consistent direction, which played a role in RHF’s second-quarter slide. Longer-term returns were better on a relative basis and were impressive on an absolute basis for the 10-year, and since inception (12/27/95) periods ended June 30, 2012. From the previous small-cap peak on July 13, 2007 through April 29, 2011, the Fund gained 25.3% versus 6.6% for the Russell 2000. From that same peak through June 30, 2012, RHF gained 5.3%, while its |
| GOOD IDEAS THAT WORKED Top Contributors to Performance Year-to-Date through 6/30/121 | |||||||||||
| Advisory Board (The) | 0.30% | ||||||||||
| IPG Photonics | 0.29 | ||||||||||
| Verisk Analytics Cl. A | 0.27 | ||||||||||
| Valmont Industries | 0.25 | ||||||||||
| Alleghany Corporation | 0.25 | ||||||||||
| 1 Includes dividends | |||||||||||
Important Performance and Expense Information All performance information in this Report reflects past performance, is presented on a total return basis, reflects the reinvestment of distributions and does not reflect the deduction of taxes that a shareholder would pay on fund distributions or the redemption of fund shares. Past performance is no guarantee of future results. Investment return and principal value of an investment will fluctuate, so that shares may be worth more or less than their original cost when redeemed. Shares redeemed within 180 days of purchase may be subject to a 1% redemption fee payable to the Fund, which is not reflected in the performance shown above; if it were, performance would be lower. Current month-end performance may be higher or lower than performance quoted and may be obtained at www.roycefunds.com. All performance and risk information reflects results of the Service Class (its oldest class). Price and total return information is based on net asset values calculated for shareholder transactions. Certain immaterial adjustments were made to the net assets of Royce Heritage Fund at 12/30/11 for financial reporting purposes, and as a result the net asset values for shareholder transactions on that date and the total returns based on those net asset values differ from the adjusted net asset values and total returns reported in the Financial Highlights. Operating expenses reflect the Fund’s total annual operating expenses for the Service Class as of the Fund’s most current prospectus and include management fees, 12b-1 distribution and service fees, other expenses and acquired fund fees and expenses. Shares of RHF’s Consultant and R Classes bear an annual distribution expense that is higher than that of the Service Class. Acquired fund fees and expenses reflect the estimated amount of the fees and expenses incurred indirectly by the Fund through its investments in mutual funds, hedge funds, private equity funds and other investment companies. Regarding the two “Good Ideas” tables shown above, the sum of all contributors to, and all detractors from, performance for all securities in the portfolio would approximate the Fund’s year-to-date performance for 2012. | |||||||||||
18 | The Royce Funds 2012 Semiannual Report to Shareholders
Performance and Portfolio Review |
benchmark managed a slim gain of 0.04%. The Fund outperformed the small-cap index for the five-, 10-, 15-year, and since inception (12/27/95) periods ended June 30, 2012. RHF’s average annual total return since inception was 13.0%. Only two of the Fund’s nine equity sectors—Energy and Materials—finished the first half in the red, though net losses were relatively low. At the industry level, the energy equipment & services group detracted most significantly from both the Energy sector and the portfolio as a whole. A similar pattern could be seen in the Materials sector, but with two important differences—net losses for its top-detracting group, metals & mining, were lower and were also blunted by a small net gain from the chemicals group. In June, we parted ways with Lamprell, which repairs and refurbishes drilling rigs. The company faced problems with suppliers in its recent efforts to enter the rig construction business, but met with more serious issues when a profit warning announced in May came in the wake of insider selling that followed a series of investor meetings that were initially seen as unusually positive. It was no surprise when these events caused its share price to plummet. We had a more optimistic take on both Trican Well Service and Helmerich & Payne, two long-time Royce favorites that we first purchased in RHF in 2008 and 2007, respectively. We were first drawn to Trican Well Service by its growing business, talented management, and pristine balance sheet. The company provides specialized equipment and services for drilling, completion, and reworking oil and gas wells. Confident in its long-term prospects and believing that the market was punishing it disproportionately, we were pleased to hold a good-sized position at the end of the period. Helmerich & Payne—one of 2011’s top contributors—faced tougher times for its share price than in its business operations. The company is one of the largest land drillers in the U.S. and also provides contract drilling for oil and gas wells in the Gulf of Mexico and South America. While its business has slowed, the long-term outlook is positive, but impatient investors have shown little interest in the long run. Six sectors posted net gains, with Financials out in front, followed by Industrials, Consumer Discretionary, Information Technology, Health Care, and Consumer Staples. The Fund’s two top contributors were also top-ten positions at the end of June. Also a top gainer in 2011, The Advisory Board offers programs, services, and software focused on best practices research services while also providing management and advisory services. Strong execution and innovative technology appeared to boost the health of its stock price through the first half. IPG Photonics develops and manufactures fiber-optic lasers and other laser products. Its share price made its first-half high in February, a month in which we took gains before going on to begin adding to our stake in May at more attractive prices. |
| GOOD IDEAS AT THE TIME Top Detractors from Performance Year-to-Date through 6/30/121 | |
| Lamprell | -0.37% |
| Trican Well Service | -0.30 |
| Helmerich & Payne | -0.25 |
| Gardner Denver | -0.24 |
| Major Drilling Group International | -0.22 |
| 1 Net of dividends | |
 | |||
Includes reinvestment of distributions. |
| PORTFOLIO DIAGNOSTICS | |||||
| Fund Net Assets | $265 million | ||||
| Number of Holdings | 233 | ||||
| Turnover Rate | 21% | ||||
| Average Market Capitalization1 | $2,303 million | ||||
| Weighted Average P/E Ratio2,3 | 14.9x | ||||
| Weighted Average P/B Ratio2 | 2.1x | ||||
| U.S. Investments (% of Net Assets) | 73.7% | ||||
| Non-U.S. Investments (% of Net Assets) | 22.5% | ||||
| Symbol | |||||
| Investment Class | RHFHX | ||||
| Service Class | RGFAX | ||||
| Consultant Class | RYGCX | ||||
| R Class | RHFRX | ||||
| K Class | RHFKX | ||||
| 1 Geometric average | |||||
| 2 Harmonic average | |||||
3 The Fund’s P/E ratio calculation excludes companies with zero or negative earnings (3% of portfolio holdings as of 6/30/12). | |||||
| MORNINGSTAR STATISTICAL MEASURES1 | |||||
| RHF | Category Median | Best Quartile Breakpoint | |||
| Sharpe Ratio | 0.16 | 0.11 | 0.16 | ||
| Standard Deviation | 26.21 | 24.37 | 23.17 | ||
1 Five years ended 6/30/12. Category Median and Best Quartile Breakpoint based on 349 small-cap objective funds (oldest class only) with at least five years of history. | |||||
| RISK/RETURN COMPARISON Five-Year Period Ended 6/30/12 | |||||
| Average Annual Total Return | Standard Deviation | Return Efficiency1 | |||
| RHF | 1.53% | 26.21 | 0.06 | ||
| Russell 2000 | 0.54 | 24.90 | 0.02 | ||
1 Return Efficiency is the average annual total return divided by the annualized standard deviation over a designated time period. Please read the prospectus for a more complete discussion of risk. | |||||
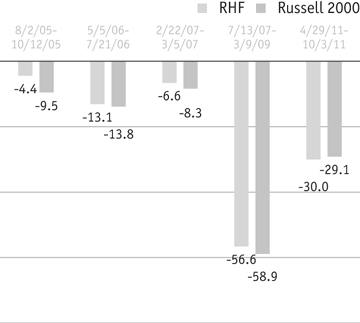
| DOWN MARKET PERFORMANCE COMPARISON All Down Periods of 7.5% or Greater Over the Last 7 Years, in Percentages(%) | |||||
 | |||||
The Royce Funds 2012 Semiannual Report to Shareholders | 19
Royce Total Return Fund |
| CORE + DIVIDENDS | ||||||||||||
Core + Dividends Funds generally invest in dividend-paying smaller companies using a diversified approach. | ||||||||||||
| ||||||||||||
| AVERAGE ANNUAL TOTAL RETURNS Through 6/30/12 | ||||||||||||
| Jan-June 20121 | 4.18 | % | ||||||||||
| One-Year | -2.82 | |||||||||||
| Three-Year | 15.61 | |||||||||||
| Five-Year | 0.65 | |||||||||||
| 10-Year | 7.11 | |||||||||||
| 15-Year | 8.40 | |||||||||||
| Since Inception (12/15/93) | 10.46 | |||||||||||
| ANNUAL EXPENSE RATIO | ||||||||||||
| Operating Expenses | 1.15 | % | ||||||||||
| 1 Not annualized | ||||||||||||
| CALENDAR YEAR TOTAL RETURNS | ||||||||||||
| Year | RTR | Year | RTR | |||||||||
| 2011 | -1.7 | % | 2003 | 30.0 | % | |||||||
| 2010 | 23.5 | 2002 | -1.6 | |||||||||
| 2009 | 26.2 | 2001 | 14.8 | |||||||||
| 2008 | -31.2 | 2000 | 19.4 | |||||||||
| 2007 | 2.4 | 1999 | 1.5 | |||||||||
| 2006 | 14.5 | 1998 | 4.8 | |||||||||
| 2005 | 8.2 | 1997 | 23.7 | |||||||||
| 2004 | 17.5 | 1996 | 25.5 | |||||||||
| TOP 10 POSITIONS % of Net Assets | ||||||||||||
| Erie Indemnity Cl. A | 1.0 | % | ||||||||||
| Cato Corporation (The) Cl. A | 1.0 | |||||||||||
| Federated Investors Cl. B | 1.0 | |||||||||||
| Guess? | 0.9 | |||||||||||
| Reinsurance Group of America | 0.9 | |||||||||||
| Chemed Corporation | 0.9 | |||||||||||
| Helmerich & Payne | 0.9 | |||||||||||
| Cubic Corporation | 0.9 | |||||||||||
| Nordson Corporation | 0.8 | |||||||||||
| MEDNAX | 0.8 | |||||||||||
| PORTFOLIO SECTOR BREAKDOWN % of Net Assets | ||||||||||||
| Financials | 28.5 | % | ||||||||||
| Industrials | 18.7 | |||||||||||
| Consumer Discretionary | 11.7 | |||||||||||
| Energy | 7.5 | |||||||||||
| Materials | 6.7 | |||||||||||
| Health Care | 6.1 | |||||||||||
| Information Technology | 6.0 | |||||||||||
| Consumer Staples | 3.7 | |||||||||||
| Utilities | 2.7 | |||||||||||
| Telecommunication Services | 0.6 | |||||||||||
| Diversified Investment Companies | 0.3 | |||||||||||
| Miscellaneous | 1.0 | |||||||||||
| Bonds | 0.1 | |||||||||||
| Cash and Cash Equivalents | 6.4 | |||||||||||
 Managers’ Discussion Dividend-paying small-caps provided a measure of protection when share prices were falling in the first half of 2012, though in the case of Royce Total Return Fund (RTR), it was not enough to provide a relative return advantage. For the period ended June 30, 2012, RTR gained 4.2%, trailing its small-cap benchmark, the Russell 2000 Index, which climbed 8.5% for the same period. The bullish phase that followed the small-cap low on October 3, 2011 lasted through much of the first quarter of 2012, a period that saw the Fund gain 8.9% versus 12.4% for its benchmark. We were among those cheered by the confluence of improving economic data and a resurgence for equities, seeing it as a sign that the market might be finally gaining the traction it needed for an extended rally. This hope collapsed in the middle of yet another round of worries over European sovereign debt and the overall well-being of the global economy. As they did in 2010 and 2011, these anxieties made for a highly volatile, mostly dismal second quarter for equities. Small-caps reached a high on March 26, 2012. Prior to the energetic uptick on the final day of June, which helped to give a decidedly positive result to that month, share prices fell through much of the second quarter. During the bear months of April and May, the Fund somewhat narrowed the performance gap between it and the Russell 2000, but the rally then widened the spread once more. The outcome was that RTR slipped 4.3% in the second quarter compared to a decline of 3.5% for the small-cap index. Market cycle and other long-term results were better on a relative basis, though one must go back 10 years to find a combination of strong absolute and relative returns. During the most recent peak-to-peak period, from July 13, 2007 through April 29, 2011, RTR had a modest edge over its benchmark, up 6.8% versus 6.6%. (Please see page 6 for more market cycle results.) To say the least, the last five years have provided more than their share of frustrations for our disciplined, bottom-up stock pickers’ approach. Indeed, our challenge going forward is to improve the Fund’s results for three- and five-year periods in which we have historically performed better on both an absolute and relative basis. The Fund outpaced the Russell 2000 for the five-, 10-, 15-year and since inception (12/15/93) periods ended June 30, 2012. RTR’s average annual total return since inception was 10.5%. |
GOOD IDEAS THAT WORKED | |||||||||||
| Federated Investors Cl. B | 0.29% | ||||||||||
| Cato Corporation (The) Cl. A | 0.22 | ||||||||||
| Allied World Assurance Company Holdings | 0.21 | ||||||||||
| Ascena Retail Group | 0.21 | ||||||||||
| American Eagle Outfitters | 0.20 | ||||||||||
| 1 Includes dividends | |||||||||||
Important Performance and Expense Information All performance information in this Report reflects past performance, is presented on a total return basis, reflects the reinvestment of distributions and does not reflect the deduction of taxes that a shareholder would pay on fund distributions or the redemption of fund shares. Past performance is no guarantee of future results. Investment return and principal value of an investment will fluctuate, so that shares may be worth more or less than their original cost when redeemed. Shares redeemed within 180 days of purchase may be subject to a 1% redemption fee payable to the Fund, which is not reflected in the performance shown above; if it were, performance would be lower. Current month-end performance may be higher or lower than performance quoted and may be obtained at www.roycefunds.com. All performance and risk information reflects results of the Investment Class (its oldest class). Operating expenses reflect the Fund’s total annual operating expenses for the Investment Class as of the Fund’s most current prospectus and include management fees, other expenses, and acquired fund fees and expenses. Acquired fund fees and expenses reflect the estimated amount of the fees and expenses incurred indirectly by the Fund through its investments in mutual funds, hedge funds, private equity funds and other investment companies. Shares of RTR’s Service, Consultant, R and K Classes bear an annual distribution expense that is not borne by the Investment Class. Regarding the two “Good Ideas” tables shown above, the sum of all contributors to, and all detractors from, performance for all securities in the portfolio would approximate the Fund’s year-to-date performance for 2012. | |||||||||||
20 | The Royce Funds 2012 Semiannual Report to Shareholders
Performance and Portfolio Review Nine of the Fund’s 11 equity sectors finished the first half with net gains, one was flat, and another—Energy—was in the red. In general, energy stocks were hurt through much of the year-to-date period by lower natural gas prices, with declines growing worse in the second quarter when oil prices also began to fall. These downward moves resulted in energy equipment & services companies and oil, gas & consumable fuels stocks being the loss leaders among the portfolio’s industry groups. Net losses in the latter group were spread across a number of holdings, while in the former category they were borne most heavily by two companies that we have held for a number of years. Our first purchase of CARBO Ceramics in RTR was back in 1998, and we have held a position continuously since then in this manufacturer of resin-coated ceramic and sand proppants used in the hydraulic fracturing of natural gas and oil wells. Falling natural gas prices slowed production, which led to higher proppant inventories. Taking the long view, we like its prospects, especially with ample natural gas reserves still untapped here in the U.S. We had a similar view of Helmerich & Payne, whose shares we also first bought in the portfolio in 1998. The company is one of the largest land drillers in the U.S. and also provides contract drilling for oil and gas wells in the Gulf of Mexico and South America. Its business has slowed, which, along with lower energy prices, led investors away from the stock. We think it is well positioned to benefit from a resurgent energy market. It was a top-ten position at the end of June. We also held a good-sized position in new and used video game retailer GameStop Corporation, adding to our stake during much of the year’s first six months. The company faces several hurdles, including declining sales, aging game consoles, and questions about how compatible older games will be when new consoles roll out. Yet it also has had success with its digital and trade-in businesses, and its market share remains enviable. Financials led all sectors by a wide margin, keyed by terrific performances from the insurance and capital markets industries. We remained optimistic about the long-term prospects for asset manager and money market specialist Federated Investors, which we first bought in 1999 and built during some of the darkest days of the financial crisis between late 2008 and early 2009. New regulations affecting money market funds are a ‘when,’ not an ‘if,’ but the consensus is that the longer it takes for them to go into effect, the less draconian they are likely to be. In other words, no news on that front was good news in the first half. This boosted Federated’s share price. It was the portfolio’s third-largest holding at the end of June. Three specialty retailers also stood out in the first half—Cato Corporation, Ascena Retail Group, and American Eagle Outfitters. |
GOOD IDEAS AT THE TIME | |
| CARBO Ceramics | -0.25% |
| GameStop Corporation Cl. A | -0.19 |
| Helmerich & Payne | -0.18 |
| Balchem Corporation | -0.15 |
| ManTech International Cl. A | -0.14 |
| 1 Net of dividends | |
 | |||
Includes reinvestment of distributions. |
| PORTFOLIO DIAGNOSTICS | |||||
| Fund Net Assets | $4,483 million | ||||
| Number of Holdings | 537 | ||||
| Turnover Rate | 11% | ||||
| Average Market Capitalization1 | $1,945 million | ||||
| Weighted Average P/E Ratio2,3 | 14.2x | ||||
| Weighted Average P/B Ratio2 | 1.6x | ||||
| U.S. Investments (% of Net Assets) | 82.7% | ||||
| Non-U.S. Investments (% of Net Assets) | 10.9% | ||||
| Symbol | |||||
| Investment Class | RYTRX | ||||
| Service Class | RYTFX | ||||
| Consultant Class | RYTCX | ||||
| Institutional Class | RTRIX | ||||
| W Class | RTRWX | ||||
| R Class | RTRRX | ||||
| K Class | RTRKX | ||||
| 1 Geometric average | |||||
| 2 Harmonic average | |||||
3 The Fund’s P/E ratio calculation excludes companies with zero or negative earnings (5% of portfolio holdings as of 6/30/12). | |||||
| MORNINGSTAR STATISTICAL MEASURES1 | |||||
| RTR | Category Median | Best Decile Breakpoint | |||
| Sharpe Ratio | 0.09 | 0.11 | 0.24 | ||
| Standard Deviation | 20.29 | 24.37 | 21.73 | ||
1 Five years ended 6/30/12. Category Median and Best Decile Breakpoint based on 349 small-cap objective funds (oldest class only) with at least five years of history. | |||||
| RISK/RETURN COMPARISON Five-Year Period Ended 6/30/12 | |||||
| Average Annual Total Return | Standard Deviation | Return Efficiency1 | |||
| RTR | 0.65% | 20.29 | 0.03 | ||
| Russell 2000 | 0.54 | 24.90 | 0.02 | ||
1 Return Efficiency is the average annual total return divided by the annualized standard deviation over a designated time period. Please read the prospectus for a more complete discussion of risk. | |||||
| DOWN MARKET PERFORMANCE COMPARISON All Down Periods of 7.5% or Greater Over the Last 7 Years, in Percentages(%) | |||||
 | |||||
The Royce Funds 2012 Semiannual Report to Shareholders | 21
| CORE + DIVIDENDS | |||||||||
| Core + Dividends Funds generally invest in dividend-paying smaller companies using a diversified approach. | |||||||||
| |||||||||
| AVERAGE ANNUAL TOTAL RETURNS Through 6/30/12 | |||||||||
| Jan-June 20121 | 4.85 | % | |||||||
| One-Year | -4.34 | ||||||||
| Three-Year | 17.17 | ||||||||
| Five-Year | 2.84 | ||||||||
| Since Inception (5/3/04) | 7.37 | ||||||||
| ANNUAL EXPENSE RATIOS | |||||||||
| Operating Expenses | 1.50 | % | |||||||
| 1 Not annualized | |||||||||
| CALENDAR YEAR TOTAL RETURNS | |||||||||
| Year | RDV | Year | RDV | ||||||
| 2011 | -4.5 | % | 2007 | 0.0 | % | ||||
| 2010 | 30.1 | 2006 | 19.9 | ||||||
| 2009 | 37.7 | 2005 | 7.3 | ||||||
| 2008 | -31.5 | ||||||||
| TOP 10 POSITIONS % of Net Assets | |||||||||
| Kennametal | 1.5 | % | |||||||
| Manning & Napier | 1.4 | ||||||||
| SEI Investments | 1.4 | ||||||||
| Federated Investors Cl. B | 1.3 | ||||||||
| Nu Skin Enterprises Cl. A | 1.2 | ||||||||
| Helmerich & Payne | 1.2 | ||||||||
| Valmont Industries | 1.2 | ||||||||
| Ascena Retail Group | 1.1 | ||||||||
| Reinsurance Group of America | 1.1 | ||||||||
| Chemed Corporation | 1.1 | ||||||||
| PORTFOLIO SECTOR BREAKDOWN % of Net Assets | |||||||||
| Financials | 31.5 | % | |||||||
| Industrials | 22.4 | ||||||||
| Consumer Discretionary | 10.9 | ||||||||
| Materials | 7.9 | ||||||||
| Information Technology | 6.8 | ||||||||
| Health Care | 4.3 | ||||||||
| Energy | 3.8 | ||||||||
| Consumer Staples | 3.0 | ||||||||
| Utilities | 0.0 | ||||||||
| Telecommunication Services | 0.0 | ||||||||
| Miscellaneous | 2.7 | ||||||||
| Cash and Cash Equivalents | 6.7 | ||||||||
 |
Managers’ Discussion Royce Dividend Value Fund (RDV) gained 4.9% for the year-to-date period ended June 30, 2012 versus an 8.5% increase for its small-cap benchmark, the Russell 2000 Index, for the same period. While the Fund posted a solid result on an absolute basis, its relative performance was disappointing, especially in the context of a highly volatile market in which we would typically expect the Fund to perform relatively better. The bull market that kicked off following the small-cap low on October 3, 2011 lasted through most of 2012’s first quarter, with small-cap reaching its first-half high on March 26. In the opening quarter of 2012, RDV rose 11.9% while the Russell 2000 climbed 12.4%. Our initial take was that the confluence of improving economic data and the resurgence for equities were dual signs that the market was at last establishing sufficient momentum to keep moving upward for more than two quarters at a time. Unfortunately, our optimism was checked once another wave of worries about European sovereign debt, the state of the U.S. economy, and decelerating growth in China washed over the market. As they did in 2010 and 2011, these concerns made for a volatile, mostly dismal second quarter for equities. Prior to the furious rally on the final day of June, which helped to give that month a decidedly positive result, share prices fell through much of the second quarter, with May being especially negative. RDV could not hold its value through this challenging period, with the result that the Fund fell further behind its benchmark in the second quarter, losing 6.3% compared to a 3.5% decline for the small-cap index. RDV’s longer-term results were better on a relative basis. The Fund enjoyed an advantage over its benchmark from the previous small-cap peak on July 13, 2007 through the small-cap peak on April 29, 2011, up 21.6% compared to 6.6% for the small-cap index. (Please see page 6 for more market cycle results.) RDV also outpaced the Russell 2000 for the five-year and since inception (5/3/04) periods ended June 30, 2012. The Fund’s average annual total return since inception was 7.4%. Net losses in the portfolio were generally modest at the sector, industry, and company level, with Energy the lone sector detracting from first-half performance. Stocks throughout the sector struggled, challenged by tumbling natural gas prices during the entire year-to-date period and plunging oil prices in the second quarter. Top-ten position Helmerich & Payne endured tougher |
| GOOD IDEAS THAT WORKED Top Contributors to Performance Year-to-Date through 6/30/121 | |||||||||||
| Federated Investors Cl. B | 0.45% | ||||||||||
| Valmont Industries | 0.33 | ||||||||||
| Ascena Retail Group | 0.30 | ||||||||||
| AZZ | 0.25 | ||||||||||
| Allied World Assurance Company Holdings | 0.24 | ||||||||||
| 1 Includes dividends | |||||||||||
Important Performance and Expense Information All performance information in this Report reflects past performance, is presented on a total return basis, reflects the reinvestment of distributions and does not reflect the deduction of taxes that a shareholder would pay on fund distributions or the redemption of fund shares. Past performance is no guarantee of future results. Investment return and principal value of an investment will fluctuate, so that shares may be worth more or less than their original cost when redeemed. Shares redeemed within 180 days of purchase may be subject to a 1% redemption fee payable to the Fund, which is not reflected in the performance shown above; if it were, performance would be lower. Current month-end performance may be higher or lower than performance quoted and may be obtained at www.roycefunds.com. All performance and risk information reflects results of the Service Class (its oldest class). Operating expenses reflect the Fund’s gross total annual operating expenses for the Service Class as of the Fund’s most current prospectus, and include management fees, 12b-1 distribution and service fees, other expenses and acquired fund fees and expenses. Acquired fund fees and expenses reflect the estimated amount of the fees and expenses incurred indirectly by the Fund through its investments in mutual funds, hedge funds, private equity funds and other investment companies. Regarding the two “Good Ideas” tables shown above, the sum of all contributors to, and all detractors from, performance for all securities in the portfolio would approximate the Fund’s year-to-date performance for 2012. | |||||
| 22 | The Royce Funds 2012 Semiannual Report to Shareholders |
Performance and Portfolio Review times for its share price than it did in its business operations. The company is one the of the largest land drillers in the U.S. and also provides contract drilling for oil and gas wells in the Gulf of Mexico and South America. While its business has slowed a bit, the long-term outlook is positive, though impatient investors disregarded that view. We added shares while others were selling. Kennametal manufactures specialized metal products. As an industrial company with significant exposure to the coal and natural gas markets, its share price was hurt by the difficulties for energy stocks. In April, the company announced quarterly earnings that were in line with Wall Street’s expectations, along with revenues that were better than expected, while also discussing higher cost pressures and moderating organic growth, with the possibility that 2012’s second half could see slowing demand. While this led to a wave of selling, we built our position through much of the first half. It was the Fund’s largest holding at the end of June. GameStop Corporation is a video game retailer that sells new and used games. Video game industry sales declined significantly on a year-over-year basis, in large part the result of aging gaming consoles such as the Wii and Xbox. Questions also persist about whether older games will be compatible with new equipment, an especially relevant issue for GameStop as it derives a chunk of its sales from selling used games. On the other hand, earnings are positive, its balance sheet remains strong, its digital strategy has been successful, its trade-in business has done well, and its market share is solid. We added to our stake in the first quarter. We were also optimistic about the long-term prospects for asset manager and money market specialist Federated Investors. We re-initiated a position in the teeth of the financial crisis during October 2008. New regulations that will affect money market funds are a ‘when,’ not an ‘if,’ but the consensus is that the longer they take to materialize, the less draconian they are likely to be. In other words, no news was good news on that front in the first half, which boosted its share price. It was the portfolio’s fourth-largest holding at the end of June. Valmont Industries, another top-ten holding, produces fabricated metal products, pole and tower structures, and mechanized irrigation systems. The global reach of its core businesses, as well as improving earnings, helped to keep its price on the rise through most of the first half. Women’s fashion retailer Ascena Retail Group is an old Royce favorite and was also a top-ten position at the end of June. Already successfully operating stores under the dressbarn, maurices, and Justice brands, the firm completed a buyout in June of Charming Shoppes, which runs Lane Bryant. We continue to have confidence in what we think is a very well-run business with a proven ability to execute profitably during difficult times for most retailers. | |||
GOOD IDEAS AT THE TIME | |
| Helmerich & Payne | -0.26% |
| GameStop Corporation Cl. A | -0.22 |
| Kennametal | -0.19 |
| Jos. A. Bank Clothiers | -0.12 |
| Balchem Corporation | -0.12 |
| 1 Net of dividends | |
| ROYCE DIVIDEND VALUE FUND VS. RUSSELL 2000 Value of $10,000 Invested on 5/3/04 | |||
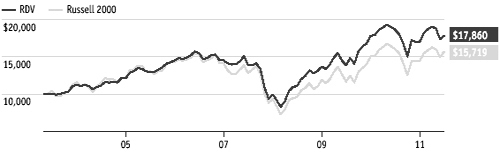 | |||
| Includes reinvestment of distributions. |
| PORTFOLIO DIAGNOSTICS | |||
| Fund Net Assets | $356 million | ||
| Number of Holdings | 277 | ||
| Turnover Rate | 5% | ||
| Average Market Capitalization1 | $1,868 million | ||
| Weighted Average P/E Ratio2,3 | 14.2x | ||
| Weighted Average P/B Ratio2 | 1.7x | ||
| U.S. Investments (% of Net Assets) | 77.1% | ||
| Non-U.S. Investments (% of Net Assets) | 16.2% | ||
| Symbol | |||
| Investment Class | RDVIX | ||
| Service Class | RYDVX | ||
| 1 Geometric average | |||
| 2 Harmonic average | |||
3 The Fund’s P/E ratio calculation excludes companies with zero or negative earnings (6% of portfolio holdings as of 6/30/12). | |||
| MORNINGSTAR STATISTICAL MEASURES1 | |||
| RDV | Category Median | Best Decile Breakpoint | |
| Sharpe Ratio | 0.20 | 0.11 | 0.24 |
| Standard Deviation | 21.79 | 24.37 | 21.73 |
1 Five years ended 6/30/12. Category Median and Best Decile Breakpoint based on 349 small-cap objective funds (oldest class only) with at least five years of history. | |||
| RISK/RETURN COMPARISON Five-Year Period Ended 6/30/12 | |||
| Average Annual Total Return | Standard Deviation | Return Efficiency1 | |
| RDV | 2.84% | 21.79 | 0.13 |
| Russell 2000 | 0.54 | 24.90 | 0.02 |
1 Return Efficiency is the average annual total return divided by the annualized standard deviation over a designated time period. Please read the prospectus for a more complete discussion of risk. | |||
| DOWN MARKET PERFORMANCE COMPARISON All Down Periods of 7.5% or Greater Over the Last 7 Years, in Percentages(%) | |||
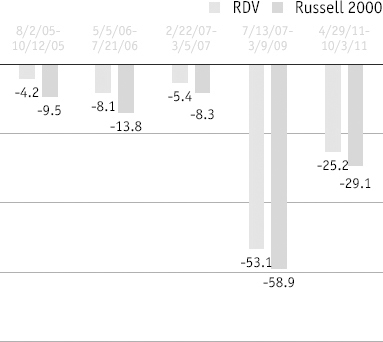 | |||
| The Royce Funds 2012 Semiannual Report to Shareholders | 23 |
Royce Premier Fund
| FOCUSED | |||||||||
| Focused Funds generally employ a more limited portfolio approach—typically holding no more than 100 positions that we believe possess high quality. | |||||||||
| |||||||||
| AVERAGE ANNUAL TOTAL RETURNS Through 6/30/12 | |||||||||
| Jan-June 20121 | 2.65 | % | |||||||
| One-Year | -6.54 | ||||||||
| Three-Year | 16.34 | ||||||||
| Five-Year | 3.89 | ||||||||
| 10-Year | 10.85 | ||||||||
| 15-Year | 10.35 | ||||||||
| 20-Year | 12.09 | ||||||||
| Since Inception (12/31/91) | 11.86 | ||||||||
| ANNUAL EXPENSE RATIO | |||||||||
| Operating Expenses | 1.09 | % | |||||||
| 1 Not annualized | |||||||||
| CALENDAR YEAR TOTAL RETURNS | |||||||||
| Year | RPR | Year | RPR | ||||||
| 2011 | -0.9 | % | 2003 | 38.7 | % | ||||
| 2010 | 26.5 | 2002 | -7.8 | ||||||
| 2009 | 33.3 | 2001 | 9.6 | ||||||
| 2008 | -28.3 | 2000 | 17.1 | ||||||
| 2007 | 12.7 | 1999 | 11.5 | ||||||
| 2006 | 8.8 | 1998 | 6.7 | ||||||
| 2005 | 17.1 | 1997 | 18.4 | ||||||
| 2004 | 22.8 | 1996 | 18.1 | ||||||
| TOP 10 POSITIONS % of Net Assets | |||||||||
| Lincoln Electric Holdings | 3.3 | % | |||||||
| Gartner | 2.9 | ||||||||
| Nu Skin Enterprises Cl. A | 2.8 | ||||||||
| Alleghany Corporation | 2.6 | ||||||||
| Westlake Chemical | 2.3 | ||||||||
| Woodward | 2.3 | ||||||||
| IDEXX Laboratories | 2.2 | ||||||||
| ProAssurance Corporation | 2.0 | ||||||||
| Reliance Steel & Aluminum | 1.9 | ||||||||
| FEI Company | 1.8 | ||||||||
| PORTFOLIO SECTOR BREAKDOWN % of Net Assets | |||||||||
| Industrials | 23.9 | % | |||||||
| Information Technology | 19.1 | ||||||||
| Financials | 12.5 | ||||||||
| Materials | 11.8 | ||||||||
| Consumer Discretionary | 10.9 | ||||||||
| Energy | 5.9 | ||||||||
| Consumer Staples | 5.2 | ||||||||
| Health Care | 4.7 | ||||||||
| Miscellaneous | 0.1 | ||||||||
| Cash and Cash Equivalents | 5.9 | ||||||||
 |
Managers’ Discussion Our practice of selecting a limited number of what we think are the highest-quality small-cap stocks for the portfolio of Royce Premier Fund (RPR) did not yield favorable results in the first half of 2012. The Fund was up 2.7% for the year-to-date period ended June 30, 2012 versus a gain of 8.5% for its small-cap benchmark, the Russell 2000 Index, for the same period. While the markets have been closely correlated of late, those attributes that we seek for portfolio holdings—strong balance sheets, established records of earnings, the ability to generate free cash flow, and high returns on invested capital—have been decidedly out of favor. One consequence of this was that over the last three quarters RPR followed a similar pattern to its benchmark, while underperforming in both up and down markets. The pleasantly bullish first quarter extended the upswing that began following 2011’s small-cap market low on October 3. The Fund rose 11.7% in 2012’s opening quarter compared to a gain of 12.4% for the Russell 2000. The upswing ended on March 26, 2012, just before the end of the first quarter, making the second quarter markedly bearish, despite a strong rally on the last day of trading in June. For the third consecutive year, a market rally was interrupted by fears of European defaults and questions about the pace of growth here in the U.S. and in China. During the second quarter, RPR was down 8.1% compared to a loss of 3.5% for the small-cap index. This was disappointing not only because the Fund fell short of its benchmark, but also because we take great pride in its historical track record during both down markets and down quarters. Unfortunately, the recent pattern of risk-on, risk-off behavior has not allowed the market to establish a consistent direction, which we see as a factor in RPR’s second-quarter downslide. Longer-term results were better, though we were not especially pleased that one must go back five years for better relative performance. From the last small-cap peak on July 13, 2007 through 2012’s small-cap high on March 26, the Fund gained 29.2%, substantially outpacing the Russell 2000, which rose 6.6% for the same period. Measuring from the same July 2007 peak through June 30, 2012, the Fund returned 17.2% compared to a miniscule gain of 0.04% for the small-cap index. (Please see page 6 for market cycle results.) RPR outperformed the Russell 2000 for the five-, 10-, 15-, 20-year, and since inception (12/31/91) periods ended June 30, 2012. The Fund’s average annual total return since inception was 11.9%. |
| GOOD IDEAS THAT WORKED Top Contributors to Performance Year-to-Date through 6/30/121 | |||||||||||
| Westlake Chemical | 0.50% | ||||||||||
| Gartner | 0.50 | ||||||||||
| Veeco Instruments | 0.47 | ||||||||||
| IDEXX Laboratories | 0.43 | ||||||||||
| Fossil | 0.42 | ||||||||||
| 1 Includes dividends | |||||||||||
Important Performance and Expense Information All performance information in this Report reflects past performance, is presented on a total return basis, reflects the reinvestment of distributions and does not reflect the deduction of taxes that a shareholder would pay on fund distributions or the redemption of fund shares. Past performance is no guarantee of future results. Investment return and principal value of an investment will fluctuate, so that shares may be worth more or less than their original cost when redeemed. Shares redeemed within 180 days of purchase may be subject to a 1% redemption fee payable to the Fund, which is not reflected in the performance shown above; if it were, performance would be lower. Current month-end performance may be higher or lower than performance quoted and may be obtained at www.roycefunds.com. All performance and risk information reflects results of the Investment Class (its oldest class). Operating expenses reflect the Fund’s total annual operating expenses for the Investment Class as of the Fund’s most current prospectus and include management fees, and other expenses. Shares of RPR’s Service, Consultant, R and K Classes bear an annual distribution expense that is not borne by the Investment Class. Regarding the two “Good Ideas” tables shown above, the sum of all contributors to, and all detractors from, performance for all securities in the portfolio would approximate the Fund’s year-to-date performance for 2012. |
| 24 | The Royce Funds 2012 Semiannual Report to Shareholders |
Performance and Portfolio Review Returns were affected most negatively by net losses in the Energy sector, followed by those for Materials and Industrials. Each of these remains an area of investment interest for us. All include several long-term holdings that have been suffering in a market particularly tough for commodity-based and industrial businesses. Energy stocks were first hurt by low natural gas prices only to fall harder when oil prices slid in the second quarter. Steel companies, like Industrials, were adversely affected by both the slower pace of the Chinese economy and the perception that the European situation would further hinder global industrial activity. Metals & mining stocks felt the effect of mostly flat gold and silver prices. Thinking more about the long term, we see increases for the prices of oil, natural gas and precious metals, as well as upticks in industrial and construction work as the developed world’s economies mend themselves and the developing world resumes a more consistent rate of growth. Our patience has been tested, to be sure, but we are still highly confident in our disciplined, bottom-up approach. We first purchased shares of Trican Well Service in the portfolio in 2004, attracted by its growing business, talented management, and pristine balance sheet. The company provides specialized equipment and services for drilling, completion, and reworking oil and gas wells. As its stock price fell, we increased our stake, confident that an improved energy market can bring investors back. Gardner Denver, which we have owned in the Fund since 2007, makes specially engineered industrial machinery and related parts and services. Although it serves many industries, it has a sizable exposure to the energy industry. Exposure to two struggling areas—energy and industry—perhaps best explains its recent descent. We were happy to hold a good-sized position at the end of June. Two top-10 positions were also the Fund’s top contributors during the first half. Westlake Chemical manufactures basic chemicals, vinyls, polymers, and fabricated building products. It also makes plastics and high-end plastic films used to wrap food. Low natural gas prices gave it a significant cost advantage, as the company uses gas as a primary feedstock for plastic manufacture. We like this founder-controlled business for its conservative and intelligent management and think its ongoing prospects remain more than solid. Gartner provides research and analysis on IT (information technology), computer hardware, software, communications, and other technologies. It share price was mostly on the rise during the first half. The uncertain global economy seemed to put a premium on its consulting expertise, which, along with generous margins, placed its stock in high demand. | |||
GOOD IDEAS AT THE TIME | |
| Trican Well Service | -0.58% |
| Gardner Denver | -0.43 |
| Schnitzer Steel Industries Cl. A | -0.40 |
| Unit Corporation | -0.37 |
| Kirby Corporation | -0.35 |
| 1 Net of dividends | |
| ROYCE PREMIER FUND VS. RUSSELL 2000 Value of $10,000 Invested on 12/31/91 | |||
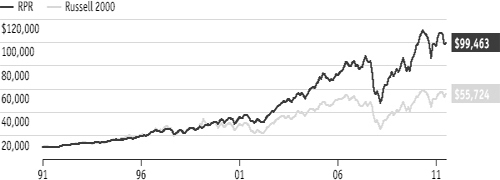 | |||
| Includes reinvestment of distributions. |
| PORTFOLIO DIAGNOSTICS | |||
| Fund Net Assets | $6,743 million | ||
| Number of Holdings | 78 | ||
| Turnover Rate | 3% | ||
| Average Market Capitalization1 | $2,224 million | ||
| Weighted Average P/E Ratio2,3 | 14.0x | ||
| Weighted Average P/B Ratio2 | 2.0x | ||
| U.S. Investments (% of Net Assets) | 81.4% | ||
| Non-U.S. Investments (% of Net Assets) | 12.7% | ||
| Symbol | |||
| Investment Class | RYPRX | ||
| Service Class | RPFFX | ||
| Consultant Class | RPRCX | ||
| Institutional Class | RPFIX | ||
| W Class | RPRWX | ||
| R Class | RPRRX | ||
| K Class | RPRKX | ||
| 1 Geometric average | |||
| 2 Harmonic average | |||
3 The Fund’s P/E ratio calculation excludes companies with zero or negative earnings (6% of portfolio holdings as of 6/30/12). | |||
| MORNINGSTAR STATISTICAL MEASURES1 | |||
| RPR | Category Median | Best Quartile Breakpoint | |
| Sharpe Ratio | 0.25 | 0.11 | 0.16 |
| Standard Deviation | 22.74 | 24.37 | 23.17 |
1 Five years ended 6/30/12. Category Median and Best Quartile Breakpoint based on 349 small-cap objective funds (lowest expense class only) with at least five years of history. | |||
| RISK/RETURN COMPARISON Five-Year Period Ended 6/30/12 | |||
| Average Annual Total Return | Standard Deviation | Return Efficiency1 | |
| RPR | 3.89% | 22.74 | 0.17 |
| Russell 2000 | 0.54 | 24.90 | 0.02 |
1 Return Efficiency is the average annual total return divided by the annualized standard deviation over a designated time period. Please read the prospectus for a more complete discussion of risk. | |||
| DOWN MARKET PERFORMANCE COMPARISON All Down Periods of 7.5% or Greater Over the Last 7 Years, in Percentages(%) | |||
 | |||
| The Royce Funds 2012 Semiannual Report to Shareholders | 25 |
| FOCUSED | |||||||||
| Focused Funds generally employ a more limited portfolio approach—typically holding no more than 100 positions that we believe possess high quality. | |||||||||
| |||||||||
| AVERAGE ANNUAL TOTAL RETURNS Through 6/30/12 | |||||||||
| Jan-June 20121 | 5.99 | % | |||||||
| One-Year | 2.87 | ||||||||
| Three-Year | 14.46 | ||||||||
| Five-Year | 4.27 | ||||||||
| 10-Year | 8.07 | ||||||||
| Since Inception (5/1/98) | 8.85 | ||||||||
| ANNUAL EXPENSE RATIO | |||||||||
| Operating Expenses | 1.15 | % | |||||||
| 1 Not annualized | |||||||||
| CALENDAR YEAR TOTAL RETURNS | |||||||||
| Year | RSE | Year | RSE | ||||||
| 2011 | 0.1 | % | 2004 | 13.9 | % | ||||
| 2010 | 19.6 | 2003 | 27.6 | ||||||
| 2009 | 28.4 | 2002 | 15.3 | ||||||
| 2008 | -19.6 | 2001 | 30.7 | ||||||
| 2007 | 4.7 | 2000 | 16.3 | ||||||
| 2006 | 14.0 | 1999 | -9.6 | ||||||
| 2005 | -1.0 | ||||||||
| TOP 10 POSITIONS % of Net Assets | |||||||||
| Bio-Rad Laboratories Cl. A | 3.7 | % | |||||||
| American Eagle Outfitters | 3.7 | ||||||||
| Hubbell Cl. B | 3.5 | ||||||||
| UniFirst Corporation | 3.2 | ||||||||
| Bed Bath & Beyond | 3.1 | ||||||||
| Teradyne | 3.1 | ||||||||
| AVX Corporation | 3.0 | ||||||||
| Lancaster Colony | 2.9 | ||||||||
| Minerals Technologies | 2.9 | ||||||||
| Applied Industrial Technologies | 2.9 | ||||||||
| PORTFOLIO SECTOR BREAKDOWN % of Net Assets | |||||||||
| Consumer Discretionary | 22.8 | % | |||||||
| Industrials | 22.0 | ||||||||
| Information Technology | 21.0 | ||||||||
| Materials | 11.0 | ||||||||
| Consumer Staples | 6.8 | ||||||||
| Health Care | 5.4 | ||||||||
| Cash and Cash Equivalents | 11.0 | ||||||||
 |
Manager’s Discussion The market struggled through the latter part of 2012’s first half, reflecting investors’ growing concerns about global debt, the viability of the U.S. economy, and an economic slowdown in China. Royce Special Equity Fund (RSE) was not immune to the effects of this widespread apprehension. For the year-to-date period ended June 30, 2012, the Fund gained 6.0% versus 8.5% for RSE’s small-cap benchmark, the Russell 2000 Index, for the same period. We were not terribly disappointed in this result, in part because it was a solid absolute return, and in part because the Fund performed largely in line with our expectations. During the mostly bullish first quarter, RSE was up 10.9%, trailing its benchmark’s rise of 12.4%. When stock prices began to plunge in late March, the Fund effectively held its value, falling 9.9% versus a drop of 12.6% for the Russell 2000 from the interim small-cap high on March 26, 2012 through the 2012 small-cap low on June 4. For the second quarter, RSE was down 4.4%, underperforming its benchmark, which was down 3.5%. Not surprisingly, the majority of the Fund’s underperformance for the quarter came in June, when the Fund gained 2.3%, trailing the benchmark’s 5.0% gain. From the most recent small-cap peak on April 29, 2011 through the end of June 2012, RSE declined 1.1% versus a 6.1% loss for the Russell 2000. In the first bearish phase from the peak on April 29, 2011 through October 3, 2011, the Fund declined 20.6%, outperforming its benchmark, which lost 29.1%. The bullish phase that followed the small-cap low on October 3, 2011 lasted through much of the 2012’s first quarter. This period saw the Fund gain 31.9% versus 39.7% for its benchmark. (Please see page 6 for more market cycle results.) These market cycle performances helped the Fund to secure strong absolute results and relative advantages over its benchmark for average annual total return periods. RSE beat the Russell 2000 for the one-, five-, 10-year, and since inception (5/1/98) periods ended June 30, 2012. The Fund’s average annual total return since inception was 8.8%. In a market increasingly demonstrating that investors are interested in the return of their capital rather than the return on their capital (think of U.S. Treasuries), we believe that our investment approach takes on increasing attraction and offers opportunity. With increased uncertainty and higher volatility, quality has often outperformed. We think this is even more likely as, in our opinion, quality is generally inexpensively priced. The labor market, which earlier had been supporting an improved outlook and therefore higher equity prices, has deteriorated and can no longer be expected to buoy stocks. We continue to wish to “get paid to wait” until |
GOOD IDEAS THAT WORKED | |||||||||||
| American Eagle Outfitters | 0.92% | ||||||||||
| Thomas & Betts | 0.85 | ||||||||||
| Dorman Products | 0.71 | ||||||||||
| Hubbell Cl. B | 0.56 | ||||||||||
| Littelfuse | 0.56 | ||||||||||
| 1 Includes dividends | |||||||||||
Important Performance and Expense Information All performance information in this Report reflects past performance, is presented on a total return basis, reflects the reinvestment of distributions and does not reflect the deduction of taxes that a shareholder would pay on fund distributions or the redemption of fund shares. Past performance is no guarantee of future results. Investment return and principal value of an investment will fluctuate, so that shares may be worth more or less than their original cost when redeemed. Shares redeemed within 180 days of purchase may be subject to a 1% redemption fee payable to the Fund, which is not reflected in the performance shown above; if it were, performance would be lower. Current month-end performance may be higher or lower than performance quoted and may be obtained at www.roycefunds.com. All performance and risk information reflects results of the Investment Class (its oldest class). Operating expenses reflect the Fund’s total annual operating expenses for the Investment Class as of the Fund’s most current prospectus and include management fees, and other expenses. Shares of RSE’s Service and Consultant Classes bear an annual distribution expense that is not borne by the Investment Class. Regarding the two “Good Ideas” tables shown above, the sum of all contributors to, and all detractors from, performance for all securities in the portfolio would approximate the Fund’s year-to-date performance for 2012. | |||||
| 26 | The Royce Funds 2012 Semiannual Report to Shareholders |
Performance and Portfolio Review much of the uncertainty is lifted, which could take a long time. We continue to seek and stress dividend payers—better yet, dividend growers—that are attractively priced, self-financing, and have pricing power. Simply put, companies with these attributes look better to us than many (dare we say most) nation-states. Strength and stability, while old-fashioned, tend to be enduring virtues. There is an old expression that the market dislikes uncertainty. For most investors, including ourselves, this is an unusually uncertain time. In the context of great uncertainty, the market is likely to remain range bound with no multiple improvements absent structural reforms within nation states or sustainable evidence of economic growth. Thus, earnings growth plus dividends should equate to total return. We believe that we can beat those returns through our selection process and that our attractively priced quality selections can advance, despite a range-bound market. We also expect to see more transactional events from our holdings than the market as a whole seems likely to provide. Finally, we think that increases in dividends in some of our names can add to the dividend component of total return. For the year-to-date period, all of the Fund’s six equity sectors were positive. Industrials and Consumer Discretionary—also RSE’s two largest sectors at the end of June—led by wide margins, followed by strong net gains from the Information Technology sector. The leading industry groups were electronic equipment companies, specialty retail stocks, and auto components businesses. AVX Corporation was again among the largest detractors from performance during 2012’s first half. The Greenville, S.C.-based company manufactures electronic components, including ceramic and tantalum capacitors used in electronic products to store, filter, or regulate electric energy. Another detractor from first half performance was National Presto Industries, a diversified manufacturing firm that produces defense products, small appliances, and absorbent products. American Eagle Outfitters was the best performer for the semiannual period. The Pittsburgh, PA-based firm is a leading lifestyle retailer that designs, markets, and sells its own brand of casual clothing. The company, which operates more than 1,090 stores across the U.S., benefited from restructuring efforts and a shift in strategy instituted by its new CEO, who came aboard last fall. Founded in 1898, Thomas & Betts is a leading manufacturer of electrical components used in industrial, construction, retail, utility, and communications markets. With operations in 20 countries, the company was acquired by Swiss based ABB, LTD. for $3.9 Billion in May 2012. |
GOOD IDEAS AT THE TIME | |
| AVX Corporation | -0.51% |
| National Presto Industries | -0.36 |
| Scholastic Corporation | -0.22 |
| Atrion Corporation | -0.18 |
| Children’s Place Retail Stores | -0.14 |
| 1 Net of dividends | |
| ROYCE SPECIAL EQUITY FUND VS. RUSSELL 2000 Value of $10,000 Invested on 5/1/98 | |||
 | |||
| Includes reinvestment of distributions. |
| PORTFOLIO DIAGNOSTICS | |||
| Fund Net Assets | $2,765 million | ||
| Number of Holdings | 57 | ||
| Turnover Rate | 17% | ||
| Average Market Capitalization1 | $1,467 million | ||
| Weighted Average P/E Ratio2,3 | 14.5x | ||
| Weighted Average P/B Ratio2 | 1.8x | ||
| U.S. Investments (% of Net Assets) | 89.0% | ||
| Non-U.S. Investments (% of Net Assets) | 0.0% | ||
| Symbol | |||
| Investment Class | RYSEX | ||
| Service Class | RSEFX | ||
| Consultant Class | RSQCX | ||
| Institutional Class | RSEIX | ||
| 1 Geometric average | |||
| 2 Harmonic average | |||
3 The Fund’s P/E ratio calculation excludes companies with zero or negative earnings (0% of portfolio holdings as of 6/30/12). | |||
| MORNINGSTAR STATISTICAL MEASURES1 | |||
| RSE | Category Median | Best Decile Breakpoint | |
| Sharpe Ratio | 0.27 | 0.11 | 0.24 |
| Standard Deviation | 18.24 | 24.37 | 21.73 |
1 Five years ended 6/30/12 Category Median and Best Decile Breakpoint based on 349 small-cap objective funds (oldest class only) with at least five years of history. | |||
| RISK/RETURN COMPARISON Five-Year Period Ended 6/30/12 | |||
| Average Annual Total Return | Standard Deviation | Return Efficiency1 | |
| RSE | 4.27% | 18.24 | 0.23 |
| Russell 2000 | 0.54 | 24.90 | 0.02 |
1 Return Efficiency is the average annual total return divided by the annualized standard deviation over a designated time period. Please read the prospectus for a more complete discussion of risk. | |||
| DOWN MARKET PERFORMANCE COMPARISON All Down Periods of 7.5% or Greater Over the Last 7 Years, in Percentages(%) | |||
 | |||
| The Royce Funds 2012 Semiannual Report to Shareholders | 27 |
Royce Value Fund
| FOCUSED | ||||||||||||
| Focused Funds generally employ a more limited portfolio approach—typically holding no more than 100 positions that we believe possess high quality. | ||||||||||||
| ||||||||||||
| AVERAGE ANNUAL TOTAL RETURNS Through 6/30/12 | ||||||||||||
| Jan-June 20121 | -1.65 | % | ||||||||||
| One-Year | -14.23 | |||||||||||
| Three-Year | 12.62 | |||||||||||
| Five-Year | -0.20 | |||||||||||
| 10-Year | 11.08 | |||||||||||
| Since Inception (6/14/01) | 9.90 | |||||||||||
| ANNUAL EXPENSE RATIO | ||||||||||||
| Operating Expenses | 1.45 | % | ||||||||||
| 1 Not annualized | ||||||||||||
| CALENDAR YEAR TOTAL RETURNS | ||||||||||||
| Year | RVV | Year | RVV | |||||||||
| 2011 | -7.4 | % | 2006 | 16.8 | % | |||||||
| 2010 | 25.0 | 2005 | 17.2 | |||||||||
| 2009 | 44.7 | 2004 | 30.9 | |||||||||
| 2008 | -34.2 | 2003 | 54.3 | |||||||||
| 2007 | 3.8 | 2002 | -23.5 | |||||||||
| TOP 10 POSITIONS % of Net Assets | ||||||||||||
| Unit Corporation | 3.5 | % | ||||||||||
| Teradyne | 3.5 | |||||||||||
| GameStop Corporation Cl. A | 3.4 | |||||||||||
| Reinsurance Group of America | 3.1 | |||||||||||
| Reliance Steel & Aluminum | 3.0 | |||||||||||
| Helmerich & Payne | 2.9 | |||||||||||
| Ascena Retail Group | 2.9 | |||||||||||
| Westlake Chemical | 2.8 | |||||||||||
| Chemed Corporation | 2.8 | |||||||||||
| Buckle (The) | 2.7 | |||||||||||
| PORTFOLIO SECTOR BREAKDOWN % of Net Assets | ||||||||||||
| Consumer Discretionary | 18.2 | % | ||||||||||
| Materials | 18.0 | |||||||||||
| Financials | 17.2 | |||||||||||
| Information Technology | 15.0 | |||||||||||
| Energy | 11.3 | |||||||||||
| Industrials | 9.2 | |||||||||||
| Health Care | 6.2 | |||||||||||
| Consumer Staples | 1.7 | |||||||||||
| Miscellaneous | 2.4 | |||||||||||
| Cash and Cash Equivalents | 0.8 | |||||||||||
 |
Managers’ Discussion For the year-to-date period ended June 30, 2012, RVV declined 1.7% while its small-cap benchmark, the Russell 2000 Index, rose 8.5%. This gave the Fund an unfortunate and dubious distinction—its widest underperformance spread versus the small-cap index since RVV’s inception on June 14, 2001. Needless to say, the last several months have not been the Fund’s finest hours. The market has been mired in a fairly narrow range of returns, which has led to uninspiring results and investors abandoning equities in growing numbers. The market has also been unkind to many of the industries and sectors in which we have seen both high quality and attractive valuations. This has tested our patience and commitment, but we remain convinced that our disciplined approach that focuses on companies with strong balance sheets, high returns on invested capital, long-term earnings histories, and plentiful cash flows remains viable and more than capable of long-term success once the market returns to more historically typical cycles. The year began on a high note. The upswing that kicked off following the 2011 small-cap low on October 3 continued through most of the first quarter, with small-caps reaching their first-half high on March 26. RVV participated to a large extent, rising 10.7% in the first quarter compared to a 12.4% gain for the Russell 2000. The Fund lost more ground in the bearish second quarter, which would have been far worse if not for a furious rally that closed out June. April saw share prices declining across the globe, as once again anxieties over European debt and the state of the American and Chinese economies drove investors away from stocks. Unfortunately, RVV more than fully participated in this bearish moment, losing 11.2% in the second quarter compared to the small-cap index, which fell 3.5%. Longer-term results were stronger, though we were not happy to see the Fund cede its relative advantage for the current three- and five-year periods. The Fund did, however, maintain its advantage over the last market cycle. From the previous small-cap peak on July 13, 2007 through the small-cap high on April 29, 2011, RVV rose 17.4% versus a gain of 6.6% for the Russell 2000. (Please see page 6 for more market cycle results.) The Fund outperformed its benchmark for the 10-year and since inception periods (6/14/01) ended June 30, 2012. RVV’s average annual total return since inception was 9.9%. |
GOOD IDEAS THAT WORKED | |||||||||||
| Federated Investors Cl. B | 0.63% | ||||||||||
| Veeco Instruments | 0.58 | ||||||||||
| Westlake Chemical | 0.57 | ||||||||||
| Ascena Retail Group | 0.56 | ||||||||||
| Allied World Assurance Company Holdings | 0.55 | ||||||||||
| 1 Includes dividends | |||||||||||
Important Performance and Expense Information All performance information in this Report reflects past performance, is presented on a total return basis, reflects the reinvestment of distributions and does not reflect the deduction of taxes that a shareholder would pay on fund distributions or the redemption of fund shares. Past performance is no guarantee of future results. Investment return and principal value of an investment will fluctuate, so that shares may be worth more or less than their original cost when redeemed. Shares redeemed within 180 days of purchase may be subject to a 1% redemption fee payable to the Fund, which is not reflected in the performance shown above; if it were, performance would be lower. Current month-end performance may be higher or lower than performance quoted and may be obtained at www.roycefunds.com. All performance and risk information reflects results of the Service Class (its oldest class). Operating expenses reflect the Fund’s total annual operating expenses for the Service Class as of the Fund’s most current prospectus and include management fees, 12b-1 distribution and service fees, and other expenses. Shares of RVV’s Consultant and R Classes bear an annual distribution expense that is higher than that of the Service Class. Regarding the two “Good Ideas” tables shown above, the sum of all contributors to, and all detractors from, performance for all securities in the portfolio would approximate the Fund’s year-to-date performance for 2012. |
| 28 | The Royce Funds 2012 Semiannual Report to Shareholders |
Performance and Portfolio Review Energy was RVV’s poorest-performing sector in the first half. The Fund’s largest position, Unit Corporation, was the sector’s most significant detractor. A contract oil and gas driller, the company also explores for oil and gas and is involved in midstream transport and processing work. Its stock price fell in the general downturn for energy companies, which grew worse in the second quarter when oil prices slipped. We first took a position late in 2002, intrigued by its ability to operate successfully in different areas of the energy industry. Its sliding price led us to build our stake in the first half. Helmerich & Payne was another top-ten position from the Energy sector that endured tougher times for its share price than it did in its business operations. The company is one the of the largest land drillers in the U.S. and also provides contract drilling for oil and gas wells in the Gulf of Mexico and South America. While its business has slowed, the long-term outlook is positive, but impatient investors disregarded that view. Drawn by its growing business, talented management, and pristine balance sheet, we first bought shares of Trican Well Service in the portfolio in 2004. The company provides specialized equipment and services for drilling, completion, and reworking oil and gas wells. Confident in its long-term prospects and secure in the belief that the market was punishing it disproportionately, we were happy to hold a good-sized position at the end of the period. GameStop Corporation, the Fund’s largest detractor for the period, is a video game retailer that sells new and used games. Video game industry sales declined significantly on a year-over-year basis, in large part the result of aging gaming consoles such as the Wii and Xbox. Questions also persist about whether older games will be compatible with new equipment, an especially relevant issue for GameStop as it derives a chunk of its sales from selling used games. On the other hand, earnings are positive, its balance sheet remains strong, its digital strategy has been successful, its trade-in business has done well, and its market share is solid. It was the portfolio’s third-largest holding at the end of June. We have owned shares of steel and scrap metal recycler Schnitzer Steel Industries since 2004. Demand for recycled metals slackened amid the slow pace of growth in the U.S. Along with lower-than-normal spring scrap flows and margins compressed from increases in raw materials and transport costs, this helped keep investors selling, while we continued to hold our shares in anticipation of a rebound in industrial activity that should help to spark demand. Financials was the only Fund sector with a notable net gain in the first half, although Information Technology, Health Care, and Consumer Staples also ended the period in the black. Asset manager and money market specialist Federated Investors and casualty and liability insurer Allied World Assurance Company were the financial standouts. | |||
GOOD IDEAS AT THE TIME | |
| GameStop Corporation Cl. A | -0.90% |
| Unit Corporation | -0.72 |
| Trican Well Service | -0.61 |
| Schnitzer Steel Industries Cl. A | -0.58 |
| Helmerich & Payne | -0.53 |
| 1 Net of dividends | |
| ROYCE VALUE FUND VS. RUSSELL 2000 Value of $10,000 Invested on 6/14/01 | |||
 | |||
| Includes reinvestment of distributions. |
| PORTFOLIO DIAGNOSTICS | |||
| Fund Net Assets | $1,415 million | ||
| Number of Holdings | 71 | ||
| Turnover Rate | 15% | ||
| Average Market Capitalization1 | $2,162 million | ||
| Weighted Average P/E Ratio2,3 | 10.9x | ||
| Weighted Average P/B Ratio2 | 1.5x | ||
| U.S. Investments (% of Net Assets) | 80.1% | ||
| Non-U.S. Investments (% of Net Assets) | 19.1% | ||
| Symbol | |||
| Investment Class | RVVHX | ||
| Service Class | RYVFX | ||
| Consultant Class | RVFCX | ||
| Institutional Class | RVFIX | ||
| R Class | RVVRX | ||
| K Class | RVFKX | ||
| 1 Geometric average | |||
| 2 Harmonic average | |||
3 The Fund’s P/E ratio calculation excludes companies with zero or negative earnings (1% of portfolio holdings as of 6/30/12). | |||
| MORNINGSTAR STATISTICAL MEASURES1 | |||
| RVV | Category Median | Best Quartile Breakpoint | |
| Sharpe Ratio | 0.09 | 0.11 | 0.16 |
| Standard Deviation | 25.26 | 24.37 | 23.17 |
1 Five years ended 6/30/12. Category Median and Best Quartile Breakpoint based on 349 small-cap objective funds (oldest class only) with at least five years of history. | |||
| DOWN MARKET PERFORMANCE COMPARISON All Down Periods of 7.5% or Greater Over the Last 7 Years, in Percentages(%) | |||
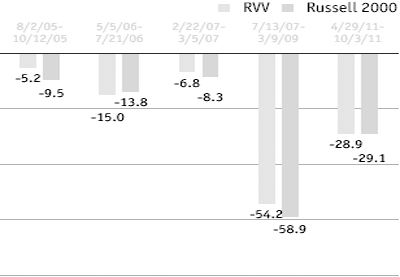 | |||
| The Royce Funds 2012 Semiannual Report to Shareholders | 29 |
| FOCUSED | ||||||||||||
| Focused Funds generally employ a more limited portfolio approach—typically holding no more than 100 positions that we believe possess high quality. | ||||||||||||
| ||||||||||||
| AVERAGE ANNUAL TOTAL RETURNS Through 6/30/12 | ||||||||||||
| Jan-June 20121 | 1.73 | % | ||||||||||
| One-Year | -9.72 | |||||||||||
| Three-Year | 13.55 | |||||||||||
| Five-Year | 2.50 | |||||||||||
| Since Inception (6/30/03) | 9.65 | |||||||||||
| ANNUAL EXPENSE RATIOS | ||||||||||||
| Operating Expenses | 1.47 | % | ||||||||||
| 1 Not annualized | ||||||||||||
| CALENDAR YEAR TOTAL RETURNS | ||||||||||||
| Year | ROH | Year | ROH | |||||||||
| 2011 | -6.5 | % | 2007 | 7.3 | % | |||||||
| 2010 | 24.8 | 2006 | 13.7 | |||||||||
| 2009 | 38.0 | 2005 | 14.9 | |||||||||
| 2008 | -29.2 | 2004 | 27.2 | |||||||||
| TOP 10 POSITIONS % of Net Assets | ||||||||||||
| Verisk Analytics Cl. A | 2.2 | % | ||||||||||
| Valmont Industries | 1.9 | |||||||||||
| Reliance Steel & Aluminum | 1.8 | |||||||||||
| NVR | 1.7 | |||||||||||
| Cymer | 1.7 | |||||||||||
| ShawCor Cl. A | 1.6 | |||||||||||
| Kennametal | 1.5 | |||||||||||
| Mohawk Industries | 1.5 | |||||||||||
| ANSYS | 1.5 | |||||||||||
| AZZ | 1.5 | |||||||||||
| PORTFOLIO SECTOR BREAKDOWN % of Net Assets | ||||||||||||
| Industrials | 28.1 | % | ||||||||||
| Information Technology | 20.9 | |||||||||||
| Consumer Discretionary | 13.6 | |||||||||||
| Financials | 10.7 | |||||||||||
| Materials | 9.7 | |||||||||||
| Energy | 8.8 | |||||||||||
| Health Care | 3.0 | |||||||||||
| Consumer Staples | 2.0 | |||||||||||
| Miscellaneous | 1.9 | |||||||||||
| Cash and Cash Equivalents | 1.3 | |||||||||||
 |
Managers’ Discussion For the limited portfolio of Royce 100 Fund (ROH), the first half of 2012 was one of those periods when “the market giveth, and the market taketh away.” Unfortunately, the market did not give quite enough. For the year-to-date period ended June 30, 2012, the Fund was up 1.7%, well behind its small-cap benchmark, the Russell 2000 Index, which gained 8.5% for the same period. The rally that began after small-cap stocks hit a low on October 3, 2011 was a rewarding period for the portfolio. From that 2011 small-cap low through the first-half small-cap high on March 26, 2012, ROH gained 31.9%, essentially tied with its benchmark’s 39.8% gain. During the bullish first quarter, the Fund rose 13.1%, ahead of the 12.4% gain for the Russell 2000, though ROH began to lose ground when stock prices started to tumble in late March. Throughout its relatively short history, the Fund has demonstrated ample resilience in down markets, so we were disappointed by its failure to hold its value more effectively during the downturn, particularly in May, the worst month so far in 2012. ROH fell 10.1% in the second quarter compared to a far more modest decline of 3.5% for the Russell 2000. Focusing more widely, we were also frustrated by poor results for the third consecutive year during the spring and early summer months, which were once again driven by worries about Europe and the strength of the economies in the U.S. and China. While we take full responsibility for the Fund’s underwhelming first-half results, the market’s recent pattern of risk-on, risk-off behavior has prevented many stocks from establishing a consistent direction, and this played a role in the portfolio’s second-quarter struggles. Market cycle and other long-term results were an improvement over recent performance. From the previous small-cap market peak on July 13, 2007 through the small-cap peak on April 29, 2011, the Fund climbed 27.6% versus 6.6% for the small-cap index. (Please see page 6 for more market cycle results.) For the periods ended June 30, 2012, the Fund outperformed the Russell 2000 for the five-year and since inception (6/30/03) periods. ROH’s average annual total return since inception was 9.6%. Net gains and losses at the sector level were generally modest, befitting a period of positive, single-digit returns. In this context, several performances merit a mention. The Consumer Discretionary, Financials, and Health Care sectors all registered solid net gains for the year-to-date period, while Materials and Energy were the only two sectors that detracted from performance. |
GOOD IDEAS THAT WORKED | |||||||||||
| Valmont Industries | 0.44% | ||||||||||
| AZZ | 0.41 | ||||||||||
| Federated Investors Cl. B | 0.39 | ||||||||||
| Carter’s | 0.34 | ||||||||||
| ShawCor Cl. A | 0.32 | ||||||||||
| 1 Includes dividends | |||||||||||
Important Performance and Expense Information All performance information in this Report reflects past performance, is presented on a total return basis, reflects the reinvestment of distributions and does not reflect the deduction of taxes that a shareholder would pay on fund distributions or the redemption of fund shares. Past performance is no guarantee of future results. Investment return and principal value of an investment will fluctuate, so that shares may be worth more or less than their original cost when redeemed. Shares redeemed within 180 days of purchase may be subject to a 1% redemption fee payable to the Fund, which is not reflected in the performance shown above; if it were, performance would be lower. Current month-end performance may be higher or lower than performance quoted and may be obtained at www.roycefunds.com. All performance and risk information reflects results of the Service Class (its oldest class). Operating expenses reflect the Fund’s gross total annual operating expenses for the Service Class as of the Fund’s most current prospectus, and include management fees, 12b-1 distribution and service fees, and other expenses. Shares of ROH’s R Class bear an annual distribution expense that is higher than that of the Service Class. Regarding the two “Good Ideas” tables shown above, the sum of all contributors to, and all detractors from, performance for all securities in the portfolio would approximate the Fund’s year-to-date performance for 2012. | |||||
| 30 | The Royce Funds 2012 Semiannual Report to Shareholders |
Performance and Portfolio Review Doing the most to keep these sectors in the red were the metals & mining group, including Major Drilling Group International, and energy equipment & services stocks, such as Helmerich & Payne and Trican Well Service. The Fund’s two most significant detractors, however, came from the otherwise respectable Industrials sector. Arkansas Best is a shipping and transport company that has been struggling through a difficult period for its industry, with investors motoring away from its shares as revenues declined. Seeing more attractive opportunities elsewhere, we sold our shares in June. By adding to our position, we showed our more positive view of the long-term prospects for GrafTech International, which manufactures synthetic and natural graphite and carbon based products that are used to produce steel. The company experienced slowing steel demand and capacity utilization, which may have made its second-half guidance too optimistic. As our investment horizon extends well past the end of 2012, we were comfortable purchasing shares at what we thought were appealingly low prices. Industrials was the Fund’s largest sector at the end of June. It experienced weakness during the market’s recent risk-off periods, which gave us opportunities to add to existing names. We were most active in those businesses that we believe dominate their market niches, possess global reach, and are poised to benefit not only from the U.S. manufacturing revival, but also from revived industrial activity in developing economies. In addition, we held several asset-light businesses, such as freight forwarders and professional services firms. Valmont Industries—ROH’s second-largest holding at the end of June—produces fabricated metal products, pole and tower structures, and mechanized irrigation systems. The global reach of its core businesses, as well as improving earnings, helped to keep its price on the rise through most of the first half. In May, we began to reduce our position in AZZ as its price began to climb. The company makes electrical and industrial products and provides galvanizing services to the steel fabrication industry. Rising revenues and earnings, including earnings for the fiscal first quarter of 2013 that exceeded Wall Street estimates, helped to keep its share price on the move. Asset manager and money market specialist Federated Investors was the Fund’s fifteenth-largest position at June 30. Its shares appear to have benefited from the consensus that the longer it takes to implement new regulations on money market funds, the less onerous they are likely to be. We reduced our position in branded children’s wear maker Carter’s during June as its price rose. Investors seemed to cotton to its growing revenues and solid financials. | |||
GOOD IDEAS AT THE TIME | |
| Arkansas Best | -0.38% |
| GrafTech International | -0.37 |
| Helmerich & Payne | -0.37 |
| Trican Well Service | -0.31 |
| Major Drilling Group International | -0.29 |
| 1 Net of dividends | |
| ROYCE 100 FUND VS. RUSSELL 2000 Value of $10,000 Invested on 6/30/03 | |||
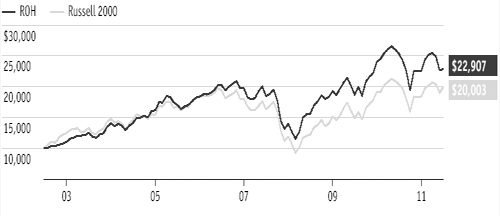 | |||
| Includes reinvestment of distributions. |
| PORTFOLIO DIAGNOSTICS | |||
| Fund Net Assets | $354 million | ||
| Number of Holdings | 95 | ||
| Turnover Rate | 7% | ||
| Average Market Capitalization1 | $2,095 million | ||
| Weighted Average P/E Ratio2,3 | 15.3x | ||
| Weighted Average P/B Ratio2 | 1.9x | ||
| U.S. Investments (% of Net Assets) | 88.6% | ||
| Non-U.S. Investments (% of Net Assets) | 10.1% | ||
| Symbol | |||
| Investment Class | ROHHX | ||
| Service Class | RYOHX | ||
| R Class | ROHRX | ||
| K Class | ROHKX | ||
| 1 Geometric average | |||
| 2 Harmonic average | |||
3 The Fund’s P/E ratio calculation excludes companies with zero or negative earnings (4% of portfolio holdings as of 6/30/12). | |||
| MORNINGSTAR STATISTICAL MEASURES1 | |||
| ROH | Category Median | Best Quartile Breakpoint | |
| Sharpe Ratio | 0.19 | 0.11 | 0.16 |
| Standard Deviation | 23.90 | 24.37 | 23.17 |
1 Five years ended 6/30/12. Category Median and Best Quartile Breakpoint based on 349 small-cap objective funds (oldest class only) with at least five years of history. | |||
| RISK/RETURN COMPARISON Five-Year Period Ended 6/30/12 | |||
| Average Annual Total Return | Standard Deviation | Return Efficiency1 | |
| ROH | 2.50% | 23.90 | 0.10 |
| Russell 2000 | 0.54 | 24.90 | 0.02 |
1 Return Efficiency is the average annual total return divided by the annualized standard deviation over a designated time period. Please read the prospectus for a more complete discussion of risk. | |||
| DOWN MARKET PERFORMANCE COMPARISON All Down Periods of 7.5% or Greater Over the Last 7 Years, in Percentages(%) | |||
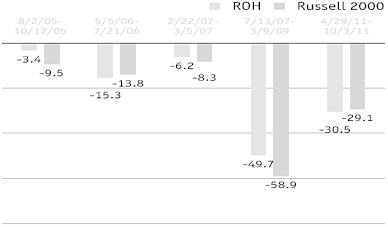 | |||
| The Royce Funds 2012 Semiannual Report to Shareholders | 31 |
Royce Focus Value Fund
| FOCUSED | ||||||||||||
| Focused Funds generally employ a more limited portfolio approach—typically holding no more than 100 positions that we believe possess high quality. | ||||||||||||
| ||||||||||||
| AVERAGE ANNUAL TOTAL RETURNS Through 6/30/12 | ||||||||||||
| Jan-June 20121 | 0.00 | % | ||||||||||
| One-Year | -14.65 | |||||||||||
| Three-Year | 5.89 | |||||||||||
| Since Inception (2/27/09) | 13.37 | |||||||||||
| ANNUAL EXPENSE RATIOS | ||||||||||||
| Gross Operating Expenses | 1.98 | % | ||||||||||
| Net Operating Expenses | 1.36 | |||||||||||
| 1Not annualized | ||||||||||||
| CALENDAR YEAR TOTAL RETURNS | ||||||||||||
| Year | RFV | Year | RFV | |||||||||
| 2011 | -13.9 | % | 2010 | 15.2 | % | |||||||
| TOP 10 POSITIONS % of Net Assets | ||||||||||||
| Berkshire Hathaway Cl. B | 3.9 | % | ||||||||||
| Analog Devices | 3.7 | |||||||||||
| Microsoft Corporation | 3.5 | |||||||||||
| Exxon Mobil | 3.5 | |||||||||||
| Franklin Resources | 3.2 | |||||||||||
| Mosaic Company (The) | 3.2 | |||||||||||
| Western Digital | 3.0 | |||||||||||
| Apple | 2.7 | |||||||||||
| MKS Instruments | 2.7 | |||||||||||
| Newmont Mining | 2.5 | |||||||||||
| PORTFOLIO SECTOR BREAKDOWN % of Net Assets | ||||||||||||
| Materials | 25.9 | % | ||||||||||
| Information Technology | 22.3 | |||||||||||
| Financials | 17.2 | |||||||||||
| Energy | 13.4 | |||||||||||
| Consumer Staples | 4.4 | |||||||||||
| Consumer Discretionary | 4.2 | |||||||||||
| Industrials | 3.4 | |||||||||||
| Health Care | 2.1 | |||||||||||
| Government Bonds | 1.3 | |||||||||||
| Cash and Cash Equivalents | 5.8 | |||||||||||
 |
Managers’ Discussion Though not as explosive or bearish as 2011 (at least not yet), the first half of 2012 provided enough of its own volatility, correlation, and downward movements to leave many investors asking when all of this uncertainty would be over. It was also a frustrating period for Royce Focus Value Fund (RFV), as both absolute and relative results fell below our expectations. RFV was flat for the year-to-date period ended June 30, 2012, returning 0.0% and trailing its small-cap and mid-cap benchmark, the Russell 2500 Index, which gained 8.3% for the same period. The Fund suffered multiple disappointments from holdings in its largest sector, Materials, as well as from several non-U.S. positions. Poor performance from these areas—all of them overweight relative to the Fund’s benchmark—neatly sums up its first-half struggles. A welcome and vigorous rally began last year following the early October lows and lasting into the last days of March. While the Fund certainly benefited from the upswing, it consistently lagged the Russell 2500 throughout the entire run, underperforming both in 2011’s fourth quarter (+8.0% versus +14.5%) and in the first quarter of 2012, when it gained 10.5% versus a 13.0% rise for its benchmark. Given our disciplined value approach, these spreads were not a major surprise. Being out of sync during short, dynamic phases is nothing new for bottom-up stock pickers such as ourselves. RFV’s recent showings in down market periods, on the other hand, have been far more frustrating, with 2012’s second quarter providing a telling illustration. Share prices began to fall late in March and continued to drop into early June. While losses were initially modest—the Fund and its benchmark lost 2.7% and 0.7%, respectively, in April—the pace of decline spiked considerably in May. During that suddenly dismal month, RFV fell 9.5% and the Russell 2500 was down 6.8%. So while in June the Fund improved its relative record versus its benchmark a bit, up 2.8% compared to 3.6%, it was not nearly enough to help recoup what was lost when prices were plummeting. For the second quarter as a whole, RFV was down 9.5% versus a loss of 4.1% for the Russell 2500. This has meant generally underwhelming results in market cycle periods since the Fund’s inception (2/27/09), which came just before the last small-cap bottom on March 9, 2009. From that bottom through the most recent small-cap peak on |
GOOD IDEAS THAT WORKED | |||||||||||
| Africa Oil | 1.00% | ||||||||||
| Apple | 0.80 | ||||||||||
| Microsoft Corporation | 0.50 | ||||||||||
| Franklin Resources | 0.40 | ||||||||||
| Veeco Instruments | 0.31 | ||||||||||
| 1 Includes dividends | |||||||||||
Important Performance and Expense Information All performance information in this Report reflects past performance, is presented on a total return basis, reflects the reinvestment of distributions and does not reflect the deduction of taxes that a shareholder would pay on fund distributions or the redemption of fund shares. Past performance is no guarantee of future results. Investment return and principal value of an investment will fluctuate, so that shares may be worth more or less than their original cost when redeemed. Shares redeemed within 180 days of purchase may be subject to a 1% redemption fee payable to the Fund, which is not reflected in the performance shown above; if it were, performance would be lower. Current month-end performance may be higher or lower than performance quoted and may be obtained at www.roycefunds.com. Gross operating expenses reflect total gross annual operating expenses and include management fees, 12b-1 distribution and service fees, other expenses and acquired fund fees and expenses. Net operating expenses reflect contractual fee waivers and/or reimbursements. All expense information is reported as of the Fund’s most current prospectus. Royce & Associates has contractually agreed to waive its fees and/or reimburse operating expenses to the extent necessary to maintain the Fund’s net annual operating expenses, other than acquired fund fees and expenses, at or below 1.35% through April 30, 2013. Acquired fund fees and expenses reflect the estimated amount of the fees and expenses incurred indirectly by the Fund through its investments in mutual funds, hedge funds, private equity funds and other investment companies. Regarding the two “Good Ideas” tables shown above, the sum of all contributors to, and all detractors from, performance for all securities in the portfolio would approximate the Fund’s year-to-date performance for 2012. |
| 32 | The Royce Funds 2012 Semiannual Report to Shareholders |
Performance and Portfolio Review April 29, 2011, RFV was up 93.8% compared to a gain of 162.5% for the small-cap and mid-cap index. From that same peak through June 30, 2012, the Fund lost 20.5%, while the Russell 2500 was down 5.6%. Despite the relative performance shortcomings, the Fund’s average annual total return since inception was 13.4%. Two of the Fund’s equity sectors—Materials and Consumer Discretionary—finished the first half in negative territory, though the former detracted most, and by a wide margin. The metals & mining group was the loss leader within the sector, while net gains from holdings in chemicals stocks helped to mitigate its losses. Six of RFV’s 10 largest-detracting stocks came from the metals & mining group, including Schnitzer Steel Industries, a leading steel and scrap metal recycler. Demand for recycled metals slackened amid the slow pace of growth in the U.S. Lower-than-normal spring scrap flows and margins compressed from increases in raw materials and transport costs kept investors selling. We continued to hold our shares in anticipation of a rebound in industrial activity that should help to spark demand. Major Drilling International, which provides contract drilling services for metals miners, announced record revenues for its most recent fiscal third and fourth quarters. Even this kind of glowing news was not enough to attract investors to what we see as a well-managed business with considerable upside. Holdings in the Energy sector provided some of the portfolio’s best and worst performances in the first half. A slumping stock price led us to add to our stake in Trican Well Service in March. A long-time Royce favorite, we were initially attracted to its well-run business and low-debt balance sheet. We continue to have a high opinion of this specialized equipment and service provider for drilling, completion, and reworking oil and gas wells. It was a top-20 holding at the end of June. Helmerich & Payne was another top-20 position from the Energy sector that endured tougher times for its share price than it did in its operations. While its business has slowed, the long-term outlook is positive, but impatient investors disregarded that view. The company is one the of the largest land drillers in the U.S. and also provides contract drilling for oil and gas wells in the Gulf of Mexico and South America. A rapidly increasing share price gave us a very profitable experience with Africa Oil, which explores for oil and gas primarily in East Africa but is based in Vancouver, British Columbia. Its stock price first began to spout late in March on news that it had discovered oil in Kenya, that nation’s first major oil discovery. We reduced our position in May. Other top contributors in the first half, each a top-10 position, included Apple, still the darling of investors everywhere, and its chief rival, Microsoft Corporation. The latter’s price was more volatile, peaking in mid-March, though never closing beneath its early January low. |
GOOD IDEAS AT THE TIME | |
| Trican Well Service | -0.80% |
| Schnitzer Steel Industries Cl. A | -0.63 |
| Helmerich & Payne | -0.55 |
| Major Drilling Group International | -0.50 |
| GameStop Corporation Cl. A | -0.50 |
| 1 Net of dividends | |
| ROYCE FOCUS VALUE FUND VS. RUSSELL 2500 Value of $10,000 Invested on 2/27/09 | |||
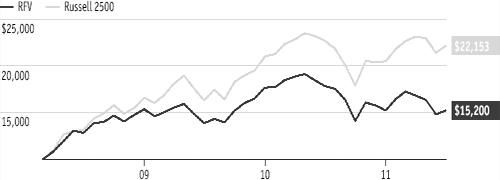 | |||
| Includes reinvestment of distributions. |
| PORTFOLIO DIAGNOSTICS | |||
| Fund Net Assets | $9 million | ||
| Number of Holdings | 52 | ||
| Turnover Rate | 14% | ||
| Average Market Capitalization1 | $5,450 million | ||
| Weighted Average P/E Ratio2,3 | 12.1x | ||
| Weighted Average P/B Ratio2 | 1.7x | ||
| U.S. Investments (% of Net Assets) | 70.8% | ||
| Non-U.S. Investments (% of Net Assets) | 23.4% | ||
| Symbol | |||
| Service Class | RYFVX | ||
| 1 Geometric average | |||
| 2 Harmonic average | |||
3 The Fund’s P/E ratio calculation excludes companies with zero or negative earnings (8% of portfolio holdings as of 6/30/12). | |||
| MORNINGSTAR STATISTICAL MEASURES1 | |||
| RFV | Category Median | Best Quartile Breakpoint | |
| Sharpe Ratio | 0.38 | 0.90 | 1.01 |
| Standard Deviation | 20.00 | 19.38 | 18.17 |
1 Three years ended 6/30/12. Category Median and Best Quartile Breakpoint based on 403 mid-cap objective funds (oldest class only) with at least three years of history. | |||
| RISK/RETURN COMPARISON Three-Year Period Ended 6/30/12 | |||
| Average Annual Total Return | Standard Deviation | Return Efficiency1 | |
| RFV | 5.89% | 20.00 | 0.29 |
| Russell 2500 | 19.06 | 20.60 | 0.93 |
1 Return Efficiency is the average annual total return divided by the annualized standard deviation over a designated time period. Please read the prospectus for a more complete discussion of risk. | |||
| The Royce Funds 2012 Semiannual Report to Shareholders | 33 |
Royce Partners Fund
| FOCUSED | ||||||||||||
| Focused Funds generally employ a more limited portfolio approach—typically holding no more than 100 positions that we believe possess high quality. | ||||||||||||
| ||||||||||||
| AVERAGE ANNUAL TOTAL RETURNS Through 6/30/12 | ||||||||||||
| Jan-June 20121 | 7.33 | % | ||||||||||
| One-Year | -9.19 | |||||||||||
| Three-Year | 8.25 | |||||||||||
| Since Inception (4/27/09) | 8.65 | |||||||||||
| ANNUAL EXPENSE RATIOS | ||||||||||||
| Gross Operating Expenses | 4.28 | % | ||||||||||
| Net Operating Expenses | 1.38 | |||||||||||
| 1Not annualized | ||||||||||||
| CALENDAR YEAR TOTAL RETURNS | ||||||||||||
| Year | PTR | Year | PTR | |||||||||
| 2011 | -11.7 | % | 2010 | 18.7 | % | |||||||
| TOP 10 POSITIONS % of Net Assets | ||||||||||||
| NVR | 4.6 | % | ||||||||||
| Mayr-Melnhof Karton | 4.0 | |||||||||||
| Valmont Industries | 3.9 | |||||||||||
| Verisk Analytics Cl. A | 3.1 | |||||||||||
| Value Partners Group | 2.9 | |||||||||||
| Marsh & McLennan | 2.8 | |||||||||||
| AllianceBernstein Holding L.P. | 2.8 | |||||||||||
| Advisory Board (The) | 2.7 | |||||||||||
| FX Alliance | 2.6 | |||||||||||
| IPG Photonics | 2.6 | |||||||||||
| PORTFOLIO SECTOR BREAKDOWN % of Net Assets | ||||||||||||
| Financials | 31.9 | % | ||||||||||
| Industrials | 29.9 | |||||||||||
| Information Technology | 13.7 | |||||||||||
| Materials | 11.0 | |||||||||||
| Consumer Discretionary | 7.3 | |||||||||||
| Energy | 2.6 | |||||||||||
| Health Care | 0.5 | |||||||||||
| Cash and Cash Equivalents | 3.1 | |||||||||||
|
Manager’s Discussion Equity markets entered 2012 on reasonably solid footing, continuing the strong advance off the prior year’s low on October 3, 2011. Continued bond buying by the Fed through Operation Twist had the intended effect of pushing treasury yields even lower, gave a modest boost to economic activity, and rejuvenated—however briefly—investor interest in equities. However, for a third year in a row the market’s early optimism was quickly stunted as the European sovereign debt crisis spread to two of the region’s larger economies—Spain and Italy—once again raising the prospect of severe economic dislocation. Concurrently on the other side of the globe, China was struggling with a decelerating economy that was moving ever closer to a pace of economic activity insufficient to support the ambitions of their dynamic and upwardly mobile population. The U.S. economy was not immune to these global issues. While on somewhat better footing, it has not yet achieved a sufficient level of self-sustaining activity, making it highly sensitive to even subtle changes in the global economy. So as weakness in Europe and China resurfaced, so did concerns about the ability of the U.S. economy to maintain its footing. Equity markets reversed course in sympathy, unwinding some of the year’s early advance. Royce Partners Fund (PTR) is one of a select group of our offerings afforded the flexibility to pursue opportunities up and down the market capitalization spectrum. Consistent with our view that leadership in the market will most likely rotate between small-cap and large-cap stocks over time, this flexibility can be of great value, especially in the context of an equity asset class that looks broadly attractive to us versus other investment vehicles, particularly fixed income. We use the same rigorous analytical standards of strong balance sheets, high internal rates of return, and compelling valuation combined with a long-term investment horizon that has come to distinguish the Royce approach over the past four decades. So while a meaningful portion of the portfolio will continue to be sourced from our favored segment of smaller companies, the Fund also has the opportunity to apply our strict methodology to companies of all sizes. In the frenetic first half of 2012, PTR trailed its benchmark, advancing 7.3% compared to the Russell 2500 Index, which rose 8.3% for the same period. |
GOOD IDEAS THAT WORKED | |||||||||||
| Valmont Industries | 1.51% | ||||||||||
| NVR | 0.92 | ||||||||||
| IPG Photonics | 0.80 | ||||||||||
| Advisory Board (The) | 0.67 | ||||||||||
| Verisk Analytics Cl. A | 0.55 | ||||||||||
| 1 Includes dividends | |||||||||||
Important Performance and Expense Information All performance information in this Report reflects past performance, is presented on a total return basis, reflects the reinvestment of distributions and does not reflect the deduction of taxes that a shareholder would pay on fund distributions or the redemption of fund shares. Past performance is no guarantee of future results. Investment return and principal value of an investment will fluctuate, so that shares may be worth more or less than their original cost when redeemed. Shares redeemed within 180 days of purchase may be subject to a 1% redemption fee payable to the Fund, which is not reflected in the performance shown above; if it were, performance would be lower. Current month-end performance may be higher or lower than performance quoted and may be obtained at www.roycefunds.com. Gross operating expenses reflect total gross annual operating expenses and include management fees, 12b-1 distribution and service fees, other expenses and acquired fund fees and expenses. Net operating expenses reflect contractual fee waivers and/or reimbursements. All expense information is reported as of the Fund’s most current prospectus. Royce & Associates has contractually agreed to waive its fees and/or reimburse operating expenses to the extent necessary to maintain the Fund’s net annual operating expenses, other than acquired fund fees and expenses, at or below 1.35% through April 30, 2013 and 1.99% through April 30, 2022. Acquired fund fees and expenses reflect the estimated amount of the fees and expenses incurred indirectly by the Fund through its investments in mutual funds, hedge funds, private equity funds and other investment companies. Regarding the two “Good Ideas” tables shown above, the sum of all contributors to, and all detractors from, performance for all securities in the portfolio would approximate the Fund’s year-to-date performance for 2012. |
| 34 | The Royce Funds 2012 Semiannual Report to Shareholders |
Performance and Portfolio Review In the strong first quarter, PTR produced a stellar return, advancing 15.7%, ahead of the Russell 2500, which rose 13.0%. The second quarter, which included the difficult months of April and May followed by a partial recovery in June, saw PTR underperform its benchmark as equities of all sizes fell. The Fund fell 7.3% versus a loss of 4.1% for the index. Since its inception in the midst of the financial crisis on April 27, 2009, PTR lagged its benchmark, owing in large part to our cautious investment stance in the early stages of the powerful recovery from the bear market lows in March 2009. Six of the Fund’s seven equity sectors made positive contributions in the first half of 2012, with Industrials and Financials leading the way. The Information Technology sector also posted strong results, with one of the Fund’s top three individual performers coming from this important area. Energy made a very modest contribution to returns and Health Care was essentially flat. The Fund has very little exposure in these areas, representing a major deviation from their weightings in its benchmark index. Valmont Industries, PTR’s third-largest holding at the end of the period, makes fabricated metal products, pole and tower structures, and mechanized irrigation systems. Its galvanized steel electric utility poles business boomed as it won a number of large bids for projects. Another top-ten position in the Fund, IPG Photonics, is a leading manufacturer of fiber lasers and amplifiers for use in materials processing, telecommunications, and medical applications. The company continued its winning ways as it experienced broad expansion in end markets for its fiber laser technology. Already surpassing prior peak earnings levels, we believe that accelerating expansion in global end markets, combined with IPG’s first-mover advantage in numerous laser applications, positions the company very well for continued success. We showed our positive view of the long-term prospects of top-ten holding AllianceBernstein Holdings by adding to this veteran of the investment management industry as it struggled with asset flows, most notably in its equity business. Lost on many investors has been the offsetting inflows in their fixed income offerings that have largely stemmed the level of net outflows over the past several quarters. GrafTech International manufactures synthetic and natural graphite and carbon based products that are used to produce steel. The company experienced slowing steel demand and capacity utilization, which may have made its second-half guidance too optimistic. As our investment horizon extends well past the end of 2012, we were comfortable maintaining a position. | |||
GOOD IDEAS AT THE TIME | |
| AllianceBernstein Holding L.P. | -0.54% |
| GrafTech International | -0.35 |
| MoneyGram International | -0.32 |
| Brink’s Company (The) | -0.25 |
| Air Lease Cl. A | -0.25 |
| 1 Net of dividends | |
| ROYCE PARTNERS FUND VS. RUSSELL 2500 Value of $10,000 Invested on 4/27/09 | |||
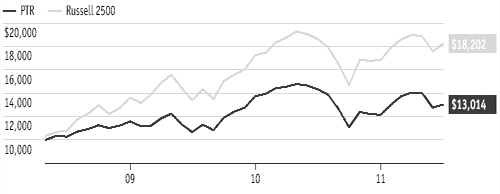 | |||
| Includes reinvestment of distributions. |
| PORTFOLIO DIAGNOSTICS | |||
| Fund Net Assets | $2 million | ||
| Number of Holdings | 53 | ||
| Turnover Rate | 5% | ||
| Average Market Capitalization1 | $3,403 million | ||
| Weighted Average P/E Ratio2,3 | 16.8x | ||
| Weighted Average P/B Ratio2 | 2.0x | ||
| U.S. Investments (% of Net Assets) | 76.3% | ||
| Non-U.S. Investments (% of Net Assets) | 20.6% | ||
| Symbol | |||
| Service Class | RPTRX | ||
| 1 Geometric average | |||
| 2 Harmonic average | |||
3 The Fund’s P/E ratio calculation excludes companies with zero or negative earnings (6% of portfolio holdings as of 6/30/12). | |||
| MORNINGSTAR STATISTICAL MEASURES1 | |||
| PTR | Category Median | Best Quartile Breakpoint | |
| Sharpe Ratio | 0.52 | 0.90 | 1.01 |
| Standard Deviation | 18.50 | 19.38 | 18.17 |
1 Three years ended 6/30/12. Category Median and Best Quartile Breakpoint based on 403 mid-cap objective funds (oldest class only) with at least three years of history. | |||
| RISK/RETURN COMPARISON Three-Year Period Ended 6/30/12 | |||
| Average Annual Total Return | Standard Deviation | Return Efficiency1 | |
| PTR | 8.25% | 18.50 | 0.45 |
| Russell 2500 | 19.06 | 20.60 | 0.93 |
1 Return Efficiency is the average annual total return divided by the annualized standard deviation over a designated time period. Please read the prospectus for a more complete discussion of risk. | |||
| The Royce Funds 2012 Semiannual Report to Shareholders | 35 |
| FOCUSED | ||||||||||||
| Focused Funds generally employ a more limited portfolio approach—typically holding no more than 100 positions that we believe possess high quality. | ||||||||||||
| ||||||||||||
| AVERAGE ANNUAL TOTAL RETURNS Through 6/30/12 | ||||||||||||
| Jan-June 20121 | 6.67 | % | ||||||||||
| One-Year | 6.17 | |||||||||||
| Since Inception (12/31/10) | 9.38 | |||||||||||
| ANNUAL EXPENSE RATIOS | ||||||||||||
| Gross Operating Expenses | 1.97 | % | ||||||||||
| Net Operating Expenses | 1.39 | |||||||||||
| 1 Not annualized | ||||||||||||
| CALENDAR YEAR TOTAL RETURNS | ||||||||||||
| Year | RSM | |||||||||||
| 2011 | 7.2 | % | ||||||||||
| TOP 10 POSITIONS % of Net Assets | ||||||||||||
| Molex Cl. A | 3.7 | % | ||||||||||
| C.R. Bard | 3.5 | |||||||||||
| Scripps Networks Interactive Cl. A | 3.5 | |||||||||||
| Emerson Electric | 3.4 | |||||||||||
| Mattel | 3.2 | |||||||||||
| Microsoft Corporation | 3.2 | |||||||||||
| Johnson & Johnson | 3.1 | |||||||||||
| Intel Corporation | 3.1 | |||||||||||
| Occidental Petroleum | 3.1 | |||||||||||
| Kohl’s Corporation | 3.1 | |||||||||||
| PORTFOLIO SECTOR BREAKDOWN % of Net Assets | ||||||||||||
| Consumer Discretionary | 26.2 | % | ||||||||||
| Information Technology | 22.8 | |||||||||||
| Industrials | 21.4 | |||||||||||
| Health Care | 15.2 | |||||||||||
| Consumer Staples | 7.4 | |||||||||||
| Energy | 3.1 | |||||||||||
| Cash and Cash Equivalents | 3.9 | |||||||||||
|
Manager’s Discussion We are pleased to provide the second semiannual report on Royce Special Equity Multi-Cap Fund (RSM). The Fund, which debuted on December 31, 2010, seeks long-term growth of capital by using an intensive value approach that attempts to combine classic value analysis, the identification of good businesses and accounting cynicism. Since its inception, the Fund has invested mainly in mid-cap and large-cap companies with market capitalizations of more than $5 billion. At the end of the semiannual period, more than 94% of net assets were invested in companies with market capitalizations greater than $5 billion. During the semiannual period ended June 30, 2012, the Fund gained 6.7% versus 9.4% for RSM’s large-cap benchmark, the Russell 1000 Index, for the same period. Following a robust first quarter in which the Fund rose 12.1%, lagging its benchmark’s gain of 12.9%, the second quarter ushered in a far more tumultuous market in which RSM lost 4.9%, again underperforming its benchmark, which lost 3.1%. The majority of the underperformance came in the dynamic up month of June, when the Russell 1000 gained 3.8%, while RSM only added 2.5%. RSM beat the Russell 1000 for the one-year and since inception (12/31/10) periods ended June 30, 2012. The Fund’s average annual total return since inception was 9.4%. In a market increasingly demonstrating that investors are interested in the return of their capital rather than the return on their capital (think of U.S. Treasuries), we believe that our investment approach takes on increasing attraction and offers opportunity. As we have stated before, we believe that our ability to differentiate among stocks is crucial at this juncture. One needs, within the confines of strict adherence to discerning metrics, to find securities that could benefit from whatever comes of our tangled situation. We believe that, regardless of the ultimate outcome, inexpensive, quality businesses that generate free cash flow remain—at a minimum—relatively better than other investment choices, and we continue to believe they can provide solid absolute returns as well. Companies that are inexpensively priced, that have high returns on capital, that are conservatively financed, and that are able to generate cash are likely to outperform. The ability to pay, and even increase, dividends also seems valuable to us in the currently uncertain environment. Thus, we believe that the “tangibility” of dividends from companies |
| GOOD IDEAS THAT WORKED Top Contributors to Performance Year-to-Date through 6/30/121 | |||||||||||
| Gap (The) | 1.24% | ||||||||||
| Scripps Networks Interactive Cl. A | 0.95 | ||||||||||
| C.R. Bard | 0.71 | ||||||||||
| Home Depot (The) | 0.65 | ||||||||||
| Microsoft Corporation | 0.61 | ||||||||||
| 1 Includes dividends | |||||||||||
Important Performance and Expense Information All performance information in this Report reflects past performance, is presented on a total return basis, reflects the reinvestment of distributions and does not reflect the deduction of taxes that a shareholder would pay on fund distributions or the redemption of fund shares. Past performance is no guarantee of future results. Investment return and principal value of an investment will fluctuate, so that shares may be worth more or less than their original cost when redeemed. Shares redeemed within 180 days of purchase may be subject to a 1% redemption fee payable to the Fund, which is not reflected in the performance shown above; if it were, performance would be lower. Current month-end performance may be higher or lower than performance quoted and may be obtained at www.roycefunds.com. All performance and risk information reflects results of the service class (its oldest class). Gross operating expenses reflect total gross annual operating expenses for the Service Class, and include management fees, 12b-1 distribution and service fees and other expenses. Net operating expenses reflect contractual fee waivers and/or reimbursements. All expense information is reported as of the Fund’s most current prospectus. Royce & Associates has contractually agreed to waive its fees and/or reimburse operating expenses to the extent necessary to maintain the Fund’s net annual operating expenses, at or below 1.39% through April 30, 2014. Regarding the two “Good Ideas” tables shown above, the sum of all contributors to, and all detractors from, performance for all securities in the portfolio would approximate the Fund’s year-to-date performance for 2012. | |||||
| 36 | The Royce Funds 2012 Semiannual Report to Shareholders |
Performance and Portfolio Review generating stable cash flow will become more important. We expect the market to become more discerning about stocks—quality and valuation should be increasingly important. Free cash flow’s importance should also increase for this reason. It has been a long time since the continuing generation of free cash has been more valuable. With all of the uncertainty and ambiguity, the market is likely to remain range bound with no multiple improvements absent structural reforms within nation states or sustainable evidence of economic growth. Thus, earnings growth plus dividends should equate to total return. We believe that we can beat those returns through our selection process and that our attractively priced quality selections can advance, despite a range-bound market. We also expect to see more transactional events from our holdings than the market as a whole seems likely to provide. Finally, we think that increases in dividends in some of our names can add to the dividend component of total return. All but one of the Fund’s six equity sectors were positive performers in the first half, with Consumer Discretionary leading by a wide margin. The Information Technology and Health Care sectors also had a strong positive impact on performance. Specialty retail stocks made the most sizable contribution of RSM’s industry groups, while health care equipment & supplies, media, and semiconductors & semiconductor equipment were also top-performing industries. Energy was the only sector that detracted from first-half results, hurt by net losses in the oil, gas & consumable fuels industry. The machinery industry was the worst-performing industry for the year-to-date period. The Consumer Discretionary and Information Technology sectors, which were the Fund’s largest at the end of 2011, remained the two largest sector weightings, respectively, at the end of June. Molex was the largest individual holding as of June 30. The Lisle, IL-based company is the world’s largest manufacturer of electronic, electrical, and fiber-optic interconnection products and systems. The company has a strong international presence with more than 70% of revenue derived from outside the Americas. Well-known casual clothing retailer, The Gap, was the best performer during the semiannual period. A strong contribution also came from top-ten holding Scripps Networks Interactive, which operates websites and television networks, including Home and Garden Television, the Food Network, and the Travel Channel. Cummins was the largest detractor to performance during the period. Based in Columbus, IN, the company manufactures and services diesel and natural gas engines, electric power generation systems, and engine-related component products. Drugstore chain operator Walgreen Company also posted net losses. It was a top-15 position at the end of June. | |||
GOOD IDEAS AT THE TIME | |
| Cummins | -0.32% |
| Walgreen Company | -0.25 |
| Avnet | -0.24 |
| Occidental Petroleum | -0.21 |
| Kohl’s Corporation | -0.19 |
| 1 Net of dividends | |
| ROYCE SPECIAL EQUITY MULTI-CAP FUND VS. RUSSELL 1000 Value of $10,000 Invested on 12/31/10 | |||
 | |||
| Includes reinvestment of distributions. |
| PORTFOLIO DIAGNOSTICS | |||
| Fund Net Assets | $87 million | ||
| Number of Holdings | 39 | ||
| Turnover Rate | 2% | ||
| Average Market Capitalization1 | $21,431 million | ||
| Weighted Average P/E Ratio2,3 | 13.1x | ||
| Weighted Average P/B Ratio2 | 2.5x | ||
| U.S. Investments (% of Net Assets) | 96.1% | ||
| Non-U.S. Investments (% of Net Assets) | 0.0% | ||
| Symbol | |||
| Investment Class | RSMCX | ||
| Service Class | RSEMX | ||
| Institutional Class | RMUIX | ||
| 1 Geometric average | |||
| 2 Harmonic average | |||
3 The Fund’s P/E ratio calculation excludes companies with zero or negative earnings (0% of portfolio holdings as of 6/30/12). | |||
| The Royce Funds 2012 Semiannual Report to Shareholders | 37 |
Royce Low-Priced Stock Fund
| OPPORTUNISTIC THEMES | ||||||||||||
| Opportunistic Themes Funds generally invest in micro-caps and/or those companies considered more opportunistic. | ||||||||||||
| ||||||||||||
| AVERAGE ANNUAL TOTAL RETURNS Through 6/30/12 | ||||||||||||
| Jan-June 20121 | -1.05 | % | ||||||||||
| One-Year | -18.17 | |||||||||||
| Three-Year | 13.47 | |||||||||||
| Five-Year | 0.33 | |||||||||||
| 10-Year | 7.39 | |||||||||||
| 15-Year | 10.68 | |||||||||||
| Since Inception (12/15/93) | 11.59 | |||||||||||
| ANNUAL EXPENSE RATIOS | ||||||||||||
| Gross Operating Expenses | 1.58 | % | ||||||||||
| Net Operating Expenses | 1.51 | |||||||||||
| 1Not annualized | ||||||||||||
| CALENDAR YEAR TOTAL RETURNS | ||||||||||||
| Year | RLP | Year | RLP | |||||||||
| 2011 | -14.6 | % | 2003 | 44.0 | % | |||||||
| 2010 | 31.5 | 2002 | -16.3 | |||||||||
| 2009 | 53.6 | 2001 | 25.1 | |||||||||
| 2008 | -36.0 | 2000 | 24.0 | |||||||||
| 2007 | 2.3 | 1999 | 29.8 | |||||||||
| 2006 | 19.0 | 1998 | 2.4 | |||||||||
| 2005 | 9.7 | 1997 | 19.5 | |||||||||
| 2004 | 13.6 | 1996 | 22.8 | |||||||||
| TOP 10 POSITIONS % of Net Assets | ||||||||||||
| Fairchild Semiconductor International | 1.9 | % | ||||||||||
| HEICO Corporation Cl. A | 1.9 | |||||||||||
| Myriad Genetics | 1.8 | |||||||||||
| Teradyne | 1.8 | |||||||||||
| Pretium Resources | 1.8 | |||||||||||
| Nu Skin Enterprises Cl. A | 1.7 | |||||||||||
| Alamos Gold | 1.6 | |||||||||||
| Globe Specialty Metals | 1.6 | |||||||||||
| International Rectifier | 1.6 | |||||||||||
| Allied Nevada Gold | 1.5 | |||||||||||
| PORTFOLIO SECTOR BREAKDOWN % of Net Assets | ||||||||||||
| Information Technology | 20.7 | % | ||||||||||
| Materials | 20.5 | |||||||||||
| Industrials | 13.0 | |||||||||||
| Financials | 12.0 | |||||||||||
| Energy | 10.6 | |||||||||||
| Consumer Discretionary | 8.2 | |||||||||||
| Health Care | 7.5 | |||||||||||
| Consumer Staples | 3.4 | |||||||||||
| Telecommunication Services | 0.5 | |||||||||||
| Utilities | 0.1 | |||||||||||
| Miscellaneous | 0.8 | |||||||||||
| Cash and Cash Equivalents | 2.7 | |||||||||||
 |
Manager’s Discussion Royce Low-Priced Stock Fund (RLP) finished the year-to-date period ended June 30, 2012 with a loss of 1.0% versus a gain of 8.5% for the Russell 2000 Index, its small-cap benchmark, for the same period. Although the stock market has demonstrated ample correlation over the last couple of years, the Fund has been well out of sync with most of the small-cap market since 2011’s small-cap low on October 3, a generally solid period for small-caps in spite of the correction that dominated the second quarter of 2012. The upshot was a poor showing in both the bullish first quarter and bearish second quarter, a double whammy of relative underperformance that was itself out of sync with RLP’s previous history. During the first quarter, the Fund rose 11.5%, trailing its benchmark’s gain of 12.4%. This was a better relative result than the Fund managed during the earlier stage of the rally in 2011’s fourth quarter (+7.9% versus +15.5%). Coupled with improving U.S. economic numbers, we were initially cheered by these strong quarterly results, thinking that both the market and economy were establishing more lasting and positive directions. For the third consecutive year, however, spring brought a spate of negative news centered on European debt, concerns over the pace and strength of the U.S. recovery, and fears of decelerating growth in China. The effect on share prices was the same as it was in 2010 and 2011, with the difference that many more economically sensitive areas of the stock market—including energy, materials, and industrial companies—were among the hardest hit. These are among the sectors in which we have been seeing especially compelling valuations. Their punishment by investors led to a significant second-quarter tailspin for the portfolio, which declined 11.3% from the beginning of April through the end of June, while the Russell 2000 fell a more modest 3.5%. The Fund’s investments in non-U.S. companies also made an outsized contribution to its second-quarter loss. This was a highly disappointing performance for the portfolio, one that we take very seriously. We were pleased, however, that the Fund was well ahead of the Russell 2000 from the previous small-cap peak on July 13, 2007 through the most recent small-cap peak on April 29, 2011, gaining 27.2% versus 6.6% for the benchmark. (Please see page 6 for more market cycle results.) |
GOOD IDEAS THAT WORKED | |||||||||||
| Fairchild Semiconductor International | 0.28% | ||||||||||
| Kennedy-Wilson Holdings | 0.24 | ||||||||||
| Pretium Resources | 0.23 | ||||||||||
| Myriad Genetics | 0.22 | ||||||||||
| Hochschild Mining | 0.21 | ||||||||||
| 1 Includes dividends | |||||||||||
Important Performance and Expense Information All performance information in this Report reflects past performance, is presented on a total return basis, reflects the reinvestment of distributions and does not reflect the deduction of taxes that a shareholder would pay on fund distributions or the redemption of fund shares. Past performance is no guarantee of future results. Investment return and principal value of an investment will fluctuate, so that shares may be worth more or less than their original cost when redeemed. Shares redeemed within 180 days of purchase may be subject to a 1% redemption fee payable to the Fund, which is not reflected in the performance shown above; if it were, performance would be lower. Current month-end performance may be higher or lower than performance quoted and may be obtained at www.roycefunds.com. All performance and risk information reflects results of the Service Class (its oldest class). Gross operating expenses reflect the Fund’s gross total annual operating expenses for the Service Class, including management fees, 12b-1 distribution and service fees, other expenses and acquired fund fees and expenses. Net operating expenses reflect contractual fee waivers and/or expense reimbursements. All expense information is reported as of the Fund’s most current prospectus. Royce & Associates has contractually agreed to waive fees and/or reimburse operating expenses to the extent necessary to maintain the Service Class’s net annual operating expenses, other than acquired fund fee and expenses, at or below 1.49% through April 30, 2013. Acquired fund fees and expenses reflect the estimated amount of the fees and expenses incurred indirectly by the Fund through its investments in mutual funds, hedge funds, private equity funds and other investment companies. Shares of RLP’s R Class bear an annual distribution expense that is higher than that of the Service Class. Regarding the two “Good Ideas” tables shown above, the sum of all contributors to, and all detractors from, performance for all securities in the portfolio would approximate the Fund’s year-to-date performance for 2012. |
| 38 | The Royce Funds 2012 Semiannual Report to Shareholders |
Performance and Portfolio Review The Fund also outpaced its benchmark for the 10-, 15-year and since inception (12/15/93) periods ended June 30, 2012. RLP’s average annual total return since inception was 11.6%. The biggest net losses came principally from the Energy sector. We view this sector the same way that we view certain other commodity-based businesses and many technology companies. Our interest is typically focused on companies closer to the periphery, those that provide services or otherwise appear less risky than, in the case of Energy, exploration and production firms (though we own a few of those, too). Along with our usual emphasis on a margin of safety and other signs of quality, these elements were not enough to spare some of our largest holdings. Lamprell is a leading UAE-based construction and engineering firm that specializes in the repair and refurbishment of oil and gas rigs. It has stumbled recently in its efforts to enter the rig construction business. More seriously, its share price plunged in May when the company issued a major profit warning on the heels of insider selling that had followed a series of investor meetings which were seen by many investors as unusually encouraging. A slumping stock price led us to add to our stake in Trican Well Service during January, May, and June. First purchasing shares in the portfolio in 2006, we were drawn to its well-run business and low-debt balance sheet. If anything, the ensuing years have only increased our high regard for this specialized equipment and service provider for drilling, completion, and reworking oil and gas wells. It was RLP’s fourteenth-largest holding at the end of June. Calfrac Well Services, which we first purchased in 2006, offers pressure pumping, hydraulic fracturing, and other well stimulation services. The company has been digesting the cost of new supply from 2011 and dealing with decreased demand for its services thus far in 2012. We think that it is near a low point in its business cycle and that its long-term prospects are very favorable. GrafTech International, the portfolio’s eleventh-largest position at June 30, manufactures synthetic and natural graphite and carbon-based products used in steel production. Its business suffered from the across-the-board weakness for industrial companies, which reflected concerns that ongoing fiscal and economic woes in the eurozone and decelerating growth in China could lead to negative earnings adjustments rather than recovery in the second half of the year. The company also experienced slowing steel demand and capacity utilization, which may have made its second-half guidance too optimistic. From the metals & mining group, Major Drilling International, which provides contract drilling services for metals miners, was the loss leader. Record revenues for its most recent fiscal third and fourth quarters could not interest investors in what we see as a well-managed business with considerable upside. We were cheered by the recovery in the share price of Fairchild Semiconductor International, although it traveled a rocky road between January and June. | |||
GOOD IDEAS AT THE TIME | |
| Lamprell | -1.01% |
| Trican Well Service | -0.51 |
| GrafTech International | -0.41 |
| Major Drilling Group International | -0.25 |
| Calfrac Well Services | -0.23 |
| 1 Net of dividends | |
| ROYCE LOW-PRICED STOCK FUND VS. RUSSELL 2000 Value of $10,000 Invested on 12/15/93 | |||
 | |||
| Includes reinvestment of distributions. |
| PORTFOLIO DIAGNOSTICS | |||
| Fund Net Assets | $3,545 million | ||
| Number of Holdings | 173 | ||
| Turnover Rate | 5% | ||
| Average Market Capitalization1 | $1,144 million | ||
| Weighted Average P/E Ratio2,3 | 12.3x | ||
| Weighted Average P/B Ratio2 | 1.5x | ||
| U.S. Investments (% of Net Assets) | 64.6% | ||
| Non-U.S. Investments (% of Net Assets) | 32.7% | ||
| Symbol | |||
| Investment Class | RLPHX | ||
| Service Class | RYLPX | ||
| Institutional Class | RLPIX | ||
| R Class | RLPRX | ||
| K Class | RLPKX | ||
| 1 Geometric average | |||
| 2 Harmonic average | |||
3 The Fund’s P/E ratio calculation excludes companies with zero or negative earnings (11% of portfolio holdings as of 6/30/12). | |||
| MORNINGSTAR STATISTICAL MEASURES1 | |||
| RLP | Category Median | Best Quartile Breakpoint | |
| Sharpe Ratio | 0.12 | 0.11 | 0.16 |
| Standard Deviation | 26.81 | 24.37 | 23.17 |
1 Five years ended 6/30/12 Category Median and Best Quartile Breakpoint based on 349 small-cap objective funds (oldest class only) with at least five years of history. | |||
| RISK/RETURN COMPARISON Five-Year Period Ended 6/30/12 | |||
| Average Annual Total Return | Standard Deviation | Return Efficiency1 | |
| RLP | 0.33% | 26.81 | 0.01 |
| Russell 2000 | 0.54 | 24.90 | 0.02 |
1 Return Efficiency is the average annual total return divided by the annualized standard deviation over a designated time period. Please read the prospectus for a more complete discussion of risk. | |||
| DOWN MARKET PERFORMANCE COMPARISON All Down Periods of 7.5% or Greater Over the Last 7 Years, in Percentages(%) | |||
 | |||
| The Royce Funds 2012 Semiannual Report to Shareholders | 39 |
| OPPORTUNISTIC THEMES | ||||||||||||
| Opportunistic Themes Funds generally invest in micro-caps and/or those companies considered more opportunistic. | ||||||||||||
| ||||||||||||
| AVERAGE ANNUAL TOTAL RETURNS Through 6/30/12 | ||||||||||||
| Jan-June 20121 | 11.24 | % | ||||||||||
| One-Year | -5.59 | |||||||||||
| Three-Year | 20.78 | |||||||||||
| Five-Year | -0.18 | |||||||||||
| 10-Year | 8.51 | |||||||||||
| 15-Year | 11.33 | |||||||||||
| Since Inception (11/19/96) | 11.94 | |||||||||||
| ANNUAL EXPENSE RATIO | ||||||||||||
| Operating Expenses | 1.17 | % | ||||||||||
| 1 Not annualized | ||||||||||||
| CALENDAR YEAR TOTAL RETURNS | ||||||||||||
| Year | ROF | Year | ROF | |||||||||
| 2011 | -13.0 | % | 2003 | 72.9 | % | |||||||
| 2010 | 33.8 | 2002 | -17.0 | |||||||||
| 2009 | 62.1 | 2001 | 17.3 | |||||||||
| 2008 | -45.7 | 2000 | 19.8 | |||||||||
| 2007 | -2.0 | 1999 | 32.3 | |||||||||
| 2006 | 18.8 | 1998 | 4.9 | |||||||||
| 2005 | 4.8 | 1997 | 20.8 | |||||||||
| 2004 | 17.5 | |||||||||||
| TOP 10 POSITIONS % of Net Assets | ||||||||||||
| Toll Brothers | 0.9 | % | ||||||||||
| Louisiana-Pacific Corporation | 0.8 | |||||||||||
| M.D.C. Holdings | 0.8 | |||||||||||
| Kaiser Aluminum | 0.8 | |||||||||||
| Apogee Enterprises | 0.8 | |||||||||||
| LaSalle Hotel Properties | 0.8 | |||||||||||
| MarineMax | 0.8 | |||||||||||
| Trex Company | 0.7 | |||||||||||
| Quanex Building Products | 0.7 | |||||||||||
| Cambrex Corporation | 0.7 | |||||||||||
| PORTFOLIO SECTOR BREAKDOWN % of Net Assets | ||||||||||||
| Information Technology | 22.6 | % | ||||||||||
| Industrials | 19.1 | |||||||||||
| Consumer Discretionary | 18.5 | |||||||||||
| Financials | 11.8 | |||||||||||
| Materials | 10.0 | |||||||||||
| Energy | 4.3 | |||||||||||
| Health Care | 2.8 | |||||||||||
| Consumer Staples | 1.3 | |||||||||||
| Telecommunication Services | 0.6 | |||||||||||
| Miscellaneous | 2.7 | |||||||||||
| Preferred Stock | 0.3 | |||||||||||
| Cash and Cash Equivalents | 6.0 | |||||||||||
 |
Manager’s Discussion Many small-caps struggled in the first half, plenty of industry groups languished, and certain sectors were out of favor. None of these obstacles got in the way of a very strong first half for Royce Opportunity Fund (ROF), which had an impressive showing on both an absolute and relative basis. The Fund gained 11.2% for the year-to-date period ended June 30, 2012, ahead of the 8.5% increase for the Russell 2000 Index, its small-cap benchmark, for the same period. The Fund’s strength has come most recently (as it has historically) in bullish periods. The rally that began off the 2011 small-cap low on October 3 and continued through the 2012 small-cap high on March 26, 2012 was a particularly rewarding one for the portfolio, in which it climbed 50.5% compared to a gain of 39.8% for the small-cap index. This span included a strong first-quarter result in 2012 on both an absolute and relative basis: ROF gained 17.4% for the first quarter, while the Russell 2000 was up 12.4%. The good times did not keep rolling, however, as stock prices fell through most of the second quarter, driven down by yet another round of worry about European debt, deficits, and the strength of the U.S. and Chinese economies. While ROF gave up some ground to its benchmark through these mostly dismal months, it easily held its year-to-date advantage. The Fund finished the second quarter with a 5.3% loss versus a decline of 3.5% for the Russell 2000. In addition to the year-to-date period, the Fund outperformed the Russell 2000 for the three-, 10-, 15-year and since inception (11/19/96) periods ended June 30, 2012. ROF’s average annual total return since inception was 11.9%. The Fund’s focus on domestic small-caps and its success in resurgent industries helped to key its recent results. Each of the Fund’s equity sectors finished the first half with net gains, with the exception of Energy, which posted a modest loss. Consumer Discretionary led all sectors by a sizable margin, though impressive contributions also came from Industrials, Information Technology, Materials, and Financials. Four of the Fund’s ten top-performing industry groups came from the Consumer Discretionary sector, including strong results from specialty retail companies and the household durables groups. Holdings in the Chemicals industry, slotted in the Materials sector, also enjoyed a terrific first half, in many cases benefiting from the low natural gas prices that also hurt the performance of energy stocks. |
| GOOD IDEAS THAT WORKED Top Contributors to Performance Year-to-Date through 6/30/121 | |||||||||||
| Cost Plus | 0.71% | ||||||||||
| M.D.C. Holdings | 0.41 | ||||||||||
| Solutia | 0.35 | ||||||||||
| Toll Brothers | 0.33 | ||||||||||
| Lumber Liquidators Holdings | 0.28 | ||||||||||
| 1 Includes dividends | |||||||||||
Important Performance and Expense Information All performance information in this Report reflects past performance, is presented on a total return basis, reflects the reinvestment of distributions and does not reflect the deduction of taxes that a shareholder would pay on fund distributions or the redemption of fund shares. Past performance is no guarantee of future results. Investment return and principal value of an investment will fluctuate, so that shares may be worth more or less than their original cost when redeemed. Shares redeemed within 180 days of purchase may be subject to a 1% redemption fee payable to the Fund, which is not reflected in the performance shown above; if it were, performance would be lower. Current month-end performance may be higher or lower than performance quoted and may be obtained at www.roycefunds.com. All performance and risk information reflects results of the Investment Class (its oldest class). Operating expenses reflect the Fund’s total annual operating expenses for the Investment Class as of the Fund’s most current prospectus and include management fees, other expenses and acquired fund fees and expenses. Acquired fund fees and expenses reflect the estimated amount of the fees and expenses incurred indirectly by the Fund through its investments in mutual funds, hedge funds, private equity funds and other investment companies. Shares of ROF’s Service, Consultant, R and K Classes bear an annual distribution expense that is not borne by the Investment Class. Regarding the two “Good Ideas” tables shown above, the sum of all contributors to, and all detractors from, performance for all securities in the portfolio would approximate the Fund’s year-to-date performance for 2012. | |||||
| 40 | The Royce Funds 2012 Semiannual Report to Shareholders |
Performance and Portfolio Review Positions that disappointed included supermarket and pharmacy operator SUPERVALU, which is a turnaround possibility that had not yet changed direction by the end of June. Our initial thought was that its solid business and attractive cash-flow characteristics could help it to eventually reverse direction. Events in early July then forced us to reconsider our optimistic forecast. Shipping and transport company Arkansas Best struggled through a difficult period for its industry, and investors sped away from its shares as revenues declined. We reduced our position, though we remained intrigued by its low valuation—it traded near or below book value at times—and industry expertise. Through late 2008 and early 2009, as well as during the briefer, less dramatic downturns over the last two-and-a-half years, we scoured the market for bargains, looking for attractive businesses with low price-to-book and/or price-to-sales ratios (our preferred metrics). Our goal was to use the market’s increased volatility to our best advantage. We understood that many of these opportunities would not bear fruit in the short or intermediate terms, but we were more than willing to show patience, especially considering how appealing so many of the valuations were. Several of these selections began to pay off in the first half. Nearly a dozen portfolio holdings were acquired in the period, including the Fund’s top contributor, Cost Plus, which was bought by Bed Bath & Beyond in a deal that closed late in June. Cost Plus retails specialty food items, kitchen utensils, and other home goods. New management emphasized this merchandise while de-emphasizing furniture, helping the firm to operate more effectively. We finished selling our stake shortly after the announcement was made in early May. The acquisition of Solutia, which makes specialty chemicals for consumer and industrial applications, was announced in January and completed in July. The shares of many homebuilders were on the rise through the second quarter, part of a nascent recovery for the U.S. housing market. M.D.C. Holdings benefited from the resurgence and was also helped by management’s success in reworking the company’s cost structure. Toll Brothers builds everything from single-family suburban homes to luxury apartment buildings in Manhattan. Its status as a high-end builder seemed to be an additional draw for many investors. We took gains in both companies as their share prices headed for the roof. | |||
GOOD IDEAS AT THE TIME | |
| SUPERVALU | -0.19% |
| Arkansas Best | -0.18 |
| Key Energy Services | -0.17 |
| Maxwell Technologies | -0.17 |
| bebe stores | -0.14 |
| 1 Net of dividends | |
| ROYCE OPPORTUNITY FUND VS. RUSSELL 2000 Value of $10,000 Invested on 11/19/96 | |||
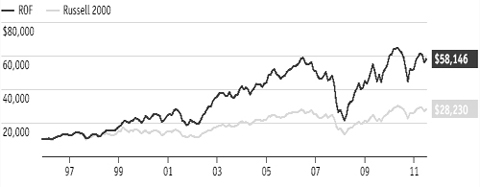 | |||
| Includes reinvestment of distributions. |
| PORTFOLIO DIAGNOSTICS | |||
| Fund Net Assets | $1,744 million | ||
| Number of Holdings | 310 | ||
| Turnover Rate | 18% | ||
| Average Market Capitalization1 | $593 million | ||
| Weighted Average P/E Ratio2,3 | 14.7 | ||
| Weighted Average P/B Ratio2 | 1.2x | ||
| U.S. Investments (% of Net Assets) | 91.4% | ||
| Non-U.S. Investments (% of Net Assets) | 2.6% | ||
| Symbol | |||
| Investment Class | RYPNX | ||
| Service Class | RYOFX | ||
| Consultant Class | ROFCX | ||
| Institutional Class | ROFIX | ||
| R Class | ROFRX | ||
| K Class | ROFKX | ||
| 1 Geometric average | |||
| 2 Harmonic average | |||
3 The Fund’s P/E ratio calculation excludes companies with zero or negative earnings (26% of portfolio holdings as of 6/30/12). | |||
| MORNINGSTAR STATISTICAL MEASURES1 | |||
| ROF | Category Median | Best Quartile Breakpoint | |
| Sharpe Ratio | 0.13 | 0.11 | 0.16 |
| Standard Deviation | 31.86 | 24.37 | 23.17 |
1 Five years ended 6/30/12 Category Median and Best Quartile Breakpoint based on 349 small-cap objective funds (oldest class only) with at least five years of history. | |||
| DOWN MARKET PERFORMANCE COMPARISON All Down Periods of 7.5% or Greater Over the Last 7 Years, in Percentages(%) | |||
 | |||
| The Royce Funds 2012 Semiannual Report to Shareholders | 41 |
Royce Value Plus Fund
| OPPORTUNISTIC THEMES | |||||||||
| Opportunistic Themes Funds generally invest in micro-caps and/or those companies considered more opportunistic. | |||||||||
| |||||||||
| AVERAGE ANNUAL TOTAL RETURNS Through 6/30/12 | |||||||||
| Jan-June 20121 | 5.92 | % | |||||||
| One-Year | -8.41 | ||||||||
| Three-Year | 11.60 | ||||||||
| Five-Year | -2.73 | ||||||||
| 10-Year | 10.30 | ||||||||
| Since Inception (6/14/01) | 11.00 | ||||||||
| ANNUAL EXPENSE RATIO | |||||||||
| Operating Expenses | 1.45 | % | |||||||
| 1Not annualized | |||||||||
| CALENDAR YEAR TOTAL RETURNS | |||||||||
| Year | RVP | Year | RVP | ||||||
| 2011 | -10.0 | % | 2006 | 19.3 | % | ||||
| 2010 | 19.7 | 2005 | 13.2 | ||||||
| 2009 | 41.4 | 2004 | 28.2 | ||||||
| 2008 | -41.1 | 2003 | 79.9 | ||||||
| 2007 | 3.2 | 2002 | -14.7 | ||||||
| TOP 10 POSITIONS % of Net Assets | |||||||||
| Valmont Industries | 2.0 | % | |||||||
| Gildan Activewear | 2.0 | ||||||||
| Carlisle Companies | 2.0 | ||||||||
| Worthington Industries | 1.9 | ||||||||
| Robert Half International | 1.9 | ||||||||
| Myriad Genetics | 1.9 | ||||||||
| Teradyne | 1.7 | ||||||||
| IPG Photonics | 1.7 | ||||||||
| Carter’s | 1.7 | ||||||||
| International Rectifier | 1.7 | ||||||||
| PORTFOLIO SECTOR BREAKDOWN % of Net Assets | |||||||||
| Information Technology | 22.3 | % | |||||||
| Industrials | 18.7 | ||||||||
| Materials | 14.4 | ||||||||
| Financials | 13.7 | ||||||||
| Consumer Discretionary | 9.0 | ||||||||
| Health Care | 8.8 | ||||||||
| Energy | 3.6 | ||||||||
| Consumer Staples | 2.3 | ||||||||
| Miscellaneous | 3.5 | ||||||||
| Cash and Cash Equivalents | 3.7 | ||||||||
 |
Manager’s Discussion The first half of 2012 was a split decision for Royce Value Plus Fund (RVP), as it posted a solid performance on an absolute basis, but was unable to best its benchmark. RVP gained 5.9% for the year-to-date-period ended June 30, 2012, trailing its small-cap benchmark, the Russell 2000 Index, which was up 8.5% for the same period. The Fund also performed well on an absolute basis during the rally that began following small-cap’s 2011 low on October 3 through the first-half high on March 26. While we were somewhat disappointed that the Fund lagged the Russell 2000 during this period (+35.7% versus +39.8%), we were pleased by its absolute strength. We were even happier that RVP outpaced its benchmark in first quarter, rising 15.1% versus 12.4% for the Russell 2000. Aside from the performance advantage itself, this was also good news in light of the fact that the portfolio had previously trailed during each of the market’s short-term upswings dating back to the previous small-cap peak on July 13, 2007. We were initially encouraged by the market’s robust opening in 2012, thinking that both equities and the economy were settling in for a more prolonged period of growth than we have seen over the last couple of years. Of course, this did not last, as yet another round of worries about European sovereign debt, the strength of the U.S. economy, and the deceleration of growth in China all combined to send large numbers of investors scurrying away from equities again, with May being a particularly difficult month. This resulted in a mostly dismal second quarter, and even the wild rally that ushered out the first half could not do enough to bring quarterly returns into the black. RVP fell 8.0% for the quarter versus a loss of 3.5% for the Russell 2000. This gap helped to extend the Fund’s relative disadvantage over recent market cycle and other intermediate-term periods. (Please see page 6 for market cycle results.) RVP outpaced the Russell 2000 for the 10-year and since inception (6/14/01) periods ended June 30, 2012. The Fund’s average annual total return since inception was 11.0%. We first recognized the need to reposition the portfolio near the end of the third quarter of 2010, which was the first quarter in which the Fund underperformed the Russell 2000 by an alarming margin. Our first step in trying to amend matters involved examining those factors that were driving—or failing to drive—performance. These moves did not involve major strategy change or abandonment of Royce’s investment discipline. Instead, we modified the existing |
| GOOD IDEAS THAT WORKED Top Contributors to Performance Year-to-Date through 6/30/121 | |||||||||||
| Gildan Activewear | 0.66% | ||||||||||
| Valmont Industries | 0.49 | ||||||||||
| Liquidity Services | 0.49 | ||||||||||
| Carter’s | 0.48 | ||||||||||
| Thomas & Betts | 0.46 | ||||||||||
| 1Includes dividends | |||||||||||
Important Performance and Expense Information All performance information in this Report reflects past performance, is presented on a total return basis, reflects the reinvestment of distributions and does not reflect the deduction of taxes that a shareholder would pay on fund distributions or the redemption of fund shares. Past performance is no guarantee of future results. Investment return and principal value of an investment will fluctuate, so that shares may be worth more or less than their original cost when redeemed. Shares redeemed within 180 days of purchase may be subject to a 1% redemption fee payable to the Fund, which is not reflected in the performance shown above; if it were, performance would be lower. Current month-end performance may be higher or lower than performance quoted and may be obtained at www.roycefunds.com. All performance and risk information reflects results of the Service Class (its oldest class). Operating expenses reflect the Fund’s total annual operating expenses for the Service Class as of the Fund’s most current prospectus and include management fees, 12b-1 distribution and service fees, other expenses and acquired fund fees and expenses. Acquired fund fees and expenses reflect the estimated amount of fees and expenses incurred indirectly by the Fund through its investments in mutual funds, hedge funds, private equity funds and other investment companies. Shares of RVP’s Consultant and R Classes bear an annual distribution expense that is higher than that of the Service Class. Regarding the two “Good Ideas” tables shown above, the sum of all contributors to, and all detractors from, performance for all securities in the portfolio would approximate the Fund’s year-to-date performance for 2012. |
| 42 | The Royce Funds 2012 Semiannual Report to Shareholders |
Performance and Portfolio Review process by repositioning the portfolio. We remain long-term investors, and the Fund remains a growth-oriented portfolio with a critical overlay of value. The changes represented more of a shift in emphasis away from turnarounds and toward stronger, higher-quality growth. During much of 2011, we opted to pay a little more for what we deemed to be exceptional growth prospects. In introducing more growth, we also began to sell problem positions more quickly and hold growing companies a bit longer. With the economy slowly recovering, the last several years have not seen an enormous number of great growth stories, but in 2011 we began to uncover many smaller companies that were generating above-average growth that also fit well in the portfolio. Energy was the only the sector to finish the first half with net losses. Industrials, the portfolio’s second-largest sector at the end of June, led net gainers by a wide margin, while three others—Consumer Discretionary, Materials, and Health Care—also posted solid contributions. Although the Information Technology sector showed modest net gains, two of its holdings detracted most from first-half results at the individual company level. We first began to reduce our stake in Lattice Semiconductor in 2011, and we continued to do so in 2012. The company makes PLDs (programmable logic devices) for handheld and other portable equipment. Ongoing revisions to earnings guidance and declining revenues informed our decision to start selling. We also began reducing our position in flash memory storage device maker SanDisk in 2011 and by mid-May of 2012 had exited completely. The company had looked poised to benefit from the proliferation of tablets and mobile devices, but increasing price declines in its industry—mostly the result of undisciplined competitors in its marketplace—led us to part ways. We enjoyed success with the portfolio’s ‘underwear theme’ in the first half, as two top-ten holdings in the apparel business posted net gains. The stock prices of Gildan Activewear and Carter’s suffered when cotton prices were on the rise and began to turn around in the first quarter when the cost of cotton declined. Gildan makes t-shirts, fleece, and activewear for wholesale distributors. Carter’s markets branded children’s wear. Valmont Industries, RVP’s largest holding at the end of the period, makes fabricated metal products, pole and tower structures, and mechanized irrigation systems. Its galvanized steel electric utility poles business boomed as it won a number of large bids for projects. | |||
GOOD IDEAS AT THE TIME | |
| Lattice Semiconductor | -0.38% |
| SanDisk Corporation | -0.31 |
| Trican Well Service | -0.26 |
| Rex Energy | -0.23 |
| Unit Corporation | -0.15 |
| 1 Net of dividends | |
| ROYCE VALUE PLUS FUND VS. RUSSELL 2000 Value of $10,000 Invested on 6/14/01 | |||
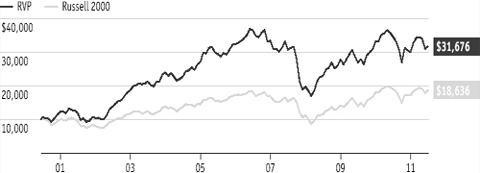 | |||
| Includes reinvestment of distributions. |
| PORTFOLIO DIAGNOSTICS | |||
| Fund Net Assets | $1,712 million | ||
| Number of Holdings | 122 | ||
| Turnover Rate | 15% | ||
| Average Market Capitalization1 | $1,697 million | ||
| Weighted Average P/E Ratio2,3 | 17.7x | ||
| Weighted Average P/B Ratio2 | 2.0x | ||
| U.S. Investments (% of Net Assets) | 81.8% | ||
| Non-U.S. Investments (% of Net Assets) | 14.5% | ||
| Symbol | |||
| Investment Class | RVPHX | ||
| Service Class | RYVPX | ||
| Consultant Class | RVPCX | ||
| Institutional Class | RVPIX | ||
| R Class | RVPRX | ||
| K Class | RVPKX | ||
| 1 Geometric average | |||
| 2 Harmonic average | |||
3 The Fund’s P/E ratio calculation excludes companies with zero or negative earnings (12% of portfolio holdings as of 6/30/12). | |||
| MORNINGSTAR STATISTICAL MEASURES1 | |||
| RVP | Category Median | Best Quartile Breakpoint | |
| Sharpe Ratio | -0.02 | 0.11 | 0.16 |
| Standard Deviation | 24.75 | 24.37 | 23.17 |
1 Five years ended 6/30/12. Category Median and Best Quartile Breakpoint based on 349 small-cap objective funds (oldest class only) with at least five years of history. | |||
| DOWN MARKET PERFORMANCE COMPARISON All Down Periods of 7.5% or Greater Over the Last 7 Years, in Percentages(%) | |||
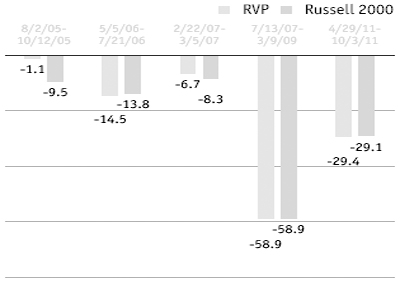 | |||
| The Royce Funds 2012 Semiannual Report to Shareholders | 43 |
| OPPORTUNISTIC THEMES | |||||||||
| Opportunistic Themes Funds generally invest in micro-caps and/or those companies considered more opportunistic. | |||||||||
| |||||||||
| AVERAGE ANNUAL TOTAL RETURNS Through 6/30/12 | |||||||||
| Jan-June 20121 | 8.23 | % | |||||||
| One-Year | -6.44 | ||||||||
| Three-Year | 9.68 | ||||||||
| Five-Year | -1.83 | ||||||||
| Since Inception (12/31/03) | 4.81 | ||||||||
| ANNUAL EXPENSE RATIOS | |||||||||
| Gross Operating Expenses | 1.89 | % | |||||||
| Net Operating Expenses | 1.54 | ||||||||
| 1 Not annualized | |||||||||
| CALENDAR YEAR TOTAL RETURNS | |||||||||
| Year | RFS | Year | RFS | ||||||
| 2011 | -11.3 | % | 2007 | -4.7 | % | ||||
| 2010 | 18.5 | 2006 | 24.8 | ||||||
| 2009 | 32.1 | 2005 | 12.2 | ||||||
| 2008 | -35.4 | 2004 | 15.1 | ||||||
| TOP 10 POSITIONS % of Net Assets | |||||||||
| Ashmore Group | 3.1 | % | |||||||
| Verisk Analytics Cl. A | 2.6 | ||||||||
| Invesco | 2.6 | ||||||||
| Northern Trust | 2.5 | ||||||||
| Regional Management | 2.5 | ||||||||
| AllianceBernstein Holding L.P. | 2.4 | ||||||||
| SEI Investments | 2.2 | ||||||||
| Jupiter Fund Management | 2.1 | ||||||||
| WisdomTree Investments | 2.1 | ||||||||
| Fair Isaac | 2.1 | ||||||||
| PORTFOLIO INDUSTRY BREAKDOWN % of Net Assets | |||||||||
| Capital Markets | 58.2 | % | |||||||
| Insurance | 9.9 | ||||||||
| Diversified Financial Services | 6.4 | ||||||||
| Commercial Banks | 4.5 | ||||||||
| Consumer Finance | 4.3 | ||||||||
| IT Services | 3.5 | ||||||||
| Professional Services | 2.6 | ||||||||
| Software | 2.1 | ||||||||
| Trading Companies & Distributors | 2.0 | ||||||||
| Real Estate Management & Development | 1.8 | ||||||||
| Media | 1.8 | ||||||||
| Closed-End Funds | 1.1 | ||||||||
| Miscellaneous | 0.4 | ||||||||
| Cash and Cash Equivalents | 1.4 | ||||||||
|
Manager’s Discussion It was a very disappointing first half for Royce Financial Services Fund (RFS) on a relative basis. The Fund finished the year-to-date period ended June 30, 2012 with a gain of 8.2%, trailing both its small-cap benchmark, the Russell 2000 Index, which rose 8.5%, and the Russell 2500 Financial Services Index, which climbed an impressive 12.2% for the same period. This was an unsatisfying performance because RFS began the year with a terrific showing in the first quarter and because the portfolio failed to effectively hold its net gains when stock prices began to fall following the first-half small-cap high on March 26. A spirited rally started for small-cap stocks following their 2011 low on October 3. The Fund was slow out of the gate in last year’s fourth quarter, up 8.2% and behind both its benchmark (+15.5%) and the Russell 2500’s financial services companies (+14.8%). The first quarter of 2012 saw a welcome reversal of this trend, as RFS climbed 15.4%, ahead of both the Russell 2000, which rose 12.4%, and the financial services component of the Russell 2500, which was up 12.5%. So far so good. However, markets began to struggle following their late March highs. The culprits, as they have been in one form or another for three years running, were fears of European sovereign debt solvency and related concerns about the pace of economic growth both here in the U.S. and in China. The effect these remounting anxieties had on share prices was as predictable as it was unwelcome. We were also chastened by the fact that, while many financial companies weathered the storm well, too many portfolio holdings did not. The second quarter was dominated by a market that grew steadily more bearish through the first week of June, with May sustaining the worst losses. Yet during April and May, a period in which the Russell 2000 fell 8.1%, RFS lost 10.1%, and the financial services companies in the Russell 2500 slipped a more modest 4.4%. For the quarter as a whole, the Fund fell 6.2% compared to respective declines of 3.5% and 0.2% for the benchmark and the Russell 2500 Financial Services Index. While we never enjoy giving away an advantage versus a benchmark or related index of stocks, losing an edge during a downturn is especially frustrating considering the disciplined, risk-averse approach that we employ. |
GOOD IDEAS THAT WORKED | |||||||||||
| Federated Investors Cl. B | 0.59% | ||||||||||
| Kennedy-Wilson Holdings | 0.58 | ||||||||||
| Verisk Analytics Cl. A | 0.45 | ||||||||||
| Invesco | 0.44 | ||||||||||
| Northern Trust | 0.41 | ||||||||||
| 1 Includes dividends | |||||||||||
Important Performance and Expense Information All performance information in this Report reflects past performance, is presented on a total return basis, reflects the reinvestment of distributions and does not reflect the deduction of taxes that a shareholder would pay on fund distributions or the redemption of fund shares. Past performance is no guarantee of future results. Investment return and principal value of an investment will fluctuate, so that shares may be worth more or less than their original cost when redeemed. Shares redeemed within 180 days of purchase may be subject to a 1% redemption fee payable to the Fund, which is not reflected in the performance shown above; if it were, performance would be lower. Current month-end performance may be higher or lower than performance quoted and may be obtained at www.roycefunds.com. Gross operating expenses reflect the Fund’s gross total annual operating expenses for the Service Class and include management fees, 12b-1 distribution and service fees, other expenses and acquired fund fees and expenses. Net operating expenses reflect contractual fee waivers and/or expense reimbursements. All expense information is reported as of the Fund’s most current prospectus. Royce & Associates has contractually agreed to waive fees and/or reimburse expenses to the extent necessary to maintain the Fund’s net annual operating expenses, other than acquired fund fees and expenses, at or below 1.49% through April 30, 2013. Acquired fund fees and expenses reflect the estimated amount of the fees and expenses incurred indirectly by the Fund through its investments in mutual funds, hedge funds, private equity funds and other investment companies. Regarding the two “Good Ideas” tables shown above, the sum of all contributors to, and all detractors from, performance for all securities in the portfolio would approximate the Fund’s year-to-date performance for 2012. | |||||
| 44 | The Royce Funds 2012 Semiannual Report to Shareholders |
Performance and Portfolio Review Results over the last full market cycle were a mixed bag, while they were more disappointing over other long-term periods. RFS was up 1.2% from the previous small-cap peak on July 13, 2007 through the most recent peak on April 29, 2011 versus an increase of 6.6% for the Russell 2000 and a loss of 13.5% for the financial services component of the Russell 2500. The Fund outperformed the financial services companies in the Russell 2500 for the five-year and since inception (12/31/03) periods ended June 30, 2012. Our disciplined approach to investing in what we believe are fundamentally strong, conservatively capitalized, and attractively valued financial companies has at times put us out of sync both with the benchmark and the index that tracks the performance of micro-cap, small-cap and mid-cap financial services stocks. The portfolio’s overweight in capital markets cut both ways in the first half, housing six of the Fund’s top-ten contributors and seven of its largest detractors. However, the industry did finish the period showing a solid net gain. We remained optimistic about the long-term prospects for asset manager and money market specialist Federated Investors, which we first bought in the portfolio in 2004 and built during the summer and early fall of 2008. New regulations that will affect money market funds are a ‘when,’ not an ‘if,’ but the consensus is that the longer they take to implement, the less draconian they are likely to be. In other words, no news was good news on that front in the first half, which boosted the company’s share price. Top-ten positions Invesco and Northern Trust also posted solid net gains. Invesco is an investment manager catering to high-net-worth individuals and institutions with a great dividend, attractive margins, and increased assets under management. Its share price reached its first-half peak on March 26, but its subsequent slip failed to erase its earlier gains. Shares of financial and banking services company Northern Trust exhibited a similar pattern, hitting their first-half high on April 3. From the real estate management & development group, Kennedy-Wilson holdings saw improvements with earnings and other fundamentals that seemed to make it an attractive buy. The Fund’s most significant detractor was Air Lease, which purchases and leases commercial aircraft to airlines worldwide and provides fleet management services. Profits have been solid, but recent earnings were below expectations, which was a factor in the declining price of its shares. We added shares in June. AGF Management is a Canadian mutual fund company that saw its profits blunted by asset outflows, which discouraged investors. | |||
GOOD IDEAS AT THE TIME | |
| Air Lease Cl. A | -0.39% |
| AGF Management Cl. B | -0.23 |
| U.S. Global Investors Cl. A | -0.21 |
| Artio Global Investors Cl. A | -0.20 |
| World Acceptance | -0.18 |
| 1 Net of dividends | |
| ROYCE FINANCIAL SERVICES FUND VS. RUSSELL 2000 AND RUSSELL 2500 FINANCIAL SERVICES Value of $10,000 Invested on 12/31/03 | |||
 | |||
| Includes reinvestment of distributions. |
| PORTFOLIO DIAGNOSTICS | |||
| Fund Net Assets | $15 million | ||
| Number of Holdings | 85 | ||
| Turnover Rate | 12% | ||
| Average Market Capitalization1 | $1,789 million | ||
| Weighted Average P/E Ratio2,3 | 15.9x | ||
| Weighted Average P/B Ratio2 | 1.7x | ||
| U.S. Investments (% of Net Assets) | 69.5% | ||
| Non-U.S. Investments (% of Net Assets) | 29.1% | ||
| Symbol | |||
| Service Class | RYFSX | ||
| 1 Geometric average | |||
| 2 Harmonic average | |||
3 The Fund’s P/E ratio calculation excludes companies with zero or negative earnings (14% of portfolio holdings as of 6/30/12). | |||
| MORNINGSTAR STATISTICAL MEASURES1 | |||
| RFS | Category Median | Best Quartile Breakpoint | |
| Sharpe Ratio | 0.01 | -0.16 | -0.08 |
| Standard Deviation | 23.72 | 26.30 | 23.17 |
1 Five years ended 6/30/12. Category Median and Best Quartile Breakpoint based on 30 financial services objective funds (oldest class only) with at least five years of history. | |||
| DOWN MARKET PERFORMANCE COMPARISON All Down Periods of 7.5% or Greater Over the Last 7 Years, in Percentages(%) | |||
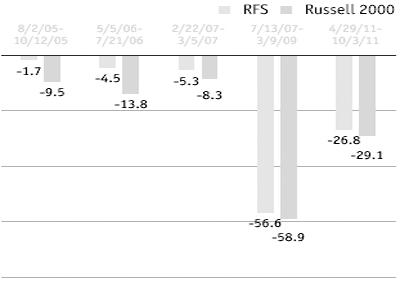 | |||
| The Royce Funds 2012 Semiannual Report to Shareholders | 45 |
Royce Micro-Cap Fund
| MICRO-CAP | |||||||||
| Micro-Cap Funds generally invest in companies with market capitalizations up to $750 million, using our core investment approach. | |||||||||
| |||||||||
| AVERAGE ANNUAL TOTAL RETURNS Through 6/30/12 | |||||||||
| Jan-June 20121 | 2.61 | % | |||||||
| One-Year | -12.35 | ||||||||
| Three-Year | 14.51 | ||||||||
| Five-Year | 0.95 | ||||||||
| 10-Year | 8.78 | ||||||||
| 15-Year | 10.23 | ||||||||
| 20-Year | 12.26 | ||||||||
| Since Inception (12/31/91) | 12.32 | ||||||||
| ANNUAL EXPENSE RATIO | |||||||||
| Operating Expenses | 1.50 | % | |||||||
| 1Not annualized | |||||||||
| CALENDAR YEAR TOTAL RETURNS | |||||||||
| Year | RMC | Year | RMC | ||||||
| 2011 | -12.1 | % | 2003 | 52.6 | % | ||||
| 2010 | 30.1 | 2002 | -13.4 | ||||||
| 2009 | 55.7 | 2001 | 23.1 | ||||||
| 2008 | -40.9 | 2000 | 16.7 | ||||||
| 2007 | 7.1 | 1999 | 13.7 | ||||||
| 2006 | 22.3 | 1998 | -3.3 | ||||||
| 2005 | 11.5 | 1997 | 24.7 | ||||||
| 2004 | 15.8 | 1996 | 15.5 | ||||||
| TOP 10 POSITIONS % of Net Assets | |||||||||
| GP Strategies | 1.4 | % | |||||||
| Marten Transport | 1.3 | ||||||||
| Anaren | 1.3 | ||||||||
| Drew Industries | 1.2 | ||||||||
| Perry Ellis International | 1.2 | ||||||||
| Global Power Equipment Group | 1.2 | ||||||||
| Universal Stainless & Alloy Products | 1.1 | ||||||||
| Cavco Industries | 1.1 | ||||||||
| Kennedy-Wilson Holdings | 1.1 | ||||||||
| Graham Corporation | 1.0 | ||||||||
| PORTFOLIO SECTOR BREAKDOWN % of Net Assets | |||||||||
| Industrials | 20.4 | % | |||||||
| Information Technology | 14.5 | ||||||||
| Materials | 14.1 | ||||||||
| Consumer Discretionary | 14.1 | ||||||||
| Health Care | 9.6 | ||||||||
| Energy | 8.4 | ||||||||
| Financials | 6.3 | ||||||||
| Consumer Staples | 3.1 | ||||||||
| Telecommunication Services | 1.5 | ||||||||
| Utilities | 0.1 | ||||||||
| Miscellaneous | 4.0 | ||||||||
| Cash and Cash Equivalents | 3.9 | ||||||||
 |
Manager’s Discussion The diversified portfolio of Royce Micro-Cap Fund (RMC) was up 2.6% for the year-to-date period ended June 30, 2012 compared to gains of 13.0% for its benchmark, the Russell Microcap Index, and 8.5% for the small-cap Russell 2000 Index for the same period. The year started on a slightly more promising note. Following the rally that began off the most recent small-cap low on October 3, 2011, the Fund continued to lag in the bullish first quarter, though it did narrow the gap. RMC was up 12.2% between the beginning of January and the end of March versus respective gains of 15.3% and 12.4% for the Russell micro-cap and small-cap indexes. The rally slackened after small-caps reached a first-half high on March 26, for the third straight year thrown off course by the same three worries—sovereign debt in Europe and the pace of economic growth in the U.S. and China. These anxieties drove share prices down through most of the second quarter, with May seeing the largest losses. RMC fell 8.6% in the second quarter, while the Russell Microcap lost 2.0% and the Russell 2000 was off 3.5%. This helped to erode some of the Fund’s recent market cycle advantage, though RMC remained ahead of both indexes from the last micro-cap peak on July 12, 2007 through June 30, 2012, up 2.5% versus a decline of 12.2% for the micro-cap index and a very slim 0.1% gain for the small-cap index. (Please see page 6 for more market cycle results.) For the periods ended June 30, 2012, the Fund was ahead of the Russell Microcap for the five- and 10-year periods, while also beating the Russell 2000 for the five-, 10-, 15-, 20-year, and since inception (12/31/91) periods. (Data for the micro-cap index goes back only as far as 2000.) The Fund’s average annual total return since inception was 12.3%. Correlation and a relatively narrow performance range have hindered recent results for equities in general, but RMC’s poor relative performance had less to do with those phenomena and more to do with two other factors. First, two areas that helped to drive the terrific results for the Russell Microcap Index during the first half were areas that the Fund has avoided through its long history: banks and REITs (real estate investment trusts). The former were beaten down to very low valuations during late 2008 and early 2009, but the lack of balance sheet strength and other fundamental factors led us to avoid making any significant investments in the industry. Similarly, REITs often boast attractive yields, which was a key driver of first-half results, but do not offer much else in the way of strong business fundamentals, so we have generally steered clear. |
GOOD IDEAS THAT WORKED | |||||||||||
| Kensey Nash | 0.42% | ||||||||||
| GP Strategies | 0.40 | ||||||||||
| Perry Ellis International | 0.35 | ||||||||||
| Lexicon Pharmaceuticals | 0.32 | ||||||||||
| USANA Health Sciences | 0.31 | ||||||||||
| 1Includes dividends | |||||||||||
Important Performance and Expense Information All performance information in this Report reflects past performance, is presented on a total return basis, reflects the reinvestment of distributions and does not reflect the deduction of taxes that a shareholder would pay on fund distributions or the redemption of fund shares. Past performance is no guarantee of future results. Investment return and principal value of an investment will fluctuate, so that shares may be worth more or less than their original cost when redeemed. Shares redeemed within 180 days of purchase may be subject to a 1% redemption fee payable to the Fund, which is not reflected in the performance shown above; if it were, performance would be lower. Current month-end performance may be higher or lower than performance quoted and may be obtained at www.roycefunds.com. All performance and risk information reflects results of the Investment Class (its oldest class). Price and total return information is based on net asset values calculated for shareholder transactions. Certain immaterial adjustments were made to the net assets of Royce Micro-Cap Fund at 12/30/11 for financial reporting purposes, and as a result the net asset values for shareholder transactions on that date and the total returns based on those net asset values differ from the adjusted net asset values and total returns reported in the Financial Highlights. Operating expenses reflect the Fund’s total annual operating expenses for the Investment Class as of the date of the Fund’s most current prospectus and include management fees, and other expenses. Shares of RMC’s Service and Consultant Classes bear an annual distribution expense that is not borne by the Investment Class. Regarding the two “Good Ideas” tables shown above, the sum of all contributors to, and all detractors from, performance for all securities in the portfolio would approximate the Fund’s year-to-date performance for 2012. |
| 46 | The Royce Funds 2012 Semiannual Report to Shareholders |
Performance and Portfolio Review The second, more important reason is that many of those companies in which we have been seeing attractive valuations and excellent potential over the last year fell further out of favor in a market that has been largely indifferent to quality and uninterested in those sectors in which we have seen the most compelling bargains. Seven of the 10 Fund’s equity sectors were net contributors to first-half returns, with Health Care leading by a wide margin, followed by Information Technology and Consumer Discretionary. The top gainer for the period was Exton, PA-based biomedical device company Kensey Nash. Its acquisition by a larger Dutch competitor at a healthy premium was announced in early May, which led us to begin selling our stake in earnest. We had been drawn to its attractive niche in absorbable medical devices and its strong balance sheet. Top holding GP Strategies provides customized training services for a wide variety of industries in the U.S. and the U.K. We have long admired both its business and its ability to execute successfully in oft-times challenging markets for its industry. It made several acquisitions over the last few years that helped its business to improve, something increasing numbers of investors began to notice. Both the Materials and Energy sectors posted net losses. We still hold a favorable view of the long-term prospects for both areas, though recent disappointments have been frustrating. Commodity-based businesses are often among the most volatile, which is one reason why we prefer the relative safety of energy services businesses. Yet neither the metals & mining group nor the energy equipment & services industry offered Fund investors much in the way of defense or high stock prices through the market’s recent attempts to make sense of global economic uncertainty, which included sluggish oil and natural gas prices and flattish gold and silver prices. Lamprell remains a leader in the repair and refurbishment of drilling rigs, but has endured issues with suppliers in its more recent efforts to enter the rig construction business. More seriously, its share price fell dramatically in May when the company issued a profit warning on the heels of insider selling that had followed a series of investor meetings which were initially seen as encouraging. Our thought was that this well-run business could learn from these missteps and recover. E-learning services business ChinaCast Education, a U.S.-listed company did not inspire similar confidence after disputes among Board members resulted in a hostile proxy battle. The resulting disarray prompted us to exit our position. | |||
GOOD IDEAS AT THE TIME | |
| Lamprell | -0.49% |
| ChinaCast Education | -0.47 |
| Richmont Mines | -0.42 |
| Olympic Steel | -0.28 |
| Dawson Geophysical | -0.26 |
| 1 Net of dividends | |
| ROYCE MICRO-CAP FUND VS. RUSSELL MICROCAP AND RUSSELL 2000 Value of $10,000 Invested on 6/30/00 (Russell Microcap Inception) | |||
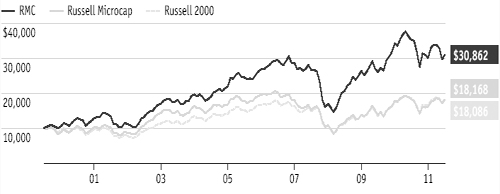 | |||
| Includes reinvestment of distributions. |
| PORTFOLIO DIAGNOSTICS | |||
| Fund Net Assets | $1,122 million | ||
| Number of Holdings | 218 | ||
| Turnover Rate | 9% | ||
| Average Market Capitalization1 | $348 million | ||
| Weighted Average P/E Ratio2,3 | 13.5x | ||
| Weighted Average P/B Ratio2 | 1.4x | ||
| U.S. Investments (% of Net Assets) | 66.0% | ||
| Non-U.S. Investments (% of Net Assets) | 30.1% | ||
| Symbol | |||
| Investment Class | RYOTX | ||
| Service Class | RMCFX | ||
| Consultant Class | RYMCX | ||
| 1 Geometric average | |||
| 2 Harmonic average | |||
3 The Fund’s P/E ratio calculation excludes companies with zero or negative earnings (20% of portfolio holdings as of 6/30/12). | |||
| MORNINGSTAR STATISTICAL MEASURES1 | |||
| RMC | Category Median | Best Quartile Breakpoint | |
| Sharpe Ratio | 0.13 | 0.09 | 0.13 |
| Standard Deviation | 24.32 | 25.18 | 24.45 |
1 Five years ended 6/30/12. Category Median and Best Quartile Breakpoint based on 28 micro-cap objective funds (oldest class only) with at least five years of history. | |||
| RISK/RETURN COMPARISON Five-Year Period Ended 6/30/12 | |||
| Average Annual Total Return | Standard Deviation | Return Efficiency1 | |
| RMC | 0.95% | 24.32 | 0.04 |
| Russell Microcap | -2.19 | 25.95 | -0.08 |
1 Return Efficiency is the average annual total return divided by the annualized standard deviation over a designated time period. Please read the prospectus for a more complete discussion of risk. | |||
| DOWN MARKET PERFORMANCE COMPARISON All Down Periods of 7.5% or Greater Over the Last 7 Years, in Percentages(%) | |||
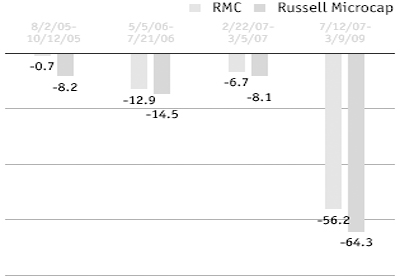 | |||
| The Royce Funds 2012 Semiannual Report to Shareholders | 47 |
Royce Micro-Cap Discovery Fund Formerly Royce Discovery Fund
| MICRO-CAP | |||||||||
| Micro-Cap Funds generally invest in companies with market capitalizations up to $750 million, using our core investment approach. | |||||||||
| |||||||||
| AVERAGE ANNUAL TOTAL RETURNS THROUGH 6/30/12 | |||||||||
| Jan-June 20121 | 0.00 | % | |||||||
| One-Year | -4.78 | ||||||||
| Three-Year | 10.47 | ||||||||
| Five-Year | -2.62 | ||||||||
| Since Inception (10/3/03) | 4.24 | ||||||||
| ANNUAL EXPENSE RATIOS | |||||||||
| Gross Operating Expenses | 2.99 | % | |||||||
| Net Operating Expenses | 1.49 | ||||||||
| 1Not annualized | |||||||||
| CALENDAR YEAR TOTAL RETURNS | |||||||||
| Year | RDF | Year | RDF | ||||||
| 2011 | -2.2 | % | 2007 | -7.4 | % | ||||
| 2010 | 19.6 | 2006 | 16.8 | ||||||
| 2009 | 25.9 | 2005 | 7.6 | ||||||
| 2008 | -35.1 | 2004 | 13.3 | ||||||
| TOP 10 POSITIONS % of Net Assets | |||||||||
| Computer Task Group | 2.1 | % | |||||||
| Horsehead Holding Corporation | 1.8 | ||||||||
| Materion Corporation | 1.7 | ||||||||
| Presidential Life | 1.7 | ||||||||
| Shoe Carnival | 1.6 | ||||||||
| Stage Stores | 1.6 | ||||||||
| Hi-Tech Pharmacal | 1.6 | ||||||||
| Universal Stainless & Alloy Products | 1.5 | ||||||||
| Miller Industries | 1.5 | ||||||||
| Fushi Copperweld | 1.5 | ||||||||
| PORTFOLIO SECTOR BREAKDOWN % of Net Assets | |||||||||
| Information Technology | 21.5 | % | |||||||
| Consumer Discretionary | 18.1 | ||||||||
| Industrials | 15.2 | ||||||||
| Materials | 11.3 | ||||||||
| Health Care | 7.9 | ||||||||
| Financials | 6.4 | ||||||||
| Energy | 6.3 | ||||||||
| Miscellaneous | 4.3 | ||||||||
| Cash and Cash Equivalents | 9.0 | ||||||||
 |
Managers’ Discussion Royce Micro-Cap Discovery Fund (RDF), formerly Royce Discovery Fund, was flat (+0.0%) for the year-to-date period ended June 30, 2012, compared to gains of 13.0% for its benchmark, the Russell Microcap Index, and 8.5% for the small-cap Russell 2000 Index for the same period. Following the rally that began off the most recent small-cap low on October 3, 2011, the Fund continued to lag in the bullish first quarter, though it did so with a strong absolute showing. RDF was up 10.9% between the beginning of January and the end of March versus respective gains of 15.3% and 12.4% for Russell’s micro-cap and small-cap indexes. The rally slackened after small-caps reached a first-half high on March 26, thrown off course for the third straight year by the same trio of worries—sovereign debt in Europe and the pace of economic growth in the U.S. and China. These anxieties drove share prices down through most of the second quarter, with May seeing the largest losses. RDF fell 9.9% in the second quarter, while the Russell Microcap lost 2.0%, and the Russell 2000 was off 3.5%. Longer-term results were somewhat better. The Fund outpaced its benchmark for the since inception (10/3/03) period ended June 30, 2012. It is also worth pointing out that RDF outperformed the Russell Microcap in 93% of all monthly rolling five-year return periods between October 31, 2008 and June 30, 2012, a mostly bearish time span. Correlation and a relatively narrow performance range have hindered recent results for many equities, but RDF’s poor relative performance had less to do with those phenomena and more to do with two other factors. First, two areas that helped to drive the terrific results for the Russell Microcap Index during the first half were areas that the Fund has historically avoided: banks and REITs (real estate investment trusts). The former were beaten down to very low valuations during late 2008 and early 2009, but the lack of balance sheet strength and other fundamental factors led us to avoid making any significant investments in the industry. Similarly, REITs often boast attractive yields, which was a key driver of first-half results, but do not offer much else in the way of strong business fundamentals, so we have generally steered clear. The second, more important reason is that many of those companies in which we have been seeing attractive valuations and excellent |
GOOD IDEAS THAT WORKED | |||||||||||
| Kensey Nash | 0.60% | ||||||||||
| SciClone Pharmaceuticals | 0.47 | ||||||||||
| Obagi Medical Products | 0.42 | ||||||||||
| Metropolitan Health Networks | 0.41 | ||||||||||
| Intersections | 0.40 | ||||||||||
| 1Includes dividends | |||||||||||
Important Performance and Expense Information All performance information in this Report reflects past performance, is presented on a total return basis, reflects the reinvestment of distributions and does not reflect the deduction of taxes that a shareholder would pay on fund distributions or the redemption of fund shares. Past performance is no guarantee of future results. Investment return and principal value of an investment will fluctuate, so that shares may be worth more or less than their original cost when redeemed. Shares redeemed within 180 days of purchase may be subject to a 1% redemption fee payable to the Fund, which is not reflected in the performance shown above; if it were, performance would be lower. Current month-end performance may be higher or lower than performance quoted and may be obtained at www.roycefunds.com. Price and total return information is based on net asset values calculated for shareholder transactions. Certain immaterial adjustments were made to the net assets of Royce Micro-Cap Discovery Fund at 6/29/12 for financial reporting purposes, and as a result the net asset values for shareholder transactions on that date and total returns based on those net asset values differ from the adjusted net asset values and total returns reported in the Financial Highlights. Gross operating expenses reflect the Fund’s gross total annual operating expenses for the Service Class and include management fees, 12b-1 distribution and service fees, and other expenses. Net operating expenses reflect contractual fee waivers and/or expense reimbursements. All expense information is reported as of the Fund’s most current prospectus. Royce & Associates has contractually agreed to waive fees and/or reimburse operating expenses to the extent necessary to maintain the Service Class’s net annual operating expense ratio at or below 1.49% through April 30, 2013 and at or below 1.99% through April 30, 2022. Regarding the two “Good Ideas” tables shown above, the sum of all contributors to, and all detractors from, performance for all securities in the portfolio would approximate the Fund’s year-to-date performance for 2012. |
| 48 | The Royce Funds 2012 Semiannual Report to Shareholders |
Performance and Portfolio Review potential over the last year fell further out of favor in a market that has been largely indifferent to quality and uninterested in those sectors in which the most compelling bargains have most recently been found. Since August 2010, the Fund’s selection process entails its portfolio managers evaluating the purchase and sale recommendations of its proprietary model, which uses both quantitative and qualitative portfolio analysis, before investment decisions are implemented. Both the model and the Fund’s portfolio managers focus on factors such as balance sheet quality, cash flow levels and various other measures of a company’s profitability. We believe that integrating our portfolio managers’ analysis before implementation of the model’s investment recommendations should enhance the investment decision-making process for the Fund. At the end of the semiannual period, five of the Fund’s eight equity sectors were in positive territory, with Health Care leading by a hefty margin, followed by Industrials. At the industry level, several groups made positive contributions, with electrical equipment, health care equipment & supplies, pharmaceuticals, leisure equipment & products, and health care providers & services among the leaders through the end of June. The Materials, Information Technology, and Financials sectors all detracted from first-half results. In Materials, the metals & mining industry posted a sizable net loss, which was slightly mitigated by net gains from that same sector’s chemicals industry. RDF ended the semiannual period with 95 holdings, down from 101 at the end of 2011. Information Technology, Consumer Discretionary, and Industrials remained the Fund’s largest sector weightings. Canadian gold producer Richmont Mines was the top detractor from performance in the first half. The company’s CEO resigned in February and the firm recently announced revised reserve and resource guidance on several mines, which has pressured annual production estimates. We added shares between April and June. The Fund’s top detractor in 2011, Amtech Systems builds and installs capital equipment and other items used in the manufacture of wafers, primarily for the solar and semiconductor industries. It continues to be hampered by tough times for its industries, especially with demand for solar flat-lining. We liked its low-debt balance sheet and attractive niche in businesses that we still think offer strong long-term growth potential. Exton, PA-based biomedical device company Kensey Nash was the Fund’s top contributor for the period. Its acquisition by a larger Dutch competitor at a healthy premium was announced in early May, which led us to complete the sale of our position in the portfolio. SciClone Pharmaceuticals provides therapies that treat cancer, hepatitis, and other diseases. In early May, the announcement of better-than-expected results helped its stock price to stay healthy. | |||
GOOD IDEAS AT THE TIME | |
| Richmont Mines | -0.91% |
| Amtech Systems | -0.68 |
| Dynamics Research | -0.65 |
| Metalico | -0.56 |
| Revett Minerals | -0.34 |
| 1 Net of dividends | |
| ROYCE MICRO-CAP DISCOVERY FUND VS. RUSSELL MICROCAP Value of $10,000 Invested on 10/3/03 | |||
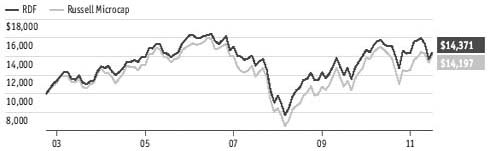 | |||
| Includes reinvestment of distributions. |
| PORTFOLIO DIAGNOSTICS | |||
| Fund Net Assets | $4 million | ||
| Number of Holdings | 95 | ||
| Turnover Rate | 36% | ||
| Average Market Capitalization1 | $368 million | ||
| Weighted Average P/E Ratio2,3 | 11.7x | ||
| Weighted Average P/B Ratio2 | 1.2x | ||
| U.S. Investments (% of Net Assets) | 81.1% | ||
| Non-U.S. Investments (% of Net Assets) | 9.9% | ||
| Symbol | |||
| Service Class | RYDFX | ||
| 1 Geometric average | |||
| 2 Harmonic average | |||
3 The Fund’s P/E ratio calculation excludes companies with zero or negative earnings (6% of portfolio holdings as of 6/30/12). | |||
| MORNINGSTAR STATISTICAL MEASURES1 | |||
| RDF | Category Median | Best Quartile Breakpoint | |
| Sharpe Ratio | -0.02 | 0.09 | 0.13 |
| Standard Deviation | 24.06 | 25.18 | 24.45 |
1 Five years ended 6/30/12. Category Median and Best Quartile Breakpoint based on 28 micro-cap objective funds (oldest class only) with at least five years of history. | |||
| DOWN MARKET PERFORMANCE COMPARISON All Down Periods of 7.5% or Greater Over the Last 7 Years, in Percentages(%) | |||
 | |||
| The Royce Funds 2012 Semiannual Report to Shareholders | 49 |
Royce SMid-Cap Value Fund
| MID-CAP | |||||||||
| Mid-Cap Funds generally invest in mid-cap companies with market capitalizations from $2.5 billion to $15 billion, or smid-cap companies with market caps from $750 million to $10 billion. | |||||||||
| |||||||||
| AVERAGE ANNUAL TOTAL RETURNS Through 6/30/12 | |||||||||
| Jan-June 20121 | 2.67 | % | |||||||
| One-Year | -13.37 | ||||||||
| Three-Year | 11.65 | ||||||||
| Since Inception (9/28/07) | 0.90 | ||||||||
| ANNUAL EXPENSE RATIOS | |||||||||
| Gross Operating Expenses | 1.95 | % | |||||||
| Net Operating Expenses | 1.35 | ||||||||
| 1 Not annualized | |||||||||
| CALENDAR YEAR TOTAL RETURNS | |||||||||
| Year | RSV | Year | RSV | ||||||
| 2011 | -11.6 | % | 2009 | 28.7 | % | ||||
| 2010 | 26.0 | 2008 | -29.3 | ||||||
| TOP 10 POSITIONS % of Net Assets | |||||||||
| Analog Devices | 3.5 | % | |||||||
| International Rectifier | 3.4 | ||||||||
| Semperit AG Holding | 3.3 | ||||||||
| Globe Specialty Metals | 3.2 | ||||||||
| C&J Energy Services | 2.9 | ||||||||
| Valmont Industries | 2.8 | ||||||||
| Autoliv | 2.7 | ||||||||
| Ashmore Group | 2.7 | ||||||||
| Reliance Steel & Aluminum | 2.6 | ||||||||
| Westlake Chemical | 2.6 | ||||||||
| PORTFOLIO SECTOR BREAKDOWN % of Net Assets | |||||||||
| Materials | 18.0 | % | |||||||
| Information Technology | 17.5 | ||||||||
| Industrials | 14.3 | ||||||||
| Energy | 10.0 | ||||||||
| Financials | 9.7 | ||||||||
| Consumer Discretionary | 9.6 | ||||||||
| Health Care | 4.4 | ||||||||
| Consumer Staples | 0.7 | ||||||||
| Cash and Cash Equivalents | 15.8 | ||||||||
 | |
Managers’ Discussion Seemingly stuck in a cycle of anemic organic growth periodically bolstered by central bank intervention, equity markets in the first half of 2012 exhibited characteristics reminiscent of the comparable periods in each of the prior two years. The U.S. economy once again rang in the new year with residual strength, this time from the prior year’s Operation Twist orchestrated by the Fed, only to be met with yet another mid-year lull brought on primarily by external factors. The omnipresent woes in the European Union flared up once more, with funding troubles in two larger economies—Spain and Italy—leading to a sharp dip in their overall economy. China’s growth rate also decelerated notably, prompting actions by their monetary authorities to revive economic activity, but with little noticeable effect through the end of June. So what began with a very robust first quarter for equities quickly turned negative in the second, as investors adjusted for the renewed uncertainty that inevitably lay ahead. Royce SMid-Cap Value Fund (RSV), with its mandate to explore the larger reaches of the smaller company universe, posted a modest absolute return for the period, though it failed to keep pace with its small-cap and mid-cap benchmark, the Russell 2500 Index. Interesting to note is that the smid-cap sector slightly underperformed both the large- and small-cap segments in the year’s first half, perhaps owing mostly to underperformance in the year’s difficult second quarter. For the year-to-date period ended June 30, 2012, RSV gained 2.7%, trailing the Russell 2500, which gained 8.3%. RSV made a very impressive showing in 2012’s first quarter, rising 15.2% and easily surpassing the 13.0% advance for the Russell 2500. The second quarter was more challenging, as the Fund fell 10.9%, compared to the more modest drop of 4.1% for the index. Launched on September 28, 2007, on the eve of the financial crisis, RSV has seen its share of market volatility and a seemingly continuous tension between specific company fundamentals and the constant stream of macroeconomic risks vying for investor attention. Now approaching its fifth anniversary, the Fund has experienced ample market and economic instability. Throughout this time period, RSV has stayed true to its investment mandate to invest in well-capitalized, high-quality businesses that we believe are mispriced in the marketplace. | |
GOOD IDEAS THAT WORKED | |||||||||||
| Westlake Chemical | 1.20% | ||||||||||
| Valmont Industries | 0.64 | ||||||||||
| Stella-Jones | 0.62 | ||||||||||
| Lincoln Electric Holdings | 0.50 | ||||||||||
| Veeco Instruments | 0.50 | ||||||||||
| 1 Includes dividends | |||||||||||
Important Performance and Expense Information All performance information in this Report reflects past performance, is presented on a total return basis, reflects the reinvestment of distributions and does not reflect the deduction of taxes that a shareholder would pay on fund distributions or the redemption of fund shares. Past performance is no guarantee of future results. Investment return and principal value of an investment will fluctuate, so that shares may be worth more or less than their original cost when redeemed. Shares redeemed within 180 days of purchase may be subject to a 1% redemption fee payable to the Fund, which is not reflected in the performance shown above; if it were, performance would be lower. Current month-end performance may be higher or lower than performance quoted and may be obtained at www.roycefunds.com. Gross operating expenses reflect gross total annual operating expenses for the Service Class and include management fees, 12b-1 distribution and service fees and other expenses. Net operating expenses reflect contractual fee waivers and/or expense reimbursements. All expense information is reported as of the Fund’s most current prospectus. Royce & Associates has contractually agreed to waive fees and/or reimburse operating expenses to the extent necessary to maintain the Service Class’s net annual operating expenses at or below 1.35% through April 30, 2013. Regarding the two “Good Ideas” tables shown above, the sum of all contributors to, and all detractors from, performance for all securities in the portfolio would approximate the Fund’s year-to-date performance for 2012. |
| 50 | The Royce Funds 2012 Semiannual Report to Shareholders |
Performance and Portfolio Review Performance in the first half of 2012 was mostly positive from a sector standpoint, with only one of the Fund’s eight equity sectors meaningfully detracting from returns. Leading the list of positive contributors was the Materials sector, followed by Industrials, Information Technology, and Consumer Discretionary. Energy was the notable detractor, as both oil and natural gas prices fell in the first half, hurting the underlying companies engaged in their extraction. Consumer Staples was also in negative territory, though only slightly. Results were largely consistent at the industry level, with energy equipment & services being the portfolio’s most notable trouble spot. Metals & mining companies and the computers & peripherals group rounded out the bottom three industry group performers. On the positive side, chemicals was a bright spot, leading all industry groups, followed by semiconductors & semiconductor equipment stocks and machinery companies. Two top-10 positions were also the Fund’s top contributors during the first half. Westlake Chemical manufactures basic chemicals, vinyls, polymers, and fabricated building products. It also makes plastics and high-end plastic films used to wrap food. Low natural gas prices gave it a significant cost advantage, as the company uses gas as a primary feedstock for plastic manufacture. We like this founder-controlled business for its conservative and intelligent management and think its ongoing prospects remain more than solid. Valmont Industries, makes fabricated metal products, pole and tower structures, and mechanized irrigation systems. Its galvanized steel electric utility poles business boomed as it won a number of large bids for projects. Not surprisingly, three of the Fund’s five largest detractors hailed from the Energy sector. We have long been attracted to Trican Well Service by its growing business, talented management, and pristine balance sheet. The company provides specialized equipment and services for drilling, completion and reworking oil and gas wells. As its stock price fell alongside the commodities, we increased our stake, confident that an improved energy market will rekindle investor interest. We hold a similar view of Helmerich & Payne, whose shares also struggled in the period. The company is one the of the largest land drillers in the U.S. and also provides contract drilling for oil and gas wells in the Gulf of Mexico and South America. Its business has slowed, which, along with lower energy prices, led investors away from the stock. We think the issues are temporary and it is well positioned to benefit from an inevitably resurgent energy market. We increased our stake in C&J Energy Services, which provides hydraulic fracturing, coiled tubing, and pressure pumping services to oil and natural gas exploration and production companies. | |||
GOOD IDEAS AT THE TIME | |
| Trican Well Service | -0.85% |
| Helmerich & Payne | -0.56 |
| C&J Energy Services | -0.44 |
| Silver Standard Resources | -0.33 |
| SanDisk Corporation | -0.25 |
| 1 Net of dividends | |
| ROYCE SMID-CAP VALUE FUND VS. RUSSELL 2500 Value of $10,000 Invested on 9/28/07 | |||
 | |||
| Includes reinvestment of distributions. |
| PORTFOLIO DIAGNOSTICS | |||
| Fund Net Assets | $11 million | ||
| Number of Holdings | 47 | ||
| Turnover Rate | 23% | ||
| Average Market Capitalization1 | $2,663 million | ||
| Weighted Average P/E Ratio2,3 | 12.0x | ||
| Weighted Average P/B Ratio2 | 1.8x | ||
| U.S. Investments (% of Net Assets) | 56.1% | ||
| Non-U.S. Investments (% of Net Assets) | 28.1% | ||
| Symbol | |||
| Service Class | RMVSX | ||
| 1 Geometric average | |||
| 2 Harmonic average | |||
3 The Fund’s P/E ratio calculation excludes companies with zero or negative earnings (3% of portfolio holdings as of 6/30/12). | |||
| MORNINGSTAR STATISTICAL MEASURES1 | |||
| RSV | Category Median | Best Quartile Breakpoint | |
| Sharpe Ratio | 0.61 | 0.90 | 1.01 |
| Standard Deviation | 21.57 | 19.38 | 18.17 |
1 Three years ended 6/30/12. Category Median and Best Quartile Breakpoint based on 403 mid-cap objective funds (oldest class only) with at least three years of history. | |||
| RISK/RETURN COMPARISON Three-Year Period Ended 6/30/12 | |||
| Average Annual Total Return | Standard Deviation | Return Efficiency1 | |
| RSV | 11.65% | 21.57 | 0.54 |
| Russell 2500 | 19.06 | 20.60 | 0.93 |
1 Return Efficiency is the average annual total return divided by the annualized standard deviation over a designated time period. Please read the prospectus for a more complete discussion of risk. | |||
| The Royce Funds 2012 Semiannual Report to Shareholders | 51 |
| MID-CAP | |||||||||
| Mid-Cap Funds generally invest in mid-cap companies with market capitalizations from $2.5 billion to $15 billion, or smid-cap companies with market caps from $750 million to $10 billion. | |||||||||
| |||||||||
| AVERAGE ANNUAL TOTAL RETURNS Through 6/30/12 | |||||||||
| Jan-June 20121 | -0.75 | % | |||||||
| One-Year | -13.19 | ||||||||
| Since Inception (12/31/09) | 3.79 | ||||||||
| ANNUAL EXPENSE RATIOS | |||||||||
| Gross Operating Expenses | 2.34 | % | |||||||
| Net Operating Expenses | 1.35 | ||||||||
| 1 Not annualized | |||||||||
| CALENDAR YEAR TOTAL RETURNS | |||||||||
| Year | RMM | Year | RMM | ||||||
| 2011 | -6.8 | % | 2010 | 18.6 | % | ||||
| TOP 10 POSITIONS % of Net Assets | |||||||||
| Analog Devices | 3.6 | % | |||||||
| Staples | 3.4 | ||||||||
| Reliance Steel & Aluminum | 3.2 | ||||||||
| Agrium | 3.1 | ||||||||
| LSI Corporation | 3.1 | ||||||||
| Allegheny Technologies | 3.1 | ||||||||
| Teradyne | 3.0 | ||||||||
| Affiliated Managers Group | 2.8 | ||||||||
| Western Digital | 2.7 | ||||||||
| Lam Research | 2.6 | ||||||||
| PORTFOLIO SECTOR BREAKDOWN % of Net Assets | |||||||||
| Materials | 19.0 | % | |||||||
| Information Technology | 18.7 | ||||||||
| Consumer Discretionary | 14.5 | ||||||||
| Financials | 11.2 | ||||||||
| Industrials | 10.8 | ||||||||
| Health Care | 10.8 | ||||||||
| Energy | 9.0 | ||||||||
| Miscellaneous | 0.5 | ||||||||
| Cash and Cash Equivalents | 5.5 | ||||||||
 |
Managers’ Discussion From a market standpoint, the first half of 2012 exhibited many of the same performance characteristics as the comparable periods in 2011 and 2010. Early gains gave way to yet another sharp correction as investors weighed the diminishing impact of the Fed’s Operation Twist launched in the second half of 2011 with renewed fears about the ever-present sovereign debt crisis in Europe and a sharp deceleration of growth in the world’s emerging economies, particularly China and Brazil. Royce Mid-Cap Fund (RMM) struggled on both and absolute and relative basis in this volatile environment for equities. RMM fell 0.8% for the year-to-date period ended June 30, 2012, trailing its benchmark, the Russell Midcap index, which rose 8.0% over the same period. RMM’s selection universe incorporates companies ranging from $2.5 billion to $15 billion in market capitalization. While above the threshold for the bulk of our Funds, investing in this segment allows our portfolio managers to extend the use of our institutional knowledge of companies as they grow out of our traditional capitalization range. This space also includes many larger-cap companies that have produced disappointing financial results or that have fallen out of favor with investors and seen a resulting drop in their market values, which often provided interesting opportunities for our contrarian and long-term approach to security selection. RMM largely kept pace in the dynamic first quarter of 2012, advancing 11.7%, compared to its mid-cap benchmark, which rose 12.9%. In the more challenging second quarter that experienced a meaningful correction in April and May followed by a modest rebound in June, RMM fell 11.2% versus a drop of 4.4% for the index. Spain and Italy joined the ranks of European countries seeking some sort of debt relief and then, for the third year in a row, investors took flight from equities. Mid-cap stocks finished the first half modestly trailing other asset classes in the year-to-date period, which was characterized by continued flows out of equities and into bonds. Now in its third year of operation, RMM is still working to catch up to its benchmark following a slow start in early 2010. |
GOOD IDEAS THAT WORKED | |||||||||||
| Agrium | 0.78% | ||||||||||
| CA | 0.60 | ||||||||||
| Chico’s FAS | 0.41 | ||||||||||
| Regal-Beloit | 0.34 | ||||||||||
| Biogen Idec | 0.34 | ||||||||||
| 1 Includes dividends | |||||||||||
Important Performance and Expense Information All performance information in this Report reflects past performance, is presented on a total return basis, reflects the reinvestment of distributions and does not reflect the deduction of taxes that a shareholder would pay on fund distributions or the redemption of fund shares. Past performance is no guarantee of future results. Investment return and principal value of an investment will fluctuate, so that shares may be worth more or less than their original cost when redeemed. Shares redeemed within 180 days of purchase may be subject to a 1% redemption fee payable to the Fund, which is not reflected in the performance shown above; if it were, performance would be lower. Current month-end performance may be higher or lower than performance quoted and may be obtained at www.roycefunds.com. Gross operating expenses reflect total gross annual operating expenses and include management fees, 12b-1 distribution and service fees and other expenses. Net operating expenses reflect contractual fee waivers and/or reimbursements. All expense information is reported as of the Fund’s most current prospectus. Royce & Associates has contractually agreed to waive its fees and/or reimburse operating expenses to the extent necessary to maintain the Fund’s net annual operating expense ratio at or below 1.35% through April 30, 2013 and 1.99% through April 30, 2022. Regarding the two “Good Ideas” tables shown above, the sum of all contributors to, and all detractors from, performance for all securities in the portfolio would approximate the Fund’s year-to-date performance for 2012. | |||||
| 52 | The Royce Funds 2012 Semiannual Report to Shareholders |
Performance and Portfolio Review Three of the Fund’s eight equity sectors generated positive performance for the first half of 2012, led by Health Care and Financials, which benefited from investors’ growing propensity for yield and earnings stability. Consumer Discretionary was the other positive contributor. Holdings in this sector saw net gains in part from strong underlying trends in the auto components industry. The most challenging sectors from a performance standpoint were those most negatively affected by the broad correction in commodity prices in the first half. The Energy sector was the biggest detractor, as both natural gas and oil prices dropped in reaction to a weakening global economy. Positions in the Materials sector also hurt the Fund in this period of falling inflationary expectations. A similar story was evident at the industry level, as results from the metals & mining group and the energy equipment & services industry hurt results. Net gains were achieved more broadly, with capital markets, chemicals, and software companies all contributing. Agrium was the leading individual gainer in RMM in the first half of 2012. The company is a global supplier of fertilizer products, such as nitrogen, potash, and phosphate, and also provides seeds and crop protection chemicals. Agrium has assembled a unique and valuable asset base that would be very challenging to replicate. The company benefited from broad-based demand in its end markets that lifted its stock and gave us increased confidence in our long-term thesis on its prospects. CA, a leading IT management software and solutions company, won favor early in the year with a new capital allocation plan that increased both the annual dividend payment and the share buyback program already in place at the company. While confident that CA will remain a defensible stock in a challenging economic environment, we used the strength to reduce our position. Allegheny Technologies held the top spot among positions that detracted from returns. This manufacturer of specialty metals and alloys with significant exposure to the aerospace industry struggled as demand for its products slowed due to economic challenges in Europe and China. Allegheny is also one of the few North American producers of stainless steel that saw a weaker pricing environment due to global overcapacity. We have long been attracted to Trican Well Service by its growing business, talented management, and pristine balance sheet. The company provides specialized equipment and services for drilling, completion, and reworking oil and gas wells. Although its stock price fell alongside its peers, we remain confident that an improved energy market will rekindle investor interest in this well-positioned company. After buying shares in February and April, we began reducing our position in flash memory storage device maker SanDisk in June. The company had looked poised to benefit from the proliferation of tablets and mobile devices, but increasing price declines in its industry—mostly the result of undisciplined competitors in its marketplace—have hampered recent results. | |||
GOOD IDEAS AT THE TIME | |
| Allegheny Technologies | -1.11% |
| Trican Well Service | -0.93 |
| SanDisk Corporation | -0.86 |
| Helmerich & Payne | -0.55 |
| Gardner Denver | -0.45 |
| 1 Net of dividends | |
| ROYCE MID-CAP FUND VS. RUSSELL MIDCAP Value of $10,000 Invested on 12/31/09 | |||
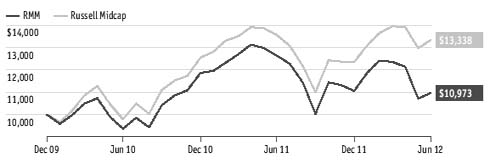 | |||
| Includes reinvestment of distributions. |
| PORTFOLIO DIAGNOSTICS | |||
| Fund Net Assets | $5 million | ||
| Number of Holdings | 53 | ||
| Turnover Rate | 26% | ||
| Average Market Capitalization1 | $4,926 million | ||
| Weighted Average P/E Ratio2,3 | 12.7x | ||
| Weighted Average P/B Ratio2 | 1.9x | ||
| U.S. Investments (% of Net Assets) | 72.3% | ||
| Non-U.S. Investments (% of Net Assets) | 22.2% | ||
| Symbol | |||
| Service Class | RMIDX | ||
| 1 Geometric average | |||
| 2 Harmonic average | |||
3 The Fund’s P/E ratio calculation excludes companies with zero or negative earnings (4% of portfolio holdings as of 6/30/12). | |||
| The Royce Funds 2012 Semiannual Report to Shareholders | 53 |
| Schedules of Investments |
| Royce Pennsylvania Mutual Fund |
| SHARES | VALUE | ||||||
| COMMON STOCKS – 98.1% | |||||||
| Consumer Discretionary – 15.3% | |||||||
| Auto Components - 1.6% | |||||||
China XD Plastics 1,2 | 231,300 | $ | 1,059,354 | ||||
Dorman Products 2 | 1,278,546 | 32,078,719 | |||||
Drew Industries 2 | 864,088 | 24,064,851 | |||||
Gentex Corporation | 43,000 | 897,410 | |||||
Spartan Motors | 109,000 | 571,160 | |||||
Strattec Security | 150,000 | 3,156,000 | |||||
Superior Industries International | 488,000 | 7,988,560 | |||||
WABCO Holdings 2 | 494,200 | 26,158,006 | |||||
| 95,974,060 | |||||||
| Automobiles - 0.6% | |||||||
Thor Industries | 658,750 | 18,056,338 | |||||
Winnebago Industries 2,3 | 1,504,450 | 15,330,345 | |||||
| 33,386,683 | |||||||
| Distributors - 0.5% | |||||||
LKQ Corporation 2 | 52,100 | 1,740,140 | |||||
Pool Corporation | 261,400 | 10,576,244 | |||||
Weyco Group 3 | 590,500 | 13,687,790 | |||||
| 26,004,174 | |||||||
| Diversified Consumer Services - 0.9% | |||||||
ChinaCast Education 2 | 116,043 | 75,428 | |||||
Corinthian Colleges 2 | 100,000 | 289,000 | |||||
Lincoln Educational Services | 288,000 | 1,872,000 | |||||
Sotheby’s | 1,210,608 | 40,385,883 | |||||
Steiner Leisure 2 | 16,594 | 770,128 | |||||
Universal Technical Institute | 824,114 | 11,133,780 | |||||
| 54,526,219 | |||||||
| Hotels, Restaurants & Leisure - 0.2% | |||||||
Benihana | 191,000 | 3,077,010 | |||||
CEC Entertainment | 140,600 | 5,113,622 | |||||
International Speedway Cl. A | 48,781 | 1,277,087 | |||||
| 9,467,719 | |||||||
| Household Durables - 2.5% | |||||||
Desarrolladora Homex ADR 1,2 | 292,400 | 4,502,960 | |||||
Ethan Allen Interiors 3 | 1,623,910 | 32,364,526 | |||||
Furniture Brands International 1,2 | 1,029,400 | 1,276,456 | |||||
Harman International Industries | 401,900 | 15,915,240 | |||||
La-Z-Boy 2 | 907,300 | 11,150,717 | |||||
Mohawk Industries 2 | 434,900 | 30,369,067 | |||||
Natuzzi ADR 2 | 2,096,300 | 5,094,009 | |||||
NVR 2 | 44,851 | 38,123,350 | |||||
Skullcandy 1,2 | 163,200 | 2,309,280 | |||||
Skyline Corporation 1,2 | 183,400 | 931,672 | |||||
Stanley Furniture 2,3 | 912,235 | 3,639,818 | |||||
| 145,677,095 | |||||||
| Internet & Catalog Retail - 0.0% | |||||||
NutriSystem | 65,100 | 752,556 | |||||
| Leisure Equipment & Products - 0.2% | |||||||
Callaway Golf | 250,000 | 1,477,500 | |||||
Leapfrog Enterprises Cl. A 2 | 122,800 | 1,259,928 | |||||
Polaris Industries | 129,000 | 9,220,920 | |||||
Sturm, Ruger & Co. | 35,850 | 1,439,377 | |||||
| 13,397,725 | |||||||
| Media - 1.2% | |||||||
† Acquity Group ADR 1,2 | 36,000 | 354,600 | |||||
DreamWorks Animation SKG Cl. A 1,2 | 746,800 | 14,234,008 | |||||
Global Sources 2 | 150,855 | 995,643 | |||||
Morningstar | 634,800 | 36,716,832 | |||||
Rentrak Corporation 2 | 64,746 | 1,337,005 | |||||
Scholastic Corporation | 393,000 | 11,066,880 | |||||
World Wrestling Entertainment Cl. A | 672,307 | 5,257,441 | |||||
| 69,962,409 | |||||||
| Multiline Retail - 0.0% | |||||||
Tuesday Morning 2 | 370,000 | 1,587,300 | |||||
| Specialty Retail - 5.2% | |||||||
American Eagle Outfitters | 1,077,591 | 21,260,871 | |||||
America’s Car-Mart 2,3 | 476,600 | 18,515,910 | |||||
Ascena Retail Group 2 | 2,194,474 | 40,861,106 | |||||
Buckle (The) | 733,942 | 29,042,085 | |||||
Cato Corporation (The) Cl. A | 1,400,802 | 42,668,429 | |||||
GameStop Corporation Cl. A | 1,071,000 | 19,663,560 | |||||
Guess? | 921,814 | 27,995,491 | |||||
Jos. A. Bank Clothiers 2 | 719,579 | 30,553,324 | |||||
Le Chateau Cl. A 2 | 886,300 | 1,044,652 | |||||
Men’s Wearhouse (The) | 219,467 | 6,175,801 | |||||
Penske Automotive Group | 389,200 | 8,266,608 | |||||
Pier 1 Imports | 1,210,400 | 19,886,872 | |||||
Shoe Carnival 3 | 1,311,398 | 28,181,943 | |||||
Stein Mart 2 | 742,152 | 5,900,108 | |||||
Urban Outfitters 2 | 150,000 | 4,138,500 | |||||
Wet Seal (The) Cl. A 2 | 385,000 | 1,216,600 | |||||
| 305,371,860 | |||||||
| Textiles, Apparel & Luxury Goods - 2.4% | |||||||
Barry (R.G.) | 198,969 | 2,703,989 | |||||
Carter’s 2 | 153,300 | 8,063,580 | |||||
Columbia Sportswear | 375,261 | 20,121,495 | |||||
Deckers Outdoor 1,2 | 113,900 | 5,012,739 | |||||
G-III Apparel Group 2 | 650,623 | 15,413,259 | |||||
Gildan Activewear | 239,000 | 6,577,280 | |||||
K-Swiss Cl. A 1,2 | 654,450 | 2,015,706 | |||||
Maidenform Brands 2 | 969,807 | 19,318,555 | |||||
Movado Group | 50,000 | 1,251,000 | |||||
Steven Madden 2 | 466,106 | 14,798,865 | |||||
True Religion Apparel | 416,100 | 12,058,578 | |||||
† Vera Bradley 1,2 | 237,300 | 5,002,284 | |||||
Warnaco Group (The) 2 | 500,500 | 21,311,290 | |||||
Wolverine World Wide | 155,700 | 6,038,046 | |||||
| 139,686,666 | |||||||
| Total (Cost $759,761,684) | 895,794,466 | ||||||
| Consumer Staples – 1.7% | |||||||
| Food & Staples Retailing - 0.0% | |||||||
Village Super Market Cl. A | 57,809 | 1,883,417 | |||||
| 54 | The Royce Funds 2012 Semiannual Report to Shareholders | THE ACCOMPANYING NOTES ARE AN INTEGRAL PART OF THESE FINANCIAL STATEMENTS. |
| June 30, 2012 (unaudited) |
| SHARES | VALUE | ||||||
| Consumer Staples (continued) | |||||||
| Food Products - 0.6% | |||||||
Calavo Growers | 43,700 | $ | 1,117,846 | ||||
Cal-Maine Foods | 252,321 | 9,865,751 | |||||
Darling International 2 | 20,000 | 329,800 | |||||
Industrias Bachoco ADR | 103,886 | 2,280,298 | |||||
Sanderson Farms | 366,900 | 16,811,358 | |||||
Westway Group | 368,500 | 2,207,315 | |||||
| 32,612,368 | |||||||
| Household Products - 0.1% | |||||||
Harbinger Group 1,2 | 1,009,600 | 7,864,784 | |||||
| Personal Products - 1.0% | |||||||
Inter Parfums | 1,246,871 | 21,533,462 | |||||
Nu Skin Enterprises Cl. A | 625,400 | 29,331,260 | |||||
Nutraceutical International 2 | 312,500 | 4,765,625 | |||||
Schiff Nutrition International Cl. A 2 | 43,385 | 778,761 | |||||
| 56,409,108 | |||||||
| Total (Cost $66,232,706) | 98,769,677 | ||||||
| Energy – 7.0% | |||||||
| Energy Equipment & Services - 6.0% | |||||||
Atwood Oceanics 2 | 243,788 | 9,224,938 | |||||
† C&J Energy Services 1,2 | 301,177 | 5,571,774 | |||||
CARBO Ceramics | 277,300 | 21,277,229 | |||||
Ensign Energy Services | 1,710,100 | 23,515,765 | |||||
Exterran Holdings 1,2 | 951,700 | 12,134,175 | |||||
Geodrill 2 | 497,300 | 1,050,187 | |||||
Helmerich & Payne | 1,150,739 | 50,034,132 | |||||
ION Geophysical 2 | 816,700 | 5,382,053 | |||||
Lufkin Industries | 167,600 | 9,104,032 | |||||
Matrix Service 2 | 1,298,343 | 14,736,193 | |||||
Oil States International 2 | 704,415 | 46,632,273 | |||||
Pason Systems | 2,300,100 | 33,617,019 | |||||
Patterson-UTI Energy | 419,800 | 6,112,288 | |||||
Rowan Companies 2 | 14,000 | 452,620 | |||||
RPC | 1,280,475 | 15,224,848 | |||||
SEACOR Holdings 2 | 267,200 | 23,882,336 | |||||
ShawCor Cl. A | 280,800 | 10,163,520 | |||||
Tidewater | 51,000 | 2,364,360 | |||||
Trican Well Service | 1,442,700 | 16,650,354 | |||||
Unit Corporation 2 | 1,064,643 | 39,274,680 | |||||
Willbros Group 2 | 230,800 | 1,490,968 | |||||
| 347,895,744 | |||||||
| Oil, Gas & Consumable Fuels - 1.0% | |||||||
Cimarex Energy | 405,508 | 22,351,601 | |||||
Energen Corporation | 269,698 | 12,171,471 | |||||
Gastar Exploration 2 | 175,000 | 337,750 | |||||
SM Energy | 229,100 | 11,251,101 | |||||
Sprott Resource 2 | 2,957,400 | 11,532,144 | |||||
VAALCO Energy 2 | 239,600 | 2,067,748 | |||||
| 59,711,815 | |||||||
| Total (Cost $295,071,616) | 407,607,559 | ||||||
| Financials – 11.3% | |||||||
| Capital Markets - 5.3% | |||||||
Affiliated Managers Group 2 | 264,265 | 28,923,804 | |||||
AGF Management Cl. B | 846,600 | 9,363,241 | |||||
AllianceBernstein Holding L.P. | 1,595,850 | 20,251,336 | |||||
Artio Global Investors Cl. A | 1,397,300 | 4,890,550 | |||||
Cohen & Steers | 949,970 | 32,783,465 | |||||
Cowen Group Cl. A 2 | 2,152,377 | 5,725,323 | |||||
Diamond Hill Investment Group | 85,021 | 6,656,294 | |||||
Duff & Phelps Cl. A | 90,000 | 1,305,000 | |||||
Edelman Financial Group (The) | 319,476 | 2,779,441 | |||||
FBR & Co. 2 | 8,005 | 22,174 | |||||
Federated Investors Cl. B | 1,995,655 | 43,605,062 | |||||
† Financial Engines 1,2 | 97,000 | 2,080,650 | |||||
GAMCO Investors Cl. A | 145,200 | 6,445,428 | |||||
GFI Group | 580,000 | 2,064,800 | |||||
INTL FCStone 2 | 83,617 | 1,617,989 | |||||
Janus Capital Group | 650,000 | 5,083,000 | |||||
Jefferies Group | 985,200 | 12,797,748 | |||||
Knight Capital Group Cl. A 2 | 392,148 | 4,682,247 | |||||
Lazard Cl. A | 1,048,300 | 27,245,317 | |||||
Manning & Napier | 677,292 | 9,637,865 | |||||
MVC Capital | 223,600 | 2,895,620 | |||||
Oppenheimer Holdings Cl. A | 25,000 | 393,000 | |||||
SEI Investments | 1,955,800 | 38,900,862 | |||||
Sprott | 403,900 | 1,963,761 | |||||
Waddell & Reed Financial Cl. A | 862,027 | 26,102,178 | |||||
Westwood Holdings Group | 359,735 | 13,403,726 | |||||
| 311,619,881 | |||||||
| Commercial Banks - 0.1% | |||||||
City Holding Company | 255,459 | 8,606,414 | |||||
| Consumer Finance - 0.1% | |||||||
World Acceptance 2 | 50,000 | 3,290,000 | |||||
| Diversified Financial Services - 0.6% | |||||||
Interactive Brokers Group | 788,600 | 11,608,192 | |||||
Leucadia National | 300,000 | 6,381,000 | |||||
MSCI Cl. A 2 | 229,500 | 7,807,590 | |||||
PICO Holdings 2 | 487,400 | 10,922,634 | |||||
| 36,719,416 | |||||||
| Insurance - 4.5% | |||||||
Alleghany Corporation 2 | 13,600 | 4,620,600 | |||||
Allied World Assurance Company Holdings | 223,310 | 17,746,446 | |||||
Alterra Capital Holdings | 457,431 | 10,681,014 | |||||
Aspen Insurance Holdings | 597,973 | 17,281,420 | |||||
Baldwin & Lyons Cl. B | 306,000 | 7,111,440 | |||||
Brown & Brown | 806,300 | 21,987,801 | |||||
E-L Financial | 40,980 | 16,704,351 | |||||
Enstar Group 2 | 158,300 | 15,662,202 | |||||
Erie Indemnity Cl. A | 416,880 | 29,852,777 | |||||
Fidelity National Financial Cl. A | 545,000 | 10,496,700 | |||||
Gallagher (Arthur J.) & Co. | 611,100 | 21,431,277 | |||||
Greenlight Capital Re Cl. A 2 | 308,500 | 7,842,070 | |||||
HCC Insurance Holdings | 77,403 | 2,430,454 | |||||
Meadowbrook Insurance Group | 1,123,211 | 9,873,025 | |||||
Montpelier Re Holdings | 153,668 | 3,271,592 | |||||
ProAssurance Corporation | 276,154 | 24,602,560 | |||||
Reinsurance Group of America | 523,905 | 27,876,985 | |||||
| THE ACCOMPANYING NOTES ARE AN INTEGRAL PART OF THESE FINANCIAL STATEMENTS. | The Royce Funds 2012 Semiannual Report to Shareholders | 55 |
| Schedules of Investments |
| Royce Pennsylvania Mutual Fund (continued) |
| SHARES | VALUE | ||||||
| Financials (continued) | |||||||
| Insurance (continued) | |||||||
RLI | 65,231 | $ | 4,448,754 | ||||
StanCorp Financial Group | 172,004 | 6,391,668 | |||||
Stewart Information Services | 116,600 | 1,789,810 | |||||
Validus Holdings | 25,756 | 824,964 | |||||
| 262,927,910 | |||||||
| Real Estate Management & Development - 0.5% | |||||||
E-House China Holdings ADR | 304,200 | 1,673,100 | |||||
Forestar Group 2 | 50,000 | 640,500 | |||||
Jones Lang LaSalle | 322,000 | 22,659,140 | |||||
Tejon Ranch 2 | 111,624 | 3,194,679 | |||||
| 28,167,419 | |||||||
| Thrifts & Mortgage Finance - 0.2% | |||||||
BofI Holding 2 | 112,100 | 2,215,096 | |||||
Doral Financial 2 | 214,600 | 321,900 | |||||
Genworth MI Canada | 561,700 | 10,173,606 | |||||
| 12,710,602 | |||||||
| Total (Cost $667,794,311) | 664,041,642 | ||||||
| Health Care – 7.3% | |||||||
| Biotechnology - 0.1% | |||||||
Emergent Biosolutions 2 | 10,000 | 151,500 | |||||
Lexicon Pharmaceuticals 1,2 | 1,522,400 | 3,425,400 | |||||
Myriad Genetics 2 | 37,000 | 879,490 | |||||
3SBio ADR 1,2 | 82,200 | 1,122,030 | |||||
| 5,578,420 | |||||||
| Health Care Equipment & Supplies - 1.8% | |||||||
CryoLife 2 | 124,427 | 650,753 | |||||
Exactech 2 | 115,900 | 1,943,643 | |||||
Hill-Rom Holdings | 24,500 | 755,825 | |||||
ICU Medical 2 | 25,376 | 1,354,571 | |||||
IDEXX Laboratories 1,2 | 504,099 | 48,459,037 | |||||
Invacare Corporation | 136,800 | 2,110,824 | |||||
Medical Action Industries 2 | 304,262 | 1,058,832 | |||||
Merit Medical Systems 2 | 534,586 | 7,382,633 | |||||
STERIS Corporation | 577,600 | 18,119,312 | |||||
SurModics 2 | 346,900 | 6,001,370 | |||||
Teleflex | 60,000 | 3,654,600 | |||||
Thoratec Corporation 2 | 366,600 | 12,310,428 | |||||
Young Innovations | 111,350 | 3,840,461 | |||||
| 107,642,289 | |||||||
| Health Care Providers & Services - 2.8% | |||||||
Almost Family 1,2 | 34,147 | 762,844 | |||||
Chemed Corporation | 453,887 | 27,432,930 | |||||
Cross Country Healthcare 2 | 240,700 | 1,051,859 | |||||
HealthSouth Corporation 2 | 915,000 | 21,282,900 | |||||
Hooper Holmes 2 | 2,392,970 | 1,368,061 | |||||
Landauer | 291,424 | 16,707,338 | |||||
Lincare Holdings | 498,750 | 16,967,475 | |||||
Magellan Health Services 2 | 253,222 | 11,478,553 | |||||
MEDNAX 2 | 353,602 | 24,235,881 | |||||
Owens & Minor | 654,000 | 20,032,020 | |||||
U.S. Physical Therapy 3 | 813,706 | 20,692,544 | |||||
VCA Antech 2 | 48,683 | 1,070,052 | |||||
| 163,082,457 | |||||||
| Life Sciences Tools & Services - 2.0% | |||||||
Bio-Rad Laboratories Cl. A 2 | 90,512 | 9,052,105 | |||||
Covance 2 | 340,000 | 16,269,000 | |||||
Furiex Pharmaceuticals 2 | 43,625 | 913,944 | |||||
ICON ADR 2 | 511,123 | 11,515,601 | |||||
Mettler-Toledo International 2 | 206,200 | 32,136,270 | |||||
PAREXEL International 2 | 270,000 | 7,622,100 | |||||
PerkinElmer | 1,018,020 | 26,264,916 | |||||
Techne Corporation | 174,300 | 12,933,060 | |||||
| 116,706,996 | |||||||
| Pharmaceuticals - 0.6% | |||||||
Endo Health Solutions 2 | 307,500 | 9,526,350 | |||||
Hi-Tech Pharmacal 2 | 530,400 | 17,184,960 | |||||
Obagi Medical Products 2 | 634,535 | 9,689,350 | |||||
| 36,400,660 | |||||||
| Total (Cost $327,455,160) | 429,410,822 | ||||||
| Industrials – 25.5% | |||||||
| Aerospace & Defense - 1.8% | |||||||
Astronics Corporation 2 | 65,883 | 1,860,536 | |||||
Ceradyne | 75,000 | 1,923,750 | |||||
CPI Aerostructures 2 | 99,665 | 1,096,315 | |||||
Cubic Corporation | 446,587 | 21,471,903 | |||||
Curtiss-Wright | 255,620 | 7,937,001 | |||||
HEICO Corporation | 975,428 | 38,548,915 | |||||
HEICO Corporation Cl. A | 151,952 | 4,901,972 | |||||
Kratos Defense & Security Solutions 1,2 | 95,578 | 558,175 | |||||
Teledyne Technologies 2 | 437,494 | 26,971,505 | |||||
| 105,270,072 | |||||||
| Air Freight & Logistics - 1.0% | |||||||
Forward Air | 869,900 | 28,071,673 | |||||
Hub Group Cl. A 2 | 247,500 | 8,959,500 | |||||
Pacer International 2 | 792,040 | 4,292,857 | |||||
UTi Worldwide | 1,279,900 | 18,699,339 | |||||
| 60,023,369 | |||||||
| Airlines - 0.0% | |||||||
Spirit Airlines 2 | 63,800 | 1,241,548 | |||||
| Building Products - 2.1% | |||||||
AAON | 1,150,650 | 21,689,753 | |||||
Ameresco Cl. A 2 | 173,700 | 2,072,241 | |||||
American Woodmark 2 | 645,774 | 11,042,735 | |||||
Apogee Enterprises | 114,569 | 1,841,124 | |||||
Armstrong World Industries | 379,300 | 18,646,388 | |||||
Gibraltar Industries 2 | 615,120 | 6,384,946 | |||||
Insteel Industries | 233,708 | 2,605,844 | |||||
Owens Corning 2 | 850,700 | 24,278,978 | |||||
Quanex Building Products | 30,000 | 536,400 | |||||
Simpson Manufacturing | 984,600 | 29,055,546 | |||||
WaterFurnace Renewable Energy | 110,900 | 1,770,086 | |||||
| 119,924,041 | |||||||
| 56 | The Royce Funds 2012 Semiannual Report to Shareholders | THE ACCOMPANYING NOTES ARE AN INTEGRAL PART OF THESE FINANCIAL STATEMENTS. |
| June 30, 2012 (unaudited) |
| SHARES | VALUE | ||||||
| Industrials (continued) | |||||||
| Commercial Services & Supplies - 2.8% | |||||||
Brink’s Company (The) | 1,277,085 | $ | 29,602,830 | ||||
Cintas Corporation | 531,100 | 20,505,771 | |||||
Copart 2 | 1,260,012 | 29,849,684 | |||||
Healthcare Services Group | 652,275 | 12,641,090 | |||||
Mine Safety Appliances | 332,100 | 13,363,704 | |||||
Ritchie Bros. Auctioneers | 1,726,900 | 36,696,625 | |||||
Steelcase Cl. A | 100,000 | 903,000 | |||||
Team 2 | 320,490 | 9,992,878 | |||||
Tetra Tech 2 | 141,300 | 3,685,104 | |||||
TMS International Cl. A 2 | 204,500 | 2,038,865 | |||||
Viad Corporation | 203,666 | 4,073,320 | |||||
| 163,352,871 | |||||||
| Construction & Engineering - 1.4% | |||||||
Baker (Michael) 2 | 163,100 | 4,255,279 | |||||
Chicago Bridge & Iron | 23,000 | 873,080 | |||||
Comfort Systems USA | 619,484 | 6,207,230 | |||||
EMCOR Group | 1,131,840 | 31,487,789 | |||||
Jacobs Engineering Group 2 | 95,500 | 3,615,630 | |||||
KBR | 1,030,300 | 25,458,713 | |||||
Layne Christensen 1,2 | 141,300 | 2,923,497 | |||||
Pike Electric 2 | 237,915 | 1,836,704 | |||||
Sterling Construction 2 | 274,671 | 2,807,137 | |||||
| 79,465,059 | |||||||
| Electrical Equipment - 2.5% | |||||||
AZZ | 408,044 | 24,996,775 | |||||
Brady Corporation Cl. A | 481,900 | 13,257,069 | |||||
Encore Wire | 361,579 | 9,683,086 | |||||
EnerSys 2 | 53,000 | 1,858,710 | |||||
Franklin Electric | 636,500 | 32,544,245 | |||||
Fushi Copperweld 2 | 193,204 | 1,678,943 | |||||
Global Power Equipment Group | 545,205 | 11,907,277 | |||||
GrafTech International 2 | 2,158,206 | 20,826,688 | |||||
Hubbell Cl. B | 10,500 | 818,370 | |||||
Jinpan International 1 | 161,183 | 1,308,806 | |||||
Powell Industries 2 | 345,000 | 12,889,200 | |||||
Preformed Line Products 3 | 291,088 | 16,856,906 | |||||
| 148,626,075 | |||||||
| Industrial Conglomerates - 0.5% | |||||||
Raven Industries | 407,135 | 28,332,525 | |||||
| Machinery - 7.5% | |||||||
Astec Industries 2 | 36,024 | 1,105,216 | |||||
Briggs & Stratton | 252,600 | 4,417,974 | |||||
Cascade Corporation | 255,608 | 12,026,356 | |||||
Chart Industries 2 | 19,500 | 1,340,820 | |||||
CLARCOR | 625,400 | 30,119,264 | |||||
Columbus McKinnon 2 | 294,550 | 4,444,759 | |||||
Crane Company | 37,500 | 1,364,250 | |||||
Donaldson Company | 867,000 | 28,931,790 | |||||
Foster (L.B.) Company | 126,598 | 3,621,969 | |||||
FreightCar America | 37,100 | 852,187 | |||||
Gardner Denver | 107,000 | 5,661,370 | |||||
Gorman-Rupp Company | 49,733 | 1,482,043 | |||||
Graco | 605,449 | 27,899,090 | |||||
Graham Corporation | 106,248 | 1,978,338 | |||||
Hurco Companies 2 | 30,552 | 626,010 | |||||
IDEX Corporation | 343,500 | 13,389,630 | |||||
Industrea | 1,383,635 | 1,824,818 | |||||
Kaydon Corporation | 148,400 | 3,174,276 | |||||
Kennametal | 1,739,454 | 57,662,900 | |||||
Lincoln Electric Holdings | 904,360 | 39,601,924 | |||||
Lindsay Corporation | 10,300 | 668,470 | |||||
Miller Industries | 82,735 | 1,317,969 | |||||
Nordson Corporation | 944,064 | 48,421,043 | |||||
† Proto Labs 1,2 | 25,000 | 719,000 | |||||
RBC Bearings 2 | 459,400 | 21,729,620 | |||||
Robbins & Myers | 261,586 | 10,939,527 | |||||
Sun Hydraulics | 545,900 | 13,259,911 | |||||
Tennant Company | 764,500 | 30,541,775 | |||||
Valmont Industries | 354,700 | 42,908,059 | |||||
Wabtec Corporation | 294,170 | 22,948,202 | |||||
| 434,978,560 | |||||||
| Marine - 0.2% | |||||||
Kirby Corporation 2 | 213,700 | 10,060,996 | |||||
| Professional Services - 3.3% | |||||||
Advisory Board (The) 2 | 1,346,758 | 66,785,729 | |||||
Barrett Business Services | 160,800 | 3,399,312 | |||||
Corporate Executive Board | 619,700 | 25,333,336 | |||||
CRA International 2,3 | 592,143 | 8,698,581 | |||||
Equifax | 17,356 | 808,790 | |||||
Exponent 2 | 373,893 | 19,752,767 | |||||
FTI Consulting 2 | 186,600 | 5,364,750 | |||||
GP Strategies 2 | 107,815 | 1,991,343 | |||||
Korn/Ferry International 2 | 50,000 | 717,500 | |||||
ManpowerGroup | 471,230 | 17,270,579 | |||||
On Assignment 2 | 85,000 | 1,356,600 | |||||
Robert Half International | 521,500 | 14,899,255 | |||||
Towers Watson & Company Cl. A | 367,700 | 22,025,230 | |||||
TrueBlue 2 | 273,200 | 4,229,136 | |||||
| 192,632,908 | |||||||
| Road & Rail - 0.9% | |||||||
Arkansas Best | 486,600 | 6,131,160 | |||||
Landstar System | 593,500 | 30,695,820 | |||||
Patriot Transportation Holding 2 | 254,400 | 5,986,032 | |||||
Universal Truckload Services | 769,643 | 11,640,850 | |||||
| 54,453,862 | |||||||
| Trading Companies & Distributors - 1.3% | |||||||
Air Lease Cl. A 1,2 | 568,800 | 11,029,032 | |||||
Applied Industrial Technologies | 990,610 | 36,503,978 | |||||
Houston Wire & Cable | 22,700 | 248,111 | |||||
MFC Industrial | 72,600 | 489,324 | |||||
MSC Industrial Direct Cl. A | 433,500 | 28,415,925 | |||||
| 76,686,370 | |||||||
| Transportation Infrastructure - 0.2% | |||||||
Wesco Aircraft Holdings 1,2 | 1,068,787 | 13,605,659 | |||||
Total (Cost $1,110,326,075) | 1,488,653,915 | ||||||
| THE ACCOMPANYING NOTES ARE AN INTEGRAL PART OF THESE FINANCIAL STATEMENTS. | The Royce Funds 2012 Semiannual Report to Shareholders | 57 |
| Schedules of Investments |
| Royce Pennsylvania Mutual Fund (continued) |
| SHARES | VALUE | ||||||
| Information Technology – 20.9% | |||||||
| Communications Equipment - 1.7% | |||||||
ADTRAN | 1,050,315 | $ | 31,709,010 | ||||
Black Box | 317,502 | 9,112,307 | |||||
Cogo Group 1,2 | 127,841 | 225,000 | |||||
Digi International 2 | 388,644 | 3,979,715 | |||||
Finisar Corporation 2 | 54,000 | 807,840 | |||||
Globecomm Systems 2 | 107,300 | 1,088,022 | |||||
Harmonic 2 | 150,000 | 639,000 | |||||
NETGEAR 2 | 1,120,992 | 38,685,434 | |||||
Oplink Communications 2 | 126,700 | 1,714,251 | |||||
Plantronics | 393,121 | 13,130,241 | |||||
| 101,090,820 | |||||||
| Computers & Peripherals - 1.3% | |||||||
Diebold | 701,000 | 25,873,910 | |||||
Lexmark International Cl. A | 349,000 | 9,276,420 | |||||
Logitech International 1,2 | 1,287,100 | 13,733,357 | |||||
Rimage Corporation | 153,000 | 1,224,000 | |||||
Stratasys 1,2 | 289,335 | 14,336,549 | |||||
Super Micro Computer 2 | 501,851 | 7,959,357 | |||||
| 72,403,593 | |||||||
| Electronic Equipment, Instruments & Components - 7.7% | |||||||
Anixter International | 316,264 | 16,777,805 | |||||
AVX Corporation | 1,577,821 | 16,866,907 | |||||
Benchmark Electronics 2 | 900,000 | 12,555,000 | |||||
Celestica 2 | 263,000 | 1,909,380 | |||||
Checkpoint Systems 2 | 132,700 | 1,155,817 | |||||
Cognex Corporation | 888,835 | 28,131,628 | |||||
Coherent 2 | 772,600 | 33,453,580 | |||||
Dolby Laboratories Cl. A 2 | 931,250 | 38,460,625 | |||||
DTS 2 | 567,192 | 14,792,367 | |||||
Electro Rent | 77,074 | 1,250,911 | |||||
Fabrinet 2 | 1,231,211 | 15,451,698 | |||||
FARO Technologies 2 | 283,700 | 11,938,096 | |||||
FEI Company 2 | 33,650 | 1,609,816 | |||||
FLIR Systems | 831,400 | 16,212,300 | |||||
Frequency Electronics 2 | 95,400 | 770,832 | |||||
Hollysys Automation Technologies 2 | 275,755 | 2,349,433 | |||||
IPG Photonics 1,2 | 953,130 | 41,546,937 | |||||
Littelfuse | 256,538 | 14,594,447 | |||||
† LRAD Corporation 1,2 | 214,944 | 255,783 | |||||
Mercury Computer Systems 2 | 183,944 | 2,378,396 | |||||
Molex | 10,400 | 248,976 | |||||
Molex Cl. A | 674,788 | 13,650,961 | |||||
MTS Systems | 217,874 | 8,399,043 | |||||
Multi-Fineline Electronix 2 | 178,778 | 4,405,090 | |||||
Nam Tai Electronics | 311,397 | 1,812,331 | |||||
National Instruments | 1,388,700 | 37,300,482 | |||||
Newport Corporation 2 | 1,186,722 | 14,264,398 | |||||
Park Electrochemical | 70,200 | 1,816,776 | |||||
Plexus Corporation 2 | 788,200 | 22,227,240 | |||||
Pulse Electronics 1,2,3 | 2,231,739 | 4,396,526 | |||||
Rofin-Sinar Technologies 1,2 | 1,412,780 | 26,743,925 | |||||
Rogers Corporation 2 | 20,000 | 792,200 | |||||
Tech Data 1,2 | 473,391 | 22,803,244 | |||||
TTM Technologies 2 | 300,000 | 2,823,000 | |||||
Vishay Intertechnology 2 | 1,590,109 | 14,994,728 | |||||
Vishay Precision Group 2 | 62,958 | 878,264 | |||||
| 450,018,942 | |||||||
| Internet Software & Services - 0.2% | |||||||
Active Network 1,2 | 128,500 | 1,977,615 | |||||
† KIT digital 1,2 | 600,000 | 2,574,000 | |||||
Stamps.com 2 | 13,300 | 328,111 | |||||
ValueClick 2 | 206,645 | 3,386,912 | |||||
| 8,266,638 | |||||||
| IT Services - 3.0% | |||||||
Booz Allen Hamilton Holding Corporation Cl. A | 438,795 | 6,704,787 | |||||
Convergys Corporation | 667,845 | 9,864,071 | |||||
CoreLogic 2 | 169,000 | 3,094,390 | |||||
Dynamics Research 2 | 271,431 | 1,577,014 | |||||
Forrester Research | 298,200 | 10,097,052 | |||||
Gartner 2 | 704,000 | 30,307,200 | |||||
ManTech International Cl. A | 967,670 | 22,711,215 | |||||
MAXIMUS | 366,600 | 18,971,550 | |||||
MoneyGram International 2 | 1,207,239 | 17,625,689 | |||||
Sapient Corporation | 1,980,000 | 19,938,600 | |||||
† ServiceSource International 1,2 | 385,761 | 5,342,790 | |||||
Syntel | 358,200 | 21,742,740 | |||||
Total System Services | 389,400 | 9,318,342 | |||||
| 177,295,440 | |||||||
| Office Electronics - 0.0% | |||||||
Zebra Technologies Cl. A 2 | 58,700 | 2,016,932 | |||||
| Semiconductors & Semiconductor Equipment - 4.6% | |||||||
Advanced Energy Industries 2 | 211,400 | 2,836,988 | |||||
Aixtron ADR | 277,600 | 3,972,456 | |||||
Alpha & Omega Semiconductor 2 | 163,200 | 1,493,280 | |||||
Amtech Systems 1,2 | 234,800 | 882,848 | |||||
ATMI 2 | 101,485 | 2,087,546 | |||||
AXT 2 | 128,400 | 507,180 | |||||
BCD Semiconductor Manufacturing ADR 2 | 408,256 | 1,759,583 | |||||
Cabot Microelectronics | 237,376 | 6,933,753 | |||||
Cirrus Logic 2 | 1,501,900 | 44,876,772 | |||||
Cymer 2 | 227,319 | 13,400,455 | |||||
Diodes 2 | 1,333,700 | 25,033,549 | |||||
Exar Corporation 2 | 824,441 | 6,727,439 | |||||
Fairchild Semiconductor International 2 | 1,205,300 | 16,994,730 | |||||
GSI Technology 2 | 834,252 | 3,954,355 | |||||
Integrated Device Technology 2 | 300,000 | 1,686,000 | |||||
Integrated Silicon Solution 2 | 856,215 | 8,639,209 | |||||
International Rectifier 2 | 870,800 | 17,407,292 | |||||
IXYS Corporation 2 | 1,163,253 | 12,993,536 | |||||
LTX-Credence Corporation 2 | 182,800 | 1,224,760 | |||||
Micrel | 1,080,800 | 10,300,024 | |||||
MKS Instruments | 870,386 | 25,180,267 | |||||
Nanometrics 1,2 | 274,671 | 4,218,947 | |||||
O2Micro International ADR 2 | 205,000 | 904,050 | |||||
OmniVision Technologies 2 | 301,700 | 4,030,712 | |||||
Photronics 2 | 439,160 | 2,678,876 | |||||
RDA Microelectronics ADR 2 | 237,633 | 2,385,835 | |||||
| 58 | The Royce Funds 2012 Semiannual Report to Shareholders | THE ACCOMPANYING NOTES ARE AN INTEGRAL PART OF THESE FINANCIAL STATEMENTS. |
| June 30, 2012 (unaudited) |
| SHARES | VALUE | ||||||
| Information Technology (continued) | |||||||
| Semiconductors & Semiconductor Equipment (continued) | |||||||
Rudolph Technologies 2 | 89,422 | $ | 779,760 | ||||
† Silicon Motion Technology ADR 1,2 | 89,600 | 1,264,256 | |||||
Supertex 2 | 334,000 | 6,295,900 | |||||
Teradyne 2 | 1,760,296 | 24,749,762 | |||||
Ultra Clean Holdings 2 | 898,640 | 5,778,255 | |||||
Veeco Instruments 1,2 | 137,000 | 4,707,320 | |||||
| 266,685,695 | |||||||
| Software - 2.4% | |||||||
ACI Worldwide 2 | 427,600 | 18,904,196 | |||||
Actuate Corporation 2 | 263,100 | 1,823,283 | |||||
American Software Cl. A | 159,084 | 1,264,718 | |||||
ANSYS 2 | 603,400 | 38,080,574 | |||||
Blackbaud | 689,291 | 17,694,100 | |||||
FactSet Research Systems | 110,900 | 10,307,046 | |||||
Fair Isaac | 506,900 | 21,431,732 | |||||
Manhattan Associates 2 | 440,000 | 20,112,400 | |||||
NetScout Systems 2 | 47,573 | 1,027,101 | |||||
Pervasive Software 2,3 | 1,461,500 | 10,946,635 | |||||
| 141,591,785 | |||||||
| Total (Cost $1,075,481,157) | 1,219,369,845 | ||||||
| Materials – 8.0% | |||||||
Chemicals - 2.5% | |||||||
Balchem Corporation | 305,000 | 9,946,050 | |||||
Cabot Corporation | 478,300 | 19,466,810 | |||||
Hawkins | 29,617 | 1,130,777 | |||||
Innospec 2 | 855,906 | 25,343,377 | |||||
Intrepid Potash 2 | 1,051,106 | 23,923,173 | |||||
KMG Chemicals | 86,089 | 1,659,796 | |||||
LSB Industries 2 | 271,900 | 8,404,429 | |||||
Minerals Technologies | 125,016 | 7,973,520 | |||||
Olin Corporation | 34,800 | 726,972 | |||||
OM Group 2 | 46,700 | 887,300 | |||||
Quaker Chemical | 312,546 | 14,442,751 | |||||
Schulman (A.) | 269,690 | 5,353,346 | |||||
Sensient Technologies | 50,000 | 1,836,500 | |||||
Stepan Company | 69,000 | 6,498,420 | |||||
Westlake Chemical | 391,000 | 20,433,660 | |||||
| 148,026,881 | |||||||
| Construction Materials - 0.1% | |||||||
Ash Grove Cement 4 | 50,018 | 6,752,430 | |||||
| Containers & Packaging - 0.7% | |||||||
AptarGroup | 221,700 | 11,317,785 | |||||
Greif Cl. A | 572,088 | 23,455,608 | |||||
UFP Technologies 2 | 209,297 | 3,537,119 | |||||
| 38,310,512 | |||||||
| Metals & Mining - 4.4% | |||||||
Agnico-Eagle Mines | 329,000 | 13,311,340 | |||||
Allegheny Technologies | 284,700 | 9,079,083 | |||||
Allied Nevada Gold 2 | 178,000 | 5,051,640 | |||||
Carpenter Technology | 117,500 | 5,621,200 | |||||
Centamin 2 | 450,000 | 495,040 | |||||
Commercial Metals | 238,700 | 3,017,168 | |||||
Compass Minerals International | 200,526 | 15,296,123 | |||||
Eldorado Gold | 1,511,500 | 18,621,680 | |||||
Franco-Nevada Corporation | 300,000 | 13,560,000 | |||||
Globe Specialty Metals | 916,803 | 12,312,664 | |||||
Haynes International | 216,600 | 11,033,604 | |||||
Hecla Mining | 2,044,100 | 9,709,475 | |||||
Hochschild Mining | 351,100 | 2,590,469 | |||||
Horsehead Holding Corporation 2 | 633,100 | 6,305,676 | |||||
Kingsrose Mining | 100,000 | 118,131 | |||||
Major Drilling Group International | 997,700 | 11,534,160 | |||||
Olympic Steel | 129,000 | 2,118,180 | |||||
Pan American Silver | 851,100 | 14,375,079 | |||||
Randgold Resources ADR | 106,700 | 9,604,067 | |||||
Reliance Steel & Aluminum | 726,700 | 36,698,350 | |||||
Richmont Mines 2 | 236,400 | 1,094,532 | |||||
Schnitzer Steel Industries Cl. A | 372,410 | 10,434,928 | |||||
Scorpio Mining 2 | 364,000 | 228,818 | |||||
Seabridge Gold 2 | 346,200 | 5,016,438 | |||||
Silver Standard Resources 2 | 689,000 | 7,744,360 | |||||
Sims Metal Management ADR | 1,404,647 | 13,906,005 | |||||
Steel Dynamics | 383,521 | 4,506,372 | |||||
Universal Stainless & Alloy Products 2 | 107,401 | 4,414,181 | |||||
Worthington Industries | 523,733 | 10,720,815 | |||||
| 258,519,578 | |||||||
| Paper & Forest Products - 0.3% | |||||||
Stella-Jones | 297,600 | 15,653,158 | |||||
| Total (Cost $411,440,920) | 467,262,559 | ||||||
| Telecommunication Services – 0.1% | |||||||
| Diversified Telecommunication Services - 0.1% | |||||||
Premiere Global Services 2 | 516,500 | 4,333,435 | |||||
| Total (Cost $4,038,835) | 4,333,435 | ||||||
| Miscellaneous5 – 1.0% | |||||||
| Total (Cost $53,792,207) | 57,665,369 | ||||||
| TOTAL COMMON STOCKS | |||||||
(Cost $4,771,394,671) | 5,732,909,289 | ||||||
| PRINCIPAL | |||||||
| AMOUNT | |||||||
| CORPORATE BOND – 0.0% | |||||||
GAMCO Investors (Debentures) 0.00% | |||||||
due 12/31/15 | |||||||
(Cost $464,640) | $ | 464,600 | 404,504 | ||||
| THE ACCOMPANYING NOTES ARE AN INTEGRAL PART OF THESE FINANCIAL STATEMENTS. | The Royce Funds 2012 Semiannual Report to Shareholders | 59 |
| Schedules of Investments |
| Royce Pennsylvania Mutual Fund (continued) |
| VALUE | ||||||||
| REPURCHASE AGREEMENT – 1.9% | ||||||||
| Fixed Income Clearing Corporation, | ||||||||
0.11% dated 6/29/12, due 7/2/12, | ||||||||
maturity value $107,562,986 (collateralized | ||||||||
by obligations of various U.S. Government | ||||||||
Agencies, 0.875% due 12/31/16, valued at | ||||||||
$109,716,962) | ||||||||
(Cost $107,562,000) | $ | 107,562,000 | ||||||
| COLLATERAL RECEIVED FOR SECURITIES | ||||||||
LOANED – 1.7% | ||||||||
| Money Market Funds | ||||||||
Federated Government Obligations Fund | ||||||||
(7 day yield-0.0115%) | ||||||||
(Cost $100,351,338) | 100,351,338 | |||||||
| TOTAL INVESTMENTS – 101.7% | ||||||||
(Cost $4,979,772,649) | 5,941,227,131 | |||||||
| LIABILITIES LESS CASH | ||||||||
AND OTHER ASSETS – (1.7)% | (97,516,982 | ) | ||||||
| NET ASSETS – 100.0% | $ | 5,843,710,149 | ||||||
| Royce Micro-Cap Fund |
| SHARES | VALUE | ||||||
| COMMON STOCKS – 96.1% | |||||||
| Consumer Discretionary – 14.1% | |||||||
| Auto Components - 1.3% | |||||||
Drew Industries 2 | 498,745 | $ | 13,890,048 | ||||
Fuel Systems Solutions 1,2 | 60,000 | 1,001,400 | |||||
| 14,891,448 | |||||||
| Diversified Consumer Services - 0.9% | |||||||
Lincoln Educational Services 3 | 1,560,527 | 10,143,426 | |||||
Household Durables - 1.1% | |||||||
Cavco Industries 2 | 241,888 | 12,404,017 | |||||
| Internet & Catalog Retail - 0.8% | |||||||
GS Home Shopping | 40,500 | 3,415,432 | |||||
Manutan International | 74,797 | 2,840,641 | |||||
Vitacost.com 2 | 379,400 | 2,238,460 | |||||
| 8,494,533 | |||||||
| Leisure Equipment & Products - 0.7% | |||||||
Callaway Golf | 859,154 | 5,077,600 | |||||
Piscines Desjoyaux | 437,000 | 2,686,741 | |||||
| 7,764,341 | |||||||
| Media - 0.2% | |||||||
Saraiva S/A Livreiros Editores | 211,500 | 2,337,715 | |||||
| Specialty Retail - 5.9% | |||||||
Buckle (The) | 161,275 | 6,381,652 | |||||
Cato Corporation (The) Cl. A | 243,250 | 7,409,395 | |||||
Citi Trends 2 | 184,950 | 2,855,628 | |||||
hhgregg 2 | 450,476 | 5,094,883 | |||||
Jos. A. Bank Clothiers 2 | 127,280 | 5,404,309 | |||||
Kirkland’s 2 | 732,560 | 8,241,300 | |||||
Lewis Group | 84,000 | 723,939 | |||||
Luk Fook Holdings (International) | 663,000 | 1,390,998 | |||||
Padini Holdings | 13,101,900 | 7,641,401 | |||||
Shoe Carnival | 471,114 | 10,124,240 | |||||
Stein Mart 2 | 1,288,142 | 10,240,729 | |||||
| 65,508,474 | |||||||
| Textiles, Apparel & Luxury Goods - 3.2% | |||||||
Calida Holding | 84,200 | 2,256,922 | |||||
K-Swiss Cl. A 2 | 741,637 | 2,284,242 | |||||
LaCrosse Footwear 3 | 522,669 | 5,691,865 | |||||
Maidenform Brands 2 | 213,700 | 4,256,904 | |||||
Perry Ellis International 2 | 649,366 | 13,474,344 | |||||
True Religion Apparel | 217,300 | 6,297,354 | |||||
Van de Velde | 44,648 | 1,926,809 | |||||
| 36,188,440 | |||||||
| Total (Cost $142,790,514) | 157,732,394 | ||||||
| Consumer Staples – 3.1% | |||||||
| Food Products - 2.1% | |||||||
Asian Citrus Holdings | 8,000,000 | 4,504,687 | |||||
Binggrae | 57,420 | 3,610,467 | |||||
Legumex Walker 2,3 | 702,500 | 4,140,065 | |||||
Sipef | 61,448 | 4,425,667 | |||||
Super Group | 4,000,000 | 6,649,729 | |||||
Waterloo Investment Holdings 2,6 | 2,760,860 | 389,281 | |||||
| 23,719,896 | |||||||
| 60 | The Royce Funds 2012 Semiannual Report to Shareholders | THE ACCOMPANYING NOTES ARE AN INTEGRAL PART OF THESE FINANCIAL STATEMENTS. |
| June 30, 2012 (unaudited) |
| SHARES | VALUE | ||||||
| Consumer Staples (continued) | |||||||
| Personal Products - 1.0% | |||||||
Nutraceutical International 2 | 225,300 | $ | 3,435,825 | ||||
USANA Health Sciences 1,2 | 174,146 | 7,160,884 | |||||
| 10,596,709 | |||||||
| Total (Cost $25,153,838) | 34,316,605 | ||||||
| Energy – 8.4% | |||||||
| Energy Equipment & Services - 6.4% | |||||||
Canadian Energy Services & Technology | 960,900 | 9,239,968 | |||||
Dawson Geophysical 2 | 211,733 | 5,043,480 | |||||
GASFRAC Energy Services 2 | 175,000 | 531,136 | |||||
Geodrill 2 | 1,664,000 | 3,513,997 | |||||
Gulf Island Fabrication | 340,044 | 9,592,641 | |||||
Lamprell | 2,380,756 | 3,765,887 | |||||
Natural Gas Services Group 2 | 397,866 | 5,896,374 | |||||
OYO Geospace 2 | 85,748 | 7,716,463 | |||||
Tesco Corporation 2 | 542,600 | 6,511,200 | |||||
TGC Industries 2 | 990,950 | 9,622,125 | |||||
Total Energy Services | 675,900 | 9,553,286 | |||||
Union Drilling 2 | 233,331 | 1,045,323 | |||||
| 72,031,880 | |||||||
| Oil, Gas & Consumable Fuels - 2.0% | |||||||
Gran Tierra Energy 1,2 | 916,700 | 4,500,997 | |||||
† Renewable Energy Group 1,2 | 430,000 | 3,194,900 | |||||
Sprott Resource 2 | 2,214,900 | 8,636,825 | |||||
Triangle Petroleum 1,2 | 1,010,569 | 5,638,975 | |||||
Uranium Resources 1,2 | 1,146,479 | 711,046 | |||||
| 22,682,743 | |||||||
| Total (Cost $70,384,950) | 94,714,623 | ||||||
| Financials – 6.3% | |||||||
| Capital Markets - 2.2% | |||||||
FBR & Co. 2 | 1,143,885 | 3,168,562 | |||||
Gluskin Sheff + Associates | 412,200 | 5,356,454 | |||||
GMP Capital | 550,600 | 3,023,135 | |||||
INTL FCStone 2 | 459,755 | 8,896,259 | |||||
U.S. Global Investors Cl. A | 313,849 | 1,371,520 | |||||
Westwood Holdings Group | 86,572 | 3,225,673 | |||||
| 25,041,603 | |||||||
| Commercial Banks - 0.7% | |||||||
Bancorp (The) 2 | 373,567 | 3,530,208 | |||||
BCB Holdings 2 | 2,760,860 | 821,546 | |||||
Pacific Continental | 356,897 | 3,165,676 | |||||
| 7,517,430 | |||||||
| Diversified Financial Services - 0.2% | |||||||
Hellenic Exchanges | 767,000 | 2,628,107 | |||||
| Insurance - 1.6% | |||||||
American Safety Insurance Holdings 2 | 265,100 | 4,970,625 | |||||
eHealth 2 | 603,898 | 9,728,797 | |||||
Navigators Group 2 | 54,164 | 2,710,908 | |||||
| 17,410,330 | |||||||
| Real Estate Management & Development - 1.6% | |||||||
Kennedy-Wilson Holdings | 871,007 | 12,202,808 | |||||
Midland Holdings | 8,059,500 | 3,940,165 | |||||
Syswin ADR 2 | 1,062,645 | 1,700,232 | |||||
| 17,843,205 | |||||||
| Total (Cost $73,854,359) | 70,440,675 | ||||||
| Health Care – 9.6% | |||||||
Biotechnology - 1.0% | |||||||
Burcon NutraScience 2 | 279,600 | 1,652,436 | |||||
Dyax Corporation 2 | 1,586,884 | 3,380,063 | |||||
Lexicon Pharmaceuticals 2 | 2,896,671 | 6,517,510 | |||||
| 11,550,009 | |||||||
| Health Care Equipment & Supplies - 4.1% | |||||||
Anika Therapeutics 2 | 113,127 | 1,537,396 | |||||
Cerus Corporation 1,2 | 1,071,554 | 3,557,559 | |||||
CryoLife 2 | 512,395 | 2,679,826 | |||||
Exactech 2 | 414,479 | 6,950,813 | |||||
Merit Medical Systems 2 | 386,765 | 5,341,225 | |||||
STRATEC Biomedical | 46,000 | 2,043,678 | |||||
SurModics 2 | 465,054 | 8,045,434 | |||||
Syneron Medical 2 | 927,674 | 9,629,256 | |||||
Young Innovations | 86,787 | 2,993,284 | |||||
† ZELTIQ Aesthetics 1,2 | 592,986 | 3,320,721 | |||||
| 46,099,192 | |||||||
| Health Care Providers & Services - 1.9% | |||||||
CorVel Corporation 2 | 129,657 | 6,353,193 | |||||
PDI 2,3 | 1,015,694 | 8,369,319 | |||||
U.S. Physical Therapy | 251,840 | 6,404,291 | |||||
| 21,126,803 | |||||||
| Health Care Technology - 0.2% | |||||||
Epocrates 1,2 | 221,800 | 1,778,836 | |||||
| Life Sciences Tools & Services - 1.1% | |||||||
BG Medicine 1,2 | 351,265 | 2,451,830 | |||||
BioClinica 2 | 464,806 | 2,245,013 | |||||
EPS | 3,000 | 8,202,191 | |||||
| 12,899,034 | |||||||
| Pharmaceuticals - 1.3% | |||||||
Unichem Laboratories | 1,074,000 | 2,470,174 | |||||
Vetoquinol | 373,826 | 9,715,514 | |||||
Zogenix 1,2 | 826,100 | 2,048,728 | |||||
| 14,234,416 | |||||||
| Total (Cost $96,679,903) | 107,688,290 | ||||||
| Industrials – 20.4% | |||||||
| Aerospace & Defense - 0.4% | |||||||
American Science & Engineering | 42,718 | 2,411,431 | |||||
Ducommun 2 | 252,427 | 2,476,309 | |||||
| 4,887,740 | |||||||
| Building Products - 1.7% | |||||||
AAON | 393,727 | 7,421,754 | |||||
Quanex Building Products | 408,000 | 7,295,040 | |||||
WaterFurnace Renewable Energy | 259,100 | 4,135,522 | |||||
| 18,852,316 | |||||||
| Commercial Services & Supplies - 1.2% | |||||||
Courier Corporation | 280,182 | 3,712,412 | |||||
| THE ACCOMPANYING NOTES ARE AN INTEGRAL PART OF THESE FINANCIAL STATEMENTS. | The Royce Funds 2012 Semiannual Report to Shareholders | 61 |
| Schedules of Investments |
| Royce Micro-Cap Fund (continued) |
| SHARES | VALUE | ||||||
| Industrials (continued) | |||||||
| Commercial Services & Supplies (continued) | |||||||
Ennis | 476,251 | $ | 7,324,740 | ||||
Viad Corporation | 114,949 | 2,298,980 | |||||
| 13,336,132 | |||||||
| Construction & Engineering - 2.0% | |||||||
Layne Christensen 2 | 356,860 | 7,383,433 | |||||
Raubex Group | 3,086,800 | 5,054,147 | |||||
Severfield-Rowen | 1,353,500 | 3,272,406 | |||||
Sterling Construction 2 | 661,711 | 6,762,687 | |||||
| 22,472,673 | |||||||
| Electrical Equipment - 3.0% | |||||||
Elektrobudowa | 57,600 | 1,678,852 | |||||
Global Power Equipment Group | 597,512 | 13,049,662 | |||||
Graphite India | 4,552,600 | 7,347,048 | |||||
LSI Industries | 1,006,336 | 7,165,112 | |||||
Voltamp Transformers | 472,616 | 4,023,018 | |||||
| 33,263,692 | |||||||
| Machinery - 7.0% | |||||||
AIA Engineering | 293,587 | 1,819,542 | |||||
Burckhardt Compression Holding | 26,500 | 6,802,105 | |||||
CB Industrial Product Holding | 3,615,800 | 2,912,727 | |||||
Foster (L.B.) Company | 240,426 | 6,878,588 | |||||
FreightCar America | 362,609 | 8,329,128 | |||||
Gorman-Rupp Company | 90,971 | 2,710,936 | |||||
Graham Corporation 3 | 621,249 | 11,567,656 | |||||
Kadant 2 | 326,762 | 7,662,569 | |||||
Key Technology 2,3 | 446,814 | 4,468,140 | |||||
Pfeiffer Vacuum Technology | 68,000 | 6,921,664 | |||||
RBC Bearings 2 | 195,967 | 9,269,239 | |||||
Semperit AG Holding | 258,100 | 9,432,152 | |||||
| 78,774,446 | |||||||
| Marine - 0.1% | |||||||
Euroseas | 1,323,465 | 1,561,689 | |||||
| Professional Services - 2.6% | |||||||
CRA International 2 | 358,783 | 5,270,522 | |||||
Exponent 2 | 148,769 | 7,859,467 | |||||
GP Strategies 2 | 864,775 | 15,972,394 | |||||
| 29,102,383 | |||||||
| Road & Rail - 2.1% | |||||||
Marten Transport | 678,219 | 14,418,936 | |||||
Patriot Transportation Holding 2 | 404,869 | 9,526,567 | |||||
| 23,945,503 | |||||||
| Trading Companies & Distributors - 0.3% | |||||||
Houston Wire & Cable | 277,200 | 3,029,796 | |||||
Total (Cost $212,519,885) | 229,226,370 | ||||||
| Information Technology – 14.5% | |||||||
| Communications Equipment - 2.9% | |||||||
Anaren 2 | 717,236 | 14,057,825 | |||||
Digi International 2 | 671,108 | 6,872,146 | |||||
KVH Industries 2 | 523,400 | 6,542,500 | |||||
Parrot 2 | 182,200 | 5,372,037 | |||||
| 32,844,508 | |||||||
| Computers & Peripherals - 1.3% | |||||||
Avid Technology 2 | 159,343 | 1,183,918 | |||||
Novatel Wireless 1,2,3 | 2,529,740 | 6,299,053 | |||||
Super Micro Computer 2 | 423,631 | 6,718,788 | |||||
| 14,201,759 | |||||||
Electronic Equipment, Instruments & Components - 2.0% | |||||||
Diploma | 585,000 | 4,086,753 | |||||
Domino Printing Sciences | 317,600 | 2,688,255 | |||||
Electro Rent | 262,000 | 4,252,260 | |||||
Fabrinet 2 | 289,294 | 3,630,640 | |||||
Inficon Holding | 17,300 | 3,530,302 | |||||
Nice | 384,500 | 1,257,733 | |||||
Vaisala Cl. A | 172,500 | 3,274,161 | |||||
| 22,720,104 | |||||||
| Internet Software & Services - 0.5% | |||||||
Envestnet 2 | 272,300 | 3,267,600 | |||||
World Energy Solutions 2,3 | 747,900 | 2,325,969 | |||||
| 5,593,569 | |||||||
| IT Services - 0.5% | |||||||
CSE Global | 3,066,500 | 1,933,610 | |||||
Neurones | 335,000 | 3,453,522 | |||||
| 5,387,132 | |||||||
| Semiconductors & Semiconductor Equipment - 5.8% | |||||||
Advanced Energy Industries 2 | 625,736 | 8,397,377 | |||||
ATMI 2 | 461,300 | 9,488,941 | |||||
AXT 2,3 | 1,889,361 | 7,462,976 | |||||
GSI Technology 2 | 947,937 | 4,493,222 | |||||
Integrated Silicon Solution 2 | 949,300 | 9,578,437 | |||||
Mindspeed Technologies 1,2 | 716,700 | 1,763,082 | |||||
Rudolph Technologies 2 | 1,277,065 | 11,136,007 | |||||
Sigma Designs 2 | 1,298,451 | 8,284,117 | |||||
Ultra Clean Holdings 2 | 663,824 | 4,268,388 | |||||
| 64,872,547 | |||||||
| Software - 1.5% | |||||||
Monotype Imaging Holdings 2 | 411,493 | 6,900,738 | |||||
VASCO Data Security International 1,2 | 1,261,139 | 10,316,117 | |||||
| 17,216,855 | |||||||
| Total (Cost $158,544,912) | 162,836,474 | ||||||
| Materials – 14.1% | |||||||
| Chemicals - 2.2% | |||||||
C. Uyemura & Co. | 119,700 | 4,528,581 | |||||
Huchems Fine Chemical | 300,000 | 5,936,792 | |||||
Quaker Chemical | 201,150 | 9,295,141 | |||||
Societe Internationale de Plantations d’Heveas | 56,786 | 4,828,080 | |||||
| 24,588,594 | |||||||
| Construction Materials - 0.1% | |||||||
Mardin Cimento Sanayii | 322,000 | 994,463 | |||||
| Metals & Mining - 11.8% | |||||||
Alamos Gold | 488,900 | 7,635,311 | |||||
Allied Nevada Gold 2 | 350,500 | 9,947,190 | |||||
Argonaut Gold 2 | 463,200 | 3,494,132 | |||||
Aureus Mining 2 | 1,364,000 | 1,178,980 | |||||
| 62 | The Royce Funds 2012 Semiannual Report to Shareholders | THE ACCOMPANYING NOTES ARE AN INTEGRAL PART OF THESE FINANCIAL STATEMENTS. |
| June 30, 2012 (unaudited) |
| SHARES | VALUE | |||||||
| Materials (continued) | ||||||||
| Metals & Mining (continued) | ||||||||
Bear Creek Mining 2 | 1,024,500 | $ | 2,867,916 | |||||
Castle (A.M.) & Co. 2 | 473,353 | 5,027,009 | ||||||
Endeavour Mining 2 | 1,971,000 | 4,297,829 | ||||||
Endeavour Silver 2 | 1,064,200 | 8,641,304 | ||||||
Entree Gold 2 | 1,901,000 | 1,216,640 | ||||||
Goldgroup Mining 2 | 1,576,500 | 650,359 | ||||||
Great Basin Gold 2 | 2,648,600 | 1,795,044 | ||||||
Great Panther Silver 1,2 | 510,600 | 852,702 | ||||||
Horsehead Holding Corporation 2 | 1,061,974 | 10,577,261 | ||||||
Imdex | 1,521,265 | 2,768,254 | ||||||
International Tower Hill Mines 2 | 678,000 | 1,884,840 | ||||||
Lumina Copper 2 | 792,700 | 7,279,978 | ||||||
Materion Corporation | 126,266 | 2,907,906 | ||||||
McEwen Mining 1,2 | 1,648,804 | 4,962,900 | ||||||
NorthIsle Copper and Gold 1,2 | 735,499 | 101,139 | ||||||
Olympic Steel | 516,672 | 8,483,754 | ||||||
Pilot Gold 2,3 | 3,114,500 | 3,365,043 | ||||||
Quaterra Resources 2 | 1,885,000 | 796,139 | ||||||
Revett Minerals 1,2 | 265,000 | 871,850 | ||||||
Richmont Mines 2 | 969,900 | 4,490,637 | ||||||
Saracen Mineral Holdings 2 | 7,500,000 | 4,296,787 | ||||||
Scorpio Mining 2 | 2,205,400 | 1,386,363 | ||||||
Silvercorp Metals | 830,200 | 4,591,006 | ||||||
Soltoro 2 | 1,680,000 | 594,048 | ||||||
Synalloy Corporation | 180,942 | 2,062,739 | ||||||
Timmins Gold 2 | 1,723,200 | 3,153,456 | ||||||
Torex Gold Resources 2 | 2,091,000 | 3,388,812 | ||||||
Universal Stainless & Alloy Products 2 | 310,252 | 12,751,357 | ||||||
Village Main Reef 2 | 7,500,000 | 1,651,783 | ||||||
Western Copper and Gold 2 | 1,471,000 | 1,103,250 | ||||||
Wildcat Silver 2 | 1,959,400 | 1,424,178 | ||||||
| 132,497,896 | ||||||||
| Total (Cost $152,350,317) | 158,080,953 | |||||||
| Telecommunication Services – 1.5% | ||||||||
Diversified Telecommunication Services - 1.5% | ||||||||
Atlantic Tele-Network | 264,845 | 8,933,222 | ||||||
Neutral Tandem 2 | 623,689 | 8,220,221 | ||||||
| Total (Cost $11,718,750) | 17,153,443 | |||||||
| Utilities – 0.1% | ||||||||
| Independent Power Producers & Energy Traders - 0.1% | ||||||||
Alterra Power 2 | 3,498,400 | 1,563,473 | ||||||
| Total (Cost $4,304,472) | 1,563,473 | |||||||
| Miscellaneous5 – 4.0% | ||||||||
| Total (Cost $44,954,084) | 44,662,931 | |||||||
| TOTAL COMMON STOCKS | ||||||||
(Cost $993,255,984) | 1,078,416,231 | |||||||
| REPURCHASE AGREEMENT – 3.4% | ||||||||
| Fixed Income Clearing Corporation, | ||||||||
0.11% dated 6/29/12, due 7/2/12, | ||||||||
maturity value $38,233,350 (collateralized | ||||||||
by obligations of various U.S. Government | ||||||||
Agencies, 3.25% due 6/30/16, valued at | ||||||||
$38,998,400) | ||||||||
(Cost $38,233,000) | 38,233,000 | |||||||
COLLATERAL RECEIVED FOR SECURITIES | ||||||||
| Money Market Funds | ||||||||
Federated Government Obligations Fund | ||||||||
(7 day yield-0.0115%) | ||||||||
(Cost $26,420,880) | 26,420,880 | |||||||
| TOTAL INVESTMENTS – 101.9% | ||||||||
(Cost $1,057,909,864) | 1,143,070,111 | |||||||
| LIABILITIES LESS CASH | ||||||||
AND OTHER ASSETS – (1.9)% | (21,220,655 | ) | ||||||
| NET ASSETS – 100.0% | $ | 1,121,849,456 | ||||||
| THE ACCOMPANYING NOTES ARE AN INTEGRAL PART OF THESE FINANCIAL STATEMENTS. | The Royce Funds 2012 Semiannual Report to Shareholders | 63 |
| Schedules of Investments |
| Royce Premier Fund |
| SHARES | VALUE | ||||||
| COMMON STOCKS – 94.1% | |||||||
| Consumer Discretionary – 10.9% | |||||||
| Automobiles - 1.8% | |||||||
Thor Industries 3 | 4,407,057 | $ | 120,797,432 | ||||
| Distributors - 1.1% | |||||||
Pool Corporation | 1,811,400 | 73,289,244 | |||||
| Diversified Consumer Services - 3.1% | |||||||
Sotheby’s | 2,828,594 | 94,361,896 | |||||
Strayer Education 3 | 1,068,485 | 116,486,235 | |||||
| 210,848,131 | |||||||
| Media - 1.2% | |||||||
Morningstar | 1,333,206 | 77,112,635 | |||||
| Specialty Retail - 1.0% | |||||||
Buckle (The) | 1,730,836 | 68,489,181 | |||||
| Textiles, Apparel & Luxury Goods - 2.7% | |||||||
Carter’s 2 | 1,144,800 | 60,216,480 | |||||
Columbia Sportswear | 1,341,600 | 71,936,592 | |||||
Warnaco Group (The) 2 | 1,240,100 | 52,803,458 | |||||
| 184,956,530 | |||||||
| Total (Cost $621,802,074) | 735,493,153 | ||||||
| Consumer Staples – 5.2% | |||||||
| Food Products - 2.5% | |||||||
Cal-Maine Foods 3 | 1,771,686 | 69,272,922 | |||||
Sanderson Farms 3 | 2,130,191 | 97,605,352 | |||||
| 166,878,274 | |||||||
| Personal Products - 2.7% | |||||||
Nu Skin Enterprises Cl. A 3 | 3,966,994 | 186,052,019 | |||||
| Total (Cost $202,111,192) | 352,930,293 | ||||||
| Energy – 5.9% | |||||||
| Energy Equipment & Services - 5.9% | |||||||
Ensign Energy Services | 7,128,000 | 98,017,876 | |||||
Pason Systems | 3,916,300 | 57,238,526 | |||||
SEACOR Holdings 2 | 479,540 | 42,861,285 | |||||
Trican Well Service 3 | 7,977,100 | 92,064,557 | |||||
Unit Corporation 2,3 | 2,896,073 | 106,836,133 | |||||
| Total (Cost $304,039,338) | 397,018,377 | ||||||
| Financials – 12.5% | |||||||
| Capital Markets - 4.9% | |||||||
Affiliated Managers Group 2 | 500,000 | 54,725,000 | |||||
Federated Investors Cl. B | 3,689,300 | 80,611,205 | |||||
Knight Capital Group Cl. A 2 | 4,667,200 | 55,726,368 | |||||
Partners Group Holding | 316,613 | 56,287,982 | |||||
Stifel Financial 2 | 2,590,777 | 80,055,010 | |||||
| 327,405,565 | |||||||
| Diversified Financial Services - 1.0% | |||||||
TMX Group | 1,451,300 | 66,143,129 | |||||
| Insurance - 4.5% | |||||||
Alleghany Corporation 2 | 514,525 | 174,809,869 | |||||
ProAssurance Corporation | 1,483,449 | 132,160,471 | |||||
| 306,970,340 | |||||||
| Real Estate Management & Development - 2.1% | |||||||
Jones Lang LaSalle | 1,269,700 | 89,348,789 | |||||
St. Joe Company (The) 1,2 | 3,388,074 | 53,565,450 | |||||
| 142,914,239 | |||||||
| Total (Cost $643,292,345) | 843,433,273 | ||||||
| Health Care – 4.7% | |||||||
| Biotechnology - 1.7% | |||||||
Myriad Genetics 2,3 | 5,015,765 | 119,224,734 | |||||
| Health Care Equipment & Supplies - 2.2% | |||||||
IDEXX Laboratories 2 | 1,536,500 | 147,703,745 | |||||
| Life Sciences Tools & Services - 0.8% | |||||||
PerkinElmer | 2,083,200 | 53,746,560 | |||||
| Total (Cost $193,259,508) | 320,675,039 | ||||||
| Industrials – 23.9% | |||||||
| Air Freight & Logistics - 0.9% | |||||||
Forward Air | 790,128 | 25,497,431 | |||||
UTi Worldwide | 2,259,700 | 33,014,217 | |||||
| 58,511,648 | |||||||
| Building Products - 2.2% | |||||||
Armstrong World Industries | 970,170 | 47,693,557 | |||||
Simpson Manufacturing 3 | 3,387,886 | 99,976,516 | |||||
| 147,670,073 | |||||||
| Commercial Services & Supplies - 2.3% | |||||||
Copart 2 | 2,534,800 | 60,049,412 | |||||
Ritchie Bros. Auctioneers | 4,441,250 | 94,376,562 | |||||
| 154,425,974 | |||||||
| Construction & Engineering - 1.0% | |||||||
EMCOR Group | 2,508,145 | 69,776,594 | |||||
| Electrical Equipment - 1.5% | |||||||
Brady Corporation Cl. A | 1,479,200 | 40,692,792 | |||||
GrafTech International 2 | 6,034,076 | 58,228,833 | |||||
| 98,921,625 | |||||||
| Machinery - 12.4% | |||||||
Gardner Denver | 1,386,518 | 73,360,667 | |||||
Kennametal | 1,563,500 | 51,830,025 | |||||
Lincoln Electric Holdings 3 | 5,074,994 | 222,233,987 | |||||
Rational | 303,306 | 72,302,116 | |||||
Semperit AG Holding 3 | 1,894,996 | 69,251,801 | |||||
Valmont Industries | 813,440 | 98,401,837 | |||||
Wabtec Corporation | 1,208,137 | 94,246,767 | |||||
Woodward 3 | 3,906,024 | 154,053,587 | |||||
| 835,680,787 | |||||||
| Marine - 0.9% | |||||||
Kirby Corporation 2 | 1,322,335 | 62,255,532 | |||||
| Professional Services - 0.7% | |||||||
Towers Watson & Company Cl. A | 741,011 | 44,386,559 | |||||
| Road & Rail - 1.1% | |||||||
Landstar System | 1,500,300 | 77,595,516 | |||||
| 64 | The Royce Funds 2012 Semiannual Report to Shareholders | THE ACCOMPANYING NOTES ARE AN INTEGRAL PART OF THESE FINANCIAL STATEMENTS. |
| June 30, 2012 (unaudited) |
| SHARES | VALUE | |||||||
| Industrials (continued) | ||||||||
| Trading Companies & Distributors - 0.9% | ||||||||
MSC Industrial Direct Cl. A | 952,284 | $ | 62,422,216 | |||||
| Total (Cost $992,162,839) | 1,611,646,524 | |||||||
| Information Technology – 19.1% | ||||||||
| Communications Equipment - 1.2% | ||||||||
ADTRAN | 2,635,434 | 79,563,752 | ||||||
| Electronic Equipment, Instruments & Components - 6.1% | ||||||||
Anixter International | 910,000 | 48,275,500 | ||||||
Benchmark Electronics 2 | 2,760,000 | 38,502,000 | ||||||
Cognex Corporation 3 | 3,052,717 | 96,618,493 | ||||||
FEI Company 2,3 | 2,543,120 | 121,662,861 | ||||||
National Instruments | 4,096,201 | 110,023,959 | ||||||
| 415,082,813 | ||||||||
| IT Services - 3.9% | ||||||||
Gartner 2 | 4,607,100 | 198,335,655 | ||||||
Jack Henry & Associates | 1,856,640 | 64,091,213 | ||||||
| �� | 262,426,868 | |||||||
| Office Electronics - 1.2% | ||||||||
Zebra Technologies Cl. A 2 | 2,275,125 | 78,173,295 | ||||||
| Semiconductors & Semiconductor Equipment - 5.6% | ||||||||
Cabot Microelectronics 3 | 2,086,191 | 60,937,639 | ||||||
Cymer 1,2 | 750,000 | 44,212,500 | ||||||
Fairchild Semiconductor International 2,3 | 6,508,112 | 91,764,379 | ||||||
MKS Instruments 3 | 2,971,910 | 85,977,356 | ||||||
Veeco Instruments 1,2,3 | 2,708,912 | 93,078,217 | ||||||
| 375,970,091 | ||||||||
| Software - 1.1% | ||||||||
Fair Isaac 3 | 1,832,600 | 77,482,328 | ||||||
| Total (Cost $1,023,180,367) | 1,288,699,147 | |||||||
| Materials – 11.8% | ||||||||
| Chemicals - 3.0% | ||||||||
Cabot Corporation | 1,155,000 | 47,008,500 | ||||||
Westlake Chemical | 2,975,481 | 155,498,637 | ||||||
| 202,507,137 | ||||||||
| Metals & Mining - 8.8% | ||||||||
Allied Nevada Gold 2 | 2,205,500 | 62,592,090 | ||||||
Globe Specialty Metals | 3,632,763 | 48,788,007 | ||||||
Pan American Silver | 5,138,544 | 86,790,008 | ||||||
† Pretium Resources 1,2 | 4,208,900 | 58,082,820 | ||||||
Reliance Steel & Aluminum | 2,569,800 | 129,774,900 | ||||||
Schnitzer Steel Industries Cl. A 3 | 2,108,038 | 59,067,225 | ||||||
Seabridge Gold 2,3 | 3,108,900 | 45,047,961 | ||||||
Silver Standard Resources 2,3 | 4,911,099 | 55,200,753 | ||||||
Sims Metal Management ADR | 4,744,014 | 46,965,738 | ||||||
| 592,309,502 | ||||||||
| Total (Cost $819,106,568) | 794,816,639 | |||||||
| Miscellaneous5 – 0.1% | ||||||||
| Total (Cost $4,464,701) | 4,686,313 | |||||||
| TOTAL COMMON STOCKS | ||||||||
(Cost $4,803,418,932) | 6,349,398,758 | |||||||
| REPURCHASE AGREEMENT – 6.0% | ||||||||
| Fixed Income Clearing Corporation, | ||||||||
0.11% dated 6/29/12, due 7/2/12, | ||||||||
maturity value $404,032,704 (collateralized | ||||||||
by obligations of various U.S. Government | ||||||||
Agencies, 0.875% due 12/31/16-1/31/17, valued at | ||||||||
$412,115,824) | ||||||||
(Cost $404,029,000) | 404,029,000 | |||||||
| COLLATERAL RECEIVED FOR SECURITIES | ||||||||
LOANED – 2.0% | ||||||||
| Money Market Funds | ||||||||
Federated Government Obligations Fund | ||||||||
(7 day yield-0.0115%) | ||||||||
(Cost $133,233,943) | 133,233,943 | |||||||
| TOTAL INVESTMENTS – 102.1% | ||||||||
(Cost $5,340,681,875) | 6,886,661,701 | |||||||
| LIABILITIES LESS CASH | ||||||||
AND OTHER ASSETS – (2.1)% | (143,700,029 | ) | ||||||
| NET ASSETS – 100.0% | $ | 6,742,961,672 | ||||||
| THE ACCOMPANYING NOTES ARE AN INTEGRAL PART OF THESE FINANCIAL STATEMENTS. | The Royce Funds 2012 Semiannual Report to Shareholders | 65 |
| Schedules of Investments |
| Royce Low-Priced Stock Fund |
| SHARES | VALUE | ||||||
| COMMON STOCKS – 97.3% | |||||||
| Consumer Discretionary – 8.2% | |||||||
| Automobiles - 1.0% | |||||||
Thor Industries | 1,076,753 | $ | 29,513,800 | ||||
Winnebago Industries 2 | 670,535 | 6,832,751 | |||||
| 36,346,551 | |||||||
| Diversified Consumer Services - 1.1% | |||||||
Corinthian Colleges 1,2,3 | 4,741,854 | 13,703,958 | |||||
Universal Technical Institute 3 | 1,730,679 | 23,381,473 | |||||
| 37,085,431 | |||||||
| Household Durables - 0.6% | |||||||
Ekornes | 265,000 | 3,800,535 | |||||
Helen of Troy 2 | 526,996 | 17,859,894 | |||||
| 21,660,429 | |||||||
| Internet & Catalog Retail - 0.5% | |||||||
NutriSystem | 1,375,690 | 15,902,977 | |||||
| Media - 0.2% | |||||||
Pico Far East Holdings | 30,000,000 | 7,435,605 | |||||
| Multiline Retail - 0.2% | |||||||
Tuesday Morning 1,2 | 1,986,450 | 8,521,871 | |||||
| Specialty Retail - 3.7% | |||||||
Buckle (The) | 704,575 | 27,880,032 | |||||
Cato Corporation (The) Cl. A | 597,350 | 18,195,281 | |||||
Chico’s FAS | 1,156,000 | 17,155,040 | |||||
GameStop Corporation Cl. A | 850,000 | 15,606,000 | |||||
Lewis Group | 1,543,747 | 13,304,514 | |||||
Luk Fook Holdings (International) 1 | 4,077,800 | 8,555,370 | |||||
Men’s Wearhouse (The) | 606,700 | 17,072,538 | |||||
Williams-Sonoma | 390,405 | 13,652,463 | |||||
| 131,421,238 | |||||||
| Textiles, Apparel & Luxury Goods - 0.9% | |||||||
Gildan Activewear | 611,448 | 16,827,049 | |||||
Grendene | 2,039,200 | 10,660,493 | |||||
Li Ning 1,2 | 7,300,000 | 4,111,813 | |||||
| 31,599,355 | |||||||
| Total (Cost $264,636,644) | 289,973,457 | ||||||
| Consumer Staples – 3.4% | |||||||
| Food Products - 1.8% | |||||||
Asian Citrus Holdings | 30,918,000 | 17,409,489 | |||||
Darling International 2 | 1,253,770 | 20,674,667 | |||||
Industrias Bachoco ADR | 1,125,365 | 24,701,762 | |||||
| 62,785,918 | |||||||
| Personal Products - 1.6% | |||||||
Nu Skin Enterprises Cl. A | 1,257,833 | 58,992,368 | |||||
| Total (Cost $67,880,111) | 121,778,286 | ||||||
| Energy – 10.6% | |||||||
| Energy Equipment & Services - 10.3% | |||||||
C&J Energy Services 1,2,3 | 2,610,593 | 48,295,971 | |||||
Calfrac Well Services | 1,706,100 | 38,190,765 | |||||
Ensign Energy Services | 2,204,100 | 30,308,811 | |||||
Lamprell | 12,524,952 | 19,812,009 | |||||
Oil States International 2 | 352,343 | 23,325,107 | |||||
Pason Systems | 2,250,700 | 32,895,016 | |||||
RPC | 1,283,769 | 15,264,013 | |||||
Tesco Corporation 1,2,3 | 2,732,105 | 32,785,260 | |||||
TGS-NOPEC Geophysical | 635,000 | 17,115,363 | |||||
Total Energy Services 3 | 1,866,700 | 26,384,257 | |||||
Trican Well Service | 4,019,800 | 46,392,938 | |||||
Unit Corporation 2 | 878,400 | 32,404,176 | |||||
| 363,173,686 | |||||||
| Oil, Gas & Consumable Fuels - 0.3% | |||||||
Sprott Resource 2 | 2,980,100 | 11,620,661 | |||||
| Total (Cost $286,708,004) | 374,794,347 | ||||||
| Financials – 12.0% | |||||||
| Capital Markets - 7.3% | |||||||
Artio Global Investors Cl. A | 2,081,437 | 7,285,029 | |||||
Ashmore Group | 4,080,363 | 22,392,119 | |||||
Close Brothers Group | 300,000 | 3,513,033 | |||||
Deutsche Beteiligungs | 409,995 | 8,081,269 | |||||
Duff & Phelps Cl. A | 1,131,400 | 16,405,300 | |||||
Federated Investors Cl. B | 1,271,900 | 27,791,015 | |||||
† INTL FCStone 1,2 | 536,600 | 10,383,210 | |||||
Jefferies Group | 248,200 | 3,224,118 | |||||
Jupiter Fund Management | 8,734,349 | 29,494,768 | |||||
Knight Capital Group Cl. A 2 | 2,749,500 | 32,829,030 | |||||
Sprott | 8,302,400 | 40,366,252 | |||||
Stifel Financial 2 | 470,663 | 14,543,487 | |||||
U.S. Global Investors Cl. A | 661,751 | 2,891,852 | |||||
Value Partners Group | 81,255,900 | 39,810,934 | |||||
| 259,011,416 | |||||||
| Diversified Financial Services - 1.2% | |||||||
KKR Financial Holdings LLC | 2,213,430 | 18,858,424 | |||||
PICO Holdings 1,2 | 1,010,398 | 22,643,019 | |||||
| 41,501,443 | |||||||
| Insurance - 2.2% | |||||||
Argo Group International Holdings | 521,897 | 15,275,925 | |||||
Aspen Insurance Holdings 1 | 553,000 | 15,981,700 | |||||
Brown & Brown | 300,000 | 8,181,000 | |||||
Greenlight Capital Re Cl. A 1,2 | 423,812 | 10,773,301 | |||||
Montpelier Re Holdings | 522,500 | 11,124,025 | |||||
Validus Holdings 1 | 536,140 | 17,172,564 | |||||
| 78,508,515 | |||||||
| Real Estate Management & Development - 1.3% | |||||||
E-House China Holdings ADR 1 | 2,086,204 | 11,474,122 | |||||
Kennedy-Wilson Holdings | 2,573,614 | 36,056,332 | |||||
| 47,530,454 | |||||||
| Total (Cost $467,891,504) | 426,551,828 | ||||||
| Health Care – 7.5% | |||||||
| Biotechnology - 2.4% | |||||||
Emergent Biosolutions 2 | 841,734 | 12,752,270 | |||||
Maxygen 2 | 640,200 | 3,815,592 | |||||
Myriad Genetics 2 | 2,734,800 | 65,006,196 | |||||
| 66 | The Royce Funds 2012 Semiannual Report to Shareholders | THE ACCOMPANYING NOTES ARE AN INTEGRAL PART OF THESE FINANCIAL STATEMENTS. |
| June 30, 2012 (unaudited) |
| SHARES | VALUE | ||||||
| Health Care (continued) | |||||||
| Biotechnology (continued) | |||||||
Sinovac Biotech 2 | 1,749,629 | $ | 3,691,717 | ||||
| 85,265,775 | |||||||
| Health Care Equipment & Supplies - 2.1% | |||||||
Carl Zeiss Meditec | 1,906,800 | 45,958,242 | |||||
CONMED Corporation | 155,500 | 4,302,685 | |||||
Nihon Kohden | 342,000 | 10,414,043 | |||||
Thoratec Corporation 2 | 350,000 | 11,753,000 | |||||
| 72,427,970 | |||||||
| Health Care Providers & Services - 0.3% | |||||||
Cross Country Healthcare 2,3 | 2,592,607 | 11,329,693 | |||||
| Life Sciences Tools & Services - 0.3% | |||||||
eResearchTechnology 2 | 1,265,849 | 10,114,133 | |||||
| Pharmaceuticals - 2.4% | |||||||
Adcock Ingram Holdings | 2,311,000 | 17,018,927 | |||||
Endo Health Solutions 2 | 342,352 | 10,606,065 | |||||
Medicines Company (The) 2 | 1,500,140 | 34,413,212 | |||||
Recordati | 1,488,800 | 10,593,224 | |||||
Sino Biopharmaceutical | 15,950,000 | 5,780,041 | |||||
ViroPharma 1,2 | 311,003 | 7,370,771 | |||||
| 85,782,240 | |||||||
| Total (Cost $242,702,103) | 264,919,811 | ||||||
| Industrials – 13.0% | |||||||
| Aerospace & Defense - 3.1% | |||||||
Ceradyne | 1,110,667 | 28,488,609 | |||||
HEICO Corporation Cl. A | 2,123,435 | 68,502,013 | |||||
† Orbital Sciences 1,2 | 852,523 | 11,014,597 | |||||
| 108,005,219 | |||||||
| Building Products - 0.6% | |||||||
AAON | 298,016 | 5,617,602 | |||||
WaterFurnace Renewable Energy 3 | 970,500 | 15,490,251 | |||||
| 21,107,853 | |||||||
| Commercial Services & Supplies - 1.0% | |||||||
Ennis | 1,004,600 | 15,450,748 | |||||
Moshi Moshi Hotline | 1,900,000 | 19,556,362 | |||||
| 35,007,110 | |||||||
| Construction & Engineering - 0.2% | |||||||
Raubex Group | 5,279,971 | 8,645,118 | |||||
| Electrical Equipment - 1.7% | |||||||
GrafTech International 1,2 | 5,057,800 | 48,807,770 | |||||
Powell Industries 1,2 | 285,017 | 10,648,235 | |||||
| 59,456,005 | |||||||
| Machinery - 2.0% | |||||||
Gardner Denver | 178,830 | 9,461,895 | |||||
Kennametal | 1,124,500 | 37,277,175 | |||||
Lincoln Electric Holdings | 569,770 | 24,950,229 | |||||
| 71,689,299 | |||||||
| Professional Services - 3.1% | |||||||
CBIZ 1,2 | 597,600 | 3,549,744 | |||||
Exponent 1,2 | 225,400 | 11,907,882 | |||||
Kforce 2 | 448,774 | 6,040,498 | |||||
Korn/Ferry International 1,2,3 | 2,886,963 | 41,427,919 | |||||
TrueBlue 1,2,3 | 3,062,691 | 47,410,457 | |||||
| 110,336,500 | |||||||
| Road & Rail - 0.8% | |||||||
Heartland Express | 688,366 | 9,850,517 | |||||
Universal Truckload Services | 387,561 | 5,861,860 | |||||
Werner Enterprises | 490,600 | 11,720,434 | |||||
| 27,432,811 | |||||||
| Trading Companies & Distributors - 0.5% | |||||||
Houston Wire & Cable 3 | 1,591,200 | 17,391,816 | |||||
| Total (Cost $365,639,322) | 459,071,731 | ||||||
| Information Technology – 20.7% | |||||||
| Communications Equipment - 3.5% | |||||||
ADTRAN | 983,900 | 29,703,941 | |||||
Arris Group 2 | 1,391,971 | 19,362,317 | |||||
Harmonic 1,2 | 2,022,500 | 8,615,850 | |||||
KVH Industries 1,2,3 | 1,100,200 | 13,752,500 | |||||
NETGEAR 2 | 1,067,800 | 36,849,778 | |||||
PC-Tel 3 | 1,095,592 | 7,088,480 | |||||
Tellabs | 2,932,600 | 9,765,558 | |||||
| 125,138,424 | |||||||
| Computers & Peripherals - 0.8% | |||||||
QLogic Corporation 2 | 250,000 | 3,422,500 | |||||
STEC 1,2 | 1,662,400 | 12,966,720 | |||||
Xyratex 1 | 1,177,566 | 13,318,271 | |||||
| 29,707,491 | |||||||
| Electronic Equipment, Instruments & Components - 2.1% | |||||||
AVX Corporation | 1,018,900 | 10,892,041 | |||||
Cognex Corporation | 40,638 | 1,286,193 | |||||
GSI Group 2 | 1,175,000 | 13,465,500 | |||||
Littelfuse | 258,400 | 14,700,376 | |||||
Methode Electronics | 1,176,000 | 10,007,760 | |||||
TTM Technologies 1,2 | 2,606,735 | 24,529,376 | |||||
| 74,881,246 | |||||||
| Internet Software & Services - 0.4% | |||||||
ValueClick 2 | 852,600 | 13,974,114 | |||||
| IT Services - 1.7% | |||||||
Forrester Research | 468,300 | 15,856,638 | |||||
MAXIMUS | 168,782 | 8,734,469 | |||||
TeleTech Holdings 1,2 | 2,173,700 | 34,779,200 | |||||
| 59,370,307 | |||||||
| Semiconductors & Semiconductor Equipment - 12.1% | |||||||
Advanced Energy Industries 1,2 | 1,251,400 | 16,793,788 | |||||
Aixtron ADR 1 | 1,652,701 | 23,650,151 | |||||
ATMI 1,2 | 1,125,000 | 23,141,250 | |||||
Brooks Automation | 3,172,582 | 29,949,174 | |||||
Cirrus Logic 2 | 278,400 | 8,318,592 | |||||
Exar Corporation 2 | 461,700 | 3,767,472 | |||||
Fairchild Semiconductor International 2 | 4,895,039 | 69,020,050 | |||||
Integrated Device Technology 2 | 650,000 | 3,653,000 | |||||
International Rectifier 1,2 | 2,776,822 | 55,508,672 | |||||
Lam Research 1,2 | 793,800 | 29,958,012 | |||||
Micrel | 685,744 | 6,535,140 | |||||
| THE ACCOMPANYING NOTES ARE AN INTEGRAL PART OF THESE FINANCIAL STATEMENTS. | The Royce Funds 2012 Semiannual Report to Shareholders | 67 |
| Schedules of Investments |
| Royce Low-Priced Stock Fund (continued) |
| SHARES | VALUE | |||||||
| Information Technology (continued) | ||||||||
| Semiconductors & Semiconductor Equipment (continued) | ||||||||
MKS Instruments | 1,587,800 | $ | 45,935,054 | |||||
OmniVision Technologies 1,2 | 2,127,191 | 28,419,272 | ||||||
Sigma Designs 2,3 | 2,007,658 | 12,808,858 | ||||||
Supertex 2 | 386,900 | 7,293,065 | ||||||
Teradyne 2 | 4,599,596 | 64,670,320 | ||||||
| 429,421,870 | ||||||||
| Software - 0.1% | ||||||||
Smith Micro Software 1,2 | 958,576 | 1,763,780 | ||||||
| Total (Cost $681,198,046) | 734,257,232 | |||||||
| Materials – 20.5% | ||||||||
| Chemicals - 2.0% | ||||||||
Intrepid Potash 1,2 | 1,509,900 | 34,365,324 | ||||||
Schulman (A.) | 220,980 | 4,386,453 | ||||||
Victrex | 407,442 | 8,126,104 | ||||||
Westlake Chemical | 464,800 | 24,290,448 | ||||||
| 71,168,329 | ||||||||
| Construction Materials - 0.2% | ||||||||
Mardin Cimento Sanayii | 2,160,000 | 6,670,933 | ||||||
| Metals & Mining - 17.6% | ||||||||
Alamos Gold | 3,651,400 | 57,025,104 | ||||||
Allied Nevada Gold 1,2 | 1,848,878 | 52,471,158 | ||||||
AuRico Gold 2 | 1,747,500 | 13,997,475 | ||||||
Castle (A.M.) & Co. 1,2,3 | 1,799,667 | 19,112,463 | ||||||
Centamin 2 | 20,152,400 | 22,169,421 | ||||||
CGA Mining 2 | 4,690,000 | 8,522,247 | ||||||
Endeavour Mining 2 | 3,625,000 | 7,904,430 | ||||||
Globe Specialty Metals 3 | 4,160,280 | 55,872,560 | ||||||
Hecla Mining | 3,077,715 | 14,619,146 | ||||||
Hochschild Mining | 5,858,563 | 43,225,358 | ||||||
Horsehead Holding Corporation 1,2 | 1,849,035 | 18,416,389 | ||||||
Kirkland Lake Gold 2 | 1,491,100 | 16,051,917 | ||||||
Major Drilling Group International | 2,736,800 | 31,639,461 | ||||||
McEwen Mining 1,2 | 8,058,918 | 24,257,343 | ||||||
Medusa Mining | 1,686,300 | 8,364,422 | ||||||
Olympic Steel | 510,800 | 8,387,336 | ||||||
Orbit Garant Drilling 2 | 1,512,500 | 5,125,356 | ||||||
Pan American Silver | 2,413,053 | 40,756,465 | ||||||
Pretium Resources 1,2 | 4,516,000 | 62,320,800 | ||||||
Reliance Steel & Aluminum | 180,000 | 9,090,000 | ||||||
Schnitzer Steel Industries Cl. A | 177,100 | 4,962,342 | ||||||
Seabridge Gold 2 | 1,111,783 | 16,109,736 | ||||||
Silver Standard Resources 1,2 | 2,599,400 | 29,217,256 | ||||||
Silvercorp Metals | 3,760,400 | 20,795,012 | ||||||
Sims Metal Management ADR | 1,708,952 | 16,918,625 | ||||||
Tahoe Resources 2 | 1,169,400 | 16,171,466 | ||||||
| 623,503,288 | ||||||||
| Paper & Forest Products - 0.7% | ||||||||
Buckeye Technologies | 831,300 | 23,683,737 | ||||||
China Forestry Holdings 6 | 23,300,000 | 1,756,972 | ||||||
| 25,440,709 | ||||||||
| Total (Cost $649,749,411) | 726,783,259 | |||||||
| Telecommunication Services – 0.5% | ||||||||
| Diversified Telecommunication Services - 0.5% | ||||||||
Neutral Tandem 1,2 | 1,431,614 | 18,868,672 | ||||||
| �� | ||||||||
| Total (Cost $19,689,082) | 18,868,672 | |||||||
| Utilities – 0.1% | ||||||||
| Independent Power Producers & Energy Traders - 0.1% | ||||||||
Alterra Power 2 | 9,732,900 | 4,349,739 | ||||||
| Total (Cost $12,581,546) | 4,349,739 | |||||||
| Miscellaneous5 – 0.8% | ||||||||
| Total (Cost $30,795,840) | 27,315,180 | |||||||
| TOTAL COMMON STOCKS | ||||||||
(Cost $3,089,471,613) | 3,448,663,542 | |||||||
| REPURCHASE AGREEMENT – 2.6% | ||||||||
| Fixed Income Clearing Corporation, | ||||||||
0.11% dated 6/29/12, due 7/2/12, | ||||||||
maturity value $91,117,835 (collateralized | ||||||||
by obligations of various U.S. Government | ||||||||
Agencies, 0.875% due 2/28/17, valued at | ||||||||
$92,943,988) | ||||||||
(Cost $91,117,000) | 91,117,000 | |||||||
| COLLATERAL RECEIVED FOR SECURITIES | ||||||||
LOANED – 5.0% | ||||||||
| Money Market Funds | ||||||||
Federated Government Obligations Fund | ||||||||
(7 day yield-0.0115%) | ||||||||
(Cost $176,801,115) | 176,801,115 | |||||||
| TOTAL INVESTMENTS – 104.9% | ||||||||
(Cost $3,357,389,728) | 3,716,581,657 | |||||||
| LIABILITIES LESS CASH | ||||||||
AND OTHER ASSETS – (4.9)% | (171,919,841 | ) | ||||||
| NET ASSETS – 100.0% | $ | 3,544,661,816 | ||||||
| 68 | The Royce Funds 2012 Semiannual Report to Shareholders | THE ACCOMPANYING NOTES ARE AN INTEGRAL PART OF THESE FINANCIAL STATEMENTS. |
| June 30, 2012 (unaudited) |
| Royce Total Return Fund |
| SHARES | VALUE | ||||||
| COMMON STOCKS – 93.5% | |||||||
| Consumer Discretionary – 11.7% | |||||||
| Auto Components - 0.4% | |||||||
Autoliv | 25,900 | $ | 1,415,694 | ||||
Cie Generale des Etablissements Michelin | 2,800 | 183,133 | |||||
Gentex Corporation | 595,000 | 12,417,650 | |||||
Nippon Seiki | 19,100 | 195,107 | |||||
Sanoh Industrial | 28,300 | 233,342 | |||||
Spartan Motors | 47,557 | 249,199 | |||||
Standard Motor Products | 60,506 | 851,924 | |||||
Superior Industries International | 153,187 | 2,507,671 | |||||
Yorozu Corporation | 9,600 | 157,664 | |||||
| 18,211,384 | |||||||
| Automobiles - 0.2% | |||||||
Thor Industries | 399,649 | 10,954,379 | |||||
| Distributors - 0.2% | |||||||
Weyco Group | 282,000 | 6,536,760 | |||||
| Diversified Consumer Services - 0.3% | |||||||
DeVry | 88,800 | 2,750,136 | |||||
Hillenbrand | 243,625 | 4,477,828 | |||||
Regis Corporation | 231,100 | 4,150,556 | |||||
Slater & Gordon | 104,500 | 198,938 | |||||
Strayer Education | 21,000 | 2,289,420 | |||||
| 13,866,878 | |||||||
| Hotels, Restaurants & Leisure - 0.8% | |||||||
Abu Dhabi National Hotels | 1,200,000 | 575,007 | |||||
Ambassadors Group | 30,570 | 166,301 | |||||
Bob Evans Farms | 458,073 | 18,414,535 | |||||
DineEquity 1,2 | 61,030 | 2,724,379 | |||||
International Speedway Cl. A | 587,800 | 15,388,604 | |||||
REXLot Holdings | 479,200 | 34,348 | |||||
Sportingbet | 295,700 | 141,903 | |||||
William Hill | 88,400 | 391,882 | |||||
| 37,836,959 | |||||||
| Household Durables - 0.7% | |||||||
Alpine Electronics | 22,600 | 269,994 | |||||
American Greetings Cl. A | 110,000 | 1,608,200 | |||||
Blyth | 11,038 | 381,473 | |||||
Ethan Allen Interiors | 1,170,250 | 23,323,083 | |||||
Harman International Industries 1 | 62,200 | 2,463,120 | |||||
Leggett & Platt | 39,003 | 824,133 | |||||
Man Wah Holdings | 324,800 | 134,835 | |||||
McPherson’s | 70,300 | 114,970 | |||||
SEB | 3,000 | 186,440 | |||||
| 29,306,248 | |||||||
| Internet & Catalog Retail - 0.0% | |||||||
NutriSystem | 103,860 | 1,200,622 | |||||
| Leisure Equipment & Products - 0.3% | |||||||
Arctic Cat 2 | 92,881 | 3,395,729 | |||||
Callaway Golf | 962,900 | 5,690,739 | |||||
Fields Corporation | 100 | 174,244 | |||||
Hasbro | 12,438 | 421,275 | |||||
JAKKS Pacific | 106,468 | 1,704,553 | |||||
Sankyo | 5,200 | 253,709 | |||||
Sturm, Ruger & Co. | 16,762 | 672,994 | |||||
| 12,313,243 | |||||||
| Media - 0.5% | |||||||
Arbitron | 39,900 | 1,396,500 | |||||
Chime Communications | 54,400 | 133,549 | |||||
Fuji Media Holdings | 100 | 172,042 | |||||
Harte-Hanks | 274,927 | 2,512,833 | |||||
Meredith Corporation | 100,220 | 3,201,027 | |||||
Scholastic Corporation | 87,499 | 2,463,972 | |||||
Societe Television Francaise 1 | 14,500 | 116,104 | |||||
STW Communications Group | 182,800 | 177,051 | |||||
Washington Post Cl. B | 7,900 | 2,953,178 | |||||
World Wrestling Entertainment Cl. A | 1,382,092 | 10,807,959 | |||||
| 23,934,215 | |||||||
| Multiline Retail - 0.0% | |||||||
Dillard’s Cl. A | 22,086 | 1,406,436 | |||||
Myer Holdings | 77,900 | 129,624 | |||||
| 1,536,060 | |||||||
| Specialty Retail - 6.8% | |||||||
Aaron’s | 2,500 | 70,775 | |||||
American Eagle Outfitters | 1,651,162 | 32,577,426 | |||||
Ascena Retail Group 2 | 1,913,398 | 35,627,471 | |||||
bebe stores | 20,400 | 119,748 | |||||
Buckle (The) | 918,036 | 36,326,684 | |||||
Cato Corporation (The) Cl. A | 1,444,815 | 44,009,065 | |||||
Chico’s FAS | 51,400 | 762,776 | |||||
DSW Cl. A | 5,000 | 272,000 | |||||
Finish Line (The) Cl. A | 113,366 | 2,370,483 | |||||
Foot Locker | 112,992 | 3,455,295 | |||||
GameStop Corporation Cl. A | 1,652,157 | 30,333,603 | |||||
Guess? | 1,348,429 | 40,951,789 | |||||
Halfords Group | 43,500 | 156,747 | |||||
Jos. A. Bank Clothiers 1,2 | 856,336 | 36,360,027 | |||||
JUMBO | 32,900 | 128,083 | |||||
Men’s Wearhouse (The) | 303,139 | 8,530,331 | |||||
RadioShack Corporation | 159,981 | 614,327 | |||||
Rent-A-Center | 26,400 | 890,736 | |||||
Ross Stores | 59,800 | 3,735,706 | |||||
Stage Stores 1 | 47,178 | 864,301 | |||||
Systemax 2 | 295,961 | 3,498,259 | |||||
Tiffany & Co. | 407,500 | 21,577,125 | |||||
Williams-Sonoma | 63,800 | 2,231,086 | |||||
| 305,463,843 | |||||||
| Textiles, Apparel & Luxury Goods - 1.5% | |||||||
Barry (R.G.) 3 | 1,048,496 | 14,249,061 | |||||
Columbia Sportswear | 54,129 | 2,902,397 | |||||
G-III Apparel Group 1,2 | 639,590 | 15,151,887 | |||||
Glorious Sun Enterprises | 554,100 | 171,787 | |||||
Jones Group (The) | 599,881 | 5,734,862 | |||||
K-Swiss Cl. A 1,2 | 90,575 | 278,971 | |||||
Movado Group | 10,541 | 263,736 | |||||
Pandora 1 | 5,200 | 48,849 | |||||
Steven Madden 2 | 753,131 | 23,911,909 | |||||
| THE ACCOMPANYING NOTES ARE AN INTEGRAL PART OF THESE FINANCIAL STATEMENTS. | The Royce Funds 2012 Semiannual Report to Shareholders | 69 |
| Schedules of Investments |
| Royce Total Return Fund (continued) |
| SHARES | VALUE | ||||||
| Consumer Discretionary (continued) | |||||||
| Textiles, Apparel & Luxury Goods (continued) | |||||||
Wolverine World Wide | 56,717 | $ | 2,199,485 | ||||
| 64,912,944 | |||||||
| Total (Cost $472,488,542) | 526,073,535 | ||||||
| Consumer Staples – 3.7% | |||||||
| Food & Staples Retailing - 0.6% | |||||||
Kasumi Company | 30,000 | 206,202 | |||||
Ministop | 15,000 | 260,454 | |||||
Village Super Market Cl. A 3 | 714,661 | 23,283,655 | |||||
Weis Markets | 11,071 | 492,881 | |||||
| 24,243,192 | |||||||
| Food Products - 2.2% | |||||||
Cal-Maine Foods | 140,598 | 5,497,382 | |||||
Farmer Bros. 2 | 542,300 | 4,316,708 | |||||
Flowers Foods | 600,150 | 13,941,484 | |||||
Fresh Del Monte Produce | 11,900 | 279,293 | |||||
Hershey Creamery 4 | 882 | 1,558,935 | |||||
Hormel Foods | 442,266 | 13,453,732 | |||||
J&J Snack Foods | 72,575 | 4,289,182 | |||||
J.M. Smucker Company (The) | 324,000 | 24,468,480 | |||||
Lancaster Colony | 69,714 | 4,964,334 | |||||
Parmalat | 81,700 | 154,836 | |||||
Sino Grandness Food Industry Group 2 | 349,000 | 113,884 | |||||
Tootsie Roll Industries | 1,130,396 | 26,971,249 | |||||
| 100,009,499 | |||||||
| Household Products - 0.0% | |||||||
WD-40 Company | 7,696 | 383,338 | |||||
| Personal Products - 0.9% | |||||||
Inter Parfums | 1,137,497 | 19,644,573 | |||||
Mandom Corporation | 10,100 | 256,595 | |||||
Nu Skin Enterprises Cl. A | 459,610 | 21,555,709 | |||||
| 41,456,877 | |||||||
| Tobacco - 0.0% | |||||||
Universal Corporation | 6,664 | 308,743 | |||||
| Total (Cost $136,146,551) | 166,401,649 | ||||||
| Diversified Investment Companies – 0.3% | |||||||
| Closed-End Funds - 0.3% | |||||||
British Empire Securities and General Trust | 420,000 | 2,686,918 | |||||
Central Fund of Canada Cl. A | 650,500 | 12,873,395 | |||||
| Total (Cost $10,772,426) | 15,560,313 | ||||||
| Energy – 7.5% | |||||||
| Energy Equipment & Services - 2.5% | |||||||
CARBO Ceramics | 255,700 | 19,619,861 | |||||
CH Offshore | 642,000 | 211,470 | |||||
Core Laboratories | 100 | 11,590 | |||||
Exterran Partners L.P. | 629,700 | 12,109,131 | |||||
Gulf Island Fabrication | 11,473 | 323,653 | |||||
Helmerich & Payne | 894,468 | 38,891,469 | |||||
Lufkin Industries | 53,136 | 2,886,348 | |||||
Oceaneering International | 28,601 | 1,368,844 | |||||
Patterson-UTI Energy | 58,877 | 857,249 | |||||
Precision Drilling 1,2 | 621,450 | 4,238,289 | |||||
Rowan Companies 1,2 | 5,000 | 161,650 | |||||
RPC | 109,100 | 1,297,199 | |||||
SEACOR Holdings 2 | 330,416 | 29,532,582 | |||||
Trican Well Service | 14,700 | 169,654 | |||||
| 111,678,989 | |||||||
| Oil, Gas & Consumable Fuels - 5.0% | |||||||
Alliance Holdings GP L.P. | 578,500 | 23,996,180 | |||||
Alliance Resource Partners L.P. | 278,000 | 15,601,360 | |||||
Arch Coal | 111,518 | 768,359 | |||||
Cimarex Energy | 367,190 | 20,239,513 | |||||
Delek US Holdings | 15,203 | 267,421 | |||||
Energen Corporation | 635,698 | 28,689,051 | |||||
Energy Transfer Equity L.P. | 424,500 | 17,412,990 | |||||
Hugoton Royalty Trust | 558,500 | 4,361,885 | |||||
Magellan Midstream Partners L.P. | 433,701 | 30,636,638 | |||||
Natural Resource Partners L.P. | 537,700 | 11,920,809 | |||||
NuStar GP Holdings LLC | 369,200 | 11,459,968 | |||||
Pengrowth Energy | 31,257 | 199,107 | |||||
Penn Virginia | 633,760 | 4,651,798 | |||||
Penn Virginia Resource Partners L.P. | 514,500 | 12,605,250 | |||||
Pioneer Southwest Energy Partners L.P. | 250,401 | 6,440,314 | |||||
Plains All American Pipeline L.P. | 90,000 | 7,272,900 | |||||
Sabine Royalty Trust | 10,400 | 521,248 | |||||
San Juan Basin Royalty Trust | 10,720 | 160,693 | |||||
SM Energy | 18,342 | 900,775 | |||||
Sunoco Logistics Partners L.P. | 693,000 | 25,135,110 | |||||
W&T Offshore | 77,700 | 1,188,810 | |||||
| 224,430,179 | |||||||
| Total (Cost $243,077,851) | 336,109,168 | ||||||
| Financials – 28.5% | |||||||
| Capital Markets - 7.6% | |||||||
A.F.P. Provida ADR | 311,700 | 26,005,131 | |||||
AGF Management Cl. B | 815,600 | 9,020,387 | |||||
AllianceBernstein Holding L.P. | 1,941,900 | 24,642,711 | |||||
AP Alternative Assets L.P. 2 | 76,000 | 798,369 | |||||
Apollo Global Management LLC Cl. A | 584,500 | 7,247,800 | |||||
Apollo Investment | 1,161,400 | 8,919,552 | |||||
Artio Global Investors Cl. A | 61,266 | 214,431 | |||||
ASA Gold and Precious Metals | 220,000 | 4,903,800 | |||||
Bank Sarasin & Co. Cl. B 2 | 82,000 | 2,308,209 | |||||
Banque Privee Edmond de Rothschild | 202 | 4,041,631 | |||||
CI Financial | 933,500 | 20,245,241 | |||||
Cohen & Steers | 385,630 | 13,308,091 | |||||
Egyptian Financial Group-Hermes Holding Company 2 | 2,860,027 | 4,857,585 | |||||
Egyptian Financial Group-Hermes Holding Company GDR 2 | 75,000 | 247,500 | |||||
Federated Investors Cl. B | 1,952,163 | 42,654,762 | |||||
GAMCO Investors Cl. A | 278,300 | 12,353,737 | |||||
Intermediate Capital Group | 44,700 | 189,546 | |||||
Janus Capital Group | 1,038,609 | 8,121,922 | |||||
| 70 | The Royce Funds 2012 Semiannual Report to Shareholders | THE ACCOMPANYING NOTES ARE AN INTEGRAL PART OF THESE FINANCIAL STATEMENTS. |
| June 30, 2012 (unaudited) |
| SHARES | VALUE | ||||||
| Financials (continued) | |||||||
| Capital Markets (continued) | |||||||
KKR & Co. L.P. | 1,315,600 | $ | 16,958,084 | ||||
Lazard Cl. A | 546,700 | 14,208,733 | |||||
MVC Capital | 495,000 | 6,410,250 | |||||
Och-Ziff Capital Management Group LLC | |||||||
Cl. A | 370,000 | 2,804,600 | |||||
Oppenheimer Holdings Cl. A | 4,867 | 76,509 | |||||
Paris Orleans | 239,213 | 5,131,937 | |||||
Raymond James Financial | 597,925 | 20,472,952 | |||||
Schroders | 131,100 | 2,759,728 | |||||
SEI Investments | 1,651,492 | 32,848,176 | |||||
T. Rowe Price Group | 411,100 | 25,882,856 | |||||
Teton Advisors Cl. A 4 | 1,297 | 16,861 | |||||
Tokai Tokyo Financial Holdings | 63,500 | 229,253 | |||||
Vontobel Holding | 75,400 | 1,488,176 | |||||
W.P. Carey & Co. LLC | 281,231 | 12,945,063 | |||||
Waddell & Reed Financial Cl. A | 285,600 | 8,647,968 | |||||
Westwood Holdings Group | 45,895 | 1,710,048 | |||||
| 342,671,599 | |||||||
| Commercial Banks - 3.4% | |||||||
Ames National | 247,129 | 5,681,496 | |||||
Banco Latinoamericano de Comercio | |||||||
Exterior Cl. E | 110,775 | 2,373,908 | |||||
Bank of Hawaii | 757,001 | 34,784,196 | |||||
Bank of N.T. Butterfield & Son 2 | 1,916,857 | 2,434,408 | |||||
BLOM Bank GDR | 684,500 | 5,256,960 | |||||
BOK Financial | 516,382 | 30,053,432 | |||||
Canadian Western Bank | 783,200 | 20,324,275 | |||||
City Holding Company | 629,577 | 21,210,449 | |||||
Farmers & Merchants Bank of Long | |||||||
Beach | 479 | 2,107,600 | |||||
First Citizens BancShares Cl. A | 52,754 | 8,791,454 | |||||
First National Bank Alaska | 3,110 | 4,913,800 | |||||
National Bankshares | 183,068 | 5,514,008 | |||||
Peapack-Gladstone Financial 3 | 475,350 | 7,372,679 | |||||
Sun Bancorp 1,2 | 284,428 | 767,956 | |||||
| 151,586,621 | |||||||
| Consumer Finance - 0.0% | |||||||
Cash America International | 1,400 | 61,656 | |||||
| Diversified Financial Services - 0.5% | |||||||
Leucadia National | 433,800 | 9,226,926 | |||||
Sofina | 195,572 | 15,105,078 | |||||
| 24,332,004 | |||||||
| Insurance - 12.8% | |||||||
Alleghany Corporation 2 | 102,949 | 34,976,923 | |||||
Allied World Assurance Company | |||||||
Holdings | 400,002 | 31,788,159 | |||||
Alterra Capital Holdings 1 | 744,226 | 17,377,677 | |||||
American Equity Investment Life Holding | |||||||
Company | 3,200 | 35,232 | |||||
American Financial Group | 137,100 | 5,378,433 | |||||
American National Insurance | 145,093 | 10,340,778 | |||||
AmTrust Financial Services | 42,500 | 1,262,675 | |||||
APRIL Group | 9,100 | 129,335 | |||||
Argo Group International Holdings | 93,481 | 2,736,189 | |||||
Aspen Insurance Holdings | 1,186,614 | 34,293,145 | |||||
Assurant | 51,959 | 1,810,252 | |||||
Assured Guaranty 1 | 180,992 | 2,551,987 | |||||
Baldwin & Lyons Cl. B | 108,741 | 2,527,141 | |||||
Brown & Brown | 110,000 | 2,999,700 | |||||
Cincinnati Financial | 280,000 | 10,659,600 | |||||
Crawford & Company Cl. B | 118,091 | 482,992 | |||||
E-L Financial | 83,588 | 34,072,311 | |||||
EMC Insurance Group | 101,164 | 2,043,513 | |||||
Employers Holdings | 10,400 | 187,616 | |||||
Endurance Specialty Holdings | 147,698 | 5,659,787 | |||||
Erie Indemnity Cl. A | 635,400 | 45,500,994 | |||||
Everest Re Group | 39,900 | 4,129,251 | |||||
FBL Financial Group Cl. A | 14,900 | 417,349 | |||||
Fidelity National Financial Cl. A | 1,213,752 | 23,376,863 | |||||
First American Financial | 530,161 | 8,991,531 | |||||
Flagstone Reinsurance Holdings 1 | 424,879 | 3,403,281 | |||||
Gallagher (Arthur J.) & Co. | 978,200 | 34,305,474 | |||||
HCC Insurance Holdings | 662,046 | 20,788,244 | |||||
Infinity Property & Casualty | 107,762 | 6,214,634 | |||||
Kansas City Life Insurance | 3,299 | 116,092 | |||||
Lincoln National | 1,900 | 41,553 | |||||
Markel Corporation 2 | 67,900 | 29,991,430 | |||||
Meadowbrook Insurance Group | 1,813,424 | 15,939,997 | |||||
Mercury General | 217,300 | 9,054,891 | |||||
Montpelier Re Holdings | 872,810 | 18,582,125 | |||||
Old Republic International | 1,087,000 | 9,011,230 | |||||
PartnerRe | 384,797 | 29,117,589 | |||||
Platinum Underwriters Holdings 1 | 287,606 | 10,957,789 | |||||
Presidential Life | 700 | 6,881 | |||||
Protective Life | 92,430 | 2,718,366 | |||||
Reinsurance Group of America | 767,205 | 40,822,978 | |||||
RenaissanceRe Holdings 1 | 9,809 | 745,582 | |||||
RLI | 78,635 | 5,362,907 | |||||
StanCorp Financial Group | 495,513 | 18,413,263 | |||||
State Auto Financial | 362,000 | 5,086,100 | |||||
Symetra Financial | 717,400 | 9,053,588 | |||||
Tower Group | 90,555 | 1,889,883 | |||||
United Fire Group | 108,691 | 2,318,379 | |||||
Validus Holdings | 414,901 | 13,289,279 | |||||
White Mountains Insurance Group 1 | 3,760 | 1,961,780 | |||||
| 572,922,748 | |||||||
| Real Estate Investment Trusts (REITs) - 3.4% | |||||||
Annaly Capital Management | 450,500 | 7,559,390 | |||||
Colony Financial | 1,468,688 | 25,408,302 | |||||
Cousins Properties | 818,085 | 6,340,159 | |||||
DCT Industrial Trust | 1,121,600 | 7,066,080 | |||||
Essex Property Trust | 83,000 | 12,775,360 | |||||
Lexington Realty Trust | 1,711,246 | 14,494,254 | |||||
MFA Financial | 692,000 | 5,459,880 | |||||
National Health Investors | 159,570 | 8,125,304 | |||||
National Retail Properties | 650,000 | 18,388,500 | |||||
PS Business Parks | 168,500 | 11,410,820 | |||||
Rayonier | 794,100 | 35,655,090 | |||||
| 152,683,139 | |||||||
| THE ACCOMPANYING NOTES ARE AN INTEGRAL PART OF THESE FINANCIAL STATEMENTS. | The Royce Funds 2012 Semiannual Report to Shareholders | 71 |
| Schedules of Investments |
| Royce Total Return Fund (continued) |
| SHARES | VALUE | ||||||
| Financials (continued) | |||||||
| Thrifts & Mortgage Finance - 0.8% | |||||||
Genworth MI Canada | 989,800 | $ | 17,927,426 | ||||
HopFed Bancorp | 129,009 | 891,452 | |||||
Kearny Financial 1 | 312,100 | 3,024,249 | |||||
TrustCo Bank Corp NY | 2,394,025 | 13,071,376 | |||||
| 34,914,503 | |||||||
| Total (Cost $1,094,763,687) | 1,279,172,270 | ||||||
| Health Care – 6.1% | |||||||
| Health Care Equipment & Supplies - 2.4% | |||||||
Analogic Corporation | 164,300 | 10,186,600 | |||||
Atrion Corporation | 1,088 | 223,018 | |||||
Cantel Medical | 78,609 | 2,142,095 | |||||
Carl Zeiss Meditec | 12,200 | 294,048 | |||||
Essilor International | 3,100 | 287,971 | |||||
Hill-Rom Holdings | 558,370 | 17,225,715 | |||||
IDEXX Laboratories 1,2 | 379,600 | 36,490,948 | |||||
Invacare Corporation | 156,389 | 2,413,082 | |||||
Nihon Kohden | 8,500 | 258,829 | |||||
STERIS Corporation | 602,100 | 18,887,877 | |||||
Teleflex | 309,700 | 18,863,827 | |||||
Young Innovations | 15,705 | 541,665 | |||||
| 107,815,675 | |||||||
| Health Care Providers & Services - 3.1% | |||||||
BML | 8,100 | 201,967 | |||||
Chemed Corporation | 674,559 | 40,770,346 | |||||
Coventry Health Care | 44,500 | 1,414,655 | |||||
Ensign Group | 93,455 | 2,641,973 | |||||
Landauer | 407,271 | 23,348,846 | |||||
Lincare Holdings | 2,092 | 71,170 | |||||
Mediq | 12,400 | 152,536 | |||||
MEDNAX 2 | 549,876 | 37,688,501 | |||||
National HealthCare | 59,602 | 2,695,799 | |||||
Omnicare | 76,799 | 2,398,433 | |||||
Owens & Minor | 911,950 | 27,933,029 | |||||
| 139,317,255 | |||||||
| Life Sciences Tools & Services - 0.4% | |||||||
PerkinElmer | 712,600 | 18,385,080 | |||||
| Pharmaceuticals - 0.2% | |||||||
China Shineway Pharmaceutical Group | 150,000 | 217,530 | |||||
H. Lundbeck | 11,700 | 241,035 | |||||
Medicis Pharmaceutical Cl. A | 78,025 | 2,664,554 | |||||
Mochida Pharmaceutical | 20,700 | 238,378 | |||||
Recordati | 25,200 | 179,305 | |||||
Valeant Pharmaceuticals International 2 | 55,768 | 2,497,849 | |||||
| 6,038,651 | |||||||
| Total (Cost $175,605,831) | 271,556,661 | ||||||
| Industrials – 18.7% | |||||||
| Aerospace & Defense - 1.7% | |||||||
American Science & Engineering | 63,734 | 3,597,784 | |||||
Cubic Corporation | 797,918 | 38,363,897 | |||||
HEICO Corporation | 371,875 | 14,696,500 | |||||
HEICO Corporation Cl. A | 390,933 | 12,611,499 | |||||
National Presto Industries | 66,226 | 4,620,588 | |||||
Triumph Group | 24,776 | 1,394,146 | |||||
| 75,284,414 | |||||||
| Air Freight & Logistics - 0.9% | |||||||
Aramex | 1,600,000 | 755,948 | |||||
C. H. Robinson Worldwide | 256,000 | 14,983,680 | |||||
Expeditors International of Washington | 458,400 | 17,763,000 | |||||
UTi Worldwide 1 | 492,600 | 7,196,886 | |||||
| 40,699,514 | |||||||
| Building Products - 0.5% | |||||||
Sekisui Jushi | 24,000 | 249,306 | |||||
Smith (A.O.) Corporation | 497,894 | 24,342,037 | |||||
| 24,591,343 | |||||||
| Commercial Services & Supplies - 2.5% | |||||||
ABM Industries | 755,800 | 14,783,448 | |||||
Ennis | 410,601 | 6,315,043 | |||||
G&K Services Cl. A | 1,955 | 60,977 | |||||
Healthcare Services Group | 33,732 | 653,726 | |||||
HNI Corporation | 474,173 | 12,209,955 | |||||
Kimball International Cl. B | 724,600 | 5,579,420 | |||||
McGrath RentCorp | 291,300 | 7,719,450 | |||||
Mine Safety Appliances | 196,000 | 7,887,040 | |||||
Progressive Waste Solutions | 10,400 | 196,768 | |||||
Ritchie Bros. Auctioneers | 1,596,320 | 33,921,800 | |||||
Rollins | 833,625 | 18,648,191 | |||||
RPS Group | 70,800 | 231,814 | |||||
Schawk Cl. A | 38,073 | 483,527 | |||||
Tokyu Community | 4,100 | 136,515 | |||||
Transcontinental Cl. A | 16,400 | 149,647 | |||||
UniFirst Corporation | 33,216 | 2,117,520 | |||||
US Ecology | 36,752 | 651,981 | |||||
Viad Corporation | 6,342 | 126,840 | |||||
| 111,873,662 | |||||||
| Construction & Engineering - 0.3% | |||||||
Comfort Systems USA | 301,150 | 3,017,523 | |||||
EMCOR Group | 64,839 | 1,803,821 | |||||
Global Construction Services | 117,900 | 152,751 | |||||
Granite Construction | 205,475 | 5,364,952 | |||||
Great Lakes Dredge & Dock | 4,432 | 31,556 | |||||
KBR | 92,113 | 2,276,112 | |||||
NEC Networks & System Integration | 18,300 | 290,007 | |||||
Yongnam Holdings | 1,064,000 | 194,003 | |||||
| 13,130,725 | |||||||
| Electrical Equipment - 2.2% | |||||||
Acuity Brands | 11,268 | 573,654 | |||||
AZZ | 182,333 | 11,169,720 | |||||
Belden | 6,173 | 205,870 | |||||
Brady Corporation Cl. A | 471,373 | 12,967,471 | |||||
Franklin Electric | 366,900 | 18,759,597 | |||||
Hubbell Cl. B | 337,377 | 26,295,163 | |||||
LSI Industries | 1,104,161 | 7,861,626 | |||||
Preformed Line Products | 202,671 | 11,736,678 | |||||
Regal-Beloit | 12,702 | 790,826 | |||||
| 72 | The Royce Funds 2012 Semiannual Report to Shareholders | THE ACCOMPANYING NOTES ARE AN INTEGRAL PART OF THESE FINANCIAL STATEMENTS. |
| June 30, 2012 (unaudited) |
| SHARES | VALUE | ||||||
| Industrials (continued) | |||||||
| Electrical Equipment (continued) | |||||||
Roper Industries | 76,000 | $ | 7,492,080 | ||||
| 97,852,685 | |||||||
| Industrial Conglomerates - 0.8% | |||||||
Raven Industries | 156,201 | 10,870,028 | |||||
Seaboard Corporation 2 | 10,476 | 22,345,098 | |||||
Standex International | 62,043 | 2,641,170 | |||||
| 35,856,296 | |||||||
| Machinery - 6.8% | |||||||
Alamo Group | 190,447 | 5,974,322 | |||||
American Railcar Industries 2 | 119,609 | 3,241,404 | |||||
Ampco-Pittsburgh | 189,320 | 3,470,236 | |||||
Briggs & Stratton | 530,130 | 9,271,974 | |||||
Cascade Corporation | 184,121 | 8,662,893 | |||||
Chen Hsong Holdings | 421,700 | 125,612 | |||||
Crane Company | 360,400 | 13,111,352 | |||||
FreightCar America | 10,539 | 242,081 | |||||
Fuji Machine Manufacturing | 11,200 | 197,008 | |||||
Gardner Denver | 2,600 | 137,566 | |||||
Gorman-Rupp Company | 576,633 | 17,183,663 | |||||
Harsco Corporation | 200 | 4,076 | |||||
Hoshizaki Electric | 12,900 | 326,087 | |||||
Kaydon Corporation | 39,500 | 844,905 | |||||
Kennametal | 1,057,559 | 35,058,081 | |||||
Kinki Sharyo | 41,700 | 150,713 | |||||
Lincoln Electric Holdings | 240,800 | 10,544,632 | |||||
Lindsay Corporation | 221,982 | 14,406,632 | |||||
Muehlbauer Holding AG & Co. | 4,400 | 121,916 | |||||
Mueller (Paul) Company 1,2,3,4 | 116,700 | 2,567,400 | |||||
Mueller Industries | 451,262 | 19,219,249 | |||||
Nordson Corporation | 736,000 | 37,749,440 | |||||
Starrett (L.S.) Company (The) Cl. A 3 | 529,400 | 6,125,158 | |||||
Sun Hydraulics | 1,014,697 | 24,646,990 | |||||
Tennant Company | 640,198 | 25,575,910 | |||||
Timken Company (The) | 45,232 | 2,071,173 | |||||
Toro Company (The) | 328,275 | 24,059,275 | |||||
Trinity Industries | 645,587 | 16,126,763 | |||||
Watts Water Technologies Cl. A | 1,500 | 50,010 | |||||
Woodward | 609,200 | 24,026,848 | |||||
| 305,293,369 | |||||||
| Marine - 0.6% | |||||||
Alexander & Baldwin Holdings | 494,700 | 26,342,775 | |||||
Euroseas | 125,346 | 147,908 | |||||
| 26,490,683 | |||||||
| Professional Services - 1.5% | |||||||
CDI Corporation | 19,985 | 327,754 | |||||
Corporate Executive Board | 236,000 | 9,647,680 | |||||
Heidrick & Struggles International | 168,432 | 2,947,560 | |||||
Kelly Services Cl. A | 595,000 | 7,681,450 | |||||
ManpowerGroup | 462,152 | 16,937,871 | |||||
Resources Connection | 5,200 | 63,960 | |||||
Robert Half International | 26,300 | 751,391 | |||||
RWS Holdings | 18,500 | 147,038 | |||||
Towers Watson & Company Cl. A | 489,400 | 29,315,060 | |||||
| 67,819,764 | |||||||
| Road & Rail - 0.1% | |||||||
Arkansas Best | 246,281 | 3,103,141 | |||||
Nippon Konpo Unyu Soko | 21,700 | 275,633 | |||||
| 3,378,774 | |||||||
| Trading Companies & Distributors - 0.8% | |||||||
Applied Industrial Technologies | 783,970 | 28,889,294 | |||||
GATX Corporation | 79,000 | 3,041,500 | |||||
Houston Wire & Cable | 59,164 | 646,663 | |||||
Kuroda Electric | 19,900 | 227,038 | |||||
MFC Industrial | 331,598 | 2,234,971 | |||||
Watsco | 6,902 | 509,368 | |||||
| 35,548,834 | |||||||
| Transportation Infrastructure - 0.0% | |||||||
Grupo Aeroportuario del Pacifico ADR | 40,000 | 1,578,400 | |||||
| Total (Cost $517,337,882) | 839,398,463 | ||||||
| Information Technology – 6.0% | |||||||
| Communications Equipment - 1.9% | |||||||
Aastra Technologies | 4,780 | 83,994 | |||||
ADTRAN | 220,400 | 6,653,876 | |||||
Bel Fuse Cl. A | 22,350 | 404,758 | |||||
Bel Fuse Cl. B | 74,000 | 1,303,140 | |||||
Black Box | 323,153 | 9,274,491 | |||||
China All Access Holdings | 1,000,000 | 211,318 | |||||
Comtech Telecommunications | 94,500 | 2,700,810 | |||||
NEC Mobiling | 7,600 | 300,678 | |||||
NETGEAR 2 | 947,509 | 32,698,536 | |||||
Nolato Cl. B | 17,041 | 163,789 | |||||
Plantronics | 834,245 | 27,863,783 | |||||
Tellabs | 741,355 | 2,468,712 | |||||
| 84,127,885 | |||||||
| Computers & Peripherals - 0.0% | |||||||
Diebold | 13,700 | 505,667 | |||||
Melco Holdings | 9,000 | 196,541 | |||||
Xyratex | 89,003 | 1,006,624 | |||||
| 1,708,832 | |||||||
| Electronic Equipment, Instruments & Components - 2.3% | |||||||
AVX Corporation | 1,218,031 | 13,020,752 | |||||
Cognex Corporation | 418,300 | 13,239,195 | |||||
Electro Rent | 4,700 | 76,281 | |||||
Littelfuse | 449,518 | 25,573,079 | |||||
Methode Electronics | 1,123,473 | 9,560,755 | |||||
Molex | 93,511 | 2,238,653 | |||||
Molex Cl. A | 985,465 | 19,935,957 | |||||
MTS Systems | 126,841 | 4,889,721 | |||||
Nam Tai Electronics | 1,756,871 | 10,224,989 | |||||
Park Electrochemical | 131,648 | 3,407,050 | |||||
| 102,166,432 | |||||||
| Internet Software & Services - 0.2% | |||||||
EarthLink | 434,698 | 3,234,153 | |||||
j2 Global | 55,000 | 1,453,100 | |||||
NIFTY Corporation | 100 | 141,567 | |||||
United Online | 788,715 | 3,328,377 | |||||
| 8,157,197 | |||||||
| THE ACCOMPANYING NOTES ARE AN INTEGRAL PART OF THESE FINANCIAL STATEMENTS. | The Royce Funds 2012 Semiannual Report to Shareholders | 73 |
| Schedules of Investments |
| Royce Total Return Fund (continued) |
| SHARES | VALUE | ||||||
| Information Technology (continued) | |||||||
| IT Services - 0.9% | |||||||
Bechtle | 137 | $ | 5,042 | ||||
Broadridge Financial Solutions | 52,300 | 1,112,421 | |||||
Calian Technologies | 12,200 | 247,331 | |||||
Computer Sciences | 3,900 | 96,798 | |||||
DWS | 156,700 | 235,687 | |||||
Global Payments | 10,546 | 455,904 | |||||
Groupe Steria SCA | 7,600 | 117,498 | |||||
ManTech International Cl. A | 932,768 | 21,892,065 | |||||
MAXIMUS | 114,184 | 5,909,022 | |||||
Total System Services | 394,738 | 9,446,080 | |||||
| 39,517,848 | |||||||
| Semiconductors & Semiconductor Equipment - 0.5% | |||||||
Brooks Automation | 65,390 | 617,281 | |||||
Elmos Semiconductor | 15,000 | 123,483 | |||||
Micrel | 69,460 | 661,954 | |||||
MKS Instruments | 89,283 | 2,582,957 | |||||
Regent Manner International Holdings | 417,800 | 92,904 | |||||
SMA Solar Technology | 2,000 | 68,532 | |||||
Teradyne 2 | 1,341,300 | 18,858,678 | |||||
UMS Holdings | 474,000 | 152,772 | |||||
| 23,158,561 | |||||||
| Software - 0.2% | |||||||
Fair Isaac | 173,457 | 7,333,762 | |||||
Hansen Technologies | 133,799 | 126,200 | |||||
Micro Focus International | 9,457 | 78,796 | |||||
OPNET Technologies | 14,800 | 393,532 | |||||
| 7,932,290 | |||||||
| Total (Cost $293,017,096) | 266,769,045 | ||||||
| Materials – 6.7% | |||||||
| Chemicals - 3.8% | |||||||
Agrium | 5,200 | 460,044 | |||||
Albemarle Corporation | 445,000 | 26,539,800 | |||||
Balchem Corporation | 994,900 | 32,443,689 | |||||
Cabot Corporation | 781,000 | 31,786,700 | |||||
Chase Corporation 3 | 773,974 | 10,216,457 | |||||
FutureFuel Corporation | 80,549 | 846,570 | |||||
H.B. Fuller Company | 10,022 | 307,675 | |||||
Innophos Holdings | 233,185 | 13,165,625 | |||||
International Flavors & Fragrances | 255,300 | 13,990,440 | |||||
Koatsu Gas Kogyo | 30,400 | 187,925 | |||||
Koninklijke DSM | 600 | 29,603 | |||||
Konishi Company | 14,000 | 199,512 | |||||
Kronos Worldwide | 74,000 | 1,168,460 | |||||
Methanex Corporation | 310,710 | 8,650,166 | |||||
Minerals Technologies | 50,067 | 3,193,273 | |||||
NewMarket Corporation | 7,526 | 1,630,132 | |||||
Quaker Chemical | 435,129 | 20,107,311 | |||||
Sakai Chemical Industry | 33,600 | 112,861 | |||||
Stepan Company | 12,064 | 1,136,188 | |||||
Tredegar Corporation | 31,800 | 463,008 | |||||
Westlake Chemical | 42,700 | 2,231,502 | |||||
| 168,866,941 | |||||||
| Construction Materials - 0.1% | |||||||
Ash Grove Cement 4 | 39,610 | 5,347,350 | |||||
| Containers & Packaging - 1.2% | |||||||
AptarGroup | 41,300 | 2,108,365 | |||||
Bemis Company | 464,800 | 14,566,832 | |||||
Greif Cl. A | 586,801 | 24,058,841 | |||||
Myers Industries | 14,700 | 252,252 | |||||
Pack Corporation (The) | 13,800 | 234,636 | |||||
Sealed Air | 7,013 | 108,281 | |||||
Sonoco Products | 359,778 | 10,847,307 | |||||
| 52,176,514 | |||||||
| Metals & Mining - 1.2% | |||||||
Agnico-Eagle Mines | 117,000 | 4,733,820 | |||||
Carpenter Technology | 284,375 | 13,604,500 | |||||
Eramet | 1,500 | 173,377 | |||||
Gold Fields ADR | 391,200 | 5,011,272 | |||||
HudBay Minerals | 12,500 | 96,375 | |||||
IAMGOLD Corporation | 196,620 | 2,320,116 | |||||
Olympic Steel | 39,297 | 645,257 | |||||
Panoramic Resources | 102,100 | 64,376 | |||||
Reliance Steel & Aluminum | 566,613 | 28,613,956 | |||||
| 55,263,049 | |||||||
| Paper & Forest Products - 0.4% | |||||||
Buckeye Technologies | 19,200 | 547,008 | |||||
Deltic Timber | 172,000 | 10,488,560 | |||||
Domtar Corporation | 33,700 | 2,585,127 | |||||
Glatfelter | 27,302 | 446,934 | |||||
Louisiana-Pacific Corporation 2 | 78,000 | 848,640 | |||||
Schweitzer-Mauduit International | 31,100 | 2,119,154 | |||||
TFS Corporation 2 | 270,400 | 137,794 | |||||
| 17,173,217 | |||||||
| Total (Cost $204,850,833) | 298,827,071 | ||||||
| Telecommunication Services – 0.6% | |||||||
| Diversified Telecommunication Services - 0.2% | |||||||
Atlantic Tele-Network | 284,303 | 9,589,540 | |||||
| Wireless Telecommunication Services - 0.4% | |||||||
Telephone and Data Systems | 792,190 | 16,865,725 | |||||
USA Mobility | 143,566 | 1,846,259 | |||||
| 18,711,984 | |||||||
| Total (Cost $28,161,646) | 28,301,524 | ||||||
| Utilities – 2.7% | |||||||
| Electric Utilities - 0.8% | |||||||
ALLETE | 199,147 | 8,324,345 | |||||
ITC Holdings | 250,000 | 17,227,500 | |||||
PNM Resources | 638,900 | 12,484,106 | |||||
| 38,035,951 | |||||||
| Gas Utilities - 1.2% | |||||||
AGL Resources | 312,558 | 12,111,623 | |||||
National Fuel Gas | 61,676 | 2,897,538 | |||||
Piedmont Natural Gas | 539,500 | 17,366,505 | |||||
UGI Corporation | 660,076 | 19,426,037 | |||||
| 51,801,703 | |||||||
| 74 | The Royce Funds 2012 Semiannual Report to Shareholders | THE ACCOMPANYING NOTES ARE AN INTEGRAL PART OF THESE FINANCIAL STATEMENTS. |
| June 30, 2012 (unaudited) |
| SHARES | VALUE | |||||||
| Utilities (continued) | ||||||||
| Water Utilities - 0.7% | ||||||||
Aqua America | 819,766 | $ | 20,461,359 | |||||
Consolidated Water 1 | 25,827 | 214,106 | ||||||
SJW | 400,400 | 9,613,604 | ||||||
| 30,289,069 | ||||||||
| Total (Cost $93,414,655) | 120,126,723 | |||||||
| Miscellaneous5 – 1.0% | ||||||||
| Total (Cost $43,983,680) | 46,166,452 | |||||||
| TOTAL COMMON STOCKS | ||||||||
(Cost $3,313,620,680) | 4,194,462,874 | |||||||
| PRINCIPAL | ||||||||
| AMOUNT | ||||||||
| CORPORATE BONDS – 0.1% | ||||||||
GAMCO Investors (Debentures) 0.00% | ||||||||
due 12/31/15 | $ | 890,500 | 775,314 | |||||
Leucadia National 3.75% | ||||||||
Conv. Senior Note due 4/15/14 | 3,000,000 | 3,277,500 | ||||||
| TOTAL CORPORATE BONDS | ||||||||
(Cost $3,890,542) | 4,052,814 | |||||||
| REPURCHASE AGREEMENT – 6.2% | ||||||||
| Fixed Income Clearing Corporation, | ||||||||
0.11% dated 6/29/12, due 7/2/12, | ||||||||
maturity value $277,574,544 (collateralized | ||||||||
by obligations of various U.S. Government | ||||||||
Agencies, 0.875% due 1/31/17-2/28/17, valued at | ||||||||
$283,124,719) | ||||||||
(Cost $277,572,000) | 277,572,000 | |||||||
| COLLATERAL RECEIVED FOR SECURITIES | ||||||||
LOANED – 0.6% | ||||||||
| Money Market Funds | ||||||||
Federated Government Obligations Fund | ||||||||
(7 day yield-0.0115%) | ||||||||
(Cost $25,664,495) | 25,664,495 | |||||||
| TOTAL INVESTMENTS – 100.4% | ||||||||
(Cost $3,620,747,717) | 4,501,752,183 | |||||||
| LIABILITIES LESS CASH | ||||||||
AND OTHER ASSETS – (0.4)% | (18,515,385 | ) | ||||||
| NET ASSETS – 100.0% | $ | 4,483,236,798 | ||||||
| Royce Heritage Fund |
| SHARES | VALUE | |||||||
| COMMON STOCKS – 96.2% | ||||||||
| Consumer Discretionary – 12.2% | ||||||||
| Auto Components - 1.6% | ||||||||
Autoliv | 4,630 | $ | 253,076 | |||||
Drew Industries 2 | 54,800 | 1,526,180 | ||||||
Gentex Corporation | 40,000 | 834,800 | ||||||
Minth Group | 501,700 | 544,478 | ||||||
Nokian Renkaat | 28,000 | 1,067,197 | ||||||
| 4,225,731 | ||||||||
| Automobiles - 0.4% | ||||||||
Thor Industries | 36,300 | 994,983 | ||||||
| Distributors - 0.6% | ||||||||
LKQ Corporation 2 | 47,900 | 1,599,860 | ||||||
| Diversified Consumer Services - 0.9% | ||||||||
Sotheby’s | 73,400 | 2,448,624 | ||||||
| Household Durables - 4.5% | ||||||||
Cavco Industries 2 | 18,400 | 943,552 | ||||||
Ethan Allen Interiors | 55,900 | 1,114,087 | ||||||
Garmin | 19,400 | 742,826 | ||||||
Harman International Industries | 58,340 | 2,310,264 | ||||||
Mohawk Industries 2 | 51,800 | 3,617,194 | ||||||
NVR 2 | 3,920 | 3,332,000 | ||||||
| 12,059,923 | ||||||||
| Media - 0.5% | ||||||||
Morningstar | 20,928 | 1,210,475 | ||||||
| Specialty Retail - 2.4% | ||||||||
Advance Auto Parts | 13,820 | 942,801 | ||||||
American Eagle Outfitters | 20,000 | 394,600 | ||||||
Children’s Place Retail Stores 2 | 6,800 | 338,844 | ||||||
Fielmann | 4,700 | 434,412 | ||||||
Guess? | 12,200 | 370,514 | ||||||
Lewis Group | 59,500 | 512,790 | ||||||
Luk Fook Holdings (International) | 85,000 | 178,333 | ||||||
Signet Jewelers | 11,300 | 497,313 | ||||||
Tiffany & Co. | 35,000 | 1,853,250 | ||||||
USS | 7,000 | 756,122 | ||||||
| 6,278,979 | ||||||||
| Textiles, Apparel & Luxury Goods - 1.3% | ||||||||
Daphne International Holdings | 240,800 | 245,847 | ||||||
G-III Apparel Group 2 | 15,665 | 371,104 | ||||||
Gildan Activewear | 15,900 | 437,568 | ||||||
Stella International Holdings | 568,200 | 1,409,945 | ||||||
Warnaco Group (The) 2 | 25,000 | 1,064,500 | ||||||
| 3,528,964 | ||||||||
| Total (Cost $27,320,312) | 32,347,539 | |||||||
| Consumer Staples – 1.4% | ||||||||
| Beverages - 0.4% | ||||||||
National Beverage 2 | 71,700 | 1,071,198 | ||||||
| Food Products - 1.0% | ||||||||
Darling International 2 | 102,500 | 1,690,225 | ||||||
First Resources | 273,100 | 417,443 | ||||||
Sanderson Farms | 2,200 | 100,804 | ||||||
| THE ACCOMPANYING NOTES ARE AN INTEGRAL PART OF THESE FINANCIAL STATEMENTS. | The Royce Funds 2012 Semiannual Report to Shareholders | 75 |
| Schedules of Investments |
| Royce Heritage Fund (continued) |
| SHARES | VALUE | ||||||
| Consumer Staples (continued) | |||||||
| Food Products (continued) | |||||||
Super Group | 204,000 | $ | 339,136 | ||||
| 2,547,608 | |||||||
| Total (Cost $2,835,202) | 3,618,806 | ||||||
| Energy – 4.9% | |||||||
| Energy Equipment & Services - 4.8% | |||||||
C&J Energy Services 1,2 | 33,400 | 617,900 | |||||
CARBO Ceramics | 750 | 57,548 | |||||
Ensco Cl. A | 1,800 | 84,546 | |||||
Ensign Energy Services | 24,800 | 341,027 | |||||
Helmerich & Payne | 56,970 | 2,477,056 | |||||
Oil States International 2 | 43,000 | 2,846,600 | |||||
Pason Systems | 90,900 | 1,328,545 | |||||
RPC | 51,300 | 609,957 | |||||
TGS-NOPEC Geophysical | 58,400 | 1,574,074 | |||||
Total Energy Services | 74,000 | 1,045,929 | |||||
Trican Well Service | 151,300 | 1,746,169 | |||||
| 12,729,351 | |||||||
| Oil, Gas & Consumable Fuels - 0.1% | |||||||
Energen Corporation | 1,500 | 67,695 | |||||
Swift Energy 2 | 11,900 | 221,459 | |||||
| 289,154 | |||||||
| Total (Cost $10,587,685) | 13,018,505 | ||||||
| Financials – 17.7% | |||||||
| Capital Markets - 13.7% | |||||||
Affiliated Managers Group 2 | 18,560 | 2,031,392 | |||||
AllianceBernstein Holding L.P. | 65,070 | 825,738 | |||||
ARA Asset Management | 620,000 | 702,065 | |||||
Ashmore Group | 651,000 | 3,572,542 | |||||
Banque Privee Edmond de Rothschild | 26 | 520,210 | |||||
Blackstone Group L.P. | 75,000 | 980,250 | |||||
Cohen & Steers | 48,400 | 1,670,284 | |||||
Egyptian Financial Group-Hermes Holding | |||||||
Company 2 | 308,000 | 523,120 | |||||
Federated Investors Cl. B | 49,600 | 1,083,760 | |||||
Invesco | 93,700 | 2,117,620 | |||||
Jupiter Fund Management | 475,900 | 1,607,053 | |||||
KKR & Co. L.P. | 203,000 | 2,616,670 | |||||
Lazard Cl. A | 108,500 | 2,819,915 | |||||
Reinet Investments 2 | 7,355 | 134,370 | |||||
SEI Investments | 155,600 | 3,094,884 | |||||
Sprott | 336,400 | 1,635,576 | |||||
T. Rowe Price Group | 26,800 | 1,687,328 | |||||
TD AMERITRADE Holding Corporation | 130,000 | 2,210,000 | |||||
Value Partners Group | 3,581,500 | 1,754,738 | |||||
VZ Holding | 5,500 | 521,081 | |||||
Waddell & Reed Financial Cl. A | 43,600 | 1,320,208 | |||||
† WisdomTree Investments 1,2 | 450,700 | 2,961,099 | |||||
| 36,389,903 | |||||||
| Diversified Financial Services - 1.9% | |||||||
Bolsa Mexicana de Valores | 801,800 | 1,579,594 | |||||
Moody’s Corporation | 30,230 | 1,104,906 | |||||
Singapore Exchange | 260,000 | 1,305,209 | |||||
Warsaw Stock Exchange | 100,000 | 1,146,867 | |||||
| 5,136,576 | |||||||
| Insurance - 2.0% | |||||||
Alleghany Corporation 2 | 15,190 | 5,160,802 | |||||
| Real Estate Management & Development - 0.1% | |||||||
E-House China Holdings ADR | 59,000 | 324,500 | |||||
| Total (Cost $42,972,812) | 47,011,781 | ||||||
| Health Care – 4.0% | |||||||
| Biotechnology - 0.3% | |||||||
Myriad Genetics 2 | 27,900 | 663,183 | |||||
| Health Care Equipment & Supplies - 1.2% | |||||||
Atrion Corporation | 4,900 | 1,004,402 | |||||
Carl Zeiss Meditec | 57,000 | 1,373,830 | |||||
IDEXX Laboratories 2 | 5,500 | 528,715 | |||||
Kossan Rubber Industries | 324,997 | 330,032 | |||||
| 3,236,979 | |||||||
| Health Care Providers & Services - 0.3% | |||||||
Schein (Henry) 2 | 10,700 | 839,843 | |||||
| Life Sciences Tools & Services - 1.6% | |||||||
ICON ADR 2 | 65,100 | 1,466,703 | |||||
PerkinElmer | 27,950 | 721,110 | |||||
Techne Corporation | 12,100 | 897,820 | |||||
Waters Corporation 1,2 | 13,250 | 1,052,978 | |||||
| 4,138,611 | |||||||
| Pharmaceuticals - 0.6% | |||||||
Adcock Ingram Holdings | 105,000 | 773,253 | |||||
Perrigo Company | 1,900 | 224,067 | |||||
Santen Pharmaceutical | 16,300 | 668,501 | |||||
| 1,665,821 | |||||||
| Total (Cost $8,973,712) | 10,544,437 | ||||||
| Industrials – 25.3% | |||||||
| Aerospace & Defense - 0.5% | |||||||
HEICO Corporation | 27,343 | 1,080,596 | |||||
Teledyne Technologies 2 | 4,100 | 252,765 | |||||
| 1,333,361 | |||||||
| Air Freight & Logistics - 1.7% | |||||||
Forward Air | 89,800 | 2,897,846 | |||||
UTi Worldwide | 103,000 | 1,504,830 | |||||
| 4,402,676 | |||||||
| Building Products - 1.3% | |||||||
AAON | 82,350 | 1,552,298 | |||||
Simpson Manufacturing | 63,000 | 1,859,130 | |||||
| 3,411,428 | |||||||
| Commercial Services & Supplies - 1.5% | |||||||
Brink’s Company (The) | 20,280 | 470,090 | |||||
Cintas Corporation | 8,800 | 339,768 | |||||
Ritchie Bros. Auctioneers | 131,700 | 2,798,625 | |||||
Team 2 | 10,176 | 317,288 | |||||
| 3,925,771 | |||||||
| 76 | The Royce Funds 2012 Semiannual Report to Shareholders | THE ACCOMPANYING NOTES ARE AN INTEGRAL PART OF THESE FINANCIAL STATEMENTS. |
| June 30, 2012 (unaudited) |
| SHARES | VALUE | ||||||
| Industrials (continued) | |||||||
| Construction & Engineering - 3.4% | |||||||
Chicago Bridge & Iron | 2,300 | $ | 87,308 | ||||
EMCOR Group | 81,400 | 2,264,548 | |||||
Fluor Corporation | 27,700 | 1,366,718 | |||||
Jacobs Engineering Group 2 | 55,000 | 2,082,300 | |||||
KBR | 90,500 | 2,236,255 | |||||
Pike Electric 2 | 48,385 | 373,532 | |||||
Quanta Services 2 | 5,200 | 125,164 | |||||
Raubex Group | 245,000 | 401,149 | |||||
| 8,936,974 | |||||||
| Electrical Equipment - 0.8% | |||||||
AZZ | 2,000 | 122,520 | |||||
EnerSys 2 | 4,000 | 140,280 | |||||
GrafTech International 2 | 139,100 | 1,342,315 | |||||
Hubbell Cl. B | 7,750 | 604,035 | |||||
| 2,209,150 | |||||||
| Industrial Conglomerates - 0.6% | |||||||
Raven Industries | 25,200 | 1,753,668 | |||||
| Machinery - 6.6% | |||||||
Astec Industries 2 | 2,800 | 85,904 | |||||
Burckhardt Compression Holding | 4,000 | 1,026,733 | |||||
Chart Industries 2 | 1,600 | 110,016 | |||||
Foster (L.B.) Company | 51,600 | 1,476,276 | |||||
Gardner Denver | 31,300 | 1,656,083 | |||||
Graham Corporation | 9,900 | 184,338 | |||||
Kaydon Corporation | 44,400 | 949,716 | |||||
Kennametal | 87,030 | 2,885,045 | |||||
Lincoln Electric Holdings | 50,500 | 2,211,395 | |||||
Pfeiffer Vacuum Technology | 17,000 | 1,730,416 | |||||
Spirax-Sarco Engineering | 57,800 | 1,801,042 | |||||
Timken Company (The) | 2,500 | 114,475 | |||||
Valmont Industries | 26,920 | 3,256,512 | |||||
| 17,487,951 | |||||||
| Marine - 0.0% | |||||||
Kirby Corporation 2 | 2,900 | 136,532 | |||||
| Professional Services - 6.2% | |||||||
Advisory Board (The) 2 | 79,600 | 3,947,364 | |||||
Equifax | 35,700 | 1,663,620 | |||||
ManpowerGroup | 78,725 | 2,885,271 | |||||
Towers Watson & Company Cl. A | 58,750 | 3,519,125 | |||||
Verisk Analytics Cl. A 2 | 91,000 | 4,482,660 | |||||
| 16,498,040 | |||||||
| Road & Rail - 2.1% | |||||||
Landstar System | 71,100 | 3,677,292 | |||||
Patriot Transportation Holding 2 | 79,512 | 1,870,917 | |||||
| 5,548,209 | |||||||
| Trading Companies & Distributors - 0.6% | |||||||
Air Lease Cl. A 1,2 | 78,200 | 1,516,298 | |||||
| Total (Cost $55,407,837) | 67,160,058 | ||||||
| Information Technology – 17.7% | |||||||
| Communications Equipment - 1.0% | |||||||
ADTRAN | 48,450 | 1,462,705 | |||||
Comba Telecom Systems Holdings | 1,099,700 | 460,866 | |||||
Oplink Communications 2 | 25,200 | 340,956 | |||||
Plantronics | 8,000 | 267,200 | |||||
| 2,531,727 | |||||||
| Computers & Peripherals - 0.5% | |||||||
Catcher Technology | 41,600 | 281,567 | |||||
Super Micro Computer 2 | 30,500 | 483,730 | |||||
Western Digital 2 | 16,300 | 496,824 | |||||
| 1,262,121 | |||||||
| Electronic Equipment, Instruments & Components - 7.4% | |||||||
Amphenol Corporation Cl. A | 16,900 | 928,148 | |||||
Anixter International | 35,900 | 1,904,495 | |||||
Avnet 2 | 13,500 | 416,610 | |||||
AVX Corporation | 52,500 | 561,225 | |||||
China High Precision Automation | |||||||
Group 1,6 | 1,926,000 | 340,118 | |||||
Cognex Corporation | 72,300 | 2,288,295 | |||||
Coherent 2 | 58,200 | 2,520,060 | |||||
FEI Company 2 | 34,500 | 1,650,480 | |||||
FLIR Systems | 69,100 | 1,347,450 | |||||
IPG Photonics 1,2 | 74,879 | 3,263,976 | |||||
Mercury Computer Systems 2 | 26,800 | 346,524 | |||||
Molex | 25,000 | 598,500 | |||||
Multi-Fineline Electronix 2 | 12,995 | 320,197 | |||||
National Instruments | 75,750 | 2,034,645 | |||||
Rofin-Sinar Technologies 2 | 55,500 | 1,050,615 | |||||
| 19,571,338 | |||||||
| Internet Software & Services - 0.4% | |||||||
† Ancestry.com 1,2 | 30,900 | 850,677 | |||||
ValueClick 2 | 17,285 | 283,301 | |||||
| 1,133,978 | |||||||
| IT Services - 2.2% | |||||||
CSE Global | 545,400 | 343,907 | |||||
Fiserv 2 | 36,890 | 2,664,196 | |||||
MAXIMUS | 29,000 | 1,500,750 | |||||
Sapient Corporation | 119,800 | 1,206,386 | |||||
| 5,715,239 | |||||||
| Office Electronics - 0.1% | |||||||
Zebra Technologies Cl. A 2 | 11,100 | 381,396 | |||||
| Semiconductors & Semiconductor Equipment - 4.5% | |||||||
Aixtron ADR | 4,500 | 64,395 | |||||
Analog Devices | 46,500 | 1,751,655 | |||||
ASM International | 13,100 | 497,788 | |||||
Cymer 2 | 40,100 | 2,363,895 | |||||
Diodes 2 | 98,300 | 1,845,091 | |||||
Fairchild Semiconductor International 2 | 6,800 | 95,880 | |||||
Integrated Silicon Solution 2 | 42,400 | 427,816 | |||||
International Rectifier 2 | 34,684 | 693,333 | |||||
Lam Research 2 | 2,000 | 75,480 | |||||
MKS Instruments | 11,300 | 326,909 | |||||
Photronics 2 | 86,600 | 528,260 | |||||
RDA Microelectronics ADR 2 | 46,410 | 465,956 | |||||
Teradyne 2 | 189,300 | 2,661,558 | |||||
Veeco Instruments 1,2 | 2,500 | 85,900 | |||||
| 11,883,916 | |||||||
| THE ACCOMPANYING NOTES ARE AN INTEGRAL PART OF THESE FINANCIAL STATEMENTS. | The Royce Funds 2012 Semiannual Report to Shareholders | 77 |
| Schedules of Investments |
| Royce Heritage Fund (continued) |
| SHARES | VALUE | |||||||
| Information Technology (continued) | ||||||||
| Software - 1.6% | ||||||||
Actuate Corporation 2 | 54,200 | $ | 375,606 | |||||
American Software Cl. A | 31,730 | 252,254 | ||||||
ANSYS 2 | 58,400 | 3,685,624 | ||||||
| 4,313,484 | ||||||||
| Total (Cost $40,454,372) | 46,793,199 | |||||||
| Materials – 9.3% | ||||||||
| Chemicals - 2.0% | ||||||||
Airgas | 8,000 | 672,080 | ||||||
Cabot Corporation | 34,060 | 1,386,242 | ||||||
Fufeng Group | 305,200 | 115,952 | ||||||
Intrepid Potash 2 | 33,100 | 753,356 | ||||||
Minerals Technologies | 6,000 | 382,680 | ||||||
OM Group 2 | 15,200 | 288,800 | ||||||
Sigma-Aldrich Corporation | 9,140 | 675,720 | ||||||
Stepan Company | 600 | 56,508 | ||||||
Victrex | 40,000 | 797,768 | ||||||
Westlake Chemical | 2,000 | 104,520 | ||||||
| 5,233,626 | ||||||||
| Containers & Packaging - 0.9% | ||||||||
Boise | 29,600 | 194,768 | ||||||
Greif Cl. A | 52,700 | 2,160,700 | ||||||
| 2,355,468 | ||||||||
| Metals & Mining - 5.8% | ||||||||
Allegheny Technologies | 19,100 | 609,099 | ||||||
Allied Nevada Gold 2 | 52,500 | 1,489,950 | ||||||
Compass Minerals International | 15,000 | 1,144,200 | ||||||
Endeavour Mining 2 | 80,400 | 175,315 | ||||||
Fresnillo | 48,000 | 1,101,602 | ||||||
Globe Specialty Metals | 37,500 | 503,625 | ||||||
Haynes International | 7,700 | 392,238 | ||||||
Hochschild Mining | 279,200 | 2,059,980 | ||||||
Horsehead Holding Corporation 2 | 38,500 | 383,460 | ||||||
Major Drilling Group International | 182,000 | 2,104,056 | ||||||
Nucor Corporation | 46,000 | 1,743,400 | ||||||
Pan American Silver | 57,600 | 972,864 | ||||||
Randgold Resources ADR | 15,000 | 1,350,150 | ||||||
Reliance Steel & Aluminum | 3,080 | 155,540 | ||||||
Seabridge Gold 2 | 19,400 | 281,106 | ||||||
Sims Metal Management ADR | 68,900 | 682,110 | ||||||
Universal Stainless & Alloy Products 2 | 7,800 | 320,580 | ||||||
| 15,469,275 | ||||||||
| Paper & Forest Products - 0.6% | ||||||||
China Forestry Holdings 6 | 1,462,500 | 110,282 | ||||||
Stella-Jones | 26,260 | 1,381,223 | ||||||
| 1,491,505 | ||||||||
| Total (Cost $23,499,002) | 24,549,874 | |||||||
| Utilities – 0.1% | ||||||||
| Gas Utilities - 0.1% | ||||||||
UGI Corporation | 5,700 | 167,751 | ||||||
| Total (Cost $160,321) | 167,751 | |||||||
| Miscellaneous5 – 3.6% | ||||||||
| Total (Cost $9,319,453) | 9,618,362 | |||||||
| TOTAL COMMON STOCKS | ||||||||
(Cost $221,530,708) | 254,830,312 | |||||||
| REPURCHASE AGREEMENT – 3.5% | ||||||||
| Fixed Income Clearing Corporation, | ||||||||
0.11% dated 6/29/12, due 7/2/12, | ||||||||
maturity value $9,328,086 (collateralized | ||||||||
by obligations of various U.S. Government | ||||||||
Agencies, 3.25% due 6/30/16, valued at $9,520,000) | ||||||||
(Cost $9,328,000) | 9,328,000 | |||||||
| COLLATERAL RECEIVED FOR SECURITIES | ||||||||
LOANED – 3.4% | ||||||||
| Money Market Funds | ||||||||
Federated Government Obligations Fund | ||||||||
(7 day yield-0.0115%) | ||||||||
(Cost $8,913,537) | 8,913,537 | |||||||
| TOTAL INVESTMENTS – 103.1% | ||||||||
(Cost $239,772,245) | 273,071,849 | |||||||
| LIABILITIES LESS CASH | ||||||||
AND OTHER ASSETS – (3.1)% | (8,244,943 | ) | ||||||
| NET ASSETS – 100.0% | $ | 264,826,906 | ||||||
| 78 | The Royce Funds 2012 Semiannual Report to Shareholders | THE ACCOMPANYING NOTES ARE AN INTEGRAL PART OF THESE FINANCIAL STATEMENTS. |
| June 30, 2012 (unaudited) |
| Royce Opportunity Fund |
| SHARES | VALUE | |||||
| COMMON STOCKS – 93.7% | ||||||
| Consumer Discretionary – 18.5% | ||||||
Auto Components - 1.5% | ||||||
Cooper Tire & Rubber | 342,293 | $ | 6,003,819 | |||
Dana Holding Corporation | 422,836 | 5,416,529 | ||||
† Fuel Systems Solutions 1,2 | 218,200 | 3,641,758 | ||||
Tower International 2 | 514,105 | 5,398,103 | ||||
Visteon Corporation 2 | 140,300 | 5,261,250 | ||||
| 25,721,459 | ||||||
| Automobiles - 0.2% | ||||||
Winnebago Industries 2 | 303,536 | 3,093,032 | ||||
| Distributors - 0.3% | ||||||
VOXX International Cl. A 2 | 521,594 | 4,861,256 | ||||
| Hotels, Restaurants & Leisure - 2.1% | ||||||
Carrols Restaurant Group 2 | 364,202 | 2,163,360 | ||||
Einstein Noah Restaurant Group | 253,252 | 4,447,105 | ||||
Gaylord Entertainment 2 | 37,600 | 1,449,856 | ||||
Isle of Capri Casinos 1,2 | 1,107,036 | 6,830,412 | ||||
Jamba 2 | 2,174,853 | 4,262,712 | ||||
Kona Grill 1,2 | 257,877 | 2,326,051 | ||||
Krispy Kreme Doughnuts 2 | 700,800 | 4,478,112 | ||||
Orient-Express Hotels Cl. A 2 | 1,282,011 | 10,730,432 | ||||
| 36,688,040 | ||||||
| Household Durables - 3.8% | ||||||
Comstock Holding Companies Cl. A 1,2,3 | 1,290,590 | 1,690,673 | ||||
Dixie Group 2,3 | 819,019 | 3,112,272 | ||||
Ethan Allen Interiors | 264,800 | 5,277,464 | ||||
Furniture Brands International 1,2 | 1,901,425 | 2,357,767 | ||||
Harman International Industries | 92,500 | 3,663,000 | ||||
Kid Brands 2 | 796,560 | 1,593,120 | ||||
La-Z-Boy 2 | 912,241 | 11,211,442 | ||||
M.D.C. Holdings | 430,000 | 14,048,100 | ||||
Standard Pacific 1,2 | 1,282,000 | 7,935,580 | ||||
Toll Brothers 1,2 | 525,400 | 15,620,142 | ||||
| 66,509,560 | ||||||
| Internet & Catalog Retail - 0.8% | ||||||
dELiA*s 1,2 | 1,509,576 | 2,339,843 | ||||
Gaiam Cl. A 2 | 790,614 | 3,083,394 | ||||
1-800-FLOWERS.COM Cl. A 1,2 | 850,927 | 2,969,735 | ||||
Vitacost.com 1,2 | 866,222 | 5,110,710 | ||||
| 13,503,682 | ||||||
| Leisure Equipment & Products - 0.8% | ||||||
Callaway Golf | 863,626 | 5,104,030 | ||||
Steinway Musical Instruments 2 | 358,003 | 8,771,073 | ||||
| 13,875,103 | ||||||
| Media - 2.3% | ||||||
Ballantyne Strong 1,2 | 566,207 | 3,380,256 | ||||
Belo Corporation Cl. A | 737,554 | 4,749,848 | ||||
Harris Interactive 2 | 2,263,397 | 2,557,638 | ||||
Interpublic Group of Companies | 165,200 | 1,792,420 | ||||
Journal Communications Cl. A 2 | 518,679 | 2,676,384 | ||||
Martha Stewart Living Omnimedia Cl. A | 1,228,557 | 4,177,094 | ||||
McClatchy Company (The) Cl. A 2 | 1,687,500 | 3,712,500 | ||||
Media General Cl. A 1,2 | 822,343 | 3,791,001 | ||||
Meredith Corporation | 205,662 | 6,568,844 | ||||
New York Times Cl. A 1,2 | 946,600 | 7,383,480 | ||||
| 40,789,465 | ||||||
| Multiline Retail - 0.2% | ||||||
Dillard’s Cl. A | 72,900 | 4,642,272 | ||||
| Specialty Retail - 3.9% | ||||||
bebe stores | 1,082,521 | 6,354,398 | ||||
Brown Shoe | 634,059 | 8,185,702 | ||||
Coldwater Creek 2 | 1,030,200 | 562,489 | ||||
Conn’s 1,2 | 144,907 | 2,144,624 | ||||
Haverty Furniture | 432,526 | 4,831,315 | ||||
Lithia Motors Cl. A | 423,000 | 9,750,150 | ||||
Lumber Liquidators Holdings 1,2 | 192,900 | 6,518,091 | ||||
MarineMax 2,3 | 1,382,850 | 13,150,904 | ||||
Penske Automotive Group | 320,000 | 6,796,800 | ||||
West Marine 2 | 789,256 | 9,273,758 | ||||
| 67,568,231 | ||||||
| Textiles, Apparel & Luxury Goods - 2.6% | ||||||
† Delta Apparel 1,2 | 142,235 | 1,942,930 | ||||
Fifth & Pacific 1,2 | 617,369 | 6,624,369 | ||||
Hanesbrands 2 | 184,600 | 5,118,958 | ||||
Jones Group (The) | 1,053,071 | 10,067,359 | ||||
Quiksilver 2 | 1,479,800 | 3,447,934 | ||||
Skechers U.S.A. Cl. A 1,2 | 319,800 | 6,514,326 | ||||
Unifi 2,3 | 1,040,849 | 11,792,819 | ||||
| 45,508,695 | ||||||
| Total (Cost $325,268,691) | 322,760,795 | |||||
| Consumer Staples – 1.3% | ||||||
| Food & Staples Retailing - 0.8% | ||||||
Pantry (The) 1,2 | 397,450 | 5,842,515 | ||||
SUPERVALU | 1,623,300 | 8,408,694 | ||||
| 14,251,209 | ||||||
| Food Products - 0.1% | ||||||
Inventure Foods 2 | 253,832 | 1,599,142 | ||||
| Household Products - 0.4% | ||||||
Central Garden & Pet 1,2 | 696,300 | 7,227,594 | ||||
| Personal Products - 0.0% | ||||||
Physicians Formula Holdings 2 | 118,001 | 411,823 | ||||
| Total (Cost $27,364,575) | 23,489,768 | |||||
| Energy – 4.3% | ||||||
| Energy Equipment & Services - 1.4% | ||||||
Cal Dive International 2 | 788,350 | 2,286,215 | ||||
Hercules Offshore 2 | 653,100 | 2,311,974 | ||||
Key Energy Services 2 | 476,500 | 3,621,400 | ||||
Matrix Service 1,2 | 724,787 | 8,226,332 | ||||
Newpark Resources 1,2 | 736,577 | 4,345,804 | ||||
Union Drilling 2 | 532,649 | 2,386,268 | ||||
Willbros Group 2 | 359,700 | 2,323,662 | ||||
| 25,501,655 | ||||||
| Oil, Gas & Consumable Fuels - 2.9% | ||||||
Goodrich Petroleum 1,2 | 521,100 | 7,222,446 | ||||
McMoRan Exploration 1,2 | 427,202 | 5,412,649 | ||||
| THE ACCOMPANYING NOTES ARE AN INTEGRAL PART OF THESE FINANCIAL STATEMENTS. | The Royce Funds 2012 Semiannual Report to Shareholders | 79 |
| Schedules of Investments |
| Royce Opportunity Fund (continued) |
| SHARES | VALUE | |||||
| Energy (continued) | ||||||
| Oil, Gas & Consumable Fuels (continued) | ||||||
Overseas Shipholding Group 1,2 | 314,750 | $ | 3,496,873 | |||
PDC Energy 2 | 271,500 | 6,657,180 | ||||
Penn Virginia | 624,750 | 4,585,665 | ||||
REX American Resources 2 | 199,400 | 3,892,288 | ||||
Scorpio Tankers 2 | 334,689 | 2,138,663 | ||||
StealthGas 2 | 867,245 | 5,038,693 | ||||
Stone Energy 1,2 | 259,635 | 6,579,151 | ||||
Swift Energy 1,2 | 278,800 | 5,188,468 | ||||
| 50,212,076 | ||||||
| Total (Cost $88,356,135) | 75,713,731 | |||||
| Financials – 11.8% | ||||||
| Capital Markets - 1.7% | ||||||
Evercore Partners Cl. A | 210,500 | 4,923,595 | ||||
GFI Group | 186,300 | 663,228 | ||||
Harris & Harris Group 2 | 664,502 | 2,525,108 | ||||
Janus Capital Group | 539,200 | 4,216,544 | ||||
Piper Jaffray 2 | 412,000 | 9,653,160 | ||||
Stifel Financial 2 | 264,300 | 8,166,870 | ||||
| 30,148,505 | ||||||
| Commercial Banks - 2.8% | ||||||
BancorpSouth | 352,000 | 5,111,040 | ||||
Boston Private Financial Holdings | 1,158,046 | 10,341,351 | ||||
Columbia Banking System | 177,800 | 3,346,196 | ||||
First Bancorp | 144,308 | 1,282,898 | ||||
Guaranty Bancorp 1,2 | 791,284 | 1,669,609 | ||||
Old National Bancorp | 327,500 | 3,933,275 | ||||
Peapack-Gladstone Financial | 56,027 | 868,979 | ||||
State Bank Financial 2 | 215,459 | 3,266,358 | ||||
Sterling Bancorp | 195,800 | 1,954,084 | ||||
SVB Financial Group 2 | 75,900 | 4,456,848 | ||||
Umpqua Holdings | 530,700 | 6,984,012 | ||||
Valley National Bancorp | 390,868 | 4,143,201 | ||||
Virginia Commerce Bancorp 2 | 185,667 | 1,565,173 | ||||
| 48,923,024 | ||||||
| Insurance - 3.9% | ||||||
Argo Group International Holdings | 244,600 | 7,159,442 | ||||
Fidelity National Financial Cl. A | 437,800 | 8,432,028 | ||||
Hilltop Holdings 2 | 313,124 | 3,228,309 | ||||
Kemper Corporation | 345,700 | 10,630,275 | ||||
MBIA 1,2 | 1,001,610 | 10,827,404 | ||||
Navigators Group 2 | 221,919 | 11,107,046 | ||||
Old Republic International | 869,200 | 7,205,668 | ||||
Tower Group | 442,569 | 9,236,415 | ||||
| 67,826,587 | ||||||
| Real Estate Investment Trusts (REITs) - 2.0% | ||||||
LaSalle Hotel Properties | 451,800 | 13,165,452 | ||||
Mack-Cali Realty | 334,550 | 9,725,368 | ||||
PennyMac Mortgage Investment Trust | 483,300 | 9,535,509 | ||||
RAIT Financial Trust | 451,600 | 2,086,392 | ||||
| 34,512,721 | ||||||
| Real Estate Management & Development - 0.0% | ||||||
Maui Land & Pineapple 2 | 194,351 | 728,816 | ||||
| Thrifts & Mortgage Finance - 1.4% | ||||||
Berkshire Hills Bancorp | 140,000 | 3,080,000 | ||||
Brookline Bancorp | 247,600 | 2,191,260 | ||||
First Financial Holdings | 184,300 | 1,975,696 | ||||
MGIC Investment 1,2 | 1,612,785 | 4,644,821 | ||||
Radian Group | 1,453,100 | 4,780,699 | ||||
Washington Federal | 408,400 | 6,897,876 | ||||
| 23,570,352 | ||||||
| Total (Cost $212,754,119) | 205,710,005 | |||||
| Health Care – 2.8% | ||||||
| Health Care Equipment & Supplies - 1.2% | ||||||
Analogic Corporation | 90,100 | 5,586,200 | ||||
AngioDynamics 2 | 438,403 | 5,265,220 | ||||
DGT Holdings 2 | 88,041 | 968,451 | ||||
Exactech 1,2 | 306,282 | 5,136,349 | ||||
Wright Medical Group 1,2 | 150,876 | 3,221,203 | ||||
| 20,177,423 | ||||||
| Health Care Providers & Services - 0.7% | ||||||
Kindred Healthcare 2 | 566,400 | 5,567,712 | ||||
Select Medical Holdings 2 | 410,600 | 4,151,166 | ||||
Skilled Healthcare Group Cl. A 2 | 500,890 | 3,145,589 | ||||
| 12,864,467 | ||||||
| Life Sciences Tools & Services - 0.9% | ||||||
Albany Molecular Research 1,2 | 1,235,884 | 3,151,504 | ||||
Cambrex Corporation 2 | 1,306,054 | 12,289,968 | ||||
| 15,441,472 | ||||||
| Total (Cost $47,849,830) | 48,483,362 | |||||
| Industrials – 19.1% | ||||||
| Aerospace & Defense - 1.3% | ||||||
GenCorp 2 | 861,561 | 5,608,762 | ||||
Hexcel Corporation 2 | 291,847 | 7,526,734 | ||||
Moog Cl. A 2 | 216,491 | 8,951,903 | ||||
| 22,087,399 | ||||||
| Airlines - 0.4% | ||||||
JetBlue Airways 1,2 | 653,300 | 3,462,490 | ||||
Republic Airways Holdings 1,2 | 685,047 | 3,802,011 | ||||
| 7,264,501 | ||||||
| Building Products - 4.3% | ||||||
Ameresco Cl. A 2 | 318,390 | 3,798,393 | ||||
American Woodmark 2 | 442,360 | 7,564,356 | ||||
Apogee Enterprises | 854,616 | 13,733,679 | ||||
† Builders FirstSource 1,2 | 1,254,811 | 5,947,804 | ||||
Insteel Industries | 357,500 | 3,986,125 | ||||
NCI Building Systems 2,3 | 1,038,569 | 11,247,702 | ||||
PGT 1,2 | 1,189,200 | 3,603,276 | ||||
Quanex Building Products | 703,800 | 12,583,944 | ||||
Trex Company 1,2 | 430,040 | 12,939,904 | ||||
| 75,405,183 | ||||||
| Commercial Services & Supplies - 1.0% | ||||||
Interface Cl. A | 523,800 | 7,139,394 | ||||
| 80 | The Royce Funds 2012 Semiannual Report to Shareholders | THE ACCOMPANYING NOTES ARE AN INTEGRAL PART OF THESE FINANCIAL STATEMENTS. |
| June 30, 2012 (unaudited) |
| SHARES | VALUE | |||||
| Industrials (continued) | ||||||
| Commercial Services & Supplies (continued) | ||||||
TRC Companies 2,3 | 1,703,682 | $ | 10,358,386 | |||
| 17,497,780 | ||||||
Construction & Engineering - 2.8% | ||||||
Aegion Corporation Cl. A 1,2 | 491,711 | 8,796,710 | ||||
Furmanite Corporation 2 | 1,073,830 | 5,218,814 | ||||
iShares Dow Jones US Home Construction Index Fund | 487,100 | 8,183,280 | ||||
† Layne Christensen 1,2 | 265,481 | 5,492,802 | ||||
MasTec 1,2 | 467,208 | 7,026,808 | ||||
Northwest Pipe 2 | 444,735 | 10,789,271 | ||||
Pike Electric 2 | 456,021 | 3,520,482 | ||||
| 49,028,167 | ||||||
| Electrical Equipment - 0.3% | ||||||
GrafTech International 2 | 214,800 | 2,072,820 | ||||
Lime Energy 1,2 | 666,640 | 1,513,273 | ||||
Magnetek 2 | 134,641 | 2,078,857 | ||||
| 5,664,950 | ||||||
| Machinery - 5.3% | ||||||
Albany International Cl. A | 211,700 | 3,960,907 | ||||
Barnes Group | 235,349 | 5,716,627 | ||||
CIRCOR International | 272,080 | 9,275,207 | ||||
Dynamic Materials | 180,629 | 3,130,301 | ||||
Federal Signal 2 | 1,292,370 | 7,547,441 | ||||
Flow International 1,2 | 1,896,972 | 5,975,462 | ||||
Hardinge | 566,291 | 5,153,248 | ||||
Hurco Companies 2 | 200,095 | 4,099,947 | ||||
Lydall 1,2 | 705,500 | 9,538,360 | ||||
Meritor 1,2 | 1,050,906 | 5,485,729 | ||||
Mueller Industries | 214,500 | 9,135,555 | ||||
Mueller Water Products Cl. A | 1,678,275 | 5,806,831 | ||||
NN 2 | 328,389 | 3,352,852 | ||||
Timken Company (The) | 141,700 | 6,488,443 | ||||
Trinity Industries | 258,750 | 6,463,575 | ||||
Wabash National 1,2 | 149,000 | 986,380 | ||||
| 92,116,865 | ||||||
| Marine - 0.4% | ||||||
Diana Containerships | 232,034 | 1,721,692 | ||||
Diana Shipping 2 | 689,000 | 5,360,420 | ||||
| 7,082,112 | ||||||
| Professional Services - 0.4% | ||||||
CTPartners Executive Search 2 | 256,800 | 1,386,720 | ||||
Hill International 2 | 700,407 | 2,241,302 | ||||
Hudson Global 2 | 295,110 | 1,230,609 | ||||
Korn/Ferry International 2 | 102,300 | 1,468,005 | ||||
| 6,326,636 | ||||||
| Road & Rail - 0.7% | ||||||
Arkansas Best | 420,539 | 5,298,792 | ||||
Swift Transportation 2 | 757,134 | 7,154,916 | ||||
| 12,453,708 | ||||||
| Trading Companies & Distributors - 2.1% | ||||||
Aceto Corporation | 924,160 | 8,345,165 | ||||
Beacon Roofing Supply 2 | 189,700 | 4,784,234 | ||||
Kaman Corporation | 325,331 | 10,065,741 | ||||
SeaCube Container Leasing | 220,950 | 3,771,616 | ||||
United Rentals 1,2 | 251,192 | 8,550,576 | ||||
| 35,517,332 | ||||||
| Transportation Infrastructure - 0.1% | ||||||
Wesco Aircraft Holdings 1,2 | 166,300 | 2,116,999 | ||||
| Total (Cost $289,072,260) | 332,561,632 | |||||
| Information Technology – 22.6% | ||||||
| Communications Equipment - 2.3% | ||||||
Aviat Networks 2 | 1,754,792 | 4,913,418 | ||||
† Ciena Corporation 1,2 | 513,000 | 8,397,810 | ||||
ClearOne Communications 2,3 | 556,620 | 2,276,576 | ||||
Harmonic 2 | 819,450 | 3,490,857 | ||||
Oclaro 1,2 | 927,800 | 2,820,512 | ||||
Oplink Communications 1,2 | 364,229 | 4,928,018 | ||||
Opnext 2 | 677,206 | 853,280 | ||||
Symmetricom 1,2 | 1,211,304 | 7,255,711 | ||||
UTStarcom Holdings 1,2 | 2,713,502 | 3,229,067 | ||||
Westell Technologies Cl. A 2 | 556,074 | 1,323,456 | ||||
| 39,488,705 | ||||||
| Computers & Peripherals - 1.5% | ||||||
Avid Technology 1,2 | 422,133 | 3,136,448 | ||||
Concurrent Computer 1,2 | 47,284 | 196,229 | ||||
Cray 2 | 699,359 | 8,448,257 | ||||
Dot Hill Systems 1,2 | 1,801,371 | 2,053,563 | ||||
Intermec 1,2 | 1,186,250 | 7,354,750 | ||||
Interphase Corporation 2 | 302,304 | 1,324,091 | ||||
Intevac 1,2 | 384,594 | 2,892,147 | ||||
† Overland Storage 1,2 | 632,400 | 1,188,912 | ||||
| 26,594,397 | ||||||
| Electronic Equipment, Instruments & Components - 5.4% | ||||||
Benchmark Electronics 2 | 642,460 | 8,962,317 | ||||
CTS Corporation | 279,403 | 2,631,976 | ||||
Echelon Corporation 2 | 409,186 | 1,423,967 | ||||
Evans & Sutherland Computer 2,4 | 542,898 | 59,719 | ||||
FEI Company 2 | 193,875 | 9,274,980 | ||||
Frequency Electronics 1,2 | 181,770 | 1,468,702 | ||||
Identive Group 1,2 | 958,575 | 897,610 | ||||
Ingram Micro Cl. A 2 | 189,000 | 3,301,830 | ||||
KEMET Corporation 1,2 | 1,134,554 | 6,818,670 | ||||
Maxwell Technologies 2 | 502,961 | 3,299,424 | ||||
Mercury Computer Systems 1,2 | 344,097 | 4,449,174 | ||||
Newport Corporation 2 | 615,284 | 7,395,714 | ||||
Park Electrochemical | 383,000 | 9,912,040 | ||||
Planar Systems 2,3 | 1,554,792 | 2,565,407 | ||||
Sanmina-SCI Corporation 2 | 1,129,865 | 9,253,594 | ||||
SigmaTron International 1,2,3 | 344,172 | 1,152,976 | ||||
TTM Technologies 2 | 567,900 | 5,343,939 | ||||
Viasystems Group 2 | 285,808 | 4,858,736 | ||||
Vishay Intertechnology 2 | 667,023 | 6,290,027 | ||||
Zygo Corporation 2 | 292,834 | 5,230,015 | ||||
| 94,590,817 | ||||||
| Internet Software & Services - 2.5% | ||||||
AOL 1,2 | 249,016 | 6,992,369 | ||||
Autobytel 2 | 1,803,010 | 1,357,666 | ||||
| THE ACCOMPANYING NOTES ARE AN INTEGRAL PART OF THESE FINANCIAL STATEMENTS. | The Royce Funds 2012 Semiannual Report to Shareholders | 81 |
| Schedules of Investments |
| Royce Opportunity Fund (continued) |
| SHARES | VALUE | |||||
| Information Technology (continued) | ||||||
| Internet Software & Services (continued) | ||||||
Blucora 2 | 438,530 | $ | 5,402,690 | |||
EarthLink | 1,264,600 | 9,408,624 | ||||
† KIT digital 1,2 | 396,600 | 1,701,414 | ||||
† Monster Worldwide 1,2 | 687,500 | 5,843,750 | ||||
QuinStreet 1,2 | 225,811 | 2,091,010 | ||||
Support.com 2 | 1,033,585 | 3,297,136 | ||||
ValueClick 2 | 473,691 | 7,763,795 | ||||
WebMediaBrands 2 | 660,609 | 416,184 | ||||
| 44,274,638 | ||||||
| IT Services - 1.3% | ||||||
CIBER 2 | 1,223,272 | 5,272,302 | ||||
† Lender Processing Services | 378,944 | 9,579,705 | ||||
† Unisys Corporation 1,2 | 416,600 | 8,144,530 | ||||
| 22,996,537 | ||||||
| Semiconductors & Semiconductor Equipment - 8.0% | ||||||
Advanced Energy Industries 2 | 564,488 | 7,575,429 | ||||
Alpha & Omega Semiconductor 2 | 788,600 | 7,215,690 | ||||
ANADIGICS 1,2 | 2,233,514 | 4,042,660 | ||||
ATMI 2 | 412,000 | 8,474,840 | ||||
Axcelis Technologies 2 | 1,010,094 | 1,212,113 | ||||
AXT 2 | 629,230 | 2,485,458 | ||||
Brooks Automation | 1,049,400 | 9,906,336 | ||||
BTU International 2,3 | 690,763 | 1,837,430 | ||||
Cohu | 278,409 | 2,828,635 | ||||
Cree 1,2 | 223,600 | 5,739,812 | ||||
Exar Corporation 2 | 426,385 | 3,479,302 | ||||
Fairchild Semiconductor International 2 | 732,520 | 10,328,532 | ||||
FormFactor 1,2 | 418,161 | 2,705,502 | ||||
Integrated Silicon Solution 2 | 290,775 | 2,933,920 | ||||
International Rectifier 2 | 540,702 | 10,808,633 | ||||
Kulicke & Soffa Industries 2 | 758,700 | 6,767,604 | ||||
LTX-Credence Corporation 2 | 851,906 | 5,707,770 | ||||
MEMC Electronic Materials 1,2 | 1,817,834 | 3,944,700 | ||||
Mindspeed Technologies 1,2 | 733,300 | 1,803,918 | ||||
Nanometrics 1,2 | 623,242 | 9,572,997 | ||||
Pericom Semiconductor 1,2 | 1,182,829 | 10,645,461 | ||||
Rudolph Technologies 1,2 | 425,111 | 3,706,968 | ||||
SemiLEDs Corporation 1,2 | 599,356 | 1,852,010 | ||||
Spire Corporation 2,3 | 505,783 | 300,941 | ||||
SunPower Corporation 1,2 | 841,153 | 4,045,946 | ||||
TriQuint Semiconductor 2 | 954,900 | 5,251,950 | ||||
Ultra Clean Holdings 2 | 281,406 | 1,809,440 | ||||
Vitesse Semiconductor 1,2 | 873,893 | 2,315,816 | ||||
| 139,299,813 | ||||||
| Software - 1.6% | ||||||
Actuate Corporation 1,2 | 736,983 | 5,107,292 | ||||
American Software Cl. A | 163,899 | 1,302,997 | ||||
Aspen Technology 2 | 215,635 | 4,991,950 | ||||
Bottomline Technologies 1,2 | 165,700 | 2,990,885 | ||||
Cinedigm Digital Cinema Cl. A 2 | 1,567,736 | 2,351,604 | ||||
Mentor Graphics 1,2 | 587,900 | 8,818,500 | ||||
Smith Micro Software 2 | 1,084,892 | 1,996,202 | ||||
| 27,559,430 | ||||||
| Total (Cost $441,300,815) | 394,804,337 | |||||
| Materials – 10.0% | ||||||
| Chemicals - 5.0% | ||||||
Chemtura Corporation 2 | 477,350 | 6,921,575 | ||||
Cytec Industries | 150,863 | 8,846,606 | ||||
Ferro Corporation 1,2 | 1,549,395 | 7,437,096 | ||||
H.B. Fuller Company | 225,700 | 6,928,990 | ||||
Material Sciences 2 | 491,727 | 4,032,161 | ||||
Minerals Technologies | 90,600 | 5,778,468 | ||||
OM Group 1,2 | 536,100 | 10,185,900 | ||||
PolyOne Corporation | 756,300 | 10,346,184 | ||||
Quaker Chemical | 222,867 | 10,298,684 | ||||
Spartech Corporation 1,2,3 | 1,741,540 | 9,003,762 | ||||
Zoltek Companies 1,2 | 895,450 | 8,085,914 | ||||
| 87,865,340 | ||||||
| Construction Materials - 0.7% | ||||||
Texas Industries 1,2 | 299,377 | 11,678,697 | ||||
| Containers & Packaging - 0.4% | ||||||
Boise | 1,008,300 | 6,634,614 | ||||
| Metals & Mining - 3.1% | ||||||
Carpenter Technology | 102,181 | 4,888,339 | ||||
Century Aluminum 1,2 | 1,033,600 | 7,576,288 | ||||
Commercial Metals | 735,261 | 9,293,699 | ||||
Haynes International | 149,944 | 7,638,147 | ||||
Kaiser Aluminum | 268,300 | 13,908,672 | ||||
RTI International Metals 1,2 | 438,000 | 9,911,940 | ||||
| 53,217,085 | ||||||
| Paper & Forest Products - 0.8% | ||||||
Louisiana-Pacific Corporation 2 | 1,294,800 | 14,087,424 | ||||
| Total (Cost $148,286,723) | 173,483,160 | |||||
| Telecommunication Services – 0.6% | ||||||
| Diversified Telecommunication Services - 0.6% | ||||||
General Communication Cl. A 1,2 | 330,937 | 2,750,087 | ||||
Iridium Communications 1,2 | 814,846 | 7,301,020 | ||||
| Total (Cost $8,339,969) | 10,051,107 | |||||
| Miscellaneous 5 – 2.7% | ||||||
| Total (Cost $41,990,142) | 47,239,036 | |||||
| TOTAL COMMON STOCKS | ||||||
(Cost $1,630,583,259) | 1,634,296,933 | |||||
| PREFERRED STOCK – 0.3% | ||||||
Hovnanian Enterprises 7.25% Conv. | 273,100 | 4,437,875 | ||||
| 82 | The Royce Funds 2012 Semiannual Report to Shareholders | THE ACCOMPANYING NOTES ARE AN INTEGRAL PART OF THESE FINANCIAL STATEMENTS. |
| June 30, 2012 (unaudited) |
| VALUE | ||||||
| REPURCHASE AGREEMENT – 6.1% | ||||||
| Fixed Income Clearing Corporation, | ||||||
0.11% dated 6/29/12, due 7/2/12, | ||||||
maturity value $106,391,975 (collateralized | ||||||
by obligations of various U.S. Government | ||||||
Agencies, 0.875% due 11/30/16, valued at | ||||||
$108,519,450) | ||||||
(Cost $106,391,000) | $ | 106,391,000 | ||||
| COLLATERAL RECEIVED FOR SECURITIES | ||||||
LOANED – 7.2% | ||||||
| Money Market Funds | ||||||
Federated Government Obligations Fund | ||||||
(7 day yield-0.0115%) | ||||||
(Cost $125,418,345) | 125,418,345 | |||||
| TOTAL INVESTMENTS – 107.3% | ||||||
(Cost $1,868,133,217) | 1,870,544,153 | |||||
| LIABILITIES LESS CASH | ||||||
AND OTHER ASSETS – (7.3)% | (126,841,374 | ) | ||||
| NET ASSETS – 100.0% | $ | 1,743,702,779 | ||||
| Royce Special Equity Fund |
| SHARES | VALUE | |||||
| COMMON STOCKS – 89.0% | ||||||
| Consumer Discretionary – 22.8% | ||||||
| Auto Components - 2.5% | ||||||
Dorman Products 1,2,3 | 2,819,660 | $ | 70,745,269 | |||
| Diversified Consumer Services - 1.6% | ||||||
† Sotheby’s | 1,292,600 | 43,121,136 | ||||
| Hotels, Restaurants & Leisure - 0.7% | ||||||
Bowl America Cl. A 3 | 342,575 | 4,299,316 | ||||
Frisch’s Restaurants 3 | 505,100 | 14,314,534 | ||||
| 18,613,850 | ||||||
| Household Durables - 0.7% | ||||||
CSS Industries 3 | 974,100 | 20,017,755 | ||||
| Media - 4.4% | ||||||
Meredith Corporation | 2,129,000 | 68,000,260 | ||||
† Scholastic Corporation 3 | 1,885,643 | 53,099,707 | ||||
| 121,099,967 | ||||||
| Specialty Retail - 12.9% | ||||||
American Eagle Outfitters | 5,187,082 | 102,341,128 | ||||
Bed Bath & Beyond 2 | 1,393,000 | 86,087,400 | ||||
Buckle (The) | 890,402 | 35,233,207 | ||||
Children’s Place Retail Stores 2,3 | 1,283,838 | 63,973,648 | ||||
Finish Line (The) Cl. A 3 | 3,284,700 | 68,683,077 | ||||
| 356,318,460 | ||||||
| Textiles, Apparel & Luxury Goods - 0.0% | ||||||
Movado Group | 41,999 | 1,050,815 | ||||
| Total (Cost $514,912,177) | 630,967,252 | |||||
| Consumer Staples – 6.8% | ||||||
| Beverages - 0.4% | ||||||
National Beverage 2 | 656,551 | 9,808,872 | ||||
| Food & Staples Retailing - 2.2% | ||||||
Arden Group Cl. A 3 | 219,000 | 19,098,990 | ||||
Weis Markets | 949,014 | 42,250,103 | ||||
| 61,349,093 | ||||||
| Food Products - 4.2% | ||||||
J&J Snack Foods | 609,900 | 36,045,090 | ||||
Lancaster Colony | 1,139,389 | 81,135,891 | ||||
| 117,180,981 | ||||||
| Total (Cost $136,897,925) | 188,338,946 | |||||
| Health Care – 5.4% | ||||||
| Health Care Equipment & Supplies - 1.5% | ||||||
Atrion Corporation 3 | 166,433 | 34,115,436 | ||||
Utah Medical Products 3 | 186,030 | 6,237,586 | ||||
| 40,353,022 | ||||||
| Health Care Providers & Services - 0.2% | ||||||
Owens & Minor | 205,250 | 6,286,808 | ||||
| Life Sciences Tools & Services - 3.7% | ||||||
Bio-Rad Laboratories Cl. A 2 | 1,027,785 | 102,788,778 | ||||
| Total (Cost $118,775,353) | 149,428,608 | |||||
| Industrials – 22.0% | ||||||
| Aerospace & Defense - 1.6% | ||||||
National Presto Industries 3 | 651,500 | 45,455,155 | ||||
| THE ACCOMPANYING NOTES ARE AN INTEGRAL PART OF THESE FINANCIAL STATEMENTS. | The Royce Funds 2012 Semiannual Report to Shareholders | 83 |
| Schedules of Investments |
| Royce Special Equity Fund (continued) |
| SHARES | VALUE | |||||
| Industrials (continued) | ||||||
| Commercial Services & Supplies - 3.2% | ||||||
UniFirst Corporation 3 | 1,384,137 | $ | 88,238,734 | |||
| Electrical Equipment - 8.0% | ||||||
† EnerSys 2 | 2,002,900 | 70,241,703 | ||||
Hubbell Cl. B | 1,240,500 | 96,684,570 | ||||
Regal-Beloit | 870,500 | 54,197,330 | ||||
| 221,123,603 | ||||||
| Industrial Conglomerates - 1.3% | ||||||
Standex International 3 | 839,600 | 35,741,772 | ||||
| Machinery - 3.3% | ||||||
Ampco-Pittsburgh 3 | 984,500 | 18,045,885 | ||||
Foster (L.B.) Company 3 | 928,875 | 26,575,114 | ||||
Hurco Companies 2,3 | 433,679 | 8,886,082 | ||||
Kaydon Corporation | 1,266,300 | 27,086,157 | ||||
Mueller Industries | 253,620 | 10,801,676 | ||||
| 91,394,914 | ||||||
| Professional Services - 1.2% | ||||||
Towers Watson & Company Cl. A | 540,285 | 32,363,072 | ||||
| Trading Companies & Distributors - 3.4% | ||||||
Applied Industrial Technologies 3 | 2,177,952 | 80,257,531 | ||||
Watsco | 169,150 | 12,483,270 | ||||
| 92,740,801 | ||||||
| Total (Cost $511,201,293) | 607,058,051 | |||||
| Information Technology – 21.0% | ||||||
| Communications Equipment - 2.4% | ||||||
Plantronics | 1,970,000 | 65,798,000 | ||||
| Computers & Peripherals - 0.3% | ||||||
Rimage Corporation 3 | 982,738 | 7,861,904 | ||||
| Electronic Equipment, Instruments & Components - 10.6% | ||||||
AVX Corporation | 7,862,400 | 84,049,056 | ||||
Littelfuse | 1,145,977 | 65,194,631 | ||||
Mesa Laboratories | 145,944 | 6,784,937 | ||||
Molex Cl. A | 3,784,268 | 76,555,742 | ||||
Park Electrochemical 3 | 2,011,012 | 52,044,991 | ||||
Vishay Intertechnology 2 | 995,070 | 9,383,510 | ||||
| 294,012,867 | ||||||
| IT Services - 3.3% | ||||||
Computer Services 4 | 645,914 | 20,669,248 | ||||
NeuStar Cl. A 2 | 1,510,100 | 50,437,340 | ||||
Total System Services | 899,566 | 21,526,614 | ||||
| 92,633,202 | ||||||
| Office Electronics - 0.5% | ||||||
Zebra Technologies Cl. A 2 | 403,875 | 13,877,145 | ||||
| Semiconductors & Semiconductor Equipment - 3.9% | ||||||
† Entegris 1,2 | 2,636,400 | 22,514,856 | ||||
Teradyne 2 | 6,032,000 | 84,809,920 | ||||
| 107,324,776 | ||||||
| Total (Cost $557,433,326) | 581,507,894 | |||||
| Materials – 11.0% | ||||||
| Chemicals - 7.7% | ||||||
Hawkins 3 | 916,625 | 34,996,742 | ||||
Minerals Technologies 3 | 1,268,900 | 80,930,442 | ||||
Schulman (A.) 3 | 1,584,500 | 31,452,325 | ||||
Stepan Company 3 | 692,200 | 65,191,396 | ||||
| 212,570,905 | ||||||
| Containers & Packaging - 0.7% | ||||||
Sonoco Products | 675,200 | 20,357,280 | ||||
| Metals & Mining - 0.1% | ||||||
Central Steel & Wire 4 | 3,734 | 2,520,450 | ||||
| Paper & Forest Products - 2.5% | ||||||
Clearwater Paper 1,2,3 | 2,002,000 | 68,308,240 | ||||
| Total (Cost $269,559,472) | 303,756,875 | |||||
| TOTAL COMMON STOCKS | ||||||
(Cost $2,108,779,546) | 2,461,057,626 | |||||
| REPURCHASE AGREEMENT – 10.8% | ||||||
| Fixed Income Clearing Corporation, | ||||||
0.11% dated 6/29/12, due 7/2/12, | ||||||
maturity value $299,545,746 (collateralized | ||||||
by obligations of various U.S. Government | ||||||
Agencies, 0.875%-2.625% due 5/7/13-4/30/18, | ||||||
valued at $305,536,008) | ||||||
(Cost $299,543,000) | 299,543,000 | |||||
| COLLATERAL RECEIVED FOR SECURITIES | ||||||
LOANED – 0.0% | ||||||
| Money Market Funds | ||||||
Federated Government Obligations Fund | ||||||
(7 day yield-0.0115%) | ||||||
(Cost $153,750) | 153,750 | |||||
| TOTAL INVESTMENTS – 99.8% | ||||||
(Cost $2,408,476,296) | 2,760,754,376 | |||||
| CASH AND OTHER ASSETS | ||||||
LESS LIABILITIES – 0.2% | 4,281,952 | |||||
| NET ASSETS – 100.0% | $ | 2,765,036,328 | ||||
| 84 | The Royce Funds 2012 Semiannual Report to Shareholders | THE ACCOMPANYING NOTES ARE AN INTEGRAL PART OF THESE FINANCIAL STATEMENTS. |
| June 30, 2012 (unaudited) |
| Royce Value Fund |
| SHARES | VALUE | |||||
| COMMON STOCKS – 99.2% | ||||||
| Consumer Discretionary – 18.2% | ||||||
| Automobiles - 1.3% | ||||||
Thor Industries | 651,540 | $ | 17,858,711 | |||
| Hotels, Restaurants & Leisure - 0.0% | ||||||
International Speedway Cl. A | 17,243 | 451,422 | ||||
| Specialty Retail - 15.6% | ||||||
American Eagle Outfitters | 1,118,165 | 22,061,396 | ||||
Ascena Retail Group 2 | 2,166,034 | 40,331,553 | ||||
Buckle (The) | 978,426 | 38,716,317 | ||||
GameStop Corporation Cl. A | 2,631,526 | 48,314,817 | ||||
Guess? | 1,054,232 | 32,017,026 | ||||
Jos. A. Bank Clothiers 2 | 910,442 | 38,657,367 | ||||
| 220,098,476 | ||||||
| Textiles, Apparel & Luxury Goods - 1.3% | ||||||
† Deckers Outdoor 1,2 | 94,100 | 4,141,341 | ||||
Steven Madden 2 | 457,714 | 14,532,420 | ||||
| 18,673,761 | ||||||
| Total (Cost $237,370,746) | 257,082,370 | |||||
| Consumer Staples – 1.7% | ||||||
| Food Products - 0.7% | ||||||
Hormel Foods | 349,088 | 10,619,257 | ||||
| Personal Products - 1.0% | ||||||
Nu Skin Enterprises Cl. A | 300,000 | 14,070,000 | ||||
| Total (Cost $18,090,270) | 24,689,257 | |||||
| Energy – 11.3% | ||||||
| Energy Equipment & Services - 9.1% | ||||||
Atwood Oceanics 2 | 166,238 | 6,290,446 | ||||
Helmerich & Payne | 941,856 | 40,951,899 | ||||
Oil States International 2 | 149,100 | 9,870,420 | ||||
Trican Well Service | 1,925,500 | 22,222,400 | ||||
Unit Corporation 2 | 1,360,659 | 50,194,710 | ||||
| 129,529,875 | ||||||
| Oil, Gas & Consumable Fuels - 2.2% | ||||||
Cimarex Energy | 169,192 | 9,325,863 | ||||
Energen Corporation | 469,616 | 21,193,770 | ||||
| 30,519,633 | ||||||
| Total (Cost $177,396,862) | 160,049,508 | |||||
| Financials – 17.2% | ||||||
| Capital Markets - 9.3% | ||||||
Affiliated Managers Group 2 | 139,418 | 15,259,300 | ||||
Ashmore Group | 6,261,900 | 34,363,906 | ||||
Federated Investors Cl. B | 1,596,826 | 34,890,648 | ||||
Knight Capital Group Cl. A 2 | 2,158,532 | 25,772,872 | ||||
Partners Group Holding | 68,990 | 12,265,156 | ||||
Value Partners Group | 20,000,000 | 9,798,903 | ||||
| 132,350,785 | ||||||
| Insurance - 7.9% | ||||||
Allied World Assurance Company Holdings | 336,171 | 26,715,509 | ||||
Alterra Capital Holdings | 278,437 | 6,501,504 | ||||
Aspen Insurance Holdings | 622,501 | 17,990,279 | ||||
PartnerRe | 218,089 | 16,502,795 | ||||
Reinsurance Group of America | 818,799 | 43,568,295 | ||||
| 111,278,382 | ||||||
| Total (Cost $229,541,059) | 243,629,167 | |||||
| Health Care – 6.2% | ||||||
| Health Care Providers & Services - 6.2% | ||||||
Chemed Corporation | 654,642 | 39,566,562 | ||||
Magellan Health Services 2 | 217,035 | 9,838,197 | ||||
MEDNAX 2 | 553,135 | 37,911,873 | ||||
| Total (Cost $76,782,361) | 87,316,632 | |||||
| Industrials – 9.2% | ||||||
| Aerospace & Defense - 0.8% | ||||||
† Cubic Corporation | 237,174 | 11,403,326 | ||||
| Building Products - 0.6% | ||||||
Simpson Manufacturing | 297,200 | 8,770,372 | ||||
| Construction & Engineering - 1.3% | ||||||
Jacobs Engineering Group 2 | 502,500 | 19,024,650 | ||||
| Electrical Equipment - 1.0% | ||||||
GrafTech International 2 | 1,420,125 | 13,704,206 | ||||
| Machinery - 4.2% | ||||||
Gardner Denver | 166,375 | 8,802,901 | ||||
Kennametal | 781,114 | 25,893,929 | ||||
Lincoln Electric Holdings | 409,770 | 17,943,828 | ||||
Pfeiffer Vacuum Technology | 59,089 | 6,014,621 | ||||
| 58,655,279 | ||||||
| Trading Companies & Distributors - 1.3% | ||||||
Applied Industrial Technologies | 507,290 | 18,693,637 | ||||
| Total (Cost $121,939,634) | 130,251,470 | |||||
| Information Technology – 15.0% | ||||||
| Communications Equipment - 2.5% | ||||||
NETGEAR 2 | 672,822 | 23,219,087 | ||||
Plantronics | 371,500 | 12,408,100 | ||||
| 35,627,187 | ||||||
| Electronic Equipment, Instruments & Components - 2.9% | ||||||
Littelfuse | 241,658 | 13,747,924 | ||||
Molex Cl. A | 621,566 | 12,574,280 | ||||
Rofin-Sinar Technologies 2 | 106,926 | 2,024,109 | ||||
† Vishay Intertechnology 2 | 1,318,742 | 12,435,737 | ||||
| 40,782,050 | ||||||
| IT Services - 1.9% | ||||||
ManTech International Cl. A | 1,078,224 | 25,305,917 | ||||
MAXIMUS | 17,600 | 910,800 | ||||
| 26,216,717 | ||||||
| Semiconductors & Semiconductor Equipment - 7.7% | ||||||
Cabot Microelectronics | 213,550 | 6,237,795 | ||||
Lam Research 2 | 318,200 | 12,008,868 | ||||
MKS Instruments | 894,404 | 25,875,108 | ||||
Teradyne 2 | 3,480,327 | 48,933,398 | ||||
| THE ACCOMPANYING NOTES ARE AN INTEGRAL PART OF THESE FINANCIAL STATEMENTS. | The Royce Funds 2012 Semiannual Report to Shareholders | 85 |
| Schedules of Investments |
| Royce Value Fund (continued) |
| SHARES | VALUE | |||||
| Information Technology (continued) | ||||||
| Semiconductors & Semiconductor Equipment (continued) | ||||||
Veeco Instruments 1,2 | 481,500 | $ | 16,544,340 | |||
| 109,599,509 | ||||||
| Total (Cost $239,063,212) | 212,225,463 | |||||
| Materials – 18.0% | ||||||
| Chemicals - 4.2% | ||||||
LSB Industries 2 | 631,413 | 19,516,976 | ||||
Westlake Chemical | 765,370 | 39,998,236 | ||||
| 59,515,212 | ||||||
| Metals & Mining - 13.8% | ||||||
Allied Nevada Gold 2 | 1,283,000 | 36,411,540 | ||||
Centamin 2 | 6,821,600 | 7,504,363 | ||||
Hochschild Mining | 1,680,000 | 12,395,293 | ||||
Major Drilling Group International | 2,400,300 | 27,749,268 | ||||
Pan American Silver | 1,275,430 | 21,542,013 | ||||
Reliance Steel & Aluminum | 831,500 | 41,990,750 | ||||
Schnitzer Steel Industries Cl. A | 676,100 | 18,944,322 | ||||
Seabridge Gold 2 | 956,000 | 13,852,440 | ||||
Silver Standard Resources 2 | 1,281,101 | 14,399,575 | ||||
| 194,789,564 | ||||||
| Total (Cost $294,262,120) | 254,304,776 | |||||
| Miscellaneous 5 – 2.4% | ||||||
| Total (Cost $34,402,899) | 34,383,087 | |||||
| TOTAL COMMON STOCKS | ||||||
(Cost $1,428,849,163) | 1,403,931,730 | |||||
| REPURCHASE AGREEMENT – 2.6% | ||||||
| Fixed Income Clearing Corporation, | ||||||
0.11% dated 6/29/12, due 7/2/12, | ||||||
maturity value $37,422,343 (collateralized | ||||||
by obligations of various U.S. Government | ||||||
Agencies, 3.25% due 6/30/16, valued at | ||||||
$38,175,200) | ||||||
(Cost $37,422,000) | 37,422,000 | |||||
| COLLATERAL RECEIVED FOR SECURITIES | ||||||
LOANED – 1.2% | ||||||
| Money Market Funds | ||||||
Federated Government Obligations Fund | ||||||
(7 day yield-0.0115%) | ||||||
(Cost $16,434,818) | 16,434,818 | |||||
| TOTAL INVESTMENTS – 103.0% | ||||||
(Cost $1,482,705,981) | 1,457,788,548 | |||||
| LIABILITIES LESS CASH | ||||||
AND OTHER ASSETS – (3.0)% | (42,426,780 | ) | ||||
| NET ASSETS – 100.0% | $ | 1,415,361,768 | ||||
| Royce Value Plus Fund |
| SHARES | VALUE | |||||
| COMMON STOCKS – 96.3% | ||||||
| Consumer Discretionary – 9.0% | ||||||
| Hotels, Restaurants & Leisure - 1.0% | ||||||
Buffalo Wild Wings 1,2 | 144,000 | $ | 12,476,160 | |||
Cosi 1,2,3 | 6,833,773 | 4,853,345 | ||||
| 17,329,505 | ||||||
| Household Durables - 0.4% | ||||||
† iRobot Corporation 1,2 | 324,000 | 7,176,600 | ||||
| Multiline Retail - 1.1% | ||||||
Dollar Tree 2 | 346,000 | 18,614,800 | ||||
| Specialty Retail - 1.7% | ||||||
† Lumber Liquidators Holdings 1,2 | 378,100 | 12,775,999 | ||||
Tractor Supply | 201,000 | 16,695,060 | ||||
| 29,471,059 | ||||||
| Textiles, Apparel & Luxury Goods - 4.8% | ||||||
Carter’s 2 | 557,200 | 29,308,720 | ||||
Coach | 328,500 | 19,210,680 | ||||
Gildan Activewear | 1,233,342 | 33,941,572 | ||||
| 82,460,972 | ||||||
| Total (Cost $110,551,526) | 155,052,936 | |||||
| Consumer Staples – 2.3% | ||||||
| Food & Staples Retailing - 0.3% | ||||||
United Natural Foods 2 | 105,517 | 5,788,663 | ||||
| Food Products - 2.0% | ||||||
Darling International 2 | 863,262 | 14,235,190 | ||||
Sanderson Farms | 276,671 | 12,677,065 | ||||
Snyders-Lance | 290,000 | 7,316,700 | ||||
| 34,228,955 | ||||||
| Total (Cost $29,899,338) | 40,017,618 | |||||
| Energy – 3.6% | ||||||
| Energy Equipment & Services - 1.8% | ||||||
Helmerich & Payne | 88,000 | 3,826,240 | ||||
Pason Systems | 934,000 | 13,650,840 | ||||
Trican Well Service | 680,800 | 7,857,185 | ||||
Unit Corporation 2 | 127,400 | 4,699,786 | ||||
| 30,034,051 | ||||||
| Oil, Gas & Consumable Fuels - 1.8% | ||||||
Energy Partners 2 | 841,160 | 14,215,604 | ||||
Sprott Resource 2 | 1,515,000 | 5,907,621 | ||||
Whiting Petroleum 2 | 273,000 | 11,225,760 | ||||
| 31,348,985 | ||||||
| Total (Cost $66,973,367) | 61,383,036 | |||||
| Financials – 13.7% | ||||||
| Capital Markets - 7.5% | ||||||
Affiliated Managers Group 2 | 189,000 | 20,686,050 | ||||
Ashmore Group | 2,180,000 | 11,963,352 | ||||
Manning & Napier | 425,000 | 6,047,750 | ||||
Northern Trust | 471,000 | 21,675,420 | ||||
Partners Group Holding | 65,000 | 11,555,807 | ||||
Raymond James Financial | 605,000 | 20,715,200 | ||||
| 86 | The Royce Funds 2012 Semiannual Report to Shareholders | THE ACCOMPANYING NOTES ARE AN INTEGRAL PART OF THESE FINANCIAL STATEMENTS. |
| June 30, 2012 (unaudited) |
| SHARES | VALUE | |||||
| Financials (continued) | ||||||
| Capital Markets (continued) | ||||||
Sprott | 1,951,000 | $ | 9,485,758 | |||
U.S. Global Investors Cl. A | 464,541 | 2,030,044 | ||||
Value Partners Group | 18,128,500 | 8,881,971 | ||||
Waddell & Reed Financial Cl. A | 519,000 | 15,715,320 | ||||
| 128,756,672 | ||||||
| Commercial Banks - 3.3% | ||||||
Associated Banc-Corp | 1,045,000 | 13,783,550 | ||||
Columbia Banking System | 255,000 | 4,799,100 | ||||
Enterprise Financial Services | 730,800 | 8,009,568 | ||||
Fifth Third Bancorp | 1,101,800 | 14,764,120 | ||||
Umpqua Holdings | 1,162,300 | 15,295,868 | ||||
| 56,652,206 | ||||||
| Consumer Finance - 0.7% | ||||||
† Netspend Holdings 1,2 | 1,348,000 | 12,388,120 | ||||
| Diversified Financial Services - 1.0% | ||||||
PICO Holdings 2 | 737,222 | 16,521,145 | ||||
| Thrifts & Mortgage Finance - 1.2% | ||||||
Berkshire Hills Bancorp | 886,700 | 19,507,400 | ||||
| Total (Cost $244,195,632) | 233,825,543 | |||||
| Health Care – 8.8% | ||||||
| Biotechnology - 3.5% | ||||||
† Celldex Therapeutics 1,2 | 300,000 | 1,557,000 | ||||
Cubist Pharmaceuticals 1,2 | 395,000 | 14,974,450 | ||||
Myriad Genetics 2 | 1,357,000 | 32,255,890 | ||||
Rigel Pharmaceuticals 2 | 1,150,000 | 10,695,000 | ||||
| 59,482,340 | ||||||
| Health Care Equipment & Supplies - 2.9% | ||||||
Cerus Corporation 1,2,3 | 2,884,500 | 9,576,540 | ||||
NuVasive 1,2 | 618,400 | 15,682,624 | ||||
Thoratec Corporation 2 | 723,900 | 24,308,562 | ||||
| 49,567,726 | ||||||
| Health Care Providers & Services - 0.5% | ||||||
Healthways 2 | 1,135,000 | 9,057,300 | ||||
| Life Sciences Tools & Services - 0.8% | ||||||
PerkinElmer | 530,000 | 13,674,000 | ||||
| Pharmaceuticals - 1.1% | ||||||
UCB | 369,000 | 18,620,332 | ||||
| Total (Cost $137,595,288) | 150,401,698 | |||||
| Industrials – 18.7% | ||||||
| Aerospace & Defense - 0.3% | ||||||
AeroVironment 2 | 197,000 | 5,183,070 | ||||
| Building Products - 1.0% | ||||||
Quanex Building Products | 901,533 | 16,119,410 | ||||
| Commercial Services & Supplies - 2.2% | ||||||
† Heritage-Crystal Clean 1,2 | 701,028 | 11,461,808 | ||||
Ritchie Bros. Auctioneers | 426,600 | 9,065,250 | ||||
UniFirst Corporation | 266,400 | 16,983,000 | ||||
| 37,510,058 | ||||||
| Construction & Engineering - 1.8% | ||||||
Dycom Industries 2 | 389,000 | 7,239,290 | ||||
MYR Group 2 | 498,608 | 8,506,253 | ||||
Quanta Services 2 | 641,000 | 15,428,870 | ||||
| 31,174,413 | ||||||
| Electrical Equipment - 1.2% | ||||||
Acuity Brands | 408,095 | 20,776,116 | ||||
| Industrial Conglomerates - 2.0% | ||||||
Carlisle Companies | 638,900 | 33,874,478 | ||||
| Machinery - 3.3% | ||||||
Chart Industries 2 | 204,000 | 14,027,040 | ||||
Tennant Company | 199,502 | 7,970,105 | ||||
Valmont Industries | 285,400 | 34,524,838 | ||||
| 56,521,983 | ||||||
| Professional Services - 2.3% | ||||||
Robert Half International | 1,138,800 | 32,535,516 | ||||
† WageWorks 1,2 | 497,665 | 7,494,835 | ||||
| 40,030,351 | ||||||
| Road & Rail - 2.5% | ||||||
Celadon Group 3 | 1,234,800 | 20,226,024 | ||||
Knight Transportation | 725,100 | 11,594,349 | ||||
Werner Enterprises | 464,000 | 11,084,960 | ||||
| 42,905,333 | ||||||
| Trading Companies & Distributors - 2.1% | ||||||
Grainger (W.W.) | 89,600 | 17,135,104 | ||||
Watsco | 251,100 | 18,531,180 | ||||
| 35,666,284 | ||||||
| Total (Cost $260,649,287) | 319,761,496 | |||||
| Information Technology – 22.3% | ||||||
| Communications Equipment - 3.0% | ||||||
Digi International 2 | 886,600 | 9,078,784 | ||||
EXFO 2 | 1,952,500 | 9,742,975 | ||||
Infinera Corporation 1,2 | 1,328,833 | 9,089,218 | ||||
NETGEAR 2 | 480,820 | 16,593,098 | ||||
Oplink Communications 2 | 503,212 | 6,808,458 | ||||
| 51,312,533 | ||||||
| Electronic Equipment, Instruments & Components - 6.6% | ||||||
Fabrinet 1,2 | 489,700 | 6,145,735 | ||||
FARO Technologies 2 | 331,344 | 13,942,956 | ||||
GSI Group 2 | 1,095,238 | 12,551,427 | ||||
IPG Photonics 1,2 | 673,732 | 29,367,978 | ||||
Littelfuse | 186,744 | 10,623,866 | ||||
Mercury Computer Systems 2,3 | 1,727,749 | 22,339,795 | ||||
Rogers Corporation 2 | 435,143 | 17,236,014 | ||||
| 112,207,771 | ||||||
| Internet Software & Services - 1.8% | ||||||
Bankrate 1,2 | 833,127 | 15,321,205 | ||||
Liquidity Services 2 | 308,436 | 15,788,839 | ||||
| 31,110,044 | ||||||
| IT Services - 1.8% | ||||||
† CoreLogic 2 | 1,332,929 | 24,405,930 | ||||
ExlService Holdings 2 | 237,000 | 5,839,680 | ||||
| 30,245,610 | ||||||
| Semiconductors & Semiconductor Equipment - 8.9% | ||||||
Analog Devices | 630,000 | 23,732,100 | ||||
| THE ACCOMPANYING NOTES ARE AN INTEGRAL PART OF THESE FINANCIAL STATEMENTS. | The Royce Funds 2012 Semiannual Report to Shareholders | 87 |
| Schedules of Investments |
| Royce Value Plus Fund (continued) |
| SHARES | VALUE | |||||
| Information Technology (continued) | ||||||
| Semiconductors & Semiconductor Equipment (continued) | ||||||
International Rectifier 2 | 1,442,048 | $ | 28,826,539 | |||
Lattice Semiconductor 2 | 2,971,700 | 11,203,309 | ||||
LSI Corporation 2 | 4,436,000 | 28,257,320 | ||||
Micrel | 1,680,901 | 16,018,987 | ||||
Teradyne 2 | 2,096,000 | 29,469,760 | ||||
Ultratech 2 | 461,400 | 14,534,100 | ||||
| 152,042,115 | ||||||
| Software - 0.2% | ||||||
† Splunk 1,2 | 154,800 | 4,349,880 | ||||
| Total (Cost $352,262,748) | 381,267,953 | |||||
| Materials – 14.4% | ||||||
Chemicals - 2.3% | ||||||
Calgon Carbon 2 | 927,000 | 13,181,940 | ||||
LSB Industries 1,2 | 460,643 | 14,238,475 | ||||
Westlake Chemical | 225,091 | 11,763,256 | ||||
| 39,183,671 | ||||||
| Construction Materials - 0.9% | ||||||
† Eagle Materials | 445,000 | 16,616,300 | ||||
| Metals & Mining - 11.2% | ||||||
Alamos Gold | 1,182,600 | 18,469,050 | ||||
Allied Nevada Gold 2 | 567,400 | 16,102,812 | ||||
Centamin 2 | 3,000,000 | 3,300,265 | ||||
Detour Gold 2 | 472,000 | 9,508,614 | ||||
Globe Specialty Metals | 823,300 | 11,056,919 | ||||
Gryphon Minerals 2 | 1,350,000 | 946,857 | ||||
Hochschild Mining | 1,448,000 | 10,683,562 | ||||
Horsehead Holding Corporation 2 | 1,476,353 | 14,704,476 | ||||
Major Drilling Group International | 923,000 | 10,670,572 | ||||
McEwen Mining 1,2 | 1,250,000 | 3,762,500 | ||||
Medusa Mining | 1,528,000 | 7,579,219 | ||||
Pretium Resources 2 | 778,600 | 10,749,853 | ||||
Reliance Steel & Aluminum | 459,100 | 23,184,550 | ||||
Tahoe Resources 2 | 459,000 | 6,346,823 | ||||
Talison Lithium 2 | 3,046,000 | 11,309,184 | ||||
Worthington Industries | 1,609,488 | 32,946,219 | ||||
| 191,321,475 | ||||||
| Total (Cost $258,334,851) | 247,121,446 | |||||
| Miscellaneous 5 – 3.5% | ||||||
| Total (Cost $59,550,529) | 59,261,194 | |||||
| TOTAL COMMON STOCKS | ||||||
(Cost $1,520,012,566) | 1,648,092,920 | |||||
| REPURCHASE AGREEMENT – 4.4% | ||||||
| Fixed Income Clearing Corporation, | ||||||
0.11% dated 6/29/12, due 7/2/12, | ||||||
maturity value $75,045,688 (collateralized | ||||||
by obligations of various U.S. Government | ||||||
Agencies, 3.25% due 6/30/16, valued at | ||||||
$76,546,400) | ||||||
(Cost $75,045,000) | 75,045,000 | |||||
| COLLATERAL RECEIVED FOR SECURITIES | ||||||
LOANED – 5.0% | ||||||
| Money Market Funds | ||||||
Federated Government Obligations Fund | ||||||
(7 day yield-0.0115%) | ||||||
(Cost $85,720,096) | 85,720,096 | |||||
| ||||||
| TOTAL INVESTMENTS – 105.7% | ||||||
(Cost $1,680,777,662) | 1,808,858,016 | |||||
| LIABILITIES LESS CASH | ||||||
AND OTHER ASSETS – (5.7)% | (97,253,893 | ) | ||||
| NET ASSETS – 100.0% | $ | 1,711,604,123 | ||||
| 88 | The Royce Funds 2012 Semiannual Report to Shareholders | THE ACCOMPANYING NOTES ARE AN INTEGRAL PART OF THESE FINANCIAL STATEMENTS. |
| June 30, 2012 (unaudited) |
| Royce 100 Fund |
| SHARES | VALUE | |||||
| COMMON STOCKS – 98.7% | ||||||
| Consumer Discretionary – 13.6% | ||||||
| Auto Components - 1.4% | ||||||
Drew Industries 2 | 174,956 | $ | 4,872,525 | |||
| Distributors - 0.6% | ||||||
LKQ Corporation 2 | 68,000 | 2,271,200 | ||||
| Diversified Consumer Services - 0.8% | ||||||
Sotheby’s | 80,300 | 2,678,808 | ||||
| Household Durables - 5.2% | ||||||
Ethan Allen Interiors | 130,100 | 2,592,893 | ||||
Harman International Industries | 109,100 | 4,320,360 | ||||
Mohawk Industries 2 | 76,715 | 5,357,008 | ||||
NVR 2 | 7,200 | 6,120,000 | ||||
| 18,390,261 | ||||||
| Media - 2.1% | ||||||
DreamWorks Animation SKG Cl. A 1,2 | 199,000 | 3,792,940 | ||||
Morningstar | 61,872 | 3,578,677 | ||||
| 7,371,617 | ||||||
| Specialty Retail - 1.2% | ||||||
Ascena Retail Group 2 | 237,000 | 4,412,940 | ||||
| Textiles, Apparel & Luxury Goods - 2.3% | ||||||
Carter’s 2 | 12,000 | 631,200 | ||||
Columbia Sportswear | 56,800 | 3,045,616 | ||||
Warnaco Group (The) 2 | 107,000 | 4,556,060 | ||||
| 8,232,876 | ||||||
| Total (Cost $39,777,044) | 48,230,227 | |||||
| Consumer Staples – 2.0% | ||||||
| Food Products - 2.0% | ||||||
Darling International 2 | 212,800 | 3,509,072 | ||||
Sanderson Farms | 75,700 | 3,468,574 | ||||
| Total (Cost $5,612,749) | 6,977,646 | |||||
| Energy – 8.8% | ||||||
| Energy Equipment & Services - 8.8% | ||||||
Ensign Energy Services | 201,500 | 2,770,848 | ||||
Helmerich & Payne | 115,325 | 5,014,331 | ||||
Oil States International 2 | 66,500 | 4,402,300 | ||||
Pason Systems | 270,300 | 3,950,559 | ||||
SEACOR Holdings 2 | 41,500 | 3,709,270 | ||||
ShawCor Cl. A | 152,900 | 5,534,196 | ||||
Trican Well Service | 265,200 | 3,060,701 | ||||
Unit Corporation 2 | 73,200 | 2,700,348 | ||||
| Total (Cost $23,481,711) | 31,142,553 | |||||
| Financials – 10.7% | ||||||
| Capital Markets - 8.9% | ||||||
Affiliated Managers Group 2 | 46,997 | 5,143,822 | ||||
AllianceBernstein Holding L.P. | 235,569 | 2,989,370 | ||||
Federated Investors Cl. B | 231,700 | 5,062,645 | ||||
KKR & Co. L.P. | 145,000 | 1,869,050 | ||||
Knight Capital Group Cl. A 2 | 294,300 | 3,513,942 | ||||
Lazard Cl. A | 170,800 | 4,439,092 | ||||
SEI Investments | 249,000 | 4,952,610 | ||||
Waddell & Reed Financial Cl. A | 115,900 | 3,509,452 | ||||
| 31,479,983 | ||||||
| Diversified Financial Services - 1.8% | ||||||
Interactive Brokers Group | 313,700 | 4,617,664 | ||||
NASDAQ OMX Group (The) | 75,000 | 1,700,250 | ||||
| 6,317,914 | ||||||
| Total (Cost $40,541,645) | 37,797,897 | |||||
| Health Care – 3.0% | ||||||
| Life Sciences Tools & Services - 3.0% | ||||||
Bio-Rad Laboratories Cl. A 2 | 32,500 | 3,250,325 | ||||
ICON ADR 2 | 113,900 | 2,566,167 | ||||
PerkinElmer | 187,900 | 4,847,820 | ||||
| Total (Cost $9,081,803) | 10,664,312 | |||||
| Industrials – 28.1% | ||||||
| Aerospace & Defense - 2.1% | ||||||
HEICO Corporation Cl. A | 148,140 | 4,778,996 | ||||
Teledyne Technologies 2 | 45,000 | 2,774,250 | ||||
| 7,553,246 | ||||||
| Air Freight & Logistics - 2.4% | ||||||
Forward Air | 158,800 | 5,124,476 | ||||
UTi Worldwide | 223,900 | 3,271,179 | ||||
| 8,395,655 | ||||||
| Building Products - 0.8% | ||||||
Simpson Manufacturing | 95,500 | 2,818,205 | ||||
| Commercial Services & Supplies - 0.3% | ||||||
Brink’s Company (The) | 44,615 | 1,034,176 | ||||
| Construction & Engineering - 3.6% | ||||||
EMCOR Group | 137,300 | 3,819,686 | ||||
Jacobs Engineering Group 2 | 105,000 | 3,975,300 | ||||
KBR | 204,500 | 5,053,195 | ||||
| 12,848,181 | ||||||
| Electrical Equipment - 3.6% | ||||||
AZZ | 84,900 | 5,200,974 | ||||
GrafTech International 2 | 450,100 | 4,343,465 | ||||
Regal-Beloit | 49,500 | 3,081,870 | ||||
| 12,626,309 | ||||||
| Machinery - 6.3% | ||||||
CLARCOR | 25,000 | 1,204,000 | ||||
Kaydon Corporation | 134,500 | 2,876,955 | ||||
Kennametal | 161,900 | 5,366,985 | ||||
Lincoln Electric Holdings | 60,000 | 2,627,400 | ||||
Valmont Industries | 56,200 | 6,798,514 | ||||
Wabtec Corporation | 44,700 | 3,487,047 | ||||
| 22,360,901 | ||||||
| Professional Services - 5.9% | ||||||
Advisory Board (The) 2 | 89,082 | 4,417,576 | ||||
CRA International 2 | 152,313 | 2,237,478 | ||||
ManpowerGroup | 90,266 | 3,308,249 | ||||
Robert Half International | 110,000 | 3,142,700 | ||||
Verisk Analytics Cl. A 2 | 156,800 | 7,723,968 | ||||
| 20,829,971 | ||||||
| THE ACCOMPANYING NOTES ARE AN INTEGRAL PART OF THESE FINANCIAL STATEMENTS. | The Royce Funds 2012 Semiannual Report to Shareholders | 89 |
| Schedules of Investments |
| Royce 100 Fund (continued) |
| SHARES | VALUE | |||||
| Industrials (continued) | ||||||
| Road & Rail - 0.8% | ||||||
Landstar System | 51,600 | $ | 2,668,752 | |||
| Trading Companies & Distributors - 2.3% | ||||||
Applied Industrial Technologies | 111,300 | 4,101,405 | ||||
MSC Industrial Direct Cl. A | 61,500 | 4,031,325 | ||||
| 8,132,730 | ||||||
| Total (Cost $79,917,022) | 99,268,126 | |||||
| Information Technology – 20.9% | ||||||
| Communications Equipment - 1.3% | ||||||
ADTRAN | 155,800 | 4,703,602 | ||||
| Computers & Peripherals - 1.0% | ||||||
Diebold | 90,500 | 3,340,355 | ||||
| Electronic Equipment, Instruments & Components - 11.7% | ||||||
Coherent 2 | 108,700 | 4,706,710 | ||||
Dolby Laboratories Cl. A 2 | 70,000 | 2,891,000 | ||||
DTS 2 | 150,600 | 3,927,648 | ||||
FARO Technologies 2 | 93,887 | 3,950,765 | ||||
FEI Company 2 | 57,500 | 2,750,800 | ||||
FLIR Systems | 143,900 | 2,806,050 | ||||
IPG Photonics 1,2 | 117,786 | 5,134,292 | ||||
Littelfuse | 45,000 | 2,560,050 | ||||
National Instruments | 193,200 | 5,189,352 | ||||
Plexus Corporation 2 | 113,400 | 3,197,880 | ||||
Rofin-Sinar Technologies 2 | 229,500 | 4,344,435 | ||||
| 41,458,982 | ||||||
| IT Services - 1.0% | ||||||
Sapient Corporation | 357,900 | 3,604,053 | ||||
| Semiconductors & Semiconductor Equipment - 3.8% | ||||||
Cabot Microelectronics | 95,200 | 2,780,792 | ||||
Cymer 2 | 100,500 | 5,924,475 | ||||
Diodes 2 | 125,000 | 2,346,250 | ||||
International Rectifier 1,2 | 123,000 | 2,458,770 | ||||
| 13,510,287 | ||||||
| Software - 2.1% | ||||||
ANSYS 2 | 84,400 | 5,326,484 | ||||
Blackbaud | 78,900 | 2,025,363 | ||||
| 7,351,847 | ||||||
| Total (Cost $65,226,078) | 73,969,126 | |||||
| Materials – 9.7% | ||||||
| Chemicals - 1.3% | ||||||
Intrepid Potash 2 | 203,500 | 4,631,660 | ||||
| Containers & Packaging - 1.1% | ||||||
Greif Cl. A | 95,300 | 3,907,300 | ||||
| Metals & Mining - 7.3% | ||||||
Fresnillo | 156,500 | 3,591,683 | ||||
Major Drilling Group International | 340,500 | 3,936,436 | ||||
Randgold Resources ADR | 50,500 | 4,545,505 | ||||
Reliance Steel & Aluminum | 126,900 | 6,408,450 | ||||
Schnitzer Steel Industries Cl. A | 57,600 | 1,613,952 | ||||
Sims Metal Management ADR | 331,617 | 3,283,008 | ||||
Steel Dynamics | 208,500 | 2,449,875 | ||||
| 25,828,909 | ||||||
| Total (Cost $34,563,955) | 34,367,869 | |||||
| Miscellaneous 5 – 1.9% | ||||||
| Total (Cost $6,396,318) | 6,870,352 | |||||
| TOTAL COMMON STOCKS | ||||||
(Cost $304,598,325) | 349,288,108 | |||||
| REPURCHASE AGREEMENT – 0.4% | ||||||
| Fixed Income Clearing Corporation, | ||||||
0.11% dated 6/29/12, due 7/2/12, | ||||||
maturity value $1,289,012 (collateralized | ||||||
by obligations of various U.S. Government | ||||||
Agencies, 3.25% due 6/30/16, valued at $1,316,000) | ||||||
(Cost $1,289,000) | 1,289,000 | |||||
| COLLATERAL RECEIVED FOR SECURITIES | ||||||
LOANED – 3.2% | ||||||
| Money Market Funds | ||||||
Federated Government Obligations Fund | ||||||
(7 day yield-0.0115%) | ||||||
(Cost $11,277,609) | 11,277,609 | |||||
| TOTAL INVESTMENTS – 102.3% | ||||||
(Cost $317,164,934) | 361,854,717 | |||||
| LIABILITIES LESS CASH | ||||||
AND OTHER ASSETS – (2.3)% | (7,986,006 | ) | ||||
| NET ASSETS – 100.0% | $ | 353,868,711 | ||||
| 90 | The Royce Funds 2012 Semiannual Report to Shareholders | THE ACCOMPANYING NOTES ARE AN INTEGRAL PART OF THESE FINANCIAL STATEMENTS. |
| June 30, 2012 (unaudited) |
| Royce Micro-Cap Discovery Fund |
| SHARES | VALUE | |||||
| COMMON STOCKS – 91.0% | ||||||
| Consumer Discretionary – 18.1% | ||||||
| Auto Components - 2.5% | ||||||
China XD Plastics 2 | 11,000 | $ | 50,380 | |||
Standard Motor Products | 3,000 | 42,240 | ||||
| 92,620 | ||||||
| Distributors - 0.3% | ||||||
VOXX International Cl. A 2 | 1,260 | 11,743 | ||||
| Diversified Consumer Services - 3.3% | ||||||
Capella Education 2 | 1,100 | 38,236 | ||||
Lincoln Educational Services | 7,163 | 46,560 | ||||
Universal Technical Institute | 2,900 | 39,179 | ||||
| 123,975 | ||||||
| Hotels, Restaurants & Leisure - 1.1% | ||||||
† Ruby Tuesday 2 | 5,800 | 39,498 | ||||
| Household Durables - 0.8% | ||||||
Universal Electronics 2 | 2,300 | 30,291 | ||||
| Internet & Catalog Retail - 0.3% | ||||||
NutriSystem | 1,100 | 12,716 | ||||
| Leisure Equipment & Products - 1.8% | ||||||
Arctic Cat 2 | 700 | 25,592 | ||||
JAKKS Pacific | 1,489 | 23,839 | ||||
Sturm, Ruger & Co. | 400 | 16,060 | ||||
| 65,491 | ||||||
| Media - 1.5% | ||||||
Scholastic Corporation | 2,000 | 56,320 | ||||
| Specialty Retail - 5.0% | ||||||
Shoe Carnival | 2,750 | 59,097 | ||||
† Stage Stores | 3,200 | 58,624 | ||||
Stein Mart 2 | 5,100 | 40,545 | ||||
Wet Seal (The) Cl. A 2 | 9,600 | 30,336 | ||||
| 188,602 | ||||||
| Textiles, Apparel & Luxury Goods - 1.5% | ||||||
G-III Apparel Group 2 | 500 | 11,845 | ||||
† True Religion Apparel | 1,500 | 43,470 | ||||
| 55,315 | ||||||
| Total (Cost $680,277) | 676,571 | |||||
| Energy – 6.3% | ||||||
| Energy Equipment & Services - 2.6% | ||||||
Geodrill 2 | 8,100 | 17,105 | ||||
Matrix Service 2 | 4,900 | 55,615 | ||||
TGC Industries 2 | 2,535 | 24,615 | ||||
| 97,335 | ||||||
| Oil, Gas & Consumable Fuels - 3.7% | ||||||
PetroQuest Energy 2 | 3,800 | 19,000 | ||||
TransGlobe Energy 2 | 3,500 | 31,325 | ||||
VAALCO Energy 2 | 6,200 | 53,506 | ||||
Warren Resources 2 | 14,000 | 33,600 | ||||
| 137,431 | ||||||
| Total (Cost $228,775) | 234,766 | |||||
| Financials – 6.4% | ||||||
| Capital Markets - 1.7% | ||||||
Artio Global Investors Cl. A | 6,700 | 23,450 | ||||
INTL FCStone 2 | 2,100 | 40,635 | ||||
| 64,085 | ||||||
| Insurance - 4.7% | ||||||
American Safety Insurance Holdings 2 | 2,300 | 43,125 | ||||
Infinity Property & Casualty | 500 | 28,835 | ||||
Meadowbrook Insurance Group | 4,700 | 41,313 | ||||
Presidential Life | 6,300 | 61,929 | ||||
| 175,202 | ||||||
| Total (Cost $275,653) | 239,287 | |||||
| Health Care – 7.9% | ||||||
| Biotechnology - 0.7% | ||||||
Astex Pharmaceuticals 2 | 12,200 | 25,498 | ||||
| Health Care Equipment & Supplies - 2.5% | ||||||
Atrion Corporation | 150 | 30,747 | ||||
ICU Medical 2 | 700 | 37,366 | ||||
Symmetry Medical 2 | 3,000 | 25,740 | ||||
| 93,853 | ||||||
| Health Care Providers & Services - 0.6% | ||||||
Almost Family 2 | 1,100 | 24,574 | ||||
| Pharmaceuticals - 4.1% | ||||||
Hi-Tech Pharmacal 2 | 1,800 | 58,320 | ||||
Obagi Medical Products 2 | 3,200 | 48,864 | ||||
SciClone Pharmaceuticals 2 | 6,700 | 46,967 | ||||
| 154,151 | ||||||
| Total (Cost $246,086) | 298,076 | |||||
| Industrials – 15.2% | ||||||
| Commercial Services & Supplies - 3.4% | ||||||
Intersections | 3,200 | 50,720 | ||||
† Metalico 2 | 14,400 | 31,680 | ||||
† Sykes Enterprises 2 | 2,800 | 44,688 | ||||
| 127,088 | ||||||
| Construction & Engineering - 2.6% | ||||||
Baker (Michael) 2 | 700 | 18,263 | ||||
Comfort Systems USA | 2,800 | 28,056 | ||||
MYR Group 2 | 2,900 | 49,474 | ||||
| 95,793 | ||||||
| Electrical Equipment - 4.4% | ||||||
AZZ | 700 | 42,882 | ||||
Fushi Copperweld 2 | 6,500 | 56,485 | ||||
Global Power Equipment Group | 2,200 | 48,048 | ||||
Preformed Line Products | 300 | 17,373 | ||||
| 164,788 | ||||||
| Machinery - 2.4% | ||||||
Foster (L.B.) Company | 1,150 | 32,901 | ||||
Miller Industries | 3,600 | 57,348 | ||||
| 90,249 | ||||||
| Professional Services - 1.7% | ||||||
ICF International 2 | 900 | 21,456 | ||||
† Korn/Ferry International 2 | 3,000 | 43,050 | ||||
| 64,506 | ||||||
| THE ACCOMPANYING NOTES ARE AN INTEGRAL PART OF THESE FINANCIAL STATEMENTS. | The Royce Funds 2012 Semiannual Report to Shareholders | 91 |
| Schedules of Investments |
| Royce Micro-Cap Discovery Fund (continued) |
| SHARES | VALUE | |||||
| Industrials (continued) | ||||||
| Trading Companies & Distributors - 0.7% | ||||||
MFC Industrial | 4,000 | $ | 26,960 | |||
| Total (Cost $583,731) | 569,384 | |||||
| Information Technology – 21.5% | ||||||
| Communications Equipment - 2.9% | ||||||
Bel Fuse Cl. B | 1,000 | 17,610 | ||||
Globecomm Systems 2 | 4,700 | 47,658 | ||||
Oplink Communications 2 | 3,200 | 43,296 | ||||
| 108,564 | ||||||
| Computers & Peripherals - 2.7% | ||||||
| STEC 2 | 3,000 | 23,400 | ||||
| Super Micro Computer 2 | 3,100 | 49,166 | ||||
Xyratex | 2,600 | 29,406 | ||||
| 101,972 | ||||||
| Electronic Equipment, Instruments & Components - 2.7% | ||||||
Electro Scientific Industries | 2,900 | 34,278 | ||||
† Fabrinet 2 | 2,500 | 31,375 | ||||
Multi-Fineline Electronix 2 | 1,400 | 34,496 | ||||
| 100,149 | ||||||
| Internet Software & Services - 1.3% | ||||||
Blucora 2 | 2,700 | 33,264 | ||||
United Online | 3,300 | 13,926 | ||||
| 47,190 | ||||||
| IT Services - 3.2% | ||||||
Computer Task Group 2 | 5,199 | 77,933 | ||||
Dynamics Research 2 | 3,200 | 18,592 | ||||
TeleTech Holdings 2 | 1,500 | 24,000 | ||||
| 120,525 | ||||||
| Semiconductors & Semiconductor Equipment - 5.3% | ||||||
Amtech Systems 2 | 5,900 | 22,184 | ||||
Brooks Automation | 1,400 | 13,216 | ||||
Cohu | 1,600 | 16,256 | ||||
Integrated Silicon Solution 2 | 5,400 | 54,486 | ||||
IXYS Corporation 2 | 3,200 | 35,744 | ||||
Kulicke & Soffa Industries 2 | 4,600 | 41,032 | ||||
Rudolph Technologies 2 | 2,000 | 17,440 | ||||
| 200,358 | ||||||
| Software - 3.4% | ||||||
Actuate Corporation 2 | 5,900 | 40,887 | ||||
ePlus 2 | 1,500 | 48,525 | ||||
Manhattan Associates 2 | 800 | 36,568 | ||||
| 125,980 | ||||||
| Total (Cost $837,880) | 804,738 | |||||
| Materials – 11.3% | ||||||
| Chemicals - 1.0% | ||||||
Stepan Company | 400 | 37,672 | ||||
| Metals & Mining - 9.2% | ||||||
Aurizon Mines 2 | 8,600 | 38,786 | ||||
Endeavour Silver 2 | 3,900 | 31,668 | ||||
Horsehead Holding Corporation 2 | 6,612 | 65,856 | ||||
Materion Corporation | 2,700 | 62,181 | ||||
Revett Minerals 2 | 10,500 | 34,545 | ||||
Richmont Mines 2 | 7,100 | 32,873 | ||||
Taseko Mines 2 | 8,700 | 23,142 | ||||
Universal Stainless & Alloy Products 2 | 1,400 | 57,540 | ||||
| 346,591 | ||||||
| Paper & Forest Products - 1.1% | ||||||
KapStone Paper and Packaging 2 | 2,500 | 39,625 | ||||
| Total (Cost $406,517) | 423,888 | |||||
| Miscellaneous5 – 4.3% | ||||||
| Total (Cost $163,028) | 160,533 | |||||
| TOTAL COMMON STOCKS | ||||||
(Cost $3,421,947) | 3,407,243 | |||||
| REPURCHASE AGREEMENT – 9.0% | ||||||
| Fixed Income Clearing Corporation, | ||||||
0.11% dated 6/29/12, due 7/2/12, | ||||||
maturity value $339,003 (collateralized | ||||||
by obligations of various U.S. Government | ||||||
Agencies, 3.25% due 6/30/16, valued at $347,200) | ||||||
(Cost $339,000) | 339,000 | |||||
| TOTAL INVESTMENTS – 100.0% | ||||||
(Cost $3,760,947) | 3,746,243 | |||||
| LIABILITIES LESS CASH | ||||||
AND OTHER ASSETS – (0.0)% | (1,241 | ) | ||||
| NET ASSETS – 100.0% | $ | 3,745,002 | ||||
| 92 | The Royce Funds 2012 Semiannual Report to Shareholders | THE ACCOMPANYING NOTES ARE AN INTEGRAL PART OF THESE FINANCIAL STATEMENTS. |
| June 30, 2012 (unaudited) |
| Royce Financial Services Fund |
| SHARES | VALUE | |||||
| COMMON STOCKS – 98.6% | ||||||
| Capital Markets - 58.2% | ||||||
Affiliated Managers Group 2 | 1,500 | $ | 164,175 | |||
AGF Management Cl. B | 9,600 | 106,174 | ||||
AllianceBernstein Holding L.P. | 29,100 | 369,279 | ||||
Apollo Global Management LLC Cl. A | 22,000 | 272,800 | ||||
Artio Global Investors Cl. A | 25,000 | 87,500 | ||||
Ashmore Group | 85,000 | 466,461 | ||||
Bank Sarasin & Co. Cl. B 2 | 3,085 | 86,839 | ||||
Banque Privee Edmond de Rothschild | 3 | 60,024 | ||||
Blackstone Group L.P. | 5,000 | 65,350 | ||||
Citadel Capital 2 | 150,000 | 78,237 | ||||
Cohen & Steers | 8,900 | 307,139 | ||||
Coronation Fund Managers | 62,000 | 210,128 | ||||
Cowen Group Cl. A 2 | 60,000 | 159,600 | ||||
Daewoo Securities | 3,800 | 35,377 | ||||
Diamond Hill Investment Group | 2,500 | 195,725 | ||||
Edelman Financial Group (The) | 18,200 | 158,340 | ||||
Egyptian Financial Group-Hermes Holding Company 2 | 31,875 | 54,138 | ||||
Federated Investors Cl. B | 11,900 | 260,015 | ||||
GMP Capital | 6,000 | 32,944 | ||||
Invesco | 17,200 | 388,720 | ||||
Investec | 8,500 | 49,620 | ||||
IOOF Holdings | 11,528 | 71,919 | ||||
Jefferies Group | 13,800 | 179,262 | ||||
Jupiter Fund Management | 95,500 | 322,491 | ||||
KBW | 4,500 | 74,025 | ||||
KKR & Co. L.P. | 16,000 | 206,240 | ||||
Lazard Cl. A | 9,500 | 246,905 | ||||
Manning & Napier | 17,800 | 253,294 | ||||
MVC Capital | 3,800 | 49,210 | ||||
Northern Trust | 8,400 | 386,568 | ||||
Och-Ziff Capital Management Group LLC Cl. A | 9,000 | 68,220 | ||||
Oppenheimer Holdings Cl. A | 11,500 | 180,780 | ||||
Partners Group Holding | 1,000 | 177,782 | ||||
Raymond James Financial | 5,100 | 174,624 | ||||
Reinet Investments 2 | 5,500 | 100,480 | ||||
Samsung Securities | 1,791 | 77,541 | ||||
SEI Investments | 16,500 | 328,185 | ||||
SHUAA Capital 2 | 580,000 | 105,540 | ||||
Sprott | 60,900 | 296,096 | ||||
Stifel Financial 2 | 6,073 | 187,656 | ||||
T. Rowe Price Group | 3,500 | 220,360 | ||||
Tokai Tokyo Financial Holdings | 9,400 | 33,937 | ||||
U.S. Global Investors Cl. A | 33,100 | 144,647 | ||||
UOB-Kay Hian Holdings | 95,000 | 118,105 | ||||
Value Partners Group | 430,000 | 210,676 | ||||
Virtus Investment Partners 2 | 3,600 | 291,600 | ||||
Vontobel Holding | 3,000 | 59,211 | ||||
Waddell & Reed Financial Cl. A | 5,900 | 178,652 | ||||
Westwood Holdings Group | 5,300 | 197,478 | ||||
WisdomTree Investments 2 | 48,000 | 315,360 | ||||
| Total (Cost $9,301,788) | 8,865,429 | |||||
| Closed-End Funds - 1.1% | ||||||
† RIT Capital Partners | 8,500 | 165,612 | ||||
| Total (Cost $153,505) | 165,612 | |||||
| Commercial Banks - 4.5% | ||||||
BLOM Bank GDR | 8,000 | 61,440 | ||||
BOK Financial | 4,600 | 267,720 | ||||
Fauquier Bankshares | 2,400 | 31,200 | ||||
First Republic Bank 2 | 8,400 | 282,240 | ||||
Peapack-Gladstone Financial | 2,835 | 43,971 | ||||
| Total (Cost $640,275) | 686,571 | |||||
| Consumer Finance - 4.3% | ||||||
Credit Acceptance 2 | 1,066 | 90,002 | ||||
† Regional Management 2 | 22,700 | 373,415 | ||||
World Acceptance 2 | 3,000 | 197,400 | ||||
| Total (Cost $486,538) | 660,817 | |||||
| Diversified Financial Services - 6.4% | ||||||
Bolsas y Mercados Espanoles | 4,000 | 80,520 | ||||
† FX Alliance 2 | 15,500 | 243,505 | ||||
Hellenic Exchanges | 10,500 | 35,978 | ||||
Interactive Brokers Group | 12,600 | 185,472 | ||||
MSCI Cl. A 2 | 2,800 | 95,256 | ||||
RHJ International 2 | 10,000 | 45,121 | ||||
Singapore Exchange | 25,000 | 125,501 | ||||
Warsaw Stock Exchange | 14,500 | 166,296 | ||||
| Total (Cost $1,104,846) | 977,649 | |||||
| Insurance - 9.9% | ||||||
Brown & Brown | 2,600 | 70,902 | ||||
E-L Financial | 400 | 163,049 | ||||
First American Financial | 10,000 | 169,600 | ||||
Greenlight Capital Re Cl. A 2 | 9,000 | 228,780 | ||||
Hilltop Holdings 2 | 5,200 | 53,612 | ||||
Marsh & McLennan | 7,400 | 238,502 | ||||
Platinum Underwriters Holdings | 5,500 | 209,550 | ||||
RLI | 1,100 | 75,020 | ||||
State Auto Financial | 11,000 | 154,550 | ||||
Willis Group Holdings | 4,000 | 145,960 | ||||
| Total (Cost $1,368,198) | 1,509,525 | |||||
| IT Services - 3.5% | ||||||
MasterCard Cl. A | 700 | 301,077 | ||||
† Vantiv Cl. A 2 | 10,000 | 232,900 | ||||
| Total (Cost $293,957) | 533,977 | |||||
| Media - 1.8% | ||||||
Morningstar | 4,600 | 266,064 | ||||
| Total (Cost $181,189) | 266,064 | |||||
| Professional Services - 2.6% | ||||||
Verisk Analytics Cl. A 2 | 8,000 | 394,080 | ||||
| Total (Cost $253,293) | 394,080 | |||||
| THE ACCOMPANYING NOTES ARE AN INTEGRAL PART OF THESE FINANCIAL STATEMENTS. | The Royce Funds 2012 Semiannual Report to Shareholders | 93 |
Schedules of Investments
| Royce Financial Services Fund (continued) |
| SHARES | VALUE | |||||
| Real Estate Management & Development - 1.8% | ||||||
Kennedy-Wilson Holdings | 19,676 | $ | 275,661 | |||
| Total (Cost $186,246) | 275,661 | |||||
| Software - 2.1% | ||||||
Fair Isaac | 7,400 | 312,872 | ||||
| Total (Cost $153,499) | 312,872 | |||||
| Trading Companies & Distributors - 2.0% | ||||||
Air Lease Cl. A 2 | 15,700 | 304,423 | ||||
| Total (Cost $356,874) | 304,423 | |||||
| Miscellaneous 5 - 0.4% | ||||||
| Total (Cost $72,326) | 64,350 | |||||
| TOTAL COMMON STOCKS | ||||||
(Cost $14,552,534) | 15,017,030 | |||||
| REPURCHASE AGREEMENT – 2.1% | ||||||
| Fixed Income Clearing Corporation, | ||||||
0.11% dated 6/29/12, due 7/2/12, | ||||||
maturity value $315,003 (collateralized | ||||||
by obligations of various U.S. Government | ||||||
Agencies, 3.25% due 6/30/16, valued at $324,800) | ||||||
(Cost $315,000) | 315,000 | |||||
| TOTAL INVESTMENTS – 100.7% | ||||||
(Cost $14,867,534) | 15,332,030 | |||||
| LIABILITIES LESS CASH | ||||||
AND OTHER ASSETS – (0.7)% | (101,153 | ) | ||||
| NET ASSETS – 100.0% | $ | 15,230,877 | ||||
| Royce Dividend Value Fund |
| SHARES | VALUE | |||||
| COMMON STOCKS – 93.3% | ||||||
| Consumer Discretionary – 10.9% | ||||||
| Auto Components - 0.1% | ||||||
Autoliv | 4,000 | $ | 218,640 | |||
Tianneng Power International | 324,000 | 172,237 | ||||
Xinyi Glass Holdings | 130,000 | 69,505 | ||||
| 460,382 | ||||||
| Automobiles - 0.1% | ||||||
Thor Industries | 4,000 | 109,640 | ||||
| Distributors - 0.1% | ||||||
Weyco Group | 11,600 | 268,888 | ||||
| Diversified Consumer Services - 1.6% | ||||||
Benesse Holdings | 4,000 | 178,832 | ||||
Regis Corporation | 127,800 | 2,295,288 | ||||
† Strayer Education | 29,000 | 3,161,580 | ||||
| 5,635,700 | ||||||
| Hotels, Restaurants & Leisure - 0.3% | ||||||
Abu Dhabi National Hotels | 642,000 | 307,629 | ||||
International Speedway Cl. A | 28,800 | 753,984 | ||||
| 1,061,613 | ||||||
| Household Durables - 1.3% | ||||||
Ethan Allen Interiors | 49,000 | 976,570 | ||||
Hanssem | 34,300 | 554,951 | ||||
Harman International Industries | 54,400 | 2,154,240 | ||||
Hunter Douglas | 24,000 | 935,749 | ||||
| 4,621,510 | ||||||
| Internet & Catalog Retail - 0.2% | ||||||
Manutan International | 2,100 | 79,754 | ||||
PetMed Express | 56,000 | 680,960 | ||||
| 760,714 | ||||||
| Media - 0.6% | ||||||
Pico Far East Holdings | 1,278,000 | 316,757 | ||||
Value Line | 119,088 | 1,415,956 | ||||
World Wrestling Entertainment Cl. A | 64,731 | 506,196 | ||||
| 2,238,909 | ||||||
| Specialty Retail - 6.0% | ||||||
American Eagle Outfitters | 125,500 | 2,476,115 | ||||
Ascena Retail Group 2 | 210,384 | 3,917,350 | ||||
Buckle (The) | 82,901 | 3,280,393 | ||||
Cato Corporation (The) Cl. A | 40,310 | 1,227,843 | ||||
Fielmann | 3,200 | 295,770 | ||||
GameStop Corporation Cl. A | 135,400 | 2,485,944 | ||||
Guess? | 112,800 | 3,425,736 | ||||
Jos. A. Bank Clothiers 1,2 | 71,535 | 3,037,376 | ||||
Lewis Group | 41,000 | 353,351 | ||||
USS | 7,000 | 756,122 | ||||
Williams-Sonoma | 5,100 | 178,347 | ||||
| 21,434,347 | ||||||
| Textiles, Apparel & Luxury Goods - 0.6% | ||||||
Barry (R.G.) | 12,375 | 168,176 | ||||
Jones Group (The) | 93,600 | 894,816 | ||||
Marimekko | 22,500 | 368,018 | ||||
| 94 | The Royce Funds 2012 Semiannual Report to Shareholders | THE ACCOMPANYING NOTES ARE AN INTEGRAL PART OF THESE FINANCIAL STATEMENTS. |
June 30, 2012 (unaudited) |
| SHARES | VALUE | |||||
| Consumer Discretionary (continued) | ||||||
| Textiles, Apparel & Luxury Goods (continued) | ||||||
Stella International Holdings | 314,000 | $ | 779,167 | |||
| 2,210,177 | ||||||
| Total (Cost $38,768,161) | 38,801,880 | |||||
| Consumer Staples – 3.0% | ||||||
| Beverages - 0.1% | ||||||
Thai Beverage | 740,000 | 199,324 | ||||
| Food & Staples Retailing - 0.8% | ||||||
FamilyMart | 15,850 | 725,727 | ||||
Village Super Market Cl. A | 58,569 | 1,908,178 | ||||
| 2,633,905 | ||||||
| Food Products - 0.8% | ||||||
China Green (Holdings) 2 | 168,000 | 38,308 | ||||
Hormel Foods | 32,376 | 984,878 | ||||
Industrias Bachoco ADR | 6,100 | 133,895 | ||||
J&J Snack Foods | 10,300 | 608,730 | ||||
Lancaster Colony | 5,600 | 398,776 | ||||
Lindt & Spruengli | 4 | 146,951 | ||||
Sanderson Farms | 1,300 | 59,566 | ||||
Super Group | 346,000 | 575,202 | ||||
| 2,946,306 | ||||||
| Personal Products - 1.3% | ||||||
Inter Parfums | 30,919 | 533,971 | ||||
Nu Skin Enterprises Cl. A | 89,645 | 4,204,351 | ||||
| 4,738,322 | ||||||
| Total (Cost $8,736,507) | 10,517,857 | |||||
| Energy – 3.8% | ||||||
| Energy Equipment & Services - 2.7% | ||||||
Ensco Cl. A | 44,600 | 2,094,862 | ||||
Ensign Energy Services | 25,300 | 347,903 | ||||
Exterran Partners L.P. | 6,404 | 123,149 | ||||
Helmerich & Payne | 95,400 | 4,147,992 | ||||
Lamprell | 92,300 | 146,000 | ||||
Lufkin Industries | 7,400 | 401,968 | ||||
Oil States International 2 | 21,400 | 1,416,680 | ||||
TGS-NOPEC Geophysical | 18,500 | 498,637 | ||||
Tidewater | 12,600 | 584,136 | ||||
| 9,761,327 | ||||||
| Oil, Gas & Consumable Fuels - 1.1% | ||||||
Cimarex Energy | 7,400 | 407,888 | ||||
Energen Corporation | 41,300 | 1,863,869 | ||||
Golar LNG | 10,700 | 403,390 | ||||
Natural Resource Partners L.P. | 37,500 | 831,375 | ||||
Pioneer Southwest Energy Partners L.P. | 14,304 | 367,899 | ||||
| 3,874,421 | ||||||
| Total (Cost $13,507,870) | 13,635,748 | |||||
| Financials – 31.5% | ||||||
| Capital Markets - 15.7% | ||||||
Affiliated Managers Group 2 | 19,800 | 2,167,110 | ||||
AGF Management Cl. B | 144,400 | 1,597,037 | ||||
AllianceBernstein Holding L.P. | 157,600 | 1,999,944 | ||||
Apollo Global Management LLC Cl. A | 179,800 | 2,229,520 | ||||
Apollo Investment | 7,300 | 56,064 | ||||
Artio Global Investors Cl. A | 198,000 | 693,000 | ||||
Ashmore Group | 406,000 | 2,228,037 | ||||
Banca Generali | 4,200 | 48,460 | ||||
Bank Sarasin & Co. Cl. B 2 | 27,600 | 776,909 | ||||
Close Brothers Group | 18,000 | 210,782 | ||||
Cohen & Steers | 44,200 | 1,525,342 | ||||
Edelman Financial Group (The) | 189,000 | 1,644,300 | ||||
Egyptian Financial Group-Hermes Holding Company 2 | 132,500 | 225,043 | ||||
Epoch Holding Corporation | 51,800 | 1,180,004 | ||||
Federated Investors Cl. B | 205,700 | 4,494,545 | ||||
Fortress Investment Group LLC Cl. A | 50,000 | 168,500 | ||||
Gluskin Sheff + Associates | 9,200 | 119,552 | ||||
Invesco | 123,800 | 2,797,880 | ||||
Investec | 52,200 | 304,728 | ||||
Jefferies Group | 135,000 | 1,753,650 | ||||
Jupiter Fund Management | 550,000 | 1,857,279 | ||||
KKR & Co. L.P. | 268,200 | 3,457,098 | ||||
Lazard Cl. A | 134,600 | 3,498,254 | ||||
Manning & Napier | 347,500 | 4,944,925 | ||||
Och-Ziff Capital Management Group LLC Cl. A | 108,100 | 819,398 | ||||
Oppenheimer Holdings Cl. A | 111,512 | 1,752,969 | ||||
Partners Group Holding | 500 | 88,891 | ||||
Raymond James Financial | 7,800 | 267,072 | ||||
SEI Investments | 245,700 | 4,886,973 | ||||
Sprott | 200,000 | 972,400 | ||||
T. Rowe Price Group | 42,000 | 2,644,320 | ||||
U.S. Global Investors Cl. A | 84,000 | 367,080 | ||||
Value Partners Group | 1,225,000 | 600,183 | ||||
VZ Holding | 8,300 | 786,358 | ||||
Waddell & Reed Financial Cl. A | 37,600 | 1,138,528 | ||||
Westwood Holdings Group | 41,173 | 1,534,106 | ||||
| 55,836,241 | ||||||
| Commercial Banks - 2.3% | ||||||
Ames National | 14,764 | 339,424 | ||||
Bank of Hawaii | 55,900 | 2,568,605 | ||||
Bank of N.T. Butterfield & Son 2 | 350 | 444 | ||||
BLOM Bank GDR | 63,000 | 483,840 | ||||
BOK Financial | 30,400 | 1,769,280 | ||||
City Holding Company | 54,265 | 1,828,188 | ||||
First Republic Bank 2 | 26,600 | 893,760 | ||||
National Bankshares | 6,613 | 199,184 | ||||
| 8,082,725 | ||||||
| Diversified Financial Services - 1.4% | ||||||
Bolsa Mexicana de Valores | 674,900 | 1,329,593 | ||||
Hellenic Exchanges | 45,000 | 154,191 | ||||
KKR Financial Holdings LLC | 228,350 | 1,945,542 | ||||
Singapore Exchange | 140,000 | 702,805 | ||||
Warsaw Stock Exchange | 80,000 | 917,494 | ||||
| 5,049,625 | ||||||
| THE ACCOMPANYING NOTES ARE AN INTEGRAL PART OF THESE FINANCIAL STATEMENTS. | The Royce Funds 2012 Semiannual Report to Shareholders | 95 |
Schedules of Investments
| Royce Dividend Value Fund (continued) |
| SHARES | VALUE | |||||
| Financials (continued) | ||||||
| Insurance - 9.3% | ||||||
Alleghany Corporation 2 | 6,000 | $ | 2,038,500 | |||
Allied World Assurance Company Holdings | 39,698 | 3,154,800 | ||||
Alterra Capital Holdings | 30,620 | 714,977 | ||||
Aspen Insurance Holdings | 40,724 | 1,176,923 | ||||
Berkley (W.R.) | 60,500 | 2,354,660 | ||||
Brown & Brown | 13,400 | 365,418 | ||||
Cincinnati Financial | 4,700 | 178,929 | ||||
E-L Financial | 4,900 | 1,997,348 | ||||
Endurance Specialty Holdings | 9,850 | 377,452 | ||||
Erie Indemnity Cl. A | 24,200 | 1,732,962 | ||||
Fidelity National Financial Cl. A | 20,000 | 385,200 | ||||
First American Financial | 127,700 | 2,165,792 | ||||
HCC Insurance Holdings | 32,000 | 1,004,800 | ||||
Marsh & McLennan | 85,900 | 2,768,557 | ||||
Montpelier Re Holdings | 35,530 | 756,434 | ||||
Old Republic International | 212,600 | 1,762,454 | ||||
PartnerRe | 29,606 | 2,240,286 | ||||
Reinsurance Group of America | 72,080 | 3,835,377 | ||||
StanCorp Financial Group | 21,900 | 813,804 | ||||
United Fire Group | 11,900 | 253,827 | ||||
Willis Group Holdings | 87,800 | 3,203,822 | ||||
| 33,282,322 | ||||||
| Real Estate Investment Trusts (REITs) - 2.0% | ||||||
Colony Financial | 133,700 | 2,313,010 | ||||
CommonWealth REIT | 6,250 | 119,500 | ||||
Cousins Properties | 40,010 | 310,077 | ||||
DCT Industrial Trust | 98,400 | 619,920 | ||||
Essex Property Trust | 8,000 | 1,231,360 | ||||
Lexington Realty Trust | 58,706 | 497,240 | ||||
National Health Investors | 38,700 | 1,970,604 | ||||
Summit Hotel Properties | 25,000 | 209,250 | ||||
| 7,270,961 | ||||||
| Real Estate Management & Development - 0.2% | ||||||
Kennedy-Wilson Holdings | 48,600 | 680,886 | ||||
| Thrifts & Mortgage Finance - 0.6% | ||||||
Capitol Federal Financial | 27,000 | 320,760 | ||||
Genworth MI Canada | 49,518 | 896,878 | ||||
TrustCo Bank Corp NY | 142,810 | 779,743 | ||||
| 1,997,381 | ||||||
| Total (Cost $111,572,794) | 112,200,141 | |||||
| Health Care – 4.3% | ||||||
| Health Care Equipment & Supplies - 0.5% | ||||||
Atrion Corporation | 7,400 | 1,516,852 | ||||
Carl Zeiss Meditec | 9,500 | 228,972 | ||||
| 1,745,824 | ||||||
| Health Care Providers & Services - 3.4% | ||||||
Chemed Corporation | 63,154 | 3,817,028 | ||||
Landauer | 41,100 | 2,356,263 | ||||
MEDNAX 2 | 37,500 | 2,570,250 | ||||
OdontoPrev | 38,400 | 195,011 | ||||
Owens & Minor | 101,500 | 3,108,945 | ||||
| 12,047,497 | ||||||
| Pharmaceuticals - 0.4% | ||||||
Adcock Ingram Holdings | 48,900 | 360,115 | ||||
Boiron | 1,500 | 38,954 | ||||
Hikma Pharmaceuticals | 11,000 | 112,544 | ||||
Recordati | 20,000 | 142,306 | ||||
Santen Pharmaceutical | 18,100 | 742,323 | ||||
| 1,396,242 | ||||||
| Total (Cost $14,781,650) | 15,189,563 | |||||
| Industrials – 22.4% | ||||||
| Aerospace & Defense - 1.8% | ||||||
American Science & Engineering | 49,545 | 2,796,815 | ||||
Cubic Corporation | 56,420 | 2,712,674 | ||||
HEICO Corporation Cl. A | 28,906 | 932,507 | ||||
| 6,441,996 | ||||||
| Air Freight & Logistics - 0.9% | ||||||
Forward Air | 88,000 | 2,839,760 | ||||
UTi Worldwide | 16,700 | 243,987 | ||||
| 3,083,747 | ||||||
| Building Products - 0.9% | ||||||
AAON | 78,350 | 1,476,897 | ||||
American Woodmark 2 | 3,700 | 63,270 | ||||
Geberit | 1,000 | 197,254 | ||||
Insteel Industries | 72,000 | 802,800 | ||||
TOTO | 74,000 | 552,622 | ||||
WaterFurnace Renewable Energy | 6,000 | 95,767 | ||||
| 3,188,610 | ||||||
| Commercial Services & Supplies - 2.0% | ||||||
Brink’s Company (The) | 115,300 | 2,672,654 | ||||
CompX International Cl. A | 25,800 | 325,080 | ||||
Interface Cl. A | 8,000 | 109,040 | ||||
Mine Safety Appliances | 35,000 | 1,408,400 | ||||
Ritchie Bros. Auctioneers | 88,900 | 1,889,125 | ||||
Societe BIC | 6,600 | 681,852 | ||||
US Ecology | 7,700 | 136,598 | ||||
| 7,222,749 | ||||||
| Construction & Engineering - 0.2% | ||||||
Jacobs Engineering Group 2 | 12,000 | 454,320 | ||||
Raubex Group | 135,000 | 221,041 | ||||
| 675,361 | ||||||
| Electrical Equipment - 2.6% | ||||||
AZZ | 51,600 | 3,161,016 | ||||
Brady Corporation Cl. A | 54,300 | 1,493,793 | ||||
Franklin Electric | 6,000 | 306,780 | ||||
Hubbell Cl. B | 36,700 | 2,860,398 | ||||
Preformed Line Products | 13,100 | 758,621 | ||||
Regal-Beloit | 11,400 | 709,764 | ||||
| 9,290,372 | ||||||
| Industrial Conglomerates - 0.2% | ||||||
Raven Industries | 9,600 | 668,064 | ||||
| 96 | The Royce Funds 2012 Semiannual Report to Shareholders | THE ACCOMPANYING NOTES ARE AN INTEGRAL PART OF THESE FINANCIAL STATEMENTS. |
June 30, 2012 (unaudited) |
| SHARES | VALUE | |||||
| Industrials (continued) | ||||||
| Machinery - 9.9% | ||||||
Burckhardt Compression Holding | 1,600 | $ | 410,693 | |||
CLARCOR | 45,300 | 2,181,648 | ||||
Donaldson Company | 80,800 | 2,696,296 | ||||
Flowserve Corporation | 7,900 | 906,525 | ||||
Foster (L.B.) Company | 110,500 | 3,161,405 | ||||
Gardner Denver | 16,000 | 846,560 | ||||
Graco | 64,000 | 2,949,120 | ||||
Kaydon Corporation | 83,200 | 1,779,648 | ||||
Kennametal | 156,399 | 5,184,627 | ||||
Lincoln Electric Holdings | 59,300 | 2,596,747 | ||||
Lindsay Corporation | 32,800 | 2,128,720 | ||||
Met-Pro Corporation | 62,000 | 571,020 | ||||
Nordson Corporation | 15,400 | 789,866 | ||||
Pall Corporation | 9,900 | 542,619 | ||||
Pfeiffer Vacuum Technology | 13,500 | 1,374,154 | ||||
Rational | 1,000 | 238,380 | ||||
Semperit AG Holding | 25,000 | 913,614 | ||||
Spirax-Sarco Engineering | 36,500 | 1,137,337 | ||||
Tennant Company | 18,400 | 735,080 | ||||
Valmont Industries | 33,900 | 4,100,883 | ||||
| 35,244,942 | ||||||
| Professional Services - 1.6% | ||||||
Corporate Executive Board | 3,900 | 159,432 | ||||
Kelly Services Cl. A | 39,200 | 506,072 | ||||
ManpowerGroup | 72,800 | 2,668,120 | ||||
Michael Page International | 36,000 | 212,163 | ||||
Towers Watson & Company Cl. A | 32,900 | 1,970,710 | ||||
| 5,516,497 | ||||||
| Road & Rail - 1.1% | ||||||
Arkansas Best | 49,600 | 624,960 | ||||
Landstar System | 66,300 | 3,429,036 | ||||
| 4,053,996 | ||||||
| Trading Companies & Distributors - 1.0% | ||||||
Applied Industrial Technologies | 88,506 | 3,261,446 | ||||
Houston Wire & Cable | 37,700 | 412,061 | ||||
| 3,673,507 | ||||||
| Transportation Infrastructure - 0.2% | ||||||
Grupo Aeroportuario del Centro Norte ADR 1 | 14,600 | 239,440 | ||||
Grupo Aeroportuario del Pacifico ADR | 11,500 | 453,790 | ||||
| 693,230 | ||||||
| Total (Cost $74,290,409) | 79,753,071 | |||||
| Information Technology – 6.8% | ||||||
| Communications Equipment - 0.5% | ||||||
ADTRAN | 3,300 | 99,627 | ||||
Plantronics | 42,603 | 1,422,940 | ||||
Tellabs | 84,500 | 281,385 | ||||
| 1,803,952 | ||||||
| Computers & Peripherals - 0.2% | ||||||
Diebold | 13,800 | 509,358 | ||||
| Electronic Equipment, Instruments & Components - 4.9% | ||||||
Amphenol Corporation Cl. A | 47,100 | 2,586,732 | ||||
AVX Corporation | 152,300 | 1,628,087 | ||||
Cognex Corporation | 78,700 | 2,490,855 | ||||
Domino Printing Sciences | 36,000 | 304,714 | ||||
Electro Rent | 15,900 | 258,057 | ||||
FLIR Systems | 53,200 | 1,037,400 | ||||
Littelfuse | 47,411 | 2,697,212 | ||||
Mesa Laboratories | 3,103 | 144,259 | ||||
Molex | 91,000 | 2,178,540 | ||||
Molex Cl. A | 61,226 | 1,238,602 | ||||
MTS Systems | 21,300 | 821,115 | ||||
National Instruments | 78,500 | 2,108,510 | ||||
Vaisala Cl. A | 3,300 | 62,636 | ||||
| 17,556,719 | ||||||
| IT Services - 0.7% | ||||||
CoreLogic 2 | 9,300 | 170,283 | ||||
Jack Henry & Associates | 32,300 | 1,114,996 | ||||
ManTech International Cl. A | 45,736 | 1,073,424 | ||||
MAXIMUS | 2,000 | 103,500 | ||||
| 2,462,203 | ||||||
| Semiconductors & Semiconductor Equipment - 0.5% | ||||||
Aixtron ADR | 15,000 | 214,650 | ||||
Teradyne 2 | 112,100 | 1,576,126 | ||||
| 1,790,776 | ||||||
| Total (Cost $25,183,853) | 24,123,008 | |||||
| Materials – 7.9% | ||||||
| Chemicals - 3.0% | ||||||
Balchem Corporation | 50,150 | 1,635,392 | ||||
Cabot Corporation | 18,000 | 732,600 | ||||
International Flavors & Fragrances | 27,100 | 1,485,080 | ||||
Quaker Chemical | 72,000 | 3,327,120 | ||||
Stepan Company | 31,300 | 2,947,834 | ||||
Victrex | 7,500 | 149,581 | ||||
Westlake Chemical | 4,300 | 224,718 | ||||
| 10,502,325 | ||||||
| Containers & Packaging - 1.5% | ||||||
AptarGroup | 45,200 | 2,307,460 | ||||
Greif Cl. A | 75,500 | 3,095,500 | ||||
| 5,402,960 | ||||||
| Metals & Mining - 3.4% | ||||||
Allegheny Technologies | 13,000 | 414,570 | ||||
Aquarius Platinum 2 | 81,500 | 58,690 | ||||
Commercial Metals | 18,700 | 236,368 | ||||
Compass Minerals International | 26,100 | 1,990,908 | ||||
Endeavour Mining 2 | 90,000 | 196,248 | ||||
Fresnillo | 18,000 | 413,101 | ||||
Kingsgate Consolidated | 33,000 | 164,893 | ||||
Major Drilling Group International | 88,000 | 1,017,346 | ||||
Nucor Corporation | 84,600 | 3,206,340 | ||||
Reliance Steel & Aluminum | 16,000 | 808,000 | ||||
Schnitzer Steel Industries Cl. A | 12,400 | 347,448 | ||||
Sims Metal Management ADR | 96,000 | 950,400 | ||||
Steel Dynamics | 21,000 | 246,750 | ||||
| THE ACCOMPANYING NOTES ARE AN INTEGRAL PART OF THESE FINANCIAL STATEMENTS. | The Royce Funds 2012 Semiannual Report to Shareholders | 97 |
Schedules of Investments
| Royce Dividend Value Fund (continued) |
| SHARES | VALUE | |||||
| Materials (continued) | ||||||
| Metals & Mining (continued) | ||||||
Worthington Industries | 103,800 | $ | 2,124,786 | |||
| 12,175,848 | ||||||
| Paper & Forest Products - 0.0% | ||||||
China Forestry Holdings 6 | 920,000 | 69,374 | ||||
Duratex | 16,489 | 87,268 | ||||
| 156,642 | ||||||
| Total (Cost $29,482,782) | 28,237,775 | |||||
| Telecommunication Services – 0.0% | ||||||
| Diversified Telecommunication Services - 0.0% | ||||||
Citic Telecom International Holdings | 551,000 | 100,239 | ||||
| Total (Cost $163,939) | 100,239 | |||||
| Utilities – 0.0% | ||||||
| Electric Utilities - 0.0% | ||||||
Northeast Utilities | 4,100 | 159,121 | ||||
| Total (Cost $90,469) | 159,121 | |||||
| Miscellaneous5 – 2.7% | ||||||
| Total (Cost $9,162,773) | 9,513,453 | |||||
| TOTAL COMMON STOCKS | ||||||
(Cost $325,741,207) | 332,231,856 | |||||
| REPURCHASE AGREEMENT – 7.8% | ||||||
| Fixed Income Clearing Corporation, | ||||||
0.11% dated 6/29/12, due 7/2/12, | ||||||
maturity value $27,836,255 (collateralized | ||||||
by obligations of various U.S. Government | ||||||
Agencies, 3.25% due 6/30/16, valued at | ||||||
$28,397,600) | ||||||
(Cost $27,836,000) | 27,836,000 | |||||
| COLLATERAL RECEIVED FOR SECURITIES | ||||||
LOANED – 0.3% | ||||||
| Money Market Funds | ||||||
Federated Government Obligations Fund | ||||||
(7 day yield-0.0115%) | ||||||
(Cost $1,093,223) | 1,093,223 | |||||
| TOTAL INVESTMENTS – 101.4% | ||||||
(Cost $354,670,430) | 361,161,079 | |||||
| LIABILITIES LESS CASH | ||||||
AND OTHER ASSETS – (1.4)% | (5,063,034 | ) | ||||
| NET ASSETS – 100.0% | $ | 356,098,045 | ||||
| Royce SMid-Cap Value Fund |
| SHARES | VALUE | |||||
| COMMON STOCKS – 84.2% | ||||||
| Consumer Discretionary – 9.6% | ||||||
| Auto Components - 2.7% | ||||||
Autoliv | 5,200 | $ | 284,232 | |||
| Automobiles - 0.8% | ||||||
Thor Industries | 2,900 | 79,489 | ||||
| Household Durables - 2.5% | ||||||
Garmin | 7,000 | 268,030 | ||||
| Specialty Retail - 2.1% | ||||||
Ascena Retail Group 2 | 12,200 | 227,164 | ||||
| Textiles, Apparel & Luxury Goods - 1.5% | ||||||
Gildan Activewear | 5,800 | 159,616 | ||||
| Total (Cost $1,070,576) | 1,018,531 | |||||
| Consumer Staples – 0.7% | ||||||
| Food Products - 0.7% | ||||||
Sanderson Farms | 1,700 | 77,894 | ||||
| Total (Cost $90,213) | 77,894 | |||||
| Energy – 10.0% | ||||||
| Energy Equipment & Services - 10.0% | ||||||
C&J Energy Services 2 | 16,500 | 305,250 | ||||
Helmerich & Payne | 5,800 | 252,184 | ||||
Pason Systems | 12,000 | 175,385 | ||||
Trican Well Service | 22,200 | 256,213 | ||||
Unit Corporation 2 | 1,900 | 70,091 | ||||
| Total (Cost $1,336,038) | 1,059,123 | |||||
| Financials – 9.7% | ||||||
| Capital Markets - 9.0% | ||||||
Affiliated Managers Group 2 | 1,800 | 197,010 | ||||
Ashmore Group | 51,600 | 283,169 | ||||
Partners Group Holding | 500 | 88,891 | ||||
Sprott | 39,700 | 193,021 | ||||
Value Partners Group | 384,000 | 188,139 | ||||
| 950,230 | ||||||
| Real Estate Management & Development - 0.7% | ||||||
Jones Lang LaSalle | 1,100 | 77,407 | ||||
| Total (Cost $1,177,917) | 1,027,637 | |||||
| Health Care – 4.4% | ||||||
| Biotechnology - 2.1% | ||||||
Myriad Genetics 2 | 9,100 | 216,307 | ||||
| Health Care Providers & Services - 2.3% | ||||||
Schein (Henry) 2 | 3,100 | 243,319 | ||||
| Total (Cost $434,893) | 459,626 | |||||
| Industrials – 14.3% | ||||||
| Construction & Engineering - 2.4% | ||||||
Jacobs Engineering Group 2 | 6,700 | 253,662 | ||||
| Electrical Equipment - 2.3% | ||||||
Hubbell Cl. B | 3,100 | 241,614 | ||||
| 98 | The Royce Funds 2012 Semiannual Report to Shareholders | THE ACCOMPANYING NOTES ARE AN INTEGRAL PART OF THESE FINANCIAL STATEMENTS. |
June 30, 2012 (unaudited) |
| SHARES | VALUE | |||||
| Industrials (continued) | ||||||
| Machinery - 8.0% | ||||||
Kennametal | 6,100 | $ | 202,215 | |||
Semperit AG Holding | 9,500 | 347,174 | ||||
Valmont Industries | 2,425 | 293,352 | ||||
| 842,741 | ||||||
| Marine - 0.6% | ||||||
Kirby Corporation 2 | 1,300 | 61,204 | ||||
| Professional Services - 1.0% | ||||||
Towers Watson & Company Cl. A | 1,800 | 107,820 | ||||
| Total (Cost $1,494,429) | 1,507,041 | |||||
| Information Technology – 17.5% | ||||||
| Computers & Peripherals - 2.8% | ||||||
SanDisk Corporation 2 | 3,700 | 134,976 | ||||
Western Digital 2 | 5,200 | 158,496 | ||||
| 293,472 | ||||||
| Electronic Equipment, Instruments & Components - 3.2% | ||||||
Avnet 2 | 5,200 | 160,472 | ||||
AVX Corporation | 9,600 | 102,624 | ||||
FEI Company 2 | 1,600 | 76,544 | ||||
| 339,640 | ||||||
| Semiconductors & Semiconductor Equipment - 10.4% | ||||||
Analog Devices | 9,800 | 369,166 | ||||
International Rectifier 2 | 17,942 | 358,660 | ||||
Lam Research 2 | 2,800 | 105,672 | ||||
Teradyne 2 | 19,050 | 267,843 | ||||
| 1,101,341 | ||||||
| Software - 1.1% | ||||||
† SimCorp | 700 | 120,378 | ||||
| Total (Cost $2,109,347) | 1,854,831 | |||||
| Materials – 18.0% | ||||||
| Chemicals - 4.5% | ||||||
Cabot Corporation | 3,400 | 138,380 | ||||
LSB Industries 2 | 2,100 | 64,911 | ||||
Westlake Chemical | 5,200 | 271,752 | ||||
| 475,043 | ||||||
| Metals & Mining - 12.6% | ||||||
Allied Nevada Gold 2 | 5,600 | 158,928 | ||||
Globe Specialty Metals | 25,100 | 337,093 | ||||
Hochschild Mining | 21,300 | 157,155 | ||||
Pan American Silver | 10,900 | 184,101 | ||||
† Pretium Resources 2 | 11,800 | 162,840 | ||||
Reliance Steel & Aluminum | 5,500 | 277,750 | ||||
Schnitzer Steel Industries Cl. A | 1,900 | 53,238 | ||||
| 1,331,105 | ||||||
| Paper & Forest Products - 0.9% | ||||||
Stella-Jones | 1,925 | 101,251 | ||||
| Total (Cost $2,194,264) | 1,907,399 | |||||
| TOTAL COMMON STOCKS | ||||||
(Cost $9,907,677) | 8,912,082 | |||||
| REPURCHASE AGREEMENT – 9.3% | ||||||
Fixed Income Clearing Corporation, 0.11% dated 6/29/12, due 7/2/12, maturity value $980,009 (collateralized by obligations of various U.S. Government Agencies, 3.25% due 6/30/16, valued at $1,002,400) | 980,000 | |||||
| TOTAL INVESTMENTS – 93.5% | ||||||
(Cost $10,887,677) | 9,892,082 | |||||
| CASH AND OTHER ASSETS | ||||||
LESS LIABILITIES – 6.5% | 693,241 | |||||
| NET ASSETS – 100.0% | $ | 10,585,323 | ||||
| THE ACCOMPANYING NOTES ARE AN INTEGRAL PART OF THESE FINANCIAL STATEMENTS. | The Royce Funds 2012 Semiannual Report to Shareholders | 99 |
Schedules of Investments
| Royce Focus Value Fund |
| SHARES | VALUE | |||||
| COMMON STOCKS – 92.9% | ||||||
| Consumer Discretionary – 4.2% | ||||||
| Automobiles - 0.9% | ||||||
Thor Industries | 3,000 | $ | 82,230 | |||
| Specialty Retail - 3.3% | ||||||
Buckle (The) | 3,500 | 138,495 | ||||
GameStop Corporation Cl. A | 8,000 | 146,880 | ||||
| 285,375 | ||||||
| Total (Cost $384,129) | 367,605 | |||||
| Consumer Staples – 4.4% | ||||||
| Food Products - 3.3% | ||||||
Cal-Maine Foods | 2,500 | 97,750 | ||||
Industrias Bachoco ADR | 4,500 | 98,775 | ||||
Sanderson Farms | 2,000 | 91,640 | ||||
| 288,165 | ||||||
| Personal Products - 1.1% | ||||||
† Nu Skin Enterprises Cl. A | 2,000 | 93,800 | ||||
| Total (Cost $321,095) | 381,965 | |||||
| Energy – 13.4% | ||||||
| Energy Equipment & Services - 8.2% | ||||||
† C&J Energy Services 2 | 7,000 | 129,500 | ||||
Helmerich & Payne | 4,500 | 195,660 | ||||
Pason Systems | 10,000 | 146,155 | ||||
Trican Well Service | 14,000 | 161,575 | ||||
Unit Corporation 2 | 2,000 | 73,780 | ||||
| 706,670 | ||||||
| Oil, Gas & Consumable Fuels - 5.2% | ||||||
† Africa Oil 2 | 19,900 | 153,242 | ||||
Exxon Mobil | 3,500 | 299,495 | ||||
| 452,737 | ||||||
| Total (Cost $986,960) | 1,159,407 | |||||
| Financials – 17.2% | ||||||
| Capital Markets - 12.0% | ||||||
Affiliated Managers Group 2 | 1,000 | 109,450 | ||||
Ashmore Group | 30,000 | 164,633 | ||||
Franklin Resources | 2,500 | 277,475 | ||||
Knight Capital Group Cl. A 2 | 8,000 | 95,520 | ||||
Partners Group Holding | 700 | 124,447 | ||||
Sprott | 25,000 | 121,550 | ||||
Value Partners Group | 300,000 | 146,984 | ||||
| 1,040,059 | ||||||
| Insurance - 3.9% | ||||||
Berkshire Hathaway Cl. B 2 | 4,000 | 333,320 | ||||
| Real Estate Management & Development - 1.3% | ||||||
Kennedy-Wilson Holdings | 8,000 | 112,080 | ||||
| Total (Cost $1,289,377) | 1,485,459 | |||||
| Health Care – 2.1% | ||||||
| Biotechnology - 2.1% | ||||||
Myriad Genetics 2 | 7,500 | 178,275 | ||||
| Total (Cost $165,619) | 178,275 | |||||
| Industrials – 3.4% | ||||||
| Construction & Engineering - 1.8% | ||||||
Jacobs Engineering Group 2 | 4,000 | 151,440 | ||||
| Road & Rail - 1.6% | ||||||
Patriot Transportation Holding 2 | 6,000 | 141,180 | ||||
| Total (Cost $315,525) | 292,620 | |||||
| Information Technology – 22.3% | ||||||
| Computers & Peripherals - 6.9% | ||||||
Apple 2 | 400 | 233,600 | ||||
SanDisk Corporation 2 | 3,000 | 109,440 | ||||
Western Digital 2 | 8,500 | 259,080 | ||||
| 602,120 | ||||||
| Semiconductors & Semiconductor Equipment - 10.9% | ||||||
Aixtron ADR | 7,000 | 100,170 | ||||
Analog Devices | 8,500 | 320,195 | ||||
MKS Instruments | 8,000 | 231,440 | ||||
Teradyne 2 | 12,000 | 168,720 | ||||
Veeco Instruments 2 | 3,500 | 120,260 | ||||
| 940,785 | ||||||
| Software - 4.5% | ||||||
Microsoft Corporation | 10,000 | 305,900 | ||||
† SimCorp | 500 | 85,984 | ||||
| 391,884 | ||||||
| Total (Cost $1,757,422) | 1,934,789 | |||||
| Materials – 25.9% | ||||||
| Chemicals - 4.9% | ||||||
LSB Industries 2 | 5,000 | 154,550 | ||||
Mosaic Company (The) | 5,000 | 273,800 | ||||
| 428,350 | ||||||
| Metals & Mining - 21.0% | ||||||
Allied Nevada Gold 2 | 7,500 | 212,850 | ||||
Fresnillo | 4,000 | 91,800 | ||||
Globe Specialty Metals | 10,000 | 134,300 | ||||
Horsehead Holding Corporation 2 | 10,000 | 99,600 | ||||
† Kirkland Lake Gold 2 | 7,000 | 75,356 | ||||
Major Drilling Group International | 12,500 | 144,510 | ||||
Newmont Mining | 4,500 | 218,295 | ||||
Nucor Corporation | 3,000 | 113,700 | ||||
Pan American Silver | 12,000 | 202,680 | ||||
† Pretium Resources 2 | 12,000 | 165,600 | ||||
Reliance Steel & Aluminum | 4,000 | 202,000 | ||||
Schnitzer Steel Industries Cl. A | 4,000 | 112,080 | ||||
Seabridge Gold 2 | 3,000 | 43,470 | ||||
| 1,816,241 | ||||||
| Total (Cost $2,325,080) | 2,244,591 | |||||
| 100 | The Royce Funds 2012 Semiannual Report to Shareholders | THE ACCOMPANYING NOTES ARE AN INTEGRAL PART OF THESE FINANCIAL STATEMENTS. |
June 30, 2012 (unaudited) |
| SHARES | VALUE | |||||
| TOTAL COMMON STOCKS | ||||||
(Cost $7,545,207) | $ | 8,044,711 | ||||
| FIXED INCOME – 1.3% | ||||||
| Government Bonds – 1.3% | ||||||
ProShares UltraShort 20+ Year Treasury 2 | 7,000 | 110,880 | ||||
| TOTAL FIXED INCOME | ||||||
(Cost $185,658) | 110,880 | |||||
| REPURCHASE AGREEMENT – 5.8% | ||||||
Fixed Income Clearing Corporation, 0.11% dated 6/29/12, due 7/2/12, maturity value $500,005 (collateralized by obligations of various U.S. Government Agencies, 3.25% due 6/30/16, valued at $515,200) | 500,000 | |||||
| TOTAL INVESTMENTS – 100.0% | ||||||
| (Cost $8,230,865) | 8,655,591 | |||||
| CASH AND OTHER ASSETS | ||||||
LESS LIABILITIES – 0.0% | 1,396 | |||||
| NET ASSETS – 100.0% | $ | 8,656,987 | ||||
| Royce Partners Fund |
| SHARES | VALUE | |||||
| COMMON STOCKS – 96.9% | ||||||
| Consumer Discretionary – 7.3% | ||||||
| Household Durables - 5.4% | ||||||
Hunter Douglas | 400 | $ | 15,596 | |||
NVR 2 | 100 | 85,000 | ||||
| 100,596 | ||||||
| Media - 1.9% | ||||||
Morningstar | 600 | 34,704 | ||||
| Total (Cost $96,785) | 135,300 | |||||
| Energy – 2.6% | ||||||
| Energy Equipment & Services - 2.6% | ||||||
Ensco Cl. A | 500 | 23,485 | ||||
Schlumberger | 360 | 23,367 | ||||
| Total (Cost $45,785) | 46,852 | |||||
| Financials – 31.9% | ||||||
| Capital Markets - 21.7% | ||||||
AllianceBernstein Holding L.P. | 4,000 | 50,760 | ||||
Ashmore Group | 8,000 | 43,902 | ||||
Bank of New York Mellon (The) | 1,400 | 30,730 | ||||
Bank Sarasin & Co. Cl. B 2 | 514 | 14,469 | ||||
Citadel Capital 2 | 16,000 | 8,345 | ||||
Egyptian Financial Group-Hermes Holding Company 2 | 4,375 | 7,431 | ||||
Jupiter Fund Management | 7,200 | 24,313 | ||||
Northern Trust | 900 | 41,418 | ||||
SEI Investments | 1,500 | 29,835 | ||||
SHUAA Capital 2 | 100,000 | 18,196 | ||||
State Street | 900 | 40,176 | ||||
Value Partners Group | 110,000 | 53,894 | ||||
† WisdomTree Investments 2 | 5,600 | 36,792 | ||||
| 400,261 | ||||||
| Diversified Financial Services - 4.2% | ||||||
† FX Alliance 2 | 3,100 | 48,701 | ||||
Moody’s Corporation | 800 | 29,240 | ||||
| 77,941 | ||||||
| Insurance - 6.0% | ||||||
Alleghany Corporation 2 | 102 | 34,655 | ||||
E-L Financial | 60 | 24,457 | ||||
Marsh & McLennan | 1,600 | 51,568 | ||||
| 110,680 | ||||||
| Total (Cost $616,685) | 588,882 | |||||
| Health Care – 0.5% | ||||||
| Pharmaceuticals - 0.5% | ||||||
Adcock Ingram Holdings | 1,300 | 9,574 | ||||
| Total (Cost $11,114) | 9,574 | |||||
| Industrials – 29.9% | ||||||
| Building Products - 0.8% | ||||||
Ameresco Cl. A 2 | 1,300 | 15,509 | ||||
| Commercial Services & Supplies - 3.5% | ||||||
Brink’s Company (The) | 1,100 | 25,498 | ||||
| THE ACCOMPANYING NOTES ARE AN INTEGRAL PART OF THESE FINANCIAL STATEMENTS. | The Royce Funds 2012 Semiannual Report to Shareholders | 101 |
Schedules of Investments
| Royce Partners Fund (continued) |
| SHARES | VALUE | |||||
| Industrials (continued) | ||||||
| Commercial Services & Supplies (continued) | ||||||
Ritchie Bros. Auctioneers | 1,800 | $ | 38,250 | |||
| 63,748 | ||||||
| Construction & Engineering - 3.3% | ||||||
EMCOR Group | 800 | 22,256 | ||||
Fluor Corporation | 800 | 39,472 | ||||
| 61,728 | ||||||
| Electrical Equipment - 1.1% | ||||||
GrafTech International 2 | 2,050 | 19,783 | ||||
| Machinery - 9.0% | ||||||
Foster (L.B.) Company | 800 | 22,888 | ||||
Graco | 1,000 | 46,080 | ||||
Spirax-Sarco Engineering | 800 | 24,928 | ||||
Valmont Industries | 600 | 72,582 | ||||
| 166,478 | ||||||
| Professional Services - 7.2% | ||||||
Advisory Board (The) 2 | 1,000 | 49,590 | ||||
ManpowerGroup | 700 | 25,655 | ||||
Verisk Analytics Cl. A 2 | 1,170 | 57,634 | ||||
| 132,879 | ||||||
| Road & Rail - 3.8% | ||||||
Landstar System | 800 | 41,376 | ||||
Patriot Transportation Holding 2 | 1,200 | 28,236 | ||||
| 69,612 | ||||||
| Trading Companies & Distributors - 1.2% | ||||||
Air Lease Cl. A 2 | 1,100 | 21,329 | ||||
| Total (Cost $476,738) | 551,066 | |||||
| Information Technology – 13.7% | ||||||
| Electronic Equipment, Instruments & Components - 4.9% | ||||||
Amphenol Corporation Cl. A | 300 | 16,476 | ||||
Anixter International | 500 | 26,525 | ||||
IPG Photonics 2 | 1,100 | 47,949 | ||||
| 90,950 | ||||||
| IT Services - 5.9% | ||||||
MasterCard Cl. A | 100 | 43,011 | ||||
MoneyGram International 2 | 2,100 | 30,660 | ||||
Western Union | 2,100 | 35,364 | ||||
| 109,035 | ||||||
| Software - 2.9% | ||||||
ANSYS 2 | 600 | 37,866 | ||||
Microsoft Corporation | 500 | 15,295 | ||||
| 53,161 | ||||||
| Total (Cost $232,974) | 253,146 | |||||
| Materials – 11.0% | ||||||
| Chemicals - 3.4% | ||||||
Airgas | 400 | 33,604 | ||||
Sigma-Aldrich Corporation | 400 | 29,572 | ||||
| 63,176 | ||||||
| Containers & Packaging - 5.5% | ||||||
Greif Cl. A | 700 | 28,700 | ||||
Mayr-Melnhof Karton | 800 | 73,349 | ||||
| 102,049 | ||||||
| Metals & Mining - 2.1% | ||||||
Nucor Corporation | 1,000 | 37,900 | ||||
| Total (Cost $211,064) | 203,125 | |||||
| TOTAL COMMON STOCKS | ||||||
(Cost $1,691,145) | 1,787,945 | |||||
| TOTAL INVESTMENTS – 96.9% | ||||||
(Cost $1,691,145) | 1,787,945 | |||||
| CASH AND OTHER ASSETS | ||||||
LESS LIABILITIES – 3.1% | 56,697 | |||||
| NET ASSETS – 100.0% | $ | 1,844,642 | ||||
| 102 | The Royce Funds 2012 Semiannual Report to Shareholders | THE ACCOMPANYING NOTES ARE AN INTEGRAL PART OF THESE FINANCIAL STATEMENTS. |
June 30, 2012 (unaudited) |
| Royce Mid-Cap Fund |
| SHARES | VALUE | ||||||
| COMMON STOCKS – 94.5% | |||||||
| Consumer Discretionary – 14.5% | |||||||
| Auto Components - 2.1% | |||||||
Autoliv | 2,050 | $ | 112,053 | ||||
| Specialty Retail - 9.8% | |||||||
American Eagle Outfitters | 3,500 | 69,055 | |||||
† Ascena Retail Group 2 | 2,500 | 46,550 | |||||
Chico’s FAS | 7,900 | 117,236 | |||||
GameStop Corporation Cl. A | 2,350 | 43,146 | |||||
† Guess? | 2,100 | 63,777 | |||||
Staples | 14,200 | 185,310 | |||||
| 525,074 | |||||||
| Textiles, Apparel & Luxury Goods - 2.6% | |||||||
† Gildan Activewear | 2,200 | 60,544 | |||||
Warnaco Group (The) 2 | 1,900 | 80,902 | |||||
| 141,446 | |||||||
| Total (Cost $811,832) | 778,573 | ||||||
| Energy – 9.0% | |||||||
| Energy Equipment & Services - 6.1% | |||||||
C&J Energy Services 2 | 2,000 | 37,000 | |||||
Ensco Cl. A | 1,150 | 54,016 | |||||
Helmerich & Payne | 3,000 | 130,440 | |||||
Trican Well Service | 9,150 | 105,601 | |||||
| 327,057 | |||||||
| Oil, Gas & Consumable Fuels - 2.9% | |||||||
QEP Resources | 3,600 | 107,892 | |||||
Whiting Petroleum 2 | 1,200 | 49,344 | |||||
| 157,236 | |||||||
| Total (Cost $561,271) | 484,293 | ||||||
| Financials – 11.2% | |||||||
| Capital Markets - 11.2% | |||||||
Affiliated Managers Group 2 | 1,400 | 153,230 | |||||
Ashmore Group | 22,050 | 121,006 | |||||
Partners Group Holding | 425 | 75,557 | |||||
T. Rowe Price Group | 1,150 | 72,404 | |||||
TD AMERITRADE Holding Corporation | 6,900 | 117,300 | |||||
† Waddell & Reed Financial Cl. A | 2,000 | 60,560 | |||||
| Total (Cost $554,423) | 600,057 | ||||||
| Health Care – 10.8% | |||||||
| Biotechnology - 6.8% | |||||||
† Actelion | 2,750 | 112,948 | |||||
Biogen Idec 2 | 500 | 72,190 | |||||
Cubist Pharmaceuticals 2 | 2,400 | 90,984 | |||||
Myriad Genetics 2 | 3,700 | 87,949 | |||||
| 364,071 | |||||||
| Health Care Equipment & Supplies - 1.3% | |||||||
C.R. Bard | 650 | 69,836 | |||||
| Pharmaceuticals - 2.7% | |||||||
† Medicines Company (The) 2 | 4,000 | 91,760 | |||||
UCB | 1,100 | 55,508 | |||||
| 147,268 | |||||||
| Total (Cost $468,035) | 581,175 | ||||||
| Industrials – 10.8% | |||||||
| Aerospace & Defense - 1.3% | |||||||
Rockwell Collins | 1,400 | 69,090 | |||||
| Construction & Engineering - 1.1% | |||||||
Jacobs Engineering Group 2 | 1,600 | 60,576 | |||||
| Electrical Equipment - 2.1% | |||||||
Regal-Beloit | 1,850 | 115,181 | |||||
| Machinery - 6.3% | |||||||
Flowserve Corporation | 750 | 86,062 | |||||
† Gardner Denver | 2,000 | 105,820 | |||||
† Kennametal | 1,400 | 46,410 | |||||
Parker Hannifin | 1,300 | 99,944 | |||||
| 338,236 | |||||||
| Total (Cost $619,159) | 583,083 | ||||||
| Information Technology – 18.7% | |||||||
| Computers & Peripherals - 4.8% | |||||||
SanDisk Corporation 2 | 3,000 | 109,440 | |||||
Western Digital 2 | 4,850 | 147,828 | |||||
| 257,268 | |||||||
| Semiconductors & Semiconductor Equipment - 12.2% | |||||||
Analog Devices | 5,100 | 192,117 | |||||
Lam Research 2 | 3,700 | 139,638 | |||||
LSI Corporation 2 | 26,150 | 166,576 | |||||
Teradyne 2 | 11,500 | 161,690 | |||||
| 660,021 | |||||||
| Software - 1.7% | |||||||
CA | 3,350 | 90,751 | |||||
| Total (Cost $1,019,269) | 1,008,040 | ||||||
| Materials – 19.0% | |||||||
| Chemicals - 6.3% | |||||||
Agrium | 1,900 | 168,093 | |||||
CF Industries Holdings | 300 | 58,122 | |||||
† Methanex Corporation | 4,000 | 111,360 | |||||
| 337,575 | |||||||
| Metals & Mining - 12.7% | |||||||
Agnico-Eagle Mines | 1,750 | 70,805 | |||||
Alamos Gold | 3,400 | 53,099 | |||||
Allegheny Technologies | 5,200 | 165,828 | |||||
Allied Nevada Gold 2 | 4,400 | 124,872 | |||||
IAMGOLD Corporation | 4,500 | 53,100 | |||||
Kinross Gold | 5,000 | 40,750 | |||||
Reliance Steel & Aluminum | 3,450 | 174,225 | |||||
| 682,679 | |||||||
| Total (Cost $1,090,573) | 1,020,254 | ||||||
| THE ACCOMPANYING NOTES ARE AN INTEGRAL PART OF THESE FINANCIAL STATEMENTS. | The Royce Funds 2012 Semiannual Report to Shareholders | 103 |
Schedules of Investments
| Royce Mid-Cap Fund (continued) |
| VALUE | |||||||
| Miscellaneous5 – 0.5% | |||||||
| Total (Cost $31,184) | $ | 28,668 | |||||
| TOTAL COMMON STOCKS | |||||||
(Cost $5,155,746) | 5,084,143 | ||||||
| REPURCHASE AGREEMENT – 4.3% | |||||||
Fixed Income Clearing Corporation, 0.11% dated 6/29/12, due 7/2/12, maturity value $231,002 (collateralized by obligations of various U.S. Government Agencies, 3.25% due 6/30/16, valued at $240,800) | 231,000 | ||||||
| TOTAL INVESTMENTS – 98.8% | |||||||
(Cost $5,386,746) | 5,315,143 | ||||||
| CASH AND OTHER ASSETS | |||||||
LESS LIABILITIES – 1.2% | 65,323 | ||||||
| NET ASSETS – 100.0% | $ | 5,380,466 | |||||
| Royce Special Equity Multi-Cap Fund |
| SHARES | VALUE | ||||||
| COMMON STOCKS – 96.1% | |||||||
| Consumer Discretionary – 26.2% | |||||||
| Distributors - 2.0% | |||||||
Genuine Parts | 29,510 | $ | 1,777,977 | ||||
| Leisure Equipment & Products - 3.2% | |||||||
Mattel | 87,325 | 2,832,823 | |||||
| Media - 3.5% | |||||||
Scripps Networks Interactive Cl. A | 53,465 | 3,040,020 | |||||
| Multiline Retail - 6.0% | |||||||
Kohl’s Corporation | 59,325 | 2,698,694 | |||||
Nordstrom | 51,125 | 2,540,402 | |||||
| 5,239,096 | |||||||
| Specialty Retail - 11.5% | |||||||
Bed Bath & Beyond 2 | 31,680 | 1,957,824 | |||||
Gap (The) | 92,345 | 2,526,559 | |||||
Home Depot (The) | 28,340 | 1,501,737 | |||||
Limited Brands | 33,715 | 1,433,899 | |||||
Staples | 202,345 | 2,640,602 | |||||
| 10,060,621 | |||||||
| Total (Cost $21,244,066) | 22,950,537 | ||||||
| Consumer Staples – 7.4% | |||||||
| Food & Staples Retailing - 3.0% | |||||||
Walgreen Company | 88,740 | 2,624,929 | |||||
| Food Products - 4.3% | |||||||
† ConAgra Foods | 44,500 | 1,153,885 | |||||
Hormel Foods | 86,800 | 2,640,456 | |||||
| 3,794,341 | |||||||
| Household Products - 0.1% | |||||||
Church & Dwight | 220 | 12,203 | |||||
Kimberly-Clark | 615 | 51,519 | |||||
| 63,722 | |||||||
| Total (Cost $6,691,390) | 6,482,992 | ||||||
| Energy – 3.1% | |||||||
| Oil, Gas & Consumable Fuels - 3.1% | |||||||
Occidental Petroleum | 31,520 | 2,703,470 | |||||
| Total (Cost $2,883,814) | 2,703,470 | ||||||
| Health Care – 15.2% | |||||||
| Health Care Equipment & Supplies - 9.2% | |||||||
C.R. Bard | 28,520 | 3,064,189 | |||||
Medtronic | 64,655 | 2,504,088 | |||||
Stryker Corporation | 45,485 | 2,506,224 | |||||
| 8,074,501 | |||||||
| Health Care Providers & Services - 2.8% | |||||||
Quest Diagnostics | 40,790 | 2,443,321 | |||||
| Pharmaceuticals - 3.2% | |||||||
Johnson & Johnson | 40,690 | 2,749,016 | |||||
| Total (Cost $12,404,380) | 13,266,838 | ||||||
| 104 | The Royce Funds 2012 Semiannual Report to Shareholders | THE ACCOMPANYING NOTES ARE AN INTEGRAL PART OF THESE FINANCIAL STATEMENTS. |
June 30, 2012 (unaudited) |
| SHARES | VALUE | ||||||
| Industrials – 21.4% | |||||||
| Aerospace & Defense - 5.6% | |||||||
Raytheon Company | 44,595 | $ | 2,523,631 | ||||
United Technologies | 31,320 | 2,365,600 | |||||
| 4,889,231 | |||||||
| Electrical Equipment - 3.4% | |||||||
Emerson Electric | 62,930 | 2,931,279 | |||||
| Industrial Conglomerates - 2.8% | |||||||
3M | 27,305 | 2,446,528 | |||||
| Machinery - 9.1% | |||||||
† Cummins | 18,975 | 1,838,867 | |||||
Dover Corporation | 44,665 | 2,394,491 | |||||
Illinois Tool Works | 37,950 | 2,007,175 | |||||
† Parker Hannifin | 22,775 | 1,750,942 | |||||
| 7,991,475 | |||||||
| Trading Companies & Distributors - 0.5% | |||||||
Grainger (W.W.) | 2,160 | 413,079 | |||||
| Total (Cost $18,902,978) | 18,671,592 | ||||||
| Information Technology – 22.8% | |||||||
| Communications Equipment - 2.7% | |||||||
Cisco Systems | 138,075 | 2,370,748 | |||||
| Electronic Equipment, Instruments & Components - 5.6% | |||||||
† Avnet 2 | 52,845 | 1,630,797 | |||||
Molex Cl. A | 160,090 | 3,238,620 | |||||
| 4,869,417 | |||||||
| IT Services - 0.3% | |||||||
International Business Machines | 1,565 | 306,083 | |||||
| Semiconductors & Semiconductor Equipment - 11.0% | |||||||
Analog Devices | 71,125 | 2,679,279 | |||||
Applied Materials | 222,845 | 2,553,804 | |||||
Intel Corporation | 102,150 | 2,722,297 | |||||
Texas Instruments | 57,000 | 1,635,330 | |||||
| 9,590,710 | |||||||
| Software - 3.2% | |||||||
Microsoft Corporation | 91,860 | 2,809,997 | |||||
| Total (Cost $20,357,970) | 19,946,955 | ||||||
| TOTAL COMMON STOCKS | |||||||
(Cost $82,484,598) | 84,022,384 | ||||||
| REPURCHASE AGREEMENT – 4.1% | |||||||
Fixed Income Clearing Corporation, 0.11% dated 6/29/12, due 7/2/12, maturity value $3,586,033 (collateralized by obligations of various U.S. Government Agencies, 3.25% due 6/30/16, valued at $3,662,400) | 3,586,000 | ||||||
| TOTAL INVESTMENTS – 100.2% | |||||||
(Cost $86,070,598) | 87,608,384 | ||||||
| LIABILITIES LESS CASH | |||||||
AND OTHER ASSETS – (0.2)% | (198,066 | ) | |||||
| NET ASSETS – 100.0% | $ | 87,410,318 | |||||
| † | New additions in 2012. | |
| 1 | All or a portion of these securities were on loan at June 30, 2012. | |
| 2 | Non-income producing. | |
| 3 | At June 30, 2012, the Fund owned 5% or more of the Company’s outstanding voting securities thereby making the Company an Affiliated Company as that term is defined in the Investment Company Act of 1940. See Notes to Financial Statements. | |
| 4 | These securities are defined as Level 2 securities due to fair value being based on quoted prices for similar securities. See Notes to Financial Statements. | |
| 5 | Includes securities first acquired in 2012 and less than 1% of net assets. | |
| 6 | Securities for which market quotations are not readily available represent 0.0%, 0.0%, 0.2% and 0.0% of net assets for Royce Micro-Cap Fund, Royce Low-Priced Stock Fund, Royce Heritage Fund and Royce Dividend Value Fund, respectively. These securities have been valued at their fair value under procedures approved by the Fund’s Board of Trustees. These securities are defined as Level 3 securities due to the use of significant unobservable inputs in the determination of fair value. See Notes to Financial Statements. | |
| ||
| THE ACCOMPANYING NOTES ARE AN INTEGRAL PART OF THESE FINANCIAL STATEMENTS. | The Royce Funds 2012 Semiannual Report to Shareholders | 105 |
| Statements of Assets and Liabilities |
| Royce | Royce | Royce | Royce | |||||||||||||
| Pennsylvania | Micro-Cap | Premier | Low-Priced | |||||||||||||
| Mutual Fund | Fund | Fund | Stock Fund | |||||||||||||
| ASSETS: | ||||||||||||||||
| Investments at value (including collateral on loaned securities) | ||||||||||||||||
Non-Affiliated Companies | $ | 5,660,353,607 | $ | 1,041,003,599 | $ | 4,241,940,214 | $ | 3,239,228,741 | ||||||||
Affiliated Companies | 173,311,524 | 63,833,512 | 2,240,692,487 | 386,235,916 | ||||||||||||
| Repurchase agreements (at cost and value) | 107,562,000 | 38,233,000 | 404,029,000 | 91,117,000 | ||||||||||||
| Cash and foreign currency | 662,840 | 620,287 | – | 44,183 | ||||||||||||
| Receivable for investments sold | 7,884,681 | 6,211,621 | 465,106 | 9,422,720 | ||||||||||||
| Receivable for capital shares sold | 19,429,056 | 1,076,937 | 7,064,557 | 43,277,736 | ||||||||||||
| Receivable for dividends and interest | 3,252,616 | 730,411 | 5,314,148 | 2,705,646 | ||||||||||||
| Prepaid expenses and other assets | 1,913,362 | 5,947 | 29,851 | 19,950 | ||||||||||||
Total Assets | 5,974,369,686 | 1,151,715,314 | 6,899,535,363 | 3,772,051,892 | ||||||||||||
| LIABILITIES: | ||||||||||||||||
| Payable for collateral on loaned securities | 100,351,338 | 26,420,880 | 133,233,943 | 176,801,115 | ||||||||||||
| Payable for investments purchased | 16,445,528 | 162,943 | 7,232,769 | 4,898,463 | ||||||||||||
| Payable for capital shares redeemed | 9,921,850 | 1,750,132 | 9,902,229 | 41,749,548 | ||||||||||||
| Payable to custodian for overdrawn balance | – | – | 35 | – | ||||||||||||
| Payable for investment advisory fees | 3,503,580 | 1,165,991 | 5,091,873 | 3,231,293 | ||||||||||||
| Accrued expenses | 437,241 | 365,912 | 1,112,842 | 709,657 | ||||||||||||
Total Liabilities | 130,659,537 | 29,865,858 | 156,573,691 | 227,390,076 | ||||||||||||
Net Assets | $ | 5,843,710,149 | $ | 1,121,849,456 | $ | 6,742,961,672 | $ | 3,544,661,816 | ||||||||
| ANALYSIS OF NET ASSETS: | ||||||||||||||||
| Paid-in capital | $ | 4,773,193,915 | $ | 1,010,666,591 | $ | 4,869,733,336 | $ | 3,157,879,394 | ||||||||
| Undistributed net investment income (loss) | 9,514,877 | (9,663,286 | ) | 46,654,446 | (28,752,968 | ) | ||||||||||
| Accumulated net realized gain (loss) on investments and | ||||||||||||||||
foreign currency | 99,541,918 | 35,680,490 | 280,653,871 | 56,335,982 | ||||||||||||
| Net unrealized appreciation (depreciation) on investments and | ||||||||||||||||
foreign currency | 961,459,439 | 85,165,661 | 1,545,920,019 | 359,199,408 | ||||||||||||
Net Assets | $ | 5,843,710,149 | $ | 1,121,849,456 | $ | 6,742,961,672 | $ | 3,544,661,816 | ||||||||
Investment Class | $ | 4,341,063,457 | $ | 855,440,170 | $ | 4,652,621,197 | $ | 316,929,323 | ||||||||
Service Class | 425,101,528 | 138,065,222 | 615,422,895 | 2,144,136,066 | ||||||||||||
Consultant Class | 646,583,253 | 128,344,064 | 59,132,244 | |||||||||||||
Institutional Class | 395,278,972 | 827,913,671 | 1,069,131,193 | |||||||||||||
W Class | 549,942,092 | |||||||||||||||
R Class | 28,428,709 | 27,914,367 | 6,325,237 | |||||||||||||
K Class | 7,254,230 | 10,015,206 | 8,139,997 | |||||||||||||
| SHARES OUTSTANDING (unlimited number of $.001 par value): | ||||||||||||||||
Investment Class | 387,891,189 | 57,350,022 | 244,702,645 | 22,298,513 | ||||||||||||
Service Class | 38,095,262 | 9,346,942 | 32,924,070 | 151,382,608 | ||||||||||||
Consultant Class | 64,493,428 | 9,592,485 | 3,431,219 | |||||||||||||
Institutional Class | 35,196,938 | 43,192,011 | 75,092,330 | |||||||||||||
W Class | 28,841,287 | |||||||||||||||
R Class | 2,612,067 | 1,516,254 | 455,723 | |||||||||||||
K Class | 722,631 | 1,127,420 | 951,154 | |||||||||||||
| NET ASSET VALUES (Net Assets ÷ Shares Outstanding): | ||||||||||||||||
Investment Class1 | $ | 11.19 | $ | 14.92 | $ | 19.01 | $ | 14.21 | ||||||||
Service Class1 | 11.16 | 14.77 | 18.69 | 14.16 | ||||||||||||
Consultant Class2 | 10.03 | 13.38 | 17.23 | |||||||||||||
Institutional Class3 | 11.23 | 19.17 | 14.24 | |||||||||||||
W Class3 | 19.07 | |||||||||||||||
R Class3 | 10.88 | 18.41 | 13.88 | |||||||||||||
K Class3 | 10.04 | 8.88 | 8.56 | |||||||||||||
Investments at identified cost | $ | 4,872,210,649 | $ | 1,019,676,864 | $ | 4,936,652,875 | $ | 3,266,272,728 | ||||||||
Market value of loaned securities | 99,747,706 | 25,869,263 | 134,357,765 | 175,238,137 | ||||||||||||
| 1 | Offering and redemption price per share; shares held less than 180 days may be subject to a 1% redemption fee, payable to the Fund. |
| 2 | Offering and redemption price per share; shares held less than 365 days may be subject to a 1% contingent deferred sales charge, payable to Royce Fund Services, Inc. |
| 3 | Offering and redemption price per share. |
| 106 | The Royce Funds 2012 Semiannual Report to Shareholders | THE ACCOMPANYING NOTES ARE AN INTEGRAL PART OF THESE FINANCIAL STATEMENTS. |
| June 30, 2012 (unaudited) |
| Royce | Royce | Royce | Royce | ||||||||||||
| Total Return | Heritage | Opportunity | Special Equity | ||||||||||||
| Fund | Fund | Fund | Fund | ||||||||||||
| ASSETS: | |||||||||||||||
| Investments at value (including collateral on loaned securities) | |||||||||||||||
Non-Affiliated Companies | $ | 4,160,365,773 | $ | 263,743,849 | $ | 1,695,663,305 | $ | 1,462,639,745 | |||||||
Affiliated Companies | 63,814,410 | – | 68,489,848 | 998,571,631 | |||||||||||
| Repurchase agreements (at cost and value) | 277,572,000 | 9,328,000 | 106,391,000 | 299,543,000 | |||||||||||
| Cash and foreign currency | 25,837 | 61,938 | 758 | 350 | |||||||||||
| Receivable for investments sold | 25,094,956 | 1,087,988 | 8,811,673 | 1,335,956 | |||||||||||
| Receivable for capital shares sold | 3,800,719 | 537,024 | 645,942 | 8,590,651 | |||||||||||
| Receivable for dividends and interest | 5,836,999 | 218,569 | 493,038 | 2,803,531 | |||||||||||
| Prepaid expenses and other assets | 20,000 | 1,219 | 8,717 | 9,818 | |||||||||||
Total Assets | 4,536,530,694 | 274,978,587 | 1,880,504,281 | 2,773,494,682 | |||||||||||
| LIABILITIES: | |||||||||||||||
| Payable for collateral on loaned securities | 25,664,495 | 8,913,537 | 125,418,345 | 153,750 | |||||||||||
| Payable for investments purchased | 15,367,706 | 640,978 | 5,866,697 | 2,810,517 | |||||||||||
| Payable for capital shares redeemed | 7,966,471 | 274,431 | 3,811,892 | 3,242,680 | |||||||||||
| Payable for investment advisory fees | 3,469,916 | 212,479 | 1,372,697 | 2,158,008 | |||||||||||
| Accrued expenses | 825,308 | 110,256 | 331,871 | 93,399 | |||||||||||
Total Liabilities | 53,293,896 | 10,151,681 | 136,801,502 | 8,458,354 | |||||||||||
Net Assets | $ | 4,483,236,798 | $ | 264,826,906 | $ | 1,743,702,779 | $ | 2,765,036,328 | |||||||
| ANALYSIS OF NET ASSETS: | |||||||||||||||
| Paid-in capital | $ | 3,357,447,320 | $ | 231,654,451 | $ | 1,677,807,029 | $ | 2,269,185,039 | |||||||
| Undistributed net investment income (loss) | (1,581,320 | ) | (269,376 | ) | (1,945,355 | ) | 17,897,663 | ||||||||
| Accumulated net realized gain (loss) on investments and | |||||||||||||||
foreign currency | 246,358,907 | 143,870 | 65,430,169 | 125,675,546 | |||||||||||
| Net unrealized appreciation (depreciation) on investments and | |||||||||||||||
foreign currency | 881,011,891 | 33,297,961 | 2,410,936 | 352,278,080 | |||||||||||
Net Assets | $ | 4,483,236,798 | $ | 264,826,906 | $ | 1,743,702,779 | $ | 2,765,036,328 | |||||||
Investment Class | $ | 3,106,853,179 | $ | 28,697,282 | $ | 914,929,232 | $ | 1,927,092,215 | |||||||
Service Class | 283,544,907 | 211,742,177 | 169,206,080 | 236,199,530 | |||||||||||
Consultant Class | 323,236,418 | 13,364,782 | 12,045,293 | 55,197,908 | |||||||||||
Institutional Class | 378,300,954 | 635,320,775 | 546,546,675 | ||||||||||||
W Class | 147,199,663 | ||||||||||||||
R Class | 43,496,508 | 5,379,880 | 4,638,397 | ||||||||||||
K Class | 200,605,169 | 5,642,785 | 7,563,002 | ||||||||||||
| SHARES OUTSTANDING (unlimited number of $.001 par value): | |||||||||||||||
Investment Class | 236,568,268 | 2,139,743 | 79,721,225 | 92,313,238 | |||||||||||
Service Class | 21,527,626 | 15,899,787 | 15,196,002 | 11,349,697 | |||||||||||
Consultant Class | 24,396,492 | 1,231,199 | 1,125,912 | 2,772,600 | |||||||||||
Institutional Class | 28,890,865 | 54,905,089 | 26,269,218 | ||||||||||||
W Class | 11,201,130 | ||||||||||||||
R Class | 3,283,684 | 533,139 | 419,049 | ||||||||||||
K Class | 19,562,430 | 555,214 | 729,857 | ||||||||||||
| NET ASSET VALUES (Net Assets ÷ Shares Outstanding): | |||||||||||||||
Investment Class1 | $ | 13.13 | $ | 13.41 | $ | 11.48 | $ | 20.88 | |||||||
Service Class1 | 13.17 | 13.32 | 11.13 | 20.81 | |||||||||||
Consultant Class2 | 13.25 | 10.86 | 10.70 | 19.91 | |||||||||||
Institutional Class3 | 13.09 | 11.57 | 20.81 | ||||||||||||
W Class3 | 13.14 | ||||||||||||||
R Class3 | 13.25 | 10.09 | 11.07 | ||||||||||||
K Class3 | 10.25 | 10.16 | 10.36 | ||||||||||||
Investments at identified cost | $ | 3,343,175,717 | $ | 230,444,245 | $ | 1,761,742,217 | $ | 2,108,933,296 | |||||||
Market value of loaned securities | 25,808,873 | 8,721,010 | 125,305,280 | 154,460 | |||||||||||
| 1 | Offering and redemption price per share; shares held less than 180 days may be subject to a 1% redemption fee, payable to the Fund. |
| 2 | Offering and redemption price per share; shares held less than 365 days may be subject to a 1% contingent deferred sales charge, payable to Royce Fund Services, Inc. |
| 3 | Offering and redemption price per share. |
| THE ACCOMPANYING NOTES ARE AN INTEGRAL PART OF THESE FINANCIAL STATEMENTS. | The Royce Funds 2012 Semiannual Report to Shareholders | 107 |
| Statements of Assets and Liabilities |
| Royce | Royce | Royce | Royce Micro-Cap | ||||||||||||
| Value | Value Plus | 100 | Discovery | ||||||||||||
| Fund | Fund | Fund | Fund | ||||||||||||
| ASSETS: | |||||||||||||||
| Investments at value (including collateral on loaned securities) | |||||||||||||||
Non-Affiliated Companies | $ | 1,420,366,548 | $ | 1,676,817,312 | $ | 360,565,717 | $ | 3,407,243 | |||||||
Affiliated Companies | – | 56,995,704 | – | – | |||||||||||
| Repurchase agreements (at cost and value) | 37,422,000 | 75,045,000 | 1,289,000 | 339,000 | |||||||||||
| Cash and foreign currency | 366 | 202,304 | 341 | 890 | |||||||||||
| Receivable for investments sold | 9,050,292 | 9,001,812 | 4,913,640 | 6,220 | |||||||||||
| Receivable for capital shares sold | 1,071,953 | 1,311,911 | 407,181 | 453 | |||||||||||
| Receivable for dividends and interest | 825,717 | 1,111,703 | 252,369 | 948 | |||||||||||
| Prepaid expenses and other assets | 7,918 | 12,125 | 1,931 | 16 | |||||||||||
Total Assets | 1,468,744,794 | 1,820,497,871 | 367,430,179 | 3,754,770 | |||||||||||
| LIABILITIES: | |||||||||||||||
| Payable for collateral on loaned securities | 16,434,818 | 85,720,096 | 11,277,609 | – | |||||||||||
| Payable for investments purchased | 5,397,204 | 10,417,477 | 814,634 | – | |||||||||||
| Payable for capital shares redeemed | 29,959,976 | 10,648,857 | 1,022,759 | 1,067 | |||||||||||
| Payable for investment advisory fees | 1,163,649 | 1,384,440 | 288,924 | – | |||||||||||
| Accrued expenses | 427,379 | 722,878 | 157,542 | 8,701 | |||||||||||
Total Liabilities | 53,383,026 | 108,893,748 | 13,561,468 | 9,768 | |||||||||||
Net Assets | $ | 1,415,361,768 | $ | 1,711,604,123 | $ | 353,868,711 | $ | 3,745,002 | |||||||
| ANALYSIS OF NET ASSETS: | |||||||||||||||
| Paid-in capital | $ | 1,384,973,030 | $ | 1,733,182,681 | $ | 294,789,917 | $ | 4,116,928 | |||||||
| Undistributed net investment income (loss) | 3,262,081 | (10,935,289 | ) | 2,115,216 | (13,517 | ) | |||||||||
| Accumulated net realized gain (loss) on investments and | |||||||||||||||
foreign currency | 52,050,873 | (138,713,308 | ) | 12,273,145 | (343,705 | ) | |||||||||
| Net unrealized appreciation (depreciation) on investments and | |||||||||||||||
foreign currency | (24,924,216 | ) | 128,070,039 | 44,690,433 | (14,704 | ) | |||||||||
Net Assets | $ | 1,415,361,768 | $ | 1,711,604,123 | $ | 353,868,711 | $ | 3,745,002 | |||||||
Investment Class | $ | 213,481,770 | $ | 267,871,537 | $ | 73,443,234 | |||||||||
Service Class | 921,412,919 | 1,197,884,477 | 271,893,349 | $ | 3,745,002 | ||||||||||
Consultant Class | 34,709,898 | 19,849,279 | |||||||||||||
Institutional Class | 192,781,854 | 224,066,737 | |||||||||||||
R Class | 36,685,062 | 1,378,083 | 4,203,623 | ||||||||||||
K Class | 16,290,265 | 554,010 | 4,328,505 | ||||||||||||
| SHARES OUTSTANDING (unlimited number of $.001 par value): | |||||||||||||||
Investment Class | 19,753,814 | 20,965,891 | 8,240,172 | ||||||||||||
Service Class | 85,627,424 | 94,222,072 | 30,812,770 | 730,554 | |||||||||||
Consultant Class | 3,385,035 | 1,621,501 | |||||||||||||
Institutional Class | 17,814,316 | 17,518,292 | |||||||||||||
R Class | 3,463,665 | 110,734 | 395,756 | ||||||||||||
K Class | 1,850,751 | 59,601 | 402,824 | ||||||||||||
| NET ASSET VALUES (Net Assets ÷ Shares Outstanding): | |||||||||||||||
Investment Class1 | $ | 10.81 | $ | 12.78 | $ | 8.91 | |||||||||
Service Class1 | 10.76 | 12.71 | 8.82 | $ | 5.13 | ||||||||||
Consultant Class2 | 10.25 | 12.24 | |||||||||||||
Institutional Class3 | 10.82 | 12.79 | |||||||||||||
R Class3 | 10.59 | 12.45 | 10.62 | ||||||||||||
K Class3 | 8.80 | 9.30 | 10.75 | ||||||||||||
Investments at identified cost | $ | 1,445,283,981 | $ | 1,605,732,662 | $ | 315,875,934 | $ | 3,421,947 | |||||||
Market value of loaned securities | 16,723,715 | 85,322,359 | 11,272,136 | ||||||||||||
| 1 | Offering and redemption price per share; shares held less than 180 days may be subject to a 1% redemption fee, payable to the Fund. |
| 2 | Offering and redemption price per share; shares held less than 365 days may be subject to a 1% contingent deferred sales charge, payable to Royce Fund Services, Inc. |
| 3 | Offering and redemption price per share. |
| 108 | The Royce Funds 2012 Semiannual Report to Shareholders | THE ACCOMPANYING NOTES ARE AN INTEGRAL PART OF THESE FINANCIAL STATEMENTS. |
| June 30, 2012 (unaudited) |
| Royce | Royce | Royce | Royce | |||||||||||||
| Financial | Dividend | SMid-Cap | Focus Value | |||||||||||||
| Services Fund | Value Fund | Value Fund | Fund | |||||||||||||
| ASSETS: | ||||||||||||||||
| Investments at value (including collateral on loaned securities) | ||||||||||||||||
Non-Affiliated Companies | $ | 15,017,030 | $ | 333,325,079 | $ | 8,912,082 | $ | 8,155,591 | ||||||||
| Repurchase agreements (at cost and value) | 315,000 | 27,836,000 | 980,000 | 500,000 | ||||||||||||
| Cash and foreign currency | 295 | 308 | 1,171 | 600 | ||||||||||||
| Receivable for investments sold | – | 1,326,691 | 855,512 | – | ||||||||||||
| Receivable for capital shares sold | 54,411 | 1,192,577 | 12,593 | 3,393 | ||||||||||||
| Receivable for dividends and interest | 20,295 | 425,944 | 12,077 | 7,198 | ||||||||||||
| Prepaid expenses and other assets | 71 | 1,021 | 43 | 39 | ||||||||||||
Total Assets | 15,407,102 | 364,107,620 | 10,773,478 | 8,666,821 | ||||||||||||
| LIABILITIES: | ||||||||||||||||
| Payable for collateral on loaned securities | – | 1,093,223 | – | – | ||||||||||||
| Payable for investments purchased | – | 5,939,058 | 106,526 | – | ||||||||||||
| Payable for capital shares redeemed | 150,197 | 626,333 | 64,292 | 1,998 | ||||||||||||
| Payable for investment advisory fees | 7,427 | 278,936 | – | – | ||||||||||||
| Accrued expenses | 18,601 | 72,025 | 17,337 | 7,836 | ||||||||||||
Total Liabilities | 176,225 | 8,009,575 | 188,155 | 9,834 | ||||||||||||
Net Assets | $ | 15,230,877 | $ | 356,098,045 | $ | 10,585,323 | $ | 8,656,987 | ||||||||
| ANALYSIS OF NET ASSETS: | ||||||||||||||||
| Paid-in capital | $ | 15,990,027 | $ | 346,830,992 | $ | 17,521,592 | $ | 8,346,778 | ||||||||
| Undistributed net investment income (loss) | (36,877 | ) | 472,674 | (17,245 | ) | (9,691 | ) | |||||||||
| Accumulated net realized gain (loss) on investments and | ||||||||||||||||
foreign currency | (1,186,358 | ) | 2,304,678 | (5,923,276 | ) | (104,826 | ) | |||||||||
| Net unrealized appreciation (depreciation) on investments and | ||||||||||||||||
foreign currency | 464,085 | 6,489,701 | (995,748 | ) | 424,726 | |||||||||||
Net Assets | $ | 15,230,877 | $ | 356,098,045 | $ | 10,585,323 | $ | 8,656,987 | ||||||||
Investment Class | $ | 124,363,726 | ||||||||||||||
Service Class | $ | 15,230,877 | 231,734,319 | $ | 10,585,323 | $ | 8,656,987 | |||||||||
| SHARES OUTSTANDING (unlimited number of $.001 par value): | ||||||||||||||||
Investment Class | 18,806,195 | |||||||||||||||
Service Class | 2,465,705 | 34,838,706 | 1,021,027 | 629,608 | ||||||||||||
| NET ASSET VALUES (Net Assets ÷ Shares Outstanding): | ||||||||||||||||
Investment Class1 | $ | 6.61 | ||||||||||||||
Service Class1 | $ | 6.18 | 6.65 | $ | 10.37 | $ | 13.75 | |||||||||
Investments at identified cost | $ | 14,552,534 | $ | 326,834,430 | $ | 9,907,677 | $ | 7,730,865 | ||||||||
Market value of loaned securities | 1,106,212 | |||||||||||||||
| 1 | Offering and redemption price per share; shares held less than 180 days may be subject to a 1% redemption fee, payable to the Fund. |
| THE ACCOMPANYING NOTES ARE AN INTEGRAL PART OF THESE FINANCIAL STATEMENTS. | The Royce Funds 2012 Semiannual Report to Shareholders | 109 |
| Statements of Assets and Liabilities | June 30, 2012 (unaudited) | |
| Royce | Royce | Royce | ||||||||||
| Partners | Mid-Cap | Special Equity | ||||||||||
| Fund | Fund | Multi-Cap Fund | ||||||||||
| ASSETS: | ||||||||||||
| Investments at value | ||||||||||||
Non-Affiliated Companies | $ | 1,787,945 | $ | 5,084,143 | $ | 84,022,384 | ||||||
| Repurchase agreements (at cost and value) | – | 231,000 | 3,586,000 | |||||||||
| Cash and foreign currency | 50,408 | 120 | 644 | |||||||||
| Receivable for investments sold | – | 54,522 | 9,229 | |||||||||
| Receivable for capital shares sold | 300 | 16,227 | 74,818 | |||||||||
| Receivable for dividends and interest | 1,855 | 7,183 | 130,679 | |||||||||
| Receivable due from investment advisor | 4,163 | 3,995 | 7,348 | |||||||||
| Prepaid expenses and other assets | 7 | 24 | 35 | |||||||||
Total Assets | 1,844,678 | 5,397,214 | 87,831,137 | |||||||||
| LIABILITIES: | ||||||||||||
| Payable for investments purchased | – | 9,305 | 314,045 | |||||||||
| Payable for capital shares redeemed | – | – | 33,387 | |||||||||
| Payable for investment advisory fees | – | – | 69,124 | |||||||||
| Accrued expenses | 36 | 7,443 | 4,263 | |||||||||
Total Liabilities | 36 | 16,748 | 420,819 | |||||||||
Net Assets | $ | 1,844,642 | $ | 5,380,466 | $ | 87,410,318 | ||||||
| ANALYSIS OF NET ASSETS: | ||||||||||||
| Paid-in capital | $ | 1,732,304 | $ | 5,488,233 | $ | 85,126,621 | ||||||
| Undistributed net investment income (loss) | 3,687 | (1,458 | ) | 332,499 | ||||||||
| Accumulated net realized gain (loss) on investments and | ||||||||||||
foreign currency | 11,864 | (34,690 | ) | 413,412 | ||||||||
| Net unrealized appreciation (depreciation) on investments and foreign currency | 96,787 | (71,619 | ) | 1,537,786 | ||||||||
Net Assets | $ | 1,844,642 | $ | 5,380,466 | $ | 87,410,318 | ||||||
Investment Class | $ | 25,814,042 | ||||||||||
Service Class | $ | 1,844,642 | $ | 5,380,466 | 40,834,933 | |||||||
Institutional Class | 20,761,343 | |||||||||||
| SHARES OUTSTANDING (unlimited number of $.001 par value): | ||||||||||||
Investment Class | 2,275,151 | |||||||||||
Service Class | 165,713 | 508,985 | 3,598,935 | |||||||||
Institutional Class | 1,828,477 | |||||||||||
| NET ASSET VALUES (Net Assets ÷ Shares Outstanding): | ||||||||||||
Investment Class 1 | $ | 11.35 | ||||||||||
Service Class 1 | $ | 11.13 | $ | 10.57 | 11.35 | |||||||
Institutional Class 2 | 11.35 | |||||||||||
Investments at identified cost | $ | 1,691,145 | $ | 5,155,746 | $ | 82,484,598 | ||||||
| 1 | Offering and redemption price per share; shares held less than 180 days may be subject to a 1% redemption fee, payable to the Fund. |
| 2 | Offering and redemption price per share. |
| 110 | The Royce Funds 2012 Semiannual Report to Shareholders | THE ACCOMPANYING NOTES ARE AN INTEGRAL PART OF THESE FINANCIAL STATEMENTS. |
| Statements of Changes in Net Assets |
| Royce Pennsylvania | ||||||||||||||||||||||||
| Mutual Fund | Royce Micro-Cap Fund | Royce Premier Fund | ||||||||||||||||||||||
| Six months ended | Six months ended | Six months ended | ||||||||||||||||||||||
| 6/30/12 | Year ended | 6/30/12 | Year ended | 6/30/12 | Year ended | |||||||||||||||||||
| (unaudited) | 12/31/11 | (unaudited) | 12/31/11 | (unaudited) | 12/31/11 | |||||||||||||||||||
| INVESTMENT OPERATIONS: | ||||||||||||||||||||||||
| Net investment income (loss) | $ | 10,550,113 | $ | (1,736,062 | ) | $ | (2,010,281 | ) | $ | (8,590,607 | ) | $ | 39,154,145 | $ | (8,208,621 | ) | ||||||||
| Net realized gain (loss) on investments and | ||||||||||||||||||||||||
foreign currency | 127,249,656 | 227,496,225 | 26,190,826 | 85,770,324 | 139,868,348 | 684,906,171 | ||||||||||||||||||
| Net change in unrealized appreciation | ||||||||||||||||||||||||
(depreciation) on investments and | ||||||||||||||||||||||||
foreign currency | 78,326,864 | (504,275,913 | ) | 5,137,645 | (256,605,573 | ) | (2,743,113 | ) | (761,470,308 | ) | ||||||||||||||
| Net increase (decrease) in net assets from | ||||||||||||||||||||||||
investment operations | 216,126,633 | (278,515,750 | ) | 29,318,190 | (179,425,856 | ) | 176,279,380 | (84,772,758 | ) | |||||||||||||||
| DISTRIBUTIONS: | ||||||||||||||||||||||||
| Net investment income | ||||||||||||||||||||||||
Investment Class | – | (7,553,630 | ) | – | (12,205,302 | ) | – | (12,153,429 | ) | |||||||||||||||
Service Class | – | – | – | (1,545,545 | ) | – | (752,969 | ) | ||||||||||||||||
Consultant Class | – | – | – | (521,659 | ) | – | – | |||||||||||||||||
Institutional Class | – | – | – | (3,198,893 | ) | |||||||||||||||||||
W Class | – | (2,087,838 | ) | |||||||||||||||||||||
R Class | – | – | – | (49,192 | ) | |||||||||||||||||||
K Class | – | – | – | (54,734 | ) | |||||||||||||||||||
| Net realized gain on investments and | ||||||||||||||||||||||||
foreign currency | ||||||||||||||||||||||||
Investment Class | – | (147,840,546 | ) | – | (42,238,594 | ) | – | (362,055,233 | ) | |||||||||||||||
Service Class | – | (14,504,009 | ) | – | (5,775,719 | ) | – | (50,755,242 | ) | |||||||||||||||
Consultant Class | – | (25,426,352 | ) | – | (6,858,461 | ) | – | (5,210,713 | ) | |||||||||||||||
Institutional Class | – | (8,073,158 | ) | – | (65,746,753 | ) | ||||||||||||||||||
W Class | – | (44,761,892 | ) | |||||||||||||||||||||
R Class | – | (773,990 | ) | – | (1,872,119 | ) | ||||||||||||||||||
K Class | – | (218,971 | ) | – | (1,393,122 | ) | ||||||||||||||||||
| Total distributions | – | (204,390,656 | ) | – | (69,145,280 | ) | – | (550,092,129 | ) | |||||||||||||||
| CAPITAL SHARE TRANSACTIONS: | ||||||||||||||||||||||||
| Net capital share transactions | ||||||||||||||||||||||||
Investment Class | (98,618,270 | ) | (103,999,144 | ) | (71,245,025 | ) | 11,342,816 | (10,486,127 | ) | (9,633,723 | ) | |||||||||||||
Service Class | 4,060,452 | (4,630,665 | ) | 11,810,023 | 9,291,180 | (28,111,989 | ) | 105,553,789 | ||||||||||||||||
Consultant Class | (42,522,529 | ) | (115,290,247 | ) | (9,449,571 | ) | (18,158,871 | ) | (1,964,245 | ) | (5,810,352 | ) | ||||||||||||
Institutional Class | 150,251,453 | 258,340,306 | (6,089,095 | ) | 197,239,074 | |||||||||||||||||||
W Class | (15,418,243 | ) | 182,723,037 | |||||||||||||||||||||
R Class | 5,130,396 | 6,206,100 | 3,932,546 | 16,429,482 | ||||||||||||||||||||
K Class | 1,308,198 | 2,401,452 | 1,091,411 | 6,908,558 | ||||||||||||||||||||
| Shareholder redemption fees | ||||||||||||||||||||||||
Investment Class | 66,140 | 249,468 | 12,592 | 37,257 | 76,269 | 276,230 | ||||||||||||||||||
Service Class | 30,341 | 169,200 | 3,871 | 20,092 | 20,841 | 119,591 | ||||||||||||||||||
Consultant Class | – | (948 | ) | – | (734 | ) | – | (25 | ) | |||||||||||||||
R Class | – | (382 | ) | – | (385 | ) | ||||||||||||||||||
K Class | – | (1,263 | ) | – | – | |||||||||||||||||||
| Net increase (decrease) in net assets from | ||||||||||||||||||||||||
capital share transactions | 19,706,181 | 43,443,877 | (68,868,110 | ) | 2,531,740 | (56,948,632 | ) | 493,805,276 | ||||||||||||||||
| NET INCREASE (DECREASE) IN NET ASSETS | 235,832,814 | (439,462,529 | ) | (39,549,920 | ) | (246,039,396 | ) | 119,330,748 | (141,059,611 | ) | ||||||||||||||
| NET ASSETS: | ||||||||||||||||||||||||
Beginning of period | 5,607,877,335 | 6,047,339,864 | 1,161,399,376 | 1,407,438,772 | 6,623,630,924 | 6,764,690,535 | ||||||||||||||||||
End of period | $ | 5,843,710,149 | $ | 5,607,877,335 | $ | 1,121,849,456 | $ | 1,161,399,376 | $ | 6,742,961,672 | $ | 6,623,630,924 | ||||||||||||
| UNDISTRIBUTED NET INVESTMENT INCOME | ||||||||||||||||||||||||
(LOSS) AT END OF PERIOD | $ | 9,514,877 | $ | (1,035,236 | ) | $ | (9,663,286 | ) | $ | (7,653,005 | ) | $ | 46,654,446 | $ | 7,500,301 | |||||||||
| THE ACCOMPANYING NOTES ARE AN INTEGRAL PART OF THESE FINANCIAL STATEMENTS. | The Royce Funds 2012 Semiannual Report to Shareholders | 111 |
| Statements of Changes in Net Assets |
| Royce Low-Priced Stock Fund | Royce Total Return Fund | Royce Heritage Fund | ||||||||||||||||||||||
| Six months ended | Six months ended | Six months ended | ||||||||||||||||||||||
| 6/30/12 | Year ended | 6/30/12 | Year ended | 6/30/12 | Year ended | |||||||||||||||||||
| (unaudited) | 12/31/11 | (unaudited) | 12/31/11 | (unaudited) | 12/31/11 | |||||||||||||||||||
| INVESTMENT OPERATIONS: | ||||||||||||||||||||||||
| Net investment income (loss) | $ | (1,078,564 | ) | $ | (13,606,980 | ) | $ | 25,757,285 | $ | 48,152,272 | $ | 513,043 | $ | (316,386 | ) | |||||||||
| Net realized gain (loss) on investments and | ||||||||||||||||||||||||
foreign currency | 79,989,454 | 328,960,886 | 159,406,240 | 277,439,732 | 1,976,065 | 4,744,335 | ||||||||||||||||||
| Net change in unrealized appreciation | ||||||||||||||||||||||||
(depreciation) on investments and | ||||||||||||||||||||||||
foreign currency | (102,661,008 | ) | (1,002,287,882 | ) | 1,104,445 | (403,974,188 | ) | 4,172,292 | (34,193,708 | ) | ||||||||||||||
| Net increase (decrease) in net assets from | ||||||||||||||||||||||||
investment operations | (23,750,118 | ) | (686,933,976 | ) | 186,267,970 | (78,382,184 | ) | 6,661,400 | (29,765,759 | ) | ||||||||||||||
| DISTRIBUTIONS: | ||||||||||||||||||||||||
| Net investment income | ||||||||||||||||||||||||
Investment Class | – | (2,622,938 | ) | (19,215,135 | ) | (30,675,794 | ) | – | (82,990 | ) | ||||||||||||||
Service Class | – | (15,929,733 | ) | (1,329,787 | ) | (1,488,830 | ) | – | (408,937 | ) | ||||||||||||||
Consultant Class | – | – | – | – | ||||||||||||||||||||
Institutional Class | – | (9,414,641 | ) | (2,480,954 | ) | (4,368,776 | ) | |||||||||||||||||
W Class | (929,689 | ) | (1,201,279 | ) | ||||||||||||||||||||
R Class | – | (61,040 | ) | (127,551 | ) | (96,644 | ) | – | (12,269 | ) | ||||||||||||||
K Class | – | (122,723 | ) | (853,724 | ) | (719,572 | ) | – | (32,521 | ) | ||||||||||||||
| Net realized gain on investments and | ||||||||||||||||||||||||
foreign currency | ||||||||||||||||||||||||
Investment Class | – | (21,174,775 | ) | – | (35,538,995 | ) | – | (908,574 | ) | |||||||||||||||
Service Class | – | (197,159,302 | ) | – | (3,245,517 | ) | – | (9,538,084 | ) | |||||||||||||||
Consultant Class | – | (3,759,667 | ) | – | (743,095 | ) | ||||||||||||||||||
Institutional Class | – | (74,891,179 | ) | – | (4,472,089 | ) | ||||||||||||||||||
W Class | – | (1,506,553 | ) | |||||||||||||||||||||
R Class | – | (572,840 | ) | – | (385,835 | ) | – | (200,554 | ) | |||||||||||||||
K Class | – | (1,048,801 | ) | – | (2,596,783 | ) | – | (436,155 | ) | |||||||||||||||
| Total distributions | – | (322,997,972 | ) | (24,936,840 | ) | (90,056,334 | ) | – | (12,363,179 | ) | ||||||||||||||
| CAPITAL SHARE TRANSACTIONS: | ||||||||||||||||||||||||
| Net capital share transactions | ||||||||||||||||||||||||
Investment Class | 46,021,278 | 200,509,136 | (111,328,787 | ) | (336,209,156 | ) | 7,519,874 | 10,893,188 | ||||||||||||||||
Service Class | (339,014,307 | ) | (303,687,732 | ) | (9,504,243 | ) | (1,872,348 | ) | (12,784,363 | ) | 9,640,655 | |||||||||||||
Consultant Class | (17,830,946 | ) | (50,011,884 | ) | (810,493 | ) | 3,645,699 | |||||||||||||||||
Institutional Class | 89,613,002 | 183,689,075 | (26,840,073 | ) | 52,023,722 | |||||||||||||||||||
W Class | 10,028,849 | 63,365,878 | ||||||||||||||||||||||
R Class | (958,882 | ) | 5,966,770 | 7,660,182 | 15,625,875 | 1,179,137 | 2,807,392 | |||||||||||||||||
K Class | (509,325 | ) | 6,633,649 | 16,891,444 | 82,088,857 | (2,529,194 | ) | 3,622,168 | ||||||||||||||||
| Shareholder redemption fees | ||||||||||||||||||||||||
Investment Class | 1,537 | 52,306 | 26,030 | 176,798 | 6,916 | 10,466 | ||||||||||||||||||
Service Class | 61,056 | 313,978 | 8,962 | 71,858 | 7,584 | 26,956 | ||||||||||||||||||
Consultant Class | – | (1,669 | ) | – | – | |||||||||||||||||||
R Class | – | – | – | – | – | (55 | ) | |||||||||||||||||
K Class | – | (61 | ) | – | – | – | – | |||||||||||||||||
| Net increase (decrease) in net assets from | ||||||||||||||||||||||||
capital share transactions | (204,785,641 | ) | 93,477,121 | (130,888,582 | ) | (174,742,069 | ) | (7,410,539 | ) | 30,646,469 | ||||||||||||||
| NET INCREASE (DECREASE) IN NET ASSETS | (228,535,759 | ) | (916,454,827 | ) | 30,442,548 | (343,180,587 | ) | (749,139 | ) | (11,482,469 | ) | |||||||||||||
| NET ASSETS: | ||||||||||||||||||||||||
Beginning of period | 3,773,197,575 | 4,689,652,402 | 4,452,794,250 | 4,795,974,837 | 265,576,045 | 277,058,514 | ||||||||||||||||||
End of period | $ | 3,544,661,816 | $ | 3,773,197,575 | $ | 4,483,236,798 | $ | 4,452,794,250 | $ | 264,826,906 | $ | 265,576,045 | ||||||||||||
| UNDISTRIBUTED NET INVESTMENT INCOME | ||||||||||||||||||||||||
(LOSS) AT END OF PERIOD | $ | (28,752,968 | ) | $ | (27,674,403 | ) | $ | (1,581,320 | ) | $ | (2,401,765 | ) | $ | (269,376 | ) | $ | (782,419 | ) | ||||||
| 112 | The Royce Funds 2012 Semiannual Report to Shareholders | THE ACCOMPANYING NOTES ARE AN INTEGRAL PART OF THESE FINANCIAL STATEMENTS. |
| Royce Opportunity Fund | Royce Special Equity Fund | Royce Value Fund | ||||||||||||||||||||||
| Six months ended | Six months ended | Six months ended | ||||||||||||||||||||||
| 6/30/12 | Year ended | 6/30/12 | Year ended | 6/30/12 | Year ended | |||||||||||||||||||
| (unaudited) | 12/31/11 | (unaudited) | 12/31/11 | (unaudited) | 12/31/11 | |||||||||||||||||||
| INVESTMENT OPERATIONS: | ||||||||||||||||||||||||
| Net investment income (loss) | $ | (1,360,306 | ) | $ | (7,692,995 | ) | $ | 17,803,459 | $ | 5,246,783 | $ | 3,331,600 | $ | (3,005,590 | ) | |||||||||
| Net realized gain (loss) on investments and | ||||||||||||||||||||||||
foreign currency | 75,993,408 | 200,833,727 | 96,049,101 | 133,073,710 | 45,880,412 | 183,939,122 | ||||||||||||||||||
| Net change in unrealized appreciation | ||||||||||||||||||||||||
(depreciation) on investments and | ||||||||||||||||||||||||
foreign currency | 108,383,112 | (466,957,664 | ) | 28,080,755 | (153,511,418 | ) | (67,904,583 | ) | (340,931,439 | ) | ||||||||||||||
| Net increase (decrease) in net assets from | ||||||||||||||||||||||||
investment operations | 183,016,214 | (273,816,932 | ) | 141,933,315 | (15,190,925 | ) | (18,692,571 | ) | (159,997,907 | ) | ||||||||||||||
| DISTRIBUTIONS: | ||||||||||||||||||||||||
| Net investment income | ||||||||||||||||||||||||
Investment Class | – | – | – | (7,506,674 | ) | – | (1,311,276 | ) | ||||||||||||||||
Service Class | – | – | – | (533,230 | ) | – | (2,106,179 | ) | ||||||||||||||||
Consultant Class | – | – | – | – | – | – | ||||||||||||||||||
Institutional Class | – | – | – | (2,738,810 | ) | – | (1,186,806 | ) | ||||||||||||||||
R Class | – | – | – | (113,727 | ) | |||||||||||||||||||
K Class | – | – | – | (63,344 | ) | |||||||||||||||||||
| Net realized gain on investments and | ||||||||||||||||||||||||
foreign currency | ||||||||||||||||||||||||
Investment Class | – | (16,007,095 | ) | – | (86,786,033 | ) | – | (14,160,961 | ) | |||||||||||||||
Service Class | – | (3,015,764 | ) | – | (11,156,408 | ) | – | (71,209,823 | ) | |||||||||||||||
Consultant Class | – | (226,990 | ) | – | (2,659,079 | ) | – | (2,423,117 | ) | |||||||||||||||
Institutional Class | – | (10,373,465 | ) | – | (24,966,735 | ) | – | (11,887,154 | ) | |||||||||||||||
R Class | – | (58,426 | ) | – | (2,190,124 | ) | ||||||||||||||||||
K Class | – | (125,508 | ) | – | (1,042,529 | ) | ||||||||||||||||||
| Total distributions | – | (29,807,248 | ) | – | (136,346,969 | ) | – | (107,695,040 | ) | |||||||||||||||
| CAPITAL SHARE TRANSACTIONS: | ||||||||||||||||||||||||
| Net capital share transactions | ||||||||||||||||||||||||
Investment Class | (63,660,761 | ) | (128,372,272 | ) | 150,606,612 | 294,451,345 | (2,638,721 | ) | 147,753,479 | |||||||||||||||
Service Class | (9,254,367 | ) | (119,333,649 | ) | 8,575,862 | 68,539,674 | (150,961,820 | ) | (152,759,752 | ) | ||||||||||||||
Consultant Class | (1,117,795 | ) | 1,059,226 | 2,311,291 | 14,957,245 | (680,204 | ) | 6,999,042 | ||||||||||||||||
Institutional Class | (2,462,969 | ) | (24,517,878 | ) | 35,861,333 | 66,765,812 | 5,134,058 | 438,275 | ||||||||||||||||
R Class | 1,193,811 | 2,092,297 | 3,539,086 | 13,089,183 | ||||||||||||||||||||
K Class | 366,789 | 1,293,607 | 2,660,395 | 3,612,310 | ||||||||||||||||||||
| Shareholder redemption fees | ||||||||||||||||||||||||
Investment Class | 18,613 | 79,778 | 86,670 | 249,340 | 6,086 | 110,138 | ||||||||||||||||||
Service Class | 946 | 180,844 | 16,917 | 51,327 | 41,214 | 634,242 | ||||||||||||||||||
K Class | – | (9 | ) | – | – | |||||||||||||||||||
| Net increase (decrease) in net assets from | ||||||||||||||||||||||||
capital share transactions | (74,915,733 | ) | (267,518,056 | ) | 197,458,685 | 445,014,743 | (142,899,906 | ) | 19,876,917 | |||||||||||||||
| NET INCREASE (DECREASE) IN NET ASSETS | 108,100,481 | (571,142,236 | ) | 339,392,000 | 293,476,849 | (161,592,477 | ) | (247,816,030 | ) | |||||||||||||||
| NET ASSETS: | ||||||||||||||||||||||||
Beginning of period | 1,635,602,298 | 2,206,744,534 | 2,425,644,328 | 2,132,167,479 | 1,576,954,245 | 1,824,770,275 | ||||||||||||||||||
End of period | $ | 1,743,702,779 | $ | 1,635,602,298 | $ | 2,765,036,328 | $ | 2,425,644,328 | $ | 1,415,361,768 | $ | 1,576,954,245 | ||||||||||||
| UNDISTRIBUTED NET INVESTMENT INCOME | ||||||||||||||||||||||||
(LOSS) AT END OF PERIOD | $ | (1,945,355 | ) | $ | (585,048 | ) | $ | 17,897,663 | $ | 94,204 | $ | 3,262,081 | $ | (69,519 | ) | |||||||||
| THE ACCOMPANYING NOTES ARE AN INTEGRAL PART OF THESE FINANCIAL STATEMENTS. | The Royce Funds 2012 Semiannual Report to Shareholders | 113 |
| Statements of Changes in Net Assets |
| Royce Micro-Cap | ||||||||||||||||||||||||
| Royce Value Plus Fund | Royce 100 Fund | Discovery Fund | ||||||||||||||||||||||
| Six months ended | Six months ended | Six months ended | ||||||||||||||||||||||
| 6/30/12 | Year ended | 6/30/12 | Year ended | 6/30/12 | Year ended | |||||||||||||||||||
| (unaudited) | 12/31/11 | (unaudited) | 12/31/11 | (unaudited) | 12/31/11 | |||||||||||||||||||
| INVESTMENT OPERATIONS: | ||||||||||||||||||||||||
| Net investment income (loss) | $ | (6,095,362 | ) | $ | (17,942,015 | ) | $ | 2,115,216 | $ | (2,203,228 | ) | $ | (13,518 | ) | $ | (26,392 | ) | |||||||
| Net realized gain (loss) on investments and | ||||||||||||||||||||||||
foreign currency | 20,297,398 | 282,999,938 | 6,379,519 | 21,557,245 | 83,209 | 167,446 | ||||||||||||||||||
| Net change in unrealized appreciation | ||||||||||||||||||||||||
(depreciation) on investments and | ||||||||||||||||||||||||
foreign currency | 120,316,464 | (522,171,703 | ) | (403,475 | ) | (53,701,837 | ) | (73,602 | ) | (258,889 | ) | |||||||||||||
| Net increase (decrease) in net assets from | ||||||||||||||||||||||||
investment operations | 134,518,500 | (257,113,780 | ) | 8,091,260 | (34,347,820 | ) | (3,911 | ) | (117,835 | ) | ||||||||||||||
| DISTRIBUTIONS: | ||||||||||||||||||||||||
| Net investment income | ||||||||||||||||||||||||
Investment Class | – | (3,973,855 | ) | – | (46,735 | ) | ||||||||||||||||||
Service Class | – | (9,654,977 | ) | – | – | – | (1,952 | ) | ||||||||||||||||
Consultant Class | – | – | ||||||||||||||||||||||
Institutional Class | – | (3,466,339 | ) | |||||||||||||||||||||
R Class | – | (8,226 | ) | – | – | |||||||||||||||||||
K Class | – | – | – | – | ||||||||||||||||||||
| Net realized gain on investments and | ||||||||||||||||||||||||
foreign currency | ||||||||||||||||||||||||
Investment Class | – | – | – | (3,108,241 | ) | |||||||||||||||||||
Service Class | – | – | – | (15,452,399 | ) | – | – | |||||||||||||||||
Consultant Class | – | – | ||||||||||||||||||||||
Institutional Class | – | – | ||||||||||||||||||||||
R Class | – | – | – | (130,243 | ) | |||||||||||||||||||
K Class | – | – | – | (181,337 | ) | |||||||||||||||||||
| Total distributions | – | (17,103,397 | ) | – | (18,918,955 | ) | – | (1,952 | ) | |||||||||||||||
| CAPITAL SHARE TRANSACTIONS: | ||||||||||||||||||||||||
| Net capital share transactions | ||||||||||||||||||||||||
Investment Class | (52,271,733 | ) | 33,159,380 | 9,088,077 | 5,131,162 | |||||||||||||||||||
Service Class | (314,071,955 | ) | (848,101,245 | ) | (45,606,687 | ) | (11,187,742 | ) | 128,151 | 94,984 | ||||||||||||||
Consultant Class | (1,547,856 | ) | (7,468,096 | ) | ||||||||||||||||||||
Institutional Class | (54,616,147 | ) | (121,895,301 | ) | ||||||||||||||||||||
R Class | 244,074 | 281,374 | 724,724 | 2,419,632 | ||||||||||||||||||||
K Class | 25,639 | (1,181,200 | ) | (197,696 | ) | 2,100,132 | ||||||||||||||||||
| Shareholder redemption fees | ||||||||||||||||||||||||
Investment Class | 3,967 | 84,677 | 1,159 | 21,461 | ||||||||||||||||||||
Service Class | 23,431 | 164,613 | 15,036 | 66,531 | – | 8,416 | ||||||||||||||||||
| Net increase (decrease) in net assets from | ||||||||||||||||||||||||
capital share transactions | (422,210,580 | ) | (944,955,798 | ) | (35,975,387 | ) | (1,448,824 | ) | 128,151 | 103,400 | ||||||||||||||
| NET INCREASE (DECREASE) IN NET ASSETS | (287,692,080 | ) | (1,219,172,975 | ) | (27,884,127 | ) | (54,715,599 | ) | 124,240 | (16,387 | ) | |||||||||||||
| NET ASSETS: | ||||||||||||||||||||||||
Beginning of period | 1,999,296,203 | 3,218,469,178 | 381,752,838 | 436,468,437 | 3,620,762 | 3,637,149 | ||||||||||||||||||
End of period | $ | 1,711,604,123 | $ | 1,999,296,203 | $ | 353,868,711 | $ | 381,752,838 | $ | 3,745,002 | $ | 3,620,762 | ||||||||||||
| UNDISTRIBUTED NET INVESTMENT INCOME | ||||||||||||||||||||||||
(LOSS) AT END OF PERIOD | $ | (10,935,289 | ) | $ | (4,839,927 | ) | $ | 2,115,216 | $ | – | $ | (13,517 | ) | $ | – | |||||||||
| 114 | The Royce Funds 2012 Semiannual Report to Shareholders | THE ACCOMPANYING NOTES ARE AN INTEGRAL PART OF THESE FINANCIAL STATEMENTS. |
| Royce Financial Services Fund | Royce Dividend Value Fund | Royce SMid-Cap Value Fund | ||||||||||||||||||||||
| Six months ended | Six months ended | Six months ended | ||||||||||||||||||||||
| 6/30/12 | Year ended | 6/30/12 | Year ended | 6/30/12 | Year ended | |||||||||||||||||||
| (unaudited) | 12/31/11 | (unaudited) | 12/31/11 | (unaudited) | 12/31/11 | |||||||||||||||||||
| INVESTMENT OPERATIONS: | ||||||||||||||||||||||||
| Net investment income (loss) | $ | 60,775 | $ | 121,123 | $ | 2,138,649 | $ | 2,332,072 | $ | (14,479 | ) | $ | (57,490 | ) | ||||||||||
| Net realized gain (loss) on investments and | ||||||||||||||||||||||||
foreign currency | 257,110 | (176,059 | ) | 1,982,716 | 4,242,268 | (183,647 | ) | 371,294 | ||||||||||||||||
| Net change in unrealized appreciation | ||||||||||||||||||||||||
(depreciation) on investments and | ||||||||||||||||||||||||
foreign currency | 752,803 | (2,305,850 | ) | 10,122,911 | (24,682,355 | ) | 394,340 | (2,367,229 | ) | |||||||||||||||
| Net increase (decrease) in net assets from | ||||||||||||||||||||||||
investment operations | 1,070,688 | (2,360,786 | ) | 14,244,276 | (18,108,015 | ) | 196,214 | (2,053,425 | ) | |||||||||||||||
| DISTRIBUTIONS: | ||||||||||||||||||||||||
| Net investment income | ||||||||||||||||||||||||
Investment Class | (812,315 | ) | (714,241 | ) | ||||||||||||||||||||
Service Class | – | (139,894 | ) | (1,341,033 | ) | (1,059,090 | ) | – | (16,431 | ) | ||||||||||||||
| Net realized gain on investments and | ||||||||||||||||||||||||
foreign currency | ||||||||||||||||||||||||
Investment Class | – | (1,223,501 | ) | |||||||||||||||||||||
Service Class | – | – | – | (2,867,224 | ) | – | – | |||||||||||||||||
| Total distributions | – | (139,894 | ) | (2,153,348 | ) | (5,864,056 | ) | – | (16,431 | ) | ||||||||||||||
| CAPITAL SHARE TRANSACTIONS: | ||||||||||||||||||||||||
| Net capital share transactions | ||||||||||||||||||||||||
Investment Class | 35,020,920 | 57,157,873 | ||||||||||||||||||||||
Service Class | 63,131 | 1,897,713 | 22,148,542 | 100,621,245 | 60,602 | 6,195,095 | ||||||||||||||||||
| Shareholder redemption fees | ||||||||||||||||||||||||
Investment Class | 11,810 | 17,078 | ||||||||||||||||||||||
Service Class | 1,505 | 10,903 | 3,534 | 67,799 | 1,098 | 7,021 | ||||||||||||||||||
| Net increase (decrease) in net assets from | ||||||||||||||||||||||||
capital share transactions | 64,636 | 1,908,616 | 57,184,806 | 157,863,995 | 61,700 | 6,202,116 | ||||||||||||||||||
| NET INCREASE (DECREASE) IN NET ASSETS | 1,135,324 | (592,064 | ) | 69,275,734 | 133,891,924 | 257,914 | 4,132,260 | |||||||||||||||||
| NET ASSETS: | ||||||||||||||||||||||||
Beginning of period | 14,095,553 | 14,687,617 | 286,822,311 | 152,930,387 | 10,327,409 | 6,195,149 | ||||||||||||||||||
End of period | $ | 15,230,877 | $ | 14,095,553 | $ | 356,098,045 | $ | 286,822,311 | $ | 10,585,323 | $ | 10,327,409 | ||||||||||||
| UNDISTRIBUTED NET INVESTMENT INCOME | ||||||||||||||||||||||||
(LOSS) AT END OF PERIOD | $ | (36,877 | ) | $ | (97,652 | ) | $ | 472,674 | $ | 487,373 | $ | (17,245 | ) | $ | (2,767 | ) | ||||||||
| THE ACCOMPANYING NOTES ARE AN INTEGRAL PART OF THESE FINANCIAL STATEMENTS. | The Royce Funds 2012 Semiannual Report to Shareholders | 115 |
| Statements of Changes in Net Assets |
| Royce Focus Value Fund | Royce Partners Fund | |||||||||||||||
| Six months ended | Six months ended | |||||||||||||||
| 6/30/12 | Year ended | 6/30/12 | Year ended | |||||||||||||
| (unaudited) | 12/31/11 | (unaudited) | 12/31/11 | |||||||||||||
| INVESTMENT OPERATIONS: | ||||||||||||||||
| Net investment income (loss) | $ | (2,395 | ) | $ | (28,804 | ) | $ | 3,715 | $ | (4,575 | ) | |||||
| Net realized gain (loss) on investments and foreign currency | (106,714 | ) | 363,209 | 10,948 | 133,930 | |||||||||||
| Net change in unrealized appreciation (depreciation) on investments and foreign | ||||||||||||||||
currency | 122,531 | (1,706,389 | ) | 106,605 | (347,167 | ) | ||||||||||
| Net increase (decrease) in net assets from investment operations | 13,422 | (1,371,984 | ) | 121,268 | (217,812 | ) | ||||||||||
| DISTRIBUTIONS: | ||||||||||||||||
| Net investment income | ||||||||||||||||
Service Class | – | – | – | (6,563 | ) | |||||||||||
| Net realized gain on investments and foreign currency | ||||||||||||||||
Service Class | – | (333,049 | ) | – | (171,566 | ) | ||||||||||
| Total distributions | – | (333,049 | ) | – | (178,129 | ) | ||||||||||
| CAPITAL SHARE TRANSACTIONS: | ||||||||||||||||
| Net capital share transactions | ||||||||||||||||
Service Class | (84,019 | ) | 1,487,601 | 41,118 | 306,626 | |||||||||||
| Shareholder redemption fees | ||||||||||||||||
Service Class | 115 | 2,805 | – | 76 | ||||||||||||
| Net increase (decrease) in net assets from capital share transactions | (83,904 | ) | 1,490,406 | 41,118 | 306,702 | |||||||||||
| NET INCREASE (DECREASE) IN NET ASSETS | (70,482 | ) | (214,627 | ) | 162,386 | (89,239 | ) | |||||||||
| NET ASSETS: | ||||||||||||||||
Beginning of period | 8,727,469 | 8,942,096 | 1,682,256 | 1,771,495 | ||||||||||||
End of period | $ | 8,656,987 | $ | 8,727,469 | $ | 1,844,642 | $ | 1,682,256 | ||||||||
| UNDISTRIBUTED NET INVESTMENT INCOME (LOSS) AT END OF PERIOD | $ | (9,691 | ) | $ | (7,296 | ) | $ | 3,687 | $ | (28 | ) | |||||
| 116 | The Royce Funds 2012 Semiannual Report to Shareholders | THE ACCOMPANYING NOTES ARE AN INTEGRAL PART OF THESE FINANCIAL STATEMENTS. |
| Royce Special Equity | ||||||||||||||||
| Royce Mid-Cap Fund | Multi-Cap Fund | |||||||||||||||
| Six months ended | Six months ended | |||||||||||||||
| 6/30/12 | Year ended | 6/30/12 | Period ended | |||||||||||||
| (unaudited) | 12/31/11 | (unaudited) | 12/31/111 | |||||||||||||
| INVESTMENT OPERATIONS: | ||||||||||||||||
| Net investment income (loss) | $ | (1,368 | ) | $ | (23,182 | ) | $ | 332,499 | $ | 190,225 | ||||||
| Net realized gain (loss) on investments and foreign currency | (44,013 | ) | 231,173 | 363,091 | 96,064 | |||||||||||
Net change in unrealized appreciation (depreciation) on investments and foreign currency | (2,321 | ) | (670,734 | ) | 862,267 | 675,520 | ||||||||||
| Net increase (decrease) in net assets from investment operations | (47,702 | ) | (462,743 | ) | 1,557,857 | 961,809 | ||||||||||
| DISTRIBUTIONS: | ||||||||||||||||
| Net investment income | ||||||||||||||||
Investment Class | – | |||||||||||||||
Service Class | – | – | – | (191,929 | ) | |||||||||||
Institutional Class | – | |||||||||||||||
| Net realized gain on investments and foreign currency | ||||||||||||||||
Investment Class | – | |||||||||||||||
Service Class | – | (213,640 | ) | – | (44,040 | ) | ||||||||||
Institutional Class | – | |||||||||||||||
| Total distributions | – | (213,640 | ) | – | (235,969 | ) | ||||||||||
| CAPITAL SHARE TRANSACTIONS: | ||||||||||||||||
| Net capital share transactions | ||||||||||||||||
Investment Class | 26,861,342 | |||||||||||||||
Service Class | (302,340 | ) | 1,513,013 | 622,524 | 36,078,487 | |||||||||||
Institutional Class | 21,548,000 | |||||||||||||||
| Shareholder redemption fees | ||||||||||||||||
Service Class | 3,151 | 1,671 | 9,334 | 6,934 | ||||||||||||
| Net increase (decrease) in net assets from capital share transactions | (299,189 | ) | 1,514,684 | 49,041,200 | 36,085,421 | |||||||||||
| NET INCREASE (DECREASE) IN NET ASSETS | (346,891 | ) | 838,301 | 50,599,057 | 36,811,261 | |||||||||||
| NET ASSETS: | ||||||||||||||||
Beginning of period | 5,727,357 | 4,889,056 | 36,811,261 | |||||||||||||
End of period | $ | 5,380,466 | $ | 5,727,357 | $ | 87,410,318 | $ | 36,811,261 | ||||||||
| UNDISTRIBUTED NET INVESTMENT INCOME (LOSS) AT END OF PERIOD | $ | (1,458 | ) | $ | (90 | ) | $ | 332,499 | $ | – | ||||||
| 1 | The Fund commenced operations on January 3, 2011. |
| THE ACCOMPANYING NOTES ARE AN INTEGRAL PART OF THESE FINANCIAL STATEMENTS. | The Royce Funds 2012 Semiannual Report to Shareholders | 117 |
| Statements of Operations | Six Months Ended June 30, 2012 (unaudited) | |
| Royce | Royce | Royce | Royce | Royce | Royce | Royce | ||||||||||||||||||||||
| Pennsylvania | Micro-Cap | Premier | Low-Priced | Total Return | Heritage | Opportunity | ||||||||||||||||||||||
| Mutual Fund | Fund | Fund | Stock Fund | Fund | Fund | Fund | ||||||||||||||||||||||
| INVESTMENT INCOME: | ||||||||||||||||||||||||||||
| Income: | ||||||||||||||||||||||||||||
Dividends | ||||||||||||||||||||||||||||
Non-Affiliated Companies | $ | 40,246,729 | $ | 7,284,591 | $ | 30,397,894 | $ | 23,372,868 | $ | 50,460,381 | $ | 2,580,540 | $ | 8,394,339 | ||||||||||||||
Affiliated Companies | 762,379 | 362,483 | 46,705,388 | 2,033,446 | 2,594,609 | – | – | |||||||||||||||||||||
Interest | 205,491 | 11,159 | 116,440 | 26,545 | 687,322 | 1,559 | 23,139 | |||||||||||||||||||||
Securities lending | 358,784 | 226,362 | 589,569 | 721,174 | 103,541 | 9,515 | 609,655 | |||||||||||||||||||||
| Total income | 41,573,383 | 7,884,595 | 77,809,291 | 26,154,033 | 53,845,853 | 2,591,614 | 9,027,133 | |||||||||||||||||||||
| Expenses: | ||||||||||||||||||||||||||||
Investment advisory fees | 22,502,592 | 7,847,468 | 32,912,221 | 22,066,199 | 22,190,543 | 1,395,689 | 8,900,040 | |||||||||||||||||||||
Distribution fees | 4,041,410 | 849,104 | 1,232,902 | 3,161,864 | 2,383,490 | 375,934 | 303,182 | |||||||||||||||||||||
Shareholder servicing | 2,959,035 | 661,571 | 2,709,358 | 2,162,190 | 2,253,062 | 161,848 | 728,191 | |||||||||||||||||||||
Shareholder reports | 627,893 | 245,573 | 825,412 | 449,386 | 525,899 | 42,812 | 141,571 | |||||||||||||||||||||
Administrative and office facilities | 320,114 | 70,373 | 373,677 | 234,398 | 248,858 | 15,135 | 101,847 | |||||||||||||||||||||
Custody | 257,930 | 170,493 | 278,333 | 339,019 | 211,854 | 43,598 | 85,842 | |||||||||||||||||||||
Trustees’ fees | 86,867 | 18,646 | 102,336 | 61,762 | 67,461 | 4,107 | 27,029 | |||||||||||||||||||||
Legal | 65,079 | 14,745 | 75,678 | 49,291 | 50,571 | 3,327 | 21,457 | |||||||||||||||||||||
Registration | 59,922 | 35,248 | 74,599 | 45,379 | 62,991 | 28,873 | 39,020 | |||||||||||||||||||||
Audit | 33,676 | 35,874 | 33,463 | 33,678 | 37,334 | 16,950 | 20,877 | |||||||||||||||||||||
Other expenses | 69,591 | 15,711 | 71,328 | 46,426 | 57,259 | 5,572 | 20,734 | |||||||||||||||||||||
| Total expenses | 31,024,109 | 9,964,806 | 38,689,307 | 28,649,592 | 28,089,322 | 2,093,845 | 10,389,790 | |||||||||||||||||||||
| Compensating balance credits | (839 | ) | (651 | ) | (690 | ) | (3,135 | ) | (754 | ) | (88 | ) | (178 | ) | ||||||||||||||
| Fees waived by distributor | – | – | (33,471 | ) | – | – | (11,405 | ) | – | |||||||||||||||||||
| Expenses reimbursed by investment adviser | – | (69,279 | ) | – | (1,413,860 | ) | – | (3,781 | ) | (2,173 | ) | |||||||||||||||||
| Net expenses | 31,023,270 | 9,894,876 | 38,655,146 | 27,232,597 | 28,088,568 | 2,078,571 | 10,387,439 | |||||||||||||||||||||
| Net investment income (loss) | 10,550,113 | (2,010,281 | ) | 39,154,145 | (1,078,564 | ) | 25,757,285 | 513,043 | (1,360,306 | ) | ||||||||||||||||||
| REALIZED AND UNREALIZED GAIN (LOSS) ON INVESTMENTS AND FOREIGN CURRENCY: | ||||||||||||||||||||||||||||
| Net realized gain (loss): | ||||||||||||||||||||||||||||
Investments in Non-Affiliated Companies | 126,154,704 | 24,147,902 | 127,442,740 | 98,499,080 | 156,116,681 | 1,961,677 | 65,534,630 | |||||||||||||||||||||
Investments in Affiliated Companies | 1,101,966 | 2,080,102 | 12,465,251 | (18,432,195 | ) | 3,263,183 | – | 10,458,778 | ||||||||||||||||||||
Foreign currency transactions | (7,014 | ) | (37,178 | ) | (39,643 | ) | (77,431 | ) | 26,376 | 14,388 | – | |||||||||||||||||
| Net change in unrealized appreciation (depreciation): | ||||||||||||||||||||||||||||
Investments and foreign currency translations | 78,327,688 | 5,125,025 | (2,763,009 | ) | (102,669,357 | ) | 1,101,383 | 4,170,804 | 108,383,112 | |||||||||||||||||||
Other assets and liabilities denominated in foreign currency | (824 | ) | 12,620 | 19,896 | 8,349 | 3,062 | 1,488 | – | ||||||||||||||||||||
Net realized and unrealized gain (loss) on investments and foreign currency | 205,576,520 | 31,328,471 | 137,125,235 | (22,671,554 | ) | 160,510,685 | 6,148,357 | 184,376,520 | ||||||||||||||||||||
NET INCREASE (DECREASE) IN NET ASSETS FROM INVESTMENT OPERATIONS | $ | 216,126,633 | $ | 29,318,190 | $ | 176,279,380 | $ | (23,750,118 | ) | $ | 186,267,970 | $ | 6,661,400 | $ | 183,016,214 | |||||||||||||
| 118 | The Royce Funds 2012 Semiannual Report to Shareholders | THE ACCOMPANYING NOTES ARE AN INTEGRAL PART OF THESE FINANCIAL STATEMENTS. |
| Statements of Operations | Six Months Ended June 30, 2012 (unaudited) | |
| Royce | Royce | Royce | Royce | Royce Micro-Cap | Royce | Royce | |||||||||||||||||||||||||||||
| Special Equity | Value | Value Plus | 100 | Discovery | Financial | Dividend | |||||||||||||||||||||||||||||
| Fund | Fund | Fund | Fund | Fund | Services Fund | Value Fund | |||||||||||||||||||||||||||||
| INVESTMENT INCOME: | |||||||||||||||||||||||||||||||||||
| Income: | |||||||||||||||||||||||||||||||||||
Dividends | |||||||||||||||||||||||||||||||||||
Non-Affiliated Companies | $ | 24,421,666 | $ | 14,533,341 | $ | 7,377,393 | $ | 4,853,820 | $ | 15,018 | $ | 176,277 | $ | 4,359,057 | |||||||||||||||||||||
Affiliated Companies | 8,885,222 | – | 28,372 | – | – | – | – | ||||||||||||||||||||||||||||
Interest | 64,270 | 4,522 | 12,719 | 1,788 | 51 | 90 | 4,862 | ||||||||||||||||||||||||||||
Securities lending | 48,177 | 71,327 | 84,957 | 4,327 | – | – | 266 | ||||||||||||||||||||||||||||
| Total income | 33,419,335 | 14,609,190 | 7,503,441 | 4,859,935 | 15,069 | 176,367 | 4,364,185 | ||||||||||||||||||||||||||||
| Expenses: | |||||||||||||||||||||||||||||||||||
Investment advisory fees | 13,341,869 | 8,048,860 | 9,764,291 | 1,963,582 | 19,185 | 77,581 | 1,625,472 | ||||||||||||||||||||||||||||
Distribution fees | 586,325 | 1,663,402 | 1,845,424 | 410,962 | 4,796 | 19,395 | 280,387 | ||||||||||||||||||||||||||||
Shareholder servicing | 1,040,003 | 1,029,280 | 1,296,879 | 258,113 | 11,976 | 14,674 | 186,037 | ||||||||||||||||||||||||||||
Shareholder reports | 258,359 | 222,506 | 373,202 | 93,800 | 3,514 | 3,559 | 59,384 | ||||||||||||||||||||||||||||
Administrative and office facilities | 130,016 | 94,469 | 133,160 | 22,928 | 199 | 842 | 14,945 | ||||||||||||||||||||||||||||
Custody | 105,559 | 85,037 | 105,807 | 18,507 | 2,608 | 8,219 | 31,517 | ||||||||||||||||||||||||||||
Trustees’ fees | 36,636 | 25,048 | 33,522 | 6,065 | 58 | 224 | 4,190 | ||||||||||||||||||||||||||||
Legal | 25,372 | 19,681 | 29,351 | 4,787 | 1,000 | 176 | 2,703 | ||||||||||||||||||||||||||||
Registration | 66,287 | 48,493 | 38,224 | 22,300 | 9,791 | 11,655 | 24,808 | ||||||||||||||||||||||||||||
Audit | 25,377 | 20,877 | 25,384 | 13,918 | 6,959 | 6,960 | 15,368 | ||||||||||||||||||||||||||||
Other expenses | 26,154 | 20,362 | 30,610 | 7,168 | 662 | 765 | 3,319 | ||||||||||||||||||||||||||||
| Total expenses | 15,641,957 | 11,278,015 | 13,675,854 | 2,822,130 | 60,748 | 144,050 | 2,248,130 | ||||||||||||||||||||||||||||
Compensating balance credits | (513 | ) | (425 | ) | (264 | ) | (122 | ) | (3 | ) | (13 | ) | (163 | ) | |||||||||||||||||||||
Fees waived by investment adviser and distributor | – | – | (69,431 | ) | (63,167 | ) | (19,185 | ) | (28,445 | ) | (22,431 | ) | |||||||||||||||||||||||
Expenses reimbursed by investment adviser | (25,568 | ) | – | (7,356 | ) | (14,122 | ) | (12,973 | ) | – | – | ||||||||||||||||||||||||
| Net expenses | 15,615,876 | 11,277,590 | 13,598,803 | 2,744,719 | 28,587 | 115,592 | 2,225,536 | ||||||||||||||||||||||||||||
Net investment income (loss) | 17,803,459 | 3,331,600 | (6,095,362 | ) | 2,115,216 | (13,518 | ) | 60,775 | 2,138,649 | ||||||||||||||||||||||||||
| REALIZED AND UNREALIZED GAIN (LOSS) ON INVESTMENTS AND FOREIGN CURRENCY: | |||||||||||||||||||||||||||||||||||
Net realized gain (loss): | |||||||||||||||||||||||||||||||||||
Investments in Non-Affiliated Companies | 93,236,848 | 45,890,697 | 44,955,353 | 6,377,438 | 83,209 | 257,878 | 1,983,724 | ||||||||||||||||||||||||||||
Investments in Affiliated Companies | 2,812,253 | – | (24,687,791 | ) | – | – | – | – | |||||||||||||||||||||||||||
Foreign currency transactions | – | (10,285 | ) | 29,836 | 2,081 | – | (768 | ) | (1,008 | ) | |||||||||||||||||||||||||
| Net change in unrealized appreciation (depreciation): | |||||||||||||||||||||||||||||||||||
Investments and foreign currency translations | 28,080,755 | (67,910,504 | ) | 120,320,718 | (402,970 | ) | (73,602 | ) | 752,948 | 10,123,072 | |||||||||||||||||||||||||
Other assets and liabilities denominated in foreign | |||||||||||||||||||||||||||||||||||
currency | – | 5,921 | (4,254 | ) | (505 | ) | – | (145 | ) | (161 | ) | ||||||||||||||||||||||||
| Net realized and unrealized gain (loss) on investments | |||||||||||||||||||||||||||||||||||
and foreign currency | 124,129,856 | (22,024,171 | ) | 140,613,862 | 5,976,044 | 9,607 | 1,009,913 | 12,105,627 | |||||||||||||||||||||||||||
| NET INCREASE (DECREASE) IN NET ASSETS | |||||||||||||||||||||||||||||||||||
FROM INVESTMENT OPERATIONS | $ | 141,933,315 | $ | (18,692,571 | ) | $ | 134,518,500 | $ | 8,091,260 | $ | (3,911 | ) | $ | 1,070,688 | $ | 14,244,276 | |||||||||||||||||||
| THE ACCOMPANYING NOTES ARE AN INTEGRAL PART OF THESE FINANCIAL STATEMENTS. | The Royce Funds 2012 Semiannual Report to Shareholders | 119 |
| Statements of Operations | Six Months Ended June 30, 2012 (unaudited) | |
| Royce | Royce | Royce | Royce | Royce | ||||||||||||||||
| SMid-Cap | Focus Value | Partners | Mid-Cap | Special Equity | ||||||||||||||||
| Value Fund | Fund | Fund | Fund | Multi-Cap Fund | ||||||||||||||||
| INVESTMENT INCOME: | ||||||||||||||||||||
| Income: | ||||||||||||||||||||
Dividends | $ | 61,450 | $ | 58,694 | $ | 16,215 | $ | 38,077 | $ | 750,017 | ||||||||||
Interest | 160 | 82 | – | 55 | 1,095 | |||||||||||||||
| Total income | 61,610 | 58,776 | 16,215 | 38,132 | 751,112 | |||||||||||||||
| Expenses: | ||||||||||||||||||||
Investment advisory fees | 56,363 | 45,314 | 9,259 | 29,259 | 321,577 | |||||||||||||||
Distribution fees | 14,091 | 11,328 | 2,315 | 7,315 | 53,089 | |||||||||||||||
Shareholder servicing | 9,708 | 10,743 | 10,558 | 11,573 | 45,287 | |||||||||||||||
Shareholder reports | 2,154 | 493 | 123 | 492 | 2,899 | |||||||||||||||
Administrative and office facilities | 562 | 491 | 96 | 306 | 1,679 | |||||||||||||||
Custody | 6,512 | 6,326 | 5,874 | 6,327 | 9,277 | |||||||||||||||
Trustees’ fees | 157 | 134 | 26 | 88 | 512 | |||||||||||||||
Legal | 111 | 99 | 19 | 60 | 3,625 | |||||||||||||||
Registration | 11,119 | 8,182 | 4,853 | 6,206 | 24,161 | |||||||||||||||
Audit | 6,959 | 6,960 | 6,959 | 6,939 | 9,709 | |||||||||||||||
Other expenses | 620 | 690 | 655 | 650 | 2,471 | |||||||||||||||
| Total expenses | 108,356 | 90,760 | 40,737 | 69,215 | 474,286 | |||||||||||||||
| Compensating balance credits | (5 | ) | (3 | ) | (16 | ) | (1 | ) | (9 | ) | ||||||||||
| Fees waived by investment adviser and distributor | (32,262 | ) | (29,586 | ) | (9,259 | ) | (29,259 | ) | (8,494 | ) | ||||||||||
| Expenses reimbursed by investment adviser | – | – | (18,962 | ) | (455 | ) | (47,170 | ) | ||||||||||||
| Net expenses | 76,089 | 61,171 | 12,500 | 39,500 | 418,613 | |||||||||||||||
| Net investment income (loss) | (14,479 | ) | (2,395 | ) | 3,715 | (1,368 | ) | 332,499 | ||||||||||||
| REALIZED AND UNREALIZED GAIN (LOSS) ON INVESTMENTS AND FOREIGN CURRENCY: | ||||||||||||||||||||
| Net realized gain (loss): | ||||||||||||||||||||
Investments | (182,679 | ) | (106,368 | ) | 10,977 | (44,048 | ) | 363,091 | ||||||||||||
Foreign currency transactions | (968 | ) | (346 | ) | (29 | ) | 35 | – | ||||||||||||
| Net change in unrealized appreciation (depreciation): | ||||||||||||||||||||
Investments and foreign currency translations | 394,401 | 122,599 | 106,615 | (2,304 | ) | 862,267 | ||||||||||||||
Other assets and liabilities denominated in foreign currency | (61 | ) | (68 | ) | (10 | ) | (17 | ) | – | |||||||||||
| Net realized and unrealized gain (loss) on investments and foreign currency | 210,693 | 15,817 | 117,553 | (46,334 | ) | 1,225,358 | ||||||||||||||
| NET INCREASE (DECREASE) IN NET ASSETS | ||||||||||||||||||||
FROM INVESTMENT OPERATIONS | $ | 196,214 | $ | 13,422 | $ | 121,268 | $ | (47,702 | ) | $ | 1,557,857 | |||||||||
| 120 | The Royce Funds 2012 Semiannual Report to Shareholders | THE ACCOMPANYING NOTES ARE AN INTEGRAL PART OF THESE FINANCIAL STATEMENTS. |
|
Financial Highlights |
| ||||||||||||||||||||||||||||||||||||||||||||||||||||||
|
| Net |
| Net |
| Net Realized and Unrealized |
|
| Distributions |
| Distributions from Net |
|
|
|
|
|
| Ratio of Expenses to Average Net Assets |
| Ratio of Net Investment |
|
| ||||||||||||||||||||||||||||||||
|
| Asset Value, |
| Investment |
| Gain (Loss) on |
| Total from Investment Operations |
| from Net Investment Income |
| Realized Gain on |
| Total Distributions |
| Shareholder Redemption Fees |
| Net Asset |
| Total Return |
| Net Assets, |
| Prior to Fee |
| Prior |
| Net of |
| Income (Loss) |
| Portfolio Turnover Rate |
| |||||||||||||||||||||
|
|
|
|
|
|
|
|
|
|
|
|
|
|
|
|
|
|
|
|
|
|
|
|
|
|
|
|
|
|
|
|
|
|
|
|
|
|
|
|
|
|
|
|
|
|
|
|
|
|
|
|
|
|
|
Royce Pennsylvania Mutual Fund – Investment Class | ||||||||||||||||||||||||||||||||||||||||||||||||||||||
†2012 |
| $ | 10.76 |
| $ | 0.03 |
| $ | 0.40 |
| $ | 0.43 |
| $ | – |
| $ | – |
| $ | – |
| $ | – |
| $ | 11.19 |
|
| 4.00 | %1 | $ | 4,341,063 |
|
| 0.91 | %2 |
|
| 0.91 | %2 |
|
| 0.91 | %2 |
|
| 0.48 | %2 |
|
| 12 | % |
|
2011 |
|
| 11.65 |
|
| 0.01 |
|
| (0.50 | ) |
| (0.49 | ) |
| (0.02 | ) |
| (0.38 | ) |
| (0.40 | ) |
| – |
|
| 10.76 |
|
| (4.17 | ) |
| 4,266,754 |
|
| 0.90 |
|
|
| 0.90 |
|
|
| 0.90 |
|
|
| 0.11 |
|
|
| 20 |
|
|
2010 |
|
| 9.45 |
|
| 0.06 |
|
| 2.19 |
|
| 2.25 |
|
| (0.05 | ) |
| – |
|
| (0.05 | ) |
| – |
|
| 11.65 |
|
| 23.86 |
|
| 4,735,403 |
|
| 0.90 |
|
|
| 0.90 |
|
|
| 0.90 |
|
|
| 0.63 |
|
|
| 25 |
|
|
2009 |
|
| 6.94 |
|
| 0.02 |
|
| 2.50 |
|
| 2.52 |
|
| (0.01 | ) |
| – |
|
| (0.01 | ) |
| – |
|
| 9.45 |
|
| 36.28 |
|
| 3,555,507 |
|
| 0.92 |
|
|
| 0.92 |
|
|
| 0.92 |
|
|
| 0.33 |
|
|
| 23 |
|
|
2008 |
|
| 10.82 |
|
| 0.05 |
|
| (3.82 | ) |
| (3.77 | ) |
| (0.01 | ) |
| (0.10 | ) |
| (0.11 | ) |
| – |
|
| 6.94 |
|
| (34.78 | ) |
| 2,293,526 |
|
| 0.90 |
|
|
| 0.89 |
|
|
| 0.89 |
|
|
| 0.55 |
|
|
| 36 |
|
|
2007 |
|
| 11.57 |
|
| 0.05 |
|
| 0.29 |
|
| 0.34 |
|
| (0.08 | ) |
| (1.01 | ) |
| (1.09 | ) |
| – |
|
| 10.82 |
|
| 2.75 |
|
| 3,157,742 |
|
| 0.89 |
|
|
| 0.88 |
|
|
| 0.88 |
|
|
| 0.44 |
|
|
| 43 |
|
|
Royce Pennsylvania Mutual Fund – Service Class | ||||||||||||||||||||||||||||||||||||||||||||||||||||||
†2012 |
| $ | 10.75 |
| $ | 0.01 |
| $ | 0.40 |
| $ | 0.41 |
| $ | – |
| $ | – |
| $ | – |
| $ | – |
| $ | 11.16 |
|
| 3.81 | %1 | $ | 425,102 |
|
| 1.23 | %2 |
|
| 1.23 | %2 |
|
| 1.23 | %2 |
|
| 0.16 | %2 |
|
| 12 | % |
|
2011 |
|
| 11.65 |
|
| (0.02 | ) |
| (0.50 | ) |
| (0.52 | ) |
| – |
|
| (0.38 | ) |
| (0.38 | ) |
| – |
|
| 10.75 |
|
| (4.42 | ) |
| 406,052 |
|
| 1.19 |
|
|
| 1.19 |
|
|
| 1.19 |
|
|
| (0.18 | ) |
|
| 20 |
|
|
2010 |
|
| 9.41 |
|
| 0.02 |
|
| 2.20 |
|
| 2.22 |
|
| – |
|
| – |
|
| – |
|
| 0.02 |
|
| 11.65 |
|
| 23.80 |
|
| 448,784 |
|
| 1.27 |
|
|
| 1.27 |
|
|
| 1.25 |
|
|
| 0.18 |
|
|
| 25 |
|
|
2009 |
|
| 6.90 |
|
| (0.00 | ) |
| 2.49 |
|
| 2.49 |
|
| – |
|
| – |
|
| – |
|
| 0.02 |
|
| 9.41 |
|
| 36.38 |
|
| 609,445 |
|
| 1.31 |
|
|
| 1.31 |
|
|
| 1.29 |
|
|
| (0.05 | ) |
|
| 23 |
|
|
2008 |
|
| 10.78 |
|
| 0.04 |
|
| (3.82 | ) |
| (3.78 | ) |
| – |
|
| (0.10 | ) |
| (0.10 | ) |
| – |
|
| 6.90 |
|
| (35.00 | ) |
| 115,959 |
|
| 1.11 |
|
|
| 1.11 |
|
|
| 1.11 |
|
|
| 0.41 |
|
|
| 36 |
|
|
2007 |
|
| 11.53 |
|
| 0.03 |
|
| 0.28 |
|
| 0.31 |
|
| (0.05 | ) |
| (1.01 | ) |
| (1.06 | ) |
| – |
|
| 10.78 |
|
| 2.56 |
|
| 55,478 |
|
| 1.10 |
|
|
| 1.09 |
|
|
| 1.09 |
|
|
| 0.24 |
|
|
| 43 |
|
|
Royce Pennsylvania Mutual Fund – Consultant Class | ||||||||||||||||||||||||||||||||||||||||||||||||||||||
†2012 |
| $ | 9.69 |
| $ | (0.03 | ) | $ | 0.37 |
| $ | 0.34 |
| $ | – |
| $ | – |
| $ | – |
| $ | – |
| $ | 10.03 |
|
| 3.51 | %1 | $ | 646,583 |
|
| 1.88 | %2 |
|
| 1.88 | %2 |
|
| 1.88 | %2 |
|
| (0.49 | )%2 |
|
| 12 | % |
|
2011 |
|
| 10.61 |
|
| (0.09 | ) |
| (0.45 | ) |
| (0.54 | ) |
| – |
|
| (0.38 | ) |
| (0.38 | ) |
| – |
|
| 9.69 |
|
| (5.05 | ) |
| 664,778 |
|
| 1.85 |
|
|
| 1.85 |
|
|
| 1.85 |
|
|
| (0.85 | ) |
|
| 20 |
|
|
2010 |
|
| 8.65 |
|
| (0.03 | ) |
| 1.99 |
|
| 1.96 |
|
| – |
|
| – |
|
| – |
|
| – |
|
| 10.61 |
|
| 22.66 |
|
| 841,525 |
|
| 1.87 |
|
|
| 1.87 |
|
|
| 1.87 |
|
|
| (0.36 | ) |
|
| 25 |
|
|
2009 |
|
| 6.40 |
|
| (0.05 | ) |
| 2.30 |
|
| 2.25 |
|
| – |
|
| – |
|
| – |
|
| – |
|
| 8.65 |
|
| 35.16 |
|
| 757,734 |
|
| 1.89 |
|
|
| 1.89 |
|
|
| 1.89 |
|
|
| (0.64 | ) |
|
| 23 |
|
|
2008 |
|
| 10.09 |
|
| (0.04 | ) |
| (3.55 | ) |
| (3.59 | ) |
| – |
|
| (0.10 | ) |
| (0.10 | ) |
| – |
|
| 6.40 |
|
| (35.52 | ) |
| 635,688 |
|
| 1.88 |
|
|
| 1.87 |
|
|
| 1.87 |
|
|
| (0.46 | ) |
|
| 36 |
|
|
2007 |
|
| 10.89 |
|
| (0.06 | ) |
| 0.27 |
|
| 0.21 |
|
| – |
|
| (1.01 | ) |
| (1.01 | ) |
| – |
|
| 10.09 |
|
| 1.73 |
|
| 1,164,136 |
|
| 1.89 |
|
|
| 1.88 |
|
|
| 1.88 |
|
|
| (0.55 | ) |
|
| 43 |
|
|
Royce Pennsylvania Mutual Fund – Institutional Class a | ||||||||||||||||||||||||||||||||||||||||||||||||||||||
†2012 |
| $ | 10.79 |
| $ | 0.04 |
| $ | 0.40 |
| $ | 0.44 |
| $ | – |
| $ | – |
| $ | – |
| $ | – |
| $ | 11.23 |
|
| 4.08 | %1 | $ | 395,279 |
|
| 0.79 | %2 |
|
| 0.79 | %2 |
|
| 0.79 | %2 |
|
| 0.63 | %2 |
|
| 12 | % |
|
2011 |
|
| 12.19 |
|
| 0.03 |
|
| (1.05 | ) |
| (1.02 | ) |
| – |
|
| (0.38 | ) |
| (0.38 | ) |
| – |
|
| 10.79 |
|
| (8.33 | )1 |
| 241,951 |
|
| 0.78 | 2 |
|
| 0.78 | 2 |
|
| 0.78 | 2 |
|
| 0.46 | 2 |
|
| 20 |
|
|
Royce Pennsylvania Mutual Fund – R Class b | ||||||||||||||||||||||||||||||||||||||||||||||||||||||
†2012 |
| $ | 10.50 |
| $ | (0.01 | ) | $ | 0.39 |
| $ | 0.38 |
| $ | – |
| $ | – |
| $ | – |
| $ | – |
| $ | 10.88 |
|
| 3.62 | %1 | $ | 28,429 |
|
| 1.51 | %2 |
|
| 1.51 | %2 |
|
| 1.51 | %2 |
|
| (0.11 | )%2 |
|
| 12 | % |
|
2011 |
|
| 11.43 |
|
| (0.05 | ) |
| (0.50 | ) |
| (0.55 | ) |
| – |
|
| (0.38 | ) |
| (0.38 | ) |
| – |
|
| 10.50 |
|
| (4.77 | ) |
| 22,542 |
|
| 1.51 |
|
|
| 1.51 |
|
|
| 1.51 |
|
|
| (0.47 | ) |
|
| 20 |
|
|
2010 |
|
| 9.28 |
|
| 0.01 |
|
| 2.14 |
|
| 2.15 |
|
| (0.00 | ) |
| – |
|
| (0.00 | ) |
| – |
|
| 11.43 |
|
| 23.21 |
|
| 17,868 |
|
| 1.51 |
|
|
| 1.51 |
|
|
| 1.51 |
|
|
| 0.06 |
|
|
| 25 |
|
|
2009 |
|
| 6.87 |
|
| (0.05 | ) |
| 2.46 |
|
| 2.41 |
|
| – |
|
| – |
|
| – |
|
| – |
|
| 9.28 |
|
| 35.08 |
|
| 9,808 |
|
| 1.95 |
|
|
| 1.95 |
|
|
| 1.84 |
|
|
| (0.61 | ) |
|
| 23 |
|
|
2008 |
|
| 10.78 |
|
| (0.00 | ) |
| (3.81 | ) |
| (3.81 | ) |
| – |
|
| (0.10 | ) |
| (0.10 | ) |
| – |
|
| 6.87 |
|
| (35.28 | ) |
| 5,270 |
|
| 1.58 |
|
|
| 1.57 |
|
|
| 1.57 |
|
|
| (0.03 | ) |
|
| 36 |
|
|
2007 |
|
| 12.71 |
|
| (0.11 | ) |
| (0.75 | ) |
| (0.86 | ) |
| (0.06 | ) |
| (1.01 | ) |
| (1.07 | ) |
| – |
|
| 10.78 |
|
| (6.91 | )1 |
| 871 |
|
| 7.52 | 2 |
|
| 7.50 | 2 |
|
| 1.74 | 2 |
|
| (0.42 | )2 |
|
| 43 |
|
|
Royce Pennsylvania Mutual Fund – K Class c | ||||||||||||||||||||||||||||||||||||||||||||||||||||||
†2012 |
| $ | 9.68 |
| $ | 0.00 |
| $ | 0.36 |
| $ | 0.36 |
| $ | – |
| $ | – |
| $ | – |
| $ | – |
| $ | 10.04 |
|
| 3.72 | %1 | $ | 7,254 |
|
| 1.38 | %2 |
|
| 1.38 | %2 |
|
| 1.38 | %2 |
|
| 0.04 | %2 |
|
| 12 | % |
|
2011 |
|
| 10.57 |
|
| (0.05 | ) |
| (0.46 | ) |
| (0.51 | ) |
| – |
|
| (0.38 | ) |
| (0.38 | ) |
| – |
|
| 9.68 |
|
| (4.78 | ) |
| 5,800 |
|
| 1.55 |
|
|
| 1.55 |
|
|
| 1.55 |
|
|
| (0.49 | ) |
|
| 20 |
|
|
2010 |
|
| 8.59 |
|
| 0.00 |
|
| 1.98 |
|
| 1.98 |
|
| (0.00 | ) |
| – |
|
| (0.00 | ) |
| – |
|
| 10.57 |
|
| 23.11 |
|
| 3,760 |
|
| 1.61 |
|
|
| 1.61 |
|
|
| 1.59 |
|
|
| 0.01 |
|
|
| 25 |
|
|
2009 |
|
| 6.34 |
|
| (0.02 | ) |
| 2.27 |
|
| 2.25 |
|
| – |
|
| – |
|
| – |
|
| – |
|
| 8.59 |
|
| 35.49 |
|
| 1,920 |
|
| 1.79 |
|
|
| 1.79 |
|
|
| 1.59 |
|
|
| (0.34 | ) |
|
| 23 |
|
|
2008 |
|
| 10.00 |
|
| 0.01 |
|
| (3.57 | ) |
| (3.56 | ) |
| – |
|
| (0.10 | ) |
| (0.10 | ) |
| – |
|
| 6.34 |
|
| (35.53 | )1 |
| 694 |
|
| 12.12 | 2 |
|
| 12.12 | 2 |
|
| 1.59 | 2 |
|
| 0.13 | 2 |
|
| 36 |
|
|
|
|
|
THE ACCOMPANYING NOTES ARE AN INTEGRAL PART OF THESE FINANCIAL STATEMENTS. |
| The Royce Funds 2012 Semiannual Report to Shareholders | 121 |
|
Financial Highlights |
|
|
|
|
|
|
|
|
|
|
|
|
|
|
|
|
|
|
|
|
|
|
|
|
|
|
|
|
|
|
|
|
|
|
|
|
|
|
|
|
|
|
|
|
|
|
|
|
|
|
|
| Net |
| Net |
| Net Realized and Unrealized |
|
| Distributions |
| Distributions from Net |
|
|
|
|
|
| Ratio of Expenses to Average Net Assets |
| Ratio of Net Investment |
|
| |||||||||||||||||||||||||||
|
| Asset Value, |
| Investment |
| Gain (Loss) on |
| Total from Investment Operations |
| from Net Investment Income |
| Realized Gain on |
| Total Distributions |
| Shareholder Redemption Fees |
| Net Asset |
| Total Return |
| Net Assets, |
| Prior to Fee |
| Prior |
| Net of |
| Income (Loss) |
| Portfolio Turnover Rate |
| ||||||||||||||||
Royce Micro-Cap Fund – Investment Class | |||||||||||||||||||||||||||||||||||||||||||||||||
†2012 |
| $ | 14.55 |
| $ | (0.02 | ) | $ | 0.39 |
| $ | 0.37 |
| $ | – |
| $ | – |
| $ | – |
| $ | – |
| $ | 14.92 |
|
| 2.61 | %1 | $ | 855,440 |
|
| 1.52 | %2 |
| 1.52 | %2 |
| 1.52 | %2 |
| (0.21 | )%2 |
| 9 | % |
2011 |
|
| 17.57 |
|
| (0.07 | ) |
| (2.05 | ) |
| (2.12 | ) |
| (0.20 | ) |
| (0.70 | ) |
| (0.90 | ) |
| – |
|
| 14.55 |
|
| (12.04 | ) |
| 904,168 |
|
| 1.50 |
|
| 1.50 |
|
| 1.50 |
|
| (0.50 | ) |
| 35 |
|
2010 |
|
| 13.71 |
|
| (0.03 | ) |
| 4.14 |
|
| 4.11 |
|
| (0.25 | ) |
| – |
|
| (0.25 | ) |
| – |
|
| 17.57 |
|
| 30.06 |
|
| 1,085,782 |
|
| 1.50 |
|
| 1.50 |
|
| 1.50 |
|
| (0.27 | ) |
| 36 |
|
2009 |
|
| 8.93 |
|
| (0.06 | ) |
| 5.02 |
|
| 4.96 |
|
| (0.18 | ) |
| – |
|
| (0.18 | ) |
| – |
|
| 13.71 |
|
| 55.67 |
|
| 844,859 |
|
| 1.54 |
|
| 1.54 |
|
| 1.54 |
|
| (0.41 | ) |
| 34 |
|
2008 |
|
| 15.72 |
|
| 0.12 |
|
| (6.58 | ) |
| (6.46 | ) |
| – |
|
| (0.33 | ) |
| (0.33 | ) |
| – |
|
| 8.93 |
|
| (40.94 | ) |
| 455,077 |
|
| 1.52 |
|
| 1.51 |
|
| 1.51 |
|
| 0.89 |
|
| 43 |
|
2007 |
|
| 17.35 |
|
| 0.00 |
|
| 1.22 |
|
| 1.22 |
|
| (0.45 | ) |
| (2.40 | ) |
| (2.85 | ) |
| – |
|
| 15.72 |
|
| 7.07 |
|
| 693,320 |
|
| 1.46 |
|
| 1.46 |
|
| 1.46 |
|
| (0.06 | ) |
| 49 |
|
|
|
|
|
|
|
|
|
|
|
|
|
|
|
|
|
|
|
|
|
|
|
|
|
|
|
|
|
|
|
|
|
|
|
|
|
|
|
|
|
|
|
|
|
|
|
|
|
|
|
Royce Micro-Cap Fund – Service Class | |||||||||||||||||||||||||||||||||||||||||||||||||
†2012 |
| $ | 14.41 |
| $ | (0.03 | ) | $ | 0.39 |
| $ | 0.36 |
| $ | – |
| $ | – |
| $ | – |
| $ | – |
| $ | 14.77 |
|
| 2.50 | %1 | $ | 138,065 |
|
| 1.77 | %2 |
| 1.77 | %2 |
| 1.66 | %2 |
| (0.36 | )%2 |
| 9 | % |
2011 |
|
| 17.43 |
|
| (0.10 | ) |
| (2.04 | ) |
| (2.14 | ) |
| (0.18 | ) |
| (0.70 | ) |
| (0.88 | ) |
| – |
|
| 14.41 |
|
| (12.23 | ) |
| 122,479 |
|
| 1.76 |
|
| 1.76 |
|
| 1.66 |
|
| (0.65 | ) |
| 35 |
|
2010 |
|
| 13.61 |
|
| (0.08 | ) |
| 4.14 |
|
| 4.06 |
|
| (0.24 | ) |
| – |
|
| (0.24 | ) |
| – |
|
| 17.43 |
|
| 29.85 |
|
| 139,911 |
|
| 1.78 |
|
| 1.78 |
|
| 1.66 |
|
| (0.41 | ) |
| 36 |
|
2009 |
|
| 8.87 |
|
| (0.10 | ) |
| 5.01 |
|
| 4.91 |
|
| (0.18 | ) |
| – |
|
| (0.18 | ) |
| 0.01 |
|
| 13.61 |
|
| 55.49 |
|
| 84,771 |
|
| 1.77 |
|
| 1.77 |
|
| 1.66 |
|
| (0.53 | ) |
| 34 |
|
2008 |
|
| 15.63 |
|
| 0.07 |
|
| (6.51 | ) |
| (6.44 | ) |
| – |
|
| (0.33 | ) |
| (0.33 | ) |
| 0.01 |
|
| 8.87 |
|
| (40.98 | ) |
| 28,245 |
|
| 1.79 |
|
| 1.78 |
|
| 1.66 |
|
| 0.58 |
|
| 43 |
|
2007 |
|
| 17.27 |
|
| (0.14 | ) |
| 1.33 |
|
| 1.19 |
|
| (0.43 | ) |
| (2.40 | ) |
| (2.83 | ) |
| – |
|
| 15.63 |
|
| 6.90 |
|
| 27,224 |
|
| 1.72 |
|
| 1.71 |
|
| 1.66 |
|
| (0.21 | ) |
| 49 |
|
Royce Micro-Cap Fund – Consultant Class | |||||||||||||||||||||||||||||||||||||||||||||||||
†2012 |
| $ | 13.11 |
| $ | (0.08 | ) | $ | 0.35 |
| $ | 0.27 |
| $ | – |
| $ | – |
| $ | – |
| $ | – |
| $ | 13.38 |
|
| 2.06 | %1 | $ | 128,344 |
|
| 2.44 | %2 |
| 2.44 | %2 |
| 2.44 | %2 |
| (1.14 | )%2 |
| 9 | % |
2011 |
|
| 15.91 |
|
| (0.21 | ) |
| (1.84 | ) |
| (2.05 | ) |
| (0.05 | ) |
| (0.70 | ) |
| (0.75 | ) |
| – |
|
| 13.11 |
|
| (12.86 | ) |
| 134,752 |
|
| 2.42 |
|
| 2.42 |
|
| 2.42 |
|
| (1.41 | ) |
| 35 |
|
2010 |
|
| 12.45 |
|
| (0.15 | ) |
| 3.74 |
|
| 3.59 |
|
| (0.13 | ) |
| – |
|
| (0.13 | ) |
| – |
|
| 15.91 |
|
| 28.85 |
|
| 181,746 |
|
| 2.43 |
|
| 2.43 |
|
| 2.43 |
|
| (1.20 | ) |
| 36 |
|
2009 |
|
| 8.14 |
|
| (0.13 | ) |
| 4.53 |
|
| 4.40 |
|
| (0.09 | ) |
| – |
|
| (0.09 | ) |
| – |
|
| 12.45 |
|
| 54.14 |
|
| 149,454 |
|
| 2.46 |
|
| 2.46 |
|
| 2.46 |
|
| (1.30 | ) |
| 34 |
|
2008 |
|
| 14.51 |
|
| 0.00 |
|
| (6.04 | ) |
| (6.04 | ) |
| – |
|
| (0.33 | ) |
| (0.33 | ) |
| – |
|
| 8.14 |
|
| (41.46 | ) |
| 103,038 |
|
| 2.45 |
|
| 2.45 |
|
| 2.45 |
|
| 0.02 |
|
| 43 |
|
2007 |
|
| 16.21 |
|
| (0.16 | ) |
| 1.13 |
|
| 0.97 |
|
| (0.27 | ) |
| (2.40 | ) |
| (2.67 | ) |
| – |
|
| 14.51 |
|
| 6.01 |
|
| 203,044 |
|
| 2.45 |
|
| 2.45 |
|
| 2.45 |
|
| (1.06 | ) |
| 49 |
|
Royce Premier Fund – Investment Class | |||||||||||||||||||||||||||||||||||||||||||||||||
†2012 |
| $ | 18.52 |
| $ | 0.11 |
| $ | 0.38 |
| $ | 0.49 |
| $ | – |
| $ | – |
| $ | – |
| $ | – |
| $ | 19.01 |
|
| 2.65 | %1 | $ | 4,652,621 |
|
| 1.08 | %2 |
| 1.08 | %2 |
| 1.08 | %2 |
| 1.12 | %2 |
| 3 | % |
2011 |
|
| 20.35 |
|
| (0.02 | ) |
| (0.17 | ) |
| (0.19 | ) |
| (0.05 | ) |
| (1.59 | ) |
| (1.64 | ) |
| – |
|
| 18.52 |
|
| (0.86 | ) |
| 4,539,127 |
|
| 1.09 |
|
| 1.09 |
|
| 1.09 |
|
| (0.11 | ) |
| 18 |
|
2010 |
|
| 16.31 |
|
| (0.01 | ) |
| 4.32 |
|
| 4.31 |
|
| – |
|
| (0.27 | ) |
| (0.27 | ) |
| – |
|
| 20.35 |
|
| 26.46 |
|
| 4,961,891 |
|
| 1.12 |
|
| 1.12 |
|
| 1.12 |
|
| (0.07 | ) |
| 10 |
|
2009 |
|
| 12.24 |
|
| (0.02 | ) |
| 4.09 |
|
| 4.07 |
|
| – |
|
| – |
|
| – |
|
| – |
|
| 16.31 |
|
| 33.25 |
|
| 3,911,502 |
|
| 1.15 |
|
| 1.15 |
|
| 1.15 |
|
| (0.14 | ) |
| 14 |
|
2008 |
|
| 17.36 |
|
| 0.02 |
|
| (4.94 | ) |
| (4.92 | ) |
| – |
|
| (0.20 | ) |
| (0.20 | ) |
| – |
|
| 12.24 |
|
| (28.29 | ) |
| 2,634,045 |
|
| 1.13 |
|
| 1.12 |
|
| 1.12 |
|
| 0.15 |
|
| 11 |
|
2007 |
|
| 17.66 |
|
| 0.07 |
|
| 2.21 |
|
| 2.28 |
|
| (0.28 | ) |
| (2.30 | ) |
| (2.58 | ) |
| – |
|
| 17.36 |
|
| 12.73 |
|
| 3,702,043 |
|
| 1.10 |
|
| 1.10 |
|
| 1.10 |
|
| 0.29 |
|
| 21 |
|
Royce Premier Fund – Service Class | |||||||||||||||||||||||||||||||||||||||||||||||||
†2012 |
| $ | 18.23 |
| $ | 0.09 |
| $ | 0.37 |
| $ | 0.46 |
| $ | – |
| $ | – |
| $ | – |
| $ | – |
| $ | 18.69 |
|
| 2.52 | %1 | $ | 615,423 |
|
| 1.34 | %2 |
| 1.34 | %2 |
| 1.33 | %2 |
| 0.89 | %2 |
| 3 | % |
2011 |
|
| 20.07 |
|
| (0.07 | ) |
| (0.16 | ) |
| (0.23 | ) |
| (0.02 | ) |
| (1.59 | ) |
| (1.61 | ) |
| – |
|
| 18.23 |
|
| (1.07 | ) |
| 628,824 |
|
| 1.34 |
|
| 1.34 |
|
| 1.32 |
|
| (0.33 | ) |
| 18 |
|
2010 |
|
| 16.12 |
|
| (0.05 | ) |
| 4.27 |
|
| 4.22 |
|
| – |
|
| (0.27 | ) |
| (0.27 | ) |
| – |
|
| 20.07 |
|
| 26.22 |
|
| 584,817 |
|
| 1.39 |
|
| 1.39 |
|
| 1.37 |
|
| (0.30 | ) |
| 10 |
|
2009 |
|
| 12.14 |
|
| (0.06 | ) |
| 4.04 |
|
| 3.98 |
|
| – |
|
| – |
|
| – |
|
| – |
|
| 16.12 |
|
| 32.78 |
|
| 377,079 |
|
| 1.44 |
|
| 1.44 |
|
| 1.43 |
|
| (0.41 | ) |
| 14 |
|
2008 |
|
| 17.25 |
|
| (0.01 | ) |
| (4.91 | ) |
| (4.92 | ) |
| – |
|
| (0.20 | ) |
| (0.20 | ) |
| 0.01 |
|
| 12.14 |
|
| (28.41 | ) |
| 209,647 |
|
| 1.37 |
|
| 1.37 |
|
| 1.34 |
|
| (0.06 | ) |
| 11 |
|
2007 |
|
| 17.56 |
|
| 0.01 |
|
| 2.23 |
|
| 2.24 |
|
| (0.25 | ) |
| (2.30 | ) |
| (2.55 | ) |
| – |
|
| 17.25 |
|
| 12.56 |
|
| 246,313 |
|
| 1.38 |
|
| 1.38 |
|
| 1.29 |
|
| 0.12 |
|
| 21 |
|
|
|
|
122 | The Royce Funds 2012 Semiannual Report to Shareholders |
| THE ACCOMPANYING NOTES ARE AN INTEGRAL PART OF THESE FINANCIAL STATEMENTS. |
|
Financial Highlights |
| Net Asset | Net | Net Realized and Unrealized | Distributions | Distributions from Net | Ratio of Expenses to Average Net Assets | Ratio of Net Investment | ||||||||||||||||||||||||||||||||||||||||||||||||||||||
| Value, Beginning of Period | Investment Income (Loss) | Gain (Loss) on Investments and Foreign Currency | Total from Investment Operations | from Net Investment Income | Realized Gain on Investments and Foreign Currency | Total Distributions | Shareholder Redemption Fees | Net Asset Value, End of Period | Total Return | Net Assets, End of Period (in thousands) | Prior to Fee Waivers and Balance Credits | Prior to Fee Waivers | Net of Fee Waivers | Income (Loss) to Average Net Assets | Portfolio Turnover Rate | |||||||||||||||||||||||||||||||||||||||||||||
|
|
|
|
|
|
|
|
|
|
|
|
|
|
|
|
|
|
|
|
|
|
|
|
|
|
|
|
|
|
|
|
|
|
|
|
|
|
|
|
|
|
|
|
|
|
|
|
|
| |||||||||||
Royce Premier Fund – Consultant Class | ||||||||||||||||||||||||||||||||||||||||||||||||||||||||||||
†2012 |
| $ | 16.87 |
| $ | 0.01 |
| $ | 0.35 |
| $ | 0.36 |
| $ | – |
| $ | – |
| $ | – |
| $ | – |
| $ | 17.23 |
|
| 2.13 | %1 | $ | 59,132 |
|
| 2.07 | %2 |
| 2.07 | %2 |
| 2.07 | %2 |
| 0.14 | %2 |
| 3 | % | |||||||||||
2011 |
|
| 18.81 |
|
| (0.21 | ) |
| (0.14 | ) |
| (0.35 | ) |
| – |
|
| (1.59 | ) |
| (1.59 | ) |
| – |
|
| 16.87 |
|
| (1.80 | ) |
| 59,766 |
|
| 2.05 |
|
| 2.05 |
|
| 2.05 |
|
| (1.07 | ) |
| 18 |
| |||||||||||
2010 |
|
| 15.24 |
|
| (0.17 | ) |
| 4.01 |
|
| 3.84 |
|
| – |
|
| (0.27 | ) |
| (0.27 | ) |
| – |
|
| 18.81 |
|
| 25.24 |
|
| 71,686 |
|
| 2.08 |
|
| 2.08 |
|
| 2.08 |
|
| (1.04 | ) |
| 10 |
| |||||||||||
2009 |
|
| 11.55 |
|
| (0.15 | ) |
| 3.84 |
|
| 3.69 |
|
| – |
|
| – |
|
| – |
|
| – |
|
| 15.24 |
|
| 31.95 |
|
| 58,241 |
|
| 2.14 |
|
| 2.14 |
|
| 2.14 |
|
| (1.13 | ) |
| 14 |
| |||||||||||
2008 |
|
| 16.57 |
|
| (0.13 | ) |
| (4.69 | ) |
| (4.82 | ) |
| – |
|
| (0.20 | ) |
| (0.20 | ) |
| – |
|
| 11.55 |
|
| (29.04 | ) |
| 28,977 |
|
| 2.12 |
|
| 2.11 |
|
| 2.11 |
|
| (0.84 | ) |
| 11 |
| |||||||||||
2007 |
|
| 16.96 |
|
| (0.13 | ) |
| 2.13 |
|
| 2.00 |
|
| (0.09 | ) |
| (2.30 | ) |
| (2.39 | ) |
| – |
|
| 16.57 |
|
| 11.60 |
|
| 51,700 |
|
| 2.10 |
|
| 2.09 |
|
| 2.09 |
|
| (0.70 | ) |
| 21 |
| |||||||||||
Royce Premier Fund – Institutional Class | ||||||||||||||||||||||||||||||||||||||||||||||||||||||||||||
†2012 |
| $ | 18.66 |
| $ | 0.12 |
| $ | 0.39 |
| $ | 0.51 |
| $ | – |
| $ | – |
| $ | – |
| $ | – |
| $ | 19.17 |
|
| 2.73 | %1 | $ | 827,914 |
|
| 0.97 | %2 |
| 0.97 | %2 |
| 0.97 | %2 |
| 1.26 | %2 |
| 3 | % | |||||||||||
2011 |
|
| 20.49 |
|
| 0.00 |
|
| (0.16 | ) |
| (0.16 | ) |
| (0.08 | ) |
| (1.59 | ) |
| (1.67 | ) |
| – |
|
| 18.66 |
|
| (0.73 | ) |
| 813,837 |
|
| 0.97 |
|
| 0.97 |
|
| 0.97 |
|
| 0.02 |
|
| 18 |
| |||||||||||
2010 |
|
| 16.40 |
|
| 0.01 |
|
| 4.35 |
|
| 4.36 |
|
| – |
|
| (0.27 | ) |
| (0.27 | ) |
| – |
|
| 20.49 |
|
| 26.62 |
|
| 706,870 |
|
| 0.99 |
|
| 0.99 |
|
| 0.99 |
|
| 0.07 |
|
| 10 |
| |||||||||||
2009 |
|
| 12.30 |
|
| (0.00 | ) |
| 4.10 |
|
| 4.10 |
|
| – |
|
| – |
|
| – |
|
| – |
|
| 16.40 |
|
| 33.33 |
|
| 516,900 |
|
| 1.03 |
|
| 1.03 |
|
| 1.03 |
|
| (0.01 | ) |
| 14 |
| |||||||||||
2008 |
|
| 17.42 |
|
| 0.04 |
|
| (4.96 | ) |
| (4.92 | ) |
| – |
|
| (0.20 | ) |
| (0.20 | ) |
| – |
|
| 12.30 |
|
| (28.19 | ) |
| 352,804 |
|
| 1.01 |
|
| 1.01 |
|
| 1.01 |
|
| 0.27 |
|
| 11 |
| |||||||||||
2007 |
|
| 17.71 |
|
| 0.06 |
|
| 2.25 |
|
| 2.31 |
|
| (0.30 | ) |
| (2.30 | ) |
| (2.60 | ) |
| – |
|
| 17.42 |
|
| 12.86 |
|
| 450,492 |
|
| 1.01 |
|
| 1.00 |
|
| 1.00 |
|
| 0.40 |
|
| 21 |
| |||||||||||
| Royce Premier Fund – W Class | ||||||||||||||||||||||||||||||||||||||||||||||||||||||||||||
| †2012 | $ | 18.57 | $ | 0.12 | $ | 0.38 | $ | 0.50 | $ | – | $ | – | $ | – | $ | – | $ | 19.07 | 2.69 | %1 | $ | 549,942 | 1.01 | %2 | 1.00 | %2 | 1.00 | %2 | 1.20 | %2 | 3 | % | ||||||||||||||||||||||||||||
| 2011 | 20.40 | (0.01 | ) | (0.15 | ) | (0.16 | ) | (0.08 | ) | (1.59 | ) | (1.67 | ) | – | 18.57 | (0.75 | ) | 549,648 | 1.00 | 1.00 | 1.00 | (0.01 | ) | 18 | ||||||||||||||||||||||||||||||||||||
| 2010 | 16.33 | 0.01 | 4.33 | 4.34 | – | (0.27 | ) | (0.27 | ) | – | 20.40 | 26.61 | 425,397 | 1.02 | 1.02 | 1.02 | 0.04 | 10 | ||||||||||||||||||||||||||||||||||||||||||
| 2009 | 12.25 | (0.01 | ) | 4.09 | 4.08 | – | – | – | – | 16.33 | 33.31 | 319,120 | 1.07 | 1.07 | 1.07 | (0.06 | ) | 14 | ||||||||||||||||||||||||||||||||||||||||||
| 2008 | 17.36 | 0.04 | (4.95 | ) | (4.91 | ) | – | (0.20 | ) | (0.20 | ) | – | 12.25 | (28.23 | ) | 234,618 | 1.04 | 1.04 | 1.04 | 0.23 | 11 | |||||||||||||||||||||||||||||||||||||||
| 2007 | 17.67 | 0.07 | 2.21 | 2.28 | (0.29 | ) | (2.30 | ) | (2.59 | ) | – | 17.36 | 12.72 | 332,720 | 1.05 | 1.05 | 1.05 | 0.34 | 21 | |||||||||||||||||||||||||||||||||||||||||
| Royce Premier Fund – R Class b | ||||||||||||||||||||||||||||||||||||||||||||||||||||||||||||
| †2012 | $ | 17.99 | $ | 0.05 | $ | 0.37 | $ | 0.42 | $ | – | $ | – | $ | – | $ | – | $ | 18.41 | 2.33 | %1 | $ | 27,915 | 1.66 | %2 | 1.662 | % | 1.66 | %2 | 0.54 | %2 | 3 | % | ||||||||||||||||||||||||||||
| 2011 | 19.91 | (0.14 | ) | (0.15 | ) | (0.29 | ) | (0.04 | ) | (1.59 | ) | (1.63 | ) | – | 17.99 | (1.38 | ) | 23,653 | 1.66 | 1.66 | 1.66 | (0.63 | ) | 18 | ||||||||||||||||||||||||||||||||||||
| 2010 | 16.07 | (0.11 | ) | 4.22 | 4.11 | – | (0.27 | ) | (0.27 | ) | – | 19.91 | 25.61 | 10,185 | 1.78 | 1.78 | 1.78 | (0.64 | ) | 10 | ||||||||||||||||||||||||||||||||||||||||
| 2009 | 12.15 | (0.12 | ) | 4.04 | 3.92 | – | – | – | – | 16.07 | 32.26 | 2,634 | 2.26 | 2.26 | 1.84 | (0.83 | ) | 14 | ||||||||||||||||||||||||||||||||||||||||||
| 2008 | 17.36 | (0.08 | ) | (4.93 | ) | (5.01 | ) | – | (0.20 | ) | (0.20 | ) | – | 12.15 | (28.81 | ) | 396 | 3.97 | 3.97 | 1.84 | (0.54 | ) | 11 | |||||||||||||||||||||||||||||||||||||
| 2007 | 20.38 | (0.02 | ) | (0.49 | ) | (0.51 | ) | (0.21 | ) | (2.30 | ) | (2.51 | ) | – | 17.36 | (2.67 | )1 | 97 | 14.23 | 2 | 14.23 | 2 | 1.74 | 2 | (0.18 | )2 | 21 | |||||||||||||||||||||||||||||||||
| Royce Premier Fund – K Class c | ||||||||||||||||||||||||||||||||||||||||||||||||||||||||||||
| †2012 | $ | 8.67 | $ | 0.04 | $ | 0.17 | $ | 0.21 | $ | – | $ | – | $ | – | $ | – | $ | 8.88 | 2.42 | %1 | $ | 10,015 | 1.47 | %2 | 1.47 | %2 | 1.47 | %2 | 0.77 | %2 | 3 | % | ||||||||||||||||||||||||||||
| 2011 | 10.46 | (0.05 | ) | (0.09 | ) | (0.14 | ) | (0.06 | ) | (1.59 | ) | (1.65 | ) | – | 8.67 | (1.20 | ) | 8,776 | 1.49 | 1.49 | 1.49 | (0.46 | ) | 18 | ||||||||||||||||||||||||||||||||||||
| 2010 | 8.53 | (0.04 | ) | 2.24 | 2.20 | – | (0.27 | ) | (0.27 | ) | – | 10.46 | 25.86 | 3,845 | 1.63 | 1.63 | 1.59 | (0.47 | ) | 10 | ||||||||||||||||||||||||||||||||||||||||
| 2009 | 6.44 | (0.05 | ) | 2.14 | 2.09 | – | – | – | – | 8.53 | 32.45 | 1,551 | 2.39 | 2.39 | 1.59 | (0.60 | ) | 14 | ||||||||||||||||||||||||||||||||||||||||||
| 2008 | 10.00 | (0.02 | ) | (3.34 | ) | (3.36 | ) | – | (0.20 | ) | (0.20 | ) | – | 6.44 | (33.51 | )1 | 35 | 35.36 | 2 | 35.36 | 2 | 1.59 | 2 | (0.38 | )2 | 11 | ||||||||||||||||||||||||||||||||||
| Royce Low-Priced Stock Fund – Investment Class d | ||||||||||||||||||||||||||||||||||||||||||||||||||||||||||||
| †2012 | $ | 14.34 | $ | 0.01 | $ | (0.14 | ) | $ | (0.13 | ) | $ | – | $ | – | $ | – | $ | – | $ | 14.21 | (0.91 | )%1 | $ | 316,930 | 1.25 | %2 | 1.25 | %2 | 1.24 | %2 | 0.11 | %2 | 5 | % | ||||||||||||||||||||||||||
| 2011 | 18.31 | (0.06 | ) | (2.57 | ) | (2.63 | ) | (0.14 | ) | (1.20 | ) | (1.34 | ) | – | 14.34 | (14.37 | ) | 276,247 | 1.26 | 1.26 | 1.24 | (0.15 | ) | 22 | ||||||||||||||||||||||||||||||||||||
| 2010 | 14.08 | (0.03 | ) | 4.50 | 4.47 | (0.10 | ) | (0.14 | ) | (0.24 | ) | – | 18.31 | 31.77 | 148,144 | 1.26 | 1.26 | 1.24 | (0.10 | ) | 24 | |||||||||||||||||||||||||||||||||||||||
| 2009 | 9.17 | (0.01 | ) | 4.96 | 4.95 | (0.04 | ) | – | (0.04 | ) | – | 14.08 | 54.04 | 94,966 | 1.27 | 1.27 | 1.24 | (0.14 | ) | 22 | ||||||||||||||||||||||||||||||||||||||||
| 2008 | 14.75 | 0.03 | (5.35 | ) | (5.32 | ) | – | (0.27 | ) | (0.27 | ) | 0.01 | 9.17 | (35.77 | ) | 65,004 | 1.24 | 1.24 | 1.24 | 0.29 | 39 | |||||||||||||||||||||||||||||||||||||||
| 2007 | 17.06 | (2.35 | ) | 2.58 | 0.23 | (0.49 | ) | (2.05 | ) | (2.54 | ) | – | 14.75 | 1.15 | 1 | 29,260 | 2.11 | 2 | 2.12 | 2 | 1.24 | 2 | 0.44 | 2 | 30 | |||||||||||||||||||||||||||||||||||
| THE ACCOMPANYING NOTES ARE AN INTEGRAL PART OF THESE FINANCIAL STATEMENTS. | The Royce Funds 2012 Semiannual Report to Shareholders | 123 |
|
Financial Highlights |
| Net Asset | Net | Net Realized and Unrealized | Distributions | Distributions from Net | Ratio of Expenses to Average Net Assets | Ratio of Net Investment | ||||||||||||||||||||||||||||||||||||||||||||||||||||||
| Value, Beginning of Period | Investment Income (Loss) | Gain (Loss) on Investments and Foreign Currency | Total from Investment Operations | from Net Investment Income | Realized Gain on Investments and Foreign Currency | Total Distributions | Shareholder Redemption Fees | Net Asset Value, End of Period | Total Return | Net Assets, End of Period (in thousands) | Prior to Fee Waivers and Balance Credits | Prior to Fee Waivers | Net of Fee Waivers | Income (Loss) to Average Net Assets | Portfolio Turnover Rate | |||||||||||||||||||||||||||||||||||||||||||||
|
|
|
|
|
|
|
|
|
|
|
|
|
|
|
|
|
|
|
|
|
|
|
|
|
|
|
|
|
|
|
|
|
|
|
|
|
|
|
|
|
|
|
|
|
|
|
|
|
| |||||||||||
| Royce Low-Priced Stock Fund – Service Class | ||||||||||||||||||||||||||||||||||||||||||||||||||||||||||||
| †2012 | $ | 14.31 | $ | (0.01 | ) | $ | (0.14 | ) | $ | (0.15 | ) | $ | – | $ | – | $ | – | $ | – | $ | 14.16 | (1.05 | )%1 | $ | 2,144,136 | 1.60 | %2 | 1.60 | %2 | 1.49 | %2 | (0.16 | )%2 | 5 | % | |||||||||||||||||||||||||
| 2011 | 18.26 | (0.06 | ) | (2.60 | ) | (2.66 | ) | (0.09 | ) | (1.20 | ) | (1.29 | ) | – | 14.31 | (14.58 | ) | 2,489,189 | 1.56 | 1.56 | 1.49 | (0.39 | ) | 22 | ||||||||||||||||||||||||||||||||||||
| 2010 | 14.05 | (0.05 | ) | 4.47 | 4.42 | (0.07 | ) | (0.14 | ) | (0.21 | ) | – | 18.26 | 31.49 | 3,456,142 | 1.60 | 1.60 | 1.49 | (0.37 | ) | 24 | |||||||||||||||||||||||||||||||||||||||
| 2009 | 9.16 | (0.04 | ) | 4.95 | 4.91 | (0.02 | ) | – | (0.02 | ) | – | 14.05 | 53.58 | 2,669,235 | 1.60 | 1.60 | 1.49 | (0.38 | ) | 22 | ||||||||||||||||||||||||||||||||||||||||
| 2008 | 14.78 | (0.01 | ) | (5.34 | ) | (5.35 | ) | – | (0.27 | ) | (0.27 | ) | – | 9.16 | (35.97 | ) | 1,870,016 | 1.56 | 1.55 | 1.49 | (0.10 | ) | 39 | |||||||||||||||||||||||||||||||||||||
| 2007 | 16.83 | 0.02 | 0.40 | 0.42 | (0.42 | ) | (2.05 | ) | (2.47 | ) | – | 14.78 | 2.32 | 3,337,488 | 1.53 | 1.53 | 1.49 | (0.16 | ) | 30 | ||||||||||||||||||||||||||||||||||||||||
| Royce Low-Priced Stock Fund – Institutional Class | ||||||||||||||||||||||||||||||||||||||||||||||||||||||||||||
| †2012 | $ | 14.36 | $ | 0.01 | $ | (0.13 | ) | $ | (0.12 | ) | $ | – | $ | – | $ | – | $ | – | $ | 14.24 | (0.84 | )%1 | $ | 1,069,131 | 1.19 | %2 | 1.19 | %2 | 1.19 | %2 | 0.15 | %2 | 5 | % | ||||||||||||||||||||||||||
| 2011 | 18.33 | (0.01 | ) | (2.61 | ) | (2.62 | ) | (0.15 | ) | (1.20 | ) | (1.35 | ) | – | 14.36 | (14.35 | ) | 991,706 | 1.17 | 1.17 | 1.17 | (0.07 | ) | 22 | ||||||||||||||||||||||||||||||||||||
| 2010 | 14.09 | (0.02 | ) | 4.50 | 4.48 | (0.10 | ) | (0.14 | ) | (0.24 | ) | – | 18.33 | 31.82 | 1,077,659 | 1.18 | 1.18 | 1.18 | (0.04 | ) | 24 | |||||||||||||||||||||||||||||||||||||||
| 2009 | 9.18 | (0.01 | ) | 4.96 | 4.95 | (0.04 | ) | – | (0.04 | ) | – | 14.09 | 53.97 | 673,846 | 1.24 | 1.24 | 1.24 | (0.15 | ) | 22 | ||||||||||||||||||||||||||||||||||||||||
| 2008 | 14.76 | 0.03 | (5.34 | ) | (5.31 | ) | – | (0.27 | ) | (0.27 | ) | – | 9.18 | (35.75 | ) | 553,070 | 1.18 | 1.18 | 1.18 | 0.22 | 39 | |||||||||||||||||||||||||||||||||||||||
| 2007 | 16.82 | (0.04 | ) | 0.51 | 0.47 | (0.48 | ) | (2.05 | ) | (2.53 | ) | – | 14.76 | 2.61 | 869,042 | 1.22 | 1.22 | 1.22 | 0.12 | 30 | ||||||||||||||||||||||||||||||||||||||||
| Royce Low-Priced Stock Fund – R Class b | ||||||||||||||||||||||||||||||||||||||||||||||||||||||||||||
| †2012 | $ | 14.05 | $ | (0.04 | ) | $ | (0.13 | ) | $ | (0.17 | ) | $ | – | $ | – | $ | – | $ | – | $ | 13.88 | (1.21 | )%1 | $ | 6,325 | 1.97 | %2 | 1.97 | %2 | 1.84 | %2 | (0.52 | )%2 | 5 | % | |||||||||||||||||||||||||
| 2011 | 18.05 | (0.19 | ) | (2.49 | ) | (2.68 | ) | (0.12 | ) | (1.20 | ) | (1.32 | ) | – | 14.05 | (14.86 | ) | 7,337 | 1.95 | 1.95 | 1.84 | (0.72 | ) | 22 | ||||||||||||||||||||||||||||||||||||
| 2010 | 13.95 | (0.12 | ) | 4.44 | 4.32 | (0.08 | ) | (0.14 | ) | (0.22 | ) | – | 18.05 | 31.00 | 2,925 | 2.21 | 2.21 | 1.84 | (0.67 | ) | 24 | |||||||||||||||||||||||||||||||||||||||
| 2009 | 9.11 | (0.09 | ) | 4.92 | 4.83 | (0.00 | ) | – | (0.00 | ) | 0.01 | 13.95 | 53.13 | 1,134 | 3.02 | 3.02 | 1.84 | (0.76 | ) | 22 | ||||||||||||||||||||||||||||||||||||||||
| 2008 | 14.76 | (0.05 | ) | (5.33 | ) | (5.38 | ) | – | (0.27 | ) | (0.27 | ) | – | 9.11 | (36.22 | ) | 74 | 10.95 | 10.94 | 1.84 | (0.42 | ) | 39 | |||||||||||||||||||||||||||||||||||||
| 2007 | 18.69 | (0.02 | ) | (1.44 | ) | (1.46 | ) | (0.42 | ) | (2.05 | ) | (2.47 | ) | – | 14.76 | (7.96 | )1 | 92 | 11.93 | 2 | 11.93 | 2 | 1.74 | 2 | (0.28 | )2 | 30 | |||||||||||||||||||||||||||||||||
| Royce Low-Priced Stock Fund – K Class c | ||||||||||||||||||||||||||||||||||||||||||||||||||||||||||||
| †2012 | $ | 8.65 | $ | (0.01 | ) | $ | (0.08 | ) | $ | (0.09 | ) | $ | – | $ | – | $ | – | $ | – | $ | 8.56 | (1.04 | )%1 | $ | 8,140 | 1.70 | %2 | 1.70 | %2 | 1.59 | %2 | (0.26 | )%2 | 5 | % | |||||||||||||||||||||||||
| 2011 | 11.70 | (0.08 | ) | (1.63 | ) | (1.71 | ) | (0.14 | ) | (1.20 | ) | (1.34 | ) | – | 8.65 | (14.71 | ) | 8,719 | 1.68 | 1.68 | 1.59 | (0.48 | ) | 22 | ||||||||||||||||||||||||||||||||||||
| 2010 | 9.09 | (0.08 | ) | 2.93 | 2.85 | (0.10 | ) | (0.14 | ) | (0.24 | ) | – | 11.70 | 31.44 | 4,782 | 1.78 | 1.78 | 1.59 | (0.40 | ) | 24 | |||||||||||||||||||||||||||||||||||||||
| 2009 | 5.95 | (0.10 | ) | 3.28 | 3.18 | (0.04 | ) | – | (0.04 | ) | – | 9.09 | 53.45 | 676 | 4.75 | 4.75 | 1.59 | (0.44 | ) | 22 | ||||||||||||||||||||||||||||||||||||||||
| 2008 | 10.00 | (0.01 | ) | (3.77 | ) | (3.78 | ) | – | (0.27 | ) | (0.27 | ) | – | 5.95 | (37.47 | )1 | 30 | 40.19 | 2 | 40.19 | 2 | 1.59 | 2 | (0.19 | )2 | 39 | ||||||||||||||||||||||||||||||||||
| Royce Total Return Fund – Investment Class | ||||||||||||||||||||||||||||||||||||||||||||||||||||||||||||
| †2012 | $ | 12.68 | $ | 0.08 | $ | 0.45 | $ | 0.53 | $ | (0.08 | ) | $ | – | $ | (0.08 | ) | $ | – | $ | 13.13 | 4.18 | %1 | $ | 3,106,853 | 1.13 | %2 | 1.13 | %2 | 1.13 | %2 | 1.21 | %2 | 11 | % | ||||||||||||||||||||||||||
| 2011 | 13.17 | 0.15 | (0.37 | ) | (0.22 | ) | (0.12 | ) | (0.15 | ) | (0.27 | ) | – | 12.68 | (1.68 | ) | 3,106,208 | 1.12 | 1.12 | 1.12 | 1.10 | 21 | ||||||||||||||||||||||||||||||||||||||
| 2010 | 10.81 | 0.19 | 2.32 | 2.51 | (0.15 | ) | – | (0.15 | ) | – | 13.17 | 23.47 | 3,562,002 | 1.14 | 1.14 | 1.14 | 1.64 | 15 | ||||||||||||||||||||||||||||||||||||||||||
| 2009 | 8.70 | 0.16 | 2.09 | 2.25 | (0.14 | ) | – | (0.14 | ) | – | 10.81 | 26.22 | 3,077,099 | 1.17 | 1.17 | 1.17 | 1.74 | 20 | ||||||||||||||||||||||||||||||||||||||||||
| 2008 | 12.93 | 0.20 | (4.20 | ) | (4.00 | ) | (0.23 | ) | (0.00 | ) | (0.23 | ) | – | 8.70 | (31.17 | ) | 2,577,031 | 1.12 | 1.12 | 1.12 | 1.69 | 25 | ||||||||||||||||||||||||||||||||||||||
| 2007 | 13.75 | 0.19 | 0.16 | 0.35 | (0.17 | ) | (1.00 | ) | (1.17 | ) | – | 12.93 | 2.39 | 4,214,156 | 1.08 | 1.08 | 1.08 | 1.29 | 27 | |||||||||||||||||||||||||||||||||||||||||
| Royce Total Return Fund – Service Class | ||||||||||||||||||||||||||||||||||||||||||||||||||||||||||||
| †2012 | $ | 12.71 | $ | 0.06 | $ | 0.46 | $ | 0.52 | $ | (0.06 | ) | $ | – | $ | (0.06 | ) | $ | – | $ | 13.17 | 4.09 | %1 | $ | 283,545 | 1.41 | %2 | 1.41 | %2 | 1.41 | %2 | 0.94 | %2 | 11 | % | ||||||||||||||||||||||||||
| 2011 | 13.19 | 0.11 | (0.38 | ) | (0.27 | ) | (0.06 | ) | (0.15 | ) | (0.21 | ) | – | 12.71 | (2.01 | ) | 282,704 | 1.41 | 1.41 | 1.41 | 0.82 | 21 | ||||||||||||||||||||||||||||||||||||||
| 2010 | 10.81 | 0.16 | 2.32 | 2.48 | (0.10 | ) | – | (0.10 | ) | – | 13.19 | 23.11 | 295,656 | 1.42 | 1.42 | 1.42 | 1.39 | 15 | ||||||||||||||||||||||||||||||||||||||||||
| 2009 | 8.67 | 0.14 | 2.09 | 2.23 | (0.10 | ) | – | (0.10 | ) | 0.01 | 10.81 | 26.16 | 215,939 | 1.42 | 1.42 | 1.42 | 1.49 | 20 | ||||||||||||||||||||||||||||||||||||||||||
| 2008 | 12.82 | 0.17 | (4.16 | ) | (3.99 | ) | (0.18 | ) | (0.00 | ) | (0.18 | ) | 0.02 | 8.67 | (31.17 | ) | 155,644 | 1.37 | 1.37 | 1.34 | 1.49 | 25 | ||||||||||||||||||||||||||||||||||||||
| 2007 | 13.61 | 0.15 | 0.17 | 0.32 | (0.11 | ) | (1.00 | ) | (1.11 | ) | – | 12.82 | 2.20 | 268,562 | 1.39 | 1.39 | 1.29 | 1.09 | 27 | |||||||||||||||||||||||||||||||||||||||||
| 124 | The Royce Funds 2012 Semiannual Report to Shareholders | THE ACCOMPANYING NOTES ARE AN INTEGRAL PART OF THESE FINANCIAL STATEMENTS. |
|
Financial Highlights |
| Net Asset | Net | Net Realized and Unrealized | Distributions | Distributions from Net | Ratio of Expenses to Average Net Assets | Ratio of Net Investment | ||||||||||||||||||||||||||||||||||||||||||||||||||||||
| Value, Beginning of Period | Investment Income (Loss) | Gain (Loss) on Investments and Foreign Currency | Total from Investment Operations | from Net Investment Income | Realized Gain on Investments and Foreign Currency | Total Distributions | Shareholder Redemption Fees | Net Asset Value, End of Period | Total Return | Net Assets, End of Period (in thousands) | Prior to Fee Waivers and Balance Credits | Prior to Fee Waivers | Net of Fee Waivers | Income (Loss) to Average Net Assets | Portfolio Turnover Rate | |||||||||||||||||||||||||||||||||||||||||||||
|
|
|
|
|
|
|
|
|
|
|
|
|
|
|
|
|
|
|
|
|
|
|
|
|
|
|
|
|
|
|
|
|
|
|
|
|
|
|
|
|
|
|
|
|
|
|
|
|
| |||||||||||
| Royce Total Return Fund – Consultant Class | ||||||||||||||||||||||||||||||||||||||||||||||||||||||||||||
| †2012 | $ | 12.77 | $ | 0.02 | $ | 0.46 | $ | 0.48 | $ | – | $ | – | $ | – | $ | – | $ | 13.25 | 3.76 | %1 | $ | 323,236 | 2.09 | %2 | 2.09 | %2 | 2.09 | %2 | 0.24 | %2 | 11 | % | ||||||||||||||||||||||||||||
| 2011 | 13.27 | 0.02 | (0.37 | ) | (0.35 | ) | – | (0.15 | ) | (0.15 | ) | – | 12.77 | (2.64 | ) | 328,610 | 2.07 | 2.07 | 2.07 | 0.15 | 21 | |||||||||||||||||||||||||||||||||||||||
| 2010 | 10.90 | 0.08 | 2.33 | 2.41 | (0.04 | ) | – | (0.04 | ) | – | 13.27 | 22.18 | 391,886 | 2.09 | 2.09 | 2.09 | 0.68 | 15 | ||||||||||||||||||||||||||||||||||||||||||
| 2009 | 8.76 | 0.07 | 2.12 | 2.19 | (0.05 | ) | – | (0.05 | ) | – | 10.90 | 25.12 | 366,367 | 2.12 | 2.12 | 2.12 | 0.78 | 20 | ||||||||||||||||||||||||||||||||||||||||||
| 2008 | 12.91 | 0.08 | (4.18 | ) | (4.10 | ) | (0.05 | ) | (0.00 | ) | (0.05 | ) | – | 8.76 | (31.83 | ) | 354,384 | 2.09 | 2.08 | 2.08 | 0.71 | 25 | ||||||||||||||||||||||||||||||||||||||
| 2007 | 13.73 | 0.04 | 0.17 | 0.21 | (0.03 | ) | (1.00 | ) | (1.03 | ) | – | 12.91 | 1.35 | 648,191 | 2.08 | 2.07 | 2.07 | 0.30 | 27 | |||||||||||||||||||||||||||||||||||||||||
| Royce Total Return Fund – Institutional Class | ||||||||||||||||||||||||||||||||||||||||||||||||||||||||||||
| †2012 | $ | 12.64 | $ | 0.09 | $ | 0.45 | $ | 0.54 | $ | (0.09 | ) | $ | – | $ | (0.09 | ) | $ | – | $ | 13.09 | 4.23 | %1 | $ | 378,301 | 1.01 | %2 | 1.01 | %2 | 1.01 | %2 | 1.33 | %2 | 11 | % | ||||||||||||||||||||||||||
| 2011 | 13.14 | 0.16 | (0.37 | ) | (0.21 | ) | (0.14 | ) | (0.15 | ) | (0.29 | ) | – | 12.64 | (1.55 | ) | 390,277 | 1.00 | 1.00 | 1.00 | 1.26 | 21 | ||||||||||||||||||||||||||||||||||||||
| 2010 | 10.80 | 0.21 | 2.31 | 2.52 | (0.18 | ) | – | (0.18 | ) | – | 13.14 | 23.56 | 356,038 | 1.01 | 1.01 | 1.01 | 1.79 | 15 | ||||||||||||||||||||||||||||||||||||||||||
| 2009 | 8.70 | 0.17 | 2.09 | 2.26 | (0.16 | ) | – | (0.16 | ) | – | 10.80 | 26.41 | 264,041 | 1.04 | 1.04 | 1.04 | 1.87 | 20 | ||||||||||||||||||||||||||||||||||||||||||
| 2008 | 12.95 | 0.20 | (4.19 | ) | (3.99 | ) | (0.26 | ) | (0.00 | ) | (0.26 | ) | – | 8.70 | (31.09 | ) | 191,014 | 1.00 | 0.99 | 0.99 | 1.82 | 25 | ||||||||||||||||||||||||||||||||||||||
| 2007 | 13.77 | 0.20 | 0.17 | 0.37 | (0.19 | ) | (1.00 | ) | (1.19 | ) | – | 12.95 | 2.52 | 257,066 | 0.99 | 0.99 | 0.99 | 1.38 | 27 | |||||||||||||||||||||||||||||||||||||||||
| Royce Total Return Fund – W Class | ||||||||||||||||||||||||||||||||||||||||||||||||||||||||||||
| †2012 | $ | 12.69 | $ | 0.09 | $ | 0.45 | $ | 0.54 | $ | (0.09 | ) | $ | – | $ | (0.09 | ) | $ | – | $ | 13.14 | 4.22 | %1 | $ | 147,200 | 1.05 | %2 | 1.05 | %2 | 1.05 | %2 | 1.31 | %2 | 11 | % | ||||||||||||||||||||||||||
| 2011 | 13.19 | 0.16 | (0.37 | ) | (0.21 | ) | (0.14 | ) | (0.15 | ) | (0.29 | ) | – | 12.69 | (1.58 | ) | 132,488 | 1.05 | 1.05 | 1.05 | 1.27 | 21 | ||||||||||||||||||||||||||||||||||||||
| 2010 | 10.83 | 0.20 | 2.32 | 2.52 | (0.16 | ) | – | (0.16 | ) | – | 13.19 | 23.44 | 75,063 | 1.09 | 1.09 | 1.09 | 1.74 | 15 | ||||||||||||||||||||||||||||||||||||||||||
| 2009 | 8.71 | 0.16 | 2.10 | 2.26 | (0.14 | ) | – | (0.14 | ) | – | 10.83 | 26.28 | 48,058 | 1.13 | 1.13 | 1.13 | 1.78 | 20 | ||||||||||||||||||||||||||||||||||||||||||
| 2008 | 12.95 | 0.23 | (4.23 | ) | (4.00 | ) | (0.24 | ) | (0.00 | ) | (0.24 | ) | – | 8.71 | (31.18 | ) | 65,260 | 1.08 | 1.08 | 1.08 | 1.66 | 25 | ||||||||||||||||||||||||||||||||||||||
| 2007 | 13.76 | 0.19 | 0.18 | 0.37 | (0.18 | ) | (1.00 | ) | (1.18 | ) | – | 12.95 | 2.49 | 250,178 | 1.06 | 1.06 | 1.06 | 1.31 | 27 | |||||||||||||||||||||||||||||||||||||||||
| Royce Total Return Fund – R Class b | ||||||||||||||||||||||||||||||||||||||||||||||||||||||||||||
| †2012 | $ | 12.79 | $ | 0.04 | $ | 0.46 | $ | 0.50 | $ | (0.04 | ) | $ | – | $ | (0.04 | ) | $ | – | $ | 13.25 | 3.91 | %1 | $ | 43,497 | 1.70 | %2 | 1.70 | %2 | 1.70 | %2 | 0.67 | %2 | 11 | % | ||||||||||||||||||||||||||
| 2011 | 13.28 | 0.08 | (0.38 | ) | (0.30 | ) | (0.04 | ) | (0.15 | ) | (0.19 | ) | – | 12.79 | (2.23 | ) | 34,695 | 1.68 | 1.68 | 1.68 | 0.62 | 21 | ||||||||||||||||||||||||||||||||||||||
| 2010 | 10.88 | 0.15 | 2.32 | 2.47 | (0.07 | ) | – | (0.07 | ) | – | 13.28 | 22.76 | 20,011 | 1.71 | 1.71 | 1.71 | 1.20 | 15 | ||||||||||||||||||||||||||||||||||||||||||
| 2009 | 8.74 | 0.10 | 2.10 | 2.20 | (0.06 | ) | – | (0.06 | ) | – | 10.88 | 25.43 | 6,450 | 1.85 | 1.85 | 1.84 | 1.05 | 20 | ||||||||||||||||||||||||||||||||||||||||||
| 2008 | 12.93 | 0.11 | (4.19 | ) | (4.08 | ) | (0.11 | ) | (0.00 | ) | (0.11 | ) | – | 8.74 | (31.67 | ) | 2,946 | 2.03 | 2.02 | 1.84 | 1.10 | 25 | ||||||||||||||||||||||||||||||||||||||
| 2007 | 14.89 | (0.02 | ) | (0.87 | ) | (0.89 | ) | (0.07 | ) | (1.00 | ) | (1.07 | ) | – | 12.93 | (6.15 | )1 | 1,224 | 6.15 | 2 | 6.14 | 2 | 1.74 | 2 | 0.78 | 2 | 27 | |||||||||||||||||||||||||||||||||
| Royce Total Return Fund – K Class e | ||||||||||||||||||||||||||||||||||||||||||||||||||||||||||||
| †2012 | $ | 9.90 | $ | 0.05 | $ | 0.35 | $ | 0.40 | $ | (0.05 | ) | $ | – | $ | (0.05 | ) | $ | – | $ | 10.25 | 3.99 | %1 | $ | 200,605 | 1.43 | %2 | 1.43 | %2 | 1.43 | %2 | 0.93 | %2 | 11 | % | ||||||||||||||||||||||||||
| 2011 | 10.31 | 0.09 | (0.30 | ) | (0.21 | ) | (0.05 | ) | (0.15 | ) | (0.20 | ) | – | 9.90 | (1.97 | ) | 177,812 | 1.44 | 1.44 | 1.44 | 0.90 | 21 | ||||||||||||||||||||||||||||||||||||||
| 2010 | 8.47 | 0.13 | 1.81 | 1.94 | (0.10 | ) | – | (0.10 | ) | – | 10.31 | 23.08 | 95,319 | 1.43 | 1.43 | 1.43 | 1.46 | 15 | ||||||||||||||||||||||||||||||||||||||||||
| 2009 | 6.81 | 0.11 | 1.63 | 1.74 | (0.08 | ) | – | (0.08 | ) | – | 8.47 | 25.89 | 43,281 | 1.42 | 1.42 | 1.42 | 1.44 | 20 | ||||||||||||||||||||||||||||||||||||||||||
| 2008 | 10.00 | 0.02 | (3.07 | ) | (3.05 | ) | (0.14 | ) | (0.00 | ) | (0.14 | ) | – | 6.81 | (30.56 | )1 | 14,064 | 1.46 | 2 | 1.46 | 2 | 1.46 | 2 | 1.81 | 2 | 25 | ||||||||||||||||||||||||||||||||||
| Royce Heritage Fund – Investment Class d | ||||||||||||||||||||||||||||||||||||||||||||||||||||||||||||
| †2012 | $ | 13.07 | $ | 0.05 | $ | 0.29 | $ | 0.34 | $ | – | $ | – | $ | – | $ | – | $ | 13.41 | 2.52 | %1 | $ | 28,697 | 1.20 | %2 | 1.20 | %2 | 1.20 | %2 | 0.72 | %2 | 21 | % | ||||||||||||||||||||||||||||
| 2011 | 15.10 | 0.01 | (1.41 | ) | (1.40 | ) | (0.05 | ) | (0.59 | ) | (0.64 | ) | 0.01 | 13.07 | (9.16 | ) | 21,088 | 1.22 | 1.22 | 1.22 | 0.15 | 51 | ||||||||||||||||||||||||||||||||||||||
| 2010 | 12.12 | 0.04 | 3.31 | 3.35 | (0.08 | ) | (0.29 | ) | (0.37 | ) | – | 15.10 | 27.71 | 13,313 | 1.25 | 1.25 | 1.24 | 0.35 | 66 | |||||||||||||||||||||||||||||||||||||||||
| 2009 | 7.97 | 0.02 | 4.13 | 4.15 | – | – | – | – | 12.12 | 52.07 | 10,052 | 1.34 | 1.34 | 1.24 | 0.19 | 59 | ||||||||||||||||||||||||||||||||||||||||||||
| 2008 | 12.88 | 0.04 | (4.70 | ) | (4.66 | ) | – | (0.25 | ) | (0.25 | ) | – | 7.97 | (36.07 | ) | 5,522 | 1.39 | 1.38 | 1.24 | 0.40 | 128 | |||||||||||||||||||||||||||||||||||||||
| 2007 | 14.03 | (0.01 | ) | 0.28 | 0.27 | – | (1.42 | ) | (1.42 | ) | – | 12.88 | 1.64 | 1 | 8,884 | 3.33 | 2 | 3.33 | 2 | 1.24 | 2 | (0.06 | )2 | 138 | ||||||||||||||||||||||||||||||||||||
| THE ACCOMPANYING NOTES ARE AN INTEGRAL PART OF THESE FINANCIAL STATEMENTS. | The Royce Funds 2012 Semiannual Report to Shareholders | 125 |
|
Financial Highlights |
| Net | Net | Net Realized and Unrealized | Distributions | Distributions from Net | Ratio of Expenses to Average Net Assets | Ratio of Net Investment | ||||||||||||||||||||||||||||||||||||||||||||||||||||||
| Asset Value, Beginning | Investment Income | Gain (Loss) on Investments and | Total from Investment | from Net Investment | Realized Gain on Investments and | Total | Shareholder Redemption | Net Asset Value, End | Total | Net Assets, End of Period | Prior to Fee Waivers and | Prior to Fee | Net of Fee | Income (Loss) to Average | Portfolio Turnover | |||||||||||||||||||||||||||||||||||||||||||||
| of Period | (Loss) | Foreign Currency | Operations | Income | Foreign Currency | Distributions | Fees | of Period | Return | (in thousands) | Balance Credits | Waivers | Waivers | Net Assets | Rate | |||||||||||||||||||||||||||||||||||||||||||||
|
|
|
|
|
|
|
|
|
|
|
|
|
|
|
|
|
|
|
|
|
|
|
|
|
|
|
|
|
|
|
|
|
|
|
|
|
|
|
|
|
|
|
|
|
|
|
|
|
| |||||||||||
| Royce Heritage Fund – Service Class | ||||||||||||||||||||||||||||||||||||||||||||||||||||||||||||
| †2012 | $ | 13.00 | $ | 0.03 | $ | 0.29 | $ | 0.32 | $ | – | $ | – | $ | – | $ | – | $ | 13.32 | 2.38 | %1 | $ | 211,742 | 1.47 | %2 | 1.47 | %2 | 1.46 | %2 | 0.39 | %2 | 21 | % | ||||||||||||||||||||||||||||
| 2011 | 15.03 | (0.01 | ) | (1.40 | ) | (1.41 | ) | (0.03 | ) | (0.59 | ) | (0.62 | ) | – | 13.00 | (9.39 | ) | 218,770 | 1.47 | 1.47 | 1.44 | (0.07 | ) | 51 | ||||||||||||||||||||||||||||||||||||
| 2010 | 12.07 | 0.03 | 3.28 | 3.31 | (0.06 | ) | (0.29 | ) | (0.35 | ) | – | 15.03 | 27.50 | 243,822 | 1.47 | 1.47 | 1.38 | 0.21 | 66 | |||||||||||||||||||||||||||||||||||||||||
| 2009 | 7.95 | (0.00 | ) | 4.12 | 4.12 | – | – | – | – | 12.07 | 51.82 | 182,690 | 1.51 | 1.51 | 1.42 | (0.02 | ) | 59 | ||||||||||||||||||||||||||||||||||||||||||
| 2008 | 12.88 | 0.02 | (4.70 | ) | (4.68 | ) | – | (0.25 | ) | (0.25 | ) | – | 7.95 | (36.22 | ) | 78,526 | 1.50 | 1.49 | 1.49 | 0.14 | 128 | |||||||||||||||||||||||||||||||||||||||
| 2007 | 14.09 | (0.02 | ) | 0.22 | 0.20 | – | (1.42 | ) | (1.42 | ) | 0.01 | 12.88 | 1.20 | 103,652 | 1.42 | 1.42 | 1.27 | (0.10 | ) | 138 | ||||||||||||||||||||||||||||||||||||||||
| Royce Heritage Fund – Consultant Class | ||||||||||||||||||||||||||||||||||||||||||||||||||||||||||||
| †2012 | $ | 10.64 | $ | (0.03 | ) | $ | 0.25 | $ | 0.22 | $ | – | $ | – | $ | – | $ | – | $ | 10.86 | 1.97 | %1 | $ | 13,365 | 2.31 | %2 | 2.31 | %2 | 2.31 | %2 | (0.46 | )%2 | 21 | % | |||||||||||||||||||||||||||
| 2011 | 12.50 | (0.11 | ) | (1.16 | ) | (1.27 | ) | – | (0.59 | ) | (0.59 | ) | – | 10.64 | (10.14 | ) | 13,850 | 2.28 | 2.28 | 2.28 | (0.91 | ) | 51 | |||||||||||||||||||||||||||||||||||||
| 2010 | 10.14 | (0.08 | ) | 2.73 | 2.65 | – | (0.29 | ) | (0.29 | ) | – | 12.50 | 26.22 | 12,801 | 2.36 | 2.36 | 2.36 | (0.77 | ) | 66 | ||||||||||||||||||||||||||||||||||||||||
| 2009 | 6.75 | (0.09 | ) | 3.48 | 3.39 | – | – | – | – | 10.14 | 50.22 | 7,485 | 2.55 | 2.55 | 2.49 | (1.05 | ) | 59 | ||||||||||||||||||||||||||||||||||||||||||
| 2008 | 11.10 | (0.08 | ) | (4.03 | ) | (4.11 | ) | – | (0.25 | ) | (0.25 | ) | 0.01 | 6.75 | (36.81 | ) | 4,609 | 2.69 | 2.68 | 2.49 | (0.86 | ) | 128 | |||||||||||||||||||||||||||||||||||||
| 2007 | 12.47 | (0.17 | ) | 0.21 | 0.04 | – | (1.42 | ) | (1.42 | ) | 0.01 | 11.10 | 0.07 | 6,728 | 2.61 | 2.60 | 2.49 | (1.33 | ) | 138 | ||||||||||||||||||||||||||||||||||||||||
| Royce Heritage Fund – R Class c | ||||||||||||||||||||||||||||||||||||||||||||||||||||||||||||
| †2012 | $ | 9.87 | $ | 0.00 | $ | 0.22 | $ | 0.22 | $ | – | $ | – | $ | – | $ | – | $ | 10.09 | 2.13 | %1 | $ | 5,380 | 1.87 | %2 | 1.87 | %2 | 1.84 | %2 | 0.03 | %2 | 21 | % | ||||||||||||||||||||||||||||
| 2011 | 11.63 | (0.06 | ) | (1.07 | ) | (1.13 | ) | (0.04 | ) | (0.59 | ) | (0.63 | ) | – | 9.87 | (9.73 | ) | 4,081 | 1.90 | 1.90 | 1.84 | (0.45 | ) | 51 | ||||||||||||||||||||||||||||||||||||
| 2010 | 9.43 | (0.03 | ) | 2.55 | 2.52 | (0.03 | ) | (0.29 | ) | (0.32 | ) | – | 11.63 | 26.84 | 1,909 | 2.22 | 2.22 | 1.84 | (0.25 | ) | 66 | |||||||||||||||||||||||||||||||||||||||
| 2009 | 6.23 | (0.05 | ) | 3.25 | 3.20 | – | – | – | – | 9.43 | 51.36 | 832 | 4.03 | 4.03 | 1.84 | (0.56 | ) | 59 | ||||||||||||||||||||||||||||||||||||||||||
| 2008 | 10.00 | (0.01 | ) | (3.51 | ) | (3.52 | ) | – | (0.25 | ) | (0.25 | ) | – | 6.23 | (35.05 | )1 | 65 | 19.77 | 2 | 19.76 | 2 | 1.84 | 2 | (0.27 | )2 | 128 | ||||||||||||||||||||||||||||||||||
| Royce Heritage Fund – K Class c | ||||||||||||||||||||||||||||||||||||||||||||||||||||||||||||
| †2012 | $ | 9.93 | $ | 0.01 | $ | 0.22 | $ | 0.23 | $ | – | $ | – | $ | – | $ | – | $ | 10.16 | 2.21 | %1 | $ | 5,643 | 1.69 | %2 | 1.69 | %2 | 1.59 | %2 | 0.15 | %2 | 21 | % | ||||||||||||||||||||||||||||
| 2011 | 11.68 | (0.04 | ) | (1.08 | ) | (1.12 | ) | (0.04 | ) | (0.59 | ) | (0.63 | ) | – | 9.93 | (9.53 | ) | 7,787 | 1.66 | 1.66 | 1.59 | (0.24 | ) | 51 | ||||||||||||||||||||||||||||||||||||
| 2010 | 9.46 | (0.03 | ) | 2.60 | 2.57 | (0.06 | ) | (0.29 | ) | (0.35 | ) | – | 11.68 | 27.29 | 5,214 | 1.67 | 1.67 | 1.59 | (0.00 | ) | 66 | |||||||||||||||||||||||||||||||||||||||
| 2009 | 6.24 | (0.02 | ) | 3.24 | 3.22 | – | – | – | – | 9.46 | 51.60 | 287 | 5.82 | 5.82 | 1.59 | (0.26 | ) | 59 | ||||||||||||||||||||||||||||||||||||||||||
| 2008 | 10.00 | (0.00 | ) | (3.51 | ) | (3.51 | ) | – | (0.25 | ) | (0.25 | ) | – | 6.24 | (34.95 | )1 | 65 | 19.53 | 2 | 19.53 | 2 | 1.59 | 2 | (0.02 | )2 | 128 | ||||||||||||||||||||||||||||||||||
| Royce Opportunity Fund – Investment Class | ||||||||||||||||||||||||||||||||||||||||||||||||||||||||||||
| †2012 | $ | 10.32 | $ | (0.01 | ) | $ | 1.17 | $ | 1.16 | $ | – | $ | – | $ | – | $ | – | $ | 11.48 | 11.24 | %1 | $ | 914,929 | 1.17 | %2 | 1.17 | %2 | 1.17 | %2 | (0.16 | )%2 | 18 | % | |||||||||||||||||||||||||||
| 2011 | 12.08 | (0.04 | ) | (1.53 | ) | (1.57 | ) | – | (0.19 | ) | (0.19 | ) | – | 10.32 | (12.95 | ) | 878,824 | 1.16 | 1.16 | 1.16 | (0.38 | ) | 35 | |||||||||||||||||||||||||||||||||||||
| 2010 | 9.03 | (0.04 | ) | 3.09 | 3.05 | – | – | – | – | 12.08 | 33.78 | 1,170,607 | 1.17 | 1.17 | 1.17 | (0.44 | ) | 47 | ||||||||||||||||||||||||||||||||||||||||||
| 2009 | 5.57 | (0.03 | ) | 3.49 | 3.46 | (0.00 | ) | – | (0.00 | ) | – | 9.03 | 62.14 | 836,268 | 1.22 | 1.22 | 1.22 | (0.43 | ) | 44 | ||||||||||||||||||||||||||||||||||||||||
| 2008 | 11.02 | 0.06 | (5.12 | ) | (5.06 | ) | (0.05 | ) | (0.34 | ) | (0.39 | ) | – | 5.57 | (45.73 | ) | 581,860 | 1.17 | 1.17 | 1.17 | 0.63 | 52 | ||||||||||||||||||||||||||||||||||||||
| 2007 | 13.04 | 0.06 | (0.27 | ) | (0.21 | ) | (0.07 | ) | (1.74 | ) | (1.81 | ) | – | 11.02 | (2.00 | ) | 1,550,045 | 1.11 | 1.10 | 1.10 | 0.36 | 50 | ||||||||||||||||||||||||||||||||||||||
| Royce Opportunity Fund – Service Class | ||||||||||||||||||||||||||||||||||||||||||||||||||||||||||||
| †2012 | $ | 10.03 | $ | (0.03 | ) | $ | 1.13 | $ | 1.10 | $ | – | $ | – | $ | – | $ | – | $ | 11.13 | 10.97 | %1 | $ | 169,206 | 1.49 | %2 | 1.49 | %2 | 1.49 | %2 | (0.48 | )%2 | 18 | % | |||||||||||||||||||||||||||
| 2011 | 11.78 | (0.08 | ) | (1.49 | ) | (1.57 | ) | – | (0.19 | ) | (0.19 | ) | 0.01 | 10.03 | (13.20 | ) | 160,496 | 1.48 | 1.48 | 1.48 | (0.73 | ) | 35 | |||||||||||||||||||||||||||||||||||||
| 2010 | 8.83 | (0.08 | ) | 3.03 | 2.95 | – | – | – | – | 11.78 | 33.41 | 312,728 | 1.46 | 1.46 | 1.46 | (0.78 | ) | 47 | ||||||||||||||||||||||||||||||||||||||||||
| 2009 | 5.46 | (0.05 | ) | 3.42 | 3.37 | – | – | – | – | 8.83 | 61.72 | 298,410 | 1.47 | 1.47 | 1.47 | (0.69 | ) | 44 | ||||||||||||||||||||||||||||||||||||||||||
| 2008 | 10.80 | 0.04 | (5.00 | ) | (4.96 | ) | (0.04 | ) | (0.34 | ) | (0.38 | ) | – | 5.46 | (45.76 | ) | 162,607 | 1.41 | 1.41 | 1.34 | 0.40 | 52 | ||||||||||||||||||||||||||||||||||||||
| 2007 | 12.82 | 0.02 | (0.25 | ) | (0.23 | ) | (0.05 | ) | (1.74 | ) | (1.79 | ) | – | 10.80 | (2.22 | ) | 293,012 | 1.39 | 1.39 | 1.29 | 0.14 | 50 | ||||||||||||||||||||||||||||||||||||||
| 126 | The Royce Funds 2012 Semiannual Report to Shareholders | THE ACCOMPANYING NOTES ARE AN INTEGRAL PART OF THESE FINANCIAL STATEMENTS. |
|
Financial Highlights |
| Net | Net | Net Realized and Unrealized | Distributions | Distributions from Net | Ratio of Expenses to Average Net Assets | Ratio of Net Investment | ||||||||||||||||||||||||||||||||||||||||||||||||||||||
| Asset Value, Beginning of Period | Investment Income (Loss) | Gain (Loss) on Investments and Foreign Currency | Total from Investment Operations | from Net Investment Income | Realized Gain on Investments and Foreign Currency | Total Distributions | Shareholder Redemption Fees | Net Asset Value, End of Period | Total Return | Net Assets, End of Period (in thousands) | Prior to Fee Waivers and Balance Credits | Prior to Fee Waivers | Net of Fee Waivers | Income (Loss) to Average Net Assets | Portfolio Turnover Rate | |||||||||||||||||||||||||||||||||||||||||||||
|
|
|
|
|
|
|
|
|
|
|
|
|
|
|
|
|
|
|
|
|
|
|
|
|
|
|
|
|
|
|
|
|
|
|
|
|
|
|
|
|
|
|
|
|
|
|
|
|
| |||||||||||
| Royce Opportunity Fund – Consultant Class | ||||||||||||||||||||||||||||||||||||||||||||||||||||||||||||
| †2012 | $ | 9.67 | $ | (0.07 | ) | $ | 1.10 | $ | 1.03 | $ | – | $ | – | $ | – | $ | – | $ | 10.70 | 10.65 | %1 | $ | 12,045 | 2.28 | %2 | 2.28 | %2 | 2.28 | %2 | (1.26 | )%2 | 18 | % | |||||||||||||||||||||||||||
| 2011 | 11.46 | (0.15 | ) | (1.45 | ) | (1.60 | ) | – | (0.19 | ) | (0.19 | ) | – | 9.67 | (13.91 | ) | 11,884 | 2.24 | 2.24 | 2.24 | (1.44 | ) | 35 | |||||||||||||||||||||||||||||||||||||
| 2010 | 8.66 | (0.15 | ) | 2.95 | 2.80 | – | – | – | – | 11.46 | 32.33 | 13,126 | 2.29 | 2.29 | 2.29 | (1.56 | ) | 47 | ||||||||||||||||||||||||||||||||||||||||||
| 2009 | 5.42 | (0.11 | ) | 3.35 | 3.24 | – | – | – | – | 8.66 | 59.78 | 7,500 | 2.45 | 2.45 | 2.45 | (1.66 | ) | 44 | ||||||||||||||||||||||||||||||||||||||||||
| 2008 | 10.78 | (0.07 | ) | (4.95 | ) | (5.02 | ) | – | (0.34 | ) | (0.34 | ) | – | 5.42 | (46.40 | ) | 4,707 | 2.48 | 2.47 | 2.47 | (0.74 | ) | 52 | |||||||||||||||||||||||||||||||||||||
| 2007 | 12.90 | (0.14 | ) | (0.24 | ) | (0.38 | ) | – | (1.74 | ) | (1.74 | ) | – | 10.78 | (3.34 | ) | 7,982 | 2.48 | 2.46 | 2.46 | (1.03 | ) | 50 | |||||||||||||||||||||||||||||||||||||
| Royce Opportunity Fund – Institutional Class | ||||||||||||||||||||||||||||||||||||||||||||||||||||||||||||
| †2012 | $ | 10.40 | $ | (0.00 | ) | $ | 1.17 | $ | 1.17 | $ | – | $ | – | $ | – | $ | – | $ | 11.57 | 11.25 | %1 | $ | 635,321 | 1.04 | %2 | 1.04 | %2 | 1.04 | %2 | (0.02 | )%2 | 18 | % | |||||||||||||||||||||||||||
| 2011 | 12.16 | (0.03 | ) | (1.54 | ) | (1.57 | ) | – | (0.19 | ) | (0.19 | ) | – | 10.40 | (12.86 | ) | 574,826 | 1.03 | 1.03 | 1.03 | (0.24 | ) | 35 | |||||||||||||||||||||||||||||||||||||
| 2010 | 9.07 | (0.03 | ) | 3.12 | 3.09 | – | – | – | – | 12.16 | 34.07 | 702,220 | 1.04 | 1.04 | 1.04 | (0.32 | ) | 47 | ||||||||||||||||||||||||||||||||||||||||||
| 2009 | 5.60 | (0.02 | ) | 3.50 | 3.48 | (0.01 | ) | – | (0.01 | ) | – | 9.07 | 62.23 | 502,300 | 1.04 | 1.04 | 1.04 | (0.26 | ) | 44 | ||||||||||||||||||||||||||||||||||||||||
| 2008 | 11.09 | 0.05 | (5.13 | ) | (5.08 | ) | (0.07 | ) | (0.34 | ) | (0.41 | ) | – | 5.60 | (45.66 | ) | 310,272 | 1.04 | 1.04 | 1.04 | 0.60 | 52 | ||||||||||||||||||||||||||||||||||||||
| 2007 | 13.11 | 0.06 | (0.25 | ) | (0.19 | ) | (0.09 | ) | (1.74 | ) | (1.83 | ) | – | 11.09 | (1.89 | ) | 333,452 | 1.02 | 1.02 | 1.02 | 0.47 | 50 | ||||||||||||||||||||||||||||||||||||||
| Royce Opportunity Fund – R Class b | ||||||||||||||||||||||||||||||||||||||||||||||||||||||||||||
| †2012 | $ | 9.98 | $ | (0.04 | ) | $ | 1.13 | $ | 1.09 | $ | – | $ | – | $ | – | $ | – | $ | 11.07 | 10.92 | %1 | $ | 4,639 | 1.95 | %2 | 1.95 | %2 | 1.84 | %2 | (0.82 | )%2 | 18 | % | |||||||||||||||||||||||||||
| 2011 | 11.78 | (0.10 | ) | (1.51 | ) | (1.61 | ) | – | (0.19 | ) | (0.19 | ) | – | 9.98 | (13.62 | ) | 3,088 | 2.03 | 2.03 | 1.84 | (0.98 | ) | 35 | |||||||||||||||||||||||||||||||||||||
| 2010 | 8.86 | (0.11 | ) | 3.03 | 2.92 | – | – | – | – | 11.78 | 32.96 | 1,407 | 2.88 | 2.88 | 1.84 | (1.06 | ) | 47 | ||||||||||||||||||||||||||||||||||||||||||
| 2009 | 5.50 | (0.07 | ) | 3.43 | 3.36 | – | – | – | – | 8.86 | 61.09 | 341 | 9.91 | 9.91 | 1.84 | (1.05 | ) | 44 | ||||||||||||||||||||||||||||||||||||||||||
| 2008 | 11.02 | (0.06 | ) | (5.08 | ) | (5.14 | ) | (0.04 | ) | (0.34 | ) | (0.38 | ) | – | 5.50 | (46.50 | ) | 64 | 18.28 | 18.27 | 1.84 | (0.04 | ) | 52 | ||||||||||||||||||||||||||||||||||||
| 2007 | 14.43 | (0.08 | ) | (1.57 | ) | (1.65 | ) | (0.02 | ) | (1.74 | ) | (1.76 | ) | – | 11.02 | (11.77 | )1 | 88 | 14.59 | 2 | 14.59 | 2 | 1.74 | 2 | (0.92 | )2 | 50 | |||||||||||||||||||||||||||||||||
| Royce Opportunity Fund – K Class c | ||||||||||||||||||||||||||||||||||||||||||||||||||||||||||||
| †2012 | $ | 9.33 | $ | (0.02 | ) | $ | 1.05 | $ | 1.03 | $ | – | $ | – | $ | – | $ | – | $ | 10.36 | 11.04 | %1 | $ | 7,563 | 1.47 | %2 | 1.47 | %2 | 1.47 | %2 | (0.45 | )%2 | 18 | % | |||||||||||||||||||||||||||
| 2011 | 10.98 | (0.07 | ) | (1.39 | ) | (1.46 | ) | – | (0.19 | ) | (0.19 | ) | – | 9.33 | (13.25 | ) | 6,484 | 1.46 | 1.46 | 1.46 | (0.68 | ) | 35 | |||||||||||||||||||||||||||||||||||||
| 2010 | 8.24 | (0.07 | ) | 2.81 | 2.74 | – | – | – | – | 10.98 | 33.25 | 6,657 | 1.63 | 1.63 | 1.59 | (0.76 | ) | 47 | ||||||||||||||||||||||||||||||||||||||||||
| 2009 | 5.11 | (0.06 | ) | 3.19 | 3.13 | – | – | – | – | 8.24 | 61.25 | 286 | 6.85 | 6.85 | 1.59 | (0.86 | ) | 44 | ||||||||||||||||||||||||||||||||||||||||||
| 2008 | 10.00 | (0.00 | ) | (4.51 | ) | (4.51 | ) | (0.04 | ) | (0.34 | ) | (0.38 | ) | – | 5.11 | (44.92 | )1 | 24 | 44.39 | 2 | 44.39 | 2 | 1.59 | 2 | (0.06 | )2 | 52 | |||||||||||||||||||||||||||||||||
| Royce Special Equity Fund – Investment Class | ||||||||||||||||||||||||||||||||||||||||||||||||||||||||||||
| †2012 | $ | 19.70 | $ | 0.14 | $ | 1.04 | $ | 1.18 | $ | – | $ | – | $ | – | $ | – | $ | 20.88 | 5.99 | %1 | $ | 1,927,092 | 1.13 | %2 | 1.13 | %2 | 1.13 | %2 | 1.34 | %2 | 17 | % | ||||||||||||||||||||||||||||
| 2011 | 20.87 | 0.05 | (0.05 | ) | 0.00 | (0.09 | ) | (1.08 | ) | (1.17 | ) | – | 19.70 | 0.08 | 1,677,393 | 1.15 | 1.15 | 1.15 | 0.23 | 23 | ||||||||||||||||||||||||||||||||||||||||
| 2010 | 17.50 | 0.14 | 3.29 | 3.43 | (0.06 | ) | – | (0.06 | ) | – | 20.87 | 19.61 | 1,487,632 | 1.17 | 1.16 | 1.16 | 0.78 | 21 | ||||||||||||||||||||||||||||||||||||||||||
| 2009 | 13.69 | 0.07 | 3.80 | 3.87 | (0.07 | ) | – | (0.07 | ) | 0.01 | 17.50 | 28.38 | 842,678 | 1.17 | 1.17 | 1.17 | 0.62 | 10 | ||||||||||||||||||||||||||||||||||||||||||
| 2008 | 18.27 | 0.21 | (3.83 | ) | (3.62 | ) | (0.21 | ) | (0.75 | ) | (0.96 | ) | – | 13.69 | (19.62 | ) | 316,558 | 1.15 | 1.15 | 1.15 | 1.32 | 27 | ||||||||||||||||||||||||||||||||||||||
| 2007 | 19.72 | 0.13 | 0.86 | 0.99 | (0.12 | ) | (2.32 | ) | (2.44 | ) | – | 18.27 | 4.74 | 385,864 | 1.12 | 1.11 | 1.11 | 0.57 | 29 | |||||||||||||||||||||||||||||||||||||||||
| Royce Special Equity Fund – Service Class | ||||||||||||||||||||||||||||||||||||||||||||||||||||||||||||
| †2012 | $ | 19.66 | $ | 0.11 | $ | 1.04 | $ | 1.15 | $ | – | $ | – | $ | – | $ | – | $ | 20.81 | 5.85 | %1 | $ | 236,199 | 1.41 | %2 | 1.41 | %2 | 1.39 | %2 | 1.09 | %2 | 17 | % | ||||||||||||||||||||||||||||
| 2011 | 20.83 | 0.00 | (0.05 | ) | (0.05 | ) | (0.05 | ) | (1.08 | ) | (1.13 | ) | 0.01 | 19.66 | (0.12 | ) | 216,143 | 1.45 | 1.45 | 1.39 | 0.00 | 23 | ||||||||||||||||||||||||||||||||||||||
| 2010 | 17.48 | 0.10 | 3.27 | 3.37 | (0.03 | ) | – | (0.03 | ) | 0.01 | 20.83 | 19.33 | 160,870 | 1.48 | 1.48 | 1.39 | 0.56 | 21 | ||||||||||||||||||||||||||||||||||||||||||
| 2009 | 13.69 | (0.00 | ) | 3.84 | 3.84 | (0.06 | ) | – | (0.06 | ) | 0.01 | 17.48 | 28.11 | 72,360 | 1.52 | 1.52 | 1.39 | 0.29 | 10 | |||||||||||||||||||||||||||||||||||||||||
| 2008 | 18.28 | 0.11 | (3.77 | ) | (3.66 | ) | (0.19 | ) | (0.75 | ) | (0.94 | ) | 0.01 | 13.69 | (19.74 | ) | 9,549 | 1.83 | 1.82 | 1.35 | 1.27 | 27 | ||||||||||||||||||||||||||||||||||||||
| 2007 | 19.73 | 0.03 | 0.92 | 0.95 | (0.09 | ) | (2.32 | ) | (2.41 | ) | 0.01 | 18.28 | 4.58 | 2,758 | 2.04 | 2.03 | 1.35 | 0.27 | 29 | |||||||||||||||||||||||||||||||||||||||||
| THE ACCOMPANYING NOTES ARE AN INTEGRAL PART OF THESE FINANCIAL STATEMENTS. | The Royce Funds 2012 Semiannual Report to Shareholders | 127 |
|
Financial Highlights |
|
|
|
|
|
|
|
|
|
|
|
|
|
|
|
|
|
|
|
|
|
|
|
|
|
|
|
|
|
|
|
|
|
|
|
|
|
|
|
|
|
|
|
|
|
|
|
|
|
| |||||||||||
|
| Net |
| Net |
| Net Realized and Unrealized |
|
| Distributions |
| Distributions from Net |
|
|
|
|
|
| Ratio of Expenses to Average Net Assets |
| Ratio of Net Investment |
|
| ||||||||||||||||||||||||||||||||||||||
|
| Asset Value, |
| Investment |
| Gain (Loss) on |
| Total from Investment Operations |
| from Net Investment Income |
| Realized Gain on |
| Total Distributions |
| Shareholder Redemption Fees |
| Net Asset |
| Total Return |
| Net Assets, |
| Prior to Fee |
| Prior |
| Net of |
| Income (Loss) |
| Portfolio Turnover Rate |
| |||||||||||||||||||||||||||
|
|
|
|
|
|
|
|
|
|
|
|
|
|
|
|
|
|
|
|
|
|
|
|
|
|
|
|
|
|
|
|
|
|
|
|
|
|
|
|
|
|
|
|
|
|
|
|
|
| |||||||||||
Royce Special Equity Fund – Consultant Class | ||||||||||||||||||||||||||||||||||||||||||||||||||||||||||||
†2012 |
| $ | 18.88 |
| $ | 0.03 |
| $ | 1.00 |
| $ | 1.03 |
| $ | – |
| $ | – |
| $ | – |
| $ | – |
| $ | 19.91 |
|
| 5.46 | %1 | $ | 55,198 |
|
| 2.15 | %2 |
| 2.15 | %2 |
| 2.15 | %2 |
| 0.33 | %2 |
| 17 | % | |||||||||||
2011 |
|
| 20.16 |
|
| (0.15 | ) |
| (0.05 | ) |
| (0.20 | ) |
| – |
|
| (1.08 | ) |
| (1.08 | ) |
| – |
|
| 18.88 |
|
| (0.93 | ) |
| 50,253 |
|
| 2.16 |
|
| 2.16 |
|
| 2.16 |
|
| (0.77 | ) |
| 23 |
| |||||||||||
2010 |
|
| 17.03 |
|
| (0.04 | ) |
| 3.17 |
|
| 3.13 |
|
| – |
|
| – |
|
| – |
|
| – |
|
| 20.16 |
|
| 18.38 |
|
| 38,497 |
|
| 2.17 |
|
| 2.17 |
|
| 2.17 |
|
| (0.22 | ) |
| 21 |
| |||||||||||
2009 |
|
| 13.42 |
|
| (0.06 | ) |
| 3.67 |
|
| 3.61 |
|
| – |
|
| – |
|
| – |
|
| – |
|
| 17.03 |
|
| 26.90 |
|
| 20,891 |
|
| 2.23 |
|
| 2.23 |
|
| 2.23 |
|
| (0.41 | ) |
| 10 |
| |||||||||||
2008 |
|
| 17.87 |
|
| 0.03 |
|
| (3.72 | ) |
| (3.69 | ) |
| (0.01 | ) |
| (0.75 | ) |
| (0.76 | ) |
| – |
|
| 13.42 |
|
| (20.46 | ) |
| 11,460 |
|
| 2.26 |
|
| 2.26 |
|
| 2.26 |
|
| 0.18 |
|
| 27 |
| |||||||||||
2007 |
|
| 19.43 |
|
| (0.10 | ) |
| 0.86 |
|
| 0.76 |
|
| – |
|
| (2.32 | ) |
| (2.32 | ) |
| – |
|
| 17.87 |
|
| 3.63 |
|
| 15,778 |
|
| 2.20 |
|
| 2.19 |
|
| 2.19 |
|
| (0.50 | ) |
| 29 |
| |||||||||||
Royce Special Equity Fund – Institutional Class | ||||||||||||||||||||||||||||||||||||||||||||||||||||||||||||
†2012 |
| $ | 19.63 |
| $ | 0.15 |
| $ | 1.03 |
| $ | 1.18 |
| $ | – |
| $ | – |
| $ | – |
| $ | – |
| $ | 20.81 |
|
| 6.01 | %1 | $ | 546,547 |
|
| 1.02 | %2 |
| 1.02 | %2 |
| 1.02 | %2 |
| 1.46 | %2 |
| 17 | % | |||||||||||
2011 |
|
| 20.79 |
|
| 0.07 |
|
| (0.03 | ) |
| 0.04 |
|
| (0.12 | ) |
| (1.08 | ) |
| (1.20 | ) |
| – |
|
| 19.63 |
|
| 0.25 |
|
| 481,855 |
|
| 1.03 |
|
| 1.03 |
|
| 1.03 |
|
| 0.36 |
|
| 23 |
| |||||||||||
2010 |
|
| 17.44 |
|
| 0.16 |
|
| 3.27 |
|
| 3.43 |
|
| (0.08 | ) |
| – |
|
| (0.08 | ) |
| – |
|
| 20.79 |
|
| 19.69 |
|
| 445,168 |
|
| 1.04 |
|
| 1.04 |
|
| 1.04 |
|
| 0.91 |
|
| 21 |
| |||||||||||
2009 |
|
| 13.65 |
|
| 0.11 |
|
| 3.77 |
|
| 3.88 |
|
| (0.09 | ) |
| – |
|
| (0.09 | ) |
| – |
|
| 17.44 |
|
| 28.42 |
|
| 280,253 |
|
| 1.05 |
|
| 1.05 |
|
| 1.05 |
|
| 0.81 |
|
| 10 |
| |||||||||||
2008 |
|
| 18.22 |
|
| 0.21 |
|
| (3.80 | ) |
| (3.59 | ) |
| (0.23 | ) |
| (0.75 | ) |
| (0.98 | ) |
| – |
|
| 13.65 |
|
| (19.52 | ) |
| 161,840 |
|
| 1.05 |
|
| 1.05 |
|
| 1.05 |
|
| 1.43 |
|
| 27 |
| |||||||||||
2007 |
|
| 19.68 |
|
| 0.13 |
|
| 0.87 |
|
| 1.00 |
|
| (0.14 | ) |
| (2.32 | ) |
| (2.46 | ) |
| – |
|
| 18.22 |
|
| 4.79 |
|
| 157,100 |
|
| 1.04 |
|
| 1.04 |
|
| 1.04 |
|
| 0.64 |
|
| 29 |
| |||||||||||
Royce Value Fund – Investment Class d | ||||||||||||||||||||||||||||||||||||||||||||||||||||||||||||
†2012 |
| $ | 10.97 |
| $ | 0.04 |
| $ | (0.20 | ) | $ | (0.16 | ) | $ | – |
| $ | – |
| $ | – |
| $ | – |
| $ | 10.81 |
|
| (1.46 | )%1 | $ | 213,482 |
|
| 1.18 | %2 |
| 1.18 | %2 |
| 1.18 | %2 |
| 0.63 | %2 |
| 15 | % | |||||||||||
2011 |
|
| 12.70 |
|
| 0.00 |
|
| (0.92 | ) |
| (0.92 | ) |
| (0.07 | ) |
| (0.75 | ) |
| (0.82 | ) |
| 0.01 |
|
| 10.97 |
|
| (7.17 | ) |
| 218,126 |
|
| 1.17 |
|
| 1.17 |
|
| 1.17 |
|
| 0.09 |
|
| 35 |
| |||||||||||
2010 |
|
| 10.16 |
|
| 0.03 |
|
| 2.55 |
|
| 2.58 |
|
| (0.04 | ) |
| – |
|
| (0.04 | ) |
| – |
|
| 12.70 |
|
| 25.42 |
|
| 115,007 |
|
| 1.16 |
|
| 1.16 |
|
| 1.16 |
|
| 0.32 |
|
| 35 |
| |||||||||||
2009 |
|
| 7.00 |
|
| 0.01 |
|
| 3.15 |
|
| 3.16 |
|
| – |
|
| – |
|
| – |
|
| – |
|
| 10.16 |
|
| 45.14 |
|
| 67,249 |
|
| 1.14 |
|
| 1.14 |
|
| 1.14 |
|
| 0.06 |
|
| 49 |
| |||||||||||
2008 |
|
| 10.62 |
|
| (0.01 | ) |
| (3.61 | ) |
| (3.62 | ) |
| – |
|
| – |
|
| – |
|
| – |
|
| 7.00 |
|
| (34.09 | ) |
| 18,993 |
|
| 1.16 |
|
| 1.16 |
|
| 1.16 |
|
| (0.06 | ) |
| 41 |
| |||||||||||
2007 |
|
| 11.22 |
|
| (0.32 | ) |
| 0.60 |
|
| 0.28 |
|
| (0.19 | ) |
| (0.69 | ) |
| (0.88 | ) |
| – |
|
| 10.62 |
|
| 2.36 | 1 |
| 13,233 |
|
| 1.89 | 2 |
| 1.88 | 2 |
| 1.24 | 2 |
| 0.06 | 2 |
| 67 |
| |||||||||||
Royce Value Fund – Service Class | ||||||||||||||||||||||||||||||||||||||||||||||||||||||||||||
†2012 |
| $ | 10.94 |
| $ | 0.02 |
| $ | (0.20 | ) | $ | (0.18 | ) | $ | – |
| $ | – |
| $ | – |
| $ | – |
| $ | 10.76 |
|
| (1.65 | )%1 | $ | 921,413 |
|
| 1.47 | %2 |
| 1.47 | %2 |
| 1.47 | %2 |
| 0.34 | %2 |
| 15 | % | |||||||||||
2011 |
|
| 12.65 |
|
| (0.03 | ) |
| (0.92 | ) |
| (0.95 | ) |
| (0.02 | ) |
| (0.75 | ) |
| (0.77 | ) |
| 0.01 |
|
| 10.94 |
|
| (7.41 | ) |
| 1,083,903 |
|
| 1.45 |
|
| 1.45 |
|
| 1.44 |
|
| (0.23 | ) |
| 35 |
| |||||||||||
2010 |
|
| 10.13 |
|
| 0.00 |
|
| 2.53 |
|
| 2.53 |
|
| (0.01 | ) |
| – |
|
| (0.01 | ) |
| – |
|
| 12.65 |
|
| 24.97 |
|
| 1,415,766 |
|
| 1.46 |
|
| 1.46 |
|
| 1.44 |
|
| 0.04 |
|
| 35 |
| |||||||||||
2009 |
|
| 7.00 |
|
| (0.03 | ) |
| 3.16 |
|
| 3.13 |
|
| – |
|
| – |
|
| – |
|
| – |
|
| 10.13 |
|
| 44.71 |
|
| 1,178,806 |
|
| 1.47 |
|
| 1.47 |
|
| 1.45 |
|
| (0.31 | ) |
| 49 |
| |||||||||||
2008 |
|
| 10.64 |
|
| (0.03 | ) |
| (3.62 | ) |
| (3.65 | ) |
| – |
|
| – |
|
| – |
|
| 0.01 |
|
| 7.00 |
|
| (34.21 | ) |
| 704,406 |
|
| 1.45 |
|
| 1.45 |
|
| 1.45 |
|
| (0.34 | ) |
| 41 |
| |||||||||||
2007 |
|
| 11.06 |
|
| (0.03 | ) |
| 0.45 |
|
| 0.42 |
|
| (0.16 | ) |
| (0.69 | ) |
| (0.85 | ) |
| 0.01 |
|
| 10.64 |
|
| 3.77 |
|
| 663,808 |
|
| 1.43 |
|
| 1.43 |
|
| 1.36 |
|
| (0.08 | ) |
| 67 |
| |||||||||||
Royce Value Fund – Consultant Class | ||||||||||||||||||||||||||||||||||||||||||||||||||||||||||||
†2012 |
| $ | 10.46 |
| $ | (0.02 | ) | $ | (0.19 | ) | $ | (0.21 | ) | $ | – |
| $ | – |
| $ | – |
| $ | – |
| $ | 10.25 |
|
| (2.01 | )%1 | $ | 34,710 |
|
| 2.20 | %2 |
| 2.20 | %2 |
| 2.20 | %2 |
| (0.39 | )%2 |
| 15 | % | |||||||||||
2011 |
|
| 12.21 |
|
| (0.11 | ) |
| (0.89 | ) |
| (1.00 | ) |
| – |
|
| (0.75 | ) |
| (0.75 | ) |
| – |
|
| 10.46 |
|
| (8.20 | ) |
| 36,104 |
|
| 2.17 |
|
| 2.17 |
|
| 2.17 |
|
| (0.94 | ) |
| 35 |
| |||||||||||
2010 |
|
| 9.84 |
|
| (0.07 | ) |
| 2.44 |
|
| 2.37 |
|
| – |
|
| – |
|
| – |
|
| – |
|
| 12.21 |
|
| 24.09 |
|
| 35,167 |
|
| 2.18 |
|
| 2.18 |
|
| 2.18 |
|
| (0.69 | ) |
| 35 |
| |||||||||||
2009 |
|
| 6.85 |
|
| (0.09 | ) |
| 3.08 |
|
| 2.99 |
|
| – |
|
| – |
|
| – |
|
| – |
|
| 9.84 |
|
| 43.65 |
|
| 27,625 |
|
| 2.23 |
|
| 2.23 |
|
| 2.23 |
|
| (1.09 | ) |
| 49 |
| |||||||||||
2008 |
|
| 10.50 |
|
| (0.11 | ) |
| (3.54 | ) |
| (3.65 | ) |
| – |
|
| – |
|
| – |
|
| – |
|
| 6.85 |
|
| (34.76 | ) |
| 15,915 |
|
| 2.29 |
|
| 2.28 |
|
| 2.28 |
|
| (1.18 | ) |
| 41 |
| |||||||||||
2007 |
|
| 10.98 |
|
| (0.16 | ) |
| 0.45 |
|
| 0.29 |
|
| (0.09 | ) |
| (0.69 | ) |
| (0.78 | ) |
| 0.01 |
|
| 10.50 |
|
| 2.65 |
|
| 14,374 |
|
| 2.35 |
|
| 2.33 |
|
| 2.33 |
|
| (1.05 | ) |
| 67 |
| |||||||||||
|
|
|
128 | The Royce Funds 2012 Semiannual Report to Shareholders |
| THE ACCOMPANYING NOTES ARE AN INTEGRAL PART OF THESE FINANCIAL STATEMENTS. |
|
Financial Highlights |
|
|
|
|
|
|
|
|
|
|
|
|
|
|
|
|
|
|
|
|
|
|
|
|
|
|
|
|
|
|
|
|
|
|
|
|
|
|
|
|
|
|
|
|
|
|
|
|
|
|
|
| Net |
| Net |
| Net Realized and Unrealized |
|
| Distributions |
| Distributions from Net |
|
|
|
|
|
| Ratio of Expenses to Average Net Assets |
| Ratio of Net Investment |
|
| |||||||||||||||||||||||||||
|
| Asset Value, |
| Investment |
| Gain (Loss) on |
| Total from Investment Operations |
| from Net Investment Income |
| Realized Gain on |
| Total Distributions |
| Shareholder Redemption Fees |
| Net Asset |
| Total Return |
| Net Assets, |
| Prior to Fee |
| Prior |
| Net of |
| Income (Loss) |
| Portfolio Turnover Rate |
| ||||||||||||||||
|
|
|
|
|
|
|
|
|
|
|
|
|
|
|
|
|
|
|
|
|
|
|
|
|
|
|
|
|
|
|
|
|
|
|
|
|
|
|
|
|
|
|
|
|
|
|
|
|
|
Royce Value Fund – Institutional Class | |||||||||||||||||||||||||||||||||||||||||||||||||
†2012 |
| $ | 10.98 |
| $ | 0.05 |
| $ | (0.21 | ) | $ | (0.16 | ) | $ | – |
| $ | – |
| $ | – |
| $ | – |
| $ | 10.82 |
|
| (1.46 | )%1 | $ | 192,782 |
|
| 1.05 | %2 |
| 1.05 | %2 |
| 1.05 | %2 |
| 0.78 | %2 |
| 15 | % |
2011 |
|
| 12.71 |
|
| 0.03 |
|
| (0.94 | ) |
| (0.91 | ) |
| (0.07 | ) |
| (0.75 | ) |
| (0.82 | ) |
| – |
|
| 10.98 |
|
| (7.12 | ) |
| 190,591 |
|
| 1.04 |
|
| 1.04 |
|
| 1.04 |
|
| 0.19 |
|
| 35 |
|
2010 |
|
| 10.17 |
|
| 0.05 |
|
| 2.54 |
|
| 2.59 |
|
| (0.05 | ) |
| – |
|
| (0.05 | ) |
| – |
|
| 12.71 |
|
| 25.52 |
|
| 219,111 |
|
| 1.04 |
|
| 1.04 |
|
| 1.04 |
|
| 0.45 |
|
| 35 |
|
2009 |
|
| 7.00 |
|
| 0.01 |
|
| 3.16 |
|
| 3.17 |
|
| – |
|
| – |
|
| – |
|
| – |
|
| 10.17 |
|
| 45.29 |
|
| 167,215 |
|
| 1.04 |
|
| 1.04 |
|
| 1.04 |
|
| 0.10 |
|
| 49 |
|
2008 |
|
| 10.61 |
|
| 0.00 |
|
| (3.61 | ) |
| (3.61 | ) |
| – |
|
| – |
|
| – |
|
| – |
|
| 7.00 |
|
| (34.02 | ) |
| 114,244 |
|
| 1.04 |
|
| 1.04 |
|
| 1.04 |
|
| 0.03 |
|
| 41 |
|
2007 |
|
| 11.04 |
|
| 0.02 |
|
| 0.43 |
|
| 0.45 |
|
| (0.19 | ) |
| (0.69 | ) |
| (0.88 | ) |
| – |
|
| 10.61 |
|
| 4.00 |
|
| 172,877 |
|
| 1.03 |
|
| 1.03 |
|
| 1.03 |
|
| 0.25 |
|
| 67 |
|
Royce Value Fund – R Class f | |||||||||||||||||||||||||||||||||||||||||||||||||
†2012 |
| $ | 10.78 |
| $ | 0.00 |
| $ | (0.19 | ) | $ | (0.19 | ) | $ | – |
| $ | – |
| $ | – |
| $ | – |
| $ | 10.59 |
|
| (1.76 | )%1 | $ | 36,685 |
|
| 1.76 | %2 |
| 1.76 | %2 |
| 1.76 | %2 |
| 0.06 | %2 |
| 15 | % |
2011 |
|
| 12.54 |
|
| (0.06 | ) |
| (0.91 | ) |
| (0.97 | ) |
| (0.04 | ) |
| (0.75 | ) |
| (0.79 | ) |
| – |
|
| 10.78 |
|
| (7.75 | ) |
| 34,151 |
|
| 1.68 |
|
| 1.68 |
|
| 1.68 |
|
| (0.44 | ) |
| 35 |
|
2010 |
|
| 10.05 |
|
| (0.02 | ) |
| 2.51 |
|
| 2.49 |
|
| (0.00 | ) |
| – |
|
| (0.00 | ) |
| – |
|
| 12.54 |
|
| 24.81 |
|
| 26,524 |
|
| 1.68 |
|
| 1.67 |
|
| 1.67 |
|
| (0.16 | ) |
| 35 |
|
2009 |
|
| 6.97 |
|
| (0.06 | ) |
| 3.14 |
|
| 3.08 |
|
| – |
|
| – |
|
| – |
|
| – |
|
| 10.05 |
|
| 44.19 |
|
| 6,114 |
|
| 2.08 |
|
| 2.08 |
|
| 1.84 |
|
| (0.68 | ) |
| 49 |
|
2008 |
|
| 10.63 |
|
| (0.06 | ) |
| (3.62 | ) |
| (3.68 | ) |
| – |
|
| – |
|
| – |
|
| 0.02 |
|
| 6.97 |
|
| (34.43 | ) |
| 326 |
|
| 6.72 |
|
| 6.71 |
|
| 1.84 |
|
| (0.68 | ) |
| 41 |
|
2007 |
|
| 11.64 |
|
| (0.01 | ) |
| (0.14 | ) |
| (0.15 | ) |
| (0.17 | ) |
| (0.69 | ) |
| (0.86 | ) |
| – |
|
| 10.63 |
|
| (1.39 | )1 |
| 99 |
|
| 16.39 | 2 |
| 16.39 | 2 |
| 1.74 | 2 |
| (0.26 | )2 |
| 67 |
|
Royce Value Fund – K Class c | |||||||||||||||||||||||||||||||||||||||||||||||||
†2012 |
| $ | 8.95 |
| $ | 0.02 |
| $ | (0.17 | ) | $ | (0.15 | ) | $ | – |
| $ | – |
| $ | – |
| $ | – |
| $ | 8.80 |
|
| (1.68 | )%1 | $ | 16,290 |
|
| 1.53 | %2 |
| 1.53 | %2 |
| 1.53 | %2 |
| 0.32 | %2 |
| 15 | % |
2011 |
|
| 10.54 |
|
| (0.03 | ) |
| (0.77 | ) |
| (0.80 | ) |
| (0.04 | ) |
| (0.75 | ) |
| (0.79 | ) |
| – |
|
| 8.95 |
|
| (7.54 | ) |
| 14,079 |
|
| 1.54 |
|
| 1.54 |
|
| 1.54 |
|
| (0.33 | ) |
| 35 |
|
2010 |
|
| 8.46 |
|
| (0.00 | ) |
| 2.10 |
|
| 2.10 |
|
| (0.02 | ) |
| – |
|
| (0.02 | ) |
| – |
|
| 10.54 |
|
| 24.82 |
|
| 13,195 |
|
| 1.50 |
|
| 1.50 |
|
| 1.50 |
|
| 0.01 |
|
| 35 |
|
2009 |
|
| 5.91 |
|
| (0.03 | ) |
| 2.58 |
|
| 2.55 |
|
| – |
|
| – |
|
| – |
|
| – |
|
| 8.46 |
|
| 43.15 |
|
| 4,721 |
|
| 1.73 |
|
| 1.73 |
|
| 1.59 |
|
| (0.43 | ) |
| 49 |
|
2008 |
|
| 10.00 |
|
| (0.01 | ) |
| (4.08 | ) |
| (4.09 | ) |
| – |
|
| – |
|
| – |
|
| – |
|
| 5.91 |
|
| (40.90 | )1 |
| 1,550 |
|
| 9.63 | 2 |
| 9.63 | 2 |
| 1.59 | 2 |
| (0.35 | )2 |
| 41 |
|
Royce Value Plus Fund – Investment Class d | |||||||||||||||||||||||||||||||||||||||||||||||||
†2012 |
| $ | 12.04 |
| $ | (0.03 | ) | $ | 0.77 |
| $ | 0.74 |
| $ | – |
| $ | – |
| $ | – |
| $ | – |
| $ | 12.78 |
|
| 6.15 | %1 | $ | 267,872 |
|
| 1.18 | %2 |
| 1.18 | %2 |
| 1.18 | %2 |
| (0.42 | )%2 |
| 15 | % |
2011 |
|
| 13.52 |
|
| (0.06 | ) |
| (1.27 | ) |
| (1.33 | ) |
| (0.15 | ) |
| – |
|
| (0.15 | ) |
| – |
|
| 12.04 |
|
| (9.79 | ) |
| 298,073 |
|
| 1.13 |
|
| 1.13 |
|
| 1.13 |
|
| (0.42 | ) |
| 49 |
|
2010 |
|
| 11.31 |
|
| (0.02 | ) |
| 2.31 |
|
| 2.29 |
|
| (0.08 | ) |
| – |
|
| (0.08 | ) |
| – |
|
| 13.52 |
|
| 20.25 |
|
| 305,161 |
|
| 1.08 |
|
| 1.08 |
|
| 1.08 |
|
| (0.14 | ) |
| 48 |
|
2009 |
|
| 7.97 |
|
| 0.01 |
|
| 3.33 |
|
| 3.34 |
|
| – |
|
| – |
|
| – |
|
| – |
|
| 11.31 |
|
| 41.91 |
|
| 261,906 |
|
| 1.06 |
|
| 1.06 |
|
| 1.06 |
|
| 0.13 |
|
| 39 |
|
2008 |
|
| 13.80 |
|
| (0.02 | ) |
| (5.63 | ) |
| (5.65 | ) |
| – |
|
| (0.18 | ) |
| (0.18 | ) |
| – |
|
| 7.97 |
|
| (40.88 | ) |
| 122,043 |
|
| 1.07 |
|
| 1.07 |
|
| 1.07 |
|
| (0.15 | ) |
| 42 |
|
2007 |
|
| 14.38 |
|
| (0.61 | ) |
| 0.81 |
|
| 0.20 |
|
| (0.21 | ) |
| (0.58 | ) |
| (0.79 | ) |
| 0.01 |
|
| 13.80 |
|
| 1.33 | 1 |
| 66,888 |
|
| 1.33 | 2 |
| 1.32 | 2 |
| 1.24 | 2 |
| (0.24 | )2 |
| 42 |
|
Royce Value Plus Fund – Service Class | |||||||||||||||||||||||||||||||||||||||||||||||||
†2012 |
| $ | 12.00 |
| $ | (0.05 | ) | $ | 0.76 |
| $ | 0.71 |
| $ | – |
| $ | – |
| $ | – |
| $ | – |
| $ | 12.71 |
|
| 5.92 | %1 | $ | 1,197,884 |
|
| 1.49 | %2 |
| 1.49 | %2 |
| 1.48 | %2 |
| (0.71 | )%2 |
| 15 | % |
2011 |
|
| 13.42 |
|
| (0.08 | ) |
| (1.26 | ) |
| (1.34 | ) |
| (0.08 | ) |
| – |
|
| (0.08 | ) |
| – |
|
| 12.00 |
|
| (9.98 | ) |
| 1,417,973 |
|
| 1.44 |
|
| 1.44 |
|
| 1.42 |
|
| (0.74 | ) |
| 49 |
|
2010 |
|
| 11.24 |
|
| (0.06 | ) |
| 2.27 |
|
| 2.21 |
|
| (0.03 | ) |
| – |
|
| (0.03 | ) |
| – |
|
| 13.42 |
|
| 19.70 |
|
| 2,454,325 |
|
| 1.44 |
|
| 1.44 |
|
| 1.42 |
|
| (0.53 | ) |
| 48 |
|
2009 |
|
| 7.95 |
|
| (0.02 | ) |
| 3.31 |
|
| 3.29 |
|
| – |
|
| – |
|
| – |
|
| – |
|
| 11.24 |
|
| 41.38 |
|
| 2,505,017 |
|
| 1.47 |
|
| 1.47 |
|
| 1.45 |
|
| (0.25 | ) |
| 39 |
|
2008 |
|
| 13.81 |
|
| (0.06 | ) |
| (5.62 | ) |
| (5.68 | ) |
| – |
|
| (0.18 | ) |
| (0.18 | ) |
| – |
|
| 7.95 |
|
| (41.07 | ) |
| 1,709,764 |
|
| 1.44 |
|
| 1.43 |
|
| 1.43 |
|
| (0.53 | ) |
| 42 |
|
2007 |
|
| 14.09 |
|
| (0.08 | ) |
| 0.54 |
|
| 0.46 |
|
| (0.17 | ) |
| (0.58 | ) |
| (0.75 | ) |
| 0.01 |
|
| 13.81 |
|
| 3.24 |
|
| 2,690,448 |
|
| 1.41 |
|
| 1.40 |
|
| 1.33 |
|
| (0.37 | ) |
| 42 |
|
Royce Value Plus Fund – Consultant Class | |||||||||||||||||||||||||||||||||||||||||||||||||
†2012 |
| $ | 11.60 |
| $ | (0.09 | ) | $ | 0.73 |
| $ | 0.64 |
| $ | – |
| $ | – |
| $ | – |
| $ | – |
| $ | 12.24 |
|
| 5.52 | %1 | $ | 19,849 |
|
| 2.28 | %2 |
| 2.28 | %2 |
| 2.28 | %2 |
| (1.51 | )%2 |
| 15 | % |
2011 |
|
| 12.99 |
|
| (0.19 | ) |
| (1.20 | ) |
| (1.39 | ) |
| – |
|
| – |
|
| – |
|
| – |
|
| 11.60 |
|
| (10.70 | ) |
| 20,245 |
|
| 2.19 |
|
| 2.19 |
|
| 2.19 |
|
| (1.50 | ) |
| 49 |
|
2010 |
|
| 10.93 |
|
| (0.14 | ) |
| 2.20 |
|
| 2.06 |
|
| – |
|
| – |
|
| – |
|
| – |
|
| 12.99 |
|
| 18.85 |
|
| 30,279 |
|
| 2.16 |
|
| 2.16 |
|
| 2.16 |
|
| (1.26 | ) |
| 48 |
|
2009 |
|
| 7.79 |
|
| (0.09 | ) |
| 3.23 |
|
| 3.14 |
|
| – |
|
| – |
|
| – |
|
| – |
|
| 10.93 |
|
| 40.31 |
|
| 31,154 |
|
| 2.20 |
|
| 2.20 |
|
| 2.20 |
|
| (0.98 | ) |
| 39 |
|
2008 |
|
| 13.65 |
|
| (0.15 | ) |
| (5.53 | ) |
| (5.68 | ) |
| – |
|
| (0.18 | ) |
| (0.18 | ) |
| – |
|
| 7.79 |
|
| (41.55 | ) |
| 26,024 |
|
| 2.21 |
|
| 2.21 |
|
| 2.21 |
|
| (1.30 | ) |
| 42 |
|
2007 |
|
| 13.97 |
|
| (0.20 | ) |
| 0.54 |
|
| 0.34 |
|
| (0.09 | ) |
| (0.58 | ) |
| (0.67 | ) |
| 0.01 |
|
| 13.65 |
|
| 2.40 |
|
| 47,409 |
|
| 2.18 |
|
| 2.16 |
|
| 2.16 |
|
| (1.18 | ) |
| 42 |
|
|
|
|
THE ACCOMPANYING NOTES ARE AN INTEGRAL PART OF THESE FINANCIAL STATEMENTS. |
| The Royce Funds 2012 Semiannual Report to Shareholders | 129 |
|
Financial Highlights |
|
|
|
|
|
|
|
|
|
|
|
|
|
|
|
|
|
|
|
|
|
|
|
|
|
|
|
|
|
|
|
|
|
|
|
|
|
|
|
|
|
|
|
|
|
|
|
|
|
|
|
| Net |
| Net |
| Net Realized and Unrealized |
|
| Distributions |
| Distributions from Net |
|
|
|
|
|
| Ratio of Expenses to Average Net Assets |
| Ratio of Net Investment |
|
| |||||||||||||||||||||||||||
|
| Asset Value, |
| Investment |
| Gain (Loss) on |
| Total from Investment Operations |
| from Net Investment Income |
| Realized Gain on |
| Total Distributions |
| Shareholder Redemption Fees |
| Net Asset |
| Total Return |
| Net Assets, |
| Prior to Fee |
| Prior |
| Net of |
| Income (Loss) |
| Portfolio Turnover Rate |
| ||||||||||||||||
|
|
|
|
|
|
|
|
|
|
|
|
|
|
|
|
|
|
|
|
|
|
|
|
|
|
|
|
|
|
|
|
|
|
|
|
|
|
|
|
|
|
|
|
|
|
|
|
|
|
Royce Value Plus Fund – Institutional Class | |||||||||||||||||||||||||||||||||||||||||||||||||
†2012 |
| $ | 12.05 |
| $ | (0.02 | ) | $ | 0.76 |
| $ | 0.74 |
| $ | – |
| $ | – |
| $ | – |
| $ | – |
| $ | 12.79 |
|
| 6.14 | %1 | $ | 224,067 |
|
| 1.08 | %2 |
| 1.08 | %2 |
| 1.08 | %2 |
| (0.31 | )%2 |
| 15 | % |
2011 |
|
| 13.52 |
|
| (0.01 | ) |
| (1.30 | ) |
| (1.31 | ) |
| (0.16 | ) |
| – |
|
| (0.16 | ) |
| – |
|
| 12.05 |
|
| (9.70 | ) |
| 261,425 |
|
| 1.05 |
|
| 1.05 |
|
| 1.05 |
|
| (0.36 | ) |
| 49 |
|
2010 |
|
| 11.31 |
|
| (0.01 | ) |
| 2.30 |
|
| 2.29 |
|
| (0.08 | ) |
| – |
|
| (0.08 | ) |
| – |
|
| 13.52 |
|
| 20.25 |
|
| 425,911 |
|
| 1.04 |
|
| 1.04 |
|
| 1.04 |
|
| (0.12 | ) |
| 48 |
|
2009 |
|
| 7.97 |
|
| 0.01 |
|
| 3.33 |
|
| 3.34 |
|
| – |
|
| – |
|
| – |
|
| – |
|
| 11.31 |
|
| 41.91 |
|
| 357,734 |
|
| 1.06 |
|
| 1.06 |
|
| 1.06 |
|
| 0.08 |
|
| 39 |
|
2008 |
|
| 13.80 |
|
| (0.01 | ) |
| (5.64 | ) |
| (5.65 | ) |
| – |
|
| (0.18 | ) |
| (0.18 | ) |
| – |
|
| 7.97 |
|
| (40.88 | ) |
| 143,315 |
|
| 1.04 |
|
| 1.04 |
|
| 1.04 |
|
| (0.13 | ) |
| 42 |
|
2007 |
|
| 14.08 |
|
| (0.17 | ) |
| 0.68 |
|
| 0.51 |
|
| (0.21 | ) |
| (0.58 | ) |
| (0.79 | ) |
| – |
|
| 13.80 |
|
| 3.52 |
|
| 143,312 |
|
| 1.05 |
|
| 1.04 |
|
| 1.04 |
|
| (0.05 | ) |
| 42 |
|
Royce Value Plus Fund – R Class f | |||||||||||||||||||||||||||||||||||||||||||||||||
†2012 |
| $ | 11.77 |
| $ | (0.07 | ) | $ | 0.75 |
| $ | 0.68 |
| $ | – |
| $ | – |
| $ | – |
| $ | – |
| $ | 12.45 |
|
| 5.78 | %1 | $ | 1,378 |
|
| 2.35 | %2 |
| 2.35 | %2 |
| 1.84 | %2 |
| (1.04 | )%2 |
| 15 | % |
2011 |
|
| 13.24 |
|
| (0.15 | ) |
| (1.23 | ) |
| (1.38 | ) |
| (0.09 | ) |
| – |
|
| (0.09 | ) |
| – |
|
| 11.77 |
|
| (10.40 | ) |
| 1,079 |
|
| 2.45 |
|
| 2.45 |
|
| 1.84 |
|
| (1.12 | ) |
| 49 |
|
2010 |
|
| 11.13 |
|
| (0.11 | ) |
| 2.26 |
|
| 2.15 |
|
| (0.04 | ) |
| – |
|
| (0.04 | ) |
| – |
|
| 13.24 |
|
| 19.34 |
|
| 942 |
|
| 2.75 |
|
| 2.75 |
|
| 1.84 |
|
| (0.90 | ) |
| 48 |
|
2009 |
|
| 7.91 |
|
| (0.06 | ) |
| 3.28 |
|
| 3.22 |
|
| – |
|
| – |
|
| – |
|
| – |
|
| 11.13 |
|
| 40.71 |
|
| 642 |
|
| 3.76 |
|
| 3.76 |
|
| 1.84 |
|
| (0.70 | ) |
| 39 |
|
2008 |
|
| 13.80 |
|
| (0.09 | ) |
| (5.62 | ) |
| (5.71 | ) |
| – |
|
| (0.18 | ) |
| (0.18 | ) |
| – |
|
| 7.91 |
|
| (41.31 | ) |
| 331 |
|
| 6.62 |
|
| 6.62 |
|
| 1.84 |
|
| (0.92 | ) |
| 42 |
|
2007 |
|
| 15.16 |
|
| (0.03 | ) |
| (0.57 | ) |
| (0.60 | ) |
| (0.18 | ) |
| (0.58 | ) |
| (0.76 | ) |
| – |
|
| 13.80 |
|
| (4.05 | )1 |
| 96 |
|
| 16.18 | 2 |
| 16.18 | 2 |
| 1.74 | 2 |
| (0.68 | )2 |
| 42 |
|
Royce Value Plus Fund – K Class c | |||||||||||||||||||||||||||||||||||||||||||||||||
†2012 |
| $ | 8.78 |
| $ | (0.04 | ) | $ | 0.56 |
| $ | 0.52 |
| $ | – |
| $ | – |
| $ | – |
| $ | – |
| $ | 9.30 |
|
| 5.92 | %1 | $ | 554 |
|
| 3.04 | %2 |
| 3.04 | %2 |
| 1.59 | %2 |
| (0.80 | )%2 |
| 15 | % |
2011 |
|
| 9.77 |
|
| (0.08 | ) |
| (0.91 | ) |
| (0.99 | ) |
| – |
|
| – |
|
| – |
|
| – |
|
| 8.78 |
|
| (10.13 | ) |
| 501 |
|
| 1.86 |
|
| 1.86 |
|
| 1.59 |
|
| (0.86 | ) |
| 49 |
|
2010 |
|
| 8.22 |
|
| (0.06 | ) |
| 1.67 |
|
| 1.61 |
|
| (0.06 | ) |
| – |
|
| (0.06 | ) |
| – |
|
| 9.77 |
|
| 19.55 |
|
| 1,851 |
|
| 1.88 |
|
| 1.88 |
|
| 1.59 |
|
| (0.67 | ) |
| 48 |
|
2009 |
|
| 5.82 |
|
| (0.03 | ) |
| 2.43 |
|
| 2.40 |
|
| – |
|
| – |
|
| – |
|
| – |
|
| 8.22 |
|
| 41.24 |
|
| 1,363 |
|
| 2.46 |
|
| 2.45 |
|
| 1.59 |
|
| (0.38 | ) |
| 39 |
|
2008 |
|
| 10.00 |
|
| (0.04 | ) |
| (3.96 | ) |
| (4.00 | ) |
| – |
|
| (0.18 | ) |
| (0.18 | ) |
| – |
|
| 5.82 |
|
| (39.91 | )1 |
| 31 |
|
| 39.36 | 2 |
| 39.36 | 2 |
| 1.59 | 2 |
| (0.75 | )2 |
| 42 |
|
Royce 100 Fund – Investment Class d | |||||||||||||||||||||||||||||||||||||||||||||||||
†2012 |
| $ | 8.74 |
| $ | 0.06 |
| $ | 0.11 |
| $ | 0.17 |
| $ | – |
| $ | – |
| $ | – |
| $ | – |
| $ | 8.91 |
|
| 1.95 | %1 | $ | 73,443 |
|
| 1.18 | %2 |
| 1.18 | %2 |
| 1.18 | %2 |
| 1.28 | %2 |
| 7 | % |
2011 |
|
| 9.82 |
|
| (0.03 | ) |
| (0.60 | ) |
| (0.63 | ) |
| (0.00 | ) |
| (0.45 | ) |
| (0.45 | ) |
| – |
|
| 8.74 |
|
| (6.31 | ) |
| 63,012 |
|
| 1.17 |
|
| 1.17 |
|
| 1.17 |
|
| (0.27 | ) |
| 27 |
|
2010 |
|
| 7.94 |
|
| 0.03 |
|
| 1.96 |
|
| 1.99 |
|
| – |
|
| (0.11 | ) |
| (0.11 | ) |
| – |
|
| 9.82 |
|
| 25.06 |
|
| 66,011 |
|
| 1.17 |
|
| 1.17 |
|
| 1.17 |
|
| 0.33 |
|
| 27 |
|
2009 |
|
| 5.74 |
|
| 0.00 |
|
| 2.20 |
|
| 2.20 |
|
| – |
|
| – |
|
| – |
|
| – |
|
| 7.94 |
|
| 38.33 |
|
| 35,165 |
|
| 1.22 |
|
| 1.22 |
|
| 1.22 |
|
| 0.03 |
|
| 42 |
|
2008 |
|
| 8.23 |
|
| 0.01 |
|
| (2.41 | ) |
| (2.40 | ) |
| – |
|
| (0.09 | ) |
| (0.09 | ) |
| – |
|
| 5.74 |
|
| (29.13 | ) |
| 15,748 |
|
| 1.39 |
|
| 1.39 |
|
| 1.24 |
|
| 0.21 |
|
| 72 |
|
2007 |
|
| 8.42 |
|
| 0.00 |
|
| 0.54 |
|
| 0.54 |
|
| – |
|
| (0.73 | ) |
| (0.73 | ) |
| – |
|
| 8.23 |
|
| 6.20 | 1 |
| 7,246 |
|
| 3.37 | 2 |
| 3.36 | 2 |
| 1.24 | 2 |
| 0.04 | 2 |
| 85 |
|
Royce 100 Fund – Service Class | |||||||||||||||||||||||||||||||||||||||||||||||||
†2012 |
| $ | 8.67 |
| $ | 0.05 |
| $ | 0.10 |
| $ | 0.15 |
| $ | – |
| $ | – |
| $ | – |
| $ | – |
| $ | 8.82 |
|
| 1.73 | %1 | $ | 271,893 |
|
| 1.48 | %2 |
| 1.48 | %2 |
| 1.44 | %2 |
| 1.04 | %2 |
| 7 | % |
2011 |
|
| 9.76 |
|
| (0.05 | ) |
| (0.59 | ) |
| (0.64 | ) |
| – |
|
| (0.45 | ) |
| (0.45 | ) |
| – |
|
| 8.67 |
|
| (6.52 | ) |
| 310,825 |
|
| 1.47 |
|
| 1.47 |
|
| 1.42 |
|
| (0.53 | ) |
| 27 |
|
2010 |
|
| 7.91 |
|
| 0.00 |
|
| 1.96 |
|
| 1.96 |
|
| – |
|
| (0.11 | ) |
| (0.11 | ) |
| – |
|
| 9.76 |
|
| 24.77 |
|
| 366,184 |
|
| 1.50 |
|
| 1.50 |
|
| 1.46 |
|
| 0.03 |
|
| 27 |
|
2009 |
|
| 5.73 |
|
| (0.01 | ) |
| 2.19 |
|
| 2.18 |
|
| – |
|
| – |
|
| – |
|
| – |
|
| 7.91 |
|
| 38.05 |
|
| 197,607 |
|
| 1.54 |
|
| 1.54 |
|
| 1.49 |
|
| (0.19 | ) |
| 42 |
|
2008 |
|
| 8.22 |
|
| (0.01 | ) |
| (2.40 | ) |
| (2.41 | ) |
| – |
|
| (0.09 | ) |
| (0.09 | ) |
| 0.01 |
|
| 5.73 |
|
| (29.17 | ) |
| 43,882 |
|
| 1.57 |
|
| 1.56 |
|
| 1.49 |
|
| (0.10 | ) |
| 72 |
|
2007 |
|
| 8.32 |
|
| (0.01 | ) |
| 0.64 |
|
| 0.63 |
|
| – |
|
| (0.73 | ) |
| (0.73 | ) |
| – |
|
| 8.22 |
|
| 7.34 |
|
| 28,749 |
|
| 1.56 |
|
| 1.56 |
|
| 1.31 |
|
| (0.08 | ) |
| 85 |
|
Royce 100 Fund – R Class c | |||||||||||||||||||||||||||||||||||||||||||||||||
†2012 |
| $ | 10.46 |
| $ | 0.04 |
| $ | 0.12 |
| $ | 0.16 |
| $ | – |
| $ | – |
| $ | – |
| $ | – |
| $ | 10.62 |
|
| 1.53 | %1 | $ | 4,204 |
|
| 2.43 | %2 |
| 2.43 | %2 |
| 1.84 | %2 |
| 0.66 | %2 |
| 7 | % |
2011 |
|
| 11.72 |
|
| (0.10 | ) |
| (0.71 | ) |
| (0.81 | ) |
| – |
|
| (0.45 | ) |
| (0.45 | ) |
| – |
|
| 10.46 |
|
| (6.88 | ) |
| 3,469 |
|
| 2.70 |
|
| 2.69 |
|
| 1.84 |
|
| (0.88 | ) |
| 27 | |
2010 |
|
| 9.52 |
|
| (0.03 | ) |
| 2.34 |
|
| 2.31 |
|
| – |
|
| (0.11 | ) |
| (0.11 | ) |
| – |
|
| 11.72 |
|
| 24.26 |
|
| 1,358 |
|
| 2.22 |
|
| 2.21 |
|
| 1.84 |
|
| (0.29 | ) |
| 27 |
|
2009 |
|
| 6.93 |
|
| (0.05 | ) |
| 2.64 |
|
| 2.59 |
|
| – |
|
| – |
|
| – |
|
| – |
|
| 9.52 |
|
| 37.37 |
|
| 296 |
|
| 6.58 |
|
| 6.57 |
|
| 1.84 |
|
| (0.56 | ) |
| 42 |
|
2008 |
|
| 10.00 |
|
| (0.02 | ) |
| (2.96 | ) |
| (2.98 | ) |
| – |
|
| (0.09 | ) |
| (0.09 | ) |
| – |
|
| 6.93 |
|
| (29.78 | )1 |
| 70 |
|
| 18.97 | 2 |
| 18.97 | 2 |
| 1.84 | 2 |
| (0.44 | )2 |
| 72 |
|
|
|
|
130 | The Royce Funds 2012 Semiannual Report to Shareholders |
| THE ACCOMPANYING NOTES ARE AN INTEGRAL PART OF THESE FINANCIAL STATEMENTS. |
|
Financial Highlights |
|
|
|
|
|
|
|
|
|
|
|
|
|
|
|
|
|
|
|
|
|
|
|
|
|
|
|
|
|
|
|
|
|
|
|
|
|
|
|
|
|
|
|
|
|
|
|
|
|
| |||||||||||
|
| Net |
| Net |
| Net Realized and Unrealized |
|
| Distributions |
| Distributions from Net |
|
|
|
|
|
| Ratio of Expenses to Average Net Assets |
| Ratio of Net Investment |
|
| ||||||||||||||||||||||||||||||||||||||
|
| Asset Value, |
| Investment |
| Gain (Loss) on |
| Total from Investment Operations |
| from Net Investment Income |
| Realized Gain on |
| Total Distributions |
| Shareholder Redemption Fees |
| Net Asset |
| Total Return |
| Net Assets, |
| Prior to Fee |
| Prior |
| Net of |
| Income (Loss) |
| Portfolio Turnover Rate |
| |||||||||||||||||||||||||||
|
|
|
|
|
|
|
|
|
|
|
|
|
|
|
|
|
|
|
|
|
|
|
|
|
|
|
|
|
|
|
|
|
|
|
|
|
|
|
|
|
|
|
|
|
|
|
|
|
| |||||||||||
Royce 100 Fund – K Class c | ||||||||||||||||||||||||||||||||||||||||||||||||||||||||||||
†2012 |
| $ | 10.56 |
| $ | 0.05 |
| $ | 0.14 |
| $ | 0.19 |
| $ | – |
| $ | – |
| $ | – |
| $ | – |
| $ | 10.75 |
|
| 1.80 | %1 | $ | 4,329 |
|
| 1.68 | %2 |
| 1.68 | %2 |
| 1.59 | %2 |
| 0.89 | %2 |
| 7 | % | |||||||||||
2011 |
|
| 11.81 |
|
| (0.08 | ) |
| (0.72 | ) |
| (0.80 | ) |
| – |
|
| (0.45 | ) |
| (0.45 | ) |
| – |
|
| 10.56 |
|
| (6.75 | ) |
| 4,447 |
|
| 1.66 |
|
| 1.66 |
|
| 1.59 |
|
| (0.68 | ) |
| 27 |
| |||||||||||
2010 |
|
| 9.57 |
|
| 0.02 |
|
| 2.33 |
|
| 2.35 |
|
| – |
|
| (0.11 | ) |
| (0.11 | ) |
| – |
|
| 11.81 |
|
| 24.55 |
|
| 2,915 |
|
| 1.89 |
|
| 1.89 |
|
| 1.59 |
|
| 0.20 |
|
| 27 |
| |||||||||||
2009 |
|
| 6.94 |
|
| (0.03 | ) |
| 2.66 |
|
| 2.63 |
|
| – |
|
| – |
|
| – |
|
| – |
|
| 9.57 |
|
| 37.90 |
|
| 186 |
|
| 5.78 |
|
| 5.78 |
|
| 1.59 |
|
| (0.41 | ) |
| 42 |
| |||||||||||
2008 |
|
| 10.00 |
|
| (0.01 | ) |
| (2.96 | ) |
| (2.97 | ) |
| – |
|
| (0.09 | ) |
| (0.09 | ) |
| – |
|
| 6.94 |
|
| (29.68 | )1 |
| 95 |
|
| 17.55 | 2 |
| 17.55 | 2 |
| 1.59 | 2 |
| (0.13 | )2 |
| 72 |
| |||||||||||
Royce Micro-Cap Discovery Fund – Service Class | ||||||||||||||||||||||||||||||||||||||||||||||||||||||||||||
†2012 |
| $ | 5.12 |
| $ | (0.02 | ) | $ | 0.03 |
| $ | 0.01 |
| $ | – |
| $ | – |
| $ | – |
| $ | – |
| $ | 5.13 |
|
| 0.20 | %1 | $ | 3,745 |
|
| 3.17 | %2 |
| 3.17 | %2 |
| 1.49 | %2 |
| (0.70 | )%2 |
| 36 | % | |||||||||||
2011 |
|
| 5.24 |
|
| (0.04 | ) |
| (0.09 | ) |
| (0.13 | ) |
| (0.00 | ) |
| – |
|
| (0.00 | ) |
| 0.01 |
|
| 5.12 |
|
| (2.24 | ) |
| 3,621 |
|
| 2.99 |
|
| 2.99 |
|
| 1.49 |
|
| (0.71 | ) |
| 72 |
| |||||||||||
2010 |
|
| 4.38 |
|
| (0.01 | ) |
| 0.87 |
|
| 0.86 |
|
| – |
|
| – |
|
| – |
|
| – |
|
| 5.24 |
|
| 19.63 |
|
| 3,637 |
|
| 3.04 |
|
| 3.04 |
|
| 1.49 |
|
| (0.19 | ) |
| 105 |
| |||||||||||
2009 |
|
| 3.48 |
|
| (0.01 | ) |
| 0.91 |
|
| 0.90 |
|
| – |
|
| – |
|
| – |
|
| – |
|
| 4.38 |
|
| 25.86 |
|
| 2,910 |
|
| 3.56 |
|
| 3.56 |
|
| 1.49 |
|
| (0.30 | ) |
| 13 |
| |||||||||||
2008 |
|
| 5.85 |
|
| (0.01 | ) |
| (2.06 | ) |
| (2.07 | ) |
| – |
|
| (0.30 | ) |
| (0.30 | ) |
| – |
|
| 3.48 |
|
| (35.07 | ) |
| 2,332 |
|
| 2.77 |
|
| 2.77 |
|
| 1.49 |
|
| (0.22 | ) |
| 63 |
| |||||||||||
2007 |
|
| 6.87 |
|
| (0.02 | ) |
| (0.49 | ) |
| (0.51 | ) |
| – |
|
| (0.51 | ) |
| (0.51 | ) |
| – |
|
| 5.85 |
|
| (7.44 | ) |
| 3,911 |
|
| 2.43 |
|
| 2.43 |
|
| 1.49 |
|
| (0.35 | ) |
| 105 |
| |||||||||||
Royce Financial Services Fund – Service Class | ||||||||||||||||||||||||||||||||||||||||||||||||||||||||||||
†2012 |
| $ | 5.71 |
| $ | 0.02 |
| $ | 0.45 |
| $ | 0.47 |
| $ | – |
| $ | – |
| $ | – |
| $ | – |
| $ | 6.18 |
|
| 8.23 | %1 | $ | 15,231 |
|
| 1.86 | %2 |
| 1.86 | %2 |
| 1.49 | %2 |
| 0.78 | %2 |
| 12 | % | |||||||||||
2011 |
|
| 6.50 |
|
| 0.05 |
|
| (0.78 | ) |
| (0.73 | ) |
| (0.06 | ) |
| – |
|
| (0.06 | ) |
| – |
|
| 5.71 |
|
| (11.29 | ) |
| 14,096 |
|
| 1.84 |
|
| 1.84 |
|
| 1.49 |
|
| 0.73 |
|
| 23 |
| |||||||||||
2010 |
|
| 5.57 |
|
| 0.07 |
|
| 0.96 |
|
| 1.03 |
|
| (0.10 | ) |
| – |
|
| (0.10 | ) |
| – |
|
| 6.50 |
|
| 18.45 |
|
| 14,688 |
|
| 1.94 |
|
| 1.94 |
|
| 1.49 |
|
| 1.14 |
|
| 16 |
| |||||||||||
2009 |
|
| 4.25 |
|
| 0.04 |
|
| 1.31 |
|
| 1.35 |
|
| (0.04 | ) |
| – |
|
| (0.04 | ) |
| 0.01 |
|
| 5.57 |
|
| 32.13 |
|
| 13,525 |
|
| 2.06 |
|
| 2.06 |
|
| 1.49 |
|
| 0.90 |
|
| 34 |
| |||||||||||
2008 |
|
| 6.71 |
|
| 0.07 |
|
| (2.46 | ) |
| (2.39 | ) |
| (0.05 | ) |
| (0.03 | ) |
| (0.08 | ) |
| 0.01 |
|
| 4.25 |
|
| (35.37 | ) |
| 9,553 |
|
| 2.35 |
|
| 2.34 |
|
| 1.49 |
|
| 1.85 |
|
| 48 |
| |||||||||||
2007 |
|
| 7.37 |
|
| 0.08 |
|
| (0.43 | ) |
| (0.35 | ) |
| (0.08 | ) |
| (0.24 | ) |
| (0.32 | ) |
| 0.01 |
|
| 6.71 |
|
| (4.72 | ) |
| 4,650 |
|
| 2.38 |
|
| 2.37 |
|
| 1.49 |
|
| 1.01 |
|
| 36 |
| |||||||||||
| Royce Dividend Value Fund – Investment Class f | ||||||||||||||||||||||||||||||||||||||||||||||||||||||||||||
†2012 |
| $ | 6.34 |
| $ | 0.05 |
| $ | 0.27 |
| $ | 0.32 |
| $ | (0.05 | ) | $ | – |
| $ | (0.05 | ) | $ | – |
| $ | 6.61 |
|
| 5.04 | %1 | $ | 124,364 |
|
| 1.19 | %2 |
| 1.19 | %2 |
| 1.19 | %2 |
| 1.51 | %2 |
| 5 | % | |||||||||||
| 2011 | 6.80 | 0.07 | (0.37 | ) | (0.30 | ) | (0.07 | ) | (0.09 | ) | (0.16 | ) | – | 6.34 | (4.46 | ) | 85,188 | 1.20 | 1.20 | 1.20 | 1.14 | 14 | ||||||||||||||||||||||||||||||||||||||
| 2010 | 5.31 | 0.09 | 1.51 | 1.60 | (0.08 | ) | (0.03 | ) | (0.11 | ) | – | 6.80 | 30.46 | 35,626 | 1.38 | 1.38 | 1.24 | 1.56 | 21 | |||||||||||||||||||||||||||||||||||||||||
| 2009 | 3.90 | 0.07 | 1.40 | 1.47 | (0.06 | ) | – | (0.06 | ) | – | 5.31 | 38.22 | 13,208 | 1.69 | 1.69 | 1.24 | 1.70 | 43 | ||||||||||||||||||||||||||||||||||||||||||
| 2008 | 5.82 | 0.11 | (1.91 | ) | (1.80 | ) | (0.12 | ) | (0.00 | ) | (0.12 | ) | – | 3.90 | (31.38 | ) | 1,881 | 2.84 | 2.83 | 1.24 | 2.13 | 61 | ||||||||||||||||||||||||||||||||||||||
| 2007 | 6.94 | 0.01 | (0.11 | ) | (0.10 | ) | (0.02 | ) | (1.00 | ) | (1.02 | ) | – | 5.82 | (1.71 | )1 | 1,843 | 17.04 | 2 | 17.04 | 2 | 1.24 | 2 | 2.83 | 2 | 126 | ||||||||||||||||||||||||||||||||||
| Royce Dividend Value Fund – Service Class | ||||||||||||||||||||||||||||||||||||||||||||||||||||||||||||
†2012 |
| $ | 6.38 |
| $ | 0.04 |
| $ | 0.27 |
| $ | 0.31 |
| $ | (0.04 | ) | $ | – |
| $ | (0.04 | ) | $ | – |
| $ | 6.65 |
|
| 4.85 | %1 | $ | 231,734 |
|
| 1.47 | %2 |
| 1.47 | %2 |
| 1.45 | %2 |
| 1.23 | %2 |
| 5 | % | |||||||||||
| 2011 | 6.82 | 0.05 | (0.36 | ) | (0.31 | ) | (0.04 | ) | (0.09 | ) | (0.13 | ) | – | 6.38 | (4.55 | ) | 201,634 | 1.48 | 1.48 | 1.46 | 0.84 | 14 | ||||||||||||||||||||||||||||||||||||||
| 2010 | 5.33 | 0.08 | 1.51 | 1.59 | (0.07 | ) | (0.03 | ) | (0.10 | ) | – | 6.82 | 30.11 | 117,304 | 1.56 | 1.56 | 1.49 | 1.32 | 21 | |||||||||||||||||||||||||||||||||||||||||
| 2009 | 3.92 | 0.07 | 1.39 | 1.46 | (0.05 | ) | – | (0.05 | ) | – | 5.33 | 37.73 | 16,107 | 2.04 | 2.04 | 1.49 | 1.45 | 43 | ||||||||||||||||||||||||||||||||||||||||||
| 2008 | 5.83 | 0.09 | (1.90 | ) | (1.81 | ) | (0.10 | ) | (0.00 | ) | (0.10 | ) | – | 3.92 | (31.47 | ) | 4,872 | 2.54 | 2.54 | 1.49 | 1.89 | 61 | ||||||||||||||||||||||||||||||||||||||
| 2007 | 6.92 | 0.14 | (0.13 | ) | 0.01 | (0.11 | ) | (1.00 | ) | (1.11 | ) | 0.01 | 5.83 | (0.02 | ) | 3,835 | 2.03 | 2.04 | 1.49 | 2.08 | 126 | |||||||||||||||||||||||||||||||||||||||
| Royce SMid-Cap Value Fund – Service Class g | ||||||||||||||||||||||||||||||||||||||||||||||||||||||||||||
†2012 |
| $ | 10.10 |
| $ | (0.01 | ) | $ | 0.28 |
| $ | 0.27 |
| $ | – |
| $ | – |
| $ | – |
| $ | – |
| $ | 10.37 |
|
| 2.67 | %1 | $ | 10,585 |
|
| 1.92 | %2 |
| 1.92 | %2 |
| 1.35 | %2 |
| (0.26 | )%2 |
| 23 | % | |||||||||||
| 2011 | 11.44 | (0.06 | ) | (1.27 | ) | (1.33 | ) | (0.02 | ) | – | (0.02 | ) | 0.01 | 10.10 | (11.57 | ) | 10,327 | 1.95 | 1.95 | 1.49 | (0.54 | ) | 54 | |||||||||||||||||||||||||||||||||||||
| 2010 | 9.08 | (0.03 | ) | 2.39 | 2.36 | – | – | – | – | 11.44 | 25.99 | 6,195 | 2.40 | 2.40 | 1.49 | (0.26 | ) | 126 | ||||||||||||||||||||||||||||||||||||||||||
| 2009 | 7.06 | (0.01 | ) | 2.03 | 2.02 | (0.01 | ) | – | (0.01 | ) | 0.01 | 9.08 | 28.75 | 7,365 | 2.03 | 2.03 | 1.49 | (0.20 | ) | 216 | ||||||||||||||||||||||||||||||||||||||||
| 2008 | 9.99 | 0.02 | (2.96 | ) | (2.94 | ) | (0.01 | ) | – | (0.01 | ) | 0.02 | 7.06 | (29.27 | ) | 14,059 | 2.05 | 2.04 | 1.49 | 0.31 | 397 | |||||||||||||||||||||||||||||||||||||||
| 2007 | 10.00 | 0.01 | 0.01 | 0.02 | (0.02 | ) | (0.01 | ) | (0.03 | ) | – | 9.99 | 0.16 | 1 | 1,379 | 16.82 | 2 | 16.40 | 2 | 1.49 | 2 | 0.67 | 2 | 17 | ||||||||||||||||||||||||||||||||||||
|
|
|
THE ACCOMPANYING NOTES ARE AN INTEGRAL PART OF THESE FINANCIAL STATEMENTS. |
| The Royce Funds 2012 Semiannual Report to Shareholders | 131 |
|
Financial Highlights |
| ||||||||||||||||||||||||||||||||||||||||||||||||||||||||||||
| Net | Net | Net Realized and Unrealized | Distributions | Distributions from Net | Ratio of Expenses to Average Net Assets | Ratio of Net Investment | ||||||||||||||||||||||||||||||||||||||||||||||||||||||
| Asset Value, Beginning of Period | Investment Income (Loss) | Gain (Loss) on Investments and Foreign Currency | Total from Investment Operations | from Net Investment Income | Realized Gain on Investments and Foreign Currency | Total Distributions | Shareholder Redemption Fees | Net Asset Value, End of Period | Total Return | Net Assets, End of Period (in thousands) | Prior to Fee Waivers and Balance Credits | Prior to Fee Waivers | Net of Fee Waivers | Income (Loss) to Average Net Assets | Portfolio Turnover Rate | |||||||||||||||||||||||||||||||||||||||||||||
|
|
|
|
|
|
|
|
|
|
|
|
|
|
|
|
|
|
|
|
|
|
|
|
|
|
|
|
|
|
|
|
|
|
|
|
|
|
|
|
|
|
|
|
|
|
|
|
|
| |||||||||||
| Royce Focus Value Fund – Service Class h | ||||||||||||||||||||||||||||||||||||||||||||||||||||||||||||
| †2012 | $ | 13.75 | $ | (0.00 | ) | $ | 0.00 | $ | 0.00 | $ | – | $ | – | $ | – | $ | – | $ | 13.75 | 0.00 | %1 | $ | 8,657 | 2.00 | %2 | 2.00 | %2 | 1.35 | %2 | (0.05 | )%2 | 14 | % | |||||||||||||||||||||||||||
| 2011 | 16.59 | (0.05 | ) | (2.25 | ) | (2.30 | ) | – | (0.54 | ) | (0.54 | ) | – | 13.75 | (13.88 | ) | 8,727 | 1.97 | 1.97 | 1.49 | (0.31 | ) | 25 | |||||||||||||||||||||||||||||||||||||
| 2010 | 14.82 | (0.06 | ) | 2.30 | 2.24 | (0.06 | ) | (0.41 | ) | (0.47 | ) | – | 16.59 | 15.16 | 8,942 | 1.95 | 1.95 | 1.49 | (0.32 | ) | 31 | |||||||||||||||||||||||||||||||||||||||
| 2009 | 10.00 | 0.00 | 5.31 | 5.31 | (0.05 | ) | (0.44 | ) | (0.49 | ) | – | 14.82 | 53.27 | 1 | 4,796 | 2.97 | 2 | 2.97 | 2 | 1.49 | 2 | 0.17 | 2 | 21 | ||||||||||||||||||||||||||||||||||||
| Royce Partners Fund – Service Class i | ||||||||||||||||||||||||||||||||||||||||||||||||||||||||||||
| †2012 | $ | 10.37 | $ | 0.02 | $ | 0.74 | $ | 0.76 | $ | – | $ | – | $ | – | $ | – | $ | 11.13 | 7.33 | %1 | $ | 1,845 | 4.40 | %2 | 4.40 | %2 | 1.35 | %2 | 0.40 | %2 | 5 | % | ||||||||||||||||||||||||||||
| 2011 | 13.15 | (0.03 | ) | (1.52 | ) | (1.55 | ) | (0.05 | ) | (1.18 | ) | (1.23 | ) | – | 10.37 | (11.66 | ) | 1,682 | 4.25 | 4.25 | 1.49 | (0.25 | ) | 44 | ||||||||||||||||||||||||||||||||||||
| 2010 | 11.56 | 0.01 | 2.14 | 2.15 | (0.16 | ) | (0.41 | ) | (0.57 | ) | 0.01 | 13.15 | 18.74 | 1,771 | 3.72 | 3.72 | 1.49 | 0.10 | 38 | |||||||||||||||||||||||||||||||||||||||||
| 2009 | 10.00 | (0.05 | ) | 1.61 | 1.56 | – | – | – | – | 11.56 | 15.60 | 1 | 1,501 | 5.27 | 2 | 5.27 | 2 | 1.49 | 2 | (0.71 | )2 | 14 | ||||||||||||||||||||||||||||||||||||||
| Royce Mid-Cap Fund – Service Class j | ||||||||||||||||||||||||||||||||||||||||||||||||||||||||||||
| †2012 | $ | 10.65 | $ | (0.00 | ) | $ | (0.09 | ) | $ | (0.09 | ) | $ | – | $ | – | $ | – | $ | 0.01 | $ | 10.57 | (0.75 | )%1 | $ | 5,380 | 2.37 | %2 | 2.37 | %2 | 1.35 | %2 | (0.05 | )%2 | 26 | % | |||||||||||||||||||||||||
| 2011 | 11.86 | (0.05 | ) | (0.75 | ) | (0.80 | ) | – | (0.41 | ) | (0.41 | ) | – | 10.65 | (6.78 | ) | 5,727 | 2.34 | 2.34 | 1.49 | (0.40 | ) | 59 | |||||||||||||||||||||||||||||||||||||
| 2010 | 10.00 | (0.03 | ) | 1.87 | 1.84 | – | – | – | 0.02 | 11.86 | 18.60 | 1 | 4,889 | 2.64 | 2 | 2.64 | 2 | 1.49 | 2 | (0.25 | )2 | 117 | ||||||||||||||||||||||||||||||||||||||
| Royce Special Equity Multi-Cap Fund – Investment Class k | ||||||||||||||||||||||||||||||||||||||||||||||||||||||||||||
| †2012 | $ | 11.54 | $ | 0.05 | $ | (0.24 | ) | $ | (0.19 | ) | $ | – | $ | – | $ | – | $ | – | $ | 11.35 | (1.65 | )%1 | $ | 25,814 | 1.18 | %2 | 1.18 | %2 | 1.18 | %2 | 1.28 | %2 | 2 | % | ||||||||||||||||||||||||||
| Royce Special Equity Multi-Cap Fund – Service Class l | ||||||||||||||||||||||||||||||||||||||||||||||||||||||||||||
| †2012 | $ | 10.64 | $ | 0.05 | $ | 0.66 | $ | 0.71 | $ | – | $ | – | $ | – | $ | – | $ | 11.35 | 6.67 | %1 | $ | 40,835 | 1.63 | %2 | 1.63 | %2 | 1.39 | %2 | 0.86 | %2 | 2 | % | ||||||||||||||||||||||||||||
| 2011 | 10.00 | 0.06 | 0.65 | 0.71 | (0.06 | ) | (0.02 | ) | (0.08 | ) | 0.01 | 10.64 | 7.20 | 1 | 36,811 | 1.97 | 2 | 1.97 | 2 | 1.39 | 2 | 1.45 | 2 | 5 | ||||||||||||||||||||||||||||||||||||
| Royce Special Equity Multi-Cap Fund – Institutional Class m | ||||||||||||||||||||||||||||||||||||||||||||||||||||||||||||
| †2012 | $ | 11.83 | $ | 0.04 | $ | (0.52 | ) | $ | (0.48 | ) | $ | – | $ | – | $ | – | $ | – | $ | 11.35 | (4.06 | )%1 | $ | 20,761 | 1.14 | %2 | 1.14 | %2 | 1.05 | %2 | 1.56 | %2 | 2 | % | ||||||||||||||||||||||||||
| † | Six months ended June 30, 2012 (unaudited). | f | The Class commenced operations on September 14, 2007. | |
| 1 | Not annualized | g | The Fund commenced operations on September 28, 2007. | |
| 2 | Annualized | h | The Fund commenced operations on March 2, 2009. | |
| a | The Class commenced operations on June 6, 2011. | i | The Fund commenced operations on April 28, 2009. | |
| b | The Class commenced operations on May 21, 2007. | j | The Fund commenced operations on January 4, 2010. | |
| c | The Class commenced operations on May 15, 2008. | k | The Class commenced operations on March 1, 2012. | |
| d | The Class commenced operations on March 15, 2007. | l | The Class commenced operations on January 3, 2011. | |
| e | The Class commenced operations on May 1, 2008. | m | The Class commenced operations on April 18, 2012. |
| 132 | The Royce Funds 2012 Semiannual Report to Shareholders | THE ACCOMPANYING NOTES ARE AN INTEGRAL PART OF THESE FINANCIAL STATEMENTS. |
| Notes to Financial Statements (unaudited) |
Summary of Significant Accounting Policies: |
Royce Pennsylvania Mutual Fund, Royce Micro-Cap Fund, Royce Premier Fund, Royce Low-Priced Stock Fund, Royce Total Return Fund, Royce Heritage Fund, Royce Opportunity Fund, Royce Special Equity Fund, Royce Value Fund, Royce Value Plus Fund, Royce 100 Fund, Royce Micro-Cap Discovery Fund, Royce Financial Services Fund, Royce Dividend Value Fund, Royce SMid-Cap Value Fund, Royce Focus Value Fund, Royce Partners Fund, Royce Mid-Cap Fund and Royce Special Equity Multi-Cap Fund (the “Fund” or “Funds”), are nineteen series of The Royce Fund (the “Trust”), a diversified open-end management investment company organized as a Delaware statutory trust. Effective May 1, 2012, Royce Discovery Fund became Royce Micro-Cap Discovery Fund. |
Classes of shares have equal rights as to earnings and assets, except that each class may bear different fees and expenses for distribution, shareholder servicing, registration and shareholder reports, and receive different compensating balance credits and expense reimbursements. Investment income, realized and unrealized capital gains or losses on investments and foreign currency, and expenses other than those attributable to a specific class are allocated to each class of shares based on its relative net assets. |
The preparation of financial statements in conformity with accounting principles generally accepted in the United States requires management to make estimates and assumptions that affect the reported amounts of assets and liabilities and the disclosure of contingent assets and liabilities at the date of the financial statements and the reported amounts of income and expenses during the reporting period. Actual results could differ from those estimates. |
Under the Fund’s organizational documents, the officers and trustees are indemnified against certain liabilities that may arise out of the performance of their duties to the Fund. Additionally, in the normal course of business, the Fund enters into contracts with service providers that contain general indemnification clauses. |
At June 30, 2012, officers, employees of Royce & Associates, LLC (“Royce”), Fund trustees, the Royce retirement plans and other affiliates owned more than 10% of the following Funds: |
| Royce Micro-Cap Discovery Fund | 54 | % | Royce SMid-Cap Value Fund | 22 | % | Royce Partners Fund | 80 | % | ||
| Royce Financial Services Fund | 13 | % | Royce Focus Value Fund | 72 | % | Royce Mid-Cap Fund | 37 | % |
| Valuation of Investments: |
Securities are valued as of the close of trading on the New York Stock Exchange (NYSE) (generally 4:00 p.m. Eastern time) on the valuation date. Securities that trade on an exchange, and securities traded on Nasdaq’s Electronic Bulletin Board, are valued at their last reported sales price or Nasdaq official closing price taken from the primary market in which each security trades or, if no sale is reported for such day, at their bid price. Other over-the-counter securities for which market quotations are readily available are valued at their highest bid price, except in the case of some bonds and other fixed income securities which may be valued by reference to other securities with comparable ratings, interest rates and maturities, using established independent pricing services. The Funds value their non-U.S. dollar denominated securities in U.S. dollars daily at the prevailing foreign currency exchange rates as quoted by a major bank. Securities for which market quotations are not readily available are valued at their fair value in accordance with the provisions of the 1940 Act, under procedures approved by the Fund's Board of Trustees, and are reported as Level 3 securities. As a general principle, the fair value of a security is the amount which the Fund might reasonably expect to receive for the security upon its current sale. However, in light of the judgment involved in fair valuations, there can be no assurance that a fair value assigned to a particular security will be the amount which the Fund might be able to receive upon its current sale. In addition, if, between the time trading ends on a particular security and the close of the customary trading session on the NYSE, events occur that are significant and may make the closing price unreliable, a Fund may fair value the security. The Funds use an independent pricing service to provide fair value estimates for relevant non-U.S. equity securities on days when the U.S. market volatility exceeds a certain threshold. This pricing service uses proprietary correlations it has developed between the movement of prices of non-U.S. equity securities and indices of U.S.-traded securities, futures contracts and other indications to estimate the fair value of relevant non-U.S. securities. When fair value pricing is employed, the prices of securities used by a Fund may differ from quoted or published prices for the same security. Investments in money market funds are valued at net asset value per share. |
| Various inputs are used in determining the value of each Fund’s investments, as noted above. These inputs are summarized in the three broad levels below: |
| Level 1 | – quoted prices in active markets for identical securities. | |
| Level 2 | – other significant observable inputs (including quoted prices for similar securities, foreign securities that may be fair valued and repurchase agreements). The table below includes all Level 2 securities. Level 2 securities with values based on quoted prices for similar securities are noted in the Schedules of Investments. | |
| Level 3 | – significant unobservable inputs (including last trade price before trading was suspended, or at a discount thereto for lack of marketability or otherwise, market price information regarding other securities, information received from the company and/or published documents, including SEC filings and financial statements, or other publicly available information). |
The inputs or methodology used for valuing securities are not necessarily an indication of the risk associated with investing in those securities. | |
The following is a summary of the inputs used to value each Fund’s investments as of June 30, 2012. For a detailed breakout of common stocks by sector classification, please refer to the Schedules of Investments. | |
| The Royce Funds 2012 Semiannual Report to Shareholders | 133 |
| Notes to Financial Statements (unaudited) (continued) |
Valuation of Investments (continued): |
| Level 1 | Level 2 | Level 3 | Total | |||||||||
| Royce Pennsylvania Mutual Fund | ||||||||||||
| Common Stocks | $ | 5,556,163,578 | $ | 176,745,711 | $ | – | $ | 5,732,909,289 | ||||
| Corporate Bonds | – | 404,504 | – | 404,504 | ||||||||
| Cash Equivalents | 100,351,338 | 107,562,000 | – | 207,913,338 | ||||||||
| Royce Micro-Cap Fund | ||||||||||||
| Common Stocks | 796,566,540 | 281,460,410 | 389,281 | 1,078,416,231 | ||||||||
| Cash Equivalents | 26,420,880 | 38,233,000 | – | 64,653,880 | ||||||||
| Royce Premier Fund | ||||||||||||
| Common Stocks | 5,833,406,458 | 515,992,300 | – | 6,349,398,758 | ||||||||
| Cash Equivalents | 133,233,943 | 404,029,000 | – | 537,262,943 | ||||||||
| Royce Low-Priced Stock Fund | ||||||||||||
| Common Stocks | 2,648,531,891 | 798,374,679 | 1,756,972 | 3,448,663,542 | ||||||||
| Cash Equivalents | 176,801,115 | 91,117,000 | – | 267,918,115 | ||||||||
| Royce Total Return Fund | ||||||||||||
| Common Stocks | 4,018,305,778 | 176,157,096 | – | 4,194,462,874 | ||||||||
| Corporate Bonds | – | 4,052,814 | – | 4,052,814 | ||||||||
| Cash Equivalents | 25,664,495 | 277,572,000 | – | 303,236,495 | ||||||||
| Royce Heritage Fund | ||||||||||||
| Common Stocks | 207,767,904 | 46,612,008 | 450,400 | 254,830,312 | ||||||||
| Cash Equivalents | 8,913,537 | 9,328,000 | – | 18,241,537 | ||||||||
| Royce Opportunity Fund | ||||||||||||
| Common Stocks | 1,634,237,214 | 59,719 | – | 1,634,296,933 | ||||||||
| Preferred Stocks | 4,437,875 | – | – | 4,437,875 | ||||||||
| Cash Equivalents | 125,418,345 | 106,391,000 | – | 231,809,345 | ||||||||
| Royce Special Equity Fund | ||||||||||||
| Common Stocks | 2,437,867,928 | 23,189,698 | – | 2,461,057,626 | ||||||||
| Cash Equivalents | 153,750 | 299,543,000 | – | 299,696,750 | ||||||||
| Royce Value Fund | ||||||||||||
| Common Stocks | 1,250,691,858 | 153,239,872 | – | 1,403,931,730 | ||||||||
| Cash Equivalents | 16,434,818 | 37,422,000 | – | 53,856,818 | ||||||||
| Royce Value Plus Fund | ||||||||||||
| Common Stocks | 1,481,010,236 | 167,082,684 | – | 1,648,092,920 | ||||||||
| Cash Equivalents | 85,720,096 | 75,045,000 | – | 160,765,096 | ||||||||
| Royce 100 Fund | ||||||||||||
| Common Stocks | 326,443,686 | 22,844,422 | – | 349,288,108 | ||||||||
| Cash Equivalents | 11,277,609 | 1,289,000 | – | 12,566,609 | ||||||||
| Royce Micro-Cap Discovery Fund | ||||||||||||
| Common Stocks | 3,390,138 | 17,105 | – | 3,407,243 | ||||||||
| Cash Equivalents | – | 339,000 | – | 339,000 | ||||||||
| Royce Financial Services Fund | ||||||||||||
| Common Stocks | 11,481,233 | 3,535,797 | – | 15,017,030 | ||||||||
| Cash Equivalents | – | 315,000 | – | 315,000 | ||||||||
| Royce Dividend Value Fund | ||||||||||||
| Common Stocks | 295,577,601 | 36,584,881 | 69,374 | 332,231,856 | ||||||||
| Cash Equivalents | 1,093,223 | 27,836,000 | – | 28,929,223 | ||||||||
| Royce SMid-Cap Value Fund | ||||||||||||
| Common Stocks | 7,001,307 | 1,910,775 | – | 8,912,082 | ||||||||
| Cash Equivalents | – | 980,000 | – | 980,000 | ||||||||
| Royce Focus Value Fund | ||||||||||||
| Common Stocks | 6,628,475 | 1,416,236 | – | 8,044,711 | ||||||||
| Fixed Income | 110,880 | – | – | 110,880 | ||||||||
| Cash Equivalents | – | 500,000 | – | 500,000 | ||||||||
| Royce Partners Fund | ||||||||||||
| Common Stocks | 1,469,491 | 318,454 | – | 1,787,945 | ||||||||
| Royce Mid-Cap Fund | ||||||||||||
| Common Stocks | 4,560,424 | 523,719 | – | 5,084,143 | ||||||||
| Cash Equivalents | – | 231,000 | – | 231,000 | ||||||||
| Royce Special Equity Multi-Cap Fund | ||||||||||||
| Common Stocks | 84,022,384 | – | – | 84,022,384 | ||||||||
| Cash Equivalents | – | 3,586,000 | – | 3,586,000 | ||||||||
| 134 | The Royce Funds 2012 Semiannual Report to Shareholders |
Valuation of Investments (continued): |
Level 3 Reconciliation: |
| Realized and Unrealized | ||||||||||||||||
| Balance as of 12/31/11 | Gain (Loss)1 | Balance as of 6/30/12 | ||||||||||||||
| Royce Micro-Cap Fund | ||||||||||||||||
Common Stocks | $ | 385,968 | $ | 3,313 | $ | 389,281 | ||||||||||
| Royce Low-Priced Stock Fund | ||||||||||||||||
Common Stocks | 4,425,038 | (2,668,066 | ) | 1,756,972 | ||||||||||||
| Royce Heritage Fund | ||||||||||||||||
Common Stocks | 641,800 | (191,400 | ) | 450,400 | ||||||||||||
| Royce Dividend Value Fund | ||||||||||||||||
Common Stocks | 174,722 | (105,348 | ) | 69,374 | ||||||||||||
| 1 | The net change in unrealized appreciation (depreciation) is included in the accompanying Statement of Operations. Change in unrealized appreciation (depreciation) includes net unrealized appreciation (depreciation) resulting from changes in investment values during the reporting period and the reversal of previously recorded unrealized appreciation (depreciation) when gains or losses are realized. Net realized gain (loss) from investments and foreign currency transactions is included in the accompanying Statement of Operations. |
| Repurchase Agreements: |
The Funds may enter into repurchase agreements with institutions that the Funds’ investment adviser has determined are creditworthy. Each Fund restricts repurchase agreements to maturities of no more than seven days. Securities pledged as collateral for repurchase agreements, which are held until maturity of the repurchase agreements, are marked-to-market daily and maintained at a value at least equal to the principal amount of the repurchase agreement (including accrued interest). Repurchase agreements could involve certain risks in the event of default or insolvency of the counter-party, including possible delays or restrictions upon the ability of each Fund to dispose of its underlying securities. |
| Foreign Currency: |
Net realized foreign exchange gains or losses arise from sales and maturities of short-term securities, sales of foreign currencies, expiration of currency forward contracts, currency gains or losses realized between the trade and settlement dates on securities transactions, and the difference between the amounts of dividends, interest, and foreign withholding taxes recorded on each Fund’s books and the U.S. dollar equivalent of the amounts actually received or paid. Net unrealized foreign exchange gains and losses arise from changes in the value of assets and liabilities, including investments in securities at the end of the reporting period, as a result of changes in foreign currency exchange rates. |
| Securities Lending: |
The Funds loan securities through a lending agent to qualified institutional investors for the purpose of realizing additional income. Collateral for the Funds on all securities loaned is accepted in cash and cash equivalents and invested temporarily by the custodian. The collateral maintained is at least 100% of the current market value of the loaned securities. The market value of the loaned securities is determined at the close of business of the Funds and any additional required collateral is delivered to the Funds on the next business day. The Funds retain the risk of any loss on the securities on loan as well as incurring the potential loss on investments purchased with cash collateral received for securities lending. The Funds’ securities lending income consists of the income earned on investing cash collateral, plus any premium payments received for lending certain securities, less any rebates paid to borrowers and lending agent fees associated with the loan. The lending agent is not affiliated with Royce. |
| Distributions and Taxes: |
As qualified regulated investment companies under Subchapter M of the Internal Revenue Code, the Funds are not subject to income taxes to the extent that each Fund distributes substantially all of its taxable income for its fiscal year. |
| Investment Transactions and Related Investment Income: |
Investment transactions are accounted for on the trade date. Dividend income is recorded on the ex-dividend date. Non-cash dividend income is recorded at the fair market value of the securities received. Interest income is recorded on an accrual basis. Premium and discounts on debt securities are amortized using the effective yield-to-maturity method. Realized gains and losses from investment transactions are determined on the basis of identified cost for book and tax purposes. |
| Expenses: |
The Funds incur direct and indirect expenses. Expenses directly attributable to a Fund are charged to the Fund’s operations, while expenses applicable to more than one of the Royce Funds are allocated equitably. Certain personnel, occupancy costs and other administrative expenses related to the Royce Funds are allocated by Royce under an administration agreement and are included in administrative and office facilities and legal expenses. The Fund has adopted a deferred fee agreement that allows the Trustees to defer the receipt of all or a portion of trustees’ fees otherwise payable. The deferred fees are invested in certain Royce Funds until distributed in accordance with the agreement. |
| The Royce Funds 2012 Semiannual Report to Shareholders | 135 |
| Notes to Financial Statements (unaudited) (continued) |
| Compensating Balance Credits: |
The Funds have arrangements with their custodian bank and transfer agent, whereby a portion of the custodian’s fee and transfer agent’s fee is paid indirectly by credits earned on a Fund’s cash on deposit with the bank and transfer agent. These deposit arrangements are an alternative to purchasing overnight investments. Conversely, a Fund pays interest to the custodian on any cash overdrafts, to the extent they are not offset by credits earned on positive cash balances. |
| Line of Credit: |
The Funds, along with certain other Royce Funds, participate in a $75 million line of credit (“Credit Agreement”) to be used for temporary or emergency purposes. This 364-day revolving Credit Agreement expires on July 12, 2013. Pursuant to the Credit Agreement, each participating Fund is liable only for principal and interest payments related to borrowings made by that Fund. Borrowings under the Credit Agreement bear interest at a rate equal to the higher of the federal funds rate + 1.25% or overnight LIBOR + 1.25%. The Funds did not utilize the line of credit during the six months ended June 30, 2012. |
| Capital Share Transactions (in dollars): |
| Shares issued for | Net increase (decrease) from | |||||||||||||||||||||||||||||||||||||||
| Shares sold | reinvestment of distributions | Shares redeemed | capital share transactions | |||||||||||||||||||||||||||||||||||||
| Period ended | Period ended | Period ended | Period ended | |||||||||||||||||||||||||||||||||||||
| 6/30/12 | Period ended | 6/30/12 | Period ended | 6/30/12 | Period ended | 6/30/12 | Period ended | |||||||||||||||||||||||||||||||||
| (unaudited) | 12/31/11 | (unaudited) | 12/31/11 | (unaudited) | 12/31/11 | (unaudited) | 12/31/11 | |||||||||||||||||||||||||||||||||
| Royce Pennsylvania Mutual Fund | ||||||||||||||||||||||||||||||||||||||||
Investment Class | $ | 434,216,392 | $ | 1,102,213,825 | $ | – | $ | 139,754,604 | $ | (532,834,662 | ) | $ | (1,345,967,573 | ) | $ | (98,618,270 | ) | $ | (103,999,144 | ) | ||||||||||||||||||||
Service Class | 87,472,945 | 169,728,944 | – | 14,465,251 | (83,412,493 | ) | (188,824,860 | ) | 4,060,452 | (4,630,665 | ) | |||||||||||||||||||||||||||||
Consultant Class | 20,280,586 | 60,497,490 | – | 24,684,398 | (62,803,115 | ) | (200,472,135 | ) | (42,522,529 | ) | (115,290,247 | ) | ||||||||||||||||||||||||||||
Institutional Class | 171,673,556 | 270,513,053 | – | 8,073,158 | (21,422,103 | ) | (20,245,905 | ) | 150,251,453 | 258,340,306 | ||||||||||||||||||||||||||||||
R Class | 9,308,125 | 13,140,277 | – | 773,925 | (4,177,729 | ) | (7,708,102 | ) | 5,130,396 | 6,206,100 | ||||||||||||||||||||||||||||||
K Class | 2,462,302 | 4,738,021 | – | 182,665 | (1,154,104 | ) | (2,519,234 | ) | 1,308,198 | 2,401,452 | ||||||||||||||||||||||||||||||
| Royce Micro-Cap Fund | ||||||||||||||||||||||||||||||||||||||||
Investment Class | 67,177,602 | 249,149,983 | – | 49,969,999 | (138,422,627 | ) | (287,777,166 | ) | (71,245,025 | ) | 11,342,816 | |||||||||||||||||||||||||||||
Service Class | 55,350,712 | 50,283,758 | – | 7,305,787 | (43,540,689 | ) | (48,298,365 | ) | 11,810,023 | 9,291,180 | ||||||||||||||||||||||||||||||
Consultant Class | 3,015,208 | 13,417,277 | – | 7,216,221 | (12,464,779 | ) | (38,792,369 | ) | (9,449,571 | ) | (18,158,871 | ) | ||||||||||||||||||||||||||||
| Royce Premier Fund | ||||||||||||||||||||||||||||||||||||||||
Investment Class | 468,644,962 | 1,177,957,241 | – | 350,452,967 | (479,131,089 | ) | (1,538,043,931 | ) | (10,486,127 | ) | (9,633,723 | ) | ||||||||||||||||||||||||||||
Service Class | 87,695,395 | 219,593,689 | – | 51,342,238 | (115,807,384 | ) | (165,382,138 | ) | (28,111,989 | ) | 105,553,789 | |||||||||||||||||||||||||||||
Consultant Class | 2,901,647 | 6,859,040 | – | 5,081,665 | (4,865,892 | ) | (17,751,057 | ) | (1,964,245 | ) | (5,810,352 | ) | ||||||||||||||||||||||||||||
Institutional Class | 83,171,002 | 405,946,501 | – | 67,306,892 | (89,260,097 | ) | (276,014,319 | ) | (6,089,095 | ) | 197,239,074 | |||||||||||||||||||||||||||||
W Class | 74,069,249 | 303,893,656 | – | 32,794,914 | (89,487,492 | ) | (153,965,533 | ) | (15,418,243 | ) | 182,723,037 | |||||||||||||||||||||||||||||
R Class | 7,076,816 | 20,687,253 | – | 1,921,311 | (3,144,270 | ) | (6,179,082 | ) | 3,932,546 | 16,429,482 | ||||||||||||||||||||||||||||||
K Class | 2,127,480 | 10,047,005 | – | 1,442,829 | (1,036,069 | ) | (4,581,276 | ) | 1,091,411 | 6,908,558 | ||||||||||||||||||||||||||||||
| Royce Low-Priced Stock Fund | ||||||||||||||||||||||||||||||||||||||||
Investment Class | 90,731,878 | 267,858,377 | – | 21,315,767 | (44,710,600 | ) | (88,665,008 | ) | 46,021,278 | 200,509,136 | ||||||||||||||||||||||||||||||
Service Class | 146,637,664 | 649,126,714 | – | 209,213,994 | (485,651,971 | ) | (1,162,028,440 | ) | (339,014,307 | ) | (303,687,732 | ) | ||||||||||||||||||||||||||||
Institutional Class | 173,012,395 | 363,441,878 | – | 83,945,467 | (83,399,393 | ) | (263,698,270 | ) | 89,613,002 | 183,689,075 | ||||||||||||||||||||||||||||||
R Class | 987,334 | 7,291,736 | – | 633,549 | (1,946,216 | ) | (1,958,515 | ) | (958,882 | ) | 5,966,770 | |||||||||||||||||||||||||||||
K Class | 1,416,122 | 7,773,938 | – | 1,169,483 | (1,925,447 | ) | (2,309,772 | ) | (509,325 | ) | 6,633,649 | |||||||||||||||||||||||||||||
| Royce Total Return Fund | ||||||||||||||||||||||||||||||||||||||||
Investment Class | 239,778,526 | 570,309,226 | 17,681,405 | 61,427,071 | (368,788,718 | ) | (967,945,453 | ) | (111,328,787 | ) | (336,209,156 | ) | ||||||||||||||||||||||||||||
Service Class | 41,954,454 | 97,812,608 | 1,325,639 | 4,720,762 | (52,784,336 | ) | (104,405,718 | ) | (9,504,243 | ) | (1,872,348 | ) | ||||||||||||||||||||||||||||
Consultant Class | 10,108,076 | 31,585,192 | – | 3,609,466 | (27,939,022 | ) | (85,206,542 | ) | (17,830,946 | ) | (50,011,884 | ) | ||||||||||||||||||||||||||||
Institutional Class | 47,402,638 | 142,262,470 | 2,220,815 | 7,938,613 | (76,463,526 | ) | (98,177,361 | ) | (26,840,073 | ) | 52,023,722 | |||||||||||||||||||||||||||||
W Class | 25,511,593 | 84,832,543 | 922,740 | 2,638,508 | (16,405,484 | ) | (24,105,173 | ) | 10,028,849 | 63,365,878 | ||||||||||||||||||||||||||||||
R Class | 11,163,933 | 22,947,769 | 127,551 | 482,478 | (3,631,302 | ) | (7,804,372 | ) | 7,660,182 | 15,625,875 | ||||||||||||||||||||||||||||||
K Class | 61,616,200 | 166,693,686 | 853,724 | 3,316,355 | (45,578,480 | ) | (87,921,184 | ) | 16,891,444 | 82,088,857 | ||||||||||||||||||||||||||||||
| Royce Heritage Fund | ||||||||||||||||||||||||||||||||||||||||
Investment Class | 11,640,088 | 13,834,446 | – | 960,195 | (4,120,214 | ) | (3,901,453 | ) | 7,519,874 | 10,893,188 | ||||||||||||||||||||||||||||||
Service Class | 10,331,173 | 52,657,922 | – | 9,824,989 | (23,115,536 | ) | (52,842,256 | ) | (12,784,363 | ) | 9,640,655 | |||||||||||||||||||||||||||||
Consultant Class | 1,006,216 | 5,827,667 | – | 735,831 | (1,816,709 | ) | (2,917,799 | ) | (810,493 | ) | 3,645,699 | |||||||||||||||||||||||||||||
R Class | 1,550,903 | 4,544,349 | – | 212,823 | (371,766 | ) | (1,949,780 | ) | 1,179,137 | 2,807,392 | ||||||||||||||||||||||||||||||
K Class | 1,374,350 | 6,751,172 | – | 468,676 | (3,903,544 | ) | (3,597,680 | ) | (2,529,194 | ) | 3,622,168 | |||||||||||||||||||||||||||||
| 136 | The Royce Funds 2012 Semiannual Report to Shareholders |
Capital Share Transactions (in dollars)(continued): |
| Shares issued for | Net increase (decrease) from | |||||||||||||||||||||||||||||||||||||||
| Shares sold | reinvestment of distributions | Shares redeemed | capital share transactions | |||||||||||||||||||||||||||||||||||||
| Period ended | Period ended | Period ended | Period ended | |||||||||||||||||||||||||||||||||||||
| 6/30/12 | Period ended | 6/30/12 | Period ended | 6/30/12 | Period ended | 6/30/12 | Period ended | |||||||||||||||||||||||||||||||||
| (unaudited) | 12/31/11 | (unaudited) | 12/31/11 | (unaudited) | 12/31/11 | (unaudited) | 12/31/11 | |||||||||||||||||||||||||||||||||
| Royce Opportunity Fund | ||||||||||||||||||||||||||||||||||||||||
Investment Class | $ | 65,096,737 | $ | 187,675,587 | $ | – | $ | 15,192,502 | $ | (128,757,498 | ) | $ | (331,240,361 | ) | $ | (63,660,761 | ) | $ | (128,372,272 | ) | ||||||||||||||||||||
Service Class | 18,189,506 | 72,921,825 | – | 3,011,889 | (27,443,873 | ) | (195,267,363 | ) | (9,254,367 | ) | (119,333,649 | ) | ||||||||||||||||||||||||||||
Consultant Class | 839,379 | 4,180,186 | – | 220,159 | (1,957,174 | ) | (3,341,119 | ) | (1,117,795 | ) | 1,059,226 | |||||||||||||||||||||||||||||
Institutional Class | 76,397,251 | 145,203,393 | – | 9,624,122 | (78,860,220 | ) | (179,345,393 | ) | (2,462,969 | ) | (24,517,878 | ) | ||||||||||||||||||||||||||||
R Class | 1,620,200 | 2,725,250 | – | 58,426 | (426,389 | ) | (691,379 | ) | 1,193,811 | 2,092,297 | ||||||||||||||||||||||||||||||
K Class | 1,175,988 | 12,548,071 | – | 125,508 | (809,199 | ) | (11,379,972 | ) | 366,789 | 1,293,607 | ||||||||||||||||||||||||||||||
| Royce Special Equity Fund | ||||||||||||||||||||||||||||||||||||||||
Investment Class | 353,102,903 | 696,228,274 | – | 86,530,365 | (202,496,291 | ) | (488,307,294 | ) | 150,606,612 | 294,451,345 | ||||||||||||||||||||||||||||||
Service Class | 60,153,354 | 118,969,742 | – | 11,164,951 | (51,577,492 | ) | (61,595,019 | ) | 8,575,862 | 68,539,674 | ||||||||||||||||||||||||||||||
Consultant Class | 6,158,273 | 20,800,103 | – | 2,609,373 | (3,846,982 | ) | (8,452,231 | ) | 2,311,291 | 14,957,245 | ||||||||||||||||||||||||||||||
Institutional Class | 70,554,287 | 156,918,524 | – | 26,944,460 | (34,692,954 | ) | (117,097,172 | ) | 35,861,333 | 66,765,812 | ||||||||||||||||||||||||||||||
| Royce Value Fund | ||||||||||||||||||||||||||||||||||||||||
Investment Class | 50,855,605 | 236,538,146 | – | 12,574,342 | (53,494,326 | ) | (101,359,009 | ) | (2,638,721 | ) | 147,753,479 | |||||||||||||||||||||||||||||
Service Class | 69,938,682 | 339,194,986 | – | 71,891,837 | (220,900,502 | ) | (563,846,575 | ) | (150,961,820 | ) | (152,759,752 | ) | ||||||||||||||||||||||||||||
Consultant Class | 2,466,254 | 11,153,721 | – | 2,303,504 | (3,146,458 | ) | (6,458,183 | ) | (680,204 | ) | 6,999,042 | |||||||||||||||||||||||||||||
Institutional Class | 27,914,738 | 64,381,177 | – | 12,914,796 | (22,780,680 | ) | (76,857,698 | ) | 5,134,058 | 438,275 | ||||||||||||||||||||||||||||||
R Class | 8,425,333 | 20,039,567 | – | 2,303,851 | (4,886,247 | ) | (9,254,235 | ) | 3,539,086 | 13,089,183 | ||||||||||||||||||||||||||||||
K Class | 5,471,365 | 17,684,351 | – | 1,103,064 | (2,810,970 | ) | (15,175,105 | ) | 2,660,395 | 3,612,310 | ||||||||||||||||||||||||||||||
| Royce Value Plus Fund | ||||||||||||||||||||||||||||||||||||||||
Investment Class | 45,497,774 | 185,667,134 | – | 3,286,855 | (97,769,507 | ) | (155,794,609 | ) | (52,271,733 | ) | 33,159,380 | |||||||||||||||||||||||||||||
Service Class | 83,059,929 | 272,171,440 | – | 9,452,816 | (397,131,884 | ) | (1,129,725,501 | ) | (314,071,955 | ) | (848,101,245 | ) | ||||||||||||||||||||||||||||
Consultant Class | 870,531 | 1,284,171 | – | – | (2,418,387 | ) | (8,752,267 | ) | (1,547,856 | ) | (7,468,096 | ) | ||||||||||||||||||||||||||||
Institutional Class | 27,887,908 | 111,467,750 | – | 3,221,338 | (82,504,055 | ) | (236,584,389 | ) | (54,616,147 | ) | (121,895,301 | ) | ||||||||||||||||||||||||||||
R Class | 496,688 | 451,652 | – | 8,226 | (252,614 | ) | (178,504 | ) | 244,074 | 281,374 | ||||||||||||||||||||||||||||||
K Class | 110,898 | 3,058,200 | – | – | (85,259 | ) | (4,239,400 | ) | 25,639 | (1,181,200 | ) | |||||||||||||||||||||||||||||
| Royce 100 Fund | ||||||||||||||||||||||||||||||||||||||||
Investment Class | 20,829,393 | 32,341,098 | – | 2,656,739 | (11,741,316 | ) | (29,866,675 | ) | 9,088,077 | 5,131,162 | ||||||||||||||||||||||||||||||
Service Class | 22,461,005 | 118,580,030 | – | 15,193,911 | (68,067,692 | ) | (144,961,683 | ) | (45,606,687 | ) | (11,187,742 | ) | ||||||||||||||||||||||||||||
R Class | 1,424,148 | 3,262,072 | – | 130,243 | (699,424 | ) | (972,683 | ) | 724,724 | 2,419,632 | ||||||||||||||||||||||||||||||
K Class | 679,897 | 4,756,044 | – | 181,048 | (877,593 | ) | (2,836,960 | ) | (197,696 | ) | 2,100,132 | |||||||||||||||||||||||||||||
| Royce Micro-Cap Discovery Fund | ||||||||||||||||||||||||||||||||||||||||
Service Class | 187,318 | 1,374,528 | – | 1,803 | (59,167 | ) | (1,281,347 | ) | 128,151 | 94,984 | ||||||||||||||||||||||||||||||
| Royce Financial Services Fund | ||||||||||||||||||||||||||||||||||||||||
Service Class | 2,617,768 | 7,530,782 | – | 136,589 | (2,554,637 | ) | (5,769,658 | ) | 63,131 | 1,897,713 | ||||||||||||||||||||||||||||||
| Royce Dividend Value Fund | ||||||||||||||||||||||||||||||||||||||||
Investment Class | 48,121,227 | 79,351,633 | 758,093 | 1,764,026 | (13,858,400 | ) | (23,957,786 | ) | 35,020,920 | 57,157,873 | ||||||||||||||||||||||||||||||
Service Class | 49,103,197 | 167,064,708 | 1,201,267 | 3,620,595 | (28,155,922 | ) | (70,064,058 | ) | 22,148,542 | 100,621,245 | ||||||||||||||||||||||||||||||
| Royce SMid-Cap Value Fund | ||||||||||||||||||||||||||||||||||||||||
Service Class | 2,515,774 | 10,808,481 | – | 15,542 | (2,455,172 | ) | (4,628,928 | ) | 60,602 | 6,195,095 | ||||||||||||||||||||||||||||||
| Royce Focus Value Fund | ||||||||||||||||||||||||||||||||||||||||
Service Class | 546,826 | 1,859,177 | – | 333,049 | (630,845 | ) | (704,625 | ) | (84,019 | ) | 1,487,601 | |||||||||||||||||||||||||||||
| Royce Partners Fund | ||||||||||||||||||||||||||||||||||||||||
Service Class | 91,705 | 263,745 | – | 177,889 | (50,587 | ) | (135,008 | ) | 41,118 | 306,626 | ||||||||||||||||||||||||||||||
| Royce Mid-Cap Fund | ||||||||||||||||||||||||||||||||||||||||
Service Class | 513,443 | 1,890,618 | – | 200,777 | (815,783 | ) | (578,382 | ) | (302,340 | ) | 1,513,013 | |||||||||||||||||||||||||||||
| Royce Special Equity Multi-Cap Fund | ||||||||||||||||||||||||||||||||||||||||
Investment Class | 26,925,487 | – | (64,145 | ) | 26,861,342 | |||||||||||||||||||||||||||||||||||
Service Class | 27,720,679 | 37,414,885 | – | 233,120 | (27,098,155 | ) | (1,569,518 | ) | 622,524 | 36,078,487 | ||||||||||||||||||||||||||||||
Institutional Class | 21,548,000 | – | – | 21,548,000 | ||||||||||||||||||||||||||||||||||||
| The Royce Funds 2012 Semiannual Report to Shareholders | 137 |
| Notes to Financial Statements (unaudited) (continued) |
Capital Share Transactions (in shares): |
| Shares issued for | Net increase (decrease) in | |||||||||||||||||||||||||||||||
| Shares sold | reinvestment of distributions | Shares redeemed | shares outstanding | |||||||||||||||||||||||||||||
| Period ended | Period ended | Period ended | Period ended | |||||||||||||||||||||||||||||
| 6/30/12 | Period ended | 6/30/12 | Period ended | 6/30/12 | Period ended | 6/30/12 | Period ended | |||||||||||||||||||||||||
| (unaudited) | 12/31/11 | (unaudited) | 12/31/11 | (unaudited) | 12/31/11 | (unaudited) | 12/31/11 | |||||||||||||||||||||||||
| Royce Pennsylvania Mutual Fund | ||||||||||||||||||||||||||||||||
Investment Class | 37,455,937 | 93,955,432 | – | 13,159,567 | (45,978,019 | ) | (117,108,017 | ) | (8,522,082 | ) | (9,993,018 | ) | ||||||||||||||||||||
Service Class | 7,549,992 | 14,475,377 | – | 1,363,360 | (7,230,201 | ) | (16,595,769 | ) | 319,791 | (757,032 | ) | |||||||||||||||||||||
Consultant Class | 1,952,704 | 5,643,268 | – | 2,579,352 | (6,071,961 | ) | (18,914,549 | ) | (4,119,257 | ) | (10,691,929 | ) | ||||||||||||||||||||
Institutional Class | 14,637,982 | 23,477,535 | – | 758,043 | (1,856,578 | ) | (1,820,044 | ) | 12,781,404 | 22,415,534 | ||||||||||||||||||||||
R Class | 836,529 | 1,175,009 | – | 74,703 | (371,559 | ) | (666,563 | ) | 464,970 | 583,149 | ||||||||||||||||||||||
K Class | 235,390 | 456,460 | – | 19,127 | (112,112 | ) | (231,873 | ) | 123,278 | 243,714 | ||||||||||||||||||||||
| Royce Micro-Cap Fund | ||||||||||||||||||||||||||||||||
Investment Class | 4,297,481 | 14,410,692 | – | 3,453,352 | (9,108,589 | ) | (17,485,122 | ) | (4,811,108 | ) | 378,922 | |||||||||||||||||||||
Service Class | 3,743,782 | 2,868,077 | – | 509,469 | (2,894,463 | ) | (2,905,990 | ) | 849,319 | 471,556 | ||||||||||||||||||||||
Consultant Class | 213,289 | 861,120 | – | 552,967 | (901,294 | ) | (2,554,011 | ) | (688,005 | ) | (1,139,924 | ) | ||||||||||||||||||||
| Royce Premier Fund | ||||||||||||||||||||||||||||||||
Investment Class | 23,705,337 | 56,921,269 | – | 19,056,714 | (24,078,756 | ) | (74,774,521 | ) | (373,419 | ) | 1,203,462 | |||||||||||||||||||||
Service Class | 4,478,179 | 10,661,741 | – | 2,836,588 | (6,046,341 | ) | (8,148,599 | ) | (1,568,162 | ) | 5,349,730 | |||||||||||||||||||||
Consultant Class | 160,377 | 358,012 | – | 303,202 | (271,699 | ) | (930,069 | ) | (111,322 | ) | (268,855 | ) | ||||||||||||||||||||
Institutional Class | 4,072,479 | 19,132,729 | – | 3,634,281 | (4,488,770 | ) | (13,659,607 | ) | (416,291 | ) | 9,107,403 | |||||||||||||||||||||
W Class | 3,725,334 | 14,454,090 | – | 1,779,431 | (4,486,533 | ) | (7,486,167 | ) | (761,199 | ) | 8,747,354 | |||||||||||||||||||||
R Class | 366,232 | 1,006,378 | – | 107,576 | (165,041 | ) | (310,552 | ) | 201,191 | 803,402 | ||||||||||||||||||||||
K Class | 228,610 | 910,788 | – | 167,576 | (113,372 | ) | (433,639 | ) | 115,238 | 644,725 | ||||||||||||||||||||||
| Royce Low-Priced Stock Fund | ||||||||||||||||||||||||||||||||
Investment Class | 6,003,067 | 14,766,141 | – | 1,480,262 | (2,969,388 | ) | (5,072,436 | ) | 3,033,679 | 11,173,967 | ||||||||||||||||||||||
Service Class | 9,541,183 | 36,270,301 | – | 14,559,081 | (32,139,477 | ) | (66,117,217 | ) | (22,598,294 | ) | (15,287,835 | ) | ||||||||||||||||||||
Institutional Class | 11,542,485 | 19,794,095 | – | 5,821,461 | (5,506,674 | ) | (15,354,755 | ) | 6,035,811 | 10,260,801 | ||||||||||||||||||||||
R Class | 64,609 | 433,871 | – | 44,901 | (131,244 | ) | (118,436 | ) | (66,635 | ) | 360,336 | |||||||||||||||||||||
K Class | 150,925 | 674,843 | – | 134,578 | (207,852 | ) | (210,142 | ) | (56,927 | ) | 599,279 | |||||||||||||||||||||
| Royce Total Return Fund | ||||||||||||||||||||||||||||||||
Investment Class | 17,955,710 | 43,347,125 | 1,349,625 | 4,874,317 | (27,732,468 | ) | (73,682,294 | ) | (8,427,133 | ) | (25,460,852 | ) | ||||||||||||||||||||
Service Class | 3,144,967 | 7,382,050 | 100,998 | 374,791 | (3,955,167 | ) | (7,941,788 | ) | (709,202 | ) | (184,947 | ) | ||||||||||||||||||||
Consultant Class | 750,845 | 2,356,914 | – | 288,296 | (2,078,604 | ) | (6,445,536 | ) | (1,327,759 | ) | (3,800,326 | ) | ||||||||||||||||||||
Institutional Class | 3,557,399 | 10,769,148 | 169,717 | 632,149 | (5,716,590 | ) | (7,607,871 | ) | (1,989,474 | ) | 3,793,426 | |||||||||||||||||||||
W Class | 1,916,080 | 6,414,204 | 70,572 | 210,690 | (1,228,591 | ) | (1,871,026 | ) | 758,061 | 4,753,868 | ||||||||||||||||||||||
R Class | 830,908 | 1,760,255 | 9,697 | 38,216 | (270,661 | ) | (591,978 | ) | 569,944 | 1,206,493 | ||||||||||||||||||||||
K Class | 5,916,724 | 16,865,834 | 83,531 | 339,825 | (4,402,876 | ) | (8,485,413 | ) | 1,597,379 | 8,720,246 | ||||||||||||||||||||||
| Royce Heritage Fund | ||||||||||||||||||||||||||||||||
Investment Class | 830,599 | 920,375 | – | 73,804 | (303,913 | ) | (262,754 | ) | 526,686 | 731,425 | ||||||||||||||||||||||
Service Class | 739,220 | 3,478,683 | – | 759,273 | (1,665,571 | ) | (3,632,933 | ) | (926,351 | ) | 605,023 | |||||||||||||||||||||
Consultant Class | 87,387 | 458,167 | – | 69,418 | (157,680 | ) | (249,851 | ) | (70,293 | ) | 277,734 | |||||||||||||||||||||
R Class | 154,605 | 404,387 | – | 21,650 | (34,941 | ) | (176,673 | ) | 119,664 | 249,364 | ||||||||||||||||||||||
K Class | 127,665 | 594,107 | – | 47,389 | (356,553 | ) | (303,773 | ) | (228,888 | ) | 337,723 | |||||||||||||||||||||
| Royce Opportunity Fund | ||||||||||||||||||||||||||||||||
Investment Class | 5,647,725 | 16,080,330 | – | 1,525,352 | (11,098,820 | ) | (29,329,940 | ) | (5,451,095 | ) | (11,724,258 | ) | ||||||||||||||||||||
Service Class | 1,650,329 | 6,253,247 | – | 311,146 | (2,460,986 | ) | (17,108,991 | ) | (810,657 | ) | (10,544,598 | ) | ||||||||||||||||||||
Consultant Class | 79,091 | 371,087 | – | 23,572 | (181,955 | ) | (311,141 | ) | (102,864 | ) | 83,518 | |||||||||||||||||||||
Institutional Class | 6,442,040 | 12,519,115 | – | 959,534 | (6,828,289 | ) | (15,954,285 | ) | (386,249 | ) | (2,475,636 | ) | ||||||||||||||||||||
R Class | 148,500 | 247,611 | – | 6,061 | (38,690 | ) | (63,912 | ) | 109,810 | 189,760 | ||||||||||||||||||||||
K Class | 112,028 | 1,128,142 | – | 13,930 | (77,166 | ) | (1,053,344 | ) | 34,862 | 88,728 | ||||||||||||||||||||||
| Royce Special Equity Fund | �� | |||||||||||||||||||||||||||||||
Investment Class | 16,786,358 | 33,469,863 | – | 4,453,441 | (9,614,278 | ) | (24,072,476 | ) | 7,172,080 | 13,850,828 | ||||||||||||||||||||||
Service Class | 2,859,159 | 5,712,641 | – | 575,810 | (2,500,914 | ) | (3,018,331 | ) | 358,245 | 3,270,120 | ||||||||||||||||||||||
Consultant Class | 303,550 | 1,037,328 | – | 140,063 | (192,040 | ) | (425,823 | ) | 111,510 | 751,568 | ||||||||||||||||||||||
Institutional Class | 3,372,073 | 7,481,863 | – | 1,392,479 | (1,655,817 | ) | (5,729,562 | ) | 1,716,256 | 3,144,780 | ||||||||||||||||||||||
| Royce Value Fund | ||||||||||||||||||||||||||||||||
Investment Class | 4,396,693 | 18,150,120 | – | 1,150,443 | (4,529,475 | ) | (8,468,180 | ) | (132,782 | ) | 10,832,383 | |||||||||||||||||||||
Service Class | 5,999,201 | 25,928,581 | – | 6,595,581 | (19,469,015 | ) | (45,319,524 | ) | (13,469,814 | ) | (12,795,362 | ) | ||||||||||||||||||||
Consultant Class | 221,170 | 892,206 | – | 220,854 | (287,476 | ) | (542,320 | ) | (66,306 | ) | 570,740 | |||||||||||||||||||||
Institutional Class | 2,401,695 | 5,163,976 | – | 1,180,512 | (1,951,043 | ) | (6,225,995 | ) | 450,652 | 118,493 | ||||||||||||||||||||||
R Class | 728,265 | 1,581,685 | – | 214,312 | (432,318 | ) | (743,888 | ) | 295,947 | 1,052,109 | ||||||||||||||||||||||
K Class | 570,795 | 1,654,858 | – | 123,662 | (293,262 | ) | (1,456,778 | ) | 277,533 | 321,742 | ||||||||||||||||||||||
| 138 | The Royce Funds 2012 Semiannual Report to Shareholders |
Capital Share Transactions (in shares)(continued): |
| Shares issued for | Net increase (decrease) in | |||||||||||||||||||||||||||||||
| Shares sold | reinvestment of distributions | Shares redeemed | shares outstanding | |||||||||||||||||||||||||||||
| Period ended | Period ended | Period ended | Period ended | |||||||||||||||||||||||||||||
| 6/30/12 | Period ended | 6/30/12 | Period ended | 6/30/12 | Period ended | 6/30/12 | Period ended | |||||||||||||||||||||||||
| (unaudited) | 12/31/11 | (unaudited) | 12/31/11 | (unaudited) | 12/31/11 | (unaudited) | 12/31/11 | |||||||||||||||||||||||||
| Royce Value Plus Fund | ||||||||||||||||||||||||||||||||
Investment Class | 3,543,646 | 13,953,159 | – | 275,512 | (7,325,424 | ) | (12,058,932 | ) | (3,781,778 | ) | 2,169,739 | |||||||||||||||||||||
Service Class | 6,383,215 | 20,796,051 | – | 795,022 | (30,296,527 | ) | (86,273,369 | ) | (23,913,312 | ) | (64,682,296 | ) | ||||||||||||||||||||
Consultant Class | 67,259 | 99,173 | – | – | (190,490 | ) | (684,718 | ) | (123,231 | ) | (585,545 | ) | ||||||||||||||||||||
Institutional Class | 2,094,037 | 8,212,310 | – | 269,794 | (6,268,016 | ) | (18,297,908 | ) | (4,173,979 | ) | (9,815,804 | ) | ||||||||||||||||||||
R Class | 38,238 | 33,407 | – | 705 | (19,184 | ) | (13,559 | ) | 19,054 | 20,553 | ||||||||||||||||||||||
K Class | 11,282 | 333,094 | – | – | (8,732 | ) | (465,542 | ) | 2,550 | (132,448 | ) | |||||||||||||||||||||
| Royce 100 Fund | ||||||||||||||||||||||||||||||||
Investment Class | 2,304,150 | 3,285,201 | – | 309,283 | (1,270,626 | ) | (3,107,511 | ) | 1,033,524 | 486,973 | ||||||||||||||||||||||
Service Class | 2,385,911 | 12,069,200 | – | 1,783,323 | (7,432,686 | ) | (15,506,812 | ) | (5,046,775 | ) | (1,654,289 | ) | ||||||||||||||||||||
R Class | 125,450 | 287,703 | – | 12,682 | (61,509 | ) | (84,431 | ) | 63,941 | 215,954 | ||||||||||||||||||||||
K Class | 59,268 | 398,695 | – | 17,442 | (77,455 | ) | (241,925 | ) | (18,187 | ) | 174,212 | |||||||||||||||||||||
| Royce Micro-Cap Discovery Fund | ||||||||||||||||||||||||||||||||
Service Class | 34,761 | 255,798 | – | 361 | (11,099 | ) | (243,232 | ) | 23,662 | 12,927 | ||||||||||||||||||||||
| Royce Financial Services Fund | ||||||||||||||||||||||||||||||||
Service Class | 410,879 | 1,139,664 | – | 24,005 | (412,961 | ) | (955,674 | ) | (2,082 | ) | 207,995 | |||||||||||||||||||||
| Royce Dividend Value Fund | ||||||||||||||||||||||||||||||||
Investment Class | 7,311,675 | 11,679,392 | 114,320 | 279,799 | (2,049,052 | ) | (3,772,024 | ) | 5,376,943 | 8,187,167 | ||||||||||||||||||||||
Service Class | 7,181,071 | 24,465,109 | 179,359 | 569,317 | (4,128,049 | ) | (10,620,820 | ) | 3,232,381 | 14,413,606 | ||||||||||||||||||||||
| Royce SMid-Cap Value Fund | ||||||||||||||||||||||||||||||||
Service Class | 220,125 | 904,031 | – | 1,519 | (221,592 | ) | (424,769 | ) | (1,467 | ) | 480,781 | |||||||||||||||||||||
| Royce Focus Value Fund | ||||||||||||||||||||||||||||||||
Service Class | 37,652 | 116,985 | – | 23,960 | (42,688 | ) | (45,252 | ) | (5,036 | ) | 95,693 | |||||||||||||||||||||
| Royce Partners Fund | ||||||||||||||||||||||||||||||||
Service Class | 7,967 | 20,712 | – | 17,389 | (4,542 | ) | (10,504 | ) | 3,425 | 27,597 | ||||||||||||||||||||||
| Royce Mid-Cap Fund | ||||||||||||||||||||||||||||||||
Service Class | 44,869 | 156,553 | – | 18,694 | (73,589 | ) | (49,671 | ) | (28,720 | ) | 125,576 | |||||||||||||||||||||
| Royce Special Equity Multi-Cap Fund | ||||||||||||||||||||||||||||||||
Investment Class | 2,280,817 | – | (5,666 | ) | 2,275,151 | |||||||||||||||||||||||||||
Service Class | 2,442,833 | 3,594,359 | – | 22,013 | (2,303,178 | ) | (157,093 | ) | 139,655 | 3,459,279 | ||||||||||||||||||||||
Institutional Class | 1,828,477 | – | – | 1,828,477 | ||||||||||||||||||||||||||||
| The Royce Funds 2012 Semiannual Report to Shareholders | 139 |
| Notes to Financial Statements (unaudited) (continued) |
Investment Adviser and Distributor:
Investment Adviser: Under the Trust’s investment advisory agreements with Royce, Royce is entitled to receive Investment Advisory fees that are computed daily and payable monthly. Royce’s commitment to waive its fees and reimburse class-specific expenses to the extent necessary to maintain certain Funds’ net annual operating expense ratios at specified levels through April 30, 2013, is shown below to the extent that it impacted net expenses for the period ended June 30, 2012. See the Prospectus for contractual waiver expiration dates.
| Annual contractual | Committed net annual | Period ended | |||||||||||||||||||||||
| advisory fee as a | operating expense ratio cap | June 30, 2012 | |||||||||||||||||||||||
| percentage of | Investment | Service | Consultant | Institutional | Net advisory | Advisory | |||||||||||||||||||
| average net assets1 | Class3 | Class3 | Class3 | Class3 | W Class3 | R Class3 | K Class3 | fees | fees waived | ||||||||||||||||
Royce Pennsylvania Mutual Fund | 0.75 | %2 | N/A | N/A | N/A | N/A | N/A | N/A | N/A | $ | 22,502,592 | $ | – | ||||||||||||
Royce Micro-Cap Fund | 1.30 | % | N/A | 1.66% | N/A | N/A | N/A | N/A | N/A | 7,847,468 | – | ||||||||||||||
Royce Premier Fund | 0.93 | % | N/A | N/A | N/A | N/A | N/A | N/A | N/A | 32,912,221 | – | ||||||||||||||
Royce Low-Priced Stock Fund | 1.12 | % | 1.24% | 1.49% | N/A | N/A | N/A | 1.84% | 1.59% | 22,066,199 | – | ||||||||||||||
Royce Total Return Fund | 0.96 | % | N/A | N/A | N/A | N/A | N/A | N/A | N/A | 22,190,543 | – | ||||||||||||||
Royce Heritage Fund | 1.00 | % | N/A | N/A | N/A | N/A | N/A | 1.84% | 1.59% | 1,395,689 | – | ||||||||||||||
Royce Opportunity Fund | 1.00 | % | N/A | N/A | N/A | N/A | N/A | 1.84% | N/A | 8,900,040 | – | ||||||||||||||
Royce Special Equity Fund | 0.99 | % | N/A | 1.39% | N/A | N/A | N/A | N/A | N/A | 13,341,869 | – | ||||||||||||||
Royce Value Fund | 1.00 | % | N/A | N/A | N/A | N/A | N/A | N/A | N/A | 8,048,860 | – | ||||||||||||||
Royce Value Plus Fund | 1.00 | % | N/A | N/A | N/A | N/A | N/A | 1.84% | 1.59% | 9,764,291 | – | ||||||||||||||
Royce 100 Fund | 1.00 | % | N/A | N/A | N/A | N/A | N/A | 1.84% | 1.59% | 1,963,582 | – | ||||||||||||||
Royce Micro-Cap Discovery Fund | 1.00 | % | N/A | 1.49% | N/A | N/A | N/A | N/A | N/A | – | 19,185 | ||||||||||||||
Royce Financial Services Fund | 1.00 | % | N/A | 1.49% | N/A | N/A | N/A | N/A | N/A | 49,136 | 28,445 | ||||||||||||||
Royce Dividend Value Fund | 1.00 | % | N/A | N/A | N/A | N/A | N/A | N/A | N/A | 1,625,472 | – | ||||||||||||||
Royce SMid-Cap Value Fund | 1.00 | % | N/A | 1.35% | N/A | N/A | N/A | N/A | N/A | 24,101 | 32,262 | ||||||||||||||
Royce Focus Value Fund | 1.00 | % | N/A | 1.35% | N/A | N/A | N/A | N/A | N/A | 15,728 | 29,586 | ||||||||||||||
Royce Partners Fund | 1.00 | % | N/A | 1.35% | N/A | N/A | N/A | N/A | N/A | – | 9,259 | ||||||||||||||
Royce Mid-Cap Fund | 1.00 | % | N/A | 1.35% | N/A | N/A | N/A | N/A | N/A | – | 29,259 | ||||||||||||||
Royce Special Equity Multi-Cap Fund | 1.00 | % | N/A | 1.39% | N/A | 1.04% | N/A | N/A | N/A | 321,577 | – | ||||||||||||||
| 1 | From a base annual rate of 1.00% (1.30% for Royce Micro-Cap Fund and 1.15% for Royce Low-Priced Stock Fund), the annual rates of investment advisory fees payable by each of the Funds, other than Royce Pennsylvania Mutual Fund, are reduced by the indicated amount at the following breakpoints applicable to a Fund’s net assets in excess of $2 billion: more than $2 billion to $4 billion – .05% per annum; more than $4 billion to $6 billion – .10% per annum; over $6 billion – .15% per annum. |
| 2 | Royce Pennsylvania Mutual Fund’s fees are calculated at the annual rate of 1.00% of the first $50 million of the Fund’s average net assets, 0.875% of the next $50 million of average net assets and 0.75% of average net assets in excess of $100 million. |
| 3 | Committed net annual operating expense ratio cap excludes acquired fund fees and expenses. |
Distributor: Royce Fund Services, Inc. (“RFS”), the distributor of the Trust’s shares, is a wholly owned subsidiary of Royce. RFS is entitled to receive distribution fees that are computed daily and payable monthly.
| Period ended June 30, 2012 | ||||||||||||||
| Annual contractual distribution fee as | Net distribution | Distribution fees | ||||||||||||
| a percentage of average net assets | fees | waived | ||||||||||||
Royce Pennsylvania Mutual Fund – Service Class | 0.25 | % | $ | 546,164 | $ | – | ||||||||
Royce Pennsylvania Mutual Fund – Consultant Class | 1.00 | % | 3,419,023 | – | ||||||||||
Royce Pennsylvania Mutual Fund – R Class | 0.50 | % | 66,843 | – | ||||||||||
Royce Pennsylvania Mutual Fund – K Class | 0.25 | % | 9,380 | – | ||||||||||
Royce Micro-Cap Fund – Service Class | 0.25 | % | 156,443 | – | ||||||||||
Royce Micro-Cap Fund – Consultant Class | 1.00 | % | 692,661 | – | ||||||||||
Royce Premier Fund – Service Class | 0.25 | % | 803,300 | 33,471 | ||||||||||
Royce Premier Fund – Consultant Class | 1.00 | % | 313,784 | – | ||||||||||
Royce Premier Fund – R Class | 0.50 | % | 69,685 | – | ||||||||||
Royce Premier Fund – K Class | 0.25 | % | 12,662 | – | ||||||||||
Royce Low-Priced Stock Fund – Service Class | 0.25 | % | 3,131,939 | – | ||||||||||
Royce Low-Priced Stock Fund – R Class | 0.50 | % | 18,639 | – | ||||||||||
Royce Low-Priced Stock Fund – K Class | 0.25 | % | 11,286 | – | ||||||||||
Royce Total Return Fund – Service Class | 0.25 | % | 369,185 | – | ||||||||||
Royce Total Return Fund – Consultant Class | 1.00 | % | 1,670,596 | – | ||||||||||
Royce Total Return Fund – R Class | 0.50 | % | 102,064 | – | ||||||||||
Royce Total Return Fund – K Class | 0.25 | % | 241,645 | – | ||||||||||
| 140 | The Royce Funds 2012 Semiannual Report to Shareholders |
Distributor (continued): |
| Period ended June 30, 2012 | ||||||||||||||
| Annual contractual distribution fee as | Net distribution | Distribution fees | ||||||||||||
| a percentage of average net assets | fees | waived | ||||||||||||
Royce Heritage Fund – Service Class | 0.25 | % | $ | 273,732 | $ | 11,405 | ||||||||
Royce Heritage Fund – Consultant Class | 1.00 | % | 70,738 | – | ||||||||||
Royce Heritage Fund – R Class | 0.50 | % | 11,857 | – | ||||||||||
Royce Heritage Fund – K Class | 0.25 | % | 8,202 | – | ||||||||||
Royce Opportunity Fund – Service Class | 0.25 | % | 221,118 | – | ||||||||||
Royce Opportunity Fund – Consultant Class | 1.00 | % | 63,355 | – | ||||||||||
Royce Opportunity Fund – R Class | 0.50 | % | 9,469 | – | ||||||||||
Royce Opportunity Fund – K Class | 0.25 | % | 9,240 | – | ||||||||||
Royce Special Equity Fund – Service Class | 0.25 | % | 309,701 | – | ||||||||||
Royce Special Equity Fund – Consultant Class | 1.00 | % | 276,624 | – | ||||||||||
Royce Value Fund – Service Class | 0.25 | % | �� | 1,359,996 | – | |||||||||
Royce Value Fund – Consultant Class | 1.00 | % | 188,397 | – | ||||||||||
Royce Value Fund – R Class | 0.50 | % | 94,332 | – | ||||||||||
Royce Value Fund – K Class | 0.25 | % | 20,677 | – | ||||||||||
Royce Value Plus Fund – Service Class | 0.25 | % | 1,666,345 | 69,431 | ||||||||||
Royce Value Plus Fund – Consultant Class | 1.00 | % | 105,763 | – | ||||||||||
Royce Value Plus Fund – R Class | 0.50 | % | 3,173 | – | ||||||||||
Royce Value Plus Fund – K Class | 0.25 | % | 712 | – | ||||||||||
Royce 100 Fund – Service Class | 0.25 | % | 331,628 | 63,167 | ||||||||||
Royce 100 Fund – R Class | 0.50 | % | 10,325 | – | ||||||||||
Royce 100 Fund – K Class | 0.25 | % | 5,842 | – | ||||||||||
Royce Micro-Cap Discovery Fund – Service Class | 0.25 | % | 4,796 | – | ||||||||||
Royce Financial Services Fund – Service Class | 0.25 | % | 19,395 | – | ||||||||||
Royce Dividend Value Fund – Service Class | 0.25 | % | 257,956 | 22,431 | ||||||||||
Royce SMid-Cap Value Fund – Service Class | 0.25 | % | 14,091 | – | ||||||||||
Royce Focus Value Fund – Service Class | 0.25 | % | 11,328 | – | ||||||||||
Royce Partners Fund – Service Class | 0.25 | % | 2,315 | – | ||||||||||
Royce Mid-Cap Fund – Service Class | 0.25 | % | 7,315 | – | ||||||||||
Royce Special Equity Multi-Cap Fund – Service Class | 0.25 | % | 44,595 | 8,494 | ||||||||||
Purchases and Sales of Investment Securities:
For the period ended June 30, 2012, the costs of purchases and the proceeds from sales of investment securities, other than short-term securities and collateral received for securities loaned, were as follows:
| Purchases | Sales | |||||
Royce Pennsylvania Mutual Fund | $ | 773,468,128 | $ | 711,580,424 | ||
Royce Micro-Cap Fund | 105,897,363 | 187,108,960 | ||||
Royce Premier Fund | 308,692,918 | 191,453,534 | ||||
Royce Low-Priced Stock Fund | 187,783,330 | 440,020,175 | ||||
Royce Total Return Fund | 463,839,833 | 646,061,636 | ||||
Royce Heritage Fund | 55,500,216 | 61,114,028 | ||||
Royce Opportunity Fund | 297,080,685 | 408,981,425 | ||||
Royce Special Equity Fund | 539,604,717 | 413,725,577 | ||||
Royce Value Fund | 237,637,047 | 368,637,062 | ||||
Royce Value Plus Fund | 285,357,881 | 723,178,785 | ||||
| Purchases | Sales | |||||
Royce 100 Fund | $ | 26,713,180 | $ | 59,984,002 | ||
Royce Micro-Cap Discovery Fund | 1,299,605 | 1,301,416 | ||||
Royce Financial Services Fund | 1,821,997 | 1,857,538 | ||||
Royce Dividend Value Fund | 54,267,162 | 16,281,246 | ||||
Royce SMid-Cap Value Fund | 2,467,642 | 3,901,771 | ||||
Royce Focus Value Fund | 1,195,178 | 1,360,364 | ||||
Royce Partners Fund | 153,417 | 81,314 | ||||
Royce Mid-Cap Fund | 1,448,869 | 1,810,525 | ||||
Royce Special Equity Multi-Cap Fund | 49,449,280 | 1,471,282 | ||||
| The Royce Funds 2012 Semiannual Report to Shareholders | 141 |
| Notes to Financial Statements (unaudited) (continued) |
Class Specific Expenses:
Class specific expenses, for Funds with multiple classes, were as follows for the period ended June 30, 2012:
| Transfer | Expenses | |||||||||||||||||||||||||||
| Net | Agent | Reimbursed by | ||||||||||||||||||||||||||
| Distribution | Shareholder | Shareholder | Balance | Investment | ||||||||||||||||||||||||
| Fees | Servicing | Reports | Registration | Credits | Total | Adviser | ||||||||||||||||||||||
Royce Pennsylvania Mutual Fund – Investment Class | $ | – | $ | 2,343,819 | $ | 447,210 | $ | 33,397 | $ | (507 | ) | $ | 2,823,919 | $ | – | |||||||||||||
Royce Pennsylvania Mutual Fund – Service Class | 546,164 | 374,888 | 62,105 | 7,218 | (12 | ) | 990,363 | – | ||||||||||||||||||||
Royce Pennsylvania Mutual Fund – Consultant Class | 3,419,023 | 196,800 | 116,288 | 9,014 | (222 | ) | 3,740,903 | – | ||||||||||||||||||||
Royce Pennsylvania Mutual Fund – Institutional Class | – | 3,276 | 136 | 8,858 | – | 12,270 | – | |||||||||||||||||||||
Royce Pennsylvania Mutual Fund – R Class | 66,843 | 28,217 | 1,742 | 653 | (5 | ) | 97,450 | – | ||||||||||||||||||||
Royce Pennsylvania Mutual Fund – K Class | 9,380 | 12,035 | 412 | 782 | (1 | ) | 22,608 | – | ||||||||||||||||||||
| 4,041,410 | 2,959,035 | 627,893 | 59,922 | (747 | ) | |||||||||||||||||||||||
Royce Micro-Cap Fund – Investment Class | – | 544,663 | 211,158 | 21,926 | (136 | ) | 777,611 | – | ||||||||||||||||||||
Royce Micro-Cap Fund – Service Class | 156,443 | 82,594 | 14,152 | 6,881 | (8 | ) | 260,062 | 69,279 | ||||||||||||||||||||
Royce Micro-Cap Fund – Consultant Class | 692,661 | 34,314 | 20,263 | 6,441 | (39 | ) | 753,640 | – | ||||||||||||||||||||
| 849,104 | 661,571 | 245,573 | 35,248 | (183 | ) | 69,279 | ||||||||||||||||||||||
Royce Premier Fund – Investment Class | – | 2,228,262 | 649,437 | 39,677 | (376 | ) | 2,917,000 | – | ||||||||||||||||||||
Royce Premier Fund – Service Class | 803,300 | 386,413 | 42,445 | 9,087 | (24 | ) | 1,241,221 | – | ||||||||||||||||||||
Royce Premier Fund – Consultant Class | 313,784 | 18,890 | 8,887 | 5,910 | (20 | ) | 347,451 | – | ||||||||||||||||||||
Royce Premier Fund – Institutional Class | – | 4,756 | 40,081 | 9,155 | (2 | ) | 53,990 | – | ||||||||||||||||||||
Royce Premier Fund – W Class | – | 32,525 | 83,162 | 9,234 | (84 | ) | 124,837 | – | ||||||||||||||||||||
Royce Premier Fund – R Class | 69,685 | 26,671 | 1,103 | 721 | (3 | ) | 98,177 | – | ||||||||||||||||||||
Royce Premier Fund – K Class | 12,662 | 11,841 | 297 | 815 | (1 | ) | 25,614 | – | ||||||||||||||||||||
| 1,199,431 | 2,709,358 | 825,412 | 74,599 | (510 | ) | |||||||||||||||||||||||
Royce Low-Priced Stock Fund – Investment Class | – | 104,404 | 22,030 | 11,829 | (6 | ) | 138,257 | 18,361 | ||||||||||||||||||||
Royce Low-Priced Stock Fund – Service Class | 3,131,939 | 2,031,853 | 300,177 | 22,642 | (235 | ) | 5,486,376 | 1,385,406 | ||||||||||||||||||||
Royce Low-Priced Stock Fund – Institutional Class | – | 4,114 | 125,744 | 9,447 | (1 | ) | 139,304 | – | ||||||||||||||||||||
Royce Low-Priced Stock Fund – R Class | 18,639 | 10,232 | 746 | 643 | (2 | ) | 30,258 | 5,000 | ||||||||||||||||||||
Royce Low-Priced Stock Fund – K Class | 11,286 | 11,587 | 689 | 818 | (1 | ) | 24,379 | 5,093 | ||||||||||||||||||||
| 3,161,864 | 2,162,190 | 449,386 | 45,379 | (245 | ) | 1,413,860 | ||||||||||||||||||||||
Royce Total Return Fund – Investment Class | – | 1,733,477 | 396,234 | 28,368 | (417 | ) | 2,157,662 | – | ||||||||||||||||||||
Royce Total Return Fund – Service Class | 369,185 | 197,485 | 32,639 | 8,173 | (11 | ) | 607,471 | – | ||||||||||||||||||||
Royce Total Return Fund – Consultant Class | 1,670,596 | 97,098 | 58,447 | 7,749 | (116 | ) | 1,833,774 | – | ||||||||||||||||||||
Royce Total Return Fund – Institutional Class | – | 5,524 | 9,675 | 9,646 | (2 | ) | 24,843 | – | ||||||||||||||||||||
Royce Total Return Fund – W Class | – | 4,541 | 26,281 | 7,000 | (2 | ) | 37,820 | – | ||||||||||||||||||||
Royce Total Return Fund – R Class | 102,064 | 39,979 | 1,778 | 709 | (6 | ) | 144,524 | – | ||||||||||||||||||||
Royce Total Return Fund – K Class | 241,645 | 174,958 | 845 | 1,346 | (2 | ) | 418,792 | – | ||||||||||||||||||||
| 2,383,490 | 2,253,062 | 525,899 | 62,991 | (556 | ) | |||||||||||||||||||||||
Royce Heritage Fund – Investment Class | – | 9,018 | 1,733 | 6,617 | (1 | ) | 17,367 | – | ||||||||||||||||||||
Royce Heritage Fund – Service Class | 273,732 | 128,029 | 36,565 | 14,994 | (70 | ) | 453,250 | – | ||||||||||||||||||||
Royce Heritage Fund – Consultant Class | 70,738 | 8,064 | 3,631 | 5,836 | (8 | ) | 88,261 | – | ||||||||||||||||||||
Royce Heritage Fund – R Class | 11,857 | 6,081 | 519 | 624 | (1 | ) | 19,080 | 658 | ||||||||||||||||||||
Royce Heritage Fund – K Class | 8,202 | 10,656 | 364 | 802 | (1 | ) | 20,023 | 3,123 | ||||||||||||||||||||
| 364,529 | 161,848 | 42,812 | 28,873 | (81 | ) | 3,781 | ||||||||||||||||||||||
Royce Opportunity Fund – Investment Class | – | 551,852 | 101,035 | 17,378 | (162 | ) | 670,103 | – | ||||||||||||||||||||
Royce Opportunity Fund – Service Class | 221,118 | 152,158 | 28,088 | 7,434 | (5 | ) | 408,793 | – | ||||||||||||||||||||
Royce Opportunity Fund – Consultant Class | 63,355 | 7,775 | 2,462 | 5,190 | (6 | ) | 78,776 | – | ||||||||||||||||||||
Royce Opportunity Fund – Institutional Class | – | 3,805 | 9,092 | 7,618 | (1 | ) | 20,514 | – | ||||||||||||||||||||
Royce Opportunity Fund – R Class | 9,469 | 6,758 | 631 | 615 | (3 | ) | 17,470 | 2,173 | ||||||||||||||||||||
Royce Opportunity Fund – K Class | 9,240 | 5,843 | 263 | 785 | – | 16,131 | – | |||||||||||||||||||||
| 303,182 | 728,191 | 141,571 | 39,020 | (177 | ) | 2,173 | ||||||||||||||||||||||
Royce Special Equity Fund – Investment Class | – | 874,752 | 210,998 | 41,283 | (300 | ) | 1,126,733 | – | ||||||||||||||||||||
Royce Special Equity Fund – Service Class | 309,701 | 138,060 | 36,310 | 9,685 | (81 | ) | 493,675 | 25,568 | ||||||||||||||||||||
Royce Special Equity Fund – Consultant Class | 276,624 | 22,080 | 7,879 | 6,993 | (17 | ) | 313,559 | – | ||||||||||||||||||||
Royce Special Equity Fund – Institutional Class | – | 5,111 | 3,172 | 8,326 | (1 | ) | 16,608 | – | ||||||||||||||||||||
| 586,325 | 1,040,003 | 258,359 | 66,287 | (399 | ) | 25,568 | ||||||||||||||||||||||
| 142 | The Royce Funds 2012 Semiannual Report to Shareholders |
Class Specific Expenses (continued): |
| Transfer | Expenses | |||||||||||||||||||||||||||
| Net | Agent | Reimbursed by | ||||||||||||||||||||||||||
| Distribution | Shareholder | Shareholder | Balance | Investment | ||||||||||||||||||||||||
| Fees | Servicing | Reports | Registration | Credits | Total | Adviser | ||||||||||||||||||||||
Royce Value Fund – Investment Class | $ | – | $ | 100,220 | $ | 51,620 | $ | 11,037 | $ | (99 | ) | $ | 162,778 | $ | – | |||||||||||||
Royce Value Fund – Service Class | 1,359,996 | 848,471 | 159,462 | 22,875 | (194 | ) | 2,390,610 | – | ||||||||||||||||||||
Royce Value Fund – Consultant Class | 188,397 | 18,230 | 7,879 | 5,887 | (23 | ) | 220,370 | – | ||||||||||||||||||||
Royce Value Fund – Institutional Class | – | 3,905 | 1,126 | 7,202 | (1 | ) | 12,232 | – | ||||||||||||||||||||
Royce Value Fund – R Class | 94,332 | 39,956 | 1,309 | 699 | (5 | ) | 136,291 | – | ||||||||||||||||||||
Royce Value Fund – K Class | 20,677 | 18,498 | 1,110 | 793 | (1 | ) | 41,077 | – | ||||||||||||||||||||
| 1,663,402 | 1,029,280 | 222,506 | 48,493 | (323 | ) | |||||||||||||||||||||||
Royce Value Plus Fund – Investment Class | – | 127,494 | 70,403 | 9,256 | (27 | ) | 207,126 | – | ||||||||||||||||||||
Royce Value Plus Fund – Service Class | 1,666,345 | 1,136,065 | 260,521 | 13,277 | (144 | ) | 3,076,064 | – | ||||||||||||||||||||
Royce Value Plus Fund – Consultant Class | 105,763 | 14,643 | 6,449 | 5,207 | (19 | ) | 132,043 | – | ||||||||||||||||||||
Royce Value Plus Fund – Institutional Class | – | 10,304 | 35,411 | 9,107 | (1 | ) | 54,821 | – | ||||||||||||||||||||
Royce Value Plus Fund – R Class | 3,173 | 4,303 | 258 | 605 | (1 | ) | 8,338 | 3,224 | ||||||||||||||||||||
Royce Value Plus Fund – K Class | 712 | 4,070 | 160 | 772 | – | 5,714 | 4,132 | |||||||||||||||||||||
| 1,775,993 | 1,296,879 | 373,202 | 38,224 | (192 | ) | 7,356 | ||||||||||||||||||||||
Royce 100 Fund – Investment Class | – | 31,481 | 10,759 | 6,390 | (27 | ) | 48,603 | – | ||||||||||||||||||||
Royce 100 Fund – Service Class | 331,628 | 205,652 | 78,143 | 14,266 | (69 | ) | 629,620 | – | ||||||||||||||||||||
Royce 100 Fund – R Class | 10,325 | 13,104 | 4,452 | 864 | (25 | ) | 28,720 | 12,093 | ||||||||||||||||||||
Royce 100 Fund – K Class | 5,842 | 7,876 | 446 | 780 | (1 | ) | 14,943 | 2,029 | ||||||||||||||||||||
| 347,795 | 258,113 | 93,800 | 22,300 | (122 | ) | 14,122 | ||||||||||||||||||||||
Royce Dividend Value Fund – Investment Class | – | 49,274 | 12,902 | 9,431 | (7 | ) | 71,600 | – | ||||||||||||||||||||
Royce Dividend Value Fund – Service Class | 257,956 | 136,763 | 46,482 | 15,377 | (150 | ) | 456,428 | – | ||||||||||||||||||||
| 257,956 | 186,037 | 59,384 | 24,808 | (157 | ) | |||||||||||||||||||||||
Royce Special Equity Multi-Cap Fund – Investment Class | – | 3,933 | 33 | 5,772 | – | 9,738 | – | |||||||||||||||||||||
Royce Special Equity Multi-Cap Fund – Service Class | 44,595 | 39,496 | 2,848 | 16,407 | (6 | ) | 103,340 | 43,312 | ||||||||||||||||||||
Royce Special Equity Multi-Cap Fund – Institutional Class | – | 1,858 | 18 | 1,982 | – | 3,858 | 3,858 | |||||||||||||||||||||
| 44,595 | 45,287 | 2,899 | 24,161 | (6 | ) | 47,170 | ||||||||||||||||||||||
Tax Information:
At June 30, 2012, net unrealized appreciation (depreciation) based on identified cost for tax purposes was as follows:
| Net Unrealized | ||||||||||||||||
| Appreciation | Gross Unrealized | |||||||||||||||
| Tax Basis Cost | (Depreciation) | Appreciation | Depreciation | |||||||||||||
Royce Pennsylvania Mutual Fund | $ | 4,990,433,678 | $ | 950,793,453 | $ | 1,482,703,381 | $ | 531,909,928 | ||||||||
Royce Micro-Cap Fund | 1,057,986,433 | 85,083,678 | 245,987,896 | 160,904,218 | ||||||||||||
Royce Premier Fund | 5,341,327,357 | 1,545,334,344 | 1,936,188,749 | 390,854,405 | ||||||||||||
Royce Low-Priced Stock Fund | 3,358,323,225 | 358,258,432 | 815,355,923 | 457,097,491 | ||||||||||||
Royce Total Return Fund | 3,623,527,910 | 878,224,273 | 1,211,069,534 | 332,845,261 | ||||||||||||
Royce Heritage Fund | 239,950,823 | 33,121,026 | 45,415,486 | 12,294,460 | ||||||||||||
Royce Opportunity Fund | 1,881,257,426 | (10,713,273 | ) | 277,156,430 | 287,869,703 | |||||||||||
Royce Special Equity Fund | 2,408,502,202 | 352,252,174 | 418,823,963 | 66,571,789 | ||||||||||||
Royce Value Fund | 1,483,160,705 | (25,372,157 | ) | 165,991,743 | 191,363,900 | |||||||||||
Royce Value Plus Fund | 1,681,447,273 | 127,410,743 | 310,213,383 | 182,802,640 | ||||||||||||
Royce 100 Fund | 317,275,417 | 44,579,300 | 70,777,746 | 26,198,446 | ||||||||||||
Royce Micro-Cap Discovery Fund | 3,762,225 | (15,982 | ) | 397,596 | 413,578 | |||||||||||
Royce Financial Services Fund | 14,867,534 | 464,496 | 2,694,377 | 2,229,881 | ||||||||||||
Royce Dividend Value Fund | 354,728,999 | 6,432,080 | 33,662,070 | 27,229,990 | ||||||||||||
Royce SMid-Cap Value Fund | 10,897,105 | (1,005,023 | ) | 382,649 | 1,387,672 | |||||||||||
Royce Focus Value Fund | 8,257,494 | 398,097 | 1,070,507 | 672,410 | ||||||||||||
Royce Partners Fund | 1,691,145 | 96,800 | 253,529 | 156,729 | ||||||||||||
Royce Mid-Cap Fund | 5,390,514 | (75,371 | ) | 405,327 | 480,698 | |||||||||||
Royce Special Equity Multi-Cap Fund | 86,070,598 | 1,537,786 | 4,606,519 | 3,068,733 | ||||||||||||
The primary difference between book and tax basis cost is the timing of the recognition of losses on securities sold.
| The Royce Funds 2012 Semiannual Report to Shareholders | 143 |
| Notes to Financial Statements (unaudited) (continued) |
Transactions in Affiliated Companies:
An “Affiliated Company,” as defined in the Investment Company Act of 1940, is a company in which a fund owns 5% or more of the company’s outstanding voting securities at any time during the period. The following transactions were effected in shares of such companies for the six months ended June 30, 2012:
| Market | Realized | Market | ||||||||||||||||||||||
| Shares | Value | Cost of | Cost of | Gain | Dividend | Shares | Value | |||||||||||||||||
| Affiliated Company | 12/31/11 | 12/31/11 | Purchases | Sales | (Loss) | Income | 6/30/12 | 6/30/12 | ||||||||||||||||
| Royce Pennsylvania Mutual Fund | ||||||||||||||||||||||||
| America’s Car-Mart | 451,600 | $ | 17,693,688 | $ | 1,064,094 | $ | – | $ | – | $ | – | 476,600 | $ | 18,515,910 | ||||||||||
| CRA International | 592,143 | 11,748,117 | – | – | – | – | 592,143 | 8,698,581 | ||||||||||||||||
| Ethan Allen Interiors | 1,623,910 | 38,502,906 | – | – | – | 227,347 | 1,623,910 | 32,364,526 | ||||||||||||||||
| Obagi Medical Products1 | 1,053,977 | 10,708,407 | – | 4,862,175 | 731,870 | – | ||||||||||||||||||
| Pervasive Software | 1,461,500 | 8,505,930 | – | – | – | – | 1,461,500 | 10,946,635 | ||||||||||||||||
| Preformed Line Products | 291,088 | 17,366,310 | – | – | – | 116,435 | 291,088 | 16,856,906 | ||||||||||||||||
| Pulse Electronics | 2,231,739 | 6,248,869 | – | – | – | – | 2,231,739 | 4,396,526 | ||||||||||||||||
| Rofin-Sinar Technologies1 | 1,642,767 | 37,537,226 | 2,082,179 | 8,669,858 | (244,043 | ) | – | |||||||||||||||||
| Shoe Carnival | 639,729 | 16,441,035 | 6,122,731 | 9 | – | 65,570 | 1,311,398 | 28,181,943 | ||||||||||||||||
| Stanley Furniture | 912,235 | 2,736,705 | – | – | – | – | 912,235 | 3,639,818 | ||||||||||||||||
| U.S. Physical Therapy | 883,675 | 17,390,724 | – | 1,072,454 | 614,139 | 158,162 | 813,706 | 20,692,544 | ||||||||||||||||
| Weyco Group | 590,500 | 14,496,775 | – | – | – | 194,865 | 590,500 | 13,687,790 | ||||||||||||||||
| Winnebago Industries | 1,504,450 | 11,102,841 | – | – | – | – | 1,504,450 | 15,330,345 | ||||||||||||||||
| 210,479,533 | 1,101,966 | 762,379 | 173,311,524 | |||||||||||||||||||||
| Royce Micro-Cap Fund | ||||||||||||||||||||||||
| Anaren1 | 743,436 | 12,355,906 | 122,988 | 714,845 | (79,752 | ) | – | |||||||||||||||||
| AXT | 1,879,961 | 7,839,438 | 146,710 | 212,720 | (88,924 | ) | – | 1,889,361 | 7,462,976 | |||||||||||||||
| GP Strategies1 | 1,029,900 | 13,883,052 | – | 1,435,420 | 1,268,386 | – | ||||||||||||||||||
| Graham Corporation | 621,249 | 13,940,828 | – | – | – | 24,850 | 621,249 | 11,567,656 | ||||||||||||||||
| Key Technology | 446,814 | 5,781,773 | – | – | – | – | 446,814 | 4,468,140 | ||||||||||||||||
| LaCrosse Footwear | 532,669 | 6,722,283 | – | 184,171 | (55,571 | ) | 130,667 | 522,669 | 5,691,865 | |||||||||||||||
| Legumex Walker | 702,500 | 3,557,532 | – | – | – | – | 702,500 | 4,140,065 | ||||||||||||||||
| Lincoln Educational Services | 1,382,527 | 10,921,963 | 1,436,046 | – | – | 206,966 | 1,560,527 | 10,143,426 | ||||||||||||||||
| Novatel Wireless | 413,900 | 1,295,507 | 4,739,482 | – | – | – | 2,529,740 | 6,299,053 | ||||||||||||||||
| PDI | 1,015,694 | 6,551,226 | – | – | – | – | 1,015,694 | 8,369,319 | ||||||||||||||||
| Pilot Gold | 3,114,500 | 3,943,761 | – | – | – | – | 3,114,500 | 3,365,043 | ||||||||||||||||
| TGC Industries1 | 1,105,667 | 7,894,463 | – | 1,025,826 | 825,513 | – | ||||||||||||||||||
| Universal Stainless & Alloy Products1 | 326,512 | 12,198,488 | 1,547,641 | 1,946,287 | 657,183 | – | ||||||||||||||||||
| Voltamp Transformers1 | 524,000 | 4,499,463 | – | 902,850 | (446,733 | ) | – | |||||||||||||||||
| World Energy Solutions | 747,900 | 2,258,658 | – | – | – | – | 747,900 | 2,325,969 | ||||||||||||||||
| 113,644,341 | 2,080,102 | 362,483 | 63,833,512 | |||||||||||||||||||||
| Royce Premier Fund | ||||||||||||||||||||||||
| Alleghany Corporation1 | 514,525 | 146,788,837 | – | – | – | – | ||||||||||||||||||
| Cabot Microelectronics | 2,086,191 | 98,572,525 | – | – | – | 31,292,865 | 2,086,191 | 60,937,639 | ||||||||||||||||
| Cal-Maine Foods | 1,771,686 | 64,790,557 | – | – | – | 1,220,692 | 1,771,686 | 69,272,922 | ||||||||||||||||
| Cognex Corporation | 3,052,717 | 109,256,741 | – | – | – | 641,071 | 3,052,717 | 96,618,493 | ||||||||||||||||
| Fair Isaac | 1,832,600 | 65,680,384 | – | – | – | 73,304 | 1,832,600 | 77,482,328 | ||||||||||||||||
| Fairchild Semiconductor International | 6,458,112 | 77,755,668 | 714,525 | – | – | – | 6,508,112 | 91,764,379 | ||||||||||||||||
| FEI Company | 2,693,120 | 109,825,434 | – | 5,950,723 | 1,718,770 | – | 2,543,120 | 121,662,861 | ||||||||||||||||
| Knight Capital Group Cl. A1 | 4,667,200 | 55,166,304 | – | – | – | – | ||||||||||||||||||
| Lincoln Electric Holdings | 5,074,994 | 198,533,765 | – | – | – | 1,725,498 | 5,074,994 | 222,233,987 | ||||||||||||||||
| MKS Instruments | 2,971,910 | 82,678,536 | – | – | – | 891,573 | 2,971,910 | 85,977,356 | ||||||||||||||||
| Myriad Genetics | 4,329,367 | 90,656,945 | 15,929,488 | – | – | – | 5,015,765 | 119,224,734 | ||||||||||||||||
| Nu Skin Enterprises Cl. A | 4,181,500 | 203,095,455 | – | 6,592,640 | 6,171,452 | 1,629,699 | 3,966,994 | 186,052,019 | ||||||||||||||||
| ProAssurance Corporation1 | 1,683,449 | 134,372,899 | – | 11,863,322 | 4,868,989 | 760,474 | ||||||||||||||||||
| Sanderson Farms | 2,130,191 | 106,786,475 | – | – | – | 724,265 | 2,130,191 | 97,605,352 | ||||||||||||||||
| Schnitzer Steel Industries Cl. A | 2,108,038 | 89,127,846 | – | – | – | 431,094 | 2,108,038 | 59,067,225 | ||||||||||||||||
| Seabridge Gold | 2,883,900 | 46,459,629 | 4,663,178 | 612,250 | (293,960 | ) | – | 3,108,900 | 45,047,961 | |||||||||||||||
| Semperit AG Holding | 1,689,463 | 65,050,999 | 8,528,212 | – | – | 1,392,137 | 1,894,996 | 69,251,801 | ||||||||||||||||
| Silver Standard Resources | 4,621,999 | 63,876,026 | 4,788,635 | – | – | – | 4,911,099 | 55,200,753 | ||||||||||||||||
| Simpson Manufacturing | 3,387,886 | 114,036,243 | – | – | – | 846,972 | 3,387,886 | 99,976,516 | ||||||||||||||||
| Strayer Education | 1,068,485 | 103,846,057 | – | – | – | 2,136,970 | 1,068,485 | 116,486,235 | ||||||||||||||||
| Thor Industries | 4,407,057 | 120,885,574 | – | – | – | 1,322,117 | 4,407,057 | 120,797,432 | ||||||||||||||||
| Trican Well Service | 7,241,100 | 124,742,386 | 11,454,065 | – | – | 991,693 | 7,977,100 | 92,064,557 | ||||||||||||||||
| Unit Corporation | 2,896,073 | 134,377,787 | – | – | – | – | 2,896,073 | 106,836,133 | ||||||||||||||||
| Veeco Instruments | 2,658,912 | 55,305,370 | 1,401,520 | – | – | – | 2,708,912 | 93,078,217 | ||||||||||||||||
| Woodward | 3,906,024 | 159,873,562 | – | – | – | 624,964 | 3,906,024 | 154,053,587 | ||||||||||||||||
| 2,621,542,004 | 12,465,251 | 46,705,388 | 2,240,692,487 | |||||||||||||||||||||
| 144 | The Royce Funds 2012 Semiannual Report to Shareholders |
Transactions in Affiliated Companies (continued): |
| Market | Realized | Market | ||||||||||||||||||||||
| Shares | Value | Cost of | Cost of | Gain | Dividend | Shares | Value | |||||||||||||||||
| Affiliated Company | 12/31/11 | 12/31/11 | Purchases | Sales | (Loss) | Income | 6/30/12 | 6/30/12 | ||||||||||||||||
| Royce Low-Priced Stock Fund | ||||||||||||||||||||||||
| C&J Energy Services | 450,000 | $ | 9,418,500 | $ | 41,882,532 | $ | – | $ | – | $ | – | 2,610,593 | $ | 48,295,971 | ||||||||||
| Castle (A.M.) & Co. | 1,799,667 | 17,024,850 | – | – | – | – | 1,799,667 | 19,112,463 | ||||||||||||||||
| Corinthian Colleges | 5,239,000 | 11,368,630 | – | 8,033,076 | (5,831,344 | ) | – | 4,741,854 | 13,703,958 | |||||||||||||||
| Cross Country Healthcare | 2,692,607 | 14,943,969 | – | 473,793 | (72,049 | ) | – | 2,592,607 | 11,329,693 | |||||||||||||||
| Globe Specialty Metals | 4,160,280 | 55,706,149 | – | – | – | – | 4,160,280 | 55,872,560 | ||||||||||||||||
| Houston Wire & Cable | 1,591,200 | 21,990,384 | – | – | – | 286,416 | 1,591,200 | 17,391,816 | ||||||||||||||||
| Kennedy-Wilson Holdings1 | 2,891,499 | 30,592,059 | – | 3,315,452 | 886,280 | 274,691 | ||||||||||||||||||
| Korn/Ferry International | 2,836,963 | 48,398,589 | 820,315 | – | – | – | 2,886,963 | 41,427,919 | ||||||||||||||||
| KVH Industries | 1,100,200 | 8,559,556 | – | – | – | – | 1,100,200 | 13,752,500 | ||||||||||||||||
| McEwen Mining1 | 7,858,918 | 26,405,964 | 813,865 | 255,525 | 660 | – | ||||||||||||||||||
| Neutral Tandem1 | 1,681,614 | 17,976,454 | – | 4,208,764 | (937,251 | ) | – | |||||||||||||||||
| Novatel Wireless1 | 3,205,176 | 10,032,201 | – | 18,431,709 | (11,252,115 | ) | – | |||||||||||||||||
| NutriSystem1 | 1,625,690 | 21,020,172 | – | 5,930,862 | (2,555,623 | ) | 507,742 | |||||||||||||||||
| PC-Tel | 1,095,592 | 7,493,849 | – | – | – | 65,736 | 1,095,592 | 7,088,480 | ||||||||||||||||
| Pretium Resources1 | 5,037,000 | 61,853,124 | – | 5,021,331 | 4,057,158 | – | ||||||||||||||||||
| Sigma Designs | 2,007,658 | 12,045,948 | – | – | – | – | 2,007,658 | 12,808,858 | ||||||||||||||||
| Smith Micro Software1 | 2,208,776 | 2,495,917 | – | 1,850,296 | 1,112,234 | – | ||||||||||||||||||
| Tesco Corporation | 3,475,005 | 43,924,063 | – | 14,508,959 | (3,492,691 | ) | – | 2,732,105 | 32,785,260 | |||||||||||||||
| Total Energy Services | 1,866,700 | 31,809,485 | – | – | – | 156,761 | 1,866,700 | 26,384,257 | ||||||||||||||||
| TrueBlue | 3,212,691 | 44,592,151 | – | 2,765,281 | (347,454 | ) | – | 3,062,691 | 47,410,457 | |||||||||||||||
| Universal Technical Institute | 1,730,679 | 22,118,078 | – | – | – | 346,136 | 1,730,679 | 23,381,473 | ||||||||||||||||
| WaterFurnace Renewable Energy | 970,500 | 14,823,048 | – | – | – | 395,964 | 970,500 | 15,490,251 | ||||||||||||||||
| 534,593,140 | (18,432,195 | ) | 2,033,446 | 386,235,916 | ||||||||||||||||||||
| Royce Total Return Fund | ||||||||||||||||||||||||
| Barry (R.G.) | 1,048,496 | 12,665,832 | – | – | – | 167,759 | 1,048,496 | 14,249,061 | ||||||||||||||||
| Cato Corporation (The) Cl. A1 | 1,477,815 | 35,763,123 | – | 818,841 | 152,938 | 709,351 | ||||||||||||||||||
| Chase Corporation | 773,974 | 10,758,239 | – | – | – | – | 773,974 | 10,216,457 | ||||||||||||||||
| Colony Financial1 | 2,082,230 | 32,711,833 | – | 11,415,298 | (1,107,930 | ) | 1,075,799 | |||||||||||||||||
| DDi Corporation1 | 1,093,312 | 10,200,601 | – | 9,903,624 | 4,218,584 | 131,197 | ||||||||||||||||||
| Mueller (Paul) Company | 116,700 | 2,042,250 | – | – | – | – | 116,700 | 2,567,400 | ||||||||||||||||
| Peapack-Gladstone Financial | 473,145 | 5,081,577 | 33,604 | – | – | 47,314 | 475,350 | 7,372,679 | ||||||||||||||||
| Starrett (L.S.) Company (The) Cl. A | 529,400 | 6,802,790 | – | – | – | 105,880 | 529,400 | 6,125,158 | ||||||||||||||||
| Village Super Market Cl. A | 714,675 | 20,332,504 | 20,610 | 22,742 | (409 | ) | 357,309 | 714,661 | 23,283,655 | |||||||||||||||
| 136,358,749 | 3,263,183 | 2,594,609 | 63,814,410 | |||||||||||||||||||||
| Royce Opportunity Fund | ||||||||||||||||||||||||
| BTU International | 690,763 | 1,795,984 | – | – | – | – | 690,763 | 1,837,430 | ||||||||||||||||
| ClearOne Communications | 556,620 | 2,404,598 | – | – | – | – | 556,620 | 2,276,576 | ||||||||||||||||
| Comstock Holding Companies Cl. A | 1,290,590 | 1,342,214 | – | – | – | – | 1,290,590 | 1,690,673 | ||||||||||||||||
| Cost Plus1 | 1,393,623 | 13,587,824 | – | 7,118,946 | 18,863,319 | – | ||||||||||||||||||
| dELiA*s1 | 1,721,584 | 1,756,016 | – | 1,392,120 | (1,112,386 | ) | – | |||||||||||||||||
| Dixie Group | 819,019 | 2,416,106 | – | – | – | – | 819,019 | 3,112,272 | ||||||||||||||||
| Evans & Sutherland Computer1 | 654,730 | 134,220 | – | 773,985 | (755,625 | ) | – | |||||||||||||||||
| MarineMax | 1,415,750 | 9,230,690 | 295,321 | 1,159,238 | (438,877 | ) | – | 1,382,850 | 13,150,904 | |||||||||||||||
| Material Sciences1 | 560,160 | 4,570,906 | – | 878,630 | (305,044 | ) | – | |||||||||||||||||
| NCI Building Systems | 1,005,369 | 10,928,361 | 514,691 | 180,419 | (8,866 | ) | – | 1,038,569 | 11,247,702 | |||||||||||||||
| Network Equipment Technologies1 | 1,972,468 | 2,288,063 | 81,459 | 8,187,146 | (5,635,146 | ) | – | |||||||||||||||||
| Planar Systems | 1,554,792 | 3,016,296 | – | – | – | – | 1,554,792 | 2,565,407 | ||||||||||||||||
| SigmaTron International | 345,972 | 1,141,708 | – | 11,867 | (5,052 | ) | – | 344,172 | 1,152,976 | |||||||||||||||
| Spartech Corporation | 1,597,940 | 7,558,256 | 716,317 | – | – | – | 1,741,540 | 9,003,762 | ||||||||||||||||
| Spire Corporation | 505,783 | 313,585 | – | – | – | – | 505,783 | 300,941 | ||||||||||||||||
| TRC Companies | 1,644,680 | 9,884,527 | 408,188 | 210,422 | (143,545 | ) | – | 1,703,682 | 10,358,386 | |||||||||||||||
| Unifi | 945,600 | 7,186,560 | 919,492 | – | – | – | 1,040,849 | 11,792,819 | ||||||||||||||||
| 79,555,914 | 10,458,778 | – | 68,489,848 | |||||||||||||||||||||
| Royce Special Equity Fund | ||||||||||||||||||||||||
| Ampco-Pittsburgh | 979,650 | 18,946,431 | 96,743 | – | – | 353,457 | 984,500 | 18,045,885 | ||||||||||||||||
| Applied Industrial Technologies | 1,627,973 | 57,255,810 | 21,697,730 | – | – | 819,459 | 2,177,952 | 80,257,531 | ||||||||||||||||
| Arden Group Cl. A | 182,543 | 16,430,695 | 3,165,007 | – | – | 105,716 | 219,000 | 19,098,990 | ||||||||||||||||
| Atrion Corporation | 158,000 | 37,956,340 | 2,435,630 | 561,686 | 273,802 | 160,979 | 166,433 | 34,115,436 | ||||||||||||||||
| Bowl America Cl. A | 342,575 | 4,282,188 | – | – | – | 109,624 | 342,575 | 4,299,316 | ||||||||||||||||
| Children’s Place Retail Stores | 1,173,000 | 62,309,760 | 5,335,499 | – | – | – | 1,283,838 | 63,973,648 | ||||||||||||||||
| Clearwater Paper | 1,901,200 | 67,701,732 | 3,358,969 | – | – | – | 2,002,000 | 68,308,240 | ||||||||||||||||
| Computer Services1 | 929,517 | 26,258,855 | 69,328 | 6,830,637 | 2,577,617 | 200,915 | ||||||||||||||||||
| The Royce Funds 2012 Semiannual Report to Shareholders | 145 |
| Notes to Financial Statements (unaudited) (continued) |
Transactions in Affiliated Companies (continued):
| Market | Realized | Market | ||||||||||||||||||||||
| Shares | Value | Cost of | Cost of | Gain | Dividend | Shares | Value | |||||||||||||||||
| Affiliated Company | 12/31/11 | 12/31/11 | Purchases | Sales | (Loss) | Income | 6/30/12 | 6/30/12 | ||||||||||||||||
| Royce Special Equity Fund (continued) | ||||||||||||||||||||||||
| CSS Industries | 974,100 | $ | 19,404,072 | $ | – | $ | – | $ | – | $ | 292,230 | 974,100 | $ | 20,017,755 | ||||||||||
| Dorman Products | 1,396,165 | 51,560,373 | 657,904 | – | – | – | 2,819,660 | 70,745,269 | ||||||||||||||||
| Finish Line (The) Cl. A | 2,390,550 | 46,101,757 | 18,798,616 | – | – | 354,406 | 3,284,700 | 68,683,077 | ||||||||||||||||
| Foster (L.B.) Company | 926,600 | 26,213,514 | 65,200 | – | – | 46,387 | 928,875 | 26,575,114 | ||||||||||||||||
| Frisch’s Restaurants | 505,100 | 9,859,552 | – | – | – | 161,632 | 505,100 | 14,314,534 | ||||||||||||||||
| Hawkins | 877,400 | 32,340,964 | 1,439,299 | 214,121 | (21,129 | ) | 279,270 | 916,625 | 34,996,742 | |||||||||||||||
| Hurco Companies | 170,000 | 3,570,000 | 6,415,322 | – | – | – | 433,679 | 8,886,082 | ||||||||||||||||
| Mesa Laboratories1 | 315,000 | 13,053,600 | – | 4,114,964 | 3,753,720 | 77,653 | ||||||||||||||||||
| Minerals Technologies | 507,500 | 28,688,975 | 49,181,565 | – | – | 95,550 | 1,268,900 | 80,930,442 | ||||||||||||||||
| National Presto Industries | 612,000 | 57,283,200 | 3,123,623 | – | – | 3,693,000 | 651,500 | 45,455,155 | ||||||||||||||||
| Park Electrochemical | 1,879,800 | 48,160,476 | 3,777,042 | – | – | 385,999 | 2,011,012 | 52,044,991 | ||||||||||||||||
| Rimage Corporation | 807,000 | 9,078,750 | 1,910,829 | – | – | 316,630 | 982,738 | 7,861,904 | ||||||||||||||||
| Scholastic Corporation | 59,828,680 | – | – | 162,851 | 1,885,643 | 53,099,707 | ||||||||||||||||||
| Schulman (A.) | 1,423,500 | 30,149,730 | 3,823,331 | – | – | 534,786 | 1,584,500 | 31,452,325 | ||||||||||||||||
| Standex International | 792,200 | 27,069,474 | 1,815,889 | – | – | 113,603 | 839,600 | 35,741,772 | ||||||||||||||||
| Stepan Company | 692,200 | 55,486,752 | – | – | – | 387,632 | 692,200 | 65,191,396 | ||||||||||||||||
| UniFirst Corporation | 886,600 | 50,305,684 | 29,830,155 | – | – | 90,825 | 1,384,137 | 88,238,734 | ||||||||||||||||
| Universal Electronics1 | 755,000 | 12,736,850 | – | 14,675,309 | (4,466,779 | ) | – | |||||||||||||||||
| Utah Medical Products | 321,331 | 8,675,937 | – | 3,835,395 | 695,022 | 142,618 | 186,030 | 6,237,586 | ||||||||||||||||
| 820,881,471 | 2,812,253 | 8,885,222 | 998,571,631 | |||||||||||||||||||||
| Royce Value Plus Fund | ||||||||||||||||||||||||
| Casual Male Retail Group1 | 3,578,734 | 12,239,270 | – | 33,643,616 | (22,473,582 | ) | – | |||||||||||||||||
| Celadon Group | 1,663,600 | 19,647,116 | – | 6,336,518 | 266,419 | 28,372 | 1,234,800 | 20,226,024 | ||||||||||||||||
| Cerus Corporation | 2,884,500 | 8,076,600 | – | – | – | – | 2,884,500 | 9,576,540 | ||||||||||||||||
| Cosi | 4,975,812 | 3,507,948 | 1,207,675 | – | – | – | 6,833,773 | 4,853,345 | ||||||||||||||||
| Digi International1 | 1,504,600 | 16,791,336 | – | 6,301,100 | (132,555 | ) | – | |||||||||||||||||
| Mercury Computer Systems | 2,218,749 | 29,487,174 | – | 6,072,296 | 329,494 | – | 1,727,749 | 22,339,795 | ||||||||||||||||
| Oplink Communications1 | 1,395,012 | 22,975,848 | – | 16,241,858 | (2,677,567 | ) | – | |||||||||||||||||
| 112,725,292 | (24,687,791 | ) | 28,372 | 56,995,704 | ||||||||||||||||||||
1 Not an Affiliated Company at June 30, 2012.
| 146 | The Royce Funds 2012 Semiannual Report to Shareholders |
| Understanding Your Fund’s Expenses (unaudited) | |
As a shareholder of a mutual fund, you pay ongoing expenses, including management fees and other Fund expenses including, for some funds, distribution and/or service (12b-1) fees. Using the information below, you can estimate how these ongoing expenses (in dollars) affect your investment and compare them with the ongoing expenses of other funds. You may also incur one-time transaction expenses, including redemption fees, which are not shown in this section and would result in higher total costs. The example is based on an investment of $1,000 invested at January 1, 2012, and held for the entire six-month period ended June 30, 2012. Service, Consultant, R and K Class shares are generally available only through certain brokers or retirement plan administrators who receive distribution and/or service fees from the Fund for services that they perform. Institutional and W Class shares are generally available only to institutions or intermediaries with a minimum account size of $1 million. |
| Actual Expenses |
The first part of the table below provides information about actual account values and actual expenses. You may use the information in this section, together with the amount you invested, to estimate the expenses that you paid over the period. Simply divide your account value at June 30, 2012, by $1,000 (for example, an $8,600 account value divided by $1,000 = 8.6), then multiply the result by the number under the heading entitled “Expenses Paid During the Period” to estimate the expenses you paid on your account during this period. |
| Hypothetical Example for Comparison Purposes |
The second part of the table below provides information about hypothetical account values and hypothetical expenses based on the Fund’s actual expense ratio and an assumed rate of return of 5% per year before expenses, which is not the Fund’s actual return. The hypothetical account values and expenses may not be used to estimate the actual ending account balance or expenses you paid for the period. You may use this information to compare the ongoing costs of investing in the Fund and other funds. To do so, compare this 5% hypothetical example with the 5% hypothetical examples that appear in the shareholder reports of the other funds. |
Please note that the expenses shown in the table are meant to highlight your ongoing costs only and do not reflect any transactional costs, such as sales charges (loads), redemption fees, or exchange fees. Therefore, this section is useful in comparing ongoing costs only, and will not help you determine the relative total costs of owning different funds. In addition, if these transactional costs were included, your costs would have been higher. |
| Actual | Hypothetical (5% per year return before expenses) | |||||||||||||||||||||||
| Beginning | Ending | Expenses Paid | Beginning | Ending | Expenses Paid | Annualized | ||||||||||||||||||
| Account Value | Account Value | During the | Account Value | Account Value | During the | Expense | ||||||||||||||||||
| 1/1/12 | 6/30/12 | Period1 | 1/1/12 | 6/30/12 | Period1 | Ratio2 | ||||||||||||||||||
| Investment Class | ||||||||||||||||||||||||
| Royce Pennsylvania Mutual Fund | $1,000.00 | $1,039.96 | $4.62 | $1,000.00 | $1,020.34 | $4.57 | 0.91% | |||||||||||||||||
| Royce Micro-Cap Fund | 1,000.00 | 1,026.13 | 7.66 | 1,000.00 | 1,017.30 | 7.62 | 1.52 | |||||||||||||||||
| Royce Premier Fund | 1,000.00 | 1,026.46 | 5.44 | 1,000.00 | 1,019.49 | 5.42 | 1.08 | |||||||||||||||||
| Royce Low-Priced Stock Fund | 1,000.00 | 990.93 | 6.14 | 1,000.00 | 1,018.70 | 6.22 | 1.24 | |||||||||||||||||
| Royce Total Return Fund | 1,000.00 | 1,041.82 | 5.74 | 1,000.00 | 1,019.24 | 5.67 | 1.13 | |||||||||||||||||
| Royce Heritage Fund3 | 1,000.00 | 1,025.23 | 6.04 | 1,000.00 | 1,018.90 | 6.02 | 1.20 | |||||||||||||||||
| Royce Opportunity Fund | 1,000.00 | 1,112.40 | 6.15 | 1,000.00 | 1,019.05 | 5.87 | 1.17 | |||||||||||||||||
| Royce Special Equity Fund | 1,000.00 | 1,059.90 | 5.79 | 1,000.00 | 1,019.24 | 5.67 | 1.13 | |||||||||||||||||
| Royce Value Fund | 1,000.00 | 985.41 | 5.82 | 1,000.00 | 1,019.00 | 5.92 | 1.18 | |||||||||||||||||
| Royce Value Plus Fund | 1,000.00 | 1,061.46 | 6.05 | 1,000.00 | 1,019.00 | 5.92 | 1.18 | |||||||||||||||||
| Royce 100 Fund | 1,000.00 | 1,019.45 | 5.92 | 1,000.00 | 1,019.00 | 5.92 | 1.18 | |||||||||||||||||
| Royce Dividend Value Fund | 1,000.00 | 1,050.42 | 6.07 | 1,000.00 | 1,018.95 | 5.97 | 1.19 | |||||||||||||||||
Royce Special Equity Multi-Cap Fund | 1,000.00 | 983.54 | 3.87 | 1,000.00 | 1,012.63 | 3.93 | 1.18 | |||||||||||||||||
| Service Class | ||||||||||||||||||||||||
| Royce Pennsylvania Mutual Fund | 1,000.00 | 1,038.14 | 6.23 | 1,000.00 | 1,018.75 | 6.17 | 1.23 | |||||||||||||||||
| Royce Micro-Cap Fund | 1,000.00 | 1,024.98 | 8.36 | 1,000.00 | 1,016.61 | 8.32 | 1.66 | |||||||||||||||||
| Royce Premier Fund | 1,000.00 | 1,025.23 | 6.70 | 1,000.00 | 1,018.25 | 6.67 | 1.33 | |||||||||||||||||
| Royce Low-Priced Stock Fund | 1,000.00 | 989.52 | 7.37 | 1,000.00 | 1,017.45 | 7.47 | 1.49 | |||||||||||||||||
| Royce Total Return Fund | 1,000.00 | 1,040.94 | 7.16 | 1,000.00 | 1,017.85 | 7.07 | 1.41 | |||||||||||||||||
| Royce Heritage Fund3 | 1,000.00 | 1,023.83 | 7.35 | 1,000.00 | 1,017.60 | 7.32 | 1.46 | |||||||||||||||||
| Royce Opportunity Fund | 1,000.00 | 1,109.67 | 7.82 | 1,000.00 | 1,017.45 | 7.47 | 1.49 | |||||||||||||||||
| Royce Special Equity Fund | 1,000.00 | 1,058.49 | 7.11 | 1,000.00 | 1,017.95 | 6.97 | 1.39 | |||||||||||||||||
| Royce Value Fund | 1,000.00 | 983.55 | 7.25 | 1,000.00 | 1,017.55 | 7.37 | 1.47 | |||||||||||||||||
| Royce Value Plus Fund | 1,000.00 | 1,059.17 | 7.58 | 1,000.00 | 1,017.50 | 7.42 | 1.48 | |||||||||||||||||
| Royce 100 Fund | 1,000.00 | 1,017.30 | 7.22 | 1,000.00 | 1,017.70 | 7.22 | 1.44 | |||||||||||||||||
| Royce Micro-Cap Discovery Fund | 1,000.00 | 1,002.00 | 7.42 | 1,000.00 | 1,017.45 | 7.47 | 1.49 | |||||||||||||||||
| Royce Financial Services Fund | 1,000.00 | 1,082.31 | 7.71 | 1,000.00 | 1,017.45 | 7.47 | 1.49 | |||||||||||||||||
| Royce Dividend Value Fund | 1,000.00 | 1,048.55 | 7.39 | 1,000.00 | 1,017.65 | 7.27 | 1.45 | |||||||||||||||||
| Royce SMid-Cap Value Fund | 1,000.00 | 1,026.73 | 6.80 | 1,000.00 | 1,018.15 | 6.77 | 1.35 | |||||||||||||||||
| Royce Focus Value Fund | 1,000.00 | 1,000.00 | 6.71 | 1,000.00 | 1,018.15 | 6.77 | 1.35 | |||||||||||||||||
| The Royce Funds 2012 Semiannual Report to Shareholders | 147 |
| Understanding Your Fund’s Expenses (unaudited) (continued) | |
| Actual | Hypothetical (5% per year return before expenses) | |||||||||||||||||||||||
| Beginning | Ending | Expenses Paid | Beginning | Ending | Expenses Paid | Annualized | ||||||||||||||||||
| Account Value | Account Value | During the | Account Value | Account Value | During the | Expense | ||||||||||||||||||
| 1/1/12 | 6/30/12 | Period1 | 1/1/12 | 6/30/12 | Period1 | Ratio2 | ||||||||||||||||||
| Service Class (continued) | ||||||||||||||||||||||||
| Royce Partners Fund | $1,000.00 | $1,073.29 | $6.96 | $1,000.00 | $1,018.15 | $6.77 | 1.35% | |||||||||||||||||
| Royce Mid-Cap Fund | 1,000.00 | 992.49 | 6.69 | 1,000.00 | 1,018.15 | 6.77 | 1.35 | |||||||||||||||||
Royce Special Equity Multi-Cap Fund | 1,000.00 | 1,066.73 | 7.14 | 1,000.00 | 1,017.95 | 6.97 | 1.39 | |||||||||||||||||
| Consultant Class | ||||||||||||||||||||||||
| Royce Pennsylvania Mutual Fund | 1,000.00 | 1,035.09 | 9.51 | 1,000.00 | 1,015.51 | 9.42 | 1.88 | |||||||||||||||||
| Royce Micro-Cap Fund | 1,000.00 | 1,020.59 | 12.26 | 1,000.00 | 1,012.73 | 12.21 | 2.44 | |||||||||||||||||
| Royce Premier Fund | 1,000.00 | 1,021.34 | 10.40 | 1,000.00 | 1,014.57 | 10.37 | 2.07 | |||||||||||||||||
| Royce Total Return Fund | 1,000.00 | 1,037.59 | 10.59 | 1,000.00 | 1,014.47 | 10.47 | 2.09 | |||||||||||||||||
| Royce Heritage Fund3 | 1,000.00 | 1,019.70 | 11.60 | 1,000.00 | 1,013.38 | 11.56 | 2.31 | |||||||||||||||||
| Royce Opportunity Fund | 1,000.00 | 1,106.51 | 11.94 | 1,000.00 | 1,013.53 | 11.41 | 2.28 | |||||||||||||||||
| Royce Special Equity Fund | 1,000.00 | 1,054.56 | 10.98 | 1,000.00 | 1,014.17 | 10.77 | 2.15 | |||||||||||||||||
| Royce Value Fund | 1,000.00 | 979.92 | 10.83 | 1,000.00 | 1,013.92 | 11.02 | 2.20 | |||||||||||||||||
| Royce Value Plus Fund | 1,000.00 | 1,055.17 | 11.65 | 1,000.00 | 1,013.53 | 11.41 | 2.28 | |||||||||||||||||
| Institutional Class | ||||||||||||||||||||||||
| Royce Pennsylvania Mutual Fund | 1,000.00 | 1,040.78 | 4.01 | 1,000.00 | 1,020.93 | 3.97 | 0.79 | |||||||||||||||||
| Royce Premier Fund | 1,000.00 | 1,027.33 | 4.89 | 1,000.00 | 1,020.04 | 4.87 | 0.97 | |||||||||||||||||
| Royce Low-Priced Stock Fund | 1,000.00 | 991.64 | 5.89 | 1,000.00 | 1,018.95 | 5.97 | 1.19 | |||||||||||||||||
| Royce Total Return Fund | 1,000.00 | 1,042.34 | 5.13 | 1,000.00 | 1,019.84 | 5.07 | 1.01 | |||||||||||||||||
| Royce Opportunity Fund | 1,000.00 | 1,112.50 | 5.46 | 1,000.00 | 1,019.69 | 5.22 | 1.04 | |||||||||||||||||
| Royce Special Equity Fund | 1,000.00 | 1,060.11 | 5.22 | 1,000.00 | 1,019.79 | 5.12 | 1.02 | |||||||||||||||||
| Royce Value Fund | 1,000.00 | 985.43 | 5.18 | 1,000.00 | 1,019.64 | 5.27 | 1.05 | |||||||||||||||||
| Royce Value Plus Fund | 1,000.00 | 1,061.41 | 5.54 | 1,000.00 | 1,019.49 | 5.42 | 1.08 | |||||||||||||||||
Royce Special Equity Multi-Cap Fund | 1,000.00 | 959.43 | 2.05 | 1,000.00 | 1,007.88 | 2.10 | 1.05 | |||||||||||||||||
| W Class | ||||||||||||||||||||||||
| Royce Premier Fund | 1,000.00 | 1,026.93 | 5.04 | 1,000.00 | 1,019.89 | 5.02 | 1.00 | |||||||||||||||||
| Royce Total Return Fund | 1,000.00 | 1,042.20 | 5.33 | 1,000.00 | 1,019.64 | 5.27 | 1.05 | |||||||||||||||||
| R Class | ||||||||||||||||||||||||
| Royce Pennsylvania Mutual Fund | 1,000.00 | 1,036.19 | 7.64 | 1,000.00 | 1,017.35 | 7.57 | 1.51 | |||||||||||||||||
| Royce Premier Fund | 1,000.00 | 1,023.35 | 8.35 | 1,000.00 | 1,016.61 | 8.32 | 1.66 | |||||||||||||||||
| Royce Low-Priced Stock Fund | 1,000.00 | 987.90 | 9.09 | 1,000.00 | 1,015.71 | 9.22 | 1.84 | |||||||||||||||||
| Royce Total Return Fund | 1,000.00 | 1,039.12 | 8.62 | 1,000.00 | 1,016.41 | 8.52 | 1.70 | |||||||||||||||||
| Royce Heritage Fund | 1,000.00 | 1,021.26 | 9.25 | 1,000.00 | 1,015.71 | 9.22 | 1.84 | |||||||||||||||||
| Royce Opportunity Fund | 1,000.00 | 1,109.22 | 9.65 | 1,000.00 | 1,015.71 | 9.22 | 1.84 | |||||||||||||||||
| Royce Value Fund | 1,000.00 | 982.37 | 8.67 | 1,000.00 | 1,016.11 | 8.82 | 1.76 | |||||||||||||||||
| Royce Value Plus Fund | 1,000.00 | 1,057.77 | 9.41 | 1,000.00 | 1,015.71 | 9.22 | 1.84 | |||||||||||||||||
| Royce 100 Fund | 1,000.00 | 1,015.30 | 9.22 | 1,000.00 | 1,015.71 | 9.22 | 1.84 | |||||||||||||||||
| K Class | ||||||||||||||||||||||||
| Royce Pennsylvania Mutual Fund | 1,000.00 | 1,037.19 | 6.99 | 1,000.00 | 1,018.00 | 6.92 | 1.38 | |||||||||||||||||
| Royce Premier Fund | 1,000.00 | 1,024.22 | 7.40 | 1,000.00 | 1,017.55 | 7.37 | 1.47 | |||||||||||||||||
| Royce Low-Priced Stock Fund | 1,000.00 | 989.60 | 7.87 | 1,000.00 | 1,016.96 | 7.97 | 1.59 | |||||||||||||||||
| Royce Total Return Fund | 1,000.00 | 1,039.91 | 7.25 | 1,000.00 | 1,017.75 | 7.17 | 1.43 | |||||||||||||||||
| Royce Heritage Fund | 1,000.00 | 1,022.13 | 7.99 | 1,000.00 | 1,016.96 | 7.97 | 1.59 | |||||||||||||||||
| Royce Opportunity Fund | 1,000.00 | 1,110.40 | 7.71 | 1,000.00 | 1,017.55 | 7.37 | 1.47 | |||||||||||||||||
| Royce Value Fund | 1,000.00 | 983.24 | 7.54 | 1,000.00 | 1,017.26 | 7.67 | 1.53 | |||||||||||||||||
| Royce Value Plus Fund | 1,000.00 | 1,059.23 | 8.14 | 1,000.00 | 1,016.96 | 7.97 | 1.59 | |||||||||||||||||
| Royce 100 Fund | 1,000.00 | 1,017.99 | 7.98 | 1,000.00 | 1,016.96 | 7.97 | 1.59 | |||||||||||||||||
| 1 | Expenses are equal to the Fund’s annualized expense ratio multiplied by the average account value for the period, multiplied by 182 days in the most recent fiscal half-year divided by 366 days (to reflect the half-year period for all funds existing for the full half-year period; Royce Special Equity Multi-Cap Fund-Investment Class multiplied by 121 days and Royce Special Equity Multi-Cap Fund-Institutional Class multiplied by 73 days). | |
| 2 | Annualized expense ratio used to derive figures in the table is based on the most recent fiscal half-year. | |
| 3 | GiftShare accounts pay an annual $50 trustee fee to State Street Bank, NA, as trustee. If these fees were included above, your costs would be higher. |
| 148 | The Royce Funds 2012 Semiannual Report to Shareholders |
| Trustees and Officers |
| All Trustees and Officers may be reached c/o The Royce Funds, 745 Fifth Avenue, New York, NY 10151 |
| Charles M. Royce, Trustee1, President |
| Age: 72 | Number of Funds Overseen: 35 | Tenure: Since 1982 |
| Non-Royce Directorships: Director of TICC Capital Corp. |
| Principal Occupation(s) During Past Five Years: President, Co-Chief Investment Officer and Member of Board of Managers of Royce & Associates, LLC (“Royce”), the Trust’s investment adviser. |
| Mark R. Fetting, Trustee1 |
| Age: 57 | Number of Funds Overseen: 49 | Tenure: Since 2001 |
| Non-Royce Directorships: Director of Legg Mason, Inc. and Director/Trustee of registered investment companies constituting the 14 Legg Mason Funds. |
| Principal Occupation(s) During Past 5 Years: President, CEO, Chairman and Director of Legg Mason, Inc. and Chairman of Legg Mason Funds. Mr. Fetting’s prior business experience includes having served as a member of the Board of Managers of Royce; President of all Legg Mason Funds; Senior Executive Vice President of Legg Mason, Inc.; Director and/or officer of various Legg Mason, Inc. affiliates; Division President and Senior Officer of Prudential Financial Group, Inc. and related companies. |
| Patricia W. Chadwick, Trustee |
| Age: 63 | Number of Funds Overseen: 35 | Tenure: Since 2009 |
| Non-Royce Directorships: Trustee of ING Mutual Funds and Director of Wisconsin Energy Corp. |
| Principal Occupation(s) During Past 5 Years: Consultant and President of Ravengate Partners LLC (since 2000). |
| Richard M. Galkin, Trustee |
| Age: 74 | Number of Funds Overseen: 35 | Tenure: Since 1982 |
| Non-Royce Directorships: None |
| Principal Occupation(s) During Past Five Years: Private investor. Mr. Galkin’s prior business experience includes having served as President of Richard M. Galkin Associates, Inc., telecommunications consultants, President of Manhattan Cable Television (a subsidiary of Time, Inc.), President of Haverhills Inc. (another Time, Inc. subsidiary), President of Rhode Island Cable Television and Senior Vice President of Satellite Television Corp. (a subsidiary of Comsat). |
| Stephen L. Isaacs, Trustee |
| Age: 72 | Number of Funds Overseen: 35 | Tenure: Since 1989 |
| Non-Royce Directorships: None |
| Principal Occupation(s) During Past Five Years: President of The Center for Health and Social Policy (since September 1996); Attorney and President of Health Policy Associates, Inc., consultants. Mr. Isaacs’s prior business experience includes having served as Director of Columbia University Development Law and Policy Program and Professor at Columbia University (until August 1996). |
| Arthur S. Mehlman, Trustee |
| Age: 70 | Number of Funds Overseen: 49 | Tenure: Since 2004 |
| Non-Royce Directorships: Director/Trustee of registered investment companies constituting the 14 Legg Mason Funds. |
| Principal Occupation(s) During Past Five Years: Director of The League for People with Disabilities, Inc.; Director of University of Maryland Foundation (non-profits). Formerly: Director of Municipal Mortgage & Equity, LLC (from October 2004 to April 1, 2011); Director of University of Maryland College Park Foundation (non-profit) (from 1998 to 2005); Partner, KPMG LLP (international accounting firm) (from 1972 to 2002); Director of Maryland Business Roundtable for Education (from July 1984 to June 2002). |
| David L. Meister, Trustee |
| Age: 72 | Number of Funds Overseen: 35 | Tenure: Since 1982 |
| Non-Royce Directorships: None |
| Principal Occupation(s) During Past Five Years: Consultant. Chairman and Chief Executive Officer of The Tennis Channel (from June 2000 to March 2005). Mr. Meister’s prior business experience includes having served as Chief Executive Officer of Seniorlife.com, a consultant to the communications industry, President of Financial News Network, Senior Vice President of HBO, President of Time-Life Films and Head of Broadcasting for Major League Baseball. |
| G. Peter O’Brien, Trustee |
| Age: 66 | Number of Funds Overseen: 51 | Tenure: Since 2001 |
| Non-Royce Directorships: Director/Trustee of registered investment companies constituting the 16 Legg Mason Funds; Director of TICC Capital Corp. |
| Principal Occupation(s) During Past Five Years: Trustee Emeritus of Colgate University (since 2005); Board Member of Hill House, Inc. (since 1999); Formerly: Trustee of Colgate University (from 1996 to 2005), President of Hill House, Inc. (from 2001 to 2005) and Managing Director/Equity Capital Markets Group of Merrill Lynch & Co. (from 1971 to 1999). |
| John D. Diederich, Vice President and Treasurer |
| Age: 60 | Tenure: Since 2001 |
| Principal Occupation(s) During Past Five Years: Chief Operating Officer, Managing Director and member of the Board of Managers of Royce; Chief Financial Officer of Royce; Director of Administration of the Trust; and President of RFS, having been employed by Royce since April 1993. |
| Jack E. Fockler, Jr., Vice President |
| Age: 53 | Tenure: Since 1995 |
| Principal Occupation(s) During Past Five Years: Managing Director and Vice President of Royce, and Vice President of RFS, having been employed by Royce since October 1989. |
| W. Whitney George, Vice President |
| Age: 54 | Tenure: Since 1995 |
| Principal Occupation(s) During Past Five Years: Co-Chief Investment Officer, Managing Director and Vice President of Royce, having been employed by Royce since October 1991. |
| Daniel A. O’Byrne, Vice President and Assistant Secretary |
| Age: 50 | Tenure: Since 1994 |
| Principal Occupation(s) During Past Five Years: Principal and Vice President of Royce, having been employed by Royce since October 1986. |
| John E. Denneen, Secretary and Chief Legal Officer |
| Age: 45 | Tenure: 1996-2001 and Since April 2002 |
Principal Occupation(s) During Past Five Years: General Counsel, Principal, Chief Legal and Compliance Officer and Secretary of Royce; Secretary and Chief Legal Officer of The Royce Funds. |
| Lisa Curcio, Chief Compliance Officer |
| Age: 52 | Tenure: Since 2004 |
| Principal Occupation(s) During Past Five Years: Chief Compliance Officer of The Royce Funds (since October 2004) and Compliance Officer of Royce (since June 2004). |
| 1 Interested Trustee. |
| Trustees will hold office until their successors have been duly elected and qualified or until their earlier resignation or removal. The Statement of Additional Information, which contains additional information about the Trust’s trustees and officers, is available and can be obtained without charge at www.roycefunds.com or by calling (800) 221-4268. |
| The Royce Funds 2012 Semiannual Report to Shareholders | 149 |
| Notes to Performance and Other Important Information |
The thoughts expressed in this report concerning recent market movements and future prospects for small company stocks are solely the opinion of Royce at June 30, 2012, and, of course, historical market trends are not necessarily indicative of future market movements. Statements regarding the future prospects for particular securities held in the Funds’ portfolios and Royce’s investment intentions with respect to those securities reflect Royce’s opinions as of June 30, 2012 and are subject to change at any time without notice. There can be no assurance that securities mentioned in this report will be included in any Royce-managed portfolio in the future. Sector weightings are determined using the Global Industry Classification Standard (“GICS”). GICS was developed by, and is the exclusive property of, Standard & Poor’s Financial Services LLC (“S&P”) and MSCI Inc. (“MSCI”). GICS is the trademark of S&P and MSCI. “Global Industry Classification Standard (GICS)” and “GICS Direct” are service marks of S&P and MSCI. All indexes referred to are unmanaged and capitalization weighted. Each index’s returns include net reinvested dividends and/or interest income. Russell Investment Group is the source and owner of the trademarks, service marks and copyrights related to the Russell Indexes. Russell® is a trademark of Russell Investment Group. The Russell 2000 is an index of domestic small-cap stocks. It measures the performance of the 2,000 smallest publicly traded U.S. companies in the Russell 3000 Index. The Russell 1000 Index is an index of domestic large-cap stocks. It measures the performance of the 1,000 largest publicly traded U.S. companies in the Russell 3000 Index. The Russell 2000 Value and Growth Indexes consist of the respective value and growth stocks within the Russell 2000 as determined by Russell Investments. The Russell Microcap Index includes 1,000 of the smallest securities in the Russell 2000 Index. The Russell 2500 is an index of domestic small- to mid-cap stocks. It includes approximately 2,500 of the smallest securities in the Russell 3000 Index. The returns for the Russell 2500–Financial Sector represent those of the financial services companies within the Russell 2500 Index. The Russell Midcap Index measures the performance of the mid-cap segment of the U.S. equity universe. It includes approximately 800 of the smallest securities in the Russell 1000 Index. The Russell Global ex-U.S. Large Cap Index is an index of global large-cap stocks, excluding the United States. The Russell Global ex-U.S. Small Cap Index is an index of global small-cap stocks, excluding the United States. The S&P 500 is an index of U.S. large-cap stocks, selected by Standard & Poor’s based on market size, liquidity and industry grouping, among other factors. The Nasdaq Composite is an index of the more than 3,000 common equities listed on the Nasdaq stock exchange. Returns for the market indexes used in this report were based on information supplied to Royce by Russell Investments. Royce has not independently verified the above described information. The CRSP (Center for Research in Security Pricing) equally divides the companies listed on the NYSE into 10 deciles based on market capitalization. Deciles 1-5 represent the largest domestic equity companies and Deciles 6-10 represent the smallest. CRSP then sorts all listed domestic equity companies based on these market cap ranges. By way of comparison, the CRSP 1-5 would have similar capitalization parameters to the S&P 500 Index and the CRSP 6-10 would have similar capitalization parameters to those of the Russell 2000 Index. The Sharpe Ratio is calculated for a specified period by dividing a fund’s annualized excess returns by its annualized standard deviation. The higher the Sharpe Ratio, the better the fund’s historical risk-adjusted performance. Standard deviation is a statistical measure within which a fund’s total returns have varied over time. The greater the standard deviation, the greater a fund’s volatility. The Royce Funds is a service mark of The Royce Funds. Distributor: Royce Fund Services, Inc. Investments in securities of micro-cap, small-cap and/or mid-cap companies may involve considerably more risk than investments in securities of larger-cap companies. (Please see “Primary Risks for Fund Investors” in the prospectus.) All Royce Funds may invest up to 25% (35% of Royce Heritage, Focus Value, Partners, Low-Priced Stock, Financial Services, Micro-Cap and SMid-Cap Value Funds, 10% of Opportunity Fund and 5% of Special Equity Fund) of their respective assets in foreign securities, which generally may involve political, economic, currency and other risks not encountered in U.S. investments. (Please see “Investing in Foreign Securities” in the prospectus.) Please read the prospectus carefully before investing or sending money. A copy of the Funds’ current prospectus and Statement of Additional Information may be obtained by calling (800) 221-4268, or by visiting www.roycefunds.com. All publicly released material Fund information is disclosed by the Funds on their website at www.roycefunds.com. |
| Forward-Looking Statements | |
This material contains forward-looking statements within the meaning of the Securities Exchange Act of 1934, as amended (the “Exchange Act”), that involve risks and uncertainties, including, among others, statements as to: | |
| • | the Funds’ future operating results, |
| • | the prospects of the Funds’ portfolio companies, |
| • | the impact of investments that the Funds have made or may make, |
| • | the dependence of the Funds’ future success on the general economy and its impact on the companies and industries in which the Funds invest, and |
| • | the ability of the Funds’ portfolio companies to achieve their objectives. |
This review and report use words such as “anticipates,” “believes,” “expects,” “future,” “intends,” and similar expressions to identify forward-looking statements. Actual results may differ materially from those projected in the forward-looking statements for any reason. | |
The Royce Funds have based the forward-looking statements included in this review and report on information available to us on the date of the report, and we assume no obligation to update any such forward-looking statements. Although The Royce Funds undertake no obligation to revise or update any forward-looking statements, whether as a result of new information, future events or otherwise, you are advised to consult any additional disclosures that we may make through future shareholder communications or reports. | |
| Proxy Voting |
A copy of the policies and procedures that The Royce Funds use to determine how to vote proxies relating to portfolio securities and information regarding how each of The Royce Funds voted proxies relating to portfolio securities during the most recent 12-month period ended June 30 is available, without charge, on The Royce Funds’ website at www.roycefunds.com, by calling (800) 221-4268 (toll-free) and on the website of the Securities and Exchange Commission (“SEC”), at www.sec.gov. |
| Form N-Q Filing |
The Funds file their complete schedules of investments with the SEC for the first and third quarters of each fiscal year on Form N-Q. The Funds’ Forms N-Q are available on the SEC’s website at www.sec.gov. The Royce Funds’ holdings are also on the Funds’ website approximately 15 to 20 days after each calendar quarter end and remain available until the next quarter’s holdings are posted. The Funds’ Forms N-Q may also be reviewed and copied at the SEC’s Public Reference Room in Washington, D.C. To find out more about this public service, call the SEC at (202) 942-8090. The Funds’ complete schedules of investments are updated quarterly, and are available at www.roycefunds.com. |
| 150 | The Royce Funds 2012 Semiannual Report to Shareholders |
| Board Approval of Investment Advisory Agreement |
At meetings held on June 6-7, 2012, The Royce Fund’s Board of Trustees, including all of the non-interested trustees, approved the continuance of the Investment Advisory Agreements between Royce & Associates, LLC (“R&A”) and The Royce Fund relating to each of Royce Pennsylvania Mutual Fund, Royce Micro-Cap Fund, Royce Premier Fund, Royce Low-Priced Stock Fund, Royce Total Return Fund, Royce Heritage Fund, Royce Opportunity Fund, Royce Special Equity Fund, Royce Value Fund, Royce Value Plus Fund, Royce 100 Fund, Royce Micro-Cap Discovery Fund, Royce Financial Services Fund, Royce Dividend Value Fund, Royce SMid-Cap Value Fund, Royce Focus Value Fund, Royce Partners Fund, Royce Mid-Cap Fund and Royce Special Equity Multi-Cap Fund (the “Funds”). In reaching these decisions, the Board reviewed, among other things, information prepared internally by R&A and independently by Morningstar Associates, LLC ("Morningstar") containing detailed expense ratio and investment performance comparisons for each Fund with other mutual funds in their "peer group" and "category", information regarding the past performance of the Funds and other registered investment companies managed by R&A and a memorandum outlining the legal duties of the Board prepared by independent counsel to the non-interested trustees. R&A also provided the trustees with an analysis of its profitability with respect to providing investment advisory services to each Fund. In addition, the Board took into account information furnished throughout the year at regular Board meetings, including reports on investment performance, shareholder services, distribution fees and expenses, regulatory compliance, brokerage commissions and research, brokerage and other execution products and services provided to the Funds. The Board also considered other matters they deemed important to the approval process such as allocation of Fund brokerage commissions, “soft dollar” research services R&A receives, payments made to R&A or its affiliates relating to distribution of Fund shares and other direct and indirect benefits to R&A and its affiliates from their relationship with the Funds. The trustees also met throughout the year with investment advisory personnel from R&A. The Board, in its deliberations, recognized that, for many of the Funds’ shareholders, the decision to purchase Fund shares included a decision to select R&A as the investment adviser and that there was a strong association in the minds of Fund shareholders between R&A and each of the Funds. In considering factors relating to the approval of the continuance of the Investment Advisory Agreements, the non-interested trustees received assistance and advice from, and met separately with, their independent counsel. While the Investment Advisory Agreements for the Funds were considered at the same meetings, the trustees dealt with each agreement separately. Among other factors, the trustees considered the following: The nature, extent and quality of services provided by R&A: The trustees considered the following factors to be of fundamental importance to their consideration of whether to approve the continuance of the Funds’ Investment Advisory Agreements: (i) R&A’s more than 35 years of value investing experience and track record; (ii) the history of long-tenured R&A portfolio managers managing many of the Funds; (iii) R&A’s focus on mid-cap, small-cap and micro-cap value investing; (iv) the consistency of R&A’s approach to managing the Funds over more than 35 years; (v) the integrity and high ethical standards adhered to at R&A; (vi) R&A’s specialized experience in the area of trading small- and micro-cap securities; (vii) R&A’s historical ability to attract and retain portfolio management talent; and (viii) R&A’s focus on shareholder interests as exemplified by capping expenses on smaller funds, closing funds to new investors when R&A believed such closings were in the best interests of existing shareholders, establishing breakpoints for a number of funds and providing expansive shareholder reporting and communications. The trustees reviewed the services that R&A provides to the Funds, including, but not limited to, managing each Fund’s investments in accordance with the stated policies of each Fund. The Board considered the fact that R&A provided certain administrative services to the Funds at cost pursuant to the Administration Agreement between the Funds and R&A which went into effect on January 1, 2008. The trustees determined that the services to be provided to each Fund by R&A would be the same as those it previously provided to the Funds. They also took into consideration the histories, reputations and backgrounds of R&A’s portfolio managers for Funds, finding that these would likely have an impact on the continued success of the Funds. Lastly, the trustees noted R&A’s ability to attract and retain quality and experienced personnel. The trustees concluded that the investment advisory services provided by R&A to each Fund compared favorably to services provided by R&A to other R&A client accounts, including other funds, in both nature and quality, and that the scope of services provided by R&A would continue to be suitable for each Fund. Investment performance of the Funds and R&A: In light of R&A’s risk-averse approach to investing, the trustees believe that risk-adjusted performance continues to be an appropriate measure of each Fund’s investment performance. One measure of risk-adjusted performance the trustees have historically used in their review of the Funds’ performance is the Sharpe Ratio. The Sharpe Ratio is a risk-adjusted measure of performance developed by Nobel Laureate William Sharpe. It is calculated by dividing a fund’s annualized excess returns by its annualized standard deviation to determine reward per unit of risk. The higher the Sharpe Ratio, the better a fund’s historical risk-adjusted performance. The Board attaches primary importance to risk-adjusted performance over relatively long periods of time, typically three to ten years. Except as described below, all of the Funds with three years or more of performance fell in the 1st or 2nd quartile within their Morningstar categories and the small-cap universe for the three-year, five-year and 10-year periods ended December 31, 2011. Royce Premier Fund (“RPR”) fell in the 3rd quartile for the three-year period within its Morningstar assigned Mid-Cap Growth category as its volatility for the period was slightly higher than the category median. The trustees also noted that among all small-cap objective funds, its Sharpe Ratio placed in the 28th percentile for the three-year period. Likewise, Royce 100 Fund (“ROH”) placed in the 3rd quartile for the three-year period within its Morningstar assigned Small Growth category but within the middle quintile for the three-year period among all small-cap objective funds. Royce Opportunity Fund’s (“ROF”) Sharp Ratio placed in the 3rd quartile for the 10-year period within its small value category as its 2nd quartile total return was overshadowed by its 4th quartile volatility. Among all small-cap objective funds, ROF placed in the 2nd quintile. The Board noted that Royce Value Plus Fund (“RVP”) has struggled during the recent market cycles as its portfolio manager had taken a more defensive portfolio composition going into the strong up market beginning with the March 2009 market low, leading to a 4th quartile total return and Sharpe Ratio performance for the three- and five-year periods. RVP was in the top quartile for the 10-year period. It was also noted that RVP’s portfolio manager had repositioned the Fund to take it back to its “value plus” growth roots, resulting in a total return as of May 3, 2012 that was 260 basis points higher than the Russell 2000. Royce Micro-Cap Discovery Fund (“RDF”) fell in the 4th quartile for the three- and five-year periods as compared with its Small Blend category. The Board noted the positive impact of the addition of an active management component layered onto RDF’s quant structure in August 2010 as indicated by its 2nd quartile performance for the one-year period ended December 31, 2011 in its Small Blend category and its top quartile rank among its micro-cap |
| The Royce Funds 2012 Semiannual Report to Shareholders | 151 |
focused peer group. The Board also noted that other than a net 31 basis point fee received in 2007, R&A has not received a management fee on DSC since its 2003 inception. Royce SMid-Cap Value Fund’s (“RSV”) total return and Sharpe Ratio fell in the 4th quartile for the three-year period within its Mid-Cap Blend category and its performance in 2011 was 910 basis points worse than its Russell 2500 benchmark, with its significant overweighting in materials, particularly metals and mining companies, contributing to its lagging performance. In addition to each Fund’s risk–adjusted performance the trustees also reviewed and considered each Fund’s absolute total returns, down market performance and for the Funds in existence for such periods, long-term performance records over periods of ten years or longer. The Board noted that Royce Focus Value Fund (“RFV”), Royce Partners Fund (“PTR”), Royce Mid-Cap Fund (“RMM”) and Royce Special Equity Multi-Cap Fund (“RSM”) have less than three years of performance. The Board noted that R&A’s general process of investing new funds over time led to higher cash positions and market lagging performance for most of these newer funds in their initial periods of operation and they noted that RSM’s Sharpe Ratio placed it in the top-quartile for the one year period. The trustees noted that R&A manages a number of funds that invest in small-cap and micro-cap issuers, many of which were outperforming their benchmark indexes and their competitors. Although the trustees recognized that past performance is not necessarily an indicator of future results, they found that R&A had the necessary qualifications, experience and track record in managing mid-cap, small-cap and micro-cap securities to manage the Funds. The trustees determined that R&A continued to be an appropriate investment adviser for the Funds and concluded that each of the Funds’ performance supported the continuation of its Investment Advisory Agreement. Cost of the services provided and profits realized by R&A from its relationship with each Fund: The trustees considered the cost of the services provided by R&A and profits realized by R&A from its relationship with each Fund. As part of the analysis, the Board discussed with R&A its methodology in allocating its costs to each Fund and concluded that its allocations were reasonable. The trustees noted that at times R&A had closed certain of the Funds to new investors because of the rate of growth in Fund assets. The trustees concluded that R&A’s profits were reasonable in relation to the nature and quality of services provided. The extent to which economies of scale would be realized as the Funds grow and whether fee levels would reflect such economies of scale: The trustees considered whether there have been economies of scale in respect of the management of the Funds, whether the Funds have appropriately benefited from any economies of scale and whether there is potential for realization of any further economies of scale. The trustees noted the time and effort involved in managing portfolios of small- and micro-cap stocks and that they did not involve the same efficiencies as do portfolios of large-cap stocks. The trustees noted that in 2004 breakpoints had been added to the investment advisory fees for all Funds except Royce Pennsylvania Mutual Fund (“PMF”) (PMF’s fee schedule already had breakpoints) and that the contractual investment advisory fee rate for Royce Micro-Cap Fund ("RMC") and Royce Low-Priced Stock Fund (“RLP”) had each been reduced in recent years. The trustees concluded that the current fee structure for each Fund was reasonable and that shareholders sufficiently participated in economies of scale. Comparison of services to be rendered and fees to be paid to those under other investment advisory contracts, such as contracts of the same and other investment advisers or other clients: The trustees reviewed the investment advisory fee paid by each Fund and compared both the services to be rendered and the fees to be paid under the Investment Advisory Agreements to other contracts of R&A and to contracts of other investment advisers to registered investment companies investing in small- and micro-cap stocks, as provided by Morningstar. The trustees noted the importance of the net expense ratio in measuring a fund’s efficiency, particularly in light of the variations in the mutual fund industry as to who is responsible for which expenses. The net expense ratios for PMF, RPR, Royce Total Return Fund, Royce Heritage Fund, Royce Special Equity Fund, DSC, Royce Financial Services Fund and RSM ranked within the 1st or 2nd quartile among their peers, as selected by Morningstar. ROF fell in the middle quintile among its peers. RMC placed in the 4th quartile within its peer group, six basis points higher than its peer group median. RMC’s net expense ratio is below the average net expense ratio for the 44 non-institutional, non-ETF, domestic stock funds in the Morningstar database with market caps below $500 million and 12b-1 fees equal to or less than 0.25%. It was noted that RLP’s expense ratio placed in the 4th quartile, 19 basis points higher than its peer group median. RLP’s higher management fee, reflecting the Fund’s use of low-priced and micro-cap stocks, accounts for this difference. RLP’s net expense ratio is three basis points higher than the mean for all small-cap category funds (non-institutional, non-index, non-ETF) with 12b-1 fees of 25 basis points. The trustees noted that Royce Value Fund’s (“RVV”) expense ratio placed in the 4th quartile within its peer group, 24 basis points higher than its peer group median as its management fee was 21 basis points higher than the peer group median. RVP’s expense ratio placed in the 4th quartile, seven basis points higher than its peer group median. Each of ROH’s and Royce Dividend Value Fund’s (“RDV”) expense ratios placed in the 3rd quartile, six basis points higher than their peer group median as their management fees were 17 basis points higher than their respective peer group median. The management fees for RVV, RVP, ROH and RDV are consistent with other Royce open-end funds and their fund net expense ratios are below the mean for all small-cap objective funds (non-institutional, non-index, non-ETF) with 12b-1 fees of 25 basis points. The Board noted that R&A recommended a reduction in the net expenses, through reimbursement of expenses, for RSV, RFV, PTR and RMM, each essentially a smid- or mid-cap fund, to 1.35% retroactive to January 1, 2012. This change would put each of these Fund’s net expenses at the median and within three basis points of the average for the mid-cap category funds (non-institutional, non-index, non-ETF) with 12b-1 fees of 25 basis points. The trustees noted that R&A has waived advisory fees in order to maintain expense ratios at competitive levels and acknowledged R&A’s intention to continue this expense limitation practice. The trustees also considered fees charged by R&A to institutional and other clients and noted that, given the greater levels of services that R&A provides to registered investment companies such as the Funds as compared to other accounts, each of the Fund’s advisory fees compared favorably to these other accounts. It was noted that no single factor was cited as determinative to the decision of the trustees. Rather, after weighing all of considerations and conclusions discussed above, the entire Board, including all the non-interested trustees, determined to approve the continuation of the existing Investment Advisory Agreements, concluding that a contract continuation on the existing terms was in the best interest of the shareholders of each Fund and that each investment advisory fee rate was reasonable in relation to the services provided. |
| 152 | The Royce Funds 2012 Semiannual Report to Shareholders |
| Is the Business Cycle Dead? |
“Plus ça change, plus c’est la même chose.” (“The more things change, the more they stay the same.”) – Alphonse Karr |
One striking effect of the financial crisis has been the apparent disappearance of the traditional business cycle. The world’s developed economies—heavily indebted, still deleveraging, and in some cases in the midst of painful austerity—are being supported by periodic and unconventional interventions from increasingly leveraged central banks. The result has been an anemic, albeit steady, pace of economic activity marked by fits and starts that are increasingly difficult for investors to interpret. It makes sense, then, that market cycles have followed suit, with equities showing sudden, at times violent, moves that have alternated between strong rallies and steep declines over relatively short periods, each driven by marginal changes in the trajectory of economic expectations. Single-stock correlation remains high due to this uncertainty, with more cyclical market sectors the most disadvantaged. Several factors are at work: Deleveraging associated with the housing bust is a persistent and long-term headwind; personal savings remain elusive; rising commodity prices have affected consumer purchasing power and sentiment; unemployment remains stubbornly high; and, importantly, the primary source of economic stimulus is coming from central bank programs instead of traditional private business investment. As if all this were not enough, there is the backdrop of the sovereign debt crises in Europe and slower growth in the all-important emerging economies, especially China. Interestingly, none of these issues are new. They have been part of the landscape for several years now, and distinct patterns have developed around them that have been repeated in each of the last three years, giving investors the sense that cycles of economic activity have compressed dramatically. Previously marked in years, moves up and down in business momentum are now counted in months, if not weeks. Which leads to two questions: Has the business cycle fundamentally changed? Should traditionally cyclical businesses carry lower multiples as a result? It appears to us that in the short term, the market has answered with a resounding ‘yes.’ Cyclical sectors, such as Industrials, Energy, Technology, and Materials, have become increasingly volatile and have borne the brunt of the selling during market downturns. Within these areas, even high-quality businesses (as measured by balance sheet strength and returns on invested capital) are suffering from the altered preferences of investors who once flocked to the perceived safety of more stable vehicles. Investors continue to abandon equities, gravitating instead toward fixed income securities even as they recognize the inevitable loss of purchasing power that comes with them. Today, it seems that we have a bubble in fear, which is manifesting itself in ways that have our contrarian pulses racing.  We are finding what we think are excellent values in currently unpopular pro-cyclical businesses. Cycles have certainly become shorter over the past three years, but we hold the view that these are anomalous times and that the traditional business cycle will reemerge before long. The economy does not yet have sufficient self-sustaining business momentum that will allow it to be weaned off the artificial support currently being provided by central banks. The opportunity from our standpoint lies in looking where others are not while holding fast to our time-tested investment approach governed by absolute standards for valuation and return. In the short term, our interest in cyclical businesses has been putting us out of sync with the return patterns of the market. While unpleasant, it is a by-product of our contrarian nature. In fact, this period is somewhat reminiscent of the late ’90s when investors were citing the demise of traditional value investing because of the emergence of the internet and the technology revolution. What was then a bubble in greed has become today’s bubble in fear. Investing is a perennially dynamic endeavor requiring both patience and conviction. Those tenets are being sorely tested in the current market. Although business cycles have looked different of late, and the market has been reacting accordingly, our belief is that they will ultimately revert to the mean, benefiting higher-quality companies in cyclical sectors. We take heart from the timeless wisdom of Alphonse Karr, for indeed, “the more things change, the more they stay the same.” The thoughts in this essay concerning the stock market are solely those of Royce & Associates and, of course, there can be no assurance with regard to future market movements. |
| This page is not part of the 2012 Semiannual Report to Shareholders |
 | |||||||||||||||||||
 | |||||||||||||||||||
About The Royce Funds This Review and Report must be accompanied or preceded by a current prospectus for the Funds. Please read the prospectus carefully before investing or sending money. | |||||||||||||||||||
| Contact Us | |||||||||||||||||||
| General Information Additional Report Copies and Prospectus Inquiries (800) 221-4268 | RIA Services Fund Materials and Performance Updates (800) 33-ROYCE (337-6923) | Broker/Dealer Services Fund Materials and Performance Updates (800) 59-ROYCE (597-6923) | Shareholder Services Transactions and Account Inquiries (800) 841-1180 | Royce InfoLine 24-Hour Automated Telephone Service (800) 78-ROYCE (787-6923) |  | ||||||||||||||
|

SEMIANNUAL
REVIEW AND REPORT
TO SHAREHOLDERS
| GLOBAL/INTERNATIONAL Royce European Smaller- Companies Fund Royce Global Value Fund Royce International Smaller- Companies Fund Royce Global Dividend Value Fund Royce International Micro-Cap Fund Royce International Premier Fund | |||
www.roycefunds.com |  | ||
| Performance and Expenses | Through June 30, 2012 |
| Average Annual Total Returns | Gross Annual | Net Annual | ||||||||||||||||||||||||||||||
| CATEGORY | Since | Inception | Operating | Operating | ||||||||||||||||||||||||||||
| Fund | Year-to-Date1 | One-Year | Three-Year | Five-Year | Inception | Date | Expenses | Expenses | ||||||||||||||||||||||||
| GLOBAL/INTERNATIONAL | ||||||||||||||||||||||||||||||||
| Royce European Smaller-Companies Fund | 5.41 | % | -20.71 | % | 13.42 | % | -2.46 | % | -0.48 | % | 12/29/06 | 2.10 | % | 1.70 | % | |||||||||||||||||
| Royce Global Value Fund | -0.42 | -22.03 | 13.13 | 1.07 | 3.70 | 12/29/06 | 1.77 | 1.69 | ||||||||||||||||||||||||
| Royce International Smaller-Companies Fund | 4.49 | -17.97 | 10.54 | n.a. | 3.06 | 6/30/08 | 2.15 | 1.69 | ||||||||||||||||||||||||
| Royce Global Dividend Value Fund | 5.77 | -12.50 | n.a. | n.a. | -7.14 | 12/31/10 | 3.48 | 1.70 | ||||||||||||||||||||||||
| Royce International Micro-Cap Fund | 4.15 | -19.62 | n.a. | n.a. | -12.61 | 12/31/10 | 4.01 | 1.78 | ||||||||||||||||||||||||
| Royce International Premier Fund | 8.60 | -13.16 | n.a. | n.a. | -6.52 | 12/31/10 | 3.77 | 1.69 | ||||||||||||||||||||||||
| Russell Europe Small Cap Index | 8.28 | -20.13 | 8.97 | -8.48 | n.a. | n.a. | n.a. | n.a. | ||||||||||||||||||||||||
| Russell Global Small Cap Index | 6.06 | -11.04 | 12.66 | -2.55 | n.a. | n.a. | n.a. | n.a | ||||||||||||||||||||||||
| Russell Global ex-U.S. Small Cap Index | 4.75 | -15.49 | 10.23 | -3.87 | n.a. | n.a. | n.a. | n.a. | ||||||||||||||||||||||||
Important Performance, Expense and Risk Information All performance information in this Review and Report reflects past performance, is presented on a total return basis, reflects the reinvestment of distributions and does not reflect the deduction of taxes a shareholder would pay on fund distributions or the redemption of fund shares. Past performance is no guarantee of future results. Investment return and principal value of an investment will fluctuate, so that shares may be worth more or less than their original cost when redeemed. Shares redeemed within 180 days of purchase may be subject to a 2% redemption fee payable to the Fund. Redemption fees are not reflected in the performance shown above; if they were, performance would be lower. Current performance may be higher or lower than performance quoted. Current month-end performance may be obtained at www.roycefunds.com. All performance and expense information reflects results of each Fund’s Service Class. Gross annual operating expenses reflect each Fund’s gross total annual operating expenses and include management fees, any 12b-1 distribution and service fees, other expenses, and any applicable acquired fund fees and expenses. Net annual operating expenses reflect contractual fee waivers and/or reimbursements. All expense information is reported as of each Fund’s most current prospectus. Royce & Associates has contractually agreed to waive fees and/or reimburse operating expenses, other than acquired fund fees and expenses, to the extent necessary to maintain net operating expenses at or below: 1.69% for Royce European Smaller-Companies, Global Value and International Smaller-Companies Funds through April 30, 2013 and at or below 1.99% through April 30, 2022; and 1.69% for Royce Global Dividend Value, International Micro-Cap and International Premier Funds through April 30, 2014; and 1.99% through April 30, 2022. Acquired fund fees and expenses reflect the estimated amount of fees and expenses incurred indirectly by the Fund through its investments in mutual funds, hedge funds, private equity funds and other investment companies. Shares of Royce Global Value Fund’s Consultant, R, and K Classes have higher annual expenses than the Service Class. Investments in securities of micro-cap, small-cap and/or mid-cap companies may involve considerably more risk than investments in securities of larger-cap companies. (Please see “Primary Risks for Fund Investors” in the prospectus.) The Funds invest a significant portion of their respective assets in foreign companies which may be subject to different risks than investments in securities of U.S. companies, including adverse political, social, economic or other developments that are unique to a particular country or region. (Please see “Investing in Foreign Securities” in the prospectus.) Therefore, the prices of securities of foreign companies, in particular countries or regions may, at times, move in a different direction than those of securities of U.S. companies. (Please see “Primary Risk of Fund Investors” in the prospectus.) Please read the prospectus carefully before investing or sending money. Russell Investment Group is the source and owner of the trademarks, service marks and copyrights related to the Russell Indexes. Russell® is a trademark of Russell Investment Group. The Russell Europe Small Cap Index is an unmanaged, capitalization-weighted index of European small-cap stocks. The Russell Global Small Cap Index is an unmanaged, capitalization-weighted index of global small-cap stocks. The Russell Global ex-U.S. Small Cap Index is an unmanaged, capitalization-weighted index of global small-cap stocks, excluding the United States. Index returns include net reinvested dividends and/or interest income. Distributor: Royce Fund Services, Inc. |
| This page is not part of the 2012 Semiannual Report to Shareholders |
| Portfolio Characteristics | As of June 30, 2012 |
| CATEGORY | Market Cap | Portfolio | ||||
| Fund | Breakdown | Approach | Volatility | |||
| GLOBAL/INTERNATIONAL | ||||||
| Royce European Smaller-Companies Fund |  | Limited | Moderate | |||
| Royce Global Value Fund |  | Limited | Higher | |||
| Royce International Smaller-Companies Fund |  | Diversified | Lower | |||
| Royce Global Dividend Value Fund1 |  | Diversified | — | |||
| Royce International Micro-Cap Fund1 |  | Limited | — | |||
| Royce International Premier Fund1 |  | Limited | — | |||
Market Cap Breakdown Key:  Micro-Cap Micro-Cap  Small-Cap Small-Cap  Mid-Cap Mid-Cap  Large-Cap Large-Cap |
Investment Universe Micro-Cap: Market Caps up to $750 million Small-Cap: Market Caps between $750 million and $2.5 billion Mid-Cap: Market Caps between $2.5 billion and $15 billion Large-Cap: Greater than $15 billion Portfolio Approach Diversified: A diversified portfolio at Royce is one that generally holds more than 100 securities and whose top positions generally do not exceed 2% of net assets. Limited: A limited portfolio at Royce is one that either (i) generally invests in no more than 100 companies, and whose top positions generally exceed 2% of net assets, or (ii) invests primarily in a single sector. Volatility Each Fund’s volatility is measured using Morningstar’s Risk Ratio, which measures variations in a fund’s monthly returns, with an emphasis on downside performance. Each Royce Fund’s overall Risk Ratio is a weighted combination of its three-, five- and 10-year scores, if applicable. For Royce European Smaller-Companies Fund, all European stock funds tracked by Morningstar with at least three years of history (31 funds as of 6/30/12) are included. For Royce Global Value Fund, all world stock funds with weighted-average market-caps of less than $5 billion tracked by Morningstar that have at least three years of history (25 funds as of 6/30/12) are included. For Royce International Smaller-Companies Fund, all foreign small/mid stock funds tracked by Morningstar with at least three years of history (62 funds as of 6/30/12) are included. We consider funds whose results rank in the top third of the category to have relatively low volatility; those in the middle third to have moderate volatility; and those in the bottom third to have high volatility. |
| This page is not part of the 2012 Semiannual Report to Shareholders | 1 |
| Table of Contents | |
| Semiannual Review | |
| Letter to Our Shareholders | 3 |
| 2012: In Quotes | 8 |
| Postscript: Is the Business Cycle Dead? | Inside Back Cover |
| Semiannual Report to Shareholders | 9 |
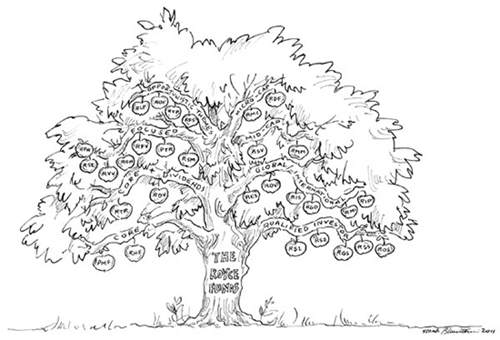
| 2 | This page is not part of the 2012 Semiannual Report to Shareholders |
 Charles M. Royce, President We have often stressed the importance of capital preservation in asset management, arguing that not losing money is as critical as making it grow. Implicit in this belief is the idea that capital preservation is mostly synonymous with preserving purchasing power. However, we now find ourselves in a very non-traditional investment environment, an age marked by near-zero interest rates; regular, short-term bursts of volatility for equities; and relentless money printing on the part of the developed world’s central banks. While this has not altered our view of the significance of risk aversion, it has led us to ask if at this moment in history capital preservation and preservation of purchasing power should be defined differently. The answer approaches what we think is one of the most underappreciated risks to which investors are now subject: the potential for meaningful loss in the future purchasing power of investments. With so much attention being paid to preservation of capital, too little has been placed on what that capital, once returned, will actually be worth. Continued on page 4. . . |
| Letter to Our Shareholders |
 |
“I Read the News Today, Oh Boy.” |
Another dismal summer has dawned with spring having brought a wave of worries back to the market for the third consecutive year. Karl Marx—as canny an observer of the global scene as he was a checkered prognosticator of its future—wrote in 1852 that all events in history occur twice: the first time as tragedy the second as farce. Allowing for the accuracy of this observation, what are we then to make of this third round of wobbly recovery, sluggish markets, panic-stuffed headlines, and the by now reflexive anxiety about the potential horrors of European debt for the world economy? What lies beyond farce, other than lousy returns, high correlation, and growing numbers of investors disenchanted with equities? To this kind of question, too many investors have no answer, having lost not only their belief in the viability of investing in stocks, but also in the prospects for the global economy. Indeed, one unfortunate result of the contagion of uncertainty has been the erosion of confidence in the ability of equities to deliver returns that will beat inflation and build wealth over the long term. On May 7, a USA Today headline asked and answered, “Invest in stocks? Forget About It.” It was not quite as damning as the now infamous Business Week cover from August 1979 that proclaimed “The Death of Equities,” but the overall message was not much happier: “Wall Street’s long-running story about how stocks are the best way to build wealth seems tired, dated and less believable to many individual investors.” And the USA Today piece was published early in May, just before the current bear bit down most sharply. The implicit assumption that the best days for the stock market may be (way) behind it seems to us to be the distinguishing feature of this third round of poor results for most equities. Panic has given way to a shrug of resignation. This stance sees equity investing as a mug’s game, even if the alternatives—Treasuries, bonds, money markets, etc.—are not much more attractive or profitable. Such a belief—as ultimately wrong-headed as we think it is—has the advantage that recent history, as far back as five years, is on its side. With a few exceptions, there is simply not much of a defense for equity investing as a whole since the respective index peaks in 2007. The explanation for why the market has been so troublesome and unprofitable seems simple: The world is still emerging from the most serious economic crisis since the Great Depression. Yet this account may be in equal parts true and unhelpful, at least to anyone who had been looking for a way to safely and effectively grow capital during the last few years, which helps to explain why panic and resignation are symptoms of the same fatalism that has gripped investors since the early days of the mortgage and banking crisis in 2008. |
| This page is not part of the 2012 Semiannual Report to Shareholders | 3 |
| For more than three decades, an investment vehicle provided highly consistent returns with such low volatility that they were nearly devoid of risk—U.S. government bonds, specifically Treasury securities. They were the instruments that possessed that highly desired standard, “the risk-free rate of return.” The currently volatile investment climate has greatly expanded the appeal of this designation. Investors trying to cope with the economic uncertainty and asset-price volatility caused by the bursting credit bubble have grown increasingly sensitive to the possibilities of capital loss. Yet if history is any proxy—and we believe that it is—a healthy degree of skepticism should greet the notion that Treasuries remain risk free or provide an acceptable rate of return. If nothing else, the lens through which we see them needs to be adjusted to include the growing uncertainty of ultimate purchasing power (of real goods and services) of the currency in which they are denominated. This risk, one for which we have a healthy respect over the intermediate term, is the ominous combination of ongoing currency debasement and acceleration in inflationary pressures. These could erode the purchasing power of non- productive assets. Central banks around the world, with the U.S. Federal Reserve a primary contributor, have been pumping liquidity into the capital markets through a combination of Continued on page 6. . . |
| Letter to Our Shareholders |
We understand the pessimism and the unwillingness to take risks on the part of so many investors today. At the same time, we still see many of the same positive signs that have been inspiring our confidence about stocks and the economy as a whole since the spring of 2010. By taking the long view (a common perspective for us), we can offer, in addition to a Nostra Culpa for much recent fund performance, the benefit of nearly 40 years of small-cap value investing. Our collective experience tells us that this highly volatile, tightly correlated, range-bound market will be remembered as being as anomalous as it has been painful, one that tends to occur once or twice a century. It does not, in our view, change the fact that stocks remain the single best way of building wealth over the long run. We know that in the current environment these words may sound hollow or even self-serving. We are more than willing to assume that risk in the hope that investors will continue to look to equities (and to our portfolios) as effective and ultimately successful ways to invest in the years to come. |
“They’ve Been Going in and out of Style” |
The kind of dynamic rally that ushered out the first half of 2012 is always guaranteed to raise a smile, even if it could not completely erase losses in the second quarter, losses that spoiled a promising upswing that lasted through most of the year’s opening quarter. Indeed, lack of direction has arguably been the most distinguishing characteristic of the recent market. Still, the globe’s major indexes finished the year-to-date period ended June 30, 2012 in decent condition, though domestic small-caps brought up the rear. Recent performance for the two non-U.S. indexes that we track followed patterns somewhat similar to their domestic cousins, though with more muted results. This was not entirely surprising considering both Europe’s ongoing travails and worries about the pace of growth in China. Non-U.S. small-caps enjoyed an advantage over their large-cap siblings, with the Russell Global ex-U.S. Small Cap up 4.8% for the year-to-date period ended June 30, 2012 versus a 2.8% gain for the Russell Global ex-U.S. Large Cap Index. Both indexes enjoyed strong first-quarter results. The Russell Global ex-U.S. Small Cap Index rose 14.4%, and the Russell Global ex-U.S. Large Cap Index was up 11.5% in the first three months of 2012. We were among those hopeful souls who saw a nearly six-month bull run and thought that maybe the market was ready for some consistent recovery. Yet April and May were cruel months, the latter especially so, as the now-traditional spring downturn caused by concerns about European debt and the state of the American and Chinese economies spoiled the party and tamped down returns. (If not for the rally on the final trading day of June, that month would also have been less solidly in the black.) That rally was welcome—they always are—but second-quarter returns were still negative. Each index’s second quarter was difficult, as Europe’s troubles registered more dramatically outside the U.S. Small-cap lost a bit more in the downturn, with the Russell Global ex-U.S. Small Cap Index falling 8.5%, while the Russell Global ex-U.S. Large Cap Index was down 7.9%. The Russell 2000 Index was up 8.5% in the first half compared to respective gains of 9.4% and 9.5% for the large-cap Russell 1000 and S&P 500 Indexes and an electrifying 12.7% for the Nasdaq Composite. It was an interesting road for each index. The first quarter extended a rally that began following the October 2011 lows. Small-cap trailed, though its 12.4% gain was its best |
| 4 | This page is not part of the 2012 Semiannual Report to Shareholders |
opening quarter since 2006. It was also not far behind its large-cap counterparts. The Russell 1000 rose 12.9%, and the S&P 500 gained 12.6%. The Nasdaq was especially impressive, notching an 18.7% increase for the quarter before leading on the downside, falling 5.1%, while the Russell 2000 slipped 3.5%. Large-caps held their value a bit better, with the Russell 1000 losing 3.1% and the S&P 500 declining 2.8%. So the first half concluded with a bang, but still left investors whimpering about the future. Considering both the significant volatility and the unpopularity of stocks, the strength of micro-cap stocks was something of a surprise in the first half. Year-to-date through June 30, 2012, the Russell Microcap Index gained an impressive 13.0%. That the index accomplished this feat with stronger and steadier quarterly performances was equally notable: the Russell Microcap climbed 15.3% in the first quarter and fell only 2.0% in the bearish second. | Our collective experience tells us that this highly volatile, tightly correlated, range-bound market will be remembered as being as anomalous as it has been painful, one that tends to occur once or twice a century. It does not, in our view, change the fact that stocks remain the single best way of building wealth over the long run. | ||
| Looking at longer-term returns, the recent uncertainty felt by many investors has been well-earned. While three- and 10-year average annual total returns for the major global indexes were solid-to-strong, one-, five-, and 12-year results for the periods ended June 30, 2012 were generally poor. The 12-year period—not a period that we, or anyone else, usually discusses—is instructive because it encompasses the Internet Bubble, the subsequent recovery, the worldwide recession that was followed by the equally far-reaching financial crisis, and the market’s herky-jerky, volatile aftermath. So we think it is worth pointing out that for the 12-year period ended December 31, 2011, the average annual total return for the S&P 500 was its lowest since the end of World War II (beginning with the period from the end of 1945 through the end of 1957). Small-cap returns for that same period ended December 31, 2011 for the Russell 2000 and the CRSP 6-10, a domestic small-cap proxy that dates back to the 1920s, were among the worst for both since the launch of the Russell 2000 on December 31, 1978 and since the end of 1945 for the CRSP 6-10. | |||
“The Act You’ve Known for all these Years...” If only our own portfolios had done as well. On an absolute basis, most of the Funds’ in this Semiannual Review and Report posted results that ranged from uninspiring to strong in the first half. Normally, this does not trouble us. Long ago, we accepted that our disciplined approaches to stock selection would result in out-of-sync moments against our portfolios’ respective benchmarks during shorter time periods. Our goal has always been strong absolute performance over long-term periods. If we met that standard, then relative results would most likely not be an issue, at least over long-term time spans. We have also been glad to accept the historical trade-off in which underperformance was more common for our Funds during short-term periods of 18 months or less, while outperformance was more typical over full market cycle and other long-term periods of three years or more. Three-year results were fine on an absolute and relative | Our expectation is for a less extreme, more historically normal phase, without so many of the stomach-churning drops followed by equally steep upticks that we saw last summer and fall and have seen so far in 2012. It is worth noting that a more historically normal range is one in which we think our Funds can generate strong absolute and relative performance over the long run. | ||
| basis, as were five-year returns on a relative basis. Using the absolute standard that we prefer, however, shows five-year results that were underwhelming at best. With significant investments in all of our Funds, we share our investors’ frustrations with recent results. Those areas of the market in which we have seen both high quality and compelling valuations during the last three-to-five years—energy and mining companies, in particular— | |||
| This page is not part of the 2012 Semiannual Report to Shareholders | 5 |
| historically low interest rates and quantitative easing or, more simply stated, money printing. Headline inflation numbers have remained subdued due to the continuing struggles in the labor market and stubbornly weak housing markets, but commodity inflation has been on the rise. With the recent uptick in U.S. leading economic indicators and encouraging signs of stability and improvement in the housing market, it would not take much to see a more broad-based uptick in inflation. So while U.S. government bonds are likely to continue to pay their meager coupons and return principal on schedule, the value of what is being returned to investors will be declining. For the first time in almost 30 years, we think that investors risk meaningful losses in that portion of their investment portfolio they deem to be the safest. Commodities offer one possible way to protect against the loss of purchasing power caused by currency debasement. Unsurprisingly, however, we prefer assets that are inherently productive and flexible and can adjust quickly to changing pricing environments. To us, investments in quality companies that possess embedded pricing power and high returns on their invested capital look to be some of the best investments to protect, and grow, purchasing power. We believe they need much broader representation in investors’ asset allocation. |
| Letter to Our Shareholders | ||
were among the worst performers in the first half. Many of these stocks remain in our portfolios, as their attractive valuations and our ongoing high regard have combined to keep turnover low. In many cases, we have been building, or at least maintaining, positions in those businesses in which we have the highest conviction. As has been our practice since the 1970s, we are keeping our focus on company fundamentals. We seek companies that look capable of surviving adversity and flourishing when their fortunes change. Those that generate free cash via high returns on capital can give investors a return in the form of dividends, take advantage of their low valuation by buying back stock, or make acquisitions to grow their business when organic growth is harder to come by. Strong fundamentals mean these companies have the necessary tools to make it through difficult periods and emerge stronger. While many of our recent efforts have not been successful, nothing about the way that we select stocks has changed, including our insistence on rock-solid fundamentals in the companies that we choose. Selectiveness, patience, and discipline remain our watchwords. | ||
| 2012 YEAR-TO-DATE TOTAL RETURNS FOR THE ROYCE GLOBAL/INTERNATIONAL FUNDS VS. BENCHMARK INDEXES As of 6/30/12 | ||
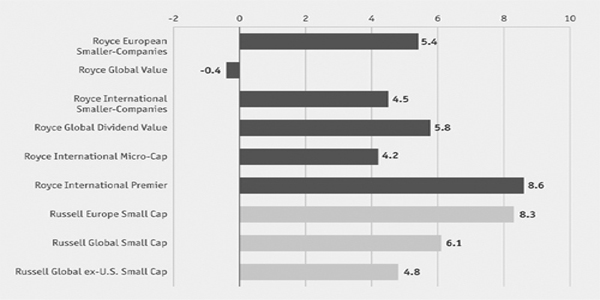 | ||
Getting Better We do not know how much longer markets and economies will remain so uncertain. The fiscal turmoil that continues to haunt Europe has been hampering equity markets across the globe and contributing to the tight range of returns that have nonetheless demonstrated ample levels of volatility. The fragile recovery here in the U.S. has also played a role, as has the recent deceleration of the Chinese economy. These major macro events, which have been the dominant influence on investors’ behavior over the last three years, largely account for why stocks have struggled to create any direction for longer than a few months. Instead, markets have been mired in a pattern of short-term swings in which they have moved straight up or straight down, and for no longer than a few months at a time. One consequence of this closely correlated, range-bound cycle is that our Funds have not had the time to create the spread that we would usually seek to build through a full market cycle. However, we think that as Europe meets its challenges and as the U.S. | ||
| 6 | This page is not part of the 2012 Semiannual Report to Shareholders |
begins to get its own fiscal house in order, which is not likely to happen until after the election, we will escape this range and move toward a more lasting upswing. Our expectation is for a less extreme, more historically normal phase, without so many of the stomach-churning drops followed by equally steep upticks that we saw last summer and fall and have seen so far in 2012. It is worth noting that a more historically normal range is one in which we think our funds can generate strong absolute and relative performance over the long run. We would like to think that long-term history is on our side in this assessment. | Through all manner of markets—many of which were thought to establish a “New Normal”—we have never wavered in our convictions. We still believe that equities remain the best way—maybe the only way—to beat inflation and build wealth over the long term. | ||
Good Morning, Good Morning Obviously, we would all like to reach it soon. As always, patience is critical. Indeed, the ability to be patient is probably the single most important quality that an investor who seeks strong long-term returns can possess. It is easy to talk about the importance of patience and discipline when markets are solid and portfolios are doing well. Yet at some point, these things will change, and both will be tested, as they have been in this market. It has been a very difficult time, but we believe it will pass. When it does, our disciplined approach will remain and, we believe, be effective. | |||
As we approach our 40th anniversary as a firm this coming November, we look back at what we have seen—the “Nifty Fifty” market of the ’70s, Black Friday in the ’80s, the first stirrings of the Internet boom in the ’90s, the horrific events of 9/11, our current era of uncertainty, and much, much more. Through all manner of markets—many of which were thought to establish a “New Normal”—we have never wavered in our convictions. We still believe that equities remain the best way—maybe the only way—to beat inflation and build wealth over the long term. (We also think that equities are capable of beating the fixed income markets over the next five years.) Our guess is that stocks can deliver returns in the mid- to upper-single digits, which we think would be respectable on an absolute basis and, equally important, higher than the rate of inflation. When things are working well, the underlying parts of an equity portfolio, the companies | It is easy to talk about the importance of patience and discipline when markets are solid and portfolios are doing well. Yet at some point, these things will change, and both will be tested, as they have been in this market. It has been a very difficult time, but we believe it will pass. When it does, our disciplined approach will remain and, we believe, be effective. | ||
themselves, can act as compounding machines—compounding book value. We are confident that we have created portfolios that can grow commendably, especially in the more historically typical market climate that we believe we will eventually see. | |||
 |  |  |
| Charles M. Royce | W. Whitney George | Jack E. Fockler, Jr. |
| President | Vice President | Vice President |
| July 31, 2012 |
| This page is not part of the 2012 Semiannual Report to Shareholders | 7 |
| 2012: In Quotes |
| We don’t have to be smarter than the rest. We have to be more disciplined than the rest. |
| – Warren Buffet, 2012 |
Points To Ponder Dividend-payers stand to benefit in coming decades from an event that has only just begun, the retirement of the baby boomers. – Savita Subramanian, WSJ.com, January 4, 2012 Do not trust financial market risk models. Despite the predilection of some analysts to model the financial markets using sophisticated mathematics, the markets are governed by behavioral science, not physical science. – Seth Klarman No matter how diversified you are, you probably aren’t as diversified as you think. As recently as 1997, it took 20 stocks to eliminate most of the likelihood of enduring more risk than the market as a whole; today it takes 40. If you hold the same number of stocks that you used to, you are about half as diversified as you were. You need to spread your bets wider. – Jason Zweig, The Wall Street Journal, February 18, 2012 Leverage reduces the investor’s critical asset: patience. – Jeremy Grantham, GMO Letter, February 2012 In Absolute Agreement In the fourth quarter of 1984, there were 32 FDIC-insured banks with assets greater than $10 billion, and they controlled 27.5% of the nation’s banking assets. In the fourth quarter of 2011, there were 107 banks with assets greater than $10 billion, and they controlled 79.6% of the nation’s banking assets. – Jim Grant, Grant’s Interest Rate Observer, May 18, 2012 | The disruptive technologies and government policies have created an extremely highly correlated environment with all financial markets and all financial institutions. The risks were manifest in 2008, but rather than defuse them, government policies have since increased the interconnectedness. – Simon Mikhailovich, Barron’s, June 2, 2012 We don’t try to predict (the stock market)… That’s folly. We are looking at the macro picture, but it is best to focus on forward risk-adjusted returns at individual securities. We have learned that over and over again. – Don Yacktman, Barron’s, May 8, 2012 The public will only consider equities once they start to lose money in bonds. In an era of financial repression, this might take a long time but this moment will arrive just the same. – Jason Trennert, Strategas Investment Strategy Viewpoint, May 25, 2012 It is important to recognize that results in the short term reflect a lot of randomness. Even skillful managers will slump, and unskillful managers will shine. But over the long haul, good process wins. – Michael Mauboussin, Daily News & Analysis, June 4, 2012 It’s never as good as you think it is when it’s great, and never as bad as you think it is when it’s bad. – Preston Athey, Barron’s, June 16, 2012 | Cocktail Conversation Stocks were losers to bonds in 2011. But don’t invest with a rear view mirror… Emerging markets offer the best prospects for both equity and bond returns over the next 10 years. – Burton Malkiel, The Wall Street Journal, January 6, 2012 Apple’s iPhone business alone is now bigger than Microsoft. Not Windows. Not Office. Microsoft. Think about that. The iPhone did not exist five years ago. And now it’s bigger than a company that, 15 years ago, was dragged into court and threatened with forcible break-up because it had amassed an unassailable and unthinkably profitable monopoly… In the December quarter, Apple’s iPhone business generated $24.4 billion of revenue. Microsoft’s whole company, meanwhile, from Windows to Office to servers to XBox, generated $20.9 billion. – Henry Blodget, BusinessInsider, February 7, 2012 Adjusted for inflation, current oil prices are below the levels that existed thirty years ago. – William Strauss, Economic Outlook, April 26, 2012 Timeless Tidbits It is amazing what you can accomplish if you do not care who gets the credit. – Harry S. Truman In any moment of decision, the best thing you can do is the right thing. The worst thing you can do is nothing. – Theodore Roosevelt | ||
| 8 | This page is not part of the 2012 Semiannual Report to Shareholders |
| Table of Contents |
| Semiannual Report to Shareholders | ||||||||||
| Managers’ Discussions of Fund Performance | ||||||||||
| Royce European Smaller-Companies Fund | 10 | |||||||||
| Royce Global Value Fund | 12 | |||||||||
| Royce International Smaller-Companies Fund | 14 | |||||||||
| Royce Global Dividend Value Fund | 16 | |||||||||
| Royce International Micro-Cap Fund | 18 | |||||||||
| Royce International Premier Fund | 20 | |||||||||
| Schedules of Investments and Financial Statements | 22 | |||||||||
| Notes to Financial Statements | 42 | |||||||||
| Understanding Your Fund’s Expenses | 47 | |||||||||
| Board Approval of Investment Advisory Agreement | 48 | |||||||||
| Trustees and Officers | 50 | |||||||||
| Notes to Performance and Other Important Information | 51 | |||||||||
| The Royce Funds 2012 Semiannual Report to Shareholders | 9 |
| Royce European Smaller-Companies Fund |
| GLOBAL/INTERNATIONAL | ||||||||||||||||||
Global/International Funds generally focus on non-U.S. based companies using our core approach to security selection. | ||||||||||||||||||
| ||||||||||||||||||
| AVERAGE ANNUAL TOTAL RETURNS Through 6/30/12 | ||||||||||||||||||
| Jan–June 20121 | 5.41 | % | ||||||||||||||||
| One-Year | -20.71 | |||||||||||||||||
| Three-Year | 13.42 | |||||||||||||||||
| Five-Year | -2.46 | |||||||||||||||||
| Since Inception (12/29/06) | -0.48 | |||||||||||||||||
| ANNUAL EXPENSE RATIOS | ||||||||||||||||||
| Gross Operating Expenses | 2.10 | % | ||||||||||||||||
| Net Operating Expenses | 1.70 | |||||||||||||||||
| 1 Not annualized | ||||||||||||||||||
| CALENDAR YEAR TOTAL RETURNS | ||||||||||||||||||
| Year | RES | Year | RES | |||||||||||||||
| 2011 | -20.3 | % | 2008 | -46.4 | % | |||||||||||||
| 2010 | 35.2 | 2007 | 1.4 | |||||||||||||||
| 2009 | 57.7 | |||||||||||||||||
| TOP 10 POSITIONS % of Net Assets | ||||||||||||||||||
| Jupiter Fund Management | 2.9 | % | ||||||||||||||||
| Semperit AG Holding | 2.9 | |||||||||||||||||
| Mayr-Melnhof Karton | 2.5 | |||||||||||||||||
| Ashmore Group | 2.3 | |||||||||||||||||
| Hochschild Mining | 2.2 | |||||||||||||||||
| KWS Saat | 2.1 | |||||||||||||||||
| Fuchs Petrolub | 2.1 | |||||||||||||||||
| Burckhardt Compression Holding | 2.0 | |||||||||||||||||
| Parrot | 2.0 | |||||||||||||||||
| Takkt | 2.0 | |||||||||||||||||
| PORTFOLIO SECTOR BREAKDOWN % of Net Assets | ||||||||||||||||||
| Health Care | 16.9 | % | ||||||||||||||||
| Industrials | 16.4 | |||||||||||||||||
| Information Technology | 14.9 | |||||||||||||||||
| Financials | 14.3 | |||||||||||||||||
| Consumer Discretionary | 12.4 | |||||||||||||||||
| Materials | 12.3 | |||||||||||||||||
| Consumer Staples | 4.0 | |||||||||||||||||
| Energy | 3.2 | |||||||||||||||||
| Cash and Cash Equivalents | 5.6 | |||||||||||||||||
| PORTFOLIO COUNTRY BREAKDOWN1,2 % of Net Assets | ||||||||||||||||||
| United Kingdom | 17.3 | % | ||||||||||||||||
| Germany | 15.8 | |||||||||||||||||
| France | 15.7 | |||||||||||||||||
| Switzerland | 11.9 | |||||||||||||||||
| Italy | 5.7 | |||||||||||||||||
| Austria | 5.3 | |||||||||||||||||
| South Africa | 4.4 | |||||||||||||||||
| Belgium | 3.6 | |||||||||||||||||
| Norway | 3.2 | |||||||||||||||||
| 1 Represents countries that are 3% or more of net assets. 2 Securities are categorized by the country of their headquarters. | ||||||||||||||||||
 |
Managers’ Discussion For the third year in a row, a fragile yet meaningful advance in equity markets early in the year abruptly reversed course as investors once more grew uncomfortable with risk assets. The macroeconomic factors that fueled this change of heart were the same ones that have dominated the landscape for the last three years, with primary attention on the seemingly always worsening condition of the eurozone. Spain was the latest country in the region to seek a bailout for its ailing banking industry, as it became clear that its government could no longer support it internally. Decelerating growth rates in the world’s emerging economies also weighed on investor sentiment, as both China and Brazil experienced notable downticks in economic activity. Royce European Smaller Companies Fund (RES), with its charter to invest in the highest conviction ideas we are finding in our European research efforts, performed solidly in absolute terms in what was a volatile first half for European small-caps. For the year-to-date period ended June 30, 2012, RES gained 5.4%, lagging its benchmark, the Russell Europe Small Cap Index, which advanced 8.3% for the same period. During the powerful rally in the year’s first quarter, RES gained 16.0%, trailing the Russell’s European small-cap index, which advanced 19.7%. Investor confidence was shaken late in the quarter when global economic growth once again began to stall, and European efforts to manage the ever-increasing complexity of their prior fiscal mismanagement were deemed inadequate. This made for a mostly difficult three months notwithstanding a dynamic rally on the last day of June that elevated share prices around most of the globe. RES fell 9.1% in 2012’s second quarter, compared to its benchmark’s decline of 9.6%. Now past its fifth anniversary, the Fund continued to hold its longer-term relative advantage over its benchmark. For the since inception period (12/31/06) ended June 30, 2012, RES lost a modest 0.5% on an annualized basis versus a loss of 5.4% for the Russell Europe Small Cap Index over the same period. While not achieving our ultimate standard for positive absolute returns—our preferred performance measure—the Fund has had to navigate one of the most challenging macroeconomic environments on record, giving us a small measure of comfort in its slight loss for the since inception period. |
| GOOD IDEAS THAT WORKED Top Contributors to Performance Year-to-Date through 06/30/121 | ||
| Hochschild Mining | 0.71% | |
| Fuchs Petrolub | 0.66 | |
| Pfeiffer Vacuum Technology | 0.56 | |
| Parrot | 0.49 | |
| KWS Saat | 0.47 | |
| 1 Includes dividends | �� | |
Important Performance and Expense Information All performance information in this Report reflects past performance, is presented on a total return basis, reflects the reinvestment of distributions and does not reflect the deduction of taxes that a shareholder would pay on fund distributions or the redemption of fund shares. Past performance is no guarantee of future results. Investment return and principal value of an investment will fluctuate, so that shares may be worth more or less than their original cost when redeemed. Shares redeemed within 180 days of purchase may be subject to a 2% redemption fee payable to the Fund, which is not reflected in the performance shown above; if it were, performance would be lower. Current month end performance may be higher or lower than performance quoted and may be obtained at www.roycefunds.com. Gross operating expenses reflect total gross annual operating expenses and include management fees, 12b-1 distribution and service fees, other expenses and acquired fund fees and expenses. Net operating expenses reflect contractual fee waivers and/or expense reimbursements. All expense information is reported as of the Fund’s most current prospectus. Royce & Associates has contractually agreed to waive its fees and/or reimburse operating expenses to the extent necessary to maintain the Fund’s net annual operating expenses, other than acquired fund fees and expenses, at or below 1.69% through April 30, 2013 and at or below 1.99% through April 30, 2022. Acquired fund fees and expenses reflect the estimated amount of the fees and expenses incurred indirectly by the Fund through its investments in mutual funds, hedge funds, private equity funds and other investment companies. Regarding the two “Good Ideas” tables shown above, the sum of all contributors to, and all detractors from, performance for all securities in the portfolio would approximate the Fund’s year-to-date performance for 2012. |
10 | The Royce Funds 2012 Semiannual Report to Shareholders
Performance and Portfolio Review Six of the Fund’s eight equity sectors finished the first half with positive performance, led by strong net gains from Materials, Information Technology, and Industrials. The Health Care, Financials, and Consumer Staples sectors also posted respectable contributions, demonstrating solid performance characteristics from both the cyclical and more traditionally defensive segments of the market. The Energy and Consumer Discretionary sectors finished the period in the red, though losses in both sectors were relatively small. At the industry level, results were also broadly positive, with machinery, chemicals and metals & mining companies the top gainers. Not surprisingly given sector results, energy equipment & services stocks were the biggest detractors in the period. Our emphasis on seeking a margin of safety and strict attention to quality business metrics, such as ROIC (returns on invested capital), were not enough to spare some of our largest holdings. Lamprell, a leading UAE-based construction and engineering firm that specializes in the repair and refurbishment of oil and gas rigs, had the notable distinction of being the Fund’s top loser in the first half. The company stumbled badly in the second quarter in its efforts to enter the rig construction business, mostly due to problems with suppliers. More troubling was what followed: Its share price fell dramatically in May when the company issued a profit warning on the heels of insider selling that had followed a series of investor meetings which were initially seen as unusually positive and encouraging. We chose to sell out of the position and monitor future progress from the sidelines. SMA Solar Technology, a German manufacturer of photo-voltaic inverters used for solar electricity generation, struggled as record subsidy cuts in the important markets of Germany and Italy hurt margins. Although its shares were somewhat supported by the company’s strong cash position, we became increasingly concerned about eroding barriers to entry and intensifying price competition and ultimately decided to exit the position in RES’s portfolio. Hochschild Mining, a standout from the Fund’s overweight position in the metals & mining industry, was the top performer in the first half. After ending 2011 near a low, this U.K.-based gold and silver mining company with operations primarily in South America saw its shares advance early in the year after the company released feasibility studies for two mines that are potentially lucrative enough to replace production at some its older, maturing properties. We took advantage of its share price strength to modestly reduce our position in January and June. Also hailing from the materials sector, Fuchs Petrolub is one of the world’s leading refiners and producers of industrial and automotive lubricants. The company benefited from a solid spike in demand, especially in emerging markets, and a decline in base oil prices, its primary raw material cost input. |
GOOD IDEAS AT THE TIME | |
| Lamprell | -1.13% |
| SMA Solar Technology | -0.27 |
| Audika Groupe | -0.26 |
| Ipsen | -0.21 |
| JUMBO | -0.20 |
| 1 Net of dividends | |
| ROYCE EUROPEAN SMALLER-COMPANIES FUND VS. RUSSELL EUROPE SMALL CAP Value of $10,000 Invested on 12/29/06 | |
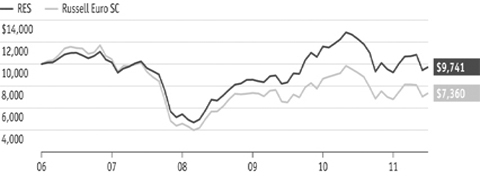 | |
Includes reinvestment of distributions. | |
| PORTFOLIO DIAGNOSTICS | |||||
| Fund Net Assets | $15 million | ||||
| Number of Holdings | 70 | ||||
| Turnover Rate | 10% | ||||
| Average Market Capitalization1 | $1,140 million | ||||
| Weighted Average P/E Ratio2,3 | 13.0x | ||||
| Weighted Average P/B Ratio2 | 2.0x | ||||
| Ticker Symbol Service Class | RISCX | ||||
| 1 Geometric average | |||||
| 2 Harmonic average | |||||
3 The Fund’s P/E ratio calculation excludes companies with zero or negative earnings (1% of portfolio holdings as of 6/30/12). | |||||
| MORNINGSTAR STATISTICAL MEASURES1 | |||||
| RES | Category Median | Best Quartile Breakpoint | |||
| Sharpe Ratio | 0.01 | -0.14 | -0.05 | ||
| Standard Deviation | 26.42 | 26.63 | 25.69 | ||
1 Five years ended 6/30/12. Category Median and Best Quartile Breakpoint based on 29 European stock objective funds (oldest class only) with at least five years of history. | |||||
| DOWN MARKET PERFORMANCE COMPARISON All Down Periods of 7.5% or Greater in Percentages(%) | |||||
 | |||||
The Royce Funds 2012 Semiannual Report to Shareholders | 11
| Royce Global Value Fund |
| GLOBAL/INTERNATIONAL | ||||||||||||||||||
Global/International Funds generally focus on non-U.S. based companies using our core approach to security selection. | ||||||||||||||||||
| ||||||||||||||||||
| AVERAGE ANNUAL TOTAL RETURNS Through 6/30/12 | ||||||||||||||||||
| Jan–June 20121 | -0.42 | % | ||||||||||||||||
| One-Year | -22.03 | |||||||||||||||||
| Three-Year | 13.13 | |||||||||||||||||
| Five-Year | 1.07 | |||||||||||||||||
| Since Inception (12/29/06) | 3.70 | |||||||||||||||||
| ANNUAL EXPENSE RATIOS | ||||||||||||||||||
| Gross Operating Expenses | 1.77 | % | ||||||||||||||||
| Net Operating Expenses | 1.69 | |||||||||||||||||
| 1 Not annualized | ||||||||||||||||||
| CALENDAR YEAR TOTAL RETURNS | ||||||||||||||||||
| Year | RGV | Year | RGV | |||||||||||||||
| 2011 | -18.7 | % | 2008 | -39.9 | % | |||||||||||||
| 2010 | 35.7 | 2007 | 14.3 | |||||||||||||||
| 2009 | 61.9 | |||||||||||||||||
| TOP 10 POSITIONS % of Net Assets | ||||||||||||||||||
| Semperit AG Holding | 3.0 | % | ||||||||||||||||
| Jupiter Fund Management | 2.9 | |||||||||||||||||
| Santen Pharmaceutical | 2.8 | |||||||||||||||||
| Mayr-Melnhof Karton | 2.8 | |||||||||||||||||
| Value Partners Group | 2.8 | |||||||||||||||||
| FamilyMart | 2.8 | |||||||||||||||||
| Ashmore Group | 2.5 | |||||||||||||||||
| Allied Nevada Gold | 2.3 | |||||||||||||||||
| Hochschild Mining | 2.2 | |||||||||||||||||
| Trican Well Service | 2.2 | |||||||||||||||||
| PORTFOLIO SECTOR BREAKDOWN % of Net Assets | ||||||||||||||||||
| Materials | 22.1 | % | ||||||||||||||||
| Industrials | 14.9 | |||||||||||||||||
| Financials | 13.2 | |||||||||||||||||
| Consumer Discretionary | 9.8 | |||||||||||||||||
| Information Technology | 8.9 | |||||||||||||||||
| Health Care | 8.0 | |||||||||||||||||
| Energy | 7.4 | |||||||||||||||||
| Consumer Staples | 7.3 | |||||||||||||||||
| Cash and Cash Equivalents | 8.4 | |||||||||||||||||
| PORTFOLIO COUNTRY BREAKDOWN1,2 % of Net Assets | ||||||||||||||||||
| United States | 14.0 | % | ||||||||||||||||
| United Kingdom | 10.3 | |||||||||||||||||
| Japan | 9.7 | |||||||||||||||||
| Canada | 9.4 | |||||||||||||||||
| Austria | 5.8 | |||||||||||||||||
| Hong Kong | 5.8 | |||||||||||||||||
| Germany | 5.1 | |||||||||||||||||
| South Africa | 3.8 | |||||||||||||||||
| Switzerland | 3.4 | |||||||||||||||||
| 1 Represents countries that are 3% or more of net assets. 2 Securities are categorized by their country of headquarters. | ||||||||||||||||||
 |
Managers’ Discussion Global markets saw significant volatility in the first half of 2012. Royce Global Value Fund (RGV) finished the year-to-date period ended June 30, 2012 with a loss of 0.4%, trailing its global small-cap benchmark, the Russell Global Small Cap Index, which gained 6.1% for the same period. This was a disappointing outcome on both an absolute and relative basis. Compounding our dissatisfaction was the portfolio’s poor performance in the more tumultuous second quarter, the kind of bear phase in which the Fund has historically held its value a bit more effectively. As was the case in 2011, two areas in the portfolio with some overlap—non-U.S. investments and holdings in the Materials sector—detracted most from results in the first half. The portfolio had a large exposure to metals & mining companies and also remained more heavily invested in non-U.S. stocks versus its benchmark. The Fund’s non-U.S. investments accounted for 77.6% of net assets at the end of June versus 62.5% for the Russell Global Small Cap. The year’s first half was wildly eventful, even if the events and pattern of market returns were something of a repeat of what we saw in both 2010 and 2011. Share prices rose through most of the first quarter, extending a bull run that began early in last year’s fourth quarter. Domestic small-caps reached their first-half high on March 26. The dynamic first quarter saw the Fund gain 13.1%, mostly keeping pace with its benchmark, which rose 13.7%. April brought more volatility, though May was the worst month of the year so far. The by-now usual suspects were guilty—European sovereign debt, worries about the fragility of the economic recovery here in the U.S., and concerns over the slowing pace of growth in China. June offered some respite from this, as the final day of the month saw a dynamic rally spurred by word from Europe that more was being done to address the ongoing debt woes of Spain and Italy. The Fund fell 11.9% for the second quarter, while the Russell Global Small Cap lost 6.7%. Longer-term results offered a more positive view, helped by a robust performance in the last full-market cycle for domestic small-caps. From the previous domestic small-cap market peak on July 13, 2007 through April 29, 2011, RGV climbed 34.2%, well ahead of its global benchmark, which declined 0.9%. This advantage was critical in the Fund’s |
| GOOD IDEAS THAT WORKED Top Contributors to Performance Year-to-Date through 06/30/121 | ||
| Veeco Instruments | 0.58% | |
| Hochschild Mining | 0.57 | |
| TGS-NOPEC Geophysical | 0.42 | |
| USS | 0.39 | |
| Pfeiffer Vacuum Technology | 0.37 | |
| 1 Includes dividends | ||
Important Performance and Expense Information All performance information in this Report reflects past performance, is presented on a total return basis, reflects the reinvestment of distributions and does not reflect the deduction of taxes that a shareholder would pay on fund distributions or the redemption of fund shares. Past performance is no guarantee of future results. Investment return and principal value of an investment will fluctuate, so that shares may be worth more or less than their original cost when redeemed. Shares redeemed within 180 days of purchase may be subject to a 2% redemption fee payable to the Fund, which is not reflected in the performance shown above; if it were, performance would be lower. Current month-end performance may be higher or lower than performance quoted and may be obtained at www.roycefunds.com. All performance and risk information reflects results of the Service Class (its oldest class). Gross operating expenses reflect gross total annual operating expenses for the Service Class and include management fees, 12b-1 distribution and service fees and other expenses. Net operating expenses reflect contractual fee waivers and/or reimbursements. All expense information is reported as of the Fund’s most current prospectus. Royce & Associates has contractually agreed to waive fees and/or reimburse operating expenses to the extent necessary to maintain the Fund’s net annual operating expenses, at or below 1.69% through April 30, 2013. Regarding the two “Good Ideas” tables shown above, the sum of all contributors to, and all detractors from, performance for all securities in the portfolio would approximate the Fund’s year-to-date performance for 2012. |
12 | The Royce Funds 2012 Semiannual Report to Shareholders
Performance and Portfolio Review outperformance of the Russell Global Small Cap for the three-, five-year and since inception (12/29/06) periods ended June 30, 2012. Three of the Fund’s most significant detractors came from the Energy sector, which posted the largest net losses at the sector level. Lamprell repairs and refurbishes drilling rigs, but endured issues with suppliers in its recent efforts to enter the rig construction business. More seriously, its share price fell dramatically in May when the company issued a profit warning on the heels of insider selling that had followed a series of investor meetings which were initially seen as unusually positive and encouraging. These were more than enough mixed messages for us, and we sold our position in the portfolio in June. A slumping stock price led us to add to our stake in Trican Well Service in March. A long-time Royce favorite, we were initially attracted to its well-run business and low-debt balance sheet and continue to hold a high opinion of this specialized equipment and service provider for drilling, completion, and reworking oil and gas wells. It was RGV’s tenth-largest holding at the end of June. Helmerich & Payne was another large position that endured tougher times for its share price than it did in its business operations. The company is one of the largest land drillers in the U.S. and provides contract drilling for oil and gas wells in the Gulf of Mexico and South America. While its business has slowed, our long-term outlook is positive, but other investors were not so patient. Luk Fook Holdings (International) found itself caught between sluggish gold prices and the increasingly negative sentiment towards smaller Chinese consumer stocks. Results announced in June for the company’s fiscal 2012 showed some margin pressure, which we view as temporary. The valuation for this designer, wholesaler, and retailer of gold and gem-set jewelry became attractive enough for us to begin building our position in March. The stock price of LED (light-emitting diode) equipment maker Veeco Instruments rallied on signs that MOCVD—a key piece of equipment used to make LEDs—had bottomed. The company has been gaining market share, LED manufacturer utilization rates have been improving, and there is a growing tailwind for the early adoption phase of LEDs into the $100 billion general lighting market. We think these events have all set the stage for second-half momentum and renewed sales and profit growth in 2013. Top-10 position Hochschild Mining was a happy exception to the performance of the Fund’s mining & metals holdings. After ending 2011 near a low, its shares advanced in January after the company released feasibility studies for two mines that are potentially lucrative enough to replace production at some its older, maturing properties. |
GOOD IDEAS AT THE TIME | |
| Lamprell | -1.43% |
| Trican Well Service | -0.91 |
| Luk Fook Holdings (International) | -0.57 |
| MegaStudy | -0.52 |
| Helmerich & Payne | -0.38 |
| 1 Net of dividends | |
| ROYCE GLOBAL VALUE FUND VS. RUSSELL GLOBAL SMALL CAP Value of $10,000 Invested on 12/29/06 | |
 | |
Includes reinvestment of distributions. | |
| PORTFOLIO DIAGNOSTICS | |||
| Fund Net Assets | $298 million | ||
| Number of Holdings | 64 | ||
| Turnover Rate | 17% | ||
| Average Market Capitalization1 | $1,498 million | ||
| Weighted Average P/E Ratio2,3 | 11.2x | ||
| Weighted Average P/B Ratio2 | 1.8x | ||
| Ticker Symbol | |||
| Investment Class | RGVIX | ||
| Service Class | RIVFX | ||
| Consultant Class | RGVHX | ||
| 1 Geometric average | |||
| 2 Harmonic average | |||
3 The Fund’s P/E ratio calculation excludes companies with zero or negative earnings (2% of portfolio holdings as of 6/30/12). | |||
| MORNINGSTAR STATISTICAL MEASURES1 | |||
| RGV | Category Median | Best Quartile Breakpoint | |
| Sharpe Ratio | 0.15 | 0.02 | 0.14 |
| Standard Deviation | 27.17 | 24.72 | 23.33 |
1 Five years ended 6/30/12. Category Median and Best Quartile Breakpoint based on 21 world stock small-cap objective funds (oldest class only) with at least five years of history. | |||
| RISK/RETURN COMPARISON Five-Year Period Ended 6/30/12 | |||
| Average Annual Total Return | Standard Deviation | Return Efficiency1 | |
| RGV | 1.07% | 27.17 | 0.04 |
| Russell Global Small Cap | -2.55 | 24.87 | -0.10 |
1 Return Efficiency is the average annual total return divided by the annualized standard deviation over a designated time period. Please read the prospectus for a more complete discussion of risk. | |||
| DOWN MARKET PERFORMANCE COMPARISON All Down Periods of 7.5% or Greater in Percentages(%) | |||
 | |||
The Royce Funds 2012 Semiannual Report to Shareholders | 13
| Royce International Smaller-Companies Fund |
| GLOBAL/INTERNATIONAL | ||||||||||||||||||
Global/International Funds generally focus on non-U.S. based companies using our core approach to security selection. | ||||||||||||||||||
| ||||||||||||||||||
| AVERAGE ANNUAL TOTAL RETURNS Through 6/30/12 | ||||||||||||||||||
| Jan–June 20121 | 4.49 | % | ||||||||||||||||
| One-Year | -17.97 | |||||||||||||||||
| Three-Year | 10.54 | |||||||||||||||||
| Since Inception (6/30/08) | 3.06 | |||||||||||||||||
| ANNUAL EXPENSE RATIOS | ||||||||||||||||||
| Gross Operating Expenses | 2.15 | % | ||||||||||||||||
| Net Operating Expenses | 1.69 | |||||||||||||||||
| 1 Not annualized | ||||||||||||||||||
| CALENDAR YEAR TOTAL RETURNS | ||||||||||||||||||
| Year | RIS | Year | RIS | |||||||||||||||
| 2011 | -18.7 | % | 2009 | 50.3 | % | |||||||||||||
| 2010 | 26.5 | |||||||||||||||||
| TOP 10 POSITIONS % of Net Assets | ||||||||||||||||||
| Santen Pharmaceutical | 1.5 | % | ||||||||||||||||
| SimCorp | 1.5 | |||||||||||||||||
| FamilyMart | 1.5 | |||||||||||||||||
| Recordati | 1.5 | |||||||||||||||||
| Jupiter Fund Management | 1.5 | |||||||||||||||||
| Pfeiffer Vacuum Technology | 1.5 | |||||||||||||||||
| Semperit AG Holding | 1.3 | |||||||||||||||||
| Ashmore Group | 1.3 | |||||||||||||||||
| Carl Zeiss Meditec | 1.3 | |||||||||||||||||
| Mayr-Melnhof Karton | 1.2 | |||||||||||||||||
| PORTFOLIO SECTOR BREAKDOWN % of Net Assets | ||||||||||||||||||
| Consumer Discretionary | 19.0 | % | ||||||||||||||||
| Health Care | 15.8 | |||||||||||||||||
| Financials | 14.9 | |||||||||||||||||
| Materials | 14.2 | |||||||||||||||||
| Industrials | 13.2 | |||||||||||||||||
| Consumer Staples | 7.2 | |||||||||||||||||
| Information Technology | 5.1 | |||||||||||||||||
| Energy | 4.0 | |||||||||||||||||
| Diversified Investment Companies | 1.3 | |||||||||||||||||
| Cash and Cash Equivalents | 5.3 | |||||||||||||||||
| PORTFOLIO COUNTRY BREAKDOWN1,2 % of Net Assets | ||||||||||||||||||
| Japan | 9.4 | % | ||||||||||||||||
| France | 8.5 | |||||||||||||||||
| United Kingdom | 8.5 | |||||||||||||||||
| Hong Kong | 7.7 | |||||||||||||||||
| Germany | 7.5 | |||||||||||||||||
| Switzerland | 7.5 | |||||||||||||||||
| Canada | 5.5 | |||||||||||||||||
| South Africa | 4.5 | |||||||||||||||||
| South Korea | 3.8 | |||||||||||||||||
| Italy | 3.2 | |||||||||||||||||
| India | 3.2 | |||||||||||||||||
| China | 3.0 | |||||||||||||||||
| 1 Represents countries that are 3% or more of net assets. 2 Securities are categorized by the country of their headquarters. | ||||||||||||||||||
 |
Managers’ Discussion International markets became increasingly volatile throughout 2012’s first half. Lingering growth fears in the world’s emerging economies became a stark reality as both China and Brazil exhibited notable decelerations in GDP. When combined with increasing investor skepticism about the ability of European authorities to adequately address the region’s fiscal and economic woes and yet another spring-time lull in U.S. business activity, financial markets quickly unwound much of their earlier gains. Royce International Smaller-Companies Fund (RIS), with its mandate to invest in smaller companies primarily outside the U.S., managed to generate a modest absolute return for the first six months of 2012, largely in line with its benchmark index on a relative basis. For the year-to-date period ended June 30, 2012, RIS gained 4.5% versus an advance of 4.8% for the Russell Global ex-U.S. Small Cap Index, over the same period. Similar to the early months of both 2010 and 2011, the first half of 2012 was marked by two distinct periods—one of relative optimism and the other of renewed investor concern and risk aversion. Positive business momentum early in the year extended the rally from 2011’s October lows only to be disrupted by an escalation in the Spanish banking crisis and ultimately a request from that nation’s authorities for a full-blown bank bailout by the ECB (European Central Bank). In the bullish first quarter, RIS gained 13.8%, just behind the non-U.S. small-cap index, which advanced 14.4%. As global markets moved lower in the second quarter, RIS lost 8.2%, slightly better than its benchmark’s decline of 8.5%. RIS was launched mid-year in 2008, in the midst of the gathering storm that would greatly intensify a global recession and vicious bear market. Needless to say, beginning with the U.S. housing crash and followed by the sovereign debt crisis in Europe, the Fund has seen its share of volatility and market stress. Navigating treacherous waters, RIS managed to generate a positive absolute return since inception (6/30/08). The Fund also outperformed its benchmark for the since inception period, with an average annual total return of 3.1% for the period ended June 30, 2012 versus a loss of 1.1% for the Russell Global ex-U.S. Small Cap. Seven of the Fund’s 10 equity sectors generated positive performance in the first half, led by broad gains in Materials, Industrials, Consumer Staples, and Health Care. We were pleased to see the portfolio demonstrating solid performance within both cyclical and more |
| GOOD IDEAS THAT WORKED Top Contributors to Performance Year-to-Date through 06/30/121 | ||
| Padini Holdings | 0.38% | |
| Gildan Activewear | 0.32 | |
| Grendene | 0.30 | |
| Hochschild Mining | 0.30 | |
| Fuchs Petrolub | 0.29 | |
| 1 Includes dividends | ||
Important Performance and Expense Information All performance information in this Report reflects past performance, is presented on a total return basis, reflects the reinvestment of distributions and does not reflect the deduction of taxes that a shareholder would pay on fund distributions or the redemption of fund shares. Past performance is no guarantee of future results. Investment return and principal value of an investment will fluctuate, so that shares may be worth more or less than their original cost when redeemed. Shares redeemed within 180 days of purchase may be subject to a 2% redemption fee payable to the Fund, which is not reflected in the performance shown above; if it were, performance would be lower. Current month-end performance may be higher or lower than performance quoted and may be obtained at www.roycefunds.com. Gross operating expenses reflect total gross annual operating expenses and include management fees, 12b-1 distribution and service fees, and other expenses. Net operating expenses reflect contractual fee waivers and/or expense reimbursements. All expense information is reported as of the Fund’s most current prospectus. Royce & Associates has contractually agreed to waive its fees and/or reimburse operating expenses, to the extent necessary to maintain the Fund’s net annual operating expenses, at or below 1.69% through April 30, 2013 and at or below 1.99% through April 30, 2022. Regarding the two “Good Ideas” tables shown above, the sum of all contributors to, and all detractors from, performance for all securities in the portfolio would approximate the Fund’s year-to-date performance for 2012. |
14 | The Royce Funds 2012 Semiannual Report to Shareholders
Performance and Portfolio Review traditionally defensive areas of the market. Energy and, to a much lesser extent, Consumer Discretionary and Diversified Investment Companies, detracted for the period. Falling natural gas prices combined with a sharp second-quarter drop in oil prices hurt the Fund’s investments in the energy equipment & services industry, as investors grew increasingly concerned about the declining pace of global economic activity as the year progressed. Other detractors at the industry level included diversified consumer services and, far more modestly, specialty retail. Each struggled in reaction to growing austerity measures around the world and the persistent headwind of a de-leveraging consumer. On the positive side, the more stable characteristics of investments in the food products industry allowed it to lead performance from an industry standpoint. Machinery and chemicals also made strong contributions in the first half. Our emphasis on seeking a margin of safety and quality business metrics such as ROIC (returns on invested capital) were not enough to spare some of our largest holdings. Lamprell, a leading UAE-based construction and engineering firm that specializes in the repair and refurbishment of oil and gas rigs, had the notable distinction of being the Fund’s top loser in the first half. The company stumbled badly in the second quarter in its efforts to enter the rig construction business, mostly due to problems with suppliers. More seriously, its share price fell dramatically in May when the company issued a profit warning on the heels of insider selling that had followed a series of investor meetings which were initially seen as unusually positive. These were more than enough mixed messages for us, and we sold our position in the portfolio in June. MegaStudy, a South Korean educational firm that specializes in online tutoring and test preparation, was another challenging position in the first half. We added to our position as its stock price fell on disappointing quarterly results for its business given our confidence in the company’s long-term prospects in this rapidly growing field. Padini Holdings was the top performer in the first half. Based in Kuala Lumpur, Malaysia, Padini is an investment holding with subsidiaries that distribute apparel, footwear, and accessories under seven different brands. Founded in 1971 as a manufacturer and wholesaler of women’s clothing, the group operates a network of 80 stores in Malaysia and an additional 83 abroad. Its steadily growing business helped its share price to do the same in the first half. Hailing from the Materials sector, Fuchs Petrolub was another notable winner. One of the world’s leading refiners and producers of industrial and automotive lubricants, the company benefited from solid demand growth, particularly in emerging markets, and from a decline in base oil prices, its primary raw material cost input. |
GOOD IDEAS AT THE TIME | |
| Lamprell | -0.68% |
| Anta Sports Products | -0.35 |
| MegaStudy | -0.30 |
| Trican Well Service | -0.30 |
| Esprit Holdings | -0.27 |
| 1 Net of dividends | |
| ROYCE INTERNATIONAL SMALLER-COMPANIES FUND VS. RUSSELL GLOBAL EX-U.S. SMALL CAP Value of $10,000 Invested on 6/30/08 | |
 | |
Includes reinvestment of distributions. | |
| PORTFOLIO DIAGNOSTICS | |||||
| Fund Net Assets | $23 million | ||||
| Number of Holdings | 135 | ||||
| Turnover Rate | 20% | ||||
| Average Market Capitalization1 | $1,100 million | ||||
| Weighted Average P/E Ratio2,3 | 12.2x | ||||
| Weighted Average P/B Ratio2 | 1.8x | ||||
| Ticker Symbol | |||||
| Service Class | RYGSX | ||||
| 1 Geometric average | |||||
| 2 Harmonic average | |||||
3 The Fund’s P/E ratio calculation excludes companies with zero or negative earnings (2% of portfolio holdings as of 6/30/12). | |||||
| MORNINGSTAR STATISTICAL MEASURES1 | |||||
| RIS | Category Median | Best Quartile Breakpoint | |||
| Sharpe Ratio | 0.60 | 0.63 | 0.74 | ||
| Standard Deviation | 20.15 | 20.53 | 19.08 | ||
1 Three years ended 6/30/12. Category Median and Best Quartile Breakpoint based on 62 foreign small/mid objective funds (oldest class only) with at least three years of history. | |||||
| RISK/RETURN COMPARISON Three-Year Period Ended 6/30/12 | |||||
| Average Annual Total Return | Standard Deviation | Return Efficiency1 | |||
| RIS | 10.54% | 20.15 | 0.52 | ||
| Russell Global ex-U.S. Small Cap | 10.23 | 20.09 | 0.51 | ||
1 Return Efficiency is the average annual total return divided by the annualized standard deviation over a designated time period. Please read the prospectus for a more complete discussion of risk. | |||||
The Royce Funds 2012 Semiannual Report to Shareholders | 15
| Royce Global Dividend Value Fund |
| GLOBAL/INTERNATIONAL | |||||||||
Global/International Funds generally focus on non-U.S. based companies using our core approach to security selection. | |||||||||
| |||||||||
| AVERAGE ANNUAL TOTAL RETURNS Through 6/30/12 | |||||||||
| Jan–June 20121 | 5.77 | % | |||||||
| One-Year | -12.50 | ||||||||
| Since Inception (12/31/10) | -7.14 | ||||||||
| ANNUAL EXPENSE RATIOS | |||||||||
| Gross Operating Expenses | 3.48 | % | |||||||
| Net Operating Expenses | 1.70 | ||||||||
| 1 Not annualized | |||||||||
| CALENDAR YEAR TOTAL RETURNS | |||||||||
| Year | RGD | ||||||||
| 2011 | -15.4 | % | |||||||
| TOP 10 POSITIONS % of Net Assets | |||||||||
| SimCorp | 2.5 | % | |||||||
| Pfeiffer Vacuum Technology | 1.8 | ||||||||
| Jupiter Fund Management | 1.7 | ||||||||
| Ashmore Group | 1.7 | ||||||||
| Semperit AG Holding | 1.7 | ||||||||
| FamilyMart | 1.6 | ||||||||
| Burckhardt Compression Holding | 1.5 | ||||||||
| Fuchs Petrolub | 1.5 | ||||||||
| USS | 1.5 | ||||||||
| Hecla Mining | 1.5 | ||||||||
| PORTFOLIO SECTOR BREAKDOWN % of Net Assets | |||||||||
| Consumer Discretionary | 18.5 | % | |||||||
| Industrials | 18.4 | ||||||||
| Financials | 18.2 | ||||||||
| Health Care | 12.7 | ||||||||
| Materials | 12.7 | ||||||||
| Information Technology | 9.7 | ||||||||
| Consumer Staples | 5.6 | ||||||||
| Energy | 2.3 | ||||||||
| Diversified Investment Companies | 0.6 | ||||||||
| Cash and Cash Equivalents | 1.3 | ||||||||
 |
Manager’s Discussion We are pleased to provide the second semiannual discussion for Royce Global Dividend Value Fund (RGD). The Fund, launched on December 31, 2010, seeks long-term growth of capital and current income by investing primarily in both U.S. and non-U.S. dividend-paying micro-cap, small-cap and/or mid-cap companies with market capitalizations up to $5 billion. The Fund gained 5.8% for the year-to-date period ended June 30, 2012 versus a 6.1% increase for its benchmark, the Russell Global Small Cap Index, for the same period. The bull market that kicked off following the small-cap low on October 3, 2011 lasted through most of 2012’s first quarter, with small-cap reaching its first-half high on March 26. In the year’s opening quarter, RGD rose 15.3%, ahead of its global small-cap benchmark, which climbed 13.7%. Our initial take was that the combination of improving economic data and the resurgence for equities were dual signs that the market was at last establishing sufficient momentum to keep moving upward for more than two quarters at a time. Unfortunately, our optimism was checked once another wave of worries about European sovereign debt, the state of the U.S. economy, and decelerating growth in China washed over the market. As they did in 2011 (and 2010), these concerns made for a volatile, mostly dismal second quarter for equities. Prior to the furious rally on the final day of June, which helped to give that month a decidedly positive result, share prices fell through much of the second quarter, with May being especially negative. RGD could not hold its value through this challenging period, with the result that the Fund fell behind its benchmark in the second quarter, losing 8.3% compared to a 6.7% decline for the global small-cap index. We have always regarded dividends as a marker of quality in the smaller capitalization space that can also potentially provide a cushion against high volatility. However, this has not been as evident as we would like for RGD in its so-far short-term tenure. At the end of the semiannual period, the largest country weightings in the Fund were Japan at 10.6%, Switzerland at 9.8%, Germany at 8.5%, and the United Kingdom at 8.2%. Compared to its benchmark, the Fund had far less exposure to U.S. companies at the end of June, 6.6% versus 37.5% for the Russell Global Small Cap. During the first half, all but one of the Fund’s eight equity sectors were in positive territory, with six sectors posting net gains that ranged from strong to solid—Industrials, Financials, Consumer Discretionary, |
| GOOD IDEAS THAT WORKED Top Contributors to Performance Year-to-Date through 06/30/121 | ||
| Padini Holdings | 0.37% | |
| Fuchs Petrolub | 0.33 | |
| Harman International Industries | 0.33 | |
| Valmont Industries | 0.30 | |
| Pfeiffer Vacuum Technology | 0.26 | |
| 1 Includes dividends | ||
Important Performance and Expense Information All performance information in this Report reflects past performance, is presented on a total return basis, reflects the reinvestment of distributions and does not reflect the deduction of taxes that a shareholder would pay on fund distributions or the redemption of fund shares. Past performance is no guarantee of future results. Investment return and principal value of an investment will fluctuate, so that shares may be worth more or less than their original cost when redeemed. Shares redeemed within 180 days of purchase may be subject to a 2% redemption fee payable to the Fund, which is not reflected in the performance shown above; if it were, performance would be lower. Current month-end performance may be higher or lower than performance quoted and may be obtained at www.roycefunds.com. Gross operating expenses reflect total gross annual operating expenses and include management fees, 12b-1 distribution and service fees, other expenses and acquired fund fees and expenses. Net operating expenses reflect contractual fee waivers and/or expense reimbursements. All expense information is reported as of the Fund’s most current prospectus. Royce & Associates has contractually agreed to waive its fees and/or reimburse operating expenses, to the extent necessary to maintain the Fund’s net annual operating expenses other than acquired fund fees and expenses, at or below 1.69% through April 30, 2014 and at or below 1.99% through April 30, 2022. Acquired fund fees and expenses reflect the estimated amount of the fees and expenses incurred indirectly by the Fund through its investments in mutual funds, hedge funds, private equity funds and other investment companies. Regarding the two “Good Ideas” tables shown above, the sum of all contributors to, and all detractors from, performance for all securities in the portfolio would approximate the Fund’s year-to-date performance for 2012. |
16 | The Royce Funds 2012 Semiannual Report to Shareholders
Performance and Portfolio Review Consumer Staples, Information Technology, and Materials. (The contribution of the Health Care sector was more modest.) At the industry level, machinery led the advance, followed by food products stocks and capital markets companies. Energy was the only sector that detracted from performance due to net losses from both the energy equipment & services industry and the oil, gas & consumables group. Denmark-based SimCorp was the Fund’s largest holding at the end of June 2012. SimCorp runs a global business providing specialized software for the investment management industry. Padini Holdings was the top performer in the first half. Based in Kuala Lumpur, Malaysia, Padini is an investment holding with subsidiaries that distribute apparel, footwear and accessories under seven different brands. Founded in 1971 as a manufacturer and wholesaler of women’s clothing, the group operates a network of 80 stores in Malaysia and an additional 83 abroad. Its steadily growing business helped its share price to do the same in the first half. Top-ten position Fuchs Petrolub, a German lubricant and grease maker, is the world’s largest independent lubricant manufacturer. Through much of the first half, the company benefited from lower raw-materials costs as well as results released in February that were both quite strong and ahead of expectations. Early March saw us selling our position in Harman International Industries at a respectable net gain. The company manufactures audio equipment and electronic systems under a variety of brand names, including JBL, Mark Levinson, and Infinity. Strong fiscal second-quarter results turned up the volume on its stock price in February. Lamprell repairs and refurbishes drilling rigs, but endured issues with suppliers in its recent efforts to enter the rig construction business. More ominously, its share price fell dramatically in May when the company issued a profit warning on the heels of insider selling that had followed a series of investor meetings which were initially seen as unusually positive and encouraging. These were more than enough mixed messages for us, and we sold our position in the portfolio in June. The primary customers for MegaStudy, the leading online-education services provider in South Korea, are high-school students preparing for university entrance exams. Its stock price fell on disappointing quarterly results for its business, in part the result of unwanted government intrusion into online education. In March, we initiated a position in Hong King-based Esprit Holdings, a leading retailer of fashion apparel in Europe and Asia. Management had embarked on a plan to turn the business around two years ago, but the lack of progress led to the departure of both the CEO and COO in June. The company also faces intensive pricing pressure from competitors that are fighting for shares of a shrinking consumer spending pie in Europe. |
GOOD IDEAS AT THE TIME | |
| Lamprell | -0.48% |
| MegaStudy | -0.22 |
| Esprit Holdings | -0.18 |
| Trican Well Service | -0.16 |
| Major Drilling Group International | -0.14 |
| 1 Net of dividends | |
| ROYCE GLOBAL DIVIDEND VALUE FUND VS. RUSSELL GLOBAL SMALL CAP Value of $10,000 Invested on 12/31/10 | |
 | |
Includes reinvestment of distributions. | |
| PORTFOLIO DIAGNOSTICS | |||
| Fund Net Assets | $6 million | ||
| Number of Holdings | 160 | ||
| Turnover Rate | 8% | ||
| Average Market Capitalization1 | $1,157 million | ||
| Weighted Average P/E Ratio2,3 | 13.1x | ||
| Weighted Average P/B Ratio2 | 2.0x | ||
| Ticker Symbol | |||
| Service Class | RGVDX | ||
| 1 Geometric average | |||
| 2 Harmonic average | |||
3 The Fund’s P/E ratio calculation excludes companies with zero or negative earnings (3% of portfolio holdings as of 6/30/12). | |||
| PORTFOLIO COUNTRY BREAKDOWN1,2 % of Net Assets | |||
| Japan | 10.6% | ||
| Switzerland | 9.8 | ||
| Germany | 8.5 | ||
| United Kingdom | 8.2 | ||
| Hong Kong | 7.1 | ||
| United States | 6.6 | ||
| France | 4.8 | ||
| South Africa | 4.6 | ||
| South Korea | 4.3 | ||
| Canada | 4.0 | ||
| Austria | 3.0 | ||
1 Represents countries that are 3% or more of net assets. | |||
2 Securities are categorized by the country of their headquarters. | |||
The Royce Funds 2012 Semiannual Report to Shareholders | 17
| Royce International Micro-Cap Fund |
| GLOBAL/INTERNATIONAL | ||||||||||||
Global/International Funds generally focus on non-U.S. based companies using our core approach to security selection. | ||||||||||||
| ||||||||||||
| AVERAGE ANNUAL TOTAL RETURNS Through 6/30/12 | ||||||||||||
| Jan–June 20121 | 4.15 | % | ||||||||||
| One-Year | -19.62 | |||||||||||
| Since Inception (12/31/10) | -12.61 | |||||||||||
| ANNUAL EXPENSE RATIOS | ||||||||||||
| Gross Operating Expenses | 4.01 | % | ||||||||||
| Net Operating Expenses | 1.78 | |||||||||||
| 1 Not annualized | ||||||||||||
| CALENDAR YEAR TOTAL RETURNS | ||||||||||||
| Year | RMI | |||||||||||
| 2011 | -21.5 | % | ||||||||||
| TOP 10 POSITIONS % of Net Assets | ||||||||||||
| Eternit | 1.6 | % | ||||||||||
| Raubex Group | 1.6 | |||||||||||
| Parrot | 1.5 | |||||||||||
| Midland Holdings | 1.5 | |||||||||||
| Daewoong Pharmaceutical | 1.5 | |||||||||||
| Vetoquinol | 1.5 | |||||||||||
| Semperit AG Holding | 1.4 | |||||||||||
| EPS | 1.4 | |||||||||||
| Selamat Sempurna | 1.4 | |||||||||||
| Manutan International | 1.4 | |||||||||||
| PORTFOLIO SECTOR BREAKDOWN % of Net Assets | ||||||||||||
| Consumer Discretionary | 23.4 | % | ||||||||||
| Industrials | 19.0 | |||||||||||
| Materials | 16.1 | |||||||||||
| Information Technology | 12.1 | |||||||||||
| Health Care | 11.0 | |||||||||||
| Financials | 7.9 | |||||||||||
| Energy | 4.2 | |||||||||||
| Consumer Staples | 1.9 | |||||||||||
| Cash and Cash Equivalents | 4.4 | |||||||||||
 |
Manager’s Discussion The first half of 2012 saw ample volatility for markets outside the U.S., as once again many stocks struggled in the face of potential European sovereign defaults, concerns about the fragile, slow-paced economic recovery here in the U.S., and the deceleration of the Chinese economy. While correlation was not quite as close as it was in the past two years, returns remained within a fairly narrow range, which was reflected in the first-half results for Royce International Micro-Cap Fund (RMI). The Fund gained 4.1% for the year-to-date period ended June 30, 2012, slightly trailing its international small-cap benchmark, the Russell Global ex-U.S. Small Cap Index, which was up 4.8% for the same period. While not as strong a performance as we might ideally prefer, we were pleased to see RMI take steps toward narrowing the performance gap versus its benchmark during the year’s first six months. As was the case in 2011, the first quarter was a generally bullish period. What made 2012 different was both the greater strength of the rally and how that strength extended more evenly throughout the globe. The Fund gained 15.7% for the first quarter, outpacing its international small-cap benchmark’s rise of 14.4%. (For the comparable period, the domestic small-cap Russell 2000 Index was up 12.4%, while the Russell Microcap Index gained 15.3%.) The rally, of course, proved to be short lived, as the aforementioned concerns about Europe, China, and the U.S. once again led to an exodus from stocks and thus extended the range-bound, risk-on/risk-off return pattern that has characterized the market for much of the past 30 months. The result was a generally disappointing second quarter for nearly all equity investors. April witnessed modest losses, while May took a turn as the cruelest month, with several non-U.S. indexes showing double-digit losses, before markets began to stabilize in June, helped by a furious rally on the last trading day of the month. Given our disciplined and risk-averse approach, we were a bit chagrined that the Fund did not hold up better during this volatile period. RMI fell 10.0% in the second quarter (losing 10.1% in May alone), while its benchmark declined 8.5%. The Fund emphasizes the selection of what we think are quality micro-cap businesses trading at compelling valuations. In spite of a difficult year |
| GOOD IDEAS THAT WORKED Top Contributors to Performance Year-to-Date through 06/30/121 | ||
| Padini Holdings | 0.83% | |
| GlobeOp Financial Services | 0.60 | |
| Industrea | 0.54 | |
| DBA Telecommunication (Asia) Holdings | 0.52 | |
| Parrot | 0.50 | |
| 1 Includes dividends | ||
Important Performance and Expense Information All performance information in this Report reflects past performance, is presented on a total return basis, reflects the reinvestment of distributions and does not reflect the deduction of taxes that a shareholder would pay on fund distributions or the redemption of fund shares. Past performance is no guarantee of future results. Investment return and principal value of an investment will fluctuate, so that shares may be worth more or less than their original cost when redeemed. Shares redeemed within 180 days of purchase may be subject to a 2% redemption fee payable to the Fund, which is not reflected in the performance shown above; if it were, performance would be lower. Current month-end performance may be higher or lower than performance quoted and may be obtained at www.roycefunds.com. Gross operating expenses reflect total gross annual operating expenses and include management fees, 12b-1 distribution and service fees, other expenses and acquired fund fees and expenses. Net operating expenses reflect contractual fee waivers and/or expense reimbursements. All expense information is reported as of the Fund’s most current prospectus. Royce & Associates has contractually agreed to waive its fees and/or reimburse operating expenses, to the extent necessary to maintain the Fund’s net annual operating expenses other than acquired fund fees and expenses, at or below 1.69% through April 30, 2014 and at or below 1.99% though April 30, 2022. Expenses are estimated for the current fiscal year. Acquired fund fees and expenses reflect the estimated amount of the fees and expenses incurred indirectly by the Fund through its investments in mutual funds, hedge funds, private equity funds and other investment companies. Regarding the two “Good Ideas” tables shown above, the sum of all contributors to, and all detractors from, performance for all securities in the portfolio would approximate the Fund’s year-to-date performance for 2012. |
18 | The Royce Funds 2012 Semiannual Report to Shareholders
Performance and Portfolio Review in 2011 and a volatile start to 2012, we are confident that our disciplined approach can achieve strong absolute returns over the long term. Three of the Fund’s eight equity sectors finished the first half in the red, though only the Materials sector posted substantial net losses. This was primarily due to poor results from holdings in the metals & mining group, where several companies suffered in part because of the combination of weaker precious metals prices and increased operating costs. We nearly doubled our stake in Canadian gold miner Richmont Mines as its price slid. Its near-term prospects were also hurt by a dramatic reduction in reserve estimates at one of its properties. Its status as an often-vulnerable micro-cap mining business probably didn’t help. However, the company has two mines in production—always a significant advantage for mining firms—located in Canada. We think very highly of its potential to rebound in a more robust market for gold prices. We more than doubled our position in Vancouver, British Columbia-based Goldgroup Mining, signaling our confidence in the ability of its shares to recover. We like its pristine balance sheet, its management, and the fact that it too is a smaller miner with proven gold-producing properties. Two consumer businesses also struggled in the first half. Based in Lancashire, England, Promethean World develops interactive learning software and other technologies. Recent substantial sales declines in North America were not offset by the company’s net gains from the rest of the world, which led to revised earnings guidance for fiscal 2012 in April. Seeing better potential values elsewhere, we sold our shares early in July. We re-initiated a position in Hong Kong-based Oriental Watch Holdings in February before adding to it in March and May. Softening demand for luxury watches in both Hong Kong and mainland China led to slower sales and declining profits. We like its core business and conservative balance sheet; we also remain bullish on growth in China. Based in Kuala Lumpur, Malaysia, Padini Holdings is an investment holding company with subsidiaries that distribute apparel, footwear, and accessories under seven different brands. Its steadily growing business helped its share price to do the same in the first half. Although we reduced our position in May and June, it was the Fund’s twelfth-largest holding at the end of June. In May, we also completed selling our shares of GlobeOp Financial Services, which provides fund administration, operational, and other support services for hedge funds and private wealth managers. Its steadily growing business attracted interest from two potential acquirers, with its shares benefiting from the bidding war between private equity firm TPG Capital and SS&C Technologies, in which the latter ultimately prevailed. |
GOOD IDEAS AT THE TIME | |
| Richmont Mines | -0.80% |
| Promethean World | -0.62 |
| Goldgroup Mining | -0.55 |
| Oriental Watch Holdings | -0.42 |
| Audika Groupe | -0.29 |
| 1 Net of dividends | |
| ROYCE INTERNATIONAL MICRO-CAP FUND VS. RUSSELL GLOBAL EX-U.S. SMALL CAP Value of $10,000 Invested on 12/31/10 | |
 | |
Includes reinvestment of distributions. | |
| PORTFOLIO DIAGNOSTICS | |||||
| Fund Net Assets | $4 million | ||||
| Number of Holdings | 116 | ||||
| Turnover Rate | 34% | ||||
| Average Market Capitalization1 | $288 million | ||||
| Weighted Average P/E Ratio2,3 | 9.8x | ||||
| Weighted Average P/B Ratio2 | 1.2x | ||||
| Ticker Symbol | |||||
| Service Class | ROIMX | ||||
| 1 Geometric average | |||||
| 2 Harmonic average | |||||
3 The Fund’s P/E ratio calculation excludes companies with zero or negative earnings (6% of portfolio holdings as of 6/30/12). | |||||
| PORTFOLIO COUNTRY BREAKDOWN1,2 % of Net Assets | |||||
| Hong Kong | 13.5% | ||||
| France | 9.9 | ||||
| Australia | 6.5 | ||||
| Canada | 5.9 | ||||
| Germany | 5.5 | ||||
| Japan | 5.4 | ||||
| India | 4.7 | ||||
| South Africa | 4.4 | ||||
| Malaysia | 4.1 | ||||
| United Kingdom | 4.0 | ||||
| South Korea | 3.8 | ||||
| Switzerland | 3.4 | ||||
| Italy | 3.0 | ||||
1 Represents countries that are 3% or more of net assets. | |||||
2 Securities are categorized by the country of their headquarters. | |||||
The Royce Funds 2012 Semiannual Report to Shareholders | 19
| Royce International Premier Fund |
| GLOBAL/INTERNATIONAL | ||||||||||||
Global/International Funds generally focus on non-U.S. based companies using our core approach to security selection. | ||||||||||||
| ||||||||||||
| AVERAGE ANNUAL TOTAL RETURNS Through 6/30/12 | ||||||||||||
| Jan–June 20121 | 8.60 | % | ||||||||||
| One-Year | -13.16 | |||||||||||
| Since Inception (12/31/10) | -6.52 | |||||||||||
| ANNUAL EXPENSE RATIOS | ||||||||||||
| Gross Operating Expenses | 3.77 | % | ||||||||||
| Net Operating Expenses | 1.69 | |||||||||||
| 1 Not annualized | ||||||||||||
| CALENDAR YEAR TOTAL RETURNS | ||||||||||||
| Year | RIP | |||||||||||
| 2011 | -16.8 | % | ||||||||||
| TOP 10 POSITIONS % of Net Assets | ||||||||||||
| MegaStudy | 2.6 | % | ||||||||||
| Semperit AG Holding | 2.6 | |||||||||||
| Ashmore Group | 2.5 | |||||||||||
| FamilyMart | 2.3 | |||||||||||
| Santen Pharmaceutical | 2.3 | |||||||||||
| Jupiter Fund Management | 2.3 | |||||||||||
| Value Partners Group | 2.3 | |||||||||||
| Takkt | 2.2 | |||||||||||
| SimCorp | 2.2 | |||||||||||
| Domino Printing Sciences | 2.2 | |||||||||||
| PORTFOLIO SECTOR BREAKDOWN % of Net Assets | ||||||||||||
| Health Care | 20.7 | % | ||||||||||
| Consumer Discretionary | 18.1 | |||||||||||
| Industrials | 13.7 | |||||||||||
| Financials | 12.5 | |||||||||||
| Information Technology | 8.2 | |||||||||||
| Materials | 7.5 | |||||||||||
| Consumer Staples | 6.7 | |||||||||||
| Cash and Cash Equivalents | 12.6 | |||||||||||
|
Manager’s Discussion Launched at the end of 2010, Royce International Premier Fund (RIP) is tasked with uncovering and investing in the highest-quality and most durable small-cap businesses we can find outside the U.S. Modeled after Royce Premier Fund, whose primary selection universe is small-cap companies domiciled in the U.S., RIP invests in a limited portfolio of our highest conviction ideas sourced from our global research efforts. Having invested actively in international smaller companies for more than a decade, the Royce investment team has ample experience in this large and labor-intensive asset class. The first half of 2012 closely resembled the comparable periods in each of the preceding two years in that early market gains abruptly gave way to a market correction driven by macro events that heightened investor risk aversion. The same list of concerns once again radically shifted investor sentiment. New fronts opened up in the European sovereign debt crisis, as both Italy and Spain saw funding costs escalate, and officials from the latter country formally requested aid for their ailing banking industry. Deceleration in the important emerging economies of China and Brazil, combined with questions about the sustainability of the fragile U.S. recovery, led to speculation later in the period that perhaps the already tenuous global economic recovery was unsustainable. Over these volatile first six months of 2012, RIP performed admirably on both an absolute and relative basis. Advancing 8.6% for the year-to-date period ended June 30, 2012, the Fund surpassed its benchmark, the Russell Global ex-U.S. Small Cap Index, which gained 4.8% for the same period. During the robustly bullish first quarter, RIP’s portfolio delivered a compelling absolute return (our favored standard) while keeping pace on a relative basis with the strong advances experienced by many global equity markets. The Fund gained 14.8% in the first quarter, narrowly beating the Russell international small-cap index, which rose 14.4%. As the global investment landscape grew more treacherous in the second quarter, RIP retreated 5.4%, again outpacing its benchmark, which fell more sharply, losing 8.5%. Annualized returns for the Fund over its short operating history remain in negative territory, mostly due to the dramatic downdraft in 2011’s third quarter. Compared to the benchmark, however, the Fund’s preservation of capital discipline and quality orientation provided a measure of safety and relative outperformance. For the periods ended June 30, 2012, RIP outperformed the Russell Global ex-U.S. Small Cap Index for the one-year and since inception (12/31/10) periods. |
| GOOD IDEAS THAT WORKED Top Contributors to Performance Year-to-Date through 06/30/121 | ||
| E-House China Holdings ADR | 0.74% | |
| Hochschild Mining | 0.66 | |
| EPS | 0.57 | |
| Pfeiffer Vacuum Technology | 0.56 | |
| Duratex | 0.51 | |
| 1 Includes dividends | ||
Important Performance and Expense Information All performance information in this Report reflects past performance, is presented on a total return basis, reflects the reinvestment of distributions and does not reflect the deduction of taxes that a shareholder would pay on fund distributions or the redemption of fund shares. Past performance is no guarantee of future results. Investment return and principal value of an investment will fluctuate, so that shares may be worth more or less than their original cost when redeemed. Shares redeemed within 180 days of purchase may be subject to a 2% redemption fee payable to the Fund, which is not reflected in the performance shown above; if it were, performance would be lower. Current month-end performance may be higher or lower than performance quoted and may be obtained at www.roycefunds.com. Gross operating expenses reflect total gross annual operating expenses and include management fees, 12b-1 distribution and service fees and other expenses. Net operating expenses reflect contractual fee waivers and/or expense reimbursements. All expense information is reported as of the Fund’s most current prospectus. Royce & Associates has contractually agreed to waive its fees and/or reimburse operating expenses, to the extent necessary to maintain the Fund’s net annual operating expenses, at or below 1.69% through April 30, 2014 and at or below 1.99% through April 30, 2022. Regarding the two “Good Ideas” tables shown above, the sum of all contributors to, and all detractors from, performance for all securities in the portfolio would approximate the Fund’s year-to-date performance for 2012. |
20 | The Royce Funds 2012 Semiannual Report to Shareholders
Performance and Portfolio Review We were quite pleased that all eight of the Fund’s equity sectors generated positive performance in the first half of 2012. Materials and Health Care led by wide margins, though solid net gains also came from Consumer Discretionary, Industrials, Consumer Staples, and Financials. We were pleased that the portfolio was able to demonstrate solid performance from both cyclical and more traditionally defensive areas of the market. Not surprisingly, Telecommunication Services made the most modest contribution, as this sector had very little representation in the Fund. At the industry level, results were broadly positive as well, with the metals & mining group, textiles apparel & luxury goods companies and machinery stocks the top net gainers. Diversified consumer services, electrical equipment, and electronic equipment instruments & components were the biggest detractors among a relatively short list of industries that posted net losses. E-House China Holdings was the largest contributor to performance during the first half of 2012. The Shanghai-based firm is a leading real estate services business in China. The company benefited from a healthy real estate market early in the year. We chose to sell our position in April as it became clear that the pace of economic activity in China was slowing faster than expectations and that additional easing measures would be required to support a market segment that is highly dependent on government intervention. Hochschild Mining was a strong performer from the Fund’s metals & mining industry. After ending 2011 near a low, its shares advanced in January after the company released feasibility studies for two mines that are potentially lucrative enough to replace production at some of its older, maturing properties. We took advantage of its rising share price to sell our position in April. MegaStudy, a South Korean educational firm that specializes in online tutoring and test preparation, was the most challenging position in the first half. The Fund’s top holding at the end of June, we added to our position as its stock price fell on disappointing quarterly results. We were confident in the company’s long-term prospects in a rapidly growing field. Lung Kee, a Hong Kong-based manufacturer of precision machining and mold-base components, saw pressure on its share price fueled by a decline in demand for its products. A newer position—we first bought shares in the portfolio in April—concerns over the credit crisis in Europe as well as the slowdown in domestic consumption in China led to a reduction in orders from its customers. Inflation on the ground in China also created a double-whammy for the company, as it saw its costs increase. |
| GOOD IDEAS AT THE TIME | |||
| Top Detractors from Performance | |||
| Year-to-Date through 06/30/121 | |||
| MegaStudy | -0.73 | % | |
| Lung Kee (Bermuda) Holdings | -0.29 | ||
| Manutan International | -0.22 | ||
| Mobotix | -0.20 | ||
| VZ Holding | -0.18 | ||
| 1 | Net of dividends |
| ROYCE INTERNATIONAL PREMIER FUND VS. RUSSELL GLOBAL EX-U.S. SMALL CAP Value of $10,000 Invested on 12/31/10 |
 |
Includes reinvestment of distributions. |
| PORTFOLIO DIAGNOSTICS | |||
| Fund Net Assets | $4 million | ||
| Number of Holdings | 59 | ||
| Turnover Rate | 38% | ||
| Average Market Capitalization1 | $1,520 million | ||
| Weighted Average P/E Ratio2,3 | 15.1x | ||
| Weighted Average P/B Ratio2 | 2.5x | ||
| Ticker Symbol Service Class | RYIPX | ||
| 1 | Geometric average |
| 2 | Harmonic average |
| 3 | The Fund’s P/E ratio calculation excludes companies with zero or negative earnings (0% of portfolio holdings as of 6/30/12). |
| PORTFOLIO COUNTRY BREAKDOWN1,2 | |||
| % of Net Assets | |||
| United Kingdom | 13.9 | % | |
| Germany | 10.6 | ||
| Japan | 9.2 | ||
| Switzerland | 9.1 | ||
| France | 7.1 | ||
| South Korea | 5.6 | ||
| Hong Kong | 5.2 | ||
| Italy | 4.9 | ||
| Austria | 4.7 | ||
| South Africa | 3.5 | ||
| Singapore | 3.1 | ||
| 1 | Represents countries that are 3% or more of net assets. |
| 2 | Securities are categorized by the country of their headquarters. |
| The Royce Funds 2012 Semiannual Report to Shareholders | 21 |
Schedules of Investments
| Royce European Smaller-Companies Fund |
| SHARES | VALUE | |||||
| COMMON STOCKS – 94.4% | ||||||
| Australia – 0.5% | ||||||
Allied Gold Mining 1 | 35,000 | $ | 76,866 | |||
| Total (Cost $113,975) | 76,866 | |||||
| Austria – 5.3% | ||||||
Mayr-Melnhof Karton | 4,000 | 366,744 | ||||
Semperit AG Holding | 11,500 | 420,263 | ||||
| Total (Cost $941,578) | 787,007 | |||||
| Belgium – 3.6% | ||||||
EVS Broadcast Equipment | 1,500 | 70,634 | ||||
GIMV | 3,900 | 177,385 | ||||
Sipef | 3,900 | 280,890 | ||||
| Total (Cost $646,591) | 528,909 | |||||
| Denmark – 2.4% | ||||||
H. Lundbeck | 3,700 | 76,225 | ||||
SimCorp | 1,600 | 275,149 | ||||
| Total (Cost $312,440) | 351,374 | |||||
| Finland – 1.6% | ||||||
Nokian Renkaat | 3,500 | 133,399 | ||||
Vaisala Cl. A | 5,700 | 108,190 | ||||
| Total (Cost $345,374) | 241,589 | |||||
| France – 15.7% | ||||||
Altamir Amboise | 17,500 | 132,517 | ||||
Alten | 4,000 | 110,965 | ||||
Audika Groupe | 12,000 | 130,402 | ||||
Beneteau | 20,000 | 192,631 | ||||
bioMerieux | 2,500 | 205,579 | ||||
Boiron | 8,000 | 207,757 | ||||
Ipsen | 6,000 | 148,868 | ||||
Manutan International | 4,000 | 151,912 | ||||
Parrot 1 | 10,000 | 294,843 | ||||
Piscines Desjoyaux | 10,000 | 61,481 | ||||
Societe Internationale de Plantations d’Heveas | 2,000 | 170,045 | ||||
† Stallergenes | 1,200 | 67,238 | ||||
Vetoquinol | 9,000 | 233,905 | ||||
Virbac | 1,200 | 198,280 | ||||
| Total (Cost $2,993,315) | 2,306,423 | |||||
| Germany – 15.8% | ||||||
Aixtron | 9,000 | 128,816 | ||||
Carl Zeiss Meditec | 12,000 | 289,227 | ||||
Fuchs Petrolub | 5,900 | 302,002 | ||||
KWS Saat | 1,200 | 312,253 | ||||
Nemetschek | 6,000 | 222,642 | ||||
Pfeiffer Vacuum Technology | 2,700 | 274,831 | ||||
PUMA | 900 | 259,447 | ||||
Rational | 1,000 | 238,380 | ||||
Takkt | 23,500 | 292,449 | ||||
| Total (Cost $2,267,344) | 2,320,047 | |||||
| Greece – 1.4% | ||||||
Hellenic Exchanges | 25,000 | 85,662 | ||||
JUMBO | 30,000 | 116,793 | ||||
| Total (Cost $286,134) | 202,455 | |||||
| Italy – 5.7% | ||||||
Azimut Holding | 18,200 | 187,472 | ||||
† DiaSorin | 8,000 | 233,320 | ||||
Geox | 60,000 | 132,783 | ||||
Recordati | 40,000 | 284,611 | ||||
| Total (Cost $920,827) | 838,186 | |||||
| Jersey – 1.2% | ||||||
Centamin 1 | 165,000 | 179,534 | ||||
| Total (Cost $324,104) | 179,534 | |||||
| Netherlands – 1.3% | ||||||
ASM International | 5,000 | 189,995 | ||||
| Total (Cost $167,580) | 189,995 | |||||
| Norway – 3.2% | ||||||
Ekornes | 18,700 | 268,189 | ||||
TGS-NOPEC Geophysical | 7,400 | 199,454 | ||||
| Total (Cost $553,379) | 467,643 | |||||
| South Africa – 4.4% | ||||||
Adcock Ingram Holdings | 27,500 | 202,519 | ||||
Lewis Group | 26,000 | 224,076 | ||||
Raubex Group | 137,664 | 225,403 | ||||
| Total (Cost $865,843) | 651,998 | |||||
| Spain – 1.4% | ||||||
Almirall | 27,900 | 200,647 | ||||
| Total (Cost $262,136) | 200,647 | |||||
| Sweden – 0.5% | ||||||
Lundin Petroleum 1 | 4,100 | 76,916 | ||||
| Total (Cost $81,941) | 76,916 | |||||
| Switzerland – 11.9% | ||||||
Bank Sarasin & Co. Cl. B 1 | 5,500 | 154,819 | ||||
Banque Privee Edmond de Rothschild | 5 | 100,040 | ||||
Burckhardt Compression Holding | 1,150 | 295,186 | ||||
Inficon Holding | 800 | 163,251 | ||||
Logitech International 1 | 22,500 | 242,792 | ||||
Partners Group Holding | 1,600 | 284,451 | ||||
Sika | 55 | 105,927 | ||||
Sulzer | 1,600 | 189,683 | ||||
| 22 | The Royce Funds 2012 Semiannual Report to Shareholders | THE ACCOMPANYING NOTES ARE AN INTEGRAL PART OF THESE FINANCIAL STATEMENTS. |
June 30, 2012 (unaudited) |
| SHARES | VALUE | |||||
| Switzerland (continued) | ||||||
VZ Holding | 2,300 | $ | 217,906 | |||
| Total (Cost $1,706,940) | 1,754,055 | |||||
| Turkey – 1.2% | ||||||
Mardin Cimento Sanayii | 56,000 | 172,950 | ||||
| Total (Cost $282,079) | 172,950 | |||||
| United Kingdom – 17.3% | ||||||
Ashmore Group | 62,500 | 342,986 | ||||
Diploma | 35,000 | 244,507 | ||||
Domino Printing Sciences | 15,000 | 126,964 | ||||
EnQuest 1 | 115,000 | 194,967 | ||||
Hochschild Mining | 44,500 | 328,328 | ||||
Jupiter Fund Management | 125,000 | 422,109 | ||||
Keller Group | 20,000 | 113,409 | ||||
Michael Page International | 10,000 | 58,934 | ||||
Rotork | 6,000 | 185,348 | ||||
Severfield-Rowen | 67,500 | 163,197 | ||||
Spirax-Sarco Engineering | 8,000 | 249,279 | ||||
Victrex | 5,500 | 109,693 | ||||
| Total (Cost $2,407,200) | 2,539,721 | |||||
| TOTAL COMMON STOCKS | ||||||
(Cost $15,478,780) | 13,886,315 | |||||
| REPURCHASE AGREEMENT – 7.4% | ||||||
Fixed Income Clearing Corporation, | ||||||
(Cost $1,090,000) | 1,090,000 | |||||
| TOTAL INVESTMENTS – 101.8% | ||||||
(Cost $16,568,780) | 14,976,315 | |||||
LIABILITIES LESS CASH | (269,220 | ) | ||||
| NET ASSETS – 100.0% | $ | 14,707,095 | ||||
| Royce Global Value Fund |
| SHARES | VALUE | |||||
| COMMON STOCKS – 91.6% | ||||||
| Australia – 2.5% | ||||||
CGA Mining 1 | 1,550,000 | $ | 2,816,521 | |||
Medusa Mining | 950,000 | 4,712,211 | ||||
| Total (Cost $10,988,899) | 7,528,732 | |||||
| Austria – 5.8% | ||||||
Mayr-Melnhof Karton | 90,000 | 8,251,751 | ||||
Semperit AG Holding | 247,410 | 9,041,490 | ||||
| Total (Cost $23,950,597) | 17,293,241 | |||||
| Belgium – 2.1% | ||||||
GIMV | 45,000 | 2,046,753 | ||||
Sipef | 57,300 | 4,126,916 | ||||
| Total (Cost $8,040,029) | 6,173,669 | |||||
| Canada – 9.4% | ||||||
Aurizon Mines 1 | 440,000 | 1,984,400 | ||||
† Kirkland Lake Gold 1 | 160,000 | 1,722,424 | ||||
Major Drilling Group International | 350,000 | 4,046,263 | ||||
Pan American Silver | 260,000 | 4,391,400 | ||||
Pason Systems | 325,000 | 4,750,025 | ||||
Sprott | 960,000 | 4,667,518 | ||||
Trican Well Service | 569,000 | 6,566,889 | ||||
| Total (Cost $41,113,620) | 28,128,919 | |||||
| China – 2.1% | ||||||
China Forestry Holdings 2 | 3,300,000 | 248,842 | ||||
E-House China Holdings ADR | 750,000 | 4,125,000 | ||||
Li Ning 1 | 3,500,000 | 1,971,417 | ||||
| Total (Cost $14,663,051) | 6,345,259 | |||||
| Denmark – 1.3% | ||||||
† SimCorp | 22,249 | 3,826,127 | ||||
| Total (Cost $4,029,556) | 3,826,127 | |||||
| France – 2.0% | ||||||
Boiron | 85,000 | 2,207,419 | ||||
Societe Internationale de Plantations d’Heveas | 45,000 | 3,826,006 | ||||
| Total (Cost $8,145,502) | 6,033,425 | |||||
| Germany – 5.1% | ||||||
Aixtron 3 | 175,000 | 2,504,753 | ||||
Carl Zeiss Meditec | 190,000 | 4,579,435 | ||||
Fuchs Petrolub | 70,000 | 3,583,077 | ||||
Pfeiffer Vacuum Technology | 45,000 | 4,580,513 | ||||
| Total (Cost $19,534,435) | 15,247,778 | |||||
| Hong Kong – 5.8% | ||||||
Asian Citrus Holdings | 8,000,000 | 4,504,687 | ||||
Luk Fook Holdings (International) 3 | 2,150,000 | 4,510,777 | ||||
| THE ACCOMPANYING NOTES ARE AN INTEGRAL PART OF THESE FINANCIAL STATEMENTS. | The Royce Funds 2012 Semiannual Report to Shareholders | 23 |
Schedules of Investments
| Royce Global Value Fund (continued) |
| SHARES | VALUE | |||||
| Hong Kong (continued) | ||||||
Value Partners Group | 16,834,000 | $ | 8,247,736 | |||
| Total (Cost $25,907,798) | 17,263,200 | |||||
| India – 2.7% | ||||||
Graphite India | 2,500,000 | 4,034,534 | ||||
Maharashtra Seamless | 675,000 | 4,113,977 | ||||
| Total (Cost $10,394,298) | 8,148,511 | |||||
| Italy – 1.8% | ||||||
Recordati | 735,000 | 5,229,729 | ||||
| Total (Cost $6,400,631) | 5,229,729 | |||||
| Japan – 9.7% | ||||||
FamilyMart | 180,000 | 8,241,699 | ||||
Moshi Moshi Hotline | 550,000 | 5,661,052 | ||||
Santen Pharmaceutical | 205,000 | 8,407,528 | ||||
USS | 60,000 | 6,481,048 | ||||
| Total (Cost $24,134,676) | 28,791,327 | |||||
| Jersey – 1.1% | ||||||
Centamin 1 | 2,975,000 | 3,272,763 | ||||
| Total (Cost $6,901,999) | 3,272,763 | |||||
| Mexico – 1.7% | ||||||
Grupo SIMEC Ser. B 1 | 480,000 | 1,501,923 | ||||
Industrias Bachoco ADR | 158,229 | 3,473,126 | ||||
| Total (Cost $5,016,748) | 4,975,049 | |||||
| Norway – 2.9% | ||||||
Ekornes | 255,000 | 3,657,118 | ||||
TGS-NOPEC Geophysical | 185,000 | 4,986,366 | ||||
| Total (Cost $8,356,123) | 8,643,484 | |||||
| South Africa – 3.8% | ||||||
Adcock Ingram Holdings | 460,000 | 3,387,584 | ||||
Lewis Group | 460,000 | 3,964,430 | ||||
Raubex Group | 2,501,600 | 4,095,974 | ||||
| Total (Cost $15,609,507) | 11,447,988 | |||||
| South Korea – 1.5% | ||||||
MegaStudy | 65,500 | 4,491,843 | ||||
| Total (Cost $9,068,998) | 4,491,843 | |||||
| Sweden – 1.4% | ||||||
Autoliv | 75,000 | 4,099,500 | ||||
| Total (Cost $5,286,369) | 4,099,500 | |||||
| Switzerland – 3.4% | ||||||
Burckhardt Compression Holding | 15,500 | 3,978,589 | ||||
Partners Group Holding | 24,000 | 4,266,760 | ||||
Sika | 1,000 | 1,925,934 | ||||
| Total (Cost $11,195,092) | 10,171,283 | |||||
| Turkey – 1.2% | ||||||
Mardin Cimento Sanayii | 1,121,145 | 3,462,538 | ||||
| Total (Cost $5,052,828) | 3,462,538 | |||||
| United Kingdom – 10.3% | ||||||
Ashmore Group | 1,350,000 | 7,408,498 | ||||
† Domino Printing Sciences | 255,000 | 2,158,391 | ||||
Hochschild Mining | 900,000 | 6,640,335 | ||||
Jupiter Fund Management | 2,550,000 | 8,611,020 | ||||
Spirax-Sarco Engineering | 100,000 | 3,115,990 | ||||
Victrex | 130,000 | 2,592,746 | ||||
| Total (Cost $35,749,792) | 30,526,980 | |||||
| United States – 14.0% | ||||||
Allied Nevada Gold 1 | 236,500 | 6,711,870 | ||||
† Dolby Laboratories Cl. A 1 | 50,000 | 2,065,000 | ||||
Helmerich & Payne | 130,000 | 5,652,400 | ||||
Jacobs Engineering Group 1 | 75,000 | 2,839,500 | ||||
Kennametal | 145,000 | 4,806,750 | ||||
Lam Research 1,3 | 85,000 | 3,207,900 | ||||
Lincoln Electric Holdings | 55,000 | 2,408,450 | ||||
Nu Skin Enterprises Cl. A | 30,000 | 1,407,000 | ||||
Teradyne 1 | 385,000 | 5,413,100 | ||||
Veeco Instruments 1,3 | 110,000 | 3,779,600 | ||||
Western Digital 1 | 115,000 | 3,505,200 | ||||
| Total (Cost $50,005,577) | 41,796,770 | |||||
| TOTAL COMMON STOCKS | ||||||
(Cost $349,546,125) | 272,898,115 | |||||
| REPURCHASE AGREEMENT – 8.0% | ||||||
Fixed Income Clearing Corporation, | ||||||
(Cost $23,900,000) | 23,900,000 | |||||
| 24 | The Royce Funds 2012 Semiannual Report to Shareholders | THE ACCOMPANYING NOTES ARE AN INTEGRAL PART OF THESE FINANCIAL STATEMENTS. |
June 30, 2012 (unaudited) |
| VALUE | ||||||
COLLATERAL RECEIVED FOR SECURITIES | ||||||
Money Market Funds | ||||||
Federated Government Obligations Fund | ||||||
(7 day yield-0.0115%) | ||||||
(Cost $8,677,163) | $ | 8,677,163 | ||||
| TOTAL INVESTMENTS – 102.5% | ||||||
(Cost $382,123,288) | 305,475,278 | |||||
LIABILITIES LESS CASH | (7,530,909 | ) | ||||
| NET ASSETS – 100.0% | $ | 297,944,369 | ||||
| Royce International Smaller-Companies Fund |
| SHARES | VALUE | |||||
| COMMON STOCKS – 94.7% | ||||||
| Australia – 2.9% | ||||||
Allied Gold Mining 1 | 50,000 | $ | 109,808 | |||
CGA Mining 1 | 75,000 | 136,283 | ||||
Medusa Mining | 25,000 | 124,005 | ||||
Regis Resources 1 | 40,000 | 161,366 | ||||
Saracen Mineral Holdings 1 | 225,000 | 128,904 | ||||
| Total (Cost $812,855) | 660,366 | |||||
| Austria – 2.5% | ||||||
Mayr-Melnhof Karton | 3,000 | 275,058 | ||||
Semperit AG Holding | 8,500 | 310,629 | ||||
| Total (Cost $662,532) | 585,687 | |||||
| Belgium – 1.2% | ||||||
GIMV | 3,500 | 159,192 | ||||
Sipef | 1,500 | 108,034 | ||||
| Total (Cost $272,464) | 267,226 | |||||
| Brazil – 2.6% | ||||||
† Brasil Brokers Participacoes | 45,000 | 146,303 | ||||
Eternit | 35,000 | 191,511 | ||||
Grendene | 50,000 | 261,389 | ||||
| Total (Cost $620,146) | 599,203 | |||||
| Canada – 5.5% | ||||||
Alexco Resource 1 | 20,000 | 88,200 | ||||
Ensign Energy Services | 8,000 | 110,009 | ||||
Gildan Activewear | 7,600 | 209,152 | ||||
Gluskin Sheff + Associates | 7,000 | 90,964 | ||||
† Kirkland Lake Gold 1 | 10,000 | 107,652 | ||||
Major Drilling Group International | 15,000 | 173,411 | ||||
Ritchie Bros. Auctioneers | 3,500 | 74,375 | ||||
ShawCor Cl. A | 2,300 | 83,248 | ||||
Sprott | 25,000 | 121,550 | ||||
Trican Well Service | 17,500 | 201,969 | ||||
| Total (Cost $1,336,602) | 1,260,530 | |||||
| Cayman Islands – 1.1% | ||||||
Greenlight Capital Re Cl. A 1 | 10,000 | 254,200 | ||||
| Total (Cost $194,676) | 254,200 | |||||
| China – 3.0% | ||||||
Anta Sports Products | 150,000 | 91,446 | ||||
China Forestry Holdings 2 | 201,000 | 15,157 | ||||
Daphne International Holdings | 141,000 | 143,955 | ||||
E-House China Holdings ADR | 36,500 | 200,750 | ||||
Guggenheim China Small Cap ETF | 8,500 | 168,470 | ||||
† Haitian International Holdings | 90,000 | 89,512 | ||||
| Total (Cost $1,014,656) | 709,290 | |||||
| THE ACCOMPANYING NOTES ARE AN INTEGRAL PART OF THESE FINANCIAL STATEMENTS. | The Royce Funds 2012 Semiannual Report to Shareholders | 25 |
Schedules of Investments
Royce International Smaller-Companies Fund (continued) |
| SHARES | VALUE | |||||
| Denmark – 1.5% | ||||||
SimCorp | 2,000 | $ | 343,937 | |||
| Total (Cost $345,815) | 343,937 | |||||
| France – 8.5% | ||||||
Altamir Amboise | 12,500 | 94,655 | ||||
Alten | 5,500 | 152,577 | ||||
Audika Groupe | 12,000 | 130,401 | ||||
Beneteau | 15,000 | 144,473 | ||||
bioMerieux | 2,000 | 164,463 | ||||
Boiron | 5,500 | 142,833 | ||||
Ipsen | 4,500 | 111,651 | ||||
Manutan International | 4,000 | 151,912 | ||||
Paris Orleans | 5,000 | 107,267 | ||||
Parrot 1 | 7,000 | 206,390 | ||||
Piscines Desjoyaux | 12,500 | 76,852 | ||||
Societe Internationale de Plantations d’Heveas | 2,000 | 170,045 | ||||
Vetoquinol | 7,500 | 194,921 | ||||
Virbac | 750 | 123,925 | ||||
| Total (Cost $2,384,331) | 1,972,365 | |||||
| Germany – 7.5% | ||||||
Carl Zeiss Meditec | 12,500 | 301,279 | ||||
Fuchs Petrolub | 5,000 | 255,934 | ||||
KWS Saat | 1,000 | 260,211 | ||||
Nemetschek | 4,000 | 148,428 | ||||
Pfeiffer Vacuum Technology | 3,300 | 335,904 | ||||
PUMA | 615 | 177,289 | ||||
STRATEC Biomedical | 2,000 | 88,855 | ||||
Takkt | 14,000 | 174,225 | ||||
| Total (Cost $1,498,144) | 1,742,125 | |||||
| Greece – 0.5% | ||||||
JUMBO | 30,000 | 116,793 | ||||
| Total (Cost $169,476) | 116,793 | |||||
| Hong Kong – 7.7% | ||||||
Asian Citrus Holdings | 250,000 | 140,771 | ||||
ASM Pacific Technology | 8,000 | 102,069 | ||||
Bosideng International Holdings | 350,000 | 90,526 | ||||
Esprit Holdings | 80,000 | 102,918 | ||||
Luk Fook Holdings (International) | 85,000 | 178,333 | ||||
Midland Holdings | 301,000 | 147,154 | ||||
New World Department Store China | 300,000 | 162,400 | ||||
Pacific Textiles Holdings | 220,000 | 135,233 | ||||
Pico Far East Holdings | 300,000 | 74,356 | ||||
Stella International Holdings | 45,000 | 111,664 | ||||
Texwinca Holdings | 131,000 | 124,491 | ||||
Value Partners Group | 498,000 | 243,993 | ||||
Xtep International Holdings | 500,000 | 175,131 | ||||
| Total (Cost $2,171,401) | 1,789,039 | |||||
| India – 3.2% | ||||||
AIA Engineering | 20,000 | 123,953 | ||||
Educomp Solutions | 50,000 | 152,900 | ||||
Graphite India | 125,000 | 201,727 | ||||
Maharashtra Seamless | 27,500 | 167,606 | ||||
Unichem Laboratories | 40,000 | 91,999 | ||||
| Total (Cost $951,822) | 738,185 | |||||
| Indonesia – 0.4% | ||||||
† Selamat Sempurna | 450,000 | 97,005 | ||||
| Total (Cost $99,109) | 97,005 | |||||
| Italy – 3.2% | ||||||
DiaSorin | 8,500 | 247,903 | ||||
Geox | 70,000 | 154,913 | ||||
Recordati | 47,500 | 337,976 | ||||
| Total (Cost $855,597) | 740,792 | |||||
| Japan – 9.4% | ||||||
BML | 6,000 | 149,605 | ||||
C. Uyemura & Co. | 5,500 | 208,080 | ||||
EPS | 75 | 205,055 | ||||
FamilyMart | 7,500 | 343,404 | ||||
Hisamitsu Pharmaceutical | 2,800 | 137,908 | ||||
Hogy Medical | 3,500 | 159,905 | ||||
† Mandom Corporation | 3,400 | 86,379 | ||||
Moshi Moshi Hotline | 25,000 | 257,320 | ||||
Santen Pharmaceutical | 8,500 | 348,605 | ||||
USS | 2,500 | 270,044 | ||||
| Total (Cost $1,857,347) | 2,166,305 | |||||
| Jersey – 0.5% | ||||||
Centamin 1 | 100,000 | 110,009 | ||||
| Total (Cost $182,844) | 110,009 | |||||
| Luxembourg – 0.4% | ||||||
Reinet Investments 1 | 5,000 | 91,346 | ||||
| Total (Cost $82,407) | 91,346 | |||||
| Malaysia – 0.9% | ||||||
Padini Holdings | 350,000 | 204,130 | ||||
| Total (Cost $137,404) | 204,130 | |||||
| Mexico – 2.1% | ||||||
Grupo Herdez | 100,000 | 229,391 | ||||
† Grupo SIMEC Ser. B 1 | 31,000 | 96,999 | ||||
Industrias Bachoco ADR | 7,500 | 164,625 | ||||
| Total (Cost $400,325) | 491,015 | |||||
| 26 | The Royce Funds 2012 Semiannual Report to Shareholders | THE ACCOMPANYING NOTES ARE AN INTEGRAL PART OF THESE FINANCIAL STATEMENTS. |
June 30, 2012 (unaudited) |
| SHARES | VALUE | |||||
| Netherlands – 0.3% | ||||||
Hunter Douglas | 2,000 | $ | 77,979 | |||
| Total (Cost $82,673) | 77,979 | |||||
| Norway – 0.8% | ||||||
TGS-NOPEC Geophysical | 6,500 | 175,197 | ||||
| Total (Cost $87,966) | 175,197 | |||||
| Poland – 0.4% | ||||||
Warsaw Stock Exchange | 9,000 | 103,218 | ||||
| Total (Cost $124,290) | 103,218 | |||||
| Russia – 0.5% | ||||||
Globaltrans Investment GDR | 7,000 | 125,976 | ||||
| Total (Cost $94,058) | 125,976 | |||||
| Singapore – 0.4% | ||||||
ARA Asset Management | 79,900 | 90,476 | ||||
| Total (Cost $50,891) | 90,476 | |||||
| South Africa – 4.5% | ||||||
Adcock Ingram Holdings | 30,000 | 220,929 | ||||
ADvTECH | 150,000 | 104,380 | ||||
† AVI | 19,000 | 116,595 | ||||
Discovery Holdings | 20,000 | 127,522 | ||||
Lewis Group | 20,000 | 172,366 | ||||
Northam Platinum | 40,000 | 114,530 | ||||
Raubex Group | 110,000 | 180,108 | ||||
| Total (Cost $1,274,668) | 1,036,430 | |||||
| South Korea – 3.8% | ||||||
Binggrae | 3,500 | 220,074 | ||||
Green Cross | 1,500 | 195,648 | ||||
GS Home Shopping | 1,500 | 126,497 | ||||
MegaStudy | 2,500 | 171,444 | ||||
Woongjin Coway | 5,000 | 155,832 | ||||
| Total (Cost $928,476) | 869,495 | |||||
| Spain – 0.6% | ||||||
Almirall | 20,200 | 145,272 | ||||
| Total (Cost $190,408) | 145,272 | |||||
| Sweden – 1.0% | ||||||
Lundin Petroleum 1 | 12,000 | 225,120 | ||||
| Total (Cost $166,038) | 225,120 | |||||
| Switzerland – 7.5% | ||||||
Bank Sarasin & Co. Cl. B 1 | 3,000 | 84,447 | ||||
Banque Privee Edmond de Rothschild | 3 | 60,024 | ||||
Belimo Holding | 50 | 86,713 | ||||
Burckhardt Compression Holding | 1,000 | 256,683 | ||||
† Kaba Holding Cl. B | 350 | 132,939 | ||||
Logitech International 1 | 20,000 | 215,815 | ||||
Partners Group Holding | 1,400 | 248,895 | ||||
Sika | 60 | 115,556 | ||||
Sulzer | 2,000 | 237,104 | ||||
Vontobel Holding | 3,000 | 59,211 | ||||
VZ Holding | 2,500 | 236,855 | ||||
| Total (Cost $1,686,634) | 1,734,242 | |||||
| Turkey – 0.7% | ||||||
Mardin Cimento Sanayii | 50,000 | 154,420 | ||||
| Total (Cost $235,861) | 154,420 | |||||
| United Kingdom – 8.5% | ||||||
Ashmore Group | 55,000 | 301,828 | ||||
EnQuest 1 | 80,000 | 135,629 | ||||
Hikma Pharmaceuticals | 15,000 | 153,470 | ||||
Hochschild Mining | 32,500 | 239,790 | ||||
† Homeserve | 50,000 | 122,305 | ||||
Jupiter Fund Management | 100,000 | 337,687 | ||||
† RIT Capital Partners | 6,300 | 122,748 | ||||
Rotork | 3,000 | 92,674 | ||||
Severfield-Rowen | 50,000 | 120,887 | ||||
Spirax-Sarco Engineering | 5,500 | 171,379 | ||||
Victrex | 7,000 | 139,609 | ||||
| Total (Cost $1,857,072) | 1,938,006 | |||||
| United States – 1.1% | ||||||
† FX Alliance 1 | 8,800 | 138,248 | ||||
WaterFurnace Renewable Energy | 7,500 | 119,708 | ||||
| Total (Cost $265,319) | 257,956 | |||||
| TOTAL COMMON STOCKS | ||||||
(Cost $23,094,307) | 21,873,335 | |||||
| REPURCHASE AGREEMENT – 5.2% | ||||||
Fixed Income Clearing Corporation, | ||||||
(Cost $1,204,000) | 1,204,000 | |||||
| TOTAL INVESTMENTS – 99.9% | ||||||
(Cost $24,298,307) | 23,077,335 | |||||
CASH AND OTHER ASSETS | 23,576 | |||||
| NET ASSETS – 100.0% | $ | 23,100,911 | ||||
| THE ACCOMPANYING NOTES ARE AN INTEGRAL PART OF THESE FINANCIAL STATEMENTS. | The Royce Funds 2012 Semiannual Report to Shareholders | 27 |
Schedules of Investments
| Royce Global Dividend Value Fund |
| SHARES | VALUE | |||||
| COMMON STOCKS – 98.7% | ||||||
| Australia – 1.5% | ||||||
Cochlear | 300 | $ | 20,318 | |||
Industrea | 13,137 | 17,326 | ||||
Medusa Mining | 8,000 | 39,682 | ||||
Platinum Asset Management | 3,000 | 12,006 | ||||
| Total (Cost $118,086) | 89,332 | |||||
| Austria – 3.0% | ||||||
Mayr-Melnhof Karton | 800 | 73,349 | ||||
Semperit AG Holding | 2,700 | 98,670 | ||||
| Total (Cost $224,585) | 172,019 | |||||
| Belgium – 1.2% | ||||||
EVS Broadcast Equipment | 600 | 28,253 | ||||
Sipef | 600 | 43,214 | ||||
| Total (Cost $92,737) | 71,467 | |||||
| Brazil – 1.4% | ||||||
Eternit | 6,000 | 32,831 | ||||
Grendene | 9,000 | 47,050 | ||||
| Total (Cost $89,593) | 79,881 | |||||
| Canada – 4.0% | ||||||
AGF Management Cl. B | 800 | 8,848 | ||||
Canadian Energy Services & Technology | 1,200 | 11,539 | ||||
E-L Financial | 40 | 16,305 | ||||
Major Drilling Group International | 4,200 | 48,555 | ||||
Pan American Silver | 1,600 | 27,024 | ||||
Pason Systems | 1,000 | 14,616 | ||||
ShawCor Cl. A | 450 | 16,288 | ||||
Sprott | 4,500 | 21,879 | ||||
Stella-Jones | 800 | 42,078 | ||||
Trican Well Service | 2,000 | 23,082 | ||||
| Total (Cost $303,264) | 230,214 | |||||
| China – 1.9% | ||||||
Anta Sports Products | 15,000 | 9,145 | ||||
Daphne International Holdings | 39,000 | 39,817 | ||||
E-House China Holdings ADR | 8,500 | 46,750 | ||||
Li Ning 1 | 30,000 | 16,898 | ||||
| Total (Cost $186,601) | 112,610 | |||||
| Denmark – 2.8% | ||||||
H. Lundbeck | 700 | 14,421 | ||||
SimCorp | 860 | 147,893 | ||||
| Total (Cost $159,022) | 162,314 | |||||
| Egypt – 0.6% | ||||||
Egyptian Financial Group-Hermes Holding Company 1 | 21,875 | 37,153 | ||||
| Total (Cost $61,534) | 37,153 | |||||
| Finland – 1.8% | ||||||
Marimekko | 1,500 | 24,534 | ||||
Nokian Renkaat | 600 | 22,869 | ||||
Ponsse | 3,500 | 30,277 | ||||
Vaisala Cl. A | 1,500 | 28,471 | ||||
| Total (Cost $146,387) | 106,151 | |||||
| France – 4.8% | ||||||
Alten | 1,200 | 33,289 | ||||
Audika Groupe | 1,500 | 16,300 | ||||
bioMerieux | 300 | 24,670 | ||||
Ipsen | 1,000 | 24,811 | ||||
LaCie | 7,500 | 37,793 | ||||
Manutan International | 700 | 26,585 | ||||
Paris Orleans | 500 | 10,727 | ||||
Piscines Desjoyaux | 3,000 | 18,444 | ||||
Societe BIC | 215 | 22,212 | ||||
Societe Internationale de Plantations d’Heveas | 300 | 25,507 | ||||
Vetoquinol | 1,500 | 38,984 | ||||
| Total (Cost $381,182) | 279,322 | |||||
| Germany – 8.5% | ||||||
Carl Zeiss Meditec | 2,500 | 60,255 | ||||
Fielmann | 200 | 18,486 | ||||
Fuchs Petrolub | 1,700 | 87,017 | ||||
KWS Saat | 75 | 19,516 | ||||
Nemetschek | 1,100 | 40,818 | ||||
Pfeiffer Vacuum Technology | 1,050 | 106,879 | ||||
PUMA | 145 | 41,800 | ||||
Rational | 225 | 53,635 | ||||
STRATEC Biomedical | 500 | 22,214 | ||||
Takkt | 3,500 | 43,556 | ||||
| Total (Cost $502,915) | 494,176 | |||||
| Greece – 0.3% | ||||||
JUMBO | 4,000 | 15,572 | ||||
| Total (Cost $24,602) | 15,572 | |||||
| Hong Kong – 7.1% | ||||||
Arts Optical International Holdings | 76,000 | 20,768 | ||||
Asian Citrus Holdings | 40,000 | 22,524 | ||||
ASM Pacific Technology | 1,300 | 16,586 | ||||
† Esprit Holdings | 10,000 | 12,865 | ||||
Lung Kee (Bermuda) Holdings | 50,000 | 18,169 | ||||
Midland Holdings | 75,000 | 36,666 | ||||
New World Department Store China | 35,500 | 19,217 | ||||
Pacific Textiles Holdings | 30,000 | 18,441 | ||||
Pico Far East Holdings | 85,000 | 21,068 | ||||
Stella International Holdings | 10,000 | 24,814 | ||||
Tao Heung Holdings | 40,000 | 20,336 | ||||
Texwinca Holdings | 35,000 | 33,261 | ||||
Value Partners Group | 126,000 | 61,733 | ||||
VTech Holdings | 2,000 | 23,818 | ||||
Win Hanverky Holdings | 276,000 | 23,262 | ||||
| 28 | The Royce Funds 2012 Semiannual Report to Shareholders | THE ACCOMPANYING NOTES ARE AN INTEGRAL PART OF THESE FINANCIAL STATEMENTS. |
June 30, 2012 (unaudited) |
| SHARES | VALUE | |||||
| Hong Kong (continued) | ||||||
Xtep International Holdings | 105,000 | $ | 36,778 | |||
| Total (Cost $550,189) | 410,306 | |||||
| Indonesia – 0.9% | ||||||
Selamat Sempurna | 250,000 | 53,892 | ||||
| Total (Cost $34,519) | 53,892 | |||||
| Italy – 1.2% | ||||||
DiaSorin | 1,000 | 29,165 | ||||
Recordati | 3,500 | 24,903 | ||||
Sabaf | 1,300 | 16,132 | ||||
| Total (Cost $122,610) | 70,200 | |||||
| Japan – 10.6% | ||||||
BML | 1,200 | 29,921 | ||||
EPS | 20 | 54,681 | ||||
FamilyMart | 2,000 | 91,574 | ||||
Hisamitsu Pharmaceutical | 600 | 29,552 | ||||
† Hogy Medical | 500 | 22,844 | ||||
Moshi Moshi Hotline | 8,000 | 82,343 | ||||
Nihon Kohden | 1,200 | 36,540 | ||||
Nomura Research Institute | 1,000 | 22,040 | ||||
Osaka Securities Exchange | 3 | 16,902 | ||||
Santen Pharmaceutical | 1,800 | 73,822 | ||||
Shimano | 800 | 52,328 | ||||
TOTO | 2,000 | 14,936 | ||||
USS | 800 | 86,414 | ||||
| Total (Cost $504,780) | 613,897 | |||||
| Jersey – 1.2% | ||||||
Randgold Resources ADR | 800 | 72,008 | ||||
| Total (Cost $61,335) | 72,008 | |||||
| Lebanon – 0.2% | ||||||
BLOM Bank GDR | 1,600 | 12,288 | ||||
| Total (Cost $16,017) | 12,288 | |||||
| Malaysia – 1.8% | ||||||
CB Industrial Product Holding | 40,000 | 32,222 | ||||
Faber Group | 25,000 | 12,420 | ||||
Padini Holdings | 100,000 | 58,323 | ||||
| Total (Cost $84,746) | 102,965 | |||||
| Mexico – 2.0% | ||||||
Bolsa Mexicana de Valores | 26,500 | 52,207 | ||||
Grupo Herdez | 17,500 | 40,143 | ||||
Industrias Bachoco ADR | 1,100 | 24,145 | ||||
| Total (Cost $108,663) | 116,495 | |||||
| Netherlands – 0.8% | ||||||
Beter Bed Holding | 1,500 | 29,154 | ||||
Hunter Douglas | 400 | 15,596 | ||||
| Total (Cost $46,657) | 44,750 | |||||
| Norway – 1.8% | ||||||
Ekornes | 3,500 | 50,196 | ||||
TGS-NOPEC Geophysical | 2,000 | 53,906 | ||||
| Total (Cost $127,077) | 104,102 | |||||
| Poland – 0.9% | ||||||
Warsaw Stock Exchange | 4,500 | 51,609 | ||||
| Total (Cost $69,866) | 51,609 | |||||
| Russia – 0.8% | ||||||
Globaltrans Investment GDR | 2,500 | 44,992 | ||||
| Total (Cost $33,391) | 44,992 | |||||
| Singapore – 2.7% | ||||||
ARA Asset Management | 35,500 | 40,199 | ||||
Armstrong Industrial | 90,000 | 18,985 | ||||
Broadway Industrial Group | 90,000 | 25,764 | ||||
SATS | 6,600 | 14,007 | ||||
Singapore Exchange | 2,900 | 14,558 | ||||
Super Group | 25,000 | 41,561 | ||||
| Total (Cost $161,188) | 155,074 | |||||
| South Africa – 4.6% | ||||||
Adcock Ingram Holdings | 6,000 | 44,186 | ||||
ADvTECH | 45,000 | 31,314 | ||||
† Coronation Fund Managers | 11,500 | 38,976 | ||||
Discovery Holdings | 7,500 | 47,821 | ||||
Lewis Group | 4,000 | 34,473 | ||||
Northam Platinum | 8,000 | 22,906 | ||||
Raubex Group | 30,000 | 49,120 | ||||
| Total (Cost $342,032) | 268,796 | |||||
| South Korea – 4.3% | ||||||
Binggrae | 700 | 44,015 | ||||
Bukwang Pharmaceutical | 1,575 | 15,885 | ||||
Daewoong Pharmaceutical | 1,500 | 31,987 | ||||
Green Cross | 300 | 39,130 | ||||
† GS Home Shopping | 300 | 25,299 | ||||
MegaStudy | 500 | 34,289 | ||||
Sung Kwang Bend | 1,500 | 25,528 | ||||
Woongjin Coway | 1,000 | 31,166 | ||||
| Total (Cost $307,846) | 247,299 | |||||
| Spain – 0.2% | ||||||
Bolsas y Mercados Espanoles | 600 | 12,078 | ||||
| Total (Cost $17,729) | 12,078 | |||||
| Switzerland – 9.8% | ||||||
Bank Sarasin & Co. Cl. B 1 | 700 | 19,704 | ||||
Belimo Holding | 15 | 26,014 | ||||
Burckhardt Compression Holding | 350 | 89,839 | ||||
| THE ACCOMPANYING NOTES ARE AN INTEGRAL PART OF THESE FINANCIAL STATEMENTS. | The Royce Funds 2012 Semiannual Report to Shareholders | 29 |
Schedules of Investments
| Royce Global Dividend Value Fund (continued) |
| SHARES | VALUE | |||||
| Switzerland (continued) | ||||||
Coltene Holding | 1,200 | $ | 34,109 | |||
Inficon Holding | 300 | 61,219 | ||||
† Kaba Holding Cl. B | 100 | 37,982 | ||||
LEM Holding | 100 | 50,786 | ||||
Partners Group Holding | 400 | 71,113 | ||||
Sika | 16 | 30,815 | ||||
Straumann Holding | 250 | 36,717 | ||||
Sulzer | 400 | 47,421 | ||||
Vontobel Holding | 350 | 6,908 | ||||
VZ Holding | 600 | 56,845 | ||||
| Total (Cost $660,374) | 569,472 | |||||
| Taiwan – 0.3% | ||||||
Chroma Ate | 4,160 | 9,468 | ||||
Hotung Investment Holdings | 90,000 | 9,634 | ||||
| Total (Cost $25,010) | 19,102 | |||||
| Thailand – 0.2% | ||||||
Hana Microelectronics | 18,000 | 10,849 | ||||
| Total (Cost $15,019) | 10,849 | |||||
| Turkey – 0.7% | ||||||
Mardin Cimento Sanayii | 12,500 | 38,605 | ||||
| Total (Cost $56,120) | 38,605 | |||||
| United Kingdom – 8.2% | ||||||
Ashmore Group | 18,000 | 98,780 | ||||
Close Brothers Group | 1,200 | 14,052 | ||||
De La Rue | 1,200 | 19,071 | ||||
Diploma | 4,100 | 28,642 | ||||
Domino Printing Sciences | 3,000 | 25,393 | ||||
Hochschild Mining | 7,500 | 55,336 | ||||
JKX Oil & Gas 1 | 7,000 | 11,073 | ||||
Jupiter Fund Management | 30,000 | 101,306 | ||||
Michael Page International | 2,500 | 14,734 | ||||
Rathbone Brothers | 700 | 13,579 | ||||
† RIT Capital Partners | 1,700 | 33,122 | ||||
Severfield-Rowen | 10,200 | 24,661 | ||||
Spirax-Sarco Engineering | 1,200 | 37,392 | ||||
| Total (Cost $541,855) | 477,141 | |||||
| United States – 6.6% | ||||||
Apollo Global Management LLC Cl. A | 4,800 | 59,520 | ||||
Expeditors International of Washington | 1,200 | 46,500 | ||||
† Hecla Mining | 18,000 | 85,500 | ||||
Invesco | 2,900 | 65,540 | ||||
KBR | 2,600 | 64,246 | ||||
Sims Metal Management ADR | 3,000 | 29,700 | ||||
Towers Watson & Company Cl. A | 260 | 15,574 | ||||
WaterFurnace Renewable Energy | 1,000 | 15,961 | ||||
| Total (Cost $445,471) | 382,541 | |||||
| TOTAL COMMON STOCKS | ||||||
(Cost $6,623,002) | 5,728,672 | |||||
| TOTAL INVESTMENTS – 98.7% | ||||||
(Cost $6,623,002) | 5,728,672 | |||||
CASH AND OTHER ASSETS | 76,794 | |||||
| NET ASSETS – 100.0% | $ | 5,805,466 | ||||
| 30 | The Royce Funds 2012 Semiannual Report to Shareholders | THE ACCOMPANYING NOTES ARE AN INTEGRAL PART OF THESE FINANCIAL STATEMENTS. |
June 30, 2012 (unaudited) |
| Royce International Micro-Cap Fund |
| SHARES | VALUE | |||||
| COMMON STOCKS – 95.6% | ||||||
| Australia – 6.5% | ||||||
Evolution Mining 1 | 30,000 | $ | 45,378 | |||
Imdex | 10,000 | 18,197 | ||||
Industrea | 35,000 | 46,160 | ||||
Kingsrose Mining | 15,000 | 17,720 | ||||
Saracen Mineral Holdings 1 | 85,000 | 48,697 | ||||
TFS Corporation 1 | 80,000 | 40,768 | ||||
Troy Resources | 9,500 | 38,074 | ||||
| Total (Cost $298,368) | 254,994 | |||||
| Austria – 1.4% | ||||||
† Semperit AG Holding | 1,500 | 54,817 | ||||
| Total (Cost $54,456) | 54,817 | |||||
| Belgium – 0.4% | ||||||
† EVS Broadcast Equipment | 300 | 14,127 | ||||
| Total (Cost $14,579) | 14,127 | |||||
| Bermuda – 0.8% | ||||||
Northern Offshore | 20,000 | 30,488 | ||||
| Total (Cost $39,962) | 30,488 | |||||
| Brazil – 2.1% | ||||||
† Brasil Brokers Participacoes | 6,000 | 19,507 | ||||
Eternit | 11,500 | 62,925 | ||||
| Total (Cost $82,438) | 82,432 | |||||
| Canada – 5.9% | ||||||
Alexco Resource 1 | 4,400 | 19,404 | ||||
† Endeavour Silver 1 | 2,000 | 16,240 | ||||
Goldgroup Mining 1 | 41,000 | 16,914 | ||||
† IROC Energy Services | 9,500 | 22,395 | ||||
† Kirkland Lake Gold 1 | 2,000 | 21,530 | ||||
Richmont Mines 1 | 7,000 | 32,410 | ||||
† Sprott | 4,000 | 19,448 | ||||
Sprott Resource 1 | 10,000 | 38,994 | ||||
Total Energy Services | 3,000 | 42,402 | ||||
| Total (Cost $292,276) | 229,737 | |||||
| China – 1.4% | ||||||
E-House China Holdings ADR | 9,500 | 52,250 | ||||
Qunxing Paper Holdings 2 | 41,000 | 2,182 | ||||
| Total (Cost $68,711) | 54,432 | |||||
| Denmark – 1.3% | ||||||
† SimCorp | 300 | 51,590 | ||||
| Total (Cost $48,613) | 51,590 | |||||
| Finland – 0.4% | ||||||
Ponsse | 2,000 | 17,301 | ||||
| Total (Cost $22,270) | 17,301 | |||||
| France – 9.9% | ||||||
Altamir Amboise | 3,000 | 22,717 | ||||
Audika Groupe | 3,000 | 32,600 | ||||
† Boiron | 600 | 15,582 | ||||
Exel Industries | 600 | 24,686 | ||||
† Foraco International | 4,500 | 18,299 | ||||
Manutan International | 1,400 | 53,169 | ||||
Neurones | 4,500 | 46,391 | ||||
Parrot 1 | 2,000 | 58,969 | ||||
Piscines Desjoyaux | 3,500 | 21,519 | ||||
† Societe Internationale de Plantations d’Heveas | 200 | 17,004 | ||||
† Stallergenes | 400 | 22,412 | ||||
Vetoquinol | 2,200 | 57,177 | ||||
| Total (Cost $496,223) | 390,525 | |||||
| Germany – 5.5% | ||||||
Aurelius | 1,000 | 36,064 | ||||
Deutsche Beteiligungs | 2,500 | 49,277 | ||||
† LPKF Laser & Electronics | 1,000 | 15,549 | ||||
Mobotix | 1,000 | 24,060 | ||||
Nemetschek | 1,400 | 51,950 | ||||
† SMT Scharf | 1,000 | 26,152 | ||||
STRATEC Biomedical | 300 | 13,328 | ||||
| Total (Cost $251,996) | 216,380 | |||||
| Greece – 0.3% | ||||||
† JUMBO | 3,200 | 12,458 | ||||
| Total (Cost $14,982) | 12,458 | |||||
| Hong Kong – 13.5% | ||||||
† Acquity Group ADR 1 | 2,000 | 19,700 | ||||
Arts Optical International Holdings | 150,000 | 40,990 | ||||
† Asian Citrus Holdings | 40,000 | 22,523 | ||||
Chen Hsong Holdings | 120,000 | 35,744 | ||||
China High Precision Automation Group 2 | 30,000 | 5,298 | ||||
China Ting Group Holdings | 701,000 | 40,720 | ||||
† EVA Precision Industrial Holdings | 200,000 | 16,478 | ||||
Fairwood Holdings | 17,000 | 31,657 | ||||
Goldlion Holdings | 120,000 | 49,662 | ||||
Lung Kee (Bermuda) Holdings | 80,000 | 29,071 | ||||
Midland Holdings | 118,000 | 57,688 | ||||
Oriental Watch Holdings | 90,000 | 24,036 | ||||
Pico Far East Holdings | 208,000 | 51,554 | ||||
Tak Sing Alliance Holdings | 400,000 | 43,647 | ||||
Tse Sui Luen Jewellery (International) | 43,000 | 29,766 | ||||
Win Hanverky Holdings | 350,000 | 29,499 | ||||
| Total (Cost $680,824) | 528,033 | |||||
| India – 4.7% | ||||||
eClerx Services | 1,300 | 14,323 | ||||
† Educomp Solutions | 10,000 | 30,580 | ||||
FAG Bearings India | 1,700 | 44,367 | ||||
Graphite India | 30,000 | 48,414 | ||||
| THE ACCOMPANYING NOTES ARE AN INTEGRAL PART OF THESE FINANCIAL STATEMENTS. | The Royce Funds 2012 Semiannual Report to Shareholders | 31 |
Schedules of Investments
| Royce International Micro-Cap Fund (continued) |
| SHARES | VALUE | |||||
| India (continued) | ||||||
Maharashtra Seamless | 7,500 | $ | 45,711 | |||
| Total (Cost $188,166) | 183,395 | |||||
| Indonesia – 1.4% | ||||||
Selamat Sempurna | 250,000 | 53,892 | ||||
| Total (Cost $32,516) | 53,892 | |||||
| Isle of Man – 0.8% | ||||||
Geodrill 1 | 15,000 | 31,677 | ||||
| Total (Cost $43,992) | 31,677 | |||||
| Italy – 3.0% | ||||||
† Geox | 10,500 | 23,237 | ||||
Nice | 15,000 | 49,066 | ||||
Piquadro | 17,500 | 32,154 | ||||
Sabaf | 1,200 | 14,891 | ||||
| Total (Cost $164,046) | 119,348 | |||||
| Japan – 5.4% | ||||||
† BML | 800 | 19,947 | ||||
C. Uyemura & Co. | 1,400 | 52,966 | ||||
EPS | 20 | 54,681 | ||||
† Hogy Medical | 400 | 18,275 | ||||
Miraial | 3,000 | 47,989 | ||||
† Moshi Moshi Hotline | 1,700 | 17,498 | ||||
| Total (Cost $231,879) | 211,356 | |||||
| Malaysia – 4.1% | ||||||
CB Industrial Product Holding | 55,000 | 44,306 | ||||
† Coastal Contracts | 42,000 | 25,056 | ||||
Kossan Rubber Industries | 40,000 | 40,620 | ||||
Padini Holdings | 90,000 | 52,490 | ||||
| Total (Cost $141,199) | 162,472 | |||||
| Mexico – 0.4% | ||||||
† Medica Sur Ser. B | 8,500 | 14,655 | ||||
| Total (Cost $15,744) | 14,655 | |||||
| Netherlands – 0.5% | ||||||
Beter Bed Holding | 1,000 | 19,436 | ||||
| Total (Cost $17,485) | 19,436 | |||||
| Norway – 0.8% | ||||||
† Ekornes | 2,300 | 32,986 | ||||
| Total (Cost $34,690) | 32,986 | |||||
| Poland – 1.6% | ||||||
Elektrobudowa | 1,600 | 46,635 | ||||
† FAMUR Group 1 | 14,000 | 16,840 | ||||
| Total (Cost $95,748) | 63,475 | |||||
| Singapore – 2.8% | ||||||
Armstrong Industrial | 125,000 | 26,369 | ||||
CSE Global | 75,000 | 47,292 | ||||
Hersing Corporation | 230,000 | 35,001 | ||||
| Total (Cost $147,388) | 108,662 | |||||
| South Africa – 4.4% | ||||||
ADvTECH | 20,000 | 13,918 | ||||
Bell Equipment 1 | 8,000 | 19,800 | ||||
Merafe Resources 1 | 500,000 | 49,048 | ||||
Raubex Group | 37,500 | 61,400 | ||||
† Village Main Reef 1 | 125,000 | 27,530 | ||||
| Total (Cost $240,452) | 171,696 | |||||
| South Korea – 3.8% | ||||||
Binggrae | 600 | 37,727 | ||||
Daewoong Pharmaceutical | 2,700 | 57,577 | ||||
† GS Home Shopping | 300 | 25,300 | ||||
† MegaStudy | 400 | 27,431 | ||||
| Total (Cost $175,906) | 148,035 | |||||
| Spain – 0.5% | ||||||
Clinica Baviera | 3,500 | 20,465 | ||||
| Total (Cost $32,443) | 20,465 | |||||
| Sri Lanka – 0.4% | ||||||
† Distilleries Company of Sri Lanka | 16,000 | 15,763 | ||||
| Total (Cost $17,585) | 15,763 | |||||
| Sweden – 0.9% | ||||||
Bjoern Borg | 7,500 | 35,350 | ||||
| Total (Cost $54,468) | 35,350 | |||||
| Switzerland – 3.4% | ||||||
Calida Holding | 1,200 | 32,165 | ||||
Coltene Holding | 1,000 | 28,424 | ||||
Inficon Holding | 150 | 30,610 | ||||
LEM Holding | 50 | 25,393 | ||||
† VZ Holding | 200 | 18,948 | ||||
| Total (Cost $154,400) | 135,540 | |||||
| Turkey – 1.0% | ||||||
Mardin Cimento Sanayii | 12,500 | 38,605 | ||||
| Total (Cost $46,651) | 38,605 | |||||
| United Arab Emirates – 0.4% | ||||||
† Aramex | 34,000 | 16,064 | ||||
| Total (Cost $16,822) | 16,064 | |||||
| United Kingdom – 4.0% | ||||||
Diploma | 4,500 | 31,437 | ||||
† Immunodiagnostic Systems Holdings | 7,500 | 36,211 | ||||
Latchways | 2,500 | 40,131 | ||||
Promethean World | 50,000 | 17,226 | ||||
| 32 | The Royce Funds 2012 Semiannual Report to Shareholders | THE ACCOMPANYING NOTES ARE AN INTEGRAL PART OF THESE FINANCIAL STATEMENTS. |
June 30, 2012 (unaudited) |
| SHARES | VALUE | |||||
| United Kingdom (continued) | ||||||
Severfield-Rowen | 12,500 | $ | 30,222 | |||
| Total (Cost $206,194) | 155,227 | |||||
| United States – 1.9% | ||||||
Century Casinos 1 | 12,000 | 32,640 | ||||
WaterFurnace Renewable Energy | 2,600 | 41,499 | ||||
| Total (Cost $95,032) | 74,139 | |||||
| TOTAL COMMON STOCKS | ||||||
(Cost $4,518,504) | 3,749,552 | |||||
| REPURCHASE AGREEMENT – 4.0% | ||||||
Fixed Income Clearing Corporation, | ||||||
(Cost $157,000) | 157,000 | |||||
| TOTAL INVESTMENTS – 99.6% | ||||||
(Cost $4,675,504) | 3,906,552 | |||||
CASH AND OTHER ASSETS | 17,250 | |||||
| NET ASSETS – 100.0% | $ | 3,923,802 | ||||
| Royce International Premier Fund |
| SHARES | VALUE | |||||
| COMMON STOCKS – 87.4% | ||||||
| Austria – 4.7% | ||||||
Mayr-Melnhof Karton | 900 | $ | 82,517 | |||
Semperit AG Holding | 2,800 | 102,325 | ||||
| Total (Cost $231,628) | 184,842 | |||||
| Denmark – 2.2% | ||||||
† SimCorp | 500 | 85,984 | ||||
| Total (Cost $86,244) | 85,984 | |||||
| Finland – 2.2% | ||||||
Nokian Renkaat | 1,600 | 60,983 | ||||
† Vacon | 600 | 25,669 | ||||
| Total (Cost $100,786) | 86,652 | |||||
| France – 7.1% | ||||||
Beneteau | 5,000 | 48,158 | ||||
bioMerieux | 600 | 49,339 | ||||
Manutan International | 1,500 | 56,967 | ||||
Vetoquinol | 2,500 | 64,973 | ||||
Virbac | 350 | 57,832 | ||||
| Total (Cost $356,191) | 277,269 | |||||
| Germany – 10.6% | ||||||
Carl Zeiss Meditec | 2,500 | 60,256 | ||||
Fuchs Petrolub | 1,200 | 61,424 | ||||
KWS Saat | 100 | 26,021 | ||||
Nemetschek | 1,600 | 59,371 | ||||
Pfeiffer Vacuum Technology | 600 | 61,074 | ||||
Rational | 250 | 59,595 | ||||
Takkt | 7,000 | 87,112 | ||||
| Total (Cost $408,245) | 414,853 | |||||
| Hong Kong – 5.2% | ||||||
ASM Pacific Technology | 2,200 | 28,069 | ||||
† Lung Kee (Bermuda) Holdings | 120,000 | 43,606 | ||||
Stella International Holdings | 18,000 | 44,666 | ||||
Value Partners Group | 181,000 | 88,680 | ||||
| Total (Cost $273,050) | 205,021 | |||||
| Italy – 4.9% | ||||||
DiaSorin | 2,500 | 72,913 | ||||
Recordati | 11,000 | 78,268 | ||||
Tod’s | 400 | 40,182 | ||||
| Total (Cost $222,123) | 191,363 | |||||
| Japan – 9.2% | ||||||
EPS | 25 | 68,352 | ||||
FamilyMart | 2,000 | 91,574 | ||||
† M3 | 7 | 33,521 | ||||
Santen Pharmaceutical | 2,200 | 90,227 | ||||
| THE ACCOMPANYING NOTES ARE AN INTEGRAL PART OF THESE FINANCIAL STATEMENTS. | The Royce Funds 2012 Semiannual Report to Shareholders | 33 |
| Schedules of Investments | June 30, 2012 (unaudited) |
| Royce International Premier Fund (continued) |
| SHARES | VALUE | |||||
| Japan (continued) | ||||||
USS | 700 | $ | 75,612 | |||
| Total (Cost $286,591) | 359,286 | |||||
| Jersey – 1.4% | ||||||
Randgold Resources ADR | 600 | 54,006 | ||||
| Total (Cost $46,623) | 54,006 | |||||
| Mexico – 1.2% | ||||||
Fresnillo | 2,000 | 45,900 | ||||
| Total (Cost $50,144) | 45,900 | |||||
| Norway – 1.8% | ||||||
Ekornes | 5,000 | 71,708 | ||||
| Total (Cost $114,000) | 71,708 | |||||
| Philippines – 0.9% | ||||||
GMA Holdings PDR | 150,000 | 37,409 | ||||
| Total (Cost $23,594) | 37,409 | |||||
| Singapore – 3.1% | ||||||
† Singapore Exchange | 9,000 | 45,180 | ||||
Super Group | 45,500 | 75,641 | ||||
| Total (Cost $112,564) | 120,821 | |||||
| South Africa – 3.5% | ||||||
Adcock Ingram Holdings | 7,500 | 55,232 | ||||
Discovery Holdings | 4,000 | 25,505 | ||||
Lewis Group | 6,500 | 56,019 | ||||
| Total (Cost $152,598) | 136,756 | |||||
| South Korea – 5.6% | ||||||
Binggrae | 600 | 37,727 | ||||
Green Cross | 600 | 78,259 | ||||
MegaStudy | 1,500 | 102,867 | ||||
| Total (Cost $266,811) | 218,853 | |||||
| Switzerland – 9.1% | ||||||
Belimo Holding | 10 | 17,343 | ||||
Burckhardt Compression Holding | 200 | 51,336 | ||||
Geberit | 150 | 29,588 | ||||
LEM Holding | 60 | 30,472 | ||||
Partners Group Holding | 400 | 71,113 | ||||
Straumann Holding | 250 | 36,717 | ||||
Sulzer | 400 | 47,421 | ||||
† VZ Holding | 750 | 71,056 | ||||
| Total (Cost $395,463) | 355,046 | |||||
| Thailand – 0.8% | ||||||
† Thai Beverage | 120,000 | 32,323 | ||||
| Total (Cost $31,849) | 32,323 | |||||
| United Kingdom – 13.9% | ||||||
† Abcam | 10,000 | 65,377 | ||||
Ashmore Group | 17,500 | 96,036 | ||||
† Aveva Group | 1,200 | 30,684 | ||||
† Burberry Group | 1,300 | 27,117 | ||||
† Domino Printing Sciences | 10,000 | 84,643 | ||||
Jupiter Fund Management | 26,700 | 90,163 | ||||
Rotork | 1,200 | 37,069 | ||||
Spirax-Sarco Engineering | 2,000 | 62,320 | ||||
Victrex | 2,500 | 49,861 | ||||
| Total (Cost $550,799) | 543,270 | |||||
| TOTAL COMMON STOCKS | ||||||
(Cost $3,709,303) | 3,421,362 | |||||
| REPURCHASE AGREEMENT – 9.4% | ||||||
Fixed Income Clearing Corporation, | ||||||
(Cost $369,000) | 369,000 | |||||
| TOTAL INVESTMENTS – 96.8% | ||||||
(Cost $4,078,303) | 3,790,362 | |||||
CASH AND OTHER ASSETS | 126,371 | |||||
| NET ASSETS – 100.0% | $ | 3,916,733 | ||||
| † | New additions in 2012. |
| 1 | Non-income producing. |
| 2 | Securities for which market quotations are not readily available represent 0.1%, 0.1% and 0.2% of net assets for Royce Global Value Fund, Royce International Smaller-Companies Fund and Royce International Micro-Cap Fund, respectively. These securities have been valued at their fair value under procedures approved by the Fund’s Board of Trustees. These securities are defined as Level 3 securities due to the use of significant unobservable inputs in the determination of fair value. See Notes to Financial Statements. |
| 3 | All or a portion of these securities were on loan at June 30, 2012. |
Securities of Global/International Funds are categorized by the country of their headquarters, with the exception of exchange-traded funds. | |
| Bold indicates a Fund’s 20 largest equity holdings in terms of June 30, 2012, market value. | |
| 34 | The Royce Funds 2012 Semiannual Report to Shareholders | THE ACCOMPANYING NOTES ARE AN INTEGRAL PART OF THESE FINANCIAL STATEMENTS. |
| Statements of Assets and Liabilities | June 30, 2012 (unaudited) | ||||||||||
| Royce | Royce | Royce | |||||||||||||
| European Smaller- | Global | International Smaller- | |||||||||||||
| Companies Fund | Value Fund | Companies Fund | |||||||||||||
| ASSETS: | |||||||||||||||
| Investments at value (including collateral on loaned securities) | $ | 13,886,315 | $ | 281,575,278 | $ | 21,873,335 | |||||||||
| Repurchase agreements (at cost and value) | 1,090,000 | 23,900,000 | 1,204,000 | ||||||||||||
| Cash and foreign currency | 20,072 | 387,982 | 25,580 | ||||||||||||
| Receivable for capital shares sold | 14,414 | 1,034,729 | 60,030 | ||||||||||||
| Receivable for dividends and interest | 44,079 | 629,416 | 43,737 | ||||||||||||
| Prepaid expenses and other assets | 85 | 1,758 | 86 | ||||||||||||
Total Assets | 15,054,965 | 307,529,163 | 23,206,768 | ||||||||||||
| LIABILITIES: | |||||||||||||||
| Payable for collateral on loaned securities | – | 8,677,163 | – | ||||||||||||
| Payable for investments purchased | 9,214 | 213,780 | – | ||||||||||||
| Payable for capital shares redeemed | 312,592 | 327,910 | 75,927 | ||||||||||||
| Payable for investment advisory fees | 8,502 | 295,661 | 14,844 | ||||||||||||
| Accrued expenses | 17,562 | 70,280 | 15,086 | ||||||||||||
Total Liabilities | 347,870 | 9,584,794 | 105,857 | ||||||||||||
Net Assets | $ | 14,707,095 | $ | 297,944,369 | $ | 23,100,911 | |||||||||
| ANALYSIS OF NET ASSETS: | |||||||||||||||
| Paid-in capital | $ | 18,870,764 | $ | 403,057,674 | $ | 24,805,364 | |||||||||
| Undistributed net investment income (loss) | 175,622 | 2,168,529 | 203,432 | ||||||||||||
| Accumulated net realized gain (loss) on investments and foreign currency | (2,745,675 | ) | (30,621,962 | ) | (686,321 | ) | |||||||||
| Net unrealized appreciation (depreciation) on investments and foreign currency | (1,593,616 | ) | (76,659,872 | ) | (1,221,564 | ) | |||||||||
Net Assets | $ | 14,707,095 | $ | 297,944,369 | $ | 23,100,911 | |||||||||
Investment Class | $ | 169,229,496 | |||||||||||||
Service Class | $ | 14,707,095 | 108,087,394 | $ | 23,100,911 | ||||||||||
Consultant Class | 20,529,247 | ||||||||||||||
R Class | 60,857 | ||||||||||||||
K Class | 37,375 | ||||||||||||||
| SHARES OUTSTANDING (unlimited number of $.001 par value): | |||||||||||||||
Investment Class | 14,443,986 | ||||||||||||||
Service Class | 1,640,573 | 9,219,439 | 2,308,139 | ||||||||||||
Consultant Class | 1,766,728 | ||||||||||||||
R Class | 6,902 | ||||||||||||||
K Class | 4,237 | ||||||||||||||
| NET ASSET VALUES (Net Assets ÷ Shares Outstanding): | |||||||||||||||
Investment Class1 | $11.72 | ||||||||||||||
Service Class1 | $8.96 | 11.72 | $10.01 | ||||||||||||
Consultant Class2 | 11.62 | ||||||||||||||
R Class3 | 8.82 | ||||||||||||||
K Class3 | 8.82 | ||||||||||||||
Investments at identified cost | $ | 15,478,780 | $ | 358,223,288 | $ | 23,094,307 | |||||||||
Market value of loaned securities | 8,721,503 | ||||||||||||||
| 1 | Offering and redemption price per share; shares held less than 180 days may be subject to a 2% redemption fee, payable to the Fund. |
| 2 | Offering and redemption price per share; shares held less than 365 days may be subject to a 1% contingent deferred sales charge, payable to Royce Fund Services, Inc. |
| 3 | Offering and redemption price per share. |
| THE ACCOMPANYING NOTES ARE AN INTEGRAL PART OF THESE FINANCIAL STATEMENTS. | The Royce Funds 2012 Semiannual Report to Shareholders | 35 |
| Statements of Assets and Liabilities | June 30, 2012 (unaudited) | ||||||||||
| Royce | Royce | Royce | |||||||||||||
| Global Dividend | International | International | |||||||||||||
| Value Fund | Micro-Cap Fund | Premier Fund | |||||||||||||
| ASSETS: | |||||||||||||||
| Investments at value | $ | 5,728,672 | $ | 3,749,552 | $ | 3,421,362 | |||||||||
| Repurchase agreements (at cost and value) | – | 157,000 | 369,000 | ||||||||||||
| Cash and foreign currency | 75,329 | 3,274 | 1,349 | ||||||||||||
| Receivable for investments sold | – | 18,952 | 91,510 | ||||||||||||
| Receivable for capital shares sold | 2,500 | 5,378 | 40,000 | ||||||||||||
| Receivable for dividends and interest | 7,334 | 3,065 | 5,038 | ||||||||||||
| Prepaid expenses and other assets | 19 | 19 | 16 | ||||||||||||
Total Assets | 5,813,854 | 3,937,240 | 3,928,275 | ||||||||||||
| LIABILITIES: | |||||||||||||||
| Payable for capital shares redeemed | – | 531 | 5,200 | ||||||||||||
| Accrued expenses | 8,388 | 12,907 | 6,342 | ||||||||||||
Total Liabilities | 8,388 | 13,438 | 11,542 | ||||||||||||
Net Assets | $ | 5,805,466 | $ | 3,923,802 | $ | 3,916,733 | |||||||||
| ANALYSIS OF NET ASSETS: | |||||||||||||||
| Paid-in capital | $ | 6,825,116 | $ | 5,497,527 | $ | 4,640,357 | |||||||||
| Undistributed net investment income (loss) | 46,733 | 42,695 | 40,081 | ||||||||||||
| Accumulated net realized gain (loss) on investments and foreign currency | (171,870 | ) | (844,935 | ) | (475,169 | ) | |||||||||
| Net unrealized appreciation (depreciation) on investments and foreign currency | (894,513 | ) | (771,485 | ) | (288,536 | ) | |||||||||
Net Assets | $ | 5,805,466 | $ | 3,923,802 | $ | 3,916,733 | |||||||||
Service Class | $ | 5,805,466 | $ | 3,923,802 | $ | 3,916,733 | |||||||||
| SHARES OUTSTANDING (unlimited number of $.001 par value): | |||||||||||||||
Service Class | 657,426 | 488,200 | 436,791 | ||||||||||||
| NET ASSET VALUES (Net Assets ÷ Shares Outstanding): | |||||||||||||||
Service Class1 | $8.83 | $8.04 | $8.97 | ||||||||||||
Investments at identified cost | $ | 6,623,002 | $ | 4,518,504 | $ | 3,709,303 | |||||||||
| 1 | Offering and redemption price per share; shares held less than 180 days may be subject to a 2% redemption fee, payable to the Fund. |
| 36 | The Royce Funds 2012 Semiannual Report to Shareholders | THE ACCOMPANYING NOTES ARE AN INTEGRAL PART OF THESE FINANCIAL STATEMENTS. |
| Statements of Changes in Net Assets |
| Royce European Smaller- | Royce International Smaller- | |||||||||||||||||||||||||||||
| Companies Fund | Royce Global Value Fund | Companies Fund | ||||||||||||||||||||||||||||
| Six months ended | Six months ended | Six months ended | ||||||||||||||||||||||||||||
| 6/30/12 | Year ended | 6/30/12 | Year ended | 6/30/12 | Year ended | |||||||||||||||||||||||||
| (unaudited) | 12/31/11 | (unaudited) | 12/31/11 | (unaudited) | 12/31/11 | |||||||||||||||||||||||||
| INVESTMENT OPERATIONS: | ||||||||||||||||||||||||||||||
| Net investment income (loss) | $ | 222,192 | $ | 189,271 | $ | 2,269,676 | $ | 2,363,099 | $ | 214,443 | $ | 186,087 | ||||||||||||||||||
| Net realized gain (loss) on investments and | ||||||||||||||||||||||||||||||
foreign currency | (397,933 | ) | 345,669 | (18,763,795 | ) | (1,113,155 | ) | (209,339 | ) | 428,419 | ||||||||||||||||||||
| Net change in unrealized appreciation | ||||||||||||||||||||||||||||||
(depreciation) on investments and | ||||||||||||||||||||||||||||||
foreign currency | 1,086,565 | (5,588,818 | ) | 12,863,120 | (115,351,653 | ) | 649,755 | (5,301,142 | ) | |||||||||||||||||||||
| Net increase (decrease) in net assets from | ||||||||||||||||||||||||||||||
investment operations | 910,824 | (5,053,878 | ) | (3,630,999 | ) | (114,101,709 | ) | 654,859 | (4,686,636 | ) | ||||||||||||||||||||
| DISTRIBUTIONS: | ||||||||||||||||||||||||||||||
| Net investment income | ||||||||||||||||||||||||||||||
Investment Class | – | (1,481,274 | ) | |||||||||||||||||||||||||||
Service Class | – | (191,729 | ) | – | (794,372 | ) | – | (158,172 | ) | |||||||||||||||||||||
Consultant Class | – | (102,078 | ) | |||||||||||||||||||||||||||
R Class | – | |||||||||||||||||||||||||||||
K Class | – | |||||||||||||||||||||||||||||
| Net realized gain on investments and | ||||||||||||||||||||||||||||||
foreign currency | ||||||||||||||||||||||||||||||
Investment Class | – | – | ||||||||||||||||||||||||||||
Service Class | – | – | – | – | – | (1,529,125 | ) | |||||||||||||||||||||||
Consultant Class | – | – | ||||||||||||||||||||||||||||
R Class | – | |||||||||||||||||||||||||||||
K Class | – | |||||||||||||||||||||||||||||
| Return of capital | ||||||||||||||||||||||||||||||
Investment Class | – | – | ||||||||||||||||||||||||||||
Service Class | – | – | – | – | – | (12,924 | ) | |||||||||||||||||||||||
Consultant Class | – | – | ||||||||||||||||||||||||||||
R Class | – | |||||||||||||||||||||||||||||
K Class | – | |||||||||||||||||||||||||||||
| Total distributions | – | (191,729 | ) | – | (2,377,724 | ) | – | (1,700,221 | ) | |||||||||||||||||||||
| CAPITAL SHARE TRANSACTIONS: | ||||||||||||||||||||||||||||||
| Net capital share transactions | ||||||||||||||||||||||||||||||
Investment Class | 31,181,084 | 207,132,510 | ||||||||||||||||||||||||||||
Service Class | (2,125,893 | ) | 5,751,691 | (14,543,554 | ) | 19,816,952 | 2,333,163 | 8,177,613 | ||||||||||||||||||||||
Consultant Class | 2,431,290 | 22,957,004 | ||||||||||||||||||||||||||||
R Class | 65,079 | |||||||||||||||||||||||||||||
K Class | 42,371 | |||||||||||||||||||||||||||||
| Shareholder redemption fees | ||||||||||||||||||||||||||||||
Investment Class | 42,871 | 95,961 | ||||||||||||||||||||||||||||
Service Class | 4,299 | 43,230 | 17,070 | 198,465 | 10,020 | 14,620 | ||||||||||||||||||||||||
| Net increase (decrease) in net assets from | ||||||||||||||||||||||||||||||
capital share transactions | (2,121,594 | ) | 5,794,921 | 19,236,211 | 250,200,892 | 2,343,183 | 8,192,233 | |||||||||||||||||||||||
| NET INCREASE (DECREASE) IN NET ASSETS | (1,210,770 | ) | 549,314 | 15,605,212 | 133,721,459 | 2,998,042 | 1,805,376 | |||||||||||||||||||||||
| NET ASSETS: | ||||||||||||||||||||||||||||||
Beginning of period | 15,917,865 | 15,368,551 | 282,339,157 | 148,617,698 | 20,102,869 | 18,297,493 | ||||||||||||||||||||||||
End of period | $ | 14,707,095 | $ | 15,917,865 | $ | 297,944,369 | $ | 282,339,157 | $ | 23,100,911 | $ | 20,102,869 | ||||||||||||||||||
| UNDISTRIBUTED NET INVESTMENT INCOME | ||||||||||||||||||||||||||||||
(LOSS) AT END OF PERIOD | $ | 175,622 | $ | (46,571 | ) | $ | 2,168,529 | $ | (101,148 | ) | $ | 203,432 | $ | (11,012 | ) | |||||||||||||||
| THE ACCOMPANYING NOTES ARE AN INTEGRAL PART OF THESE FINANCIAL STATEMENTS. | The Royce Funds 2012 Semiannual Report to Shareholders | 37 |
| Statements of Changes in Net Assets | |||||||||||
| Royce Global | Royce International | Royce International | ||||||||||||||||||||||||||||
| Dividend Value Fund | Micro-Cap Fund | Premier Fund | ||||||||||||||||||||||||||||
| Six months ended | Six months ended | Six months ended | ||||||||||||||||||||||||||||
| 6/30/12 | Period ended | 6/30/12 | Period ended | 6/30/12 | Period ended | |||||||||||||||||||||||||
| (unaudited) | 12/31/111 | (unaudited) | 12/31/111 | (unaudited) | 12/31/111 | |||||||||||||||||||||||||
| INVESTMENT OPERATIONS: | ||||||||||||||||||||||||||||||
| Net investment income (loss) | $ | 77,784 | $ | 54,007 | $ | 51,034 | $ | 48,932 | $ | 40,080 | $ | 26,443 | ||||||||||||||||||
| Net realized gain (loss) on investments and | ||||||||||||||||||||||||||||||
foreign currency | (113,112 | ) | (57,178 | ) | (33,728 | ) | (805,059 | ) | (359,173 | ) | (113,170 | ) | ||||||||||||||||||
| Net change in unrealized appreciation | ||||||||||||||||||||||||||||||
(depreciation) on investments and | ||||||||||||||||||||||||||||||
foreign currency | 377,104 | (1,271,617 | ) | 102,055 | (873,541 | ) | 669,672 | (958,207 | ) | |||||||||||||||||||||
| Net increase (decrease) in net assets from | ||||||||||||||||||||||||||||||
investment operations | 341,776 | (1,274,788 | ) | 119,361 | (1,629,668 | ) | 350,579 | (1,044,934 | ) | |||||||||||||||||||||
| DISTRIBUTIONS: | ||||||||||||||||||||||||||||||
| Net investment income | ||||||||||||||||||||||||||||||
Service Class | (31,371 | ) | (50,231 | ) | – | (63,419 | ) | – | (28,433 | ) | ||||||||||||||||||||
| Net realized gain on investments and | ||||||||||||||||||||||||||||||
foreign currency | ||||||||||||||||||||||||||||||
Service Class | – | (5,036 | ) | – | – | – | (835 | ) | ||||||||||||||||||||||
| Return of capital | ||||||||||||||||||||||||||||||
Service Class | – | – | – | (3,157 | ) | – | (4,438 | ) | ||||||||||||||||||||||
| Total distributions | (31,371 | ) | (55,267 | ) | – | (66,576 | ) | – | (33,706 | ) | ||||||||||||||||||||
| CAPITAL SHARE TRANSACTIONS: | ||||||||||||||||||||||||||||||
| Net capital share transactions | ||||||||||||||||||||||||||||||
Service Class | (640,197 | ) | 7,459,390 | 231,949 | 5,265,392 | (523,920 | ) | 5,165,082 | ||||||||||||||||||||||
| Shareholder redemption fees | ||||||||||||||||||||||||||||||
Service Class | 569 | 5,354 | 782 | 2,562 | 283 | 3,349 | ||||||||||||||||||||||||
| Net increase (decrease) in net assets from | ||||||||||||||||||||||||||||||
capital share transactions | (639,628 | ) | 7,464,744 | 232,731 | 5,267,954 | (523,637 | ) | 5,168,431 | ||||||||||||||||||||||
| NET INCREASE (DECREASE) IN NET ASSETS | (329,223 | ) | 6,134,689 | 352,092 | 3,571,710 | (173,058 | ) | 4,089,791 | ||||||||||||||||||||||
| NET ASSETS: | ||||||||||||||||||||||||||||||
Beginning of period | 6,134,689 | 3,571,710 | 4,089,791 | |||||||||||||||||||||||||||
End of period | $ | 5,805,466 | $ | 6,134,689 | $ | 3,923,802 | $ | 3,571,710 | $ | 3,916,733 | $ | 4,089,791 | ||||||||||||||||||
| UNDISTRIBUTED NET INVESTMENT INCOME | ||||||||||||||||||||||||||||||
(LOSS) AT END OF PERIOD | $ | 46,733 | $ | 320 | $ | 42,695 | $ | (8,339 | ) | $ | 40,081 | $ | – | |||||||||||||||||
| 1 The Fund commenced operations on January 3, 2011. |
| 38 | The Royce Funds 2012 Semiannual Report to Shareholders | THE ACCOMPANYING NOTES ARE AN INTEGRAL PART OF THESE FINANCIAL STATEMENTS. |
| Statements of Operations | Six Months Ended June 30, 2012 (unaudited) | ||||||||||
| Royce | Royce | Royce | Royce | Royce | Royce | |||||||||||||||||||||||||
| European Smaller- | Global | International Smaller- | Global Dividend | International | International | |||||||||||||||||||||||||
| Companies Fund | Value Fund | Companies Fund | Value Fund | Micro-Cap Fund | Premier Fund | |||||||||||||||||||||||||
| INVESTMENT INCOME: | ||||||||||||||||||||||||||||||
| Income: | ||||||||||||||||||||||||||||||
Dividends | $ | 358,391 | $ | 4,768,225 | $ | 411,768 | $ | 133,852 | $ | 85,337 | $ | 74,255 | ||||||||||||||||||
Interest | 184 | 4,776 | 419 | 18 | 52 | 57 | ||||||||||||||||||||||||
Securities lending | – | 5,934 | – | – | – | – | ||||||||||||||||||||||||
| Total income | 358,575 | 4,778,935 | 412,187 | 133,870 | 85,389 | 74,312 | ||||||||||||||||||||||||
| Expenses: | ||||||||||||||||||||||||||||||
Investment advisory fees | 100,882 | 1,946,198 | 146,273 | 41,488 | 26,429 | 25,319 | ||||||||||||||||||||||||
Distribution fees | 20,177 | 267,453 | 29,255 | 8,298 | 5,083 | 5,064 | ||||||||||||||||||||||||
Shareholder servicing | 16,477 | 197,855 | 20,335 | 10,353 | 8,711 | 8,317 | ||||||||||||||||||||||||
Custody | 12,446 | 102,061 | 20,589 | 9,646 | 16,995 | 10,739 | ||||||||||||||||||||||||
Registration | 11,143 | 39,229 | 11,472 | 14,802 | 15,808 | 16,419 | ||||||||||||||||||||||||
Audit | 6,959 | 35,550 | 11,713 | 6,959 | 7,959 | 7,959 | ||||||||||||||||||||||||
Shareholder reports | 4,296 | 51,620 | 4,236 | 1,250 | 945 | 576 | ||||||||||||||||||||||||
Administrative and office facilities | 976 | 19,172 | 1,114 | 304 | 221 | 216 | ||||||||||||||||||||||||
Trustees’ fees | 253 | 4,836 | 315 | 86 | 58 | 58 | ||||||||||||||||||||||||
Legal | 208 | 5,605 | 222 | 51 | 46 | 40 | ||||||||||||||||||||||||
Other expenses | 803 | 8,501 | 915 | 712 | 722 | 945 | ||||||||||||||||||||||||
| Total expenses | 174,620 | 2,678,080 | 246,439 | 93,949 | 82,977 | 75,652 | ||||||||||||||||||||||||
| Compensating balance credits | (9 | ) | (60 | ) | (6 | ) | (6 | ) | (2 | ) | (5 | ) | ||||||||||||||||||
| Fees waived by investment adviser and distributor | (38,228 | ) | – | (48,689 | ) | (37,857 | ) | (26,632 | ) | (25,927 | ) | |||||||||||||||||||
| Expenses reimbursed by investment adviser | – | (168,761 | ) | – | – | (21,988 | ) | (15,488 | ) | |||||||||||||||||||||
| Net expenses | 136,383 | 2,509,259 | 197,744 | 56,086 | 34,355 | 34,232 | ||||||||||||||||||||||||
| Net investment income (loss) | 222,192 | 2,269,676 | 214,443 | 77,784 | 51,034 | 40,080 | ||||||||||||||||||||||||
| REALIZED AND UNREALIZED GAIN (LOSS) ON INVESTMENTS AND FOREIGN CURRENCY: | ||||||||||||||||||||||||||||||
| Net realized gain (loss): | ||||||||||||||||||||||||||||||
Investments | (396,952 | ) | (18,700,090 | ) | (207,793 | ) | (111,351 | ) | (29,777 | ) | (355,803 | ) | ||||||||||||||||||
Foreign currency transactions | (981 | ) | (63,705 | ) | (1,546 | ) | (1,761 | ) | (3,951 | ) | (3,370 | ) | ||||||||||||||||||
| Net change in unrealized appreciation (depreciation): | ||||||||||||||||||||||||||||||
Investments and foreign currency translations | 1,086,267 | 12,856,143 | 649,576 | 377,007 | 104,640 | 669,990 | ||||||||||||||||||||||||
Other assets and liabilities denominated in foreign currency | 298 | 6,977 | 179 | 97 | (2,585 | ) | (318 | ) | ||||||||||||||||||||||
| Net realized and unrealized gain (loss) on investments and | ||||||||||||||||||||||||||||||
foreign currency | 688,632 | (5,900,675 | ) | 440,416 | 263,992 | 68,327 | 310,499 | |||||||||||||||||||||||
| NET INCREASE (DECREASE) IN NET ASSETS FROM | ||||||||||||||||||||||||||||||
INVESTMENT OPERATIONS | $ | 910,824 | $ | (3,630,999 | ) | $ | 654,859 | $ | 341,776 | $ | 119,361 | $ | 350,579 | |||||||||||||||||
| THE ACCOMPANYING NOTES ARE AN INTEGRAL PART OF THESE FINANCIAL STATEMENTS. | The Royce Funds 2012 Semiannual Report to Shareholders | 39 |
| Financial Highlights | ||||||||||||||||||||||||||||||||||||||||||||||||||||||||||||||||
| This table is presented to show selected data for a share outstanding throughout each period, and to assist shareholders in evaluating a Fund’s performance for the periods presented. Per share amounts have been determined on the basis of the weighted average number of shares outstanding during the period. | ||||||||||||||||||||||||||||||||||||||||||||||||||||||||||||||||
| Net Realized and | Distributions | Ratio of Expenses to Average Net Assets | Ratio of | |||||||||||||||||||||||||||||||||||||||||||||||||||||||||||||
| Net Asset Value, Beginning of Period | Net Investment Income (Loss) | Unrealized Gain (Loss) on Investments and Foreign Currency | Total from Investment Operations | Distributions from Net Investment Income | from Net Realized Gain on Investments and Foreign Currency | Distributions from Return of Capital | Total Distributions | Shareholder Redemption Fees | Net Asset Value, End of Period | Total Return | Net Assets, End of Period (in thousands) | Prior to Fee Waivers and Balance Credits | Prior to Fee Waivers | Net of Fee Waivers | Net Investment Income (Loss) to Average Net Assets | Portfolio Turnover Rate | ||||||||||||||||||||||||||||||||||||||||||||||||
| Royce European Smaller-Companies Fund – Service Class a | ||||||||||||||||||||||||||||||||||||||||||||||||||||||||||||||||
| †2012 | $ | 8.50 | $ | 0.13 | $ | 0.33 | $ | 0.46 | $ | – | $ | – | $ | – | $ | – | $ | – | $ | 8.96 | 5.41 | %1 | $ | 14,707 | 2.16 | %2 | 2.16 | %2 | 1.69 | %2 | 2.75 | %2 | 10 | % | ||||||||||||||||||||||||||||||
| 2011 | 10.79 | 0.10 | (2.31 | ) | (2.21 | ) | (0.10 | ) | – | – | (0.10 | ) | 0.02 | 8.50 | (20.32 | ) | 15,918 | 2.09 | 2.09 | 1.69 | 0.95 | 36 | ||||||||||||||||||||||||||||||||||||||||||
| 2010 | 8.06 | 0.03 | 2.79 | 2.82 | (0.10 | ) | – | – | (0.10 | ) | 0.01 | 10.79 | 35.20 | 15,369 | 2.57 | 2.57 | 1.69 | 0.70 | 32 | |||||||||||||||||||||||||||||||||||||||||||||
| 2009 | 5.19 | 0.06 | 2.93 | 2.99 | (0.12 | ) | – | – | (0.12 | ) | – | 8.06 | 57.69 | 6,887 | 3.21 | 3.21 | 1.69 | 1.11 | 51 | |||||||||||||||||||||||||||||||||||||||||||||
| 2008 | 10.14 | 0.22 | (4.95 | ) | (4.73 | ) | (0.23 | ) | – | – | (0.23 | ) | 0.01 | 5.19 | (46.38 | ) | 4,044 | 2.74 | 2.72 | 1.69 | 2.22 | 88 | ||||||||||||||||||||||||||||||||||||||||||
| 2007 | 10.00 | 0.03 | 0.10 | 0.13 | (0.00 | ) | – | – | (0.00 | ) | 0.01 | 10.14 | 1.44 | 1 | 9,469 | 3.03 | 2 | 2.60 | 2 | 1.69 | 2 | 0.28 | 2 | 47 | ||||||||||||||||||||||||||||||||||||||||
| Royce Global Value Fund – Investment Class b | ||||||||||||||||||||||||||||||||||||||||||||||||||||||||||||||||
| †2012 | $ | 11.74 | $ | 0.11 | $ | (0.13 | ) | $ | (0.02 | ) | $ | – | $ | – | $ | – | $ | – | $ | – | $ | 11.72 | (0.17 | )%1 | $ | 169,230 | 1.49 | %2 | 1.49 | %2 | 1.44 | %2 | 1.71 | %2 | 17 | % | ||||||||||||||||||||||||||||
| 2011 | 14.54 | 0.13 | (2.82 | ) | (2.69 | ) | (0.12 | ) | – | – | (0.12 | ) | 0.01 | 11.74 | (18.48 | ) | 141,180 | 1.42 | 1.42 | 1.42 | 0.80 | 77 | ||||||||||||||||||||||||||||||||||||||||||
| 2010 | 11.02 | (0.06 | ) | 3.68 | 3.62 | (0.10 | ) | – | – | (0.10 | ) | – | 14.54 | 32.88 | 1 | 6,626 | 2.07 | 2 | 2.07 | 2 | 1.44 | 2 | (0.58 | ) 2 | 42 | |||||||||||||||||||||||||||||||||||||||
| Royce Global Value Fund – Service Class c | ||||||||||||||||||||||||||||||||||||||||||||||||||||||||||||||||
| †2012 | $ | 11.77 | $ | 0.08 | $ | (0.13 | ) | $ | (0.05 | ) | $ | – | $ | – | $ | – | $ | – | $ | – | $ | 11.72 | (0.42 | )%1 | $ | 108,087 | 1.86 | %2 | 1.86 | %2 | 1.69 | %2 | 1.27 | %2 | 17 | % | ||||||||||||||||||||||||||||
| 2011 | 14.56 | 0.07 | (2.80 | ) | (2.73 | ) | (0.07 | ) | – | – | (0.07 | ) | 0.01 | 11.77 | (18.69 | ) | 122,574 | 1.77 | 1.77 | 1.69 | 0.41 | 77 | ||||||||||||||||||||||||||||||||||||||||||
| 2010 | 10.79 | (0.03 | ) | 3.87 | 3.84 | (0.08 | ) | – | – | (0.08 | ) | 0.01 | 14.56 | 35.69 | 141,992 | 1.84 | 1.84 | 1.69 | 0.01 | 42 | ||||||||||||||||||||||||||||||||||||||||||||
| 2009 | 6.70 | 0.01 | 4.13 | 4.14 | (0.06 | ) | – | – | (0.06 | ) | 0.01 | 10.79 | 61.89 | 50,946 | 1.88 | 1.88 | 1.69 | 0.11 | 71 | |||||||||||||||||||||||||||||||||||||||||||||
| 2008 | 11.20 | 0.14 | (4.65 | ) | (4.51 | ) | (0.03 | ) | (0.00 | ) | – | (0.03 | ) | 0.04 | 6.70 | (39.92 | ) | 31,040 | 1.91 | 1.90 | 1.69 | 1.64 | 45 | |||||||||||||||||||||||||||||||||||||||||
| 2007 | 10.00 | (0.14 | ) | 1.53 | 1.39 | (0.21 | ) | (0.02 | ) | – | (0.23 | ) | 0.04 | 11.20 | 14.28 | 1 | 19,876 | 2.17 | 2 | 2.00 | 2 | 1.69 | 2 | (0.23 | ) 2 | 54 | ||||||||||||||||||||||||||||||||||||||
| Royce Global Value Fund – Consultant Class d | ||||||||||||||||||||||||||||||||||||||||||||||||||||||||||||||||
| †2012 | $ | 11.71 | $ | 0.04 | $ | (0.13 | ) | $ | (0.09 | ) | $ | – | $ | – | $ | – | $ | – | $ | – | $ | 11.62 | (0.77 | )%1 | $ | 20,529 | 2.56 | %2 | 2.56 | %2 | 2.44 | %2 | 0.67 | %2 | 17 | % | ||||||||||||||||||||||||||||
| 2011 | 15.66 | (0.09 | ) | (3.80 | ) | (3.89 | ) | (0.06 | ) | – | – | (0.06 | ) | – | 11.71 | (24.82 | )1 | 18,585 | 2.64 | 2 | 2.64 | 2 | 2.44 | 2 | (0.77 | )2 | 77 | |||||||||||||||||||||||||||||||||||||
| Royce Global Value Fund – R Class e | ||||||||||||||||||||||||||||||||||||||||||||||||||||||||||||||||
| †2012 | $ | 10.00 | $ | 0.07 | $ | (1.25 | ) | $ | (1.18 | ) | $ | – | $ | – | $ | – | $ | – | $ | – | $ | 8.82 | (11.80 | )%1 | $ | 61 | 43.37 | %2 | 43.37 | %2 | 1.99 | %2 | 2.59 | %2 | 17 | % | ||||||||||||||||||||||||||||
| Royce Global Value Fund – K Class e | ||||||||||||||||||||||||||||||||||||||||||||||||||||||||||||||||
| †2012 | $ | 10.00 | $ | 0.07 | $ | (1.25 | ) | $ | (1.18 | ) | $ | – | $ | – | $ | – | $ | – | $ | – | $ | 8.82 | (11.80 | )%1 | $ | 37 | 43.16 | %2 | 43.16 | %2 | 1.74 | %2 | 2.70 | %2 | 17 | % | ||||||||||||||||||||||||||||
| Royce International Smaller-Companies Fund – Service Class f | ||||||||||||||||||||||||||||||||||||||||||||||||||||||||||||||||
| †2012 | $ | 9.58 | $ | 0.09 | $ | 0.34 | $ | 0.43 | $ | – | $ | – | $ | – | $ | – | $ | – | $ | 10.01 | 4.49 | %1 | $ | 23,101 | 2.11 | %2 | 2.11 | %2 | 1.69 | %2 | 1.83 | %2 | 20 | % | ||||||||||||||||||||||||||||||
| 2011 | 12.85 | 0.10 | (2.51 | ) | (2.41 | ) | (0.08 | ) | (0.78 | ) | (0.01 | ) | (0.87 | ) | 0.01 | 9.58 | (18.75 | ) | 20,103 | 2.15 | 2.15 | 1.69 | 0.88 | 38 | ||||||||||||||||||||||||||||||||||||||||
| 2010 | 10.49 | 0.03 | 2.72 | 2.75 | (0.10 | ) | (0.30 | ) | – | (0.40 | ) | 0.01 | 12.85 | 26.45 | 18,297 | 2.35 | 2.35 | 1.69 | 0.45 | 55 | ||||||||||||||||||||||||||||||||||||||||||||
| 2009 | 6.99 | (0.02 | ) | 3.53 | 3.51 | (0.02 | ) | – | – | (0.02 | ) | 0.01 | 10.49 | 50.31 | 7,871 | 3.01 | 3.01 | 1.69 | (0.18 | ) | 38 | |||||||||||||||||||||||||||||||||||||||||||
| 2008 | 10.00 | (0.02 | ) | (2.99 | ) | (3.01 | ) | – | – | – | – | – | 6.99 | (30.10 | ) 1 | 1,960 | 6.24 | 2 | 5.98 | 2 | 1.69 | 2 | (0.43 | ) 2 | 1 | |||||||||||||||||||||||||||||||||||||||
| Royce Global Dividend Value Fund – Service Class g | ||||||||||||||||||||||||||||||||||||||||||||||||||||||||||||||||
| †2012 | $ | 8.39 | $ | 0.11 | $ | 0.38 | $ | 0.49 | $ | (0.05 | ) | $ | – | $ | – | $ | (0.05 | ) | $ | – | $ | 8.83 | 5.77 | %1 | $ | 5,805 | 2.83 | %2 | 2.83 | %2 | 1.69 | %2 | 2.34 | %2 | 8 | % | ||||||||||||||||||||||||||||
| 2011 | 10.00 | 0.08 | (1.62 | ) | (1.54 | ) | (0.07 | ) | (0.01 | ) | – | (0.08 | ) | 0.01 | 8.39 | (15.37 | )1 | 6,135 | 3.47 | 2 | 3.47 | 2 | 1.69 | 2 | 1.10 | 2 | 20 | |||||||||||||||||||||||||||||||||||||
| 40 | The Royce Funds 2012 Semiannual Report to Shareholders | THE ACCOMPANYING NOTES ARE AN INTEGRAL PART OF THESE FINANCIAL STATEMENTS. |
| Financial Highlights | ||||||||||||||||||||||||||||||||||||||||||||||||||||||||||||||||
| This table is presented to show selected data for a share outstanding throughout each period, and to assist shareholders in evaluating a Fund’s performance for the periods presented. Per share amounts have been determined on the basis of the weighted average number of shares outstanding during the period. | ||||||||||||||||||||||||||||||||||||||||||||||||||||||||||||||||
| Net Realized and | Distributions | Ratio of Expenses to Average Net Assets | Ratio of | |||||||||||||||||||||||||||||||||||||||||||||||||||||||||||||
| Net Asset Value, Beginning of Period | Net Investment Income (Loss) | Unrealized Gain (Loss) on Investments and Foreign Currency | Total from Investment Operations | Distributions from Net Investment Income | from Net Realized Gain on Investments and Foreign Currency | Distributions from Return of Capital | Total Distributions | Shareholder Redemption Fees | Net Asset Value, End of Period | Total Return | Net Assets, End of Period (in thousands) | Prior to Fee Waivers and Balance Credits | Prior to Fee Waivers | Net of Fee Waivers | Net Investment Income (Loss) to Average Net Assets | Portfolio Turnover Rate | ||||||||||||||||||||||||||||||||||||||||||||||||
| Royce International Micro-Cap Fund – Service Class g | ||||||||||||||||||||||||||||||||||||||||||||||||||||||||||||||||
| †2012 | $ | 7.72 | $ | 0.11 | $ | 0.21 | $ | 0.32 | $ | – | $ | – | $ | – | $ | – | $ | – | $ | 8.04 | 4.15 | %1 | $ | 3,924 | 4.08 | %2 | 4.08 | %2 | 1.69 | %2 | 2.51 | %2 | 34 | % | ||||||||||||||||||||||||||||||
| 2011 | 10.00 | 0.10 | (2.26 | ) | (2.16 | ) | (0.12 | ) | – | (0.01 | ) | (0.13 | ) | 0.01 | 7.72 | (21.51 | )1 | 3,572 | 3.92 | 2 | 3.92 | 2 | 1.69 | 2 | 1.08 | 2 | 71 | |||||||||||||||||||||||||||||||||||||
| Royce International Premier Fund – Service Class g | ||||||||||||||||||||||||||||||||||||||||||||||||||||||||||||||||
| †2012 | $ | 8.26 | $ | 0.09 | $ | 0.62 | $ | 0.71 | $ | – | $ | – | $ | – | $ | – | $ | – | $ | 8.97 | 8.60 | %1 | $ | 3,917 | 3.73 | %2 | 3.73 | %2 | 1.69 | %2 | 1.98 | %2 | 38 | % | ||||||||||||||||||||||||||||||
| 2011 | 10.00 | 0.05 | (1.73 | ) | (1.68 | ) | (0.06 | ) | (0.00 | ) | (0.01 | ) | (0.07 | ) | 0.01 | 8.26 | (16.75 | )1 | 4,090 | 3.77 | 2 | 3.77 | 2 | 1.69 | 2 | 0.67 | 2 | 42 | ||||||||||||||||||||||||||||||||||||
| † | Six months ended June 30, 2012 (unaudited). |
| a | The Fund commenced operations on January 3, 2007. |
| b | The Class commenced operations on September 1, 2010. |
| c | The Class commenced operations on January 3, 2007. |
| d | The Class commenced operations on May 2, 2011. |
| e | The Class commenced operations on March 21, 2012. |
| f | The Fund commenced operations on July 1, 2008. |
| g | The Fund commenced operations on January 3, 2011. |
| 1 | Not annualized |
| 2 | Annualized |
| THE ACCOMPANYING NOTES ARE AN INTEGRAL PART OF THESE FINANCIAL STATEMENTS. | The Royce Funds 2012 Semiannual Report to Shareholders | 41 |
| Notes to Financial Statements (unaudited) |
| Royce International Smaller-Companies Fund | 12 | % | Royce International Micro-Cap Fund | 37 | % | |||
| Royce Global Dividend Value Fund | 12 | % | Royce International Premier Fund | 31 | % |
Securities are valued as of the close of trading on the New York Stock Exchange (NYSE) (generally 4:00 p.m. Eastern time) on the valuation date. Securities that trade on an exchange, and securities traded on Nasdaq’s Electronic Bulletin Board, are valued at their last reported sales price or Nasdaq official closing price taken from the primary market in which each security trades or, if no sale is reported for such day, at their bid price. Other over-the-counter securities for which market quotations are readily available are valued at their highest bid price, except in the case of some bonds and other fixed income securities which may be valued by reference to other securities with comparable ratings, interest rates and maturities, using established independent pricing services. The Funds value their non-U.S. dollar denominated securities in U.S. dollars daily at the prevailing foreign currency exchange rates as quoted by a major bank. Securities for which market quotations are not readily available are valued at their fair value in accordance with the provisions of the 1940 Act, under procedures approved by the Fund’s Board of Trustees, and are reported as Level 3 securities. As a general principle, the fair value of a security is the amount which the Fund might reasonably expect to receive for the security upon its current sale. However, in light of the judgment involved in fair valuations, there can be no assurance that a fair value assigned to a particular security will be the amount which the Fund might be able to receive upon its current sale. In addition, if, between the time trading ends on a particular security and the close of the customary trading session on the NYSE, events occur that are significant and may make the closing price unreliable, a Fund may fair value the security. The Funds use an independent pricing service to provide fair value estimates for relevant non-U.S. equity securities on days when the U.S. market volatility exceeds a certain threshold. This pricing service uses proprietary correlations it has developed between the movement of prices of non-U.S. equity securities and indices of U.S.-traded securities, futures contracts and other indications to estimate the fair value of relevant non-U.S. securities. When fair value pricing is employed, the prices of securities used by a Fund may differ from quoted or published prices for the same security. Investments in money market funds are valued at net asset value per share.
| Level 1 | – quoted prices in active markets for identical securities. | |
| Level 2 | – other significant observable inputs (including quoted prices for similar securities, foreign securities that may be fair valued and repurchase agreements). The table below includes all Level 2 securities. Any Level 2 securities with values based on quoted prices for similar securities would be noted in the Schedules of Investments. | |
| Level 3 | – significant unobservable inputs (including last trade price before trading was suspended, or at a discount thereto for lack of marketability or otherwise, market price information regarding other securities, information received from the company and/or published documents, including SEC filings and financial statements, or other publicly available information). |
| Level 1 | Level 2 | Level 3 | Total | ||||||||||||
| Royce European Smaller-Companies Fund | |||||||||||||||
| Common Stocks | $ | – | $ | 13,886,315 | $ | – | $ | 13,886,315 | |||||||
| Cash Equivalents | – | 1,090,000 | – | 1,090,000 | |||||||||||
| Royce Global Value Fund | |||||||||||||||
| Common Stocks | 59,870,196 | 212,779,077 | 248,842 | 272,898,115 | |||||||||||
| Cash Equivalents | 8,677,163 | 23,900,000 | – | 32,577,163 | |||||||||||
| 42 | The Royce Funds 2012 Semiannual Report to Shareholders |
| Valuation of Investments (continued): | ||||||||||||
| Level 1 | Level 2 | Level 3 | Total | |||||||||
| Royce International Smaller-Companies Fund | ||||||||||||
| Common Stocks | $ | 1,298,020 | $ | 20,560,158 | $ | 15,157 | $ | 21,873,335 | ||||
| Cash Equivalents | – | 1,204,000 | – | 1,204,000 | ||||||||
| Royce Global Dividend Value Fund | ||||||||||||
| Common Stocks | 548,795 | 5,179,877 | – | 5,728,672 | ||||||||
| Royce International Micro-Cap Fund | ||||||||||||
| Common Stocks | 172,644 | 3,569,428 | 7,480 | 3,749,552 | ||||||||
| Cash Equivalents | – | 157,000 | – | 157,000 | ||||||||
| Royce International Premier Fund | ||||||||||||
| Common Stocks | 54,006 | 3,367,356 | – | 3,421,362 | ||||||||
| Cash Equivalents | – | 369,000 | – | 369,000 | ||||||||
Level 3 Reconciliation: | ||||||||||||
| Realized and | ||||||||||||
| Balance as of | Unrealized | Balance as of | ||||||||||
| 12/31/11 | Gain (Loss)1 | 6/30/12 | ||||||||||
| Royce Global Value Fund | ||||||||||||
Common Stocks | $ | 626,722 | $ | (377,880 | ) | $ | 248,842 | |||||
| Royce International Smaller-Companies Fund | ||||||||||||
Common Stocks | 38,173 | (23,016 | ) | 15,157 | ||||||||
| Royce International Micro-Cap Fund | ||||||||||||
Common Stocks | 10,717 | (3,237 | ) | 7,480 | ||||||||
| 1 | The net change in unrealized appreciation (depreciation) is included in the accompanying Statement of Operations. Change in unrealized appreciation (depreciation) includes net unrealized appreciation (depreciation) resulting from changes in investment values during the reporting period and the reversal of previously recorded unrealized appreciation (depreciation) when gains or losses are realized. Net realized gain (loss) from investments and foreign currency transactions is included in the accompanying Statement of Operations. |
Repurchase Agreements:
The Funds may enter into repurchase agreements with institutions that the Funds’ investment adviser has determined are creditworthy. Each Fund restricts repurchase agreements to maturities of no more than seven days. Securities pledged as collateral for repurchase agreements, which are held until maturity of the repurchase agreements, are marked-to-market daily and maintained at a value at least equal to the principal amount of the repurchase agreement (including accrued interest). Repurchase agreements could involve certain risks in the event of default or insolvency of the counter-party, including possible delays or restrictions upon the ability of each Fund to dispose of its underlying securities.
Foreign Currency:
Net realized foreign exchange gains or losses arise from sales and maturities of short-term securities, sales of foreign currencies, expiration of currency forward contracts, currency gains or losses realized between the trade and settlement dates on securities transactions, and the difference between the amounts of dividends, interest, and foreign withholding taxes recorded on each Fund’s books and the U.S. dollar equivalent of the amounts actually received or paid. Net unrealized foreign exchange gains and losses arise from changes in the value of assets and liabilities, including investments in securities at the end of the reporting period, as a result of changes in foreign currency exchange rates.
Securities Lending:
The Funds loan securities through a lending agent to qualified institutional investors for the purpose of realizing additional income. Collateral for the Funds on all securities loaned is accepted in cash and cash equivalents and invested temporarily by the custodian. The collateral maintained is at least 100% of the current market value of the loaned securities. The market value of the loaned securities is determined at the close of business of the Funds and any additional required collateral is delivered to the Funds on the next business day. The Funds retain the risk of any loss on the securities on loan as well as incurring the potential loss on investments purchased with cash collateral received for securities lending. The Funds’ securities lending income consists of the income earned on investing cash collateral, plus any premium payments received for lending certain securities, less any rebates paid to borrowers and lending agent fees associated with the loan. The lending agent is not affiliated with Royce.
As qualified regulated investment companies under Subchapter M of the Internal Revenue Code, the Funds are not subject to income taxes to the extent that each Fund distributes substantially all of its taxable income for its fiscal year.
| The Royce Funds 2012 Semiannual Report to Shareholders | 43 |
| Notes to Financial Statements (unaudited) (continued) |
| Capital Share Transactions (in dollars): | ||||||||||||||||||||||||||||||||
| Shares issued for | Net increase (decrease) from | |||||||||||||||||||||||||||||||
| Shares sold | reinvestment of distributions | Shares redeemed | capital share transactions | |||||||||||||||||||||||||||||
| Period ended | Period ended | Period ended | Period ended | |||||||||||||||||||||||||||||
| 6/30/12 | Period ended | 6/30/12 | Period ended | 6/30/12 | Period ended | 6/30/12 | Period ended | |||||||||||||||||||||||||
| (unaudited) | 12/31/11 | (unaudited) | 12/31/11 | (unaudited) | 12/31/11 | (unaudited) | 12/31/11 | |||||||||||||||||||||||||
| Royce European Smaller-Companies Fund | ||||||||||||||||||||||||||||||||
Service Class | $ | 2,059,170 | $ | 13,766,916 | $ | – | $ | 184,460 | $ | (4,185,063 | ) | $ | (8,199,685 | ) | $ | (2,125,893 | ) | $ | 5,751,691 | |||||||||||||
| Royce Global Value Fund | ||||||||||||||||||||||||||||||||
Investment Class | 68,962,213 | 458,023,470 | – | 1,438,187 | (37,781,129 | ) | (252,329,147 | ) | 31,181,084 | 207,132,510 | ||||||||||||||||||||||
Service Class | 25,886,404 | 179,708,594 | – | 771,935 | (40,429,958 | ) | (160,663,577 | ) | (14,543,554 | ) | 19,816,952 | |||||||||||||||||||||
Consultant Class | 4,161,791 | 24,267,972 | – | 99,255 | (1,730,501 | ) | (1,410,223 | ) | 2,431,290 | 22,957,004 | ||||||||||||||||||||||
R Class | 65,079 | – | – | 65,079 | ||||||||||||||||||||||||||||
K Class | 42,371 | – | – | 42,371 | ||||||||||||||||||||||||||||
| Royce International Smaller-Companies Fund | ||||||||||||||||||||||||||||||||
Service Class | 6,563,373 | 17,672,503 | – | 1,683,837 | (4,230,210 | ) | (11,178,727 | ) | 2,333,163 | 8,177,613 | ||||||||||||||||||||||
| Royce Global Dividend Value Fund | ||||||||||||||||||||||||||||||||
Service Class | 881,482 | 8,402,077 | 31,262 | 55,187 | (1,552,941 | ) | (997,874 | ) | (640,197 | ) | 7,459,390 | |||||||||||||||||||||
| Royce International Micro-Cap Fund | ||||||||||||||||||||||||||||||||
Service Class | 729,024 | 8,027,605 | – | 65,597 | (497,075 | ) | (2,827,810 | ) | 231,949 | 5,265,392 | ||||||||||||||||||||||
| Royce International Premier Fund | ||||||||||||||||||||||||||||||||
Service Class | 529,980 | 5,928,422 | – | 33,706 | (1,053,900 | ) | (797,046 | ) | (523,920 | ) | 5,165,082 | |||||||||||||||||||||
| 44 | The Royce Funds 2012 Semiannual Report to Shareholders |
| Capital Share Transactions (in shares): | ||||||||||||||||||||||||||||||||
| Shares issued for | Net increase (decrease) in | |||||||||||||||||||||||||||||||
| Shares sold | reinvestment of distributions | Shares redeemed | shares outstanding | |||||||||||||||||||||||||||||
| Period ended | Period ended | Period ended | Period ended | |||||||||||||||||||||||||||||
| 6/30/12 | Period ended | 6/30/12 | Period ended | 6/30/12 | Period ended | 6/30/12 | Period ended | |||||||||||||||||||||||||
| (unaudited) | 12/31/11 | (unaudited) | 12/31/11 | (unaudited) | 12/31/11 | (unaudited) | 12/31/11 | |||||||||||||||||||||||||
| Royce European Smaller-Companies Fund | ||||||||||||||||||||||||||||||||
Service Class | 217,093 | 1,255,164 | – | 21,524 | (448,485 | ) | (828,541 | ) | (231,392 | ) | 448,147 | |||||||||||||||||||||
| Royce Global Value Fund | ||||||||||||||||||||||||||||||||
Investment Class | 5,454,272 | 31,068,356 | – | 119,550 | (3,030,978 | ) | (19,622,886 | ) | 2,423,294 | 11,565,020 | ||||||||||||||||||||||
Service Class | 2,011,294 | 12,306,022 | – | 64,008 | (3,206,539 | ) | (11,710,844 | ) | (1,195,245 | ) | 659,186 | |||||||||||||||||||||
Consultant Class | 324,213 | 1,694,955 | – | 8,264 | (144,559 | ) | (116,145 | ) | 179,654 | 1,587,074 | ||||||||||||||||||||||
R Class | 6,902 | – | – | 6,902 | ||||||||||||||||||||||||||||
K Class | 4,237 | – | – | 4,237 | ||||||||||||||||||||||||||||
| Royce International Smaller-Companies Fund | ||||||||||||||||||||||||||||||||
Service Class | 624,754 | 1,481,538 | – | 173,413 | (415,286 | ) | (980,107 | ) | 209,468 | 674,844 | ||||||||||||||||||||||
| Royce Global Dividend Value Fund | ||||||||||||||||||||||||||||||||
Service Class | 94,378 | 838,658 | 3,473 | 6,354 | (171,541 | ) | (113,895 | ) | (73,690 | ) | 731,117 | |||||||||||||||||||||
| Royce International Micro-Cap Fund | ||||||||||||||||||||||||||||||||
Service Class | 84,803 | 799,332 | – | 8,378 | (59,522 | ) | (344,791 | ) | 25,281 | 462,919 | ||||||||||||||||||||||
| Royce International Premier Fund | ||||||||||||||||||||||||||||||||
Service Class | 58,537 | 583,848 | – | 4,017 | (117,045 | ) | (92,567 | ) | (58,508 | ) | 495,298 | |||||||||||||||||||||
| Annual contractual | Committed net annual | Period ended | ||||||||||||||||||||||||||||||
| advisory fee as a | operating expense ratio cap | June 30, 2012 | ||||||||||||||||||||||||||||||
| percentage of | Investment | Service | Consultant | Net advisory | Advisory | |||||||||||||||||||||||||||
| average net assets1 | Class2 | Class2 | Class2 | R Class2 | K Class2 | fees | fees waived | |||||||||||||||||||||||||
Royce European Smaller-Companies Fund | 1.25 | % | N/A | 1.69 | % | N/A | N/A | N/A | $ | 62,654 | $ | 38,228 | ||||||||||||||||||||
Royce Global Value Fund | 1.25 | % | N/A | 1.69 | % | 2.44 | % | 1.99 | % | 1.74 | % | 1,946,198 | – | |||||||||||||||||||
Royce International Smaller-Companies Fund | 1.25 | % | N/A | 1.69 | % | N/A | N/A | N/A | 97,584 | 48,689 | ||||||||||||||||||||||
Royce Global Dividend Value Fund | 1.25 | % | N/A | 1.69 | % | N/A | N/A | N/A | 3,631 | 37,857 | ||||||||||||||||||||||
Royce International Micro-Cap Fund | 1.30 | % | N/A | 1.69 | % | N/A | N/A | N/A | – | 26,429 | ||||||||||||||||||||||
Royce International Premier Fund | 1.25 | % | N/A | 1.69 | % | N/A | N/A | N/A | – | 25,319 | ||||||||||||||||||||||
| 1 | From a base annual rate of 1.25% (1.30% for Royce International Micro-Cap Fund), the annual rates of investment advisory fees payable by each of the Funds, are reduced by the indicated amount at the following breakpoints applicable to a Fund’s net assets in excess of $2 billion: more than $2 billion to $4 billion - .05% per annum; more than $4 billion to $6 billion - .10% per annum; over $6 billion - .15% per annum. |
| 2 | Committed net annual operating expense ratio cap excludes acquired fund fees and expenses. |
| Period ended June 30, 2012 | ||||||||||||
| Annual contractual distribution fee as | Net distribution | Distribution fees | ||||||||||
| a percentage of average net assets | fees | waived | ||||||||||
| Royce European Smaller-Companies Fund – Service Class | 0.25 | % | $ | 20,177 | $ | – | ||||||
| Royce Global Value Fund – Service Class | 0.25 | % | 160,218 | – | ||||||||
| Royce Global Value Fund – Consultant Class | 1.00 | % | 107,153 | – | ||||||||
| Royce Global Value Fund – R Class | 0.50 | % | 55 | – | ||||||||
| Royce Global Value Fund – K Class | 0.25 | % | 27 | – | ||||||||
| Royce International Smaller-Companies Fund – Service Class | 0.25 | % | 29,255 | – | ||||||||
| Royce Global Dividend Value Fund – Service Class | 0.25 | % | 8,298 | – | ||||||||
| Royce International Micro-Cap Fund – Service Class | 0.25 | % | 4,880 | 203 | ||||||||
| Royce International Premier Fund – Service Class | 0.25 | % | 4,456 | 608 | ||||||||
| The Royce Funds 2012 Semiannual Report to Shareholders | 45 |
| Notes to Financial Statements (unaudited) (continued) |
| Purchases | Sales | Purchases | Sales | |||||||||||||||||
| Royce European Smaller- | Royce Global Dividend Value Fund | $ | 510,949 | $ | 1,054,633 | |||||||||||||||
Companies Fund | $ | 1,478,578 | $ | 3,968,171 | Royce International Micro- | |||||||||||||||
| Royce Global Value Fund | 53,889,191 | 48,605,889 | Cap Fund | 1,414,394 | 1,300,992 | |||||||||||||||
| Royce International Smaller- | Royce International Premier Fund | 1,436,124 | 2,333,509 | |||||||||||||||||
Companies Fund | 6,709,832 | 4,298,007 | ||||||||||||||||||
| Transfer | Expenses | |||||||||||||||||||||||||||
| Net | Agent | Reimbursed by | ||||||||||||||||||||||||||
| Distribution | Shareholder | Shareholder | Balance | Investment | ||||||||||||||||||||||||
| Fees | Servicing | Reports | Registration | Credits | Total | Adviser | ||||||||||||||||||||||
| Royce Global Value Fund – Investment Class | $ | – | $ | 73,297 | $ | 12,927 | $ | 14,007 | $ | (6 | ) | $ | 100,225 | $ | 38,297 | |||||||||||||
| Royce Global Value Fund – Service Class | 160,218 | 109,633 | 34,674 | 14,177 | (48 | ) | 318,654 | 108,807 | ||||||||||||||||||||
| Royce Global Value Fund – Consultant Class | 107,153 | 6,996 | 3,958 | 9,919 | (6 | ) | 128,020 | 12,576 | ||||||||||||||||||||
| Royce Global Value Fund – R Class | 55 | 4,001 | 31 | 563 | – | 4,650 | 4,577 | |||||||||||||||||||||
| Royce Global Value Fund – K Class | 27 | 3,928 | 30 | 563 | – | 4,548 | 4,504 | |||||||||||||||||||||
| 267,453 | 197,855 | 51,620 | 39,229 | (60 | ) | 168,761 | ||||||||||||||||||||||
| Net Unrealized | ||||||||||||||||
| Appreciation | Gross Unrealized | |||||||||||||||
| Tax Basis Cost | (Depreciation) | Appreciation | Depreciation | |||||||||||||
| Royce European Smaller-Companies Fund | $ | 16,574,194 | $ | (1,597,879 | ) | $ | 1,154,300 | $ | 2,752,179 | |||||||
| Royce Global Value Fund | 382,943,706 | (77,468,428 | ) | 7,968,157 | 85,436,585 | |||||||||||
| Royce International Smaller-Companies Fund | 24,343,724 | (1,266,389 | ) | 1,899,752 | 3,166,141 | |||||||||||
| Royce Global Dividend Value Fund | 6,623,002 | (894,330 | ) | 353,127 | 1,247,457 | |||||||||||
| Royce International Micro-Cap Fund | 4,676,126 | (769,574 | ) | 155,586 | 925,160 | |||||||||||
| Royce International Premier Fund | 4,078,863 | (288,501 | ) | 167,924 | 456,425 | |||||||||||
| 46 | The Royce Funds 2012 Semiannual Report to Shareholders |
| Understanding Your Fund’s Expenses (unaudited) |
Hypothetical Example for Comparison Purposes
The second part of the table below provides information about hypothetical account values and hypothetical expenses based on the Fund’s actual expense ratio and an assumed rate of return of 5% per year before expenses, which is not the Fund’s actual return. The hypothetical account values and expenses may not be used to estimate the actual ending account balance or expenses you paid for the period. You may use this information to compare the ongoing costs of investing in the Fund and other funds. To do so, compare this 5% hypothetical example with the 5% hypothetical examples that appear in the shareholder reports of the other funds.
Please note that the expenses shown in the table are meant to highlight your ongoing costs only and do not reflect any transactional costs, such as sales charges (loads), redemption fees, or exchange fees. Therefore, this section is useful in comparing ongoing costs only, and will not help you determine the relative total costs of owning different funds. In addition, if these transactional costs were included, your costs would have been higher.
| Actual | Hypothetical (5% per year return before expenses) | |||||||||||||||||||||||||||
| Beginning | Ending | Expenses Paid | Beginning | Ending | Expenses Paid | Annualized | ||||||||||||||||||||||
| Account Value | Account Value | During the | Account Value | Account Value | During the | Expense | ||||||||||||||||||||||
| 1/1/12 | 6/30/12 | Period1 | 1/1/12 | 6/30/12 | Period1 | Ratio2 | ||||||||||||||||||||||
| Investment Class | ||||||||||||||||||||||||||||
| Royce Global Value Fund | $ | 1,000.00 | $ | 998.30 | $ | 7.15 | $ | 1,000.00 | $ | 1,017.70 | $ | 7.22 | 1.44 | % | ||||||||||||||
| Service Class | ||||||||||||||||||||||||||||
| Royce European Smaller- | ||||||||||||||||||||||||||||
Companies Fund | 1,000.00 | 1,054.12 | 8.63 | 1,000.00 | 1,016.46 | 8.47 | 1.69 | |||||||||||||||||||||
| Royce Global Value Fund | 1,000.00 | 995.75 | 8.39 | 1,000.00 | 1,016.46 | 8.47 | 1.69 | |||||||||||||||||||||
| Royce International Smaller- | ||||||||||||||||||||||||||||
Companies Fund | 1,000.00 | 1,044.88 | 8.59 | 1,000.00 | 1,016.46 | 8.47 | 1.69 | |||||||||||||||||||||
| Royce Global Dividend | ||||||||||||||||||||||||||||
Value Fund | 1,000.00 | 1,057.72 | 8.65 | 1,000.00 | 1,016.46 | 8.47 | 1.69 | |||||||||||||||||||||
| Royce International Micro- | ||||||||||||||||||||||||||||
Cap Fund | 1,000.00 | 1,041.45 | 8.58 | 1,000.00 | 1,016.46 | 8.47 | 1.69 | |||||||||||||||||||||
| Royce International | ||||||||||||||||||||||||||||
Premier Fund | 1,000.00 | 1,085.96 | 8.77 | 1,000.00 | 1,016.46 | 8.47 | 1.69 | |||||||||||||||||||||
| Consultant Class | ||||||||||||||||||||||||||||
| Royce Global Value Fund | 1,000.00 | 992.31 | 12.09 | 1,000.00 | 1,012.73 | 12.21 | 2.44 | |||||||||||||||||||||
| R Class | ||||||||||||||||||||||||||||
| Royce Global Value Fund | 1,000.00 | 882.00 | 5.17 | 1,000.00 | 1,008.31 | 5.51 | 1.99 | |||||||||||||||||||||
| K Class | ||||||||||||||||||||||||||||
| Royce Global Value Fund | 1,000.00 | 882.00 | 4.52 | 1,000.00 | 1,009.00 | 4.82 | 1.74 | |||||||||||||||||||||
| 1 | Expenses are equal to the Fund’s annualized expense ratio multiplied by the average account value for the period, multiplied by 182 days in the most recent fiscal half-year divided by 366 days (to reflect the half-year period for all funds existing for the full half-year period; Royce Global Value Fund-R Class and Royce Global Value Fund-K Class multiplied by 101 days). |
| 2 | Annualized expense ratio used to derive figures in the table is based on the most recent fiscal half-year. |
| The Royce Funds 2012 Semiannual Report to Shareholders | 47 |
| Board Approval of Investment Advisory Agreement |
At meetings held on June 6-7, 2012, The Royce Fund’s Board of Trustees, including all of the non-interested trustees, approved the continuance of the Investment Advisory Agreements between Royce & Associates, LLC (“R&A”) and The Royce Fund relating to each of Royce Global Value Fund, Royce European Smaller-Companies Fund, Royce International Smaller-Companies Fund, Royce International Micro-Cap Fund, Royce International Premier Fund and Royce Global Dividend Value Fund (the “Funds”). In reaching these decisions, the Board reviewed, among other things, information prepared internally by R&A and independently by Morningstar Associates, LLC (“Morningstar”) containing detailed expense ratio and investment performance comparisons for each Fund with other mutual funds in their “peer group” and “category”, information regarding the past performance of the Funds and other registered investment companies managed by R&A and a memorandum outlining the legal duties of the Board prepared by independent counsel to the non-interested trustees. R&A also provided the trustees with an analysis of its profitability with respect to providing investment advisory services to each Fund. In addition, the Board took into account information furnished throughout the year at regular Board meetings, including reports on investment performance, shareholder services, distribution fees and expenses, regulatory compliance, brokerage commissions and research, brokerage and other execution products and services provided to the Funds. The Board also considered other matters they deemed important to the approval process such as allocation of Fund brokerage commissions, “soft dollar” research services R&A receives, payments made to R&A or its affiliates relating to distribution of Fund shares and other direct and indirect benefits to R&A and its affiliates from their relationship with the Funds. The trustees also met throughout the year with investment advisory personnel from R&A. The Board, in its deliberations, recognized that, for many of the Funds’ shareholders, the decision to purchase Fund shares included a decision to select R&A as the investment adviser and that there was a strong association in the minds of Fund shareholders between R&A and each of the Funds. In considering factors relating to the approval of the continuance of the Investment Advisory Agreements, the non-interested trustees received assistance and advice from, and met separately with, their independent counsel. While the Investment Advisory Agreements for the Funds were considered at the same meetings, the trustees dealt with each agreement separately. Among other factors, the trustees considered the following:
The nature, extent and quality of services provided by R&A:
The trustees considered the following factors to be of fundamental importance to their consideration of whether to approve the continuance of the Funds’ Investment Advisory Agreements: (i) R&A’s more than 35 years of value investing experience and track record; (ii) the history of long-tenured R&A portfolio managers managing many of the Funds; (iii) R&A’s focus on mid-cap, small-cap and micro-cap value investing; (iv) the consistency of R&A’s approach to managing the Funds over more than 35 years; (v) the integrity and high ethical standards adhered to at R&A; (vi) R&A’s specialized experience in the area of trading small- and micro-cap securities; (vii) R&A’s historical ability to attract and retain portfolio management talent; and (viii) R&A’s focus on shareholder interests as exemplified by capping expenses on smaller funds, closing funds to new investors when R&A believed such closings were in the best interests of existing shareholders, establishing breakpoints for a number of funds and providing expansive shareholder reporting and communications. The trustees reviewed the services that R&A provides to the Funds, including, but not limited to, managing each Fund’s investments in accordance with the stated policies of each Fund. The Board considered the fact that R&A provided certain administrative services to the Funds at cost pursuant to the Administration Agreement between the Funds and R&A which went into effect on January 1, 2008. The trustees determined that the services to be provided to each Fund by R&A would be the same as those it previously provided to the Funds. They also took into consideration the histories, reputations and backgrounds of R&A’s portfolio managers for Funds, finding that these would likely have an impact on the continued success of the Funds. Lastly, the trustees noted R&A’s ability to attract and retain quality and experienced personnel. The trustees concluded that the investment advisory services provided by R&A to each Fund compared favorably to services provided by R&A to other R&A client accounts, including other funds, in both nature and quality, and that the scope of services provided by R&A would continue to be suitable for each Fund.
Investment performance of the Funds and R&A:
In light of R&A’s risk-averse approach to investing, the trustees believe that risk-adjusted performance continues to be an appropriate measure of each Fund’s investment performance. One measure of risk-adjusted performance the trustees have historically used in their review of the Funds’ performance is the Sharpe Ratio. The Sharpe Ratio is a risk-adjusted measure of performance developed by Nobel Laureate William Sharpe. It is calculated by dividing a fund’s annualized excess returns by its annualized standard deviation to determine reward per unit of risk. The higher the Sharpe Ratio, the better a fund’s historical risk-adjusted performance. The Board attaches primary importance to risk-adjusted performance over relatively long periods of time, typically three to ten years. Except as described below, all of the Funds with three years or more of performance fell in the 1st or 2nd quartile within their Morningstar categories and the small-cap universe for the three-year and five-year periods ended December 31, 2011. Royce International Smaller-Companies Fund (“RIS”) placed in the middle quintile for the three-year period ended December 31, 2011 within its Morningstar category. In addition to each Fund’s risk–adjusted performance the trustees also reviewed and considered each Fund’s absolute total returns and down market performance. The Board noted that Royce International Micro-Cap (“RMI”), Royce International Premier (“RIP”) and Royce Global Dividend Value (“RGD”) have less than three years of performance. R&A’s general process of investing new funds over time led to higher cash positions and market lagging performance for most of these newer funds in their initial periods of operation.
The trustees noted that R&A manages a number of funds that invest in small-cap and micro-cap issuers, many of which were outperforming their benchmark indexes and their competitors. Although the trustees recognized that past performance is not necessarily an indicator of future results, they found that R&A had the necessary qualifications, experience and track record in managing mid-cap, small-cap and micro-cap securities to manage the Funds. The trustees determined that R&A continued to be an appropriate investment adviser for the Funds and concluded that each of the Funds’ performance supported the continuation of its Investment Advisory Agreement.
| 48 | The Royce Funds 2012 Semiannual Report to Shareholders |
Cost of the services provided and profits realized by R&A from its relationship with each Fund:
The trustees considered the cost of the services provided by R&A and profits realized by R&A from its relationship with each Fund. As part of the analysis, the Board discussed with R&A its methodology in allocating its costs to each Fund and concluded that its allocations were reasonable. The trustees noted that at times R&A had closed certain of the Funds to new investors because of the rate of growth in Fund assets. The trustees concluded that R&A’s profits were reasonable in relation to the nature and quality of services provided.
The extent to which economies of scale would be realized as the Funds grow and whether fee levels would reflect such economies of scale:
The trustees considered whether there have been economies of scale in respect of the management of the Funds, whether the Funds have appropriately benefited from any economies of scale and whether there is potential for realization of any further economies of scale. The trustees noted the time and effort involved in managing portfolios of small- and micro-cap stocks and that they did not involve the same efficiencies as do portfolios of large-cap stocks. The trustees noted that there are breakpoints in the investment advisory fees for the Funds. The trustees concluded that the current fee structure for each Fund was reasonable and that shareholders sufficiently participated in economies of scale.
Comparison of services to be rendered and fees to be paid to those under other investment advisory contracts, such as contracts of the same and other investment advisers or other clients:
The trustees reviewed the investment advisory fee paid by each Fund and compared both the services to be rendered and the fees to be paid under the Investment Advisory Agreements to other contracts of R&A and to contracts of other investment advisers to registered investment companies investing in small- and micro-cap stocks, as provided by Morningstar. The trustees noted the importance of the net expense ratio in measuring a fund’s efficiency, particularly in light of the variations in the mutual fund industry as to who is responsible for which expenses. It was noted that most of Royce European Smaller-Companies Fund’s, Royce Global Value Fund’s and RGD’s peers are in large-cap style boxes per the Morningstar data. The trustees took into consideration that the level of work necessary to invest in small-cap international securities is significantly greater than that necessary to invest in larger-cap securities, noting that the basis point differential in management fees, which give rise to the generally higher expense ratios were appropriate for these Funds. It was also noted that 50% of the peers for RIS, RMI and RIP, as selected by Morningstar, do not have 12b-1 fees. Despite having no 12b-1 fees, they were selected because of their investment market-cap ranges to get comparable smaller-cap funds. Morningstar reports the median 12b-1 fee for these peer groups as 25 basis points because they do not include null values. The average 12b-1 fee for the peer groups is ten basis points, and the 15 basis point difference between that average and the Funds’ 25 basis point 12b-1 fee accounts for the differentials for net expenses for these Funds.
The trustees noted that R&A has waived advisory fees in order to maintain expense ratios at competitive levels and acknowledged R&A’s intention to continue this expense limitation practice. The trustees also considered fees charged by R&A to institutional and other clients and noted that, given the greater levels of services that R&A provides to registered investment companies such as the Funds as compared to other accounts, each of the Fund’s advisory fees compared favorably to these other accounts. It was noted that no single factor was cited as determinative to the decision of the trustees. Rather, after weighing all of considerations and conclusions discussed above, the entire Board, including all the non-interested trustees, determined to approve the continuation of the existing Investment Advisory Agreements, concluding that a contract continuation on the existing terms was in the best interest of the shareholders of each Fund and that each investment advisory fee rate was reasonable in relation to the services provided.
| The Royce Funds 2012 Semiannual Report to Shareholders | 49 |
| Trustees and Officers |
| All Trustees and Officers may be reached c/o The Royce Funds, 745 Fifth Avenue, New York, NY 10151 |
| Charles M. Royce, Trustee1, President |
| Age: 72 | Number of Funds Overseen: 35 | Tenure: Since 1982 |
| Non-Royce Directorships: Director of TICC Capital Corp. |
Principal Occupation(s) During Past Five Years: President, Co-Chief Investment Officer and Member of Board of Managers of Royce & Associates, LLC (“Royce”), the Trust’s investment adviser. |
| Mark R. Fetting, Trustee1 |
| Age: 57 | Number of Funds Overseen: 49 | Tenure: Since 2001 |
Non-Royce Directorships: Director of Legg Mason, Inc.; Director/Trustee of registered investment companies constituting the 14 Legg Mason Funds. |
Principal Occupation(s) During Past 5 Years: President, CEO, Chairman and Director of Legg Mason, Inc. and Chairman of Legg Mason Funds. Mr. Fetting’s prior business experience includes having served as a member of the Board of Managers of Royce; President of all Legg Mason Funds; Senior Executive Vice President of Legg Mason, Inc.; Director and/or officer of various Legg Mason, Inc. affiliates; Division President and Senior Officer of Prudential Financial Group, Inc. and related companies. |
| Patricia W. Chadwick, Trustee |
| Age: 63 | Number of Funds Overseen: 35 | Tenure: Since 2009 |
Non-Royce Directorships: Trustee of ING Mutual Funds and Director of Wisconsin Energy Corp. |
Principal Occupation(s) During Past 5 Years: Consultant and President of Ravengate Partners LLC (since 2000). |
| Richard M. Galkin, Trustee |
| Age: 74 | Number of Funds Overseen: 35 | Tenure: Since 1982 |
| Non-Royce Directorships: None |
Principal Occupation(s) During Past Five Years: Private investor. Mr. Galkin’s prior business experience includes having served as President of Richard M. Galkin Associates, Inc., telecommunications consultants, President of Manhattan Cable Television (a subsidiary of Time, Inc.), President of Haverhills Inc. (another Time, Inc. subsidiary), President of Rhode Island Cable Television and Senior Vice President of Satellite Television Corp. (a subsidiary of Comsat). |
| Stephen L. Isaacs, Trustee |
| Age: 72 | Number of Funds Overseen: 35 | Tenure: Since 1989 |
| Non-Royce Directorships: None |
Principal Occupation(s) During Past Five Years: President of The Center for Health and Social Policy (since September 1996); Attorney and President of Health Policy Associates, Inc., consultants. Mr. Isaacs’s prior business experience includes having served as Director of Columbia University Development Law and Policy Program and Professor at Columbia University (until August 1996). |
| Arthur S. Mehlman, Trustee |
| Age: 70 | Number of Funds Overseen: 49 | Tenure: Since 2004 |
Non-Royce Directorships: Director/Trustee of registered investment companies constituting the 14 Legg Mason Funds. |
Principal Occupation(s) During Past Five Years: Director of The League for People with Disabilities, Inc.; Director of University of Maryland Foundation (non-profits). Formerly: Director of Municipal Mortgage & Equity, LLC (from October 2004 to April 2011); Director of University of Maryland College Park Foundation (non-profit) (from 1998 to 2005); Partner, KPMG LLP (international accounting firm) (from 1972 to 2002); Director of Maryland Business Roundtable for Education (from July 1984 to June 2002). |
| David L. Meister, Trustee |
| Age: 72 | Number of Funds Overseen: 35 | Tenure: Since 1982 |
| Non-Royce Directorships: None |
Principal Occupation(s) During Past Five Years: Consultant. Chairman and Chief Executive Officer of The Tennis Channel (from June 2000 to March 2005). Mr. Meister’s prior business experience includes having served as Chief Executive Officer of Seniorlife.com, a consultant to the communications industry, President of Financial News Network, Senior Vice President of HBO, President of Time-Life Films and Head of Broadcasting for Major League Baseball. |
| G. Peter O’Brien, Trustee |
| Age: 66 | Number of Funds Overseen: 51 | Tenure: Since 2001 |
Non-Royce Directorships: Director/Trustee of registered investment companies constituting the 16 Legg Mason Funds; Director of TICC Capital Corp. |
Principal Occupation(s) During Past Five Years: Trustee Emeritus of Colgate University (since 2005); Board Member of Hill House, Inc. (since 1999); Formerly: Trustee of Colgate University (from 1996 to 2005), President of Hill House, Inc. (from 2001 to 2005) and Managing Director/Equity Capital Markets Group of Merrill Lynch & Co. (from 1971 to 1999). |
| John D. Diederich, Vice President and Treasurer |
| Age: 60 | Tenure: Since 2001 |
Principal Occupation(s) During Past Five Years: Chief Operating Officer, Managing Director and member of the Board of Managers of Royce; Chief Financial Officer of Royce; Director of Administration of the Trust; and President of RFS, having been employed by Royce since April 1993. |
| Jack E. Fockler, Jr., Vice President |
| Age: 53 | Tenure: Since 1995 |
Principal Occupation(s) During Past Five Years: Managing Director and Vice President of Royce, and Vice President of RFS, having been employed by Royce since October 1989. |
| W. Whitney George, Vice President |
| Age: 54 | Tenure: Since 1995 |
Principal Occupation(s) During Past Five Years: Co-Chief Investment Officer, Managing Director and Vice President of Royce, having been employed by Royce since October 1991. |
Daniel A. O’Byrne, Vice President and Assistant Secretary |
| Age: 50 | Tenure: Since 1994 |
Principal Occupation(s) During Past Five Years: Principal and Vice President of Royce, having been employed by Royce since October 1986. |
| John E. Denneen, Secretary and Chief Legal Officer |
| Age: 45 | Tenure: 1996-2001 and Since April 2002 |
Principal Occupation(s) During Past Five Years: General Counsel, Principal, Chief Legal and Compliance Officer and Secretary of Royce; Secretary and Chief Legal Officer of The Royce Funds. |
| Lisa Curcio, Chief Compliance Officer |
| Age: 52 | Tenure: Since 2004 |
Principal Occupation(s) During Past Five Years: Chief Compliance Officer of The Royce Funds (since October 2004) and Compliance Officer of Royce (since June 2004). |
| 1 Interested Trustee. |
Trustees will hold office until their successors have been duly elected and qualified or until their earlier resignation or removal. The Statement of Additional Information, which contains additional information about the Trust’s trustees and officers, is available and can be obtained without charge at www.roycefunds.com or by calling (800) 221-4268. |
| 50 | The Royce Funds 2012 Semiannual Report to Shareholders |
| Notes to Performance and Other Important Information |
The thoughts expressed in this report concerning recent market movements and future prospects for small company stocks are solely the opinion of Royce at June 30, 2012, and, of course, historical market trends are not necessarily indicative of future market movements. Statements regarding the future prospects for particular securities held in the Funds’ portfolios and Royce’s investment intentions with respect to those securities reflect Royce’s opinions as of June 30, 2012 and are subject to change at any time without notice. There can be no assurance that securities mentioned in this report will be included in any Royce-managed portfolio in the future. Sector weightings are determined using the Global Industry Classification Standard (“GICS”). GICS was developed by, and is the exclusive property of, Standard & Poor’s Financial Services LLC (“S&P”) and MSCI Inc. (“MSCI”). GICS is the trademark of S&P and MSCI. “Global Industry Classification Standard (GICS)” and “GICS Direct” are service marks of S&P and MSCI. All indexes referenced are unmanaged and capitalization weighted. Each index’s returns include net reinvested dividends and/or interest income. Russell Investment Group is the source and owner of the trademarks, service marks and copyrights related to the Russell Indexes. Russell® is a trademark of Russell Investment Group. The Russell 2000 is an index of domestic small-cap stocks. It measures the performance of the 2,000 smallest publicly traded U.S. companies in the Russell 3000 Index. The Russell 1000 Index is an index of domestic large-cap stocks. It measures the performance of the 1,000 largest publicly traded U.S. companies in the Russell 3000 Index. The Russell Europe Small Cap Index is an index of European small-cap stocks. The Russell Global Small Cap Index is an index of global small-cap stocks. The Russell Global ex-U.S. Small Cap Index is an index of global small-cap stocks, excluding the United States. The Russell Global ex-U.S. Large-Cap Index is an index of global large-cap stocks, excluding the United States. The S&P 500 is an index of U.S. large-cap stocks selected by Standard & Poor’s based on market size, liquidity and industry grouping, among other factors. The Nasdaq Composite is an index of the more than 3,000 common equities listed on the Nasdaq stock exchange. The MSCI Europe Small Core Index represents the small-cap segment within the developed equity markets in Europe. The MSCI World Small Core Index represents the small-cap segment in the world’s developed equity markets. The MSCI World ex USA Small Core represents these markets excluding the United States. Returns for the market indexes used in this report were based on information supplied to Royce by Russell Investments and MSCI. The CRSP (Center for Research in Security Pricing) equally divides the companies listed on the NYSE into 10 deciles based on market capitalization. Deciles 1-5 represent the largest domestic equity companies and Deciles 6-10 represent the smallest. CRSP then sorts all listed domestic equity companies based on these market cap ranges. By way of comparison, the CRSP 1-5 would have similar capitalization parameters to the S&P 500 Index and the CRSP 6-10 would have similar capitalization parameters to those of the Russell 2000 Index. Royce has not independently verified the above described information. The Sharpe Ratio is calculated for a specified period by dividing a fund’s annualized excess returns by its annualized standard deviation. The higher the Sharpe Ratio, the better the fund’s historical risk-adjusted performance. Standard deviation is a statistical measure within which a fund’s total returns have varied over time. The greater the standard deviation, the greater a fund’s volatility. The Royce Funds is a service mark of The Royce Funds. Distributor: Royce Fund Services, Inc. Investments in securities of micro-cap, small-cap and/or mid-cap companies may involve considerably more risk than investments in securities of larger-cap companies (see “Primary Risks for Fund Investors” in the prospectus). Royce European Smaller-Companies, Global Value, International Smaller-Companies, Global Dividend Value, International Micro-Cap and International Premier Funds may invest a significant portion of their assets in foreign companies which may be subject to different risks than investments in securities of U.S. companies, including adverse political, social, economic or other developments that are unique to a particular country or region. (Please see “Investing in Foreign Securities” in the prospectus.) Therefore, the prices of securities of foreign companies in particular countries or regions may, at times, move in a different direction than those of securities of U.S. companies. (Please see “Primary Risk of Fund Investors” in the prospectus.) Please read the prospectus carefully before investing or sending money. A copy of the Funds’ current prospectus and Statement of Additional Information may be obtained by calling (800) 221-4268, or by visiting www.roycefunds.com. All publicly released material Fund information is disclosed by the Funds on their website at www.roycefunds.com. |
| Forward-Looking Statements | |
This material contains forward-looking statements within the meaning of the Securities Exchange Act of 1934, as amended (the “Exchange Act”), that involve risks and uncertainties, including, among others, statements as to: | |
| • | the Funds’ future operating results, |
| • | the prospects of the Funds’ portfolio companies, |
| • | the impact of investments that the Funds have made or may make, |
| • | the dependence of the Funds’ future success on the general economy and its impact on the companies and industries in which the Funds invest, and |
| • | the ability of the Funds’ portfolio companies to achieve their objectives. |
This review and report use words such as “anticipates,” “believes,” “expects,” “future,” “intends,” and similar expressions to identify forward-looking statements. Actual results may differ materially from those projected in the forward-looking statements for any reason. | |
The Royce Funds have based the forward-looking statements included in this review and report on information available to us on the date of the report, and we assume no obligation to update any such forward-looking statements. Although The Royce Funds undertake no obligation to revise or update any forward-looking statements, whether as a result of new information, future events or otherwise, you are advised to consult any additional disclosures that we may make through future shareholder communications or reports. | |
| Proxy Voting | ||
A copy of the policies and procedures that The Royce Funds use to determine how to vote proxies relating to portfolio securities and information regarding how each of The Royce Funds voted proxies relating to portfolio securities during the most recent 12-month period ended June 30 is available, without charge, on The Royce Funds’ website at www.roycefunds.com, by calling (800) 221-4268 (toll-free) and on the website of the Securities and Exchange Commission (“SEC”), at www.sec.gov. | ||
| Form N-Q Filing | ||
The Funds file their complete schedules of investments with the SEC for the first and third quarters of each fiscal year on Form N-Q. The Funds’ Forms N-Q are available on the SEC’s website at www.sec.gov. The Royce Funds’ holdings are also on the Funds’ website approximately 15 to 20 days after each calendar quarter end and remain available until the next quarter’s holdings are posted. The Funds’ Forms N-Q may also be reviewed and copied at the SEC’s Public Reference Room in Washington, D.C. To find out more about this public service, call the SEC at (202) 942-8090. The Funds’ complete schedules of investments are updated quarterly, and are available at www.roycefunds.com. | ||
| The Royce Funds 2012 Semiannual Report to Shareholders | 51 |
This page is intentionally left blank.
| 52 | This page is not part of the 2012 Semiannual Report to Shareholders |
| Is the Business Cycle Dead? |
| “Plus ça change, plus c'est la même chose.” (“The more things change, the more they stay the same.”) —Alphonse Karr |
One striking effect of the financial crisis has been the apparent disappearance of the traditional business cycle. The world’s developed economies—heavily indebted, still deleveraging, and in some cases in the midst of painful austerity—are being supported by periodic and unconventional interventions from increasingly leveraged central banks. The result has been an anemic, albeit steady pace of economic activity marked by fits and starts that are increasingly difficult for investors to interpret. It makes sense, then, that market cycles have followed suit, with equities showing sudden, at times violent, moves that have alternated between strong rallies and steep declines over relatively short periods, each driven by marginal changes in the trajectory of economic expectations. Single-stock correlation remains high due to this uncertainty, with more cyclical market sectors the most disadvantaged. Several factors are at work: Deleveraging associated with the housing bust is a persistent and long-term headwind; personal savings remain elusive; rising commodity prices have affected consumer purchasing power and sentiment; unemployment remains stubbornly high; and, importantly, the primary source of economic stimulus is coming from central bank programs instead of traditional private business investment. As if all this were not enough, there is the backdrop of the sovereign debt crises in Europe and slower growth in the all-important emerging economies, especially China. Interestingly, none of these issues are new. They have been part of the landscape for several years now, and distinct patterns have developed around them that have been repeated in each of the last three years, giving investors the sense that cycles of economic activity have compressed dramatically. Previously marked in years, moves up and down in business momentum are now counted in months, if not weeks. Which leads to two questions: Has the business cycle fundamentally changed? Should traditionally cyclical businesses carry lower multiples as a result? It appears to us that in the short term, the market has answered with a resounding ‘yes.’ Cyclical sectors, such as Industrials, Energy, Technology, and Materials have become increasingly volatile and have borne the brunt of the selling during market downturns.  Within these areas, even high-quality businesses (as measured by balance sheet strength and returns on invested capital) are suffering from the altered preferences of investors who once flocked to the perceived safety of more stable vehicles. Investors continue to abandon equities, gravitating instead toward fixed income securities even as they recognize the inevitable loss of purchasing power that comes with them. Today, it seems that we have a bubble in fear, which is manifesting itself in ways that have our contrarian pulses racing. We are finding what we think are excellent values in currently unpopular pro-cyclical businesses. Cycles have certainly become shorter over the past three years, but we hold the view that these are anomalous times and that the traditional business cycle will reemerge before long. The economy does not yet have sufficient self-sustaining business momentum that will allow it to be weaned off the artificial support currently being provided by central banks. The opportunity from our standpoint lies in looking where others are not while holding fast to our time-tested investment approach governed by absolute standards for valuation and return. In the short term, our interest in cyclical businesses has been putting us out of sync with the return patterns of the market. While unpleasant, it is a by-product of our contrarian nature. In fact, this period is somewhat reminiscent of the late ‘90s when investors were citing the demise of traditional value investing because of the emergence of the internet and the technology revolution. What was then a bubble in greed has become today’s bubble in fear. Investing is a perennially dynamic endeavor requiring both patience and conviction. Those tenets are being sorely tested in the current market. Although business cycles have looked different of late, and the market has been reacting accordingly, our belief is that they will ultimately revert to the mean, benefiting higher-quality companies in cyclical sectors. We take heart from the timeless wisdom of Alphonse Karr, for indeed “the more things change, the more they stay the same.” |
The thoughts in this essay concerning the stock market are solely those of Royce & Associates and, of course, there can be no assurance with regard to future market movements. | |
| This page is not part of the 2012 Semiannual Report to Shareholders |
| |||||||||||||||||||
 | |||||||||||||||||||
About The Royce Funds Wealth Of Experience With approximately $36 billion in total assets under management, Royce & Associates is committed to the same small-company investing principles that have served us well for nearly 40 years. Charles M. Royce, our President and Co-Chief Investment Officer, enjoys one of the longest tenures of any active mutual fund manager. Royce’s investment staff also includes Co-Chief Investment Officer W. Whitney George, 18 Portfolio Managers, five assistant portfolio managers and analysts, and nine traders. Multiple Funds, Common Focus Our goal is to offer both individual and institutional investors the best available smaller-cap portfolios. Unlike a lot of mutual fund groups with broad product offerings, we have chosen to concentrate on smaller-company investing by providing investors with a range of funds that take full advantage of this large and diverse sector. Consistent Discipline Our approach emphasizes paying close attention to risk and maintaining the same discipline, regardless of market movements and trends. The price we pay for a security must be significantly below our appraisal of its current worth. This requires a thorough analysis of the financial and business dynamics of an enterprise, as though we were purchasing the entire company. Co-Ownership Of Funds It is important that our employees and shareholders share a common financial goal; our officers, employees and their families currently have approximately $136 million invested in The Royce Funds. This Review and Report must be accompanied or preceded by a current prospectus for the Funds. Please read the prospectus carefully before investing or sending money. | |||||||||||||||||||
| Contact Us | |||||||||||||||||||
| General Information Additional Report Copies and Prospectus Inquiries (800) 221-4268 | RIA Services Fund Materials and Performance Updates (800) 33-ROYCE (337-6923) | Broker/Dealer Services Fund Materials and Performance Updates (800) 59-ROYCE (597-6923) | Shareholder Services Transactions and Account Inquiries (800) 841-1180 | Royce InfoLine 24-Hour Automated Telephone Service (800) 78-ROYCE (787-6923) |  | ||||||||||||||
|
SEMIANNUAL
REVIEW AND REPORT
TO SHAREHOLDERS
QUALIFIED INVESTOR Royce Select Fund I Royce Select Fund II Royce Global Select Long/Short Fund Royce Enterprise Select Fund Royce Opportunity Select Fund | |||
www.roycefunds.com |  | ||
| Performance and Expenses | Through June 30, 2012 |
| Average Annual Total Returns | ||||||||||||||||||||
| CATEGORY | 10-Year/ | Annual Operating | ||||||||||||||||||
| Fund | Year-to-Date1 | 1-Year | 3-Year | 5-Year | Since Inception(Date) | Expenses | ||||||||||||||
| QUALIFIED INVESTOR | ||||||||||||||||||||
| Royce Select Fund I | 2.78 | % | -7.36 | % | 13.20 | % | 4.09 | % | 10.57 | % | 1.45 | % | ||||||||
| Royce Select Fund II | 5.41 | -6.19 | 11.14 | 2.00 | 5.70 | (6/30/05) | 1.30 | |||||||||||||
| Royce Global Select Long/Short Fund | 3.38 | -16.74 | 14.15 | 2.93 | 9.82 | (6/30/05) | 0.98 | |||||||||||||
| Royce Enterprise Select Fund | 5.77 | 0.13 | 13.67 | n. a. | 3.00 | (9/28/07) | 1.31 | |||||||||||||
| Royce Opportunity Select Fund | 16.75 | -2.14 | n. a. | n. a. | 13.29 | (8/31/10) | 1.16 | |||||||||||||
| Russell 2000 Index | 8.53 | -2.08 | 17.80 | 0.54 | 7.00 | n.a. | ||||||||||||||
| Russell Global Small Cap Index | 6.06 | -11.04 | 12.66 | -2.55 | 8.69 | n.a. | ||||||||||||||
| Russell 2500 Index | 8.31 | -2.29 | 19.06 | 1.18 | 8.01 | n.a. | ||||||||||||||
| Royce Select Fund I’s average annual total return since inception (11/18/98) was 13.07%. | ||||||||||||||||||||
Important Performance, Expense and Risk Information All performance information in this Review and Report reflects past performance, is presented on a total return basis, reflects the reinvestment of distributions, and does not reflect the deduction of taxes that a shareholder would pay on fund distributions or the redemption of fund shares. Past performance is no guarantee of future results. Investment return and principal value of an investment will fluctuate, so that shares may be worth more or less than their original cost when redeemed. Shares redeemed within 365 days of purchase may be subject to a 2% redemption fee, payable to the respective Fund. Redemption fees are not reflected in the performance shown above; if they were, performance would be lower. Current performance may be higher or lower than performance quoted. Current month-end performance may be obtained at www.roycefunds.com. Annual operating expenses reflect each Fund’s total annual operating expenses as of the most current prospectus and include management fees based on 12.5% of their pre-fee, high-watermark total returns in 2011, (+11.60% for Royce Select Fund I, +8.88% for Royce Select Fund II, +6.56% for Royce Global Select Long/Short Fund, +10.40% for Royce Enterprise Select Fund, and +7.68% for Royce Opportunity Select Fund). The management fee can vary significantly from year to year based on the Fund’s performance. For Royce Select Fund II and Royce Opportunity Select Fund, total annual operating expenses included dividends on securities sold short, acquired fund fees and expenses, and interest expense on borrowings. For Royce Global Select Long/Short Fund, total annual operating expenses included dividends on securities sold short and interest expense on borrowing. For Royce Enterprise Select Fund total annual operating expenses included interest expense on borrowings. Actual management fees will depend on each Fund’s future returns. Royce & Associates has contractually agreed to absorb all other operating expenses of each Select Fund, other than acquired fund fees and expenses, dividend expenses relating to any short selling activity and interest expense on borrowings of these Funds. Acquired fund fees and expenses reflect the estimated amount of the fees and expenses incurred indirectly by any applicable Fund through its investments in mutual funds, hedge funds, private equity funds and other investment companies. Investments in securities of micro-cap, small-cap and/or mid-cap companies may involve considerably more risk than investments in securities of larger-cap companies (see “Primary Risks for Fund Investors” in the Prospectus). The Funds may sell securities short which involves selling a security it does not own in anticipation that the security’s price will decline. Short sales present unlimited risk on an individual stock basis since the Funds may be required to buy the security sold short at a time when the security has appreciated in value. Please read the Prospectus carefully before investing or sending money. Russell Investment Group is the source and owner of the trademarks, service marks and copyrights related to the Russell Indexes. Russell® is a trademark of Russell Investment Group. The Russell 2000 Index is an unmanaged, capitalization-weighted index of domestic small-cap stocks. It measures the performance of the 2,000 smallest publicly traded U.S. companies in the Russell 3000 Index. The Russell 2500 Index is an index of domestic small to mid-cap stocks. It includes approximately 2,500 of the smallest securities in the Russell 3000 Index. The Russell Global Small Cap Index is an index of global small-cap stocks. Index returns include net reinvested dividends and/or interest income. Distributor: Royce Fund Services, Inc. |
| This page is not part of the 2012 Semiannual Report to Shareholders |
| Portfolio Characteristics | As of June 30, 2012 |
| Portfolio Composition | ||||||||||
| CATEGORY | Market Cap | Foreign | Portfolio | |||||||
| Fund | Breakdown | Securities | Approach | Volatility | ||||||
| QUALIFIED INVESTOR | ||||||||||
| Royce Select Fund I |  | 0% |  | 35% | Limited | Lower | ||||
| Royce Select Fund II |  | 0% |  | 100% | Limited | Moderate | ||||
| Royce Global Select Long/Short Fund |  | 0% |  | 100% | Limited | Moderate | ||||
| Royce Enterprise Select Fund |  | 0% |  | 35% | Limited | Lower | ||||
| Royce Opportunity Select Fund1 |  | 0% |  | 35% | Limited | — | ||||
Market Cap Breakdown Key:  Micro-Cap Micro-Cap  Small-Cap Small-Cap  Mid-Cap Mid-Cap  Large-Cap Large-Cap |
Investment Universe Micro-Cap: Market Caps up to $750 million Small-Cap: Market Caps between $750 million and $2.5 billion Mid-Cap: Market Caps between $2.5 billion and $15 billion Large-Cap: Market Caps greater than $15 billion Foreign Securities: Foreign securities are those securities that do not trade on a U.S. exchange, trade outside the U.S. and/or are issued by companies that are domiciled outside the U.S. Portfolio Approach Limited: A limited portfolio at Royce is one that either (i) generally invests in no more than 100 companies, and whose top positions generally exceed 2% of net assets, or (ii) invests primarily in a single sector. Volatility Each Fund’s volatility is measured using Morningstar’s Risk Ratio, which measures variations in a fund’s monthly returns, with an emphasis on downside performance. Each Royce Fund’s overall Risk Ratio is a weighted combination of its three-, five- and 10-year scores, if applicable. For Royce Select I, results reflect its score compared with all small-cap objective funds tracked by Morningstar with at least three years of history (369 funds as of 6/30/12). For Royce Global Select Long/Short Fund and Royce Select Fund II all world stock funds with weighted average market-caps of less than $5 billion tracked by Morningstar that have at least three years of history (25 funds as of 6/30/12) are included. For Royce Enterprise Select Fund, all mid-cap stock funds with weighted average market-caps between $750 million and $10 billion tracked by Morningstar that have at least three years of history (403 funds as of 6/30/12 ) are included. We consider funds whose results rank in the top third of the category to have relatively low volatility; those in the middle third to have moderate volatility; and those in the bottom third to have high volatility. |
| This page is not part of the 2012 Semiannual Report to Shareholders | 1 |
| Table of Contents | |
| Semiannual Review | |
| Letter to Our Shareholders | 3 |
| Postscript: Is the Business Cycle Dead? | Inside Back Cover |
| Semiannual Report to Shareholders | 9 |
| The Select Choice—Royce’s Qualified Investor Funds | |
Royce’s Qualified Investor Funds incorporate the same fundamental investment disciplines of our core long-only offerings with added flexibility—the Funds may also short stocks and use leverage. When they choose to, the Funds’ portfolio managers can seek to profit from both positive and negative views of an enterprise that develop out of the normal course of our investment due diligence. This increased investment flexibility provides more efficient use of Royce’s in-depth research process, while also presenting opportunities for an enhanced portfolio. Each Qualified Investor Fund seeks long-term growth of capital and may invest in both long and short positions in equity securities. The long portion of each portfolio is primarily invested in a limited number (generally less than 100) of smaller companies. Short portions may include individual equity securities and pooled investment vehicles, such as ETFs. | |
 | |
| 2 | This page is not part of the 2012 Semiannual Report to Shareholders |
 Charles M. Royce, President We have often stressed the importance of capital preservation in asset management, arguing that not losing money is as critical as making it grow. Implicit in this belief is the idea that capital preservation is mostly synonymous with preserving purchasing power. However, we now find ourselves in a very non-traditional investment environment, an age marked by near-zero interest rates; regular, short-term bursts of volatility for equities; and relentless money printing on the part of the developed world’s central banks. While this has not altered our view of the significance of risk aversion, it has led us to ask if at this moment in history capital preservation and preservation of purchasing power should be defined differently. The answer approaches what we think is one of the most underappreciated risks to which investors are now subject: the potential for meaningful loss in the future purchasing power of investments. Continued on page 4. . . |
| Letter to Our Shareholders |
 |
“I Read the News Today, Oh Boy.” |
Another dismal summer has dawned with spring having brought a wave of worries back to the market for the third consecutive year. Karl Marx—as canny an observer of the global scene as he was a checkered prognosticator of its future—wrote in 1852 that all events in history occur twice: the first time as tragedy, the second as farce. Allowing for the accuracy of this observation, what are we then to make of this third round of wobbly recovery, sluggish markets, panic-stuffed headlines, and the by now reflexive anxiety about the potential horrors of European debt for the world economy? What lies beyond farce, other than lousy returns, high correlation, and growing numbers of investors disenchanted with equities? To this kind of question, too many investors have no answer, having lost not only their belief in the viability of investing in stocks, but also in the prospects for the global economy. Indeed, one unfortunate result of the contagion of uncertainty has been the erosion of confidence in the ability of equities to deliver returns that will beat inflation and build wealth over the long term. On May 7, a USA Today headline asked and answered, “Invest in stocks? Forget About It.” It was not quite as damning as the now infamous Business Week cover from August 1979 that proclaimed “The Death of Equities,” but the overall message was not much happier: “Wall Street’s long-running story about how stocks are the best way to build wealth seems tired, dated and less believable to many individual investors.” And the USA Today piece was published early in May, just before the current bear bit down most sharply. The implicit assumption that the best days for the stock market may be (way) behind it seems to us to be the distinguishing feature of this third round of poor results for most equities. Panic has given way to a shrug of resignation. This stance sees equity investing as a mug’s game, even if the alternatives—Treasuries, bonds, money markets, etc.—are not much more attractive or profitable. Such a belief—as ultimately wrong-headed as we think it is—has the advantage that recent history, as far back as five years, is on its side. With a few exceptions, there is simply not much of a defense for equity investing as a whole since the respective index peaks in 2007. The explanation for why the market has been so troublesome and unprofitable seems simple: The world is still emerging from the most serious economic crisis since the Great Depression. Yet this account may be in equal parts true and unhelpful, at least to anyone who had been looking for a way to safely and effectively grow capital during the last few |
| This page is not part of the 2012 Semiannual Report to Shareholders | 3 |
| With so much attention being paid to preservation of capital, too little has been placed on what that capital, once returned, will actually be worth. For more than three decades, an investment vehicle provided highly consistent returns with such low volatility that they were nearly devoid of risk—U.S. government bonds, specifically Treasury securities. They were the instruments that possessed that highly desired standard, "the risk-free rate of return." The currently volatile investment climate has greatly expanded the appeal of this designation. Investors trying to cope with the economic uncertainty and asset-price volatility caused by the bursting credit bubble have grown increasingly sensitive to the possibilities of capital loss. Yet if history is any proxy—and we believe that it is—a healthy degree of skepticism should greet the notion that Treasuries remain risk free or provide an acceptable rate of return. If nothing else, the lens through which we see them needs to be adjusted to include the growing uncertainty of ultimate purchasing power (of real goods and services) of the currency in which they are denominated. Continued on page 6. . . |
| Letter to Our Shareholders |
years, which helps to explain why panic and resignation are symptoms of the same fatalism that has gripped investors since the early days of the mortgage and banking crisis in 2008. We understand the pessimism and the unwillingness to take risks on the part of so many investors today. At the same time, we still see many of the same positive signs that have been inspiring our confidence about stocks and the economy as a whole since the spring of 2010. By taking the long view (a common perspective for us), we can offer, in addition to a Nostra Culpa for much recent fund performance, the benefit of nearly 40 years of small-cap value investing. Our collective experience tells us that this highly volatile, tightly correlated, range-bound market will be remembered as being as anomalous as it has been painful, one that tends to occur once or twice a century. It does not, in our view, change the fact that stocks remain the single best way of building wealth over the long run. We know that in the current environment these words may sound hollow or even self-serving. We are more than willing to assume that risk in the hope that investors will continue to look to equities (and to our portfolios) as effective and ultimately successful ways to invest in the years to come. |
“They’ve Been Going in and out of Style” |
The kind of dynamic rally that ushered out the first half of 2012 is always guaranteed to raise a smile, even if it could not completely erase earlier losses in the second quarter, losses that spoiled a promising upswing that lasted through most of the year’s opening quarter. Indeed, lack of direction has arguably been the most distinguishing characteristic of the recent market. Still, the major U.S. indexes finished the year-to-date period ended June 30, 2012 in decent condition, as did their overseas counterparts. Domestic small-caps brought up the rear. The Russell 2000 Index was up 8.5% in the first half, compared to respective gains of 9.4% and 9.5% for the large-cap Russell 1000 and S&P 500 Indexes and an electrifying 12.7% for the Nasdaq Composite. It was an interesting road for each index. The first quarter extended a rally that began following the October 2011 lows. Small-cap trailed, though its 12.4% gain was its best opening quarter since 2006. It was also not far behind its large-cap counterparts. The Russell 1000 rose 12.9%, and the S&P 500 gained 12.6%. The Nasdaq was especially impressive, notching an 18.7% increase for the quarter. We were among those hopeful souls who saw a nearly six-month bull run and thought that maybe the market was ready for some consistent recovery. Yet April and May were cruel months, the latter especially so, as the now-traditional spring downturn caused by concerns about European debt and the state of the American and Chinese economies spoiled the party and tamped down returns. (If not for the rally on the final trading day of June, that month would also have been less solidly in the black.) That rally was welcome—they always are—but second-quarter returns were still negative. The Nasdaq led on the downside, falling 5.1%, while the Russell 2000 slipped 3.5%. Large-caps held their value a bit better, with the Russell 1000 losing 3.1% and the S&P 500 declining 2.8%. So the first half concluded with a bang, but still left investors whimpering about the future. Looking at longer-term returns, this uncertainty has been well-earned. While three- and 10-year average annual total returns for the major indexes were solid-to-strong, one-, five-, |
| 4 | This page is not part of the 2012 Semiannual Report to Shareholders |
| and 12-year results for the periods ended June 30, 2012 were generally poor. The 12-year period—not a period that we, or anyone else, usually discusses—is instructive because it encompasses the Internet Bubble, the subsequent recovery, the recession that was followed by the financial crisis, and the market’s herky-jerky, volatile aftermath. So we think it is worth pointing out that for the 12-year period ended December 31, 2011, the average annual total return for the S&P 500 was its lowest since the end of World War II (beginning with the period from the end of 1945 through the end of 1957). Small-cap returns for that same period ended December 31, 2011 for the Russell 2000 and the CRSP 6-10, a small-cap proxy that dates back to the 1920s, were among the worst for both since the launch of the Russell 2000 on December 21, 1978 and since the end of 1945 for the CRSP 6-10. | Our collective experience tells us that this highly volatile, tightly correlated, range-bound market will be remembered as being as anomalous as it has been painful, one that tends to occur once or twice a century. It does not, in our view, change the fact that stocks remain the single best way of building wealth over the long run. | ||
Recent performance for the two non-U.S. indexes that we track followed patterns similar to their domestic cousins, though with more muted results. This was not entirely surprising considering both Europe’s ongoing travails and worries about the pace of growth in China. Non-U.S. small-caps enjoyed an advantage over their large-cap siblings, with the Russell Global ex-U.S. Small Cap up 4.8% for the year-to-date period ended June 30, 2012 versus a 2.7% gain for the Russell Global ex-U.S. Large Cap Index. Both indexes enjoyed strong first-quarter results. The Russell Global ex-U.S. Small Cap Index rose 14.4%, and the Russell Global ex-U.S. Large Cap Index was up 11.5% in the first three months of 2012. Each index’s second quarter was far more difficult, as Europe’s troubles registered more dramatically outside the U.S. Small-cap lost a bit more in the downturn, with the Russell Global ex-U.S. Small Cap Index falling 8.5%, while the Russell Global ex-U.S. Large Cap Index was down 7.9%. | |||
U.S. mid-caps performed well on an absolute basis, though they were behind the domestic micro-cap, small-cap, and large-cap indexes in the first half. The Russell Midcap Index gained 8.0% through the end of June. Like the domestic indexes, they enjoyed a strong first quarter, up 12.9%, before slipping in the second quarter with a loss of 4.4%. Considering both the significant volatility and the unpopularity of stocks, the strength of micro-cap stocks was something of a surprise in the first half. Year-to-date through June 30, 2012, the Russell Microcap Index gained an impressive 13.0%. That the index accomplished this feat with stronger and steadier quarterly performances was equally notable: the Russell Microcap climbed 15.3% in the first quarter and fell only 2.0% in the bearish second. | Our expectation is for a less extreme, more historically normal phase, without so many of the stomach-churning drops followed by equally steep upticks that we saw last summer and fall and have seen so far in 2012. It is worth noting that a more historically normal range is one in which we think our funds can generate strong absolute and relative performance over the long run. | ||
“The Act You’ve Known for all these Years...” If only our own portfolios had done as well. On an absolute basis, the Funds in this Semiannual Review and Report posted results that ranged from uninspiring to strong in the first half. With the exception of Royce Opportunity Select Fund, relative performance was a more significant issue. Normally, this does not trouble us. Long ago, we accepted that our disciplined approaches to stock selection would result in out-of-sync moments against our | |||
| This page is not part of the 2012 Semiannual Report to Shareholders | 5 |
| This risk, one for which we have a healthy respect over the intermediate term, is the ominous combination of ongoing currency debasement and acceleration in inflationary pressures. These could erode the purchasing power of non-productive assets. Central banks around the world, with the U.S. Federal Reserve a primary contributor, have been pumping liquidity into the capital markets through a combination of historically low interest rates and quantitative easing or, more simply stated, money printing. Headline inflation numbers have remained subdued due to the continuing struggles in the labor market and stubbornly weak housing markets, but commodity inflation has been on the rise. With the recent uptick in U.S. leading economic indicators and encouraging signs of stability and improvement in the housing market, it would not take much to see a more broad-based uptick in inflation. So while U.S. government bonds are likely to continue to pay their meager coupons and return principal on schedule, the value of what is being returned to investors will be declining. Continued on page 8. . . |
| Letter to Our Shareholders | ||
portfolios’ respective benchmarks. Our goal has always been strong absolute performance over long-term periods. If we met that standard, then relative results would most likely not be an issue, at least over long-term time spans. We have also been glad to accept the historical trade-off in which underperformance was more common for our Funds during short-term periods of 18 months or less, while outperformance was more typical over full market cycle and other long-term periods of three years or more. For too many time periods ended June 30, 2012, that history has become too exclusively long-term, even for us. Three-year results were fine on an absolute basis in most cases, but trailed on a relative score, while the five-year returns were solid on a relative basis, but underwhelming at best using the absolute standard that we prefer. With significant investments in all of our Funds, we share our investors’ frustrations with recent results. | ||
| 2012 YEAR-TO-DATE TOTAL RETURNS FOR THE ROYCE SELECT FUNDS VS. BENCHMARK INDEXES As of 6/30/12 | ||
 | ||
1 Price and total return information is based on net asset values calculated for shareholder transactions. Certain immaterial adjustments were made to the net assets of Royce Select Fund II at 12/30/11 for financial reporting purposes, and as a result the net asset values for shareholder transactions on that date and the total returns based on those net asset values differ from the adjusted net asset values and total returns reported in the Financial Highlights. | ||
Those areas of the market in which we have seen both high quality and compelling valuations during the last three-to-five years—energy companies in particular—were among the worst performers in the first half, with net losses in some cases stretching back even further. Many of these stocks remain in our portfolios, as their attractive valuations and our ongoing high regard have combined to keep turnover low. In many cases, we have been building, or at least maintaining, positions in those businesses in which we have the highest conviction. As has been our practice since the 1970s, we are keeping our focus on company fundamentals. We seek companies that look capable of surviving adversity and flourishing when their fortunes change. Those that generate free cash via high returns on capital can give investors a return in the form of dividends, take advantage of their low valuation by buying back stock, or make acquisitions to grow their business when organic growth is harder to come by. Strong fundamentals mean these companies have the necessary tools to make it through difficult periods and emerge stronger. | ||
| 6 | This page is not part of the 2012 Semiannual Report to Shareholders |
While many of our recent efforts have not been successful, nothing about the way that we select stocks has changed, including our insistence on rock-solid fundamentals in the companies that we choose. Selectiveness, patience, and discipline remain our watchwords. Getting Better | Through all manner of markets—many of which were thought to establish a “New Normal”—we have never wavered in our convictions. We still believe that equities remain the best way—maybe the only way—to beat inflation and build wealth over the long term. | ||
We do not know how much longer markets and economies will remain so uncertain. The fiscal turmoil that continues to haunt Europe has been hampering equity markets across the globe and contributing to the tight range of returns that have nonetheless demonstrated ample levels of volatility. The fragile recovery here in the U.S. has also played a role, as has the recent deceleration of the Chinese economy. These major macro events, which have been the dominant influence on investors’ behavior over the last three years, largely account for why stocks have struggled to create any direction for longer than a few months. Instead, markets have been mired in a pattern of short-term swings in which they have moved straight up or straight down, and for no longer than a few months at a time. One consequence of this closely correlated, range-bound cycle is that our Funds have not had the time to create the spread that we would usually seek to build through a full market cycle. However, we think that as Europe meets its challenges and as the U.S. begins to get its own fiscal house in order, which is not likely to happen until after the election, we will escape this range and move toward a more lasting upswing. Our expectation is for a less extreme, more historically normal phase, without so many of the stomach-churning drops followed by equally steep upticks that we saw last summer and fall and have seen so far in 2012. It is worth noting that a more historically normal range is one in which we think our funds can generate strong absolute and relative performance over the long run. We would like to think that long-term history is on our side in this assessment. | |||
Good Morning, Good Morning Obviously we would all like to reach a more hospitable market climate soon. As always, patience is critical. Indeed, the ability to be patient is probably the single most important quality that an investor who seeks strong long-term returns can possess. It is easy to talk about the importance of patience and discipline when markets are solid and portfolios are doing well. Yet at some point, these things will change, and both will be tested, as they have been in this market. It has been a very difficult time, but we believe it will pass. When it does, our disciplined approach will remain and, we believe, be effective. | It is easy to talk about the importance of patience and discipline when markets are solid and portfolios are doing well. Yet at some point, these things will change, and both will be tested, as they have been in this market. It has been a very difficult time, but we believe it will pass. When it does, our disciplined approach will remain and, we believe, be effective. | ||
As we approach our 40th anniversary as a firm this coming November, we look back at what we have seen—the “Nifty Fifty” market of the ’70s, Black Friday in the’80s, the first stirrings of the Internet boom in the ’90s, the horrific events of 9/11, our current era of uncertainty, and much, much more. Through all manner of markets—many of which were thought to establish a “New Normal”—we have never wavered in our convictions. | |||
| This page is not part of the 2012 Semiannual Report to Shareholders | 7 |
| For the first time in almost 30 years, we think that investors risk meaningful losses in that portion of their investment portfolio they deem to be the safest. Commodities offer one possible way to protect against the loss of purchasing power caused by currency debasement. Unsurprisingly, however, we prefer assets that are inherently productive and flexible and can adjust quickly to changing pricing environments. To us, investments in quality companies that possess embedded pricing power and high returns on their invested capital look to be some of the best investments to protect, and grow, purchasing power. We believe they need much broader representation in investors’ asset allocation. |
| Letter to Our Shareholders | ||
 | ||
We still believe that equities remain the best way—maybe the only way—to beat inflation and build wealth over the long term. (We also think that equities are capable of beating the fixed income markets over the next five years.) Our guess is that stocks can deliver returns in the mid- to upper-single digits, which we think would be respectable on an absolute basis and, equally important, higher than the rate of inflation. When things are working well, the underlying parts of an equity portfolio, the companies themselves, can act as compounding machines—compounding book value, returns on equity, etc. We are confident that we can create portfolios that can grow commendably, especially in the more historically typical market climate that we believe we will eventually see. | ||
 |  |  |
| Charles M. Royce | W. Whitney George | Jack E. Fockler, Jr. |
| President | Vice President | Vice President |
| July 31, 2012 | ||
| 8 | This page is not part of the 2012 Semiannual Report to Shareholders |
| Table of Contents |
| Semiannual Report to Shareholders | ||||||||||
| Managers’ Discussions of Fund Performance | ||||||||||
| Royce Select Fund I | 10 | |||||||||
| Royce Select Fund II | 12 | |||||||||
| Royce Global Select Long/Short Fund | 14 | |||||||||
| Royce Enterprise Select Fund | 16 | |||||||||
| Royce Opportunity Select Fund | 18 | |||||||||
| Schedules of Investments and Financial Statements | 20 | |||||||||
| Notes to Financial Statements | 36 | |||||||||
| Understanding Your Fund’s Expenses | 40 | |||||||||
| Trustees and Officers | 41 | |||||||||
| Board Approval of Investment Advisory Agreements | 42 | |||||||||
| Notes to Performance and Other Important Information | 44 | |||||||||
| The Royce Funds 2012 Semiannual Report to Shareholders | 9 |
| Royce Select Fund I |
| QUALIFIED INVESTOR Qualified Investor Funds use a performance fee structure with a specific portfolio management style. AVERAGE ANNUAL TOTAL RETURNS | ||||||||||
| Jan-June 20121 | 2.78 | % | ||||||||
| One-Year | -7.36 | |||||||||
| Three-Year | 13.20 | |||||||||
| Five-Year | 4.09 | |||||||||
| 10-Year | 10.57 | |||||||||
| Since Inception (11/18/98) | 13.07 | |||||||||
| ANNUAL EXPENSE RATIO | ||||||||||
| Operating Expenses | 1.45 | % | ||||||||
| 1 Not annualized | ||||||||||
| CALENDAR YEAR TOTAL RETURNS | ||||||||||
| Year | RS1 | Year | RS1 | |||||||
| 2011 | -3.6 | % | 2004 | 19.1 | % | |||||
| 2010 | 18.2 | 2003 | 48.7 | |||||||
| 2009 | 39.6 | 2002 | -15.8 | |||||||
| 2008 | -25.9 | 2001 | 24.5 | |||||||
| 2007 | 10.7 | 2000 | 15.0 | |||||||
| 2006 | 15.0 | 1999 | 35.4 | |||||||
| 2005 | 10.9 | |||||||||
| TOP 10 POSITIONS % of Net Assets | ||||||||||
| Intrepid Potash | 2.7 | % | ||||||||
| Alleghany Corporation | 2.6 | |||||||||
| GrafTech International | 2.5 | |||||||||
| Warnaco Group (The) | 2.5 | |||||||||
| AZZ | 2.4 | |||||||||
| Reliance Steel & Aluminum | 2.3 | |||||||||
| Oil States International | 2.2 | |||||||||
| Helmerich & Payne | 2.2 | |||||||||
| Bio-Rad Laboratories Cl. A | 2.1 | |||||||||
| Tetra Tech | 2.1 | |||||||||
| PORTFOLIO SECTOR BREAKDOWN % of Net Assets | ||||||||||
| Industrials | 22.0 | % | ||||||||
| Information Technology | 19.8 | |||||||||
| Materials | 14.6 | |||||||||
| Energy | 10.4 | |||||||||
| Consumer Discretionary | 10.3 | |||||||||
| Financials | 6.7 | |||||||||
| Health Care | 3.9 | |||||||||
| Consumer Staples | 1.2 | |||||||||
| Cash and Cash Equivalents | 11.1 | |||||||||
 | |||||||||
Manager’s Discussion The first half was somewhat frustrating for the limited portfolio of Royce Select Fund I (RS1). The Fund gained 2.8% for the year-to-date period ended June 30, 2012, trailing the Russell 2000 Index, its small-cap benchmark, which rose 8.5% for the same period. Although the markets have been tightly correlated over the last couple of years, those attributes that we seek for portfolio holdings—strong balance sheets, established records of earnings, the ability to generate free cash flow, and high returns on invested capital—have not been strongly in favor. One consequence of this was that, over the last three quarters, RS1 followed a similar pattern to its benchmark, while underperforming in both up and down markets. The year began on a positive note, extending the rally that began following 2011’s small-cap market low on October 3. The Fund rose 11.5% in the first quarter of 2012, behind the 12.4% rise for the Russell 2000. The bull phase ended, or was at least derailed, on March 26, 2012, just before the end of the first quarter. This made for a markedly bearish second quarter, despite a furious rally on the last day of trading in June. For the third consecutive year, a market rally was rudely interrupted by fears of European defaults and questions about the pace of growth here in the U.S. and in China. During the second quarter, RS1 fell 7.8% (with most of its losses coming in a particularly brutal May) versus a loss of 3.5% for its small-cap benchmark. This was disappointing not only because the Fund underperformed, but also because we take great pride in the portfolio’s historical track record during both down markets and down quarters. Unfortunately, the recent run of risk-on, risk-off behavior has prevented the market from establishing any consistent direction. This was a factor in RS1’s second-quarter slide. Longer-term returns were better on a relative basis and were impressive on an absolute basis for the 10-year and since inception (11/18/98) periods ended June 30, 2012. From the previous small-cap peak on July 13, 2007 through April 29, 2011, the Fund gained 32.9% versus 6.6% for the Russell 2000. From that same peak through June 30, 2012, RS1 climbed 19.3%, while its benchmark managed a slim gain of 0.04%. The Fund outperformed the small-cap index for the five-, 10-year and since inception periods ended June 30, 2012. RS1’s average annual total return since inception was 13.1%. Only three of the Fund’s sectors—Materials, Energy, and Consumer Discretionary—were in negative territory at the end of June, though net losses were modest. At the industry level, | |||||||||
| 10 | The Royce Funds 2012 Semiannual Report to Shareholders |
Performance and Portfolio Review the metals & mining group notched a sizable net loss, which was mitigated somewhat in the Materials sector by a respectable net gain for holdings in the chemicals group. Road & rail stocks were the next-largest detractors at the industry group level. In contrast, the Information Technology sector led all by a comfortable margin, followed by solid contributions from the Financials, Health Care, and Industrials sectors and a smaller net gain from Consumer Staples. In addition to chemicals companies, the electronic equipment & components group, insurance companies, machinery stocks, and life sciences, tools & services businesses all posted net gains in the first half. The Fund’s two most significant detractors came from the otherwise strong Industrials sector. Arkansas Best is a shipping and transport company that has been struggling through a difficult period for its industry, with investors motoring away from its shares as revenues declined. Seeing more attractive opportunities elsewhere, we sold our shares in June. We showed our more positive view of the long-term prospects for top-ten holding GrafTech International, which manufactures synthetic and natural graphite and carbon based products that are used to produce steel, by building our position. The company experienced slowing steel demand and capacity utilization, which may have made its second-half guidance too optimistic. As our investment horizon extends well past the end of 2012, we were comfortable adding shares at what we thought were appealingly low prices. Industrials was the Fund’s largest sector at the end of June. It experienced weakness during the market’s recent risk-off periods, which gave us opportunities to add to existing names. We were most active in those businesses that we believe dominate their market niches, possess global reach, and are poised to benefit not only from the U.S. manufacturing revival, but also from revived industrial activity in developing economies. In addition, we held several asset-light businesses, such as freight forwarders and professional services firms. We began to reduce our position in AZZ during May as its price began to climb. The company makes electrical and industrial products and provides galvanizing services to the steel fabrication industry. Rising revenues and earnings, including earnings for the fiscal first quarter of 2013 that exceeded Wall Street estimates, helped to keep its share price on the move. Valmont Industries—RS1’s eleventh-largest holding at the end of June—produces fabricated metal products, pole and tower structures, and mechanized irrigation systems. The global reach of its core businesses, as well as improving earnings, helped to keep its price on the rise through most of the first half. |
GOOD IDEAS AT THE TIME | |
| Arkansas Best | -0.67% |
| GrafTech International | -0.58 |
| Major Drilling Group International | -0.41 |
| Cliffs Natural Resources | -0.39 |
| Helmerich & Payne | -0.39 |
| 1 Net of dividends | |
 |
| FUND INFORMATION AND PORTFOLIO DIAGNOSTICS | |||
| Fund Net Assets | $48 million | ||
| Number of Holdings | 66 | ||
| Turnover Rate | 29% | ||
| Average Market Capitalization1 | $1,623 million | ||
| Weighted Average P/E Ratio2,3 | 12.4x | ||
| Weighted Average P/B Ratio2 | 1.7x | ||
| U.S. Investments (% of Net Assets) | 79.1% | ||
| Non-U.S. Investments (% of Net Assets) | 9.8% | ||
| Ticker Symbol | RYSFX | ||
| 1 Geometric average | |||
2 Harmonic average | |||
3 The Fund’s P/E calculation excludes companies with zero or negative earnings (2% of portfolio holdings as of 6/30/12). | |||
| MORNINGSTAR STATISTICAL MEASURES1 | |||
| RS1 | Category Median | Best Decile Breakpoint | |
| Sharpe Ratio | 0.26 | 0.11 | 0.24 |
| Standard Deviation | 21.93 | 24.37 | 21.73 |
1 Five years ended 6/30/12. Category Median and Best Decile Breakpoint based on 349 small-cap objective funds (oldest class) with at least five years of history. | |||
| RISK/RETURN COMPARISON Five-Year Period Ended 6/30/12 | |||
| Average Annual Total Return | Standard Deviation | Return Efficiency1 | |
| RS1 | 4.09% | 21.93 | 0.19 |
| Russell 2000 | 0.54 | 24.90 | 0.02 |
1 Return Efficiency is the average annual total return divided by the annualized standard deviation over a designated time period. Please read the prospectus for a more complete discussion of risk. | |||
| DOWN MARKET PERFORMANCE COMPARISON All Down Periods of 7.5% or Greater Over the Last 7 Years, in Percentages(%) | |||
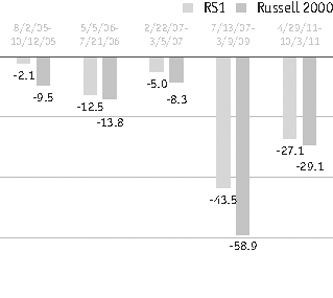 | |||
| The Royce Funds 2012 Semiannual Report to Shareholders | 11 |
| Royce Select Fund II |
| QUALIFIED INVESTOR Qualified Investor Funds use a performance fee structure with a specific portfolio management style. AVERAGE ANNUAL TOTAL RETURNS | ||||||||||
| Jan-June 20121 | 5.41 | % | ||||||||
| One-Year | -6.19 | |||||||||
| Three-Year | 11.14 | |||||||||
| Five-Year | 2.00 | |||||||||
| Since Inception (6/30/05) | 5.70 | |||||||||
| ANNUAL EXPENSE RATIO | ||||||||||
| Operating Expenses | 1.30 | % | ||||||||
| 1 Not Annualized | ||||||||||
| CALENDAR YEAR TOTAL RETURNS | ||||||||||
| Year | RS2 | Year | RS2 | |||||||
| 2011 | -14.0 | % | 2008 | -33.4 | % | |||||
| 2010 | 21.0 | 2007 | -5.5 | |||||||
| 2009 | 66.6 | 2006 | 19.8 | |||||||
| TOP 10 LONG POSITIONS % of Net Assets | ||||||||||
Ancestry.com | 2.9 | % | ||||||||
| Market Vectors Junior Gold Miners ETF | 2.1 | |||||||||
| Teradyne | 2.1 | |||||||||
| Industrea | 2.1 | |||||||||
| RPC | 2.0 | |||||||||
| Sprott | 2.0 | |||||||||
| Benihana | 2.0 | |||||||||
| Hochschild Mining | 1.8 | |||||||||
| Photronics | 1.8 | |||||||||
| Minth Group | 1.8 | |||||||||
| SHORT POSITIONS % of Net Assets | ||||||||||
| Financial Select Sector SPDR Fund | -1.0 | % | ||||||||
| PowerShares QQQ Trust, Series 1 | -0.9 | |||||||||
| LinkedIn Corporation | -0.9 | |||||||||
| Simon Property Group | -0.9 | |||||||||
| iShares Russell Microcap Index Fund | -0.8 | |||||||||
| VF Corporation | -0.8 | |||||||||
iShares Barclays 20+ Year Treasury Bond Fund | -0.4 | |||||||||
| lululemon athletica | -0.3 | |||||||||
| PORTFOLIO SECTOR BREAKDOWN1 % of Net Assets | ||||||||||
| Information Technology | 30.1 | % | ||||||||
| Consumer Discretionary | 18.7 | |||||||||
| Industrials | 12.6 | |||||||||
| Materials | 12.3 | |||||||||
| Energy | 8.4 | |||||||||
| Financials | 7.2 | |||||||||
| Health Care | 1.9 | |||||||||
| Consumer Staples | 1.4 | |||||||||
| Miscellaneous | 3.9 | |||||||||
| Cash and Cash Equivalents | 3.5 | |||||||||
| 1 Long positions only | ||||||||||
 |
Manager’s Discussion Royce Select Fund II (RS2) gained 5.4% for the year-to-date period ended June 30, 2012 versus an 8.5% increase for its domestic small-cap benchmark, the Russell 2000 Index, and a 6.1% rise for its global small-cap benchmark, the Russell Global Small Cap Index, for the same period. (The Fund has the ability to invest in U.S. and/ or foreign securities, and since May 1, 2011 there has been no limit to its foreign exposure. As such, we have introduced the Russell Global Small Cap Index as an additional benchmark. At the end of the semiannual period, 34.0% of the Fund’s net assets were held in non-U.S. investments.) While RS2 posted a solid result on an absolute basis, its relative performance was mildly disappointing. The bull market, which began following the small-cap low on October 3, 2011, lasted through most of 2012’s opening quarter, with small-cap reaching its first-half high on March 26. In 2012’s first quarter, RS2 rose 11.7%, while the Russell 2000 climbed 12.4%, and the Russell Global Small Cap gained 13.7%. Our initial take was that the confluence of improving economic data and the resurgence for equities were signs that the market was at last establishing sufficient momentum to keep moving upward for more than two quarters at a time. Unfortunately, our optimism was checked once another wave of worries about European sovereign debt, the state of the U.S. economy, and decelerating growth in China washed over the market. As they did in 2010 and 2011, these concerns made for a volatile, mostly dismal second quarter for equities. Prior to the furious rally on the final day of June, share prices fell through much of the second quarter, with May being especially negative. RS2 fell further behind its domestic benchmark in this period, losing 5.7% compared to a 3.5% decline for the Russell 2000. However, RS2 did beat the Russell Global Small Cap, which declined 6.7%, in the second quarter. The Fund’s longer-term results were better on a relative basis. In the last domestic small-cap market cycle, RS2 handily outpaced both of its benchmarks. From the previous U.S. small-cap market peak on July 13, 2007 through the last small-cap peak on April 29, 2011, |
Important Performance and Expense Information All performance information in this Report reflects past performance, is presented on a total return basis, reflects the reinvestment distributions and does not reflect the deduction of taxes that a shareholder would pay on fund distributions or the redemption of fund shares. Past performance is no guarantee of future results. Investment return and principal value of an investment will fluctuate, so that shares may be worth more or less than their original cost when redeemed. Shares redeemed within 365 days of purchase may be subject to a 2% redemption fee, payable to the Fund, which is not reflected in the performance shown above; if it were, performance would be lower. Current month-end performance may be higher or lower than performance quoted and may be obtained at www.roycefunds.com. Price and total return information is based on net asset values calculated for shareholder transactions. Certain immaterial adjustments were made to the net assets of Royce Select Fund II at 12/30/11 for financial reporting purposes, and as a result the net asset values for shareholder transactions on that date and the total returns based on those net asset values differ from the adjusted net asset values and total returns reported in the Financial Highlights. Operating expenses reflect the Fund’s total annual operating expenses as of most current prospectus and include the Fund’s management fee based on 12.5% of the Fund’s pre-fee, high watermark return of 8.88% in 2011. The management fee can vary significantly from year to year based on the Fund’s performance. The Fund’s total annual operating expense ratio of 1.30% consisted of the management fee, dividends on securities sold short, interest expense on borrowings, and acquired fund fees and expenses. Royce & Associates has contractually agreed to absorb all other operating expenses of the Fund, other than dividend expense relating to any short selling activity of the Fund, acquired fund fees and expenses and interest expense on borrowings, when applicable. Acquired fund fees and expenses reflect the estimated amount of the fees and expenses incurred indirectly by the Fund through its investments in mutual funds, hedge funds, private equity funds and other investment companies. Regarding the two “Good Ideas” tables shown above, the sum of all contributors to, and all detractors from, performance for all securities in the portfolio would approximate the Fund’s year-to-date performance for 2012. |
| 12 | The Royce Funds 2012 Semiannual Report to Shareholders |
Performance and Portfolio Review |
the Fund gained 27.0% versus a gain of 6.6% for the Russell 2000 and a loss of 0.9% for the Russell Global Small Cap. RS2 was ahead of both small-cap indexes for the five-year and since inception (6/30/05) periods ended June 30, 2012. The Fund also outperformed the Russell Global Small Cap for the one-year period ended June 30, 2012. All but two of the Fund’s nine equity sectors finished the first half in positive territory. Information Technology led all sectors by a healthy margin, boosted by strong contributions from computers & peripherals stocks, semiconductors & semiconductor equipment companies, and electronic equipment, instruments & components businesses. The sector was also home to the industry group with the largest net losses for the period, communications equipment companies, which is where one finds Comba Telecom Systems Holdings. Comba, a top-20 holding at the end of June, is one of the leading wireless coverage solution providers in China, specializing in products that enhance mobile network coverage. The company has been under pressure of late due to year-over-year declines in capital expenditures from China Mobile and increased competition. Optimistic about the long-term prospects for China as a whole and this company’s business, we substantially increased our stake throughout the first half. Results for the Energy and Financials sectors were hampered by respective net losses in the energy equipment & services group and real estate investment trusts (REITs). Losses in the latter group were particularly frustrating because REITs are not an area in which we have had much interest historically, and outside the portfolio they were among the market’s top-performing industries in the first half. Helmerich & Payne endured tougher times for its share price than it did in its business operations. The Fund’s eleventh-largest holding at the end of June, the company is one the of the largest land drillers in the U.S. and also provides contract drilling for oil and gas wells in the Gulf of Mexico and South America. While its business has slowed a bit, the long-term outlook is positive, though impatient investors disregarded that view. Charming Shoppes is the largest plus-size retailer of women’s clothing in the U.S. After announcing plans in early December 2011 to conduct a strategic financial review, the firm was acquired by Ascena Retail Group in June. Headquartered in Queensland, Australia, Industrea Limited comprises a group of rapidly expanding companies that provide specialized mining services and products, with a focus on open-cut and underground mining productivity and safety. The company announced it was being acquired in the first half of 2012. After initiating a position in April, we added shares of online family history research business Ancestry.com to the point where it was the portfolio’s largest holding at the end of June. |
 |
| FUND INFORMATION AND PORTFOLIO DIAGNOSTICS | ||||
| Fund Net Assets | $3 million | |||
| Number of Holdings | 86 | |||
| Turnover Rate | 58% | |||
| Average Market Capitalization1,4 | $900 million | |||
| Weighted Average P/E Ratio2,3,4 | 11.6x | |||
| Weighted Average P/B Ratio2,4 | 1.6x | |||
| Ticker Symbol | RSFDX | |||
| 1 Geometric average | ||||
3 The Fund’s P/E calculation excludes companies with zero or negative earnings (6% of portfolio holdings as of 6/30/12). | ||||
| 4 Long positions only | ||||
| MORNINGSTAR STATISTICAL MEASURES1 | ||||
| RS2 | Category Median | Best Quartile Breakpoint | ||
| Sharpe Ratio | 0.17 | 0.11 | 0.16 | |
| Standard Deviation | 25.48 | 24.37 | 23.17 | |
1 Five years ended 6/30/12. Category Median and Best Quartile Breakpoint based on 349 small-cap objective funds (oldest class) with at least five years of history. | ||||
| RISK/RETURN COMPARISON Five-Year Period Ended 6/30/12 | ||||
| Average Annual Total Return | Standard Deviation | Return Efficiency1 | ||
| RS2 | 2.00% | 25.48 | 0.08 | |
| Russell 2000 | 0.54 | 24.90 | 0.02 | |
1 Return Efficiency is the average annual total return divided by the annualized standard deviation over a designated time period. Please read the prospectus for a more complete discussion of risk. | ||||
| PORTFOLIO COUNTRY BREAKPOINT1,2 % of Net Assets | ||||
| United States | 62.5% | |||
| Hong Kong | 7.3 | |||
| China | 5.3 | |||
| Canada | 5.0 | |||
| United Kingdom | 4.3 | |||
1 Represents countries that are 3% or more of net assets. | ||||
2 Long positions only are represented above and except in the case of ETF’s securities are categorized by the country of their headquarters. | ||||
| DOWN MARKET PERFORMANCE COMPARISON All Down Periods of 7.5% or Greater in Percentages(%) | ||||
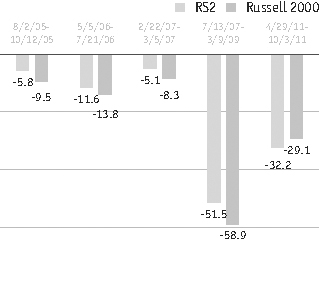 | ||||
| The Royce Funds 2012 Semiannual Report to Shareholders | 13 |
| Royce Global Select Long/Short Fund (Formerly Royce Global Select Fund) |
| QUALIFIED INVESTOR Qualified Investor Funds use a performance fee structure with a specific portfolio management style. AVERAGE ANNUAL TOTAL RETURNS Through 6/30/12 | ||||||||||
| Jan-June 20121 | 3.38 | % | ||||||||
| One-Year | -16.74 | |||||||||
| Three-Year | 14.15 | |||||||||
| Five-Year | 2.93 | |||||||||
| Since Inception (6/30/05) | 9.82 | |||||||||
| ANNUAL EXPENSE RATIO | ||||||||||
| Operating Expenses | 0.98 | % | ||||||||
| 1 Not annualized | ||||||||||
| CALENDAR YEAR TOTAL RETURNS | ||||||||||
| Year | RGS | Year | RGS | |||||||
| 2011 | -17.8 | % | 2008 | -34.4 | % | |||||
| 2010 | 33.2 | 2007 | 18.2 | |||||||
| 2009 | 56.1 | 2006 | 19.4 | |||||||
| TOP 10 LONG POSITIONS % of Net Assets | ||||||||||
Santen Pharmaceutical | 3.2 | % | ||||||||
| Semperit AG Holding | 3.1 | |||||||||
| FamilyMart | 2.9 | |||||||||
| Jupiter Fund Management | 2.8 | |||||||||
| Mayr-Melnhof Karton | 2.7 | |||||||||
| Ashmore Group | 2.6 | |||||||||
| USS | 2.5 | |||||||||
| Value Partners Group | 2.3 | |||||||||
| Hochschild Mining | 2.2 | |||||||||
| Helmerich & Payne | 2.2 | |||||||||
| TOP 10 SHORT POSITIONS % of Net Assets | ||||||||||
| ProShares Ultra Health Care | -1.9 | % | ||||||||
ProShares Ultra MSCI Emerging Markets | -1.9 | |||||||||
| Ultra Oil & Gas ProShares | -1.8 | |||||||||
| iShares MSCI Canada Index Fund | -1.4 | |||||||||
| Toll Brothers | -1.2 | |||||||||
| Deluxe Corporation | -1.0 | |||||||||
| Accenture Cl. A | -1.0 | |||||||||
| Panera Bread Cl. A | -1.0 | |||||||||
| United Rentals | -0.9 | |||||||||
| Simon Property Group | -0.9 | |||||||||
| PORTFOLIO SECTOR BREAKDOWN1 % of Net Assets | ||||||||||
| Materials | 21.0 | % | ||||||||
| Industrials | 14.8 | |||||||||
| Financials | 14.2 | |||||||||
| Consumer Discretionary | 13.3 | |||||||||
| Health Care | 10.9 | |||||||||
| Information Technology | 9.0 | |||||||||
| Consumer Staples | 8.5 | |||||||||
| Energy | 7.6 | |||||||||
| Miscellaneous | 2.5 | |||||||||
| Cash and Cash Equivalents | -1.8 | |||||||||
| 1 Long positions only | ||||||||||
 |
Manager’s Discussion Global markets saw significant volatility in the first half of 2012. Royce Global Select Long/Short Fund (RGS), formerly Royce Global Select Fund, finished the year-to-date period ended June 30, 2012 up 3.4%, trailing its global small-cap benchmark, the Russell Global Small Cap Index, which gained 6.1% for the same period. This was a disappointing outcome on a relative basis. The portfolio’s poor showing in the more tumultuous second quarter, the kind of bear phase in which the Fund has historically held its value more effectively, was the primary source of our displeasure. Two areas in the portfolio with some overlap—non-U.S. investments and holdings in the Energy sector—detracted most from results in the first half. The portfolio had a large exposure to energy services companies and also remained more heavily invested in non-U.S. stocks compared to its benchmark. The Fund’s non-U.S. investments accounted for 90.7% of net assets at the end of June versus 62.5% for the Russell Global Small Cap. The year’s first half was wildly eventful, even if the events and pattern of market returns were something of a repeat of what we saw in both 2010 and 2011. Share prices rose through the bulk of the first quarter, extending a bull run that began early in last year’s fourth quarter. In fact, domestic small-caps reached their first-half high on March 26. The dynamic opening quarter of 2012 saw the Fund gain 12.7%, somewhat keeping pace with its benchmark, which rose 13.7%. April brought more volatility, and by May (the worst month of the year so far) the markets were struggling to hold on to first-quarter gains. The by-now usual suspects were guilty—the market once again reeling from anxiety over European sovereign debt, worries about the fragility of the economic recovery here in the U.S., and concerns over the slowing pace of growth in China’s economy. June offered some respite from this, as the final day of the month saw a dynamic rally spurred by word from Europe that more was being done to address the ongoing debt woes of Spain and Italy. This resulted in a mostly pleasant June, but a negative second quarter in which the Fund fell 8.3%, while the Russell Global Small Cap lost 6.7%. Those areas of the market in which we have found the most attractive qualities trading at highly compelling valuations—notably in the Energy sector—were among the hardest hit during this bearish period. Investors seemed to lose all interest in quality, and several holdings failed to offer the sort of downside protection we regularly seek in all of our long positions in the Fund. |
Important Performance and Expense Information All performance information in this Report reflects past performance, is presented on a total return basis, reflects the reinvestment of distributions and does not reflect the deduction of taxes that a shareholder would pay on fund distributions or the redemption of fund shares. Past performance is no guarantee of future results. Investment return and principal value of an investment will fluctuate, so that shares may be worth more or less than their original cost when redeemed. Shares redeemed within 365 days of purchase may be subject to a 2% redemption fee, payable to the Fund, which is not reflected in the performance shown above; if it were, performance would be lower. Current month-end performance may be higher or lower than performance quoted and may be obtained at www.roycefunds.com. Operating expenses reflect the Fund’s total annual operating expenses as of the most current prospectus and include the Fund’s management fee based on 12.5% of the Fund’s pre-fee, high watermark return of 6.56% in 2011. The management fee can vary significantly from year to year based on the Fund’s performance. The Fund’s total annual operating expense ratio of 0.98% consisted of the management fee, dividends on securities sold short, and interest expense on borrowings. Royce & Associates has contractually agreed to absorb all other operating expenses of the Fund, other than dividend expense relating to any short selling activity of the Fund and interest expense on borrowings, when applicable. Regarding the two “Good Ideas” tables shown above, the sum of all contributors to, and all detractors from, performance for all securities in the portfolio would approximate the Fund’s year-to-date performance for 2012. |
| 14 | The Royce Funds 2012 Semiannual Report to Shareholders |
Performance and Portfolio Review |
Longer-term results offered a more positive view, helped by a robust performance in the last full-market cycle for domestic small-caps, which was also the last peak for the Russell Global Small-Cap Index. From the previous domestic small-cap market peak on July 13, 2007 through April 29, 2011, RGS climbed 38.3%, well ahead of its global benchmark, which declined 0.9%. This advantage was critical in the Fund’s outperformance of the Russell Global Small Cap for the three-, five-year and since inception (6/30/05) periods ended June 30, 2012. The Fund’s average annual total return since inception was 9.8%. Lamprell repairs and refurbishes drilling rigs, but endured issues with suppliers in its recent efforts to enter the rig construction business. More ominously, its share price fell dramatically in May when the company issued a profit warning on the heels of insider selling that had followed a series of investor meetings which were initially seen as unusually positive and encouraging. These were more than enough mixed messages for us, and we sold our position in the portfolio in June. The slipping share price of Li Ning, China’s largest sportswear maker and retailer, allowed us to add shares in the first half. Its business suffered from escalating costs, increased competition, and bulging inventories, all of which are problems we think the firm can solve in the long run. MegaStudy is a South Korean educational firm that specializes in online tutoring and test preparation. We built our stake in February and June as its stock price fell on disappointing quarterly results for its business, in part the result of unwanted government intrusion into online education. Luk Fook Holdings (International) found itself caught between sluggish gold prices and the increasingly negative sentiment towards smaller Chinese consumer stocks. Results announced in June for the company’s fiscal 2012 showed some margin pressure, which we view as temporary. The valuation for this designer, wholesaler, and retailer of gold and gem-set jewelry became attractive enough for us to begin building our position in March. The stock price of LED (light-emitting diode) equipment maker Veeco Instruments rallied on signs that MOCVD—a key piece of equipment used to make LEDs—had bottomed. Its rising price prompted us to sell our shares in the portfolio in May and June. Top-10 position Hochschild Mining was a happy exception to the performance of the Fund’s mining & metals holdings. After ending 2011 near a low, its shares advanced in January after the company released feasibility studies for two mines that are potentially lucrative enough to replace production at some its older, maturing properties. |
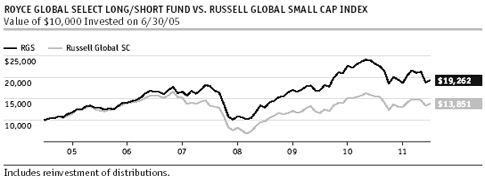 |
| The Royce Funds 2012 Semiannual Report to Shareholders | 15 |
| Royce Enterprise Select Fund (Formerly Royce SMid-Cap Select Fund) |
| QUALIFIED INVESTOR Qualified Investor Funds use a performance fee structure with a specific portfolio management style. AVERAGE ANNUAL TOTAL RETURNS Through 6/30/12 | ||||||||||
| Jan-June 20121 | 5.77 | % | ||||||||
| One-Year | 0.13 | |||||||||
| Three-Year | 13.67 | |||||||||
| Since Inception (9/28/07) | 3.00 | |||||||||
| ANNUAL EXPENSE RATIO | ||||||||||
| Operating Expenses | 1.31 | % | ||||||||
| 1 Not annualized | ||||||||||
| CALENDAR YEAR TOTAL RETURNS | ||||||||||
| Year | RSS | Year | RSS | |||||||
| 2011 | 0.7 | % | 2009 | 23.1 | % | |||||
| 2010 | 17.2 | 2008 | -25.5 | |||||||
| TOP 10 POSITIONS % of Net Assets | ||||||||||
Alleghany Corporation | 3.6 | % | ||||||||
| Schein (Henry) | 3.1 | |||||||||
| Cabot Corporation | 2.8 | |||||||||
| IDEXX Laboratories | 2.8 | |||||||||
| PerkinElmer | 2.7 | |||||||||
| Valmont Industries | 2.7 | |||||||||
| Garmin | 2.5 | |||||||||
| Teradyne | 2.5 | |||||||||
| Jones Lang LaSalle | 2.5 | |||||||||
| Mohawk Industries | 2.4 | |||||||||
| PORTFOLIO SECTOR BREAKDOWN % of Net Assets | ||||||||||
| Information Technology | 18.7 | % | ||||||||
| Industrials | 17.9 | |||||||||
| Health Care | 13.1 | |||||||||
| Consumer Discretionary | 11.2 | |||||||||
| Materials | 8.5 | |||||||||
| Financials | 7.8 | |||||||||
| Energy | 2.1 | |||||||||
| Utilities | 1.4 | |||||||||
| Cash and Cash Equivalents | 19.3 | |||||||||
 |
Manager’s Discussion The global economy in the wake of the financial crisis has seen a clear separation between growth-starved debtor nations attempting to balance required budget austerity with doses of monetary stimulus and those mostly emerging economies that are attempting to navigate a rapidly decelerating marketplace for their goods and services. In a repeat of the market patterns exhibited in the first half of the prior two years, the first six months of 2012 enjoyed early strength in equity markets boosted by ever-creative central bank initiatives only to see those gains threatened by renewed investor caution around a host of macroeconomic issues. European leaders were confronted with new challenges in their evolving sovereign debt crises, as both Italy and Spain experienced dangerous increases in their wholesale funding costs. In a change of course, Spanish authorities took the rare and perilous step of asking for ECB (European Central Bank) assistance in bailing out its troubled banking industry. Royce Enterprise Select Fund (RSS), formerly Royce SMid-Cap Select Fund, with its focus on the larger end of the smaller company universe, achieved a modest absolute return while underperforming on a relative basis. For the year-to-date period ended June 30, 2012, the Fund gained 5.8%, compared to its small-cap and mid-cap benchmark, the Russell 2500 Index, which advanced 8.3% for the same period. The first two quarters of 2012 were strikingly similar to the comparable periods in both 2010 and 2011. Market strength in the first quarter was driven by solid corporate earnings and the residual effects of the prior fall’s actions by the Fed only to be followed by a correction in the second quarter precipitated by the aforementioned litany of macroeconomic headwinds. During the bullish first quarter, RSS gained 11.6%, trailing its small-cap and mid-cap benchmark, the Russell 2500 Index, which advanced 13.0%. The volatile second quarter contained a sharp correction that actually began in late March, intensified in May, and was nearly undone by a recovery in June. The result was a modestly negative, highly volatile period for most stocks and market indexes. For the second quarter, RSS fell 5.3%, compared to its benchmark, which lost 4.1%. Launched on September 28, 2007, a mere two months after an historical peak for U.S. small-caps and at the onset of the recession, the Fund has already seen its fair share of volatility and dislocation. So while the Fund’s absolute returns have fallen shy of our intent, we were encouraged that our vigilance with regard to risk and consistent focus on |
Important Performance and Expense Information All performance information in this Report reflects past performance, is presented on a total return basis, reflects the reinvestment of distributions and does not reflect the deduction of taxes that a shareholder would pay on fund distributions or the redemption of fund shares. Past performance is no guarantee of future results. Investment return and principal value of an investment will fluctuate, so that shares may be worth more or less than their original cost when redeemed. Shares redeemed within 365 days of purchase may be subject to a 2% redemption fee, payable to the Fund, which is not reflected in the performance shown above; if it were, performance would be lower. Current month-end performance may be higher or lower than performance quoted and may be obtained at www.roycefunds.com. Operating expenses reflect the Fund’s total annual operating expenses as of the most current prospectus and include the Fund’s management fee based on 12.5% of the Fund’s pre-fee, high watermark return of 10.40% in 2011. The management fee can vary significantly from year to year based on the Fund’s performance. The Fund’s total annual operating expense ratio of 1.31% consisted of the management fee and interest expense on borrowings. Royce & Associates has contractually agreed to absorb all other operating expenses of the Fund, other than dividend expense relating to any short selling activity of the Fund, acquired fund fees and expenses and interest expense on borrowings, when applicable. Regarding the two “Good Ideas” tables shown above, the sum of all contributors to, and all detractors from, performance for all securities in the portfolio would approximate the Fund’s year-to-date performance for 2012. |
| 16 | The Royce Funds 2012 Semiannual Report to Shareholders |
Performance and Portfolio Review |
quality companies with high internal rates of return and strong balance sheets has allowed for relative outperformance of the benchmark. For the periods ended June 30, 2012, RSS outperformed its benchmark for the one-year and since inception periods. Industrials was the Fund’s best-performing sector in the first half of 2012, leading by a comfortable margin. Our sector holdings benefited from strong stock selection and the advantage of a significant position being acquired at a hefty premium. Materials and Health Care also made healthy contributions to returns in a period that saw six of the Fund’s eight equity sectors post net gains. Energy was the only notable weak spot, along with a very modest loss from the Utilities sector. At the industry level, results were similar, with the majority of industries generating positive aggregate returns. Electrical equipment companies and chemicals stocks were the standouts among the contributors, followed by the machinery, IT services, and paper & forest products groups. Unsurprisingly, energy equipment & services was the most significant detractor, while the semiconductors & semiconductor equipment group also posted a notable net loss that was nonetheless modest compared to RSS’s stronger industry groups. With natural gas and oil prices falling, it was no surprise that the portfolio’s largest individual detractor came from the Energy sector. We have long been attracted to Trican Well Service by its growing business, talented management, and pristine balance sheet. The company, which we began to purchase in RSS late in 2010, provides specialized equipment and services for the drilling, completion and reworking of oil and gas wells. While confident that an improved energy market will ultimately rekindle interest in the company’s prospects, we pared our position slightly in the period to better reflect our conviction level and intended time frame. Teradyne was another notable disappointment in the first half, as this provider of automatic test equipment and electronic manufacturing services fell mostly on fears of industry cyclicality and concerns about the macro environment. While we are a bit out of sync with the consensus, earnings in the first quarter exceeded expectations and, when combined with upbeat guidance provided by management, reaffirmed our conviction. Thomas & Betts was a case of a small-cap company being well-positioned for the ‘urge to merge,’ as this leading manufacturer of electrical connectors and components was acquired at a healthy premium by ABB Limited, a Swiss industrial conglomerate. Hubbell was another solid gainer from the Industrials sector. A manufacturer of electronic products for a broad range of commercial, industrials and residential applications, the company delivered excellent financial results with particular strength in residential lighting and construction thanks to an improving U.S. housing market. |
 |
| The Royce Funds 2012 Semiannual Report to Shareholders | 17 |
| Royce Opportunity Select Fund |
| QUALIFIED INVESTOR | |||||||||||
| Qualified Investor Funds use a performance fee structure with a specific portfolio management style. | |||||||||||
AVERAGE ANNUAL TOTAL RETURNS Through 6/30/12 | |||||||||||
| Jan–June 20121 | 16.75 | % | |||||||||
| One-Year | -2.14 | ||||||||||
| Since Inception (8/31/10) | 13.29 | ||||||||||
| ANNUAL EXPENSE RATIO | |||||||||||
| Operating Expenses | 1.16 | % | |||||||||
| 1 Not annualized | |||||||||||
| CALENDAR YEAR TOTAL RETURNS | |||||||||||
| Year | ROS | ||||||||||
| 2011 | -17.1 | % | |||||||||
| TOP 10 LONG POSITIONS % of Net Assets | |||||||||||
| Standard Pacific | 4.7 | % | |||||||||
| Ellie Mae | 4.5 | ||||||||||
| Lithia Motors Cl. A | 3.5 | ||||||||||
| Newpark Resources | 3.2 | ||||||||||
| Exar Corporation | 3.0 | ||||||||||
| Harman International Industries | 2.9 | ||||||||||
| Mack-Cali Realty | 2.6 | ||||||||||
| PennyMac Mortgage Investment Trust | 2.4 | ||||||||||
| Northwest Pipe | 2.4 | ||||||||||
| JetBlue Airways | 2.1 | ||||||||||
| TOP 10 SHORT POSITIONS % of Net Assets | |||||||||||
| lululemon athletica | -2.9 | % | |||||||||
| Michael Kors Holdings | -2.5 | ||||||||||
| General Motors | -2.4 | ||||||||||
| Illinois Tool Works | -2.1 | ||||||||||
| Nike Cl. B | -1.8 | ||||||||||
| Caterpillar | -1.7 | ||||||||||
| J.C. Penney Company | -1.4 | ||||||||||
| ANN | -1.0 | ||||||||||
| Darden Restaurants | -1.0 | ||||||||||
| PVH | -0.9 | ||||||||||
| PORTFOLIO SECTOR BREAKDOWN1 % of Net Assets | |||||||||||
| Information Technology | 27.0 | % | |||||||||
| Industrials | 17.6 | ||||||||||
| Consumer Discretionary | 16.3 | ||||||||||
| Financials | 13.3 | ||||||||||
| Energy | 13.1 | ||||||||||
| Materials | 7.5 | ||||||||||
| Consumer Staples | 2.8 | ||||||||||
| Miscellaneous | 1.3 | ||||||||||
| Cash and Cash Equivalents | 1.1 | ||||||||||
 | |||||||||
Manager’s Discussion Many small-caps struggled in the first half, as did some industry groups, and certain sectors were out of favor. None of those formidable obstacles got in the way of a very strong first half for Royce Opportunity Select Fund (ROS), which had an impressive showing on both an absolute and relative basis. The Fund gained 16.8% for the year-to-date period ended June 30, 2012, well ahead of the 8.5% increase for the Russell 2000 Index, its small-cap benchmark, for the same period. The Fund’s strength came both in the first half’s bullish period (as we would expect) and in its more bearish phase. The rally that began off the 2011 small-cap low on October 3 and continued through the 2012 small-cap high on March 26, 2012 was a rewarding one for the portfolio on both an absolute and relative basis. During this period, the Fund climbed 45.0%, compared to a gain of 39.8% for the small-cap index. This span included a strong first quarter of 2012 in which ROS gained 18.1%, while the Russell 2000 was up 12.4%. These fine times for equities did not last, however, as stock prices fell through most of the second quarter, driven down by yet another round of worry about debt, deficits, and the strength of the U.S. and Chinese economies. ROS gave up no ground to its benchmark through these mostly dismal months, allowing it to easily hold its year-to-date advantage. The Fund finished the second quarter with a loss of 1.2% versus a decline of 3.5% for the Russell 2000. This was an impressive turnaround for the Fund, which struggled in 2011. That struggle was not entirely a surprise. We spent the last months of 2010 (the Fund launched on August 31, 2010) and all of 2011 fleshing out the portfolio by scouting for long-term opportunities. We focused mainly on companies that seemed to be approaching the low point in their business cycle and/or were experiencing earnings disappointments. We did this on the idea that many of these stocks could benefit from an eventual pick-up in activity for their industries and that earnings-driven growth and increased utilization would help their share prices to rise toward our estimate of their worth as businesses. It’s worth pointing out that in general we were not expecting the majority of these selections to bear fruit before the end of 2011. It turns out that we were correct. However, we were obviously pleased that many began to turn around in the first six months of 2012, which boosted performance. For the period ended June 30, 2012, the Fund’s average annual total return since inception was 13.3%. | |||||||||
| 18 | The Royce Funds 2012 Semiannual Report to Shareholders |
Performance and Portfolio Review The Fund’s focus on domestic small-caps and its success in resurgent industries helped to key its recent strong showing, as did profitable results from several short positions. Five of the Fund’s seven equity sectors posted net gains in the first half, and net losses for the Energy and Consumer Staples sectors were comparably modest. Consumer Discretionary holdings led by a comfortable margin, while Information Technology and Industrials also posted strong net gains. Household durables companies were ROS’s leading industry group, boosted by terrific results for homebuilder Standard Pacific, the Fund’s largest holding at the end of June. Homebuilding stocks were generally stalwart performers in the first half, as the industry continues to show encouraging signs of a comeback. Standard Pacific also benefited from new management that helped to steer its turnaround. Ellie Mae, the Fund’s second-largest position, was helped by the rebound for housing-related businesses. The company provides business automation software for the mortgage industry in the U.S. Its business has grown, along with its market share, as it has been partnering with mortgage originators. Georgia Gulf manufactures chemicals, operating through three segments: chloroforms, building products, and aromatics. Its business reaped a benefit from lower natural gas prices, as gas is used as a chemical feedstock. It was also aided by the recovery for businesses involved in housing. Finally, an improved cost structure helped the business to operate more efficiently. We began to reduce our position in January and sold the last of our shares in April. Semiconductor maker PLX Technology was acquired by a larger competitor at a better-than-60% premium. We sold our shares in May shortly after the announcement. The market seemed to be expecting a quicker turnaround than we thought was possible for multi-line retailer J.C. Penney Company. Early in 2012, its stock looked very expensive to us, so we began to short the stock. By mid-June, we began to cover our position at a hefty gain. Positions that disappointed included supermarket and pharmacy operator SUPERVALU, which is a turnaround possibility that had not yet changed direction by the end of June. Our initial thought was that its solid business and attractive cash-flow characteristics could help it to eventually reverse direction. Events in early July then forced us to reconsider our optimistic forecast. SM Energy explores for and produces oil and natural gas in the U.S. Its stock slid as its earnings disappointed amid falling oil and gas prices. In March, we initiated a position in OmniVision Technologies, which makes semiconductor image-sensor devices, attracted to its low debt, ample cash, and its core business making image sensors for iPads and iPhones. Its shares suffered through some recent earnings disappointments, allowing us to build our stake. The firm is already focusing on its products being included in the next iteration of the iPhone. |
 |
| FUND INFORMATION AND PORTFOLIO DIAGNOSTICS | |||
| Fund Net Assets | $2 million | ||
| Number of Holdings | 86 | ||
| Turnover Rate | 62% | ||
| Average Market Capitalization1,4 | $563 million | ||
| Weighted Average P/E Ratio2,3,4 | 13.9x | ||
| Weighted Average P/B Ratio2,4 | 1.1x | ||
| U.S. Investments4 (% of Net Assets) | 95.7% | ||
| Non-U.S. Investments4 (% of Net Assets) | 3.2% | ||
| Ticker Symbol | ROSFX | ||
| 1 Geometric average | |||
2 Harmonic average | |||
3 The Fund’s P/E calculation excludes companies with zero or negative earnings (28% of portfolio holdings as of 6/30/12). | |||
4 Long positions only | |||
| The Royce Funds 2012 Semiannual Report to Shareholders | 19 |
| Schedules of Investments |
| Royce Select Fund I |
| SHARES | VALUE | |||||
| COMMON STOCKS – 88.9% | ||||||
| Consumer Discretionary – 10.3% | ||||||
| Auto Components - 1.7% | ||||||
Drew Industries 1 | 20,296 | $ | 565,243 | |||
Gentex Corporation | 11,400 | 237,918 | ||||
| 803,161 | ||||||
| Automobiles - 0.8% | ||||||
Thor Industries | 13,300 | 364,553 | ||||
| Diversified Consumer Services - 2.0% | ||||||
Sotheby’s | 21,892 | 730,317 | ||||
Universal Technical Institute | 18,629 | 251,678 | ||||
| 981,995 | ||||||
| Specialty Retail - 1.7% | ||||||
Men’s Wearhouse (The) | 28,200 | 793,548 | ||||
| Textiles, Apparel & Luxury Goods - 4.1% | ||||||
Columbia Sportswear | 14,927 | 800,386 | ||||
Warnaco Group (The) 1 | 27,700 | 1,179,466 | ||||
| 1,979,852 | ||||||
| Total (Cost $4,587,345) | 4,923,109 | |||||
| Consumer Staples – 1.2% | ||||||
| Food Products - 1.2% | ||||||
Cal-Maine Foods | 15,127 | 591,466 | ||||
| Total (Cost $417,786) | 591,466 | |||||
| Energy – 10.4% | ||||||
| Energy Equipment & Services - 10.4% | ||||||
CARBO Ceramics | 2,000 | 153,460 | ||||
Helmerich & Payne | 24,100 | 1,047,868 | ||||
Oil States International 1 | 16,000 | 1,059,200 | ||||
Pason Systems | 47,100 | 688,388 | ||||
ShawCor Cl. A | 23,300 | 843,341 | ||||
† Trican Well Service | 49,000 | 565,514 | ||||
Unit Corporation 1 | 16,150 | 595,773 | ||||
| Total (Cost $3,875,840) | 4,953,544 | |||||
| Financials – 6.7% | ||||||
| Capital Markets - 3.4% | ||||||
Lazard Cl. A | 30,000 | 779,700 | ||||
SEI Investments | 42,500 | 845,325 | ||||
| 1,625,025 | ||||||
| Insurance - 3.3% | ||||||
Alleghany Corporation 1 | 3,605 | 1,224,799 | ||||
Brown & Brown | 13,400 | 365,418 | ||||
| 1,590,217 | ||||||
| Total (Cost $2,683,959) | 3,215,242 | |||||
| Health Care – 3.9% | ||||||
| Health Care Providers & Services - 0.6% | ||||||
VCA Antech 1 | 13,177 | 289,630 | ||||
| Life Sciences Tools & Services - 3.3% | ||||||
Bio-Rad Laboratories Cl. A 1 | 10,000 | 1,000,100 | ||||
ICON ADR 1 | 24,724 | 557,032 | ||||
| 1,557,132 | ||||||
| Total (Cost $1,602,759) | 1,846,762 | |||||
| Industrials – 22.0% | ||||||
| Aerospace & Defense - 1.9% | ||||||
Teledyne Technologies 1 | 14,728 | 907,981 | ||||
| Building Products - 1.0% | ||||||
Apogee Enterprises | 30,732 | 493,863 | ||||
Commercial Services & Supplies - 2.1% | ||||||
Tetra Tech 1 | 37,900 | 988,432 | ||||
Electrical Equipment - 5.9% | ||||||
AZZ | 19,000 | 1,163,940 | ||||
† Global Power Equipment Group | 20,418 | 445,929 | ||||
GrafTech International 1 | 126,159 | 1,217,434 | ||||
| 2,827,303 | ||||||
Machinery - 7.2% | ||||||
Astec Industries 1 | 9,500 | 291,460 | ||||
Flowserve Corporation | 2,339 | 268,400 | ||||
Gardner Denver | 4,700 | 248,677 | ||||
Kennametal | 17,000 | 563,550 | ||||
Lincoln Electric Holdings | 9,550 | 418,194 | ||||
Robbins & Myers | 5,700 | 238,374 | ||||
Valmont Industries | 8,000 | 967,760 | ||||
Wabtec Corporation | 5,775 | 450,508 | ||||
| 3,446,923 | ||||||
Professional Services - 2.1% | ||||||
CRA International 1 | 24,279 | 356,659 | ||||
Robert Half International | 22,500 | 642,825 | ||||
| 999,484 | ||||||
Road & Rail - 0.9% | ||||||
Universal Truckload Services | 28,800 | 435,600 | ||||
Trading Companies & Distributors - 0.9% | ||||||
MSC Industrial Direct Cl. A | 6,452 | 422,929 | ||||
| Total ( Cost $8,630,432) | 10,522,515 | |||||
Information Technology – 19.8% | ||||||
Communications Equipment - 1.7% | ||||||
ADTRAN | 27,300 | 824,187 | ||||
Electronic Equipment, Instruments & Components - 6.4% | ||||||
Coherent 1 | 11,981 | 518,777 | ||||
Dolby Laboratories Cl. A 1 | 16,500 | 681,450 | ||||
FEI Company 1 | 8,652 | 413,912 | ||||
IPG Photonics 1 | 13,990 | 609,824 | ||||
Rofin-Sinar Technologies 1 | 43,677 | 826,806 | ||||
| 3,050,769 | ||||||
Office Electronics - 0.9% | ||||||
Zebra Technologies Cl. A 1 | 13,000 | 446,680 | ||||
Semiconductors & Semiconductor Equipment - 10.3% | ||||||
Aixtron ADR | 32,900 | 470,799 | ||||
ATMI 1 | 27,600 | 567,732 | ||||
Cabot Microelectronics | 15,000 | 438,150 | ||||
| 20 | The Royce Funds 2012 Semiannual Report to Shareholders | THE ACCOMPANYING NOTES ARE AN INTEGRAL PART OF THESE FINANCIAL STATEMENTS. |
| June 30, 2012 (unaudited) |
| SHARES | VALUE | ||||||
| Information Technology (continued) | |||||||
| Semiconductors & Semiconductor Equipment (continued) | |||||||
Cymer 1 | 5,881 | $ | 346,685 | ||||
Integrated Silicon Solution 1 | 93,500 | 943,415 | |||||
Nanometrics 1 | 60,900 | 935,424 | |||||
Teradyne 1 | 57,500 | 808,450 | |||||
Veeco Instruments 1 | 12,500 | 429,500 | |||||
| 4,940,155 | |||||||
Software - 0.5% | |||||||
NetScout Systems 1 | 10,027 | 216,483 | |||||
| Total (Cost $9,176,546) | 9,478,274 | ||||||
Materials – 14.6% | |||||||
Chemicals - 7.3% | |||||||
Intrepid Potash 1 | 57,758 | 1,314,572 | |||||
KMG Chemicals | 22,845 | 440,452 | |||||
LSB Industries 1 | 29,300 | 905,663 | |||||
Minerals Technologies | 12,870 | 820,849 | |||||
| 3,481,536 | |||||||
Metals & Mining - 7.3% | |||||||
Allied Nevada Gold 1 | 23,000 | 652,740 | |||||
Cliffs Natural Resources | 10,200 | 502,758 | |||||
Major Drilling Group International | 67,000 | 774,570 | |||||
Reliance Steel & Aluminum | 21,500 | 1,085,750 | |||||
Sims Metal Management ADR | 49,870 | 493,713 | |||||
| 3,509,531 | |||||||
| Total (Cost $6,770,748) | 6,991,067 | ||||||
TOTAL COMMON STOCKS | |||||||
(Cost $37,745,415) | 42,521,979 | ||||||
REPURCHASE AGREEMENT – 11.4% | |||||||
| Fixed Income Clearing Corporation, | |||||||
0.11% dated 6/29/12, due 7/2/12, | |||||||
maturity value $5,480,050 (collateralized | |||||||
by obligations of various U.S. Government | |||||||
Agencies, 3.25% due 6/30/16, valued at $5,594,400) | |||||||
(Cost $5,480,000) | 5,480,000 | ||||||
TOTAL INVESTMENTS – 100.3% | |||||||
(Cost $43,225,415) | 48,001,979 | ||||||
| LIABILITIES LESS CASH | |||||||
AND OTHER ASSETS – (0.3)% | (158,121 | ) | |||||
NET ASSETS – 100.0% | $ | 47,843,858 | |||||
| Royce Select Fund II |
| SHARES | VALUE | |||||
COMMON STOCKS – 96.5% | ||||||
Consumer Discretionary – 18.7% | ||||||
Auto Components - 2.8% | ||||||
Drew Industries 1,2 | 1,301 | $ | 36,233 | |||
Minth Group | 57,200 | 62,077 | ||||
| 98,310 | ||||||
Diversified Consumer Services - 1.3% | ||||||
Lincoln Educational Services | 6,700 | 43,550 | ||||
Hotels, Restaurants & Leisure - 2.0% | ||||||
† Benihana | 4,300 | 69,273 | ||||
Specialty Retail - 9.4% | ||||||
American Eagle Outfitters 2 | 2,400 | 47,352 | ||||
Children’s Place Retail Stores 1 | 800 | 39,864 | ||||
GameStop Corporation Cl. A | 2,100 | 38,556 | ||||
Guess? | 1,500 | 45,555 | ||||
Luk Fook Holdings (International) | 21,100 | 44,269 | ||||
Signet Jewelers | 1,300 | 57,213 | ||||
† Stage Stores | 3,000 | 54,960 | ||||
| 327,769 | ||||||
Textiles, Apparel & Luxury Goods - 3.2% | ||||||
Daphne International Holdings | 27,800 | 28,382 | ||||
G-III Apparel Group 1 | 1,800 | 42,642 | ||||
Stella International Holdings | 16,700 | 41,440 | ||||
| 112,464 | ||||||
| Total (Cost $602,543) | 651,366 | |||||
Consumer Staples – 1.4% | ||||||
Food Products - 1.4% | ||||||
First Resources | 32,100 | 49,066 | ||||
| Total (Cost $35,156) | 49,066 | |||||
Energy – 8.4% | ||||||
Energy Equipment & Services - 7.7% | ||||||
† C&J Energy Services 1 | 2,000 | 37,000 | ||||
Helmerich & Payne | 1,390 | 60,437 | ||||
† Matrix Service 1 | 3,300 | 37,455 | ||||
RPC | 5,900 | 70,151 | ||||
TGS-NOPEC Geophysical | 900 | 24,258 | ||||
Total Energy Services | 2,800 | 39,576 | ||||
| 268,877 | ||||||
Oil, Gas & Consumable Fuels - 0.7% | ||||||
Swift Energy 1 | 1,400 | 26,054 | ||||
| Total (Cost $307,753) | 294,931 | |||||
Financials – 7.2% | ||||||
Capital Markets - 6.1% | ||||||
Ashmore Group | 9,500 | 52,134 | ||||
Lazard Cl. A | 1,500 | 38,985 | ||||
Sprott | 14,300 | 69,527 | ||||
Value Partners Group | 103,700 | 50,807 | ||||
| 211,453 | ||||||
| THE ACCOMPANYING NOTES ARE AN INTEGRAL PART OF THESE FINANCIAL STATEMENTS. | The Royce Funds 2012 Semiannual Report to Shareholders | 21 |
| Schedules of Investments |
| Royce Select Fund II (continued) |
| SHARES | VALUE | |||||
Financials (continued) | ||||||
Real Estate Management & Development - 1.1% | ||||||
E-House China Holdings ADR 2 | 7,000 | $ | 38,500 | |||
| Total (Cost $305,939) | 249,953 | |||||
Health Care – 1.9% | ||||||
Health Care Equipment & Supplies - 1.9% | ||||||
† Invacare Corporation | 3,200 | 49,376 | ||||
Kossan Rubber Industries | 15,235 | 15,471 | ||||
| Total (Cost $62,772) | 64,847 | |||||
Industrials – 12.6% | ||||||
Aerospace & Defense - 2.6% | ||||||
AeroVironment 1 | 1,800 | 47,358 | ||||
† Astronics Corporation 1 | 1,500 | 42,360 | ||||
| 89,718 | ||||||
Commercial Services & Supplies - 2.0% | ||||||
Portfolio Recovery Associates 1 | 400 | 36,504 | ||||
Team 1,2 | 1,144 | 35,670 | ||||
| 72,174 | ||||||
Construction & Engineering - 2.5% | ||||||
† Layne Christensen 1 | 2,100 | 43,449 | ||||
Pike Electric 1 | 5,600 | 43,232 | ||||
| 86,681 | ||||||
Electrical Equipment - 1.2% | ||||||
† Global Power Equipment Group | 1,900 | 41,496 | ||||
Machinery - 4.3% | ||||||
Gardner Denver | 400 | 21,164 | ||||
Graham Corporation | 1,102 | 20,519 | ||||
Industrea | 55,381 | 73,040 | ||||
Spirax-Sarco Engineering | 1,100 | 34,276 | ||||
| 148,999 | ||||||
| Total (Cost $407,869) | 439,068 | |||||
Information Technology – 30.1% | ||||||
Communications Equipment - 4.8% | ||||||
ADTRAN 2 | 1,300 | 39,247 | ||||
Comba Telecom Systems Holdings | 132,300 | 55,445 | ||||
Oplink Communications 1 | 2,949 | 39,900 | ||||
Plantronics | 1,000 | 33,400 | ||||
| 167,992 | ||||||
Computers & Peripherals - 4.2% | ||||||
Catcher Technology | 4,800 | 32,489 | ||||
Super Micro Computer 1 | 3,500 | 55,510 | ||||
Western Digital 1,2 | 1,900 | 57,912 | ||||
| 145,911 | ||||||
Electronic Equipment, Instruments & Components - 3.0% | ||||||
China High Precision Automation Group 4 | 140,700 | 24,847 | ||||
Mercury Computer Systems 1 | 3,200 | 41,376 | ||||
Multi-Fineline Electronix 1 | 1,518 | 37,403 | ||||
| 103,626 | ||||||
Internet Software & Services - 3.9% | ||||||
† Ancestry.com 1,2 | 3,700 | 101,861 | ||||
ValueClick 1,2 | 2,105 | 34,501 | ||||
| 136,362 | ||||||
IT Services - 2.5% | ||||||
† Computer Task Group 1 | 3,200 | 47,968 | ||||
CSE Global | 63,200 | 39,851 | ||||
| 87,819 | ||||||
Semiconductors & Semiconductor Equipment - 9.6% | ||||||
ASM International | 1,500 | 56,999 | ||||
Integrated Silicon Solution 1 | 5,200 | 52,468 | ||||
MKS Instruments | 1,200 | 34,716 | ||||
Photronics 1 | 10,240 | 62,464 | ||||
RDA Microelectronics ADR 1 | 5,600 | 56,224 | ||||
Teradyne 1,2 | 5,250 | 73,815 | ||||
| 336,686 | ||||||
Software - 2.1% | ||||||
Actuate Corporation 1,2 | 6,200 | 42,966 | ||||
American Software Cl. A 2 | 3,670 | 29,176 | ||||
| 72,142 | ||||||
| Total (Cost $1,009,001) | 1,050,538 | |||||
Materials – 12.3% | ||||||
Chemicals - 2.4% | ||||||
Fufeng Group | 37,500 | 14,247 | ||||
Minerals Technologies | 700 | 44,646 | ||||
OM Group 1,2 | 1,300 | 24,700 | ||||
| 83,593 | ||||||
Containers & Packaging - 0.6% | ||||||
Boise 2 | 3,400 | 22,372 | ||||
Metals & Mining - 9.3% | ||||||
Haynes International | 900 | 45,846 | ||||
Hochschild Mining | 8,700 | 64,190 | ||||
Horsehead Holding Corporation 1 | 3,800 | 37,848 | ||||
Market Vectors Junior Gold Miners ETF 2 | 3,900 | 74,763 | ||||
† Pan American Silver | 2,200 | 37,158 | ||||
Seabridge Gold 1,2 | 1,900 | 27,531 | ||||
Universal Stainless & Alloy Products 1 | 900 | 36,990 | ||||
| 324,326 | ||||||
| Total (Cost $461,818) | 430,291 | |||||
Miscellaneous3 – 3.9% | ||||||
| Total (Cost $144,844) | 136,090 | |||||
TOTAL COMMON STOCKS | ||||||
(Cost $3,337,695) | 3,366,150 | |||||
| 22 | The Royce Funds 2012 Semiannual Report to Shareholders | THE ACCOMPANYING NOTES ARE AN INTEGRAL PART OF THESE FINANCIAL STATEMENTS. |
| June 30, 2012 (unaudited) |
| SHARES | VALUE | ||||||
REPURCHASE AGREEMENT – 8.7% | |||||||
Fixed Income Clearing Corporation, | |||||||
0.11% dated 6/29/12, due 7/2/12, | |||||||
maturity value $303,003 (collateralized | |||||||
by obligations of various U.S. Government | |||||||
Agencies, 3.25% due 6/30/16, valued at $313,600) | |||||||
(Cost $303,000) | $ | 303,000 | |||||
TOTAL INVESTMENTS – 105.2% | |||||||
(Cost $3,640,695) | 3,669,150 | ||||||
LIABILITIES LESS CASH | |||||||
AND OTHER ASSETS – (5.2)% | (181,467 | ) | |||||
NET ASSETS – 100.0% | $ | 3,487,683 | |||||
SECURITIES SOLD SHORT | |||||||
COMMON STOCKS – 5.6% | |||||||
Consumer Discretionary – 1.1% | |||||||
Textiles, Apparel & Luxury Goods - 1.1% | |||||||
lululemon athletica | 200 | $ | 11,926 | ||||
VF Corporation | 200 | 26,690 | |||||
Total (Proceeds $41,154) | 38,616 | ||||||
Diversified Investment Companies – 0.8% | |||||||
Exchange Traded Funds - 0.8% | |||||||
iShares Russell Microcap Index Fund | 600 | 30,024 | |||||
Total (Proceeds $30,740) | 30,024 | ||||||
Financials – 1.9% | |||||||
Diversified Financial Services - 1.0% | |||||||
Financial Select Sector SPDR Fund | 2,300 | 33,626 | |||||
Real Estate Investment Trusts (REITs) - 0.9% | |||||||
Simon Property Group | 200 | 31,132 | |||||
Total (Proceeds $54,170) | 64,758 | ||||||
Information Technology – 1.8% | |||||||
Internet Software & Services - 1.8% | |||||||
LinkedIn Corporation | 300 | 31,881 | |||||
PowerShares QQQ Trust, Series 1 | 500 | 32,080 | |||||
Total (Proceeds $62,420) | 63,961 | ||||||
FIXED INCOME – 0.4% | |||||||
Government Bonds – 0.4% | |||||||
Government Bonds - 0.4% | |||||||
iShares Barclays 20+ Year Treasury Bond Fund | 100 | 12,520 | |||||
Total (Proceeds $12,329) | 12,520 | ||||||
TOTAL SECURITIES SOLD SHORT | |||||||
(Proceeds $200,813) | $ | 209,879 | |||||
| Royce Global Select Long/Short Fund |
| SHARES | VALUE | |||||
COMMON STOCKS – 101.8% | ||||||
Australia – 5.1% | ||||||
Allied Gold Mining 1 | 100,000 | $ | 219,616 | |||
CGA Mining 1 | 160,000 | 290,738 | ||||
Medusa Mining | 65,000 | 322,414 | ||||
Saracen Mineral Holdings 1 | 475,000 | 272,130 | ||||
| Total (Cost $1,293,759) | 1,104,898 | |||||
Austria – 5.9% | ||||||
Mayr-Melnhof Karton 2 | 6,500 | 595,960 | ||||
Semperit AG Holding | 18,500 | 676,074 | ||||
| Total (Cost $1,400,390) | 1,272,034 | |||||
Belgium – 1.5% | ||||||
Sipef | 4,500 | 324,103 | ||||
| Total (Cost $321,981) | 324,103 | |||||
Brazil – 3.4% | ||||||
† Brasil Brokers Participacoes | 70,000 | 227,583 | ||||
† Eternit | 35,000 | 191,511 | ||||
Grendene | 60,000 | 313,667 | ||||
| Total (Cost $709,204) | 732,761 | |||||
Canada – 4.4% | ||||||
Pason Systems 2 | 20,000 | 292,309 | ||||
Sprott 2 | 65,000 | 316,030 | ||||
Trican Well Service 2 | 30,000 | 346,233 | ||||
| Total (Cost $1,040,291) | 954,572 | |||||
China – 3.2% | ||||||
China Forestry Holdings 4 | 325,000 | 24,507 | ||||
E-House China Holdings ADR 2 | 86,000 | 473,000 | ||||
Li Ning 1 | 350,000 | 197,142 | ||||
| Total (Cost $1,296,736) | 694,649 | |||||
Denmark – 1.7% | ||||||
† SimCorp | 2,200 | 378,331 | ||||
| Total (Cost $375,105) | 378,331 | |||||
Finland – 0.9% | ||||||
Nokian Renkaat | 5,000 | 190,571 | ||||
| Total (Cost $180,597) | 190,571 | |||||
France – 2.1% | ||||||
Boiron | 8,000 | 207,757 | ||||
Societe Internationale de Plantations d’Heveas | 3,000 | 255,067 | ||||
| Total (Cost $518,374) | 462,824 | |||||
Germany – 7.3% | ||||||
Carl Zeiss Meditec | 15,500 | 373,586 | ||||
Fuchs Petrolub 2 | 5,000 | 255,934 | ||||
KWS Saat 2 | 1,100 | 286,232 | ||||
| THE ACCOMPANYING NOTES ARE AN INTEGRAL PART OF THESE FINANCIAL STATEMENTS. | The Royce Funds 2012 Semiannual Report to Shareholders | 23 |
| Schedules of Investments |
| Royce Global Select Long/Short Fund (continued) |
| SHARES | VALUE | ||||||
Germany (continued) | |||||||
Nemetschek 2 | 8,500 | $ | 315,409 | ||||
Pfeiffer Vacuum Technology 2 | 3,500 | 356,262 | |||||
| Total (Cost $1,236,819) | 1,587,423 | ||||||
Hong Kong – 5.3% | |||||||
Asian Citrus Holdings | 600,000 | 337,851 | |||||
† Luk Fook Holdings (International) | 155,000 | 325,196 | |||||
Value Partners Group | 1,000,000 | 489,945 | |||||
| Total (Cost $1,531,501) | 1,152,992 | ||||||
India – 2.9% | |||||||
Graphite India | 200,000 | 322,763 | |||||
Maharashtra Seamless | 50,000 | 304,739 | |||||
| Total (Cost $764,881) | 627,502 | ||||||
Italy – 2.2% | �� | ||||||
Recordati | 67,000 | 476,724 | |||||
| Total (Cost $518,785) | 476,724 | ||||||
Japan – 12.3% | |||||||
EPS | 95 | 259,736 | |||||
FamilyMart | 13,500 | 618,127 | |||||
† Hogy Medical | 4,000 | 182,748 | |||||
Moshi Moshi Hotline | 35,000 | 360,249 | |||||
Santen Pharmaceutical | 17,000 | 697,210 | |||||
USS | 5,000 | 540,087 | |||||
| Total (Cost $2,143,724) | 2,658,157 | ||||||
Jersey – 3.1% | |||||||
Centamin 1 | 240,000 | 261,141 | |||||
Randgold Resources ADR 2 | 4,500 | 405,045 | |||||
| Total (Cost $841,774) | 666,186 | ||||||
Mexico – 3.4% | |||||||
Fresnillo 2 | 15,000 | 344,251 | |||||
Grupo SIMEC Ser. B 1 | 40,000 | 125,160 | |||||
Industrias Bachoco ADR 2 | 12,500 | 274,375 | |||||
| Total (Cost $794,449) | 743,786 | ||||||
Norway – 2.7% | |||||||
Ekornes | 22,500 | 322,687 | |||||
TGS-NOPEC Geophysical | 10,000 | 269,533 | |||||
| Total (Cost $540,896) | 592,220 | ||||||
South Africa – 5.4% | |||||||
Adcock Ingram Holdings | 47,500 | 349,805 | |||||
Lewis Group 2 | 40,000 | 344,733 | |||||
Northam Platinum | 45,000 | 128,846 | |||||
Raubex Group | 210,000 | 343,842 | |||||
| Total (Cost $1,442,614) | 1,167,226 | ||||||
| South Korea – 1.7% | |||||||
MegaStudy | 5,500 | 377,178 | |||||
| Total (Cost $709,148) | 377,178 | ||||||
Switzerland – 3.5% | |||||||
Burckhardt Compression Holding | 1,400 | 359,356 | |||||
Partners Group Holding | 2,200 | 391,120 | |||||
| Total (Cost $557,365) | 750,476 | ||||||
Turkey – 1.3% | |||||||
Mardin Cimento Sanayii | 90,000 | 277,955 | |||||
| Total (Cost $408,642) | 277,955 | ||||||
United Kingdom – 11.4% | |||||||
Ashmore Group 2 | 103,000 | 565,241 | |||||
† Domino Printing Sciences 2 | 48,000 | 406,285 | |||||
EnQuest 1 | 150,000 | 254,304 | |||||
Hochschild Mining 2 | 65,000 | 479,580 | |||||
Jupiter Fund Management | 180,000 | 607,837 | |||||
Spirax-Sarco Engineering 2 | 5,500 | 171,379 | |||||
| Total (Cost $2,297,122) | 2,484,626 | ||||||
United States – 11.1% | |||||||
† Abercrombie & Fitch Cl. A 2 | 5,000 | 170,700 | |||||
† Dolby Laboratories Cl. A 1,2 | 6,000 | 247,800 | |||||
GrafTech International 1,2 | 26,500 | 255,725 | |||||
† Guess? 2 | 9,000 | 273,330 | |||||
Helmerich & Payne 2 | 11,000 | 478,280 | |||||
Kennametal 2 | 11,000 | 364,650 | |||||
Lam Research 1,2 | 5,000 | 188,700 | |||||
Teradyne 1,2 | 30,000 | 421,800 | |||||
| Total (Cost $2,669,793) | 2,400,985 | ||||||
TOTAL COMMON STOCKS | |||||||
(Cost $23,593,950) | 22,078,179 | ||||||
| REPURCHASE AGREEMENT – 5.6% | |||||||
Fixed Income Clearing Corporation, | |||||||
0.11% dated 6/29/12, due 7/2/12, | |||||||
maturity value $1,226,011 (collateralized | |||||||
by obligations of various U.S. Government | |||||||
Agencies, 3.25% due 6/30/16, valued at $1,254,400) | |||||||
(Cost $1,226,000) | 1,226,000 | ||||||
TOTAL INVESTMENTS – 107.4% | |||||||
(Cost $24,819,950) | 23,304,179 | ||||||
LIABILITIES LESS CASH | |||||||
AND OTHER ASSETS – (7.4)% | (1,615,054 | ) | |||||
NET ASSETS – 100.0% | $ | 21,689,125 | |||||
| 24 | The Royce Funds 2012 Semiannual Report to Shareholders | THE ACCOMPANYING NOTES ARE AN INTEGRAL PART OF THESE FINANCIAL STATEMENTS. |
| June 30, 2012 (unaudited) |
| SHARES | VALUE | |||||
| SECURITIES SOLD SHORT | ||||||
COMMON STOCKS – 22.3% | ||||||
Argentina – 0.5% | ||||||
MercadoLibre | 1,500 | $ | 113,700 | |||
Total (Proceeds $109,832) | 113,700 | |||||
Brazil – 0.3% | ||||||
Petroleo Brasileiro ADR | 4,000 | 75,080 | ||||
Total (Proceeds $74,798) | 75,080 | |||||
Canada – 2.6% | ||||||
Goldcorp | 3,800 | 142,804 | ||||
iShares MSCI Canada Index Fund | 11,600 | 299,744 | ||||
lululemon athletica | 2,000 | 119,260 | ||||
Total (Proceeds $590,175) | 561,808 | |||||
Cayman Islands – 0.8% | ||||||
Herbalife | 3,700 | 178,821 | ||||
Total (Proceeds $202,410) | 178,821 | |||||
Hong Kong – 0.6% | ||||||
Michael Kors Holdings | 3,000 | 125,520 | ||||
Total (Proceeds $119,278) | 125,520 | |||||
Ireland – 1.0% | ||||||
Accenture Cl. A | 3,500 | 210,315 | ||||
Total (Proceeds $218,347) | 210,315 | |||||
United States – 14.6% | ||||||
Blyth | 4,000 | 138,240 | ||||
Brunswick Corporation | 4,800 | 106,656 | ||||
Deluxe Corporation | 9,000 | 224,460 | ||||
Direxion Daily Gold Miners Bull 3x Shares | 6,000 | 65,520 | ||||
GNC Holdings Cl. A | 5,000 | 196,000 | ||||
Las Vegas Sands | 4,000 | 173,960 | ||||
LinkedIn Corporation | 1,500 | 159,405 | ||||
Mattress Firm Holding Corporation | 6,000 | 181,860 | ||||
Panera Bread Cl. A | 1,500 | 209,160 | ||||
priceline.com | 200 | 132,904 | ||||
ProShares Ultra Health Care | 5,500 | 414,315 | ||||
Simon Property Group | 1,300 | 202,358 | ||||
Terex Corporation | 6,200 | 110,546 | ||||
Toll Brothers | 8,500 | 252,705 | ||||
Ultra Oil & Gas ProShares | 9,500 | 385,320 | ||||
United Rentals | 6,000 | 204,240 | ||||
Total (Proceeds $2,981,293) | 3,157,649 | |||||
| Non-Country Specific – 1.9% | ||||||
ProShares Ultra MSCI Emerging Markets | 6,000 | 402,960 | ||||
Total (Proceeds $477,643) | 402,960 | |||||
TOTAL SECURITIES SOLD SHORT | ||||||
(Proceeds $4,773,776) | $ | 4,825,853 | ||||
| THE ACCOMPANYING NOTES ARE AN INTEGRAL PART OF THESE FINANCIAL STATEMENTS. | The Royce Funds 2012 Semiannual Report to Shareholders | 25 |
| Schedules of Investments |
| Royce Enterprise Select Fund |
| SHARES | VALUE | |||||
COMMON STOCKS – 80.7% | ||||||
Consumer Discretionary – 11.2% | ||||||
Distributors - 0.6% | ||||||
† Genuine Parts | 120 | $ | 7,230 | |||
Household Durables - 6.3% | ||||||
Garmin | 780 | 29,866 | ||||
Harman International Industries | 420 | 16,632 | ||||
Mohawk Industries 1 | 405 | 28,281 | ||||
| 74,779 | ||||||
Specialty Retail - 2.8% | ||||||
Advance Auto Parts | 400 | 27,288 | ||||
Tiffany & Co. | 100 | 5,295 | ||||
| 32,583 | ||||||
Textiles, Apparel & Luxury Goods - 1.5% | ||||||
Gildan Activewear | 650 | 17,888 | ||||
| Total (Cost $134,269) | 132,480 | |||||
Energy – 2.1% | ||||||
Energy Equipment & Services - 2.1% | ||||||
† Pason Systems | 900 | 13,154 | ||||
Trican Well Service | 1,050 | 12,118 | ||||
| Total (Cost $31,336) | 25,272 | |||||
Financials – 7.8% | ||||||
Diversified Financial Services - 1.7% | ||||||
Moody’s Corporation | 560 | 20,468 | ||||
Insurance - 3.6% | ||||||
Alleghany Corporation 1 | 126 | 42,809 | ||||
Real Estate Management & Development - 2.5% | ||||||
Jones Lang LaSalle | 420 | 29,555 | ||||
Total (Cost $89,991) | 92,832 | |||||
Health Care – 13.1% | ||||||
Biotechnology - 2.0% | ||||||
† Myriad Genetics 1 | 1,000 | 23,770 | ||||
Health Care Equipment & Supplies - 3.5% | ||||||
C.R. Bard | 80 | 8,595 | ||||
IDEXX Laboratories 1 | 350 | 33,646 | ||||
| 42,241 | ||||||
Health Care Providers & Services - 3.8% | ||||||
† Laboratory Corporation of America | ||||||
Holdings 1 | 85 | 7,872 | ||||
Schein (Henry) 1,2 | 470 | 36,890 | ||||
| 44,762 | ||||||
Life Sciences Tools & Services - 2.7% | ||||||
PerkinElmer | 1,240 | 31,992 | ||||
Pharmaceuticals - 1.1% | ||||||
† Perrigo Company | 112 | 13,208 | ||||
| Total (Cost $142,239) | 155,973 | |||||
| Industrials – 17.9% | ||||||
Commercial Services & Supplies - 2.2% | ||||||
Cintas Corporation | 500 | 19,305 | ||||
† Ritchie Bros. Auctioneers | 300 | 6,375 | ||||
| 25,680 | ||||||
Electrical Equipment - 2.8% | ||||||
Franklin Electric | 100 | 5,113 | ||||
Hubbell Cl. B | 360 | 28,058 | ||||
| 33,171 | ||||||
Industrial Conglomerates - 0.9% | ||||||
Carlisle Companies | 200 | 10,604 | ||||
Machinery - 5.2% | ||||||
Kennametal | 690 | 22,874 | ||||
Valmont Industries | 260 | 31,452 | ||||
Wabtec Corporation | 100 | 7,801 | ||||
| 62,127 | ||||||
Marine - 0.5% | ||||||
Kirby Corporation 1 | 120 | 5,650 | ||||
Professional Services - 6.3% | ||||||
Equifax | 560 | 26,096 | ||||
ManpowerGroup | 590 | 21,623 | ||||
Towers Watson & Company Cl. A | 450 | 26,955 | ||||
| 74,674 | ||||||
| Total (Cost $192,130) | 211,906 | |||||
Information Technology – 18.7% | ||||||
Communications Equipment - 0.6% | ||||||
ADTRAN | 225 | 6,793 | ||||
Electronic Equipment, Instruments & Components - 6.2% | ||||||
Avnet 1 | 618 | 19,071 | ||||
AVX Corporation | 2,135 | 22,823 | ||||
Coherent 1 | 330 | 14,289 | ||||
† IPG Photonics 1 | 400 | 17,436 | ||||
| 73,619 | ||||||
IT Services - 4.3% | ||||||
† CoreLogic 1 | 920 | 16,845 | ||||
Fiserv 1 | 348 | 25,133 | ||||
† Gartner 1 | 200 | 8,610 | ||||
| 50,588 | ||||||
Office Electronics - 1.4% | ||||||
Zebra Technologies Cl. A 1 | 500 | 17,180 | ||||
Semiconductors & Semiconductor Equipment - 6.2% | ||||||
Analog Devices | 600 | 22,602 | ||||
International Rectifier 1 | 1,050 | 20,989 | ||||
Teradyne 1 | 2,110 | 29,667 | ||||
| 73,258 | ||||||
| Total (Cost $225,213) | 221,438 | |||||
Materials – 8.5% | ||||||
Chemicals - 4.8% | ||||||
Cabot Corporation | 830 | 33,781 | ||||
Sigma-Aldrich Corporation | 206 | 15,230 | ||||
Stepan Company | 30 | 2,825 | ||||
| 26 | The Royce Funds 2012 Semiannual Report to Shareholders | THE ACCOMPANYING NOTES ARE AN INTEGRAL PART OF THESE FINANCIAL STATEMENTS. |
| June 30, 2012 (unaudited) |
| SHARES | VALUE | ||||||
| Materials (continued) | |||||||
| Chemicals (continued) | |||||||
Westlake Chemical | 100 | $ | 5,226 | ||||
| 57,062 | |||||||
Metals & Mining - 1.9% | |||||||
Pan American Silver | 1,020 | 17,228 | |||||
Reliance Steel & Aluminum | 110 | 5,555 | |||||
| 22,783 | |||||||
Paper & Forest Products - 1.8% | |||||||
Stella-Jones | 400 | 21,039 | |||||
| Total (Cost $90,838) | 100,884 | ||||||
Utilities – 1.4% | |||||||
Gas Utilities - 1.4% | |||||||
UGI Corporation 2 | 580 | 17,070 | |||||
| �� | |||||||
| Total (Cost $15,189) | 17,070 | ||||||
TOTAL COMMON STOCKS | |||||||
(Cost $921,205) | 957,855 | ||||||
| REPURCHASE AGREEMENT – 21.2% | |||||||
Fixed Income Clearing Corporation, | |||||||
0.11% dated 6/29/12, due 7/2/12, | |||||||
maturity value $252,002 (collateralized | |||||||
by obligations of various U.S. Government | |||||||
Agencies, 3.25% due 6/30/16, valued at $257,600) | |||||||
(Cost $252,000) | 252,000 | ||||||
TOTAL INVESTMENTS – 101.9% | |||||||
(Cost $1,173,205) | 1,209,855 | ||||||
LIABILITIES LESS CASH | |||||||
AND OTHER ASSETS – (1.9)% | (22,700 | ) | |||||
NET ASSETS – 100.0% | $ | 1,187,155 | |||||
| Royce Opportunity Select Fund |
| SHARES | VALUE | |||||
| COMMON STOCKS – 98.9% | ||||||
| Consumer Discretionary – 16.3% | ||||||
Hotels, Restaurants & Leisure - 0.7% | ||||||
Orient-Express Hotels Cl. A 1 | 2,100 | $ | 17,577 | |||
Household Durables - 10.7% | ||||||
Ethan Allen Interiors | 1,000 | 19,930 | ||||
Furniture Brands International 1 | 11,000 | 13,640 | ||||
Harman International Industries 2 | 1,800 | 71,280 | ||||
† Meritage Homes 1 | 1,300 | 44,122 | ||||
Standard Pacific 1,2 | 18,800 | 116,372 | ||||
| 265,344 | ||||||
Leisure Equipment & Products - 0.5% | ||||||
Callaway Golf 2 | 2,100 | 12,411 | ||||
Specialty Retail - 3.5% | ||||||
Lithia Motors Cl. A | 3,700 | 85,285 | ||||
Textiles, Apparel & Luxury Goods - 0.9% | ||||||
Delta Apparel 1,2 | 1,600 | 21,856 | ||||
| Total (Cost $351,496) | 402,473 | |||||
Consumer Staples – 2.8% | ||||||
Food & Staples Retailing - 1.4% | ||||||
SUPERVALU 2 | 6,800 | 35,224 | ||||
Personal Products - 1.4% | ||||||
Physicians Formula Holdings 1,2 | 9,500 | 33,155 | ||||
| Total (Cost $89,046) | 68,379 | |||||
Energy – 13.1% | ||||||
Energy Equipment & Services - 8.0% | ||||||
Hercules Offshore 1 | 10,900 | 38,586 | ||||
Key Energy Services 1 | 1,400 | 10,640 | ||||
† Natural Gas Services Group 1 | 2,500 | 37,050 | ||||
Newpark Resources 1 | 13,300 | 78,470 | ||||
Pioneer Drilling 1 | 3,000 | 23,910 | ||||
Union Drilling 1 | 1,900 | 8,512 | ||||
| 197,168 | ||||||
Oil, Gas & Consumable Fuels - 5.1% | ||||||
Goodrich Petroleum 1 | 1,500 | 20,790 | ||||
Penn Virginia | 2,500 | 18,350 | ||||
Scorpio Tankers 1 | 6,500 | 41,535 | ||||
SM Energy 2 | 500 | 24,555 | ||||
StealthGas 1 | 3,500 | 20,335 | ||||
| 125,565 | ||||||
| Total (Cost $316,108) | 322,733 | |||||
Financials – 13.3% | ||||||
Commercial Banks - 0.6% | ||||||
State Bank Financial 1 | 1,000 | 15,160 | ||||
Insurance - 1.5% | ||||||
MBIA 1 | 3,500 | 37,835 | ||||
Real Estate Investment Trusts (REITs) - 8.1% | ||||||
LaSalle Hotel Properties 2 | 1,600 | 46,624 | ||||
Mack-Cali Realty 2 | 2,200 | 63,954 | ||||
PennyMac Mortgage Investment Trust | 3,000 | 59,190 | ||||
| THE ACCOMPANYING NOTES ARE AN INTEGRAL PART OF THESE FINANCIAL STATEMENTS. | The Royce Funds 2012 Semiannual Report to Shareholders | 27 |
| Schedules of Investments |
| Royce Opportunity Select Fund (continued) |
| SHARES | VALUE | |||||
| Financials (continued) | ||||||
| Real Estate Investment Trusts (REITs) (continued) | ||||||
RAIT Financial Trust | 6,600 | $ | 30,492 | |||
| 200,260 | ||||||
Thrifts & Mortgage Finance - 3.1% | ||||||
Radian Group 2 | 11,600 | 38,164 | ||||
Walker & Dunlop 1 | 3,000 | 38,550 | ||||
| 76,714 | ||||||
| Total (Cost $362,646) | 329,969 | |||||
Industrials – 17.6% | ||||||
Airlines - 2.1% | ||||||
† JetBlue Airways 1 | 10,000 | 53,000 | ||||
Building Products - 4.5% | ||||||
Ameresco Cl. A 1,2 | 2,800 | 33,404 | ||||
Apogee Enterprises | 2,500 | 40,175 | ||||
† Builders FirstSource 1 | 8,000 | 37,920 | ||||
| 111,499 | ||||||
Construction & Engineering - 3.0% | ||||||
iShares Dow Jones US Home Construction | ||||||
Index Fund | 1,000 | 16,800 | ||||
Northwest Pipe 1,2 | 2,400 | 58,224 | ||||
| 75,024 | ||||||
Machinery - 6.2% | ||||||
CIRCOR International | 1,100 | 37,499 | ||||
Commercial Vehicle Group 1 | 2,000 | 17,240 | ||||
Flow International 1,2 | 6,000 | 18,900 | ||||
Hardinge | 2,700 | 24,570 | ||||
Meritor 1 | 4,000 | 20,880 | ||||
Mueller Water Products Cl. A | 9,500 | 32,870 | ||||
| 151,959 | ||||||
Road & Rail - 0.8% | ||||||
Swift Transportation 1,2 | 2,000 | 18,900 | ||||
Trading Companies & Distributors - 1.0% | ||||||
SeaCube Container Leasing | 1,400 | 23,898 | ||||
| Total (Cost $412,645) | 434,280 | |||||
Information Technology – 27.0% | ||||||
Communications Equipment - 1.9% | ||||||
ClearOne Communications 1 | 3,700 | 15,133 | ||||
Oclaro 1 | 5,000 | 15,200 | ||||
Opnext 1 | 13,000 | 16,380 | ||||
| 46,713 | ||||||
Electronic Equipment, Instruments & Components - 2.7% | ||||||
Benchmark Electronics 1 | 2,000 | 27,900 | ||||
Newport Corporation 1 | 3,300 | 39,666 | ||||
| 67,566 | ||||||
Internet Software & Services - 2.6% | ||||||
† Carbonite 1 | 5,500 | 49,170 | ||||
Limelight Networks 1 | 5,000 | 14,650 | ||||
| 63,820 | ||||||
Semiconductors & Semiconductor Equipment - 13.4% | ||||||
Alpha & Omega Semiconductor 1,2 | 3,100 | 28,365 | ||||
ANADIGICS 1 | 10,000 | 18,100 | ||||
AXT 1 | 5,000 | 19,750 | ||||
† Exar Corporation 1 | 9,100 | 74,256 | ||||
Inphi Corporation 1 | 3,800 | 36,024 | ||||
Integrated Silicon Solution 1 | 2,700 | 27,243 | ||||
Kulicke & Soffa Industries 1 | 3,000 | 26,760 | ||||
† OmniVision Technologies 1 | 2,500 | 33,400 | ||||
Rudolph Technologies 1 | 2,500 | 21,800 | ||||
TriQuint Semiconductor 1 | 8,500 | 46,750 | ||||
| 332,448 | ||||||
Software - 6.4% | ||||||
Aspen Technology 1 | 2,000 | 46,300 | ||||
† Ellie Mae 1 | 6,200 | 111,600 | ||||
| 157,900 | ||||||
| Total (Cost $648,178) | 668,447 | |||||
Materials – 7.5% | ||||||
Chemicals - 2.0% | ||||||
Minerals Technologies | 300 | 19,134 | ||||
OM Group 1 | 1,600 | 30,400 | ||||
| 49,534 | ||||||
Metals & Mining - 5.5% | ||||||
Century Aluminum 1 | 5,800 | 42,514 | ||||
Kaiser Aluminum | 700 | 36,288 | ||||
RTI International Metals 1,2 | 1,500 | 33,945 | ||||
Titanium Metals | 2,100 | 23,751 | ||||
| 136,498 | ||||||
| Total (Cost $220,611) | 186,032 | |||||
Miscellaneous3 – 1.3% | ||||||
| Total (Cost $32,545) | 33,161 | |||||
TOTAL COMMON STOCKS | ||||||
(Cost $2,433,275) | 2,445,474 | |||||
TOTAL INVESTMENTS – 98.9% | ||||||
(Cost $2,433,275) | 2,445,474 | |||||
CASH AND OTHER ASSETS | ||||||
LESS LIABILITIES – 1.1% | 26,308 | |||||
NET ASSETS – 100.0% | $ | 2,471,782 | ||||
SECURITIES SOLD SHORT | ||||||
COMMON STOCKS – 20.9% | ||||||
Consumer Discretionary – 14.8% | ||||||
Automobiles - 2.4% | ||||||
General Motors | 3,000 | $ | 59,160 | |||
Hotels, Restaurants & Leisure - 1.8% | ||||||
Darden Restaurants | 500 | 25,315 | ||||
Hyatt Hotels Cl. A | 500 | 18,580 | ||||
| 43,895 | ||||||
| 28 | The Royce Funds 2012 Semiannual Report to Shareholders | THE ACCOMPANYING NOTES ARE AN INTEGRAL PART OF THESE FINANCIAL STATEMENTS. |
| June 30, 2012 (unaudited) |
| SHARES | VALUE | |||||
| Consumer Discretionary (continued) | ||||||
Multiline Retail - 1.4% | ||||||
J.C. Penney Company | 1,500 | $ | 34,965 | |||
Specialty Retail - 1.0% | ||||||
ANN | 1,000 | 25,490 | ||||
Textiles, Apparel & Luxury Goods - 8.2% | ||||||
lululemon athletica | 1,200 | 71,556 | ||||
Michael Kors Holdings | 1,500 | 62,760 | ||||
Nike Cl. B | 500 | 43,890 | ||||
PVH | 300 | 23,337 | ||||
| 201,543 | ||||||
Total (Proceeds $413,346) | 365,053 | |||||
Industrials – 5.5% | ||||||
Machinery - 5.5% | ||||||
Caterpillar | 500 | 42,455 | ||||
Cummins | 200 | 19,382 | ||||
Illinois Tool Works | 1,000 | 52,890 | ||||
Lincoln Electric Holdings | 500 | 21,895 | ||||
Total (Proceeds $150,319) | 136,622 | |||||
Information Technology – 0.6% | ||||||
Software - 0.6% | ||||||
salesforce.com | 100 | 13,826 | ||||
Total (Proceeds $11,397) | 13,826 | |||||
TOTAL SECURITIES SOLD SHORT | ||||||
(Proceeds $575,062) | $ | 515,501 | ||||
| † | New additions in 2012. |
| 1 | Non-income producing. |
| 2 | All or a portion of these securities have been segregated as collateral for short sales. |
| 3 | Includes securities first acquired in 2012 and less than 1% of net assets. |
| 4 | Securities for which market quotations are not readily available represent 0.7% and 0.1% of net assets for Royce Select Fund II and Royce Global Select Long/Short Fund, respectively. These securities have been valued at their fair value under procedures approved by the Fund’s Board of Trustees. These securities are defined as Level 3 securities due to the use of significant unobservable inputs in the determination of fair value. See Notes to Financial Statements. |
| Securities of Global/International Funds are categorized by the country of their headquarters, with the exception of exchange-traded funds. | |
| Bold indicates a Fund’s 20 largest equity holdings in terms of June 30, 2012, market value. | |
| THE ACCOMPANYING NOTES ARE AN INTEGRAL PART OF THESE FINANCIAL STATEMENTS. | The Royce Funds 2012 Semiannual Report to Shareholders | 29 |
| Statements of Assets and Liabilities |
| Royce | Royce | Royce | ||||||||
| Select | Select | Global Select | ||||||||
| Fund I | Fund II | Long/Short Fund | ||||||||
| ASSETS: | ||||||||||
| Investments at value | $ | 42,521,979 | $ | 3,366,150 | $ | 22,078,179 | ||||
| Repurchase agreements (at cost and value) | 5,480,000 | 303,000 | 1,226,000 | |||||||
| Deposits with brokers for securities sold short | – | 6,217 | 2,857,613 | |||||||
| Cash and foreign currency | 902 | 634 | 26,739 | |||||||
| Receivable for investments sold | 128,353 | 21,148 | 340,784 | |||||||
| Receivable for dividends and interest | 21,318 | 596 | 36,392 | |||||||
Total Assets | 48,152,552 | 3,697,745 | 26,565,707 | |||||||
| LIABILITIES: | ||||||||||
| Securities sold short, at fair value | – | 209,879 | 4,825,853 | |||||||
| Payable for investments purchased | 308,694 | – | 46,498 | |||||||
| Payable for dividends and interest | – | 183 | 1,440 | |||||||
| Accrued foreign taxes | – | – | 2,791 | |||||||
Total Liabilities | 308,694 | 210,062 | 4,876,582 | |||||||
Net Assets | $ | 47,843,858 | $ | 3,487,683 | $ | 21,689,125 | ||||
| ANALYSIS OF NET ASSETS: | ||||||||||
| Paid-in capital | $ | 40,482,890 | $ | 3,235,755 | $ | 23,835,946 | ||||
| Undistributed net investment income (loss) | 384,313 | 8,056 | 347,664 | |||||||
| Accumulated net realized gain (loss) on investments and foreign currency | 2,199,974 | 224,512 | (923,110 | ) | ||||||
| Net unrealized appreciation (depreciation) on investments and foreign currency | 4,776,681 | 19,360 | (1,571,375 | ) | ||||||
Net Assets | $ | 47,843,858 | $ | 3,487,683 | $ | 21,689,125 | ||||
Investment Class | $ | 47,843,858 | $ | 3,487,683 | $ | 21,689,125 | ||||
| SHARES OUTSTANDING (unlimited number of $.001 par value): | ||||||||||
Investment Class | 2,750,411 | 331,281 | 1,364,021 | |||||||
| NET ASSET VALUES (Net Assets ÷ Shares Outstanding): | ||||||||||
Investment Class1 | $17.40 | $10.53 | $15.90 | |||||||
Investments at identified cost | $ | 37,745,415 | $ | 3,337,695 | $ | 23,593,950 | ||||
Proceeds of short sales | – | 200,813 | 4,773,776 | |||||||
Aggregate value of segregated securities | – | 496,013 | 7,716,210 | |||||||
| 1 | Offering and redemption price per share; shares held less than 365 days may be subject to a 2% redemption fee, payable to the Fund. |
| 30 | The Royce Funds 2012 Semiannual Report to Shareholders | THE ACCOMPANYING NOTES ARE AN INTEGRAL PART OF THESE FINANCIAL STATEMENTS. |
| June 30, 2012 (unaudited) |
| Royce | Royce | |||||||
| Enterprise Select | Opportunity Select | |||||||
| Fund | Fund | |||||||
| ASSETS: | ||||||||
| Investments at value | $ | 957,855 | $ | 2,445,474 | ||||
| Repurchase agreements (at cost and value) | 252,000 | – | ||||||
| Deposits with brokers for securities sold short | – | 552,328 | ||||||
| Cash and foreign currency | 336 | – | ||||||
| Receivable for investments sold | 18,954 | 9,612 | ||||||
| Receivable for dividends and interest | 1,061 | 320 | ||||||
Total Assets | 1,230,206 | 3,007,734 | ||||||
| LIABILITIES: | ||||||||
| Securities sold short, at fair value | – | 515,501 | ||||||
| Payable for investments purchased | 42,019 | 13,278 | ||||||
| Payable for dividends and interest | – | 445 | ||||||
| Payable to custodian for overdrawn balance | – | 6,728 | ||||||
| Payable to brokers for securities sold short | 1,032 | – | ||||||
Total Liabilities | 43,051 | 535,952 | ||||||
Net Assets | $ | 1,187,155 | $ | 2,471,782 | ||||
| ANALYSIS OF NET ASSETS: | ||||||||
| Paid-in capital | $ | 1,063,897 | $ | 2,233,174 | ||||
| Undistributed net investment income (loss) | (1,257 | ) | 9,036 | |||||
| Accumulated net realized gain (loss) on investments and foreign currency | 87,863 | 157,812 | ||||||
| Net unrealized appreciation (depreciation) on investments and foreign currency | 36,652 | 71,760 | ||||||
Net Assets | $ | 1,187,155 | $ | 2,471,782 | ||||
Investment Class | $ | 1,187,155 | $ | 2,471,782 | ||||
| SHARES OUTSTANDING (unlimited number of $.001 par value): | ||||||||
Investment Class | 113,604 | 204,885 | ||||||
| NET ASSET VALUES (Net Assets ÷ Shares Outstanding): | ||||||||
Investment Class1 | $10.45 | $12.06 | ||||||
Investments at identified cost | $ | 921,205 | $ | 2,433,275 | ||||
Proceeds of short sales | – | 575,062 | ||||||
Aggregate value of segregated securities | 15,452 | 592,848 | ||||||
| 1 | Offering and redemption price per share; shares held less than 365 days may be subject to a 2% redemption fee, payable to the Fund. |
| THE ACCOMPANYING NOTES ARE AN INTEGRAL PART OF THESE FINANCIAL STATEMENTS. | The Royce Funds 2012 Semiannual Report to Shareholders | 31 |
Statements of Changes in Net Assets
| Royce Global Select | ||||||||||||||||||||||||
| Royce Select Fund I | Royce Select Fund II | Long/Short Fund | ||||||||||||||||||||||
| Six months ended | Six months ended | Six months ended | ||||||||||||||||||||||
| 6/30/12 | Year ended | 6/30/12 | Year ended | 6/30/12 | Year ended | |||||||||||||||||||
| (unaudited) | 12/31/11 | (unaudited) | 12/31/11 | (unaudited) | 12/31/11 | |||||||||||||||||||
| INVESTMENT OPERATIONS: | ||||||||||||||||||||||||
| Net investment income (loss) | $ | 384,314 | $ | (439,121 | ) | $ | 19,792 | $ | (4,183 | ) | $ | 351,595 | $ | 351,544 | ||||||||||
Net realized gain (loss) on investments and foreign currency | 1,539,331 | 7,191,315 | 188,503 | 323,131 | (580,955 | ) | 702,435 | |||||||||||||||||
Net change in unrealized appreciation (depreciation) on investments and foreign currency | (591,491 | ) | (8,971,484 | ) | (2,643 | ) | (944,657 | ) | 1,033,556 | (6,288,113 | ) | |||||||||||||
Net increase (decrease) in net assets from investment operations | 1,332,154 | (2,219,290 | ) | 205,652 | (625,709 | ) | 804,196 | (5,234,134 | ) | |||||||||||||||
| DISTRIBUTIONS: | ||||||||||||||||||||||||
| Net investment income | ||||||||||||||||||||||||
Investment Class | – | – | – | – | – | (353,292 | ) | |||||||||||||||||
| Net realized gain on investments and | ||||||||||||||||||||||||
foreign currency | ||||||||||||||||||||||||
Investment Class | – | (6,464,732 | ) | – | (553,183 | ) | – | (994,032 | ) | |||||||||||||||
| Total distributions | – | (6,464,732 | ) | – | (553,183 | ) | – | (1,347,324 | ) | |||||||||||||||
| CAPITAL SHARE TRANSACTIONS: | ||||||||||||||||||||||||
| Value of shares sold | ||||||||||||||||||||||||
Investment Class | 2,951,758 | 3,885,367 | 6,284 | 367,444 | 568,010 | 15,162,769 | ||||||||||||||||||
| Distributions reinvested | ||||||||||||||||||||||||
Investment Class | – | 6,201,698 | – | 553,183 | – | 1,300,066 | ||||||||||||||||||
| Value of shares redeemed | ||||||||||||||||||||||||
Investment Class | (3,785,920 | ) | (12,849,352 | ) | (144,263 | ) | (1,463,114 | ) | (2,193,601 | ) | (3,750,110 | ) | ||||||||||||
| Shareholder redemption fees | ||||||||||||||||||||||||
Investment Class | 635 | 3,979 | – | 202 | 3,739 | 20,295 | ||||||||||||||||||
Net increase (decrease) in net assets from capital share transactions | (833,527 | ) | (2,758,308 | ) | (137,979 | ) | (542,285 | ) | (1,621,852 | ) | 12,733,020 | |||||||||||||
| NET INCREASE (DECREASE) IN NET ASSETS | 498,627 | (11,442,330 | ) | 67,673 | (1,721,177 | ) | (817,656 | ) | 6,151,562 | |||||||||||||||
| NET ASSETS: | ||||||||||||||||||||||||
Beginning of period | 47,345,231 | 58,787,561 | 3,420,010 | 5,141,187 | 22,506,781 | 16,355,219 | ||||||||||||||||||
End of period | $ | 47,843,858 | $ | 47,345,231 | $ | 3,487,683 | $ | 3,420,010 | $ | 21,689,125 | $ | 22,506,781 | ||||||||||||
UNDISTRIBUTED NET INVESTMENT INCOME (LOSS) AT END OF PERIOD | $ | 384,313 | $ | – | $ | 8,056 | $ | (11,737 | ) | $ | 347,664 | $ | (3,930 | ) | ||||||||||
| 32 | The Royce Funds 2012 Semiannual Report to Shareholders | THE ACCOMPANYING NOTES ARE AN INTEGRAL PART OF THESE FINANCIAL STATEMENTS. |
| Royce Enterprise Select Fund | Royce Opportunity Select Fund | |||||||||||||||
| Six months ended | Six months ended | |||||||||||||||
| 6/30/12 | Year ended | 6/30/12 | Year ended | |||||||||||||
| (unaudited) | 12/31/11 | (unaudited) | 12/31/11 | |||||||||||||
| INVESTMENT OPERATIONS: | ||||||||||||||||
| Net investment income (loss) | $ | (1,257 | ) | $ | (4,614 | ) | $ | 9,602 | $ | 1,939 | ||||||
Net realized gain (loss) on investments and foreign currency | 92,922 | 84,598 | 154,629 | 4,162 | ||||||||||||
Net change in unrealized appreciation (depreciation) on investments and foreign currency | (26,882 | ) | (73,989 | ) | 188,696 | (450,431 | ) | |||||||||
Net increase (decrease) in net assets from investment operations | 64,783 | 5,995 | 352,927 | (444,330 | ) | |||||||||||
| DISTRIBUTIONS: | ||||||||||||||||
| Net investment income | ||||||||||||||||
Investment Class | – | – | – | (3,339 | ) | |||||||||||
| Net realized gain on investments and foreign currency | ||||||||||||||||
Investment Class | – | (63,941 | ) | – | (77,223 | ) | ||||||||||
| Total distributions | – | (63,941 | ) | – | (80,562 | ) | ||||||||||
| CAPITAL SHARE TRANSACTIONS: | ||||||||||||||||
| Value of shares sold | ||||||||||||||||
Investment Class | – | 70,238 | 17,000 | 780,224 | ||||||||||||
| Distributions reinvested | ||||||||||||||||
Investment Class | – | 63,941 | – | 80,562 | ||||||||||||
| Value of shares redeemed | ||||||||||||||||
Investment Class | (589 | ) | (111,341 | ) | – | (148,016 | ) | |||||||||
| Shareholder redemption fees | ||||||||||||||||
Investment Class | – | – | – | 947 | ||||||||||||
Net increase (decrease) in net assets from capital share transactions | (589 | ) | 22,838 | 17,000 | 713,717 | |||||||||||
| NET INCREASE (DECREASE) IN NET ASSETS | 64,194 | (35,108 | ) | 369,927 | 188,825 | |||||||||||
| NET ASSETS: | ||||||||||||||||
Beginning of period | 1,122,961 | 1,158,069 | 2,101,855 | 1,913,030 | ||||||||||||
End of period | $ | 1,187,155 | $ | 1,122,961 | $ | 2,471,782 | $ | 2,101,855 | ||||||||
UNDISTRIBUTED NET INVESTMENT INCOME (LOSS) AT END OF PERIOD | $ | (1,257 | ) | $ | – | $ | 9,036 | $ | (566 | ) | ||||||
| THE ACCOMPANYING NOTES ARE AN INTEGRAL PART OF THESE FINANCIAL STATEMENTS. | The Royce Funds 2012 Semiannual Report to Shareholders | 33 |
| Statements of Operations | Six Months Ended June 30, 2012 (unaudited) |
| Royce | Royce | |||||||||||||||||||
| Royce | Royce | Global Select | Royce | Opportunity | ||||||||||||||||
| Select | Select | Long/Short | Enterprise Select | Select | ||||||||||||||||
| Fund I | Fund II | Fund | Fund | Fund | ||||||||||||||||
| INVESTMENT INCOME: | ||||||||||||||||||||
| Income: | ||||||||||||||||||||
Dividends | $ | 382,805 | $ | 23,996 | $ | 398,273 | $ | 5,047 | $ | 11,756 | ||||||||||
Interest | 1,509 | 112 | 67 | 60 | – | |||||||||||||||
| Total income | 384,314 | 24,108 | 398,340 | 5,107 | 11,756 | |||||||||||||||
| Expenses: | ||||||||||||||||||||
Investment advisory fees | – | – | – | 6,359 | – | |||||||||||||||
Dividends on securities sold short | – | 2,533 | 21,103 | – | 1,606 | |||||||||||||||
Interest expense | – | 1,783 | 25,642 | 5 | 548 | |||||||||||||||
| Total expenses | – | 4,316 | 46,745 | 6,364 | 2,154 | |||||||||||||||
| Net investment income (loss) | 384,314 | 19,792 | 351,595 | (1,257 | ) | 9,602 | ||||||||||||||
REALIZED AND UNREALIZED GAIN (LOSS) ON INVESTMENTS AND FOREIGN CURRENCY: | ||||||||||||||||||||
| Net realized gain (loss): | ||||||||||||||||||||
Investments | 1,539,269 | 189,525 | (574,573 | ) | 92,921 | 154,629 | ||||||||||||||
Foreign currency transactions | 62 | (1,022 | ) | (6,382 | ) | 1 | – | |||||||||||||
Net change in unrealized appreciation (depreciation): | ||||||||||||||||||||
Investments and foreign currency translations | (591,534 | ) | (2,614 | ) | 1,035,820 | (26,884 | ) | 188,696 | ||||||||||||
Other assets and liabilities denominated in foreign currency | 43 | (29 | ) | (2,264 | ) | 2 | – | |||||||||||||
Net realized and unrealized gain (loss) on investments and foreign currency | 947,840 | 185,860 | 452,601 | 66,040 | 343,325 | |||||||||||||||
NET INCREASE (DECREASE) IN NET ASSETS FROM INVESTMENT OPERATIONS | $ | 1,332,154 | $ | 205,652 | $ | 804,196 | $ | 64,783 | $ | 352,927 | ||||||||||
| 34 | The Royce Funds 2012 Semiannual Report to Shareholders | THE ACCOMPANYING NOTES ARE AN INTEGRAL PART OF THESE FINANCIAL STATEMENTS. |
| Financial Highlights | |
This table is presented to show selected data for a share outstanding throughout each period, and to assist shareholders in evaluating a Fund’s performance for the periods presented. Per share amounts have been determined on the basis of the weighted average number of shares outstanding during the period.
| Net Realized and | Distributions | Ratio of Net | ||||||||||||||||||||||||||||||||||||||||||||
| Net Asset | Net | Unrealized Gain | Distributions | from Net | Investment | |||||||||||||||||||||||||||||||||||||||||
| Value, | Investment | (Loss) on | Total from | from Net | Realized Gain on | Shareholder | Net Asset | Net Assets, | Ratio of Expenses | Income (Loss) | Portfolio | |||||||||||||||||||||||||||||||||||
| Beginning of | Income | Investments and | Investment | Investment | Investments and | Total | Redemption | Value, End | Total | End of Period | to Average Net | to Average Net | Turnover | |||||||||||||||||||||||||||||||||
| Period | (Loss) | Foreign Currency | Operations | Income | Foreign Currency | Distributions | Fees | of Period | Return | (in thousands) | Assets | Assets | Rate | |||||||||||||||||||||||||||||||||
| Royce Select Fund I | ||||||||||||||||||||||||||||||||||||||||||||||
| † 2012 | $ | 16.93 | $ | 0.14 | $ | 0.33 | $ | 0.47 | $ | – | $ | – | $ | – | $ | – | $ | 17.40 | 2.78 | %1 | $ | 47,844 | 0.00 | %1 | 0.77 | %1 | 29 | % | ||||||||||||||||||
| 2011 | 20.32 | (0.16 | ) | (0.67 | ) | (0.83 | ) | – | (2.56 | ) | (2.56 | ) | – | 16.93 | (3.61 | ) | 47,345 | 1.45 | (0.78 | ) | 63 | |||||||||||||||||||||||||
| 2010 | 17.42 | (0.23 | ) | 3.39 | 3.16 | – | (0.26 | ) | (0.26 | ) | – | 20.32 | 18.15 | 58,788 | 2.37 | (1.26 | ) | 49 | ||||||||||||||||||||||||||||
| 2009 | 12.59 | 0.15 | 4.83 | 4.98 | (0.15 | ) | – | (0.15 | ) | – | 17.42 | 39.59 | 33,896 | 0.01 | 1.28 | 80 | ||||||||||||||||||||||||||||||
| 2008 | 18.20 | 0.19 | (4.93 | ) | (4.74 | ) | (0.16 | ) | (0.71 | ) | (0.87 | ) | – | 12.59 | (25.91 | ) | 17,480 | 0.08 | 1.25 | 116 | ||||||||||||||||||||||||||
| 2007 | 19.02 | (0.04 | ) | 2.09 | 2.05 | (0.00 | ) | (2.87 | ) | (2.87 | ) | – | 18.20 | 10.70 | 23,235 | 2.09 | (0.20 | ) | 77 | |||||||||||||||||||||||||||
| Royce Select Fund II | ||||||||||||||||||||||||||||||||||||||||||||||
| † 2012 | $ | 9.95 | $ | 0.06 | $ | 0.52 | $ | 0.58 | $ | – | $ | – | $ | – | $ | – | $ | 10.53 | 5.41 | %1 | $ | 3,488 | 0.12 | %1 | 0.55 | %1 | 58 | % | ||||||||||||||||||
| 2011 | 13.90 | (0.01 | ) | (2.04 | ) | (2.05 | ) | – | (1.90 | ) | (1.90 | ) | – | 9.95 | (14.35 | ) | 3,420 | 1.29 | (0.09 | ) | 153 | |||||||||||||||||||||||||
| 2010 | 11.62 | (0.18 | ) | 2.60 | 2.42 | (0.00 | ) | (0.15 | ) | (0.15 | ) | 0.01 | 13.90 | 20.96 | 5,141 | 2.77 | (1.47 | ) | 126 | |||||||||||||||||||||||||||
| 2009 | 7.02 | 0.03 | 4.64 | 4.67 | (0.07 | ) | – | (0.07 | ) | – | 11.62 | 66.58 | 4,109 | 0.67 | 0.53 | 114 | ||||||||||||||||||||||||||||||
| 2008 | 10.66 | 0.09 | (3.65 | ) | (3.56 | ) | (0.08 | ) | – | (0.08 | ) | – | 7.02 | (33.37 | ) | 1,698 | 0.24 | 0.98 | 268 | |||||||||||||||||||||||||||
| 2007 | 12.01 | (0.02 | ) | (0.64 | ) | (0.66 | ) | – | (0.69 | ) | (0.69 | ) | – | 10.66 | (5.53 | ) | 2,416 | 1.01 | (0.15 | ) | 393 | |||||||||||||||||||||||||
| Royce Global Select Long/Short Fund | ||||||||||||||||||||||||||||||||||||||||||||||
| † 2012 | $ | 15.38 | $ | 0.25 | $ | 0.27 | $ | 0.52 | $ | – | $ | – | $ | – | $ | – | $ | 15.90 | 3.38 | %1 | $ | 21,689 | 0.20 | %1 | 1.48 | %1 | 38 | % | ||||||||||||||||||
| 2011 | 19.89 | 0.25 | (3.83 | ) | (3.58 | ) | (0.25 | ) | (0.70 | ) | (0.95 | ) | 0.02 | 15.38 | (17.77 | ) | 22,507 | 0.98 | 1.46 | 45 | ||||||||||||||||||||||||||
| 2010 | 14.97 | (0.26 | ) | 5.22 | 4.96 | (0.05 | ) | – | (0.05 | ) | 0.01 | 19.89 | 33.21 | 16,355 | 3.48 | (1.55 | ) | 80 | ||||||||||||||||||||||||||||
| 2009 | 9.76 | 0.18 | 5.27 | 5.45 | (0.26 | ) | – | (0.26 | ) | 0.02 | 14.97 | 56.11 | 9,117 | 0.00 | 1.55 | 85 | ||||||||||||||||||||||||||||||
| 2008 | 15.01 | 0.23 | (5.40 | ) | (5.17 | ) | – | (0.09 | ) | (0.09 | ) | 0.01 | 9.76 | (34.39 | ) | 6,049 | 0.50 | 1.75 | 41 | |||||||||||||||||||||||||||
| 2007 | 13.43 | (0.24 | ) | 2.68 | 2.44 | (0.35 | ) | (0.51 | ) | (0.86 | ) | – | 15.01 | 18.16 | 5,786 | 2.40 | (0.56 | ) | 75 | |||||||||||||||||||||||||||
| Royce Enterprise Select Fund a | ||||||||||||||||||||||||||||||||||||||||||||||
| † 2012 | $ | 9.88 | $ | (0.01 | ) | $ | 0.58 | $ | 0.57 | $ | – | $ | – | $ | – | $ | – | $ | 10.45 | 5.77 | %1 | $ | 1,187 | 0.53 | %1 | (0.10 | )%1 | 78 | % | |||||||||||||||||
| 2011 | 10.43 | (0.04 | ) | 0.09 | 0.05 | – | (0.60 | ) | (0.60 | ) | – | 9.88 | 0.66 | 1,123 | 1.31 | (0.42 | ) | 136 | ||||||||||||||||||||||||||||
| 2010 | 8.95 | 0.05 | 1.49 | 1.54 | (0.06 | ) | – | (0.06 | ) | – | 10.43 | 17.22 | 1,158 | 0.70 | 0.50 | 166 | ||||||||||||||||||||||||||||||
| 2009 | 7.33 | 0.07 | 1.62 | 1.69 | (0.07 | ) | – | (0.07 | ) | – | 8.95 | 23.13 | 1,150 | 0.03 | 0.88 | 415 | ||||||||||||||||||||||||||||||
| 2008 | 10.04 | 0.13 | (2.80 | ) | (2.67 | ) | (0.12 | ) | (0.02 | ) | (0.14 | ) | 0.10 | 7.33 | (25.53 | ) | 917 | 0.28 | 1.48 | 764 | ||||||||||||||||||||||||||
| 2007 | 10.00 | 0.00 | 0.06 | 0.06 | (0.02 | ) | – | (0.02 | ) | – | 10.04 | 0.56 | 1 | 1,319 | 0.48 | 1 | 0.11 | 1 | 47 | |||||||||||||||||||||||||||
| Royce Opportunity Select Fund b | ||||||||||||||||||||||||||||||||||||||||||||||
| † 2012 | $ | 10.33 | $ | 0.05 | $ | 1.68 | $ | 1.73 | $ | – | $ | – | $ | – | $ | – | $ | 12.06 | 16.75 | %1 | $ | 2,472 | 0.09 | %1 | 0.40 | %1 | 62 | % | ||||||||||||||||||
| 2011 | 12.99 | 0.01 | (2.26 | ) | (2.25 | ) | (0.02 | ) | (0.39 | ) | (0.41 | ) | – | 10.33 | (17.14 | ) | 2,102 | 1.14 | 0.08 | 299 | ||||||||||||||||||||||||||
| 2010 | 10.00 | (0.43 | ) | 3.42 | 2.99 | – | – | – | – | 12.99 | 29.90 | 1 | 1,913 | 4.01 | 1 | (3.79 | )1 | 95 | ||||||||||||||||||||||||||||
| † | Six months ended June 30, 2012 (unaudited). | |
| 1 | Not annualized | |
| a | The Fund commenced operations on September 28, 2007. | |
| b | The Fund commenced operations on September 1, 2010. |
| THE ACCOMPANYING NOTES ARE AN INTEGRAL PART OF THESE FINANCIAL STATEMENTS. | The Royce Funds 2012 Semiannual Report to Shareholders | 35 |
| Notes to Financial Statements (unaudited) | |
| Summary of Significant Accounting Policies: |
Royce Select Fund I, Royce Select Fund II, Royce Global Select Long/Short Fund, Royce Enterprise Select Fund and Royce Opportunity Select Fund (the “Fund” or “Funds”), are five series of the Royce Fund (the “Trust”), a diversified open-end management investment company organized as a Delaware statutory trust. Effective May 1, 2012, Royce Global Select Fund became Royce Global Select Long/Short Fund and Royce SMid-Cap Select Fund became Royce Enterprise Select Fund. |
| Royce Select Fund I | 10% | Royce Global Select Long/Short Fund | 12% | Royce Opportunity Select Fund | 68% | |||||
| Royce Select Fund II | 45% | Royce Enterprise Select Fund | 79% |
| Valuation of Investments: |
Securities are valued as of the close of trading on the New York Stock Exchange (NYSE) (generally 4:00 p.m. Eastern time) on the valuation date. Securities that trade on an exchange, and securities traded on Nasdaq’s Electronic Bulletin Board, are valued at their last reported sales price or Nasdaq official closing price taken from the primary market in which each security trades or, if no sale is reported for such day, at their highest bid price (in the case of long positions) or at the lowest ask price (in the case of short positions). Other over-the-counter securities for which market quotations are readily available are valued at their highest bid price, except in the case of some bonds and other fixed income securities which may be valued by reference to other securities with comparable ratings, interest rates and maturities, using established independent pricing services. The Funds value their non-U.S. dollar denominated securities in U.S. dollars daily at the prevailing foreign currency exchange rates as quoted by a major bank. Securities for which market quotations are not readily available are valued at their fair value in accordance with the provisions of the 1940 Act, under procedures approved by the Fund’s Board of Trustees, and are reported as Level 3 securities. As a general principle, the fair value of a security is the amount which the Fund might reasonably expect to receive for the security upon its current sale. However, in light of the judgment involved in fair valuations, there can be no assurance that a fair value assigned to a particular security will be the amount which the Fund might be able to receive upon its current sale. In addition, if, between the time trading ends on a particular security and the close of the customary trading session on the NYSE, events occur that are significant and may make the closing price unreliable, a Fund may fair value the security. The Funds use an independent pricing service to provide fair value estimates for relevant non-U.S. equity securities on days when the U.S. market volatility exceeds a certain threshold. This pricing service uses proprietary correlations it has developed between the movement of prices of non-U.S. equity securities and indices of U.S.-traded securities, futures contracts and other indications to estimate the fair value of relevant non-U.S. securities. When fair value pricing is employed, the prices of securities used by a Fund may differ from quoted or published prices for the same security. Investments in money market funds are valued at net asset value per share. |
Various inputs are used in determining the value of each Fund’s investments, as noted above. These inputs are summarized in the three broad levels below: | |||
Level 1 – quoted prices in active markets for identical securities. | |||
Level 2 – other significant observable inputs (including quoted prices for similar securities, foreign securities that may be fair valued and repurchase agreements). The table below includes all Level 2 securities. Any Level 2 securities with values based on quoted prices for similar securities would be noted in the Schedules of Investments. | |||
| Level 3 – significant unobservable inputs (including last trade price before trading was suspended, or at a discount thereto for lack of marketability or otherwise, market price information regarding other securities, information received from the company and/or published documents, including SEC filings and financial statements, or other publicly available information). | |||
The inputs or methodology used for valuing securities are not necessarily an indication of the risk associated with investing in those securities. |
The following is a summary of the inputs used to value each Fund’s investments as of June 30, 2012. For a detailed breakout of common stocks by sector classification, please refer to the Schedules of Investments. |
| Level 1 | Level 2 | Level 3 | Total | |||||||
| Royce Select Fund I | ||||||||||
| Common Stocks | $39,650,166 | $2,871,813 | $ | – | $42,521,979 | |||||
| Cash Equivalents | – | 5,480,000 | – | 5,480,000 | ||||||
| Royce Select Fund II | ||||||||||
| Common Stocks | 2,435,553 | 905,750 | 24,847 | 3,366,150 | ||||||
| Cash Equivalents | – | 303,000 | – | 303,000 | ||||||
| 36 | The Royce Funds 2012 Semiannual Report to Shareholders |
| Valuation of Investments (continued): | ||||||||||||||
| Level 1 | Level 2 | Level 3 | Total | |||||||||||
| Royce Global Select Long/Short Fund | ||||||||||||||
| Common Stocks | $ | 3,553,405 | $ | 18,500,267 | $ | 24,507 | $ | 22,078,179 | ||||||
| Cash Equivalents | – | 1,226,000 | – | 1,226,000 | ||||||||||
| Royce Enterprise Select Fund | ||||||||||||||
| Common Stocks | 911,544 | 46,311 | – | 957,855 | ||||||||||
| Cash Equivalents | – | 252,000 | – | 252,000 | ||||||||||
| Royce Opportunity Select Fund | ||||||||||||||
| Common Stocks | 2,445,474 | – | – | 2,445,474 | ||||||||||
| Short positions: | ||||||||||||||
| Level 1 | Level 2 | Level 3 | Total | |||||||||||
| Royce Select Fund II | ||||||||||||||
| Common Stocks | $ | (197,359 | ) | – | – | $ | (197,359 | ) | ||||||
| Fixed Income | (12,520 | ) | – | – | (12,520 | ) | ||||||||
| Royce Global Select Long/Short Fund | ||||||||||||||
| Common Stocks | (4,825,853 | ) | – | – | (4,825,853 | ) | ||||||||
| Royce Opportunity Select Fund | ||||||||||||||
| Common Stocks | (515,501 | ) | – | – | (515,501 | ) | ||||||||
| Level 3 Reconciliation: | ||||||||||||
| Realized and Unrealized | ||||||||||||
| Balance as of 12/31/11 | Gain (Loss)1 | Balance as of 6/30/12 | ||||||||||
| Royce Select Fund II | ||||||||||||
| Common Stocks | $24,763 | $ | 84 | $24,847 | ||||||||
| Royce Global Select Long/Short Fund | ||||||||||||
| Common Stocks | 61,723 | (37,216 | ) | 24,507 | ||||||||
| 1 | The net change in unrealized appreciation (depreciation) is included in the accompanying Statement of Operations. Change in unrealized appreciation (depreciation) includes net unrealized appreciation (depreciation) resulting from changes in investment values during the reporting period and the reversal of previously recorded unrealized appreciation (depreciation) when gains or losses are realized. Net realized gain (loss) from investments and foreign currency transactions is included in the accompanying Statement of Operations. |
| The Royce Funds 2012 Semiannual Report to Shareholders | 37 |
Notes to Financial Statements (unaudited) (continued)
| Shares issued for | Net increase (decrease) in | |||||||||||||||||||||||||||||
| Shares sold | reinvestment of distributions | Shares redeemed | shares outstanding | |||||||||||||||||||||||||||
| Period ended | Period ended | Period ended | Period ended | |||||||||||||||||||||||||||
| 6/30/12 | Period ended | 6/30/12 | Period ended | 6/30/12 | Period ended | 6/30/12 | Period ended | |||||||||||||||||||||||
| (unaudited) | 12/31/11 | (unaudited) | 12/31/11 | (unaudited) | 12/31/11 | (unaudited) | 12/31/11 | |||||||||||||||||||||||
| Royce Select Fund I | ||||||||||||||||||||||||||||||
| Investment Class | 160,978 | 187,707 | – | 379,773 | (207,869 | ) | (663,214 | ) | (46,891 | ) | (95,734 | ) | ||||||||||||||||||
| Royce Select Fund II | ||||||||||||||||||||||||||||||
| Investment Class | 594 | 27,667 | – | 57,265 | (13,090 | ) | (111,010 | ) | (12,496 | ) | (26,078 | ) | ||||||||||||||||||
| Royce Global Select Long/Short Fund | ||||||||||||||||||||||||||||||
| Investment Class | 33,982 | 764,053 | – | 86,729 | (133,043 | ) | (209,902 | ) | (99,061 | ) | 640,880 | |||||||||||||||||||
| Royce Enterprise Select Fund | ||||||||||||||||||||||||||||||
| Investment Class | – | 6,232 | – | 6,702 | (59 | ) | (10,332 | ) | (59 | ) | 2,602 | |||||||||||||||||||
| Royce Opportunity Select Fund | ||||||||||||||||||||||||||||||
| Investment Class | 1,444 | 59,479 | – | 8,187 | – | (11,464 | ) | 1,444 | 56,202 | |||||||||||||||||||||
| Royce Select Fund I | $ | – | |
| Royce Select Fund II | – | ||
| Royce Global Select Long/Short Fund | – | ||
| Royce Enterprise Select Fund | 6,359 | ||
| Royce Opportunity Select Fund | – |
| Short | Purchases to | ||||||||||
| Purchases | Sales | Sales | Cover Short Sales | ||||||||
| Royce Select Fund I | $ | 12,650,297 | $14,200,268 | $ | – | $ | – | ||||
| Royce Select Fund II | 1,520,829 | 1,834,263 | 280,145 | 278,583 | |||||||
| Royce Global Select Long/Short Fund | 6,883,387 | 8,396,111 | 4,008,260 | 1,173,881 | |||||||
| Royce Enterprise Select Fund | 744,428 | 780,967 | – | – | |||||||
| Royce Opportunity Select Fund | 946,197 | 880,708 | 718,699 | 349,140 | |||||||
| 38 | The Royce Funds 2012 Semiannual Report to Shareholders |
| Net Unrealized Appreciation | Gross Unrealized | |||||||||||||||
| Tax Basis Cost | (Depreciation) | Appreciation | Depreciation | |||||||||||||
| Royce Select Fund I | $ | 43,229,021 | $ | 4,772,958 | $ | 6,231,739 | $ | 1,458,781 | ||||||||
| Royce Select Fund II | 3,448,159 | 11,112 | 336,122 | 325,010 | ||||||||||||
| Royce Global Select Long/Short Fund | 20,049,840 | (1,571,514 | ) | 2,034,525 | 3,606,039 | |||||||||||
| Royce Enterprise Select Fund | 1,173,439 | 36,416 | 75,310 | 38,894 | ||||||||||||
| Royce Opportunity Select Fund | 1,862,043 | 67,930 | 289,815 | 221,885 | ||||||||||||
| The Royce Funds 2012 Semiannual Report to Shareholders | 39 |
Understanding Your Fund’s Expenses (unaudited)
| Actual | Hypothetical (5% per year return before expenses) | |||||||||||||||||||||||||||||||
| Beginning | Ending | Expenses Paid | Actual | Beginning | Ending | Expenses Paid | Hypothetical | |||||||||||||||||||||||||
| Account Value | Account Value | During the | Expense | Account Value | Account Value | During the | Expense | |||||||||||||||||||||||||
| 1/1/12 | 6/30/12 | Period1 | Ratio1,2 | 1/1/12 | 6/30/12 | Period3 | Ratio4 | |||||||||||||||||||||||||
| Investment Class | ||||||||||||||||||||||||||||||||
| Royce Select Fund I | $ | 1,000.00 | $ | 1,027.76 | $ | 0.00 | 0.00 | % | $ | 1,000.00 | $ | 1,018.91 | $ | 6.36 | 0.63 | % | ||||||||||||||||
| Royce Select Fund II | 1,000.00 | 1,054.05 | 1.23 | 0.12 | % | 1,000.00 | 1,018.91 | 6.36 | 0.63 | % | ||||||||||||||||||||||
| Royce Global Select Long/Short Fund | 1,000.00 | 1,033.81 | 2.03 | 0.20 | % | 1,000.00 | 1,018.91 | 6.36 | 0.63 | % | ||||||||||||||||||||||
| Royce Enterprise Select Fund | 1,000.00 | 1,057.69 | 5.45 | 0.53 | % | 1,000.00 | 1,018.91 | 6.36 | 0.63 | % | ||||||||||||||||||||||
| Royce Opportunity Select Fund | 1,000.00 | 1,167.47 | 0.98 | 0.09 | % | 1,000.00 | 1,018.91 | 6.36 | 0.63 | % | ||||||||||||||||||||||
| 1 | Expenses are equal to the Fund’s actual expense ratio for the most recent fiscal half-year multiplied by the average account value for the period. |
| 2 | Actual expense ratio used to derive figures in the table is based on the most recent fiscal half-year. |
| 3 | Expenses are equal to the Fund’s hypothetical annualized expense ratio for the most recent fiscal half-year multiplied by the average account value for the period. |
| 4 | Hypothetical expense ratio used to derive figures in the table is based on 12.5% of the assumed rate of return of 5% per year before expenses and excludes dividends on securities sold short and interest expense. |
| 40 | The Royce Funds 2012 Semiannual Report to Shareholders |
| Trustees and Officers |
| All Trustees and Officers may be reached c/o The Royce Funds, 745 Fifth Avenue, New York, NY 10151 |
| Charles M. Royce, Trustee1, President |
| Age: 72 | Number of Funds Overseen: 35 | Tenure: Since 1982 |
| Non-Royce Directorships: Director of TICC Capital Corp. |
Principal Occupation(s) During Past Five Years: President, Co-Chief Investment Officer and Member of Board of Managers of Royce & Associates, LLC (“Royce”), the Trust’s investment adviser. |
| Mark R. Fetting, Trustee1 |
| Age: 57 | Number of Funds Overseen: 49 | Tenure: Since 2001 |
Non-Royce Directorships: Director of Legg Mason, Inc.; Director/Trustee of registered investment companies constituting the 14 Legg Mason Funds. |
Principal Occupation(s) During Past 5 Years: President, CEO, Chairman and Director of Legg Mason, Inc. and Chairman of Legg Mason Funds. Mr. Fetting’s prior business experience includes having served as a member of the Board of Managers of Royce; President of all Legg Mason Funds; Senior Executive Vice President of Legg Mason, Inc.; Director and/or officer of various Legg Mason, Inc. affiliates; Division President and Senior Officer of Prudential Financial Group, Inc. and related companies. |
| Patricia W. Chadwick, Trustee |
| Age: 63 | Number of Funds Overseen: 35 | Tenure: Since 2009 |
Non-Royce Directorships: Trustee of ING Mutual Funds and Director of Wisconsin Energy Corp. |
Principal Occupation(s) During Past 5 Years: Consultant and President of Ravengate Partners LLC (since 2000). |
| Richard M. Galkin, Trustee |
| Age: 74 | Number of Funds Overseen: 35 | Tenure: Since 1982 |
| Non-Royce Directorships: None |
Principal Occupation(s) During Past Five Years: Private investor. Mr. Galkin’s prior business experience includes having served as President of Richard M. Galkin Associates, Inc., telecommunications consultants, President of Manhattan Cable Television (a subsidiary of Time, Inc.), President of Haverhills Inc. (another Time, Inc. subsidiary), President of Rhode Island Cable Television and Senior Vice President of Satellite Television Corp. (a subsidiary of Comsat). |
| Stephen L. Isaacs, Trustee |
| Age: 72 | Number of Funds Overseen: 35 | Tenure: Since 1989 |
| Non-Royce Directorships: None |
Principal Occupation(s) During Past Five Years: President of The Center for Health and Social Policy (since September 1996); Attorney and President of Health Policy Associates, Inc., consultants. Mr. Isaacs’s prior business experience includes having served as Director of Columbia University Development Law and Policy Program and Professor at Columbia University (until August 1996). |
| Arthur S. Mehlman, Trustee |
| Age: 70 | Number of Funds Overseen: 49 | Tenure: Since 2004 |
Non-Royce Directorships: Director/Trustee of registered investment companies constituting the 14 Legg Mason Funds. |
Principal Occupation(s) During Past Five Years: Director of The League for People with Disabilities, Inc.; Director of University of Maryland Foundation (non-profits). Formerly: Director of Municipal Mortgage & Equity, LLC (from October 2004 to April 2011); Director of University of Maryland College Park Foundation (non-profit) (from 1998 to 2005); Partner, KPMG LLP (international accounting firm) (from 1972 to 2002); Director of Maryland Business Roundtable for Education (from July 1984 to June 2002). |
| David L. Meister, Trustee |
| Age: 72 | Number of Funds Overseen: 35 | Tenure: Since 1982 |
| Non-Royce Directorships: None |
Principal Occupation(s) During Past Five Years: Consultant. Chairman and Chief Executive Officer of The Tennis Channel (from June 2000 to March 2005). Mr. Meister’s prior business experience includes having served as Chief Executive Officer of Seniorlife.com, a consultant to the communications industry, President of Financial News Network, Senior Vice President of HBO, President of Time-Life Films and Head of Broadcasting for Major League Baseball. |
| G. Peter O’Brien, Trustee |
| Age: 66 | Number of Funds Overseen: 49 | Tenure: Since 2001 |
Non-Royce Directorships: Director/Trustee of registered investment companies constituting the 14 Legg Mason Funds; Director of TICC Capital Corp. |
Principal Occupation(s) During Past Five Years: Trustee Emeritus of Colgate University (since 2005); Board Member of Hill House, Inc. (since 1999); Formerly: Trustee of Colgate University (from 1996 to 2005), President of Hill House, Inc. (from 2001 to 2005) and Managing Director/Equity Capital Markets Group of Merrill Lynch & Co. (from 1971 to 1999). |
| John D. Diederich, Vice President and Treasurer |
| Age: 60 | Tenure: Since 2001 |
Principal Occupation(s) During Past Five Years: Chief Operating Officer, Managing Director and member of the Board of Managers of Royce; Chief Financial Officer of Royce; Director of Administration of the Trust; and President of RFS, having been employed by Royce since April 1993. |
| Jack E. Fockler, Jr., Vice President |
| Age: 53 | Tenure: Since 1995 |
Principal Occupation(s) During Past Five Years: Managing Director and Vice President of Royce, and Vice President of RFS, having been employed by Royce since October 1989. |
| W. Whitney George, Vice President |
| Age: 54 | Tenure: Since 1995 |
Principal Occupation(s) During Past Five Years: Co-Chief Investment Officer, Managing Director and Vice President of Royce, having been employed by Royce since October 1991. |
Daniel A. O’Byrne, Vice President and Assistant Secretary |
| Age: 50 | Tenure: Since 1994 |
Principal Occupation(s) During Past Five Years: Principal and Vice President of Royce, having been employed by Royce since October 1986. |
| John E. Denneen, Secretary and Chief Legal Officer |
| Age: 45 | Tenure: 1996-2001 and Since April 2002 |
Principal Occupation(s) During Past Five Years: General Counsel, Principal, Chief Legal and Compliance Officer and Secretary of Royce; Secretary and Chief Legal Officer of The Royce Funds. |
| Lisa Curcio, Chief Compliance Officer |
| Age: 52 | Tenure: Since 2004 |
Principal Occupation(s) During Past Five Years: Chief Compliance Officer of The Royce Funds (since October 2004) and Compliance Officer of Royce (since June 2004). |
| 1 Interested Trustee. |
Trustees will hold office until their successors have been duly elected and qualified or until their earlier resignation or removal. The Statement of Additional Information, which contains additional information about the Trust’s trustees and officers, is available and can be obtained without charge at www.roycefunds.com or by calling (800) 221-4268. |
| The Royce Funds 2012 Semiannual Report to Shareholders | 41 |
| Board Approval of Investment Advisory Agreements |
At meetings held on June 6-7, 2012, The Royce Fund’s Board of Trustees, including all of the non-interested trustees, approved the continuance of the Investment Advisory Agreements between Royce & Associates, LLC (“R&A”) and The Royce Fund relating to each of Royce Select Fund I, Royce Select Fund II, Royce Global Select Long/Short Fund, Royce Enterprise Select Fund and Royce Opportunity Select Fund (the “Funds”). In reaching these decisions, the Board reviewed, among other things, information prepared internally by R&A and independently by Morningstar Associates, LLC (“Morningstar”) containing detailed expense ratio and investment performance comparisons for each Fund with other mutual funds in their “peer group” and “category”, information regarding the past performance of the Funds and other registered investment companies managed by R&A and a memorandum outlining the legal duties of the Board prepared by independent counsel to the non-interested trustees. R&A also provided the trustees with an analysis of its profitability with respect to providing investment advisory services to each Fund. In addition, the Board took into account information furnished throughout the year at regular Board meetings, including reports on investment performance, shareholder services and expenses, regulatory compliance, brokerage commissions and research, brokerage and other execution products and services provided to the Funds. The Board also considered other matters they deemed important to the approval process such as allocation of Fund brokerage commissions, “soft dollar” research services R&A receives, and other direct and indirect benefits to R&A and its affiliates from their relationship with the Funds. The trustees also met throughout the year with investment advisory personnel from R&A. The Board, in its deliberations, recognized that, for many of the Funds’ shareholders, the decision to purchase Fund shares included a decision to select R&A as the investment adviser and that there was a strong association in the minds of Fund shareholders between R&A and each of the Funds. In considering factors relating to the approval of the continuance of the Investment Advisory Agreements, the non-interested trustees received assistance and advice from, and met separately with, their independent counsel. While the Investment Advisory Agreements for the Funds were considered at the same meetings, the trustees dealt with each agreement separately. Among other factors, the trustees considered the following:
The nature, extent and quality of services provided by R&A:
The trustees considered the following factors to be of fundamental importance to their consideration of whether to approve the continuance of the Funds’ Investment Advisory Agreements: (i) R&A’s more than 35 years of value investing experience and track record; (ii) the history of long-tenured R&A portfolio managers managing many of The Royce Funds; (iii) R&A’s focus on mid-cap, small-cap and micro-cap value investing; (iv) the consistency of R&A’s approach to managing The Royce Funds over more than 35 years; (v) the integrity and high ethical standards adhered to at R&A; (vi) R&A’s specialized experience in the area of trading small- and micro-cap securities; (vii) R&A’s historical ability to attract and retain portfolio management talent; and (viii) R&A’s focus on shareholder interests and providing expansive shareholder reporting and communications. The trustees reviewed the services that R&A provides to the Funds, including, but not limited to, managing each Fund’s investments in accordance with the stated policies of each Fund. The Board considered the fact that the Funds’ “all-inclusive” management fee included the provision of administrative services and the payment of certain other ordinary operating expenses by R&A. The trustees determined that the services to be provided to each Fund by R&A would be the same as those it previously provided to the Funds. They also took into consideration the histories, reputations and backgrounds of R&A’s portfolio managers for Funds, finding that these would likely have an impact on the continued success of the Funds. Lastly, the trustees noted R&A’s ability to attract and retain quality and experienced personnel. The trustees concluded that the investment advisory services provided by R&A to each Fund compared favorably to services provided by R&A to other R&A client accounts, including other funds, in both nature and quality, and that the scope of services provided by R&A would continue to be suitable for each Fund.
Investment performance of the Funds and R&A
In light of R&A’s risk-averse approach to investing, the trustees believe that risk-adjusted performance continues to be an appropriate measure of each Fund’s investment performance. One measure of risk-adjusted performance the trustees have historically used in their review of the Funds’ performance is the Sharpe Ratio. The Sharpe Ratio is a risk-adjusted measure of performance developed by Nobel Laureate William Sharpe. It is calculated by dividing a fund’s annualized excess returns by its annualized standard deviation to determine reward per unit of risk. The higher the Sharpe Ratio, the better a fund’s historical risk-adjusted performance. The Board attaches primary importance to risk-adjusted performance over relatively long periods of time, typically three to ten years. Except as described below, all of the Funds with three years or more of performance fell in the 1st or 2nd quartile within their Morningstar categories and the small-cap universe for the three-year, five-year and 10-year periods ended December 31, 2011. Royce Enterprise Select Fund (“RSS”) placed in the middle quintile for the three-year period ended December 31, 2011 within its Morningstar category. The Board noted that Royce Opportunity Select Fund (“ROS”) had only commenced operations in the third quarter of 2010 so it only had a limited operating history. In addition to each Fund’s risk–adjusted performance the trustees also reviewed and considered each Fund’s absolute total returns, down market performance and for Royce Select Fund I, long-term performance over more than 10 years.
The trustees noted that R&A manages a number of funds that invest in small-cap and micro-cap issuers, many of which were outperforming their benchmark indexes and their competitors. Although the trustees recognized that past performance is not necessarily an indicator of future results, they found that R&A had the necessary qualifications, experience and track record in managing mid-cap, small-cap and micro-cap securities to manage the Funds. The trustees determined that R&A continued to be an appropriate investment adviser for the Funds and concluded that each of the Funds’ performance supported the continuation of its Investment Advisory Agreement.
| 42 | The Royce Funds 2012 Semiannual Report to Shareholders |
Cost of the services provided and profits realized by R&A from its relationship with each Fund:
The trustees considered the cost of the services provided by R&A and profits realized by R&A from its relationship with each Fund. It was noted that the Funds each pay R&A an “all-inclusive” management fee equal to 12.5% of each Fund’s pre-fee high watermark total return and that R&A is responsible for paying most other ordinary operating expenses of the Funds. As part of the analysis, the Board discussed with R&A its methodology in allocating its costs to each Fund and concluded that its allocations were reasonable. The trustees concluded that R&A’s profits were reasonable in relation to the nature and quality of services provided.
The extent to which economies of scale would be realized as the Funds grow and whether fee levels would reflect such economies of scale:
The trustees considered whether there have been economies of scale in respect of the management of the Funds, whether the Funds have appropriately benefited from any economies of scale and whether there is potential for realization of any further economies of scale. The trustees noted the time and effort involved in managing portfolios of small- and micro-cap stocks and that they did not involve the same efficiencies as do portfolios of large-cap stocks. The trustees noted that the Funds charge an all-inclusive performance fee. The trustees concluded that the current fee structure for each Fund was reasonable and that shareholders sufficiently participated in economies of scale.
Comparison of services to be rendered and fees to be paid to those under other investment advisory contracts, such as contracts of the same and other investment advisers or other clients:
The trustees reviewed the investment advisory fee paid by each Fund and compared both the services to be rendered and the fees to be paid under the Investment Advisory Agreements to other contracts of R&A and to contracts of other investment advisers to registered investment companies investing in small- and micro-cap stocks, as provided by Morningstar. The trustees noted the importance of the net expense ratio in measuring a fund’s efficiency, particularly in light of the variations in the mutual fund industry as to who is responsible for which expenses. The trustees noted that due to the unique nature of their expense structure, direct comparisons of the Funds to other funds were not helpful. The Funds pay an all-inclusive management fee equal to 12.5% of their pre-fee total return, measured using a high watermark test and that R&A is responsible for paying most other ordinary expenses for them.
The trustees also considered fees charged by R&A to institutional and other clients and noted that due to the unique nature of the Funds’ expense structure, direct comparisons to these other accounts were not helpful. It was noted that no single factor was cited as determinative to the decision of the trustees. Rather, after weighing all of considerations and conclusions discussed above, the entire Board, including all the non-interested trustees, determined to approve the continuation of the existing Investment Advisory Agreements, concluding that a contract continuation on the existing terms was in the best interest of the shareholders of each Fund and that each investment advisory fee rate was reasonable in relation to the services provided.
| The Royce Funds 2012 Semiannual Report to Shareholders | 43 |
| Notes to Performance and Other Important Information |
The thoughts expressed in this report concerning recent market movements and future prospects for small company stocks are solely the opinion of Royce at June 30, 2012, and, of course, historical market trends are not necessarily indicative of future market movements. Statements regarding the future prospects for particular securities held in the Funds’ portfolios and Royce’s investment intentions with respect to those securities reflect Royce’s opinions as of June 30, 2012 and are subject to change at any time without notice. There can be no assurance that securities mentioned in this report will be included in any Royce-managed portfolio in the future. Sector weightings are determined using the Global Industry Classification Standard (“GICS”). GICS was developed by, and is the exclusive property of, Standard & Poor’s Financial Services LLC (“S&P”) and MSCI Inc. (“MSCI”). GICS is the trademark of S&P and MSCI. “Global Industry Classification Standard (GICS)” and “GICS Direct” are service marks of S&P and MSCI. All indexes referenced are unmanaged and capitalization weighted. Each indexes’s returns include net reinvested dividends and/or interest income. Russell Investment Group is the source and owner of the trademarks, service marks and copyrights related to the Russell Indexes. Russell® is a trademark of Russell Investment Group. The Russell 2000 Index is an index of domestic small-cap stocks. It measures the performance of the 2,000 smallest publicly traded U.S. companies in the Russell 3000 Index. The Russell Microcap Index includes 1,000 of the smallest securities in the small-cap Russell 2000 Index. The Russell Midcap Index measures the performance of the mid-cap segment of the U.S. equity universe. It includes approximately 800 of the smallest securities in the Russell 1000 Index. The Russell 1000 Index is an index of domestic large-cap stocks. It measures the performance of the 1,000 largest publicly traded U.S. companies in the Russell 3000 Index. The Russell 2500 Index is an index of domestic small to mid-cap stocks. It includes approximately 2,500 of the smallest securities in the Russell 3000 Index. The Russell Global Small Cap Index is an index of global small-cap stocks. The Russell Global ex-U.S. Small Cap Index is an index of global small-cap stocks, excluding the United States. The Russell Global ex-U.S. Large-Cap Index is an index of global large-cap stocks, excluding the United States. The S&P 500 is an index of U.S. large-cap stocks selected by Standard & Poor’s based on market size, liquidity and industry grouping, among other factors. The Nasdaq Composite is an index of the more than 3,000 common equities listed on the Nasdaq stock exchange. The MSCI World Small Core Index represents the small-cap segment in the world’s developed equity markets. The MSCI World ex USA Small Core represents these markets excluding the United States. Returns for the market indexes used in this report were based on information supplied to Royce by Russell Investments and MSCI. The CRSP (Center for Research in Security Pricing) equally divides the companies listed on the NYSE into 10 deciles based on market capitalization. Deciles 1-5 represent the largest domestic equity companies and Deciles 6-10 represent the smallest. CRSP then sorts all listed domestic equity companies based on these market cap ranges. By way of comparison, the CRSP 1-5 would have similar capitalization parameters to the S&P 500 Index and the CRSP 6-10 would have similar capitalization parameters to those of the Russell 2000 Index. Royce has not independently verified the above described information. The Royce Funds is a service mark of The Royce Funds. Distributor: Royce Fund Services, Inc. The Sharpe Ratio is calculated for a specified period by dividing a fund’s annualized excess returns by its annualized standard deviation. The higher the Sharpe Ratio, the better the fund’s historical risk-adjusted performance. Standard deviation is a statistical measure within which a fund’s total returns have varied over time. The greater the standard deviation, the greater a fund’s volatility. The Funds invest primarily in limited number of securities which may involve considerably more risk than a less concentrated portfolio because a decline in the value of one of these securities would cause a Fund’s overall value to decline to a greater degree. Investments in securities of micro-cap, small-cap and/or mid-cap companies may involve considerably more risk than investments in securities of larger-cap companies. (Please see “Primary Risks for Fund Investors” in the prospectus.) Royce Select Fund I (up to 10%), Royce Select Fund II (up to 100%), Royce Global Select Long/Short Fund (up to 100%), Royce Enterprise Select Fund (up to 25%) and Royce Opportunity Select Fund (up to 25%) may each invest its assets in foreign securities that may involve political, economic, currency and other risks not encountered in U.S. investments. (Please see “Investing in Foreign Securities” in the prospectus.) Please read the prospectus carefully before investing or sending money. The Funds may sell securities short which involves selling a security it does not own in anticipation that the security’s price will decline. Short sales present unlimited risk on an individual stock basis since the Funds may be required to buy the security sold short at a time when the security has appreciated in value. |
| Forward-Looking Statements | |
This material contains forward-looking statements within the meaning of the Securities Exchange Act of 1934, as amended (the “Exchange Act”), that involve risks and uncertainties, including, among others, statements as to: | |
| • | the Funds’ future operating results, |
| • | the prospects of the Funds’ portfolio companies, |
| • | the impact of investments that the Funds have made or may make, |
| • | the dependence of the Funds’ future success on the general economy and its impact on the companies and industries in which the Funds invest, and |
| • | the ability of the Funds’ portfolio companies to achieve their objectives. |
This review and report use words such as “anticipates,” “believes,” “expects,” “future,” “intends,” and similar expressions to identify forward-looking statements. Actual results may differ materially from those projected in the forward-looking statements for any reason. | |
The Royce Funds have based the forward-looking statements included in this review and report on information available to us on the date of the report, and we assume no obligation to update any such forward-looking statements. Although The Royce Funds undertake no obligation to revise or update any forward-looking statements, whether as a result of new information, future events or otherwise, you are advised to consult any additional disclosures that we may make through future shareholder communications or reports. | |
| Proxy Voting | ||
A copy of the policies and procedures that The Royce Funds use to determine how to vote proxies relating to portfolio securities and information regarding how each of The Royce Funds voted proxies relating to portfolio securities during the most recent 12-month period ended June 30 is available, without charge, on The Royce Funds’ website at www.roycefunds.com, by calling (800) 221-4268 (toll-free) and on the website of the Securities and Exchange Commission (“SEC”), at www.sec.gov. | ||
| Form N-Q Filing | ||
The Funds file their complete schedules of investments with the SEC for the first and third quarters of each fiscal year on Form N-Q. The Funds’ Forms N-Q are available on the SEC’s website at www.sec.gov. The Royce Funds’ holdings are also on the Funds’ website approximately 15 to 20 days after each calendar quarter end and remain available until the next quarter’s holdings are posted. The Funds’ Forms N-Q may also be reviewed and copied at the SEC’s Public Reference Room in Washington, D.C. To find out more about this public service, call the SEC at (202) 942-8090. The Funds’ complete schedules of investments are updated quarterly, and are available at www.roycefunds.com. | ||
| 44 | The Royce Funds 2012 Semiannual Report to Shareholders |
| Is the Business Cycle Dead? |
| “Plus ça change, plus c’est la même chose.” (“The more things change, the more they stay the same.”) —Alphonse Karr |
One striking effect of the financial crisis has been the apparent disappearance of the traditional business cycle. The world’s developed economies—heavily indebted, still deleveraging, and in some cases in the midst of painful austerity—are being supported by periodic and unconventional interventions from increasingly leveraged central banks. The result has been an anemic, albeit steady pace of economic activity marked by fits and starts that are increasingly difficult for investors to interpret. It makes sense, then, that market cycles have followed suit, with equities showing sudden, at times violent, moves that have alternated between strong rallies and steep declines over relatively short periods, each driven by marginal changes in the trajectory of economic expectations. Single-stock correlation remains high due to this uncertainty, with more cyclical market sectors the most disadvantaged. Several factors are at work: Deleveraging associated with the housing bust is a persistent and long-term headwind; personal savings remain elusive; rising commodity prices have affected consumer purchasing power and sentiment; unemployment remains stubbornly high; and, importantly, the primary source of economic stimulus is coming from central bank programs instead of traditional private business investment. As if all this were not enough, there is the backdrop of the sovereign debt crises in Europe and slower growth in the all-important emerging economies, especially China. Interestingly, none of these issues are new. They have been part of the landscape for several years now, and distinct patterns have developed around them that have been repeated in each of the last three years, giving investors the sense that cycles of economic activity have compressed dramatically. Previously marked in years, moves up and down in business momentum are now counted in months, if not weeks. Which leads to two questions: Has the business cycle fundamentally changed? Should traditionally cyclical businesses carry lower multiples as a result? It appears to us that in the short term, the market has answered with a resounding ‘yes.’ Cyclical sectors, such as Industrials, Energy, Technology, and Materials have become increasingly volatile and have borne the brunt of the selling during market downturns.  Within these areas, even high-quality businesses (as measured by balance sheet strength and returns on invested capital) are suffering from the altered preferences of investors who once flocked to the perceived safety of more stable vehicles. Investors continue to abandon equities, gravitating instead toward fixed income securities even as they recognize the inevitable loss of purchasing power that comes with them. Today, it seems that we have a bubble in fear, which is manifesting itself in ways that have our contrarian pulses racing. We are finding what we think are excellent values in currently unpopular pro-cyclical businesses. Cycles have certainly become shorter over the past three years, but we hold the view that these are anomalous times and that the traditional business cycle will reemerge before long. The economy does not yet have sufficient self-sustaining business momentum that will allow it to be weaned off the artificial support currently being provided by central banks. The opportunity from our standpoint lies in looking where others are not while holding fast to our time-tested investment approach governed by absolute standards for valuation and return. In the short term, our interest in cyclical businesses has been putting us out of sync with the return patterns of the market. While unpleasant, it is a by-product of our contrarian nature. In fact, this period is somewhat reminiscent of the late ’90s when investors were citing the demise of traditional value investing because of the emergence of the internet and the technology revolution. What was then a bubble in greed has become today’s bubble in fear. Investing is a perennially dynamic endeavor requiring both patience and conviction. Those tenets are being sorely tested in the current market. Although business cycles have looked different of late, and the market has been reacting accordingly, our belief is that they will ultimately revert to the mean, benefiting higher-quality companies in cyclical sectors. We take heart from the timeless wisdom of Alphonse Karr, for indeed “the more things change, the more they stay the same.” |
| The thoughts in this essay concerning the stock market are solely those of Royce & Associates and, of course, there can be no assurance with regard to future market movements. | |
| This page is not part of the 2012 Semiannual Report to Shareholders |
| |||||||||||||||||||
 | |||||||||||||||||||
About The Royce Funds Wealth Of Experience With approximately $36 billion in total assets under management, Royce & Associates is committed to the same small-company investing principles that have served us well for nearly 40 years. Charles M. Royce, our President and Co-Chief Investment Officer, enjoys one of the longest tenures of any active mutual fund manager. Royce’s investment staff also includes Co-Chief Investment Officer W. Whitney George, 18 Portfolio Managers, five assistant portfolio managers and analysts, and nine traders. Multiple Funds, Common Focus Our goal is to offer both individual and institutional investors the best available smaller-cap portfolios. Unlike a lot of mutual fund groups with broad product offerings, we have chosen to concentrate on smaller-company investing by providing investors with a range of funds that take full advantage of this large and diverse sector. Consistent Discipline Our approach emphasizes paying close attention to risk and maintaining the same discipline, regardless of market movements and trends. The price we pay for a security must be significantly below our appraisal of its current worth. This requires a thorough analysis of the financial and business dynamics of an enterprise, as though we were purchasing the entire company. Co-Ownership Of Funds It is important that our employees and shareholders share a common financial goal; our officers, employees and their families currently have approximately $136 million invested in The Royce Funds. This Review and Report must be accompanied or preceded by a current prospectus for the Funds. Please read the prospectus carefully before investing or sending money. | |||||||||||||||||||
| Contact Us | |||||||||||||||||||
| General Information Additional Report Copies and Prospectus Inquiries (800) 221-4268 | RIA Services Fund Materials and Performance Updates (800) 33-ROYCE (337-6923) | Broker/Dealer Services Fund Materials and Performance Updates (800) 59-ROYCE (597-6923) | Shareholder Services Transactions and Account Inquiries (800) 841-1180 | Royce InfoLine 24-Hour Automated Telephone Service (800) 78-ROYCE (787-6923) |  | ||||||||||||||
Item 2. Code(s) of Ethics. Not applicable to this semi-annual report.
Item 3. Audit Committee Financial Expert. Not applicable to this semi-annual report.
Item 4. Principal Accountant Fees and Services. Not applicable to this semi-annual report.
Item 5. Audit Committee of Listed Registrants. Not Applicable.
Item 6. Investments.
(a) See Item 1.
(b) Not Applicable
Item 7. Disclosure of Proxy Voting Policies and Procedures for Closed-End Management Investment Companies. Not Applicable.
Item 8. Portfolio Managers of Closed-End Management Investment Companies. Not Applicable.
Item 9. Purchases of Equity Securities by Closed-End Management Investment Company and Affiliated Purchasers. Not Applicable
Item 10. Submission of Matters to a Vote of Security Holders. Not Applicable.
Item 11. Controls and Procedures.
(a) Disclosure Controls and Procedures. The Principal Executive and Financial Officers concluded that the Registrant’s Disclosure Controls and Procedures are effective based on their evaluation of the Disclosure Controls and Procedures as of a date within 90 days of the filing date of this report.
(b) Internal Control over Financial Reporting. There were no significant changes in Registrant’s internal control over financial reporting or in other factors that could significantly affect this control subsequent to the date of the evaluation, including any corrective actions with regard to significant deficiencies and material weaknesses during the second fiscal quarter of the period covered by this report.
Item 12. Exhibits. Attached hereto.
(a)(1) Not applicable to this semi-annual report.
(a)(2) Separate certifications by the Registrant’s Principal Executive Officer and Principal Financial Officer as required by Rule 30a-2(a) under the Investment Company Act of 1940.
(a)(3) Not Applicable
(b) Separate certifications by the Registrant’s Principal Executive Officer and Principal Financial Officer, pursuant to Section 906 of the Sarbanes-Oxley Act of 2002 and required by Rule 30a-2(b) under the Investment Company Act of 1940.
Pursuant to the requirements of the Securities Exchange Act of 1934 and the Investment Company Act of 1940, the registrant has duly caused this report to be signed on its behalf by the undersigned, thereunto duly authorized.
| THE ROYCE FUND |
| BY: /s/ Charles M. Royce |
Charles M. Royce |
President |
| Date: August 15, 2012 |
Pursuant to the requirements of the Securities Exchange Act of 1934 and the Investment Company Act of 1940, this report has been signed below by the following persons on behalf of the registrant and in the capacities and on the dates indicated.
| THE ROYCE FUND | THE ROYCE FUND | |
| BY: /s/ Charles M. Royce | BY: /s/ John D. Diederich | |
Charles M. Royce | John D. Diederich | |
President | Chief Financial Officer | |
| Date: August 15, 2012 | Date: August 15, 2012 |