0000709364 ck0000709364:C000026028Member ck0000709364:InformationTechnologyMember 2024-06-30
UNITED STATES
SECURITIES AND EXCHANGE COMMISSION
Washington, D.C. 20549
FORM N-CSR
CERTIFIED SHAREHOLDER REPORT
OF
REGISTERED MANAGEMENT INVESTMENT COMPANIES
Investment Company Act File Number: 811-03599
Name of Registrant: The Royce Fund
Address of Registrant: 745 Fifth Avenue
New York, NY 10151
Name and address of agent for service: John E. Denneen, Esq.
745 Fifth Avenue
New York, NY 10151
Registrant’s telephone number, including area code: (212) 508-4500
Date of fiscal year end: December 31, 2023
Date of reporting period: January 1, 2024 – June 30, 2024
Item 1. Reports to Shareholders.
| The Royce Funds | June 30, 2024 |
| | |
Royce Small-Cap Fund
Consultant Class—RYPCX |  |
Semiannual Shareholder Report
This semiannual shareholder report contains important information about Royce Small-Cap Fund for the period of January 1, 2024 to June 30, 2024. You can find additional information at www.royceinvest.com/literature. You can also request this information by contacting us at 1-800-221-4268.
What Were the Fund Costs for the Last Six-Months?
Based on a hypothetical $10,000 investment
| FUND/CLASS | COSTS OF A
$10,000 INVESTMENT | COSTS PAID AS A PERCENTAGE
OF A $10,000 INVESTMENT¹ |
| Royce Small-Cap Fund—Consultant Class | $98 | 1.94% |
¹Annualized
Key Fund Statistics
As of 6/30/24
| Fund Size (Millions) | $1,901 |
| Number of Holdings | 285 |
| Turnover Rate | 20% |
What Did The Fund Invest In?
Representing percentage of total net assets of the Fund as of 6/30/24 (%)
| Top 10 Positions | | | Portfolio Sector Breakdown |
| Arcosa | 1.8 | | 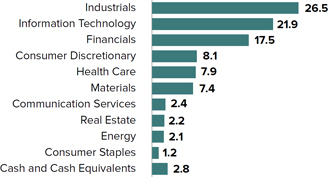 |
| First Citizens BancShares Cl. A | 1.6 | |
| Air Lease Cl. A | 1.6 | |
| Element Solutions | 1.5 | |
| Haemonetics Corporation | 1.4 | |
| Onto Innovation | 1.4 | |
| Enovis Corporation | 1.2 | |
| Computer Modelling Group | 1.2 | |
| Cirrus Logic | 1.2 | |
| Alamos Gold Cl. A | 1.2 | |
| Portfolio Sector Breakdown | |
| Industrials | 26.5 |
| Information Technology | 21.9 |
| Financials | 17.5 |
| Consumer Discretionary | 8.1 |
| Health Care | 7.9 |
| Materials | 7.4 |
| Communication Services | 2.4 |
| Real Estate | 2.2 |
| Energy | 2.1 |
| Consumer Staples | 1.2 |
| Cash and Cash Equivalents | 2.8 |
Where Can I Find Additional Information About The Fund?
Additional information is available at www.royceinvest.com/literature, including its:
 | ● Prospectus | ● Fund Holdings |
| ● Financial Information | ● Proxy Voting Information |
Householding
We will deliver a single copy of prospectuses, proxies, financial reports, and other communication to shareholders with the same residential address, provided they have the same last name or we reasonably believe them to be members of the same family. Unless we are notified otherwise, we will continue to send you only one copy of these materials for as long as you remain a shareholder of the Fund. If you would like to receive individual mailings, please call 1-800-221-4268. Please allow 30 days for your request to be processed. Shareholders may also elect to receive these reports electronically. Please go to www.royceinvest.com for more details.
Important Information
Sector weightings are determined using the Global Industry Classification Standard (“GICS”). GICS was developed by, and is the exclusive property of, Standard & Poor’s Financial Services LLC (“S&P”) and MSCI Inc. (“MSCI”). GICS is the trademark of S&P and MSCI. “Global Industry Classification Standard (GICS)” and “GICS Direct” are service marks of S&P and MSCI. Distributor: Royce Fund Services, LLC.
| NOT FDIC INSURED ● MAY LOSE VALUE ● NOT BANK GUARANTEED | PMF-CC-STSR-0624 |
| The Royce Funds | June 30, 2024 |
| | |
Royce Small-Cap Fund
Investment Class—PENNX | |
Semiannual Shareholder Report
This semiannual shareholder report contains important information about Royce Small-Cap Fund for the period of January 1, 2024 to June 30, 2024. You can find additional information at www.royceinvest.com/literature. You can also request this information by contacting us at 1-800-221-4268.
What Were the Fund Costs for the Last Six-Months?
Based on a hypothetical $10,000 investment
| FUND/CLASS | COSTS OF A
$10,000 INVESTMENT | COSTS PAID AS A PERCENTAGE
OF A $10,000 INVESTMENT¹ |
| Royce Small-Cap Fund—Investment Class | $47 | 0.93% |
¹Annualized
Key Fund Statistics
As of 6/30/24
| Fund Size (Millions) | $1,901 |
| Number of Holdings | 285 |
| Turnover Rate | 20% |
What Did The Fund Invest In?
Representing percentage of total net assets of the Fund as of 6/30/24 (%)
| Top 10 Positions | | | Portfolio Sector Breakdown |
| Arcosa | 1.8 | |  |
| First Citizens BancShares Cl. A | 1.6 | |
| Air Lease Cl. A | 1.6 | |
| Element Solutions | 1.5 | |
| Haemonetics Corporation | 1.4 | |
| Onto Innovation | 1.4 | |
| Enovis Corporation | 1.2 | |
| Computer Modelling Group | 1.2 | |
| Cirrus Logic | 1.2 | |
| Alamos Gold Cl. A | 1.2 | |
| Portfolio Sector Breakdown | |
| Industrials | 26.5 |
| Information Technology | 21.9 |
| Financials | 17.5 |
| Consumer Discretionary | 8.1 |
| Health Care | 7.9 |
| Materials | 7.4 |
| Communication Services | 2.4 |
| Real Estate | 2.2 |
| Energy | 2.1 |
| Consumer Staples | 1.2 |
| Cash and Cash Equivalents | 2.8 |
Where Can I Find Additional Information About The Fund?
Additional information is available at www.royceinvest.com/literature, including its:
 | ● Prospectus | ● Fund Holdings |
| ● Financial Information | ● Proxy Voting Information |
Householding
We will deliver a single copy of prospectuses, proxies, financial reports, and other communication to shareholders with the same residential address, provided they have the same last name or we reasonably believe them to be members of the same family. Unless we are notified otherwise, we will continue to send you only one copy of these materials for as long as you remain a shareholder of the Fund. If you would like to receive individual mailings, please call 1-800-221-4268. Please allow 30 days for your request to be processed. Shareholders may also elect to receive these reports electronically. Please go to www.royceinvest.com for more details.
Important Information
Sector weightings are determined using the Global Industry Classification Standard (“GICS”). GICS was developed by, and is the exclusive property of, Standard & Poor’s Financial Services LLC (“S&P”) and MSCI Inc. (“MSCI”). GICS is the trademark of S&P and MSCI. “Global Industry Classification Standard (GICS)” and “GICS Direct” are service marks of S&P and MSCI. Distributor: Royce Fund Services, LLC.
| NOT FDIC INSURED ● MAY LOSE VALUE ● NOT BANK GUARANTEED | PMF-IC-STSR-0624 |
| The Royce Funds | June 30, 2024 |
| | |
Royce Small-Cap Fund
Institutional Class—RPMIX | |
Semiannual Shareholder Report
This semiannual shareholder report contains important information about Royce Small-Cap Fund for the period of January 1, 2024 to June 30, 2024. You can find additional information at www.royceinvest.com/literature. You can also request this information by contacting us at 1-800-221-4268.
What Were the Fund Costs for the Last Six-Months?
Based on a hypothetical $10,000 investment
| FUND/CLASS | COSTS OF A
$10,000 INVESTMENT | COSTS PAID AS A PERCENTAGE
OF A $10,000 INVESTMENT¹ |
| Royce Small-Cap Fund—Institutional Class | $45 | 0.88% |
¹Annualized
Key Fund Statistics
As of 6/30/24
| Fund Size (Millions) | $1,901 |
| Number of Holdings | 285 |
| Turnover Rate | 20% |
What Did The Fund Invest In?
Representing percentage of total net assets of the Fund as of 6/30/24 (%)
| Top 10 Positions | | | Portfolio Sector Breakdown |
| Arcosa | 1.8 | |  |
| First Citizens BancShares Cl. A | 1.6 | |
| Air Lease Cl. A | 1.6 | |
| Element Solutions | 1.5 | |
| Haemonetics Corporation | 1.4 | |
| Onto Innovation | 1.4 | |
| Enovis Corporation | 1.2 | |
| Computer Modelling Group | 1.2 | |
| Cirrus Logic | 1.2 | |
| Alamos Gold Cl. A | 1.2 | |
| Portfolio Sector Breakdown | |
| Industrials | 26.5 |
| Information Technology | 21.9 |
| Financials | 17.5 |
| Consumer Discretionary | 8.1 |
| Health Care | 7.9 |
| Materials | 7.4 |
| Communication Services | 2.4 |
| Real Estate | 2.2 |
| Energy | 2.1 |
| Consumer Staples | 1.2 |
| Cash and Cash Equivalents | 2.8 |
Where Can I Find Additional Information About The Fund?
Additional information is available at www.royceinvest.com/literature, including its:
 | ● Prospectus | ● Fund Holdings |
| ● Financial Information | ● Proxy Voting Information |
Householding
We will deliver a single copy of prospectuses, proxies, financial reports, and other communication to shareholders with the same residential address, provided they have the same last name or we reasonably believe them to be members of the same family. Unless we are notified otherwise, we will continue to send you only one copy of these materials for as long as you remain a shareholder of the Fund. If you would like to receive individual mailings, please call 1-800-221-4268. Please allow 30 days for your request to be processed. Shareholders may also elect to receive these reports electronically. Please go to www.royceinvest.com for more details.
Important Information
Sector weightings are determined using the Global Industry Classification Standard (“GICS”). GICS was developed by, and is the exclusive property of, Standard & Poor’s Financial Services LLC (“S&P”) and MSCI Inc. (“MSCI”). GICS is the trademark of S&P and MSCI. “Global Industry Classification Standard (GICS)” and “GICS Direct” are service marks of S&P and MSCI. Distributor: Royce Fund Services, LLC.
| NOT FDIC INSURED ● MAY LOSE VALUE ● NOT BANK GUARANTEED | PMF-INC-STSR-0624 |
| The Royce Funds | June 30, 2024 |
| | |
Royce Small-Cap Fund
Service Class—RYPFX | |
Semiannual Shareholder Report
This semiannual shareholder report contains important information about Royce Small-Cap Fund for the period of January 1, 2024 to June 30, 2024. You can find additional information at www.royceinvest.com/literature. You can also request this information by contacting us at 1-800-221-4268.
What Were the Fund Costs for the Last Six-Months?
Based on a hypothetical $10,000 investment
| FUND/CLASS | COSTS OF A
$10,000 INVESTMENT | COSTS PAID AS A PERCENTAGE
OF A $10,000 INVESTMENT¹ |
| Royce Small-Cap Fund—Service Class | $64 | 1.26% |
¹Annualized
Key Fund Statistics
As of 6/30/24
| Fund Size (Millions) | $1,901 |
| Number of Holdings | 285 |
| Turnover Rate | 20% |
What Did The Fund Invest In?
Representing percentage of total net assets of the Fund as of 6/30/24 (%)
| Top 10 Positions | | | Portfolio Sector Breakdown |
| Arcosa | 1.8 | | 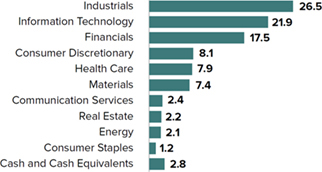 |
| First Citizens BancShares Cl. A | 1.6 | |
| Air Lease Cl. A | 1.6 | |
| Element Solutions | 1.5 | |
| Haemonetics Corporation | 1.4 | |
| Onto Innovation | 1.4 | |
| Enovis Corporation | 1.2 | |
| Computer Modelling Group | 1.2 | |
| Cirrus Logic | 1.2 | |
| Alamos Gold Cl. A | 1.2 | |
| Portfolio Sector Breakdown | |
| Industrials | 26.5 |
| Information Technology | 21.9 |
| Financials | 17.5 |
| Consumer Discretionary | 8.1 |
| Health Care | 7.9 |
| Materials | 7.4 |
| Communication Services | 2.4 |
| Real Estate | 2.2 |
| Energy | 2.1 |
| Consumer Staples | 1.2 |
| Cash and Cash Equivalents | 2.8 |
Where Can I Find Additional Information About The Fund?
Additional information is available at www.royceinvest.com/literature, including its:
 | ● Prospectus | ● Fund Holdings |
| ● Financial Information | ● Proxy Voting Information |
Householding
We will deliver a single copy of prospectuses, proxies, financial reports, and other communication to shareholders with the same residential address, provided they have the same last name or we reasonably believe them to be members of the same family. Unless we are notified otherwise, we will continue to send you only one copy of these materials for as long as you remain a shareholder of the Fund. If you would like to receive individual mailings, please call 1-800-221-4268. Please allow 30 days for your request to be processed. Shareholders may also elect to receive these reports electronically. Please go to www.royceinvest.com for more details.
Important Information
“Costs paid” reflect contractual fee waivers and/or expense reimbursements. Sector weightings are determined using the Global Industry Classification Standard (“GICS”). GICS was developed by, and is the exclusive property of, Standard & Poor’s Financial Services LLC (“S&P”) and MSCI Inc. (“MSCI”). GICS is the trademark of S&P and MSCI. “Global Industry Classification Standard (GICS)” and “GICS Direct” are service marks of S&P and MSCI. Distributor: Royce Fund Services, LLC.
| NOT FDIC INSURED ● MAY LOSE VALUE ● NOT BANK GUARANTEED | PMF-SC-STSR-0624 |
| | |
| The Royce Funds | June 30, 2024 |
| | |
Royce Dividend Value Fund Investment Class—RDVIX | |
Semiannual Shareholder Report
This semiannual shareholder report contains important information about Royce Dividend Value Fund for the period of January 1, 2024 to June 30, 2024. You can find additional information at www.royceinvest.com/literature. You can also request this information by contacting us at 1-800-221-4268.
What Were the Fund Costs for the Last Six-Months?
Based on a hypothetical $10,000 investment
| | COSTS OF A | COSTS PAID AS A PERCENTAGE |
| FUND/CLASS | $10,000 INVESTMENT | OF A $10,000 INVESTMENT¹ |
| Royce Dividend Value Fund—Investment Class | $56 | 1.09% |
| ¹Annualized | | |
Key Fund Statistics
As of 6/30/24
| Fund Size (Millions) | $66 |
| Number of Holdings | 47 |
| Turnover Rate | 2% |
What Did The Fund Invest In?
Representing percentage of total net assets of the Fund as of 6/30/24 (%)
| Top 10 Positions | | | Portfolio Sector Breakdown |
| HEICO Corporation Cl. A | 5.1 | |  |
| Carlyle Group | 4.6 | |
| Evercore Cl. A | 4.3 | |
| Applied Industrial Technologies | 4.0 | |
| SEI Investments | 3.7 | |
| First Citizens BancShares Cl. A | 3.4 | |
| Royal Gold | 3.3 | |
| KKR & Co. | 3.1 | |
| Franco-Nevada | 3.0 | |
| Hubbell Incorporated | 2.9 | |
| | | |
| Portfolio Sector Breakdown | |
| Financials | 34.7 |
| Industrials | 30.0 |
| Materials | 14.6 |
| Consumer Discretionary | 5.5 |
| Health care | 4.0 |
| Energy | 1.6 |
| Real Estate | 1.5 |
| Cash and Cash Equivalents | 8.1 |
Where Can I Find Additional Information About The Fund?
Additional information is available at www.royceinvest.com/literature, including its:
 | ● Prospectus ● Financial Information | ● Fund Holdings ● Proxy Voting Information |
Householding
We will deliver a single copy of prospectuses, proxies, financial reports, and other communication to shareholders with the same residential address, provided they have the same last name or we reasonably believe them to be members of the same family. Unless we are notified otherwise, we will continue to send you only one copy of these materials for as long as you remain a shareholder of the Fund. If you would like to receive individual mailings, please call 1-800-221-4268. Please allow 30 days for your request to be processed. Shareholders may also elect to receive these reports electronically. Please go to www.royceinvest.com for more details.
Important Information
“Costs paid” reflect contractual fee waivers and/or expense reimbursements. Sector weightings are determined using the Global Industry Classification Standard (“GICS”). GICS was developed by, and is the exclusive property of, Standard & Poor’s Financial Services LLC (“S&P”) and MSCI Inc. (“MSCI”). GICS is the trademark of S&P and MSCI. “Global Industry Classification Standard (GICS)” and “GICS Direct” are service marks of S&P and MSCI. Distributor: Royce Fund Services, LLC.
| NOT FDIC INSURED ● MAY LOSE VALUE ● NOT BANK GUARANTEED | RDV-IC-STSR-0624 |
| | |
| The Royce Funds | June 30, 2024 |
| | |
Royce Dividend Value Fund Service Class—RYDVX | |
Semiannual Shareholder Report
This semiannual shareholder report contains important information about Royce Dividend Value Fund for the period of January 1, 2024 to June 30, 2024. You can find additional information at www.royceinvest.com/literature. You can also request this information by contacting us at 1-800-221-4268.
What Were the Fund Costs for the Last Six-Months?
Based on a hypothetical $10,000 investment
| | COSTS OF A | COSTS PAID AS A PERCENTAGE |
| FUND/CLASS | $10,000 INVESTMENT | OF A $10,000 INVESTMENT¹ |
| Royce Dividend Value Fund—Service Class | $69 | 1.34% |
| ¹Annualized | | |
Key Fund Statistics
As of 6/30/24
| Fund Size (Millions) | $66 |
| Number of Holdings | 47 |
| Turnover Rate | 2% |
What Did The Fund Invest In?
Representing percentage of total net assets of the Fund as of 6/30/24 (%)
| Top 10 Positions | | | Portfolio Sector Breakdown |
| HEICO Corporation Cl. A | 5.1 | |  |
| Carlyle Group | 4.6 | |
| Evercore Cl. A | 4.3 | |
| Applied Industrial Technologies | 4.0 | |
| SEI Investments | 3.7 | |
| First Citizens BancShares Cl. A | 3.4 | |
| Royal Gold | 3.3 | |
| KKR & Co. | 3.1 | |
| Franco-Nevada | 3.0 | |
| Hubbell Incorporated | 2.9 | |
| Portfolio Sector Breakdown | |
| Financials | 34.7 |
| Industrials | 30.0 |
| Materials | 14.6 |
| Consumer Discretionary | 5.5 |
| Health Care | 4.0 |
| Energy | 1.6 |
| Real Estate | 1.5 |
| Cash and Cash Equivalents | 8.1 |
Where Can I Find Additional Information About The Fund?
Additional information is available at www.royceinvest.com/literature, including its:
 | ● Prospectus ● Financial Information | ● Fund Holdings ● Proxy Voting Information |
Householding
We will deliver a single copy of prospectuses, proxies, financial reports, and other communication to shareholders with the same residential address, provided they have the same last name or we reasonably believe them to be members of the same family. Unless we are notified otherwise, we will continue to send you only one copy of these materials for as long as you remain a shareholder of the Fund. If you would like to receive individual mailings, please call 1-800-221-4268. Please allow 30 days for your request to be processed. Shareholders may also elect to receive these reports electronically. Please go to www.royceinvest.com for more details.
Important Information
“Costs paid” reflect contractual fee waivers and/or expense reimbursements. Sector weightings are determined using the Global Industry Classification Standard (“GICS”). GICS was developed by, and is the exclusive property of, Standard & Poor’s Financial Services LLC (“S&P”) and MSCI Inc. (“MSCI”). GICS is the trademark of S&P and MSCI. “Global Industry Classification Standard (GICS)” and “GICS Direct” are service marks of S&P and MSCI. Distributor: Royce Fund Services, LLC.
| NOT FDIC INSURED ● MAY LOSE VALUE ● NOT BANK GUARANTEED | RDV-SC-STSR-0624 |
| | |
| The Royce Funds | June 30, 2024 |
| | |
Royce Global Financial Services Fund Institutional Class—RGFIX | |
Semiannual Shareholder Report
This semiannual shareholder report contains important information about Royce Global Financial Services Fund for the period of January 1, 2024 to June 30, 2024. You can find additional information at www.royceinvest.com/literature. You can also request this information by contacting us at 1-800-221-4268.
This report provides information about the adoption of a plan of liquidation with respect to the Fund.
What Were the Fund Costs for the Last Six-Months?
Based on a hypothetical $10,000 investment
| | COSTS OF A | COSTS PAID AS A PERCENTAGE |
| FUND/CLASS | $10,000 INVESTMENT | OF A $10,000 INVESTMENT¹ |
| Royce Global Financial Services Fund—Institutional Class | $77 | 1.49% |
| ¹Annualized | | |
Key Fund Statistics
As of 6/30/24
| Fund Size (Millions) | $29 |
| Number of Holdings | 48 |
| Turnover Rate | 3% |
What Did The Fund Invest In?
Representing percentage of total net assets of the Fund as of 6/30/24 (%)
| Top 10 Positions | | | Country Breakdown1,2 | | |
| Tel Aviv Stock Exchange | 5.7 | | United States | 43.8 | |
| Sprott | 5.2 | | Canada | 28.4 | |
| KKR & Co. | 4.7 | | Israel | 5.7 | |
| First Citizens BancShares Cl. A | 4.7 | | Bermuda | 5.5 | |
| FirstService Corporation | 4.0 | | United Kingdom | 3.7 | |
| E-L Financial | 3.7 | | ¹Represents countries that are 3% or more of net assets. |
| Intermediate Capital Group | 3.7 | | ²Securities are categorized by the country of their headquarters. |
| FTAI Aviation | 3.6 | | | | |
| Franco-Nevada | 3.5 | | | | |
| Altus Group | 3.0 | | | | |
| | | | | |
| Portfolio Industry Breakdown |
| |
 |
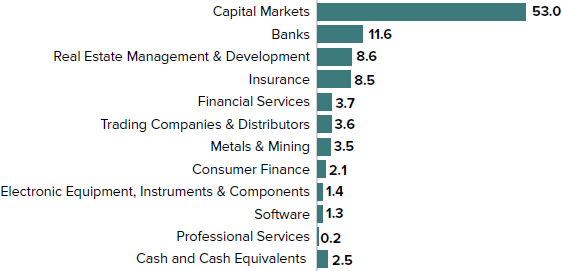
| Portfolio Industry Breakdown | |
| Capital Market | 53.0 |
| Banks | 11.6 |
| Real Estate Management & Development | 8.6 |
| Insurance | 8.5 |
| Financial Services | 3.7 |
| Trading Companies & Distributors | 3.6 |
| Metals & Mining | 3.5 |
| Consumer Finance | 2.1 |
| Electronic Equipment, Instruments & Components | 1.4 |
| Software | 1.3 |
| Professional Services | 0.2 |
| Cash and Cash Equivalents | 2.5 |
| ROYCE GLOBAL FINANCIAL SERVICES FUND—INSTITUTIONAL CLASS (RGFIX) | Semiannual Shareholder Report—June 30, 2024 |
How Has the Fund Changed?
The Board of Trustees of The Royce Fund has approved a plan of liquidation for Royce Global Financial Services Fund (“RFS”). RFS is being liquidated primarily because it has not maintained assets at a sufficient level for it to be viable. A final distribution was paid on August 1, 2024, to shareholders of record on July 31, 2024. The liquidation of RFS will be completed on September 9, 2024.
Where Can I Find Additional Information About The Fund?
Additional information is available at www.royceinvest.com/literature, including its:
 | ● Prospectus ● Financial Information | ● Fund Holdings ● Proxy Voting Information |
Householding
We will deliver a single copy of prospectuses, proxies, financial reports, and other communication to shareholders with the same residential address, provided they have the same last name or we reasonably believe them to be members of the same family. Unless we are notified otherwise, we will continue to send you only one copy of these materials for as long as you remain a shareholder of the Fund. If you would like to receive individual mailings, please call 1-800-221-4268. Please allow 30 days for your request to be processed. Shareholders may also elect to receive these reports electronically. Please go to www.royceinvest.com for more details.
Important Information
“Costs paid” reflect contractual fee waivers and/or expense reimbursements. Industry weightings are determined using the Global Industry Classification Standard (“GICS”). GICS was developed by, and is the exclusive property of, Standard & Poor’s Financial Services LLC (“S&P”) and MSCI Inc. (“MSCI”). GICS is the trademark of S&P and MSCI. “Global Industry Classification Standard (GICS)” and “GICS Direct” are service marks of S&P and MSCI. Distributor: Royce Fund Services, LLC.
| NOT FDIC INSURED ● MAY LOSE VALUE ● NOT BANK GUARANTEED | RFS-INC-STSR-0624 |
| | |
| The Royce Funds | June 30, 2024 |
| | |
Royce Global Financial Services Fund Service Class—RYFSX | |
Semiannual Shareholder Report
This semiannual shareholder report contains important information about Royce Global Financial Services Fund for the period of January 1, 2024 to June 30, 2024. You can find additional information at www.royceinvest.com/literature. You can also request this information by contacting us at 1-800-221-4268.
This report provides information about the adoption of a plan of liquidation with respect to the Fund.
What Were the Fund Costs for the Last Six-Months?
Based on a hypothetical $10,000 investment
| FUND/CLASS | COSTS OF A $10,000 INVESTMENT | COSTS PAID AS A PERCENTAGE OF A $10,000 INVESTMENT¹ |
| Royce Global Financial Services Fund—Service Class | $77 | 1.49% |
| ¹Annualized | | |
Key Fund Statistics
As of 6/30/24
| Fund Size (Millions) | $29 |
| Number of Holdings | 48 |
| Turnover Rate | 3% |
What Did The Fund Invest In?
Representing percentage of total net assets of the Fund as of 6/30/24 (%)
| Top 10 Positions | | Country Breakdown1,2 | |
| Tel Aviv Stock Exchange | 5.7 | | United States | 43.8 | |
| Sprott | 5.2 | | Canada | 28.4 | |
| KKR & Co. | 4.7 | | Israel | 5.7 | |
| First Citizens BancShares Cl. A | 4.7 | | Bermuda | 5.5 | |
| FirstService Corporation | 4.0 | | United Kingdom | 3.7 | |
| E-L Financial | 3.7 | | ¹Represents countries that are 3% or more of net assets. |
| Intermediate Capital Group | 3.7 | | ²Securities are categorized by the country of their headquarters. |
| FTAI Aviation | 3.6 | | |
| Franco-Nevada | 3.5 | | |
| Altus Group | 3.0 | | |
| | | | | |
Portfolio Industry Breakdown
| Portfolio Industry Breakdown | |
| Capital Market | 53.0 |
| Banks | 11.6 |
| Real Estate Management & Development | 8.6 |
| Insurance | 8.5 |
| Financial Services | 3.7 |
| Trading Companies & Distributors | 3.6 |
| Metals & Mining | 3.5 |
| Consumer Finance | 2.1 |
| Electronic Equipment, Instruments & Components | 1.4 |
| Software | 1.3 |
| Professional Services | 0.2 |
| Cash and Cash Equivalents | 2.5 |
| ROYCE GLOBAL FINANCIAL SERVICES FUND—SERVICE CLASS (RYFSX) | Semiannual Shareholder Report—June 30, 2024 |
How Has the Fund Changed?
The Board of Trustees of The Royce Fund has approved a plan of liquidation for Royce Global Financial Services Fund (“RFS”). RFS is being liquidated primarily because it has not maintained assets at a sufficient level for it to be viable. A final distribution was paid on August 1, 2024, to shareholders of record on July 31, 2024. The liquidation of RFS will be completed on September 9, 2024.
Where Can I Find Additional Information About The Fund?
Additional information is available at www.royceinvest.com/literature, including its:
 | ● Prospectus | ● Fund Holdings |
| ● Financial Information | ● Proxy Voting Information |
Householding
We will deliver a single copy of prospectuses, proxies, financial reports, and other communication to shareholders with the same residential address, provided they have the same last name or we reasonably believe them to be members of the same family. Unless we are notified otherwise, we will continue to send you only one copy of these materials for as long as you remain a shareholder of the Fund. If you would like to receive individual mailings, please call 1-800-221-4268. Please allow 30 days for your request to be processed. Shareholders may also elect to receive these reports electronically. Please go to www.royceinvest.com for more details.
Important Information
“Costs paid” reflect contractual fee waivers and/or expense reimbursements.Industry weightings are determined using the Global Industry Classification Standard (“GICS”). GICS was developed by, and is the exclusive property of, Standard & Poor’s Financial Services LLC (“S&P”) and MSCI Inc. (“MSCI”). GICS is the trademark of S&P and MSCI. “Global Industry Classification Standard (GICS)” and “GICS Direct” are service marks of S&P and MSCI. Distributor: Royce Fund Services, LLC.
| NOT FDIC INSURED ● MAY LOSE VALUE ● NOT BANK GUARANTEED | RFS-SC-STSR-0624 |
| | |
| The Royce Funds | June 30, 2024 |
| | |
Royce International Premier Fund Investment Class—RIPNX | |
Semiannual Shareholder Report
This semiannual shareholder report contains important information about Royce International Premier Fund for the period of January 1, 2024 to June 30, 2024. You can find additional information at www.royceinvest.com/literature. You can also request this information by contacting us at 1-800-221-4268.
What Were the Fund Costs for the Last Six-Months?
Based on a hypothetical $10,000 investment
| FUND/CLASS | COSTS OF A $10,000 INVESTMENT | COSTS PAID AS A PERCENTAGE OF A $10,000 INVESTMENT¹ |
| Royce International Premier Fund—Investment Class | $58 | 1.19% |
| ¹Annualized | | |
Key Fund Statistics
As of 6/30/24
| Fund Size (Millions) | $317 |
| Number of Holdings | 60 |
| Turnover Rate | 20% |
What Did The Fund Invest In?
Representing percentage of total net assets of the Fund as of 6/30/24 (%)
| Top 10 Positions | | Country Breakdown1,2 | |
| Hansen Technologies | 2.5 | | United Kingdom | 23.5 | |
| TKC Corporation | 2.2 | | Japan | 22.7 | |
| IPH | 2.1 | | Sweden | 8.0 | |
| Riken Keiki | 2.1 | | Australia | 6.3 | |
| Intertek Group | 2.1 | | Italy | 4.9 | |
| Zuken | 2.0 | | Switzerland | 4.0 | |
| NICE Information Service | 2.0 | | Canada | 3.7 | |
| JCU | 2.0 | | France | 3.6 | |
| As One | 2.0 | | Brazil | 3.4 | |
| Diploma | 1.9 | | ¹Represents countries that are 3% or more of net assets. |
| | | | ²Securities are categorized by the country of their headquarters. |
| | | | | |
Portfolio Sector Breakdown

| Portfolio Sector Breakdown | |
| Industrials | 40.2 |
| Information Technology | 27.6 |
| Health Care | 9.0 |
| Financials | 7.0 |
| Materials | 4.5 |
| Communication Services | 3.6 |
| Consumer Discretionary | 3.3 |
| Preferred Stock | 1.5 |
| Cash and Cash Equivalents | 3.3 |
| ROYCE INTERNATIONAL PREMIER FUND—INVESTMENT CLASS (RIPNX) | Semiannual Shareholder Report—June 30, 2024 |
Where Can I Find Additional Information About The Fund?
Additional information is available at www.royceinvest.com/literature, including its:
 | ● Prospectus | ● Fund Holdings |
| ● Financial Information | ● Proxy Voting Information |
Householding
We will deliver a single copy of prospectuses, proxies, financial reports, and other communication to shareholders with the same residential address, provided they have the same last name or we reasonably believe them to be members of the same family. Unless we are notified otherwise, we will continue to send you only one copy of these materials for as long as you remain a shareholder of the Fund. If you would like to receive individual mailings, please call 1-800-221-4268. Please allow 30 days for your request to be processed. Shareholders may also elect to receive these reports electronically. Please go to www.royceinvest.com for more details.
Important Information
“Costs paid” reflect contractual fee waivers and/or expense reimbursements. Sector weightings are determined using the Global Industry Classification Standard (“GICS”). GICS was developed by, and is the exclusive property of, Standard & Poor’s Financial Services LLC (“S&P”) and MSCI Inc. (“MSCI”). GICS is the trademark of S&P and MSCI. “Global Industry Classification Standard (GICS)” and “GICS Direct” are service marks of S&P and MSCI. Distributor: Royce Fund Services, LLC.
| NOT FDIC INSURED ● MAY LOSE VALUE ● NOT BANK GUARANTEED | RIP-IC-STSR-0624 |
| The Royce Funds | June 30, 2024 |
| | |
Royce International Premier Fund
Institutional Class—RIPIX | |
Semiannual Shareholder Report
This semiannual shareholder report contains important information about Royce International Premier Fund for the period of January 1, 2024 to June 30, 2024. You can find additional information at www.royceinvest.com/literature. You can also request this information by contacting us at 1-800-221-4268.
What Were the Fund Costs for the Last Six-Months?
Based on a hypothetical $10,000 investment
| FUND/CLASS | COSTS OF A
$10,000 INVESTMENT | COSTS PAID AS A PERCENTAGE
OF A $10,000 INVESTMENT¹ |
| Royce International Premier Fund—Institutional Class | $51 | 1.04% |
¹Annualized
Key Fund Statistics
As of 6/30/24
| Fund Size (Millions) | $317 |
| Number of Holdings | 60 |
| Turnover Rate | 20% |
What Did The Fund Invest In?
Representing percentage of total net assets of the Fund as of 6/30/24 (%)
| Top 10 Positions | | | Country Breakdown1,2 | | |
| Hansen Technologies | 2.5 | | United Kingdom | 23.5 | |
| TKC Corporation | 2.2 | | Japan | 22.7 | |
| IPH | 2.1 | | Sweden | 8.0 | |
| Riken Keiki | 2.1 | | Australia | 6.3 | |
| Intertek Group | 2.1 | | Italy | 4.9 | |
| Zuken | 2.0 | | Switzerland | 4.0 | |
| NICE Information Service | 2.0 | | Canada | 3.7 | |
| JCU | 2.0 | | France | 3.6 | |
| As One | 2.0 | | Brazil | 3.4 | |
| Diploma | 1.9 | | ¹Represents countries that are 3% or more of net assets. | |
| | | | ²Securities are categorized by the country of their headquarters. | |
| Portfolio Sector Breakdown |
 |
| Portfolio Sector Breakdown | |
| Industrials | 40.2 |
| Information Technology | 27.6 |
| Health Care | 9.0 |
| Financials | 7.0 |
| Materials | 4.5 |
| Communication Services | 3.6 |
| Consumer Discretionary | 3.3 |
| Preferred Stock | 1.5 |
| Cash and Cash Equivalents | 3.3 |
| ROYCE INTERNATIONAL PREMIER FUND—INSTITUTIONAL CLASS (RIPIX) | Semiannual Shareholder Report—June 30, 2024 |
Where Can I Find Additional Information About The Fund?
Additional information is available at www.royceinvest.com/literature, including its:
 | ● Prospectus | ● Fund Holdings |
| ● Financial Information | ● Proxy Voting Information |
Householding
We will deliver a single copy of prospectuses, proxies, financial reports, and other communication to shareholders with the same residential address, provided they have the same last name or we reasonably believe them to be members of the same family. Unless we are notified otherwise, we will continue to send you only one copy of these materials for as long as you remain a shareholder of the Fund. If you would like to receive individual mailings, please call 1-800-221-4268. Please allow 30 days for your request to be processed. Shareholders may also elect to receive these reports electronically. Please go to www.royceinvest.com for more details.
Important Information
“Costs paid” reflect contractual fee waivers and/or expense reimbursements. Sector weightings are determined using the Global Industry Classification Standard (“GICS”). GICS was developed by, and is the exclusive property of, Standard & Poor’s Financial Services LLC (“S&P”) and MSCI Inc. (“MSCI”). GICS is the trademark of S&P and MSCI. “Global Industry Classification Standard (GICS)” and “GICS Direct” are service marks of S&P and MSCI. Distributor: Royce Fund Services, LLC.
| NOT FDIC INSURED ● MAY LOSE VALUE ● NOT BANK GUARANTEED | RIP-INC-STSR-0624 |
| The Royce Funds | June 30, 2024 |
| | |
Royce International Premier Fund
Service Class—RYIPX | |
Semiannual Shareholder Report
This semiannual shareholder report contains important information about Royce International Premier Fund for the period of January 1, 2024 to June 30, 2024. You can find additional information at www.royceinvest.com/literature. You can also request this information by contacting us at 1-800-221-4268.
What Were the Fund Costs for the Last Six-Months?
Based on a hypothetical $10,000 investment
| FUND/CLASS | COSTS OF A
$10,000 INVESTMENT | COSTS PAID AS A PERCENTAGE
OF A $10,000 INVESTMENT¹ |
| Royce International Premier Fund—Service Class | $70 | 1.44% |
¹Annualized
Key Fund Statistics
As of 6/30/24
| Fund Size (Millions) | $317 |
| Number of Holdings | 60 |
| Turnover Rate | 20% |
What Did The Fund Invest In?
Representing percentage of total net assets of the Fund as of 6/30/24 (%)
| Top 10 Positions | | | Country Breakdown1,2 | | |
| Hansen Technologies | 2.5 | | United Kingdom | 23.5 | |
| TKC Corporation | 2.2 | | Japan | 22.7 | |
| IPH | 2.1 | | Sweden | 8.0 | |
| Riken Keiki | 2.1 | | Australia | 6.3 | |
| Intertek Group | 2.1 | | Italy | 4.9 | |
| Zuken | 2.0 | | Switzerland | 4.0 | |
| NICE Information Service | 2.0 | | Canada | 3.7 | |
| JCU | 2.0 | | France | 3.6 | |
| As One | 2.0 | | Brazil | 3.4 | |
| Diploma | 1.9 | | ¹Represents countries that are 3% or more of net assets. | |
| | | | ²Securities are categorized by the country of their headquarters. | |
| Portfolio Sector Breakdown |
 |
| Portfolio Sector Breakdown | |
| Industrials | 40.2 |
| Information Technology | 27.6 |
| Health Care | 9.0 |
| Financials | 7.0 |
| Materials | 4.5 |
| Communication Services | 3.6 |
| Consumer Discretionary | 3.3 |
| Preferred Stock | 1.5 |
| Cash and Cash Equivalents | 3.3 |
| ROYCE INTERNATIONAL PREMIER FUND—SERVICE CLASS (RYIPX) | Semiannual Shareholder Report—June 30, 2024 |
Where Can I Find Additional Information About The Fund?
Additional information is available at www.royceinvest.com/literature, including its:
 | ● Prospectus | ● Fund Holdings |
| ● Financial Information | ● Proxy Voting Information |
Householding
We will deliver a single copy of prospectuses, proxies, financial reports, and other communication to shareholders with the same residential address, provided they have the same last name or we reasonably believe them to be members of the same family. Unless we are notified otherwise, we will continue to send you only one copy of these materials for as long as you remain a shareholder of the Fund. If you would like to receive individual mailings, please call 1-800-221-4268. Please allow 30 days for your request to be processed. Shareholders may also elect to receive these reports electronically. Please go to www.royceinvest.com for more details.
Important Information
“Costs paid” reflect contractual fee waivers and/or expense reimbursements. Sector weightings are determined using the Global Industry Classification Standard (“GICS”). GICS was developed by, and is the exclusive property of, Standard & Poor’s Financial Services LLC (“S&P”) and MSCI Inc. (“MSCI”). GICS is the trademark of S&P and MSCI. “Global Industry Classification Standard (GICS)” and “GICS Direct” are service marks of S&P and MSCI. Distributor: Royce Fund Services, LLC.
| NOT FDIC INSURED ● MAY LOSE VALUE ● NOT BANK GUARANTEED | RIP-SC-STSR-0624 |
| The Royce Funds | June 30, 2024 |
| | |
Royce Micro-Cap Fund
Consultant Class—RYMCX | |
Semiannual Shareholder Report
This semiannual shareholder report contains important information about Royce Micro-Cap Fund for the period of January 1, 2024 to June 30, 2024. You can find additional information at www.royceinvest.com/literature. You can also request this information by contacting us at 1-800-221-4268.
What Were the Fund Costs for the Last Six-Months?
Based on a hypothetical $10,000 investment
| FUND/CLASS | COSTS OF A
$10,000 INVESTMENT | COSTS PAID AS A PERCENTAGE
OF A $10,000 INVESTMENT¹ |
| Royce Micro-Cap Fund—Consultant Class | $113 | 2.24% |
¹Annualized
Key Fund Statistics
As of 6/30/24
| Fund Size (Millions) | $300 |
| Number of Holdings | 123 |
| Turnover Rate | 10% |
What Did The Fund Invest In?
Representing percentage of total net assets of the Fund as of 6/30/24 (%)
| Top 10 Positions | | | Portfolio Sector Breakdown |
| CECO Environmental | 1.6 | | 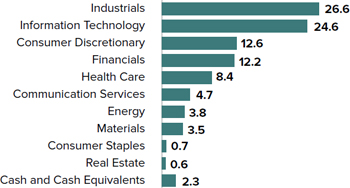 |
| Artivion | 1.4 | |
| Newpark Resources | 1.4 | |
| Graham Corporation | 1.3 | |
| American Superconductor | 1.3 | |
| VSE Corporation | 1.3 | |
| QuinStreet | 1.3 | |
| Shoe Carnival | 1.3 | |
| CRA International | 1.3 | |
| Arlo Technologies | 1.3 | |
| Portfolio Sector Breakdown | |
| Industrials | 26.6 |
| Information Technology | 24.6 |
| Consumer Discretionary | 12.6 |
| Financials | 12.2 |
| Health Care | 8.4 |
| Communication Services | 4.7 |
| Energy | 3.8 |
| Materials | 3.5 |
| Consumer Staples | 0.7 |
| Real Estate | 0.6 |
| Cash and Cash Equivalents | 2.3 |
Where Can I Find Additional Information About The Fund?
Additional information is available at www.royceinvest.com/literature, including its:
 | ● Prospectus | ● Fund Holdings |
| ● Financial Information | ● Proxy Voting Information |
Householding
We will deliver a single copy of prospectuses, proxies, financial reports, and other communication to shareholders with the same residential address, provided they have the same last name or we reasonably believe them to be members of the same family. Unless we are notified otherwise, we will continue to send you only one copy of these materials for as long as you remain a shareholder of the Fund. If you would like to receive individual mailings, please call 1-800-221-4268. Please allow 30 days for your request to be processed. Shareholders may also elect to receive these reports electronically. Please go to www.royceinvest.com for more details.
Important Information
“Costs paid” reflect contractual fee waivers and/or expense reimbursements. Sector weightings are determined using the Global Industry Classification Standard (“GICS”). GICS was developed by, and is the exclusive property of, Standard & Poor’s Financial Services LLC (“S&P”) and MSCI Inc. (“MSCI”). GICS is the trademark of S&P and MSCI. “Global Industry Classification Standard (GICS)” and “GICS Direct” are service marks of S&P and MSCI. Distributor: Royce Fund Services, LLC.
| NOT FDIC INSURED ● MAY LOSE VALUE ● NOT BANK GUARANTEED | RMC-CC-STSR-0624 |
| The Royce Funds | June 30, 2024 |
| | |
Royce Micro-Cap Fund
Investment Class—RYOTX | |
Semiannual Shareholder Report
This semiannual shareholder report contains important information about Royce Micro-Cap Fund for the period of January 1, 2024 to June 30, 2024. You can find additional information at www.royceinvest.com/literature. You can also request this information by contacting us at 1-800-221-4268.
What Were the Fund Costs for the Last Six-Months?
Based on a hypothetical $10,000 investment
| FUND/CLASS | COSTS OF A
$10,000 INVESTMENT | COSTS PAID AS A PERCENTAGE
OF A $10,000 INVESTMENT¹ |
| Royce Micro-Cap Fund—Investment Class | $62 | 1.23% |
¹Annualized
Key Fund Statistics
As of 6/30/24
| Fund Size (Millions) | $300 |
| Number of Holdings | 123 |
| Turnover Rate | 10% |
What Did The Fund Invest In?
Representing percentage of total net assets of the Fund as of 6/30/24 (%)
| Top 10 Positions | | | Portfolio Sector Breakdown |
| CECO Environmental | 1.6 | | 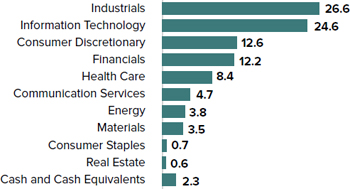 |
| Artivion | 1.4 | |
| Newpark Resources | 1.4 | |
| Graham Corporation | 1.3 | |
| American Superconductor | 1.3 | |
| VSE Corporation | 1.3 | |
| QuinStreet | 1.3 | |
| Shoe Carnival | 1.3 | |
| CRA International | 1.3 | |
| Arlo Technologies | 1.3 | |
| Portfolio Sector Breakdown | |
| Industrials | 26.6 |
| Information Technology | 24.6 |
| Consumer Discretionary | 12.6 |
| Financials | 12.2 |
| Health Care | 8.4 |
| Communication Services | 4.7 |
| Energy | 3.8 |
| Materials | 3.5 |
| Consumer Staples | 0.7 |
| Real Estate | 0.6 |
| Cash and Cash Equivalents | 2.3 |
Where Can I Find Additional Information About The Fund?
Additional information is available at www.royceinvest.com/literature, including its:
 | ● Prospectus | ● Fund Holdings |
| ● Financial Information | ● Proxy Voting Information |
Householding
We will deliver a single copy of prospectuses, proxies, financial reports, and other communication to shareholders with the same residential address, provided they have the same last name or we reasonably believe them to be members of the same family. Unless we are notified otherwise, we will continue to send you only one copy of these materials for as long as you remain a shareholder of the Fund. If you would like to receive individual mailings, please call 1-800-221-4268. Please allow 30 days for your request to be processed. Shareholders may also elect to receive these reports electronically. Please go to www.royceinvest.com for more details.
Important Information
Sector weightings are determined using the Global Industry Classification Standard (“GICS”). GICS was developed by, and is the exclusive property of, Standard & Poor’s Financial Services LLC (“S&P”) and MSCI Inc. (“MSCI”). GICS is the trademark of S&P and MSCI. “Global Industry Classification Standard (GICS)” and “GICS Direct” are service marks of S&P and MSCI. Distributor: Royce Fund Services, LLC.
| NOT FDIC INSURED ● MAY LOSE VALUE ● NOT BANK GUARANTEED | RMC-IC-STSR-0624 |
| The Royce Funds | June 30, 2024 |
| | |
Royce Micro-Cap Fund
Service Class—RMCFX | |
Semiannual Shareholder Report
This semiannual shareholder report contains important information about Royce Micro-Cap Fund for the period of January 1, 2024 to June 30, 2024. You can find additional information at www.royceinvest.com/literature. You can also request this information by contacting us at 1-800-221-4268.
What Were the Fund Costs for the Last Six-Months?
Based on a hypothetical $10,000 investment
| FUND/CLASS | COSTS OF A
$10,000 INVESTMENT | COSTS PAID AS A PERCENTAGE
OF A $10,000 INVESTMENT¹ |
| Royce Micro-Cap Fund—Service Class | $75 | 1.49% |
¹Annualized
Key Fund Statistics
As of 6/30/24
| Fund Size (Millions) | $300 |
| Number of Holdings | 123 |
| Turnover Rate | 10% |
What Did The Fund Invest In?
Representing percentage of total net assets of the Fund as of 6/30/24 (%)
| Top 10 Positions | | | Portfolio Sector Breakdown |
| CECO Environmental | 1.6 | |  |
| Artivion | 1.4 | |
| Newpark Resources | 1.4 | |
| Graham Corporation | 1.3 | |
| American Superconductor | 1.3 | |
| VSE Corporation | 1.3 | |
| QuinStreet | 1.3 | |
| Shoe Carnival | 1.3 | |
| CRA International | 1.3 | |
| Arlo Technologies | 1.3 | |
| Portfolio Sector Breakdown | |
| Industrials | 26.6 |
| Information Technology | 24.6 |
| Consumer Discretionary | 12.6 |
| Financials | 12.2 |
| Health Care | 8.4 |
| Communication Services | 4.7 |
| Energy | 3.8 |
| Materials | 3.5 |
| Consumer Staples | 0.7 |
| Real Estate | 0.6 |
| Cash and Cash Equivalents | 2.3 |
Where Can I Find Additional Information About The Fund?
Additional information is available at www.royceinvest.com/literature, including its:
 | ● Prospectus | ● Fund Holdings |
| ● Financial Information | ● Proxy Voting Information |
Householding
We will deliver a single copy of prospectuses, proxies, financial reports, and other communication to shareholders with the same residential address, provided they have the same last name or we reasonably believe them to be members of the same family. Unless we are notified otherwise, we will continue to send you only one copy of these materials for as long as you remain a shareholder of the Fund. If you would like to receive individual mailings, please call 1-800-221-4268. Please allow 30 days for your request to be processed. Shareholders may also elect to receive these reports electronically. Please go to www.royceinvest.com for more details.
Important Information
“Costs paid” reflect contractual fee waivers and/or expense reimbursements. Sector weightings are determined using the Global Industry Classification Standard (“GICS”). GICS was developed by, and is the exclusive property of, Standard & Poor’s Financial Services LLC (“S&P”) and MSCI Inc. (“MSCI”). GICS is the trademark of S&P and MSCI. “Global Industry Classification Standard (GICS)” and “GICS Direct” are service marks of S&P and MSCI. Distributor: Royce Fund Services, LLC.
| NOT FDIC INSURED ● MAY LOSE VALUE ● NOT BANK GUARANTEED | RMC-SC-STSR-0624 |
| The Royce Funds | June 30, 2024 |
| | |
Royce Small-Cap Opportunity Fund
Consultant Class—ROFCX | |
Semiannual Shareholder Report
This semiannual shareholder report contains important information about Royce Small-Cap Opportunity Fund for the period of January 1, 2024 to June 30, 2024. You can find additional information at www.royceinvest.com/literature. You can also request this information by contacting us at 1-800-221-4268.
What Were the Fund Costs for the Last Six-Months?
Based on a hypothetical $10,000 investment
| FUND/CLASS | COSTS OF A
$10,000 INVESTMENT | COSTS PAID AS A PERCENTAGE
OF A $10,000 INVESTMENT¹ |
| Royce Small-Cap Opportunity Fund—Consultant Class | $113 | 2.24% |
¹Annualized
Key Fund Statistics
As of 6/30/24
| Fund Size (Millions) | $1,238 |
| Number of Holdings | 225 |
| Turnover Rate | 15% |
What Did The Fund Invest In?
Representing percentage of total net assets of the Fund as of 6/30/24 (%)
| Top 10 Positions | | | Portfolio Sector Breakdown |
| CECO Environmental | 0.9 | |  |
| Artivion | 0.9 | |
| Ultra Clean Holdings | 0.8 | |
| VSE Corporation | 0.8 | |
| Veeco Instruments | 0.8 | |
| Kyndryl Holdings | 0.8 | |
| Lakeland Industries | 0.8 | |
| AAR Corp. | 0.8 | |
| Select Water Solutions Cl. A | 0.8 | |
| Carpenter Technology | 0.8 | |
| Portfolio Sector Breakdown | |
| Industrials | 28.2 |
| Information Technology | 21.0 |
| Consumer Discretionary | 13.3 |
| Financials | 7.6 |
| Energy | 7.6 |
| Materials | 6.8 |
| Health Care | 6.8 |
| Communication Services | 5.2 |
| Consumer Staples | 1.2 |
| Real Estate | 0.3 |
| Cash and Cash Equivalents | 2.0 |
Where Can I Find Additional Information About The Fund?
Additional information is available at www.royceinvest.com/literature, including its:
 | ● Prospectus | ● Fund Holdings |
| ● Financial Information | ● Proxy Voting Information |
Householding
We will deliver a single copy of prospectuses, proxies, financial reports, and other communication to shareholders with the same residential address, provided they have the same last name or we reasonably believe them to be members of the same family. Unless we are notified otherwise, we will continue to send you only one copy of these materials for as long as you remain a shareholder of the Fund. If you would like to receive individual mailings, please call 1-800-221-4268. Please allow 30 days for your request to be processed. Shareholders may also elect to receive these reports electronically. Please go to www.royceinvest.com for more details.
Important Information
“Costs paid” reflect contractual fee waivers and/or expense reimbursements. Sector weightings are determined using the Global Industry Classification Standard (“GICS”). GICS was developed by, and is the exclusive property of, Standard & Poor’s Financial Services LLC (“S&P”) and MSCI Inc. (“MSCI”). GICS is the trademark of S&P and MSCI. “Global Industry Classification Standard (GICS)” and “GICS Direct” are service marks of S&P and MSCI. Distributor: Royce Fund Services, LLC.
| NOT FDIC INSURED ● MAY LOSE VALUE ● NOT BANK GUARANTEED | ROF-CC-STSR-0624 |
| The Royce Funds | June 30, 2024 |
| | |
Royce Small-Cap Opportunity Fund
Investment Class—RYPNX | |
Semiannual Shareholder Report
This semiannual shareholder report contains important information about Royce Small-Cap Opportunity Fund for the period of January 1, 2024 to June 30, 2024. You can find additional information at www.royceinvest.com/literature. You can also request this information by contacting us at 1-800-221-4268.
What Were the Fund Costs for the Last Six-Months?
Based on a hypothetical $10,000 investment
| FUND/CLASS | COSTS OF A
$10,000 INVESTMENT | COSTS PAID AS A PERCENTAGE
OF A $10,000 INVESTMENT¹ |
| Royce Small-Cap Opportunity Fund—Investment Class | $62 | 1.22% |
¹Annualized
Key Fund Statistics
As of 6/30/24
| Fund Size (Millions) | $1,238 |
| Number of Holdings | 225 |
| Turnover Rate | 15% |
What Did The Fund Invest In?
Representing percentage of total net assets of the Fund as of 6/30/24 (%)
| Top 10 Positions | | | Portfolio Sector Breakdown |
| CECO Environmental | 0.9 | |  |
| Artivion | 0.9 | |
| Ultra Clean Holdings | 0.8 | |
| VSE Corporation | 0.8 | |
| Veeco Instruments | 0.8 | |
| Kyndryl Holdings | 0.8 | |
| Lakeland Industries | 0.8 | |
| AAR Corp. | 0.8 | |
| Select Water Solutions Cl. A | 0.8 | |
| Carpenter Technology | 0.8 | |
| Portfolio Sector Breakdown | |
| Industrials | 28.2 |
| Information Technology | 21.0 |
| Consumer Discretionary | 13.3 |
| Financials | 7.6 |
| Energy | 7.6 |
| Materials | 6.8 |
| Health Care | 6.8 |
| Communication Services | 5.2 |
| Consumer Staples | 1.2 |
| Real Estate | 0.3 |
| Cash and Cash Equivalents | 2.0 |
Where Can I Find Additional Information About The Fund?
Additional information is available at www.royceinvest.com/literature, including its:
 | ● Prospectus | ● Fund Holdings |
| ● Financial Information | ● Proxy Voting Information |
Householding
We will deliver a single copy of prospectuses, proxies, financial reports, and other communication to shareholders with the same residential address, provided they have the same last name or we reasonably believe them to be members of the same family. Unless we are notified otherwise, we will continue to send you only one copy of these materials for as long as you remain a shareholder of the Fund. If you would like to receive individual mailings, please call 1-800-221-4268. Please allow 30 days for your request to be processed. Shareholders may also elect to receive these reports electronically. Please go to www.royceinvest.com for more details.
Important Information
Sector weightings are determined using the Global Industry Classification Standard (“GICS”). GICS was developed by, and is the exclusive property of, Standard & Poor’s Financial Services LLC (“S&P”) and MSCI Inc. (“MSCI”). GICS is the trademark of S&P and MSCI. “Global Industry Classification Standard (GICS)” and “GICS Direct” are service marks of S&P and MSCI. Distributor: Royce Fund Services, LLC.
| NOT FDIC INSURED ● MAY LOSE VALUE ● NOT BANK GUARANTEED | ROF-IC-STSR-0624 |
| The Royce Funds | June 30, 2024 |
| | |
Royce Small-Cap Opportunity Fund
Institutional Class—ROFIX | |
Semiannual Shareholder Report
This semiannual shareholder report contains important information about Royce Small-Cap Opportunity Fund for the period of January 1, 2024 to June 30, 2024. You can find additional information at www.royceinvest.com/literature. You can also request this information by contacting us at 1-800-221-4268.
What Were the Fund Costs for the Last Six-Months?
Based on a hypothetical $10,000 investment
| FUND/CLASS | COSTS OF A
$10,000 INVESTMENT | COSTS PAID AS A PERCENTAGE
OF A $10,000 INVESTMENT¹ |
| Royce Small-Cap Opportunity Fund—Institutional Class | $57 | 1.12% |
¹Annualized
Key Fund Statistics
As of 6/30/24
| Fund Size (Millions) | $1,238 |
| Number of Holdings | 225 |
| Turnover Rate | 15% |
What Did The Fund Invest In?
Representing percentage of total net assets of the Fund as of 6/30/24 (%)
| Top 10 Positions | | | Portfolio Sector Breakdown |
| CECO Environmental | 0.9 | | 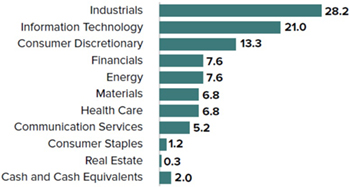 |
| Artivion | 0.9 | |
| Ultra Clean Holdings | 0.8 | |
| VSE Corporation | 0.8 | |
| Veeco Instruments | 0.8 | |
| Kyndryl Holdings | 0.8 | |
| Lakeland Industries | 0.8 | |
| AAR Corp. | 0.8 | |
| Select Water Solutions Cl. A | 0.8 | |
| Carpenter Technology | 0.8 | |
| Portfolio Sector Breakdown | |
| Industrials | 28.2 |
| Information Technology | 21.0 |
| Consumer Discretionary | 13.3 |
| Financials | 7.6 |
| Energy | 7.6 |
| Materials | 6.8 |
| Health Care | 6.8 |
| Communication Services | 5.2 |
| Consumer Staples | 1.2 |
| Real Estate | 0.3 |
| Cash and Cash Equivalents | 2.0 |
Where Can I Find Additional Information About The Fund?
Additional information is available at www.royceinvest.com/literature, including its:
 | ● Prospectus | ● Fund Holdings |
| ● Financial Information | ● Proxy Voting Information |
Householding
We will deliver a single copy of prospectuses, proxies, financial reports, and other communication to shareholders with the same residential address, provided they have the same last name or we reasonably believe them to be members of the same family. Unless we are notified otherwise, we will continue to send you only one copy of these materials for as long as you remain a shareholder of the Fund. If you would like to receive individual mailings, please call 1-800-221-4268. Please allow 30 days for your request to be processed. Shareholders may also elect to receive these reports electronically. Please go to www.royceinvest.com for more details.
Important Information
Sector weightings are determined using the Global Industry Classification Standard (“GICS”). GICS was developed by, and is the exclusive property of, Standard & Poor’s Financial Services LLC (“S&P”) and MSCI Inc. (“MSCI”). GICS is the trademark of S&P and MSCI. “Global Industry Classification Standard (GICS)” and “GICS Direct” are service marks of S&P and MSCI. Distributor: Royce Fund Services, LLC.
| NOT FDIC INSURED ● MAY LOSE VALUE ● NOT BANK GUARANTEED | ROF-INC-STSR-0624 |
| The Royce Funds | June 30, 2024 |
| | |
Royce Small-Cap Opportunity Fund
R Class—ROFRX | |
Semiannual Shareholder Report
This semiannual shareholder report contains important information about Royce Small-Cap Opportunity Fund for the period of January 1, 2024 to June 30, 2024. You can find additional information at www.royceinvest.com/literature. You can also request this information by contacting us at 1-800-221-4268.
What Were the Fund Costs for the Last Six-Months?
Based on a hypothetical $10,000 investment
| FUND/CLASS | COSTS OF A
$10,000 INVESTMENT | COSTS PAID AS A PERCENTAGE
OF A $10,000 INVESTMENT¹ |
| Royce Small-Cap Opportunity Fund—R Class | $93 | 1.85% |
¹Annualized
Key Fund Statistics
As of 6/30/24
| Fund Size (Millions) | $1,238 |
| Number of Holdings | 225 |
| Turnover Rate | 15% |
What Did The Fund Invest In?
Representing percentage of total net assets of the Fund as of 6/30/24 (%)
| Top 10 Positions | | | Portfolio Sector Breakdown |
| CECO Environmental | 0.9 | |  |
| Artivion | 0.9 | |
| Ultra Clean Holdings | 0.8 | |
| VSE Corporation | 0.8 | |
| Veeco Instruments | 0.8 | |
| Kyndryl Holdings | 0.8 | |
| Lakeland Industries | 0.8 | |
| AAR Corp. | 0.8 | |
| Select Water Solutions Cl. A | 0.8 | |
| Carpenter Technology | 0.8 | |
| Portfolio Sector Breakdown | |
| Industrials | 28.2 |
| Information Technology | 21.0 |
| Consumer Discretionary | 13.3 |
| Financials | 7.6 |
| Energy | 7.6 |
| Materials | 6.8 |
| Health Care | 6.8 |
| Communication Services | 5.2 |
| Consumer Staples | 1.2 |
| Real Estate | 0.3 |
| Cash and Cash Equivalents | 2.0 |
Where Can I Find Additional Information About The Fund?
Additional information is available at www.royceinvest.com/literature, including its:
 | ● Prospectus | ● Fund Holdings |
| ● Financial Information | ● Proxy Voting Information |
Householding
We will deliver a single copy of prospectuses, proxies, financial reports, and other communication to shareholders with the same residential address, provided they have the same last name or we reasonably believe them to be members of the same family. Unless we are notified otherwise, we will continue to send you only one copy of these materials for as long as you remain a shareholder of the Fund. If you would like to receive individual mailings, please call 1-800-221-4268. Please allow 30 days for your request to be processed. Shareholders may also elect to receive these reports electronically. Please go to www.royceinvest.com for more details.
Important Information
Sector weightings are determined using the Global Industry Classification Standard (“GICS”). GICS was developed by, and is the exclusive property of, Standard & Poor’s Financial Services LLC (“S&P”) and MSCI Inc. (“MSCI”). GICS is the trademark of S&P and MSCI. “Global Industry Classification Standard (GICS)” and “GICS Direct” are service marks of S&P and MSCI. Distributor: Royce Fund Services, LLC.
| NOT FDIC INSURED ● MAY LOSE VALUE ● NOT BANK GUARANTEED | ROF-RC-STSR-0624 |
| The Royce Funds | June 30, 2024 |
| | |
Royce Small-Cap Opportunity Fund
Service Class—RYOFX | |
Semiannual Shareholder Report
This semiannual shareholder report contains important information about Royce Small-Cap Opportunity Fund for the period of January 1, 2024 to June 30, 2024. You can find additional information at www.royceinvest.com/literature. You can also request this information by contacting us at 1-800-221-4268.
What Were the Fund Costs for the Last Six-Months?
Based on a hypothetical $10,000 investment
| FUND/CLASS | COSTS OF A
$10,000 INVESTMENT | COSTS PAID AS A PERCENTAGE
OF A $10,000 INVESTMENT¹ |
| Royce Small-Cap Opportunity Fund—Service Class | $75 | 1.49% |
¹Annualized
Key Fund Statistics
As of 6/30/24
| Fund Size (Millions) | $1,238 |
| Number of Holdings | 225 |
| Turnover Rate | 15% |
What Did The Fund Invest In?
Representing percentage of total net assets of the Fund as of 6/30/24 (%)
| Top 10 Positions | | | Portfolio Sector Breakdown |
| CECO Environmental | 0.9 | |  |
| Artivion | 0.9 | |
| Ultra Clean Holdings | 0.8 | |
| VSE Corporation | 0.8 | |
| Veeco Instruments | 0.8 | |
| Kyndryl Holdings | 0.8 | |
| Lakeland Industries | 0.8 | |
| AAR Corp. | 0.8 | |
| Select Water Solutions Cl. A | 0.8 | |
| Carpenter Technology | 0.8 | |
| Portfolio Sector Breakdown | |
| Industrials | 28.2 |
| Information Technology | 21.0 |
| Consumer Discretionary | 13.3 |
| Financials | 7.6 |
| Energy | 7.6 |
| Materials | 6.8 |
| Health Care | 6.8 |
| Communication Services | 5.2 |
| Consumer Staples | 1.2 |
| Real Estate | 0.3 |
| Cash and Cash Equivalents | 2.0 |
Where Can I Find Additional Information About The Fund?
Additional information is available at www.royceinvest.com/literature, including its:
 | ● Prospectus | ● Fund Holdings |
| ● Financial Information | ● Proxy Voting Information |
Householding
We will deliver a single copy of prospectuses, proxies, financial reports, and other communication to shareholders with the same residential address, provided they have the same last name or we reasonably believe them to be members of the same family. Unless we are notified otherwise, we will continue to send you only one copy of these materials for as long as you remain a shareholder of the Fund. If you would like to receive individual mailings, please call 1-800-221-4268. Please allow 30 days for your request to be processed. Shareholders may also elect to receive these reports electronically. Please go to www.royceinvest.com for more details.
Important Information
“Costs paid” reflect contractual fee waivers and/or expense reimbursements. Sector weightings are determined using the Global Industry Classification Standard (“GICS”). GICS was developed by, and is the exclusive property of, Standard & Poor’s Financial Services LLC (“S&P”) and MSCI Inc. (“MSCI”). GICS is the trademark of S&P and MSCI. “Global Industry Classification Standard (GICS)” and “GICS Direct” are service marks of S&P and MSCI. Distributor: Royce Fund Services, LLC.
| NOT FDIC INSURED ● MAY LOSE VALUE ● NOT BANK GUARANTEED | ROF-SC-STSR-0624 |
| The Royce Funds | June 30, 2024 |
| | |
Royce Premier Fund
Consultant Class—RPRCX | |
Semiannual Shareholder Report
This semiannual shareholder report contains important information about Royce Premier Fund for the period of January 1, 2024 to June 30, 2024. You can find additional information at www.royceinvest.com/literature. You can also request this information by contacting us at 1-800-221-4268.
What Were the Fund Costs for the Last Six-Months?
Based on a hypothetical $10,000 investment
| FUND/CLASS | COSTS OF A
$10,000 INVESTMENT | COSTS PAID AS A PERCENTAGE
OF A $10,000 INVESTMENT¹ |
| Royce Premier Fund—Consultant Class | $112 | 2.24% |
¹Annualized
Key Fund Statistics
As of 6/30/24
| Fund Size (Millions) | $1,396 |
| Number of Holdings | 50 |
| Turnover Rate | 7% |
What Did The Fund Invest In?
Representing percentage of total net assets of the Fund as of 6/30/24 (%)
| Top 10 Positions | | | Portfolio Sector Breakdown |
| MKS Instruments | 3.2 | | 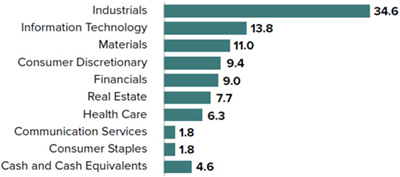 |
| Innospec | 3.0 | |
| Stella-Jones | 3.0 | |
| Arcosa | 3.0 | |
| SEI Investments | 2.9 | |
| Kadant | 2.8 | |
| FirstService Corporation | 2.8 | |
| Reliance | 2.7 | |
| Cirrus Logic | 2.7 | |
| Haemonetics Corporation | 2.6 | |
| Portfolio Sector Breakdown | |
| Industrials | 34.6 |
| Information Technology | 13.8 |
| Materials | 11.0 |
| Consumer Discretionary | 9.4 |
| Financials | 9.0 |
| Real Estate | 7.7 |
| Health Care | 6.3 |
| Communication Services | 1.8 |
| Consumer Staples | 1.8 |
| Cash and Cash Equivalents | 4.6 |
Where Can I Find Additional Information About The Fund?
Additional information is available at www.royceinvest.com/literature, including its:
 | ● Prospectus | ● Fund Holdings |
| ● Financial Information | ● Proxy Voting Information |
Householding
We will deliver a single copy of prospectuses, proxies, financial reports, and other communication to shareholders with the same residential address, provided they have the same last name or we reasonably believe them to be members of the same family. Unless we are notified otherwise, we will continue to send you only one copy of these materials for as long as you remain a shareholder of the Fund. If you would like to receive individual mailings, please call 1-800-221-4268. Please allow 30 days for your request to be processed. Shareholders may also elect to receive these reports electronically. Please go to www.royceinvest.com for more details.
Important Information
“Costs paid” reflect contractual fee waivers and/or expense reimbursements. Sector weightings are determined using the Global Industry Classification Standard (“GICS”). GICS was developed by, and is the exclusive property of, Standard & Poor’s Financial Services LLC (“S&P”) and MSCI Inc. (“MSCI”). GICS is the trademark of S&P and MSCI. “Global Industry Classification Standard (GICS)” and “GICS Direct” are service marks of S&P and MSCI. Distributor: Royce Fund Services, LLC.
| NOT FDIC INSURED ● MAY LOSE VALUE ● NOT BANK GUARANTEED | RPR-CC-STSR-0624 |
| | |
| The Royce Funds | June 30, 2024 |
| | |
Royce Premier Fund Investment Class—RYPRX | |
Semiannual Shareholder Report
This semiannual shareholder report contains important information about Royce Premier Fund for the period of January 1, 2024 to June 30, 2024. You can find additional information at www.royceinvest.com/literature. You can also request this information by contacting us at 1-800-221-4268.
What Were the Fund Costs for the Last Six-Months?
Based on a hypothetical $10,000 investment
| | COSTS OF A | COSTS PAID AS A PERCENTAGE |
| FUND/CLASS | $10,000 INVESTMENT | OF A $10,000 INVESTMENT¹ |
| Royce Premier Fund—Investment Class | $59 | 1.18% |
| ¹Annualized | | |
Key Fund Statistics
As of 6/30/24
| Fund Size (Millions) | $1,396 |
| Number of Holdings | 50 |
| Turnover Rate | 7% |
What Did The Fund Invest In?
Representing percentage of total net assets of the Fund as of 6/30/24 (%)
| Top 10 Positions | | | Portfolio Sector Breakdown |
| MKS Instruments | 3.2 | |  |
| Innospec | 3.0 | |
| Stella-Jones | 3.0 | |
| Arcosa | 3.0 | |
| SEI Investments | 2.9 | |
| Kadant | 2.8 | |
| FirstService Corporation | 2.8 | |
| Reliance | 2.7 | |
| Cirrus Logic | 2.7 | |
| Haemonetics Corporation | 2.6 | |
| | | |
| Portfolio Sector Breakdown | |
| Industrials | 34.6 |
| Information Technology | 13.8 |
| Materials | 11.0 |
| Consumer Discretionary | 9.4 |
| Financials | 9.0 |
| Real Estate | 7.7 |
| Health Care | 6.3 |
| Communication Services | 1.8 |
| Consumer Staples | 1.8 |
| Cash and Cash Equivalents | 4.6 |
Where Can I Find Additional Information About The Fund?
Additional information is available at www.royceinvest.com/literature, including its:
 | ● Prospectus ● Financial Information | ● Fund Holdings ● Proxy Voting Information |
Householding
We will deliver a single copy of prospectuses, proxies, financial reports, and other communication to shareholders with the same residential address, provided they have the same last name or we reasonably believe them to be members of the same family. Unless we are notified otherwise, we will continue to send you only one copy of these materials for as long as you remain a shareholder of the Fund. If you would like to receive individual mailings, please call 1-800-221-4268. Please allow 30 days for your request to be processed. Shareholders may also elect to receive these reports electronically. Please go to www.royceinvest.com for more details.
Important Information
Sector weightings are determined using the Global Industry Classification Standard (“GICS”). GICS was developed by, and is the exclusive property of, Standard & Poor’s Financial Services LLC (“S&P”) and MSCI Inc. (“MSCI”). GICS is the trademark of S&P and MSCI. “Global Industry Classification Standard (GICS)” and “GICS Direct” are service marks of S&P and MSCI. Distributor: Royce Fund Services, LLC.
| NOT FDIC INSURED ● MAY LOSE VALUE ● NOT BANK GUARANTEED | RPR-IC-STSR-0624 |
| | |
| The Royce Funds | June 30, 2024 |
| | |
Royce Premier Fund Institutional Class—RPFIX | |
Semiannual Shareholder Report
This semiannual shareholder report contains important information about Royce Premier Fund for the period of January 1, 2024 to June 30, 2024. You can find additional information at www.royceinvest.com/literature. You can also request this information by contacting us at 1-800-221-4268.
What Were the Fund Costs for the Last Six-Months?
Based on a hypothetical $10,000 investment
| | COSTS OF A | COSTS PAID AS A PERCENTAGE |
| FUND/CLASS | $10,000 INVESTMENT | OF A $10,000 INVESTMENT¹ |
| Royce Premier Fund—Institutional Class | $55 | 1.11% |
| ¹Annualized | | |
Key Fund Statistics
As of 6/30/24
| Fund Size (Millions) | $1,396 |
| Number of Holdings | 50 |
| Turnover Rate | 7% |
What Did The Fund Invest In?
Representing percentage of total net assets of the Fund as of 6/30/24 (%)
| Top 10 Positions | | | Portfolio Sector Breakdown |
| MKS Instruments | 3.2 | |  |
| Innospec | 3.0 | |
| Stella-Jones | 3.0 | |
| Arcosa | 3.0 | |
| SEI Investments | 2.9 | |
| Kadant | 2.8 | |
| FirstService Corporation | 2.8 | |
| Reliance | 2.7 | |
| Cirrus Logic | 2.7 | |
| Haemonetics Corporation | 2.6 | |
| | | |
| Portfolio Sector Breakdown | |
| Industrials | 34.6 |
| Information Technology | 13.8 |
| Materials | 11.0 |
| Consumer Discretionary | 9.4 |
| Financials | 9.0 |
| Real Estate | 7.7 |
| Health Care | 6.3 |
| Communication Services | 1.8 |
| Consumer Staples | 1.8 |
| Cash and Cash Equivalents | 4.6 |
Where Can I Find Additional Information About The Fund?
Additional information is available at www.royceinvest.com/literature, including its:
 | ● Prospectus ● Financial Information | ● Fund Holdings ● Proxy Voting Information |
Householding
We will deliver a single copy of prospectuses, proxies, financial reports, and other communication to shareholders with the same residential address, provided they have the same last name or we reasonably believe them to be members of the same family. Unless we are notified otherwise, we will continue to send you only one copy of these materials for as long as you remain a shareholder of the Fund. If you would like to receive individual mailings, please call 1-800-221-4268. Please allow 30 days for your request to be processed. Shareholders may also elect to receive these reports electronically. Please go to www.royceinvest.com for more details.
Important Information
Sector weightings are determined using the Global Industry Classification Standard (“GICS”). GICS was developed by, and is the exclusive property of, Standard & Poor’s Financial Services LLC (“S&P”) and MSCI Inc. (“MSCI”). GICS is the trademark of S&P and MSCI. “Global Industry Classification Standard (GICS)” and “GICS Direct” are service marks of S&P and MSCI. Distributor: Royce Fund Services, LLC.
| NOT FDIC INSURED ● MAY LOSE VALUE ● NOT BANK GUARANTEED | RPR-INC-STSR-0624 |
| | |
| The Royce Funds | June 30, 2024 |
| | |
Royce Premier Fund Service Class—RPFFX | |
Semiannual Shareholder Report
This semiannual shareholder report contains important information about Royce Premier Fund for the period of January 1, 2024 to June 30, 2024. You can find additional information at www.royceinvest.com/literature. You can also request this information by contacting us at 1-800-221-4268.
What Were the Fund Costs for the Last Six-Months?
Based on a hypothetical $10,000 investment
| | COSTS OF A | COSTS PAID AS A PERCENTAGE |
| FUND/CLASS | $10,000 INVESTMENT | OF A $10,000 INVESTMENT¹ |
| Royce Premier Fund—Service Class | $74 | 1.49% |
| ¹Annualized | | |
Key Fund Statistics
As of 6/30/24
| Fund Size (Millions) | $1,396 |
| Number of Holdings | 50 |
| Turnover Rate | 7% |
What Did The Fund Invest In?
Representing percentage of total net assets of the Fund as of 6/30/24 (%)
| Top 10 Positions | | | Portfolio Sector Breakdown |
| MKS Instruments | 3.2 | | 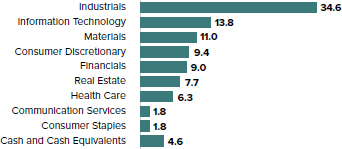 |
| Innospec | 3.0 | |
| Stella-Jones | 3.0 | |
| Arcosa | 3.0 | |
| SEI Investments | 2.9 | |
| Kadant | 2.8 | |
| FirstService Corporation | 2.8 | |
| Reliance | 2.7 | |
| Cirrus Logic | 2.7 | |
| Haemonetics Corporation | 2.6 | |
| | | |
| Portfolio Sector Breakdown | |
| Industrials | 34.6 |
| Information Technology | 13.8 |
| Materials | 11.0 |
| Consumer Discretionary | 9.4 |
| Financials | 9.0 |
| Real Estate | 7.7 |
| Health Care | 6.3 |
| Communication Services | 1.8 |
| Consumer Staples | 1.8 |
| Cash and Cash Equivalents | 4.6 |
Where Can I Find Additional Information About The Fund?
Additional information is available at www.royceinvest.com/literature, including its:
 | ● Prospectus ● Financial Information | ● Fund Holdings ● Proxy Voting Information |
Householding
We will deliver a single copy of prospectuses, proxies, financial reports, and other communication to shareholders with the same residential address, provided they have the same last name or we reasonably believe them to be members of the same family. Unless we are notified otherwise, we will continue to send you only one copy of these materials for as long as you remain a shareholder of the Fund. If you would like to receive individual mailings, please call 1-800-221-4268. Please allow 30 days for your request to be processed. Shareholders may also elect to receive these reports electronically. Please go to www.royceinvest.com for more details.
Important Information
“Costs paid” reflect contractual fee waivers and/or expense reimbursements. Sector weightings are determined using the Global Industry Classification Standard (“GICS”). GICS was developed by, and is the exclusive property of, Standard & Poor’s Financial Services LLC (“S&P”) and MSCI Inc. (“MSCI”). GICS is the trademark of S&P and MSCI. “Global Industry Classification Standard (GICS)” and “GICS Direct” are service marks of S&P and MSCI. Distributor: Royce Fund Services, LLC.
| NOT FDIC INSURED ● MAY LOSE VALUE ● NOT BANK GUARANTEED | RPR-SC-STSR-0624 |
| | |
| The Royce Funds | June 30, 2024 |
| | |
Royce Small-Cap Special Equity Fund Consultant Class—RSQCX | |
Semiannual Shareholder Report
This semiannual shareholder report contains important information about Royce Small-Cap Special Equity Fund for the period of January 1, 2024 to June 30, 2024. You can find additional information at www.royceinvest.com/literature. You can also request this information by contacting us at 1-800-221-4268.
What Were the Fund Costs for the Last Six-Months?
Based on a hypothetical $10,000 investment
| | COSTS OF A | COSTS PAID AS A PERCENTAGE |
| FUND/CLASS | $10,000 INVESTMENT | OF A $10,000 INVESTMENT¹ |
| Royce Small-Cap Special Equity Fund—Consultant Class | $110 | 2.24% |
| ¹Annualized | | |
Key Fund Statistics
As of 6/30/24
| Fund Size (Millions) | $707 |
| Number of Holdings | 34 |
| Turnover Rate | 2% |
What Did The Fund Invest In?
Representing percentage of total net assets of the Fund as of 6/30/24 (%)
| Top 10 Positions | | | Portfolio Sector Breakdown |
| Encore Wire | 8.1 | |  |
| Vishay Intertechnology | 5.1 | |
| Mueller Industries | 4.5 | |
| John B. Sanfilippo & Son | 4.2 | |
| Ennis | 4.0 | |
| TEGNA | 3.9 | |
| Standard Motor Products | 3.8 | |
| United States Lime & Minerals | 3.7 | |
| Ingles Markets Cl. A | 3.7 | |
| Movado Group | 3.6 | |
| | | |
| Portfolio Sector Breakdown |
| 29.4 |
| 14.1 |
| 9.9 |
| 9.1 |
| 8.5 |
| 4.6 |
| 3.9 |
| 3.2 |
| 1.2 |
| 16.1 |
Where Can I Find Additional Information About The Fund?
Additional information is available at www.royceinvest.com/literature, including its:
 | ● Prospectus ● Financial Information | ● Fund Holdings ● Proxy Voting Information |
Householding
We will deliver a single copy of prospectuses, proxies, financial reports, and other communication to shareholders with the same residential address, provided they have the same last name or we reasonably believe them to be members of the same family. Unless we are notified otherwise, we will continue to send you only one copy of these materials for as long as you remain a shareholder of the Fund. If you would like to receive individual mailings, please call 1-800-221-4268. Please allow 30 days for your request to be processed. Shareholders may also elect to receive these reports electronically. Please go to www.royceinvest.com for more details.
Important Information
“Costs paid” reflect contractual fee waivers and/or expense reimbursements. Sector weightings are determined using the Global Industry Classification Standard (“GICS”). GICS was developed by, and is the exclusive property of, Standard & Poor’s Financial Services LLC (“S&P”) and MSCI Inc. (“MSCI”). GICS is the trademark of S&P and MSCI. “Global Industry Classification Standard (GICS)” and “GICS Direct” are service marks of S&P and MSCI. Distributor: Royce Fund Services, LLC.
| NOT FDIC INSURED ● MAY LOSE VALUE ● NOT BANK GUARANTEED | RSE-CC-STSR-0624 |
| | |
| The Royce Funds | June 30, 2024 |
| | |
Royce Small-Cap Special Equity Fund Investment Class—RYSEX | |
Semiannual Shareholder Report
This semiannual shareholder report contains important information about Royce Small-Cap Special Equity Fund for the period of January 1, 2024 to June 30, 2024. You can find additional information at www.royceinvest.com/literature. You can also request this information by contacting us at 1-800-221-4268.
What Were the Fund Costs for the Last Six-Months?
Based on a hypothetical $10,000 investment
| | COSTS OF A | COSTS PAID AS A PERCENTAGE |
| FUND/CLASS | $10,000 INVESTMENT | OF A $10,000 INVESTMENT¹ |
| Royce Small-Cap Special Equity Fund—Investment Class | $60 | 1.22% |
| ¹Annualized | | |
Key Fund Statistics
As of 6/30/24
| Fund Size (Millions) | $707 |
| Number of Holdings | 34 |
| Turnover Rate | 2% |
What Did The Fund Invest In?
Representing percentage of total net assets of the Fund as of 6/30/24 (%)
| Top 10 Positions | | | Portfolio Sector Breakdown |
| Encore Wire | 8.1 | |  |
| Vishay Intertechnology | 5.1 | |
| Mueller Industries | 4.5 | |
| John B. Sanfilippo & Son | 4.2 | |
| Ennis | 4.0 | |
| TEGNA | 3.9 | |
| Standard Motor Products | 3.8 | |
| United States Lime & Minerals | 3.7 | |
| Ingles Markets Cl. A | 3.7 | |
| Movado Group | 3.6 | |
| | | |
| Portfolio Sector Breakdown |
| 29.4 |
| 14.1 |
| 9.9 |
| 9.1 |
| 8.5 |
| 4.6 |
| 3.9 |
| 3.2 |
| 1.2 |
| 16.1 |
Where Can I Find Additional Information About The Fund?
Additional information is available at www.royceinvest.com/literature, including its:
 | ● Prospectus ● Financial Information | ● Fund Holdings ● Proxy Voting Information |
Householding
We will deliver a single copy of prospectuses, proxies, financial reports, and other communication to shareholders with the same residential address, provided they have the same last name or we reasonably believe them to be members of the same family. Unless we are notified otherwise, we will continue to send you only one copy of these materials for as long as you remain a shareholder of the Fund. If you would like to receive individual mailings, please call 1-800-221-4268. Please allow 30 days for your request to be processed. Shareholders may also elect to receive these reports electronically. Please go to www.royceinvest.com for more details.
Important Information
Sector weightings are determined using the Global Industry Classification Standard (“GICS”). GICS was developed by, and is the exclusive property of, Standard & Poor’s Financial Services LLC (“S&P”) and MSCI Inc. (“MSCI”). GICS is the trademark of S&P and MSCI. “Global Industry Classification Standard (GICS)” and “GICS Direct” are service marks of S&P and MSCI. Distributor: Royce Fund Services, LLC.
| NOT FDIC INSURED ● MAY LOSE VALUE ● NOT BANK GUARANTEED | RSE-IC-STSR-0624 |
| | |
| The Royce Funds | June 30, 2024 |
| | |
Royce Small-Cap Special Equity Fund Institutional Class—RSEIX | |
Semiannual Shareholder Report
This semiannual shareholder report contains important information about Royce Small-Cap Special Equity Fund for the period of January 1, 2024 to June 30, 2024. You can find additional information at www.royceinvest.com/literature. You can also request this information by contacting us at 1-800-221-4268.
What Were the Fund Costs for the Last Six-Months?
Based on a hypothetical $10,000 investment
| | COSTS OF A | COSTS PAID AS A PERCENTAGE |
| FUND/CLASS | $10,000 INVESTMENT | OF A $10,000 INVESTMENT¹ |
| Royce Small-Cap Special Equity Fund—Institutional Class | $56 | 1.13% |
| ¹Annualized | | |
Key Fund Statistics
As of 6/30/24
| Fund Size (Millions) | $707 |
| Number of Holdings | 34 |
| Turnover Rate | 2% |
What Did The Fund Invest In?
Representing percentage of total net assets of the Fund as of 6/30/24 (%)
| Top 10 Positions | | | Portfolio Sector Breakdown |
| Encore Wire | 8.1 | | 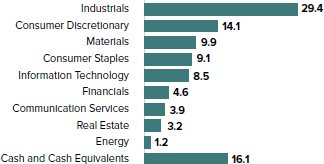 |
| Vishay Intertechnology | 5.1 | |
| Mueller Industries | 4.5 | |
| John B. Sanfilippo & Son | 4.2 | |
| Ennis | 4.0 | |
| TEGNA | 3.9 | |
| Standard Motor Products | 3.8 | |
| United States Lime & Minerals | 3.7 | |
| Ingles Markets Cl. A | 3.7 | |
| Movado Group | 3.6 | |
| | | |
| Portfolio Sector Breakdown |
29.4 |
| 14.1 |
| 9.9 |
| 9.1 |
| 8.5 |
| 4.6 |
| 3.9 |
| 3.2 |
| 1.2 |
| 16.1 |
Where Can I Find Additional Information About The Fund?
Additional information is available at www.royceinvest.com/literature, including its:
 | ● Prospectus ● Financial Information | ● Fund Holdings ● Proxy Voting Information |
Householding
We will deliver a single copy of prospectuses, proxies, financial reports, and other communication to shareholders with the same residential address, provided they have the same last name or we reasonably believe them to be members of the same family. Unless we are notified otherwise, we will continue to send you only one copy of these materials for as long as you remain a shareholder of the Fund. If you would like to receive individual mailings, please call 1-800-221-4268. Please allow 30 days for your request to be processed. Shareholders may also elect to receive these reports electronically. Please go to www.royceinvest.com for more details.
Important Information
Sector weightings are determined using the Global Industry Classification Standard (“GICS”). GICS was developed by, and is the exclusive property of, Standard & Poor’s Financial Services LLC (“S&P”) and MSCI Inc. (“MSCI”). GICS is the trademark of S&P and MSCI. “Global Industry Classification Standard (GICS)” and “GICS Direct” are service marks of S&P and MSCI. Distributor: Royce Fund Services, LLC.
| NOT FDIC INSURED ● MAY LOSE VALUE ● NOT BANK GUARANTEED | RSE-INC-STSR-0624 |
| | |
| The Royce Funds | June 30, 2024 |
| | |
Royce Small-Cap Special Equity Fund Service Class—RSEFX | |
Semiannual Shareholder Report
This semiannual shareholder report contains important information about Royce Small-Cap Special Equity Fund for the period of January 1, 2024 to June 30, 2024. You can find additional information at www.royceinvest.com/literature. You can also request this information by contacting us at 1-800-221-4268.
What Were the Fund Costs for the Last Six-Months?
Based on a hypothetical $10,000 investment
| | COSTS OF A | COSTS PAID AS A PERCENTAGE |
| FUND/CLASS | $10,000 INVESTMENT | OF A $10,000 INVESTMENT¹ |
| Royce Small-Cap Special Equity Fund—Service Class | $74 | 1.49% |
| ¹Annualized | | |
Key Fund Statistics
As of 6/30/24
| Fund Size (Millions) | $707 |
| Number of Holdings | 34 |
| Turnover Rate | 2% |
What Did The Fund Invest In?
Representing percentage of total net assets of the Fund as of 6/30/24 (%)
| Top 10 Positions | | | Portfolio Sector Breakdown |
| Encore Wire | 8.1 | | 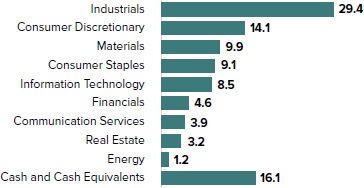 |
| Vishay Intertechnology | 5.1 | |
| Mueller Industries | 4.5 | |
| John B. Sanfilippo & Son | 4.2 | |
| Ennis | 4.0 | |
| TEGNA | 3.9 | |
| Standard Motor Products | 3.8 | |
| United States Lime & Minerals | 3.7 | |
| Ingles Markets Cl. A | 3.7 | |
| Movado Group | 3.6 | |
| | | |
| Portfolio Sector Breakdown |
29.4 |
| 14.1 |
| 9.9 |
| 9.1 |
| 8.5 |
| 4.6 |
| 3.9 |
| 3.2 |
| 1.2 |
| 16.1 |
Where Can I Find Additional Information About The Fund?
Additional information is available at www.royceinvest.com/literature, including its:
 | ● Prospectus ● Financial Information | ● Fund Holdings ● Proxy Voting Information |
Householding
We will deliver a single copy of prospectuses, proxies, financial reports, and other communication to shareholders with the same residential address, provided they have the same last name or we reasonably believe them to be members of the same family. Unless we are notified otherwise, we will continue to send you only one copy of these materials for as long as you remain a shareholder of the Fund. If you would like to receive individual mailings, please call 1-800-221-4268. Please allow 30 days for your request to be processed. Shareholders may also elect to receive these reports electronically. Please go to www.royceinvest.com for more details.
Important Information
“Costs paid” reflect contractual fee waivers and/or expense reimbursements. Sector weightings are determined using the Global Industry Classification Standard (“GICS”). GICS was developed by, and is the exclusive property of, Standard & Poor’s Financial Services LLC (“S&P”) and MSCI Inc. (“MSCI”). GICS is the trademark of S&P and MSCI. “Global Industry Classification Standard (GICS)” and “GICS Direct” are service marks of S&P and MSCI. Distributor: Royce Fund Services, LLC.
| NOT FDIC INSURED ● MAY LOSE VALUE ● NOT BANK GUARANTEED | RSE-SC-STSR-0624 |
| | |
| The Royce Funds | June 30, 2024 |
| | |
Royce Small-Cap Total Return Fund Consultant Class—RYTCX | |
Semiannual Shareholder Report
This semiannual shareholder report contains important information about Royce Small-Cap Total Return Fund for the period of January 1, 2024 to June 30, 2024. You can find additional information at www.royceinvest.com/literature. You can also request this information by contacting us at 1-800-221-4268.
What Were the Fund Costs for the Last Six-Months?
Based on a hypothetical $10,000 investment
| | COSTS OF A | COSTS PAID AS A PERCENTAGE |
| FUND/CLASS | $10,000 INVESTMENT | OF A $10,000 INVESTMENT¹ |
| Royce Small-Cap Total Return Fund—Consultant Class | $111 | 2.23% |
| ¹Annualized | | |
Key Fund Statistics
As of 6/30/24
| Fund Size (Millions) | $1,007 |
| Number of Holdings | 67 |
| Turnover Rate | 31% |
What Did The Fund Invest In?
Representing percentage of total net assets of the Fund as of 6/30/24 (%)
| Top 10 Positions | | | Portfolio Sector Breakdown |
| International General Insurance Holdings | 3.2 | | 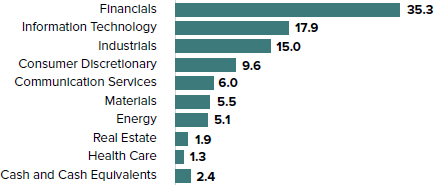 |
| Kyndryl Holdings | 3.0 | |
| Advance Auto Parts | 2.8 | |
| Kulicke & Soffa Industries | 2.5 | |
| Ziff Davis | 2.4 | |
| Coherent Corp. | 2.4 | |
| Air Lease Cl. A | 2.4 | |
| Axis Capital Holdings | 2.3 | |
| Element Solutions | 2.2 | |
| Barrett Business Services | 2.2 | |
| | | |
| Portfolio Sector Breakdown |
35.3 |
| 17.9 |
| 15.0 |
| 9.6 |
| 6.0 |
| 5.5 |
| 5.1 |
| 1.9 |
| 1.3 |
| 2.4 |
Where Can I Find Additional Information About The Fund?
Additional information is available at www.royceinvest.com/literature, including its:
 | ● Prospectus ● Financial Information | ● Fund Holdings ● Proxy Voting Information |
Householding
We will deliver a single copy of prospectuses, proxies, financial reports, and other communication to shareholders with the same residential address, provided they have the same last name or we reasonably believe them to be members of the same family. Unless we are notified otherwise, we will continue to send you only one copy of these materials for as long as you remain a shareholder of the Fund. If you would like to receive individual mailings, please call 1-800-221-4268. Please allow 30 days for your request to be processed. Shareholders may also elect to receive these reports electronically. Please go to www.royceinvest.com for more details.
Important Information
Sector weightings are determined using the Global Industry Classification Standard (“GICS”). GICS was developed by, and is the exclusive property of, Standard & Poor’s Financial Services LLC (“S&P”) and MSCI Inc. (“MSCI”). GICS is the trademark of S&P and MSCI. “Global Industry Classification Standard (GICS)” and “GICS Direct” are service marks of S&P and MSCI. Distributor: Royce Fund Services, LLC.
| NOT FDIC INSURED ● MAY LOSE VALUE ● NOT BANK GUARANTEED | RTR-CC-STSR-0624 |
| | |
| The Royce Funds | June 30, 2024 |
| | |
Royce Small-Cap Total Return Fund Investment Class—RYTRX | |
Semiannual Shareholder Report
This semiannual shareholder report contains important information about Royce Small-Cap Total Return Fund for the period of January 1, 2024 to June 30, 2024. You can find additional information at www.royceinvest.com/literature. You can also request this information by contacting us at 1-800-221-4268.
What Were the Fund Costs for the Last Six-Months?
Based on a hypothetical $10,000 investment
| | COSTS OF A | COSTS PAID AS A PERCENTAGE |
| FUND/CLASS | $10,000 INVESTMENT | OF A $10,000 INVESTMENT¹ |
| Royce Small-Cap Total Return Fund—Investment Class | $61 | 1.21% |
| ¹Annualized | | |
Key Fund Statistics
As of 6/30/24
| Fund Size (Millions) | $1,007 |
| Number of Holdings | 67 |
| Turnover Rate | 31% |
What Did The Fund Invest In?
Representing percentage of total net assets of the Fund as of 6/30/24 (%)
| Top 10 Positions | | | Portfolio Sector Breakdown |
International General Insurance
Holdings | 3.2 | |  |
| Kyndryl Holdings | 3.0 | |
| Advance Auto Parts | 2.8 | |
| Kulicke & Soffa Industries | 2.5 | |
| Ziff Davis | 2.4 | |
| Coherent Corp. | 2.4 | |
| Air Lease Cl. A | 2.4 | |
| Axis Capital Holdings | 2.3 | |
| Element Solutions | 2.2 | |
| Barrett Business Services | 2.2 | |
| | | |
| Portfolio Sector Breakdown |
35.3 |
| 17.9 |
| 15.0 |
| 9.6 |
| 6.0 |
| 5.5 |
| 5.1 |
| 1.9 |
| 1.3 |
| 2.4 |
Where Can I Find Additional Information About The Fund?
Additional information is available at www.royceinvest.com/literature, including its:
 | ● Prospectus ● Financial Information | ● Fund Holdings ● Proxy Voting Information |
Householding
We will deliver a single copy of prospectuses, proxies, financial reports, and other communication to shareholders with the same residential address, provided they have the same last name or we reasonably believe them to be members of the same family. Unless we are notified otherwise, we will continue to send you only one copy of these materials for as long as you remain a shareholder of the Fund. If you would like to receive individual mailings, please call 1-800-221-4268. Please allow 30 days for your request to be processed. Shareholders may also elect to receive these reports electronically. Please go to www.royceinvest.com for more details.
Important Information
Sector weightings are determined using the Global Industry Classification Standard (“GICS”). GICS was developed by, and is the exclusive property of, Standard & Poor’s Financial Services LLC (“S&P”) and MSCI Inc. (“MSCI”). GICS is the trademark of S&P and MSCI. “Global Industry Classification Standard (GICS)” and “GICS Direct” are service marks of S&P and MSCI. Distributor: Royce Fund Services, LLC.
| NOT FDIC INSURED ● MAY LOSE VALUE ● NOT BANK GUARANTEED | RTR-IC-STSR-0624 |
| | |
| The Royce Funds | June 30, 2024 |
| | |
Royce Small-Cap Total Return Fund Institutional Class—RTRIX | |
Semiannual Shareholder Report
This semiannual shareholder report contains important information about Royce Small-Cap Total Return Fund for the period of January 1, 2024 to June 30, 2024. You can find additional information at www.royceinvest.com/literature. You can also request this information by contacting us at 1-800-221-4268.
What Were the Fund Costs for the Last Six-Months?
Based on a hypothetical $10,000 investment
| | COSTS OF A | COSTS PAID AS A PERCENTAGE |
| FUND/CLASS | $10,000 INVESTMENT | OF A $10,000 INVESTMENT¹ |
| Royce Small-Cap Total Return Fund—Institutional Class | $56 | 1.12% |
| ¹Annualized | | |
Key Fund Statistics
As of 6/30/24
| Fund Size (Millions) | $1,007 |
| Number of Holdings | 67 |
| Turnover Rate | 31% |
What Did The Fund Invest In?
Representing percentage of total net assets of the Fund as of 6/30/24 (%)
| Top 10 Positions | | | Portfolio Sector Breakdown |
International General Insurance Holdings | 3.2 | | 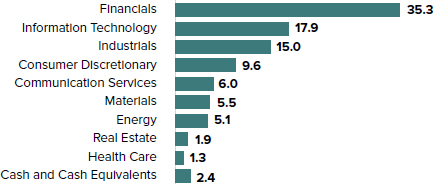 |
| Kyndryl Holdings | 3.0 | |
| Advance Auto Parts | 2.8 | |
| Kulicke & Soffa Industries | 2.5 | |
| Ziff Davis | 2.4 | |
| Coherent Corp. | 2.4 | |
| Air Lease Cl. A | 2.4 | |
| Axis Capital Holdings | 2.3 | |
| Element Solutions | 2.2 | |
| Barrett Business Services | 2.2 | |
| | | |
| Portfolio Sector Breakdown |
35.3 |
| 17.9 |
| 15.0 |
| 9.6 |
| 6.0 |
| 5.5 |
| 5.1 |
| 1.9 |
| 1.3 |
| 2.4 |
Where Can I Find Additional Information About The Fund?
Additional information is available at www.royceinvest.com/literature, including its:
 | ● Prospectus ● Financial Information | ● Fund Holdings ● Proxy Voting Information |
Householding
We will deliver a single copy of prospectuses, proxies, financial reports, and other communication to shareholders with the same residential address, provided they have the same last name or we reasonably believe them to be members of the same family. Unless we are notified otherwise, we will continue to send you only one copy of these materials for as long as you remain a shareholder of the Fund. If you would like to receive individual mailings, please call 1-800-221-4268. Please allow 30 days for your request to be processed. Shareholders may also elect to receive these reports electronically. Please go to www.royceinvest.com for more details.
Important Information
Sector weightings are determined using the Global Industry Classification Standard (“GICS”). GICS was developed by, and is the exclusive property of, Standard & Poor’s Financial Services LLC (“S&P”) and MSCI Inc. (“MSCI”). GICS is the trademark of S&P and MSCI. “Global Industry Classification Standard (GICS)” and “GICS Direct” are service marks of S&P and MSCI. Distributor: Royce Fund Services, LLC.
| NOT FDIC INSURED ● MAY LOSE VALUE ● NOT BANK GUARANTEED | RTR-INC-STSR-0624 |
| The Royce Funds | June 30, 2024 |
| | |
Royce Small-Cap Total Return Fund
R Class—RTRRX | |
Semiannual Shareholder Report
This semiannual shareholder report contains important information about Royce Small-Cap Total Return Fund for the period of January 1, 2024 to June 30, 2024. You can find additional information at www.royceinvest.com/literature. You can also request this information by contacting us at 1-800-221-4268.
What Were the Fund Costs for the Last Six-Months?
Based on a hypothetical $10,000 investment
| FUND/CLASS | COSTS OF A $10,000 INVESTMENT | COSTS PAID AS A PERCENTAGE OF A $10,000 INVESTMENT¹ |
| Royce Small-Cap Total Return Fund—R Class | $94 | 1.89% |
| ¹Annualized | | |
Key Fund Statistics
As of 6/30/24
| Fund Size (Millions) | $1,007 |
| Number of Holdings | 67 |
| Turnover Rate | 31% |
What Did The Fund Invest In?
Representing percentage of total net assets of the Fund as of 6/30/24 (%)
| Top 10 Positions | | | Portfolio Sector Breakdown |
| International General Insurance Holdings | 3.2 | |  |
| Kyndryl Holdings | 3.0 | |
| Advance Auto Parts | 2.8 | |
| Kulicke & Soffa Industries | 2.5 | |
| Ziff Davis | 2.4 | |
| Coherent Corp. | 2.4 | |
| Air Lease Cl. A | 2.4 | |
| Axis Capital Holdings | 2.3 | |
| Element Solutions | 2.2 | |
| Barrett Business Services | 2.2 | |
| Portfolio Sector Breakdown |
35.3 |
| 17.9 |
| 15.0 |
| 9.6 |
| 6.0 |
| 5.5 |
| 5.1 |
| 1.9 |
| 1.3 |
| 2.4 |
Where Can I Find Additional Information About The Fund?
Additional information is available at www.royceinvest.com/literature, including its:
 | ● Prospectus ● Financial Information | ● Fund Holdings ● Proxy Voting Information |
Householding
We will deliver a single copy of prospectuses, proxies, financial reports, and other communication to shareholders with the same residential address, provided they have the same last name or we reasonably believe them to be members of the same family. Unless we are notified otherwise, we will continue to send you only one copy of these materials for as long as you remain a shareholder of the Fund. If you would like to receive individual mailings, please call 1-800-221-4268. Please allow 30 days for your request to be processed. Shareholders may also elect to receive these reports electronically. Please go to www.royceinvest.com for more details.
Important Information
Sector weightings are determined using the Global Industry Classification Standard (“GICS”). GICS was developed by, and is the exclusive property of, Standard & Poor’s Financial Services LLC (“S&P”) and MSCI Inc. (“MSCI”). GICS is the trademark of S&P and MSCI. “Global Industry Classification Standard (GICS)” and “GICS Direct” are service marks of S&P and MSCI. Distributor: Royce Fund Services, LLC.
| NOT FDIC INSURED ● MAY LOSE VALUE ● NOT BANK GUARANTEED | RTR-RC-STSR-0624 |
| The Royce Funds | June 30, 2024 |
| | |
Royce Small-Cap Total Return Fund
Service Class—RYTFX | |
Semiannual Shareholder Report
This semiannual shareholder report contains important information about Royce Small-Cap Total Return Fund for the period of January 1, 2024 to June 30, 2024. You can find additional information at www.royceinvest.com/literature. You can also request this information by contacting us at 1-800-221-4268.
What Were the Fund Costs for the Last Six-Months?
Based on a hypothetical $10,000 investment
| FUND/CLASS | COSTS OF A $10,000 INVESTMENT | COSTS PAID AS A PERCENTAGE OF A $10,000 INVESTMENT¹ |
| Royce Small-Cap Total Return Fund—Service Class | $74 | 1.49% |
| ¹Annualized | | |
Key Fund Statistics
As of 6/30/24
| Fund Size (Millions) | $1,007 |
| Number of Holdings | 67 |
| Turnover Rate | 31% |
What Did The Fund Invest In?
Representing percentage of total net assets of the Fund as of 6/30/24 (%)
| Top 10 Positions | | | Portfolio Sector Breakdown |
| International General Insurance | | |  |
| Holdings | 3.2 | |
| Kyndryl Holdings | 3.0 | |
| Advance Auto Parts | 2.8 | |
| Kulicke & Soffa Industries | 2.5 | |
| Ziff Davis | 2.4 | |
| Coherent Corp. | 2.4 | |
| Air Lease Cl. A | 2.4 | |
| Axis Capital Holdings | 2.3 | |
| Element Solutions | 2.2 | |
| Barrett Business Services | 2.2 | |
| Portfolio Sector Breakdown |
35.3 |
| 17.9 |
| 15.0 |
| 9.6 |
| 6.0 |
| 5.5 |
| 5.1 |
| 1.9 |
| 1.3 |
| 2.4 |
Where Can I Find Additional Information About The Fund?
Additional information is available at www.royceinvest.com/literature, including its:
 | ● Prospectus ● Financial Information | ● Fund Holdings ● Proxy Voting Information |
Householding
We will deliver a single copy of prospectuses, proxies, financial reports, and other communication to shareholders with the same residential address, provided they have the same last name or we reasonably believe them to be members of the same family. Unless we are notified otherwise, we will continue to send you only one copy of these materials for as long as you remain a shareholder of the Fund. If you would like to receive individual mailings, please call 1-800-221-4268. Please allow 30 days for your request to be processed. Shareholders may also elect to receive these reports electronically. Please go to www.royceinvest.com for more details.
Important Information
“Costs paid” reflect contractual fee waivers and/or expense reimbursements. Sector weightings are determined using the Global Industry Classification Standard (“GICS”). GICS was developed by, and is the exclusive property of, Standard & Poor’s Financial Services LLC (“S&P”) and MSCI Inc. (“MSCI”). GICS is the trademark of S&P and MSCI. “Global Industry Classification Standard (GICS)” and “GICS Direct” are service marks of S&P and MSCI. Distributor: Royce Fund Services, LLC.
| NOT FDIC INSURED ● MAY LOSE VALUE ● NOT BANK GUARANTEED | RTR-SC-STSR-0624 |
| | |
| The Royce Funds | June 30, 2024 |
| | |
Royce Smaller-Companies Growth Fund Investment Class—RVPHX | |
Semiannual Shareholder Report
This semiannual shareholder report contains important information about Royce Smaller-Companies Growth Fund for the period of January 1, 2024 to June 30, 2024. You can find additional information at www.royceinvest.com/literature. You can also request this information by contacting us at 1-800-221-4268.
What Were the Fund Costs for the Last Six-Months?
Based on a hypothetical $10,000 investment
| | COSTS OF A | COSTS PAID AS A PERCENTAGE |
| FUND/CLASS | $10,000 INVESTMENT | OF A $10,000 INVESTMENT¹ |
| Royce Smaller-Companies Growth Fund—Investment Class | $64 | 1.24% |
| ¹Annualized | | |
Key Fund Statistics
As of 6/30/24
| Fund Size (Millions) | $178 |
| Number of Holdings | 80 |
| Turnover Rate | 36% |
What Did The Fund Invest In?
Representing percentage of total net assets of the Fund as of 6/30/24 (%)
| Top 10 Positions | | | Portfolio Sector Breakdown |
| VSE Corporation | 3.5 | |  |
| FTAI Aviation | 3.1 | |
| JFrog | 3.0 | |
| Freshpet | 2.5 | |
| CyberArk Software | 2.3 | |
| Zeta Global Holdings Cl. A | 2.2 | |
| Texas Roadhouse | 2.1 | |
| Agilysys | 2.0 | |
| Distribution Solutions Group | 2.0 | |
| DraftKings Cl. A | 2.0 | |
| | | |
| Portfolio Sector Breakdown |
| 26.5 |
| 23.2 |
| 17.8 |
| 8.1 |
| 7.2 |
| 5.0 |
| 4.0 |
| 2.7 |
| 1.4 |
| 4.1 |
Where Can I Find Additional Information About The Fund?
Additional information is available at www.royceinvest.com/literature, including its:
 | ● Prospectus ● Financial Information | ● Fund Holdings ● Proxy Voting Information |
Householding
We will deliver a single copy of prospectuses, proxies, financial reports, and other communication to shareholders with the same residential address, provided they have the same last name or we reasonably believe them to be members of the same family. Unless we are notified otherwise, we will continue to send you only one copy of these materials for as long as you remain a shareholder of the Fund. If you would like to receive individual mailings, please call 1-800-221-4268. Please allow 30 days for your request to be processed. Shareholders may also elect to receive these reports electronically. Please go to www.royceinvest.com for more details.
Important Information
“Costs paid” reflect contractual fee waivers and/or expense reimbursements. Sector weightings are determined using the Global Industry Classification Standard (“GICS”). GICS was developed by, and is the exclusive property of, Standard & Poor’s Financial Services LLC (“S&P”) and MSCI Inc. (“MSCI”). GICS is the trademark of S&P and MSCI. “Global Industry Classification Standard (GICS)” and “GICS Direct” are service marks of S&P and MSCI. Distributor: Royce Fund Services, LLC.
| NOT FDIC INSURED ● MAY LOSE VALUE ● NOT BANK GUARANTEED | RVP-IC-STSR-0624 |
| | |
| The Royce Funds | June 30, 2024 |
| | |
Royce Smaller-Companies Growth Fund Institutional Class—RVPIX | |
Semiannual Shareholder Report
This semiannual shareholder report contains important information about Royce Smaller-Companies Growth Fund for the period of January 1, 2024 to June 30, 2024. You can find additional information at www.royceinvest.com/literature. You can also request this information by contacting us at 1-800-221-4268.
What Were the Fund Costs for the Last Six-Months?
Based on a hypothetical $10,000 investment
| | COSTS OF A | COSTS PAID AS A PERCENTAGE |
| FUND/CLASS | $10,000 INVESTMENT | OF A $10,000 INVESTMENT¹ |
| Royce Smaller-Companies Growth Fund—Institutional Class | $64 | 1.24% |
| ¹Annualized | | |
Key Fund Statistics
As of 6/30/24
| Fund Size (Millions) | $178 |
| Number of Holdings | 80 |
| Turnover Rate | 36% |
What Did The Fund Invest In?
Representing percentage of total net assets of the Fund as of 6/30/24 (%)
| Top 10 Positions | | | Portfolio Sector Breakdown |
| VSE Corporation | 3.5 | | 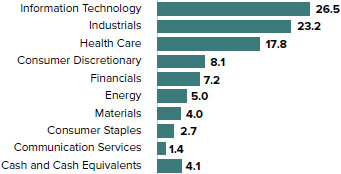 |
| FTAI Aviation | 3.1 | |
| JFrog | 3.0 | |
| Freshpet | 2.5 | |
| CyberArk Software | 2.3 | |
| Zeta Global Holdings Cl. A | 2.2 | |
| Texas Roadhouse | 2.1 | |
| Agilysys | 2.0 | |
| Distribution Solutions Group | 2.0 | |
| DraftKings Cl. A | 2.0 | |
| | | |
| Portfolio Sector Breakdown |
| 26.5 |
| 23.2 |
| 17.8 |
| 8.1 |
| 7.2 |
| 5.0 |
| 4.0 |
| 2.7 |
| 1.4 |
| 4.1 |
Where Can I Find Additional Information About The Fund?
Additional information is available at www.royceinvest.com/literature, including its:
 | ● Prospectus ● Financial Information | ● Fund Holdings ● Proxy Voting Information |
Householding
We will deliver a single copy of prospectuses, proxies, financial reports, and other communication to shareholders with the same residential address, provided they have the same last name or we reasonably believe them to be members of the same family. Unless we are notified otherwise, we will continue to send you only one copy of these materials for as long as you remain a shareholder of the Fund. If you would like to receive individual mailings, please call 1-800-221-4268. Please allow 30 days for your request to be processed. Shareholders may also elect to receive these reports electronically. Please go to www.royceinvest.com for more details.
Important Information
“Costs paid” reflect contractual fee waivers and/or expense reimbursements. Sector weightings are determined using the Global Industry Classification Standard (“GICS”). GICS was developed by, and is the exclusive property of, Standard & Poor’s Financial Services LLC (“S&P”) and MSCI Inc. (“MSCI”). GICS is the trademark of S&P and MSCI. “Global Industry Classification Standard (GICS)” and “GICS Direct” are service marks of S&P and MSCI. Distributor: Royce Fund Services, LLC.
| NOT FDIC INSURED ● MAY LOSE VALUE ● NOT BANK GUARANTEED | RVP-INC-STSR-0624 |
| | |
| The Royce Funds | June 30, 2024 |
| | |
Royce Smaller-Companies Growth Fund Service Class—RYVPX | |
Semiannual Shareholder Report
This semiannual shareholder report contains important information about Royce Smaller-Companies Growth Fund for the period of January 1, 2024 to June 30, 2024. You can find additional information at www.royceinvest.com/literature. You can also request this information by contacting us at 1-800-221-4268.
What Were the Fund Costs for the Last Six-Months?
Based on a hypothetical $10,000 investment
| | COSTS OF A | COSTS PAID AS A PERCENTAGE |
| FUND/CLASS | $10,000 INVESTMENT | OF A $10,000 INVESTMENT¹ |
| Royce Smaller-Companies Growth Fund—Service Class | $76 | 1.49% |
| ¹Annualized | | |
Key Fund Statistics
As of 6/30/24
| Fund Size (Millions) | $178 |
| Number of Holdings | 80 |
| Turnover Rate | 36% |
What Did The Fund Invest In?
Representing percentage of total net assets of the Fund as of 6/30/24 (%)
| Top 10 Positions | | | Portfolio Sector Breakdown |
| VSE Corporation | 3.5 | |  |
| FTAI Aviation | 3.1 | |
| JFrog | 3.0 | |
| Freshpet | 2.5 | |
| CyberArk Software | 2.3 | |
| Zeta Global Holdings Cl. A | 2.2 | |
| Texas Roadhouse | 2.1 | |
| Agilysys | 2.0 | |
| Distribution Solutions Group | 2.0 | |
| DraftKings Cl. A | 2.0 | |
| | | |
| Sector Breakdown | |
| Information Technology | 26.5 |
| Industrials | 23.2 |
| Health Care | 17.8 |
| Consumer Discretionary | 8.1 |
| Financials | 7.2 |
| Energy | 5.0 |
| Materials | 4.0 |
| Consumer Staples | 2.7 |
| Communication Services | 1.4 |
| Cash And Cash Equivalents | 4.1 |
Where Can I Find Additional Information About The Fund?
Additional information is available at www.royceinvest.com/literature, including its:
 | ● Prospectus ● Financial Information | ● Fund Holdings ● Proxy Voting Information |
Householding
We will deliver a single copy of prospectuses, proxies, financial reports, and other communication to shareholders with the same residential address, provided they have the same last name or we reasonably believe them to be members of the same family. Unless we are notified otherwise, we will continue to send you only one copy of these materials for as long as you remain a shareholder of the Fund. If you would like to receive individual mailings, please call 1-800-221-4268. Please allow 30 days for your request to be processed. Shareholders may also elect to receive these reports electronically. Please go to www.royceinvest.com for more details.
Important Information
“Costs paid” reflect contractual fee waivers and/or expense reimbursements. Sector weightings are determined using the Global Industry Classification Standard (“GICS”). GICS was developed by, and is the exclusive property of, Standard & Poor’s Financial Services LLC (“S&P”) and MSCI Inc. (“MSCI”). GICS is the trademark of S&P and MSCI. “Global Industry Classification Standard (GICS)” and “GICS Direct” are service marks of S&P and MSCI. Distributor: Royce Fund Services, LLC.
| NOT FDIC INSURED ● MAY LOSE VALUE ● NOT BANK GUARANTEED | RVP-SC-STSR-0624 |
| The Royce Funds | June 30, 2024 |
| | |
Royce Small-Cap Value Fund
Investment Class—RVVHX | |
Semiannual Shareholder Report
This semiannual shareholder report contains important information about Royce Small-Cap Value Fund for the period of January 1, 2024 to June 30, 2024. You can find additional information at www.royceinvest.com/literature. You can also request this information by contacting us at 1-800-221-4268.
What Were the Fund Costs for the Last Six-Months?
Based on a hypothetical $10,000 investment
| FUND/CLASS | COSTS OF A $10,000 INVESTMENT | COSTS PAID AS A PERCENTAGE OF A $10,000 INVESTMENT¹ |
| Royce Small-Cap Value Fund-Investment Class | $61 | 1.24% |
| ¹Annualized | | |
Key Fund Statistics
As of 6/30/24
| Fund Size (Millions) | $112 |
| Number of Holdings | 83 |
| Turnover Rate | 24% |
What Did The Fund Invest In?
Representing percentage of total net assets of the Fund as of 6/30/24 (%)
| Top 10 Positions | | | Portfolio Sector Breakdown |
| PulteGroup | 1.9 | | 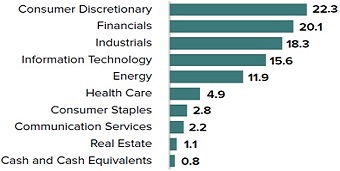 |
| Sanmina Corporation | 1.9 | |
| M/I Homes | 1.9 | |
| SilverBow Resources | 1.8 | |
| Flex | 1.7 | |
| Tri Pointe Homes | 1.7 | |
| ePlus | 1.7 | |
| Shoe Carnival | 1.6 | |
| Village Super Market Cl. A | 1.6 | |
| Caleres | 1.6 | |
| Sector Breakdown | |
| Consumer Discretionary | 22.3 |
| Financials | 20.1 |
| Industrials | 18.3 |
| Information Technology | 15.6 |
| Energy | 11.9 |
| Health Care | 4.9 |
| Consumer Staples | 2.8 |
| Communication Services | 2.2 |
| Real Estate | 1.1 |
| Cash And Cash Equivalents | 0.8 |
Where Can I Find Additional Information About The Fund?
Additional information is available at www.royceinvest.com/literature, including its:
 | ● Prospectus ● Financial Information | ● Fund Holdings ● Proxy Voting Information |
Householding
We will deliver a single copy of prospectuses, proxies, financial reports, and other communication to shareholders with the same residential address, provided they have the same last name or we reasonably believe them to be members of the same family. Unless we are notified otherwise, we will continue to send you only one copy of these materials for as long as you remain a shareholder of the Fund. If you would like to receive individual mailings, please call 1-800-221-4268. Please allow 30 days for your request to be processed. Shareholders may also elect to receive these reports electronically. Please go to www.royceinvest.com for more details.
Important Information
“Costs paid” reflect contractual fee waivers and/or expense reimbursements. Sector weightings are determined using the Global Industry Classification Standard (“GICS”). GICS was developed by, and is the exclusive property of, Standard & Poor’s Financial Services LLC (“S&P”) and MSCI Inc. (“MSCI”). GICS is the trademark of S&P and MSCI. “Global Industry Classification Standard (GICS)” and “GICS Direct” are service marks of S&P and MSCI. Distributor: Royce Fund Services, LLC.
| NOT FDIC INSURED ● MAY LOSE VALUE ● NOT BANK GUARANTEED | RVV-IC-STSR-0624 |
| The Royce Funds | June 30, 2024 |
| | |
Royce Small-Cap Value Fund
Service Class—RYVFX
| |
Semiannual Shareholder Report
This semiannual shareholder report contains important information about Royce Small-Cap Value Fund for the period of January 1, 2024 to June 30, 2024. You can find additional information at www.royceinvest.com/literature. You can also request this information by contacting us at 1-800-221-4268.
What Were the Fund Costs for the Last Six-Months?
Based on a hypothetical $10,000 investment
| FUND/CLASS | COSTS OF A $10,000 INVESTMENT | COSTS PAID AS A PERCENTAGE OF A $10,000 INVESTMENT¹ |
| Royce Small-Cap Value Fund-Service Class | $73 | 1.49% |
| ¹Annualized | | |
Key Fund Statistics
As of 6/30/24
| Fund Size (Millions) | $112 |
| Number of Holdings | 83 |
| Turnover Rate | 24% |
What Did The Fund Invest In?
Representing percentage of total net assets of the Fund as of 6/30/24 (%)
| Top 10 Positions | | | Portfolio Sector Breakdown |
| PulteGroup | 1.9 | |  |
| Sanmina Corporation | 1.9 | |
| M/I Homes | 1.9 | |
| SilverBow Resources | 1.8 | |
| Flex | 1.7 | |
| Tri Pointe Homes | 1.7 | |
| ePlus | 1.7 | |
| Shoe Carnival | 1.6 | |
| Village Super Market Cl. A | 1.6 | |
| Caleres | 1.6 | |
| Sector Breakdown |
| Consumer Discretionary | 22.3 |
| Financials | 20.1 |
| Industrials | 18.3 |
| Information Technology | 15.6 |
| Energy | 11.9 |
| Health Care | 4.9 |
| Consumer Staples | 2.8 |
| Communication Services | 2.2 |
| Real Estate | 1.1 |
| Cash And Cash Equivalents | 0.8 |
Where Can I Find Additional Information About The Fund?
Additional information is available at www.royceinvest.com/literature, including its:
 | ● Prospectus ● Financial Information | ● Fund Holdings ● Proxy Voting Information |
Householding
We will deliver a single copy of prospectuses, proxies, financial reports, and other communication to shareholders with the same residential address, provided they have the same last name or we reasonably believe them to be members of the same family. Unless we are notified otherwise, we will continue to send you only one copy of these materials for as long as you remain a shareholder of the Fund. If you would like to receive individual mailings, please call 1-800-221-4268. Please allow 30 days for your request to be processed. Shareholders may also elect to receive these reports electronically. Please go to www.royceinvest.com for more details.
Important Information
“Costs paid” reflect contractual fee waivers and/or expense reimbursements. Sector weightings are determined using the Global Industry Classification Standard (“GICS”). GICS was developed by, and is the exclusive property of, Standard & Poor’s Financial Services LLC (“S&P”) and MSCI Inc. (“MSCI”). GICS is the trademark of S&P and MSCI. “Global Industry Classification Standard (GICS)” and “GICS Direct” are service marks of S&P and MSCI. Distributor: Royce Fund Services, LLC.
| NOT FDIC INSURED ● MAY LOSE VALUE ● NOT BANK GUARANTEED | RVV-SC-STSR-0624 |
Item 2. Code(s) of Ethics. Not applicable to this semi-annual report.
Item 3. Audit Committee Financial Expert. Not applicable to this semi-annual report.
Item 4. Principal Accountant Fees and Services. Not applicable to this semi-annual report.
Item 5. Audit Committee of Listed Registrants. Not Applicable.
Item 6. Investments.
(a) Please see the Schedule of Investments contained in the Financial Statements included under Item 7 of this Form N-CSR.
(b) Not Applicable.
Item 7. Financial Statements and Financial Highlights for Open-End Management Investment Companies.
| | The Royce Funds |  | |
| | | | |
| | | |
| | Financial Statements and
Other Important Information | |
| | | |
| | Semiannual—June 30, 2024 | |
| | | |
| | | |
| | | |
| | | |
| | Royce Dividend Value Fund | |
| | | |
| | Royce Global Financial Services Fund | |
| | | |
| | Royce International Premier Fund | |
| | | |
| | Royce Micro-Cap Fund | |
| | | |
| | Royce Premier Fund | |
| | | |
| | Royce Small-Cap Fund | |
| | | |
| | Royce Small-Cap Opportunity Fund | |
| | | |
| | Royce Small-Cap Special Equity Fund | |
| | | |
| | Royce Small-Cap Total Return Fund | |
| | | |
| | Royce Small-Cap Value Fund | |
| | | |
| | Royce Smaller-Companies Growth Fund | |
| | | |
| | | |
| | | |
Schedules of Investments
Royce Dividend Value Fund
Common Stocks – 91.9%
| | | SHARES | | | VALUE |
| | | | | | | | |
| CONSUMER DISCRETIONARY – 5.5% | | | | | | | |
| HOTELS, RESTAURANTS & LEISURE - 0.2% | | | | | | | |
| Travel + Leisure | | | 3,100 | | | $ | 139,438 |
| HOUSEHOLD DURABLES - 3.9% | | | | | | | |
| Vistry Group 1,2 | | | 77,500 | | | | 1,153,925 |
| Worthington Enterprises | | | 30,000 | | | | 1,419,900 |
| | | | | | | | 2,573,825 |
| SPECIALTY RETAIL - 1.4% | | | | | | | |
| USS 1 | | | 112,000 | | | | 942,601 |
| Total (Cost $1,449,792) | | | | | | | 3,655,864 |
| | | | | | | | |
| ENERGY – 1.6% | | | | | | | |
| OIL, GAS & CONSUMABLE FUELS - 1.6% | | | | | | | |
| Gaztransport Et Technigaz 1 | | | 7,800 | | | | 1,016,581 |
| Total (Cost $491,861) | | | | | | | 1,016,581 |
| | | | | | | | |
| FINANCIALS – 34.7% | | | | | | | |
| BANKS - 5.5% | | | | | | | |
| BOK Financial | | | 15,414 | | | | 1,412,539 |
| First Citizens BancShares Cl. A | | | 1,314 | | | | 2,212,264 |
| | | | | | | | 3,624,803 |
| CAPITAL MARKETS - 25.3% | | | | | | | |
| Artisan Partners Asset Management Cl. A | | | 25,600 | | | | 1,056,512 |
| B3-Brasil, Bolsa, Balcao | | | 336,600 | | | | 616,587 |
| Bolsa Mexicana de Valores | | | 444,000 | | | | 750,638 |
| Canaccord Genuity Group | | | 31,500 | | | | 194,795 |
| Carlyle Group | | | 76,020 | | | | 3,052,203 |
| Evercore Cl. A | | | 13,500 | | | | 2,813,805 |
| KKR & Co. | | | 19,138 | | | | 2,014,083 |
| Moelis & Company Cl. A | | | 19,359 | | | | 1,100,753 |
| SEI Investments | | | 37,900 | | | | 2,451,751 |
| Sprott | | | 37,500 | | | | 1,555,042 |
| State Street | | | 15,120 | | | | 1,118,880 |
| | | | | | | | 16,725,049 |
| CONSUMER FINANCE - 1.8% | | | | | | | |
| goeasy | | | 8,125 | | | | 1,170,717 |
| INSURANCE - 2.1% | | | | | | | |
| Assured Guaranty | | | 17,900 | | | | 1,380,985 |
| Total (Cost $10,829,959) | | | | | | | 22,901,554 |
| | | | | | | | |
| HEALTH CARE – 4.0% | | | | | | | |
| HEALTH CARE PROVIDERS & SERVICES - 1.4% | | | | | | | |
| Ensign Group (The) | | | 7,439 | | | | 920,130 |
| PHARMACEUTICALS - 2.6% | | | | | | | |
| Recordati Industria Chimica e Farmaceutica 1 | | | 24,210 | | | | 1,265,977 |
| Santen Pharmaceutical 1 | | | 41,600 | | | | 424,627 |
| | | | | | | | 1,690,604 |
| Total (Cost $808,041) | | | | | | | 2,610,734 |
| | | | | | | | |
| INDUSTRIALS – 30.0% | | | | | | | |
| AEROSPACE & DEFENSE - 5.1% | | | | | | | |
| HEICO Corporation Cl. A | | | 18,800 | | | | 3,337,376 |
| BUILDING PRODUCTS - 0.7% | | | | | | | |
| Geberit 1 | | | 800 | | | | 473,538 |
| CONSTRUCTION & ENGINEERING - 1.6% | | | | | | | |
| Comfort Systems USA | | | 3,584 | | | | 1,089,966 |
| ELECTRICAL EQUIPMENT - 2.9% | | | | | | | |
| Hubbell Incorporated | | | 5,295 | | | | 1,935,217 |
| MACHINERY - 5.8% | | | | | | | |
| Graco | | | 20,179 | | | | 1,599,791 |
| Lincoln Electric Holdings | | | 2,255 | | | | 425,383 |
| Lindsay Corporation | | | 5,287 | | | | 649,667 |
| Spirax Group 1 | | | 10,782 | | | | 1,156,714 |
| | | | | | | | 3,831,555 |
| MARINE TRANSPORTATION - 1.3% | | | | | | | |
| Clarkson 1 | | | 16,707 | | | | 874,726 |
| PROFESSIONAL SERVICES - 6.2% | | | | | | | |
| KBR | | | 28,573 | | | | 1,832,672 |
| Korn Ferry | | | 8,723 | | | | 585,662 |
| ManpowerGroup | | | 19,300 | | | | 1,347,140 |
| Robert Half | | | 4,794 | | | | 306,720 |
| | | | | | | | 4,072,194 |
| TRADING COMPANIES & DISTRIBUTORS - 6.4% | | | | | | | |
| Applied Industrial Technologies | | | 13,642 | | | | 2,646,548 |
| FTAI Aviation | | | 15,031 | | | | 1,551,650 |
| | | | | | | | 4,198,198 |
| Total (Cost $4,394,495) | | | | | | | 19,812,770 |
| | | | | | | | |
| MATERIALS – 14.6% | | | | | | | |
| CHEMICALS - 2.1% | | | | | | | |
| Quaker Houghton | | | 6,122 | | | | 1,038,903 |
| Scotts Miracle-Gro Cl. A | | | 5,000 | | | | 325,300 |
| | | | | | | | 1,364,203 |
| CONTAINERS & PACKAGING - 2.6% | | | | | | | |
| AptarGroup | | | 12,238 | | | | 1,723,233 |
| METALS & MINING - 9.9% | | | | | | | |
| Franco-Nevada | | | 16,500 | | | | 1,955,580 |
| Reliance | | | 4,982 | | | | 1,422,859 |
| Royal Gold | | | 17,500 | | | | 2,190,300 |
| Worthington Steel | | | 30,000 | | | | 1,000,800 |
| | | | | | | | 6,569,539 |
| Total (Cost $3,651,598) | | | | | | | 9,656,975 |
| | | | | | | | |
| REAL ESTATE – 1.5% | | | | | | | |
| REAL ESTATE MANAGEMENT & DEVELOPMENT - 1.1% | | | | | | | |
| RMR Group (The) Cl. A | | | 32,700 | | | | 739,020 |
| SPECIALIZED REITS - 0.4% | | | | | | | |
| OUTFRONT Media | | | 17,900 | | | | 255,970 |
| Total (Cost $1,229,161) | | | | | | | 994,990 |
| | | | | | | | |
| TOTAL COMMON STOCKS | | | | | | | |
| (Cost $22,854,907) | | | | | | | 60,649,468 |
| | | | | | | | |
| REPURCHASE AGREEMENT– 8.2% | | | | | | | |
Fixed Income Clearing Corporation, 4.75% dated 6/28/24, due 7/1/24, maturity value
$5,434,120 (collateralized by obligations of U.S. Government Agencies, 3.625%
due 5/15/26, valued at $5,540,667) |
| (Cost $5,431,970) | | | | | | | 5,431,970 |
| | | | | | | | |
| TOTAL INVESTMENTS – 100.1% | | | | | | | |
| (Cost $28,286,877) | | | | | | | 66,081,438 |
| | | | | | | | |
| LIABILITIES LESS CASH AND OTHER ASSETS – (0.1)% | | | | | | | (64,097) |
| | | | | | | | |
| NET ASSETS – 100.0% | | | | | | $ | 66,017,341 |
| See Notes to Financial Statements | 1 |
June 30, 2024 (unaudited)
Royce Global Financial Services Fund
Common Stocks – 97.5%
| | | SHARES | | | VALUE |
| | | | | | | | |
| BANKS - 11.6% | | | | | |
| Bank of N.T. Butterfield & Son | | | 5,805 | | | $ | 203,872 |
| BOK Financial | | | 8,935 | | | | 818,803 |
| Capital City Bank Group | | | 16,988 | | | | 483,139 |
| First Citizens BancShares Cl. A | | | 808 | | | | 1,360,357 |
| Western Alliance Bancorp | | | 8,000 | | | | 502,560 |
| Total (Cost $1,516,825) | | | | | | | 3,368,731 |
| | | | | | | | |
| CAPITAL MARKETS - 53.0% | | | | | | | |
| Ares Management Cl. A | | | 3,998 | | | | 532,854 |
| Artisan Partners Asset Management Cl. A | | | 7,512 | | | | 310,020 |
| B3-Brasil, Bolsa, Balcao | | | 183,000 | | | | 335,221 |
| Carlyle Group | | | 21,185 | | | | 850,578 |
| Charles Schwab | | | 10,270 | | | | 756,796 |
| Coronation Fund Managers 1 | | | 30,600 | | | | 60,395 |
| CRISIL 1 | | | 14,000 | | | | 712,490 |
| Donnelley Financial Solutions 2 | | | 5,128 | | | | 305,731 |
| EFG Holding 1,2 | | | 277,186 | | | | 113,691 |
| GCM Grosvenor Cl. A | | | 21,300 | | | | 207,888 |
| Intermediate Capital Group 1 | | | 39,111 | | | | 1,071,495 |
| JSE 1 | | | 51,000 | | | | 304,124 |
| KKR & Co. | | | 13,057 | | | | 1,374,119 |
| MarketAxess Holdings | | | 1,423 | | | | 285,354 |
| MarketWise Cl. A | | | 88,300 | | | | 102,428 |
| Morningstar | | | 1,199 | | | | 354,724 |
| NZX 1 | | | 580,000 | | | | 377,918 |
| Onex Corporation | | | 11,615 | | | | 789,757 |
| Rand Capital | | | 5,000 | | | | 76,500 |
| SEI Investments | | | 9,540 | | | | 617,143 |
| Silvercrest Asset Management Group Cl. A | | | 27,612 | | | | 430,471 |
| Sprott | | | 36,450 | | | | 1,511,501 |
| StoneX Group 2 | | | 8,971 | | | | 675,606 |
| Tel Aviv Stock Exchange 1 | | | 232,705 | | | | 1,664,620 |
| TMX Group | | | 22,233 | | | | 618,861 |
| U.S. Global Investors Cl. A | | | 165,500 | | | | 431,955 |
| Virtu Financial Cl. A | | | 10,476 | | | | 235,186 |
| Warsaw Stock Exchange 1 | | | 23,169 | | | | 279,092 |
| Total (Cost $8,036,381) | | | | | | | 15,386,518 |
| | | | | | | | |
| CONSUMER FINANCE - 2.1% | | | | | | | |
| goeasy | | | 4,300 | | | | 619,580 |
| Total (Cost $400,901) | | | | | | | 619,580 |
| | | | | | | | |
| ELECTRONIC EQUIPMENT, INSTRUMENTS & COMPONENTS - 1.4% | | | | | | | |
| Crane NXT | | | 6,500 | | | | 399,230 |
| Total (Cost $260,788) | | | | | | | 399,230 |
| | | | | | | | |
| FINANCIAL SERVICES - 3.7% | | | | | | | |
| Banco Latinoamericano de Comercio Exterior Cl. E | | | 25,700 | | | | 762,519 |
| ECN Capital | | | 100,000 | | | | 122,071 |
| PayPal Holdings 2 | | | 3,466 | | | | 201,132 |
| Total (Cost $735,194) | | | | | | | 1,085,722 |
| | | | | | | | |
| INSURANCE - 8.5% | | | | | | | |
| Assured Guaranty | | | 7,594 | | | | 585,877 |
| Axis Capital Holdings | | | 11,554 | | | | 816,290 |
| E-L Financial | | | 1,327 | | | | 1,072,086 |
| Total (Cost $1,616,927) | | | | | | | 2,474,253 |
| | | | | | |
| METALS & MINING - 3.5% | | | | | |
| Franco-Nevada | | | 8,571 | | | | 1,015,835 |
| Total (Cost $373,656) | | | | | | | 1,015,835 |
| | | | | | | | |
| PROFESSIONAL SERVICES - 0.2% | | | | | | | |
| Quess Corp 1 | | | 8,900 | | | | 64,294 |
| Total (Cost $40,822) | | | | | | | 64,294 |
| | | | | | | | |
| REAL ESTATE MANAGEMENT & DEVELOPMENT - 8.6% | | | | | | | |
| Altus Group | | | 23,760 | | | | 877,421 |
| FirstService Corporation | | | 7,541 | | | | 1,149,022 |
| Real Matters 2 | | | 100,000 | | | | 459,047 |
| Total (Cost $1,236,206) | | | | | | | 2,485,490 |
| | | | | | | | |
| SOFTWARE - 1.3% | | | | | | | |
| Envestnet 2 | | | 6,000 | | | | 375,540 |
| Total (Cost $256,690) | | | | | | | 375,540 |
| | | | | | | | |
| TRADING COMPANIES & DISTRIBUTORS - 3.6% | | | | | | | |
| FTAI Aviation | | | 10,000 | | | | 1,032,300 |
| Total (Cost $259,576) | | | | | | | 1,032,300 |
| | | | | | | |
| TOTAL COMMON STOCKS | | | | | | | |
| (Cost $14,733,966) | | | | | | | 28,307,493 |
| | | | | | | | |
| REPURCHASE AGREEMENT– 2.6% | | | | | | | |
Fixed Income Clearing Corporation, 4.75% dated 6/28/24, due 7/1/24, maturity value
$761,111 (collateralized by obligations of U.S. Government Agencies, 3.625%
due 5/15/26, valued at $776,120) |
| (Cost $760,810) | | | | | | | 760,810 |
| | | | | | | | |
| TOTAL INVESTMENTS – 100.1% | | | | | | | |
| (Cost $15,494,776) | | | | | | | 29,068,303 |
| | | | | | | | |
| LIABILITIES LESS CASH AND OTHER ASSETS – (0.1)% | | | | | | | (31,339) |
| | | | | | | | |
| NET ASSETS – 100.0% | | | | | | $ | 29,036,964 |
| See Notes to Financial Statements | 2 |
Schedules of Investments
Royce International Premier Fund
Common Stocks – 95.2%
| | | SHARES | | | VALUE |
| | | | | | | | |
| AUSTRALIA – 6.3% | | | | | | | |
| Hansen Technologies 1 | | | 2,666,427 | | | $ | 8,076,734 |
| IPH 1 | | | 1,628,899 | | | | 6,792,918 |
| †Johns Lyng Group 1 | | | 1,352,031 | | | | 5,114,394 |
| Total (Cost $16,729,884) | | | | | | | 19,984,046 |
| | | | | | | | |
| BELGIUM – 1.7% | | | | | | | |
| Azelis Group 1 | | | 302,623 | | | | 5,398,436 |
| Total (Cost $6,841,346) | | | | | | | 5,398,436 |
| | | | | | | | |
| BRAZIL – 3.4% | | | | | | | |
| Odontoprev | | | 2,699,377 | | | | 5,485,577 |
| TOTVS | | | 970,766 | | | | 5,284,415 |
| Total (Cost $10,055,193) | | | | | | | 10,769,992 |
| | | | | | | | |
| CANADA – 3.7% | | | | | | | |
| Enghouse Systems | | | 269,492 | | | | 5,943,184 |
| Open Text | | | 196,962 | | | | 5,914,403 |
| Total (Cost $14,223,554) | | | | | | | 11,857,587 |
| | | | | | | | |
| FINLAND – 1.6% | | | | | | | |
| Enento Group 1 | | | 284,555 | | | | 5,003,579 |
| Total (Cost $6,477,126) | | | | | | | 5,003,579 |
| | | | | | | | |
| FRANCE – 3.6% | | | | | | | |
| Antin Infrastructure Partners 1 | | | 403,403 | | | | 4,900,263 |
| Lectra 1 | | | 156,896 | | | | 4,628,047 |
| Robertet 1 | | | 1,961 | | | | 1,714,435 |
| Total (Cost $12,821,976) | | | | | | | 11,242,745 |
| | | | | | | | |
| GERMANY – 0.8% | | | | | | | |
| †CTS Eventim AG & Co. 1 | | | 29,991 | | | | 2,503,171 |
| Total (Cost $2,682,116) | | | | | | | 2,503,171 |
| | | | | | | | |
| ISRAEL – 1.7% | | | | | | | |
| †Nice ADR 2 | | | 31,188 | | | | 5,363,400 |
| Total (Cost $6,362,696) | | | | | | | 5,363,400 |
| | | | | | | | |
| ITALY – 4.9% | | | | | | | |
| Carel Industries 1 | | | 294,471 | | | | 5,455,653 |
| DiaSorin 1 | | | 55,025 | | | | 5,466,789 |
| GVS 1,2 | | | 671,468 | | | | 4,716,329 |
| Total (Cost $14,269,956) | | | | | | | 15,638,771 |
| | | | | | | | |
| JAPAN – 22.7% | | | | | | | |
| As One 1 | | | 352,200 | | | | 6,296,401 |
| BML 1 | | | 339,200 | | | | 6,081,926 |
| Fukui Computer Holdings 1 | | | 142,000 | | | | 2,233,758 |
| †Hirose Electric 1 | | | 52,900 | | | | 5,858,067 |
| JCU 1 | | | 254,000 | | | | 6,331,319 |
| Maruwa 1 | | | 25,400 | | | | 6,106,939 |
| MEITEC Group Holdings 1 | | | 179,300 | | | | 3,628,669 |
| NSD 1 | | | 181,400 | | | | 3,476,365 |
| OBIC Business Consultants 1 | | | 145,100 | | | | 6,103,093 |
| Riken Keiki 1 | | | 249,300 | | | | 6,567,496 |
| TKC Corporation 1 | | | 326,800 | | | | 7,055,244 |
| USS 1 | | | 671,800 | | | | 5,653,922 |
| Zuken 1 | | | 243,100 | | | | 6,405,605 |
| Total (Cost $63,036,966) | | | | | | | 71,798,804 |
| | | | | | | | |
| JERSEY – 1.9% | | | | | | | |
| JTC 1 | | | 502,432 | | | | 6,109,926 |
| Total (Cost $4,247,296) | | | | | | | 6,109,926 |
| | | | | | | | |
| NETHERLANDS – 1.7% | | | | | | | |
| IMCD 1 | | | 39,834 | | | | 5,514,397 |
| Total (Cost $3,442,961) | | | | | | | 5,514,397 |
| | | | | | | | |
| POLAND – 1.8% | | | | | | | |
| Asseco Poland 1 | | | 294,346 | | | | 5,838,879 |
| Total (Cost $4,701,737) | | | | | | | 5,838,879 |
| | | | | | | | |
| SINGAPORE – 1.9% | | | | | | | |
| XP Power 1 | | | 323,616 | | | | 6,053,893 |
| Total (Cost $4,657,488) | | | | | | | 6,053,893 |
| | | | | | | | |
| SOUTH KOREA – 2.0% | | | | | | | |
| NICE Information Service 1 | | | 768,182 | | | | 6,332,857 |
| Total (Cost $13,422,133) | | | | | | | 6,332,857 |
| | | | | | | | |
| SWEDEN – 8.0% | | | | | | | |
| Alimak Group 1 | | | 373,713 | | | | 4,062,098 |
| Karnov Group 1,2 | | | 602,492 | | | | 4,021,976 |
| Loomis 1 | | | 186,404 | | | | 4,862,932 |
| Norva24 Group 1,2 | | | 2,139,277 | | | | 5,831,900 |
| †Sdiptech 1,2 | | | 69,496 | | | | 2,115,703 |
| †Vitec Software Group 1 | | | 82,486 | | | | 4,279,627 |
| Total (Cost $22,616,505) | | | | | | | 25,174,236 |
| | | | | | | | |
| SWITZERLAND – 4.0% | | | | | | | |
| Kardex Holding 1 | | | 22,540 | | | | 5,708,218 |
| Partners Group Holding 1 | | | 2,644 | | | | 3,400,208 |
| VZ Holding 1 | | | 27,214 | | | | 3,486,394 |
| Total (Cost $4,873,522) | | | | | | | 12,594,820 |
| | | | | | | | |
| UNITED KINGDOM – 23.5% | | | | | | | |
| †Ashtead Technology Holdings 1 | | | 454,216 | | | | 4,370,309 |
| Auction Technology Group 1,2 | | | 731,134 | | | | 4,605,748 |
| Croda International 1 | | | 45,660 | | | | 2,268,666 |
| CVS Group 1 | | | 408,732 | | | | 5,208,956 |
| Diploma 1 | | | 117,624 | | | | 6,137,326 |
| DiscoverIE Group 1 | | | 699,134 | | | | 5,935,312 |
| †Halma 1 | | | 159,811 | | | | 5,440,739 |
| Intertek Group 1 | | | 107,299 | | | | 6,506,268 |
| Learning Technologies Group 1 | | | 5,709,486 | | | | 6,091,241 |
| Marlowe 1 | | | 926,629 | | | | 5,039,817 |
| Mortgage Advice Bureau Holdings 1 | | | 415,552 | | | | 4,296,237 |
| Restore 1 | | | 1,802,181 | | | | 6,106,473 |
| Rightmove 1 | | | 715,815 | | | | 4,837,307 |
| Spirax Group 1 | | | 33,694 | | | | 3,614,757 |
| Victrex 1 | | | 279,752 | | | | 4,057,184 |
| Total (Cost $72,702,190) | | | | | | | 74,516,340 |
| | | | | | | | |
| TOTAL COMMON STOCKS | | | | | | | |
| (Cost $284,164,645) | | | | | | | 301,695,879 |
| | | | | | | | |
| PREFERRED STOCK – 1.5% | | | | | | | |
| GERMANY – 1.5% | | | | | | | |
| FUCHS1 | | | 99,575 | | | | 4,548,924 |
| (Cost $3,584,508) | | | | | | | 4,548,924 |
| See Notes to Financial Statements | 3 |
June 30, 2024 (unaudited)
Royce International Premier Fund (continued)
| | | VALUE |
| | | |
| REPURCHASE AGREEMENT– 1.5% | | |
Fixed Income Clearing Corporation, 4.75% dated 6/28/24, due 7/1/24, maturity value
$4,863,679 (collateralized by obligations of U.S. Government Agencies, 3.625%
due 5/15/26, valued at $4,959,161) |
| (Cost $4,861,755) | | $ | 4,861,755 |
| | | | |
| TOTAL INVESTMENTS – 98.2% | | | |
| (Cost $292,610,908) | | | 311,106,558 |
| | | | |
| CASH AND OTHER ASSETS LESS LIABILITIES – 1.8% | | | 5,719,710 |
| | | | |
| NET ASSETS – 100.0% | | $ | 316,826,268 |
Royce Micro-Cap Fund
Common Stocks – 97.7%
| | | SHARES | | | |
| | | | | | |
| COMMUNICATION SERVICES – 4.7% | | | | | |
| ENTERTAINMENT - 0.9% | | | | | |
| IMAX Corporation 2 | | | 159,100 | | | | 2,668,107 |
| INTERACTIVE MEDIA & SERVICES - 1.7% | | | | | | | |
| DHI Group 2 | | | 348,731 | | | | 728,848 |
| QuinStreet 2 | | | 236,710 | | | | 3,927,019 |
| †Vimeo 2 | | | 113,633 | | | | 423,851 |
| | | | | | | | 5,079,718 |
| MEDIA - 2.1% | | | | | | | |
| Entravision Communications Cl. A | | | 116,933 | | | | 237,374 |
| Innovid Corp. 2 | | | 916,227 | | | | 1,695,020 |
| Magnite 2 | | | 214,167 | | | | 2,846,279 |
| Thryv Holdings 2 | | | 97,704 | | | | 1,741,085 |
| | | | | | | | 6,519,758 |
| Total (Cost $10,897,687) | | | | | | | 14,267,583 |
| | | | | | | | |
| CONSUMER DISCRETIONARY – 12.6% | | | | | | | |
| AUTOMOBILE COMPONENTS - 1.9% | | | | | | | |
| Modine Manufacturing 2 | | | 32,717 | | | | 3,277,916 |
| Stoneridge 2 | | | 163,670 | | | | 2,612,173 |
| | | | | | | | 5,890,089 |
| DIVERSIFIED CONSUMER SERVICES - 0.9% | | | | | | | |
| Lincoln Educational Services 2 | | | 224,238 | | | | 2,659,463 |
| HOTELS, RESTAURANTS & LEISURE - 1.3% | | | | | | | |
| Century Casinos 2 | | | 430,485 | | | | 1,192,444 |
| Lindblad Expeditions Holdings 2 | | | 283,196 | | | | 2,732,841 |
| | | | | | | | 3,925,285 |
| HOUSEHOLD DURABLES - 1.9% | | | | | | | |
| Hovnanian Enterprises Cl. A 2 | | | 20,328 | | | | 2,884,950 |
| Legacy Housing 2 | | | 117,973 | | | | 2,706,300 |
| | | | | | | | 5,591,250 |
| LEISURE PRODUCTS - 1.4% | | | | | | | |
| American Outdoor Brands 2 | | | 282,224 | | | | 2,540,016 |
| MasterCraft Boat Holdings 2 | | | 85,300 | | | | 1,610,464 |
| | | | | | | | 4,150,480 |
| SPECIALTY RETAIL - 4.5% | | | | | | | |
| Beyond 2 | | | 125,133 | | | | 1,636,740 |
| Citi Trends 2 | | | 129,516 | | | | 2,753,510 |
| OneWater Marine Cl. A 2 | | | 95,860 | | | | 2,642,860 |
| Shoe Carnival | | | 105,822 | | | | 3,903,774 |
| Zumiez 2 | | | 127,900 | | | | 2,491,492 |
| | | | | | | | 13,428,376 |
| TEXTILES, APPAREL & LUXURY GOODS - 0.7% | | | | | | | |
| Fossil Group 2 | | | 175,828 | | | | 253,192 |
| Vera Bradley 2 | | | 304,120 | | | | 1,903,791 |
| | | | | | | | 2,156,983 |
| Total (Cost $28,975,719) | | | | | | | 37,801,926 |
| | | | | | | | |
| CONSUMER STAPLES – 0.7% | | | | | | | |
| FOOD PRODUCTS - 0.7% | | | | | | | |
| Seneca Foods Cl. A 2 | | | 36,345 | | | | 2,086,203 |
| Total (Cost $1,995,697) | | | | | | | 2,086,203 |
| | | | | | | | |
| ENERGY – 3.8% | | | | | | | |
| ENERGY EQUIPMENT & SERVICES - 3.8% | | | | | | | |
| Natural Gas Services Group 2 | | | 176,014 | | | | 3,541,402 |
| Newpark Resources 2 | | | 504,400 | | | | 4,191,564 |
| Profire Energy 2 | | | 1,404,632 | | | | 1,994,577 |
| Ranger Energy Services Cl. A | | | 153,277 | | | | 1,612,474 |
| Total (Cost $6,107,444) | | | | | | | 11,340,017 |
| See Notes to Financial Statements | 4 |
Schedules of Investments
| Royce Micro-Cap Fund (continued) | | | | | |
| | | | | | |
| | | SHARES | | | VALUE |
| | | | | | | | |
| FINANCIALS - 12.2% | | | | | | | |
| BANKS - 7.8% | | | | | | | |
| BayCom Corp. | | | 148,162 | | | $ | 3,015,097 |
| Customers Bancorp 2 | | | 69,000 | | | | 3,310,620 |
| HarborOne Bancorp | | | 251,253 | | | | 2,796,446 |
| HBT Financial | | | 153,472 | | | | 3,133,898 |
| HomeTrust Bancshares | | | 111,500 | | | | 3,348,345 |
| Investar Holding | | | 179,900 | | | | 2,770,460 |
| Midway Investments 2,3 | | | 1,858,170 | | | | 0 |
| Stellar Bancorp | | | 99,377 | | | | 2,281,696 |
| Western New England Bancorp | | | 389,115 | | | | 2,677,111 |
| | | | | | | | 23,333,673 |
| CAPITAL MARKETS - 3.6% | | | | | | | |
| Canaccord Genuity Group | | | 400,517 | | | | 2,476,791 |
| Silvercrest Asset Management Group Cl. A | | | 161,773 | | | | 2,522,041 |
| Sprott | | | 70,380 | | | | 2,918,503 |
| StoneX Group 2 | | | 39,469 | | | | 2,972,410 |
| | | | | | | | 10,889,745 |
| FINANCIAL SERVICES - 0.8% | | | | | | | |
| Cass Information Systems | | | 58,216 | | | | 2,332,715 |
| Total (Cost $30,684,717) | | | | | | | 36,556,133 |
| | | | | | | | |
| HEALTH CARE - 8.4% | | | | | | | |
| BIOTECHNOLOGY - 2.5% | | | | | | | |
| ARS Pharmaceuticals 2,4 | | | 203,124 | | | | 1,728,585 |
| CareDx 2 | | | 179,671 | | | | 2,790,291 |
| Dynavax Technologies 2 | | | 185,200 | | | | 2,079,796 |
| MeiraGTx Holdings 2 | | | 240,893 | | | | 1,014,160 |
| | | | | | | | 7,612,832 |
| HEALTH CARE EQUIPMENT & SUPPLIES - 2.9% | | | | | | | |
| Apyx Medical 2 | | | 602,455 | | | | 807,290 |
| Artivion 2 | | | 169,055 | | | | 4,336,261 |
| Profound Medical 2 | | | 227,937 | | | | 1,952,722 |
| †Zynex 2 | | | 160,286 | | | | 1,493,865 |
| | | | | | | | 8,590,138 |
| LIFE SCIENCES TOOLS & SERVICES - 2.0% | | | | | | | |
| BioLife Solutions 2 | | | 107,908 | | | | 2,312,469 |
| Harvard Bioscience 2 | | | 641,759 | | | | 1,829,013 |
| Mesa Laboratories | | | 22,621 | | | | 1,962,824 |
| | | | | | | | 6,104,306 |
| PHARMACEUTICALS - 1.0% | | | | | | | |
| Harrow 2 | | | 138,016 | | | | 2,883,154 |
| Total (Cost $25,300,365) | | | | | | | 25,190,430 |
| | | | | | | | |
| INDUSTRIALS - 26.6% | | | | | | | |
| AEROSPACE & DEFENSE - 1.2% | | | | | | | |
| Astronics Corporation 2 | | | 129,200 | | | | 2,587,876 |
| CPI Aerostructures 2 | | | 343,190 | | | | 847,679 |
| †Park Aerospace | | | 13,903 | | | | 190,193 |
| | | | | | | | 3,625,748 |
| BUILDING PRODUCTS - 1.0% | | | | | | | |
| Quanex Building Products | | | 111,694 | | | | 3,088,339 |
| COMMERCIAL SERVICES & SUPPLIES - 4.5% | | | | | | | |
| Acme United | | | 77,030 | | | | 2,701,442 |
| CECO Environmental 2 | | | 163,007 | | | | 4,702,752 |
| Montrose Environmental Group 2 | | | 48,745 | | | | 2,172,077 |
| VSE Corporation | | | 45,330 | | | | 4,001,733 |
| | | | | | | | 13,578,004 |
| CONSTRUCTION & ENGINEERING - 3.3% | | | | | | | |
| †Bowman Consulting Group 2 | | | 55,615 | | | | 1,768,001 |
| Concrete Pumping Holdings 2 | | | 276,163 | | | | 1,659,740 |
| IES Holdings 2 | | | 21,428 | | | | 2,985,563 |
| Northwest Pipe 2 | | | 105,247 | | | | 3,575,240 |
| | | | | | | | 9,988,544 |
| ELECTRICAL EQUIPMENT - 1.4% | | | | | | | |
| American Superconductor 2 | | | 172,739 | | | | 4,040,365 |
| GROUND TRANSPORTATION - 0.7% | | | | | | | |
| Covenant Logistics Group Cl. A | | | 42,786 | | | | 2,108,922 |
| MACHINERY - 5.9% | | | | | | | |
| Alimak Group 1 | | | 199,400 | | | | 2,167,392 |
| Commercial Vehicle Group 2 | | | 291,407 | | | | 1,427,894 |
| Graham Corporation 2 | | | 143,624 | | | | 4,044,452 |
| Luxfer Holdings | | | 177,419 | | | | 2,056,286 |
| Porvair 1 | | | 329,800 | | | | 2,750,725 |
| Shyft Group (The) | | | 187,523 | | | | 2,224,023 |
| Wabash National | | | 136,956 | | | | 2,991,119 |
| | | | | | | | 17,661,891 |
| MARINE TRANSPORTATION - 1.2% | | | | | | | |
| Clarkson 1 | | | 71,210 | | | | 3,728,331 |
| PROFESSIONAL SERVICES - 4.8% | | | | | | | |
| CRA International | | | 22,225 | | | | 3,827,590 |
| Forrester Research 2 | | | 89,604 | | | | 1,530,436 |
| Kforce | | | 39,732 | | | | 2,468,549 |
| NV5 Global 2 | | | 24,400 | | | | 2,268,468 |
| Resources Connection | | | 217,997 | | | | 2,406,687 |
| TrueBlue 2 | | | 171,976 | | | | 1,771,353 |
| | | | | | | | 14,273,083 |
| TRADING COMPANIES & DISTRIBUTORS - 2.6% | | | | | | | |
| †Alta Equipment Group | | | 80,051 | | | | 643,610 |
| Distribution Solutions Group 2 | | | 112,248 | | | | 3,367,440 |
| Transcat 2 | | | 30,555 | | | | 3,656,823 |
| | | | | | | | 7,667,873 |
| Total (Cost $52,807,593) | | | | | | | 79,761,100 |
| | | | | | | | |
| INFORMATION TECHNOLOGY - 24.6% | | | | | | | |
| COMMUNICATIONS EQUIPMENT - 3.4% | | | | | | | |
| Applied Optoelectronics 2 | | | 201,126 | | | | 1,667,335 |
| Clearfield 2 | | | 72,448 | | | | 2,793,595 |
| Digi International 2 | | | 102,500 | | | | 2,350,325 |
| Genasys 2 | | | 567,594 | | | | 1,200,461 |
| Harmonic 2 | | | 195,900 | | | | 2,305,743 |
| | | | | | | | 10,317,459 |
| ELECTRONIC EQUIPMENT, INSTRUMENTS & COMPONENTS - 8.0% | | | | | | | |
| Arlo Technologies 2 | | | 291,725 | | | | 3,804,094 |
| †Bel Fuse Cl. B | | | 39,667 | | | | 2,587,875 |
| FARO Technologies 2 | | | 168,114 | | | | 2,689,824 |
| LightPath Technologies Cl. A 2 | | | 852,684 | | | | 1,074,382 |
| Luna Innovations 2 | | | 460,269 | | | | 1,472,861 |
| nLIGHT 2 | | | 270,257 | | | | 2,953,909 |
| PAR Technology 2 | | | 75,000 | | | | 3,531,750 |
| Powerfleet NJ 2 | | | 539,309 | | | | 2,464,642 |
| †SmartRent Cl. A 2 | | | 319,702 | | | | 764,088 |
| Vishay Precision Group 2 | | | 83,000 | | | | 2,526,520 |
| | | | | | | | 23,869,945 |
| SEMICONDUCTORS & SEMICONDUCTOR EQUIPMENT - 10.8% | | | | | | | |
| Aehr Test Systems 2,4 | | | 119,656 | | | | 1,336,557 |
| Amtech Systems 2 | | | 285,853 | | | | 1,675,099 |
| AXT 2 | | | 496,600 | | | | 1,678,508 |
| Camtek | | | 26,729 | | | | 3,347,540 |
| Cohu 2 | | | 82,400 | | | | 2,727,440 |
| See Notes to Financial Statements | 5 |
June 30, 2024 (unaudited)
| Royce Micro-Cap Fund (continued) | | | | | |
| | | | | | |
| | | SHARES | | | VALUE |
| | | | | | |
| INFORMATION TECHNOLOGY (continued) | | | | | |
| SEMICONDUCTORS & SEMICONDUCTOR EQUIPMENT (continued) | | | | | | | |
| Ichor Holdings 2 | | | 85,900 | | | $ | 3,311,445 |
| inTEST Corporation 2 | | | 213,279 | | | | 2,107,196 |
| Kopin Corporation 2 | | | 795,051 | | | | 667,763 |
| Nova 2 | | | 16,115 | | | | 3,779,451 |
| NVE Corporation | | | 34,143 | | | | 2,550,141 |
| PDF Solutions 2 | | | 68,600 | | | | 2,495,668 |
| Photronics 2 | | | 121,704 | | | | 3,002,438 |
| Ultra Clean Holdings 2 | | | 77,389 | | | | 3,792,061 |
| | | | | | | | 32,471,307 |
| SOFTWARE - 0.9% | | | | | | | |
| Agilysys 2 | | | 26,290 | | | | 2,737,840 |
| TECHNOLOGY HARDWARE, STORAGE & PERIPHERALS - 1.5% | | | | | | | |
| AstroNova 2 | | | 168,405 | | | | 2,600,173 |
| Intevac 2 | | | 509,044 | | | | 1,964,910 |
| | | | | | | | 4,565,083 |
| Total (Cost $55,183,590) | | | | | | | 73,961,634 |
| | | | | | | | |
| MATERIALS - 3.5% | | | | | | | |
| CHEMICALS - 1.1% | | | | | | | |
| Aspen Aerogels 2 | | | 80,578 | | | | 1,921,785 |
| Core Molding Technologies 2 | | | 94,294 | | | | 1,503,047 |
| | | | | | | | 3,424,832 |
| METALS & MINING - 2.4% | | | | | | | |
| Altius Minerals | | | 109,900 | | | | 1,702,263 |
| Ferroglobe | | | 397,896 | | | | 2,132,723 |
| Major Drilling Group International 2 | | | 507,100 | | | | 3,365,716 |
| | | | | | | | 7,200,702 |
| Total (Cost $8,305,040) | | | | | | | 10,625,534 |
| | | | | | | | |
| REAL ESTATE - 0.6% | | | | | | | |
| REAL ESTATE MANAGEMENT & DEVELOPMENT - 0.6% | | | | | | | |
| FRP Holdings 2 | | | 59,150 | | | | 1,686,958 |
| Total (Cost $534,936) | | | | | | | 1,686,958 |
| | | | | | | | |
| TOTAL COMMON STOCKS | | | | | | | |
| (Cost $220,792,788) | | | | | | | 293,277,518 |
| | | | | | | | |
| REPURCHASE AGREEMENT- 2.4% | | | | | | | |
Fixed Income Clearing Corporation, 4.75% dated 6/28/24, due 7/1/24, maturity value
$7,277,089 (collateralized by obligations of U.S. Government Agencies, 3.625%
due 5/15/26, valued at $7,419,753) |
| (Cost $7,274,209) | | | | | | | 7,274,209 |
| | | | | | | | |
| COLLATERAL RECEIVED FOR SECURITIES LOANED - 0.1% |
| Money Market Funds | | | | | | | |
| Federated Hermes Government Obligations Fund - Institutional Shares (7 day yield-5.18%) |
| (Cost $271,625) | | | 271,625 | | | | 271,625 |
| | | | | | | | |
| TOTAL INVESTMENTS - 100.2% | | | | | | | |
| (Cost $228,338,622) | | | | | | | 300,823,352 |
| | | | | | | | |
| LIABILITIES LESS CASH AND OTHER ASSETS - (0.2)% | | | | | | | (685,924) |
| | | | | | | | |
| NET ASSETS - 100.0% | | | | | | $ | 300,137,428 |
Royce Premier Fund
Common Stocks – 95.4%
| COMMUNICATION SERVICES - 1.8% | | | | | |
| INTERACTIVE MEDIA & SERVICES - 1.8% | | | | | |
| Ziff Davis 2 | | | 455,867 | | | | 25,095,478 |
| Total (Cost $32,632,179) | | | | | | | 25,095,478 |
| | | | | | | | |
| CONSUMER DISCRETIONARY - 9.4% | | | | | | | |
| AUTOMOBILE COMPONENTS - 2.1% | | | | | | | |
| Dorman Products 2 | | | 194,316 | | | | 17,776,028 |
| LCI Industries | | | 118,038 | | | | 12,202,768 |
| | | | | | | | 29,978,796 |
| DISTRIBUTORS - 1.1% | | | | | | | |
| Pool Corporation | | | 50,355 | | | | 15,475,602 |
| HOUSEHOLD DURABLES - 1.3% | | | | | | | |
| Installed Building Products | | | 88,338 | | | | 18,169,360 |
| LEISURE PRODUCTS - 1.3% | | | | | | | |
| Brunswick Corporation | | | 246,935 | | | | 17,969,460 |
| SPECIALTY RETAIL - 1.7% | | | | | | | |
| Valvoline 2 | | | 559,000 | | | | 24,148,800 |
| TEXTILES, APPAREL & LUXURY GOODS - 1.9% | | | | | | | |
| Ralph Lauren Cl. A | | | 149,719 | | | | 26,209,808 |
| Total (Cost $81,501,981) | | | | | | | 131,951,826 |
| | | | | | | | |
| CONSUMER STAPLES - 1.8% | | | | | | | |
| PERSONAL CARE PRODUCTS - 1.8% | | | | | | | |
| Inter Parfums | | | 212,411 | | | | 24,646,048 |
| Total (Cost $12,131,180) | | | | | | | 24,646,048 |
| | | | | | | | |
| FINANCIALS - 9.0% | | | | | | | |
| CAPITAL MARKETS - 9.0% | | | | | | | |
| Ares Management Cl. A | | | 15,900 | | | | 2,119,152 |
| Lazard | | | 474,562 | | | | 18,118,777 |
| Morningstar | | | 114,158 | | | | 33,773,644 |
| SEI Investments | | | 615,771 | | | | 39,834,226 |
| TMX Group | | | 1,136,994 | | | | 31,648,501 |
| Total (Cost $65,650,866) | | | | | | | 125,494,300 |
| | | | | | | | |
| HEALTH CARE - 6.3% | | | | | | | |
| HEALTH CARE EQUIPMENT & SUPPLIES - 4.5% | | | | | | | |
| Enovis Corporation 2 | | | 580,824 | | | | 26,253,245 |
| Haemonetics Corporation 2 | | | 440,619 | | | | 36,452,410 |
| | | | | | | | 62,705,655 |
| LIFE SCIENCES TOOLS & SERVICES - 1.8% | | | | | | | |
| Bio-Techne | | | 349,149 | | | | 25,016,526 |
| Total (Cost $74,913,822) | | | | | | | 87,722,181 |
| | | | | | | | |
| INDUSTRIALS - 34.6% | | | | | | | |
| AEROSPACE & DEFENSE - 2.4% | | | | | | | |
| Woodward | | | 194,403 | | | | 33,899,995 |
| BUILDING PRODUCTS - 2.9% | | | | | | | |
| Simpson Manufacturing | | | 154,382 | | | | 26,017,999 |
| UFP Industries | | | 124,060 | | | | 13,894,720 |
| | | | | | | | 39,912,719 |
| COMMERCIAL SERVICES & SUPPLIES - 2.2% | | | | | | | |
| RB Global | | | 402,022 | | | | 30,698,400 |
| CONSTRUCTION & ENGINEERING - 5.0% | | | | | | | |
| Arcosa | | | 498,054 | | | | 41,542,684 |
| Valmont Industries | | | 103,599 | | | | 28,432,746 |
| | | | | | | | 69,975,430 |
| | | | | | | | |
| GROUND TRANSPORTATION - 2.1% | | | | | | | |
| Landstar System | | | 161,303 | | | | 29,757,177 |
| MACHINERY - 15.3% | | | | | | | |
| Enpro | | | 103,793 | | | | 15,109,147 |
| See Notes to Financial Statements | 6 |
Schedules of Investments
| Royce Premier Fund (continued) | | | | | |
| | | | | | |
| | | SHARES | | | VALUE |
| | | | | | | | |
| INDUSTRIALS (continued) | | | | | | | |
| MACHINERY (continued) | | | | | | | |
| ESAB Corporation | | | 275,455 | | | $ | 26,011,216 |
| ESCO Technologies | | | 268,028 | | | | 28,153,661 |
| John Bean Technologies | | | 306,081 | | | | 29,068,513 |
| Kadant | | | 132,899 | | | | 39,043,068 |
| Lincoln Electric Holdings | | | 134,145 | | | | 25,305,113 |
| Lindsay Corporation | | | 196,340 | | | | 24,126,259 |
| RBC Bearings 2 | | | 99,294 | | | | 26,787,535 |
| | | | | | | | 213,604,512 |
| PROFESSIONAL SERVICES - 2.5% | | | | | | | |
| †Exponent | | | 92,567 | | | | 8,804,973 |
| Forrester Research 2 | | | 733,345 | | | | 12,525,533 |
| Korn Ferry | | | 203,652 | | | | 13,673,195 |
| | | | | | | | 35,003,701 |
| TRADING COMPANIES & DISTRIBUTORS - 2.2% | | | | | | | |
| Air Lease Cl. A | | | 627,000 | | | | 29,801,310 |
| Total (Cost $223,347,076) | | | | | | | 482,653,244 |
| | | | | | | | |
| INFORMATION TECHNOLOGY – 13.8% | | | | | | | |
| ELECTRONIC EQUIPMENT, INSTRUMENTS & COMPONENTS - 5.7% | | | | | | | |
| Cognex Corporation | | | 546,349 | | | | 25,547,279 |
| Littelfuse | | | 102,764 | | | | 26,265,451 |
| Rogers Corporation 2 | | | 229,636 | | | | 27,696,398 |
| | | | | | | | 79,509,128 |
| SEMICONDUCTORS & SEMICONDUCTOR EQUIPMENT - 8.1% | | | | | | | |
| Cirrus Logic 2 | | | 291,027 | | | | 37,152,507 |
| FormFactor 2 | | | 512,014 | | | | 30,992,207 |
| MKS Instruments | | | 343,767 | | | | 44,889,095 |
| | | | | | | | 113,033,809 |
| Total (Cost $110,819,410) | | | | | | | 192,542,937 |
| | | | | | | | |
| MATERIALS - 11.0% | | | | | | | |
| CHEMICALS - 5.3% | | | | | | | |
| Innospec | | | 342,837 | | | | 42,371,225 |
| Quaker Houghton | | | 188,206 | | | | 31,938,558 |
| | | | | | | | 74,309,783 |
| METALS & MINING - 2.7% | | | | | | | |
| Reliance | | | 130,525 | | | | 37,277,940 |
| PAPER & FOREST PRODUCTS - 3.0% | | | | | | | |
| Stella-Jones | | | 649,257 | | | | 42,366,268 |
| Total (Cost $73,793,952) | | | | | | | 153,953,991 |
| | | | | | | | |
| REAL ESTATE - 7.7% | | | | | | | |
| REAL ESTATE MANAGEMENT & DEVELOPMENT - 7.7% | | | | | | | |
| Colliers International Group | | | 284,226 | | | | 31,733,833 |
| FirstService Corporation | | | 253,413 | | | | 38,612,539 |
| Kennedy-Wilson Holdings | | | 2,432,354 | | | | 23,642,481 |
| Marcus & Millichap | | | 439,331 | | | | 13,847,713 |
| Total (Cost $117,393,358) | | | | | | | 107,836,566 |
| | | | | | | | |
| TOTAL COMMON STOCKS | | | | | | | |
| (Cost $792,183,824) | | | | | | | 1,331,896,571 |
| | | | | | | | |
| REPURCHASE AGREEMENT- 4.6% | | | | | | | |
Fixed Income Clearing Corporation, 4.75% dated 6/28/24, due 7/1/24, maturity value
$65,002,331 (collateralized by obligations of U.S. Government Agencies, 3.625%
due 5/15/26, valued at $66,276,315) |
| (Cost $64,976,611) | | | | | | $ | 64,976,611 |
| | | | | | | | |
| TOTAL INVESTMENTS - 100.0% | | | | | | | |
| (Cost $857,160,435) | | | | | | | 1,396,873,182 |
| | | | | | | | |
| LIABILITIES LESS CASH AND OTHER ASSETS - (0.0)% | | | | | | | (672,708) |
| | | | | | | | |
| NET ASSETS - 100.0% | | | | | | $ | 1,396,200,474 |
| See Notes to Financial Statements | 7 |
June 30, 2024 (unaudited)
Royce Small-Cap Fund
Common Stocks – 97.2%
| | | SHARES | | | VALUE |
| | | | | | |
| COMMUNICATION SERVICES – 2.4% | | | | | | | |
| DIVERSIFIED TELECOMMUNICATION SERVICES - 0.5% | | | | | | | |
| Globalstar 2 | | | 4,708,344 | | | $ | 5,273,345 |
| IDT Corporation Cl. B | | | 74,257 | | | | 2,667,312 |
| Liberty Latin America Cl. C 2 | | | 187,820 | | | | 1,806,828 |
| | | | | | | | 9,747,485 |
| ENTERTAINMENT - 0.4% | | | | | | | |
| IMAX Corporation 2 | | | 512,346 | | | | 8,592,043 |
| INTERACTIVE MEDIA & SERVICES - 1.3% | | | | | | | |
| QuinStreet 2 | | | 77,243 | | | | 1,281,461 |
| Shutterstock | | | 108,341 | | | | 4,192,797 |
| Ziff Davis 2 | | | 347,020 | | | | 19,103,451 |
| | | | | | | | 24,577,709 |
| MEDIA - 0.2% | | | | | | | |
| TEGNA | | | 245,697 | | | | 3,425,016 |
| Total (Cost $57,752,787) | | | | | | | 46,342,253 |
| | | | | | | | |
| CONSUMER DISCRETIONARY – 8.1% | | | | | | | |
| AUTOMOBILE COMPONENTS - 2.0% | | | | | | | |
| Dorman Products 2 | | | 115,789 | | | | 10,592,378 |
| Fox Factory Holding 2 | | | 50,000 | | | | 2,409,500 |
| Gentex Corporation | | | 154,664 | | | | 5,213,723 |
| LCI Industries | | | 59,363 | | | | 6,136,947 |
| Modine Manufacturing 2 | | | 70,451 | | | | 7,058,486 |
| Stoneridge 2 | | | 57,057 | | | | 910,630 |
| Visteon Corporation 2 | | | 55,805 | | | | 5,954,393 |
| | | | | | | | 38,276,057 |
| BROADLINE RETAIL - 0.1% | | | | | | | |
| Ollie’s Bargain Outlet Holdings 2 | | | 13,511 | | | | 1,326,375 |
| DISTRIBUTORS - 0.0% | | | | | | | |
| LKQ Corporation | | | 5,779 | | | | 240,348 |
| Pool Corporation | | | 2,993 | | | | 919,839 |
| | | | | | | | 1,160,187 |
| DIVERSIFIED CONSUMER SERVICES - 0.2% | | | | | | | |
| †frontdoor 2 | | | 94,024 | | | | 3,177,071 |
| HOTELS, RESTAURANTS & LEISURE - 0.2% | | | | | | | |
| Bloomin’ Brands | | | 166,505 | | | | 3,201,891 |
| HOUSEHOLD DURABLES - 1.3% | | | | | | | |
| Helen of Troy 2 | | | 31,570 | | | | 2,927,802 |
| Installed Building Products | | | 15,167 | | | | 3,119,549 |
| Legacy Housing 2 | | | 97,929 | | | | 2,246,491 |
| M/I Homes 2 | | | 28,710 | | | | 3,506,639 |
| PulteGroup | | | 32,636 | | | | 3,593,224 |
| Skyline Champion 2 | | | 75,360 | | | | 5,105,640 |
| TopBuild Corp. 2 | | | 4,515 | | | | 1,739,494 |
| †Tri Pointe Homes 2 | | | 94,753 | | | | 3,529,549 |
| | | | | | | | 25,768,388 |
| LEISURE PRODUCTS - 0.4% | | | | | | | |
| Brunswick Corporation | | | 67,261 | | | | 4,894,583 |
| YETI Holdings 2 | | | 69,448 | | | | 2,649,441 |
| | | | | | | | 7,544,024 |
| SPECIALTY RETAIL - 3.4% | | | | | | | |
| Academy Sports & Outdoors | | | 92,896 | | | | 4,946,712 |
| Advance Auto Parts | | | 107,186 | | | | 6,788,089 |
| Asbury Automotive Group 2 | | | 57,809 | | | | 13,172,937 |
| Buckle (The) | | | 90,329 | | | | 3,336,753 |
| Caleres | | | 104,204 | | | | 3,501,255 |
| Destination XL Group 2 | | | 991,465 | | | | 3,608,933 |
| Murphy USA | | | 13,589 | | | | 6,379,492 |
| OneWater Marine Cl. A 2 | | | 178,016 | | | | 4,907,901 |
| Shoe Carnival | | | 152,180 | | | | 5,613,920 |
| Signet Jewelers | | | 35,557 | | | | 3,185,196 |
| Valvoline 2 | | | 174,937 | | | | 7,557,279 |
| Williams-Sonoma | | | 5,279 | | | | 1,490,631 |
| | | | | | | | 64,489,098 |
| TEXTILES, APPAREL & LUXURY GOODS - 0.5% | | | | | | | |
| Carter’s | | | 111,386 | | | | 6,902,590 |
| Kontoor Brands | | | 43,860 | | | | 2,901,339 |
| | | | | | | | 9,803,929 |
| Total (Cost $110,526,459) | | | | | | | 154,747,020 |
| | | | | | | | |
| CONSUMER STAPLES – 1.2% | | | | | | | |
| FOOD PRODUCTS - 0.5% | | | | | | | |
| Nomad Foods | | | 534,749 | | | | 8,812,664 |
| PERSONAL CARE PRODUCTS - 0.7% | | | | | | | |
| Inter Parfums | | | 112,515 | | | | 13,055,115 |
| Total (Cost $15,921,288) | | | | | | | 21,867,779 |
| | | | | | | | |
| ENERGY – 2.1% | | | | | | | |
| ENERGY EQUIPMENT & SERVICES - 1.1% | | | | | | | |
| Core Laboratories | | | 119,796 | | | | 2,430,661 |
| Helmerich & Payne | | | 94,743 | | | | 3,424,012 |
| Pason Systems | | | 1,141,896 | | | | 15,383,314 |
| | | | | | | | 21,237,987 |
| OIL, GAS & CONSUMABLE FUELS - 1.0% | | | | | | | |
| Chord Energy | | | 20,558 | | | | 3,447,165 |
| Civitas Resources | | | 50,841 | | | | 3,508,029 |
| Matador Resources | | | 58,841 | | | | 3,506,924 |
| Northern Oil & Gas | | | 5,197 | | | | 193,172 |
| SilverBow Resources 2 | | | 100,460 | | | | 3,800,402 |
| SM Energy | | | 71,960 | | | | 3,110,831 |
| | | | | | | | 17,566,523 |
| Total (Cost $27,456,030) | | | | | | | 38,804,510 |
| | | | | | | | |
| FINANCIALS – 17.5% | | | | | | | |
| BANKS - 5.5% | | | | | | | |
| †Banc of California | | | 239,318 | | | | 3,058,484 |
| Bank of N.T. Butterfield & Son | | | 190,500 | | | | 6,690,360 |
| BankUnited | | | 199,887 | | | | 5,850,693 |
| BOK Financial | | | 40,738 | | | | 3,733,230 |
| CNB Financial | | | 170,465 | | | | 3,479,191 |
| First Bancshares (The) | | | 160,741 | | | | 4,176,051 |
| First Citizens BancShares Cl. A | | | 18,024 | | | | 30,345,387 |
| First Hawaiian | | | 252,895 | | | | 5,250,100 |
| Hingham Institution for Savings | | | 21,496 | | | | 3,845,204 |
| Home BancShares | | | 215,764 | | | | 5,169,705 |
| Independent Bank Group | | | 31,045 | | | | 1,413,168 |
| Origin Bancorp | | | 187,468 | | | | 5,946,485 |
| Popular | | | 189,632 | | | | 16,769,158 |
| Timberland Bancorp | | | 80,979 | | | | 2,193,721 |
| TrustCo Bank Corp NY | | | 119,367 | | | | 3,434,189 |
| Western Alliance Bancorp | | | 42,977 | | | | 2,699,815 |
| | | | | | | | 104,054,941 |
| CAPITAL MARKETS - 6.3% | | | | | | | |
| Artisan Partners Asset Management Cl. A | | | 358,400 | | | | 14,791,168 |
| Evercore Cl. A | | | 38,270 | | | | 7,976,616 |
| GCM Grosvenor Cl. A | | | 865,058 | | | | 8,442,966 |
| Houlihan Lokey Cl. A | | | 35,247 | | | | 4,753,410 |
| Lazard | | | 133,923 | | | | 5,113,180 |
| †Marex Group 2 | | | 234,478 | | | | 4,689,560 |
| See Notes to Financial Statements | 8 |
Schedules of Investments
| Royce Small-Cap Fund (continued) | | | | | | | |
| | | | | | | | |
| | | SHARES | | | VALUE |
| | | | | | |
| FINANCIALS (continued) | | | | | | | |
| CAPITAL MARKETS (continued) | | | | | | | |
| Morningstar | | | 42,716 | | | $ | 12,637,529 |
| Onex Corporation | | | 160,000 | | | | 10,879,135 |
| Perella Weinberg Partners Cl. A | | | 57,061 | | | | 927,241 |
| SEI Investments | | | 318,732 | | | | 20,618,773 |
| Sprott | | | 244,764 | | | | 10,149,820 |
| TMX Group | | | 449,739 | | | | 12,518,593 |
| Tradeweb Markets Cl. A | | | 51,349 | | | | 5,442,994 |
| | | | | | | | 118,940,985 |
| CONSUMER FINANCE - 0.5% | | | | | | | |
| FirstCash Holdings | | | 25,560 | | | | 2,680,733 |
| goeasy | | | 31,251 | | | | 4,502,903 |
| PRA Group 2 | | | 118,066 | | | | 2,321,178 |
| | | | | | | | 9,504,814 |
| FINANCIAL SERVICES - 0.8% | | | | | | | |
| Compass Diversified Holdings | | | 99,808 | | | | 2,184,797 |
| International Money Express 2 | | | 165,469 | | | | 3,448,374 |
| NewtekOne | | | 66,966 | | | | 841,763 |
| Repay Holdings Cl. A 2 | | | 779,064 | | | | 8,226,916 |
| WEX 2 | | | 8,600 | | | | 1,523,404 |
| | | | | | | | 16,225,254 |
| INSURANCE - 4.4% | | | | | | | |
| Assured Guaranty | | | 278,494 | | | | 21,485,812 |
| Axis Capital Holdings | | | 58,026 | | | | 4,099,537 |
| Berkley (W.R.) | | | 107,152 | | | | 8,420,004 |
| E-L Financial | | | 23,618 | | | | 19,081,024 |
| International General Insurance Holdings | | | 516,386 | | | | 7,229,404 |
| RenaissanceRe Holdings | | | 33,386 | | | | 7,462,105 |
| RLI Corp. | | | 40,775 | | | | 5,736,635 |
| Safety Insurance Group | | | 40,347 | | | | 3,027,235 |
| Tiptree | | | 107,698 | | | | 1,775,940 |
| White Mountains Insurance Group | | | 2,793 | | | | 5,076,138 |
| | | | | | | | 83,393,834 |
| Total (Cost $231,904,568) | | | | | | | 332,119,828 |
| | | | | | | | |
| HEALTH CARE – 7.9% | | | | | | | |
| BIOTECHNOLOGY - 0.8% | | | | | | | |
| CareDx 2 | | | 34,191 | | | | 530,986 |
| Catalyst Pharmaceuticals 2 | | | 591,692 | | | | 9,165,309 |
| Halozyme Therapeutics 2 | | | 52,152 | | | | 2,730,679 |
| †Insmed 2 | | | 44,292 | | | | 2,967,564 |
| MeiraGTx Holdings 2 | | | 95,578 | | | | 402,383 |
| | | | | | | | 15,796,921 |
| HEALTH CARE EQUIPMENT & SUPPLIES - 4.3% | | | | | | | |
| Alphatec Holdings 2 | | | 359,035 | | | | 3,751,916 |
| AtriCure 2 | | | 24,482 | | | | 557,455 |
| Enovis Corporation 2 | | | 513,199 | | | | 23,196,595 |
| Haemonetics Corporation 2 | | | 325,036 | | | | 26,890,228 |
| Insulet Corporation 2 | | | 8,332 | | | | 1,681,398 |
| OrthoPediatrics Corp. 2 | | | 13,220 | | | | 380,207 |
| Profound Medical 2 | | | 52,098 | | | | 446,320 |
| †RxSight 2 | | | 41,660 | | | | 2,506,682 |
| Surmodics 2 | | | 42,305 | | | | 1,778,502 |
| TransMedics Group 2 | | | 141,198 | | | | 21,267,243 |
| | | | | | | | 82,456,546 |
| HEALTH CARE PROVIDERS & SERVICES - 0.5% | | | | | | | |
| Molina Healthcare 2 | | | 13,824 | | | | 4,109,875 |
| †Surgery Partners 2 | | | 211,677 | | | | 5,035,796 |
| | | | | | | | 9,145,671 |
| LIFE SCIENCES TOOLS & SERVICES - 1.9% | | | | | | | |
| Azenta 2 | | | 161,515 | | | | 8,498,919 |
| BioLife Solutions 2 | | | 155,235 | | | | 3,326,686 |
| Bio-Techne | | | 139,376 | | | | 9,986,291 |
| Harvard Bioscience 2 | | | 163,620 | | | | 466,317 |
| Maravai LifeSciences Holdings Cl. A 2 | | | 175,556 | | | | 1,256,981 |
| Mesa Laboratories | | | 121,051 | | | | 10,503,595 |
| Quanterix Corporation 2,4 | | | 16,148 | | | | 213,315 |
| Stevanato Group | | | 119,766 | | | | 2,196,509 |
| | | | | | | | 36,448,613 |
| PHARMACEUTICALS - 0.4% | | | | | | | |
| Collegium Pharmaceutical 2,4 | | | 101,892 | | | | 3,280,922 |
| SIGA Technologies | | | 421,874 | | | | 3,202,024 |
| | | | | | | | 6,482,946 |
| Total (Cost $136,112,949) | | | | | | | 150,330,697 |
| | | | | | | | |
| INDUSTRIALS – 26.5% | | | | | | | |
| AEROSPACE & DEFENSE - 1.3% | | | | | | | |
| HEICO Corporation | | | 61,618 | | | | 13,778,401 |
| Leonardo DRS 2 | | | 422,902 | | | | 10,788,230 |
| | | | | | | | 24,566,631 |
| AIR FREIGHT & LOGISTICS - 0.4% | | | | | | | |
| Hub Group Cl. A | | | 190,212 | | | | 8,188,626 |
| BUILDING PRODUCTS - 2.5% | | | | | | | |
| Builders FirstSource 2 | | | 93,221 | | | | 12,902,719 |
| Carlisle Companies | | | 12,178 | | | | 4,934,647 |
| CSW Industrials | | | 9,200 | | | | 2,440,852 |
| Janus International Group 2 | | | 290,662 | | | | 3,671,061 |
| Quanex Building Products | | | 131,597 | | | | 3,638,657 |
| Simpson Manufacturing | | | 51,035 | | | | 8,600,929 |
| UFP Industries | | | 106,170 | | | | 11,891,040 |
| | | | | | | | 48,079,905 |
| COMMERCIAL SERVICES & SUPPLIES - 0.9% | | | | | | | |
| Brady Corporation Cl. A | | | 64,769 | | | | 4,276,049 |
| Healthcare Services Group 2 | | | 574,379 | | | | 6,076,930 |
| Montrose Environmental Group 2 | | | 56,434 | | | | 2,514,699 |
| RB Global | | | 45,619 | | | | 3,483,467 |
| †Vestis Corporation | | | 116,086 | | | | 1,419,732 |
| | | | | | | | 17,770,877 |
| CONSTRUCTION & ENGINEERING - 3.3% | | | | | | | |
| Arcosa | | | 401,057 | | | | 33,452,164 |
| Comfort Systems USA | | | 6,946 | | | | 2,112,418 |
| Construction Partners Cl. A 2 | | | 133,067 | | | | 7,346,629 |
| EMCOR Group | | | 12,807 | | | | 4,675,580 |
| Northwest Pipe 2 | | | 36,303 | | | | 1,233,213 |
| Valmont Industries | | | 40,416 | | | | 11,092,171 |
| WillScot Mobile Mini Holdings Corp. 2 | | | 67,458 | | | | 2,539,119 |
| | | | | | | | 62,451,294 |
| ELECTRICAL EQUIPMENT - 1.8% | | | | | | | |
| American Superconductor 2 | | | 93,326 | | | | 2,182,895 |
| Atkore | | | 36,959 | | | | 4,986,878 |
| Encore Wire | | | 19,189 | | | | 5,561,548 |
| †nVent Electric | | | 46,910 | | | | 3,593,775 |
| Preformed Line Products | | | 101,976 | | | | 12,700,091 |
| Vertiv Holdings Cl. A | | | 46,668 | | | | 4,040,049 |
| | | | | | | | 33,065,236 |
| GROUND TRANSPORTATION - 0.8% | | | | | | | |
| ArcBest Corporation | | | 31,810 | | | | 3,406,215 |
| Landstar System | | | 56,312 | | | | 10,388,438 |
| See Notes to Financial Statements | 9 |
June 30, 2024 (unaudited)
| Royce Small-Cap Fund (continued) | | | | | | | |
| | | | | | | | |
| | | SHARES | | | VALUE |
| | | | | | | | |
| INDUSTRIALS (continued) | | | | | | | |
| GROUND TRANSPORTATION (continued) | | | | | | | |
| Schneider National Cl. B | | | 22,007 | | | $ | 531,689 |
| | | | | | | | 14,326,342 |
| MACHINERY - 7.0% | | | | | |
| Allison Transmission Holdings | | | 50,788 | | | | 3,854,809 |
| Atmus Filtration Technologies 2 | | | 310,724 | | | | 8,942,637 |
| Chart Industries 2,4 | | | 7,875 | | | | 1,136,678 |
| Enpro | | | 90,860 | | | | 13,226,490 |
| ESAB Corporation | | | 154,035 | | | | 14,545,525 |
| ESCO Technologies | | | 117,304 | | | | 12,321,612 |
| Graham Corporation 2 | | | 91,849 | | | | 2,586,468 |
| Helios Technologies | | | 55,536 | | | | 2,651,844 |
| John Bean Technologies | | | 161,933 | | | | 15,378,777 |
| Kadant | | | 46,851 | | | | 13,763,887 |
| Lincoln Electric Holdings | | | 56,716 | | | | 10,698,906 |
| Lindsay Corporation | | | 63,420 | | | | 7,793,050 |
| Miller Industries | | | 177,468 | | | | 9,764,289 |
| Mueller Industries | | | 5,000 | | | | 284,700 |
| RBC Bearings 2 | | | 37,430 | | | | 10,097,865 |
| †Terex Corporation | | | 59,125 | | | | 3,242,415 |
| Wabash National | | | 154,981 | | | | 3,384,785 |
| Westport Fuel Systems 2,4 | | | 11,598 | | | | 64,601 |
| | | | | | | | 133,739,338 |
| MARINE TRANSPORTATION - 1.1% | | | | | | | |
| Clarkson 1 | | | 30,004 | | | | 1,570,915 |
| Genco Shipping & Trading | | | 101,158 | | | | 2,155,677 |
| Kirby Corporation 2 | | | 144,699 | | | | 17,324,811 |
| | | | | | | | 21,051,403 |
| PASSENGER AIRLINES - 0.1% | | | | | | | |
| Sun Country Airlines Holdings 2 | | | 194,570 | | | | 2,443,799 |
| PROFESSIONAL SERVICES - 2.8% | | | | | | | |
| Barrett Business Services | | | 95,037 | | | | 3,114,363 |
| CBIZ 2 | | | 90,716 | | | | 6,722,056 |
| Dun & Bradstreet Holdings | | | 504,048 | | | | 4,667,484 |
| Exponent | | | 34,363 | | | | 3,268,609 |
| Forrester Research 2 | | | 471,040 | | | | 8,045,363 |
| IBEX 2,4 | | | 241,873 | | | | 3,913,505 |
| KBR | | | 238,957 | | | | 15,326,702 |
| Korn Ferry | | | 116,610 | | | | 7,829,195 |
| NV5 Global 2 | | | 10,870 | | | | 1,010,584 |
| | | | | | | | 53,897,861 |
| TRADING COMPANIES & DISTRIBUTORS - 4.5% | | | | | | | |
| Air Lease Cl. A | | | 628,222 | | | | 29,859,392 |
| Applied Industrial Technologies | | | 60,190 | | | | 11,676,860 |
| Distribution Solutions Group 2 | | | 108,002 | | | | 3,240,060 |
| EVI Industries | | | 342,790 | | | | 6,485,587 |
| FTAI Aviation | | | 22,553 | | | | 2,328,146 |
| MSC Industrial Direct Cl. A | | | 30,432 | | | | 2,413,562 |
| Richelieu Hardware | | | 292,057 | | | | 8,793,412 |
| †SiteOne Landscape Supply 2,4 | | | 585 | | | | 71,025 |
| Transcat 2 | | | 134,918 | | | | 16,146,986 |
| WESCO International | | | 22,329 | | | | 3,539,593 |
| | | | | | | | 84,554,623 |
| Total (Cost $290,825,701) | | | | | | | 504,135,935 |
| | | | | | | | |
| INFORMATION TECHNOLOGY – 21.9% | | | | | | | |
| COMMUNICATIONS EQUIPMENT - 0.7% | | | | | | | |
| Aviat Networks 2 | | | 110,513 | | | | 3,170,618 |
| Calix 2 | | | 2,234 | | | | 79,151 |
| Digi International 2 | | | 261,424 | | | | 5,994,452 |
| Harmonic 2 | | | 279,071 | | | | 3,284,666 |
| | | | | | | | 12,528,887 |
| ELECTRONIC EQUIPMENT, INSTRUMENTS & COMPONENTS - 8.7% | | | | | | | |
| Bel Fuse Cl. B | | | 40,725 | | | | 2,656,899 |
| Cognex Corporation | | | 340,069 | | | | 15,901,626 |
| Coherent Corp. 2 | | | 125,605 | | | | 9,101,338 |
| Crane NXT | | | 89,640 | | | | 5,505,689 |
| ePlus 2 | | | 43,940 | | | | 3,237,499 |
| Fabrinet 2 | | | 84,273 | | | | 20,629,188 |
| FARO Technologies 2 | | | 31,712 | | | | 507,392 |
| Flex 2 | | | 99,926 | | | | 2,946,818 |
| Jabil | | | 27,505 | | | | 2,992,269 |
| Kimball Electronics 2 | | | 256,185 | | | | 5,630,946 |
| Littelfuse | | | 39,664 | | | | 10,137,722 |
| Luna Innovations 2 | | | 654,362 | | | | 2,093,958 |
| NAPCO Security Technologies | | | 180,000 | | | | 9,351,000 |
| nLIGHT 2 | | | 318,154 | | | | 3,477,423 |
| PAR Technology 2 | | | 355,975 | | | | 16,762,863 |
| Powerfleet NJ 2,4 | | | 910,774 | | | | 4,162,237 |
| Rogers Corporation 2 | | | 131,355 | | | | 15,842,727 |
| Sanmina Corporation 2 | | | 58,087 | | | | 3,848,264 |
| TD SYNNEX | | | 30,211 | | | | 3,486,349 |
| Teledyne Technologies 2 | | | 8,140 | | | | 3,158,157 |
| †Trimble 2 | | | 13,300 | | | | 743,736 |
| Vishay Intertechnology | | | 119,355 | | | | 2,661,617 |
| Vishay Precision Group 2 | | | 141,374 | | | | 4,303,425 |
| Vontier Corporation | | | 442,512 | | | | 16,903,958 |
| | | | | | | | 166,043,100 |
| IT SERVICES - 0.6% | | | | | | | |
| Hackett Group (The) | | | 142,345 | | | | 3,091,733 |
| Kyndryl Holdings 2 | | | 344,597 | | | | 9,066,347 |
| | | | | | | | 12,158,080 |
| SEMICONDUCTORS & SEMICONDUCTOR EQUIPMENT - 8.8% | | | | | | | |
| †Allegro MicroSystems 2 | | | 48,341 | | | | 1,365,150 |
| Amkor Technology | | | 76,149 | | | | 3,047,483 |
| Axcelis Technologies 2 | | | 34,817 | | | | 4,950,629 |
| Camtek | | | 81,136 | | | | 10,161,473 |
| Cirrus Logic 2 | | | 175,602 | | | | 22,417,351 |
| Cohu 2 | | | 149,206 | | | | 4,938,719 |
| Diodes 2 | | | 77,596 | | | | 5,581,480 |
| FormFactor 2 | | | 285,178 | | | | 17,261,824 |
| Ichor Holdings 2 | | | 32,701 | | | | 1,260,624 |
| Impinj 2 | | | 69,330 | | | | 10,868,864 |
| Kulicke & Soffa Industries | | | 107,192 | | | | 5,272,775 |
| MKS Instruments | | | 102,025 | | | | 13,322,425 |
| Nova 2 | | | 49,448 | | | | 11,597,039 |
| NVE Corporation | | | 25,461 | | | | 1,901,682 |
| Onto Innovation 2 | | | 119,746 | | | | 26,291,432 |
| Photronics 2 | | | 132,417 | | | | 3,266,727 |
| Rambus 2 | | | 91,953 | | | | 5,403,158 |
| Silicon Motion Technology ADR | | | 66,382 | | | | 5,376,278 |
| SiTime Corporation 2 | | | 32,186 | | | | 4,003,295 |
| Synaptics 2 | | | 16,727 | | | | 1,475,321 |
| Ultra Clean Holdings 2 | | | 157,588 | | | | 7,721,812 |
| | | | | | | | 167,485,541 |
| SOFTWARE - 3.0% | | | | | | | |
| Agilysys 2 | | | 95,768 | | | | 9,973,279 |
| Alkami Technology 2 | | | 103,766 | | | | 2,955,256 |
| Computer Modelling Group | | | 2,393,592 | | | | 23,077,723 |
| See Notes to Financial Statements | 10 |
Schedules of Investments
| Royce Small-Cap Fund (continued) | | | | | | | |
| | | | | | | | |
| | | SHARES | | | VALUE |
| | | | | | |
| INFORMATION TECHNOLOGY (continued) | | | | | | | |
| SOFTWARE (continued) | | | | | | | |
| Dolby Laboratories Cl. A | | | 63,720 | | | $ | 5,048,536 |
| Five9 2 | | | 50,041 | | | | 2,206,808 |
| †Intapp 2 | | | 56,338 | | | | 2,065,914 |
| †JFrog 2 | | | 85,985 | | | | 3,228,737 |
| PROS Holdings 2 | | | 69,346 | | | | 1,986,763 |
| Q2 Holdings 2,4 | | | 3,850 | | | | 232,270 |
| Sapiens International | | | 81,247 | | | | 2,756,711 |
| Teradata Corporation 2 | | | 100,306 | | | | 3,466,575 |
| | | | | | | | 56,998,572 |
| TECHNOLOGY HARDWARE, STORAGE & PERIPHERALS - 0.1% | | | | | | | |
| AstroNova 2 | | | 81,672 | | | | 1,261,016 |
| Total (Cost $243,832,486) | | | | | | | 416,475,196 |
| | | | | | | | |
| MATERIALS – 7.4% | | | | | | | |
| CHEMICALS - 4.5% | | | | | | | |
| Aspen Aerogels 2 | | | 117,172 | | | | 2,794,552 |
| Element Solutions | | | 1,037,902 | | | | 28,147,902 |
| Ingevity Corporation 2 | | | 186,842 | | | | 8,166,864 |
| Innospec | | | 166,937 | | | | 20,631,744 |
| Minerals Technologies | | | 156,838 | | | | 13,042,648 |
| Quaker Houghton | | | 71,196 | | | | 12,081,961 |
| | | | | | | | 84,865,671 |
| CONTAINERS & PACKAGING - 0.2% | | | | | | | |
| Graphic Packaging Holding Company | | | 48,964 | | | | 1,283,346 |
| Silgan Holdings | | | 62,250 | | | | 2,635,043 |
| | | | | | | | 3,918,389 |
| METALS & MINING - 1.8% | | | | | | | |
| Alamos Gold Cl. A | | | 1,393,592 | | | | 21,860,666 |
| Major Drilling Group International 2 | | | 285,000 | | | | 1,891,598 |
| Materion Corporation | | | 50,000 | | | | 5,406,500 |
| Reliance | | | 15,160 | | | | 4,329,696 |
| | | | | | | | 33,488,460 |
| PAPER & FOREST PRODUCTS - 0.9% | | | | | | | |
| Louisiana-Pacific | | | 52,815 | | | | 4,348,259 |
| Stella-Jones | | | 208,572 | | | | 13,610,045 |
| | | | | | | | 17,958,304 |
| Total (Cost $63,622,686) | | | | | | | 140,230,824 |
| | | | | | | | |
| REAL ESTATE – 2.2% | | | | | | | |
| REAL ESTATE MANAGEMENT & DEVELOPMENT - 2.2% | | | | | | | |
| Colliers International Group | | | 43,489 | | | | 4,855,547 |
| DigitalBridge Group Cl. A | | | 38,263 | | | | 524,203 |
| FirstService Corporation | | | 48,380 | | | | 7,371,661 |
| FRP Holdings 2 | | | 172,446 | | | | 4,918,160 |
| Kennedy-Wilson Holdings | | | 1,325,854 | | | | 12,887,301 |
| Marcus & Millichap | | | 247,297 | | | | 7,794,801 |
| RMR Group (The) Cl. A | | | 139,685 | | | | 3,156,881 |
| Total (Cost $41,189,851) | | | | | | | 41,508,554 |
| | | | | | | | |
| TOTAL COMMON STOCKS | | | | | | | |
| (Cost $1,219,144,805) | | | | | | | 1,846,562,596 |
| | | | | | |
| REPURCHASE AGREEMENT– 2.6% | | | | | |
Fixed Income Clearing Corporation, 4.75% dated 6/28/24, due 7/1/24, maturity value
$50,220,466 (collateralized by obligations of various U.S. Government Agencies, 0.125%-0.50%
due 4/15/27-01/15/28, valued at $51,204,702) |
| (Cost $50,200,595) | | | | | | | 50,200,595 |
| | | | | | | | |
| COLLATERAL RECEIVED FOR SECURITIES LOANED – 0.0% | | | | | | | |
| Money Market Funds | | | | | | | |
| Federated Hermes Government Obligations Fund - Institutional Shares (7 day yield-5.18%) | | | | | | | |
| (Cost $552,173) | | | 552,173 | | | | 552,173 |
| | | | | | | | |
| TOTAL INVESTMENTS – 99.8% | | | | | | | |
| (Cost $1,269,897,573) | | | | | | | 1,897,315,364 |
| | | | | | | | |
| CASH AND OTHER ASSETS LESS LIABILITIES – 0.2% | | | | | | | 3,418,916 |
| | | | | | | | |
| NET ASSETS – 100.0% | | | | | | $ | 1,900,734,280 |
| See Notes to Financial Statements | 11 |
June 30, 2024 (unaudited)
Royce Small-Cap Opportunity Fund
Common Stocks — 98.0%
| | | SHARES | | | VALUE |
| | | | | | |
| COMMUNICATION SERVICES – 5.2% | | | | | | | |
| ENTERTAINMENT - 0.6% | | | | | | | |
| IMAX Corporation 2 | | | 238,784 | | | $ | 4,004,408 |
| Lions Gate Entertainment Cl. A 2 | | | 372,026 | | | | 3,504,485 |
| | | | | | | | 7,508,893 |
| INTERACTIVE MEDIA & SERVICES - 2.8% | | | | | | | |
| Cars.com 2 | | | 303,362 | | | | 5,976,231 |
| DHI Group 2 | | | 1,639,263 | | | | 3,426,060 |
| EverQuote Cl. A 2 | | | 413,942 | | | | 8,634,830 |
| IAC 2 | | | 161,298 | | | | 7,556,811 |
| QuinStreet 2 | | | 552,066 | | | | 9,158,775 |
| | | | | | | | 34,752,707 |
| MEDIA - 1.8% | | | | | | | |
| comScore 2,4 | | | 59,910 | | | | 850,123 |
| Criteo ADR 2 | | | 205,708 | | | | 7,759,306 |
| Innovid Corp. 2 | | | 1,720,062 | | | | 3,182,115 |
| Magnite 2 | | | 488,050 | | | | 6,486,184 |
| Thryv Holdings 2 | | | 244,548 | | | | 4,357,845 |
| | | | | | | | 22,635,573 |
| Total (Cost $58,727,806) | | | | | | | 64,897,173 |
| | | | | | | | |
| CONSUMER DISCRETIONARY – 13.3% | | | | | | | |
| AUTOMOBILE COMPONENTS - 3.7% | | | | | | | |
| †Fox Factory Holding 2 | | | 143,539 | | | | 6,917,145 |
| Garrett Motion 2 | | | 939,232 | | | | 8,068,003 |
| Gentherm 2 | | | 127,892 | | | | 6,307,634 |
| Goodyear Tire & Rubber 2 | | | 182,961 | | | | 2,076,607 |
| Modine Manufacturing 2 | | | 82,658 | | | | 8,281,505 |
| Patrick Industries | | | 53,346 | | | | 5,790,708 |
| Stoneridge 2 | | | 522,893 | | | | 8,345,372 |
| | | | | | | | 45,786,974 |
| BROADLINE RETAIL - 1.4% | | | | | | | |
| Dillard's Cl. A | | | 19,610 | | | | 8,636,048 |
| Nordstrom | | | 386,147 | | | | 8,194,039 |
| | | | | | | | 16,830,087 |
| DIVERSIFIED CONSUMER SERVICES - 0.4% | | | | | | | |
| Udemy 2 | | | 568,907 | | | | 4,909,668 |
| HOTELS, RESTAURANTS & LEISURE - 0.3% | | | | | | | |
| Century Casinos 2 | | | 427,984 | | | | 1,185,516 |
| Noodles & Company Cl. A 2 | | | 1,528,494 | | | | 2,415,020 |
| | | | | | | | 3,600,536 |
| HOUSEHOLD DURABLES - 2.9% | | | | | | | |
| Beazer Homes USA 2 | | | 111,402 | | | | 3,061,327 |
| Cavco Industries 2 | | | 17,654 | | | | 6,111,285 |
| Century Communities | | | 38,776 | | | | 3,166,448 |
| M/I Homes 2 | | | 27,877 | | | | 3,404,897 |
| Skyline Champion 2 | | | 102,597 | | | | 6,950,947 |
| Taylor Morrison Home 2 | | | 97,773 | | | | 5,420,535 |
| Toll Brothers | | | 34,382 | | | | 3,960,119 |
| Tri Pointe Homes 2 | | | 108,950 | | | | 4,058,387 |
| | | | | | | | 36,133,945 |
| SPECIALTY RETAIL - 3.1% | | | | | | | |
| †Advance Auto Parts | | | 65,317 | | | | 4,136,525 |
| Asbury Automotive Group 2 | | | 16,372 | | | | 3,730,688 |
| Beyond 2 | | | 217,496 | | | | 2,844,848 |
| Caleres | | | 163,998 | | | | 5,510,333 |
| Designer Brands Cl. A | | | 396,914 | | | | 2,710,923 |
| J.Jill | | | 184,365 | | | | 6,447,244 |
| MarineMax 2 | | | 154,470 | | | | 5,000,194 |
| OneWater Marine Cl. A 2 | | | 192,907 | | | | 5,318,446 |
| Victoria's Secret & Co. 2,4 | | | 156,753 | | | | 2,769,825 |
| | | | | | | | 38,469,026 |
| TEXTILES, APPAREL & LUXURY GOODS - 1.5% | | | | | | | |
| Lakeland Industries 5 | | | 433,360 | | | | 9,941,278 |
| Rocky Brands | | | 150,699 | | | | 5,569,835 |
| Vera Bradley 2 | | | 541,979 | | | | 3,392,789 |
| | | | | | | | 18,903,902 |
| Total (Cost $128,485,354) | | | | | | | 164,634,138 |
| | | | | | | | |
| CONSUMER STAPLES – 1.2% | | | | | | | |
| FOOD PRODUCTS - 0.4% | | | | | | | |
| SunOpta 2 | | | 860,051 | | | | 4,644,276 |
| HOUSEHOLD PRODUCTS - 0.5% | | | | | | | |
| Spectrum Brands Holdings | | | 72,610 | | | | 6,239,377 |
| PERSONAL CARE PRODUCTS - 0.3% | | | | | | | |
| Inter Parfums | | | 31,346 | | | | 3,637,076 |
| Total (Cost $12,919,242) | | | | | | | 14,520,729 |
| | | | | | | | |
| ENERGY – 7.6% | | | | | | | |
| ENERGY EQUIPMENT & SERVICES - 3.7% | | | | | | | |
| Archrock | | | 268,696 | | | | 5,433,033 |
| DMC Global 2 | | | 218,214 | | | | 3,146,646 |
| Mammoth Energy Services 2 | | | 718,638 | | | | 2,357,133 |
| Newpark Resources 2 | | | 725,154 | | | | 6,026,030 |
| Patterson-UTI Energy | | | 492,596 | | | | 5,103,294 |
| ProPetro Holding Corp. 2 | | | 362,201 | | | | 3,140,283 |
| Ranger Energy Services Cl. A | | | 427,602 | | | | 4,498,373 |
| Select Water Solutions Cl. A | | | 917,943 | | | | 9,821,990 |
| Solaris Oilfield Infrastructure Cl. A | | | 760,180 | | | | 6,522,344 |
| | | | | | | | 46,049,126 |
| OIL, GAS & CONSUMABLE FUELS - 3.9% | | | | | | | |
| Ardmore Shipping | | | 414,552 | | | | 9,339,857 |
| Baytex Energy | | | 1,506,617 | | | | 5,243,027 |
| Comstock Resources 2 | | | 233,613 | | | | 2,424,903 |
| Matador Resources | | | 96,393 | | | | 5,745,023 |
| Navigator Holdings | | | 434,282 | | | | 7,582,564 |
| Northern Oil & Gas | | | 175,173 | | | | 6,511,180 |
| †SandRidge Energy | | | 94,538 | | | | 1,222,376 |
| Scorpio Tankers | | | 97,423 | | | | 7,919,516 |
| Southwestern Energy 2 | | | 354,187 | | | | 2,383,678 |
| | | | | | | | 48,372,124 |
| Total (Cost $65,225,901) | | | | | | | 94,421,250 |
| | | | | | | | |
| FINANCIALS – 7.6% | | | | | | | |
| BANKS - 3.0% | | | | | | | |
| Axos Financial 2 | | | 61,298 | | | | 3,503,181 |
| BankUnited | | | 168,469 | | | | 4,931,088 |
| BayCom Corp. | | | 168,028 | | | | 3,419,370 |
| Business First Bancshares | | | 214,048 | | | | 4,657,684 |
| Customers Bancorp 2 | | | 99,661 | | | | 4,781,735 |
| First Bancshares (The) | | | 129,228 | | | | 3,357,343 |
| First Foundation | | | 169,900 | | | | 1,112,845 |
| Hilltop Holdings | | | 155,974 | | | | 4,878,867 |
| Seacoast Banking Corporation of Florida | | | 152,640 | | | | 3,608,409 |
| Western Alliance Bancorp | | | 56,757 | | | | 3,565,475 |
| | | | | | | | 37,815,997 |
| CAPITAL MARKETS - 2.7% | | | | | | | |
| Artisan Partners Asset Management Cl. A | | | 123,348 | | | | 5,090,572 |
| †Bridge Investment Group Holdings Cl. A | | | 400,023 | | | | 2,968,171 |
| See Notes to Financial Statements | 12 |
Schedules of Investments
Royce Small-Cap Opportunity Fund (continued)
| | | SHARES | | | VALUE |
| | | | | | |
| FINANCIALS (continued) | | | | | | | |
| CAPITAL MARKETS (continued) | | | | | | | |
| Canaccord Genuity Group | | | 1,111,241 | | | $ | 6,871,897 |
| GCM Grosvenor Cl. A | | | 508,268 | | | | 4,960,696 |
| Moelis & Company Cl. A | | | 98,307 | | | | 5,589,736 |
| Perella Weinberg Partners Cl. A | | | 467,465 | | | | 7,596,306 |
| | | | | | | | 33,077,378 |
| FINANCIAL SERVICES - 1.3% | | | | | | | |
| Acacia Research 2 | | | 506,381 | | | | 2,536,969 |
| †I3 Verticals Cl. A 2 | | | 266,986 | | | | 5,895,051 |
| †Repay Holdings Cl. A 2 | | | 342,223 | | | | 3,613,875 |
| Walker & Dunlop | | | 47,641 | | | | 4,678,346 |
| | | | | | | | 16,724,241 |
| INSURANCE - 0.6% | | | | | | | |
| Brighthouse Financial 2 | | | 162,712 | | | | 7,051,938 |
| Total (Cost $79,369,769) | | | | | | | 94,669,554 |
| | | | | | | | |
| HEALTH CARE – 6.8% | | | | | | | |
| BIOTECHNOLOGY - 0.3% | | | | | | | |
| MiMedx Group 2 | | | 557,046 | | | | 3,860,329 |
| HEALTH CARE EQUIPMENT & SUPPLIES - 2.3% | | | | | | | |
| Accuray 2 | | | 1,758,124 | | | | 3,199,786 |
| AngioDynamics 2 | | | 532,092 | | | | 3,219,157 |
| Apyx Medical 2,4 | | | 996,696 | | | | 1,335,573 |
| Artivion 2 | | | 424,467 | | | | 10,887,578 |
| Tactile Systems Technology 2 | | | 361,116 | | | | 4,311,725 |
| Varex Imaging 2 | | | 329,796 | | | | 4,857,895 |
| | | | | | | | 27,811,714 |
| HEALTH CARE PROVIDERS & SERVICES - 2.5% | | | | | | | |
| †AdaptHealth Corp. 2 | | | 417,821 | | | | 4,178,210 |
| Community Health Systems 2 | | | 818,621 | | | | 2,750,566 |
| Cross Country Healthcare 2 | | | 312,340 | | | | 4,322,786 |
| NeoGenomics 2 | | | 377,999 | | | | 5,242,846 |
| Quipt Home Medical 2 | | | 931,925 | | | | 3,000,798 |
| RadNet 2 | | | 103,802 | | | | 6,116,014 |
| Select Medical Holdings | | | 150,627 | | | | 5,280,983 |
| | | | | | | | 30,892,203 |
| HEALTH CARE TECHNOLOGY - 0.3% | | | | | | | |
| LifeMD 2 | | | 479,626 | | | | 3,290,234 |
| LIFE SCIENCES TOOLS & SERVICES - 0.5% | | | | | | | |
| Azenta 2 | | | 122,987 | | | | 6,471,576 |
| PHARMACEUTICALS - 0.9% | | | | | | | |
| †Harrow 2,4 | | | 137,130 | | | | 2,864,646 |
| Organon & Co | | | 407,968 | | | | 8,444,937 |
| | | | | | | | 11,309,583 |
| Total (Cost $74,733,097) | | | | | | | 83,635,639 |
| | | | | | | | |
| INDUSTRIALS – 28.2% | | | | | | | |
| AEROSPACE & DEFENSE - 5.6% | | | | | | | |
| AAR Corp. 2 | | | 136,478 | | | | 9,921,951 |
| Astronics Corporation 2 | | | 433,171 | | | | 8,676,415 |
| BWX Technologies | | | 71,402 | | | | 6,783,190 |
| Ducommun 2 | | | 141,129 | | | | 8,193,950 |
| Kratos Defense & Security Solutions 2 | | | 375,157 | | | | 7,506,891 |
| Leonardo DRS 2 | | | 362,950 | | | | 9,258,854 |
| Mercury Systems 2 | | | 134,331 | | | | 3,625,594 |
| Triumph Group 2 | | | 614,597 | | | | 9,470,940 |
| V2X 2 | | | 127,907 | | | | 6,134,420 |
| | | | | | | | 69,572,205 |
| AIR FREIGHT & LOGISTICS - 1.0% | | | | | | | |
| Hub Group Cl. A | | | 186,198 | | | | 8,015,824 |
| Radiant Logistics 2 | | | 804,231 | | | | 4,576,074 |
| | | | | | | | 12,591,898 |
| BUILDING PRODUCTS - 1.3% | | | | | | | |
| Gibraltar Industries 2 | | | 83,717 | | | | 5,738,800 |
| Insteel Industries | | | 150,161 | | | | 4,648,985 |
| Resideo Technologies 2 | | | 275,264 | | | | 5,384,164 |
| | | | | | | | 15,771,949 |
| COMMERCIAL SERVICES & SUPPLIES - 2.9% | | | | | | | |
| ACV Auctions Cl. A 2 | | | 307,617 | | | | 5,614,010 |
| CECO Environmental 2 | | | 392,072 | | | | 11,311,277 |
| Healthcare Services Group 2 | | | 777,093 | | | | 8,221,644 |
| VSE Corporation | | | 116,969 | | | | 10,326,024 |
| | | | | | | | 35,472,955 |
| CONSTRUCTION & ENGINEERING - 4.3% | | | | | | | |
| Arcosa | | | 29,100 | | | | 2,427,231 |
| Argan | | | 83,659 | | | | 6,120,492 |
| Concrete Pumping Holdings 2 | | | 530,666 | | | | 3,189,303 |
| Construction Partners Cl. A 2 | | | 68,056 | | | | 3,757,372 |
| Limbach Holdings 2 | | | 73,678 | | | | 4,194,488 |
| Matrix Service 2 | | | 427,163 | | | | 4,241,729 |
| Northwest Pipe 2 | | | 256,280 | | | | 8,705,832 |
| Orion Group Holdings 2 | | | 940,998 | | | | 8,948,891 |
| Primoris Services | | | 183,510 | | | | 9,155,314 |
| Sterling Infrastructure 2 | | | 25,245 | | | | 2,987,493 |
| | | | | | | | 53,728,145 |
| ELECTRICAL EQUIPMENT - 0.7% | | | | | | | |
| American Superconductor 2 | | | 319,710 | | | | 7,478,017 |
| Babcock & Wilcox Enterprises 2 | | | 1,054,826 | | | | 1,529,497 |
| | | | | | | | 9,007,514 |
| MACHINERY - 5.6% | | | | | | | |
| †Ag Growth International | | | 82,278 | | | | 3,158,686 |
| Chart Industries 2,4 | | | 62,967 | | | | 9,088,657 |
| Commercial Vehicle Group 2 | | | 1,005,614 | | | | 4,927,509 |
| Enpro | | | 34,130 | | | | 4,968,304 |
| Evercel 2,3 | | | 203,243 | | | | 152,432 |
| Helios Technologies | | | 115,965 | | | | 5,537,329 |
| Hurco Companies | | | 14,489 | | | | 221,102 |
| Luxfer Holdings | | | 481,745 | | | | 5,583,425 |
| Manitex International 2,5 | | | 1,023,026 | | | | 4,532,005 |
| Mayville Engineering 2 | | | 403,306 | | | | 6,719,078 |
| Shyft Group (The) | | | 376,147 | | | | 4,461,103 |
| Terex Corporation | | | 61,447 | | | | 3,369,753 |
| Trinity Industries | | | 207,191 | | | | 6,199,155 |
| Twin Disc | | | 240,609 | | | | 2,834,374 |
| Wabash National | | | 343,288 | | | | 7,497,410 |
| | | | | | | | 69,250,322 |
| PASSENGER AIRLINES - 0.2% | | | | | | | |
| Allegiant Travel | | | 41,915 | | | | 2,105,390 |
| PROFESSIONAL SERVICES - 3.6% | | | | | | | |
| Conduent 2 | | | 1,191,150 | | | | 3,883,149 |
| Korn Ferry | | | 126,830 | | | | 8,515,366 |
| Mistras Group 2 | | | 922,007 | | | | 7,643,438 |
| Resources Connection | | | 491,595 | | | | 5,427,209 |
| †TaskUs Cl. A 2 | | | 373,057 | | | | 4,965,389 |
| TrueBlue 2 | | | 361,004 | | | | 3,718,341 |
| TTEC Holdings | | | 272,113 | | | | 1,600,024 |
| WNS (Holdings) 2 | | | 171,973 | | | | 9,028,583 |
| | | | | | | | 44,781,499 |
| See Notes to Financial Statements | 13 |
June 30, 2024 (unaudited)
Royce Small-Cap Opportunity Fund (continued)
| | | SHARES | | | VALUE |
| | | | | | |
| INDUSTRIALS (continued) | | | | | | | |
| TRADING COMPANIES & DISTRIBUTORS - 3.0% | | | | | | | |
| Air Lease Cl. A | | | 162,581 | | | $ | 7,727,475 |
| DNOW 2,4 | | | 341,275 | | | | 4,685,706 |
| Herc Holdings | | | 41,727 | | | | 5,561,792 |
| Hudson Technologies 2 | | | 451,046 | | | | 3,964,694 |
| MRC Global 2 | | | 555,993 | | | | 7,177,870 |
| WESCO International | | | 49,687 | | | | 7,876,383 |
| | | | | | | | 36,993,920 |
| Total (Cost $278,955,811) | | | | | | | 349,275,797 |
| | | | | | | | |
| INFORMATION TECHNOLOGY – 21.0% | | | | | | | |
| COMMUNICATIONS EQUIPMENT - 2.6% | | | | | | | |
| Applied Optoelectronics 2 | | | 458,370 | | | | 3,799,887 |
| Aviat Networks 2 | | | 209,732 | | | | 6,017,211 |
| Clearfield 2 | | | 173,893 | | | | 6,705,314 |
| Digi International 2 | | | 316,636 | | | | 7,260,464 |
| DZS 2,4 | | | 777,577 | | | | 909,765 |
| Infinera Corporation 2,4 | | | 577,567 | | | | 3,517,383 |
| Ribbon Communications 2 | | | 1,307,279 | | | | 4,300,948 |
| | | | | | | | 32,510,972 |
| ELECTRONIC EQUIPMENT, INSTRUMENTS & COMPONENTS - 6.8% | | | | | | | |
| Advanced Energy Industries | | | 46,222 | | | | 5,027,105 |
| Arlo Technologies 2,4 | | | 727,872 | | | | 9,491,451 |
| Benchmark Electronics | | | 144,922 | | | | 5,718,622 |
| Coherent Corp. 2 | | | 119,930 | | | | 8,690,128 |
| CTS Corporation | | | 155,835 | | | | 7,889,926 |
| Fabrinet 2 | | | 12,838 | | | | 3,142,614 |
| †FARO Technologies 2 | | | 342,541 | | | | 5,480,656 |
| Frequency Electronics 2 | | | 98,451 | | | | 896,888 |
| Identiv 2 | | | 757,524 | | | | 3,257,353 |
| IPG Photonics 2 | | | 85,120 | | | | 7,183,277 |
| Knowles Corporation 2,4 | | | 507,015 | | | | 8,751,079 |
| nLIGHT 2 | | | 625,197 | | | | 6,833,403 |
| SmartRent Cl. A 2 | | | 1,313,649 | | | | 3,139,621 |
| Vishay Intertechnology | | | 199,879 | | | | 4,457,302 |
| Vishay Precision Group 2 | | | 125,119 | | | | 3,808,622 |
| | | | | | | | 83,768,047 |
| IT SERVICES - 1.5% | | | | | | | |
| Applied Digital 2,4 | | | 650,624 | | | | 3,871,213 |
| Grid Dynamics Holdings 2 | | | 460,846 | | | | 4,843,491 |
| Kyndryl Holdings 2 | | | 382,487 | | | | 10,063,233 |
| | | | | | | | 18,777,937 |
| SEMICONDUCTORS & SEMICONDUCTOR EQUIPMENT - 6.7% | | | | | | | |
| Alpha & Omega Semiconductor 2 | | | 252,995 | | | | 9,454,423 |
| Amkor Technology | | | 158,665 | | | | 6,349,773 |
| Amtech Systems 2,5 | | | 750,407 | | | | 4,397,385 |
| Cohu 2 | | | 205,273 | | | | 6,794,536 |
| FormFactor 2 | | | 157,479 | | | | 9,532,204 |
| Ichor Holdings 2 | | | 226,492 | | | | 8,731,267 |
| inTEST Corporation 2 | | | 395,212 | | | | 3,904,695 |
| Kulicke & Soffa Industries | | | 132,279 | | | | 6,506,804 |
| Onto Innovation 2 | | | 14,244 | | | | 3,127,413 |
| †SMART Global Holdings 2 | | | 169,128 | | | | 3,867,957 |
| Ultra Clean Holdings 2 | | | 210,915 | | | | 10,334,835 |
| Veeco Instruments 2 | | | 217,628 | | | | 10,165,404 |
| | | | | | | | 83,166,696 |
| SOFTWARE - 2.0% | | | | | | | |
| A10 Networks | | | 453,216 | | | | 6,277,042 |
| LiveRamp Holdings 2 | | | 111,371 | | | | 3,445,819 |
| Ooma 2 | | | 242,550 | | | | 2,408,521 |
| SecureWorks Corp. Cl. A 2,4 | | | 787,670 | | | | 5,513,690 |
| †Telos Corporation 2 | | | 97,804 | | | | 393,172 |
| Viant Technology Cl. A 2 | | | 595,548 | | | | 5,878,059 |
| | | | | | | | 23,916,303 |
| TECHNOLOGY HARDWARE, STORAGE & PERIPHERALS - 1.4% | | | | | | | |
| Eastman Kodak 2 | | | 534,029 | | | | 2,873,076 |
| Immersion Corporation | | | 528,110 | | | | 4,969,515 |
| Intevac 2,5 | | | 1,362,203 | | | | 5,258,104 |
| Xerox Holdings | | | 363,910 | | | | 4,228,634 |
| | | | | | | | 17,329,329 |
| Total (Cost $190,830,632) | | | | | | | 259,469,284 |
| | | | | | | | |
| MATERIALS – 6.8% | | | | | | | |
| CHEMICALS - 1.8% | | | | | | | |
| †Arcadium Lithium 2,4 | | | 1,044,891 | | | | 3,510,834 |
| Aspen Aerogels 2 | | | 287,441 | | | | 6,855,468 |
| Mativ Holdings | | | 501,641 | | | | 8,507,831 |
| Tronox Holdings | | | 249,096 | | | | 3,908,316 |
| | | | | | | | 22,782,449 |
| CONSTRUCTION MATERIALS - 0.6% | | | | | | | |
| Summit Materials Cl. A 2 | | | 213,358 | | | | 7,811,036 |
| METALS & MINING - 4.4% | | | | | | | |
| ATI 2 | | | 161,277 | | | | 8,942,810 |
| Capstone Copper 2 | | | 977,231 | | | | 6,928,943 |
| Carpenter Technology | | | 88,313 | | | | 9,677,339 |
| Commercial Metals | | | 131,461 | | | | 7,229,040 |
| Ferroglobe | | | 1,259,225 | | | | 6,749,446 |
| Major Drilling Group International 2 | | | 1,073,395 | | | | 7,124,320 |
| Metallus 2 | | | 362,743 | | | | 7,352,801 |
| Noranda Aluminum Holding Corporation 2,3 | | | 488,157 | | | | 0 |
| | | | | | | | 54,004,699 |
| Total (Cost $48,098,714) | | | | | | | 84,598,184 |
| | | | | | | | |
| REAL ESTATE – 0.3% | | | | | | | |
| REAL ESTATE MANAGEMENT & DEVELOPMENT - 0.3% | | | | | | | |
| †Kennedy-Wilson Holdings | | | 376,568 | | | | 3,660,241 |
| Total (Cost $3,443,618) | | | | | | | 3,660,241 |
| | | | | | | | |
| TOTAL COMMON STOCKS | | | | | | | |
| (Cost $940,789,944) | | | | | | | 1,213,781,989 |
| | | | | | | | |
| REPURCHASE AGREEMENT – 1.7 % | | | | | | | |
| Fixed Income Clearing Corporation, 4.75% dated 6/28/24, due 7/1/24, maturity value | | | | | | | |
| $20,965,279 (collateralized by obligations of U.S. Government Agencies, 3.625% | | | | | | | |
| due 5/15/26, valued at $21,376,178) | | | | | | | |
| (Cost $20,956,983) | | | | | | | 20,956,983 |
| | | | | | | | |
| COLLATERAL RECEIVED FOR SECURITIES LOANED – 0.3% | | | | | | | |
| Money Market Funds | | | | | | | |
| Federated Hermes Government Obligations Fund - Institutional Shares (7 day yield-5.18%) | | | | | | | |
| (Cost $3,094,061) | | | 3,094,061 | | | | 3,094,061 |
| | | | | | | | |
| TOTAL INVESTMENTS – 100.0% | | | | | | | |
| (Cost $964,840,988) | | | | | | | 1,237,833,033 |
| | | | | | | | |
| CASH AND OTHER ASSETS LESS LIABILITIES – 0.0% | | | | | | | 210,326 |
| | | | | | | | |
| NET ASSETS – 100.0% | | | | | | $ | 1,238,043,359 |
| See Notes to Financial Statements | 14 |
Schedules of Investments
Royce Small-Cap Special Equity Fund
Common Stocks – 83.9%
| | | SHARES | | | VALUE |
| | | | | | |
| COMMUNICATION SERVICES – 3.9% | | | | | | | |
| MEDIA - 3.9% | | | | | | | |
| TEGNA | | | 2,000,000 | | | $ | 27,880,000 |
| Total (Cost $38,476,325) | | | | | | | 27,880,000 |
| | | | | | | | |
| CONSUMER DISCRETIONARY – 14.1% | | | | | | | |
| AUTOMOBILE COMPONENTS - 3.8% | | | | | | | |
| Standard Motor Products | | | 977,000 | | | | 27,092,210 |
| BROADLINE RETAIL - 2.7% | | | | | | | |
| Macy's | | | 985,000 | | | | 18,912,000 |
| DIVERSIFIED CONSUMER SERVICES - 1.0% | | | | | | | |
| H&R Block | | | 133,000 | | | | 7,212,590 |
| HOTELS, RESTAURANTS & LEISURE - 0.6% | | | | | | | |
| Nathan's Famous | | | 65,000 | | | | 4,405,700 |
| HOUSEHOLD DURABLES - 0.9% | | | | | | | |
| Ethan Allen Interiors | | | 228,500 | | | | 6,372,865 |
| SPECIALTY RETAIL - 1.5% | | | | | | | |
| ODP Corporation (The) 2 | | | 268,000 | | | | 10,524,360 |
| TEXTILES, APPAREL & LUXURY GOODS - 3.6% | | | | | | | |
| Movado Group | | | 1,019,000 | | | | 25,332,340 |
| Total (Cost $100,922,870) | | | | | | | 99,852,065 |
| | | | | | | | |
| CONSUMER STAPLES – 9.1% | | | | | | | |
| CONSUMER STAPLES DISTRIBUTION & RETAIL - 3.7% | | | | | | | |
| Ingles Markets Cl. A | | | 381,100 | | | | 26,147,271 |
| FOOD PRODUCTS - 4.2% | | | | | | | |
| John B. Sanfilippo & Son | | | 303,500 | | | | 29,491,095 |
| HOUSEHOLD PRODUCTS - 1.2% | | | | | | | |
| Oil-Dri Corporation of America | | | 135,200 | | | | 8,664,968 |
| Total (Cost $50,157,840) | | | | | | | 64,303,334 |
| | | | | | | | |
| ENERGY – 1.2% | | | | | | | |
| ENERGY EQUIPMENT & SERVICES - 1.2% | | | | | | | |
| RPC | | | 985,000 | | | | 6,156,250 |
| U.S. Silica Holdings 2 | | | 160,000 | | | | 2,472,000 |
| Total (Cost $9,972,386) | | | | | | | 8,628,250 |
| | | | | | | | |
| FINANCIALS – 4.6% | | | | | | | |
| CAPITAL MARKETS - 4.6% | | | | | | | |
| Diamond Hill Investment Group 5 | | | 139,500 | | | | 19,634,625 |
| Federated Hermes Cl. B | | | 303,500 | | | | 9,979,080 |
| GAMCO Investors Cl. A 1 | | | 116,000 | | | | 2,807,200 |
| Total (Cost $28,516,749) | | | | | | | 32,420,905 |
| | | | | | | | |
| INDUSTRIALS – 29.4% | | | | | | | |
| BUILDING PRODUCTS - 3.8% | | | | | | | |
| Insteel Industries | | | 410,000 | | | | 12,693,600 |
| UFP Industries | | | 126,500 | | | | 14,168,000 |
| | | | | | | | 26,861,600 |
| COMMERCIAL SERVICES & SUPPLIES - 4.0% | | | | | | | |
| Ennis | | | 1,284,000 | | | | 28,106,760 |
| ELECTRICAL EQUIPMENT - 13.4% | | | | | | | |
| Atkore | | | 154,500 | | | | 20,846,685 |
| Encore Wire | | | 197,500 | | | | 57,241,425 |
| Preformed Line Products | | | 134,000 | | | | 16,688,360 |
| | | | | | | | 94,776,470 |
| MACHINERY - 7.4% | | | | | | | |
| Gencor Industries 2,5 | | | 910,000 | | | | 17,599,400 |
| Miller Industries | | | 54,500 | | | | 2,998,590 |
| Mueller Industries | | | 555,500 | | | | 31,630,170 |
| | | | | | | | 52,228,160 |
| PROFESSIONAL SERVICES - 0.8% | | | | | | | |
| Resources Connection | | | 505,000 | | | | 5,575,200 |
| Total (Cost $120,196,715) | | | | | | | 207,548,190 |
| | | | | | | | |
| INFORMATION TECHNOLOGY – 8.5% | | | | | | | |
| ELECTRONIC EQUIPMENT, INSTRUMENTS & COMPONENTS - 5.1% | | | | | | | |
| Vishay Intertechnology | | | 1,611,000 | | | | 35,925,300 |
| SEMICONDUCTORS & SEMICONDUCTOR EQUIPMENT - 3.4% | | | | | | | |
| NVE Corporation 5 | | | 326,500 | | | | 24,386,285 |
| Total (Cost $43,081,661) | | | | | | | 60,311,585 |
| | | | | | | | |
| MATERIALS – 9.9% | | | | | | | |
| CHEMICALS - 1.4% | | | | | | | |
| Huntsman Corporation | | | 419,900 | | | | 9,561,123 |
| CONSTRUCTION MATERIALS - 3.7% | | | | | | | |
| United States Lime & Minerals | | | 72,100 | | | | 26,257,378 |
| METALS & MINING - 1.5% | | | | | | | |
| Commercial Metals | | | 108,000 | | | | 5,938,920 |
| Metallus 2 | | | 245,500 | | | | 4,976,285 |
| | | | | | | | 10,915,205 |
| PAPER & FOREST PRODUCTS - 3.3% | | | | | | | |
| Sylvamo Corporation | | | 338,000 | | | | 23,186,800 |
| Total (Cost $36,368,514) | | | | | | | 69,920,506 |
| | | | | | | | |
| REAL ESTATE – 3.2% | | | | | | | |
| REAL ESTATE MANAGEMENT & DEVELOPMENT - 3.2% | | | | | | | |
| Marcus & Millichap | | | 719,000 | | | | 22,662,880 |
| Total (Cost $18,964,945) | | | | | | | 22,662,880 |
| | | | | | | | |
| TOTAL COMMON STOCKS | | | | | | | |
| (Cost $446,658,005) | | | | | | | 593,527,715 |
| | | | | | | | |
| REPURCHASE AGREEMENT – 16.0% | | | | | | | |
| Fixed Income Clearing Corporation, 4.75% dated 6/28/24, due 7/1/24, maturity value | | | | | | | |
| $113,198,958 (collateralized by obligations of U.S. Government Agencies, 3.625% | | | | | | | |
| due 5/15/26, valued at $115,417,270) | | | | | | | |
| (Cost $113,154,168) | | | | | | | 113,154,168 |
| | | | | | | | |
| TOTAL INVESTMENTS – 99.9% | | | | | | | |
| (Cost $559,812,173) | | | | | | | 706,681,883 |
| | | | | | | | |
| CASH AND OTHER ASSETS LESS LIABILITIES – 0.1% | | | | | | | 436,972 |
| | | | | | | | |
| NET ASSETS – 100.0% | | | | | | $ | 707,118,855 |
| See Notes to Financial Statements | 15 |
June 30, 2024 (unaudited)
Royce Small-Cap Total Return Fund
Common Stocks – 97.6%
| | | SHARES | | | VALUE |
| | | | | | |
| COMMUNICATION SERVICES – 6.0% | | | | | | | |
| DIVERSIFIED TELECOMMUNICATION SERVICES - 1.6% | | | | | | | |
| IDT Corporation Cl. B | | | 460,447 | | | $ | 16,539,256 |
| INTERACTIVE MEDIA & SERVICES - 4.4% | | | | | | | |
| Shutterstock | | | 504,083 | | | | 19,508,012 |
| Ziff Davis 2 | | | 442,621 | | | | 24,366,286 |
| | | | | | | | 43,874,298 |
| Total (Cost $67,690,562) | | | | | | | 60,413,554 |
| | | | | | | | |
| CONSUMER DISCRETIONARY – 9.6% | | | | | | | |
| HOUSEHOLD DURABLES - 1.7% | | | | | | | |
| Helen of Troy 2 | | | 186,238 | | | | 17,271,712 |
| LEISURE PRODUCTS - 1.4% | | | | | | | |
| YETI Holdings 2 | | | 366,354 | | | | 13,976,405 |
| SPECIALTY RETAIL - 6.5% | | | | | | | |
| Academy Sports & Outdoors | | | 329,502 | | | | 17,545,982 |
| Advance Auto Parts | | | 452,654 | | | | 28,666,578 |
| OneWater Marine Cl. A 2 | | | 695,237 | | | | 19,167,684 |
| | | | | | | | 65,380,244 |
| Total (Cost $94,347,063) | | | | | | | 96,628,361 |
| | | | | | | | |
| ENERGY – 5.1% | | | | | | | |
| ENERGY EQUIPMENT & SERVICES - 5.1% | | | | | | | |
| Cactus Cl. A | | | 157,612 | | | | 8,312,457 |
| Core Laboratories | | | 709,409 | | | | 14,393,909 |
| Dril-Quip 2 | | | 523,443 | | | | 9,736,040 |
| Pason Systems | | | 1,355,944 | | | | 18,266,911 |
| Total (Cost $44,867,852) | | | | | | | 50,709,317 |
| | | | | | | | |
| FINANCIALS – 35.3% | | | | | | | |
| BANKS - 15.1% | | | | | | | |
| Atlantic Union Bankshares | | | 31,979 | | | | 1,050,510 |
| †Banc of California | | | 1,097,474 | | | | 14,025,718 |
| BankUnited | | | 530,997 | | | | 15,542,282 |
| First Bancshares (The) | | | 330,594 | | | | 8,588,832 |
| First Financial Bankshares | | | 87,707 | | | | 2,589,988 |
| German American Bancorp | | | 92,061 | | | | 3,254,356 |
| Glacier Bancorp | | | 96,921 | | | | 3,617,092 |
| Hingham Institution for Savings | | | 90,617 | | | | 16,209,569 |
| Home BancShares | | | 781,736 | | | | 18,730,394 |
| OceanFirst Financial | | | 505,418 | | | | 8,031,092 |
| Origin Bancorp | | | 476,815 | | | | 15,124,572 |
| Seacoast Banking Corporation of Florida | | | 596,755 | | | | 14,107,288 |
| TowneBank | | | 464,779 | | | | 12,674,523 |
| Western Alliance Bancorp | | | 141,422 | | | | 8,884,130 |
| Wintrust Financial | | | 94,794 | | | | 9,342,897 |
| | | | | | | | 151,773,243 |
| CAPITAL MARKETS - 4.6% | | | | | | | |
| GCM Grosvenor Cl. A | | | 1,599,173 | | | | 15,607,928 |
| †Marex Group 2 | | | 853,710 | | | | 17,074,200 |
| Tel Aviv Stock Exchange 1 | | | 1,984,631 | | | | 14,196,758 |
| | | | | | | | 46,878,886 |
| CONSUMER FINANCE - 2.2% | | | | | | | |
| Encore Capital Group 2,4 | | | 267,017 | | | | 11,142,619 |
| PRA Group 2 | | | 541,325 | | | | 10,642,450 |
| | | | | | | | 21,785,069 |
| FINANCIAL SERVICES - 4.7% | | | | | | | |
| Compass Diversified Holdings | | | 611,993 | | | | 13,396,527 |
| †Merchants Bancorp | | | 199,732 | | | | 8,097,135 |
| NewtekOne | | | 490,173 | | | | 6,161,475 |
| Repay Holdings Cl. A 2 | | | 1,832,823 | | | | 19,354,611 |
| | | | | | | | 47,009,748 |
| INSURANCE - 8.7% | | | | | | | |
| Assured Guaranty | | | 260,033 | | | | 20,061,546 |
| Axis Capital Holdings | | | 323,600 | | | | 22,862,340 |
| International General Insurance Holdings 5 | | | 2,311,547 | | | | 32,361,658 |
| RenaissanceRe Holdings | | | 57,436 | | | | 12,837,520 |
| | | | | | | | 88,123,064 |
| Total (Cost $295,560,658) | | | | | | | 355,570,010 |
| | | | | | | | |
| HEALTH CARE – 1.3% | | | | | | | |
| HEALTH CARE PROVIDERS & SERVICES - 1.3% | | | | | | | |
| †PACS Group 2 | | | 450,810 | | | | 13,298,895 |
| Total (Cost $10,479,985) | | | | | | | 13,298,895 |
| | | | | | | | |
| INDUSTRIALS – 15.0% | | | | | | | |
| BUILDING PRODUCTS - 1.5% | | | | | | | |
| UFP Industries | | | 130,624 | | | | 14,629,888 |
| COMMERCIAL SERVICES & SUPPLIES - 2.5% | | | | | | | |
| Healthcare Services Group 2 | | | 1,953,254 | | | | 20,665,428 |
| †Vestis Corporation | | | 404,379 | | | | 4,945,555 |
| | | | | | | | 25,610,983 |
| ELECTRICAL EQUIPMENT - 0.9% | | | | | | | |
| †Atkore | | | 67,670 | | | | 9,130,713 |
| MACHINERY - 0.9% | | | | | | | |
| Timken Company (The) | | | 108,862 | | | | 8,723,112 |
| PROFESSIONAL SERVICES - 3.6% | | | | | | | |
| Barrett Business Services | | | 664,652 | | | | 21,780,646 |
| KBR | | | 225,460 | | | | 14,461,004 |
| | | | | | | | 36,241,650 |
| TRADING COMPANIES & DISTRIBUTORS - 5.6% | | | | | | | |
| Air Lease Cl. A | | | 503,259 | | | | 23,919,900 |
| Applied Industrial Technologies | | | 61,524 | | | | 11,935,656 |
| FTAI Aviation | | | 83,208 | | | | 8,589,562 |
| MSC Industrial Direct Cl. A | | | 154,535 | | | | 12,256,171 |
| | | | | | | | 56,701,289 |
| Total (Cost $110,179,064) | | | | | | | 151,037,635 |
| | | | | | | | |
| INFORMATION TECHNOLOGY – 17.9% | | | | | | | |
| ELECTRONIC EQUIPMENT, INSTRUMENTS & COMPONENTS - 5.5% | | | | | | | |
| Bel Fuse Cl. B | | | 194,647 | | | | 12,698,771 |
| Coherent Corp. 2 | | | 334,120 | | | | 24,210,335 |
| Vontier Corporation | | | 491,411 | | | | 18,771,900 |
| | | | | | | | 55,681,006 |
| IT SERVICES - 5.0% | | | | | | | |
| Hackett Group (The) | | | 899,094 | | | | 19,528,321 |
| Kyndryl Holdings 2 | | | 1,151,583 | | | | 30,298,149 |
| | | | | | | | 49,826,470 |
| SEMICONDUCTORS & SEMICONDUCTOR EQUIPMENT - 3.6% | | | | | | | |
| Kulicke & Soffa Industries | | | 504,802 | | | | 24,831,211 |
| MKS Instruments | | | 89,795 | | | | 11,725,431 |
| | | | | | | | 36,556,642 |
| SOFTWARE - 3.8% | | | | | | | |
| Sapiens International | | | 501,246 | | | | 17,007,277 |
| Teradata Corporation 2 | | | 617,517 | | | | 21,341,387 |
| | | | | | | | 38,348,664 |
| Total (Cost $126,896,125) | | | | | | | 180,412,782 |
| See Notes to Financial Statements | 16 |
Schedules of Investments
Royce Small-Cap Total Return Fund (continued)
| | | SHARES | | | VALUE |
| | | | | | |
| MATERIALS – 5.5% | | | | | | | |
| CHEMICALS - 3.9% | | | | | | | |
| Element Solutions | | | 816,960 | | | $ | 22,155,956 |
| Ingevity Corporation 2 | | | 399,796 | | | | 17,475,083 |
| | | | | | | | 39,631,039 |
| CONTAINERS & PACKAGING - 1.6% | | | | | | | |
| Silgan Holdings | | | 378,652 | | | | 16,028,339 |
| Total (Cost $44,994,046) | | | | | | | 55,659,378 |
| | | | | | | | |
| REAL ESTATE – 1.9% | | | | | | | |
| OFFICE REITS - 1.0% | | | | | | | |
| Equity Commonwealth 2 | | | 488,735 | | | | 9,481,459 |
| REAL ESTATE MANAGEMENT & DEVELOPMENT - 0.9% | | | | | | | |
| Kennedy-Wilson Holdings | | | 934,675 | | | | 9,085,041 |
| Total (Cost $18,632,596) | | | | | | | 18,566,500 |
| | | | | | | | |
| TOTAL COMMON STOCKS | | | | | | | |
| (Cost $813,647,951) | | | | | | | 982,296,432 |
| | | |
| REPURCHASE AGREEMENT– 2.3% | | |
Fixed Income Clearing Corporation, 4.75% dated 6/28/24, due 7/1/24, maturity value
$23,615,125 (collateralized by obligations of U.S. Government Agencies, 3.625%
due 5/15/26, valued at $24,077,990) |
| (Cost $23,605,781) | | | 23,605,781 |
| | | | |
| TOTAL INVESTMENTS – 99.9% | | | |
| (Cost $837,253,732) | | | 1,005,902,213 |
| | | | |
| CASH AND OTHER ASSETS LESS LIABILITIES – 0.1% | | | 866,722 |
| | | | |
| NET ASSETS – 100.0% | | $ | 1,006,768,935 |
Royce Small-Cap Value Fund
Common Stocks – 99.2%
| COMMUNICATION SERVICES – 2.2% | | | | | |
| MEDIA - 2.2% | | | | | |
| Saga Communications Cl. A | | | 59,976 | | | | 944,622 |
| TEGNA | | | 105,799 | | | | 1,474,838 |
| Total (Cost $3,274,299) | | | | | | | 2,419,460 |
| | | | | | | | |
| CONSUMER DISCRETIONARY – 22.3% | | | | | | | |
| AUTOMOBILE COMPONENTS - 1.2% | | | | | | | |
| Visteon Corporation 2 | | | 12,883 | | | | 1,374,616 |
| DIVERSIFIED CONSUMER SERVICES - 1.0% | | | | | | | |
| †frontdoor 2 | | | 33,423 | | | | 1,129,363 |
| HOTELS, RESTAURANTS & LEISURE - 1.3% | | | | | | | |
| Bloomin’ Brands | | | 74,310 | | | | 1,428,981 |
| HOUSEHOLD DURABLES - 7.0% | | | | | | | |
| M/I Homes 2 | | | 17,095 | | | | 2,087,983 |
| Meritage Homes | | | 10,409 | | | | 1,684,697 |
| PulteGroup | | | 19,346 | | | | 2,129,995 |
| Tri Pointe Homes 2 | | | 49,964 | | | | 1,861,159 |
| | | | | | | | 7,763,834 |
| SPECIALTY RETAIL - 8.5% | | | | | | | |
| Buckle (The) | | | 41,456 | | | | 1,531,385 |
| Caleres | | | 53,573 | | | | 1,800,053 |
| Destination XL Group 2 | | | 277,072 | | | | 1,008,542 |
| Haverty Furniture | | | 38,823 | | | | 981,834 |
| Shoe Carnival | | | 49,838 | | | | 1,838,524 |
| Signet Jewelers | | | 16,625 | | | | 1,489,267 |
| Williams-Sonoma | | | 2,949 | | | | 832,709 |
| | | | | | | | 9,482,314 |
| TEXTILES, APPAREL & LUXURY GOODS - 3.3% | | | | | | | |
| Carter’s | | | 21,310 | | | | 1,320,581 |
| Kontoor Brands | | | 23,200 | | | | 1,534,680 |
| †Oxford Industries | | | 7,895 | | | | 790,684 |
| Steven Madden | | | 1,264 | | | | 53,467 |
| | | | | | | | 3,699,412 |
| Total (Cost $19,166,666) | | | | | | | 24,878,520 |
| CONSUMER STAPLES – 2.8% | | | | | | | |
| CONSUMER STAPLES DISTRIBUTION & RETAIL - 2.8% | | | | | | | |
| Ingles Markets Cl. A | | | 19,661 | | | | 1,348,941 |
| Village Super Market Cl. A | | | 68,368 | | | | 1,805,599 |
| Total (Cost $3,260,434) | | | | | | | 3,154,540 |
| | | | | | | | |
| ENERGY – 11.9% | | | | | | | |
| ENERGY EQUIPMENT & SERVICES - 1.5% | | | | | | | |
| Helmerich & Payne | | | 46,022 | | | | 1,663,235 |
| OIL, GAS & CONSUMABLE FUELS - 10.4% | | | | | | | |
| Chord Energy | | | 10,206 | | | | 1,711,342 |
| Civitas Resources | | | 23,417 | | | | 1,615,773 |
| Dorchester Minerals L.P. | | | 51,215 | | | | 1,579,983 |
| Matador Resources | | | 22,429 | | | | 1,336,769 |
| Riley Exploration Permian | | | 55,319 | | | | 1,566,081 |
| SilverBow Resources 2 | | | 53,199 | | | | 2,012,518 |
| SM Energy | | | 41,180 | | | | 1,780,211 |
| | | | | | | | 11,602,677 |
| Total (Cost $10,362,329) | | | | | | | 13,265,912 |
| | | | | | | | |
| FINANCIALS – 20.1% | | | | | | | |
| BANKS - 15.5% | | | | | | | |
| †Burke & Herbert Financial Services | | | 28,384 | | | | 1,447,016 |
| Citizens Community Bancorp | | | 57,666 | | | | 667,196 |
| CNB Financial | | | 78,064 | | | | 1,593,286 |
| Dime Community Bancshares | | | 80,778 | | | | 1,647,871 |
| See Notes to Financial Statements | 17 |
June 30, 2024 (unaudited)
Royce Small-Cap Value Fund (continued)
| | | SHARES | | | VALUE |
| | | | | | |
| FINANCIALS (continued) | | | | | | | |
| BANKS (continued) | | | | | | | |
| Heritage Financial | | | 82,731 | | | $ | 1,491,640 |
| Mid Penn Bancorp | | | 71,615 | | | | 1,571,949 |
| †Premier Financial | | | 42,118 | | | | 861,734 |
| Princeton Bancorp | | | 19,002 | | | | 628,966 |
| Riverview Bancorp | | | 96,270 | | | | 384,117 |
| Timberland Bancorp | | | 49,295 | | | | 1,335,402 |
| TrustCo Bank Corp NY | | | 46,536 | | | | 1,338,841 |
| Unity Bancorp | | | 59,171 | | | | 1,749,687 |
| Univest Financial | | | 77,440 | | | | 1,767,955 |
| Western New England Bancorp | | | 124,146 | | | | 854,125 |
| | | | | | | | 17,339,785 |
| CAPITAL MARKETS - 1.6% | | | | | | | |
| Evercore Cl. A | | | 8,436 | | | | 1,758,315 |
| FINANCIAL SERVICES - 1.5% | | | | | | | |
| International Money Express 2 | | | 83,769 | | | | 1,745,746 |
| INSURANCE - 1.5% | | | | | | | |
| Tiptree | | | 100,226 | | | | 1,652,727 |
| Total (Cost $20,180,077) | | | | | | | 22,496,573 |
| | | | | | | | |
| HEALTH CARE – 4.9% | | | | | | | |
| BIOTECHNOLOGY - 1.5% | | | | | | | |
| Catalyst Pharmaceuticals 2 | | | 111,097 | | | | 1,720,892 |
| HEALTH CARE PROVIDERS & SERVICES - 1.3% | | | | | | | |
| Cross Country Healthcare 2 | | | 3,151 | | | | 43,610 |
| Molina Healthcare 2 | | | 4,590 | | | | 1,364,607 |
| | | | | | | | 1,408,217 |
| PHARMACEUTICALS - 2.1% | | | | | | | |
| Collegium Pharmaceutical 2 | | | 43,990 | | | | 1,416,478 |
| SIGA Technologies | | | 118,273 | | | | 897,692 |
| | | | | | | | 2,314,170 |
| Total (Cost $3,769,476) | | | | | | | 5,443,279 |
| | | | | | | | |
| INDUSTRIALS – 18.3% | | | | | | | |
| AIR FREIGHT & LOGISTICS - 0.9% | | | | | | | |
| Hub Group Cl. A | | | 23,824 | | | | 1,025,623 |
| BUILDING PRODUCTS - 1.9% | | | | | | | |
| Quanex Building Products | | | 44,691 | | | | 1,235,706 |
| UFP Industries | | | 7,988 | | | | 894,656 |
| | | | | | | | 2,130,362 |
| CONSTRUCTION & ENGINEERING - 0.9% | | | | | | | |
| Sterling Infrastructure 2 | | | 8,711 | | | | 1,030,860 |
| ELECTRICAL EQUIPMENT - 0.4% | | | | | | | |
| Preformed Line Products | | | 3,987 | | | | 496,541 |
| GROUND TRANSPORTATION - 3.2% | | | | | | | |
| ArcBest Corporation | | | 14,813 | | | | 1,586,176 |
| Schneider National Cl. B | | | 44,930 | | | | 1,085,509 |
| Universal Logistics Holdings | | | 21,653 | | | | 878,895 |
| | | | | | | | 3,550,580 |
| MACHINERY - 4.3% | | | | | | | |
| †Allison Transmission Holdings | | | 18,676 | | | | 1,417,508 |
| Commercial Vehicle Group 2 | | | 102,994 | | | | 504,671 |
| †Terex Corporation | | | 25,466 | | | | 1,396,556 |
| Wabash National | | | 65,935 | | | | 1,440,020 |
| | | | | | | | 4,758,755 |
| MARINE TRANSPORTATION - 2.7% | | | | | | | |
| Genco Shipping & Trading | | | 57,192 | | | | 1,218,762 |
| Pangaea Logistics Solutions | | | 226,065 | | | | 1,770,089 |
| | | | | | | | 2,988,851 |
| PROFESSIONAL SERVICES - 4.0% | | | | | |
| Barrett Business Services | | | 47,124 | | | | 1,544,254 |
| IBEX 2 | | | 110,841 | | | | 1,793,407 |
| Korn Ferry | | | 17,460 | | | | 1,172,264 |
| | | | | | | | 4,509,925 |
| Total (Cost $14,982,053) | | | | | | | 20,491,497 |
| | | | | | | | |
| INFORMATION TECHNOLOGY – 15.6% | | | | | | | |
| COMMUNICATIONS EQUIPMENT - 1.3% | | | | | | | |
| Aviat Networks 2 | | | 52,519 | | | | 1,506,770 |
| ELECTRONIC EQUIPMENT, INSTRUMENTS & COMPONENTS - 12.9% | | | | | | | |
| Bel Fuse Cl. B | | | 23,991 | | | | 1,565,173 |
| ePlus 2 | | | 25,251 | | | | 1,860,494 |
| Flex 2 | | | 64,186 | | | | 1,892,845 |
| Insight Enterprises 2 | | | 4,408 | | | | 874,371 |
| Jabil | | | 13,056 | | | | 1,420,362 |
| Kimball Electronics 2 | | | 61,404 | | | | 1,349,660 |
| PC Connection | | | 13,995 | | | | 898,479 |
| Sanmina Corporation 2 | | | 31,674 | | | | 2,098,402 |
| TD SYNNEX | | | 11,370 | | | | 1,312,098 |
| Vishay Intertechnology | | | 48,684 | | | | 1,085,653 |
| | | | | | | | 14,357,537 |
| SEMICONDUCTORS & SEMICONDUCTOR EQUIPMENT - 1.0% | | | | | | | |
| Amkor Technology | | | 27,529 | | | | 1,101,711 |
| SOFTWARE - 0.4% | | | | | | | |
| Adeia | | | 36,989 | | | | 413,722 |
| Total (Cost $9,573,472) | | | | | | | 17,379,740 |
| | | | | | | | |
| REAL ESTATE – 1.1% | | | | | | | |
| REAL ESTATE MANAGEMENT & DEVELOPMENT - 1.1% | | | | | | | |
| RMR Group (The) Cl. A | | | 56,624 | | | | 1,279,702 |
| Total (Cost $1,592,764) | | | | | | | 1,279,702 |
| | | | | | | | |
| TOTAL COMMON STOCKS | | | | | | | |
| (Cost $86,161,570) | | | | | | | 110,809,223 |
| | | |
| REPURCHASE AGREEMENT– 0.7% | | |
Fixed Income Clearing Corporation, 4.75% dated 6/28/24, due 7/1/24, maturity value
$804,440 (collateralized by obligations of U.S. Government Agencies, 0.125%
due 4/15/27, valued at $820,384) |
| (Cost $804,122) | | | 804,122 |
| | | | |
| TOTAL INVESTMENTS – 99.9% | | | |
| (Cost $86,965,692) | | | 111,613,345 |
| | | | |
| CASH AND OTHER ASSETS LESS LIABILITIES – 0.1% | | | 75,754 |
| | | | |
| NET ASSETS – 100.0% | | $ | 111,689,099 |
| See Notes to Financial Statements | 18 |
Schedules of Investments
Royce Smaller-Companies Growth Fund
Common Stocks – 95.9%
| | | SHARES | | | VALUE |
| | | | | | |
| COMMUNICATION SERVICES – 1.4% | | | | | | | |
| INTERACTIVE MEDIA & SERVICES - 1.4% | | | | | | | |
| †Reddit Cl. A 2 | | | 39,400 | | | $ | 2,517,266 |
| Total (Cost $1,630,136) | | | | | | | 2,517,266 |
| | | | | | | | |
| CONSUMER DISCRETIONARY – 8.1% | | | | | | | |
| DIVERSIFIED CONSUMER SERVICES - 1.1% | | | | | | | |
| Bright Horizons Family Solutions 2,4 | | | 17,000 | | | | 1,871,360 |
| HOTELS, RESTAURANTS & LEISURE - 6.0% | | | | | | | |
| Bragg Gaming Group 2 | | | 234,000 | | | | 1,392,318 |
| DraftKings Cl. A 2 | | | 92,000 | | | | 3,511,640 |
| Kura Sushi USA Cl. A 2 | | | 33,000 | | | | 2,081,970 |
| Texas Roadhouse | | | 21,500 | | | | 3,691,765 |
| | | | | | | | 10,677,693 |
| HOUSEHOLD DURABLES - 1.0% | | | | | | | |
| Installed Building Products | | | 9,000 | | | | 1,851,120 |
| Total (Cost $9,111,469) | | | | | | | 14,400,173 |
| | | | | | | | |
| CONSUMER STAPLES – 2.7% | | | | | | | |
| BEVERAGES - 0.2% | | | | | | | |
| Celsius Holdings 2 | | | 7,500 | | | | 428,175 |
| FOOD PRODUCTS - 2.5% | | | | | | | |
| Freshpet 2 | | | 34,000 | | | | 4,399,260 |
| Total (Cost $2,092,575) | | | | | | | 4,827,435 |
| | | | | | | | |
| ENERGY – 5.0% | | | | | | | |
| ENERGY EQUIPMENT & SERVICES - 3.8% | | | | | | | |
| Cactus Cl. A | | | 47,000 | | | | 2,478,780 |
| Oceaneering International 2 | | | 83,000 | | | | 1,963,780 |
| †Tidewater 2 | | | 24,500 | | | | 2,332,645 |
| | | | | | | | 6,775,205 |
| OIL, GAS & CONSUMABLE FUELS - 1.2% | | | | | | | |
| †Golar LNG | | | 40,000 | | | | 1,254,000 |
| †Uranium Energy 2 | | | 130,000 | | | | 781,300 |
| | | | | | | | 2,035,300 |
| Total (Cost $8,250,480) | | | | | | | 8,810,505 |
| | | | | | | | |
| FINANCIALS – 7.2% | | | | | | | |
| BANKS - 3.5% | | | | | | | |
| Atlantic Union Bankshares | | | 78,000 | | | | 2,562,300 |
| Seacoast Banking Corporation of Florida | | | 107,000 | | | | 2,529,480 |
| Webster Financial | | | 28,000 | | | | 1,220,520 |
| | | | | | | | 6,312,300 |
| CONSUMER FINANCE - 0.4% | | | | | | | |
| †Encore Capital Group 2 | | | 18,000 | | | | 751,140 |
| FINANCIAL SERVICES - 2.2% | | | | | | | |
| AvidXchange Holdings 2 | | | 171,974 | | | | 2,074,006 |
| Cantaloupe 2 | | | 282,000 | | | | 1,861,200 |
| | | | | | | | 3,935,206 |
| INSURANCE - 1.1% | | | | | | | |
| †Abacus Life 2 | | | 220,000 | | | | 1,903,000 |
| Total (Cost $12,488,131) | | | | | | | 12,901,646 |
| | | | | | | | |
| HEALTH CARE – 17.8% | | | | | | | |
| BIOTECHNOLOGY - 6.6% | | | | | | | |
| †Alkermes 2 | | | 15,000 | | | | 361,500 |
| †Alvotech 2 | | | 94,000 | | | | 1,143,040 |
| ARS Pharmaceuticals 2,4 | | | 275,000 | | | | 2,340,250 |
| Avid Bioservices 2 | | | 462,000 | | | | 3,298,680 |
| †Catalyst Pharmaceuticals 2 | | | 25,000 | | | | 387,250 |
| Cytokinetics 2 | | | 14,250 | | | | 772,065 |
| MeiraGTx Holdings 2 | | | 176,989 | | | | 745,124 |
| PureTech Health 1,2 | | | 1,166,000 | | | | 2,698,847 |
| | | | | | | | 11,746,756 |
| HEALTH CARE EQUIPMENT & SUPPLIES - 3.1% | | | | | | | |
| Alphatec Holdings 2 | | | 208,000 | | | | 2,173,600 |
| SI-BONE 2 | | | 145,000 | | | | 1,874,850 |
| TransMedics Group 2 | | | 10,000 | | | | 1,506,200 |
| | | | | | | | 5,554,650 |
| HEALTH CARE PROVIDERS & SERVICES - 0.9% | | | | | | | |
| Hims & Hers Health Cl. A 2 | | | 82,000 | | | | 1,655,580 |
| LIFE SCIENCES TOOLS & SERVICES - 2.7% | | | | | | | |
| Azenta 2 | | | 45,000 | | | | 2,367,900 |
| BioLife Solutions 2 | | | 111,000 | | | | 2,378,730 |
| | | | | | | | 4,746,630 |
| PHARMACEUTICALS - 4.5% | | | | | | | |
| Axsome Therapeutics 2 | | | 13,000 | | | | 1,046,500 |
| Corcept Therapeutics 2,4 | | | 78,000 | | | | 2,534,220 |
| Harrow 2,4 | | | 116,700 | | | | 2,437,863 |
| †Intra-Cellular Therapies 2 | | | 27,500 | | | | 1,883,475 |
| | | | | | | | 7,902,058 |
| Total (Cost $31,348,502) | | | | | | | 31,605,674 |
| | | | | | | | |
| INDUSTRIALS – 23.2% | | | | | | | |
| AEROSPACE & DEFENSE - 4.0% | | | | | | | |
| AeroVironment 2 | | | 16,000 | | | | 2,914,560 |
| BWX Technologies | | | 26,500 | | | | 2,517,500 |
| †Heroux-Devtek 2 | | | 90,000 | | | | 1,638,098 |
| | | | | | | | 7,070,158 |
| AIR FREIGHT & LOGISTICS - 0.7% | | | | | | | |
| GXO Logistics 2 | | | 26,000 | | | | 1,313,000 |
| COMMERCIAL SERVICES & SUPPLIES - 5.7% | | | | | | | |
| ACV Auctions Cl. A 2 | | | 169,000 | | | | 3,084,250 |
| †Montrose Environmental Group 2 | | | 20,000 | | | | 891,200 |
| VSE Corporation | | | 70,000 | | | | 6,179,600 |
| | | | | | | | 10,155,050 |
| CONSTRUCTION & ENGINEERING - 3.8% | | | | | | | |
| †Argan | | | 8,500 | | | | 621,860 |
| †Badger Infrastructure Solutions | | | 50,500 | | | | 1,520,482 |
| †Bowman Consulting Group 2 | | | 94,000 | | | | 2,988,260 |
| †Limbach Holdings 2 | | | 30,000 | | | | 1,707,900 |
| | | | | | | | 6,838,502 |
| GROUND TRANSPORTATION - 0.7% | | | | | | | |
| RXO 2 | | | 44,000 | | | | 1,150,600 |
| MACHINERY - 0.9% | | | | | | | |
| ATS Corporation 2 | | | 25,500 | | | | 825,178 |
| Symbotic Cl. A 2,4 | | | 23,500 | | | | 826,260 |
| | | | | | | | 1,651,438 |
| PROFESSIONAL SERVICES - 1.0% | | | | | | | |
| Paylocity Holding 2 | | | 13,786 | | | | 1,817,684 |
| TRADING COMPANIES & DISTRIBUTORS - 6.4% | | | | | | | |
| Distribution Solutions Group 2 | | | 119,111 | | | | 3,573,330 |
| FTAI Aviation | | | 53,000 | | | | 5,471,190 |
| Herc Holdings | | | 17,000 | | | | 2,265,930 |
| | | | | | | | 11,310,450 |
| Total (Cost $26,889,182) | | | | | | | 41,306,882 |
| | | | | | | | |
| INFORMATION TECHNOLOGY – 26.5% | | | | | | | |
| ELECTRONIC EQUIPMENT, INSTRUMENTS & COMPONENTS - 3.6% | | | | | | | |
| Evolv Technologies Holdings 2 | | | 279,000 | | | | 711,450 |
| †Mirion Technologies Cl. A 2,4 | | | 214,000 | | | | 2,298,360 |
| See Notes to Financial Statements | 19 |
June 30, 2024 (unaudited)
Royce Smaller-Companies Growth Fund (continued)
| | | SHARES | | | VALUE |
| | | | | | |
| INFORMATION TECHNOLOGY (continued) | | | | | |
| ELECTRONIC EQUIPMENT, INSTRUMENTS & COMPONENTS (continued) | | | | | | | |
| NAPCO Security Technologies | | | 66,000 | | | $ | 3,428,700 |
| | | | | | | | 6,438,510 |
| IT SERVICES - 1.0% | | | | | | | |
| †Couchbase 2 | | | 93,000 | | | | 1,698,180 |
| SEMICONDUCTORS & SEMICONDUCTOR EQUIPMENT - 6.2% | | | | | | | |
| Credo Technology Group Holding 2 | | | 55,000 | | | | 1,756,700 |
| Impinj 2 | | | 8,800 | | | | 1,379,576 |
| PDF Solutions 2 | | | 82,000 | | | | 2,983,160 |
| Semtech Corporation 2 | | | 86,000 | | | | 2,569,680 |
| Silicon Laboratories 2 | | | 20,500 | | | | 2,267,915 |
| | | | | | | | 10,957,031 |
| SOFTWARE - 15.7% | | | | | | | |
| Agilysys 2 | | | 35,000 | | | | 3,644,900 |
| †C3.ai Cl. A 2,4 | | | 44,000 | | | | 1,274,240 |
| Coveo Solutions 2 | | | 469,000 | | | | 2,670,597 |
| CyberArk Software 2 | | | 15,000 | | | | 4,101,300 |
| Descartes Systems Group (The) 2 | | | 32,033 | | | | 3,102,076 |
| JFrog 2 | | | 140,318 | | | | 5,268,941 |
| NextNav 2,4 | | | 336,894 | | | | 2,732,210 |
| Vertex Cl. A 2,4 | | | 35,000 | | | | 1,261,750 |
| Zeta Global Holdings Cl. A 2,4 | | | 223,000 | | | | 3,935,950 |
| | | | | | | | 27,991,964 |
| Total (Cost $31,744,778) | | | | | | | 47,085,685 |
| | | | | | | | |
| MATERIALS – 4.0% | | | | | | | |
| CHEMICALS - 1.8% | | | | | | | |
| Albemarle Corporation | | | 14,500 | | | | 1,385,040 |
| Bioceres Crop Solutions 2,4 | | | 172,000 | | | | 1,928,120 |
| | | | | | | | 3,313,160 |
| METALS & MINING - 2.2% | | | | | | | |
| Carpenter Technology | | | 19,000 | | | | 2,082,020 |
| Lithium Royalty 2 | | | 208,000 | | | | 1,003,472 |
| †Sigma Lithium 2,4 | | | 66,000 | | | | 793,980 |
| | | | | | | | 3,879,472 |
| Total (Cost $8,050,074) | | | | | | | 7,192,632 |
| | | | | | | | |
| TOTAL COMMON STOCKS | | | | | | | |
| (Cost $131,605,327) | | | | | | | 170,647,898 |
| | | |
| REPURCHASE AGREEMENT– 4.8% | | |
Fixed Income Clearing Corporation, 4.75% dated 6/28/24, due 7/1/24, maturity value
$8,541,367 (collateralized by obligations of U.S. Government Agencies, 0.125%
due 4/15/27, valued at $8,708,952) |
| (Cost $8,537,988) | | | 8,537,988 |
| | | | |
| COLLATERAL RECEIVED FOR SECURITIES LOANED – 2.5% | | | |
| Money Market Funds | | | |
| Federated Hermes Government Obligations Fund - Institutional Shares (7 day yield-5.18%) | | | |
| (Cost $4,531,444) | | | 4,531,444 | | | | 4,531,444 |
| | | | | | | | |
| TOTAL INVESTMENTS – 103.2% | | | | | | | |
| (Cost $144,674,759) | | | | | | | 183,717,330 |
| | | | | | | | |
| LIABILITIES LESS CASH AND OTHER ASSETS – (3.2)% | | | | | | | (5,763,070) |
| | | | | | | | |
| NET ASSETS – 100.0% | | | | | | $ | 177,954,260 |
ADR- American Depository Receipt
| 1 | These securities are defined as Level 2 securities due to fair value being based on quoted prices for similar securities and/or due to the application of fair value factors. See Notes to Financial Statements. |
| 3 | Securities for which market quotations are not readily available represent 0.0% and 0.0% of net assets for Royce Micro-Cap Fund and Royce Small-Cap Opportunity Fund. These securities have been valued at their fair value under procedures approved by the Fund’s Board of Trustees. These securities are defined as Level 3 securities due to the use of significant unobservable inputs in the determination of fair value. See Notes to Financial Statements. |
| 4 | All or a portion of these securities were on loan as of June 30, 2024. |
| 5 | As of June 30, 2024, the Fund owned 5% or more of the Company’s outstanding voting securities thereby making the Company an Affiliated Company as that term is defined in the Investment Company Act of 1940. See Notes to Financial Statements. |
Securities of Royce International Premier Fund are categorized by the country of their headquarters.
Bold indicates a Fund’s 20 largest equity holdings in terms of June 30, 2024, market value.
| See Notes to Financial Statements | 20 |
| Statements of Assets and Liabilities | June 30, 2024 (unaudited) |
| | | Royce Dividend
Value Fund | | | Royce Global
Financial Services
Fund | | | Royce International
Premier Fund | | | Royce Micro-Cap
Fund | |
| ASSETS: | | | | | | | | | | | | |
| Investments at value (including collateral on loaned securities)1 | | | | | | | | | | | | |
| Non-Affiliated Companies | | $ | 60,649,468 | | | $ | 28,307,493 | | | $ | 306,244,803 | | | $ | 293,549,143 | |
| Repurchase agreements (at cost and value) | | | 5,431,970 | | | | 760,810 | | | | 4,861,755 | | | | 7,274,209 | |
| Foreign currency2 | | | – | | | | – | | | | 715,842 | | | | – | |
| Receivable for investments sold | | | – | | | | – | | | | 740,343 | | | | – | |
| Receivable for capital shares sold | | | 9,023 | | | | 191 | | | | 228,721 | | | | 28,684 | |
| Receivable for dividends and interest | | | 55,657 | | | | 47,451 | | | | 5,082,324 | | | | 38,478 | |
| Receivable for securities lending income | | | – | | | | – | | | | – | | | | 223 | |
| Prepaid expenses and other assets | | | 1,750 | | | | 785 | | | | 23,070 | | | | 9,187 | |
| Total Assets | | | 66,147,868 | | | | 29,116,730 | | | | 317,896,858 | | | | 300,899,924 | |
| LIABILITIES: | | | | | | | | | | | | | | | | |
| Payable for collateral on loaned securities | | | – | | | | – | | | | – | | | | 271,625 | |
| Payable for investments purchased | | | 31,291 | | | | – | | | | – | | | | – | |
| Payable for capital shares redeemed | | | 3,148 | | | | 356 | | | | 535,587 | | | | 98,574 | |
| Payable for investment advisory fees | | | 46,025 | | | | 23,660 | | | | 270,878 | | | | 245,725 | |
| Payable for trustees’ fees | | | 2,501 | | | | 1,096 | | | | 28,164 | | | | 12,237 | |
| Accrued expenses | | | 47,562 | | | | 30,029 | | | | 235,961 | | | | 134,335 | |
| Deferred capital gains tax | | | – | | | | 24,625 | | | | – | | | | – | |
| Total Liabilities | | | 130,527 | | | | 79,766 | | | | 1,070,590 | | | | 762,496 | |
| Net Assets | | $ | 66,017,341 | | | $ | 29,036,964 | | | $ | 316,826,268 | | | $ | 300,137,428 | |
| ANALYSIS OF NET ASSETS: | | | | | | | | | | | | | | | | |
| Paid-in capital | | $ | 22,226,277 | | | $ | 14,812,317 | | | $ | 430,784,493 | | | $ | 204,535,994 | |
| Total distributable earnings (loss) | | | 43,791,064 | | | | 14,224,647 | | | | (113,958,225 | ) | | | 95,601,434 | |
| Net Assets | | $ | 66,017,341 | | | $ | 29,036,964 | | | $ | 316,826,268 | | | $ | 300,137,428 | |
| Investment Class | | $ | 46,782,842 | | | | | | | $ | 123,233,053 | | | $ | 161,808,791 | |
| Service Class | | | 19,234,499 | | | $ | 20,076,532 | | | | 27,163,291 | | | | 128,110,691 | |
| Consultant Class | | | | | | | | | | | | | | | 10,217,946 | |
| Institutional Class | | | | | | | 8,960,432 | | | | 166,429,924 | | | | | |
| SHARES OUTSTANDING (unlimited number of $.001 par value): | | | | | | | | | | | | | | | | |
| Investment Class | | | 7,338,909 | | | | | | | | 9,852,861 | | | | 14,327,578 | |
| Service Class | | | 2,889,640 | | | | 1,823,673 | | | | 1,801,836 | | | | 11,733,116 | |
| Consultant Class | | | | | | | | | | | | | | | 1,246,166 | |
| Institutional Class | | | | | | | 617,518 | | | | 13,292,145 | | | | | |
| NET ASSET VALUES (Net Assets ÷ Shares Outstanding): | | | | | | | | | | | | | | | | |
| Investment Class3 | | | $6.37 | | | | | | | | $12.51 | | | | $11.29 | |
| Service Class3 | | | 6.66 | | | | $11.01 | | | | 15.08 | | | | 10.92 | |
| Consultant Class4 | | | | | | | | | | | | | | | 8.20 | |
| Institutional Class5 | | | | | | | 14.51 | | | | 12.52 | | | | | |
| Investments at identified cost - Non-Affiliated Companies | | $ | 22,854,907 | | | $ | 14,733,966 | | | $ | 287,749,153 | | | $ | 221,064,413 | |
| Market value of loaned securities6 | | | – | | | | – | | | | – | | | | 1,202,153 | |
| 1 | See Notes to Financial Statements for information on non-cash collateral on loaned securities. |
| 2 | The cost of foreign currency is $715,726 for Royce International Premier Fund. |
| 3 | Offering and redemption price per share; Prior to May 1, 2024, shares held less than 30 days may have been subject to a 1% redemption fee, or a 2% redemption fee (Royce International Premier Fund), payable to the Fund. |
| 4 | Offering and redemption price per share; shares held less than 365 days may be subject to a 1% contingent deferred sales charge, payable to Royce Fund Services, LLC. |
| 5 | Offering and redemption price per share. |
| 6 | Market value of loaned securities backed by non-cash collateral is as of prior business day. |
| See Notes to Financial Statements | 21 |
| Statements of Assets and Liabilities | June 30, 2024 (unaudited) |
| | | Royce Premier Fund | | | Royce Small-Cap
Fund | | | Royce Small-Cap
Opportunity Fund | | | Royce Small-Cap
Special Equity Fund | |
| ASSETS: | | | | | | | | | | | | |
| Investments at value (including collateral on loaned securities)1 | | | | | | | | | | | | |
| Non-Affiliated Companies | | $ | 1,331,896,571 | | | $ | 1,847,114,769 | | | $ | 1,192,747,278 | | | $ | 531,907,405 | |
| Affiliated Companies | | | – | | | | – | | | | 24,128,772 | | | | 61,620,310 | |
| Repurchase agreements (at cost and value) | | | 64,976,611 | | | | 50,200,595 | | | | 20,956,983 | | | | 113,154,168 | |
| Foreign currency2 | | | – | | | | 97,589 | | | | – | | | | – | |
| Receivable for investments sold | | | 1,350,481 | | | | 8,874,090 | | | | 4,884,248 | | | | – | |
| Receivable for capital shares sold | | | 970,351 | | | | 913,777 | | | | 1,537,847 | | | | 1,071,750 | |
| Receivable for dividends and interest | | | 870,344 | | | | 872,511 | | | | 427,550 | | | | 538,470 | |
| Receivable for securities lending income | | | – | | | | 1,385 | | | | 17,319 | | | | – | |
| Prepaid expenses and other assets | | | 40,013 | | | | 1,915,717 | | | | 38,946 | | | | 23,199 | |
| Total Assets | | | 1,400,104,371 | | | | 1,909,990,433 | | | | 1,244,738,943 | | | | 708,315,302 | |
| LIABILITIES: | | | | | | | | | | | | | | | | |
| Payable for collateral on loaned securities | | | – | | | | 552,173 | | | | 3,094,061 | | | | – | |
| Payable to custodian for cash overdrawn | | | – | | | | 53,576 | | | | – | | | | – | |
| Payable for investments purchased | | | – | | | | 6,312,941 | | | | 1,262,471 | | | | 68,560 | |
| Payable for capital shares redeemed | | | 2,425,620 | | | | 632,027 | | | | 885,091 | | | | 296,209 | |
| Payable for investment advisory fees | | | 1,152,481 | | | | 1,181,659 | | | | 1,020,342 | | | | 587,637 | |
| Payable for trustees’ fees | | | 54,499 | | | | 68,032 | | | | 49,004 | | | | 31,033 | |
| Accrued expenses | | | 271,297 | | | | 455,745 | | | | 384,615 | | | | 213,008 | |
| Total Liabilities | | | 3,903,897 | | | | 9,256,153 | | | | 6,695,584 | | | | 1,196,447 | |
| Net Assets | | $ | 1,396,200,474 | | | $ | 1,900,734,280 | | | $ | 1,238,043,359 | | | $ | 707,118,855 | |
| ANALYSIS OF NET ASSETS: | | | | | | | | | | | | | | | | |
| Paid-in capital | | $ | 746,553,943 | | | $ | 1,163,954,862 | | | $ | 930,360,384 | | | $ | 525,529,397 | |
| Total distributable earnings (loss) | | | 649,646,531 | | | | 736,779,418 | | | | 307,682,975 | | | | 181,589,458 | |
| Net Assets | | $ | 1,396,200,474 | | | $ | 1,900,734,280 | | | $ | 1,238,043,359 | | | $ | 707,118,855 | |
| Investment Class | | $ | 1,076,473,489 | | | $ | 1,426,175,333 | | | $ | 852,865,207 | | | $ | 542,378,015 | |
| Service Class | | | 33,354,032 | | | | 70,575,200 | | | | 60,492,442 | | | | 30,273,146 | |
| Consultant Class | | | 11,436,742 | | | | 189,406,613 | | | | 12,440,043 | | | | 13,823,684 | |
| Institutional Class | | | 274,936,211 | | | | 214,577,134 | | | | 269,468,605 | | | | 120,644,010 | |
| R Class | | | | | | | | | | | 42,777,062 | | | | | |
| SHARES OUTSTANDING (unlimited number of $.001 par value): | | | | | | | | | | | | | | | | |
| Investment Class | | | 92,494,553 | | | | 148,657,553 | | | | 54,501,654 | | | | 32,271,030 | |
| Service Class | | | 2,975,695 | | | | 7,412,457 | | | | 4,251,243 | | | | 1,803,635 | |
| Consultant Class | | | 1,309,197 | | | | 25,814,089 | | | | 1,033,379 | | | | 910,097 | |
| Institutional Class | | | 23,236,219 | | | | 22,278,682 | | | | 16,756,041 | | | | 7,243,717 | |
| R Class | | | | | | | | | | | 3,144,015 | | | | | |
| NET ASSET VALUES (Net Assets ÷ Shares Outstanding): | | | | | | | | | | | | | | | | |
| Investment Class3 | | | $11.64 | | | | $9.59 | | | | $15.65 | | | | $16.81 | |
| Service Class3 | | | 11.21 | | | | 9.52 | | | | 14.23 | | | | 16.78 | |
| Consultant Class4 | | | 8.74 | | | | 7.34 | | | | 12.04 | | | | 15.19 | |
| Institutional Class5 | | | 11.83 | | | | 9.63 | | | | 16.08 | | | | 16.65 | |
| R Class5 | | | | | | | | | | | 13.61 | | | | | |
| Investments at identified cost - Non-Affiliated Companies | | $ | 792,183,824 | | | $ | 1,219,696,978 | | | $ | 917,689,889 | | | $ | 397,403,754 | |
| Investments at identified cost - Affiliated Companies | | | – | | | | – | | | | 26,194,116 | | | | 49,254,251 | |
| Market value of loaned securities6 | | | – | | | | 3,674,526 | | | | 19,876,081 | | | | – | |
| 1 | See Notes to Financial Statements for information on non-cash collateral on loaned securities. |
| 2 | The cost of foreign currency is $97,489 for Royce Small-Cap Fund. |
| 3 | Offering and redemption price per share; Prior to May 1, 2024, shares held less than 30 days may have been subject to a 1% redemption fee, payable to the Fund. |
| 4 | Offering and redemption price per share; shares held less than 365 days may be subject to a 1% contingent deferred sales charge, payable to Royce Fund Services, LLC. |
| 5 | Offering and redemption price per share. |
| 6 | Market value of loaned securities backed by non-cash collateral is as of prior business day. |
| See Notes to Financial Statements | 22 |
| Statements of Assets and Liabilities | June 30, 2024 (unaudited) |
| | | Royce Small-Cap
Total Return Fund | | | Royce Small-Cap
Value Fund | | | Royce Smaller-
Companies Growth
Fund | |
| ASSETS: | | | | | | | | | |
| Investments at value (including collateral on loaned securities)1 | | | | | | | | | |
| Non-Affiliated Companies | | $ | 949,934,774 | | | $ | 110,809,223 | | | $ | 175,179,342 | |
| Affiliated Companies | | | 32,361,658 | | | | – | | | | – | |
| Repurchase agreements (at cost and value) | | | 23,605,781 | | | | 804,122 | | | | 8,537,988 | |
| Foreign currency2 | | | 133,586 | | | | – | | | | – | |
| Receivable for investments sold | | | 3,968,074 | | | | 268,522 | | | | – | |
| Receivable for capital shares sold | | | 933,682 | | | | 6,109 | | | | 23,611 | |
| Receivable for dividends and interest | | | 880,260 | | | | 40,707 | | | | 19,377 | |
| Receivable for securities lending income | | | 23 | | | | – | | | | 11,669 | |
| Prepaid expenses and other assets | | | 28,234 | | | | 3,273 | | | | 5,484 | |
| Total Assets | | | 1,011,846,072 | | | | 111,931,956 | | | | 183,777,471 | |
| LIABILITIES: | | | | | | | | | | | | |
| Payable for collateral on loaned securities | | | – | | | | – | | | | 4,531,444 | |
| Payable for investments purchased | | | 3,481,423 | | | | – | | | | 896,161 | |
| Payable for capital shares redeemed | | | 380,992 | | | | 73,457 | | | | 153,086 | |
| Payable for investment advisory fees | | | 819,272 | | | | 92,252 | | | | 145,048 | |
| Payable for trustees’ fees | | | 39,412 | | | | 4,848 | | | | 7,507 | |
| Accrued expenses | | | 356,038 | | | | 72,300 | | | | 89,965 | |
| Total Liabilities | | | 5,077,137 | | | | 242,857 | | | | 5,823,211 | |
| Net Assets | | $ | 1,006,768,935 | | | $ | 111,689,099 | | | $ | 177,954,260 | |
| ANALYSIS OF NET ASSETS: | | | | | | | | | | | | |
| Paid-in capital | | $ | 796,369,589 | | | $ | 80,107,846 | | | $ | 141,545,861 | |
| Total distributable earnings (loss) | | | 210,399,346 | | | | 31,581,253 | | | | 36,408,399 | |
| Net Assets | | $ | 1,006,768,935 | | | $ | 111,689,099 | | | $ | 177,954,260 | |
| Investment Class | | $ | 630,162,234 | | | $ | 35,380,386 | | | $ | 63,685,883 | |
| Service Class | | | 56,148,019 | | | | 76,308,713 | | | | 109,317,363 | |
| Consultant Class | | | 81,491,539 | | | | | | | | | |
| Institutional Class | | | 216,446,457 | | | | | | | | 4,951,014 | |
| R Class | | | 22,520,686 | | | | | | | | | |
| SHARES OUTSTANDING (unlimited number of $.001 par value): | | | | | | | | | | | | |
| Investment Class | | | 84,287,761 | | | | 3,532,795 | | | | 9,007,154 | |
| Service Class | | | 7,222,573 | | | | 7,673,669 | | | | 16,087,564 | |
| Consultant Class | | | 10,333,591 | | | | | | | | | |
| Institutional Class | | | 29,574,555 | | | | | | | | 689,395 | |
| R Class | | | 2,842,993 | | | | | | | | | |
| NET ASSET VALUES (Net Assets ÷ Shares Outstanding): | | | | | | | | | | | | |
| Investment Class3 | | | $7.48 | | | | $10.01 | | | | $7.07 | |
| Service Class3 | | | 7.77 | | | | 9.94 | | | | 6.80 | |
| Consultant Class4 | | | 7.89 | | | | | | | | | |
| Institutional Class5 | | | 7.32 | | | | | | | | 7.18 | |
| R Class5 | | | 7.92 | | | | | | | | | |
| Investments at identified cost - Non-Affiliated Companies | | $ | 794,765,415 | | | $ | 86,161,570 | | | $ | 136,136,771 | |
| Investments at identified cost - Affiliated Companies | | | 18,882,536 | | | | – | | | | – | |
| Market value of loaned securities6 | | | 208,416 | | | | – | | | | 12,128,561 | |
| 1 | See Notes to Financial Statements for information on non-cash collateral on loaned securities. |
| 2 | The cost of foreign currency is $133,449 for Royce Small-Cap Total Return Fund. |
| 3 | Offering and redemption price per share; Prior to May 1, 2024, shares held less than 30 days may have been subject to a 1% redemption fee, payable to the Fund. |
| 4 | Offering and redemption price per share; shares held less than 365 days may be subject to a 1% contingent deferred sales charge, payable to Royce Fund Services, LLC. |
| 5 | Offering and redemption price per share. |
| 6 | Market value of loaned securities backed by non-cash collateral is as of prior business day. |
| See Notes to Financial Statements | 23 |
| Statements of Operations | Six Months Ended June 30, 2024 (unaudited) |
| | | Royce Dividend
Value Fund | | | Royce Global
Financial Services
Fund | | | Royce International
Premier Fund | | | Royce Micro-Cap
Fund | |
| INVESTMENT INCOME: | | | | | | | | | | | | | | | | |
| INCOME: | | | | | | | | | | | | | | | | |
| Dividends | | $ | 645,835 | | | $ | 392,706 | | | $ | 8,100,738 | | | $ | 1,043,702 | |
| Foreign withholding tax | | | (23,549 | ) | | | (33,037 | ) | | | (508,617 | ) | | | (33,226 | ) |
| Interest | | | 86,208 | | | | 14,213 | | | | 648,761 | | | | 184,601 | |
| Securities lending | | | – | | | | – | | | | – | | | | 6,785 | |
| Total income | | | 708,494 | | | | 373,882 | | | | 8,240,882 | | | | 1,201,862 | |
| EXPENSES: | | | | | | | | | | | | | | | | |
| Investment advisory fees | | | 279,126 | | | | 140,953 | | | | 2,199,732 | | | | 1,511,323 | |
| Distribution fees | | | 23,721 | | | | 24,503 | | | | 38,240 | | | | 213,963 | |
| Shareholder servicing | | | 49,605 | | | | 19,100 | | | | 232,120 | | | | 193,627 | |
| Administrative and office facilities | | | 25,366 | | | | 16,352 | | | | 160,298 | | | | 86,080 | |
| Audit | | | 18,234 | | | | 18,738 | | | | 22,453 | | | | 19,003 | |
| Registration | | | 16,775 | | | | 16,279 | | | | 27,422 | | | | 23,380 | |
| Custody | | | 11,246 | | | | 13,990 | | | | 99,226 | | | | 23,659 | |
| Trustees' fees | | | 5,098 | | | | 2,199 | | | | 44,109 | | | | 24,270 | |
| Shareholder reports | | | 4,306 | | | | 2,159 | | | | 36,079 | | | | 19,307 | |
| Legal | | | 1,296 | | | | 561 | | | | 12,725 | | | | 6,234 | |
| Other expenses | | | 3,717 | | | | 2,939 | | | | 31,366 | | | | 13,223 | |
| Total expenses | | | 438,490 | | | | 257,773 | | | | 2,903,770 | | | | 2,134,069 | |
| Compensating balance credits | | | (961 | ) | | | (539 | ) | | | (14,981 | ) | | | (7,965 | ) |
| Fees waived by investment adviser and distributor | | | – | | | | (3,921 | ) | | | (285,835 | ) | | | – | |
| Expenses reimbursed by investment adviser | | | (55,870 | ) | | | (43,292 | ) | | | (89,353 | ) | | | (42,295 | ) |
| Net expenses | | | 381,659 | | | | 210,021 | | | | 2,513,601 | | | | 2,083,809 | |
| Net investment income (loss) | | | 326,835 | | | | 163,861 | | | | 5,727,281 | | | | (881,947 | ) |
| REALIZED AND UNREALIZED GAIN (LOSS) ON INVESTMENTS AND FOREIGN CURRENCY: | |
| NET REALIZED GAIN (LOSS): | | | | | | | | | | | | | | | | |
| Investments | | | 4,962,917 | | | | 709,628 | | | | (39,290,622 | ) | | | 17,504,722 | |
| Foreign currency transactions | | | (1,065 | ) | | | (2,958 | ) | | | (215,264 | ) | | | 1,659 | |
| NET CHANGE IN UNREALIZED APPRECIATION (DEPRECIATION): | | | | | | | | | | | | | | | | |
| Investments | | | (1,100,772 | ) | | | 1,571,059 | | | | 11,925,230 | | | | (8,964,507 | ) |
| Other assets and liabilities denominated in foreign currency | | | (1,380 | ) | | | 3,207 | | | | (176,841 | ) | | | 40 | |
| Net realized and unrealized gain (loss) on investments and foreign currency | | | 3,859,700 | | | | 2,280,936 | | | | (27,757,497 | ) | | | 8,541,914 | |
| NET INCREASE (DECREASE) IN NET ASSETS FROM INVESTMENT OPERATIONS | | $ | 4,186,535 | | | $ | 2,444,797 | | | $ | (22,030,216 | ) | | $ | 7,659,967 | |
| See Notes to Financial Statements | 24 |
| Statements of Operations | Six Months Ended June 30, 2024 (unaudited) |
| | | Royce Premier
Fund | | | Royce Small-Cap
Fund | | | Royce Small-Cap
Opportunity Fund | | | Royce Small-Cap
Special Equity Fund | |
| INVESTMENT INCOME: | | | | | | | | | | | | |
| INCOME: | | | | | | | | | | | | |
| Dividends | | | | | | | | | | | | |
| Non-Affiliated Companies | | $ | 7,242,293 | | | $ | 11,497,454 | | | $ | 4,908,860 | | | $ | 5,863,812 | |
| Affiliated Companies | | | – | | | | – | | | | 26,841 | | | | 1,070,450 | |
| Foreign withholding tax | | | (144,110 | ) | | | (376,555 | ) | | | (28,369 | ) | | | – | |
| Interest | | | 1,728,703 | | | | 927,493 | | | | 845,939 | | | | 2,841,546 | |
| Securities lending | | | – | | | | 195,493 | | | | 38,389 | | | | – | |
| Total income | | | 8,826,886 | | | | 12,243,885 | | | | 5,791,660 | | | | 9,775,808 | |
| EXPENSES: | | | | | | | | | | | | | | | | |
| Investment advisory fees | | | 7,092,427 | | | | 7,092,141 | | | | 6,205,044 | | | | 3,705,593 | |
| Distribution fees | | | 99,980 | | | | 1,037,341 | | | | 260,785 | | | | 110,883 | |
| Shareholder servicing | | | 529,691 | | | | 652,687 | | | | 627,608 | | | | 372,215 | |
| Administrative and office facilities | | | 360,423 | | | | 457,971 | | | | 329,567 | | | | 205,619 | |
| Audit | | | 23,052 | | | | 27,218 | | | | 25,772 | | | | 21,889 | |
| Registration | | | 37,854 | | | | 38,243 | | | | 41,906 | | | | 32,718 | |
| Custody | | | 54,894 | | | | 89,324 | | | | 71,084 | | | | 30,988 | |
| Trustees' fees | | | 112,271 | | | | 144,538 | | | | 100,228 | | | | 61,241 | |
| Shareholder reports | | | 58,141 | | | | 74,445 | | | | 50,541 | | | | 30,949 | |
| Legal | | | 28,577 | | | | 36,538 | | | | 26,274 | | | | 15,974 | |
| Other expenses | | | 56,528 | | | | 70,733 | | | | 53,587 | | | | 33,517 | |
| Total expenses | | | 8,453,838 | | | | 9,721,179 | | | | 7,792,396 | | | | 4,621,586 | |
| Compensating balance credits | | | (14,296 | ) | | | (36,672 | ) | | | (22,363 | ) | | | (12,716 | ) |
| Fees waived by distributor | | | – | | | | (7,167 | ) | | | – | | | | – | |
| Expenses reimbursed by investment adviser | | | (22,397 | ) | | | (2,290 | ) | | | (19,804 | ) | | | (22,100 | ) |
| Net expenses | | | 8,417,145 | | | | 9,675,050 | | | | 7,750,229 | | | | 4,586,770 | |
| Net investment income (loss) | | | 409,741 | | | | 2,568,835 | | | | (1,958,569 | ) | | | 5,189,038 | |
| REALIZED AND UNREALIZED GAIN (LOSS) ON INVESTMENTS AND FOREIGN CURRENCY: | |
| NET REALIZED GAIN (LOSS): | | | | | | | | | | | | | | | | |
| Investments in Non-Affiliated Companies | | | 100,941,021 | | | | 92,492,816 | | | | 31,459,344 | | | | 27,110,569 | |
| Investments in Affiliated Companies | | | – | | | | – | | | | 181,796 | | | | – | |
| Foreign currency transactions | | | (2,940 | ) | | | (35,999 | ) | | | (90 | ) | | | – | |
| NET CHANGE IN UNREALIZED APPRECIATION (DEPRECIATION): | | | | | | | | | | | | | | | | |
| Investments in Non-Affiliated Companies | | | (88,780,111 | ) | | | (12,883,573 | ) | | | 13,798,436 | | | | (41,612,668 | ) |
| Investments in Affiliated Companies | | | – | | | | – | | | | (1,551,087 | ) | | | (1,763,486 | ) |
| Other assets and liabilities denominated in foreign currency | | | – | | | | (63 | ) | | | (39 | ) | | | – | |
| Net realized and unrealized gain (loss) on investments and foreign currency | | | 12,157,970 | | | | 79,573,181 | | | | 43,888,360 | | | | (16,265,585 | ) |
| NET INCREASE (DECREASE) IN NET ASSETS FROM INVESTMENT OPERATIONS | | $ | 12,567,711 | | | $ | 82,142,016 | | | $ | 41,929,791 | | | $ | (11,076,547 | ) |
| See Notes to Financial Statements | 25 |
| Statements of Operations | Six Months Ended June 30, 2024 (unaudited) |
| | | Royce Small-Cap
Total Return Fund | | | Royce Small-Cap
Value Fund | | | Royce Smaller-
Companies Growth
Fund | |
| INVESTMENT INCOME: | | | | | | | | | |
| INCOME: | | | | | | | | | |
| Dividends | | | | | | | | | |
| Non-Affiliated Companies | | $ | 7,109,003 | | | $ | 1,591,430 | | | $ | 349,492 | |
| Affiliated Companies | | | 1,441,853 | | | | – | | | | – | |
| Foreign withholding tax | | | (133,379 | ) | | | – | | | | (1,762 | ) |
| Interest | | | 624,761 | | | | 56,917 | | | | 133,042 | |
| Securities lending | | | 10,001 | | | | 19 | | | | 40,270 | |
| Total income | | | 9,052,239 | | | | 1,648,366 | | | | 521,042 | |
| EXPENSES: | | | | | | | | | | | | |
| Investment advisory fees | | | 4,998,278 | | | | 626,682 | | | | 899,215 | |
| Distribution fees | | | 534,656 | | | | 111,575 | | | | 138,349 | |
| Shareholder servicing | | | 430,701 | | | | 95,950 | | | | 117,443 | |
| Administrative and office facilities | | | 259,882 | | | | 41,142 | | | | 55,185 | |
| Audit | | | 25,779 | | | | 16,533 | | | | 17,160 | |
| Registration | | | 34,437 | | | | 21,986 | | | | 21,960 | |
| Custody | | | 65,885 | | | | 15,933 | | | | 15,599 | |
| Trustees' fees | | | 79,552 | | | | 10,408 | | | | 14,503 | |
| Shareholder reports | | | 54,612 | | | | 8,257 | | | | 10,920 | |
| Legal | | | 20,347 | | | | 2,581 | | | | 3,750 | |
| Other expenses | | | 43,450 | | | | 5,644 | | | | 8,731 | |
| Total expenses | | | 6,547,579 | | | | 956,691 | | | | 1,302,815 | |
| Compensating balance credits | | | (12,970 | ) | | | (2,201 | ) | | | (3,771 | ) |
| Expenses reimbursed by investment adviser | | | (18,527 | ) | | | (65,830 | ) | | | (45,668 | ) |
| Net expenses | | | 6,516,082 | | | | 888,660 | | | | 1,253,376 | |
| Net investment income (loss) | | | 2,536,157 | | | | 759,706 | | | | (732,334 | ) |
| REALIZED AND UNREALIZED GAIN (LOSS) ON INVESTMENTS AND FOREIGN CURRENCY: | |
| NET REALIZED GAIN (LOSS): | | | | | | | | | | | | |
| Investments in Non-Affiliated Companies | | | 31,813,887 | | | | 5,200,571 | | | | 14,366,859 | |
| Investments in Affiliated Companies | | | 1,942,271 | | | | – | | | | – | |
| Foreign currency transactions | | | (26,708 | ) | | | – | | | | (3,404 | ) |
| NET CHANGE IN UNREALIZED APPRECIATION (DEPRECIATION): | | | | | | | | | | | | |
| Investments in Non-Affiliated Companies | | | (25,058,413 | ) | | | (9,356,713 | ) | | | (3,000,771 | ) |
| Investments in Affiliated Companies | | | 1,079,335 | | | | – | | | | – | |
| Other assets and liabilities denominated in foreign currency | | | 4,071 | | | | – | | | | (1 | ) |
| Net realized and unrealized gain (loss) on investments and foreign currency | | | 9,754,443 | | | | (4,156,142 | ) | | | 11,362,683 | |
| NET INCREASE (DECREASE) IN NET ASSETS FROM INVESTMENT OPERATIONS | | $ | 12,290,600 | | | $ | (3,396,436 | ) | | $ | 10,630,349 | |
| See Notes to Financial Statements | 26 |
Statements of Changes in Net Assets
| | | Royce Dividend Value Fund | | | Royce Global Financial
Services Fund | | | Royce International Premier Fund | |
| | | Six Months Ended
6/30/24 (unaudited) | | | Year Ended 12/31/23 | | | Six Months Ended
6/30/24 (unaudited) | | | Year Ended 12/31/23 | | | Six Months Ended
6/30/24 (unaudited) | | | Year Ended 12/31/23 | |
| INVESTMENT OPERATIONS: | | | | | | | | | | | | | | | | | | | | | | | | |
| Net investment income (loss) | | $ | 326,835 | | | $ | 594,324 | | | $ | 163,861 | | | $ | 439,490 | | | $ | 5,727,281 | | | $ | 8,180,796 | |
| Net realized gain (loss) on investments and foreign currency | | | 4,961,852 | | | | 7,402,145 | | | | 706,670 | | | | 2,255,241 | | | | (39,505,886 | ) | | | (59,465,778 | ) |
| Net change in unrealized appreciation (depreciation) on investments and foreign currency | | | (1,102,152 | ) | | | 4,555,773 | | | | 1,574,266 | | | | 1,221,367 | | | | 11,748,389 | | | | 88,231,890 | |
| Net increase (decrease) in net assets from investment operations | | | 4,186,535 | | | | 12,552,242 | | | | 2,444,797 | | | | 3,916,098 | | | | (22,030,216 | ) | | | 36,946,908 | |
| DISTRIBUTIONS: | | | | | | | | | | | | | | | | | | | | | | | | |
| Total distributable earnings | | | | | | | | | | | | | | | | | | | | | | | | |
| Investment Class | | | (221,572 | ) | | | (5,042,548 | ) | | | | | | | | | | | – | | | | (7,746,903 | ) |
| Service Class | | | (57,579 | ) | | | (2,006,314 | ) | | | – | | | | (1,418,068 | ) | | | – | | | | (729,574 | ) |
| Institutional Class | | | – | | | | (247 | ) | | | – | | | | (567,704 | ) | | | – | | | | (7,720,585 | ) |
| Total distributions | | | (279,151 | ) | | | (7,049,109 | ) | | | – | | | | (1,985,772 | ) | | | – | | | | (16,197,062 | ) |
| CAPITAL SHARE TRANSACTIONS: | | | | | | | | | | | | | | | | | | | | | | | | |
| Net capital share transactions | | | | | | | | | | | | | | | | | | | | | | | | |
| Investment Class | | | (766,317 | ) | | | (2,513,377 | ) | | | | | | | | | | | (118,107,848 | ) | | | (3,654,818 | ) |
| Service Class | | | (298,494 | ) | | | 2,961,580 | | | | (758,274 | ) | | | (1,634,082 | ) | | | (4,928,534 | ) | | | (1,119,634 | ) |
| Consultant Class | | | | | | | (1,669,601 | ) | | | | | | | | | | | | | | | (5,029,442 | ) |
| Institutional Class | | | | | | | (135,683 | ) | | | (42,009 | ) | | | 161,796 | | | | (38,613,537 | ) | | | (250,345,128 | ) |
| Shareholder redemption fees | | | | | | | | | | | | | | | | | | | | | | | | |
| Investment Class | | | – | | | | 396 | | | | | | | | | | | | 1,485 | | | | 1,501 | |
| Service Class | | | 1 | | | | – | | | | – | | | | 31 | | | | 45 | | | | 2,968 | |
| Net increase (decrease) in net assets from capital share transactions | | | (1,064,810 | ) | | | (1,356,685 | ) | | | (800,283 | ) | | | (1,472,255 | ) | | | (161,648,389 | ) | | | (260,144,553 | ) |
| Net Increase (Decrease) In Net Assets | | | 2,842,574 | | | | 4,146,448 | | | | 1,644,514 | | | | 458,071 | | | | (183,678,605 | ) | | | (239,394,707 | ) |
| NET ASSETS: | | | | | | | | | | | | | | | | | | | | | | | | |
| Beginning of period | | | 63,174,767 | | | | 59,028,319 | | | | 27,392,450 | | | | 26,934,379 | | | | 500,504,873 | | | | 739,899,580 | |
| End of period | | $ | 66,017,341 | | | $ | 63,174,767 | | | $ | 29,036,964 | | | $ | 27,392,450 | | | $ | 316,826,268 | | | $ | 500,504,873 | |
| See Notes to Financial Statements | 27 |
Statements of Changes in Net Assets
| | | Royce Micro-Cap Fund | | | Royce Premier Fund | | | Royce Small-Cap Fund | |
| | | Six Months Ended
6/30/24 (unaudited) | | | Year Ended 12/31/23 | | | Six Months Ended
6/30/24 (unaudited) | | | Year Ended 12/31/23 | | | Six Months Ended
6/30/24 (unaudited) | | | Year Ended 12/31/23 | |
| INVESTMENT OPERATIONS: | | | | | | | | | | | | | | | | | | | | | | | | |
| Net investment income (loss) | | $ | (881,947 | ) | | $ | (1,672,097 | ) | | $ | 409,741 | | | $ | 1,267,358 | | | $ | 2,568,835 | | | $ | 2,177,822 | |
| Net realized gain (loss) on investments and foreign currency | | | 17,506,381 | | | | 27,692,148 | | | | 100,938,081 | | | | 93,027,953 | | | | 92,456,817 | | | | 111,671,680 | |
| Net change in unrealized appreciation (depreciation) on investments and foreign currency | | | (8,964,467 | ) | | | 26,342,764 | | | | (88,780,111 | ) | | | 179,451,497 | | | | (12,883,636 | ) | | | 288,599,020 | |
| Net increase (decrease) in net assets from investment operations | | | 7,659,967 | | | | 52,362,815 | | | | 12,567,711 | | | | 273,746,808 | | | | 82,142,016 | | | | 402,448,522 | |
| DISTRIBUTIONS: | | | | | | | | | | | | | | | | | | | | | | | | |
| Total distributable earnings | | | | | | | | | | | | | | | | | | | | | | | | |
| Investment Class | | | – | | | | (10,989,696 | ) | | | – | | | | (74,373,756 | ) | | | – | | | | (65,933,131 | ) |
| Service Class | | | – | | | | (8,936,398 | ) | | | – | | | | (2,295,254 | ) | | | – | | | | (3,275,912 | ) |
| Consultant Class | | | – | | | | (707,046 | ) | | | – | | | | (762,327 | ) | | | – | | | | (8,438,738 | ) |
| Institutional Class | | | | | | | | | | | – | | | | (16,644,913 | ) | | | – | | | | (9,421,722 | ) |
| Total distributions | | | – | | | | (20,633,140 | ) | | | – | | | | (94,076,250 | ) | | | – | | | | (87,069,503 | ) |
| CAPITAL SHARE TRANSACTIONS: | | | | | | | | | | | | | | | | | | | | | | | | |
| Net capital share transactions | | | | | | | | | | | | | | | | | | | | | | | | |
| Investment Class | | | (8,956,838 | ) | | | (175,080 | ) | | | (73,204,390 | ) | | | (4,998,002 | ) | | | (38,018,618 | ) | | | (29,489,951 | ) |
| Service Class | | | (9,834,870 | ) | | | (11,363,544 | ) | | | (1,856,032 | ) | | | 6,039,867 | | | | (6,135,989 | ) | | | 3,384,794 | |
| Consultant Class | | | (745,570 | ) | | | (606,724 | ) | | | (399,463 | ) | | | (913,538 | ) | | | (11,426,300 | ) | | | (15,806,157 | ) |
| Institutional Class | | | | | | | | | | | 16,037,095 | | | | 18,701,299 | | | | 7,192,897 | | | | 34,304,093 | |
| R Class | | | | | | | | | | | | | | | (6,605,757 | ) | | | | | | | (7,470,321 | ) |
| Shareholder redemption fees | | | | | | | | | | | | | | | | | | | | | | | | |
| Investment Class | | | 14 | | | | 970 | | | | 661 | | | | 447 | | | | 435 | | | | 1,158 | |
| Service Class | | | 5 | | | | 1,067 | | | | – | | | | – | | | | 39 | | | | 202 | |
| Net increase (decrease) in net assets from capital share transactions | | | (19,537,259 | ) | | | (12,143,311 | ) | | | (59,422,129 | ) | | | 12,224,316 | | | | (48,387,536 | ) | | | (15,076,182 | ) |
| Net Increase (Decrease) In Net Assets | | | (11,877,292 | ) | | | 19,586,364 | | | | (46,854,418 | ) | | | 191,894,874 | | | | 33,754,480 | | | | 300,302,837 | |
| NET ASSETS: | | | | | | | | | | | | | | | | | | | | | | | | |
| Beginning of period | | | 312,014,720 | | | | 292,428,356 | | | | 1,443,054,892 | | | | 1,251,160,018 | | | | 1,866,979,800 | | | | 1,566,676,963 | |
| End of period | | $ | 300,137,428 | | | $ | 312,014,720 | | | $ | 1,396,200,474 | | | $ | 1,443,054,892 | | | $ | 1,900,734,280 | | | $ | 1,866,979,800 | |
| See Notes to Financial Statements | 28 |
Statements of Changes in Net Assets
| | | Royce Small-Cap Opportunity Fund | | | Royce Small-Cap Special
Equity Fund | | | Royce Small-Cap Total Return Fund | |
| | | Six Months Ended
6/30/24 (unaudited) | | | Year Ended 12/31/23 | | | Six Months Ended
6/30/24 (unaudited) | | | Year Ended 12/31/23 | | | Six Months Ended
6/30/24 (unaudited) | | | Year Ended 12/31/23 | |
| INVESTMENT OPERATIONS: | | | | | | | | | | | | | | | | | | | | | | | | |
| Net investment income (loss) | | $ | (1,958,569 | ) | | $ | (506,632 | ) | | $ | 5,189,038 | | | $ | 11,056,200 | | | $ | 2,536,157 | | | $ | 7,240,407 | |
| Net realized gain (loss) on investments and foreign currency | | | 31,641,050 | | | | 74,676,437 | | | | 27,110,569 | | | | 19,047,269 | | | | 33,729,450 | | | | 88,192,988 | |
| Net change in unrealized appreciation (depreciation) on investments and foreign currency | | | 12,247,310 | | | | 143,786,459 | | | | (43,376,154 | ) | | | 62,658,927 | | | | (23,975,007 | ) | | | 112,810,575 | |
| Net increase (decrease) in net assets from investment operations | | | 41,929,791 | | | | 217,956,264 | | | | (11,076,547 | ) | | | 92,762,396 | | | | 12,290,600 | | | | 208,243,970 | |
| DISTRIBUTIONS: | | | | | | | | | | | | | | | | | | | | | | | | |
| Total distributable earnings | | | | | | | | | | | | | | | | | | | | | | | | |
| Investment Class | | | – | | | | (39,071,925 | ) | | | – | | | | (31,210,014 | ) | | | (1,707,861 | ) | | | (58,941,637 | ) |
| Service Class | | | – | | | | (3,291,030 | ) | | | – | | | | (1,555,626 | ) | | | (72,632 | ) | | | (5,006,920 | ) |
| Consultant Class | | | – | | | | (559,481 | ) | | | – | | | | (657,508 | ) | | | – | | | | (6,494,539 | ) |
| Institutional Class | | | – | | | | (12,002,169 | ) | | | – | | | | (6,876,676 | ) | | | (583,736 | ) | | | (19,349,504 | ) |
| R Class | | | – | | | | (1,964,587 | ) | | | | | | | | | | | – | | | | (1,761,612 | ) |
| Total distributions | | | – | | | | (56,889,192 | ) | | | – | | | | (40,299,824 | ) | | | (2,364,229 | ) | | | (91,554,212 | ) |
| CAPITAL SHARE TRANSACTIONS: | | | | | | | | | | | | | | | | | | | | | | | | |
| Net capital share transactions | | | | | | | | | | | | | | | | | | | | | | | | |
| Investment Class | | | (66,548,843 | ) | | | (135,355,933 | ) | | | (54,607,042 | ) | | | (22,889,342 | ) | | | (18,878,309 | ) | | | (22,783,520 | ) |
| Service Class | | | (17,507,409 | ) | | | (1,863,203 | ) | | | (1,513,603 | ) | | | (4,629,957 | ) | | | (2,783,410 | ) | | | (7,348,656 | ) |
| Consultant Class | | | (869,795 | ) | | | 55,614 | | | | (1,208,260 | ) | | | (883,022 | ) | | | (4,584,800 | ) | | | (9,626,037 | ) |
| Institutional Class | | | (1,789,601 | ) | | | 16,944,127 | | | | (8,352,912 | ) | | | 6,248,547 | | | | 1,727,728 | | | | 8,493,692 | |
| R Class | | | (3,994,300 | ) | | | 1,076,523 | | | | | | | | | | | | 159 | | | | (469,274 | ) |
| Shareholder redemption fees | | | | | | | | | | | | | | | | | | | | | | | | |
| Investment Class | | | 223 | | | | 12,846 | | | | 367 | | | | 1,640 | | | | 279 | | | | 687 | |
| Service Class | | | 65 | | | | 1,305 | | | | 823 | | | | 112 | | | | – | | | | 293 | |
| Net increase (decrease) in net assets from capital share transactions | | | (90,709,660 | ) | | | (119,128,721 | ) | | | (65,680,627 | ) | | | (22,152,022 | ) | | | (24,518,353 | ) | | | (31,732,815 | ) |
| Net Increase (Decrease) In Net Assets | | | (48,779,869 | ) | | | 41,938,351 | | | | (76,757,174 | ) | | | 30,310,550 | | | | (14,591,982 | ) | | | 84,956,943 | |
| NET ASSETS: | | | | | | | | | | | | | | | | | | | | | | | | |
| Beginning of period | | | 1,286,823,228 | | | | 1,244,884,877 | | | | 783,876,029 | | | | 753,565,479 | | | | 1,021,360,917 | | | | 936,403,974 | |
| End of period | | $ | 1,238,043,359 | | | $ | 1,286,823,228 | | | $ | 707,118,855 | | | $ | 783,876,029 | | | $ | 1,006,768,935 | | | $ | 1,021,360,917 | |
| See Notes to Financial Statements | 29 |
Statements of Changes in Net Assets
| | | Royce Small-Cap Value Fund | | | Royce Smaller-Companies
Growth Fund | |
| | | Six Months Ended 6/30/24 (unaudited) | | | Year Ended 12/31/23 | | | Six Months Ended 6/30/24 (unaudited) | | | Year Ended 12/31/23 | |
| INVESTMENT OPERATIONS: | | | | | | | | | | | | | | | | |
| Net investment income (loss) | | $ | 759,706 | | | $ | 1,055,971 | | | $ | (732,334 | ) | | $ | (1,525,709 | ) |
| Net realized gain (loss) on investments and foreign currency | | | 5,200,571 | | | | 8,713,674 | | | | 14,363,455 | | | | 7,463,010 | |
| Net change in unrealized appreciation (depreciation) on investments and foreign currency | | | (9,356,713 | ) | | | 15,859,268 | | | | (3,000,772 | ) | | | 22,084,532 | |
| Net increase (decrease) in net assets from investment operations | | | (3,396,436 | ) | | | 25,628,913 | | | | 10,630,349 | | | | 28,021,833 | |
| DISTRIBUTIONS: | | | | | | | | | | | | | | | | |
| Total distributable earnings | | | | | | | | | | | | | | | | |
| Investment Class | | | – | | | | (2,893,809 | ) | | | – | | | | – | |
| Service Class | | | – | | | | (6,304,788 | ) | | | – | | | | – | |
| Institutional Class | | | | | | | | | | | – | | | | – | |
| Total distributions | | | – | | | | (9,198,597 | ) | | | – | | | | – | |
| CAPITAL SHARE TRANSACTIONS: | | | | | | | | | | | | | | | | |
| Net capital share transactions | | | | | | | | | | | | | | | | |
| Investment Class | | | (1,014,863 | ) | | | (3,318,421 | ) | | | (3,489,729 | ) | | | (7,846,011 | ) |
| Service Class | | | (20,431,173 | ) | | | 19,172,063 | | | | (9,223,663 | ) | | | (10,576,956 | ) |
| Consultant Class | | | | | | | (3,079,281 | ) | | | | | | | (4,414,617 | ) |
| Institutional Class | | | | | | | | | | | (550,244 | ) | | | 114,033 | |
| R Class | | | | | | | (5,632,125 | ) | | | | | | | | |
| Shareholder redemption fees | | | | | | | | | | | | | | | | |
| Investment Class | | | 251 | | | | 512 | | | | 153 | | | | 8 | |
| Service Class | | | 13,576 | | | | 544 | | | | 1 | | | | 2,572 | |
| Net increase (decrease) in net assets from capital share transactions | | | (21,432,209 | ) | | | 7,143,292 | | | | (13,263,482 | ) | | | (22,720,971 | ) |
| Net Increase (Decrease) In Net Assets | | | (24,828,645 | ) | | | 23,573,608 | | | | (2,633,133 | ) | | | 5,300,862 | |
| NET ASSETS: | | | | | | | | | | | | | | | | |
| Beginning of period | | | 136,517,744 | | | | 112,944,136 | | | | 180,587,393 | | | | 175,286,531 | |
| End of period | | $ | 111,689,099 | | | $ | 136,517,744 | | | $ | 177,954,260 | | | $ | 180,587,393 | |
| See Notes to Financial Statements | 30 |
Financial Highlights
This table is presented to show selected data for a share outstanding throughout each period and to assist shareholders in evaluating a Fund’s performance for the periods presented. Per share amounts have been determined on the basis of the weighted average number of shares outstanding during the period.
| | | | | | | | | Net Realized and
Unrealized Gain (Loss)
on Investments and
Foreign Currency | | | | | | | | Distributions
from Net
Realized Gain on
Investments and
Foreign Currency | | | | | | | | | | | | | | Ratio of Expenses to Average Net Assets | | | Ratio of Net
Investment
Income (Loss) to
Average Net
Assets | | | |
| | | Net Asset
Value,
Beginning of
Period | | Net
Investment
Income (Loss) | | | Total from
Investment
Operations | | Distributions
from Net
Investment
Income | | | Total
Distributions | | Net Asset Value,
End of Period | | Total Return | | Net Assets,
End of Period
(in thousands) | | Prior to Fee
Waivers, Expense
Reimbursements and
Balance Credits | | Prior to Fee
Waivers and
Expense
Reimbursements | | Net of Fee
Waivers and
Expense
Reimbursements | | | Portfolio
Turnover
Rate |
| Royce Dividend Value Fund–Investment Class |
| 2024† | | $ | 6.00 | | | $ | 0.03 | | | $ | 0.37 | | | $ | 0.40 | | | $ | (0.03 | ) | | $ | – | | | $ | (0.03 | ) | | $ | 6.37 | | | | 6.67 | %1 | | $ | 46,783 | | | | 1.24 | %2 | | | 1.24 | %2 | | | 1.09 | %2 | | | 1.07 | %2 | | | 2 | % |
| 2023 | | | 5.48 | | | | 0.06 | | | | 1.20 | | | | 1.26 | | | | (0.08 | ) | | | (0.66 | ) | | | (0.74 | ) | | | 6.00 | | | | 23.12 | | | | 44,754 | | | | 1.28 | | | | 1.27 | | | | 1.09 | | | | 1.05 | | | | 14 | |
| 2022 | | | 6.40 | | | | 0.04 | | | | (0.90 | ) | | | (0.86 | ) | | | (0.05 | ) | | | (0.01 | ) | | | (0.06 | ) | | | 5.48 | | | | (13.45 | ) | | | 43,264 | | | | 1.27 | | | | 1.27 | | | | 1.09 | | | | 0.80 | | | | 3 | |
| 2021 | | | 6.11 | | | | 0.05 | | | | 1.17 | | | | 1.22 | | | | (0.06 | ) | | | (0.87 | ) | | | (0.93 | ) | | | 6.40 | | | | 20.47 | | | | 54,466 | | | | 1.21 | | | | 1.21 | | | | 1.09 | | | | 0.76 | | | | 0 | |
| 2020 | | | 6.21 | | | | 0.07 | | | | 0.20 | | | | 0.27 | | | | (0.11 | ) | | | (0.26 | ) | | | (0.37 | ) | | | 6.11 | | | | 4.57 | | | | 53,421 | | | | 1.26 | | | | 1.26 | | | | 1.09 | | | | 1.27 | | | | 4 | |
| 2019 | | | 5.56 | | | | 0.09 | | | | 1.58 | | | | 1.67 | | | | (0.10 | ) | | | (0.92 | ) | | | (1.02 | ) | | | 6.21 | | | | 30.34 | | | | 76,273 | | | | 1.21 | | | | 1.20 | | | | 1.09 | | | | 1.37 | | | | 8 | |
| Royce Dividend Value Fund–Service Class |
| 2024† | | $ | 6.27 | | | $ | 0.03 | | | $ | 0.38 | | | $ | 0.41 | | | $ | (0.02 | ) | | $ | – | | | $ | (0.02 | ) | | $ | 6.66 | | | | 6.54 | %1 | | $ | 19,234 | | | | 1.57 | %2 | | | 1.56 | %2 | | | 1.34 | %2 | | | 0.82 | %2 | | | 2 | % |
| 2023 | | | 5.71 | | | | 0.05 | | | | 1.25 | | | | 1.30 | | | | (0.06 | ) | | | (0.68 | ) | | | (0.74 | ) | | | 6.27 | | | | 22.92 | | | | 18,421 | | | | 1.62 | | | | 1.61 | | | | 1.34 | | | | 0.81 | | | | 14 | |
| 2022 | | | 6.65 | | | | 0.03 | | | | (0.94 | ) | | | (0.91 | ) | | | (0.02 | ) | | | (0.01 | ) | | | (0.03 | ) | | | 5.71 | | | | (13.62 | ) | | | 14,005 | | | | 1.62 | | | | 1.62 | | | | 1.34 | | | | 0.55 | | | | 3 | |
| 2021 | | | 6.34 | | | | 0.04 | | | | 1.21 | | | | 1.25 | | | | (0.04 | ) | | | (0.90 | ) | | | (0.94 | ) | | | 6.65 | | | | 20.11 | | | | 19,518 | | | | 1.54 | | | | 1.54 | | | | 1.34 | | | | 0.51 | | | | 0 | |
| 2020 | | | 6.42 | | | | 0.06 | | | | 0.21 | | | | 0.27 | | | | (0.08 | ) | | | (0.27 | ) | | | (0.35 | ) | | | 6.34 | | | | 4.47 | | | | 19,687 | | | | 1.60 | | | | 1.60 | | | | 1.34 | | | | 1.02 | | | | 4 | |
| 2019 | | | 5.73 | | | | 0.08 | | | | 1.61 | | | | 1.69 | | | | (0.06 | ) | | | (0.94 | ) | | | (1.00 | ) | | | 6.42 | | | | 29.78 | | | | 25,256 | | | | 1.53 | | | | 1.52 | | | | 1.34 | | | | 1.14 | | | | 8 | |
| Royce Global Financial Services Fund–Service Class |
| 2024† | | $ | 10.09 | | | $ | 0.06 | | | $ | 0.86 | | | $ | 0.92 | | | $ | – | | | $ | – | | | $ | – | | | $ | 11.01 | | | | 9.12 | %1 | | $ | 20,077 | | | | 1.91 | %2 | | | 1.90 | %2 | | | 1.49 | %2 | | | 1.16 | %2 | | | 3 | % |
| 2023 | | | 9.41 | | | | 0.16 | 3 | | | 1.31 | | | | 1.47 | | | | (0.28 | ) | | | (0.51 | ) | | | (0.79 | ) | | | 10.09 | | | | 15.72 | | | | 19,136 | | | | 1.92 | | | | 1.91 | | | | 1.49 | | | | 1.65 | 3 | | | 12 | |
| 2022 | | | 12.06 | | | | 0.07 | | | | (2.52 | ) | | | (2.45 | ) | | | (0.08 | ) | | | (0.12 | ) | | | (0.20 | ) | | | 9.41 | | | | (20.32 | ) | | | 19,443 | | | | 1.90 | | | | 1.90 | | | | 1.49 | | | | 0.71 | | | | 10 | |
| 2021 | | | 10.66 | | | | 0.23 | 4 | | | 1.91 | | | | 2.14 | | | | (0.39 | ) | | | (0.35 | ) | | | (0.74 | ) | | | 12.06 | | | | 20.27 | | | | 28,574 | | | | 1.78 | | | | 1.78 | | | | 1.49 | | | | 1.84 | 4 | | | 5 | |
| 2020 | | | 9.91 | | | | 0.07 | | | | 1.42 | | | | 1.49 | | | | (0.04 | ) | | | (0.70 | ) | | | (0.74 | ) | | | 10.66 | | | | 15.25 | | | | 25,919 | | | | 1.88 | | | | 1.88 | | | | 1.49 | | | | 0.80 | | | | 4 | |
| 2019 | | | 8.18 | | | | 0.10 | | | | 1.87 | | | | 1.97 | | | | (0.15 | ) | | | (0.09 | ) | | | (0.24 | ) | | | 9.91 | | | | 24.17 | | | | 30,202 | | | | 1.82 | | | | 1.81 | | | | 1.49 | | | | 0.86 | | | | 5 | |
| Royce Global Financial Services Fund–Institutional Class |
| 2024† | | $ | 13.30 | | | $ | 0.08 | | | $ | 1.13 | | | $ | 1.21 | | | $ | – | | | $ | – | | | $ | – | | | $ | 14.51 | | | | 9.10 | %1 | | $ | 8,960 | | | | 1.64 | %2 | | | 1.64 | %2 | | | 1.49 | %2 | | | 1.16 | %2 | | | 3 | % |
| 2023 | | | 12.32 | | | | 0.22 | 3 | | | 1.71 | | | | 1.93 | | | | (0.28 | ) | | | (0.67 | ) | | | (0.95 | ) | | | 13.30 | | | | 15.72 | | | | 8,256 | | | | 1.66 | | | | 1.66 | | | | 1.49 | | | | 1.69 | 3 | | | 12 | |
| 2022 | | | 15.76 | | | | 0.10 | | | | (3.31 | ) | | | (3.21 | ) | | | (0.08 | ) | | | (0.15 | ) | | | (0.23 | ) | | | 12.32 | | | | (20.35 | ) | | | 7,491 | | | | 1.64 | | | | 1.64 | | | | 1.49 | | | | 0.72 | | | | 10 | |
| 2021 | | | 13.81 | | | | 0.32 | 4 | | | 2.47 | | | | 2.79 | | | | (0.39 | ) | | | (0.45 | ) | | | (0.84 | ) | | | 15.76 | | | | 20.35 | | | | 9,709 | | | | 1.51 | | | | 1.51 | | | | 1.49 | | | | 1.98 | 4 | | | 5 | |
| 2020 | | | 12.83 | | | | 0.10 | | | | 1.82 | | | | 1.92 | | | | (0.04 | ) | | | (0.90 | ) | | | (0.94 | ) | | | 13.81 | | | | 15.18 | | | | 7,746 | | | | 1.67 | | | | 1.67 | | | | 1.49 | | | | 0.81 | | | | 4 | |
| 2019 | | | 10.55 | | | | 0.14 | | | | 2.42 | | | | 2.56 | | | | (0.16 | ) | | | (0.12 | ) | | | (0.28 | ) | | | 12.83 | | | | 24.35 | | | | 6,738 | | | | 1.60 | | | | 1.60 | | | | 1.33 | | | | 1.04 | | | | 5 | |
| Royce International Premier Fund–Investment Class |
| 2024† | | $ | 13.12 | | | $ | 0.16 | | | $ | (0.77 | ) | | $ | (0.61 | ) | | $ | – | | | $ | – | | | $ | – | | | $ | 12.51 | | | | (4.65 | )%1 | | $ | 123,233 | | | | 1.32 | %2 | | | 1.32 | %2 | | | 1.19 | %2 | | | 2.46 | %2 | | | 20 | % |
| 2023 | | | 12.54 | | | | 0.13 | | | | 0.84 | | | | 0.97 | | | | (0.39 | ) | | | – | | | | (0.39 | ) | | | 13.12 | | | | 7.81 | | | | 252,621 | | | | 1.29 | | | | 1.29 | | | | 1.19 | | | | 1.02 | | | | 36 | |
| 2022 | | | 17.81 | | | | 0.13 | | | | (4.94 | ) | | | (4.81 | ) | | | (0.13 | ) | | | (0.33 | ) | | | (0.46 | ) | | | 12.54 | | | | (26.96 | ) | | | 248,170 | | | | 1.26 | | | | 1.26 | | | | 1.17 | | | | 0.95 | | | | 31 | |
| 2021 | | | 17.64 | | | | 0.06 | | | | 0.99 | | | | 1.05 | | | | (0.07 | ) | | | (0.81 | ) | | | (0.88 | ) | | | 17.81 | | | | 6.06 | | | | 480,550 | | | | 1.23 | | | | 1.23 | | | | 1.16 | | | | 0.33 | | | | 32 | |
| 2020 | | | 15.25 | | | | 0.04 | | | | 2.40 | | | | 2.44 | | | | (0.05 | ) | | | – | | | | (0.05 | ) | | | 17.64 | | | | 15.99 | | | | 486,378 | | | | 1.26 | | | | 1.26 | | | | 1.19 | | | | 0.30 | | | | 21 | |
| 2019 | | | 11.39 | | | | 0.11 | | | | 3.82 | | | | 3.93 | | | | (0.07 | ) | | | – | | | | (0.07 | ) | | | 15.25 | | | | 34.49 | | | | 360,623 | | | | 1.26 | | | | 1.26 | | | | 1.18 | | | | 0.74 | | | | 40 | |
| See Notes to Financial Statements | 31 |
Financial Highlights
This table is presented to show selected data for a share outstanding throughout each period and to assist shareholders in evaluating a Fund’s performance for the periods presented. Per share amounts have been determined on the basis of the weighted average number of shares outstanding during the period.
| | | | | | | | | Net Realized and
Unrealized Gain (Loss)
on Investments and
Foreign Currency | | | | | | | | Distributions
from Net
Realized Gain on
Investments and
Foreign Currency | | | | | | | | | | | | | | Ratio of Expenses to Average Net Assets | | | Ratio of Net
Investment
Income (Loss) to
Average Net
Assets | | | |
| | | Net Asset
Value,
Beginning of
Period | | Net
Investment
Income (Loss) | | | Total from
Investment
Operations | | Distributions
from Net
Investment
Income | | | Total
Distributions | | Net Asset Value,
End of Period | | Total Return | | Net Assets,
End of Period
(in thousands) | | Prior to Fee
Waivers, Expense
Reimbursements and
Balance Credits | | Prior to Fee
Waivers and
Expense
Reimbursements | | Net of Fee
Waivers and
Expense
Reimbursements | | | Portfolio
Turnover
Rate |
| Royce International Premier Fund–Service Class |
| 2024† | | $ | 15.83 | | | $ | 0.19 | | | $ | (0.94 | ) | | $ | (0.75 | ) | | $ | – | | | $ | – | | | $ | – | | | $ | 15.08 | | | | (4.74 | )%1 | | $ | 27,163 | | | | 1.64 | %2 | | | 1.64 | %2 | | | 1.44 | %2 | | | 2.42 | %2 | | | 20 | % |
| 2023 | | | 15.04 | | | | 0.12 | | | | 1.01 | | | | 1.13 | | | | (0.34 | ) | | | – | | | | (0.34 | ) | | | 15.83 | | | | 7.62 | | | | 33,645 | | | | 1.62 | | | | 1.61 | | | | 1.44 | | | | 0.79 | | | | 36 | |
| 2022 | | | 21.33 | | | | 0.11 | | | | (5.92 | ) | | | (5.81 | ) | | | (0.08 | ) | | | (0.40 | ) | | | (0.48 | ) | | | 15.04 | | | | (27.21 | ) | | | 33,163 | | | | 1.59 | | | | 1.59 | | | | 1.44 | | | | 0.63 | | | | 31 | |
| 2021 | | | 21.10 | | | | 0.01 | | | | 1.18 | | | | 1.19 | | | | – | | | | (0.96 | ) | | | (0.96 | ) | | | 21.33 | | | | 5.78 | | | | 59,258 | | | | 1.54 | | | | 1.54 | | | | 1.44 | | | | 0.05 | | | | 32 | |
| 2020 | | | 18.24 | | | | 0.01 | | | | 2.85 | | | | 2.86 | | | | – | | | | – | | | | – | | | | 21.10 | | | | 15.68 | | | | 69,153 | | | | 1.57 | | | | 1.57 | | | | 1.44 | | | | 0.04 | | | | 21 | |
| 2019 | | | 13.61 | | | | 0.10 | | | | 4.57 | | | | 4.67 | | | | (0.04 | ) | | | – | | | | (0.04 | ) | | | 18.24 | | | | 34.29 | | | | 71,350 | | | | 1.58 | | | | 1.58 | | | | 1.41 | | | | 0.63 | | | | 40 | |
| Royce International Premier Fund–Institutional Class |
| 2024† | | $ | 13.12 | | | $ | 0.18 | | | $ | (0.78 | ) | | $ | (0.60 | ) | | $ | – | | | $ | – | | | $ | – | | | $ | 12.52 | | | | (4.57 | )%1 | | $ | 166,430 | | | | 1.26 | %2 | | | 1.25 | %2 | | | 1.04 | %2 | | | 2.79 | %2 | | | 20 | % |
| 2023 | | | 12.53 | | | | 0.16 | | | | 0.84 | | | | 1.00 | | | | (0.41 | ) | | | – | | | | (0.41 | ) | | | 13.12 | | | | 8.05 | | | | 214,238 | | | | 1.21 | | | | 1.19 | | | | 1.04 | | | | 1.24 | | | | 36 | |
| 2022 | | | 17.82 | | | | 0.14 | | | | (4.95 | ) | | | (4.81 | ) | | | (0.15 | ) | | | (0.33 | ) | | | (0.48 | ) | | | 12.53 | | | | (26.92 | ) | | | 453,793 | | | | 1.20 | | | | 1.19 | | | | 1.04 | | | | 1.03 | | | | 31 | |
| 2021 | | | 17.64 | | | | 0.08 | | | | 0.99 | | | | 1.07 | | | | (0.09 | ) | | | (0.80 | ) | | | (0.89 | ) | | | 17.82 | | | | 6.23 | | | | 704,714 | | | | 1.16 | | | | 1.16 | | | | 1.04 | | | | 0.44 | | | | 32 | |
| 2020 | | | 15.25 | | | | 0.06 | | | | 2.39 | | | | 2.45 | | | | (0.06 | ) | | | – | | | | (0.06 | ) | | | 17.64 | | | | 16.12 | | | | 567,878 | | | | 1.20 | | | | 1.20 | | | | 1.04 | | | | 0.44 | | | | 21 | |
| 2019 | | | 11.39 | | | | (0.03 | ) | | | 3.98 | | | | 3.95 | | | | (0.09 | ) | | | – | | | | (0.09 | ) | | | 15.25 | | | | 34.68 | | | | 366,870 | | | | 1.19 | | | | 1.19 | | | | 1.04 | | | | 0.57 | | | | 40 | |
| Royce Micro-Cap Fund–Investment Class |
| 2024† | | $ | 11.00 | | | $ | (0.02 | ) | | $ | 0.31 | | | $ | 0.29 | | | $ | – | | | $ | – | | | $ | – | | | $ | 11.29 | | | | 2.64 | %1 | | $ | 161,809 | | | | 1.24 | %2 | | | 1.23 | %2 | | | 1.23 | %2 | | | (0.44 | )%2 | | | 10 | % |
| 2023 | | | 9.88 | | | | (0.04 | ) | | | 1.93 | | | | 1.89 | | | | – | | | | (0.77 | ) | | | (0.77 | ) | | | 11.00 | | | | 19.31 | | | | 166,477 | | | | 1.25 | | | | 1.25 | | | | 1.24 | | | | (0.42 | ) | | | 19 | |
| 2022 | | | 13.41 | | | | (0.05 | ) | | | (2.98 | ) | | | (3.03 | ) | | | – | | | | (0.50 | ) | | | (0.50 | ) | | | 9.88 | | | | (22.55 | ) | | | 149,934 | | | | 1.25 | | | | 1.24 | | | | 1.24 | | | | (0.50 | ) | | | 13 | |
| 2021 | | | 12.74 | | | | (0.07 | ) | | | 3.84 | | | | 3.77 | | | | – | | | | (3.10 | ) | | | (3.10 | ) | | | 13.41 | | | | 31.02 | | | | 209,032 | | | | 1.20 | | | | 1.20 | | | | 1.20 | | | | (0.43 | ) | | | 26 | |
| 2020 | | | 11.02 | | | | (0.05 | ) | | | 2.71 | | | | 2.66 | | | | – | | | | (0.94 | ) | | | (0.94 | ) | | | 12.74 | | | | 24.50 | | | | 174,339 | | | | 1.29 | | | | 1.29 | | | | 1.24 | | | | (0.46 | ) | | | 25 | |
| 2019 | | | 9.35 | | | | (0.05 | ) | | | 2.02 | | | | 1.97 | | | | – | | | | (0.30 | ) | | | (0.30 | ) | | | 11.02 | | | | 21.16 | | | | 158,112 | | | | 1.51 | | | | 1.50 | | | | 1.36 | | | | (0.46 | ) | | | 21 | |
| Royce Micro-Cap Fund–Service Class |
| 2024† | | $ | 10.65 | | | $ | (0.04 | ) | | $ | 0.31 | | | $ | 0.27 | | | $ | – | | | $ | – | | | $ | – | | | $ | 10.92 | | | | 2.54 | %1 | | $ | 128,110 | | | | 1.54 | %2 | | | 1.54 | %2 | | | 1.49 | %2 | | | (0.70 | )%2 | | | 10 | % |
| 2023 | | | 9.59 | | | | (0.07 | ) | | | 1.87 | | | | 1.80 | | | | – | | | | (0.74 | ) | | | (0.74 | ) | | | 10.65 | | | | 19.03 | | | | 134,780 | | | | 1.55 | | | | 1.55 | | | | 1.49 | | | | (0.67 | ) | | | 19 | |
| 2022 | | | 13.05 | | | | (0.08 | ) | | | (2.89 | ) | | | (2.97 | ) | | | – | | | | (0.49 | ) | | | (0.49 | ) | | | 9.59 | | | | (22.76 | ) | | | 132,133 | | | | 1.54 | | | | 1.54 | | | | 1.49 | | | | (0.75 | ) | | | 13 | |
| 2021 | | | 12.45 | | | | (0.11 | ) | | | 3.74 | | | | 3.63 | | | | – | | | | (3.03 | ) | | | (3.03 | ) | | | 13.05 | | | | 30.64 | | | | 197,089 | | | | 1.51 | | | | 1.51 | | | | 1.49 | | | | (0.73 | ) | | | 26 | |
| 2020 | | | 10.79 | | | | (0.07 | ) | | | 2.65 | | | | 2.58 | | | | – | | | | (0.92 | ) | | | (0.92 | ) | | | 12.45 | | | | 24.26 | | | | 168,285 | | | | 1.60 | | | | 1.60 | | | | 1.49 | | | | (0.71 | ) | | | 25 | |
| 2019 | | | 9.15 | | | | (0.01 | ) | | | 1.94 | | | | 1.93 | | | | – | | | | (0.29 | ) | | | (0.29 | ) | | | 10.79 | | | | 21.22 | | | | 164,956 | | | | 1.51 | | | | 1.51 | | | | 1.50 | | | | (0.09 | ) | | | 21 | |
| Royce Micro-Cap Fund–Consultant Class |
| 2024† | | $ | 8.03 | | | $ | (0.06 | ) | | $ | 0.23 | | | $ | 0.17 | | | $ | – | | | $ | – | | | $ | – | | | $ | 8.20 | | | | 2.12 | %1 | | $ | 10,218 | | | | 2.42 | %2 | | | 2.42 | %2 | | | 2.24 | %2 | | | (1.45 | )%2 | | | 10 | % |
| 2023 | | | 7.29 | | | | (0.11 | ) | | | 1.41 | | | | 1.30 | | | | – | | | | (0.56 | ) | | | (0.56 | ) | | | 8.03 | | | | 18.03 | | | | 10,758 | | | | 2.42 | | | | 2.42 | | | | 2.30 | | | | (1.48 | ) | | | 19 | |
| 2022 | | | 10.00 | | | | (0.13 | ) | | | (2.21 | ) | | | (2.34 | ) | | | – | | | | (0.37 | ) | | | (0.37 | ) | | | 7.29 | | | | (23.37 | ) | | | 10,361 | | | | 2.37 | | | | 2.37 | | | | 2.37 | | | | (1.63 | ) | | | 13 | |
| 2021 | | | 9.62 | | | | (0.18 | ) | | | 2.89 | | | | 2.71 | | | | – | | | | (2.33 | ) | | | (2.33 | ) | | | 10.00 | | | | 29.56 | | | | 15,777 | | | | 2.30 | | | | 2.30 | | | | 2.30 | | | | (1.53 | ) | | | 26 | |
| 2020 | | | 8.42 | | | | (0.13 | ) | | | 2.04 | | | | 1.91 | | | | – | | | | (0.71 | ) | | | (0.71 | ) | | | 9.62 | | | | 23.04 | | | | 14,025 | | | | 2.41 | | | | 2.41 | | | | 2.41 | | | | (1.63 | ) | | | 25 | |
| 2019 | | | 7.23 | | | | (0.13 | ) | | | 1.55 | | | | 1.42 | | | | – | | | | (0.23 | ) | | | (0.23 | ) | | | 8.42 | | | | 19.72 | | | | 14,204 | | | | 2.59 | | | | 2.59 | | | | 2.58 | | | | (1.69 | ) | | | 21 | |
| See Notes to Financial Statements | 32 |
Financial Highlights
This table is presented to show selected data for a share outstanding throughout each period and to assist shareholders in evaluating a Fund’s performance for the periods presented. Per share amounts have been determined on the basis of the weighted average number of shares outstanding during the period.
| | | | | | | | | Net Realized and
Unrealized Gain (Loss)
on Investments and
Foreign Currency | | | | | | | | Distributions
from Net
Realized Gain on
Investments and
Foreign Currency | | | | | | | | | | | | | | Ratio of Expenses to Average Net Assets | | | Ratio of Net
Investment
Income (Loss) to
Average Net
Assets | | | |
| | | Net Asset
Value,
Beginning of
Period | | Net
Investment
Income (Loss) | | | Total from
Investment
Operations | | Distributions
from Net
Investment
Income | | | Total
Distributions | | Net Asset Value,
End of Period | | Total Return | | Net Assets,
End of Period
(in thousands) | | Prior to Fee
Waivers, Expense
Reimbursements and
Balance Credits | | Prior to Fee
Waivers and
Expense
Reimbursements | | Net of Fee
Waivers and
Expense
Reimbursements | | | Portfolio
Turnover
Rate |
| Royce Premier Fund–Investment Class |
| 2024† | | $ | 11.52 | | | $ | 0.00 | | | $ | 0.12 | | | $ | 0.12 | | | $ | – | | | $ | – | | | $ | – | | | $ | 11.64 | | | | 1.04 | %1 | | $ | 1,076,473 | | | | 1.19 | %2 | | | 1.18 | %2 | | | 1.18 | %2 | | | 0.06 | %2 | | | 7 | % |
| 2023 | | | 10.06 | | | | 0.01 | | | | 2.24 | | | | 2.25 | | | | (0.00 | ) | | | (0.79 | ) | | | (0.79 | ) | | | 11.52 | | | | 22.53 | | | | 1,140,122 | | | | 1.19 | | | | 1.19 | | | | 1.19 | | | | 0.10 | | | | 15 | |
| 2022 | | | 12.97 | | | | (0.00 | ) | | | (2.00 | ) | | | (2.00 | ) | | | – | | | | (0.91 | ) | | | (0.91 | ) | | | 10.06 | | | | (15.46 | ) | | | 1,001,894 | | | | 1.18 | | | | 1.18 | | | | 1.18 | | | | (0.02 | ) | | | 23 | |
| 2021 | | | 13.59 | | | | (0.03 | ) | | | 2.16 | | | | 2.13 | | | | (0.01 | ) | | | (2.74 | ) | | | (2.75 | ) | | | 12.97 | | | | 16.36 | | | | 1,401,347 | | | | 1.17 | | | | 1.17 | | | | 1.17 | | | | (0.19 | ) | | | 20 | |
| 2020 | | | 12.88 | | | | 0.05 | | | | 1.41 | | | | 1.46 | | | | (0.12 | ) | | | (0.63 | ) | | | (0.75 | ) | | | 13.59 | | | | 11.50 | | | | 1,414,718 | | | | 1.21 | | | | 1.21 | | | | 1.21 | | | | 0.41 | | | | 23 | |
| 2019 | | | 11.62 | | | | 0.05 | | | | 3.87 | | | | 3.92 | | | | (0.05 | ) | | | (2.61 | ) | | | (2.66 | ) | | | 12.88 | | | | 34.13 | | | | 1,505,821 | | | | 1.20 | | | | 1.19 | | | | 1.19 | | | | 0.32 | | | | 19 | |
| Royce Premier Fund–Service Class |
| 2024† | | $ | 11.11 | | | $ | (0.01 | ) | | $ | 0.11 | | | $ | 0.10 | | | $ | – | | | $ | – | | | $ | – | | | $ | 11.21 | | | | 0.90 | %1 | | $ | 33,354 | | | | 1.59 | %2 | | | 1.58 | %2 | | | 1.49 | %2 | | | (0.25 | )%2 | | | 7 | % |
| 2023 | | | 9.72 | | | | (0.02 | ) | | | 2.17 | | | | 2.15 | | | | – | | | | (0.76 | ) | | | (0.76 | ) | | | 11.11 | | | | 22.24 | | | | 34,923 | | | | 1.63 | | | | 1.62 | | | | 1.49 | | | | (0.19 | ) | | | 15 | |
| 2022 | | | 12.58 | | | | (0.04 | ) | | | (1.95 | ) | | | (1.99 | ) | | | – | | | | (0.87 | ) | | | (0.87 | ) | | | 9.72 | | | | (15.79 | ) | | | 24,968 | | | | 1.59 | | | | 1.59 | | | | 1.49 | | | | (0.33 | ) | | | 23 | |
| 2021 | | | 13.22 | | | | (0.07 | ) | | | 2.09 | | | | 2.02 | | | | – | | | | (2.66 | ) | | | (2.66 | ) | | | 12.58 | | | | 15.98 | | | | 36,488 | | | | 1.56 | | | | 1.56 | | | | 1.49 | | | | (0.50 | ) | | | 20 | |
| 2020 | | | 12.54 | | | | 0.01 | | | | 1.37 | | | | 1.38 | | | | (0.09 | ) | | | (0.61 | ) | | | (0.70 | ) | | | 13.22 | | | | 11.16 | | | | 29,588 | | | | 1.57 | | | | 1.57 | | | | 1.49 | | | | 0.12 | | | | 23 | |
| 2019 | | | 11.31 | | | | (0.01 | ) | | | 3.78 | | | | 3.77 | | | | – | | | | (2.54 | ) | | | (2.54 | ) | | | 12.54 | | | | 33.65 | | | | 29,696 | | | | 1.57 | | | | 1.57 | | | | 1.46 | | | | (0.06 | ) | | | 19 | |
| Royce Premier Fund–Consultant Class |
| 2024† | | $ | 8.69 | | | $ | (0.04 | ) | | $ | 0.09 | | | $ | 0.05 | | | $ | – | | | $ | – | | | $ | – | | | $ | 8.74 | | | | 0.58 | %1 | | $ | 11,437 | | | | 2.36 | %2 | | | 2.36 | %2 | | | 2.24 | %2 | | | (1.00 | )%2 | | | 7 | % |
| 2023 | | | 7.67 | | | | (0.08 | ) | | | 1.69 | | | | 1.61 | | | | – | | | | (0.59 | ) | | | (0.59 | ) | | | 8.69 | | | | 21.16 | | | | 11,782 | | | | 2.36 | | | | 2.36 | | | | 2.28 | | | | (0.99 | ) | | | 15 | |
| 2022 | | | 10.00 | | | | (0.10 | ) | | | (1.53 | ) | | | (1.63 | ) | | | – | | | | (0.70 | ) | | | (0.70 | ) | | | 7.67 | | | | (16.36 | ) | | | 11,265 | | | | 2.33 | | | | 2.33 | | | | 2.33 | | | | (1.17 | ) | | | 23 | |
| 2021 | | | 10.60 | | | | (0.15 | ) | | | 1.67 | | | | 1.52 | | | | – | | | | (2.12 | ) | | | (2.12 | ) | | | 10.00 | | | | 15.01 | | | | 16,016 | | | | 2.29 | | | | 2.29 | | | | 2.29 | | | | (1.30 | ) | | | 20 | |
| 2020 | | | 10.09 | | | | (0.07 | ) | | | 1.09 | | | | 1.02 | | | | (0.02 | ) | | | (0.49 | ) | | | (0.51 | ) | | | 10.60 | | | | 10.19 | | | | 15,686 | | | | 2.34 | | | | 2.34 | | | | 2.34 | | | | (0.72 | ) | | | 23 | |
| 2019 | | | 9.17 | | | | (0.10 | ) | | | 3.05 | | | | 2.95 | | | | – | | | | (2.03 | ) | | | (2.03 | ) | | | 10.09 | | | | 32.55 | | | | 17,585 | | | | 2.26 | | | | 2.26 | | | | 2.26 | | | | (0.91 | ) | | | 19 | |
| Royce Premier Fund–Institutional Class |
| 2024† | | $ | 11.71 | | | $ | 0.01 | | | $ | 0.11 | | | $ | 0.12 | | | $ | – | | | $ | – | | | $ | – | | | $ | 11.83 | | | | 1.02 | %1 | | $ | 274,936 | | | | 1.11 | %2 | | | 1.11 | %2 | | | 1.11 | %2 | | | 0.14 | %2 | | | 7 | % |
| 2023 | | | 10.22 | | | | 0.02 | | | | 2.28 | | | | 2.30 | | | | (0.01 | ) | | | (0.80 | ) | | | (0.81 | ) | | | 11.71 | | | | 22.64 | | | | 256,228 | | | | 1.12 | | | | 1.12 | | | | 1.12 | | | | 0.17 | | | | 15 | |
| 2022 | | | 13.16 | | | | 0.01 | | | | (2.03 | ) | | | (2.02 | ) | | | – | | | | (0.92 | ) | | | (0.92 | ) | | | 10.22 | | | | (15.37 | ) | | | 206,916 | | | | 1.11 | | | | 1.11 | | | | 1.11 | | | | 0.05 | | | | 23 | |
| 2021 | | | 13.80 | | | | (0.02 | ) | | | 2.19 | | | | 2.17 | | | | (0.02 | ) | | | (2.79 | ) | | | (2.81 | ) | | | 13.16 | | | | 16.39 | | | | 273,853 | | | | 1.09 | | | | 1.09 | | | | 1.09 | | | | (0.11 | ) | | | 20 | |
| 2020 | | | 13.08 | | | | 0.05 | | | | 1.44 | | | | 1.49 | | | | (0.13 | ) | | | (0.64 | ) | | | (0.77 | ) | | | 13.80 | | | | 11.53 | | | | 266,587 | | | | 1.15 | | | | 1.15 | | | | 1.15 | | | | 0.44 | | | | 23 | |
| 2019 | | | 11.79 | | | | 0.05 | | | | 3.94 | | | | 3.99 | | | | (0.05 | ) | | | (2.65 | ) | | | (2.70 | ) | | | 13.08 | | | | 34.23 | | | | 244,343 | | | | 1.15 | | | | 1.15 | | | | 1.15 | | | | 0.33 | | | | 19 | |
| Royce Small-Cap Fund–Investment Class |
| 2024† | | $ | 9.18 | | | $ | 0.02 | | | $ | 0.39 | | | $ | 0.41 | | | $ | – | | | $ | – | | | $ | – | | | $ | 9.59 | | | | 4.47 | %1 | | $ | 1,426,175 | | | | 0.93 | %2 | | | 0.93 | %2 | | | 0.93 | %2 | | | 0.39 | %2 | | | 20 | % |
| 2023 | | | 7.61 | | | | 0.02 | | | | 2.00 | | | | 2.02 | | | | (0.04 | ) | | | (0.41 | ) | | | (0.45 | ) | | | 9.18 | | | | 26.66 | | | | 1,401,591 | | | | 0.94 | | | | 0.94 | | | | 0.94 | | | | 0.25 | | | | 40 | |
| 2022 | | | 9.65 | | | | 0.03 | | | | (1.68 | ) | | | (1.65 | ) | | | (0.00 | ) | | | (0.39 | ) | | | (0.39 | ) | | | 7.61 | | | | (17.06 | ) | | | 1,191,941 | | | | 0.94 | | | | 0.94 | | | | 0.94 | | | | 0.31 | | | | 45 | |
| 2021 | | | 10.24 | | | | 0.02 | | | | 2.11 | | | | 2.13 | | | | (0.01 | ) | | | (2.71 | ) | | | (2.72 | ) | | | 9.65 | | | | 22.05 | | | | 1,605,587 | | | | 0.91 | | | | 0.91 | | | | 0.91 | | | | 0.15 | | | | 60 | |
| 2020 | | | 9.44 | | | | 0.03 | | | | 1.29 | | | | 1.32 | | | | (0.06 | ) | | | (0.46 | ) | | | (0.52 | ) | | | 10.24 | | | | 14.08 | | | | 1,426,472 | | | | 0.95 | | | | 0.95 | | | | 0.95 | | | | 0.37 | | | | 32 | |
| 2019 | | | 7.75 | | | | 0.04 | | | | 2.01 | | | | 2.05 | | | | (0.02 | ) | | | (0.34 | ) | | | (0.36 | ) | | | 9.44 | | | | 26.56 | | | | 1,429,042 | | | | 0.95 | | | | 0.94 | | | | 0.94 | | | | 0.39 | | | | 30 | |
| See Notes to Financial Statements | 33 |
Financial Highlights
This table is presented to show selected data for a share outstanding throughout each period and to assist shareholders in evaluating a Fund’s performance for the periods presented. Per share amounts have been determined on the basis of the weighted average number of shares outstanding during the period.
| | | | | | | | | Net Realized and
Unrealized Gain (Loss)
on Investments and
Foreign Currency | | | | | | | | Distributions
from Net
Realized Gain on
Investments and
Foreign Currency | | | | | | | | | | | | | | Ratio of Expenses to Average Net Assets | | | Ratio of Net
Investment
Income (Loss) to
Average Net
Assets | | | |
| | | Net Asset
Value,
Beginning of
Period | | Net
Investment
Income (Loss) | | | Total from
Investment
Operations | | Distributions
from Net
Investment
Income | | | Total
Distributions | | Net Asset Value,
End of Period | | Total Return | | Net Assets,
End of Period
(in thousands) | | Prior to Fee
Waivers, Expense
Reimbursements and
Balance Credits | | Prior to Fee
Waivers and
Expense
Reimbursements | | Net of Fee
Waivers and
Expense
Reimbursements | | | Portfolio
Turnover
Rate |
| Royce Small-Cap Fund–Service Class |
| 2024† | | $ | 9.12 | | | $ | 0.00 | | | $ | 0.40 | | | $ | 0.40 | | | $ | – | | | $ | – | | | $ | – | | | $ | 9.52 | | | | 4.39 | %1 | | $ | 70,575 | | | | 1.29 | %2 | | | 1.28 | %2 | | | 1.26 | %2 | | | 0.05 | %2 | | | 20 | % |
| 2023 | | | 7.56 | | | | (0.01 | ) | | | 1.99 | | | | 1.98 | | | | (0.01 | ) | | | (0.41 | ) | | | (0.42 | ) | | | 9.12 | | | | 26.31 | | | | 73,661 | | | | 1.31 | | | | 1.31 | | | | 1.25 | | | | (0.06 | ) | | | 40 | |
| 2022 | | | 9.62 | | | | (0.00 | ) | | | (1.67 | ) | | | (1.67 | ) | | | – | | | | (0.39 | ) | | | (0.39 | ) | | | 7.56 | | | | (17.41 | ) | | | 58,043 | | | | 1.30 | | | | 1.30 | | | | 1.25 | | | | (0.01 | ) | | | 45 | |
| 2021 | | | 10.23 | | | | (0.02 | ) | | | 2.11 | | | | 2.09 | | | | – | | | | (2.70 | ) | | | (2.70 | ) | | | 9.62 | | | | 21.64 | | | | 84,060 | | | | 1.27 | | | | 1.27 | | | | 1.27 | | | | (0.22 | ) | | | 60 | |
| 2020 | | | 9.42 | | | | 0.02 | | | | 1.28 | | | | 1.30 | | | | (0.03 | ) | | | (0.46 | ) | | | (0.49 | ) | | | 10.23 | | | | 13.88 | | | | 78,789 | | | | 1.25 | | | | 1.24 | | | | 1.13 | | | | 0.23 | | | | 32 | |
| 2019 | | | 7.77 | | | | (0.00 | ) | | | 2.00 | | | | 2.00 | | | | (0.01 | ) | | | (0.34 | ) | | | (0.35 | ) | | | 9.42 | | | | 25.75 | | | | 142,864 | | | | 1.31 | | | | 1.30 | | | | 1.30 | | | | (0.01 | ) | | | 30 | |
| Royce Small-Cap Fund–Consultant Class |
| 2024† | | $ | 7.05 | | | $ | (0.02 | ) | | $ | 0.31 | | | $ | 0.29 | | | $ | – | | | $ | – | | | $ | – | | | $ | 7.34 | | | | 4.11 | %1 | | $ | 189,407 | | | | 1.94 | %2 | | | 1.94 | %2 | | | 1.94 | %2 | | | (0.63 | )%2 | | | 20 | % |
| 2023 | | | 5.88 | | | | (0.05 | ) | | | 1.54 | | | | 1.49 | | | | – | | | | (0.32 | ) | | | (0.32 | ) | | | 7.05 | | | | 25.39 | | | | 193,390 | | | | 1.95 | | | | 1.94 | | | | 1.94 | | | | (0.76 | ) | | | 40 | |
| 2022 | | | 7.53 | | | | (0.04 | ) | | | (1.31 | ) | | | (1.35 | ) | | | – | | | | (0.30 | ) | | | (0.30 | ) | | | 5.88 | | | | (17.94 | ) | | | 175,956 | | | | 1.94 | | | | 1.94 | | | | 1.94 | | | | (0.70 | ) | | | 45 | |
| 2021 | | | 8.07 | | | | (0.08 | ) | | | 1.66 | | | | 1.58 | | | | – | | | | (2.12 | ) | | | (2.12 | ) | | | 7.53 | | | | 20.78 | | | | 249,816 | | | | 1.92 | | | | 1.92 | | | | 1.92 | | | | (0.86 | ) | | | 60 | |
| 2020 | | | 7.47 | | | | (0.04 | ) | | | 1.00 | | | | 0.96 | | | | – | | | | (0.36 | ) | | | (0.36 | ) | | | 8.07 | | | | 12.94 | | | | 238,595 | | | | 1.96 | | | | 1.96 | | | | 1.96 | | | | (0.64 | ) | | | 32 | |
| 2019 | | | 6.18 | | | | (0.04 | ) | | | 1.60 | | | | 1.56 | | | | – | | | | (0.27 | ) | | | (0.27 | ) | | | 7.47 | | | | 25.25 | | | | 262,007 | | | | 1.96 | | | | 1.95 | | | | 1.95 | | | | (0.62 | ) | | | 30 | |
| Royce Small-Cap Fund–Institutional Class |
| 2024† | | $ | 9.21 | | | $ | 0.02 | | | $ | 0.40 | | | $ | 0.42 | | | $ | – | | | $ | – | | | $ | – | | | $ | 9.63 | | | | 4.56 | %1 | | $ | 214,577 | | | | 0.89 | %2 | | | 0.88 | %2 | | | 0.88 | %2 | | | 0.43 | %2 | | | 20 | % |
| 2023 | | | 7.63 | | | | 0.02 | | | | 2.02 | | | | 2.04 | | | | (0.04 | ) | | | (0.42 | ) | | | (0.46 | ) | | | 9.21 | | | | 26.77 | | | | 198,338 | | | | 0.91 | | | | 0.91 | | | | 0.91 | | | | 0.29 | | | | 40 | |
| 2022 | | | 9.68 | | | | 0.03 | | | | (1.68 | ) | | | (1.65 | ) | | | (0.01 | ) | | | (0.39 | ) | | | (0.40 | ) | | | 7.63 | | | | (17.07 | ) | | | 133,606 | | | | 0.90 | | | | 0.90 | | | | 0.90 | | | | 0.33 | | | | 45 | |
| 2021 | | | 10.27 | | | | 0.03 | | | | 2.12 | | | | 2.15 | | | | (0.01 | ) | | | (2.73 | ) | | | (2.74 | ) | | | 9.68 | | | | 22.10 | | | | 199,842 | | | | 0.86 | | | | 0.86 | | | | 0.86 | | | | 0.21 | | | | 60 | |
| 2020 | | | 9.47 | | | | 0.04 | | | | 1.28 | | | | 1.32 | | | | (0.06 | ) | | | (0.46 | ) | | | (0.52 | ) | | | 10.27 | | | | 14.10 | | | | 163,944 | | | | 0.89 | | | | 0.89 | | | | 0.89 | | | | 0.42 | | | | 32 | |
| 2019 | | | 7.78 | | | | 0.04 | | | | 2.02 | | | | 2.06 | | | | (0.03 | ) | | | (0.34 | ) | | | (0.37 | ) | | | 9.47 | | | | 26.53 | | | | 106,564 | | | | 0.89 | | | | 0.89 | | | | 0.89 | | | | 0.45 | | | | 30 | |
| Royce Small-Cap Opportunity Fund–Investment Class |
| 2024† | | $ | 15.11 | | | $ | (0.02 | ) | | $ | 0.56 | | | $ | 0.54 | | | $ | – | | | $ | – | | | $ | – | | | $ | 15.65 | | | | 3.57 | %1 | | $ | 852,865 | | | | 1.23 | %2 | | | 1.22 | %2 | | | 1.22 | %2 | | | (0.29 | )%2 | | | 15 | % |
| 2023 | | | 13.22 | | | | (0.00 | ) | | | 2.57 | | | | 2.57 | | | | – | | | | (0.68 | ) | | | (0.68 | ) | | | 15.11 | | | | 19.58 | | | | 890,662 | | | | 1.23 | | | | 1.23 | | | | 1.23 | | | | (0.02 | ) | | | 35 | |
| 2022 | | | 16.76 | | | | 0.00 | | | | (2.86 | ) | | | (2.86 | ) | | | – | | | | (0.68 | ) | | | (0.68 | ) | | | 13.22 | | | | (17.08 | ) | | | 911,802 | | | | 1.23 | | | | 1.23 | | | | 1.23 | | | | 0.03 | | | | 35 | |
| 2021 | | | 15.84 | | | | (0.06 | ) | | | 4.75 | | | | 4.69 | | | | – | | | | (3.77 | ) | | | (3.77 | ) | | | 16.76 | | | | 30.85 | | | | 1,332,050 | | | | 1.21 | | | | 1.21 | | | | 1.21 | | | | (0.30 | ) | | | 69 | |
| 2020 | | | 12.52 | | | | (0.03 | ) | | | 3.35 | | | | 3.32 | | | | – | | | | – | | | | – | | | | 15.84 | | | | 26.52 | | | | 786,849 | | | | 1.24 | | | | 1.23 | | | | 1.23 | | | | (0.28 | ) | | | 53 | |
| 2019 | | | 9.92 | | | | (0.06 | ) | | | 2.86 | | | | 2.80 | | | | – | | | | (0.20 | ) | | | (0.20 | ) | | | 12.52 | | | | 28.21 | | | | 609,316 | | | | 1.23 | | | | 1.22 | | | | 1.22 | | | | (0.50 | ) | | | 47 | |
| Royce Small-Cap Opportunity Fund–Service Class |
| 2024† | | $ | 13.76 | | | $ | (0.04 | ) | | $ | 0.51 | | | $ | 0.47 | | | $ | – | | | $ | – | | | $ | – | | | $ | 14.23 | | | | 3.42 | %1 | | $ | 60,492 | | | | 1.53 | %2 | | | 1.53 | %2 | | | 1.49 | %2 | | | (0.56 | )%2 | | | 15 | % |
| 2023 | | | 12.07 | | | | (0.04 | ) | | | 2.35 | | | | 2.31 | | | | – | | | | (0.62 | ) | | | (0.62 | ) | | | 13.76 | | | | 19.26 | | | | 75,831 | | | | 1.54 | | | | 1.54 | | | | 1.49 | | | | (0.27 | ) | | | 35 | |
| 2022 | | | 15.34 | | | | (0.03 | ) | | | (2.62 | ) | | | (2.65 | ) | | | – | | | | (0.62 | ) | | | (0.62 | ) | | | 12.07 | | | | (17.28 | ) | | | 68,292 | | | | 1.54 | | | | 1.54 | | | | 1.49 | | | | (0.23 | ) | | | 35 | |
| 2021 | | | 14.66 | | | | (0.11 | ) | | | 4.39 | | | | 4.28 | | | | – | | | | (3.60 | ) | | | (3.60 | ) | | | 15.34 | | | | 30.43 | | | | 109,440 | | | | 1.50 | | | | 1.50 | | | | 1.49 | | | | (0.61 | ) | | | 69 | |
| 2020 | | | 11.61 | | | | (0.06 | ) | | | 3.11 | | | | 3.05 | | | | – | | | | – | | | | – | | | | 14.66 | | | | 26.27 | | | | 131,725 | | | | 1.54 | | | | 1.54 | | | | 1.49 | | | | (0.54 | ) | | | 53 | |
| 2019 | | | 9.23 | | | | (0.09 | ) | | | 2.65 | | | | 2.56 | | | | – | | | | (0.18 | ) | | | (0.18 | ) | | | 11.61 | | | | 27.79 | | | | 46,032 | | | | 1.55 | | | | 1.55 | | | | 1.49 | | | | (0.77 | ) | | | 47 | |
| See Notes to Financial Statements | 34 |
Financial Highlights
This table is presented to show selected data for a share outstanding throughout each period and to assist shareholders in evaluating a Fund’s performance for the periods presented. Per share amounts have been determined on the basis of the weighted average number of shares outstanding during the period.
| | | | | | | | | Net Realized and
Unrealized Gain (Loss)
on Investments and
Foreign Currency | | | | | | | | Distributions
from Net
Realized Gain on
Investments and
Foreign Currency | | | | | | | | | | | | | | Ratio of Expenses to Average Net Assets | | | Ratio of Net
Investment
Income (Loss) to
Average Net
Assets | | | |
| | | Net Asset
Value,
Beginning of
Period | | Net
Investment
Income (Loss) | | | Total from
Investment
Operations | | Distributions
from Net
Investment
Income | | | Total
Distributions | | Net Asset Value,
End of Period | | Total Return | | Net Assets,
End of Period
(in thousands) | | Prior to Fee
Waivers, Expense
Reimbursements and
Balance Credits | | Prior to Fee
Waivers and
Expense
Reimbursements | | Net of Fee
Waivers and
Expense
Reimbursements | | | Portfolio
Turnover
Rate |
| Royce Small-Cap Opportunity Fund–Consultant Class |
| 2024† | | $ | 11.69 | | | $ | (0.08 | ) | | $ | 0.43 | | | $ | 0.35 | | | $ | – | | | $ | – | | | $ | – | | | $ | 12.04 | | | | 2.99 | %1 | | $ | 12,440 | | | | 2.33 | %2 | | | 2.33 | %2 | | | 2.24 | %2 | | | (1.31 | )%2 | | | 15 | % |
| 2023 | | | 10.33 | | | | (0.12 | ) | | | 2.01 | | | | 1.89 | | | | – | | | | (0.53 | ) | | | (0.53 | ) | | | 11.69 | | | | 18.39 | | | | 12,898 | | | | 2.34 | | | | 2.34 | | | | 2.27 | | | | (1.06 | ) | | | 35 | |
| 2022 | | | 13.24 | | | | (0.12 | ) | | | (2.26 | ) | | | (2.38 | ) | | | – | | | | (0.53 | ) | | | (0.53 | ) | | | 10.33 | | | | (17.98 | ) | | | 11,396 | | | | 2.35 | | | | 2.35 | | | | 2.35 | | | | (1.07 | ) | | | 35 | |
| 2021 | | | 12.61 | | | | (0.21 | ) | | | 3.78 | | | | 3.57 | | | | – | | | | (2.94 | ) | | | (2.94 | ) | | | 13.24 | | | | 29.46 | | | | 14,871 | | | | 2.26 | | | | 2.26 | | | | 2.26 | | | | (1.35 | ) | | | 69 | |
| 2020 | | | 10.09 | | | | (0.14 | ) | | | 2.66 | | | | 2.52 | | | | – | | | | – | | | | – | | | | 12.61 | | | | 24.98 | | | | 13,477 | | | | 2.45 | | | | 2.45 | | | | 2.45 | | | | (1.50 | ) | | | 53 | |
| 2019 | | | 8.09 | | | | (0.16 | ) | | | 2.32 | | | | 2.16 | | | | – | | | | (0.16 | ) | | | (0.16 | ) | | | 10.09 | | | | 26.70 | | | | 8,621 | | | | 2.41 | | | | 2.41 | | | | 2.41 | | | | (1.67 | ) | | | 47 | |
| Royce Small-Cap Opportunity Fund–Institutional Class |
| 2024† | | $ | 15.52 | | | $ | (0.01 | ) | | $ | 0.57 | | | $ | 0.56 | | | $ | – | | | $ | – | | | $ | – | | | $ | 16.08 | | | | 3.61 | %1 | | $ | 269,469 | | | | 1.12 | %2 | | | 1.12 | %2 | | | 1.12 | %2 | | | (0.18 | )%2 | | | 15 | % |
| 2023 | | | 13.59 | | | | 0.01 | | | | 2.65 | | | | 2.66 | | | | (0.02 | ) | | | (0.71 | ) | | | (0.73 | ) | | | 15.52 | | | | 19.65 | | | | 262,010 | | | | 1.12 | | | | 1.12 | | | | 1.12 | | | | 0.10 | | | | 35 | |
| 2022 | | | 17.21 | | | | 0.02 | | | | (2.94 | ) | | | (2.92 | ) | | | – | | | | (0.70 | ) | | | (0.70 | ) | | | 13.59 | | | | (16.94 | ) | | | 214,424 | | | | 1.12 | | | | 1.12 | | | | 1.12 | | | | 0.15 | | | | 35 | |
| 2021 | | | 16.22 | | | | (0.03 | ) | | | 4.84 | | | | 4.81 | | | | – | | | | (3.82 | ) | | | (3.82 | ) | | | 17.21 | | | | 30.89 | | | | 291,961 | | | | 1.08 | | | | 1.08 | | | | 1.08 | | | | (0.18 | ) | | | 69 | |
| 2020 | | | 12.80 | | | | (0.02 | ) | | | 3.44 | | | | 3.42 | | | | – | | | | – | | | | – | | | | 16.22 | | | | 26.72 | | | | 340,877 | | | | 1.12 | | | | 1.12 | | | | 1.12 | | | | (0.17 | ) | | | 53 | |
| 2019 | | | 10.13 | | | | (0.05 | ) | | | 2.92 | | | | 2.87 | | | | – | | | | (0.20 | ) | | | (0.20 | ) | | | 12.80 | | | | 28.36 | | | | 230,439 | | | | 1.12 | | | | 1.12 | | | | 1.12 | | | | (0.39 | ) | | | 47 | |
| Royce Small-Cap Opportunity Fund–R Class |
| 2024† | | $ | 13.18 | | | $ | (0.06 | ) | | $ | 0.49 | | | $ | 0.43 | | | $ | – | | | $ | – | | | $ | – | | | $ | 13.61 | | | | 3.26 | %1 | | $ | 42,777 | | | | 1.85 | %2 | | | 1.85 | %2 | | | 1.85 | %2 | | | (0.91 | )%2 | | | 15 | % |
| 2023 | | | 11.61 | | | | (0.08 | ) | | | 2.25 | | | | 2.17 | | | | – | | | | (0.60 | ) | | | (0.60 | ) | | | 13.18 | | | | 18.76 | | | | 45,422 | | | | 1.85 | | | | 1.85 | | | | 1.85 | | | | (0.63 | ) | | | 35 | |
| 2022 | | | 14.80 | | | | (0.07 | ) | | | (2.53 | ) | | | (2.60 | ) | | | – | | | | (0.59 | ) | | | (0.59 | ) | | | 11.61 | | | | (17.54 | ) | | | 38,971 | | | | 1.85 | | | | 1.85 | | | | 1.85 | | | | (0.57 | ) | | | 35 | |
| 2021 | | | 14.03 | | | | (0.16 | ) | | | 4.20 | | | | 4.04 | | | | – | | | | (3.27 | ) | | | (3.27 | ) | | | 14.80 | | | | 30.01 | | | | 51,537 | | | | 1.81 | | | | 1.81 | | | | 1.81 | | | | (0.90 | ) | | | 69 | |
| 2020 | | | 11.16 | | | | (0.09 | ) | | | 2.96 | | | | 2.87 | | | | – | | | | – | | | | – | | | | 14.03 | | | | 25.72 | | | | 36,065 | | | | 1.88 | | | | 1.87 | | | | 1.87 | | | | (0.93 | ) | | | 53 | |
| 2019 | | | 8.90 | | | | (0.12 | ) | | | 2.55 | | | | 2.43 | | | | – | | | | (0.17 | ) | | | (0.17 | ) | | | 11.16 | | | | 27.38 | | | | 31,230 | | | | 1.86 | | | | 1.85 | | | | 1.85 | | | | (1.13 | ) | | | 47 | |
| Royce Small-Cap Special Equity Fund–Investment Class |
| 2024† | | $ | 17.05 | | | $ | 0.12 | | | $ | (0.36 | ) | | $ | (0.24 | ) | | $ | – | | | $ | – | | | $ | – | | | $ | 16.81 | | | | (1.41 | )%1 | | $ | 542,378 | | | | 1.22 | %2 | | | 1.22 | %2 | | | 1.22 | %2 | | | 1.42 | %2 | | | 2 | % |
| 2023 | | | 15.92 | | | | 0.24 | | | | 1.80 | | | | 2.04 | | | | (0.25 | ) | | | (0.66 | ) | | | (0.91 | ) | | | 17.05 | | | | 12.83 | | | | 605,345 | | | | 1.22 | | | | 1.22 | | | | 1.22 | | | | 1.45 | | | | 14 | |
| 2022 | | | 19.09 | | | | 0.18 | | | | (1.39 | ) | | | (1.21 | ) | | | (0.19 | ) | | | (1.77 | ) | | | (1.96 | ) | | | 15.92 | | | | (6.33 | ) | | | 587,346 | | | | 1.21 | | | | 1.21 | | | | 1.21 | | | | 1.01 | | | | 23 | |
| 2021 | | | 18.22 | | | | 0.17 | | | | 3.86 | | | | 4.03 | | | | (0.20 | ) | | | (2.96 | ) | | | (3.16 | ) | | | 19.09 | | | | 22.50 | | | | 755,338 | | | | 1.20 | | | | 1.20 | | | | 1.20 | | | | 0.82 | | | | 42 | |
| 2020 | | | 17.59 | | | | 0.27 | | | | 1.03 | | | | 1.30 | | | | (0.26 | ) | | | (0.41 | ) | | | (0.67 | ) | | | 18.22 | | | | 7.43 | | | | 702,556 | | | | 1.23 | | | | 1.23 | | | | 1.23 | | | | 1.68 | | | | 39 | |
| 2019 | | | 17.43 | | | | 0.21 | | | | 1.98 | | | | 2.19 | | | | (0.21 | ) | | | (1.82 | ) | | | (2.03 | ) | | | 17.59 | | | | 12.63 | | | | 819,015 | | | | 1.21 | | | | 1.21 | | | | 1.21 | | | | 0.99 | | | | 20 | |
| Royce Small-Cap Special Equity Fund–Service Class |
| 2024† | | $ | 17.05 | | | $ | 0.10 | | | $ | (0.37 | ) | | $ | (0.27 | ) | | $ | – | | | $ | – | | | $ | – | | | $ | 16.78 | | | | (1.58 | )%1 | | $ | 30,273 | | | | 1.58 | %2 | | | 1.58 | %2 | | | 1.49 | %2 | | | 1.15 | %2 | | | 2 | % |
| 2023 | | | 15.92 | | | | 0.19 | | | | 1.79 | | | | 1.98 | | | | (0.20 | ) | | | (0.65 | ) | | | (0.85 | ) | | | 17.05 | | | | 12.50 | | | | 32,297 | | | | 1.58 | | | | 1.57 | | | | 1.49 | | | | 1.16 | | | | 14 | |
| 2022 | | | 19.06 | | | | 0.12 | | | | (1.37 | ) | | | (1.25 | ) | | | (0.13 | ) | | | (1.76 | ) | | | (1.89 | ) | | | 15.92 | | | | (6.56 | ) | | | 34,729 | | | | 1.57 | | | | 1.57 | | | | 1.49 | | | | 0.70 | | | | 23 | |
| 2021 | | | 18.19 | | | | 0.12 | | | | 3.85 | | | | 3.97 | | | | (0.16 | ) | | | (2.94 | ) | | | (3.10 | ) | | | 19.06 | | | | 22.19 | | | | 57,738 | | | | 1.54 | | | | 1.54 | | | | 1.46 | | | | 0.57 | | | | 42 | |
| 2020 | | | 17.56 | | | | 0.24 | | | | 1.04 | | | | 1.28 | | | | (0.24 | ) | | | (0.41 | ) | | | (0.65 | ) | | | 18.19 | | | | 7.29 | | | | 46,671 | | | | 1.60 | | | | 1.60 | | | | 1.39 | | | | 1.49 | | | | 39 | |
| 2019 | | | 17.41 | | | | 0.16 | | | | 1.99 | | | | 2.15 | | | | (0.17 | ) | | | (1.83 | ) | | | (2.00 | ) | | | 17.56 | | | | 12.40 | | | | 60,070 | | | | 1.58 | | | | 1.58 | | | | 1.39 | | | | 0.80 | | | | 20 | |
| See Notes to Financial Statements | 35 |
Financial Highlights
This table is presented to show selected data for a share outstanding throughout each period and to assist shareholders in evaluating a Fund’s performance for the periods presented. Per share amounts have been determined on the basis of the weighted average number of shares outstanding during the period.
| | | | | | | | | Net Realized and
Unrealized Gain (Loss)
on Investments and
Foreign Currency | | | | | | | | Distributions
from Net
Realized Gain on
Investments and
Foreign Currency | | | | | | | | | | | | | | Ratio of Expenses to Average Net Assets | | | Ratio of Net
Investment
Income (Loss) to
Average Net
Assets | | | |
| | | Net Asset
Value,
Beginning of
Period | | Net
Investment
Income (Loss) | | | Total from
Investment
Operations | | Distributions
from Net
Investment
Income | | | Total
Distributions | | Net Asset Value,
End of Period | | Total Return | | Net Assets,
End of Period
(in thousands) | | Prior to Fee
Waivers, Expense
Reimbursements and
Balance Credits | | Prior to Fee
Waivers and
Expense
Reimbursements | | Net of Fee
Waivers and
Expense
Reimbursements | | | Portfolio
Turnover
Rate |
| Royce Small-Cap Special Equity Fund–Consultant Class |
| 2024† | | $ | 15.49 | | | $ | 0.03 | | | $ | (0.33 | ) | | $ | (0.30 | ) | | $ | – | | | $ | – | | | $ | – | | | $ | 15.19 | | | | (1.94 | )%1 | | $ | 13,824 | | | | 2.36 | %2 | | | 2.35 | %2 | | | 2.24 | %2 | | | 0.40 | %2 | | | 2 | % |
| 2023 | | | 14.49 | | | | 0.05 | | | | 1.63 | | | | 1.68 | | | | (0.09 | ) | | | (0.59 | ) | | | (0.68 | ) | | | 15.49 | | | | 11.64 | | | | 15,317 | | | | 2.36 | | | | 2.35 | | | | 2.31 | | | | 0.35 | | | | 14 | |
| 2022 | | | 17.37 | | | | (0.04 | ) | | | (1.25 | ) | | | (1.29 | ) | | | – | | | | (1.59 | ) | | | (1.59 | ) | | | 14.49 | | | | (7.43 | ) | | | 15,189 | | | | 2.40 | | | | 2.40 | | | | 2.40 | | | | (0.23 | ) | | | 23 | |
| 2021 | | | 16.60 | | | | (0.05 | ) | | | 3.50 | | | | 3.45 | | | | (0.01 | ) | | | (2.67 | ) | | | (2.68 | ) | | | 17.37 | | | | 21.16 | | | | 25,068 | | | | 2.31 | | | | 2.31 | | | | 2.31 | | | | (0.29 | ) | | | 42 | |
| 2020 | | | 16.05 | | | | 0.09 | | | | 0.92 | | | | 1.01 | | | | (0.09 | ) | | | (0.37 | ) | | | (0.46 | ) | | | 16.60 | | | | 6.27 | | | | 18,852 | | | | 2.31 | | | | 2.31 | | | | 2.31 | | | | 0.59 | | | | 39 | |
| 2019 | | | 15.90 | | | | (0.02 | ) | | | 1.82 | | | | 1.80 | | | | (0.00 | ) | | | (1.65 | ) | | | (1.65 | ) | | | 16.05 | | | | 11.38 | | | | 24,793 | | | | 2.25 | | | | 2.25 | | | | 2.25 | | | | (0.12 | ) | | | 20 | |
| Royce Small-Cap Special Equity Fund–Institutional Class |
| 2024† | | $ | 16.89 | | | $ | 0.13 | | | $ | (0.37 | ) | | $ | (0.24 | ) | | $ | – | | | $ | – | | | $ | – | | | $ | 16.65 | | | | (1.42 | )%1 | | $ | 120,644 | | | | 1.14 | %2 | | | 1.13 | %2 | | | 1.13 | %2 | | | 1.51 | %2 | | | 2 | % |
| 2023 | | | 15.77 | | | | 0.25 | | | | 1.79 | | | | 2.04 | | | | (0.27 | ) | | | (0.65 | ) | | | (0.92 | ) | | | 16.89 | | | | 12.95 | | | | 130,917 | | | | 1.14 | | | | 1.14 | | | | 1.14 | | | | 1.55 | | | | 14 | |
| 2022 | | | 18.92 | | | | 0.19 | | | | (1.37 | ) | | | (1.18 | ) | | | (0.21 | ) | | | (1.76 | ) | | | (1.97 | ) | | | 15.77 | | | | (6.27 | ) | | | 116,301 | | | | 1.12 | | | | 1.12 | | | | 1.12 | | | | 1.08 | | | | 23 | |
| 2021 | | | 18.06 | | | | 0.19 | | | | 3.82 | | | | 4.01 | | | | (0.22 | ) | | | (2.93 | ) | | | (3.15 | ) | | | 18.92 | | | | 22.63 | | | | 238,810 | | | | 1.11 | | | | 1.11 | | | | 1.11 | | | | 0.92 | | | | 42 | |
| 2020 | | | 17.43 | | | | 0.30 | | | | 1.01 | | | | 1.31 | | | | (0.28 | ) | | | (0.40 | ) | | | (0.68 | ) | | | 18.06 | | | | 7.52 | | | | 194,911 | | | | 1.15 | | | | 1.15 | | | | 1.15 | | | | 1.84 | | | | 39 | |
| 2019 | | | 17.28 | | | | 0.22 | | | | 1.96 | | | | 2.18 | | | | (0.22 | ) | | | (1.81 | ) | | | (2.03 | ) | | | 17.43 | | | | 12.65 | | | | 187,785 | | | | 1.14 | | | | 1.14 | | | | 1.14 | | | | 1.04 | | | | 20 | |
| Royce Small-Cap Total Return Fund–Investment Class |
| 2024† | | $ | 7.40 | | | $ | 0.02 | | | $ | 0.08 | | | $ | 0.10 | | | $ | (0.02 | ) | | $ | – | | | $ | (0.02 | ) | | $ | 7.48 | | | | 1.36 | %1 | | $ | 630,162 | | | | 1.21 | %2 | | | 1.21 | %2 | | | 1.21 | %2 | | | 0.61 | %2 | | | 31 | % |
| 2023 | | | 6.56 | | | | 0.06 | 5 | | | 1.50 | | | | 1.56 | | | | (0.25 | ) | | | (0.47 | ) | | | (0.72 | ) | | | 7.40 | | | | 24.07 | | | | 642,546 | | | | 1.22 | | | | 1.22 | | | | 1.22 | | | | 0.86 | 5 | | | 65 | |
| 2022 | | | 8.78 | | | | 0.08 | | | | (1.25 | ) | | | (1.17 | ) | | | (0.11 | ) | | | (0.94 | ) | | | (1.05 | ) | | | 6.56 | | | | (13.25 | ) | | | 591,730 | | | | 1.22 | | | | 1.22 | | | | 1.22 | | | | 0.97 | | | | 62 | |
| 2021 | | | 9.34 | | | | 0.12 | | | | 2.21 | | | | 2.33 | | | | (0.13 | ) | | | (2.76 | ) | | | (2.89 | ) | | | 8.78 | | | | 25.78 | | | | 1,016,331 | | | | 1.20 | | | | 1.20 | | | | 1.20 | | | | 1.09 | | | | 64 | |
| 2020 | | | 10.93 | | | | 0.17 | | | | 0.19 | | | | 0.36 | | | | (0.21 | ) | | | (1.74 | ) | | | (1.95 | ) | | | 9.34 | | | | 3.82 | | | | 893,868 | | | | 1.24 | | | | 1.24 | | | | 1.24 | | | | 1.88 | | | | 61 | |
| 2019 | | | 9.71 | | | | 0.16 | | | | 2.10 | | | | 2.26 | | | | (0.15 | ) | | | (0.89 | ) | | | (1.04 | ) | | | 10.93 | | | | 23.45 | | | | 1,026,074 | | | | 1.21 | | | | 1.21 | | | | 1.21 | | | | 1.42 | | | | 21 | |
| Royce Small-Cap Total Return Fund–Service Class |
| 2024† | | $ | 7.70 | | | $ | 0.01 | | | $ | 0.07 | | | $ | 0.08 | | | $ | (0.01 | ) | | $ | – | | | $ | (0.01 | ) | | $ | 7.77 | | | | 1.04 | %1 | | $ | 56,148 | | | | 1.56 | %2 | | | 1.56 | %2 | | | 1.49 | %2 | | | 0.32 | %2 | | | 31 | % |
| 2023 | | | 6.80 | | | | 0.04 | 5 | | | 1.57 | | | | 1.61 | | | | (0.23 | ) | | | (0.48 | ) | | | (0.71 | ) | | | 7.70 | | | | 23.85 | | | | 58,424 | | | | 1.58 | | | | 1.58 | | | | 1.49 | | | | 0.58 | 5 | | | 65 | |
| 2022 | | | 9.08 | | | | 0.06 | | | | (1.30 | ) | | | (1.24 | ) | | | (0.07 | ) | | | (0.97 | ) | | | (1.04 | ) | | | 6.80 | | | | (13.54 | ) | | | 58,571 | | | | 1.57 | | | | 1.57 | | | | 1.49 | | | | 0.74 | | | | 62 | |
| 2021 | | | 9.62 | | | | 0.09 | | | | 2.28 | | | | 2.37 | | | | (0.07 | ) | | | (2.84 | ) | | | (2.91 | ) | | | 9.08 | | | | 25.54 | | | | 80,478 | | | | 1.52 | | | | 1.52 | | | | 1.49 | | | | 0.78 | | | | 64 | |
| 2020 | | | 11.27 | | | | 0.16 | | | | 0.18 | | | | 0.34 | | | | (0.19 | ) | | | (1.80 | ) | | | (1.99 | ) | | | 9.62 | | | | 3.51 | | | | 69,634 | | | | 1.55 | | | | 1.55 | | | | 1.49 | | | | 1.64 | | | | 61 | |
| 2019 | | | 9.97 | | | | 0.13 | | | | 2.16 | | | | 2.29 | | | | (0.08 | ) | | | (0.91 | ) | | | (0.99 | ) | | | 11.27 | | | | 23.08 | | | | 77,177 | | | | 1.52 | | | | 1.52 | | | | 1.49 | | | | 1.13 | | | | 21 | |
| Royce Small-Cap Total Return Fund–Consultant Class |
| 2024† | | $ | 7.83 | | | $ | (0.02 | ) | | $ | 0.08 | | | $ | 0.06 | | | $ | – | | | $ | – | | | $ | – | | | $ | 7.89 | | | | 0.77 | %1 | | $ | 81,492 | | | | 2.24 | %2 | | | 2.23 | %2 | | | 2.23 | %2 | | | (0.42 | )%2 | | | 31 | % |
| 2023 | | | 6.89 | | | | (0.01 | )5 | | | 1.58 | | | | 1.57 | | | | (0.14 | ) | | | (0.49 | ) | | | (0.63 | ) | | | 7.83 | | | | 22.91 | | | | 85,488 | | | | 2.25 | | | | 2.24 | | | | 2.24 | | | | (0.17 | )5 | | | 65 | |
| 2022 | | | 9.18 | | | | 0.00 | | | | (1.31 | ) | | | (1.31 | ) | | | – | | | | (0.98 | ) | | | (0.98 | ) | | | 6.89 | | | | (14.15 | ) | | | 84,448 | | | | 2.23 | | | | 2.23 | | | | 2.23 | | | | 0.01 | | | | 62 | |
| 2021 | | | 9.75 | | | | 0.01 | | | | 2.31 | | | | 2.32 | | | | (0.01 | ) | | | (2.88 | ) | | | (2.89 | ) | | | 9.18 | | | | 24.63 | | | | 112,649 | | | | 2.18 | | | | 2.18 | | | | 2.18 | | | | 0.09 | | | | 64 | |
| 2020 | | | 11.31 | | | | 0.09 | | | | 0.18 | | | | 0.27 | | | | (0.03 | ) | | | (1.80 | ) | | | (1.83 | ) | | | 9.75 | | | | 2.76 | | | | 110,179 | | | | 2.22 | | | | 2.22 | | | | 2.22 | | | | 0.88 | | | | 61 | |
| 2019 | | | 10.02 | | | | 0.05 | | | | 2.17 | | | | 2.22 | | | | (0.02 | ) | | | (0.91 | ) | | | (0.93 | ) | | | 11.31 | | | | 22.18 | | | | 150,175 | | | | 2.20 | | | | 2.20 | | | | 2.20 | | | | 0.43 | | | | 21 | |
| See Notes to Financial Statements | 36 |
Financial Highlights
This table is presented to show selected data for a share outstanding throughout each period and to assist shareholders in evaluating a Fund’s performance for the periods presented. Per share amounts have been determined on the basis of the weighted average number of shares outstanding during the period.
| | | | | | | | | Net Realized and
Unrealized Gain (Loss)
on Investments and
Foreign Currency | | | | | | | | Distributions
from Net
Realized Gain on
Investments and
Foreign Currency | | | | | | | | | | | | | | Ratio of Expenses to Average Net Assets | | | Ratio of Net
Investment
Income (Loss) to
Average Net
Assets | | | |
| | | Net Asset
Value,
Beginning of
Period | | Net
Investment
Income (Loss) | | | Total from
Investment
Operations | | Distributions
from Net
Investment
Income | | | Total
Distributions | | Net Asset Value,
End of Period | | Total Return | | Net Assets,
End of Period
(in thousands) | | Prior to Fee
Waivers, Expense
Reimbursements and
Balance Credits | | Prior to Fee
Waivers and
Expense
Reimbursements | | Net of Fee
Waivers and
Expense
Reimbursements | | | Portfolio
Turnover
Rate |
| Royce Small-Cap Total Return Fund–Institutional Class |
| 2024† | | $ | 7.24 | | | $ | 0.02 | | | $ | 0.08 | | | $ | 0.10 | | | $ | (0.02 | ) | | $ | – | | | $ | (0.02 | ) | | $ | 7.32 | | | | 1.39 | %1 | | $ | 216,446 | | | | 1.12 | %2 | | | 1.12 | %2 | | | 1.12 | %2 | | | 0.69 | %2 | | | 31 | % |
| 2023 | | | 6.43 | | | | 0.07 | 5 | | | 1.46 | | | | 1.53 | | | | (0.27 | ) | | | (0.45 | ) | | | (0.72 | ) | | | 7.24 | | | | 24.12 | | | | 212,581 | | | | 1.13 | | | | 1.13 | | | | 1.13 | | | | 0.95 | 5 | | | 65 | |
| 2022 | | | 8.61 | | | | 0.08 | | | | (1.22 | ) | | | (1.14 | ) | | | (0.12 | ) | | | (0.92 | ) | | | (1.04 | ) | | | 6.43 | | | | (13.13 | ) | | | 181,476 | | | | 1.14 | | | | 1.14 | | | | 1.14 | | | | 1.07 | | | | 62 | |
| 2021 | | | 9.17 | | | | 0.13 | | | | 2.17 | | | | 2.30 | | | | (0.14 | ) | | | (2.72 | ) | | | (2.86 | ) | | | 8.61 | | | | 25.91 | | | | 279,510 | | | | 1.10 | | | | 1.10 | | | | 1.10 | | | | 1.19 | | | | 64 | |
| 2020 | | | 10.77 | | | | 0.18 | | | | 0.18 | | | | 0.36 | | | | (0.24 | ) | | | (1.72 | ) | | | (1.96 | ) | | | 9.17 | | | | 3.87 | | | | 208,605 | | | | 1.13 | | | | 1.13 | | | | 1.13 | | | | 1.98 | | | | 61 | |
| 2019 | | | 9.58 | | | | 0.17 | | | | 2.07 | | | | 2.24 | | | | (0.18 | ) | | | (0.87 | ) | | | (1.05 | ) | | | 10.77 | | | | 23.59 | | | | 232,479 | | | | 1.13 | | | | 1.13 | | | | 1.13 | | | | 1.49 | | | | 21 | |
| Royce Small-Cap Total Return Fund–R Class |
| 2024† | | $ | 7.85 | | | $ | (0.00 | ) | | $ | 0.07 | | | $ | 0.07 | | | $ | – | | | $ | – | | | $ | – | | | $ | 7.92 | | | | 0.89 | %1 | | $ | 22,521 | | | | 1.90 | %2 | | | 1.89 | %2 | | | 1.89 | %2 | | | (0.08 | )%2 | | | 31 | % |
| 2023 | | | 6.92 | | | | 0.01 | 5 | | | 1.59 | | | | 1.60 | | | | (0.18 | ) | | | (0.49 | ) | | | (0.67 | ) | | | 7.85 | | | | 23.28 | | | | 22,322 | | | | 1.91 | | | | 1.91 | | | | 1.91 | | | | 0.17 | 5 | | | 65 | |
| 2022 | | | 9.20 | | | | 0.03 | | | | (1.32 | ) | | | (1.29 | ) | | | (0.01 | ) | | | (0.98 | ) | | | (0.99 | ) | | | 6.92 | | | | (13.87 | ) | | | 20,180 | | | | 1.91 | | | | 1.91 | | | | 1.91 | | | | 0.32 | | | | 62 | |
| 2021 | | | 9.76 | | | | 0.05 | | | | 2.31 | | | | 2.36 | | | | (0.04 | ) | | | (2.88 | ) | | | (2.92 | ) | | | 9.20 | | | | 25.01 | | | | 27,040 | | | | 1.85 | | | | 1.85 | | | | 1.85 | | | | 0.42 | | | | 64 | |
| 2020 | | | 11.38 | | | | 0.12 | | | | 0.18 | | | | 0.30 | | | | (0.12 | ) | | | (1.80 | ) | | | (1.92 | ) | | | 9.76 | | | | 3.08 | | | | 30,027 | | | | 1.89 | | | | 1.88 | | | | 1.88 | | | | 1.23 | | | | 61 | |
| 2019 | | | 10.06 | | | | 0.09 | | | | 2.18 | | | | 2.27 | | | | (0.03 | ) | | | (0.92 | ) | | | (0.95 | ) | | | 11.38 | | | | 22.66 | | | | 36,345 | | | | 1.85 | | | | 1.84 | | | | 1.84 | | | | 0.76 | | | | 21 | |
| Royce Small-Cap Value Fund–Investment Class |
| 2024† | | $ | 10.30 | | | $ | 0.07 | | | $ | (0.36 | ) | | $ | (0.29 | ) | | $ | – | | | $ | – | | | $ | – | | | $ | 10.01 | | | | (2.82 | )%1 | | $ | 35,380 | | | | 1.34 | %2 | | | 1.33 | %2 | | | 1.24 | %2 | | | 1.39 | %2 | | | 24 | % |
| 2023 | | | 8.85 | | | | 0.11 | | | | 2.21 | | | | 2.32 | | | | (0.12 | ) | | | (0.75 | ) | | | (0.87 | ) | | | 10.30 | | | | 26.39 | | | | 37,440 | | | | 1.36 | | | | 1.35 | | | | 1.24 | | | | 1.15 | | | | 48 | |
| 2022 | | | 10.43 | | | | 0.07 | | | | (1.09 | ) | | | (1.02 | ) | | | (0.05 | ) | | | (0.51 | ) | | | (0.56 | ) | | | 8.85 | | | | (9.87 | ) | | | 35,545 | | | | 1.35 | | | | 1.35 | | | | 1.24 | | | | 0.76 | | | | 62 | |
| 2021 | | | 8.61 | | | | 0.02 | | | | 2.41 | | | | 2.43 | | | | (0.01 | ) | | | (0.60 | ) | | | (0.61 | ) | | | 10.43 | | | | 28.48 | | | | 44,621 | | | | 1.31 | | | | 1.31 | | | | 1.24 | | | | 0.20 | | | | 53 | |
| 2020 | | | 9.57 | | | | 0.06 | | | | (0.66 | ) | | | (0.60 | ) | | | (0.17 | ) | | | (0.19 | ) | | | (0.36 | ) | | | 8.61 | | | | (6.25 | ) | | | 34,523 | | | | 1.39 | | | | 1.39 | | | | 1.24 | | | | 0.76 | | | | 61 | |
| 2019 | | | 8.35 | | | | 0.09 | | | | 1.46 | | | | 1.55 | | | | (0.08 | ) | | | (0.25 | ) | | | (0.33 | ) | | | 9.57 | | | | 18.60 | | | | 53,234 | | | | 1.30 | | | | 1.30 | | | | 1.24 | | | | 0.84 | | | | 64 | |
| Royce Small-Cap Value Fund–Service Class |
| 2024† | | $ | 10.24 | | | $ | 0.06 | | | $ | (0.36 | ) | | $ | (0.30 | ) | | $ | – | | | $ | – | | | $ | – | | | $ | 9.94 | | | | (2.93 | )%1 | | $ | 76,309 | | | | 1.60 | %2 | | | 1.60 | %2 | | | 1.49 | %2 | | | 1.14 | %2 | | | 24 | % |
| 2023 | | | 8.81 | | | | 0.09 | | | | 2.18 | | | | 2.27 | | | | (0.10 | ) | | | (0.74 | ) | | | (0.84 | ) | | | 10.24 | | | | 25.96 | | | | 99,077 | | | | 1.62 | | | | 1.62 | | | | 1.49 | | | | 0.92 | | | | 48 | |
| 2022 | | | 10.38 | | | | 0.05 | | | | (1.09 | ) | | | (1.04 | ) | | | (0.03 | ) | | | (0.50 | ) | | | (0.53 | ) | | | 8.81 | | | | (10.06 | ) | | | 68,455 | | | | 1.59 | | | | 1.59 | | | | 1.49 | | | | 0.52 | | | | 62 | |
| 2021 | | | 8.58 | | | | (0.01 | ) | | | 2.41 | | | | 2.40 | | | | – | | | | (0.60 | ) | | | (0.60 | ) | | | 10.38 | | | | 28.24 | | | | 81,840 | | | | 1.55 | | | | 1.55 | | | | 1.49 | | | | (0.06 | ) | | | 53 | |
| 2020 | | | 9.54 | | | | 0.04 | | | | (0.66 | ) | | | (0.62 | ) | | | (0.15 | ) | | | (0.19 | ) | | | (0.34 | ) | | | 8.58 | | | | (6.47 | ) | | | 75,502 | | | | 1.62 | | | | 1.62 | | | | 1.49 | | | | 0.50 | | | | 61 | |
| 2019 | | | 8.33 | | | | 0.07 | | | | 1.44 | | | | 1.51 | | | | (0.05 | ) | | | (0.25 | ) | | | (0.30 | ) | | | 9.54 | | | | 18.21 | | | | 102,465 | | | | 1.56 | | | | 1.55 | | | | 1.49 | | | | 0.65 | | | | 64 | |
| Royce Smaller-Companies Growth Fund–Investment Class |
| 2024† | | $ | 6.66 | | | $ | (0.02 | ) | | $ | 0.43 | | | $ | 0.41 | | | $ | – | | | $ | – | | | $ | – | | | $ | 7.07 | | | | 6.16 | %1 | | $ | 63,686 | | | | 1.26 | %2 | | | 1.25 | %2 | | | 1.24 | %2 | | | (0.66 | )%2 | | | 36 | % |
| 2023 | | | 5.69 | | | | (0.04 | ) | | | 1.01 | | | | 0.97 | | | | – | | | | – | | | | – | | | | 6.66 | | | | 17.05 | | | | 63,279 | | | | 1.27 | | | | 1.27 | | | | 1.24 | | | | (0.68 | ) | | | 65 | |
| 2022 | | | 8.74 | | | | (0.06 | ) | | | (2.74 | ) | | | (2.80 | ) | | | – | | | | (0.25 | ) | | | (0.25 | ) | | | 5.69 | | | | (32.07 | ) | | | 61,107 | | | | 1.26 | | | | 1.26 | | | | 1.24 | | | | (0.97 | ) | | | 66 | |
| 2021 | | | 11.06 | | | | (0.11 | ) | | | 0.83 | | | | 0.72 | | | | – | | | | (3.04 | ) | | | (3.04 | ) | | | 8.74 | | | | 8.09 | | | | 106,318 | | | | 1.19 | | | | 1.19 | | | | 1.19 | | | | (0.91 | ) | | | 50 | |
| 2020 | | | 8.21 | | | | (0.07 | ) | | | 4.06 | | | | 3.99 | | | | – | | | | (1.14 | ) | | | (1.14 | ) | | | 11.06 | | | | 49.61 | | | | 112,668 | | | | 1.25 | | | | 1.25 | | | | 1.24 | | | | (0.86 | ) | | | 61 | |
| 2019 | | | 6.86 | | | | (0.05 | ) | | | 1.68 | | | | 1.63 | | | | – | | | | (0.28 | ) | | | (0.28 | ) | | | 8.21 | | | | 23.92 | | | | 91,670 | | | | 1.25 | | | | 1.24 | | | | 1.24 | | | | (0.69 | ) | | | 53 | |
| See Notes to Financial Statements | 37 |
Financial Highlights
This table is presented to show selected data for a share outstanding throughout each period and to assist shareholders in evaluating a Fund’s performance for the periods presented. Per share amounts have been determined on the basis of the weighted average number of shares outstanding during the period.
| | | | | | | | | Net Realized and
Unrealized Gain (Loss)
on Investments and
Foreign Currency | | | | | | | | Distributions
from Net
Realized Gain on
Investments and
Foreign Currency | | | | | | | | | | | | | | Ratio of Expenses to Average Net Assets | | | Ratio of Net
Investment
Income (Loss) to
Average Net
Assets | | | |
| | | Net Asset
Value,
Beginning of
Period | | Net
Investment
Income (Loss) | | | Total from
Investment
Operations | | Distributions
from Net
Investment
Income | | | Total
Distributions | | Net Asset Value,
End of Period | | Total Return | | Net Assets,
End of Period
(in thousands) | | Prior to Fee
Waivers, Expense
Reimbursements and
Balance Credits | | Prior to Fee
Waivers and
Expense
Reimbursements | | Net of Fee
Waivers and
Expense
Reimbursements | | | Portfolio
Turnover
Rate |
| Royce Smaller-Companies Growth Fund–Service Class |
| 2024† | | $ | 6.41 | | | $ | (0.03 | ) | | $ | 0.42 | | | $ | 0.39 | | | $ | – | | | $ | – | | | $ | – | | | $ | 6.80 | | | | 6.08 | %1 | | $ | 109,317 | | | | 1.55 | %2 | | | 1.55 | %2 | | | 1.49 | %2 | | | (0.91 | )%2 | | | 36 | % |
| 2023 | | | 5.48 | | | | (0.06 | ) | | | 0.99 | | | | 0.93 | | | | – | | | | – | | | | – | | | | 6.41 | | | | 16.97 | | | | 112,078 | | | | 1.57 | | | | 1.57 | | | | 1.49 | | | | (0.93 | ) | | | 65 | |
| 2022 | | | 8.45 | | | | (0.08 | ) | | | (2.65 | ) | | | (2.73 | ) | | | – | | | | (0.24 | ) | | | (0.24 | ) | | | 5.48 | | | | (32.37 | ) | | | 105,585 | | | | 1.55 | | | | 1.55 | | | | 1.49 | | | | (1.22 | ) | | | 66 | |
| 2021 | | | 10.74 | | | | (0.15 | ) | | | 0.82 | | | | 0.67 | | | | – | | | | (2.96 | ) | | | (2.96 | ) | | | 8.45 | | | | 7.78 | | | | 178,553 | | | | 1.51 | | | | 1.51 | | | | 1.49 | | | | (1.21 | ) | | | 50 | |
| 2020 | | | 7.99 | | | | (0.09 | ) | | | 3.95 | | | | 3.86 | | | | – | | | | (1.11 | ) | | | (1.11 | ) | | | 10.74 | | | | 49.26 | | | | 181,591 | | | | 1.54 | | | | 1.54 | | | | 1.49 | | | | (1.11 | ) | | | 61 | |
| 2019 | | | 6.69 | | | | (0.07 | ) | | | 1.65 | | | | 1.58 | | | | – | | | | (0.28 | ) | | | (0.28 | ) | | | 7.99 | | | | 23.67 | | | | 154,236 | | | | 1.55 | | | | 1.54 | | | | 1.49 | | | | (0.93 | ) | | | 53 | |
| Royce Smaller-Companies Growth Fund–Institutional Class |
| 2024† | | $ | 6.77 | | | $ | (0.02 | ) | | $ | 0.43 | | | $ | 0.41 | | | $ | – | | | $ | – | | | $ | – | | | $ | 7.18 | | | | 6.06 | %1 | | $ | 4,951 | | | | 1.55 | %2 | | | 1.55 | %2 | | | 1.24 | %2 | | | (0.66 | )%2 | | | 36 | % |
| 2023 | | | 5.77 | | | | (0.04 | ) | | | 1.04 | | | | 1.00 | | | | – | | | | – | | | | – | | | | 6.77 | | | | 17.33 | | | | 5,231 | | | | 1.54 | | | | 1.53 | | | | 1.21 | | | | (0.65 | ) | | | 65 | |
| 2022 | | | 8.87 | | | | (0.06 | ) | | | (2.79 | ) | | | (2.85 | ) | | | – | | | | (0.25 | ) | | | (0.25 | ) | | | 5.77 | | | | (32.17 | ) | | | 4,400 | | | | 1.53 | | | | 1.53 | | | | 1.16 | | | | (0.89 | ) | | | 66 | |
| 2021 | | | 11.23 | | | | (0.11 | ) | | | 0.85 | | | | 0.74 | | | | – | | | | (3.10 | ) | | | (3.10 | ) | | | 8.87 | | | | 8.16 | | | | 7,278 | | | | 1.41 | | | | 1.41 | | | | 1.16 | | | | (0.88 | ) | | | 50 | |
| 2020 | | | 8.33 | | | | (0.07 | ) | | | 4.13 | | | | 4.06 | | | | – | | | | (1.16 | ) | | | (1.16 | ) | | | 11.23 | | | | 49.70 | | | | 5,646 | | | | 1.44 | | | | 1.44 | | | | 1.23 | | | | (0.85 | ) | | | 61 | |
| 2019 | | | 6.95 | | | | (0.05 | ) | | | 1.72 | | | | 1.67 | | | | – | | | | (0.29 | ) | | | (0.29 | ) | | | 8.33 | | | | 24.10 | | | | 8,021 | | | | 1.35 | | | | 1.35 | | | | 1.17 | | | | (0.62 | ) | | | 53 | |
† Six months ended June 30, 2024 (unaudited).
1 Not annualized
2 Annualized
3 For Royce Global Financial Services Fund, a special distribution from Tel Aviv Stock Exchange resulted in an increase in net investment income (loss) per share of $0.04 and an increase in the ratio of net investment income (loss) to average net assets of 0.45% for the Service Class, and $0.06 per share and 0.47% for the Institutional Class.
4 For Royce Global Financial Services Fund, a special distribution from ECN Capital resulted in an increase in net investment income (loss) per share of $0.12 and an increase in the ratio of net investment income (loss) to average net assets of 1.00% for the Service Class, and $0.18 per share and 1.14% for the Institutional Class.
5 For Royce Small-Cap Total Return Fund, a special distribution from Tel Aviv Stock Exchange resulted in an increase in net investment income (loss) per share of $0.01 and an increase in the ratio of net investment income (loss) to average net assets of 0.17% for the Investment Class, $0.01 per share and 0.16% for the Service Class, $0.01 per share and 0.16% for the Consultant Class, $0.01 per share and 0.17% for the Institutional Class and $0.01 per share and 0.17% for the R Class.
| See Notes to Financial Statements | 38 |
Notes to Financial Statements (unaudited)
Summary of Significant Accounting Policies:
Royce Dividend Value Fund, Royce Global Financial Services Fund, Royce International Premier Fund, Royce Micro-Cap Fund, Royce Premier Fund, Royce Small-Cap Fund (formerly Royce Pennsylvania Mutual Fund) Royce Small-Cap Opportunity Fund, Royce Small-Cap Special Equity Fund, Royce Small-Cap Total Return Fund, Royce Small-Cap Value Fund and Royce Smaller-Companies Growth Fund (each, a “Fund,” and collectively, the “Funds”) are the 11 series of The Royce Fund (the “Trust”), an open-end management investment company organized as a Delaware statutory trust.
Classes of shares have equal rights as to earnings and assets, except that each class may bear different fees and expenses for distribution, shareholder servicing, registration and shareholder reports, and receive different transfer agent balance credits and expense reimbursements. Investment income, realized and unrealized capital gains or losses on investments and foreign currency, and expenses other than those attributable to a specific class are allocated to each class of shares based on its relative net assets.
The preparation of financial statements in conformity with accounting principles generally accepted in the United States of America requires management to make estimates and assumptions that affect the reported amounts of assets and liabilities and the disclosure of contingent assets and liabilities at the date of the financial statements and the reported amounts of income and expenses during the reporting period. Actual results could differ from those estimates.
Each Fund is an investment company registered under the Investment Company Act of 1940 (the “1940 Act”) and accordingly follows the investment company accounting and reporting guidance of the Financial Accounting Standards Board (FASB) Accounting Standard Codification Topic 946 “Financial Services-Investment Companies.”
Royce & Associates, LP, the Funds’ investment adviser, is a majority-owned subsidiary of Franklin Resources, Inc. and primarily conducts business using the name Royce Investment Partners (“Royce”). As of June 30, 2024, officers and employees of Royce, Fund trustees, the Royce retirement plans and other affiliates owned more than 10% of the following Fund:
Royce Global Financial Services Fund 15%
VALUATION OF INVESTMENTS:
Portfolio securities held by the Funds are valued as of the close of trading on the New York Stock Exchange (“NYSE”) (generally 4:00 p.m. Eastern time) on the valuation date. Investments in money market funds are valued at net asset value per share. Values for non-U.S. dollar denominated equity securities are converted to U.S. dollars daily based upon prevailing foreign currency exchange rates as quoted by a major bank.
Portfolio securities that are listed on an exchange or Nasdaq, or traded on OTC Market Group Inc.’s OTC Link ATS or other alternative trading system, are valued: (i) on the basis of their last reported sales prices or official closing prices, as applicable, on a valuation date; or (ii) at their highest reported bid prices in the event such equity securities did not trade on a valuation date. Such inputs are generally referred to as “Level 1” inputs because they represent reliable quoted prices in active markets for identical securities.
If the value of a portfolio security held by a Fund cannot be determined solely by reference to Level 1 inputs, such portfolio security will be “fair valued.” The Trust’s Board of Trustees has designated Royce as valuation designee to perform fair value determinations for such portfolio securities in accordance with Rule 2a-5 under the 1940 Act (“Rule 2a-5”). Pursuant to Rule 2a-5, fair values are determined in accordance with policies and procedures approved by the Trust's Board of Trustees and policies and procedures adopted by Royce in its capacity as valuation designee for the Trust. Fair valued securities are reported as either “Level 2” or “Level 3” securities.
As a general principle, the fair value of a security is the amount which a Fund might reasonably expect to receive for the security upon its current sale. However, in light of the judgment involved in fair valuations, no assurance can be given that a fair value assigned to a particular portfolio security will be the amount which the Fund might be able to receive upon its current sale. When a fair value pricing methodology is used, the fair value prices used by the Fund for such securities will likely differ from the quoted or published prices for the same securities.
Level 2 inputs are other significant observable inputs (e.g., dealer bid side quotes and quoted prices for securities with comparable characteristics). Examples of situations in which Level 2 inputs are used to fair value portfolio securities held by the Funds on a particular valuation date include:
| ● | Over-the-counter equity securities other than those traded on OTC Market Group Inc.’s OTC Link ATS or other alternative trading system (collectively referred to herein as “Other OTC Equity Securities”) are fair valued at their highest bid price when Royce receives at least two bid side quotes from dealers who make markets in such securities; |
| ● | Certain bonds and other fixed income securities may be fair valued by reference to other securities with comparable ratings, interest rates, and maturities in accordance with valuation methodologies maintained by certain independent pricing services; and |
| ● | The Funds use an independent pricing service to fair value certain non-U.S. equity securities when U.S. market volatility exceeds a certain threshold. This pricing service uses proprietary correlations it has developed between the movement of prices of non-U.S. equity securities and indices of U.S.-traded securities, futures contracts, and other indications to estimate the fair value of such non-U.S. securities. |
Notes to Financial Statements (unaudited) (continued)
VALUATION OF INVESTMENTS (continued):
Level 3 inputs are significant unobservable inputs. Examples of Level 3 inputs include (without limitation) the last trade price for a security before trading was suspended or terminated; discounts to last trade price for lack of marketability or otherwise; market price information regarding other securities; information received from the issuer and/or published documents, including SEC filings and financial statements; and other publicly available information. Pursuant to the above-referenced policies and procedures, Royce may use various techniques in making fair value determinations based upon Level 3 inputs, which techniques may include (without limitation): (i) workout valuation methods (e.g., earnings multiples, discounted cash flows, liquidation values, derivations of book value, firm or probable offers from qualified buyers for the issuer’s ongoing business, etc.); (ii) discount or premium from market, or compilation of other observable market information, for other similar freely traded securities; (iii) conversion from the readily available market price of a security into which an affected security is convertible or exchangeable; and (iv) pricing models or other formulas. In the case of restricted securities, fair value determinations generally start with the inherent or intrinsic worth of the relevant security, without regard to the restrictive feature, and are reduced for any diminution in value resulting from the restrictive feature. Due to the inherent uncertainty of such valuations, these fair values may differ significantly from the values that would have been used had an active market existed.
A security that is valued by reference to Level 1 or Level 2 inputs may drop to Level 3 on a particular valuation date for several reasons, including if:
| ● | an equity security that is listed on an exchange or Nasdaq, or traded on OTC Market Group Inc.’s OTC Link ATS or other alternative trading system, has not traded and there are no bids; |
| ● | Royce does not receive at least two bid side quotes for an Other OTC Equity Security; |
| ● | the independent pricing services are unable to supply fair value prices; or |
| ● | the Level 1 or Level 2 inputs become otherwise unreliable for any reason (e.g., a significant event occurs after the close of trading for a security but prior to the time a Fund prices its shares). |
The table below shows the aggregate value of the various Level 1, Level 2, and Level 3 securities held by the Funds as of June 30, 2024. Any Level 2 or Level 3 securities held by a Fund are noted in its Schedule of Investments. The inputs or methodology used for valuing securities are not necessarily an indication of the risk associated with owning those securities.
| | | LEVEL 1 | | | LEVEL 2 | | | LEVEL 3 | | | TOTAL | |
| Royce Dividend Value Fund | | | | | | | | | | | | | | | | |
| Common Stocks | | $ | 53,340,780 | | | $ | 7,308,688 | | | $ | – | | | $ | 60,649,468 | |
| Repurchase Agreement | | | – | | | | 5,431,970 | | | | – | | | | 5,431,970 | |
| Royce Global Financial Services Fund | | | | | | | | | | | | | | | | |
| Common Stocks | | | 23,659,374 | | | | 4,648,119 | | | | – | | | | 28,307,493 | |
| Repurchase Agreement | | | – | | | | 760,810 | | | | – | | | | 760,810 | |
| Royce International Premier Fund | | | | | | | | | | | | | | | | |
| Common Stocks | | | 27,990,980 | | | | 273,704,899 | | | | – | | | | 301,695,879 | |
| Preferred Stocks | | | – | | | | 4,548,924 | | | | – | | | | 4,548,924 | |
| Repurchase Agreement | | | – | | | | 4,861,755 | | | | – | | | | 4,861,755 | |
| Royce Micro-Cap Fund | | | | | | | | | | | | | | | | |
| Common Stocks | | | 284,631,070 | | | | 8,646,448 | | | | 0 | | | | 293,277,518 | |
| Repurchase Agreement | | | – | | | | 7,274,209 | | | | – | | | | 7,274,209 | |
| Money Market Fund/Collateral Received for Securities Loaned | | | 271,625 | | | | – | | | | – | | | | 271,625 | |
| Royce Premier Fund | | | | | | | | | | | | | | | | |
| Common Stocks | | | 1,331,896,571 | | | | – | | | | – | | | | 1,331,896,571 | |
| Repurchase Agreement | | | – | | | | 64,976,611 | | | | – | | | | 64,976,611 | |
| Royce Small-Cap Fund | | | | | | | | | | | | | | | | |
| Common Stocks | | | 1,844,991,681 | | | | 1,570,915 | | | | – | | | | 1,846,562,596 | |
| Repurchase Agreement | | | – | | | | 50,200,595 | | | | – | | | | 50,200,595 | |
| Money Market Fund/Collateral Received for Securities Loaned | | | 552,173 | | | | – | | | | – | | | | 552,173 | |
| Royce Small-Cap Opportunity Fund | | | | | | | | | | | | | | | | |
| Common Stocks | | | 1,213,629,557 | | | | – | | | | 152,432 | | | | 1,213,781,989 | |
| Repurchase Agreement | | | – | | | | 20,956,983 | | | | – | | | | 20,956,983 | |
| Money Market Fund/Collateral Received for Securities Loaned | | | 3,094,061 | | | | – | | | | – | | | | 3,094,061 | |
| Royce Small-Cap Special Equity Fund | | | | | | | | | | | | | | | | |
| Common Stocks | | | 590,720,515 | | | | 2,807,200 | | | | – | | | | 593,527,715 | |
| Repurchase Agreement | | | – | | | | 113,154,168 | | | | – | | | | 113,154,168 | |
Notes to Financial Statements (unaudited) (continued)
VALUATION OF INVESTMENTS (continued):
| | | LEVEL 1 | | LEVEL 2 | | LEVEL 3 | | TOTAL |
| Royce Small-Cap Total Return Fund | | | | | | | | | | | | |
| Common Stocks | | $968,099,674 | | | $14,196,758 | | | $ – | | | $982,296,432 | |
| Repurchase Agreement | | – | | | 23,605,781 | | | – | | | 23,605,781 | |
| Royce Small-Cap Value Fund | | | | | | | | | | | | |
| Common Stocks | | 110,809,223 | | | – | | | – | | | 110,809,223 | |
| Repurchase Agreement | | – | | | 804,122 | | | – | | | 804,122 | |
| Royce Smaller-Companies Growth Fund | | | | | | | | | | | | |
| Common Stocks | | 167,949,051 | | | 2,698,847 | | | – | | | 170,647,898 | |
| Repurchase Agreement | | – | | | 8,537,988 | | | – | | | 8,537,988 | |
| Money Market Fund/Collateral Received for Securities Loaned | | 4,531,444 | | | – | | | – | | | 4,531,444 | |
Level 3 Reconciliation:
| | | | | | | | | | | | | | | | | UNREALIZED GAIN (LOSS) 2 | | | |
| | | BALANCE AS OF
12/31/23 | | | PURCHASES | | | TRANSFERS IN 1 | | | SALES | | | REALIZED GAIN
(LOSS) 2 | | | CURRENTLY HELD
SECURITIES | | SECURITIES NO
LONGER HELD | | | BALANCE AS OF
6/30/24 | |
| Royce Small-Cap Opportunity Fund | | | | | | | | | | | | | | | | | | | | | | | |
| Common Stocks | | $ 0 | | | $ – | | | $ 152,432 | | | $ – | | | $ – | | | $ 0 | | $ – | | | $ 152,432 | |
| 1 | Transfers into Level 3 represents a security for which there were no longer readily available market quotations at June 30, 2024. |
| 2 | The net change in unrealized appreciation (depreciation) is included in the accompanying Statement of Operations. Change in unrealized appreciation (depreciation) includes net unrealized appreciation (depreciation) resulting from changes in investment values during the reporting period and the reversal of previously recorded unrealized appreciation (depreciation) when gains or losses are realized. Net realized gain (loss) from investments and foreign currency transactions is included in the accompanying Statement of Operations. |
REPURCHASE AGREEMENTS:
The Funds may enter into repurchase agreements with institutions that the Funds’ investment adviser has determined are creditworthy. Each Fund restricts repurchase agreements to maturities of no more than seven days. Securities pledged as collateral for repurchase agreements, which are held until maturity of the repurchase agreements, are marked-to-market daily and maintained at a value at least equal to the principal amount of the repurchase agreement (including accrued interest). Repurchase agreements could involve certain risks in the event of default or insolvency of the counter-party, including possible delays or restrictions upon the ability of each Fund to dispose of its underlying securities. The remaining contractual maturities of repurchase agreements held by the Funds as of June 30, 2024, are next business day and continuous.
FOREIGN CURRENCY:
Net realized foreign exchange gains or losses arise from sales and maturities of short-term securities, sales of foreign currencies, expiration of currency forward contracts, currency gains or losses realized between the trade and settlement dates on securities transactions, and the difference between the amounts of dividends, interest, and foreign withholding taxes recorded on each Fund’s books and the U.S. dollar equivalent of the amounts actually received or paid. Net unrealized foreign exchange gains and losses arise from changes in the value of assets and liabilities, other than investments in securities at the end of the reporting period, as a result of changes in foreign currency exchange rates.
The Funds do not isolate that portion of the results of operations resulting from fluctuations in foreign exchange rates on investments from the fluctuations arising from changes in market prices of securities held. Such fluctuations are included with the net realized and unrealized gain or loss on investments.
Certain Funds invest a significant portion of their respective assets in foreign companies that may be subject to different risks than investments in securities of U.S. companies, including adverse political, social, economic, or other developments that are unique to a particular country or region. Therefore, the prices of securities of foreign companies in particular countries or regions may, at times, move in a different direction than those of securities of U.S. companies. Because such investments in securities of foreign companies are usually denominated in foreign currencies and such Funds do not intend to hedge their foreign currency exposures, the U.S. dollar value of such investments may be harmed by declines in the value of foreign currencies in relation to the U.S. dollar.
SECURITIES LENDING:
The Funds loan securities through a lending agent, State Street Bank and Trust Company, to qualified institutional investors for the purpose of earning additional income. The lending agent receives and holds collateral from such borrowers to secure their obligations to the Funds. Such loans must be secured at all times by collateral in an amount at least equal to the market value of the loaned securities. The market values of the loaned securities and the collateral fluctuate and are determined at the close of each business day by the lending agent. Borrowers are required to post additional collateral to the lending agent on the next succeeding business day in the event of a collateral shortfall. Counterparty risk is further reduced by loaning securities only to parties that participate in a Global Securities Lending Program organized and monitored by the lending agent and that are deemed by it to satisfy its requirements and by having the lending agent enter into securities lending agreements with such borrowers. The lending agent is not affiliated with Royce.
Notes to Financial Statements (unaudited) (continued)
SECURITIES LENDING (continued):
Collateral may be in the form of cash or U.S. Treasuries. Cash collateral is invested in certain money market pooled investment vehicles. The Funds record a liability in their respective Statements of Assets and Liabilities for the return of such cash collateral during periods in which securities are on loan. The Funds bear the risk of loss for any decrease in the market value of the loaned securities or the investments purchased with cash collateral received from the borrowers.
Pursuant to the agreement in place between the Funds and the lending agent, if a borrower fails to return loaned securities, and the cash collateral being maintained by the lending agent on behalf of such borrower is insufficient to cover the value of loaned securities and provided such collateral insufficiency is not the result of investment losses, the lending agent shall, at its option, either replace the loaned securities or pay the amount of the shortfall to the Funds. In the event of the bankruptcy of a borrower, the Funds could experience delay in recovering the loaned securities or only recover cash or a security of equivalent value.
Loans of securities generally do not have stated maturity dates, and the Funds may recall a security at any time. The Funds’ securities lending income consists of the income earned on investing cash collateral, plus any premium payments received for lending certain securities, less any rebates paid to borrowers and lending agent fees associated with the loan. Pursuant to the agreement in place between the Funds and the lending agent, the Funds are responsible for any shortfall in the event the value of the investments purchased with cash collateral is insufficient to pay the rebate fee to the borrower.
The following table presents cash collateral and the market value of securities on loan collateralized by cash collateral held by the Funds as of June 30, 2024:
| | | CASH COLLATERAL1 | | SECURITIES ON LOAN COLLATERALIZED
BY CASH COLLATERAL | | NET AMOUNT |
| Royce Micro-Cap Fund | | $ | 271,625 | | | $ | (271,530 | ) | | $ | 95 | |
| Royce Small-Cap Fund | | | 552,173 | | | | (541,077 | ) | | | 11,096 | |
| Royce Small-Cap Opportunity Fund | | | 3,094,061 | | | | (2,846,256 | ) | | | 247,805 | |
| Royce Smaller-Companies Growth Fund | | | 4,531,444 | | | | (4,458,699 | ) | | | 72,745 | |
| 1 | Absent an event of default, assets and liabilities are presented gross and not offset in the Statements of Assets and Liabilities. The contractual maturity of cash collateral is overnight and continuous. |
The following table presents non-cash collateral and the market value of securities on loan collateralized by non-cash collateral held by the Funds’ custodian as of June 30, 2024:
| | | NON-CASH COLLATERAL | | SECURITIES ON LOAN COLLATERALIZED
BY NON-CASH COLLATERAL | | NET AMOUNT |
| Royce Micro-Cap Fund | | $ | 951,940 | | | $ | (930,623 | ) | | $ | 21,317 | |
| Royce Small-Cap Fund | | | 3,205,387 | | | | (3,133,449 | ) | | | 71,938 | |
| Royce Small-Cap Opportunity Fund | | | 17,483,952 | | | | (17,029,825 | ) | | | 454,127 | |
| Royce Small-Cap Total Return Fund | | | 212,587 | | | | (208,416 | ) | | | 4,171 | |
| Royce Smaller-Companies Growth Fund | | | 7,834,647 | | | | (7,669,862 | ) | | | 164,785 | |
DISTRIBUTIONS AND TAXES:
As qualified regulated investment companies under Subchapter M of the Internal Revenue Code, the Funds are not subject to income taxes to the extent that each Fund distributes substantially all of its taxable income for its fiscal year.
Royce Dividend Value Fund and Royce Small-Cap Total Return Fund pay any dividends from net investment income quarterly and make any distributions from net realized gains annually in December. The other Funds pay any dividends and capital gain distributions annually in December. Dividends from net investment income and distributions from capital gains are determined at a class level. Because federal income tax regulations differ from generally accepted accounting principles, income and capital gain distributions determined in accordance with tax regulations may differ from net investment income and realized gains recognized for financial reporting purposes. Accordingly, the character of distributions and composition of net assets for tax purposes differ from those reflected in the accompanying financial statements.
CAPITAL GAINS TAXES:
The Funds may be subject to a tax imposed on capital gains on securities of issuers domiciled in certain countries. The Funds record an estimated deferred tax liability for gains in these securities that have been held for less than one year. This amount, if any, is reported as deferred capital gains tax in the accompanying Statements of Assets and Liabilities, assuming those positions were disposed of at the end of the period, and accounted for as a reduction in the market value of the security.
INVESTMENT TRANSACTIONS AND RELATED INVESTMENT INCOME:
Investment transactions are accounted for on the trade date. Dividend income is recorded on the ex-dividend date except for certain dividends from securities where the dividend rate is not available. In such cases, the dividend is recorded as soon as the information is received by the Funds. Non-cash dividend income is recorded at the fair market value of the securities received. Interest income is recorded on an accrual basis. Premiums and discounts on debt securities are amortized using the effective yield-to-maturity method. Realized gains and losses from investment transactions are determined on the basis of identified cost for book and tax purposes.
Notes to Financial Statements (unaudited) (continued)
EXPENSES:
The Funds incur direct and indirect expenses. Expenses directly attributable to a Fund are charged to the Fund, while expenses applicable to more than one of the Royce Funds are allocated equitably. Certain personnel, occupancy costs and other administrative expenses related to all of the Royce Funds are allocated by Royce under an administration agreement and are included in administrative and office facilities and legal expenses.
COMPENSATING BALANCE CREDITS:
The Funds have an arrangement with their transfer agent, whereby a portion of the transfer agent’s fee is paid indirectly by credits earned on a Fund’s cash on deposit with the transfer agent.
LINE OF CREDIT:
The Funds, along with certain other Royce Funds, participate in a $65 million line of credit (“Credit Agreement”) with State Street Bank and Trust Company to be used for short-term working capital purposes, to include the funding of shareholder redemptions and trade settlements. This revolving Credit Agreement expires on October 4, 2024. Pursuant to the Credit Agreement, each participating Fund is liable for a portion of the commitment fee for the credit facility (i.e., 0.25% of any unused portion of the line of credit) and for principal and interest payments related to borrowings made by that Fund. Borrowings under the Credit Agreement bear interest at a variable rate equal to the Applicable Rate plus the Applicable Margin. The term Applicable Rate means, for any day, a rate equal to the sum of (a) 0.10%, plus (b) the higher of (i) the Federal Funds Effective Rate for such day, or (ii) the Overnight Bank Funding Rate for such day. The term Applicable Margin means 1.25%. The Funds did not utilize the line of credit during the six months ended June 30, 2024.
INDEMNIFICATION PROVISIONS:
Reference is made to Delaware law and the Trust’s Certificate of Trust, Trust Instrument, and By-laws, as amended and supplemented, each of which provides for the indemnification by the Trust of the Trust’s officers and trustees under the circumstances and to the extent set forth therein. Reference is also made to the investment advisory agreements between the Trust, on behalf of the Funds, and Royce which provides for the indemnification by the relevant Fund of Royce under the circumstances and to the extent set forth therein. Additionally, in the normal course of business, the Trust, on behalf of the Funds, enters into contracts with service providers that contain general indemnification provisions in favor of such service providers and other covered persons. The amount of any potential Fund liability under these indemnification arrangements, if any, currently cannot be determined with any degree of specificity. The Trust is not currently in possession of any information that would cause it to believe that any Fund is reasonably likely to be subject to any material adverse impact from the operation of these indemnification arrangements. No assurance can be given, however, that any Fund will not incur any liability from the operation of these indemnification arrangements. Any future liability to a Fund that may arise from the operation of such arrangements will be publicly disclosed to the extent required by relevant accounting guidance and applicable laws, rules, and regulations.
Capital Share Transactions (in dollars):
| | SHARES SOLD | SHARES ISSUED FOR
REINVESTMENT OF DISTRIBUTIONS | SHARES REDEEMED | SHARE CLASS CONVERSIONS | NET INCREASE (DECREASE) FROM
CAPITAL SHARE TRANSACTIONS |
| | Six Months Ended
6/30/24
(unaudited) | Year Ended
12/31/23 | Six Months Ended
6/30/24
(unaudited) | Year Ended
12/31/23 | Six Months Ended
6/30/24
(unaudited) | Year Ended
12/31/23 | Six Months Ended
6/30/24
(unaudited) | Year Ended
12/31/231 | Six Months Ended
6/30/24
(unaudited) | Year Ended
12/31/23 |
| Royce Dividend Value Fund | | | | | | | | | |
| Investment Class | $ 2,345,738 | $ 3,371,909 | $ 198,749 | $4,622,952 | $ (3,310,804) | $ (10,646,830) | | $ 138,592 | $ (766,317) | $ (2,513,377) |
| Service Class | 1,280,741 | 1,830,118 | 41,288 | 1,771,922 | (1,620,523) | (2,454,783) | | 1,814,323 | (298,494) | 2,961,580 |
| Consultant Class | | 210,153 | | – | | (65,431) | | (1,814,323) | | (1,669,601) |
| Institutional Class | | 3,063 | | 226 | | (380) | | (138,592) | | (135,683) |
| Royce Global Financial Services Fund | | | | | | | | |
| Service Class | 577,166 | 491,150 | – | 1,249,996 | (1,335,440) | (3,375,228) | | | (758,274) | (1,634,082) |
| Institutional Class | 15,860 | 3,545 | – | 286,206 | (57,869) | (127,955) | | | (42,009) | 161,796 |
| Royce International Premier Fund | | | | | | | | |
| Investment Class | 25,406,365 | 107,678,901 | – | 6,060,642 | (143,514,213) | (117,394,361) | | | (118,107,848) | (3,654,818) |
| Service Class | 1,631,397 | 2,157,306 | – | 616,946 | (6,559,931) | (8,592,048) | | 4,698,162 | (4,928,534) | (1,119,634) |
| Consultant Class | | 30,324 | | – | | (361,604) | | (4,698,162) | | (5,029,442) |
| Institutional Class | 14,402,683 | 42,412,902 | – | 4,586,782 | (53,016,220) | (297,344,812) | | | (38,613,537) | (250,345,128) |
| Royce Micro-Cap Fund | | | | | | | | | |
| Investment Class | 3,254,082 | 9,635,607 | – | 9,965,314 | (12,210,920) | (19,776,001) | | | (8,956,838) | (175,080) |
| Service Class | 604,382 | 1,295,075 | – | 8,183,040 | (10,439,252) | (20,841,659) | | | (9,834,870) | (11,363,544) |
| Consultant Class | 7,368 | 19,443 | – | 647,373 | (752,938) | (1,273,540) | | | (745,570) | (606,724) |
Notes to Financial Statements (unaudited) (continued)
Capital Share Transactions (in dollars) (continued):
| | SHARES SOLD | SHARES ISSUED FOR
REINVESTMENT OF DISTRIBUTIONS | SHARES REDEEMED | SHARE CLASS CONVERSIONS | NET INCREASE (DECREASE) FROM
CAPITAL SHARE TRANSACTIONS |
| | Six Months Ended
6/30/24
(unaudited) | Year Ended
12/31/23 | Six Months Ended
6/30/24
(unaudited) | Year Ended
12/31/23 | Six Months Ended
6/30/24
(unaudited) | Year Ended
12/31/23 | Six Months Ended
6/30/24
(unaudited) | Year Ended
12/31/231 | Six Months Ended
6/30/24
(unaudited) | Year Ended
12/31/23 |
| Royce Premier Fund | | | | | | | | | |
| Investment Class | $87,824,603 | $169,049,919 | $ – | $58,712,623 | $(161,028,993) | $(232,760,544) | | | $(73,204,390) | $(4,998,002) |
| Service Class | 3,224,182 | 11,634,237 | – | 2,160,921 | (5,080,214) | (8,257,640) | | $ 502,349 | (1,856,032) | 6,039,867 |
| Consultant Class | 309,717 | 690,713 | – | 730,118 | (709,180) | (2,334,369) | | | (399,463) | (913,538) |
| Institutional Class | 42,560,797 | 51,805,843 | – | 15,789,022 | (26,523,702) | (48,893,566) | | | 16,037,095 | 18,701,299 |
| R Class | | 183,825 | | – | | (6,287,233) | | (502,349) | | (6,605,757) |
| Royce Small-Cap Fund | | | | | | | | | |
| Investment Class | 54,534,755 | 79,544,369 | – | 59,046,248 | (92,553,373) | (168,080,568) | | | (38,018,618) | (29,489,951) |
| Service Class | 2,696,484 | 10,290,971 | – | 2,961,254 | (8,832,473) | (11,876,975) | | 2,009,544 | (6,135,989) | 3,384,794 |
| Consultant Class | 1,903,604 | 2,521,669 | – | 7,851,890 | (13,329,904) | (26,179,716) | | | (11,426,300) | (15,806,157) |
| Institutional Class | 23,980,302 | 53,155,609 | – | 9,282,608 | (16,787,405) | (28,134,124) | | | 7,192,897 | 34,304,093 |
| R Class | | 158,917 | | – | | (5,619,694) | | (2,009,544) | | (7,470,321) |
| Royce Small-Cap Opportunity Fund | | | | | | | | |
| Investment Class | 61,897,821 | 165,497,370 | – | 33,252,633 | (128,446,664) | (334,105,936) | | | (66,548,843) | (135,355,933) |
| Service Class | 4,619,599 | 14,034,208 | – | 3,169,540 | (22,127,008) | (19,066,951) | | | (17,507,409) | (1,863,203) |
| Consultant Class | 590,469 | 1,381,496 | – | 512,023 | (1,460,264) | (1,837,905) | | | (869,795) | 55,614 |
| Institutional Class | 27,091,047 | 79,555,925 | – | 9,350,666 | (28,880,648) | (71,962,464) | | | (1,789,601) | 16,944,127 |
| R Class | 1,139,619 | 6,503,400 | – | 1,964,573 | (5,133,919) | (7,391,450) | | | (3,994,300) | 1,076,523 |
| Royce Small-Cap Special Equity Fund | | | | | | | | |
| Investment Class | 24,971,715 | 80,810,358 | – | 26,814,396 | (79,578,757) | (130,514,096) | | | (54,607,042) | (22,889,342) |
| Service Class | 1,469,656 | 4,077,772 | – | 1,106,792 | (2,983,259) | (9,814,521) | | | (1,513,603) | (4,629,957) |
| Consultant Class | 349,514 | 317,388 | – | 572,830 | (1,557,774) | (1,773,240) | | | (1,208,260) | (883,022) |
| Institutional Class | 11,306,863 | 33,909,101 | – | 4,352,603 | (19,659,775) | (32,013,157) | | | (8,352,912) | 6,248,547 |
| Royce Small-Cap Total Return Fund | | | | | | | | |
| Investment Class | 38,148,926 | 41,935,943 | 1,469,589 | 51,009,988 | (58,496,824) | (115,729,451) | | | (18,878,309) | (22,783,520) |
| Service Class | 4,313,547 | 6,373,369 | 67,258 | 4,719,947 | (7,164,215) | (18,441,972) | | | (2,783,410) | (7,348,656) |
| Consultant Class | 2,279,841 | 2,057,356 | – | 5,905,962 | (6,864,641) | (17,589,355) | | | (4,584,800) | (9,626,037) |
| Institutional Class | 18,969,494 | 23,321,203 | 571,430 | 19,219,822 | (17,813,196) | (34,047,333) | | | 1,727,728 | 8,493,692 |
| R Class | 2,143,602 | 2,641,296 | – | 1,761,612 | (2,143,443) | (4,872,182) | | | 159 | (469,274) |
| Royce Small-Cap Value Fund | | | | | | | | |
| Investment Class | 1,679,767 | 2,365,304 | – | 2,665,001 | (2,694,630) | (8,348,726) | | | (1,014,863) | (3,318,421) |
| Service Class | 16,975,631 | 21,486,015 | – | 5,843,957 | (37,406,804) | (14,846,995) | | 6,689,086 | (20,431,173) | 19,172,063 |
| Consultant Class | | 897 | | – | | (190,820) | | (2,889,358) | | (3,079,281) |
| R Class | | 274,078 | | – | | (2,106,475) | | (3,799,728) | | (5,632,125) |
| Royce Smaller-Companies Growth Fund | | | | | | | | |
| Investment Class | 2,009,048 | 4,439,689 | – | – | (5,498,777) | (12,285,700) | | | (3,489,729) | (7,846,011) |
| Service Class | 848,498 | 3,656,743 | – | – | (10,072,161) | (18,187,433) | | 3,953,734 | (9,223,663) | (10,576,956) |
| Consultant Class | | 7,157 | | – | | (468,040) | | (3,953,734) | | (4,414,617) |
| Institutional Class | 126,068 | 866,567 | – | – | (676,312) | (752,534) | | | (550,244) | 114,033 |
Capital Share Transactions (in shares):
| | SHARES SOLD | SHARES ISSUED FOR
REINVESTMENT OF DISTRIBUTIONS | SHARES REDEEMED | SHARE CLASS CONVERSIONS | NET INCREASE (DECREASE) IN
SHARES OUTSTANDING |
| | Six Months Ended
6/30/24
(unaudited) | Year Ended
12/31/23 | Six Months Ended
6/30/24
(unaudited) | Year Ended
12/31/23 | Six Months Ended
6/30/24
(unaudited) | Year Ended
12/31/23 | Six Months Ended
6/30/24
(unaudited) | Year Ended
12/31/231 | Six Months Ended
6/30/24
(unaudited) | Year Ended
12/31/23 |
| Royce Dividend Value Fund | | | | | | | | | |
| Investment Class | 381,070 | 570,027 | 31,127 | 774,173 | (526,479) | (1,805,395) | | 24,530 | (114,282) | (436,665) |
| Service Class | 193,542 | 292,085 | 6,194 | 284,444 | (249,380) | (397,725) | | 308,035 | (49,644) | 486,839 |
| Consultant Class | | 30,591 | | – | | (9,600) | | (270,888) | | (249,897) |
| Institutional Class | | 539 | | 41 | | (66) | | (24,934) | | (24,420) |
| Royce Global Financial Services Fund | | | | | | | | |
| Service Class | 54,365 | 51,084 | – | 124,999 | (126,475) | (347,129) | | | (72,110) | (171,046) |
| Institutional Class | 1,126 | 275 | – | 21,715 | (4,136) | (9,753) | | | (3,010) | 12,237 |
Notes to Financial Statements (unaudited) (continued)
Capital Share Transactions (in shares) (continued):
| | SHARES SOLD | SHARES ISSUED FOR
REINVESTMENT OF DISTRIBUTIONS | SHARES REDEEMED | SHARE CLASS CONVERSIONS | NET INCREASE (DECREASE) IN
SHARES OUTSTANDING |
| | Six Months Ended
6/30/24
(unaudited) | Year Ended
12/31/23 | Six Months Ended
6/30/24
(unaudited) | Year Ended
12/31/23 | Six Months Ended
6/30/24
(unaudited) | Year Ended
12/31/23 | Six Months Ended
6/30/24
(unaudited) | Year Ended
12/31/231 | Six Months Ended
6/30/24
(unaudited) | Year Ended
12/31/23 |
| Royce International Premier Fund | | | | | | | | |
| Investment Class | 1,994,240 | 8,187,775 | – | 477,216 | (11,397,555) | (9,206,880) | | | (9,403,315) | (541,889) |
| Service Class | 106,377 | 140,416 | – | 40,244 | (429,896) | (555,432) | | 295,668 | (323,519) | (79,104) |
| Consultant Class | | 1,803 | | – | | (21,630) | | (280,651) | | (300,478) |
| Institutional Class | 1,142,159 | 3,250,170 | – | 361,164 | (4,176,873) | (23,493,797) | | | (3,034,714) | (19,882,463) |
| Royce Micro-Cap Fund | | | | | | | | | |
| Investment Class | 296,451 | 900,369 | – | 930,468 | (1,102,146) | (1,865,472) | | | (805,695) | (34,635) |
| Service Class | 56,972 | 128,976 | – | 789,107 | (980,289) | (2,033,028) | | | (923,317) | (1,114,945) |
| Consultant Class | 939 | 2,606 | – | 82,785 | (95,008) | (166,622) | | | (94,069) | (81,231) |
| Royce Premier Fund | | | | | | | | | |
| Investment Class | 7,546,947 | 15,115,666 | – | 5,177,480 | (14,026,938) | (20,949,988) | | | (6,479,991) | (656,842) |
| Service Class | 289,575 | 1,099,873 | – | 197,525 | (456,923) | (771,331) | | 49,298 | (167,348) | 575,365 |
| Consultant Class | 35,598 | 80,081 | – | 85,294 | (81,890) | (279,287) | | | (46,292) | (113,912) |
| Institutional Class | 3,612,005 | 4,607,393 | – | 1,369,386 | (2,261,641) | (4,343,129) | | | 1,350,364 | 1,633,650 |
| R Class | | 18,464 | | – | | (637,782) | | (52,611) | | (671,929) |
| Royce Small-Cap Fund | | | | | | | | | |
| Investment Class | 5,900,551 | 9,342,337 | – | 6,546,147 | (9,957,819) | (19,888,598) | | | (4,057,268) | (4,000,114) |
| Service Class | 291,645 | 1,224,130 | – | 330,129 | (952,997) | (1,412,822) | | 257,965 | (661,352) | 399,402 |
| Consultant Class | 265,013 | 383,489 | – | 1,131,397 | (1,864,228) | (4,015,139) | | | (1,599,215) | (2,500,253) |
| Institutional Class | 2,553,103 | 6,259,443 | – | 1,024,570 | (1,804,453) | (3,256,245) | | | 748,650 | 4,027,768 |
| R Class | | 21,258 | | – | | (760,823) | | (279,491) | | (1,019,056) |
| Royce Small-Cap Opportunity Fund | | | | | | | | |
| Investment Class | 4,073,166 | 11,526,963 | – | 2,246,800 | (8,499,543) | (23,795,316) | | | (4,426,377) | (10,021,553) |
| Service Class | 333,704 | 1,075,540 | – | 235,304 | (1,592,859) | (1,458,374) | | | (1,259,155) | (147,530) |
| Consultant Class | 51,374 | 122,026 | – | 44,718 | (121,674) | (166,141) | | | (70,300) | 603 |
| Institutional Class | 1,725,801 | 5,334,621 | – | 615,175 | (1,846,807) | (4,852,493) | | | (121,006) | 1,097,303 |
| R Class | 86,925 | 526,142 | – | 152,174 | (388,673) | (590,638) | | | (301,748) | 87,678 |
| Royce Small-Cap Special Equity Fund | | | | | | | | |
| Investment Class | 1,485,987 | 4,879,316 | – | 1,581,970 | (4,711,693) | (7,852,907) | | | (3,225,706) | (1,391,621) |
| Service Class | 87,262 | 246,275 | – | 65,298 | (177,518) | (599,369) | | | (90,256) | (287,796) |
| Consultant Class | 22,680 | 21,121 | – | 37,197 | (101,402) | (117,448) | | | (78,722) | (59,130) |
| Institutional Class | 679,891 | 2,056,148 | – | 259,238 | (1,186,421) | (1,938,056) | | | (506,530) | 377,330 |
| Royce Small-Cap Total Return Fund | | | | | | | | |
| Investment Class | 5,234,439 | 5,989,446 | 199,137 | 7,007,761 | (7,961,907) | (16,402,558) | | | (2,528,331) | (3,405,351) |
| Service Class | 563,503 | 879,575 | 8,769 | 622,548 | (941,238) | (2,523,128) | | | (368,966) | (1,021,005) |
| Consultant Class | 291,901 | 277,558 | – | 764,031 | (882,273) | (2,375,820) | | | (590,372) | (1,334,231) |
| Institutional Class | 2,622,685 | 3,368,703 | 79,145 | 2,699,062 | (2,478,492) | (4,954,924) | | | 223,338 | 1,112,841 |
| R Class | 274,389 | 357,894 | – | 227,606 | (275,917) | (657,564) | | | (1,528) | (72,064) |
| Royce Small-Cap Value Fund | | | | | | | | | |
| Investment Class | 165,963 | 243,757 | – | 263,861 | (267,737) | (887,380) | | | (101,774) | (379,762) |
| Service Class | 1,701,123 | 2,135,035 | – | 582,067 | (3,702,532) | (1,599,835) | | 784,184 | (2,001,409) | 1,901,451 |
| Consultant Class | | 114 | | – | | (23,761) | | (394,479) | | (418,126) |
| R Class | | 31,309 | | – | | (250,388) | | (469,746) | | (688,825) |
| Royce Smaller-Companies Growth Fund | | | | | | | | |
| Investment Class | 300,140 | 717,461 | – | – | (790,887) | (1,966,328) | | | (490,747) | (1,248,867) |
| Service Class | 127,198 | 605,212 | – | – | (1,522,157) | (3,058,267) | | 685,222 | (1,394,959) | (1,767,833) |
| Consultant Class | | 1,523 | | – | | (94,490) | | (825,397) | | (918,364) |
| Institutional Class | 18,005 | 132,361 | – | – | (101,533) | (121,506) | | | (83,528) | 10,855 |
| 1 | On April 26, 2023, Institutional Class shares converted to Investment Class shares for Royce Dividend Value Fund; Consultant Class shares converted to Service Class shares for the following funds: Royce Dividend Value Fund, Royce International Premier Fund, Royce Small-Cap Value Fund and Royce Smaller-Companies Growth Fund; and R Class shares converted to Service Class shares for the following funds: Royce Premier Fund, Royce Small-Cap Fund and Royce Small-Cap Value Fund. |
Notes to Financial Statements (unaudited) (continued)
Investment Adviser and Distributor:
INVESTMENT ADVISER:
Under the Trust’s investment advisory agreements with Royce, Royce is entitled to receive investment advisory fees in respect of each Fund that are computed daily and payable monthly. Royce has contractually agreed, without right of termination, to waive fees and/or reimburse expenses (excluding brokerage commissions, taxes, interest, litigation expenses, acquired fund fees and expenses, and other expenses not borne in the ordinary course of business) to the extent necessary to maintain certain Funds’ net annual operating expense ratios at specified levels through April 30, 2025. To the extent that they impacted net expenses for the six months ended June 30, 2024, the effects of those arrangements are shown below. See the Prospectuses for contractual waivers and expiration dates for all classes of all Funds.
| | | ANNUAL CONTRACTUAL
ADVISORY FEE AS A | | COMMITTED NET ANNUAL OPERATING EXPENSE RATIO CAP | | SIX MONTHS ENDED
JUNE 30, 2024 (UNAUDITED) | |
| | | PERCENTAGE OF AVERAGE
NET ASSETS1 | | Investment
Class | | Service
Class | | Consultant
Class | | Institutional
Class | | R Class | | Net advisory fees | | | Advisory fees
waived | |
| Royce Dividend Value Fund | | | 0.85% | | | 1.09% | | | 1.34% | | | N/A | | | N/A | | N/A | | $ | 279,126 | | | $ | – | |
| Royce Global Financial Services Fund | | | 1.00% | | | N/A | | | 1.49%3 | | | N/A | | | 1.49%3 | | N/A | | | 140,953 | | | | – | |
| Royce International Premier Fund | | | 1.00% | | | 1.19% | | | 1.44% | | | N/A | | | 1.04% | | N/A | | | 1,913,897 | | | | 285,835 | |
| Royce Micro-Cap Fund | | | 1.00% | | | N/A | | | 1.49% | | | 2.24% | | | N/A | | N/A | | | 1,511,323 | | | | – | |
| Royce Premier Fund | | | 1.00% | | | N/A | | | 1.49% | | | 2.24% | | | N/A | | N/A | | | 7,092,427 | | | | – | |
| Royce Small-Cap Fund | | | 0.76%2 | | | N/A | | | N/A4 | | | N/A | | | N/A | | N/A | | | 7,092,141 | | | | – | |
| Royce Small-Cap Opportunity Fund | | | 1.00% | | | N/A | | | 1.49% | | | 2.24% | | | N/A | | N/A | | | 6,205,044 | | | | – | |
| Royce Small-Cap Special Equity Fund | | | 1.00% | | | N/A | | | 1.49% | | | 2.24% | | | N/A | | N/A | | | 3,705,593 | | | | – | |
| Royce Small-Cap Total Return Fund | | | 1.00% | | | N/A | | | 1.49%3 | | | N/A | | | N/A5 | | N/A | | | 4,998,278 | | | | – | |
| Royce Small-Cap Value Fund | | | 1.00% | | | 1.24% | | | 1.49% | | | N/A | | | N/A | | N/A | | | 626,682 | | | | – | |
| Royce Smaller-Companies Growth Fund | | | 1.00% | | | 1.24% | | | 1.49% | | | N/A | | | 1.24% | | N/A | | | 899,215 | | | | – | |
| 1 | From a base annual rate of 1.00% (0.85% for Royce Dividend Value Fund), the annual rates of investment advisory fees payable by each of the Funds, other than Royce Small-Cap Fund, are reduced by the indicated amount at the following breakpoints applicable to a Fund’s net assets in excess of $2 billion: more than $2 billion to $3 billion -- .05% per annum; more than $3 billion to $4 billion -- .10% per annum; over $4 billion -- .15% per annum. |
| 2 | Royce Small-Cap Fund's fees are calculated at the annual rate of 1.00% of the first $50 million of the Fund's average net assets, 0.875% of the next $50 million of average net assets and 0.75% of average net assets in excess of $100 million. |
| 3 | Committed net annual operating expense ratio cap excludes acquired fund fees and expenses. |
| 4 | Royce Small-Cap Fund's committed net annual operating expense ratio cap of 1.25% for Service Class was eliminated, effective May 1, 2024. |
| 5 | Royce Small-Cap Total Return Fund's committed net annual operating expense ratio cap (excludes acquired fund fees and expenses) is 1.02% for Institutional Class, effective July 1, 2024. |
DISTRIBUTOR:
Royce Fund Services, LLC (“RFS”), the distributor of the Trust’s shares, is a wholly owned subsidiary of Royce. RFS is entitled to receive distribution fees that are computed daily and payable monthly.
| | | ANNUAL CONTRACTUAL DISTRIBUTION FEE AS A | | | SIX MONTHS ENDED JUNE 30, 2024 (UNAUDITED) |
| | | PERCENTAGE OF AVERAGE NET ASSETS | | | Net distribution fees | | Distribution fees waived |
| Royce Dividend Value Fund – Service Class | | | 0.25% | | | $ | 23,721 | | | $ | – | |
| Royce Global Financial Services Fund – Service Class | | | 0.25% | | | | 20,582 | | | | 3,921 | |
| Royce International Premier Fund – Service Class | | | 0.25% | | | | 38,240 | | | | – | |
| Royce Micro-Cap Fund – Service Class | | | 0.25% | | | | 162,164 | | | | – | |
| Royce Micro-Cap Fund – Consultant Class | | | 1.00% | | | | 51,799 | | | | – | |
| Royce Premier Fund – Service Class | | | 0.25% | | | | 42,741 | | | | – | |
| Royce Premier Fund – Consultant Class | | | 1.00% | | | | 57,239 | | | | – | |
| Royce Small-Cap Fund – Service Class | | | 0.25% | | | | 82,423 | | | | 7,167 | |
| Royce Small-Cap Fund – Consultant Class | | | 1.00% | | | | 947,751 | | | | – | |
| Royce Small-Cap Opportunity Fund – Service Class | | | 0.25% | | | | 89,138 | | | | – | |
| Royce Small-Cap Opportunity Fund – Consultant Class | | | 1.00% | | | | 63,213 | | | | – | |
| Royce Small-Cap Opportunity Fund – R Class | | | 0.50% | | | | 108,434 | | | | – | |
| Royce Small-Cap Special Equity Fund – Service Class | | | 0.25% | | | | 38,924 | | | | – | |
| Royce Small-Cap Special Equity Fund – Consultant Class | | | 1.00% | | | | 71,959 | | | | – | |
| Royce Small-Cap Total Return Fund – Service Class | | | 0.25% | | | | 69,826 | | | | – | |
| Royce Small-Cap Total Return Fund – Consultant Class | | | 1.00% | | | | 410,471 | | | | – | |
| Royce Small-Cap Total Return Fund – R Class | | | 0.50% | | | | 54,359 | | | | – | |
| Royce Small-Cap Value Fund – Service Class | | | 0.25% | | | | 111,575 | | | | – | |
| Royce Smaller-Companies Growth Fund – Service Class | | | 0.25% | | | | 138,349 | | | | – | |
Notes to Financial Statements (unaudited) (continued)
Purchases and Sales of Investment Securities:
For the six months ended June 30, 2024, the costs of purchases and the proceeds from sales of investment securities, other than short-term securities and collateral received for securities loaned, were as follows:
| | | PURCHASES | | | SALES | |
| Royce Dividend Value Fund | | $ | 1,133,929 | | | $ | 6,745,863 | |
| Royce Global Financial Services Fund | | | 788,114 | | | | 1,543,951 | |
| Royce International Premier Fund | | | 81,607,638 | | | | 228,070,096 | |
| Royce Micro-Cap Fund | | | 30,369,956 | | | | 51,068,613 | |
| Royce Premier Fund | | | 92,966,841 | | | | 146,505,428 | |
| Royce Small-Cap Fund | | | 371,069,642 | | | | 438,024,211 | |
| Royce Small-Cap Opportunity Fund | | | 179,934,043 | | | | 262,094,463 | |
| Royce Small-Cap Special Equity Fund | | | 13,291,583 | | | | 69,581,508 | |
| Royce Small-Cap Total Return Fund | | | 305,811,577 | | | | 311,308,169 | |
| Royce Small-Cap Value Fund | | | 29,084,199 | | | | 43,161,338 | |
| Royce Smaller-Companies Growth Fund | | | 62,657,040 | | | | 80,708,356 | |
Cross trades were executed by the Funds pursuant to Rule 17a-7 under the 1940 Act. Cross trading is the buying or selling of portfolio securities between funds to which Royce or an affiliate of Franklin Resources, Inc. serves as investment adviser. The Trust’s Chief Compliance Officer reviews such transactions each quarter for compliance with the requirements and restrictions set forth by Rule 17a-7, and reports the results of that review to the Board of Trustees. Cross trades for the six months ended June 30, 2024, were as follows:
| | | COSTS OF PURCHASES | | PROCEEDS FROM SALES | | REALIZED GAIN (LOSS) |
| Royce Micro-Cap Fund | | $ | 259,062 | | | $ | – | | | $ | – | |
| Royce Small-Cap Fund | | | – | | | | 1,000,012 | | | | (991,484 | ) |
| Royce Small-Cap Opportunity Fund | | | 430,690 | | | | – | | | | – | |
Class Specific Expenses:
Class specific expenses were as follows for the six months ended June 30, 2024:
| | | NET DISTRIBUTION
FEES | | | SHAREHOLDER
SERVICING | | | SHAREHOLDER
REPORTS | | | REGISTRATION | | | TRANSFER AGENT
BALANCE CREDITS | | | TOTAL | | | CLASS LEVEL
EXPENSES
REIMBURSED BY
INVESTMENT
ADVISER | |
| Royce Dividend Value Fund – Investment Class | | $ | – | | | $ | 32,639 | | | $ | 2,947 | | | $ | 9,468 | | | $ | (643 | ) | | $ | 44,411 | | | $ | 34,558 | |
| Royce Dividend Value Fund – Service Class | | | 23,721 | | | | 16,966 | | | | 1,359 | | | | 7,307 | | | | (318 | ) | | | 49,035 | | | | 21,312 | |
| | | | 23,721 | | | | 49,605 | | | | 4,306 | | | | 16,775 | | | | (961 | ) | | | | | | | 55,870 | |
| Royce Global Financial Services Fund –Service Class | | | 20,582 | | | | 15,779 | | | | 1,641 | | | | 9,205 | | | | (533 | ) | | | 46,674 | | | | 36,725 | |
| Royce Global Financial Services Fund – Institutional Class | | | – | | | | 3,321 | | | | 518 | | | | 7,074 | | | | (6 | ) | | | 10,907 | | | | 6,567 | |
| | | | 20,582 | | | | 19,100 | | | | 2,159 | | | | 16,279 | | | | (539 | ) | | | | | | | 43,292 | |
| Royce International Premier Fund – Investment Class | | | – | | | | 146,034 | | | | 14,776 | | | | 12,059 | | | | (1,462 | ) | | | 171,407 | | | | 3,107 | |
| Royce International Premier Fund – Service Class | | | 38,240 | | | | 25,689 | | | | 2,076 | | | | 6,023 | | | | (277 | ) | | | 71,751 | | | | 10,524 | |
| Royce International Premier Fund – Institutional Class | | | – | | | | 60,397 | | | | 19,227 | | | | 9,340 | | | | (13,242 | ) | | | 75,722 | | | | 75,722 | |
| | | | 38,240 | | | | 232,120 | | | | 36,079 | | | | 27,422 | | | | (14,981 | ) | | | | | | | 89,353 | |
| Royce Micro-Cap Fund – Investment Class | | | – | | | | 84,068 | | | | 11,836 | | | | 8,916 | | | | (6,946 | ) | | | 97,874 | | | | – | |
| Royce Micro-Cap Fund – Service Class | | | 162,164 | | | | 101,250 | | | | 6,194 | | | | 8,198 | | | | (767 | ) | | | 277,039 | | | | 33,213 | |
| Royce Micro-Cap Fund – Consultant Class | | | 51,799 | | | | 8,309 | | | | 1,277 | | | | 6,266 | | | | (252 | ) | | | 67,399 | | | | 9,082 | |
| | | | 213,963 | | | | 193,627 | | | | 19,307 | | | | 23,380 | | | | (7,965 | ) | | | | | | | 42,295 | |
| Royce Premier Fund – Investment Class | | | – | | | | 483,765 | | | | 37,159 | | | | 15,133 | | | | (12,456 | ) | | | 523,601 | | | | – | |
| Royce Premier Fund – Service Class | | | 42,741 | | | | 30,731 | | | | 5,217 | | | | 6,165 | | | | (892 | ) | | | 83,962 | | | | 15,488 | |
| Royce Premier Fund – Consultant Class | | | 57,239 | | | | 8,454 | | | | 1,139 | | | | 6,129 | | | | (218 | ) | | | 72,743 | | | | 6,909 | |
| Royce Premier Fund – Institutional Class | | | – | | | | 6,741 | | | | 14,626 | | | | 10,427 | | | | (730 | ) | | | 31,064 | | | | – | |
| | | | 99,980 | | | | 529,691 | | | | 58,141 | | | | 37,854 | | | | (14,296 | ) | | | | | | | 22,397 | |
| Royce Small-Cap Fund – Investment Class | | | – | | | | 503,916 | | | | 52,433 | | | | 15,301 | | | | (25,583 | ) | | | 546,067 | | | | – | |
| Royce Small-Cap Fund – Service Class | | | 82,423 | | | | 55,778 | | | | 5,033 | | | | 6,305 | | | | (1,047 | ) | | | 148,492 | | | | 2,290 | |
| Royce Small-Cap Fund – Consultant Class | | | 947,751 | | | | 70,336 | | | | 8,357 | | | | 6,981 | | | | (3,062 | ) | | | 1,030,363 | | | | – | |
| Royce Small-Cap Fund – Institutional Class | | | – | | | | 22,657 | | | | 8,622 | | | | 9,656 | | | | (6,980 | ) | | | 33,955 | | | | – | |
| | | | 1,030,174 | | | | 652,687 | | | | 74,445 | | | | 38,243 | | | | (36,672 | ) | | | | | | | 2,290 | |
Notes to Financial Statements (unaudited) (continued)
Class Specific Expenses (continued):
| | | NET DISTRIBUTION
FEES | | | SHAREHOLDER
SERVICING | | | SHAREHOLDER
REPORTS | | | REGISTRATION | | | TRANSFER AGENT
BALANCE CREDITS | | | TOTAL | | | CLASS LEVEL
EXPENSES
REIMBURSED BY
INVESTMENT
ADVISER | |
| Royce Small-Cap Opportunity Fund – Investment Class | | $ | – | | | $ | 507,720 | | | $ | 38,453 | | | $ | 15,552 | | | $ | (20,109 | ) | | $ | 541,616 | | | $ | – | |
| Royce Small-Cap Opportunity Fund – Service Class | | | 89,138 | | | | 53,523 | | | | 4,663 | | | | 7,248 | | | | (349 | ) | | | 154,223 | | | | 13,973 | |
| Royce Small-Cap Opportunity Fund – Consultant Class | | | 63,213 | | | | 8,012 | | | | 1,117 | | | | 5,847 | | | | (172 | ) | | | 78,017 | | | | 5,831 | |
| Royce Small-Cap Opportunity Fund – Institutional Class | | | – | | | | 10,650 | | | | 5,318 | | | | 7,984 | | | | (1,450 | ) | | | 22,502 | | | | – | |
| Royce Small-Cap Opportunity Fund – R Class | | | 108,434 | | | | 47,703 | | | | 990 | | | | 5,275 | | | | (283 | ) | | | 162,119 | | | | – | |
| | | | 260,785 | | | | 627,608 | | | | 50,541 | | | | 41,906 | | | | (22,363 | ) | | | | | | | 19,804 | |
| Royce Small-Cap Special Equity Fund – Investment Class | | | – | | | | 321,037 | | | | 22,818 | | | | 13,440 | | | | (9,570 | ) | | | 347,725 | | | | – | |
| Royce Small-Cap Special Equity Fund – Service Class | | | 38,924 | | | | 27,699 | | | | 2,481 | | | | 6,044 | | | | (267 | ) | | | 74,881 | | | | 14,167 | |
| Royce Small-Cap Special Equity Fund – Consultant Class | | | 71,959 | | | | 10,903 | | | | 1,315 | | | | 6,244 | | | | (428 | ) | | | 89,993 | | | | 7,933 | |
| Royce Small-Cap Special Equity Fund – Institutional Class | | | – | | | | 12,576 | | | | 4,335 | | | | 6,990 | | | | (2,451 | ) | | | 21,450 | | | | – | |
| | | | 110,883 | | | | 372,215 | | | | 30,949 | | | | 32,718 | | | | (12,716 | ) | | | | | | | 22,100 | |
| Royce Small-Cap Total Return Fund – Investment Class | | | – | | | | 306,117 | | | | 28,758 | | | | 11,055 | | | | (9,525 | ) | | | 336,405 | | | | – | |
| Royce Small-Cap Total Return Fund – Service Class | | | 69,826 | | | | 48,436 | | | | 3,874 | | | | 6,217 | | | | (557 | ) | | | 127,796 | | | | 18,527 | |
| Royce Small-Cap Total Return Fund – Consultant Class | | | 410,471 | | | | 43,133 | | | | 6,731 | | | | 6,683 | | | | (2,089 | ) | | | 464,929 | | | | – | |
| Royce Small-Cap Total Return Fund – Institutional Class | | | – | | | | 5,936 | | | | 13,585 | | | | 6,731 | | | | (385 | ) | | | 25,867 | | | | – | |
| Royce Small-Cap Total Return Fund – R Class | | | 54,359 | | | | 27,079 | | | | 1,664 | | | | 3,751 | | | | (414 | ) | | | 86,439 | | | | – | |
| | | | 534,656 | | | | 430,701 | | | | 54,612 | | | | 34,437 | | | | (12,970 | ) | | | | | | | 18,527 | |
| Royce Small-Cap Value Fund – Investment Class | | | – | | | | 24,551 | | | | 2,548 | | | | 7,355 | | | | (1,346 | ) | | | 33,108 | | | | 16,890 | |
| Royce Small-Cap Value Fund – Service Class | | | 111,575 | | | | 71,399 | | | | 5,709 | | | | 14,631 | | | | (855 | ) | | | 202,459 | | | | 48,940 | |
| | | | 111,575 | | | | 95,950 | | | | 8,257 | | | | 21,986 | | | | (2,201 | ) | | | | | | | 65,830 | |
| Royce Smaller-Companies Growth Fund – Investment Class | | | – | | | | 31,769 | | | | 4,349 | | | | 7,469 | | | | (2,928 | ) | | | 40,659 | | | | 4,617 | |
| Royce Smaller-Companies Growth Fund – Service Class | | | 138,349 | | | | 81,959 | | | | 5,861 | | | | 8,682 | | | | (763 | ) | | | 234,088 | | | | 33,586 | |
| Royce Smaller-Companies Growth Fund – Institutional Class | | | – | | | | 3,715 | | | | 710 | | | | 5,809 | | | | (80 | ) | | | 10,154 | | | | 7,465 | |
| | | | 138,349 | | | | 117,443 | | | | 10,920 | | | | 21,960 | | | | (3,771 | ) | | | | | | | 45,668 | |
Tax Information:
As of June 30, 2024, net unrealized appreciation (depreciation) based on identified cost for tax purposes was as follows:
| | | | | | NET UNREALIZED | | GROSS UNREALIZED |
| | | TAX BASIS COST | | APPRECIATION (DEPRECIATION) | | Appreciation | | (Depreciation) |
| Royce Dividend Value Fund | | $ | 28,343,974 | | | $ | 37,737,464 | | | $ | 37,990,919 | | | $ | 253,455 | |
| Royce Global Financial Services Fund | | | 15,494,776 | | | | 13,573,527 | | | | 14,437,039 | | | | 863,512 | |
| Royce International Premier Fund | | | 295,671,671 | | | | 15,434,887 | | | | 46,271,482 | | | | 30,836,595 | |
| Royce Micro-Cap Fund | | | 228,501,672 | | | | 72,321,680 | | | | 103,205,240 | | | | 30,883,560 | |
| Royce Premier Fund | | | 858,575,502 | | | | 538,297,680 | | | | 579,078,439 | | | | 40,780,759 | |
| Royce Small-Cap Fund | | | 1,275,625,717 | | | | 621,689,647 | | | | 688,615,209 | | | | 66,925,562 | |
| Royce Small-Cap Opportunity Fund | | | 971,123,572 | | | | 266,709,461 | | | | 384,713,293 | | | | 118,003,832 | |
| Royce Small-Cap Special Equity Fund | | | 559,828,963 | | | | 146,852,920 | | | | 170,648,855 | | | | 23,795,935 | |
| Royce Small-Cap Total Return Fund | | | 841,488,430 | | | | 164,413,783 | | | | 203,332,564 | | | | 38,918,781 | |
| Royce Small-Cap Value Fund | | | 87,282,638 | | | | 24,330,707 | | | | 28,008,141 | | | | 3,677,434 | |
| Royce Smaller-Companies Growth Fund | | | 144,675,309 | | | | 39,042,021 | | | | 48,982,474 | | | | 9,940,453 | |
The primary cause of the difference between book and tax basis cost is the timing of the recognition of losses on securities sold.
Notes to Financial Statements (unaudited) (continued)
Transactions in Affiliated Companies:
An “Affiliated Company,” as defined in the 1940 Act, is a company in which a Fund owns 5% or more of the company’s outstanding voting securities at any time during the period. The following transactions were effected in shares of such companies for the six months ended June 30, 2024:
| AFFILIATED COMPANY 1 | | SHARES
12/31/23 | | | MARKET
VALUE
12/31/23 | | | COSTS OF
PURCHASES | | | PROCEEDS
FROM SALES | | | REALIZED
GAIN
(LOSS) | | | CHANGE IN NET
UNREALIZED
APPRECIATION
(DEPRECIATION) | | | DIVIDEND
INCOME | | | SHARES
6/30/24 | | | MARKET
VALUE
6/30/24 | |
| Royce Small-Cap Opportunity Fund | | | | | | | | | | | | | | | | | | | | | | | | | | | | | | | | | | | | |
| CONSUMER DISCRETIONARY – 0.8% | | | | | | | | | | | | | | | | | | | | | | | | | | | | | | | | | | | | |
| TEXTILES, APPAREL & LUXURY GOODS – 0.8% | | | | | | | | | | | | | | | | | | | | | | | | | | | | | | | | | | | | |
| Lakeland Industries 2 | | | 437,480 | | | $ | 8,110,879 | | | $ | 313,830 | | | $ | 541,607 | | | $ | 181,796 | | | $ | 1,876,380 | | | $ | 26,841 | | | | 433,360 | | | $ | 9,941,278 | |
| | | | | | | | 8,110,879 | | | | | | | | | | | | 181,796 | | | | 1,876,380 | | | | 26,841 | | | | | | | | 9,941,278 | |
| INDUSTRIALS – 0.4% | | | | | | | | | | | | | | | | | | | | | | | | | | | | | | | | | | | | |
| MACHINERY – 0.4% | | | | | | | | | | | | | | | | | | | | | | | | | | | | | | | | | | | | |
| Manitex International 2,3 | | | 862,450 | | | | 7,537,813 | | | | 1,003,242 | | | | – | | | | – | | | | (4,009,050 | ) | | | – | | | | 1,023,026 | | | | 4,532,005 | |
| | | | | | | | 7,537,813 | | | | | | | | | | | | – | | | | (4,009,050 | ) | | | – | | | | | | | | 4,532,005 | |
| INFORMATION TECHNOLOGY – 0.8% | | | | | | | | | | | | | | | | | | | | | | | | | | | | | | | | | | | | |
| SEMICONDUCTORS & SEMICONDUCTOR EQUIPMENT – 0.4% | | | | | | | | | | | | | | | | | | | | | | | | | | | | | | | | | | | | |
| Amtech Systems 2,3 | | | 692,350 | | | | 2,907,870 | | | | 284,454 | | | | – | | | | – | | | | 1,205,061 | | | | – | | | | 750,407 | | | | 4,397,385 | |
| TECHNOLOGY HARDWARE, STORAGE & PERIPHERALS– 0.4% | | | | | | | | | | | | | | | | | | | | | | | | | | | | | | | | | | | | |
| Intevac 2,3 | | | 1,344,751 | | | | 5,809,325 | | | | 72,257 | | | | – | | | | – | | | | (623,478 | ) | | | – | | | | 1,362,203 | | | | 5,258,104 | |
| | | | | | | | 8,717,195 | | | | | | | | | | | | – | | | | 581,583 | | | | – | | | | | | | | 9,655,489 | |
| | | | | | | | 24,365,887 | | | | | | | | | | | | 181,796 | | | | (1,551,087 | ) | | | 26,841 | | | | | | | | 24,128,772 | |
| Royce Small-Cap Special Equity Fund | | | | | | | | | | | | | | | | | | | | | | | | | | | | | | | | | | | | |
| FINANCIALS – 2.8% | | | | | | | | | | | | | | | | | | | | | | | | | | | | | | | | | | | | |
| CAPITAL MARKETS – 2.8% | | | | | | | | | | | | | | | | | | | | | | | | | | | | | | | | | | | | |
| Diamond Hill Investment Group 2 | | | 138,800 | | | | 22,983,892 | | | | 105,109 | | | | – | | | | – | | | | (3,454,376 | ) | | | 417,450 | | | | 139,500 | | | | 19,634,625 | |
| | | | | | | | 22,983,892 | | | | | | | | | | | | – | | | | (3,454,376 | ) | | | 417,450 | | | | | | | | 19,634,625 | |
| INDUSTRIALS – 2.5% | | | | | | | | | | | | | | | | | | | | | | | | | | | | | | | | | | | | |
| MACHINERY – 2.5% | | | | | | | | | | | | | | | | | | | | | | | | | | | | | | | | | | | | |
| Gencor Industries 2,3 | | | 910,000 | | | | 14,687,400 | | | | – | | | | – | | | | – | | | | 2,912,000 | | | | – | | | | 910,000 | | | | 17,599,400 | |
| | | | | | | | 14,687,400 | | | | | | | | | | | | – | | | | 2,912,000 | | | | – | | | | | | | | 17,599,400 | |
| INFORMATION TECHNOLOGY – 3.4% | | | | | | | | | | | | | | | | | | | | | | | | | | | | | | | | | | | | |
| SEMICONDUCTORS & SEMICONDUCTOR EQUIPMENT – 3.4% | | | | | | | | | | | | | | | | | | | | | | | | | | | | | | | | | | | | |
| NVE Corporation 2 | | | 326,500 | | | | 25,607,395 | | | | – | | | | – | | | | – | | | | (1,221,110 | ) | | | 653,000 | | | | 326,500 | | | | 24,386,285 | |
| | | | | | | | 25,607,395 | | | | | | | | | | | | – | | | | (1,221,110 | ) | | | 653,000 | | | | | | | | 24,386,285 | |
| | | | | | | | 63,278,687 | | | | | | | | | | | | – | | | | (1,763,486 | ) | | | 1,070,450 | | | | | | | | 61,620,310 | |
| Royce Small-Cap Total Return Fund | | | | | | | | | | | | | | | | | | | | | | | | | | | | | | | | | | | | |
| FINANCIALS – 3.2% | | | | | | | | | | | | | | | | | | | | | | | | | | | | | | | | | | | | |
| INSURANCE – 3.2% | | | | | | | | | | | | | | | | | | | | | | | | | | | | | | | | | | | | |
| International General Insurance Holdings 2 | | | 2,674,312 | | | | 34,445,139 | | | | 398,038 | | | | 5,503,125 | | | | 1,942,271 | | | | 1,079,335 | | | | 1,441,853 | | | | 2,311,547 | | | | 32,361,658 | |
| | | | | | | | 34,445,139 | | | | | | | | | | | | 1,942,271 | | | | 1,079,335 | | | | 1,441,853 | | | | | | | | 32,361,658 | |
1 Percentages represent the percentages of the investments in the Affiliated Companies of the Fund’s net assets.
2 As of June 30, 2024, the Fund owned 5% or more of the Company’s outstanding voting securities thereby making the Company an Affiliated Company as that term is defined in the Investment Company Act of 1940.
3 Non-income producing.
New Accounting Pronouncements and Regulations:
On October 26, 2022, the SEC adopted rule and form amendments which require open-end mutual funds to transmit streamlined annual and semi-annual reports to shareholders that highlight key information to investors. In connection with these amendments, certain information that was previously disclosed in fund shareholder reports will instead be made available online, delivered free of charge upon request, and filed on a semi-annual basis on Form N-CSR. The rule and form amendments have a compliance date of July 24, 2024, and will have no effect on the Funds’ accounting policies or financial statements.
Subsequent Events:
Subsequent events have been evaluated through the date the financial statements were issued and it has been determined that the following event requires disclosure. The Board of Trustees of The Royce Fund has approved a plan of liquidation for Royce Global Financial Services Fund (“RFS”). RFS is being liquidated primarily because it has not maintained assets at a sufficient level for it to be viable. A final distribution was paid on August 1, 2024, to shareholders of record on July 31, 2024. The liquidation of RFS will be completed on September 9, 2024.
Understanding Your Fund’s Expenses (unaudited) (continued)
As a shareholder of a mutual fund, you pay ongoing expenses, including management fees and other Fund expenses including, for some fund share classes, distribution and/or service (12b-1) fees. Using the information below, you can estimate how these ongoing expenses (in dollars) affect your investment and compare them with the ongoing expenses of other funds. You may also incur one-time transaction expenses, including redemption fees, which are not shown in this section and would result in higher total costs. The example is based on an investment of $1,000 invested at January 1, 2024, and held for the entire six-month period ended June 30, 2024. Service, Consultant and R Class shares are generally available only through certain brokers or retirement plan administrators who receive distribution and/or service fees from the Fund for services that they perform. Institutional Class shares are generally available only to institutions or intermediaries with a minimum account size of $1 million.
Actual Expenses
The first part of the table below provides information about actual account values and actual expenses. You may use the information in this section, together with the amount you invested, to estimate the expenses that you paid over the period. Simply divide your account value at June 30, 2024, by $1,000 (for example, an $8,600 account value divided by $1,000 = 8.6), then multiply the result by the number under the heading entitled “Expenses Paid During the Period” to estimate the expenses you paid on your account during this period.
Hypothetical Example for Comparison Purposes
The second part of the table below provides information about hypothetical account values and hypothetical expenses based on the Fund’s actual expense ratio and an assumed rate of return of 5% per year before expenses, which is not the Fund’s actual rate of return. The hypothetical account values and expenses may not be used to estimate the actual ending account balance or expenses you paid for the period. You may use this information to compare the ongoing costs of investing in the Fund and other funds. To do so, compare this 5% hypothetical example with the 5% hypothetical examples that appear in the shareholder reports of the other funds.
Please note that the expenses shown in the table are meant to highlight your ongoing costs only and do not reflect any transactional costs, such as sales charges (loads), redemption fees, or exchange fees. Therefore, this section is useful in comparing ongoing costs only, and will not help you determine the relative total costs of owning different funds. In addition, if these transactional costs were included, your costs would have been higher.
| | | ACTUAL | | HYPOTHETICAL (5% PER YEAR BEFORE EXPENSES) | |
| | | | Beginning Account Value 1/1/24 | | | Ending Account Value 6/30/24 | | | Expenses Paid During the Period1 | | | Beginning Account Value 1/1/24 | | | Ending Account Value 6/30/24 | | | Expenses Paid During the Period1 | | | Net Annualized
Operating
Expense Ratio2 |
| Investment Class | | | | | | | | | | | | | | | | | | | | | | |
| Royce Dividend Value Fund | | $ | 1,000.00 | | $ | 1,066.66 | | $ | 5.60 | | $ | 1,000.00 | | $ | 1,019.44 | | $ | 5.47 | | | 1.09 | % |
| Royce International Premier Fund | | | 1,000.00 | | | 953.51 | | | 5.78 | | | 1,000.00 | | | 1,018.95 | | | 5.97 | | | 1.19 | % |
| Royce Micro-Cap Fund | | | 1,000.00 | | | 1,026.36 | | | 6.20 | | | 1,000.00 | | | 1,018.75 | | | 6.17 | | | 1.23 | % |
| Royce Premier Fund | | | 1,000.00 | | | 1,010.42 | | | 5.90 | | | 1,000.00 | | | 1,019.00 | | | 5.92 | | | 1.18 | % |
| Royce Small-Cap Fund3 | | | 1,000.00 | | | 1,044.66 | | | 4.73 | | | 1,000.00 | | | 1,020.24 | | | 4.67 | | | 0.93 | % |
| Royce Small-Cap Opportunity Fund | | | 1,000.00 | | | 1,035.74 | | | 6.18 | | | 1,000.00 | | | 1,018.80 | | | 6.12 | | | 1.22 | % |
| Royce Small-Cap Special Equity Fund | | | 1,000.00 | | | 985.92 | | | 6.02 | | | 1,000.00 | | | 1,018.80 | | | 6.12 | | | 1.22 | % |
| Royce Small-Cap Total Return Fund | | | 1,000.00 | | | 1,013.55 | | | 6.06 | | | 1,000.00 | | | 1,018.85 | | | 6.07 | | | 1.21 | % |
| Royce Small-Cap Value Fund | | | 1,000.00 | | | 971.84 | | | 6.08 | | | 1,000.00 | | | 1,018.70 | | | 6.22 | | | 1.24 | % |
| Royce Smaller-Companies Growth Fund | | | 1,000.00 | | | 1,061.56 | | | 6.36 | | | 1,000.00 | | | 1,018.70 | | | 6.22 | | | 1.24 | % |
| Service Class | | | | | | | | | | | | | | | | | | | | | | |
| Royce Dividend Value Fund | | | 1,000.00 | | | 1,065.39 | | | 6.88 | | | 1,000.00 | | | 1,018.20 | | | 6.72 | | | 1.34 | % |
| Royce Global Financial Services Fund | | | 1,000.00 | | | 1,091.18 | | | 7.75 | | | 1,000.00 | | | 1,017.45 | | | 7.47 | | | 1.49 | % |
| Royce International Premier Fund | | | 1,000.00 | | | 952.62 | | | 6.99 | | | 1,000.00 | | | 1,017.70 | | | 7.22 | | | 1.44 | % |
| Royce Micro-Cap Fund | | | 1,000.00 | | | 1,025.35 | | | 7.50 | | | 1,000.00 | | | 1,017.45 | | | 7.47 | | | 1.49 | % |
| Royce Premier Fund | | | 1,000.00 | | | 1,009.00 | | | 7.44 | | | 1,000.00 | | | 1,017.45 | | | 7.47 | | | 1.49 | % |
| Royce Small-Cap Fund3 | | | 1,000.00 | | | 1,043.86 | | | 6.40 | | | 1,000.00 | | | 1,018.60 | | | 6.32 | | | 1.26 | % |
| Royce Small-Cap Opportunity Fund | | | 1,000.00 | | | 1,034.16 | | | 7.54 | | | 1,000.00 | | | 1,017.45 | | | 7.47 | | | 1.49 | % |
| Royce Small-Cap Special Equity Fund | | | 1,000.00 | | | 984.16 | | | 7.35 | | | 1,000.00 | | | 1,017.45 | | | 7.47 | | | 1.49 | % |
| Royce Small-Cap Total Return Fund | | | 1,000.00 | | | 1,010.41 | | | 7.45 | | | 1,000.00 | | | 1,017.45 | | | 7.47 | | | 1.49 | % |
| Royce Small-Cap Value Fund | | | 1,000.00 | | | 970.70 | | | 7.30 | | | 1,000.00 | | | 1,017.45 | | | 7.47 | | | 1.49 | % |
| Royce Smaller-Companies Growth Fund | | | 1,000.00 | | | 1,060.84 | | | 7.63 | | | 1,000.00 | | | 1,017.45 | | | 7.47 | | | 1.49 | % |
| Consultant Class | | | | | | | | | | | | | | | | | | | | | | |
| Royce Micro-Cap Fund | | | 1,000.00 | | | 1,021.17 | | | 11.26 | | | 1,000.00 | | | 1,013.72 | | | 11.22 | | | 2.24 | % |
| Royce Premier Fund | | | 1,000.00 | | | 1,005.75 | | | 11.17 | | | 1,000.00 | | | 1,013.72 | | | 11.22 | | | 2.24 | % |
| Royce Small-Cap Fund3 | | | 1,000.00 | | | 1,041.13 | | | 9.85 | | | 1,000.00 | | | 1,015.22 | | | 9.72 | | | 1.94 | % |
| Royce Small-Cap Opportunity Fund | | | 1,000.00 | | | 1,029.94 | | | 11.31 | | | 1,000.00 | | | 1,013.72 | | | 11.22 | | | 2.24 | % |
| Royce Small-Cap Special Equity Fund | | | 1,000.00 | | | 980.63 | | | 11.03 | | | 1,000.00 | | | 1,013.72 | | | 11.22 | | | 2.24 | % |
| Royce Small-Cap Total Return Fund | | | 1,000.00 | | | 1,007.66 | | | 11.13 | | | 1,000.00 | | | 1,013.77 | | | 11.17 | | | 2.23 | % |
Understanding Your Fund’s Expenses (unaudited) (continued)
| | | ACTUAL | | HYPOTHETICAL (5% PER YEAR BEFORE EXPENSES) | |
| | | | Beginning Account Value 1/1/24 | | | Ending Account Value 6/30/24 | | | Expenses Paid During the Period1 | | | Beginning Account Value 1/1/24 | | | Ending Account Value 6/30/24 | | | Expenses Paid During the Period1 | | | Net Annualized
Operating
Expense Ratio2 |
| Institutional Class | | | | | | | | | | | | | | | | | | | | | | |
| Royce Global Financial Services Fund | | $ | 1,000.00 | | $ | 1,090.98 | | $ | 7.75 | | $ | 1,000.00 | | $ | 1,017.45 | | $ | 7.47 | | | 1.49 | % |
| Royce International Premier Fund | | | 1,000.00 | | | 954.27 | | | 5.05 | | | 1,000.00 | | | 1,019.69 | | | 5.22 | | | 1.04 | % |
| Royce Premier Fund | | | 1,000.00 | | | 1,010.25 | | | 5.55 | | | 1,000.00 | | | 1,019.34 | | | 5.57 | | | 1.11 | % |
| Royce Small-Cap Fund | | | 1,000.00 | | | 1,045.60 | | | 4.48 | | | 1,000.00 | | | 1,020.49 | | | 4.42 | | | 0.88 | % |
| Royce Small-Cap Opportunity Fund | | | 1,000.00 | | | 1,036.08 | | | 5.67 | | | 1,000.00 | | | 1,019.29 | | | 5.62 | | | 1.12 | % |
| Royce Small-Cap Special Equity Fund | | | 1,000.00 | | | 985.79 | | | 5.58 | | | 1,000.00 | | | 1,019.24 | | | 5.67 | | | 1.13 | % |
| Royce Small-Cap Total Return Fund | | | 1,000.00 | | | 1,013.85 | | | 5.61 | | | 1,000.00 | | | 1,019.29 | | | 5.62 | | | 1.12 | % |
| Royce Smaller-Companies Growth Fund | | | 1,000.00 | | | 1,060.56 | | | 6.35 | | | 1,000.00 | | | 1,018.70 | | | 6.22 | | | 1.24 | % |
| R Class | | | | | | | | | | | | | | | | | | | | | | |
| Royce Small-Cap Opportunity Fund | | | 1,000.00 | | | 1,032.63 | | | 9.35 | | | 1,000.00 | | | 1,015.66 | | | 9.27 | | | 1.85 | % |
| Royce Small-Cap Total Return Fund | | | 1,000.00 | | | 1,008.92 | | | 9.44 | | | 1,000.00 | | | 1,015.47 | | | 9.47 | | | 1.89 | % |
1 Expenses are equal to the Fund’s net annualized operating expense ratio multiplied by the average account value for the period, multiplied by 182 days in the most recent fiscal half-year divided by 366 days (to reflect the half-year period).
2 Net annualized operating expense ratio used to derive figures in the table is based on the most recent fiscal half-year.
3 GiftShare accounts pay an annual $50 trustee fee to Alliance Trust Company, as trustee. If these fees were included above, your costs would be higher.
Changes In and Disagreements with Accountants for the Period Covered by this Report
Not applicable.
Results of Meeting(s) of Shareholders for the Period Covered by this Report
Not applicable.
Remuneration Paid to Directors, Officers and Others for the Period Covered by this Report
Refer to the financial statements included herein.
Board Approval of Investment Advisory Agreements
At meetings held on June 17-18, 2024, the Board of Trustees of The Royce Fund (the “Board”), including all of the non-interested trustees, approved the continuation of the investment advisory agreements between Royce & Associates, LP (“Royce”) and The Royce Fund (“TRF”) relating to each of Royce Small-Cap Fund (formerly Royce Pennsylvania Mutual Fund), Royce Micro-Cap Fund, Royce Premier Fund, Royce Small-Cap Total Return Fund, Royce Small-Cap Opportunity Fund, Royce Small-Cap Special Equity Fund, Royce Small-Cap Value Fund, Royce Smaller-Companies Growth Fund, Royce Dividend Value Fund, Royce Global Financial Services Fund, and Royce International Premier Fund (each, an “Agreement” and collectively, the “Agreements”). In reaching these decisions, the Board reviewed the materials provided by Royce, which included, among other things, information prepared internally by Royce and independently by Broadridge Financial Solutions, Inc. (“Broadridge”) using the database and methodology of Morningstar Associates, LLC (“Morningstar”). Such materials contained detailed investment advisory fee, expense ratio, and investment performance comparisons for each series of TRF listed above (each, a “Fund” and collectively, the “Funds”) with other mutual funds in its Broadridge-assigned “peer group” and Morningstar “category”, information regarding the past performance of the Funds and other registered investment companies managed by Royce and a memorandum outlining the legal duties of the Board prepared by independent counsel to the non-interested trustees. Royce also provided the trustees with an analysis of its profitability with respect to providing investment advisory services to each of the Funds. In addition, the Board took into account information furnished throughout the year at regular Board meetings, including reports on investment performance, shareholder services, distribution fees and expenses, regulatory compliance, brokerage commissions and research, brokerage and other execution products and services provided to the Funds. The Board also took into account information furnished by Royce in response to various trustee questions regarding Royce operations and the Funds. The Board also considered other matters it deemed important to the approval process such as allocation of brokerage commissions, “soft dollar” research services Royce receives, payments made to affiliates of Royce, as well as payments made by Royce relating to the servicing and distribution of Fund shares, and other direct and indirect benefits Royce and its affiliates receive from their relationship with the Funds. The trustees also met throughout the year with investment advisory personnel from Royce. The Board also noted Royce’s efforts to provide enhanced analytical tools to its investment staff along with the ongoing meetings conducted by Royce’s Co-Chief Investment Officers with portfolio managers experiencing performance challenges in an attempt to address such challenges. The Board, in its deliberations, recognized that, for many of the Funds’ shareholders, the decision to purchase shares of one or more of the Funds included a decision to select Royce as the investment adviser and that there was a strong association in the minds of such shareholders between Royce and each Fund. In considering factors relating to the approval of the continuation of the Agreement for each Fund, the non-interested trustees received assistance and advice from, and met separately with, their independent legal counsel. While continuation of the investment advisory and administrative arrangements for each Fund was considered at the same Board meeting, the trustees considered the circumstances and interests of each Fund separately. Among other factors, the trustees noted that they considered the following:
The nature, extent and quality of services provided by Royce
The Board considered the following factors to be of fundamental importance to its consideration of
Board Approval of Investment Advisory Agreements (cont.)
whether to approve the continuation of the Agreement for each Fund: (i) Royce’s more than 50 years of value investing experience and track record; (ii) the history of long-tenured Royce portfolio managers managing many of the Funds; (iii) Royce’s focus on micro-, small-, and mid-cap value investing; (iv) the consistency of Royce’s approach to managing each Fund, other open-end mutual funds, and closed-end funds over more than 50 years; (v) the integrity and high ethical standards adhered to at Royce; (vi) Royce’s specialized experience in the area of trading small- and micro-cap securities; (vii) Royce’s historical ability to attract and retain portfolio management, research, and analytical talent (and, in this regard, considered the effort and resources Royce had committed to acquiring portfolio management, research, and analytical talent in recent years); and (viii) Royce’s focus on shareholder interests as exemplified by capping expenses on smaller funds, temporarily closing various Funds to new investors when Royce believed such temporary closings were in the best interests of existing shareholders, liquidating share classes for certain Funds that did not attract sufficient assets to make them viable on a long-term basis or, when appropriate under the Fund’s Rule 18f-3 Plan, converting shares of such Funds into shares of other share classes that had lower net annualized operating expense ratios, establishing breakpoints for a number of Funds and providing expansive shareholder reporting and communications. The Board also noted that Royce’s compensation policy arrangements strongly encourage portfolio manager investment in each Fund that they manage. The Board reviewed the services that Royce provides to the Funds, including, but not limited to, managing each Fund’s investments in accordance with the stated policies of each Fund. The Board considered the fact that Royce provided certain administrative services to the Funds at cost, pursuant to the Administration Agreement between Royce and TRF, on behalf of each Fund. The Board determined that the services to be provided to each Fund by Royce would be the same as those that it previously provided to each Fund. The Board also took into consideration the histories, reputations and backgrounds of Royce’s portfolio managers for each Fund, finding that these would likely have an impact on the continued success of such Fund. The Board concluded that the investment advisory services provided by Royce to each Fund compared favorably to services provided by Royce to other Royce client accounts, including other funds, in both nature and quality, and that the scope of services provided by Royce continues to be suitable for each Fund.
Investment performance of the Funds and Royce
The Board believes that risk-adjusted performance continues to be an appropriate measure of each Fund’s investment performance. One measure of risk-adjusted performance historically used by the trustees in their review of each Fund’s performance is the Sharpe Ratio. The Sharpe Ratio is a risk-adjusted measure of performance developed by Nobel Laureate William Sharpe. It is calculated by dividing a fund’s annualized excess returns by its annualized standard deviation to determine reward per unit of risk. The higher the Sharpe Ratio, the better a fund’s historical risk-adjusted performance. The Board attaches importance to risk-adjusted performance over relatively long periods of time, typically 3 to 10 years, because such periods tend to encompass different market environments and cycles, unlike shorter time periods.
U.S. small- and large-cap stocks overcame multiple macro-economic and political headwinds in 2023, including the ongoing war in Ukraine, stubborn inflation, a hawkish Fed which continued to raise interest rates through June and promoted a “higher for longer” approach to interest rates for much of the year, several high-profile bank failures, and the terrorist attack on Israel and resulting Middle East conflict, to post positive returns for the year. After experiencing a downward trend from February through late October 2023, the Russell 2000 Index
Board Approval of Investment Advisory Agreements (cont.)
rallied 22.4% in November and December. Overall, the Russell 2000 Index and the Russell Micro-Cap Index rose 16.9% and 9.3%, respectively, during 2023. Within the U.S. small-cap market, the Board noted that small-cap growth stocks fared better than small-cap value stocks during 2023, with the Russell 2000 Growth Index posting a return of 18.66% compared to a gain of 14.65% for the Russell 2000 Value Index. Despite the solid absolute returns for the Russell 2000 Index and the Russell Micro-Cap Index in 2023, the Russell 1000 Index gained 26.5% during the period and outperformed its smaller-cap siblings.
It was also noted that a large portion of the post-2008 market period was marked by historically low interest rates and significant U.S. Federal Reserve market intervention. During this period, highly leveraged, non-earning companies and yield-oriented securities (e.g., master limited partnerships, real estate investment trusts, and utilities) generally outperformed those companies with more conservative balance sheets, low leverage, the ability to generate and effectively allocate free cash flow, and strong returns on invested capital and cyclical companies generally favored by the Funds. The Board noted that the relative risk-adjusted investment performance of certain Funds was adversely affected during periods in which the above-described market factors were prevalent.
The Board noted that seven of the eleven Funds (63.6%) ranked in the 1st Sharpe Ratio quartile within their respective Morningstar categories for the 1-year period ended December 31, 2023, with nine of the eleven Funds (81.8%) ranking in the 1st or 2nd Sharpe Ratio quartile for that period. In addition, the Board noted that six of the eleven Funds (54.5%) ranked in the 1st or 2nd Sharpe Ratio quartile within their respective Morningstar categories for each of the 3- and 5-year periods ended December 31, 2023. The Board further noted that six of the seven largest Funds (85.7%) ranked in the 1st or 2nd Sharpe Ratio quartile within their respective Morningstar categories for the 1-year period ended December 31, 2023, while five of the seven largest Funds (71.4%) ranked in the 1st or 2nd Sharpe Ratio quartile within their respective Morningstar categories for the 5-year period ended December 31, 2023.
The Board also received an analysis that compared the Sharpe Ratio of each Fund with the arithmetic average of the Sharpe Ratios of the funds within its Morningstar category for each of the 1-, 3-, 5-, and 10-year periods ended December 31, 2023. The Board noted that the Sharpe Ratios of the Funds equaled or exceeded the arithmetic average of the Sharpe Ratios of the funds within their respective Morningstar categories as follows: (i) all four time periods (3 Funds: Royce Small-Cap Fund, Royce Premier Fund, and Royce Global Financial Services Fund); (ii) three of the four time periods (3 Funds: Royce Micro-Cap Fund, Royce Small-Cap Total Return Fund, and Royce Small-Cap Opportunity Fund); (iii) two of the four time periods (3 Funds: Royce Small-Cap Special Equity Fund, Royce Small-Cap Value Fund, and Royce Dividend Value Fund); (iv) one of the four time periods (1 Fund: Royce International Premier Fund); and (v) none of the four time periods (1 Fund: Royce Smaller-Companies Growth Fund). Thus, the Sharpe Ratios for nine of the eleven Funds equaled or exceeded the arithmetic average of the Sharpe Ratios of the funds within their respective Morningstar categories during at least two of the four applicable time periods, with the Sharpe Ratios for six of the eleven Funds equaling or exceeding the arithmetic average of the Sharpe Ratios of the funds within their respective Morningstar categories during at least three of the four relevant time periods.
The Board noted that Royce Small-Cap Fund (formerly Royce Pennsylvania Mutual Fund) (“PMF”), Royce Premier Fund (“RPR”), and Royce Small-Cap Total Return Fund (“RTR”), three of the four largest Funds, ranked in the 1st or 2nd Sharpe
Board Approval of Investment Advisory Agreements (cont.)
Ratio quartile within their respective Morningstar categories for each of the 1-, 3-, 5-, and 10-year periods ended December 31, 2023 (i.e., PMF: 1st, 1st, 1st, and 2nd; RPR: 1st, 2nd, 2nd, and 2nd; and RTR: 1st, 2nd, 2nd, and 1st). The relative risk-adjusted performance of Royce Small-Cap Opportunity Fund (“ROF”), the third largest Fund, and Royce Global Financial Services Fund (“RFS”) was close behind that of the above-referenced group, ranking in the 1st or 2nd Sharpe Ratio quartile within their respective Morningstar categories for three of the 1-, 3-, 5-, and 10-year periods ended December 31, 2023 (i.e., ROF: 1st, 4th, 1st, and 1st; and RFS: 1st, 4th, 2nd, and 2nd). Royce Micro-Cap Fund (“RMC”), the seventh largest Fund, Royce Small-Cap Special Equity Fund (“RSE”), the fifth largest Fund, Royce Small-Cap Value Fund (“RVV”), and Royce Dividend Value Fund (“RDV”) posted stronger relative risk-adjusted performance during the 1-, 3-, and 5-year periods ended December 31, 2023, and weaker relative risk-adjusted performance during the 10-year period ended December 31, 2023. In particular, the trustees noted that: (i) RMC ranked in the 2nd, 3rd, 2nd, and 4th Sharpe Ratio quartiles within its Morningstar category for the 1-, 3-, 5-, and 10-year periods, respectively, ended December 31, 2023; (ii) RSE ranked in the 2nd, 2nd, 3rd, and 3rd Sharpe Ratio quartiles within its Morningstar category for the 1-, 3-, 5-, and 10-year periods, respectively, ended December 31, 2023; (iii) RVV ranked in the 1st, 1st, 3rd, and 4th Sharpe Ratio quartiles within its Morningstar category for the 1-, 3-, 5-, and 10-year periods, respectively, ended December 31, 2023; and (iv) RDV ranked in the 1st, 2nd, 3rd, and 4th Sharpe Ratio quartiles within its Morningstar category for the 1-, 3-, 5-, and 10-year periods, respectively, ended December 31, 2023. Finally, the Board noted that Royce Smaller-Companies Growth Fund (“RVP”) and Royce International Premier Fund (“RIP”) produced relative risk-adjusted performance within their respective Morningstar categories that differed from the performance trends described above. In particular, each of RVP and RIP ranked in the 3rd or 4th Sharpe Ratio quartile within its Morningstar category for each of the 1-, 3-, and 5-year periods ended December 31, 2023. RVP also ranked in the 4th Sharpe Ratio quartile for the 10-year period ended December 31, 2023.
The Board also received an analysis that compared the Sharpe Ratio of each Fund with the Sharpe Ratio of its primary benchmark index for each of the 1-, 3-, 5-, and 10-year periods ended December 31, 2023. The Board noted that the Sharpe Ratios of the Funds equaled or exceeded the Sharpe Ratios of their respective primary benchmark indexes as follows: (i) all four time periods (5 Funds: PMF, RPR, RTR, ROF, and RSE); (ii) three of the four time periods (3 Funds: RMC, RVV, and RDV); (iii) two of the four time periods (2 Funds: RVP and RFS); and (iv) none of the four time periods (1 Fund: RIP). Thus, the Sharpe Ratios for ten of the eleven Funds equaled or exceeded the Sharpe Ratios of their respective primary benchmark indexes during at least two of the four applicable time periods, with the Sharpe Ratios for eight of the eleven Funds equaling or exceeding the Sharpe Ratios of their respective primary benchmark indexes during at least three of the four relevant time periods.
The Board also noted that the peer groups included in the Broadridge materials provided to them for a number of Funds may not be appropriate for performance comparisons and that Royce had augmented the data provided to the Board throughout the years by including performance information for other funds that Royce believes are more comparable to those Funds.
In addition to the relative risk–adjusted performance of each Fund, the Board also reviewed and considered absolute total returns and down-market performance and long-term performance records over periods exceeding ten years. In reviewing such long-term performance records for the Funds, it was noted that certain
Board Approval of Investment Advisory Agreements (cont.)
Funds had generally outperformed their respective primary benchmark indexes and competitors during the periods prior to the U.S. Federal Reserve’s near zero interest rate policy and related market interventions that followed the 2008 financial crisis. The Board also received detailed information from Royce comparing each Fund’s average annual total returns to those of its primary benchmark index for the 1-, 3-, 5-, and 10-year periods ended March 31, 2024, and noted that: (i) four Funds (i.e., PMF, RMC, RTR, and RFS) outperformed their respective primary benchmark indexes during all four performance periods; (ii) four Funds (i.e., RPR, ROF, RVV, and RDV) outperformed their respective primary benchmark indexes during three of the four performance periods; (iii) one Fund (i.e., RSE) outperformed its primary benchmark index during two of the four performance periods; and (iv) two Funds (i.e., RVP and RIP) outperformed their respective primary benchmark indexes during only one of the four performance periods. Thus, nine of the eleven Funds outperformed their respective primary benchmark indexes on an absolute return basis during at least two of the 1-, 3-, 5-, and 10-year periods ended March 31, 2024.
The Board also considered it important to look beyond “snapshot” performance as of December 31, 2023, and therefore examined monthly rolling average returns for each Fund relative to its primary benchmark index for the 3-, 5-, and 10-year periods ended March 31, 2024. The Board noted that: (i) RPR, ROF, and RIP outperformed their respective primary benchmark indexes for a majority of the monthly rolling average annual return periods during all three of the applicable time periods; and (ii) PMF, RMC, and RFS outperformed their respective primary benchmark indexes for a majority of the monthly rolling average annual return periods during two of the three applicable time periods. Thus, six Funds overall and five of the seven largest Funds outperformed their respective primary benchmark indexes for a majority of the monthly rolling average annual return periods during at least two of the 3-, 5-, and 10-year periods ended March 31, 2024.
Although the Board recognized that past performance is not necessarily an indicator of future results, it found that Royce had the necessary qualifications, experience and track record in managing equity mutual funds to manage each Fund. The Board determined that Royce continues to be an appropriate investment adviser for each Fund.
Cost of the services provided and profits realized by Royce from its relationship with each Fund
The Board considered the cost of the services provided by Royce and profits realized by Royce from its relationship with each Fund. As part of the analysis, the Board discussed with Royce its methodology in allocating its costs to each Fund and concluded that Royce’s allocations were reasonable. The Board noted that at times in the past Royce had temporarily closed certain of the Funds to new investors because of the rate of growth in Fund assets. The Board concluded that Royce’s profits with respect to each Fund during the calendar year ended December 31, 2023, were reasonable in relation to the nature and quality of services provided.
The extent to which economies of scale would be realized as the Funds grow and whether fee levels would reflect such economies of scale
While acknowledging that the presence or absence of economies of scale in fund management businesses can be debated and is in any event difficult to measure and directly assess, the Board considered whether there have been economies of scale in respect of the management of each Fund, whether each Fund has appropriately benefited from any economies of scale and whether there is potential for realization of any further economies of scale. The Board noted the time and effort involved in managing portfolios of small- and micro-cap stocks and that they did not involve the same
Board Approval of Investment Advisory Agreements (cont.)
efficiencies as do portfolios of large-cap stocks. The Board also noted that in 2004 breakpoints were added to the investment advisory fees for all of the then-existing Funds except PMF (PMF’s fee schedule already had breakpoints) and that the investment advisory fees for all Funds organized since 2004 included breakpoints. The Board further noted the reduced contractual breakpoint levels for each Fund other than PMF that became effective as of July 1, 2017. The Board concluded that the current fee structure for each Fund is reasonable and that the relevant shareholders sufficiently participated in economies of scale (while again noting the various potential issues with assessing such economies of scale both in general and under the facts at hand) and that no changes were currently necessary.
Comparison of services to be rendered and fees to be paid to those under other investment advisory contracts, such as contracts of the same and other investment advisers or other clients
The Board reviewed the investment advisory fee paid by each Fund and compared both the services to be rendered and the fees to be paid under the Agreements to other contracts of Royce and to contracts of other investment advisers to registered investment companies investing in micro- and small-cap stocks, as provided by Broadridge. The Board noted that the effective investment advisory fee rates for: (i) PMF, RMC, and RVV equaled the median for their respective Broadridge-assigned peer groups; and (ii) the remaining Funds exceeded the median for their respective Broadridge-assigned peer groups. The Board also noted the importance of the net annual operating expense ratio in measuring a fund’s efficiency, particularly in light of the variations in the mutual fund industry as to which entity is responsible for particular types of expenses.
The Board noted that the net annual operating expense ratio for RVV ranked in the 2nd quintile among its Broadridge-assigned peers for the calendar year ended December 31, 2023. The trustees further noted that the net annual operating expense ratios for PMF, RMC, ROF, RSE, RVP, and RIP ranked in the middle quintile among their respective Broadridge-assigned peer groups for the relevant period. The net annual operating expense ratios of PMF and RMC equaled the median for their respective Broadridge-assigned peer groups while the net annual operating expense ratios of ROF, RSE, RVP, and RIP were only 4, 4, 7, and 2 basis points higher, respectively, than the median for their respective Broadridge-assigned peer groups.
In addition, the Board noted the net annual operating expense ratio for the remaining four Funds (i.e., RPR, RTR, RDV, and RFS) ranked in the 5th (most expensive) quintile among their respective Broadridge-assigned peers for the calendar year ended December 31, 2023. Although these rankings can be attributed in large part to the investment advisory fees for these Funds, such fees are also consistent with those of other Royce-advised open-end funds.
While the Board noted that the net annual operating expense ratios of RPR and RTR were 25 and 12 basis points higher, respectively, than the median for their respective Broadridge-assigned peer groups, they also noted that such net annual operating expense ratios were only 8 and 11 basis points, respectively, higher than the average net annual operating expense ratio for the 222 small-cap funds in the Morningstar small-cap category (oldest share class only, non-institutional, non-index, non-ETF funds with Rule 12b-1 fees of 0.25% or less). Additionally, the trustees noted that although RDV’s net annual operating expense ratio was 14 basis points higher than the median for its Broadridge-assigned peers, such net annual operating expense ratios was 2 basis points lower than the average net annual operating expense ratio for the 222 small-cap funds in the Morningstar small-cap category (oldest share class only, non-institutional, non-index, non-ETF funds with Rule
Board Approval of Investment Advisory Agreements (cont.)
12b-1 fees of 0.25% or less). The trustees also noted that RDV’s average net assets and weighted average market capitalization for the period were also lower than the relevant medians for its Broadridge-assigned peer group. Although RFS’s net annual operating expense ratio was 17 basis points higher than the median for its Broadridge-assigned peers, the trustees noted that: (i) such peer group consisted of only nine funds (including RFS); (ii) RFS had the lowest average net assets of its peers for the period; (iii) RFS’s average net assets for the period were significantly lower than the median average net assets for its Broadridge-assigned peer group (i.e., average net assets of $26.46 million for RFS compared to median average net assets of $134.38 million for its Broadridge-assigned peers for the period); (iv) RFS had the lowest weighted average market capitalization of its peers for the period; and (v) RFS’s weighted average market capitalization for the period was significantly lower than the median weighted average market capitalization for its Broadridge-assigned peer group (i.e., weighted average market capitalization of $3.67 billion for RFS compared to a median weighted average market capitalization of $25.68 billion for its Broadridge-assigned peers for the period).
The Board further noted that the contractual investment advisory fee rate for each of RPR, RTR, and RFS is consistent with those of the other Funds that invest primarily in micro-cap and small-cap equity securities. After taking into consideration that the level of work necessary to invest in domestic and/or international micro-cap and small-cap equity securities is significantly greater than that necessary to invest in larger-cap securities, the trustees noted that the basis point differentials in investment advisory fees, which in large measure give rise to the generally higher net annual operating expense ratios for RPR, RTR, and RFS were appropriate for those series of the Fund. The trustees also noted that the contractual investment advisory fee rate for RDV is slightly lower than that of the other Funds because RDV invests a greater portion of its assets in larger-cap securities compared such other Funds.
The Board also noted that Royce manages each Fund in an active fashion. The industry accepted metric for measuring how actively an equity portfolio is managed is called “active share.” In particular, active share measures how much the holdings of an equity portfolio differ from the holdings of its appropriate passive benchmark index. At the extremes, a portfolio with no holdings in common with the benchmark would have 100% active share, while a portfolio that is identical to the benchmark would have 0% active share. Royce presented several analyses to the Board which demonstrated that mutual funds with high active share scores had higher expense ratios than mutual funds with lower active share scores due to the resources required for the active management of those funds. The trustees noted that each of PMF and ROF had an active share of 87%, RMC had an active share of 90%, RVP had an active share of 93%, RVV had an active share of 94%, and the remaining six Funds had active shares of 96% or greater for the calendar year ended December 31, 2023.
The Board further noted that Royce waived investment advisory fees and/or reimbursed expenses for numerous Funds, both during the calendar year ended December 31, 2023, and during earlier periods, in order to maintain expense ratios at competitive levels and acknowledged Royce’s intention to continue this expense limitation practice. The Board also noted lower contractual asset breakpoints for each Fund other than PMF became effective as of July 1, 2017. The Board also considered investment advisory fees charged by Royce to institutional and other clients and noted that, given the greater levels of services that Royce provides to registered investment companies such as the Funds as compared to other
Board Approval of Investment Advisory Agreements (cont.)
accounts, each Fund’s investment advisory fees compared favorably to these other accounts.
No single factor was cited as determinative to the decision of the Board. Rather, after weighing all of the considerations and conclusions discussed above, the entire Board, including all the non-interested trustees, determined to approve the continuation of the existing Agreement for each Fund, concluding that continuation of the Agreement for each Fund is in the best interest of the shareholders of the relevant Fund and that each Fund’s investment advisory fee rate is reasonable in relation to the services provided.
Item 8. Changes in and Disagreements with Accountants for Open-End Management Investment Companies. This information is disclosed as part of the Financial Statements and Financial Highlights included under Item 7 of this Form N-CSR.
Item 9. Proxy Disclosures for Open-End Management Investment Companies. The information is disclosed as part of the Financial Statements and Financial Highlights included under Item 7 of this Form N-CSR.
Item 10. Remuneration Paid to Directors, Officers, and Others of Open-End Management Investment Companies. This information is disclosed as part of the Financial Statements and Financial Highlights included under Item 7 of this Form N-CSR.
Item 11. Statement Regarding Basis for Approval of Investment Advisory Contract. This information is disclosed as part of the Financial Statements and Financial Highlights included under Item 7 of this Form N-CSR.
Item 12. Disclosure of Proxy Voting Policies and Procedures for Closed-End Management Investment Companies. Not Applicable.
Item 13. Portfolio Managers of Closed-End Management Investment Companies. Not Applicable.
Item 14. Purchases of Equity Securities by Closed-End Management Investment Company and Affiliated Purchasers. Not Applicable.
Item 15. Submission of Matters to a Vote of Security Holders. None.
Item 16. Controls and Procedures.
(a) Disclosure Controls and Procedures. The Principal Executive and Financial Officers concluded that the Registrant's Disclosure Controls and Procedures are effective based on their evaluation of the Disclosure Controls and Procedures as of a date within 90 days of the filing date of this report.
(b) Internal Control over Financial Reporting. There were no changes in Registrant's internal control over financial reporting (as defined in Rule 30a-3(d) under the Investment Company Act of 1940) that occurred during the period covered by this report that has materially affected, or is reasonably likely to materially affect, the Registrant’s internal control over financial reporting.
Item 17. Disclosure of Securities Lending Activities for Closed-End Management Investment Companies. Not Applicable.
Item 18. Recovery of Erroneously Awarded Compensation. Not Applicable.
Item 19. Exhibits. Attached hereto.
(a)(1) Not applicable to this semi-annual report.
(a)(2) Not Applicable to this semi-annual report.
(a)(3)(a) Separate certifications by the Registrant’s Principal Executive Officer and Principal Financial Officer as required by Rule 30a-2(a) under the Investment Company Act of 1940.
(a)(3)(b) Not Applicable.
(a)(4) Not Applicable.
(b) Separate certifications by the Registrant’s Principal Executive Officer and Principal Financial Officer, pursuant to Section 906 of the Sarbanes-Oxley Act of 2002 and required by Rule 30a-2(b) under the Investment Company Act of 1940.
Pursuant to the requirements of the Securities Exchange Act of 1934 and the Investment Company Act of 1940, the registrant has duly caused this report to be signed on its behalf by the undersigned, thereunto duly authorized.
THE ROYCE FUND
| BY: | /s/ Christopher D. Clark | |
Christopher D. Clark
President
Date: August 8, 2024
Pursuant to the requirements of the Securities Exchange Act of 1934 and the Investment Company Act of 1940, this report has been signed below by the following persons on behalf of the registrant and in the capacities and on the dates indicated.
| THE ROYCE FUND | | THE ROYCE FUND | |
| | | | | | |
| BY: | /s/ Christopher D. Clark | | BY: | /s/ Peter K. Hoglund | |
| Christopher D. Clark | | Peter K. Hoglund | |
| President | | Chief Financial Officer | |
| | | | |
| Date: August 8, 2024 | | Date: August 8, 2024 | |