40|86 Series Trust | Semi-Annual Report |
Portfolio Managers' Review (unaudited) | June 30, 2005 |
Government Securities Portfolio
How did the Portfolio perform relative to its benchmark?
The 40|86 Series Trust Government Securities Portfolio returned 2.20% for the six months ended June 30, 2005. The Portfolio’s benchmarks, the Lehman Brothers Government Index and the Lehman Brothers Mortgage-Backed Securities Index, returned 2.93% and 2.15%, respectively, for the same period.
What caused the variance in performance between the Portfolio and its benchmark?
The Portfolio trailed the Lehman Brothers Government Index due to its lower allocation to long-term US Treasury bonds. Longer-term interest rates have fallen despite the Federal Reserve’s increases to short-term rates. In addition the Portfolio had greater exposure to higher coupon Mortgage-backed Securities, which lagged lower coupons in price appreciation.
The Portfolio’s allocation to Commercial Mortgage-backed Securities and Asset-backed Securities mitigated the under-performance of the Lehman Brothers Government Index and helped the Portfolio out-perform the Lehman Brother Mortgage-Backed Securities Index. These sectors have performed well over the first half of the year, and we expect that to continue.
Which Portfolio holdings enhanced the Portfolio’s performance?
The Portfolio’s performance was enhanced by an Asset-backed Security issued by Atlantic City Electric Transition Funding LLC, 30-year US Treasury bonds and a Commercial Mortgage-backed Security with a 5% coupon rate.
Which holdings detracted from the Portfolio’s performance?
Mortgage-backed Securities with higher coupon rates detracted from performance for the first half of the year. Specifically, those holdings with coupon rates above 5.5% hurt the Portfolio’s performance. As interest rates fell during the first six months, these positions lagged with respect to price appreciation.
What is your outlook for the next fiscal year?
The Federal Reserve has indicated it will continue raising short-term interest rates. Toward the second half of the next fiscal year, we anticipate investors becoming concerned over non-US Treasury bonds, which are trading at historically low risk premiums, as measured by the spread between corporate yields and US Treasury yields. As such, investors may reallocate funds from non-US Treasury bonds to US Treasury bonds. This move would result in greater yield spreads and under-performance of the non-US Treasury sectors.
| Michael J. Dunlop | Willie Brown |
| Senior Vice President | Structured Securities Analyst |
| 40|86 Advisors, Inc. | 40|86 Advisors, Inc. |
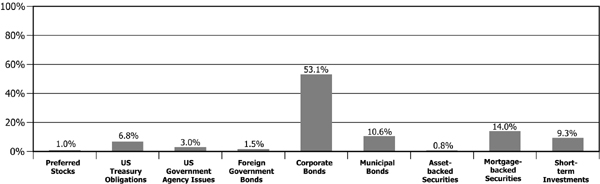
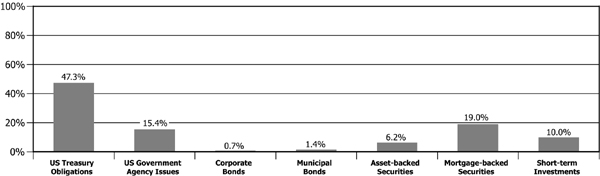
Asset Allocation as a Percent of Total Investments (excluding Securities Lending)
| (1) | Past performance does not guarantee future results. Your investment return and principal will fluctuate, and your shares may be worth more or less than their original cost. Total return is provided in accordance with SEC guidelines for comparative purposes and reflects certain contractual expense reimbursements through April 30, 2006. If the expense reimbursement were not in place, the portfolio’s return would have been lower. The total returns shown do not include separate account expenses or the deduction of taxes that a contractholder would pay on portfolio distributions or the redemption of portfolio shares. The Lehman Brothers Government Index is an unmanaged index considered to be representative of bonds issued by the U.S. government or its agencies. The Lehman Brothers Mortgage-Backed Securities Index is an unmanaged index composed of all fixed securities mortgage pools by GNMA, FNMA and the FHLCM, including GHMA Graduated Payment Mortgages. Investors cannot actually invest in an index. |
40|86 Series Trust | Semi-Annual Report |
Schedule of Investments (unaudited) | June 30, 2005 |
Government Securities Portfolio
SHARES OR PRINCIPAL AMOUNT | | | | VALUE |
ASSET BACKED SECURITIES (6.5%) | | |
| $75,000 | | Atlantic City Electric Transition Funding LLC, Series #2002-1 A4, 5.550%, 10/20/2023 | $ | 82,151 |
| 8,749 | | Centex Home Equity, Series #2001-A A4, 6.470%, 07/25/2029 | | 8,801 |
| 5,000 | | Citibank Credit Card Issuance Trust, Series #2003-C4 C4, 5.000%, 06/10/2015 | | 5,096 |
| 91,839 | | Countrywide Asset-Backed Certificates, Series #200 -S1 A5, 5.960%, 11/25/2016 (b) | | 91,687 |
| 70,000 | | MBNA Credit Card Master Note Trust, Series #2002-C1 C1, 6.800%, 07/15/2014 | | 78,171 |
| 276,550 | | The Money Store Home Equity Trust, Series #1998-B AF9, 6.335%, 08/15/2039 | | 280,211 |
| 7,072 | | Residential Asset Mortgage Products, Inc., Series #2002-RZ3 A4, 4.730%, 12/25/2031 | | 7,060 |
| 141,725 | | Residential Asset Securities Corp., Series #1999-KS2 AI9, 7.150%, 07/25/2030 | | 142,314 |
| 194,827 | | Residential Asset Securities Corp., Series #2000-KS3 AI6, 7.810%, 07/25/2031 | | 197,899 |
| | | Total asset backed securities (cost $902,752) | | 893,390 |
CORPORATE BONDS (0.7%) | | |
Insurance (0.7%) | | |
| 95,000 | | MGIC Investment Corp., 6.000%, 03/15/2007 | | 97,885 |
| | | Total corporate bonds (cost $94,998) | | 97,885 |
MORTGAGE BACKED SECURITIES (19.8%) | | |
| 20,812 | | Bear Stearns Commercial Mortgage Securities, Series #1999-C A1, 5.910%, 02/14/2031 | | 21,326 |
| 57,335 | | Commercial Mortgage Asset Trust, Series #1999-C1 A1, 6.250%, 01/17/2032 | | 57,642 |
| 53,726 | | DLJ Commercial Mortgage Corp., Series #1999-CG3, 7.120%, 10/10/2032 | | 55,983 |
| 623,074 | | Federal Home Loan Mortgage Corp., Pool #2407 BJ, 6.500%, 01/15/2032 | | 651,530 |
| 24,012 | | Federal Home Loan Mortgage Corp. Gold, Pool #C01131, 6.500%, 01/01/2031 | | 24,932 |
| 25,794 | | Federal Home Loan Mortgage Corp. Gold, Pool #C01148, 6.500%, 02/01/2031 | | 26,782 |
| 78,230 | | Federal Home Loan Mortgage Corp. Gold, Pool #C01184, 6.500%, 06/01/2031 | | 81,179 |
| 75,893 | | Federal Home Loan Mortgage Corp. Gold, Pool #C01186, 6.000%, 06/01/2031 | | 77,972 |
| 34,842 | | Federal Home Loan Mortgage Corp. Gold, Pool #C28063, 6.500%, 07/01/2029 | | 36,201 |
| 14,571 | | Federal Home Loan Mortgage Corp. Gold, Pool #C29168, 6.500%, 07/01/2029 | | 15,139 |
| 5,854 | | Federal Home Loan Mortgage Corp. Gold, Pool #D66012, 7.000%, 11/01/2025 | | 6,187 |
| 4,578 | | Federal Home Loan Mortgage Corp. Gold, Pool #E00441, 7.500%, 07/01/2011 | | 4,840 |
| 249,465 | | Federal Home Loan Mortgage Corp. Gold, Pool #G01805, 4.500%, 04/01/2035 | | 243,951 |
| 100,000 | | Federal National Mortgage Assn., Pool #2001-80 PE, 6.000%, 07/25/2029 | | 103,922 |
| 456,222 | | Federal National Mortgage Assn., Pool #2004-91 AH, 4.500%, 05/25/2029 | | 455,447 |
| 198,686 | | Federal National Mortgage Assn., Pool #253845, 6.000%, 06/01/2016 | | 205,556 |
| 32,112 | | Federal National Mortgage Assn., Pool #254091, 6.000%, 12/01/2031 | | 32,973 |
| 5,094 | | Federal National Mortgage Assn., Pool #303780, 7.000%, 03/01/2026 | | 5,393 |
| 28,727 | | Federal National Mortgage Assn., Pool #320582, 6.500%, 01/01/2011 | | 29,917 |
| 68,015 | | Federal National Mortgage Assn., Pool #336290, 6.500%, 04/01/2011 | | 70,828 |
| 32,181 | | Federal National Mortgage Assn., Pool #535837, 6.000%, 04/01/2031 | | 33,044 |
| 118,130 | | Federal National Mortgage Assn., Pool #545449, 6.500%, 02/01/2017 | | 123,058 |
| 7,225 | | Federal National Mortgage Assn., Pool #609583, 6.000%, 11/01/2031 | | 7,418 |
| 204,364 | | Federal National Mortgage Assn., Pool #645649, 6.000%, 06/01/2017 | | 211,437 |
| 29,317 | | Federal National Mortgage Assn. Grantor Trust, Series #1999-T2 A1, 7.500%, 01/19/2039 | | 31,352 |
| 75,000 | | First Union National Bank Commercial Mortgage, Series #1999-C4 A2, 7.390%, 12/15/2031 | | 83,759 |
| 10,372 | | GMAC Commercial Mortgage Securities, Inc., Series #1999-C2 A1, 6.570%, 09/15/2033 | | 10,432 |
| 3,686 | | Government National Mortgage Assn., Pool #119896, 13.000%, 11/15/2014 | | 4,210 |
| 28,182 | | Government National Mortgage Assn., Pool #408675, 7.500%, 01/15/2026 | | 30,281 |
| | | Total mortgage backed securities (cost $2,723,683) | | 2,742,691 |
The accompanying notes are an integral part of these financial statements.
40|86 Series Trust | Semi-Annual Report |
Schedule of Investments (unaudited) | June 30, 2005 |
Government Securities Portfolio
SHARES OR PRINCIPAL AMOUNT | | | VALUE |
MUNICIPAL BONDS (1.5%) | | |
| $ 100,000 | | Alaska Industrial Development & Export Auth., 6.625%, 05/01/2006 | $ | 101,537 |
| 105,000 | | Tobacco Settlement Financing Corp., 5.920%, 06/01/2012 | | 104,386 |
| | | Total municipal bonds (cost $204,630) | | 205,923 |
U.S. GOVERNMENT AGENCY ISSUES (16.0%) | | |
| 400,000 | | Federal Home Loan Mortgage Corp., 6.250%, 03/05/2012 | | 414,506 |
| 750,000 | | Federal Home Loan Mortgage Corp. Gold TBA, 5.000%, 07/15/2035 | | 750,234 |
| 1,000,000 | | Federal National Mortgage Assn., 5.250%, 08/01/2012 | | 1,055,606 |
| | | Total U.S. government agency issues (cost $2,187,800) | | 2,220,346 |
U.S. TREASURY OBLIGATIONS (49.3%) | | |
| 700,000 | | 2.375%, 08/31/2006 (a) | | 690,704 |
| 1,500,000 | | 3.875%, 05/15/2009 | | 1,509,141 |
| 650,000 | | 4.000%, 02/15/2014 (a) | | 654,114 |
| 250,000 | | 5.375%, 02/15/2031 (a) | | 295,078 |
| 500,000 | | 5.500%, 02/15/2008 (a) | | 523,301 |
| 2,000,000 | | 11.250%, 02/15/2015 (a) | | 3,157,736 |
| | | Total U.S. treasury obligations (cost $6,648,816) | | 6,830,074 |
INVESTMENTS PURCHASED WITH CASH PROCEEDS FROM SECURITIES LENDING (22.1%) | | |
| 2,996,000 | | Bank of New York Institutional Cash Reserve Fund | | 2,996,535 |
| Pooled Investments - | | |
| 67,974 | | Bank of New York, collateralized by various United States Government and Agency Issues, | | |
| | | 3.250% to 7.500%, 11/15/2005 to 08/15/2044 | | 67,974 |
| | | Total investments purchased with cash proceeds from securities lending (cost $3,064,509) | | 3,064,509 |
SHORT TERM INVESTMENTS (10.4%) | | |
| 97,000 | | AIM Liquid Asset Portfolio | | 97,000 |
| 250,000 | | Federal Home Loan Mortgage Corp. Discount Note, 3.020%, 07/05/2005 | | 249,916 |
| 350,000 | | Federal Home Loan Mortgage Corp. Discount Note, 3.440%, 12/09/2005 | | 344,615 |
| 750,000 | | Federal National Mortgage Assn. Discount Note, 2.990%, 07/11/2005 | | 749,377 |
| | | Total short term investments (cost $1,440,908) | | 1,440,908 |
| | | Total investments (cost $17,268,096) 126.3% | | 17,495,726 |
| | | Liabilities in excess of other assets (26.3)% | | (3,714,572) |
| | | Total net assets 100.0% | | $13,781,154 |
_________
| (a) | Securities (entire/partial) out on loan. |
| (b) | STEP — Bonds where the coupon increases or steps up at a predetermined rate. |
The accompanying notes are an integral part of these financial statements.
40|86 Series Trust | Semi-Annual Report |
Portfolio Manager’s Review (unaudited) | June 30, 2005 |
Money Market Portfolio
The Federal Reserve continued to raise short-term interest rates throughout the first half of 2005. Real Gross Domestic Product declined to 3.8% and inflation remained low, allowing yields on longer-term issues to remain low. The rise in short-term interest rates and stability in longer-term rates has produced a dramatic flattening of the yield curve (a graphic representation of the yields of fixed income maturities) in the first half of 2005. Money market yields, as measured by LIBOR (the rate offered by London banks to other banks for overnight deposits), rose throughout the first half of the year. Although the entire yield curve rose, the 1-month rate rose more than the 1-year rate, resulting in a curve flattened by 16 basis points (equivalent to 1/100th of 1%).
As rates rose, we maintained the weighted-average maturity of the Portfolio at well under one month. Approximately 96% of the Portfolio was invested in securities with maturities of less than 20 days. We invested significantly in Variable Rate Demand Notes (VRDNs), which have floating rate coupons that reset weekly. In a rising interest rate environment, coupons of VRDNs reset to higher rates weekly as rates increase. In addition, VRDNs are highly liquid and offer higher yields than 1-week Tier-1 Non-Asset-Backed securities.
The Federal Reserve has signaled its intention to continue raising short-term rates at a measured pace. We will maintain the short duration of the Portfolio and add yield by investing in VRDNs and cheap short-term corporate offerings. Once we believe interest rates have risen to levels more consistent with the current economic environment, we will start lengthening the Portfolio duration to take advantage of higher yields.
Michael J. Dunlop
Senior Vice President
40|86 Advisors, Inc.
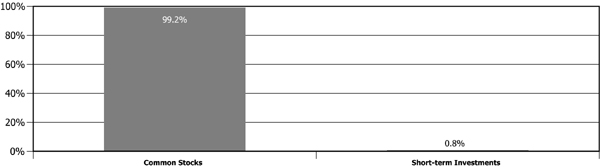
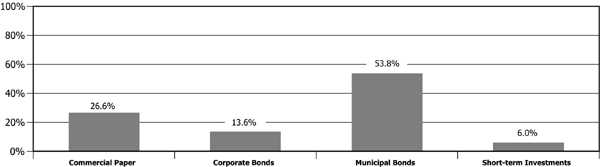
Asset Allocation as a Percent of Total Investments
40|86 Series Trust | | Semi-Annual Report |
Schedule of Investments (unaudited) | | June 30, 2005 |
Money Market Portfolio
SHARES OR PRINCIPAL AMOUNT | | | VALUE |
CORPORATE BONDS (13.6%) | | |
Non-Depository Credit Institutions (5.0%) | | |
| $1,000,000 | | Corporate Finance Managers, Inc., 3.170%, 07/07/2005 (a)(b) | $ | 1,000,000 |
| 500,000 | | Westgate Investment Fund, 3.170%, 07/07/2005 (a)(b) | | 500,000 |
| | | | | 1,500,000 |
Insurance (1.9%) | | | |
| 560,000 | | ASIF Global Financing XX, 2.650%, 01/17/2006, (c) Cost — $556,454; Acquired — 05/04/2005 | | 556,454 |
Real Estate (1.6%) | | | |
| 490,000 | | Kuehn Enterprises LLC, 3.250%, 07/07/2005 (a)(b) | | 490,000 |
Diversified Financial Services (3.3%) | | |
| 1,000,000 | | CIT Group Inc, 3.620%, 07/29/2005 (a) | | 1,000,280 |
Trusts, Except Educational, Religious, And Charitable (1.8%) | | |
| 545,000 | | Cunat Capital Corp., 3.580%, 07/30/2005 (a)(b) | | 545,000 |
| | | Total corporate bonds (cost $4,091,734) | | 4,091,734 |
MUNICIPAL BONDS (54.0%) | | |
| 100,000 | | ABAG Financial Authorities for Nonprofit Corps, 3.400%, 07/07/2005 (a)(b) (CS: Federal National Mortgage Assn.) | | 100,000 |
| 1,000,000 | | Arlington County Virginia Industrial Development Authority, 3.140%, 07/07/2005 (a)(b) (LOC: Bank of America) | | 1,000,000 |
| 1,300,000 | | California Housing Finance Agency, 3.140%, 07/07/2005 (a)(b) | | 1,300,000 |
| 100,000 | | Colorado Housing & Finance Authority, 3.120%, 07/07/2005 (a)(b) (CS: Federal National Mortgage Assn.) | | 100,000 |
| 1,000,000 | | Colorado Housing & Finance Authority, 3.140%, 07/07/2005 (a)(b) (SPA: Dexia Credit Local) | | 1,000,000 |
| 1,000,000 | | Florida Housing & Finance Authority, 3.200%, 07/07/2005 (a)(b) | | 1,000,000 |
| 1,000,000 | | Fulton County Georgia Development Authority, 3.250%, 07/07/2005 (a)(b) (LOC: Regions Bank) | | 1,000,000 |
| 1,000,000 | | Los Angeles County California Transport Authority, 1.910%, 07/01/2005 (CS: Ambac Financial Group) | | 1,000,000 |
| 900,000 | | Louisiana Public Facilities Authority, 3.700%, 07/07/2005 (a)(b) | | 900,000 |
| 580,000 | | Michigan State Housing Development Authority, 3.080%, 07/07/2005 (a)(b) (CS: MBIA, Inc.) | | 580,000 |
| 1,000,000 | | North Texas Education Authority, 3.200%, 07/07/2005 (a)(b) (CS:Ambac Financial Group) | | 1,000,000 |
| 1,395,000 | | Philadelphia Authority For Industrial Development, 3.200%, 07/07/2005 (a)(b) | | 1,395,000 |
| 700,000 | | Portland Maine Pension, 3.200%, 07/07/2005 (a)(b) (SPA: Bayerische Landesbank) | | 700,000 |
| 600,000 | | Sacramento County California Pension, 3.130%, 07/07/2005 (a)(b) (LOC: Bayerische Landesbank) | | 600,000 |
| 805,000 | | St. Francis Healthcare Foundation Hawaii, 3.830%, 07/07/2005 (a)(b) (LOC: First Hawaiian Bank) | | 805,000 |
| 1,000,000 | | St. John’s County Florida Industrial Development Authority, 3.300%, 07/07/2005 (a)(b) (LOC: Allied Irish Bank PLC) | | 1,000,000 |
| 450,000 | | San Jose California Financing Authority, 3.180%, 07/07/2005 (a)(b) | | 450,000 |
| 885,000 | | University of Minnesota, 3.140%, 07/07/2005 (a)(b) | | 885,000 |
| 900,000 | | Utah Housing Finance Agency, 3.140%, 07/07/2005 (a)(b) (SPA: Bayerische Landesbank) | | 900,000 |
| 500,000 | | Westminster Colorado Economic Development Authority, 3.350%, 07/07/2005 (a)(b) (LOC: HSH Nordbank) | | 500,000 |
| | | Total municipal bonds (cost $16,215,000) | | 16,215,000 |
The accompanying notes are an integral part of these financial statements.
40|86 Series Trust | | Semi-Annual Report |
Schedule of Investments (unaudited) | | June 30, 2005 |
Money Market Portfolio
SHARES OR PRINCIPAL AMOUNT | | | VALUE |
COMMERCIAL PAPER (26.7%) | | |
Household Durables (6.7%) | | |
| $2,000,000 | | Fortune Brands, Inc., 3.400%, 07/01/2005 | $ | 2,000,000 |
Automobiles (3.3%) | | | |
| 1,000,000 | | BMW U.S. Capital, 3.350%, 07/01/2005 | | 1,000,000 |
Oil & Gas (6.7%) | | | |
| 2,000,000 | | Total Capital SA, 3.370%, 07/01/2005 | | 2,000,000 |
Banks (6.7%) | | |
| 2,000,000 | | UBS Financial Services Inc., 3.390%, 07/01/2005 | | 2,000,000 |
Communication Services (3.3%) | | |
| 1,000,000 | | Verizon Global Funding Corp., 3.180%, 07/11/2005 | | 999,117 |
| | | Total commercial paper (cost $7,999,117) | | 7,999,117 |
SHORT TERM INVESTMENTS (6.0%) | | |
| 1,358,000 | | AIM Liquid Asset Portfolio | | 1,358,000 |
| 433,000 | | NationsTreasury Reserve | | 433,000 |
| | | Total short term investments (cost $1,791,000) | | 1,791,000 |
| | | Total investments (cost $30,096,851) (100.3%) | | 30,096,851 |
| | | Liabilities in excess of other assets (0.3%) | | (87,801) |
| | | Total net assets 100.00% | $ | 30,009,050 |
________
| (a) | Variable Coupon Rate — The rate reported is the rate in effect as of June 30, 2005. |
| (b) | Maturity date represents first available put date. |
| (c) | Restricted under Rule 144A of the Securities Act of 1933. |
| CS — Credit Support. |
| LOC — Letter of Credit. |
| SPA — Standby Purchase Agreement. |
The accompanying notes are an integral part of these financial statements.
40|86 Series Trust | Semi-Annual Report |
Financial Highlights | |
For a share outstanding during the six months ended June 30, 2005 (unaudited) and through the year or period ended December 31,
| | | EQUITY PORTFOLIO |
| | | | 2005 | | | 2004 | | | 2003 | | | 2002 | | | 2001 | | | 2000 | |
| Net asset value per share, beginning of period | | $ | 24.53 | | $ | 20.42 | | $ | 14.92 | | $ | 17.30 | | $ | 19.43 | | $ | 23.18 | |
| Income from investment operations: | | | | | | | | | | | | | | | | | | | |
| Net investment income | | | 0.05 | | | 0.08 | | | 0.06 | | | 0.06 | | | 0.07 | | | 0.00 | (c) |
| Net realized gain (loss) and change in unrealized appreciation (depreciation) on investments | | | 0.97 | | | 4.20 | | | 5.49 | | | (2.38 | ) | | (2.07 | ) | | 0.63 | |
| Total income (loss) from investment operations | | | 1.02 | | | 4.28 | | | 5.55 | | | (2.32 | ) | | (2.00 | ) | | 0.63 | |
| Distributions: | | | | | | | | | | | | | | | | | | | |
| Dividends from net investment income | | | — | | | (0.08 | ) | | (0.05 | ) | | (0.06 | ) | | (0.07 | ) | | (0.00 | )(c) |
| Distributions of net realized gain | | | — | | | (0.09 | ) | | — | | | — | | | (0.06 | ) | | (4.38 | ) |
| Total distributions | | | — | | | (0.17 | ) | | (0.05 | ) | | (0.06 | ) | | (0.13 | ) | | (4.38 | ) |
| Net asset value per share, end of period | | $ | 25.55 | | $ | 24.53 | | $ | 20.42 | | $ | 14.92 | | $ | 17.30 | | $ | 19.43 | |
| Total return (a)(b)(d) | | | 4.16 | % | | 20.94 | % | | 37.17 | % | | (13.42 | %) | | (10.30 | %) | | 2.71 | % |
| | | | | | | | | | | | | | | | | | | | |
| Ratios/supplemental data: | | | | | | | | | | | | | | | | | | | |
| Net assets (dollars in thousands), end of period | | $ | 167,155 | | $ | 168,901 | | $ | 165,798 | | $ | 148,881 | | $ | 233,983 | | $ | 309,201 | |
| Ratio of expenses to average net assets (b)(e): | | | | | | | | | | | | | | | | | | | |
| Before expense reimbursement and recoveries | | | 1.17 | % | | 1.13 | % | | 1.14 | % | | 1.15 | % | | 1.02 | % | | 0.81 | % |
| After expense reimbursement and recoveries | | | 1.10 | % | | 1.10 | % | | 1.10 | % | | 1.10 | % | | 1.02 | % | | 0.78 | % |
| Ratio of net investment income | | | | | | | | | | | | | | | | | | | |
| to average net assets (b)(e) | | | 0.43 | % | | 0.38 | % | | 0.28 | % | | 0.32 | % | | 0.38 | % | | (0.02 | %) |
| Portfolio turnover rate (d) | | | 46 | % | | 89 | % | | 107 | % | | 102 | % | | 133 | % | | 431 | % |
| (a) | Total return represents performance of the Portfolio only and does not include mortality and expense deductions in separate accounts. |
| (b) | The Adviser and Administrator have contractually agreed to reimburse Portfolio expenses to the extent that the ratio of expenses to average net assets exceeds, on an annual basis, the net expenses defined in Note 3. These contractual limits may be discontinued at any time after April 30, 2006. |
| (c) | Amount calculated is less than $0.005 per share. |
| (d) | Not annualized for periods of less than one full year. |
| (e) | Annualized for periods of less than one year. |
The accompanying notes are an integral part of these financial statements.
40|86 Series Trust | Semi-Annual Report |
Financial Highlights | |
For a share outstanding during the six months ended June 30, 2005 (unaudited) and through the year or period ended December 31,
| | BALANCED PORTFOLIO |
| | | 2005 | | | 2004 | | | 2003 | | | 2002 | | | 2001 | | | 2000 | |
| Net asset value per share, beginning of period | $ | 13.42 | | $ | 12.35 | | $ | 10.25 | | $ | 12.16 | | $ | 13.45 | | $ | 14.65 | |
| Income from investment operations: | | | | | | | | | | | | | | | | | | |
| Net investment income | | 0.11 | | | 0.26 | | | 0.27 | | | 0.36 | | | 0.40 | | | 0.43 | |
| Net realized gain (loss) and change in unrealized appreciation (depreciation) on investments | | 0.14 | | | 1.07 | | | 2.09 | | | (1.91 | ) | | (1.29 | ) | | 0.67 | |
| Total income (loss) from investment operations | | 0.25 | | | 1.33 | | | 2.36 | | | (1.55 | ) | | (0.89 | ) | | 1.10 | |
| Distributions: | | | | | | | | | | | | | | | | | | |
| Dividends from net investment income | | (0.11 | ) | | (0.26 | ) | | (0.26 | ) | | (0.36 | ) | | (0.40 | ) | | (0.43 | ) |
| Distributions of net realized gain | | — | | | — | | | — | | | — | | | (0.00) (c | ) | | (1.87 | ) |
| Total distributions | | (0.11 | ) | | (0.26 | ) | | (0.26 | ) | | (0.36 | ) | | (0.40 | ) | | (2.30 | ) |
| Net asset value per share, end of period | $ | 13.56 | | $ | 13.42 | | $ | 12.35 | | $ | 10.25 | | $ | 12.16 | | $ | 13.45 | |
| Total return (a)(b)(d) | | 1.88 | % | | 10.84 | % | | 23.29 | % | | (12.87 | %) | | (6.60 | %) | | 7.29 | % |
| | | | | | | | | | | | | | | | | | | |
| Ratios/supplemental data: | | | | | | | | | | | | | | | | | | |
| Net assets (dollars in thousands), end of period | $ | 45,323 | | $ | 47,056 | | $ | 48,282 | | $ | 44,455 | | $ | 71,635 | | $ | 75,355 | |
| Ratio of expenses to average net assets (b)(e): | | | | | | | | | | | | | | | | | | |
| Before expense reimbursement and recoveries | | 1.18 | % | | 1.14 | % | | 1.15 | % | | 1.18 | % | | 1.04 | % | | 0.83 | % |
| After expense reimbursement and recoveries | | 1.10 | % | | 1.10 | % | | 1.10 | % | | 1.10 | % | | 1.04 | % | | 0.78 | % |
| Ratio of net investment income to average net assets (b)(e) | | 1.73 | % | | 2.03 | % | | 2.27 | % | | 3.11 | % | | 3.16 | % | | 2.77 | % |
| Portfolio turnover rate (d) | | 42 | % | | 97 | % | | 100 | % | | 180 | % | | 239 | % | | 334 | % |
_________
| (a) | Total return represents performance of the Portfolio only and does not include mortality and expense deductions in separate accounts. |
| (b) | The Adviser and Administrator have contractually agreed to reimburse Portfolio expenses to the extent that the ratio of expenses to average net assets exceeds, on an annual basis, the net expenses defined in Note 3. These contractual limits may be discontinued at any time after April 30, 2006. |
| (c) | Amount calculated is less than $0.005 per share. |
| (d) | Not annualized for period of less than one full year. |
| (e) | Annualized for periods of less than one year. |
The accompanying notes are an integral part of these financial statements.
40|86 Series Trust | Semi-Annual Report |
Financial Highlights | |
For a share outstanding during the six months ended June 30, 2005 (unaudited) and through the year or period ended December 31,
| | | HIGH YIELD PORTFOLIO |
| | | | 2005 | | | 2004 | | | 2003 | | | 2002 | | | 2001 | | | 2000 | (c) |
| Net asset value per share, beginning of period | | $ | 10.40 | | $ | 10.53 | | $ | 8.86 | | $ | 9.28 | | $ | 10.07 | | $ | 10.00 | |
| Income from investment operations: | | | | | | | | | | | | | | | | | | | |
| Net investment income | | | 0.31 | | | 0.71 | | | 0.67 | | | 0.86 | | | 1.10 | | | 0.24 | |
| Net realized gain (loss) and change in unrealized appreciation (depreciation) on investments | | | (0.26 | ) | | 0.37 | | | 1.68 | | | (0.42 | ) | | (0.78 | ) | | 0.07 | |
| Total income from investment operations | | | 0.05 | | | 1.08 | | | 2.35 | | | 0.44 | | | 0.32 | | | 0.31 | |
| Distributions: | | | | | | | | | | | | | | | | | | | |
| Dividends from net investment income | | | (0.32 | ) | | (0.70 | ) | | (0.68 | ) | | (0.86 | ) | | (1.11 | ) | | (0.24 | ) |
| Distributions of net realized gain | | | — | | | (0.51 | ) | | — | | | — | | | — | | | — | |
| Total distributions | | | (0.32 | ) | | (1.21 | ) | | (0.68 | ) | | (0.86 | ) | | (1.11 | ) | | (0.24 | ) |
| Net asset value per share, end of period | | $ | 10.13 | | $ | 10.40 | | $ | 10.53 | | $ | 8.86 | | $ | 9.28 | | $ | 10.07 | |
| Total return (a)(b)(d) | | | 0.48 | % | | 10.69 | % | | 27.38 | % | | 5.47 | % | | 3.17 | % | | 3.20 | % |
| | | | | | | | | | | | | | | | | | | | |
| Ratios/supplemental data: | | | | | | | | | | | | | | | | | | | |
| Net assets (dollars in thousands), end of period | | $ | 8,817 | | $ | 8,876 | | $ | 10,941 | | $ | 9,202 | | $ | 7,091 | | $ | 4,040 | |
| Ratio of expenses to average net assets (b)(e): | | | | | | | | | | | | | | | | | | | |
| Before expense reimbursement | | | 1.28 | % | | 1.24 | % | | 1.25 | % | | 1.47 | % | | 1.11 | % | | 0.90 | % |
| After expense reimbursement | | | 1.15 | % | | 1.15 | % | | 1.15 | % | | 1.15 | % | | 1.11 | % | | 0.90 | % |
| Ratio of net investment income (loss) | | | | | | | | | | | | | | | | | | | |
| to average net assets (b)(e) | | | 6.38 | % | | 6.53 | % | | 6.53 | % | | 8.95 | % | | 11.12 | % | | 3.31 | % |
| Portfolio turnover rate (d) | | | 74 | % | | 177 | % | | 126 | % | | 258 | % | | 232 | % | | 1 | % |
_________
| (a) | Total return represents performance of the Portfolio only and does not include mortality and expense deductions in separate accounts. |
| (b) | The Adviser and Administrator have contractually agreed to reimburse Portfolio expenses to the extent that the ratio of expenses to average net assets exceeds, on an annual basis, the net expenses defined in Note 3. These contractual limits may be discontinued at any time after April 30, 2006. |
| (c) | For the period from June 13, 2000 (commencement of operations) through December 31, 2000. |
| (d) | Not annualized for periods of less than one full year. |
| (e) | Annualized for periods of less than one full year. |
The accompanying notes are an integral part of these financial statements.
40|86 Series Trust | Semi-Annual Report |
Financial Highlights | |
For a share outstanding during the six months ended June 30, 2005 (unaudited) and through the year or period ended December 31,
| | FIXED INCOME PORTFOLIO |
| | | 2005 | | | 2004 | | | 2003 | | | 2002 | | | 2001 | | | 2000 | |
| Net asset value per share, beginning of period | $ | 10.10 | | $ | 10.08 | | $ | 9.66 | | $ | 9.88 | | $ | 9.63 | | $ | 9.39 | |
| Income from investment operations: | | | | | | | | | | | | | | | | | | |
| Net investment income | | 0.22 | | | 0.44 | | | 0.46 | | | 0.58 | | | 0.59 | | | 0.65 | |
| Net realized gain (loss) and change in unrealized appreciation (depreciation) on investments | | (0.02 | ) | | 0.02 | | | 0.42 | | | (0.13 | ) | | 0.25 | | | 0.24 | |
| Total income from investment operations | | 0.20 | | | 0.46 | | | 0.88 | | | 0.45 | | | 0.84 | | | 0.89 | |
| Distributions: | | | | | | | | | | | | | | | | | | |
| Dividends from net investment income | | (0.22 | ) | | (0.44 | ) | | (0.46 | ) | | (0.58 | ) | | (0.59 | ) | | (0.65 | ) |
| Distributions of net realized gain | | — | | | — | | | — | | | (0.09 | ) | | — | | | — | |
| Total distributions | | (0.22 | ) | | (0.44 | ) | | (0.46 | ) | | (0.67 | ) | | (0.59 | ) | | (0.65 | ) |
| Net asset value per share, end of period | $ | 10.08 | | $ | 10.10 | | $ | 10.08 | | $ | 9.66 | | $ | 9.88 | | $ | 9.63 | |
| Total return (a)(b)(c) | | 2.00 | % | | 4.74 | % | | 9.33 | % | | 4.68 | % | | 8.84 | % | | 9.87 | % |
| | | | | | | | | | | | | | | | | | | |
| Ratios/supplemental data: | | | | | | | | | | | | | | | | | | |
| Net assets (dollars in thousands), end of period | $ | 25,856 | | $ | 27,448 | | $ | 35,068 | | $ | 41,957 | | $ | 60,649 | | $ | 37,433 | |
| Ratio of expenses to average net assets (b)(d): | | | | | | | | | | | | | | | | | | |
| Before expense reimbursement and recoveries | | 1.03 | % | | 0.98 | % | | 1.00 | % | | 1.02 | % | | 0.91 | % | | 0.67 | % |
| After expense reimbursement and recoveries | | 0.95 | % | | 0.95 | % | | 0.95 | % | | 0.95 | % | | 0.91 | % | | 0.67 | % |
| Ratio of net investment income to average net assets (b)(d) | | 4.48 | % | | 4.40 | % | | 4.61 | % | | 5.86 | % | | 5.96 | % | | 6.87 | % |
| Portfolio turnover rate (c) | | 102 | % | | 226 | % | | 307 | % | | 371 | % | | 515 | % | | 281 | % |
_________
| (a) | Total return represents performance of the Portfolio only and does not include mortality and expense deductions in separate accounts. |
| (b) | The Adviser and Administrator have contractually agreed to reimburse Portfolio expenses to the extent that the ratio of expenses to average net assets exceeds, on an annual basis, the net expenses defined in Note 3. These contractual limits may be discontinued at any time after April 30, 2006. |
| (c) | Not annualized for periods of less than one full year. |
| (d) | Annualized for periods of less than one year. |
The accompanying notes are an integral part of these financial statements.
40|86 Series Trust | Semi-Annual Report |
Financial Highlights | |
For a share outstanding during the six months ended June 30, 2005 (unaudited) and through the year or period ended December 31,
| | GOVERNMENT SECURITIES PORTFOLIO |
| | | 2005 | | | 2004 | | | 2003 | | | 2002 | | | 2001 | | | 2000 | |
| Net asset value per share, beginning of period | $ | 11.59 | | $ | 11.70 | | $ | 12.04 | | $ | 11.70 | | $ | 11.54 | | $ | 10.96 | |
| Income from investment operations: | | | | | | | | | | | | | | | | | | |
| Net investment income | | 0.21 | | | 0.40 | | | 0.42 | | | 0.47 | | | 0.54 | | | 0.66 | |
| Net realized gain (loss) and change in unrealized appreciation (depreciation) on investments | | 0.04 | | | (0.11 | ) | | (0.25 | ) | | 0.60 | | | 0.16 | | | 0.58 | |
| Total income from investment operations | | 0.25 | | | 0.29 | | | 0.17 | | | 1.07 | | | 0.70 | | | 1.24 | |
| Distributions: | | | | | | | | | | | | | | | | | | |
| Dividends from net investment income | | (0.21 | ) | | (0.40 | ) | | (0.42 | ) | | (0.47 | ) | | (0.54 | ) | | (0.66 | ) |
| Distributions of net realized gain | | — | | | — | | | (0.09 | ) | | (0.26 | ) | | — | | | — | |
| Total distributions | | (0.21 | ) | | (0.40 | ) | | (0.51 | ) | | (0.73 | ) | | (0.54 | ) | | (0.66 | ) |
| Net asset value per share, end of period | $ | 11.63 | | $ | 11.59 | | $ | 11.70 | | $ | 12.04 | | $ | 11.70 | | $ | 11.54 | |
| Total return (a)(b)(c) | | 2.20 | % | | 2.48 | % | | 1.36 | % | | 9.33 | % | | 6.13 | % | | 11.71 | % |
| | | | | | | | | | | | | | | | | | | |
| Ratios/supplemental data: | | | | | | | | | | | | | | | | | | |
| Net assets (dollars in thousands), end of period | $ | 13,781 | | $ | 14,565 | | $ | 22,791 | | $ | 41,676 | | $ | 31,267 | | $ | 18,833 | |
| Ratio of expenses to average net assets (b)(d): | | | | | | | | | | | | | | | | | | |
| Before expense reimbursement and recoveries | | 0.99 | % | | 0.94 | % | | 1.04 | % | | 0.99 | % | | 0.91 | % | | 0.66 | % |
| After expense reimbursement and recoveries | | 0.95 | % | | 0.95 | % | | 0.95 | % | | 0.95 | % | | 0.91 | % | | 0.66 | % |
| Ratio of net investment income to average net assets (b)(d) | | 3.75 | % | | 3.29 | % | | 3.32 | % | | 3.78 | % | | 4.60 | % | | 5.89 | % |
| Portfolio turnover rate (c) | | 134 | % | | 250 | % | | 175 | % | | 174 | % | | 199 | % | | 69 | % |
_________
| (a) | Total return represents performance of the Portfolio only and does not include mortality and expense deductions in separate accounts. |
| (b) | The Adviser and Administrator have contractually agreed to reimburse Portfolio expenses to the extent that the ratio of expenses to average net assets exceeds, on an annual basis, the net expenses defined in Note 3. These contractual limits may be discontinued at any time after April 30, 2006. |
| (c) | Not annualized for periods of less than one full year. |
| (d) | Annualized for periods of less than one year. |
The accompanying notes are an integral part of these financial statements.
40|86 Series Trust | Semi-Annual Report |
Financial Highlights | |
For a share outstanding during the six months ended June 30, 2005 (unaudited) and through the year or period ended December 31,
| | MONEY MARKET PORTFOLIO |
| | | 2005 | | | 2004 | | | 2003 | | | 2002 | | | 2001 | | | 2000 | |
| Net asset value per share, beginning of period | $ | 1.00 | | $ | 1.00 | | $ | 1.00 | | $ | 1.00 | | $ | 1.00 | | $ | 1.00 | |
| Income from investment operations: | | | | | | | | | | | | | | | | | | |
| Net investment income | | 0.01 | | | 0.01 | | | 0.01 | | | 0.01 | | | 0.04 | | | 0.06 | |
| Net realized gain (loss) and change in unrealized appreciation (depreciation) on investments | | 0.00 | (c) | | 0.00 | (c) | | — | | | (0.00) | (c) | | 0.00 | (c) | | — | |
| Total income from investment operations | | 0.01 | | | 0.01 | | | 0.01 | | | 0.01 | | | 0.04 | | | 0.06 | |
| Distributions: | | | | | | | | | | | | | | | | | | |
| Dividends from net investment income | | (0.01 | ) | | (0.01 | ) | | (0.01 | ) | | (0.01 | ) | | (0.04 | ) | | (0.06 | ) |
| Distributions of net realized gain | | — | | | — | | | — | | | (0.00) (c | ) | | — | | | — | |
| Total distributions | | (0.01 | ) | | (0.01 | ) | | (0.01 | ) | | (0.01 | ) | | (0.04 | ) | | (0.06 | ) |
| Net asset value per share, end of period | $ | 1.00 | | $ | 1.00 | | $ | 1.00 | | $ | 1.00 | | $ | 1.00 | | $ | 1.00 | |
| Total return (a)(b)(d) | | 1.17 | % | | 0.93 | % | | 0.63 | % | | 1.24 | % | | 3.97 | % | | 6.08 | % |
| | | | | | | | | | | | | | | | | | | |
| Ratios/supplemental data: | | | | | | | | | | | | | | | | | | |
| Net assets (dollars in thousands), end of period | $ | 30,009 | | $ | 33,755 | | $ | 41,965 | | $ | 95,767 | | $ | 129,530 | | $ | 96,616 | |
| Ratio of expenses to average net assets (b)(e): | | | | | | | | | | | | | | | | | | |
| Before expense reimbursement and recoveries | | 0.80 | % | | 0.71 | % | | 0.76 | % | | 0.73 | % | | 0.72 | % | | 0.66 | % |
| After expense reimbursement and recoveries | | 0.45 | % | | 0.45 | % | | 0.45 | % | | 0.45 | % | | 0.43 | % | | 0.41 | % |
| Ratio of net investment income to average net assets (b)(e) | | 2.70 | % | | 1.16 | % | | 0.64 | % | | 1.23 | % | | 3.74 | % | | 5.98 | % |
_________
| (a) | Total return represents performance of the Portfolio only and does not include mortality and expense deductions in separate accounts. |
| (b) | The Adviser and Administrator have contractually agreed to reimburse Portfolio expenses to the extent that the ratio of expenses to average net assets exceeds, on an annual basis, the net expenses defined in Note 3. These contractual limits may be discontinued at any time after April 30, 2006. |
| (c) | Amount calculated is less than $0.005 per share. |
| (d) | Not annualized for periods of less than one year. |
| (e) | Annualized for periods of less than one year. |
The accompanying notes are an integral part of these financial statements.
40|86 Series Trust | Semi-Annual Report |
Notes to Financial Statements (unaudited) | June 30, 2005 |
1. GENERAL
40|86 Series Trust (the “Trust”) is an open-end management investment company registered with the Securities and Exchange Commission under the Investment Company Act of 1940, as amended (the “Act”), and was organized as a Massachusetts Trust effective November 15, 1982. The Trust is a “series” type of mutual fund which issues separate series of shares, each of which currently represents a separate portfolio of investments. The Trust consists of six series (“Portfolios”) each with its own investment objective and investment policies. The Portfolios are the Equity, Balanced, High Yield, Fixed Income, Government Securities and Money Market. Effective May 31, 2005, the Focus 20 Portfolio was terminated. The Trust offers shares to affiliated and unaffiliated life insurance company separate accounts (registered as unit investment trusts under the Act) to fund the benefits under variable annuity and variable life contracts.
2. SUMMARY OF SIGNIFICANT ACCOUNTING POLICIES
SECURITY VALUATION, TRANSACTIONS AND RELATED INVESTMENT INCOME
The investments in each Portfolio are valued at the close of regular trading on the New York Stock Exchange on each business day. Investment transactions are accounted for on trade date (the date the order to buy or sell is executed). Dividend income is recorded on the ex-dividend date and interest income is accrued daily. The cost of investments sold is determined on the specific identification basis. The following summarizes the investments, which carry certain restrictions as to resale from the Trust to certain qualified buyers:
Portfolio | Cost | Value | % of Net Assets |
| Balanced Portfolio — | | | |
| bonds | $805,631 | $839,735 | 1.85% |
| High Yield Portfolio — | | | |
| bonds | 2,292,192 | 2,294,429 | 26.02% |
| Fixed Income Portfolio — | | | |
| bonds | 1,805,661 | 1,860,865 | 7.20% |
| Money Market Portfolio — | | | |
| bonds | 556,454 | 556,454 | 1.85% |
These securities are eligible for resale to qualified institutional buyers in transactions exempt from registration under Rule 144A of the Securities Act of 1933. In addition, 40|86 Advisors, Inc. (the “Adviser”), a wholly-owned subsidiary of Conseco, Inc. (“Conseco”), which serves as investment adviser to the Portfolios, has determined that the securities are liquid securities through a procedure approved by the Board of Trustees of the Trust (the “Trustees”).
The Trustees determined that the Money Market Portfolio will value investments at amortized cost, which is conditioned on the Trust’s compliance with certain conditions contained in Rule 2a-7 of the Act. The Adviser continuously reviews this method of valuation and recommends changes to the Trustees, if necessary, to ensure that the Money Market Portfolio investments are valued at fair value (as determined by the Trustees in good faith).
In all Portfolios of the Trust, except for the Money Market Portfolio, securities that are traded on stock exchanges, excluding the NASDAQ national market system, are valued at the last sale price as of the close of business on the day the securities are being valued, or lacking any sales, at the mean between the closing bid and asked prices. Securities that are principally traded on the NASDAQ national market system are generally valued at the NASDAQ Official Closing Price (“NOCP”). Securities traded in the over-the-counter market are valued at the mean between the bid and asked prices obtained from a pricing service or brokers. Prices for fixed income securities may be obtained from an independent pricing source that uses information provided by market makers or estimates of market value obtained from yield data relating to investments or securities with similar characteristics. Portfolio securities that are traded both in the over-the-counter market and on a stock exchange are valued according to the broadest and most representative market, and it is expected that for debt securities this ordinarily will be the over-the-counter market. Debt securities with maturities of sixty (60) days or less are valued at amortized cost that approximates value.
Under the direction of the Trustees, the Adviser may use a practice known as fair value pricing under certain circumstances. These may include, but are not limited to, securities and assets for which market quotations are not readily available, situations where events occur after an exchange closes are likely to affect the value of the security or the Adviser deems that the market price is not reflective of a security’s appropriate price. The Adviser may consider many factors when determining fair values, including but not limited to, the type of security, the financial statements of the issuer, the cost at date of purchase, the size of holdings and information as to any transactions or offers with respect to the security, existence of merger proposals or tender offers with respect to the security. These general and specific factors listed do not provide all the criteria, which may be considered when using the fair value method. When using the fair value method, the Adviser will take into consideration all indications of value available to them in determining the “fair value” assigned to a particular security.
If an investment owned by a Portfolio experiences a default and has accrued interest from purchase or has recorded accrued interest during the period it is owned, the Portfolio’s policy is to cease interest accruals from the time the investments are traded as “flat” in the market. The Portfolio evaluates the collectibility of purchased accrued interest and previously recorded interest on an investment-by-investment basis.
FEDERAL INCOME TAXES
Each Portfolio is treated as a separate taxable entity for federal income tax purposes and intends to qualify as a regulated investment company under Subchapter M of the Internal Revenue Code. The Trust intends to distribute substantially all taxable income and net realized gains to shareholders annually, and otherwise comply with the requirements for regulated investment companies. Therefore, no provision has been made for federal income taxes.
Net investment income and net realized gains (losses) may differ for financial statement and tax purposes because of temporary
40|86 Series Trust | Semi-Annual Report |
Notes to Financial Statements (unaudited) | June 30, 2005 |
or permanent book/tax differences. To the extent these differences are permanent, reclassifications are made to the appropriate equity accounts in the period the difference arises.
DIVIDENDS TO SHAREHOLDERS
Dividends are declared and reinvested from net investment income on a daily basis in the Money Market Portfolio, on a monthly basis in the Government Securities, Fixed Income and High Yield Portfolios, on a quarterly basis in the Balanced Portfolio and on an annual basis in the Equity Portfolio. Distributions of net short-term capital gains and losses are declared and reinvested on an annual basis as a component of net realized gains (losses).
Dividends to shareholders from net investment income are determined in accordance with income tax regulations which may differ from accounting principles generally accepted in the United States of America. Permanent book and tax differences relating to dividends to shareholders may result in reclassifications to paid-in capital and may effect per-share allocation between net investment income and realized and unrealized gains (losses). Any taxable income or gain of the Trust remaining at fiscal year end will be declared and distributed in the following year to the shareholders of the Portfolio or Portfolios to which such gains are attributable.
SECURITIES LENDING
The Portfolios have entered into a Securities Lending Agreement (the “Agreement”) with the Bank of New York. Under terms of the Agreement, the Portfolios may lend portfolio securities to qualified institutional borrowers in order to earn additional income. The Agreement requires that loans are collateralized at all times in an amount equal to at least 102% of the market value of any loaned securities, plus accrued interest. Cash collateral is invested in short-term securities or variable rate bonds and Certificates of Deposit that are included in the respective Portfolio’s Schedule of Investments.
At June 30, 2005, the Equity, Balanced, Fixed Income and Government Securities Portfolios had securities with a market value of $50,987,067, $12,014,065, $3,729,051 and $3,009,121, respectively, on loan (included within Investments in securities in the Statements of Assets and Liabilities) and had received $52,420,508, $12,358,240, $3,792,853 and $3,064,509, respectively, in collateral. Amounts earned as interest on investments of cash collateral, net of rebates and other securities lending expenses, are included in Securities Lending income in the Statements of Operations. For the six months ended June 30, 2005, the securities lending income totaled $19,822, $7,707, $3,001 and $3,141, respectively.
The primary risk associated with securities lending is if the borrower defaults on its obligation to return the securities loaned because of insolvency or other reasons. The Portfolios could experience delays and costs in recovering securities loaned or in gaining access to the collateral.
USE OF ESTIMATES
The preparation of financial statements in conformity with accounting principles generally accepted in the United States of America requires management to make estimates and assumptions that affect the reported amount of assets and liabilities, and disclosure of contingent assets and liabilities as of the date of the financial statements and the reported amounts of increases and decreases in net assets from operations during the reporting period. Actual results may differ from these estimates.
3. TRANSACTIONS WITH AFFILIATES
INVESTMENT ADVISORY AGREEMENT
The Adviser provides investment advice and, in general, supervises the Trust’s management and investment program, furnishes office space, prepares Portfolio reports for the Trust, monitors Portfolio compliance by the Trust in its investment activities and pays compensation of officers and Trustees of the Trust who are affiliated persons of the Adviser. The Trust pays all other expenses incurred in the operation of the Trust, including fees and expenses of unaffiliated Trustees of the Trust.
Under the Investment Advisory Agreement, the Adviser receives an investment advisory fee based on the daily net asset value at an annual rate of 0.70 percent for the High Yield Portfolio, 0.65 percent for the Equity and Balanced Portfolios, and 0.50 percent for the Fixed Income, Government Securities, and Money Market Portfolios. The Adviser has voluntarily reduced its advisory fee to 0.25 percent of the average daily net assets of the Money Market Portfolio. The total fees incurred for such services were $890,100 for the six months ended June 30, 2005.
The Adviser has entered into Subadvisory Agreements for the management of the investments in the Equity Portfolio and the equity portion of the Balanced Portfolio. The Adviser is solely responsible for the payment of all fees to the Subadviser. The Subadviser for the Equity Portfolio and the equity portion of the Balanced Portfolio is Chicago Equity Partners, LLC.
The Adviser has contractually agreed to waive its investment advisory fee and/or reimburse the Portfolios through April 30, 2006 to the extent that the ratio of expenses to net assets on an annual basis exceed the following:
Portfolio | |
| Equity | 1.10% |
| Balanced | 1.10% |
| High Yield | 1.15% |
| Fixed Income | 0.95% |
| Government Securities | 0.95% |
| Money Market | 0.45% |
The Adviser may discontinue these contractual limits at any time after April 30, 2006. After this date the Adviser may elect to continue, modify or terminate the limitation on Portfolio operating expenses. Further, under the terms of this agreement, any Portfolio expenses waived or reimbursed may be recouped by the Adviser from the Portfolio to the extent actual operating expenses for a period are less than the expense limitation caps. The Adviser may only be entitled to recoup such amounts for a period of three years from the fiscal year that they were waived or reimbursed. Reimbursed/absorbed expenses subject to potential recovery by year of expiration are as follows:
40|86 Series Trust | Semi-Annual Report |
Notes to Financial Statements (unaudited) | June 30, 2005 |
| | | |
| | | December 31, |
| | | 2005 | | 2006 | | 2007 |
| Equity | | $ 98,019 | | $ 64,540 | | $ 42,025 |
| Balanced | | 49,725 | | 21,956 | | 18,765 |
| High Yield | | 22,304 | | 8,570 | | 8,536 |
| Fixed Income | | 36,301 | | 20,431 | | 8,208 |
| Government Securities | | 10,671 | | 31,927 | | — |
| Money Market | | 335,352 | | 237,653 | | 103,777 |
ADMINISTRATIVE AGREEMENT
Conseco Services, LLC (the “Administrator”), a wholly-owned subsidiary of Conseco, supervises the preparation and filing of regulatory documents required for compliance by the Portfolios with applicable laws and regulations, supervises the maintenance of books and records of the Portfolios and provides other general and administrative services. Effective May 1, 2001, the Administrator receives an annual fee, for providing these services, equal to 0.15 percent for the first $200 million of average daily net assets of the Trust; 0.10 percent of the next $300 million of average daily net assets of the Trust; and 0.08 percent of the average daily net assets in excess of $500 million of the Trust. The total fees under this Agreement for the six months ended June 30, 2005 were $190,878. The Administrator has contractually agreed to waive its administration fee and/or reimburse the Portfolios through April 30, 2006 to the extent that the ratio of expenses to net assets on an annual basis exceeds the expense limitations as stated above for the Investment Advisory Agreement. The Administrator may discontinue these contractual limits at any time after April 30, 2006.
DISTRIBUTION AGREEMENT
Conseco Equity Sales, Inc. (the “Distributor”), a wholly-owned subsidiary of Conseco, serves as the principal underwriter for each Portfolio pursuant to a Principal Underwriting Agreement, approved by the Trustees. The Distributor is a registered broker-dealer and a member of the National Association of Securities Dealers, Inc. (“NASD”). Shares of each Portfolio will be continuously offered to life insurance company separate accounts to fund the benefits under variable annuity and variable life contracts. The Distributor bears all the expenses of providing services pursuant to the Principal Underwriting Agreement including the payment of the expenses relating to the distribution of prospectuses for sales purposes, as well as, any advertising or sales literature.
The Trust adopted a Distribution and Service Plan pursuant to Rule 12b-1 (the “Plan”), dated May 1, 2001, for the Equity, Balanced, High Yield, Fixed Income and Government Securities Portfolios in accordance with the requirements of Rule 12b-1 under the 1940 Act and the requirements of the applicable rules of the NASD regarding asset based sales charges. Pursuant to the Plan, a Portfolio may compensate the Distributor for its expenditures in financing any activity primarily intended to result in the sale of shares of the Portfolio and for account maintenance provided to shareholders. The Plan authorizes payments to the Distributor at 0.25 percent annually of each Portfolio’s average daily net assets. The Plan provides for periodic payments by the Distributor to financial intermediaries for providing shareholder services to accounts that hold shares and for promotional and other sales related costs. The total fees incurred by the Trust for such services for the six months ended June 30, 2005, were $322,462.
4. INVESTMENT TRANSACTIONS
The aggregate cost of purchases and the aggregate proceeds from sales of investments for six months ended June 30, 2005 are shown below:
| | | EQUITY PORTFOLIO | | BALANCED PORTFOLIO | | HIGH YIELD PORTFOLIO | | FIXED INCOME PORTFOLIO | | GOVERNMENT SECURITIES PORTFOLIO |
| Purchases: | | | | | | | | | | |
| U.S. Government | $ | — | $ | 4,790,362 | $ | — | $ | 9,056,352 | $ | 6,933,724 |
| Other | | 76,538,629 | | 13,469,470 | | 5,819,272 | | 15,872,741 | | 10,902,647 |
| Sales: | | | | | | | | | | |
| U.S. Government | $ | — | $ | 5,288,548 | $ | — | $ | 7,925,526 | $ | 5,809,061 |
| Other | | 84,319,882 | | 16,970,930 | | 6,836,514 | | 20,007,678 | | 11,629,796 |
5. FEDERAL INCOME TAXES
The following information for the Portfolios is presented on an income tax basis as of December 31, 2004:
| | | EQUITY PORTFOLIO | | BALANCED PORTFOLIO | | HIGH YIELD PORTFOLIO | | FIXED INCOME PORTFOLIO | | GOVERNMENT SECURITIES PORTFOLIO |
| Cost of investments (a) | $ | 169,008,020 | $ | 47,570,642 | $ | 8,290,633 | $ | 28,018,993 | $ | 17,588,786 |
| Gross unrealized appreciation | $ | 38,412,742 | $ | 6,744,657 | $ | 465,693 | $ | 1,104,954 | $ | 235,880 |
| Gross unrealized depreciation | | (532,846) | | (584,934) | | (43,956) | | (123,133) | | (85,478) |
| Net unrealized appreciation on investments | $ | 37,879,896 | $ | 6,159,723 | $ | 421,737 | $ | 981,821 | $ | 150,402 |
(a) Represents cost for federal income tax purposes and differs from the cost for financial reporting purposes by the amount of losses recognized for the financial reporting purposes in excess of federal income tax purposes.
40|86 Series Trust | Semi-Annual Report |
Notes to Financial Statements (unaudited) | June 30, 2005 |
As of December 31, 2004, the components of accumulated earnings (deficit) on a tax basis were:
| | | EQUITY PORTFOLIO | | BALANCED PORTFOLIO | | HIGH YIELD PORTFOLIO | | FIXED INCOME PORTFOLIO | | GOVERNMENT SECURITIES PORTFOLIO | | MONEY MARKET PORTFOLIO |
| Distributable ordinary income | $ | — | $ | — | $ | 131,312 | $ | — | $ | 1,275 | $ | 9,296 |
| Distributable long-term gains | | 15,930,340 | | — | | 323,316 | | — | | — | | — |
| Accumulated earnings | | 15,930,340 | | — | | 454,628 | | — | | 1,275 | | 9,296 |
| Accumulated capital and post-October losses | | (28,393,992) | | (13,845,300) | | (530,199) | | (869,533) | | (216,567) | | (9,296) |
| Unrealized appreciation | | 37,879,896 | | 6,159,723 | | 421,737 | | 981,821 | | 150,402 | | — |
| Total accumulated earnings (deficit) | $ | 25,416,244 | $ | (7,685,577) | $ | 346,166 | $ | 112,288 | $ | (64,890) | $ | — |
The tax character of dividends paid during the years ended December 31, 2004 and December 31, 2003 were as follows:
| | | EQUITY PORTFOLIO | | BALANCED PORTFOLIO | | HIGH YIELD PORTFOLIO | | FIXED INCOME PORTFOLIO | | GOVERNMENT SECURITIES PORTFOLIO | | MONEY MARKET PORTFOLIO |
| Ordinary Income dividends | | | | | | | | | | | | |
| December 31, 2004 | $ | 546,828 | $ | 919,319 | $ | 888,049 | $ | 1,327,299 | $ | 630,280 | $ | 362,228 |
| December 31, 2003 | | 371,095 | | 1,040,088 | | 565,486 | | 1,849,081 | | 1,190,887 | | 491,400 |
| Long-term capital gain distributions | | | | | | | | | | | | |
| December 31, 2004 | $ | 590,150 | $ | — | $ | 140,663 | $ | — | $ | — | $ | — |
| December 31, 2003 | | — | | — | | — | | — | | 172,058 | | — |
As of December 31, 2004, the following Portfolios have capital loss carryforwards available to offset capital gains in the future, if any:
| | | AMOUNT | EXPIRES |
| Balanced Portfolio | $ | 1,887,956 | 2010 |
| Balanced Portfolio | | 1,556,918 | 2011 |
| Fixed Income Portfolio | | 435,737 | 2010 |
| Government Securities Portfolio | | 200,502 | 2012 |
| Money Market Portfolio | | 4,462 | 2010 |
| Money Market Portfolio | | 80 | 2011 |
| Money Market Portfolio | | 4,754 | 2012 |
As of the tax year end December 31, 2004, the following Portfolios had additional net capital loss carryforwards, subject to certain limitations on availability, to offset future net capital gains, if any. To the extent that these carryovers are used to offset future capital gains, it is probable that the gains so offset will not be distributed to shareholders:
| | | AMOUNT | EXPIRES |
| Equity Portfolio | $ | 22,371,666 | 2009 |
| Equity Portfolio | | 6,022,326 | 2010 |
| Balanced Portfolio | | 2,444,046 | 2009 |
| Balanced Portfolio | | 7,956,380 | 2010 |
| High Yield Portfolio | | 71,041 | 2009 |
| High Yield Portfolio | | 420,330 | 2010 |
| High Yield Portfolio | | 38,828 | 2011 |
| Fixed Income Portfolio | | 433,796 | 2010 |
Net realized gains or losses may differ from Federal income tax purposes primarily as a result of wash sales and post-October losses which may not be recognized for tax purposes until the first of the following fiscal year. Such amounts may be used to offset future capital gains.
The Government Securities Portfolio deferred $15,644 of post-October losses for the year ended December 31, 2004. The other Portfolios deferred no post-October losses.
40|86 Series Trust | Semi-Annual Report |
Notes to Financial Statements (unaudited) | June 30, 2005 |
6. INDEMNIFICATIONS
Under the Trust’s organizational documents, its officers and trustees are indemnified against certain liabilities arising out of the performance of their duties to the Trust. In addition, in the normal course of business, the Trust enters into contacts with its vendors and others that may provide for general indemnifications. The Trust’s maximum exposure under these arrangements is unknown as this would involve future claims be made against the Trust. However, based on experience, the Trust expects the risk of loss to be remote.
Expense Example
June 30, 2005 (unaudited)
As a shareholder of the 40|86 Series Trust (the “Trust”), you incur two types of costs: (1) transaction costs, including sales charges (loads) on purchase payments, reinvested dividends, or other distributions; redemption fees; and exchange fees; and (2) ongoing costs, including management fees; distribution and/or service fees; and other Trust expenses. This Example is intended to help you understand your ongoing costs (in dollars) of investing in the Trust and to compare these costs with the ongoing costs of investing in other mutual funds. The Example is based on an investment of $1,000 invested at the beginning of the period and held for the entire period (01/01/05 - 6/30/05).
Actual Expenses
The first line of the table below provides information about actual account values and actual expenses. The example below includes, but is not limited to, management fees, shareholder servicing fees, fund accounting, custody and transfer agent fees. However, the example below does not include portfolio trading commissions and related expenses, and other extraordinary expenses as determined under generally accepted accounting principles. You may use the information in this line, together with the amount you invested, to estimate the expenses that you paid over the period. Simply divide your account value by $1,000 (for example, an $8,600 account value divided by $1,000 = 8.6), then multiply the result by the number in the first line under the heading entitled “Expenses Paid During Period” to estimate the expenses you paid on your account during this period.
Hypothetical Example for Comparison Purposes
The second line of the table below provides information about hypothetical account values and hypothetical expenses based on the Trust’s actual expense ratio and an assumed rate of return of 5% per year before expenses, which is not the Trust’s actual return. The hypothetical account values and expenses may not be used to estimate the actual ending account balance or expenses you paid for the period. You may use this information to compare the ongoing costs of investing in the Trust and other funds. To do so, compare this 5% hypothetical example with the 5% hypothetical examples that appear in the shareholder reports of the other funds. Please note that the expenses shown in the table are meant to highlight your ongoing costs only and do not reflect any transactional costs, such as sales charges (loads), redemption fees, or exchange fees. Therefore, the second line of the table is useful in comparing ongoing costs only, and will not help you determine the relative total costs of owning different funds. In addition, if these transactional costs were included, your costs would have been higher.
Equity Portfolio | Beginning Account Value 01/01/05 | Ending Account Value 06/30/05 | Expenses Paid During Period 01/01/05 - 06/30/05(1) |
| Actual | $1,000.00 | $1,041.60 | $5.57 |
| Hypothetical (5% return before expenses) | 1,000.00 | 1,019.34 | 5.51 |
(1) Expenses are equal to the Fund’s annualized expense ratio of 1.10% multiplied by the average account value over the period multiplied by 181/365 (to reflect the one-half year period).
The accompanying notes are an integral part of these financial statements.
40|86 Series Trust | | Semi-Annual Report |
Expense Example | | |
June 30, 2005 (unaudited) | | |
Balanced Portfolio | Beginning Account Value 01/01/05 | Ending Account Value 06/30/05 | Expenses Paid During Period 01/01/05 - 06/30/05(2) |
| Actual | $1,000.00 | $1,018.00 | $5.50 |
| Hypothetical (5% return before expenses) | 1,000.00 | 1,019.34 | 5.51 |
(2) | Expenses are equal to the Fund’s annualized expense ratio of 1.10% multiplied by the average account value over the period multiplied by 181/365 (to reflect the one-half year period). |
High Yield Portfolio | Beginning Account Value 01/01/05 | Ending Account Value 06/30/05 | Expenses Paid During Period 01/01/05 - 06/30/05(3) |
| Actual | $1,000.00 | $1,004.80 | $5.72 |
| Hypothetical (5% returnbefore expenses) | 1,000.00 | 1,019.09 | 5.76 |
(3) | Expenses are equal to the Fund’s annualized expense ratio of 1.15% multiplied by the average account value over the period multiplied by 181/365 (to reflect the one-half year period). |
Fixed Income Portfolio | Beginning Account Value 01/01/05 | Ending Account Value 06/30/05 | Expenses Paid During Period 01/01/05 - 06/30/05(4) |
| Actual | $1,000.00 | $1,020.00 | $4.76 |
| Hypothetical (5% return before expenses) | 1,000.00 | 1,020.08 | 4.76 |
(4) | Expenses are equal to the Fund’s annualized expense ratio of 0.95% multiplied by the average account value over the period multiplied by 181/365 (to reflect the one-half year period). |
Government Securities Portfolio | Beginning Account Value 01/01/05 | Ending Account Value 06/30/05 | Expenses Paid During Period 01/01/05 - 06/30/05(5) |
| Actual | $1,000.00 | $1,022.00 | $4.76 |
| Hypothetical (5% return before expenses) | 1,000.00 | 1,020.08 | 4.76 |
(5) | Expenses are equal to the Fund’s annualized expense ratio of 0.95% multiplied by the average account value over the period multiplied by 181/365 (to reflect the one-half year period). |
Money Market Portfolio | Beginning Account Value 01/01/05 | Ending Account Value 06/30/05 | Expenses Paid During Period 01/01/05 - 06/30/05(6) |
| Actual | $1,000.00 | $1,011.70 | $2.24 |
| Hypothetical (5% return before expenses) | 1,000.00 | 1,022.56 | 2.26 |
(6) | Expenses are equal to the Fund’s annualized expense ratio of 0.45% multiplied by the average account value over the period multiplied by 181/365 (to reflect the one-half year period). |
The accompanying notes are an integral part of these financial statements.
40|86 Series Trust | Semi-Annual Report |
Board of Trustees Approval of Investment Management Conract |
Members of the Board of Trustees (the “Board” or “Trustees”) of 40|86 Series Trust (the “Trust”) were advised by, and met in executive session with, independent legal counsel to consider the Trust’s investment management contract with 40|86 Advisors, Inc. (the “Adviser”) for the Equity, Balanced, High Yield, Fixed Income, Government Securities and Money Market Portfolios (the “Portfolios”). Based upon the evaluation of the information provided, the Board, at a meeting held February 17, 2005, approved the continuation of the investment advisory contract of the Trust for a period through March 29, 2006.
The Board based its decision upon its most recent evaluation of the Adviser’s investment staff, portfolio process and performance. The Trustees considered the factors discussed below, among others. No single factor determined whether the Board approved the arrangement. Rather, it was the totality of the circumstances that drove the Trustees’ decision.
Nature and Quality of Services Provided by the Adviser and Sub-advisers
The Trustees noted that the Adviser, subject to the Board’s control, administers the Trust's business and other affairs. The Adviser (or the sub-adviser, as the case may be) manages the investment of the assets of each Portfolio, including making purchases and sales of portfolio securities consistent with each Portfolio's investment objective and policies. The Adviser also provides the Trust with such office space, administrative and other services and executive and other personnel as are necessary for the Fund's operations. The Adviser pays all of the compensation of Trustees who are affiliated persons of the Adviser and of the officers of the Trust.
The Trustees considered the scope and quality of services provided by the Adviser under the Investment Management Agreement and noted that the scope of services provided had expanded over time as a result of regulatory and other developments. The Trustees noted that, for example, the Adviser is responsible for maintaining and monitoring its own and, to varying degrees, the Trust's compliance programs, and these compliance programs have recently been refined and enhanced in light of new regulatory requirements. The Trustees considered the quality of the investment capabilities of the Adviser and the other resources it has dedicated to performing services for the Trust. The quality of administrative and other services, including the Adviser's role in coordinating the activities of the Trust's other service providers, were also considered.
The Trustees concluded that, overall, they were satisfied with the nature, extent and quality of services provided to the Trust under the Investment Management Agreement.
Fund Performance
In addition to the information reviewed by the Trustees in connection with the meeting, the Trustees had received performance information for each Portfolio at each regular Board meeting during the year. At the meeting, the Trustees received oral presentations from the Adviser on the current and historical performance of each Portfolio. The Trustees noted that the current and historical performance for each Portfolio exceeded the peer group median in nearly every instance, except for the Focus 20 Portfolio. The Trustees noted that the Adviser had recommended the closure and liquidation of the Focus 20 Portfolio.
Based on their review and their discussion of each Portfolio's investment performance with the Adviser, the Trustees expressed confidence in the Adviser's ability to continue to manage the various portfolios of the Trust and concluded that the Fund's investment performance was acceptable. The Board informed the Adviser that they planned to closely monitor the Trust's continued investment performance.
Management Fee and Total Operating Expenses
The Trustees compared the management fee payable to the Adviser for each Portfolio, as well as the management fee payable after waivers, with the comparative management fee information for other funds. The Board recognized that it is difficult to make comparisons of management fees because there are variations in the services that are included in the fees paid by other funds. The Trustees noted that while the management fee for some comparative funds was lower than for the respective Portfolios, the management fee for each of the Portfolios was within the median and average for the presented peer group. The Trustees concluded that each Portfolio’s management fee was satisfactory.
The Board also compared the total operating expenses, after expense limitations, for each of the Portfolios with the total operating expenses charged by other funds of similar asset size, that serve as an underlying investment option for variable insurance products considering contractual or voluntary expense limitations. The Trustees recognized that the total operating expense information reflects upon the Adviser's overall provision of services, as the Adviser is responsible for coordinating services provided to the Trust by others. The Trustees noted that while the total operating expenses for some comparative funds was lower than the respective Portfolios, the total operating expense for each of the Portfolios was within the median and average for the presented peer group. The Trustees concluded that each Portfolio’s total operating expenses were satisfactory.
Profitability
The Board reviewed a schedule of the revenues, expenses and related notes indicating the profitability of the Trust to the Adviser for 2004. The Board reviewed the assumptions and methods of allocation used by the Adviser in preparing Portfolio-specific profitability data. It was noted that the Adviser believed that the methods of allocation used in preparing the profitability information were reasonable and appropriate and that there is no generally accepted allocation methodology for information of this type.
40|86 Series Trust | Semi-Annual Report |
Board of Trustees Approval of Investment Management Conract |
The Trustees recognized that comparative profitability information is not generally publicly available and is affected by numerous factors, including the structure of the particular adviser, the types of funds it manages, its business mix, numerous assumptions regarding allocations and the adviser's capital structure and cost of capital. The Board also considered that the Distributor, a wholly-owned subsidiary of Conseco, Inc. (also, the Adviser’s parent company), receives 12b-1 fees from the Trust and receives compensation for distributing shares of the Portfolios.
The Board recognized that the Adviser is entitled to earn a reasonable level of profits for the services it provides to the Trust and, based upon their review, concluded that the Adviser's profitability from its relationship with the Trust was not excessive.
Economies of Scale
The Trustees determined, based upon their discussions and the materials provided to them by the Adviser, that the benefits derived by the Adviser through economies of scale relative to the Trust were not excessive.
After full consideration of the above factors, as well as, other factors, the Board concluded that the approval of the Trust’s agreement was in the best interest of the Trust and its shareholders.
40|86 Series Trust | Semi-Annual Report |
May 9, 2005 Special Meeting of Shareholders | |
PROPOSAL ONE: LIQUIDATE FOCUS 20 PORTFOLIO
For the Focus 20 Portfolio, approve or disapprove a Plan of Liquidation to liquidate the assets of the Focus 20 Portfolio and distribute the liquidation proceeds to the Focus 20 Portfolio’s shareholders.
Focus 20 Portfolio | No. of Shares | % of Outstanding Shares | % of Shares Voted |
| Affirmative | 377,657.931 | 96.661% | 96.661% |
| Withhold | 3,544.371 | 0.907% | 0.907% |
| Abstain | 9,502.758 | 2.432% | 2.432% |
| Total | 390,705.060 | 100.000% | 100.000% |
PROPOSAL TWO: ELECT TRUSTEES
Elect six trustees to the Board of Trustees.
Diana H. Hamilton | No. of Shares | % of Outstanding Shares | % of Shares Voted |
| Affirmative | 49,009,076.574 | 98.774% | 99.055% |
| Withhold | 467,669.744 | 0.943% | 0.945% |
| Total | 49,476,746.318 | 99.717% | 100.000% |
| | | | |
R. Matthew Neff | | | |
| Affirmative | 48,967,631.056 | 98.691% | 98.971% |
| Withhold | 509,115.262 | 1.026% | 1.029% |
| Total | 49,476,746.318 | 99.717% | 100.000% |
| | | | |
David N. Walthall | | | |
| Affirmative | 48,925,487.089 | 98.606% | 98.886% |
| Withhold | 551,259.229 | 1.111% | 1.114% |
| Total | 49,476,746.318 | 99.717% | 100.000% |
| | | | |
Harold W. Hartley | | | |
| Affirmative | 48,770,797.251 | 98.294% | 98.573% |
| Withhold | 705,949.067 | 1.423% | 1.427% |
| Total | 49,476,746.318 | 99.717% | 100.000% |
| | | | |
R. Jan LeCroy | | | |
| Affirmative | 48,727,785.376 | 98.208% | 98.486% |
| Withhold | 748,960.942 | 1.509% | 1.514% |
| Total | 49,476,746.318 | 99.717% | 100.000% |
| | | | |
Gregory J. Hahn | | | |
| Affirmative | 49,010,164.926 | 98.777% | 99.057% |
| Withhold | 466,581.392 | 0.940% | 0.943% |
| Total | 49,476,746.318 | 99.717% | 100.000% |
40|86 Series Trust | Semi-Annual Report |
May 9, 2005 Special Meeting of Shareholders | |
PROPOSAL THREE: AMEND DECLARATION OF TRUST
Amend the Trust’s Declaration of Trust to permit the Trustees to authorize the liquidation of one or more of the Portfolios without obtaining shareholder approval if shareholder approval is not otherwise required by applicable law.
Focus 20 Portfolio | No. of Shares | % of Outstanding Shares | % of Shares Voted |
| Affirmative | 318,909.406 | 81.624% | 81.624% |
| Withhold | 49,706.925 | 12.722% | 12.722% |
| Abstain | 22,088.729 | 5.654% | 5.654% |
| Total | 390,705.060 | 100.000% | 100.000% |
| | | | |
Equity Portfolio | | | |
| Affirmative | 4,791,516.015 | 71.143% | 71.143% |
| Withhold | 1,655,548.473 | 24.582% | 24.582% |
| Abstain | 287,951.242 | 4.275% | 4.275% |
| Total | 6,735,015.730 | 100.000% | 100.000% |
| | | | |
Balanced Portfolio | | | |
| Affirmative | 2,600,857.580 | 76.422% | 78.203% |
| Withhold | 515,592.592 | 15.149% | 15.503% |
| Abstain | 209,313.558 | 6.151% | 6.294% |
| Total | 3,325,763.730 | 97.722% | 100.000% |
| | | | |
High Yield Portfolio | | | |
| Affirmative | 618,736.980 | 81.687% | 81.687% |
| Withhold | 122,309.736 | 16.148% | 16.148% |
| Abstain | 16,398.414 | 2.165% | 2.165% |
| Total | 757,445.130 | 100.000% | 100.000% |
| | | | |
Fixed Income Portfolio | | | |
| Affirmative | 1,951,655.414 | 75.826% | 75.826% |
| Withhold | 405,901.702 | 15.770% | 15.770% |
| Abstain | 216,316.232 | 8.404% | 8.404% |
| Total | 2,573,873.348 | 100.000% | 100.000% |
| | | | |
Government Securities Portfolio | | | |
| Affirmative | 702,328.887 | 61.005% | 61.005% |
| Withhold | 336,535.480 | 29.232% | 29.232% |
| Abstain | 112,394.163 | 9.763% | 9.763% |
| Total | 1,151,258.530 | 100.000% | 100.000% |
| | | | |
Money Market Portfolio | | | |
| Affirmative | 26,570,971.318 | 76.782% | 76.922% |
| Withhold | 3,499,314.765 | 10.112% | 10.131% |
| Abstain | 4,472,398.707 | 12.924% | 12.947% |
| Total | 34,542,684.790 | 99.818% | 100.000% |
40|86 Series Trust | Semi-Annual Report |
Board of Trustees and Officers (unaudited) | |
Name (Age) Address | Position Held With Trust | Principal Occupation(s) During Past 5 Years |
David N. Walthall (59) 11815 N. Pennsylvania St. Carmel, IN 46032 | Chairman of the Board Since March 2004 and Trustee Since December 1998 | Principal, Walthall Asset Management. Director, Da-Lite Screen Company, Former President, Chief Executive Officer and Director of Lyrick Corporation. Formerly, President and CEO, Heritage Media Corporation. Formerly, Director, Eagle National Bank. Chairman of the Board and Trustee of one other mutual fund managed by the Adviser. |
| | | |
Audrey L. Kurzawa* (38) 11815 N. Pennsylvania St. Carmel, IN 46032 | President and Trustee Since June 2005 and Formerly Treasurer Since October 2002 | Certified Public Accountant. Controller, Adviser. President and Trustee of one other mutual fund managed by the Adviser. |
| | | |
Harold W. Hartley (81) 11815 N. Pennsylvania St. Carmel, IN 46032 | Trustee Since July 1998 | Chartered Financial Analyst. Director, Ennis, Inc. Retired, Executive Vice President, Tenneco Financial Services, Inc. Trustee of one other mutual fund managed by the Adviser. |
| | | |
Dr. R. Jan LeCroy (73) 11815 N. Pennsylvania St. Carmel, IN 46032 | Trustee Since July 1998 | Director, SWS Group, Inc. Retired, President, Dallas Citizens Council. Trustee of one other mutual fund managed by the Adviser. |
| | | |
Diana H. Hamilton (48) 11815 N. Pennsylvania St. Carmel, IN 46032 | Trustee Since December 2004 | President, Sycamore Advisors, LLC, a municipal finance advisory firm; Formerly, State of Indiana Director of Public Finance. Trustee of one other mutual fund managed by the Adviser. |
| | | |
R. Matthew Neff (49) 11815 N. Pennsylvania St. Carmel, IN 46032 | Trustee Since December 2004 | Chairman and Co-Chief Executive Officer of Senex Financial Corp., a financial services company engaged in the healthcare finance field. Trustee of one other mutual fund managed by the Adviser. |
| | | |
William T. Devanney (49) 11815 N. Pennsylvania St. Carmel, IN 46032 | Vice President Since July 1998 | Senior Vice President, Corporate Taxes of Conseco Services, LLC and various affiliates. Vice President of one other mutual fund managed by the Adviser. |
| | | |
Daniel Murphy (49) 11815 N. Pennsylvania St. Carmel, IN 46032 | Treasurer Since June 2005 | Senior Vice President and Treasurer, Conseco, Inc. Treasurer of one other mutual fund managed by the Adviser. |
| | | |
Jeffrey M. Stautz (47) 11815 N. Pennsylvania St. Carmel, IN 46032 | Chief Legal Officer and Secretary Since May 2005 | Vice President, General Counsel, Secretary and Chief Compliance Officer, Adviser. Chief Legal Officer and Secretary of one other mutual fund managed by the Adviser. |
| | | |
Sarah L. Bertrand (37) 11815 N. Pennsylvania St. Carmel, IN 46032 | Chief Compliance Officer and Assistant Secretary Since December 2004 | Assistant Vice President, Legal and Compliance, Adviser. Chief Compliance Officer and Assistant Secretary of one other mutual fund managed by the Adviser. |
| * | The Trustee so indicated is an ”interested person,” as defined in the 1940 Act, of the Trust due to the positions indicated with the Adviser and its affiliates. Each Trustee serves until the expiration of the term of his designated class and until his successor is elected and qualified, or until his death or resignation, or removal as provided in the Fund’s by—laws or charter or statute. All Trustees oversee the 7 portfolios that make up the total fund complex including 40|86 Strategic Income Fund (1) and 40|86 Series Trust (6). |
INVESTMENT ADVISER | LEGAL COUNSEL |
| 40|86 Advisors, Inc. | Kirkpatrick & Lockhart |
| Carmel, IN | Nicholson Graham LLP |
| | Washington, D.C. |
CUSTODIAN | |
| The Bank of New York | INVESTMENT SUB-ADVISERS |
| New York, NY | Chicago Equity Partners, LLC |
| | Chicago, IL |
INDEPENDENT REGISTERED | |
PUBLIC ACCOUNTING FIRM | |
| PricewaterhouseCoopers LLP | |
| Indianapolis, IN | |
PROXY VOTING POLICIES AND PROCEDURES
A description of the policies and procedures that the Portfolios use to determine how to vote proxies relating to portfolio securities is available without charge, upon request, by calling (866) 299-4086. Furthermore, you can obtain the description on the SEC’s website at http://www.sec.gov.
PROXY VOTING RECORDS FOR THE 12-MONTH PERIOD ENDED JUNE 30, 2005
Information regarding how the Portfolios voted proxies relating to portfolio securities during the most recent 12-month period ended June 30 is available without charge, upon request, by calling (866) 299-4086. Furthermore, you can obtain the Portfolio’s proxy voting records on the SEC’s website at http://www.sec.gov.
AVAILABILITY OF QUARTERLY PORTFOLIO SCHEDULE
The Portfolios file complete schedule of portfolio holdings with the SEC for the first and third quarters of each fiscal year on Form N-Q. The filing for the most recent quarter is available without charge, upon request, by calling (866) 299-4086. Furthermore, you can obtain the Portfolio’s quarterly portfolio schedule on the SEC’s website at http://www.sec.gov. The Portfolio’s Forms N-Q may also be reviewed and copied at the SEC’s Public Reference Room in Washington, DC, and information on the operation of the Public Reference Room may be obtained by calling (800) SEC-0330.
40|86 Series Trust is a registered investment company managed by
40|86 Advisors, Inc., a leading fixed-income investment advisor.
40|86 Series Trust
11815 North Pennsylvania Street
Carmel, Indiana 46032
Principal Underwriter:
Conseco Equity Sales, Inc.
11815 North Pennsylvania Street
Carmel, Indiana 46032
Item 2. | Code of Ethics. |
| | Not applicable for semi-annual reports. |
| | |
Item 3. | Audit Committee Financial Expert. |
| | Not applicable for semi-annual reports. |
| | |
Item 4. | Principal Accountant Fees and Services. |
| | Not applicable for semi-annual reports. |
| | |
Item 5. | Audit Committee of Listed Registrants. |
| | Not applicable to open-end investment companies. |
| | |
Item 6. | Schedule of Investments. |
| | Schedule of Investments in securities of unaffiliated issuers as of the close of the reporting period is included as part of the report to shareholders filed under Item 1 of this form. |
| | |
Item 7. | Disclosure of Proxy Voting Policies and Procedures for Closed-End Management Investment Companies. |
| | Not applicable to open-end investment companies. |
| | |
Item 8. | Portfolio Managers of Closed-End Management Investment Companies |
| | Not applicable to open-end investment companies. |
| | |
Item 9. | Purchases of Equity Securities by Closed-End Management Investment Company and Affiliated Purchasers. |
| | Not applicable to open-end investment companies. |
| | |
Item 10. | Submission of Matters to a Vote of Security Holders. |
| | No material changes. |
| | |
Item 11. | Controls and Procedures. |
| | |
| (a) | The registrant’s principal executive and principal financial officers, or persons performing similar functions, have concluded that the registrant's disclosure controls and procedures (as defined in Rule 30a-3(c) under the Investment Company Act of 1940, as amended (the "1940 Act") (17 CFR 270.30a-3(c))) are effective, as of a date within 90 days of the filing date of the report that includes the disclosure required by this paragraph, based on their evaluation of these controls and procedures required by Rule 30a-3(b) under the 1940 Act (17 CFR 270.30a-3(b)) and Rules 13a-15(b) or 15d-15(b) under the Exchange Act (17 CFR 240.13a-15(b) or 240.15d-15(b)). |
| | |
| (b) | There were no changes in the registrant's internal control over financial reporting (as defined in Rule 30a-3(d) under the 1940 Act (17 CFR 270.30a-3(d)) that occurred during the registrant's last fiscal half-year (the registrant's second fiscal half-year in the case of an annual report) that has materially affected, or is reasonably likely to materially affect, the registrant's internal control over financial reporting. |
| | |
Item 12. | Exhibits. |
| | |
| (a)(1) | Any code of ethics or amendment thereto. Not applicable for semi-annual reports. |
| | |
| (a)(2) | Certifications pursuant to Section 302 of the Sarbanes-Oxley Act of 2002. Filed herewith. |
| | |
| (a)(3) | Any written solicitation to purchase securities under Rule 23c-1 under the Act sent or given during the period covered by the report by or on behalf of the registrant to 10 or more persons. Not applicable to open-end investment companies. |
| | |
| (b) | Certifications pursuant to Section 906 of the Sarbanes-Oxley Act of 2002. Filed herewith. |
| | |
SIGNATURES
Pursuant to the requirements of the Securities Exchange Act of 1934 and the Investment Company Act of 1940, the registrant has duly caused this report to be signed on its behalf by the undersigned, thereunto duly authorized.
| (registrant) | 40|86 Series Trust |
| | |
| By (Signature and Title) | /s/ Audrey L. Kurzawa |
| | Audrey L. Kurzawa, President |
| | (principal executive officer) |
| | |
| Date | 8/26/05 |
| | |
| Pursuant to the requirements of the Securities Exchange Act of 1934 and the Investment Company Act of 1940, this report has been signed below by the following persons on behalf of the registrant and in the capacities and on the dates indicated. |
| |
| By (Signature and Title) | /s/ Audrey L. Kurzawa |
| | Audrey L. Kurzawa, President |
| | (principal executive officer) |
| | |
| Date | 8/26/05 |
| | |
| | |
| By (Signature and Title) | /s/ Daniel J. Murphy |
| | Daniel J. Murphy, Treasurer |
| | (principal financial officer) |
| | |
| Date | 8/29/05 |