UNITED STATES
SECURITIES AND EXCHANGE COMMISSION
Washington, D.C. 20549
FORM N-CSR
CERTIFIED SHAREHOLDER REPORT OF REGISTERED MANAGEMENT INVESTMENT COMPANIES
Investment Company Act file number: 811-03641
40|86 Series Trust
(Exact name of registrant as specified in charter)
11815 North Pennsylvania Street
Carmel, IN 46032
(Address of principal executive offices) (Zip code)
Jeffrey M. Stautz
11815 North Pennsylvania Street
Carmel, IN 46032
(Name and address of agent for service)
Registrant's telephone number, including area code: 317-817-4086
Date of fiscal year end: December 31
Date of reporting period: December 31, 2006
Form N-CSR is to be used by management investment companies to file reports with the Commission not later than 10 days after the transmission to stockholders of any report that is required to be transmitted to stockholders under Rule 30e-1 under the Investment Company Act of 1940 (17 CFR 270.30e-1). The Commission may use the information provided on Form N-CSR in its regulatory, disclosure review, inspection, and policymaking roles.
A registrant is required to disclose the information specified by Form N-CSR, and the Commission will make this information public. A registrant is not required to respond to the collection of information contained in Form N-CSR unless the Form displays a currently valid Office of Management and Budget ("OMB") control number. Please direct comments concerning the accuracy of the information collection burden estimate and any suggestions for reducing the burden to Secretary, Securities and Exchange Commission, 450 Fifth Street, NW, Washington, DC 20549-0609. The OMB has reviewed this collection of information under the clearance requirements of 44 U.S.C. § 3507.
Item 1. Reports to Stockholders.
The Report to Shareholders is attached herewith.

December 31, 2006
Annual Report
Equity Portfolio
Balanced Portfolio
Fixed Income Portfolio
Government Securities Portfolio
Money Market Portfolio
40|86 Series Trust | Annual Report |
Table of Contents | December 31, 2006 |
| Letter to Shareholders | 1 |
| Statements of Assets and Liabilities | 2 |
| Statements of Operations | 2 |
| Statements of Changes in Net Assets | 4 |
| Key Terms | 6 |
| | |
Equity Portfolio | |
| Portfolio Managers’ Review | 7 |
| Schedule of Investments | 8 |
| | |
Balanced Portfolio | |
| Portfolio Managers’ Review | 15 |
| Schedule of Investments | 17 |
| | |
Fixed Income Portfolio | |
| Portfolio Managers’ Review | 27 |
| Schedule of Investments | 29 |
| | |
Government Securities Portfolio | |
| Portfolio Managers’ Review | 34 |
| Schedule of Investments | 35 |
| | |
Money Market Portfolio | |
| Portfolio Managers' Review | 37 |
| Schedule of Investments | 38 |
| | |
| Financial Highlights | 40 |
| Notes to Financial Statements | 45 |
| Report of Independent Registered Public Accounting Firm | 50 |
| Expense Example | 51 |
| Board of Trustees and Officers. | 53 |
This report is for the information of 40|86 Series Trust contract owners.
It is authorized for distribution to other persons only when preceded, or accompanied by, a
current prospectus that contains more complete information, including charges and expenses.
40|86 Series Trust | Annual Report |
Letter to Shareholders (unaudited) | December 31, 2006 |
Liquidation of Fixed Income, Government Securities and Money Market Portfolios
As previously communicated to insurance contract owners on January 16, 2007, the Board of Trustees of the 40|86 Series Trust (the “Trust”) has approved a plan to liquidate and terminate the Fixed Income, Government Securities and Money Market Portfolios (the “Liquidated Portfolios”). The liquidation of the Liquidated Portfolios is expected to occur on or about March 23, 2007 (the “Liquidation Date”). On the Liquidation Date, each of the Liquidated Portfolios will distribute its assets to shareholders by redeeming their shares for cash, and will thereafter wind up its operations and terminate its existence.
In anticipation of the liquidation of the Liquidated Portfolios, the Board of Trustees approved the suspension of sales of shares of the Liquidated Portfolios to insurance company separate accounts used to support variable annuity contracts and variable life insurance contracts that offer the Liquidated Portfolios as an investment. As of January 31, 2007, the Trust no longer offered or sold shares of the Liquidated Portfolios to any such separate account or other investors. Until the Liquidation Date, however, dividends and distributions, if any, will continue to be reinvested in shares of the Liquidated Portfolios.
The Trust expects that many shareholders may decide to redeem their shares in the Liquidated Portfolios prior to the liquidation. As a result, it is possible that the total assets of the Liquidated Portfolios may reach a level at which it can no longer meet its investment objectives while maintaining an adequate level of diversification and liquidity. In the event that such an asset level is reached, the Liquidated Portfolios may invest its assets in cash and in U.S. dollar-denominated high-quality money market instruments and other short-term securities, including money market funds.
Exemptive Application for Equity and Balanced Portfolios
The Equity and Balanced Portfolios (the “Exemptive Portfolios”) are the subject of an exemptive application filed with the Securities and Exchange Commission (the “SEC”). The exemptive application seeks authority from the SEC to substitute shares of the Exemptive Portfolios with shares of two newly created Funds. The date for completing the substitution is subject to SEC approval.
Questions regarding the liquidation or the exemptive application may be directed to the Jefferson National Life Insurance Company Customer Service Center at 866-667-0561.
Thank you for your continued support of the 40|86 Series Trust.
Audrey L. Kurzawa
President and Trustee
The accompanying notes are an integral part of these financial statements.
40|86 Series Trust | Annual Report |
Statements of Assets and Liabilities | |
| December 31, 2006 | |
| | | EQUITY PORTFOLIO | |
ASSETS: | | | |
| Investments in securities at cost | | $ | 196,074,573 | |
| Investments in securities at value (Note 2) | | $ | 220,121,645 | |
| Interest and dividends receivable | | | 233,933 | |
| Receivable for securities sold | | | — | |
| Receivable from Conseco, Inc. subsidiaries | | | 31,895 | |
| Receivable for shares sold | | | — | |
| Prepaid expenses | | | 11,040 | |
| Total assets | | | 220,398,513 | |
LIABILITIES AND NET ASSETS: | | | | |
| Payable to Conseco, Inc. subsidiaries | | | 112,750 | |
| Payable to Custodian | | | — | |
| Accrued expenses | | | 197,783 | |
| Payable for shares redeemed | | | 20,876 | |
| Payable upon return of securities on loan | | | 50,679,175 | |
| Total liabilities | | | 51,010,584 | |
| Net assets | | $ | 169,387,929 | |
NET ASSETS CONSIST OF: | | | | |
| Paid-in capital | | $ | 140,511,456 | |
| Accumulated (overdistributed) undistributed net investment income | | | | |
| Accumulated undistributed net realized gain (loss) on investments | | | 4,829,401 | |
| Net unrealized appreciation (depreciation) on investments | | | 24,047,072 | |
| Net assets | | $ | 169,387,929 | |
| Shares outstanding (unlimited shares authorized) | | | 6,832,849 | |
| Net asset value, redemption price and offering price per share | | $ | 24.79 | |
| | | | | |
| | | | | |
Statements of Operations | | | | |
| For the year ended December 31, 2006 | | | | |
| | | | | |
| | | | EQUITY PORTFOLIO | |
INVESTMENT INCOME: | | | | |
| Interest | | $ | 51,932 | |
| Dividends | | | 2,440,077 | |
| Securities lending income, net | | | 69,092 | |
| Total investment income | | | 2,561,101 | |
EXPENSES: | | | | |
| Investment advisory fees | | | 1,107,459 | |
| Distribution fees | | | 425,946 | |
| Administration fee | | | 226,712 | |
| Custody fees | | | 14,898 | |
| Auditor fees | | | 62,248 | |
| Reports - printing | | | 26,318 | |
| Trustee fees and expenses | | | 49,234 | |
| Insurance | | | 4,527 | |
| Legal | | | 48,750 | |
| Other | | | 7,720 | |
| Total expenses before expense reimbursement by Adviser | | | 1,973,812 | |
| Expense reimbursement by Adviser (Note 3) | | | (99,601 | ) |
| Net expenses | | | 1,874,211 | |
| Net investment income | | | 686,890 | |
NET REALIZED AND UNREALIZED GAIN (LOSS) ON INVESTMENTS: | | | | |
| Net realized gain (loss) on sales of investments | | | 26,013,342 | |
| Net change in unrealized appreciation or depreciation on investments | | | (3,463,011 | ) |
| Net realized and unrealized gain (loss) on investments | | | 22,550,331 | |
| Net increase in net assets from operations | | $ | 23,237,221 | |
The accompanying notes are an integral part of these financial statements.
40|86 Series Trust | Annual Report |
| | BALANCED PORTFOLIO | | FIXED INCOME PORTFOLIO | | GOVERNMENT SECURITIES PORTFOLIO | | MONEY MARKET PORTFOLIO | |
| | | | | | | | | |
| $ | 47,203,075 | | $ | 20,978,064 | | $ | 11,714,121 | | $ | 30,476,699 | |
| $ | 52,272,918 | | $ | 21,011,075 | | $ | 11,637,566 | | $ | 30,476,699 | |
| | — | | | — | | | — | | | 5,000,000 | |
| | 216,073 | | | 270,426 | | | 106,490 | | | 175,035 | |
| | 8,504 | | | 2,498 | | | 1,770 | | | 13,127 | |
| 23,496 | | | — | | | 37,074 | | | — | |
| 2,757 | | | 1,221 | | | 562 | | | 2,570 | |
| 52,523,748 | | | 21,285,220 | | | 11,783,462 | | | 35,664,431 | |
| | | | | | | | | | | |
| 28,244 | | | 10,409 | | | 5,311 | | | 14,192 | |
| — | | | 3,999 | | | — | | | — | |
| 53,722 | | | 24,821 | | | 14,663 | | | 27,682 | |
| 1,163 | | | 262 | | | 423 | | | 475,338 | |
| 10,279,555 | | | 2,332,929 | | | 2,047,014 | | | — | |
| 10,362,684 | | | 2,372,420 | | | 2,067,411 | | | 517,212 | |
| $ | 42,161,064 | | $ | 18,912,800 | | $ | 9,716,051 | | $ | 35,147,219 | |
| | | | | | | | | | | |
| $ | 43,718,056 | | $ | 19,467,346 | | $ | 10,118,468 | | $ | 35,157,263 | |
| | | | 8,018 | | | (3,141 | ) | | — | |
| (6,626,835 | ) | | (595,575 | ) | | (329,003 | ) | | (10,044 | ) |
| 5,069,843 | | | 33,011 | | | (76,555 | ) | | — | |
| $ | 42,161,064 | | $ | 18,912,800 | | $ | 9,716,051 | | $ | 35,147,219 | |
| 2,724,966 | | | 1,922,429 | | | 859,509 | | | 35,157,463 | |
| $15.47 | | $ | 9.84 | | $ | 11.30 | | $ | 1.00 | |
| | | | | | | | | | | | |
| | | | | | | | | | | | |
| BALANCED PORTFOLIO | | | FIXED INCOME PORTFOLIO | | | GOVERNMENT SECURITIES PORTFOLIO | | | MONEY MARKET PORTFOLIO | |
| | | | | | | | | | | | |
| $ | 643,338 | | $ | 1,128,104 | | $ | 478,909 | | $ | 2,298,401 | |
| 576,538 | | | 12,640 | | | — | | | — | |
| 14,503 | | | 7,318 | | | 5,330 | | | — | |
| 1,234,379 | | | 1,148,062 | | | 484,239 | | | 2,298,401 | |
| | | | | | | | | | | |
| 275,381 | | | 104,180 | | | 52,523 | | | 183,513 | |
| 105,916 | | | 50,395 | | | 25,394 | | | — | |
| 56,369 | | | 27,741 | | | 13,984 | | | 61,781 | |
| 13,614 | | | 5,749 | | | 3,816 | | | 15,811 | |
| 19,087 | | | 10,902 | | | 6,970 | | | 19,640 | |
| 6,969 | | | 3,339 | | | 1,753 | | | 7,729 | |
| 12,883 | | | 6,433 | | | 3,509 | | | 15,805 | |
| 1,195 | | | 621 | | | 315 | | | 1,436 | |
| 13,015 | | | 6,546 | | | 3,367 | | | 13,975 | |
| 2,130 | | | 1,160 | | | 630 | | | 2,093 | |
| 506,559 | | | 217,066 | | | 112,261 | | | 321,783 | |
| | (40,530 | ) | | (19,130 | ) | | (12,470 | ) | | (112,734 | ) |
| | 466,029 | | | 197,936 | | | 99,791 | | | 209,049 | |
| 768,350 | | | 950,126 | | | 384,448 | | | 2,089,352 | |
| | | | | | | | | | | | |
| | 3,663,539 | | | 3,360 | | | (70,623 | ) | | (748 | ) |
| | 743,843 | | | (104,156 | ) | | 27,936 | | | — | |
| | 4,407,382 | | | (100,796 | ) | | (42,687 | ) | | (748 | ) |
| $ | 5,175,732 | | $ | 849,330 | | $ | 341,761 | | $ | 2,088,604 | |
The accompanying notes are an integral part of these financial statements.
40|86 Series Trust | Annual Report |
Statements of Changes in Net Assets | |
| For the years ended December 31, | |
| | | EQUITY PORTFOLIO |
| | | | | | |
| | | 2006 | | 2005 | |
OPERATIONS: | | | | | |
| Net investment income | | $ | 686,890 | | $ | 810,158 | |
| Net realized gain (loss) on sale of investments | | | 26,013,342 | | | 27,768,050 | |
| Net change in unrealized appreciation or depreciation on investments | | | (3,463,011 | ) | | (10,442,976 | ) |
| Net increase from operations | | | 23,237,221 | | | 18,135,232 | |
DIVIDENDS AND DISTRIBUTIONS: | | | | | | | |
| Dividends to shareholders from net investment income | | | (932,783 | ) | | (805,018 | ) |
| Distributions to shareholders of net realized gain | | | (20,244,004 | ) | | (15,930,420 | ) |
| Net decrease from dividends and distributions | | | (21,176,787 | ) | | (16,735,438 | ) |
CAPITAL SHARE TRANSACTIONS: | | | | | | | |
| Shares sold | | | 1,617,226 | | | 6,070,310 | |
| Reinvested dividends and distributions | | | 21,176,785 | | | 16,735,438 | |
| Shares redeemed | | | (27,245,950 | ) | | (21,327,098 | ) |
| Net increase (decrease) from capital share transactions | | | (4,451,939 | ) | | 1,478,650 | |
| Total increase (decrease) in net assets | | | (2,391,505 | ) | | 2,878,444 | |
NET ASSETS: | | | | | | | |
| Beginning of year | | | 171,779,434 | | | 168,900,990 | |
| End of year | | $ | 169,387,929 | | $ | 171,779,434 | |
| Including (overdistributed) undistributed net investment income of | | $ | | | $ | — | |
| | | | | | | | |
| | | | | | | | |
SHARE DATA: | | | | | | | |
| Shares sold | | | 61,596 | | | 238,166 | |
| Reinvested dividends and distributions | | | 848,258 | | | 674,272 | |
| Shares redeemed | | | (1,033,909 | ) | | (840,010 | ) |
| Net increase (decrease) | | | (124,055 | ) | | 72,428 | |
| Shares Outstanding | | | | | | | |
| Beginning of year | | | 6,956,904 | | | 6,884,476 | |
| End of year | | | 6,832,849 | | | 6,956,904 | |
The accompanying notes are an integral part of these financial statements.
40|86 Series Trust | Annual Report |
| | BALANCED PORTFOLIO | | FIXED INCOME PORTFOLIO | | GOVERNMENT SECURITIES PORTFOLIO | | MONEY MARKET PORTFOLIO | |
| | | | | | | | | | | | | | | | | |
| | 2006 | | 2005 | | 2006 | | 2005 | | 2006 | | 2005 | | 2006 | | 2005 | |
| | | | | | | | | | | | | | | | | |
| $ | 768,350 | | $ | 746,196 | | $ | 950,126 | | $ | 1,089,498 | | $ | 384,448 | | $ | 445,134 | | $ | 2,089,352 | | $ | 998,425 | |
| 3,663,539 | | | 3,950,044 | | | 3,360 | | | 381,363 | | | (70,623 | ) | | 21,687 | | | (748 | ) | | — | |
| | 743,843 | | | (2,231,094 | ) | | (104,156 | ) | | (897,462 | ) | | 27,936 | | | (255,549 | ) | | — | | | — | |
| | 5,175,732 | | | 2,465,146 | | | 849,330 | | | 573,399 | | | 341,761 | | | 211,272 | | | 2,088,604 | | | 998,425 | |
| | | | | | | | | | | | | | | | | | | | | | | | |
| | (778,127 | ) | | (744,826 | ) | | (983,774 | ) | | (1,104,249 | ) | | (408,114 | ) | | (482,446 | ) | | (2,098,648 | ) | | (998,425 | ) |
| | — | | | — | | | — | | | — | | | — | | | — | | | (200 | ) | | — | |
| | (778,127 | ) | | (744,826 | ) | | (983,774 | ) | | (1,104,249 | ) | | (408,114 | ) | | (482,446 | ) | | (2,098,848 | ) | | (998,425 | ) |
| | | | | | | | | | | | | | | | | | | | | | | | |
| | 2,479,084 | | | 3,163,254 | | | 1,062,385 | | | 2,906,364 | | | 1,141,860 | | | 2,443,817 | | | 297,099,815 | | | 90,474,421 | |
| 778,127 | | | 744,826 | | | 983,774 | | | 1,104,249 | | | 408,114 | | | 482,446 | | | 2,098,848 | | | 998,425 | |
| | (9,004,954 | ) | | (9,173,334 | ) | | (6,090,397 | ) | | (7,835,826 | ) | | (3,976,186 | ) | | (5,011,025 | ) | | (304,381,290 | ) | | (84,887,785 | ) |
| | (5,747,743 | ) | | (5,265,254 | ) | | (4,044,238 | ) | | (3,825,213 | ) | | (2,426,212 | ) | | (2,084,762 | ) | | (5,182,627 | ) | | 6,585,061 | |
| | (1,350,138 | ) | | (3,544,934 | ) | | (4,178,682 | ) | | (4,356,063 | ) | | (2,492,565 | ) | | (2,355,936 | ) | | (5,192,871 | ) | | 6,585,061 | |
| | | | | | | | | | | | | | | | | | | | | | | | |
| | 43,511,202 | | | 47,056,136 | | | 23,091,482 | | | 27,447,545 | | | 12,208,616 | | | 14,564,552 | | | 40,340,090 | | | 33,755,029 | |
$ | 42,161,064 | | $ | 43,511,202 | | $ | 18,912,800 | | $ | 23,091,482 | | $ | 9,716,051 | | $ | 12,208,616 | | $ | 35,147,219 | | $ | 40,340,090 | |
$ | | | $ | — | | $ | 8,018 | | $ | 5,527 | | $ | 3,141 | | $ | 2,019 | | $ | — | | $ | 9,296 | |
| | | | | | | | | | | | | | | | | | | | | | | | |
| | | | | | | | | | | | | | | | | | | | | | | | |
| | 170,658 | | | 234,142 | | | 108,894 | | | 290,079 | | | 101,522 | | | 212,047 | | | 297,099,815 | | | 90,474,421 | |
| | 52,632 | | | 54,501 | | | 100,889 | | | 110,584 | | | 36,302 | | | 42,037 | | | 2,098,848 | | | 998,425 | |
| | (619,284 | ) | | (674,392 | ) | | (623,576 | ) | | (781,400 | ) | | (353,354 | ) | | (435,184 | ) | | (304,381,290 | ) | | (84,887,785 | ) |
| | (395,994 | ) | | (385,749 | ) | | (413,793 | ) | | (380,737 | ) | | (215,530 | ) | | (181,100 | ) | | (5,182,627 | ) | | 6,585,061 | |
| | | | | | | | | | | | | | | | | | | | | | | | |
| | 3,120,960 | | | 3,506,709 | | | 2,336,222 | | | 2,716,959 | | | 1,075,039 | | | 1,256,139 | | | 40,340,090 | | | 33,755,029 | |
| | 2,724,966 | | | 3,120,960 | | | 1,922,429 | | | 2,336,222 | | | 859,509 | | | 1,075,039 | | | 35,157,463 | | | 40,340,090 | |
The accompanying notes are an integral part of these financial statements.
40|86 Series Trust | Annual Report |
Key Terms (unaudited) | |
Agency security - bond issued by US government entity such as the Federal National Mortgage Association (FNMA or “Fannie Mae”).
Asset-backed security - bond backed by loans or by the outstanding amounts owed to a bank, credit card company or other lender.
Barbell structure - bond investment strategy that focuses holdings in short-term and long-term securities.
Basis points (bps) - equivalent to 1/100th of 1%. .01% equals 1 basis point. 1% equals 100 basis points.
Collateralized Mortgage Obligation (CMO) - mortgage-backed security that creates separate pools of pass-through rates for different classes of holders.
Commercial paper - short-term debt obligations (maturing within 270 days) issued to investors by banks, corporations and other borrowers.
Credit spread - difference between yields of identical Treasury fixed income securities and corporate fixed income securities.
Duration - measurement of how long, in years, it takes for the price of a bond to be repaid by its internal cash flows. In general, bonds with higher durations carry more risk and have higher price volatility.
Event risk - risk due to unforeseen events associated with a company.
Federal Open Market Committee (FOMC or the “Fed”) - branch of the Federal Reserve Board that meets 8 times per year to determine the direction of monetary policy, specifically by setting key interest rates.
Floating-rate note - bond with a variable interest rate, usually tied to a money market index.
Gross Domestic Product (GDP) - measure of all finished goods and services produced within a country’s borders. Represents broad measure of economic activity in a specific country.
Investment grade - fixed income securities that are rated “triple B” or better by a ratings agency. These bonds are judged likely to meet payment obligations.
Leveraged buyout (LBO) - strategy used to buy another company using primarily debt obligations. The acquired company’s assets are often used as collateral to secure the debt.
London Interbank Offered Rate (LIBOR) - interest rate at which banks can borrow funds from other banks in the London interbank market.
Maturity date - the date the principal amount of a note, bond or other debt instrument becomes due or payable.
Mortgage-backed security - bond that represents an interest in a pool of mortgages issued by the Government National Mortgage Association (GNMA or “Ginnie Mae”), FNMA or other federal entities.
Overweight - a portfolio’s investment in a security that is larger, in percentage terms, than the portfolio’s corresponding benchmark. A portfolio may be overweight a specific security or sector because the portfolio manager believes that security or sector will produce higher returns.
Security - the general name for a stock (also known as an “equity”), bond (also known as “fixed income”) or other investment.
Underweight - a portfolio’s investment in a security that is smaller, in percentage terms, than the portfolio’s corresponding benchmark. A portfolio may be underweight a specific security or sector because the portfolio manager believes that security or sector will produce lower returns.
Variable-rate demand note (VRDN) - long-term, fixed income security that can be tendered for purchase at par whenever rates reset. The variable rate of the security is tied to the money market.
Yankee bond - bond denominated in US dollars and offered in the US by foreign banks.
Yield curve - graphical representation of yields of fixed income securities. A normal yield curve exists when short-term yields are lower than long-term yields. A flat yield curve exists when short-term and long-term yields are equal. An inverted yield curve exists when short-term yields are higher than long-term yields.
40|86 Series Trust | Annual Report |
Portfolio Managers' Review (unaudited) | December 31, 2006 |
Equity Portfolio
How did the Portfolio perform relative to its benchmark?
The 40|86 Series Trust Equity Portfolio returned 14.63% for the year ended December 31, 2006(1). The Portfolio’s benchmark, the Russell Mid Cap Index, returned 15.26% for the same period.
What factors contributed to the variance between the Portfolio and its benchmark?
We believe the Portfolio will outperform its benchmark by building a portfolio of companies with stronger fundamentals than the benchmark. These fundamentals can be described in three groups: Momentum/Growth - company and stock growth; Value - cheap relative to peers; Quality - clean balance sheets. Over the last 12 months, the market was not rewarding momentum factors (companies with favorable earnings outlooks), as investors were concerned with companies’ earnings trends in this environment of slower growth. This was enough to offset the Portfolio’s positive performance from the overweight position in stocks with good quality and favorable valuations. Therefore, the top rated stocks in our model had negative performance, which led to the Portfolio’s slight under-performance. We consider this a short-term situation because fundamentals drive stock prices, and earnings do matter in the long-term.
Which holdings most enhanced the Portfolio’s performance?
Stock selection in Materials, Discretionary and Industrial sectors were the largest contributors. The largest individual contributors were overweight positions in steel manufacturer Nucor, semiconductor manufacturer Freescale Semiconductor and CB Richard Ellis Group, a global leader in real estate services.
Which holdings most negatively impacted the Portfolio’s performance?
For the year, stock selection in the Technology, Staples and Energy sectors detracted the most. The largest individual detractors were overweight positions in mining equipment manufacturer Joy Global and software developer Citrix Systems and an underweight position in Celgene Corp., a biopharmaceutical company.
What is your outlook for the next year?
The forecast for 2007 is generally optimistic. Overall expectations are that the weakness in housing and manufacturing should moderate, the strength in the service sector will continue and inflation will decline. All three factors should lead to a good year for the economy.
Given the expected slow down in earnings and GDP, we anticipate momentum to work, shifting from price momentum to downward earnings and earnings momentum, which will focus on companies with smaller downward earnings trends. We believe quality will continue to outperform. Value will continue to show positive returns as multiples expand due to lower inflation expectations and anticipation of economic recovery.
Overall, our philosophy will not change based on short-term trends or conditions in the market. Our goal is to add value through security selection, while attempting to neutralize other risk factors, such as market timing and sector rotation, for which there is not adequate compensation by the market.
Exemptive Application filed for the Equity Portfolio
Please refer to the Letter to Shareholders at the front of this report for information regarding an exemptive application filed with the SEC for the Equity Portfolio.
Chicago Equity Partners, LLC
(1) | Past performance does not guarantee future results. Your investment return and principal will fluctuate, and your shares may be worth more or less than their original cost. Total return is provided in accordance with SEC guidelines for comparative purposes and reflects certain contractual expense reimbursements through April 30, 2007. If the expense reimbursements were not in place, the Portfolio's return would have been lower. The total returns shown do not include separate account expenses or the deduction of taxes that a contract holder would pay on portfolio distributions or the redemption of portfolio shares. The Russell MidCap Index is an unmanaged index believed to be representative of medium-sized U.S. companies. Investors cannot actually invest in an index. |
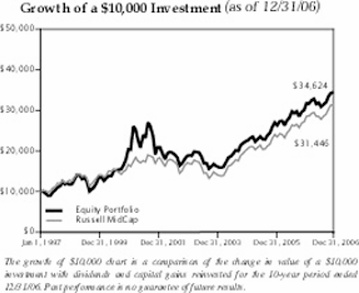
The growth of $10,000 chart is a comparison of the change in value of a $10,000
investment with dividends and capital gains reinvested for the 10-year period
ended 12/31/06. Past performance is no guarantee of future results.
Average Annual Total Return(1) (as of 12/31/06)
| | 1 YEAR | 5 YEARS | 10 YEARS |
| Equity Portfolio | 14.63% | 12.91% | 13.22% |
| Russell MidCap | 15.26% | 12.88% | 12.14% |
(1) | Past performance does not guarantee future results. Your investment return and principal will fluctuate, and your shares may be worth more or less than their original cost. Total return is provided in accordance with SEC guidelines for comparative purposes and reflects certain contractual expense reimbursements through April 30, 2007. If the expense reimbursements were not in place, the Portfolio's return would have been lower. The total returns shown do not include separate account expenses or the deduction of taxes that a contract holder would pay on portfolio distributions or the redemption of portfolio shares. The Russell MidCap Index is an unmanaged index believed to be representative of medium-sized U.S. companies. Investors cannot actually invest in an index. |
40|86 Series Trust | Annual Report |
Schedule of Investments | December 31, 2006 |
| Equity Portfolio | |
SHARES OR PRINCIPAL AMOUNT | | | VALUE |
| | | | | | |
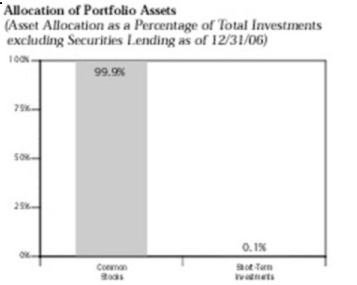
COMMON STOCKS (99.9%) | | |
Aerospace & Defense (0.7%) | | |
| | 19,300 | | Rockwell Collins, Inc. | | $ 1,221,497 |
Air Freight & Logistics (0.5%) | | |
| | 16,200 | | Ryder System, Inc. | | 827,172 |
Airlines (1.5%) | | |
| | 31,200 | | Continental Airlines, Inc. (a)(c) | | 1,287,000 |
| | 36,400 | | Southwest Airlines Co. | | 557,648 |
| | 15,700 | | UAL Corp. (a)(c) | | 690,800 |
| | | | | | 2,535,448 |
Auto Components (1.1%) | | |
| | 17,900 | | Autoliv, Inc. | | 1,079,370 |
| | 29,300 | | TRW Automotive Holdings Corp. (a) | | 757,991 |
| | | | | | 1,837,361 |
Automobiles (1.0%) | | |
| | 24,900 | | Harley-Davidson, Inc. (c) | | 1,754,703 |
Beverages (0.4%) | | |
| | 9,000 | | Brown-Forman Corp. - Class B | | 596,160 |
Biotechnology (1.2%) | | |
| | 26,900 | | Biogen Idec, Inc. (a) | | 1,323,211 |
| | 14,600 | | ImClone Systems, Inc. (a)(c) | | 390,696 |
| | 29,200 | | Millennium Pharmaceuticals, Inc. (a)(c) | | 318,280 |
| | | | | | 2,032,187 |
Capital Markets (2.8%) | | |
| | 16,000 | | The Bear Stearns Companies, Inc. | | 2,604,480 |
| | 36,400 | | Mellon Financial Corp. (c) | | 1,534,260 |
| | 9,100 | | Northern Trust Corp. | | 552,279 |
| | | | | | 4,691,019 |
Chemicals (2.8%) | | |
| | 10,300 | | Albemarle Corp. | | 739,540 |
| | 39,300 | | Ashland, Inc. (c) | | 2,718,774 |
| | 3,800 | | FMC Corp. | | 290,890 |
| | 12,500 | | International Flavors & Fragrances, Inc. (c) | | 614,500 |
| | 4,700 | | PPG Industries, Inc. | | 301,787 |
| | | | | | 4,665,491 |
Commercial Banks (3.2%) | | |
| | 21,100 | | Comerica, Inc. | | 1,238,148 |
| | 9,600 | | Compass Bancshares, Inc. (c) | | 572,640 |
| | 82,000 | | KeyCorp (c) | | 3,118,460 |
| | 4,400 | | M&T Bank Corp. (c) | | 537,504 |
| | | | | | 5,466,752 |
The accompanying notes are an integral part of these financial statements.
40|86 Series Trust | Annual Report |
Schedule of Investments | December 31, 2006 |
Equity Portfolio
SHARES OR PRINCIPAL AMOUNT | | VALUE |
| | | |
Commercial Services & Supplies (3.2%) | |
| 3,800 | Avery Dennison Corp | $ 258,134 |
| 7,800 | Corrections Corporation of America (a) | 352,794 |
| 6,400 | Dun & Bradstreet Corp. (a) | 529,856 |
| 20,600 | Manpower, Inc. (c) | 1,543,558 |
| 58,200 | RR Donnelley & Sons Co. (c) | 2,068,428 |
| 33,400 | Steelcase, Inc. (c) | 606,544 |
| | | 5,359,314 |
Communications Equipment (1.6%) | |
| 18,900 | Avaya, Inc. (a)(c) | 264,222 |
| 60,128 | Ciena Corp. (a)(c) | 1,666,147 |
| 70,200 | Tellabs, Inc. (a) | 720,252 |
| | | 2,650,621 |
Computer Programming Services (0.4%) | |
| 48,900 | BEA Systems, Inc. (a) | 615,162 |
Computers & Peripherals (1.9%) | |
| 13,100 | Lexmark International, Inc. (a)(c) | 958,920 |
| 113,600 | Western Digital Corp. (a)(c) | 2,324,256 |
| | | 3,283,176 |
Construction Materials (0.6%) | |
| 11,600 | Vulcan Materials Co. (c) | 1,042,492 |
Consumer Finance (1.6%) | |
| 63,000 | AmeriCredit Corp. (a)(c) | 1,585,710 |
| 15,000 | The First Marblehead Corporation (c) | 819,750 |
| 8,000 | MoneyGram International, Inc. (c) | 250,880 |
| | | 2,656,340 |
Containers & Packaging (0.5%) | |
| 24,100 | Pactiv Corp. (a) | 860,129 |
Diversified Financial Services (0.7%) | |
| 20,600 | CIT Group, Inc. | 1,148,862 |
Diversified Telecommunication Services (1.4%) | |
| 30,100 | CenturyTel, Inc. (c) | 1,314,166 |
| 125,100 | Qwest Communications International (a)(c) | 1,047,087 |
| | | 2,361,253 |
Electric Utilities (5.7%) | |
| 24,300 | Allegheny Energy, Inc. (a) | 1,115,613 |
| 65,600 | American Electric Power Co., Inc. | 2,793,248 |
| 26,300 | Edison International. | 1,196,124 |
| 15,300 | OGE Energy Corp. (c) | 612,000 |
| 83,800 | PG&E Corp. (c) | 3,966,254 |
| | | 9,683,239 |
Electrical Equipment (0.4%) | |
| 10,300 | Rockwell Automation, Inc. | 629,124 |
The accompanying notes are an integral part of these financial statements.
40|86 Series Trust | Annual Report |
Schedule of Investments | December 31, 2006 |
Equity Portfolio
SHARES OR PRINCIPAL AMOUNT | | VALUE |
| | | |
Electronic Equipment & Instruments (1.0%) | |
| 17,400 | Avnet, Inc. (a) | $ 444,222 |
| 20,700 | AVX Corp. (c) | 306,153 |
| 23,800 | Ingram Micro, Inc. (a) | 485,758 |
| 13,100 | Tech Data Corp. (a) | 496,097 |
| | | 1,732,230 |
Energy Equipment & Services (2.4%) | |
| 22,900 | Patterson-UTI Energy, Inc. (c) | 531,967 |
| 55,100 | Tidewater, Inc. (c) | 2,664,636 |
| 19,100 | Unit Corp. (a) | 925,395 |
| | | 4,121,998 |
Food & Staples Retailing (1.3%) | |
| 30,600 | The Kroger Co. | 705,942 |
| 45,300 | Safeway, Inc. (c) | 1,565,568 |
| | | 2,271,510 |
Food Products (2.2%) | |
| 68,100 | Archer Daniels Midland Co. | 2,176,476 |
| 25,200 | Campbell Soup Co. (c) | 980,028 |
| 20,900 | ConAgra Foods, Inc. | 564,300 |
| | | 3,720,804 |
Gas Utilities (2.0%) | |
| 24,500 | Energen Corp. | 1,150,030 |
| 36,900 | NiSource, Inc.. | 889,290 |
| 16,900 | Questar Corp | 1,403,545 |
| | | 3,442,865 |
Health Care Equipment & Supplies (1.9%) | |
| 18,700 | Becton, Dickinson & Co. | 1,311,805 |
| 9,900 | C.R. Bard, Inc. (c) | 821,403 |
| 7,400 | Dentsply International, Inc. | 220,890 |
| 22,800 | Kinetic Concepts, Inc. (a)(c) | 901,740 |
| | | 3,255,838 |
Health Care Providers & Services (4.3%) | |
| 9,000 | AMERIGROUP Corp. (a) | 323,010 |
| 38,100 | AmerisourceBergen Corp. | 1,712,976 |
| 25,700 | Cigna Corp. | 3,381,349 |
| 11,200 | Health Net, Inc. (a) | 544,992 |
| 6,300 | Laboratory Corporation of America Holdings (a)(c) | 462,861 |
| 25,500 | Sierra Health Services (a)(c) | 919,020 |
| | | 7,344,208 |
Hotels, Restaurants & Leisure (2.2%) | |
| 38,250 | Brinker International, Inc | 1,153,620 |
| 44,500 | Darden Restaurants, Inc. | 1,787,565 |
| 17,900 | International Game Technology (c) | 826,980 |
| | | 3,768,165 |
The accompanying notes are an integral part of these financial statements.
40|86 Series Trust | Annual Report |
Schedule of Investments | December 31, 2006 |
Equity Portfolio
SHARES OR PRINCIPAL AMOUNT | | VALUE |
| | | |
Household Durables (2.0%) | |
| 52,400 | Newell Rubbermaid, Inc. (c) | $ 1,516,980 |
| 13,100 | Ryland Group, Inc. (c) | 715,522 |
| 5,500 | Snap-On, Inc. | 262,020 |
| 10,600 | Whirlpool Corp. (c) | 880,012 |
| | | 3,374,534 |
Household Products (0.5%) | |
| 11,200 | Energizer Holdings, Inc. (a)(c) | 795,088 |
Industrial Conglomerates (0.2%) | |
| 3,200 | Carlisle Companies, Inc. | 251,200 |
Insurance (3.0%) | |
| 49,350 | American Financial Group, Inc. | 1,772,158 |
| 26,900 | Assurant, Inc. (c). | 1,486,225 |
| 13,500 | Lincoln National Corp. | 896,400 |
| 16,100 | Safeco Corp. (c) | 1,007,055 |
| | | 5,161,838 |
Internet & Catalog Retail (2.4%) | |
| 17,700 | Expedia, Inc. (a)(c) | 371,346 |
| 80,200 | IAC/InterActiveCorp (a)(c) | 2,980,232 |
| 11,000 | Nutri/System, Inc. (a)(c) | 697,290 |
| | | 4,048,868 |
IT Services (2.9%) | |
| 48,000 | Computer Sciences Corp. (a) | 2,561,760 |
| 25,800 | Electronic Data Systems Corp. (c) | 710,790 |
| 34,800 | Global Payments, Inc. (c) | 1,611,240 |
| | | 4,883,790 |
Leisure Equipment & Products (1.6%) | |
| 36,400 | Marvel Entertainment, Inc. (a)(c) | 979,524 |
| 74,400 | Mattel, Inc. | 1,685,904 |
| | | 2,665,428 |
Life Science Tools & Services (1.9%) | |
| 54,400 | Applera Corp. - Applied Biosystems Group (c) | 1,995,936 |
| 21,800 | Techne Corp. (a) | 1,208,810 |
| | | 3,204,746 |
Machinery (4.1%) | |
| 16,600 | Cummins, Inc. (c) | 1,961,788 |
| 11,500 | Manitowoc Co. | 683,445 |
| 17,200 | SPX Corp.. | 1,051,952 |
| 50,500 | Terex Corp. (a) | 3,261,290 |
| | | 6,958,475 |
Media (0.4%) | |
| 14,200 | Dreamworks Animation SKG, Inc. (a)(c) | 418,758 |
| 7,500 | Univision Communications, Inc. (a)(c) | 265,650 |
| | | 684,408 |
The accompanying notes are an integral part of these financial statements.
40|86 Series Trust | Annual Report |
Schedule of Investments | December 31, 2006 |
Equity Portfolio
SHARES OR PRINCIPAL AMOUNT | | VALUE |
| | | |
Metals & Mining (1.8%) | |
| 2,500 | Carpenter Technology | $ 256,300 |
| 28,500 | Nucor Corp. (c) | 1,557,810 |
| 3,100 | Phelps Dodge Corp. | 371,132 |
| 5,300 | Southern Copper Corp. (c) | 285,617 |
| 8,500 | United States Steel Corp | 621,690 |
| | | 3,092,549 |
Multiline Retail (1.7%) | |
| 27,600 | J.C. Penney Company, Inc. | 2,135,136 |
| 15,700 | Nordstrom, Inc. (c) | 774,638 |
| 1 | Sears Holdings Corp. (a) | 168 |
| | | 2,909,942 |
Multi-Utilities & Unregulated Power (1.1%) | |
| 41,200 | MDU Resources Group, Inc. (c) | 1,056,368 |
| 9,300 | National Fuel Gas Co. (c) | 358,422 |
| 10,900 | Oneok, Inc. | 470,008 |
| | | 1,884,798 |
Office Electronics (0.3%) | |
| 32,700 | Xerox Corp. (a) | 554,265 |
Oil, Gas & Consumable Fuels (3.0%) | |
| 41,800 | Frontier Oil Corp. (c) | 1,201,332 |
| 6,400 | Holly Corp. (c) | 328,960 |
| 14,100 | Overseas Shipholding Group, Inc. (c) | 793,830 |
| 17,000 | Sunoco, Inc. | 1,060,120 |
| 25,200 | Tesoro Petroleum Corp. (c) | 1,657,404 |
| | | 5,041,646 |
Paper & Forest Products (0.3%) | |
| 24,900 | Louisiana-Pacific Corp. | 536,097 |
Personal Products (0.1%) | |
| 7,500 | Avon Products, Inc | 247,800 |
Pharmaceuticals (0.5%) | |
| 20,700 | Endo Pharmaceuticals Holdings, Inc. (a) | 570,906 |
| 16,600 | King Pharmaceuticals, Inc. (a)(c) | 264,272 |
| | | 835,178 |
Real Estate (0.5%) | |
| 26,600 | United Dominion Realty Trust, Inc. (c) | 845,614 |
Real Estate Investment Trusts (7.2%) | |
| 17,300 | AvalonBay Communities, Inc. (c) | 2,249,865 |
| 4,000 | Boston Properties, Inc. (c) | 447,520 |
| 78,700 | CB Richard Ellis Group, Inc. (a) | 2,612,840 |
| 28,200 | CBL & Associates Properties, Inc. | 1,222,470 |
| 134,700 | HRPT Properties Trust (c) | 1,663,545 |
| 21,200 | Kimco Realty Corp. (c) | 952,940 |
The accompanying notes are an integral part of these financial statements.
40|86 Series Trust | Annual Report |
Schedule of Investments | December 31, 2006 |
Equity Portfolio
SHARES OR PRINCIPAL AMOUNT | | VALUE |
| | | |
Real Estate Investment Trusts (continued) | |
| 9,200 | New Century Financial Corp. (c) | $ 290,628 |
| 58,900 | New Plan Excel Realty Trust (c) | 1,618,572 |
| 28,100 | Rayonier, Inc.. | 1,153,505 |
| | | 12,211,885 |
Semiconductor & Semiconductor Equipment (3.6%) | |
| 38,900 | Advanced Micro Devices, Inc. (a)(c) | 791,615 |
| 54,100 | Agere Systems, Inc. (a). | 1,037,097 |
| 43,300 | Intersil Corp. (c) | 1,035,736 |
| 14,900 | Lam Research Corp. (a)(c) | 754,238 |
| 77,400 | LSI Logic Corp. (a)(c) | 696,600 |
| 51,800 | Micron Technology, Inc. (a)(c) | 723,128 |
| 9,800 | Nvidia Corp. (a) | 362,698 |
| 32,300 | Xilinx, Inc. | 769,063 |
| | | 6,170,175 |
Software (2.3%) | |
| 58,000 | BMC Software, Inc. (a) | 1,867,600 |
| 38,500 | Compuware Corp. (a) | 320,705 |
| 9,900 | McAfee, Inc. (a) | 280,962 |
| 58,200 | Sybase, Inc. (a)(c) | 1,437,540 |
| | | 3,906,807 |
Specialty Retail (4.1%) | |
| 75,000 | American Eagle Outfitters, Inc. (c) | 2,340,750 |
| 12,800 | Ann Taylor Stores Corp. (a) | 420,352 |
| 42,800 | Office Depot, Inc. (a) | 1,633,676 |
| 11,500 | Rent-A-Center, Inc. (a)(c) | 339,365 |
| 35,000 | The Sherwin-Williams Co. | 2,225,300 |
| | | 6,959,443 |
Textiles, Apparel & Luxury Goods (0.7%) | |
| 6,800 | Coach, Inc. (a) | 292,128 |
| 10,400 | Polo Ralph Lauren Corp. | 807,664 |
| | | 1,099,792 |
Thrifts & Mortgage Finance (1.8%) | |
| 8,500 | MGIC Investment Corp. (c) | 531,590 |
| 35,500 | The PMI Group, Inc. (c) | 1,674,535 |
| 15,300 | Radian Group, Inc. | 824,823 |
| | | 3,030,948 |
Tobacco (0.7%) | |
| 18,900 | UST, Inc. (c). | 1,099,980 |
Wireless Telecommunication Services (0.7%) | |
| 10,100 | NII Holdings, Inc. (a)(c) | 650,844 |
| 11,300 | Telephone & Data Systems, Inc. | 613,929 |
| | | 1,264,773 |
| | Total common stocks (cost $145,248,115) | 169,295,187 |
The accompanying notes are an integral part of these financial statements.
40|86 Series Trust | Annual Report |
Schedule of Investments | December 31, 2006 |
Equity Portfolio
SHARES OR PRINCIPAL AMOUNT | | VALUE | |
| | | | |
| INVESTMENTS PURCHASED WITH CASH PROCEEDS FROM SECURITIES LENDING (29.9%) | | |
| $ 1,355,362 | Ace Securities Corp., 5.390%, 01/25/2007 (b). | $ 1,355,443 | |
| 24,346,847 | Bank of New York Institutional Cash Reserve Fund, 5.403% | 24,346,847 | |
| 275,518 | Bear Stearns Asset Backed Securities, 5.470%, 01/25/2007 (b) | 275,561 | |
| 1,000,000 | Berkshire Hathaway Finance, 5.420%, 01/11/2007, Cost - $1,000,770; Acquired - 01/11/2005 (b)(e) | 1,000,770 | |
| 1,000,000 | Berkshire Hathaway Finance, 5.435%, 02/16/2007 (b) | 1,001,110 | |
| 1,000,000 | Beta Finance, Inc., 5.410%, 01/02/2007, Cost - $1,000,030; Acquired - 01/14/2005 (b)(e). | 1,000,030 | |
| 419,752 | Capital Auto Receivables Asset Trust, 5.410%, 01/16/2007 (b) | 419,783 | |
| 985,937 | Carrington Mortgage Loan Trust, 5.430%, 01/25/2007 (b) | 985,821 | |
| 1,500,000 | Commonwealth Bank Australia, 5.390%, 01/08/2007, Cost - $1,500,045; Acquired - 06/08/2006 (b)(d)(e) | 1,500,045 | |
| 1,123,539 | Credit-Based Asset Servicing and Securities, 5.410%, 01/25/2007 (b) | 1,123,539 | |
| 59,196 | First Franklin Mortgage Loan, 5.450%, 01/25/2007 (b) | 59,212 | |
| 2,000,000 | Goldman Sachs Group, Inc., 5.430%, 01/23/2007 (b) | 2,000,000 | |
| 157,654 | Granite Master Issuer PLC, 5.390%, 01/22/2007 (b)(d) | 157,654 | |
| 1,500,000 | JP Morgan Chase & Co., 5.400%, 01/26/2007 (b) | 1,500,510 | |
| 2,000,000 | Morgan Stanley Group, 5.485%, 02/09/2007 (b) | 2,003,120 | |
| 627,336 | Nomura Home Equity Loan, Inc., 5.430%, 01/25/2007(b) | 627,450 | |
| 1,700,000 | Permanent Financing PLC, 5.443%, 03/12/2007 (b)(d) | 1,701,742 | |
| 2,000,000 | Protective Life Secured Trust, 5.454%, 01/16/2007 (b) | 2,001,680 | |
| 2,000,000 | Royal Bank of Scotland PLC, 5.4240%, 01/22/2007, Cost - $2,001,200; Acquired - 07/21/2005 (b)(d)(e) . | 2,001,200 | |
| 830,104 | Structured Asset Investment Loan Trust, 5.390%, 01/25/2007 (b) | 830,098 | |
| 182,282 | Structured Asset Investment Loan Trust, 5.470%, 01/25/2007 (b) | 182,296 | |
| 1,600,000 | Superior Wholesale Inventory Financing Trust, 5.450%, 01/16/2007 (b) . | 1,600,250 | |
| 1,000,000 | Textron Financial Floorplan Master Note, 5.470%, 01/16/2007, Cost - $1,001,894; Acquired - 05/26/2005 (b)(e)1,001,894 | | |
| 2,000,000 | World Savings Bank FSB, 5.415%, 03/20/2007 (b) | 2,003,120 | |
| | Total investments purchased with cash proceeds from securities lending (cost $50,679,175) | 50,679,175 | |
| | | | |
SHORT-TERM INVESTMENTS (0.1%) | | |
| $ 13,283 | Bank of New York Cash Reserve, 1.550% | 13,283 | |
| 134,000 | JP Morgan Prime Money Market Institutional, 5.180% | 134,000 | |
| | Total short-term investments (cost $147,283) | 147,283 | |
| | | | |
| Total investments (cost $196,074,573) (129.9%) | 220,121,645 | |
| | Liabilities in excess of other assets (-29.9%) | (50,733,716 | ) |
| | | | |
| | Total Net Assets (100.0%) | $169,387,929 | |
____________
| (a) | Non-income producing security. |
| (b) | Variable Coupon Rate — the rate reported is the rate in effect as of December 31, 2006. |
| (c) | All or a portion of the security is out on loan. |
| (d) | Foreign security or a U.S. security of a foreign company. |
| (e) | Restricted under Rule 144A of the Securities Act of 1933. |
The accompanying notes are an integral part of these financial statements.
40|86 Series Trust | Annual Report |
Portfolio Managers’ Review (unaudited) | December 31, 2006 |
Balanced Portfolio
How did the Portfolio perform relative to its benchmark?
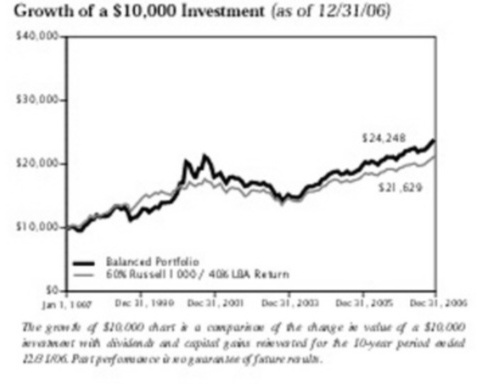
The 40|86 Series Trust Balanced Portfolio returned 13.05% for the year ended December 31, 2006(1). The Portfolio’s benchmark, a 60% weighting of the Russell 1000 Index and 40% weighting of the Lehman Brothers Aggregate Index, returned 10.93% for the same period.
What factors contributed to the variance between the Portfolio and its benchmark?
The equity portion of the Portfolio outperformed its benchmark by building a portfolio of companies with stronger fundamentals than the benchmark. These fundamentals can be described in three groups: Momentum/Growth - company and stock growth; Value -cheap relative to peers; Quality - clean balance sheets. For the year, momentum continued to struggle, but was more than offset by the Portfolio’s overweight position in stocks with good quality and value relative to its peers, which led to excess return.
The primary factors for the fixed income variance were a shorter duration bias for most of the year and security selection. The continuance of the Fed’s tightening cycle put an upward pressure on interest rates, producing a slight flattening of the yield curve and leading the entire yield curve to rise between 25 and 95 bps. Since the price of a fixed income instrument moves inversely to yields, the performance of the Portfolio was aided by our shorter duration bias. Our performance was also enhanced by the Portfolio’s above-average cash position combined with our investment in LIBOR-based floating-rate notes.
All spread sectors outperformed Treasury bonds. Our overweight positions in Corporates, Commercial Mortgage-backed Securities, Collateralized Mortgage Obligations, Agencies and Municipal bonds helped the performance of the Portfolio. Additionally, the allocation to high yield securities proved beneficial with high yield securities outperforming their cohort investment grade bonds for the year. The Lehman Brothers Aggregate Index is comprised completely of investment grade securities.
Which holdings most enhanced the Portfolio’s performance?
Stock selection in Technology, Healthcare and Telecom sectors were the largest contributors. The largest individual contributors were overweight positions in telecom service provider Bellsouth, semiconductor manufacturer Freescale Semiconductor and technology company Hewlett Packard. Performance was enhanced by fixed income holdings in GM’s financial subsidiary GMAC, construction equipment manufacturer Case Corp and Republic of Philippines.
Average Annual Total Return(1) (as of 12/31/06) |
| | 1 YEAR | 5 YEARS | 10 YEARS |
| Balanced Portfolio | 13.05% | 7.29% | 9.26% |
| 60% Russell 1000/40% LBA | 10.93% | 6.36% | 8.02% |
(1) | Past performance does not guarantee future results. Your investment return and principal will fluctuate, and your shares may be worth more or less than their original cost. Total return is provided in accordance with SEC guidelines for comparative purposes and reflects certain contractual expense reimbursements through April 30, 2007. If the expense reimbursements were not in place, the Portfolio's return would have been lower. The total returns shown do not include separate account expenses or the deduction of taxes that a contract holder would pay on portfolio distributions or the redemption of portfolio shares. The Russell 1000 Index is an unmanaged index believed to be representative of the U.S. stock market, including large- and medium-sized companies. The Lehman Brothers Aggregate Index ("LBA") is an unmanaged broad-based market index that includes mortgage-backed securities. Investors cannot actually invest in an index. |
40|86 Series Trust | Annual Report |
Portfolio Managers’ Review (unaudited) | December 31, 2006 |
Which holdings most negatively impacted the Portfolio’s performance?
Stock selection in the Utility, Energy and Staples sectors detracted the most. The largest individual detractors were underweight positions in telecom service provider AT&T and energy developer Chevron and an overweight position in software developer Citrix Systems. Fixed income positions in Latin American wireless communications service provider American Movil and natural gas and electric utility provider Pacific Gas & Electric detracted the most from the Portfolio’s return.
What is your outlook for the next year?
For the equity portion of the portfolio, the forecast for 2007 is generally optimistic. Overall expectations are that the weakness in housing and manufacturing should moderate; the strength in the service sector will continue, and inflation will decline. All three factors should lead to moderate real growth for the economy. With the forward price to earnings ratio of the S&P 500 below average historical levels, valuations should continue to show positive returns as multiples expand due to lower inflation expectations and anticipated future economic growth. We believe investors will focus on high quality balance sheets and less on price momentum. Overall, our philosophy will not change based on short-term trends or conditions in the market. Our goal is to add value through security selection, while attempting to neutralize other risk factors, such as market timing and sector rotation, for which there is not adequate compensation by the market.
For the fixed income portion of the Portfolio, we expect the Fed Funds target rate to remain at 5.25% throughout 2007. Although high oil and other commodity prices will put pressure on growth, strong corporate earnings and continued demand from the Asian economies will support favorable economic performance in the U.S. Geopolitical risk including tensions in Israel, concerns with Iran and North Korea’s nuclear plans and continued terrorist threats, remain a risk for the capital markets. We plan to maintain our overweight positions in corporate and BBB-rated securities as the Fed maintains the current rate target. We have structured a duration bias of neutral to slightly long in anticipation of a Treasury rally as the Fed moves to a more accommodative position.
Exemptive Application filed for the Balanced Portfolio
Please refer to the Letter to Shareholders at the front of this report for information regarding an exemptive application filed with the SEC for the Balanced Portfolio.
| Michael J. Dunlop | Chicago Equity Partners, LLC |
| Senior Vice President | |
| 40|86 Advisors, Inc. | |
| | |
| Vishal Mahajan | |
| Assistant Vice President | |
| 40|86 Advisors, Inc. | |
40|86 Series Trust | Annual Report |
Schedule of Investments | December 31, 2006 |
| Balanced Portfolio | |
SHARES OR PRINCIPAL AMOUNT | | VALUE |
| | | |
COMMON STOCKS (70.3%) | |
Aerospace & Defense (1.4%) | |
| 2,500 | Honeywell International, Inc. | $ 113,100 |
| 2,200 | Lockheed Martin Corp. | 202,554 |
| 3,900 | Northrop Grumman Corp. | 264,030 |
| | | 579,684 |
Air Freight & Logistics (0.3%) | |
| 2,100 | Ryder System, Inc. | 107,226 |
Airlines (1.0%) | |
| 1,900 | AMR Corp. (a)(d) | 57,437 |
| 4,700 | Continental Airlines, Inc. (a)(d) | 193,875 |
| 4,300 | UAL Corp. (a)(d) | 189,200 |
| | | 440,512 |
Automobiles (0.7%) | |
| 6,100 | General Motors Corp. (d) | 187,392 |
| 1,800 | Harley-Davidson, Inc. (d) | 126,846 |
| | | 314,238 |
Beverages (1.3%) | |
| 3,800 | The Coca-Cola Co. | 183,350 |
| 600 | Molson Coors Brewing Co. (d) | 45,864 |
| 4,860 | PepsiCo, Inc. | 303,993 |
| | | 533,207 |
Biotechnology (1.0%) | |
| 7,300 | Biogen Idec, Inc. (a) | 359,087 |
| 2,900 | ImClone Systems, Inc. (a)(d) | 77,604 |
| | | 436,691 |
Capital Markets (2.6%) | |
| 1,100 | The Bear Stearns Companies, Inc. | 179,058 |
| 1,600 | The Goldman Sachs Group, Inc. | 318,960 |
| 5,000 | Merrill Lynch & Co, Inc. | 465,500 |
| 1,400 | Morgan Stanley | 114,002 |
| | | 1,077,520 |
Chemicals (1.6%) | |
| 800 | Ashland, Inc. | 55,344 |
| 5,500 | Celanesé Corp. | 142,340 |
| 2,000 | The Dow Chemical Co. (d) | 79,880 |
| 900 | International Flavors & Fragrances, Inc. (d) | 44,244 |
| 5,700 | Lyondell Chemical Co. (d) | 145,749 |
| 3,000 | PPG Industries, Inc. | 192,630 |
| | | 660,187 |
The accompanying notes are an integral part of these financial statements.
40|86 Series Trust | Annual Report |
Schedule of Investments | December 31, 2006 |
Balanced Portfolio
SHARES OR PRINCIPAL AMOUNT | | VALUE |
| | | |
Commercial Banks (3.4%) | |
| 17,800 | Bank of America Corp. (d) | $ 950,342 |
| 2,300 | BB&T Corp. (d) | 101,039 |
| 3,300 | KeyCorp (d) | 125,499 |
| 1,200 | PNC Financial Services Group | 88,848 |
| 2,900 | Regions Financial Corp. (d) | 108,460 |
| 700 | SunTrust Banks, Inc. (d) | 59,115 |
| | | 1,433,303 |
Commercial Services & Supplies (0.2%) | |
| 1,200 | Manpower, Inc. (d) | 89,916 |
Communications Equipment (2.0%) | |
| 3,342 | Ciena Corp. (a)(d) | 92,607 |
| 17,770 | Cisco Systems, Inc. (a) | 485,654 |
| 13,300 | Motorola, Inc. | 273,448 |
| | | 851,709 |
Computer Programming Services (0.4%) | |
| 15,000 | BEA Systems, Inc. (a) | 188,700 |
Computers & Peripherals (2.9%) | |
| 17,888 | Hewlett-Packard Co. | 736,807 |
| 3,500 | International Business Machines Corp. | 340,025 |
| 7,400 | Western Digital Corp. (a)(d) | 151,404 |
| | | 1,228,236 |
Consumer Finance (0.3%) | |
| 2,350 | The First Marblehead Corporation (d) | 128,428 |
Containers & Packaging (0.1%) | |
| 1,300 | Pactiv Corp. (a)(d) | 46,397 |
Diversified Financial Services (4.1%) | |
| 4,100 | CIT Group, Inc. | 228,657 |
| 10,532 | Citigroup, Inc. | 586,632 |
| 16,740 | J.P. Morgan Chase & Co. | 808,542 |
| 1,600 | Principal Financial Group, Inc. (d) | 93,920 |
| | | 1,717,751 |
Diversified Telecommunication Services (2.3%) | |
| 17,300 | BellSouth Corp. | 815,003 |
| 1,800 | CenturyTel, Inc. (d) | 78,588 |
| 8,900 | Qwest Communications International (a)(d) | 74,493 |
| | | 968,084 |
Electric Utilities (1.9%) | |
| 8,200 | Edison International | 372,936 |
| 9,100 | PG&E Corp. (d) | 430,703 |
| | | 803,639 |
Electrical Equipment (1.2%) | |
| 7,100 | Emerson Electric Co. | 313,039 |
| 2,900 | Rockwell Automation, Inc.. | 177,132 |
| | | 490,171 |
The accompanying notes are an integral part of these financial statements.
40|86 Series Trust | Annual Report |
Schedule of Investments | December 31, 2006 |
Balanced Portfolio
SHARES OR PRINCIPAL AMOUNT | | VALUE |
| | | |
| Electronic Equipment & Instruments (0.1%) | |
| 3,300 | Vishay Intertechnology, Inc. (a) | $ 44,682 |
Energy Equipment & Services (0.9%) | |
| 7,000 | Tidewater, Inc. (d). | 338,520 |
| 1,100 | Unit Corp. (a)(d) | 53,295 |
| | | 391,815 |
Food & Staples Retailing (0.4%) | |
| 6,700 | The Kroger Co. (d). | 154,569 |
Food Products (1.2%) | |
| 2,600 | Archer Daniels Midland | 83,096 |
| 11,300 | Kraft Foods, Inc. (d) | 403,410 |
| | | 486,506 |
Gas Utilities (0.3%) | |
| 5,000 | NiSource, Inc. (d) | 120,500 |
Health Care Equipment & Supplies (0.8%) | |
| 2,700 | Becton, Dickinson & Co. (d) | 189,405 |
| 2,000 | C.R. Bard, Inc. (d) | 165,940 |
| | | 355,345 |
Health Care Providers & Services (2.2%) | |
| 7,700 | Aetna, Inc. | 332,486 |
| 3,100 | AmerisourceBergen Corp. | 139,376 |
| 1,900 | Cigna Corp. | 249,983 |
| 1 | Medco Health Solutions, Inc. (a) | 53 |
| 2,500 | Wellpoint, Inc. (a)(d) | 196,725 |
| | | 918,623 |
Hotels, Restaurants & Leisure (1.2%) | |
| 1,500 | Darden Restaurants, Inc. | 60,255 |
| 9,700 | McDonald’s Corp. (d) | 430,001 |
| | | 490,256 |
Household Durables (0.2%) | |
| 1,200 | Whirlpool Corp. (d) | 99,624 |
Household Products (1.2%) | |
| 2,600 | Colgate-Palmolive Co. | 169,624 |
| 5,265 | Procter & Gamble Co. (d) | 338,382 |
| | | 508,006 |
Independent Power Producers & Energy Traders (0.5%) | |
| 3,700 | TXU Corp. | 200,577 |
Industrial Conglomerates (1.0%) | |
| 9,100 | General Electric Co. | 338,611 |
| 1,100 | Textron, Inc. | 103,147 |
| | | 441,758 |
The accompanying notes are an integral part of these financial statements.
40|86 Series Trust | Annual Report |
Schedule of Investments | December 31, 2006 |
Balanced Portfolio
SHARES OR PRINCIPAL AMOUNT | | VALUE |
| | | |
Insurance (2.6%) | |
| 800 | The Allstate Corp. | $ 52,088 |
| 2,300 | Chubb Corp. (d) | 121,693 |
| 1,400 | CNA Financial Corp. (a) | 56,448 |
| 3,600 | Genworth Financial, Inc. (d) | 123,156 |
| 2,300 | Metlife, Inc. (d) | 135,723 |
| 4,300 | Old Republic International Corp. (d) | 100,104 |
| 6,200 | The St. Paul Travelers Companies, Inc. (d) | 332,878 |
| 8,300 | UnumProvident Corp. (d) | 172,474 |
| | | 1,094,564 |
Internet & Catalog Retail (0.5%) | |
| 4,000 | IAC/InterActiveCorp (a)(d) | 148,640 |
| 700 | Nutri/System, Inc. (a)(d) | 44,373 |
| | | 193,013 |
IT Services (1.6%) | |
| 2,500 | Computer Sciences Corp. (a) | 133,425 |
| 10,700 | Electronic Data Systems Corp. (d) | 294,785 |
| 800 | Global Payments, Inc. (d) | 37,040 |
| 2,200 | Mastercard, Inc. (d) | 216,678 |
| | | 681,928 |
Leisure Equipment & Products (0.1%) | |
| 2,500 | Mattel, Inc. | 56,650 |
Life Science Tools & Services (0.2%) | |
| 1,900 | Applera Corp. - Applied Biosystems Group (d) | 69,711 |
Machinery (1.0%) | |
| 1,800 | Cummins, Inc. (d) | 212,724 |
| 3,400 | Manitowoc Co. | 202,062 |
| | | 414,786 |
Media (2.8%) | |
| 3,100 | CBS Corp. Class B | 96,658 |
| 3,150 | The McGraw-Hill Companies, Inc. (d) | 214,263 |
| 3,000 | News Corp. | 64,440 |
| 2,300 | Omnicom Group (d) | 240,442 |
| 12,130 | Time Warner, Inc. (d) | 264,191 |
| 8,300 | The Walt Disney Co. | 284,441 |
| | | 1,164,435 |
Metals & Mining (1.0%) | |
| 2,700 | Nucor Corp. (d) | 147,582 |
| 500 | Phelps Dodge Corp. | 59,860 |
| 1,600 | Southern Copper Corp. (d) | 86,224 |
| 1,800 | United States Steel Corp. | 131,652 |
| | | 425,318 |
The accompanying notes are an integral part of these financial statements.
40|86 Series Trust | Annual Report |
Schedule of Investments | December 31, 2006 |
Balanced Portfolio
SHARES OR PRINCIPAL AMOUNT | | VALUE |
| | | |
Multiline Retail (1.3%) | |
| 2,100 | Dillard’s, Inc. (d) | $ 73,437 |
| 2,300 | Dollar Tree Stores, Inc. (a) | 69,230 |
| 4,300 | J.C. Penney Co., Inc. Holding Co. (d) | 332,648 |
| 1,200 | Kohl’s Corp. (a) | 82,116 |
| | | 557,431 |
Oil, Gas & Consumable Fuels (5.1%) | |
| 4,800 | ConocoPhillips | 345,360 |
| 2,500 | Devon Energy Corp. (d) | 167,700 |
| 10,240 | Exxon Mobil Corp. | 784,691 |
| 1,400 | Hess Corp. (d) | 69,398 |
| 3,800 | Marathon Oil Corp. | 351,500 |
| 1,500 | Occidental Petroleum Corp. (d) | 73,245 |
| 1,900 | Sunoco, Inc. | 118,484 |
| 5,000 | Valero Energy Corp. | 255,800 |
| | | 2,166,178 |
Personal Products (0.6%) | |
| 7,100 | Avon Products, Inc. | 234,584 |
Pharmaceuticals (4.4%) | |
| 1,800 | Endo Pharmaceuticals Holdings, Inc. (a)(d) | 49,644 |
| 12,980 | Johnson & Johnson | 856,940 |
| 2,800 | King Pharmaceuticals, Inc. (a) | 44,576 |
| 9,100 | Merck & Co., Inc. | 396,760 |
| 15,140 | Pfizer, Inc. | 392,126 |
| 2,100 | Wyeth (d) | 106,932 |
| | | 1,846,978 |
Real Estate (1.0%) | |
| 700 | AMB Property Corp. (d) | 41,027 |
| 1,400 | AvalonBay Communities, Inc. (d) | 182,070 |
| 1,100 | CBL & Associates Properties, Inc. (d) | 47,685 |
| 3,500 | Kimco Realty Corp. (d) | 157,325 |
| | | 428,107 |
Real Estate Investment Trusts (1.3%) | |
| 6,300 | CB Richard Ellis Group, Inc. (a) | 209,160 |
| 7,100 | New Century Financial Corp. (d) | 224,289 |
| 1,600 | ProLogis | 97,232 |
| | | 530,681 |
Road & Rail (0.4%) | |
| 4,100 | CSX Corp. | 141,163 |
| 800 | Norfolk Southern Corp. | 40,232 |
| | | 181,395 |
The accompanying notes are an integral part of these financial statements.
40|86 Series Trust | Annual Report |
Schedule of Investments | December 31, 2006 |
Balanced Portfolio
SHARES OR PRINCIPAL AMOUNT | | VALUE |
| | | |
Semiconductor & Semiconductor Equipment (1.7%) | |
| 2,100 | Advanced Micro Devices, Inc. (a)(d) | $ 42,735 |
| 3,300 | Altera Corp. (a) | 64,944 |
| 17,700 | LSI Logic Corp. (a)(d) | 159,300 |
| 10,500 | Nvidia Corp. (a)(d) | 388,605 |
| 2,300 | Texas Instruments, Inc. (d) | 66,240 |
| | | 721,824 |
Software (2.2%) | |
| 3,200 | BMC Software, Inc. (a) | 103,040 |
| 24,440 | Microsoft Corp. | 729,778 |
| 6,100 | Oracle Corp. (a)(d) | 104,554 |
| | | 937,372 |
Specialty Retail (2.1%) | |
| 2,000 | Abercrombie & Fitch Co. - Class A. | 139,260 |
| 4,200 | American Eagle Outfitters, Inc. (d) | 131,082 |
| 3,300 | Ann Taylor Stores Corp. (a) | 108,372 |
| 6,200 | Office Depot, Inc. (a) | 236,654 |
| 4,200 | The Sherwin-Williams Co. (d) | 267,036 |
| | | 882,404 |
Textiles, Apparel & Luxury Goods (0.2%) | |
| 1,100 | Polo Ralph Lauren Corp. (d) | 85,426 |
Thrifts & Mortgage Finance (0.6%) | |
| 1,500 | Countrywide Financial Corp. (d) | 63,675 |
| 2,000 | MGIC Investment Corp. (d) | 125,080 |
| 1,400 | Radian Group, Inc. | 75,474 |
| | | 264,229 |
Tobacco (0.9%) | |
| 4,610 | Altria Group, Inc. | 395,630 |
| | Total common stocks (cost $24,664,702) | 29,640,504 |
| | |
PREFERRED STOCKS (0.4%) | |
Media (0.4%) | |
| 145 | Centaur Funding Corp., 9.080%, 04/21/2020, Cost - $171,062; Acquired - 07/22/2003 (b) | 169,559 |
| | Total preferred stocks (cost $171,062) | 169,559 |
| | |
COLLATERALIZED MORTGAGE OBLIGATIONS (0.3%) | |
| $130,000 | Credit Suisse Mortgage Capital Certificate, Series 2006 - OMA, 5.538%, 05/15/2023, | |
| | Cost $130,620; Acquired - 01/27/2006 (b) | 130,202 |
| | Total collateralized mortgage obligations (cost $130,620) | 130,202 |
| | |
CONVERTIBLE BONDS (0.1%) | |
Energy Equipment & Services (0.1%) | |
| 25,000 | Halliburton Co., 3.125%, 07/15/2023 | 42,406 |
| | Total convertible bonds (cost $42,488) | 42,406 |
The accompanying notes are an integral part of these financial statements.
40|86 Series Trust | Annual Report |
Schedule of Investments | December 31, 2006 |
Balanced Portfolio
SHARES OR PRINCIPAL AMOUNT | | VALUE |
| | | |
CORPORATE BONDS (15.2%) | |
Beverages (0.2%) | |
| $ 70,000 | Miller Brewing Co., 5.500%, 08/15/2013, Cost - $71,742; Acquired - 07/13/2005 (b) | $ 69,318 |
Chemicals (0.6%) | |
| 50,000 | Lubrizol Corp. 5.500%, 10/01/2014 | 48,819 |
| 190,000 | Terra Capital, Inc. 12.875%, 10/15/2008 | 212,800 |
| | | 261,619 |
Commercial Banks (0.6%) | |
| 70,000 | ICICI Bank Ltd., 5.750%, 11/16/2010, Cost - $69,844; Acquired - 02/28/2006 (b)(e) | . 69,961 |
| | 35,000 | Oversea-Chinese Banking Corporation Ltd., 7.750%, 09/06/2011, Cost - $38,493; Acquired - 11/08/2005 (b)(e) | 38,603 |
| | 85,000 | PNC Funding Corp., 7.500%, 11/01/2009 | . 89,820 |
| | 40,000 | Union Planters Bank NA, 6.500%, 03/15/2018 | 40,537 |
| | | 238,921 |
Commercial Services & Supplies ( 0.8%) | |
| | 85,000 | Cintas Corp. No. 2, 6.150%, 08/15/2036 | 87,408 |
| | 80,000 | Corrections Corporation of America, 6.250%, 03/15/2013 | 79,700 |
| | 170,000 | Steelcase, Inc., 6.500%, 08/15/2011 | 172,853 |
| | | | 339,961 |
Construction & Engineering (0.3%) | |
| | 85,000 | CRH America, Inc., 5.300%, 10/15/2013 | 82,865 |
| | 50,000 | William Lyon Homes, Inc., 7.625%, 12/15/2012 (d) | 42,875 |
| | | | 125,740 |
Consumer Finance (0.2%) | |
| | 70,000 | General Motors Acceptance Corp., 7.750%, 01/19/2010 | 73,316 |
Containers & Packaging (0.7%) | |
| | 275,000 | Owens-Brockway Glass Container, 8.875%, 02/15/2009 | . 282,562 |
Diversified Financial Services (0.6%) | |
| | 80,000 | American General Finance Corp., 4.875%, 07/15/2012 | 78,144 |
| | 70,000 | Erac USA Finance Co., 6.750%, 05/15/2007, Cost - $70,377; Acquired - 02/16/2006 (b) | 70,282 |
| | 100,000 | Hutchison Whampoa Finance CI Ltd., 7.450%, 08/01/2017, Cost - $113,107; Acquired - 12/19/2005 (b)(d)(e) | 113,169 |
| | | | 261,595 |
Diversified Telecommunication Services (0.5%) | |
| | 65,000 | Intelsat Subsidiary Holding Co. Ltd., 8.625%, 01/15/2015 (d)(e) | 67,925 |
| | 25,000 | Sprint Capital Corp., 8.375%, 03/15/2012 | 27,814 |
| | 65,000 | Sprint Capital Corp., 8.750%, 03/15/2032 | 78,456 |
| | 54,000 | TELUS Corp., 8.000%, 06/01/2011 (e) | 59,106 |
| | | | 233,301 |
Electric Utilities (0.5%) | |
| | 195,000 | Pacific Gas & Electric Co., 6.050%, 03/01/2034 | 197,329 |
Electronic Equipment & Instruments (0.1%) | |
| | 35,000 | Jabil Circuit, Inc., 5.875%, 07/15/2010 | 34,780 |
The accompanying notes are an integral part of these financial statements.
40|86 Series Trust | Annual Report |
Schedule of Investments | December 31, 2006 |
Balanced Portfolio
SHARES OR PRINCIPAL AMOUNT | | VALUE |
| | | | |
Health Care Equipment & Supplies (0.6%) | |
| $ | 270,000 | Hillenbrand Industries, Inc., 4.500%, 06/15/2009 | $ 264,679 |
Health Care Providers & Services (0.3%) | |
| | 55,000 | Davita, Inc., 6.625%, 03/15/2013 | 55,412 |
| | 35,000 | Laboratory Corporation of America Holdings, 5.625%, 12/15/2015 | 34,468 |
| | 35,000 | Quest Diagnostics, Inc., 5.450%, 11/01/2015. | 33,844 |
| | | | 123,724 |
Hotels, Restaurants & Leisure (1.0%) | |
| | 155,000 | Hyatt Equities LLC, 6.875%, 06/15/2007, Cost - $154,961; Acquired - 06/12/2002 (b) | 155,661 |
| | 70,000 | MGM Mirage, 6.875%, 04/01/2016 (d) | 67,550 |
| | 150,000 | Starwood Hotels & Resorts Worldwide, Inc., 7.875%, 05/01/2012 | 158,590 |
| | 40,000 | Wynn Las Vegas LLC, 6.625%, 12/01/2014 (d) | 39,950 |
| | | | 421,751 |
Household Durables (0.9%) | |
| | 175,000 | KB Home, 5.750%, 02/01/2014 | 161,919 |
| | 240,000 | NVR, Inc., 5.000%, 06/15/2010 | 234,302 |
| | | | 396,221 |
Insurance (0.4%) | |
| | 130,000 | Arch Capital Group Ltd., 7.350%, 05/01/2034 (e) | 143,843 |
| | 35,000 | The St. Paul Travelers Companies, Inc., 5.500%, 12/01/2015 | 34,926 |
| | | | 178,769 |
Machinery (0.1%) | |
| | 55,000 | Case Corp., 7.250%, 01/15/2016 | 55,962 |
Media (1.2%) | |
| | 40,000 | British Sky Broadcasting PLC, 8.200%, 07/15/2009 (e) | 42,616 |
| | 155,000 | Charter Communications, Inc., 8.000%, 04/30/2012, Cost - $155,140; Acquired 04/21/2004 (b)(d) | 161,781 |
| | 61,000 | DirecTV Holdings LLC, 8.375%, 03/15/2013 | 63,745 |
| | 100,000 | EchoStar DBS Corporation, 6.625%, 10/01/2014 | 97,750 |
| | 125,000 | News America, Inc., 6.200%, 12/15/2034 | 121,044 |
| | | | 486,936 |
Multiline Retail (0.2%) | |
| | 75,000 | J.C. Penney Co., Inc. Holding Co., 8.000%, 03/01/2010 | 79,910 |
Multi-Utilities (0.2%) | |
| | 70,000 | Sempra Energy, 6.000%, 02/01/2013 | 71,482 |
| | |
Oil, Gas & Consumable Fuels (1.4%) | |
| | 175,000 | Anadarko Finance Co., 7.500%, 05/01/2031 (e). | 199,148 |
| | 100,000 | Chesapeake Energy Corp., 6.250%, 01/15/2018 (d) | 96,750 |
| | 70,000 | Enterprise Products Operating LP, 5.600%, 10/15/2014 | 68,856 |
| | 54,150 | Ras Laffan Liquefied Natural Gas Co., Ltd., 3.437%, 09/15/2009, Cost - $53,643;Acquired - 07/02/2004 (b)(e) | 52,794 |
| | 110,000 | Southern Natural Gas Co., 8.875%, 03/15/2010 (d) | 115,950 |
| | 65,000 | XTO Energy, Inc., 6.100%, 04/01/2036 | 63,648 |
| | | | 597,146 |
Paper & Forest Products (0.1%) | |
| | 50,000 | Boise Cascade LLC, 7.125%, 10/15/2014 | 48,625 |
The accompanying notes are an integral part of these financial statements.
40|86 Series Trust | Annual Report |
Schedule of Investments | December 31, 2006 |
Balanced Portfolio
SHARES OR PRINCIPAL AMOUNT | | VALUE |
| | |
Real Estate (2.1%) | |
| $ | 150,000 | Chelsea Property Group, 7.250%, 10/21/2007 | $ 151,215 |
| | 80,000 | Health Care REIT, Inc., 7.500%, 08/15/2007 | 80,688 |
| | 215,000 | Hospitality Properties Trust, 6.750%, 02/15/2013 | 225,307 |
| | 40,000 | iStar Financial, Inc., 5.150%, 03/01/2012 | 38,945 |
| | 55,000 | iStar Financial, Inc., 5.950%, 10/15/2013, Cost - $55,000; Acquired - 10/04/2006 (b) | 55,353 |
| | 35,000 | New Plan Excel Realty Trust, Inc., 5.125%, 09/15/2012 | 34,209 |
| | 200,000 | Senior Housing Properties Trust, 8.625%, 01/15/2012 | 218,000 |
| | 70,000 | Spieker Properties, Inc., 7.125%, 07/01/2009 | 73,440 |
| | | | 877,157 |
Software (0.2%) | |
| | 70,000 | Oracle Corp., 5.000%, 01/15/2011 | 69,358 |
| | |
Wireless Telecommunication Services (1.4%) | |
| | 65,000 | America Movil SA de CV, 6.375%, 03/01/2035 (e). | 63,742 |
| | 155,000 | Cingular Wireless Services, Inc., 8.750%, 03/01/2031 | 202,017 |
| | 270,000 | Nextel Communications, Inc., 6.875%, 10/31/2013 | 273,066 |
| | 60,000 | Rogers Wireless, Inc., 7.500%, 03/15/2015 (e) | 65,400 |
| | | | 604,225 |
| | | Total corporate bonds (cost $6,326,763) | 6,394,387 |
| | | | |
FOREIGN GOVERNMENT NOTES/BONDS (0.3%) | |
| | 40,000 | Ministry Finance Russia, 3.000%, 05/14/2011 (e) | 36,187 |
| | 70,000 | Republic of Philippines, 7.750%, 01/14/2031 (e) | 79,800 |
| | | Total foreign government notes/bonds (cost $104,893) | 115,987 |
| | |
MORTGAGE-BACKED SECURITIES (0.3%) | |
| | 22,966 | First Union National Bank Commercial Mortgage, Series 1999-C4, 7.184%, 12/15/2031 | 23,048 |
| | 121,775 | Residential Funding Mortgage Securities I, Series 2005-S7, 5.500%, 11/25/2035 | 120,748 |
| | | Total mortgage-backed securities (cost $143,538). | 143,796 |
| | |
MUNICIPAL BONDS (2.0%) | |
| | 30,000 | Baltimore Maryland General Obligation Unlimited, 7.250%, 10/15/2010 | 31,049 |
| | 140,000 | California County TOB Securitization Agency, 7.500%, 06/01/2019 | 142,033 |
| | 30,000 | Crestwood School District Pennsylvania, 5.800%, 03/01/2018 | 30,094 |
| | 135,503 | Louisiana Tobacco Settlement Financing Corp., 6.360%, 05/15/2025 | 135,650 |
| | 125,000 | Rhode Island Tobacco Settlement Financing Corp., 5.920%, 06/01/2012 | 124,611 |
| | 80,000 | Santa Rosa California Redevelopment Agency Tax Allocation, 5.500%, 08/01/2020 | 77,909 |
| | 130,424 | South Dakota Educational Enhancement Funding Corp., 6.720%, 06/01/2025 | 130,844 |
| | 95,000 | South El Monte California Tax Allocation Note, 4.950%, 08/01/2014 | 91,170 |
| | 85,000 | University of Illinois at Chicago Certificates, 5.200%, 02/15/2022 | 81,224 |
| | | Total municipal bonds (cost $843,881) | 844,584 |
| | |
U.S. GOVERNMENT AGENCY ISSUES (0.8%) | |
| | 43,221 | Federal Home Loan Mortgage Corp., Pool #A2-2364, 5.000%, 05/01/2034 | 41,761 |
| | 127,589 | Federal Home Loan Mortgage Corp., Pool #A5-2422, 5.500%, 09/01/2036 | 126,207 |
| | 126,270 | Federal Home Loan Mortgage Corp., Pool #A5-2536, 6.000%, 09/01/2036 | 127,244 |
| | 42,455 | Federal Home Loan Mortgage Corp., Pool #A5-2593, 6.500%, 10/01/2036 | 43,255 |
| | | Total U.S. government agency issues (cost $336,448) | 338,467 |
The accompanying notes are an integral part of these financial statements
40|86 Series Trust | Annual Report |
Schedule of Investments | December 31, 2006 |
Balanced Portfolio
SHARES OR PRINCIPAL AMOUNT | | VALUE | |
| | | |
U.S. TREASURY OBLIGATIONS (4.3%) | | |
| $ 330,000 | U.S. Treasury Bond, 5.375%, 02/15/2031 (d) | $ 353,590 | |
| 36,996 | U.S. Treasury Inflation Index Bond, 1.625%, 01/15/2015 | 34,834 | |
| 40,000 | U.S. Treasury Note, 4.500%, 02/28/2011 (d) | 39,717 | |
| 275,000 | U.S. Treasury Note, 4.750%, 03/31/2011 (d) | 275,548 | |
| 710,000 | U.S. Treasury Note, 4.250%, 08/15/2015 (d) | 687,258 | |
| 420,000 | U.S. Treasury Note, 4.500%, 11/15/2015 (d) | 413,668 | |
| | Total U.S. treasury obligations (cost $1,790,269) | 1,804,615 | |
| | | |
INVESTMENTS PURCHASED WITH CASH PROCEEDS FROM SECURITIES LENDING (24.4%) | | |
| 6,506,580 | Bank of New York Institutional Cash Reserve Fund, 5.403% | 6,506,580 | |
| 500,000 | Berkshire Hathaway Finance, 5.435%, 02/16/2007 (c) | 500,555 | |
| 104,938 | Capital Auto Receivables Asset Trust, 5.410%, 01/16/2007 (c) | 104,946 | |
| 140,442 | Credit-Based Asset Servicing and Securities, 5.410%, 01/25/2007 (c) | 140,442 | |
| 29,598 | First Franklin Mortgage Loan, 5.450%, 01/25/2007 (c) | 29,606 | |
| 52,551 | Granite Master Issuer PLC, 5.390%, 01/22/2007 (c)(e) | 52,551 | |
| 400,000 | JP Morgan Chase & Co., 5.400%, 01/26/2007 (c) | 400,136 | |
| 400,000 | Permanent Financing PLC, 5.443%, 03/12/2007 (c)(e) | 400,410 | |
| 500,000 | Royal Bank of Scotland PLC, 5.424%, 01/22/2007, Cost - $500,300; Acquired - 07/21/2005 (b)(c)(e) | 500,300 | |
| 317,393 | Specialty Underwriting and Residential Finance Trust, 5.430%, 01/25/2007 (c) | 317,392 | |
| 425,000 | Superior Wholesale Inventory Financing Trust, 5.450%, 01/16/2007 (c) | 425,066 | |
| 500,000 | Textron Financial Floorplan Master Note, 5.470%, 01/16/2007, Cost - $500,947; Acquired - 05/26/2005 (b)(c) | 500,947 | |
| 400,000 | World Savings Bank FSB, 5.415%, 03/20/2007 (c) | 400,624 | |
| | Total investments purchased with cash proceeds from securities lending (cost $10,279,555) | 10,279,555 | |
| | | |
SHORT-TERM INVESTMENTS (5.6%) | | |
| 475,000 | AIM Liquid Asset Portfolio, 5.130% | 475,000 | |
| 2,856 | Bank of New York Cash Reserve, 1.550% | 2,856 | |
| 1,891,000 | JP Morgan Prime Money Market Institutional, 5.180% | 1,891,000 | |
| | Total short-term investments (cost $2,368,856) | 2,368,856 | |
| | | | |
| | Total investments (cost $47,203,075) (124.0%) | 52,272,918 | |
| | Liabilities in excess of other assets (-24.0%) | (10,111,854 | ) |
| | Total Net Assets (100.0%) | $42,161,064 | |
____________
| (a) | Non-income producing security. |
| (b) | Restricted under Rule 144A of the Securities Act of 1933. |
| (c) | Variable Coupon Rate - the rate reported is the rate in effect as of December 31, 2006. |
| (d) | All or a portion of the security is out on loan. |
| (e) | Foreign security or a U.S. security of a foreign company. |
The accompanying notes are an integral part of these financial statements.
40|86 Series Trust | Annual Report |
Portfolio Managers’ Review (unaudited) | December 31, 2006 |
Fixed Income Portfolio
How did the Portfolio perform relative to its benchmark?
The 40|86 Series Trust Fixed Income Portfolio returned 4.45% for the year ended December 31, 2006(1). The Portfolio’s benchmark, the Lehman Brothers Aggregate Index, returned 4.33% for the same period.
What factors contributed to the variance between the Portfolio and its benchmark?
The primary factors for the variance were a shorter duration bias for most of the year and security selection. The continuance of the Fed’s tightening cycle put upward pressure on interest rates, producing a slight flattening of the yield curve and leading the entire yield curve to rise between 25 and 95 bps. Since the price of a fixed income instrument moves inversely to yields, the performance of the Portfolio was aided by our shorter duration bias. Our performance was also enhanced by the Portfolio’s above-average cash position combined with our investment in LIBOR-based floating-rate notes.
Spread sectors outperformed Treasury bonds. Our overweight positions in Corporates, Commercial Mortgage-backed Securities, Collateralized Mortgage Obligations, Agencies and Municipal bonds helped the performance of the Portfolio. Additionally, the allocation to high yield securities proved beneficial with high yield securities outperforming their cohort investment grade bonds for the year. The Portfolio’s benchmark is comprised completely of investment grade securities.
Which holdings most enhanced the Portfolio’s performance?
The Portfolio’s performance was enhanced by holdings in GM’s financial subsidiary GMAC, construction equipment manufacturer Case Corp and Republic of Philippines.
Which holdings most negatively impacted the Portfolio’s performance?
Positions in Latin American wireless communications service provider American Movil and natural gas and electric utility provider Pacific Gas & Electric detracted the most from the Portfolio’s return.
Liquidation and Closing of the Fixed Income Portfolio
Please refer to the Letter to Shareholders at the front of this report for information regarding the liquidation and termination of the Fixed Income Portfolio.
| Michael J. Dunlop | Vishal Mahajan |
| Senior Vice President | Assistant Vice President |
| 40|86 Advisors, Inc. | 40|86 Advisors, Inc. |
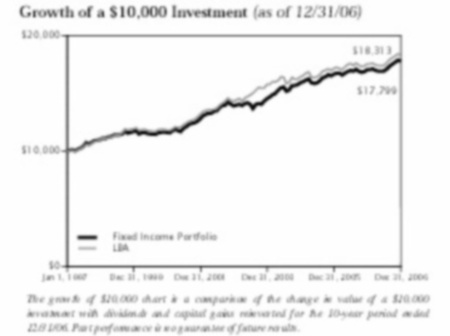
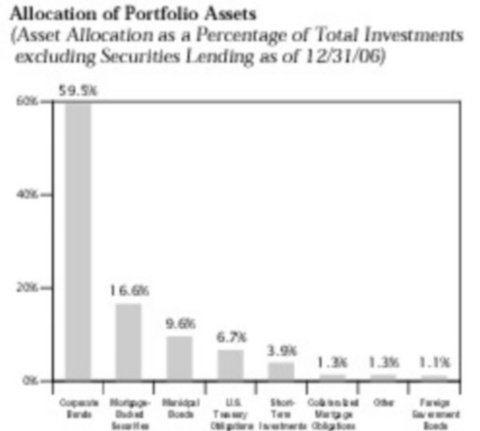
Average Annual Total Return(1) (as of 12/31/06) |
| | 1 YEAR | 5 YEARS | 10 YEARS |
| Fixed Income Portfolio | 4.45% | 5.07% | 5.94% |
| LBA | 4.33% | 5.06% | 6.24% |
(1) | Past performance does not guarantee future results. Your investment return and principal will fluctuate, and your shares may be worth more or less than their original cost. Total return is provided in accordance with SEC guidelines for comparative purposes and reflects certain contractual expense reimbursements through April 30, 2007. If the expense reimbursements were not in place, the portfolio's return would have been lower. The total returns shown do not include separate account expenses or the deduction of taxes that a contract holder would pay on portfolio distributions or the redemption of portfolio shares. The Lehman Brothers Aggregate Index ("LBA") is an unmanaged broad-based market index that includes mortgage- backed securities. Investors cannot actually invest in an index. |
40|86 Series Trust | Annual Report |
Schedule of Investments | December 31, 2006 |
Fixed Income Portfolio
| | SHARES OR PRINCIPAL AMOUNT | | VALUE |
| | | | |
| | PREFERRED STOCKS (0.8%) | |
| | Media (0.8%) | |
| | 130 | Centaur Funding Corp., 9.080%, 04/21/2020, Cost — $153,366; Acquired — 07/22/2003 (b) | $ 152,019 |
| | | Total preferred stocks (cost $153,366) | 152,019 |
| | COLLATERALIZED MORTGAGE OBLIGATIONS (1.3%) | |
| | $ 250,000 | Credit Suisse Mortgage Capital Certificate Series 2006-OMA, 5.538%, 05/15/2023, Cost — $251,192;
Acquired — 01/27/2006 (b) | 250,387 |
| | | Total collateralized mortgage obligations (cost $251,192) | 250,387 |
| | CONVERTIBLE BONDS (0.5%) | |
| | Energy Equipment & Services (0.5%) | |
| | 50,000 | Halliburton Co., 3.125%, 07/15/2023 | 84,813 |
| | | Total convertible bonds (cost $84,975) | 84,813 |
| | CORPORATE BONDS (58.8%) | |
| | Beverages (0.7%) | |
| | 135,000 | Miller Brewing Co., 5.500%, 08/15/2013, Cost — $138,360; Acquired — 07/13/2005 (b) | 133,684 |
| | Capital Markets (0.3%) | |
| | 65,000 | Lehman Brothers Holdings, Inc., 3.600%, 03/13/2009 (d) | 62,854 |
| | Chemicals (1.0%) | |
| | 100,000 | Lubrizol Corp., 5.500%, 10/01/2014 | 97,638 |
| | 80,000 | Terra Capital, Inc., 12.875%, 10/15/2008 | 89,600 |
| | | | 187,238 |
| | Commercial Banks (3.8%) | |
| | 145,000 | Huntington National Bank, 3.125%, 05/15/2008 | 140,825 |
| | 135,000 | ICICI Bank Ltd., 5.750%, 11/16/2010, Cost — $134,700; Acquired — 02/28/2006 (a)(b)(d) | 134,924 |
| | 70,000 | Oversea-Chinese Banking Corporation Ltd., 7.750%, 09/06/2011, Cost — $76,986; Acquired — 11/08/2005 (a)(b) | 77,205 |
| | 165,000 | PNC Funding Corp., 7.500%, 11/01/2009 | 174,357 |
| | 185,000 | Union Planters Bank NA, 6.500%, 03/15/2018 | 187,484 |
| | | | 714,795 |
| | Commercial Services & Supplies (3.6%) | |
| | 170,000 | Cintas Corp. No. 2, 6.150%, 08/15/2036 | 174,816 |
| | 170,000 | Corrections Corporation of America, 6.250%, 03/15/2013 | 169,362 |
| | 340,000 | Steelcase, Inc., 6.500%, 08/15/2011 | 345,707 |
| | | | 689,885 |
| | Computers & Peripherals (0.4%) | |
| | 70,000 | NCR Corp., 7.125%, 06/15/2009 | 71,830 |
| | Construction & Engineering (1.4%) | |
| | 170,000 | CRH America, Inc., 5.300%, 10/15/2013 | . 165,730 |
| | 105,000 | William Lyon Homes, Inc., 7.625%, 12/15/2012 (d) | 90,038 |
| | | | 255,768 |
| | Consumer Finance (1.3%) | |
| | 230,000 | General Motors Acceptance Corp., 7.750%, 01/19/2010 | 240,895 |
The accompanying notes are an integral part of these financial statements
40|86 Series Trust | Annual Report |
Schedule of Investments | December 31, 2006 |
Fixed Income Portfolio
SHARES OR PRINCIPAL AMOUNT | | VALUE |
| | | |
Containers & Packaging (0.5%) | |
| $ 100,000 | Owens-Brockway Glass Container, 8.875%, 02/15/2009 | $ 102,750 |
| | |
Diversified Financial Services (3.0%) | |
| 150,000 | American General Finance Corp., 4.875%, 07/15/2012 | 146,520 |
| 50,000 | Bunge Ltd. Finance Corp., 4.375%, 12/15/2008 | 48,969 |
| 135,000 | Erac USA Finance Co., 6.750%, 05/15/2007, Cost — $135,727; Acquired — 02/16/2006 (b) | 135,543 |
| 135,000 | Hutchison Whampoa Finance CI Ltd., 7.450%, 08/01/2017, Cost — $152,694; Acquired — 12/19/2005 (a)(b)(d) | 152,778 |
| 75,000 | Residential Capital Corp., 6.500%, 04/17/2013 | 76,105 |
| | | 559,915 |
Diversified Telecommunication Services (2.9%) | |
| 135,000 | Intelsat Subsidiary Holding Co., 8.625%, 01/15/2015 (a)(d). | 141,075 |
| 50,000 | Sprint Capital Corp., 8.375%, 03/15/2012 | 55,628 |
| 130,000 | Sprint Capital Corp., 8.750%, 03/15/2032 | 156,912 |
| 75,000 | Tele Communications, Inc., 9.800%, 02/01/2012 | 88,530 |
| 105,000 | TELUS Corp., 8.000%, 06/01/2011 (a) | 114,929 |
| | | 557,074 |
Electric Utilities (3.8%) | |
| 135,000 | Cilcorp, Inc., 8.700%, 10/15/2009 | 145,277 |
| 250,000 | Majapahit Holding BV, 7.750%, 10/17/2016, Cost — $247,476; Acquired — 10/11/2006 (a)(b) | 265,937 |
| 155,000 | Nisource Finance Corp., 7.875%, 11/15/2010 | 167,363 |
| 130,000 | Pacific Gas & Electric Co., 6.050%, 03/01/2034 | 131,553 |
| | | 710,130 |
Electronic Equipment & Instruments (0.4%) | |
| 80,000 | Jabil Circuit, Inc., 5.875%, 07/15/2010 | 79,496 |
Food Products (0.7%) | |
| 125,000 | Corn Products International, Inc., 8.450%, 08/15/2009 | 133,360 |
| | |
Health Care Providers & Services (2.3%) | |
| 100,000 | Davita, Inc., 6.625%, 03/15/2013 | 100,750 |
| 70,000 | Laboratory Corporation of America Holdings, 5.625%, 12/15/2015 | 68,936 |
| 185,000 | Medco Health Solutions, Inc., 7.250%, 08/15/2013 | 198,837 |
| 70,000 | Quest Diagnostics, Inc., 5.450%, 11/01/2015 | 67,687 |
| | | 436,210 |
Hotels, Restaurants & Leisure (2.4%) | |
| 135,000 | Hyatt Equities LLC, 6.875%, 06/15/2007, Cost — $134,966; Acquired — 06/12/2002 (b) | 135,576 |
| 130,000 | MGM Mirage, 6.875%, 04/01/2016 (d) | 125,450 |
| 100,000 | Starwood Hotels & Resorts Worldwide, Inc., 7.875%, 05/01/2012 | 105,726 |
| 80,000 | Wynn Las Vegas LLC, 6.625%, 12/01/2014 (d) | 79,900 |
| | | 446,652 |
Household Durables (2.3%) | |
| 110,000 | KB Home, 5.750%, 02/01/2014. | 101,778 |
| 155,000 | NVR, Inc., 5.000%, 06/15/2010 | 151,320 |
| 175,000 | Ryland Group, Inc., 5.375%, 06/01/2008 | 173,886 |
| | | 426,984 |
The accompanying notes are an integral part of these financial statements.
40|86 Series Trust | Annual Report |
Schedule of Investments | December 31, 2006 |
Fixed Income Portfolio
| | SHARES OR PRINCIPAL AMOUNT | | VALUE |
| | | | |
Insurance (3.8%) | |
| $ | 120,000 | ACE Limited, 6.000%, 04/01/2007 (a) | $ 120,132 |
| | 250,000 | Arch Capital Group Ltd., 7.350%, 05/01/2034. | 276,621 |
| | 30,000 | Citizens Property Insurance Corp., 6.850%, 08/25/2007, Cost — $30,162; Acquired — 06/22/2001 (b) | 30,260 |
| | 220,000 | Monumental Global Funding II, 4.625%, 03/15/2010, Cost — $219,994; Acquired — 03/09/2005 (b) | 215,553 |
| | 5,000 | Nationwide Life Global Funding I, 5.350%, 02/15/2007, Cost — $5,000; Acquired — 06/05/2006 (b) | 5,000 |
| | 70,000 | The St. Paul Travelers Companies, Inc., 5.500%, 12/01/2015 | 69,852 |
| | | | 717,418 |
Machinery (1.0%) | |
| | 105,000 | Case Corp., 7.250%, 01/15/2016 (d) | 106,838 |
| | 80,000 | Kennametal, Inc., 7.200%, 06/15/2012 | 84,341 |
| | | | 191,179 |
Media (4.5%) | |
| | 75,000 | British Sky Broadcasting PLC, 8.200%, 07/15/2009 (a)(d). | 79,905 |
| | 100,000 | Charter Communications Operating LLC, 8.000%, 04/30/2012, Cost — $100,091; Acquired — 04/21/2004 (b)(d) | 104,375 |
| | 185,000 | Clear Channel Communications, Inc., 8.000%, 11/01/2008 | 192,418 |
| | 90,000 | Clear Channel Communications, Inc., 6.625%, 06/15/2008 | 90,975 |
| | 60,000 | DirecTV Holdings LLC, 8.375%, 03/15/2013 | 62,700 |
| | 100,000 | EchoStar DBS Corporation, 6.625%, 10/01/2014 | 97,750 |
| | 110,000 | News America Holdings, 7.700%, 10/30/2025 | 124,030 |
| | 95,000 | News America, Inc., 6.200%, 12/15/2034. | 91,993 |
| | | | 844,146 |
Multi-Utilities (1.5%) | |
| | 145,000 | Consolidated Edison, Inc., 3.625%, 08/01/2008 | 141,316 |
| | 135,000 | Sempra Energy, 6.000%, 02/01/2013 | 137,859 |
| | | | 279,175 |
Oil, Gas & Consumable Fuels (5.9%) | |
| | 335,000 | Anadarko Finance Co., 7.500%, 05/01/2031 (a). | 381,227 |
| | 200,000 | Chesapeake Energy Corp., 6.250%, 01/15/2018 (d) | 193,500 |
| | 135,000 | Enterprise Products Operating LP, 5.600%, 10/15/2014 | 132,794 |
| | 82,650 | Ras Laffan Liquefied Natural Gas Co., Ltd., 3.437%, 09/15/2009, Cost — $82,650; Acquired — 03/02/2004 (a)(b). | 80,580 |
| | 100,000 | Southern Natural Gas Co., 8.875%, 03/15/2010 | 105,409 |
| | 115,000 | TGT Pipeline LLC, 5.200%, 06/01/2018 | 107,157 |
| | 125,000 | XTO Energy, Inc., 6.100%, 04/01/2036. | 122,399 |
| | | | 1,123,066 |
Paper & Forest Products (0.5%) | |
| | 100,000 | Boise Cascade LLC, 7.125%, 10/15/2014 | 97,250 |
Pharmaceuticals (0.3%) | |
| | 60,000 | Wyeth, 5.500%, 03/15/2013 | 60,467 |
The accompanying notes are an integral part of these financial statements.
40|86 Series Trust | Annual Report |
Schedule of Investments | December 31, 2006 |
Fixed Income Portfolio
SHARES OR VALUE PRINCIPAL AMOUNT | | VALUE |
| | | | |
Real Estate (6.5%) | |
| $ | 150,000 | Chelsea Property Group, 7.250%, 10/21/2007 | $ 151,215 |
| | 85,000 | Developers Diversified Realty Corp., 3.875%, 01/30/2009 | 82,360 |
| | 160,000 | Equity One, Inc., 3.875%, 04/15/2009 | 154,006 |
| | 62,000 | Health Care REIT, Inc., 7.500%, 08/15/2007 | 62,533 |
| | 175,000 | Hospitality Properties Trust, 6.750%, 02/15/2013 | 183,389 |
| | 70,000 | iStar Financial, Inc., 5.150%, 03/01/2012 | 68,153 |
| | 65,000 | iStar Financial, Inc., 5.950%, 10/15/2013, Cost — $65,078; Acquired — 10/04/2006 (b) | 65,418 |
| | 70,000 | New Plan Excel Realty Trust, Inc., 5.125%, 09/15/2012 | 68,418 |
| | 150,000 | Senior Housing Properties Trust, 8.625%, 01/15/2012 | 163,500 |
| | 135,000 | Spieker Properties, Inc., 7.125%, 07/01/2009 | 141,635 |
| | 90,000 | United Dominion Realty Trust, Inc., 6.500%, 06/15/2009 | 92,566 |
| | | | 1,233,193 |
Software (0.7%) | |
| | 140,000 | Oracle Corp., 5.000%, 01/15/2011 | 138,716 |
Textiles, Apparel & Luxury Goods (0.3%) | |
| | 50,000 | Brown Shoe Inc., 8.750%, 05/01/2012 | 53,000 |
Thrifts & Mortgage Finance (1.4%) | |
| | 150,000 | Key Bank National Association, 5.000%, 07/17/2007 | 149,570 |
| | 120,000 | Washington Mutual, Inc., 5.625%, 01/15/2007 | 120,007 |
| | | | 269,577 |
Wireless Telecommunication Services (1.6%) | |
| | 125,000 | America Movil SA de CV, 6.375%, 03/01/2035 (a) | 122,581 |
| | 125,000 | Nextel Communications, Inc., 6.875%, 10/31/2013 | 126,419 |
| | 50,000 | Rogers Wireless, Inc., 7.500%, 03/15/2015 (a) | 54,500 |
| | | | 303,500 |
| | | Total corporate bonds (cost $11,046,691) | 11,120,207 |
| | |
FOREIGN GOVERNMENT NOTES/BONDS (1.1%) | |
| | 70,000 | Ministry Finance Russia, 3.000%, 05/14/2011 (a) | 63,328 |
| | 130,000 | Republic of Philippines, 7.750%, 01/14/2031 (a) | 148,200 |
| | | Total foreign government notes/bonds (cost $190,963) | 211,528 |
| | |
MORTGAGE-BACKED SECURITIES (16.4%) | |
| | 169,533 | Bank of America Mortgage Securities, Series #2004-7 5A10, 5.250%, 08/25/2034 | 167,275 |
| | 26,348 | Bear Stearns Commercial Mortgage Securities, Series #1999-C1 A1, 5.910%, 02/14/2031 | 26,371 |
| | 250,000 | Bear Stearns Commercial Mortgage Securities, Series #2002-TOP6 A2, 6.460%, 10/15/2036 | 262,891 |
| | 42,271 | CS First Boston Mortgage Securities Corp., Series #2001-CKN5 A3, 5.107%, 09/15/2034 | 42,103 |
| | 137,347 | Deutsche Mortgage and Asset Receiving Corp., Series #1998-C1 A2, 6.538%, 06/15/2031 | 138,342 |
| | 2,697 | DLJ Commercial Mortgage Corp., Series #1999-CG3 A1A, 7.120%, 10/10/2032 | 2,700 |
| | 20,469 | Federal Home Loan Mortgage Corp., Series #2614CH, 3.500%, 12/15/2010 | 20,402 |
| | 135,000 | Federal Home Loan Mortgage Corp., Series #2614TD, 3.500%, 05/15/2016 | 128,921 |
| | 165,000 | Federal Home Loan Mortgage Corp., Series #2517VH, 6.000%, 03/15/2019 | 166,287 |
| | 14,970 | Federal Home Loan Mortgage Corp., Gold Pool #G00479, 9.000%, 04/01/2025 | 16,199 |
| | 25,183 | Federal Home Loan Mortgage Corp., Gold Pool #G00943, 6.000%, 07/01/2028 | 25,496 |
The accompanying notes are an integral part of these financial statements.
40|86 Series Trust | Annual Report |
Schedule of Investments | December 31, 2006 |
Fixed Income Portfolio
| | SHARES OR PRINCIPAL AMOUNT | | VALUE |
| | | | |
MORTGAGE-BACKED SECURITIES (continued) | |
| $ | 2,140 | Federal Home Loan Mortgage Corp., Gold Pool #C00712, 6.500%, 02/01/2029 | $ 2,196 |
| | 26,159 | Federal Home Loan Mortgage Corp., Gold Pool #C50964, 6.500%, 05/01/2031 | 26,781 |
| | 13,152 | Federal Home Loan Mortgage Corp., Gold Pool #C60697, 6.000%, 11/01/2031 | 13,294 |
| | 35,948 | Federal Home Loan Mortgage Corp., Series #2407BJ, 6.500%, 01/15/2032 | 37,041 |
| | 79,960 | Federal Home Loan Mortgage Corp., Pool #A2-2364, 5.000%, 05/01/2034 | 77,259 |
| | 250,271 | Federal Home Loan Mortgage Corp., Pool #A5-2422, 5.500%, 09/01/2036 | 247,560 |
| | 247,684 | Federal Home Loan Mortgage Corp., Pool #A5-2536, 6.000%, 09/01/2036 | 249,593 |
| | 80,192 | Federal Home Loan Mortgage Corp., Pool #A5-2593, 6.500%, 10/01/2036 | 81,704 |
| | 113,313 | Federal National Mortgage Assn., Series #200357, 4.500%, 12/25/2012 | 112,424 |
| | 59,908 | Federal National Mortgage Assn., Pool #545449, 6.500%, 02/01/2017 | 61,390 |
| | 156,472 | Federal National Mortgage Assn., Series #200336, 4.500%, 07/25/2022 | 155,412 |
| | 2,511 | Federal National Mortgage Assn., Pool #349410, 7.000%, 08/01/2026 | 2,594 |
| | 1,763 | Federal National Mortgage Assn., Pool #062289, 5.065%, 03/01/2028 | 1,778 |
| | 150,000 | Federal National Mortgage Assn., Series #200180, 6.000%, 07/25/2029 | 151,172 |
| | 378 | Government National Mortgage Assn., Pool #051699, 15.000%, 07/15/2011 | 432 |
| | 360 | Government National Mortgage Assn., Pool #354859, 9.000%, 07/15/2024 | 389 |
| | 277,791 | JP Morgan Chase Commercial Mortgage Securities Corp., Series #2001-CIB3 A2, 6.044%, 11/15/2035 | 282,570 |
| | 239,202 | Residential Funding Mortgage Securities I, Series 2005-S7, 5.500%, 11/25/2035 | 237,182 |
| | 365,459 | Salomon Brothers Mortgage Securities VII, Series #2001-C2, 6.168%, 11/13/2036 | 368,604 |
| | | Total mortgage-backed securities (cost $3,174,487) | 3,106,362 |
| | |
MUNICIPAL BONDS (9.5%) | |
| | 55,000 | Baltimore Maryland General Obligation Unlimited, 7.250%, 10/15/2010 | 56,924 |
| | 25,000 | Bay Area Government Assn. California Revenue Tax Allocation Note, 4.290%, 09/01/2009 | 24,495 |
| | 110,000 | California County TOB Securitization Agency, 7.500%, 06/01/2019 | 111,597 |
| | 150,000 | Cameron Texas Education Corporate Revenue, 6.750%, 08/15/2016 | 155,018 |
| | 170,000 | Crestwood School District Pennsylvania, 5.800%, 03/01/2018 | 170,534 |
| | 90,000 | Decatur Hospital Authority, 7.750%, 09/01/2009 | 91,771 |
| | 55,000 | Heart of Texas Education Finance Corp., 5.000%, 02/15/2013 | 52,622 |
| | 145,541 | Louisiana Tobacco Settlement Financing Corp, 6.360%, 05/15/2025 | 145,698 |
| | 145,000 | Rhode Island Tobacco Settlement Financing Corp., 5.920%, 06/01/2012 | 144,549 |
| | 155,000 | Santa Rosa California Redevelopment Agency Tax Allocation, 5.500%, 08/01/2020 | 150,948 |
| | 109,388 | South Dakota Educational Enhancement Funding Corp., 6.720%, 06/01/2025 | 109,740 |
| | 180,000 | South El Monte California Improvement District Tax Allocation, 4.700%, 08/01/2011 | 174,096 |
| | 170,000 | University of Illinois at Chicago Certificates, 5.200%, 02/15/2022 | 162,449 |
| | 245,000 | Vigo County Indiana Redevelopment Authority, 5.300%, 02/01/2021 | 237,665 |
| | | Total municipal bonds (cost $1,774,309) | 1,788,106 |
| | |
U.S. TREASURY OBLIGATIONS (6.6%) | |
| | 260,000 | U.S. Treasury Bond, 4.500%, 02/15/2036 (d) | 247,325 |
| | 207,545 | U.S. Treasury Inflation Index Note, 2.000%, 01/15/2014 | 201,675 |
| | 79,277 | U.S. Treasury Inflation Index Note, 1.625%, 01/15/2015 | 74,645 |
| | 100,000 | U.S. Treasury Note, 4.625%, 08/31/2011 (d) | 99,715 |
| | 440,000 | U.S. Treasury Note, 4.500%, 02/15/2016 (d) | 433,125 |
| | 185,000 | U.S. Treasury Note, 4.875%, 08/15/2016 (d) | 187,269 |
| | | Total U.S. treasury obligations (cost $1,248,182) | 1,243,754 |
The accompanying notes are an integral part of these financial statements.
40|86 Series Trust | Annual Report |
Schedule of Investments | December 31, 2006 |
Fixed Income Portfolio
SHARES OR PRINCIPAL AMOUNT | | VALUE | |
| | | | |
INVESTMENTS PURCHASED WITH CASH PROCEEDS FROM SECURITIES LENDING (12.3%) | | |
| $2,322,419 | Bank of New York Institutional Cash Reserve Fund, 5.404% | $ 2,322,419 | |
| 10,510 | Granite Master Issuer PLC, 5.390%, 01/22/2007 (a)(c) | 10,510 | |
| | Total investments purchased with cash proceeds from securities lending (cost $2,332,929) | 2,332,929 | |
| | | |
SHORT-TERM INVESTMENTS (3.8%) | | |
| 970 | Bank of New York Cash Reserve, 1.550% | 970 | |
| 720,000 | JP Morgan Prime Money Market Institutional, 5.180% | 720,000 | |
| | Total short-term investments (cost $720,970) | 720,970 | |
| | | | |
| | Total investments (Cost $20,978,064) (111.1%) | 21,011,075 | |
| | Liabilities in excess of other assets (-11.1%) | (2,098,275 | ) |
| | | | |
| | Total Net Assets (100.0%) | $18,912,800 | |
____________
| (a) | Foreign security or a U.S. security of a foreign company. |
| (b) | Restricted under Rule 144A of Securities Act of 1933. |
| (c) | Variable Coupon Rate — the rate reported is the rate in effect as of December 31, 2006. |
| (d) | All or a portion of the security is out on loan. |
The accompanying notes are an integral part of these financial statements.
40|86 Series Trust | Annual Report |
Portfolio Managers’ Review (unaudited) | December 31, 2006 |
Government Securities Portfolio
How did the Portfolio perform relative to its benchmark?
The 40|86 Series Trust Government Securities Portfolio returned 3.45% for the year ended December 31, 2006(1). The Lehman Brothers Government Index and the Lehman Brothers Mortgage-Backed Security Index gained 3.48% and 5.22%, respectively, for the same period.
What factors contributed to the variance between the Portfolio and its benchmark?
The Portfolio was aided versus the Lehman Brothers Government Index due to its lower allocation to long-term bonds. Interest rates rose roughly 35 bps from the end of 2005 to the end of 2006. The Portfolio trailed the Lehman Brothers Mortgage-Backed Securities Index because of greater interest rate exposure. The Portfolio’s allocation to Commercial Mortgage-backed Securities and Asset-backed Securities enhanced its performance.
Which holdings most enhanced the Portfolio’s performance?
The Portfolio’s performance was enhanced by higher coupon Mortgage-backed Securities and short duration Asset-backed Securities.
Which holdings most negatively impacted the Portfolio’s performance?
Longer-term U.S. Treasury bonds detracted from performance. As interest rates rose, these positions lagged with respect to price appreciation.
Liquidation and Closing of the Government Securities Portfolio
Please refer to the Letter to Shareholders at the front of this report for information regarding the liquidation and termination of the Government Securities Portfolio.
| Michael J. Dunlop | Willie M. Brown, CFA |
| Senior Vice President | Assistant Vice President |
| 40|86 Advisors, Inc. | 40|86 Advisors, Inc. |
Growth of a $10,000 Investment (as of 12/31/06)
Average Annual Total Return(1) (as of 12/31/06) | |
| | 1 YEAR | 5 YEARS | 10 YEARS |
| Government Securities Portfolio | 3.45% | 3.63% | 4.83% |
| LB Government | 3.48% | 4.64% | 6.01% |
| LB MBS | 5.22% | 4.85% | 6.16% |
(1) | Past performance does not guarantee future results. Your investment return and principal will fluctuate, and your shares may be worth more or less than their original cost. Total return is provided in accordance with SEC guidelines for comparative purposes and reflects certain contractual expense reimbursements through April 30, 2007. If the expense reimbursements were not in place, the portfolio's return would have been lower. The total returns shown do not include separate account expenses or the deduction of taxes that a contract holder would pay on portfolio distributions or the redemption of portfolio shares. The Lehman Brothers Government Index (“LB Government”) is an unmanaged index considered to be representative of bonds issued by the U.S. government or its agencies. The Lehman Brothers Mortgage-Backed Securities Index ("LB MBS") is an unmanaged index composed of all fixed securities mortgage pools by GNMA, FNMA and the FHLCM, including GHMA Graduated Payment Mortgages. Investors cannot actually invest in an index. |
40|86 Series Trust | Annual Report |
Schedule of Investments | December 31, 2006 |
Government Securities Portfolio
| | SHARES OR PRINCIPAL AMOUNT | | VALUE |
| | | | |
ASSET-BACKED SECURITIES (4.2%) | |
| $ | 75,000 | Atlantic City Electric Transition Funding LLC, Series #2002-1 A4, 5.550%, 10/20/2023 | $ 76,615 |
| | 150,000 | Credit-Based Asset Servicing and Securities, Series 2005-CB7, 5.147%, 11/25/2035 | 149,157 |
| | 5,000 | Citibank Credit Card Issuance Trust, Series #2003-C4 C4, 5.000%, 06/10/2015 | 4,865 |
| | 91,839 | Countrywide Asset-Backed Certificates, Series #2002-S1 A5, 6.460%, 11/25/2016 | 93,702 |
| | 81,369 | The Money Store Home Equity Trust, Series #1998-B AF9, 6.335%, 08/15/2039 | 81,400 |
| | | Total asset-backed securities (cost $405,638) | 405,739 |
| | |
CORPORATE BONDS (1.0%) | |
Insurance (1.0%) | |
| | 95,000 | MGIC Investment Corp., 6.000%, 03/15/2007 | 95,080 |
| | | Total corporate bonds (cost $95,000) | 95,080 |
| | |
MORTGAGE-BACKED SECURITIES (36.3%) | |
| | 6,586 | Bear Stearns Commercial Mortgage Securities, Series #1999-C A1, 5.910%, 02/14/2031 | 6,592 |
| | 100,000 | Bear Stearns Commercial Mortgage Securities, Series 2005-PWR8, 4.674%, 06/11/2041 | 95,794 |
| | 330,000 | Citicorp Mortgage Securities, Inc., Series 2005-4, 5.500%, 07/25/2035 | 317,427 |
| | 7,417 | DLJ Commercial Mortgage Corp., Series #1999-CG3, 7.120%, 10/10/2032 | 7,426 |
| | 326,805 | Federal Home Loan Mortgage Corp., Pool #2407 BJ, 6.500%, 01/15/2032 | 336,737 |
| | 2,778 | Federal Home Loan Mortgage Corp. Gold, Pool #D66012, 7.000%, 11/01/2025 | 2,867 |
| | 18,751 | Federal Home Loan Mortgage Corp. Gold, Pool #C28063, 6.500%, 07/01/2029 | 19,232 |
| | 10,952 | Federal Home Loan Mortgage Corp. Gold, Pool #C29168, 6.500%, 07/01/2029 | 11,233 |
| | 16,127 | Federal Home Loan Mortgage Corp. Gold, Pool #C01131, 6.500%, 01/01/2031 | 16,526 |
| | 16,469 | Federal Home Loan Mortgage Corp. Gold, Pool #C01148, 6.500%, 02/01/2031 | 16,876 |
| | 52,037 | Federal Home Loan Mortgage Corp. Gold, Pool #C01186, 6.000%, 06/01/2031 | 52,596 |
| | 51,884 | Federal Home Loan Mortgage Corp. Gold, Pool #C01184, 6.500%, 06/01/2031 | 53,117 |
| | 220,351 | Federal Home Loan Mortgage Corp. Gold, Pool #G01805, 4.500%, 04/01/2035 | 207,510 |
| | 219,790 | Federal Home Loan Mortgage Corp. Gold, Pool #A3-5760, 5.000%, 07/01/2035 | 212,214 |
| | 99,687 | Federal Home Loan Mortgage Corp. Gold, Pool #A4-4090, 5.500%, 03/01/2036 | 98,607 |
| | 21,769 | Federal National Mortgage Assn., Pool #320582, 6.500%, 01/01/2011 | 22,184 |
| | 52,150 | Federal National Mortgage Assn., Pool #336290, 6.500%, 04/01/2011 | 53,400 |
| | 133,053 | Federal National Mortgage Assn., Pool #253845, 6.000%, 06/01/2016 | 135,075 |
| | 75,313 | Federal National Mortgage Assn., Pool #545449, 6.500%, 02/01/2017 | 77,177 |
| | 132,675 | Federal National Mortgage Assn., Pool #645649, 6.000%, 06/01/2017 | 134,666 |
| | 3,211 | Federal National Mortgage Assn., Pool #303780, 7.000%, 03/01/2026 | 3,316 |
| | 344,119 | Federal National Mortgage Assn., Pool #2004-91 AH, 4.500%, 05/25/2029 | 335,900 |
| | 100,000 | Federal National Mortgage Assn., Pool #2001-80 PE, 6.000%, 07/25/2029 | 100,781 |
| | 20,378 | Federal National Mortgage Assn., Pool #535837, 6.000%, 04/01/2031 | 20,584 |
| | 5,319 | Federal National Mortgage Assn., Pool #609583, 6.000%, 11/01/2031 | 5,373 |
| | 22,610 | Federal National Mortgage Assn., Pool #254091, 6.000%, 12/01/2031 | 22,839 |
| | 216,632 | Federal National Mortgage Assn., Pool #816362, 4.887%, 01/01/2035 | 215,939 |
| | 257,455 | Federal National Mortgage Assn., Pool #826443, 4.975%, 07/01/2035 | 253,263 |
| | 249,096 | Federal National Mortgage Assn., Pool #837926, 4.846%, 08/01/2035 | 246,539 |
| | 18,998 | Federal National Mortgage Assn. Grantor Trust, Series #1999-T2 A1, 7.500%, 01/19/2029 | 19,857 |
| | 75,000 | First Union National Bank Commercial Mortgage, Series #1999-C4 A2, 7.390%, 12/15/2031 | 78,524 |
| | 191,543 | FNMA Remic Trust 2006-b1, Series 2006-B1, 6.000%, 06/25/2016 | 192,065 |
| | 3,357 | Government National Mortgage Assn., Pool #119896, 13.000%, 11/15/2014 | 3,765 |
The accompanying notes are an integral part of these financial statements.
40|86 Series Trust | Annual Report |
Schedule of Investments | December 31, 2006 |
Government Securities Portfolio
SHARES OR PRINCIPAL AMOUNT | | VALUE |
| | | |
MORTGAGE-BACKED SECURITIES (continued) | |
| $ 5,401 | Government National Mortgage Assn., Pool #408675, 7.500%, 01/15/2026 | $ 5,647 |
| 150,000 | GS Mortgage Securities Corporation II, Series 2004-GG2, 5.396%, 08/10/2038 | 150,664 |
| | Total mortgage-backed securities (cost $3,571,934) | 3,532,312 |
| | |
MUNICIPAL BONDS (0.8%) | |
| 75,000 | Tobacco Settlement Financing Corp., 5.920%, 06/01/2012 | 74,767 |
| | Total municipal bonds (cost $74,792) | 74,767 |
| | |
U.S. GOVERNMENT AGENCY ISSUES (21.9%) | |
| 150,000 | Federal Home Loan Bank, 5.375%, 05/18/2016 | 154,357 |
| 280,000 | Federal Home Loan Mortgage Corp., 6.750%, 03/15/2031 | 340,093 |
| 400,000 | Federal Home Loan Bank, 3.875%, 08/22/2008 | 392,693 |
| 400,000 | Federal Home Loan Bank, 4.500%, 09/16/2013 | 389,760 |
| 400,000 | Federal Home Loan Mortgage Corp., 6.250%, 03/05/2012 | 400,615 |
| 300,000 | Federal National Mortgage Assn., 5.000%, 03/15/2016 | 301,267 |
| 150,000 | Federal National Mortgage Assn., 5.250%, 09/15/2016 (a) | 153,001 |
| | Total U.S. government agency issues (cost $2,121,599) | 2,131,786 |
| | |
U.S. TREASURY OBLIGATIONS (34.3%) | |
| 587,000 | U.S. Treasury Bond, 11.250%, 02/15/2015 (a) | 843,492 |
| 75,000 | U.S. Treasury Bond, 9.000%, 11/15/2018 (a) | 103,154 |
| 325,000 | U.S. Treasury Bond, 5.375%, 02/15/2031 (a) | 348,233 |
| 100,000 | U.S. Treasury Note, 5.500%, 02/15/2008 (a) | 100,586 |
| 300,000 | U.S. Treasury Note, 4.125%, 08/15/2008 (a) | 296,836 |
| 1,000,000 | U.S. Treasury Note, 3.875%, 05/15/2009 (a) | 980,665 |
| 350,000 | U.S. Treasury Note, 3.875%, 09/15/2010 (a) | 340,334 |
| 300,000 | U.S. Treasury Note, 4.000%, 02/15/2014 (a) | 287,262 |
| 30,000 | U.S. Treasury Note, 4.250%, 08/15/2015 (a) | 29,039 |
| | Total U.S. treasury obligations (cost $3,376,877) | 3,329,601 |
| | |
INVESTMENTS PURCHASED WITH CASH PROCEEDS FROM SECURITIES LENDING (21.1%) | |
| 2,047,014 | Bank of New York Institutional Cash Reserve Fund, 5.403% | 2,047,014 |
| | Total investments purchased with cash proceeds from securities lending (cost $2,047,014) | 2,047,014 |
| | |
SHORT-TERM INVESTMENTS (0.2%) | |
| 267 | Bank of New York Cash Reserve, 1.550% | 267 |
| 21,000 | JP Morgan Prime Money Market Institutional, 5.180% | 21,000 |
| | Total short-term investments (cost $21,267) | 21,267 |
| | | |
| | Total investments (Cost $11,714,121) (119.8%) | 11,637,566 |
| | Liabilities in excess of other assets (-19.8%) | (1,921,515) |
| | | |
| | Total Net Assets (100.0%) | $ 9,716,051 |
____________
| (a) | All or a portion of the security is out on loan. |
The accompanying notes are an integral part of these financial statements.
40|86 Series Trust | Annual Report |
Portfolio Managers’ Review (unaudited) | December 31, 2006 |
Money Market Portfolio
The 40|86 Series Trust Money Market Portfolio returned 4.61% for the year ended December 31, 2006. The Federal Reserve maintained the Fed Funds rate of 5.25% at the December meeting. The rise in short-term interest rates produced a slight flattening of the yield curve, although the entire U.S. Treasury curve rose between 25 bps and 95 bps.
We finished the year with the Portfolio’s weighted average days-to-maturity below 25 as the U.S. Treasury market sold off into year-end. We invested significantly in Variable Rate Demand Notes (VRDNs), which have floating rate coupons that reset weekly. In a rising interest rate environment, coupons of VRDNs reset to higher rates weekly as rates increase. In addition, VRDNs are highly liquid and offer higher yields than 1-week Tier-1 Non-Asset-backed securities. We also selectively started investing in short corporate paper toward the longer end of the money market curve because we believe the Fed is close to the end of its tightening cycle.
Trading in commercial paper remained heavily skewed to short maturities, although investors have slowly started extending to longer maturities as the Fed tightening comes to a close. We have also begun to divest the variable rate paper and invest in longer maturities.
Liquidation and Closing of the Money Market Portfolio
Please refer to the Letter to Shareholders at the front of this report for information regarding the liquidation and termination of the Money Market Portfolio.
| Michael J. Dunlop | Vishal Mahajan |
| Senior Vice President | Assistant Vice President |
| 40|86 Advisors, Inc. | 40|86 Advisors, Inc. |
40|86 Series Trust | Annual Report |
Schedule of Investments | December 31, 2006 |
Money Market Portfolio
SHARES OR PRINCIPAL AMOUNT | | VALUE |
| | | |
CORPORATE BONDS (13.0%) | |
Capital Markets (3.7%) | |
| $ 800,000 | Corporate Finance Managers, Inc., 5.380%, 01/05/2007 (a)(b) | $ 800,000 |
| 500,000 | Westgate Investment Fund, 5.380%, 02/01/2012 (a) | 500,000 |
| | | 1,300,000 |
Diversified Financial Services (1.4%) | |
| 475,000 | HBOS plc, 3.125%, 01/12/2007 Cost — $474,712; Acquired — 01/26/2006 (c) | 474,712 |
| 30,000 | Toyota Motor Credit Corp., 5.650%, 01/15/2007 (d). | 30,007 |
| | | 504,719 |
Health Care Providers & Services (0.8%) | |
| 290,000 | UnitedHealth Group, Inc., 5.200%, 01/17/2007 | 290,038 |
Insurance (5.7%) | |
| 1,000,000 | Hartford Life Global Fund, 5.330%, 09/15/2007 (a) | 1,000,000 |
| 1,000,000 | Monumental Global Funding II, 5.200%, 01/30/2007, Cost — $999,895; Acquired — 05/22/2006 (c) | 999,895 |
| | | 1,999,895 |
Real Estate (1.4%) | |
| 490,000 | Kuehn Enterprises LLC, 5.280%, 01/05/2007 (a)(b) | 490,000 |
| | Total corporate bonds (amortized cost $4,584,652) | 4,584,652 |
| | |
MUNICIPAL BONDS (17.3%) | |
| 100,000 | ABAG Financial Authorities for Nonprofit Corps., 5.450%, 01/05/2007 (b) (CS: Federal National Mortgage Assn.) | 100,000 |
| 1,000,000 | Brooklyn Park Minnesota Economic Development Authority, 3.590%, 03/01/2007 (CS: Radian) | 996,816 |
| 100,000 | Colorado Housing & Finance Authority, 5.290%, 01/05/2007 (b) (CS: Federal National Mortgage Assn.) | 100,000 |
| 900,000 | Florida Housing & Finance Authority, 5.330%, 01/05/2007 (b) (CS: MBIA; SPA: West Deutsche Landesbank) | 900,000 |
| 1,000,000 | New Orleans Louisiana Pension, 5.550%, 01/05/2007 (b) (CS: Ambac Financial Group; SPA: Bank One Louisiana) | 1,000,000 |
| 700,000 | Portland Maine Pension, 5.330%, 01/05/2007 (b) (SPA: Bayerische Hessen-Thuringen) | 700,000 |
| 1,000,000 | St. Johns County Industrial Development Authority, 5.420%, 01/05/2007 (b) (LOC: Allied Irish Bank PLC). | 1,000,000 |
| 665,000 | University of Minnesota, 5.380%, 01/05/2007 (b) | 665,000 |
| 600,000 | Utah Housing Finance Agency, 5.380%, 01/05/2007 (b) (SPA: Bayerische Landesbank) | 600,000 |
| | Total municipal bonds (amortized cost $6,061,816) | 6,061,816 |
The accompanying notes are an integral part of these financial statements.
40|86 Series Trust | Annual Report |
Schedule of Investments | December 31, 2006 |
Money Market Portfolio
SHARES OR PRINCIPAL AMOUNT | | VALUE | |
| | | | |
COMMERCIAL PAPER (53.9%) | | |
Diversified Financial Services (48.2%) | | |
| $ 2,000,000 | BMW US Capital LLC, 5.293%, 01/02/2007, Cost — $1,999,118; Acquired — 12/29/2006 (c) | $ 1,999,118 | |
| 1,000,000 | Britannia Building Society, 5.265%, 01/11/2007. | 998,245 | |
| 2,000,000 | Cargill Global Funding, 5.273%, 01/02/2007, Cost — $1,999,122; Acquired — 12/29/2006 (c) | 1,999,122 | |
| 2,000,000 | Dresdner US Finance, Inc., 5.300%, 01/02/2007 | 1,999,117 | |
| 2,000,000 | Greenwich Capital Holdings, 5.290%, 01/02/2007 | 1,999,118 | |
| 2,000,000 | Korea Development Bank NY, 5.255%, 03/12/2007 | 1,978,980 | |
| 2,000,000 | Mitsubishi International Corp., 5.250%, 01/11/2007 | 1,996,500 | |
| 2,000,000 | Norddeutsche Landesbank, 5.320%, 01/08/2007, Cost — $1,997,375; Acquired — 10/10/2006 (c) | 1,997,375 | |
| 2,000,000 | Sumitomo Corporation of America, 5.260%, 02/26/2007 | 1,983,051 | |
| | | 16,950,626 | |
Diversified Consumer Services (5.7%) | | |
| 2,000,000 | Harvard University, 5.240%, 01/02/2007 | 1,999,127 | |
| | Total commerical paper (amortized cost $18,949,753) | 18,949,753 | |
| | | |
SHORT-TERM INVESTMENTS (2.5%) | | |
| 708,478 | Bank of New York Cash Reserve, 1.550% | 708,478 | |
| 172,000 | JP Morgan Prime Money Market Institutional, 5.180%. | 172,000 | |
| | Total short-term investments (amortized cost $880,478) | 880,478 | |
| | | | |
| | Total investments (amortized cost $30,476,699) (86.7%) | 30,476,699 | |
| | Other assets in excess of liabilities (13.3%) | 4,670,520 | |
| | | | |
| | Total Net Assets (100.0%). | $35,147,219 | |
| | | | |
____________
| (a) | Variable Coupon Rate — the rate reported is the rate in effect as of December 31, 2006. |
| (b) | Maturity date represents first available put date. |
| (c) | Restricted under Rule 144A of the Securities Act of 1933. |
| (d) | Foreign security or a U.S. security of a foreign company. |
CS — Credit Support.
LOC — Letter of Credit.
SPA — Standby Purchase Agreement.
The accompanying notes are an integral part of these financial statements.
40|86 Series Trust | Annual Report |
Financial Highlights | |
For a share outstanding during the years ended December 31,
| | | EQUITY PORTFOLIO |
| | | 2006 | | 2005 | | 2004 | | 2003 | | 2002 | |
| | | | | | | | | | | | |
| Net asset value per share, beginning of year | | $ | 24.69 | | $ | 24.53 | | $ | 20.42 | | $ | 14.92 | | $ | 17.30 | |
| Income from investment operations: | | | | | | | | | | | | | | | | |
| Net investment income | | | 0.12 | | | 0.13 | | | 0.08 | | | 0.06 | | | 0.06 | |
| Net realized gain (loss) and change in unrealized appreciation (depreciation) on investments | | | 3.51 | | | 2.69 | | | 4.20 | | | 5.49 | | | (2.38 | ) |
| Total income (loss) from investment operations | | | 3.63 | | | 2.82 | | | 4.28 | | | 5.55 | | | (2.32 | ) |
| Distributions: | | | | | | | | | | | | | | | | |
| Dividends from net investment income | | | (0.15 | ) | | (0.13 | ) | | (0.08 | ) | | (0.05 | ) | | (0.06 | ) |
| Distributions of net realized gains | | | (3.38 | ) | | (2.53 | ) | | (0.09 | ) | | — | | | — | |
| Total dividends and distributions | | | (3.53 | ) | | (2.66 | ) | | (0.17 | ) | | (0.05 | ) | | (0.06 | ) |
| Net asset value per share, end of year | | $ | 24.79 | | $ | 24.69 | | $ | 24.53 | | $ | 20.42 | | $ | 14.92 | |
| Total return (a)(b) | | | 14.63 | % | | 11.43 | % | | 20.94 | % | | 37.17 | % | | (13.42 | %) |
| | | | | | | | | | | | | | | | | |
| Ratios/supplemental data: | | | | | | | | | | | | | | | | |
| Net assets (dollars in thousands), end of year. | | $ | 169,388 | | $ | 171,779 | | $ | 168,901 | | $ | 165,798 | | $ | 148,881 | |
| Ratio of expenses to average net assets (b): | | | | | | | | | | | | | | | | |
| Before expense reimbursement | | | 1.16 | % | | 1.20 | % | | 1.13 | % | | 1.14 | % | | 1.15 | % |
| After expense reimbursement | | | 1.10 | % | | 1.10 | % | | 1.10 | % | | 1.10 | % | | 1.10 | % |
| Ratio of net investment income to average net assets (b) | | | 0.40 | % | | 0.48 | % | | 0.38 | % | | 0.28 | % | | 0.32 | % |
| Portfolio turnover rate | | | 87 | % | | 90 | % | | 89 | % | | 107 | % | | 102 | % |
____________
| (a) | Total return represents performance of the Portfolio only and does not include mortality and expense deductions in separate accounts. |
| (b) | The Adviser and Administrator have contractually agreed to reimburse Portfolio expenses to the extent that the ratio of expenses to average net assets exceeds, on an annual basis, the net expenses defined in Note 3. These contractual limits may be discontinued at any time after April 30, 2007. |
The accompanying notes are an integral part of these financial statements.
40|86 Series Trust | Annual Report |
Financial Highlights | |
For a share outstanding during the years ended December 31,
| | | BALANCED PORTFOLIO |
| | | 2006 | | 2005 | | 2004 | | 2003 | | 2002 | |
| | | | | | | | | | | | |
| Net asset value per share, beginning of year | | $ | 13.94 | | $ | 13.42 | | $ | 12.35 | | $ | 10.25 | | $ | 12.16 | |
| Income from investment operations: | | | | | | | | | | | | | | | | |
| Net investment income | | | 0.27 | | | 0.23 | | | 0.26 | | | 0.27 | | | 0.36 | |
| Net realized gain (loss) and change in unrealized appreciation (depreciation) on investments | | | 1.53 | | | 0.52 | | | 1.07 | | | 2.09 | | | (1.91 | ) |
| Total income (loss) from investment operations | | | 1.80 | | | 0.75 | | | 1.33 | | | 2.36 | | | (1.55 | ) |
| Distributions: | | | | | | | | | | | | | | | | |
| Dividends from net investment income | | | (0.27 | ) | | (0.23 | ) | | (0.26 | ) | | (0.26 | ) | | (0.36 | ) |
| Distributions of net realized gains | | | — | | | — | | | — | | | — | | | — | |
| Total distributions | | | (0.27 | ) | | (0.23 | ) | | (0.26 | ) | | (0.26 | ) | | (0.36 | ) |
| Net asset value per share, end of year | | $ | 15.47 | | $ | 13.94 | | $ | 13.42 | | $ | 12.35 | | $ | 10.25 | |
| Total return (a)(b) | | | 13.05 | % | | 5.63 | % | | 10.84 | % | | 23.29 | % | | (12.87 | %) |
| | | | | | | | | | | | | | | | | |
| Ratios/supplemental data: | | | | | | | | | | | | | | | | |
| Net assets (dollars in thousands), end of year | | $ | 42,161 | | $ | 43,511 | | $ | 47,056 | | $ | 48,282 | | $ | 44,455 | |
| Ratio of expenses to average net assets (b): | | | | | | | | | | | | | | | | |
| Before expense reimbursement | | | 1.20 | % | | 1.22 | % | | 1.14 | % | | 1.15 | % | | 1.18 | % |
| After expense reimbursement. | | | 1.10 | % | | 1.10 | % | | 1.10 | % | | 1.10 | % | | 1.10 | % |
| Ratio of net investment income to average net assets (b) | | | 1.81 | % | | 1.66 | % | | 2.03 | % | | 2.27 | % | | 3.11 | % |
| Portfolio turnover rate | | | 69 | % | | 91 | % | | 97 | % | | 100 | % | | 180 | % |
____________
| (a) | Total return represents performance of the Portfolio only and does not include mortality and expense deductions in separate accounts. |
| (b) | The Adviser and Administrator have contractually agreed to reimburse Portfolio expenses to the extent that the ratio of expenses to average net assets exceeds, on an annual basis, the net expenses defined in Note 3. These contractual limits may be discontinued at any time after April 30, 2007. |
The accompanying notes are an integral part of these financial statements.
40|86 Series Trust | Annual Report |
Financial Highlights | |
For a share outstanding during the years ended December 31,
| | | | FIXED INCOME PORTFOLIO |
| | | | 2006 | | 2005 | | 2004 | | 2003 | | 2002 | |
| | | | | | | | | | | | | |
| Net asset value per share, beginning of year. | | | $ | 9.88 | | $ | 10.10 | | $ | 10.08 | | $ | 9.66 | | $ | 9.88 | |
| Income from investment operations: | | | | | | | | | | | | | | | | | |
| Net investment income | | | | 0.45 | | | 0.44 | | | 0.44 | | | 0.46 | | | 0.58 | |
| Net realized gain (loss) and change in unrealized appreciation or depreciation on investments | | | | (0.02 | ) | | (0.22 | ) | | 0.02 | | | 0.42 | | | (0.13 | ) |
| Total income from investment operations | | | | 0.43 | | | 0.22 | | | 0.46 | | | 0.88 | | | 0.45 | |
| Distributions: | | | | | | | | | | | | | | | | | |
| Dividends from net investment income | | | | (0.47 | ) | | (0.44 | ) | | (0.44 | ) | | (0.46 | ) | | (0.58 | ) |
| Distributions of net realized gains | | | | — | | | — | | | — | | | — | | | (0.09 | ) |
| Total distributions | | | | (0.47 | ) | | (0.44 | ) | | (0.44 | ) | | (0.46 | ) | | (0.67 | ) |
| Net asset value per share, end of year | | | $ | 9.84 | | $ | 9.88 | | $ | 10.10 | | $ | 10.08 | | $ | 9.66 | |
| Total return (a)(b) | | | | 4.45 | % | | 2.26 | % | | 4.74 | % | | 9.33 | % | | 4.68 | % |
| | | | | | | | | | | | | | | | | | |
| Ratios/supplemental data: | | | | | | | | | | | | | | | | | |
| Net assets (dollars in thousands), end of year | | | $ | 18,913 | | $ | 23,091 | | $ | 27,448 | | $ | 35,068 | | $ | 41,957 | |
| Ratio of expenses to average net assets (b): | | | | | | | | | | | | | | | | | |
| Before expense reimbursement | | | | 1.04 | % | | 1.06 | % | | 0.98 | % | | 1.00 | % | | 1.02 | % |
| After expense reimbursement | | | | 0.95 | % | | 0.95 | % | | 0.95 | % | | 0.95 | % | | 0.95 | % |
| Ratio of net investment income to average net assets (b) | | | | 4.56 | % | | 4.33 | % | | 4.40 | % | | 4.61 | % | | 5.86 | % |
| Portfolio turnover rate | | | | 170 | % | | 197 | % | | 226 | % | | 307 | % | | 371 | % |
____________
| (a) | Total return represents performance of the Portfolio only and does not include mortality and expense deductions in separate accounts. |
| (b) | The Adviser and Administrator have contractually agreed to reimburse Portfolio expenses to the extent that the ratio of expenses to average net assets exceeds, on an annual basis, the net expenses defined in Note 3. These contractual limits may be discontinued at any time after April 30, 2007. |
The accompanying notes are an integral part of these financial statements.
40|86 Series Trust | Annual Report |
Financial Highlights | |
For a share outstanding during the years ended December 31,
| | GOVERNMENT SECURITIES PORTFOLIO |
| | | 2006 | | 2005 | | 2004 | | 2003 | | 2002 | |
| | | | | | | | | | | | |
| Net asset value per share, beginning of year | | $ | 11.36 | | $ | 11.59 | | $ | 11.70 | | $ | 12.04 | | $ | 11.70 | |
| Income from investment operations: | | | | | | | | | | | | | | | | |
| Net investment income | | | 0.41 | | | 0.39 | | | 0.40 | | | 0.42 | | | 0.47 | |
| Net realized gain (loss) and change in unrealized appreciation or depreciation on investments | | | (0.03 | ) | | (0.19 | ) | | (0.11 | ) | | (0.25 | ) | | 0.60 | |
| Total income from investment operations | | | 0.38 | | | 0.20 | | | 0.29 | | | 0.17 | | | 1.07 | |
| Distributions: | | | | | | | | | | | | | | | | |
| Dividends from net investment income | | | (0.44 | ) | | (0.43 | ) | | (0.40 | ) | | (0.42 | ) | | (0.47 | ) |
| Distributions of net realized gains | | | — | | | — | | | — | | | (0.09 | ) | | (0.26 | ) |
| Total distributions | | | (0.44 | ) | | (0.43 | ) | | (0.40 | ) | | (0.51 | ) | | (0.73 | ) |
| Net asset value per share, end of year | | $ | 11.30 | | $ | 11.36 | | $ | 11.59 | | $ | 11.70 | | $ | 12.04 | |
| Total return (a)(b) | | | 3.45 | % | | 1.73 | % | | 2.48 | % | | 1.36 | % | | 9.33 | % |
| | | | | | | | | | | | | | | | | |
| Ratios/supplemental data: | | | | | | | | | | | | | | | | |
| Net assets (dollars in thousands), end of year | | $ | 9,716 | | $ | 12,209 | | $ | 14,565 | | $ | 22,791 | | $ | 41,676 | |
| Ratio of expenses to average net assets (b): | | | | | | | | | | | | | | | | |
| Before expense reimbursement | | | 1.07 | % | | 1.06 | % | | 0.94 | % | | 1.04 | % | | 0.99 | % |
| After expense reimbursement | | | 0.95 | % | | 0.95 | % | | 0.95 | % | | 0.95 | % | | 0.95 | % |
| Ratio of net investment income to average net assets (b) | | | 3.66 | % | | 3.40 | % | | 3.29 | % | | 3.32 | % | | 3.78 | % |
| Portfolio turnover rate. | | | 16 | % | | 189 | % | | 250 | % | | 175 | % | | 174 | % |
____________
| (a) | Total return represents performance of the Portfolio only and does not include mortality and expense deductions in separate accounts. |
| (b) | The Adviser and Administrator have contractually agreed to reimburse Portfolio expenses to the extent that the ratio of expenses to average net assets exceeds, on an annual basis, the net expenses defined in Note 3. These contractual limits may be discontinued at any time after April 30, 2007. |
The accompanying notes are an integral part of these financial statements.
40|86 Series Trust | Annual Report |
Financial Highlights | |
For a share outstanding during the years ended December 31,
| | | MONEY MARKET PORTFOLIO |
| | | 2006 | | 2005 | | 2004 | | 2003 | | 2002 | |
| | | | | | | | | | | | |
| Net asset value per share, beginning of year | | $ | 1.00 | | $ | 1.00 | | $ | 1.00 | | $ | 1.00 | | $ | 1.00 | |
| Income from investment operations: | | | | | | | | | | | | | | | | |
| Net investment income | | | 0.04 | | | 0.03 | | | 0.01 | | | 0.01 | | | 0.01 | |
| Net realized gain (loss) and change in unrealized appreciation (depreciation) on investments | | | — | | | 0.00 | | | 0.00 (c | ) | | — | | | (0.00 | )(c) |
| Total income from investment operations | | | 0.04 | | | 0.03 | | | 0.01 | | | 0.01 | | | 0.01 | |
| Distributions: | | | | | | | | | | | | | | | | |
| Dividends from net investment income | | | (0.04 | ) | | (0.03 | ) | | (0.01 | ) | | (0.01 | ) | | (0.01 | ) |
| Distributions of net realized gains | | | — | | | — | | | — | | | — | | | (0.00 | )(c) |
| Total distributions | | | (0.04 | ) | | (0.03 | ) | | (0.01 | ) | | (0.01 | ) | | (0.01 | ) |
| Net asset value per share, end of year | | $ | 1.00 | | $ | 1.00 | | $ | 1.00 | | $ | 1.00 | | $ | 1.00 | |
| Total return (a)(b) | | | 4.61 | % | | 2.89 | % | | 0.93 | % | | 0.63 | % | | 1.24 | % |
| | | | | | | | | | | | | | | | | |
| Ratios/supplemental data: | | | | | | | | | | | | | | | | |
| Net assets (dollars in thousands), end of year | | $ | 35,147 | | $ | 40,340 | | $ | 33,755 | | $ | 41,965 | | $ | 95,767 | |
| Ratio of expenses to average net assets (b): | | | | | | | | | | | | | | | | |
| Before expense reimbursement | | | 0.69 | % | | 0.83 | % | | 0.71 | % | | 0.76 | % | | 0.73 | % |
| After expense reimbursement | | | 0.45 | % | | 0.45 | % | | 0.45 | % | | 0.45 | % | | 0.45 | % |
| Ratio of net investment income to average net assets (b) | | | 4.49 | % | | 2.90 | % | | 1.16 | % | | 0.64 | % | | 1.23 | % |
____________
| (a) | Total return represents performance of the Portfolio only and does not include mortality and expense deductions in separate accounts. |
| (b) | The Adviser and Administrator have contractually agreed to reimburse Portfolio expenses to the extent that the ratio of expenses to average net assets exceeds, on an annual basis, the net expenses defined in Note 3. These contractual limits may be discontinued at any time after April 30, 2007. |
| (c) | Amount calculated is less than $0.005 per share. |
The accompanying notes are an integral part of these financial statements.
40|86 Series Trust | Annual Report |
Notes to Financial Statements | December 31, 2006 |
1. GENERAL
40|86 Series Trust (the “Trust”) is an open-end management investment company registered with the Securities and Exchange Commission under the Investment Company Act of 1940, as amended (the “Act”), and was organized as a Massachusetts Trust effective November 15, 1982. The Trust is a “series” type of mutual fund which issues separate series of shares, each of which currently represents a separate portfolio of investments. The Trust consists of five series (“Portfolios”) each with its own investment objective and investment policies. The Portfolios are the Equity, Balanced, Fixed Income, Government Securities and Money Market. The Trust offers shares to affiliated and unaffiliated life insurance company separate accounts (registered as unit investment trusts under the Act) to fund the benefits under variable annuity and variable life contracts. However, Jefferson National Life variable annuity products own a majority of the shares offered by each Portfolio.
2. SUMMARY OF SIGNIFICANT ACCOUNTING POLICIES
SECURITY VALUATION, TRANSACTIONS AND RELATED INVESTMENT INCOME
The investments in each Portfolio are valued at the close of regular trading on the New York Stock Exchange on each business day. Investment transactions are accounted for on trade date (the date the order to buy or sell is executed). Dividend income is recorded on the ex-dividend date and interest income is accrued daily. The cost of investments sold is determined on the specific identification basis. The following summarizes the investments, which carry certain restrictions as to resale from the Trust to certain qualified buyers:
Portfolio | | Cost | | Value | | Percent of Net Assets | |
| Equity | | $ | 6,503,939 | | $ | 6,503,939 | | | 3.84% | |
| Balanced | | | 2,085,236 | | | 2,087,929 | | | 4.95% | |
| Fixed Income | | | 1,928,442 | | | 1,939,241 | | | 10.25% | |
| Money Market | | | 7,470,222 | | | 7,470,222 | | | 21.25% | |
These securities are eligible for resale to qualified institutional buyers in transactions exempt from registration under Rule 144Aof the Securities Act of 1933. In addition, 40|86 Advisors, Inc. (the “Adviser”), a wholly-owned subsidiary of Conseco, Inc. (“Conseco”), which served as investment adviser to the Portfolios, has determined that the securities are liquid securities through a procedure approved by the Board of Trustees of the Trust (the “Trustees”).
The Trustees determined that the Money Market Portfolio will value investments at amortized cost, which is conditioned on the Trust’s compliance with certain conditions contained in Rule 2a-7 of the Act. The Adviser continuously reviews this method of valuation and recommends changes to the Trustees, if necessary, to ensure that the Money Market Portfolio investments are valued at fair value (as determined by the Trustees in good faith)
In all Portfolios of the Trust, except for the Money Market Portfolio, securities that are traded on stock exchanges, excluding the NASDAQ national market system, are valued at the last sale price as of the close of business on the day the securities are being valued, or lacking any sales, at the mean between the closing bid and asked prices. Securities that are principally traded on the NASDAQ national market system are generally valued at the NASDAQ Official Closing Price (“NOCP”). Securities traded in the over-the-counter market are valued at the mean between the bid and asked prices obtained from a pricing service or brokers. Prices for fixed income securities may be obtained from an independent pricing source that uses information provided by market makers or estimates of market value obtained from yield data relating to investments or securities with similar characteristics. Portfolio securities that are traded both in the over-the-counter market and on a stock exchange are valued according to the broadest and most representative market, and it is expected that for debt securities this ordinarily will be the over-the-counter market. Debt securities with maturities of sixty (60) days or less are valued at amortized cost that approximates value.
Under the direction of the Trustees, the Adviser may use a practice known as fair value pricing under certain circumstances. This may include, but is not limited to, securities and assets for which market quotations are not readily available, situations where events occur after an exchange closes that are likely to affect the value of the security or the Adviser deems that the market price is not reflective of a security’s appropriate value. The Adviser may consider many factors when determining fair values, including but not limited to, the type of security, the financial statements of the issuer, the cost at date of purchase, the size of holdings and information as to any transactions or offers with respect to the security, existence of merger proposals or tender offers with respect to the security. These general and specific factors listed do not provide all the criteria, which may be considered when using the fair value method. When using the fair value method, the Adviser will take into consideration all indications of value available to them in determining the “fair value” assigned to a particular security.
If an investment owned by a Portfolio experiences a default and has accrued interest from purchase or has recorded accrued interest during the period it is owned, the Portfolio’s policy is to cease interest accruals from the time the investments are traded as “flat” in the market. The Portfolio evaluates the collectibility of purchased accrued interest and previously recorded interest on an investment-by-investment basis.
FEDERAL INCOME TAXES
Each Portfolio is treated as a separate taxable entity for federal income tax purposes and intends to qualify as a regulated investment company under Subchapter M of the Internal Revenue Code. The Trust intends to distribute substantially all taxable income and net realized gains to shareholders annually, and otherwise comply with the requirements for regulated investment companies. Therefore, no provision has been made for federal income taxes.
Net investment income and net realized gains (losses) may differ for financial statement and tax purposes because of temporary or permanent book/tax differences. To the extent these differences are permanent, reclassifications are made to the appropriate equity accounts in the period the difference arises. The reclassifi-
40|86 Series Trust | Annual Report |
Notes to Financial Statements | December 31, 2006 |
cations have no effect on net assets or net asset value per share. For the year ended December 31, 2006, the Equity Portfolio had a decrease in undistributed net investment loss of $245,893 and a decrease in accumulated realized gain of $245,893. The Balanced Portfolio had a decrease in undistributed net investment loss of $9,777, an increase in accumulated realized loss of $1,078 and a decrease in paid-in capital of $8,699. The Fixed Income Portfolio had an increase in undistributed net investment loss of $36,139 and an increase in accumulated realized loss of $36,139. The Government Securities Portfolio had a decrease in net investment loss of $24,788 and an increase in accumulated realized loss of $24,788. The Money Market Portfolio had a decrease in accumulated realized loss of $200 and a decrease in paid-in capital of $200.
DIVIDENDS TO SHAREHOLDERS
Dividends are declared and paid from net investment income on a daily basis in the Money Market Portfolio, on a monthly basis in the Government Securities and Fixed Income Portfolios, on a quarterly basis in the Balanced Portfolio and on an annual basis in the Equity Portfolio. Distributions of net short-term capital gains and losses are declared and reinvested, at least annually, as a component of net realized gains (losses).
Dividends to shareholders from net investment income are determined in accordance with income tax regulations which may differ from accounting principles generally accepted in the United States of America. Permanent book and tax differences relating to dividends to shareholders may result in reclassifications to paid-in capital and may effect per-share allocation between net investment income and realized and unrealized gains (losses). Any taxable income or gain of the Trust remaining at fiscal year end will be declared and distributed in the following year to the shareholders of the Portfolio or Portfolios to which such gains are attributable.
SECURITIES LENDING
The Portfolios have entered into a Securities Lending Agreement (the “Agreement”) with the Bank of New York. Under terms of the Agreement, the Portfolios may lend portfolio securities to qualified institutional borrowers in order to earn additional income. The Agreement requires that loans are collateralized at all times in an amount equal to at least 102% of the market value of any loaned securities, plus accrued interest. Cash collateral is invested in short-term securities or variable rate bonds and Certificates of Deposit that are included in the respective Portfolio’s Schedule of Investments. At December 31, 2006, the Equity, Balanced, Fixed Income and Government Securities Portfolios had securities with a market value of $49,107,726, $9,945,733, $2,239,071 and $1,961,207, respectively, on loan (included within Investments in securities in the Statements of Assets and Liabilities) and had received $50,679,175, $10,279,555, $2,332,929, and $2,047,014, respectively, in collateral. Amounts earned as interest on investments of cash collateral, net of rebates and other securities lending expenses, are included in Securities Lending income in the Statements of Operations. For the year ended December 31, 2006, the securities lending income totaled $69,092, $14,503, $7,318 and $5,330.
The primary risk associated with securities lending is if the borrower defaults on its obligation to return the securities loaned because of insolvency or other reasons. The Portfolios could experience delays and costs in recovering securities loaned or in gaining access to the collateral.
USE OF ESTIMATES
The preparation of financial statements in conformity with accounting principles generally accepted in the United States of America requires management to make estimates and assumptions that affect the reported amount of assets and liabilities, and disclosure of contingent assets and liabilities as of the date of the financial statements and the reported amounts of increases and decreases in net assets from operations during the reporting period. Actual results may differ from these estimates.
3. TRANSACTIONS WITH AFFILIATES
INVESTMENT ADVISORY AGREEMENT
The Adviser provides investment advice and, in general, supervises the Trust’s management and investment program, furnishes office space, prepares Portfolio reports for the Trust, monitors Portfolio compliance by the Trust in its investment activities and pays compensation of officers and Trustees of the Trust who are affiliated persons of the Adviser. The Trust pays all other expenses incurred in the operation of the Trust, including fees and expenses of unaffiliated Trustees of the Trust.
Under the Investment Advisory Agreement, the Adviser receives an investment advisory fee based on the daily net asset value at an annual rate of 0.65 percent for the Equity and Balanced Portfolios and 0.50 percent for the Fixed Income and Government Securities Portfolios. Effective March 1, 2005, the investment advisory fee for the Money Market Portfolio was reduced from an annual rate of 0.50 percent to 0.35 percent. The Adviser has voluntarily reduced its advisory fee to 0.25 percent of the average daily net assets of the Money Market Portfolio. The total fees incurred for such services were $1,723,056 for the year ended December 31, 2006.
The Adviser has entered into Subadvisory Agreements for the management of the investments in the Equity Portfolio and the equity portion of the Balanced Portfolio. The Adviser is solely responsible for the payment of all fees to the Subadviser. The Subadviser for the Equity Portfolio and the equity portion of the Balanced Portfolio is Chicago Equity Partners, LLC.
The Adviser has contractually agreed to waive its investment advisory fee and/or reimburse the Portfolios through April 30, 2007 to the extent that the ratio of expenses to net assets on an annual basis exceeds the following:
| Portfolio | |
| Equity | 1.10% |
| Balanced. | 1.10% |
| Fixed Income | 0.95% |
| Government Securities | 0.95% |
| Money Market | 0.45% |
The Adviser may discontinue these contractual limits at any time after April 30, 2007. After this date the Adviser may elect to continue, modify or terminate the limitation on Portfolio operating expenses. Further, under the terms of this agreement, any Portfolio
40|86 Series Trust | Annual Report |
Notes to Financial Statements | December 31, 2006 |
expenses waived or reimbursed may be recouped by the Adviser from the Portfolio to the extent actual operating expenses for a period are less than the expense limitation caps. The Adviser may only be entitled to recoup such amounts for a period of three years from the fiscal year that they were waived or reimbursed. Reimbursed/absorbed expenses subject to potential recovery by year of expiration are as follows:
| | Year of Expiration |
| | | December 31, |
| | | 2006 | | 2007 | | 2008 | |
| Equity | | | S64,540 | | $ | 42,025 | | $ | 99,601 | |
| Balanced | | | 21,956 | | | 18,765 | | | 40,530 | |
| Fixed Income | | | 20,431 | | | 8,208 | | | 19,130 | |
| Government Securities | | | 31,927 | | | — | | | 12,470 | |
| Money Market | | | 237,653 | | | 103,777 | | | 112,734 | |
ADMINISTRATIVE AGREEMENT
Conseco Services, LLC (the “Administrator”), a wholly-owned subsidiary of Conseco, supervises the preparation of regulatory documents required for compliance by the Portfolios with applicable laws and regulations, supervises the maintenance of books and records of the Portfolios and provides other general and administrative services. The Administrator receives an annual fee, for providing these services, equal to 0.15 percent for the first $200 million of average daily net assets of the Trust; 0.10 percent of the next $300 million of average daily net assets of the Trust; and 0.08 percent of the average daily net assets in excess of $500 million of the Trust. The total fees under this Agreement for the year ended December 31, 2006 were $386,587. The Administrator has contractually agreed to waive its administration fee and/or reimburse the Portfolios through April 30, 2007 to the extent that the ratio of expenses to net assets on an annual basis exceeds the expense limitations as stated for the Investment Advisory Agreement. The Administrator may discontinue these contractual limits at any time after April 30, 2007.
DISTRIBUTION AGREEMENT
Conseco Equity Sales, Inc. (the “Distributor”), a wholly-owned subsidiary of Conseco, serves as the principal underwriter for each Portfolio pursuant to a Principal Underwriting Agreement, approved by the Trustees. The Distributor is a registered broker-dealer and a member of the National Association of Securities Dealers, Inc. (“NASD”). Shares of each Portfolio will be continuously offered to life insurance company separate accounts to fund the benefits under variable annuity and variable life contracts. The Distributor bears all the expenses of providing services pursuant to the Principal Underwriting Agreement including the payment of the expenses relating to the distribution of prospectuses for sales purposes, as well as, any advertising or sales literature.
The Trust adopted a Distribution and Service Plan pursuant to Rule 12b-1 (the “Plan”), for the Equity, Balanced, Fixed Income and Government Securities Portfolios in accordance with the requirements of Rule 12b-1 under the 1940 Act and the requirement of the applicable rules of the NASD regarding asset based sales charges. Pursuant to the Plan, a Portfolio compensates the Distributor at an annual rate of 0.25 percent, for its expenditures in financing any activity primarily intended to result in the sale of shares of the Portfolio and for account maintenance provided to shareholders. The Plan provides for periodic payments by the Distributor to financial intermediaries for providing shareholder services to accounts that hold shares and for promotional and other sales related costs. The total fees incurred by the Trust for such services for the year ended December 31, 2006 were $607,651.
As of December 20, 2006, Rule 12b-1 fees are no longer being incurred by the Fixed Income, Government Securities or Money Market Portfolios (Note 8).
4. INVESTMENT TRANSACTIONS
The aggregate cost of purchases and the aggregate proceeds from sales of investments (excluding short-term securities) for the year ended December 31, 2006 are shown below:
| | EQUITY PORTFOLIO | | BALANCED PORTFOLIO | | FIXED INCOME PORTFOLIO | | GOVERNMENT SECURITIES PORTFOLIO | |
| Purchases: | | | | | | | | | |
| U.S. Government | | $ | — | | $ | 2,049,617 | | $ | 10,146,163 | | $ | 1,413,586 | |
| Other | | | 146,771,889 | | | 26,347,485 | | | 23,317,882 | | | 239,164 | |
| Sales: | | | | | | | | | | | | | |
| U.S. Government | | $ | — | | $ | 996,527 | | $ | 9,991,044 | | $ | 3,261,596 | |
| Other | | | 169,853,060 | | | 34,112,941 | | | 24,896,274 | | | 510,818 | |
5. FEDERAL INCOME TAXES
The following information for the Portfolios is presented on an income tax basis as of December 31, 2006:
| | | GOVERNMENT EQUITY PORTFOLIO | | MONEY BALANCED PORTFOLIO | | FIXED INCOME PORTFOLIO | | SECURITIES PORTFOLIO | | MARKET PORTFOLIO | |
| Cost of investments (a) | | $ | 196,188,001 | | $ | 47,405,900 | | $ | 20,979,418 | | $ | 11,714,773 | | $ | 30,476,699 | |
| Gross unrealized appreciation | | $ | 27,023,095 | | $ | 5,565,517 | | $ | 289,994 | | $ | 44,206 | | $ | — | |
| Gross unrealized depreciation | | | (3,089,451 | ) | | (698,499 | ) | | (258,337 | ) | | (121,413 | ) | | — | |
| Net unrealized appreciation (depreciation) on investments | | $ | 23,933,644 | | $ | 4,867,018 | | $ | 31,657 | | $ | (77,207 | ) | $ | — | |
____________
| (a) | Represents cost for federal income tax purposes and differs from the cost for financial reporting purposes by the amount of losses recognized for the financial reporting purposes in excess of federal income tax purposes. |
40|86 Series Trust | Annual Report |
Notes to Financial Statements | December 31, 2006 |
As of December 31, 2006, the components of accumulated earnings (deficit) on a tax basis were:
| | | EQUITY PORTFOLIO | | BALANCED PORTFOLIO | | FIXED INCOME PORTFOLIO | | GOVERNMENT SECURITIES PORTFOLIO | | MONEY MARKET PORTFOLIO | |
| | | | | | | | | | | | |
| Distributable ordinary income | | $ | — | | $ | — | | $ | 8,018 | | $ | 3,141 | | $ | — | |
| Distributable long-term gains | | | 18,295,527 | | | 632,802 | | | — | | | — | | | — | |
| Accumulated earnings | | | 18,295,527 | | | 632,802 | | | 8,018 | | | 3,141 | | | — | |
| Accumulated capital and post-October losses | | | (13,352,698 | ) | | (7,056,812 | ) | | (594,221 | ) | | (328,351 | ) | | (10,044 | ) |
| Unrealized appreciation (depreciation) | | | 23,933,644 | | | 4,867,018 | | | 31,657 | | | (77,207 | ) | | — | |
| Total accumulated earnings (deficit) | | $ | 28,876,473 | | $ | (1,556,992 | ) | $ | (554,546 | ) | $ | (402,417 | ) | $ | (10,044 | ) |
The tax character of dividends paid during the years ended December 31, 2006 and December 31, 2005 were as follows:(b)
| | | EQUITY PORTFOLIO | | BALANCED PORTFOLIO | | FIXED INCOME PORTFOLIO | | GOVERNMENT SECURITIES PORTFOLIO | | MONEY MARKET PORTFOLIO | |
| | | | | | | | | | | | |
| Ordinary Income dividends | | | | | | | | | | | |
| December 31, 2006 | | $ | 577,592 | | $ | 768,141 | | $ | 983,774 | | $ | 408,114 | | $ | 2,098,848 | |
| December 31, 2005 | | | 749,443 | | | 744,826 | | | 1,104,249 | | | 482,446 | | | 998,425 | |
| Long-term capital gain distributions | | | | | | | | | | | | | | | | |
| December 31, 2006 | | $ | 20,599,194 | | $ | 9,986 | | $ | — | | $ | — | | $ | — | |
| December 31, 2005 | | | 15,985,995 | | | — | | | — | | | — | | | — | |
Each of the Portfolios designated as long-term capital gain dividend, pursuant to Internal Revenue Code Section 852(b)(3), the amount necessary to reduce the earnings and profits of the Portfolio related to net capital gain to zero for the tax year ended December 31, 2006.
As of December 31, 2006, the following Portfolios have capital loss carryforwards available to offset capital gains in the future, if any:
| | | AMOUNT | | EXPIRES | |
| Balanced Portfolio | | $ | 1,887,955 | | | 2010 | |
| Balanced Portfolio | | | 1,556,918 | | | 2011 | |
| Fixed Income Portfolio | | | 420,142 | | | 2010 | |
| Fixed Income Portfolio | | | 174,079 | | | 2014 | |
| Government Securities Portfolio | | | 200,502 | | | 2012 | |
| Government Securities Portfolio | | | 21,830 | | | 2013 | |
| Government Securities Portfolio | | | 102,825 | | | 2014 | |
| Money Market Portfolio | | | 856 | | | 2010 | |
| Money Market Portfolio | | | 80 | | | 2011 | |
| Money Market Portfolio | | | 4,754 | | | 2012 | |
| Money Market Portfolio. | | | 748 | | | 2014 | |
As of the tax year end December 31, 2006, the following Portfolios had additional net capital loss carryforwards, subject to certain limitations on availability, to offset future net capital gains, if any. To the extent that these carryovers are used to offset future capital gains, it is probable that the gains so offset will not be distributed to shareholders:
| | AMOUNT | | EXPIRES | |
| Equity Portfolio | $7,330,372 | | 2009 | |
| Equity Portfolio | 6,022,326 | | 2010 | |
| Balanced Portfolio | 3,611,939 | | 2010 | |
| Money Market Portfolio | 3,606 | | 2010 | |
Net realized gains or losses may differ from Federal income tax purposes primarily as a result of wash sales and post-October losses which may not be recognized for tax purposes until the first of the following fiscal year. Such amounts may be used to offset future capital gains.
The following summarizes the amount of post-October losses deferred, on a tax basis, for the year ended December 31, 2006.
| | | AMOUNT | |
| Government Securities Portfolio | .. | $3,194 | |
____________
| (b) | (The total distributions paid differs from the Statement of Changes in Net Assets because, for tax purposes, dividends are recognized when actually paid) |
40|86 Series Trust | Annual Report |
Notes to Financial Statements | December 31, 2006 |
6. INDEMNIFICATIONS
Under the Trust’s organizational documents, its officers and trustees are indemnified against certain liabilities arising out of the performance of their duties to the Trust. In addition, in the normal course of business, the Trust enters into contacts with its vendors and others that may provide for general indemnifications. The Trust’s maximum exposure under these arrangements is unknown as this would involve future claims be made against the Trust. However, based on experience, the Trust expects the risk of loss to be remote.
7. NEW ACCOUNTING PRONOUNCEMENTS
FASB INTERPRETATION NO. 48
On July 13, 2006, the Financial Accounting Standards Board (“FASB”) issued FASB Interpretation No. 48, Accounting for Uncertainty in Income Taxes (“FIN 48”) to create a single model to address accounting for uncertainty in tax positions. FIN 48 provides guidance for how uncertain tax positions should be recognized, measured, presented and disclosed in the financial statements. FIN 48 is required as of the date of the last Net Asset Value (“NAV”) calculation in the first required financial statement reporting period for fiscal years beginning after December 15, 2006. Management is evaluating the implications of FIN 48, and its impact on the financial statements has not yet been determined.
STATEMENT OF FINANCIAL ACCOUNTING STANDARDS NO. 157
On September 15, 2006, the FASB issued Statement of Financial Accounting Standards No. 157, Fair Value Measurements (“SFAS 157” or the “Statement”). The Statement defines fair value, establishes a framework for measuring fair value in generally accepted accounting principles (GAAP) and expands disclosures about fair value measurements. The Statement establishes a fair value hierarchy that distinguishes between (1) market participant assumptions developed based on market data obtained from sources independent of the reporting entity (observable inputs) and (2) the reporting entity’s own assumptions about market participant assumptions developed based on the best information available in the circumstances (unobservable inputs). The Statement is effective for financial statements issued for fiscal years beginning after November 15, 2007 and is to be applied prospectively as of the beginning of the fiscal year in which this Statement is initially applied. At this time, management is evaluating the implications of SFAS 157, and its impact, if any, on the Trust’s financial statements has not yet been determined.
8. SUBSEQUENT EVENTS
LIQUIDATION AND EXEMPTIVE APPLICATION
Effective on or about March 23, 2007, the Fixed Income, Government Securities and Money Market Portfolios will be liquidated and terminated. The Equity and Balanced Portfolios are the subject of an exemptive application filed with the Securities and Exchange Commission (the “SEC”). The exemptive application seeks authority from the SEC to substitute shares of these two Portfolios with shares of two newly created Funds. The date for completing the substitution is subject to SEC approval.
The accompanying notes are an integral part of these financial statements.
40|86 Series Trust | Annual Report |
Report of Independent Registered Public Accounting Firm | |
To the Board of Trustees and Shareholders of 40|86 Series Trust:
In our opinion, the accompanying statements of assets and liabilities, including the schedules of investments, and the related statements of operations and of changes in net assets and the financial highlights present fairly, in all material respects, the financial position of the Equity Portfolio, Balanced Portfolio, Fixed Income Portfolio, Government Securities Portfolio and Money Market Portfolio (five Portfolios comprising 40|86 Series Trust, hereinafter referred to as the "Trust") at December 31, 2006, the results of each of their operations for the year then ended, the changes in each of their net assets for each of the two years in the period then ended and the financial highlights for each of the five years in the period then ended, in conformity with accounting principles generally accepted in the United States of America. These financial statements and financial highlights (hereafter referred to as "financial statements") are the responsibility of the Trust's management; our responsibility is to express an opinion on these financial statements based on our audits. We conducted our audits of these financial statements in accordance with the standards of the Public Company Accounting Oversight Board (United States). Those standards require that we plan and perform the audit to obtain reasonable assurance about whether the financial statements are free of material misstatement. An audit includes examining, on a test basis, evidence supporting the amounts and disclosures in the financial statements, assessing the accounting principles used and significant estimates made by management, and evaluating the overall financial statement presentation. We believe that our audits, which included confirmation of securities at December 31, 2006 by correspondence with the custodian, provide a reasonable basis for our opinion.
As discussed in Note 8 to the financial statements, effective on or about March 23, 2007, the Fixed Income, Government Securities Portfolio and Money Market Portfolios will be liquidated and terminated. The Equity Portfolio and Balanced Portfolio are the subject of an exemptive application filed with the Securities and Exchange Commission to substitute shares of these two Portfolios with shares of two newly created Funds.
 Indianapolis, Indiana
February 27, 2007
40|86 Series Trust | Annual Report |
Expense Example (unaudited) | |
| December 31, 2006 | |
As a shareholder of the 40|86 Series Trust (“the Trust”), you incur ongoing costs, including management fees, distribution fees and other Trust expenses. This Example is intended to help you understand your ongoing costs (in dollars) of investing in the Trust and to compare these costs with the ongoing costs of investing in other mutual funds. The Example is based on an investment of $1,000 invested at the beginning of the period and held for the entire period (07/01/06 - 12/31/06).
Actual Expenses
The first line of the table below provides information about actual account values and actual expenses. The example below includes, but is not limited to, management fees, administration, distribution and custody fees. However, the example below does not include portfolio trading commissions and related expenses and other extraordinary expenses as determined under generally accepted accounting principles. You may use the information in this line, together with the amount you invested, to estimate the expenses that you paid over the period. Simply divide your account value by $1,000 (for example, an $8,600 account value divided by $1,000 = 8.6), then multiply the result by the number in the first line under the heading entitled "Expenses Paid During Period" to estimate the expenses you paid on your account during this period.
Hypothetical Example for Comparison Purposes
The second line of the table below provides information about hypothetical account values and hypothetical expenses based on the Trust’s actual expense ratio and an assumed rate of return of 5% per year before expenses, which is not the Trust’s actual return. The hypothetical account values and expenses may not be used to estimate the actual ending account balance or expenses you paid for the period. You may use this information to compare the ongoing costs of investing in the Trust and other funds. To do so, compare this 5% hypothetical example with the 5% hypothetical examples that appear in the shareholder reports of the other funds. Please note that the expenses shown in the table are meant to highlight your ongoing costs only and do not reflect any transactional costs, such as sales charges (loads), redemption fees, or exchange fees. Therefore, the second line of the table is useful in comparing ongoing costs only, and will not help you determine the relative total costs of owning different funds. In addition, if these transactional costs were included, your costs would have been higher.
Equity Portfolio | Beginning Account Value 07/01/06 | | Ending Account Value 12/31/06 | | Expenses Paid During Period 07/01/06 - 12/31/06(1) | |
| Actual | | $1,000.00 | | | $1,082.30 | | | $5.77 | |
| | | | | | | | | | |
Hypothetical (5% return before expenses) | | 1,000.00 | | | 1,019.66 | | | 5.60 | |
(1) | Expenses are equal to the Fund’s annualized expense ratio of 1.10% multiplied by the average account value over the period multiplied by 184/365 (reflect the one-half year period) |
The first line of the table below provides information about actual account values and actual expenses. The example below includes, but is not limited to, management fees, administration, distribution, and custodyfees. However, the example below does not include portfolio trading commissions and related expenses and other extraordinary expenses as determined under generally accepted accounting principles. You may use the information in this line, together with the amount you invested, to estimate the expenses that you paid over the period. Simply divide your account value by $1,000 (for example, an $8,600 account value divided by $1,000 = 8.6), then multiply the result by the number in the first line under the heading entitled “Expenses Paid During Period’’ to estimate the expenses you paid on your account during this period.
Balanced Portfolio | Beginning Account Value 07/01/06 | | Ending Account Value 12/31/06 | | Expenses Paid During Period 07/01/06 - 12/31/06(2) | |
| Actual | | $1,000.00 | | | $1,094.00 | | | $5.81 | |
| | | | | | | | | | |
| Hypothetical (5% return before expenses) | | 1,000.00 | | | 1,019.66 | | | 5.60 | |
(2) | Expenses are equal to the Fund’s annualized expense ratio of 1.10% multiplied by the average account value over the period multiplied by 184/365 (to reflect the one-half year period). |
Fixed Income Portfolio | Beginning Account Value 07/01/06 | | Ending Account Value 12/31/06 | | Expenses Paid During Period 07/01/06 - 12/31/06(3) | |
| Actual | | $1,000.00 | | | $1,052.80 | | | $4.92 | |
| | | | | | | | | | |
Hypothetical (5% return before expenses) | | 1,000.00 | | | 1,020.42 | | | 4.84 | |
(3) | Expenses are equal to the Fund’s annualized expense ratio of 0.95% multiplied by the average account value over the period multiplied by 184/365 (to reflect the one-half year period). |
40|86 Series Trust | Annual Report |
Expense Example (unaudited) | |
| December 31, 2006 | |
Government Securities Portfolio | Beginning Account Value 07/01/06 | | Ending Account Value 12/31/06 | | Expenses Paid During Period 07/01/06 - 12/31/06(4) | |
| Actual | | $1,000.00 | | | $1,040.00 | | | $4.88 | |
| | | | | | | | | | |
| Hypothetical (5% return before expenses) | | 1,000.00 | | | 1,020.42 | | | 4.84 | |
(4) | Expenses are equal to the Fund’s annualized expense ratio of 0.95% multiplied by the average account value over the period multiplied by 184/365 (to reflect the one-half year period). |
Money Market Portfolio | Beginning Account Value 07/01/06 | | Ending Account Value 12/31/06 | | Expenses Paid During Period 07/01/06 - 12/31/06(5) | |
| Actual | | $1,000.00 | | | $1,024.30 | | | $2.30 | |
| | | | | | | | | | |
| Hypothetical (5% return before expenses) | | 1,000.00 | | | 1,022.94 | | | 2.29 | |
(5) | Expenses are equal to the Fund’s annualized expense ratio of 0.45% multiplied by the average account value over the period multiplied by 184/365 (to reflect the one-half year period). |
The accompanying notes are an integral part of these financial statements.
40|86 Series Trust | Annual Report |
Board of Trustees and Officers (unaudited) | |
INDEPENDENT TRUSTEES
Name (Age) Address | Position Held With Trust | Principal Occupation(s) During Past 5 Years |
Diana H. Hamilton (50) 11815 N. Pennsylvania St. Carmel, IN 46032 | Chairman of the Board Since December 2005 and Trustee Since December 2004 | President, Sycamore Advisors, LLC, a municipal finance advisory firm; Formerly, State of Indiana Director of Public Finance. Chairman and Trustee of one other mutual fund managed by the Adviser. |
| | | |
R. Matthew Neff (51) 11815 N. Pennsylvania St. Carmel, IN 46032 | Trustee Since December 2004 | Chairman and Chief Executive Officer of Senex Financial Corp., a financial services company engaged in the healthcare finance field. Trustee of one other mutual fund managed by the Adviser. |
| | | |
Vincent J. Otto (47) 11815 N. Pennsylvania St. Carmel, IN 46032 | Trustee Since December 2005 Audit Committee Financial Expert Since February 2006 | Chief Executive Officer, Commerce Street Venture Fund, a financial company engaged in assisting with raising capital. Formerly, Executive Vice President and Chief Financial Officer, Waterfield Mortgage Company and Union Federal Bank. Formerly, Director, Federal Home Loan Bank of Indianapolis. Trustee of one other mutual fund managed by the Adviser. |
| | | |
Steven R. Plump (54) 11815 N. Pennsylvania St. Carmel, IN 46032 | Trustee Since June 2006 | Group Vice President, Global Marketing and Sales and Chief Marketing Officer of Eli Lilly Company. Trustee of one other mutual fund managed by the Adviser. |
INTERESTED TRUSTEES AND OFFICERS
Audrey L. Kurzawa* (39) 11815 N. Pennsylvania St. Carmel, IN 46032 | President and Trustee Since June 2005 and Formerly Treasurer Since October 2002 | Certified Public Accountant. Senior Vice President and Controller, Adviser. President and Trustee of one other mutual fund managed by the Adviser. |
| | | |
Daniel Murphy (50) 11815 N. Pennsylvania St. Carmel, IN 46032 | Treasurer Since June 2005 | President, Conseco Services, LLC; Senior Vice President and Treasurer, Conseco, Inc. and various affiliates. Treasurer of one other mutual fund managed by the Adviser. |
| | | |
Jeffrey M. Stautz (49) 11815 N. Pennsylvania St. Carmel, IN 46032 | Chief Legal Officer and Secretary Since May 2005 | Vice President, General Counsel, Secretary and Chief Compliance Officer, Adviser. Formerly, Partner at Baker & Daniels, Law firm. Chief Legal Officer and Secretary of one other mutual fund managed by the Adviser. |
| | | |
William T. Devanney (51) 11815 N. Pennsylvania St. Carmel, IN 46032 | Vice President Since July 1998 | Senior Vice President, Corporate Taxes of Conseco Services, LLC and various affiliates. Vice President of one other mutual fund managed by the Adviser. |
| | | |
Sarah L. Bertrand (39) 11815 N. Pennsylvania St. Carmel, IN 46032 | Chief Compliance Officer and Assistant Secretary Since December 2004 | Second Vice President, Legal and Compliance, Adviser. Chief Compliance Officer and Assistant Secretary of one other mutual fund managed by the Adviser. |
____________
| * | The Trustee so indicated is an ”interested person,” as defined in the 1940 Act, of the Trust due to the positions indicated with the Adviser and its affiliates. Each Trustee serves until the expiration of the term of his designated class and until his successor is elected and qualified, or until his death or resignation, or removal as provided in the Fund’s by—laws or charter or statute. |
All Trustees oversee the six portfolios that make up the total fund complex including 40|86 Strategic Income Fund (1) and 40|86 Series Trust (5).
The accompanying notes are an integral part of these financial statements.
40|86 Series Trust | Annual Report |
INVESTMENT ADVISER | LEGAL COUNSEL |
40|86 Advisors, Inc. | Kirkpatrick & Lockhart |
| Carmel, IN | Preston Gates Ellis LLP |
| | Washington, D.C. |
CUSTODIAN | |
| The Bank of New York | INVESTMENT SUB-ADVISERS |
| New York, NY | Chicago Equity Partners, LLC |
| | Chicago, IL |
INDEPENDENT REGISTERED
PUBLIC ACCOUNTING FIRM
PricewaterhouseCoopers LLP
Indianapolis, IN
PROXY VOTING POLICIES AND PROCEDURES
A description of the policies and procedures that the Portfolios use to determine how to vote proxies relating to portfolio securities is available without charge, upon request, by calling (866) 299-4086. Furthermore, you can obtain the description on the SEC’s website at http://www.sec.gov.
PROXY VOTING RECORDS FOR THE 12-MONTH PERIOD ENDED JUNE 30, 2006
Information regarding how the Portfolios voted proxies relating to portfolio securities during the most recent 12-month period ended June 30 is available without charge, upon request, by calling (866) 299-4086. Furthermore, you can obtain the Portfolio’s proxy voting records on the SEC’s website at http://www.sec.gov.
AVAILABILITY OF QUARTERLY PORTFOLIO SCHEDULE
The Portfolios file complete schedule of portfolio holdings with the SEC for the first and third quarters of each fiscal year on Form N-Q. The filing for the most recent quarter is available without charge, upon request, by calling (866) 299-4086. Furthermore, you can obtain the Portfolios' quarterly portfolio schedule on the SEC’s website at http://www.sec.gov. The Portfolios' Forms N-Q may also be reviewed and copied at the SEC’s Public Reference Room in Washington, DC, and information on the operation of the Public Reference Room may be obtained by calling (800) SEC-0330.
40|86 Series Trust is a registered investment company managed by
40|86 Advisors, Inc., a leading fixed-income investment advisor.
40|86 Series Trust
11815 North Pennsylvania Street
Carmel, Indiana 46032
Principal Underwriter:
Conseco Equity Sales, Inc.
11815 North Pennsylvania Street
Carmel, Indiana 46032
Item 2. Code of Ethics.
| (a) | The registrant, as of the end of the period covered by this report, has adopted a code of ethics that applies to the registrant’s principal executive officer, principal financial officer, principal accounting officer or controller, or persons performing similar functions, regardless of whether these individuals are employed by the registrant or a third party. |
| | (c) | There have been no amendments, during the period covered by this report, to a provision of the code of ethics that applies to the registrant’s principal executive officer, principal financial officer, principal accounting officer or controller, or persons performing similar functions, regardless of whether these individuals are employed by the registrant or a third party, and that relates to any element of the code of ethics description. |
| | (d) | The registrant has not granted any waivers, including an implicit waiver, from a provision of the code of ethics that applies to the registrant’s principal executive officer, principal financial officer, principal accounting officer or controller, or persons performing similar functions, regardless of whether these individuals are employed by the registrant or a third party, that relates to one or more of the items set forth in paragraph (b) of this item’s instructions. |
A copy of the registrant’s Code of Ethics is filed herewith.
Item 3. Audit Committee Financial Expert.
The registrant’s board of trustees determined that Vincent J. Otto is qualified to serve as an audit committee financial expert serving on its audit committee. The board of trustees determined that Mr. Otto was “independent,” as that term is defined by Item 3 of Form N-CSR.
Item 4. Principal Accountant Fees and Services.
Audit Fees
| (a) | The aggregate fees billed for each of the last two fiscal years for professional services rendered by the principal accountant for the audit of the registrant's annual financial statements or services that are normally provided by the accountant in connection with statutory and regulatory filings or engagements for those fiscal years are $113,400 for the year ended December 31, 2005 and $103,606 for the year ended December 31, 2006. |
Audit-Related Fees
| (b) | There were no fees billed in either of the last two fiscal years for assurance and related services by the principal accountant that are reasonably related to the performance of the audit of the registrant's financial statements and are not reported under paragraph (a) of this Item. |
Tax Fees
| (c) | The aggregate fees billed in each of the last two fiscal years for professional services rendered by the principal accountant for tax compliance, tax advice, and tax planning are $20,580 for the year ended December 31, 2005 and $11,400 for the year ended December 31, 2006. |
Tax return review and Excise Review
All Other Fees
| | (d) | There were no fees billed in either of the last two fiscal years for products and services provided by the principal accountant, other than the services reported in paragraphs (a) through (c) of this Item. |
(e)(1) Disclose the audit committee's pre-approval policies and procedures described in paragraph (c)(7) of Rule 2-01 of Regulation S-X.
| | | Before the accountant is engaged by the registrant to render audit or non-audit services, the engagement is approved by the registrant’s audit committee. The Chairman of the audit committee is authorized to pre-approve engagement of the accountant to perform other non-audit services for the registrant and to report such pre-approvals to the audit committee at their next meeting. |
(e)(2) The percentage of services described in each of paragraphs (b) through (d) of this Item that were approved by the audit committee pursuant to paragraph (c)(7)(i)(C) of Rule 2-01 of Regulation S-X are as follows:
(b) N/A
(c) 100%
(d) N/A
| (f) | The percentage of hours expended on the principal accountant's engagement to audit the registrant's financial statements for the most recent fiscal year that were attributed to work performed by persons other than the principal accountant's full-time, permanent employees was less than fifty percent. |
| (g) | The aggregate non-audit fees billed by the registrant's accountant for services rendered to the registrant, and rendered to the registrant's investment adviser (not including any sub-adviser whose role is primarily portfolio management and is subcontracted with or overseen by another investment adviser), and any entity controlling, controlled by, or under common control with the adviser that provides ongoing services to the registrant for each of the last two fiscal years of the registrant was $58,000 for the year ended December 31, 2005 and $60,268 for the year ended December 31, 2006. |
| | (h) | The registrant's audit committee of the board of directors has considered whether the provision of non-audit services that were rendered to the registrant's investment adviser (not including any sub-adviser whose role is primarily portfolio management and is subcontracted with or overseen by another investment adviser), and any entity controlling, controlled by, or under common control with the investment adviser that provides ongoing services to the registrant that were not pre-approved pursuant to paragraph (c)(7)(ii) of Rule 2-01 of Regulation S-X is compatible with maintaining the principal accountant's independence. |
Item 5. Audit Committee of Listed registrants.
The registrant has a separately designated audit committee consisting of all the independent directors of the registrant. The members of the audit committee are: Diana H. Hamilton, R. Matthew Neff, Steven R. Plump and Vincent J. Otto
Item 6. Schedule of Investments
Schedule of Investments in securities of unaffiliated issuers as of the close of the reporting period is included as part of the report to shareholders filed under Item 1 of this form.
Item 7. Disclosure of Proxy Voting Policies and Procedures for Closed-End Management Investment Companies.
Not applicable to open-end investment companies.
Item 8. Portfolio Managers of Closed-End Management Investment Companies.
Not applicable to open-end investment companies.
Item 9. Purchases of Equity Securities by Closed-End Management Investment Company and Affiliated Purchasers.
Not applicable to open-end investment companies.
Item 10. Submission of Matters to a Vote of Security Holders.
There have been no material changes to the procedures by which the shareholders may recommend nominees to the registrant’s board of directors, where those changes were implemented after the registrant last provided disclosure in response to the requirements of Item 7(d)(2)(ii)(G) of Schedule 14A (17 CFR 240.14a-101), or this Item.
Item 11. Controls and Procedures.
| (a) | The registrant’s principal executive and principal financial officers, or persons performing similar functions, have concluded that the registrant’s disclosure controls and procedures (as defined in Rule 30a-3(c) under the Investment Company Act of 1940, as amended (the “1940 Act”) (17 CFR 270.30a-3(c))) are effective, as of a date within 90 days of the filing date of the report that includes the disclosure required by this paragraph, based on their evaluation of these controls and procedures required by Rule 30a-3(b) under the 1940 Act (17 CFR 270.30a-3(b)) and Rules 13a-15(b) or 15d-15(b) under the Securities Exchange Act of 1934, as amended (17 CFR 240.13a-15(b) or 240.15d-15(b)). |
| (b) | There were no changes in the registrant’s internal control over financial reporting (as defined in Rule 30a-3(d) under the 1940 Act (17 CFR 270.30a-3(d)) that occurred during the registrant’s second fiscal quarter of the period covered by this report that has materially affected, or is reasonably likely to materially affect, the registrant’s internal control over financial reporting. |
Item 12. Exhibits.
| | (a)(1) | Any code of ethics or amendment thereto. Attached hereto. |
| | (a)(2) | Certifications pursuant to Section 302 of the Sarbanes-Oxley Act of 2002. Filed herewith. |
(a)(3) Any written solicitation to purchase securities under Rule 23c-1 under the Act sent or given during the period covered by the report by or on behalf of the registrant to 10 or more persons. Not applicable to open-end investment companies.
| | (b) | Certifications pursuant to Rule 30a-2(b) under the 1940 Act and Section 906 of the Sarbanes-Oxley Act of 2002. Filed herewith. |
SIGNATURES
Pursuant to the requirements of the Securities Exchange Act of 1934 and the Investment Company Act of 1940, the registrant has duly caused this report to be signed on its behalf by the undersigned, thereunto duly authorized.
(Registrant) 40|86 Series Trust
By (Signature and Title)* /s/ Audrey L. Kurzawa
Audrey L. Kurzawa, President
(principal executive officer)
Date 3/7/07
Pursuant to the requirements of the Securities Exchange Act of 1934 and the Investment Company Act of 1940, this report has been signed below by the following persons on behalf of the registrant and in the capacities and on the dates indicated.
By (Signature and Title) /s/ Audrey L. Kurzawa
Audrey L. Kurzawa, President
(principal executive officer)
Date 3/7/07
By (Signature and Title) /s/ Daniel J. Murphy
Daniel J. Murphy, Treasurer
(principal financial officer)
Date 3/7/07