The high yield market has outperformed expectations. As investors searched for higher yields, lower quality issues outperformed those of higher quality. The Portfolio was negatively affected by maintaining overweight positions in higher quality securities within the high yield market.
Tobacco, auto/auto parts and metals/mining sectors provided positive returns. The Portfolio’s return was positively impacted by sector weights and security selections in the paper/forest products, healthcare and telecommunications sectors. The Portfolio’s return was negatively impacted by sector weights and security selections in the auto/auto parts, cable/media and gaming sectors.
As previously communicated to insurance contract owners, on June 7, 2006, the Board of Trustees of the 40|86 Series Trust (the "Trust") approved a plan to liquidate and terminate the High Yield Portfolio (the "Liquidation"). The Liquidation of the High Yield Portfolio is expected to occur on or about August 31, 2006 (the "Liquidation Date"). On the Liquidation Date, the High Yield Portfolio will distribute its assets to shareholders by redeeming their shares for cash, and will thereafter wind up its operations and terminate its existence.
In anticipation of the Liquidation of the High Yield Portfolio, the Board of Trustees approved the suspension of sales of shares of the High Yield Portfolio to insurance company separate accounts used to support variable annuity contracts and variable life insurance contracts that offer the High Yield Portfolio as an investment. As of June 16, 2006, the Trust no longer offered or sold shares of the High Yield Portfolio to contract owners of such separate accounts who were not already invested in the High Yield Portfolio. As of June 30, 2006, the Trust no longer offered or sold shares of the High Yield Portfolio to any such separate account or other investors. Until the Liquidation Date, however, dividends and distributions, if any, will continue to be reinvested in shares of the High Yield Portfolio.
The Trust expects that many shareholders may decide to redeem their shares in the High Yield Portfolio prior to the Liquidation. As a result, it is possible that the total assets of the High Yield Portfolio may reach a level at which it can no longer meet its investment objectives while maintaining an adequate level of diversification and liquidity. In the event that such an asset level is reached, the High Yield Portfolio may invest its assets in cash and in U.S. dollardenominated high-quality money market instruments and other short-term securities, including money market funds.
Questions regarding the Liquidation may be directed to the Jefferson National Life Insurance Company Customer Service Center at 866-667-0561.
The accompanying notes are an integral part of these financial statements.
The accompanying notes are an integral part of these financial statements.
The primary factors for the variance were duration bias and sector selection. The continuance of the Fed’s tightening cycle put upward pressure on interest rates, producing a slight flattening of the yield curve and leading the entire yield curve to rise between 65 bps and 90 bps. Since the prices of fixed income instruments move inversely to yields, the performance of the Portfolio was aided by our short duration bias. Our performance was also enhanced by the Portfolio’s above-average cash position combined with our investment in LIBOR-based floating-rate notes. Cash again proved to be king, with almost all other fixed income sectors producing negative total returns.
All spread sectors outperformed Treasury bonds. Our overweight positions in Commercial Mortgage-backed Securities, Collateralized Mortgage Obligation Securities, Agencies and Municipal bonds helped the performance of the Portfolio. Being overweight in the corporate sector also helped the Portfolio’s performance. Additionally, the 13.0% allocation to high yield securities proved beneficial since high yield securities outperformed similar duration Treasury bonds for the year. The Portfolio’s benchmark is comprised completely of investment grade securities.
The Portfolio’s performance was enhanced by holdings in GM’s financial subsidiary General Motors Acceptance Corp., construction equipment manufacturer Case Corp. and Republic of Philippines.
Positions in Latin American wireless communications service provider American Movil and natural gas and electric utility provider Pacific Gas & Electric detracted the most from the Portfolio’s return.
We expect the Fed to stop tightening interest rates in the second half of 2006 as additional economic data becomes available. Although high oil and other commodity prices will put downward pressure on growth, strong corporate earnings and continued demand from the Asian economies will support further growth in the U.S. Geopolitical risk including tensions in Israel, concerns with Iran and North Korea’s nuclear plans and continued terrorist threats, remain a risk for the capital markets. We plan to maintain our overweight positions in corporate and BBB-rated securities as the Fed stops its tightening cycle. We will structure duration bias to neutral or slightly long in anticipation of a Treasury rally when the Fed stops tightening.
The accompanying notes are an integral part of these financial statements.
The accompanying notes are an integral part of these financial statements.
40|86 Series Trust | Semi-Annual Report |
Schedule of Investments (unaudited) | June 30, 2006 |
| Fixed Income Portfolio | |
SHARES OR PRINCIPAL AMOUNT | | | VALUE |
| | | | | |
Household Durables — 2.0% | | |
| $110,000 | | KB Home, 5.750%, 02/01/2014 | | $ 97,265 |
| 155,000 | | NVR, Inc., 5.000%, 06/15/2010 (d) | | 147,715 |
| 175,000 | | Ryland Group, Inc., 5.375%, 06/01/2008 | | 172,416 |
| | | | | 417,396 |
Insurance — 3.5% | | |
| 120,000 | | ACE Limited, 6.000%, 04/01/2007 (a) | | 120,135 |
| 250,000 | | Arch Capital Group Ltd., 7.350%, 05/01/2034 (a) | | 249,844 |
| 30,000 | | Citizens Property Insurance Corp., 6.850%, 08/25/2007, Cost — $30,284; Acquired — 06/22/2001 (b) | | 30,218 |
| 220,000 | | Monumental Global Funding II, 4.625%, 03/15/2010, Cost — $219,993; Acquired — 03/09/2005 (b) | | 212,132 |
| 5,000 | | Nationwide Life Global Funding I, 5.350%, 02/15/2007, Cost — $4,997; Acquired — 06/05/2006 (b) | | 4,992 |
| 70,000 | | The St. Paul Travelers Companies, Inc., 5.500%, 12/01/2015 | | 66,236 |
| 35,000 | | Transamerica Corp., 6.750%, 11/15/2006 | | 35,130 |
| | | | | 718,687 |
Machinery — 0.9% | | |
| 105,000 | | Case Corp., 7.250%, 01/15/2016 | | 99,750 |
| 80,000 | | Kennametal, Inc., 7.200%, 06/15/2012 | | 83,537 |
| | | | | 183,287 |
Media — 4.0% | | |
| 75,000 | | British Sky Broadcasting PLC, 8.200%, 07/15/2009 (a)(d) | | 79,701 |
| 100,000 | | Charter Communications Operating LLC, 8.000%, 04/30/2012, Cost — $100,097; | | |
| | | Acquired — 04/21/2004 (b) | | 100,000 |
| | | 90,000 Clear Channel Communications, Inc., 6.625%, 06/15/2008 | | 90,753 |
| | | 185,000 Clear Channel Communications, Inc., 8.000%, 11/01/2008 | | 192,446 |
| | | 60,000 DirecTV Holdings LLC, 8.375%, 03/15/2013 | | 63,150 |
| | | 100,000 EchoStar DBS Corporation, 6.625%, 10/01/2014 | | 94,250 |
| | | 110,000 News America Holdings, 7.700%, 10/30/2025 | | 117,728 |
| | | 95,000 News America, Inc., 6.200%, 12/15/2034 | | 86,484 |
| | | | | 824,512 |
Multi-Utilities — 1.3% | | |
| 145,000 | | Consolidated Edison, Inc., 3.625%, 08/01/2008 | | 139,369 |
| 135,000 | | Sempra Energy, 6.000%, 02/01/2013 | | 134,530 |
| | | | | 273,899 |
Oil, Gas & Consumable Fuels — 5.3% | | |
| 335,000 | | Anadarko Finance Co., 7.500%, 05/01/2031 (a) | | 360,976 |
| 200,000 | | Chesapeake Energy Corp., 6.250%, 01/15/2018 | | 183,500 |
| 135,000 | | Enterprise Products Operating LP, 5.600%, 10/15/2014 | | 128,005 |
| 95,410 | | Ras Laffan Liquefied Natural Gas Co., Ltd. 3.437%, 09/15/2009, Cost — $95,410; | | |
| | | Acquired — 03/02/2004 (a)(b) | | 91,659 |
| 100,000 | | Southern Natural Gas Co., 8.875%, 03/15/2010 | | 106,125 |
| 115,000 | | TGT Pipeline LLC, 5.200%, 06/01/2018 | | 102,603 |
| 125,000 | | XTO Energy, Inc., 6.100%, 04/01/2036 (d) | | 113,510 |
| | | | | 1,086,378 |
The accompanying notes are an integral part of these financial statements.
40|86 Series Trust | Semi-Annual Report |
Schedule of Investments (unaudited) | June 30, 2006 |
| Fixed Income Portfolio | |
SHARES OR PRINCIPAL AMOUNT | | | VALUE |
| | | |
Paper & Forest Products — 0.4% | | |
| $ 100,000 | | Boise Cascade LLC, 7.125%, 10/15/2014 | | $ 89,000 |
Pharmaceuticals — 0.3% | | |
| 60,000 | | Wyeth, 5.500%, 03/15/2013 | | 58,492 |
Real Estate — 6.0% | | |
| 150,000 | | Chelsea Property Group, 7.250%, 10/21/2007 | | 151,913 |
| 85,000 | | Developers Diversified Realty Corp., 3.875%, 01/30/2009 | | 80,950 |
| 160,000 | | Equity One, Inc., 3.875%, 04/15/2009 | | 151,226 |
| 62,000 | | Health Care REIT, Inc., 7.500%, 08/15/2007 | | 62,484 |
| 175,000 | | Hospitality Properties Trust, 6.750%, 02/15/2013 | | 179,326 |
| 70,000 | | iStar Financial, Inc., 5.150%, 03/01/2012 | | 66,636 |
| 65,000 | | iStar Financial, Inc., 8.750%, 08/15/2008 | | 68,461 |
| 70,000 | | New Plan Excel Realty Trust, Inc., 5.125%, 09/15/2012 | | 66,378 |
| 150,000 | | Senior Housing Properties Trust, 8.625%, 01/15/2012 | | 159,375 |
| 135,000 | | Spieker Properties, Inc., 7.125%, 07/01/2009 | | 140,556 |
| 90,000 | | United Dominion Realty Trust, Inc., 6.500%, 06/15/2009 | | 92,686 |
| | | | | 1,219,991 |
Software — 0.7% | | |
| 140,000 | | Oracle Corp., 5.000%, 01/15/2011 | | 135,245 |
Textiles, Apparel & Luxury Goods — 0.3% | | |
| 50,000 | | Brown Shoe, Inc., 8.750%, 05/01/2012 | | 51,625 |
Thrifts & Mortgage Finance — 0.6% | | |
| 120,000 | | Washington Mutual, Inc., 5.625%, 01/15/2007 | | 119,912 |
Wireless Telecommunication Services — 1.4% | | |
| 125,000 | | America Movil SA de CV, 6.375%, 03/01/2035 (a) | | 109,278 |
| 125,000 | | Nextel Communications, Inc., 6.875%, 10/31/2013 | | 125,871 |
| 50,000 | | Rogers Wireless, Inc., 7.500%, 03/15/2015 (a) | | 50,750 |
| | | | | 285,899 |
| | | Total corporate bonds (cost $10,746,618) | | 10,501,100 |
| | | |
FOREIGN GOVERNMENT NOTES/BONDS — 1.9% | | |
| 215,000 | | Export-Import Bank Of Korea, 4.500%, 08/12/2009 (a) | | 206,615 |
| 70,000 | | Ministry Finance Russia, 3.000%, 05/14/2011 (a) | | 60,550 |
| 130,000 | | Republic of Philippines, 7.750%, 01/14/2031 (a)(d) | | 129,350 |
| | | Total foreign government notes/bonds (cost $404,191) | | 396,515 |
| | | |
MORTGAGE-BACKED SECURITIES — 14.5% | | |
| 95,266 | | Bank of America Mortgage Securities, Series #2004-7 6A1, 4.500%, 08/25/2019 | | 90,193 |
| 183,138 | | Bank of America Mortgage Securities, Series #2004-7 5A10, 5.250%, 08/25/2034 | | 179,159 |
| 44,720 | | Bear Stearns Commercial Mortgage Securities, Series #1999-C1 A1, 5.910%, 02/14/2031 | | 44,727 |
| 250,000 | | Bear Stearns Commercial Mortgage Securities, Series #2002-TOP6 A2, 6.460%, 10/15/2036 | | 257,644 |
| 50,661 | | CS First Boston Mortgage Securities Corp., Series #2001-CKN5 A3, 5.107%, 09/15/2034 | | 50,221 |
| 161,272 | | Deutsche Mortgage and Asset Receiving Corp., Series #1998-C1 A2, 6.538%, 06/15/2031 | | 162,756 |
| 5,536 | | DLJ Commercial Mortgage Corp. Series #1999-CG3 A1A, 7.120%, 10/10/2032 | | 5,549 |
| 53,283 | | Federal Home Loan Mortgage Corp., Series #2614CH, 3.500%, 12/15/2010 | | 52,844 |
| 135,000 | | Federal Home Loan Mortgage Corp., Series #2614TD, 3.500%, 05/15/2016 | | 126,673 |
| 165,000 | | Federal Home Loan Mortgage Corp., Series #2517VH, 6.000%, 03/15/2019 | | 165,960 |
The accompanying notes are an integral part of these financial statements.
40|86 Series Trust | Semi-Annual Report |
Schedule of Investments (unaudited) | June 30, 2006 |
| Fixed Income Portfolio | |
SHARES OR PRINCIPAL AMOUNT | | | VALUE |
| | | |
MORTGAGE-BACKED SECURITIES — (continued) | | |
| $ 15,801 | | Federal Home Loan Mortgage Corp., Gold Pool #G00479, 9.000%, 04/01/2025 | | $ 17,110 |
| 27,454 | | Federal Home Loan Mortgage Corp., Gold Pool #G00943, 6.000%, 07/01/2028 | | 27,169 |
| 2,367 | | Federal Home Loan Mortgage Corp., Gold Pool #C00712, 6.500%, 02/01/2029 | | 2,394 |
| 27,091 | | Federal Home Loan Mortgage Corp., Gold Pool #C50964, 6.500%, 05/01/2031 | | 27,363 |
| 14,033 | | Federal Home Loan Mortgage Corp., Gold Pool #C60697, 6.000%, 11/01/2031 | | 13,882 |
| 42,468 | | Federal Home Loan Mortgage Corp., Series #2407BJ, 6.500%, 01/15/2032 | | 43,398 |
| 151,826 | | Federal National Mortgage Assn., Series #200357, 4.500%, 12/25/2012 | | 149,930 |
| 68,100 | | Federal National Mortgage Assn., Pool #545449, 6.500%, 02/01/2017 | | 69,104 |
| 220,000 | | Federal National Mortgage Assn., Series #200336, 4.500%, 07/25/2022 | | 217,530 |
| 2,550 | | Federal National Mortgage Assn., Pool #349410, 7.000%, 08/01/2026 | | 2,615 |
| 3,552 | | Federal National Mortgage Assn., Pool #062289, 5.065%, 03/01/2028 | | 3,502 |
| 150,000 | | Federal National Mortgage Assn., Series #200180, 6.000%, 07/25/2029 | | 150,263 |
| 888 | | GMAC Commercial Mortgage Securities, Inc., Series #1999-C2 A1, 6.570%, 09/15/2033 | | 887 |
| 408 | | Government National Mortgage Assn., Pool #051699, 15.000%, 07/15/2011 | | 463 |
| 477 | | Government National Mortgage Assn., Pool #354859, 9.000%, 07/15/2024 | | 516 |
| 395,623 | | JP Morgan Chase Commercial Mortgage Securities Corp., Series #2001-CIB3 A2, 6.044%, 11/15/2035 | | 398,356 |
| 258,871 | | Residential Funding Mortgage Securities I, Series 2005-S7, 5.500%, 11/25/2035 | | 253,615 |
| 443,013 | | Salomon Brothers Mortgage Securities VII, Series #2001-C2, 6.168%, 11/13/2036 | | 445,074 |
| | | Total mortgage-backed securities (cost $3,080,561) | | 2,958,897 |
| | | |
MUNICIPAL BONDS — 15.8% | | |
| 55,000 | | Baltimore Maryland General Obligation Unlimited, 7.250%, 10/15/2010 | | 57,155 |
| 60,000 | | Bay Area Government Assn. California Revenue Tax Allocation Note, 4.290%, 09/01/2009 | | 57,921 |
| 150,000 | | Brooklyn Park Minnesota Economic Development Authority, 3.330%, 09/01/2006 | | 149,447 |
| 110,000 | | California County Tobacco Securitization Agency, 7.500%, 06/01/2019 | | 110,787 |
| 115,000 | | Decatur Hospital Authority, 7.750%, 09/01/2009 | | 118,897 |
| 70,000 | | Harrisburg Pennsylvania Rescue & Recovery Revenue Notes, 3.090%, 11/01/2022 | | 69,593 |
| 55,000 | | Heart of Texas Education Finance Corp., 5.000%, 02/15/2013 | | 51,264 |
| 90,000 | | Indiana Development Finance Authority 5.500%, 01/01/2033 | | 93,647 |
| 145,541 | | Louisiana Tobacco Settlement Financing Corp., 6.360%, 05/15/2025 | | 145,081 |
| 320,000 | | Mansfield Texas General Obligation Limited, 5.410%, 02/15/2019 | | 303,175 |
| 100,000 | | New Jersey Economic Development Authority 3.250%, 09/15/2006 | | 99,572 |
| 640,000 | | Oakland County Michigan Building Authority, 5.250%, 06/01/2021 | | 591,923 |
| 145,000 | | Rhode Island Tobacco Settlement Financing Corp., 5.920%, 06/01/2012 | | 144,295 |
| 600,000 | | San Diego California Redevelopment Agency Tax Allocation, 6.200%, 09/01/2031 | | 593,160 |
| 155,000 | | Santa Rosa California Redevelopment Agency Tax Allocation, 5.500%, 08/01/2020 | | 145,043 |
| 110,010 | | South Dakota Educational Enhancement Funding Corp., 6.720%, 06/01/2025 | | 109,600 |
| 180,000 | | South El Monte California Improvement District Tax Allocation, 4.700%, 08/01/2011 | | 170,420 |
| 245,000 | | Vigo County Indiana Redevelopment Authority, 5.300%, 02/01/2021 | | 228,034 |
| | | Total municipal bonds (cost $3,285,622) | | 3,239,014 |
| | | |
U.S. TREASURY OBLIGATIONS — 11.7% | | |
| 1,410,000 | | U.S. Treasury Note, 4.750%, 03/31/2011 (d) | | 1,389,236 |
| 207,140 | | U.S. Treasury Inflation Index Note, 2.000%, 01/15/2014 (d) | | 200,003 |
| 79,171 | | U.S. Treasury Inflation Index Bond, 1.625%, 01/15/2015 | | 73,830 |
| 760,000 | | U.S. Treasury Note, 4.500%, 02/15/2016 (d) | | 723,307 |
| | | Total U.S. treasury obligations (cost $2,417,168) | | 2,386,376 |
The accompanying notes are an integral part of these financial statements.
40|86 Series Trust | Semi-Annual Report |
Schedule of Investments (unaudited) | June 30, 2006 |
| Fixed Income Portfolio | |
SHARES OR PRINCIPAL AMOUNT | | | VALUE |
| | | |
INVESTMENTS PURCHASED WITH CASH PROCEEDS FROM SECURITIES LENDING — 17.9% | | |
| $3,634,613 | | Bank of New York Institutional Cash Reserve Fund, 5.298% (c) | | $ 3,634,613 |
| 37,783 | | Granite Master Issuer PLC, 5.307%, 07/20/2006 (c) | | 37,783 |
| | | Total investments purchased with cash proceeds from securities lending (cost $3,672,396) | | 3,672,396 |
| | | |
SHORT-TERM INVESTMENTS — 1.2% | | |
| 240,000 | | AIM Liquid Asset Portfolio, 4.380% | | 240,000 |
| 700 | | Bank of New York Cash Reserve, 1.550% | | 700 |
| | | Total short-term investments (cost $240,700) | | 240,700 |
| | | | | |
| | | Total investments (Cost $24,352,327) — 116.7% | | 23,884,337 |
| | | Liabilities in excess of other assets — (16.7%) | | (3,416,532) |
| | | Total Net Assets — 100.0% | | $ 20,467,805 |
______________
| (a) | Foreign security or a U.S. security of a foreign company. |
| (b) | Restricted under Rule 144A of securities Act of 1933. |
| (c) | Variable Coupon Rate — The rate reported is the rate in effect as of June 30, 2006. |
| (d) | All or a portion of the security is out on loan. |
The accompanying notes are an integral part of these financial statements.
40|86 Series Trust | Semi-Annual Report |
Portfolio Managers’ Review (unaudited) | June 30, 2006 |
Government Securities Portfolio
How did the Portfolio perform relative to its benchmark?
The 40|86 Series Trust Government Securities Portfolio declined 0.53% for the six months ended June 30, 2006. The Portfolio’s benchmarks, the Lehman Brothers Government Index and the Lehman Brothers Mortgage-Backed Security Index, declined 0.89% and 0.06%, respectively, for the same period.(1)
What factors contributed to the variance between the Portfolio and its benchmark?
The Portfolio exceeded the Lehman Brothers Government Index due to its lower allocation to long-term bonds. Interest rates rose roughly 80 bps from the end of 2005 to June 30, 2006. The Portfolio trailed the Lehman Brothers Mortgage-Backed Securities Index because of greater interest rate exposure than the mortgage index. The Portfolio’s allocation to Commercial Mortgage-backed Securities and Asset-backed Securities mitigated its underperformance.
Which holdings most enhanced the Portfolio’s performance?
The Portfolio’s performance was enhanced by higher coupon mortgage-backed securities and short duration asset-backed securities.
Which holdings most negatively impacted the Portfolio’s performance?
Longer-term U.S. Treasury bonds detracted from performance. As interest rates rose, these positions lagged with respect to price appreciation.
What is your outlook for the rest of the year?
The Federal Reserve has indicated it will continue raising short-term interest rates; however, it may be nearing a pause or halt to the increases. Toward the second half of the year, we anticipate investors becoming concerned over non-U.S. Treasury
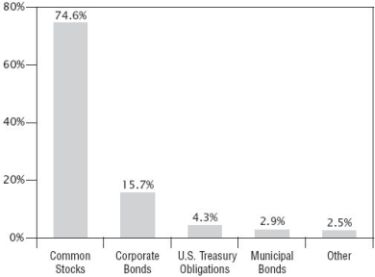
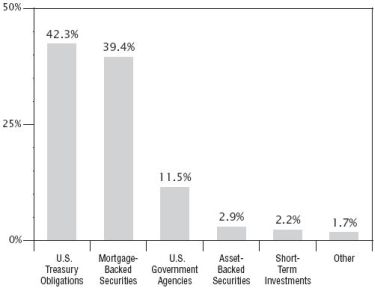
| | Allocation of Portfolio Assets (Asset Allocation as a Percentage of Total Investments excluding Securities Lending) | |
| | | |
bonds, which are trading at historically low risk premiums, as measured by the spread between corporate yields and U.S. Treasury yields. As such, investors may reallocate funds from non- U.S. Treasury bonds to U.S. Treasury bonds. This move would result in greater yield spreads and underperformance of the non- U.S. Treasury sectors.
| Michael J. Dunlop | | Willie M. Brown, CFA |
| Senior Vice President | | Assistant Vice President |
| 40|86 Advisors, Inc. | | 40|86 Advisors, Inc. |
(1) | Past performance does not guarantee future results. Your investment return and principal will fluctuate, and your shares may be worth more or less than their original cost. Total return is provided in accordance with SEC guidelines for comparative purposes and reflects certain contractual expense reimbursements through April 30, 2007. If the expense reimbursements were not in place, the Portfolio's return would have been lower. The total returns shown do not include separate account expenses or the deduction of taxes that a contract holder would pay on portfolio distributions or the redemption of portfolio shares. The Lehman Brothers Government Index (“LB Government”) is an unmanaged index considered to be representative of bonds issued by the U.S. government or its agencies. The Lehman Brothers Mortgage-Backed Securities Index ("LB MBS") is an unmanaged index composed of all fixed securities mortgage pools by GNMA, FNMA and the FHLCM, including GHMA Graduated Payment Mortgages. Investors cannot actually invest in an index. |
40|86 Series Trust | Semi-Annual Report |
Schedule of Investments | June 30, 2006 |
| Government Securities Portfolio | |
SHARES OR PRINCIPAL AMOUNT | | | VALUE |
| | | |
ASSET-BACKED SECURITIES — 2.9% | | |
| $ 75,000 | | Atlantic City Electric Transition Funding LLC, Series #2002-1 A4, 5.550%, 10/20/2023 | | $ 73,231 |
| 5,000 | | Citibank Credit Issuance Trust, Series #2003-C4 C4, 5.000%, 06/10/2015 | | 4,705 |
| 91,839 | | Countrywide Asset-Backed Certificates, Series #2002-S1 A5, 6.460%, 11/25/2016 | | 92,704 |
| 121,672 | | The Money Store Home Equity Trust, Series #1998-B AF9, 6.335%, 08/15/2039 | | 121,765 |
| | | Total asset-backed securities (cost $299,848) | | 292,405 |
| | | |
CORPORATE BONDS — 1.0% | | |
Insurance — 1.0% | | |
| 95,000 | | MGIC Investment Corp., 6.000%, 03/15/2007 | | 94,981 |
| | | Total corporate bonds (cost $95,000) | | 94,981 |
| | | |
MORTGAGE-BACKED SECURITIES — 39.4% | | |
| 11,179 | | Bear Stearns Commercial Mortgage Securities, Series #1999-C A1, 5.910%, 02/14/2031 | | 11,181 |
| 100,000 | | Bear Stearns Commercial Mortgage Securities, Series 2005-PWR8, 4.674%, 06/11/2041 | | 91,658 |
| 330,000 | | Citicorp Mortgage Securities, Inc., Series 2005-4, 5.500%, 07/25/2035 | | 309,046 |
| 15,224 | | DLJ Commercial Mortgage Corp., Series #1999-CG3, 7.120%, 10/10/2032 | | 15,261 |
| 386,069 | | Federal Home Loan Mortgage Corp., Pool #2407 BJ, 6.500%, 01/15/2032 | | 394,527 |
| 3,231 | | Federal Home Loan Mortgage Corp. Gold, Pool #E00441, 7.500%, 07/01/2011 | | 3,325 |
| 2,819 | | Federal Home Loan Mortgage Corp. Gold, Pool #D66012, 7.000%, 11/01/2025 | | 2,895 |
| 25,777 | | Federal Home Loan Mortgage Corp. Gold, Pool #C28063, 6.500%, 07/01/2029 | | 26,067 |
| 11,666 | | Federal Home Loan Mortgage Corp. Gold, Pool #C29168, 6.500%, 07/01/2029 | | 11,798 |
| 17,420 | | Federal Home Loan Mortgage Corp. Gold, Pool #C01131, 6.500%, 01/01/2031 | | 17,600 |
| 18,264 | | Federal Home Loan Mortgage Corp. Gold, Pool #C01148, 6.500%, 02/01/2031 | | 18,453 |
| 57,305 | | Federal Home Loan Mortgage Corp. Gold, Pool #C01186, 6.000%, 06/01/2031 | | 56,685 |
| 56,610 | | Federal Home Loan Mortgage Corp. Gold, Pool #C01184, 6.500%, 06/01/2031 | | 57,179 |
| 229,148 | | Federal Home Loan Mortgage Corp. Gold, Pool #G01805, 4.500%, 04/01/2035 | | 208,474 |
| 471,364 | | Federal Home Loan Mortgage Corp. Gold, Pool #G0-8062, 5.000%, 06/01/2035 | | 440,697 |
| 233,867 | | Federal Home Loan Mortgage Corp. Gold, Pool #A3-5760, 5.000%, 07/01/2035 | | 218,652 |
| 103,102 | | Federal Home Loan Mortgage Corp. Gold, Pool #A4-4090, 5.500%, 03/01/2036 | | 99,066 |
| 24,184 | | Federal National Mortgage Assn., Pool #320582, 6.500%, 01/01/2011 | | 24,415 |
| 57,549 | | Federal National Mortgage Assn., Pool #336290, 6.500%, 04/01/2011 | | 58,248 |
| 150,132 | | Federal National Mortgage Assn., Pool #253845, 6.000%, 06/01/2016 | | 150,723 |
| 85,612 | | Federal National Mortgage Assn., Pool #545449, 6.500%, 02/01/2017 | | 86,873 |
| 137,961 | | Federal National Mortgage Assn., Pool #645649, 6.000%, 06/01/2017 | | 138,531 |
| 3,485 | | Federal National Mortgage Assn., Pool #303780, 7.000%, 03/01/2026 | | 3,575 |
| 374,34 | | 3 Federal National Mortgage Assn., Pool #2004-91 AH, 4.500%, 05/25/2029 | | 360,883 |
| 100,000 | | Federal National Mortgage Assn., Pool #2001-80 PE, 6.000%, 07/25/2029 | | 100,175 |
| 22,898 | | Federal National Mortgage Assn., Pool #535837, 6.000%, 04/01/2031 | | 22,643 |
| 5,679 | | Federal National Mortgage Assn., Pool #609583, 6.000%, 11/01/2031 | | 5,616 |
| 24,606 | | Federal National Mortgage Assn., Pool #254091, 6.000%, 12/01/2031 | | 24,331 |
| 229,903 | | Federal National Mortgage Assn., Pool #816362, 4.887%, 01/01/2035 | | 226,576 |
| 288,403 | | Federal National Mortgage Assn., Pool #826443, 4.975%, 07/01/2035 | | 278,565 |
| 270,868 | | Federal National Mortgage Assn., Pool #837926, 4.846%, 08/01/2035 | | 263,869 |
| 21,478 | | Federal National Mortgage Assn. Grantor Trust, Series #1999-T2 A1, 7.500%, 01/19/2029 | | 22,162 |
The accompanying notes are an integral part of these financial statements.
40|86 Series Trust | Semi-Annual Report |
Schedule of Investments (unaudited) | June 30, 2006 |
| Government Securities Portfolio | |
SHARES OR PRINCIPAL AMOUNT | | | VALUE |
| | | |
MORTGAGE-BACKED SECURITIES — (continued) | | |
| $ 75,000 | | First Union National Bank Commercial Mortgage, Series #1999-C4 A2, 7.390%, 12/15/2031 | | $ 78,575 |
| 951 | | GMAC Commercial Mortgage Securities, Inc., Series #1999-C2 A1, 6.570%, 09/15/2033 | | 950 |
| 3,474 | | Government National Mortgage Assn., Pool #119896, 13.000%, 11/15/2014 | | 3,854 |
| 5,461 | | Government National Mortgage Assn., Pool #408675, 7.500%, 01/15/2026 | | 5,721 |
| 150,000 | | GS Mortgage Securities Corporation II, Series 2004-GG2, 5.396%, 08/10/2038 | | 145,195 |
| | | Total mortgage-backed securities (cost $4,121,670) | | 3,984,044 |
| | | |
MUNICIPAL BONDS — 0.7% | | |
| 75,000 | | Tobacco Settlement Financing Corp., 5.920%, 06/01/2012 | | 74,636 |
| | | Total municipal bonds (cost $74,776) | | 74,636 |
| | | |
U.S. GOVERNMENT AGENCY ISSUES — 11.5% | | |
| 400,000 | | Federal Home Loan Bank, 3.875%, 08/22/2008 | | 387,544 |
| 400,000 | | Federal Home Loan Bank, 6.250%, 03/05/2012 | | 401,125 |
| 400,000 | | Federal Home Loan Bank, 4.500%, 09/16/2013 | | 376,833 |
| | | Total U.S. government agency issues (cost $1,190,216) | | 1,165,502 |
| | | |
U.S. TREASURY OBLIGATIONS — 42.3% | | |
| 400,000 | | U.S. Treasury Note, 2.375%, 08/31/2006 (a) | | 398,422 |
| 500,000 | | U.S. Treasury Note, 5.500%, 02/15/2008 (a) | | 502,774 |
| 300,000 | | U.S. Treasury Note, 4.125%, 08/15/2008 (a) | | 294,223 |
| 1,000,000 | | U.S. Treasury Note, 3.875%, 05/15/2009 (a) | | 966,993 |
| 750,000 | | U.S. Treasury Note, 3.875%, 09/15/2010 (a) | | 715,899 |
| 300,000 | | U.S. Treasury Note, 4.000%, 02/15/2014 (a) | | 278,789 |
| 587,000 | | U.S. Treasury Note, 11.250%, 02/15/2015 (a) | | 833,861 |
| 30,000 | | U.S. Treasury Note, 4.250%, 08/15/2015 (a) | | 28,079 |
| 250,000 | | U.S. Treasury Note, 5.375%, 02/15/2031 (a) | | 254,395 |
| | | Total U.S. treasury obligations (cost $4,424,264) | | 4,273,435 |
| | | |
INVESTMENTS PURCHASED WITH CASH PROCEEDS FROM SECURITIES LENDING — 30.3% | | |
| 3,058,040 | | Bank of New York Institutional Cash Reserve Fund, 5.298% | | 3,058,040 |
| | | Total investments purchased with cash proceeds from securities lending (cost $3,058,040) | | 3,058,040 |
| | | |
SHORT-TERM INVESTMENTS — 2.2% | | |
| 221,000 | | AIM Liquid Asset Portfolio, 4.890% | | 221,000 |
| 779 | | Bank of New York Cash Reserve, 1.550% | | 779 |
| | | Total short-term investments (cost $221,779) | | 221,779 |
| | | | | |
| | | Total investments (cost $13,485,593) — 130.3% | | 13,164,822 |
| | | Liabilities in excess of other assets — (30.3%) | | (3,060,289) |
| | | Total Net Assets — 100.0% | | $ 10,104,533 |
_____________
| (a) | All or a portion of the security is out on loan. |
The accompanying notes are an integral part of these financial statements.
40|86 Series Trust | Semi-Annual Report |
Portfolio Managers’ Review (unaudited) | June 30, 2006 |
Money Market Portfolio
The 40|86 Series Trust Money Market Portfolio returned 2.13% for the six months ended June 30, 2006.(1) The Federal Reserve continued its tightening cycle through the first half of 2006, raising the Fed Funds rate from 4.25% to 5.25%. The rise in short-term interest rates produced a slight flattening of the yield curve, although the entire curve rose between 65 bps and 90 bps.
Money market yields, as measured by LIBOR, rose throughout the year. Although the entire yield curve rose, the 1-month rate rose more than the 1-year rate, resulting in a curve flattening of 9 bps for the year.
We maintained the Portfolio’s weighted average days-to-maturity below 50 days as the Fed raised rates. We invested significantly in Variable Rate Demand Notes (VRDNs), which have floating rate coupons that reset weekly. In a rising interest rate environment, coupons of VRDNs reset to higher rates weekly as rates increase. In addition, VRDNs are highly liquid and offer higher yields than 1-week, Tier-1 Non-Asset-backed securities. We also selectively started investing in short corporate paper toward the longer end of the money market curve because we believe the Fed is close to the end of its tightening cycle.
Trading in commercial paper should remain heavily skewed to short maturities, although investors might slowly start extending to longer maturities as Fed tightening comes to a close. We will maintain the short weighted-average maturity of the Portfolio until the Fed stops raising rates, and then lengthen when compensated to invest in the intermediate and long end of the money market curve. We expect VRDNs to continue to outperform fixed coupon short-term bonds in the current economic environment.
| Michael J. Dunlop | | Vishal Mahajan |
| Senior Vice President | | Assistant Vice President |
| 40|86 Advisors, Inc. | | 40|86 Advisors, Inc |
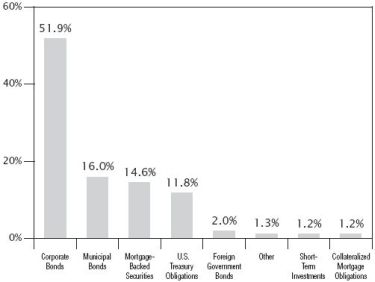
| | Allocation of Portfolio Assets (Asset Allocation as a Percentage of Total Investments) | |
| | | |
(1) | Past performance does not guarantee future results. Your investment return and principal will fluctuate, and your shares may be worth more or less than their original cost. Total return is provided in accordance with SEC guidelines for comparative purposes and reflects certain contractual expense reimbursements through April 30, 2007. If the expense reimbursements were not in place, the Portfolio's return would have been lower. The total returns shown do not include separate account expenses or the deduction of taxes that a contract holder would pay on portfolio distributions or the redemption of portfolio shares. |
40|86 Series Trust | Semi-Annual Report |
Schedule of Investments (unaudited) | June 30, 2006 |
| Money Market Portfolio | |
SHARES OR PRINCIPAL AMOUNT | | | VALUE |
| | | | | |
CORPORATE BONDS — 23.4% | | |
| | | |
Aerospace & Defense — 0.5% | | |
| $ 300,000 | | Honeywell International, Inc., 5.125%, 11/01/2006 | | $ 300,198 |
| | | |
Beverages — 1.7% | | |
| 75,000 | | Anheuser-Busch Cos., Inc., 5.600%, 07/06/2006 | | 75,009 |
| 1,000,000 | | Coca-Cola Enterprises, Inc., 5.375%, 08/15/2006 | | 1,000,715 |
| | | | | 1,075,724 |
Capital Markets — 3.0% | | |
| 845,000 | | Corporate Finance Managers, Inc., 5.290%, 07/07/2006 (a)(b) | | 845,000 |
| 525,000 | | Cunat Capital Corp., 5.490%, 07/30/2006 (a)(b) | | 525,000 |
| 500,000 | | Westgate Investment Fund, 5.290%, 07/07/2006 (a)(b) | | 500,000 |
| | | | | 1,870,000 |
Computers & Peripherals — 1.3% | | |
| 800,000 | | Hewlett-Packard Co., 5.750%, 12/15/2006 | | 803,049 |
| | | |
Diversified Financial Services — 4.1% | | |
| 1,000,000 | | American Honda Finance Corp., 5.060%, 09/11/2006, Cost — $1,000,336; Acquired — 05/22/2006 (a)(c) | | 1,000,336 |
| 325,000 | | Countrywide Home Loans, Inc., 7.200%, 10/30/2006 | | 327,518 |
| 350,000 | | Diageo Finance BV, 3.000%, 12/15/2006 (d) | | 346,998 |
| 475,000 | | HBOS plc, 3.125%, 01/12/2007, Cost — $470,674; Acquired — 01/26/2006 (c)(d) | | 470,674 |
| 155,000 | | International Bank for Recon and Development, 4.375%, 09/28/2006 (d) | | 154,792 |
| 100,000 | | National Rural Utilities Cooperative Finance Corp., 7.300%, 09/15/2006 | | 100,491 |
| 25,000 | | PNC Funding Corp., 5.750%, 08/01/2006 | | 25,019 |
| 30,000 | | Toyota Motor Credit Corp., 5.650%, 01/15/2007 | | 30,091 |
| 100,000 | | Wells Fargo & Company, 6.550%, 12/01/2006 | | 100,514 |
| | | | | 2,556,433 |
Health Care Providers & Services — 0.5% | | |
| 290,000 | | UnitedHealth Group, Inc., 5.200%, 01/17/2007 | | 290,418 |
| | | |
Insurance — 7.3% | | |
| 800,000 | | Allstate Financial Global Funding II, 2.625%, 10/22/2006, Cost — $794,687; Acquired — 01/20/2006 (c) | | 794,687 |
| 1,000,000 | | Hartford Life Global Fund, 5.061%, 08/15/2006 (a)(b) | | 1,000,000 |
| 800,000 | | MetLife, Inc., 5.250%, 12/01/2006 | | 801,366 |
| 1,000,000 | | Monumental Global Funding II, 5.200%, 01/30/2007, Cost — $999,281; Acquired — 05/22/2006 (c) | | 999,281 |
| 1,000,000 | | Protective Life US Funding Trust, 5.875%, 08/15/2006, Cost — $1,001,360; Acquired — 01/05/2006 (c) | | 1,001,360 |
| | | | | 4,596,694 |
Oil, Gas & Consumable Fuels — 0.8% | | |
| 535,000 | | Conoco Funding Co., 5.450%, 10/15/2006 (d) | | 535,914 |
| | | |
Pharmaceuticals — 3.2% | | |
| 1,000,000 | | Abbott Laboratories, 5.625%, 07/01/2006 | | 1,000,000 |
| 1,000,000 | | Merck & Co., Inc., 5.250%, 07/01/2006 | | 1,000,000 |
| | | | | 2,000,000 |
Real Estate — 0.8% | | |
| 490,000 | | Kuehn Enterprises LLC, 5.250%, 07/07/2006 (a)(b) | | 490,000 |
The accompanying notes are an integral part of these financial statements.
40|86 Series Trust | Semi-Annual Report |
Schedule of Investments (unaudited) | June 30, 2006 |
| Money Market Portfolio | |
SHARES OR PRINCIPAL AMOUNT | | | VALUE |
| | | | | |
Road & Rail — 0.2% | | |
| $ 150,000 | | Canadian National Railway Co., 6.450%, 06/30/2007 (a)(b)(d) | | $ 151,022 |
| | | Total corporate bonds (amortized cost $14,669,452) | | 14,669,452 |
| | | |
MUNICIPAL BONDS — 25.3% | | |
| 100,000 | | ABAG Financial Authorities for Nonprofit Corps., 5.340%, 07/07/2006 (a)(b) | | |
| | | (CS: Federal National Mortgage Assn.) | | 100,000 |
| 1,000,000 | | Arlington County Virginia Industrial Development Authority, 5.220%, 07/07/2006 (a)(b) | | |
| | | (LOC: Bank of America) | | 1,000,000 |
| 900,000 | | California Housing Finance Agency, 5.220%, 07/07/2006 (a)(b) (CS: Ambac Financial Group; | | |
| | | SPA: Bank of America) | | 900,000 |
| 1,000,000 | | California Statewide Community Development Authority, 4.000%, 11/15/2006 (CS: FSA) | | 996,316 |
| 100,000 | | Colorado Housing & Finance Authority, 5.120%, 07/07/2006 (a)(b) | | |
| | | (CS: Federal National Mortgage Assn.) | | 100,000 |
| 865,000 | | Colorado Housing & Finance Authority, 5.220%, 07/07/2006 (a)(b) (SPA: Dexia Credit Local) | | 865,000 |
| 1,000,000 | | Colorado Housing & Finance Authority, 5.220%, 07/07/2006 (a)(b) (SPA: Dexia Credit Local) | | 1,000,000 |
| 1,000,000 | | Florida Housing & Finance Agency, 5.220%, 07/07/2006 (a)(b) | | |
| | | (CS: MBIA; SPA: West Deutsche Landesbank) | | 1,000,000 |
| 1,000,000 | | Fulton County Georgia Development Authority, 5.270%, 07/07/2006 (a)(b) (LOC: Regions Bank) | | 1,000,000 |
| 580,000 | | Michigan State Housing Development Authority, 5.220%, 07/07/2006 (a)(b) | | |
| | | (CS: MBIA; SPA: Dexia Credit Local) | | 580,000 |
| 500,000 | | Michigan State Housing Development Authority, 5.260%, 07/07/2006 (a)(b) (SPA: DEPFA Bank PLC) | | 500,000 |
| 1,000,000 | | New Orleans Louisiana Pension, 5.450%, 07/07/2006 (a)(b) (CS: Ambac Financial Group; | | |
| | | SPA: Bank One Louisiana) | | 1,000,000 |
| 1,000,000 | | North Texas Higher Education Authority, 5.220%, 07/07/2006 (a)(b) | | |
| | | (CS: Ambac Financial Group, SPA: DEPFA Bank PLC) | | 1,000,000 |
| 1,210,000 | | Philadelphia Pennsylvania Authority For Industrial Development, 5.220%, 07/07/2006 (a)(b) | | |
| | | (CS: Ambac Financial Group; SPA: Landesbank Baden-Wurttemberg) | | 1,210,000 |
| 700,000 | | Portland Maine Pension, 5.220%, 07/07/2006 (a)(b) (SPA: Landesbank Hessen-Thuringen) | | 700,000 |
| 600,000 | | Sacramento County California Pension, 5.220%, 07/07/2006 (a)(b) (LOC: Bayerische Landesbank) | | 600,000 |
| 805,000 | | St. Francis Healthcare Foundation Hawaii, 5.780%, 07/07/2006 (a)(b) (LOC: First Hawaiian Bank) | | 805,000 |
| 1,000,000 | | St. Johns County Florida Industrial Development Authority, 5.290%, 07/07/2006 (a)(b) | | |
| | | (LOC: Allied Irish Bank PLC) | | 1,000,000 |
| 785,000 | | University of Minnesota, 5.220%, 07/07/2006 (a)(b) | | 785,000 |
| 700,000 | | Utah State Housing Finance Agency, 5.220%, 07/07/2006 (a)(b) (SPA: Bayerische Landesbank) | | 700,000 |
| | | Total municipal bonds (amortized cost $15,841,316) | | 15,841,316 |
| | | |
| COMMERCIAL PAPER — 37.5% | | |
| Diversified Financial Services — 34.3% | | |
| 2,000,000 | | Anz (Delaware), Inc., 5.050, 07/20/2006 | | 1,994,669 |
| 2,000,000 | | BMW US Capital LLC, 5.260%, 07/03/2006, Cost — $1,999,416; Acquired — 06/30/2006 (c) | | 1,999,416 |
| 1,000,000 | | Britannia Building Society, 4.940%, 07/06/2006 | | 999,314 |
| 500,000 | | Britannia Building Society, 5.240%, 07/14/2006 | | 499,054 |
| 1,000,000 | | Citigroup, Inc., 4.920%, 07/06/2006 | | 999,317 |
| 1,000,000 | | Citigroup Funding, Inc., 5.000%, 07/26/2006 | | 996,528 |
| 2,000,000 | | Colonial Pipeline Co., 5.250%, 07/12/2006, Cost — $1,996,792; Acquired — 06/20/2006 (c) | | 1,996,792 |
| 1,000,000 | | Danske Corp., 4.980%, 07/20/2006 | | 997,372 |
| 1,000,000 | | FPL Group Capital, Inc., 5.230%, 07/18/2006, Cost — $997,530; Acquired — 06/20/2006 (c) | | 997,530 |
The accompanying notes are an integral part of these financial statements.
40|86 Series Trust | Semi-Annual Report |
Schedule of Investments (unaudited) | June 30, 2006 |
| Money Market Portfolio | |
SHARES OR PRINCIPAL AMOUNT | | | VALUE |
| | | |
Diversified Financial Services — (continued) | | |
| $1,000,000 | | General Electric Capital Corp., 4.990%, 07/24/2006 | | $ 996,812 |
| 1,000,000 | | Hitachi Capital Corp., 5.040%, 07/24/2006 | | 996,780 |
| 1,000,000 | | ING America Insurance Holdings, 5.000%, 07/19/2006 | | 997,500 |
| 2,000,000 | | MGIC Investment Corp., 5.170%, 07/27/2006, Cost — $1,992,532; Acquired — 06/12/2006 (c) | | 1,992,532 |
| 2,000,000 | | Nationwide Building Society, Inc., 5.170%, 08/04/2006, Cost — $1,990,234; Acquired — 06/12/2006 (c) | | 1,990,234 |
| 1,000,000 | | Prudential PLC, 4.910%, 07/05/2006, Cost — $999,454; Acquired — 04/11/2006 (c) | | 999,454 |
| 1,000,000 | | Province of Quebec, 4.970%, 07/19/2006, Cost — $997,515; Acquired — 04/27/2006 (c)(d) | | 997,515 |
| 1,000,000 | | Wal-Mart Funding Corp., 5.070%, 07/25/2006, Cost — $996,620; Acquired — 05/26/2006 (c) | | 996,620 |
| | | | | 21,447,439 |
| | | |
Diversified Telecommunication Services — 3.2% | | |
| 2,000,000 | | AT&T, Inc., 5.230%, 07/18/2006, Cost — $1,995,060; Acquired — 06/20/2006 (c) | | 1,995,060 |
| | | Total commercial paper (amortized cost $23,442,499) | | 23,442,499 |
| | | |
SHORT-TERM INVESTMENTS — 1.4% | | |
| 873,000 | | AIM Liquid Asset Portfolio, 4.890% | | 873,000 |
| 160 | | Bank of New York Cash Reserve, 1.550% | | 160 |
| | | Total short-term investments (amortized cost $873,160) | | 873,160 |
| | | | | |
| | | Total investments (amortized cost $54,826,427) — 87.6% | | 54,826,427 |
| | | Other assets in excess of liabilities — 12.4% | | 7,753,451 |
| | | Total Net Assets — 100.0% | | $ 62,579,878 |
_______________
| (a) | Variable Coupon Rate — The rate reported is the rate in effect as of June 30, 2006. |
| (b) | Maturity date represents first available put date. |
| (c) | Restricted under Rule 144A of the Securities Act of 1933. |
| (d) | Foreign security or a U.S. security of a foreign company. |
CS — Credit Support
LOC — Letter of Credit
SPA — Standby Purchase Agreement
The accompanying notes are an integral part of these financial statements.
40|86 Series Trust | Semi-Annual Report |
Financial Highlights | |
For a share outstanding during the six months ended June 30, 2006 (unaudited) and through the year ended December 31,
| | | EQUITY PORTFOLIO |
| | | 2006 | 2005 | 2004 | 2003 | 2002 | 2001 |
| Net asset value per share, beginning of period | | $ | 24.69 | | $ | 24.53 | | $ | 20.42 | | $ | 14.92 | | $ | 17.30 | | $ | 19.43 | |
| Income from investment operations: | | | | | | | | | | | | | | | | | | | |
| Net investment income | | | 0.05 | | | 0.13 | | | 0.08 | | | 0.06 | | | 0.06 | | | 0.07 | |
| Net realized gain (loss) and change in unrealized appreciation (depreciation) on investments | | | 1.42 | | | 2.69 | | | 4.20 | | | 5.49 | | | (2.38 | ) | | (2.07 | ) |
| Total income (loss) from investment operations | | | 1.47 | | | 2.82 | | | 4.28 | | | 5.55 | | | (2.32 | ) | | (2.00 | ) |
| Distributions: | | | | | | | | | | | | | | | | | | | |
| Dividends from net investment income | | | — | | | (0.13 | ) | | (0.08 | ) | | (0.05 | ) | | (0.06 | ) | | (0.07 | ) |
| Distributions of net realized gain | | | — | | | (2.53 | ) | | (0.09 | ) | | — | | | — | | | (0.06 | ) |
| Total distributions | | | — | | | (2.66 | ) | | (0.17 | ) | | (0.05 | ) | | (0.06 | ) | | (0.13 | ) |
| Net asset value per share, end of period | | $ | 26.16 | | $ | 24.69 | | $ | 24.53 | | $ | 20.42 | | $ | 14.92 | | $ | 17.30 | |
| Total return (a)(b)(c) | | | 5.91 | % | | 11.43 | % | | 20.94 | % | | 37.17 | % | | (13.42 | %) | | (10.30 | %) |
| | | | | | | | | | | | | | | | | | | | |
| | | | | | | | | | | | | | | | | | | | |
| Ratios/supplemental data: | | | | | | | | | | | | | | | | | | | |
| Net assets (dollars in thousands), end of period | | $ | 169,843 | | $ | 171,779 | | $ | 168,901 | | $ | 165,798 | | $ | 148,881 | | $ | 233,983 | |
| Ratio of expenses to average net assets (b)(d): | | | | | | | | | | | | | | | | | | | |
| Before expense reimbursement | | | 1.14 | % | | 1.20 | % | | 1.13 | % | | 1.14 | % | | 1.15 | % | | 1.02 | % |
| After expense reimbursement | | | 1.10 | % | | 1.10 | % | | 1.10 | % | | 1.10 | % | | 1.10 | % | | 1.02 | % |
| Ratio of net investment income to average net assets (b)(d) | | | 0.37 | % | | 0.48 | % | | 0.38 | % | | 0.28 | % | | 0.32 | % | | 0.38 | % |
| Portfolio turnover rate (c) | | | 44 | % | | 90 | % | | 89 | % | | 107 | % | | 102 | % | | 133 | % |
_____________
| (a) | Total return represents performance of the Portfolio only and does not include mortality and expense deductions in separate accounts. |
| (b) | The Adviser and Administrator have contractually agreed to reimburse Portfolio expenses to the extent that the ratio of expenses to average net assets exceeds, on an annual basis, the net expenses defined in Note 3. These contractual limits may be discontinued at any time after April 30, 2007. |
| (c) | Not annualized for periods of less than one full year. |
| (d) | Annualized for periods of less than one year. |
The accompanying notes are an integral part of these financial statements.
40|86 Series Trust | Semi-Annual Report |
Financial Highlights | |
For a share outstanding during the six months ended June 30, 2006 (unaudited) and through the year ended December 31,
| | | BALANCED PORTFOLIO |
| | | 2006 | 2005 | 2004 | 2003 | 2002 | 2001 |
| Net asset value per share, beginning of period | | $ | 13.94 | | $ | 13.42 | | $ | 12.35 | | $ | 10.25 | | $ | 12.16 | | $ | 13.45 | |
| Income from investment operations: | | | | | | | | | | | | | | | | | | | |
| Net investment income | | | 0.10 | | | 0.23 | | | 0.26 | | | 0.27 | | | 0.36 | | | 0.40 | |
| Net realized gain (loss) and change in unrealized appreciation (depreciation) on investments | | | 0.34 | | | 0.52 | | | 1.07 | | | 2.09 | | | (1.91 | ) | | (1.29 | ) |
| Total income (loss) from investment operations | | | 0.44 | | | 0.75 | | | 1.33 | | | 2.36 | | | (1.55 | ) | | (0.89 | ) |
| Distributions: | | | | | | | | | | | | | | | | | | | |
| Dividends from net investment income | | | (0.10 | ) | | (0.23 | ) | | (0.26 | ) | | (0.26 | ) | | (0.36 | ) | | (0.40 | ) |
| Distributions of net realized gain | | | — | | | — | | | — | | | — | | | — | | | (0.00 | ) (c) |
| Total distributions | | | (0.10 | ) | | (0.23 | ) | | (0.26 | ) | | (0.26 | ) | | (0.36 | ) | | (0.40 | ) |
| Net asset value per share, end of period | | $ | 14.28 | | $ | 13.94 | | $ | 13.42 | | $ | 12.35 | | $ | 10.25 | | $ | 12.16 | |
| Total return (a)(b)(d) | | | 3.34 | % | | 5.63 | % | | 10.84 | % | | 23.29 | % | | (12.87 | %) | | (6.60 | %) |
| | | | | | | | | | | | | | | | | | | | |
| | | | | | | | | | | | | | | | | | | | |
| Ratios/supplemental data: | | | | | | | | | | | | | | | | | | | |
| Net assets (dollars in thousands), end of period | | $ | 41,139 | | $ | 43,511 | | $ | 47,056 | | $ | 48,282 | | $ | 44,455 | | $ | 71,635 | |
| Ratio of expenses to average net assets (b)(e): | | | | | | | | | | | | | | | | | | | |
| Before expense reimbursement | | | 1.19 | % | | 1.22 | % | | 1.14 | % | | 1.15 | % | | 1.18 | % | | 1.04 | % |
| After expense reimbursement | | | 1.10 | % | | 1.10 | % | | 1.10 | % | | 1.10 | % | | 1.10 | % | | 1.04 | % |
| Ratio of net investment income to average net assets (b)(e) | | | 1.73 | % | | 1.66 | % | | 2.03 | % | | 2.27 | % | | 3.11 | % | | 3.16 | % |
| Portfolio turnover rate (d) | | | 36 | % | | 91 | % | | 97 | % | | 100 | % | | 180 | % | | 239 | % |
____________
| (a) | Total return represents performance of the Portfolio only and does not include mortality and expense deductions in separate accounts. |
| (b) | The Adviser and Administrator have contractually agreed to reimburse Portfolio expenses to the extent that the ratio of expenses to average net assets exceeds, on an annual basis, the net expenses defined in Note 3. These contractual limits may be discontinued at any time after April 30, 2007. |
| (c) | Amount calculated is less than $0.005 per share. |
| (d) | Not annualized for periods of less than one full year. |
| (e) | Annualized for periods of less than one year. |
The accompanying notes are an integral part of these financial statements.
40|86 Series Trust | Semi-Annual Report |
Financial Highlights | |
For a share outstanding during the six months ended June 30, 2006 (unaudited) and through the year ended December 31,
| | | HIGH YIELD PORTFOLIO |
| | | 2006 | 2005 | 2004 | 2003 | 2002 | 2001 |
| Net asset value per share, beginning of period | | $ | 9.38 | | $ | 10.40 | | $ | 10.53 | | $ | 8.86 | | $ | 9.28 | | $ | 10.07 | |
| Income from investment operations: | | | | | | | | | | | | | | | | | | | |
| Net investment income | | | 0.31 | | | 0.62 | | | 0.71 | | | 0.67 | | | 0.86 | | | 1.10 | |
| Net realized gain (loss) and change in unrealized appreciation (depreciation) on investments | | | (0.23 | ) | | (0.50 | ) | | 0.37 | | | 1.68 | | | (0.42 | ) | | (0.78 | ) |
| Total income from investment operations | | | 0.08 | | | 0.12 | | | 1.08 | | | 2.35 | | | 0.44 | | | 0.32 | |
| Distributions: | | | | | | | | | | | | | | | | | | | |
| Dividends from net investment income | | | (0.31 | ) | | (0.62 | ) | | (0.70 | ) | | (0.68 | ) | | (0.86 | ) | | (1.11 | ) |
| Distributions of net realized gain | | | — | | | (0.52 | ) | | (0.51 | ) | | — | | | — | | | — | |
| Total distributions | | | (0.31 | ) | | (1.14 | ) | | (1.21 | ) | | (0.68 | ) | | (0.86 | ) | | (1.11 | ) |
| Net asset value per share, end of period | | $ | 9.15 | | $ | 9.38 | | $ | 10.40 | | $ | 10.53 | | $ | 8.86 | | $ | 9.28 | |
| Total return (a)(b)(c) | | | 0.80 | % | | 1.15 | % | | 10.69 | % | | 27.38 | % | | 5.47 | % | | 3.17 | % |
| | | | | | | | | | | | | | | | | | | | |
| | | | | | | | | | | | | | | | | | | | |
| Ratios/supplemental data: | | | | | | | | | | | | | | | | | | | |
| Net assets (dollars in thousands), end of period | | $ | 4,557 | | $ | 8,759 | | $ | 8,876 | | $ | 10,941 | | $ | 9,202 | | $ | 7,091 | |
| Ratio of expenses to average net assets (b)(d): | | | | | | | | | | | | | | | | | | | |
| Before expense reimbursement | | | 1.25 | % | | 1.36 | % | | 1.24 | % | | 1.25 | % | | 1.47 | % | | 1.11 | % |
| After expense reimbursement | | | 1.15 | % | | 1.15 | % | | 1.15 | % | | 1.15 | % | | 1.15 | % | | 1.11 | % |
| Ratio of net investment income to average net assets (b)(d) | | | 6.15 | % | | 6.01 | % | | 6.53 | % | | 6.53 | % | | 8.95 | % | | 11.12 | % |
| Portfolio turnover rate (c) | | | 46 | % | | 125 | % | | 177 | % | | 126 | % | | 258 | % | | 232 | % |
____________
| (a) | Total return represents performance of the Portfolio only and does not include mortality and expense deductions in separate accounts. |
| (b) | The Adviser and Administrator have contractually agreed to reimburse Portfolio expenses to the extent that the ratio of expenses to average net assets exceeds, on an annual basis, the net expenses defined in Note 3. These contractual limits may be discontinued at any time after April 30, 2007. |
| (c) | Not annualized for periods of less than one full year. |
| (d) | Annualized for periods of less than one year. |
The accompanying notes are an integral part of these financial statements.
40|86 Series Trust | Semi-Annual Report |
Financial Highlights | |
For a share outstanding during the six months ended June 30, 2006 (unaudited) and through the year ended December 31,
| | | FIXED INCOME PORTFOLIO |
| | | 2006 | 2005 | 2004 | 2003 | 2002 | 2001 |
| Net asset value per share, beginning of period | | $ | 9.88 | | $ | 10.10 | | $ | 10.08 | | $ | 9.66 | | $ | 9.88 | | $ | 9.63 | |
| Income from investment operations: | | | | | | | | | | | | | | | | | | | |
| Net investment income | | | 0.23 | | | 0.44 | | | 0.44 | | | 0.46 | | | 0.58 | | | 0.59 | |
| Net realized gain (loss) and change in unrealized appreciation (depreciation) on investments | | | (0.31 | ) | | (0.22 | ) | | 0.02 | | | 0.42 | | | (0.13 | ) | | 0.25 | |
| Total income (loss) from investment operations | | | (0.08 | ) | | 0.22 | | | 0.46 | | | 0.88 | | | 0.45 | | | 0.84 | |
| Distributions: | | | | | | | | | | | | | | | | | | | |
| Dividends from net investment income | | | (0.23 | ) | | (0.44 | ) | | (0.44 | ) | | (0.46 | ) | | (0.58 | ) | | (0.59 | ) |
| Distributions of net realized gain | | | — | | | — | | | — | | | — | | | (0.09 | ) | | — | |
| Total distributions | | | (0.23 | ) | | (0.44 | ) | | (0.44 | ) | | (0.46 | ) | | (0.67 | ) | | (0.59 | ) |
| Net asset value per share, end of period | | $ | 9.57 | | $ | 9.88 | | $ | 10.10 | | $ | 10.08 | | $ | 9.66 | | $ | 9.88 | |
| Total return (a)(b)(c) | | | (0.79 | %) | | 2.26 | % | | 4.74 | % | | 9.33 | % | | 4.68 | % | | 8.84 | % |
| | | | | | | | | | | | | | | | | | | | |
| | | | | | | | | | | | | | | | | | | | |
| Ratios/supplemental data: | | | | | | | | | | | | | | | | | | | |
| Net assets (dollars in thousands), end of period | | $ | 20,468 | | $ | 23,091 | | $ | 27,448 | | $ | 35,068 | | $ | 41,957 | | $ | 60,649 | |
| Ratio of expenses to average net assets (b)(d): | | | | | | | | | | | | | | | | | | | |
| Before expense reimbursement | | | 1.05 | % | | 1.06 | % | | 0.98 | % | | 1.00 | % | | 1.02 | % | | 0.91 | % |
| After expense reimbursement | | | 0.95 | % | | 0.95 | % | | 0.95 | % | | 0.95 | % | | 0.95 | % | | 0.91 | % |
| Ratio of net investment income to average net assets (b)(d) | | | 4.76 | % | | 4.33 | % | | 4.42 | % | | 4.61 | % | | 5.86 | % | | 5.96 | % |
| Portfolio turnover rate (c) | | | 111 | % | | 197 | % | | 226 | % | | 307 | % | | 371 | % | | 515 | % |
______________
| (a) | Total return represents performance of the Portfolio only and does not include mortality and expense deductions in separate accounts. |
| (b) | The Adviser and Administrator have contractually agreed to reimburse Portfolio expenses to the extent that the ratio of expenses to average net assets exceeds, on an annual basis, the net expenses defined in Note 3. These contractual limits may be discontinued at any time after April 30, 2007. |
| (c) | Not annualized for periods of less than one full year. |
| (d) | Annualized for periods of less than one year. |
The accompanying notes are an integral part of these financial statements.
40|86 Series Trust | Semi-Annual Report |
Financial Highlights | |
For a share outstanding during the six months ended June 30, 2006 (unaudited) and through the year ended December 31,
| | | GOVERNMENT SECURITIES PORTFOLIO |
| | | 2006 | 2005 | 2004 | 2003 | 2002 | 2001 |
| Net asset value per share, beginning of period | | $ | 11.36 | | $ | 11.59 | | $ | 11.70 | | $ | 12.04 | | $ | 11.70 | | $ | 11.54 | |
| Income from investment operations: | | | | | | | | | | | | | | | | | | | |
| Net investment income | | | 0.22 | | | 0.39 | | | 0.40 | | | 0.42 | | | 0.47 | | | 0.54 | |
| Net realized gain (loss) and change in unrealized appreciation (depreciation) on investments | | | (0.28 | ) | | (0.19 | ) | | (0.11 | ) | | (0.25 | ) | | 0.60 | | | 0.16 | |
| Total income (loss) from investment operations | | | (0.06 | ) | | 0.20 | | | 0.29 | | | 0.17 | | | 1.07 | | | 0.70 | |
| Distributions: | | | | | | | | | | | | | | | | | | | |
| Dividends from net investment income | | | (0.22 | ) | | (0.43 | ) | | (0.40 | ) | | (0.42 | ) | | (0.47 | ) | | (0.54 | ) |
| Distributions of net realized gain | | | (0.00 | ) (c) | | — | | | — | | | (0.09 | ) | | (0.26 | ) | | — | |
| Total Distributions | | | (0.22 | ) | | (0.43 | ) | | (0.40 | ) | | (0.51 | ) | | (0.73 | ) | | (0.54 | ) |
| Net asset value per share, end of period | | $ | 11.08 | | $ | 11.36 | | $ | 11.59 | | $ | 11.70 | | $ | 12.04 | | $ | 11.70 | |
| Total return (a)(b)(c) | | | (0.53 | %) | | 1.73 | % | | 2.48 | % | | 1.36 | % | | 9.33 | % | | 6.13 | % |
| | | | | | | | | | | | | | | | | | | | |
| | | | | | | | | | | | | | | | | | | | |
| Ratios/supplemental data: | | | | | | | | | | | | | | | | | | | |
| Net assets (dollars in thousands), end of period | | $ | 10,105 | | $ | 12,209 | | $ | 14,565 | | $ | 22,791 | | $ | 41,676 | | $ | 31,267 | |
| Ratio of expenses to average net assets (b)(d): | | | | | | | | | | | | | | | | | | | |
| Before expense reimbursement | | | 1.08 | % | | 1.06 | % | | 0.94 | % | | 1.04 | % | | 0.99 | % | | 0.91 | % |
| After expense reimbursement | | | 0.95 | % | | 0.95 | % | | 0.95 | % | | 0.95 | % | | 0.95 | % | | 0.91 | % |
| Ratio of net investment income to average net assets (b)(d) | | | 3.88 | % | | 3.40 | % | | 3.29 | % | | 3.32 | % | | 3.78 | % | | 4.60 | % |
| Portfolio turnover rate (c) | | | 2 | % | | 189 | % | | 250 | % | | 175 | % | | 174 | % | | 199 | % |
______________
| (a) | Total return represents performance of the Portfolio only and does not include mortality and expense deductions in separate accounts. |
| (b) | The Adviser and Administrator have contractually agreed to reimburse Portfolio expenses to the extent that the ratio of expenses to average net assets exceeds, on an annual basis, the net expenses defined in Note 3. These contractual limits may be discontinued at any time after April 30, 2007. |
| (c) | Not annualized for periods of less than one full year. |
| (d) | Annualized for periods of less than one year. |
The accompanying notes are an integral part of these financial statements.
40|86 Series Trust | Semi-Annual Report |
Financial Highlights | |
For a share outstanding during the six months ended June 30, 2006 (unaudited) and through the year ended December 31,
| | | MONEY MARKET PORTFOLIO | |
| | | 2006 | | 2005 | | 2004 | | 2003 | | 2002 | | 2001 | |
| Net asset value per share, beginning of period | | $ | 1.00 | | $ | 1.00 | | $ | 1.00 | | $ | 1.00 | | $ | 1.00 | | $ | 1.00 | |
| Income from investment operations: | | | | | | | | | | | | | | | | | | | |
| Net investment income | | | 0.02 | | | 0.03 | | | 0.01 | | | 0.01 | | | 0.01 | | | 0.04 | |
| Net realized gain (loss) and change in unrealized appreciation (depreciation) on investments | | | 0.00 | (c) | | — | | | 0.00 | (c) | | — | | | (0.00 | ) (c) | | 0.00 | (c) |
| Total income from investment operations | | | 0.02 | | | 0.03 | | | 0.01 | | | 0.01 | | | 0.01 | | | 0.04 | |
| Distributions: | | | | | | | | | | | | | | | | | | | |
| Dividends from net investment income | | | (0.02 | ) | | (0.03 | ) | | (0.01 | ) | | (0.01 | ) | | (0.01 | ) | | (0.04 | ) |
| Distributions of net realized gain | | | (0.00 | ) (c) | | — | | | — | | | — | | | (0.00 | ) (c) | | — | |
| Total distributions | | | (0.02 | ) | | (0.03 | ) | | (0.01 | ) | | (0.01 | ) | | (0.01 | ) | | (0.04 | ) |
| Net asset value per share, end of period | | $ | 1.00 | | $ | 1.00 | | $ | 1.00 | | $ | 1.00 | | $ | 1.00 | | $ | 1.00 | |
| Total return (a)(b)(d) | | | 2.13 | % | | 2.89 | % | | 0.93 | % | | 0.63 | % | | 1.24 | % | | 3.97 | % |
| | | | | | | | | | | | | | | | | | | | |
| | | | | | | | | | | | | | | | | | | | |
| Ratios/supplemental data: | | | | | | | | | | | | | | | | | | | |
| Net assets (dollars in thousands), end of period | | $ | 62,602 | | $ | 40,340 | | $ | 33,755 | | $ | 41,965 | | $ | 95,767 | | $ | 129,530 | |
| Ratio of expenses to average net assets (b)(e): | | | | | | | | | | | | | | | | | | | |
| Before expense reimbursement | | | 0.72 | % | | 0.83 | % | | 0.71 | % | | 0.76 | % | | 0.73 | % | | 0.72 | % |
| After expense reimbursement | | | 0.45 | % | | 0.45 | % | | 0.45 | % | | 0.45 | % | | 0.45 | % | | 0.43 | % |
| Ratio of net investment income to average net assets (b)(e) | | | 4.27 | % | | 2.90 | % | | 1.16 | % | | 0.64 | % | | 1.23 | % | | 3.74 | % |
_____________
| (a) | Total return represents performance of the Portfolio only and does not include mortality and expense deductions in separate accounts. |
| (b) | The Adviser and Administrator have contractually agreed to reimburse Portfolio expenses to the extent that the ratio of expenses to average net assets exceeds, on an annual basis, the net expenses defined in Note 3. These contractual limits may be discontinued at any time after April 30, 2007. |
| (c) | Amount calculated is less than $0.005 per share. |
| (d) | Not annualized for periods of less than one full year. |
| (e) | Annualized for periods of less than one year. |
The accompanying notes are an integral part of these financial statements.
40|86 Series Trust | Semi-Annual Report |
Notes to Financial Statements (unaudited) | June 30, 2006 |
1. GENERAL
40|86 Series Trust (the “Trust”) is an open-end management investment company registered with the Securities and Exchange Commission under the Investment Company Act of 1940, as amended (the “Act”), and was organized as a Massachusetts Trust effective November 15, 1982. The Trust is a “series” type of mutual fund which issues separate series of shares, each of which currently represents a separate portfolio of investments. The Trust consists of six series (“Portfolios”) each with its own investment objective and investment policies. The Portfolios are the Equity, Balanced, High Yield, Fixed Income, Government Securities and Money Market. Effective on or about August 31, 2006, the High Yield Portfolio will be liquidated and terminated. The Trust offers shares to affiliated and unaffiliated life insurance company separate accounts (registered as unit investment trusts under the Act) to fund the benefits under variable annuity and variable life contracts. However, Jefferson National Life variable annuity products own a majority of the shares offered by each Portfolio.
2. SUMMARY OF SIGNIFICANT ACCOUNTING POLICIES
SECURITY VALUATION, TRANSACTIONS AND RELATED INVESTMENT INCOME
The investments in each Portfolio are valued at the close of regular trading on the New York Stock Exchange on each business day. Investment transactions are accounted for on trade date (the date the order to buy or sell is executed). Dividend income is recorded on the ex-dividend date and interest income is accrued daily. The cost of investments sold is determined on the specific identification basis. The following summarizes the investments, which carry certain restrictions as to resale from the Trust to certain qualified buyers:
Portfolio | | Cost | Value | Percent of Net Assets |
| Equity | | $ | 8,503,547 | | $ | 8,503,547 | | | 5.01 | % |
| Balanced | | | 2,109,548 | | | 2,081,246 | | | 5.06 | % |
| High Yield | | | 522,800 | | | 513,306 | | | 11.26 | % |
| Fixed Income | | | 1,761,165 | | | 1,702,027 | | | 8.32 | % |
| Money Market | | | 18,231,491 | | | 18,231,491 | | | 29.12 | % |
These securities are eligible for resale to qualified institutional buyers in transactions exempt from registration under Rule 144A of the Securities Act of 1933. In addition, 40|86 Advisors, Inc. (the “Adviser”), a wholly-owned subsidiary of Conseco, Inc. (“Conseco”), which serves as investment adviser to the Portfolios, has determined that the securities are liquid securities through a procedure approved by the Board of Trustees of the Trust (the “Trustees”).
The Trustees determined that the Money Market Portfolio will value investments at amortized cost, which is conditioned on the Trust’s compliance with certain conditions contained in Rule 2a-7 of the Act. The Adviser continuously reviews this method of valuation and recommends changes to the Trustees, if necessary, to ensure that the Money Market Portfolio investments are valued at fair value (as determined by the Trustees in good faith).
In all Portfolios of the Trust, except for the Money Market Portfolio, securities that are traded on stock exchanges, excluding the NASDAQ national market system, are valued at the last sale price as of the close of business on the day the securities are being valued, or lacking any sales, at the mean between the closing bid and asked prices. Securities that are principally traded on the NASDAQ national market system are generally valued at the NASDAQ Official Closing Price (“NOCP”). Securities traded in the over-thecounter market are valued at the mean between the bid and asked prices obtained from a pricing service or brokers. Prices for fixed income securities may be obtained from an independent pricing source that uses information provided by market makers or estimates of market value obtained from yield data relating to investments or securities with similar characteristics. Portfolio securities that are traded both in the over-the-counter market and on a stock exchange are valued according to the broadest and most representative market, and it is expected that for debt securities this ordinarily will be the over-the-counter market. Debt securities with maturities of sixty (60) days or less are valued at amortized cost that approximates value.
Under the direction of the Trustees, the Adviser may use a practice known as fair value pricing under certain circumstances. This may include, but is not limited to, securities and assets for which market quotations are not readily available, situations where events occur after an exchange closes that are likely to affect the value of the security or the Adviser deems that the market price is not reflective of a security’s appropriate value. The Adviser may consider many factors when determining fair values, including but not limited to, the type of security, the financial statements of the issuer, the cost at date of purchase, the size of holdings and information as to any transactions or offers with respect to the security, existence of merger proposals or tender offers with respect to the security. These general and specific factors listed do not provide all the criteria, which may be considered when using the fair value method. When using the fair value method, the Adviser will take into consideration all indications of value available to them in determining the “fair value” assigned to a particular security.
If an investment owned by a Portfolio experiences a default and has accrued interest from purchase or has recorded accrued interest during the period it is owned, the Portfolio’s policy is to cease interest accruals from the time the Investments are traded as “flat” in the market. The Portfolio evaluates the collectibility of purchased accrued interest and previously recorded interest on an investmentby- investment basis.
FEDERAL INCOME TAXES
Each Portfolio is treated as a separate taxable entity for federal income tax purposes and intends to qualify as a regulated investment company under Subchapter M of the Internal Revenue Code. The Trust intends to distribute substantially all taxable income and net realized gains to shareholders annually, and otherwise comply with the requirements for regulated investment companies. Therefore, no provision has been made for federal income taxes.
40|86 Series Trust | Semi-Annual Report |
Notes to Financial Statements (unaudited) | June 30, 2006 |
Net investment income and net realized gains (losses) may differ for financial statement and tax purposes because of temporary or permanent book/tax differences. To the extent these differences are permanent, reclassifications are made to the appropriate equity accounts in the period the difference arises.
DIVIDENDS TO SHAREHOLDERS
Dividends are declared and paid from net investment income on a daily basis in the Money Market Portfolio, on a monthly basis in the Government Securities, Fixed Income and High Yield Portfolios, on a quarterly basis in the Balanced Portfolio and on an annual basis in the Equity Portfolio. Distributions of net short-term capital gains and losses are declared and reinvested, at least annually, as a component of net realized gains (losses).
Dividends to shareholders from net investment income are determined in accordance with income tax regulations which may differ from accounting principles generally accepted in the United States of America. Permanent book and tax differences relating to dividends to shareholders may result in reclassifications to paid-in capital and may effect per-share allocation between net investment income and realized and unrealized gains (losses). Any taxable income or gain of the Trust remaining at fiscal year end will be declared and distributed in the following year to the shareholders of the Portfolio or Portfolios to which such gains are attributable.
SECURITIES LENDING
The Portfolios have entered into a Securities Lending Agreement (the “Agreement”) with the Bank of New York. Under terms of the Agreement, the Portfolios may lend portfolio securities to qualified institutional borrowers in order to earn additional income. The Agreement requires that loans are collateralized at all times in an amount equal to at least 102% of the market value of any loaned securities, plus accrued interest. Cash collateral is invested in short-term securities or variable rate bonds and Certificates of Deposit that are included in the respective Portfolio’s Schedule of Investments.
At June 30, 2006, the Equity, Balanced, Fixed Income and Government Securities Portfolios had securities with a market value of $44,797,466, $10,991,011, $3,551,845 and $3,001,669, respectively, on loan (included within Investments in securities in the Statements of Assets and Liabilities) and had received $45,847,066, $11,227,970, $3,672,396, and $3,058,040, respectively, in collateral. Amounts earned as interest on investments of cash collateral, net of rebates and other securities lending expenses, are included in Securities Lending income in the Statements of Operations. For the six months ended June 30, 2006, the securities lending income totaled $32,062, $6,110, $4,353 and $3,318, respectively.
The primary risk associated with securities lending is if the borrower defaults on its obligation to return the securities loaned because of insolvency or other reasons. The Portfolios could experience delays and costs in recovering securities loaned or in gaining access to the collateral.
USE OF ESTIMATES
The preparation of financial statements in conformity with accounting principles generally accepted in the United States of America requires management to make estimates and assumptions that affect the reported amount of assets and liabilities, and disclosure of contingent assets and liabilities as of the date of the financial statements and the reported amounts of increases and decreases in net assets from operations during the reporting period. Actual results may differ from these estimates.
3. TRANSACTIONS WITH AFFILIATES
INVESTMENT ADVISORY AGREEMENT
The Adviser provides investment advice and, in general, supervises the Trust’s management and investment program, furnishes office space, prepares Portfolio reports for the Trust, monitors Portfolio compliance by the Trust in its investment activities and pays compensation of officers and Trustees of the Trust who are affiliated persons of the Adviser. The Trust pays all other expenses incurred in the operation of the Trust, including fees and expenses of unaffiliated Trustees of the Trust.
Under the Investment Advisory Agreement, the Adviser receives an investment advisory fee based on the daily net asset value at an annual rate of 0.70 percent for the High Yield Portfolio, 0.65 percent for the Equity and Balanced Portfolios, 0.50 percent for the Fixed Income and Government Securities Portfolios and 0.35 percent for the Money Market Portfolio. The Adviser has voluntarily reduced its advisory fee to 0.25 percent of the average daily net assets of the Money Market Portfolio. The total fees incurred for such services were $914,124 for the six months ended June 30, 2006.
The Adviser has entered into a Subadvisory Agreement for the management of the investments in the Equity Portfolio and the equity portion of the Balanced Portfolio. The Adviser is solely responsible for the payment of all fees to the Subadviser. The Subadviser for the Equity Portfolio and the equity portion of the Balanced Portfolio is Chicago Equity Partners, LLC.
The Adviser has contractually agreed to waive its investment advisory fee and/or reimburse the Portfolios through April 30, 2007 to the extent that the ratio of expenses to net assets on an annual basis exceeds the following:
Portfolio | | | |
| Equity | | | 1.10 | % |
| Balanced | | | 1.10 | % |
| High Yield | | | 1.15 | % |
| Fixed Income | | | 0.95 | % |
| Government Securities | | | 0.95 | % |
| Money Market | | | 0.45 | % |
The Adviser may discontinue these contractual limits at any time after April 30, 2007. After this date the Adviser may elect to continue, modify or terminate the limitation on Portfolio operating expenses. Further, under the terms of this agreement, any Portfolio expenses waived or reimbursed may be recouped by the Adviser
40|86 Series Trust | Semi-Annual Report |
Notes to Financial Statements (unaudited) | June 30, 2006 |
from the Portfolio to the extent actual operating expenses for a period are less than the expense limitation caps. The Adviser may only be entitled to recoup such amounts for a period of three years from the fiscal year that they were waived or reimbursed. Reimbursed/absorbed expenses subject to potential recovery by year of expiration are as follows:
| | | Year of Expiration |
| | | December 31, |
| | | 2006 | 2007 | 2008 |
| Equity | | $ | 64,540 | | $ | 42,025 | | $ | 163,295 | |
| Balanced | | | 21,956 | | | 18,765 | | | 51,616 | |
| High Yield | | | 8,570 | | | 8,536 | | | 17,536 | |
| Fixed Income | | | 20,431 | | | 8,208 | | | 28,208 | |
| Government Securities | | | 31,927 | | | — | | | 13,948 | |
| Money Market | | | 237,653 | | | 103,777 | | | 129,638 | |
ADMINISTRATIVE AGREEMENT
Conseco Services, LLC (the “Administrator”), a wholly-owned subsidiary of Conseco, supervises the preparation of regulatory documents required for compliance by the Portfolios with applicable laws and regulations, supervises the maintenance of books and records of the Portfolios and provides other general and administrative services. The Administrator receives and annual fee, for providing these services, equal to 0.15 percent for the first $200 million of average daily net assets of the Trust; 0.10 percent of the next $300 million of average daily net assets of the Trust; and 0.08 percent of the average daily net assets in excess of $500 million of the Trust. The total fees under this Agreement for the six months ended June 30, 2006 were $198,027. The Administrator has contractually agreed to waive its administration fee and/or reimburse the Portfolios through April 30, 2007 to the extent that the ratio of expenses to net assets on an annual basis exceeds the expense limitations as stated for the Investment Advisory Agreement. The Administrator may discontinue these contractual limits at any time after April 30, 2007.
DISTRIBUTION AGREEMENT
Conseco Equity Sales, Inc. (the “Distributor”), a wholly-owned subsidiary of Conseco, serves as the principal underwriter for each Portfolio pursuant to a Principal Underwriting Agreement, approved by the Trustees. The Distributor is a registered brokerdealer and a member of the National Association of Securities Dealers, Inc. (“NASD”). Shares of each Portfolio will be continuously offered to life insurance company separate accounts to fund the benefits under variable annuity and variable life contracts. The Distributor bears all the expenses of providing services pursuant to the Principal Underwriting Agreement including the payment of the expenses relating to the distribution of prospectuses for sales purposes, as well as, any advertising or sales literature. The Trust adopted a Distribution and Service Plan pursuant to Rule 12b-1 (the “Plan”) for the Equity, Balanced, High Yield, Fixed Income and Government Securities Portfolios in accordance with the requirements of Rule 12b-1 under the 1940 Act and the requirement of the applicable rules of the NASD regarding asset based sales charges. Pursuant to the Plan, a Portfolio may compensate the Distributor for its expenditures in financing any activity primarily intended to result in the sale of shares of the Portfolio and for account maintenance provided to shareholders. The Plan provides for periodic payments by the Distributor to financial intermediaries for providing shareholder services to accounts that hold shares and for promotional and other sales related costs. The total fees incurred by the Trust for such services for the six months ended June 30, 2006 were $320,536.
4. INVESTMENT TRANSACTIONS
The aggregate cost of purchases and the aggregate proceeds from sales of investments (excluding short-term securities) for the six months ended June 30, 2006 are shown below:
| | | EQUITY PORTFOLIO | BALANCED PORTFOLIO | HIGH YIELD PORTFOLIO | FIXED INCOME PORTFOLIO | GOVERNMENT SECURITIES PORTFOLIO |
| | | | | | | | | | | | |
| Purchases: | | | | | | | | | | | |
| U.S. Government | | $ | — | | $ | 1,703,140 | | $ | — | | $ | 7,978,551 | | $ | 99,831 | |
| Other | | | 76,310,600 | | | 13,382,142 | | | 3,019,250 | | | 14,767,180 | | | 91,344 | |
| Sales: | | | | | | | | | | | | | | | | |
| U.S. Government | | $ | — | | $ | 986,424 | | $ | — | | $ | 7,605,206 | | $ | 1,357,329 | |
| Other | | | 87,360,669 | | | 16,394,059 | | | 5,293,000 | | | 16,085,721 | | | 457,165 | |
5. FEDERAL INCOME TAXES
The following information for the Portfolios is presented on an income tax basis as of December 31, 2005:
| | | EQUITY PORTFOLIO | BALANCED PORTFOLIO | HIGH YIELD PORTFOLIO | FIXED INCOME PORTFOLIO | GOVERNMENT SECURITIES PORTFOLIO | MONEY MARKET PORTFOLIO |
| Cost of investments (a) | | $ | 194,100,202 | | $ | 50,592,102 | | $ | 7,630,276 | | $ | 25,962,652 | | $ | 15,051,785 | | $ | 38,714,161 | |
| Gross unrealized appreciation | | $ | 29,988,385 | | $ | 4,740,169 | | $ | 114,460 | | $ | 368,736 | | $ | 51,840 | | $ | — | |
| Gross unrealized depreciation | | | (2,542,571 | ) | | (668,364 | ) | | (176,304 | ) | | (284,156 | ) | | (156,983 | ) | | — | |
| Net unrealized appreciation (depreciation) on investments | | $ | 27,445,814 | | $ | 4,071,805 | | $ | (61,844 | ) | $ | 84,580 | | $ | (105,143 | ) | $ | — | |
____________
| (a) | Represents cost for federal income tax purposes and differs from the cost for financial reporting purposes by the amount of losses recognized for the financial reporting purposes in excess of federal income tax purposes. |
40|86 Series Trust | Semi-Annual Report |
Notes to Financial Statements (unaudited) | June 30, 2006 |
As of December 31, 2005, the components of accumulated earnings (deficit) on a tax basis were:
| | | EQUITY PORTFOLIO | BALANCED PORTFOLIO | HIGH YIELD PORTFOLIO | FIXED INCOME PORTFOLIO | GOVERNMENT SECURITIES PORTFOLIO | MONEY MARKET PORTFOLIO |
| Distributable ordinary income | | $ | — | | $ | — | | $ | 2,128 | | $ | 5,527 | | $ | 2,019 | | $ | 9,296 | |
| Distributable long-term gains | | | 20,243,570 | | | — | | | — | | | — | | | — | | | — | |
| Accumulated earnings | | | 20,243,570 | | | — | | | 2,128 | | | 5,527 | | | 2,019 | | | 9,296 | |
| Accumulated capital and post-October losses | | | (20,873,345 | ) | | (10,035,101 | ) | | (427,624 | ) | | (510,209 | ) | | (232,940 | ) | | (9,296 | ) |
| Unrealized appreciation (depreciation) | | | 27,445,814 | | | 4,071,805 | | | (61,844 | ) | | 84,580 | | | (105,143 | ) | | — | |
| Total accumulated earnings (deficit) | | $ | 26,816,039 | | $ | (5,963,296 | ) | $ | (487,340 | ) | $ | (420,102 | ) | $ | (336,064 | ) | $ | — | |
The tax character of dividends paid during the years ended December 31, 2005 and December 31, 2004 were as follows:(a)
| | | EQUITY PORTFOLIO | BALANCED PORTFOLIO | HIGH YIELD PORTFOLIO | FIXED INCOME PORTFOLIO | GOVERNMENT SECURITIES PORTFOLIO | MONEY MARKET PORTFOLIO |
| Ordinary income dividends | | | | | | | | | | | | | |
| December 31, 2005 | | $ | 749,443 | | $ | 744,826 | | $ | 633,160 | | $ | 1,104,249 | | $ | 482,446 | | $ | 998,425 | |
| December 31, 2004 | | | 546,828 | | | 919,319 | | | 888,049 | | | 1,327,299 | | | 630,280 | | | 362,228 | |
| Long-term capital gain distributions | | | | | | | | | | | | | | | | | | | |
| December 31, 2005 | | $ | 15,985,995 | | $ | — | | $ | 323,316 | | $ | — | | $ | — | | $ | — | |
| December 31, 2004 | | | 590,150 | | | — | | | 140,663 | | | — | | | — | | | — | |
As of December 31, 2005, the following Portfolios have capital loss carryforwards available to offset capital gains in the future, if any:
| | | AMOUNT | EXPIRES |
| Balanced Portfolio | | $ | 2,672,638 | | | 2010 | |
| Balanced Portfolio | | | 1,556,918 | | | 2011 | |
| Fixed Income Portfolio | | | 420,142 | | | 2010 | |
| Government Securities Portfolio | | | 200,502 | | | 2012 | |
| Government Securities Portfolio | | | 21,830 | | | 2013 | |
| Money Market Portfolio | | | 4,462 | | | 2010 | |
| Money Market Portfolio | | | 80 | | | 2011 | |
| Money Market Portfolio | | | 4,754 | | | 2012 | |
As of the tax year end December 31, 2005, the following Portfolios had additional net capital loss carryforwards, subject to certain limitations on availability, to offset future net capital gains, if any. To the extent that these carryovers are used to offset future capital gains, it is probable that the gains so offset will not be distributed to shareholders:
| | | AMOUNT | EXPIRES |
| Equity Portfolio | | $ | 14,851,019 | | | 2009 | |
| Equity Portfolio | | | 6,022,326 | | | 2010 | |
| Balanced Portfolio | | | 5,805,545 | | | 2010 | |
| High Yield Portfolio | | | 400,775 | | | 2010 | |
| High Yield Portfolio | | | 23,814 | | | 2011 | |
Net realized gains or losses may differ from Federal income tax purposes primarily as a result of wash sales and post-October losses which may not be recognized for tax purposes until the first of the following fiscal year. Such amounts may be used to offset future capital gains.
The following summarizes the amount of post-October losses deferred, on a tax basis, for the year ended December 31, 2005.
| | | AMOUNT | | |
| High Yield Portfolio | | $ | 3,035 | | | | |
| Government Securities Portfolio | | | 10,608 | | | | |
| Fixed Income Portfolio | | | 88,527 | | | | |
_____________
(a) | (The total distributions paid differs from the Statement of Changes in Net Assets because, for tax purposes, dividends are recognized when actually paid). |
40|86 Series Trust | Semi-Annual Report |
Notes to Financial Statements (unaudited) | June 30, 2006 |
6. INDEMNIFICATIONS
Under the Trust’s organizational documents, its officers and trustees are indemnified against certain liabilities arising out of the performance of their duties to the Trust. In addition, in the normal course of business, the Trust enters into contacts with its vendors and others that may provide for general indemnifications. The Trust’s maximum exposure under these arrangements is unknown as this would involve future claims be made against the Trust. However, based on experience, the Trust expects the risk of loss to be remote.
7. NEW ACCOUNTING POLICIES
FASB Interpretation No. 48
On July 13, 2006, the Financial Accounting Standards Board (”FASB”) issued FASB Interpretation No. 48, Accounting for Uncertainty in Income Taxes (“FIN 48”) to create a single model to address accounting for uncertainty in tax positions. FIN 48 provides guidance for how uncertain tax positions should be recognized, measured, presented and disclosed in the financial statements. FIN 48 is effective for fiscal years beginning after December 15, 2006. Management is evaluating the implications of FIN 48, and its impact on the financial statements has not yet been determined.
Expense Example (unaudited)
June 30, 2006
As a shareholder of the 40|86 Series Trust (the “Trust”), you incur ongoing costs, including management fees, distribution fees and other Trust expenses. This Example is intended to help you understand your ongoing costs (in dollars) of investing in the Trust and to compare these costs with the ongoing costs of investing in other mutual funds. The Example is based on an investment of $1,000 invested at the beginning of the period and held for the entire period (01/01/06 - 06/30/06).
Actual Expenses
The first line of the table below provides information about actual account values and actual expenses. The example below includes, but is not limited to, management fees, administration, distribution, custody and transfer agent fees. However, the example below does not include portfolio trading commissions and related expenses and other extraordinary expenses as determined under generally accepted accounting principles. You may use the information in this line, together with the amount you invested, to estimate the expenses that you paid over the period. Simply divide your account value by $1,000 (for example, an $8,600 account value divided by $1,000 = 8.6), then multiply the result by the number in the first line under the heading entitled "Expenses Paid During Period'' to estimate the expenses you paid on your account during this period.
Hypothetical Example for Comparison Purposes
The second line of the table below provides information about hypothetical account values and hypothetical expenses based on the Trust’s actual expense ratio and an assumed rate of return of 5% per year before expenses, which is not the Trust’s actual return. The hypothetical account values and expenses may not be used to estimate the actual ending account balance or expenses you paid for the period. You may use this information to compare the ongoing costs of investing in the Trust and other funds. To do so, compare this 5% hypothetical example with the 5% hypothetical examples that appear in the shareholder reports of the other funds. Please note that the expenses shown in the table are meant to highlight your ongoing costs only and do not reflect any transactional costs, such as sales charges (loads), redemption fees, or exchange fees. Therefore, the second line of the table is useful in comparing ongoing costs only, and will not help you determine the relative total costs of owning different funds. In addition, if these transactional costs were included, your costs would have been higher.
Equity Portfolio | Beginning Account Value 01/01/06 | Ending Account Value 06/30/06 | Expenses Paid During Period 01/01/06 - 06/30/06(1) |
| Actual | $1,000.00 | $1,059.10 | $5.62 |
| Hypothetical (5% return before expenses) | 1,000.00 | 1,019.55 | 5.51 |
(1) | Expenses are equal to the Fund’s annualized expense ratio of 1.10% multiplied by the average account value over the period multiplied by 181/365 (to reflect the one-half year period). |
The accompanying notes are an integral part of these financial statements.
40|86 Series Trust | Semi-Annual Report |
Expense Example (unaudited) | |
June 30, 2006
Balanced Portfolio | Beginning Account Value 01/01/06 | Ending Account Value 06/30/06 | Expenses Paid During Period 01/01/06 - 06/30/06(2) |
| Actual | $1,000.00 | $1,033.40 | $5.55 |
| Hypothetical (5% return before expenses) | 1,000.00 | 1,019.55 | 5.51 |
(2) | Expenses are equal to the Fund’s annualized expense ratio of 1.10% multiplied by the average account value over the period multiplied by 181/365 (to reflect the one-half year period). |
High Yield Portfolio | Beginning Account Value 01/01/06 | Ending Account Value 06/30/06 | Expenses Paid During Period 01/01/06 - 06/30/06(3) |
| Actual | $1,000.00 | $1,008.00 | $5.73 |
| Hypothetical (5% return before expenses) | 1,000.00 | 1,019.30 | 5.76 |
(3) | Expenses are equal to the Fund’s annualized expense ratio of 1.15% multiplied by the average account value over the period multiplied by 181/365 (to reflect the one-half year period). |
Fixed Income Portfolio | Beginning Account Value 01/01/06 | Ending Account Value 06/30/06 | Expenses Paid During Period 01/01/06 - 06/30/06(4) |
| Actual | $1,000.00 | $992.10 | $4.69 |
| Hypothetical (5% return before expenses) | 1,000.00 | 1,020.29 | 4.76 |
(4) | Expenses are equal to the Fund’s annualized expense ratio of 0.95% multiplied by the average account value over the period multiplied by 181/365 (to reflect the one-half year period). |
Government Securities Portfolio | Beginning Account Value 01/01/06 | Ending Account Value 06/30/06 | Expenses Paid During Period 01/01/06 - 06/30/06(5) |
| Actual | $1,000.00 | $994.70 | $4.70 |
| Hypothetical (5% return before expenses) | 1,000.00 | 1,020.29 | 4.76 |
(5) | Expenses are equal to the Fund’s annualized expense ratio of 0.95% multiplied by the average account value over the period multiplied by 181/365 (to reflect the one-half year period). |
Money Market Portfolio | Beginning Account Value 01/01/06 | Ending Account Value 06/30/06 | Expenses Paid During Period 01/01/06 - 06/30/06(6) |
| Actual | $1,000.00 | $1,021.30 | $2.26 |
| Hypothetical (5% return before expenses) | 1,000.00 | 1,022.77 | 2.26 |
(6) | Expenses are equal to the Fund’s annualized expense ratio of 0.45% multiplied by the average account value over the period multiplied by 181/365 (to reflect the one-half year period). |
40|86 Series Trust | Semi-Annual Report |
Disclosure of Investment Management Agreement (unaudited) |
ACTIVITIES AND COMPOSITION OF THE BOARD OF TRUSTEES
All but one member of the Trust’s Board of Trustees is a noninterested trustee as that term is defined in the Investment Company Act of 1940, as amended. We refer to these non-interested persons as independent trustees throughout this report. The Chairman of the Board is an independent trustee, and nominees to become independent trustees are chosen by a Nominating Committee comprised solely of independent trustees. All independent trustees are also members of the Board's Audit Committee. The independent trustees meet in executive session at each regular Board meeting. The Board meets in person at least once each quarter and conducts other in-person and telephonic meetings throughout the year. Independent counsel to the independent trustees attends regular in-person Board and Audit Committee meetings and attends other meetings at the request of the independent trustees in-person or telephonically.
INVESTMENT MANAGEMENT AGREEMENT — MATTERS CONSIDERED BY THE BOARD
Every year the Board considers renewal of the investment management agreement with respect to the Trust and each Portfolio (the “Investment Management Agreement”) and throughout each year, reviews and evaluates the performance of and services provided by 40|86 Advisors, Inc. (the “Investment Adviser”). The Board also annually reviews and considers renewal of the subadvisory agreement with respect to the Equity and Balanced Portfolios between the Investment Adviser and Chicago Equity Partners, LLC (the “Sub-Adviser”) (the “Sub-Advisory Agreement”). The Board assesses the nature, scope and quality of the services provided to the Trust and/or each Portfolio by the personnel of the Investment Adviser and its affiliates, and the Sub- Adviser, including administrative services, and compliance with legal and regulatory requirements. The Board also receives and assesses information regarding the services provided to the Portfolios and the Trust by certain unaffiliated service providers.
At various times throughout the year, the Board also considers a range of information in connection with its oversight of the services provided to the Trust. Among the matters considered throughout the year with respect to each Portfolio are: (a) fees (in addition to management fees) paid to the Investment Adviser and its affiliates by the Portfolios and the Trust, such as fees for marketing and distribution; (b) overall Portfolio/Trust operating expenses; (c) the resources devoted to and compliance reports relating to the Portfolios’ investment objective, policies and restrictions, and the Trust’s compliance with its respective Code of Ethics and the Investment Adviser's compliance policies and procedures; and (d) the nature, cost and character of any non-investment management services provided by the Investment Adviser and its affiliates.
ANNUAL CONSIDERATION OF APPROVAL OF THE INVESTMENT MANAGEMENT AGREEMENT BY THE BOARD OF TRUSTEES
In the period prior to the Board meeting to consider renewal of the Investment Management Agreement and the Sub-Advisory Agreement, the Board requests and receives materials specifically relating to the Investment Management Agreement and the Sub- Advisory Agreement. These materials include (a) information compiled by Lipper Inc. (“Lipper”) on the investment performance of the Portfolios as compared to a comparable group of Portfolios as classified by Lipper; (b) information on fees and expenses of other funds of similar asset size that serve as underlying investment options for variable insurance products; (c) sales and redemption data for the Portfolios; (d) a discussion by the Portfolios’ management team regarding investment strategies used by the Portfolios; and (e) information on the profitability to the Investment Adviser of its relationships with each Portfolio and the Trust. The Board also considers other matters it deems important to the approval process including any direct and indirect benefits to the Investment Adviser, the Sub-Adviser and their affiliates from their relationship with the Portfolios and the Trust.
CERTAIN SPECIFIC RENEWAL DATA
In connection with the most recent consideration and renewal of the Investment Management Agreement and Sub-Advisory Agreement, the Board conducted two in-person meetings in February 2006. At each meeting, the independent trustees met in executive session with their counsel to discuss the information presented regarding contract renewals. Among other matters, the Board deliberations focused on the following areas:
The Nature and Quality of Services Provided by the Adviser and Sub-Adviser — The Board reviewed the nature, scope and quality of services provided by the Investment Adviser and the Sub- Adviser. The Trustees noted that the scope of service provided had expanded over time as a result of regulatory and other mutual fund developments. The Trustees also considered the quality of the investment capabilities of the Adviser and the other resources dedicated to performing service for the Portfolios and the Trust. The Trustees concluded that, overall, the nature, extent and quality of services provided to the Portfolios and the Trust were acceptable and therefore, supported the continuation of the Investment Management Agreement and the Sub-Advisory Agreement.
Investment Adviser's Portfolio Performance — The Board focused primarily on the resulting investment performance for each Portfolio. The Board compared each Portfolio's performance — both including and excluding the effects of the fees and expenses of each Portfolio and the Trust — to the performance of a comparable group of mutual fund portfolios which serve as underlying investment options for variable insurance products, and the performance of a relevant index or combination of indexes. While the Board reviews performance data at least quarterly, consistent with the Investment Adviser's investment goals, the Board attaches more importance to performance over relatively longer periods of time. The Trustees noted that the current and historical performance for each Portfolio exceeded the peer group median in nearly every instance, except for the Government Securities Portfolio and the recent performance of the High Yield Portfolio. The Trustees recognized the Investment Adviser’s efforts to remedy cash flow volatility in the High Yield Portfolio and the improved recent performance of the Government Securities Portfolio. The Trustees noted that performance for the High Yield and Government Securities Portfolios would continue to be closely monitored. Considering these factors, the Board expressed confidence in the Investment Adviser’s ability to continue to manage the Portfolios and concluded that the Portfolios’ investment performance was acceptable and therefore, supported the continuation of the Investment Management Agreement and the Sub-Advisory Agreement.
The accompanying notes are an integral part of these financial statements.
40|86 Series Trust | Semi-Annual Report |
Disclosure of Investment Management Agreement (unaudited) |
Management Fees and Other Expenses — The Board reviewed the Portfolios’ contractual management fee rate and actual management fee rate as a percentage of total assets at common asset levels -- the actual rate includes advisory and administrative service fees and the effects of any fee waivers -- compared to the other Portfolios that serve as an underlying investment option for variable insurance products considered comparable by Lipper and the Investment Adviser. It also compared the Portfolios’ total expenses to those of similar comparable portfolios. The Board recognized that it is difficult to make comparison of management fees because there are variations in the service included in the fees paid by other portfolios. The Board also noted that the Investment Adviser proposed a reduction in the contractual Money Market Portfolio’s investment advisory fee. The Board concluded that each Portfolios’ investment advisory fee and overall expense ratio were satisfactory compared to those of other comparable Portfolios and therefore, supported the continuation of the Investment Management Agreement.
Profitability — The Board considered the cost of the services provided to the Portfolios and/or the Trust by the Investment Adviser and the Investment Adviser's and its affiliates' profits relating to the management and distribution of the Portfolios. As part of its analysis, the Board reviewed the Investment Adviser's assumptions and methodology in allocating its costs to the management of each Portfolio and the Trust and concluded that there was a reasonable basis for the allocation. The Board recognized that comparative profitability information is not generally publicly available and is affected by numerous factors, including the structure of the investment adviser, the type of portfolio managed, and the adviser’s capital structure and cost of capital. The Board noted that the Investment Adviser is entitled to earn a reasonable level of profits for the services it provides to the Portfolios and Trust, and concluded that the Investment Adviser's profits were acceptable and not excessive in relation to the nature and quality of services provided and given the level of fees and expenses overall and therefore, supported the continuation of the Investment Management Agreement.
Economies of Scale — The Board considered the extent to which economies of scale might be realized as the assets of the Portfolios and Trust increase and whether there should be changes in the management fee rate or structure in order to enable the Portfolios and the Trust to participate in these economies of scale. The Trustees recognized that, given the stable or declining size of the Portfolios and the expense limits maintained by the Investment Adviser, no additional adjustment to fees or other steps were necessary to reflect economies of scale.
Conclusion — After the independent trustees deliberated in executive session, the Board of Trustees, including all of the independent trustees, approved the renewal of the existing Investment Management Agreement and Sub-Advisory Agreement, concluding that the contract renewal was in the best interests of the shareholders.
The accompanying notes are an integral part of these financial statements.
40|86 Series Trust | Semi-Annual Report |
Board of Trustees and Officers (unaudited) |
Name (Age) Address | | Position Held With Trust | | Principal Occupation(s) During Past 5 Years |
Diana H. Hamilton (50) 11815 N. Pennsylvania St. Carmel, IN 46032 | | Chairman of the Board Since December 2005 and Trustee Since December 2004 | | President, Sycamore Advisors, LLC, a municipal finance advisory firm; Formerly, State of Indiana Director of Public Finance. Chairman and Trustee of one other mutual fund managed by the Adviser. |
| | | | | |
R. Matthew Neff (51) 11815 N. Pennsylvania St. Carmel, IN 46032 | | Trustee Since December 2004 | | Chairman and Co-Chief Executive Officer of Senex Financial Corp., a financial services company engaged in the healthcare finance field. Trustee of one other mutual fund managed by the Adviser. |
| | | | | |
Vincent J. Otto (47) 11815 N. Pennsylvania St. Carmel, IN 46032 | | Trustee Since December 2005 Audit Committee Financial Expert Since February 2006 | | Executive Vice President and Chief Financial Officer, Waterfield Mortgage Company and Union Federal Bank. Director, Federal Home Loan Bank of Indianapolis. Trustee of one other mutual fund managed by the Adviser. |
| | | | | |
Steven R. Plump (53) 11815 N. Pennsylvania St. Carmel, IN 46032 | | Trustee Since June 2006 | | Group Vice President, Global Marketing and Sales and Chief Marketing Officer of Eli Lilly Company. Trustee of one other mutual fund managed by the Adviser. |
INTERESTED TRUSTEES AND OFFICERS |
Audrey L. Kurzawa* (39) 11815 N. Pennsylvania St. Carmel, IN 46032 | | President and Trustee Since June 2005 and Formerly Treasurer Since October 2002 | | Certified Public Accountant. Senior Vice President and Controller, Adviser. President and Trustee of one other mutual fund managed by the Adviser. |
| | | | | |
Daniel Murphy (50) 11815 N. Pennsylvania St. Carmel, IN 46032 | | Treasurer Since June 2005 | | President, Conseco Services, LLC; Senior Vice President and Treasurer, Conseco, Inc. and various affiliates. Treasurer of one other mutual fund managed by the Adviser. |
| | | | | |
Jeffrey M. Stautz (48) 11815 N. Pennsylvania St. Carmel, IN 46032 | | Chief Legal Officer and Secretary Since May 2005 | | Vice President, General Counsel, Secretary and Chief Compliance Officer, Adviser. Formerly, Partner at Baker & Daniels, Law firm. Chief Legal Officer and Secretary of one other mutual fund managed by the Adviser. |
| | | | | |
William T. Devanney (49) 11815 N. Pennsylvania St. Carmel, IN 46032 | | Vice President Since July 1998 | | Senior Vice President, Corporate Taxes of Conseco Services, LLC and various affiliates. Vice President of one other mutual fund managed by the Adviser. |
| | | | | |
Sarah L. Bertrand (38) 11815 N. Pennsylvania St. Carmel, IN 46032 | | Chief Compliance Officer and Assistant Secretary Since December 2004 | | Second Vice President, Legal and Compliance, Adviser. Chief Compliance Officer and Assistant Secretary of one other mutual fund managed by the Adviser. |
______________
| * | The Trustee so indicated is an ”interested person,” as defined in the 1940 Act, of the Trust due to the positions indicated with the Adviser and its affiliates. |
Each Trustee serves until the expiration of the term of his designated class and until his successor is elected and qualified, or until his death or resignation, or removal as provided in the Fund’s by—laws or charter or statute.
All Trustees oversee the seven portfolios that make up the total fund complex including 40|86 Strategic Income Fund (1) and 40|86 Series Trust (6).
The accompanying notes are an integral part of these financial statements.
| 40|86 Series Trust | Semi-Annual Report |
INVESTMENT ADVISER | | LEGAL COUNSEL |
| 40|86 Advisors, Inc. | | Kirkpatrick & Lockhart |
| Carmel, IN | | Nicholson Graham LLP |
| | | Washington, D.C. |
CUSTODIAN | | |
| The Bank of New York | | INVESTMENT SUB ADVISER |
| New York, NY | | Chicago Equity Partners, LLC |
| | | Chicago, IL |
INDEPENDENT REGISTERED | | |
PUBLIC ACCOUNTING FIRM | | |
| PricewaterhouseCoopers LLP | | |
| Indianapolis, IN | | |
PROXY VOTING POLICIES AND PROCEDURES
A description of the policies and procedures that the Portfolios use to determine how to vote proxies relating to portfolio securities is available without charge, upon request, by calling (866) 299-4086. Furthermore, you can obtain the description on the SEC’s website at http://www.sec.gov.
PROXY VOTING RECORDS FOR THE 12-MONTH PERIOD ENDED JUNE 30, 2006
Information regarding how the Portfolios voted proxies relating to portfolio securities during the most recent 12-month period ended June 30 is available without charge, upon request, by calling (866) 299-4086. Furthermore, you can obtain the Portfolio’s proxy voting records on the SEC’s website at http://www.sec.gov.
AVAILABILITY OF QUARTERLY PORTFOLIO SCHEDULE
The Portfolios file complete schedule of portfolio holdings with the SEC for the first and third quarters of each fiscal year on Form N-Q. The filing for the most recent quarter is available without charge, upon request, by calling (866) 299-4086. Furthermore, you can obtain the Portfolio’s quarterly portfolio schedule on the SEC’s website at http://www.sec.gov. The Portfolio’s Forms N-Q may also be reviewed and copied at the SEC’s Public Reference Room in Washington, DC, and information on the operation of the Public Reference Room may be obtained by calling (800) SEC-0330.
40|86 Series Trust is a registered investment company managed by
40|86 Advisors, Inc., a leading fixed-income investment advisor.
40|86 Series Trust
11815 North Pennsylvania Street
Carmel, Indiana 46032
Principal Underwriter:
Conseco Equity Sales, Inc.
11815 North Pennsylvania Street
Carmel, Indiana 46032