UNITED STATES
SECURITIES AND EXCHANGE COMMISSION
Washington, D.C. 20549
FORM N-CSR
CERTIFIED SHAREHOLDER REPORT OF REGISTERED
MANAGEMENT INVESTMENT COMPANIES
Investment Company Act file number: 811-3618
Metropolitan Series Fund, Inc.
(Exact name of registrant as specified in charter)
501 Boylston Street
Boston, Massachusetts 02116
(Address of Principal Executive Office)
JAMES L. LIPSCOMB, ESQ.
Executive Vice President & General Counsel
MetLife Group, Inc.
200 Park Avenue
New York, New York 10166-0188
(Name and address of agent for service)
Copy to:
THOMAS M. LENZ, ESQ.
MetLife Advisers, LLC
501 Boylston Street
Boston, Massachusetts 02116
Registrant’s telephone number, including area code: 617-578-3104
Date of fiscal year end: December 31
Date of reporting period: July 1, 2005 to December 31, 2005
Form N-CSR is to be used by management investment companies to file reports with the Commission not later than 10 days after the transmission to stockholders of any report that is required to be transmitted to stockholders under Rule 30e-1 under the Investment Company Act of 1940 (17 CFR 270.30e-1). The Commission may use the information provided on Form N-CSR in its regulatory, disclosure review, inspection, and policymaking roles.
A registrant is required to disclose the information specified by Form N-CSR, and the Commission will make this information public. A registrant is not required to respond to the collection of information contained in Form N-CSR unless the Form displays a currently valid Office of Management and Budget (“OMB”) control number. Please direct comments concerning the accuracy of the information collection burden estimate and any suggestions for reducing the burden to Secretary, Securities and Exchange Commission, 450 Fifth Street, NW, Washington, DC 20549-0609. The OMB has reviewed this collection of information under the clearance requirements of 44 U.S.C. §3507.
Item 1. Reports to Stockholders.
The following is a copy of the report transmitted to stockholders pursuant to Rule 30e-1 under the Investment Company Act of 1940 (the “Act”):
Metropolitan Series Fund, Inc.
Table of Contents
Not all Portfolios are available under every product.
Please refer to your prospectus for information on the Portfolios that are available.
Morgan Stanley sponsors the MSCI EAFE® Index, Lehman Brothers sponsors the Lehman Brothers® Aggregate Bond Index, Standard & Poor’s sponsors the S&P 500® Index and the S&P 400 MidCap Index, and Frank Russell Company sponsors the Russell 2000® Index (together referred to as the “index sponsors”). Direct investment in the indexes is not possible. The index sponsors do not sponsor, endorse, sell or promote any of the Metropolitan Series Fund, Inc.’s (the “Fund’s”) Portfolios (the “Portfolios”) or make any representation regarding the advisability of investing in the Portfolios. The index sponsors have no responsibility for and do not participate in the management of the Portfolio assets, or sale of the Portfolio shares. Each index and its associated service marks are the exclusive property of the respective index sponsor, and references thereto have been made with permission. The Fund’s Statement of Additional Information contains a more detailed description of the limited relationship the index sponsors have with Metropolitan Life Insurance Company and the Fund.
Letter from the President
February 2006
To Our Policyholders/Contract Owners:
We are pleased to provide you with the December 31, 2005 Annual Report for the Metropolitan Series Fund, Inc. The Report is designed to help you make informed decisions on how to allocate your money within your variable product.
Like world events and the economy, the capital markets are subject to volatility and the possibility of rapid change. We encourage you to work with your registered representative to develop an investment program to meet your long-term retirement, investment, and insurance needs.
You have the opportunity to join other policyholders and contract owners who are already taking advantage of our eDelivery service. When you register for eDelivery, fund reports, prospectuses and other informational documents are sent to you electronically. You can view and save your documents on-line, rather than receiving them in the mail. eDelivery is free, convenient, paperless and easy. See the inside front cover for information on how to sign up for eDelivery.
We look forward to serving your future investment needs.
Sincerely,

Hugh McHaffie
President, Metropolitan Series Fund, Inc.
Metropolitan Series Fund, Inc.
MetLife Conservative Allocation Portfolio
Managed by MetLife Advisers, LLC
Portfolio Manager Commentary*
PORTFOLIO PERFORMANCE
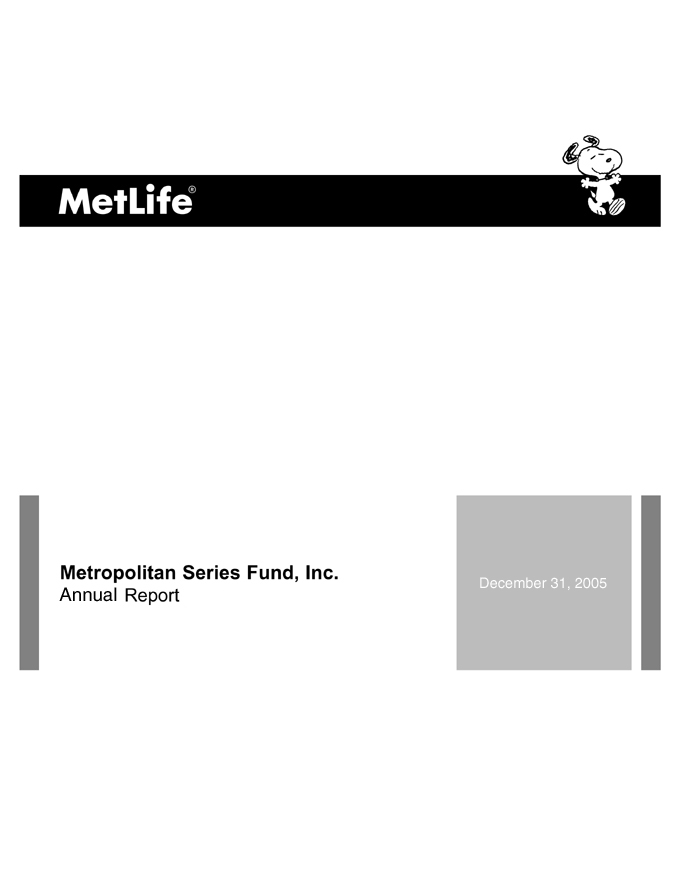
The MetLife Conservative Allocation Portfolio commenced operations on May 1, 2005. For the eight months ended December 31, 2005, the Class A shares of the Portfolio returned 4.1% compared to the 11.4% return of the Wilshire 5000 Stock Index1 and the 2.1% return of the Lehman Brothers Universal Bond Index.2 Considering that no single index or benchmark can accurately capture the multiple asset class design of the Portfolio, we have created a blended benchmark comprised of several indices for portfolio design and evaluation purposes. Specifically, the blended benchmark for the MetLife Conservative Allocation Portfolio consists of a 16% allocation to the Lehman Brothers 1 to 3 Year Government Bond Index,3 a 64% allocation to the Lehman Brothers Universal Bond Index, a 16% allocation to the Wilshire 5000 Stock Index, and a 4% allocation to the Morgan Stanley Capital International EAFE Index.4 During the eight-month period ending December 31, 2005, the blended benchmark returned 4.0%.
PORTFOLIO REVIEW
Since the inception date of the Portfolio on May 1, 2005, common stocks outperformed bonds by a wide margin. Within domestic stocks, small and mid cap stocks performed better than larger stocks. By investment style, growth style stocks did better than value style stocks during this eight-month period. Foreign stocks outperformed domestic stocks. The total return of bonds was only modestly positive due to a general rise in interest rates, which caused bond prices to fall. Below investment grade bonds did better than higher quality bonds as credit concerns eased.
The MetLife Conservative Allocation Portfolio is a “fund of funds” that invests in other portfolios of Metropolitan Series Fund, Inc. (the “Fund”) and Met Investors Series Trust. The Portfolio’s initial target allocations were 20% in equity investments and 80% in fixed income investments. The MetLife Conservative Allocation Portfolio is considered the most conservative of the Fund’s five Asset Allocation Portfolios as measured by its potential risk.
* The views expressed above are those of the investment advisor firm as of December 31, 2005 and are subject to change based on market and other conditions. Information about the Portfolio’s holdings, asset allocation, industry allocation or country diversification is historical and is not an indication of future Portfolio composition, which will vary.
1 The Wilshire 5000 Equity Index measures the performance of all U.S. headquartered equity securities with readily available price data. The Index is market capitalized weighted. Approximately 82% of the equity securities that the Index is comprised of are listed on the New York Stock Exchange, approximately 2% are listed on the American Stock Exchange and approximately 16% are over-the-counter securities (1995). The Index was created in 1974 and backdated to 1971, with a base index of December 1980 (base index equals 1,044.596). Dividends are reinvested on the “ex” dividend date and the rebalancing of share weights is done on a monthly basis. No attempt has been made to adjust the market capitalization of the Index to take into account cross holding between corporations. The Index does not include fees or expenses and is not available for direct investment.
2 The Lehman Brothers U.S. Universal Bond Index represents the union of the U.S. Aggregate Index, the U.S. High-Yield Corporate Index, the 144A Index, the Eurodollar Index, the Emerging Markets Index, the non-EIRSA portion of the Commercial Mortgage Backed Securities Index and the Commercial Mortgage Backed Securities High Yield Index. Municipal debt, private placements, and non-dollar denominated issues are excluded from the Universal Index. The only constituent of the Index that includes floating-rate debt is the Emerging Markets Index. Bonds and securities must (i) be fixed rate, although they can carry a coupon that steps up or changes according to a predetermined schedule; (ii) be dollar-denominated and (iii) include bonds with maturities up to ten years and long-term indices composed of bonds with maturities longer than ten years. All returns are market value weighted inclusive of accrued interest. Yield is defined as the yield to worst, the lesser of the yield to maturity and yield to call. Market values are expressed in millions of dollars. The Index does not include fees or expenses and is not available for direct investment.
3 The Lehman Brothers 1 to 3 Year Government Bond Index includes most obligations of the U.S Treasury, agencies and quasi-federal corporations having maturities between one to three years. The Index has not been adjusted for ongoing management, distribution and operating expenses, and sales charges applicable to mutual fund investments. Direct investment in the Index is not possible.
4 The Morgan Stanley Capital International Europe, Australasia and Far East Index (“MSCI EAFE Index”) is an unmanaged free float-adjusted market capitalization index that is designed to measure developed market equity performance, excluding the U.S. & Canada. The Index does not include fees or expenses and is not available for direct investment.
MSF-2
Metropolitan Series Fund, Inc.
MetLife Conservative Allocation Portfolio
A $10,000 INVESTMENT COMPARED TO
THE WILSHIRE 5000 STOCK INDEX AND THE LEHMAN BROTHERS
UNIVERSAL BOND INDEX
Average Annual Returns as of December 31, 2005
| | | | | | | | | | | | |
| | | MetLife Conservative Allocation Portfolio | | | Wilshire 5000
Stock Index | | | Lehman Brothers
Universal Bond Index | |
| | | Class A | | | Class B | | | |
| Since Inception | | 4.1 | % | | 4.0 | % | | 11.4 | % | | 2.1 | % |
Performance numbers are net of all Portfolio expenses but do not include any insurance, sales, or administrative charges of variable annuity or life insurance contracts. If these charges were included, the returns would be lower.
Inception date of the Class A and Class B shares is 5/1/05. Index since inception returns are based on the Class A inception date.
This information represents past performance and is not indicative of future results. Investment return and principal value may fluctuate so that shares, upon redemption, may be worth more or less than the original cost.
PORTFOLIO COMPOSITION as of December 31, 2005
Top Holdings
| | |
| | | % of Total Net Assets
|
Met Investors Series Trust—PIMCO Total Return Portfolio, (Class A) | | 26.8% |
Metropolitan Series Fund, Inc.—Salomon Brothers Strategic Bond Opportunities Portfolio, (Class A) | | 17.9% |
Metropolitan Series Fund, Inc.—BlackRock Bond Income Portfolio, (Class A) | | 15.9% |
Metropolitan Series Fund, Inc.—Salomon Brothers U.S. Government Portfolio, (Class A) | | 11.9% |
Met Investors Series Trust—Lord Abbett Bond Debenture Portfolio, (Class A) | | 6.0% |
Metropolitan Series Fund, Inc.—T. Rowe Price Large Cap Growth Portfolio, (Class A) | | 4.1% |
Metropolitan Series Fund, Inc.—MetLife Stock Index Portfolio, (Class A) | | 3.0% |
Metropolitan Series Fund, Inc.—FI International Stock Portfolio, (Class A) | | 2.1% |
Met Investors Series Trust—Harris Oakmark International Portfolio, (Class A) | | 2.0% |
Metropolitan Series Fund, Inc.—Davis Venure Value Portfolio, (Class A) | | 2.0% |
MSF-3
Metropolitan Series Fund, Inc.
MetLife Conservative to Moderate Allocation Portfolio
Managed by MetLife Advisers, LLC
Portfolio Manager Commentary*
PORTFOLIO PERFORMANCE
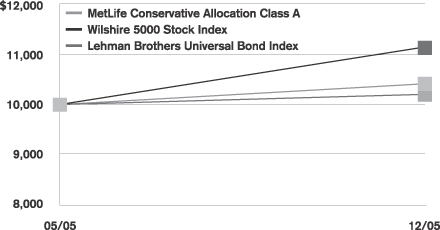
The MetLife Conservative to Moderate Allocation Portfolio commenced operations on May 1, 2005. For the eight months ended December 31, 2005, the Class A shares of the Portfolio returned 6.4% compared to the 11.4% return of the Wilshire 5000 Stock Index1 and the 2.1% return of the Lehman Brothers Universal Bond Index.2 Considering that no single index or benchmark can accurately capture the multiple asset class design of the Portfolio, we have created a blended benchmark comprised of several indices for portfolio design and evaluation purposes. Specifically, the blended benchmark for the MetLife Conservative to Moderate Allocation Portfolio consists of a 12% allocation to the Lehman Brothers 1 to 3 Year Government Bond Index3, a 48% allocation to the Lehman Brothers Universal Bond Index, a 32% allocation to the Wilshire 5000 Stock Index, and an 8% allocation to the Morgan Stanley Capital International EAFE Index4. During the eight-month period ending December 31, 2005, the blended benchmark returned 6.1%.
PORTFOLIO REVIEW
Since the inception date of the Portfolio on May 1, 2005, common stocks outperformed bonds by a wide margin. Within domestic stocks, small and mid cap stocks performed better than larger stocks. By investment style, growth style stocks did better than value style stocks during this eight-month period. Foreign stocks outperformed domestic stocks. The total return of bonds was only modestly positive due to a general rise in interest rates, which caused bond prices to fall. Below investment grade bonds did better than higher quality bonds as credit concerns eased.
The MetLife Conservative to Moderate Allocation Portfolio is a “fund of funds” that invests in other portfolios of the Metropolitan Series Fund, Inc. (the “Fund”) and the Met Investors Series Trust. The Portfolio’s initial target allocations were 40% in equity investments and 60% in fixed income investments. The MetLife Conservative to Moderate Allocation Portfolio is considered the second most conservative of the Fund’s five Asset Allocation Portfolios as measured by potential risk.
* The views expressed above are those of the investment advisor firm as of December 31, 2005 and are subject to change based on market and other conditions. Information about the Portfolio’s holdings, asset allocation, industry allocation or country diversification is historical and is not an indication of future Portfolio composition, which will vary.
1 The Wilshire 5000 Equity Index measures the performance of all U.S. headquartered equity securities with readily available price data. The Index is market capitalized weighted. Approximately 82% of the equity securities that the Index is comprised of are listed on the New York Stock Exchange, approximately 2% are listed on the American Stock Exchange and approximately 16% are over-the-counter securities (1995). The Index was created in 1974 and backdated to 1971, with a base index of December 1980 (base index equals 1,044.596). Dividends are reinvested on the “ex” dividend date and the rebalancing of share weights is done on a monthly basis. No attempt has been made to adjust the market capitalization of the index to take into account cross holding between corporations. The Index does not include fees or expenses and is not available for direct investment.
2 The Lehman Brothers U.S. Universal Bond Index represents the union of the U.S. Aggregate Index, the U.S. High-Yield Corporate Index, the 144A Index, the Eurodollar Index, the Emerging Markets Index, the non-EIRSA portion of the Commercial Mortgage Backed Securities Index and the Commercial Mortgage Backed Securities High Yield Index. Municipal debt, private placements, and non-dollar denominated issues are excluded from the Universal Index. The only constituent of the index that includes floating-rate debt is the Emerging Markets Index. Bonds and securities must be fixed rate, although they can carry a coupon that steps up or changes according to a predetermined schedule; must be dollar-denominated and including bonds with maturities up to ten years and long-term indices composed of bonds with maturities longer than ten years. All returns are market value weighted inclusive of accrued interest. Yield is defined as the yield to worst, the lesser of the yield to maturity and yield to call. Market values are expressed in millions of dollars. The Index does not include fees or expenses and is not available for direct investment.
3 The Lehman Brothers 1 to 3 Year Government Bond Index includes most obligations of the U.S Treasury, agencies and quasi-federal corporations having maturities between one to three years. The Index has not been adjusted for ongoing management, distribution and operating expenses, and sales charges applicable to mutual fund investments. Direct investment in the Index is not possible.
4 The Morgan Stanley Capital International Europe, Australasia and Far East Index (“MSCI EAFE Index”) is an unmanaged free float-adjusted market capitalization index that is designed to measure developed market equity performance, excluding the U.S. & Canada. The Index does not include fees or expenses and is not available for direct investment.
MSF-4
Metropolitan Series Fund, Inc.
MetLife Conservative to Moderate Allocation Portfolio
A $10,000 INVESTMENT COMPARED TO
THE WILSHIRE 5000 STOCK INDEX AND THE LEHMAN BROTHERS
UNIVERSAL BOND INDEX
Average Annual Returns as of December 31, 2005
| | | | | | | | | | | | |
| | | MetLife Conservative to Moderate
Allocation Portfolio | | | Wilshire 5000
Stock Index | | | Lehman Brothers
Universal Bond Index | |
| | | Class A | | | Class B | | | |
| Since Inception | | 6.4 | % | | 6.2 | % | | 11.4 | % | | 2.1 | % |
Performance numbers are net of all Portfolio expenses but do not include any insurance, sales, or administrative charges of variable annuity or life insurance contracts. If these charges were included, the returns would be lower.
Inception date of the Class A and Class B shares is 5/1/05. Index since inception returns are based on the Class A inception date.
This information represents past performance and is not indicative of future results. Investment return and principal value may fluctuate so that shares, upon redemption, may be worth more or less than the original cost.
PORTFOLIO COMPOSITION
as of December 31, 2005
Top Holdings
| | |
| | | % of Total Net Assets
|
Met Investors Series Trust—PIMCO Total Return Portfolio, (Class A) | | 21.8% |
Metropolitan Series Fund, Inc.—Salomon Brothers Strategic Bond Opportunities Portfolio, (Class A) | | 14.9% |
Metropolitan Series Fund, Inc.—BlackRock Bond Income Portfolio, (Class A) | | 7.9% |
Metropolitan Series Fund, Inc.—T. Rowe Price Large Cap Growth Portfolio, (Class A) | | 7.1% |
Metropolitan Series Fund, Inc.—MetLife Stock Index Portfolio, (Class A) | | 7.0% |
Metropolitan Series Fund, Inc.—Salomon Brothers U.S. Government Portfolio, (Class A) | | 6.9% |
Met Investors Series Trust—Lord Abbett Bond Debenture Portfolio, (Class A) | | 5.9% |
Metropolitan Series Fund, Inc.—FI International Stock Portfolio, (Class A) | | 4.2% |
Met Investors Series Trust—Harris Oakmark International Portfolio, (Class A) | | 4.0% |
Metropolitan Series Fund, Inc.—Davis Venure Value Portfolio, (Class A) | | 4.0% |
MSF-5
Metropolitan Series Fund, Inc.
MetLife Moderate Allocation Portfolio
Managed by MetLife Advisers, LLC
Portfolio Manager Commentary*
PORTFOLIO PERFORMANCE
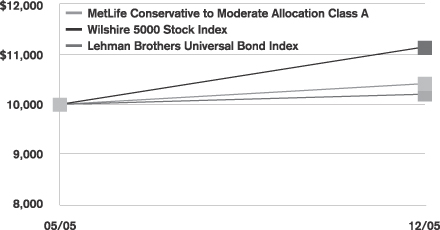
The MetLife Moderate Allocation Portfolio commenced operations on May 1, 2005. For the eight months ended December 31, 2005, the Class A shares of the Portfolio returned 8.7% compared to the 11.4% return of the Wilshire 5000 Stock Index1 and the 2.1% return of the Lehman Brothers Universal Bond Index.2 Considering that no single index or benchmark can accurately capture the multiple asset class design of the Portfolio, we have created a blended benchmark comprised of several indices for portfolio design and evaluation purposes. Specifically, the blended benchmark for the MetLife Moderate Allocation Portfolio consists of an 8% allocation to the Lehman Brothers 1 to 3 Year Government Bond Index3, a 32% allocation to the Lehman Brothers Universal Bond Index, a 48% allocation to the Wilshire 5000 Stock Index, and a 12% allocation to the Morgan Stanley Capital International EAFE Index4. During the eight-month period ending December 31, 2005, the blended benchmark returned 8.2%.
PORTFOLIO REVIEW
Since the inception date of the Portfolio on May 1, 2005, common stocks outperformed bonds by a wide margin. Within domestic stocks, small and mid cap stocks performed better than larger stocks. By investment style, growth style stocks did better than value style stocks during this eight-month period. Foreign stocks outperformed domestic stocks. The total return of bonds was only modestly positive due to a general rise in interest rates, which caused bond prices to fall. Below investment grade bonds did better than higher quality bonds as credit concerns eased.
The MetLife Moderate Allocation Portfolio is a “fund of funds” that invests in other portfolios of the Metropolitan Series Fund, Inc. (the “Fund”) and the Met Investors Series Trust. The Portfolio’s initial target allocations were 60% in equity investments and 40% in fixed income investments. The MetLife Moderate Allocation Portfolio is considered the “middle” of the Fund’s five Asset Allocation Portfolios as measured by its potential risk.
* The views expressed above are those of the investment advisor firm as of December 31, 2005 and are subject to change based on market and other conditions. Information about the Portfolio’s holdings, asset allocation, industry allocation or country diversification is historical and is not an indication of future Portfolio composition, which will vary.
1 The Wilshire 5000 Equity Index measures the performance of all U.S. headquartered equity securities with readily available price data. The Index is market capitalized weighted. Approximately 82% of the equity securities that the Index is comprised of are listed on the New York Stock Exchange, approximately 2% are listed on the American Stock Exchange and approximately 16% are over-the-counter securities (1995). The Index was created in 1974 and backdated to 1971, with a base index of December 1980 (base index equals 1,044.596). Dividends are reinvested on the “ex” dividend date and the rebalancing of share weights is done on a monthly basis. No attempt has been made to adjust the market capitalization of the index to take into account cross holding between corporations. The Index does not include fees or expenses and is not available for direct investment.
2 The Lehman Brothers U.S. Universal Bond Index represents the union of the U.S. Aggregate Index, the U.S. High-Yield Corporate Index, the 144A Index, the Eurodollar Index, the Emerging Markets Index, the non-EIRSA portion of the Commercial Mortgage Backed Securities Index and the Commercial Mortgage Backed Securities High Yield Index. Municipal debt, private placements, and non-dollar denominated issues are excluded from the Universal Index. The only constituent of the index that includes floating-rate debt is the Emerging Markets Index. Bonds and securities must be fixed rate, although they can carry a coupon that steps up or changes according to a predetermined schedule, must be dollar-denominated and including bonds with maturities up to ten years and long-term indices composed of bonds with maturities longer than ten years. All returns are market value weighted inclusive of accrued interest. Yield is defined as the yield to worst, the lesser of the yield to maturity and yield to call. Market values are expressed in millions of dollars. The Index does not include fees or expenses and is not available for direct investment.
3 The Lehman Brothers 1 to 3 Year Government Bond Index includes most obligations of the U.S Treasury, agencies and quasi-federal corporations having maturities between one to three years. The Index has not been adjusted for ongoing management, distribution and operating expenses, and sales charges applicable to mutual fund investments. Direct investment in the Index is not possible.
4 The Morgan Stanley Capital International Europe, Australasia and Far East Index (“MSCI EAFE Index”) is an unmanaged free float-adjusted market capitalization index that is designed to measure developed market equity performance, excluding the U.S. & Canada. The Index does not include fees or expenses and is not available for direct investment.
MSF-6
Metropolitan Series Fund, Inc.
MetLife Moderate Allocation Portfolio
A $10,000 INVESTMENT COMPARED TO
THE WILSHIRE 5000 STOCK INDEX AND THE LEHMAN BROTHERS
UNIVERSAL BOND INDEX
Average Annual Returns as of December 31, 2005
| | | | | | | | | | | | |
| | | MetLife Moderate Allocation Portfolio | | | Wilshire 5000
Stock Index | | | Lehman Brothers
Universal Bond Index | |
| | | Class A | | | Class B | | | |
| Since Inception | | 8.7 | % | | 8.5 | % | | 11.4 | % | | 2.1 | % |
Performance numbers are net of all Portfolio expenses but do not include any insurance, sales, or administrative charges of variable annuity or life insurance contracts. If these charges were included, the returns would be lower.
Inception date of the Class A and Class B shares is 5/1/05. Index since inception returns are based on the Class A inception date.
This information represents past performance and is not indicative of future results. Investment return and principal value may fluctuate so that shares, upon redemption, may be worth more or less than the original cost.
PORTFOLIO COMPOSITION as of December 31, 2005
Top Holdings
| | |
| | | % of Total Net Assets
|
Met Investors Series Trust—PIMCO Total Return Portfolio, (Class A) | | 17.8% |
Metropolitan Series Fund, Inc.—Salomon Brothers Strategic Bond Opportunities Portfolio, (Class A) | | 11.9% |
Metropolitan Series Fund, Inc.—T. Rowe Price Large Cap Growth Portfolio, (Class A) | | 11.0% |
Metropolitan Series Fund, Inc.—MetLife Stock Index Portfolio, (Class A) | | 11.0% |
Met Investors Series Trust—Harris Oakmark International Portfolio, (Class A) | | 7.0% |
Metropolitan Series Fund, Inc.—FI International Stock Portfolio, (Class A) | | 6.3% |
Metropolitan Series Fund, Inc.—Davis Venure Value Portfolio, (Class A) | | 5.0% |
Metropolitan Series Fund, Inc.—Harris Oakmark Large Cap Value Portfolio, (Class A) | | 5.0% |
Metropolitan Series Fund, Inc.—Neuberger Berman Mid Cap Value Portfolio, (Class A) | | 4.1% |
Met Investors Series Trust—Lazard Mid Cap Portfolio, (Class A) | | 4.0% |
MSF-7
Metropolitan Series Fund, Inc.
MetLife Moderate to Aggressive Allocation Portfolio
Managed by MetLife Advisers, LLC
Portfolio Manager Commentary*
PORTFOLIO PERFORMANCE
The MetLife Moderate to Aggressive Allocation Portfolio commenced operations on May 1, 2005. For the eight months ended December 31, 2005, the Class A shares of the Portfolio returned 10.9% compared to the 11.4% return of the Wilshire 5000 Stock Index1 and the 2.1% return of the Lehman Brothers Universal Bond Index.2 Considering that no single index or benchmark can accurately capture the multiple asset class design of the Portfolio, we have created a blended benchmark comprised of several indices for portfolio design and evaluation purposes. Specifically, the blended benchmark for the MetLife Moderate to Aggressive Allocation Portfolio consists of a 4% allocation to the Lehman Brothers 1 to 3 Year Government Bond Index3, a 16% allocation to the Lehman Brothers Universal Bond Index, a 64% allocation to the Wilshire 5000 Stock Index, and a 16% allocation to the Morgan Stanley Capital International EAFE Index4. During the eight-month period ending December 31, 2005, the blended benchmark returned 10.3%.
PORTFOLIO REVIEW
Since the inception date of the Portfolio on May 1, 2005, common stocks outperformed bonds by a wide margin. Within domestic stocks, small and mid cap stocks performed better than larger stocks. By investment style, growth style stocks did better than value style stocks during this eight-month period. Foreign stocks outperformed domestic stocks. The total return of bonds was only modestly positive due to a general rise in interest rates, which caused bond prices to fall. Below investment grade bonds did better than higher quality bonds as credit concerns eased.
The MetLife Moderate to Aggressive Allocation Portfolio is a “fund of funds” that invests in other portfolios of the Metropolitan Series Fund, Inc. (the “Fund”) and the Met Investors Series Trust. The Portfolio’s initial target allocations were 80% in equity investments and 20% in fixed income investments. The MetLife Moderate to Aggressive Allocation Portfolio is considered the second most aggressive of the Fund’s five Asset Allocation Portfolios as measured by potential risk.
* The views expressed above are those of the investment advisor firm as of December 31, 2005 and are subject to change based on market and other conditions. Information about the Portfolio’s holdings, asset allocation, industry allocation or country diversification is historical and is not an indication of future Portfolio composition, which will vary.
1 The Wilshire 5000 Equity Index measures the performance of all U.S. headquartered equity securities with readily available price data. The Index is market capitalized weighted. Approximately 82% of the equity securities that the Index is comprised of are listed on the New York Stock Exchange, approximately 2% are listed on the American Stock Exchange and approximately 16% are over-the-counter securities (1995). The Index was created in 1974 and backdated to 1971, with a base index of December 1980 (base index equals 1,044.596). Dividends are reinvested on the “ex” dividend date and the rebalancing of share weights is done on a monthly basis. No attempt has been made to adjust the market capitalization of the index to take into account cross holding between corporations. The Index does not include fees or expenses and is not available for direct investment.
2 The Lehman Brothers U.S. Universal Bond Index represents the union of the U.S. Aggregate Index, the U.S. High-Yield Corporate Index, the 144A Index, the Eurodollar Index, the Emerging Markets Index, the non-EIRSA portion of the Commercial Mortgage Backed Securities Index and the Commercial Mortgage Backed Securities High Yield Index. Municipal debt, private placements, and non-dollar denominated issues are excluded from the Universal Index. The only constituent of the index that includes floating-rate debt is the Emerging Markets Index. Bonds and securities must be fixed rate, although they can carry a coupon that steps up or changes according to a predetermined schedule, must be dollar-denominated and including bonds with maturities up to ten years and long-term indices composed of bonds with maturities longer than ten years. All returns are market value weighted inclusive of accrued interest. Yield is defined as the yield to worst, the lesser of the yield to maturity and yield to call. Market values are expressed in millions of dollars. The Index does not include fees or expenses and is not available for direct investment.
3 The Lehman Brothers 1 to 3 Year Government Bond Index includes most obligations of the U.S. Treasury, agencies and quasi-federal corporations having maturities between one to three years. The Index has not been adjusted for ongoing management, distribution and operating expenses, and sales charges applicable to mutual fund investments. Direct investment in the Index is not possible.
4 The Morgan Stanley Capital International Europe, Australasia and Far East Index (“MSCI EAFE Index”) is an unmanaged free float-adjusted market capitalization index that is designed to measure developed market equity performance, excluding the U.S. & Canada. The Index does not include fees or expenses and is not available for direct investment.
MSF-8
Metropolitan Series Fund, Inc.
MetLife Moderate to Aggressive Allocation Portfolio
A $10,000 INVESTMENT COMPARED TO
THE WILSHIRE 5000 STOCK INDEX AND THE LEHMAN BROTHERS
UNIVERSAL BOND INDEX
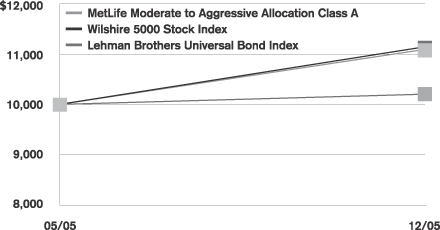
Average Annual Returns as of December 31, 2005
| | | | | | | | | | | | |
| | | MetLife Moderate to
Aggressive Allocation Portfolio | | | Wilshire 5000
Stock Index | | | Lehman Brothers
Universal Bond Index | |
| | | Class A | | | Class B | | | |
| Since Inception | | 10.9 | % | | 10.8 | % | | 11.4 | % | | 2.1 | % |
Performance numbers are net of all Portfolio expenses but do not include any insurance, sales, or administrative charges of variable annuity or life insurance contracts. If these charges were included, the returns would be lower.
Inception date of the Class A and Class B shares is 5/1/05. Index since inception returns are based on the Class A inception date.
This information represents past performance and is not indicative of future results. Investment return and principal value may fluctuate so that shares, upon redemption, may be worth more or less than the original cost.
PORTFOLIO COMPOSITION
as of December 31, 2005
Top Holdings
| | |
| | | % of Total Net Assets
|
Metropolitan Series Fund, Inc.—MetLife Stock Index Portfolio, (Class A) | | 14.9% |
Metropolitan Series Fund, Inc.—T. Rowe Price Large Cap Growth Portfolio, (Class A) | | 14.0% |
Met Investors Series Trust—Harris Oakmark International Portfolio, (Class A) | | 9.0% |
Met Investors Series Trust—PIMCO Total Return Portfolio, (Class A) | | 8.8% |
Metropolitan Series Fund, Inc.—FI International Stock Portfolio, (Class A) | | 8.3% |
Metropolitan Series Fund, Inc.—Harris Oakmark Large Cap Value Portfolio, (Class A) | | 6.9% |
Metropolitan Series Fund, Inc.—Neuberger Berman Mid Cap Value Portfolio, (Class A) | | 6.1% |
Metropolitan Series Fund, Inc.—Davis Venure Value Portfolio, (Class A) | | 6.0% |
Met Investors Series Trust—Lazard Mid Cap Portfolio, (Class A) | | 5.0% |
Metropolitan Series Fund, Inc.—Salomon Brothers Strategic Bond Opportunities Portfolio, (Class A) | | 4.9% |
MSF-9
Metropolitan Series Fund, Inc.
MetLife Aggressive Allocation Portfolio
Managed by MetLife Advisers, LLC
Portfolio Manager Commentary*
��
PORTFOLIO PERFORMANCE
The MetLife Aggressive Allocation Portfolio commenced operations on May 1, 2005. For the eight months ended December 31, 2005, the Class A shares of the Portfolio returned 12.7% compared to the 11.4% return of the Wilshire 5000 Stock Index1 and the 2.1% return of the Lehman Brothers Universal Bond Index.2 Considering that no single index or benchmark can accurately capture the multiple asset class design of the Portfolio, we have created a blended benchmark comprised of several indices for portfolio design and evaluation purposes. Specifically, the blended benchmark for the MetLife Aggressive Allocation Portfolio consists of an 80% allocation to the Wilshire 5000 Stock Index and a 20% allocation to the Morgan Stanley Capital International EAFE Index3. During the eight-month period ending December 31, 2005, the blended benchmark returned 12.5%.
PORTFOLIO REVIEW
Since the inception date of the Portfolio on May 1, 2005, common stocks outperformed bonds by a wide margin. Within domestic stocks, small and mid cap stocks performed better than larger stocks. By investment style, growth style stocks did better than value style stocks during this eight-month period. Foreign stocks outperformed domestic stocks. The total return of bonds was only modestly positive due to a general rise in interest rates, which caused bond prices to fall. Below investment grade bonds did better than higher quality bonds as credit concerns eased.
The MetLife Aggressive Allocation Portfolio is a “fund of funds” that invests in other portfolios of the Metropolitan Series Fund, Inc. (the “Fund”) and the Met Investors Series Trust. The Portfolio’s initial target allocations were 100% in equity investments and 0% in fixed income investments, although the other Portfolios in which the Aggressive Allocation Portfolio invests may have held cash during the period. The MetLife Aggressive Allocation Portfolio is considered the most aggressive of the Fund’s five Asset Allocation Portfolios as measured by its potential risk.
* The views expressed above are those of the investment advisor firm as of December 31, 2005 and are subject to change based on market and other conditions. Information about the Portfolio’s holdings, asset allocation, industry allocation or country diversification is historical and is not an indication of future Portfolio composition, which will vary.
1 The Wilshire 5000 Equity Index measures the performance of all U.S. headquartered equity securities with readily available price data. The Index is market capitalized weighted. Approximately 82% of the equity securities that the Index is comprised of are listed on the New York Stock Exchange, approximately 2% are listed on the American Stock Exchange and approximately 16% are over-the-counter securities (1995). The Index was created in 1974 and backdated to 1971, with a base index of December 1980 (base index equals 1,044.596). Dividends are reinvested on the “ex” dividend date and the rebalancing of share weights is done on a monthly basis. No attempt has been made to adjust the market capitalization of the index to take into account cross holding between corporations. The Index does not include fees or expenses and is not available for direct investment.
2 The Lehman Brothers U.S. Universal Bond Index represents the union of the U.S. Aggregate Index, the U.S. High-Yield Corporate Index, the 144A Index, the Eurodollar Index, the Emerging Markets Index, the non-EIRSA portion of the Commercial Mortgage Backed Securities Index and the Commercial Mortgage Backed Securities High Yield Index. Municipal debt, private placements, and non-dollar denominated issues are excluded from the Universal Index. The only constituent of the index that includes floating-rate debt is the Emerging Markets Index. Bonds and securities must be fixed rate, although they can carry a coupon that steps up or changes according to a predetermined schedule, must be dollar-denominated and including bonds with maturities up to ten years and long-term indices composed of bonds with maturities longer than ten years. All returns are market value weighted inclusive of accrued interest. Yield is defined as the yield to worst, the lesser of the yield to maturity and yield to call. Market values are expressed in millions of dollars. The Index does not include fees or expenses and is not available for direct investment.
3 The Morgan Stanley Capital International Europe, Australasia and Far East Index (“MSCI EAFE Index”) is an unmanaged free float-adjusted market capitalization index that is designed to measure developed market equity performance, excluding the U.S. & Canada. The Index does not include fees or expenses and is not available for direct investment.
MSF-10
Metropolitan Series Fund, Inc.
MetLife Aggressive Allocation Portfolio
A $10,000 INVESTMENT COMPARED TO
THE WILSHIRE 5000 STOCK INDEX AND THE LEHMAN BROTHERS
UNIVERSAL BOND INDEX
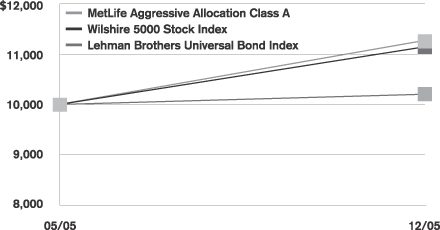
Average Annual Returns as of December 31, 2005
| | | | | | | | | | | | |
| | | MetLife Aggressive Allocation Portfolio | | | Wilshire 5000
Stock Index | | | Lehman Brothers
Universal Bond Index | |
| | | Class A | | | Class B | | | |
| Since Inception | | 12.7 | % | | 12.6 | % | | 11.4 | % | | 2.1 | % |
Performance numbers are net of all Portfolio expenses but do not include any insurance, sales, or administrative charges of variable annuity or life insurance contracts. If these charges were included, the returns would be lower.
Inception date of the Class A and Class B shares is 5/1/05. Index since inception returns are based on the Class A inception date.
This information represents past performance and is not indicative of future results. Investment return and principal value may fluctuate so that shares, upon redemption, may be worth more or less than the original cost.
PORTFOLIO COMPOSITION as of December 31, 2005
Top Holdings
| | |
| | | % of Total Net Assets
|
Metropolitan Series Fund, Inc.—T. Rowe Price Large Cap Growth Portfolio, (Class A) | | 16.9% |
Metropolitan Series Fund, Inc.—MetLife Stock Index Portfolio, (Class A) | | 16.8% |
Metropolitan Series Fund, Inc.—FI International Stock Portfolio, (Class A) | | 10.3% |
Met Investors Series Trust—Harris Oakmark International Portfolio, (Class A) | | 10.0% |
Metropolitan Series Fund, Inc.—Neuberger Berman Mid Cap Value Portfolio, (Class A) | | 8.0% |
Metropolitan Series Fund, Inc.—Davis Venure Value Portfolio, (Class A) | | 7.9% |
Metropolitan Series Fund, Inc.—Harris Oakmark Large Cap Value Portfolio, (Class A) | | 7.9% |
Met Investors Series Trust—Lazard Mid Cap Portfolio, (Class A) | | 6.0% |
Metropolitan Series Fund, Inc.—Russell 2000 Index Portfolio, (Class A) | | 5.0% |
Met Investors Series Trust—T. Rowe Price Mid Cap Growth Portfolio, (Class A) | | 3.0% |
MSF-11
Metropolitan Series Fund, Inc.
BlackRock Investment Trust Portfolio
Managed by BlackRock Advisors, Inc.
Portfolio Manager Commentary*
PORTFOLIO PERFORMANCE
For the year ended December 31, 2005, the Class A shares of the BlackRock Investment Trust Portfolio returned 3.6%, compared to its benchmark, the Standard & Poor’s 500 Index1, which returned 4.9%. The average return of its peer group, the Lipper Variable Insurance Products Large-Cap Core Funds Universe2, was 5.8% over the same period.
PORTFOLIO REVIEW
With investor focus on the level of energy prices, the direction of interest rates, a flattening yield curve, a possible economic “soft patch” during the first half of the year, and the ultimate impact of the devastating weather disaster in the Gulf region during the second half of the year, the U.S. equity market gyrated throughout 2005. Ultimately, on the strength of an almost 4% rally in November, the S&P 500 finished the year up 4.9%.
Not all segments of the equity market were positive however. Two sectors actually produced negative returns. The Telecommunication and Consumer Cyclical sectors were down about 9% and 7% respectively. Leading the market up were the Energy and Utilities sectors up over 29% and 13% respectively.
The dominance of value stocks over growth stocks had reached the five-year mark at the end of the first quarter of 2005. Although growth stocks showed some strength during the remainder of the year, the Russell 1000 Value Index3 still edged out the Russell 1000 Growth Index4 by 1.8% for the entire year. Large cap stocks (Russell 1000 Index)5 outpaced small cap stocks (Russell 2000 Index)6 by 1.7% over this same period, reversing a multi-year trend of small cap leadership. However, within the size categories, mid cap stocks (Russell Midcap Index)7 were the strongest, advancing over 12.7% for 2005.
With the completion of the BlackRock/State Street Research merger at the end of January, the Investment Trust Portfolio was transitioned to the quantitative investment process at BlackRock. The management team uses quantitative techniques to analyze a universe of approximately 800 companies, including those in the S&P 500 Index and about 300 other large and medium capitalization companies. Using a multifactor model, the management team identifies stocks with rising earnings expectations that sell at low relative valuations when compared to their sector peers. Based on this information, and using sophisticated risk measurement tools, the management team selects stocks, together with their appropriate weightings, that it believes will maximize the Portfolio’s return per unit of risk. The Portfolio seeks to maintain the market capitalization, sector allocations, and style characteristics of the S&P 500 Index.
The performance of the BlackRock core quantitative model can be clearly divided into two periods. During the first half of 2005 the model was solidly predictive and the Portfolio outperformed the index. During the second half of the year, with investors seemingly preoccupied by macro issues, the model faltered and the Portfolio under performed. Evaluated across the entire year, the model was flat to modestly positive. Both the valuation and earnings expectation components of the model were consistent with the overall model. Estimate Momentum and Earnings Revisions Up on the Earnings Expectation side and Forecast Earnings to Price on the Valuation side were the only positive individual factors. Earnings Revisions Down, Return on Equity and Book to Price were the least predictive factors.
Analyzing the sectors where stock selection had the greatest impact on relative performance, Consumer Cyclicals, Energy, and Basic Materials were the strongest performing sectors. Within these sectors, specific names that helped relative performance include Nordstrom, ConocoPhillips, Valero, Newfield Exploration, Consol Energy, and Georgia Pacific. All of these names were highly ranked by the model and were held in the Portfolio during the period. The strength of these sectors was overwhelmed by the weak relative performance in Technology, Consumer Non-Cyclicals and Commercial Services sectors. The Portfolio was hurt by an overweight in several poor performing stocks, such as IBM, Qlogic, Archer Daniels Midland, Energizer, and Cendant; and an underweight in the strong performing Apple Computer and Boeing.
* On January 31, 2005, BlackRock Advisors, Inc. (“BlackRock”) succeeded State Street Research & Management Company (“State Street Research”) as subadviser to the Portfolio, and the Portfolio’s name was changed from State Street Research Investment Trust Portfolio to BlackRock Investment Trust Portfolio. This commentary was prepared by BlackRock. The views expressed above are those of the subinvestment advisor firm as of December 31, 2005 and are subject to change based on market and other conditions. Information about the Portfolio’s holdings, asset allocation, industry allocation or country diversification is historical and is not an indication of future Portfolio composition, which will vary.
1 The Standard & Poor’s (S&P) 500® Composite Stock Price Index is an unmanaged index representing the performance of 500 major companies, most of which are listed on the New York Stock Exchange. The S&P 500 performance has not been adjusted for ongoing management, distribution and operating expenses, and sales charges applicable to mutual fund investments. Direct investment in the Index is not possible.
2 Lipper Variable Products Fund Averages. Each of these is an average of the total return performance (calculated on the basis of net asset value) of funds with similar investment objectives to those of the subject Portfolio as calculated by Lipper Analytical Services, an independent mutual fund ranking service.
3 The Russell 1000® Value Index is an unmanaged measure of the largest capitalized U.S. domiciled companies with a less than average growth orientation. Companies in this Index generally have a low price-to-book and price-to-earnings ratio, higher divided yields and lower forecasted growth values. The Index performance has not been adjusted for ongoing management, distribution and operating expenses and sales charges applicable to mutual fund investments. Direct investment in the Index is not possible.
4 The Russell 1000® Growth Index is an unmanaged measure of performance of the largest capitalized U.S. companies, within the Russell 1000 companies, that have higher price-to-book ratios and forecasted growth values. The Index performance has not been adjusted for ongoing management, distribution and operating expenses and sales charges applicable to mutual fund investments. Direct investment in the Index is not possible.
5 The Russell 1000® Index is an unmanaged measure of the 1,000 largest companies in the Russell 3000 Index, which represents approximately 90% of the investable U.S.equity market. The Index had a total market capitalization range of $1.8 billion to $387 billion with an average market capitalization of approximately $13 billion. The Index performance has not been adjusted for ongoing management, distribution and operating expenses and sales charges applicable to mutual fund investments. Direct investment in the Index is not possible.
6 The Russell 2000® Index is an unmanaged measure of performance of the 2,000 smallest companies in the Russell 3000 Index. The Index performance has not been adjusted for ongoing management, distribution and operating expenses and sales charges applicable to mutual fund investments. Direct investment in the Index is not possible.
7 The Russell Midcap Index is an unmanaged measure of performance of those Russell Midcap companies (the 800 smallest companies in the Russell 1000 Index) with higher price-to-book ratios and higher forecasted growth values. The Index performance has not been adjusted for ongoing management, distribution and operating expenses and sales charges applicable to mutual fund investments. Direct investment in the Index is not possible.
MSF-12
Metropolitan Series Fund, Inc.
BlackRock Investment Trust Portfolio
A $10,000 INVESTMENT COMPARED TO THE
S&P 500 INDEX
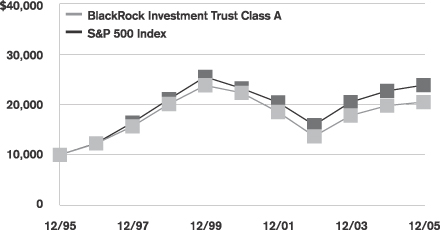
Average Annual Returns as of December 31, 2005
| | | | | | | | | | | | |
| | | BlackRock Investment Trust Portfolio | | | S&P 500
Index | |
| | | Class A | | | Class B | | | Class E | | |
| 1 Year | | 3.6 | % | | 3.3 | % | | 3.5 | % | | 4.9 | % |
| 5 Years | | -1.7 | | | N/A | | | N/A | | | 0.5 | |
| 10 Years | | 7.4 | | | N/A | | | N/A | | | 9.1 | |
| Since Inception | | — | | | -0.7 | | | -0.6 | | | — | |
Performance numbers are net of all Portfolio expenses but do not include any insurance, sales, or administrative charges of variable annuity or life insurance contracts. If these charges were included, the returns would be lower.
Inception dates of the Class A, Class B and Class E shares are: 5/16/83, 5/01/01 and 5/01/01, respectively.
This information represents past performance and is not indicative of future results. Investment return and principal value may fluctuate so that shares, upon redemption, may be worth more or less than the original cost.
PORTFOLIO COMPOSITION
as of December 31, 2005
Top Holdings
| | |
| | | % of Total
Net Assets
|
General Electric Co. | | 4.4% |
Microsoft Corp. | | 3.0% |
Bank of America Corp. | | 2.6% |
Intel Corp. | | 2.5% |
Exxon Mobil Corp. | | 2.5% |
Pfizer, Inc. | | 2.3% |
International Business Machines Corp. | | 1.9% |
Wachovia Corp. | | 1.7% |
ConocoPhillips | | 1.7% |
Altria Group, Inc. | | 1.6% |
Top Sectors
| | |
| | | % of Equity
Market Value
|
Financials | | 21.3% |
Technology | | 17.2% |
Health Care | | 12.8% |
Energy | | 9.1% |
Consumer (non-cyclical) | | 7.7% |
Consumer (cyclicals) | | 7.1% |
Industrials | | 6.4% |
Consumer Services | | 5.0% |
Utility | | 3.5% |
Telecommunications | | 3.1% |
MSF-13
Metropolitan Series Fund, Inc.
BlackRock Large Cap Value Portfolio
Managed by BlackRock Advisors, Inc.
Portfolio Manager Commentary*
PORTFOLIO PERFORMANCE
For the year ended December 31, 2005, the Class A shares of the BlackRock Large Cap Value Portfolio returned 6.0%, compared to its benchmark, the Russell 1000 Value Index1, which returned 7.1%. The average return of its peer group, the Lipper Variable Insurance Products Large-Cap Value Funds Universe2, was 4.8% over the same period.
PORTFOLIO REVIEW
With investor focus on the level of energy prices, the direction of interest rates, a flattening yield curve, a possible economic “soft patch” during the first half of the year, and the ultimate impact of the devastating weather disaster in the Gulf region during the second half of the year, the U.S. equity market gyrated throughout 2005. Ultimately, on the strength of an almost 4% rally in November, the S&P 500 finished the year up 4.9%.
Not all segments of the equity market were positive however. Two sectors actually produced negative returns. The Telecommunication and Consumer Cyclical sectors were down about 9% and 7% respectively. Leading the market up were the Energy and Utilities sectors up over 29% and 13% respectively.
The dominance of value stocks over growth stocks had reached the five-year mark at the end of the first quarter of 2005. Although growth stocks showed some strength during remainder of the year, the Russell 1000 Value Index still edged out the Russell 1000 Growth Index3 by 1.8% for the full year. Large cap stocks (Russell 1000 Index4) outpaced small cap stocks (Russell 2000 Index5) by 1.7% over this same period reversing a multi-year trend of small cap leadership. However, within the size categories, mid cap stocks (Russell Midcap Index6) were the strongest, advancing over 12.7% for 2005.
With the completion of the BlackRock/State Street Research merger at the end of January, the Portfolio was transitioned to the quantitative investment process at BlackRock. The management team uses quantitative techniques to analyze a universe of approximately 800 value companies. The management team uses a multi-factor model, which identifies the key factors that drive the performance of value stocks. Using this multi-factor model, the management team identifies stocks with low relative valuations and improving earnings expectations when compared to their sector peers. Based on this information, and using sophisticated risk measurement tools, the management team selects stocks, together with their appropriate weightings, that it believes will maximize the Portfolio’s return per unit of risk. The Portfolio seeks to maintain the market capitalization, sector allocations, and style characteristics similar to those of the Russell 1000 Value Index.
The performance of the BlackRock value quantitative model was flat to modestly predictive during 2005. Both the valuation and earnings expectation components of the model were consistent with the overall model. Estimate Momentum and Earnings Revisions Up on the Earnings Expectation side and Forecast Earnings to Price on the Valuation side along with Price Momentum were the most predictive individual factors. Earnings Revisions Down, Return on Equity and Earnings Surprise were the least predictive factors.
Analyzing the sectors where stock selection had the greatest impact on relative performance, Basic Materials, Energy, and Consumer Cyclicals were the strongest performing sectors. Within these sectors, specific names that helped relative performance include Consol Energy, Phelps Dodge, Amerada Hess, Valero, Cummins, and Barnes & Noble. All of these names were highly ranked by the model and held in the Portfolio during the period. The strength of these sectors was offset by the weak relative performance in the Technology, Consumer Non-Cyclicals and Healthcare sectors. The Portfolio was hurt by overweight positions in several poor performing stocks, Kroger, Energizer, Pfizer; and an underweight position in the strong performing Hewlett Packard.
* On January 31, 2005, BlackRock Advisors, Inc. (“BlackRock”) succeeded State Street Research & Management Company (“State Street Research”) as subadviser to the Portfolio, and the Portfolio’s name was changed from State Street Research Large Cap Value Portfolio to BlackRock Large Cap Value Portfolio. This commentary was prepared by BlackRock. The views expressed above are those of the subinvestment advisor firm as of December 31, 2005 and are subject to change based on market and other conditions. Information about the Portfolio’s holdings, asset allocation, industry allocation or country diversification is historical and is not an indication of future Portfolio composition, which will vary.
1 The Russell 1000® Value Index is an unmanaged measure of the largest capitalized U.S. domiciled companies with a less than average growth orientation. Companies in this Index generally have a low price-to-book and price-to-earnings ratio, higher divided yields and lower forecasted growth values. The Index performance has not been adjusted for ongoing management, distribution and operating expenses and sales charges applicable to mutual fund investments. Direct investment in the Index is not possible.
2 Lipper Variable Products Fund Averages. Each of these is an average of the total return performance (calculated on the basis of net asset value) of funds with similar investment objectives to those of the subject Portfolio as calculated by Lipper Analytical Services, an independent mutual fund ranking service.
3 The Russell 1000® Growth Index is an unmanaged measure of performance of the largest capitalized U.S. companies, within the Russell 1000 companies, that have higher price-to-book ratios and forecasted growth values. The Index performance has not been adjusted for ongoing management, distribution and operating expenses and sales charges applicable to mutual fund investments. Direct investment in the Index is not possible.
4 The Russell 1000® Index is an unmanaged measure of the 1,000 largest companies in the Russell 3000 Index, which represents approximately 90% of the investable U.S. equity market. The Index had a total market capitalization range of $1.8 billion to $387 billion with an average market capitalization of approximately $13 billion. The Index performance has not been adjusted for ongoing management, distribution and operating expenses and sales charges applicable to mutual fund investments. Direct investment in the Index is not possible.
5 The Russell 2000® Index is an unmanaged measure of performance of the 2,000 smallest companies in the Russell 3000 Index. The Index performance has not been adjusted for ongoing management, distribution and operating expenses and sales charges applicable to mutual fund investments. Direct investment in the Index is not possible.
6 The Russell Midcap Index is an unmanaged measure of performance of those Russell Midcap companies (the 800 smallest companies in the Russell 1000 Index) with higher price-to-book ratios and higher forecasted growth values. The Index performance has not been adjusted for ongoing management, distribution and operating expenses and sales charges applicable to mutual fund investments. Direct investment in the Index is not possible.
MSF-14
Metropolitan Series Fund, Inc.
BlackRock Large Cap Value Portfolio
A $10,000 INVESTMENT COMPARED TO THE
RUSSELL 1000 VALUE INDEX
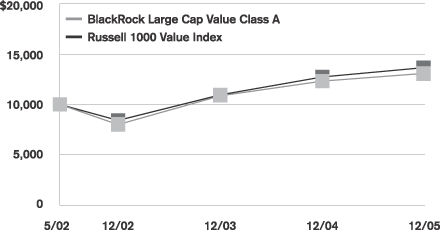
Average Annual Returns as of December 31, 2005
| | | | | | | | | | | | |
| | | BlackRock Large Cap Value Portfolio | | | Russell 1000
Value Index | |
| | | Class A | | | Class B | | | Class E | | |
| 1 Year | | 6.0 | % | | 5.6 | % | | 5.7 | % | | 7.1 | % |
| Since Inception | | 7.5 | | | 13.8 | | | 7.4 | | | 8.8 | |
Performance numbers are net of all Portfolio expenses but do not include any insurance, sales, or administrative charges of variable annuity or life insurance contracts. If these charges were included, the returns would be lower.
Inception dates of the Class A, Class B and Class E shares are: 5/01/02, 7/30/02 and 5/01/02, respectively. Index since inception returns are based on the Class A inception date.
This information represents past performance and is not indicative of future results. Investment return and principal value may fluctuate so that shares, upon redemption, may be worth more or less than the original cost.
PORTFOLIO COMPOSITION
as of December 31, 2005
Top Holdings
| | |
| | | % of Total
Net Assets
|
Exxon Mobil Corp. | | 4.6% |
Bank of America Corp. | | 4.4% |
Pfizer, Inc. | | 3.3% |
Citigroup, Inc. | | 2.9% |
ConocoPhillips | | 2.4% |
Wachovia Corp. | | 2.4% |
General Electric Co. | | 2.3% |
AT&T, Inc. | | 2.2% |
JPMorgan Chase & Co. | | 1.8% |
PPL Corp. | | 1.7% |
Top Sectors
| | |
| | | % of Equity
Market Value
|
Financials | | 36.7% |
Energy | | 13.2% |
Utility | | 6.8% |
Health Care | | 6.7% |
Technology | | 6.2% |
Consumer Services | | 5.8% |
Telecommunications | | 5.3% |
Consumer (non-cyclicals) | | 5.2% |
Basic Materials | | 4.3% |
Consumer (cyclicals) | | 3.5% |
MSF-15
Metropolitan Series Fund, Inc.
BlackRock Legacy Large Cap Growth Portfolio
Managed by BlackRock Advisors, Inc.
Portfolio Manager Commentary*
PORTFOLIO PERFORMANCE
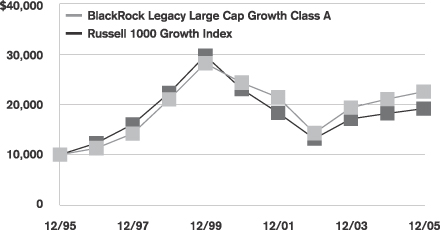
For the year ended December 31, 2005, the Class A shares of the BlackRock Legacy Large Cap Growth Portfolio returned 7.0%, compared to its benchmark, the Russell 1000 Growth Index1, which returned 5.3%. The average return of its peer group, the Lipper Variable Insurance Products Large-Cap Growth Funds Universe2, was 7.3% over the same period.
PORTFOLIO REVIEW
Equity markets delivered modest returns during the fourth quarter on the heels of subdued energy prices and economic strength. The S&P 500 Index3 ended the quarter with a gain of 2.1%, leaving the Index up 4.9% for 2005, and marking the third consecutive year of gains. However, strong earnings growth among companies did little to propel market returns during the year, as investors focused on elevated oil prices, interest rates, and a susceptible housing market.
In this environment, the Portfolio outperformed its benchmark, the Russell 1000 Growth Index. The Portfolio benefited from strong stock selection across a number of sectors including, information technology, health care, financials and materials. Stock selection decisions in consumer staples, consumer discretionary, and industrials created a modest drag on return comparisons. Additionally, our overweight to the energy sector helped to drive both absolute and relative gains higher over the course of the year.
Stock selection decisions within the information technology sector led to favorable return comparisons during the year, as the Portfolio’s positions tended to significantly outperform benchmark holdings. Among information technology holdings, Internet service provider Google was the top individual contributor to relative gains during the year. Google continues to benefit from robust trends in their paid search business, as an increasing number of companies are shifting their marketing spending from traditional media such as print and radio towards the Internet. Software proved to be another area of strength within the technology segment of the Portfolio. Customer relationship management software provider Salesforce.com posted impressive gains, rising over 70% in the portfolio. Expanded distribution of the firm’s on demand CRM software has helped to accelerate earnings, and deliver strong investment returns. Additionally, our avoidance of troubled blue chips such as International Business Machines and Dell Inc. added value relative to the benchmark.
Broad-based strength among our positions in the financials sector bolstered both absolute and relative returns during 2005. Good stock selection propelled gains, with holdings such as diversified asset manager Franklin Resources and futures exchange operator Chicago Mercantile Exchange making the largest contributions to performance.
Despite modest fourth quarter losses, energy finished 2005 as the top performing area of the market due to the fundamental backdrop of rising energy prices boosting profitability across the sector. Our overweight to the sector was instrumental in delivering above benchmark returns over the course of the year, with key contributions coming from a variety of companies including oil services firm Schlumberger, exploration and production companies, EOG Resources and Newfield Exploration, and Consol Energy in the coal industry.
Select positions in both consumer segments, as well as the industrials sector, had a negative impact on returns. Within consumer staples, cosmetics manufacturer Avon Products was the largest detractor, while the major source of underperformance in the consumer discretionary sector was audio equipment maker Harman International. Weakness in industrials can be largely attributed to a position in conglomerate Tyco International. After a strong 2003 and 2004, Tyco struggled throughout 2005, and we sold our position on concerns that the company cannot sustain growth.
* On January 31, 2005, BlackRock Advisors, Inc. (“BlackRock”) succeeded State Street Research & Management Company (“State Street Research”) as subadviser to the Portfolio, and the Portfolio’s name was changed from State Street Research Large Cap Growth Portfolio to BlackRock Legacy Large Cap Growth Portfolio. This commentary was prepared by BlackRock. The views expressed above are those of the subinvestment advisor firm as of December 31, 2005 and are subject to change based on market and other conditions. Information about the Portfolio’s holdings, asset allocation, industry allocation or country diversification is historical and is not an indication of future Portfolio composition, which will vary.
1 The Russell 1000® Growth Index is an unmanaged measure of performance of the largest capitalized U.S. companies, within the Russell 1000 companies, that have higher price-to-book ratios and forecasted growth values. The Index performance has not been adjusted for ongoing management, distribution and operating expenses and sales charges applicable to mutual fund investments. Direct investment in the Index is not possible.
2 Lipper Variable Products Fund Averages. Each of these is an average of the total return performance (calculated on the basis of net asset value) of funds with similar investment objectives to those of the subject Portfolio as calculated by Lipper Analytical Services, an independent mutual fund ranking service.
3 The Standard & Poor’s (S&P) 500® Index is an unmanaged index representing the performance of 500 major companies, most of which are listed on the New York Stock Exchange. The S&P 500 performance has not been adjusted for ongoing management, distribution and operating expenses, and sales charges applicable to mutual fund investments. Direct investment in the Index is not possible.
MSF-16
Metropolitan Series Fund, Inc.
BlackRock Legacy Large Cap Growth Portfolio
A $10,000 INVESTMENT COMPARED TO
THE RUSSELL 1000 GROWTH INDEX
Average Annual Returns as of December 31, 2005
| | | | | | | | | | | | | |
| | | BlackRock Legacy Large Cap Growth Portfolio | | | Russell 1000
Growth Index | |
| | | Class A | | | Class B | | | Class E | | |
| 1 Year | | 7.0 | % | | 6.8 | % | | 6.9 | % | | | 5.3 | % |
| 5 Years | | -1.5 | | | N/A | | | N/A | | | - | 3.6 | |
| 10 Years | | 8.5 | | | N/A | | | N/A | | | | 6.7 | |
| Since Inception | | — | | | 11.7 | | | -1.8 | | | | — | |
Performance numbers are net of all Portfolio expenses but do not include any insurance, sales, or administrative charges of variable annuity or life insurance contracts. If these charges were included, the returns would be lower.
Inception dates of the Class A, Class B and Class E shares are: 10/31/94, 7/30/02, 5/01/01, respectively.
This information represents past performance and is not indicative of future results. Investment return and principal value may fluctuate so that shares, upon redemption, may be worth more or less than the original cost.
PORTFOLIO COMPOSITION
as of December 31, 2005
Top Holdings
| | |
| | | % of Total
Net Assets
|
Microsoft Corp. | | 4.9% |
General Electric Co. | | 4.9% |
Google, Inc. (Class A) | | 3.9% |
The Procter & Gamble Co. | | 3.4% |
UnitedHealth Group, Inc. | | 3.1% |
Yahoo!, Inc. | | 3.0% |
St. Jude Medical, Inc. | | 2.7% |
American Express Co. | | 2.7% |
CONSOL Energy, Inc. | | 2.6% |
Johnson & Johnson | | 2.6% |
Top Sectors
| | |
| | | % of Total
Net Assets
|
Information Technology | | 27.6% |
Health Care | | 23.3% |
Consumer Discretionary | | 10.2% |
Energy | | 10.2% |
Financials | | 8.6% |
Industrials | | 8.4% |
Consumer Staples | | 7.9% |
Materials | | 1.6% |
Telecommunications | | 0.7% |
Cash/Other | | 1.8% |
MSF-17
Metropolitan Series Fund, Inc.
Capital Guardian U.S. Equity Portfolio
Managed by Capital Guardian Trust Company
Portfolio Manager Commentary*
PORTFOLIO PERFORMANCE
For the year ended December 31, 2005, the Class A shares of the Capital Guardian U.S. Equity Portfolio returned 5.8%, compared to its benchmark, the Standard & Poor’s 500 Index1, which returned 4.9%. The average return of its peer group, the Lipper Variable Insurance Products Multi-Cap Core Funds Universe2, was 6.7% over the same period.
PORTFOLIO REVIEW
A rally late in the year brought equity results for the full year into respectable territory. Equity markets were supported all year by solid corporate results and strong economic growth. Profits grew at a double-digit pace for the third consecutive year, while economic growth exceeded expectations despite being tested by higher energy prices, devastating hurricanes, and rising short-term interest rates.
Many economically sensitive companies, especially those in the materials and industrial sectors, rose sharply after having languished for most of the year. Conversely, defensive areas such as utilities and consumer staples lagged after posting better-than-average returns in previous quarters. Growth stocks outperformed value stocks for the year’s final three quarters, though they underperformed for the full calendar year.
Similarly, stocks in the financial sector ended the year on a high note after trailing the market for most of the year. Profits among financial stocks were strong all year especially in the area of investment banking, thanks to the high volume of mergers and acquisitions.
Information technology stocks, which were flat over the first nine months of the year, rose during the fourth quarter to end the year up slightly. Technology stocks were helped by improved earnings guidance and growing consumer demand, and, in the area of semiconductors, by tighter capacity and the emerging view that flash memory would play a larger role in the next generation of consumer products.
The energy sector was the best-performing sector by far for the full year. Integrated oil stocks slid as oil prices fell and Congress considered levying a windfall profits tax on the industry. Oil services companies, however, posted strong returns.
The Portfolio outperformed its benchmark in 2005 due mainly to strong stock selection in the health care sector. The top contributors within the health care sector represented two of the top ten holdings in the portfolio (AstraZeneca and Allergan) as well as Israel-based Teva Pharmaceutical, Wellpoint, Inc., and Amgen. During the later stages of the year, we reduced our exposure to health care somewhat on strength, though we were still overweight relative to the index at the end of year.
The Portfolio also benefited from strong stock selection in the information technology sector, where it was also overweight relative to the index. We felt that certain industry leaders represented in the Portfolio such as Google, KLA-Tencor, and Intel were gaining market share and this is not yet reflected in their valuations. In the semi-conductor equipment area, we owned a number of companies for their highly proprietary products and inexpensive valuations.
Results were also helped by an overweight position in the energy sector, where we emphasized oil services rather than integrated oil companies. Top contributors within the energy sector included Unocal Corp., Schlumberger, Ltd., and Transocean, Inc.
The top overall detractor for the year was stock selection in the financial sector. Our positions in government-sponsored mortgage providers hurt results, as continued uncertainty over their future regulatory oversight caused these stocks to decline. Other areas that detracted from returns during the year were stock selection in the material and utility sectors.
* The views expressed above are those of the subinvestment advisor firm as of December 31, 2005 and are subject to change based on market and other conditions. Information about the Portfolio’s holdings, asset allocation, industry allocation or country diversification is historical and is not an indication of future Portfolio composition, which will vary.
1 The Standard & Poor’s (S&P) 500® Composite Stock Price Index is an unmanaged index representing the performance of 500 major companies, most of which are listed on the New York Stock Exchange. The S&P 500 performance has not been adjusted for ongoing management, distribution and operating expenses, and sales charges applicable to mutual fund investments. Direct investment in the Index is not possible.
2 Lipper Variable Products Fund Averages. Each of these is an average of the total return performance (calculated on the basis of net asset value) of funds with similar investment objectives to those of the subject Portfolio as calculated by Lipper Analytical Services, an independent mutual fund ranking service.
MSF-18
Metropolitan Series Fund, Inc.
Capital Guardian U.S. Equity Portfolio
A $10,000 INVESTMENT COMPARED TO THE
S&P 500 INDEX
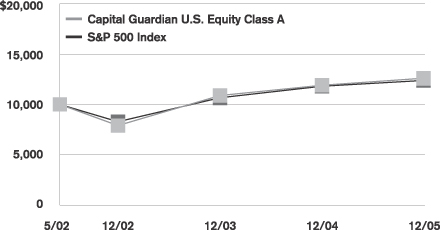
Average Annual Returns as of December 31, 2005
| | | | | | | | | |
| | | Capital Guardian U.S. Equity Portfolio | | | S&P 500
Index | |
| | | Class A | | | Class B | | |
| 1 Year | | 5.8 | % | | 5.5 | % | | 4.9 | % |
| Since Inception | | 6.5 | | | 6.2 | | | 6.0 | |
Performance numbers are net of all Portfolio expenses but do not include any insurance, sales, or administrative charges of variable annuity or life insurance contracts. If these charges were included, the returns would be lower.
Inception date of the Class A and Class B shares is 5/01/02. Index since inception returns are based on the Class A inception date.
This information represents past performance and is not indicative of future results. Investment return and principal value may fluctuate so that shares, upon redemption, may be worth more or less than the original cost.
PORTFOLIO COMPOSITION
as of December 31, 2005
Top Holdings
| | |
| | | % of Total
Net Assets
|
General Electric Co. | | 2.9% |
SLM Corp. | | 2.7% |
AstraZeneca, Plc. (ADR) | | 2.6% |
Washington Mutual, Inc. | | 2.4% |
Forest Laboratories, Inc. | | 2.4% |
JPMorgan Chase & Co. | | 2.3% |
Allergan, Inc. | | 2.1% |
Lowe’s Cos., Inc. | | 2.1% |
Microsoft Corp. | | 2.1% |
Wells Fargo & Co. | | 1.9% |
Top Sectors
| | |
| | | % of Total
Net Assets
|
Information Technology | | 21.4% |
Health Care | | 16.7% |
Financials | | 16.5% |
Industrials | | 11.3% |
Consumer Staples | | 9.0% |
Consumer Discretionary | | 8.9% |
Energy | | 7.4% |
Matrials | | 3.1% |
Telecommunication Services | | 2.9% |
Utilities | | 0.9% |
MSF-19
Metropolitan Series Fund, Inc.
Davis Venture Value Portfolio
Managed by Davis Selected Advisers, L.P.
Portfolio Manager Commentary*
PORTFOLIO PERFORMANCE
For the year ended December 31, 2005, the Class A shares of the Davis Venture Value Portfolio returned 10.3%, compared to its benchmark, the Standard & Poor’s 500 Index1, which returned 4.9%. The average return of its peer group, the Lipper Variable Insurance Products Large-Cap Value Funds Universe2, was 4.8% over the same period.
PORTFOLIO REVIEW
During the year ended December 31, 2005, the stock market, as measured by the S&P 500 Index, increased by 4.9%. U.S. economic activity, as measured by the inflation-adjusted gross domestic product (“GDP”), increased between 3.3% and 4.1% over each of the first three calendar quarters of the year. Interest rates, as measured by the 10-year Treasury bond, began 2005 at about 4.2%, ranged as low as 4.0% and ended 2005 at about 4.4%.
Energy companies were the most important contributors to the Portfolio’s performance over the year. Energy companies were also the strongest performing sector of the S&P 500 Index. The Portfolio benefited both by investing a larger percentage of its assets in energy companies than did the S&P 500 Index. As a group, the individual energy companies that the Portfolio owned out-performed the average energy company included in the S&P 500 Index. All of the Portfolio’s energy companies performed well, with EOG Resources, Devon Energy, ConocoPhillips, and Occidental Petroleum, all among the Portfolio’s top ten contributors to performance.
The Portfolio’s largest industry group holdings were in diversified financial companies, insurance companies, and consumer staple companies. All three sectors were important contributors to performance. Moody’s (a diversified financial company), Progressive, Loews, and American International Group (three insurance companies), and Altria (a consumer staples company) were among the Portfolio’s top ten contributors to performance.
The Portfolio’s holdings in both consumer discretionary companies and industrial companies detracted from the Portfolio’s performance for the year. Consumer discretionary companies that were among the top ten detractors from performance over the year included Comcast, Gannett, and Autozone (sold in October 2005). Industrial companies which were among the top ten detractors from performance included Tyco and United Parcel Services. Lexmark, an information technology company, and Fifth Third Bancorp, a bank, were also among the top ten detractors from performance. Avon Products (initially purchased in June 2005), a consumer staples company, ranked among the top ten detractors from performance.
The Portfolio had approximately 9% of its holdings invested in foreign companies at December 31, 2005. As a group, the foreign companies owned by the Portfolio under-performed the S&P 500 Index over the year.
* The views expressed above are those of the subinvestment advisor firm as of December 31, 2005 and are subject to change based on market and other conditions. Information about the Portfolio’s holdings, asset allocation, industry allocation or country diversification is historical and is not an indication of future Portfolio composition, which will vary.
1 The Standard & Poor’s (S&P) 500® Composite Stock Price Index is an unmanaged index representing the performance of 500 major companies, most of which are listed on the New York Stock Exchange. The S&P 500 performance has not been adjusted for ongoing management, distribution and operating expenses, and sales charges applicable to mutual fund investments. Direct investment in the Index is not possible.
2 Lipper Variable Products Fund Averages. Each of these is an average of the total return performance (calculated on the basis of net asset value) of funds with similar investment objectives to those of the subject Portfolio as calculated by Lipper Analytical Services, an independent mutual fund ranking service.
MSF-20
Metropolitan Series Fund, Inc.
Davis Venture Value Portfolio
A $10,000 INVESTMENT COMPARED TO THE
S&P 500 INDEX
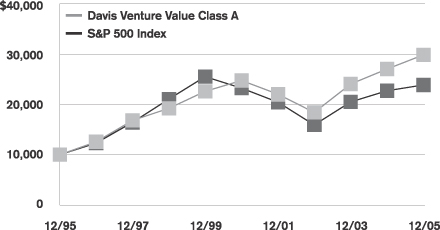
Average Annual Returns as of December 31, 2005
| | | | | | | | | | | | |
| | | Davis Venture Value Portfolio | | | S&P 500
Index | |
| | | Class A | | | Class B | | | Class E | | |
| 1 Year | | 10.3 | % | | 10.0 | % | | 10.1 | % | | 4.9 | % |
| 5 Years | | 3.8 | | | N/A | | | N/A | | | 0.5 | |
| 10 Years | | 11.5 | | | N/A | | | N/A | | | 9.1 | |
| Since Inception | | — | | | 14.4 | | | 4.6 | | | — | |
Performance numbers are net of all Portfolio expenses but do not include any insurance, sales, or administrative charges of variable annuity or life insurance contracts. If these charges were included, the returns would be lower.
Inception dates of the Class A, Class B and Class E shares are: 10/31/94, 7/30/02 and 2/20/01, respectively.
This information represents past performance and is not indicative of future results. Investment return and principal value may fluctuate so that shares, upon redemption, may be worth more of less than the original cost.
PORTFOLIO COMPOSITION
as of December 31, 2005
Top Holdings
| | |
| | | % of Total
Net Assets
|
Altria Group, Inc. | | 5.5% |
American Express Co. | | 5.4% |
American International Group, Inc. | | 4.8% |
Tyco International, Ltd. | | 3.9% |
JPMorgan Chase & Co. | | 3.7% |
Costco Wholesale Corp. | | 3.6% |
Golden West Financial Corp. | | 4.0% |
The Progressive Corp. | | 3.1% |
Wells Fargo & Co. | | 3.2% |
Berkshire Hathaway, Inc. (Class A) | | 2.9% |
Top Sectors
| | |
| | | % of Total
Net Assets
|
Financial | | 45.7% |
Consumer Staples | | 14.1% |
Energy | | 10.6% |
Consumer Discretionary | | 6.8% |
Industrials | | 6.2% |
Information Technology | | 5.2% |
Materials | | 4.0% |
Healthcare | | 3.4% |
Telecommunications | | 0.7% |
Cash/Other | | 3.3% |
MSF-21
Metropolitan Series Fund, Inc.
FI Value Leaders Portfolio
Managed by Fidelity Management & Research Company
Portfolio Manager Commentary*
PORTFOLIO PERFORMANCE
For the year ended December 31, 2005, the Class A shares of the FI Value Leaders Portfolio returned 10.7%, compared to its benchmark, the Russell 1000 Value Index1, which returned 7.1%. The average return of its peer group, the Lipper Variable Insurance Products Multi-Cap Value Funds Universe2, was 6.3% over the same period.
PORTFOLIO REVIEW
Equities realized positive, but below historical average, returns during the 12-month period ending December 31, 2005. Throughout most of the period, investors generally maintained a cautious stance, as concerns about higher oil prices, rising interest rates and the hurricanes along the Gulf Coast limited market returns. However, a healthy U.S. economy and robust corporate earnings drove stock returns into positive territory. Value stocks continued their strong performance from recent years, as the Russell 3000 Value Index3 outperformed the Russell 3000 Growth Index4. Large-cap stocks, however, managed to break the small-cap streak, as the Russell 1000 Index5 topped the Russell 2000 Index6.
In this environment, the FI Value Leaders Portfolio posted a strong return and outperformed the Russell 1000 Value benchmark. Contributing to performance was security selection within the energy sector, where the Portfolio’s holdings in the energy services industry benefited from higher commodity prices and increased spending by the energy producers. The Portfolio also was helped by its holdings in the health care sector, where it enjoyed strong security selection in the pharmaceuticals and biotechnology industries. Another source of outperformance was an underweighting in the financials sector, and particularly in the poor-performing commercial banks. Detracting from performance relative to the benchmark was negative stock selection in the materials industry, where some chemical and paper-packaging stocks overweighted by the Portfolio lagged the rest of the group. Also hurting performance was an underweighting in the utilities sector. Utilities performed well due to high energy prices and low long-term interest rates, which made the high dividend yields that these stocks typically provide even more attractive.
* The views expressed above are those of the subinvestment advisor firm as of December 31, 2005 and are subject to change based on market and other conditions. Information about the Portfolio’s holdings, asset allocation, industry allocation or country diversification is historical and is not an indication of future Portfolio composition, which will vary.
1 The Russell 1000® Value Index is an unmanaged measure of the largest capitalized U.S. domiciled companies with a less than average growth orientation. Companies in this Index generally have a low price-to-book and price-to-earnings ratio, higher divided yields and lower forecasted growth values. The Index performance has not been adjusted for ongoing management, distribution and operating expenses and sales charges applicable to mutual fund investments. Direct investment in the Index is not possible.
2 Lipper Variable Products Fund Averages. Each of these is an average of the total return performance (calculated on the basis of net asset value) of funds with similar investment objectives to those of the subject Portfolio as calculated by Lipper Analytical Services, an independent mutual fund ranking service.
3 Russell 3000® Value Index measures the performance of those Russell 3000 Index companies with lower price-to-book ratios and lower forecasted growth values. The stocks in this index are also members of either the Russell 1000 Value or the Russell 2000 Value indexes. Direct investment in the Index is not possible.
4 Russell 3000® Growth Index measures the performance of those Russell 3000 Index companies with higher price-to-book ratios and higher forecasted growth values. The stocks in this index are also members of either the Russell 1000 Growth or the Russell 2000 Growth indexes. Direct investment in the Index is not possible.
5 The Russell 1000® Index is an unmanaged measure of the 1,000 largest companies in the Russell 3000 Index, which represents approximately 90% of the investable U.S. equity market. The Index had a total market capitalization range of $1.8 billion to $387 billion with an average market capitalization of approximately $13 billion. The Index performance has not been adjusted for ongoing management, distribution and operating expenses and sales charges applicable to mutual fund investments. Direct investment in the Index is not possible.
6 The Russell 2000® Index is an unmanaged measure of performance of the 2,000 smallest companies in the Russell 3000 Index. The Index performance has not been adjusted for ongoing management, distribution and operating expenses and sales charges applicable to mutual fund investments. Direct investment in the Index is not possible.
MSF-22
Metropolitan Series Fund, Inc.
FI Value Leaders Portfolio
A $10,000 INVESTMENT COMPARED TO THE
RUSSELL 1000 VALUE INDEX
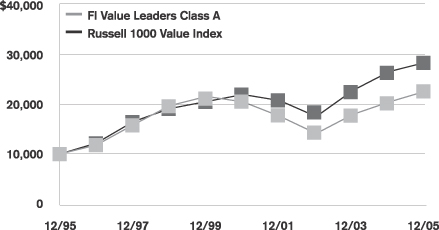
Average Annual Returns as of December 31, 2005
| | | | | | | | | | | | |
| | | FI Value Leaders Portfolio | | | Russell 1000 Value Index | |
| | | Class A | | | Class B | | | Class E | | |
| 1 Year | | 10.7 | % | | 10.4 | % | | 10.5 | % | | 7.1 | % |
| 5 Years | | 2.1 | | | N/A | | | N/A | | | 5.3 | |
| 10 Years | | 8.5 | | | N/A | | | N/A | | | 10.9 | |
| Since Inception | | — | | | 14.2 | | | 2.6 | | | — | |
Performance numbers are net of all Portfolio expenses but do not include any insurance, sales, or administrative charges of variable annuity or life insurance contracts. If these charges were included, the returns would be lower.
Inception dates of the Class A, Class B and Class E shares are: 4/30/93, 7/30/02 and 5/01/01, respectively.
This information represents past performance and is not indicative of future results. Investment return and principal value may fluctuate so that shares, upon redemption, may be worth more or less than the original cost.
PORTFOLIO COMPOSITION
as of December 31, 2005
Top Holdings
| | |
| | | % of Total
Net Assets
|
American International Group, Inc. | | 4.5% |
Honeywell International, Inc. | | 3.7% |
General Electric Co. | | 2.9% |
Exxon Mobil Corp. | | 2.7% |
Bank of America Corp. | | 1.7% |
JPMorgan Chase & Co. | | 1.6% |
Pfizer, Inc. | | 1.6% |
Halliburton Co. | | 1.5% |
Baxter International, Inc. | | 1.5% |
Hewlett-Packard Co. | | 1.5% |
Top Sectors
| | |
| | | % of Total
Net Assets
|
Financials | | 24.1% |
Industrials | | 14.0% |
Energy | | 13.3% |
Health Care | | 13.0% |
Information Technology | | 10.7% |
Consumer Discretionary | | 9.1% |
Materials | | 5.9% |
Consumer Staples | | 5.5% |
Telecommunication Services | | 3.0% |
Utilities | | 1.0% |
MSF-23
Metropolitan Series Fund, Inc.
Harris Oakmark Large Cap Value Portfolio
Managed by Harris Associates, L.P.
Portfolio Manager Commentary*
PORTFOLIO PERFORMANCE
For the year ended December 31, 2005, the Class A shares of the Harris Oakmark Large Cap Value Portfolio returned –1.4%, compared to its benchmark, the Russell 1000 Value Index,1 which returned 7.1%. The average return of its peer group, the Lipper Variable Insurance Products Large Cap Value Funds Universe,2 was 4.8% over the same period.
PORTFOLIO REVIEW
The most recent period has provided some different challenges compared to previous periods, namely severe compression of equity valuation multiples and low capital market returns for most traditional asset classes. The frustration has only been amplified by company performance that has generally been quite good: corporate profit margins are near peak levels, while earnings have grown at a double-digit rate in each quarter for the past 3 1/2 years.
During 2005 we added quality businesses such as Hewlett-Packard, Intel, and Texas Instruments among others listed below, to the Portfolio.
Hewlett-Packard is both a manufacturer and servicer of high tech equipment, including personal computers, servers, storage devices, printers, networking equipment, and software. The stock has performed well since the appointment of new CEO, Mark Hurd, and the company reported better than expected results during the period.
Intel is the world’s largest semiconductor chipmaker and a technology bellwether. The company’s products include microprocessor chips, boards, and other semiconductor components that are the building blocks to computers, servers, and networking and communications products. The company generated considerable free cash flow.
Texas Instruments is one of the oldest and largest semiconductor makers and is a leader in digital signal processors (DSPs). These DSPs can be found in over half of the wireless phones sold worldwide, as well as in VCRs, automotive systems, and computer modems. We believe Texas Instruments is a high quality semiconductor manufacturer with leading positions in fast growing areas of the chip market.
Other positions initiated during the year include InBev NV and Tyco International.
We eliminated our positions in AmerisourceBergen, Automatic Data Processing, Fannie Mae, Guidant, Kraft Foods, Sungard Data Systems, Toys R Us, and Waste Management during the period.
The main source of the Portfolio’s underperformance was our low weighting in energy stocks, which were the best performers by far in 2005. In addition, our media holdings lagged the market, although we believe the underlying fundamentals of our media stocks are favorable.
Burlington Resources, ConocoPhillips, and Hewlett-Packard had the most significant positive impact on performance during the year. Earnings at Burlington Resources were helped by lower exploration expenses and the continued increase of oil and natural gas prices throughout the year. ConocoPhillips has enjoyed an almost two year run in which its stock price more than doubled, as high petroleum prices and strong refining margins have contributed to what we consider to be strong profitability for the firm. Though Hurricane Katrina temporarily affected the company’s refining capabilities, we believe that ultimately it did not do any long term damage. The firm used its strong cash flow to pay down debt and repurchase stock. As mentioned previously, Hewlett-Packard’s stock price rose during the year due in part to the efforts of the newly appointed CEO to turn around the firm.
Fannie Mae, Comcast Corp., and Gannett had the most significant negative impact on performance during the year. We sold Fannie Mae during the third quarter as a result of further delays in the company’s release of audited financial statements, as well as growing concerns regarding future intense competition in the firm’s mortgage market from banks and other financial institutions. Although Comcast’s stock price dropped 22% during 2005 we feel that Comcast’s fundamentals are solid. We continue to like the stock. Gannett, like much of the newspaper industry, has been under pressure due to declines in circulation and ad revenue. Gannett is currently trading at historically low levels and we continue to believe it is undervalued.
* The views expressed above are those of the subinvestment advisor firm as of December 31, 2005 and are subject to change based on market and other conditions. Information about the Portfolio’s holdings, asset allocation, industry allocation or country diversification is historical and is not an indication of future Portfolio composition, which will vary.
1 The Russell 1000® Value Index is an unmanaged measure of the largest capitalized U.S. domiciled companies with a less than average growth orientation. Companies in this Index generally have a low price-to-book and price-to-earnings ratio, higher divided yields and lower forecasted growth values. The Index performance has not been adjusted for ongoing management, distribution and operating expenses and sales charges applicable to mutual fund investments. Direct investment in the Index is not possible.
2 Lipper Variable Products Fund Averages. Each of these is an average of the total return performance (calculated on the basis of net asset value) of funds with similar investment objectives to those of the subject Portfolio as calculated by Lipper Analytical Services, an independent mutual fund ranking service.
MSF-24
Metropolitan Series Fund, Inc.
Harris Oakmark Large Cap Value Portfolio
A $10,000 INVESTMENT COMPARED TO THE
RUSSELL 1000 VALUE INDEX
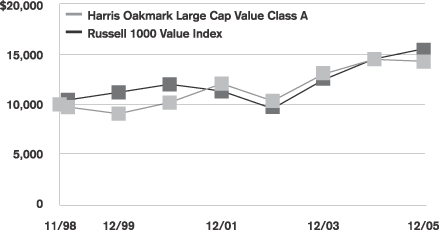
Average Annual Returns as of December 31, 2005
| | | | | | | | | | | | |
| | | Harris Oakmark Large Cap Value Portfolio | | | Russell 1000
Value Index | |
| | | Class A | | | Class B | | | Class E | | |
| 1 Year | | -1.4 | % | | -1.7 | % | | -1.5 | % | | 7.1 | % |
| 5 Years | | 7.0 | | | N/A | | | N/A | | | 5.3 | |
| Since Inception | | 5.1 | | | 8.4 | | | 4.7 | | | 6.3 | |
Performance numbers are net of all Portfolio expenses but do not include any insurance, sales, or administrative charges of variable annuity or life insurance contracts. If these charges were included, the returns would be lower.
Inception dates of the Class A, Class B and Class E shares are: 11/9/98, 7/30/02 and 5/1/01, respectively. Index since inception returns are based on the Class A inception date.
This information represents past performance and is not indicative of future results. Investment return and principal value may fluctuate so that shares, upon redemption, may be worth more or less than the original cost.
PORTFOLIO COMPOSITION
as of December 31, 2005
Top Holdings
| | |
| | | % of Total
Net Assets
|
McDonald’s Corp. | | 2.9% |
Viacom, Inc. (Class B) | | 2.5% |
Washington Mutual, Inc. | | 2.4% |
Time Warner, Inc. | | 2.4% |
Citigroup, Inc. | | 2.4% |
The Home Depot, Inc. | | 2.3% |
First Data Corp. | | 2.3% |
JPMorgan Chase & Co. | | 2.3% |
Yum! Brands, Inc. | | 2.2% |
The Walt Disney Co. | | 2.2% |
Top Sectors
| | |
| | | % of Total
Market Value
|
Consumer Discretionary | | 43.8% |
Financials | | 15.4% |
Consumer Staples | | 12.9% |
Information Technology | | 10.6% |
Industrials | | 7.9% |
Health Care | | 6.2% |
Energy | | 3.2% |
MSF-25
Metropolitan Series Fund, Inc.
Jennison Growth Portfolio
Managed by Jennison Associates LLC
Portfolio Manager Commentary*
PORTFOLIO PERFORMANCE
For the year ended December 31, 2005, the Class A shares of the Jennison Growth Portfolio returned 13.9%, compared to its new benchmark, the Russell 1000 Growth Index,1 which returned 5.3%. The Portfolio’s old benchmark, the Standard & Poor’s 500 Index2, returned 4.9%. The benchmark was changed because the portfolio manager feels the Russell 1000 Growth Index better reflects the universe of stocks in which the Portfolio generally invests. The average return of its peer group, the Lipper Variable Insurance Products Large-Cap Growth Funds Universe3, was 7.3% over the same period.
PORTFOLIO REVIEW
The sharp rise in energy prices and the devastating effects of weather across many different parts of the United States (and around the globe) were some of the more notable events that occurred this past year. But their impact on the broader economy and the strength of the U.S. corporate sector appears remarkably small when looked at in the fullness of the year. Indeed, Gross Domestic Product (GDP) grew at better than 3% for much of the year, core inflation, though higher, remained well-contained, solid growth in productivity married with employment and income growth continued, and corporate profits (as measured by the S&P 500 Index) achieved another year of double digit gains.
The Portfolio’s strong gains came from many companies across a number of different industries and sectors leading to above average performance for the whole.
The Portfolio’s Health Care positions had the largest positive impact on total return, driven by a variety of holdings. During the year, companies that brought meaningful scientific advances to the treatment arena or provided services designed to manage the costs of delivering care were rewarded, and the Portfolio benefited significantly from investing in these types of companies. Alcon, Amgen, Genentech, and Roche all benefited from strong product cycles. On the services side, Caremark and the Portfolio’s HMO holdings also posted above market returns
The performance of the Portfolio’s Information Technology holdings was also very strong for the year. Google was the top contributor to returns. Revenues have grown at a triple digit pace driven by sponsored search query, while earnings have developed even more favorably due to the operating leverage that accompanies this level of revenue growth. Another stellar performer, Apple Computer more than doubled during the Fund’s fiscal year, as it continued to benefit from the tremendous success of its iPod family of products.
There were also notable performers in the Consumer sectors. Whole Foods continued to be a consistent and important contributor to performance. The company enjoyed healthy sales and square footage growth and most importantly, very strong same-store-sales. In addition, the productivity of new stores has been exceptional. Chico’s has also been a notable performer. Increased same store sales continue to be the key to their success, while their emerging store concept, “White House Black Market” also saw tremendous growth.
eBay was the greatest detractor from the Portfolio’s returns in 2005, although the majority of weakness came early in 2005. The stock fell on concerns that domestic growth was slowing more than anticipated, coupled with increased investment in emerging markets. We added to our position because we believed that management was very focused on stimulating domestic sales, while the International and Paypal divisions continued to grow at very high rates. Notably, the stock was up significantly at year-end from the lows set in the first quarter as business performance improved.
For the full year, we achieved flat or positive total return from all sectors with the one exception being the Industrials. UPS was a weak performer earlier in the period, as a loss in market share weighed on the stock price. General Electric also underperformed as its modest positive return lagged the stronger return of the market this past fiscal year. Earnings multiple contraction (a broader theme for the market in general in 2005) was the culprit.
* The views expressed above are those of the subinvestment advisor firm as of December 31, 2005 and are subject to change based on market and other conditions. Information about the Portfolio’s holdings, asset allocation, industry allocation or country diversification is historical and is not an indication of future Portfolio composition, which will vary.
1 The Russell 1000® Growth Index is an unmanaged measure of performance of the largest capitalized U.S. companies, within the Russell 1000 companies, that have higher price-to-book ratios and forecasted growth values. The Index performance has not been adjusted for ongoing management, distribution and operating expenses and sales charges applicable to mutual fund investments. Direct investment in the Index is not possible.
2 The Standard & Poor’s (S&P) 500® Composite Stock Price Index is an unmanaged index representing the performance of 500 major companies, most of which are listed on the New York Stock Exchange. The S&P 500 performance has not been adjusted for ongoing management, distribution and operating expenses, and sales charges applicable to mutual fund investments. Direct investment in the Index is not possible.
3 Lipper Variable Products Fund Averages. Each of these is an average of the total return performance (calculated on the basis of net asset value) of funds with similar investment objectives to those of the subject Portfolio as calculated by Lipper Analytical Services, an independent mutual fund ranking service.
MSF-26
Metropolitan Series Fund, Inc.
Jennison Growth Portfolio
A $10,000 INVESTMENT COMPARED TO THE
RUSSELL 1000 GROWTH INDEX
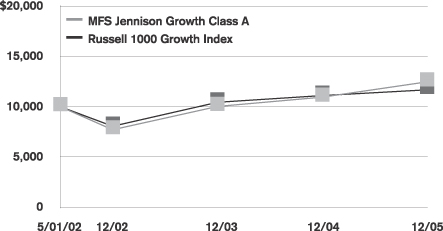
Average Annual Returns as of December 31, 2005
| | | | | | | | | | | | | | | |
| | | Jennison Growth Portfolio | | | Russell 1000
Growth Index | | | S&P 500
Index | |
| | | Class A | | | Class B | | | Class E | | | |
| 1 Year | | 13.9 | % | | 13.5 | % | | N/A | | | 5.3 | % | | 4.9 | % |
| Since Inception | | 6.2 | | | 5.9 | | | 21.7 | % | | 4.4 | | | 6.0 | |
Performance numbers are net of all Portfolio expenses but do not include any insurance, sales, or administrative charges of variable annuity or life insurance contracts. If these charges were included, the returns would be lower.
Inception dates of the Class A, Class B and Class E shares are: 5/1/02, 5/1/02 and 4/27/05, respectively. Index since inception returns are based on the Class A inception date.
This information represents past performance and is not indicative of future results. Investment return and principal value may fluctuate so that shares, upon redemption, may be worth more or less than the original cost.
PORTFOLIO COMPOSITION
as of December 31, 2005
Top Holdings
| | |
| | | % of Total
Net Assets
|
Google, Inc. (Class A) | | 3.9% |
eBay, Inc. | | 3.2% |
General Electric Co. | | 3.2% |
The Procter & Gamble Co. | | 2.9% |
Schlumberger, Ltd. | | 2.8% |
Yahoo!, Inc. | | 2.8% |
American International Group, Inc. | | 2.5% |
American Express Co. | | 2.4% |
Adobe Systems, Inc. | | 2.4% |
Marvell Technology Group, Ltd. | | 2.4% |
Top Sectors
| | |
| | | % of Total
Net Assets
|
Information Technology | | 33.0% |
Health Care | | 21.0% |
Consumer Discretionary | | 16.0% |
Financials | | 12.0% |
Consumer Staples | | 7.0% |
Energy | | 4.0% |
Industrials | | 3.0% |
Telecommunications | | 1.0% |
Cash/Other | | 3.0% |
MSF-27
Metropolitan Series Fund, Inc.
MetLife Stock Index Portfolio
Managed by Metropolitan Life Insurance Company
Portfolio Manager Commentary*
PORTFOLIO PERFORMANCE
For the year ended December 31, 2005, the Class A shares of the MetLife Stock Index Portfolio returned 4.6%, compared to its benchmark, the Standard & Poor’s 500 Index,1 which returned 4.9%. The average return of its peer group, the Lipper Variable Insurance Products S&P 500 Index Funds Universe,2 was -4.5% over the same period.
PORTFOLIO REVIEW
The S&P 500 Index had a positive return for the third consecutive year. Over the three-year period ending December 31, 2005, the S&P 500 Index returned 14.4% annualized. The market had mixed results during 2005. While during the first half of the year, the S&P 500 was in negative territory; the second half saw the market rallying over 5% to finish the full year in positive territory. This was in part due to stronger than expected corporate earnings releases. The Federal Reserve continued its measured increase in the Fed Funds Rate, raising the target 200 basis points since the beginning of the year to 4.25% at year-end. The price of oil surged to $70 per barrel by August, up over 60% from the beginning of the year and closing at approximately $61 per barrel at year-end. Some of the factors driving the equity markets included geopolitical concerns, energy prices, Federal Reserve interest rate policy, corporate earnings, and unemployment rates.
Eight of the ten sectors comprising the S&P 500 Index experienced positive returns for the year. The energy sector, which had a beginning-of-year weight of 7.2%, was the best-performing sector, up 31.4%, providing the largest positive impact to the benchmark return this year. The next best-performing sectors were utilities (2.9% beginning weight), financials (the largest sector with a 20.6% beginning weight) and health care (12.7% beginning weight), returning 16.7%, 6.5% and 6.5%, respectively. The two sectors with negative returns this year were consumer discretionary (11.9% beginning weight) and telecomm services (3.3% beginning weight), down 6.4% and 5.6%, respectively.
The stocks with the largest positive impact on the benchmark return for the year were Apple Computer, up 123.3%; Altria Group, up 27.7%; and Exxon Mobil, up 11.8%. The best performing stock was Valero Energy, up 128.5%. The stocks with the largest negative impact were Dell, down 28.8%; Verizon Communications, down 22.2%; and IBM, down 15.8%. The worst performing stock was Delphi, down 96.3%. There were twenty additions and twenty deletions to the benchmark in 2005.
* The views expressed above are those of the subinvestment advisor firm as of December 31, 2005 and are subject to change based on market and other conditions. Information about the Portfolio’s holdings, asset allocation, industry allocation or country diversification is historical and is not an indication of future Portfolio composition, which will vary.
1 The Standard & Poor’s (S&P) 500® Composite Stock Price Index is an unmanaged index representing the performance of 500 major companies, most of which are listed on the New York Stock Exchange. The S&P 500 performance has not been adjusted for ongoing management, distribution and operating expenses, and sales charges applicable to mutual fund investments. Direct investment in the Index is not possible.
2 Lipper Variable Products Fund Averages. Each of these is an average of the total return performance (calculated on the basis of net asset value) of funds with similar investment objectives to those of the subject Portfolio as calculated by Lipper Analytical Services, an independent mutual fund ranking service.
MSF-28
Metropolitan Series Fund, Inc.
MetLife Stock Index Portfolio
A $10,000 INVESTMENT COMPARED TO THE
S&P 500 INDEX
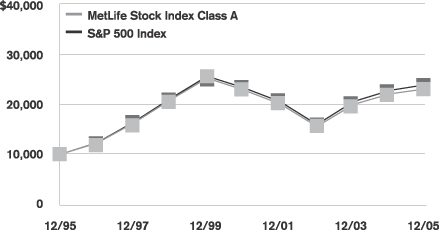
Average Annual Returns as of December 31, 2005
| | | | | | | | | | | | |
| | | MetLife Stock Index Portfolio | | | S&P 500 Index | |
| | | Class A | | | Class B | | | Class E | | |
| 1 Year | | 4.6 | % | | 4.4 | % | | 4.5 | % | | 4.9 | % |
| 5 Years | | 0.2 | | | N/A | | | N/A | | | 0.5 | |
| 10 Years | | 8.7 | | | N/A | | | N/A | | | 9.1 | |
| Since Inception | | — | | | 0.6 | | | 1.0 | | | — | |
Performance numbers are net of all Portfolio expenses but do not include any insurance, sales, or administrative charges of variable annuity or life insurance contracts. If these charges were included, the returns would be lower.
Inception dates of the Class A, Class B and Class E shares are: 5/1/90, 1/2/01 and 5/1/01, respectively.
This information represents past performance and is not indicative of future results. Investment return and principal value may fluctuate so that shares, upon redemption, may be worth more or less than the original cost.
PORTFOLIO COMPOSITION
as of December 31, 2005
Top Holdings
| | |
| | | % of Total
Net Assets
|
General Electric Co. | | 3.2% |
Exxon Mobil Corp. | | 3.1% |
Citigroup, Inc. | | 2.2% |
Microsoft Corp. | | 2.1% |
The Procter & Gamble Co. | | 1.7% |
Bank of America Corp. | | 1.6% |
Johnson & Johnson | | 1.6% |
American International Group, Inc. | | 1.6% |
Pfizer, Inc. | | 1.5% |
Altria Group, Inc. | | 1.4% |
Top Sectors
| | |
| | | % of Total
Market Value
|
Financials | | 21.2% |
Information Technology | | 15.1% |
Health Care | | 13.3% |
Industrials | | 11.3% |
Consumer Discretionary | | 10.9% |
Consumer Staples | | 9.5% |
Energy | | 9.3% |
Utilities | | 3.4% |
Telecomm Services | | 3.0% |
Materials | | 3.0% |
MSF-29
Metropolitan Series Fund, Inc.
MFS Investors Trust Portfolio
Managed by Massachusetts Financial Services Company
Portfolio Manager Commentary*
PORTFOLIO PERFORMANCE
For the year ended December 31, 2005, the Class A shares of the MFS Investors Trust Portfolio returned 7.3%, compared to its benchmark, the Standard & Poor’s 500 Index,1 which returned 4.9%. The average return of its peer group, the Lipper Variable Insurance Products Large-Cap Core Funds Universe,2 was 5.8% over the same period.
PORTFOLIO REVIEW
Global economies continued to expand during the period. In the United States, growth was robust and core inflation, while rising, remained contained. The unemployment rate hovered around 5.0%. Consumer spending, which accounts for about 70% of the U.S. economy, rose at a rate of 3.0% to 3.5%. Corporate profits increased, but at a slower pace than they did in 2004. Most major global stock indices moved higher despite the steady increase in oil prices over the period.
Consumer wages and business spending on big items moved higher in line with gross domestic product (GDP) growth at rate of about 3.5%. Throughout the year, inflation accelerated in the United States, the “Euro-Zone”, and Britain. As a result, moderate growth and inflation combined to give the U.S. Federal Reserve Board an opening to continue increasing interest rates. In March and April 2005, rising oil prices began to wear on investor confidence, which was further eroded by credit concerns at American traditional stalwarts General Motors and Ford Motor Company. Hurricanes Katrina and Rita caused heightened inflation concerns. Globally, central bankers stepped up efforts to balance the dual challenges of keeping growth at levels that would not also bring higher inflation. Still, most major global stock indices finished the 12-month period higher.
The energy, financial services, and health care sectors were the top contributors to performance relative to the benchmark. Stock selection played the major relative performance in these sectors.
In energy, oilfield services provider Halliburton, energy exploration and production company EOG Resources, offshore drilling firm Noble Corp, Canadian energy producer EnCana, which is not a constituent of the S&P 500 Index, and offshore drilling contractor Transocean were strong contributors in this sector.
Our position in investment management firm Legg Mason, which is not a constituent of the S&P 500 Index, boosted relative results in the financial services sector. In the health care sector, biotech firm Gilead Sciences aided relative performance as the stock outperformed the benchmark over the period.
Individual stocks in other sectors that also contributed to relative results included agrichemical products company Monsanto and computer manufacturer Apple Computer. Although shares of computer giant IBM declined over the entire period, our underweight in the stock boosted relative performance.
Relative to the Portfolio’s benchmark (S&P 500 Index), utilities and communications, transportation, and special products and services were the Portfolio’s top detracting sectors over the period. Stock selection in the utilities and communications sector held back relative performance with wireless service provider Vodafone Group, which is not a constituent of the index, among the Portfolio’s top detractors. Our underweighted position in transportation and stock selection in the special products and services sector also hindered relative returns. No individual stocks within either sector were among the Portfolio’s top detractors.
Although stock selection in the health care sector contributed to overall results, several individual stocks held back relative performance including health care products manufacturer Abbott Laboratories and orthopedic products marketer Zimmer Holdings. Not holding strong-performing oil and gas giant ExxonMobil also dampened investment returns.
Stocks in other sectors that hurt relative results included manufacturing conglomerate Tyco International, software games developer Electronic Arts, home improvement products maker Masco Corp., and beauty supply company Avon Products, which was not held in the Portfolio at year-end. Elsewhere, direct-sale computer vendor Dell and enterprise software giant Oracle also held back returns.
All of MFS’ investment decisions are driven by the fundamentals of each individual opportunity and, as such, it is common for portfolios which may invest in foreign securities to have different currency exposure than the benchmark. During this reporting period, our currency exposure detracted from the Portfolio’s relative performance.
* The views expressed above are those of the subinvestment advisor firm as of December 31, 2005 and are subject to change based on market and other conditions. Information about the Portfolio’s holdings, asset allocation, industry allocation or country diversification is historical and is not an indication of future Portfolio composition, which will vary.
1 The Standard & Poor’s (S&P) 500® Composite Stock Price Index is an unmanaged index representing the performance of 500 major companies, most of which are listed on the New York Stock Exchange. The S&P 500 performance has not been adjusted for ongoing management, distribution and operating expenses, and sales charges applicable to mutual fund investments. Direct investment in the Index is not possible.
2 Lipper Variable Products Fund Averages. Each of these is an average of the total return performance (calculated on the basis of net asset value) of funds with similar investment objectives to those of the subject Portfolio as calculated by Lipper Analytical Services, an independent mutual fund ranking service.
MSF-30
Metropolitan Series Fund, Inc.
MFS Investors Trust Portfolio
A $10,000 INVESTMENT COMPARED TO THE
S&P 500 INDEX
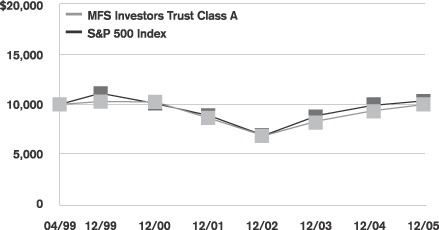
Average Annual Returns as of December 31, 2005
| | | | | | | | | | | | | |
| | | MFS Investors Trust Portfolio | | | S&P 500
Index | |
| | | Class A | | | Class B | | | Class E | | |
| 1 Year | | | 7.3 | % | | 6.9 | % | | 7.1 | % | | 4.9 | % |
| 5 Years | | - | 0.5 | | | N/A | | | N/A | | | 0.5 | |
| Since Inception | | | 0.0 | | | 5.3 | | | 0.8 | | | 0.5 | |
Performance numbers are net of all Portfolio expenses but do not include any insurance, sales, or administrative charges of variable annuity or life insurance contracts. If these charges were included, the returns would be lower.
Inception dates of the Class A, Class B and Class E shares are: 4/30/99, 5/1/02 and 5/1/01, respectively. Index since inception returns are based on the Class A inception date.
This information represents past performance and is not indicative of future results. Investment return and principal value may fluctuate so that shares, upon redemption, may be worth more or less than the original cost.
PORTFOLIO COMPOSITION
as of December 31, 2005
Top Holdings
| | |
| | | % of Total
Net Assets
|
American International Group, Inc. | | 3.4% |
Johnson & Johnson | | 2.8% |
United Technologies Corp. | | 2.6% |
EMC Corp. | | 2.3% |
Lockheed Martin Corp. | | 2.1% |
Amgen, Inc. | | 2.1% |
Bank of America Corp. | | 2.1% |
Wyeth | | 2.0% |
Reckitt Benckiser, Plc. | | 1.8% |
The Procter & Gamble Co. | | 1.8% |
Top Sectors
| | |
| | | % of Total
Net Assets
|
Financial Services | | 16.9% |
Health Care | | 16.9% |
Technology | | 15.7% |
Consumer Staples | | 10.0% |
Energy | | 9.9% |
Industrial Goods & Services | | 8.2% |
Retailing | | 6.9% |
Leisure | | 4.7% |
Basic Materials | | 4.0% |
Utilities & Communications | | 3.2% |
MSF-31
Metropolitan Series Fund, Inc.
T. Rowe Price Large Cap Growth Portfolio
Managed by T. Rowe Price Associates, Inc.
Portfolio Manager Commentary*
PORTFOLIO PERFORMANCE
For the year ended December 31, 2005, the Class A shares of the T. Rowe Price Large Cap Growth Portfolio returned 6.6%, compared to its benchmark, the Standard & Poor’s 500 Index,1 which returned 4.9%. The average return of its peer group, the Lipper Variable Insurance Products Large-Cap Growth Funds Universe,2 was 7.3% over the same period.
PORTFOLIO REVIEW
With the price of oil rising for most of the year, energy and utilities stocks dominated the market until the fourth quarter, when they gave back some of their tremendous earlier gains. But higher energy prices and rising interest rates were hard on the consumer, and many consumer-oriented stocks struggled. Growth companies in many sectors—healthcare and technology, for example—had solid business performance, but had a hard time being noticed by investors. As a consequence, value stocks were again ahead of growth stocks for the year. However, growth stocks outperformed value stocks in the second half of 2005 during which strong performances by capital markets firms, healthcare services and biotechnology companies, and Internet companies led the way as oil and utilities stocks slowed.
The Portfolio’s positioning in healthcare made the largest contribution performance. The healthcare-services segment made consistent gains and our stock choices fared especially well. Leading contributors in this area included UnitedHealth and Wellpoint, both of which reported good earnings with continuing improvements in
cost and pricing trends. In addition, key holdings in the biotechnology segment, notably Genentech and Gilead Sciences, advanced on positive drug developments.
Even though short-term interest rates rose throughout the year, many segments of the financials sector performed well. On an absolute basis, the financials sector performed well in the Portfolio. Our focus on capital markets companies made a significant contribution on a relative basis as well, with State Street, UBS, Ameritrade, and others posting strong returns. For most of the past year, we focused on capital markets companies because we believed they had good earnings prospects and would not be unduly harmed by the rising interest-rate environment.
Our stock selection in the telecommunications services sector also added value over the benchmark. Most notably, our positions in Latin America wireless provider America Movil and tower operator Crown Castle were strong performers, benefiting from subscriber growth and industry consolidation. At December 31, 2005, we remained overweighted in this sector with a focus on the larger wireless service providers and tower operators.
The good results in these areas helped overcome some challenges. An underweight in the surging energy sector—a common position for a growth portfolio—held us back compared with the benchmark. We were also well exposed to the weakening consumer sectors, and our overweight on media companies in this sector proved especially unhelpful. But the largest detractor for the period was our position in the industrials and business services sector. Many of our chosen stocks, including Cendant, Tyco, and Deere, did not live up to our expectations and weighed down our relative results.
* The views expressed above are those of the subinvestment advisor firm as of December 31, 2005 and are subject to change based on market and other conditions. Information about the Portfolio’s holdings, asset allocation, industry allocation or country diversification is historical and is not an indication of future Portfolio composition, which will vary.
1 The Standard & Poor’s (S&P) 500® Composite Stock Price Index is an unmanaged index representing the performance of 500 major companies, most of which are listed on the New York Stock Exchange. The S&P 500 performance has not been adjusted for ongoing management, distribution and operating expenses, and sales charges applicable to mutual fund investments. Direct investment in the Index is not possible.
2 Lipper Variable Products Fund Averages. Each of these is an average of the total return performance (calculated on the basis of net asset value) of funds with similar investment objectives to those of the subject Portfolio as calculated by Lipper Analytical Services, an independent mutual fund ranking service.
MSF-32
Metropolitan Series Fund, Inc.
T. Rowe Price Large Cap Growth Portfolio
A $10,000 INVESTMENT COMPARED TO THE
S&P 500 INDEX
Average Annual Returns as of December 31, 2005
| | | | | | | | | | | | |
| | | T. Rowe Price Large Cap Growth Portfolio | | | S&P 500 | |
| | | Class A | | | Class B | | | Class E | | | Index | |
| 1 Year | | 6.6 | % | | 6.3 | % | | 6.4 | % | | 4.9 | % |
| 5 Years | | 1.2 | | | N/A | | | N/A | | | 0.5 | |
| Since Inception | | 5.0 | | | 12.8 | | | 2.2 | | | 2.8 | |
Performance numbers are net of all Portfolio expenses but do not include any insurance, sales, or administrative charges of variable annuity or life insurance contracts. If these charges were included, the returns would be lower.
Inception dates of the Class A, Class B and Class E shares are: 11/9/98, 7/30/02 and 5/1/01, respectively. Index since inception returns are based on the Class A inception date.
This information represents past performance and is not indicative of future results. Investment return and principal value may fluctuate so that shares, upon redemption, may be worth more or less than the original cost.
PORTFOLIO COMPOSITION
as of December 31, 2005
Top Holdings
| | |
| | | % of Total
Net Assets
|
General Electric Co. | | 3.7% |
Microsoft Corp. | | 3.0% |
UnitedHealth Group, Inc. | | 2.5% |
Wal-Mart Stores, Inc. | | 2.4% |
American International Group, Inc. | | 2.3% |
Citigroup, Inc. | | 2.3% |
UBS AG | | 2.2% |
Dell, Inc. | | 1.8% |
Accenture, Ltd. (Class A) | | 1.8% |
American Express Co. | | 1.7% |
Top Sectors
| | |
| | | % of Total
Net Assets
|
Information Technology | | 22.3% |
Finanicials | | 19.3% |
Consumer Discretionary | | 14.8% |
Healthcare | | 14.7% |
Industrials | | 8.3% |
Consumer Staples | | 5.9% |
Energy | | 5.3% |
Telecommunications | | 3.6% |
Materials | | 2.2% |
Cash/Other | | 3.6% |
MSF-33
Metropolitan Series Fund, Inc.
Zenith Equity Portfolio
Managed by MetLife Advisers, LLC
Portfolio Manager Commentary
PORTFOLIO PERFORMANCE
For the year ended December 31, 2005, the Class A shares of the Zenith Equity Portfolio returned 10.2%, compared to its benchmark, the Standard & Poor’s 500 Index,1 which returned 4.9%. The average return of its peer group, the Lipper Variable Insurance Products Large-Cap Core Funds Universe,2 was 5.8% over the same period.
PORTFOLIO REVIEW
During the twelve months ending December 31, 2005, domestic common stocks recovered from weakness earlier in the year to post a 4.9% total return as measured by the Standard & Poor’s 500 Index. Value stocks had slightly better performance than growth stocks for the entire year. Energy and Utilities were by far the best performing sectors, while Consumer Discretionary and Telecommunications trailed.
Currently, MetLife Advisers invests the assets of Zenith Equity Portfolio equally among the Capital Guardian U.S. Equity Portfolio, the FI Value Leaders Portfolio, and Jennison Growth Portfolio (the Underlying Portfolios).
For information on the Underlying Portfolios, please see sections of this report pertaining to each of the Underlying Portfolios.
* The views expressed above are those of the investment advisor firm as of December 31, 2005 and are subject to change based on market and other conditions. Information about the Portfolio’s holdings, asset allocation, industry allocation or country diversification is historical and is not an indication of future Portfolio composition, which will vary.
1 The Standard & Poor’s (S&P) 500® Composite Stock Price Index is an unmanaged index representing the performance of 500 major companies, most of which are listed on the New York Stock Exchange. The S&P 500 performance has not been adjusted for ongoing management, distribution and operating expenses, and sales charges applicable to mutual fund investments. Direct investment in the Index is not possible.
2 Lipper Variable Products Fund Averages. Each of these is an average of the total return performance (calculated on the basis of net asset value) of funds with similar investment objectives to those of the subject Portfolio as calculated by Lipper Analytical Services, an independent mutual fund ranking service.
MSF-34
Metropolitan Series Fund, Inc.
Zenith Equity Portfolio
A $10,000 INVESTMENT COMPARED TO THE S&P 500 INDEX
Average Annual Returns as of December 31, 2005
| | | | | | |
| | | Zenith Equity
Portfolio | | | S&P 500
Index | |
| 1 Year | | 10.2 | % | | 4.9 | % |
| 5 Years | | 1.0 | | | 0.5 | |
| 10 Years | | 8.8 | | | 9.1 | |
Performance numbers are net of all Portfolio expenses but do not include any insurance, sales, or administrative charges of variable annuity or life insurance contracts. If these charges were included, the returns would be lower.
This information represents past performance and is not indicative of future results. Investment return and principal value may fluctuate so that shares, upon redemption, may be worth more or less than the original cost.
PORTFOLIO COMPOSITION
as of December 31, 2005
Top Holdings
| | | |
| | | % of Total
Net Assets
| |
Metropolitan Series Fund, Inc.—FI Value Leaders Portfolio, (Class A) | | 33.4 | % |
Metropolitan Series Fund, Inc.—Capital Guardian U.S. Equity Portfolio, (Class A) | | 33.4 | % |
Metropolitan Series Fund, Inc.—Jennison Growth Portfolio, (Class A) | | 33.2 | % |
MSF-35
Metropolitan Series Fund, Inc.
BlackRock Aggressive Growth Portfolio
Managed by BlackRock Advisors, Inc.
Portfolio Manager Commentary*
PORTFOLIO PERFORMANCE
For the year ended December 31, 2005, the Class A shares of the BlackRock Aggressive Growth Portfolio returned 10.7%, compared to its benchmark, the Russell Midcap Growth Index,1 which returned 12.1%. The average return of its peer group, the Lipper Variable Insurance Products Mid-Cap Growth Funds Universe,2 was 10.6% over the same period.
PORTFOLIO REVIEW
The U.S. equity market produced modest gains in 2005, with Mid Cap stocks demonstrating the greatest strength for the second consecutive year. Continued economic expansion, which enabled corporations to grow earnings and improve margins, proved to be the catalyst for higher stock prices. The tandem forces of rising interest rates and surging energy prices, however, dampened investor enthusiasm and muted overall returns for the year. While pressuring the consumer and industrial materials manufacturers, rising energy prices lifted the value of energy shares. In 2005, the energy portion of the Russell Midcap Growth Index surged 56% and turned in the best performance of any sector during this period.
In 2005, the energy sector produced the largest absolute and relative gains for the Portfolio. We maintained an overweighted position in the sector throughout the year, and this positioning contributed excellent absolute and relative results. Our top performers in the sector included EOG Resources, Newfield Exploration, and Consol Energy. Our positioning in the consumer discretionary sector also paid off in 2005. This sector underperformed the broader market in 2005 as consumers began to feel the pressure from rising energy prices, and our decision to be underexposed to it aided return comparisons.
While sector positioning boosted the Portfolio’s relative performance in 2005, specific security selection limited the upside and led to the Portfolio’s relative underperformance. Stock selection in the health care sector was the most significant detractor for the year, with the two worst-performing stocks in the Portfolio coming from the biotechnology industry. Biogen and OSI Pharmaceuticals both declined sharply in the first half of the year. The unexpected withdrawal of Tysabri, a major multiple sclerosis drug, dealt a substantial blow to the shares of Biogen in February. OSI Pharmaceuticals declined steadily as its lung cancer drug, Tarceva, failed to generate the expected prescription and revenue growth.
Despite success in the communications equipment industry where Adtran, Inc. and Harris Corp. notably boosted returns, stock selection in information technology also hindered absolute and relative performance in 2005. Weakness was concentrated in the software and IT services industries, two of the strongest areas in technology during the year.
* On January 31, 2005, BlackRock Advisors, Inc. (“BlackRock”) succeeded State Street Research & Management Company (“State Street Research”) as subadviser to the Portfolio, and the Portfolio’s name was changed from State Street Research Aggressive Growth Portfolio to BlackRock Aggressive Growth Portfolio. This commentary was prepared by BlackRock. The views expressed above are those of the subinvestment advisor firm as of December 31, 2005 and are subject to change based on market and other conditions. Information about the Portfolio’s holdings, asset allocation, industry allocation or country diversification is historical and is not an indication of future Portfolio composition, which will vary.
1 The Russell Midcap® Growth Index is an unmanaged measure of performance of those Russell Midcap companies (the 800 smallest companies in the Russell 1000 Index) with higher price-to-book ratios and higher forecasted growth values. The Index performance has not been adjusted for ongoing management, distribution and operating expenses and sales charges applicable to mutual fund investments. Direct investment in the Index is not possible.
2 Lipper Variable Products Fund Averages. Each of these is an average of the total return performance (calculated on the basis of net asset value) of funds with similarn investment objectives to those of the subject Portfolio as calculated by Lipper Analytical Services, an independent mutual fund ranking service.
MSF-36
Metropolitan Series Fund, Inc.
BlackRock Aggressive Growth Portfolio
A $10,000 INVESTMENT COMPARED TO THE
RUSSELL MIDCAP GROWTH INDEX
Average Annual Returns as of December 31, 2005
| | | | | | | | | | | | |
| | | BlackRock Aggressive Growth Portfolio | | | Russell
MidCap Growth Index | |
| | | Class A | | | Class B | | | Class E | | |
| 1 Year | | 10.7 | % | | 10.4 | % | | 10.5 | % | | 12.1 | % |
| 5 Years | | -0.9 | | | N/A | | | N/A | | | 1.4 | |
| 10 Years | | 4.4 | | | N/A | | | N/A | | | 9.3 | |
| Since Inception | | — | | | 10.7 | | | 1.7 | | | — | |
Performance numbers are net of all Portfolio expenses but do not include any insurance, sales, or administrative charges of variable annuity or life insurance contracts. If these charges were included, the returns would be lower.
Inception dates of the Class A, Class B and Class E shares are: 4/29/88, 4/26/04 and 5/1/01, respectively.
This information represents past performance and is not indicative of future results. Investment return and principal value may fluctuate so that shares, upon redemption, may be worth more or less than the original cost.
PORTFOLIO COMPOSITION as of December 31, 2005
Top Holdings
| | |
| | | % of Total
Net Assets
|
CONSOL Energy, Inc. | | 2.7% |
Newfield Expolration Co. | | 2.5% |
Ceridian Corp. | | 2.3% |
Avid Technology, Inc. | | 2.3% |
American Tower Corp. (Class A) | | 2.2% |
Williams-Sonoma, Inc. | | 2.2% |
EOG Resources, Inc. | | 2.1% |
Shire Pharmaceuticals Group, Plc. (ADR) | | 2.0% |
Community Health Systems, Inc. | | 1.9% |
WellPoint, Inc. | | 1.9% |
Top Sectors
| | |
| | | % of Equity
Market Value
|
Information Technology | | 26.1% |
Health Care | | 20.9% |
Consumer Discretionary | | 17.0% |
Energy | | 12.9% |
Industrials | | 9.6% |
Financials | | 4.4% |
Telecommunications | | 4.4% |
Materials | | 3.1% |
Cash/Other | | 1.6% |
MSF-37
Metropolitan Series Fund, Inc.
FI Mid Cap Opportunities Portfolio
Managed by Fidelity Management & Research Company
Portfolio Manager Commentary*
PORTFOLIO PERFORMANCE
For the year ended December 31, 2005, the Class A shares of the FI Mid Cap Opportunities Portfolio returned 6.9%, compared to its benchmark, the Standard & Poor’s MidCap 400 Index,1 which returned 12.6%. The average return of its peer group, the Lipper Variable Insurance Products Mid-Cap Growth Funds Universe,2 was 10.6% over the same period.
PORTFOLIO REVIEW
Pessimism abounded in 2005 as news flow was flush with stories related to high energy prices, increasing interest rates, inflation fears, and a collapsing housing market. Meanwhile, corporate profits remained robust, consumers continued to spend, and the economy remained on solid footing. The net effect was a stock market that did not make a meaningful move in any direction. The S&P 500 Index3 rose 4.9% during the year. The Fed continued its “measured pace” of rate increases, boosting the Fed Funds Rate eight times during the year. Despite the Fed’s increases, long-term rates remained stubbornly low. The price of oil dominated headlines during the year as it was up more than 60% at one point before retreating toward year-end. This was a boon to energy companies, the returns of which far outpaced that of the rest of the market.
In this environment, the FI Mid Cap Opportunities Portfolio underperformed the S&P MidCap 400 Index. Unfavorable stock picks in the consumer durables sector detracted the most from performance. Chief among them was audio electronics maker, Harman International, which lost ground during the year on competitive concerns. Also detracting from performance was exposure to a cruise line operator that declined amid concerns about the impact of high energy prices. On the positive side, the Portfolio’s overweighted position in energy stocks contributed to relative performance, as oil and natural gas prices crept higher through much of the one-year period. Within the energy sector, the Portfolio also benefited from security selection by emphasizing oilfield equipment makers. Finally, stock picks in the telecommunications sector contributed to relative returns. Chief among them was American Tower Corporation, a wireless infrastructure company, whose stock rose more than 45% during the year.
* The views expressed above are those of the subinvestment advisor firm as of December 31, 2005 and are subject to change based on market and other conditions. Information about the Portfolio’s holdings, asset allocation, industry allocation or country diversification is historical and is not an indication of future Portfolio composition, which will vary.
1 The Standard & Poor’s MidCap 400® Index is an unmanaged index measuring the performance of the mid-size company segment of the U.S. market. The Index consists of 400 domestic stocks chosen for market size, liquidity, and industry group representation. The Index performance has not been adjusted for ongoing management, distribution and operating expenses and sales charges applicable to mutual fund investments. Direct investment in the Index is not possible.
2 Lipper Variable Products Fund Averages. Each of these is an average of the total return performance (calculated on the basis of net asset value) of funds with similar investment objectives to those of the subject Portfolio as calculated by Lipper Analytical Services, an independent mutual fund ranking service.
3 The Standard & Poor’s (S&P) 500® Composite Stock Price Index is an unmanaged index representing the performance of 500 major companies, most of which are listed on the New York Stock Exchange. The S&P 500 performance has not been adjusted for ongoing management, distribution and operating expenses, and sales charges applicable to mutual fund investments. Direct investment in the Index is not possible.
MSF-38
Metropolitan Series Fund, Inc.
FI Mid Cap Opportunities Portfolio
A $10,000 INVESTMENT COMPARED TO THE
S&P MIDCAP 400 INDEX
Average Annual Returns as of December 31, 2005
| | | | | | | | | | | | |
| | | FI Mid Cap Opportunities Portfolio | | | S&P MidCap 400 Index | |
| | | Class A | | | Class B | | | Class E | | |
| 1 Year | | 6.9 | % | | 6.7 | % | | 6.7 | % | | 12.6 | % |
| 5 Years | | -5.6 | | | N/A | | | N/A | | | 8.6 | |
| Since Inception | | 8.3 | | | -4.4 | | | -1.9 | | | 13.7 | |
Performance numbers are net of all Portfolio expenses but do not include any insurance, sales, or administrative charges of variable annuity or life insurance contracts. If these charges were included, the returns would be lower.
Inception dates of the Class A, Class B and Class E shares are: 3/3/97, 1/2/01 and 5/1/01, respectively. Index since inception returns are based on the Class A inception date.
This information represents past performance and is not indicative of future results. Investment return and principal value may fluctuate so that shares, upon redemption, may be worth more or less than the original cost.
PORTFOLIO COMPOSITION
as of December 31, 2005
Top Holdings
| | |
| | | % of Total
Net Assets
|
Harman International Industries, Inc. | | 7.7% |
Sprint Nextel Corp. | | 6.4% |
Safeway, Inc. | | 3.0% |
NIKE, Inc. (Class B) | | 2.7% |
Nokia Corp. (ADR) | | 2.7% |
Tiffany & Co. | | 2.5% |
Empresa Brasileira de Aeronautica S.A. (ADR) | | 2.2% |
Cytyc Corp. | | 2.2% |
American Tower Corp. (Class A) | | 2.0% |
EchoStar Communications Corp. (Class A) | | 2.0% |
Top Sectors
| | |
| | | % of Equity
Market Value
|
Consumer Discretionary | | 31.3% |
Infomration Technology | | 13.8% |
Telecommunications Services | | 13.4% |
Industrials | | 9.8% |
Materials | | 9.8% |
Energy | | 9.2% |
Consumer Staples | | 4.5% |
Health Care | | 4.4% |
Financials | | 2.0% |
Utilities | | 1.2% |
MSF-39
Metropolitan Series Fund, Inc.
Harris Oakmark Focused Value Portfolio
Managed by Harris Associates, L.P.
Portfolio Manager Commentary*
PORTFOLIO PERFORMANCE
For the year ended December 31, 2005, the Class A shares of the Harris Oakmark Focused Value Portfolio returned 10.0%, compared to its benchmark, the Russell Midcap Index,1 which returned 12.7%. The average return of its peer group, the Lipper Variable Insurance Products Mid-Cap Value Funds Universe,2 was 8.5% over the same period.
PORTFOLIO REVIEW
The most recent period has provided some different challenges, compared to previous periods, namely severe compression of equity valuation multiples and low capital market returns for most traditional asset classes. The frustration has only been amplified by company performance that has generally been quite good: corporate profit margins are near peak levels, while earnings have grown at a double-digit rate in each quarter for the past 3 1/2 years.
During 2005, we added businesses such as Intel, McDonald’s, and Morgan Stanley, among others listed below, to the Portfolio.
Intel is the world’s largest semiconductor chipmaker and a technology bellwether. The company’s products include microprocessor chips, boards, and other semiconductor components that are the building blocks to computers, servers, and networking and communications products. The company generated considerable free cash flow.
McDonald’s operates and franchises quick-service restaurant businesses under the McDonald’s brand, as well as other names such as Boston Market, in countries around the world. The firm has recently initiated what we believe is a better capital allocation plan with an expanded return on investment focus. We anticipate that McDonald’s emphasis on new menu items will continue to drive revenues and increase margins. The firm has also experienced excellent revenue streams from its franchised stores, and we believe it has a great deal of international growth potential, and enjoys economies of scale that help keep costs low.
Morgan Stanley is a best-in-class investment bank with, we believe, a collection of under-managed, but valuable assets. At December 31, 2005, the company was selling at a significant discount to a sum-of-the-parts valuation as well as trading at a low price/book value compared to its peers.
In addition to the above, we also added CDW Corp., Conseco, Inc., National Semiconductor Corp., The E.W. Scripps Co., The Estee Lauder Cos., Inc., and The Timberland Co. to the Portfolio during the period. We eliminated our positions in Darden Restaurants, Janus Capital Group, Moody’s Corp., Office Depot, Rockwell Collins, and Toys R Us during the period.
Burlington Resources, Omnicare, and Darden Restaurants had the most significant positive impact on performance during the year. Earnings at Burlington Resources were helped by lower exploration expenses and the continued increase of oil and natural gas prices throughout the year. Fundamentals behind Omnicare’s business, in our view, remained strong, as the number of beds served and profitability in pharmacy services have both increased. We believe that Omnicare’s recent acquisition of Neighborcare, along with some smaller strategic deals, have added materially to overall profitability and business value. Darden Restaurants Olive Garden unit was a strong performer. That, along with changes at the Red Lobster unit, helped improve revenues. The firm saw sequential quarterly improvements in operations, and we subsequently sold the stock during the third quarter.
Liz Claiborne, Xerox, and Mattel had the most significant negative impact on performance during the year. Sales at Liz Claiborne slowed during the year as high gasoline prices and low consumer confidence kept shoppers away. Xerox was down as the company reported weak revenue growth. Mattel’s Barbie brand continued to be under pressure from its hipper, more fashion-forward rival, Bratz. The other Mattel brands (Hot Wheels, Fisher Price, American Girl) were doing well.
* The views expressed above are those of the subinvestment advisor firm as of December 31, 2005 and are subject to change based on market and other conditions. Information about the Portfolio’s holdings, asset allocation, industry allocation or country diversification is historical and is not an indication of future Portfolio composition, which will vary.
1 The Russell Midcap® Index is an unmanaged measure of performance of those Russell Midcap companies (the 800 smallest companies in the Russell 1000 Index) with higher price-to-book ratios and higher forecasted growth values. The Index performance has not been adjusted for ongoing management, distribution and operating expenses and sales charges applicable to mutual fund investments. Direct investment in the Index is not possible.
2 Lipper Variable Products Fund Averages. Each of these is an average of the total return performance (calculated on the basis of net asset value) of funds with similar investment objectives to those of the subject Portfolio as calculated by Lipper Analytical Services, an independent mutual fund ranking service.
MSF-40
Metropolitan Series Fund, Inc.
Harris Oakmark Focused Value Portfolio
A $10,000 INVESTMENT COMPARED TO THE
RUSSELL MIDCAP INDEX
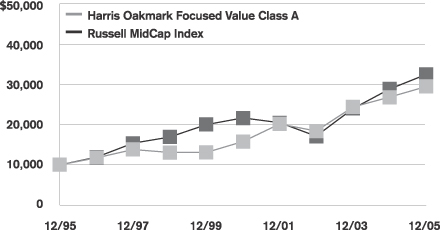
Average Annual Returns as of December 31, 2005
| | | | | | | | | | | | |
| | | Harris Oakmark Focused Value Portfolio | | | Russell MidCap Index | |
| | | Class A | | | Class B | | | Class E | | |
| 1 Year | | 10.0 | % | | 9.7 | % | | 9.8 | % | | 12.7 | % |
| 5 Years | | 13.3 | | | N/A | | | N/A | | | 8.5 | |
| 10 Years | | 11.4 | | | N/A | | | N/A | | | 12.5 | |
| Since Inception | | — | | | 11.2 | | | 11.2 | | | — | |
Performance numbers are net of all Portfolio expenses but do not include any insurance, sales, or administrative charges of variable annuity or life insurance contracts. If these charges were included, the returns would be lower.
Inception dates of the Class A, Class B and Class E shares are: 4/30/93, 2/20/01 and 5/1/01, respectively.
This information represents past performance and is not indicative of future results. Investment return and principal value may fluctuate so that shares, upon redemption, may be worth more or less than the original cost.
PORTFOLIO COMPOSITION
as of December 31, 2005
Top Holdings
| | |
| | | % of Total
Net Assets
|
Sovereign Bancorp, Inc. | | 7.0% |
Washington Mutual, Inc. | | 5.0% |
Omnicare, Inc. | | 4.3% |
H&R Block, Inc. | | 4.2% |
The E.W. Scripps Co. (Class A) | | 4.0% |
Liz Claiborne, Inc. | | 4.0% |
Yum! Brands, Inc. | | 3.9% |
R.R. Donnelley & Sons Co. | | 3.9% |
Burlington Resources, Inc. | | 3.5% |
ARAMARK Corp. (Class B) | | 3.5% |
Top Sectors
| | |
| | | % of Total
Market Value
|
Consumer Discretionary | | 35.4% |
Financials | | 18.3% |
Industrials | | 13.8% |
Information Technology | | 13.5% |
Health Care | | 8.7% |
Consumer Staples | | 6.5% |
Energy | | 3.8% |
MSF-41
Metropolitan Series Fund, Inc.
MetLife Mid Cap Stock Index Portfolio
Managed by Metropolitan Life Insurance Company
Portfolio Manager Commentary*
PORTFOLIO PERFORMANCE
For the year ended December 31, 2005, the Class A shares of the MetLife Mid Cap Stock Index Portfolio returned 12.3%, compared to its benchmark, the Standard & Poor’s MidCap 400 Index,1 which returned 12.6%.
PORTFOLIO REVIEW
The Standard & Poor’s MidCap 400 Index had a positive return for the third consecutive year. Over the three-year period ending December 31, 2005, the MidCap Index returned 21.1% annualized. MidCap stocks outperformed large cap stocks for the sixth year in a row, beating the S&P 500 Index2 by 7.6% in 2005. The best performance came in May, up 6.0%, while the weakest month was April, down 3.9%. Some of the factors driving the equity markets included geopolitical concerns, energy prices, Federal Reserve interest rate policy, corporate earnings, employment data, and the U.S. Dollar.
Nine out of ten sectors comprising the Standard & Poor’s MidCap 400 Index experienced positive returns for the year. Energy (6.8% weight in the benchmark) returned 52.7%, having the largest positive impact on the benchmark’s return this year. Energy was also the absolute best performing sector. The second-best performing sector was Health Care (10.7% weight), up 18.1%. Other strong performing sectors during the year were Consumer Staples, up 16.6%; Industrials, up 12.3%; and Utilities, up 10.1%. The Telecomm Services sector (0.5% weight in the benchmark), down 8.0% for the year, was the only sector with a negative return.
The three stocks with the largest positive impact on performance were SanDisk Corp., up 151.6%; Peabody Energy Corp., up 105.0%; and Legg Mason, Inc., up 64.5%. The three stocks with the largest negative impact on performance were Lear Corp., down 52.1%; Harman International, down 22.9%; and Washington Post, down 21.5%.
There were twenty-nine additions and twenty-nine deletions to the benchmark in 2005.
* The views expressed above are those of the subinvestment advisor firm as of December 31, 2005 and are subject to change based on market and other conditions. Information about the Portfolio’s holdings, asset allocation, industry allocation or country diversification is historical and is not an indication of future Portfolio composition, which will vary.
1 The Standard & Poor’s MidCap 400® Index is an unmanaged index measuring the performance of the mid-size company segment of the U.S. market. The Index consists of 400 domestic stocks chosen for market size, liquidity, and industry group representation. The Index performance has not been adjusted for ongoing management, distribution and operating expenses and sales charges applicable to mutual fund investments. Direct investment in the Index is not possible.
2 The Standard & Poor’s (S&P) 500® Composite Stock Price Index is an unmanaged index representing the performance of 500 major companies, most of which are listed on the New York Stock Exchange. The S&P 500 performance has not been adjusted for ongoing management, distribution and operating expenses, and sales charges applicable to mutual fund investments. Direct investment in the Index is not possible.
MSF-42
Metropolitan Series Fund, Inc.
MetLife Mid Cap Stock Index Portfolio
A $10,000 INVESTMENT COMPARED TO THE
S&P MIDCAP 400 INDEX
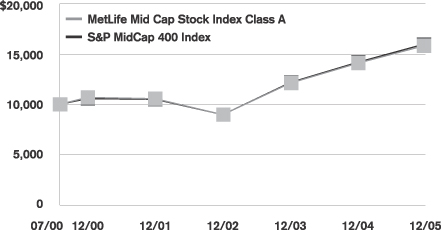
Average Annual Returns as of December 31, 2005
| | | | | | | | | | | | |
| | | MetLife Mid Cap Stock Index Portfolio | | | S&P MidCap
400 Index | |
| | | Class A | | | Class B | | | Class E | | |
| 1 Year | | 12.3 | % | | 12.0 | % | | 12.2 | % | | 12.6 | % |
| 5 Year | | 8.1 | | | N/A | | | N/A | | | 8.6 | |
| Since Inception | | 8.7 | | | 8.8 | | | 8.7 | | | 8.9 | |
Performance numbers are net of all Portfolio expenses but do not include any insurance, sales, or administrative charges of variable annuity or life insurance contracts. If these charges were included, the returns would be lower.
Inception dates of the Class A, Class B and Class E shares are: 7/5/00, 1/2/01 and 5/1/01, respectively. Index since inception returns are based on the Class A inception date.
This information represents past performance and is not indicative of future results. Investment return and principal value may fluctuate so that shares, upon redemption, may be worth more or less than the original cost.
PORTFOLIO COMPOSITION
as of December 31, 2005
Top Holdings
| | |
| | | % of Total
Net Assets
|
MidCap SPDR Trust, Series 1 | | 3.8% |
Legg Mason, Inc. | | 1.2% |
SanDisk Corp. | | 1.0% |
Peabody Energy Corp. | | 0.9% |
Chico’s FAS, Inc. | | 0.7% |
Smith International, inc. | | 0.6% |
Expeditors International of Washington, Inc. | | 0.6% |
Noble Energy, Inc. | | 0.6% |
Cognizant Technology Solutions Corp. (Class A) | | 0.6% |
Precision Castparts Corp. | | 0.6% |
Top Sectors
| | |
| | | % of Total
Market Value
|
Financials | | 18.9% |
Consumer Discretionary | | 16.3% |
Information Technology | | 15.7% |
Industrials | | 13.4% |
Health Care | | 11.8% |
Energy | | 9.7% |
Utilities | | 7.4% |
Materials | | 4.1% |
Consumer Staples | | 2.3% |
Telecomm Services | | 0.4% |
MSF-43
Metropolitan Series Fund, Inc.
Neuberger Berman Mid Cap Value Portfolio
Managed by Neuberger Berman Management, Inc.
Portfolio Manager Commentary
PORTFOLIO PERFORMANCE
For the year ended December 31, 2005, the Class A shares of the Neuberger Berman Mid Cap Value Portfolio returned 12.3%, compared to its benchmark, the Russell Midcap Value Index,1 which returned 12.7%. The average return of the Portfolio’s peer group, the Lipper Variable Insurance Products Mid-Cap Value Funds Universe,2 was 8.5% over the same period.
PORTFOLIO REVIEW
Domestic equity markets generated positive total returns for the full year 2005. The Russell Midcap Value Index (RMCV) led the widely followed U.S. indices with a return approaching 13%. Foreign stocks, as measured by the MSCI EAFE Index,3 beat all domestic indices with a gain of roughly 14%. Mid-cap stocks substantially outperformed both large-cap and small cap stocks for the year. Value generally beat growth in all market-cap segments, though the spreads were narrower in mid- and small-cap indices. The Dow Jones Industrial Average and the NASDAQ Composite indices were the lowest returning among the widely followed equity indices in 2005.
Portfolio holdings in Energy and Health Care drove total return over the year. Within Energy, some of our exploration and production and coal mining companies performed particularly well; i.e. XTO Energy, Canadian Natural Resources, Arch Coal, and Peabody Energy. We continued to favor companies involved in coal, oil sands, Barnett shale and other non-conventional sources of oil and gas and believe they are likely to benefit over the long-term from supply constraints and high energy prices. Within Health Care, Coventry Health Care, one of our managed care companies, and Omnicare, a pharmaceutical services company, contributed substantially to total return. We are less enthusiastic about the sector than we were earlier in 2005 given less attractive valuations; we decreased our allocation over the year but remain overweight versus the RMCV Index.
Portfolio holdings within Industrials, Financials and Materials also made positive contributions to 2005 total return. Joy Global and Phelps Dodge were the drivers of performance within Industrials and Materials, respectively, while IndyMac Bancorp and Arch Capital Group were the largest contributors within Financials. We found some attractively valued investment opportunities within Industrials and were overweight in the sector as of year-end.
Consumer Staples was the only sector in the Portfolio to detract from total return. Two particular holdings, Spectrum Brands and NBTY Inc., were to blame. At December 31, 2005, we were underweight in this sector.
Relative to the RMCV Index, the Portfolio benefited from positive stock selection within Health Care, as our holdings rose substantially more than index sector components. The Portfolio’s overweight allocation to Energy also boosted the portfolio’s relative performance; this was, by far, the highest-returning sector in the RMCV.
On the downside, negative stock selection in, and an overweight allocation to, Consumer Discretionary dampened the Portfolio’s relative performance. This was the lowest-returning sector in the index over the one-year period. Lear Corp., an auto parts and equipment company, and home furnishing retailer Pier 1 Imports had the largest negative effect on the Portfolio’s absolute and relative returns. The less-robust performance of our Financials stocks and the overall decline of our Consumer Staples holdings also detracted from our return relative to the RMCV Index.
* The views expressed above are those of the subinvestment advisor firm as of December 31, 2005 and are subject to change based on market and other conditions. Information about the Portfolio’s holdings, asset allocation, industry allocation or country diversification is historical and is not an indication of future Portfolio composition, which will vary.
1 The Russell Midcap® Value (RMCV) Index is an unmanaged measure of performance of those Russell Midcap companies (the 800 smallest companies in the Russell 1000 Index) with lower price-to-book ratios and higher forecasted growth values. The Index performance has not been adjusted for ongoing management, distribution and operating expenses and sales charges applicable to mutual fund investments. Direct investment in the Index is not possible.
2 Lipper Variable Products Fund Averages. Each of these is an average of the total return performance (calculated on the basis of net asset value) of funds with similar investment objectives to those of the subject Portfolio as calculated by Lipper Analytical Services, an independent mutual fund ranking service.
3 The Morgan Stanley Capital International (MSCI) EAFE® Index is an unmanaged, commonly used measure of performance for Europe, Australasia and the Far East. The Index performance has not been adjusted for ongoing management, distribution and operating expenses and sales charges applicable to mutual fund investments. Direct investment in the Index is not possible.
MSF-44
Metropolitan Series Fund, Inc.
Neuberger Berman Mid Cap Value Portfolio
A $10,000 INVESTMENT COMPARED TO THE
RUSSELL MIDCAP VALUE INDEX
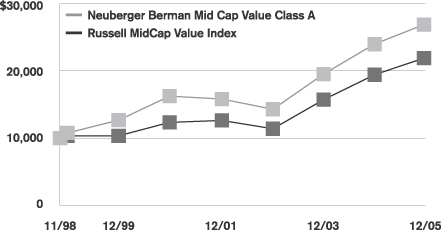
Average Annual Returns as of December 31, 2005
| | | | | | | | | | | | |
| | | Neuberger Berman Mid Cap Value Portfolio | | | Russell MidCap
Value Index | |
| | | Class A | | | Class B | | | Class E | | |
| 1 Year | | 12.3 | % | | 11.9 | % | | 12.1 | % | | 12.7 | % |
| 5 Years | | 10.7 | | | N/A | | | N/A | | | 12.2 | |
| Since Inception | | 14.8 | | | 11.4 | | | 11.6 | | | 11.6 | |
Performance numbers are net of all Portfolio expenses but do not include any insurance, sales, or administrative charges of variable annuity or life insurance contracts. If these charges were included, the returns would be lower.
Inception dates of the Class A, Class B and Class E shares are: 11/9/98, 5/1/01 and 5/1/01, respectively. Index since inception returns are based on the Class A inception date.
This information represents past performance and is not indicative of future results. Investment return and principal value may fluctuate so that shares, upon redemption, may be worth more or less than the original cost.
PORTFOLIO COMPOSITION
as of December 31, 2005
Top Holdings
| | |
| | | % of Total
Net Assets
|
Canadian Natural Resources, Ltd. | | 2.4% |
Centex Corp. | | 2.3% |
XTO Energy, Inc. | | 2.2% |
TXU Corp. | | 2.1% |
Talisman Energy, Inc. | | 2.1% |
Joy Global, Inc. | | 2.1% |
Hovnanian Enterprises, Inc. (Class A) | | 2.0% |
Arch Coal, Inc. | | 2.0% |
Lennar Corp. (Class A) | | 2.0% |
Terex Corp. | | 1.9% |
Top Sectors
| | |
| | | % of Equity
Market Value
|
Consumer Discretionary | | 28.9% |
Energy | | 22.2% |
Financials | | 18.5% |
Industrials | | 8.2% |
Health Care | | 6.1% |
Information Technology | | 5.4% |
Utilities | | 5.0% |
Consumer Staples | | 3.7% |
Materials | | 2.0% |
| | | |
MSF-45
Metropolitan Series Fund, Inc.
BlackRock Strategic Value Portfolio
Managed by BlackRock Advisors, Inc.
Portfolio Manager Commentary*
PORTFOLIO PERFORMANCE
For the year ended December 31, 2005, the Class A shares of the BlackRock Strategic Value Portfolio returned 4.2%, compared to its benchmark, the Russell 2000 Value Index,1 which returned 4.7%. The average return of its peer group, the Lipper Variable Insurance Products Small-Cap Value Funds Universe,2 was 7.6% over the same period.
PORTFOLIO REVIEW
Spiking oil prices, increasing interest rates, and the impact of two major hurricanes in the Gulf Coast made 2005 a challenging year for the domestic equity markets. Despite these headwinds, small cap stocks managed to end the year in positive territory, with the Russell 2000 Index3 gaining 4.6%. Mid cap stocks gained the most ground during the year, followed by their large cap and small cap counterparts. Value stocks outperformed growth stocks across the market capitalization spectrum for the full year. Within the benchmark Russell 2000 Value Index, the energy sector was the clear leader, while the consumer sectors were among those in negative territory. In this environment, the Portfolio underperformed the benchmark, as strength in the energy, consumer discretionary and financial sectors was overshadowed by relative weakness in the information technology and industrial sectors.
Through the first three quarters of the year, energy stocks were on a tear as crude oil prices peaked near $70/barrel in late August. Despite a slight pullback in the fourth quarter, the sector still closed the year up nearly 40%. Within the Portfolio, the combination of solid stock selection and a modest overweight in the sector proved to be the greatest driver of relative performance. Key contributors included exploration and production company, Vintage Petroleum, and coal producer, Foundation Coal. Building on strong gains throughout much of the year, shares of Vintage Petroleum appreciated sharply in mid-October following its announced acquisition by Occidental Petroleum. We took advantage of these gains and sold the stock subsequent to the announcement. At Foundation Coal, better-than-expected second quarter earnings and management raised expectations for 2005 provided the catalyst for strong gains through the second half of the year.
Resilient consumer spending and continued economic growth kept retailers, hotel, restaurant, and gaming names firmly in positive territory for the year. Within the Portfolio, stock selection, particularly among gaming industry names, drove favorable sector comparisons. Boyd Gaming added the most value as the hotel and casino operator rebounded in the fourth quarter. Although hurricanes Katrina and Rita had significantly impacted Boyd’s operations in the Gulf Coast, the company reported third quarter earnings ahead of expectations as growth at its Las Vegas and Atlantic City properties helped offset these losses.
Conversely, stock selection and an overweight in information technology, particularly in communications equipment and semiconductor names, proved to be among the greatest detractors from relative performance during the year. Within the sector, communications equipment holding, Tekelec, was the most notable individual detractor as shares of the telecommunications products producer declined following the resignation of its president/CEO.
The industrials sector was also an area of weakness relative to the benchmark Russell 2000 Value Index. Stock selection was the primary driver of underperformance as allocation within the sector had a modestly positive impact. Portfolio holding, Briggs & Stratton, was among the key detractors. Shares of the maker of engines and generators stumbled early in the year as the company reported disappointing earnings and lowered guidance for 2005. The stock was subsequently sold from the Portfolio in favor of more attractive opportunities.
During the year, the most notable sector weightings relative to the Russell 2000 Value Index included an overweight in consumer discretionary and an underweight in financials. Within consumer discretionary, our allocation to specialty retailers and hotel, restaurant and gaming names accounted for much of the overweight. In financials, we added to sector exposure throughout the year. However, at December 31, 2005, we remained underweight in Real Estate Investment Trusts (REITs).
* On January 31, 2005, BlackRock Advisors, Inc. (“BlackRock”) succeeded State Street Research & Management Company (“State Street Research”) as subadviser to the Portfolio, and the Portfolio’s name was changed from State Street Research Aurora Portfolio to BlackRock Strategic Value Portfolio. This commentary was prepared by BlackRock. The views expressed above are those of the subinvestment advisor firm as of December 31, 2005 and are subject to change based on market and other conditions. Information about the Portfolio’s holdings, asset allocation, industry allocation or country diversification is historical and is not an indication of future Portfolio composition, which will vary.
1 The Russell 2000® Value Index is an unmanaged measure of performance of those Russell 2000 companies that have lower price-to-book ratios and lower forecasted growth values. The Index performance has not been adjusted for ongoing management, distribution and operating expenses and sales charges applicable to mutual fund investments. Direct investment in the Index is not possible.
2 Lipper Variable Products Fund Averages. Each of these is an average of the total return performance (calculated on the basis of net asset value) of funds with similar investment objectives to those of the subject Portfolio as calculated by Lipper Analytical Services, an independent mutual fund ranking service.
3 The Russell 2000® Index is an unmanaged measure of performance of the 2,000 smallest companies in the Russell 3000 Index. The Index performance has not been adjusted for ongoing management, distribution and operating expenses and sales charges applicable to mutual fund investments. Direct investment in the Index is not possible.
MSF-46
Metropolitan Series Fund, Inc.
BlackRock Strategic Value Portfolio
A $10,000 INVESTMENT COMPARED TO THE
RUSSELL 2000 VALUE INDEX
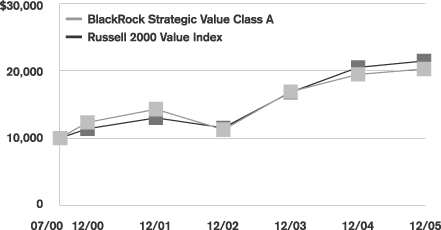
Average Annual Returns as of December 31, 2005
| | | | | | | | | | | | |
| | | BlackRock Strategic Value Portfolio | | | Russell 2000
Value Index | |
| | | Class A | | | Class B | | | Class E | | |
| 1 Year | | 4.2 | % | | 3.9 | % | | 4.0 | % | | 4.7 | % |
| 5 Years | | 10.5 | | | N/A | | | N/A | | | 13.6 | |
| Since Inception | | 13.7 | | | 7.6 | | | 7.6 | | | 14.9 | |
Performance numbers are net of all Portfolio expenses but do not include any insurance, sales, or administrative charges of variable annuity or life insurance contracts. If these charges were included, the returns would be lower.
Inception dates of the Class A, Class B and Class E shares are: 7/5/00, 5/1/01 and 5/1/01, respectively. Index since inception returns are based on the Class A inception date.
This information represents past performance and is not indicative of future results. Investment return and principal value may fluctuate so that shares, upon redemption, may be worth more or less than the original cost.
PORTFOLIO COMPOSITION
as of December 31, 2005
Top Holdings
| | |
| | | % of Total
Net Assets
|
The Brinks Co. | | 3.3% |
Walter Industries, Inc. | | 2.2% |
Jarden Corp. | | 2.1% |
Washington Group International, Inc. | | 2.0% |
Sovereign Bancorp, Inc. | | 2.0% |
GTECH Holdings Corp. | | 2.0% |
Banta Corp. | | 1.9% |
Thomas & Betts Corp. | | 1.9% |
National Financial Partners Corp. | | 1.9% |
Affiliated Managers Group, Inc. | | 1.7% |
Top Sectors
| | |
| | | % of Total
Market Value
|
Financials | | 24.8% |
Consumer Discretionary | | 23.1% |
Industrials | | 18.2% |
Information Technology | | 9.6% |
Utilities | | 5.8% |
Health Care | | 4.4% |
Materials | | 4.1% |
Energy | | 3.9% |
Consumer Staples | | 2.8% |
Cash/Other | | 2.8% |
MSF-47
Metropolitan Series Fund, Inc.
Franklin Templeton Small Cap Growth Portfolio
Managed by Franklin Advisers, Inc.
Portfolio Manager Commentary*
PORTFOLIO PERFORMANCE
For the year ended December 31, 2005, the Class A shares of the Franklin Templeton Small Cap Growth Portfolio returned 4.7%, compared to its benchmark, the Russell 2000 Growth Index,1 which returned 4.2%. The average return of its peer group, the Lipper Variable Insurance Products Small-Cap Growth Funds Universe,2 was 7.5% over the same period.
PORTFOLIO REVIEW
During the 12 months ended December 31, 2005, U.S. economic expansion was driven by strength across most industries, sectors and regions. Gross domestic product (GDP) rose during the period, benefiting primarily from increased personal consumption, business investment, and federal spending. The U.S. dollar rallied in 2005, supported by relatively strong domestic economic growth and rising short-term domestic interest rates, as the Federal Reserve Board raised the federal funds target rate from 2.25% to 4.25% during the period. Compared with the rise in short-term interest rates, long-term rates remained relatively stable, supporting overall robust housing and commercial real estate activity, which contributed to economic growth. Oil prices remained high during the period, and natural gas prices rose during the second half of the period. Despite these high commodity prices, inflation remained relatively contained. In this environment, the blue chip stocks of the Dow Jones Industrial Average3 posted a one-year total return of 1.7%, while the broader Standard & Poor’s 500 Composite Index4 and the technology-heavy NASDAQ Composite Index5 returned 4.9% and 2.1%, respectively.
During the year, several factors had a positive impact on the Portfolio’s relative performance. An overweighted position compared to the benchmark Russell 2000 Growth Index and stock selection in the industrial services sector supported overall returns, especially our investments in oilfield services and equipment industry stocks. Similarly, stock selection in electronic technology, particularly among electronic equipment and instruments, and telecommunications equipment companies, also aided the Portfolio’s relative results. As a whole, the Portfolio’s transportation sector investments also benefited from stock selection, with our holdings in the trucking industry performing particularly well.
Detractors from performance during the year included the health technology sector, particularly holdings in the biotechnology industry, where stock selection hindered our results. An overweighted position in process industries also delivered unimpressive returns, as that sector generally performed poorly in 2005. Stock selection among retail trade companies was also a detractor. For example, retailers Cost Plus and Tuesday Morning were notable underperforming stocks within the Portfolio.
* The views expressed above are those of the subinvestment advisor firm as of December 31, 2005 and are subject to change based on market and other conditions. Information about the Portfolio’s holdings, asset allocation, industry allocation or country diversification is historical and is not an indication of future Portfolio composition, which will vary.
1 The Russell 2000® Growth Index is an unmanaged measure of performance of those Russell 2000 companies (small capitalization companies) that have higher price-to-book ratios and higher forecasted growth values. The Index performance has not been adjusted for ongoing management, distribution and operating expenses and sales charges applicable to mutual fund investments. Direct investment in the Index is not possible.
2 Lipper Variable Products Fund Averages. Each of these is an average of the total return performance (calculated on the basis of net asset value) of funds with similar investment objectives to those of the subject Portfolio as calculated by Lipper Analytical Services, an independent mutual fund ranking service.
3 The Dow Jones Industrial Average is a price-weighted average of 30 blue-chip stocks that are generally regarded to the leade Russell 3000® Index measures the performance of the 3,000 largest U.S. companies based on total market capitalization, which represents approximately 98% of the investable U.S. equity market. As of the latest reconstitution, the average market capitalization was approximately $4.8 billion; the median market capitalization was approximately $944.7 million. The index had a total market capitalization range of approximately $386.9 billion to $182.6 million. Direct investment in the Index is not possible.
4 The Standard & Poor’s (S&P) 500® Composite Stock Price Index is an unmanaged index representing the performance of 500 major companies, most of which are listed on the New York Stock Exchange. The S&P 500 performance has not been adjusted for ongoing management, distribution and operating expenses, and sales charges applicable to mutual fund investments. Direct investment in the Index is not possible.
5 NASDAQ Composite Index is a market-weighted index of all common stocks traded over-the-counter that are included in the NASDAQ quotation system. It excludes those listed on an exchange and those with only one market maker. It is an index of predominantly smaller capitalization companies. This is a total return index with dividends reinvested, as calculated by Wilshire Associates. Direct investment in the Index is not possible.
MSF-48
Metropolitan Series Fund, Inc.
Franklin Templeton Small Cap Growth Portfolio
A $10,000 INVESTMENT COMPARED TO THE
RUSSELL 2000 GROWTH INDEX
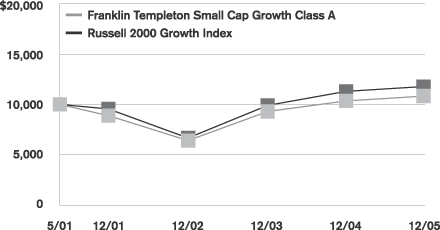
Average Annual Returns as of December 31, 2005
| | | | | | | | | | | | |
| | | | | | Russell 2000 Growth Index | |
| | | Franklin Templeton Small Cap Growth Portfolio | | |
| | | Class A | | | Class B | | | Class E | | |
| 1 Year | | 4.7 | % | | 4.4 | % | | 4.5 | % | | 4.2 | % |
| Since Inception | | 1.7 | | | 1.5 | | | 1.6 | | | 3.5 | |
Performance numbers are net of all Portfolio expenses but do not include any insurance, sales, or administrative charges of variable annuity or life insurance contracts. If these charges were included, the returns would be lower.
Inception date of the Class A, Class B and Class E shares is 5/1/01. Index since inception returns are based on the Class A inception date.
This information represents past performance and is not indicative of future results. Investment return and principal value may fluctuate so that shares, upon redemption, may be worth more or less than the original cost.
PORTFOLIO COMPOSITION
as of December 31, 2005
Top Holdings
| | |
| | | % of Total
Net Assets
|
Silicon Laboratories, Inc. | | 1.7% |
Varian Semiconductor Equipment, Inc. | | 1.7% |
Cal Dive International, Inc. | | 1.7% |
Penn National Gaming, Inc. | | 1.6% |
Forward Air Corp. | | 1.5% |
Flowserve Corp. | | 1.5% |
ViaSat, Inc. | | 1.4% |
Marchex, Inc. | | 1.4% |
Superior Energy Services, Inc. | | 1.3% |
Global Payments, Inc. | | 1.3% |
Top Sectors
| | |
| | | % of Total
Market Value
|
Information Technology | | 33% |
Health Care | | 18% |
Industrials | | 13% |
Consumer Discretionary | | 11% |
Financials | | 11% |
Energy | | 7% |
Matrials | | 4% |
Cash/Other | | 3% |
MSF-49
Metropolitan Series Fund, Inc.
Loomis Sayles Small Cap Portfolio
Managed by Loomis, Sayles & Company, L.P.
Portfolio Manager Commentary*
PORTFOLIO PERFORMANCE
For the year ended December 31, 2005, the Class A shares of the Loomis Sayles Small Cap Portfolio returned 6.9%, compared to its benchmark, the Russell 2000 Index,1 which returned 4.6%. The average return of its peer group, the Lipper Variable Insurance Products Small-Cap Core Funds Universe,2 was 5.4% over the same period.
PORTFOLIO REVIEW
We continued to emphasize high-quality investments with prospects for above average capital appreciation across the spectrum of both small cap growth and value stocks. As of December 31, 2005, the Portfolio was close to evenly balanced between misunderstood or undiscovered smaller companies that represented attractive values and small companies with the potential for significant growth. While stock selection is our primary means to drive performance, the overall economic environment certainly is considered when analyzing individual securities. With the general economy decelerating during 2005 and a flattening yield curve indicating that the slowing is likely to continue, our focus modestly shifted toward companies that can grow regardless of the overall market environment and continue to generate wealth for shareholders.
On both an absolute and relative basis, stock selection drove the Portfolio’s performance for the year versus the small cap core indexes and peer group. Stock selection was broadly positive, and accounted for virtually all of the Portfolio’s excess performance as sector weighting was a neutral factor. The strongest contributing sectors for the year included energy, producer durables, and materials and processing. Three of our best stocks for the year were Cal Dive International, LCA Vision Centers and CB Richard Ellis. Cal Dive, a marine construction company serving the offshore oil and natural gas industry, reported sharply higher earnings and improving prospects driven by rising oil and natural gas prices. LCA Vision Centers, an operator of vision correction facilities, reported strong growth numbers due to new technologies and share gains. CB Richard Ellis, a commercial real estate broker, was a beneficiary of the rebounding commercial market and consolidation within the industry. One of the few areas that detracted from performance was the consumer discretionary sector, where boating supply and apparel retailer West Marine, Inc. and specialty mattress manufacturer Tempur-Pedic International hurt results.
* The views expressed above are those of the subinvestment advisor firm as of December 31, 2005 and are subject to change based on market and other conditions. Information about the Portfolio’s holdings, asset allocation, industry allocation or country diversification is historical and is not an indication of future Portfolio composition, which will vary.
1 The Russell 2000® Index is an unmanaged measure of performance of the 2,000 smallest companies in the Russell 3000 Index. The Index performance has not been adjusted for ongoing management, distribution and operating expenses and sales charges applicable to mutual fund investments. Direct investment in the Index is not possible.
2 Lipper Variable Products Fund Averages. Each of these is an average of the total return performance (calculated on the basis of net asset value) of funds with similar investment objectives to those of the subject Portfolio as calculated by Lipper Analytical Services, an independent mutual fund ranking service.
MSF-50
Metropolitan Series Fund, Inc.
Loomis Sayles Small Cap Portfolio
A $10,000 INVESTMENT COMPARED TO THE
RUSSELL 2000 INDEX
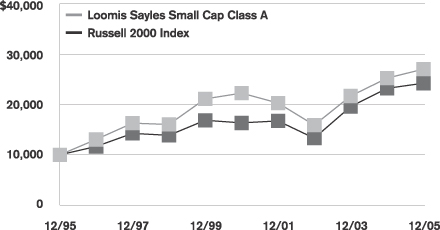
Average Annual Returns as of December 31, 2005
| | | | | | | | | | | | |
| | | Loomis Sayles Small Cap Portfolio | | | Russell 2000 Index | |
| | | Class A | | | Class B | | | Class E | | |
| 1 Year | | 6.9 | % | | 6.7 | % | | 6.8 | % | | 4.6 | % |
| 5 Years | | 4.0 | | | N/A | | | N/A | | | 8.2 | |
| 10 Years | | 10.5 | | | N/A | | | N/A | | | 9.3 | |
| Since Inception | | — | | | 15.0 | | | 5.9 | | | — | |
Performance numbers are net of all Portfolio expenses but do not include any insurance, sales, or administrative charges of variable annuity or life insurance contracts. If these charges were included, the returns would be lower.
Inception dates of the Class A, Class B and Class E shares are: 5/2/94, 7/30/02 and 5/1/01, respectively.
This information represents past performance and is not indicative of future results. Investment return and principal value may fluctuate so that shares, upon redemption, may be worth more or less than the original cost.
PORTFOLIO COMPOSITION
as of December 31, 2005
Top Holdings
| | |
| | | % of Total
Net Assets
|
R. H. Donnelley Corp. | | 1.0% |
CB Richard Ellis Group, Inc. | | 0.9% |
Wright Express Corp. | | 0.8% |
CARBO Ceramics, Inc. | | 0.7% |
Actuant Corp. | | 0.7% |
Cal Dive International, Inc. | | 0.7% |
Advanta Corp. (Class B) | | 0.7% |
Carter’s, Inc. | | 0.6% |
Cytec Industries, Inc. | | 0.6% |
Laureate Education, Inc. | | 0.6% |
Top Sectors
| | |
| | | % of Equity
Market Value
|
Information Technology | | 20.4% |
Financials | | 20.4% |
Industrials | | 18.2% |
Consumer Discrentionary | | 13.6% |
Health Care | | 9.8% |
Energy | | 6.7% |
Materials | | 3.9% |
Utilities | | 2.3% |
Consumer Staples | | 1.6% |
Cash/Other | | 2.2% |
MSF-51
Metropolitan Series Fund, Inc.
Russell 2000 Index Portfolio
Managed by Metropolitan Life Insurance Company
Portfolio Manager Commentary*
PORTFOLIO PERFORMANCE
For the year ended December 31, 2005, the Class A shares of the Russell 2000 Index Portfolio returned 4.5%, compared to its benchmark, the Russell 2000 Index,1 which returned 4.6%.
PORTFOLIO REVIEW
The Russell 2000 Index had a positive return for the third consecutive year. Over the three-year period ending December 31, 2005, the Russell 2000 Index returned 21.6% annualized. In 2005, the Russell 2000 Index posted positive returns for six of the twelve months of the year. The benchmark was down 5.3% in the first quarter, up 4.3% in the second quarter, up 4.7% in the third quarter, and up 1.1% in the fourth quarter. Some of the factors driving the equity markets included geopolitical concerns, energy prices, Federal Reserve interest rate policy, corporate earnings, employment data, and the U.S. Dollar.
Eleven out of twelve sectors comprising the Russell 2000 Index experienced positive returns for the year. Other Energy (4.8% weight in the benchmark) returned 40.0%, having the largest positive impact on the benchmark return this year. Materials & Processing (10.1% weight in the benchmark), up 8.4%; Health Care (12.0% weight), up 5.5%; and Financial Services (23.7% weight) up 2.3%; together with Other Energy accounted for 85.0% of the benchmark return this year. Integrated Oils (0.1% weight) was the best performing sector, up 69.3%, but had little impact because of its small weighting. Technology (12.6% weight), down 2.2%, was the only sector with a negative return.
The three individual stocks with the largest positive impact on performance were Intuitive Surgical, Inc., up 193.0%; Vertex Pharmaceuticals, Inc., up 161.8%; and Amylin Pharmaceuticals, Inc., up 103.9%. The three individual stocks with the largest negative impact on performance were Calpine Corp., down 93.9%; Taser International, Inc., down 77.9%; and First Bancorp Puerto Rico, down 60.3%.
On June 24, 2005, the Russell Indices underwent their annual reconstitution. In total, 286 companies were added to the Russell 2000 Index and 299 were deleted. The difference of 13 names is due to quarterly IPO adds and attrition throughout the period between annual reconstitutions. The 2005 post rebalance average marketcap of a Russell 2000 constituent was roughly $570 million versus $632 million in 2004. The 2005 annual Russell 2000 reconstitution generated approximately 24.5% turnover.
* The views expressed above are those of the subinvestment advisor firm as of December 31, 2005 and are subject to change based on market and other conditions. Information about the Portfolio’s holdings, asset allocation, industry allocation or country diversification is historical and is not an indication of future Portfolio composition, which will vary.
1 The Russell 2000® Index is an unmanaged measure of performance of the 2,000 smallest companies in the Russell 3000 Index. The Index performance has not been adjusted for ongoing management, distribution and operating expenses and sales charges applicable to mutual fund investments. Direct investment in the Index is not possible.
MSF-52
Metropolitan Series Fund, Inc.
Russell 2000 Index Portfolio
A $10,000 INVESTMENT COMPARED TO THE
RUSSELL 2000 INDEX
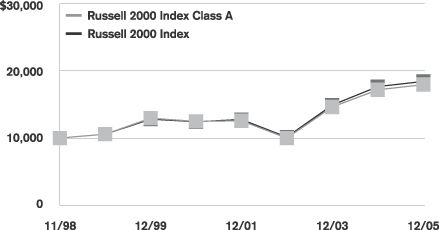
Average Annual Returns as of December 31, 2005
| | | | | | | | | | | | |
| | | Russell 2000 Index Portfolio | | | Russell 2000
Index | |
| | | Class A | | | Class B | | | Class E | | |
| 1 Year | | 4.5 | % | | 4.3 | % | | 4.4 | % | | 4.6 | % |
| 5 Years | | 7.6 | | | N/A | | | N/A | | | 8.2 | |
| Since Inception | | 8.5 | | | 8.3 | | | 7.8 | | | 8.9 | |
Performance numbers are net of all Portfolio expenses but do not include any insurance, sales, or administrative charges of variable annuity or life insurance contracts. If these charges were included, the returns would be lower.
Inception dates of the Class A, Class B and Class E shares are: 11/9/98, 1/2/01 and 5/1/01, respectively. Index since inception returns are based on the Class A inception date.
This information represents past performance and is not indicative of future results. Investment return and principal value may fluctuate so that shares, upon redemption, may be worth more or less than the original cost.
PORTFOLIO COMPOSITION as of December 31, 2005
Top Holdings
| | |
| | | % of Total
Net Assets
|
iShares Russell 2000 Index Fund | | 1.9% |
Amylin Pharmaceuticals, Inc. | | 0.3% |
Intuitive Surgical, Inc. | | 0.3% |
Cimarex Energy Co. | | 0.3% |
Vertex Pharmaceuticals, Inc. | | 0.2% |
Cal Dive International, Inc. | | 0.2% |
Integrated Device Technology, Inc. | | 0.2% |
Hughes Supply, Inc. | | 0.2% |
Neurocrine Biosciences, Inc. | | 0.2% |
MoneyGram International, Inc. | | 0.2% |
Top Sectors
| | |
| | | % of Equity
Market Value
|
Financial Services | | 23.3% |
Consumer Discretionary | | 18.2% |
Technology | | 13.9% |
Health Care | | 11.9% |
Materials & Processing | | 9.7% |
Producer Durables | | 7.6% |
Other Energy | | 5.5% |
Utilities | | 3.7% |
Auto & Transportation | | 3.6% |
Integrated Oils | | 2.3% |
Consumer Staples | | 1.8% |
Cash/Other | | 5.7% |
MSF-53
Metropolitan Series Fund, Inc.
T. Rowe Price Small Cap Growth Portfolio
Managed by T. Rowe Price Associates, Inc.
Portfolio Manager Commentary*
PORTFOLIO PERFORMANCE
For the year ended December 31, 2005, the Class A shares of the T. Rowe Price Small Cap Growth Portfolio returned 11.0%, compared to its benchmark, the Russell 2000 Growth Index,1 which returned 4.2%. The average return of its peer group, the Lipper Variable Insurance Products Small-Cap Growth Funds Universe,2 was 7.5% over the same period.
PORTFOLIO REVIEW
The U.S. economy performed well in 2005, growing by more than 3%. As the year drew to a close, factory output was strong, housing activity was moderating, and employment trends remained favorable. In addition, crude oil and gasoline prices were well below their post-Hurricane Katrina peaks, which helped lift consumer sentiment and tempered fears of a significant acceleration of inflation. Nevertheless, the Federal Reserve persisted in raising short-term interest rates at a gradual pace. In 2005, the central bank lifted the federal funds target rate from 2.25% to 4.25%, a level not seen in more than four years. However, there have been increasing signs that the Fed may be nearing the end of its rate tightening program, which began 18 months ago when the fed funds rate was only 1.00%.
Small-cap growth stocks produced a third consecutive year of positive returns in 2005. Despite soaring energy costs and rising short-term interest rates, stocks gradually worked their way higher—supported by firm economic and corporate earnings growth and merger activity—and finished near their highest levels of the year amid hopes that the Federal Reserve would soon stop raising short-term rates. Small-cap shares narrowly lagged their large-cap peers in 2005; the Russell 2000 Index3 returned 4.55% versus 4.91% for the S&P 500 Index.4 As measured by various Russell indexes, value stocks generally outperformed growth across all market capitalizations for the full year, but the relative performance of growth stocks improved notably in the second half. In the small-cap growth universe, health care, energy, and industrial and business services stocks led the advance. Technology and financial shares lagged substantially.
Favorable stock selection in several sectors, such as health care, industrials and business services, and information technology, drove the Portfolio’s outperformance relative to its index and peer funds.
In the health care sector, overweighting providers and services companies and favorable stock selection within that industry—such as Computer Programs and Systems, which was our largest contributor to performance in 2005, as well as Accredo Health and WellChoice, which were acquired by Medco Health Solutions and WellPoint, respectively—greatly helped our performance advantage. Coventry Health Care and Omnicare also performed very well; in fact, these successful long-term holdings have become mid-cap companies, which is what we hope to see all of our holdings become over time. Our equipment and supply companies also did well, and stock selection among biotechnology stocks contributed to our favorable results. Stellar performers included Cephalon, Vertex Pharmaceuticals, and Abgenix, which is being bought by Amgen.
The energy sector, though a fairly small part of our opportunity set, produced substantial gains in 2005 as oil prices surged to $70 per barrel by late August. Virtually all of our holdings appreciated; two of our largest contributors in the sector were Cal Dive International, a marine contractor and operator of offshore oil facilities, and Spinnaker Exploration, which was acquired by Norwegian company Norsk Hydro.
In the industrials and business services sector, good performance of commercial services and supply companies helped our relative results. Two of our top performers in this industry were Corporate Executive Board, which provides professional services to corporations and executives, and medical waste management company Stericycle. Air freight and logistics companies performed relatively well, and the Portfolio benefited from our overweighting.
Although consumer discretionary stock performance improved somewhat in the last few months, the sector’s full-year results were generally lackluster, as gains in specialty retailers were partially offset by weakness among media, hotel, and restaurant stocks. Our overweights in leisure equipment and diversified consumer services stocks detracted from our relative performance in 2005. However, our stock selection was strong in those industries.
* The views expressed above are those of the subinvestment advisor firm as of December 31, 2005 and are subject to change based on market and other conditions. Information about the Portfolio’s holdings, asset allocation, industry allocation or country diversification is historical and is not an indication of future Portfolio composition, which will vary.
1 The Russell 2000® Growth Index is an unmanaged measure of performance of those Russell 2000 companies (small capitalization companies) that have higher price-tobook ratios and higher forecasted growth values. The Index performance has not been adjusted for ongoing management, distribution and operating expenses and sales charges applicable to mutual fund investments. Direct investment in the Index is not possible.
2 Lipper Variable Products Fund Averages. Each of these is an average of the total return performance (calculated on the basis of net asset value) of funds with similar investment objectives to those of the subject Portfolio as calculated by Lipper Analytical Services, an independent mutual fund ranking service.
3 The Russell 2000® Index is an unmanaged measure of performance of the 2,000 smallest companies in the Russell 3000 Index. The Index performance has not been adjusted for ongoing management, distribution and operating expenses and sales charges applicable to mutual fund investments. Direct investment in the Index is not possible.
4 The Standard & Poor’s (S&P) 500® Composite Stock Price Index is an unmanaged index representing the performance of 500 major companies, most of which are listed on the New York Stock Exchange. The S&P 500 performance has not been adjusted for ongoing management, distribution and operating expenses, and sales charges applicable to mutual fund investments. Direct investment in the Index is not possible.
MSF-54
Metropolitan Series Fund, Inc.
T. Rowe Price Small Cap Growth Portfolio
A $10,000 INVESTMENT COMPARED TO THE
RUSSELL 2000 GROWTH INDEX
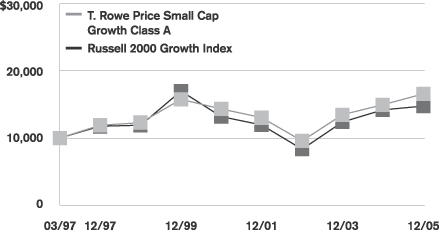
Average Annual Returns as of December 31, 2005
| | | | | | | | | | | | |
| | | T. Rowe Price Small Cap Growth Portfolio | | | Russell 2000
Growth Index | |
| | | Class A | | | Class B | | | Class E | | |
| 1 Year | | 11.0 | % | | 10.7 | % | | 10.8 | % | | 4.2 | % |
| 5 Years | | 3.0 | | | N/A | | | N/A | | | 2.3 | |
| Since Inception | | 5.9 | | | 17.1 | | | 4.4 | | | 4.5 | |
Performance numbers are net of all Portfolio expenses but do not include any insurance, sales, or administrative charges of variable annuity or life insurance contracts. If these charges were included, the returns would be lower.
Inception dates of the Class A, Class B and Class E shares are: 3/3/97, 7/30/02 and 5/1/01, respectively. Index since inception returns are based on the Class A inception date.
This information represents past performance and is not indicative of future results. Investment return and principal value may fluctuate so that shares, upon redemption, may be worth more or less than the original cost.
PORTFOLIO COMPOSITION
as of December 31, 2005
Top Holdings
| | |
| | | % of Total
Net Assets
|
The Corporate Executive Board Co. | | 1.3% |
Avid Technology, Inc. | | 1.2% |
Computer Programs & Systems, Inc. | | 1.2% |
UTI Worldwide, Inc. | | 1.1% |
The Advisory Board Co. | | 1.1% |
SkyWest, Inc. | | 1.0% |
Station Casinos, Inc. | | 0.9% |
Cal Dive International, Inc. | | 0.9% |
Respironics, Inc. | | 0.9% |
Comstock Resources, Inc. | | 0.8% |
Top Sectors
| | |
| | | % of Total
Market Value
|
Information Technology | | 26.7% |
Health Care | | 22.6% |
Consumer Discretionary | | 19.2% |
Industrials | | 14.9% |
Energy | | 6.0% |
Financials | | 5.4% |
Consumer Staples | | 1.1% |
Telecommunications | | 1.1% |
Materials | | 0.7% |
Cash/Other | | 2.3% |
MSF-55
Metropolitan Series Fund, Inc.
FI International Stock Portfolio
Managed by Fidelity Management & Research Company
Portfolio Manager Commentary*
PORTFOLIO PERFORMANCE
For the year ended December 31, 2005, the Class A shares of the FI International Stock Portfolio returned 18.0%, compared to its benchmark, the Morgan Stanley Capital International (MSCI) EAFE Index1, which returned 13.5%. The average return of its peer group, the Lipper Variable Insurance Products International Core Funds Universe2, was 14.8% over the same period
PORTFOLIO REVIEW
For the 12-month period ending December 31, 2005, most of the world’s major stock markets posted gains, as many foreign economies reached new highs, overshadowing the rally in the U.S. market. Encouraged by better-than-expected corporate earnings and improved economic indicators and undaunted by higher energy prices, equity markets around the world continued to deliver broad-based gains. Of the 23 national market constituents of the MSCI EAFE Index, all posted positive total returns when measured in their local currencies.
In this environment, FI International Stock Portfolio outperformed the MSCI EAFE Index. Stock selection in the financials sector contributed the most to the Portfolio’s relative return, with portfolio holdings in Japanese brokers and emerging-markets banks producing significant gains. Favorable stock selection in energy, consumer discretionary, information technology and health care companies further benefited Portfolio performance, as these stocks were top performers during the period. On the other hand, poor stock selection and an underweighting in the materials sector detracted the most from the Portfolio’s relative performance. Several of the top metals and mining performers in this group were absent from the Portfolio’s holdings during the period.
* The views expressed above are those of the subinvestment advisor firm as of December 31, 2005 and are subject to change based on market and other conditions. Information about the Portfolio’s holdings, asset allocation, industry allocation or country diversification is historical and is not an indication of future Portfolio composition, which will vary.
1 The Morgan Stanley Capital International (MSCI) EAFE® Index is an unmanaged, commonly used measure of performance for Europe, Australasia and the Far East. The Index performance has not been adjusted for ongoing management, distribution and operating expenses and sales charges applicable to mutual fund investments. Direct investment in the Index is not possible.
2 Lipper Variable Products Fund Averages. Each of these is an average of the total return performance (calculated on the basis of net asset value) of funds with similar investment objectives to those of the subject Portfolio as calculated by Lipper Analytical Services, an independent mutual fund ranking service.
MSF-56
Metropolitan Series Fund, Inc.
FI International Stock Portfolio
A $10,000 INVESTMENT COMPARED TO THE
MSCI EAFE INDEX
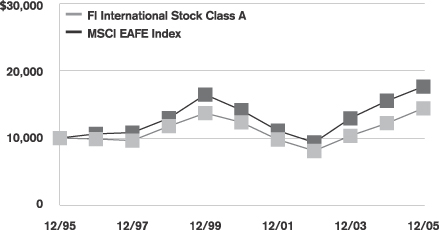
Average Annual Returns as of December 31, 2005
| | | | | | | | | | | | |
| | | FI International Stock Portfolio | | | MSCI EAFE Index | |
| | | Class A | | | Class B | | | Class E | | |
| 1 Year | | 18.0 | % | | 17.6 | % | | 17.8 | % | | 13.5 | % |
| 5 Years | | 3.2 | | | N/A | | | N/A | | | 4.6 | |
| 10 Years | | 3.7 | | | N/A | | | N/A | | | 5.8 | |
| Since Inception | | — | | | 10.7 | | | 5.2 | | | — | |
Performance numbers are net of all Portfolio expenses but do not include any insurance, sales, or administrative charges of variable annuity or life insurance contracts. If these charges were included, the returns would be lower.
Inception dates of the Class A, Class B and Class E shares are: 5/1/91, 5/1/02 and 5/1/01, respectively.
This information represents past performance and is not indicative of future results. Investment return and principal value may fluctuate so that shares, upon redemption, may be worth more or less than the original cost.
PORTFOLIO COMPOSITION
as of December 31, 2005
Top Holdings
| | |
| | | % of Total
Net Assets
|
BP, Plc. (ADR) | | 2.0% |
Total S.A. | | 1.9% |
Allianz AG | | 1.9% |
Roche Holding AG | | 1.8% |
Nikko Cordial Corp. | | 1.6% |
Novartis AG | | 1.5% |
Sumitomo Mitsui Financial Group, Inc. | | 1.4% |
AXA S.A. | | 1.2% |
Vodafone Group, Plc. | | 1.2% |
Vivendi Universal S.A. (ADR) | | 1.2% |
Top Countries
| | |
| | | % of Equity
Market Value
|
Japan | | 26.4% |
France | | 14.2% |
Germany | | 13.2% |
United States | | 9.3% |
United Kingdom | | 8.2% |
Switzerland | | 8.1% |
Netherlands | | 4.6% |
Italy | | 4.2% |
Sweden | | 2.5% |
Taiwan | | 2.4% |
MSF-57
Metropolitan Series Fund, Inc.
Morgan Stanley EAFE Index Portfolio
Managed by Metropolitan Life Insurance Company
Portfolio Manager Commentary*
PORTFOLIO PERFORMANCE
For the year ended December 31, 2005, the Class A shares of the Morgan Stanley EAFE Index Portfolio returned 13.2%, compared to its benchmark, the Morgan Stanley Capital International (MSCI) EAFE Index1, which returned 13.5%. Dividend income accounted for 2.7% of this year’s total return. The Portfolio’s performance cannot exactly duplicate the MSCI EAFE Index’s return because of differences that primarily result from sampling, pricing, and transaction costs.
PORTFOLIO REVIEW
The MSCI EAFE Index began the year with a negative return through April and rallied with positive returns in seven of the last eight months of 2005. The MSCI EAFE Index outperformed its U.S. domestic counterpart (S&P 500 Index)2 by 8.6% during the year, despite the fact that the U.S. dollar strengthened against the Euro, British Pound, and Japanese Yen in 2005 (thus making foreign securities worth less to the U.S. dollar based investor). Some of the factors driving the foreign equity markets included geopolitical concerns, energy prices, foreign exchange rates, corporate earnings, and unemployment rates.
Nineteen of the twenty-one countries that comprise the EAFE Index had positive returns in 2005. Japan and the United Kingdom (the largest country weights in the benchmark at 21.9% and 25.0%, respectively) returned 25.4% and 7.5%, respectively, and had the largest positive impact to the benchmark’s return. Besides Japan, the absolute best performing countries were Norway, up 26.0%; Austria, up 25.5%; and Denmark, up 25.3%. The only two countries with negative returns were Ireland, down 2.0%; and Portugal, down 0.9%.
The individual stocks with the largest positive impact on the benchmark return for the year were Roche Holdings, up 32.1%; Toyota Motor Corp, up 28.2%; and BP, up 12.5%. The best absolute performing stock was Sumitomo Metal Industries, up 192.7%. The stocks with the largest negative impact were Deutsche Telekom, down 23.5%; Vodafone, down 17.9%; and Telefonica, down 17.5%. The worst absolute performing stock was Kanebo, down 82.1%.
* The views expressed above are those of the subinvestment advisor firm as of December 31, 2005 and are subject to change based on market and other conditions. Information about the Portfolio’s holdings, asset allocation, industry allocation or country diversification is historical and is not an indication of future Portfolio composition, which will vary.
1 The Morgan Stanley Capital International (MSCI) EAFE® Index is an unmanaged, commonly used measure of performance for Europe, Australasia and the Far East. The Index performance has not been adjusted for ongoing management, distribution and operating expenses and sales charges applicable to mutual fund investments. Direct investment in the Index is not possible.
2 The Standard & Poor’s (S&P) 500® Composite Stock Price Index is an unmanaged index representing the performance of 500 major companies, most of which are listed on the New York Stock Exchange. The S&P 500 performance has not been adjusted for ongoing management, distribution and operating expenses, and sales charges applicable to mutual fund investments. Direct investment in the Index is not possible.
MSF-58
Metropolitan Series Fund, Inc.
Morgan Stanley EAFE Index Portfolio
A $10,000 INVESTMENT COMPARED TO THE
MSCI EAFE INDEX
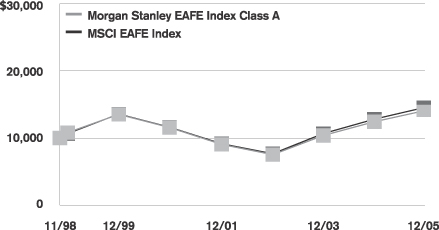
Average Annual Returns as of December 31, 2005
| | | | | | | | | | | | |
| | | Morgan Stanley EAFE Index Portfolio | | | MSCI
EAFE Index | |
| | | Class A | | | Class B | | | Class E | | |
| 1 Year | | 13.2 | % | | 12.9 | % | | 13.0 | % | | 13.5 | % |
| 5 Years | | 4.0 | | | N/A | | | N/A | | | 4.6 | |
| Since Inception | | 4.9 | | | 3.8 | | | 5.7 | | | 5.3 | |
Performance numbers are net of all Portfolio expenses but do not include any insurance, sales, or administrative charges of variable annuity or life insurance contracts. If these charges were included, the returns would be lower.
Inception dates of the Class A, Class B and Class E shares are: 11/9/98, 1/2/01 and 5/1/01, respectively. Index since inception returns are based on the Class A inception date.
This information represents past performance and is not indicative of future results. Investment return and principal value may fluctuate so that shares, upon redemption, may be worth more or less than the original cost.
PORTFOLIO COMPOSITION
as of December 31, 2005
Top Holdings
| | |
| | | % of Total
Net Assets
|
iShares MSCI EAFE Index Fund | | 3.3% |
BP, Plc. | | 2.1% |
HSBC Holdings, Plc. | | 1.7% |
Toyota Motor Corp. | | 1.4% |
GlaxoSmithKline, Plc. | | 1.4% |
Total S.A. | | 1.3% |
Vodafone Group, Plc. | | 1.3% |
Royal Dutch Shell (A Shares) | | 1.2% |
Novartis AG | | 1.2% |
Nestle S.A. | | 1.1% |
Top Countries
| | |
| | | % of Total
Net Assets
|
Japan | | 25.6% |
United Kingdom | | 24.0% |
France | | 9.3% |
Switzerland | | 6.9% |
Germany | | 6.8% |
Australia | | 5.3% |
Italy | | 3.8% |
Spain | | 3.7% |
Netherlands | | 3.4% |
Sweden | | 2.4% |
MSF-59
Metropolitan Series Fund, Inc.
Oppenheimer Global Equity Portfolio
Managed by Oppenheimer Funds, Inc.
Portfolio Manager Commentary*
On May 1, 2005, OppenheimerFunds, Inc. succeeded Deutsche Investment Management as subadviser to the Portfolio, and the Portfolio’s name was changed from Scudder Global Equity Portfolio to Oppenheimer Global Equity Portfolio.
PORTFOLIO PERFORMANCE
For the year ended December 31, 2005, the Class A shares of the Oppenheimer Global Equity Portfolio (including performance both prior to and after the subadviser change) returned 16.2%, compared to its benchmark, the Morgan Stanley Capital International (MSCI) World Index1, which returned 9.5%. The average return of its peer group, the Lipper Variable Insurance Products Global Growth Funds Universe2, was 0.1% over the same period
PORTFOLIO REVIEW
The following section was drafted by Deutsche Investment Management and refers to the period when it served as the Portfolio’s subadviser (January 1, 2005 through April 30, 2005):
Global equities finished lower during the first four months of the year, pressured by surging energy and commodity prices. Oil approached record levels, and goods such as coffee, soybeans and cotton rose at least 15%. Demand in the U.S. and China, where increased bank lending has allowed companies a greater ability to make purchases, fueled much of the increase in prices. Weak U.S. economic data emerging in April also helped to keep equities lower.
The four-month period from January 1, 2005 through April 30, 2005 was challenging for the Portfolio, although it did fall less than its benchmark, the MSCI World Index (-2.1% vs. -3.3%). While an increase in oil prices aided returns in our Energy holdings, we saw weakness in certain gold-related and Japanese stocks. Volatile commodity prices contributed to the sell-off among our holdings leveraged to the price of gold. South Africa’s Goldfields lost ground as the effects of its takeover bid by Harmony Gold, as well as the falling rand, weighed on the stock. Lower production and higher cash costs led to lower quarterly profits for U.S.-based Newmont Mining, which also fell during the period. Canada’s Placer Dome lost ground as well. Also detracting from performance were some of our Japanese holdings. Nomura Holdings fell during the period. The company’s profit dropped 63% in the first quarter, due to a decline in its underwriting business and greater hiring costs attributable to overseas expansion. Also lagging was Mitsui Fudosan, which fell as domestic economic concerns weighed on the real-estate sector in Japan.
Providing positive contribution to performance were some of our Energy stocks, many of which were leveraged to oil and natural gas. The spike in energy prices over the period helped these names rally. Among the best performers were the ConocoPhillips and Anadarko Petroleum, both based in the United States. Within this same theme, Russia also proved positive: oil giant LUKOIL finished strongly.
The following section was drafted by OppenheimerFunds and refers to the period when it served as the Portfolio’s subadviser (May 1, 2005 to December 31, 2005):
It is important to bear in mind that a discussion of the stocks that added to or detracted from performance is merely meant to illustrate our investment approach during the period rather than suggest any attempt to make a country, sector, or thematic bet. With that logic in mind, the Portfolio actually benefited from a number of its holdings during the period, mostly for company-specific reasons. Hyundai Heavy Industries, the world’s largest shipbuilder, was one of the Portfolio’s best performing stocks. A long-term holding for us, we bought the stock on the belief that the average tanker age was high and the move toward double-hulled tankers would create a demand for new ship construction. We believed that the stock was very reasonably priced due to some concerns over the Company’s ownership of non-core businesses, among other things. Those issues have now been resolved and the stock more than doubled during the reporting period.
Another winner for the Portfolio was Advanced Micro Devices, Inc. (AMD), whose new dual core processor chip achieved significant traction in the server market. The market’s skepticism of AMD’s competitive position turned to acceptance over the period helping the stock’s rise.
Two of the Portfolio’s energy stocks—Husky Energy, Inc. and Transocean, Inc.—an oil reserves company and driller, respectively, helped fuel performance due to the rising cost of oil and natural gas.
On balance, a few of the Portfolio’s stocks hindered returns during the reporting period, including JDS Uniphase Corp., an optical components company. Another negative contributor was Vodafone. As one of our largest holdings, Vodafone has yet to deliver performance in line with our expectations. A slow market in Europe coupled with greater than expected expenditure in Japan and a realized tax change all hurt expected results. A lengthening of the sales cycle in video conferencing technology led to earnings disappointments at Tandberg, one of our poorest performers during the period. Our holdings in International Game Technology, the world’s largest manufacturer of casino gaming machines, also disappointed. The company’s earnings growth did not meet investors’ expectations and consequently, its stock price fell. However, we believed the long-term prospects remained strong, the company was a leader in its industry and its stock was reasonably priced. Therefore, we added modestly to the stock on its weakness.
* The views expressed above are those of the subinvestment advisor firm as of December 31, 2005 and are subject to change based on market and other conditions. Information about the Portfolio’s holdings, asset allocation, industry allocation or country diversification is historical and is not an indication of future Portfolio composition, which will vary.
1 The Morgan Stanley Capital International (MSCI) World® Index is a capitalization weighted index that measures performance of stocks from around the world. The Index performance has not been adjusted for ongoing management, distribution and operating expenses and sales charges applicable to mutual fund investments. Direct investment in the Index is not possible.
2 Lipper Variable Products Fund Averages. Each of these is an average of the total return performance (calculated on the basis of net asset value) of funds with similar investment objectives to those of the subject Portfolio as calculated by Lipper Analytical Services, an independent mutual fund ranking service.
MSF-60
Metropolitan Series Fund, Inc.
Oppenheimer Global Equity Portfolio
A $10,000 INVESTMENT COMPARED TO THE
MSCI WORLD INDEX
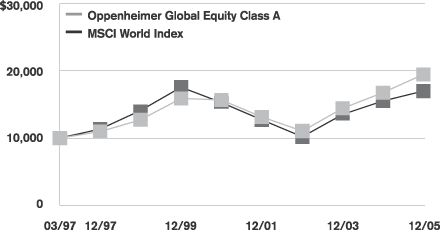
Average Annual Returns as of December 31, 2005
| | | | | | | | | | | | |
| | | Oppenheimer Global Equity Portfolio | | | MSCI
World Index | |
| | | Class A | | | Class B | | | Class E | | |
| 1 Year | | 16.2 | % | | 16.0 | % | | 16.1 | % | | 9.5 | % |
| 5 Years | | 4.5 | | | N/A | | | N/A | | | 2.2 | |
| Since Inception | | 7.8 | | | 17.2 | | | 6.0 | | | 6.2 | |
Performance numbers are net of all Portfolio expenses but do not include any insurance, sales, or administrative charges of variable annuity or life insurance contracts. If these charges were included, the returns would be lower.
Inception dates of the Class A, Class B and Class E shares are: 3/3/97, 4/26/04 and 5/1/01, respectively. Index since inception returns are based on the Class A inception date.
This information represents past performance and is not indicative of future results. Investment return and principal value may fluctuate so that shares, upon redemption, may be worth more or less than the original cost.
PORTFOLIO COMPOSITION
as of December 31, 2005
Top Holdings
| | |
| | | % of Total
Net Assets
|
Telefonaktiebolaget LM Ericsson (Class B) | | 2.7% |
Vodafone Group, Plc. | | 2.5% |
Advanced Micro Devices, Inc. | | 2.0% |
Reckitt Benckiser, Plc. | | 1.8% |
Sanofi-Aventis | | 1.7% |
Hennes & Mauritz AB (Series B) | | 1.6% |
Royal Bank of Scotland Group, Plc. | | 1.5% |
Transocean, Inc. | | 1.4% |
Microsoft Corp. | | 1.4% |
eBay, Inc. | | 1.4% |
Top Countries
| | |
| | | % of Total
Net Assets
|
United States | | 41.9% |
United Kingdom | | 13.0% |
Japan | | 10.2% |
France | | 6.9% |
Sweden | | 4.5% |
Germany | | 4.3% |
Switzerland | | 3.0% |
Republic of Korea | | 2.6% |
Brazil | | 2.3% |
MSF-61
Metropolitan Series Fund, Inc.
BlackRock Diversified Portfolio
Managed by BlackRock Advisors, Inc.
Portfolio Manager Commentary*
PORTFOLIO PERFORMANCE
For the year ended December 31, 2005, the Class A shares of the BlackRock Diversified Portfolio returned 3.1%, compared to a blend of the Standard & Poor’s 500 Index1 (60%) and the Lehman Brothers Aggregate Bond Index2 (40%), which returned 4.0%. The average return of its peer group, the Lipper Variable Insurance Products Balanced Funds Universe3, was 4.8% over the same period.
PORTFOLIO REVIEW
Throughout the annual period, we maintained an allocation of 65% equities and 35% bonds based on the view that equities offered better return potential than fixed income securities based on relative valuations between the asset classes. The broad asset allocation between equity and fixed income added value through its overweight of 65% in equities versus the benchmark 60% during the period as equities outperformed bonds. However, the overall Portfolio performance was hurt in the period by underperformance in the equity portion of the Portfolio relative to the benchmark. The equity market performed better in the second half of 2005 than the first. The S&P 500 finished the year up 4.91%. The Lehman Aggregate finished the year up 2.43%.
For the equity portion of the Portfolio, the performance of the BlackRock core quantitative model can be clearly divided into two periods. During the first half of 2005 the model was solidly predictive and the Portfolio outperformed the equity benchmark. During the second half of the year, with investors seemingly preoccupied by macroeconomic issues, the model faltered and the Portfolio under performed the equity benchmark. Evaluated across the entire year, the model was flat to modestly positive. Both the valuation and earnings expectation components of the model were consistent with the overall model. Analyzing the sectors where stock selection had the greatest impact on relative performance, Consumer Cyclicals, Energy, and Basic Materials were the strongest performing sectors. Within these sectors, specific names that helped relative performance include Nordstrom, ConocoPhillips, Valero, Newfield Exploration, Consol Energy, and Georgia Pacific. All of these names were highly ranked holdings in the model and were held in the the Portfolio during the period. The strength of these sectors was overwhelmed by the weak relative performance in the Technology, Consumer Non-Cyclicals and Commercial Services sectors. In particular, the equity portion of the Portfolio was hurt by overweight positions in several stocks that were highly ranked by the quantitative model, International Business Machines, Qlogic, Archer-Daniels-Midland, Energizer, and Cendant, did not perform well. In addition, underweight positions in stocks that were low ranked by the model (Apple Computer and Boeing), but performed well, also hurt relative performance.
For the bond portion of the Portfolio, the short duration position relative to its benchmark benefited performance as interest rates increased. The Portfolio also benefited from its yield curve positioning during the period. The Portfolio’s overweight to Asset Backed Securities (ABS) was beneficial to performance as the sector returned 0.32% over duration-adjusted treasuries. Holdings are concentrated in credit card and home equity issues. The Portfolio’s overweight position in Collateralized Mortgage-Backed Securities (CMBS) also contributed to performance as the sector returned 0.15% over duration-adjusted treasuries for the annual period. The Portfolio continued to underweight corporate securities. Within this sector, we had a bias towards financials and higher quality credits. Mortgage Backed Securities (MBS) were a detractor to performance as this sector returned -0.37% on the annual period. Although we were underweight in the sector, mortgage security selection was a detractor to performance. Within this sector, we favored 15-year over 30-year pass-throughs. Furthermore, the Portfolio maintained allocations to collateralized mortgage obligations (“CMOs”) and hybrid adjustable rate mortgages (“ARMs”). The Portfolio maintained limited exposure to the “plus” sectors such as high yield, emerging markets, and non-dollar bonds. Security selection in high yield was a positive contributor to performance and we continued to focus on higher credit quality names.
* On January 31, 2005, BlackRock Advisors, Inc. (“BlackRock”) succeeded State Street Research & Management Company (“State Street Research”) as subadviser to the Portfolio, and the Portfolio’s name was changed from State Street Research Diversified Portfolio to BlackRock Diversified Portfolio. This commentary was prepared by BlackRock. The views expressed above are those of the subinvestment advisor firm as of December 31, 2005 and are subject to change based on market and other conditions. Information about the Portfolio’s holdings, asset allocation, industry allocation or country diversification is historical and is not an indication of future Portfolio composition, which will vary.
1 The Standard & Poor’s (S&P) 500® Composite Stock Price Index is an unmanaged index representing the performance of 500 major companies, most of which are listed on the New York Stock Exchange. The S&P 500 performance has not been adjusted for ongoing management, distribution and operating expenses, and sales charges applicable to mutual fund investments. Direct investment in the Index is not possible.
2 Lehman Brothers® Aggregate Bond Index includes most obligations of the U.S. Treasury, agencies and quasi-federal corporations, most publicly issued investment grade corporate bonds and most bonds backed by mortgage pools of GNMA, FNMA and FHLMC. The Index performance has not been adjusted for ongoing management, distribution and operating expenses, and sales charges applicable to mutual fund investments. Direct investment in the Index is not possible.
3 Lipper Variable Products Fund Averages. Each of these is an average of the total return performance (calculated on the basis of net asset value) of funds with similar investment objectives to those of the subject Portfolio as calculated by Lipper Analytical Services, an independent mutual fund ranking service.
MSF-62
Metropolitan Series Fund, Inc.
BlackRock Diversified Portfolio
A $10,000 INVESTMENT COMPARED TO THE
S&P 500 INDEX AND THE LEHMAN BROTHERS
AGGREGATE BOND INDEX
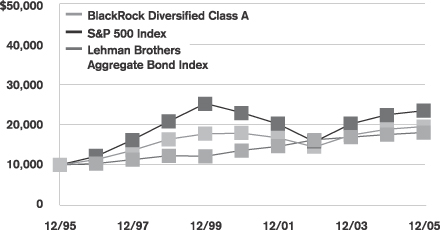
Average Annual Returns as of December 31, 2005
| | | | | | | | | | | | | | | |
| | | BlackRock Diversified Portfolio | | | S&P 500 Index | | | Lehman Brothers Aggregate Bond Index | |
| | | Class A | | | Class B | | | Class E | | | |
| 1 Year | | 3.1 | % | | 2.8 | % | | 3.0 | % | | 4.9 | % | | 2.4 | % |
| 5 Years | | 1.7 | | | N/A | | | N/A | | | 0.5 | | | 5.9 | |
| 10 Years | | 7.0 | | | N/A | | | N/A | | | 9.1 | | | 6.2 | |
| Since Inception | | — | | | 5.9 | | | 2.2 | | | — | | | — | |
Performance numbers are net of all Portfolio expenses but do not include any insurance, sales, or administrative charges of variable annuity or life insurance contracts. If these charges were included, the returns would be lower.
Inception dates of the Class A, Class B and Class E shares are: 7/25/86, 4/26/04 and 5/1/01, respectively.
This information represents past performance and is not indicative of future results. Investment return and principal value may fluctuate so that shares, upon redemption, may be worth more or less than the original cost.
PORTFOLIO COMPOSITION
as of December 31, 2005
Top Holdings
| | |
| | | % of Total
Net Assets
|
Federal National Mortgage Association | | 7.0% |
Federal Home Loan Mortgage Corp. | | 3.5% |
United States Treasury Notes | | 3.3% |
General Electric Co. | | 2.8% |
Federal Home Loan Bank | | 2.1% |
Bank of America Corp. | | 2.0% |
Microsoft Corp. | | 1.9% |
Citigroup, Inc. | | 1.8% |
United States Treasury Bonds | | 1.6% |
Intel Corp. | | 1.6% |
Top Equity Sectors
| | |
| | | % of Equity
Market Value
|
Financial Services | | 21.2% |
Technology | | 17.1% |
Health Care | | 12.9% |
Energy | | 9.1% |
Consumer (non-cyclicals) | | 7.7% |
|
| Top Fixed Income Sectors |
| | | % of Fixed Income
Market Value
|
Mortgages | | 35.1% |
Investment Grade Corporate | | 15.3% |
United States Treasury | | 14.5% |
Commercial Mortgage Backed Securities | | 13.0% |
Asset-Backed Securities | | 11.5% |
MSF-63
Metropolitan Series Fund, Inc.
MFS Total Return Portfolio
Managed by Massachusetts Financial Services Company
Portfolio Manager Commentary*
PORTFOLIO PERFORMANCE
For the year ended December 31, 2005, the Class A shares of the MFS Total Return Portfolio returned 3.1%, compared to a blend of the Standard & Poor’s 500 Index1 (60%) and the Lehman Brothers Aggregate Bond Index2 (40%), which returned 4.0%. The average return of its peer group, the Lipper Variable Insurance Products Flexible Portfolio Funds Universe3, was 4.9% over the same period.
PORTFOLIO REVIEW
Global economies continued to expand over the past 12-months. In the United States, growth was robust and core inflation, while rising, remained contained. The unemployment rate hovered around 5.0%. Consumer spending, which accounts for about 70% of the U.S. economy, rose 3.0% to 3.5%. Corporate profits increased, but at a slower pace than they did in 2004. Most major global stock indices moved higher despite the steady increase in oil prices over the period. Consumer wages and business spending on big items moved higher, in line with gross domestic product (GDP) growth, at a rate of about 3.5%. A steady increase in oil prices throughout the period resulted in an acceleration of inflation. The moderate growth and inflation combined to give the U.S. Federal Reserve Board an opening to continue raising interest rates. The Fed, which began steadily raising interest rates on June 30, 2004, continued to boost interest rates at a measured pace throughout the 12-month period. By period-end on December 31, 2005, the federal funds target rate had climbed to 4.25%.
For the equity portion of the Portfolio, a combination of positive stock selection and overweighting the strong-performing energy sector contributed to results during the year. Holdings in oil and gas producer Devon Energy, offshore drilling company Noble Corp, drilling rig operator GlobalSantaFe (not an index constituent), oil and gas service company Cooper Cameron, and energy exploration and production company EOG Resources boosted relative results over the period. While positive relative contribution from the financial services sector resulted primarily from superior stock selection, no individual stocks within the sector were among the Portfolio’s top contributors. Stocks in other sectors that added value included underweighting discount computer manufacturer Dell (since sold from the Portfolio) and computer giant International Business Machines. The Portfolio’s underweighted position in poor-performing pharmaceutical giant Pfizer (since sold from the Portfolio) also aided relative results.
Among the detractors from the equity portion of the Portfolio was stock selection in the utilities and communications sectors. Holdings in weak-performing independent power producer Calpine (since sold from the Portfolio) and telecom services provider Verizon Communications weighed on results as both stocks lagged the broad equity index. Security selection within the basic materials sector also dampened results. The Portfolio’s holding of newsprint maker Bowater (not an index constituent) detracted from relative results. A combination of weak stock selection and an overweighted position in the leisure sector also weighed on relative results. Holdings in media conglomerate Viacom were among the Portfolio’s top detractors for the period. Other securities in other sectors that detracted from performance included network security firm Symantec, network solutions and services provider Nortel Networks, and not participating in the appreciation of computer manufacturer Apple Computer. Our holdings in home improvement manufacturer Masco, health care firm Tenet Healthcare, and clothing retailer Gap also weakened investment results.
All of MFS’ investment decisions are driven by the fundamentals of each individual opportunity and, as such, it is common for portfolios which may invest in foreign securities to have different currency exposure than the benchmark. During this reporting period, our currency exposure detracted from the Portfolio’s relative performance.
For the fixed income portion of the Portfolio, overweighting “BBB”-rated credits acted as a drag on performance (bonds rated “BBB” or higher are considered investment grade; bonds rated “BB” or lower are considered non-investment grade.) Although the Portfolio’s holdings in treasury securities contributed to the Portfolio’s performance overall, treasury holdings with maturities of 3-5 years detracted over the period as short-term interest rates rose. The Portfolio’s positioning in government agencies also detracted from performance. A shorter duration stance contributed to relative performance over the period (duration is a measure of a portfolio’s sensitivity to changes in interest rates.) On a sector basis, the Portfolio enjoyed strong performance from its holdings in mortgage-backed securities. Despite the downgrading and decrease in value associated with bonds of Ford Motor Credit and General Motors Acceptance Corp., the finance subsidiaries of auto companies in the banking/finance sector, performed well.
* The views expressed above are those of the subinvestment advisor firm as of December 31, 2005 and are subject to change based on market and other conditions. Information about the Portfolio’s holdings, asset allocation, industry allocation or country diversification is historical and is not an indication of future Portfolio composition, which will vary.
1 The Standard & Poor’s (S&P) 500® Composite Stock Price Index is an unmanaged index representing the performance of 500 major companies, most of which are listed on the New York Stock Exchange. The S&P 500 performance has not been adjusted for ongoing management, distribution and operating expenses, and sales charges applicable to mutual fund investments. Direct investment in the Index is not possible.
2 Lehman Brothers® Aggregate Bond Index includes most obligations of the U.S. Treasury, agencies and quasi-federal corporations, most publicly issued investment grade corporate bonds and most bonds backed by mortgage pools of GNMA, FNMA and FHLMC. The Index performance has not been adjusted for ongoing management, distribution and operating expenses, and sales charges applicable to mutual fund investments. Direct investment in the Index is not possible.
3 Lipper Variable Products Fund Averages. Each of these is an average of the total return performance (calculated on the basis of net asset value) of funds with similar investment objectives to those of the subject Portfolio as calculated by Lipper Analytical Services, an independent mutual fund ranking service.
MSF-64
Metropolitan Series Fund, Inc.
MFS Total Return Portfolio
A $10,000 INVESTMENT COMPARED TO THE
S&P 500 INDEX AND THE LEHMAN BROTHERS
AGGREGATE BOND INDEX
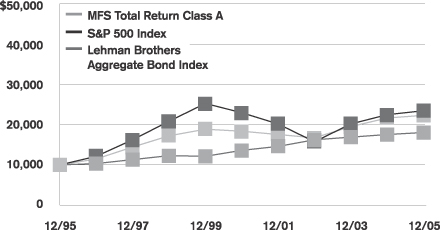
Average Annual Returns as of December 31, 2005
| | | | | | | | | | | | | | | |
| | | MFS Total Return Portfolio | | | S&P 500 Index | | | Lehman Brothers
Aggregate Bond Index | |
| | | Class A | | | Class B | | | Class E | | | |
| 1 Year | | 3.1 | % | | 2.9 | % | | 3.0 | % | | 4.9 | % | | 2.4 | % |
| 5 Years | | 4.1 | | | N/A | | | N/A | | | 0.5 | | | 5.9 | |
| 10 Years | | 8.5 | | | N/A | | | N/A | | | 9.1 | | | 6.2 | |
| Since Inception | | — | | | 5.7 | | | 6.9 | | | — | | | — | |
Performance numbers are net of all Portfolio expenses but do not include any insurance, sales, or administrative charges of variable annuity or life insurance contracts. If these charges were included, the returns would be lower.
Inception dates of the Class A, Class B and Class E shares are: 5/1/87, 5/1/02 and 4/26/04, respectively.
This information represents past performance and is not indicative of future results. Investment return and principal value may fluctuate so that shares, upon redemption, may be worth more or less than the original cost.
PORTFOLIO COMPOSITION
as of December 31, 2005
Top Holdings
| | |
| | | % of Total
Net Assets
|
Federal National Mortgage Association | | 12.2% |
United States Treasury Notes | | 5.9% |
Bank of America Corp. | | 2.8% |
United States Treasury Bonds | | 2.5% |
Federal Home Loan Bank | | 2.3% |
Federal Home Loan Mortgage Corp. | | 2.1% |
Wyeth | | 1.6% |
Sprint Nextel Corp. | | 1.6% |
PNC Financial Services Group, Inc. | | 1.5% |
JPMorgan Chase & Co. | | 1.5% |
Top Equity Sectors
| | |
| | | % of Equity
Market Value
|
Financial Services | | 26.3% |
Energy | | 11.2% |
Utilities & Communications | | 9.7% |
Technology | | 8.9% |
Health Care | | 8.1% |
|
| Top Fixed Income Sectors |
| | | % of Fixed Income
Market Value
|
Mortgage Back Securities | | 35.0% |
Governments | | 25.0% |
Corporate Securities | | 21.4% |
Agencies | | 10.6% |
Commercial Mortgage Backed Securities | | 4.0% |
MSF-65
Metropolitan Series Fund, Inc.
BlackRock Bond Income Portfolio
Managed by BlackRock Advisors, Inc.
Portfolio Manager Commentary*
PORTFOLIO PERFORMANCE
For the year ended December 31, 2005, the Class A shares of the BlackRock Bond Income Portfolio returned 2.4%, compared to its benchmark, the Lehman Brothers Aggregate Bond Index1, which returned 2.4%. The average return of its peer group, the Lipper Variable Insurance Products Corporate Debt A Rated Funds Universe2, was 2.3% over the same period.
PORTFOLIO REVIEW
For the annual period ended December 31, 2005, the tone of the fixed-income market environment was set by the Federal Reserve’s campaign to raise the federal funds rate. During the year, the Federal Open Market Committee (FOMC) increased the federal funds target rate in eight consecutive 25 basis point increments, combined with five previous increases of identical amounts in the second half of 2004, bringing the target to 4.25% at the end of the year. Throughout this tightening cycle, we anticipated the rate increases and maintained a defensive posture.
The yield curve continued to flatten during the period, a theme that has been present throughout the year. The 2- to 5-year and 2- to 10-year portions of the curve ended the year slightly inverted. The yield on the 10-year Treasury note ended the 2005 year at 4.39%, compared with 4.22% at the end of 2004. The 2-year and 5-year yields closed the year at 4.40% and 4.35%, respectively. Pressure on the front end of the yield curve came from further increases in the federal funds target rate. Long rates continued to trade in a very narrow range, supported by low volatility, benign inflation, and a constant bid from overseas investors.
The domestic spread agency sectors, Asset Backed Securities (ABS) and Collateralized Mortgage Backed Securities (CMBS), all posted positive excess returns over duration-adjusted Treasuries during the annual period. The auto sector, which includes General Motors, Ford, and various auto parts suppliers, had a particularly rough year. Valuations of ABS remained stable and spreads remained relatively tight, despite robust supply. The flatness of the yield curve hurt bank demand for Mortgage Backed Securities (MBS) while boosting the relative supply of longer maturity mortgages.
During the annual period, the Portfolio’s short duration position relative to its benchmark benefited performance as interest rates increased. The Portfolio also benefited from its yield curve positioning during the period. The Portfolio’s overweight to ABS was beneficial to performance as the sector returned 0.32% over duration-adjusted treasuries. We continued to overweight this sector relative to the benchmark. Holdings were concentrated in credit card and home equity issues. The Portfolio’s overweight position to CMBS also contributed to performance as the sector returned 0.15% over duration-adjusted treasuries for the annual period. The Portfolio continued to underweight corporate securities. Within this sector, we had a bias towards financials and higher quality credits. MBS was a detractor to performance as this sector returned -0.37% on the annual period. Although we were underweight the sector, mortgage security selection was a detractor to performance. Within this sector, we favored 15-year pass-through bonds over 30-year pass-through bonds. Furthermore, the Portfolio maintained allocations to collateralized mortgage obligations (“CMOs”) and hybrid adjustable rate mortgages (“ARMs”). The Portfolio maintained limited exposure to the “plus” sectors in high-yield, emerging market, and non-dollar bonds. Security selection in high yield was a positive contributor to performance and we continued to focus on higher credit quality names.
* On January 31, 2005, BlackRock Advisors, Inc. (“BlackRock”) succeeded State Street Research & Management Company (“State Street Research”) as subadviser to the Portfolio, and the Portfolio’s name was changed from State Street Research Bond Income Portfolio to BlackRock Bond Income Portfolio. This commentary was prepared by BlackRock. The views expressed above are those of the subinvestment advisor firm as of December 31, 2005 and are subject to change based on market and other conditions. Information about the Portfolio’s holdings, asset allocation, industry allocation or country diversification is historical and is not an indication of future Portfolio composition, which will vary.
1 Lehman Brothers® Aggregate Bond Index includes most obligations of the U.S. Treasury, agencies and quasi-federal corporations, most publicly issued investment grade corporate bonds and most bonds backed by mortgage pools of GNMA, FNMA and FHLMC. The Index performance has not been adjusted for ongoing management, distribution and operating expenses, and sales charges applicable to mutual fund investments. Direct investment in the Index is not possible.
2 Lipper Variable Products Fund Averages. Each of these is an average of the total return performance (calculated on the basis of net asset value) of funds with similar investment objectives to those of the subject Portfolio as calculated by Lipper Analytical Services, an independent mutual fund ranking service.
MSF-66
Metropolitan Series Fund, Inc.
BlackRock Bond Income Portfolio
A $10,000 INVESTMENT COMPARED TO
THE LEHMAN BROTHERS AGGREGATE BOND INDEX

Average Annual Returns as of December 31, 2005
| | | | | | | | | | | | |
| | | BlackRock Bond Income Portfolio | | | Lehman Brothers
Aggregate Bond Index | |
| | | Class A | | | Class B | | | Class E | | |
| 1 Year | | 2.4 | % | | 2.2 | % | | 2.3 | % | | 2.4 | % |
| 5 Years | | 6.0 | | | N/A | | | N/A | | | 5.9 | |
| 10 Years | | 6.2 | | | N/A | | | N/A | | | 6.2 | |
| Since Inception | | — | | | 5.4 | | | 5.1 | | | — | |
Performance numbers are net of all Portfolio expenses but do not include any insurance, sales, or administrative charges of variable annuity or life insurance contracts. If these charges were included, the returns would be lower.
Inception dates of the Class A, Class B and Class E shares are: 8/26/83, 5/1/01 and 4/23/02, respectively.
This information represents past performance and is not indicative of future results. Investment return and principal value may fluctuate so that shares, upon redemption, may be worth more or less than the original cost.
PORTFOLIO COMPOSITION as of December 31, 2005
Top Holdings
| | |
| | | % of Total
Net Assets
|
Federal National Mortgage Association | | 19.6% |
United States Treasury Notes | | 11.0% |
Federal Home Loan Mortgage Corp. | | 9.1% |
Federal Home Loan Bank | | 5.1% |
United States Treasury Bonds | | 3.2% |
LB-UBS Commercial Mortgage Trust | | 2.8% |
Government National Mortgage Association | | 2.7% |
Citigroup, Inc. | | 2.5% |
General Electric Capital Corp. | | 2.4% |
CWABS, Inc. | | 1.7% |
Top Sectors
| | |
| | | % of Total
Market Value
|
Mortgage | | 33.8% |
Investment Grade Corporates | | 17.4% |
United States Treasury | | 15.1% |
Commercial Mortgage Backed Securities | | 12.9% |
Asset Backed Securities | | 11.3% |
Government Agencies | | 5.9% |
High Yield | | 2.6% |
Cash/Other | | 2.2% |
MSF-67
Metropolitan Series Fund, Inc.
Lehman Brothers Aggregate Bond Index Portfolio
Managed by Metropolitan Life Insurance Company
Portfolio Manager Commentary*
PORTFOLIO PERFORMANCE
For the year ended December 31, 2005, the Class A shares of the Lehman Brothers Aggregate Bond Index Portfolio returned 2.1%, compared to its benchmark, the Lehman Brothers Aggregate Bond Index1, which returned 2.4% over the same period.
PORTFOLIO REVIEW
With the exception of 30-year yields, interest rates rose by an average of 0.97% along the yield curve during 2005. This was primarily the result of the Federal Reserve raising interest rates eight times during the year for a total of 2.00%. By year-end, the Fed Funds rate was 4.25%, and the yield curve was flatter by 1.63% (between 2 and 30 years). The 2-year treasury yield finished at 4.40% (up from 3.07% on 12/31/2004), and the 30-year yield finished at 4.54% (down from 4.83% on 12/31/2004). The curve flattened as a result of Fed tightening at the short-end and strong investor demand at the long end.
Asset Backed Securities (ABS) was the top-performing sector for the year on an excess return basis (excess return is a bond’s return over that of a comparable duration Treasury). The sector offered price stability in a volatile market. While all collateral types within the ABS sector had positive excess return, Manufactured Housing and Home Equity contributed the most excess return (1.16% and .79%, respectively) to the sector.
Credit was the weakest performing sector for 2005 on an excess return basis. Considerable new issuance, heavy activity in both mergers and acquisitions and leveraged buyouts, compounded by the historic downgrades (to below investment grade) of both General Motors and Ford were all contributing factors to the sector’s underperformance. Within Credit, bonds with a BBB credit rating had the worst excess return for the year (-1.77% versus -0.85% for the higher quality sector).
Mortgage Backed Securities (MBS) was the second weakest performer on an excess return basis. MBS underperformed due to increased market volatility. The sector struggled with extension risk (the tendency of the expected redemption dates of securities to extend as interest rates rise leading to negative price performance of securities).
The Agency sector had 0.13% of excess return for the year, helped by the improving news out of Washington regarding Fannie Mae and Freddie Mac. By year-end, both entities exceeded the minimum capital requirements that the federal regulator mandated in order for the agencies to recover from $15.8 billion in accounting errors.
* The views expressed above are those of the subinvestment advisor firm as of December 31, 2005 and are subject to change based on market and other conditions. Information about the Portfolio’s holdings, asset allocation, industry allocation or country diversification is historical and is not an indication of future Portfolio composition, which will vary.
1 Lehman Brothers® Aggregate Bond Index includes most obligations of the U.S. Treasury, agencies and quasi-federal corporations, most publicly issued investment grade corporate bonds and most bonds backed by mortgage pools of GNMA, FNMA and FHLMC. The Index performance has not been adjusted for ongoing management, distribution and operating expenses, and sales charges applicable to mutual fund investments. Direct investment in the Index is not possible.
MSF-68
Metropolitan Series Fund, Inc.
Lehman Brothers Aggregate Bond Index Portfolio
A $10,000 INVESTMENT COMPARED TO THE
LEHMAN BROTHERS AGGREGATE BOND INDEX
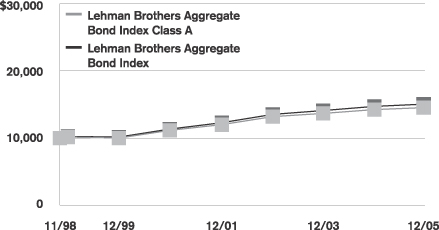
Average Annual Returns as of December 31, 2005
| | | | | | | | | | | | |
| | | Lehman Brothers Aggregate
Bond Index Portfolio | | | Lehman Brothers
Aggregate
Bond Index | |
| | | Class A | | | Class B | | | Class E | | |
| 1 Year | | 2.1 | % | | 1.9 | % | | 2.0 | % | | 2.4 | % |
| 5 Years | | 5.5 | | | N/A | | | N/A | | | 5.9 | |
| Since Inception | | 5.4 | | | 5.0 | | | 5.2 | | | 5.9 | |
Performance numbers are net of all Portfolio expenses but do not include any insurance, sales, or administrative charges of variable annuity or life insurance contracts. If these charges were included, the returns would be lower.
Inception dates of the Class A, Class B and Class E shares are: 11/9/98, 1/2/01 and 5/1/01, respectively. Index since inception returns are based on the Class A inception date.
This information represents past performance and is not indicative of future results. Investment return and principal value may fluctuate so that shares, upon redemption, may be worth more or less than the original cost.
PORTFOLIO COMPOSITION
as of December 31, 2005
Top Holdings
| | |
| | | % of Total
Net Assets
|
Federal National Mortgage Association | | 27.7% |
United States Treasury Notes | | 19.5% |
Federal Home Loan Mortgage Corp. | | 12.3% |
United States Treasury Bonds | | 6.0% |
Federal Home Loan Bank | | 4.5% |
HSBC Holdings, Plc. | | 0.7% |
LB-UBS Commercial Mortgage Trust | | 0.7% |
United Mexican States | | 0.6% |
JPMorgan Chase Commercial Mortgage Securities Corp. | | 0.6% |
General Electric Capital Corp. | | 0.6% |
Top Sectors
| | |
| | | % of Total
Net Assets
|
Mortgage Backed Securities | | 34.0% |
United States Treasury | | 25.9% |
Agency | | 11.4% |
Industrials | | 9.5% |
Finance | | 8.1% |
Commercial Mortgage-Backed Securities | | 3.9% |
Non-Corporate | | 3.8% |
Utility | | 1.9% |
Asset Backed Securities | | 1.4% |
Cash/Other | | 0.3% |
MSF-69
Metropolitan Series Fund, Inc.
Salomon Brothers Strategic Bond Opportunities Portfolio
Managed by Salomon Brothers Asset Management Inc
Portfolio Manager Commentary*
On December 1, 2005, Citigroup Inc. (“Citigroup”) sold substantially all of its worldwide asset management business, Citigroup Asset Management (“CAM”), to Legg Mason, Inc. (“Legg Mason”). As part of this transaction, the investment subadviser for the fund referenced herein became a wholly owned subsidiary of Legg Mason.
PORTFOLIO PERFORMANCE
For the year ended December 31, 2005, the Class A shares of the Salomon Brothers Strategic Bond Opportunities Portfolio returned 2.8%, compared to its benchmark, the Lehman Brothers Aggregate Bond Index1, which returned 2.4%. The average return of its peer group, the Lipper Variable Insurance Products General Bond Funds Universe2, was 2.0% over the same period.
PORTFOLIO REVIEW
During the 12 months ended December 31, 2005, the markets were primarily driven by Federal Reserve (“Fed”) activity, employment and inflation data, and rising energy costs, exacerbated by the devastating impact of Hurricane Katrina on the U.S. Gulf Coast. The Fed’s eight “measured” 25-basis-point hikes during the period brought the Fed Funds rate from 2.25% to 4.25% by period end. These measured, consecutive rate hikes exerted upward pressure on short-term bond yields, driving 2-year yields up about 134 basis points (1.34%) during the 12 months. However, yields on the long bond stayed low during the period, declining 29 basis points over the 12 months. This sharp rise in short yields and decline in longer yields resulted in the extensive yield curve flattening seen throughout the period and, near year end, a brief yield curve inversion as 2-year U.S. Treasury yields moved above 10-year yields.
The market fully expected each 25-basis-point hike in the Fed Funds rate during the period. Higher energy costs, exacerbated by the supply disruption following the Hurricanes Katrina and Rita, augmented already building inflationary pressure.
Economic growth remained positive during the annual period, particularly in light of the volatility seen in employment indicators and mixed industrial production, retail sales and consumer sentiment during Spring 2005 and in the aftermath of Fall 2005’s Hurricanes Katrina and Rita. Despite this, slowing global growth, broadly rising inflation and higher oil prices restrained economic activity during the 12 months. U.S. Gross Domestic Product (“GDP”) declined year-over-year to 3.8% growth in first quarter 2005 (from first quarter 2004’s 4.5% pace) and 3.4% growth in second quarter 2005 (from second quarter 2004’s 3.5%). While economic growth rebounded into the third quarter, gaining 4.1% on an annualized basis, the recovery was at least partially fueled by the fiscal stimulus injected into the Gulf region in the wake of the hurricanes. Core inflation remained moderate throughout the year. Consistently high energy prices began to push up core CPI inflation by December end, stopping its downward month-to-month drift to end the year with a 0.2% month-over-month increase in December, near the upper end of the Fed’s comfort range.
High yield markets ended 2004 on a positive note after an extended end-of-year rally, markets turned generally down through Spring 2005 on rising oil prices and weak equity markets. Negative auto sector headlines and isolated comments from the Fed regarding inflation influenced investors. Markets began to recover in mid-May as technical indicators strengthened and economic news turned generally positive but again turned down in the last few months of the year amid renewed volatility in the auto sector, stronger inflation, continued high energy prices and fears of a potentially slowing economy in the aftermath of Hurricanes Katrina and Rita.
Strong country fundamentals, resurgent commodity prices (particularly in metals, agriculture and oil) and positive market technicals offset the downward pressure exerted by eight “measured” increases in the Fed Funds rate throughout 2005 and credit contagion from the Auto sector during the volatile Spring of 2005. Continued progress on political and economic reform in many emerging countries, commodity price strength and the generally positive macro environment supported broad credit quality improvements across emerging markets during the year.
The Portfolio’s allocation to higher-yielding bonds, specifically emerging markets debt, once again proved beneficial to portfolio performance during the annual period, as emerging debt was the best performer among broad fixed income asset classes during the year, according to the Lehman family of indices. That said, we reduced our overall exposure to emerging markets debt by period end on a relative valuation basis, as spreads reached tightened to the all time narrowest levels on persistent strong technical indicators and fundamentals. We reallocated assets into mortgage-backed securities and U.S. Treasuries in the latter half of the annual period as both markets underwent significant selloffs during the third and fourth quarter before recovering value near period end.
We increased our duration position during the annual period, bringing duration to slightly overweight versus the benchmark. (Duration is a measure of a portfolio’s price sensitivity to interest rate movements. A shorter duration helps cushion price declines in the event of rising rates.)
* The views expressed above are those of the subinvestment advisor firm as of December 31, 2005 and are subject to change based on market and other conditions. Information about the Portfolio’s holdings, asset allocation, industry allocation or country diversification is historical and is not an indication of future Portfolio composition, which will vary.
1 Lehman Brothers® Aggregate Bond Index includes most obligations of the U.S. Treasury, agencies and quasi-federal corporations, most publicly issued investment grade corporate bonds and most bonds backed by mortgage pools of GNMA, FNMA and FHLMC. The Index performance has not been adjusted for ongoing management, distribution and operating expenses, and sales charges applicable to mutual fund investments. Direct investment in the Index is not possible.
2 Lipper Variable Products Fund Averages. Each of these is an average of the total return performance (calculated on the basis of net asset value) of funds with similar investment objectives to those of the subject Portfolio as calculated by Lipper Analytical Services, an independent mutual fund ranking service.
MSF-70
Metropolitan Series Fund, Inc.
Salomon Brothers Strategic Bond Opportunities Portfolio
A $10,000 INVESTMENT COMPARED TO THE
LEHMAN BROTHERS AGGREGATE BOND INDEX
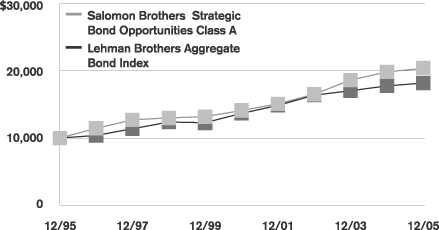
Average Annual Returns as of December 31, 2005
| | | | | | | | | | | | |
| | | Salomon Brothers Strategic
Bond Opportunities Portfolio | | | Lehman Brothers
Aggregate
Bond Index | |
| | | Class A | | | Class B | | | Class E | | |
| 1 Year | | 2.8 | % | | 2.6 | % | | 2.7 | % | | 2.4 | % |
| 5 Years | | 7.7 | | | N/A | | | N/A | | | 5.9 | |
| 10 Years | | 7.4 | | | N/A | | | N/A | | | 6.2 | |
| Since Inception | | — | | | 9.0 | | | 7.4 | | | — | |
Performance numbers are net of all Portfolio expenses but do not include any insurance, sales, or administrative charges of variable annuity or life insurance contracts. If these charges were included, the returns would be lower.
Inception dates of the Class A, Class B and Class E shares are: 10/31/94, 7/30/02 and 5/1/01, respectively.
This information represents past performance and is not indicative of future results. Investment return and principal value may fluctuate so that shares, upon redemption, may be worth more or less than the original cost.
PORTFOLIO COMPOSITION
as of December 31, 2005
Top Holdings
| | |
| | | % of Total
Net Assets
|
Federal National Mortgage Association | | 31.5% |
United States Treasury Notes | | 16.6% |
Federal Home Loan Mortgage Corp. | | 7.1% |
Targeted Return Index Securities Trust (144A) | | 1.5% |
Federative Republic of Brazil | | 1.1% |
United States Treasury Bonds | | 1.0% |
United Mexican States | | 0.9% |
Morgan Stanley | | 0.5% |
CIT Group, Inc. | | 0.5% |
Countrywide Funding Corp. | | 0.5% |
Top Sectors
| | |
| | | % of Total
Net Assets
|
U.S. Investment Grade | | 71.3% |
U.S. High Yield | | 16.0% |
Emerging Market Debt | | 4.8% |
Non U.S. Investment Grade | | 2.9% |
Cash/Other | | 5.1% |
MSF-71
Metropolitan Series Fund, Inc.
Salomon Brothers U.S. Government Portfolio
Managed by Salomon Brothers Asset Management Inc
Portfolio Manager Commentary*
On December 1, 2005, Citigroup Inc. (“Citigroup”) sold substantially all of its worldwide asset management business, Citigroup Asset Management (“CAM”), to Legg Mason, Inc. (“Legg Mason”). As part of this transaction, the investment sub-adviser for the fund referenced herein became a wholly owned subsidiary of Legg Mason.
PORTFOLIO PERFORMANCE
For the year ended December 31, 2005, the Class A shares of the Salomon Brothers U.S. Government Portfolio returned 1.7%, compared to its benchmark, the Lehman Brothers Intermediate Government Bond Index1, which returned 1.7%. The average return of its peer group, a universe of twenty-two (22) short-term and intermediate term mutual and variable funds tracked by Morningstar, was 1.6% over the same period.
PORTFOLIO REVIEW
During the 12 months ended December 31, 2005, the markets were primarily driven by Federal Reserve (“Fed”) activity, employment and inflation data, and rising energy costs, exacerbated by the devastating impact of Hurricane Katrina on the U.S. Gulf Coast. The Fed’s eight “measured” 25-basis-point hikes during the period brought the Fed Funds rate from 2.25% to 4.25% by period end. These measured, consecutive rate hikes exerted upward pressure on short-term bond yields, driving 2-year yields up about 134 basis points (1.34%) during the 12 months. However, yields on the long bond stayed low during the period, declining 29 basis points over the 12 months. This sharp rise in short yields and decline in longer yields resulted in the extensive yield curve flattening seen throughout the period and, near year end, a brief yield curve inversion as 2-year U.S. Treasury yields moved above 10-year yields.
The market fully expected each 25-basis-point hike in the Fed Funds rate during the period. Higher energy costs, exacerbated by the supply disruption following the Hurricanes Katrina and Rita, augmented already building inflationary pressure.
Economic growth remained positive during the annual period, particularly in light of the volatility seen in employment indicators and mixed industrial production, retail sales and consumer sentiment during Spring 2005 and in the aftermath of Fall 2005’s Hurricanes Katrina and Rita. Despite this, slowing global growth, broadly rising inflation and higher oil prices restrained economic activity during the 12 months. U.S. Gross Domestic Product (“GDP”) declined year-over-year to 3.8% growth in first quarter 2005 (from first quarter 2004’s 4.5% pace) and 3.4% growth in second quarter 2005 (from second quarter 2004’s 3.5%). While economic growth rebounded into the third quarter, gaining 4.1% on an annualized basis, the recovery was at least partially fueled by the fiscal stimulus injected into the Gulf region in the wake of the hurricanes. Core inflation remained moderate throughout the year; however, some inflation pressures began to seep into producer prices and U.S. economic growth continued at its surprisingly strong pace. Consistently high energy prices began to push up core CPI inflation by December end, stopping its downward month-to-month drift to end the year with a 0.2% month-over-month increase in December, near the upper end of the Fed’s comfort range.
Positive performance is attributed primarily to our asset allocation and duration positioning during the period. We managed our exposure to mortgage-backed securities carefully during the 12 months, starting the period slightly underweight and gradually decreasing exposure during the volatile first half of 2005. However, we began buying mortgages in the latter half of the period as 10-year U.S. Treasury yields became more range bound and relative value versus U.S. Treasuries improved.
We also increased our duration position during the annual period. (Duration is a measure of a portfolio’s price sensitivity to interest rate movements. A shorter duration helps cushion price declines in the event of rising rates.) We also slightly extended our yield curve positioning versus the benchmark from the beginning of the period.
* The views expressed above are those of the subinvestment advisor firm as of December 31, 2005 and are subject to change based on market and other conditions. Information about the Portfolio’s holdings, asset allocation, industry allocation or country diversification is historical and is not an indication of future Portfolio composition, which will vary.
1 Lehman Brothers® Aggregate Bond Index includes most obligations of the U.S. Treasury, agencies and quasi-federal corporations, most publicly issued investment grade corporate bonds and most bonds backed by mortgage pools of GNMA, FNMA and FHLMC. The Index performance has not been adjusted for ongoing management, distribution and operating expenses, and sales charges applicable to mutual fund investments. Direct investment in the Index is not possible.
MSF-72
Metropolitan Series Fund, Inc.
Salomon Brothers U.S. Government Portfolio
A $10,000 INVESTMENT COMPARED TO THE
LEHMAN BROTHERS INTERMEDIATE
U.S. GOVERNMENT BOND INDEX
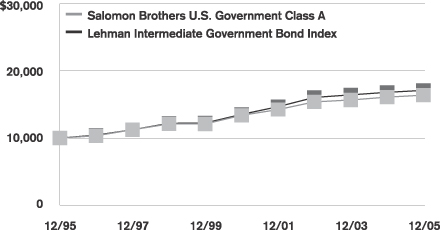
Average Annual Returns as of December 31, 2005
| | | | | | | | | | | | |
| | | Salomon Brothers U.S.
Government Portfolio | | | Lehman Brothers
Intermediate U.S.
Government Bond Index | |
| | | Class A | | | Class B | | | Class E | | |
| 1 Year | | 1.7 | % | | 1.4 | % | | 1.6 | % | | 1.7 | % |
| 5 Years | | 4.2 | | | N/A | | | N/A | | | 4.8 | |
| 10 Years | | 5.1 | | | N/A | | | N/A | | | 5.5 | |
| Since Inception | | — | | | 2.7 | | | 3.9 | | | — | |
Performance numbers are net of all Portfolio expenses but do not include any insurance, sales, or administrative charges of variable annuity or life insurance contracts. If these charges were included, the returns would be lower.
Inception dates of the Class A, Class B and Class E shares are: 10/31/94, 7/30/02 and 5/1/01, respectively.
This information represents past performance and is not indicative of future results. Investment return and principal value may fluctuate so that shares, upon redemption, may be worth more or less than the original cost.
PORTFOLIO COMPOSITION
as of December 31, 2005
Top Holdings
| | | |
| | | % of Total
Net Assets
| |
Federal National Mortgage Association | | 49.6 | % |
Federal Home Loan Mortgage Corp. | | 23.1 | % |
United States Treasury Notes | | 18.2 | % |
Government National Mortgage Association | | 0.2 | % |
Federal Home Loan Bank | | 0.2 | % |
Top Sectors
| | |
| | | % of Total
Net Assets
|
Mortgage Backed | | 72.7% |
U.S. Treasury | | 18.3% |
Cash/Other | | 9.0% |
| | | |
| | | |
MSF-73
Metropolitan Series Fund, Inc.
BlackRock Money Market Portfolio
Managed by BlackRock Advisors, Inc.
Portfolio Manager Commentary*
PORTFOLIO PERFORMANCE
For the year ended December 31, 2005, the Class A shares of the BlackRock Money Market Portfolio returned 2.9%; the Class B shares returned 2.6%; and the Class E shares returned 2.7%. The average return of its peer group, the Lipper Variable Insurance Products Money Market Funds Universe1, was 2.7% over the same period.
PORTFOLIO REVIEW
During the year ended December 31, 2005, the Federal Open Market Committee (FOMC) continued toward its stated objective of the removal of monetary policy accommodation by increasing the federal funds target rate in eight consecutive 25 basis point increments at each of their scheduled meetings during the year. These actions, combined with five previous increases of an identical amount orchestrated in the second half of 2004, brought the current target rate to 4.25% at the year-end. The money market yield curve shifted up and remained relatively steep during the period, usually indicating that short-term rate increases would continue. Specifically, the spread between one-month and twelve-month LIBOR (London Interbank Offer Rate) stood at 45 basis points on December 31, while fed funds futures contracts were predicting a terminal target rate of between 4.50-4.75% over the next six months.
The Portfolio assumed a relatively defensive posture during the period, as the majority of money market securities purchased bore maturity dates at or prior to the next two to three FOMC meetings. The strategy employed maintained the portfolio maturity in the 30-55 day range with the expectation that the proceeds at maturity would be reinvested at successively higher rates. As of December 31, the Portfolio was well positioned for higher short-term rates with 96% of the portfolio in cash or resets within 90 days.
* On January 31, 2005, BlackRock Advisors, Inc. (“BlackRock”) succeeded State Street Research & Management Company (“State Street Research”) as subadviser to the Portfolio, and the Portfolio’s name was changed from State Street Research Money Market Portfolio to BlackRock Money Market Portfolio. This commentary was prepared by BlackRock. The views expressed above are those of the subinvestment advisor firm as of December 31, 2005 and are subject to change based on market and other conditions. Information about the Portfolio’s holdings, asset allocation, industry allocation or country diversification is historical and is not an indication of future Portfolio composition, which will vary.
1 Lipper Variable Products Fund Averages. Each of these is an average of the total return performance (calculated on the basis of net asset value) of funds with similar investment objectives to those of the subject Portfolio as calculated by Lipper Analytical Services, an independent mutual fund ranking service. The Portfolio is neither insured nor guaranteed by the U.S. Government. The Portfolio seeks but cannot assure a stable share price of $100.00. Performance numbers are net of all Portfolio expenses but do not include any insurance, sales, or administrative charges of variable annuity or life insurance contracts. If these charges were included, the returns would be lower. This information represents past performance and is not indicative of future results. Investment return and principal value may fluctuate so that shares, upon redemption, may be worth more or less that the original cost.
MSF-74
Metropolitan Series Fund, Inc.
Shareholder Expense Example
As a shareholder of the Fund, you incur ongoing costs, including management fees; distribution and service (12b-1) fees; and other fund expenses. This example is intended to help you understand your ongoing costs (in dollars) (referred to as “expenses”) of investing in each Portfolio and compare these costs with the ongoing costs of investing in other mutual funds. The example is based on an investment of $1,000 invested at the beginning of the period and held for the entire period, July 1, 2005 through December 31, 2005.
Actual Expenses
The first line for each share class of each Portfolio in the table below provides information about actual account values and actual expenses. You may use the information in this line, together with the amount you invested in the particular share class of the relevant Portfolio, to estimate the expenses that you paid over the period. Simply divide your account value by $1,000 (for example, an $8,600 account value divided by $1,000=8.6), then multiply the result by the number in the first line under the heading entitled “Expenses Paid During Period” to estimate the expenses you paid on your account during this period.
Hypothetical Example for Comparison Purposes
The second line for each share class of each Portfolio in the table below provides information about hypothetical account values and hypothetical expenses based on each Portfolio’s actual expense ratio and an assumed rate of return of 5% per year before expenses, which is not the relevant Portfolio’s actual return. The hypothetical account values and expenses may not be used to estimate the actual ending account balance or expenses you paid for the period. You may use this information to compare the ongoing costs of investing in a Portfolio and other funds. To do so, compare this 5% hypothetical example with the 5% hypothetical examples that appear in the shareholder reports of the other funds.
Please note that the expenses shown in the table are meant to highlight your ongoing costs only and do not reflect any fees or charges of your variable insurance product or any additional expenses that participants in certain eligible qualified plans may bear relating to the operations of their plan. Therefore, the second line for each share class in the table is useful in comparing ongoing costs only, and will not help you determine the relative total costs of owning different funds. In addition, if these other costs were included, your costs would have been higher.
| | | | | | | | | | | | | | |
Portfolio
| | | | Annualized
Expense
Ratio
| | | Beginning
Account Value
July 1,
2005
| | Ending
Account Value
December 31,
2005
| | Expenses Paid
During Period*
July 1, 2005
to
December 31,
2005
|
BlackRock Aggressive Growth—Class A | | Actual | | 0.78 | % | | $ | 1,000.00 | | $ | 1,081.90 | | $ | 4.09 |
| | | Hypothetical | | 0.78 | % | | $ | 1,000.00 | | $ | 1,021.23 | | $ | 3.97 |
| | | | | |
BlackRock Aggressive Growth—Class B | | Actual | | 1.03 | % | | $ | 1,000.00 | | $ | 1,080.40 | | $ | 5.40 |
| | | Hypothetical | | 1.03 | % | | $ | 1,000.00 | | $ | 1,019.95 | | $ | 5.24 |
| | | | | |
BlackRock Aggressive Growth—Class E | | Actual | | 0.93 | % | | $ | 1,000.00 | | $ | 1,080.80 | | $ | 4.88 |
| | | Hypothetical | | 0.93 | % | | $ | 1,000.00 | | $ | 1,020.46 | | $ | 4.74 |
| | | | | |
BlackRock Bond Income—Class A | | Actual | | 0.47 | % | | $ | 1,000.00 | | $ | 1,001.10 | | $ | 2.37 |
| | | Hypothetical | | 0.47 | % | | $ | 1,000.00 | | $ | 1,022.81 | | $ | 2.40 |
| | | | | |
BlackRock Bond Income—Class B | | Actual | | 0.72 | % | | $ | 1,000.00 | | $ | 999.90 | | $ | 3.63 |
| | | Hypothetical | | 0.72 | % | | $ | 1,000.00 | | $ | 1,021.53 | | $ | 3.67 |
| | | | | |
BlackRock Bond Income—Class E | | Actual | | 0.62 | % | | $ | 1,000.00 | | $ | 1,000.40 | | $ | 3.13 |
| | | Hypothetical | | 0.62 | % | | $ | 1,000.00 | | $ | 1,022.05 | | $ | 3.16 |
| | | | | |
BlackRock Diversified—Class A | | Actual | | 0.50 | % | | $ | 1,000.00 | | $ | 1,027.00 | | $ | 2.55 |
| | | Hypothetical | | 0.50 | % | | $ | 1,000.00 | | $ | 1,022.66 | | $ | 2.55 |
| | | | | |
BlackRock Diversified—Class B | | Actual | | 0.75 | % | | $ | 1,000.00 | | $ | 1,025.90 | | $ | 3.83 |
| | | Hypothetical | | 0.75 | % | | $ | 1,000.00 | | $ | 1,021.38 | | $ | 3.82 |
| | | | | |
BlackRock Diversified—Class E | | Actual | | 0.65 | % | | $ | 1,000.00 | | $ | 1,026.40 | | $ | 3.32 |
| | | Hypothetical | | 0.65 | % | | $ | 1,000.00 | | $ | 1,021.89 | | $ | 3.31 |
| | | | | |
BlackRock Investment Trust—Class A | | Actual | | 0.54 | % | | $ | 1,000.00 | | $ | 1,042.00 | | $ | 2.78 |
| | | Hypothetical | | 0.54 | % | | $ | 1,000.00 | | $ | 1,022.45 | | $ | 2.75 |
| | | | | |
BlackRock Investment Trust—Class B | | Actual | | 0.80 | % | | $ | 1,000.00 | | $ | 1,040.50 | | $ | 4.11 |
| | | Hypothetical | | 0.80 | % | | $ | 1,000.00 | | $ | 1,021.13 | | $ | 4.08 |
| | | | | |
BlackRock Investment Trust—Class E | | Actual | | 0.69 | % | | $ | 1,000.00 | | $ | 1,041.50 | | $ | 3.55 |
| | | Hypothetical | | 0.69 | % | | $ | 1,000.00 | | $ | 1,021.69 | | $ | 3.52 |
MSF-75
Metropolitan Series Fund, Inc.
Shareholder Expense Example—(Continued)
| | | | | | | | | | | | | | |
Portfolio
| | | | Annualized
Expense
Ratio
| | | Beginning
Account Value
July 1,
2005
| | Ending
Account Value
December 31,
2005
| | Expenses Paid
During Period*
July 1, 2005
to
December 31,
2005
|
BlackRock Large Cap Value—Class A | | Actual | | 0.86 | % | | $ | 1,000.00 | | $ | 1,051.00 | | $ | 4.45 |
| | | Hypothetical | | 0.86 | % | | $ | 1,000.00 | | $ | 1,020.82 | | $ | 4.38 |
| | | | | |
BlackRock Large Cap Value—Class B | | Actual | | 1.11 | % | | $ | 1,000.00 | | $ | 1,049.50 | | $ | 5.73 |
| | | Hypothetical | | 1.11 | % | | $ | 1,000.00 | | $ | 1,019.54 | | $ | 5.65 |
| | | | | |
BlackRock Large Cap Value—Class E | | Actual | | 1.01 | % | | $ | 1,000.00 | | $ | 1,050.30 | | $ | 5.22 |
| | | Hypothetical | | 1.01 | % | | $ | 1,000.00 | | $ | 1,020.05 | | $ | 5.14 |
| | | | | |
BlackRock Legacy Large Cap Growth—Class A | | Actual | | 0.79 | % | | $ | 1,000.00 | | $ | 1,092.10 | | $ | 4.17 |
| | | Hypothetical | | 0.79 | % | | $ | 1,000.00 | | $ | 1,021.18 | | $ | 4.02 |
| | | | | |
BlackRock Legacy Large Cap Growth—Class B | | Actual | | 1.04 | % | | $ | 1,000.00 | | $ | 1,090.90 | | $ | 5.48 |
| | | Hypothetical | | 1.04 | % | | $ | 1,000.00 | | $ | 1,019.90 | | $ | 5.29 |
| | | | | |
BlackRock Legacy Large Cap Growth—Class E | | Actual | | 0.94 | % | | $ | 1,000.00 | | $ | 1,091.30 | | $ | 4.95 |
| | | Hypothetical | | 0.94 | % | | $ | 1,000.00 | | $ | 1,020.41 | | $ | 4.79 |
| | | | | |
BlackRock Money Market—Class A | | Actual | | 0.41 | % | | $ | 1,000.00 | | $ | 1,017.20 | | $ | 2.08 |
| | | Hypothetical | | 0.41 | % | | $ | 1,000.00 | | $ | 1,023.12 | | $ | 2.09 |
| | | | | |
BlackRock Money Market—Class B | | Actual | | 0.66 | % | | $ | 1,000.00 | | $ | 1,016.00 | | $ | 3.35 |
| | | Hypothetical | | 0.66 | % | | $ | 1,000.00 | | $ | 1,021.84 | | $ | 3.36 |
| | | | | |
BlackRock Money Market—Class E | | Actual | | 0.56 | % | | $ | 1,000.00 | | $ | 1,016.50 | | $ | 2.85 |
| | | Hypothetical | | 0.56 | % | | $ | 1,000.00 | | $ | 1,022.35 | | $ | 2.85 |
| | | | | |
BlackRock Strategic Value—Class A | | Actual | | 0.90 | % | | $ | 1,000.00 | | $ | 1,036.90 | | $ | 4.62 |
| | | Hypothetical | | 0.90 | % | | $ | 1,000.00 | | $ | 1,020.62 | | $ | 4.58 |
| | | | | |
BlackRock Strategic Value—Class B | | Actual | | 1.15 | % | | $ | 1,000.00 | | $ | 1,035.50 | | $ | 5.90 |
| | | Hypothetical | | 1.15 | % | | $ | 1,000.00 | | $ | 1,019.34 | | $ | 5.85 |
| | | | | |
BlackRock Strategic Value—Class E | | Actual | | 1.05 | % | | $ | 1,000.00 | | $ | 1,035.40 | | $ | 5.39 |
| | | Hypothetical | | 1.05 | % | | $ | 1,000.00 | | $ | 1,019.85 | | $ | 5.35 |
| | | | | |
Capital Guardian U.S. Equity—Class A | | Actual | | 0.74 | % | | $ | 1,000.00 | | $ | 1,077.80 | | $ | 3.88 |
| | | Hypothetical | | 0.74 | % | | $ | 1,000.00 | | $ | 1,021.43 | | $ | 3.77 |
| | | | | |
Capital Guardian U.S. Equity—Class B | | Actual | | 0.99 | % | | $ | 1,000.00 | | $ | 1,076.30 | | $ | 5.18 |
| | | Hypothetical | | 0.99 | % | | $ | 1,000.00 | | $ | 1,020.16 | | $ | 5.04 |
| | | | | |
Davis Venture Value—Class A | | Actual | | 0.77 | % | | $ | 1,000.00 | | $ | 1,083.00 | | $ | 4.04 |
| | | Hypothetical | | 0.77 | % | | $ | 1,000.00 | | $ | 1,021.28 | | $ | 3.92 |
| | | | | |
Davis Venture Value—Class B | | Actual | | 1.02 | % | | $ | 1,000.00 | | $ | 1,081.30 | | $ | 5.35 |
| | | Hypothetical | | 1.02 | % | | $ | 1,000.00 | | $ | 1,020.00 | | $ | 5.19 |
| | | | | |
Davis Venture Value—Class E | | Actual | | 0.92 | % | | $ | 1,000.00 | | $ | 1,082.00 | | $ | 4.83 |
| | | Hypothetical | | 0.92 | % | | $ | 1,000.00 | | $ | 1,020.51 | | $ | 4.69 |
| | | | | |
FI International Stock—Class A | | Actual | | 1.05 | % | | $ | 1,000.00 | | $ | 1,189.80 | | $ | 5.80 |
| | | Hypothetical | | 1.05 | % | | $ | 1,000.00 | | $ | 1,019.85 | | $ | 5.35 |
| | | | | |
FI International Stock—Class B | | Actual | | 1.30 | % | | $ | 1,000.00 | | $ | 1,187.20 | | $ | 7.17 |
| | | Hypothetical | | 1.30 | % | | $ | 1,000.00 | | $ | 1,018.57 | | $ | 6.61 |
| | | | | |
FI International Stock—Class E | | Actual | | 1.20 | % | | $ | 1,000.00 | | $ | 1,188.40 | | $ | 6.62 |
| | | Hypothetical | | 1.20 | % | | $ | 1,000.00 | | $ | 1,019.08 | | $ | 6.11 |
| | | | | |
FI Mid Cap Opportunities—Class A | | Actual | | 0.74 | % | | $ | 1,000.00 | | $ | 1,099.40 | | $ | 3.92 |
| | | Hypothetical | | 0.74 | % | | $ | 1,000.00 | | $ | 1,021.43 | | $ | 3.77 |
| | | | | |
FI Mid Cap Opportunities—Class B | | Actual | | 0.99 | % | | $ | 1,000.00 | | $ | 1,098.10 | | $ | 5.24 |
| | | Hypothetical | | 0.99 | % | | $ | 1,000.00 | | $ | 1,020.16 | | $ | 5.04 |
| | | | | |
FI Mid Cap Opportunities—Class E | | Actual | | 0.89 | % | | $ | 1,000.00 | | $ | 1,098.50 | | $ | 4.71 |
| | | Hypothetical | | 0.89 | % | | $ | 1,000.00 | | $ | 1,020.67 | | $ | 4.53 |
MSF-76
Metropolitan Series Fund, Inc.
Shareholder Expense Example—(Continued)
| | | | | | | | | | | | | | |
Portfolio
| | | | Annualized
Expense
Ratio
| | | Beginning
Account Value
July 1,
2005
| | Ending
Account Value
December 31,
2005
| | Expenses Paid
During Period*
July 1, 2005
to
December 31,
2005
|
FI Value Leaders—Class A | | Actual | | 0.73 | % | | $ | 1,000.00 | | $ | 1,096.20 | | $ | 3.86 |
| | | Hypothetical | | 0.73 | % | | $ | 1,000.00 | | $ | 1,021.48 | | $ | 3.72 |
| | | | | |
FI Value Leaders—Class B | | Actual | | 0.98 | % | | $ | 1,000.00 | | $ | 1,094.90 | | $ | 5.17 |
| | | Hypothetical | | 0.98 | % | | $ | 1,000.00 | | $ | 1,020.21 | | $ | 4.99 |
| | | | | |
FI Value Leaders—Class E | | Actual | | 0.88 | % | | $ | 1,000.00 | | $ | 1,095.40 | | $ | 4.65 |
| | | Hypothetical | | 0.88 | % | | $ | 1,000.00 | | $ | 1,020.72 | | $ | 4.48 |
| | | | | |
Franklin Templeton Small Cap Growth—Class A | | Actual | | 1.12 | % | | $ | 1,000.00 | | $ | 1,060.00 | | $ | 5.82 |
| | | Hypothetical | | 1.12 | % | | $ | 1,000.00 | | $ | 1,019.49 | | $ | 5.70 |
| | | | | |
Franklin Templeton Small Cap Growth—Class B | | Actual | | 1.37 | % | | $ | 1,000.00 | | $ | 1,058.50 | | $ | 7.11 |
| | | Hypothetical | | 1.37 | % | | $ | 1,000.00 | | $ | 1,018.22 | | $ | 6.97 |
| | | | | |
Franklin Templeton Small Cap Growth—Class E | | Actual | | 1.27 | % | | $ | 1,000.00 | | $ | 1,058.20 | | $ | 6.59 |
| | | Hypothetical | | 1.27 | % | | $ | 1,000.00 | | $ | 1,018.73 | | $ | 6.46 |
| | | | | |
Harris Oakmark Focused Value—Class A | | Actual | | 0.77 | % | | $ | 1,000.00 | | $ | 1,032.50 | | $ | 3.94 |
| | | Hypothetical | | 0.77 | % | | $ | 1,000.00 | | $ | 1,021.28 | | $ | 3.92 |
| | | | | |
Harris Oakmark Focused Value—Class B | | Actual | | 1.02 | % | | $ | 1,000.00 | | $ | 1,031.20 | | $ | 5.22 |
| | | Hypothetical | | 1.02 | % | | $ | 1,000.00 | | $ | 1,020.00 | | $ | 5.19 |
| | | | | |
Harris Oakmark Focused Value—Class E | | Actual | | 0.92 | % | | $ | 1,000.00 | | $ | 1,031.70 | | $ | 4.71 |
| | | Hypothetical | | 0.92 | % | | $ | 1,000.00 | | $ | 1,020.51 | | $ | 4.69 |
| | | | | |
Harris Oakmark Large Cap Value—Class A | | Actual | | 0.78 | % | | $ | 1,000.00 | | $ | 1,009.30 | | $ | 3.95 |
| | | Hypothetical | | 0.78 | % | | $ | 1,000.00 | | $ | 1,021.23 | | $ | 3.97 |
| | | | | |
Harris Oakmark Large Cap Value—Class B | | Actual | | 1.03 | % | | $ | 1,000.00 | | $ | 1,007.70 | | $ | 5.21 |
| | | Hypothetical | | 1.03 | % | | $ | 1,000.00 | | $ | 1,019.95 | | $ | 5.24 |
| | | | | |
Harris Oakmark Large Cap Value—Class E | | Actual | | 0.93 | % | | $ | 1,000.00 | | $ | 1,008.50 | | $ | 4.71 |
| | | Hypothetical | | 0.93 | % | | $ | 1,000.00 | | $ | 1,020.46 | | $ | 4.74 |
| | | | | |
Jennison Growth—Class A | | Actual | | 0.69 | % | | $ | 1,000.00 | | $ | 1,135.80 | | $ | 3.71 |
| | | Hypothetical | | 0.69 | % | | $ | 1,000.00 | | $ | 1,021.69 | | $ | 3.52 |
| | | | | |
Jennison Growth—Class B | | Actual | | 0.94 | % | | $ | 1,000.00 | | $ | 1,133.30 | | $ | 5.05 |
| | | Hypothetical | | 0.94 | % | | $ | 1,000.00 | | $ | 1,020.41 | | $ | 4.79 |
| | | | | |
Jennison Growth—Class E | | Actual | | 0.84 | % | | $ | 1,000.00 | | $ | 1,133.90 | | $ | 4.52 |
| | | Hypothetical | | 0.84 | % | | $ | 1,000.00 | | $ | 1,020.92 | | $ | 4.28 |
| | | | | |
Lehman Brothers Aggregate Bond Index—Class A | | Actual | | 0.31 | % | | $ | 1,000.00 | | $ | 997.20 | | $ | 1.56 |
| | | Hypothetical | | 0.31 | % | | $ | 1,000.00 | | $ | 1,023.63 | | $ | 1.58 |
| | | | | |
Lehman Brothers Aggregate Bond Index—Class B | | Actual | | 0.56 | % | | $ | 1,000.00 | | $ | 996.30 | | $ | 2.82 |
| | | Hypothetical | | 0.56 | % | | $ | 1,000.00 | | $ | 1,022.35 | | $ | 2.85 |
| | | | | |
Lehman Brothers Aggregate Bond Index—Class E | | Actual | | 0.46 | % | | $ | 1,000.00 | | $ | 997.20 | | $ | 2.32 |
| | | Hypothetical | | 0.46 | % | | $ | 1,000.00 | | $ | 1,022.86 | | $ | 2.35 |
| | | | | |
Loomis Sayles Small Cap—Class A(a) | | Actual | | 0.92 | % | | $ | 1,000.00 | | $ | 1,063.60 | | $ | 4.79 |
| | | Hypothetical | | 0.92 | % | | $ | 1,000.00 | | $ | 1,020.51 | | $ | 4.69 |
| | | | | |
Loomis Sayles Small Cap—Class B(a) | | Actual | | 1.18 | % | | $ | 1,000.00 | | $ | 1,062.20 | | $ | 6.13 |
| | | Hypothetical | | 1.18 | % | | $ | 1,000.00 | | $ | 1,019.19 | | $ | 6.01 |
| | | | | |
Loomis Sayles Small Cap—Class E(a) | | Actual | | 1.07 | % | | $ | 1,000.00 | | $ | 1,062.80 | | $ | 5.56 |
| | | Hypothetical | | 1.07 | % | | $ | 1,000.00 | | $ | 1,019.75 | | $ | 5.45 |
| | | | | |
MetLife Aggressive Allocation—Class A(a)(b) | | Actual | | 0.81 | % | | $ | 1,000.00 | | $ | 1,081.70 | | $ | 4.25 |
| | | Hypothetical | | 0.81 | % | | $ | 1,000.00 | | $ | 1,021.08 | | $ | 4.13 |
| | | | | |
MetLife Aggressive Allocation—Class B(a)(b) | | Actual | | 1.06 | % | | $ | 1,000.00 | | $ | 1,037.40 | | $ | 5.44 |
| | | Hypothetical | | 1.06 | % | | $ | 1,000.00 | | $ | 1,019.80 | | $ | 5.40 |
MSF-77
Metropolitan Series Fund, Inc.
Shareholder Expense Example—(Continued)
| | | | | | | | | | | | | | |
Portfolio
| | | | Annualized
Expense
Ratio
| | | Beginning
Account Value
July 1,
2005
| | Ending
Account Value
December 31,
2005
| | Expenses Paid
During Period*
July 1, 2005
to
December 31,
2005
|
MetLife Conservative Allocation—Class A(a)(b) | | Actual | | 0.72 | % | | $ | 1,000.00 | | $ | 1,017.90 | | $ | 3.66 |
| | | Hypothetical | | 0.72 | % | | $ | 1,000.00 | | $ | 1,021.53 | | $ | 3.67 |
| | | | | |
MetLife Conservative Allocation—Class B(a)(b) | | Actual | | 0.97 | % | | $ | 1,000.00 | | $ | 1,012.40 | | $ | 4.92 |
| | | Hypothetical | | 0.97 | % | | $ | 1,000.00 | | $ | 1,020.26 | | $ | 4.94 |
| | | | | |
MetLife Conservative to Moderate Allocation—Class A(a)(b) | | Actual | | 0.74 | % | | $ | 1,000.00 | | $ | 1,035.30 | | $ | 3.80 |
| | | Hypothetical | | 0.74 | % | | $ | 1,000.00 | | $ | 1,021.43 | | $ | 3.77 |
| | | | | |
MetLife Conservative to Moderate Allocation—Class B(a)(b) | | Actual | | 0.99 | % | | $ | 1,000.00 | | $ | 1,017.90 | | $ | 5.04 |
| | | Hypothetical | | 0.99 | % | | $ | 1,000.00 | | $ | 1,020.16 | | $ | 5.04 |
| | | | | |
MetLife Mid Cap Stock Index—Class A | | Actual | | 0.32 | % | | $ | 1,000.00 | | $ | 1,081.70 | | $ | 1.68 |
| | | Hypothetical | | 0.32 | % | | $ | 1,000.00 | | $ | 1,023.58 | | $ | 1.63 |
| | | | | |
MetLife Mid Cap Stock Index—Class B | | Actual | | 0.57 | % | | $ | 1,000.00 | | $ | 1,080.80 | | $ | 2.99 |
| | | Hypothetical | | 0.57 | % | | $ | 1,000.00 | | $ | 1,022.30 | | $ | 2.91 |
| | | | | |
MetLife Mid Cap Stock Index—Class E | | Actual | | 0.47 | % | | $ | 1,000.00 | | $ | 1,081.30 | | $ | 2.47 |
| | | Hypothetical | | 0.47 | % | | $ | 1,000.00 | | $ | 1,022.81 | | $ | 2.40 |
| | | | | |
MetLife Moderate Allocation—Class A(a)(b) | | Actual | | 0.78 | % | | $ | 1,000.00 | | $ | 1,051.90 | | $ | 4.03 |
| | | Hypothetical | | 0.78 | % | | $ | 1,000.00 | | $ | 1,021.23 | | $ | 3.97 |
| | | | | |
MetLife Moderate Allocation—Class B(a)(b) | | Actual | | 1.03 | % | | $ | 1,000.00 | | $ | 1,025.50 | | $ | 5.26 |
| | | Hypothetical | | 1.03 | % | | $ | 1,000.00 | | $ | 1,019.95 | | $ | 5.24 |
| | | | | |
MetLife Moderate to Aggressive Allocation—Class A(a)(b) | | Actual | | 0.80 | % | | $ | 1,000.00 | | $ | 1,068.80 | | $ | 4.17 |
| | | Hypothetical | | 0.80 | % | | $ | 1,000.00 | | $ | 1,021.13 | | $ | 4.08 |
| | | | | |
MetLife Moderate to Aggressive Allocation—Class B(a)(b) | | Actual | | 1.05 | % | | $ | 1,000.00 | | $ | 1,031.50 | | $ | 5.38 |
| | | Hypothetical | | 1.05 | % | | $ | 1,000.00 | | $ | 1,019.85 | | $ | 5.35 |
| | | | | |
MetLife Stock Index—Class A | | Actual | | 0.28 | % | | $ | 1,000.00 | | $ | 1,056.30 | | $ | 1.45 |
| | | Hypothetical | | 0.28 | % | | $ | 1,000.00 | | $ | 1,023.78 | | $ | 1.43 |
| | | | | |
MetLife Stock Index—Class B | | Actual | | 0.53 | % | | $ | 1,000.00 | | $ | 1,055.00 | | $ | 2.75 |
| | | Hypothetical | | 0.53 | % | | $ | 1,000.00 | | $ | 1,022.50 | | $ | 2.70 |
| | | | | |
MetLife Stock Index—Class E | | Actual | | 0.43 | % | | $ | 1,000.00 | | $ | 1,055.60 | | $ | 2.23 |
| | | Hypothetical | | 0.43 | % | | $ | 1,000.00 | | $ | 1,023.02 | | $ | 2.19 |
| | | | | |
MFS Investors Trust—Class A | | Actual | | 0.91 | % | | $ | 1,000.00 | | $ | 1,077.10 | | $ | 4.76 |
| | | Hypothetical | | 0.91 | % | | $ | 1,000.00 | | $ | 1,020.56 | | $ | 4.63 |
| | | | | |
MFS Investors Trust—Class B | | Actual | | 1.16 | % | | $ | 1,000.00 | | $ | 1,076.20 | | $ | 6.07 |
| | | Hypothetical | | 1.16 | % | | $ | 1,000.00 | | $ | 1,019.29 | | $ | 5.90 |
| | | | | |
MFS Investors Trust—Class E | | Actual | | 1.06 | % | | $ | 1,000.00 | | $ | 1,077.30 | | $ | 5.55 |
| | | Hypothetical | | 1.06 | % | | $ | 1,000.00 | | $ | 1,019.80 | | $ | 5.40 |
| | | | | |
MFS Total Return—Class A | | Actual | | 0.72 | % | | $ | 1,000.00 | | $ | 1,022.20 | | $ | 3.67 |
| | | Hypothetical | | 0.72 | % | | $ | 1,000.00 | | $ | 1,021.53 | | $ | 3.67 |
| | | | | |
MFS Total Return—Class B | | Actual | | 0.97 | % | | $ | 1,000.00 | | $ | 1,020.90 | | $ | 4.94 |
| | | Hypothetical | | 0.97 | % | | $ | 1,000.00 | | $ | 1,020.26 | | $ | 4.94 |
| | | | | |
MFS Total Return—Class E | | Actual | | 0.87 | % | | $ | 1,000.00 | | $ | 1,021.40 | | $ | 4.43 |
| | | Hypothetical | | 0.87 | % | | $ | 1,000.00 | | $ | 1,020.77 | | $ | 4.43 |
| | | | | |
Morgan Stanley EAFE Index—Class A | | Actual | | 0.50 | % | | $ | 1,000.00 | | $ | 1,152.10 | | $ | 2.71 |
| | | Hypothetical | | 0.50 | % | | $ | 1,000.00 | | $ | 1,022.66 | | $ | 2.55 |
| | | | | |
Morgan Stanley EAFE Index—Class B | | Actual | | 0.75 | % | | $ | 1,000.00 | | $ | 1,150.60 | | $ | 4.07 |
| | | Hypothetical | | 0.75 | % | | $ | 1,000.00 | | $ | 1,021.38 | | $ | 3.82 |
| | | | | |
Morgan Stanley EAFE Index—Class E | | Actual | | 0.65 | % | | $ | 1,000.00 | | $ | 1,150.90 | | $ | 3.52 |
| | | Hypothetical | | 0.65 | % | | $ | 1,000.00 | | $ | 1,021.89 | | $ | 3.31 |
MSF-78
Metropolitan Series Fund, Inc.
Shareholder Expense Example—(Continued)
| | | | | | | | | | | | | | |
Portfolio
| | | | Annualized
Expense
Ratio
| | | Beginning
Account Value
July 1,
2005
| | Ending
Account Value
December 31,
2005
| | Expenses Paid
During Period*
July 1, 2005
to
December 31,
2005
|
Neuberger Berman Mid Cap Value—Class A | | Actual | | 0.79 | % | | $ | 1,000.00 | | $ | 1,085.40 | | $ | 4.15 |
| | | Hypothetical | | 0.79 | % | | $ | 1,000.00 | | $ | 1,021.18 | | $ | 4.02 |
| | | | | |
Neuberger Berman Mid Cap Value—Class B | | Actual | | 1.04 | % | | $ | 1,000.00 | | $ | 1,084.00 | | $ | 5.46 |
| | | Hypothetical | | 1.04 | % | | $ | 1,000.00 | | $ | 1,019.90 | | $ | 5.29 |
| | | | | |
Neuberger Berman Mid Cap Value—Class E | | Actual | | 0.94 | % | | $ | 1,000.00 | | $ | 1,084.50 | | $ | 4.94 |
| | | Hypothetical | | 0.94 | % | | $ | 1,000.00 | | $ | 1,020.41 | | $ | 4.79 |
| | | | | |
Oppenheimer Global Equity—Class A | | Actual | | 1.00 | % | | $ | 1,000.00 | | $ | 1,142.00 | | $ | 5.40 |
| | | Hypothetical | | 1.00 | % | | $ | 1,000.00 | | $ | 1,020.11 | | $ | 5.09 |
| | | | | |
Oppenheimer Global Equity—Class B | | Actual | | 1.25 | % | | $ | 1,000.00 | | $ | 1,140.00 | | $ | 6.74 |
| | | Hypothetical | | 1.25 | % | | $ | 1,000.00 | | $ | 1,018.83 | | $ | 6.36 |
| | | | | |
Oppenheimer Global Equity—Class E | | Actual | | 1.15 | % | | $ | 1,000.00 | | $ | 1,140.80 | | $ | 6.21 |
| | | Hypothetical | | 1.15 | % | | $ | 1,000.00 | | $ | 1,019.34 | | $ | 5.85 |
| | | | | |
Russell 2000 Index—Class A | | Actual | | 0.35 | % | | $ | 1,000.00 | | $ | 1,056.90 | | $ | 1.81 |
| | | Hypothetical | | 0.35 | % | | $ | 1,000.00 | | $ | 1,023.42 | | $ | 1.79 |
| | | | | |
Russell 2000 Index—Class B | | Actual | | 0.60 | % | | $ | 1,000.00 | | $ | 1,056.20 | | $ | 3.11 |
| | | Hypothetical | | 0.60 | % | | $ | 1,000.00 | | $ | 1,022.15 | | $ | 3.06 |
| | | | | |
Russell 2000 Index—Class E | | Actual | | 0.50 | % | | $ | 1,000.00 | | $ | 1,056.40 | | $ | 2.59 |
| | | Hypothetical | | 0.50 | % | | $ | 1,000.00 | | $ | 1,022.66 | | $ | 2.55 |
| | | | | |
Salomon Brothers Strategic Bond Opportunities—Class A | | Actual | | 0.74 | % | | $ | 1,000.00 | | $ | 1,007.10 | | $ | 3.74 |
| | | Hypothetical | | 0.74 | % | | $ | 1,000.00 | | $ | 1,021.43 | | $ | 3.77 |
| | | | | |
Salomon Brothers Strategic Bond Opportunities—Class B | | Actual | | 0.99 | % | | $ | 1,000.00 | | $ | 1,005.60 | | $ | 5.00 |
| | | Hypothetical | | 0.99 | % | | $ | 1,000.00 | | $ | 1,020.16 | | $ | 5.04 |
| | | | | |
Salomon Brothers Strategic Bond Opportunities—Class E | | Actual | | 0.89 | % | | $ | 1,000.00 | | $ | 1,006.30 | | $ | 4.50 |
| | | Hypothetical | | 0.89 | % | | $ | 1,000.00 | | $ | 1,020.67 | | $ | 4.53 |
| | | | | |
Salomon Brothers U.S. Government—Class A | | Actual | | 0.61 | % | | $ | 1,000.00 | | $ | 1,000.80 | | $ | 3.08 |
| | | Hypothetical | | 0.61 | % | | $ | 1,000.00 | | $ | 1,022.10 | | $ | 3.11 |
| | | | | |
Salomon Brothers U.S. Government—Class B | | Actual | | 0.86 | % | | $ | 1,000.00 | | $ | 999.20 | | $ | 4.33 |
| | | Hypothetical | | 0.86 | % | | $ | 1,000.00 | | $ | 1,020.82 | | $ | 4.38 |
| | | | | |
Salomon Brothers U.S. Government—Class E | | Actual | | 0.76 | % | | $ | 1,000.00 | | $ | 1,000.00 | | $ | 3.83 |
| | | Hypothetical | | 0.76 | % | | $ | 1,000.00 | | $ | 1,021.33 | | $ | 3.87 |
| | | | | |
T. Rowe Price Large Cap Growth—Class A | | Actual | | 0.71 | % | | $ | 1,000.00 | | $ | 1,077.20 | | $ | 3.72 |
| | | Hypothetical | | 0.71 | % | | $ | 1,000.00 | | $ | 1,021.59 | | $ | 3.62 |
| | | | | |
T. Rowe Price Large Cap Growth—Class B | | Actual | | 0.96 | % | | $ | 1,000.00 | | $ | 1,075.90 | | $ | 5.02 |
| | | Hypothetical | | 0.96 | % | | $ | 1,000.00 | | $ | 1,020.31 | | $ | 4.89 |
| | | | | |
T. Rowe Price Large Cap Growth—Class E | | Actual | | 0.86 | % | | $ | 1,000.00 | | $ | 1,076.60 | | $ | 4.50 |
| | | Hypothetical | | 0.86 | % | | $ | 1,000.00 | | $ | 1,020.82 | | $ | 4.38 |
| | | | | |
T. Rowe Price Small Cap Growth—Class A | | Actual | | 0.59 | % | | $ | 1,000.00 | | $ | 1,088.50 | | $ | 3.11 |
| | | Hypothetical | | 0.59 | % | | $ | 1,000.00 | | $ | 1,022.20 | | $ | 3.01 |
| | | | | |
T. Rowe Price Small Cap Growth—Class B | | Actual | | 0.84 | % | | $ | 1,000.00 | | $ | 1,086.90 | | $ | 4.42 |
| | | Hypothetical | | 0.84 | % | | $ | 1,000.00 | | $ | 1,020.92 | | $ | 4.28 |
| | | | | |
T. Rowe Price Small Cap Growth—Class E | | Actual | | 0.74 | % | | $ | 1,000.00 | | $ | 1,088.10 | | $ | 3.89 |
| | | Hypothetical | | 0.74 | % | | $ | 1,000.00 | | $ | 1,021.43 | | $ | 3.77 |
| | | | | |
Zenith Equity(b) | | Actual | | 0.73 | % | | $ | 1,000.00 | | $ | 1,103.40 | | $ | 3.87 |
| | | Hypothetical | | 0.73 | % | | $ | 1,000.00 | | $ | 1,021.48 | | $ | 3.72 |
* Expenses paid are equal to the Portfolio’s annualized expense ratio for the most recent six month period, as shown above, multiplied by the average account value over the period, multiplied by the number of days in the most recent fiscal half-year, divided by 365 (to reflect the the one-half year period).
(a) The annualized expense ratio shown reflects an expense agreement between MetLife Advisers, LLC and the Portfolio as described under Expense Agreement in Note 3. to the Financial Statements.
(b) The annualized expense ratio reflects the expenses of both the Portfolio and the underlying Portfolios in which it invests.
MSF-79
Metropolitan Series Fund, Inc.
MetLife Conservative Allocation Portfolio
Schedule of Investments as of December 31, 2005
Mutual Funds—99.9% of Total Net Assets
| | | | | |
| Security Description | | Shares | | Value* |
| | | | | | |
| | |
Investment Companies—99.9% | | | | | |
Met Investors Series Trust—Harris Oakmark International Portfolio, (Class A) | | 19,273 | | $ | 312,800 |
Met Investors Series Trust—Lord Abbett Bond Debenture Portfolio, (Class A) | | 74,956 | | | 920,455 |
Met Investors Series Trust—Lazard Mid Cap Portfolio, (Class A) | | 11,534 | | | 157,436 |
Met Investors Series Trust—MET/AIM Small Cap Growth Portfolio, (Class A) | | 11,494 | | | 157,006 |
Met Investors Series Trust—PIMCO Total Return Portfolio, (Class A) | | 356,676 | | | 4,137,437 |
Met Investors Series Trust—T. Rowe Price Mid Cap Growth Portfolio, (Class A) | | 18,818 | | | 159,769 |
Metropolitan Series Fund, Inc.—BlackRock Bond Income Portfolio, (Class A) | | 22,184 | | | 2,451,160 |
Metropolitan Series Fund, Inc.—BlackRock Strategic Value Portfolio, (Class A) | | 8,449 | | | 156,817 |
Metropolitan Series Fund, Inc.—Davis Venure Value Portfolio, (Class A) | | 10,098 | | | 312,115 |
Metropolitan Series Fund, Inc.—FI International Stock Portfolio, (Class A) | | 24,083 | | | 324,643 |
Metropolitan Series Fund, Inc.—Harris Oakmark Large Cap Value Portfolio, (Class A) | | 23,616 | | | 309,134 |
Metropolitan Series Fund, Inc.—MetLife Stock Index Portfolio, (Class A) | | 14,082 | | | 467,509 |
Metropolitan Series Fund, Inc.—Neuberger Berman Mid Cap Value Portfolio, (Class A) | | 7,565 | | | 158,708 |
| | | | | |
| Security Description | | Shares | | Value* |
| | |
Investment Companies—(Continued) | | | | | |
Metropolitan Series Fund, Inc.—Russell 2000 Index Portfolio, (Class A) | | 11,240 | | $ | 156,457 |
Metropolitan Series Fund, Inc.—Salomon Brothers Strategic Bond Opportunities Portfolio, (Class A) | | 217,369 | | | 2,764,928 |
Metropolitan Series Fund, Inc.—Salomon Brothers U.S. Government Portfolio, (Class A) | | 150,077 | | | 1,833,942 |
Metropolitan Series Fund, Inc.—T. Rowe Price Large Cap Growth Portfolio, (Class A) | | 46,250 | | | 625,762 |
| | | | |
|
|
Total Mutual Funds
(Identified Cost $15,329,093) | | | | | 15,406,078 |
| | | | |
|
|
Total Investments—99.9%
(Identified Cost $15,329,093) (a) | | | | | 15,406,078 |
Other assets less liabilities | | | | | 16,301 |
| | | | |
|
|
| Total Net Assets—100% | | | | $ | 15,422,379 |
| | | | |
|
|
| (a) | The aggregate cost of investments for federal income tax purposes as of December 31, 2005 was $15,333,566 and the composition of unrealized appreciation and depreciation of investment securities was $131,487 and $(58,975), respectively. |
*See accompanying notes to financial statements.
MSF-80
Metropolitan Series Fund, Inc.
MetLife Conservative Allocation Portfolio
Statement of Assets & Liabilities
December 31, 2005
| | | | | | |
Assets | | | | | | |
Investments at value | | | | | $ | 15,406,078 |
Receivable for: | | | | | | |
Securities sold | | | | | | 281,702 |
Fund shares sold | | | | | | 7,062 |
Due from Adviser | | | | | | 35,800 |
| | | | | |
|
|
Total Assets | | | | | | 15,730,642 |
Liabilities | | | | | | |
Payable for: | | | | | | |
Fund shares redeemed | | $ | 288,764 | | | |
Accrued expenses: | | | | | | |
Service and distribution fees | | | 2,292 | | | |
Other expenses | | | 17,207 | | | |
| | |
|
| | | |
Total Liabilities | | | | | | 308,263 |
| | | | | |
|
|
Net Assets | | | | | $ | 15,422,379 |
| | | | | |
|
|
Net assets consists of: | | | | | | |
Capital paid in | | | | | $ | 15,299,892 |
Accumulated net realized gains | | | | | | 45,502 |
Unrealized appreciation on investments | | | | | | 76,985 |
| | | | | |
|
|
Net Assets | | | | | $ | 15,422,379 |
| | | | | |
|
|
| Computation of offering price: | | | | | | |
Class A | | | | | | |
Net asset value and redemption price per share ($2,784,736 divided by
268,451 shares outstanding) | | | | | $ | 10.37 |
| | | | | |
|
|
Class B | | | | | | |
Net asset value and redemption price per share ($12,637,643 divided by 1,219,957 shares outstanding) | | | | | $ | 10.36 |
| | | | | |
|
|
Identified cost of investments | | | | | $ | 15,329,093 |
| | | | | |
|
|
Statement of Operations
Period May 2, 2005(a) through December 31, 2005
| | | | | | | |
Investment Income | | | | | | | |
Dividends from underlying Portfolios | | | | | | $ | 53,703 |
| | | | | | |
|
|
Expenses | | | | | | | |
Management fees | | $ | 4,197 | | | | |
Service and distribution fees—Class B | | | 8,004 | | | | |
Directors’ fees and expenses | | | 309 | | | | |
Custodian | | | 20,715 | | | | |
Audit and tax services | | | 13,000 | | | | |
Legal | | | 2,927 | | | | |
Miscellaneous | | | 3,046 | | | | |
| | |
|
|
| | | |
Total expenses | | | 52,198 | | | | |
Expense reimbursements | | | (39,997 | ) | | | 12,201 |
| | |
|
|
| |
|
|
Net Investment Income | | | | | | | 41,502 |
| | | | | | |
|
|
Realized and Unrealized Gain | | | | | | | |
| Realized gain on: | | | | | | | |
Investments—net | | | 7,690 | | | | |
Capital gain distributions from underlying Portfolios | | | 53,234 | | | | 60,924 |
| | |
|
|
| | | |
| Unrealized appreciation on: | | | | | | | |
Investments—net | | | | | | | 76,985 |
| | | | | | |
|
|
Net gain | | | | | | | 137,909 |
| | | | | | |
|
|
Net Increase in Net Assets From Operations | | | | | | $ | 179,411 |
| | | | | | |
|
|
| (a) | Commencement of operations. |
See accompanying notes to financial statements.
MSF-81
Metropolitan Series Fund, Inc.
MetLife Conservative Allocation Portfolio
Statement of Changes in Net Assets
| | | | |
| | | May 2, 2005(a)
through
December 31,
2005
| |
From Operations | | | | |
Net investment income | | $ | 41,502 | |
Net realized gain | | | 60,924 | |
Unrealized appreciation | | | 76,985 | |
| | |
|
|
|
Increase in net assets from operations | | | 179,411 | |
| | |
|
|
|
From Distributions to Shareholders | | | | |
Net investment income | | | | |
Class A | | | (9,949 | ) |
Class B | | | (33,556 | ) |
| | |
|
|
|
| | | | (43,505 | ) |
| | |
|
|
|
Net realized gain | | | | |
Class A | | | (2,633 | ) |
Class B | | | (10,786 | ) |
| | |
|
|
|
| | | | (13,419 | ) |
| | |
|
|
|
Total distributions | | | (56,924 | ) |
| | |
|
|
|
Increase in net assets from capital share transactions | | | 15,299,892 | |
| | |
|
|
|
Total increase in net assets | | | 15,422,379 | |
| |
Net Assets | | | | |
End of the period | | $ | 15,422,379 | |
| | |
|
|
|
Undistributed Net Investment Income | | | | |
End of the period | | $ | 0 | |
| | |
|
|
|
Other Information:
Capital Shares
Transactions in capital shares were as follows:
| | | | | | | |
| | | May 2, 2005(a)
through
December 31, 2005
| |
| | | Shares
| | | $
| |
Class A | | | | | | | |
Sales | | 470,206 | | | $ | 4,830,736 | |
Reinvestments | | 1,211 | | | | 12,582 | |
Redemptions | | (202,966 | ) | | | (2,089,738 | ) |
| | |
|
| |
|
|
|
Net increase | | 268,451 | | | $ | 2,753,580 | |
| | |
|
| |
|
|
|
Class B | | | | | | | |
Sales | | 1,347,495 | | | $ | 13,853,831 | |
Reinvestments | | 4,276 | | | | 44,342 | |
Redemptions | | (131,814 | ) | | | (1,351,861 | ) |
| | |
|
| |
|
|
|
Net increase | | 1,219,957 | | | $ | 12,546,312 | |
| | |
|
| |
|
|
|
Increase derived from capital share transactions | | 1,488,408 | | | $ | 15,299,892 | |
| | |
|
| |
|
|
|
| (a) | Commencement of operations. |
See accompanying notes to financial statements.
MSF-82
Metropolitan Series Fund, Inc.
MetLife Conservative Allocation Portfolio
Financial Highlights
| | | | | | | | |
| | | Class A
| | | Class B
| |
| | | May 2, 2005(a)
through
December 31,
2005
| | | May 2, 2005(a)
through
December 31,
2005
| |
Net Asset Value, Beginning of Period | | $ | 10.00 | | | $ | 10.00 | |
| | |
|
|
| |
|
|
|
Income From Investment Operations | | | | | | | | |
Net investment income | | | 0.03 | | | | 0.03 | |
Net realized and unrealized gain of investments | | | 0.38 | | | | 0.37 | |
| | |
|
|
| |
|
|
|
Total from investment operations | | | 0.41 | | | | 0.40 | |
| | |
|
|
| |
|
|
|
Less Distributions | | | | | | | | |
Distributions from net investment income | | | (0.03 | ) | | | (0.03 | ) |
Distributions from net realized capital gains | | | (0.01 | ) | | | (0.01 | ) |
| | |
|
|
| |
|
|
|
Total distributions | | | (0.04 | ) | | | (0.04 | ) |
| | |
|
|
| |
|
|
|
Net Asset Value, End of Period | | $ | 10.37 | | | $ | 10.36 | |
| | |
|
|
| |
|
|
|
Total Return (%) | | | 4.1 | (b) | | | 4.0 | (b) |
Ratio of operating expenses to average net assets (%) | | | 0.10 | (c) | | | 0.35 | (c) |
Ratio of operating expenses to average net assets without giving effect to the contractual expense agreement would have been (%) | | | 1.05 | (c) | | | 1.30 | (c) |
Ratio of net investment income to average net assets (%) (d) | | | 0.96 | (c) | | | 1.00 | (c) |
Portfolio turnover rate (%) | | | 32 | (c) | | | 32 | (c) |
Net assets, end of period (000) | | $ | 2,785 | | | $ | 12,638 | |
| (a) | Commencement of operations. |
| (b) | Periods less than one year are not computed on an annualized basis. |
| (c) | Computed on an annualized basis. |
| (d) | Recognition of net investment income by the fund is affected by the timing of the declaration of dividends by the Underlying Funds in which the fund invests. |
See accompanying notes to financial statements.
MSF-83
Metropolitan Series Fund, Inc.
MetLife Conservative to Moderate Allocation Portfolio
Schedule of Investments as of December 31, 2005
Mutual Funds—100.0% of Total Net Assets
| | | | | |
| Security Description | | Shares | | Value* |
| | | | | | |
| | |
Investment Company—100.0% | | | | | |
Met Investors Series Trust—Harris Oakmark International Portfolio, (Class A) | | 146,520 | | $ | 2,378,025 |
Met Investors Series Trust—Lord Abbett Bond Debenture Portfolio, (Class A) | | 285,041 | | | 3,500,302 |
Met Investors Series Trust—Lazard Mid Cap
Portfolio, (Class A) | | 87,452 | | | 1,193,723 |
Met Investors Series Trust—MET/AIM Small Cap Growth Portfolio, (Class A) | | 43,572 | | | 595,194 |
Met Investors Series Trust—Neuberger Berman Real Estate Portfolio, (Class A) | | 42,956 | | | 607,825 |
Met Investors Series Trust—PIMCO Total Return Portfolio, (Class A) | | 1,105,133 | | | 12,819,544 |
Met Investors Series Trust—T. Rowe Price Mid Cap Growth Portfolio, (Class A) | | 71,308 | | | 605,409 |
Metropolitan Series Fund, Inc.—BlackRock Bond Income Portfolio, (Class A) | | 42,183 | | | 4,660,842 |
Metropolitan Series Fund, Inc.—BlackRock Strategic Value Portfolio, (Class A) | | 32,050 | | | 594,843 |
Metropolitan Series Fund, Inc.—Davis Venure Value Portfolio, (Class A) | | 76,628 | | | 2,368,583 |
Metropolitan Series Fund, Inc.—FI International Stock Portfolio, (Class A) | | 182,914 | | | 2,465,679 |
Metropolitan Series Fund, Inc.—Harris Oakmark Large Cap Value Portfolio, (Class A) | | 179,304 | | | 2,347,086 |
Metropolitan Series Fund, Inc.—MetLife Stock Index Portfolio, (Class A) | | 124,609 | | | 4,137,019 |
| | | | | |
| Security Description | | Shares | | Value* |
| | |
Investment Company—(Continued) | | | | | |
Metropolitan Series Fund, Inc.—Neuberger Berman Mid Cap Value Portfolio, (Class A) | | 86,048 | | $ | 1,805,290 |
Metropolitan Series Fund, Inc.—Russell 2000 Index Portfolio, (Class A) | | 127,845 | | | 1,779,607 |
Metropolitan Series Fund, Inc.—Salomon Brothers Strategic Bond Opportunities Portfolio, (Class A) | | 688,745 | | | 8,760,841 |
Metropolitan Series Fund, Inc.—Salomon Brothers U.S. Government Portfolio, (Class A) | | 332,955 | | | 4,068,715 |
Metropolitan Series Fund, Inc.—T. Rowe Price Large Cap Growth Portfolio, (Class A) | | 306,783 | | | 4,150,777 |
| | | | |
|
|
Total Mutual Funds
(Identified Cost $58,169,939) | | | | | 58,839,304 |
| | | | |
|
|
Total Investments—100.0%
(Identified Cost $58,169,939) (a) | | | | | 58,839,304 |
Other assets less liabilities | | | | | 5,943 |
| | | | |
|
|
| Total Net Assets—100% | | | | $ | 58,845,247 |
| | | | |
|
|
| (a) | The aggregate cost of investments for federal income tax purposes as of December 31, 2005 was $58,169,964 and the composition of unrealized appreciation and depreciation of investment securities was $916,580 and $(247,240), respectively. |
*See accompanying notes to financial statements.
MSF-84
Metropolitan Series Fund, Inc.
MetLife Conservative to Moderate Allocation Portfolio
Statement of Assets & Liabilities
December 31, 2005
| | | | | | |
Assets | | | | | | |
Investments at value | | | | | $ | 58,839,304 |
Receivable for: | | | | | | |
Fund shares sold | | | | | | 401,285 |
Due from Adviser | | | | | | 32,234 |
| | | | | |
|
|
Total Assets | | | | | | 59,272,823 |
Liabilities | | | | | | |
Payable for: | | | | | | |
Fund shares redeemed | | $ | 111,473 | | | |
Securities purchased | | | 289,813 | | | |
Accrued expenses: | | | | | | |
Service and distribution fees | | | 9,023 | | | |
Other expenses | | | 17,267 | | | |
| | |
|
| | | |
Total Liabilities | | | | | | 427,576 |
| | | | | |
|
|
Net Assets | | | | | $ | 58,845,247 |
| | | | | |
|
|
Net assets consists of: | | | | | | |
Capital paid in | | | | | $ | 57,987,310 |
Accumulated net realized gains | | | | | | 188,572 |
Unrealized appreciation on investments | | | | | | 669,365 |
| | | | | |
|
|
Net Assets | | | | | $ | 58,845,247 |
| | | | | |
|
|
| Computation of offering price: | | | | | | |
Class A | | | | | | |
Net asset value and redemption price per
share ($10,456,872 divided by
986,271 shares outstanding) | | | | | $ | 10.60 |
| | | | | |
|
|
Class B | | | | | | |
Net asset value and redemption price per
share ($48,388,375 divided by
4,572,994 shares outstanding) | | | | | $ | 10.58 |
| | | | | |
|
|
Identified cost of investments | | | | | $ | 58,169,939 |
| | | | | |
|
|
Statement of Operations
Period May 2, 2005(a) through December 31, 2005
| | | | | | | |
Investment Income | | | | | | | |
Dividends from underlying Portfolios | | | | | | $ | 236,989 |
| | | | | | |
|
|
Expenses | | | | | | | |
Management fees | | $ | 15,111 | | | | |
Service and distribution fees—Class B | | | 30,125 | | | | |
Directors’ fees and expenses | | | 309 | | | | |
Custodian | | | 20,720 | | | | |
Audit and tax services | | | 13,000 | | | | |
Legal | | | 10,269 | | | | |
Miscellaneous | | | 3,046 | | | | |
| | |
|
|
| | | |
Total expenses | | | 92,580 | | | | |
Expense reimbursements | | | (47,344 | ) | | | 45,236 |
| | |
|
|
| |
|
|
Net Investment Income | | | | | | | 191,753 |
| | | | | | |
|
|
Realized and Unrealized Gain | | | | | | | |
| Realized gain (loss) on: | | | | | | | |
Investments—net | | | (50,440 | ) | | | |
Capital gain distributions from underlying Portfolios | | | 256,975 | | | | 206,535 |
| | |
|
|
| | | |
| Unrealized appreciation on: | | | | | | | |
Investments—net | | | | | | | 669,365 |
| | | | | | |
|
|
Net gain | | | | | | | 875,900 |
| | | | | | |
|
|
Net Increase in Net Assets From Operations | | | | | | $ | 1,067,653 |
| | | | | | |
|
|
| (a) | Commencement of operations. |
See accompanying notes to financial statements.
MSF-85
Metropolitan Series Fund, Inc.
MetLife Conservative to Moderate Allocation Portfolio
Statement of Changes in Net Assets
| | | | |
| | | May 2, 2005(a)
through
December 31,
2005
| |
From Operations | | | | |
Net investment income | | $ | 191,753 | |
Net realized gain | | | 206,535 | |
Unrealized appreciation | | | 669,365 | |
| | |
|
|
|
Increase in net assets from operations | | | 1,067,653 | |
| | |
|
|
|
From Distributions to Shareholders | | | | |
Net investment income | | | | |
Class A | | | (39,826 | ) |
Class B | | | (158,869 | ) |
| | |
|
|
|
| | | | (198,695 | ) |
| | |
|
|
|
Net realized gain | | | | |
Class A | | | (1,943 | ) |
Class B | | | (9,078 | ) |
| | |
|
|
|
| | | | (11,021 | ) |
| | |
|
|
|
Total distributions | | | (209,716 | ) |
| | |
|
|
|
Increase in net assets from capital share transactions | | | 57,987,310 | |
| | |
|
|
|
Total increase in net assets | | | 58,845,247 | |
| |
Net Assets | | | | |
End of the period | | $ | 58,845,247 | |
| | |
|
|
|
Undistributed Net Investment Income | | | | |
End of the period | | $ | 0 | |
| | |
|
|
|
Other Information:
Capital Shares
Transactions in capital shares were as follows:
| | | | | | | |
| | | May 2, 2005(a)
through
December 31, 2005
| |
| | | Shares
| | | $
| |
Class A | | | | | | | |
Sales | | 1,226,378 | | | $ | 12,763,078 | |
Reinvestments | | 3,933 | | | | 41,769 | |
Redemptions | | (244,040 | ) | | | (2,544,902 | ) |
| | |
|
| |
|
|
|
Net increase | | 986,271 | | | $ | 10,259,945 | |
| | |
|
| |
|
|
|
Class B | | | | | | | |
Sales | | 4,869,411 | | | $ | 50,819,795 | |
Reinvestments | | 15,844 | | | | 167,947 | |
Redemptions | | (312,261 | ) | | | (3,260,377 | ) |
| | |
|
| |
|
|
|
Net increase | | 4,572,994 | | | $ | 47,727,365 | |
| | |
|
| |
|
|
|
Increase derived from capital share transactions | | 5,559,265 | | | $ | 57,987,310 | |
| | |
|
| |
|
|
|
| (a) | Commencement of operations. |
See accompanying notes to financial statements.
MSF-86
Metropolitan Series Fund, Inc.
MetLife Conservative to Moderate Allocation Portfolio
Financial Highlights
| | | | | | | | |
| | | Class A
| | | Class B
| |
| | | May 2, 2005(a)
through December 31, 2005
| | | May 2, 2005(a)
through December 31, 2005
| |
Net Asset Value, Beginning of Period | | $ | 10.00 | | | $ | 10.00 | |
| | |
|
|
| |
|
|
|
Income From Investment Operations | | | | | | | | |
Net investment income | | | 0.04 | | | | 0.03 | |
Net realized and unrealized gain of investments | | | 0.60 | | | | 0.59 | |
| | |
|
|
| |
|
|
|
Total from Investment Operations | | | 0.64 | | | | 0.62 | |
| | |
|
|
| |
|
|
|
Less Distributions | | | | | | | | |
Distributions from net investment income | | | (0.04 | ) | | | (0.04 | ) |
| | |
|
|
| |
|
|
|
Total distributions | | | (0.04 | ) | | | (0.04 | ) |
| | |
|
|
| |
|
|
|
Net Asset Value, End of Period | | $ | 10.60 | | | $ | 10.58 | |
| | |
|
|
| |
|
|
|
Total Return (%) | | | 6.4 | (b) | | | 6.2 | (b) |
Ratio of operating expenses to average net assets (%) | | | 0.10 | (c) | | | 0.35 | (c) |
Ratio of operating expenses to average net assets without giving effect to the contractual expense agreement would have been (%) | | | 0.41 | (c) | | | 0.66 | (c) |
Ratio of net investment income to average net assets (%) (d) | | | 1.28 | (c) | | | 1.27 | (c) |
Portfolio turnover rate (%) | | | 3 | (c) | | | 3 | (c) |
Net assets, end of period (000) | | $ | 10,457 | | | $ | 48,388 | |
| (a) | Commencement of operations. |
| (b) | Periods less than one year are not computed on an annualized basis. |
| (c) | Computed on an annualized basis. |
| (d) | Recognition of net investment income by the fund is affected by the timing of the declaration of dividends by the Underlying Funds in which the fund invests. |
See accompanying notes to financial statements.
MSF-87
Metropolitan Series Fund, Inc.
MetLife Moderate Allocation Portfolio
Schedule of Investments as of December 31, 2005
Mutual Funds—100.1% of Total Net Assets
| | | | | |
| Security Description | | Shares | | Value* |
| | | | | | |
| | |
Investment Company—100.1% | | | | | |
Met Investors Series Trust—Harris Oakmark International Portfolio, (Class A) | | 530,555 | | $ | 8,610,915 |
Met Investors Series Trust—Lord Abbett Bond Debenture Portfolio, (Class A) | | 393,372 | | | 4,830,608 |
Met Investors Series Trust—Lazard Mid Cap Portfolio, (Class A) | | 361,549 | | | 4,935,149 |
Met Investors Series Trust—MET/AIM Small Cap Growth Portfolio, (Class A) | | 179,984 | | | 2,458,583 |
Met Investors Series Trust—Neuberger Berman Real Estate Portfolio, (Class A) | | 88,779 | | | 1,256,230 |
Met Investors Series Trust—PIMCO Total Return Portfolio, (Class A) | | 1,871,840 | | | 21,713,344 |
Met Investors Series Trust—T. Rowe Price Mid Cap Growth Portfolio, (Class A) | | 294,519 | | | 2,500,464 |
Metropolitan Series Fund, Inc.—BlackRock Strategic Value Portfolio, (Class A) | | 132,421 | | | 2,457,727 |
Metropolitan Series Fund, Inc.—Davis Venure Value Portfolio, (Class A) | | 198,035 | | | 6,121,263 |
Metropolitan Series Fund, Inc.—FI International Stock Portfolio, (Class A) | | 567,083 | | | 7,644,277 |
Metropolitan Series Fund, Inc.—Harris Oakmark Large Cap Value Portfolio, (Class A) | | 463,331 | | | 6,064,997 |
Metropolitan Series Fund, Inc.—MetLife Stock Index Portfolio, (Class A) | | 404,671 | | | 13,435,079 |
| | | | | | |
| Security Description | | Shares | | Value* | |
| | |
Investment Company—(Continued) | | | | | | |
Metropolitan Series Fund, Inc.—Neuberger Berman Mid Cap Value Portfolio, (Class A) | | 237,023 | | $ | 4,972,740 | |
Metropolitan Series Fund, Inc.—Russell 2000 Index Portfolio, (Class A) | | 264,099 | | | 3,676,257 | |
Metropolitan Series Fund, Inc.—Salomon Brothers Strategic Bond Opportunities Portfolio,
(Class A) | | 1,140,521 | | | 14,507,429 | |
Metropolitan Series Fund, Inc.—Salomon Brothers U.S. Government Portfolio, (Class A) | | 295,430 | | | 3,610,153 | |
Metropolitan Series Fund, Inc.—T. Rowe Price Large Cap Growth Portfolio, (Class A) | | 996,092 | | | 13,477,124 | |
| | | | |
|
|
|
Total Mutual Funds
(Identified Cost $120,439,066) | | | | | 122,272,339 | |
| | | | |
|
|
|
Total Investments—100.1%
(Identified Cost $120,439,066) (a) | | | | | 122,272,339 | |
Liabilities in excess of other assets | | | | | (9,736 | ) |
| | | | |
|
|
|
| Total Net Assets—100% | | | | $ | 122,262,603 | |
| | | | |
|
|
|
| (a) | The aggregate cost of investments for federal income tax purposes as of December 31, 2005 was $120,439,066 and the composition of unrealized appreciation and depreciation of investment securities was $2,414,206 and $(580,933), respectively. |
*See accompanying notes to financial statements.
MSF-88
Metropolitan Series Fund, Inc.
MetLife Moderate Allocation Portfolio
Statement of Assets & Liabilities
December 31, 2005
| | | | | | |
Assets | | | | | | |
Investments at value | | | | | $ | 122,272,339 |
Receivable for: | | | | | | |
Fund shares sold | | | | | | 1,132,982 |
Due from Adviser | | | | | | 26,139 |
| | | | | |
|
|
Total Assets | | | | | | 123,431,460 |
Liabilities | | | | | | |
Payable for: | | | | | | |
Fund shares redeemed | | $ | 174,149 | | | |
Securities purchased | | | 958,832 | | | |
Accrued expenses: | | | | | | |
Service and distribution fees | | | 18,538 | | | |
Other expenses | | | 17,338 | | | |
| | |
|
| | | |
Total Liabilities | | | | | | 1,168,857 |
| | | | | |
|
|
Net Assets | | | | | $ | 122,262,603 |
| | | | | |
|
|
Net assets consists of: | | | | | | |
Capital paid in | | | | | $ | 119,869,216 |
Accumulated net realized gains | | | | | | 560,114 |
Unrealized appreciation on investments | | | | | | 1,833,273 |
| | | | | |
|
|
Net Assets | | | | | $ | 122,262,603 |
| | | | | |
|
|
| Computation of offering price: | | | | | | |
Class A | | | | | | |
Net asset value and redemption price per
share ($21,244,802 divided by
1,962,837 shares outstanding) | | | | | $ | 10.82 |
| | | | | |
|
|
Class B | | | | | | |
Net asset value and redemption price per
share ($101,017,801 divided by
9,343,063 shares outstanding) | | | | | $ | 10.81 |
| | | | | |
|
|
Identified cost of investments | | | | | $ | 120,439,066 |
| | | | | |
|
|
Statement of Operations
Period May 2, 2005(a) through December 31, 2005
| | | | | | | |
Investment Income | | | | | | | |
Dividends from underlying Portfolios | | | | | | $ | 521,074 |
| | | | | | |
|
|
Expenses | | | | | | | |
Management fees | | $ | 29,279 | | | | |
Service and distribution fees—Class B | | | 59,449 | | | | |
Directors’ fees and expenses | | | 309 | | | | |
Custodian | | | 20,752 | | | | |
Audit and tax services | | | 13,000 | | | | |
Legal | | | 18,311 | | | | |
Miscellaneous | | | 3,047 | | | | |
| | |
|
|
| | | |
Total expenses | | | 144,147 | | | | |
Expense reimbursements | | | (55,419 | ) | | | 88,728 |
| | |
|
|
| |
|
|
Net Investment Income | | | | | | | 432,346 |
| | | | | | |
|
|
Realized and Unrealized Gain | | | | | | | |
| Realized gain (loss) on: | | | | | | | |
Investments—net | | | (253,196 | ) | | | |
Capital gain distributions from underlying Portfolios | | | 834,367 | | | | 581,171 |
| | |
|
|
| | | |
| Unrealized appreciation on: | | | | | | | |
Investments—net | | | | | | | 1,833,273 |
| | | | | | |
|
|
Net gain | | | | | | | 2,414,444 |
| | | | | | |
|
|
Net Increase in Net Assets From Operations | | | | | | $ | 2,846,790 |
| | | | | | |
|
|
| (a) | Commencement of operations. |
See accompanying notes to financial statements.
MSF-89
Metropolitan Series Fund, Inc.
MetLife Moderate Allocation Portfolio
Statement of Changes in Net Assets
| | | | |
| | | May 2, 2005(a)
through
December 31,
2005
| |
From Operations | | | | |
Net investment income | | $ | 432,346 | |
Net realized gain | | | 581,171 | |
Unrealized appreciation | | | 1,833,273 | |
| | |
|
|
|
Increase in net assets from operations | | | 2,846,790 | |
| | |
|
|
|
From Distributions to Shareholders | | | | |
Net investment income | | | | |
Class A | | | (86,505 | ) |
Class B | | | (355,851 | ) |
| | |
|
|
|
| | | | (442,356 | ) |
| | |
|
|
|
Net realized gain | | | | |
Class A | | | (1,922 | ) |
Class B | | | (9,125 | ) |
| | |
|
|
|
| | | | (11,047 | ) |
| | |
|
|
|
Total distributions | | | (453,403 | ) |
| | |
|
|
|
Increase in net assets from capital share transactions | | | 119,869,216 | |
| | |
|
|
|
Total increase in net assets | | | 122,262,603 | |
| |
Net Assets | | | | |
End of the period | | $ | 122,262,603 | |
| | |
|
|
|
Undistributed Net Investment Income | | | | |
End of the period | | $ | 0 | |
| | |
|
|
|
Other Information:
Capital Shares
Transactions in capital shares were as follows:
| | | | | | | |
| | | May 2, 2005(a) through December 31, 2005
| |
| | | Shares
| | | $
| |
Class A | | | | | | | |
Sales | | 2,135,800 | | | $ | 22,592,320 | |
Reinvestments | | 8,150 | | | | 88,427 | |
Redemptions | | (181,113 | ) | | | (1,924,299 | ) |
| | |
|
| |
|
|
|
Net increase | | 1,962,837 | | | $ | 20,756,448 | |
| | |
|
| |
|
|
|
Class B | | | | | | | |
Sales | | 9,868,295 | | | $ | 104,696,467 | |
Reinvestments | | 33,669 | | | | 364,976 | |
Redemptions | | (558,901 | ) | | | (5,948,675 | ) |
| | |
|
| |
|
|
|
Net increase | | 9,343,063 | | | $ | 99,112,768 | |
| | |
|
| |
|
|
|
Increase derived from capital share transactions | | 11,305,900 | | | $ | 119,869,216 | |
| | |
|
| |
|
|
|
| (a) | Commencement of operations. |
See accompanying notes to financial statements.
MSF-90
Metropolitan Series Fund, Inc.
MetLife Moderate Allocation Portfolio
Financial Highlights
| | | | | | | | |
| | | Class A
| | | Class B
| |
| | | May 2, 2005(a) through December 31,
2005
| | | May 2, 2005(a) through December 31,
2005
| |
Net Asset Value, Beginning of Period | | $ | 10.00 | | | $ | 10.00 | |
| | |
|
|
| |
|
|
|
Income From Investment Operations | | | | | | | | |
Net investment income | | | 0.04 | | | | 0.04 | |
Net realized and unrealized gain of investments | | | 0.83 | | | | 0.81 | |
| | |
|
|
| |
|
|
|
Total from investment operations | | | 0.87 | | | | 0.85 | |
| | |
|
|
| |
|
|
|
Less Distributions | | | | | | | | |
Distributions from net investment income | | | (0.05 | ) | | | (0.04 | ) |
| | |
|
|
| |
|
|
|
Total distributions | | | (0.05 | ) | | | (0.04 | ) |
| | |
|
|
| |
|
|
|
Net Asset Value, End of Period | | $ | 10.82 | | | $ | 10.81 | |
| | |
|
|
| |
|
|
|
Total Return (%) | | | 8.7 | (b) | | | 8.5 | (b) |
Ratio of operating expenses to average net assets (%) | | | 0.10 | (c) | | | 0.35 | (c) |
Ratio of operating expenses to average net assets without giving effect to the contractual expense agreement would
have been (%) | | | 0.29 | (c) | | | 0.54 | (c) |
Ratio of net investment income to average net assets (%)(d) | | | 1.57 | (c) | | | 1.45 | (c) |
Portfolio turnover rate (%) | | | 1 | (c) | | | 1 | (c) |
Net assets, end of period (000) | | $ | 21,245 | | | $ | 101,018 | |
| (a) | Commencement of operations. |
| (b) | Periods less than one year are not computed on an annualized basis. |
| (c) | Computed on an annualized basis. |
| (d) | Recognition of net investment income by the fund is affected by the timing of the declaration of dividends by the Underlying Funds in which the fund invests. |
See accompanying notes to financial statements.
MSF-91
Metropolitan Series Fund, Inc.
MetLife Moderate to Aggressive Allocation Portfolio
Schedule of Investments as of December 31, 2005
Common Stock—100.0% of Total Net Assets
| | | | | |
| Security Description | | Shares | | Value* |
| | | | | | |
| | |
Mutual Funds—100.0% | | | | | |
Met Investors Series Trust—Harris Oakmark International Portfolio, (Class A) | | 490,045 | | $ | 7,953,426 |
Met Investors Series Trust—Lord Abbett Bond Debenture Portfolio, (Class A) | | 141,355 | | | 1,735,837 |
Met Investors Series Trust—Lazard Mid Cap
Portfolio, (Class A) | | 324,742 | | | 4,432,734 |
Met Investors Series Trust—MET/AIM Small Cap Growth Portfolio, (Class A) | | 194,080 | | | 2,651,132 |
Met Investors Series Trust—Neuberger Berman Real Estate Portfolio, (Class A) | | 127,637 | | | 1,806,063 |
Met Investors Series Trust—PIMCO Total Return Portfolio, (Class A) | | 672,737 | | | 7,803,753 |
Met Investors Series Trust—T. Rowe Price Mid Cap Growth Portfolio, (Class A) | | 317,630 | | | 2,696,680 |
Metropolitan Series Fund, Inc.—BlackRock Strategic Value Portfolio, (Class A) | | 142,797 | | | 2,650,311 |
Metropolitan Series Fund, Inc.—Davis Venure Value Portfolio, (Class A) | | 170,809 | | | 5,279,697 |
Metropolitan Series Fund, Inc.—FI International Stock Portfolio, (Class A) | | 543,465 | | | 7,325,904 |
Metropolitan Series Fund, Inc.—Harris Oakmark Large Cap Value Portfolio, (Class A) | | 466,287 | | | 6,103,695 |
Metropolitan Series Fund, Inc.—MetLife Stock Index Portfolio, (Class A) | | 396,685 | | | 13,169,936 |
Metropolitan Series Fund, Inc.—Neuberger Berman Mid Cap Value Portfolio, (Class A) | | 255,465 | | | 5,359,664 |
| | | | | | |
| Security Description | | Shares | | Value* | |
| | |
Mutual Funds—(Continued) | | | | | | |
Metropolitan Series Fund, Inc.—Russell 2000 Index Portfolio, (Class A) | | 189,825 | | $ | 2,642,368 | |
Metropolitan Series Fund, Inc.—Salomon Brothers Strategic Bond Opportunities Portfolio, (Class A) | | 341,596 | | | 4,345,097 | |
Metropolitan Series Fund, Inc.—T. Rowe Price Large Cap Growth Portfolio, (Class A) | | 911,362 | | | 12,330,734 | |
| | | | |
|
|
|
Total Common Stock
(Identified Cost $86,504,375) | | | | | 88,287,031 | |
| | | | |
|
|
|
Total Investments—100.0%
(Identified Cost $86,504,375) (a) | | | | | 88,287,031 | |
Liabilities in excess of other assets | | | | | (636 | ) |
| | | | |
|
|
|
| Total Net Assets—100% | | | | $ | 88,286,395 | |
| | | | |
|
|
|
| (a) | The aggregate cost of investments for federal income tax purposes as of December 31, 2005 was $86,504,757 and the composition of unrealized appreciation and depreciation of investment securities was $2,220,705 and $(438,431), respectively. |
*See accompanying notes to financial statements.
MSF-92
Metropolitan Series Fund, Inc.
MetLife Moderate to Aggressive Allocation Portfolio
Statement of Assets & Liabilities
December 31, 2005
| | | | | | |
Assets | | | | | | |
Investments at value | | | | | $ | 88,287,031 |
Receivable for: | | | | | | |
Fund shares sold | | | | | | 333,510 |
Due from Adviser | | | | | | 30,554 |
| | | | | |
|
|
Total Assets | | | | | | 88,651,095 |
Liabilities | | | | | | |
Payable for: | | | | | | |
Fund shares redeemed | | $ | 226,546 | | | |
Securities purchased | | | 106,964 | | | |
Accrued expenses: | | | | | | |
Service and distribution fees | | | 13,888 | | | |
Other expenses | | | 17,302 | | | |
| | |
|
| | | |
Total Liabilities | | | | | | 364,700 |
| | | | | |
|
|
Net Assets | | | | | $ | 88,286,395 |
| | | | | |
|
|
Net assets consists of: | | | | | | |
Capital paid in | | | | | $ | 86,032,997 |
Accumulated net realized gains | | | | | | 470,742 |
Unrealized appreciation on investments | | | | | | 1,782,656 |
| | | | | |
|
|
Net Assets | | | | | $ | 88,286,395 |
| | | | | |
|
|
| Computation of offering price: | | | | | | |
Class A | | | | | | |
Net asset value and redemption price per
share ($13,387,732 divided by
1,211,359 shares outstanding) | | | | | $ | 11.05 |
| | | | | |
|
|
Class B | | | | | | |
Net asset value and redemption price per
share ($74,898,663 divided by
6,782,551 shares outstanding) | | | | | $ | 11.04 |
| | | | | |
|
|
Identified cost of investments | | | | | $ | 86,504,375 |
| | | | | |
|
|
Statement of Operations
Period May 2, 2005(a) through December 31, 2005
| | | | | | | |
Investment Income | | | | | | | |
Dividends from underlying Portfolios | | | | | | $ | 357,641 |
| | | | | | |
|
|
Expenses | | | | | | | |
Management fees | | $ | 21,846 | | | | |
Service and distribution fees—Class B | | | 45,099 | | | | |
Directors’ fees and expenses | | | 309 | | | | |
Custodian | | | 20,757 | | | | |
Audit and tax services | | | 13,000 | | | | |
Legal | | | 15,287 | | | | |
Miscellaneous | | | 3,047 | | | | |
| | |
|
|
| | | |
Total expenses | | | 119,345 | | | | |
Expense reimbursements | | | (52,400 | ) | | | 66,945 |
| | |
|
|
| |
|
|
Net Investment Income | | | | | | | 290,696 |
| | | | | | |
|
|
Realized and Unrealized Gain | | | | | | | |
| Realized gain (loss) on: | | | | | | | |
Investments—net | | | (225,850 | ) | | | |
Capital gain distributions from underlying Portfolios | | | 713,072 | | | | 487,222 |
| | |
|
|
| | | |
| Unrealized appreciation on: | | | | | | | |
Investments—net | | | | | | | 1,782,656 |
| | | | | | |
|
|
Net gain | | | | | | | 2,269,878 |
| | | | | | |
|
|
Net Increase in Net Assets From Operations | | | | | | $ | 2,560,574 |
| | | | | | |
|
|
| (a) | Commencement of operations. |
See accompanying notes to financial statements.
MSF-93
Metropolitan Series Fund, Inc.
MetLife Moderate to Aggressive Allocation Portfolio
Statement of Changes in Net Assets
| | | | |
| | | May 2, 2005(a)
through
December 31,
2005
| |
From Operations | | | | |
Net investment income | | $ | 290,696 | |
Net realized gain | | | 487,222 | |
Unrealized appreciation | | | 1,782,656 | |
| | |
|
|
|
Increase in net assets from operations | | | 2,560,574 | |
| | |
|
|
|
From Distributions to Shareholders | | | | |
Net investment income | | | | |
Class A | | | (51,614 | ) |
Class B | | | (247,668 | ) |
| | |
|
|
|
| | | | (299,282 | ) |
| | |
|
|
|
Net realized gain | | | | |
Class A | | | (1,200 | ) |
Class B | | | (6,694 | ) |
| | |
|
|
|
| | | | (7,894 | ) |
| | |
|
|
|
Total Distributions | | | (307,176 | ) |
| | |
|
|
|
Increase in net assets from capital share transactions | | | 86,032,997 | |
| | |
|
|
|
Total increase in net assets | | | 88,286,395 | |
| |
Net Assets | | | | |
End of the period | | $ | 88,286,395 | |
| | |
|
|
|
| |
Undistributed Net Investment Income | | | | |
End of the period | | $ | 0 | |
| | |
|
|
|
Other Information:
Capital Shares
Transactions in capital shares were as follows:
| | | | | | | |
| | | May 2, 2005(a) through December 31, 2005
| |
| | | Shares
| | | $
| |
Class A | | | | | | | |
Sales | | 1,320,122 | | | $ | 14,177,411 | |
Reinvestments | | 4,762 | | | | 52,814 | |
Redemptions | | (113,525 | ) | | | (1,229,144 | ) |
| | |
|
| |
|
|
|
Net increase | | 1,211,359 | | | $ | 13,001,081 | |
| | |
|
| |
|
|
|
Class B | | | | | | | |
Sales | | 7,101,186 | | | $ | 76,457,396 | |
Reinvestments | | 22,957 | | | | 254,362 | |
Redemptions | | (341,592 | ) | | | (3,679,842 | ) |
| | |
|
| |
|
|
|
Net increase | | 6,782,551 | | | $ | 73,031,916 | |
| | |
|
| |
|
|
|
Increase derived from capital share transactions | | 7,993,910 | | | $ | 86,032,997 | |
| | |
|
| |
|
|
|
| (a) | Commencement of operations. |
See accompanying notes to financial statements.
MSF-94
Metropolitan Series Fund, Inc.
MetLife Moderate to Aggressive Allocation Portfolio
Financial Highlights
| | | | | | | | |
| | | Class A
| | | Class B
| |
| | | May 2, 2005(a)
through
December 31,
2005
| | | May 2, 2005(a)
through
December 31,
2005
| |
Net Asset Value, Beginning of Period | | $ | 10.00 | | | $ | 10.00 | |
| | |
|
|
| |
|
|
|
Income From Investment Operations | | | | | | | | |
Net investment income | | | 0.04 | | | | 0.04 | |
Net realized and unrealized gain of investments | | | 1.05 | | | | 1.05 | |
| | |
|
|
| |
|
|
|
Total from investment operations | | | 1.09 | | | | 1.08 | |
| | |
|
|
| |
|
|
|
Less Distributions | | | | | | | | |
Distributions from net investment income | | | (0.04 | ) | | | (0.04 | ) |
| | |
|
|
| |
|
|
|
Total distributions | | | (0.04 | ) | | | (0.04 | ) |
| | |
|
|
| |
|
|
|
Net Asset Value, End of Period | | $ | 11.05 | | | $ | 11.04 | |
| | |
|
|
| |
|
|
|
Total Return (%) | | | 10.9 | (b) | | | 10.8 | (b) |
Ratio of operating expenses to average net assets (%) | | | 0.10 | (c) | | | 0.35 | (c) |
Ratio of operating expenses to average net assets without giving effect to the contractual expense agreement would have been (%) | | | 0.34 | (c) | | | 0.59 | (c) |
Ratio of net investment income to average net assets (%) (d) | | | 1.34 | (c) | | | 1.33 | (c) |
Portfolio turnover rate (%) | | | 2 | (c) | | | 2 | (c) |
Net assets, end of period (000) | | $ | 13,388 | | | $ | 74,899 | |
| (a) | Commencement of operations. |
| (b) | Periods less than one year are not computed on an annualized basis. |
| (c) | Computed on an annualized basis. |
| (d) | Recognition of net investment income by the fund is affected by the timing of the declaration of dividends by the Underlying Funds in which the fund invests. |
See accompanying notes to financial statements.
MSF-95
Metropolitan Series Fund, Inc.
MetLife Aggressive Allocation Portfolio
Schedule of Investments as of December 31, 2005
Mutual Funds—99.8% of Total Net Assets
| | | | | |
| Security Description | | Shares | | Value* |
| | | | | | |
|
Investment Company—99.8% |
Met Investors Series Trust—Harris Oakmark International Portfolio, (Class A) | | 62,937 | | $ | 1,021,462 |
Met Investors Series Trust—Lazard Mid Cap
Portfolio, (Class A) | | 44,999 | | | 614,242 |
Met Investors Series Trust—MET/AIM Small Cap Growth Portfolio, (Class A) | | 22,402 | | | 306,013 |
Met Investors Series Trust—Neuberger Berman Real Estate Portfolio, (Class A) | | 14,743 | | | 208,613 |
Met Investors Series Trust—T. Rowe Price Mid Cap Growth Portfolio, (Class A) | | 36,694 | | | 311,531 |
Metropolitan Series Fund, Inc.—BlackRock Strategic Value Portfolio, (Class A) | | 16,489 | | | 306,039 |
Metropolitan Series Fund, Inc.—Davis Venure Value Portfolio, (Class A) | | 26,310 | | | 813,231 |
Metropolitan Series Fund, Inc.—FI International Stock Portfolio, (Class A) | | 78,583 | | | 1,059,294 |
Metropolitan Series Fund, Inc.—Harris Oakmark Large Cap Value Portfolio, (Class A) | | 61,556 | | | 805,762 |
Metropolitan Series Fund, Inc.—MetLife Stock Index Portfolio, (Class A) | | 51,934 | | | 1,724,217 |
| | | | | |
| Security Description | | Shares | | Value* |
|
Investment Company—(Continued) |
Metropolitan Series Fund, Inc.—Neuberger Berman Mid Cap Value Portfolio, (Class A) | | 39,328 | | $ | 825,110 |
Metropolitan Series Fund, Inc.—Russell 2000 Index Portfolio, (Class A) | | 36,512 | | | 508,242 |
Metropolitan Series Fund, Inc.—T. Rowe Price Large Cap Growth Portfolio, (Class A) | | 127,794 | | | 1,729,057 |
| | | | |
|
|
Total Mutual Funds
(Identified Cost $10,009,193) | | | | | 10,232,813 |
| | | | |
|
|
Total Investments—99.8%
(Identified Cost $10,009,193) (a) | | | | | 10,232,813 |
Other assets less liabilities | | | | | 17,626 |
| | | | |
|
|
| Total Net Assets—100% | | | | $ | 10,250,439 |
| | | | |
|
|
| (a) | The aggregate cost of investments for federal income tax purposes as of December 31, 2005 was $10,012,666 and the composition of unrealized appreciation and depreciation of investment securities was $271,933 and $(51,786), respectively. |
*See accompanying notes to financial statements.
MSF-96
Metropolitan Series Fund, Inc.
MetLife Aggressive Allocation Portfolio
Statement of Assets & Liabilities
December 31, 2005
| | | | | | |
Assets | | | | | | |
Investments at value | | | | | $ | 10,232,813 |
Receivable for: | | | | | | |
Fund shares sold | | | | | | 107,232 |
Due from Adviser | | | | | | 36,184 |
| | | | | |
|
|
Total Assets | | | | | | 10,376,229 |
Liabilities | | | | | | |
Payable for: | | | | | | |
Fund shares redeemed | | $ | 58,314 | | | |
Securities purchased | | | 48,918 | | | |
Accrued expenses: | | | | | | |
Service and distribution fees | | | 1,402 | | | |
Other expenses | | | 17,156 | | | |
| | |
|
| | | |
Total Liabilities | | | | | | 125,790 |
| | | | | |
|
|
Net Assets | | | | | $ | 10,250,439 |
| | | | | |
|
|
Net assets consists of: | | | | | | |
Capital paid in | | | | | $ | 9,960,568 |
Accumulated net realized gains | | | | | | 66,251 |
Unrealized appreciation on investments | | | | | | 223,620 |
| | | | | |
|
|
Net Assets | | | | | $ | 10,250,439 |
| | | | | |
|
|
| Computation of offering price: | | | | | | |
Class A | | | | | | |
Net asset value and redemption price per
share ($2,866,603 divided by
255,833 shares outstanding) | | | | | $ | 11.21 |
| | | | | |
|
|
Class B | | | | | | |
Net asset value and redemption price per
share ($7,383,836 divided by
660,040 shares outstanding) | | | | | $ | 11.19 |
| | | | | |
|
|
Identified cost of investments | | | | | $ | 10,009,193 |
| | | | | |
|
|
Statement of Operations
Period May 2, 2005(a) through December 31, 2005
| | | | | | | |
Investment Income | | | | | | | |
Dividends from underlying Portfolios | | | | | | $ | 38,135 |
| | | | | | |
|
|
Expenses | | | | | | | |
Management fees | | $ | 2,325 | | | | |
Service and distribution fees—Class B | | | 4,145 | | | | |
Directors’ fees and expenses | | | 309 | | | | |
Custodian | | | 20,722 | | | | |
Audit and tax services | | | 13,000 | | | | |
Legal | | | 1,471 | | | | |
Miscellaneous | | | 3,006 | | | | |
| | |
|
|
| | | |
Total expenses | | | 44,978 | | | | |
Expense reimbursements | | | (38,508 | ) | | | 6,470 |
| | |
|
|
| |
|
|
Net Investment Income | | | | | | | 31,665 |
| | | | | | |
|
|
Realized and Unrealized Gain | | | | | | | |
| Realized gain on: | | | | | | | |
Investments—net | | | 6,564 | | | | |
Capital gain distributions from underlying Portfolios | | | 88,951 | | | | 95,515 |
| | |
|
|
| | | |
| Unrealized appreciation on: | | | | | | | |
Investments—net | | | | | | | 223,620 |
| | | | | | |
|
|
Net gain | | | | | | | 319,135 |
| | | | | | |
|
|
Net Increase in Net Assets From Operations | | | | | | $ | 350,800 |
| | | | | | |
|
|
| (a) | Commencement of operations. |
See accompanying notes to financial statements.
MSF-97
Metropolitan Series Fund, Inc.
MetLife Aggressive Allocation Portfolio
Statement of Changes in Net Assets
| | | | |
| | | May 2, 2005(a)
through
December 31,
2005
| |
From Operations | | | | |
Net investment income | | $ | 31,665 | |
Net realized gain | | | 95,515 | |
Unrealized appreciation | | | 223,620 | |
| | |
|
|
|
Increase in net assets from operations | | | 350,800 | |
| | |
|
|
|
From Distributions to Shareholders | | | | |
Net investment income | | | | |
Class A | | | (10,536 | ) |
Class B | | | (22,499 | ) |
| | |
|
|
|
| | | | (33,035 | ) |
| | |
|
|
|
Net realized gain | | | | |
Class A | | | (7,966 | ) |
Class B | | | (19,928 | ) |
| | |
|
|
|
| | | | (27,894 | ) |
| | |
|
|
|
Total distributions | | | (60,929 | ) |
| | |
|
|
|
Increase in net assets from capital share transactions | | | 9,960,568 | |
| | |
|
|
|
Total increase in net assets | | | 10,250,439 | |
| |
Net Assets | | | | |
End of the period | | $ | 10,250,439 | |
| | |
|
|
|
Undistributed Net Investment Income | | | | |
End of the period | | $ | 0 | |
| | |
|
|
|
Other Information:
Capital Shares
Transactions in capital shares were as follows:
| | | | | | | |
| | | May 2, 2005(a)
through
December 31, 2005
| |
| | | Shares
| | | $
| |
Class A | | | | | | | |
Sales | | 331,583 | | | $ | 3,587,263 | |
Reinvestments | | 1,645 | | | | 18,502 | |
Redemptions | | (77,395 | ) | | | (845,021 | ) |
| | |
|
| |
|
|
|
Net increase | | 255,833 | | | $ | 2,760,744 | |
| | |
|
| |
|
|
|
Class B | | | | | | | |
Sales | | 843,456 | | | $ | 9,182,446 | |
Reinvestments | | 3,778 | | | | 42,427 | |
Redemptions | | (187,194 | ) | | | (2,025,049 | ) |
| | |
|
| |
|
|
|
Net increase | | 660,040 | | | $ | 7,199,824 | |
| | |
|
| |
|
|
|
Increase derived from capital share transactions | | 915,873 | | | $ | 9,960,568 | |
| | |
|
| |
|
|
|
| (a) | Commencement of operations. |
See accompanying notes to financial statements.
MSF-98
Metropolitan Series Fund, Inc.
MetLife Aggressive Allocation Portfolio
Financial Highlights
| | | | | | | | |
| | | Class A
| | | Class B
| |
| | | May 2, 2005(a)
through
December 31,
2005
| | | May 2, 2005(a)
through
December 31,
2005
| |
Net Asset Value, Beginning of Period | | $ | 10.00 | | | $ | 10.00 | |
| | |
|
|
| |
|
|
|
Income From Investment Operations | | | | | | | | |
Net investment income | | | 0.04 | | | | 0.03 | |
Net realized and unrealized gain of investments | | | 1.24 | | | | 1.23 | |
| | |
|
|
| |
|
|
|
Total from investment operations | | | 1.28 | | | | 1.26 | |
| | |
|
|
| |
|
|
|
Less Distributions | | | | | | | | |
Distributions from net investment income | | | (0.04 | ) | | | (0.04 | ) |
Distributions from net realized capital gains | | | (0.03 | ) | | | (0.03 | ) |
| | |
|
|
| |
|
|
|
Total distributions | | | (0.07 | ) | | | (0.07 | ) |
| | |
|
|
| |
|
|
|
Net Asset Value, End of Period | | $ | 11.21 | | | $ | 11.19 | |
| | |
|
|
| |
|
|
|
Total Return (%) | | | 12.7 | (b) | | | 12.6 | (b) |
Ratio of operating expenses to average net assets (%) | | | 0.10 | (c) | | | 0.35 | (c) |
Ratio of operating expenses to average net assets without giving effect to the contractual expense agreement would have
been (%) | | | 1.76 | (c) | | | 2.01 | (c) |
Ratio of net investment income to average net assets (%) (d) | | | 1.53 | (c) | | | 1.29 | (c) |
Portfolio turnover rate (%) | | | 57 | (c) | | | 57 | (c) |
Net assets, end of period (000) | | $ | 2,867 | | | $ | 7,384 | |
| (a) | Commencement of operations. |
| (b) | Periods less than one year are not computed on an annualized basis. |
| (c) | Computed on an annualized basis. |
| (d) | Recognition of net investment income by the fund is affected by the timing of the declaration of dividends by the Underlying Funds in which the fund invests. |
See accompanying notes to financial statements.
MSF-99
Metropolitan Series Fund, Inc.
BlackRock Investment Trust Portfolio
Schedule of Investments as of December 31, 2005
Common Stock—99.7% of Total Net Assets
| | | | | |
| Security Description | | Shares | | Value* |
| | | | | | |
| | |
Aerospace & Defense—2.6% | | | | | |
General Dynamics Corp. | | 166,500 | | $ | 18,989,325 |
L-3 Communications Holdings, Inc. | | 210,600 | | | 15,658,110 |
Raytheon Co. | | 305,600 | | | 12,269,840 |
| | | | |
|
|
| | | | | | 46,917,275 |
| | | | |
|
|
| | |
Air Freight & Logistics—1.3% | | | | | |
CNF, Inc. | | 246,200 | | | 13,760,118 |
Ryder System, Inc. | | 232,300 | | | 9,528,946 |
| | | | |
|
|
| | | | | | 23,289,064 |
| | | | |
|
|
| | |
Automobiles—0.6% | | | | | |
Harley-Davidson, Inc. | | 220,600 | | | 11,358,694 |
| | | | |
|
|
| | |
Beverages—1.7% | | | | | |
Coca-Cola Enterprises, Inc. (a) | | 10 | | | 192 |
PepsiCo, Inc. | | 345,300 | | | 20,400,324 |
The Pepsi Bottling Group, Inc. | | 365,600 | | | 10,459,816 |
| | | | |
|
|
| | | | | | 30,860,332 |
| | | | |
|
|
| | |
Biotechnology—1.5% | | | | | |
Amgen, Inc. (b) | | 207,400 | | | 16,355,564 |
Invitrogen Corp. (b) | | 163,100 | | | 10,868,984 |
| | | | |
|
|
| | | | | | 27,224,548 |
| | | | |
|
|
| | |
Capital Markets—3.0% | | | | | |
Ameriprise Financial, Inc. | | 79,200 | | | 3,247,200 |
Lehman Brothers Holdings, Inc. | | 176,100 | | | 22,570,737 |
State Street Corp. | | 256,200 | | | 14,203,728 |
The Bear Stearns Co., Inc. (a) | | 121,400 | | | 14,025,342 |
| | | | |
|
|
| | | | | | 54,047,007 |
| | | | |
|
|
| | |
Chemicals—1.6% | | | | | |
Lyondell Chemical Co. | | 236,280 | | | 5,628,190 |
The Dow Chemical Co. | | 260,400 | | | 11,410,728 |
The Lubrizol Corp. | | 257,000 | | | 11,161,510 |
| | | | |
|
|
| | | | | | 28,200,428 |
| | | | |
|
|
| | |
Commercial Banks—7.8% | | | | | |
Bank of America Corp. | | 1,007,300 | | | 46,486,895 |
BB&T Corp. | | 356,500 | | | 14,940,915 |
Comerica, Inc. | | 228,500 | | | 12,969,660 |
KeyCorp. | | 433,700 | | | 14,281,741 |
U.S. Bancorp. | | 703,900 | | | 21,039,571 |
Wachovia Corp. | | 573,500 | | | 30,315,210 |
| | | | |
|
|
| | | | | | 140,033,992 |
| | | | |
|
|
| | |
Commercial Services & Supplies—1.3% | | | | | |
Cendant Corp. | | 647,600 | | | 11,171,100 |
Checkfree Corp. (b) | | 255,800 | | | 11,741,220 |
| | | | |
|
|
| | | | | | 22,912,320 |
| | | | |
|
|
| | | | | |
| Security Description | | Shares | | Value* |
| | | | | | |
| | |
Communications Equipment—2.6% | | | | | |
Cisco Systems, Inc. (b) | | 889,700 | | $ | 15,231,664 |
Emulex Corp. (b) | | 443,800 | | | 8,782,802 |
Motorola, Inc. | | 994,400 | | | 22,463,496 |
| | | | |
|
|
| | | | | | 46,477,962 |
| | | | |
|
|
| | |
Computers & Peripherals—2.9% | | | | | |
Hewlett-Packard Co. | | 655,500 | | | 18,766,965 |
International Business Machines Corp. | | 410,900 | | | 33,775,980 |
| | | | |
|
|
| | | | | | 52,542,945 |
| | | | |
|
|
| | |
Consumer Finance—1.1% | | | | | |
American Express Co. | | 396,000 | | | 20,378,160 |
| | | | |
|
|
| | |
Diversified Financial Services—2.5% | | | | | |
CIT Group, Inc. | | 310,400 | | | 16,072,512 |
Citigroup, Inc. | | 379,200 | | | 18,402,576 |
Federated Investors, Inc. (Class B) | | 273,000 | | | 10,111,920 |
| | | | |
|
|
| | | | | | 44,587,008 |
| | | | |
|
|
| |
Diversified Telecommunication Services—2.3% | | | |
AT&T, Inc. | | 925,800 | | | 22,672,842 |
Verizon Communications, Inc. | | 608,428 | | | 18,325,851 |
| | | | |
|
|
| | | | | | 40,998,693 |
| | | | |
|
|
| | |
Electric Utilities—2.9% | | | | | |
FirstEnergy Corp. | | 248,400 | | | 12,169,116 |
PG&E Corp. | | 512,600 | | | 19,027,712 |
PPL Corp. | | 689,700 | | | 20,277,180 |
| | | | |
|
|
| | | | | | 51,474,008 |
| | | | |
|
|
| |
Electronic Equipment & Instruments—0.5% | | | |
Technologies Data Corp. (b) | | 226,600 | | | 8,991,488 |
| | | | |
|
|
| | |
Energy Equipment & Services—1.6% | | | | | |
Nabors Industries, Ltd. (b) | | 137,800 | | | 10,438,350 |
Patterson-UTI Energy, Inc. | | 548,600 | | | 18,076,370 |
| | | | |
|
|
| | | | | | 28,514,720 |
| | | | |
|
|
| | |
Food & Staples Retailing—0.8% | | | | | |
The Kroger Co. (b) | | 436,300 | | | 8,237,344 |
Wal-Mart Stores, Inc. | | 144,700 | | | 6,771,960 |
| | | | |
|
|
| | | | | | 15,009,304 |
| | | | |
|
|
| | |
Food Products—1.3% | | | | | |
Archer-Daniels-Midland Co. | | 458,300 | | | 11,301,678 |
General Mills, Inc. | | 246,700 | | | 12,167,244 |
| | | | |
|
|
| | | | | | 23,468,922 |
| | | | |
|
|
| |
Health Care Equipment & Supplies—1.3% | | | |
Bausch & Lomb, Inc. | | 161,000 | | | 10,931,900 |
Becton, Dickinson & Co. | | 203,600 | | | 12,232,288 |
| | | | |
|
|
| | | | | | 23,164,188 |
| | | | |
|
|
*See accompanying notes to financial statements.
MSF-100
Metropolitan Series Fund, Inc.
BlackRock Investment Trust Portfolio
Schedule of Investments as of December 31, 2005
Common Stock—(Continued)
| | | | | |
| Security Description | | Shares | | Value* |
| | | | | | |
| |
Health Care Providers & Services—3.2% | | | |
Aetna, Inc. | | 182,500 | | $ | 17,211,575 |
Coventry Health Care, Inc. (b) | | 296,143 | | | 16,868,305 |
HCA, Inc. | | 229,600 | | | 11,594,800 |
McKesson Corp. | | 211,800 | | | 10,926,762 |
| | | | |
|
|
| | | | | | 56,601,442 |
| | | | |
|
|
| | |
Hotels, Restaurants & Leisure—0.8% | | | | | |
McDonald’s Corp. | | 435,700 | | | 14,691,804 |
| | | | |
|
|
| | |
Household Durables—3.1% | | | | | |
Fortune Brands, Inc. | | 178,100 | | | 13,895,362 |
Newell Rubbermaid, Inc. (a) | | 364,300 | | | 8,663,054 |
Pulte Homes, Inc. | | 280,600 | | | 11,044,416 |
The Black & Decker Corp. | | 107,200 | | | 9,322,112 |
The Stanley Works | | 280,300 | | | 13,465,612 |
| | | | |
|
|
| | | | | | 56,390,556 |
| | | | |
|
|
| | |
Household Products—1.4% | | | | | |
The Procter & Gamble Co. | | 431,050 | | | 24,949,174 |
| | | | |
|
|
| | |
Industrial Conglomerates—5.6% | | | | | |
General Electric Co. | | 2,231,300 | | | 78,207,065 |
Textron, Inc. | | 115,100 | | | 8,860,398 |
Tyco International, Ltd. | | 432,000 | | | 12,467,520 |
| | | | |
|
|
| | | | | | 99,534,983 |
| | | | |
|
|
| | |
Insurance—5.2% | | | | | |
American International Group, Inc. | | 332,700 | | | 22,700,121 |
Genworth Financial, Inc. (Class A) | | 319,000 | | | 11,031,020 |
Prudential Financial, Inc. | | 179,400 | | | 13,130,286 |
The Allstate Corp. | | 183,100 | | | 9,900,217 |
The Chubb Corp. | | 139,300 | | | 13,602,645 |
The Hartford Financial Services Group, Inc. | | 133,700 | | | 11,483,493 |
W.R. Berkley Corp. | | 227,400 | | | 10,828,788 |
| | | | |
|
|
| | | | | | 92,676,570 |
| | | | |
|
|
| | |
Internet & Catalog Retail—0.5% | | | | | |
eBay, Inc. (b) | | 223,200 | | | 9,653,400 |
| | | | |
|
|
| | |
IT Services—0.6% | | | | | |
Computer Sciences Corp. (b) | | 202,600 | | | 10,259,664 |
| | | | |
|
|
| | |
Machinery—1.3% | | | | | |
Ingersoll-Rand Co., Ltd. (Class A) (a) | | 272,900 | | | 11,016,973 |
PACCAR, Inc. | | 185,800 | | | 12,862,934 |
| | | | |
|
|
| | | | | | 23,879,907 |
| | | | |
|
|
| | |
Media—3.6% | | | | | |
Comcast Corp. (Special Class A) (b) | | 441,600 | | | 11,344,704 |
The McGraw-Hill Cos., Inc. | | 333,200 | | | 17,203,116 |
The Walt Disney Co. | | 835,900 | | | 20,036,523 |
Time Warner, Inc. | | 887,786 | | | 15,482,988 |
| | | | |
|
|
| | | | | | 64,067,331 |
| | | | |
|
|
| | | | | |
| Security Description | | Shares | | Value* |
| | | | | | |
| | |
Metals & Mining—0.6% | | | | | |
Nucor Corp. | | 168,800 | | $ | 11,262,336 |
| | | | |
|
|
| | |
Multi-Utilities—0.6% | | | | | |
Sempra Energy | | 237,600 | | | 10,653,984 |
| | | | |
|
|
| | |
Multiline Retail—2.2% | | | | | |
Federated Department Stores, Inc. | | 194,400 | | | 12,894,552 |
J.C. Penney Co., Inc. | | 233,500 | | | 12,982,600 |
Nordstrom, Inc. | | 352,100 | | | 13,168,540 |
| | | | |
|
|
| | | | | | 39,045,692 |
| | | | |
|
|
| | |
Oil, Gas & Consumable Fuels—7.5% | | | | | |
Burlington Resources, Inc. | | 188,800 | | | 16,274,560 |
ConocoPhillips | | 510,000 | | | 29,671,800 |
Devon Energy Corp. | | 278,900 | | | 17,442,406 |
Exxon Mobil Corp. | | 787,700 | | | 44,245,109 |
Kerr-McGee Corp. | | 183,700 | | | 16,690,982 |
Valero Energy Corp. | | 202,200 | | | 10,433,520 |
| | | | |
|
|
| | | | | | 134,758,377 |
| | | | |
|
|
| |
Paper & Forest Products—0.8% | | | |
Louisiana-Pacific Corp. | | 507,000 | | | 13,927,290 |
| | | | |
|
|
| | |
Pharmaceuticals—6.9% | | | | | |
Hospira, Inc. (b) | | 183,500 | | | 7,850,130 |
Johnson & Johnson | | 374,600 | | | 22,513,460 |
Merck & Co., Inc. | | 738,800 | | | 23,501,228 |
Pfizer, Inc. | | 1,793,825 | | | 41,831,999 |
Wyeth | | 585,700 | | | 26,983,199 |
| | | | |
|
|
| | | | | | 122,680,016 |
| | | | |
|
|
| | |
Real Estate—0.6% | | | | | |
Simon Property Group, Inc. (REIT) (a) | | 133,700 | | | 10,245,431 |
| | | | |
|
|
| | |
Road & Rail—1.0% | | | | | |
Burlington Northern Santa Fe Corp. | | 249,400 | | | 17,662,508 |
| | | | |
|
|
|
Semiconductors & Semiconductor Equipment—3.0% |
Freescale Semiconductor, Inc. (Class A) (a) (b) | | 189,400 | | | 4,770,986 |
Freescale Semiconductor, Inc. (Class B) (b) | | 189,400 | | | 4,767,198 |
Intel Corp. | | 1,800,900 | | | 44,950,464 |
| | | | |
|
|
| | | | | | 54,488,648 |
| | | | |
|
|
| | |
Software—3.8% | | | | | |
Adobe Systems, Inc. | | 430,400 | | | 15,907,584 |
Microsoft Corp. | | 2,021,400 | | | 52,859,610 |
| | | | |
|
|
| | | | | | 68,767,194 |
| | | | |
|
|
| | |
Specialty Retail—2.2% | | | | | |
AutoNation, Inc. (b) | | 453,200 | | | 9,848,036 |
Barnes & Noble, Inc. (a) (b) | | 201,590 | | | 8,601,845 |
The Home Depot, Inc. | | 515,900 | | | 20,883,632 |
| | | | |
|
|
| | | | | | 39,333,513 |
| | | | |
|
|
*See accompanying notes to financial statements.
MSF-101
Metropolitan Series Fund, Inc.
BlackRock Investment Trust Portfolio
Schedule of Investments as of December 31, 2005
Common Stock—(Continued)
| | | | | |
| Security Description | | Shares | | Value* |
| | | | | | |
| |
Textiles, Apparel & Luxury Goods—0.5% | | | |
NIKE, Inc. (Class B) | | 103,800 | | $ | 9,008,802 |
| | | | |
|
|
| |
Thrifts & Mortgage Finance—1.1% | | | |
Countrywide Financial Corp. | | 251,000 | | | 8,581,690 |
Washington Mutual, Inc. | | 244,200 | | | 10,622,700 |
| | | | |
|
|
| | | | | | 19,204,390 |
| | | | |
|
|
| | |
Tobacco – 1.6% | | | | | |
Altria Group, Inc. | | 383,100 | | | 28,625,232 |
| | | | |
|
|
|
Wireless Telecommunication Services—0.8% |
Sprint Nextel Corp. | | 589,091 | | | 13,761,166 |
| | | | |
|
|
Total Common Stock
(Identified Cost $1,658,369,656) | | | | | 1,786,580,468 |
| | | | |
|
|
| | | | | | | |
|
| Short Term Investments—0.3% | |
| Security Description | | Face
Amount | | Value* | |
| | |
Discount Notes—0.3% | | | | | | | |
Federal Home Loan Bank
3.250%, 01/03/06 | | $ | 5,200,000 | | | 5,199,061 | |
| | | | | |
|
|
|
Total Short Term Investments
(Amortized Cost $5,199,061) | | | | | | 5,199,061 | |
| | | | | |
|
|
|
Total Investments—100.0%
(Identified Cost $1,663,568,717) (c) | | | | | | 1,791,779,529 | |
Liabilities in excess of other assets | | | | | | (894,119 | ) |
| | | | | |
|
|
|
| Total Net Assets—100% | | | | | $ | 1,790,885,410 | |
| | | | | |
|
|
|
| (a) | A portion or all of the security was held on loan. As of December 31, 2005, the market value of securities loaned was $18,296,465 and the collateral received consisted of cash in the amount of $18,755,894. |
| (c) | The aggregate cost of investments for federal income tax purposes as of December 31, 2005 was $1,665,080,966 and the composition of unrealized appreciation and depreciation of investment securities was $169,645,088 and $(42,946,525), respectively. |
| (REIT)— | A Real Estate Investment Trust is a pooled investment vehicle that invests primarily in income-producing real estate or real estate related loans or interest. |
Futures Contracts
| | | | | | | | | | | | | | |
Futures Contracts Long
| | Expiration Date
| | Number of
Contracts
| | Contract
Amount
| | Valuation as of
12/31/2005
| | Net Unrealized
Depreciation
| |
S&P 500 Index Futures | | 3/16/2006 | | 21 | | $ | 6,680,407 | | $ | 6,587,700 | | $ | (92,707 | ) |
| | | | | | | | | | | | |
|
|
|
*See accompanying notes to financial statements.
MSF-102
Metropolitan Series Fund, Inc.
BlackRock Investment Trust Portfolio
Statement of Assets & Liabilities
December 31, 2005
| | | | | | | |
Assets | | | | | | | |
Investments at value | | | | | $ | 1,791,779,529 | |
Cash | | | | | | 107,285 | |
Collateral for securities loaned | | | | | | 18,755,894 | |
Receivable for: | | | | | | | |
Fund shares sold | | | | | | 1,157,218 | |
Accrued interest and dividends | | | | | | 3,565,259 | |
Foreign taxes | | | | | | 1,507 | |
| | | | | |
|
|
|
Total Assets | | | | | | 1,815,366,692 | |
Liabilities | | | | | | | |
Payable for: | | | | | | | |
Fund shares redeemed | | $ | 1,630,927 | | | | |
Securities purchased | | | 3,080,037 | | | | |
Futures variation margin | | | 28,928 | | | | |
Return of collateral for securities loaned | | | 18,755,894 | | | | |
Accrued expenses: | | | | | | | |
Management fees | | | 759,345 | | | | |
Service and distribution fees | | | 13,121 | | | | |
Other expenses | | | 213,030 | �� | | | |
| | |
|
| | | | |
Total Liabilities | | | | | | 24,481,282 | |
| | | | | |
|
|
|
Net Assets | | | | | $ | 1,790,885,410 | |
| | | | | |
|
|
|
Net Assets Consists of: | | | | | | | |
Capital paid in | | | | | $ | 1,962,528,166 | |
Undistributed net investment income | | | | | | 23,209,724 | |
Accumulated net realized losses | | | | | | (322,970,585 | ) |
Unrealized appreciation on investments and futures contracts | | | | | | 128,118,105 | |
| | | | | |
|
|
|
Net Assets | | | | | $ | 1,790,885,410 | |
| | | | | |
|
|
|
| Computation of offering price: | | | | | | | |
Class A | | | | | | | |
Net asset value and redemption price per share ($1,711,587,004 divided by 61,566,231 shares outstanding) | | | | | $ | 27.80 | |
| | | | | |
|
|
|
Class B | | | | | | | |
Net asset value and redemption price per share ($33,624,113 divided by 1,224,303 shares outstanding) | | | | | $ | 27.46 | |
| | | | | |
|
|
|
Class E | | | | | | | |
Net asset value and redemption price per share ($45,674,293 divided by 1,655,718 shares outstanding) | | | | | $ | 27.59 | |
| | | | | |
|
|
|
Identified cost of investments | | | | | $ | 1,663,568,717 | |
| | | | | |
|
|
|
Statement of Operations
Year Ended December 31, 2005
| | | | | | | | |
Investment Income | | | | | | | | |
Dividends | | | | | | $ | 33,001,991 | |
Interest | | | | | | | 411,691 | (a) |
| | | | | | |
|
|
|
| | | | | | | | 33,413,682 | |
Expenses | | | | | | | | |
Management fees | | $ | 9,042,281 | | | | | |
Service and distribution fees—Class B | | | 75,756 | | | | | |
Service and distribution fees—Class E | | | 71,315 | | | | | |
Directors’ fees and expenses | | | 22,265 | | | | | |
Custodian | | | 382,234 | | | | | |
Audit and tax services | | | 18,445 | | | | | |
Legal | | | 44,927 | | | | | |
Printing | | | 475,768 | | | | | |
Insurance | | | 38,443 | | | | | |
Miscellaneous | | | 41,942 | | | | | |
| | |
|
|
| | | | |
Total expenses | | | 10,213,376 | | | | | |
Expense reductions | | | (322,097 | ) | | | 9,891,279 | |
| | |
|
|
| |
|
|
|
Net Investment Income | | | | | | | 23,522,403 | |
| | | | | | |
|
|
|
Realized and Unrealized Gain | | | | | | | | |
| Realized gain on: | | | | | | | | |
Investments—net | | | 186,241,062 | | | | | |
Futures contracts—net | | | 834,282 | | | | 187,075,344 | |
| | |
|
|
| | | | |
| Unrealized depreciation on: | | | | | | | | |
Investments—net | | | (148,387,024 | ) | | | | |
Futures contracts—net | | | (92,707 | ) | | | (148,479,731 | ) |
| | |
|
|
| |
|
|
|
Net gain | | | | | | | 38,595,613 | |
| | | | | | |
|
|
|
Net Increase in Net Assets From Operations | | | | | | $ | 62,118,016 | |
| | | | | | |
|
|
|
| (a) | Includes income on securities loaned of $51,349. |
See accompanying notes to financial statements.
MSF-103
Metropolitan Series Fund, Inc.
BlackRock Investment Trust Portfolio
Statement of Changes in Net Assets
| | | | | | | | |
| | | Year ended
December 31,
2005
| | | Year ended
December 31,
2004
| |
From Operations | | | | | | | | |
Net investment income | | $ | 23,522,403 | | | $ | 20,680,388 | |
Net realized gain | | | 187,075,344 | | | | 205,253,561 | |
Unrealized depreciation | | | (148,479,731 | ) | | | (31,114,539 | ) |
| | |
|
|
| |
|
|
|
Increase in net assets from operations | | | 62,118,016 | | | | 194,819,410 | |
| | |
|
|
| |
|
|
|
From Distributions to Shareholders | | | | | | | | |
Net investment income | | | | | | | | |
Class A | | | (19,890,110 | ) | | | (13,650,570 | ) |
Class B | | | (264,556 | ) | | | (94,035 | ) |
Class E | | | (466,636 | ) | | | (320,636 | ) |
| | |
|
|
| |
|
|
|
Total distributions | | | (20,621,302 | ) | | | (14,065,241 | ) |
| | |
|
|
| |
|
|
|
Decrease in net assets from capital share transactions | | | (206,323,663 | ) | | | (161,012,460 | ) |
| | |
|
|
| |
|
|
|
Total increase (decrease) in net assets | | | (164,826,949 | ) | | | 19,741,709 | |
| | |
Net Assets | | | | | | | | |
Beginning of the period | | | 1,955,712,359 | | | | 1,935,970,650 | |
| | |
|
|
| |
|
|
|
End of the period | | $ | 1,790,885,410 | | | $ | 1,955,712,359 | |
| | |
|
|
| |
|
|
|
Undistributed Net Investment Income | | | | | | | | |
End of the period | | $ | 23,209,724 | | | $ | 20,596,328 | |
| | |
|
|
| |
|
|
|
Other Information:
Capital Shares
Transactions in capital shares were as follows:
| | | | | | | | | | | | | | |
| | | Year ended
December 31, 2005
| | | Year ended
December 31, 2004
| |
| | | Shares
| | | $
| | | Shares
| | | $
| |
Class A | | | | | | | | | | | | | | |
Sales | | 2,577,721 | | | $ | 69,601,355 | | | 1,052,010 | | | $ | 26,207,678 | |
Reinvestments | | 776,048 | | | | 19,890,110 | | | 544,933 | | | | 13,650,570 | |
Redemptions | | (10,956,114 | ) | | | (295,454,296 | ) | | (8,912,782 | ) | | | (222,526,292 | ) |
| | |
|
| |
|
|
| |
|
| |
|
|
|
Net decrease | | (7,602,345 | ) | | $ | (205,962,831 | ) | | (7,315,839 | ) | | $ | (182,668,044 | ) |
| | |
|
| |
|
|
| |
|
| |
|
|
|
Class B | | | | | | | | | | | | | | |
Sales | | 420,244 | | | $ | 11,174,376 | | | 536,373 | | | $ | 13,228,045 | |
Reinvestments | | 10,428 | | | | 264,556 | | | 3,792 | | | | 94,035 | |
Redemptions | | (205,813 | ) | | | (5,472,786 | ) | | (123,439 | ) | | | (3,072,157 | ) |
| | |
|
| |
|
|
| |
|
| |
|
|
|
Net increase | | 224,859 | | | $ | 5,966,146 | | | 416,726 | | | $ | 10,249,923 | |
| | |
|
| |
|
|
| |
|
| |
|
|
|
Class E | | | | | | | | | | | | | | |
Sales | | 142,097 | | | $ | 3,799,271 | | | 886,852 | | | $ | 21,957,102 | |
Reinvestments | | 18,328 | | | | 466,636 | | | 12,887 | | | | 320,636 | |
Redemptions | | (394,790 | ) | | | (10,592,885 | ) | | (438,520 | ) | | | (10,872,077 | ) |
| | |
|
| |
|
|
| |
|
| |
|
|
|
Net increase (decrease) | | (234,365 | ) | | $ | (6,326,978 | ) | | 461,219 | | | $ | 11,405,661 | |
| | |
|
| |
|
|
| |
|
| |
|
|
|
Decrease derived from capital share transactions | | (7,611,851 | ) | | $ | (206,323,663 | ) | | (6,437,894 | ) | | $ | (161,012,460 | ) |
| | |
|
| |
|
|
| |
|
| |
|
|
|
See accompanying notes to financial statements.
MSF-104
Metropolitan Series Fund, Inc.
BlackRock Investment Trust Portfolio
Financial Highlights
| | | | | | | | | | | | | | | | | | | | |
| | | Class A
| |
| | | Year ended December 31,
| |
| | | 2005
| | | 2004
| | | 2003
| | | 2002
| | | 2001
| |
Net Asset Value, Beginning of Period | | $ | 27.15 | | | $ | 24.67 | | | $ | 19.12 | | | $ | 26.01 | | | $ | 36.34 | |
| | |
|
|
| |
|
|
| |
|
|
| |
|
|
| |
|
|
|
Income From Investment Operations | | | | | | | | | | | | | | | | | | | | |
Net investment income | | | 0.38 | | | | 0.29 | | | | 0.19 | | | | 0.19 | | | | 0.18 | |
Net realized and unrealized gain (loss) of investments | | | 0.57 | | | | 2.37 | | | | 5.54 | | | | (6.96 | ) | | | (6.00 | ) |
| | |
|
|
| |
|
|
| |
|
|
| |
|
|
| |
|
|
|
Total from investment operations | | | 0.95 | | | | 2.66 | | | | 5.73 | | | | (6.77 | ) | | | (5.82 | ) |
| | |
|
|
| |
|
|
| |
|
|
| |
|
|
| |
|
|
|
Less Distributions | | | | | | | | | | | | | | | | | | | | |
Distributions from net investment income | | | (0.30 | ) | | | (0.18 | ) | | | (0.18 | ) | | | (0.12 | ) | | | (0.25 | ) |
Distributions from net realized capital gains | | | 0.00 | | | | 0.00 | | | | 0.00 | | | | 0.00 | | | | (4.26 | ) |
| | |
|
|
| |
|
|
| |
|
|
| |
|
|
| |
|
|
|
Total distributions | | | (0.30 | ) | | | (0.18 | ) | | | (0.18 | ) | | | (0.12 | ) | | | (4.51 | ) |
| | |
|
|
| |
|
|
| |
|
|
| |
|
|
| |
|
|
|
Net Asset Value, End of Period | | $ | 27.80 | | | $ | 27.15 | | | $ | 24.67 | | | $ | 19.12 | | | $ | 26.01 | |
| | |
|
|
| |
|
|
| |
|
|
| |
|
|
| |
|
|
|
Total Return (%) | | | 3.6 | | | | 10.9 | | | | 30.2 | | | | (26.1 | ) | | | (17.0 | ) |
Ratio of operating expenses to average net assets before expense reductions (%) | | | 0.55 | | | | 0.54 | | | | 0.56 | | | | 0.54 | | | | 0.53 | |
Ratio of operating expenses to average net assets after expense reductions (%) (d) | | | 0.53 | | | | 0.53 | | | | 0.55 | | | | 0.52 | | | | 0.50 | |
Ratio of net investment income to average net assets (%) | | | 1.28 | | | | 1.09 | | | | 0.83 | | | | 0.79 | | | | 0.58 | |
Portfolio turnover rate (%) | | | 93 | | | | 89 | | | | 75 | | | | 79 | | | | 101 | |
Net assets, end of period (000) | | $ | 1,711,587 | | | $ | 1,877,980 | | | $ | 1,886,744 | | | $ | 1,564,635 | | | $ | 2,457,339 | |
| | | | | | | | | | | | | | | | | | | | |
| | | Class B
| |
| | | Year ended December 31,
| | | May 1, 2001(a) through December 31,
2001
| |
| | | 2005
| | | 2004
| | | 2003
| | | 2002
| | |
Net Asset Value, Beginning of Period | | $ | 26.83 | | | $ | 24.40 | | | $ | 18.93 | | | $ | 25.80 | | | $ | 29.14 | |
| | |
|
|
| |
|
|
| |
|
|
| |
|
|
| |
|
|
|
Income From Investment Operations | | | | | | | | | | | | | | | | | | | | |
Net investment income | | | 0.27 | | | | 0.24 | | | | 0.14 | | | | 0.12 | | | | 0.02 | |
Net realized and unrealized gain (loss) of investments | | | 0.60 | | | | 2.33 | | | | 5.48 | | | | (6.87 | ) | | | (3.36 | ) |
| | |
|
|
| |
|
|
| |
|
|
| |
|
|
| |
|
|
|
Total from investment operations | | | 0.87 | | | | 2.57 | | | | 5.62 | | | | (6.75 | ) | | | (3.34 | ) |
| | |
|
|
| |
|
|
| |
|
|
| |
|
|
| |
|
|
|
Less Distributions | | | | | | | | | | | | | | | | | | | | |
Distributions from net investment income | | | (0.24 | ) | | | (0.14 | ) | | | (0.15 | ) | | | (0.12 | ) | | | 0.00 | |
| | |
|
|
| |
|
|
| |
|
|
| |
|
|
| |
|
|
|
Total distributions | | | (0.24 | ) | | | (0.14 | ) | | | (0.15 | ) | | | (0.12 | ) | | | 0.00 | |
| | |
|
|
| |
|
|
| |
|
|
| |
|
|
| |
|
|
|
Net Asset Value, End of Period | | $ | 27.46 | | | $ | 26.83 | | | $ | 24.40 | | | $ | 18.93 | | | $ | 25.80 | |
| | |
|
|
| |
|
|
| |
|
|
| |
|
|
| |
|
|
|
Total Return (%) | | | 3.3 | | | | 10.6 | | | | 29.9 | | | | (26.3 | ) | | | (11.5 | )(b) |
Ratio of operating expenses to average net assets before expense reductions (%) | | | 0.80 | | | | 0.79 | | | | 0.81 | | | | 0.79 | | | | 0.78 | (c) |
Ratio of operating expenses to average net assets after expense reductions (%) (d) | | | 0.78 | | | | 0.78 | | | | 0.80 | | | | 0.77 | | | | 0.75 | (c) |
Ratio of net investment income to average net assets (%) | | | 1.06 | | | | 0.98 | | | | 0.59 | | | | 0.61 | | | | 0.45 | (c) |
Portfolio turnover rate (%) | | | 93 | | | | 89 | | | | 75 | | | | 79 | | | | 101 | |
Net assets, end of period (000) | | $ | 33,624 | | | $ | 26,815 | | | $ | 14,219 | | | $ | 6,486 | | | $ | 2,849 | |
| (a) | Commencement of operations. |
| (b) | Period less than one year is not computed on an annualized basis. |
| (c) | Computed on an annualized basis. |
| (d) | The Portfolio has entered into arrangements with certain brokers who paid a portion of the Portfolio’s expenses. |
See accompanying notes to financial statements.
MSF-105
Metropolitan Series Fund, Inc.
BlackRock Investment Trust Portfolio
Financial Highlights
| | | | | | | | | | | | | | | | | | | | |
| | | Class E
| |
| | | Year ended December 31,
| | | May 1, 2001(a)
through
December 31,
2001
| |
| | | 2005
| | | 2004
| | | 2003
| | | 2002
| | |
Net Asset Value, Beginning of Period | | $ | 26.94 | | | $ | 24.50 | | | $ | 19.01 | | | $ | 25.89 | | | $ | 29.23 | |
| | |
|
|
| |
|
|
| |
|
|
| |
|
|
| |
|
|
|
Income From Investment Operations | | | | | | | | | | | | | | | | | | | | |
Net investment income | | | 0.32 | | | | 0.24 | | | | 0.16 | | | | 0.16 | | | | 0.01 | |
Net realized and unrealized gain (loss) of investments | | | 0.59 | | | | 2.37 | | | | 5.51 | | | | (6.92 | ) | | | (3.35 | ) |
| | |
|
|
| |
|
|
| |
|
|
| |
|
|
| |
|
|
|
Total from investment operations | | | 0.91 | | | | 2.61 | | | | 5.67 | | | | (6.76 | ) | | | (3.34 | ) |
| | |
|
|
| |
|
|
| |
|
|
| |
|
|
| |
|
|
|
Less Distributions | | | | | | | | | | | | | | | | | | | | |
Distributions from net investment income | | | (0.26 | ) | | | (0.17 | ) | | | (0.18 | ) | | | (0.12 | ) | | | 0.00 | |
| | |
|
|
| |
|
|
| |
|
|
| |
|
|
| |
|
|
|
Total distributions | | | (0.26 | ) | | | (0.17 | ) | | | (0.18 | ) | | | (0.12 | ) | | | 0.00 | |
| | |
|
|
| |
|
|
| |
|
|
| |
|
|
| |
|
|
|
Net Asset Value, End of Period | | $ | 27.59 | | | $ | 26.94 | | | $ | 24.50 | | | $ | 19.01 | | | $ | 25.89 | |
| | |
|
|
| |
|
|
| |
|
|
| |
|
|
| |
|
|
|
Total Return (%) | | | 3.5 | | | | 10.7 | | | | 30.0 | | | | (26.2 | ) | | | (11.4 | )(b) |
Ratio of operating expenses to average net assets before expense reductions (%) | | | 0.70 | | | | 0.69 | | | | 0.71 | | | | 0.69 | | | | 0.68 | (c) |
Ratio of operating expenses to average net assets after expense reductions (%) (d) | | | 0.68 | | | | 0.68 | | | | 0.70 | | | | 0.67 | | | | 0.65 | (c) |
Ratio of net investment income to average net assets (%) | | | 1.13 | | | | 0.98 | | | | 0.71 | | | | 0.79 | | | | 0.43 | (c) |
Portfolio turnover rate (%) | | | 93 | | | | 89 | | | | 75 | | | | 79 | | | | 101 | |
Net assets, end of period (000) | | $ | 45,674 | | | $ | 50,917 | | | $ | 35,008 | | | $ | 7,575 | | | $ | 11 | |
| (a) | Commencement of operations. |
| (b) | Period less than one year is not computed on an annualized basis. |
| (c) | Computed on an annualized basis. |
| (d) | The Portfolio has entered into arrangements with certain brokers who paid a portion of the Portfolio’s expenses. |
See accompanying notes to financial statements.
MSF-106
Metropolitan Series Fund, Inc.
BlackRock Large Cap Value Portfolio
Schedule of Investments as of December 31, 2005
Common Stock—98.8% of Total Net Assets
| | | | | |
| Security Description | | Shares | | Value* |
| | | | | | |
| | |
Aerospace & Defense—2.1% | | | | | |
General Dynamics Corp. | | 7,500 | | $ | 855,375 |
L-3 Communications Holdings, Inc. | | 9,100 | | | 676,585 |
Lockheed Martin Corp. | | 9,600 | | | 610,848 |
Raytheon Co. | | 17,900 | | | 718,685 |
| | | | |
|
|
| | | | | | 2,861,493 |
| | | | |
|
|
| | |
Beverages—1.0% | | | | | |
Constellation Brands, Inc. (a) | | 22,000 | | | 577,060 |
The Pepsi Bottling Group, Inc. | | 24,100 | | | 689,501 |
| | | | |
|
|
| | | | | | 1,266,561 |
| | | | |
|
|
| | |
Capital Markets—5.2% | | | | | |
Affiliated Managers Group, Inc. (a) | | 11,200 | | | 898,800 |
Capital One Financial Corp. | | 10,000 | | | 864,000 |
E*TRADE Financial Corp. (a) | | 64,400 | | | 1,343,384 |
Lehman Brothers Holdings, Inc. | | 15,300 | | | 1,961,001 |
State Street Corp. | | 11,500 | | | 637,560 |
The Bear Stearns Co., Inc. | | 10,400 | | | 1,201,512 |
| | | | |
|
|
| | | | | | 6,906,257 |
| | | | |
|
|
| | |
Chemicals—1.7% | | | | | |
Eastman Chemical Co. | | 13,700 | | | 706,783 |
The Dow Chemical Co. | | 21,200 | | | 928,984 |
The Lubrizol Corp. | | 15,000 | | | 651,450 |
| | | | |
|
|
| | | | | | 2,287,217 |
| | | | |
|
|
| | |
Commercial Banks—13.1% | | | | | |
Bank of America Corp. | | 127,000 | | | 5,861,050 |
BB&T Corp. | | 39,900 | | | 1,672,209 |
Comerica, Inc. | | 24,100 | | | 1,367,916 |
KeyCorp. | | 38,200 | | | 1,257,926 |
SunTrust Banks, Inc. | | 17,300 | | | 1,258,748 |
The Colonial BancGroup, Inc. | | 40,000 | | | 952,800 |
U.S. Bancorp. | | 63,100 | | | 1,886,059 |
Wachovia Corp. | | 61,200 | | | 3,235,032 |
| | | | |
|
|
| | | | | | 17,491,740 |
| | | | |
|
|
| | |
Commercial Services & Supplies—0.5% | | | | | |
Sabre Holdings Corp. (Class A) | | 28,200 | | | 679,902 |
| | | | |
|
|
| | |
Communications Equipment – 0.6% | | | | | |
Motorola, Inc. | | 33,100 | | | 747,729 |
| | | | |
|
|
| | |
Computers & Peripherals—2.3% | | | | | |
Hewlett-Packard Co. | | 31,400 | | | 898,982 |
International Business Machines Corp. | | 16,127 | | | 1,325,639 |
Western Digital Corp. (a) | | 44,100 | | | 820,701 |
| | | | |
|
|
| | | | | | 3,045,322 |
| | | | |
|
|
| | |
Construction Materials—0.4% | | | | | |
Martin Marietta Materials, Inc. | | 7,400 | | | 567,728 |
| | | | |
|
|
| | |
Containers & Packaging—0.6% | | | | | |
Temple-Inland, Inc. | | 18,500 | | | 829,725 |
| | | | |
|
|
| | | | | |
| Security Description | | Shares | | Value* |
| | | | | | |
| | |
Diversified Financial Services—5.5% | | | | | |
CIT Group, Inc. | | 19,600 | | $ | 1,014,888 |
Citigroup, Inc. | | 78,600 | | | 3,814,458 |
JPMorgan Chase & Co. | | 62,100 | | | 2,464,749 |
| | | | |
|
|
| | | | | | 7,294,095 |
| | | | |
|
|
| |
Diversified Telecommunication Services—4.4% | | | |
ALLTEL Corp. | | 14,200 | | | 896,020 |
AT&T, Inc. | | 118,200 | | | 2,894,718 |
Verizon Communications, Inc. | | 71,390 | | | 2,150,267 |
| | | | |
|
|
| | | | | | 5,941,005 |
| | | | |
|
|
| | |
Electric Utilities—5.0% | | | | | |
CenterPoint Energy, Inc. | | 80,000 | | | 1,028,000 |
CMS Energy Corp. (a) | | 72,100 | | | 1,046,171 |
FirstEnergy Corp. | | 18,000 | | | 881,820 |
PG&E Corp. | | 36,800 | | | 1,366,016 |
PPL Corp. | | 78,860 | | | 2,318,484 |
| | | | |
|
|
| | | | | | 6,640,491 |
| | | | |
|
|
| | |
Energy Equipment & Services—0.5% | | | | | |
Nabors Industries, Ltd. (a) | | 9,600 | | | 727,200 |
| | | | |
|
|
| | |
Food & Staples Retailing—0.5% | | | | | |
The Kroger Co. (a) | | 37,500 | | | 708,000 |
| | | | |
|
|
| | |
Food Products—1.3% | | | | | |
Archer-Daniels-Midland Co. | | 40,400 | | | 996,264 |
General Mills, Inc. | | 15,300 | | | 754,596 |
| | | | |
|
|
| | | | | | 1,750,860 |
| | | | |
|
|
| | |
Gas Utilities—0.7% | | | | | |
AGL Resources, Inc. | | 26,800 | | | 932,908 |
| | | | |
|
|
| | |
Health Care Providers & Services—1.2% | | | | | |
Community Health Systems, Inc. (a) | | 21,400 | | | 820,476 |
Coventry Health Care, Inc. (a) | | 14,200 | | | 808,832 |
| | | | |
|
|
| | | | | | 1,629,308 |
| | | | |
|
|
| | |
Hotels, Restaurants & Leisure—1.5% | | | | | |
GTECH Holdings Corp. | | 21,500 | | | 682,410 |
McDonald’s Corp. | | 39,812 | | | 1,342,461 |
| | | | |
|
|
| | | | | | 2,024,871 |
| | | | |
|
|
| | |
Household Durables—2.0% | | | | | |
Centex Corp. | | 7,900 | | | 564,771 |
Fortune Brands, Inc. | | 11,900 | | | 928,438 |
The Black & Decker Corp. | | 6,900 | | | 600,024 |
The Stanley Works | | 11,900 | | | 571,676 |
| | | | |
|
|
| | | | | | 2,664,909 |
| | | | |
|
|
|
Independent Power Producers & Energy Traders—0.5% |
TXU Corp. | | 14,000 | | | 702,660 |
| | | | |
|
|
*See accompanying notes to financial statements.
MSF-107
Metropolitan Series Fund, Inc.
BlackRock Large Cap Value Portfolio
Schedule of Investments as of December 31, 2005
Common Stock—(Continued)
| | | | | |
| Security Description | | Shares | | Value* |
| | | | | | |
| | |
Industrial Conglomerates—2.3% | | | | | |
General Electric Co. | | 89,000 | | $ | 3,119,450 |
| | | | |
|
|
| | |
Insurance—7.8% | | | | | |
ACE, Ltd. | | 13,700 | | | 732,128 |
American International Group, Inc. | | 30,060 | | | 2,050,994 |
Genworth Financial, Inc. (Class A) | | 24,000 | | | 829,920 |
Nationwide Financial Services, Inc. | | 17,600 | | | 774,400 |
Prudential Financial, Inc. | | 11,600 | | | 849,004 |
The Allstate Corp. | | 21,100 | | | 1,140,877 |
The Chubb Corp. | | 14,200 | | | 1,386,630 |
The Hartford Financial Services Group, Inc. | | 20,080 | | | 1,724,671 |
W.R. Berkley Corp. | | 19,500 | | | 928,590 |
| | | | |
|
|
| | | | | | 10,417,214 |
| | | | |
|
|
| | |
Machinery—0.6% | | | | | |
Cummins, Inc. | | 9,500 | | | 852,435 |
| | | | |
|
|
| | |
Media—4.7% | | | | | |
Comcast Corp. (Class A) (a) | | 29,600 | | | 768,416 |
R. H. Donnelley Corp. (a) | | 9,200 | | | 566,904 |
The McGraw-Hill Cos., Inc. | | 24,100 | | | 1,244,283 |
The Walt Disney Co. | | 87,790 | | | 2,104,326 |
Time Warner, Inc. | | 90,800 | | | 1,583,552 |
| | | | |
|
|
| | | | | | 6,267,481 |
| | | | |
|
|
| | |
Metals & Mining—1.3% | | | | | |
Nucor Corp. | | 11,500 | | | 767,280 |
Phelps Dodge Corp. | | 6,800 | | | 978,316 |
| | | | |
|
|
| | | | | | 1,745,596 |
| | | | |
|
|
| | |
Multi-Utilities—0.6% | | | | | |
Sempra Energy | | 18,600 | | | 834,024 |
| | | | |
|
|
| | |
Multiline Retail—0.5% | | | | | |
Federated Department Stores, Inc. | | 10,300 | | | 683,199 |
| | | | |
|
|
| | |
Oil, Gas & Consumable Fuels—12.6% | | | | | |
Amerada Hess Corp. | | 13,300 | | | 1,686,706 |
Chevron Corp. | | 34,986 | | | 1,986,155 |
ConocoPhillips | | 56,200 | | | 3,269,716 |
Devon Energy Corp. | | 19,500 | | | 1,219,530 |
Exxon Mobil Corp. | | 109,400 | | | 6,144,998 |
Kerr-McGee Corp. | | 14,800 | | | 1,344,728 |
Valero Energy Corp. | | 24,200 | | | 1,248,720 |
| | | | |
|
|
| | | | | | 16,900,553 |
| | | | |
|
|
| | |
Paper & Forest Products—0.7% | | | | | |
Louisiana-Pacific Corp. | | 35,000 | | | 961,450 |
| | | | |
|
|
| | |
Pharmaceuticals—5.5% | | | | | |
Merck & Co., Inc. | | 48,500 | | | 1,542,785 |
Pfizer, Inc. | | 188,300 | | | 4,391,156 |
Wyeth | | 31,970 | | | 1,472,858 |
| | | | |
|
|
| | | | | | 7,406,799 |
| | | | |
|
|
| | | | | | | |
| Security Description | | Shares | | Value* | |
| | |
Real Estate—2.9% | | | | | | | |
General Growth Properties, Inc. (REIT) | | | 30,500 | | $ | 1,433,195 | |
HRPT Properties Trust (REIT) | | | 79,900 | | | 826,965 | |
Simon Property Group, Inc. (REIT) | | | 21,400 | | | 1,639,882 | |
| | | | | |
|
|
|
| | | | | | | 3,900,042 | |
| | | | | |
|
|
|
| | |
Road & Rail—1.4% | | | | | | | |
Burlington Northern Santa Fe Corp. | | | 26,000 | | | 1,841,320 | |
| | | | | |
|
|
|
| |
Semiconductors & Semiconductor Equipment—0.5% | | | | |
Freescale Semiconductor, Inc. (Class A) (a) | | | 18,600 | | | 468,534 | |
Freescale Semiconductor, Inc. (Class B) (a) | | | 9,400 | | | 236,598 | |
| | | | | |
|
|
|
| | | | | | | 705,132 | |
| | | | | |
|
|
|
| | |
Software—0.7% | | | | | | | |
Microsoft Corp. | | | 34,750 | | | 908,713 | |
| | | | | |
|
|
|
| | |
Specialty Retail—1.1% | | | | | | | |
AutoNation, Inc. (a) | | | 36,200 | | | 786,626 | |
Barnes & Noble, Inc. (a) | | | 14,461 | | | 617,051 | |
| | | | | |
|
|
|
| | | | | | | 1,403,677 | |
| | | | | |
|
|
|
| | |
Thrifts & Mortgage Finance—2.4% | | | | | | | |
Countrywide Financial Corp. | | | 20,400 | | | 697,476 | |
Federal National Mortgage Association | | | 20,620 | | | 1,006,462 | |
Washington Mutual, Inc. | | | 33,800 | | | 1,470,300 | |
| | | | | |
|
|
|
| | | | | | | 3,174,238 | |
| | | | | |
|
|
|
| | |
Tobacco—1.7% | | | | | | | |
Altria Group, Inc. | | | 30,100 | | | 2,249,072 | |
| | | | | |
|
|
|
| |
Wireless Telecommunication Services—0.9% | | | | |
Sprint Nextel Corp. | | | 51,354 | | | 1,199,629 | |
| | | | | |
|
|
|
Total Common Stock
(Identified Cost $121,667,724) | | | | | | 132,270,005 | |
| | | | | |
|
|
|
| | |
| Short Term Investments—2.2% | | | | | | | |
| Security Description | | Face
Amount | | Value* | |
| | |
Discount Notes—2.2% | | | | | | | |
Federal National Mortgage Association
3.500%, 01/03/06 | | $ | 2,900,000 | | | 2,899,436 | |
| | | | | |
|
|
|
Total Short Term Investments
(Amortized Cost $2,899,436) | | | | | | 2,899,436 | |
| | | | | |
|
|
|
Total Investments—101.0%
(Identified Cost $124,567,160) (b) | | | | | | 135,169,441 | |
Liabilities in excess of other assets | | | | | | (1,324,719 | ) |
| | | | | |
|
|
|
| Total Net Assets—100% | | | | | $ | 133,844,722 | |
| | | | | |
|
|
|
*See accompanying notes to financial statements.
MSF-108
Metropolitan Series Fund, Inc.
BlackRock Large Cap Value Portfolio
Schedule of Investments as of December 31, 2005
| (b) | The aggregate cost of investments for federal income tax purposes as of December 31, 2005 was $124,786,682 and the composition of unrealized appreciation and depreciation of investment securities was $13,499,955 and $(3,117,196), respectively. |
| (REIT)— | A Real Estate Investment Trust is a pooled investment vehicle that invests primarily in income-producing real estate or real estate related loans or interest. |
Futures Contracts
| | | | | | | | | | | | | | |
Futures Contracts Long
| | Expiration
Date
| | Number of
Contracts
| | Contract
Amount
| | Valuation as of
12/31/2005
| | Net Unrealized
Depreciation
| |
S&P 500 Index Futures | | 3/16/2006 | | 5 | | $ | 1,589,952 | | $ | 1,568,500 | | $ | (21,452 | ) |
| | | | | | | | | | | | |
|
|
|
See accompanying notes to financial statements.
MSF-109
Metropolitan Series Fund, Inc.
BlackRock Large Cap Value Portfolio
Statement of Assets & Liabilities
December 31, 2005
| | | | | | |
Assets | | | | | | |
Investments at value | | | | | $ | 135,169,441 |
Cash | | | | | | 61,179 |
Receivable for: | | | | | | |
Fund shares sold | | | | | | 124,794 |
Accrued interest and dividends | | | | | | 235,513 |
| | | | | |
|
|
Total Assets | | | | | | 135,590,927 |
Liabilities | | | | | | |
Payable for: | | | | | | |
Fund shares redeemed | | $ | 149,419 | | | |
Securities purchased | | | 1,450,245 | | | |
Futures variation margin | | | 6,625 | | | |
Accrued expenses: | | | | | | |
Management fees | | | 79,853 | | | |
Service and distribution fees | | | 15,196 | | | |
Other expenses | | | 44,867 | | | |
| | |
|
| | | |
Total Liabilities | | | | | | 1,746,205 |
| | | | | |
|
|
Net Assets | | | | | $ | 133,844,722 |
| | | | | |
|
|
Net Assets Consists of: | | | | | | |
Capital paid in | | | | | $ | 114,014,102 |
Undistributed net investment income | | | | | | 1,784,113 |
Accumulated net realized gains | | | | | | 7,465,678 |
Unrealized appreciation on investments and futures contracts | | | | | | 10,580,829 |
| | | | | |
|
|
Net Assets | | | | | $ | 133,844,722 |
| | | | | |
|
|
| Computation of offering price: | | | | | | |
Class A | | | | | | |
Net asset value and redemption price per
share ($38,850,422 divided by
3,093,814 shares outstanding) | | | | | $ | 12.56 |
| | | | | |
|
|
Class B | | | | | | |
Net asset value and redemption price per
share ($36,725,242 divided by
2,937,179 shares outstanding) | | | | | $ | 12.50 |
| | | | | |
|
|
Class E | | | | | | |
Net asset value and redemption price per
share ($58,269,058 divided by
4,652,703 shares outstanding) | | | | | $ | 12.52 |
| | | | | |
|
|
Identified cost of investments | | | | | $ | 124,567,160 |
| | | | | |
|
|
Statement of Operations
Year Ended December 31, 2005
| | | | | | | | |
Investment Income | | | | | | | | |
Dividends | | | | | | $ | 2,944,424 | |
Interest | | | | | | | 51,493 | |
| | | | | | |
|
|
|
| | | | | | | | 2,995,917 | |
Expenses | | | | | | | | |
Management fees | | $ | 863,508 | | | | | |
Deferred expense reimbursement | | | 24,000 | | | | | |
Service and distribution fees—Class B | | | 66,078 | | | | | |
Service and distribution fees—Class E | | | 88,622 | | | | | |
Directors’ fees and expenses | | | 22,263 | | | | | |
Custodian | | | 79,238 | | | | | |
Audit and tax services | | | 24,258 | | | | | |
Legal | | | 2,364 | | | | | |
Printing | | | 31,746 | | | | | |
Insurance | | | 2,114 | | | | | |
Miscellaneous | | | 4,521 | | | | | |
| | |
|
|
| | | | |
Total expenses | | | 1,208,712 | | | | | |
Expense reductions | | | (28,501 | ) | | | 1,180,211 | |
| | |
|
|
| |
|
|
|
Net Investment Income | | | | | | | 1,815,706 | |
| | | | | | |
|
|
|
Realized and Unrealized Gain (Loss) | | | | | | | | |
| Realized gain on: | | | | | | | | |
Investments—net | | | 11,398,900 | | | | | |
Futures contracts—net | | | 95,540 | | | | 11,494,440 | |
| | |
|
|
| | | | |
| | | | | | | | | |
| Unrealized depreciation on: | | | | | | | | |
Investments—net | | | (5,988,856 | ) | | | | |
Futures contracts—net | | | (21,452 | ) | | | (6,010,308 | ) |
| | |
|
|
| |
|
|
|
Net gain | | | | | | | 5,484,132 | |
| | | | | | |
|
|
|
Net Increase in Net Assets From Operations | | | | | | $ | 7,299,838 | |
| | | | | | |
|
|
|
See accompanying notes to financial statements.
MSF-110
Metropolitan Series Fund, Inc.
BlackRock Large Cap Value Portfolio
Statement of Changes in Net Assets
| | | | | | | |
| | | Year ended
December 31,
2005
| | | Year ended
December 31,
2004
|
From Operations | | | | | | | |
Net investment income | | $ | 1,815,706 | | | $ | 1,055,520 |
Net realized gain | | | 11,494,440 | | | | 3,374,984 |
Unrealized appreciation (depreciation) | | | (6,010,308 | ) | | | 7,332,003 |
| | |
|
|
| |
|
|
Increase in net assets from operations | | | 7,299,838 | | | | 11,762,507 |
| | |
|
|
| |
|
|
From Distributions to Shareholders | | | | | | | |
Net investment income | | | | | | | |
Class A | | | (368,702 | ) | | | 0 |
Class B | | | (183,294 | ) | | | 0 |
Class E | | | (506,615 | ) | | | 0 |
| | |
|
|
| |
|
|
| | | | (1,058,611 | ) | | | 0 |
| | |
|
|
| |
|
|
Net realized gain | | | | | | | |
Class A | | | (397,064 | ) | | | 0 |
Class B | | | (240,573 | ) | | | 0 |
Class E | | | (625,819 | ) | | | 0 |
| | |
|
|
| |
|
|
| | | | (1,263,456 | ) | | | 0 |
| | |
|
|
| |
|
|
Total distributions | | | (2,322,067 | ) | | | 0 |
| | |
|
|
| |
|
|
Increase in net assets from capital share transactions | | | 16,279,118 | | | | 38,600,872 |
| | |
|
|
| |
|
|
Total increase in net assets | | | 21,256,889 | | | | 50,363,379 |
| | |
Net Assets | | | | | | | |
Beginning of the period | | | 112,587,833 | | | | 62,224,454 |
| | |
|
|
| |
|
|
End of the period | | $ | 133,844,722 | | | $ | 112,587,833 |
| | |
|
|
| |
|
|
Undistributed Net Investment Income | | | | | | | |
End of the period | | $ | 1,784,113 | | | $ | 1,055,520 |
| | |
|
|
| |
|
|
Other Information:
Capital Shares
Transactions in capital shares were as follows:
| | | | | | | | | | | | | | |
| | | Year ended
December 31, 2005
| | | Year ended
December 31, 2004
| |
| | | Shares
| | | $
| | | Shares
| | | $
| |
Class A | | | | | | | | | | | | | | |
Sales | | 756,813 | | | $ | 9,144,105 | | | 1,286,608 | | | $ | 14,179,446 | |
Reinvestments | | 66,243 | | | | 765,766 | | | 0 | | | | 0 | |
Redemptions | | (806,644 | ) | | | (9,794,697 | ) | | (1,311,904 | ) | | | (14,526,059 | ) |
| | |
|
| |
|
|
| |
|
| |
|
|
|
Net increase (decrease) | | 16,412 | | | $ | 115,174 | | | (25,296 | ) | | $ | (346,613 | ) |
| | |
|
| |
|
|
| |
|
| |
|
|
|
Class B | | | | | | | | | | | | | | |
Sales | | 1,891,148 | | | $ | 22,826,855 | | | 1,359,175 | | | $ | 15,231,237 | |
Reinvestments | | 36,762 | | | | 423,867 | | | 0 | | | | 0 | |
Redemptions | | (306,813 | ) | | | (3,727,418 | ) | | (48,828 | ) | | | (545,419 | ) |
| | |
|
| |
|
|
| |
|
| |
|
|
|
Net increase | | 1,621,097 | | | $ | 19,523,304 | | | 1,310,347 | | | $ | 14,685,818 | |
| | |
|
| |
|
|
| |
|
| |
|
|
|
Class E | | | | | | | | | | | | | | |
Sales | | 1,129,889 | | | $ | 13,633,205 | | | 3,234,925 | | | $ | 35,653,140 | |
Reinvestments | | 98,131 | | | | 1,132,434 | | | 0 | | | | 0 | |
Redemptions | | (1,497,577 | ) | | | (18,124,999 | ) | | (1,037,179 | ) | | | (11,391,473 | ) |
| | |
|
| |
|
|
| |
|
| |
|
|
|
Net increase (decrease) | | (269,557 | ) | | $ | (3,359,360 | ) | | 2,197,746 | | | $ | 24,261,667 | |
| | |
|
| |
|
|
| |
|
| |
|
|
|
Increase derived from capital share transactions | | 1,367,952 | | | $ | 16,279,118 | | | 3,482,797 | | | $ | 38,600,872 | |
| | |
|
| |
|
|
| |
|
| |
|
|
|
See accompanying notes to financial statements.
MSF-111
Metropolitan Series Fund, Inc.
BlackRock Large Cap Value Portfolio
Financial Highlights
| | | | | | | | | | | | | | | |
| | | Class A
| |
| | | Year ended December 31,
| | | May 1, 2002(a) through December 31, 2002
| |
| | | 2005
| | | 2004
| | 2003
| | |
Net Asset Value, Beginning of Period | | $ | 12.11 | | | $ | 10.67 | | $ | 7.95 | | | $ | 10.00 | |
| | |
|
|
| |
|
| |
|
|
| |
|
|
|
Income From Investment Operations | | | | | | | | | | | | | | | |
Net investment income | | | 0.19 | | | | 0.15 | | | 0.11 | | | | 0.06 | |
Net realized and unrealized gain (loss) of investments | | | 0.51 | | | | 1.29 | | | 2.71 | | | | (2.06 | ) |
| | |
|
|
| |
|
| |
|
|
| |
|
|
|
Total from investment operations | | | 0.70 | | | | 1.44 | | | 2.82 | | | | (2.00 | ) |
| | |
|
|
| |
|
| |
|
|
| |
|
|
|
Less Distributions | | | | | | | | | | | | | | | |
Distributions from net investment income | | | (0.12 | ) | | | 0.00 | | | (0.10 | ) | | | (0.05 | ) |
Distributions from net realized capital gains | | | (0.13 | ) | | | 0.00 | | | 0.00 | | | | 0.00 | |
| | |
|
|
| |
|
| |
|
|
| |
|
|
|
Total distributions | | | (0.25 | ) | | | 0.00 | | | (0.10 | ) | | | (0.05 | ) |
| | |
|
|
| |
|
| |
|
|
| |
|
|
|
Net Asset Value, End of Period | | $ | 12.56 | | | $ | 12.11 | | $ | 10.67 | | | $ | 7.95 | |
| | |
|
|
| |
|
| |
|
|
| |
|
|
|
Total Return (%) | | | 6.0 | | | | 13.4 | | | 35.7 | | | | (20.0 | )(b) |
Ratio of operating expenses to average net assets before expense reductions (%) | | | 0.85 | | | | 0.93 | | | 0.94 | | | | 0.85 | (c) |
Ratio of operating expenses to average net assets after expense reductions (%) (d) | | | 0.83 | | | | 0.89 | | | — | | | | — | |
Ratio of operating expenses to average net assets without giving effect to the contractual expense
agreement would have been (%) | | | — | | | | — | | | 1.05 | | | | 2.33 | (c) |
Ratio of net investment income to average net assets (%) | | | 1.59 | | | | 1.31 | | | 1.28 | | | | 1.18 | (c) |
Portfolio turnover rate (%) | | | 109 | | | | 31 | | | 51 | | | | 84 | (c) |
Net assets, end of period (000) | | $ | 38,850 | | | $ | 37,259 | | $ | 33,113 | | | $ | 4,642 | |
| |
| | | Class B
| |
| | | Year ended December 31,
| | | July 30, 2002(a) through December 31, 2002
| |
| | | 2005
| | | 2004
| | 2003
| | |
Net Asset Value, Beginning of Period | | $ | 12.07 | | | $ | 10.66 | | $ | 7.95 | | | $ | 8.30 | |
| | |
|
|
| |
|
| |
|
|
| |
|
|
|
Income From Investment Operations | | | | | | | | | | | | | | | |
Net investment income | | | 0.13 | | | | 0.08 | | | 0.04 | | | | 0.03 | |
Net realized and unrealized gain (loss) of investments | | | 0.53 | | | | 1.33 | | | 2.76 | | | | (0.36 | ) |
| | |
|
|
| |
|
| |
|
|
| |
|
|
|
Total from investment operations | | | 0.66 | | | | 1.41 | | | 2.80 | | | | (0.33 | ) |
| | |
|
|
| |
|
| |
|
|
| |
|
|
|
Less Distributions | | | | | | | | | | | | | | | |
Distributions from net investment income | | | (0.10 | ) | | | 0.00 | | | (0.09 | ) | | | (0.02 | ) |
Distributions from net realized capital gains | | | (0.13 | ) | | | 0.00 | | | 0.00 | | | | 0.00 | |
| | |
|
|
| |
|
| |
|
|
| |
|
|
|
Total distributions | | | (0.23 | ) | | | 0.00 | | | (0.09 | ) | | | (0.02 | ) |
| | |
|
|
| |
|
| |
|
|
| |
|
|
|
Net Asset Value, End of Period | | $ | 12.50 | | | $ | 12.07 | | $ | 10.66 | | | $ | 7.95 | |
| | |
|
|
| |
|
| |
|
|
| |
|
|
|
Total Return (%) | | | 5.6 | | | | 13.2 | | | 35.4 | | | | (4.0 | )(b) |
Ratio of operating expenses to average net assets before expense reductions (%) | | | 1.10 | | | | 1.18 | | | 1.19 | | | | 1.10 | (c) |
Ratio of operating expenses to average net assets after expense reductions (%) (d) | | | 1.08 | | | | 1.14 | | | — | | | | — | |
Ratio of operating expenses to average net assets without giving effect to the contractual expense agreement would have been (%) | | | — | | | | — | | | 1.30 | | | | 2.58 | (c) |
Ratio of net investment income to average net assets (%) | | | 1.38 | | | | 1.46 | | | 1.02 | | | | 0.93 | (c) |
Portfolio turnover rate (%) | | | 109 | | | | 31 | | | 51 | | | | 84 | (c) |
Net assets, end of period (000) | | $ | 36,725 | | | $ | 15,880 | | $ | 61 | | | $ | 1 | |
| (a) | Commencement of operations. |
| (b) | Period less than one year is not computed on an annualized basis. |
| (c) | Computed on an annualized basis. |
| (d) | The Portfolio has entered into arrangements with certain brokers who paid a portion of the Portfolio’s expenses. |
See accompanying notes to financial statements.
MSF-112
Metropolitan Series Fund, Inc.
BlackRock Large Cap Value Portfolio
Financial Highlights
| | | | | | | | | | | | | | | |
| | | Class E
| |
| | | Year ended December 31,
| | | May 1, 2002(a) through December 31, 2002
| |
| | | 2005
| | | 2004
| | 2003
| | |
Net Asset Value, Beginning of Period | | $ | 12.08 | | | $ | 10.66 | | $ | 7.95 | | | $ | 10.00 | |
| | |
|
|
| |
|
| |
|
|
| |
|
|
|
Income From Investment Operations | | | | | | | | | | | | | | | |
Net investment income | | | 0.18 | | | | 0.12 | | | 0.08 | | | | 0.04 | |
Net realized and unrealized gain (loss) of investments | | | 0.49 | | | | 1.30 | | | 2.72 | | | | (2.04 | ) |
| | |
|
|
| |
|
| |
|
|
| |
|
|
|
Total from investment operations | | | 0.67 | | | | 1.42 | | | 2.80 | | | | (2.00 | ) |
| | |
|
|
| |
|
| |
|
|
| |
|
|
|
Less Distributions | | | | | | | | | | | | | | | |
Distributions from net investment income | | | (0.10 | ) | | | 0.00 | | | (0.09 | ) | | | (0.05 | ) |
Distributions from net realized capital gains | | | (0.13 | ) | | | 0.00 | | | 0.00 | | | | 0.00 | |
| | |
|
|
| |
|
| |
|
|
| |
|
|
|
Total distributions | | | (0.23 | ) | | | 0.00 | | | (0.09 | ) | | | (0.05 | ) |
| | |
|
|
| |
|
| |
|
|
| |
|
|
|
Net Asset Value, End of Period | | $ | 12.52 | | | $ | 12.08 | | $ | 10.66 | | | $ | 7.95 | |
| | |
|
|
| |
|
| |
|
|
| |
|
|
|
Total Return (%) | | | 5.7 | | | | 13.3 | | | 35.4 | | | | (20.0 | )(b) |
Ratio of operating expenses to average net assets before expense reductions (%) | | | 1.00 | | | | 1.08 | | | 1.09 | | | | 1.00 | (c) |
Ratio of operating expenses to average net assets after expense reductions (%) (d) | | | 0.98 | | | | 1.04 | | | — | | | | — | |
Ratio of operating expenses to average net assets without giving effect to the contractual
expense agreement would have been (%) | | | — | | | | — | | | 1.20 | | | | 2.48 | (c) |
Ratio of net investment income to average net assets (%) | | | 1.44 | | | | 1.21 | | | 1.14 | | | | 1.03 | (c) |
Portfolio turnover rate (%) | | | 109 | | | | 31 | | | 51 | | | | 84 | (c) |
Net assets, end of period (000) | | $ | 58,269 | | | $ | 59,449 | | $ | 29,051 | | | $ | 4,911 | |
| (a) | Commencement of operations. |
| (b) | Period less than one year is not computed on an annualized basis. |
| (c) | Computed on an annualized basis. |
| (d) | The Portfolio has entered into arrangements with certain brokers who paid a portion of the Portfolio’s expenses. |
See accompanying notes to financial statements.
MSF-113
Metropolitan Series Fund, Inc.
BlackRock Legacy Large Cap Growth Portfolio
Schedule of Investments as of December 31, 2005
Common Stock—98.7% of Total Net Assets
| | | | | |
| Security Description | | Shares | | Value* |
| | | | | | |
| | |
Aerospace & Defense—1.6% | | | | | |
General Dynamics Corp. | | 75,000 | | $ | 8,553,750 |
| | | | |
|
|
| | |
Beverages—2.2% | | | | | |
PepsiCo, Inc. | | 206,500 | | | 12,200,020 |
| | | | |
|
|
| | |
Biotechnology—5.0% | | | | | |
Amgen, Inc. (a) | | 140,040 | | | 11,043,554 |
Amylin Pharmaceuticals, Inc. (a) (b) | | 75,200 | | | 3,001,984 |
Genentech, Inc. (a) | | 59,700 | | | 5,522,250 |
Genzyme Corp. (a) (b) | | 110,200 | | | 7,799,956 |
| | | | |
|
|
| | | | | | 27,367,744 |
| | | | |
|
|
| | |
Capital Markets—3.8% | | | | | |
Franklin Resources, Inc. (b) | | 105,616 | | | 9,928,960 |
The Chicago Merchantile Exchange | | 18,100 | | | 6,651,569 |
The Goldman Sachs Group, Inc. | | 35,200 | | | 4,495,392 |
| | | | |
|
|
| | | | | | 21,075,921 |
| | | | |
|
|
| | |
Chemicals—1.6% | | | | | |
Monsanto Co. | | 111,546 | | | 8,648,161 |
| | | | |
|
|
| | |
Communications Equipment—2.1% | | | | | |
Corning, Inc. (a) | | 463,000 | | | 9,102,580 |
QUALCOMM, Inc. | | 59,300 | | | 2,554,644 |
| | | | |
|
|
| | | | | | 11,657,224 |
| | | | |
|
|
| | |
Computers & Peripherals—6.2% | | | | | |
Apple Computer, Inc. (a) | | 120,900 | | | 8,691,501 |
EMC Corp. (a) | | 882,900 | | | 12,025,098 |
Hewlett-Packard Co. | | 477,800 | | | 13,679,414 |
| | | | |
|
|
| | | | | | 34,396,013 |
| | | | |
|
|
| | |
Consumer Finance—4.8% | | | | | |
American Express Co. | | 284,600 | | | 14,645,516 |
SLM Corp. | | 211,800 | | | 11,668,062 |
| | | | |
|
|
| | | | | | 26,313,578 |
| | | | |
|
|
| |
Electronic Equipment & Instruments—0.7% | | | |
Broadcom Corp. (Class A) (a) | | 81,900 | | | 3,861,585 |
| | | | |
|
|
| | |
Energy Equipment & Services—3.0% | | | | | |
GlobalSantaFe Corp. | | 195,400 | | | 9,408,510 |
Schlumberger, Ltd. | | 71,700 | | | 6,965,655 |
| | | | |
|
|
| | | | | | 16,374,165 |
| | | | |
|
|
| | |
Food & Staples Retailing—2.2% | | | | | |
CVS Corp. | | 261,800 | | | 6,916,756 |
Walgreen Co. (b) | | 122,900 | | | 5,439,554 |
| | | | |
|
|
| | | | | | 12,356,310 |
| | | | |
|
|
| | | | | |
| Security Description | | Shares | | Value* |
| | | | | | |
| |
Health Care Equipment & Supplies—3.5% | | | |
St. Jude Medical, Inc. (a) | | 296,500 | | $ | 14,884,300 |
Stryker Corp. | | 95,200 | | | 4,229,736 |
| | | | |
|
|
| | | | | | 19,114,036 |
| | | | |
|
|
| | |
Health Care Providers & Services—7.3% | | | | | |
Caremark Rx, Inc. (a) | | 105,500 | | | 5,463,845 |
Humana, Inc. (a) | | 67,501 | | | 3,667,329 |
Quest Diagnostics, Inc. (b) | | 124,600 | | | 6,414,408 |
UnitedHealth Group, Inc. | | 270,714 | | | 16,822,168 |
WellPoint, Inc. (a) | | 99,000 | | | 7,899,210 |
| | | | |
|
|
| | | | | | 40,266,960 |
| | | | |
|
|
| | |
Hotels, Restaurants & Leisure—1.0% | | | | | |
Marriott International, Inc. (Class A) | | 42,400 | | | 2,839,528 |
Starwood Hotels & Resorts Worldwide, Inc. (Class B) | | 45,000 | | | 2,873,700 |
| | | | |
|
|
| | | | | | 5,713,228 |
| | | | |
|
|
| | |
Household Durables—0.8% | | | | | |
Harman International Industries, Inc. (b) | | 47,000 | | | 4,598,950 |
| | | | |
|
|
| | |
Household Products—3.4% | | | | | |
The Procter & Gamble Co. | | 327,200 | | | 18,938,336 |
| | | | |
|
|
| | |
Industrial Conglomerates—4.9% | | | | | |
General Electric Co. | | 769,859 | | | 26,983,558 |
| | | | |
|
|
| | |
Internet Software & Services—6.9% | | | | | |
Google, Inc. (Class A) (a) | | 52,015 | | | 21,578,943 |
Yahoo!, Inc. (a) | | 417,200 | | | 16,345,896 |
| | | | |
|
|
| | | | | | 37,924,839 |
| | | | |
|
|
| | |
IT Services—1.4% | | | | | |
Cognizant Technology Solutions Corp. (Class A) (a) (b) | | 149,700 | | | 7,537,395 |
| | | | |
|
|
| | |
Machinery—2.0% | | | | | |
Danaher Corp. | | 195,900 | | | 10,927,302 |
| | | | |
|
|
| | |
Media—0.8% | | | | | |
XM Satellite Radio Holdings, Inc. (a) (b) | | 153,800 | | | 4,195,664 |
| | | | |
|
|
| | |
Metals & Mining—2.6% | | | | | |
CONSOL Energy, Inc. (a) (b) | | 221,100 | | | 14,411,298 |
| | | | |
|
|
| | |
Multiline Retail—3.0% | | | | | |
Kohl’s Corp. (a) (b) | | 178,800 | | | 8,689,680 |
Target Corp. | | 138,400 | | | 7,607,848 |
| | | | |
|
|
| | | | | | 16,297,528 |
| | | | |
|
|
| | |
Oil, Gas & Consumable Fuels—4.7% | | | | | |
EOG Resources, Inc. | | 164,400 | | | 12,062,028 |
Exxon Mobil Corp. | | 77,406 | | | 4,347,895 |
Newfield Expolration Co. (a) (b) | | 183,800 | | | 9,202,866 |
| | | | |
|
|
| | | | | | 25,612,789 |
| | | | |
|
|
*See accompanying notes to financial statements.
MSF-114
Metropolitan Series Fund, Inc.
BlackRock Legacy Large Cap Growth Portfolio
Schedule of Investments as of December 31, 2005
Common Stock—(Continued)
| | | | | |
Security Description | | Shares | | Value* |
| | | | | | |
| | |
Pharmaceuticals—7.6% | | | | | |
Allergan, Inc. (b) | | 37,945 | | $ | 4,096,542 |
Johnson & Johnson | | 237,300 | | | 14,261,730 |
Medco Health Solutions, Inc. (a) | | 50,200 | | | 2,801,160 |
Novartis AG (ADR) (b) | | 190,200 | | | 9,981,696 |
Sanofi-Aventis (ADR) (b) | | 137,400 | | | 6,031,860 |
Teva Pharmaceutical Industries, Ltd. (ADR) (b) | | 104,300 | | | 4,485,943 |
| | | | |
|
|
| | | | | | 41,658,931 |
| | | | |
|
|
|
Semiconductors & Semiconductor Equipment—3.2% |
Freescale Semiconductor, Inc. (Class A) (a) (b) | | 208,100 | | | 5,242,039 |
Intel Corp. | | 235,663 | | | 5,882,149 |
Marvell Technology Group, Ltd. (a) | | 48,400 | | | 2,714,756 |
Texas Instruments, Inc. | | 120,600 | | | 3,867,642 |
| | | | |
|
|
| | | | | | 17,706,586 |
| | | | |
|
|
| | |
Software—7.1% | | | | | |
Adobe Systems, Inc. (a) | | 201,200 | | | 7,436,352 |
Microsoft Corp. | | 1,035,300 | | | 27,073,094 |
Salesforce.com, Inc. (a) (b) | | 148,800 | | | 4,769,040 |
| | | | |
|
|
| | | | | | 39,278,486 |
| | | | |
|
|
| | |
Specialty Retail—1.7% | | | | | |
Chico’s FAS, Inc. (a) | | 102,400 | | | 4,498,432 |
Staples, Inc. (b) | | 215,350 | | | 4,890,599 |
| | | | |
|
|
| | | | | | 9,389,031 |
| | | | |
|
|
| |
Textiles, Apparel & Luxury Goods—2.9% | | | |
Coach, Inc. (a) | | 122,900 | | | 4,097,486 |
NIKE, Inc. (Class B) | | 50,200 | | | 4,356,858 |
Polo Ralph Lauren Corp. | | 130,200 | | | 7,309,428 |
| | | | |
|
|
| | | | | | 15,763,772 |
| | | | |
|
|
|
Wireless Telecommunication Services—0.7% |
American Tower Corp. (Class A) (a) | | 149,800 | | | 4,059,580 |
| | | | |
|
|
Total Common Stock
(Identified Cost $459,844,940) | | | | | 543,182,740 |
| | | | |
|
|
| | | | | | | |
| |
| Short Term Investments—1.4% | | | | |
| Security Description | | Face
Amount | | Value* | |
| | | | | | | | |
| | |
Discount Notes—1.4% | | | | | | | |
Federal National Mortgage Association
3.500%, 01/03/06 | | $ | 7,800,000 | | $ | 7,798,484 | |
| | | | | |
|
|
|
Total Short Term Investments
(Amortized Cost $7,798,484) | | | | | | 7,798,484 | |
| | | | | |
|
|
|
Total Investments—100.1%
(Identified Cost $467,643,424) (c) | | | | | | 550,981,224 | |
Liabilities in excess of other assets | | | | | | (488,319 | ) |
| | | | | |
|
|
|
| Total Net Assets—100% | | | | | $ | 550,492,905 | |
| | | | | |
|
|
|
| (b) | A portion or all of the security was held on loan. As of December 31, 2005, the market value of securities loaned was $33,764,977 and the collateral received consisted of cash in the amount of $34,674,258. |
| (c) | The aggregate cost of investments for federal income tax purposes as of December 31, 2005 was $468,449,212 and the composition of unrealized appreciation and depreciation of investment securities was $86,777,055 and $(4,245,043), respectively. |
| (ADR)— | An American Depositary Receipt is a certificate issued by a custodian bank representing the right to receive securities of the foreign issuer described. Trading on exchanges not located in the United States or Canada significantly influences the value of ADRs. |
*See accompanying notes to financial statements.
MSF-115
Metropolitan Series Fund, Inc.
BlackRock Legacy Large Cap Growth Portfolio
Statement of Assets & Liabilities
December 31, 2005
| | | | | | | |
Assets | | | | | | | |
Investments at value | | | | | $ | 550,981,224 | |
Cash | | | | | | 79,372 | |
Collateral for securities loaned | | | | | | 34,674,258 | |
Receivable for: | | | | | | | |
Fund shares sold | | | | | | 624,492 | |
Accrued interest and dividends | | | | | | 441,485 | |
| | | | | |
|
|
|
Total Assets | | | | | | 586,800,831 | |
Liabilities | | | | | | | |
Payable for: | | | | | | | |
Fund shares redeemed | | $ | 1,163,620 | | | | |
Return of collateral for securities loaned | | | 34,674,258 | | | | |
Accrued expenses: | | | | | | | |
Management fees | | | 347,264 | | | | |
Service and distribution fees | | | 13,741 | | | | |
Deferred Directors’ fees | | | 28,270 | | | | |
Other expenses | | | 80,773 | | | | |
| | |
|
| | | | |
Total Liabilities | | | | | | 36,307,926 | |
| | | | | |
|
|
|
Net Assets | | | | | $ | 550,492,905 | |
| | | | | |
|
|
|
Net Assets Consists of: | | | | | | | |
Capital paid in | | | | | $ | 691,626,664 | |
Undistributed net investment income | | | | | | 494,337 | |
Accumulated net realized losses | | | | | | (224,965,896 | ) |
Unrealized appreciation on investments | | | | | | 83,337,800 | |
| | | | | |
|
|
|
Net Assets | | | | | $ | 550,492,905 | |
| | | | | |
|
|
|
| Computation of offering price: | | | | | | | |
Class A | | | | | | | |
Net asset value and redemption price per share ($468,531,788 divided by 21,591,470 shares outstanding) | | | | | $ | 21.70 | |
| | | | | |
|
|
|
Class B | | | | | | | |
Net asset value and redemption price per share ($36,798,266 divided by 1,722,638 shares outstanding) | | | | | $ | 21.36 | |
| | | | | |
|
|
|
Class E | | | | | | | |
Net asset value and redemption price per share ($45,162,851 divided by 2,099,227 shares outstanding) | | | | | $ | 21.51 | |
| | | | | |
|
|
|
Identified cost of investments | | | | | $ | 467,643,424 | |
| | | | | |
|
|
|
Statement of Operations
Year Ended December 31, 2005
| | | | | | | | |
Investment Income | | | | | | | | |
Dividends | | | | | | $ | 4,746,773 | (a) |
Interest | | | | | | | 233,910 | (b) |
| | | | | | |
|
|
|
| | | | | | | | 4,980,683 | |
Expenses | | | | | | | | |
Management fees | | $ | 3,980,763 | | | | | |
Service and distribution fees—Class B | | | 78,014 | | | | | |
Service and distribution fees—Class E | | | 66,749 | | | | | |
Directors’ fees and expenses | | | 24,114 | | | | | |
Custodian | | | 135,150 | | | | | |
Audit and tax services | | | 21,767 | | | | | |
Legal | | | 14,621 | | | | | |
Printing | | | 139,464 | | | | | |
Insurance | | | 11,518 | | | | | |
Miscellaneous | | | 10,322 | | | | | |
| | |
|
|
| | | | |
Total expenses | | | 4,482,482 | | | | | |
Expense reductions | | | (186,464 | ) | | | 4,296,018 | |
| | |
|
|
| |
|
|
|
Net Investment Income | | | | | | | 684,665 | |
| | | | | | |
|
|
|
Realized and Unrealized Gain | | | | | | | | |
| Realized gain on: | | | | | | | | |
Investments—net | | | | | | | 30,874,540 | |
| Unrealized appreciation on: | | | | | | | | |
Investments—net | | | | | | | 3,691,656 | |
| | | | | | |
|
|
|
Net gain | | | | | | | 34,566,196 | |
| | | | | | |
|
|
|
Net Increase in Net Assets From Operations | | | | | | $ | 35,250,861 | |
| | | | | | |
|
|
|
| (a) | Net of foreign taxes of $65,648. |
| (b) | Includes income on securities loaned of $38,698. |
See accompanying notes to financial statements.
MSF-116
Metropolitan Series Fund, Inc.
BlackRock Legacy Large Cap Growth Portfolio
Statement of Changes in Net Assets
| | | | | | | | |
| | | Year ended
December 31,
2005
| | | Year ended
December 31,
2004
| |
From Operations | | | | | | | | |
Net investment income | | $ | 684,665 | | | $ | 2,192,212 | |
Net realized gain | | | 30,874,540 | | | | 61,402,507 | |
Unrealized appreciation (depreciation) | | | 3,691,656 | | | | (15,127,902 | ) |
| | |
|
|
| |
|
|
|
Increase in net assets from operations | | | 35,250,861 | | | | 48,466,817 | |
| | |
|
|
| |
|
|
|
From Distributions to Shareholders | | | | | | | | |
Net investment income | | | | | | | | |
Class A | | | (2,005,932 | ) | | | 0 | |
Class B | | | (43,513 | ) | | | 0 | |
Class E | | | (125,307 | ) | | | 0 | |
| | |
|
|
| |
|
|
|
Total distributions | | | (2,174,752 | ) | | | 0 | |
| | |
|
|
| |
|
|
|
Decrease in net assets from capital share transactions | | | (69,424,051 | ) | | | (38,842,134 | ) |
| | |
|
|
| |
|
|
|
Total increase (decrease) in net assets | | | (36,347,942 | ) | | | 9,624,683 | |
| | |
Net Assets | | | | | | | | |
Beginning of the period | | | 586,840,847 | | | | 577,216,164 | |
| | |
|
|
| |
|
|
|
End of the period | | $ | 550,492,905 | | | $ | 586,840,847 | |
| | |
|
|
| |
|
|
|
Undistributed Net Investment Income | | | | | | | | |
End of the period | | $ | 494,337 | | | $ | 2,139,538 | |
| | |
|
|
| |
|
|
|
Other Information:
Capital Shares
Transactions in capital shares were as follows:
| | | | | | | | | | | | | | |
| | | Year ended
December 31, 2005
| | | Year ended
December 31, 2004
| |
| | | Shares
| | | $
| | | Shares
| | | $
| |
Class A | | | | | | | | | | | | | | |
Sales | | 3,340,014 | | | $ | 67,343,900 | | | 4,377,237 | | | $ | 82,651,664 | |
Reinvestments | | 106,303 | | | | 2,005,932 | | | 0 | | | | 0 | |
Redemptions | | (6,932,487 | ) | | | (139,604,414 | ) | | (8,138,806 | ) | | | (153,665,556 | ) |
| | |
|
| |
|
|
| |
|
| |
|
|
|
Net decrease | | (3,486,170 | ) | | $ | (70,254,582 | ) | | (3,761,569 | ) | | $ | (71,013,892 | ) |
| | |
|
| |
|
|
| |
|
| |
|
|
|
Class B | | | | | | | | | | | | | | |
Sales | | 598,836 | | | $ | 11,891,655 | | | 1,629,166 | | | $ | 29,464,501 | |
Reinvestments | | 2,339 | | | | 43,513 | | | 0 | | | | 0 | |
Redemptions | | (316,406 | ) | | | (6,251,547 | ) | | (196,110 | ) | | | (3,622,230 | ) |
| | |
|
| |
|
|
| |
|
| |
|
|
|
Net increase | | 284,769 | | | $ | 5,683,621 | | | 1,433,056 | | | $ | 25,842,271 | |
| | |
|
| |
|
|
| |
|
| |
|
|
|
Class E | | | | | | | | | | | | | | |
Sales | | 303,301 | | | $ | 6,021,019 | | | 722,082 | | | $ | 13,600,671 | |
Reinvestments | | 6,694 | | | | 125,307 | | | 0 | | | | 0 | |
Redemptions | | (550,750 | ) | | | (10,999,416 | ) | | (388,316 | ) | | | (7,271,184 | ) |
| | |
|
| |
|
|
| |
|
| |
|
|
|
Net increase (decrease) | | (240,755 | ) | | $ | (4,853,090 | ) | | 333,766 | | | $ | 6,329,487 | |
| | |
|
| |
|
|
| |
|
| |
|
|
|
Decrease derived from capital share transactions | | (3,442,156 | ) | | $ | (69,424,051 | ) | | (1,994,747 | ) | | $ | (38,842,134 | ) |
| | |
|
| |
|
|
| |
|
| |
|
|
|
See accompanying notes to financial statements.
MSF-117
Metropolitan Series Fund, Inc.
BlackRock Legacy Large Cap Growth Portfolio
Financial Highlights
| | | | | | | | | | | | | | | | | | | |
| | | Class A
| |
| | | Year ended December 31,
| |
| | | 2005
| | | 2004
| | 2003
| | | 2002
| | | 2001
| |
Net Asset Value, Beginning of Period | | $ | 20.37 | | | $ | 18.72 | | $ | 13.86 | | | $ | 20.74 | | | $ | 25.06 | |
| | |
|
|
| |
|
| |
|
|
| |
|
|
| |
|
|
|
Income From Investment Operations | | | | | | | | | | | | | | | | | | | |
Net investment income | | | 0.04 | | | | 0.08 | | | 0.00 | | | | 0.01 | | | | 0.00 | |
Net realized and unrealized gain (loss) of investments | | | 1.37 | | | | 1.57 | | | 4.87 | | | | (6.89 | ) | | | (2.91 | ) |
| | |
|
|
| |
|
| |
|
|
| |
|
|
| |
|
|
|
Total from investment operations | | | 1.41 | | | | 1.65 | | | 4.87 | | | | (6.88 | ) | | | (2.91 | ) |
| | |
|
|
| |
|
| |
|
|
| |
|
|
| |
|
|
|
Less Distributions | | | | | | | | | | | | | | | | | | | |
Distributions from net investment income | | | (0.08 | ) | | | 0.00 | | | (0.01 | ) | | | 0.00 | | | | (0.07 | ) |
Distributions from net realized capital gains | | | 0.00 | | | | 0.00 | | | 0.00 | | | | 0.00 | | | | (1.34 | ) |
| | |
|
|
| |
|
| |
|
|
| |
|
|
| |
|
|
|
Total distributions | | | (0.08 | ) | | | 0.00 | | | (0.01 | ) | | | 0.00 | | | | (1.41 | ) |
| | |
|
|
| |
|
| |
|
|
| |
|
|
| |
|
|
|
Net Asset Value, End of Period | | $ | 21.70 | | | $ | 20.37 | | $ | 18.72 | | | $ | 13.86 | | | $ | 20.74 | |
| | |
|
|
| |
|
| |
|
|
| |
|
|
| |
|
|
|
Total Return (%) | | | 7.0 | | | | 8.8 | | | 35.2 | | | | (33.2 | ) | | | (12.0 | ) |
Ratio of operating expenses to average net assets before expense reductions (%) | | | 0.80 | | | | 0.80 | | | 0.82 | | | | 0.79 | | | | 0.84 | |
Ratio of operating expenses to average net assets after expense reductions (%) (d) | | | 0.76 | | | | 0.76 | | | 0.80 | | | | — | | | | — | |
Ratio of net investment income to average net assets (%) | | | 0.15 | | | | 0.39 | | | 0.00 | | | | 0.05 | | | | 0.00 | |
Portfolio turnover rate (%) | | | 76 | | | | 190 | | | 167 | | | | 243 | | | | 88 | |
Net assets, end of period (000) | | $ | 468,532 | | | $ | 510,771 | | $ | 539,840 | | | $ | 449,676 | | | $ | 788,097 | |
| | | | | | | | | | | | | | | |
| | | Class B
| |
| | | Year ended December 31,
| | | July 30, 2002(a)
through
December 31, 2002
| |
| | | 2005
| | | 2004
| | 2003
| | |
Net Asset Value, Beginning of Period | | $ | 20.04 | | | $ | 18.46 | | $ | 13.65 | | | $ | 14.64 | |
| | |
|
|
| |
|
| |
|
|
| |
|
|
|
Income From Investment Operations | | | | | | | | | | | | | | | |
Net investment income (loss) | | | (0.03 | ) | | | 0.07 | | | 0.00 | | | | (0.01 | ) |
Net realized and unrealized gain (loss) of investments | | | 1.38 | | | | 1.51 | | | 4.81 | | | | (0.98 | ) |
| | |
|
|
| |
|
| |
|
|
| |
|
|
|
Total from investment operations | | | 1.35 | | | | 1.58 | | | 4.81 | | | | (0.99 | ) |
| | |
|
|
| |
|
| |
|
|
| |
|
|
|
Less Distributions | | | | | | | | | | | | | | | |
Distributions from net investment income | | | (0.03 | ) | | | 0.00 | | | 0.00 | | | | 0.00 | |
| | |
|
|
| |
|
| |
|
|
| |
|
|
|
Total distributions | | | (0.03 | ) | | | 0.00 | | | 0.00 | | | | 0.00 | |
| | |
|
|
| |
|
| |
|
|
| |
|
|
|
Net Asset Value, End of Period | | $ | 21.36 | | | $ | 20.04 | | $ | 18.46 | | | $ | 13.65 | |
| | |
|
|
| |
|
| |
|
|
| |
|
|
|
Total Return (%) | | | 6.8 | | | | 8.6 | | | 35.2 | | | | (6.8 | )(b) |
Ratio of operating expenses to average net assets before expense reductions (%) | | | 1.05 | | | | 1.05 | | | 1.07 | | | | 1.04 | (c) |
Ratio of operating expenses to average net assets after expense reductions (%) (d) | | | 1.01 | | | | 1.01 | | | 1.05 | | | | — | |
Ratio of net investment income (loss) to average net assets (%) | | | (0.10 | ) | | | 0.59 | | | (0.04 | ) | | | (0.24 | )(c) |
Portfolio turnover rate (%) | | | 76 | | | | 190 | | | 167 | | | | 243 | |
Net assets, end of period (000) | | $ | 36,798 | | | $ | 28,818 | | $ | 89 | | | $ | 1 | |
| (a) | Commencement of operations. |
| (b) | Period less than one year is not computed on an annualized basis. |
| (c) | Computed on an annualized basis. |
| (d) | The Portfolio has entered into arrangements with certain brokers who paid a portion of the Portfolio’s expenses. |
See accompanying notes to financial statements.
MSF-118
Metropolitan Series Fund, Inc.
BlackRock Legacy Large Cap Growth Portfolio
Financial Highlights
| | | | | | | | | | | | | | | | | | | |
| | | Class E
| |
| | | Year ended December 31,
| | | May 1, 2001(a) through
December 31, 2001
| |
| | | 2005
| | | 2004
| | 2003
| | | 2002
| | |
Net Asset Value, Beginning of Period | | $ | 20.19 | | | $ | 18.59 | | $ | 13.78 | | | $ | 20.64 | | | $ | 23.50 | |
| | |
|
|
| |
|
| |
|
|
| |
|
|
| |
|
|
|
Income From Investment Operations | | | | | | | | | | | | | | | | | | | |
Net investment income (loss) | | | 0.00 | | | | 0.06 | | | (0.02 | ) | | | (0.01 | ) | | | 0.00 | |
Net realized and unrealized gain (loss) of investments | | | 1.38 | | | | 1.54 | | | 4.83 | | | | (6.85 | ) | | | (2.86 | ) |
| | |
|
|
| |
|
| |
|
|
| |
|
|
| |
|
|
|
Total from investment operations | | | 1.38 | | | | 1.60 | | | 4.81 | | | | (6.86 | ) | | | (2.86 | ) |
| | |
|
|
| |
|
| |
|
|
| |
|
|
| |
|
|
|
Less Distributions | | | | | | | | | | | | | | | | | | | |
Distributions from net investment income | | | (0.06 | ) | | | 0.00 | | | 0.00 | | | | 0.00 | | | | 0.00 | |
| | |
|
|
| |
|
| |
|
|
| |
|
|
| |
|
|
|
Total distributions | | | (0.06 | ) | | | 0.00 | | | 0.00 | | | | 0.00 | | | | 0.00 | |
| | |
|
|
| |
|
| |
|
|
| |
|
|
| |
|
|
|
Net Asset Value, End of Period | | $ | 21.51 | | | $ | 20.19 | | $ | 18.59 | | | $ | 13.78 | | | $ | 20.64 | |
| | |
|
|
| |
|
| |
|
|
| |
|
|
| |
|
|
|
Total Return (%) | | | 6.9 | | | | 8.6 | | | 34.9 | | | | (33.2 | ) | | | (12.2 | )(b) |
Ratio of operating expenses to average net assets before expense reductions (%) | | | 0.95 | | | | 0.95 | | | 0.97 | | | | 0.94 | | | | 0.99 | (c) |
Ratio of operating expenses to average net assets after expense reductions (%) (d) | | | 0.91 | | | | 0.91 | | | 0.95 | | | | — | | | | — | |
Ratio of net investment income (loss) to average net assets (%) | | | 0.00 | | | | 0.29 | | | (0.14 | ) | | | (0.06 | ) | | | 0.00 | (c) |
Portfolio turnover rate (%) | | | 76 | | | | 190 | | | 167 | | | | 243 | | | | 88 | |
Net assets, end of period (000) | | $ | 45,163 | | | $ | 47,251 | | $ | 37,288 | | | $ | 15,218 | | | $ | 4,994 | |
| (a) | Commencement of operations. |
| (b) | Period less than one year is not computed on an annualized basis. |
| (c) | Computed on an annualized basis. |
| (d) | The Portfolio has entered into arrangements with certain brokers who paid a portion of the Portfolio’s expenses. |
See accompanying notes to financial statements.
MSF-119
Metropolitan Series Fund, Inc.
Capital Guardian U.S. Equity Portfolio
Schedule of Investments as of December 31, 2005
Common Stock—98.2% of Total Net Assets
| | | | | |
| Security Description | | Shares | | Value* |
| | | | | | |
| | |
Aerospace & Defense—1.8% | | | | | |
The Boeing Co. | | 11,600 | | $ | 814,784 |
United Technologies Corp. | | 148,540 | | | 8,304,871 |
| | | | |
|
|
| | | | | | 9,119,655 |
| | | | |
|
|
| | |
Air Freight & Logistics—1.0% | | | | | |
United Parcel Service, Inc. (Class B) | | 70,800 | | | 5,320,620 |
| | | | |
|
|
| |
Beverages—2.4% | | | |
Anheuser-Busch Cos., Inc. | | 76,400 | | | 3,282,144 |
PepsiCo, Inc. | | 108,400 | | | 6,404,272 |
The Coca-Cola Co. | | 43,200 | | | 1,741,392 |
The Pepsi Bottling Group, Inc. | | 39,600 | | | 1,132,956 |
| | | | |
|
|
| | | | | | 12,560,764 |
| | | | |
|
|
| | |
Biotechnology—1.2% | | | | | |
Amgen, Inc. (a) | | 37,300 | | | 2,941,478 |
ImClone Systems, Inc. (a) | | 63,700 | | | 2,181,088 |
Millennium Pharmaceuticals, Inc. (a) | | 125,400 | | | 1,216,380 |
| | | | |
|
|
| | | | | | 6,338,946 |
| | | | |
|
|
| | |
Building Products—0.8% | | | | | |
American Standard Cos., Inc. (a) | | 106,200 | | | 4,242,690 |
| | | | |
|
|
| | |
Capital Markets—0.6% | | | | | |
Capital One Financial Corp. | | 13,700 | | | 1,183,680 |
State Street Corp. | | 14,500 | | | 803,880 |
The Goldman Sachs Group, Inc. | | 6,900 | | | 881,199 |
| | | | |
|
|
| | | | | | 2,868,759 |
| | | | |
|
|
| | |
Chemicals—1.3% | | | | | |
Air Products & Chemicals, Inc. | | 31,600 | | | 1,870,404 |
Huntsman Corp. | | 97,400 | | | 1,677,228 |
Methanex Corp. | | 49,700 | | | 931,378 |
The Dow Chemical Co. | | 56,300 | | | 2,467,066 |
| | | | |
|
|
| | | | | | 6,946,076 |
| | | | |
|
|
| | |
Commercial Banks—3.0% | | | | | |
Fifth Third Bancorp. | | 47,500 | | | 1,791,700 |
Golden West Financial Corp. | | 24,000 | | | 1,584,000 |
Hudson City Bancorp, Inc. | | 189,700 | | | 2,299,164 |
Wells Fargo & Co. | | 158,800 | | | 9,977,404 |
| | | | |
|
|
| | | | | | 15,652,268 |
| | | | |
|
|
| |
Commercial Services & Supplies—0.6% | | | |
Allied Waste Industries, Inc. (a) | | 143,500 | | | 1,254,190 |
Checkfree Corp. (a) | | 18,300 | | | 839,970 |
Monster Worldwide, Inc. (a) | | 27,400 | | | 1,118,468 |
| | | | |
|
|
| | | | | | 3,212,628 |
| | | | |
|
|
| | |
Communications Equipment—3.0% | | | | | |
Cisco Systems, Inc. (a) | | 448,170 | | | 7,672,670 |
Corning, Inc. (a) | | 211,000 | | | 4,148,260 |
JDS Uniphase Corp. (a) | | 299,500 | | | 706,820 |
QUALCOMM, Inc. | | 64,000 | | | 2,757,120 |
| | | | |
|
|
| | | | | | 15,284,870 |
| | | | |
|
|
| | | | | |
| Security Description | | Shares | | Value* |
| | | | | | |
| | |
Computers & Peripherals—2.9% | | | | | |
Hewlett-Packard Co. | | 66,800 | | $ | 1,912,484 |
International Business Machines Corp. | | 26,000 | | | 2,137,200 |
Lexmark International, Inc. (Class A) (a) | | 41,400 | | | 1,855,962 |
SanDisk Corp. (a) | | 110,400 | | | 6,935,328 |
Seagate Technology | | 61,800 | | | 1,235,382 |
Sun Microsystems, Inc. (a) | | 255,600 | | | 1,070,964 |
| | | | |
|
|
| | | | | | 15,147,320 |
| | | | |
|
|
| | |
Construction & Engineering—1.3% | | | | | |
Fluor Corp. | | 87,900 | | | 6,791,154 |
| | | | |
|
|
| | |
Consumer Finance—2.7% | | | | | |
SLM Corp. | | 250,000 | | | 13,772,500 |
| | | | |
|
|
| | |
Diversified Financial Services—2.5% | | | | | |
AmeriCredit Corp. (a) | | 42,600 | | | 1,091,838 |
JPMorgan Chase & Co. | | 302,172 | | | 11,993,207 |
| | | | |
|
|
| | | | | | 13,085,045 |
| | | | |
|
|
| |
Diversified Telecommunication Services—1.2% | | | |
AT&T, Inc. | | 52,077 | | | 1,275,366 |
Qwest Communications International, Inc. (a) | | 384,000 | | | 2,169,600 |
Verizon Communications, Inc. | | 91,438 | | | 2,754,112 |
| | | | |
|
|
| | | | | | 6,199,078 |
| | | | |
|
|
| | |
Electric Utilities—0.8% | | | | | |
Exelon Corp. | | 18,500 | | | 983,090 |
The AES Corp. (a) | | 188,600 | | | 2,985,538 |
| | | | |
|
|
| | | | | | 3,968,628 |
| | | | |
|
|
| | |
Electrical Equipment—0.9% | | | | | |
Cooper Industries, Ltd. (Class A) | | 48,000 | | | 3,504,000 |
Emerson Electric Co. | | 13,000 | | | 971,100 |
| | | | |
|
|
| | | | | | 4,475,100 |
| | | | |
|
|
| | |
Electronic Equipment & Instruments—1.7% | | | | | |
Agilent Technologies, Inc. (a) | | 35,305 | | | 1,175,304 |
Flextronics International, Ltd. | | 263,800 | | | 2,754,072 |
Jabil Circuit, Inc. (a) | | 103,400 | | | 3,835,106 |
Thermo Electron Corp. (a) | | 38,600 | | | 1,163,018 |
| | | | |
|
|
| | | | | | 8,927,500 |
| | | | |
|
|
| | |
Energy Equipment & Services—3.0% | | | | | |
Baker Hughes, Inc. | | 33,100 | | | 2,011,818 |
BJ Services Co. | | 44,100 | | | 1,617,147 |
Halliburton Co. | | 25,300 | | | 1,567,588 |
Schlumberger, Ltd. | | 58,700 | | | 5,702,705 |
Transocean, Inc. (a) | | 24,800 | | | 1,728,312 |
Weatherford International, Ltd. (a) | | 84,200 | | | 3,048,040 |
| | | | |
|
|
| | | | | | 15,675,610 |
| | | | |
|
|
| | |
Food & Staples Retailing—0.6% | | | | | |
Sysco Corp. | | 101,200 | | | 3,142,260 |
| | | | |
|
|
*See accompanying notes to financial statements.
MSF-120
Metropolitan Series Fund, Inc.
Capital Guardian U.S. Equity Portfolio
Schedule of Investments as of December 31, 2005
Common Stock—(Continued)
| | | | | |
| Security Description | | Shares | | Value* |
| | | | | | |
| | |
Food Products—2.1% | | | | | |
Campbell Soup Co. | | 91,200 | | $ | 2,715,024 |
Kraft Foods, Inc. (Class A) | | 107,100 | | | 3,013,794 |
Sara Lee Corp. | | 65,300 | | | 1,234,170 |
Unilever NV | | 54,000 | | | 3,707,100 |
| | | | |
|
|
| | | | | | 10,670,088 |
| | | | |
|
|
| | |
Gas Utilities—0.0% | | | | | |
Kinder Morgan Management, LLC | | 3,286 | | | 149,382 |
| | | | |
|
|
| | |
Health Care Equipment & Supplies—1.3% | | | | | |
Baxter International, Inc. | | 86,600 | | | 3,260,490 |
Medtronic, Inc. | | 55,800 | | | 3,212,406 |
| | | | |
|
|
| | | | | | 6,472,896 |
| | | | |
|
|
| | |
Health Care Providers & Services—3.9% | | | | | |
AmerisourceBergen Corp. | | 79,000 | | | 3,270,600 |
DaVita, Inc. (a) | | 66,400 | | | 3,362,496 |
Lincare Holdings, Inc. (a) | | 48,900 | | | 2,049,399 |
McKesson Corp. | | 71,100 | | | 3,668,049 |
Omnicare, Inc. | | 33,200 | | | 1,899,704 |
WellPoint, Inc. (a) | | 74,000 | | | 5,904,460 |
| | | | |
|
|
| | | | | | 20,154,708 |
| | | | |
|
|
| | |
Hotels, Restaurants & Leisure—1.1% | | | | | |
Carnival Corp. | | 48,600 | | | 2,598,642 |
Las Vegas Sands Corp. (a) | | 24,100 | | | 951,227 |
McDonald’s Corp. | | 23,600 | | | 795,792 |
Starwood Hotels & Resorts Worldwide, Inc. (Class B) | | 21,200 | | | 1,353,832 |
| | | | |
|
|
| | | | | | 5,699,493 |
| | | | |
|
|
| | |
Household Durables—0.3% | | | | | |
Leggett & Platt, Inc. | | 57,300 | | | 1,315,608 |
| | | | |
|
|
| | |
Household Products—0.6% | | | | | |
The Procter & Gamble Co. | | 52,100 | | | 3,015,548 |
| | | | |
|
|
| | |
Industrial Conglomerates—3.5% | | | | | |
General Electric Co. | | 432,700 | | | 15,166,135 |
Siemens AG (ADR) | | 13,000 | | | 1,112,670 |
Tyco International, Ltd. | | 67,000 | | | 1,933,620 |
| | | | |
|
|
| | | | | | 18,212,425 |
| | | | |
|
|
| | |
Insurance—2.9% | | | | | |
American International Group, Inc. | | 67,500 | | | 4,605,525 |
Berkshire Hathaway, Inc. (Class A) (a) | | 45 | | | 3,987,900 |
RenaissanceRe Holdings, Ltd. | | 5,400 | | | 238,194 |
The Chubb Corp. | | 22,100 | | | 2,158,065 |
The Hartford Financial Services Group, Inc. | | 19,800 | | | 1,700,622 |
XL Capital, Ltd. (Class A) | | 32,800 | | | 2,210,064 |
| | | | |
|
|
| | | | | | 14,900,370 |
| | | | |
|
|
| | |
Internet & Catalog Retail—0.7% | | | | | |
Amazon.com, Inc. (a) | | 18,800 | | | 886,420 |
eBay, Inc. (a) | | 66,500 | | | 2,876,125 |
| | | | |
|
|
| | | | | | 3,762,545 |
| | | | |
|
|
| | | | | |
| Security Description | | Shares | | Value* |
| | | | | | |
| | |
Internet Software & Services—1.4% | | | | | |
Expedia, Inc. (a) | | 44,250 | | $ | 1,060,230 |
Google, Inc. (Class A) (a) | | 10,000 | | | 4,148,600 |
IAC/InterActiveCorp | | 5,500 | | | 155,705 |
Yahoo!, Inc. (a) | | 43,100 | | | 1,688,658 |
| | | | |
|
|
| | | | | | 7,053,193 |
| | | | |
|
|
| | |
IT Services—1.2% | | | | | |
Accenture, Ltd. (Class A) (a) | | 38,000 | | | 1,097,060 |
Affiliated Computer Services, Inc. (Class A) (a) | | 64,700 | | | 3,828,946 |
Automatic Data Processing, Inc. | | 30,900 | | | 1,418,001 |
| | | | |
|
|
| | | | | | 6,344,007 |
| | | | |
|
|
| | |
Machinery—1.4% | | | | | |
Danaher Corp. | | 66,300 | | | 3,698,214 |
Illinois Tool Works, Inc. | | 42,600 | | | 3,748,374 |
| | | | |
|
|
| | | | | | 7,446,588 |
| | | | |
|
|
| | |
Media—2.5% | | | | | |
Cablevision Systems Corp. (Class A) (a) | | 42,032 | | | 986,491 |
CCE Spinco, Inc. | | 9,563 | | | 125,269 |
Clear Channel Communications, Inc. | | 76,500 | | | 2,405,925 |
Comcast Corp. (Class A) (a) | | 33,400 | | | 867,064 |
Omnicom Group, Inc. | | 14,300 | | | 1,217,359 |
The DIRECTV Group, Inc. (a) | | 25,900 | | | 365,708 |
The Walt Disney Co. | | 9,900 | | | 237,303 |
Time Warner, Inc. | | 183,200 | | | 3,195,008 |
Viacom, Inc. (Class B) | | 99,500 | | | 3,243,700 |
| | | | |
|
|
| | | | | | 12,643,827 |
| | | | |
|
|
| | |
Metals & Mining—1.7% | | | | | |
Alcoa, Inc. | | 172,816 | | | 5,110,169 |
Arch Coal, Inc. | | 12,900 | | | 1,025,550 |
Barrick Gold Corp. | | 26,500 | | | 738,555 |
Newmont Mining Corp. | | 33,000 | | | 1,762,200 |
| | | | |
|
|
| | | | | | 8,636,474 |
| | | | |
|
|
| | |
Multi-Utilities—0.1% | | | | | |
Duke Energy Co. | | 24,000 | | | 658,800 |
| | | | |
|
|
| | |
Multiline Retail—1.7% | | | | | |
Costco Wholesale Corp. | | 43,500 | | | 2,151,945 |
Dollar Tree Stores, Inc. (a) | | 90,500 | | | 2,166,570 |
Target Corp. | | 78,300 | | | 4,304,151 |
| | | | |
|
|
| | | | | | 8,622,666 |
| | | | |
|
|
| | |
Oil, Gas & Consumable Fuels—4.1% | | | | | |
Chevron Corp. | | 54,773 | | | 3,109,463 |
Exxon Mobil Corp. | | 106,800 | | | 5,998,956 |
Kinder Morgan, Inc. | | 21,666 | | | 1,992,189 |
Royal Dutch Shell, Plc. (ADR) (A Shares) | | 155,600 | | | 9,567,844 |
Royal Dutch Shell, Plc. (ADR) (B Shares) | | 11,107 | | | 716,735 |
| | | | |
|
|
| | | | | | 21,385,187 |
| | | | |
|
|
| | |
Paper & Forest Products—0.3% | | | | | |
International Paper Co. | | 51,900 | | | 1,744,359 |
| | | | |
|
|
*See accompanying notes to financial statements.
MSF-121
Metropolitan Series Fund, Inc.
Capital Guardian U.S. Equity Portfolio
Schedule of Investments as of December 31, 2005
Common Stock—(Continued)
| | | | | |
| Security Description | | Shares | | Value* |
| | | | | | |
| | |
Personal Products—1.3% | | | | | |
Avon Products, Inc. | | 243,100 | | $ | 6,940,505 |
| | | | |
|
|
| | |
Pharmaceuticals—10.0% | | | | | |
Allergan, Inc. | | 100,800 | | | 10,882,368 |
AstraZeneca, Plc. (ADR) | | 277,000 | | | 13,462,200 |
Eli Lilly & Co. | | 52,400 | | | 2,965,316 |
Endo Pharmaceuticals Holdings | | 31,900 | | | 965,294 |
Forest Laboratories, Inc. (a) | | 299,200 | | | 12,171,456 |
Medco Health Solutions, Inc. (a) | | 59,300 | | | 3,308,940 |
Pfizer, Inc. | | 80,400 | | | 1,874,928 |
Sepracor, Inc. (a) | | 22,300 | | | 1,150,680 |
Teva Pharmaceutical Industries, Ltd. (ADR) | | 117,900 | | | 5,070,879 |
| | | | |
|
|
| | | | | | 51,852,061 |
| | | | |
|
|
| | |
Real Estate—0.3% | | | | | |
General Growth Properties, Inc. (REIT) | | 30,880 | | | 1,451,051 |
| | | | |
|
|
| | |
Road & Rail—0.2% | | | | | |
Union Pacific Corp. | | 9,500 | | | 764,845 |
| | | | |
|
|
| |
Semiconductors & Semiconductor Equipment—7.5% | | | |
Altera Corp. (a) | | 324,300 | | | 6,009,279 |
Applied Materials, Inc. | | 402,400 | | | 7,219,056 |
Applied Micro Circuits Corp. (a) | | 314,400 | | | 808,008 |
ASML Holding NV(a) | | 53,100 | | | 1,066,248 |
Credence Systems Corp.(a) | | 60,500 | | | 421,080 |
Fairchild Semiconductor International, Inc. (a) | | 76,400 | | | 1,291,924 |
Freescale Semiconductor, Inc. (Class A) (a) | | 125,600 | | | 3,163,864 |
Intel Corp. | | 92,200 | | | 2,301,312 |
International Rectifier Corp. (a) | | 103,100 | | | 3,288,890 |
KLA-Tencor Corp. | | 150,100 | | | 7,404,433 |
Linear Technology Corp. | | 49,500 | | | 1,785,465 |
Teradyne, Inc. (a) | | 107,900 | | | 1,572,103 |
Xilinx, Inc. | | 102,900 | | | 2,594,109 |
| | | | |
|
|
| | | | | | 38,925,771 |
| | | | |
|
|
| | |
Software—4.0% | | | | | |
Adobe Systems, Inc. (a) | | 125,100 | | | 4,623,696 |
Microsoft Corp. | | 406,700 | | | 10,635,205 |
SAP AG (ADR) | | 115,000 | | | 5,183,050 |
| | | | |
|
|
| | | | | | 20,441,951 |
| | | | |
|
|
| | |
Specialty Retail—2.8% | | | | | |
AutoNation, Inc. (a) | | 32,100 | | | 697,533 |
Lowe’s Cos., Inc. | | 160,100 | | | 10,672,266 |
RadioShack Corp. | | 42,200 | | | 887,466 |
Williams-Sonoma, Inc. (a) | | 50,200 | | | 2,166,130 |
| | | | |
|
|
| | | | | | 14,423,395 |
| | | | |
|
|
| | |
Thrifts & Mortgage Finance—4.6% | | | | | |
Federal Home Loan Mortgage Corp. | | 89,200 | | | 5,829,220 |
Federal National Mortgage Association | | 108,300 | | | 5,286,123 |
Washington Mutual, Inc. | | 284,300 | | | 12,367,050 |
| | | | |
|
|
| | | | | | 23,482,393 |
| | | | |
|
|
| | | | | | | |
| Security Description | | Shares | | Value* | |
| | | | | | | | |
| | |
Tobacco—1.7% | | | | | | | |
Altria Group, Inc. | | | 115,100 | | $ | 8,600,272 | |
| | | | | |
|
|
|
| |
Wireless Telecommunication Services—1.7% | | | | |
American Tower Corp. (Class A) (a) | | | 36,100 | | | 978,310 | |
Sprint Nextel Corp. | | | 334,550 | | | 7,815,086 | |
| | | | | |
|
|
|
| | | | | | | 8,793,396 | |
| | | | | |
|
|
|
Total Common Stock
(Identified Cost $440,441,682) | | | | | | 507,295,275 | |
| | | | | |
|
|
|
| | |
| Short Term Investments—1.9% | | | | | | | |
| Security Description | | Face
Amount | | Value* | |
| | |
Repurchase Agreement—1.9% | | | | | | | |
State Street Corp. Repurchase Agreement dated 12/30/05 at 2.05% to be repurchased at $10,021,282 on 01/03/06, collateralized by $10,155,000 U.S. Treasury Note
4.25% due 08/15/15 with a value of $10,223,648. | | $ | 10,019,000 | | | 10,019,000 | |
| | | | | |
|
|
|
Total Short Term Investments
(Amortized Cost $10,019,000) | | | | | | 10,019,000 | |
| | | | | |
|
|
|
Total Investments—100.1%
(Identified Cost $450,460,682) (b) | | | | | | 517,314,275 | |
Liabilities in excess of other assets | | | | | | (618,382 | ) |
| | | | | |
|
|
|
| Total Net Assets—100% | | | | | $ | 516,695,893 | |
| | | | | |
|
|
|
| (b) | The aggregate cost of investments for federal income tax purposes as of December 31, 2005 was $451,084,304 and the composition of unrealized appreciation and depreciation of investment securities was $82,431,288 and $(16,201,317), respectively. |
| (ADR)— An | American Depositary Receipt is a certificate issued by a custodian bank representing the right to receive securities of the foreign issuer described. Trading on exchanges not located in the United States or Canada significantly influences the value of ADRs. |
| (REIT)— A | Real Estate Investment Trust is a pooled investment vehicle that invests primarily in income-producing real estate or real estate related loans or interest. |
*See accompanying notes to financial statements.
MSF-122
Metropolitan Series Fund, Inc.
Capital Guardian U.S. Equity Portfolio
Statement of Assets & Liabilities
December 31, 2005
| | | | | | | |
Assets | | | | | | | |
Investments at value | | | | | $ | 517,314,275 | |
Cash | | | | | | 10,888 | |
Receivable for: | | | | | | | |
Securities sold | | | | | | 169,756 | |
Fund shares sold | | | | | | 76,186 | |
Accrued interest and dividends | | | | | | 579,942 | |
Foreign taxes | | | | | | 13,243 | |
| | | | | |
|
|
|
Total Assets | | | | | | 518,164,290 | |
Liabilities | | | | | | | |
Payable for: | | | | | | | |
Fund shares redeemed | | $ | 416,151 | | | | |
Securities purchased | | | 654,908 | | | | |
Withholding taxes | | | 820 | | | | |
Accrued expenses: | | | | | | | |
Management fees | | | 296,221 | | | | |
Service and distribution fees | | | 19,051 | | | | |
Deferred Directors’ fees | | | 4,056 | | | | |
Other expenses | | | 77,190 | | | | |
| | |
|
| | | | |
Total Liabilities | | | | | | 1,468,397 | |
| | | | | |
|
|
|
Net Assets | | | | | $ | 516,695,893 | |
| | | | | |
|
|
|
Net Assets Consists of: | | | | | | | |
Capital paid in | | | | | $ | 450,754,296 | |
Undistributed net investment income | | | | | | 3,449,913 | |
Accumulated net realized losses | | | | | | (4,361,909 | ) |
Unrealized appreciation on investments | | | | | | 66,853,593 | |
| | | | | |
|
|
|
Net Assets | | | | | $ | 516,695,893 | |
| | | | | |
|
|
|
| Computation of offering price: | | | | | | | |
Class A | | | | | | | |
Net asset value and redemption price per
share ($426,968,382 divided by
34,617,743 shares outstanding) | | | | | $ | 12.33 | |
| | | | | |
|
|
|
Class B | | | | | | | |
Net asset value and redemption price per
share ($89,727,511 divided by
7,311,486 shares outstanding) | | | | | $ | 12.27 | |
| | | | | |
|
|
|
Identified cost of investments | | | | | $ | 450,460,682 | |
| | | | | |
|
|
|
Statement of Operations
Year Ended December 31, 2005
| | | | | | | | |
Investment Income | | | | | | | | |
Dividends | | | | | | $ | 7,203,544 | (a) |
Interest | | | | | | | 133,698 | |
| | | | | | |
|
|
|
| | | | | | | | 7,337,242 | |
Expenses | | | | | | | | |
Management fees | | $ | 3,372,518 | | | | | |
Service and distribution fees—Class B | | | 193,051 | | | | | |
Directors’ fees and expenses | | | 22,455 | | | | | |
Custodian | | | 117,286 | | | | | |
Audit and tax services | | | 21,767 | | | | | |
Legal | | | 13,776 | | | | | |
Printing | | | 127,004 | | | | | |
Insurance | | | 9,077 | | | | | |
Miscellaneous | | | 11,135 | | | | | |
| | |
|
|
| | | | |
Total expenses | | | 3,888,069 | | | | | |
Expense reductions | | | (37,527 | ) | | | 3,850,542 | |
| | |
|
|
| |
|
|
|
Net Investment Income | | | | | | | 3,486,700 | |
| | | | | | |
|
|
|
Realized and Unrealized Gain (Loss) | | | | | | | | |
| Realized gain on: | | | | | | | | |
Investments—net | | | | | | | 26,588,995 | |
| | | | | | | | | |
| Unrealized depreciation on: | | | | | | | | |
Investments—net | | | | | | | (2,013,059 | ) |
| | | | | | |
|
|
|
Net gain | | | | | | | 24,575,936 | |
| | | | | | |
|
|
|
Net Increase in Net Assets From Operations | | | | | | $ | 28,062,636 | |
| | | | | | |
|
|
|
| (a) | Net of foreign taxes of $141,905. |
See accompanying notes to financial statements.
MSF-123
Metropolitan Series Fund, Inc.
Capital Guardian U.S. Equity Portfolio
Statement of Changes in Net Assets
| | | | | | | | |
| | | Year ended
December 31,
2005
| | | Year ended
December 31,
2004
| |
From Operations | | | | | | | | |
Net investment income | | $ | 3,486,700 | | | $ | 2,954,303 | |
Net realized gain | | | 26,588,995 | | | | 24,263,612 | |
Unrealized appreciation (depreciation) | | | (2,013,059 | ) | | | 23,824,721 | |
| | |
|
|
| |
|
|
|
Increase in net assets from operations | | | 28,062,636 | | | | 51,042,636 | |
| | |
|
|
| |
|
|
|
From Distributions to Shareholders | | | | | | | | |
Net investment income | | | | | | | | |
Class A | | | (112,272 | ) | | | (4,475,104 | ) |
Class B | | | 0 | | | | (466,474 | ) |
| | |
|
|
| |
|
|
|
Total distributions | | | (112,272 | ) | | | (4,941,578 | ) |
| | |
|
|
| |
|
|
|
Increase (decrease) in net assets from capital share transactions | | | (35,632,836 | ) | | | 97,990,337 | |
| | |
|
|
| |
|
|
|
Total increase (decrease) in net assets | | | (7,682,472 | ) | | | 144,091,395 | |
| | |
Net Assets | | | | | | | | |
Beginning of the period | | | 524,378,365 | | | | 380,286,970 | |
| | |
|
|
| |
|
|
|
End of the period | | $ | 516,695,893 | | | $ | 524,378,365 | |
| | |
|
|
| |
|
|
|
Undistributed Net Investment Income | | | | | | | | |
End of the period | | $ | 3,449,913 | | | $ | 82,982 | |
| | |
|
|
| |
|
|
|
Other Information:
Capital Shares
Transactions in capital shares were as follows:
| | | | | | | | | | | | | | |
| | | Year ended
December 31, 2005
| | | Year ended
December 31, 2004
| |
| | | Shares
| | | $
| | | Shares
| | | $
| |
Class A | | | | | | | | | | | | | | |
Sales | | 1,616,243 | | | $ | 18,923,772 | | | 1,218,348 | | | $ | 13,152,515 | |
Shares issued through acquisition | | 0 | | | | 0 | | | 9,612,487 | | | | 97,837,967 | |
Reinvestments | | 10,216 | | | | 112,272 | | | 403,072 | | | | 4,475,104 | |
Redemptions | | (6,118,776 | ) | | | (71,141,702 | ) | | (4,669,341 | ) | | | (51,561,002 | ) |
| | |
|
| |
|
|
| |
|
| |
|
|
|
Net increase (decrease) | | (4,492,317 | ) | | $ | (52,105,658 | ) | | 6,564,566 | | | $ | 63,904,584 | |
| | |
|
| |
|
|
| |
|
| |
|
|
|
Class B | | | | | | | | | | | | | | |
Sales | | 2,457,946 | | | $ | 28,478,625 | | | 2,953,353 | | | $ | 32,254,619 | |
Shares issued through acquisition | | 0 | | | | 0 | | | 941,307 | | | | 8,812,008 | |
Reinvestments | | 0 | | | | 0 | | | 42,116 | | | | 466,474 | |
Redemptions | | (1,033,651 | ) | | | (12,005,803 | ) | | (686,519 | ) | | | (7,447,348 | ) |
| | |
|
| |
|
|
| |
|
| |
|
|
|
Net increase | | 1,424,295 | | | $ | 16,472,822 | | | 3,250,257 | | | $ | 34,085,753 | |
| | |
|
| |
|
|
| |
|
| |
|
|
|
Increase (decrease) derived from capital share transactions | | (3,068,022 | ) | | $ | (35,632,836 | ) | | 9,814,823 | | | $ | 97,990,337 | |
| | |
|
| |
|
|
| |
|
| |
|
|
|
See accompanying notes to financial statements.
MSF-124
Metropolitan Series Fund, Inc.
Capital Guardian U.S. Equity Portfolio
Financial Highlights
| | | | | | | | | | | | | | | | |
| | | Class A
| |
| | | Year ended December 31,
| | | May 1, 2002(a) through December 31,
2002
| |
| | | 2005
| | | 2004
| | | 2003
| | |
Net Asset Value, Beginning of Period | | $ | 11.66 | | | $ | 10.81 | | | $ | 7.90 | | | $ | 10.00 | |
| | |
|
|
| |
|
|
| |
|
|
| |
|
|
|
Income from Investment Operations | | | | | | | | | | | | | | | | |
Net investment income | | | 0.09 | | | | 0.09 | | | | 0.07 | | | | 0.05 | |
Net realized and unrealized gain (loss) of investments | | | 0.58 | | | | 0.91 | | | | 2.89 | | | | (2.15 | ) |
| | |
|
|
| |
|
|
| |
|
|
| |
|
|
|
Total from investment operations | | | 0.67 | | | | 1.00 | | | | 2.96 | | | | (2.10 | ) |
| | |
|
|
| |
|
|
| |
|
|
| |
|
|
|
Less Distributions | | | | | | | | | | | | | | | | |
Distributions from net investment income | | | (0.00 | )(e) | | | (0.15 | ) | | | (0.05 | ) | | | 0.00 | |
| | |
|
|
| |
|
|
| |
|
|
| |
|
|
|
Total distributions | | | 0.00 | | | | (0.15 | ) | | | (0.05 | ) | | | 0.00 | |
| | |
|
|
| |
|
|
| |
|
|
| |
|
|
|
Net Asset Value, End of Period | | $ | 12.33 | | | $ | 11.66 | | | $ | 10.81 | | | $ | 7.90 | |
| | |
|
|
| |
|
|
| |
|
|
| |
|
|
|
Total Return (%) | | | 5.8 | | | | 9.3 | | | | 37.7 | | | | (21.0 | )(b) |
Ratio of operating expenses to average net assets before expense reductions (%) | | | 0.73 | | | | 0.75 | | | | 0.76 | | | | 0.74 | (c) |
Ratio of operating expenses to average net assets after expense reductions (%) (d) | | | 0.73 | | | | 0.74 | | | | 0.74 | | | | 0.60 | (c) |
Ratio of net investment income to average net assets (%) | | | 0.73 | | | | 0.77 | | | | 0.65 | | | | 0.88 | (c) |
Portfolio turnover rate (%) | | | 29 | | | | 45 | | | | 27 | | | | 30 | (c) |
Net assets, end of period (000) | | $ | 426,968 | | | $ | 455,938 | | | $ | 351,867 | | | $ | 309,078 | |
| | | | | | | | | | | | | | | |
| | | Class B
| |
| | | Year ended December 31,
| | | May 1, 2002(a) through December 31,
2002
| |
| | | 2005
| | 2004
| | | 2003
| | |
Net Asset Value, Beginning of Period | | $ | 11.63 | | $ | 10.78 | | | $ | 7.89 | | | $ | 10.00 | |
| | |
|
| |
|
|
| |
|
|
| |
|
|
|
Income from Investment Operations | | | | | | | | | | | | | | | |
Net investment income | | | 0.06 | | | 0.07 | | | | 0.04 | | | | 0.02 | |
Net realized and unrealized gain (loss) of investments | | | 0.58 | | | 0.90 | | | | 2.90 | | | | (2.13 | ) |
| | |
|
| |
|
|
| |
|
|
| |
|
|
|
Total from investment operations | | | 0.64 | | | 0.97 | | | | 2.94 | | | | (2.11 | ) |
| | |
|
| |
|
|
| |
|
|
| |
|
|
|
Less Distributions | | | | | | | | | | | | | | | |
Distributions from net investment income | | | 0.00 | | | (0.12 | ) | | | (0.05 | ) | | | 0.00 | |
| | |
|
| |
|
|
| |
|
|
| |
|
|
|
Total distributions | | | 0.00 | | | (0.12 | ) | | | (0.05 | ) | | | 0.00 | |
| | |
|
| |
|
|
| |
|
|
| |
|
|
|
Net Asset Value, End of Period | | $ | 12.27 | | $ | 11.63 | | | $ | 10.78 | | | $ | 7.89 | |
| | |
|
| |
|
|
| |
|
|
| |
|
|
|
Total Return (%) | | | 5.5 | | | 9.0 | | | | 37.4 | | | | (21.1 | )(b) |
Ratio of operating expenses to average net assets before expense reductions (%) | | | 0.98 | | | 1.00 | | | | 1.01 | | | | 0.99 | (c) |
Ratio of operating expenses to average net assets after expense reductions (%) (d) | | | 0.98 | | | 0.99 | | | | 0.99 | | | | 0.85 | (c) |
Ratio of net investment income to average net assets (%) | | | 0.48 | | | 0.56 | | | | 0.39 | | | | 0.63 | (c) |
Portfolio turnover rate (%) | | | 29 | | | 45 | | | | 27 | | | | 30 | (c) |
Net assets, end of period (000) | | $ | 89,728 | | $ | 68,440 | | | $ | 28,420 | | | $ | 9,157 | |
| (a) | Commencement of operations. |
| (b) | Period less than one year is not computed on an annualized basis. |
| (c) | Computed on an annualized basis. |
| (d) | The Portfolio has entered into arrangements with certain brokers who paid a portion of the Portfolio’s expenses. |
| (e) | Distributions for the period were less than $0.01. |
See accompanying notes to financial statements.
MSF-125
Metropolitan Series Fund, Inc.
Davis Venture Value Portfolio
Schedule of Investments as of December 31, 2005
Common Stock—96.7% of Total Net Assets
| | | | | |
| Security Description | | Shares | | Value* |
| | | | | | |
| | |
Air Freight & Logistics—0.7% | | | | | |
United Parcel Service, Inc. (Class B) (a) | | 273,100 | | $ | 20,523,465 |
| | | | |
|
|
| | |
Automobiles—1.0% | | | | | |
Harley-Davidson, Inc. (a) | | 598,000 | | | 30,791,020 |
| | | | |
|
|
| | |
Beverages—1.9% | | | | | |
Diageo, Plc. (ADR) (a) | | 685,100 | | | 39,941,330 |
Heineken Holding (EUR) | | 660,443 | | | 19,407,288 |
| | | | |
|
|
| | | | | | 59,348,618 |
| | | | |
|
|
| | |
Capital Markets—2.0% | | | | | |
Ameriprise Financial, Inc. | | 794,680 | | | 32,581,880 |
Morgan Stanley | | 359,210 | | | 20,381,575 |
State Street Corp. | | 189,100 | | | 10,483,704 |
| | | | |
|
|
| | | | | | 63,447,159 |
| | | | |
|
|
| | |
Commercial Banks—11.1% | | | | | |
Commerce Bancorp, Inc. (a) | | 336,700 | | | 11,585,847 |
Fifth Third Bancorp. (a) | | 545,901 | | | 20,591,386 |
Golden West Financial Corp. (a) | | 1,617,700 | | | 106,768,200 |
HSBC Holdings, Plc. (GBP) | | 5,568,280 | | | 89,292,577 |
Lloyds TSB Group, Plc. (ADR) (a) | | 713,600 | | | 24,119,680 |
Wells Fargo & Co. | | 1,509,400 | | | 94,835,602 |
| | | | |
|
|
| | | | | | 347,193,292 |
| | | | |
|
|
| | |
Commercial Services & Supplies—3.8% | | | | | |
H&R Block, Inc. | | 1,691,600 | | | 41,528,780 |
Iron Mountain, Inc. (a) (b) | | 1,105,900 | | | 46,691,098 |
The Dun & Bradstreet Corp. (a) (b) | | 333,800 | | | 22,351,248 |
WPP Group Plc. (a) | | 166,200 | | | 8,974,800 |
| | | | |
|
|
| | | | | | 119,545,926 |
| | | | |
|
|
| | |
Communications Equipment—0.3% | | | | | |
Nokia Corp. (ADR) | | 459,000 | | | 8,399,700 |
| | | | |
|
|
| | |
Computers & Peripherals—2.3% | | | | | |
Dell, Inc. (b) | | 953,400 | | | 28,592,466 |
Hewlett-Packard Co. | | 631,800 | | | 18,088,434 |
Lexmark International, Inc. (Class A) (b) | | 560,600 | | | 25,131,698 |
| | | | |
|
|
| | | | | | 71,812,598 |
| | | | |
|
|
| | |
Construction Materials—1.8% | | | | | |
Martin Marietta Materials, Inc. (a) | | 366,200 | | | 28,094,864 |
Vulcan Materials Co. (a) | | 409,300 | | | 27,730,075 |
| | | | |
|
|
| | | | | | 55,824,939 |
| | | | |
|
|
| | |
Consumer Finance—5.4% | | | | | |
American Express Co. | | 3,300,900 | | | 169,864,314 |
| | | | |
|
|
| | |
Containers & Packaging—2.2% | | | | | |
Sealed Air Corp. (b) | | 1,240,700 | | | 69,690,119 |
| | | | |
|
|
| | | | | |
| Security Description | | Shares | | Value* |
| | | | | | |
| | |
Diversified Financial Services—8.5% | | | | | |
Citigroup, Inc. | | 1,811,673 | | $ | 87,920,491 |
JPMorgan Chase & Co. (a) | | 2,931,308 | | | 116,343,614 |
Moody’s Corp. (a) | | 834,400 | | | 51,248,848 |
Principal Financial Group, Inc. (a) | | 240,600 | | | 11,411,658 |
| | | | |
|
|
| | | | | | 266,924,611 |
| | | | |
|
|
| |
Diversified Telecommunication Services—0.6% | | | |
NTL, Inc. (a) (b) | | 105,500 | | | 7,182,440 |
Telewest Global, Inc. (b) | | 532,200 | | | 12,677,004 |
| | | | |
|
|
| | | | | | 19,859,444 |
| | | | |
|
|
| | |
Energy Equipment & Services—0.9% | | | | | |
Transocean, Inc. (b) | | 409,700 | | | 28,551,993 |
| | | | |
|
|
| | |
Food & Staples Retailing—1.4% | | | | | |
Wal-Mart Stores, Inc. | | 964,300 | | | 45,129,240 |
| | | | |
|
|
| | |
Food Products—0.9% | | | | | |
Hershey Co. | | 493,100 | | | 27,243,775 |
| | | | |
|
|
| | |
Health Care Providers & Services—3.4% | | | | | |
Cardinal Health, Inc. (a) | | 469,100 | | | 32,250,625 |
Caremark Rx, Inc. (b) | | 717,300 | | | 37,148,967 |
HCA, Inc. | | 750,400 | | | 37,895,200 |
| | | | |
|
|
| | | | | | 107,294,792 |
| | | | |
|
|
| | |
Household Durables—0.2% | | | | | |
Hunter Douglas NV (EUR) | | 111,351 | | | 6,060,868 |
| | | | |
|
|
| | |
Industrial Conglomerates—4.2% | | | | | |
China Merchants Holdings International Co., Ltd. (HKD) | | 5,091,500 | | | 11,003,951 |
Tyco International, Ltd. | | 4,213,589 | | | 121,604,178 |
| | | | |
|
|
| | | | | | 132,608,129 |
| | | | |
|
|
| | |
Insurance—17.1% | | | | | |
American International Group, Inc. | | 2,197,007 | | | 149,901,788 |
Aon Corp. | | 807,700 | | | 29,036,815 |
Berkshire Hathaway, Inc. (Class A) (a) (b) | | 1,043 | | | 92,430,660 |
Berkshire Hathaway, Inc. (Class B) (b) | | 1,256 | | | 3,686,988 |
Everest Re Group, Ltd. | | 56,900 | | | 5,709,915 |
Loews Corp. | | 690,700 | | | 65,512,895 |
Markel Corp. (a) (b) | | 7,500 | | | 2,377,875 |
Marsh & McLennan Cos., Inc. | | 777,300 | | | 24,687,048 |
Sun Life Financial, Inc. | | 139,300 | | | 5,590,109 |
The Chubb Corp. | | 158,400 | | | 15,467,760 |
The Progressive Corp. | | 889,000 | | | 103,817,420 |
Transatlantic Holdings, Inc. | | 590,456 | | | 39,678,643 |
| | | | |
|
|
| | | | | | 537,897,916 |
| | | | |
|
|
| | |
Internet Software & Services—0.4% | | | | | |
Expedia, Inc. (a) (b) | | 220,899 | | | 5,292,740 |
IAC/InterActiveCorp (a) | | 220,899 | | | 6,253,651 |
| | | | |
|
|
| | | | | | 11,546,391 |
| | | | |
|
|
*See accompanying notes to financial statements.
MSF-126
Metropolitan Series Fund, Inc.
Davis Venture Value Portfolio
Schedule of Investments as of December 31, 2005
Common Stock—(Continued)
| | | | | |
Security Description | | Shares | | Value* |
| | | | | | |
| | |
Marine—0.6% | | | | | |
Cosco Pacific, Ltd. (HKD) | | 4,417,200 | | $ | 8,008,267 |
Kuehne & Nagel International AG (CHF) | | 35,511 | | | 10,013,715 |
| | | | |
|
|
| | | | | | 18,021,982 |
| | | | |
|
|
| | |
Media—3.4% | | | | | |
Comcast Corp. (Special Class A) (b) | | 2,575,955 | | | 66,176,284 |
Gannett Co., Inc. | | 152,500 | | | 9,236,925 |
Lagardere S.C.A. (EUR) (a) | | 401,577 | | | 30,913,243 |
| | | | |
|
|
| | | | | | 106,326,452 |
| | | | |
|
|
| | |
Multiline Retail—3.6% | | | | | |
Costco Wholesale Corp. (a) | | 2,311,300 | | | 114,340,011 |
| | | | |
|
|
| | |
Oil, Gas & Consumable Fuels—9.7% | | | | | |
ConocoPhillips | | 1,490,008 | | | 86,688,665 |
Devon Energy Corp. (a) | | 1,363,616 | | | 85,280,545 |
EOG Resources, Inc. | | 1,099,000 | | | 80,633,630 |
Occidental Petroleum Corp. | | 636,000 | | | 50,803,680 |
| | | | |
|
|
| | | | | | 303,406,520 |
| | | | |
|
|
| | |
Personal Products—0.8% | | | | | |
Avon Products, Inc. | | 915,400 | | | 26,134,670 |
| | | | |
|
|
| | |
Real Estate—1.6% | | | | | |
CenterPoint Properties Trust (REIT) (a) | | 73,100 | | | 3,616,988 |
General Growth Properties, Inc. (REIT) | | 1,008,178 | | | 47,374,284 |
| | | | |
|
|
| | | | | | 50,991,272 |
| | | | |
|
|
| | |
Software—1.1% | | | | | |
Microsoft Corp. | | 1,384,800 | | | 36,212,520 |
| | | | |
|
|
| | |
Tobacco—5.5% | | | | | |
Altria Group, Inc. | | 2,302,900 | | | 172,072,688 |
| | | | |
|
|
| |
Wireless Telecommunication Services—0.3% | | | |
SK Telecom Co., Ltd. (ADR) (a) | | 534,100 | | | 10,836,889 |
| | | | |
|
|
Total Common Stock
(Identified Cost $2,298,663,462) | | | | | 3,037,901,313 |
| | | | |
|
|
| | | | | | | |
| | |
| Short Term Investments—3.3% | | | | | | | |
| Security Description | | Face
Amount | | Value* | |
| | | | | | | | |
| | |
Commercial Paper—3.3% | | | | | | | |
Clipper Receivables Corp.
4.200%, 01/03/06 | | $ | 13,120,000 | | $ | 13,116,939 | |
| | |
San Paolo U.S. Financial Corp. | | | | | | | |
4.320%, 01/03/06 | | | 20,000,000 | | | 19,995,200 | |
4.330%, 01/05/06 | | | 30,000,000 | | | 29,985,567 | |
Three Pillars Funding Corp. | | | | | | | |
4.380%, 01/03/06 | | | 21,892,000 | | | 21,886,673 | |
UBS Americas, Inc. | | | | | | | |
4.190%, 01/03/06 | | | 19,000,000 | | | 18,995,577 | |
| | | | | |
|
|
|
Total Short Term Investments
(Amortized Cost $103,979,956) | | | | | | 103,979,956 | |
| | | | | |
|
|
|
Total Investments—100.0%
(Identified Cost $2,402,643,418) (c) | | | | | | 3,141,881,269 | |
Liabilities in excess of other assets | | | | | | (763,915 | ) |
| | | | | |
|
|
|
| Total Net Assets—100% | | | | | $ | 3,141,117,354 | |
| | | | | |
|
|
|
| (a) | A portion or all of the security was held on loan. As of December 31, 2005, the market value of securities loaned was $166,909,895 and the collateral received consisted of cash in the amount of $172,652,852. |
| (c) | The aggregate cost of investments for federal income tax purposes as of December 31, 2005 was $2,404,163,104 and the composition of unrealized appreciation and depreciation of investment securities was $790,331,503 and $(52,613,338), respectively. |
| (ADR)— | An American Depositary Receipt is a certificate issued by a custodian bank representing the right to receive securities of the foreign issuer described. Trading on exchanges not located in the United States or Canada significantly influences the value of ADRs. |
| (REIT)— | A Real Estate Investment Trust is a pooled investment vehicle that invests primarily in income-producing real estate or real estate related loans or interest. |
*See accompanying notes to financial statements.
MSF-127
Metropolitan Series Fund, Inc.
Davis Venture Value Portfolio
Statement of Assets & Liabilities
December 31, 2005
| | | | | | | |
Assets | | | | | | | |
Investments at value | | | | | $ | 3,141,881,269 | |
Cash | | | | | | 16,971 | |
Collateral for securities loaned | | | | | | 172,652,852 | |
Receivable for: | | | | | | | |
Fund shares sold | | | | | | 2,471,763 | |
Accrued interest and dividends | | | | | | 4,752,854 | |
| | | | | |
|
|
|
Total Assets | | | | | | 3,321,775,709 | |
Liabilities | | | | | | | |
Payable for: | | | | | | | |
Fund shares redeemed | | $ | 3,368,004 | | | | |
Securities purchased | | | 2,131,839 | | | | |
Withholding taxes | | | 94,421 | | | | |
Return of collateral for securities loaned | | | 172,652,852 | | | | |
Accrued expenses: | | | | | | | |
Management fees | | | 1,905,167 | | | | |
Service and distribution fees | | | 192,676 | | | | |
Deferred directors’ fees | | | 38,759 | | | | |
Other expenses | | | 274,637 | | | | |
| | |
|
| | | | |
Total Liabilities | | | | | | 180,658,355 | |
| | | | | |
|
|
|
Net Assets | | | | | $ | 3,141,117,354 | |
| | | | | |
|
|
|
Net assets consists of: | | | | | | | |
Capital paid in | | | | | $ | 2,500,256,109 | |
Undistributed net investment income | | | | | | 27,255,400 | |
Accumulated net realized losses | | | | | | (125,632,358 | ) |
Unrealized appreciation on investments and foreign currency | | | | | | 739,238,203 | |
| | | | | |
|
|
|
Net Assets | | | | | $ | 3,141,117,354 | |
| | | | | |
|
|
|
| Computation of offering price: | | | | | | | |
Class A | | | | | | | |
Net asset value and redemption price per share ($1,759,491,305 divided by 56,932,235 shares outstanding) | | | | | $ | 30.91 | |
| | | | | |
|
|
|
Class B | | | | | | | |
Net asset value and redemption price per share ($202,221,389 divided by 6,584,076 shares outstanding) | | | | | $ | 30.71 | |
| | | | | |
|
|
|
Class E | | | | | | | |
Net asset value and redemption price per share ($1,179,404,660 divided by 38,345,415 shares outstanding) | | | | | $ | 30.76 | |
| | | | | |
|
|
|
Identified cost of investments | | | | | $ | 2,402,643,418 | |
| | | | | |
|
|
|
Statement of Operations
Year Ended December 31, 2005
| | | | | | | | |
Investment Income | | | | | | | | |
Dividends | | | | | | $ | 46,923,806 | (a) |
Interest | | | | | | | 3,877,084 | (b) |
| | | | | | |
|
|
|
| | | | | | | | 50,800,890 | |
Expenses | | | | | | | | |
Management fees | | $ | 20,216,812 | | | | | |
Service and distribution fees—Class B | | | 304,037 | | | | | |
Service and distribution fees—Class E | | | 1,643,662 | | | | | |
Directors’ fees and expenses | | | 25,883 | | | | | |
Custodian | | | 423,973 | | | | | |
Audit and tax services | | | 21,767 | | | | | |
Legal | | | 73,560 | | | | | |
Printing | | | 712,419 | | | | | |
Insurance | | | 49,716 | | | | | |
Miscellaneous | | | 20,291 | | | | | |
| | |
|
|
| | | | |
Total expenses | | | 23,492,120 | | | | | |
Expense reductions | | | (55,871 | ) | | | 23,436,249 | |
| | |
|
|
| |
|
|
|
Net Investment Income | | | | | | | 27,364,641 | |
| | | | | | |
|
|
|
Realized and Unrealized Gain | | | | | | | | |
| Realized gain (loss) on: | | | | | | | | |
Investments—net | | | 59,342,292 | | | | | |
Foreign currency transactions—net | | | (31,091 | ) | | | 59,311,201 | |
| | |
|
|
| | | | |
| Unrealized appreciation on: | | | | | | | | |
Investments—net | | | 188,488,604 | | | | | |
Foreign currency transactions—net | | | 531 | | | | 188,489,135 | |
| | |
|
|
| |
|
|
|
Net gain | | | | | | | 247,800,336 | |
| | | | | | |
|
|
|
Net Increase in Net Assets From Operations | | | | | | $ | 275,164,977 | |
| | | | | | |
|
|
|
| (a) | Net of foreign taxes of $1,032,997. |
| (b) | Includes income on securities loaned of $285,704. |
See accompanying notes to financial statements.
MSF-128
Metropolitan Series Fund, Inc.
Davis Venture Value Portfolio
Statement of Changes in Net Assets
| | | | | | | | |
| | | Year ended
December 31,
2005
| | | Year ended
December 31,
2004
| |
From Operations | | | | | | | | |
Net investment income | | $ | 27,364,641 | | | $ | 18,706,761 | |
Net realized gain (loss) | | | 59,311,201 | | | | (11,181,329 | ) |
Unrealized appreciation | | | 188,489,135 | | | | 253,601,543 | |
| | |
|
|
| |
|
|
|
Increase in net assets from operations | | | 275,164,977 | | | | 261,126,975 | |
| | |
|
|
| |
|
|
|
From Distributions to Shareholders | | | | | | | | |
Net investment income | | | | | | | | |
Class A | | | (12,161,501 | ) | | | (5,085,084 | ) |
Class B | | | (488,729 | ) | | | (4,793 | ) |
Class E | | | (5,843,078 | ) | | | (5,090,726 | ) |
| | |
|
|
| |
|
|
|
Total distributions | | | (18,493,308 | ) | | | (10,181,323 | ) |
| | |
|
|
| |
|
|
|
Increase in net assets from capital share transactions | | | 225,072,169 | | | | 809,322,577 | |
| | |
|
|
| |
|
|
|
Total increase in net assets | | | 481,743,838 | | | | 1,060,268,229 | |
Net Assets | | | | | | | | |
Beginning of the period | | | 2,659,373,516 | | | | 1,599,105,287 | |
| | |
|
|
| |
|
|
|
End of the period | | $ | 3,141,117,354 | | | $ | 2,659,373,516 | |
| | |
|
|
| |
|
|
|
Undistributed Net Investment Income | | | | | | | | |
End of the period | | $ | 27,255,400 | | | $ | 18,679,455 | |
| | |
|
|
| |
|
|
|
Other Information:
Capital Shares
Transactions in capital shares were as follows:
| | | | | | | | | | | | | | |
| | | Year ended December 31, 2005
| | | Year ended December 31, 2004
| |
| | | Shares
| | | $
| | | Shares
| | | $
| |
Class A | | | | | | | | | | | | | | |
Sales | | 24,267,256 | | | $ | 696,702,444 | | | 23,804,408 | | | $ | 650,651,338 | |
Reinvestments | | 443,850 | | | | 12,161,501 | | | 193,745 | | | | 5,085,804 | |
Redemptions | | (17,871,273 | ) | | | (505,915,641 | ) | | (7,321,122 | ) | | | (191,979,808 | ) |
| | |
|
| |
|
|
| |
|
| |
|
|
|
Net increase | | 6,839,833 | | | $ | 202,948,304 | | | 16,677,031 | | | $ | 463,757,334 | |
| | |
|
| |
|
|
| |
|
| |
|
|
|
Class B | | | | | | | | | | | | | | |
Sales | | 4,936,488 | | | $ | 142,580,985 | | | 2,052,930 | | | $ | 54,140,216 | |
Reinvestments | | 17,922 | | | | 488,729 | | | 183 | | | | 4,793 | |
Redemptions | | (376,267 | ) | | | (10,934,192 | ) | | (68,895 | ) | | | (1,799,621 | ) |
| | |
|
| |
|
|
| |
|
| |
|
|
|
Net increase | | 4,578,143 | | | $ | 132,135,522 | | | 1,984,218 | | | $ | 52,345,388 | |
| | |
|
| |
|
|
| |
|
| |
|
|
|
Class E | | | | | | | | | | | | | | |
Sales | | 7,342,613 | | | $ | 211,746,726 | | | 30,453,065 | | | $ | 784,767,765 | |
Reinvestments | | 214,111 | | | | 5,843,078 | | | 194,674 | | | | 5,090,726 | |
Redemptions | | (11,543,168 | ) | | | (327,601,461 | ) | | (18,265,685 | ) | | | (496,638,636 | ) |
| | |
|
| |
|
|
| |
|
| |
|
|
|
Net increase (decrease) | | (3,986,444 | ) | | $ | (110,011,657 | ) | | 12,382,054 | | | $ | 293,219,855 | |
| | |
|
| |
|
|
| |
|
| |
|
|
|
Increase derived from capital share transactions | | 7,431,532 | | | $ | 225,072,169 | | | 31,043,303 | | | $ | 809,322,577 | |
| | |
|
| |
|
|
| |
|
| |
|
|
|
See accompanying notes to financial statements.
MSF-129
Metropolitan Series Fund, Inc.
Davis Venture Value Portfolio
Financial Highlights
| | | | | | | | | | | | | | | | | | | | |
| | | Class A
| |
| | | Year ended December 31,
| |
| | | 2005
| | | 2004
| | | 2003
| | | 2002
| | | 2001
| |
Net Asset Value, Beginning of Period | | $ | 28.23 | | | $ | 25.27 | | | $ | 19.39 | | | $ | 23.39 | | | $ | 29.20 | |
| | |
|
|
| |
|
|
| |
|
|
| |
|
|
| |
|
|
|
Income From Investment Operations | | | | | | | | | | | | | | | | | | | | |
Net investment income | | | 0.25 | | | | 0.15 | | | | 0.21 | | | | 0.17 | | | | 0.12 | |
Net realized and unrealized gain (loss) of investments | | | 2.63 | | | | 2.96 | | | | 5.75 | | | | (3.98 | ) | | | (3.07 | ) |
| | |
|
|
| |
|
|
| |
|
|
| |
|
|
| |
|
|
|
Total from investment operations | | | 2.88 | | | | 3.11 | | | | 5.96 | | | | (3.81 | ) | | | (2.95 | ) |
| | |
|
|
| |
|
|
| |
|
|
| |
|
|
| |
|
|
|
Less Distributions | | | | | | | | | | | | | | | | | | | | |
Distributions from net investment income | | | (0.20 | ) | | | (0.15 | ) | | | (0.08 | ) | | | (0.19 | ) | | | (0.15 | ) |
Distributions from net realized capital gains | | | 0.00 | | | | 0.00 | | | | 0.00 | | | | 0.00 | | | | (2.71 | ) |
| | |
|
|
| |
|
|
| |
|
|
| |
|
|
| |
|
|
|
Total distributions | | | (0.20 | ) | | | (0.15 | ) | | | (0.08 | ) | | | (0.19 | ) | | | (2.86 | ) |
| | |
|
|
| |
|
|
| |
|
|
| |
|
|
| |
|
|
|
Net Asset Value, End of Period | | $ | 30.91 | | | $ | 28.23 | | | $ | 25.27 | | | $ | 19.39 | | | $ | 23.39 | |
| | |
|
|
| |
|
|
| |
|
|
| |
|
|
| |
|
|
|
Total Return (%) | | | 10.3 | | | | 12.4 | | | | 30.9 | | | | (16.4 | ) | | | (11.1 | ) |
Ratio of operating expenses to average net assets before expense reductions (%) | | | 0.76 | | | | 0.78 | | | | 0.79 | | | | 0.80 | | | | 0.83 | |
Ratio of operating expenses to average net assets after expense reductions (%) (d) | | | 0.76 | | | | 0.77 | | | | 0.79 | | | | 0.78 | | | | 0.82 | |
Ratio of net investment income to average net assets (%) | | | 1.05 | | | | 0.97 | | | | 0.95 | | | | 0.79 | | | | 0.55 | |
Portfolio turnover rate (%) | | | 27 | | | | 5 | | | | 12 | | | | 24 | | | | 21 | |
Net assets, end of period (000) | | $ | 1,759,491 | | | $ | 1,413,953 | | | $ | 844,547 | | | $ | 675,704 | | | $ | 878,630 | |
| | | | | | | | | | | | | | | | |
| | | Class B
| |
| | | Year ended December 31,
| | | July 30, 2002(a) through
December 31, 2002
| |
| | | 2005
| | | 2004
| | | 2003
| | |
Net Asset Value, Beginning of Period | | $ | 28.07 | | | $ | 25.18 | | | $ | 19.33 | | | $ | 19.64 | |
| | |
|
|
| |
|
|
| |
|
|
| |
|
|
|
Income From Investment Operations | | | | | | | | | | | | | | | | |
Net investment income | | | 0.17 | | | | 0.14 | | | | 0.07 | | | | 0.04 | |
Net realized and unrealized gain (loss) of investments | | | 2.62 | | | | 2.86 | | | | 5.85 | | | | (0.35 | ) |
| | |
|
|
| |
|
|
| |
|
|
| |
|
|
|
Total from investment operations | | | 2.79 | | | | 3.00 | | | | 5.92 | | | | (0.31 | ) |
| | |
|
|
| |
|
|
| |
|
|
| |
|
|
|
Less Distributions | | | | | | | | | | | | | | | | |
Distributions from net investment income | | | (0.15 | ) | | | (0.11 | ) | | | (0.07 | ) | | | 0.00 | |
| | |
|
|
| |
|
|
| |
|
|
| |
|
|
|
Total distributions | | | (0.15 | ) | | | (0.11 | ) | | | (0.07 | ) | | | 0.00 | |
| | |
|
|
| |
|
|
| |
|
|
| |
|
|
|
Net Asset Value, End of Period | | $ | 30.71 | | | $ | 28.07 | | | $ | 25.18 | | | $ | 19.33 | |
| | |
|
|
| |
|
|
| |
|
|
| |
|
|
|
Total Return (%) | | | 10.0 | | | | 12.0 | | | | 30.7 | | | | (1.6 | )(b) |
Ratio of operating expenses to average net assets before expense reductions (%) | | | 1.02 | | | | 1.03 | | | | 1.04 | | | | 1.05 | (c) |
Ratio of operating expenses to average net assets after expense reductions (%) (d) | | | 1.01 | | | | 1.02 | | | | 1.04 | | | | 1.03 | (c) |
Ratio of net investment income to average net assets (%) | | | 0.77 | | | | 0.92 | | | | 0.73 | | | | 0.52 | (c) |
Portfolio turnover rate (%) | | | 27 | | | | 5 | | | | 12 | | | | 24 | |
Net assets, end of period (000) | | $ | 202,221 | | | $ | 56,301 | | | $ | 547 | | | $ | 1 | |
| (a) | Commencement of operations. |
| (b) | Period less than one year is not computed on an annualized basis. |
| (c) | Computed on an annualized basis. |
| (d) | The Portfolio has entered into arrangements with certain brokers who paid a portion of the Portfolio’s expenses. |
See accompanying notes to financial statements.
MSF-130
Metropolitan Series Fund, Inc.
Davis Venture Value Portfolio
Financial Highlights—(Continued)
| | | | | | | | | | | | | | | | | | | | |
| | | Class E
| |
| | | Year ended December 31,
| | | February 20, 2001(a) through December 31, 2001
| |
| | | 2005
| | | 2004
| | | 2003
| | | 2002
| | |
Net Asset Value, Beginning of Period | | $ | 28.09 | | | $ | 25.18 | | | $ | 19.33 | | | $ | 23.35 | | | $ | 25.29 | |
| | |
|
|
| |
|
|
| |
|
|
| |
|
|
| |
|
|
|
Income From Investment Operations | | | | | | | | | | | | | | | | | | | | |
Net investment income | | | 0.27 | | | | 0.23 | | | | 0.14 | | | | 0.16 | | | | 0.02 | |
Net realized and unrealized gain (loss) of investments | | | 2.56 | | | | 2.82 | | | | 5.78 | | | | (4.01 | ) | | | (1.96 | ) |
| | |
|
|
| |
|
|
| |
|
|
| |
|
|
| |
|
|
|
Total from investment operations | | | 2.83 | | | | 3.05 | | | | 5.92 | | | | (3.85 | ) | | | (1.94 | ) |
| | |
|
|
| |
|
|
| |
|
|
| |
|
|
| |
|
|
|
Less Distributions | | | | | | | | | | | | | | | | | | | | |
Distributions from net investment income | | | (0.16 | ) | | | (0.14 | ) | | | (0.07 | ) | | | (0.17 | ) | | | 0.00 | |
| | |
|
|
| |
|
|
| |
|
|
| |
|
|
| |
|
|
|
Total distributions | | | (0.16 | ) | | | (0.14 | ) | | | (0.07 | ) | | | (0.17 | ) | | | 0.00 | |
| | |
|
|
| |
|
|
| |
|
|
| |
|
|
| |
|
|
|
Net Asset Value, End of Period | | $ | 30.76 | | | $ | 28.09 | | | $ | 25.18 | | | $ | 19.33 | | | $ | 23.35 | |
| | |
|
|
| |
|
|
| |
|
|
| |
|
|
| |
|
|
|
Total Return (%) | | | 10.1 | | | | 12.1 | | | | 30.7 | | | | (16.6 | ) | | | (7.7 | )(b) |
Ratio of operating expenses to average net assets before expense reductions (%) | | | 0.91 | | | | 0.93 | | | | 0.94 | | | | 0.95 | | | | 0.98 | (c) |
Ratio of operating expenses to average net assets after expense reductions (%) (d) | | | 0.91 | | | | 0.92 | | | | 0.94 | | | | 0.93 | | | | 0.97 | (c) |
Ratio of net investment income to average net assets (%) | | | 0.88 | | | | 0.85 | | | | 0.81 | | | | 0.64 | | | | 0.47 | (c) |
Portfolio turnover rate (%) | | | 27 | | | | 5 | | | | 12 | | | | 24 | | | | 21 | |
Net assets, end of period (000) | | $ | 1,179,405 | | | $ | 1,189,119 | | | $ | 754,011 | | | $ | 223,228 | | | $ | 42,132 | |
| (a) | Commencement of operations. |
| (b) | Period less than one year is not computed on an annualized basis. |
| (c) | Computed on an annualized basis. |
| (d) | The Portfolio has entered into arrangements with certain brokers who paid a portion of the Portfolio’s expenses. |
See accompanying notes to financial statements.
MSF-131
Metropolitan Series Fund, Inc.
FI Value Leaders Portfolio
Schedule of Investments as of December 31, 2005
Common Stock—99.7% of Total Net Assets
| | | | | |
| Security Description | | Shares | | Value* |
| | | | | | |
| | | | | | |
|
Aerospace & Defense—1.0% |
Goodrich Corp. | | 54,000 | | $ | 2,219,400 |
Hexcel Corp. | | 35,400 | | | 638,970 |
K&F Industries Holdings, Inc. | | 5,400 | | | 82,944 |
Raytheon Co. | | 21,200 | | | 851,180 |
United Technologies Corp. | | 43,400 | | | 2,426,494 |
| | | | |
|
|
| | | | | | 6,218,988 |
| | | | |
|
|
|
Air Freight & Logistics—0.2% |
EGL, Inc. | | 36,400 | | | 1,367,548 |
| | | | |
|
|
| | |
Airlines—0.8% | | | | | |
ACE Aviation Holdings, Inc.(CAD) (a) | | 32,400 | | | 1,055,963 |
AirTran Holdings, Inc. (a) | | 82,300 | | | 1,319,269 |
JetBlue Airways Corp. (a) | | 75,000 | | | 1,153,500 |
Southwest Airlines Co. | | 42,400 | | | 696,632 |
US Airways Group, Inc. | | 10,300 | | | 382,542 |
| | | | |
|
|
| | | | | | 4,607,906 |
| | | | |
|
|
|
Auto Components—0.1% |
Gentex Corp. | | 18,200 | | | 354,900 |
| | | | |
|
|
|
Automobiles—0.2% |
Ford Motor Co. (a) | | 151,700 | | | 1,171,124 |
| | | | |
|
|
|
Beverages—0.8% |
Coca-Cola Enterprises, Inc. | | 60,600 | | | 1,161,702 |
Diageo, Plc. (ADR) | | 14,700 | | | 857,010 |
PepsiCo, Inc. | | 10,100 | | | 596,708 |
The Coca-Cola Co. | | 59,400 | | | 2,394,414 |
| | | | |
|
|
| | | | | | 5,009,834 |
| | | | |
|
|
|
Biotechnology—2.8% |
Amgen, Inc. (a) | | 17,300 | | | 1,364,278 |
Biogen Idec, Inc. (a) | | 47,700 | | | 2,162,241 |
BioMarin Pharmaceutical, Inc. | | 102,300 | | | 1,102,794 |
Cephalon, Inc. (a) | | 118,400 | | | 7,665,216 |
Connetics Corp. | | 12,200 | | | 176,290 |
Genentech, Inc. (a) | | 8,600 | | | 795,500 |
ImClone Systems, Inc. (a) | | 36,900 | | | 1,263,456 |
MedImmune, Inc. (a) | | 55,900 | | | 1,957,618 |
Serologicals Corp. (a) | | 18,700 | | | 369,138 |
| | | | |
|
|
| | | | | | 16,856,531 |
| | | | |
|
|
|
Building Products—0.3% |
Masco Corp. | | 17,800 | | | 537,382 |
Watsco, Inc. | | 20,200 | | | 1,208,162 |
| | | | |
|
|
| | | | | | 1,745,544 |
| | | | |
|
|
|
Capital Markets—3.3% |
IntercontinentalExchange, Inc. (a) | | 900 | | | 32,715 |
Investors Financial Services Corp. | | 24,900 | | | 917,067 |
Lehman Brothers Holdings, Inc. | | 15,800 | | | 2,025,086 |
Merrill Lynch & Co., Inc. | | 85,500 | | | 5,790,915 |
Morgan Stanley | | 80,800 | | | 4,584,592 |
State Street Corp. | | 76,900 | | | 4,263,336 |
| | | | | |
| Security Description | | Shares | | Value* |
| | | | | |
|
Capital Markets—(Continued) |
The Bear Stearns Co., Inc. | | 5,950 | | $ | 687,404 |
The Charles Schwab Corp. | | 114,000 | | | 1,672,380 |
| | | | |
|
|
| | | | | | 19,973,495 |
| | | | |
|
|
|
Chemicals—3.1% |
Chemtura Corp. | | 39,600 | | | 502,920 |
E. I. du Pont de Nemours & Co. | | 164,900 | | | 7,008,250 |
Ecolab, Inc. | | 29,400 | | | 1,066,338 |
Georgia Gulf Corp. | | 31,200 | | | 949,104 |
Lyondell Chemical Co. | | 125,115 | | | 2,980,239 |
Monsanto Co. | | 4,900 | | | 379,897 |
Mosaic Co.(a) | | 61,800 | | | 904,134 |
NOVA Chemicals Corp. | | 11,400 | | | 380,760 |
NOVA Chemicals Corp. (Toronto)(CAD) | | 10,000 | | | 332,862 |
Praxair, Inc. | | 46,700 | | | 2,473,232 |
Rockwood Holdings, Inc. | | 43,800 | | | 864,174 |
Rohm & Haas Co. | | 16,800 | | | 813,456 |
| | | | |
|
|
| | | | | | 18,655,366 |
| | | | |
|
|
|
Commercial Banks—4.7% |
Banco Bradesco S.A. (ADR) | | 61,300 | | | 1,786,895 |
Bank of America Corp. | | 224,754 | | | 10,372,397 |
Golden West Financial Corp. | | 14,600 | | | 963,600 |
Hudson City Bancorp, Inc. | | 54,900 | | | 665,388 |
Korea Exchange Bank(KRW) | | 167,810 | | | 2,316,092 |
UBS AG | | 18,300 | | | 1,741,245 |
UCBH Holdings, Inc. | | 67,000 | | | 1,197,960 |
W Holding Co., Inc. | | 45,288 | | | 372,720 |
Wachovia Corp. | | 124,874 | | | 6,600,840 |
Wells Fargo & Co. | | 40,800 | | | 2,563,464 |
| | | | |
|
|
| | | | | | 28,580,601 |
| | | | |
|
|
|
Commercial Services & Supplies—1.0% |
Ceridian Corp. (a) | | 72,100 | | | 1,791,685 |
Emdeon Corp. (a) | | 93,800 | | | 793,548 |
Equifax, Inc. | | 16,400 | | | 623,528 |
Robert Half International, Inc. | | 63,100 | | | 2,390,859 |
The Brinks Co. | | 13,400 | | | 641,994 |
| | | | |
|
|
| | | | | | 6,241,614 |
| | | | |
|
|
|
Communications Equipment—0.9% |
Comverse Technology, Inc. (a) | | 86,000 | | | 2,286,740 |
Extreme Networks, Inc. | | 98,100 | | | 465,975 |
Motorola, Inc. | | 37,600 | | | 849,384 |
Nokia Corp. (ADR) | | 119,500 | | | 2,186,850 |
| | | | |
|
|
| | | | | | 5,788,949 |
| | | | |
|
|
|
Computers & Peripherals—2.4% |
EMC Corp. (a) | | 33,500 | | | 456,270 |
Hewlett-Packard Co. | | 319,100 | | | 9,135,833 |
Lexmark International, Inc. (Class A) (a) | | 10,500 | | | 470,715 |
Palm, Inc. | | 42,600 | | | 1,354,680 |
Seagate Technology | | 121,400 | | | 2,426,786 |
Western Digital Corp. (a) | | 39,500 | | | 735,095 |
| | | | |
|
|
| | | | | | 14,579,379 |
| | | | |
|
|
*See accompanying notes to financial statements.
MSF-132
Metropolitan Series Fund, Inc.
FI Value Leaders Portfolio
Schedule of Investments as of December 31, 2005
Common Stock—(Continued)
| | | | | |
| Security Description | | Shares | | Value* |
| | | | | |
|
Construction & Engineering—1.4% |
Dycom Industries, Inc. (a) | | 62,900 | | $ | 1,383,800 |
Fluor Corp. | | 56,900 | | | 4,396,094 |
Jacobs Engineering Group, Inc. (a) | | 30,900 | | | 2,097,183 |
MasTec, Inc. (a) | | 55,500 | | | 581,085 |
| | | | |
|
|
| | | | | | 8,458,162 |
| | | | |
|
|
|
Construction Materials—0.2% |
Martin Marietta Materials, Inc. | | 16,800 | | | 1,288,896 |
| | | | |
|
|
|
Containers & Packaging—1.0% |
Crown Holdings, Inc. | | 25,200 | | | 492,156 |
Owens-Illinois, Inc. (a) | | 79,900 | | | 1,681,096 |
Packaging Corp. of America | | 90,700 | | | 2,081,565 |
Smurfit-Stone Container Corp. (a) | | 146,583 | | | 2,077,081 |
| | | | |
|
|
| | | | | | 6,331,898 |
| | | | |
|
|
|
Distributors—0.3% |
WESCO International, Inc. | | 38,100 | | | 1,628,013 |
| | | | |
|
|
|
Diversified Consumer Services—0.2% |
Apollo Group, Inc. (Class A) (a) | | 21,600 | | | 1,305,936 |
| | | | |
|
|
|
Diversified Financial Services—3.5% |
Citigroup, Inc. | | 151,466 | | | 7,350,645 |
Doral Financial Corp. | | 100,400 | | | 1,064,240 |
JPMorgan Chase & Co. | | 251,528 | | | 9,983,146 |
Nomura Holdings, Inc.(JPY) | | 116,000 | | | 2,228,053 |
Nuveen Investments, Inc. (Class A) | | 15,400 | | | 656,348 |
| | | | |
|
|
| | | | | | 21,282,432 |
| | | | |
|
|
|
Diversified Telecommunication Services—1.3% |
AT&T, Inc. | | 249,000 | | | 6,098,010 |
Covad Communications Group, Inc. | | 458,119 | | | 448,957 |
Verizon Communications, Inc. | | 37,800 | | | 1,138,536 |
| | | | |
|
|
| | | | | | 7,685,503 |
| | | | |
|
|
|
Electric Utilities—0.9% |
CMS Energy Corp. (a) | | 91,300 | | | 1,324,763 |
PG&E Corp. | | 33,100 | | | 1,228,672 |
PPL Corp. | | 66,200 | | | 1,946,280 |
The AES Corp. (a) | | 61,300 | | | 970,379 |
| | | | |
|
|
| | | | | | 5,470,094 |
| | | | |
|
|
|
Electrical Equipment—0.4% |
ABB, Ltd. (ADR) | | 36,000 | | | 349,920 |
Rockwell Automation, Inc. | | 33,200 | | | 1,964,112 |
| | | | |
|
|
| | | | | | 2,314,032 |
| | | | |
|
|
|
Electronic Equipment & Instruments—3.0% |
Agilent Technologies, Inc. (a) | | 145,100 | | | 4,830,379 |
Jabil Circuit, Inc. (a) | | 30,400 | | | 1,127,536 |
PerkinElmer, Inc. | | 105,400 | | | 2,483,224 |
Samsung Electronics Co., Ltd.(KRW) | | 3,040 | | | 1,956,981 |
Symbol Technologies, Inc. | | 144,200 | | | 1,848,644 |
| | | | | |
| Security Description | | Shares | | Value* |
| | | | | |
|
Electronic Equipment & Instruments—(Continued) |
Thermo Electron Corp. (a) | | 109,700 | | $ | 3,305,261 |
Trimble Navigation, Ltd. (a) | | 30,000 | | | 1,064,700 |
Vishay Intertechnology, Inc. (a) | | 109,800 | | | 1,510,848 |
| | | | |
|
|
| | | | | | 18,127,573 |
| | | | |
|
|
|
Energy Equipment & Services—5.8% |
BJ Services Co. | | 93,400 | | | 3,424,978 |
FMC Technologies, Inc. (a) | | 39,200 | | | 1,682,464 |
GlobalSantaFe Corp. | | 65,300 | | | 3,144,195 |
Halliburton Co. | | 149,900 | | | 9,287,804 |
National-Oilwell Varco, Inc. (a) | | 108,923 | | | 6,829,472 |
Noble Corp. | | 18,600 | | | 1,312,044 |
Pride International, Inc. (a) | | 88,900 | | | 2,733,675 |
Schlumberger, Ltd. | | 43,400 | | | 4,216,310 |
Smith International, inc. (a) | | 64,800 | | | 2,404,728 |
| | | | |
|
|
| | | | | | 35,035,670 |
| | | | |
|
|
| | | | | | |
|
Food & Staples Retailing—1.5% |
CVS Corp. | | 24,800 | | | 655,216 |
Safeway, Inc. (a) | | 75,200 | | | 1,779,232 |
The Kroger Co. (a) | | 200,500 | | | 3,785,440 |
Wal-Mart Stores, Inc. | | 52,300 | | | 2,447,640 |
Walgreen Co. | | 11,700 | | | 517,842 |
| | | | |
|
|
| | | | | | 9,185,370 |
| | | | |
|
|
|
Food Products—0.5% |
Nestle S.A.(CHF) | | 5,242 | | | 1,564,200 |
Tyson Foods, Inc. (Class A) | | 73,900 | | | 1,263,690 |
| | | | |
|
|
| | | | | | 2,827,890 |
| | | | |
|
|
|
Health Care Equipment & Supplies—2.9% |
Baxter International, Inc. | | 245,500 | | | 9,243,075 |
C.R. Bard, Inc. | | 14,300 | | | 942,656 |
Cooper Cos., Inc. | | 9,200 | | | 471,960 |
Foxhollow Technologies, Inc. (a) | | 2,200 | | | 65,538 |
IMS Health, Inc. | | 34,800 | | | 867,216 |
Inverness Medical Innovations, Inc. | | 41,600 | | | 986,336 |
Medtronic, Inc. | | 31,700 | | | 1,824,969 |
Varian, Inc. (a) | | 15,800 | | | 628,682 |
Waters Corp. (a) | | 62,100 | | | 2,347,380 |
| | | | |
|
|
| | | | | | 17,377,812 |
| | | | |
|
|
|
Health Care Providers & Services—1.3% |
Community Health Systems, Inc. (a) | | 22,700 | | | 870,318 |
McKesson Corp. | | 13,200 | | | 680,988 |
Psychiatric Solutions, Inc. (a) | | 22,200 | | | 1,304,028 |
Service Corp. International | | 153,300 | | | 1,253,994 |
Sierra Health Services, Inc. (a) | | 11,400 | | | 911,544 |
UnitedHealth Group, Inc. | | 42,100 | | | 2,616,094 |
WebMD Health Corp. (a) | | 20,600 | | | 598,430 |
| | | | |
|
|
| | | | | | 8,235,396 |
| | | | |
|
|
|
Hotels, Restaurants & Leisure—0.5% |
McDonald’s Corp. | | 71,800 | | | 2,421,096 |
*See accompanying notes to financial statements.
MSF-133
Metropolitan Series Fund, Inc.
FI Value Leaders Portfolio
Schedule of Investments as of December 31, 2005
Common Stock—(Continued)
| | | | | |
| Security Description | | Shares | | Value* |
| | | | | |
|
Hotels, Restaurants & Leisure—(Continued) |
Red Robin Gourmet Burgers, Inc. (a) | | 14,600 | | $ | 744,016 |
Ruth’s Chris Steak House, Inc. | | 1,100 | | | 19,910 |
| | | | |
|
|
| | | | | | 3,185,022 |
| | | | |
|
|
|
Household Durables—0.6% |
D.R. Horton, Inc. | | 26,500 | | | 946,845 |
KB HOME | | 8,600 | | | 624,876 |
Sony Corp. (ADR) | | 52,800 | | | 2,154,240 |
| | | | |
|
|
| | | | | | 3,725,961 |
| | | | |
|
|
|
Household Products—1.1% |
Colgate-Palmolive Co. | | 120,800 | | | 6,625,880 |
| | | | |
|
|
|
Independent Power Producers & Energy Traders—0.1% |
TXU Corp. | | 8,200 | | | 411,558 |
| | | | |
|
|
|
Industrial Conglomerates—8.1% |
3M Co. | | 7,000 | | | 542,500 |
General Electric Co. | | 506,800 | | | 17,763,340 |
Honeywell International, Inc. | | 611,700 | | | 22,785,825 |
Smiths Group, Plc.(GBP) | | 103,700 | | | 1,864,320 |
Tyco International, Ltd. | | 208,900 | | | 6,028,854 |
| | | | |
|
|
| | | | | | 48,984,839 |
| | | | |
|
|
|
Insurance—10.3% |
ACE, Ltd. | | 128,700 | | | 6,877,728 |
American International Group, Inc. | | 402,600 | | | 27,469,398 |
Aspen Insurance Holdings, Ltd. | | 49,000 | | | 1,159,830 |
Endurance Specialty Holdings, Ltd. | | 18,500 | | | 663,225 |
Hilb, Rogal & Hamilton Co. | | 43,700 | | | 1,682,887 |
Montpelier Re Holdings, Ltd. | | 16,500 | | | 311,850 |
Münchener Rückversicherungs-Gesellschaft AG(EUR) | | 8,000 | | | 1,083,594 |
PartnerRe, Ltd. | | 61,200 | | | 4,019,004 |
Platinum Underwriters Holdings, Ltd. | | 27,100 | | | 841,997 |
Scottish Re Group, Ltd. | | 34,800 | | | 854,340 |
Swiss Reinsurance Co.(CHF) | | 13,471 | | | 985,587 |
The Chubb Corp. | | 3,200 | | | 312,480 |
The Hartford Financial Services Group, Inc. | | 75,600 | | | 6,493,284 |
The Navigators Group, Inc. (a) | | 6,400 | | | 279,104 |
The St. Paul Travelers Cos., Inc. | | 61,100 | | | 2,729,337 |
W.R. Berkley Corp. | | 101,950 | | | 4,854,859 |
XL Capital, Ltd. (Class A) | | 29,100 | | | 1,960,758 |
| | | | |
|
|
| | | | | | 62,579,262 |
| | | | |
|
|
|
Internet & Catalog Retail—0.9% |
Coldwater Creek, Inc. (a) | | 42,100 | | | 1,285,313 |
eBay, Inc. (a) | | 90,600 | | | 3,918,450 |
| | | | |
|
|
| | | | | | 5,203,763 |
| | | | |
|
|
|
Internet Software & Services—1.0% |
Digital River, Inc. | | 12,400 | | | 368,776 |
Expedia, Inc. (a) | | 13,500 | | | 323,460 |
Google, Inc. (Class A) (a) | | 7,800 | | | 3,235,908 |
| | | | | |
| Security Description | | Shares | | Value* |
| | | | | |
|
Internet Software & Services—(Continued) |
IAC/InterActiveCorp | | 22,500 | | $ | 636,975 |
Yahoo!, Inc. (a) | | 35,100 | | | 1,375,218 |
| | | | |
|
|
| | | | | | 5,940,337 |
| | | | |
|
|
|
IT Services—0.6% |
First Data Corp. | | 50,200 | | | 2,159,102 |
NAVTEQ, Inc. (a) | | 36,500 | | | 1,601,255 |
| | | | |
|
|
| | | | | | 3,760,357 |
| | | | |
|
|
|
Leisure Equipment & Products—1.2% |
Eastman Kodak Co. | | 263,600 | | | 6,168,240 |
Leapfrog Enterprises, Inc. | | 86,700 | | | 1,010,055 |
| | | | |
|
|
| | | | | | 7,178,295 |
| | | | |
|
|
|
Machinery—0.8% |
Briggs & Stratton Corp. | | 12,300 | | | 477,117 |
Deere & Co. | | 29,100 | | | 1,982,001 |
Dionex Corp. (a) | | 17,400 | | | 853,992 |
ITT Industries, Inc. | | 8,500 | | | 873,970 |
Watts Industries, Inc. | | 30,200 | | | 914,758 |
| | | | |
|
|
| | | | | | 5,101,838 |
| | | | |
|
|
|
Marine—0.1% |
Overseas Shipholding Group, Inc. | | 9,200 | | | 463,588 |
| | | | |
|
|
|
Media—3.4% |
CCE Spinco, Inc. | | 6,738 | | | 88,261 |
Clear Channel Communications, Inc. | | 53,900 | | | 1,695,155 |
Clear Channel Outdoor Holdings, Inc. (a) | | 31,800 | | | 637,590 |
Lamar Advertising Co. (Class A) | | 76,200 | | | 3,515,868 |
News Corp. (Class A) | | 57,322 | | | 891,357 |
Omnicom Group, Inc. | | 7,300 | | | 621,449 |
The Reader’s Digest Association, Inc. (Class A) | | 38,300 | | | 582,926 |
The Walt Disney Co. | | 116,400 | | | 2,790,108 |
Time Warner, Inc. | | 225,300 | | | 3,929,232 |
Univision Communications, Inc. (Class A) (a) | | 185,200 | | | 5,443,028 |
Viacom, Inc. (Class B) | | 22,533 | | | 734,576 |
| | | | |
|
|
| | | | | | 20,929,550 |
| | | | |
|
|
|
Metals & Mining—1.9% |
Alcoa, Inc. | | 50,800 | | | 1,502,156 |
CONSOL Energy, Inc. (a) | | 10,400 | | | 677,872 |
Freeport-McMoRan Copper & Gold, Inc. (Class B) | | 29,800 | | | 1,603,240 |
International Coal Group, Inc. (a) | | 28,900 | | | 274,550 |
Massey Energy Co. | | 36,600 | | | 1,386,042 |
Newmont Mining Corp. | | 119,800 | | | 6,397,320 |
| | | | |
|
|
| | | | | | 11,841,180 |
| | | | |
|
|
|
Multiline Retail—0.3% |
Federated Department Stores, Inc. | | 24,600 | | | 1,631,718 |
| | | | |
|
|
|
Office Electronics—0.2% |
Xerox Corp. (a) | | 90,800 | | | 1,330,220 |
| | | | |
|
|
*See accompanying notes to financial statements.
MSF-134
Metropolitan Series Fund, Inc.
FI Value Leaders Portfolio
Schedule of Investments as of December 31, 2005
Common Stock—(Continued)
| | | | | |
| Security Description | | Shares | | Value* |
| | | | | |
|
Oil, Gas & Consumable Fuels—7.1% |
Amerada Hess Corp. | | 14,300 | | $ | 1,813,526 |
Apache Corp. | | 18,100 | | | 1,240,212 |
Chevron Corp. | | 96,500 | | | 5,478,305 |
ConocoPhillips | | 33,444 | | | 1,945,772 |
Devon Energy Corp. | | 9,700 | | | 606,638 |
El Paso Corp. | | 118,700 | | | 1,443,392 |
Exxon Mobil Corp. | | 291,300 | | | 16,362,321 |
Houston Exploration Co. | | 33,000 | | | 1,742,400 |
Occidental Petroleum Corp. | | 23,700 | | | 1,893,156 |
OMI Corp. | | 56,300 | | | 1,021,845 |
Quicksilver Resources, Inc. (a) | | 88,000 | | | 3,696,880 |
Valero Energy Corp. | | 69,800 | | | 3,601,680 |
XTO Energy, Inc. | | 50,000 | | | 2,197,000 |
| | | | |
|
|
| | | | | | 43,043,127 |
| | | | |
|
|
|
Personal Products—0.2% |
Avon Products, Inc. | | 45,600 | | | 1,301,880 |
| | | | |
|
|
|
Pharmaceuticals—5.0% |
Allergan, Inc. | | 11,100 | | | 1,198,356 |
Alnylam Pharmaceuticals, Inc. | | 92,200 | | | 1,231,792 |
Johnson & Johnson | | 10,300 | | | 619,030 |
Merck & Co., Inc. | | 150,900 | | | 4,800,129 |
Pfizer, Inc. | | 409,500 | | | 9,549,540 |
Schering-Plough Corp. | | 236,100 | | | 4,922,685 |
Teva Pharmaceutical Industries, Ltd. (ADR) | | 47,800 | | | 2,055,878 |
Wyeth | | 135,500 | | | 6,242,485 |
| | | | |
|
|
| | | | | | 30,619,895 |
| | | | |
|
|
|
Real Estate—1.0% |
Apartment Investment & Management Co. (REIT) (Class A) | | 31,000 | | | 1,173,970 |
Equity Lifestyle Properties, Inc. (REIT) | | 14,400 | | | 640,800 |
Equity Residential (REIT) | | 54,100 | | | 2,116,392 |
General Growth Properties, Inc. (REIT) | | 42,100 | | | 1,978,279 |
| | | | |
|
|
| | | | | | 5,909,441 |
| | | | |
|
|
|
Road & Rail—0.6% |
Norfolk Southern Corp. | | 84,400 | | | 3,783,652 |
| | | | |
|
|
|
Semiconductors & Semiconductor Equipment—1.6% |
Altera Corp. (a) | | 30,900 | | | 572,577 |
Analog Devices, Inc. | | 41,800 | | | 1,499,366 |
Cabot Microelectronics Corp. (a) | | 16,300 | | | 478,079 |
Freescale Semiconductor, Inc. (Class A) (a) | | 57,000 | | | 1,435,830 |
Intel Corp. | | 115,500 | | | 2,882,880 |
Marvell Technology Group, Ltd. (a) | | 6,100 | | | 342,149 |
Maxim Integrated Products, Inc. | | 35,800 | | | 1,297,392 |
Micron Technology, Inc. (a) | | 60,600 | | | 806,586 |
PMC-Sierra, Inc. (a) | | 50,837 | | | 391,953 |
| | | | |
|
|
| | | | | | 9,706,812 |
| | | | |
|
|
| | | | | |
| Security Description | | Shares | | Value* |
| | | | | |
|
Software—1.6% |
BEA Systems, Inc. | | 117,400 | | $ | 1,103,560 |
Cognos, Inc. | | 12,400 | | | 430,404 |
Macrovision Corp. (a) | | 23,700 | | | 396,501 |
Microsoft Corp. | | 178,300 | | | 4,662,545 |
Symantec Corp. (a) | | 101,900 | | | 1,783,250 |
TradeStation Group, Inc. | | 88,700 | | | 1,098,106 |
Ulticom, Inc. | | 32,000 | | | 313,920 |
| | | | |
|
|
| | | | | | 9,788,286 |
| | | | |
|
|
|
Specialty Retail—1.3% |
Circuit City Stores, Inc. | | 28,900 | | | 652,851 |
Staples, Inc. | | 67,300 | | | 1,528,383 |
The Gymboree Corp. (a) | | 18,400 | | | 430,560 |
The Home Depot, Inc. | | 106,250 | | | 4,301,000 |
Urban Outfitters, Inc. (a) | | 40,100 | | | 1,014,931 |
| | | | |
|
|
| | | | | | 7,927,725 |
| | | | |
|
|
|
Textiles, Apparel & Luxury Goods—0.1% |
Deckers Outdoor Corp. | | 18,300 | | | 505,446 |
Maidenform Brands, Inc. | | 2,200 | | | 27,852 |
Under Armour, Inc. (a) | | 500 | | | 19,155 |
| | | | |
|
|
| | | | | | 552,453 |
| | | | |
|
|
|
Thrifts & Mortgage Finance—1.1% |
Federal Home Loan Mortgage Corp. | | 34,100 | | | 2,228,435 |
Federal National Mortgage Association | | 84,800 | | | 4,139,088 |
Sovereign Bancorp, Inc. | | 27,700 | | | 598,874 |
| | | | |
|
|
| | | | | | 6,966,397 |
| | | | |
|
|
|
Tobacco—1.4% |
Altria Group, Inc. | | 116,900 | | | 8,734,768 |
| | | | |
|
|
|
Wireless Telecommunication Services—1.8% |
American Tower Corp. (Class A) (a) | | 156,700 | | | 4,246,570 |
Leap Wireless International, Inc. | | 23,800 | | | 901,544 |
Sprint Nextel Corp. | | 244,570 | | | 5,713,155 |
| | | | |
|
|
| | | | | | 10,861,269 |
| | | | |
|
|
Total Common Stock
(Identified Cost $538,124,827) | | | | | 605,795,529 |
| | | | |
|
|
Total Investments—99.7%
(Identified Cost $538,124,827) (b) | | | | | 605,795,529 |
Other assets less liabilities | | | | | 1,929,336 |
| | | | |
|
|
| Total Net Assets—100% | | | | $ | 607,724,865 |
| | | | |
|
|
*See accompanying notes to financial statements.
MSF-135
Metropolitan Series Fund, Inc.
FI Value Leaders Portfolio
Schedule of Investments as of December 31, 2005
| (b) | The aggregate cost of investments for federal income tax purposes as of December 31, 2005 was $542,697,552 and the composition of unrealized appreciation and depreciation of investment securities was $71,797,111 and $(8,699,134), respectively. |
| (ADR)— | An American Depositary Receipt is a certificate issued by a custodian bank representing the right to receive securities of the foreign issuer described. Trading on exchanges not located in the United States or Canada significantly influences the value of ADRs. |
| (REIT)— | A Real Estate Investment Trust is a pooled investment vehicle that invests primarily in income-producing real estate or real estate related loans or interest. |
See accompanying notes to financial statements.
MSF-136
Metropolitan Series Fund, Inc.
FI Value Leaders Portfolio
Statement of Assets & Liabilities
December 31, 2005
| | | | | | | |
Assets | | | | | | | |
Investments at value | | | | | $ | 605,795,529 | |
Cash | | | | | | 2,585,918 | |
Receivable for: | | | | | | | |
Securities sold | | | | | | 202,096 | |
Fund shares sold | | | | | | 367,810 | |
Accrued interest and dividends | | | | | | 804,743 | |
Foreign taxes | | | | | | 1,152 | |
| | | | | |
|
|
|
Total Assets | | | | | | 609,757,248 | |
Liabilities | | | | | | | |
Payable for: | | | | | | | |
Fund shares redeemed | | $ | 791,172 | | | | |
Securities purchased | | | 767,731 | | | | |
Accrued expenses: | | | | | | | |
Management fees | | | 342,191 | | | | |
Service and distribution fees | | | 11,568 | | | | |
Deferred Directors’ fees | | | 24,089 | | | | |
Other expenses | | | 95,632 | | | | |
| | |
|
| | | | |
Total Liabilities | | | | | | 2,032,383 | |
| | | | | |
|
|
|
Net Assets | | | | | $ | 607,724,865 | |
| | | | | |
|
|
|
Net assets consists of: | | | | | | | |
Capital paid in | | | | | $ | 548,549,298 | |
Undistributed net investment income | | | | | | 5,269,677 | |
Accumulated net realized losses | | | | | | (13,764,812 | ) |
Unrealized appreciation on investments | | | | | | 67,670,702 | |
| | | | | |
|
|
|
Net Assets | | | | | $ | 607,724,865 | |
| | | | | |
|
|
|
| Computation of offering price: | | | | | | | |
Class A | | | | | | | |
Net asset value and redemption price per
share ($533,728,922 divided by
2,764,312 shares outstanding) | | | | | $ | 193.08 | |
| | | | | |
|
|
|
Class B | | | | | | | |
Net asset value and redemption price per
share ($27,141,277 divided by
141,168 shares outstanding) | | | | | $ | 192.26 | |
| | | | | |
|
|
|
Class E | | | | | | | |
Net asset value and redemption price per
share ($46,854,666 divided by
243,526 shares outstanding) | | | | | $ | 192.40 | |
| | | | | |
|
|
|
Identified cost of investments | | | | | $ | 538,124,827 | |
| | | | | |
|
|
|
Statement of Operations
Year Ended December 31, 2005
| | | | | | | | |
Investment Income | | | | | | | | |
Dividends | | | | | | $ | 9,453,845 | (a) |
Interest | | | | | | | 7,873 | |
| | | | | | |
|
|
|
| | | | | | | | 9,461,718 | |
Expenses | | | | | | | | |
Management fees | | $ | 3,856,709 | | | | | |
Service and distribution fees—Class B | | | 39,119 | | | | | |
Service and distribution fees—Class E | | | 60,711 | | | | | |
Directors’ fees and expenses | | | 24,586 | | | | | |
Custodian | | | 183,944 | | | | | |
Audit and tax services | | | 21,767 | | | | | |
Legal | | | 24,655 | | | | | |
Printing | | | 146,949 | | | | | |
Insurance | | | 11,717 | | | | | |
Miscellaneous | | | 8,373 | | | | | |
| | |
|
|
| | | | |
Total expenses | | | 4,378,530 | | | | | |
Expense reductions | | | (228,451 | ) | | | 4,150,079 | |
| | |
|
|
| |
|
|
|
Net Investment Income | | | | | | | 5,311,639 | |
| | | | | | |
|
|
|
Realized and Unrealized Gain (Loss) | | | | | | | | |
| Realized gain (loss) on: | | | | | | | | |
Investments—net | | | 61,724,615 | | | | | |
Foreign currency transactions—net | | | (14,951 | ) | | | 61,709,664 | |
| | |
|
|
| | | | |
| Unrealized depreciation on: | | | | | | | | |
Investments—net | | | | | | | (7,766,702 | ) |
| | | | | | |
|
|
|
Net gain | | | | | | | 53,942,962 | |
| | | | | | |
|
|
|
Net Increase in Net Assets From Operations | | | | | | $ | 59,254,601 | |
| | | | | | |
|
|
|
| (a) | Net of foreign taxes of $35,332. |
See accompanying notes to financial statements.
MSF-137
Metropolitan Series Fund, Inc.
FI Value Leaders Portfolio
Statement of Changes in Net Assets
| | | | | | | | |
| | | Year ended
December 31,
2005
| | | Year ended
December 31,
2004
| |
From Operations | | | | | | | | |
Net investment income | | $ | 5,311,639 | | | $ | 6,918,009 | |
Net realized gain | | | 61,709,664 | | | | 62,218,808 | |
Unrealized appreciation (depreciation) | | | (7,766,702 | ) | | | 3,653,711 | |
| | |
|
|
| |
|
|
|
Increase in net assets from operations | | | 59,254,601 | | | | 72,790,528 | |
| | |
|
|
| |
|
|
|
From Distributions to Shareholders | | | | | | | | |
Net investment income | | | | | | | | |
Class A | | | (6,047,937 | ) | | | (7,094,897 | ) |
Class B | | | (120,604 | ) | | | (2,208 | ) |
Class E | | | (413,560 | ) | | | (304,237 | ) |
| | |
|
|
| |
|
|
|
Total distributions | | | (6,582,101 | ) | | | (7,401,342 | ) |
| | |
|
|
| |
|
|
|
Decrease in net assets from capital share transactions | | | (33,772,938 | ) | | | (59,561,647 | ) |
| | |
|
|
| |
|
|
|
Total increase in net assets | | | 18,899,562 | | | | 5,827,539 | |
| | |
Net Assets | | | | | | | | |
Beginning of the period | | | 588,825,303 | | | | 582,997,764 | |
| | |
|
|
| |
|
|
|
End of the period | | $ | 607,724,865 | | | $ | 588,825,303 | |
| | |
|
|
| |
|
|
|
Undistributed Net Investment Income | | | | | | | | |
End of the period | | $ | 5,269,677 | | | $ | 6,868,129 | |
| | |
|
|
| |
|
|
|
Other Information:
Capital Shares
Transactions in capital shares were as follows:
| | | | | | | | | | | | | | |
| | | Year ended December 31, 2005
| | | Year ended December 31, 2004
| |
| | | Shares
| | | $
| | | Shares
| | | $
| |
Class A | | | | | | | | | | | | | | |
Sales | | 181,830 | | | $ | 32,996,068 | | | 186,967 | | | $ | 29,859,340 | |
Reinvestments | | 35,587 | | | | 6,047,937 | | | 44,729 | | | | 7,094,897 | |
Redemptions | | (581,749 | ) | | | (104,361,516 | ) | | (689,862 | ) | | | (110,388,310 | ) |
| | |
|
| |
|
|
| |
|
| |
|
|
|
Net decrease | | (364,332 | ) | | $ | (65,317,511 | ) | | (458,166 | ) | | $ | (73,434,073 | ) |
| | |
|
| |
|
|
| |
|
| |
|
|
|
Class B | | | | | | | | | | | | | | |
Sales | | 132,163 | | | $ | 23,756,181 | | | 30,946 | | | $ | 5,052,632 | |
Reinvestments | | 711 | | | | 120,604 | | | 14 | | | | 2,208 | |
Redemptions | | (21,899 | ) | | | (3,949,132 | ) | | (1,582 | ) | | | (265,616 | ) |
| | |
|
| |
|
|
| |
|
| |
|
|
|
Net increase | | 110,975 | | | $ | 19,927,653 | | | 29,378 | | | $ | 4,789,224 | |
| | |
|
| |
|
|
| |
|
| |
|
|
|
Class E | | | | | | | | | | | | | | |
Sales | | 133,411 | | | $ | 23,750,185 | | | 84,388 | | | $ | 13,483,688 | |
Reinvestments | | 2,439 | | | | 413,560 | | | 1,923 | | | | 304,237 | |
Redemptions | | (69,624 | ) | | | (12,546,825 | ) | | (29,467 | ) | | | (4,704,723 | ) |
| | |
|
| |
|
|
| |
|
| |
|
|
|
Net increase | | 66,226 | | | $ | 11,616,920 | | | 56,844 | | | $ | 9,083,202 | |
| | |
|
| |
|
|
| |
|
| |
|
|
|
Decrease derived from capital share transactions | | (187,131 | ) | | $ | (33,772,938 | ) | | (371,944 | ) | | $ | (59,561,647 | ) |
| | |
|
| |
|
|
| |
|
| |
|
|
|
See accompanying notes to financial statements.
MSF-138
Metropolitan Series Fund, Inc.
FI Value Leaders Portfolio
Financial Highlights
| | | | | | | | | | | | | | | | | | | | |
| | | Class A
| |
| | | Year ended December 31,
| |
| | | 2005
| | | 2004
| | | 2003
| | | 2002
| | | 2001
| |
Net Asset Value, Beginning of Period | | $ | 176.54 | | | $ | 157.24 | | | $ | 124.89 | | | $ | 156.51 | | | $ | 183.39 | |
| | |
|
|
| |
|
|
| |
|
|
| |
|
|
| |
|
|
|
Income From Investment Operations | | | | | | | | | | | | | | | | | | | | |
Net investment income | | | 1.92 | | | | 2.21 | | | | 2.13 | | | | 1.53 | | | | 1.06 | |
Net realized and unrealized gain (loss) of investments | | | 16.67 | | | | 19.15 | | | | 31.23 | | | | (31.88 | ) | | | (26.45 | ) |
| | |
|
|
| |
|
|
| |
|
|
| |
|
|
| |
|
|
|
Total from investment operations | | | 18.59 | | | | 21.36 | | | | 33.36 | | | | (30.35 | ) | | | (25.39 | ) |
| | |
|
|
| |
|
|
| |
|
|
| |
|
|
| |
|
|
|
Less Distributions | | | | | | | | | | | | | | | | | | | | |
Distributions from net investment income | | | (2.05 | ) | | | (2.06 | ) | | | (1.01 | ) | | | (1.27 | ) | | | (1.49 | ) |
| | |
|
|
| |
|
|
| |
|
|
| |
|
|
| |
|
|
|
Total distributions | | | (2.05 | ) | | | (2.06 | ) | | | (1.01 | ) | | | (1.27 | ) | | | (1.49 | ) |
| | |
|
|
| |
|
|
| |
|
|
| |
|
|
| |
|
|
|
Net Asset Value, End of Period | | $ | 193.08 | | | $ | 176.54 | | | $ | 157.24 | | | $ | 124.89 | | | $ | 156.51 | |
| | |
|
|
| |
|
|
| |
|
|
| |
|
|
| |
|
|
|
Total Return (%) | | | 10.7 | | | | 13.7 | | | | 26.9 | | | | (19.5 | ) | | | (13.9 | ) |
Ratio of operating expenses to average net assets before expense reductions (%) | | | 0.73 | | | | 0.74 | | | | 0.74 | | | | 0.72 | | | | 0.78 | |
Ratio of operating expenses to average net assets after expense reductions (%) (d) | | | 0.69 | | | | 0.72 | | | | — | | | | 0.71 | | | | 0.74 | |
Ratio of net investment income to average net assets (%) | | | 0.92 | | | | 1.23 | | | | 1.49 | | | | 1.30 | | | | 0.60 | |
Portfolio turnover rate (%) | | | 94 | | | | 161 | | | | 53 | | | | 142 | | | | 154 | |
Net assets, end of period (000) | | $ | 533,729 | | | $ | 552,323 | | | $ | 563,979 | | | $ | 491,124 | | | $ | 298,982 | |
| | | | | | | | | | | | | | | | |
| | | Class B
| |
| | | Year ended December 31,
| | | July 30, 2002(a)
through
December 31,
2002
| |
| | | 2005
| | | 2004
| | | 2003
| | |
Net Asset Value, Beginning of Period | | $ | 175.91 | | | $ | 156.72 | | | $ | 124.47 | | | $ | 125.90 | |
| | |
|
|
| |
|
|
| |
|
|
| |
|
|
|
Income From Investment Operations | | | | | | | | | | | | | | | | |
Net investment income | | | 1.26 | | | | 1.88 | | | | 1.22 | | | | 0.18 | |
Net realized and unrealized gain (loss) of investments | | | 16.86 | | | | 19.12 | | | | 31.95 | | | | (1.61 | ) |
| | |
|
|
| |
|
|
| |
|
|
| |
|
|
|
Total from investment operations | | | 18.12 | | | | 21.00 | | | | 33.17 | | | | (1.43 | ) |
| | |
|
|
| |
|
|
| |
|
|
| |
|
|
|
Less Distributions | | | | | | | | | | | | | | | | |
Distributions from net investment income | | | (1.77 | ) | | | (1.81 | ) | | | (0.92 | ) | | | 0.00 | |
| | |
|
|
| |
|
|
| |
|
|
| |
|
|
|
Total distributions | | | (1.77 | ) | | | (1.81 | ) | | | (0.92 | ) | | | 0.00 | |
| | |
|
|
| |
|
|
| |
|
|
| |
|
|
|
Net Asset Value, End of Period | | $ | 192.26 | | | $ | 175.91 | | | $ | 156.72 | | | $ | 124.47 | |
| | |
|
|
| |
|
|
| |
|
|
| |
|
|
|
Total Return (%) | | | 10.4 | | | | 13.5 | | | | 26.9 | | | | (1.1 | )(b) |
Ratio of operating expenses to average net assets before expense reductions (%) | | | 0.98 | | | | 0.99 | | | | 0.99 | | | | 0.97 | (c) |
Ratio of operating expenses to average net assets after expense reductions (%) (d) | | | 0.94 | | | | 0.97 | | | | — | | | | 0.96 | (c) |
Ratio of net investment income to average net assets (%) | | | 0.70 | | | | 1.41 | | | | 1.15 | | | | 1.36 | (c) |
Portfolio turnover rate (%) | | | 94 | | | | 161 | | | | 53 | | | | 142 | |
Net assets, end of period (000) | | $ | 27,141 | | | $ | 5,311 | | | $ | 128 | | | $ | 6 | |
| (a) | Commencement of operations. |
| (b) | Period less than one year is not computed on an annualized basis. |
| (c) | Computed on an annualized basis. |
| (d) | The Portfolio has entered into arrangements with certain brokers who paid a portion of the Portfolio’s expenses. |
See accompanying notes to financial statements.
MSF-139
Metropolitan Series Fund, Inc.
FI Value Leaders Portfolio
Financial Highlights
| | | | | | | | | | | | | | | | | | | | |
| | | Class E
| |
| | | Year ended December 31,
| | | May 1, 2001(a)
through
December 31,
2001
| |
| | | 2005
| | | 2004
| | | 2003
| | | 2002
| | |
Net Asset Value, Beginning of Period | | $ | 175.93 | | | $ | 156.83 | | | $ | 124.66 | | | $ | 156.28 | | | $ | 177.17 | |
| | |
|
|
| |
|
|
| |
|
|
| |
|
|
| |
|
|
|
Income From Investment Operations | | | | | | | | | | | | | | | | | | | | |
Net investment income | | | 1.29 | | | | 1.58 | | | | 1.41 | | | | 1.35 | | | | 0.14 | |
Net realized and unrealized gain (loss) of investments | | | 16.98 | | | | 19.48 | | | | 31.68 | | | | (31.80 | ) | | | (21.03 | ) |
| | |
|
|
| |
|
|
| |
|
|
| |
|
|
| |
|
|
|
Total from investment operations | | | 18.27 | | | | 21.06 | | | | 33.09 | | | | (30.45 | ) | | | (20.89 | ) |
| | |
|
|
| |
|
|
| |
|
|
| |
|
|
| |
|
|
|
Less Distributions | | | | | | | | | | | | | | | | | | | | |
Distributions from net investment income | | | (1.80 | ) | | | (1.96 | ) | | | (0.92 | ) | | | (1.17 | ) | | | 0.00 | |
| | |
|
|
| |
|
|
| |
|
|
| |
|
|
| |
|
|
|
Total distributions | | | (1.80 | ) | | | (1.96 | ) | | | (0.92 | ) | | | (1.17 | ) | | | 0.00 | |
| | |
|
|
| |
|
|
| |
|
|
| |
|
|
| |
|
|
|
Net Asset Value, End of Period | | $ | 192.40 | | | $ | 175.93 | | | $ | 156.83 | | | $ | 124.66 | | | $ | 156.28 | |
| | |
|
|
| |
|
|
| |
|
|
| |
|
|
| |
|
|
|
Total Return (%) | | | 10.5 | | | | 13.6 | | | | 26.7 | | | | (19.6 | ) | | | (11.8 | )(b) |
Ratio of operating expenses to average net assets before expense reductions (%) | | | 0.88 | | | | 0.89 | | | | 0.89 | | | | 0.87 | | | | 0.93 | (c) |
Ratio of operating expenses to average net assets after expense reductions (%) (d) | | | 0.84 | | | | 0.87 | | | | — | | | | 0.86 | | | | 0.89 | (c) |
Ratio of net investment income to average net assets (%) | | | 0.78 | | | | 1.12 | | | | 1.31 | | | | 1.15 | | | | 0.61 | (c) |
Portfolio turnover rate (%) | | | 94 | | | | 161 | | | | 53 | | | | 142 | | | | 154 | |
Net assets, end of period (000) | | $ | 46,855 | | | $ | 31,192 | | | $ | 18,891 | | | $ | 5,619 | | | $ | 1,527 | |
| (a) | Commencement of operations. |
| (b) | Period less than one year is not computed on an annualized basis. |
| (c) | Computed on an annualized basis. |
| (d) | The Portfolio has entered into arrangements with certain brokers who paid a portion of the Portfolio’s expenses. |
See accompanying notes to financial statements.
MSF-140
Metropolitan Series Fund, Inc.
Harris Oakmark Large Cap Value Portfolio
Schedule of Investments as of December 31, 2005
Common Stock—90.7% of Total Net Assets
| | | | | |
| Security Description | | Shares | | Value* |
| | | | | | |
| | |
Aerospace & Defense—1.9% | | | | | |
Raytheon Co. | | 288,000 | | $ | 11,563,200 |
| | | | |
|
|
| | |
Automobiles—2.1% | | | | | |
Harley-Davidson, Inc. | | 249,300 | | | 12,836,457 |
| | | | |
|
|
| | |
Beverages—6.4% | | | | | |
Anheuser-Busch Cos., Inc. | | 297,700 | | | 12,789,192 |
Coca-Cola Enterprises, Inc. | | 338,700 | | | 6,492,879 |
Diageo, Plc.(ADR) | | 203,700 | | | 11,875,710 |
InBev NV(EUR) | | 168,000 | | | 7,310,738 |
| | | | |
|
|
| | | | | | 38,468,519 |
| | | | |
|
|
| | |
Building Products—2.1% | | | | | |
Masco Corp. | | 425,500 | | | 12,845,845 |
| | | | |
|
|
| | |
Commercial Banks—3.3% | | | | | |
The Bank of New York Co., Inc. | | 240,300 | | | 7,653,555 |
U.S. Bancorp. | | 414,800 | | | 12,398,372 |
| | | | |
|
|
| | | | | | 20,051,927 |
| | | | |
|
|
| |
Commercial Services & Supplies—1.8% | | | |
H&R Block, Inc. | | 447,000 | | | 10,973,850 |
| | | | |
|
|
| | |
Computers & Peripherals—3.3% | | | | | |
Hewlett-Packard Co. | | 358,000 | | | 10,249,540 |
Sun Microsystems, Inc. (a) | | 2,269,200 | | | 9,507,948 |
| | | | |
|
|
| | | | | | 19,757,488 |
| | | | |
|
|
| | |
Diversified Financial Services—4.7% | | | | | |
Citigroup, Inc. | | 293,700 | | | 14,253,261 |
JPMorgan Chase & Co. | | 345,600 | | | 13,716,864 |
| | | | |
|
|
| | | | | | 27,970,125 |
| | | | |
|
|
| | |
Food & Staples Retailing—2.2% | | | | | |
Wal-Mart Stores, Inc. | | 278,500 | | | 13,033,800 |
| | | | |
|
|
| | |
Food Products—3.1% | | | | | |
General Mills, Inc. | | 231,300 | | | 11,407,716 |
H.J. Heinz Co. | | 221,750 | | | 7,477,410 |
| | | | |
|
|
| | | | | | 18,885,126 |
| | | | |
|
|
| | |
Health Care Equipment & Supplies—2.1% | | | | | |
Baxter International, Inc. | | 330,800 | | | 12,454,620 |
| | | | |
|
|
| | |
Hotels, Restaurants & Leisure—5.1% | | | | | |
McDonald’s Corp. | | 514,700 | | | 17,355,684 |
Yum! Brands, Inc. | | 287,500 | | | 13,478,000 |
| | | | |
|
|
| | | | | | 30,833,684 |
| | | | |
|
|
| | |
Household Durables—5.9% | | | | | |
Fortune Brands, Inc. | | 153,700 | | | 11,991,674 |
Pulte Homes, Inc. | | 278,500 | | | 10,961,760 |
The Black & Decker Corp. | | 144,300 | | | 12,548,328 |
| | | | |
|
|
| | | | | | 35,501,762 |
| | | | |
|
|
| | | | | |
| Security Description | | Shares | | Value* |
| | | | | | |
| | |
Industrial Conglomerates—3.1% | | | | | |
Honeywell International, Inc. | | 254,450 | | $ | 9,478,262 |
Tyco International, Ltd. | | 315,000 | | | 9,090,900 |
| | | | |
|
|
| | | | | | 18,569,162 |
| | | | |
|
|
| | |
Insurance—3.6% | | | | | |
AFLAC, Inc. | | 248,700 | | | 11,544,654 |
MGIC Investment Corp. | | 153,000 | | | 10,070,460 |
| | | | |
|
|
| | | | | | 21,615,114 |
| | | | |
|
|
| | |
IT Services—2.3% | | | | | |
First Data Corp. | | 324,500 | | | 13,956,745 |
| | | | |
|
|
| | |
Leisure Equipment & Products—0.8% | | | | | |
Mattel, Inc. | | 285,900 | | | 4,522,938 |
| | | | |
|
|
| | |
Media—16.7% | | | | | |
Comcast Corp. (Special Class A) (a) | | 415,500 | | | 10,674,195 |
Discovery Holding Co. (Class A) (a) | | 129,100 | | | 1,955,865 |
EchoStar Communications Corp. (Class A) (a) | | 314,300 | | | 8,539,531 |
Gannett Co., Inc. | | 147,400 | | | 8,928,018 |
Knight-Ridder, Inc. | | 65,100 | | | 4,120,830 |
Liberty Media Corp. (Class A) (a) | | 1,548,900 | | | 12,189,843 |
The DIRECTV Group, Inc. (a) | | 824,072 | | | 11,635,897 |
The Walt Disney Co. | | 551,700 | | | 13,224,249 |
Time Warner, Inc. | | 822,100 | | | 14,337,424 |
Viacom, Inc. (Class B) (a) | | 459,400 | | | 14,976,440 |
| | | | |
|
|
| | | | | | 100,582,292 |
| | | | |
|
|
| | |
Multiline Retail—1.9% | | | | | |
Kohl’s Corp. (a) | | 236,700 | | | 11,503,620 |
| | | | |
|
|
| | |
Office Electronics—1.4% | | | | | |
Xerox Corp. (a) | | 572,500 | | | 8,387,125 |
| | | | |
|
|
| | |
Oil, Gas & Consumable Fuels—2.9% | | | | | |
Burlington Resources, Inc. | | 102,700 | | | 8,852,740 |
ConocoPhillips | | 150,300 | | | 8,744,454 |
| | | | |
|
|
| | | | | | 17,597,194 |
| | | | |
|
|
| | |
Pharmaceuticals—3.5% | | | | | |
Abbott Laboratories | | 267,600 | | | 10,551,468 |
Bristol-Myers Squibb Co. | | 465,300 | | | 10,692,594 |
| | | | |
|
|
| | | | | | 21,244,062 |
| | | | |
|
|
| |
Semiconductors & Semiconductor Equipment—2.7% | | | |
Intel Corp. | | 287,900 | | | 7,185,984 |
Texas Instruments, Inc. | | 272,700 | | | 8,745,489 |
| | | | |
|
|
| | | | | | 15,931,473 |
| | | | |
|
|
| | |
Specialty Retail—5.4% | | | | | |
Limited Brands, Inc. | | 430,200 | | | 9,614,970 |
The Gap, Inc. | | 485,900 | | | 8,571,276 |
The Home Depot, Inc. | | 345,200 | | | 13,973,696 |
| | | | |
|
|
| | | | | | 32,159,942 |
| | | | |
|
|
*See accompanying notes to financial statements.
MSF-141
Metropolitan Series Fund, Inc.
Harris Oakmark Large Cap Value Portfolio
Schedule of Investments as of December 31, 2005
Common Stock—(Continued)
| | | | | | |
| Security Description | | Shares | | Value* |
| | | | | | | |
| | |
Thrifts & Mortgage Finance—2.4% | | | | | | |
Washington Mutual, Inc. | | | 333,100 | | $ | 14,489,850 |
| | | | | |
|
|
Total Common Stock
(Identified Cost $468,492,563) | | | | | | 545,735,920 |
| | | | | |
|
|
|
| Short Term Investments—9.2% |
| Security Description | | Face
Amount | | Value* |
| | |
Repurchase Agreement —9.2% | | | | | | |
State Street Repurchase Agreement dated 12/30/05 at 1.350% to be repurchased at $55,324,297 on 01/03/06, collateralized by $58,815,000 U.S. Treasury Note
3.125% due 04/15/09 with a value of $56,977,031. | | $ | 55,316,000 | | | 55,316,000 |
| | | | | |
|
|
Total Short Term Investments
(Amortized Cost $55,316,000) | | | | | | 55,316,000 |
| | | | | |
|
|
Total Investments—99.9%
(Identified Cost $523,808,563) | | | | | | 601,051,920 |
Other assets less liabilities | | | | | | 607,877 |
| | | | | |
|
|
| Total Net Assets—100% | | | | | $ | 601,659,797 |
| | | | | |
|
|
| (b) | The aggregate cost of investments for federal income tax purposes as of December 31, 2005 was $523,950,234 and the composition of unrealized appreciation and depreciation of investment securities was $ 88,790,819 and $(11,689,133), respectively. |
| (ADR)— | An American Depositary Receipt is a certificate issued by a custodian bank representing the right to receive securities of the foreign issuer described. Trading on exchanges not located in the United States or Canada significantly influences the value of ADRs. |
*See accompanying notes to financial statements.
MSF-142
Metropolitan Series Fund, Inc.
Harris Oakmark Large Cap Value Portfolio
|
Statement of Assets & Liabilities
|
December 31, 2005
| | | | | | | |
Assets | | | | | | | |
Investments at value | | | | | $ | 601,051,920 | |
Cash | | | | | | 954 | |
Receivable for: | | | | | | | |
Fund shares sold | | | | | | 964,620 | |
Accrued interest and dividends | | | | | | 907,842 | |
| | | | | |
|
|
|
Total Assets | | | | | | 602,925,336 | |
Liabilities | | | | | | | |
Payable for: | | | | | | | |
Fund shares redeemed | | $ | 774,853 | | | | |
Accrued expenses: | | | | | | | |
Management fees | | | 369,853 | | | | |
Service and distribution fees | | | 40,563 | | | | |
Other expenses | | | 80,270 | | | | |
| | |
|
| | | | |
Total Liabilities | | | | | | 1,265,539 | |
| | | | | |
|
|
|
Net Assets | | | | | $ | 601,659,797 | |
| | | | | |
|
|
|
Net assets consists of: | | | | | | | |
Capital paid in | | | | | $ | 522,401,002 | |
Undistributed net investment income | | | | | | 4,374,524 | |
Accumulated net realized losses | | | | | | (2,359,086 | ) |
Unrealized appreciation on investments | | | | | | 77,243,357 | |
| | | | | |
|
|
|
Net Assets | | | | | $ | 601,659,797 | |
| | | | | |
|
|
|
| Computation of offering price: | | | | | | | |
Class A | | | | | | | |
Net asset value and redemption price per
share ($355,706,677 divided by
27,174,319 shares outstanding) | | | | | $ | 13.09 | |
| | | | | |
|
|
|
Class B | | | | | | | |
Net asset value and redemption price per
share ($108,213,664 divided by
8,310,915 shares outstanding) | | | | | $ | 13.02 | |
| | | | | |
|
|
|
Class E | | | | | | | |
Net asset value and redemption price per
share ($137,739,456 divided by
10,563,955 shares outstanding) | | | | | $ | 13.04 | |
| | | | | |
|
|
|
Identified cost of investments | | | | | $ | 523,808,563 | |
| | | | | |
|
|
|
Year Ended December 31, 2005
| | | | | | | | |
Investment Income | | | | | | | | |
Dividends | | | | | | $ | 8,641,983 | (a) |
Interest | | | | | | | 512,307 | (b) |
| | | | | | |
|
|
|
| | | | | | | | 9,154,290 | |
Expenses | | | | | | | | |
Management fees | | $ | 4,028,986 | | | | | |
Service and distribution fees—Class B | | | 194,629 | | | | | |
Service and distribution fees—Class E | | | 212,805 | | | | | |
Directors’ fees and expenses | | | 22,233 | | | | | |
Custodian | | | 115,744 | | | | | |
Audit and tax services | | | 20,986 | | | | | |
Legal | | | 14,692 | | | | | |
Printing | | | 143,052 | | | | | |
Insurance | | | 10,378 | | | | | |
Miscellaneous | | | 7,293 | | | | | |
| | |
|
|
| | | | |
Total expenses | | | 4,770,798 | | | | | |
Expense reductions | | | (24,783 | ) | | | 4,746,015 | |
| | |
|
|
| |
|
|
|
Net Investment Income | | | | | | | 4,408,275 | |
| | | | | | |
|
|
|
Realized and Unrealized Gain (Loss) | | | | | | | | |
| Realized gain (loss) on: | | | | | | | | |
Investments—net | | | 12,096,540 | | | | | |
Foreign currency transactions—net | | | (5,033 | ) | | | 12,091,507 | |
| | |
|
|
| | | | |
| Unrealized depreciation on: | | | | | | | | |
Investments—net | | | | | | | (24,104,899 | ) |
| | | | | | |
|
|
|
Net loss | | | | | | | (12,013,392 | ) |
| | | | | | |
|
|
|
Net Decrease in Net Assets
From Operations | | | | | | $ | (7,605,117 | ) |
| | | | | | |
|
|
|
| (a) | Net of foreign taxes of $14,955. |
| (b) | Includes income on securities loaned of $32,645. |
See accompanying notes to financial statements.
MSF-143
Metropolitan Series Fund, Inc.
Harris Oakmark Large Cap Value Portfolio
Statement of Changes in Net Assets
| | | | | | | | |
| | | Year ended
December 31,
2005
| | | Year ended
December 31,
2004
| |
From Operations | | | | | | | | |
Net investment income | | $ | 4,408,275 | | | $ | 3,518,515 | |
Net realized gain (loss) | | | 12,091,507 | | | | (1,465,943 | ) |
Unrealized appreciation (depreciation) | | | (24,104,899 | ) | | | 49,455,358 | |
| | |
|
|
| |
|
|
|
Increase (decrease) in net assets from operations | | | (7,605,117 | ) | | | 51,507,930 | |
| | |
|
|
| |
|
|
|
From Distributions to Shareholders | | | | | | | | |
Net investment income | | | | | | | | |
Class A | | | (2,367,986 | ) | | | (1,577,007 | ) |
Class B | | | (345,158 | ) | | | (6,125 | ) |
Class E | | | (787,432 | ) | | | (544,986 | ) |
| | |
|
|
| |
|
|
|
Total distributions | | | (3,500,576 | ) | | | (2,128,118 | ) |
| | |
|
|
| |
|
|
|
Increase in net assets from capital share transactions | | | 80,620,910 | | | | 85,702,821 | |
| | |
|
|
| |
|
|
|
Total increase in net assets | | | 69,515,217 | | | | 135,082,633 | |
| | |
Net Assets | | | | | | | | |
Beginning of the period | | | 532,144,580 | | | | 397,061,947 | |
| | |
|
|
| |
|
|
|
End of the period | | $ | 601,659,797 | | | $ | 532,144,580 | |
| | |
|
|
| |
|
|
|
Undistributed Net Investment Income | | | | | | | | |
End of the period | | $ | 4,374,524 | | | $ | 3,496,641 | |
| | |
|
|
| |
|
|
|
Other Information:
Capital Shares
Transactions in capital shares were as follows:
| | | | | | | | | | | | | | |
| | | Year ended December 31, 2005
| | | Year ended December 31, 2004
| |
| | | Shares
| | | $
| | | Shares
| | | $
| |
Class A | | | | | | | | | | | | | | |
Sales | | 11,878,287 | | | $ | 155,829,206 | | | 3,544,182 | | | $ | 44,023,180 | |
Reinvestments | | 187,341 | | | | 2,367,986 | | | 127,178 | | | | 1,577,007 | |
Redemptions | | (10,444,752 | ) | | | (136,809,125 | ) | | (2,726,496 | ) | | | (33,600,633 | ) |
| | |
|
| |
|
|
| |
|
| |
|
|
|
Net increase | | 1,620,876 | | | $ | 21,388,067 | | | 944,864 | | | $ | 11,999,554 | |
| | |
|
| |
|
|
| |
|
| |
|
|
|
Class B | | | | | | | | | | | | | | |
Sales | | 5,802,518 | | | $ | 75,344,107 | | | 3,282,128 | | | $ | 40,965,664 | |
Reinvestments | | 27,415 | | | | 345,158 | | | 496 | | | | 6,125 | |
Redemptions | | (760,700 | ) | | | (9,854,984 | ) | | (135,698 | ) | | | (1,687,160 | ) |
| | |
|
| |
|
|
| |
|
| |
|
|
|
Net increase | | 5,069,233 | | | $ | 65,834,281 | | | 3,146,926 | | | $ | 39,284,629 | |
| | |
|
| |
|
|
| |
|
| |
|
|
|
Class E | | | | | | | | | | | | | | |
Sales | | 1,460,773 | | | $ | 18,989,749 | | | 4,678,809 | | | $ | 57,458,393 | |
Reinvestments | | 62,495 | | | | 787,432 | | | 44,096 | | | | 544,986 | |
Redemptions | | (2,026,432 | ) | | | (26,378,619 | ) | | (1,908,422 | ) | | | (23,584,741 | ) |
| | |
|
| |
|
|
| |
|
| |
|
|
|
Net increase (decrease) | | (503,164 | ) | | $ | (6,601,438 | ) | | 2,814,483 | | | $ | 34,418,638 | |
| | |
|
| |
|
|
| |
|
| |
|
|
|
Increase derived from capital share transactions | | 6,186,945 | | | $ | 80,620,910 | | | 6,906,273 | | | $ | 85,702,821 | |
| | |
|
| |
|
|
| |
|
| |
|
|
|
See accompanying notes to financial statements.
MSF-144
Metropolitan Series Fund, Inc.
Harris Oakmark Large Cap Value Portfolio
Financial Highlights
| | | | | | | | | | | | | | | | | | | |
| | | Class A
| |
| | | Year ended December 31,
| |
| | | 2005
| | | 2004
| | | 2003
| | 2002
| | | 2001
| |
Net Asset Value, Beginning of Period | | $ | 13.37 | | | $ | 12.06 | | | $ | 9.61 | | $ | 11.56 | | | $ | 9.79 | |
| | |
|
|
| |
|
|
| |
|
| |
|
|
| |
|
|
|
Income From Investment Operations | | | | | | | | | | | | | | | | | | | |
Net investment income | | | 0.11 | | | | 0.10 | | | | 0.07 | | | 0.06 | | | | 0.08 | |
Net realized and unrealized gain (loss) of investments | | | (0.30 | ) | | | 1.27 | | | | 2.38 | | | (1.66 | ) | | | 1.72 | |
| | |
|
|
| |
|
|
| |
|
| |
|
|
| |
|
|
|
Total from investment operations | | | (0.19 | ) | | | 1.37 | | | | 2.45 | | | (1.60 | ) | | | 1.80 | |
| | |
|
|
| |
|
|
| |
|
| |
|
|
| |
|
|
|
Less Distributions | | | | | | | | | | | | | | | | | | | |
Distributions from net investment income | | | (0.09 | ) | | | (0.06 | ) | | | 0.00 | | | (0.09 | ) | | | (0.03 | ) |
Distributions from net realized capital gains | | | 0.00 | | | | 0.00 | | | | 0.00 | | | (0.16 | ) | | | 0.00 | |
Distributions in excess of net realized capital gains | | | 0.00 | | | | 0.00 | | | | 0.00 | | | (0.10 | ) | | | 0.00 | |
| | |
|
|
| |
|
|
| |
|
| |
|
|
| |
|
|
|
Total distributions | | | (0.09 | ) | | | (0.06 | ) | | | 0.00 | | | (0.35 | ) | | | (0.03 | ) |
| | |
|
|
| |
|
|
| |
|
| |
|
|
| |
|
|
|
Net Asset Value, End of Period | | $ | 13.09 | | | $ | 13.37 | | | $ | 12.06 | | $ | 9.61 | | | $ | 11.56 | |
| | |
|
|
| |
|
|
| |
|
| |
|
|
| |
|
|
|
Total Return (%) | | | (1.4 | ) | | | 11.4 | | | | 25.5 | | | (14.2 | ) | | | 18.4 | |
Ratio of operating expenses to average net assets before expense reductions (%) | | | 0.78 | | | | 0.79 | | | | 0.83 | | | 0.83 | | | | 0.86 | |
Ratio of operating expenses to average net assets after expense reductions (%) (d) | | | 0.78 | | | | 0.78 | | | | 0.81 | | | 0.82 | | | | 0.84 | |
Ratio of net investment income to average net assets (%) | | | 0.86 | | | | 0.80 | | | | 0.70 | | | 0.68 | | | | 0.98 | |
Portfolio turnover rate (%) | | | 13 | | | | 16 | | | | 13 | | | 30 | | | | 33 | |
Net assets, end of period (000) | | $ | 355,707 | | | $ | 341,632 | | | $ | 296,728 | | $ | 228,544 | | | $ | 213,758 | |
| | | | | | | | | | | | | | | |
| | | Class B
| |
| | | Year ended December 31,
| | July 30, 2002(a) through December 31, 2002
| |
| | | 2005
| | | 2004
| | | 2003
| |
Net Asset Value, Beginning of Period | | $ | 13.31 | | | $ | 12.01 | | | $ | 9.59 | | $ | 9.96 | |
| | |
|
|
| |
|
|
| |
|
| |
|
|
|
Income From Investment Operations | | | | | | | | | | | | | | | |
Net investment income | | | 0.06 | | | | 0.05 | | | | 0.02 | | | 0.01 | |
Net realized and unrealized gain (loss) of investments | | | (0.28 | ) | | | 1.29 | | | | 2.40 | | | (0.38 | ) |
| | |
|
|
| |
|
|
| |
|
| |
|
|
|
Total from investment operations | | | (0.22 | ) | | | 1.34 | | | | 2.42 | | | (0.37 | ) |
| | |
|
|
| |
|
|
| |
|
| |
|
|
|
Less Distributions | | | | | | | | | | | | | | | |
Distributions from net investment income | | | (0.07 | ) | | | (0.04 | ) | | | 0.00 | | | 0.00 | |
| | |
|
|
| |
|
|
| |
|
| |
|
|
|
Total distributions | | | (0.07 | ) | | | (0.04 | ) | | | 0.00 | | | 0.00 | |
| | |
|
|
| |
|
|
| |
|
| |
|
|
|
Net Asset Value, End of Period | | $ | 13.02 | | | $ | 13.31 | | | $ | 12.01 | | $ | 9.59 | |
| | |
|
|
| |
|
|
| |
|
| |
|
|
|
Total Return (%) | | | (1.7 | ) | | | 11.2 | | | | 25.2 | | | (3.7 | )(b) |
Ratio of operating expenses to average net assets before expense reductions (%) | | | 1.03 | | | | 1.04 | | | | 1.08 | | | 1.08 | (c) |
Ratio of operating expenses to average net assets after expense reductions (%) (d) | | | 1.03 | | | | 1.03 | | | | 1.06 | | | 1.07 | (c) |
Ratio of net investment income to average net assets (%) | | | 0.66 | | | | 1.07 | | | | 0.55 | | | 0.61 | (c) |
Portfolio turnover rate (%) | | | 13 | | | | 16 | | | | 13 | | | 30 | |
Net assets, end of period (000) | | $ | 108,214 | | | $ | 43,136 | | | $ | 1,138 | | $ | 9 | |
| (a) | Commencement of operations. |
| (b) | Period less than one year is not computed on an annualized basis. |
| (c) | Computed on an annualized basis. |
| (d) | The Portfolio has entered into arrangements with certain brokers who paid a portion of the Portfolio’s expenses. |
See accompanying notes to financial statements.
MSF-145
Metropolitan Series Fund, Inc.
Harris Oakmark Large Cap Value Portfolio
Financial Highlights
| | | | | | | | | | | | | | | | | | | |
| | | Class E
| |
| | | Year ended December 31,
| | | May 1, 2001(a)
through December 31, 2001
| |
| | | 2005
| | | 2004
| | | 2003
| | 2002
| | |
Net Asset Value, Beginning of Period | | $ | 13.32 | | | $ | 12.02 | | | $ | 9.59 | | $ | 11.55 | | | $ | 11.00 | |
| | |
|
|
| |
|
|
| |
|
| |
|
|
| |
|
|
|
Income From Investment Operations | | | | | | | | | | | | | | | | | | | |
Net investment income | | | 0.09 | | | | 0.07 | | | | 0.04 | | | 0.09 | | | | 0.00 | |
Net realized and unrealized gain (loss) of investments | | | (0.30 | ) | | | 1.28 | | | | 2.39 | | | (1.71 | ) | | | 0.55 | |
| | |
|
|
| |
|
|
| |
|
| |
|
|
| |
|
|
|
Total from investment operations | | | (0.21 | ) | | | 1.35 | | | | 2.43 | | | (1.62 | ) | | | 0.55 | |
| | |
|
|
| |
|
|
| |
|
| |
|
|
| |
|
|
|
Less Distributions | | | | | | | | | | | | | | | | | | | |
Distributions from net investment income | | | (0.07 | ) | | | (0.05 | ) | | | 0.00 | | | (0.08 | ) | | | 0.00 | |
Distributions from net realized capital gains | | | 0.00 | | | | 0.00 | | | | 0.00 | | | (0.16 | ) | | | 0.00 | |
Distributions in excess of net realized capital gains | | | 0.00 | | | | 0.00 | | | | 0.00 | | | (0.10 | ) | | | 0.00 | |
| | |
|
|
| |
|
|
| |
|
| |
|
|
| |
|
|
|
Total distributions | | | (0.07 | ) | | | (0.05 | ) | | | 0.00 | | | (0.34 | ) | | | 0.00 | |
| | |
|
|
| |
|
|
| |
|
| |
|
|
| |
|
|
|
Net Asset Value, End of Period | | $ | 13.04 | | | $ | 13.32 | | | $ | 12.02 | | $ | 9.59 | | | $ | 11.55 | |
| | |
|
|
| |
|
|
| |
|
| |
|
|
| |
|
|
|
Total Return (%) | | | (1.5 | ) | | | 11.3 | | | | 25.3 | | | (14.3 | ) | | | 5.0 | (b) |
Ratio of operating expenses to average net assets before expense reductions (%) | | | 0.93 | | | | 0.94 | | | | 0.98 | | | 0.98 | | | | 1.01 | (c) |
Ratio of operating expenses to average net assets after expense reductions (%) (d) | | | 0.93 | | | | 0.93 | | | | 0.96 | | | 0.97 | | | | 0.98 | (c) |
Ratio of net investment income to average net assets (%) | | | 0.70 | | | | 0.68 | | | | 0.60 | | | 0.67 | | | | 1.28 | (c) |
Portfolio turnover rate (%) | | | 13 | | | | 16 | | | | 13 | | | 30 | | | | 33 | |
Net assets, end of period (000) | | $ | 137,739 | | | $ | 147,376 | | | $ | 99,196 | | $ | 24,936 | | | $ | 185 | |
| (a) | Commencement of operations. |
| (b) | Period less than one year is not computed on an annualized basis. |
| (c) | Computed on an annualized basis. |
| (d) | The Portfolio has entered into arrangements with certain brokers who paid a portion of the Portfolio’s expenses. |
See accompanying notes to financial statements.
MSF-146
Metropolitan Series Fund, Inc.
Jennison Growth Portfolio
Schedule of Investments as of December 31, 2005
Common Stock—98.1% of Total Net Assets
| | | | | |
| Security Description | | Shares | | Value* |
| | | | | | |
| | |
Beverages—1.2% | | | | | |
PepsiCo, Inc. | | 225,000 | | $ | 13,293,000 |
| | | | |
|
|
| | |
Biotechnology—5.9% | | | | | |
Amgen, Inc. (a) | | 282,500 | | | 22,277,950 |
Genentech, Inc. (a) | | 238,600 | | | 22,070,500 |
Gilead Sciences, Inc. (a) | | 352,400 | | | 18,546,812 |
| | | | |
|
|
| | | | | | 62,895,262 |
| | | | |
|
|
| | |
Capital Markets—5.4% | | | | | |
Lehman Brothers Holdings, Inc. | | 49,200 | | | 6,305,964 |
Merrill Lynch & Co., Inc. | | 287,400 | | | 19,465,602 |
The Charles Schwab Corp. | | 1,306,600 | | | 19,167,822 |
The Goldman Sachs Group, Inc. | | 96,300 | | | 12,298,473 |
| | | | |
|
|
| | | | | | 57,237,861 |
| | | | |
|
|
| | |
Commercial Banks—1.0% | | | | | |
Bank of America Corp. | | 230,300 | | | 10,628,345 |
| | | | |
|
|
| | |
Communications Equipment—3.7% | | | | | |
Cisco Systems, Inc. (a) | | 639,800 | | | 10,953,376 |
Nokia Corp. (ADR) | | 819,700 | | | 15,000,510 |
QUALCOMM, Inc. | | 321,400 | | | 13,845,912 |
| | | | |
|
|
| | | | | | 39,799,798 |
| | | | |
|
|
| | |
Computers & Peripherals—4.0% | | | | | |
Apple Computer, Inc. (a) | | 290,000 | | | 20,848,100 |
Dell, Inc. (a) | | 361,600 | | | 10,844,384 |
EMC Corp. (a) | | 778,800 | | | 10,607,256 |
| | | | |
|
|
| | | | | | 42,299,740 |
| | | | |
|
|
| | |
Consumer Finance—2.4% | | | | | |
American Express Co. | | 499,800 | | | 25,719,708 |
| | | | |
|
|
| | |
Diversified Financial Services—1.2% | | | | | |
JPMorgan Chase & Co. | | 323,860 | | | 12,854,003 |
| | | | |
|
|
|
Electronic Equipment & Instruments—0.9% |
Agilent Technologies, Inc. (a) | | 295,900 | | | 9,850,511 |
| | | | |
|
|
| | |
Energy Equipment & Services—2.8% | | | | | |
Schlumberger, Ltd. | | 308,200 | | | 29,941,630 |
| | | | |
|
|
| | |
Food & Staples Retailing—2.0% | | | | | |
Whole Foods Market, Inc. (b) | | 274,800 | | | 21,266,772 |
| | | | |
|
|
| | |
Food Products—1.1% | | | | | |
Cadbury Schweppes, Plc. (ADR) (b) | | 307,400 | | | 11,770,346 |
| | | | |
|
|
| | |
Health Care Equipment & Supplies—3.2% | | | | | |
Alcon, Inc. | | 146,400 | | | 18,973,440 |
St. Jude Medical, Inc. (a) | | 313,500 | | | 15,737,700 |
| | | | |
|
|
| | | | | | 34,711,140 |
| | | | |
|
|
| | | | | |
| Security Description | | Shares | | Value* |
| | | | | | |
| | |
Health Care Providers & Services—5.6% | | | | | |
Caremark Rx, Inc. (a) | | 335,500 | | $ | 17,375,545 |
CIGNA Corp. | | 85,600 | | | 9,561,520 |
UnitedHealth Group, Inc. | | 292,500 | | | 18,175,950 |
WellPoint, Inc. (a) | | 181,200 | | | 14,457,948 |
| | | | |
|
|
| | | | | | 59,570,963 |
| | | | |
|
|
| | |
Hotels, Restaurants & Leisure—1.9% | | | | | |
Marriott International, Inc. (Class A) | | 160,700 | | | 10,762,079 |
Starbucks Corp. (a) | | 165,200 | | | 4,957,652 |
The Cheesecake Factory, Inc. (a)(b) | | 108,900 | | | 4,071,771 |
| | | | |
|
|
| | | | | | 19,791,502 |
| | | | |
|
|
| | |
Household Products—2.9% | | | | | |
The Procter & Gamble Co. | | 533,182 | | | 30,860,574 |
| | | | |
|
|
| | |
Industrial Conglomerates—3.2% | | | | | |
General Electric Co. | | 967,600 | | | 33,914,380 |
| | | | |
|
|
| | |
Insurance—2.5% | | | | | |
American International Group, Inc. | | 394,400 | | | 26,909,912 |
| | | | |
|
|
| | |
Internet & Catalog Retail—3.2% | | | | | |
eBay, Inc. (a) | | 797,400 | | | 34,487,550 |
| | | | |
|
|
| | |
Internet Software & Services—6.7% | | | | | |
Google, Inc. (Class A) (a) | | 101,300 | | | 42,025,318 |
Yahoo!, Inc. (a) | | 756,600 | | | 29,643,588 |
| | | | |
|
|
| | | | | | 71,668,906 |
| | | | |
|
|
| | |
Media—0.4% | | | | | |
Getty Images, Inc. (a) (b) | | 43,200 | | | 3,856,464 |
| | | | |
|
|
| | |
Multiline Retail—3.3% | | | | | |
Federated Department Stores, Inc. | | 190,600 | | | 12,642,498 |
Target Corp. | | 412,500 | | | 22,675,125 |
| | | | |
|
|
| | | | | | 35,317,623 |
| | | | |
|
|
| | |
Oil, Gas & Consumable Fuels—1.1% | | | | | |
Occidental Petroleum Corp. | | 144,200 | | | 11,518,696 |
| | | | |
|
|
| | |
Pharmaceuticals—6.1% | | | | | |
Abbott Laboratories | | 170,900 | | | 6,738,587 |
Novartis AG (ADR) | | 417,100 | | | 21,889,408 |
Roche Holding AG (ADR) | | 306,000 | | | 22,904,437 |
Sanofi-Aventis (ADR) | | 305,300 | | | 13,402,670 |
| | | | |
|
|
| | | | | | 64,935,102 |
| | | | |
|
|
*See accompanying notes to financial statements.
MSF-147
Metropolitan Series Fund, Inc.
Jennison Growth Portfolio
Schedule of Investments as of December 31, 2005
Common Stock—(Continued)
| | | | | |
Security Description | | Shares | | Value* |
| | | | | | |
|
Semiconductors & Semiconductor Equipment—9.3% |
Applied Materials, Inc. | | 921,500 | | $ | 16,531,710 |
Intel Corp. | | 579,300 | | | 14,459,328 |
Marvell Technology Group, Ltd. (a) | | 453,100 | | | 25,414,379 |
Maxim Integrated Products, Inc. | | 581,700 | | | 21,080,808 |
Texas Instruments, Inc. | | 686,700 | | | 22,022,469 |
| | | | |
|
|
| | | | | | 99,508,694 |
| | | | |
|
|
| | |
Software—8.3% | | | | | |
Adobe Systems, Inc. (a) | | 695,200 | | | 25,694,592 |
Electronic Arts, Inc. (a) | | 377,100 | | | 19,726,101 |
Microsoft Corp. | | 673,400 | | | 17,609,410 |
NAVTEQ, Inc. (a)(b) | | 190,300 | | | 8,348,461 |
SAP AG (ADR) | | 380,300 | | | 17,140,121 |
| | | | |
|
|
| | | | | | 88,518,685 |
| | | | |
|
|
| | |
Specialty Retail—4.4% | | | | | |
Chico’s FAS, Inc. (a) | | 487,300 | | | 21,407,089 |
Lowe’s Cos., Inc. | | 240,600 | | | 16,038,396 |
Williams-Sonoma, Inc. (a) | | 226,700 | | | 9,782,105 |
| | | | |
|
|
| | | | | | 47,227,590 |
| | | | |
|
|
|
Textiles, Apparel & Luxury Goods—3.1% |
Coach, Inc. (a) | | 461,400 | | | 15,383,076 |
NIKE, Inc. (Class B) | | 206,100 | | | 17,887,419 |
| | | | |
|
|
| | | | | | 33,270,495 |
| | | | |
|
|
|
Wireless Telecommunication Services—1.3% |
Sprint Nextel Corp. | | 592,684 | | | 13,845,099 |
| | | | |
|
|
Total Common Stock
(Identified Cost $850,589,655) | | | | | 1,047,470,351 |
| | | | |
|
|
| | | | | | |
|
| Short Term Investments—1.7% |
| Security Description | | Face
Amount | | Value* |
| | | | | | | |
| | |
Commercial Paper—1.7% | | | | | | |
Citigroup Funding, Inc.
4.000%, 01/03/06 | | $ | 17,943,000 | | $ | 17,943,000 |
| | | | | |
|
|
Total Short Term Investments
(Amortized Cost $17,943,000) | | | | | | 17,943,000 |
| | | | | |
|
|
Total Investments—99.8%
(Identified Cost $868,532,655) (c) | | | | | | 1,065,413,351 |
Other assets less liabilities | | | | | | 1,839,524 |
| | | | | |
|
|
| Total Net Assets—100% | | | | | $ | 1,067,252,875 |
| | | | | |
|
|
| (b) | A portion or all of the security was held on loan. As of December 31, 2005, the market value of securities loaned was $22,538,805 and the collateral received consisted of cash in the amount of $32,968,453. |
| (c) | The aggregate cost of investments for federal income tax purposes as of December 31, 2005 was $870,848,745 and the composition of unrealized appreciation and depreciation of investment securities was $203,081,448 and $(8,516,842), respectively. |
| (ADR)— | An American Depositary Receipt is a certificate issued by a custodian bank representing the right to receive securities of the foreign issuer described. Trading on exchanges not located in the United States or Canada significantly influences the value of ADRs. |
*See accompanying notes to financial statements.
MSF-148
Metropolitan Series Fund, Inc.
Jennison Growth Portfolio
Statement of Assets & Liabilities
December 31, 2005
| | | | | | | |
Assets | | | | | | | |
Investments at value | | | | | $ | 1,065,413,351 | |
Cash | | | | | | 96 | |
Collateral for securities loaned | | | | | | 32,968,453 | |
Receivable for: | | | | | | | |
Securities sold | | | | | | 6,301,584 | |
Fund shares sold | | | | | | 416,875 | |
Accrued interest and dividends | | | | | | 564,029 | |
Foreign taxes | | | | | | 13,551 | |
| | | | | |
|
|
|
Total Assets | | | | | | 1,105,677,939 | |
Liabilities | | | | | | | |
Payable for: | | | | | | | |
Fund shares redeemed | | $ | 703,854 | | | | |
Securities purchased | | | 3,952,294 | | | | |
Return of collateral for securities loaned | | | 32,968,453 | | | | |
Accrued expenses: | | | | | | | |
Management fees | | | 579,058 | | | | |
Service and distribution fees | | | 65,257 | | | | |
Deferred Directors’ fees | | | 4,372 | | | | |
Other expenses | | | 151,776 | | | | |
| | |
|
| | | | |
Total Liabilities | | | | | | 38,425,064 | |
| | | | | |
|
|
|
Net Assets | | | | | $ | 1,067,252,875 | |
| | | | | |
|
|
|
Net assets consists of: | | | | | | | |
Capital paid in | | | | | $ | 872,048,164 | |
Undistributed net investment loss | | | | | | (4,799 | ) |
Accumulated net realized gains | | | | | | (1,671,186 | ) |
Unrealized appreciation on investments | | | | | | 196,880,696 | |
| | | | | |
|
|
|
Net Assets | | | | | $ | 1,067,252,875 | |
| | | | | |
|
|
|
| Computation of offering price: | | | | | | | |
Class A | | | | | | | |
Net asset value and redemption price per share ($758,316,425 divided by 61,264,970 shares outstanding) | | | | | $ | 12.38 | |
| | | | | |
|
|
|
Class B | | | | | | | |
Net asset value and redemption price per share ($296,178,125 divided by 24,016,230 shares outstanding) | | | | | $ | 12.33 | |
| | | | | |
|
|
|
Class E | | | | | | | |
Net asset value and redemption price per share ($12,758,325 divided by 1,032,162 shares outstanding) | | | | | $ | 12.36 | |
| | | | | |
|
|
|
Identified cost of investments | | | | | $ | 868,532,655 | |
| | | | | |
|
|
|
Statement of Operations
For the Year Ended December 31, 2005
| | | | | | | | |
Investment Income | | | | | | | | |
Dividends | | | | | | $ | 6,031,385 | (a) |
Interest | | | | | | | 620,943 | (b) |
| | | | | | |
|
|
|
| | | | | | | | 6,652,328 | |
Expenses | | | | | | | | |
Management fees | | $ | 5,898,199 | | | | | |
Service and distribution fees—Class B | | | 665,960 | | | | | |
Service and distribution fees—Class E | | | 12,129 | | | | | |
Directors’ fees and expenses | | | 22,661 | | | | | |
Custodian | | | 129,536 | | | | | |
Audit and tax services | | | 21,767 | | | | | |
Legal | | | 22,662 | | | | | |
Printing | | | 286,696 | | | | | |
Insurance | | | 17,365 | | | | | |
Miscellaneous | | | 9,193 | | | | | |
| | |
|
|
| | | | |
Total expenses | | | 7,086,168 | | | | | |
Expense reductions | | | (142,276 | ) | | | 6,943,892 | |
| | |
|
|
| |
|
|
|
Net Investment Loss | | | | | | | (291,564 | ) |
| | | | | | |
|
|
|
Realized and Unrealized Gain | | | | | | | | |
| Realized gain (loss) on: | | | | | | | | |
Investments—net | | | 81,925,176 | | | | | |
Foreign currency transactions—net | | | (1,029 | ) | | | 81,924,147 | |
| | |
|
|
| | | | |
| Unrealized appreciation on: | | | | | | | | |
Investments—net | | | | | | | 53,622,680 | |
| | | | | | |
|
|
|
Net gain | | | | | | | 135,546,827 | |
| | | | | | |
|
|
|
Net Increase in Net Assets
From Operations | | | | | | $ | 135,255,263 | |
| | | | | | |
|
|
|
| (a) | Net of foreign taxes of $168,711. |
| (b) | Includes income on securities loaned of $78,906. |
See accompanying notes to financial statements.
MSF-149
Metropolitan Series Fund, Inc.
Jennison Growth Portfolio
Statement of Changes in Net Assets
| | | | | | | | |
| | | Year ended
December 31,
2005
| | | Year ended
December 31,
2004
| |
From Operations | | | | | | | | |
Net investment income (loss) | | $ | (291,564 | ) | | $ | 2,499,879 | |
Net realized gain | | | 81,924,147 | | | | 14,240,554 | |
Unrealized appreciation | | | 53,622,680 | | | | 53,934,942 | |
| | |
|
|
| |
|
|
|
Increase in net assets from operations | | | 135,255,263 | | | | 70,675,375 | |
| | |
|
|
| |
|
|
|
From Distributions to Shareholders | | | | | | | | |
Net investment income | | | | | | | | |
Class A | | | (2,574,179 | ) | | | (336,147 | ) |
Class B | | | 0 | | | | (34,259 | ) |
| | |
|
|
| |
|
|
|
Total distributions | | | (2,574,179 | ) | | | (370,406 | ) |
| | |
|
|
| |
|
|
|
Increase in net assets from capital share transactions | | | 99,282,826 | | | | 165,651,564 | |
| | |
|
|
| |
|
|
|
Total increase in net assets | | | 231,963,910 | | | | 235,956,533 | |
| | |
Net Assets | | | | | | | | |
Beginning of the period | | | 835,288,965 | | | | 599,332,432 | |
| | |
|
|
| |
|
|
|
End of the period | | $ | 1,067,252,875 | | | $ | 835,288,965 | |
| | |
|
|
| |
|
|
|
| | |
Undistributed (Overdistributed) Net Investment Income (Loss) | | | | | | | | |
End of the period | | $ | (4,799 | ) | | $ | 2,439,621 | |
| | |
|
|
| |
|
|
|
Other Information:
Capital Shares
Transactions in capital shares were as follows:
| | | | | | | | | | | | | | |
| | | Year ended December 31, 2005
| | | Year ended December 31, 2004
| |
| | | Shares
| | | $
| | | Shares
| | | $
| |
Class A | | | | | | | | | | | | | | |
Sales | | 19,312,734 | | | $ | 210,233,950 | | | 16,250,418 | | | $ | 172,828,292 | |
Shares issued through acquisition | | 4,750,559 | | | | 48,020,246 | | | 0 | | | | 0 | |
Reinvestments | | 253,864 | | | | 2,574,179 | | | 32,795 | | | | 336,147 | |
Redemptions | | (9,302,078 | ) | | | (105,820,987 | ) | | (4,310,178 | ) | | | (43,634,960 | ) |
| | |
|
| |
|
|
| |
|
| |
|
|
|
Net increase | | 15,015,079 | | | $ | 155,007,388 | | | 11,973,035 | | | $ | 129,529,479 | |
| | |
|
| |
|
|
| |
|
| |
|
|
|
Class B | | | | | | | | | | | | | | |
Sales | | 5,282,443 | | | $ | 59,532,135 | | | 26,074,444 | | | $ | 260,495,604 | |
Shares issued through acquisition | | 860,671 | | | | 9,446,761 | | | 0 | | | | 0 | |
Reinvestments | | 0 | | | | 0 | | | 3,355 | | | | 34,259 | |
Redemptions | | (12,556,952 | ) | | | (134,368,070 | ) | | (21,321,067 | ) | | | (224,407,778 | ) |
| | |
|
| |
|
|
| |
|
| |
|
|
|
Net increase (decrease) | | (6,413,838 | ) | | $ | (65,389,174 | ) | | 4,756,732 | | | $ | 36,122,085 | |
| | |
|
| |
|
|
| |
|
| |
|
|
|
Class E | | | | | | | | | | | | | | |
Sales | | 277,389 | | | $ | 3,251,480 | | | 0 | | | $ | 0 | |
Shares issued through acquisition | | 1,035,812 | | | | 9,729,050 | | | 0 | | | | 0 | |
Redemptions | | (281,039 | ) | | | (3,315,918 | ) | | 0 | | | | 0 | |
| | |
|
| |
|
|
| |
|
| |
|
|
|
Net increase | | 1,032,162 | | | $ | 9,664,612 | | | 0 | | | $ | 0 | |
| | |
|
| |
|
|
| |
|
| |
|
|
|
Increase derived from capital share transactions | | 9,633,403 | | | $ | 99,282,826 | | | 16,729,767 | | | $ | 165,651,564 | |
| | |
|
| |
|
|
| |
|
| |
|
|
|
See accompanying notes to financial statements.
MSF-150
Metropolitan Series Fund, Inc.
Jennison Growth Portfolio
Financial Highlights
| | | | | | | | | | | | | | | | |
| | | Class A
| |
| | | Year ended December 31,
| | | May 1, 2002(a) through December 31,
2002
| |
| | | 2005
| | | 2004
| | | 2003
| | |
Net Asset Value, Beginning of Period | | $ | 10.92 | | | $ | 10.01 | | | $ | 7.71 | | | $ | 10.00 | |
| | |
|
|
| |
|
|
| |
|
|
| |
|
|
|
Income From Investment Operations | | | | | | | | | | | | | | | | |
Net investment income | | | 0.00 | | | | 0.03 | | | | 0.02 | | | | 0.02 | |
Net realized and unrealized gain (loss) of investments | | | 1.51 | | | | 0.89 | | | | 2.30 | | | | (2.31 | ) |
| | |
|
|
| |
|
|
| |
|
|
| |
|
|
|
Total from investment operations | | | 1.51 | | | | 0.92 | | | | 2.32 | | | | (2.29 | ) |
| | |
|
|
| |
|
|
| |
|
|
| |
|
|
|
Less Distributions | | | | | | | | | | | | | | | | |
Distributions from net investment income | | | (0.05 | ) | | | (0.01 | ) | | | (0.02 | ) | | | 0.00 | |
| | |
|
|
| |
|
|
| |
|
|
| |
|
|
|
Total distributions | | | (0.05 | ) | | | (0.01 | ) | | | (0.02 | ) | | | 0.00 | |
| | |
|
|
| |
|
|
| |
|
|
| |
|
|
|
Net Asset Value, End of Period | | $ | 12.38 | | | $ | 10.92 | | | $ | 10.01 | | | $ | 7.71 | |
| | |
|
|
| |
|
|
| |
|
|
| |
|
|
|
Total Return (%) | | | 13.9 | | | | 9.2 | | | | 30.1 | | | | (22.9 | )(b) |
Ratio of operating expenses to average net assets before expense reductions (%) | | | 0.69 | | | | 0.71 | | | | 0.73 | | | | 0.74 | (c) |
Ratio of operating expenses to average net assets after expense reductions (%) (d) | | | 0.68 | | | | 0.69 | | | | 0.70 | | | | 0.68 | (c) |
Ratio of net investment income to average net assets (%) | | | 0.04 | | | | 0.41 | | | | 0.17 | | | | 0.31 | (c) |
Portfolio turnover rate (%) | | | 60 | | | | 68 | | | | 68 | | | | 82 | (c) |
Net assets, end of period (000) | | $ | 758,316 | | | $ | 504,940 | | | $ | 343,253 | | | $ | 283,320 | |
| | | | | | | | | | | | | | | |
| | | Class B
| |
| | | Year ended December 31,
| | | May 1,
2002(a)
through
December 31,
2002
| |
| | | 2005
| | | 2004
| | 2003
| | |
Net Asset Value, Beginning of Period | | $ | 10.86 | | | $ | 9.97 | | $ | 7.70 | | | $ | 10.00 | |
| | |
|
|
| |
|
| |
|
|
| |
|
|
|
Income From Investment Operations | | | | | | | | | | | | | | | |
Net investment income (loss) | | | (0.02 | ) | | | 0.04 | | | 0.00 | | | | 0.00 | |
Net realized and unrealized gain (loss) of investments | | | 1.49 | | | | 0.85 | | | 2.28 | | | | (2.30 | ) |
| | |
|
|
| |
|
| |
|
|
| |
|
|
|
Total from investment operations | | | 1.47 | | | | 0.89 | | | 2.28 | | | | (2.30 | ) |
| | |
|
|
| |
|
| |
|
|
| |
|
|
|
Less Distributions | | | | | | | | | | | | | | | |
Distributions from net investment income | | | 0.00 | | | | 0.00 | | | (0.01 | ) | | | 0.00 | |
| | |
|
|
| |
|
| |
|
|
| |
|
|
|
Total distributions | | | 0.00 | | | | 0.00 | | | (0.01 | ) | | | 0.00 | |
| | |
|
|
| |
|
| |
|
|
| |
|
|
|
Net Asset Value, End of Period | | $ | 12.33 | | | $ | 10.86 | | $ | 9.97 | | | $ | 7.70 | |
| | |
|
|
| |
|
| |
|
|
| |
|
|
|
Total Return (%) | | | 13.5 | | | | 8.9 | | | 29.7 | | | | (23.0 | )(b) |
Ratio of operating expenses to average net assets before expense reductions (%) | | | 0.94 | | | | 0.96 | | | 0.98 | | | | 0.99 | (c) |
Ratio of operating expenses to average net assets after expense reductions (%) (d) | | | 0.93 | | | | 0.94 | | | 0.95 | | | | 0.93 | (c) |
Ratio of net investment income (loss) to average net assets (%) | | | (0.21 | ) | | | 0.29 | | | (0.11 | ) | | | 0.06 | (c) |
Portfolio turnover rate (%) | | | 60 | | | | 68 | | | 68 | | | | 82 | (c) |
Net assets, end of period (000) | | $ | 296,178 | | | $ | 330,349 | | $ | 256,079 | | | $ | 57,259 | |
| (a) | Commencement of operations. |
| (b) | Periods less than one year are not computed on an annualized basis. |
| (c) | Computed on an annualized basis. |
| (d) | The Portfolio has entered into arrangements with certain brokers who paid a portion of the Portfolio’s expenses. |
See accompanying notes to financial statements.
MSF-151
Metropolitan Series Fund, Inc.
Jennison Growth Portfolio
Financial Highlights
| | | | |
| | | Class E
| |
| | | April 27, 2005(a)
through
December 31,
2005
| |
Net Asset Value, Beginning of Period | | $ | 10.16 | |
| | |
|
|
|
Income From Investment Operations | | | | |
Net investment loss | | | (0.01 | ) |
Net realized and unrealized gain of investments | | | 2.21 | |
| | |
|
|
|
Total from investment operations | | | 2.20 | |
| | |
|
|
|
Net Asset Value, End of Period | | $ | 12.36 | |
| | |
|
|
|
Total Return (%) | | | 21.7 | (b) |
Ratio of operating expenses to average net assets before expense reductions (%) | | | 0.84 | (c) |
Ratio of operating expenses to average net assets after expense reductions (%) (d) | | | 0.82 | (c) |
Ratio of net investment loss to average net assets (%) | | | (0.15 | )(c) |
Portfolio turnover rate (%) | | | 60 | |
Net assets, end of period (000) | | $ | 12,758 | |
| (a) | Commencement of operations. |
| (b) | Period less than one year is not computed on an annualized basis. |
| (c) | Computed on an annualized basis. |
| (d) | The Portfolio has entered into arrangements with certain brokers who paid a portion of the Portfolio’s expenses. |
See accompanying notes to financial statements.
MSF-152
Metropolitan Series Fund, Inc.
MetLife Stock Index Portfolio
Schedule of Investments as of December 31, 2005
Common Stock—99.1% of Total Net Assets
| | | | | |
| Security Description | | Shares | | Value* |
| | | | | | |
| | |
Aerospace & Defense—1.9% | | | | | |
General Dynamics Corp. | | 88,038 | | $ | 10,040,734 |
Goodrich Corp. | | 53,756 | | | 2,209,371 |
L-3 Communications Holdings, Inc. | | 52,540 | | | 3,906,349 |
Lockheed Martin Corp. | | 156,379 | | | 9,950,396 |
Northrop Grumman Corp. | | 155,388 | | | 9,340,373 |
Raytheon Co. | | 195,370 | | | 7,844,105 |
Rockwell Collins, Inc. | | 75,555 | | | 3,511,041 |
The Boeing Co. | | 353,050 | | | 24,798,232 |
United Technologies Corp. | | 445,499 | | | 24,907,849 |
| | | | |
|
|
| | | | | | 96,508,450 |
| | | | |
|
|
| | |
Air Freight & Logistics—1.0% | | | | | |
FedEx Corp. | | 132,532 | | | 13,702,484 |
Ryder System, Inc. | | 28,066 | | | 1,151,267 |
United Parcel Service, Inc. (Class B) | | 482,627 | | | 36,269,419 |
| | | | |
|
|
| | | | | | 51,123,170 |
| | | | |
|
|
| | |
Airlines—0.1% | | | | | |
Southwest Airlines Co. | | 305,088 | | | 5,012,596 |
| | | | |
|
|
| | |
Auto Components—0.2% | | | | | |
Cooper Tire & Rubber Co. | | 26,815 | | | 410,806 |
Dana Corp. (a) | | 65,766 | | | 472,200 |
Johnson Controls, Inc. | | 84,395 | | | 6,153,239 |
The Goodyear Tire & Rubber Co. (a) | | 77,148 | | | 1,340,832 |
| | | | |
|
|
| | | | | | 8,377,077 |
| | | | |
|
|
| | |
Automobiles—0.3% | | | | | |
Ford Motor Co. (a)(b) | | 812,409 | | | 6,271,797 |
General Motors Corp. (a) | | 247,319 | | | 4,802,935 |
Harley-Davidson, Inc. | | 120,101 | | | 6,184,001 |
| | | | |
|
|
| | | | | | 17,258,733 |
| | | | |
|
|
| | |
Beverages—2.1% | | | | | |
Anheuser-Busch Cos., Inc. | | 339,523 | | | 14,585,908 |
Brown-Forman Corp. (Class B) | | 36,331 | | | 2,518,465 |
Coca-Cola Enterprises, Inc. | | 132,535 | | | 2,540,696 |
Constellation Brands, Inc. (b) | | 86,039 | | | 2,256,803 |
Molson Coors Brewing Co. | | 24,692 | | | 1,654,117 |
PepsiCo, Inc. | | 725,634 | | | 42,870,457 |
The Coca-Cola Co. | | 905,242 | | | 36,490,305 |
The Pepsi Bottling Group, Inc. | | 59,959 | | | 1,715,427 |
| | | | |
|
|
| | | | | | 104,632,178 |
| | | | |
|
|
| | |
Biotechnology—1.5% | | | | | |
Amgen, Inc. (b) | | 539,819 | | | 42,570,126 |
Biogen Idec, Inc. (b) | | 148,438 | | | 6,728,695 |
Chiron Corp. (b) | | 47,834 | | | 2,126,700 |
Genzyme Corp. (b) | | 112,933 | | | 7,993,398 |
Gilead Sciences, Inc. (b) | | 200,267 | | | 10,540,052 |
MedImmune, Inc. (b) | | 107,611 | | | 3,768,537 |
| | | | |
|
|
| | | | | | 73,727,508 |
| | | | |
|
|
| | | | | |
| Security Description | | Shares | | Value* |
| | | | | | |
| | |
Building Products—0.2% | | | | | |
American Standard Cos., Inc. (b) | | 79,954 | | $ | 3,194,162 |
Masco Corp. | | 185,345 | | | 5,595,566 |
| | | | |
|
|
| | | | | | 8,789,728 |
| | | | |
|
|
| | |
Capital Markets—2.8% | | | | | |
Ameriprise Financial, Inc. | | 107,586 | | | 4,411,026 |
Capital One Financial Corp. | | 130,989 | | | 11,317,450 |
E*TRADE Financial Corp. (b) | | 178,904 | | | 3,731,937 |
Franklin Resources, Inc. | | 64,925 | | | 6,103,599 |
Janus Capital Group, Inc. | | 94,333 | | | 1,757,424 |
Lehman Brothers Holdings, Inc. | | 117,168 | | | 15,017,423 |
Merrill Lynch & Co., Inc. | | 401,895 | | | 27,220,348 |
Morgan Stanley | | 471,419 | | | 26,748,314 |
State Street Corp. | | 143,406 | | | 7,950,429 |
The Bear Stearns Co., Inc. | | 49,557 | | | 5,725,320 |
The Charles Schwab Corp. | | 451,147 | | | 6,618,326 |
The Goldman Sachs Group, Inc. | | 197,153 | | | 25,178,410 |
| | | | |
|
|
| | | | | | 141,780,006 |
| | | | |
|
|
| | |
Chemicals—1.5% | | | | | |
Air Products & Chemicals, Inc. | | 97,046 | | | 5,744,153 |
Ashland, Inc. | | 31,388 | | | 1,817,365 |
E. I. du Pont de Nemours & Co. | | 402,080 | | | 17,088,400 |
Eastman Chemical Co. | | 35,635 | | | 1,838,410 |
Ecolab, Inc. | | 80,618 | | | 2,924,015 |
Engelhard Corp. | | 52,440 | | | 1,581,066 |
Hercules, Inc. (b) | | 49,314 | | | 557,248 |
International Flavours & Fragrances, Inc. | | 35,341 | | | 1,183,923 |
Monsanto Co. | | 117,419 | | | 9,103,495 |
PPG Industries, Inc. | | 73,048 | | | 4,229,479 |
Praxair, Inc. | | 140,957 | | | 7,465,083 |
Rohm & Haas Co. | | 62,985 | | | 3,049,734 |
Sigma-Aldrich Corp. | | 29,406 | | | 1,861,106 |
The Dow Chemical Co. | | 422,087 | | | 18,495,852 |
| | | | |
|
|
| | | | | | 76,939,329 |
| | | | |
|
|
| | |
Commercial Banks—6.1% | | | | | |
AmSouth Bancorp. | | 152,440 | | | 3,995,452 |
Bank of America Corp. | | 1,756,397 | | | 81,057,721 |
BB&T Corp. | | 237,168 | | | 9,939,711 |
Comerica, Inc. | | 72,279 | | | 4,102,556 |
Compass Bancshares, Inc. | | 54,467 | | | 2,630,211 |
Fifth Third Bancorp. | | 242,660 | | | 9,153,135 |
First Horizon National Corp. (a) | | 55,106 | | | 2,118,275 |
Golden West Financial Corp. | | 111,453 | | | 7,355,898 |
Huntington Bancshares, Inc. | | 99,799 | | | 2,370,226 |
KeyCorp. | | 178,342 | | | 5,872,802 |
M&T Bank Corp. | | 34,894 | | | 3,805,191 |
Marshall & Ilsley Corp. | | 91,472 | | | 3,936,955 |
Mellon Financial Corp. | | 182,863 | | | 6,263,058 |
National City Corp. | | 241,041 | | | 8,091,746 |
Northern Trust Corp. | | 81,131 | | | 4,204,208 |
PNC Financial Services Group, Inc. | | 127,806 | | | 7,902,245 |
Regions Financial Corp. | | 200,269 | | | 6,841,189 |
SunTrust Banks, Inc. | | 158,056 | | | 11,500,155 |
Synovus Financial Corp. | | 136,585 | | | 3,689,161 |
*See accompanying notes to financial statements.
MSF-153
Metropolitan Series Fund, Inc.
MetLife Stock Index Portfolio
Schedule of Investments as of December 31, 2005
Common Stock—(Continued)
| | | | | |
| Security Description | | Shares | | Value* |
| | | | | | |
| | |
Commercial Banks—(Continued) | | | | | |
The Bank of New York Co., Inc. | | 336,847 | | $ | 10,728,577 |
U.S. Bancorp. | | 794,362 | | | 23,743,480 |
Wachovia Corp. | | 679,396 | | | 35,912,873 |
Wells Fargo & Co. | | 731,341 | | | 45,950,155 |
Zions Bancorp. | | 45,669 | | | 3,450,750 |
| | | | |
|
|
| | | | | | 304,615,730 |
| | | | |
|
|
| | |
Commercial Services & Supplies—0.9% | | | | | |
Allied Waste Industries, Inc. (b) | | 95,454 | | | 834,268 |
Avery Dennison Corp. (a) | | 48,310 | | | 2,670,094 |
Cendant Corp. | | 448,002 | | | 7,728,034 |
Cintas Corp. | | 60,234 | | | 2,480,436 |
Convergys Corp. (b) | | 61,222 | | | 970,369 |
Equifax, Inc. | | 56,796 | | | 2,159,384 |
H&R Block, Inc. | | 143,289 | | | 3,517,745 |
Monster Worldwide, Inc. (b) | | 53,837 | | | 2,197,626 |
Paychex, Inc. | | 145,857 | | | 5,560,069 |
Pitney Bowes, Inc. | | 99,764 | | | 4,215,029 |
R.R. Donnelley & Sons Co. | | 95,034 | | | 3,251,113 |
Robert Half International, Inc. | | 74,482 | | | 2,822,123 |
Sabre Holdings Corp. (Class A) | | 57,391 | | | 1,383,697 |
Waste Management, Inc. | | 241,340 | | | 7,324,669 |
| | | | |
|
|
| | | | | | 47,114,656 |
| | | | |
|
|
| | |
Communications Equipment—2.7% | | | | | |
ADC Telecommunications, Inc. (a) (b) | | 50,950 | | | 1,138,223 |
Andrew Corp. (b) | | 71,047 | | | 762,334 |
Avaya, Inc. (b) | | 183,144 | | | 1,954,146 |
CIENA Corp. (b) | | 252,767 | | | 750,718 |
Cisco Systems, Inc. (b) | | 2,686,387 | | | 45,990,945 |
Comverse Technology, Inc. (b) | | 88,345 | | | 2,349,094 |
Corning, Inc. (b) | | 666,489 | | | 13,103,174 |
JDS Uniphase Corp. (a) (b) | | 722,666 | | | 1,705,492 |
Lucent Technologies, Inc. (a) (b) | | 1,943,914 | | | 5,170,811 |
Motorola, Inc. | | 1,089,326 | | | 24,607,874 |
QUALCOMM, Inc. | | 719,071 | | | 30,977,579 |
Scientific-Atlanta, Inc. | | 67,159 | | | 2,892,538 |
Tellabs, Inc. (b) | | 196,125 | | | 2,137,763 |
| | | | |
|
|
| | | | | | 133,540,691 |
| | | | |
|
|
| | |
Computers & Peripherals—3.7% | | | | | |
Apple Computer, Inc. (b) | | 368,577 | | | 26,497,001 |
Dell, Inc. (b) | | 1,029,291 | | | 30,868,437 |
EMC Corp. (b) | | 1,045,547 | | | 14,240,350 |
Gateway, Inc. (a) (b) | | 115,866 | | | 290,824 |
Hewlett-Packard Co. | | 1,252,977 | | | 35,872,731 |
International Business Machines Corp. | | 690,788 | | | 56,782,774 |
Lexmark International, Inc. (Class A) (b) | | 50,753 | | | 2,275,257 |
NCR Corp. (b) | | 80,296 | | | 2,725,246 |
Network Appliance, Inc. (b) | | 162,737 | | | 4,393,899 |
NVIDIA Corp. (b) | | 74,862 | | | 2,736,955 |
Sun Microsystems, Inc. (b) | | 1,493,191 | | | 6,256,470 |
| | | | |
|
|
| | | | | | 182,939,944 |
| | | | |
|
|
| | | | | |
| Security Description | | Shares | | Value* |
| | | | | | |
| | |
Construction & Engineering—0.1% | | | | | |
Fluor Corp. | | 37,972 | | $ | 2,933,717 |
| | | | |
|
|
| | |
Construction Materials—0.1% | | | | | |
Vulcan Materials Co. | | 44,536 | | | 3,017,314 |
| | | | |
|
|
| | |
Consumer Finance—1.1% | | | | | |
American Express Co. | | 543,041 | | | 27,944,890 |
MBNA Corp. | | 548,899 | | | 14,902,608 |
SLM Corp. | | 182,508 | | | 10,054,365 |
| | | | |
|
|
| | | | | | 52,901,863 |
| | | | |
|
|
| | |
Containers & Packaging—0.2% | | | | | |
Ball Corp. | | 45,502 | | | 1,807,340 |
Bemis Co., Inc. | | 46,052 | | | 1,283,469 |
Pactiv Corp. (b) | | 62,663 | | | 1,378,586 |
Sealed Air Corp. (b) | | 35,597 | | | 1,999,484 |
Temple-Inland, Inc. | | 49,084 | | | 2,201,417 |
| | | | |
|
|
| | | | | | 8,670,296 |
| | | | |
|
|
| | |
Diversified Consumer Services—0.1% | | | | | |
Apollo Group, Inc. (Class A) (b) | | 63,644 | | | 3,847,916 |
| | | | |
|
|
| | |
Diversified Financial Services—3.8% | | | | | |
CIT Group, Inc. | | 87,370 | | | 4,524,019 |
Citigroup, Inc. | | 2,212,498 | | | 107,372,528 |
Federated Investors, Inc. (Class B) | | 37,033 | | | 1,371,702 |
JPMorgan Chase & Co. | | 1,530,284 | | | 60,736,972 |
Moody’s Corp. | | 108,520 | | | 6,665,298 |
Principal Financial Group, Inc. | | 122,522 | | | 5,811,218 |
T. Rowe Price Group, Inc. | | 57,157 | | | 4,117,019 |
| | | | |
|
|
| | | | | | 190,598,756 |
| | | | |
|
|
| |
Diversified Telecommunication Services—2.4% | | | |
ALLTEL Corp. | | 167,464 | | | 10,566,979 |
AT&T, Inc. | | 1,708,427 | | | 41,839,377 |
BellSouth Corp. | | 799,731 | | | 21,672,710 |
CenturyTel, Inc. | | 57,288 | | | 1,899,670 |
Citizens Communications Co. | | 146,027 | | | 1,785,910 |
Qwest Communications International, Inc. (a) (b) | | 675,165 | | | 3,814,682 |
Verizon Communications, Inc. | | 1,209,237 | | | 36,422,219 |
| | | | |
|
|
| | | | | | 118,001,547 |
| | | | |
|
|
| | |
Electric Utilities—2.6% | | | | | |
Allegheny Energy, Inc. (b) | | 71,222 | | | 2,254,176 |
Ameren Corp. (a) | | 89,337 | | | 4,577,628 |
American Electric Power Co., Inc. | | 172,174 | | | 6,385,934 |
CenterPoint Energy, Inc. (a) | | 135,622 | | | 1,742,743 |
Cinergy Corp. | | 87,221 | | | 3,703,404 |
CMS Energy Corp. (b) | | 96,256 | | | 1,396,675 |
Consolidated Edison, Inc. (a) | | 107,131 | | | 4,963,379 |
Constellation Energy Group, Inc. | | 78,057 | | | 4,496,083 |
Dominion Resources, Inc. | | 151,878 | | | 11,724,982 |
DTE Energy Co. | | 77,771 | | | 3,358,929 |
Edison International | | 142,490 | | | 6,213,989 |
Entergy Corp. | | 90,742 | | | 6,229,438 |
*See accompanying notes to financial statements.
MSF-154
Metropolitan Series Fund, Inc.
MetLife Stock Index Portfolio
Schedule of Investments as of December 31, 2005
Common Stock—(Continued)
| | | | | |
| Security Description | | Shares | | Value* |
| | | | | | |
| | |
Electric Utilities—(Continued) | | | | | |
| | | | | | |
Exelon Corp. | | 291,805 | | $ | 15,506,518 |
FirstEnergy Corp. | | 144,251 | | | 7,066,856 |
FPL Group, Inc. | | 172,686 | | | 7,176,830 |
PG&E Corp. | | 150,053 | | | 5,569,967 |
Pinnacle West Capital Corp. (a) | | 43,297 | | | 1,790,331 |
PPL Corp. | | 166,250 | | | 4,887,750 |
Progress Energy, Inc. (a) | | 110,062 | | | 4,833,923 |
Public Service Enterprise Group, Inc. | | 109,640 | | | 7,123,311 |
TECO Energy, Inc. | | 91,010 | | | 1,563,552 |
The AES Corp. (b) | | 285,660 | | | 4,521,998 |
The Southern Co. (a) | | 324,286 | | | 11,197,596 |
Xcel Energy, Inc. | | 176,199 | | | 3,252,633 |
| | | | |
|
|
| | | | | | 131,538,625 |
| | | | |
|
|
| | |
Electrical Equipment—0.4% | | | | | |
American Power Conversion Corp. | | 75,167 | | | 1,653,674 |
Cooper Industries, Ltd. (Class A) | | 40,071 | | | 2,925,183 |
Emerson Electric Co. | | 179,666 | | | 13,421,050 |
Rockwell Automation, Inc. | | 78,344 | | | 4,634,831 |
| | | | |
|
|
| | | | | | 22,634,738 |
| | | | |
|
|
| |
Electronic Equipment & Instruments—0.5% | | | |
Agilent Technologies, Inc. (b) | | 179,791 | | | 5,985,242 |
Broadcom Corp. (Class A) (b) | | 126,478 | | | 5,963,438 |
Jabil Circuit, Inc. (b) | | 76,090 | | | 2,822,178 |
Molex, Inc. | | 62,779 | | | 1,629,115 |
PerkinElmer, Inc. | | 57,202 | | | 1,347,679 |
Sanmina-SCI Corp. (b) | | 229,875 | | | 979,268 |
Solectron Corp. (b) | | 399,554 | | | 1,462,368 |
Symbol Technologies, Inc. | | 109,759 | | | 1,407,110 |
Tektronix, Inc. | | 36,469 | | | 1,028,791 |
Thermo Electron Corp. (b) | | 70,925 | | | 2,136,970 |
| | | | |
|
|
| | | | | | 24,762,159 |
| | | | |
|
|
| | |
Energy Equipment & Services—1.7% | | | | | |
Baker Hughes, Inc. | | 149,502 | | | 9,086,731 |
BJ Services Co. | | 140,974 | | | 5,169,517 |
Halliburton Co. | | 224,286 | | | 13,896,760 |
Nabors Industries, Ltd. (b) | | 69,107 | | | 5,234,855 |
National-Oilwell Varco, Inc. (a) (b) | | 76,229 | | | 4,779,558 |
Noble Corp. | | 59,879 | | | 4,223,865 |
Rowan Cos., Inc. (a) (b) | | 47,806 | | | 1,703,806 |
Schlumberger, Ltd. | | 257,633 | | | 25,029,046 |
Transocean, Inc. (b) | | 144,359 | | | 10,060,379 |
Weatherford International, Ltd. (b) | | 152,034 | | | 5,503,631 |
| | | | |
|
|
| | | | | | 84,688,148 |
| | | | |
|
|
| | |
Food & Staples Retailing—2.2% | | | | | |
Albertson’s, Inc. | | 161,282 | | | 3,443,371 |
CVS Corp. | | 356,081 | | | 9,407,660 |
Safeway, Inc. (a) (b) | | 196,497 | | | 4,649,119 |
Supervalu, Inc. | | 59,559 | | | 1,934,476 |
Sysco Corp. | | 271,283 | | | 8,423,337 |
The Kroger Co. (b) | | 317,014 | | | 5,985,225 |
Wal-Mart Stores, Inc. | | 1,092,519 | | | 51,129,889 |
| | | | | |
| Security Description | | Shares | | Value* |
| | | | | | |
| | |
Food & Staples Retailing—(Continued) | | | | | |
| | | | | | |
Walgreen Co. | | 442,624 | | $ | 19,590,538 |
Whole Foods Market, Inc. | | 60,186 | | | 4,657,795 |
| | | | |
|
|
| | | | | | 109,221,410 |
| | | | |
|
|
| | |
Food Products—1.0% | | | | | |
Archer-Daniels-Midland Co. | | 285,661 | | | 7,044,400 |
Campbell Soup Co. | | 81,396 | | | 2,423,159 |
ConAgra Foods, Inc. | | 226,942 | | | 4,602,384 |
General Mills, Inc. | | 155,376 | | | 7,663,144 |
H.J. Heinz Co. | | 146,364 | | | 4,935,394 |
Hershey Co. | | 79,200 | | | 4,375,800 |
Kellogg Co. | | 112,321 | | | 4,854,514 |
McCormick & Co., Inc. | | 58,540 | | | 1,810,057 |
Sara Lee Corp. | | 332,177 | | | 6,278,145 |
Tyson Foods, Inc. (Class A) | | 110,074 | | | 1,882,266 |
Wm. Wrigley Jr., Co. | | 78,468 | | | 5,217,337 |
| | | | |
|
|
| | | | | | 51,086,600 |
| | | | |
|
|
| | |
Gas Utilities—0.1% | | | | | |
KeySpan Corp. | | 76,255 | | | 2,721,541 |
Nicor, Inc. (a) | | 19,320 | | | 759,469 |
Peoples Energy Corp. (a) | | 16,680 | | | 584,968 |
| | | | |
|
|
| | | | | | 4,065,978 |
| | | | |
|
|
| | |
Health Care Equipment & Supplies—2.1% | | | | | |
Applera Corp.—Applied Biosystems Group | | 82,183 | | | 2,182,780 |
Bausch & Lomb, Inc. | | 23,516 | | | 1,596,736 |
Baxter International, Inc. | | 272,735 | | | 10,268,473 |
Becton, Dickinson & Co. | | 110,229 | | | 6,622,558 |
Biomet, Inc. | | 108,931 | | | 3,983,607 |
Boston Scientific Corp. (b) | | 258,043 | | | 6,319,473 |
C.R. Bard, Inc. | | 45,863 | | | 3,023,289 |
Fisher Scientific International, Inc. (b) | | 53,630 | | | 3,317,552 |
Guidant Corp. | | 145,109 | | | 9,395,808 |
IMS Health, Inc. | | 101,330 | | | 2,525,143 |
Medtronic, Inc. | | 529,005 | | | 30,454,818 |
Millipore Corp. (b) | | 22,773 | | | 1,503,929 |
Patterson Cos., Inc. (a) (b) | | 60,474 | | | 2,019,832 |
St. Jude Medical, Inc. (b) | | 160,320 | | | 8,048,064 |
Stryker Corp. | | 127,525 | | | 5,665,936 |
Waters Corp. (b) | | 48,402 | | | 1,829,596 |
Zimmer Holdings, Inc. (b) | | 108,360 | | | 7,307,798 |
| | | | |
|
|
| | | | | | 106,065,392 |
| | | | |
|
|
| | |
Health Care Providers & Services—2.9% | | | | | |
Aetna, Inc. | | 125,085 | | | 11,796,766 |
AmerisourceBergen Corp. | | 91,196 | | | 3,775,514 |
Cardinal Health, Inc. | | 187,282 | | | 12,875,638 |
Caremark Rx, Inc. (b) | | 196,701 | | | 10,187,145 |
CIGNA Corp. | | 55,009 | | | 6,144,505 |
Coventry Health Care, Inc. (b) | | 71,048 | | | 4,046,894 |
Express Scripts, Inc. (b) | | 63,692 | | | 5,337,390 |
HCA, Inc. | | 185,396 | | | 9,362,498 |
Health Management Associates, Inc. (Class A) | | 108,106 | | | 2,374,008 |
Humana, Inc. (b) | | 71,194 | | | 3,867,970 |
*See accompanying notes to financial statements.
MSF-155
Metropolitan Series Fund, Inc.
MetLife Stock Index Portfolio
Schedule of Investments as of December 31, 2005
Common Stock—(Continued)
| | | | | |
| Security Description | | Shares | | Value* |
| | | | | | |
| |
Health Care Providers & Services—(Continued) | | | |
Laboratory Corp. of America Holdings(b) | | 58,131 | | $ | 3,130,354 |
Manor Care, Inc. (a) | | 34,600 | | | 1,376,042 |
McKesson Corp. | | 134,557 | | | 6,941,796 |
Quest Diagnostics, Inc. (a) | | 72,472 | | | 3,730,859 |
Tenet Healthcare Corp. (b) | | 205,290 | | | 1,572,521 |
UnitedHealth Group, Inc. | | 596,159 | | | 37,045,320 |
WellPoint, Inc. (b) | | 288,538 | | | 23,022,447 |
| | | | |
|
|
| | | | | | 146,587,667 |
| | | | |
|
|
| | |
Hotels, Restaurants & Leisure—1.5% | | | | | |
Carnival Corp. | | 189,473 | | | 10,131,121 |
Darden Restaurants, Inc. | | 57,271 | | | 2,226,696 |
Harrah’s Entertainment, Inc. | | 80,374 | | | 5,729,862 |
Hilton Hotels Corp. | | 143,469 | | | 3,459,038 |
International Game Technology (a) | | 147,362 | | | 4,535,802 |
Marriott International, Inc. (Class A) | | 71,992 | | | 4,821,304 |
McDonald’s Corp. | | 550,425 | | | 18,560,331 |
Starbucks Corp. (b) | | 336,083 | | | 10,085,851 |
Starwood Hotels & Resorts Worldwide, Inc.
(Class B) | | 95,880 | | | 6,122,897 |
Wendy’s International, Inc. | | 50,837 | | | 2,809,253 |
Yum! Brands, Inc. | | 123,795 | | | 5,803,510 |
| | | | |
|
|
| | | | | | 74,285,665 |
| | | | |
|
|
| | |
Household Durables—0.7% | | | | | |
Centex Corp. | | 55,870 | | | 3,994,146 |
D.R. Horton, Inc. | | 119,050 | | | 4,253,657 |
Fortune Brands, Inc. | | 63,901 | | | 4,985,556 |
KB HOME | | 34,237 | | | 2,487,660 |
Leggett & Platt, Inc. | | 80,456 | | | 1,847,270 |
Lennar Corp. (Class A) | | 60,069 | | | 3,665,410 |
Maytag Corp. (a) | | 35,054 | | | 659,716 |
Newell Rubbermaid, Inc. (a) | | 120,487 | | | 2,865,181 |
Pulte Homes, Inc. | | 93,823 | | | 3,692,873 |
Snap-On, Inc. | | 25,335 | | | 951,583 |
The Black & Decker Corp. | | 34,293 | | | 2,982,119 |
The Stanley Works | | 31,813 | | | 1,528,297 |
Whirlpool Corp. | | 29,506 | | | 2,471,423 |
| | | | |
|
|
| | | | | | 36,384,891 |
| | | | |
|
|
| | |
Household Products—2.3% | | | | | |
Colgate-Palmolive Co. | | 226,567 | | | 12,427,200 |
Kimberly-Clark Corp. | | 204,321 | | | 12,187,748 |
The Clorox Co. | | 65,908 | | | 3,749,506 |
The Procter & Gamble Co. | | 1,465,864 | | | 84,844,208 |
| | | | |
|
|
| | | | | | 113,208,662 |
| | | | |
|
|
|
Independent Power Producers & Energy Traders—0.2% |
TXU Corp. | | 211,160 | | | 10,598,120 |
| | | | |
|
|
| | |
Industrial Conglomerates—4.7% | | | | | |
3M Co. | | 332,350 | | | 25,757,125 |
General Electric Co. | | 4,621,017 | | | 161,966,646 |
Honeywell International, Inc. | | 368,573 | | | 13,729,344 |
Reynolds American,, Inc. | | 37,391 | | | 3,564,484 |
| | | | | |
| Security Description | | Shares | | Value* |
| | |
Industrial Conglomerates—(Continued) | | | | | |
| | | | | | |
Textron, Inc. | | 57,892 | | $ | 4,456,526 |
Tyco International, Ltd. | | 880,392 | | | 25,408,113 |
| | | | |
|
|
| | | | | | 234,882,238 |
| | | | |
|
|
| | |
Insurance—4.9% | | | | | |
ACE, Ltd. | | 140,967 | | | 7,533,276 |
AFLAC, Inc. | | 218,832 | | | 10,158,181 |
Ambac Financial Group, Inc. | | 46,003 | | | 3,544,991 |
American International Group, Inc. | | 1,135,166 | | | 77,452,376 |
Aon Corp. | | 139,955 | | | 5,031,382 |
Cincinnati Financial Corp. | | 76,407 | | | 3,413,865 |
Genworth Financial, Inc. (Class A) | | 164,715 | | | 5,695,845 |
Jefferson-Pilot Corp. | | 58,618 | | | 3,337,123 |
Lincoln National Corp. (a) | | 75,764 | | | 4,017,765 |
Loews Corp. | | 59,302 | | | 5,624,795 |
Marsh & McLennan Cos., Inc. | | 238,219 | | | 7,565,835 |
MBIA, Inc. (a) | | 58,631 | | | 3,527,241 |
MetLife, Inc. (a) | | 331,188 | | | 16,228,212 |
MGIC Investment Corp. | | 39,680 | | | 2,611,738 |
Prudential Financial, Inc. | | 220,857 | | | 16,164,524 |
Safeco Corp. | | 54,028 | | | 3,052,582 |
The Allstate Corp. | | 283,677 | | | 15,338,415 |
The Chubb Corp. | | 87,430 | | | 8,537,540 |
The Hartford Financial Services Group, Inc. | | 131,368 | | | 11,283,198 |
The Progressive Corp. | | 86,266 | | | 10,074,143 |
The St. Paul Travelers Cos., Inc. | | 302,837 | | | 13,527,729 |
Torchmark, Inc. | | 45,386 | | | 2,523,462 |
UnumProvident Corp. (a) | | 130,335 | | | 2,965,121 |
XL Capital, Ltd. (Class A) | | 76,259 | | | 5,138,331 |
| | | | |
|
|
| | | | | | 244,347,670 |
| | | | |
|
|
| | |
Internet & Catalog Retail—0.6% | | | | | |
Amazon.com, Inc. (b) | | 134,137 | | | 6,324,560 |
eBay, Inc. (b) | | 499,832 | | | 21,617,734 |
| | | | |
|
|
| | | | | | 27,942,294 |
| | | | |
|
|
| | |
Internet Software & Services—0.4% | | | | | |
Yahoo!, Inc. (b) | | 552,219 | | | 21,635,940 |
| | | | |
|
|
| | |
IT Services—0.9% | | | | | |
Affiliated Computer Services, Inc.
(Class A) (a) (b) | | 54,355 | | | 3,216,729 |
Automatic Data Processing, Inc. | | 252,171 | | | 11,572,127 |
Computer Sciences Corp. (b) | | 80,912 | | | 4,097,384 |
Electronic Data Systems Corp. | | 228,091 | | | 5,483,308 |
First Data Corp. | | 334,153 | | | 14,371,921 |
Fiserv, Inc. (b) | | 80,687 | | | 3,491,326 |
Unisys Corp. (b) | | 149,252 | | | 870,139 |
| | | | |
|
|
| | | | | | 43,102,934 |
| | | | |
|
|
| | |
Leisure Equipment & Products—0.2% | | | | | |
Brunswick Corp. | | 42,187 | | | 1,715,323 |
Eastman Kodak Co. (a) | | 125,604 | | | 2,939,134 |
Hasbro, Inc. (a) | | 77,999 | | | 1,574,020 |
Mattel, Inc. | | 176,605 | | | 2,793,891 |
| | | | |
|
|
| | | | | | 9,022,368 |
| | | | |
|
|
*See accompanying notes to financial statements.
MSF-156
Metropolitan Series Fund, Inc.
MetLife Stock Index Portfolio
Schedule of Investments as of December 31, 2005
Common Stock—(Continued)
| | | | | |
| Security Description | | Shares | | Value* |
| | | | | | |
| | |
Machinery—1.4% | | | | | |
Caterpillar, Inc. | | 297,483 | | $ | 17,185,593 |
Cummins, Inc. (a) | | 20,479 | | | 1,837,581 |
Danaher Corp. | | 103,754 | | | 5,787,398 |
Deere & Co. | | 105,484 | | | 7,184,515 |
Dover Corp. | | 88,635 | | | 3,588,831 |
Eaton Corp. | | 64,727 | | | 4,342,534 |
Illinois Tool Works, Inc. | | 89,553 | | | 7,879,769 |
Ingersoll-Rand Co., Ltd. (Class A) | | 144,687 | | | 5,841,014 |
ITT Industries, Inc. | | 40,386 | | | 4,152,489 |
Navistar International Corp. (a) (b) | | 26,981 | | | 772,196 |
PACCAR, Inc. | | 74,038 | | | 5,125,651 |
Pall Corp. | | 54,484 | | | 1,463,440 |
Parker Hannifin Corp. | | 52,379 | | | 3,454,919 |
| | | | |
|
|
| | | | | | 68,615,930 |
| | | | |
|
|
| | |
Media—3.3% | | | | | |
CCE Spinco, Inc. | | 1 | | | 2 |
Clear Channel Communications, Inc. | | 236,393 | | | 7,434,560 |
Comcast Corp. (Class A) (a)(b) | | 949,686 | | | 24,653,848 |
Dow Jones & Co., Inc. (a) | | 25,802 | | | 915,713 |
Gannett Co., Inc. (a) | | 104,914 | | | 6,354,641 |
Knight-Ridder, Inc. (a) | | 30,349 | | | 1,921,092 |
Meredith Corp. | | 18,330 | | | 959,392 |
New York Times Co. (Class A) (a) | | 63,453 | | | 1,678,332 |
News Corp. (Class A) | | 1,064,187 | | | 16,548,108 |
Omnicom Group, Inc. | | 78,857 | | | 6,713,096 |
The E.W. Scripps Co. (Class A) | | 37,231 | | | 1,787,832 |
The Interpublic Group of Cos., Inc. (b) | | 188,286 | | | 1,816,960 |
The McGraw-Hill Cos., Inc. | | 163,959 | | | 8,465,203 |
The Walt Disney Co. | | 841,273 | | | 20,165,314 |
Time Warner, Inc. | | 2,039,150 | | | 35,562,776 |
Tribune Co. | | 114,503 | | | 3,464,861 |
Univision Communications, Inc. (Class A) (b) | | 97,784 | | | 2,873,872 |
Viacom, Inc. (Class B) | | 675,877 | | | 22,033,590 |
| | | | |
|
|
| | | | | | 163,349,192 |
| | | | |
|
|
| | |
Metals & Mining—0.8% | | | | | |
Alcoa, Inc. | | 380,579 | | | 11,253,721 |
Allegheny Technologies, Inc. | | 37,192 | | | 1,341,887 |
Freeport-McMoRan Copper & Gold, Inc.
(Class B) | | 80,490 | | | 4,330,362 |
Newmont Mining Corp. | | 195,398 | | | 10,434,253 |
Nucor Corp. | | 68,059 | | | 4,540,897 |
Phelps Dodge Corp. | | 44,412 | | | 6,389,555 |
United States Steel Corp. | | 49,587 | | | 2,383,647 |
| | | | |
|
|
| | | | | | 40,674,322 |
| | | | |
|
|
| | |
Multi-Utilities—0.4% | | | | | |
Duke Energy Co. | | 405,663 | | | 11,135,449 |
Dynegy, Inc. (Class A) (a) (b) | | 131,760 | | | 637,719 |
NiSource, Inc. | | 119,228 | | | 2,487,096 |
Sempra Energy | | 112,436 | | | 5,041,630 |
| | | | |
|
|
| | | | | | 19,301,894 |
| | | | |
|
|
| | | | | |
| Security Description | | Shares | | Value* |
| | | | | | |
| | |
Multiline Retail—1.3% | | | | | |
Big Lots, Inc. (a) (b) | | 49,831 | | $ | 598,470 |
Costco Wholesale Corp. | | 206,468 | | | 10,213,972 |
Dillard’s, Inc. (Class A) (a) | | 26,939 | | | 668,626 |
Dollar General Corp. | | 138,474 | | | 2,640,699 |
Family Dollar Stores, Inc. | | 67,903 | | | 1,683,315 |
Federated Department Stores, Inc. | | 119,051 | | | 7,896,653 |
J.C. Penney Co., Inc. | | 101,569 | | | 5,647,236 |
Kohl’s Corp. (b) | | 150,775 | | | 7,327,665 |
Nordstrom, Inc. | | 95,604 | | | 3,575,590 |
Sears Holdings Corp. (b) | | 43,650 | | | 5,042,885 |
Target Corp. | | 384,503 | | | 21,136,130 |
| | | | |
|
|
| | | | | | 66,431,241 |
| | | | |
|
|
| | |
Mutual Funds—0.5% | | | | | |
SPDR Trust Series 1 | | 197,200 | | | 24,553,372 |
| | | | |
|
|
| | |
Office Electronics—0.1% | | | | | |
Xerox Corp. (a) (b) | | 420,023 | | | 6,153,337 |
| | | | |
|
|
| | |
Oil, Gas & Consumable Fuels—7.5% | | | | | |
Amerada Hess Corp. | | 34,992 | | | 4,437,685 |
Anadarko Petroleum Corp. | | 103,738 | | | 9,829,175 |
Apache Corp. | | 144,014 | | | 9,867,839 |
Burlington Resources, Inc. | | 165,331 | | | 14,251,532 |
Chevron Corp. | | 981,823 | | | 55,738,092 |
ConocoPhillips | | 606,839 | | | 35,305,893 |
Devon Energy Corp. | | 194,311 | | | 12,152,210 |
El Paso Corp. | | 288,352 | | | 3,506,360 |
EOG Resources, Inc. | | 105,653 | | | 7,751,761 |
Exxon Mobil Corp. | | 2,721,308 | | | 152,855,870 |
Kerr-McGee Corp. | | 50,728 | | | 4,609,146 |
Kinder Morgan, Inc. | | 46,024 | | | 4,231,907 |
Marathon Oil Corp. | | 160,276 | | | 9,772,028 |
Murphy Oil Corp. | | 72,215 | | | 3,898,888 |
Occidental Petroleum Corp. | | 175,811 | | | 14,043,783 |
Sunoco, Inc. | | 59,533 | | | 4,666,197 |
The Williams Cos., Inc. | | 250,602 | | | 5,806,448 |
Valero Energy Corp. | | 269,688 | | | 13,915,901 |
XTO Energy, Inc. | | 158,840 | | | 6,979,430 |
| | | | |
|
|
| | | | | | 373,620,145 |
| | | | |
|
|
| | |
Paper & Forest Products—0.4% | | | | | |
International Paper Co. | | 214,515 | | | 7,209,849 |
Louisiana-Pacific Corp. | | 46,259 | | | 1,270,735 |
MeadWestvaco Corp. | | 79,361 | | | 2,224,489 |
Weyerhaeuser Co. | | 106,378 | | | 7,057,116 |
| | | | |
|
|
| | | | | | 17,762,189 |
| | | | |
|
|
| | |
Personal Products—0.1% | | | | | |
Alberto-Culver Co. (Class B) | | 33,016 | | | 1,510,482 |
Avon Products, Inc. | | 200,473 | | | 5,723,504 |
| | | | |
|
|
| | | | | | 7,233,986 |
| | | | |
|
|
*See accompanying notes to financial statements.
MSF-157
Metropolitan Series Fund, Inc.
MetLife Stock Index Portfolio
Schedule of Investments as of December 31, 2005
Common Stock—(Continued)
| | | | | |
| Security Description | | Shares | | Value* |
| | | | | | |
| | |
Pharmaceuticals – 6.5% | | | | | |
Abbott Laboratories | | 678,415 | | $ | 26,749,903 |
Allergan, Inc. (a) | | 57,558 | | | 6,213,962 |
Bristol-Myers Squibb Co. | | 855,666 | | | 19,663,205 |
Eli Lilly & Co. | | 497,094 | | | 28,130,549 |
Forest Laboratories, Inc. (b) | | 147,731 | | | 6,009,697 |
Hospira, Inc. (b) | | 70,348 | | | 3,009,487 |
Johnson & Johnson | | 1,301,059 | | | 78,193,646 |
King Pharmaceuticals, Inc. (b) | | 105,746 | | | 1,789,222 |
Medco Health Solutions, Inc. (b) | | 134,507 | | | 7,505,491 |
Merck & Co., Inc. | | 956,303 | | | 30,419,998 |
Mylan Laboratories, Inc. (a) | | 95,603 | | | 1,908,236 |
Pfizer, Inc. | | 3,223,813 | | | 75,179,319 |
Schering-Plough Corp. | | 646,343 | | | 13,476,252 |
Watson Pharmaceuticals, Inc. (b) | | 44,353 | | | 1,441,916 |
Wyeth | | 587,025 | | | 27,044,242 |
| | | | |
|
|
| | | | | | 326,735,125 |
| | | | |
|
|
| | |
Real Estate—0.7% | | | | | |
Apartment Investment & Management Co. (REIT) (Class A) | | 41,855 | | | 1,585,049 |
Archstone-Smith Trust (REIT) | | 92,712 | | | 3,883,706 |
Equity Office Properties Trust (REIT) | | 177,634 | | | 5,387,639 |
Equity Residential (REIT) | | 126,027 | | | 4,930,176 |
Plum Creek Timber Co., Inc. (REIT) | | 80,493 | | | 2,901,773 |
ProLogis (REIT) | | 106,491 | | | 4,975,259 |
Public Storage, Inc. | | 36,160 | | | 2,448,755 |
Simon Property Group, Inc. (REIT) | | 81,543 | | | 6,248,640 |
Vornado Realty Trust (REIT) | | 51,631 | | | 4,309,640 |
| | | | |
|
|
| | | | | | 36,670,637 |
| | | | |
|
|
| | |
Road & Rail—0.7% | | | | | |
Burlington Northern Santa Fe Corp. | | 163,314 | | | 11,565,897 |
CSX Corp. | | 95,008 | | | 4,823,556 |
Norfolk Southern Corp. | | 177,744 | | | 7,968,264 |
Union Pacific Corp. | | 115,869 | | | 9,328,613 |
| | | | |
|
|
| | | | | | 33,686,330 |
| | | | |
|
|
| |
Semiconductors & Semiconductor Equipment—3.0% | | | |
Advanced Micro Devices, Inc. (b) | | 176,716 | | | 5,407,510 |
Altera Corp. (b) | | 158,519 | | | 2,937,357 |
Analog Devices, Inc. | | 160,430 | | | 5,754,624 |
Applied Materials, Inc. | | 709,581 | | | 12,729,883 |
Applied Micro Circuits Corp. (a) (b) | | 130,657 | | | 335,788 |
Freescale Semiconductor, Inc. (Class B) (b) | | 179,482 | | | 4,517,562 |
Intel Corp. | | 2,636,728 | | | 65,812,731 |
KLA-Tencor Corp. | | 86,336 | | | 4,258,955 |
Linear Technology Corp. | | 133,287 | | | 4,807,662 |
LSI Logic Corp. (a) (b) | | 171,305 | | | 1,370,440 |
Maxim Integrated Products, Inc. | | 143,367 | | | 5,195,620 |
Micron Technology, Inc. (b) | | 270,272 | | | 3,597,320 |
National Semiconductor Corp. | | 150,301 | | | 3,904,820 |
Novellus Systems, Inc. (b) | | 58,331 | | | 1,406,944 |
PMC-Sierra, Inc. (b) | | 80,138 | | | 617,864 |
QLogic Corp. (b) | | 35,191 | | | 1,144,059 |
Teradyne, Inc. (b) | | 86,112 | | | 1,254,652 |
Texas Instruments, Inc. | | 707,641 | | | 22,694,047 |
Xilinx, Inc. | | 152,422 | | | 3,842,559 |
| | | | |
|
|
| | | | | | 151,590,397 |
| | | | |
|
|
| | | | | |
| Security Description | | Shares | | Value* |
| | | | | | |
| | |
Software—3.5% | | | | | |
Adobe Systems, Inc. (b) | | 262,936 | | $ | 9,718,115 |
Autodesk, Inc. | | 100,938 | | | 4,335,287 |
BMC Software, Inc. (b) | | 94,595 | | | 1,938,251 |
Citrix Systems, Inc. (b) | | 77,124 | | | 2,219,629 |
Computer Associates International, Inc. | | 200,683 | | | 5,657,254 |
Compuware Corp. (b) | | 169,446 | | | 1,519,931 |
Electronic Arts, Inc. (b) | | 131,456 | | | 6,876,463 |
Intuit, Inc. (b) | | 77,386 | | | 4,124,674 |
Mercury Interactive Corp. (b) | | 37,875 | | | 1,052,546 |
Microsoft Corp. | | 4,003,602 | | | 104,694,192 |
Novell, Inc. (b) | | 167,060 | | | 1,475,140 |
Oracle Corp.(b) | | 1,644,765 | | | 20,082,581 |
Parametric Technology Corp. (b) | | 119,093 | | | 726,467 |
Siebel Systems, Inc. (b) | | 231,393 | | | 2,448,138 |
Symantec Corp. (b) | | 472,973 | | | 8,277,027 |
| | | | |
|
|
| | | | | | 175,145,695 |
| | | | |
|
|
| | |
Specialty Retail—2.2% | | | | | |
AutoNation, Inc. (b) | | 79,179 | | | 1,720,560 |
AutoZone, Inc. (b) | | 24,146 | | | 2,215,395 |
Bed Bath & Beyond, Inc. (b) | | 129,828 | | | 4,693,282 |
Best Buy Co., Inc. | | 178,753 | | | 7,772,180 |
Circuit City Stores, Inc. | | 68,496 | | | 1,547,325 |
Limited Brands, Inc. | | 152,295 | | | 3,403,793 |
Lowe’s Cos., Inc. | | 341,965 | | | 22,795,387 |
Office Depot, Inc. (b) | | 135,074 | | | 4,241,323 |
OfficeMax, Inc. | | 30,963 | | | 785,222 |
RadioShack Corp. | | 58,877 | | | 1,238,183 |
Staples, Inc. | | 319,866 | | | 7,264,157 |
The Gap, Inc. | | 251,013 | | | 4,427,869 |
The Home Depot, Inc. | | 929,037 | | | 37,607,418 |
The Sherwin-Williams Co. | | 49,097 | | | 2,229,986 |
Tiffany & Co. (a) | | 62,209 | | | 2,381,983 |
TJX Cos., Inc. | | 201,478 | | | 4,680,334 |
| | | | |
|
|
| | | | | | 109,004,397 |
| | | | |
|
|
|
Textiles, Apparel & Luxury Goods—0.4% |
Coach, Inc. (b) | | 166,219 | | | 5,541,742 |
Jones Apparel Group, Inc. | | 51,092 | | | 1,569,546 |
Liz Claiborne, Inc. | | 46,641 | | | 1,670,681 |
NIKE, Inc. (Class B) | | 83,137 | | | 7,215,460 |
Reebok International, Ltd. | | 23,029 | | | 1,340,979 |
VF Corp. | | 38,898 | | | 2,152,615 |
| | | | |
|
|
| | | | | | 19,491,023 |
| | | | |
|
|
|
Thrifts & Mortgage Finance—1.5% |
Countrywide Financial Corp. | | 261,171 | | | 8,929,437 |
Federal Home Loan Mortgage Corp. | | 302,203 | | | 19,748,966 |
Federal National Mortgage Association | | 423,304 | | | 20,661,468 |
North Fork Bancorp., Inc. | | 208,034 | | | 5,691,810 |
Sovereign Bancorp, Inc. | | 156,199 | | | 3,377,022 |
Washington Mutual, Inc. | | 431,529 | | | 18,771,512 |
| | | | |
|
|
| | | | | | 77,180,215 |
| | | | |
|
|
*See accompanying notes to financial statements.
MSF-158
Metropolitan Series Fund, Inc.
MetLife Stock Index Portfolio
Schedule of Investments as of December 31, 2005
Common Stock—(Continued)
| | | | | |
Security Description | | Shares | | Value* |
| | | | | | |
|
Tobacco—1.4% |
Altria Group, Inc. | | 910,705 | | $ | 68,047,877 |
UST, Inc. | | 71,536 | | | 2,920,815 |
| | | | |
|
|
| | | | | | 70,968,692 |
| | | | |
|
|
|
Trading Companies & Distributors—0.1% |
Genuine Parts Co. | | 75,888 | | | 3,333,001 |
W.W. Grainger, Inc. | | 33,247 | | | 2,363,862 |
| | | | |
|
|
| | | | | | 5,696,863 |
| | | | |
|
|
|
Wireless Telecommunication Services—0.6% |
Sprint Nextel Corp. | | 1,292,109 | | | 30,183,666 |
| | | | |
|
|
Total Common Stock
(Identified Cost $4,091,613,700) | | | | | 4,952,441,352 |
| | | | |
|
|
| | | | | | |
|
| Short Term Investments—0.8% |
| Security Description | | Face
Amount | | Value* |
| | | | | | | |
| | |
Discount Notes—0.8% | | | | | | |
Federal Home Loan Bank
4.38%, 02/15/06 | | $ | 300,000 | | $ | 298,448 |
Federal National Mortgage Association | | | | | | |
4.45%, 03/22/06 | | | 38,300,000 | | | 37,933,171 |
4.310%, 03/22/06 | | | 1,625,000 | | | 1,609,436 |
| | | | | |
|
|
Total Short Term Investments
(Amortized Cost $39,841,055) | | | | | | 39,841,055 |
| | | | | |
|
|
Total Investments—99.9%
(Identified Cost $4,131,454,755) (c) | | | | | | 4,992,282,407 |
Other assets less liabilities | | | | | | 3,195,175 |
| | | | | |
|
|
| Total Net Assets—100% | | | | | $ | 4,995,477,582 |
| | | | | |
|
|
| (a) | A portion or all of the security was held on loan. As of December 31, 2005, the market value of securities loaned was $96,233,326 and the collateral received consisted of cash in the amount of $99,430,593. |
| (c) | The aggregate cost of investments for federal income tax purposes as of December 31, 2005 was $4,139,352,031 and the composition of unrealized appreciation and depreciation of investment securities was $1,348,920,185 and $(495,989,809), respectively. |
| (REIT)— | A Real Estate Investment Trust is a pooled investment vehicle that invests primarily in income-producing real estate or real estate related loans or interest. |
Futures Contracts
| | | | | | | | | | | | | | |
Futures Contracts Long
| | Expiration Date
| | Number of
Contracts
| | Contract
Amount
| | Valuation as of
12/31/2005
| | Net Unrealized
Depreciation
| |
S&P 500 Index Futures | | 3/16/2006 | | 127 | | $ | 40,192,560 | | $ | 39,839,900 | | ($ | 352,660 | ) |
| | | | | | | | | | | | |
|
|
|
*See accompanying notes to financial statements.
MSF-159
Metropolitan Series Fund, Inc.
MetLife Stock Index Portfolio
Statement of Assets & Liabilities
December 31, 2005
| | | | | | |
Assets | | | | | | |
Investments at value | | | | | $ | 4,992,282,407 |
Cash | | | | | | 280 |
Collateral for securities loaned | | | | | | 99,430,593 |
Receivable for: | | | | | | |
Securities sold | | | | | | 6,205,702 |
Fund shares sold | | | | | | 5,707,354 |
Accrued interest and dividends | | | | | | 6,640,924 |
| | | | | |
|
|
Total Assets | | | | | | 5,110,267,260 |
Liabilities | | | | | | |
Payable for: | | | | | | |
Fund shares redeemed | | $ | 7,297,998 | | | |
Securities purchased | | | 6,181,349 | | | |
Futures variation margin | | | 198,755 | | | |
Return of collateral for securities loaned | | | 99,430,593 | | | |
Accrued expenses: | | | | | | |
Management fees | | | 1,043,872 | | | |
Service and distribution fees | | | 200,317 | | | |
Other expenses | | | 436,794 | | | |
| | |
|
| | | |
Total Liabilities | | | | | | 114,789,678 |
| | | | | |
|
|
Net Assets | | | | | $ | 4,995,477,582 |
| | | | | |
|
|
Net assets consists of: | | | | | | |
Capital paid in | | | | | $ | 3,956,855,898 |
Undistributed net investment income | | | | | | 76,007,794 |
Accumulated net realized gains | | | | | | 102,138,898 |
Unrealized appreciation on investments and futures contracts | | | | | | 860,474,992 |
| | | | | |
|
|
Net Assets | | | | | $ | 4,995,477,582 |
| | | | | |
|
|
| Computation of offering price: | | | | | | |
Class A | | | | | | |
Net asset value and redemption price per share ($3,942,484,288 divided by 118,742,369 shares outstanding) | | | | | $ | 33.20 |
| | | | | |
|
|
Class B | | | | | | |
Net asset value and redemption price per share ($765,425,121 divided by 23,616,193 shares outstanding) | | | | | $ | 32.41 |
| | | | | |
|
|
Class E | | | | | | |
Net asset value and redemption price per share ($287,568,173 divided by 8,704,598 shares outstanding) | | | | | $ | 33.04 |
| | | | | |
|
|
Identified cost of investments | | | | | $ | 4,131,454,755 |
| | | | | |
|
|
Statement of Operations
Year Ended December 31, 2005
| | | | | | | | |
Investment Income | | | | | | | | |
Dividends | | | | | | $ | 89,325,048 | |
Interest | | | | | | | 2,821,418 | (a) |
| | | | | | |
|
|
|
| | | | | | | | 92,146,466 | |
Expenses | | | | | | | | |
Management fees | | $ | 12,246,737 | | | | | |
Service and distribution fees—Class B | | | 1,586,557 | | | | | |
Service and distribution fees—Class E | | | 429,475 | | | | | |
Directors’ fees and expenses | | | 22,265 | | | | | |
Custodian | | | 551,557 | | | | | |
Audit and tax services | | | 16,887 | | | | | |
Legal | | | 122,294 | | | | | |
Printing | | | 1,249,924 | | | | | |
Insurance | | | 97,217 | | | | | |
Miscellaneous | | | 78,548 | | | | | |
| | |
|
|
| | | | |
Total expenses | | | 16,401,461 | | | | | |
Management fee waivers | | | (231,563 | ) | | | 16,169,898 | |
| | |
|
|
| |
|
|
|
Net Investment Income | | | | | | | 75,976,568 | |
| | | | | | |
|
|
|
Realized and Unrealized Gain | | | | | | | | |
| Realized gain on: | | | | | | | | |
Investments—net | | | 109,273,667 | | | | | |
Futures contracts—net | | | 4,070,363 | | | | 113,344,030 | |
| | |
|
|
| | | | |
| Unrealized appreciation (depreciation) on: | | | | | | | | |
Investments—net | | | 36,412,698 | | | | | |
Futures contracts—net | | | (3,144,310 | ) | | | 33,268,388 | |
| | |
|
|
| |
|
|
|
Net gain | | | | | | | 146,612,418 | |
| | | | | | |
|
|
|
Net Increase in Net Assets
From Operations | | | | | | $ | 222,588,986 | |
| | | | | | |
|
|
|
| (a) | Includes income on securities loaned of $261,163. |
See accompanying notes to financial statements.
MSF-160
Metropolitan Series Fund, Inc.
MetLife Stock Index Portfolio
Statement of Changes in Net Assets
| | | | | | | | |
| | | Year ended
December 31,
2005
| | | Year ended
December 31,
2004
| |
From Operations | | | | | | | | |
Net investment income | | $ | 75,976,568 | | | $ | 77,846,810 | |
Net realized gain | | | 113,344,030 | | | | 45,750,907 | |
Unrealized appreciation | | | 33,268,388 | | | | 344,502,125 | |
| | |
|
|
| |
|
|
|
Increase in net assets from operations | | | 222,588,986 | | | | 468,099,842 | |
| | |
|
|
| |
|
|
|
From Distributions to Shareholders | | | | | | | | |
Net investment income | | | | | | | | |
Class A | | | (64,940,610 | ) | | | (34,642,595 | ) |
Class B | | | (8,290,412 | ) | | | (2,286,968 | ) |
Class E | | | (4,221,091 | ) | | | (1,628,653 | ) |
| | |
|
|
| |
|
|
|
Total distributions | | | (77,452,113 | ) | | | (38,558,216 | ) |
| | |
|
|
| |
|
|
|
Increase (decrease) in net assets from capital share transactions | | | (91,725,843 | ) | | | 186,609,239 | |
| | |
|
|
| |
|
|
|
Total increase in net assets | | | 53,411,030 | | | | 616,150,865 | |
| | |
Net Assets | | | | | | | | |
Beginning of the period | | | 4,942,066,552 | | | | 4,325,915,687 | |
| | |
|
|
| |
|
|
|
End of the period | | $ | 4,995,477,582 | | | $ | 4,942,066,552 | |
| | |
|
|
| |
|
|
|
Undistributed Net Investment Income | | | | | | | | |
End of the period | | $ | 76,007,794 | | | $ | 77,448,853 | |
| | |
|
|
| |
|
|
|
Other Information:
Capital Shares
Transactions in capital shares were as follows:
| | | | | | | | | | | | | | |
| | | Year ended
December 31, 2005
| | | Year ended
December 31, 2004
| |
| | | Shares
| | | $
| | | Shares
| | | $
| |
Class A | | | | | | | | | | | | | | |
Sales | | 13,995,651 | | | $ | 448,361,856 | | | 12,154,078 | | | $ | 363,376,092 | |
Reinvestments | | 2,143,962 | | | | 64,940,610 | | | 1,153,216 | | | | 34,642,595 | |
Redemptions | | (25,686,049 | ) | | | (822,977,332 | ) | | (18,531,590 | ) | | | (555,863,665 | ) |
| | |
|
| |
|
|
| |
|
| |
|
|
|
Net decrease | | (9,546,436 | ) | | $ | (309,674,866 | ) | | (5,224,296 | ) | | $ | (157,844,978 | ) |
| | |
|
| |
|
|
| |
|
| |
|
|
|
Class B | | | | | | | | | | | | | | |
Sales | | 11,564,331 | | | $ | 360,936,529 | | | 9,744,919 | | | $ | 286,325,159 | |
Reinvestments | | 279,892 | | | | 8,290,412 | | | 77,814 | | | | 2,286,968 | |
Redemptions | | (4,374,267 | ) | | | (137,242,753 | ) | | (2,418,420 | ) | | | (70,751,599 | ) |
| | |
|
| |
|
|
| |
|
| |
|
|
|
Net increase | | 7,469,956 | | | $ | 231,984,188 | | | 7,404,313 | | | $ | 217,860,528 | |
| | |
|
| |
|
|
| |
|
| |
|
|
|
Class E | | | | | | | | | | | | | | |
Sales | | 1,020,487 | | | $ | 32,427,764 | | | 5,444,975 | | | $ | 161,207,332 | |
Reinvestments | | 139,910 | | | | 4,221,091 | | | 54,434 | | | | 1,628,653 | |
Redemptions | | (1,589,809 | ) | | | (50,684,020 | ) | | (1,216,505 | ) | | | (36,242,296 | ) |
| | |
|
| |
|
|
| |
|
| |
|
|
|
Net increase (decrease) | | (429,412 | ) | | $ | (14,035,165 | ) | | 4,282,904 | | | $ | 126,593,689 | |
| | |
|
| |
|
|
| |
|
| |
|
|
|
Increase (decrease) derived from capital share transactions | | (2,505,892 | ) | | $ | (91,725,843 | ) | | 6,462,921 | | | $ | 186,609,239 | |
| | |
|
| |
|
|
| |
|
| |
|
|
|
See accompanying notes to financial statements.
MSF-161
Metropolitan Series Fund, Inc.
MetLife Stock Index Portfolio
Financial Highlights
| | | | | | | | | | | | | | | | | | | | |
| | | Class A
| |
| | | Year ended December 31,
| |
| | | 2005
| | | 2004
| | | 2003
| | | 2002
| | | 2001
| |
Net Asset Value, Beginning of Period | | $ | 32.27 | | | $ | 29.45 | | | $ | 23.41 | | | $ | 30.60 | | | $ | 35.26 | |
| | |
|
|
| |
|
|
| |
|
|
| |
|
|
| |
|
|
|
Income From Investment Operations | | | | | | | | | | | | | | | | | | | | |
Net investment income | | | 0.55 | | | | 0.54 | | | | 0.38 | | | | 0.35 | | | | 0.33 | |
Net realized and unrealized gain (loss) of investments | | | 0.90 | | | | 2.54 | | | | 6.11 | | | | (7.09 | ) | | | (4.59 | ) |
| | |
|
|
| |
|
|
| |
|
|
| |
|
|
| |
|
|
|
Total from investment operations | | | 1.45 | | | | 3.08 | | | | 6.49 | | | | (6.74 | ) | | | (4.26 | ) |
| | |
|
|
| |
|
|
| |
|
|
| |
|
|
| |
|
|
|
Less Distributions | | | | | | | | | | | | | | | | | | | | |
Distributions from net investment income | | | (0.52 | ) | | | (0.26 | ) | | | (0.45 | ) | | | (0.23 | ) | | | (0.09 | ) |
Distributions from net realized capital gains | | | 0.00 | | | | 0.00 | | | | 0.00 | | | | (0.22 | ) | | | (0.31 | ) |
| | |
|
|
| |
|
|
| |
|
|
| |
|
|
| |
|
|
|
Total distributions | | | (0.52 | ) | | | (0.26 | ) | | | (0.45 | ) | | | (0.45 | ) | | | (0.40 | ) |
| | |
|
|
| |
|
|
| |
|
|
| |
|
|
| |
|
|
|
Net Asset Value, End of Period | | $ | 33.20 | | | $ | 32.27 | | | $ | 29.45 | | | $ | 23.41 | | | $ | 30.60 | |
| | |
|
|
| |
|
|
| |
|
|
| |
|
|
| |
|
|
|
Total Return (%) | | | 4.6 | | | | 10.5 | | | | 28.2 | | | | (22.3 | ) | | | (12.2 | ) |
Ratio of operating expenses to average net assets (%) | | | 0.29 | | | | 0.30 | | | | 0.31 | | | | 0.31 | | | | 0.31 | |
Ratio of net investment income to average net assets (%) | | | 1.59 | | | | 1.73 | | | | 1.48 | | | | 1.30 | | | | 1.02 | |
Portfolio turnover rate (%) | | | 8 | | | | 3 | | | | 1 | | | | 7 | | | | 5 | |
Net assets, end of period (000) | | $ | 3,942,484 | | | $ | 4,139,893 | | | $ | 3,931,839 | | | $ | 2,725,874 | | | $ | 3,665,168 | |
| |
| | | Class B
| |
| | | Year ended December 31,
| | | January 2, 2001(a)
through
December 31,
2001
| |
| | | 2005
| | | 2004
| | | 2003
| | | 2002
| | |
Net Asset Value, Beginning of Period | | $ | 31.52 | | | $ | 28.80 | | | $ | 22.92 | | | $ | 30.03 | | | $ | 33.71 | |
| | |
|
|
| |
|
|
| |
|
|
| |
|
|
| |
|
|
|
Income From Investment Operations | | | | | | | | | | | | | | | | | | | | |
Net investment income | | | 0.39 | | | | 0.41 | | | | 0.34 | | | | 0.23 | | | | 0.17 | |
Net realized and unrealized gain (loss) of investments | | | 0.95 | | | | 2.53 | | | | 5.95 | | | | (6.90 | ) | | | (3.45 | ) |
| | |
|
|
| |
|
|
| |
|
|
| |
|
|
| |
|
|
|
Total from investment operations | | | 1.34 | | | | 2.94 | | | | 6.29 | | | | (6.67 | ) | | | (3.28 | ) |
| | |
|
|
| |
|
|
| |
|
|
| |
|
|
| |
|
|
|
Less Distributions | | | | | | | | | | | | | | | | | | | | |
Distributions from net investment income | | | (0.45 | ) | | | (0.22 | ) | | | (0.41 | ) | | | (0.22 | ) | | | (0.09 | ) |
Distributions from net realized capital gains | | | 0.00 | | | | 0.00 | | | | 0.00 | | | | (0.22 | ) | | | (0.31 | ) |
| | |
|
|
| |
|
|
| |
|
|
| |
|
|
| |
|
|
|
Total distributions | | | (0.45 | ) | | | (0.22 | ) | | | (0.41 | ) | | | (0.44 | ) | | | (0.40 | ) |
| | |
|
|
| |
|
|
| |
|
|
| |
|
|
| |
|
|
|
Net Asset Value, End of Period | | $ | 32.41 | | | $ | 31.52 | | | $ | 28.80 | | | $ | 22.92 | | | $ | 30.03 | |
| | |
|
|
| |
|
|
| |
|
|
| |
|
|
| |
|
|
|
Total Return (%) | | | 4.4 | | | | 10.3 | | | | 27.9 | | | | (22.5 | ) | | | (9.8 | )(b) |
Ratio of operating expenses to average net assets (%) | | | 0.54 | | | | 0.55 | | | | 0.56 | | | | 0.56 | | | | 0.56 | (c) |
Ratio of net investment income to average net assets (%) | | | 1.36 | | | | 1.59 | | | | 1.24 | | | | 1.17 | | | | 0.83 | (c) |
Portfolio turnover rate (%) | | | 8 | | | | 3 | | | | 1 | | | | 7 | | | | 5 | |
Net assets, end of period (000) | | $ | 765,425 | | | $ | 508,908 | | | $ | 251,793 | | | $ | 88,517 | | | $ | 17,421 | |
| (a) | Commencement of operations. |
| (b) | Period(s) less than one year are not computed on an annualized basis. |
| (c) | Computed on an annualized basis. |
See accompanying notes to financial statements.
MSF-162
Metropolitan Series Fund, Inc.
MetLife Stock Index Portfolio
Financial Highlights
| | | | | | | | | | | | | | | | | | | | |
| | | Class E
| |
| | | Year ended December 31,
| | | May 1, 2001(a)
through
December 31,
2001
| |
| | | 2005
| | | 2004
| | | 2003
| | | 2002
| | |
Net Asset Value, Beginning of Period | | $ | 32.11 | | | $ | 29.33 | | | $ | 23.34 | | | $ | 30.54 | | | $ | 33.45 | |
| | |
|
|
| |
|
|
| |
|
|
| |
|
|
| |
|
|
|
Income From Investment Operations | | | | | | | | | | | | | | | | | | | | |
Net investment income | | | 0.47 | | | | 0.47 | | | | 0.40 | | | | 0.31 | | | | 0.00 | |
Net realized and unrealized gain (loss) of investments | | | 0.93 | | | | 2.56 | | | | 6.02 | | | | (7.06 | ) | | | (2.91 | ) |
| | |
|
|
| |
|
|
| |
|
|
| |
|
|
| |
|
|
|
Total from investment operations | | | 1.40 | | | | 3.03 | | | | 6.42 | | | | (6.75 | ) | | | (2.91 | ) |
| | |
|
|
| |
|
|
| |
|
|
| |
|
|
| |
|
|
|
Less Distributions | | | | | | | | | | | | | | | | | | | | |
Distributions from net investment income | | | (0.47 | ) | | | (0.25 | ) | | | (0.43 | ) | | | (0.23 | ) | | | 0.00 | |
Distributions from net realized capital gains | | | 0.00 | | | | 0.00 | | | | 0.00 | | | | (0.22 | ) | | | 0.00 | |
| | |
|
|
| |
|
|
| |
|
|
| |
|
|
| |
|
|
|
Total distributions | | | (0.47 | ) | | | (0.25 | ) | | | (0.43 | ) | | | (0.45 | ) | | | 0.00 | |
| | |
|
|
| |
|
|
| |
|
|
| |
|
|
| |
|
|
|
Net Asset Value, End of Period | | $ | 33.04 | | | $ | 32.11 | | | $ | 29.33 | | | $ | 23.34 | | | $ | 30.54 | |
| | |
|
|
| |
|
|
| |
|
|
| |
|
|
| |
|
|
|
Total Return (%) | | | 4.5 | | | | 10.4 | | | | 28.0 | | | | (22.4 | ) | | | (8.7 | )(b) |
Ratio of operating expenses to average net assets (%) | | | 0.44 | | | | 0.45 | | | | 0.46 | | | | 0.46 | | | | 0.46 | (c) |
Ratio of net investment income to average net assets (%) | | | 1.44 | | | | 1.67 | | | | 1.34 | | | | 1.36 | | | | 0.93 | (c) |
Portfolio turnover rate (%) | | | 8 | | | | 3 | | | | 1 | | | | 7 | | | | 5 | |
Net assets, end of period (000) | | $ | 287,568 | | | $ | 293,266 | | | $ | 142,284 | | | $ | 25,624 | | | $ | 33 | |
| (a) | Commencement of operations. |
| (b) | Period(s) less than one year are not computed on an annualized basis. |
| (c) | Computed on an annualized basis. |
See accompanying notes to financial statements.
MSF-163
Metropolitan Series Fund, Inc.
MFS Investors Trust Portfolio
Schedule of Investments as of December 31, 2005
Common Stock—99.0% of Total Net Assets
| | | | | |
| Security Description | | Shares | | Value* |
| | | | | | |
| | |
Aerospace & Defense—4.7% | | | | | |
Lockheed Martin Corp. | | 42,260 | | $ | 2,689,004 |
United Technologies Corp. | | 58,630 | | | 3,278,003 |
| | | | |
|
|
| | | | | | 5,967,007 |
| | | | |
|
|
| | |
Air Freight & Logistics—1.0% | | | | | |
FedEx Corp. | | 11,940 | | | 1,234,477 |
| | | | |
|
|
| | |
Beverages—2.2% | | | | | |
PepsiCo, Inc. | | 32,139 | | | 1,898,772 |
The Coca-Cola Co. | | 22,590 | | | 910,603 |
| | | | |
|
|
| | | | | | 2,809,375 |
| | | | |
|
|
| | |
Biotechnology—4.2% | | | | | |
Amgen, Inc. (a) | | 33,460 | | | 2,638,656 |
Genzyme Corp. (a) | | 13,300 | | | 941,374 |
Gilead Sciences, Inc. (a) | | 35,150 | | | 1,849,944 |
| | | | |
|
|
| | | | | | 5,429,974 |
| | | | |
|
|
| | |
Building Products—0.8% | | | | | |
Masco Corp. | | 32,730 | | | 988,119 |
| | | | |
|
|
| | |
Capital Markets—3.8% | | | | | |
Legg Mason, Inc. | | 11,000 | | | 1,316,590 |
Lehman Brothers Holdings, Inc. | | 10,520 | | | 1,348,348 |
The Goldman Sachs Group, Inc. | | 16,805 | | | 2,146,167 |
| | | | |
|
|
| | | | | | 4,811,105 |
| | | | |
|
|
| | |
Chemicals—2.9% | | | | | |
Monsanto Co. | | 14,330 | | | 1,111,005 |
Praxair, Inc. | | 27,094 | | | 1,434,898 |
The Dow Chemical Co. | | 28,150 | | | 1,233,533 |
| | | | |
|
|
| | | | | | 3,779,436 |
| | | | |
|
|
| | |
Commercial Banks—3.6% | | | | | |
Bank of America Corp. | | 56,920 | | | 2,626,858 |
Wells Fargo & Co. | | 30,682 | | | 1,927,750 |
| | | | |
|
|
| | | | | | 4,554,608 |
| | | | |
|
|
| | |
Communications Equipment—2.5% | | | | | |
Cisco Systems, Inc. (a) | | 115,100 | | | 1,970,512 |
QUALCOMM, Inc. | | 27,510 | | | 1,185,131 |
| | | | |
|
|
| | | | | | 3,155,643 |
| | | | |
|
|
| | |
Computers & Peripherals—6.3% | | | | | |
Apple Computer, Inc. (a) | | 20,060 | | | 1,442,114 |
Dell, Inc. (a) | | 45,990 | | | 1,379,240 |
EMC Corp. (a) | | 217,310 | | | 2,959,762 |
International Business Machines Corp. | | 15,270 | | | 1,255,194 |
SanDisk Corp. (a) | | 17,310 | | | 1,087,414 |
| | | | |
|
|
| | | | | | 8,123,724 |
| | | | |
|
|
| | |
Consumer Finance—2.6% | | | | | |
American Express Co. | | 29,030 | | | 1,493,884 |
SLM Corp. | | 33,750 | | | 1,859,287 |
| | | | |
|
|
| | | | | | 3,353,171 |
| | | | |
|
|
| | | | | |
| Security Description | | Shares | | Value* |
| | | | | | |
| | |
Diversified Financial Services—1.8% | | | | | |
JPMorgan Chase & Co. | | 58,850 | | $ | 2,335,756 |
| | | | |
|
|
| |
Diversified Telecommunication Services—1.0% | | | |
Amdocs, Ltd. (a) | | 49,060 | | | 1,349,150 |
| | | | |
|
|
| | |
Electric Utilities—1.3% | | | | | |
Entergy Corp. | | 5,330 | | | 365,905 |
Exelon Corp. | | 25,130 | | | 1,335,408 |
| | | | |
|
|
| | | | | | 1,701,313 |
| | | | |
|
|
| | |
Electronic Equipment & Instruments—1.3% | | | | | |
Samsung Electronics Co., Ltd. (U.S. Traded Shares) (144A) (GDR) | | 5,190 | | | 1,710,105 |
| | | | |
|
|
| | |
Energy Equipment & Services—4.0% | | | | | |
GlobalSantaFe Corp. | | 28,130 | | | 1,354,460 |
Halliburton Co. | | 7,890 | | | 488,864 |
Noble Corp. | | 25,125 | | | 1,772,317 |
Transocean, Inc. (a) | | 22,200 | | | 1,547,118 |
| | | | |
|
|
| | | | | | 5,162,759 |
| | | | |
|
|
| | |
Food & Staples Retailing—1.0% | | | | | |
Wal-Mart Stores, Inc. | | 26,110 | | | 1,221,948 |
| | | | |
|
|
| | |
Food Products—1.0% | | | | | |
Nestle S.A.(CHF) | | 4,424 | | | 1,320,111 |
| | | | |
|
|
| | |
Health Care Equipment & Supplies—2.6% | | | | | |
Boston Scientific Corp. (a) | | 31,930 | | | 781,966 |
Medtronic, Inc. | | 22,080 | | | 1,271,145 |
Zimmer Holdings, Inc. (a) | | 18,950 | | | 1,277,988 |
| | | | |
|
|
| | | | | | 3,331,099 |
| | | | |
|
|
| | |
Hotels, Restaurants & Leisure—1.9% | | | | | |
Carnival Corp. | | 27,950 | | | 1,494,487 |
Hilton Group, Plc.(GBP) | | 141,220 | | | 883,070 |
| | | | |
|
|
| | | | | | 2,377,557 |
| | | | |
|
|
| | |
Household Products—5.0% | | | | | |
Colgate-Palmolive Co. | | 32,350 | | | 1,774,398 |
Reckitt Benckiser, Plc.(GBP) | | 70,970 | | | 2,339,391 |
The Procter & Gamble Co. | | 40,402 | | | 2,338,468 |
| | | | |
|
|
| | | | | | 6,452,257 |
| | | | |
|
|
| | |
Industrial Conglomerates—2.6% | | | | | |
3M Co. | | 16,950 | | | 1,313,625 |
Tyco International, Ltd. | | 68,380 | | | 1,973,447 |
| | | | |
|
|
| | | | | | 3,287,072 |
| | | | |
|
|
| | |
Insurance—5.2% | | | | | |
ACE, Ltd. | | 18,820 | | | 1,005,741 |
American International Group, Inc. | | 62,981 | | | 4,297,194 |
Genworth Financial, Inc. (Class A) | | 39,270 | | | 1,357,956 |
| | | | |
|
|
| | | | | | 6,660,891 |
| | | | |
|
|
*See accompanying notes to financial statements.
MSF-164
Metropolitan Series Fund, Inc.
MFS Investors Trust Portfolio
Schedule of Investments as of December 31, 2005
Common Stock—(Continued)
| | | | | |
| Security Description | | Shares | | Value* |
| | | | | | |
| | |
Internet Software & Services—0.5% | | | | | |
Yahoo!, Inc. (a) | | 14,920 | | $ | 584,566 |
| | | | |
|
|
| | |
IT Services—0.6% | | | | | |
Accenture, Ltd. (Class A) (a) | | 25,150 | | | 726,080 |
| | | | |
|
|
| | |
Machinery—2.0% | | | | | |
Caterpillar, Inc. | | 32,540 | | | 1,879,836 |
Illinois Tool Works, Inc. | | 7,140 | | | 628,248 |
| | | | |
|
|
| | | | | | 2,508,084 |
| | | | |
|
|
| | |
Media—1.8% | | | | | |
The Walt Disney Co. | | 44,410 | | | 1,064,508 |
Viacom, Inc. (Class B) | | 37,921 | | | 1,236,224 |
| | | | |
|
|
| | | | | | 2,300,732 |
| | | | |
|
|
| | |
Multiline Retail—2.3% | | | | | |
Kohl’s Corp. (a) | | 20,630 | | | 1,002,618 |
Target Corp. | | 36,196 | | | 1,989,694 |
| | | | |
|
|
| | | | | | 2,992,312 |
| | | | |
|
|
| | |
Oil, Gas & Consumable Fuels—5.9% | | | | | |
Amerada Hess Corp. | | 12,080 | | | 1,531,986 |
BP, Plc. (ADR) | | 21,383 | | | 1,373,216 |
EnCana Corp. | | 19,880 | | | 897,781 |
EOG Resources, Inc. | | 22,630 | | | 1,660,363 |
Total S.A. (ADR) | | 16,380 | | | 2,070,432 |
| | | | |
|
|
| | | | | | 7,533,778 |
| | | | |
|
|
| | |
Pharmaceuticals—10.1% | | | | | |
Abbott Laboratories | | 52,930 | | | 2,087,030 |
Eli Lilly & Co. | | 34,570 | | | 1,956,316 |
Johnson & Johnson | | 59,871 | | | 3,598,247 |
Roche Holding AG(CHF) | | 9,730 | | | 1,460,040 |
Teva Pharmaceutical Industries, Ltd. (ADR) | | 27,410 | | | 1,178,904 |
Wyeth | | 56,915 | | | 2,622,074 |
| | | | |
|
|
| | | | | | 12,902,611 |
| | | | |
|
|
| |
Semiconductors & Semiconductor Equipment—2.0% | | | |
Analog Devices, Inc. | | 19,660 | | | 705,204 |
Intel Corp. | | 47,770 | | | 1,192,339 |
Xilinx, Inc. | | 27,480 | | | 692,771 |
| | | | |
|
|
| | | | | | 2,590,314 |
| | | | |
|
|
| | |
Software—3.2% | | | | | |
Adobe Systems, Inc. (a) | | 21,440 | | | 792,422 |
Electronic Arts, Inc. (a) | | 26,480 | | | 1,385,169 |
Oracle Corp. (a) | | 153,200 | | | 1,870,572 |
| | | | |
|
|
| | | | | | 4,048,163 |
| | | | |
|
|
| | |
Specialty Retail—2.7% | | | | | |
Staples, Inc. | | 65,150 | | | 1,479,557 |
The Gap, Inc. | | 46,160 | | | 814,262 |
TJX Cos., Inc. | | 51,730 | | | 1,201,688 |
| | | | |
|
|
| | | | | | 3,495,507 |
| | | | |
|
|
| | | | | | |
| Security Description | | Shares | | Value* |
| | | | | | | |
| | |
Textiles, Apparel & Luxury Goods—0.9% | | | | | | |
NIKE, Inc. (Class B) | | | 13,720 | | $ | 1,190,759 |
| | | | | |
|
|
| | |
Tobacco—1.8% | | | | | | |
Altria Group, Inc. | | | 30,140 | | | 2,252,061 |
| | | | | |
|
|
| |
Wireless Telecommunication Services—1.9% | | | |
Sprint Nextel Corp. | | | 70,210 | | | 1,640,106 |
Vodafone Group, Plc. (ADR) | | | 35,949 | | | 771,825 |
| | | | | |
|
|
| | | | | | | 2,411,931 |
| | | | | |
|
|
Total Common Stock
(Identified Cost $111,178,016) | | | | | | 126,653,555 |
| | | | | |
|
|
| | |
| Short Term Investments—0.9% | | | | | | |
| Security Description | | Face
Amount | | Value* |
| | |
Commercial Paper—0.6% | | | | | | |
AIG Funding, Inc.
4.000%, 01/03/06 | | $ | 798,000 | | | 797,822 |
| | | | | |
|
|
| | |
Discount Notes—0.3% | | | | | | |
Federal Home Loan Bank
3.350%, 01/03/06 | | | 360,000 | | | 359,933 |
| | | | | |
|
|
Total Short Term Investments
(Amortized Cost $1,157,756) | | | | | | 1,157,756 |
| | | | | |
|
|
Total Investments—99.9%
(Identified Cost $112,335,772) (b) | | | | | | 127,811,311 |
Other assets less liabilities | | | | | | 109,393 |
| | | | | |
|
|
| Total Net Assets—100% | | | | | $ | 127,920,704 |
| | | | | |
|
|
| (b) | The aggregate cost of investments for federal income tax purposes as of December 31, 2005 was $112,490,333 and the composition of unrealized appreciation and depreciation of investment securities was $ 17,870,606 and $(2,549,628), respectively. |
| (144A)— | Securities exempt from registration under Rule 144A of the Securities Act of 1933. These securities may be resold in transactions exempt from registration, normally to qualified institutional buyers. As of December 31, 2005, the market value of 144A securities was $1,710,105, which is 1.3% of total net assets. |
| (ADR)— | An American Depositary Receipt is a certificate issued by a custodian bank representing the right to receive securities of the foreign issuer described. Trading on exchanges not located in the United States or Canada significantly influences the value of ADRs. |
| (GDR)— | Global Depository Receipt. |
*See accompanying notes to financial statements.
MSF-165
Metropolitan Series Fund, Inc.
MFS Investors Trust Portfolio
Statement of Assets & Liabilities
December 31, 2005
| | | | | | | |
Assets | | | | | | | |
Investments at value | | | | | $ | 127,811,311 | |
Cash | | | | | | 210,759 | |
Receivable for: | | | | | | | |
Securities sold | | | | | | 419,556 | |
Fund shares sold | | | | | | 38,390 | |
Accrued interest and dividends | | | | | | 110,295 | |
Foreign taxes | | | | | | 5,042 | |
| | | | | |
|
|
|
Total Assets | | | | | | 128,595,353 | |
Liabilities | | | | | | | |
Payable for: | | | | | | | |
Fund shares redeemed | | $ | 116,942 | | | | |
Securities purchased | | | 399,564 | | | | |
Accrued expenses: | | | | | | | |
Management fees | | | 82,233 | | | | |
Service and distribution fees | | | 13,465 | | | | |
Deferred directors’ fees | | | 13,549 | | | | |
Other expenses | | | 48,896 | | | | |
| | |
|
| | | | |
Total Liabilities | | | | | | 674,649 | |
| | | | | |
|
|
|
Net Assets | | | | | $ | 127,920,704 | |
| | | | | |
|
|
|
Net assets consists of: | | | | | | | |
Capital paid in | | | | | $ | 122,083,566 | |
Undistributed net investment income | | | | | | 389,101 | |
Accumulated net realized losses | | | | | | (10,027,166 | ) |
Unrealized appreciation on investments and foreign currency | | | | | | 15,475,203 | |
| | | | | |
|
|
|
Net Assets | | | | | $ | 127,920,704 | |
| | | | | |
|
|
|
| Computation of offering price: | | | | | | | |
Class A | | | | | | | |
Net asset value and redemption price per
share ($55,660,236 divided by
5,691,037 shares outstanding) | | | | | $ | 9.78 | |
| | | | | |
|
|
|
Class B | | | | | | | |
Net asset value and redemption price per
share ($49,130,953 divided by
5,043,988 shares outstanding) | | | | | $ | 9.74 | |
| | | | | |
|
|
|
Class E | | | | | | | |
Net asset value and redemption price per
share ($23,129,515 divided by
2,370,066 shares outstanding) | | | | | $ | 9.76 | |
| | | | | |
|
|
|
Identified cost of investments | | | | | $ | 112,335,772 | |
| | | | | |
|
|
|
Statement of Operations
Year Ended December 31, 2005
| | | | | | | | |
Investment Income | | | | | | | | |
Dividends | | | | | | $ | 1,739,984 | (a) |
Interest | | | | | | | 44,487 | |
| | | | | | |
|
|
|
| | | | | | | | 1,784,471 | |
Expenses | | | | | | | | |
Management fees | | $ | 947,620 | | | | | |
Deferred expense reimbursement | | | 41,674 | | | | | |
Service and distribution fees—Class B | | | 118,984 | | | | | |
Service and distribution fees—Class E | | | 34,029 | | | | | |
Directors’ fees and expenses | | | 23,182 | | | | | |
Custodian | | | 108,681 | | | | | |
Audit and tax services | | | 13,049 | | | | | |
Legal | | | 3,459 | | | | | |
Printing | | | 31,896 | | | | | |
Insurance | | | 2,626 | | | | | |
Miscellaneous | | | 6,129 | | | | | |
| | |
|
|
| | | | |
Total expenses | | | 1,331,329 | | | | | |
Expense reductions | | | (14,900 | ) | | | 1,316,429 | |
| | |
|
|
| |
|
|
|
Net Investment Income | | | | | | | 468,042 | |
| | | | | | |
|
|
|
Realized and Unrealized Gain (Loss) | | | | | | | | |
| Realized gain (loss) on: | | | | | | | | |
Investments—net | | | 9,835,558 | | | | | |
Foreign currency transactions—net | | | (44,165 | ) | | | 9,791,393 | |
| | |
|
|
| | | | |
| Unrealized depreciation on: | | | | | | | | |
Investments—net | | | (1,688,895 | ) | | | | |
Foreign currency transactions—net | | | (1,090 | ) | | | (1,689,985 | ) |
| | |
|
|
| |
|
|
|
Net gain | | | | | | | 8,101,408 | |
| | | | | | |
|
|
|
Net Increase in Net Assets
From Operations | | | | | | $ | 8,569,450 | |
| | | | | | |
|
|
|
| (a) | Net of foreign taxes of $30,988. |
See accompanying notes to financial statements.
MSF-166
Metropolitan Series Fund, Inc.
MFS Investors Trust Portfolio
Statement of Changes in Net Assets
| | | | | | | | |
| | | Year ended
December 31,
2005
| | | Year ended
December 31,
2004
| |
From Operations | | | | | | | | |
Net investment income | | $ | 468,042 | | | $ | 486,741 | |
Net realized gain | | | 9,791,393 | | | | 6,930,068 | |
Unrealized appreciation (depreciation) | | | (1,689,985 | ) | | | 8,341,490 | |
| | |
|
|
| |
|
|
|
Increase in net assets from operations | | | 8,569,450 | | | | 15,758,299 | |
| | |
|
|
| |
|
|
|
From Distributions to Shareholders | | | | | | | | |
Net investment income | | | | | | | | |
Class A | | | (253,383 | ) | | | (141,044 | ) |
Class B | | | (94,155 | ) | | | (193,282 | ) |
Class E | | | (66,783 | ) | | | (62,600 | ) |
| | |
|
|
| |
|
|
|
Total distributions | | | (414,321 | ) | | | (396,926 | ) |
| | |
|
|
| |
|
|
|
Increase (decrease) in net assets from capital share transactions | | | (11,367,431 | ) | | | 29,304,427 | |
| | |
|
|
| |
|
|
|
Total increase (decrease) in net assets | | | (3,212,302 | ) | | | 44,665,800 | |
| | |
Net Assets | | | | | | | | |
Beginning of the period | | | 131,133,006 | | | | 86,467,206 | |
| | |
|
|
| |
|
|
|
End of the period | | $ | 127,920,704 | | | $ | 131,133,006 | |
| | |
|
|
| |
|
|
|
Undistributed Net Investment Income | | | | | | | | |
End of the period | | $ | 389,101 | | | $ | 394,444 | |
| | |
|
|
| |
|
|
|
Other Information:
Capital Shares
Transactions in capital shares were as follows:
| | | | | | | | | | | | | | |
| | | Year ended
December 31, 2005
| | | Year ended
December 31, 2004
| |
| | | Shares
| | | $
| | | Shares
| | | $
| |
Class A | | | | | | | | | | | | | | |
Sales | | 1,023,500 | | | $ | 9,445,381 | | | 3,039,741 | | | $ | 24,899,646 | |
Shares issued through acquisition | | 0 | | | | 0 | | | 3,868,426 | | | | 29,911,327 | |
Reinvestments | | 28,958 | | | | 253,383 | | | 16,831 | | | | 141,044 | |
Redemptions | | (1,770,911 | ) | | | (16,387,893 | ) | | (3,591,062 | ) | | | (29,496,402 | ) |
| | |
|
| |
|
|
| |
|
| |
|
|
|
Net increase (decrease) | | (718,453 | ) | | $ | (6,689,129 | ) | | 3,333,936 | | | $ | 25,455,615 | |
| | |
|
| |
|
|
| |
|
| |
|
|
|
Class B | | | | | | | | | | | | | | |
Sales | | 580,119 | | | $ | 5,343,291 | | | 1,699,576 | | | $ | 14,179,860 | |
Shares issued through acquisition | | 0 | | | | 0 | | | 25,379 | | | | 207,824 | |
Reinvestments | | 10,785 | | | | 94,155 | | | 23,120 | | | | 193,282 | |
Redemptions | | (965,429 | ) | | | (8,844,462 | ) | | (2,273,714 | ) | | | (18,797,246 | ) |
| | |
|
| |
|
|
| |
|
| |
|
|
|
Net decrease | | (374,525 | ) | | $ | (3,407,016 | ) | | (525,639 | ) | | $ | (4,216,280 | ) |
| | |
|
| |
|
|
| |
|
| |
|
|
|
Class E | | | | | | | | | | | | | | |
Sales | | 259,460 | | | $ | 2,390,880 | | | 631,024 | | | $ | 5,210,442 | |
Shares issued through acquisition | | 0 | | | | 0 | | | 907,886 | | | | 6,978,460 | |
Reinvestments | | 7,641 | | | | 66,783 | | | 7,479 | | | | 62,600 | |
Redemptions | | (403,252 | ) | | | (3,728,949 | ) | | (503,493 | ) | | | (4,186,410 | ) |
| | |
|
| |
|
|
| |
|
| |
|
|
|
Net increase (decrease) | | (136,151 | ) | | $ | (1,271,286 | ) | | 1,042,896 | | | $ | 8,065,092 | |
| | |
|
| |
|
|
| |
|
| |
|
|
|
Increase (decrease) derived from capital share transactions | | (1,229,129 | ) | | $ | (11,367,431 | ) | | 3,851,193 | | | $ | 29,304,427 | |
| | |
|
| |
|
|
| |
|
| |
|
|
|
See accompanying notes to financial statements.
MSF-167
Metropolitan Series Fund, Inc.
MFS Investors Trust Portfolio
Financial Highlights
| | | | | | | | | | | | | | | | | | | | |
| | | Class A
| |
| | | Year ended December 31,
| |
| | | 2005
| | | 2004
| | | 2003
| | | 2002
| | | 2001
| |
Net Asset Value, Beginning of Period | | $ | 9.17 | | | $ | 8.27 | | | $ | 6.81 | | | $ | 8.57 | | | $ | 10.23 | |
| | |
|
|
| |
|
|
| |
|
|
| |
|
|
| |
|
|
|
Income From Investment Operations | | | | | | | | | | | | | | | | | | | | |
Net investment income | | | 0.05 | | | | 0.03 | | | | 0.05 | | | | 0.05 | | | | 0.05 | |
Net realized and unrealized gain (loss) of investments | | | 0.60 | | | | 0.92 | | | | 1.43 | | | | (1.78 | ) | | | (1.67 | ) |
| | |
|
|
| |
|
|
| |
|
|
| |
|
|
| |
|
|
|
Total from investment operations | | | 0.65 | | | | 0.95 | | | | 1.48 | | | | (1.73 | ) | | | (1.62 | ) |
| | |
|
|
| |
|
|
| |
|
|
| |
|
|
| |
|
|
|
Less Distributions | | | | | | | | | | | | | | | | | | | | |
Distributions from net investment income | | | (0.04 | ) | | | (0.05 | ) | | | (0.02 | ) | | | (0.03 | ) | | | (0.04 | ) |
| | |
|
|
| |
|
|
| |
|
|
| |
|
|
| |
|
|
|
Total distributions | | | (0.04 | ) | | | (0.05 | ) | | | (0.02 | ) | | | (0.03 | ) | | | (0.04 | ) |
| | |
|
|
| |
|
|
| |
|
|
| |
|
|
| |
|
|
|
Net Asset Value, End of Period | | $ | 9.78 | | | $ | 9.17 | | | $ | 8.27 | | | $ | 6.81 | | | $ | 8.57 | |
| | |
|
|
| |
|
|
| |
|
|
| |
|
|
| |
|
|
|
Total Return (%) | | | 7.3 | | | | 11.4 | | | | 21.9 | | | | (20.2 | ) | | | (15.9 | ) |
Ratio of operating expenses to average net assets before expense reductions (%) | | | 0.93 | | | | 0.97 | | | | 0.98 | | | | 0.90 | | | | 0.90 | |
Ratio of operating expenses to average net assets after expense reductions (%) (d) | | | 0.92 | | | | 0.95 | | | | 0.96 | | | | 0.88 | | | | — | |
Ratio of operating expenses to average net assets without giving effect to the contractual expense
agreement would have been (%) | | | — | | | | — | | | | 1.11 | | | | 1.34 | | | | 1.37 | |
Ratio of net investment income to average net assets (%) | | | 0.49 | | | | 0.56 | | | | 0.68 | | | | 0.62 | | | | 0.58 | |
Portfolio turnover rate (%) | | | 46 | | | | 107 | | | | 88 | | | | 63 | | | | 86 | |
Net assets, end of period (000) | | $ | 55,660 | | | $ | 58,752 | | | $ | 25,431 | | | $ | 20,618 | | | $ | 24,506 | |
| | | | | | | | | | | | | | | | |
| | | Class B
| |
| | | Year ended December 31,
| | | May 1, 2002(a)
through
December 31,
2002
| |
| | | 2005
| | | 2004
| | | 2003
| | |
Net Asset Value, Beginning of Period | | $ | 9.13 | | | $ | 8.24 | | | $ | 6.80 | | | $ | 8.13 | |
| | |
|
|
| |
|
|
| |
|
|
| |
|
|
|
Income From Investment Operations | | | | | | | | | | | | | | | | |
Net investment income | | | 0.02 | | | | 0.02 | | | | 0.02 | | | | 0.01 | |
Net realized and unrealized gain (loss) of investments | | | 0.61 | | | | 0.90 | | | | 1.44 | | | | (1.34 | ) |
| | |
|
|
| |
|
|
| |
|
|
| |
|
|
|
Total from investment operations | | | 0.63 | | | | 0.92 | | | | 1.46 | | | | (1.33 | ) |
| | |
|
|
| |
|
|
| |
|
|
| |
|
|
|
Less Distributions | | | | | | | | | | | | | | | | |
Distributions from net investment income | | | (0.02 | ) | | | (0.03 | ) | | | (0.02 | ) | | | 0.00 | |
| | |
|
|
| |
|
|
| |
|
|
| |
|
|
|
Total distributions | | | (0.02 | ) | | | (0.03 | ) | | | (0.02 | ) | | | 0.00 | |
| | |
|
|
| |
|
|
| |
|
|
| |
|
|
|
Net Asset Value, End of Period | | $ | 9.74 | | | $ | 9.13 | | | $ | 8.24 | | | $ | 6.80 | |
| | |
|
|
| |
|
|
| |
|
|
| |
|
|
|
Total Return (%) | | | 6.9 | | | | 11.2 | | | | 21.5 | | | | (16.4 | )(b) |
Ratio of operating expenses to average net assets before expense reductions (%) | | | 1.18 | | | | 1.22 | | | | 1.23 | | | | 1.15 | (c) |
Ratio of operating expenses to average net assets after expense reductions (%) (d) | | | 1.17 | | | | 1.20 | | | | 1.21 | | | | 1.13 | (c) |
Ratio of operating expenses to average net assets without giving effect to the contractual expense
agreement would have been (%) | | | — | | | | — | | | | 1.36 | | | | 1.59 | (c) |
Ratio of net investment income to average net assets (%) | | | 0.24 | | | | 0.30 | | | | 0.45 | | | | 0.55 | (c) |
Portfolio turnover rate (%) | | | 46 | | | | 107 | | | | 88 | | | | 63 | |
Net assets, end of period (000) | | $ | 49,131 | | | $ | 49,460 | | | $ | 48,960 | | | $ | 12,365 | |
| (a) | Commencement of operations. |
| (b) | Period less than one year is not computed on an annualized basis. |
| (c) | Computed on an annualized basis. |
| (d) | The Portfolio has entered into arrangements with certain brokers who paid a portion of the Portfolio’s expenses. |
See accompanying notes to financial statements.
MSF-168
Metropolitan Series Fund, Inc.
MFS Investors Trust Portfolio
Financial Highlights
| | | | | | | | | | | | | | | | | | | | |
| | | Class E
| |
| | | Year ended December 31,
| | | May 1, 2001(a)
through
December 31,
2001
| |
| | | 2005
| | | 2004
| | | 2003
| | | 2002
| | |
Net Asset Value, Beginning of Period | | $ | 9.15 | | | $ | 8.25 | | | $ | 6.81 | | | $ | 8.57 | | | $ | 9.56 | |
| | |
|
|
| |
|
|
| |
|
|
| |
|
|
| |
|
|
|
Income From Investment Operations | | | | | | | | | | | | | | | | | | | | |
Net investment income | | | 0.03 | | | | 0.03 | | | | 0.03 | | | | 0.04 | | | | 0.01 | |
Net realized and unrealized gain (loss) of investments | | | 0.61 | | | | 0.91 | | | | 1.43 | | | | (1.77 | ) | | | (1.00 | ) |
| | |
|
|
| |
|
|
| |
|
|
| |
|
|
| |
|
|
|
Total from investment operations | | | 0.64 | | | | 0.94 | | | | 1.46 | | | | (1.73 | ) | | | (0.99 | ) |
| | |
|
|
| |
|
|
| |
|
|
| |
|
|
| |
|
|
|
Less Distributions | | | | | | | | | | | | | | | | | | | | |
Distributions from net investment income | | | (0.03 | ) | | | (0.04 | ) | | | (0.02 | ) | | | (0.03 | ) | | | 0.00 | |
| | |
|
|
| |
|
|
| |
|
|
| |
|
|
| |
|
|
|
Total distributions | | | (0.03 | ) | | | (0.04 | ) | | | (0.02 | ) | | | (0.03 | ) | | | 0.00 | |
| | |
|
|
| |
|
|
| |
|
|
| |
|
|
| |
|
|
|
Net Asset Value, End of Period | | $ | 9.76 | | | $ | 9.15 | | | $ | 8.25 | | | $ | 6.81 | | | $ | 8.57 | |
| | |
|
|
| |
|
|
| |
|
|
| |
|
|
| |
|
|
|
Total Return (%) | | | 7.1 | | | | 11.3 | | | | 21.5 | | | | (20.2 | ) | | | (10.4 | )(b) |
Ratio of operating expenses to average net assets before expense reductions (%) | | | 1.08 | | | | 1.12 | | | | 1.13 | | | | 1.05 | | | | 1.05 | (c) |
Ratio of operating expenses to average net assets after expense reductions (%) (d) | | | 1.07 | | | | 1.10 | | | | 1.11 | | | | 1.03 | | | | — | |
Ratio of operating expenses to average net assets without giving effect to the contractual expense agreement would have been (%) | | | — | | | | — | | | | 1.26 | | | | 1.49 | | | | 1.52 | (c) |
Ratio of net investment income to average net assets (%) | | | 0.34 | | | | 0.41 | | | | 0.55 | | | | 0.55 | | | | 0.26 | (c) |
Portfolio turnover rate (%) | | | 46 | | | | 107 | | | | 88 | | | | 63 | | | | 86 | |
Net assets, end of period (000) | | $ | 23,130 | | | $ | 22,921 | | | $ | 12,077 | | | $ | 4,436 | | | $ | 730 | |
| (a) | Commencement of operations. |
| (b) | Period less than one year is not computed on an annualized basis. |
| (c) | Computed on an annualized basis. |
| (d) | The Portfolio has entered into arrangements with certain brokers who paid a portion of the Portfolio’s expenses. |
See accompanying notes to financial statements.
MSF-169
Metropolitan Series Fund, Inc.
T. Rowe Price Large Cap Growth Portfolio
Schedule of Investments as of December 31, 2005
Common Stock—96.5% of Total Net Assets
| | | | | |
| Security Description | | Shares | | Value* |
| | | | | | |
| | |
Aerospace & Defense—0.5% | | | | | |
General Dynamics Corp. | | 17,900 | | $ | 2,041,495 |
| | | | |
|
|
| | |
Airlines—0.4% | | | | | |
Southwest Airlines Co. | | 89,700 | | | 1,473,771 |
| | | | |
|
|
| | |
Beverages—0.4% | | | | | |
PepsiCo, Inc. | | 26,300 | | | 1,553,804 |
| | | | |
|
|
| | |
Biotechnology—3.2% | | | | | |
Amgen, Inc. (a) | | 79,500 | | | 6,269,370 |
Genentech, Inc. (a) | | 28,300 | | | 2,617,750 |
Gilead Sciences, Inc. (a) | | 55,200 | | | 2,905,176 |
| | | | |
|
|
| | | | | | 11,792,296 |
| | | | |
|
|
| | |
Capital Markets—7.4% | | | | | |
Ameritrade Holding Corp. (a) | | 70,400 | | | 1,689,600 |
E*TRADE Financial Corp. (a) | | 73,000 | | | 1,522,780 |
Franklin Resources, Inc. | | 19,100 | | | 1,795,591 |
Legg Mason, Inc. | | 17,700 | | | 2,118,513 |
Merrill Lynch & Co., Inc. | | 53,200 | | | 3,603,236 |
State Street Corp. | | 76,300 | | | 4,230,072 |
The Charles Schwab Corp. | | 189,300 | | | 2,777,031 |
The Goldman Sachs Group, Inc. | | 13,800 | | | 1,762,398 |
UBS AG(CHF) | | 83,700 | | | 7,963,698 |
| | | | |
|
|
| | | | | | 27,462,919 |
| | | | |
|
|
| | |
Chemicals—1.2% | | | | | |
Monsanto Co. | | 57,700 | | | 4,473,481 |
| | | | |
|
|
| | |
Commercial Banks—1.9% | | | | | |
Anglo Irish Bank Corp., Plc.(EUR) | | 214,300 | | | 3,258,050 |
Northern Trust Corp. | | 70,900 | | | 3,674,038 |
| | | | |
|
|
| | | | | | 6,932,088 |
| | | | |
|
|
| | |
Commercial Services & Supplies—0.8% | | | | | |
Cendant Corp. | | 164,600 | | | 2,839,350 |
| | | | |
|
|
| | |
Communications Equipment—3.4% | | | | | |
Cisco Systems, Inc. (a) | | 70,700 | | | 1,210,384 |
Corning, Inc. (a) | | 218,800 | | | 4,301,608 |
Juniper Networks, Inc. (a) | | 101,100 | | | 2,254,530 |
Nokia Oyj(EUR) | | 142,200 | | | 2,603,650 |
QUALCOMM, Inc. | | 54,400 | | | 2,343,552 |
| | | | |
|
|
| | | | | | 12,713,724 |
| | | | |
|
|
| | |
Computers & Peripherals—2.6% | | | | | |
Dell, Inc. (a) | | 221,000 | | | 6,627,790 |
EMC Corp. (a) | | 209,200 | | | 2,849,304 |
| | | | |
|
|
| | | | | | 9,477,094 |
| | | | |
|
|
| | |
Consumer Finance—3.0% | | | | | |
American Express Co. | | 123,000 | | | 6,329,580 |
SLM Corp. | | 84,400 | | | 4,649,596 |
| | | | |
|
|
| | | | | | 10,979,176 |
| | | | |
|
|
| | | | | |
| Security Description | | Shares | | Value* |
| | | | | | |
| | |
Diversified Consumer Services—0.8% | | | | | |
Apollo Group, Inc. (Class A) (a) | | 51,000 | | $ | 3,083,460 |
| | | | |
|
|
| | |
Diversified Financial Services—2.3% | | | | | |
Citigroup, Inc. | | 173,615 | | | 8,425,536 |
| | | | |
|
|
|
Diversified Telecommunication Services—1.2% |
Amdocs, Ltd. (a) | | 77,400 | | | 2,128,500 |
Telus Corp.(CAD) | | 19,400 | | | 796,333 |
Telus Corp. | | 35,300 | | | 1,421,178 |
| | | | |
|
|
| | | | | | 4,346,011 |
| | | | |
|
|
| | |
Electronic Equipment & Instruments—1.0% | | | | | |
Garmin, Ltd. | | 24,900 | | | 1,652,115 |
Samsung Electronics Co., Ltd.(KRW) | | 3,440 | | | 2,214,478 |
| | | | |
|
|
| | | | | | 3,866,593 |
| | | | |
|
|
| | |
Energy Equipment & Services—2.5% | | | | | |
Baker Hughes, Inc. | | 59,700 | | | 3,628,566 |
Schlumberger, Ltd. | | 57,000 | | | 5,537,550 |
| | | | |
|
|
| | | | | | 9,166,116 |
| | | | |
|
|
| | |
Food & Staples Retailing—4.1% | | | | | |
Sysco Corp. | | 66,000 | | | 2,049,300 |
Wal-Mart de Mexico S.A. de CV(MXN) | | 128,100 | | | 711,081 |
Wal-Mart de Mexico S.A. de CV (ADR) | | 20,700 | | | 1,148,092 |
Wal-Mart Stores, Inc. | | 188,100 | | | 8,803,080 |
Walgreen Co. | | 54,600 | | | 2,416,596 |
| | | | |
|
|
| | | | | | 15,128,149 |
| | | | |
|
|
| | |
Health Care Equipment & Supplies—2.3% | | | | | |
Medtronic, Inc. | | 66,900 | | | 3,851,433 |
St. Jude Medical, Inc. (a) | | 23,600 | | | 1,184,720 |
Stryker Corp. | | 38,200 | | | 1,697,226 |
Zimmer Holdings, Inc. (a) | | 29,300 | | | 1,975,992 |
| | | | |
|
|
| | | | | | 8,709,371 |
| | | | |
|
|
| | |
Health Care Providers & Services—5.7% | | | | | |
Caremark Rx, Inc. (a) | | 70,900 | | | 3,671,911 |
Humana, Inc. (a) | | 13,700 | | | 744,321 |
Quest Diagnostics, Inc. | | 63,400 | | | 3,263,832 |
UnitedHealth Group, Inc. | | 150,600 | | | 9,358,284 |
WellPoint, Inc. (a) | | 49,600 | | | 3,957,584 |
| | | | |
|
|
| | | | | | 20,995,932 |
| | | | |
|
|
| | |
Hotels, Restaurants & Leisure—2.9% | | | | | |
Carnival Corp. | | 77,800 | | | 4,159,966 |
International Game Technology | | 86,400 | | | 2,659,392 |
MGM Mirage, Inc. (a) | | 17,800 | | | 652,726 |
Wynn Resorts, Ltd. (a) | | 57,500 | | | 3,153,875 |
| | | | |
|
|
| | | | | | 10,625,959 |
| | | | |
|
|
| | |
Household Durables—1.0% | | | | | |
Harman International Industries, Inc. | | 26,200 | | | 2,563,670 |
Lennar Corp. (Class A) | | 17,000 | | | 1,037,340 |
| | | | |
|
|
| | | | | | 3,601,010 |
| | | | |
|
|
*See accompanying notes to financial statements.
MSF-170
Metropolitan Series Fund, Inc.
T. Rowe Price Large Cap Growth Portfolio
Schedule of Investments as of December 31, 2005
Common Stock—(Continued)
| | | | | |
| Security Description | | Shares | | Value* |
| | | | | | |
| | |
Household Products—1.4% | | | | | |
Reckitt Benckiser, Plc.(GBP) | | 50,381 | | $ | 1,660,714 |
The Procter & Gamble Co. | | 62,205 | | | 3,600,426 |
| | | | |
|
|
| | | | | | 5,261,140 |
| | | | |
|
|
| | |
Industrial Conglomerates—4.1% | | | | | |
General Electric Co. | | 387,700 | | | 13,588,885 |
Tyco International, Ltd. | | 59,000 | | | 1,702,740 |
| | | | |
|
|
| | | | | | 15,291,625 |
| | | | |
|
|
| | |
Insurance—4.3% | | | | | |
American International Group, Inc. | | 123,800 | | | 8,446,874 |
Genworth Financial, Inc. (Class A) | | 43,800 | | | 1,514,604 |
Marsh & McLennan Cos., Inc. | | 72,000 | | | 2,286,720 |
The Hartford Financial Services Group, Inc. | | 43,400 | | | 3,727,626 |
| | | | |
|
|
| | | | | | 15,975,824 |
| | | | |
|
|
| | |
Internet Software & Services—1.8% | | | | | |
Google, Inc. (Class A) (a) | | 7,400 | | | 3,069,964 |
Yahoo!, Inc. (a) | | 90,800 | | | 3,557,544 |
| | | | |
|
|
| | | | | | 6,627,508 |
| | | | |
|
|
| | |
IT Services—4.4% | | | | | |
Accenture, Ltd. (Class A) (a) | | 226,100 | | | 6,527,507 |
Affiliated Computer Services, Inc. (Class A) (a) | | 27,100 | | | 1,603,778 |
Automatic Data Processing, Inc. | | 90,700 | | | 4,162,223 |
First Data Corp. | | 91,200 | | | 3,922,512 |
| | | | |
|
|
| | | | | | 16,216,020 |
| | | | |
|
|
| | |
Machinery—2.4% | | | | | |
Danaher Corp. | | 112,900 | | | 6,297,562 |
Deere & Co. | | 38,400 | | | 2,615,424 |
| | | | |
|
|
| | | | | | 8,912,986 |
| | | | |
|
|
| | |
Media—4.8% | | | | | |
Comcast Corp. (Special Class A) (a) | | 77,100 | | | 1,980,699 |
Discovery Holding Co. (Class A) (a) | | 60,541 | | | 917,196 |
Liberty Media Corp. (Class A) (a) | | 522,512 | | | 4,112,170 |
News Corp. (Class A) | | 163,300 | | | 2,539,315 |
Rogers Communications, Inc. (Class B) | | 66,700 | | | 2,818,742 |
Time Warner, Inc. | | 119,000 | | | 2,075,360 |
Univision Communications, Inc. (Class A) (a) | | 109,600 | | | 3,221,144 |
| | | | |
|
|
| | | | | | 17,664,626 |
| | | | |
|
|
| | |
Metals & Mining—1.0% | | | | | |
BHP Billiton, Ltd.(AUD) | | 220,300 | | | 3,685,301 |
| | | | |
|
|
| | |
Multiline Retail—2.1% | | | | | |
Kohl’s Corp. (a) | | 103,400 | | | 5,025,240 |
Target Corp. | | 47,200 | | | 2,594,584 |
| | | | |
|
|
| | | | | | 7,619,824 |
| | | | |
|
|
| | |
Oil, Gas & Consumable Fuels—2.8% | | | | | |
Exxon Mobil Corp. | | 58,216 | | | 3,269,993 |
Murphy Oil Corp. | | 50,300 | | | 2,715,697 |
Total S.A.(EUR) | | 17,900 | | | 4,506,192 |
| | | | |
|
|
| | | | | | 10,491,882 |
| | | | |
|
|
| | | | | | |
| Security Description | | Shares | | Value* | |
| | | | | | | |
| | |
Pharmaceuticals—3.5% | | | | | | |
Johnson & Johnson | | 42,400 | | $ | 2,548,240 | |
Novartis AG(CHF) | | 79,500 | | | 4,171,993 | |
Pfizer, Inc. | | 113,263 | | | 2,641,293 | |
Roche Holding AG(CHF) | | 14,600 | | | 2,190,809 | |
Sepracor, Inc. (a) | | 28,900 | | | 1,491,240 | |
| | | | |
|
|
|
| | | | | | 13,043,575 | |
| | | | |
|
|
|
|
Semiconductors & Semiconductor Equipment—4.7% | |
Analog Devices, Inc. | | 120,700 | | | 4,329,509 | |
Intel Corp. | | 195,000 | | | 4,867,200 | |
Marvell Technology Group, Ltd. (a) | | 40,300 | | | 2,260,427 | |
Maxim Integrated Products, Inc. | | 89,800 | | | 3,254,352 | |
Xilinx, Inc. | | 113,300 | | | 2,856,293 | |
| | | | |
|
|
|
| | | | | | 17,567,781 | |
| | | | |
|
|
|
| | |
Software—4.2% | | | | | | |
Electronic Arts, Inc. (a) | | 22,400 | | | 1,171,744 | |
Microsoft Corp. | | 429,400 | | | 11,228,810 | |
Oracle Corp. (a) | | 267,700 | | | 3,268,617 | |
| | | | |
|
|
|
| | | | | | 15,669,171 | |
| | | | |
|
|
|
| | |
Specialty Retail—2.7% | | | | | | |
Best Buy Co., Inc. | | 40,900 | | | 1,778,332 | |
Industria de Diseno Textil S.A.(EUR) | | 43,500 | | | 1,419,084 | |
PETsMART, Inc. | | 106,200 | | | 2,725,092 | |
The Home Depot, Inc. | | 103,550 | | | 4,191,704 | |
| | | | |
|
|
|
| | | | | | 10,114,212 | |
| | | | |
|
|
|
| | |
Textiles, Apparel & Luxury Goods—0.9% | | | | | | |
NIKE, Inc. (Class B) | | 39,800 | | | 3,454,242 | |
| | | | |
|
|
|
| | |
Thrifts & Mortgage Finance—0.5% | | | | | | |
Countrywide Financial Corp. | | 56,700 | | | 1,938,573 | |
| | | | |
|
|
|
|
Wireless Telecommunication Services—2.3% | |
América Movil S.A. de C.V. (ADR) | | 110,300 | | | 3,227,378 | |
Crown Castle International Corp. (a) | | 91,200 | | | 2,454,192 | |
Sprint Nextel Corp. | | 79,993 | | | 1,868,636 | |
Vodafone Group, Plc.(GBP) | | 380,483 | | | 820,741 | |
| | | | |
|
|
|
| | | | | | 8,370,947 | |
| | | | |
|
|
|
Total Common Stock
(Identified Cost $311,391,219) | | | | | 357,592,572 | |
| | | | |
|
|
|
| | |
| Short Term Investments—3.8% | | | | | | |
| | |
Mutual Funds—3.8% | | | | | | |
T. Rowe Price Reserve Investment Fund | | 14,024,103 | | | 14,024,103 | |
| | | | |
|
|
|
Total Short Term Investments
(Identified Cost $14,024,103) | | | | | 14,024,103 | |
| | | | |
|
|
|
Total Investments 100.3%
(Identified Cost $325,415,322) (b) | | | | | 371,616,675 | |
Liabilities in excess of other assets | | | | | (954,757 | ) |
| | | | |
|
|
|
| Total Net Assets—100% | | | | $ | 370,661,918 | |
| | | | |
|
|
|
*See accompanying notes to financial statements.
MSF-171
Metropolitan Series Fund, Inc.
T. Rowe Price Large Cap Growth Portfolio
Schedule of Investments as of December 31, 2005
| (b) | The aggregate cost of investments for federal income tax purposes as of December 31, 2005 was $326,612,121 and the composition of unrealized appreciation and (depreciation) of investment securities was $51,575,183 and ($6,570,629), respectively. |
| (ADR)— | An American Depositary Receipt is a certificate issued by a custodian bank representing the right to receive securities of the foreign issuer described. Trading on exchanges not located in the United States or Canada significantly influences the value of ADRs. |
See accompanying notes to financial statements.
MSF-172
Metropolitan Series Fund, Inc.
T. Rowe Price Large Cap Growth Portfolio
Statement of Assets & Liabilities
December 31, 2005
| | | | | | | |
Assets | | | | | | | |
Investments at value | | | | | $ | 371,616,675 | |
Foreign cash at value | | | | | | 3 | |
Receivable for: | | | | | | | |
Fund shares sold | | | | | | 584,078 | |
Accrued interest and dividends | | | | | | 424,914 | |
Foreign taxes | | | | | | 25,341 | |
| | | | | |
|
|
|
Total Assets | | | | | | 372,651,011 | |
Liabilities | | | | | | | |
Payable for: | | | | | | | |
Fund shares redeemed | | $ | 659,690 | | | | |
Securities purchased | | | 1,036,696 | | | | |
Withholding taxes | | | 2,579 | | | | |
Accrued expenses: | | | | | | | |
Management fees | | | 186,828 | | | | |
Service and distribution fees | | | 26,225 | | | | |
Other expenses | | | 77,075 | | | | |
| | |
|
| | | | |
Total Liabilities | | | | | | 1,989,093 | |
| | | | | |
|
|
|
Net Assets | | | | | $ | 370,661,918 | |
| | | | | |
|
|
|
Net assets consists of: | | | | | | | |
Capital paid in | | | | | $ | 349,343,224 | |
Undistributed net investment income | | | | | | 1,080,212 | |
Accumulated net realized losses | | | | | | (25,959,921 | ) |
Unrealized appreciation on investments and foreign currency | | | | | | 46,198,403 | |
| | | | | |
|
|
|
Net Assets | | | | | $ | 370,661,918 | |
| | | | | |
|
|
|
| Computation of offering price: | | | | | | | |
Class A | | | | | | | |
Net asset value and redemption price per
share ($235,513,100 divided by 17,402,205 shares outstanding) | | | | | $ | 13.53 | |
| | | | | |
|
|
|
Class B | | | | | | | |
Net asset value and redemption price per
share ($106,180,510 divided by 7,881,242 shares outstanding) | | | | | $ | 13.47 | |
| | | | | |
|
|
|
Class E | | | | | | | |
Net asset value and redemption price per
share ($28,968,308 divided by
2,147,312 shares outstanding) | | | | | $ | 13.49 | |
| | | | | |
|
|
|
Identified cost of investments | | | | | $ | 325,415,322 | |
| | | | | |
|
|
|
Identified cost of foreign cash | | | | | $ | 4 | |
| | | | | |
|
|
|
Statement of Operations
Year Ended December 31, 2005
| | | | | | | | |
Investment Income | | | | | | | | |
Dividends | | | | | | $ | 3,264,098 | (a) |
Interest | | | | | | | 284,508 | |
| | | | | | |
|
|
|
| | | | | | | | 3,548,606 | |
Expenses | | | | | | | | |
Management fees | | $ | 1,887,862 | | | | | |
Service and distribution fees—Class B | | | 194,134 | | | | | |
Service and distribution fees—Class E | | | 41,720 | | | | | |
Directors’ fees and expenses | | | 22,264 | | | | | |
Custodian | | | 196,812 | | | | | |
Audit and tax services | | | 20,509 | | | | | |
Legal | | | 8,251 | | | | | |
Printing | | | 77,055 | | | | | |
Insurance | | | 5,556 | | | | | |
Miscellaneous | | | 5,413 | | | | | |
| | |
|
|
| | | | |
Total expenses | | | 2,459,576 | | | | | |
Expense reductions | | | (22,998 | ) | | | | |
Management fee waivers | | | (30,326 | ) | | | 2,406,252 | |
| | |
|
|
| |
|
|
|
Net Investment Income | | | | | | | 1,142,354 | |
| | | | | | |
|
|
|
Realized and Unrealized Gain | | | | | | | | |
| Realized gain (loss) on: | | | | | | | | |
Investments—net | | | 13,394,709 | | | | | |
Foreign currency transactions—net | | | (27,923 | ) | | | 13,366,786 | |
| | |
|
|
| |
|
|
|
| Unrealized appreciation (depreciation) on: | | | | | | | | |
Investments—net | | | 7,869,009 | | | | | |
Foreign currency transactions—net | | | (5,242 | ) | | | 7,863,767 | |
| | |
|
|
| |
|
|
|
Net gain | | | | | | | 21,230,553 | |
| | | | | | |
|
|
|
Net Increase in Net Assets From Operations | | | | | | $ | 22,372,907 | |
| | | | | | |
|
|
|
| (a) | Net of foreign taxes of $72,214. |
See accompanying notes to financial statements.
MSF-173
Metropolitan Series Fund, Inc.
T. Rowe Price Large Cap Growth Portfolio
Statement of Changes in Net Assets
| | | | | | | | |
| | | Year ended
December 31,
2005
| | | Year ended
December 31,
2004
| |
From Operations | | | | | | | | |
Net investment income | | $ | 1,142,354 | | | $ | 1,538,544 | |
Net realized gain | | | 13,366,786 | | | | 10,665,438 | |
Unrealized appreciation | | | 7,863,767 | | | | 12,684,727 | |
| | |
|
|
| |
|
|
|
Increase in net assets from operations | | | 22,372,907 | | | | 24,888,709 | |
| | |
|
|
| |
|
|
|
From Distributions to Shareholders | | | | | | | | |
Net investment income | | | | | | | | |
Class A | | | (1,114,593 | ) | | | (359,930 | ) |
Class B | | | (257,787 | ) | | | (327 | ) |
Class E | | | (115,166 | ) | | | (32,729 | ) |
| | |
|
|
| |
|
|
|
Total distributions | | | (1,487,546 | ) | | | (392,986 | ) |
| | |
|
|
| |
|
|
|
Increase in net assets from capital share transactions | | | 74,567,333 | | | | 61,427,591 | |
| | |
|
|
| |
|
|
|
Total increase in net assets | | | 95,452,694 | | | | 85,923,314 | |
| | |
Net Assets | | | | | | | | |
Beginning of the period | | | 275,209,224 | | | | 189,285,910 | |
| | |
|
|
| |
|
|
|
End of the period | | $ | 370,661,918 | | | $ | 275,209,224 | |
| | |
|
|
| |
|
|
|
| | |
Undistributed Net Investment Income | | | | | | | | |
End of the period | | $ | 1,080,212 | | | $ | 1,476,325 | |
| | |
|
|
| |
|
|
|
Other Information:
Capital Shares
Transactions in capital shares were as follows:
| | | | | | | | | | | | | | |
| | | Year ended
December 31, 2005
| | | Year ended
December 31, 2004
| |
| | | Shares
| | | $
| | | Shares
| | | $
| |
Class A | | | | | | | | | | | | | | |
Sales | | 5,063,456 | | | $ | 65,065,629 | | | 4,003,954 | | | $ | 46,763,659 | |
Reinvestments | | 94,217 | | | | 1,114,593 | | | 30,019 | | | | 359,930 | |
Redemptions | | (3,331,873 | ) | | | (42,272,321 | ) | | (3,260,041 | ) | | | (38,718,159 | ) |
| | |
|
| |
|
|
| |
|
| |
|
|
|
Net increase | | 1,825,800 | | | $ | 23,907,901 | | | 773,932 | | | $ | 8,405,430 | |
| | |
|
| |
|
|
| |
|
| |
|
|
|
Class B | | | | | | | | | | | | | | |
Sales | | 4,676,569 | | | $ | 58,967,959 | | | 4,033,414 | | | $ | 47,078,473 | |
Reinvestments | | 21,846 | | | | 257,787 | | | 27 | | | | 327 | |
Redemptions | | (665,744 | ) | | | (8,461,504 | ) | | (212,841 | ) | | | (2,504,391 | ) |
| | |
|
| |
|
|
| |
|
| |
|
|
|
Net increase | | 4,032,671 | | | $ | 50,764,242 | | | 3,820,600 | | | $ | 44,574,409 | |
| | |
|
| |
|
|
| |
|
| |
|
|
|
Class E | | | | | | | | | | | | | | |
Sales | | 391,640 | | | $ | 4,922,562 | | | 1,123,710 | | | $ | 13,226,374 | |
Reinvestments | | 9,752 | | | | 115,166 | | | 2,737 | | | | 32,729 | |
Redemptions | | (402,094 | ) | | | (5,142,538 | ) | | (411,668 | ) | | | (4,811,351 | ) |
| | |
|
| |
|
|
| |
|
| |
|
|
|
Net increase (decrease) | | (702 | ) | | $ | (104,810 | ) | | 714,779 | | | $ | 8,447,752 | |
| | |
|
| |
|
|
| |
|
| |
|
|
|
Increase derived from capital share transactions | | 5,857,769 | | | $ | 74,567,333 | | | 5,309,311 | | | $ | 61,427,591 | |
| | |
|
| |
|
|
| |
|
| |
|
|
|
See accompanying notes to financial statements.
MSF-174
Metropolitan Series Fund, Inc.
T. Rowe Price Large Cap Growth Portfolio
Financial Highlights
| | | | | | | | | | | | | | | | | | | | |
| | | Class A
| |
| | | Year ended December 31,
| |
| | | 2005
| | | 2004
| | | 2003
| | | 2002
| | | 2001
| |
Net Asset Value, Beginning of Period | | $ | 12.77 | | | $ | 11.64 | | | $ | 8.91 | | | $ | 11.64 | | | $ | 12.93 | |
| | |
|
|
| |
|
|
| |
|
|
| |
|
|
| |
|
|
|
Income From Investment Operations | | | | | | | | | | | | | | | | | | | | |
Net investment income | | | 0.05 | | | | 0.08 | | | | 0.03 | | | | 0.02 | | | | 0.03 | |
Net realized and unrealized gain (loss) of investments | | | 0.78 | | | | 1.07 | | | | 2.71 | | | | (2.72 | ) | | | (1.31 | ) |
| | |
|
|
| |
|
|
| |
|
|
| |
|
|
| |
|
|
|
Total from investment operations | | | 0.83 | | | | 1.15 | | | | 2.74 | | | | (2.70 | ) | | | (1.28 | ) |
| | |
|
|
| |
|
|
| |
|
|
| |
|
|
| |
|
|
|
Less Distributions | | | | | | | | | | | | | | | | | | | | |
Distributions from net investment income | | | (0.07 | ) | | | (0.02 | ) | | | (0.01 | ) | | | (0.03 | ) | | | (0.01 | ) |
| | |
|
|
| |
|
|
| |
|
|
| |
|
|
| |
|
|
|
Total distributions | | | (0.07 | ) | | | (0.02 | ) | | | (0.01 | ) | | | (0.03 | ) | | | (0.01 | ) |
| | |
|
|
| |
|
|
| |
|
|
| |
|
|
| |
|
|
|
Net Asset Value, End of Period | | $ | 13.53 | | | $ | 12.77 | | | $ | 11.64 | | | $ | 8.91 | | | $ | 11.64 | |
| | |
|
|
| |
|
|
| |
|
|
| |
|
|
| |
|
|
|
Total Return (%) | | | 6.6 | | | | 9.9 | | | | 30.8 | | | | (23.2 | ) | | | (9.9 | ) |
Ratio of operating expenses to average net assets before expense reductions (%) | | | 0.71 | | | | 0.74 | | | | 0.79 | | | | 0.77 | | | | 0.76 | |
Ratio of operating expenses to average net assets after expense reductions (%) (d) | | | 0.70 | | | | 0.73 | | | | 0.77 | | | | 0.76 | | | | 0.75 | |
Ratio of net investment income to average net assets (%) | | | 0.44 | | | | 0.68 | | | | 0.28 | | | | 0.22 | | | | 0.27 | |
Portfolio turnover rate (%) | | | 35 | | | | 37 | | | | 37 | | | | 49 | | | | 67 | |
Net assets, end of period (000) | | $ | 235,513 | | | $ | 198,913 | | | $ | 172,315 | | | $ | 127,939 | | | $ | 173,218 | |
| | | | | | | | | | | | | | | | |
| | | Class B
| |
| | | Year ended December 31,
| | | July 30, 2002(a)
through
December 31,
2002
| |
| | | 2005
| | | 2004
| | | 2003
| | |
Net Asset Value, Beginning of Period | | $ | 12.72 | | | $ | 11.60 | | | $ | 8.88 | | | $ | 8.96 | |
| | |
|
|
| |
|
|
| |
|
|
| |
|
|
|
Income From Investment Operations | | | | | | | | | | | | | | | | |
Net investment income | | | 0.01 | | | | 0.05 | | | | 0.01 | | | | 0.00 | |
Net realized and unrealized gain (loss) of investments | | | 0.79 | | | | 1.08 | | | | 2.72 | | | | (0.08 | ) |
| | |
|
|
| |
|
|
| |
|
|
| |
|
|
|
Total from investment operations | | | 0.80 | | | | 1.13 | | | | 2.73 | | | | (0.08 | ) |
| | |
|
|
| |
|
|
| |
|
|
| |
|
|
|
Less Distributions | | | | | | | | | | | | | | | | |
Distributions from net investment income | | | (0.05 | ) | | | (0.01 | ) | | | (0.01 | ) | | | 0.00 | |
| | |
|
|
| |
|
|
| |
|
|
| |
|
|
|
Total distributions | | | (0.05 | ) | | | (0.01 | ) | | | (0.01 | ) | | | 0.00 | |
| | |
|
|
| |
|
|
| |
|
|
| |
|
|
|
Net Asset Value, End of Period | | $ | 13.47 | | | $ | 12.72 | | | $ | 11.60 | | | $ | 8.88 | |
| | |
|
|
| |
|
|
| |
|
|
| |
|
|
|
Total Return (%) | | | 6.3 | | | | 9.7 | | | | 30.8 | | | | (0.9 | )(b) |
Ratio of operating expenses to average net assets before expense reductions (%) | | | 0.96 | | | | 0.99 | | | | 1.04 | | | | 1.02 | (c) |
Ratio of operating expenses to average net assets after expense reductions (%) (d) | | | 0.95 | | | | 0.98 | | | | 1.02 | | | | 1.01 | (c) |
Ratio of net investment income to average net assets (%) | | | 0.20 | | | | 0.93 | | | | 0.06 | | | | 0.00 | (c) |
Portfolio turnover rate (%) | | | 35 | | | | 37 | | | | 37 | | | | 49 | |
Net assets, end of period (000) | | $ | 106,181 | | | $ | 48,955 | | | $ | 325 | | | $ | 1 | |
| (a) | Commencement of operations. |
| (b) | Period less than one year is not computed on an annualized basis. |
| (c) | Computed on an annualized basis. |
| (d) | The Portfolio has entered into arrangements with certain brokers who paid a portion of the Portfolio’s expenses. |
See accompanying notes to financial statements.
MSF-175
Metropolitan Series Fund, Inc.
T. Rowe Price Large Cap Growth Portfolio
Financial Highlights
| | | | | | | | | | | | | | | | | | | | |
| | | Class E
| |
| | | Year ended December 31,
| | | May 1, 2001(a)
through
December 31,
2001
| |
| | | 2005
| | | 2004
| | | 2003
| | | 2002
| | |
Net Asset Value, Beginning of Period | | $ | 12.73 | | | $ | 11.61 | | | $ | 8.90 | | | $ | 11.63 | | | $ | 12.32 | |
| | |
|
|
| |
|
|
| |
|
|
| |
|
|
| |
|
|
|
Income From Investment Operations | | | | | | | | | | | | | | | | | | | | |
Net investment income | | | 0.04 | | | | 0.06 | | | | 0.01 | | | | 0.03 | | | | 0.00 | |
Net realized and unrealized gain (loss) of investments | | | 0.77 | | | | 1.08 | | | | 2.71 | | | | (2.73 | ) | | | (0.69 | ) |
| | |
|
|
| |
|
|
| |
|
|
| |
|
|
| |
|
|
|
Total from investment operations | | | 0.81 | | | | 1.14 | | | | 2.72 | | | | (2.70 | ) | | | (0.69 | ) |
| | |
|
|
| |
|
|
| |
|
|
| |
|
|
| |
|
|
|
Less Distributions | | | | | | | | | | | | | | | | | | | | |
Distributions from net investment income | | | (0.05 | ) | | | (0.02 | ) | | | (0.01 | ) | | | (0.03 | ) | | | 0.00 | |
| | |
|
|
| |
|
|
| |
|
|
| |
|
|
| |
|
|
|
Total distributions | | | (0.05 | ) | | | (0.02 | ) | | | (0.01 | ) | | | (0.03 | ) | | | 0.00 | |
| | |
|
|
| |
|
|
| |
|
|
| |
|
|
| |
|
|
|
Net Asset Value, End of Period | | $ | 13.49 | | | $ | 12.73 | | | $ | 11.61 | | | $ | 8.90 | | | $ | 11.63 | |
| | |
|
|
| |
|
|
| |
|
|
| |
|
|
| |
|
|
|
Total Return (%) | | | 6.4 | | | | 9.8 | | | | 30.6 | | | | (23.3 | ) | | | (5.6 | )(b) |
Ratio of operating expenses to average net assets before expense reductions (%) | | | 0.86 | | | | 0.89 | | | | 0.94 | | | | 0.92 | | | | 0.91 | (c) |
Ratio of operating expenses to average net assets after expense reductions (%) (d) | | | 0.85 | | | | 0.88 | | | | 0.92 | | | | 0.91 | | | | 0.90 | (c) |
Ratio of net investment income to average net assets (%) | | | 0.29 | | | | 0.56 | | | | 0.14 | | | | 0.07 | | | | 0.75 | (c) |
Portfolio turnover rate (%) | | | 35 | | | | 37 | | | | 37 | | | | 49 | | | | 67 | |
Net assets, end of period (000) | | $ | 28,968 | | | $ | 27,341 | | | $ | 16,646 | | | $ | 3,119 | | | $ | 23 | |
| (a) | Commencement of operations. |
| (b) | Period less than one year is not computed on an annualized basis. |
| (c) | Computed on an annualized basis. |
| (d) | The Portfolio has entered into arrangements with certain brokers who paid a portion of the Portfolio’s expenses. |
See accompanying notes to financial statements.
MSF-176
Metropolitan Series Fund, Inc.
Zenith Equity Portfolio
Schedule of Investments as of December 31, 2005
Mutual Funds—100.0% of Total Net Assets
| | | | | | |
| Security Description | | Shares | | Value* | |
| | | | | | | |
|
Investment Companies—100.0% | |
Metropolitan Series Fund, Inc.,
Capital Guardian U.S. Equity Portfolio, (Class A) | | 26,996,764 | | $ | 332,870,104 | |
Metropolitan Series Fund, Inc.,
FI Value Leaders Portfolio, (Class A) | | 1,726,138 | | | 333,282,659 | |
Metropolitan Series Fund, Inc.,
Jennison Growth Portfolio, (Class A) | | 26,723,798 | | | 330,840,614 | |
| | | | |
|
|
|
Total Common Stock
(Identified Cost $787,742,326) | | | | | 996,993,377 | |
| | | | |
|
|
|
Total Investments—100.0%
(Identified Cost $787,742,326) (a) | | | | | 996,993,377 | |
Liabilities in excess of other assets | | | | | (138,704 | ) |
| | | | |
|
|
|
| Total Net Assets—100% | | | | $ | 996,854,673 | |
| | | | |
|
|
|
| (a) | The aggregate cost of investments for federal income tax purposes as of December 31, 2005 was $799,104,449 and the composition of unrealized appreciation of investment securities was $197,888,928. |
*See accompanying notes to financial statements.
MSF-177
Metropolitan Series Fund, Inc.
Zenith Equity Portfolio
Statement of Assets & Liabilities
December 31, 2005
| | | | | | | |
Assets | | | | | | | |
Investments at value | | | | | $ | 996,993,377 | |
Receivable for: | | | | | | | |
Securities sold | | | | | | 837,617 | |
Fund shares sold | | | | | | 297,598 | |
| | | | | |
|
|
|
Total Assets | | | | | | 998,128,592 | |
Liabilities | | | | | | | |
Payable for: | | | | | | | |
Fund shares redeemed | | $ | 1,135,215 | | | | |
Accrued expenses: | | | | | | | |
Deferred directors’ fees | | | 120,122 | | | | |
Other expenses | | | 18,582 | | | | |
| | |
|
| | | | |
Total Liabilities | | | | | | 1,273,919 | |
| | | | | |
|
|
|
Net Assets | | | | | $ | 996,854,673 | |
| | | | | |
|
|
|
Net assets consists of: | | | | | | | |
Capital paid in | | | | | $ | 921,625,792 | |
Undistributed net investment income | | | | | | 5,093,493 | |
Accumulated net realized losses | | | | | | (139,115,663 | ) |
Unrealized appreciation on investments | | | | | | 209,251,051 | |
| | | | | |
|
|
|
Net Assets | | | | | $ | 996,854,673 | |
| | | | | |
|
|
|
| Computation of offering price: | | | | | | | |
Net asset value and redemption price per share ($996,854,673 divided by 2,392,396 shares outstanding) | | | | | $ | 416.68 | |
| | | | | |
|
|
|
Identified cost of investments | | | | | $ | 787,742,326 | |
| | | | | |
|
|
|
Statement of Operations
Year Ended December 31, 2005
| | | | | |
Investment Income | | | | | |
Dividends from underlying portfolios | | | | $ | 5,231,919 |
| | | | |
|
|
Expenses | | | | | |
Directors’ fees and expenses | | 11,545 | | | |
Custodian | | 20,335 | | | |
Audit and tax services | | 21,612 | | | |
Legal | | 23,985 | | | |
Miscellaneous | | 4,817 | | | |
| | |
| | | |
Total expenses | | | | | 82,294 |
| | | | |
|
|
Net Investment Income | | | | | 5,149,625 |
| | | | |
|
|
Realized and Unrealized Gain | | | | | |
| Realized gain on: | | | | | |
Investments—net | | | | | 22,293,595 |
| Unrealized appreciation on: | | | | | |
Investments—net | | | | | 66,442,705 |
| | | | |
|
|
Net gain | | | | | 88,736,300 |
| | | | |
|
|
Net Increase in Net Assets From Operations | | | | $ | 93,885,925 |
| | | | |
|
|
See accompanying notes to financial statements.
MSF-178
Metropolitan Series Fund, Inc.
Zenith Equity Portfolio
Statement of Changes in Net Assets
| | | | | | | | |
| | | Year ended
December 31,
2005
| | | Year ended
December 31,
2004
| |
From Operations | | | | | | | | |
Net investment income | | $ | 5,149,625 | | | $ | 9,094,173 | |
Net realized gain | | | 22,293,595 | | | | 10,642,133 | |
Unrealized appreciation | | | 66,442,705 | | | | 84,922,832 | |
| | |
|
|
| |
|
|
|
Increase in net assets from operations | | | 93,885,925 | | | | 104,659,138 | |
| | |
|
|
| |
|
|
|
From Distributions to Shareholders | | | | | | | | |
Net investment income | | | (9,105,003 | ) | | | (4,637,824 | ) |
| | |
|
|
| |
|
|
|
Total distributions | | | (9,105,003 | ) | | | (4,637,824 | ) |
| | |
|
|
| |
|
|
|
Decrease in net assets from capital share transactions | | | (117,309,190 | ) | | | (113,621,579 | ) |
| | |
|
|
| |
|
|
|
Total (decrease) in net assets | | | (32,528,268 | ) | | | (13,600,265 | ) |
| | |
Net Assets | | | | | | | | |
Beginning of the period | | | 1,029,382,941 | | | | 1,042,983,206 | |
| | |
|
|
| |
|
|
|
End of the period | | $ | 996,854,673 | | | $ | 1,029,382,941 | |
| | |
|
|
| |
|
|
|
Undistributed Net Investment Income | | | | | | | | |
End of the period | | $ | 5,093,493 | | | $ | 9,048,871 | |
| | |
|
|
| |
|
|
|
Other Information:
Capital Shares
Transactions in capital shares were as follows:
| | | | | | | | | | | | | | |
| | | Year ended December 31, 2005
| | | Year ended December 31, 2004
| |
| | | Shares
| | | $
| | | Shares
| | | $
| |
Sales | | 291,246 | | | $ | 112,602,224 | | | 330,042 | | | $ | 116,072,361 | |
Reinvestments | | 25,337 | | | | 9,105,003 | | | 13,106 | | | | 4,637,824 | |
Redemptions | | (619,086 | ) | | | (239,016,417 | ) | | (665,411 | ) | | | (234,331,764 | ) |
| | |
|
| |
|
|
| |
|
| |
|
|
|
Net increase (decrease) | | (302,503 | ) | | $ | (117,309,190 | ) | | (322,263 | ) | | $ | (113,621,579 | ) |
| | |
|
| |
|
|
| |
|
| |
|
|
|
See accompanying notes to financial statements.
MSF-179
Metropolitan Series Fund, Inc.
Zenith Equity Portfolio
Financial Highlights
| | | | | | | | | | | | | | | | | | | | |
| | | Year ended December 31,
| |
| | | 2005
| | | 2004
| | | 2003
| | | 2002
| | | 2001
| |
Net Asset Value, Beginning of Period | | $ | 381.97 | | | $ | 345.68 | | | $ | 263.54 | | | $ | 338.82 | | | $ | 411.89 | |
| | |
|
|
| |
|
|
| |
|
|
| |
|
|
| |
|
|
|
Income From Investment Operations | | | | | | | | | | | | | | | | | | | | |
Net investment income | | | 2.29 | | | | 3.44 | | | | 1.57 | | | | 0.79 | | | | 1.37 | |
Net realized and unrealized gain (loss) of investments | | | 35.94 | | | | 34.45 | | | | 81.36 | | | | (75.01 | ) | | | (68.85 | ) |
| | |
|
|
| |
|
|
| |
|
|
| |
|
|
| |
|
|
|
Total from investment operations | | | 38.23 | | | | 37.89 | | | | 82.93 | | | | (74.22 | ) | | | (67.48 | ) |
| | |
|
|
| |
|
|
| |
|
|
| |
|
|
| |
|
|
|
Less Distributions | | | | | | | | | | | | | | | | | | | | |
Distributions from net investment income | | | (3.52 | ) | | | (1.60 | ) | | | (0.79 | ) | | | (1.06 | ) | | | (5.59 | ) |
| | |
|
|
| |
|
|
| |
|
|
| |
|
|
| |
|
|
|
Total distributions | | | (3.52 | ) | | | (1.60 | ) | | | (0.79 | ) | | | (1.06 | ) | | | (5.59 | ) |
| | |
|
|
| |
|
|
| |
|
|
| |
|
|
| |
|
|
|
Net Asset Value, End of Period | | $ | 416.68 | | | $ | 381.97 | | | $ | 345.68 | | | $ | 263.54 | | | $ | 338.82 | |
| | |
|
|
| |
|
|
| |
|
|
| |
|
|
| |
|
|
|
Total Return (%) | | | 10.2 | | | | 11.0 | | | | 31.5 | | | | (22.0 | ) | | | (16.4 | ) |
Ratio of operating expenses to average net assets before expense reductions (%) | | | 0.01 | (a) | | | 0.01 | (a) | | | 0.01 | (a) | | | 0.26 | | | | 0.69 | |
Ratio of operating expenses to average net assets after expense reductions (%) (b) | | | 0.01 | | | | 0.01 | | | | 0.01 | | | | 0.25 | | | | 0.68 | |
Ratio of net investment income to average net assets (%) | | | 0.52 | | | | 0.91 | | | | 0.50 | | | | 0.23 | | | | 0.33 | |
Portfolio turnover rate (%) | | | 5 | | | | 4 | | | | 6 | | | | 302 | | | | 245 | |
Net assets, end of period (000) | | $ | 996,855 | | | $ | 1,029,383 | | | $ | 1,042,983 | | | $ | 888,712 | | | $ | 1,310,358 | |
| (a) | The Ratio of operating expenses does not include expenses of investment companies in which the portfolio invests. |
| (b) | The Portfolio has entered into arrangements with certain brokers who paid a portion of the Portfolio’s expenses |
See accompanying notes to financial statements.
MSF-180
Metropolitan Series Fund, Inc.
BlackRock Aggressive Growth Portfolio
Schedule of Investments as of December 31, 2005
Common Stock—98.6% of Total Net Assets
| | | | | |
| | | | | | |
| Security Description | | Shares | | Value* |
| | | | | | |
| | |
Aerospace & Defense—1.6% | | | | | |
Alliant Techsystems, Inc. (a) (b) | | 202,100 | | $ | 15,393,957 |
| | | | |
|
|
| | |
Biotechnology—2.6% | | | | | |
Cephalon, Inc. (a) (b) | | 211,000 | | | 13,660,140 |
Charles River Laboratories International, Inc. (b) | | 92,500 | | | 3,919,225 |
Martek Biosciences Corp. (a) (b) | | 299,400 | | | 7,368,234 |
| | | | |
|
|
| | | | | | 24,947,599 |
| | | | |
|
|
| | |
Building Products—1.0% | | | | | |
Lennox International, Inc. (a) | | 335,000 | | | 9,447,000 |
| | | | |
|
|
| | |
Capital Markets—1.8% | | | | | |
Nuveen Investments, Inc. (Class A) (a) | | 172,500 | | | 7,351,950 |
T. Rowe Price Group, Inc. | | 143,300 | | | 10,321,899 |
| | | | |
|
|
| | | | | | 17,673,849 |
| | | | |
|
|
| | |
Chemicals—2.5% | | | | | |
Air Products & Chemicals, Inc. | | 161,500 | | | 9,559,185 |
Airgas, Inc. (a) | | 432,300 | | | 14,222,670 |
| | | | |
|
|
| | | | | | 23,781,855 |
| | | | |
|
|
| | |
Commercial Services & Supplies—7.5% | | | | | |
Alliance Data Systems Co. (a) (b) | | 264,200 | | | 9,405,520 |
Ceridian Corp. (b) | | 897,700 | | | 22,307,845 |
ChoicePoint, Inc. (b) | | 226,300 | | | 10,072,613 |
Cogent, Inc. (a) (b) | | 322,400 | | | 7,312,032 |
Stericycle, Inc. (a) (b) | | 161,400 | | | 9,503,232 |
The Corporate Executive Board Co. | | 154,300 | | | 13,840,710 |
| | | | |
|
|
| | | | | | 72,441,952 |
| | | | |
|
|
| | |
Communications Equipment—5.5% | | | | | |
ADTRAN, Inc. | | 407,600 | | | 12,122,024 |
Comverse Technology, Inc. (b) | | 357,900 | | | 9,516,561 |
Foundry Networks, Inc. (a) (b) | | 526,100 | | | 7,265,441 |
Harris Corp. | | 346,300 | | | 14,894,363 |
Polycom, Inc. (b) | | 637,600 | | | 9,755,280 |
| | | | |
|
|
| | | | | | 53,553,669 |
| | | | |
|
|
| | |
Computers & Peripherals—2.3% | | | | | |
Avid Technology, Inc. (a) (b) | | 405,900 | | | 22,227,084 |
| | | | |
|
|
| | |
Containers & Packaging—0.6% | | | | | |
Owens-Illinois, Inc. (b) | | 297,600 | | | 6,261,504 |
| | | | |
|
|
| |
Diversified Consumer Services—1.0% | | |
Laureate Education, Inc. (a) (b) | | 191,400 | | | 10,050,414 |
| | | | |
|
|
| |
Diversified Telecommunication Services—1.7% | | | |
Amdocs, Ltd. (b) | | 602,300 | | | 16,563,250 |
| | | | |
|
|
| | |
Electronic Equipment & Instruments—2.4% | | | | | |
Amphenol Corp. (Class A) (a) | | 337,100 | | | 14,920,046 |
Ingram Micro, Inc. | | 398,600 | | | 7,944,098 |
| | | | |
|
|
| | | | | | 22,864,144 |
| | | | |
|
|
| | | | | |
| Security Description | | Shares | | Value* |
| | | | | | |
| | | | | | |
| | |
Energy Equipment & Services—4.1% | | | | | |
ESCO International, Inc. | | 372,000 | | $ | 16,498,200 |
Grant Prideco, Inc. (b) | | 114,800 | | | 5,064,976 |
Noble Corp. | | 147,800 | | | 10,425,812 |
Stolt Offshore S.A. (ADR) (a) | | 638,200 | | | 7,441,412 |
| | | | |
|
|
| | | | | | 39,430,400 |
| | | | |
|
|
| | |
Gas Utilities—0.2% | | | | | |
CNX Gas Corp. (144A) | | 77,500 | | | 1,627,500 |
| | | | |
|
|
| | |
Health Care Equipment & Supplies—5.0% | | | | | |
Cytyc Corp. (a) (b) | | 430,100 | | | 12,141,723 |
Fisher Scientific International, Inc. (b) | | 180,300 | | | 11,153,358 |
Kinetic Concepts, Inc. (b) | | 234,800 | | | 9,335,648 |
Varian Medical Systems, Inc. (b) | | 313,500 | | | 15,781,590 |
| | | | |
|
|
| | | | | | 48,412,319 |
| | | | |
|
|
| | |
Health Care Providers & Services—8.6% | | | | | |
Caremark Rx, Inc. (b) | | 284,900 | | | 14,754,971 |
Community Health Systems, Inc. (b) | | 474,800 | | | 18,203,832 |
Coventry Health Care, Inc. (b) | | 206,700 | | | 11,773,632 |
Omnicare, Inc. | | 225,400 | | | 12,897,388 |
Triad Hospitals, Inc. (b) | | 205,700 | | | 8,069,611 |
WellPoint, Inc. (b) | | 225,500 | | | 17,992,645 |
| | | | |
|
|
| | | | | | 83,692,079 |
| | | | |
|
|
| | |
Hotels, Restaurants & Leisure—4.5% | | | | | |
GTECH Holdings Corp. | | 280,300 | | | 8,896,722 |
Marriott International, Inc. (Class A) | | 75,700 | | | 5,069,629 |
Orient-Express Hotels, Ltd. (Class A) (a) | | 356,000 | | | 11,221,120 |
Ruby Tuesday, Inc. (a) | | 521,400 | | | 13,499,046 |
Starwood Hotels & Resorts Worldwide, Inc.
(Class B) | | 81,200 | | | 5,185,432 |
| | | | |
|
|
| | | | | | 43,871,949 |
| | | | |
|
|
| | |
Insurance—2.6% | | | | | |
AXIS Capital Holdings Ltd. (a) | | 323,000 | | | 10,103,440 |
Endurance Specialty Holdings, Ltd. | | 409,500 | | | 14,680,575 |
| | | | |
|
|
| | | | | | 24,784,015 |
| | | | |
|
|
| | |
Internet Software & Services—1.1% | | | | | |
Akamai Technologies, Inc. (a) | | 549,100 | | | 10,943,563 |
| | | | |
|
|
| | |
IT Services—2.3% | | | | | |
CACI International, Inc. (Class A) (b) | | 172,500 | | | 9,898,050 |
NAVTEQ, Inc. (a) (b) | | 278,500 | | | 12,217,795 |
| | | | |
|
|
| | | | | | 22,115,845 |
| | | | |
|
|
| | |
Leisure Equipment & Products—0.5% | | | | | |
Marvel Entertainment, Inc. (a) | | 297,400 | | | 4,871,412 |
| | | | |
|
|
| | |
Machinery—0.9% | | | | | |
IDEX Corp. | | 223,300 | | | 9,179,863 |
| | | | |
|
|
*See accompanying notes to financial statements.
MSF-181
Metropolitan Series Fund, Inc.
BlackRock Aggressive Growth Portfolio
Schedule of Investments as of December 31, 2005
Common Stock—(Continued)
| | | | | |
| Security Description | | Shares | | Value* |
| | | | | | |
| | |
Media—3.6% | | | | | |
CKX, Inc. (a) | | 641,800 | | $ | 8,343,400 |
Getty Images, Inc. (a) (b) | | 81,500 | | | 7,275,505 |
Univision Communications, Inc. (Class A) (b) | | 396,700 | | | 11,659,013 |
XM Satellite Radio Holdings, Inc. (a) (b) | | 279,000 | | | 7,611,120 |
| | | | |
|
|
| | | | | | 34,889,038 |
| | | | |
|
|
| | |
Metals & Mining—3.6% | | | | | |
CONSOL Energy, Inc. (a) (b) | | 396,200 | | | 25,824,316 |
Massey Energy Co. (a) | | 234,300 | | | 8,872,941 |
| | | | |
|
|
| | | | | | 34,697,257 |
| | | | |
|
|
| | |
Oil, Gas & Consumable Fuels—5.1% | | | | | |
Amerada Hess Corp. | | 37,800 | | | 4,793,796 |
EOG Resources, Inc. | | 271,200 | | | 19,897,944 |
Newfield Expolration Co. (b) | | 491,200 | | | 24,594,384 |
| | | | |
|
|
| | | | | | 49,286,124 |
| | | | |
|
|
| | |
Pharmaceuticals—4.7% | | | | | |
Endo Pharmaceuticals Holdings | | 422,500 | | | 12,784,850 |
Medco Health Solutions, Inc. (b) | | 243,500 | | | 13,587,300 |
Shire Pharmaceuticals Group, Plc. (ADR) (a) | | 499,600 | | | 19,379,484 |
| | | | |
|
|
| | | | | | 45,751,634 |
| | | | |
|
|
| | |
Road & Rail—1.1% | | | | | |
Landstar System, Inc. | | 246,300 | | | 10,280,562 |
| | | | |
|
|
| |
Semiconductors & Semiconductor Equipment— 4.8% | | | |
Analog Devices, Inc. | | 322,400 | | | 11,564,488 |
Freescale Semiconductor, Inc. (Class B) (b) | | 543,300 | | | 13,674,861 |
Lam Research Corp. (b) | | 332,300 | | | 11,856,464 |
Linear Technology Corp. | | 249,700 | | | 9,006,679 |
| | | | |
|
|
| | | | | | 46,102,492 |
| | | | |
|
|
| | |
Software—2.1% | | | | | |
Adobe Systems, Inc. (b) | | 378,200 | | | 13,978,272 |
Verifone Holdings, Inc. (a) | | 234,000 | | | 5,920,200 |
| | | | |
|
|
| | | | | | 19,898,472 |
| | | | |
|
|
| | |
Specialty Retail—6.5% | | | | | |
Bed Bath & Beyond, Inc. (b) | | 177,200 | | | 6,405,780 |
Chico’s FAS, Inc. (b) | | 252,900 | | | 11,109,897 |
Staples, Inc. | | 513,649 | | | 11,664,969 |
TJX Cos., Inc. | | 547,900 | | | 12,727,717 |
Williams-Sonoma, Inc. (b) | | 483,500 | | | 20,863,025 |
| | | | |
|
|
| | | | | | 62,771,388 |
| | | | |
|
|
| | |
Textiles, Apparel & Luxury Goods—0.8% | | | | | |
The Warnaco Group, Inc. (a) (b) | | 304,500 | | | 8,136,240 |
| | | | |
|
|
| | |
Trading Companies & Distributors—1.6% | | | | | |
MSC Industrial Direct Co. (Class A) (a) | | 383,600 | | | 15,428,392 |
| | | | |
|
|
| | | | | | | |
| Security Description | | Shares | | Value* | |
| | | | | | | | |
| |
Wireless Telecommunication Services—4.4% | | | | |
American Tower Corp. (Class A) (b) | | | 773,800 | | $ | 20,969,980 | |
Nextel Partners, Inc. (Class A) (a) (b) | | | 569,000 | | | 15,897,860 | |
Syniverse Holdings, Inc. (a) | | | 297,500 | | | 6,217,750 | |
| | | | | |
|
|
|
| | | | | | | 43,085,590 | |
| | | | | |
|
|
|
Total Common Stock
(Identified Cost $766,770,941) | | | | | | 954,462,411 | |
| | | | | |
|
|
|
| | |
| Short Term Investments—1.6% | | | | | | | |
| Security Description | | Face
Amount | | Value* | |
| | |
Discount Notes—1.6% | | | | | | | |
Federal Home Loan Bank
3.250%, 01/03/06 | | $ | 15,200,000 | | | 15,197,255 | |
| | | | | |
|
|
|
Total Short Term Investments
(Amortized Cost $15,197,255) | | | | | | 15,197,255 | |
| | | | | |
|
|
|
Total Investments—100.2%
(Identified Cost $781,968,196) | | | | | | 969,659,666 | |
Liabilities in excess of other assets | | | | | | (1,694,742 | ) |
| | | | | |
|
|
|
| Total Net Assets—100% | | | | | $ | 967,964,924 | |
| | | | | |
|
|
|
| (a) | A portion or all of the security was held on loan. As of December 31, 2005, the market value of securities loaned was $136,320,911 and the collateral received consisted of cash in the amount of $140,053,764. |
| (c) | The aggregate cost of investments for federal income tax purposes as of December 31, 2005 was $782,798,440 and the composition of unrealized appreciation and depreciation of investment securities was $203,573,363 and $(16,712,137), respectively. |
| (144A)— | Securities exempt from registration under Rule 144A of the Securities Act of 1933. These securities may be resold in transactions exempt from registration, normally to qualified institutional buyers. As of December 31, 2005, the market value of 144A securities was $1,627,500, which is 0.17% of total net assets. |
| (ADR)— | An American Depositary Receipt is a certificate issued by a custodian bank representing the right to receive securities of the foreign issuer described. Trading on exchanges not located in the United States or Canada significantly influences the value of ADRs. |
*See accompanying notes to financial statements.
MSF-182
Metropolitan Series Fund, Inc.
BlackRock Aggressive Growth Portfolio
Statement of Assets & Liabilities
December 31, 2005
| | | | | | | |
Assets | | | | | | | |
Investments at value | | | | | $ | 969,659,666 | |
Cash | | | | | | 10,958 | |
Collateral for securities loaned | | | | | | 140,053,764 | |
Receivable for: | | | | | | | |
Fund shares sold | | | | | | 442,668 | |
Accrued interest and dividends | | | | | | 290,380 | |
| | | | | |
|
|
|
Total Assets | | | | | | 1,110,457,436 | |
Liabilities | | | | | | | |
Payable for: | | | | | | | |
Fund shares redeemed | | $ | 1,707,684 | | | | |
Return of collateral for securities loaned | | | 140,053,764 | | | | |
Accrued expenses: | | | | | | | |
Management fees | | | 602,832 | | | | |
Service and distribution fees | | | 4,716 | | | | |
Other expenses | | | 123,516 | | | | |
| | |
|
| | | | |
Total Liabilities | | | | | | 142,492,512 | |
| | | | | |
|
|
|
Net Assets | | | | | $ | 967,964,924 | |
| | | | | |
|
|
|
Net assets consists of: | | | | | | | |
Capital paid in | | | | | $ | 1,090,190,472 | |
Accumulated net realized losses | | | | | | (309,917,018 | ) |
Unrealized appreciation on investments | | | | | | 187,691,470 | |
| | | | | |
|
|
|
Net Assets | | | | | $ | 967,964,924 | |
| | | | | |
|
|
|
| Computation of offering price: | | | | | | | |
Class A | | | | | | | |
Net asset value and redemption price per share ($938,549,972 divided by 41,805,176 shares outstanding) | | | | | $ | 22.45 | |
| | | | | |
|
|
|
Class B | | | | | | | |
Net asset value and redemption price per share ($11,761,462 divided by 547,357 shares outstanding) | | | | | $ | 21.49 | |
| | | | | |
|
|
|
Class E | | | | | | | |
Net asset value and redemption price per share ($17,653,490 divided by 790,650 shares outstanding) | | | | | $ | 22.33 | |
| | | | | |
|
|
|
Identified cost of investments | | | | | $ | 781,968,196 | |
| | | | | |
|
|
|
Statement of Operations
Year Ended December 31, 2005
| | | | | | | | |
Investment Income | | | | | | | | |
Dividends | | | | | | $ | 3,487,046 | (a) |
Interest | | | | | | | 639,230 | (b) |
| | | | | | |
|
|
|
| | | | | | | | 4,126,276 | |
Expenses | | | | | | | | |
Management fees | | $ | 6,869,382 | | | | | |
Service and distribution fees—Class B | | | 18,945 | | | | | |
Service and distribution fees—Class E | | | 25,571 | | | | | |
Directors’ fees and expenses | | | 22,257 | | | | | |
Custodian | | | 210,085 | | | | | |
Audit and tax services | | | 23,319 | | | | | |
Legal | | | 35,056 | | | | | |
Printing | | | 243,535 | | | | | |
Insurance | | | 19,508 | | | | | |
Miscellaneous | | | 13,408 | | | | | |
| | |
|
|
| | | | |
Total expenses | | | 7,481,066 | | | | | |
Expense reductions | | | (216,101 | ) | | | 7,264,965 | |
| | |
|
|
| |
|
|
|
Net Investment Loss | | | | | | | (3,138,689 | ) |
| | | | | | |
|
|
|
Realized and Unrealized Gain | | | | | | | | |
| Realized gain on: | | | | | | | | |
Investments—net | | | | | | | 98,876,010 | |
| Unrealized appreciation on: | | | | | | | | |
Investments—net | | | | | | | 41,184 | |
| | | | | | |
|
|
|
Net gain | | | | | | | 98,917,194 | |
| | | | | | |
|
|
|
Net Increase in Net Assets From Operations | | | | | | $ | 95,778,505 | |
| | | | | | |
|
|
|
| (a) | Net of foreign taxes of $5,361. |
| (b) | Includes income on securities loaned of $101,644. |
See accompanying notes to financial statements.
MSF-183
Metropolitan Series Fund, Inc.
BlackRock Aggressive Growth Portfolio
Statement of Changes in Net Assets
| | | | | | | | |
| | | Year ended
December 31,
2005
| | | Year ended
December 31,
2004
| |
From Operations | | | | | | | | |
Net investment loss | | $ | (3,138,689 | ) | | $ | (3,534,126 | ) |
Net realized gain | | | 98,876,010 | | | | 130,549,598 | |
Unrealized appreciation (depreciation) | | | 41,184 | | | | (13,231,417 | ) |
| | |
|
|
| |
|
|
|
Increase in net assets from operations | | | 95,778,505 | | | | 113,784,055 | |
| | |
|
|
| |
|
|
|
Decrease in net assets from capital share transactions | | | (104,607,222 | ) | | | (75,173,373 | ) |
| | |
|
|
| |
|
|
|
Total increase (decrease) in net assets | | | (8,828,717 | ) | | | 38,610,682 | |
| | |
Net Assets | | | | | | | | |
Beginning of the period | | | 976,793,641 | | | | 938,182,959 | |
| | |
|
|
| |
|
|
|
End of the period | | $ | 967,964,924 | | | $ | 976,793,641 | |
| | |
|
|
| |
|
|
|
Undistributed Net Investment Income | | | | | | | | |
End of the period | | $ | 0 | | | $ | 0 | |
| | |
|
|
| |
|
|
|
Other Information:
Capital Shares
Transactions in capital shares were as follows:
| | | | | | | | | | | | | | |
| | | Year ended
December 31, 2005
| | | Year ended
December 31, 2004
| |
| | | Shares
| | | $
| | | Shares
| | | $
| |
Class A | | | | | | | | | | | | | | |
Sales | | 2,771,433 | | | $ | 57,684,339 | | | 1,487,380 | | | $ | 27,187,174 | |
Redemptions | | (8,040,608 | ) | | | (166,999,995 | ) | | (6,050,901 | ) | | | (110,829,555 | ) |
| | |
|
| |
|
|
| |
|
| |
|
|
|
Net decrease | | (5,269,175 | ) | | $ | (109,315,654 | ) | | (4,563,521 | ) | | $ | (83,642,381 | ) |
| | |
|
| |
|
|
| |
|
| |
|
|
|
Class B | | | | | | | | | | | | | | |
Sales | | 441,418 | | | $ | 8,839,793 | | | 226,300 | | | $ | 3,970,375 | |
Redemptions | | (108,065 | ) | | | (2,196,074 | ) | | (12,296 | ) | | | (212,475 | ) |
| | |
|
| |
|
|
| |
|
| |
|
|
|
Net increase | | 333,353 | | | $ | 6,643,719 | | | 214,004 | | | $ | 3,757,900 | |
| | |
|
| |
|
|
| |
|
| |
|
|
|
Class E | | | | | | | | | | | | | | |
Sales | | 164,891 | | | $ | 3,439,010 | | | 582,858 | | | $ | 10,654,247 | |
Redemptions | | (260,008 | ) | | | (5,374,295 | ) | | (327,422 | ) | | | (5,943,139 | ) |
| | |
|
| |
|
|
| |
|
| |
|
|
|
Net increase (decrease) | | (95,117 | ) | | $ | (1,935,285 | ) | | 255,436 | | | $ | 4,711,107 | |
| | |
|
| |
|
|
| |
|
| |
|
|
|
Decrease derived from capital share transactions | | (5,030,939 | ) | | $ | (104,607,222 | ) | | (4,094,081 | ) | | $ | (75,173,373 | ) |
| | |
|
| |
|
|
| |
|
| |
|
|
|
See accompanying notes to financial statements.
MSF-184
Metropolitan Series Fund, Inc.
BlackRock Aggressive Growth Portfolio
Financial Highlights
| | | | | | | | | | | | | | | | | | | | |
| | | Class A
| |
| | | Year ended December 31,
| |
| | | 2005
| | | 2004
| | | 2003
| | | 2002
| | | 2001
| |
Net Asset Value, Beginning of Period | | $ | 20.28 | | | $ | 17.95 | | | $ | 12.75 | | | $ | 17.88 | | | $ | 31.59 | |
| | |
|
|
| |
|
|
| |
|
|
| |
|
|
| |
|
|
|
Income From Investment Operations | | | | | | | | | | | | | | | | | | | | |
Net investment loss | | | (0.07 | ) | | | (0.07 | ) | | | (0.06 | ) | | | (0.03 | ) | | | (0.02 | ) |
Net realized and unrealized gain (loss) of investments | | | 2.24 | | | | 2.40 | | | | 5.26 | | | | (5.10 | ) | | | (6.73 | ) |
| | |
|
|
| |
|
|
| |
|
|
| |
|
|
| |
|
|
|
Total from investment operations | | | 2.17 | | | | 2.33 | | | | 5.20 | | | | (5.13 | ) | | | (6.75 | ) |
| | |
|
|
| |
|
|
| |
|
|
| |
|
|
| |
|
|
|
Less Distributions | | | | | | | | | | | | | | | | | | | | |
Distributions from net investment income | | | 0.00 | | | | 0.00 | | | | 0.00 | | | | 0.00 | | | | (0.01 | ) |
Distributions from net realized capital gains | | | 0.00 | | | | 0.00 | | | | 0.00 | | | | 0.00 | | | | (6.95 | ) |
| | |
|
|
| |
|
|
| |
|
|
| |
|
|
| |
|
|
|
Total distributions | | | 0.00 | | | | 0.00 | | | | 0.00 | | | | 0.00 | | | | (6.96 | ) |
| | |
|
|
| |
|
|
| |
|
|
| |
|
|
| |
|
|
|
Net Asset Value, End of Period | | $ | 22.45 | | | $ | 20.28 | | | $ | 17.95 | | | $ | 12.75 | | | $ | 17.88 | |
| | |
|
|
| |
|
|
| |
|
|
| |
|
|
| |
|
|
|
Total Return (%) | | | 10.7 | | | | 13.0 | | | | 40.8 | | | | (28.7 | ) | | | (23.8 | ) |
Ratio of operating expenses to average net assets before expense reductions (%) | | | 0.79 | | | | 0.79 | | | | 0.81 | | | | 0.79 | | | | 0.77 | |
Ratio of operating expenses to average net assets after expense reductions (%) (d) | | | 0.77 | | | | 0.78 | | | | 0.79 | | | | 0.77 | | | | 0.76 | |
Ratio of net investment loss to average net assets (%) | | | (0.33 | ) | | | (0.38 | ) | | | (0.38 | ) | | | (0.18 | ) | | | (0.11 | ) |
Portfolio turnover rate (%) | | | 71 | | | | 95 | | | | 98 | | | | 134 | | | | 150 | |
Net assets, end of period (000) | | $ | 938,550 | | | $ | 954,736 | | | $ | 926,897 | | | $ | 687,325 | | | $ | 1,069,246 | |
| | | | | | | | |
| | | Class B
| |
| | | Year ended
December 31, | | | April 26, 2004(a) through December 31,
2004
| |
| | | 2005
| | |
Net Asset Value, Beginning of Period | | $ | 19.46 | | | $ | 18.12 | |
| | |
|
|
| |
|
|
|
Income From Investment Operations | | | | | | | | |
Net investment income (loss) | | | (0.08 | ) | | | (0.03 | ) |
Net realized and unrealized gain of investments | | | 2.11 | | | | 1.37 | |
| | |
|
|
| |
|
|
|
Total from investment operations | | | 2.03 | | | | 1.34 | |
| | |
|
|
| |
|
|
|
Net Asset Value, End of Period | | $ | 21.49 | | | $ | 19.46 | |
| | |
|
|
| |
|
|
|
Total Return (%) | | | 10.4 | | | | 7.4 | (b) |
Ratio of operating expenses to average net assets before expense reductions (%) | | | 1.04 | | | | 1.04 | (c) |
Ratio of operating expenses to average net assets after expense reductions (%) (d) | | | 1.01 | | | | 1.03 | (c) |
Ratio of net investment loss to average net assets (%) | | | (0.56 | ) | | | (0.56 | )(c) |
Portfolio turnover rate (%) | | | 71 | | | | 95 | |
Net assets, end of period (000) | | $ | 11,761 | | | $ | 4,165 | |
| (a) | Commencement of operations. |
| (b) | Period less than one year is not computed on an annualized basis. |
| (c) | Computed on an annualized basis. |
| (d) | The Portfolio has entered into arrangements with certain brokers who paid a portion of the Portfolio’s expenses. |
See accompanying notes to financial statements.
MSF-185
Metropolitan Series Fund, Inc.
BlackRock Aggressive Growth Portfolio
Financial Highlights
| | | | | | | | | | | | | | | | | | | | |
| | | Class E
| |
| | | Year ended December 31,
| | | May 1, 2001(a) through December 31, 2001
| |
| | | 2005
| | | 2004
| | | 2003
| | | 2002
| | |
Net Asset Value, Beginning of Period | | $ | 20.20 | | | $ | 17.90 | | | $ | 12.74 | | | $ | 17.88 | | | $ | 20.66 | |
| | |
|
|
| |
|
|
| |
|
|
| |
|
|
| |
|
|
|
Income From Investment Operations | | | | | | | | | | | | | | | | | | | | |
Net investment loss | | | (0.11 | ) | | | (0.09 | ) | | | (0.04 | ) | | | (0.01 | ) | | | (0.02 | ) |
Net realized and unrealized gain (loss) of investments | | | 2.24 | | | | 2.39 | | | | 5.20 | | | | (5.13 | ) | | | (2.76 | ) |
| | |
|
|
| |
|
|
| |
|
|
| |
|
|
| |
|
|
|
Total from investment operations | | | 2.13 | | | | 2.30 | | | | 5.16 | | | | (5.14 | ) | | | (2.78 | ) |
| | |
|
|
| |
|
|
| |
|
|
| |
|
|
| |
|
|
|
Net Asset Value, End of Period | | $ | 22.33 | | | $ | 20.20 | | | $ | 17.90 | | | $ | 12.74 | | | $ | 17.88 | |
| | |
|
|
| |
|
|
| |
|
|
| |
|
|
| |
|
|
|
Total Return (%) | | | 10.5 | | | | 12.8 | | | | 40.6 | | | | (28.8 | ) | | | (13.4 | )(b) |
Ratio of operating expenses to average net assets before expense reductions (%) | | | 0.94 | | | | 0.94 | | | | 0.96 | | | | 0.94 | | | | 0.92 | (c) |
Ratio of operating expenses to average net assets after expense reductions (%) (d) | | | 0.92 | | | | 0.93 | | | | 0.94 | | | | 0.92 | | | | 0.91 | (c) |
Ratio of net investment loss to average net assets (%) | | | (0.48 | ) | | | (0.52 | ) | | | (0.52 | ) | | | (0.24 | ) | | | (0.12 | )(c) |
Portfolio turnover rate (%) | | | 71 | | | | 95 | | | | 98 | | | | 134 | | | | 150 | |
Net assets, end of period (000) | | $ | 17,653 | | | $ | 17,893 | | | $ | 11,286 | | | $ | 1,361 | | | $ | 0.1 | |
| (a) | Commencement of operations. |
| (b) | Period less than one year is not computed on an annualized basis. |
| (c) | Computed on an annualized basis. |
| (d) | The Portfolio has entered into arrangements with certain brokers who paid a portion of the Portfolio’s expenses. |
See accompanying notes to financial statements.
MSF-186
Metropolitan Series Fund, Inc.
FI Mid Cap Opportunities Portfolio
Schedule of Investments as of December 31, 2005
Common Stock—99.5% of Total Net Assets
| | | | | |
| Security Description | | Shares | | Value* |
| | | | | | |
| | |
Aerospace & Defense—2.9% | | | | | |
Argon, Inc. (a) (b) | | 146,518 | | $ | 4,539,128 |
Empresa Brasileira de Aeronautica S.A. (ADR) (a) | | 574,900 | | | 22,478,590 |
Essex Corp. (a) (b) | | 162,200 | | | 2,765,510 |
| | | | |
|
|
| | | | | | 29,783,228 |
| | | | |
|
|
| | |
Airlines—0.7% | | | | | |
US Airways Group, Inc. (a) | | 189,200 | | | 7,026,888 |
| | | | |
|
|
| | |
Beverages—1.5% | | | | | |
Molson Coors Brewing Co. (a) | | 222,500 | | | 14,905,275 |
| | | | |
|
|
| | |
Biotechnology—2.1% | | | | | |
Neurocrine Biosciences, Inc. (a) (b) | | 252,362 | | | 15,830,668 |
Viropharma Inc. (a) (b) | | 291,625 | | | 5,409,644 |
| | | | |
|
|
| | | | | | 21,240,312 |
| | | | |
|
|
| | |
Capital Markets—1.2% | | | | | |
Greenhill & Co., Inc. (a) | | 165,600 | | | 9,300,096 |
IntercontinentalExchange, Inc. (b) | | 70,600 | | | 2,566,310 |
| | | | |
|
|
| | | | | | 11,866,406 |
| | | | |
|
|
| | |
Chemicals—5.3% | | | | | |
Ashland, Inc. (a) | | 227,500 | | | 13,172,250 |
Mosaic Co. (a) (b) | | 823,300 | | | 12,044,879 |
Potash Corp. of Saskatchewan, Inc. | | 248,730 | | | 19,953,120 |
Potash Corp. of Saskatchewan, Inc. (CAD) | | 100,770 | | | 8,046,389 |
| | | | |
|
|
| | | | | | 53,216,638 |
| | | | |
|
|
| | |
Commercial Services & Supplies—0.7% | | | | | |
Global Cash Access, Inc. (b) | | 419,500 | | | 6,120,505 |
Wright Express Corp. (a) (b) | | 63,700 | | | 1,401,400 |
| | | | |
|
|
| | | | | | 7,521,905 |
| | | | |
|
|
| | |
Communications Equipment—6.6% | | | | | |
Andrew Corp. (a) (b) | | 543,800 | | | 5,834,974 |
Comverse Technology, Inc. (a) (b) | | 316,400 | | | 8,413,076 |
Harris Corp. | | 261,100 | | | 11,229,911 |
Nice Systems Ltd. (ADR) (b) | | 77,700 | | | 3,742,032 |
Nokia Corp. (ADR) | | 1,479,900 | | | 27,082,170 |
Research In Motion, Ltd. (a) (b) | | 152,408 | | | 10,060,452 |
| | | | |
|
|
| | | | | | 66,362,615 |
| | | | |
|
|
| | |
Computers & Peripherals—1.4% | | | | | |
NCR Corp. (b) | | 277,700 | | | 9,425,138 |
Network Appliance, Inc. (a) (b) | | 181,897 | | | 4,911,219 |
| | | | |
|
|
| | | | | | 14,336,357 |
| | | | |
|
|
| | |
Construction & Engineering—1.7% | | | | | |
Fluor Corp. | | 216,700 | | | 16,742,242 |
| | | | |
|
|
| | |
Construction Materials—1.4% | | | | | |
Texas Industries, Inc. (a) | | 281,900 | | | 14,049,896 |
| | | | |
|
|
| | |
Containers & Packaging—1.4% | | | | | |
Pactiv Corp. (b) | | 642,432 | | | 14,133,504 |
| | | | |
|
|
| | | | | |
| Security Description | | Shares | | Value* |
| | | | | | |
| | |
Diversified Consumer Services—1.1% | | | | | |
DeVry, Inc. (a) (b) | | 135,700 | | $ | 2,714,000 |
Universal Technical Institute, Inc. (a) (b) | | 270,000 | | | 8,353,800 |
| | | | |
|
|
| | | | | | 11,067,800 |
| | | | |
|
|
| | |
Diversified Financial Services—0.7% | | | | | |
Lazard, Ltd. (a) (b) | | 232,600 | | | 7,419,940 |
| | | | |
|
|
| |
Diversified Telecommunication Services—3.4% | | | |
Citizens Communications Co. (a) | | 890,290 | | | 10,888,247 |
Philippine Long Distance Telephone Co.
(ADR) (a) (b) | | 395,200 | | | 13,255,008 |
PT Indosat Tbk (ADR) (a) | | 239,400 | | | 6,964,146 |
Qwest Communications International, Inc. (a) (b) | | 513,400 | | | 2,900,710 |
| | | | |
|
|
| | | | | | 34,008,111 |
| | | | |
|
|
| | |
Electronic Equipment & Instruments—1.3% | | | | | |
Symbol Technologies, Inc. (a) | | 996,899 | | | 12,780,245 |
| | | | |
|
|
| | |
Energy Equipment & Services—3.6% | | | | | |
National-Oilwell Varco, Inc. (a) (b) | | 317,546 | | | 19,910,134 |
Seacor Smit, Inc. (a) (b) | | 173,200 | | | 11,794,920 |
Weatherford International, Ltd. (b) | | 128,316 | | | 4,645,039 |
| | | | |
|
|
| | | | | | 36,350,093 |
| | | | |
|
|
| | |
Food & Staples Retailing—3.0% | | | | | |
Safeway, Inc. (a) (b) | | 1,296,110 | | | 30,665,963 |
| | | | |
|
|
| | |
Health Care Equipment & Supplies—2.3% | | | | | |
Cytyc Corp. (a) (b) | | 789,573 | | | 22,289,646 |
INAMED Corp. (b) | | 9,500 | | | 832,960 |
| | | | |
|
|
| | | | | | 23,122,606 |
| | | | |
|
|
|
Health Care Providers & Services—0.5% |
Service Corp. International (a) | | 563,600 | | | 4,610,248 |
| | | | |
|
|
|
Hotels, Restaurants & Leisure—4.3% |
Harrah’s Entertainment, Inc. | | 14,200 | | | 1,012,318 |
International Game Technology (a) | | 332,100 | | | 10,222,038 |
Las Vegas Sands Corp. (a) (b) | | 188,714 | | | 7,448,542 |
Royal Caribbean Cruises, Ltd. (a) | | 168,700 | | | 7,601,622 |
Sportingbet, Plc. (GBP) | | 784,334 | | | 4,634,570 |
Wynn Resorts, Ltd. (a) (b) | | 224,311 | | | 12,303,458 |
| | | | |
|
|
| | | | | | 43,222,548 |
| | | | |
|
|
|
Household Durables—8.2% |
Harman International Industries, Inc. (a) | | 797,599 | | | 78,045,062 |
Knoll, Inc. (a) (b) | | 274,800 | | | 4,701,828 |
| | | | |
|
|
| | | | | | 82,746,890 |
| | | | |
|
|
|
Independent Power Producers & Energy Traders—1.2% |
NRG Energy, Inc. (a) (b) | | 255,900 | | | 12,058,008 |
| | | | |
|
|
|
Internet & Catalog Retail—1.5% |
eBay, Inc. (b) | | 345,800 | | | 14,955,850 |
| | | | |
|
|
*See accompanying notes to financial statements.
MSF-187
Metropolitan Series Fund, Inc.
FI Mid Cap Opportunities Portfolio
Schedule of Investments as of December 31, 2005
Common Stock—(Continued)
| | | | | |
| Security Description | | Shares | | Value* |
| | | | | | |
|
Internet Software & Services—2.8% |
Arbinet Thexchange, Inc. | | 250,000 | | $ | 1,752,500 |
Google, Inc. (Class A) (b) | | 36,900 | | | 15,308,334 |
Openwave Systems, Inc. (a) (b) | | 364,353 | | | 6,365,247 |
Yahoo!, Inc. (b) | | 126,100 | | | 4,940,598 |
| | | | |
|
|
| | | | | | 28,366,679 |
| | | | |
|
|
|
IT Services—1.8% |
First Data Corp. | | 426,700 | | | 18,352,367 |
| | | | |
|
|
|
Leisure Equipment & Products—1.9% |
Eastman Kodak Co. (a) | | 815,070 | | | 19,072,638 |
| | | | |
|
|
|
Machinery—1.4% |
Flowserve Corp. (a) (b) | | 362,800 | | | 14,352,368 |
| | | | |
|
|
|
Marine—1.1% |
Diana Shipping, Inc. (a) | | 424,500 | | | 5,459,070 |
DryShips, Inc. (a) (b) | | 150,900 | | | 1,843,983 |
Horizon Lines, Inc. (a) | | 280,200 | | | 3,398,826 |
| | | | |
|
|
| | | | | | 10,701,879 |
| | | | |
|
|
|
Media—4.7% |
EchoStar Communications Corp. (Class A) | | 748,275 | | | 20,330,632 |
Getty Images, Inc. (a) (b) | | 137,700 | | | 12,292,479 |
Salem Communications Corp. (Class A) (b) | | 121,295 | | | 2,121,449 |
The Walt Disney Co. | | 544,030 | | | 13,040,399 |
| | | | |
|
|
| | | | | | 47,784,959 |
| | | | |
|
|
|
Metals & Mining—1.7% |
Novelis, Inc. | | 371,562 | | | 7,761,930 |
Novelis, Inc. (CAD) | | 459,900 | | | 9,620,448 |
| | | | |
|
|
| | | | | | 17,382,378 |
| | | | |
|
|
|
Oil, Gas & Consumable Fuels—5.6% |
Goodrich Peteroleum Corp. (a) (b) | | 93,900 | | | 2,361,585 |
Murphy Oil Corp. | | 204,800 | | | 11,057,152 |
Newfield Exploration Co. (a) (b) | | 231,200 | | | 11,576,184 |
Pioneer Natural Resources Co. | | 211,300 | | | 10,833,351 |
Tesoro Petroleum Corp. (a) | | 324,600 | | | 19,979,130 |
Ultra Petroleum Corp. (a) (b) | | 14,600 | | | 814,680 |
| | | | |
|
|
| | | | | | 56,622,082 |
| | | | |
|
|
|
Real Estate—0.1% |
Sinochem Hong Kong Holdings, Ltd. (HKD) | | 6,918,200 | | | 1,280,859 |
| | | | |
|
|
|
Road & Rail—0.9% |
Norfolk Southern Corp. | | 214,500 | | | 9,616,035 |
| | | | |
|
|
|
Specialty Retail—5.6% |
Aeropostale, Inc. (a) (b) | | 304,100 | | | 7,997,830 |
GameStop Corp. (Class A) (a) (b) | | 286,249 | | | 9,108,443 |
Tiffany & Co. (a) | | 647,900 | | | 24,808,091 |
TJX Cos., Inc. (a) | | 629,200 | | | 14,616,316 |
| | | | |
|
|
| | | | | | 56,530,680 |
| | | | |
|
|
| | | | | | | |
| Security Description | | Shares | | Value* | |
| | | | | | | | |
|
Textiles, Apparel & Luxury Goods—4.1% | |
NIKE, Inc. (Class B) | | | 319,200 | | $ | 27,703,368 | |
Phillips-Van Heusen Corp. (a) | | | 432,100 | | | 14,000,040 | |
| | | | | |
|
|
|
| | | | | | | 41,703,408 | |
| | | | | |
|
|
|
|
Wireless Telecommunication Services—9.8% | |
American Tower Corp. (Class A) (b) | | | 757,400 | | | 20,525,540 | |
Crown Castle International Corp. (a) (b) | | | 186,169 | | | 5,009,808 | |
Dobson Communications Corp. (a) | | | 503,800 | | | 3,778,500 | |
Hutchison Telecommunications
International, Ltd. (ADR) (b) | | | 257,400 | | | 5,557,266 | |
Sprint Nextel Corp. | | | 2,766,258 | | | 64,619,787 | |
| | | | | |
|
|
|
| | | | | | | 99,490,901 | |
| | | | | |
|
|
|
Total Common Stock
(Identified Cost $926,067,073) | | | | | | 1,005,450,801 | |
| | | | | |
|
|
|
|
| Short Term Investments—1.6% | |
| Security Description | | Face
Amount | | Value* | |
|
Repurchase Agreement—1.6% | |
State Street Repurchase Agreement
dated 12/30/05 at 1.350% to be repurchased at $16,587,488 on
01/03/06, collateralized by $17,220,000 U.S. Treasury Note 3.875% due
09/15/10 with a value of $17,084,444. | | $ | 16,585,000 | | $ | 16,585,000 | |
| | | | | |
|
|
|
Total Short Term Investments
(Amortized Cost $16,585,000) | | | | | | 16,585,000 | |
| | | | | |
|
|
|
Total Investments—101.1%
(Identified Cost $942,652,073) (c) | | | | | | 1,022,035,801 | |
Liabilities in excess of other assets | | | | | | (11,541,507 | ) |
| | | | | |
|
|
|
| Total Net Assets—100% | | | | | $ | 1,010,494,294 | |
| | | | | |
|
|
|
| (a) | A portion or all of the security was held on loan. As of December 31, 2005, the market value of securities loaned was $202,336,761 and the collateral received consisted of cash in the amount of $208,064,707. |
| (c) | The aggregate cost of investments for federal income tax purposes as of December 31, 2005 was $949,133,866 and the composition of unrealized appreciation and depreciation of investment securities was $88,181,865 and $(15,279,930), respectively. |
| (ADR)— | An American Depositary Receipt is a certificate issued by a custodian bank representing the right to receive securities of the foreign issuer described. Trading on exchanges not located in the United States or Canada significantly influences the value of ADRs. |
| (REIT)— | A Real Estate Investment Trust is a pooled investment vehicle that invests primarily in income-producing real estate or real estate related loans or interest. |
*See accompanying notes to financial statements.
MSF-188
Metropolitan Series Fund, Inc.
FI Mid Cap Opportunities Portfolio
Statement of Assets & Liabilities
December 31, 2005
| | | | | | | |
Assets | | | | | | | |
Investments at value | | | | | $ | 1,022,035,801 | |
Cash | | | | | | 662 | |
Foreign cash at value | | | | | | 33 | |
Collateral for securities loaned | | | | | | 208,064,707 | |
Receivable for: | | | | | | | |
Securities sold | | | | | | 25,100,088 | |
Fund shares sold | | | | | | 1,032,702 | |
Accrued interest and dividends | | | | | | 779,075 | |
| | | | | |
|
|
|
Total Assets | | | | | | 1,257,013,068 | |
Liabilities | | | | | | | |
Payable for: | | | | | | | |
Fund shares redeemed | | $ | 1,160,893 | | | | |
Securities purchased | | | 36,503,111 | | | | |
Withholding taxes | | | 45,262 | | | | |
Return of collateral for securities loaned | | | 208,064,707 | | | | |
Accrued expenses: | | | | | | | |
Management fees | | | 586,378 | | | | |
Service and distribution fees | | | 14,930 | | | | |
Deferred Directors’ fees | | | 1,911 | | | | |
Other expenses | | | 141,582 | | | | |
| | |
|
| | | | |
Total Liabilities | | | | | | 246,518,774 | |
| | | | | |
|
|
|
Net Assets | | | | | $ | 1,010,494,294 | |
| | | | | |
|
|
|
Net assets consists of: | | | | | | | |
Capital paid in | | | | | $ | 1,644,433,363 | |
Undistributed net investment loss | | | | | | (45,803 | ) |
Accumulated net realized losses | | | | | | (713,276,347 | ) |
Unrealized appreciation on investments and foreign currency | | | | | | 79,383,081 | |
| | | | | |
|
|
|
Net Assets | | | | | $ | 1,010,494,294 | |
| | | | | |
|
|
|
| Computation of offering price: | | | | | | | |
Class A | | | | | | | |
Net asset value and redemption price per share ($924,601,793 divided by 52,917,103 shares outstanding) | | | | | $ | 17.47 | |
| | | | | |
|
|
|
Class B | | | | | | | |
Net asset value and redemption price per share ($47,699,315 divided by 2,784,219 shares outstanding) | | | | | $ | 17.13 | |
| | | | | |
|
|
|
Class E | | | | | | | |
Net asset value and redemption price per share ($38,193,186 divided by 2,208,647 shares outstanding) | | | | | $ | 17.29 | |
| | | | | |
|
|
|
Identified cost of investments | | | | | $ | 942,652,073 | |
| | | | | |
|
|
|
Identified cost of foreign cash | | | | | $ | 32 | |
| | | | | |
|
|
|
Statement of Operations
Year Ended December 31, 2005
| | | | | | | | |
Investment Income | | | | | | | | |
Dividends | | | | | | $ | 7,356,103 | (a) |
Interest | | | | | | | 489,699 | (b) |
| | | | | | |
|
|
|
| | | | | | | | 7,845,802 | |
Expenses | | | | | | | | |
Management fees | | $ | 6,730,379 | | | | | |
Service and distribution fees—Class B | | | 103,230 | | | | | |
Service and distribution fees—Class E | | | 57,047 | | | | | |
Directors’ fees and expenses | | | 22,358 | | | | | |
Custodian | | | 315,462 | | | | | |
Audit and tax services | | | 23,200 | | | | | |
Legal | | | 24,862 | | | | | |
Printing | | | 238,575 | | | | | |
Insurance | | | 20,093 | | | | | |
Miscellaneous | | | 12,137 | | | | | |
| | |
|
|
| | | | |
Total expenses | | | 7,547,343 | | | | | |
Expense reductions | | | (618,481 | ) | | | 6,928,862 | |
| | |
|
|
| |
|
|
|
Net Investment Income | | | | | | | 916,940 | |
| | | | | | |
|
|
|
Realized and Unrealized Gain (Loss) | | | | | | | | |
| Realized gain (loss) on: | | | | | | | | |
Investments—net | | | 110,941,554 | | | | | |
Foreign currency transactions—net | | | (344,016 | ) | | | 110,597,538 | |
| | |
|
|
| | | | |
| Unrealized depreciation on: | | | | | | | | |
Investments—net | | | (46,387,561 | ) | | | | |
Foreign currency transactions—net | | | (1,180 | ) | | | (46,388,741 | ) |
| | |
|
|
| |
|
|
|
Net gain | | | | | | | 64,208,797 | |
| | | | | | |
|
|
|
Net Increase in Net Assets From Operations | | | | | | $ | 65,125,737 | |
| | | | | | |
|
|
|
| (a) | Net of foreign taxes of $235,129. |
| (b) | Includes income on securities loaned of $377,269. |
See accompanying notes to financial statements.
MSF-189
Metropolitan Series Fund, Inc.
FI Mid Cap Opportunities Portfolio
Statement of Changes in Net Assets
| | | | | | | | |
| | | Year ended
December 31,
2005
| | | Year ended
December 31,
2004
| |
From Operations | | | | | | | | |
Net investment income | | $ | 916,940 | | | $ | 4,901,296 | |
Net realized gain | | | 110,597,538 | | | | 204,182,456 | |
Unrealized depreciation | | | (46,388,741 | ) | | | (54,189,199 | ) |
| | |
|
|
| |
|
|
|
Increase in net assets from operations | | | 65,125,737 | | | | 154,894,553 | |
| | |
|
|
| |
|
|
|
From Distributions to Shareholders | | | | | | | | |
Net investment income | | | | | | | | |
Class A | | | 0 | | | | (4,601,317 | ) |
Class B | | | 0 | | | | (113,963 | ) |
Class E | | | 0 | | | | (149,331 | ) |
| | |
|
|
| |
|
|
|
Total distributions | | | 0 | | | | (4,864,611 | ) |
| | |
|
|
| |
|
|
|
Decrease in net assets from capital share transactions | | | (94,926,891 | ) | | | (9,775,517 | ) |
| | |
|
|
| |
|
|
|
Total increase (decrease) in net assets | | | (29,801,154 | ) | | | 140,254,425 | |
| | |
Net Assets | | | | | | | | |
Beginning of the period | | | 1,040,295,448 | | | | 900,041,023 | |
| | |
|
|
| |
|
|
|
End of the period | | $ | 1,010,494,294 | | | $ | 1,040,295,448 | |
| | |
|
|
| |
|
|
|
Undistributed (Overdistributed) Net Investment Income | | | | | | | | |
End of the period | | $ | (45,803 | ) | | $ | (245 | ) |
| | |
|
|
| |
|
|
|
Other Information:
Capital Shares
Transactions in capital shares were as follows:
| | | | | | | | | | | | | | |
| | | Year ended December 31, 2005
| | | Year ended December 31, 2004
| |
| | | Shares
| | | $
| | | Shares
| | | $
| |
Class A | | | | | | | | | | | | | | |
Sales | | 4,587,181 | | | $ | 74,350,783 | | | 2,399,444 | | | $ | 34,476,337 | |
Shares issued through acquisition | | 0 | | | | 0 | | | 1,734,777 | | | | 23,929,338 | |
Reinvestments | | 0 | | | | 0 | | | 284,383 | | | | 4,601,317 | |
Redemptions | | (10,612,982 | ) | | | (172,375,638 | ) | | (7,782,290 | ) | | | (112,213,380 | ) |
| | |
|
| |
|
|
| |
|
| |
|
|
|
Net decrease | | (6,025,801 | ) | | $ | (98,024,855 | ) | | (3,363,686 | ) | | $ | (49,206,388 | ) |
| | |
|
| |
|
|
| |
|
| |
|
|
|
Class B | | | | | | | | | | | | | | |
Sales | | 1,076,411 | | | $ | 17,083,347 | | | 1,090,024 | | | $ | 15,417,201 | |
Shares issued through acquisition | | 0 | | | | 0 | | | 841,201 | | | | 11,488,158 | |
Reinvestments | | 0 | | | | 0 | | | 7,167 | | | | 113,963 | |
Redemptions | | (584,699 | ) | | | (9,352,144 | ) | | (650,185 | ) | | | (9,195,892 | ) |
| | |
|
| |
|
|
| |
|
| |
|
|
|
Net increase | | 491,712 | | | $ | 7,731,203 | | | 1,288,207 | | | $ | 17,823,430 | |
| | |
|
| |
|
|
| |
|
| |
|
|
|
Class E | | | | | | | | | | | | | | |
Sales | | 323,932 | | | $ | 5,210,689 | | | 703,200 | | | $ | 9,983,997 | |
Shares issued through acquisition | | 0 | | | | 0 | | | 1,335,690 | | | | 18,428,256 | |
Reinvestments | | 0 | | | | 0 | | | 9,310 | | | | 149,331 | |
Redemptions | | (610,026 | ) | | | (9,843,928 | ) | | (488,279 | ) | | | (6,954,143 | ) |
| | |
|
| |
|
|
| |
|
| |
|
|
|
Net increase (decrease) | | (286,094 | ) | | $ | (4,633,239 | ) | | 1,559,921 | | | $ | 21,607,441 | |
| | |
|
| |
|
|
| |
|
| |
|
|
|
Decrease derived from capital share transactions | | (5,820,183 | ) | | $ | (94,926,891 | ) | | (515,558 | ) | | $ | (9,775,517 | ) |
| | |
|
| |
|
|
| |
|
| |
|
|
|
See accompanying notes to financial statements.
MSF-190
Metropolitan Series Fund, Inc.
FI Mid Cap Opportunities Portfolio
Financial Highlights
| | | | | | | | | | | | | | | | | | | |
| | | Class A
| |
| | | Year ended December 31,
| |
| | | 2005
| | 2004
| | | 2003
| | | 2002
| | | 2001
| |
Net Asset Value, Beginning of Period | | $ | 16.34 | | $ | 14.01 | | | $ | 10.41 | | | $ | 14.66 | | | $ | 23.38 | |
| | |
|
| |
|
|
| |
|
|
| |
|
|
| |
|
|
|
Income From Investment Operations | | | | | | | | | | | | | | | | | | | |
Net investment income (loss) | | | 0.02 | | | 0.08 | | | | (0.03 | ) | | | (0.03 | ) | | | (0.03 | ) |
Net realized and unrealized gain (loss) of investments | | | 1.11 | | | 2.33 | | | | 3.63 | | | | (4.22 | ) | | | (8.69 | ) |
| | |
|
| |
|
|
| |
|
|
| |
|
|
| |
|
|
|
Total from investment operations | | | 1.13 | | | 2.41 | | | | 3.60 | | | | (4.25 | ) | | | (8.72 | ) |
| | |
|
| |
|
|
| |
|
|
| |
|
|
| |
|
|
|
Less Distributions | | | | | | | | | | | | | | | | | | | |
Distributions from net investment income | | | 0.00 | | | (0.08 | ) | | | 0.00 | | | | 0.00 | | | | 0.00 | |
| | |
|
| |
|
|
| |
|
|
| |
|
|
| |
|
|
|
Total distributions | | | 0.00 | | | (0.08 | ) | | | 0.00 | | | | 0.00 | | | | 0.00 | |
| | |
|
| |
|
|
| |
|
|
| |
|
|
| |
|
|
|
Net Asset Value, End of Period | | $ | 17.47 | | $ | 16.34 | | | $ | 14.01 | | | $ | 10.41 | | | $ | 14.66 | |
| | |
|
| |
|
|
| |
|
|
| |
|
|
| |
|
|
|
Total Return (%) | | | 6.9 | | | 17.2 | | | | 34.6 | | | | (29.0 | ) | | | (37.3 | ) |
Ratio of operating expenses to average net assets before expense reductions (%) | | | 0.75 | | | 0.75 | | | | 0.77 | | | | 0.75 | | | | 0.74 | |
Ratio of operating expenses to average net assets after expense reductions (%) (d) | | | 0.68 | | | 0.70 | | | | 0.76 | | | | — | | | | — | |
Ratio of net investment income (loss) to average net assets (%) | | | 0.11 | | | 0.53 | | | | (0.24 | ) | | | (0.27 | ) | | | (0.17 | ) |
Portfolio turnover rate (%) | | | 149 | | | 217 | | | | 39 | | | | 78 | | | | 105 | |
Net assets, end of period (000) | | $ | 924,602 | | $ | 963,074 | | | $ | 873,202 | | | $ | 681,221 | | | $ | 1,067,259 | |
| | | | | | | | | | | | | | | | | | | | |
| | | Class B
| |
| | | Year ended December 31,
| | | January 2, 2001(a)
through
December 31, 2001
| |
| | | 2005
| | | 2004
| | | 2003
| | | 2002
| | |
Net Asset Value, Beginning of Period | | $ | 16.06 | | | $ | 13.79 | | | $ | 10.27 | | | $ | 14.50 | | | $ | 21.47 | |
| | |
|
|
| |
|
|
| |
|
|
| |
|
|
| |
|
|
|
Income From Investment Operations | | | | | | | | | | | | | | | | | | | | |
Net investment income (loss) | | | (0.01 | ) | | | 0.09 | | | | (0.05 | ) | | | (0.06 | ) | | | (0.04 | ) |
Net realized and unrealized gain (loss) of investments | | | 1.08 | | | | 2.23 | | | | 3.57 | | | | (4.17 | ) | | | (6.93 | ) |
| | |
|
|
| |
|
|
| |
|
|
| |
|
|
| |
|
|
|
Total from investment operations | | | 1.07 | | | | 2.32 | | | | 3.52 | | | | (4.23 | ) | | | (6.97 | ) |
| | |
|
|
| |
|
|
| |
|
|
| |
|
|
| |
|
|
|
Less Distributions | | | | | | | | | | | | | | | | | | | | |
Distributions from net investment income | | | 0.00 | | | | (0.05 | ) | | | 0.00 | | | | 0.00 | | | | 0.00 | |
| | |
|
|
| |
|
|
| |
|
|
| |
|
|
| |
|
|
|
Total distributions | | | 0.00 | | | | (0.05 | ) | | | 0.00 | | | | 0.00 | | | | 0.00 | |
| | |
|
|
| |
|
|
| |
|
|
| |
|
|
| |
|
|
|
Net Asset Value, End of Period | | $ | 17.13 | | | $ | 16.06 | | | $ | 13.79 | | | $ | 10.27 | | | $ | 14.50 | |
| | |
|
|
| |
|
|
| |
|
|
| |
|
|
| |
|
|
|
Total Return (%) | | | 6.7 | | | | 16.8 | | | | 34.2 | | | | (29.2 | ) | | | (32.5 | )(b) |
Ratio of operating expenses to average net assets before expense reductions (%) | | | 1.00 | | | | 1.00 | | | | 1.02 | | | | 1.00 | | | | 0.99 | (c) |
Ratio of operating expenses to average net assets after expense reductions (%) (d) | | | 0.93 | | | | 0.95 | | | | 1.01 | | | | — | | | | — | |
Ratio of net investment income (loss) to average net assets (%) | | | (0.13 | ) | | | 0.44 | | | | (0.48 | ) | | | (0.52 | ) | | | (0.40 | )(c) |
Portfolio turnover rate (%) | | | 149 | | | | 217 | | | | 39 | | | | 78 | | | | 105 | |
Net assets, end of period (000) | | $ | 47,699 | | | $ | 36,819 | | | $ | 13,849 | | | $ | 9,037 | | | $ | 12,334 | |
| (a) | Commencement of operations. |
| (b) | Period less than one year is not computed on an annualized basis. |
| (c) | Computed on an annualized basis. |
| (d) | The Portfolio has entered into arrangements with certain brokers who paid a portion of the Portfolio’s expenses. |
See accompanying notes to financial statements.
MSF-191
Metropolitan Series Fund, Inc.
FI Mid Cap Opportunities Portfolio
Financial Highlights
| | | | | | | | | | | | | | | | | | | | |
| | | Class E
| |
| | | Year ended December 31,
| | | January 2, 2001(a)
through
December 31, 2001
| |
| | | 2005
| | | 2004
| | | 2003
| | | 2002
| | |
Net Asset Value, Beginning of Period | | $ | 16.19 | | | $ | 13.90 | | | $ | 10.33 | | | $ | 14.58 | | | $ | 19.02 | |
| | |
|
|
| |
|
|
| |
|
|
| |
|
|
| |
|
|
|
Income From Investment Operations | | | | | | | | | | | | | | | | | | | | |
Net investment income (loss) | | | (0.01 | ) | | | 0.07 | | | | (0.03 | ) | | | (0.01 | ) | | | 0.00 | |
Net realized and unrealized gain (loss) of investments | | | 1.11 | | | | 2.28 | | | | 3.60 | | | | (4.24 | ) | | | (4.44 | ) |
| | |
|
|
| |
|
|
| |
|
|
| |
|
|
| |
|
|
|
Total from investment operations | | | 1.10 | | | | 2.35 | | | | 3.57 | | | | (4.25 | ) | | | (4.44 | ) |
| | |
|
|
| |
|
|
| |
|
|
| |
|
|
| |
|
|
|
Less Distributions | | | | | | | | | | | | | | | | | | | | |
Distributions from net investment income | | | 0.00 | | | | (0.06 | ) | | | 0.00 | | | | 0.00 | | | | 0.00 | |
| | |
|
|
| |
|
|
| |
|
|
| |
|
|
| |
|
|
|
Total distributions | | | 0.00 | | | | (0.06 | ) | | | 0.00 | | | | 0.00 | | | | 0.00 | |
| | |
|
|
| |
|
|
| |
|
|
| |
|
|
| |
|
|
|
Net Asset Value, End of Period | | $ | 17.29 | | | $ | 16.19 | | | $ | 13.90 | | | $ | 10.33 | | | $ | 14.58 | |
| | |
|
|
| |
|
|
| |
|
|
| |
|
|
| |
|
|
|
Total Return (%) | | | 6.7 | | | | 17.0 | | | | 34.6 | | | | (29.2 | ) | | | (23.3 | )(b) |
Ratio of operating expenses to average net assets before expense reductions (%) | | | 0.90 | | | | 0.90 | | | | 0.92 | | | | 0.90 | | | | 0.89 | (c) |
Ratio of operating expenses to average net assets after expense reductions (%) (d) | | | 0.83 | | | | 0.85 | | | | 0.91 | | | | — | | | | — | |
Ratio of net investment income (loss) to average net assets (%) | | | (0.04 | ) | | | 0.55 | | | | (0.37 | ) | | | (0.34 | ) | | | (0.22 | )(c) |
Portfolio turnover rate (%) | | | 149 | | | | 217 | | | | 39 | | | | 78 | | | | 105 | |
Net assets, end of period (000) | | $ | 38,193 | | | $ | 40,402 | | | $ | 12,991 | | | $ | 3,605 | | | $ | 28 | |
| (a) | Commencement of operations. |
| (b) | Period less than one year is not computed on an annualized basis. |
| (c) | Computed on an annualized basis. |
| (d) | The Portfolio has entered into arrangements with certain brokers who paid a portion of the Portfolio’s expenses. |
See accompanying notes to financial statements.
MSF-192
Metropolitan Series Fund, Inc.
Harris Oakmark Focused Value Portfolio
Schedule of Investments as of December 31, 2005
Common Stock—92.1% of Total Net Assets
| | | | | |
| Security Description | | Shares | | Value* |
| | | | | | |
| | |
Beverages—2.9% | | | | | |
The Pepsi Bottling Group, Inc. | | 1,989,500 | | $ | 56,919,595 |
| | | | |
|
|
| | |
Capital Markets—1.5% | | | | | |
Morgan Stanley | | 520,000 | | | 29,504,800 |
| | | | |
|
|
|
Commercial Services & Supplies—16.9% |
ARAMARK Corp. (Class B) | | 2,399,300 | | | 66,652,554 |
Equifax, Inc. (a) | | 1,270,600 | | | 48,308,212 |
H&R Block, Inc. | | 3,291,600 | | | 80,808,780 |
R.R. Donnelley & Sons Co. | | 2,175,500 | | | 74,423,855 |
The Dun & Bradstreet Corp. (b) | | 832,800 | | | 55,764,288 |
| | | | |
|
|
| | | | | | 325,957,689 |
| | | | |
|
|
|
Health Care Equipment & Supplies—0.6% |
Baxter International, Inc. | | 290,100 | | | 10,922,265 |
| | | | |
|
|
|
Health Care Providers & Services—4.3% |
Omnicare, Inc. (a) | | 1,434,200 | | | 82,064,924 |
| | | | |
|
|
| | |
Hotels, Restaurants & Leisure—4.9% | | | | | |
McDonald’s Corp. | | 550,000 | | | 18,546,000 |
Yum! Brands, Inc. | | 1,612,400 | | | 75,589,312 |
| | | | |
|
|
| | | | | | 94,135,312 |
| | | | |
|
|
| | |
Insurance—3.4% | | | | | |
Conseco, Inc. (a) (b) | | 2,807,000 | | | 65,038,190 |
| | | | |
|
|
| | |
IT Services—1.7% | | | | | |
First Data Corp. | | 769,846 | | | 33,111,076 |
| | | | |
|
|
| | |
Leisure Equipment & Products—2.2% | | | | | |
Mattel, Inc. (a) | | 2,707,000 | | | 42,824,740 |
| | | | |
|
|
| | |
Media—11.7% | | | | | |
Cablevision Systems Corp. (Class A) (b) | | 2,417,000 | | | 56,726,990 |
Knight-Ridder, Inc. (a) | | 717,400 | | | 45,411,420 |
The E.W. Scripps Co. (Class A) (a) | | 1,618,500 | | | 77,720,370 |
Time Warner, Inc. | | 2,629,200 | | | 45,853,248 |
| | | | |
|
|
| | | | | | 225,712,028 |
| | | | |
|
|
| | |
Office Electronics—2.5% | | | | | |
Xerox Corp. (a) (b) | | 3,301,000 | | | 48,359,650 |
| | | | |
|
|
| | |
Oil, Gas & Consumable Fuels—3.5% | | | | | |
Burlington Resources, Inc. | | 789,000 | | | 68,011,800 |
| | | | |
|
|
| | |
Personal Products—3.1% | | | | | |
The Estee Lauder Cos., Inc.
(Class A) (a) | | 1,768,000 | | | 59,192,640 |
| | | | |
|
|
| | |
Pharmaceuticals—3.2% | | | | | |
Hospira, Inc. (b) | | 1,445,000 | | | 61,817,100 |
| | | | |
|
|
|
Semiconductors & Semiconductor Equipment—5.3% |
Intel Corp. | | 1,479,000 | | | 36,915,840 |
National Semiconductor Corp. | | 2,542,000 | | | 66,041,160 |
| | | | |
|
|
| | | | | | 102,957,000 |
| | | | |
|
|
| | | | | | |
| Security Description | | Shares | | Value* |
| | |
Specialty Retail—5.2% | | | | | | |
AutoNation, Inc. (a) (b) | | | 2,027,000 | | $ | 44,046,710 |
CDW Corp. (a) | | | 970,000 | | | 55,842,900 |
| | | | | |
|
|
| | | | | | | 99,889,610 |
| | | | | |
|
|
|
Textiles, Apparel & Luxury Goods—7.2% |
Liz Claiborne, Inc. (a) | | | 2,130,000 | | | 76,296,600 |
The Timberland Co. (Class A) (a) (b) | | | 1,910,000 | | | 62,170,500 |
| | | | | |
|
|
| | | | | | | 138,467,100 |
| | | | | |
|
|
|
Thrifts & Mortgage Finance—12.0% |
Sovereign Bancorp, Inc. (a) | | | 6,236,200 | | | 134,826,644 |
Washington Mutual, Inc. (a) | | | 2,204,400 | | | 95,891,400 |
| | | | | |
|
|
| | | | | | | 230,718,044 |
| | | | | |
|
|
Total Common Stock
(Identified Cost $1,406,113,333) | | | | | | 1,775,603,563 |
| | | | | |
|
|
|
| Short Term Investments—7.8% |
| Security Description | | Face
Amount | | Value* |
| | |
Repurchase Agreement – 7.8% | | | | | | |
State Street Repurchase Agreement dated 12/30/05 at 2.050% to be repurchased at $150,090,189 on 01/03/06, collateralized by $975,000 U.S. Treasury Note 3.000% due 02/15/08 with a value of $959,156; by $965,000 U.S. Treasury Note 3.250% due 01/15/09 with a value of $949,312; by $890,000 U.S. Treasury Note 2.250% due 04/30/06 with a value of $887,775; by $30,705,000 U.S. Treasury Note 3.625% due 01/15/10 with a value of $30,416,711; by $11,285,000 U.S. Treasury Note 4.250% due 08/15/15 with a value of $11,361,287; and by $109,345,000 U.S. Treasury Note 3.875% due 09/15/10 with a value of $108,484,236. | | $ | 150,056,000 | | | 150,056,000 |
| | | | | |
|
|
Total Short Term Investments
(Amortized Cost $150,056,000) | | | | | | 150,056,000 |
| | | | | |
|
|
Total Investments—99.9%
(Identified Cost $1,556,169,333) (c) | | | | | | 1,925,659,563 |
Other assets less liabilities | | | | | | 2,434,908 |
| | | | | |
|
|
| Total Net Assets—100% | | | | | $ | 1,928,094,471 |
| | | | | |
|
|
| (a) | A portion or all of the security was held on loan. As of December 31, 2005, the market value of securities loaned was $136,271,829 and the collateral received consisted of cash in the amount of $140,382,363. |
| (c) | The aggregate cost of investments for federal income tax purposes as of December 31, 2005 was $1,556,169,333 and the composition of unrealized appreciation and depreciation of investment securities was $383,149,373 and $(13,659,143), respectively. |
*See accompanying notes to financial statements.
MSF-193
Metropolitan Series Fund, Inc.
Harris Oakmark Focused Value Portfolio
|
Statement of Assets & Liabilities
|
December 31, 2005
| | | | | | |
Assets | | | | | | |
Investments at value | | | | | $ | 1,925,659,563 |
Cash | | | | | | 554 |
Collateral for securities loaned | | | | | | 140,382,363 |
Receivable for: | | | | | | |
Securities sold | | | | | | 8,553,695 |
Fund shares sold | | | | | | 1,993,265 |
Accrued interest and dividends | | | | | | 1,059,390 |
| | | | | |
|
|
Total Assets | | | | | | 2,077,648,830 |
Liabilities | | | | | | |
Payable for: | | | | | | |
Fund shares redeemed | | $ | 1,507,726 | | | |
Securities purchased | | | 6,101,134 | | | |
Return of collateral for securities loaned | | | 140,382,363 | | | |
Accrued expenses: | | | | | | |
Management fees | | | 1,189,598 | | | |
Service and distribution fees | | | 167,211 | | | |
Deferred Directors’ fees | | | 29,321 | | | |
Other expenses | | | 177,006 | | | |
| | |
|
| | | |
Total Liabilities | | | | | | 149,554,359 |
| | | | | |
|
|
Net Assets | | | | | $ | 1,928,094,471 |
| | | | | |
|
|
Net assets consists of: | | | | | | |
Capital paid in | | | | | $ | 1,366,709,072 |
Undistributed net investment income | | | | | | 4,204,388 |
Accumulated net realized gains | | | | | | 187,690,781 |
Unrealized appreciation on investments | | | | | | 369,490,230 |
| | | | | |
|
|
Net Assets | | | | | $ | 1,928,094,471 |
| | | | | |
|
|
| Computation of offering price: | | | | | | |
Class A | | | | | | |
Net asset value and redemption price per share ($1,024,614,945 divided by 3,861,010 shares outstanding) | | | | | $ | 265.37 |
| | | | | |
|
|
Class B | | | | | | |
Net asset value and redemption price per share ($613,215,162 divided by 2,355,483 shares outstanding) | | | | | $ | 260.34 |
| | | | | |
|
|
Class E | | | | | | |
Net asset value and redemption price per share ($290,264,364 divided by 1,105,397 shares outstanding) | | | | | $ | 262.59 |
| | | | | |
|
|
Identified cost of investments | | | | | $ | 1,556,169,333 |
| | | | | |
|
|
Year Ended December 31, 2005
| | | | | | | | |
Investment Income | | | | | | | | |
Dividends | | | | | | $ | 17,101,068 | |
Interest | | | | | | | 2,702,938 | (a) |
| | | | | | |
|
|
|
| | | | | | | | 19,804,006 | |
Expenses | | | | | | | | |
Management fees | | $ | 12,936,021 | | | | | |
Service and distribution fees—Class B | | | 1,403,044 | | | | | |
Service and distribution fees—Class E | | | 427,534 | | | | | |
Directors’ fees and expenses | | | 24,899 | | | | | |
Custodian | | | 196,622 | | | | | |
Audit and tax services | | | 21,768 | | | | | |
Legal | | | 44,844 | | | | | |
Printing | | | 459,819 | | | | | |
Insurance | | | 33,650 | | | | | |
Miscellaneous | | | 14,037 | | | | | |
| | |
|
|
| | | | |
Total expenses | | | 15,562,238 | | | | | |
Expense reductions | | | (115,980 | ) | | | 15,446,259 | |
| | |
|
|
| |
|
|
|
Net Investment Income | | | | | | | 4,357,748 | |
| | | | | | |
|
|
|
Realized and Unrealized Gain (Loss) | | | | | | | | |
| Realized gain on: | | | | | | | | |
Investments—net | | | | | | | 187,580,838 | |
| Unrealized depreciation on: | | | | | | | | |
Investments—net | | | | | | | (25,151,648 | ) |
| | | | | | |
|
|
|
Net gain | | | | | | | 162,429,190 | |
| | | | | | |
|
|
|
Net Increase in Net Assets
From Operations | | | | | | $ | 166,786,938 | |
| | | | | | |
|
|
|
| (a) | Includes income on securities loaned of $88,747. |
See accompanying notes to financial statements.
MSF-194
Metropolitan Series Fund, Inc.
Harris Oakmark Focused Value Portfolio
Statement of Changes in Net Assets
| | | | | | | | |
| | | Year ended
December 31,
2005
| | | Year ended
December 31,
2004
| |
From Operations | | | | | | | | |
Net investment income | | $ | 4,357,748 | | | $ | 391,069 | |
Net realized gain | | | 187,580,838 | | | | 18,185,250 | |
Unrealized appreciation (depreciation) | | | (25,151,648 | ) | | | 125,457,565 | |
| | |
|
|
| |
|
|
|
Increase in net assets from operations | | | 166,786,938 | | | | 144,033,884 | |
| | |
|
|
| |
|
|
|
From Distributions to Shareholders | | | | | | | | |
Net investment income | | | | | | | | |
Class A | | | (395,501 | ) | | | (268,573 | ) |
| | |
|
|
| |
|
|
|
| | | | (395,501 | ) | | | (268,573 | ) |
| | |
|
|
| |
|
|
|
Net realized gain | | | | | | | | |
Class A | | | (9,502,828 | ) | | | (6,725,644 | ) |
Class B | | | (5,693,453 | ) | | | (7,188,107 | ) |
Class E | | | (2,990,330 | ) | | | (2,644,323 | ) |
| | |
|
|
| |
|
|
|
| | | | (18,186,611 | ) | | | (16,558,074 | ) |
| | |
|
|
| |
|
|
|
Total distributions | | | (18,582,112 | ) | | | (16,826,647 | ) |
| | |
|
|
| |
|
|
|
Increase in net assets from capital share transactions | | | 110,136,840 | | | | 182,392,649 | |
| | |
|
|
| |
|
|
|
Total increase in net assets | | | 258,341,666 | | | | 309,599,886 | |
| | |
Net Assets | | | | | | | | |
Beginning of the period | | | 1,669,752,805 | | | | 1,360,152,919 | |
| | |
|
|
| |
|
|
|
End of the period | | $ | 1,928,094,471 | | | $ | 1,669,752,805 | |
| | |
|
|
| |
|
|
|
Undistributed Net Investment Income | | | | | | | | |
End of the period | | $ | 4,204,388 | | | $ | 358,121 | |
| | |
|
|
| |
|
|
|
Other Information:
Capital Shares
Transactions in capital shares were as follows:
| | | | | | | | | | | | | | |
| | | Year ended December 31, 2005
| | | Year ended December 31, 2004
| |
| | | Shares
| | | $
| | | Shares
| | | $
| |
Class A | | | | | | | | | | | | | | |
Sales | | 1,256,909 | | | $ | 317,259,651 | | | 1,097,468 | | | $ | 255,178,043 | |
Reinvestments | | 41,204 | | | | 9,898,329 | | | 30,907 | | | | 6,994,217 | |
Redemptions | | (755,228 | ) | | | (192,380,713 | ) | | (548,409 | ) | | | (123,886,974 | ) |
| | |
|
| |
|
|
| |
|
| |
|
|
|
Net increase | | 542,885 | | | $ | 134,777,267 | | | 579,966 | | | $ | 138,285,286 | |
| | |
|
| |
|
|
| |
|
| |
|
|
|
Class B | | | | | | | | | | | | | | |
Sales | | 657,655 | | | $ | 164,311,754 | | | 1,569,818 | | | $ | 349,336,732 | |
Reinvestments | | 24,099 | | | | 5,693,453 | | | 32,224 | | | | 7,188,107 | |
Redemptions | | (739,172 | ) | | | (180,388,097 | ) | | (1,633,636 | ) | | | (366,785,835 | ) |
| | |
|
| |
|
|
| |
|
| |
|
|
|
Net decrease | | (57,418 | ) | | $ | (10,382,890 | ) | | (31,594 | ) | | $ | (10,260,996 | ) |
| | |
|
| |
|
|
| |
|
| |
|
|
|
Class E | | | | | | | | | | | | | | |
Sales | | 104,365 | | | $ | 26,321,380 | | | 395,813 | | | $ | 88,874,634 | |
Reinvestments | | 12,557 | | | | 2,990,330 | | | 11,774 | | | | 2,644,323 | |
Redemptions | | (173,197 | ) | | | (43,569,247 | ) | | (165,759 | ) | | | (37,150,598 | ) |
| | |
|
| |
|
|
| |
|
| |
|
|
|
Net increase (decrease) | | (56,275 | ) | | $ | (14,257,537 | ) | | 241,828 | | | $ | 54,368,359 | |
| | |
|
| |
|
|
| |
|
| |
|
|
|
Increase derived from capital share transactions | | 429,192 | | | $ | 110,136,840 | | | 790,200 | | | $ | 182,392,649 | |
| | |
|
| |
|
|
| |
|
| |
|
|
|
See accompanying notes to financial statements.
MSF-195
Metropolitan Series Fund, Inc.
Harris Oakmark Focused Value Portfolio
Financial Highlights
| | | | | | | | | | | | | | | | | | | | |
| | | Class A
| |
| | | Year ended December 31,
| |
| | | 2005
| | | 2004
| | | 2003
| | | 2002
| | | 2001
| |
Net Asset Value, Beginning of Period | | $ | 243.86 | | | $ | 224.26 | | | $ | 169.33 | | | $ | 186.12 | | | $ | 146.67 | |
| | |
|
|
| |
|
|
| |
|
|
| |
|
|
| |
|
|
|
Income From Investment Operations | | | | | | | | | | | | | | | | | | | | |
Net investment income | | | 0.78 | | | | 0.23 | | | | 0.24 | | | | 0.27 | | | | 0.42 | |
Net realized and unrealized gain (loss) of investments | | | 23.48 | | | | 21.85 | | | | 54.97 | | | | (16.70 | ) | | | 40.09 | |
| | |
|
|
| |
|
|
| |
|
|
| |
|
|
| |
|
|
|
Total from investment operations | | | 24.26 | | | | 22.08 | | | | 55.21 | | | | (16.43 | ) | | | 40.51 | |
| | |
|
|
| |
|
|
| |
|
|
| |
|
|
| |
|
|
|
Less Distributions | | | | | | | | | | | | | | | | | | | | |
Distributions from net investment income | | | (0.11 | ) | | | (0.10 | ) | | | (0.28 | ) | | | (0.36 | ) | | | (1.06 | ) |
Distributions from net realized capital gains | | | (2.64 | ) | | | (2.38 | ) | | | 0.00 | | | | 0.00 | | | | 0.00 | |
| | |
|
|
| |
|
|
| |
|
|
| |
|
|
| |
|
|
|
Total distributions | | | (2.75 | ) | | | (2.48 | ) | | | (0.28 | ) | | | (0.36 | ) | | | (1.06 | ) |
| | |
|
|
| |
|
|
| |
|
|
| |
|
|
| |
|
|
|
Net Asset Value, End of Period | | $ | 265.37 | | | $ | 243.86 | | | $ | 224.26 | | | $ | 169.33 | | | $ | 186.12 | |
| | |
|
|
| |
|
|
| |
|
|
| |
|
|
| |
|
|
|
Total Return (%) | | | 10.0 | | | | 9.9 | | | | 32.7 | | | | (8.8 | ) | | | 27.8 | |
Ratio of operating expenses to average net assets before expense reductions (%) | | | 0.77 | | | | 0.78 | | | | 0.80 | | | | 0.82 | | | | 0.87 | |
Ratio of operating expenses to average net assets after expense reductions (%) (d) | | | 0.77 | | | | 0.78 | | | | 0.78 | | | | 0.82 | | | | 0.84 | |
Ratio of net investment income to average net assets (%) | | | 0.35 | | | | 0.15 | | | | 0.14 | | | | 0.22 | | | | 0.43 | |
Portfolio turnover rate (%) | | | 25 | | | | 16 | | | | 16 | | | | 11 | | | | 28 | |
Net assets, end of period (000) | | $ | 1,024,615 | | | $ | 809,906 | | | $ | 614,742 | | | $ | 438,359 | | | $ | 370,959 | |
| | | | | | | | | | | | | | | | | | | | |
| | | Class B
| |
| | | Year ended December 31,
| | | February 20, 2001(a) through
December 31,
2001
| |
| | | 2005
| | | 2004
| | | 2003
| | | 2002
| | |
Net Asset Value, Beginning of Period | | $ | 239.96 | | | $ | 221.17 | | | $ | 167.26 | | | $ | 184.25 | | | $ | 159.20 | |
| | |
|
|
| |
|
|
| |
|
|
| |
|
|
| |
|
|
|
Income From Investment Operations | | | | | | | | | | | | | | | | | | | | |
Net investment income (loss) | | | 0.22 | | | | (0.24 | ) | | | 0.01 | | | | 0.16 | | | | 0.01 | |
Net realized and unrealized gain (loss) of investments | | | 22.80 | | | | 21.41 | | | | 54.02 | | | | (16.83 | ) | | | 25.04 | |
| | |
|
|
| |
|
|
| |
|
|
| |
|
|
| |
|
|
|
Total from investment operations | | | 23.02 | | | | 21.17 | | | | 54.03 | | | | (16.67 | ) | | | 25.05 | |
| | |
|
|
| |
|
|
| |
|
|
| |
|
|
| |
|
|
|
Less Distributions | | | | | | | | | | | | | | | | | | | | |
Distributions from net investment income | | | 0.00 | | | | 0.00 | | | | (0.12 | ) | | | (0.32 | ) | | | 0.00 | |
Distributions from net realized capital gains | | | (2.64 | ) | | | (2.38 | ) | | | 0.00 | | | | 0.00 | | | | 0.00 | |
| | |
|
|
| |
|
|
| |
|
|
| |
|
|
| |
|
|
|
Total distributions | | | (2.64 | ) | | | (2.38 | ) | | | (0.12 | ) | | | (0.32 | ) | | | 0.00 | |
| | |
|
|
| |
|
|
| |
|
|
| |
|
|
| |
|
|
|
Net Asset Value, End of Period | | $ | 260.34 | | | $ | 239.96 | | | $ | 221.17 | | | $ | 167.26 | | | $ | 184.25 | |
| | |
|
|
| |
|
|
| |
|
|
| |
|
|
| |
|
|
|
Total Return (%) | | | 9.7 | | | | 9.7 | | | | 32.3 | | | | (9.1 | ) | | | 15.7 | (b) |
Ratio of operating expenses to average net assets before expense reductions (%) | | | 1.02 | | | | 1.03 | | | | 1.05 | | | | 1.07 | | | | 1.12 | (c) |
Ratio of operating expenses to average net assets after expense reductions (%) (d) | | | 1.02 | | | | 1.03 | | | | 1.03 | | | | 1.07 | | | | 1.09 | (c) |
Ratio of net investment income (loss) to average net assets (%) | | | 0.10 | | | | (0.09 | ) | | | (0.13 | ) | | | (0.06 | ) | | | 0.02 | (c) |
Portfolio turnover rate (%) | | | 25 | | | | 16 | | | | 16 | | | | 11 | | | | 28 | |
Net assets, end of period (000) | | $ | 613,215 | | | $ | 578,991 | | | $ | 540,656 | | | $ | 140,273 | | | $ | 24,082 | |
| (a) | Commencement of operations. |
| (b) | Period less than one year is not computed on an annualized basis. |
| (c) | Computed on an annualized basis. |
| (d) | The Portfolio has entered into arrangements with certain brokers who paid a portion of the Portfolio’s expenses. |
See accompanying notes to financial statements.
MSF-196
Metropolitan Series Fund, Inc.
Harris Oakmark Focused Value Portfolio
Financial Highlights
| | | | | | | | | | | | | | | | | | | | |
| | | Class E
| |
| | | Year ended December 31,
| | | May 1,
2001(a)
through
December 31,
2001
| |
| | | 2005
| | | 2004
| | | 2003
| | | 2002
| | |
Net Asset Value, Beginning of Period | | $ | 241.77 | | | $ | 222.60 | | | $ | 168.22 | | | $ | 185.17 | | | $ | 164.26 | |
| | |
|
|
| |
|
|
| |
|
|
| |
|
|
| |
|
|
|
Income From Investment Operations | | | | | | | | | | | | | | | | | | | | |
Net investment income | | | 0.49 | | | | 0.04 | | | | 0.07 | | | | 0.25 | | | | 0.02 | |
Net realized and unrealized gain (loss) of investments | | | 22.97 | | | | 21.51 | | | | 54.47 | | | | (16.85 | ) | | | 20.89 | |
| | |
|
|
| |
|
|
| |
|
|
| |
|
|
| |
|
|
|
Total from investment operations | | | 23.46 | | | | 21.55 | | | | 54.54 | | | | (16.60 | ) | | | 20.91 | |
| | |
|
|
| |
|
|
| |
|
|
| |
|
|
| |
|
|
|
Less Distributions | | | | | | | | | | | | | | | | | | | | |
Distributions from net investment income | | | 0.00 | | | | 0.00 | | | | (0.16 | ) | | | (0.35 | ) | | | 0.00 | |
Distributions from net realized capital gains | | | (2.64 | ) | | | (2.38 | ) | | | 0.00 | | | | 0.00 | | | | 0.00 | |
| | |
|
|
| |
|
|
| |
|
|
| |
|
|
| |
|
|
|
Total distributions | | | (2.64 | ) | | | (2.38 | ) | | | (0.16 | ) | | | (0.35 | ) | | | 0.00 | |
| | |
|
|
| |
|
|
| |
|
|
| |
|
|
| |
|
|
|
Net Asset Value, End of Period | | $ | 262.59 | | | $ | 241.77 | | | $ | 222.60 | | | $ | 168.22 | | | $ | 185.17 | |
| | |
|
|
| |
|
|
| |
|
|
| |
|
|
| |
|
|
|
Total Return (%) | | | 9.8 | | | | 9.8 | | | | 32.5 | | | | (9.0 | ) | | | 12.7 | (b) |
Ratio of operating expenses to average net assets before expense reductions (%) | | | 0.92 | | | | 0.93 | | | | 0.95 | | | | 0.97 | | | | 1.02 | (c) |
Ratio of operating expenses to average net assets after expense reductions (%) (d) | | | 0.92 | | | | 0.93 | | | | 0.93 | | | | 0.97 | | | | 0.99 | (c) |
Ratio of net investment income (loss) to average net assets (%) | | | 0.19 | | | | 0.00 | | | | (0.03 | ) | | | 0.05 | | | | 0.09 | (c) |
Portfolio turnover rate (%) | | | 25 | | | | 16 | | | | 16 | | | | 11 | | | | 28 | |
Net assets, end of period (000) | | $ | 290,264 | | | $ | 280,856 | | | $ | 204,755 | | | $ | 74,818 | | | $ | 10,416 | |
| (a) | Commencement of operations. |
| (b) | Period less than one year is not computed on an annualized basis. |
| (c) | Computed on an annualized basis. |
| (d) | The Portfolio has entered into arrangements with certain brokers who paid a portion of the Portfolio’s expenses. |
See accompanying notes to financial statements.
MSF-197
Metropolitan Series Fund, Inc.
MetLife Mid Cap Stock Index Portfolio
Schedule of Investments as of December 31, 2005
Common Stock—96.1% of Total Net Assets
| | | | | |
| Security Description | | Shares | | Value* |
| | | | | | |
| | |
Aerospace & Defense—0.9% | | | | | |
Alliant Techsystems, Inc. (a) | | 12,726 | | $ | 969,340 |
Precision Castparts Corp. | | 46,141 | | | 2,390,565 |
Sequa Corp. (Class A) (a) (b) | | 2,226 | | | 153,705 |
| | | | |
|
|
| | | | | | 3,513,610 |
| | | | |
|
|
| | |
Air Freight & Logistics—0.9% | | | | | |
CNF, Inc. | | 18,123 | | | 1,012,895 |
Expeditors International of Washington, Inc. | | 37,028 | | | 2,499,760 |
| | | | |
|
|
| | | | | | 3,512,655 |
| | | | |
|
|
| | |
Airlines—0.4% | | | | | |
AirTran Holdings, Inc. (a) (b) | | 30,494 | | | 488,819 |
Alaska Air Group, Inc. (a) (b) | | 11,564 | | | 413,066 |
JetBlue Airways Corp. (a) (b) | | 52,385 | | | 805,674 |
| | | | |
|
|
| | | | | | 1,707,559 |
| | | | |
|
|
| | |
Auto Components—1.0% | | | | | |
ArvinMeritor, Inc. (b) | | 24,417 | | | 351,361 |
Bandag, Inc. (b) | | 4,066 | | | 173,496 |
BorgWarner, Inc. | | 19,797 | | | 1,200,292 |
Federal Signal Corp. (b) | | 16,703 | | | 250,712 |
Gentex Corp. (b) | | 53,955 | | | 1,052,122 |
Lear Corp. (b) | | 23,324 | | | 663,801 |
Modine Manufacturing Co. (b) | | 11,966 | | | 389,972 |
| | | | |
|
|
| | | | | | 4,081,756 |
| | | | |
|
|
| | |
Automobiles—0.1% | | | | | |
Thor Industries, Inc. (b) | | 12,006 | | | 481,080 |
| | | | |
|
|
| | |
Beverages—0.1% | | | | | |
PepsiAmericas, Inc. | | 21,342 | | | 496,415 |
| | | | |
|
|
| | |
Biotechnology—2.4% | | | | | |
Affymetrix, Inc. | | 23,204 | | | 1,107,991 |
Cephalon, Inc. (a) (b) | | 20,172 | | | 1,305,935 |
Charles River Laboratories International, Inc. (a) (b) | | 25,114 | | | 1,064,080 |
Gen-Probe, Inc. (a) | | 17,649 | | | 861,095 |
Invitrogen Corp. (a) | | 18,353 | | | 1,223,044 |
Martek Biosciences Corp. (a) (b) | | 11,013 | | | 271,030 |
Millennium Pharmaceuticals, Inc. (a) | | 107,805 | | | 1,045,708 |
Protein Design Laboratories, Inc. (a) (b) | | 39,183 | | | 1,113,581 |
Techne Corp. (a) | | 13,498 | | | 757,913 |
Vertex Pharmaceuticals, Inc. (a) (b) | | 34,422 | | | 952,457 |
| | | | |
|
|
| | | | | | 9,702,834 |
| | | | |
|
|
| | |
Building Products—0.1% | | | | | |
Crane Co. | | 17,317 | | | 610,771 |
| | | | |
|
|
| | |
Capital Markets—1.9% | | | | | |
Eaton Vance Corp. | | 45,330 | | | 1,240,229 |
Investors Financial Services Corp. (b) | | 22,565 | | | 831,069 |
Legg Mason, Inc. | | 42,308 | | | 5,063,844 |
Raymond James Financial, Inc. | | 19,755 | | | 744,171 |
| | | | |
|
|
| | | | | | 7,879,313 |
| | | | |
|
|
| | | | | |
| Security Description | | Shares | | Value* |
| | | | | | |
| | |
Chemicals—2.6% | | | | | |
Airgas, Inc. | | 23,268 | | $ | 765,517 |
Albemarle Corp. (b) | | 13,275 | | | 509,096 |
Cabot Corp. | | 21,540 | | | 771,132 |
Chemtura Corp. | | 83,305 | | | 1,057,974 |
Cytec Industries, Inc. | | 13,773 | | | 656,008 |
Ferro Corp. (b) | | 14,550 | | | 272,958 |
FMC Corp. (a) | | 13,185 | | | 701,046 |
Lyondell Chemical Co. | | 71,167 | | | 1,695,198 |
Minerals Technologies, Inc. (b) | | 6,974 | | | 389,777 |
Olin Corp. (b) | | 24,906 | | | 490,150 |
RPM International, Inc. (b) | | 40,883 | | | 710,138 |
The Lubrizol Corp. | | 23,615 | | | 1,025,600 |
The Scotts Miracle-Gro Co. | | 15,672 | | | 709,001 |
Valspar Corp. | | 35,164 | | | 867,496 |
| | | | |
|
|
| | | | | | 10,621,091 |
| | | | |
|
|
| | |
Commercial Banks—4.5% | | | | | |
Associated Banc-Corp | | 47,389 | | | 1,542,512 |
Bank Hawaii Corp. | | 17,820 | | | 918,443 |
Cathay General Bancorp. (a) (b) | | 17,421 | | | 626,111 |
City National Corp. | | 14,437 | | | 1,045,816 |
Commerce Bancorp, Inc. (b) | | 60,301 | | | 2,074,957 |
Cullen/Frost Bankers, Inc. | | 16,386 | | | 879,600 |
FirstMerit Corp. (b) | | 28,864 | | | 747,866 |
Greater Bay Bancorp (b) | | 17,525 | | | 448,991 |
Independence Community Bank Corp. | | 25,633 | | | 1,018,399 |
Mercantile Bankshares Corp. | | 28,504 | | | 1,608,766 |
New York Community Bancorp, Inc. (b) | | 82,240 | | | 1,358,605 |
SVB Financial Group (a) (b) | | 12,323 | | | 577,209 |
TCF Financial Corp. | | 39,478 | | | 1,071,433 |
Texas Regional Bancshares, Inc. (b) | | 14,322 | | | 405,313 |
The Colonial BancGroup, Inc. | | 53,546 | | | 1,275,466 |
Washington Federal, Inc. (b) | | 30,194 | | | 694,160 |
Webster Finanical Corp. | | 18,685 | | | 876,327 |
WestAmerica Bancorp | | 11,147 | | | 591,571 |
Wilmington Trust Corp. | | 23,551 | | | 916,369 |
| | | | |
|
|
| | | | | | 18,677,914 |
| | | | |
|
|
| |
Commercial Services & Supplies—5.5% | | | |
Adesa, Inc. | | 31,103 | | | 759,535 |
Alliance Data Systems Co. (a) | | 23,802 | | | 847,351 |
Banta Corp. (b) | | 8,327 | | | 414,685 |
C. H. Robinson Worldwide, Inc. | | 59,352 | | | 2,197,805 |
Ceridian Corp. (a) | | 50,444 | | | 1,253,533 |
Certegy, Inc. | | 21,573 | | | 875,001 |
Checkfree Corp. (a) | | 31,486 | | | 1,445,207 |
ChoicePoint, Inc. (a) | | 31,142 | | | 1,386,130 |
CSG Systems International, Inc. (a) (b) | | 16,878 | | | 376,717 |
Deluxe Corp. | | 17,602 | | | 530,524 |
DST Systems, Inc. (a) | | 21,886 | | | 1,311,190 |
Herman Miller, Inc. | | 23,977 | | | 675,912 |
Kelly Services, Inc. (Class A) | | 6,713 | | | 176,015 |
Korn/Ferry International, Inc. (a) (b) | | 14,633 | | | 273,491 |
Manpower, Inc. | | 30,327 | | | 1,410,206 |
Mine Safety Appliances Co. (b) | | 9,158 | | | 331,611 |
MoneyGram International, Inc. | | 29,575 | | | 771,316 |
*See accompanying notes to financial statements.
MSF-198
Metropolitan Series Fund, Inc.
MetLife Mid Cap Stock Index Portfolio
Schedule of Investments as of December 31, 2005
Common Stock—(Continued)
| | | | | |
| Security Description | | Shares | | Value* |
| | | | | | |
| |
Commercial Services & Supplies—(Continued) | | | |
Navigant Consulting, Inc. (a) (b) | | 17,536 | | $ | 385,441 |
Republic Sevices, Inc. | | 42,390 | | | 1,591,745 |
Rollins, Inc. (b) | | 10,200 | | | 201,042 |
Sotheby’s Holdings, Inc. (Class A) (a) (b) | | 15,568 | | | 285,828 |
Stericycle, Inc. (a) | | 15,322 | | | 902,159 |
The Bisys Group, Inc. (a) | | 41,950 | | | 587,720 |
The Brinks Co. | | 20,398 | | | 977,268 |
The Corporate Executive Board Co. | | 13,724 | | | 1,231,043 |
The Dun & Bradstreet Corp. (a) | | 23,054 | | | 1,543,696 |
| | | | |
|
|
| | | | | | 22,742,171 |
| | | | |
|
|
| |
Communications Equipment—1.6% | | | |
3Com Corp. (a) | | 134,375 | | | 483,750 |
ADTRAN, Inc. | | 23,519 | | | 699,455 |
Avocent Corp. (a) (b) | | 16,985 | | | 461,822 |
CommScope, Inc. (a) (b) | | 19,102 | | | 384,523 |
F5 Networks, Inc. (a) | | 13,689 | | | 782,874 |
Harris Corp. | | 46,454 | | | 1,997,987 |
McDATA Corp. (Class A) (a) (b) | | 53,123 | | | 201,867 |
Plantronics, Inc. (b) | | 16,454 | | | 465,648 |
Polycom, Inc. (a) | | 32,663 | | | 499,744 |
Powerwave Technologies, Inc. (a) (b) | | 38,405 | | | 482,751 |
UTStarcom, Inc. (a) (b) | | 36,498 | | | 294,174 |
| | | | |
|
|
| | | | | | 6,754,595 |
| | | | |
|
|
| |
Computers & Peripherals—1.4% | | | |
Imation Corp. (b) | | 11,911 | | | 548,740 |
SanDisk Corp. (a) | | 63,935 | | | 4,016,397 |
Western Digital Corp. (a) | | 74,902 | | | 1,393,926 |
| | | | |
|
|
| | | | | | 5,959,063 |
| | | | |
|
|
| |
Construction & Engineering—0.6% | | | |
Dycom Industries, Inc. (a) (b) | | 13,942 | | | 306,724 |
Granite Construction, Inc. (b) | | 11,440 | | | 410,810 |
Jacobs Engineering Group, Inc. (a) | | 20,203 | | | 1,371,178 |
Quanta Services, Inc. (a) (b) | | 40,976 | | | 539,654 |
| | | | |
|
|
| | | | | | 2,628,366 |
| | | | |
|
|
| |
Construction Materials—0.3% | | | |
Martin Marietta Materials, Inc. | | 16,100 | | | 1,235,192 |
| | | | |
|
|
| |
Containers & Packaging—0.5% | | | |
Longview Fibre Co. | | 17,736 | | | 369,086 |
Packaging Corp. of America | | 21,776 | | | 499,759 |
Sonoco Products Co. (b) | | 34,416 | | | 1,011,831 |
| | | | |
|
|
| | | | | | 1,880,676 |
| | | | |
|
|
| |
Diversified Consumer Services—1.2% | | | |
Career Education Corp. (a) | | 34,022 | | | 1,147,222 |
Corinthian Colleges, Inc. (a) (b) | | 31,740 | | | 373,897 |
DeVry, Inc. (a) (b) | | 20,327 | | | 406,540 |
Education Management Corp. (a) | | 23,226 | | | 778,303 |
ITT Educational Services, Inc. (a) | | 13,188 | | | 779,543 |
Laureate Education, Inc. (a) | | 17,282 | | | 907,478 |
Regis Corp. | | 15,716 | | | 606,166 |
| | | | |
|
|
| | | | | | 4,999,149 |
| | | | |
|
|
| | | | | |
| Security Description | | Shares | | Value* |
| | | | | | |
| |
Diversified Financial Services—1.2% | | | |
A.G. Edwards, Inc. | | 26,634 | | $ | 1,248,069 |
AmeriCredit Corp. (a) | | 47,858 | | | 1,226,600 |
Jefferies Group, Inc. | | 17,144 | | | 771,137 |
LaBranche & Co., Inc. (a) (b) | | 21,051 | | | 212,826 |
SEI Investments Co. (b) | | 22,055 | | | 816,035 |
Waddell & Reed Financial, Inc. (Class A) | | 29,080 | | | 609,808 |
| | | | |
|
|
| | | | | | 4,884,475 |
| | | | |
|
|
| |
Diversified Telecommunication Services—0.1% | | | |
Cincinnati Bell, Inc. (a) | | 85,484 | | | 300,049 |
| | | | |
|
|
| | |
Electric Utilities—3.7% | | | | | |
Alliant Energy Corp. | | 40,574 | | | 1,137,695 |
Black Hills Corp. (b) | | 11,503 | | | 398,119 |
DPL, Inc. | | 44,284 | | | 1,151,827 |
Duquesne Light Holdings, Inc. (b) | | 27,076 | | | 441,880 |
Energy East Corp. | | 51,289 | | | 1,169,389 |
Great Plains Energy, Inc. (b) | | 25,938 | | | 725,226 |
Hawaiian Electric Inducstries, Inc. (b) | | 28,112 | | | 728,101 |
IDACORP, Inc. (b) | | 14,696 | | | 430,593 |
Northeast Utilities | | 52,112 | | | 1,026,085 |
NSTAR (b) | | 37,089 | | | 1,064,454 |
OGE Energy Corp. | | 31,450 | | | 842,546 |
Pepco Holdings, Inc. | | 65,683 | | | 1,469,329 |
PNM Resources, Inc. | | 23,878 | | | 584,772 |
Puget Energy, Inc. | | 40,096 | | | 818,760 |
Sierra Pacific Resources (a) | | 63,694 | | | 830,570 |
Wisconsin Energy Corp. | | 40,622 | | | 1,586,695 |
WPS Resources Corp. (b) | | 13,889 | | | 768,201 |
| | | | |
|
|
| | | | | | 15,174,242 |
| | | | |
|
|
| | |
Electrical Equipment—1.0% | | | | | |
AMETEK, Inc. | | 24,372 | | | 1,036,785 |
Energizer Holdings, Inc. (a) | | 22,680 | | | 1,129,237 |
Hubbell, Inc. (Class B) | | 21,072 | | | 950,769 |
Tecumseh Products Co. (Class A) (b) | | 6,417 | | | 147,014 |
Thomas & Betts Corp. (a) | | 18,390 | | | 771,644 |
| | | | |
|
|
| | | | | | 4,035,449 |
| | | | |
|
|
| | |
Electronic Equipment & Instruments—2.0% | | | | | |
Amphenol Corp. (Class A) | | 30,863 | | | 1,365,996 |
Arrow Electronics, Inc. (a) | | 41,519 | | | 1,329,854 |
Avnet, Inc. (a) | | 50,669 | | | 1,213,016 |
Diebold, Inc. | | 24,074 | | | 914,812 |
Ingram Micro, Inc. | | 40,255 | | | 802,282 |
Kemet Corp. (a) (b) | | 30,105 | | | 212,842 |
Newport Corp. (a) (b) | | 13,869 | | | 187,786 |
Plexus Corp. (a) (b) | | 15,127 | | | 343,988 |
Technologies Data Corp. (a) | | 19,607 | | | 778,006 |
Vishay Intertechnology, Inc. (a) | | 63,935 | | | 879,746 |
| | | | |
|
|
| | | | | | 8,028,328 |
| | | | |
|
|
| | |
Energy Equipment & Services—3.8% | | | | | |
Cooper Cameron Corp. (a) | | 39,388 | | | 1,630,663 |
ESCO International, Inc. | | 53,222 | | | 2,360,396 |
*See accompanying notes to financial statements.
MSF-199
Metropolitan Series Fund, Inc.
MetLife Mid Cap Stock Index Portfolio
Schedule of Investments as of December 31, 2005
Common Stock—(Continued)
| | | | | |
| Security Description | | Shares | | Value* |
| | | | | | |
| | |
Energy Equipment & Services—(Continued) | | | | | |
FMC Technologies, Inc. (a) (b) | | 23,909 | | $ | 1,026,174 |
Grant Prideco, Inc. (a) | | 44,647 | | | 1,969,826 |
Hanover Compressor Co. (a) (b) | | 31,886 | | | 449,911 |
Helmerich & Payne, Inc. | | 18,061 | | | 1,118,157 |
Patterson-UTI Energy, Inc. | | 60,006 | | | 1,977,198 |
Pride International, Inc. (a) | | 55,020 | | | 1,691,865 |
Smith International, Inc. (a) | | 69,586 | | | 2,582,336 |
Tidewater, Inc. (b) | | 21,005 | | | 933,882 |
| | | | |
|
|
| | | | | | 15,740,408 |
| | | | |
|
|
| | |
Food & Staples Retailing—0.1% | | | | | |
Ruddick Corp. | | 12,087 | | | 257,211 |
| | | | |
|
|
| | |
Food Products—1.2% | | | | | |
Dean Foods Co. (a) | | 46,740 | | | 1,760,228 |
Hormel Foods Corp. | | 25,346 | | | 828,307 |
Sensient Technologies Corp. (b) | | 16,342 | | | 292,522 |
Smithfield Foods, Inc. (a) | | 34,334 | | | 1,050,620 |
The J. M. Smucker Co. | | 20,270 | | | 891,880 |
Tootsie Roll Industries, Inc. (b) | | 8,735 | | | 252,704 |
| | | | |
|
|
| | | | | | 5,076,261 |
| | | | |
|
|
| | |
Gas Utilities—1.6% | | | | | |
AGL Resources, Inc. | | 26,965 | | | 938,652 |
MDU Resources Group, Inc. | | 41,623 | | | 1,362,737 |
National Fuel Gas Co. (b) | | 29,329 | | | 914,771 |
ONEOK, Inc. | | 33,882 | | | 902,278 |
Southwestern Energy Co. (a) | | 58,011 | | | 2,084,915 |
WGL Holdings, Inc. (b) | | 16,910 | | | 508,315 |
| | | | |
|
|
| | | | | | 6,711,668 |
| | | | |
|
|
| | |
Health Care Equipment & Supplies—3.1% | | | | | |
Advanced Medical Optics, Inc. (a) | | 23,168 | | | 968,422 |
Beckman Coulter, Inc. | | 21,581 | | | 1,227,959 |
Cytyc Corp. (a) | | 39,569 | | | 1,117,033 |
Dentsply International, Inc. | | 27,305 | | | 1,466,006 |
Edwards Lifesciences Corp. (a) | | 20,743 | | | 863,116 |
Hillenbrand Industries, Inc. | | 21,220 | | | 1,048,480 |
INAMED Corp. (a) (b) | | 12,624 | | | 1,106,872 |
Intuitive Surgical, Inc. (a) | | 12,318 | | | 1,444,532 |
STERIS Corp. | | 23,739 | | | 593,950 |
Varian Medical Systems, Inc. (a) | | 45,677 | | | 2,299,380 |
Varian, Inc. (a) (b) | | 10,809 | | | 430,090 |
| | | | |
|
|
| | | | | | 12,565,840 |
| | | | |
|
|
| | |
Health Care Providers & Services—3.5% | | | | | |
Apria Healthcare Group, Inc. (a) (b) | | 17,211 | | | 414,957 |
Community Health Systems, Inc. (a) | | 30,741 | | | 1,178,610 |
Covance, Inc. (a) | | 21,727 | | | 1,054,846 |
Health Net, Inc. (a) | | 39,763 | | | 2,049,783 |
Henry Schein, Inc. (a) | | 30,269 | | | 1,320,939 |
LifePoint Hospitals, Inc. (a) (b) | | 19,826 | | | 743,475 |
Lincare Holdings, Inc. (a) | | 33,766 | | | 1,415,133 |
Omnicare, Inc. | | 41,465 | | | 2,372,627 |
Renal Care Group, Inc. (a) | | 23,728 | | | 1,122,572 |
| | | | | |
| Security Description | | Shares | | Value* |
| | | | | | |
| |
Health Care Providers & Services—(Continued) | | | |
Triad Hospitals, Inc. (a) | | 29,912 | | $ | 1,173,448 |
UnitedHealth Group, Inc. | | 1 | | | 43 |
Universal Health Services, Inc. (Class B) | | 18,951 | | | 885,770 |
VCA Antech, Inc. (a) | | 28,693 | | | 809,142 |
| | | | |
|
|
| | | | | | 14,541,345 |
| | | | |
|
|
| | |
Hotels, Restaurants & Leisure—1.9% | | | | | |
Applebee’s International, Inc. (b) | | 26,488 | | | 598,364 |
Bob Evans Farms, Inc. (b) | | 12,435 | | | 286,751 |
Boyd Gaming Corp. | | 15,177 | | | 723,336 |
Brinker International, Inc. (a) | | 29,865 | | | 1,154,581 |
CBRL Group, Inc. | | 16,236 | | | 570,696 |
GTECH Holdings Corp. | | 43,437 | | | 1,378,690 |
International Speedway Corp. (Class A) | | 12,221 | | | 585,386 |
Outback Steakhouse, Inc. | | 22,815 | | | 949,332 |
Ruby Tuesday, Inc. (b) | | 21,739 | | | 562,823 |
The Cheesecake Factory, Inc. (a) | | 27,270 | | | 1,019,625 |
| | | | |
|
|
| | | | | | 7,829,584 |
| | | | |
|
|
| | |
Household Durables—2.7% | | | | | |
Amereican Greetings Corp. (Class A) | | 22,820 | | | 501,356 |
Beazer Homes USA, Inc. (b) | | 14,304 | | | 1,041,903 |
Blyth, Inc. (b) | | 9,252 | | | 193,829 |
Furniture Brands International, Inc. (b) | | 17,660 | | | 394,348 |
Harman International Industries, Inc. | | 22,872 | | | 2,238,025 |
HNI Corp. | | 19,023 | | | 1,044,933 |
Hovnanian Enterprises, Inc. (Class A) (a) (b) | | 12,434 | | | 617,224 |
Lancaster Colony Corp. (b) | | 8,842 | | | 327,596 |
Mohawk Industries, Inc. (a) | | 18,351 | | | 1,596,170 |
Ryland Group, Inc. (b) | | 16,234 | | | 1,170,959 |
Toll Brothers, Inc. (a) | | 41,089 | | | 1,423,323 |
Tupperware Corp. | | 18,548 | | | 415,475 |
| | | | |
|
|
| | | | | | 10,965,141 |
| | | | |
|
|
| | |
Household Products—0.2% | | | | | |
Church & Dwight, Inc. | | 22,337 | | | 737,791 |
| | | | |
|
|
| | |
Industrial Conglomerates—0.4% | | | | | |
Carisle Cos., Inc. | | 10,591 | | | 732,367 |
Teleflex, Inc. (b) | | 14,063 | | | 913,814 |
| | | | |
|
|
| | | | | | 1,646,181 |
| | | | |
|
|
| | |
Insurance—5.7% | | | | | |
American Financial Group, Inc. | | 16,158 | | | 619,013 |
AmerUs Group Co. (b) | | 13,422 | | | 760,625 |
Arthur J. Gallagher & Co. (b) | | 33,058 | | | 1,020,831 |
Brown & Brown, Inc. (b) | | 38,616 | | | 1,179,333 |
Everest Re Group, Ltd. | | 21,483 | | | 2,155,819 |
Fidelity National Financial, Inc. | | 60,258 | | | 2,216,892 |
First American Corp. | | 33,236 | | | 1,505,591 |
Hanover Insurance Group, Inc. | | 18,646 | | | 778,843 |
HCC Insurance Holdings, Inc. | | 36,739 | | | 1,090,414 |
Horace Mann Educators Corp. | | 14,919 | | | 282,864 |
Leucadia National Corp. (b) | | 28,525 | | | 1,353,796 |
Mercury General Corp. (b) | | 12,324 | | | 717,503 |
*See accompanying notes to financial statements.
MSF-200
Metropolitan Series Fund, Inc.
MetLife Mid Cap Stock Index Portfolio
Schedule of Investments as of December 31, 2005
Common Stock—(Continued)
| | | | | |
| Security Description | | Shares | | Value* |
| | | | | | |
| | |
Insurance—(Continued) | | | | | |
Ohio Casualty Corp. (a) | | 22,090 | | $ | 625,589 |
Old Republic International Corp. | | 63,625 | | | 1,670,792 |
Protective Life Corp. | | 24,201 | | | 1,059,278 |
Radian Group, Inc. | | 28,832 | | | 1,689,267 |
StanCorp Financial Group, Inc. | | 18,952 | | | 946,652 |
The PMI Group, Inc. | | 31,097 | | | 1,277,154 |
Unitrin, Inc. | | 15,785 | | | 711,114 |
W.R. Berkley Corp. | | 38,942 | | | 1,854,418 |
| | | | |
|
|
| | | | | | 23,515,788 |
| | | | |
|
|
| | |
Internet Software & Services—0.4% | | | | | |
McAfee, Inc. (a) | | 58,257 | | | 1,580,512 |
| | | | |
|
|
| | |
IT Services—1.0% | | | | | |
Acxiom Corp. (b) | | 26,302 | | | 604,946 |
Anteon International Corp. (a) (b) | | 11,363 | | | 617,579 |
Cognizant Technology Solutions Corp. (Class A) (a) | | 47,987 | | | 2,416,146 |
SRA International, Inc. (a) (b) | | 12,910 | | | 394,271 |
| | | | |
|
|
| | | | | | 4,032,942 |
| | | | |
|
|
| | |
Leisure Equipment & Products—0.1% | | | | | |
Callaway Golf Co. | | 22,830 | | | 315,967 |
| | | | |
|
|
| | |
Machinery—2.6% | | | | | |
AGCO Corp. (a) (b) | | 31,429 | | | 520,779 |
Donaldson Co., Inc. (b) | | 23,696 | | | 753,533 |
Flowserve Corp. (a) | | 19,194 | | | 759,315 |
Graco, Inc. | | 23,802 | | | 868,297 |
Harsco Corp. | | 14,495 | | | 978,557 |
Joy Global, Inc. | | 42,196 | | | 1,687,840 |
Kennametal, Inc. | | 13,386 | | | 683,221 |
Nordson Corp. (b) | | 11,340 | | | 459,383 |
Pentair, Inc. | | 35,136 | | | 1,212,895 |
SPX Corp. | | 22,853 | | | 1,045,982 |
The Timkin Co. | | 28,893 | | | 925,154 |
Trinity Industries, Inc. (b) | | 15,142 | | | 667,308 |
| | | | |
|
|
| | | | | | 10,562,264 |
| | | | |
|
|
| | |
Marine—0.3% | | | | | |
Alexander & Baldwin, Inc. | | 15,241 | | | 826,672 |
Overseas Shipholding Group, Inc. | | 10,274 | | | 517,707 |
| | | | |
|
|
| | | | | | 1,344,379 |
| | | | |
|
|
| | |
Media—1.6% | | | | | |
Belo Corp. (Class A) | | 32,871 | | | 703,768 |
Catalina Marketing Corp. (b) | | 13,672 | | | 346,585 |
Emmis Communications Corp. (Class A) (a) (b) | | 12,802 | | | 254,888 |
Entercom Communications Corp. (a) | | 13,239 | | | 392,801 |
Harte-Hanks, Inc. | | 19,716 | | | 520,305 |
Lee Enterprises, Inc. (b) | | 15,791 | | | 582,846 |
Media General, Inc. (Class A) (b) | | 8,349 | | | 423,294 |
Scholastic Corp. (a) | | 12,383 | | | 353,040 |
The Reader’s Digest Association, Inc. (Class A) (b) | | 34,214 | | | 520,737 |
The Washington Post Co. (Class B) | | 2,034 | | | 1,556,010 |
Valassis Communications, Inc. (a) | | 16,524 | | | 480,353 |
Westwood One, Inc. (a) | | 22,777 | | | 371,265 |
| | | | |
|
|
| | | | | | 6,505,892 |
| | | | |
|
|
| | | | | |
| Security Description | | Shares | | Value* |
| | | | | | |
| | |
Metals & Mining—0.7% | | | | | |
Arch Coal, Inc. | | 22,464 | | $ | 1,785,888 |
Steel Dynamics, Inc. (b) | | 13,321 | | | 473,029 |
Worthington Industries, Inc. | | 24,803 | | | 476,465 |
| | | | |
|
|
| | | | | | 2,735,382 |
| | | | |
|
|
| | |
Multi-Utilities—1.4% | | | | | |
Aquila, Inc. (a) | | 129,665 | | | 466,794 |
Questar Corp. | | 29,614 | | | 2,241,780 |
SCANA Corp. | | 39,755 | | | 1,565,552 |
Venctren Corp. | | 26,424 | | | 717,676 |
Westar Energry, Inc. | | 30,121 | | | 647,601 |
| | | | |
|
|
| | | | | | 5,639,403 |
| | | | |
|
|
| | |
Multiline Retail—0.6% | | | | | |
99 Cents Only Stores (a) (b) | | 16,665 | | | 174,316 |
BJ’s Wholesale Club, Inc. (a) | | 23,488 | | | 694,305 |
Dollar Tree Stores, Inc. (a) | | 36,942 | | | 884,392 |
Saks, Inc. | | 48,262 | | | 813,697 |
| | | | |
|
|
| | | | | | 2,566,710 |
| | | | |
|
|
| | |
Mutual Funds—3.8% | | | | | |
MidCap SPDR Trust, Series 1 | | 114,600 | | | 15,435,474 |
| | | | |
|
|
| | |
Office Electronics—0.3% | | | | | |
Zebra Technologies Corp. (Class A) (a) | | 24,430 | | | 1,046,826 |
| | | | |
|
|
| | |
Oil, Gas & Consumable Fuels—4.4% | | | | | |
Denbury Resources, Inc. (a) | | 39,779 | | | 906,166 |
Equitable Resources, Inc. | | 41,974 | | | 1,540,026 |
Forest Oil Corp. (a) (b) | | 18,977 | | | 864,782 |
Newfield Expolration Co. (a) | | 44,183 | | | 2,212,243 |
Noble Energy, Inc. | | 60,750 | | | 2,448,225 |
Peabody Energy Corp. | | 45,661 | | | 3,763,379 |
Pioneer Natural Resources Co. | | 44,633 | | | 2,288,334 |
Plains Exploration & Prodcution Co. (a) | | 27,225 | | | 1,081,649 |
Pogo Producing Co. | | 20,803 | | | 1,036,197 |
Quicksilver Resources, Inc. (a) (b) | | 23,209 | | | 975,010 |
Western Gas Resources, Inc. (b) | | 19,952 | | | 939,540 |
| | | | |
|
|
| | | | | | 18,055,551 |
| | | | |
|
|
| | |
Paper & Forest Products—0.2% | | | | | |
Bowater, Inc. | | 19,419 | | | 596,552 |
Glatfelter (b) | | 15,303 | | | 217,150 |
| | | | |
|
|
| | | | | | 813,702 |
| | | | |
|
|
| | |
Pharmaceuticals—1.9% | | | | | |
Barr Pharmaceuticals, Inc. (a) | | 37,363 | | | 2,327,341 |
IVAX Corp. (a) (b) | | 76,041 | | | 2,382,365 |
Par Pharmaceutical Companies, Inc. (a) (b) | | 11,891 | | | 372,664 |
Perrigo Co. (b) | | 28,869 | | | 430,437 |
Sepracor, Inc. (a) (b) | | 36,837 | | | 1,900,789 |
Valeant Pharmaceuticals International, Inc. (b) | | 32,167 | | | 581,579 |
| | | | |
|
|
| | | | | | 7,995,175 |
| | | | |
|
|
*See accompanying notes to financial statements.
MSF-201
Metropolitan Series Fund, Inc.
MetLife Mid Cap Stock Index Portfolio
Schedule of Investments as of December 31, 2005
Common Stock—(Continued)
| | | | | |
| Security Description | | Shares | | Value* |
| | | | | | |
| | |
Real Estate—3.5% | | | | | |
AMB Property Corp. (REIT) | | 29,675 | | $ | 1,459,120 |
Developers Diversified Realty Corp. (REIT) | | 37,802 | | | 1,777,450 |
Highwoods Properties, Inc. (REIT) | | 18,762 | | | 533,779 |
Hospitality Properties Trust (REIT) | | 24,975 | | | 1,001,497 |
Liberty Property Trust (REIT) (b) | | 30,642 | | | 1,313,010 |
Mack-Cali Realty Corp. (REIT) | | 21,492 | | | 928,454 |
New Plan Excel Realty Trust (REIT) (b) | | 36,193 | | | 838,954 |
Potlatch Corp. (REIT) (b) | | 10,138 | | | 516,835 |
Rayonier, Inc. (REIT) | | 26,339 | | | 1,049,609 |
Regency Centers Corp. (REIT) | | 23,569 | | | 1,389,392 |
The Macerich Co. | | 20,815 | | | 1,397,519 |
United Dominion Reallty Trust, Inc. (REIT) (b) | | 47,638 | | | 1,116,635 |
Weingarten Realty Investors (REIT) | | 27,911 | | | 1,055,315 |
| | | | |
|
|
| | | | | | 14,377,569 |
| | | | |
|
|
| | |
Road & Rail—0.8% | | | | | |
GATX Corp. (b) | | 17,572 | | | 633,998 |
J.B. Hunt Transport Services, Inc. | | 42,965 | | | 972,728 |
Swift Transportation Co., Inc. (a) (b) | | 18,205 | | | 369,561 |
Werner Enterprises, Inc. (b) | | 17,919 | | | 353,004 |
YRC Worldwide, Inc. (b) | | 20,170 | | | 899,784 |
| | | | |
|
|
| | | | | | 3,229,075 |
| | | | |
|
|
| |
Semiconductors & Semiconductor Equipment—3.4% | | | |
Atmel Corp. (a) (b) | | 147,668 | | | 456,294 |
Cabot Microelectronics Corp. (a) (b) | | 8,435 | | | 247,398 |
Credence Systems Corp. (a) (b) | | 34,525 | | | 240,294 |
Cree, Inc. (a) (b) | | 26,351 | | | 665,099 |
Cypress Semiconductor Corp. (a) (b) | | 47,004 | | | 669,807 |
Fairchild Semiconductor International, Inc. (a) | | 41,710 | | | 705,316 |
Integrated Device Technology, Inc. (a) (b) | | 69,321 | | | 913,656 |
International Rectifier Corp. (a) | | 24,583 | | | 784,198 |
Intersil Corp. (Class A) | | 53,646 | | | 1,334,712 |
Lam Research Corp. (a) | | 47,224 | | | 1,684,952 |
Lattice Semiconductor Corp. (a) (b) | | 39,453 | | | 170,437 |
MEMC Electronic Materials, Inc. (a) | | 57,352 | | | 1,271,494 |
Micrel, Inc. (a) (b) | | 22,662 | | | 262,879 |
Microchip Technology, Inc. | | 72,986 | | | 2,346,500 |
MPS Group, Inc. (a) (b) | | 35,125 | | | 480,159 |
RF Micro Devices, Inc. (a) (b) | | 65,648 | | | 355,156 |
Semtech Corp. (a) | | 25,295 | | | 461,887 |
Silicon Laboratories, Inc. (a) (b) | | 15,563 | | | 570,540 |
TriQuint Semiconductor, Inc. (a) (b) | | 48,616 | | | 216,341 |
| | | | |
|
|
| | | | | | 13,837,119 |
| | | | |
|
|
| | |
Software—2.3% | | | | | |
Activision, Inc. (a) | | 95,040 | | | 1,305,850 |
Advent Software, Inc. (a) (b) | | 5,586 | | | 161,491 |
Cadence Design Systems, Inc. (a) | | 98,518 | | | 1,666,924 |
Fair Isaac Corp. | | 22,704 | | | 1,002,836 |
Gartner, Inc. (Class A) (a) (b) | | 20,105 | | | 259,354 |
Jack Henry & Associates, Inc. | | 25,983 | | | 495,756 |
Macrovision Corp. (a) | | 17,678 | | | 295,753 |
Mentor Graphics Corp. (a) (b) | | 27,494 | | | 284,288 |
National Instruments Corp. (b) | | 19,238 | | | 616,578 |
| | | | | |
| Security Description | | Shares | | Value* |
| | | | | | |
| | |
Software—(Continued) | | | | | |
RSA Security, Inc. (a) (b) | | 24,643 | | $ | 276,741 |
Sybase, Inc. (a) (b) | | 31,636 | | | 691,563 |
Synopsys, Inc. (a) | | 50,114 | | | 1,005,287 |
The Reynolds & Reynolds Co. (Class A) | | 17,759 | | | 498,495 |
Transaction Systems Architects, Inc. (Class A) (a) | | 12,908 | | | 371,621 |
Wind River Systems, Inc. (a) | | 25,958 | | | 383,400 |
| | | | |
|
|
| | | | | | 9,315,937 |
| | | | |
|
|
| | |
Specialty Retail—6.5% | | | | | |
Abercrombie & Fitch Co. (Class A) | | 30,431 | | | 1,983,493 |
Advance Auto Parts, Inc. (a) | | 37,564 | | | 1,632,531 |
Aeropostale, Inc. (a) | | 18,875 | | | 496,412 |
American Eagle Outfitters, Inc. (b) | | 45,681 | | | 1,049,749 |
AnnTaylor Stores Corp. (a) | | 25,244 | | | 871,423 |
Barnes & Noble, Inc. (a) | | 18,276 | | | 779,837 |
Borders Group, Inc. (b) | | 23,186 | | | 502,441 |
Carmax, Inc. (a) (b) | | 36,351 | | | 1,006,196 |
CDW Corp. | | 21,801 | | | 1,255,083 |
Chico’s FAS, Inc. (a) | | 62,845 | | | 2,760,781 |
Claire’s Stores, Inc. | | 34,506 | | | 1,008,265 |
Copart, Inc. (a) | | 24,194 | | | 557,914 |
Foot Locker, Inc. | | 54,191 | | | 1,278,366 |
GameStop Corp. (Class A) (a) (b) | | 19,841 | | | 631,341 |
Michaels Stores, Inc. | | 46,420 | | | 1,641,875 |
O’Reilly Automotive, Inc. (a) | | 38,920 | | | 1,245,829 |
Pacific Sunwear of California, Inc. (a) | | 25,758 | | | 641,889 |
Payless Shoesource, Inc. (a) (b) | | 23,823 | | | 597,957 |
PETsMART, Inc. | | 48,748 | | | 1,250,874 |
Pier 1 Imports, Inc. (b) | | 30,105 | | | 262,817 |
Rent-A-Center, Inc. (a) | | 24,645 | | | 464,805 |
Ross Stores, Inc. | | 50,191 | | | 1,450,520 |
United Rentals, Inc. (a) (b) | | 23,247 | | | 543,747 |
Urban Outfitters, Inc. (a) (b) | | 38,318 | | | 969,829 |
Williams-Sonoma, Inc. (a) | | 40,080 | | | 1,729,452 |
| | | | |
|
|
| | | | | | 26,613,426 |
| | | | |
|
|
| |
Textiles, Apparel & Luxury Goods—0.4% | | | |
Polo Ralph Lauren Corp. | | 21,112 | | | 1,185,228 |
The Timberland Co. (Class A) (a) | | 19,052 | | | 620,142 |
| | | | |
|
|
| | | | | | 1,805,370 |
| | | | |
|
|
| |
Thrifts & Mortgage Finance—0.4% | | | |
Astoria Financial Corp. | | 30,673 | | | 901,786 |
IndyMac Bancorp, Inc. (b) | | 22,291 | | | 869,795 |
| | | | |
|
|
| | | | | | 1,771,581 |
| | | | |
|
|
| |
Tobacco—0.1% | | | |
Universal Corp. | | 8,930 | | | 387,205 |
| | | | |
|
|
| |
Trading Companies & Distributors—0.6% | | | |
Fastenal Co. (b) | | 43,012 | | | 1,685,640 |
MSC Industrial Direct Co. (Class A) | | 18,732 | | | 753,401 |
| | | | |
|
|
| | | | | | 2,439,041 |
| | | | |
|
|
*See accompanying notes to financial statements.
MSF-202
Metropolitan Series Fund, Inc.
MetLife Mid Cap Stock Index Portfolio
Schedule of Investments as of December 31, 2005
Common Stock—(Continued)
| | | | | |
Security Description | | Shares | | Value* |
| | | | | | |
| |
Water Utilities—0.3% | | | |
Aqua America, Inc. (b) | | 44,680 | | $ | 1,219,764 |
| | | | |
|
|
| |
Wireless Telecommunication Services—0.3% | | | |
Telephone & Data Systems, Inc. | | 35,633 | | | 1,283,857 |
| | | | |
|
|
Total Common Stock
(Identified Cost $319,811,899) | | | | | 394,404,094 |
| | | | |
|
|
| | | | | | | |
| |
| Short Term Investments—3.9% | | | | |
| Security Description | | Face
Amount | | Value* | |
| | | | | | | | |
| |
Discount Notes – 3.9% | | | | |
Federal Home Loan Bank | | | | | | | |
3.350%, 01/03/06 | | $ | 1,900,000 | | $ | 1,899,647 | |
4.380%, 02/15/06 | | | 1,000,000 | | | 994,825 | |
Federal National Mortgage Association | | | | | | | |
4.310%, 03/22/06 | | | 3,500,000 | | | 3,466,478 | |
4.450%, 03/22/06 | | | 10,000,000 | | | 9,904,221 | |
| | | | | |
|
|
|
Total Short Term Investments
(Amortized Cost $16,265,171) | | | | | | 16,265,171 | |
| | | | | |
|
|
|
Total Investments—100.0%
(Identified Cost $336,077,070) (c) | | | | | | 410,669,265 | |
Liabilities in excess of other assets | | | | | | (135,893 | ) |
| | | | | |
|
|
|
| Total Net Assets—100% | | | | | $ | 410,533,372 | |
| | | | | |
|
|
|
| (b) | A portion or all of the security was held on loan. As of December 31, 2005, the market value of securities loaned was $69,797,249 and the collateral received consisted of cash in the amount of $71,899,454. |
| (c) | The aggregate cost of investments for federal income tax purposes as of December 31, 2005 was $339,520,920 and the composition of unrealized appreciation and depreciation of investment securities was $84,982,514 and $(13,834,169), respectively. |
| (REIT)— | A Real Estate Investment Trust is a pooled investment vehicle that invests primarily in income-producing real estate or real estate related loans or interest. |
Futures Contracts
| | | | | | | | | | | | | | |
Futures Contracts Long
| | Expiration Date
| | Number of
Contracts
| | Contract
Amount
| | Valuation as of
12/31/2005
| | Net Unrealized
Depreciation
| |
S&P 400 MidCap Futures | | 3/16/2006 | | 42 | | $ | 15,683,460 | | $ | 15,607,200 | | $ | (76,260 | ) |
| | | | | | | | | | | | |
|
|
|
*See accompanying notes to financial statements.
MSF-203
Metropolitan Series Fund, Inc.
MetLife Mid Cap Stock Index Portfolio
Statement of Assets & Liabilities
December 31, 2005
| | | | | | |
Assets | | | | | | |
Investments at value | | | | | $ | 410,669,265 |
Cash | | | | | | 5,021 |
Collateral for securities loaned | | | | | | 71,899,454 |
Receivable for: | | | | | | |
Securities sold | | | | | | 3,699,902 |
Fund shares sold | | | | | | 702,877 |
Accrued interest and dividends | | | | | | 306,465 |
| | | | | |
|
|
Total Assets | | | | | | 487,282,984 |
Liabilities | | | | | | |
Payable for: | | | | | | |
Fund shares redeemed | | $ | 1,049,778 | | | |
Securities purchased | | | 3,563,987 | | | |
Futures variation margin | | | 52,500 | | | |
Return of collateral for securities loaned | | | 71,899,454 | | | |
Accrued expenses: | | | | | | |
Management fees | | | 84,809 | | | |
Service and distribution fees | | | 32,071 | | | |
Other expenses | | | 67,013 | | | |
| | |
|
| | | |
Total Liabilities | | | | | | 76,749,612 |
| | | | | |
|
|
Net Assets | | | | | $ | 410,533,372 |
| | | | | |
|
|
Net assets consists of: | | | | | | |
Capital paid in | | | | | $ | 310,637,628 |
Undistributed net investment income | | | | | | 3,555,198 |
Accumulated net realized gains | | | | | | 21,824,611 |
Unrealized appreciation on investments and futures contracts | | | | | | 74,515,935 |
| | | | | |
|
|
Net Assets | | | | | $ | 410,533,372 |
| | | | | |
|
|
| Computation of offering price: | | | | | | |
Class A | | | | | | |
Net asset value and redemption price per share ($232,460,614 divided by 16,105,694 shares outstanding) | | | | | $ | 14.43 |
| | | | | |
|
|
Class B | | | | | | |
Net asset value and redemption price per share ($111,361,214 divided by 7,773,999 shares outstanding) | | | | | $ | 14.32 |
| | | | | |
|
|
Class E | | | | | | |
Net asset value and redemption price per share ($66,711,544 divided by 4,642,819 shares outstanding) | | | | | $ | 14.37 |
| | | | | |
|
|
Identified cost of investments | | | | | $ | 336,077,070 |
| | | | | |
|
|
Statement of Operations
Year ended December 31, 2005
| | | | | | | | |
Investment Income | | | | | | | | |
Dividends | | | | | | $ | 4,984,582 | |
Interest | | | | | | | 505,770 | (a) |
| | | | | | |
|
|
|
| | | | | | | | 5,490,352 | |
Expenses | | | | | | | | |
Management fees | | $ | 902,019 | | | | | |
Service and distribution fees—Class B | | | 216,506 | | | | | |
Service and distribution fees—Class E | | | 95,319 | | | | | |
Directors’ fees and expenses | | | 22,264 | | | | | |
Custodian | | | 147,281 | | | | | |
Audit and tax services | | | 20,697 | | | | | |
Legal | | | 9,383 | | | | | |
Printing | | | 91,578 | | | | | |
Insurance | | | 6,606 | | | | | |
Miscellaneous | | | 30,347 | | | | | |
| | |
|
|
| | | | |
Total expenses | | | 1,542,000 | | | | | |
Management fee waivers | | | (17,692 | ) | | | 1,524,308 | |
| | |
|
|
| |
|
|
|
Net Investment Income | | | | | | | 3,966,044 | |
| | | | | | |
|
|
|
Realized and Unrealized Gain | | | | | | | | |
| Realized gain on: | | | | | | | | |
Investments—net | | | 23,140,205 | | | | | |
Futures contracts—net | | | 1,682,385 | | | | 24,822,590 | |
| | |
|
|
| | | | |
| Unrealized appreciation (depreciation) on: | | | | | | | | |
Investments—net | | | 15,064,120 | | | | | |
Futures contracts—net | | | (545,455 | ) | | | 14,518,665 | |
| | |
|
|
| |
|
|
|
Net gain | | | | | | | 39,341,255 | |
| | | | | | |
|
|
|
Net Increase in Net Assets
From Operations | | | | | | $ | 43,307,299 | |
| | | | | | |
|
|
|
| (a) | Includes income on securities loaned of $131,987. |
See accompanying notes to financial statements.
MSF-204
Metropolitan Series Fund, Inc.
MetLife Mid Cap Stock Index Portfolio
Statement of Changes in Net Assets
| | | | | | | | |
| | | Year ended
December 31,
2005
| | | Year ended
December 31,
2004
| |
From Operations | | | | | | | | |
Net investment income | | $ | 3,966,044 | | | $ | 2,288,410 | |
Net realized gain | | | 24,822,590 | | | | 15,790,833 | |
Unrealized appreciation | | | 14,518,665 | | | | 25,780,717 | |
| | |
|
|
| |
|
|
|
Increase in net assets from operations | | | 43,307,299 | | | | 43,859,960 | |
| | |
|
|
| |
|
|
|
From Distributions to Shareholders | | | | | | | | |
Net investment income | | | | | | | | |
Class A | | | (1,458,624 | ) | | | (989,606 | ) |
Class B | | | (389,047 | ) | | | (130,991 | ) |
Class E | | | (359,618 | ) | | | (313,780 | ) |
| | |
|
|
| |
|
|
|
| | | | (2,207,289 | ) | | | (1,434,377 | ) |
| | |
|
|
| |
|
|
|
Net realized gain | | | | | | | | |
Class A | | | (10,681,839 | ) | | | (511,297 | ) |
Class B | | | (4,087,811 | ) | | | (96,684 | ) |
Class E | | | (3,300,297 | ) | | | (180,133 | ) |
| | |
|
|
| |
|
|
|
| | | | (18,069,947 | ) | | | (788,114 | ) |
| | |
|
|
| |
|
|
|
Total distributions | | | (20,277,236 | ) | | | (2,222,491 | ) |
| | |
|
|
| |
|
|
|
Increase in net assets from capital share transactions | | | 63,123,964 | | | | 20,791,779 | |
| | |
|
|
| |
|
|
|
Total increase in net assets | | | 86,154,027 | | | | 62,429,248 | |
| | |
Net Assets | | | | | | | | |
Beginning of the period | | | 324,379,345 | | | | 261,950,097 | |
| | |
|
|
| |
|
|
|
End of the period | | $ | 410,533,372 | | | $ | 324,379,345 | |
| | |
|
|
| |
|
|
|
Undistributed Net Investment Income | | | | | | | | |
End of the period | | $ | 3,555,198 | | | $ | 2,193,353 | |
| | |
|
|
| |
|
|
|
Other Information:
Capital Shares
Transactions in capital shares were as follows:
| | | | | | | | | | | | | | |
| | | Year ended
December 31, 2005
| | | Year ended
December 31, 2004
| |
| | | Shares
| | | $
| | | Shares
| | | $
| |
Class A | | | | | | | | | | | | | | |
Sales | | 4,348,162 | | | $ | 59,530,036 | | | 3,491,412 | | | $ | 43,113,882 | |
Reinvestments | | 983,033 | | | | 12,140,463 | | | 119,785 | | | | 1,500,903 | |
Redemptions | | (3,643,624 | ) | | | (49,774,072 | ) | | (4,335,834 | ) | | | (53,753,666 | ) |
| | |
|
| |
|
|
| |
|
| |
|
|
|
Net increase (decrease) | | 1,687,571 | | | $ | 21,896,427 | | | (724,637 | ) | | $ | (9,138,881 | ) |
| | |
|
| |
|
|
| |
|
| |
|
|
|
Class B | | | | | | | | | | | | | | |
Sales | | 3,862,084 | | | $ | 52,145,073 | | | 2,731,640 | | | $ | 33,587,197 | |
Reinvestments | | 364,565 | | | | 4,476,858 | | | 18,258 | | | | 227,675 | |
Redemptions | | (1,169,425 | ) | | | (15,858,271 | ) | | (725,630 | ) | | | (8,946,441 | ) |
| | |
|
| |
|
|
| |
|
| |
|
|
|
Net increase | | 3,057,224 | | | $ | 40,763,660 | | | 2,024,268 | | | $ | 24,868,431 | |
| | |
|
| |
|
|
| |
|
| |
|
|
|
Class E | | | | | | | | | | | | | | |
Sales | | 652,625 | | | $ | 8,852,544 | | | 2,785,948 | | | $ | 34,217,907 | |
Reinvestments | | 297,312 | | | | 3,659,915 | | | 39,545 | | | | 493,913 | |
Redemptions | | (888,419 | ) | | | (12,048,582 | ) | | (2,448,856 | ) | | | (29,649,591 | ) |
| | |
|
| |
|
|
| |
|
| |
|
|
|
Net increase | | 61,518 | | | $ | 463,877 | | | 376,637 | | | $ | 5,062,229 | |
| | |
|
| |
|
|
| |
|
| |
|
|
|
Increase derived from capital share transactions | | 4,806,313 | | | $ | 63,123,964 | | | 1,676,268 | | | $ | 20,791,779 | |
| | |
|
| |
|
|
| |
|
| |
|
|
|
See accompanying notes to financial statements.
MSF-205
Metropolitan Series Fund, Inc.
MetLife Mid Cap Stock Index Portfolio
Financial Highlights
| | | | | | | | | | | | | | | | | | | | |
| | | Class A
| |
| | | Year ended December 31,
| |
| | | 2005
| | | 2004
| | | 2003
| | | 2002
| | | 2001
| |
Net Asset Value, Beginning of Period | | $ | 13.71 | | | $ | 11.90 | | | $ | 8.87 | | | $ | 10.46 | | | $ | 10.64 | |
| | |
|
|
| |
|
|
| |
|
|
| |
|
|
| |
|
|
|
Income From Investment Operations | | | | | | | | | | | | | | | | | | | | |
Net investment income | | | 0.15 | | | | 0.11 | | | | 0.08 | | | | 0.05 | | | | 0.06 | |
Net realized and unrealized gain (loss) of investments | | | 1.40 | | | | 1.79 | | | | 3.00 | | | | (1.60 | ) | | | (0.19 | ) |
| | |
|
|
| |
|
|
| |
|
|
| |
|
|
| |
|
|
|
Total from investment operations | | | 1.55 | | | | 1.90 | | | | 3.08 | | | | (1.55 | ) | | | (0.13 | ) |
| | |
|
|
| |
|
|
| |
|
|
| |
|
|
| |
|
|
|
Less Distributions | | | | | | | | | | | | | | | | | | | | |
Distributions from net investment income | | | (0.10 | ) | | | (0.06 | ) | | | (0.05 | ) | | | (0.04 | ) | | | (0.02 | ) |
Distributions from net realized capital gains | | | (0.73 | ) | | | (0.03 | ) | | | 0.00 | | | | 0.00 | | | | (0.03 | ) |
| | |
|
|
| |
|
|
| |
|
|
| |
|
|
| |
|
|
|
Total distributions | | | (0.83 | ) | | | (0.09 | ) | | | (0.05 | ) | | | (0.04 | ) | | | (0.05 | ) |
| | |
|
|
| |
|
|
| |
|
|
| |
|
|
| |
|
|
|
Net Asset Value, End of Period | | $ | 14.43 | | | $ | 13.71 | | | $ | 11.90 | | | $ | 8.87 | | | $ | 10.46 | |
| | |
|
|
| |
|
|
| |
|
|
| |
|
|
| |
|
|
|
Total Return (%) | | | 12.3 | | | | 16.0 | | | | 35.0 | | | | (14.9 | ) | | | (1.2 | ) |
Ratio of operating expenses to average net assets (%) | | | 0.34 | | | | 0.35 | | | | 0.40 | | | | 0.43 | | | | 0.45 | |
Ratio of operating expenses to average net assets without giving effect to the contractual expense agreement would have been (%) | | | 0.34 | | | | 0.35 | | | | 0.40 | | | | 0.43 | | | | 0.52 | |
Ratio of net investment income to average net assets (%) | | | 1.18 | | | | 0.85 | | | | 0.85 | | | | 0.70 | | | | 0.71 | |
Portfolio turnover rate (%) | | | 33 | | | | 42 | | | | 22 | | | | 46 | | | | 45 | |
Net assets, end of period (000) | | $ | 232,461 | | | $ | 197,642 | | | $ | 180,211 | | | $ | 117,340 | | | $ | 97,505 | |
| |
| | | Class B
| |
| | | Year ended December 31,
| | | January 2, 2001(a) through
December 31, 2001
| |
| | | 2005
| | | 2004
| | | 2003
| | | 2002
| | |
Net Asset Value, Beginning of Period | | $ | 13.61 | | | $ | 11.83 | | | $ | 8.83 | | | $ | 10.43 | | | $ | 10.54 | |
| | |
|
|
| |
|
|
| |
|
|
| |
|
|
| |
|
|
|
Income From Investment Operations | | | | | | | | | | | | | | | | | | | | |
Net investment income | | | 0.11 | | | | 0.06 | | | | 0.05 | | | | 0.03 | | | | 0.04 | |
Net realized and unrealized gain (loss) of investments | | | 1.40 | | | | 1.79 | | | | 2.99 | | | | (1.60 | ) | | | (0.10 | ) |
| | |
|
|
| |
|
|
| |
|
|
| |
|
|
| |
|
|
|
Total from investment operations | | | 1.51 | | | | 1.85 | | | | 3.04 | | | | (1.57 | ) | | | (0.06 | ) |
| | |
|
|
| |
|
|
| |
|
|
| |
|
|
| |
|
|
|
Less Distributions | | | | | | | | | | | | | | | | | | | | |
Distributions from net investment income | | | (0.07 | ) | | | (0.04 | ) | | | (0.04 | ) | | | (0.03 | ) | | | (0.02 | ) |
Distributions from net realized capital gains | | | (0.73 | ) | | | (0.03 | ) | | | 0.00 | | | | 0.00 | | | | (0.03 | ) |
| | |
|
|
| |
|
|
| |
|
|
| |
|
|
| |
|
|
|
Total distributions | | | (0.80 | ) | | | (0.07 | ) | | | (0.04 | ) | | | (0.03 | ) | | | (0.05 | ) |
| | |
|
|
| |
|
|
| |
|
|
| |
|
|
| |
|
|
|
Net Asset Value, End of Period | | $ | 14.32 | | | $ | 13.61 | | | $ | 11.83 | | | $ | 8.83 | | | $ | 10.43 | |
| | |
|
|
| |
|
|
| |
|
|
| |
|
|
| |
|
|
|
Total Return (%) | | | 12.0 | | | | 15.7 | | | | 34.5 | | | | (15.1 | ) | | | 3.1 | (b) |
Ratio of operating expenses to average net assets (%) | | | 0.59 | | | | 0.60 | | | | 0.65 | | | | 0.68 | | | | 0.70 | (c) |
Ratio of operating expenses to average net assets without giving effect to the contractual expense agreement would have been (%) | | | 0.59 | | | | 0.60 | | | | 0.65 | | | | 0.68 | | | | 0.77 | (c) |
Ratio of net investment income to average net assets (%) | | | 0.94 | | | | 0.61 | | | | 0.61 | | | | 0.46 | | | | 0.48 | (c) |
Portfolio turnover rate (%) | | | 33 | | | | 42 | | | | 22 | | | | 46 | | | | 45 | |
Net assets, end of period (000) | | $ | 111,361 | | | $ | 64,207 | | | $ | 31,858 | | | $ | 12,790 | | | $ | 5,895 | |
| (a) | Commencement of operations. |
| (b) | Period less than one year is not computed on an annualized basis. |
| (c) | Computed on an annualized basis. |
See accompanying notes to financial statements.
MSF-206
Metropolitan Series Fund, Inc.
MetLife Mid Cap Stock Index Portfolio
Financial Highlights
| | | | | | | | | | | | | | | | | | | | |
| | | Class E
| |
| | | Year ended December 31,
| | | May 1, 2001(a) through December 31, 2001
| |
| | | 2005
| | | 2004
| | | 2003
| | | 2002
| | |
Net Asset Value, Beginning of Period | | $ | 13.65 | | | $ | 11.86 | | | $ | 8.85 | | | $ | 10.45 | | | $ | 10.54 | |
| | |
|
|
| |
|
|
| |
|
|
| |
|
|
| |
|
|
|
Income from Investment Operations | | | | | | | | | | | | | | | | | | | | |
Net investment income | | | 0.14 | | | | 0.08 | | | | 0.06 | | | | 0.05 | | | | 0.00 | |
Net realized and unrealized gain (loss) of investments | | | 1.39 | | | | 1.79 | | | | 3.00 | | | | (1.61 | ) | | | (0.09 | ) |
| | |
|
|
| |
|
|
| |
|
|
| |
|
|
| |
|
|
|
Total from investment operations | | | 1.53 | | | | 1.87 | | | | 3.06 | | | | (1.56 | ) | | | (0.09 | ) |
| | |
|
|
| |
|
|
| |
|
|
| |
|
|
| |
|
|
|
Less Distributions | | | | | | | | | | | | | | | | | | | | |
Distributions from net investment income | | | (0.08 | ) | | | (0.05 | ) | | | (0.05 | ) | | | (0.04 | ) | | | 0.00 | |
Distributions from net realized capital gains | | | (0.73 | ) | | | (0.03 | ) | | | 0.00 | | | | 0.00 | | | | 0.00 | |
| | |
|
|
| |
|
|
| |
|
|
| |
|
|
| |
|
|
|
Total distributions | | | (0.81 | ) | | | (0.08 | ) | | | (0.05 | ) | | | (0.04 | ) | | | 0.00 | |
| | |
|
|
| |
|
|
| |
|
|
| |
|
|
| |
|
|
|
Net Asset Value, End of Period | | $ | 14.37 | | | $ | 13.65 | | | $ | 11.86 | | | $ | 8.85 | | | $ | 10.45 | |
| | |
|
|
| |
|
|
| |
|
|
| |
|
|
| |
|
|
|
Total Return (%) | | | 12.2 | | | | 15.9 | | | | 34.8 | | | | (15.0 | ) | | | (0.9 | )(b) |
Ratio of operating expenses to average net assets (%) | | | 0.49 | | | | 0.50 | | | | 0.55 | | | | 0.58 | | | | 0.60 | (c) |
Ratio of operating expenses to average net assets without giving effect to the contractual expense agreement would have been (%) | | | 0.49 | | | | 0.50 | | | | 0.55 | | | | 0.58 | | | | 0.67 | (c) |
Ratio of net investment income to average net assets (%) | | | 1.03 | | | | 0.71 | | | | 0.71 | | | | 0.62 | | | | 0.00 | (c) |
Portfolio turnover rate (%) | | | 33 | | | | 42 | | | | 22 | | | | 46 | | | | 45 | |
Net assets, end of period (000) | | $ | 66,712 | | | $ | 62,530 | | | $ | 49,881 | | | $ | 9,804 | | | $ | 0.1 | |
| (a) | Commencement of operations. |
| (b) | Period less than one year is not computed on an annualized basis. |
| (c) | Computed on an annualized basis. |
See accompanying notes to financial statements.
MSF-207
Metropolitan Series Fund, Inc.
Neuberger Berman Mid Cap Value Portfolio
Schedule of Investments as of December 31, 2005
Common Stock—94.3% of Total Net Assets
| | | | | |
| Security Description | | Shares | | Value* |
| | |
Auto Components—2.4% | | | | | |
BorgWarner, Inc. | | 90,100 | | $ | 5,462,763 |
Johnson Controls, Inc. | | 162,400 | | | 11,840,584 |
| | | | |
|
|
| | | | | | 17,303,347 |
| | | | |
|
|
| | |
Automobiles—1.8% | | | | | |
Harley-Davidson, Inc. | | 251,800 | | | 12,965,182 |
| | | | |
|
|
| | |
Beverages—1.1% | | | | | |
Constellation Brands, Inc. (a) | | 315,800 | | | 8,283,434 |
| | | | |
|
|
| | |
Capital Markets—1.4% | | | | | |
The Bear Stearns Co., Inc. | | 91,000 | | | 10,513,230 |
| | | | |
|
|
| | |
Commercial Banks—2.7% | | | | | |
First Horizon National Corp. (b) | | 173,900 | | | 6,684,716 |
Hudson City Bancorp, Inc. | | 1,068,100 | | | 12,945,372 |
| | | | |
|
|
| | | | | | 19,630,088 |
| | | | |
|
|
| | |
Commercial Services & Supplies—0.9% | | | | | |
Manpower, Inc. | | 140,800 | | | 6,547,200 |
| | | | |
|
|
| | |
Communications Equipment—1.1% | | | | | |
Avaya, Inc. (a) | | 775,700 | | | 8,276,719 |
| | | | |
|
|
| | |
Computers & Peripherals—0.9% | | | | | |
Lexmark International, Inc. (Class A) (a) | | 148,900 | | | 6,675,187 |
| | | | |
|
|
| | |
Construction & Engineering—1.0% | | | | | |
Chicago Building & Iron Co., NV (b) | | 278,200 | | | 7,013,422 |
| | | | |
|
|
| | |
Diversified Consumer Services—1.5% | | | | | |
Career Education Corp. (a) | | 317,800 | | | 10,716,216 |
| | | | |
|
|
| | |
Diversified Financial Services—1.2% | | | | | |
CIT Group, Inc. | | 171,300 | | | 8,869,914 |
| | | | |
|
|
|
Diversified Telecommunication Services—0.4% |
Amdocs, Ltd. (a) | | 120,100 | | | 3,302,750 |
| | | | |
|
|
| | |
Electric Utilities—2.4% | | | | | |
DPL, Inc. (b) | | 368,200 | | | 9,576,882 |
Edison International | | 190,700 | | | 8,316,427 |
| | | | |
|
|
| | | | | | 17,893,309 |
| | | | |
|
|
| | |
Gas Utilities—1.1% | | | | | |
Southwestern Energy Co. (a) | | 223,400 | | | 8,028,996 |
| | | | |
|
|
|
Health Care Providers & Services—4.6% |
Coventry Health Care, Inc. (a) | | 188,550 | | | 10,739,808 |
Omnicare, Inc. | | 177,600 | | | 10,162,272 |
Triad Hospitals, Inc. (a) | | 170,800 | | | 6,700,484 |
WellPoint, Inc. (a) | | 75,600 | | | 6,032,124 |
| | | | |
|
|
| | | | | | 33,634,688 |
| | | | |
|
|
| | | | | |
| Security Description | | Shares | | Value* |
| | |
Household Durables—14.3% | | | | | |
Beazer Homes USA, Inc. (b) | | 148,300 | | $ | 10,802,172 |
Centex Corp. (b) | | 236,900 | | | 16,935,981 |
Hovnanian Enterprises, Inc. (Class A) (a) (b) | | 298,300 | | | 14,807,612 |
KB HOME | | 180,900 | | | 13,144,194 |
Lennar Corp. (Class A) (b) | | 238,800 | | | 14,571,576 |
NVR, Inc. (b) | | 15,000 | | | 10,530,000 |
Pulte Homes, Inc. | | 330,000 | | | 12,988,800 |
Whirlpool Corp. | | 132,100 | | | 11,064,696 |
| | | | |
|
|
| | | | | | 104,845,031 |
| | | | |
|
|
| | |
Household Products—1.2% | | | | | |
Spectrum Brands, Inc. (a) | | 428,700 | | | 8,706,897 |
| | | | |
|
|
|
Independent Power Producers & Energy Traders—2.3% |
NRG Energy, Inc. (a) | | 19,500 | | | 918,840 |
TXU Corp. | | 309,800 | | | 15,548,862 |
| | | | |
|
|
| | | | | | 16,467,702 |
| | | | |
|
|
| | |
Insurance—4.5% | | | | | |
Ambac Financial Group, Inc. | | 104,900 | | | 8,083,594 |
Arch Capital Group, Ltd. (a) | | 96,000 | | | 5,256,000 |
Radian Group, Inc. | | 140,300 | | | 8,220,177 |
The PMI Group, Inc. | | 282,300 | | | 11,594,061 |
| | | | |
|
|
| | | | | | 33,153,832 |
| | | | |
|
|
| | |
Internet Software & Services—1.1% | | | | | |
Check Point Software Technologies, Ltd. (a) | | 415,706 | | | 8,355,691 |
| | | | |
|
|
| | |
Machinery—5.9% | | | | | |
Briggs & Stratton Corp. (b) | | 181,700 | | | 7,048,143 |
Eaton Corp. | | 99,400 | | | 6,668,746 |
Joy Global, Inc. | | 379,500 | | | 15,180,000 |
Terex Corp. (a) (b) | | 234,500 | | | 13,929,300 |
| | | | |
|
|
| | | | | | 42,826,189 |
| | | | |
|
|
| | |
Marine—5.8% | | | | | |
Frontline, Ltd. | | 198,000 | | | 7,508,160 |
General Maritime Corp. (b) | | 205,700 | | | 7,619,128 |
Overseas Shipholding Group, Inc. | | 126,900 | | | 6,394,491 |
Talisman Energy, Inc. | | 290,100 | | | 15,340,488 |
Teekay Shipping Corp. (b) | | 141,800 | | | 5,657,820 |
| | | | |
|
|
| | | | | | 42,520,087 |
| | | | |
|
|
| | |
Metals & Mining—4.9% | | | | | |
Alpha Natural Resources, Inc. (a) (b) | | 393,700 | | | 7,562,977 |
Arch Coal, Inc. (b) | | 184,800 | | | 14,691,600 |
Phelps Dodge Corp. | | 95,400 | | | 13,725,198 |
| | | | |
|
|
| | | | | | 35,979,775 |
| | | | |
|
|
| | |
Oil, Gas & Consumable Fuels—11.0% | | | | | |
Canadian Natural Resources, Ltd. | | 356,500 | | | 17,689,530 |
Denbury Resources, Inc. (a) | | 553,400 | | | 12,606,452 |
Peabody Energy Corp. | | 158,000 | | | 13,022,360 |
*See accompanying notes to financial statements.
MSF-208
Metropolitan Series Fund, Inc.
Neuberger Berman Mid Cap Value Portfolio
Schedule of Investments as of December 31, 2005
Common Stock—(Continued)
| | | | | |
| Security Description | | Shares | | Value* |
| |
Oil, Gas & Consumable Fuels—(Continued) | | | |
Quicksilver Resources, Inc. (a) (b) | | 303,950 | | $ | 12,768,939 |
Sunoco, Inc. | | 104,200 | | | 8,167,196 |
XTO Energy, Inc. | | 364,508 | | | 16,016,482 |
| | | | |
|
|
| | | | | | 80,270,959 |
| | | | |
|
|
| | |
Personal Products—1.2% | | | | | |
NBTY, Inc. (a) (b) | | 528,300 | | | 8,584,875 |
| | | | |
|
|
| | |
Pharmaceuticals—1.2% | | | | | |
Shire Pharmaceuticals Group, Plc. (ADR) (b) | | 223,100 | | | 8,654,049 |
| | | | |
|
|
| | |
Real Estate—4.0% | | | | | |
Colonial Properties Trust (REIT) | | 167,500 | | | 7,031,650 |
Developers Diversified Realty Corp. (REIT) | | 222,400 | | | 10,457,248 |
iStar Financial, Inc. (REIT) | | 183,800 | | | 6,552,470 |
Trizec Properties, Inc. (REIT) | | 225,200 | | | 5,161,584 |
| | | | |
|
|
| | | | | | 29,202,952 |
| | | | |
|
|
|
Semiconductors & Semiconductor Equipment—0.9% |
International Rectifier Corp. (a) | | 202,000 | | | 6,443,800 |
| | | | |
|
|
| | |
Software—0.6% | | | | | |
Activision, Inc. (a) | | 299,400 | | | 4,113,756 |
| | | | |
|
|
| | |
Specialty Retail—6.7% | | | | | |
Advance Auto Parts, Inc. (a) | | 285,150 | | | 12,392,619 |
Aeropostale, Inc. (a) | | 181,900 | | | 4,783,970 |
Foot Locker, Inc. | | 234,200 | | | 5,524,778 |
Hot Topic, Inc. (a) (b) | | 382,900 | | | 5,456,325 |
Ross Stores, Inc. | | 333,700 | | | 9,643,930 |
TJX Cos., Inc. | | 473,600 | | | 11,001,728 |
| | | | |
|
|
| | | | | | 48,803,350 |
| | | | |
|
|
|
Textiles, Apparel & Luxury Goods—0.7% |
Jones Apparel Group, Inc. | | 159,600 | | | 4,902,912 |
| | | | |
|
|
| | |
Thrifts & Mortgage Finance—3.5% | | | | | |
Astoria Financial Corp. | | 259,300 | | | 7,623,420 |
IndyMac Bancorp, Inc. (b) | | 275,000 | | | 10,730,500 |
North Fork Bancorp., Inc. | | 276,440 | | | 7,563,398 |
| | | | |
|
|
| | | | | | 25,917,318 |
| | | | |
|
|
Total Common Stock
(Identified Cost $614,567,599) | | | | | 689,402,857 |
| | | | |
|
|
| | | | | | | |
| | |
| Short Term Investments—6.0% | | | | | | | |
| Security Description | | Face
Amount | | Value* | |
| | |
Repurchase Agreement—6.0% | | | | | | | |
State Street Corp. Repurchase Agreement dated 12/30/05 at 1.350% to be repurchased at $43,838,575 on 01/03/06, collateralized by $45,895,000 U.S. Treasury Note 3.000% due 02/15/08 with a value of $45,149,206. | | $ | 43,832,000 | | $ | 43,832,000 | |
| | | | | |
|
|
|
Total Short Term Investments
(Amortized Cost $43,832,000) | | | | | | 43,832,000 | |
| | | | | |
|
|
|
Total Investments—100.3%
(Identified Cost $658,399,599) (c) | | | | | | 733,234,857 | |
Liabilities in excess of other assets | | | | | | (2,194,537 | ) |
| | | | | |
|
|
|
| Total Net Assets—100% | | | | | $ | 731,040,320 | |
| | | | | |
|
|
|
| (b) | A portion or all of the security was held on loan. As of December 31, 2005, the market value of securities loaned was $105,739,417 and the collateral received consisted of cash in the amount of $108,470,861. |
| (c) | The aggregate cost of investments for federal income tax purposes as of December 31, 2005 was $658,753,422 and the composition of unrealized appreciation and (depreciation) of investment securities was $97,783,469 and ($23,302,034), respectively. |
| (ADR)— | An American Depositary Receipt is a certificate issued by a custodian bank representing the right to receive securities of the foreign issuer described. Trading on exchanges not located in the United States or Canada significantly influences the value of ADRs. |
| (REIT)— | A Real Estate Investment Trust is a pooled investment vehicle that invests primarily in income-producing real estate or real estate related loans or interest. |
*See accompanying notes to financial statements.
MSF-209
Metropolitan Series Fund, Inc.
Neuberger Berman Mid Cap Value Portfolio
Statement of Assets & Liabilities
December 31, 2005
| | | | | | |
Assets | | | | | | |
Investments at value | | | | | $ | 733,234,857 |
Cash | | | | | | 802 |
Collateral for securities loaned | | | | | | 108,470,861 |
Receivable for: | | | | | | |
Fund shares sold | | | | | | 1,401,125 |
Accrued interest and dividends | | | | | | 671,544 |
Foreign taxes | | | | | | 834 |
| | | | | |
|
|
Total Assets | | | | | | 843,780,023 |
Liabilities | | | | | | |
Payable for: | | | | | | |
Fund shares redeemed | | $ | 2,043,799 | | | |
Securities purchased | | | 1,462,132 | | | |
Withholding taxes | | | 10,501 | | | |
Return of collateral for securities loaned | | | 108,470,861 | | | |
Accrued expenses: | | | | | | |
Management fees | | | 412,066 | | | |
Service and distribution fees | | | 55,613 | | | |
Other expenses | | | 284,731 | | | |
| | |
|
| | | |
Total Liabilities | | | | | | 112,739,703 |
| | | | | |
|
|
Net Assets | | | | | $ | 731,040,320 |
| | | | | |
|
|
Net assets consists of: | | | | | | |
Capital paid in | | | | | $ | 581,018,100 |
Undistributed net investment income | | | | | | 3,499,793 |
Accumulated net realized gains | | | | | | 71,686,590 |
Unrealized appreciation on investments and foreign currency | | | | | | 74,835,837 |
| | | | | |
|
|
Net Assets | | | | | $ | 731,040,320 |
| | | | | |
|
|
| | |
| Computation of offering price: | | | | | | |
Class A | | | | | | |
Net asset value and redemption price per share ($428,896,872 divided by 20,449,133 shares outstanding) | | | | | $ | 20.97 |
| | | | | |
|
|
Class B | | | | | | |
Net asset value and redemption price per share ($209,448,182 divided by 10,080,177 shares outstanding) | | | | | $ | 20.78 |
| | | | | |
|
|
Class E | | | | | | |
Net asset value and redemption price per share ($92,695,266 divided by 4,434,555 shares outstanding) | | | | | $ | 20.90 |
| | | | | |
|
|
Identified cost of investments | | | | | $ | 658,399,599 |
| | | | | |
|
|
Statement of Operations
Year Ended December 31, 2005
| | | | | | | | |
Investment Income | | | | | | | | |
Dividends | | | | | | $ | 8,296,110 | (a) |
Interest | | | | | | | 344,494 | (b) |
| | | | | | |
|
|
|
| | | | | | | | 8,640,604 | |
Expenses | | | | | | | | |
Management fees | | $ | 4,044,482 | | | | | |
Service and distribution fees—Class B | | | 370,637 | | | | | |
Service and distribution fees—Class E | | | 122,634 | | | | | |
Directors’ fees and expenses | | | 22,264 | | | | | |
Custodian | | | 146,751 | | | | | |
Audit and tax services | | | 20,588 | | | | | |
Legal | | | 16,673 | | | | | |
Printing | | | 347,393 | | | | | |
Insurance | | | 9,833 | | | | | |
Miscellaneous | | | 5,856 | | | | | |
| | |
|
|
| | | | |
Total expenses | | | 5,107,111 | | | | | |
Expense reductions | | | (106,351 | ) | | | 5,000,760 | |
| | |
|
|
| |
|
|
|
Net Investment Income | | | | | | | 3,639,844 | |
| | | | | | |
|
|
|
Realized and Unrealized Gain (Loss) | | | | | | | | |
| Realized gain on: | | | | | | | | |
Investments—net | | | | | | | 72,027,591 | |
| Unrealized depreciation on: | | | | | | | | |
Investments—net | | | (2,076,907 | ) | | | | |
Foreign currency transactions—net | | | (421 | ) | | | (2,077,328 | ) |
| | |
|
|
| |
|
|
|
Net gain | | | | | | | 69,950,263 | |
| | | | | | |
|
|
|
Net Increase in Net Assets From Operations | | | | | | $ | 73,590,107 | |
| | | | | | |
|
|
|
| (a) | Net of foreign taxes of $15,219. |
| (b) | Includes income on securities loaned of $58,789. |
See accompanying notes to financial statements.
MSF-210
Metropolitan Series Fund, Inc.
Neuberger Berman Mid Cap Value Portfolio
Statement of Changes in Net Assets
| | | | | | | | |
| | | Year ended
December 31,
2005
| | | Year ended
December 31,
2004
| |
From Operations | | | | | | | | |
Net investment income | | $ | 3,639,844 | | | $ | 1,347,350 | |
Net realized gain | | | 72,027,591 | | | | 49,698,079 | |
Unrealized appreciation (depreciation) | | | (2,077,328 | ) | | | 30,006,292 | |
| | |
|
|
| |
|
|
|
Increase in net assets from operations | | | 73,590,107 | | | | 81,051,721 | |
| | |
|
|
| |
|
|
|
From Distributions to Shareholders | | | | | | | | |
Net investment income | | | | | | | | |
Class A | | | (1,093,272 | ) | | | (645,888 | ) |
Class B | | | (154,056 | ) | | | (46,144 | ) |
Class E | | | (131,834 | ) | | | (95,556 | ) |
| | |
|
|
| |
|
|
|
| | | | (1,379,162 | ) | | | (787,588 | ) |
| | |
|
|
| |
|
|
|
Net realized gain | | | | | | | | |
Class A | | | (31,397,414 | ) | | | (7,010,577 | ) |
Class B | | | (11,326,185 | ) | | | (1,045,262 | ) |
Class E | | | (6,923,173 | ) | | | (1,276,527 | ) |
| | |
|
|
| |
|
|
|
| | | | (49,646,772 | ) | | | (9,332,366 | ) |
| | |
|
|
| |
|
|
|
Total distributions | | | (51,025,934 | ) | | | (10,119,954 | ) |
| | |
|
|
| |
|
|
|
Increase in net assets from capital share transactions | | | 214,706,022 | | | | 145,214,752 | |
| | |
|
|
| |
|
|
|
Total increase in net assets | | | 237,270,195 | | | | 216,146,519 | |
| | |
Net Assets | | | | | | | | |
Beginning of the period | | | 493,770,125 | | | | 277,623,606 | |
| | |
|
|
| |
|
|
|
End of the period | | $ | 731,040,320 | | | $ | 493,770,125 | |
| | |
|
|
| |
|
|
|
Undistributed Net Investment Income | | | | | | | | |
End of the period | | $ | 3,500,793 | | | $ | 1,346,462 | |
| | |
|
|
| |
|
|
|
Other Information:
Capital Shares
Transactions in capital shares were as follows:
| | | | | | | | | | | | | | |
| | | Year ended
December 31, 2005
| | | Year ended
December 31, 2004
| |
| | | Shares
| | | $
| | | Shares
| | | $
| |
Class A | | | | | | | | | | | | | | |
Sales | | 8,737,915 | | | $ | 177,372,794 | | | 4,162,851 | | | $ | 76,472,061 | |
Reinvestments | | 1,812,085 | | | | 32,490,686 | | | 425,833 | | | | 7,656,465 | |
Redemptions | | (5,956,353 | ) | | | (121,309,235 | ) | | (1,532,792 | ) | | | (27,792,597 | ) |
| | |
|
| |
|
|
| |
|
| |
|
|
|
Net increase | | 4,593,647 | | | $ | 88,554,245 | | | 3,055,892 | | | $ | 56,335,929 | |
| | |
|
| |
|
|
| |
|
| |
|
|
|
Class B | | | | | | | | | | | | | | |
Sales | | 6,217,998 | | | $ | 123,832,063 | | | 3,390,016 | | | $ | 62,220,857 | |
Reinvestments | | 645,320 | | | | 11,480,241 | | | 61,075 | | | | 1,091,406 | |
Redemptions | | (1,334,921 | ) | | | (26,627,523 | ) | | (476,349 | ) | | | (8,747,209 | ) |
| | |
|
| |
|
|
| |
|
| |
|
|
|
Net increase | | 5,528,397 | | | $ | 108,684,781 | | | 2,974,742 | | | $ | 54,565,054 | |
| | |
|
| |
|
|
| |
|
| |
|
|
|
Class E | | | | | | | | | | | | | | |
Sales | | 1,463,500 | | | $ | 29,390,220 | | | 2,299,766 | | | $ | 41,790,767 | |
Reinvestments | | 394,355 | | | | 7,055,007 | | | 76,481 | | | | 1,372,083 | |
Redemptions | | (948,685 | ) | | | (18,978,231 | ) | | (491,267 | ) | | | (8,849,081 | ) |
| | |
|
| |
|
|
| |
|
| |
|
|
|
Net increase | | 909,170 | | | $ | 17,466,996 | | | 1,884,980 | | | $ | 34,313,769 | |
| | |
|
| |
|
|
| |
|
| |
|
|
|
Increase derived from capital share transactions | | 11,031,214 | | | $ | 214,706,022 | | | 7,915,614 | | | $ | 145,214,752 | |
| | |
|
| |
|
|
| |
|
| |
|
|
|
See accompanying notes to financial statements.
MSF-211
Metropolitan Series Fund, Inc.
Neuberger Berman Mid Cap Value Portfolio
Financial Highlights
| | | | | | | | | | | | | | | | | | | | |
| | | Class A
| |
| | | Year ended December 31,
| |
| | | 2005
| | | 2004
| | | 2003
| | | 2002
| | | 2001
| |
Net Asset Value, Beginning of Period | | $ | 20.67 | | | $ | 17.35 | | | $ | 12.76 | | | $ | 14.16 | | | $ | 14.82 | |
| | |
|
|
| |
|
|
| |
|
|
| |
|
|
| |
|
|
|
Income From Investment Operations | | | | | | | | | | | | | | | | | | | | |
Net investment income | | | 0.12 | | | | 0.07 | | | | 0.06 | | | | 0.06 | | | | 0.13 | |
Net realized and unrealized gain (loss) of investments | | | 2.08 | | | | 3.82 | | | | 4.58 | | | | (1.42 | ) | | | (0.50 | ) |
| | |
|
|
| |
|
|
| |
|
|
| |
|
|
| |
|
|
|
Total from investment operations | | | 2.20 | | | | 3.89 | | | | 4.64 | | | | (1.36 | ) | | | (0.37 | ) |
| | |
|
|
| |
|
|
| |
|
|
| |
|
|
| |
|
|
|
Less Distributions | | | | | | | | | | | | | | | | | | | | |
Distributions from net investment income | | | (0.06 | ) | | | (0.05 | ) | | | (0.05 | ) | | | (0.01 | ) | | | (0.03 | ) |
Distributions from net realized capital gains | | | (1.84 | ) | | | (0.52 | ) | | | 0.00 | | | | (0.03 | ) | | | (0.26 | ) |
| | |
|
|
| |
|
|
| |
|
|
| |
|
|
| |
|
|
|
Total distributions | | | (1.90 | ) | | | (0.57 | ) | | | (0.05 | ) | | | (0.04 | ) | | | (0.29 | ) |
| | |
|
|
| |
|
|
| |
|
|
| |
|
|
| |
|
|
|
Net Asset Value, End of Period | | $ | 20.97 | | | $ | 20.67 | | | $ | 17.35 | | | $ | 12.76 | | | $ | 14.16 | |
| | |
|
|
| |
|
|
| |
|
|
| |
|
|
| |
|
|
|
Total Return (%) | | | 12.3 | | | | 22.9 | | | | 36.5 | | | | (9.6 | ) | | | (2.5 | ) |
Ratio of operating expenses to average net assets before expense reductions (%) | | | 0.76 | | | | 0.76 | | | | 0.80 | | | | 0.80 | | | | 0.81 | |
Ratio of operating expenses to average net assets after expense reductions (%) (d) | | | 0.75 | | | | 0.73 | | | | 0.77 | | | | 0.77 | | | | 0.69 | |
Ratio of net investment income to average net assets (%) | | | 0.67 | | | | 0.43 | | | | 0.41 | | | | 0.43 | | | | 0.90 | |
Portfolio turnover rate (%) | | | 90 | | | | 55 | | | | 61 | | | | 84 | | | | 212 | |
Net assets, end of period (000) | | $ | 428,897 | | | $ | 327,782 | | | $ | 222,050 | | | $ | 156,117 | | | $ | 160,074 | |
| | | | | | | | | | | | | | | | | | | | |
| | | Class B
| |
| | | Year ended December 31,
| | | May 1, 2001(a)
through
December 31,
2001
| |
| | | 2005
| | | 2004
| | | 2003
| | | 2002
| | |
Net Asset Value, Beginning of Period | | $ | 20.51 | | | $ | 17.23 | | | $ | 12.69 | | | $ | 14.12 | | | $ | 14.36 | |
| | |
|
|
| |
|
|
| |
|
|
| |
|
|
| |
|
|
|
Income From Investment Operations | | | | | | | | | | | | | | | | | | | | |
Net investment income | | | 0.07 | | | | 0.03 | | | | 0.03 | | | | 0.01 | | | | 0.04 | |
Net realized and unrealized gain (loss) of investments | | | 2.06 | | | | 3.79 | | | | 4.55 | | | | (1.40 | ) | | | (0.28 | ) |
| | |
|
|
| |
|
|
| |
|
|
| |
|
|
| |
|
|
|
Total from investment operations | | | 2.13 | | | | 3.82 | | | | 4.58 | | | | (1.39 | ) | | | (0.24 | ) |
| | |
|
|
| |
|
|
| |
|
|
| |
|
|
| |
|
|
|
Less Distributions | | | | | | | | | | | | | | | | | | | | |
Distributions from net investment income | | | (0.02 | ) | | | (0.02 | ) | | | (0.04 | ) | | | (0.01 | ) | | | 0.00 | |
Distributions from net realized capital gains | | | (1.84 | ) | | | (0.52 | ) | | | 0.00 | | | | (0.03 | ) | | | 0.00 | |
| | |
|
|
| |
|
|
| |
|
|
| |
|
|
| |
|
|
|
Total distributions | | | (1.86 | ) | | | (0.54 | ) | | | (0.04 | ) | | | (0.04 | ) | | | 0.00 | |
| | |
|
|
| |
|
|
| |
|
|
| |
|
|
| |
|
|
|
Net Asset Value, End of Period | | $ | 20.78 | | | $ | 20.51 | | | $ | 17.23 | | | $ | 12.69 | | | $ | 14.12 | |
| | |
|
|
| |
|
|
| |
|
|
| |
|
|
| |
|
|
|
Total Return (%) | | | 11.9 | | | | 22.7 | | | | 36.2 | | | | (9.9 | ) | | | (1.7 | )(b) |
Ratio of operating expenses to average net assets before expense reductions (%) | | | 1.01 | | | | 1.01 | | | | 1.05 | | | | 1.05 | | | | 1.06 | (c) |
Ratio of operating expenses to average net assets after expense reductions (%) (d) | | | 0.99 | | | | 0.98 | | | | 1.02 | | | | 1.02 | | | | 0.97 | (c) |
Ratio of net investment income to average net assets (%) | | | 0.46 | | | | 0.17 | | | | 0.18 | | | | 0.17 | | | | 0.77 | (c) |
Portfolio turnover rate (%) | | | 90 | | | | 55 | | | | 61 | | | | 84 | | | | 212 | |
Net assets, end of period (000) | | $ | 209,448 | | | $ | 93,366 | | | $ | 27,173 | | | $ | 11,113 | | | $ | 2,410 | |
| (a) | Commencement of operations. |
| (b) | Period less than one year is not computed on an annualized basis. |
| (c) | Computed on an annualized basis. |
| (d) | The Portfolio has entered into arrangements with certain brokers who paid a portion of the Portfolio’s expenses. |
See accompanying notes to financial statements.
MSF-212
Metropolitan Series Fund, Inc.
Neuberger Berman Mid Cap Value Portfolio
Financial Highlights
| | | | | | | | | | | | | | | | | | | | |
| | | Class E
| |
| | | Year ended December 31,
| | | May 1, 2001(a)
through
December 31,
2001
| |
| | | 2005
| | | 2004
| | | 2003
| | | 2002
| | |
Net Asset Value, Beginning of Period | | $ | 20.61 | | | $ | 17.31 | | | $ | 12.74 | | | $ | 14.15 | | | $ | 14.37 | |
| | |
|
|
| |
|
|
| |
|
|
| |
|
|
| |
|
|
|
Income From Investment Operations | | | | | | | | | | | | | | | | | | | | |
Net investment income | | | 0.10 | | | | 0.05 | | | | 0.05 | | | | 0.03 | | | | 0.00 | |
Net realized and unrealized gain (loss) of investments | | | 2.06 | | | | 3.81 | | | | 4.57 | | | | (1.40 | ) | | | (0.22 | ) |
| | |
|
|
| |
|
|
| |
|
|
| |
|
|
| |
|
|
|
Total from investment operations | | | 2.16 | | | | 3.86 | | | | 4.62 | | | | (1.37 | ) | | | (0.22 | ) |
| | |
|
|
| |
|
|
| |
|
|
| |
|
|
| |
|
|
|
Less Distributions | | | | | | | | | | | | | | | | | | | | |
Distributions from net investment income | | | (0.03 | ) | | | (0.04 | ) | | | (0.05 | ) | | | (0.01 | ) | | | 0.00 | |
Distributions from net realized capital gains | | | (1.84 | ) | | | (0.52 | ) | | | 0.00 | | | | (0.03 | ) | | | 0.00 | |
| | |
|
|
| |
|
|
| |
|
|
| |
|
|
| |
|
|
|
Total distributions | | | (1.87 | ) | | | (0.56 | ) | | | (0.05 | ) | | | (0.04 | ) | | | 0.00 | |
| | |
|
|
| |
|
|
| |
|
|
| |
|
|
| |
|
|
|
Net Asset Value, End of Period | | $ | 20.90 | | | $ | 20.61 | | | $ | 17.31 | | | $ | 12.74 | | | $ | 14.15 | |
| | |
|
|
| |
|
|
| |
|
|
| |
|
|
| |
|
|
|
Total Return (%) | | | 12.1 | | | | 22.8 | | | | 36.4 | | | | (9.7 | ) | | | (1.5 | )(b) |
Ratio of operating expenses to average net assets before expense reductions (%) | | | 0.91 | | | | 0.91 | | | | 0.95 | | | | 0.95 | | | | 0.96 | (c) |
Ratio of operating expenses to average net assets after expense reductions (%) (d) | | | 0.90 | | | | 0.88 | | | | 0.92 | | | | 0.92 | | | | 0.87 | (c) |
Ratio of net investment income to average net assets (%) | | | 0.52 | | | | 0.28 | | | | 0.29 | | | | 0.29 | | | | 0.67 | (c) |
Portfolio turnover rate (%) | | | 90 | | | | 55 | | | | 61 | | | | 84 | | | | 212 | |
Net assets, end of period (000) | | $ | 92,695 | | | $ | 72,652 | | | $ | 28,400 | | | $ | 5,735 | | | $ | 32 | |
| (a) | Commencement of operations. |
| (b) | Period less than one year is not computed on an annualized basis. |
| (c) | Computed on an annualized basis. |
| (d) | The Portfolio has entered into arrangements with certain brokers who paid a portion of the Portfolio’s expenses. |
See accompanying notes to financial statements.
MSF-213
Metropolitan Series Fund, Inc.
BlackRock Strategic Value Portfolio
Schedule of Investments as of December 31, 2005
Common Stock—97.2% of Total Net Assets
| | | | | |
| Security Description | | Shares | | Value* |
| | | | | | |
| | |
Aerospace & Defense—0.7% | | | | | |
K&F Industries Holdings, Inc. (a) | | 428,400 | | $ | 6,580,224 |
| | | | |
|
|
| | |
Auto Components—1.6% | | | | | |
LKQ Corp. (a) | | 230,000 | | | 7,962,600 |
Tenneco Automotive, Inc. (a) | | 379,400 | | | 7,440,034 |
| | | | |
|
|
| | | | | | 15,402,634 |
| | | | |
|
|
| | |
Automobiles—0.8% | | | | | |
Winnebago Industries, Inc. (a) | | 247,000 | | | 8,220,160 |
| | | | |
|
|
| | |
Building Products—1.5% | | | | | |
Lennox International, Inc. (a) | | 524,100 | | | 14,779,620 |
| | | | |
|
|
| | |
Capital Markets—1.7% | | | | | |
Affiliated Managers Group, Inc. (a) (b) | | 204,400 | | | 16,403,100 |
| | | | |
|
|
| | |
Chemicals—1.0% | | | | | |
Airgas, Inc. | | 284,400 | | | 9,356,760 |
| | | | |
|
|
| | |
Commercial Banks—10.4% | | | | | |
Accredited Home Lenders Holding Co. (a) | | 101,796 | | | 5,047,046 |
Cathay General Bancorp. (a) (b) | | 245,100 | | | 8,808,894 |
City National Corp. | | 196,400 | | | 14,227,216 |
First Niagara Financial Group, Inc. (a) | | 412,800 | | | 5,973,216 |
Mercantile Bankshares Corp. | | 147,600 | | | 8,330,544 |
Sterling Bancshares, Inc. (a) | | 560,800 | | | 8,658,752 |
Sterling Financial Corp. (Washington) (a) | | 284,900 | | | 7,116,802 |
Trustmark Corp. (a) | | 309,300 | | | 8,496,471 |
Umpqua Holdings Corp. (a) | | 422,000 | | | 12,039,660 |
WestAmerica Bancorp (a) | | 122,300 | | | 6,490,461 |
Wintrust Financial Corp. (a) | | 191,400 | | | 10,507,860 |
WSFS Financial Corp. (a) | | 99,300 | | | 6,082,125 |
| | | | |
|
|
| | | | | | 101,779,047 |
| | | | |
|
|
| | |
Commercial Services & Supplies—6.2% | | | | | |
Banta Corp. (a) | | 373,400 | | | 18,595,320 |
Heidrick & Struggles International, Inc. (a) (b) | | 143,300 | | | 4,592,765 |
The Brinks Co. | | 666,900 | | | 31,951,179 |
Watson Wyatt & Co. Holdings (a) (b) | | 191,900 | | | 5,354,010 |
| | | | |
|
|
| | | | | | 60,493,274 |
| | | | |
|
|
| | |
Communications Equipment—1.0% | | | | | |
Polycom, Inc. (b) | | 302,200 | | | 4,623,660 |
Tekelec, Inc. (a) | | 393,800 | | | 5,473,820 |
| | | | |
|
|
| | | | | | 10,097,480 |
| | | | |
|
|
| | |
Computers & Peripherals—2.3% | | | | | |
Electronics for Imaging, Inc. (a) | | 273,500 | | | 7,277,835 |
Imation Corp. | | 323,400 | | | 14,899,038 |
| | | | |
|
|
| | | | | | 22,176,873 |
| | | | |
|
|
| | |
Construction & Engineering—3.1% | | | | | |
Dycom Industries, Inc. (a) (b) | | 482,600 | | | 10,617,200 |
Washington Group International, Inc. (a) (b) | | 374,300 | | | 19,826,671 |
| | | | |
|
|
| | | | | | 30,443,871 |
| | | | |
|
|
| | | | | |
| Security Description | | Shares | | Value* |
| | | | | | |
| | |
Containers & Packaging—3.8% | | | | | |
AptarGroup, Inc. (a) | | 74,600 | | $ | 3,894,120 |
Jarden Corp. (a) | | 674,349 | | | 20,331,622 |
Owens-Illinois, Inc. (b) | | 339,500 | | | 7,143,080 |
Packaging Corp. of America (a) | | 140,400 | | | 3,222,180 |
Smurfit-Stone Container Corp. (b) | | 186,500 | | | 2,642,705 |
| | | | |
|
|
| | | | | | 37,233,707 |
| | | | |
|
|
| | |
Diversified Financial Services—4.8% | | | | | |
CapitalSource, Inc. (a) (b) | | 333,600 | | | 7,472,640 |
National Financial Partners Corp. (a) | | 347,600 | | | 18,266,380 |
Walter Industries, Inc. (a) | | 425,200 | | | 21,140,944 |
| | | | |
|
|
| | | | | | 46,879,964 |
| | | | |
|
|
| | |
Electric Utilities—3.2% | | | | | |
Black Hills Corp. (a) | | 199,800 | | | 6,915,078 |
CMS Energy Corp. (b) | | 407,000 | | | 5,905,570 |
El Paso Electric Co. (a) | | 283,800 | | | 5,971,152 |
NorthWestern Energy Corp. (a) (b) | | 207,500 | | | 6,447,025 |
PNM Resources, Inc. | | 236,400 | | | 5,789,436 |
| | | | |
|
|
| | | | | | 31,028,261 |
| | | | |
|
|
| | |
Electrical Equipment—3.1% | | | | | |
Regal Beloit Corp. (a) | | 348,400 | | | 12,333,360 |
Thomas & Betts Corp. (b) | | 436,400 | | | 18,311,344 |
| | | | |
|
|
| | | | | | 30,644,704 |
| | | | |
|
|
| | |
Energy Equipment & Services—0.9% | | | | | |
Lone Star Technologies, Inc. (a) (b) | | 164,700 | | | 8,508,402 |
| | | | |
|
|
| | |
Food Products—1.2% | | | | | |
Hain Celestial Group, Inc. (b) | | 568,000 | | | 12,018,880 |
| | | | |
|
|
| | |
Gas Utilities—1.7% | | | | | |
CNX Gas Corp. (144A) | | 212,200 | | | 4,456,200 |
National Fuel Gas Co. (a) | | 182,800 | | | 5,701,532 |
Southern Union Co. (b) | | 254,100 | | | 6,004,383 |
| | | | |
|
|
| | | | | | 16,162,115 |
| | | | |
|
|
| |
Health Care Equipment & Supplies—3.6% | | | |
Cooper Cos., Inc. (a) | | 150,000 | | | 7,695,000 |
Dentsply International, Inc. | | 220,900 | | | 11,860,121 |
Sybron Dental Specialties, Inc. (a) (b) | | 377,100 | | | 15,012,351 |
| | | | |
|
|
| | | | | | 34,567,472 |
| | | | |
|
|
| | |
Hotels, Restaurants & Leisure—7.6% | | | | | |
Gaylord Entertainment Co. (a) (b) | | 244,100 | | | 10,640,319 |
GTECH Holdings Corp. | | 620,500 | | | 19,694,670 |
Kerzner International Ltd. (a) | | 175,900 | | | 12,093,125 |
Landry’s Restaurants, Inc. (a) | | 279,700 | | | 7,470,787 |
Lone Star Steakhouse & Saloon, Inc. (a) | | 359,000 | | | 8,522,660 |
Orient-Express Hotels, Ltd. (Class A) | | 156,500 | | | 4,932,880 |
Pinnacle Entertainment, Inc. (a) (b) | | 417,100 | | | 10,306,541 |
| | | | |
|
|
| | | | | | 73,660,982 |
| | | | |
|
|
*See accompanying notes to financial statements.
MSF-214
Metropolitan Series Fund, Inc.
BlackRock Strategic Value Portfolio
Schedule of Investments as of December 31, 2005
Common Stock—(Continued)
| | | | | |
| Security Description | | Shares | | Value* |
| | | | | | |
| | |
Household Durables—0.8% | | | | | |
The Stanley Works | | 154,300 | | $ | 7,412,572 |
| | | | |
|
|
| | |
Insurance—4.9% | | | | | |
Aspen Insurance Holdings, Ltd. | | 515,300 | | | 12,197,151 |
Hanover Insurance Group, Inc. | | 238,600 | | | 9,966,322 |
Max Re Capital, Ltd. | | 266,100 | | | 6,910,617 |
Platinum Underwriters Holdings, Ltd. (a) | | 313,400 | | | 9,737,338 |
Universal American Financial Corp. (a) (b) | | 584,000 | | | 8,806,720 |
| | | | |
|
|
| | | | | | 47,618,148 |
| | | | |
|
|
| | |
IT Services—0.7% | | | | | |
CACI International, Inc. (Class A) (b) | | 126,500 | | | 7,258,570 |
| | | | |
|
|
| | |
Leisure Equipment & Products—0.6% | | | | | |
K2, Inc. (a) (b) | | 378,900 | | | 3,830,679 |
RC2 Corp. (a) (b) | | 66,000 | | | 2,344,320 |
| | | | |
|
|
| | | | | | 6,174,999 |
| | | | |
|
|
| | |
Marine—0.8% | | | | | |
American Commercial Lines, Inc. (a) (b) | | 257,400 | | | 7,796,646 |
| | | | |
|
|
| | |
Media—0.5% | | | | | |
Regal Entertaintment Group (a) | | 278,900 | | | 5,304,678 |
| | | | |
|
|
| | |
Metals & Mining—1.3% | | | | | |
Foundation Coal Holdings, Inc. (a) | | 126,100 | | | 4,791,800 |
United States Steel Corp. (a) | | 153,800 | | | 7,393,166 |
| | | | |
|
|
| | | | | | 12,184,966 |
| | | | |
|
|
| | |
Multi-Utilities—0.7% | | | | | |
Questar Corp. | | 84,000 | | | 6,358,800 |
| | | | |
|
|
| | |
Multiline Retail—2.4% | | | | | |
BJ’s Wholesale Club, Inc. (b) | | 517,900 | | | 15,309,124 |
Saks, Inc. | | 481,000 | | | 8,109,660 |
| | | | |
|
|
| | | | | | 23,418,784 |
| | | | |
|
|
| | |
Oil, Gas & Consumable Fuels—2.8% | | | | | |
Comstock Resources, Inc. (b) | | 252,000 | | | 7,688,520 |
Equitable Resources, Inc. | | 204,200 | | | 7,492,098 |
Whiting Petroleum Corp. (a) | | 301,200 | | | 12,048,000 |
| | | | |
|
|
| | | | | | 27,228,618 |
| | | | |
|
|
| | |
Paper & Forest Products—0.6% | | | | | |
Bowater, Inc. (a) | | 205,000 | | | 6,297,600 |
| | | | |
|
|
| | |
Pharmaceuticals—0.9% | | | | | |
Par Pharmaceutical Companies, Inc. (a) (b) | | 277,400 | | | 8,693,716 |
| | | | |
|
|
| | |
Real Estate—3.1% | | | | | |
Highland Hospitality Corp. (REIT) (a) | | 435,300 | | | 4,810,065 |
LaSalle Hotel Properties (REIT) | | 150,600 | | | 5,530,032 |
| | | | | |
| Security Description | | Shares | | Value* |
| | |
Real Estate—(Continued) | | | | | |
| | | | | | |
Rayonier, Inc. (REIT) | | 282,840 | | $ | 11,271,174 |
U-Store-It Trust (REIT) | | 414,200 | | | 8,718,910 |
| | | | |
|
|
| | | | | | 30,330,181 |
| | | | |
|
|
| | |
Road & Rail—1.7% | | | | | |
Laidlaw International, Inc. (b) | | 605,000 | | | 14,054,150 |
RailAmerica, Inc. (a) (b) | | 226,200 | | | 2,485,938 |
| | | | |
|
|
| | | | | | 16,540,088 |
| | | | |
|
|
| |
Semiconductors & Semiconductor Equipment—1.6% | | | |
Axcelis Technologies, Inc. (a) (b) | | 986,900 | | | 4,707,513 |
Brooks Automation, Inc. (a) (b) | | 326,900 | | | 4,096,057 |
Integrated Device Technology, Inc. (b) | | 537,700 | | | 7,086,886 |
| | | | |
|
|
| | | | | | 15,890,456 |
| | | | |
|
|
| | |
Software—2.8% | | | | | |
Borland Software Corp. (a) (b) | | 1,115,200 | | | 7,282,256 |
Hyperion Solutions Corp. (b) | | 279,150 | | | 9,999,153 |
SkillSoft, Plc. (ADR) (a) (b) | | 1,217,600 | | | 6,696,800 |
TIBCO Software, Inc. (b) | | 450,225 | | | 3,363,181 |
| | | | |
|
|
| | | | | | 27,341,390 |
| | | | |
|
|
| | |
Specialty Retail—6.4% | | | | | |
Linens ‘N Things, Inc. (a) (b) | | 585,900 | | | 15,584,940 |
OfficeMax, Inc. (a) | | 309,000 | | | 7,836,240 |
Stage Stores, Inc. (a) | | 245,449 | | | 7,309,471 |
The Children’s Place Retail Stores,
Inc. (a) (b) | | 264,900 | | | 13,091,358 |
The Finish Line, Inc. (Class A) (a) | | 526,600 | | | 9,173,372 |
The Sports Authority, Inc. (a) (b) | | 288,000 | | | 8,965,440 |
| | | | |
|
|
| | | | | | 61,960,821 |
| | | | |
|
|
| |
Textiles, Apparel & Luxury Goods—1.9% | | | |
Jones Apparel Group, Inc. | | 349,000 | | | 10,721,280 |
Phillips-Van Heusen Corp. | | 226,100 | | | 7,325,640 |
| | | | |
|
|
| | | | | | 18,046,920 |
| | | | |
|
|
| |
Thrifts & Mortgage Finance—2.0% | | | |
Sovereign Bancorp, Inc. | | 915,100 | | | 19,784,462 |
| | | | |
|
|
| |
Wireless Telecommunication Services—0.5% | | | |
UbiquiTel, Inc. (b) | | 501,700 | | | 4,961,813 |
| | | | |
|
|
Total Common Stock
(Identified Cost $900,123,557) | | | | | 947,041,758 |
| | | | |
|
|
*See accompanying notes to financial statements.
MSF-215
Metropolitan Series Fund, Inc.
BlackRock Strategic Value Portfolio
Schedule of Investments as of December 31, 2005
Short Term Investments—5.7%
| | | | | | | |
| Security Description | | Face
Amount | | Value* | |
| | |
Discount Notes—4.2% | | | | | | | |
Federal Home Loan Bank
3.400%, 01/03/06 | | $ | 41,300,000 | | $ | 41,292,199 | |
| | | | | |
|
|
|
| | |
U.S. Treasury—1.5% | | | | | | | |
United States Treasury Bills
3.150%, 01/12/06 | | | 14,700,000 | | | 14,685,851 | |
| | | | | |
|
|
|
Total Short Term Investments
(Amortized Cost $55,978,050) | | | | | | 55,978,050 | |
| | | | | |
|
|
|
Total Investments—102.9%
(Identified Cost $956,101,607)(c) | | | | | | 1,003,019,808 | |
Liabilities in excess of other assets | | | | | | (28,551,868 | ) |
| | | | | |
|
|
|
| Total Net Assets—100% | | | | | $ | 974,467,940 | |
| | | | | |
|
|
|
| (a) | A portion or all of the security was held on loan. As of December 31, 2005, the market value of securities loaned was $221,375,977 and the collateral received consisted of cash in the amount of $228,066,900. |
| (c) | The aggregate cost of investments for federal income tax purposes as of December 31, 2005 was $956,052,261 and the composition of unrealized appreciation and depreciation of investment securities was $74,304,583 and $(27,337,036), respectively. |
| (144A)— | Securities exempt from registration under Rule 144A of the Securities Act of 1933. These securities may be resold in transactions exempt from registration, normally to qualified institutional buyers. As of December 31, 2005, the market value of 144A securities was $4,456,200, which is 0.5% of total net assets. |
| (ADR)— | An American Depositary Receipt is a certificate issued by a custodian bank representing the right to receive securities of the foreign issuer described. Trading on exchanges not located in the United States or Canada significantly influences the value of ADRs. |
| (REIT)— | A Real Estate Investment Trust is a pooled investment vehicle that invests primarily in income-producing real estate or real estate related loans or interest. |
*See accompanying notes to financial statements.
MSF-216
Metropolitan Series Fund, Inc.
BlackRock Strategic Value Portfolio
Statement of Assets & Liabilities
December 31, 2005
| | | | | | |
Assets | | | | | | |
Investments at value | | | | | $ | 1,003,019,808 |
Cash | | | | | | 123,381 |
Collateral for securities loaned | | | | | | 228,066,900 |
Receivable for: | | | | | | |
Securities sold | | | | | | 3,636,108 |
Fund shares sold | | | | | | 1,816,557 |
Accrued interest and dividends | | | | | | 1,495,951 |
| | | | | |
|
|
Total Assets | | | | | | 1,238,158,705 |
Liabilities | | | | | | |
Payable for: | | | | | | |
Fund shares redeemed | | $ | 1,017,257 | | | |
Securities purchased | | | 33,679,896 | | | |
Return of collateral for securities loaned | | | 228,066,900 | | | |
Accrued expenses: | | | | | | |
Management fees | | | 687,594 | | | |
Service and distribution fees | | | 57,185 | | | |
Other expenses | | | 181,933 | | | |
| | |
|
| | | |
Total Liabilities | | | | | | 263,690,765 |
| | | | | |
|
|
Net Assets | | | | | $ | 974,467,940 |
| | | | | |
|
|
Net assets consists of: | | | | | | |
Capital paid in | | | | | $ | 736,899,121 |
Undistributed net investment income | | | | | | 3,019,166 |
Accumulated net realized gains | | | | | | 187,631,452 |
Unrealized appreciation on investments | | | | | | 46,918,201 |
| | | | | |
|
|
Net Assets | | | | | $ | 974,467,940 |
| | | | | |
|
|
| Computation of offering price: | | | | | | |
Class A | | | | | | |
Net asset value and redemption price per share ($604,086,129 divided by 32,560,284 shares outstanding) | | | | | $ | 18.55 |
| | | | | |
|
|
Class B | | | | | | |
Net asset value and redemption price per share ($116,849,479 divided by 6,366,393 shares outstanding) | | | | | $ | 18.35 |
| | | | | |
|
|
Class E | | | | | | |
Net asset value and redemption price per share ($253,532,332 divided by 13,770,103 shares outstanding) | | | | | $ | 18.41 |
| | | | | |
|
|
Identified cost of investments | | | | | $ | 956,101,607 |
| | | | | |
|
|
Statement of Operations
Year Ended December 31, 2005
| | | | | | | | |
Investment Income | | | | | | | | |
Dividends | | | | | | $ | 10,870,244 | (a) |
Interest | | | | | | | 1,397,462 | (b) |
| | | | | | |
|
|
|
| | | | | | | | 12,267,706 | |
Expenses | | | | | | | | |
Management fees | | $ | 8,006,722 | | | | | |
Service and distribution fees—Class B | | | 223,130 | | | | | |
Service and distribution fees—Class E | | | 386,754 | | | | | |
Directors’ fees and expenses | | | 22,264 | | | | | |
Custodian | | | 202,862 | | | | | |
Audit and tax services | | | 21,038 | | | | | |
Legal | | | 25,094 | | | | | |
Printing | | | 314,564 | | | | | |
Insurance | | | 19,306 | | | | | |
Miscellaneous | | | 26,806 | | | | | |
| | |
|
|
| | | | |
Total expenses | | | 9,248,540 | | | | | |
Expense reductions | | | (482,934 | ) | | | 8,765,606 | |
| | |
|
|
| |
|
|
|
Net Investment Income | | | | | | | 3,502,100 | |
| | | | | | |
|
|
|
Realized and Unrealized Gain (Loss) | | | | | | | | |
| Realized gain on: | | | | | | | | |
Investments—net | | | | | | | 188,560,892 | |
| | | | | | | | | |
| Unrealized depreciation on: | | | | | | | | |
Investments—net | | | | | | | (152,734,201 | ) |
| | | | | | |
|
|
|
Net gain | | | | | | | 35,826,691 | |
| | | | | | |
|
|
|
Net Increase in Net Assets From Operations | | | | | | $ | 39,328,791 | |
| | | | | | |
|
|
|
| (a) | Net of foreign taxes of $4,574. |
| (b) | Includes income on securities loaned of $373,235. |
See accompanying notes to financial statements.
MSF-217
Metropolitan Series Fund, Inc.
BlackRock Strategic Value Portfolio
Statement of Changes in Net Assets
| | | | | | | | |
| | | Year ended
December 31,
2005
| | | Year ended
December 31,
2004
| |
From Operations | | | | | | | | |
Net investment income (loss) | | $ | 3,502,100 | | | $ | (550,090 | ) |
Net realized gain | | | 188,560,892 | | | | 79,538,305 | |
Unrealized appreciation (depreciation) | | | (152,734,201 | ) | | | 49,592,432 | |
| | |
|
|
| |
|
|
|
Increase in net assets from operations | | | 39,328,791 | | | | 128,580,647 | |
| | |
|
|
| |
|
|
|
From Distributions to Shareholders | | | | | | | | |
Net realized gain | | | | | | | | |
Class A | | | (42,516,221 | ) | | | 0 | |
Class B | | | (5,460,595 | ) | | | 0 | |
Class E | | | (17,557,622 | ) | | | 0 | |
| | |
|
|
| |
|
|
|
Total distributions | | | (65,534,438 | ) | | | 0 | |
| | |
|
|
| |
|
|
|
Increase in net assets from capital share transactions | | | 1,426,644 | | | | 130,062,137 | |
| | |
|
|
| |
|
|
|
Total increase (decrease) in net assets | | | (24,779,003 | ) | | | 258,642,784 | |
| | |
Net Assets | | | | | | | | |
Beginning of the period | | | 999,246,943 | | | | 740,604,159 | |
| | |
|
|
| |
|
|
|
End of the period | | $ | 974,467,940 | | | $ | 999,246,943 | |
| | |
|
|
| |
|
|
|
Undistributed Net Investment Income | | | | | | | | |
End of the period | | $ | 3,019,166 | | | $ | 0 | |
| | |
|
|
| |
|
|
|
Other Information:
Capital Shares
Transactions in capital shares were as follows:
| | | | | | | | | | | | | | |
| | | Year ended
December 31, 2005
| | | Year ended
December 31, 2004
| |
| | | Shares
| | | $
| | | Shares
| | | $
| |
Class A | | | | | | | | | | | | | | |
Sales | | 5,458,141 | | | $ | 99,439,133 | | | 6,544,337 | | | $ | 112,507,468 | |
Reinvestments | | 2,538,282 | | | | 42,516,221 | | | 0 | | | | 0 | |
Redemptions | | (10,228,100 | ) | | | (186,914,961 | ) | | (5,518,652 | ) | | | (95,179,548 | ) |
| | |
|
| |
|
|
| |
|
| |
|
|
|
Net increase (decrease) | | (2,231,677 | ) | | $ | (44,959,607 | ) | | 1,025,685 | | | $ | 17,327,920 | |
| | |
|
| |
|
|
| |
|
| |
|
|
|
Class B | | | | | | | | | | | | | | |
Sales | | 3,682,166 | | | $ | 66,518,582 | | | 3,141,001 | | | $ | 53,821,146 | |
Reinvestments | | 328,952 | | | | 5,460,595 | | | 0 | | | | 0 | |
Redemptions | | (729,889 | ) | | | (13,169,328 | ) | | (123,564 | ) | | | (2,144,803 | ) |
| | |
|
| |
|
|
| |
|
| |
|
|
|
Net increase | | 3,281,229 | | | $ | 58,809,849 | | | 3,017,437 | | | $ | 51,676,343 | |
| | |
|
| |
|
|
| |
|
| |
|
|
|
Class E | | | | | | | | | | | | | | |
Sales | | 1,110,787 | | | $ | 20,092,410 | | | 5,955,493 | | | $ | 101,427,500 | |
Reinvestments | | 1,055,146 | | | | 17,557,622 | | | 0 | | | | 0 | |
Redemptions | | (2,761,705 | ) | | | (50,073,630 | ) | | (2,357,768 | ) | | | (40,369,626 | ) |
| | |
|
| |
|
|
| |
|
| |
|
|
|
Net increase (decrease) | | (595,772 | ) | | $ | (12,423,598 | ) | | 3,597,725 | | | $ | 61,057,874 | |
| | |
|
| |
|
|
| |
|
| |
|
|
|
Increase (decrease) derived from capital share transactions | | (453,780 | ) | | $ | 1,426,644 | | | 7,640,847 | | | $ | 130,062,137 | |
| | |
|
| |
|
|
| |
|
| |
|
|
|
See accompanying notes to financial statements.
MSF-218
Metropolitan Series Fund, Inc.
BlackRock Strategic Value Portfolio
Financial Highlights
| | | | | | | | | | | | | | | | | | | | |
| | | Class A
| |
| | | Year ended December 31,
| |
| | | 2005
| | | 2004
| | | 2003
| | | 2002
| | | 2001
| |
Net Asset Value, Beginning of Period | | $ | 19.17 | | | $ | 16.62 | | | $ | 11.07 | | | $ | 14.13 | | | $ | 12.24 | |
| | |
|
|
| |
|
|
| |
|
|
| |
|
|
| |
|
|
|
Income From Investment Operations | | | | | | | | | | | | | | | | | | | | |
Net investment income (loss) | | | 0.08 | | | | 0.00 | | | | (0.01 | ) | | | (0.04 | ) | | | 0.02 | |
Net realized and unrealized gain (loss) of investments | | | 0.57 | | | | 2.55 | | | | 5.56 | | | | (2.95 | ) | | | 1.94 | |
| | |
|
|
| |
|
|
| |
|
|
| |
|
|
| |
|
|
|
Total from investment operations | | | 0.65 | | | | 2.55 | | | | 5.55 | | | | (2.99 | ) | | | 1.96 | |
| | |
|
|
| |
|
|
| |
|
|
| |
|
|
| |
|
|
|
Less Distributions | | | | | | | | | | | | | | | | | | | | |
Distributions from net investment income | | | 0.00 | | | | 0.00 | | | | 0.00 | | | | (0.01 | ) | | | (0.01 | ) |
Distributions from net realized capital gains | | | (1.27 | ) | | | 0.00 | | | | 0.00 | | | | (0.06 | ) | | | (0.06 | ) |
| | |
|
|
| |
|
|
| |
|
|
| |
|
|
| |
|
|
|
Total distributions | | | (1.27 | ) | | | 0.00 | | | | 0.00 | | | | (0.07 | ) | | | (0.07 | ) |
| | |
|
|
| |
|
|
| |
|
|
| |
|
|
| |
|
|
|
Net Asset Value, End of Period | | $ | 18.55 | | | $ | 19.17 | | | $ | 16.62 | | | $ | 11.07 | | | $ | 14.13 | |
| | |
|
|
| |
|
|
| |
|
|
| |
|
|
| |
|
|
|
Total Return (%) | | | 4.2 | | | | 15.3 | | | | 50.1 | | | | (21.3 | ) | | | 16.0 | |
Ratio of operating expenses to average net assets before expense reductions (%) | | | 0.89 | | | | 0.89 | | | | 0.93 | | | | 0.95 | | | | 0.98 | |
Ratio of operating expenses to average net assets after expense reductions (%) (d) | | | 0.84 | | | | 0.87 | | | | — | | | | — | | | | — | |
Ratio of net investment income (loss) to average net assets (%) | | | 0.42 | | | | (0.03 | ) | | | (0.10 | ) | | | (0.28 | ) | | | 0.18 | |
Portfolio turnover rate (%) | | | 175 | | | | 33 | | | | 44 | | | | 27 | | | | 15 | |
Net assets, end of period (000) | | $ | 604,086 | | | $ | 666,800 | | | $ | 561,245 | | | $ | 319,202 | | | $ | 291,426 | |
| |
| | | Class B
| |
| | | Year ended December 31,
| | | May 1, 2001(a)
through
December 31,
2001
| |
| | | 2005
| | | 2004
| | | 2003
| | | 2002
| | |
Net Asset Value, Beginning of Period | | $ | 19.02 | | | $ | 16.53 | | | $ | 11.04 | | | $ | 14.12 | | | $ | 14.12 | |
| | |
|
|
| |
|
|
| |
|
|
| |
|
|
| |
|
|
|
Income From Investment Operations | | | | | | | | | | | | | | | | | | | | |
Net investment income (loss) | | | 0.03 | | | | 0.00 | | | | (0.01 | ) | | | 0.00 | | | | 0.00 | |
Net realized and unrealized gain (loss) of investments | | | 0.57 | | | | 2.49 | | | | 5.50 | | | | (3.01 | ) | | | 0.00 | |
| | |
|
|
| |
|
|
| |
|
|
| |
|
|
| |
|
|
|
Total from investment operations | | | 0.60 | | | | 2.49 | | | | 5.49 | | | | (3.01 | ) | | | 0.00 | |
| | |
|
|
| |
|
|
| |
|
|
| |
|
|
| |
|
|
|
Less Distributions | | | | | | | | | | | | | | | | | | | | |
Distributions from net investment income | | | 0.00 | | | | 0.00 | | | | 0.00 | | | | (0.01 | ) | | | 0.00 | |
Distributions from net realized capital gains | | | (1.27 | ) | | | 0.00 | | | | 0.00 | | | | (0.06 | ) | | | 0.00 | |
| | |
|
|
| |
|
|
| |
|
|
| |
|
|
| |
|
|
|
Total distributions | | | (1.27 | ) | | | 0.00 | | | | 0.00 | | | | (0.07 | ) | | | 0.00 | |
| | |
|
|
| |
|
|
| |
|
|
| |
|
|
| |
|
|
|
Net Asset Value, End of Period | | $ | 18.35 | | | $ | 19.02 | | | $ | 16.53 | | | $ | 11.04 | | | $ | 14.12 | |
| | |
|
|
| |
|
|
| |
|
|
| |
|
|
| |
|
|
|
Total Return (%) | | | 3.9 | | | | 15.1 | | | | 49.7 | | | | (21.5 | ) | | | 0.00 | (b) |
Ratio of operating expenses to average net assets before expense reductions (%) | | | 1.14 | | | | 1.14 | | | | 1.18 | | | | 1.20 | | | | 1.23 | (c) |
Ratio of operating expenses to average net assets after expense reductions (%) (d) | | | 1.09 | | | | 1.12 | | | | — | | | | — | | | | — | |
Ratio of net investment income (loss) to average net assets (%) | | | 0.20 | | | | (0.09 | ) | | | (0.26 | ) | | | (0.53 | ) | | | 0.00 | (c) |
Portfolio turnover rate (%) | | | 175 | | | | 33 | | | | 44 | | | | 27 | | | | 15 | |
Net assets, end of period (000) | | $ | 116,849 | | | $ | 58,676 | | | $ | 1,120 | | | $ | 10 | | | $ | 0.01 | |
| (a) | Commencement of operations. |
| (b) | Period less than one year is not computed on an annualized basis. |
| (c) | Computed on an annualized basis. |
| (d) | The Portfolio has entered into arrangements with certain brokers who paid a portion of the Portfolio’s expenses. |
See accompanying notes to financial statements.
MSF-219
Metropolitan Series Fund, Inc.
BlackRock Strategic Value Portfolio
Financial Highlights
| | | | | | | | | | | | | | | | | | | | |
| | | Class E
| |
| | | Year ended December 31,
| | | May 1, 2001(a) through December 31, 2001
| |
| | | 2005
| | | 2004
| | | 2003
| | | 2002
| | |
Net Asset Value, Beginning of Period | | $ | 19.06 | | | $ | 16.55 | | | $ | 11.04 | | | $ | 14.12 | | | $ | 14.12 | |
| | |
|
|
| |
|
|
| |
|
|
| |
|
|
| |
|
|
|
Income From Investment Operations | | | | | | | | | | | | | | | | | | | | |
Net investment income (loss) | | | 0.05 | | | | (0.02 | ) | | | (0.02 | ) | | | (0.01 | ) | | | (0.01 | ) |
Net realized and unrealized gain (loss) of investments | | | 0.57 | | | | 2.53 | | | | 5.53 | | | | (3.00 | ) | | | 0.01 | |
| | |
|
|
| |
|
|
| |
|
|
| |
|
|
| |
|
|
|
Total from investment operations | | | 0.62 | | | | 2.51 | | | | 5.51 | | | | (3.01 | ) | | | 0.00 | |
| | |
|
|
| |
|
|
| |
|
|
| |
|
|
| |
|
|
|
Less Distributions | | | | | | | | | | | | | | | | | | | | |
Distributions from net investment income | | | 0.00 | | | | 0.00 | | | | 0.00 | | | | (0.01 | ) | | | 0.00 | |
Distributions from net realized capital gains | | | (1.27 | ) | | | 0.00 | | | | 0.00 | | | | (0.06 | ) | | | 0.00 | |
| | |
|
|
| |
|
|
| |
|
|
| |
|
|
| |
|
|
|
Total distributions | | | (1.27 | ) | | | 0.00 | | | | 0.00 | | | | (0.07 | ) | | | 0.00 | |
| | |
|
|
| |
|
|
| |
|
|
| |
|
|
| |
|
|
|
Net Asset Value, End of Period | | $ | 18.41 | | | $ | 19.06 | | | $ | 16.55 | | | $ | 11.04 | | | $ | 14.12 | |
| | |
|
|
| |
|
|
| |
|
|
| |
|
|
| |
|
|
|
Total Return (%) | | | 4.0 | | | | 15.2 | | | | 49.9 | | | | (21.5 | ) | | | 0.0 | (b) |
Ratio of operating expenses to average net assets before expense reductions (%) | | | 1.04 | | | | 1.04 | | | | 1.08 | | | | 1.10 | | | | 1.13 | (c) |
Ratio of operating expenses to average net assets after expense reductions (%) (d) | | | 0.99 | | | | 1.02 | | | | — | | | | — | | | | — | |
Ratio of net investment income (loss) to average net assets (%) | | | 0.27 | | | | (0.16 | ) | | | (0.22 | ) | | | (0.43 | ) | | | (0.25 | )(c) |
Portfolio turnover rate (%) | | | 175 | | | | 33 | | | | 44 | | | | 27 | | | | 15 | |
Net assets, end of period (000) | | $ | 253,532 | | | $ | 273,771 | | | $ | 178,240 | | | $ | 56,055 | | | $ | 6,720 | |
| (a) | Commencement of operations. |
| (b) | Period less than one year is not computed on an annualized basis. |
| (c) | Computed on an annualized basis. |
| (d) | The Portfolio has entered into arrangements with certain brokers who paid a portion of the Portfolio’s expenses. |
See accompanying notes to financial statements.
MSF-220
Metropolitan Series Fund, Inc.
Franklin Templeton Small Cap Growth Portfolio
Schedule of Investments as of December 31, 2005
Common Stock—97.6% of Total Net Assets
| | | | | |
| Security Description | | Shares | | Value* |
| | | | | | |
| | |
Aerospace & Defense—2.3% | | | | | |
Argon, Inc. (a) | | 14,500 | | $ | 449,210 |
Essex Corp. (a) | | 50,200 | | | 855,910 |
K&F Industries Holdings, Inc. | | 32,800 | | | 503,808 |
Orbital Sciences Corp. (a) | | 52,300 | | | 671,532 |
| | | | |
|
|
| | | | | | 2,480,460 |
| | | | |
|
|
| | |
Air Freight & Logistics—1.6% | | | | | |
Forward Air Corp. | | 46,000 | | | 1,685,900 |
| | | | |
|
|
| | |
Airlines—0.7% | | | | | |
Republic Airways Holdings, Inc. (a) | | 52,300 | | | 794,960 |
| | | | |
|
|
| | |
Automobiles—0.7% | | | | | |
Winnebago Industries, Inc. | | 24,000 | | | 798,720 |
| | | | |
|
|
| | |
Biotechnology—2.2% | | | | | |
Digene Corp. (a) | | 25,500 | | | 743,835 |
Serologicals Corp. (a) | | 38,000 | | | 750,120 |
Telik, Inc. (a) | | 52,800 | | | 897,072 |
| | | | |
|
|
| | | | | | 2,391,027 |
| | | | |
|
|
| | |
Chemicals—3.4% | | | | | |
Cabot Corp. | | 24,500 | | | 877,100 |
FMC Corp. (a) | | 24,300 | | | 1,292,031 |
Minerals Technologies, Inc. | | 17,600 | | | 983,664 |
Westlake Chemical Corp. | | 20,000 | | | 576,200 |
| | | | |
|
|
| | | | | | 3,728,995 |
| | | | |
|
|
| | |
Commercial Banks—3.3% | | | | | |
East West Bancorp, Inc. | | 19,000 | | | 693,310 |
First State Bancorp | | 34,800 | | | 834,852 |
Franklin Bank Corp. (a) | | 19,100 | | | 343,609 |
Greater Bay Bancorp | | 22,300 | | | 571,326 |
Hancock Holding Co. | | 12,500 | | | 472,625 |
Signature Bank (a) | | 14,900 | | | 418,243 |
WestAmerica Bancorp | | 4,700 | | | 249,429 |
| | | | |
|
|
| | | | | | 3,583,394 |
| | | | |
|
|
| | |
Commercial Services & Supplies—5.7% | | | | | |
Advance America Cash Advance Centers, Inc. | | 37,300 | | | 462,520 |
CDI Corp. | | 35,100 | | | 961,740 |
Global Cash Access, Inc. (a) | | 40,600 | | | 592,354 |
Global Payments, Inc. | | 30,800 | | | 1,435,588 |
Headwaters, Inc. (a) | | 26,400 | | | 935,616 |
LECG Corp. (a) | | 27,000 | | | 469,260 |
Lincoln Educational Services (a) | | 31,800 | | | 453,468 |
Strayer Education, Inc. | | 5,000 | | | 468,500 |
Waste Connections, Inc. (a) | | 10,650 | | | 366,999 |
| | | | |
|
|
| | | | | | 6,146,045 |
| | | | |
|
|
| | |
Communications Equipment—2.9% | | | | | |
Arris Group, Inc. (a) | | 75,300 | | | 713,091 |
Avocent Corp. (a) | | 32,900 | | | 894,551 |
ViaSat, Inc. (a) | | 57,800 | | | 1,544,994 |
| | | | |
|
|
| | | | | | 3,152,636 |
| | | | |
|
|
| | | | | |
| Security Description | | Shares | | Value* |
| | | | | | |
| | |
Distributors—0.6% | | | | | |
Beacon Roofing Supply, Inc. | | 22,800 | | $ | 655,044 |
| | | | |
|
|
| | |
Diversified Consumer Services—0.7% | | | | | |
Regis Corp. | | 19,000 | | | 732,830 |
| | | | |
|
|
| | |
Diversified Financial Services—5.2% | | | | | |
Ares Capital Corp. | | 37,838 | | | 608,057 |
CapitalSource, Inc. (a) | | 56,200 | | | 1,258,880 |
Doral Financial Corp. | | 40,400 | | | 428,240 |
Financial Federal Corp. | | 22,100 | | | 982,345 |
GFI Group, Inc. (a) | | 12,900 | | | 611,847 |
Jackson Hewitt Tax Service, Inc. | | 23,200 | | | 642,872 |
National Financial Partners Corp. | | 21,400 | | | 1,124,570 |
| | | | |
|
|
| | | | | | 5,656,811 |
| | | | |
|
|
| | |
Electronic Equipment & Instruments—5.9% | | | | | |
Coherent, Inc. (a) | | 23,600 | | | 700,448 |
Electro Scientific Industries, Inc. (a) | | 26,200 | | | 632,730 |
FLIR Systems, Inc. (a) | | 50,200 | | | 1,120,966 |
Greatbatch, Inc. (a) | | 50,000 | | | 1,300,500 |
Mettler-Toledo International, Inc. (a) | | 8,000 | | | 441,600 |
Tektronix, Inc. | | 38,400 | | | 1,083,264 |
Trimble Navigation, Ltd. (a) | | 32,950 | | | 1,169,395 |
| | | | |
|
|
| | | | | | 6,448,903 |
| | | | |
|
|
| | |
Energy Equipment & Services—4.8% | | | | | |
Basic Energy Services, Inc. (a) | | 7,000 | | | 139,650 |
Cal Dive International, Inc. (a) | | 50,800 | | | 1,823,212 |
FMC Technologies, Inc. (a) | | 29,400 | | | 1,261,848 |
Oil States International, Inc. (a) | | 16,200 | | | 513,216 |
Superior Energy Services, Inc. (a) | | 69,600 | | | 1,465,080 |
| | | | |
|
|
| | | | | | 5,203,006 |
| | | | |
|
|
| | |
Health Care Equipment & Supplies—4.1% | | | | | |
American Medical Systems Holdings, Inc. (a) | | 54,700 | | | 975,301 |
Merit Medical Systems, Inc. (a) | | 44,866 | | | 544,673 |
Molecular Devices Corp. (a) | | 28,100 | | | 812,933 |
STERIS Corp. | | 30,700 | | | 768,114 |
Symmetry Medical, Inc. (a) | | 17,500 | | | 339,325 |
Varian, Inc. (a) | | 26,100 | | | 1,038,519 |
| | | | |
|
|
| | | | | | 4,478,865 |
| | | | |
|
|
| | |
Health Care Providers & Services—7.0% | | | | | |
MAXIMUS, Inc. | | 15,300 | | | 561,357 |
Parexel International Corp. (a) | | 33,700 | | | 682,762 |
Pharmaceutical Product Development, Inc. (a) | | 15,300 | | | 947,835 |
Psychiatric Solutions, Inc. (a) | | 17,400 | | | 1,022,076 |
RehabCare Group, Inc. (a) | | 28,500 | | | 575,700 |
Sierra Health Services, Inc. (a) | | 14,300 | | | 1,143,428 |
Symbion, Inc. (a) | | 20,700 | | | 476,100 |
United Surgical Partners International, Inc. (a) | | 30,300 | | | 974,145 |
VCA Antech, Inc. (a) | | 44,800 | | | 1,263,360 |
| | | | |
|
|
| | | | | | 7,646,763 |
| | | | |
|
|
*See accompanying notes to financial statements.
MSF-221
Metropolitan Series Fund, Inc.
Franklin Templeton Small Cap Growth Portfolio
Schedule of Investments as of December 31, 2005
Common Stock—(Continued)
| | | | | |
| Security Description | | Shares | | Value* |
| | | | | | |
| | |
Hotels, Restaurants & Leisure—5.8% | | | | | |
BJ’s Restaurants, Inc. (a) | | 26,400 | | $ | 603,504 |
Four Seasons Hotels, Inc. | | 14,100 | | | 701,475 |
Gaylord Entertainment Co. (a) | | 18,700 | | | 815,133 |
Orient-Express Hotels, Ltd. (Class A) | | 30,500 | | | 961,360 |
P.F. Chang’s China Bistro, Inc. (a) | | 13,700 | | | 679,931 |
Panera Bread Co. (a) | | 11,700 | | | 768,456 |
Penn National Gaming, Inc. (a) | | 52,800 | | | 1,739,760 |
| | | | |
|
|
| | | | | | 6,269,619 |
| | | | |
|
|
| | |
Insurance—0.6% | | | | | |
Aspen Insurance Holdings, Ltd. | | 3,700 | | | 87,579 |
Max Re Capital, Ltd. | | 22,900 | | | 594,713 |
| | | | |
|
|
| | | | | | 682,292 |
| | | | |
|
|
| | |
Internet Software & Services—4.1% | | | | | |
FileNET Corp. (a) | | 41,900 | | | 1,083,115 |
Marchex, Inc. (a) | | 66,300 | | | 1,491,087 |
NetIQ Corp. (a) | | 48,200 | | | 592,378 |
RightNow Technologies, Inc. (a) | | 24,800 | | | 457,808 |
ValueClick, Inc. (a) | | 46,600 | | | 843,926 |
| | | | |
|
|
| | | | | | 4,468,314 |
| | | | |
|
|
| | |
IT Services—1.9% | | | | | |
BearingPoint, Inc. (a) | | 101,200 | | | 795,432 |
Sapient Corp. (a) | | 130,800 | | | 744,252 |
TNS, Inc. (a) | | 29,900 | | | 573,482 |
| | | | |
|
|
| | | | | | 2,113,166 |
| | | | |
|
|
| | |
Machinery—3.8% | | | | | |
CLARCOR, Inc. | | 9,500 | | | 282,245 |
Flowserve Corp. (a) | | 41,100 | | | 1,625,916 |
Oshkosh Truck Corp. | | 14,000 | | | 624,260 |
The Manitowoc Co., Inc. | | 15,500 | | | 778,410 |
Wabash National Corp. | | 40,700 | | | 775,335 |
| | | | |
|
|
| | | | | | 4,086,166 |
| | | | |
|
|
| | |
Media—0.2% | | | | | |
Entravision Communications Corp. (Class A) (a) | | 29,500 | | | 210,040 |
| | | | |
|
|
| | |
Metals & Mining—0.3% | | | | | |
Alpha Natural Resources, Inc. (a) | | 19,500 | | | 374,595 |
| | | | |
|
|
| | |
Multiline Retail—0.4% | | | | | |
Tuesday Morning Corp. | | 23,000 | | | 481,160 |
| | | | |
|
|
| | |
Oil, Gas & Consumable Fuels—2.0% | | | | | |
Bill Barrett Corp. (a) | | 19,800 | | | 764,478 |
Bronco Drilling Co., Inc. (a) | | 9,300 | | | 213,993 |
Denbury Resources, Inc. (a) | | 51,000 | | | 1,161,780 |
| | | | |
|
|
| | | | | | 2,140,251 |
| | | | |
|
|
| | |
Pharmaceuticals—3.8% | | | | | |
Adams Respiratory Therapeutics, Inc. (a) | | 12,800 | | | 520,448 |
Angiotech Pharmaceuticals, Inc. (a) | | 60,400 | | | 794,260 |
Coley Pharmaceutical Group, Inc. (a) | | 40,500 | | | 613,980 |
| | | | | |
| Security Description | | Shares | | Value* |
| | | | | |
| | |
Pharmaceuticals—(Continued) | | | | | |
Impax Laboratories, Inc. (a) | | 60,100 | | $ | 643,070 |
Panacos Pharmaceuticals, Inc. (a) | | 42,900 | | | 297,297 |
Pharmion Corp. (a) | | 8,300 | | | 147,491 |
The Medicines Co. (a) | | 29,600 | | | 516,520 |
Trimeris, Inc. (a) | | 52,900 | | | 607,821 |
| | | | |
|
|
| | | | | | 4,140,887 |
| | | | |
|
|
| | |
Real Estate—2.2% | | | | | |
Innkeepers USA Trust (REIT) | | 46,600 | | | 745,600 |
Jones Lang LaSalle, Inc. (a) | | 19,600 | | | 986,860 |
MeriStar Hospitality Corp. (REIT) | | 75,700 | | | 711,580 |
| | | | |
|
|
| | | | | | 2,444,040 |
| | | | |
|
|
| | |
Road & Rail—2.2% | | | | | |
Knight Transportation, Inc. | | 58,575 | | | 1,214,260 |
Landstar System, Inc. | | 27,600 | | | 1,152,024 |
| | | | |
|
|
| | | | | | 2,366,284 |
| | | | |
|
|
|
Semiconductors & Semiconductor Equipment—9.9% |
Actel Corp. (a) | | 40,500 | | | 515,565 |
Cabot Microelectronics Corp. (a) | | 8,600 | | | 252,238 |
Exar Corp. (a) | | 11,437 | | | 143,192 |
FormFactor, Inc. (a) | | 36,000 | | | 879,480 |
Integrated Device Technology, Inc. (a) | | 28,140 | | | 370,885 |
Microsemi Corp. (a) | | 48,320 | | | 1,336,531 |
Microtune, Inc. (a) | | 96,100 | | | 400,737 |
Power Integrations, Inc. (a) | | 50,400 | | | 1,200,024 |
Semtech Corp. (a) | | 71,900 | | | 1,312,894 |
Silicon Laboratories, Inc. (a) | | 50,800 | | | 1,862,328 |
Sirf Technology Holdings, Inc. | | 20,800 | | | 619,840 |
Varian Semiconductor Equipment, Inc. (a) | | 41,600 | | | 1,827,488 |
ZiLOG, Inc. (a) | | 27,600 | | | 67,344 |
| | | | |
|
|
| | | | | | 10,788,546 |
| | | | |
|
|
| | |
Software—6.8% | | | | | |
Entrust, Inc. (a) | | 94,800 | | | 458,832 |
Hyperion Solutions Corp. (a) | | 19,050 | | | 682,371 |
Jack Henry & Associates, Inc. | | 36,700 | | | 700,236 |
Micromuse, Inc. (a) | | 65,100 | | | 643,839 |
MICROS Systems, Inc. (a) | | 21,000 | | | 1,014,720 |
National Instruments Corp. | | 43,200 | | | 1,384,560 |
Quest Software, Inc. (a) | | 69,500 | | | 1,014,005 |
The Ultimate Software Group, Inc. (a) | | 6,000 | | | 114,420 |
THQ, Inc. (a) | | 36,050 | | | 859,792 |
Witness Systems, Inc. | | 26,300 | | | 517,321 |
| | | | |
|
|
| | | | | | 7,390,096 |
| | | | |
|
|
| | |
Specialty Retail—2.0% | | | | | |
Cost Plus, Inc. (a) | | 28,600 | | | 490,490 |
Hot Topic, Inc. (a) | | 41,000 | | | 584,250 |
Tractor Supply Co. (a) | | 15,200 | | | 804,688 |
Zumiez, Inc. (a) | | 6,700 | | | 289,574 |
| | | | |
|
|
| | | | | | 2,169,002 |
| | | | |
|
|
*See accompanying notes to financial statements.
MSF-222
Metropolitan Series Fund, Inc.
Franklin Templeton Small Cap Growth Portfolio
Schedule of Investments as of December 31, 2005
Common Stock—(Continued)
| | | | | | |
| Security Description | | Shares | | Value* |
| | | | | |
|
Wireless Telecommunication Services—0.5% |
JAMDAT Mobile, Inc. (a) | | | 19,300 | | $ | 512,994 |
| | | | | |
|
|
Total Common Stock
(Identified Cost $92,910,838) | | | | | | 106,221,811 |
| | | | | |
|
|
| | |
| Short Term Investments—2.3% | | | | | | |
| Security Description | | Face
Amount | | Value* |
| | |
Discount Notes—2.3% | | | | | | |
Federal Home Loan Bank
3.400%, 01/03/06 | | $ | 2,510,000 | | | 2,509,526 |
| | | | | |
|
|
Total Short Term Investments
(Amortized Cost $2,509,526) | | | | | | 2,509,526 |
| | | | | |
|
|
Total Investments—99.9%
(Identified Cost $95,420,364) (b) | | | | | | 108,731,337 |
Other assets less liabilities | | | | | | 121,042 |
| | | | | |
|
|
| Total Net Assets—100% | | | | | $ | 108,852,379 |
| | | | | |
|
|
| (b) | The aggregate cost of investments for federal income tax purposes as of December 31, 2005 was $95,572,608 and the composition of unrealized appreciation and depreciation of investment securities was $17,382,151 and $(4,223,422), respectively. |
| (REIT)— | A Real Estate Investment Trust is a pooled investment vehicle that invests primarily in income-producing real estate or real estate related loans or interest. |
*See accompanying notes to financial statements.
MSF-223
Metropolitan Series Fund, Inc.
Franklin Templeton Small Cap Growth Portfolio
Statement of Assets & Liabilities
December 31, 2005
| | | | | | |
Assets | | | | | | |
Investments at value | | | | | $ | 108,731,337 |
Cash | | | | | | 5,766 |
Receivable for: | | | | | | |
Securities sold | | | | | | 32,772 |
Fund shares sold | | | | | | 238,576 |
Accrued interest and dividends | | | | | | 174,041 |
| | | | | |
|
|
Total Assets | | | | | | 109,182,492 |
Liabilities | | | | | | |
Payable for: | | | | | | |
Fund shares redeemed | | $ | 106,401 | | | |
Securities purchased | | | 74,219 | | | |
Withholding taxes | | | 100 | | | |
Accrued expenses: | | | | | | |
Management fees | | | 84,684 | | | |
Service and distribution fees | | | 15,158 | | | |
Other expenses | | | 49,551 | | | |
| | |
|
| | | |
Total Liabilities | | | | | | 330,113 |
| | | | | |
|
|
Net Assets | | | | | $ | 108,852,379 |
| | | | | |
|
|
Net assets consists of: | | | | | | |
Capital paid in | | | | | $ | 89,659,297 |
Accumulated net realized gains | | | | | | 5,882,110 |
Unrealized appreciation on investments | | | | | | 13,310,972 |
| | | | | |
|
|
Net Assets | | | | | $ | 108,852,379 |
| | | | | |
|
|
| Computation of offering price: | | | | | | |
Class A | | | | | | |
Net asset value and redemption price per share ($33,042,167 divided by 3,167,841 shares outstanding) | | | | | $ | 10.43 |
| | | | | |
|
|
Class B | | | | | | |
Net asset value and redemption price per share ($61,757,821 divided by 5,985,466 shares outstanding) | | | | | $ | 10.32 |
| | | | | |
|
|
Class E | | | | | | |
Net asset value and redemption price per share ($14,052,391 divided by 1,354,607 shares outstanding) | | | | | $ | 10.37 |
| | | | | |
|
|
Identified cost of investments | | | | | $ | 95,420,364 |
| | | | | |
|
|
Statement of Operations
Year Ended December 31, 2005
| | | | | | | | |
Investment Income | | | | | | | | |
Dividends | | | | | | $ | 462,586 | (a) |
Interest | | | | | | | 113,431 | |
| | | | | | |
|
|
|
| | | | | | | | 576,017 | |
Expenses | | | | | | | | |
Management fees | | $ | 852,255 | | | | | |
Deferred expense reimbursement | | | 30,000 | | | | | |
Service and distribution fees—Class B | | | 121,865 | | | | | |
Service and distribution fees—Class E | | | 21,357 | | | | | |
Directors’ fees and expenses | | | 22,233 | | | | | |
Custodian | | | 105,035 | | | | | |
Audit and tax services | | | 22,044 | | | | | |
Legal | | | 2,473 | | | | | |
Printing | | | 26,116 | | | | | |
Insurance | | | 1,724 | | | | | |
Miscellaneous | | | 4,444 | | | | | |
| | |
|
|
| | | | |
Total expenses | | | 1,209,546 | | | | | |
Expense reductions | | | (18,502 | ) | | | 1,191,044 | |
| | |
|
|
| |
|
|
|
Net Investment Loss | | | | | | | (615,027 | ) |
| | | | | | |
|
|
|
Realized and Unrealized Gain (Loss) | | | | | | | | |
| Realized gain on: | | | | | | | | |
Investments—net | | | | | | | 6,499,422 | |
| Unrealized depreciation on: | | | | | | | | |
Investments—net | | | | | | | (526,903 | ) |
| | | | | | |
|
|
|
Net gain | | | | | | | 5,972,519 | |
| | | | | | |
|
|
|
Net Increase in Net Assets From Operations | | | | | | $ | 5,357,492 | |
| | | | | | |
|
|
|
| (a) | Net of foreign taxes of $1,587. |
See accompanying notes to financial statements.
MSF-224
Metropolitan Series Fund, Inc.
Franklin Templeton Small Cap Growth Portfolio
Statement of Changes in Net Assets
| | | | | | | | |
| | | Year ended
December 31,
2005
| | | Year ended
December 31,
2004
| |
From Operations | | | | | | | | |
Net investment loss | | $ | (615,027 | ) | | $ | (639,639 | ) |
Net realized gain | | | 6,499,422 | | | | 4,706,692 | |
Unrealized appreciation (depreciation) | | | (526,903 | ) | | | 3,812,327 | |
| | |
|
|
| |
|
|
|
Increase in net assets from operations | | | 5,357,492 | | | | 7,879,380 | |
| | |
|
|
| |
|
|
|
From Distributions to Shareholders | | | | | | | | |
Net realized gain | | | | | | | | |
Class A | | | (1,092,133 | ) | | | 0 | |
Class B | | | (1,500,258 | ) | | | 0 | |
Class E | | | (501,060 | ) | | | 0 | |
| | |
|
|
| |
|
|
|
Total distributions | | | (3,093,451 | ) | | | 0 | |
| | |
|
|
| |
|
|
|
Increase in net assets from capital share transactions | | | 25,487,835 | | | | 15,045,143 | |
| | |
|
|
| |
|
|
|
Total increase in net assets | | | 27,751,876 | | | | 22,924,523 | |
| | |
Net Assets | | | | | | | | |
Beginning of the period | | | 81,100,503 | | | | 58,175,980 | |
| | |
|
|
| |
|
|
|
End of the period | | $ | 108,852,379 | | | $ | 81,100,503 | |
| | |
|
|
| |
|
|
|
Undistributed Net Investment Loss | | | | | | | | |
End of the period | | $ | 0 | | | $ | 0 | |
| | |
|
|
| |
|
|
|
Other Information:
Capital Shares
Transactions in capital shares were as follows:
| | | | | | | | | | | | | | |
| | | Year ended
December 31, 2005
| | | Year ended
December 31, 2004
| |
| | | Shares
| | | $
| | | Shares
| | | $
| |
Class A | | | | | | | | | | | | | | |
Sales | | 962,709 | | | $ | 9,623,280 | | | 1,284,110 | | | $ | 12,199,181 | |
Reinvestments | | 120,147 | | | | 1,092,133 | | | 0 | | | | 0 | |
Redemptions | | (996,343 | ) | | | (9,952,683 | ) | | (976,814 | ) | | | (9,210,643 | ) |
| | |
|
| |
|
|
| |
|
| |
|
|
|
Net increase | | 86,513 | | | $ | 762,730 | | | 307,296 | | | $ | 2,988,538 | |
| | |
|
| |
|
|
| |
|
| |
|
|
|
Class B | | | | | | | | | | | | | | |
Sales | | 3,436,232 | | | $ | 33,830,167 | | | 1,583,408 | | | $ | 14,827,409 | |
Reinvestments | | 166,510 | | | | 1,500,258 | | | 0 | | | | 0 | |
Redemptions | | (993,396 | ) | | | (9,917,236 | ) | | (631,083 | ) | | | (5,914,979 | ) |
| | |
|
| |
|
|
| |
|
| |
|
|
|
Net increase | | 2,609,346 | | | $ | 25,413,189 | | | 952,325 | | | $ | 8,912,430 | |
| | |
|
| |
|
|
| |
|
| |
|
|
|
Class E | | | | | | | | | | | | | | |
Sales | | 312,152 | | | $ | 3,096,915 | | | 702,934 | | | $ | 6,660,072 | |
Reinvestments | | 55,366 | | | | 501,060 | | | 0 | | | | 0 | |
Redemptions | | (423,532 | ) | | | (4,286,059 | ) | | (374,713 | ) | | | (3,515,897 | ) |
| | |
|
| |
|
|
| |
|
| |
|
|
|
Net increase (decrease) | | (56,014 | ) | | $ | (688,084 | ) | | 328,221 | | | $ | 3,144,175 | |
| | |
|
| |
|
|
| |
|
| |
|
|
|
Increase derived from capital share transactions | | 2,639,845 | | | $ | 25,487,835 | | | 1,587,842 | | | $ | 15,045,143 | |
| | |
|
| |
|
|
| |
|
| |
|
|
|
See accompanying notes to financial statements.
MSF-225
Metropolitan Series Fund, Inc.
Franklin Templeton Small Cap Growth Portfolio
Financial Highlights
| | | | | | | | | | | | | | | | | | | | |
| | | Class A
| |
| | | Year ended December 31,
| | | May 1, 2001(a)
through
December 31,
2001
| |
| | | 2005
| | | 2004
| | | 2003
| | | 2002
| | |
Net Asset Value, Beginning of Period | | $ | 10.35 | | | $ | 9.29 | | | $ | 6.41 | | | $ | 8.88 | | | $ | 10.00 | |
| | |
|
|
| |
|
|
| |
|
|
| |
|
|
| |
|
|
|
Income from Investment Operations | | | | | | | | | | | | | | | | | | | | |
Net investment income (loss) | | | (0.05 | ) | | | (0.08 | ) | | | (0.04 | ) | | | (0.04 | ) | | | 0.00 | |
Net realized and unrealized gain (loss) of investments | | | 0.48 | | | | 1.14 | | | | 2.92 | | | | (2.43 | ) | | | (1.12 | ) |
| | |
|
|
| |
|
|
| |
|
|
| |
|
|
| |
|
|
|
Total from investment operations | | | 0.43 | | | | 1.06 | | | | 2.88 | | | | (2.47 | ) | | | (1.12 | ) |
| | |
|
|
| |
|
|
| |
|
|
| |
|
|
| |
|
|
|
Less Distributions | | | | | | | | | | | | | | | | | | | | |
Distributions from net realized capital gains | | | (0.35 | ) | | | 0.00 | | | | 0.00 | | | | 0.00 | | | | 0.00 | |
| | |
|
|
| |
|
|
| |
|
|
| |
|
|
| |
|
|
|
Total distributions | | | (0.35 | ) | | | 0.00 | | | | 0.00 | | | | 0.00 | | | | 0.00 | |
| | |
|
|
| |
|
|
| |
|
|
| |
|
|
| |
|
|
|
Net Asset Value, End of Period | | $ | 10.43 | | | $ | 10.35 | | | $ | 9.29 | | | $ | 6.41 | | | $ | 8.88 | |
| | |
|
|
| |
|
|
| |
|
|
| |
|
|
| |
|
|
|
Total Return (%) | | | 4.7 | | | | 11.4 | | | | 44.9 | | | | (27.8 | ) | | | (11.2 | )(b) |
Ratio of operating expenses to average net assets before expense reductions (%) | | | 1.13 | | | | 1.15 | | | | 1.13 | | | | 1.05 | | | | 1.05 | (c) |
Ratio of operating expenses to average net assets after expense reductions (%) (d) | | | 1.11 | | | | 1.15 | | | | — | | | | — | | | | — | |
Ratio of operating expenses to average net assets without giving effect to the contractual expense agreement would have been (%) | | | 1.13 | | | | 1.15 | | | | 1.32 | | | | 1.51 | | | | 2.69 | (c) |
Ratio of net investment income (loss) to average net assets (%) | | | (0.52 | ) | | | (0.80 | ) | | | (0.68 | ) | | | (0.60 | ) | | | 0.00 | (c) |
Portfolio turnover rate (%) | | | 52 | | | | 50 | | | | 38 | | | | 33 | | | | 67 | (c) |
Net assets, end of period (000) | | $ | 33,042 | | | $ | 31,892 | | | $ | 25,762 | | | $ | 12,079 | | | $ | 7,468 | |
| | | | | | | | | | | | | | | | | | | | |
| | | Class B
| |
| | | Year ended December 31,
| | | May 1, 2001(a)
through
December 31,
2001
| |
| | | 2005
| | | 2004
| | | 2003
| | | 2002
| | |
Net Asset Value, Beginning of Period | | $ | 10.27 | | | $ | 9.24 | | | $ | 6.39 | | | $ | 8.88 | | | $ | 10.00 | |
| | |
|
|
| |
|
|
| |
|
|
| |
|
|
| |
|
|
|
Income from Investment Operations | | | | | | | | | | | | | | | | | | | | |
Net investment loss | | | (0.05 | ) | | | (0.08 | ) | | | (0.05 | ) | | | (0.04 | ) | | | (0.01 | ) |
Net realized and unrealized gain (loss) of investments | | | 0.45 | | | | 1.11 | | | | 2.90 | | | | (2.45 | ) | | | (1.11 | ) |
| | |
|
|
| |
|
|
| |
|
|
| |
|
|
| |
|
|
|
Total from investment operations | | | 0.40 | | | | 1.03 | | | | 2.85 | | | | (2.49 | ) | | | (1.12 | ) |
| | |
|
|
| |
|
|
| |
|
|
| |
|
|
| |
|
|
|
Less Distributions | | | | | | | | | | | | | | | | | | | | |
Distributions from net realized capital gains | | | (0.35 | ) | | | 0.00 | | | | 0.00 | | | | 0.00 | | | | 0.00 | |
| | |
|
|
| |
|
|
| |
|
|
| |
|
|
| |
|
|
|
Total distributions | | | (0.35 | ) | | | 0.00 | | | | 0.00 | | | | 0.00 | | | | 0.00 | |
| | |
|
|
| |
|
|
| |
|
|
| |
|
|
| |
|
|
|
Net Asset Value, End of Period | | $ | 10.32 | | | $ | 10.27 | | | $ | 9.24 | | | $ | 6.39 | | | $ | 8.88 | |
| | |
|
|
| |
|
|
| |
|
|
| |
|
|
| |
|
|
|
Total Return (%) | | | 4.4 | | | | 11.1 | | | | 44.6 | | | | (28.0 | ) | | | (11.2 | )(b) |
Ratio of operating expenses to average net assets before expense reductions (%) | | | 1.38 | | | | 1.40 | | | | 1.38 | | | | 1.30 | | | | 1.30 | (c) |
Ratio of operating expenses to average net assets after expense reductions (%) (d) | | | 1.36 | | | | 1.40 | | | | — | | | | — | | | | — | |
Ratio of operating expenses to average net assets without giving effect to the contractual expense agreement would have been (%) | | | 1.38 | | | | 1.40 | | | | 1.57 | | | | 1.76 | | | | 2.94 | (c) |
Ratio of net investment loss to average net assets (%) | | | (0.73 | ) | | | (1.05 | ) | | | (0.93 | ) | | | (0.85 | ) | | | (0.51 | )(c) |
Portfolio turnover rate (%) | | | 52 | | | | 50 | | | | 38 | | | | 33 | | | | 67 | (c) |
Net assets, end of period (000) | | $ | 61,758 | | | $ | 34,664 | | | $ | 22,385 | | | $ | 9,403 | | | $ | 4,493 | |
| (a) | Commencement of operations. |
| (b) | Period less than one year is not computed on an annualized basis. |
| (c) | Computed on an annualized basis. |
| (d) | The Portfolio has entered into arrangements with certain brokers who paid a portion of the Portfolio’s expenses. |
See accompanying notes to financial statements.
MSF-226
Metropolitan Series Fund, Inc.
Franklin Templeton Small Cap Growth Portfolio
Financial Highlights
| | | | | | | | | | | | | | | | | | | | |
| | | Class E
| |
| | | Year ended December 31,
| | | May 1, 2001(a)
through
December 31,
2001
| |
| | | 2005
| | | 2004
| | | 2003
| | | 2002
| | |
Net Asset Value, Beginning of Period | | $ | 10.31 | | | $ | 9.27 | | | $ | 6.41 | | | $ | 8.88 | | | $ | 10.00 | |
| | |
|
|
| |
|
|
| |
|
|
| |
|
|
| |
|
|
|
Income From Investment Operations | | | | | | | | | | | | | | | | | | | | |
Net investment income (loss) | | | (0.07 | ) | | | (0.09 | ) | | | (0.04 | ) | | | (0.01 | ) | | | 0.00 | |
Net realized and unrealized gain (loss) of investments | | | 0.48 | | | | 1.13 | | | | 2.90 | | | | (2.46 | ) | | | (1.12 | ) |
| | |
|
|
| |
|
|
| |
|
|
| |
|
|
| |
|
|
|
Total from investment operations | | | 0.41 | | | | 1.04 | | | | 2.86 | | | | (2.47 | ) | | | (1.12 | ) |
| | |
|
|
| |
|
|
| |
|
|
| |
|
|
| |
|
|
|
Less Distributions | | | | | | | | | | | | | | | | | | | | |
Distributions from net realized capital gains | | | (0.35 | ) | | | 0.00 | | | | 0.00 | | | | 0.00 | | | | 0.00 | |
| | |
|
|
| |
|
|
| |
|
|
| |
|
|
| |
|
|
|
Total distributions | | | (0.35 | ) | | | 0.00 | | | | 0.00 | | | | 0.00 | | | | 0.00 | |
| | |
|
|
| |
|
|
| |
|
|
| |
|
|
| |
|
|
|
Net Asset Value, End of Period | | $ | 10.37 | | | $ | 10.31 | | | $ | 9.27 | | | $ | 6.41 | | | $ | 8.88 | |
| | |
|
|
| |
|
|
| |
|
|
| |
|
|
| |
|
|
|
Total Return (%) | | | 4.5 | | | | 11.2 | | | | 44.6 | | | | (27.8 | ) | | | (11.2 | )(b) |
Ratio of operating expenses to average net assets before expense reductions (%) | | | 1.28 | | | | 1.30 | | | | 1.28 | | | | 1.20 | | | | 1.20 | (c) |
Ratio of operating expenses to average net assets after expense reductions (%) (d) | | | 1.26 | | | | 1.30 | | | | — | | | | — | | | | — | |
Ratio of operating expenses to average net assets without giving effect to the contractual expense agreement would have been (%) | | | 1.28 | | | | 1.30 | | | | 1.47 | | | | 1.66 | | | | 2.84 | (c) |
Ratio of net investment loss to average net assets (%) | | | (0.67 | ) | | | (0.95 | ) | | | (0.84 | ) | | | (0.72 | ) | | | (0.41 | )(c) |
Portfolio turnover rate (%) | | | 52 | | | | 50 | | | | 38 | | | | 33 | | | | 67 | (c) |
Net assets, end of period (000) | | $ | 14,052 | | | $ | 14,545 | | | $ | 10,029 | | | $ | 2,235 | | | $ | 6 | |
| (a) | Commencement of operations. |
| (b) | Period less than one year is not computed on an annualized basis. |
| (c) | Computed on an annualized basis. |
| (d) | The Portfolio has entered into arrangements with certain brokers who paid a portion of the Portfolio’s expenses. |
See accompanying notes to financial statements.
MSF-227
Metropolitan Series Fund, Inc.
Loomis Sayles Small Cap Portfolio
Schedule of Investments as of December 31, 2005
Common Stock—97.9% of Total Net Assets
| | | | | |
| Security Description | | Shares | | Value* |
| | | | | | |
| | |
Aerospace & Defense—0.8% | | | | | |
Aviall, Inc. (a) | | 63,000 | | $ | 1,814,400 |
Essex Corp. (a) (b) | | 95,300 | | | 1,624,865 |
| | | | |
|
|
| | | | | | 3,439,265 |
| | | | |
|
|
| | |
Auto Components—0.8% | | | | | |
Commercial Vehicle Group, Inc. (a) (b) | | 67,200 | | | 1,262,016 |
Cooper Tire & Rubber Co. (b) | | 61,625 | | | 944,095 |
Lear Corp. (b) | | 40,425 | | | 1,150,495 |
| | | | |
|
|
| | | | | | 3,356,606 |
| | | | |
|
|
| | |
Automobiles—0.2% | | | | | |
Winnebago Industries, Inc. (b) | | 31,800 | | | 1,058,304 |
| | | | |
|
|
| | |
Biotechnology—1.4% | | | | | |
Cubist Pharmaceuticals, Inc. | | 63,025 | | | 1,339,281 |
Keryx Biopharmaceuticals, Inc. (a) (b) | | 66,450 | | | 972,828 |
Neurocrine Biosciences, Inc. (a) | | 13,625 | | | 854,696 |
Nuvelo, Inc. (a) | | 116,225 | | | 942,585 |
United Therapeutics Corp. (b) | | 12,450 | | | 860,544 |
Vertex Pharmaceuticals, Inc. (a) (b) | | 33,600 | | | 929,712 |
| | | | |
|
|
| | | | | | 5,899,646 |
| | | | |
|
|
| | |
Building Products—0.7% | | | | | |
Griffon Corp. (b) | | 40,400 | | | 961,924 |
Lennox International, Inc. | | 65,175 | | | 1,837,935 |
| | | | |
|
|
| | | | | | 2,799,859 |
| | | | |
|
|
| | |
Capital Markets—0.5% | | | | | |
Affiliated Managers Group, Inc. (a) (b) | | 24,875 | | | 1,996,219 |
| | | | |
|
|
| | |
Chemicals—1.8% | | | | | |
Cabot Corp. | | 21,875 | | | 783,125 |
Cytec Industries, Inc. | | 55,375 | | | 2,637,511 |
FMC Corp. (a) | | 19,400 | | | 1,031,498 |
Spartech Corp. (b) | | 75,750 | | | 1,662,713 |
The Scotts Miracle-Gro Co. (b) | | 31,750 | | | 1,436,370 |
| | | | |
|
|
| | | | | | 7,551,217 |
| | | | |
|
|
| | |
Commercial Banks—7.3% | | | | | |
Alabama National Bancorp (b) | | 25,025 | | | 1,620,619 |
Capital Corp. of the West | | 7,275 | | | 236,074 |
Centerstate Banks of Florida, Inc. | | 31,700 | | | 1,093,650 |
Community Bancorp (a) (b) | | 37,450 | | | 1,183,795 |
CVB Financial Corp. (b) | | 91,831 | | | 1,865,088 |
East West Bancorp, Inc. | | 63,600 | | | 2,320,764 |
First Midwest Bancorp, Inc. | | 48,850 | | | 1,712,681 |
FirstFed Financial Corp. (a) (b) | | 35,925 | | | 1,958,631 |
Hanmi Financial Corp. (b) | | 91,575 | | | 1,635,529 |
Iberiabank Corp. (b) | | 33,499 | | | 1,708,797 |
Independent Bank Corp. (b) | | 75,113 | | | 2,045,324 |
Midwest Banc Holdings, Inc. (b) | | 50,875 | | | 1,131,969 |
Pennsylvania Commerce Bancorp, Inc. (a) (b) | | 34,100 | | | 1,086,085 |
PFF Bancorp, Inc. | | 45,950 | | | 1,402,394 |
PrivateBancorp, Inc. (b) | | 55,600 | | | 1,977,692 |
Provident Bancorp, Inc. (b) | | 79,694 | | | 877,431 |
| | | | | |
| Security Description | | Shares | | Value* |
| | | | | | |
| | |
Commercial Banks—(Continued) | | | | | |
Signature Bank (a) | | 70,250 | | $ | 1,971,917 |
Texas Regional Bancshares, Inc. | | 54,312 | | | 1,537,030 |
The South Financial Group, Inc. | | 44,875 | | | 1,235,857 |
Wintrust Financial Corp. | | 44,350 | | | 2,434,815 |
| | | | |
|
|
| | | | | | 31,036,142 |
| | | | |
|
|
| | |
Commercial Services & Supplies—6.8% | | | | | |
Adesa, Inc. | | 51,725 | | | 1,263,125 |
American Ecology Corp. (b) | | 27,225 | | | 392,857 |
American Reprographics Co. (b) | | 43,400 | | | 1,102,794 |
CRA International, Inc. (a) (b) | | 45,150 | | | 2,153,203 |
Electro Rent Corp. | | 13,500 | | | 201,285 |
Gevity HR, Inc. | | 76,975 | | | 1,979,797 |
Heartland Payment Systems, Inc. (a) (b) | | 73,100 | | | 1,583,346 |
Hudson Highland Group, Inc. (a) (b) | | 129,075 | | | 2,240,742 |
LECG Corp. (a) (b) | | 80,800 | | | 1,404,304 |
Lightbridge, Inc. (a) | | 113,975 | | | 944,853 |
McGrath Rentcorp (b) | | 74,300 | | | 2,065,540 |
Mobile Mini, Inc. (a) (b) | | 27,275 | | | 1,292,835 |
Navigant Consulting, Inc. (a) (b) | | 106,850 | | | 2,348,563 |
On Assignment, Inc. (a) | | 118,075 | | | 1,288,198 |
PeopleSupport, Inc. (a) | | 168,850 | | | 1,433,537 |
The Corporate Executive Board Co. | | 21,975 | | | 1,971,157 |
Waste Connections, Inc. (a) | | 55,674 | | | 1,918,526 |
Wright Express Corp. (a) | | 158,300 | | | 3,482,600 |
| | | | |
|
|
| | | | | | 29,067,262 |
| | | | |
|
|
| | |
Communications Equipment—3.2% | | | | | |
ADTRAN, Inc. | | 54,700 | | | 1,626,778 |
Anaren, Inc. (a) | | 73,575 | | | 1,149,977 |
CommScope, Inc. (a) | | 101,375 | | | 2,040,679 |
DSP Group, Inc. (a) | | 71,975 | | | 1,803,693 |
Foundry Networks, Inc. (a) | | 124,375 | | | 1,717,619 |
McDATA Corp. (Class A) (a) (b) | | 235,925 | | | 896,515 |
Oplink Communications, Inc. (a) (b) | | 64,850 | | | 940,325 |
Polycom, Inc. (a) | | 62,325 | | | 953,572 |
Redback Networks, Inc. (a) (b) | | 95,200 | | | 1,338,512 |
SafeNet, Inc. (a) (b) | | 21,750 | | | 700,785 |
Tekelec, Inc. (b) | | 49,775 | | | 691,873 |
| | | | |
|
|
| | | | | | 13,860,328 |
| | | | |
|
|
| | |
Computers & Peripherals—1.2% | | | | | |
Avid Technology, Inc. (a) | | 33,675 | | | 1,844,043 |
Electronics for Imaging, Inc. | | 70,475 | | | 1,875,340 |
Imation Corp. | | 35,050 | | | 1,614,753 |
| | | | |
|
|
| | | | | | 5,334,136 |
| | | | |
|
|
| | |
Construction & Engineering—1.0% | | | | | |
Insituform Technologies, Inc. (a) (b) | | 108,625 | | | 2,104,066 |
Washington Group International, Inc. (a) (b) | | 44,625 | | | 2,363,786 |
| | | | |
|
|
| | | | | | 4,467,852 |
| | | | |
|
|
| | |
Construction Materials—0.6% | | | | | |
Eagle Materials, Inc. (b) | | 8,350 | | | 1,021,706 |
Texas Industries, Inc. | | 35,175 | | | 1,753,122 |
| | | | |
|
|
| | | | | | 2,774,828 |
| | | | |
|
|
*See accompanying notes to financial statements.
MSF-228
Metropolitan Series Fund, Inc.
Loomis Sayles Small Cap Portfolio
Schedule of Investments as of December 31, 2005
Common Stock—(Continued)
| | | | | |
| Security Description | | Shares | | Value* |
| | | | | | |
| | |
Diversified Consumer Services—1.5% | | | | | |
Bright Horizons Family Solutions, Inc. (a) | | 52,925 | | $ | 1,960,871 |
Laureate Education, Inc. (a) | | 50,100 | | | 2,630,751 |
Regis Corp. | | 25,325 | | | 976,785 |
Vertrue, Inc. (a) (b) | | 27,050 | | | 955,677 |
| | | | |
|
|
| | | | | | 6,524,084 |
| | | | |
|
|
| | |
Diversified Financial Services—2.4% | | | | | |
Advanta Corp. (Class B) (b) | | 92,703 | | | 3,007,285 |
GFI Group, Inc. (a) (b) | | 36,150 | | | 1,714,595 |
International Securities Exchange, Inc. (b) | | 53,925 | | | 1,484,016 |
National Financial Partners Corp. | | 47,175 | | | 2,479,046 |
United PanAm Financial Corp. (a) | | 52,750 | | | 1,364,643 |
| | | | |
|
|
| | | | | | 10,049,585 |
| | | | |
|
|
| |
Diversified Telecommunication Services—0.5% | | | |
Commonwealth Telephone Enterprises, Inc. (a) | | 24,350 | | | 822,300 |
Iowa Telecommunications Services, Inc. (b) | | 82,525 | | | 1,278,312 |
| | | | |
|
|
| | | | | | 2,100,612 |
| | | | |
|
|
| | |
Electric Utilities—0.9% | | | | | |
ALLETE, Inc. | | 18,375 | | | 808,500 |
NorthWestern Energy Corp. (a) (b) | | 82,475 | | | 2,562,498 |
Otter Tail Corp. (b) | | 21,625 | | | 626,693 |
| | | | |
|
|
| | | | | | 3,997,691 |
| | | | |
|
|
| | |
Electrical Equipment—1.0% | | | | | |
AMETEK, Inc. | | 60,600 | | | 2,577,924 |
General Cable Corp. (a) (b) | | 89,500 | | | 1,763,150 |
| | | | |
|
|
| | | | | | 4,341,074 |
| | | | |
|
|
| | |
Electronic Equipment & Instruments—2.0% | | | | | |
Anixter International, Inc. (a) | | 50,775 | | | 1,986,318 |
Excel Technology, Inc. (a) (b) | | 54,675 | | | 1,300,171 |
Intermagnetics General Corp. (a) | | 76,525 | | | 2,441,147 |
Keithley Instruments, Inc. | | 48,775 | | | 681,875 |
Rofin-Sinar Technologies, Inc. (a) | | 49,025 | | | 2,131,117 |
| | | | |
|
|
| | | | | | 8,540,628 |
| | | | |
|
|
| | |
Energy Equipment & Services—4.0% | | | | | |
Allis-Chalmers Energy, Inc. (a) (b) | | 81,250 | | | 1,011,562 |
Cal Dive International, Inc. (a) (b) | | 84,000 | | | 3,014,760 |
CARBO Ceramics, Inc. | | 55,762 | | | 3,151,668 |
Core Laboratories NV (b) | | 24,075 | | | 899,442 |
Dril-Quip, Inc. | | 28,875 | | | 1,362,900 |
FMC Technologies, Inc. (a) | | 59,875 | | | 2,569,835 |
Oil States International, Inc. (a) | | 51,375 | | | 1,627,560 |
Unit Corp. (a) | | 34,325 | | | 1,888,905 |
Universal Compression Holdings, Inc. (a) (b) | | 41,400 | | | 1,702,368 |
| | | | |
|
|
| | | | | | 17,229,000 |
| | | | |
|
|
| | |
Food & Staples Retailing—0.8% | | | | | |
Casey’s General Stores, Inc. | | 84,925 | | | 2,106,140 |
Smart & Final, Inc. (a) | | 115,525 | | | 1,487,962 |
| | | | |
|
|
| | | | | | 3,594,102 |
| | | | |
|
|
| | | | | |
| Security Description | | Shares | | Value* |
| | | | | | |
| | |
Food Products—0.7% | | | | | |
J & J Snack Foods Corp. | | 21,663 | | $ | 1,286,999 |
Ralcorp Holdings, Inc. (a) | | 47,575 | | | 1,898,718 |
| | | | |
|
|
| | | | | | 3,185,717 |
| | | | |
|
|
| | |
Gas Utilities—1.1% | | | | | |
Energen Corp. | | 18,975 | | | 689,172 |
ONEOK, Inc. | | 46,875 | | | 1,248,281 |
Southern Union Co. (a) | | 42,988 | | | 1,015,807 |
UGI Corp. | | 82,900 | | | 1,707,740 |
| | | | |
|
|
| | | | | | 4,661,000 |
| | | | |
|
|
| | |
Health Care Equipment & Supplies—4.7% | | | | | |
American Medical Systems Holdings, Inc. (a) | | 86,775 | | | 1,547,198 |
Arrow International, Inc. | | 63,425 | | | 1,838,691 |
ArthroCare Corp. (a) (b) | | 45,000 | | | 1,896,300 |
Aspect Medical Systems, Inc. (a) (b) | | 28,050 | | | 963,518 |
Computer Programs & Systems, Inc. (b) | | 40,600 | | | 1,682,058 |
ev3, Inc. (a) (b) | | 98,325 | | | 1,449,310 |
LCA-Vision, Inc. (b) | | 49,625 | | | 2,357,684 |
Meridian Bioscience, Inc. (b) | | 95,500 | | | 1,923,370 |
NuVasive, Inc. (a) (b) | | 82,600 | | | 1,495,060 |
Sybron Dental Specialties, Inc. (a) | | 40,500 | | | 1,612,305 |
Symmetry Medical, Inc. (a) (b) | | 124,975 | | | 2,423,265 |
West Pharmaceutical Services, Inc. (b) | | 40,875 | | | 1,023,101 |
| | | | |
|
|
| | | | | | 20,211,860 |
| | | | |
|
|
| | |
Health Care Providers & Services—3.3% | | | | | |
Chemed Corp. | | 51,600 | | | 2,563,488 |
LifePoint Hospitals, Inc. (a) | | 32,850 | | | 1,231,875 |
Matria Healthcare, Inc. (a) (b) | | 53,249 | | | 2,063,931 |
Psychiatric Solutions, Inc. (a) | | 27,050 | | | 1,588,917 |
Symbion, Inc. (a) (b) | | 66,950 | | | 1,539,850 |
The Advisory Board Co. (a) | | 50,750 | | | 2,419,252 |
United Surgical Partners International, Inc. (a) (b) | | 47,925 | | | 1,540,789 |
Ventiv Health, Inc. (a) (b) | | 50,475 | | | 1,192,220 |
| | | | |
|
|
| | | | | | 14,140,322 |
| | | | |
|
|
| | |
Hotels, Restaurants & Leisure—2.6% | | | | | |
CEC Entertainment, Inc. (a) | | 28,700 | | | 976,948 |
Dover Downs Gaming & Entertainment, Inc. | | 91,504 | | | 1,294,782 |
Fairmont Hotels & Resorts, Inc. (b) | | 29,525 | | | 1,252,155 |
McCormick & Schmick’s Restaurants, Inc. (a) (b) | | 58,475 | | | 1,322,120 |
Pinnacle Entertainment, Inc. (a) (b) | | 105,450 | | | 2,605,669 |
Sunterra Corp. (a) (b) | | 124,500 | | | 1,770,390 |
The Steak N Shake Co. (a) | | 33,300 | | | 564,435 |
Trump Entertainment Resorts, Inc. (a) (b) | | 63,725 | | | 1,282,784 |
| | | | |
|
|
| | | | | | 11,069,283 |
| | | | |
|
|
| | |
Household Durables—0.7% | | | | | |
Lifetime Brands, Inc. (b) | | 77,100 | | | 1,593,657 |
Tupperware Corp. | | 60,225 | | | 1,349,040 |
| | | | |
|
|
| | | | | | 2,942,697 |
| | | | |
|
|
*See accompanying notes to financial statements.
MSF-229
Metropolitan Series Fund, Inc.
Loomis Sayles Small Cap Portfolio
Schedule of Investments as of December 31, 2005
Common Stock—(Continued)
| | | | | |
| Security Description | | Shares | | Value* |
| | | | | | |
| | |
Insurance—5.3% | | | | | |
American Equity Investment Life (b) | | 163,475 | | $ | 2,133,349 |
AmerUs Group Co. (b) | | 13,350 | | | 756,545 |
Arch Capital Group, Ltd. (a) | | 32,675 | | | 1,788,956 |
Argonaut Group, Inc. | | 45,325 | | | 1,485,300 |
Delphi Financial Group, Inc. | | 51,512 | | | 2,370,067 |
Endurance Specialty Holdings, Ltd. | | 64,600 | | | 2,315,910 |
HealthExtras, Inc. (a) (b) | | 52,225 | | | 1,310,847 |
KMG America Corp. (a) (b) | | 114,375 | | | 1,049,963 |
Ohio Casualty Corp. (a) | | 70,050 | | | 1,983,816 |
ProAssurance Corp. (a) | | 41,375 | | | 2,012,480 |
Protective Life Corp. | | 40,500 | | | 1,772,685 |
RLI Corp. (b) | | 36,950 | | | 1,842,696 |
The Navigators Group, Inc. (a) | | 41,700 | | | 1,818,537 |
| | | | |
|
|
| | | | | | 22,641,151 |
| | | | |
|
|
| | |
Internet & Catalog Retail—1.1% | | | | | |
Blue Nile, Inc. (a) (b) | | 42,025 | | | 1,694,028 |
Coldwater Creek, Inc. (a) | | 58,237 | | | 1,777,976 |
FTD Group, Inc. (a) (b) | | 102,975 | | | 1,069,910 |
| | | | |
|
|
| | | | | | 4,541,914 |
| | | | |
|
|
| | |
Internet Software & Services—3.3% | | | | | |
Akamai Technologies, Inc. (b) | | 97,725 | | | 1,947,659 |
Aladdin Knowledge Systems (a) (b) | | 79,825 | | | 1,374,587 |
Digital Insight Corp. (a) | | 41,200 | | | 1,319,224 |
Digitas, Inc. (a) | | 151,875 | | | 1,901,475 |
j2 Global Communications, Inc. (a) (b) | | 41,575 | | | 1,776,916 |
Online Resources Corp. (a) (b) | | 168,225 | | | 1,858,886 |
Websense, Inc. (a) (b) | | 30,850 | | | 2,024,994 |
WebSideStory, Inc. (a) (b) | | 102,250 | | | 1,853,792 |
| | | | |
|
|
| | | | | | 14,057,533 |
| | | | |
|
|
| | |
IT Services—1.1% | | | | | |
Anteon International Corp. (a) | | 29,350 | | | 1,595,172 |
Perot Systems Corp. (Class A) (a) | | 119,850 | | | 1,694,679 |
SRA International, Inc. (a) | | 51,000 | | | 1,557,540 |
| | | | |
|
|
| | | | | | 4,847,391 |
| | | | |
|
|
| | |
Machinery—5.5% | | | | | |
Actuant Corp. (b) | | 55,825 | | | 3,115,035 |
Albany International Corp. (Class A) | | 31,900 | | | 1,153,504 |
American Science & Engineering, Inc. (a) (b) | | 20,275 | | | 1,264,552 |
Barnes Group, Inc. | | 52,975 | | | 1,748,175 |
Bucyrus International, Inc. (b) | | 41,575 | | | 2,191,002 |
CLARCOR, Inc. | | 58,100 | | | 1,726,151 |
ESCO Technologies, Inc. (a) (b) | | 32,900 | | | 1,463,721 |
Freightcar America, Inc. | | 33,825 | | | 1,626,306 |
Harsco Corp. | | 26,700 | | | 1,802,517 |
IDEX Corp. | | 57,862 | | | 2,378,707 |
Joy Global, Inc. | | 41,830 | | | 1,673,200 |
Nordson Corp. | | 29,625 | | | 1,200,109 |
RBC Bearings, Inc. (a) (b) | | 87,725 | | | 1,425,531 |
The Greenbrier Cos., Inc. | | 27,875 | | | 791,650 |
| | | | |
|
|
| | | | | | 23,560,160 |
| | | | |
|
|
| | | | | |
| Security Description | | Shares | | Value* |
| | | | | | |
| | |
Marine—0.4% | | | | | |
American Commercial Lines, Inc. (a) (b) | | 56,250 | | $ | 1,703,813 |
| | | | |
|
|
| | |
Media—2.9% | | | | | |
aQuantive, Inc. (a) | | 38,300 | | | 966,692 |
CCE Spinco, Inc. | | 119,300 | | | 1,562,830 |
Harte-Hanks, Inc. | | 59,475 | | | 1,569,545 |
John Wiley & Sons, Inc. | | 31,650 | | | 1,235,616 |
R. H. Donnelley Corp. (a) (b) | | 66,600 | | | 4,103,892 |
Saga Communications, Inc. (a) (b) | | 11,200 | | | 121,744 |
Scholastic Corp. (a) | | 35,700 | | | 1,017,807 |
Thomas Nelson, Inc. (b) | | 37,750 | | | 930,538 |
Valassis Communications, Inc. (a) | | 32,100 | | | 933,147 |
| | | | |
|
|
| | | | | | 12,441,811 |
| | | | |
|
|
| | |
Metals & Mining—1.2% | | | | | |
AMCOL International Corp. | | 60,675 | | | 1,245,051 |
Century Aluminum Co. (b) | | 46,550 | | | 1,220,076 |
Chaparral Steel Co. (a) | | 52,225 | | | 1,579,806 |
Reliance Steel & Aluminum Co. | | 16,050 | | | 980,976 |
| | | | |
|
|
| | | | | | 5,025,909 |
| | | | |
|
|
| | |
Multiline Retail—0.5% | | | | | |
Big Lots, Inc. (a) | | 79,750 | | | 957,797 |
Dollar Tree Stores, Inc. (a) | | 54,150 | | | 1,296,351 |
| | | | |
|
|
| �� | | | | | 2,254,148 |
| | | | |
|
|
| | |
Oil, Gas & Consumable Fuels—2.7% | | | | | |
ATP Oil & Gas Corp. (a) | | 41,525 | | | 1,536,840 |
Denbury Resources, Inc. (a) | | 91,550 | | | 2,085,509 |
Energy Partners, Ltd. (a) (b) | | 80,900 | | | 1,762,811 |
Gasco Energy, Inc. (b) | | 125,325 | | | 818,372 |
Pioneer Drilling Co. (a) | | 106,150 | | | 1,903,269 |
Range Resources Corp. | | 78,150 | | | 2,058,471 |
Remington Oil & Gas Corp. (a) | | 32,575 | | | 1,188,988 |
| | | | |
|
|
| | | | | | 11,354,260 |
| | | | |
|
|
| | |
Pharmaceuticals—0.2% | | | | | |
Perrigo Co. | | 71,300 | | | 1,063,083 |
| | | | |
|
|
| | |
Real Estate—5.6% | | | | | |
American Home Mortgage Investment Corp.
(REIT) (b) | | 65,250 | | | 2,125,193 |
BioMed Realty Trust, Inc. (REIT) | | 86,900 | | | 2,120,360 |
CB Richard Ellis Group, Inc. (a) | | 66,800 | | | 3,931,180 |
CBL & Associates Properties, Inc. (REIT) (b) | | 49,475 | | | 1,954,757 |
Corporate Office Properties Trust (REIT) | | 73,550 | | | 2,613,967 |
First Potomac Realty Trust (REIT) | | 86,025 | | | 2,288,265 |
Jones Lang LaSalle, Inc. (a) | | 36,325 | | | 1,828,964 |
Kite Realty Group Trust (REIT) | | 126,775 | | | 1,961,209 |
LaSalle Hotel Properties (REIT) | | 61,175 | | | 2,246,346 |
Newcastle Investment Corp. (REIT) (b) | | 64,400 | | | 1,600,340 |
Potlatch Corp. (REIT) (b) | | 21,500 | | | 1,096,070 |
| | | | |
|
|
| | | | | | 23,766,651 |
| | | | |
|
|
*See accompanying notes to financial statements.
MSF-230
Metropolitan Series Fund, Inc.
Loomis Sayles Small Cap Portfolio
Schedule of Investments as of December 31, 2005
Common Stock—(Continued)
| | | | | |
| Security Description | | Shares | | Value* |
| | | | | | |
| | |
Road & Rail—1.7% | | | | | |
Genesee & Wyoming, Inc. (a) | | 65,500 | | $ | 2,459,525 |
Laidlaw International, Inc. (a) | | 104,275 | | | 2,422,308 |
Landstar System, Inc. | | 27,600 | | | 1,152,024 |
Marten Transport, Ltd. (a) | | 63,563 | | | 1,158,109 |
| | | | |
|
|
| | | | | | 7,191,966 |
| | | | |
|
|
| |
Semiconductors & Semiconductor Equipment—4.9% | | | |
ADE Corp. (a) (b) | | 108,425 | | | 2,608,705 |
ATMI, Inc. (a) (b) | | 82,100 | | | 2,296,337 |
Diodes, Inc. (a) (b) | | 63,788 | | | 1,980,602 |
Fairchild Semiconductor International, Inc. (a) | | 122,750 | | | 2,075,702 |
Integrated Device Technology, Inc. (a) | | 100,275 | | | 1,321,625 |
Mattson Technology, Inc. (a) | | 213,700 | | | 2,149,822 |
Microsemi Corp. (a) | | 86,675 | | | 2,397,430 |
Netlogic Microsystems, Inc. (a) (b) | | 65,800 | | | 1,792,392 |
PMC-Sierra, Inc. (a) | | 111,575 | | | 860,243 |
Power Integrations, Inc. (a) (b) | | 65,950 | | | 1,570,270 |
Tessera Technologies, Inc. (a) (b) | | 66,050 | | | 1,707,393 |
| | | | |
|
|
| | | | | | 20,760,521 |
| | | | |
|
|
| | |
Software—3.2% | | | | | |
Blackboard, Inc. (b) | | 59,850 | | | 1,734,453 |
Epicor Software Corp. (b) | | 112,550 | | | 1,590,332 |
Hyperion Solutions Corp. (a) | | 56,025 | | | 2,006,815 |
Informatica Corp. (a) (b) | | 169,575 | | | 2,034,900 |
Intervoice, Inc. (a) (b) | | 69,650 | | | 554,414 |
MRO Software, Inc. (a) | | 32,825 | | | 460,863 |
Progress Software Corp. (a) | | 49,075 | | | 1,392,749 |
Quest Software, Inc. (a) | | 121,275 | | | 1,769,402 |
The Ultimate Software Group, Inc. (a) (b) | | 102,700 | | | 1,958,489 |
| | | | |
|
|
| | | | | | 13,502,417 |
| | | | |
|
|
| | |
Specialty Retail—2.0% | | | | | |
A.C. Moore Arts & Crafts, Inc. (a) (b) | | 15,775 | | | 229,526 |
Charlotte Russe Holding, Inc. (a) (b) | | 80,100 | | | 1,668,483 |
Guitar Center, Inc. (a) (b) | | 29,825 | | | 1,491,548 |
Hot Topic, Inc. (a) | | 41,900 | | | 597,075 |
The Children’s Place Retail Stores, Inc. (a) (b) | | 44,950 | | | 2,221,429 |
The Men’s Wearhouse, Inc. (a) | | 30,962 | | | 911,522 |
Zumiez, Inc. (a) (b) | | 35,650 | | | 1,540,793 |
| | | | |
|
|
| | | | | | 8,660,376 |
| | | | |
|
|
| | |
Textiles, Apparel & Luxury Goods—1.8% | | | | | |
Carter’s, Inc. (a) | | 46,000 | | | 2,707,100 |
Fossil, Inc. (a) (b) | | 46,800 | | | 1,006,668 |
Guess?, Inc. (a) (b) | | 50,700 | | | 1,804,920 |
Phillips-Van Heusen Corp. | | 64,025 | | | 2,074,410 |
| | | | |
|
|
| | | | | | 7,593,098 |
| | | | |
|
|
| | |
Trading Companies & Distributors—1.3% | | | | | |
BlueLinx Holdings, Inc. (a) (b) | | 112,075 | | | 1,260,844 |
Hughes Supply, Inc. | | 46,900 | | | 1,681,365 |
NuCo2, Inc. (a) (b) | | 60,575 | | | 1,688,831 |
UAP Holdings Corp. (a) | | 39,150 | | | 799,443 |
| | | | |
|
|
| | | | | | 5,430,483 |
| | | | |
|
|
| | | | | | |
| Security Description | | Shares | | Value* |
| | | | | | | |
| | |
Water Utilities—0.3% | | | | | | |
American State Water Co. (b) | | | 35,450 | | $ | 1,091,860 |
| | | | | |
|
|
| |
Wireless Telecommunication Services—0.4% | | | |
SBA Communications Corp.(a) (b) | | | 86,875 | | | 1,555,063 |
| | | | | |
|
|
Total Common Stock
(Identified Cost $340,858,105) | | | | | | 418,272,927 |
| | | | | |
|
|
| | |
| Short Term Investments—2.0% | | | | | | |
| Security Description | | Face
Amount | | Value* |
| | |
Commercial Paper—2.0% | | | | | | |
State Street Boston Corp.
2.900%, 01/03/06 | | $ | 8,541,000 | | | 8,539,624 |
| | | | | |
|
|
Total Short Term Investments
(Amortized Cost $8,539,624) | | | | | | 8,539,624 |
| | | | | |
|
|
Total Investments—99.9%
(Identified Cost $349,397,729) (c) | | | | | | 426,812,551 |
Other assets less liabilities | | | | | | 384,379 |
| | | | | |
|
|
| Total Net Assets—100% | | | | | $ | 427,196,930 |
| | | | | |
|
|
| (b) | A portion or all of the security was held on loan. As of December 31, 2005, the market value of securities loaned was $106,225,796 and the collateral received consisted of cash in the amount of $109,854,360. |
| (c) | The aggregate cost of investments for federal income tax purposes as of December 31, 2005 was $349,839,953 and the composition of unrealized appreciation and depreciation of investment securities was $82,506,483 and $(5,533,885), respectively. |
| (REIT)— | A Real Estate Investment Trust is a pooled investment vehicle that invests primarily in income-producing real estate or real estate related loans or interest. |
*See accompanying notes to financial statements.
MSF-231
Metropolitan Series Fund, Inc.
Loomis Sayles Small Cap Portfolio
Statement of Assets & Liabilities
December 31, 2005
| | | | | | | |
Assets | | | | | | | |
Investments at value | | | | | $ | 426,812,551 | |
Cash | | | | | | 2,825 | |
Collateral for securities loaned | | | | | | 109,854,360 | |
Receivable for: | | | | | | | |
Securities sold | | | | | | 2,467,930 | |
Fund shares sold | | | | | | 712,202 | |
Accrued interest and dividends | | | | | | 297,036 | |
| | | | | |
|
|
|
Total Assets | | | | | | 540,146,904 | |
Liabilities | | | | | | | |
Payable for: | | | | | | | |
Fund shares redeemed | | $ | 944,833 | | | | |
Securities purchased | | | 1,727,153 | | | | |
Withholding taxes | | | 266 | | | | |
Return of collateral for securities loaned | | | 109,854,360 | | | | |
Accrued expenses: | | | | | | | |
Management fees | | | 313,027 | | | | |
Service and distribution fees | | | 11,775 | | | | |
Deferred Directors’ fees | | | 24,996 | | | | |
Other expenses | | | 73,564 | | | | |
| | |
|
| | | | |
Total Liabilities | | | | | | 112,949,974 | |
| | | | | |
|
|
|
Net Assets | | | | | $ | 427,196,930 | |
| | | | | |
|
|
|
Net assets consists of: | | | | | | | |
Capital paid in | | | | | $ | 309,704,512 | |
Overdistributed net investment income | | | | | | (22,397 | ) |
Accumulated net realized gains | | | | | | 40,099,993 | |
Unrealized appreciation on investments | | | | | | 77,414,822 | |
| | | | | |
|
|
|
Net Assets | | | | | $ | 427,196,930 | |
| | | | | |
|
|
|
| Computation of offering price: | | | | | | | |
Class A | | | | | | | |
Net asset value and redemption price per share ($351,278,575 divided by 1,508,960 shares outstanding) | | | | | $ | 232.80 | |
| | | | | |
|
|
|
Class B | | | | | | | |
Net asset value and redemption price per share ($25,363,883 divided by
109,918 shares outstanding) | | | | | $ | 230.75 | |
| | | | | |
|
|
|
Class E | | | | | | | |
Net asset value and redemption price per share ($50,554,472 divided by
218,528 shares outstanding) | | | | | $ | 231.34 | |
| | | | | |
|
|
|
Identified cost of investments | | | | | $ | 349,397,729 | |
| | | | | |
|
|
|
Statement of Operations
For the Year Ended December 31, 2005
| | | | | | | | |
Investment Income | | | | | | | | |
Dividends | | | | | | $ | 3,549,326 | (a) |
Interest | | | | | | | 431,051 | (b) |
| | | | | | |
|
|
|
| | | | | | | | 3,980,377 | |
Expenses | | | | | | | | |
Management fees | | $ | 3,721,068 | | | | | |
Service and distribution fees—Class B | | | 38,346 | | | | | |
Service and distribution fees—Class E | | | 72,003 | | | | | |
Directors’ fees and expenses | | | 23,890 | | | | | |
Custodian | | | 137,019 | | | | | |
Audit and tax services | | | 21,767 | | | | | |
Legal | | | 10,413 | | | | | |
Printing | | | 105,594 | | | | | |
Insurance | | | 8,370 | | | | | |
Miscellaneous | | | 6,392 | | | | | |
| | |
|
|
| | | | |
Total expenses | | | 4,144,862 | | | | | |
Expense reductions | | | (111,039 | ) | | | | |
Management fee waivers | | | (140,295 | ) | | | 3,893,528 | |
| | |
|
|
| |
|
|
|
Net Investment Income | | | | | | | 86,849 | |
| | | | | | |
|
|
|
Realized and Unrealized Gain (Loss) | | | | | | | | |
| Realized gain on: | | | | | | | | |
Investments—net | | | | | | | 40,861,910 | |
| Unrealized depreciation on: | | | | | | | | |
Investments—net | | | | | | | (13,364,724 | ) |
| | | | | | |
|
|
|
Net gain | | | | | | | 27,497,186 | |
| | | | | | |
|
|
|
Net Increase in Net Assets From Operations | | | | | | $ | 27,584,035 | |
| | | | | | |
|
|
|
| (a) | Net of foreign taxes of $2,257. |
| (b) | Includes income on securities loaned of $148,825. |
See accompanying notes to financial statements.
MSF-232
Metropolitan Series Fund, Inc.
Loomis Sayles Small Cap Portfolio
Statement of Changes in Net Assets
| | | | | | | | |
| | | Year ended
December 31,
2005
| | | Year ended
December 31,
2004
| |
From Operations | | | | | | | | |
Net investment income (loss) | | $ | 86,849 | | | $ | (570,610 | ) |
Net realized gain | | | 40,861,910 | | | | 47,031,397 | |
Unrealized appreciation (depreciation) | | | (13,364,724 | ) | | | 13,734,212 | |
| | |
|
|
| |
|
|
|
Increase in net assets from operations | | | 27,584,035 | | | | 60,194,999 | |
| | |
|
|
| |
|
|
|
From Distributions to Shareholders | | | | | | | | |
Net realized gain | | | | | | | | |
Class A | | | (4,334,645 | ) | | | 0 | |
Class B | | | (148,451 | ) | | | 0 | |
Class E | | | (595,461 | ) | | | 0 | |
| | |
|
|
| |
|
|
|
Total distributions | | | (5,078,557 | ) | | | 0 | |
| | |
|
|
| |
|
|
|
Decrease in net assets from capital share transactions | | | (17,545,140 | ) | | | (18,222,379 | ) |
| | |
|
|
| |
|
|
|
Total increase in net assets | | | 4,960,338 | | | | 41,972,620 | |
| | |
Net Assets | | | | | | | | |
Beginning of the period | | | 422,236,592 | | | | 380,263,972 | |
| | |
|
|
| |
|
|
|
End of the period | | $ | 427,196,930 | | | $ | 422,236,592 | |
| | |
|
|
| |
|
|
|
Overdistributed Net Investment Income | | | | | | | | |
End of the period | | $ | (22,397 | ) | | $ | (20,771 | ) |
| | |
|
|
| |
|
|
|
Other Information:
Capital Shares
Transactions in capital shares were as follows:
| | | | | | | | | | | | | | |
| | | Year ended
December 31, 2005
| | | Year ended
December 31, 2004
| |
| | | Shares
| | | $
| | | Shares
| | | $
| |
Class A | | | | | | | | | | | | | | |
Sales | | 286,902 | | | $ | 63,039,143 | | | 303,175 | | | $ | 59,613,634 | |
Reinvestments | | 21,414 | | | | 4,334,645 | | | 0 | | | | 0 | |
Redemptions | | (470,538 | ) | | | (103,203,556 | ) | | (470,060 | ) | | | (92,542,660 | ) |
| | |
|
| |
|
|
| |
|
| |
|
|
|
Net decrease | | (162,222 | ) | | $ | (35,829,768 | ) | | (166,885 | ) | | $ | (32,929,026 | ) |
| | |
|
| |
|
|
| |
|
| |
|
|
|
Class B | | | | | | | | | | | | | | |
Sales | | 88,665 | | | $ | 19,357,914 | | | 30,672 | | | $ | 6,054,599 | |
Reinvestments | | 739 | | | | 148,451 | | | 0 | | | | 0 | |
Redemptions | | (8,868 | ) | | | (1,965,852 | ) | | (1,812 | ) | | | (356,158 | ) |
| | |
|
| |
|
|
| |
|
| |
|
|
|
Net increase | | 80,536 | | | $ | 17,540,513 | | | 28,860 | | | $ | 5,698,441 | |
| | |
|
| |
|
|
| |
|
| |
|
|
|
Class E | | | | | | | | | | | | | | |
Sales | | 33,265 | | | $ | 7,239,106 | | | 78,100 | | | $ | 15,255,194 | |
Reinvestments | | 2,957 | | | | 595,461 | | | 0 | | | | 0 | |
Redemptions | | (32,346 | ) | | | (7,090,452 | ) | | (31,534 | ) | | | (6,246,988 | ) |
| | |
|
| |
|
|
| |
|
| |
|
|
|
Net increase | | 3,876 | | | $ | 744,115 | | | 46,566 | | | $ | 9,008,206 | |
| | |
|
| |
|
|
| |
|
| |
|
|
|
Decrease derived from capital share transactions | | (77,810 | ) | | $ | (17,545,140 | ) | | (91,459 | ) | | $ | (18,222,379 | ) |
| | |
|
| |
|
|
| |
|
| |
|
|
|
See accompanying notes to financial statements.
MSF-233
Metropolitan Series Fund, Inc.
Loomis Sayles Small Cap Portfolio
Financial Highlights
| | | | | | | | | | | | | | | | | | | | |
| | | Class A
| |
| | | Year ended December 31,
| |
| | | 2005
| | | 2004
| | | 2003
| | | 2002
| | | 2001
| |
Net Asset Value, Beginning of Period | | $ | 220.60 | | | $ | 189.55 | | | $ | 138.89 | | | $ | 177.25 | | | $ | 210.41 | |
| | |
|
|
| |
|
|
| |
|
|
| |
|
|
| |
|
|
|
Income From Investment Operations | | | | | | | | | | | | | | | | | | | | |
Net investment income (loss) | | | 0.11 | | | | (0.27 | ) | | | (0.34 | ) | | | 0.14 | | | | 0.34 | |
Net realized and unrealized gain (loss) of investments | | | 14.79 | | | | 31.32 | | | | 51.00 | | | | (38.32 | ) | | | (19.28 | ) |
| | |
|
|
| |
|
|
| |
|
|
| |
|
|
| |
|
|
|
Total from investment operations | | | 14.90 | | | | 31.05 | | | | 50.66 | | | | (38.18 | ) | | | (18.94 | ) |
| | |
|
|
| |
|
|
| |
|
|
| |
|
|
| |
|
|
|
Less Distributions | | | | | | | | | | | | | | | | | | | | |
Distributions from net investment income | | | 0.00 | | | | 0.00 | | | | 0.00 | | | | (0.18 | ) | | | (0.53 | ) |
Distributions from net realized capital gains | | | (2.70 | ) | | | 0.00 | | | | 0.00 | | | | 0.00 | | | | (12.67 | ) |
Distributions in excess of net realized capital gains | | | 0.00 | | | | 0.00 | | | | 0.00 | | | | 0.00 | | | | (1.02 | ) |
| | |
|
|
| |
|
|
| |
|
|
| |
|
|
| |
|
|
|
Total distributions | | | (2.70 | ) | | | 0.00 | | | | 0.00 | | | | (0.18 | ) | | | (14.22 | ) |
| | |
|
|
| |
|
|
| |
|
|
| |
|
|
| |
|
|
|
Net Asset Value, End of Period | | $ | 232.80 | | | $ | 220.60 | | | $ | 189.55 | | | $ | 138.89 | | | $ | 177.25 | |
| | |
|
|
| |
|
|
| |
|
|
| |
|
|
| |
|
|
|
Total Return (%) | | | 6.9 | | | | 16.4 | | | | 36.5 | | | | (21.6 | ) | | | (8.8 | ) |
Ratio of operating expenses to average net assets before expense reductions (%) | | | 0.94 | | | | 0.98 | | | | 0.99 | | | | 0.97 | | | | 1.00 | |
Ratio of operating expenses to average net assets after expense reductions (%) (d) | | | 0.91 | | | | 0.95 | | | | — | | | | 0.97 | | | | 1.00 | |
Ratio of operating expenses to average net assets without giving effect to the contractual expense agreement would have been (%) | | | 0.94 | | | | 0.98 | | | | 0.99 | | | | 0.97 | | | | 1.00 | |
Ratio of net investment income (loss) to average net assets (%) | | | 0.05 | | | | (0.13 | ) | | | (0.21 | ) | | | 0.14 | | | | 0.18 | |
Portfolio turnover rate (%) | | | 101 | | | | 135 | | | | 118 | | | | 99 | | | | 111 | |
Net assets, end of period (000) | | $ | 351,279 | | | $ | 368,666 | | | $ | 348,406 | | | $ | 281,477 | | | $ | 406,525 | |
| | | | | | | | | | | | | | | | |
| | | Class B
| |
| | | Year ended December 31,
| | | July 29, 2002(a)
through
December 31,
2002
| |
| | | 2005
| | | 2004
| | | 2003
| | |
Net Asset Value, Beginning of Period | | $ | 219.20 | | | $ | 188.59 | | | $ | 138.20 | | | $ | 144.89 | |
| | |
|
|
| |
|
|
| |
|
|
| |
|
|
|
Income From Investment Operations | | | | | | | | | | | | | | | | |
Net investment income (loss) | | | (0.25 | ) | | | 0.08 | | | | (0.24 | ) | | | 0.00 | |
Net realized and unrealized gain (loss) of investments | | | 14.50 | | | | 30.53 | | | | 50.63 | | | | (6.69 | ) |
| | |
|
|
| |
|
|
| |
|
|
| |
|
|
|
Total from investment operations | | | 14.25 | | | | 30.61 | | | | 50.39 | | | | (6.69 | ) |
| | |
|
|
| |
|
|
| |
|
|
| |
|
|
|
Less Distributions | | | | | | | | | | | | | | | | |
Distributions from net realized capital gains | | | (2.70 | ) | | | 0.00 | | | | 0.00 | | | | 0.00 | |
| | |
|
|
| |
|
|
| |
|
|
| |
|
|
|
Total distributions | | | (2.70 | ) | | | 0.00 | | | | 0.00 | | | | 0.00 | |
| | |
|
|
| |
|
|
| |
|
|
| |
|
|
|
Net Asset Value, End of Period | | $ | 230.75 | | | $ | 219.20 | | | $ | 188.59 | | | $ | 138.20 | |
| | |
|
|
| |
|
|
| |
|
|
| |
|
|
|
Total Return (%) | | | 6.7 | | | | 16.2 | | | | 36.5 | | | | (4.6 | )(b) |
Ratio of operating expenses to average net assets before expense reductions (%) | | | 1.19 | | | | 1.23 | | | | 1.24 | | | | 1.22 | (c) |
Ratio of operating expenses to average net assets after expense reductions (%) (d) | | | 1.17 | | | | 1.20 | | | | — | | | | 1.22 | (c) |
Ratio of operating expenses to average net assets without giving effect to the contractual expense agreement would have been (%) | | | 1.19 | | | | 1.23 | | | | 1.24 | | | | 1.22 | (c) |
Ratio of net investment income (loss) to average net assets (%) | | | (0.16 | ) | | | (0.07 | ) | | | (0.46 | ) | | | 0.00 | (c) |
Portfolio turnover rate (%) | | | 101 | | | | 135 | | | | 118 | | | | 99 | |
Net assets, end of period (000) | | $ | 25,364 | | | $ | 6,440 | | | $ | 98 | | | $ | 1 | |
| (a) | Commencement of operations. |
| (b) | Period less than one year is not computed on an annualized basis. |
| (c) | Computed on an annualized basis. |
| (d) | The Portfolio has entered into arrangements with certain brokers who paid a portion of the Portfolio’s expenses. |
See accompanying notes to financial statements.
MSF-234
Metropolitan Series Fund, Inc.
Loomis Sayles Small Cap Portfolio
Financial Highlights
| | | | | | | | | | | | | | | | | | | | |
| | | Class E
| |
| | | Year ended December 31,
| | | May 1, 2001(a)
through
December 31,
2001
| |
| | | 2005
| | | 2004
| | | 2003
| | | 2002
| | |
Net Asset Value, Beginning of Period | | $ | 219.57 | | | $ | 188.95 | | | $ | 138.65 | | | $ | 177.03 | | | $ | 179.40 | |
| | |
|
|
| |
|
|
| |
|
|
| |
|
|
| |
|
|
|
Income from Investment Operations | | | | | | | | | | | | | | | | | | | | |
Net investment income (loss) | | | (0.21 | ) | | | (0.45 | ) | | | (0.37 | ) | | | 0.03 | | | | 0.07 | |
Net realized and unrealized gain (loss) of investments | | | 14.68 | | | | 31.07 | | | | 50.67 | | | | (38.32 | ) | | | (2.44 | ) |
| | |
|
|
| |
|
|
| |
|
|
| |
|
|
| |
|
|
|
Total from investment operations | | | 14.47 | | | | 30.62 | | | | 50.30 | | | | (38.29 | ) | | | (2.37 | ) |
| | |
|
|
| |
|
|
| |
|
|
| |
|
|
| |
|
|
|
Less Distributions | | | | | | | | | | | | | | | | | | | | |
Distributions from net investment income | | | 0.00 | | | | 0.00 | | | | 0.00 | | | | (0.09 | ) | | | 0.00 | |
Distributions from net realized capital gains | | | (2.70 | ) | | | 0.00 | | | | 0.00 | | | | 0.00 | | | | 0.00 | |
| | |
|
|
| |
|
|
| |
|
|
| |
|
|
| |
|
|
|
Total distributions | | | (2.70 | ) | | | 0.00 | | | | 0.00 | | | | (0.09 | ) | | | 0.00 | |
| | |
|
|
| |
|
|
| |
|
|
| |
|
|
| |
|
|
|
Net Asset Value, End of Period | | $ | 231.34 | | | $ | 219.57 | | | $ | 188.95 | | | $ | 138.65 | | | $ | 177.03 | |
| | |
|
|
| |
|
|
| |
|
|
| |
|
|
| |
|
|
|
Total Return (%) | | | 6.8 | | | | 16.2 | | | | 36.3 | | | | (21.6 | ) | | | (1.3 | )(b) |
Ratio of operating expenses to average net assets before expense reductions (%) | | | 1.09 | | | | 1.13 | | | | 1.14 | | | | 1.12 | | | | 1.15 | (c) |
Ratio of operating expenses to average net assets after expense reductions (%) (d) | | | 1.06 | | | | 1.10 | | | | — | | | | 1.12 | | | | 1.15 | (c) |
Ratio of operating expenses to average net assets without giving effect to the contractual expense agreement would have been (%) | | | 1.09 | | | | 1.13 | | | | 1.14 | | | | 1.12 | | | | 1.15 | (c) |
Ratio of net investment income (loss) to average net assets (%) | | | (0.10 | ) | | | (0.26 | ) | | | (0.37 | ) | | | (0.01 | ) | | | 0.03 | (c) |
Portfolio turnover rate (%) | | | 101 | | | | 135 | | | | 118 | | | | 99 | | | | 111 | |
Net assets, end of period (000) | | $ | 50,554 | | | $ | 47,131 | | | $ | 31,759 | | | $ | 10,242 | | | $ | 2,142 | |
| (a) | Commencement of operations. |
| (b) | Period less than one year is not computed on an annualized basis. |
| (c) | Computed on an annualized basis. |
| (d) | The Portfolio has entered into arrangements with certain brokers who paid a portion of the Portfolio’s expenses. |
See accompanying notes to financial statements.
MSF-235
Metropolitan Series Fund, Inc.
Russell 2000 Index Portfolio
Schedule of Investments as of December 31, 2005
Common Stock—95.2% of Total Net Assets
| | | | | |
| Security Description | | Shares | | Value* |
| | | | | | |
|
Aerospace & Defense—1.6% |
AAR Corp. | | 14,050 | | $ | 336,497 |
Aeroflex, Inc. (a) (b) | | 25,179 | | | 270,674 |
Applied Signal Technology, Inc. | | 2,949 | | | 66,942 |
Argon, Inc. (b) | | 2,900 | | | 89,842 |
Armor Holdings, Inc. (a) (b) | | 11,157 | | | 475,846 |
Aviall, Inc. (a) (b) | | 10,891 | | | 313,661 |
BE Aerospace, Inc. (a) | | 18,551 | | | 408,122 |
Cubic Corp. (a) | | 5,113 | | | 102,055 |
Curtiss Wright Corp. (a) | | 7,744 | | | 422,822 |
DRS Technologies, Inc. (a) | | 9,853 | | | 506,641 |
EDO Corp. (a) | | 5,132 | | | 138,872 |
Engineered Support Systems, Inc. | | 14,790 | | | 615,856 |
Essex Corp. (a) (b) | | 5,739 | | | 97,850 |
GenCorp, Inc. (a) | | 17,581 | | | 312,063 |
HEICO Corp. (a) | | 6,112 | | | 158,179 |
HEICO Corp. (Class A) | | 371 | | | 7,613 |
Herley Industries, Inc. (b) | | 4,812 | | | 79,446 |
Hexcel Corp. (a) | | 18,556 | | | 334,936 |
Innovative Solutions & Support (a) | | 7,425 | | | 94,892 |
Ionatron, Inc. (a) | | 8,248 | | | 83,387 |
K&F Industries Holdings, Inc. | | 5,316 | | | 81,654 |
Kaman Corp. | | 7,959 | | | 156,713 |
Mercury Computer Systems, Inc. (b) | | 7,510 | | | 154,931 |
Moog, Inc. (b) | | 10,933 | | | 310,279 |
MTC Technologies, Inc. (a) (b) | | 3,316 | | | 90,792 |
Orbital Sciences Corp. (a) (b) | | 17,639 | | | 226,485 |
Sequa Corp. (Class A) (a) (b) | | 2,518 | | | 173,868 |
Triumph Group, Inc. | | 5,638 | | | 206,407 |
United Industrial Corp. (a) | | 2,920 | | | 120,800 |
World Fuel Services Corp. (a) | | 10,220 | | | 344,618 |
| | | | |
|
|
| | | | | | 6,782,743 |
| | | | |
|
|
|
Air Freight & Logistics—0.3% |
ABX Air, Inc. | | 19,408 | | | 151,965 |
Dynamex, Inc. (a) | | 4,083 | | | 77,822 |
EGL, Inc. (a) | | 10,649 | | | 400,083 |
Forward Air Corp. | | 11,946 | | | 437,821 |
Hub Group, Inc. (Class A) (a) | | 6,483 | | | 229,174 |
| | | | |
|
|
| | | | | | 1,296,865 |
| | | | |
|
|
|
Airlines—0.6% |
AirTran Holdings, Inc. (a) (b) | | 29,552 | | | 473,718 |
Alaska Air Group, Inc. (b) | | 9,461 | | | 337,947 |
Continental Airlines, Inc. (Class B) (a) | | 28,999 | | | 617,679 |
ExpressJet Holdings, Inc. (a) | | 15,961 | | | 129,124 |
Frontier Airlines, Inc. (a) (b) | | 12,420 | | | 114,761 |
Mesa Air Group, Inc. (a) | | 14,947 | | | 156,346 |
Republic Airways Holdings, Inc. (b) | | 4,353 | | | 66,166 |
SkyWest, Inc. | | 20,389 | | | 547,648 |
World Air Holdings, Inc. | | 8,122 | | | 78,134 |
| | | | |
|
|
| | | | | | 2,521,523 |
| | | | |
|
|
|
Auto Components—0.9% |
Aftermarket Technology Corp. (a) | | 7,198 | | | 139,929 |
American Axle & Manufacturing Holdings, Inc. (a) | | 13,960 | | | 255,887 |
ArvinMeritor, Inc. (a) | | 26,037 | | | 374,672 |
| | | | | |
| Security Description | | Shares | | Value* |
| | | | | | |
|
Auto Components—(Continued) |
Bandag, Inc. | | 4,766 | | $ | 203,365 |
Commercial Vehicle Group, Inc. (a) (b) | | 5,540 | | | 104,041 |
Cooper Tire & Rubber Co. (a) | | 21,039 | | | 322,318 |
Federal Signal Corp. (a) | | 17,277 | | | 259,328 |
Keystone Automotive Industries, Inc. (a) | | 6,973 | | | 219,510 |
LKQ Corp. | | 6,695 | | | 231,781 |
Midas, Inc. (a) | | 4,743 | | | 87,081 |
Modine Manufacturing Co. | | 13,136 | | | 428,102 |
Sauer-Danfoss, Inc. | | 3,084 | | | 58,010 |
Strattec Security Corp. | | 1,859 | | | 75,141 |
Superior Industries International, Inc. (a) | | 7,938 | | | 176,700 |
Tenneco Automotive, Inc. (a) | | 14,015 | | | 274,834 |
Visteon Corp. | | 41,307 | | | 258,582 |
Wabtec Corp. | | 15,271 | | | 410,790 |
| | | | |
|
|
| | | | | | 3,880,071 |
| | | | |
|
|
|
Automobiles—0.2% |
Monaco Coach Corp. (a) (b) | | 9,051 | | | 120,378 |
Thor Industries, Inc. (a) | | 11,946 | | | 478,676 |
Winnebago Industries, Inc. (a) | | 10,864 | | | 361,554 |
| | | | |
|
|
| | | | | | 960,608 |
| | | | |
|
|
|
Beverages—0.2% |
Boston Beer, Inc. (b) | | 4,833 | | | 120,825 |
Coca-Cola Bottling Co. (a) | | 2,580 | | | 110,940 |
Hansen Natural Corp. (a) | | 5,086 | | | 400,828 |
Peet’s Coffee & Tea, Inc. (a) (b) | | 5,683 | | | 172,479 |
| | | | |
|
|
| | | | | | 805,072 |
| | | | |
|
|
|
Biotechnology—3.4% |
Aastrom Biosciences, Inc. (a) | | 34,746 | | | 73,314 |
Abgenix, Inc. (b) | | 29,357 | | | 631,469 |
Albany Molecular Research, Inc. | | 8,652 | | | 105,122 |
Alexion Pharmaceuticals, Inc. (a) | | 10,417 | | | 210,944 |
Alkermes, Inc. (a) (b) | | 32,024 | | | 612,299 |
Amylin Pharmaceuticals, Inc. (a) (b) | | 36,492 | | | 1,456,761 |
Applera Corp.—Celera Genomics Group (b) | | 25,586 | | | 280,423 |
Arena Pharmaceuticals, Inc. | | 12,151 | | | 172,787 |
Arqule, Inc. (a) | | 11,022 | | | 67,455 |
Array Biopharma, Inc. (a) | | 11,092 | | | 77,755 |
Bioenvision, Inc. (a) | | 11,856 | | | 77,420 |
BioMarin Pharmaceutical, Inc. (a) | | 24,964 | | | 269,112 |
Cell Genesys, Inc. (a) | | 14,634 | | | 86,780 |
Cepheid, Inc. (a) | | 13,763 | | | 120,839 |
Connetics Corp. (a) | | 11,816 | | | 170,741 |
Cotherix, Inc. (a) | | 5,412 | | | 57,475 |
Cubist Pharmaceuticals, Inc. (a) | | 19,499 | | | 414,354 |
CuRagen Corp. (a) | | 15,347 | | | 47,269 |
Curis, Inc. (a) | | 14,198 | | | 50,545 |
CV Therapeutics, Inc. (a) | | 15,971 | | | 394,963 |
Decode Genetics, Inc. (a) | | 16,241 | | | 134,151 |
Dendreon Corp. (a) | | 18,686 | | | 101,278 |
Digene Corp. (a) (b) | | 4,926 | | | 143,691 |
Encysive Pharmaceuticals, Inc. (a) (b) | | 17,726 | | | 139,858 |
Enzo Biochem, Inc. (a) | | 10,914 | | | 135,552 |
Enzon Pharmaceuticals, Inc. (a) | | 15,476 | | | 114,522 |
*See accompanying notes to financial statements.
MSF-236
Metropolitan Series Fund, Inc.
Russell 2000 Index Portfolio
Schedule of Investments as of December 31, 2005
Common Stock—(Continued)
| | | | | |
| Security Description | | Shares | | Value* |
| | | | | | |
|
Biotechnology—(Continued) |
Exelixis, Inc. (a) | | 27,242 | | $ | 256,620 |
Genta, Inc. | | 1 | | | 1 |
Geron Corp. (a) | | 19,708 | | | 169,686 |
Human Genome Sciences, Inc. (a) (b) | | 44,018 | | | 376,794 |
ICOS Corp. (a) (b) | | 20,708 | | | 572,162 |
Immunogen, Inc. | | 12,894 | | | 66,146 |
Incyte Corp. (a) (b) | | 27,378 | | | 146,198 |
ISIS Pharmaceuticals, Inc. (a) | | 15,866 | | | 83,138 |
Keryx Biopharmaceuticals, Inc. (a) (b) | | 9,652 | | | 141,305 |
Lexicon Genetics, Inc. (a) | | 20,699 | | | 75,551 |
Lifecell Corp. (a) | | 12,585 | | | 239,996 |
Luminex Corp. (a) | | 7,720 | | | 89,706 |
Martek Biosciences Corp. (b) | | 10,208 | | | 251,219 |
Maxygen, Inc. (a) | | 7,779 | | | 58,420 |
Medarex, Inc. (a) | | 35,803 | | | 495,872 |
Momenta Pharmaceuticals, Inc. (a) | | 3,016 | | | 66,473 |
Monogram Biosciences, Inc. (a) | | 40,442 | | | 75,627 |
Myogen, Inc. (a) | | 8,664 | | | 261,306 |
Myriad Genetics, Inc. | | 11,240 | | | 233,792 |
Nabi Biopharmaceuticals (b) | | 19,772 | | | 66,829 |
Neurocrine Biosciences, Inc. (a) (b) | | 12,908 | | | 809,719 |
Northfield Laboratories, Inc. (a) | | 8,731 | | | 116,995 |
Nuvelo, Inc. (a) (b) | | 13,599 | | | 110,288 |
Onyx Pharmaceuticals, Inc. (a) | | 12,500 | | | 359,500 |
OraSure Technologies, Inc. (a) (b) | | 13,839 | | | 122,060 |
PRA International (a) | | 3,841 | | | 108,124 |
Progenics Pharmaceuticals, Inc. | | 8,091 | | | 202,356 |
Regeneron Pharmaceuticals, Inc. (a) | | 12,117 | | | 193,266 |
Savient Pharmaceuticals, Inc. (a) | | 20,981 | | | 78,469 |
Senomyx, Inc. (b) | | 7,131 | | | 86,428 |
Serologicals Corp. (b) | | 11,251 | | | 222,095 |
Stemcells, Inc. (a) | | 21,515 | | | 74,227 |
Tanox, Inc. (a) | | 7,862 | | | 128,701 |
Telik, Inc. (a) (b) | | 19,117 | | | 324,798 |
United Therapeutics Corp. (a) | | 7,584 | | | 524,206 |
Vertex Pharmaceuticals, Inc. (a) (b) | | 32,928 | | | 911,118 |
Zymogenetics, Inc. | | 12,336 | | | 209,835 |
| | | | |
|
|
| | | | | | 14,455,905 |
| | | | |
|
|
| | |
Building Products—0.9% | | | | | |
American Woodmark Corp. (a) | | 3,650 | | | 90,484 |
Apogee Enterprises, Inc. | | 10,965 | | | 177,852 |
Builders Firstsource, Inc. | | 3,888 | | | 83,087 |
Color Kinetics, Inc. (a) (b) | | 4,601 | | | 66,209 |
Crane Co. (a) | | 16,681 | | | 588,339 |
Drew Industries, Inc. (a) | | 4,936 | | | 139,146 |
ElkCorp. (a) | | 6,570 | | | 221,146 |
Griffon Corp. (a) | | 8,946 | | | 213,004 |
Interline Brands, Inc. (b) | | 4,247 | | | 96,619 |
Jacuzzi Brands, Inc. (a) | | 23,923 | | | 200,953 |
Lennox International, Inc. | | 17,636 | | | 497,335 |
NCI Building Systems, Inc. (a) | | 6,863 | | | 291,540 |
Simpson Manufacturing, Inc. | | 11,740 | | | 426,749 |
Trex Co., Inc. (a) (b) | | 3,357 | | | 94,164 |
Universal Forest Products, Inc. (a) | | 5,221 | | | 288,460 |
Watsco, Inc. | | 7,183 | | | 429,615 |
| | | | |
|
|
| | | | | | 3,904,702 |
| | | | |
|
|
| | | | | |
| Security Description | | Shares | | Value* |
| | | | | | |
| | |
Capital Markets—0.1% | | | | | |
Greenhill & Co., Inc. (a) | | 3,962 | | $ | 222,506 |
IntercontinentalExchange, Inc. (b) | | 6,176 | | | 224,498 |
| | | | |
|
|
| | | | | | 447,004 |
| | | | |
|
|
| | |
Chemicals—1.2% | | | | | |
A. Schulman , Inc. (a) | | 10,504 | | | 226,046 |
American Vanguard Corp. (a) | | 3,744 | | | 87,984 |
Arch Chemicals, Inc. | | 7,821 | | | 233,848 |
Balchem Corp. | | 2,615 | | | 77,953 |
Calgon Carbon Corp. (a) | | 11,412 | | | 64,934 |
Cambrex Corp. | | 9,629 | | | 180,736 |
CF Industries Holdings, Inc. | | 13,095 | | | 199,699 |
Ferro Corp. | | 15,010 | | | 281,588 |
Georgia Gulf Corp. (a) | | 11,035 | | | 335,685 |
H.B. Fuller Co. (a) | | 10,183 | | | 326,569 |
Hercules, Inc. (b) | | 35,083 | | | 396,438 |
MacDermid, Inc. | | 9,830 | | | 274,257 |
Minerals Technologies, Inc. | | 6,658 | | | 372,116 |
NewMarket Corp. (a) | | 4,951 | | | 121,101 |
Octel Corp. | | 3,588 | | | 58,377 |
Olin Corp. | | 22,605 | | | 444,866 |
OM Group, Inc. (a) | | 8,796 | | | 165,013 |
PolyOne Corp. (a) | | 28,510 | | | 183,319 |
Rockwood Holdings, Inc. | | 6,488 | | | 128,008 |
Spartech Corp. (a) | | 10,539 | | | 231,331 |
Symyx Technologies, Inc. (b) | | 10,589 | | | 288,974 |
W.R. Grace & Co. (a) (c) | | 21,867 | | | 205,550 |
Wellman, Inc. | | 11,423 | | | 77,448 |
Westlake Chemical Corp. | | 5,818 | | | 167,617 |
| | | | |
|
|
| | | | | | 5,129,457 |
| | | | |
|
|
|
Commercial Banks—9.2% |
1st Source Corp. (a) | | 3,372 | | | 84,806 |
Accredited Home Lenders Holding Co. | | 6,732 | | | 333,773 |
Alabama National Bancorp (a) | | 5,141 | | | 332,931 |
Amcore Financial, Inc. (a) | | 8,213 | | | 249,757 |
Americanwest Bancorp | | 3,389 | | | 80,082 |
Ameris Bancorp (a) | | 5,673 | | | 112,552 |
Ames National Corp. (a) | | 2,838 | | | 72,965 |
Anchor Bancorp Wisconsin, Inc. (a) | | 8,816 | | | 267,477 |
Archipelago Holdings, Inc. (a) | | 9,564 | | | 476,000 |
Arrow Financial Corp. (a) | | 3,518 | | | 91,996 |
Bancfirst Corp. (a) | | 1,787 | | | 141,173 |
BancorpSouth, Inc. (a) | | 25,689 | | | 566,956 |
Bank Mutual Corp. | | 18,775 | | | 199,015 |
Bank of Granite Corp. | | 5,282 | | | 97,875 |
Bank of the Ozarks, Inc. (a) | | 4,816 | | | 177,710 |
BankAtlantic Bancorp, Inc. (Class A) (a) | | 14,201 | | | 198,814 |
BankFinancial Corp. | | 7,767 | | | 114,020 |
BankUnited Financial Corp. (b) | | 8,289 | | | 220,239 |
Banner Corp. | | 3,581 | | | 111,727 |
Berkshire Hill Bancorp, Inc. | | 2,446 | | | 81,941 |
Boston Private Financial Holdings, Inc. (a) | | 11,538 | | | 350,986 |
Brookline Bancorp, Inc. (a) | | 19,909 | | | 282,111 |
Camden National Corp. | | 3,268 | | | 107,452 |
*See accompanying notes to financial statements.
MSF-237
Metropolitan Series Fund, Inc.
Russell 2000 Index Portfolio
Schedule of Investments as of December 31, 2005
Common Stock—(Continued)
| | | | | |
| Security Description | | Shares | | Value* |
| | | | | | |
|
Commercial Banks—(Continued) |
Capital City Bank Group, Inc. (a) | | 5,262 | | $ | 180,434 |
Capital Corp. of the West | | 3,036 | | | 98,518 |
Capital Crossing Bank (a) | | 2,132 | | | 71,209 |
Capitol Bancorp, Ltd. | | 5,117 | | | 191,580 |
Cardinal Financial Corp. | | 7,941 | | | 87,351 |
Cascade Bancorp. (a) | | 6,290 | | | 144,733 |
Cathay General Bancorp. (a) (b) | | 15,224 | | | 547,151 |
Centennial Bank Holdings, Inc. (a) | | 20,017 | | | 247,610 |
Center Financial Corp. | | 3,217 | | | 80,940 |
Central Coast Bancorp. | | 3,220 | | | 79,663 |
Central Pacific Financial Corp. | | 10,034 | | | 360,421 |
Chemical Financial Corp. | | 8,203 | | | 260,527 |
Chittenden Corp. | | 14,881 | | | 413,841 |
Citizens & Citizens North Corp. (a) | | 2,813 | | | 72,093 |
Citizens Banking Corp. | | 15,545 | | | 431,374 |
City Bank | | 2,666 | | | 94,830 |
City Holdings Co. | | 6,400 | | | 230,080 |
Coastal Financial Corp. (a) | | 5,187 | | | 66,705 |
Cobiz, Inc. (a) | | 4,270 | | | 77,842 |
Columbia Bancorp | | 1,620 | | | 66,825 |
Columbia Banking Systems, Inc. | | 6,690 | | | 191,000 |
Community Bancorp (b) | | 1,971 | | | 62,303 |
Community Bank Systems, Inc. (a) | | 10,287 | | | 231,972 |
Community Bank, Inc. (a) | | 8,431 | | | 236,068 |
Community Trust Bancorp, Inc. | | 4,810 | | | 147,908 |
Corus Bankshares, Inc. (a) | | 6,070 | | | 341,559 |
CVB Financial Corp. | | 14,958 | | | 303,797 |
Dime Community Bancorp, Inc. | | 10,912 | | | 159,424 |
Enstar Group, Inc. (a) | | 1,068 | | | 70,755 |
F.N.B. Corp. (a) | | 18,785 | | | 326,108 |
F.N.B. Corp. (Virginia) (a) | | 2,623 | | | 80,447 |
Farmers Capital Bank Corp. (a) | | 2,164 | | | 66,521 |
Fidelity Bankshares, Inc. (a) | | 6,991 | | | 228,606 |
Financial Institutions, Inc. | | 3,294 | | | 64,628 |
First Bancorp. (a) | | 4,498 | | | 90,680 |
First Bancorp. (Puerto Rico) | | 21,228 | | | 263,439 |
First Busey Corp. (a) | | 4,770 | | | 99,645 |
First Charter Corp. | | 9,752 | | | 230,732 |
First Citizens BancShares, Inc. | | 1,983 | | | 345,875 |
First Commonwealth Financial Corp. | | 24,741 | | | 319,901 |
First Community Bancorp, Inc. | | 4,289 | | | 233,193 |
First Community Bancshares, Inc. (a) | | 3,168 | | | 98,715 |
First Defiance Financial Corp. | | 2,429 | | | 65,802 |
First Financial Bancorp (a) | | 11,494 | | | 201,375 |
First Financial Bankshares, Inc. (a) | | 5,997 | | | 210,255 |
First Financial Corp. | | 4,482 | | | 121,014 |
First Financial Holdings, Inc. | | 4,175 | | | 128,256 |
First Indiana Corp. (a) | | 4,689 | | | 161,208 |
First Merchants Corp. (a) | | 7,299 | | | 189,774 |
First Midwest Bancorp, Inc. | | 16,199 | | | 567,937 |
First Niagara Financial Group, Inc. | | 37,343 | | | 540,353 |
First Oak Brook Bancshares, Inc. | | 2,420 | | | 67,639 |
First Place Financial Corp. | | 5,245 | | | 126,142 |
First Republic Bank | | 7,313 | | | 270,654 |
First State Bancorp | | 4,936 | | | 118,415 |
FirstFed Financial Corp. (a) (b) | | 6,033 | | | 328,919 |
Flagstar Bancorp, Inc. (a) | | 10,415 | | | 149,976 |
| | | | | |
| Security Description | | Shares | | Value* |
| | | | | | |
|
Commercial Banks—(Continued) |
Flushing Financial Corp. | | 8,744 | | $ | 136,144 |
Franklin Bank Corp. (a) (b) | | 6,748 | | | 121,397 |
Frontier Financial Corp. (a) | | 8,158 | | | 261,056 |
Glacier Bancorp, Inc. | | 10,018 | | | 301,041 |
Gold Banc Corp., Inc. | | 12,586 | | | 229,317 |
Great Southern Bancorp, Inc. (a) | | 3,002 | | | 82,885 |
Greater Bay Bancorp | | 16,355 | | | 419,015 |
Greene County Bancshares, Inc. | | 2,273 | | | 62,189 |
Hancock Holding Co. (a) | | 9,534 | | | 360,481 |
Hanmi Financial Corp. | | 13,067 | | | 233,377 |
Harbor Florida Bancshares, Inc. (a) | | 6,820 | | | 252,681 |
Harleysville National Corp. | | 9,341 | | | 178,413 |
Heritage Commerce Corp. | | 4,076 | | | 87,634 |
Horizon Financial Corp. (a) | | 3,556 | | | 77,663 |
Hudson United Bancorp | | 15,841 | | | 660,253 |
Iberiabank Corp. | | 2,998 | | | 152,928 |
Independent Bank Corp. | | 7,554 | | | 205,695 |
Independent Bank Corp. (Massachusetts) | | 4,782 | | | 136,430 |
Integra Bank Corp. (a) | | 5,066 | | | 108,108 |
Interchange Financial Services Corp. | | 7,059 | | | 121,768 |
Investors Bancorp, Inc. | | 17,402 | | | 191,944 |
iPayment Holdings, Inc. (b) | | 4,207 | | | 174,675 |
Irwin Financial Corp. (a) | | 6,221 | | | 133,254 |
ITLA Capital Corp. | | 1,943 | | | 94,916 |
Kearny Financial Corp. (a) | | 7,535 | | | 91,927 |
Lakeland Bancorp, Inc. (a) | | 7,976 | | | 117,247 |
Lakeland Financial Corp. | | 2,403 | | | 97,033 |
Macatawa Bank Corp. (a) | | 3,359 | | | 122,200 |
MAF Bancorp, Inc. | | 10,444 | | | 432,173 |
Main Street Bank, Inc. | | 5,902 | | | 160,711 |
Mainsource Financial Group, Inc. (a) | | 3,554 | | | 63,439 |
MB Financial, Inc. | | 7,154 | | | 253,252 |
MBT Financial Corp. (a) | | 5,287 | | | 85,649 |
Mercantile Bankcorp | | 2,340 | | | 90,090 |
Mid-State Bancshares (a) | | 8,118 | | | 217,156 |
Midwest Banc Holdings, Inc. (a) | | 6,195 | | | 137,839 |
Nara Bancorp, Inc. (a) | | 5,666 | | | 100,741 |
National Penn Bancshares, Inc. (a) | | 13,631 | | | 259,671 |
NBC Capital Corp. | | 1 | | | 24 |
NBT Bancorp, Inc. | | 10,769 | | | 232,503 |
Net.Bank, Inc. (a) | | 16,110 | | | 115,670 |
NewAlliance Bancshares, Inc. (a) | | 36,873 | | | 536,133 |
Northern Empire Bancshares (a) | | 2,724 | | | 64,450 |
Northwest Bancorp, Inc. | | 6,125 | | | 130,218 |
Oceanfirst Financial Corp. (a) | | 2,840 | | | 64,638 |
Ocwen Financial Corp. (a) | | 13,008 | | | 113,170 |
Old National Bancorp (a) | | 21,863 | | | 473,115 |
Old Second Bancorp, Inc. | | 4,900 | | | 149,793 |
Omega Financial Corp. (a) | | 3,762 | | | 104,847 |
Oriental Financial Group, Inc. (a) | | 6,400 | | | 79,104 |
Pacific Capital Bancorp (a) | | 15,303 | | | 544,481 |
Park National Corp. (a) | | 3,936 | | | 403,991 |
Partners Trust Financial Group, Inc. | | 16,463 | | | 198,379 |
Peapack Gladstone Financial Corp. (a) | | 2,996 | | | 83,588 |
Peoples Bancorp, Inc. | | 3,541 | | | 101,025 |
PFF Bancorp, Inc. | | 6,468 | | | 197,403 |
Pinnacle Financial Partners, Inc. (a) | | 2,538 | | | 63,399 |
*See accompanying notes to financial statements.
MSF-238
Metropolitan Series Fund, Inc.
Russell 2000 Index Portfolio
Schedule of Investments as of December 31, 2005
Common Stock—(Continued)
| | | | | |
| Security Description | | Shares | | Value* |
| | | | | | |
| | |
Commercial Banks—(Continued) | | | | | |
Placer Sierra Bancshares (a) | | 2,342 | | $ | 64,897 |
Premierwest Bancorp (a) | | 4,567 | | | 63,938 |
PrivateBancorp, Inc. (a) | | 6,351 | | | 225,905 |
Prosperity Bancshares, Inc. (a) | | 6,893 | | | 198,105 |
Provident Bancorp, Inc. (a) | | 15,103 | | | 166,284 |
Provident Bankshares Corp. | | 12,031 | | | 406,287 |
Provident Financial Services, Inc. (a) | | 23,670 | | | 438,132 |
R & G Financial Corp. (Class B) | | 9,069 | | | 119,711 |
Renasant Corp. | | 3,265 | | | 103,272 |
Republic Bancorp, Inc. (a) | | 24,376 | | | 290,074 |
S & T Bancorp, Inc. (a) | | 8,641 | | | 318,162 |
S. Y. Bancorp, Inc. (a) | | 4,678 | | | 117,044 |
Sandy Spring Bancorp, Inc. | | 5,744 | | | 200,351 |
SCBT Financial Corp. | | 3,327 | | | 111,188 |
Seacoast Banking Corp. | | 4,108 | | | 94,279 |
Security Bank Corp. (a) | | 5,076 | | | 118,220 |
Signature Bank (a) (b) | | 3,972 | | | 111,494 |
Simmons First National Corp. (a) | | 4,677 | | | 129,553 |
Sound Federal Bancorp, Inc. | | 3,887 | | | 74,242 |
Southside Bancshares, Inc. (a) | | 2,598 | | | 52,480 |
Southwest Bancorp, Inc. (Oklahoma) | | 3,848 | | | 76,960 |
State Bancorp, Inc. (a) | | 2,743 | | | 45,918 |
Sterling Bancorp. | | 8,328 | | | 164,311 |
Sterling Bancshares, Inc. | | 14,150 | | | 218,476 |
Sterling Financial Corp. (Pennsylvania) (a) | | 7,630 | | | 151,074 |
Sterling Financial Corp. (Washington) | | 11,455 | | | 286,146 |
Suffolk Bancorp (a) | | 3,640 | | | 122,923 |
Summit Bankshares, Inc. | | 3,583 | | | 64,422 |
Sun Bancorp, Inc. (New Jersey) | | 3,392 | | | 66,992 |
Susquehanna Bancshares, Inc. | | 17,213 | | | 407,604 |
SVB Financial Group (a) (b) | | 11,847 | | | 554,913 |
Texas Regional Bancshares, Inc. (a) | | 13,355 | | | 377,946 |
The Bancorp, Inc. (a) | | 3,585 | | | 60,945 |
TierOne Corp. | | 7,148 | | | 210,223 |
Tompkins Trustco, Inc. (a) | | 2,952 | | | 132,250 |
TriCo Bancshares (a) | | 4,816 | | | 112,646 |
TrustCo Bank Corp. (a) | | 24,286 | | | 301,632 |
Trustmark Corp. | | 15,840 | | | 435,125 |
UCBH Holdings, Inc. (a) | | 29,560 | | | 528,533 |
UMB Financial Corp. (a) | | 5,741 | | | 366,907 |
Umpqua Holdings Corp. | | 14,146 | | | 403,585 |
Union Bankshares Corp. | | 3,102 | | | 133,696 |
United Bankshares, Inc. (a) | | 13,511 | | | 476,128 |
United Community Bank, Inc. | | 11,809 | | | 314,828 |
United Community Financial Corp. | | 9,993 | | | 118,017 |
Univest Corp. (a) | | 3,709 | | | 90,017 |
Unizan Financial Corp. (a) | | 7,422 | | | 197,128 |
USB Holding, Inc. (a) | | 3,609 | | | 78,171 |
Vineyard National Bancorp (a) | | 2,650 | | | 81,726 |
Virginia Commerce Bancorp, Inc. (a) | | 2,847 | | | 82,819 |
Virginia Financial Group, Inc. (a) | | 2,581 | | | 92,993 |
W Holding Co., Inc. (a) | | 35,463 | | | 291,860 |
Washington Trust Bancorp, Inc. (a) | | 4,321 | | | 113,124 |
Wesbanco, Inc. | | 7,824 | | | 237,928 |
West Bancorp, Inc. (a) | | 5,573 | | | 104,215 |
West Coast Bancorp | | 5,829 | | | 154,177 |
WestAmerica Bancorp | | 11,650 | | | 618,265 |
| | | | | |
| Security Description | | Shares | | Value* |
| | | | | | |
| | |
Commercial Banks—(Continued) | | | | | |
Western Sierra Bancorp (a) | | 1,846 | | $ | 67,176 |
Wilshire Bancorp, Inc. (a) | | 4,762 | | | 81,859 |
Wintrust Financial Corp. | | 7,610 | | | 417,789 |
WSFS Financial Corp. | | 2,138 | | | 130,953 |
Yardville National Bancorp | | 2,780 | | | 96,327 |
| | | | |
|
|
| | | | | | 39,137,748 |
| | | | |
|
|
|
Commercial Services & Supplies—4.3% |
ABM Industries, Inc. | | 13,807 | | | 269,927 |
Administaff, Inc. | | 7,106 | | | 298,807 |
Advance America Cash Advance Centers, Inc. (a) | | 22,152 | | | 274,685 |
Aleris International, Inc. | | 10,034 | | | 323,496 |
American Ecology Corp. (a) | | 4,069 | | | 58,716 |
American Reprograhics Co. | | 4,748 | | | 120,647 |
Arbitron, Inc. (a) | | 11,686 | | | 443,834 |
Banta Corp. | | 8,393 | | | 417,971 |
Bowne & Co., Inc. (a) | | 13,220 | | | 196,185 |
Casella Waste Systems, Inc. | | 6,512 | | | 83,288 |
CCC Information Services Group, Inc. | | 4,462 | | | 116,994 |
CDI Corp. (a) | | 4,048 | | | 110,915 |
Central Parking Corp. (a) | | 6,047 | | | 82,965 |
Cenveo, Inc. | | 16,192 | | | 213,087 |
Clark, Inc. (a) | | 5,201 | | | 68,913 |
Clean Harbors, Inc. (a) | | 5,006 | | | 144,223 |
Cogent, Inc. (a) (b) | | 9,839 | | | 223,148 |
Coinstar, Inc. | | 8,205 | | | 187,320 |
Consolidated Graphics, Inc. (a) | | 3,708 | | | 175,537 |
Convanta Holdings Corp. | | 34,170 | | | 514,600 |
CoStar Group, Inc. (a) | | 5,286 | | | 228,197 |
CRA International, Inc. (a) (b) | | 3,858 | | | 183,988 |
CSG Systems International, Inc. (a) (b) | | 16,867 | | | 376,471 |
Darling International, Inc. (a) | | 18,375 | | | 72,949 |
DiamondCluster International, Inc. | | 9,770 | | | 77,574 |
Duratek, Inc. (a) | | 7,241 | | | 108,108 |
Educate, Inc. (a) | | 5,507 | | | 64,983 |
eFunds Corp. | | 15,597 | | | 365,594 |
Electro Rent Corp. (a) | | 5,559 | | | 82,885 |
Ennis Business Forms, Inc. | | 8,338 | | | 151,501 |
FactSet Research Systems, Inc. (a) | | 11,121 | | | 457,740 |
FTI Consulting, Inc. (a) | | 14,750 | | | 404,740 |
G&K Services, Inc. (a) | | 6,327 | | | 248,335 |
Gevity HR, Inc. | | 9,435 | | | 242,668 |
Headwaters, Inc. (a) (b) | | 13,338 | | | 472,699 |
Healthcare Services Group, Inc. | | 9,604 | | | 198,899 |
Heidrick & Struggles International, Inc. (b) | | 7,652 | | | 245,247 |
Hudson Highland Group, Inc. (a) (b) | | 8,850 | | | 153,636 |
InfoUSA, Inc. | | 9,915 | | | 108,371 |
Intermec, Inc. | | 16,327 | | | 551,853 |
John H. Harland Co. (a) | | 9,491 | | | 356,862 |
Kelly Services, Inc. (Class A) (a) | | 6,631 | | | 173,865 |
Kforce, Inc. | | 11,332 | | | 126,465 |
Korn/Ferry International, Inc. (a) (b) | | 12,583 | | | 235,176 |
Labor Ready, Inc. (a) | | 19,496 | | | 405,907 |
Landauer, Inc. (a) | | 3,870 | | | 178,368 |
Layne Christensen Co. (a) | | 3,372 | | | 85,750 |
LECG Corp. (b) | | 4,356 | | | 75,707 |
McGrath Rentcorp (a) | | 6,388 | | | 177,586 |
*See accompanying notes to financial statements.
MSF-239
Metropolitan Series Fund, Inc.
Russell 2000 Index Portfolio
Schedule of Investments as of December 31, 2005
Common Stock—(Continued)
| | | | | |
| Security Description | | Shares | | Value* |
| | | | | | |
|
Commercial Services & Supplies—(Continued) |
Medis Technologies, Ltd. (a) | | 4,353 | | $ | 64,033 |
Mine Safety Appliances Co. (a) | | 9,301 | | | 336,789 |
Mobile Mini, Inc. (a) (b) | | 5,685 | | | 269,469 |
MoneyGram International, Inc. | | 30,170 | | | 786,834 |
Navigant Consulting, Inc. (b) | | 16,584 | | | 364,516 |
NCO Group, Inc. (b) | | 10,496 | | | 177,592 |
NDCHealth Corp. (a) | | 12,391 | | | 238,279 |
PHH Corp. (a) | | 18,910 | | | 529,858 |
PrePaid Legal Services, Inc. (a) | | 3,127 | | | 119,483 |
Providence Service Corp. (a) | | 3,195 | | | 91,984 |
Rollins, Inc. | | 10,521 | | | 207,369 |
Schawk, Inc. (a) | | 6,595 | | | 136,846 |
Sotheby’s Holdings, Inc. (Class A) (b) | | 15,295 | | | 280,816 |
Sourcecorp, Inc. | | 5,056 | | | 121,243 |
Spherion Corp. | | 23,740 | | | 237,637 |
StarTek, Inc. (a) | | 3,490 | | | 62,820 |
Strayer Education, Inc. | | 4,933 | | | 462,222 |
Teletech Holdings, Inc. (a) | | 12,520 | | | 150,866 |
Tetra Technologies, Inc. | | 17,868 | | | 279,992 |
The Geo Group, Inc. | | 3,388 | | | 77,687 |
The Standard Register Co. | | 5,767 | | | 91,176 |
United Stationers, Inc. | | 10,880 | | | 527,680 |
Viad Corp. | | 7,266 | | | 213,112 |
Waste Connections, Inc. (a) (b) | | 16,002 | | | 551,429 |
Waste Services, Inc. (a) | | 21,307 | | | 70,952 |
Watson Wyatt & Co. Holdings (a) (b) | | 14,195 | | | 396,040 |
Wright Express Corp. (b) | | 13,508 | | | 297,176 |
| | | | |
|
|
| | | | | | 18,081,282 |
| | | | |
|
|
|
Communications Equipment—2.6% |
3Com Corp. (a) (b) | | 123,943 | | | 446,195 |
ADTRAN, Inc. | | 23,237 | | | 691,068 |
Airspan Networks, Inc. (a) | | 13,661 | | | 77,731 |
Anaren, Inc. (b) | | 8,998 | | | 140,639 |
Arris Group, Inc. (a) (b) | | 32,983 | | | 312,349 |
Atheros Communications (a) | | 11,480 | | | 149,240 |
Audiovox Corp. | | 5,944 | | | 82,384 |
Avocent Corp. (b) | | 17,916 | | | 487,136 |
Bel Fuse, Inc. (Class B) (a) | | 3,876 | | | 123,257 |
Black Box Corp. | | 5,584 | | | 264,570 |
Brocade Communications Systems, Inc. | | 87,009 | | | 354,127 |
C-COR.net Corp. (a) | | 13,999 | | | 68,035 |
CIENA Corp. (b) | | 184,994 | | | 549,432 |
CommScope, Inc. (b) | | 18,589 | | | 374,196 |
Comtech Telecommunications Corp. (a) | | 7,443 | | | 227,309 |
Cybergaurd Corp. | | 7,568 | | | 66,825 |
Digi International, Inc. | | 7,205 | | | 75,580 |
Ditech Communications Corp. | | 9,747 | | | 81,387 |
DSP Group, Inc. (a) (b) | | 9,744 | | | 244,185 |
Echelon Corp. (a) | | 9,320 | | | 72,976 |
Emulex Corp. (b) | | 27,562 | | | 545,452 |
Extreme Networks, Inc. | | 41,400 | | | 196,650 |
Finisar Corp. (a) | | 56,999 | | | 118,558 |
Foundry Networks, Inc. (a) (b) | | 39,638 | | | 547,401 |
Glenayre Technologies, Inc. (a) | | 22,635 | | | 73,564 |
Harmonic, Inc. (a) | | 24,790 | | | 120,231 |
Inter-Tel, Inc. | | 7,313 | | | 143,115 |
InterDigital Communications Corp. | | 17,752 | | | 325,217 |
| | | | | |
| Security Description | | Shares | | Value* |
| | | | | | |
|
Communications Equipment—(Continued) |
Ixia (a) (b) | | 9,728 | | $ | 143,780 |
Kanbay International, Inc. (b) | | 8,120 | | | 129,027 |
McDATA Corp. (Class A) (a) (b) | | 49,252 | | | 187,158 |
MRV Communications, Inc. (a) | | 37,106 | | | 76,067 |
Oplink Communications, Inc. | | 5,294 | | | 76,763 |
Plantronics, Inc. (a) | | 15,777 | | | 446,489 |
Polycom, Inc. (b) | | 31,542 | | | 482,593 |
Powerwave Technologies, Inc. (a) (b) | | 36,417 | | | 457,762 |
Redback Networks, Inc. | | 14,460 | | | 203,308 |
SafeNet, Inc. (b) | | 8,748 | | | 281,861 |
Sonus Networks, Inc. (a) | | 80,309 | | | 298,749 |
Spectralink Corp. | | 5,708 | | | 67,754 |
Sycamore Networks, Inc. | | 56,314 | | | 243,276 |
Symmetricom, Inc. (a) | | 18,002 | | | 152,477 |
Tekelec, Inc. (a) | | 18,063 | | | 251,076 |
Terayon Communication Systems, Inc. (a) | | 23,226 | | | 53,652 |
UTStarcom, Inc. (a) (b) | | 32,640 | | | 263,078 |
ViaSat, Inc. (a) (b) | | 8,138 | | | 217,529 |
Westell Technologies, Inc. (a) | | 19,082 | | | 85,869 |
Zhone Technologies, Inc. (a) | | 34,882 | | | 73,950 |
| | | | |
|
|
| | | | | | 11,151,027 |
| | | | |
|
|
|
Computers & Peripherals—1.1% |
Advanced Digital Information Corp. (a) | | 21,975 | | | 215,135 |
Applied Films Corp. | | 5,226 | | | 108,544 |
Concurrent Computer Corp. | | 1 | | | 2 |
Dot Hill Systems Corp. (a) | | 13,944 | | | 96,632 |
Electronics for Imaging, Inc. | | 18,094 | | | 481,481 |
Gateway, Inc. (a) (b) | | 82,964 | | | 208,240 |
Hutchinson Technology, Inc. (a) | | 7,984 | | | 227,145 |
Hypercom Corp. | | 16,588 | | | 105,997 |
Imation Corp. | | 10,879 | | | 501,196 |
Intergraph Corp. (a) | | 9,160 | | | 456,260 |
Komag, Inc. | | 9,542 | | | 330,726 |
Maxtor Corp. (a) (b) | | 81,793 | | | 567,643 |
Mobility Electronics, Inc. (a) | | 8,312 | | | 80,294 |
Palm, Inc. (a) | | 15,153 | | | 481,865 |
Presstek, Inc. (a) | | 8,252 | | | 74,598 |
Quantum Corp. (a) | | 58,375 | | | 178,044 |
Rimage Corp. | | 3,268 | | | 94,707 |
Stratasys, Inc. (a) | | 3,679 | | | 92,012 |
Synaptics, Inc. | | 9,134 | | | 225,792 |
| | | | |
|
|
| | | | | | 4,526,313 |
| | | | |
|
|
| | |
Construction & Engineering—0.9% | | | | | |
Comfort Systems USA, Inc. | | 12,729 | | | 117,107 |
Dycom Industries, Inc. (a) (b) | | 17,175 | | | 377,850 |
EMCOR Group, Inc. | | 4,831 | | | 326,237 |
Granite Construction, Inc. (a) | | 11,649 | | | 418,315 |
Insituform Technologies, Inc. (b) | | 8,726 | | | 169,023 |
MasTec, Inc. (a) (b) | | 8,025 | | | 84,022 |
Perini Corp. (a) | | 6,452 | | | 155,816 |
Quanta Services, Inc. (a) (b) | | 37,800 | | | 497,826 |
Shaw Group, Inc. | | 25,599 | | | 744,675 |
URS Corp. | | 13,174 | | | 495,474 |
Washington Group International, Inc. (b) | | 9,366 | | | 496,117 |
| | | | |
|
|
| | | | | | 3,882,462 |
| | | | |
|
|
*See accompanying notes to financial statements.
MSF-240
Metropolitan Series Fund, Inc.
Russell 2000 Index Portfolio
Schedule of Investments as of December 31, 2005
Common Stock—(Continued)
| | | | | |
| Security Description | | Shares | | Value* |
| | | | | | |
|
Construction Materials—0.3% |
Ameron International Corp. | | 3,679 | | $ | 167,689 |
Eagle Materials, Inc. (a) | | 6,245 | | | 764,138 |
Texas Industries, Inc. | | 7,332 | | | 365,427 |
| | | | |
|
|
| | | | | | 1,297,254 |
| | | | |
|
|
|
Containers & Packaging—0.5% |
Caraustar Industries, Inc. (a) | | 11,215 | | | 97,458 |
Greif Brothers Corp. (a) | | 5,003 | | | 331,599 |
Jarden Corp. (a) | | 22,332 | | | 673,310 |
Longview Fibre Co. (a) | | 18,248 | | | 379,741 |
Myers Industries, Inc. (a) | | 8,698 | | | 126,817 |
Rock Tennessee Co. (a) | | 11,409 | | | 155,733 |
Silgan Holdings, Inc. (a) | | 7,176 | | | 259,197 |
| | | | |
|
|
| | | | | | 2,023,855 |
| | | | |
|
|
|
Distributors—0.3% |
Beacon Roofing Supply, Inc. (a) | | 5,443 | | | 156,377 |
Brightpoint, Inc. | | 9,664 | | | 267,983 |
Handleman Co. (a) | | 7,777 | | | 96,590 |
The Andersons, Inc. | | 2,322 | | | 100,032 |
WESCO International, Inc. | | 11,763 | | | 502,633 |
| | | | |
|
|
| | | | | | 1,123,615 |
| | | | |
|
|
|
Diversified Consumer Services—0.5% |
Bright Horizons Family Solutions, Inc. (a) (b) | | 9,300 | | | 344,565 |
Corinthian Colleges, Inc. (a) (b) | | 29,341 | | | 345,637 |
DeVry, Inc. (b) | | 18,827 | | | 376,540 |
Regis Corp. | | 15,984 | | | 616,503 |
Universal Technical Institute, Inc. (a) (b) | | 6,976 | | | 215,837 |
Vertrue, Inc. (a) (b) | | 2,518 | | | 88,961 |
| | | | |
|
|
| | | | | | 1,988,043 |
| | | | |
|
|
|
Diversified Financial Services—2.4% |
Ace Cash Express, Inc. (a) | | 5,698 | | | 133,048 |
Advanta Corp. (Class B) | | 7,251 | | | 235,222 |
Apollo Investment Corp. | | 19,866 | | | 356,197 |
Ares Capital Corp. | | 12,924 | | | 207,689 |
ASTA Funding, Inc. (a) | | 3,146 | | | 86,012 |
Bankrate, Inc. (a) | | 3,010 | | | 88,855 |
Calamos Asset Management, Inc. | | 7,563 | | | 237,856 |
Capital Southwest Corp. (a) | | 913 | | | 82,627 |
Cash America International, Inc. (a) | | 9,980 | | | 231,436 |
CBIZ, Inc. | | 20,992 | | | 126,372 |
Charter Municipal Mortgage Acceptance Co. (a) | | 13,876 | | | 293,894 |
Collegiate Funding Services, Inc. | | 5,074 | | | 100,212 |
Commercial Capital Bancorp, Inc. (a) | | 14,476 | | | 247,829 |
CompuCredit Corp. | | 7,564 | | | 291,063 |
Doral Financial Corp. (a) | | 27,884 | | | 295,570 |
Encore Capital Group, Inc. (a) | | 4,106 | | | 71,239 |
Euronet Worldwide, Inc. (a) | | 10,129 | | | 281,586 |
Federal Agricultural Mortgage Corp. (a) | | 4,977 | | | 148,962 |
Financial Federal Corp. (a) | | 6,485 | | | 288,258 |
First Cash Financial Services | | 3,911 | | | 114,045 |
Gamco Investors, Inc. (a) | | 2,161 | | | 94,068 |
GB&T Bancshares, Inc. (a) | | 3,432 | | | 73,479 |
| | | | | |
| Security Description | | Shares | | Value* |
| | | | | | |
|
Diversified Financial Services—(Continued) |
GFI Group, Inc. (a) (b) | | 2,077 | | $ | 98,512 |
Gladstone Capital Corp. (a) | | 3,939 | | | 84,216 |
Gladstone Capital Corp. | | 5,257 | | | 71,443 |
Harris & Harris Group, Inc. (a) | | 5,241 | | | 72,850 |
Heartland Financial USA, Inc. (a) | | 3,117 | | | 67,639 |
International Securities Exchange, Inc. (a) | | 3,815 | | | 104,989 |
Investment Technology Group, Inc. | | 14,322 | | | 507,572 |
Jackson Hewitt Tax Service, Inc. (a) | | 12,008 | | | 332,742 |
KNBT Bancorp. | | 9,880 | | | 160,945 |
Knight Capital Group, Inc. (a) | | 37,025 | | | 366,177 |
LaBranche & Co., Inc. (a) (b) | | 17,128 | | | 173,164 |
MCG Capital Corp. (a) | | 15,455 | | | 225,488 |
Morningstar, Inc. (a) | | 2,918 | | | 101,080 |
MortgageIT Holdings, Inc. | | 7,540 | | | 102,996 |
National Financial Partners Corp. (a) | | 12,627 | | | 663,549 |
OptionsXpress Holdings, Inc. (a) | | 7,020 | | | 172,341 |
Piper Jaffray Co. (a) | | 7,865 | | | 317,746 |
Portfolio Recovery Associates, Inc. (a) | | 5,116 | | | 237,587 |
Sanders Morris Haris Group, Inc. (a) | | 4,080 | | | 66,871 |
Stifel Financial Corp. (a) | | 2,560 | | | 96,230 |
SWS Group, Inc. | | 4,630 | | | 96,952 |
Technology Investment Capital Corp. | | 4,616 | | | 69,702 |
Texas Capital Bancshares, Inc. (a) | | 6,970 | | | 156,198 |
The Nasdaq Stock Market, Inc. | | 14,557 | | | 512,115 |
Tri-Valley Corp. (a) | | 7,275 | | | 56,600 |
Waddell & Reed Financial, Inc. (Class A) (a) | | 24,623 | | | 516,344 |
Walter Industries, Inc. (a) | | 11,658 | | | 579,636 |
World Acceptance Corp. | | 6,270 | | | 178,695 |
| | | | |
|
|
| | | | | | 10,275,898 |
| | | | |
|
|
|
Diversified Telecommunication Services—0.9% |
Broadwing Corp. (a) | | 27,848 | | | 168,480 |
Cincinnati Bell, Inc. (a) (b) | | 77,730 | | | 272,832 |
Commonwealth Telephone Enterprises, Inc. (b) | | 7,216 | | | 243,684 |
Consolidated Communications Holdings, Inc. (a) | | 4,976 | | | 64,638 |
CT Communications, Inc. | | 5,790 | | | 70,291 |
Fairpoint Communications, Inc. (a) | | 8,550 | | | 88,578 |
General Communication, Inc. | | 17,909 | | | 185,000 |
Golden Telecom, Inc. (a) | | 6,960 | | | 180,682 |
IDT Corp. (Class B) (a) | | 18,747 | | | 219,340 |
Intrado, Inc. (a) | | 5,162 | | | 118,829 |
Iowa Telecommunications Services, Inc. (a) | | 9,545 | | | 147,852 |
Level 3 Communications, Inc. (a) | | 222,809 | | | 639,462 |
NeuStar, Inc. (Class A) (b) | | 7,664 | | | 233,675 |
North Pittsburgh Systems, Inc. (a) | | 5,925 | | | 111,805 |
Premiere Global Services, Inc. (a) | | 23,180 | | | 188,453 |
RCN Corp. (a) | | 7,383 | | | 173,131 |
Shenandoah Telecommunications Co. | | 3,196 | | | 127,329 |
SureWest Communications (a) | | 6,370 | | | 167,977 |
TALK America Holdings, Inc. (a) | | 9,103 | | | 78,559 |
Time Warner Telecom, Inc. (a) | | 16,230 | | | 159,866 |
Valor Communications Group, Inc. | | 10,013 | | | 114,148 |
| | | | |
|
|
| | | | | | 3,754,611 |
| | | | |
|
|
|
Electric Utilities—1.2% |
ALLETE, Inc. | | 8,140 | | | 358,160 |
Black Hills Corp. (a) | | 11,578 | | | 400,715 |
*See accompanying notes to financial statements.
MSF-241
Metropolitan Series Fund, Inc.
Russell 2000 Index Portfolio
Schedule of Investments as of December 31, 2005
Common Stock—(Continued)
| | | | | |
| Security Description | | Shares | | Value* |
| | | | | | |
|
Electric Utilities—(Continued) |
Central Vermont Public Service | | 3,898 | | $ | 70,203 |
CH Energy Group, Inc. (a) | | 5,113 | | | 234,687 |
Cleco Corp. | | 18,372 | | | 383,056 |
Duquesne Light Holdings, Inc. (a) | | 25,718 | | | 419,718 |
El Paso Electric Co. | | 15,956 | | | 335,714 |
Empire District Electric Co. | | 9,579 | | | 194,741 |
IDACORP, Inc. (a) | | 13,538 | | | 396,663 |
ITC Holdings Corp. (a) | | 4,070 | | | 114,326 |
MGE Energy, Inc. | | 7,993 | | | 271,043 |
NGP Capital Resources Co. (a) | | 4,928 | | | 64,705 |
NorthWestern Energy Corp. (b) | | 11,448 | | | 355,689 |
Otter Tail Corp. | | 9,134 | | | 264,703 |
Pike Electric Corp. (a) | | 4,285 | | | 69,503 |
Sierra Pacific Resources (a) (b) | | 60,285 | | | 786,116 |
UIL Holdings Corp. | | 4,716 | | | 216,889 |
Unisource Energy Corp. | | 11,123 | | | 347,038 |
| | | | |
|
|
| | | | | | 5,283,669 |
| | | | |
|
|
|
Electrical Equipment—1.3% |
A.O. Smith Corp. | | 5,573 | | | 195,612 |
Acuity Brands, Inc. (a) | | 15,774 | | | 501,613 |
American Superconductor Corp. (a) | | 12,644 | | | 99,508 |
Baldor Electric Co. (a) | | 10,395 | | | 266,632 |
Belden CDT, Inc. (a) | | 15,657 | | | 382,500 |
Brady Corp. | | 13,327 | | | 482,171 |
C&D Technologies, Inc. (a) | | 10,301 | | | 78,494 |
Encore Wire Corp. | | 5,501 | | | 125,203 |
Energy Conversion Devices, Inc. (a) | | 7,842 | | | 319,561 |
EnerSys (a) | | 15,059 | | | 196,369 |
Evergreen Solar, Inc. (a) | | 13,338 | | | 142,050 |
Franklin Electric, Inc. | | 7,196 | | | 284,530 |
FuelCell Energy, Inc. (a) | | 14,608 | | | 123,730 |
General Cable Corp. (a) (b) | | 13,691 | | | 269,713 |
Genlyte Group, Inc. (a) | | 8,552 | | | 458,131 |
II-VI, Inc. (a) (b) | | 7,274 | | | 129,986 |
Metrologic Instruments, Inc. | | 3,747 | | | 72,167 |
Paxar Corp. | | 10,962 | | | 215,184 |
Plug Power, Inc. (a) | | 15,604 | | | 80,049 |
Power-One, Inc. (a) | | 21,131 | | | 127,209 |
Regal Beloit Corp. (a) | | 8,951 | | | 316,865 |
Superior Essex, Inc. | | 5,734 | | | 115,597 |
Tecumseh Products Co. (Class A) (a) | | 5,738 | | | 131,458 |
Ultralife Batteries, Inc. (a) | | 4,674 | | | 56,088 |
Vicor Corp. | | 6,862 | | | 108,488 |
Woodward Governor Co. | | 3,482 | | | 299,487 |
| | | | |
|
|
| | | | | | 5,578,395 |
| | | | |
|
|
|
Electronic Equipment & Instruments—2.0% |
Analogic Corp. (a) | | 4,515 | | | 216,043 |
Anixter International, Inc. (b) | | 11,633 | | | 455,083 |
Artesyn Technologies, Inc. (a) (b) | | 11,132 | | | 114,660 |
Benchmark Electronics, Inc. | | 15,438 | | | 519,180 |
Checkpoint Systems, Inc. (a) | | 13,610 | | | 335,486 |
Coherent, Inc. (b) | | 10,406 | | | 308,850 |
CTS Corp. (a) | | 11,406 | | | 126,150 |
Daktronics, Inc. (a) | | 4,716 | | | 139,452 |
| | | | | |
| Security Description | | Shares | | Value* |
| | | | | | |
|
Electronic Equipment & Instruments—(Continued) |
Electro Scientific Industries, Inc. (b) | | 10,869 | | $ | 262,486 |
Excel Technology, Inc. (b) | | 3,926 | | | 93,360 |
Fargo Electronics, Inc. | | 4,293 | | | 82,640 |
Global Imaging Systems, Inc. | | 7,763 | | | 268,833 |
Greatbatch, Inc. (a) (b) | | 7,075 | | | 184,021 |
Identix, Inc. (a) | | 28,078 | | | 140,671 |
Intermagnetics General Corp. (b) | | 9,322 | | | 297,372 |
Intevac, Inc. | | 5,969 | | | 78,791 |
Itron, Inc. | | 7,780 | | | 311,511 |
Keithley Instruments, Inc. | | 3,823 | | | 53,446 |
Kemet Corp. (a) (b) | | 30,579 | | | 216,193 |
Kopin Corp. | | 22,880 | | | 122,408 |
Lecroy Corp. | | 6,638 | | | 101,495 |
Lexar Media, Inc. (a) | | 28,777 | | | 236,259 |
Littelfuse, Inc. | | 7,349 | | | 200,260 |
LoJack Corp. (a) | | 5,656 | | | 136,479 |
LSI Industries, Inc. (a) | | 6,410 | | | 100,381 |
Measurement Specialties, Inc. (a) | | 3,555 | | | 86,564 |
Methode Electronics, Inc. (a) | | 14,807 | | | 147,626 |
MTS Systems Corp. | | 7,526 | | | 260,701 |
Multi Fineline Electronix, Inc. (a) | | 2,550 | | | 122,833 |
Newport Corp. (a) (b) | | 13,731 | | | 185,918 |
OSI Systems, Inc. (a) | | 6,662 | | | 122,514 |
Park Electrochemical Corp. (a) | | 8,044 | | | 208,983 |
Photon Dynamics, Inc. (a) | | 6,134 | | | 112,129 |
Plexus Corp. (b) | | 14,166 | | | 322,135 |
Rofin-Sinar Technologies, Inc. (a) (b) | | 5,108 | | | 222,045 |
Rogers Corp. (a) | | 5,669 | | | 222,111 |
ScanSource, Inc. (a) (b) | | 4,045 | | | 221,181 |
Taser International, Inc. (a) | | 19,871 | | | 138,700 |
Technitrol, Inc. | | 14,270 | | | 244,017 |
Teledyne Technologies, Inc. | | 11,430 | | | 332,613 |
ThermoGenesis Corp. (a) | | 15,030 | | | 72,595 |
TTM Technologies, Inc. (a) (b) | | 13,244 | | | 124,494 |
Universal Display Corp. (a) | | 8,227 | | | 86,466 |
Veeco Instruments, Inc. (a) | | 8,538 | | | 147,963 |
X-Rite, Inc. (a) | | 6,734 | | | 67,340 |
| | | | |
|
|
| | | | | | 8,550,438 |
| | | | |
|
|
|
Energy Equipment & Services—2.3% |
Atwood Oceanics, Inc. (a) (b) | | 4,416 | | | 344,580 |
Cal Dive International, Inc. (a) (b) | | 25,354 | | | 909,955 |
CARBO Ceramics, Inc. (a) | | 6,497 | | | 367,210 |
Dril-Quip, Inc. (a) | | 2,249 | | | 106,153 |
Global Industries, Inc. (a) (b) | | 26,672 | | | 302,727 |
Grey Wolf, Inc. (a) (b) | | 59,731 | | | 461,721 |
Gulf Islands Fabrication, Inc. (a) | | 3,421 | | | 83,164 |
Gulfmark Offshore, Inc. (a) | | 6,358 | | | 188,324 |
Hanover Compressor Co. (a) (b) | | 28,614 | | | 403,744 |
Hercules Offshore, Inc. (b) | | 3,011 | | | 85,542 |
Hornbeck Offshore Services, Inc. | | 6,254 | | | 204,506 |
Hydril (a) (b) | | 6,109 | | | 382,423 |
Input/Output, Inc. (a) | | 20,259 | | | 142,421 |
Lone Star Technologies, Inc. (b) | | 10,665 | | | 550,954 |
Lufkin Industries, Inc. | | 5,378 | | | 268,201 |
Maverick Tube Corp. (a) | | 14,050 | | | 560,033 |
*See accompanying notes to financial statements.
MSF-242
Metropolitan Series Fund, Inc.
Russell 2000 Index Portfolio
Schedule of Investments as of December 31, 2005
Common Stock—(Continued)
| | | | | |
| Security Description | | Shares | | Value* |
| | | | | | |
|
Energy Equipment & Services—(Continued) |
Newpark Resources, Inc. (a) | | 32,711 | | $ | 249,585 |
NS Group, Inc. | | 7,243 | | | 302,830 |
Oceaneering International, Inc. (a) | | 8,585 | | | 427,361 |
Offshore Logistics, Inc. | | 7,556 | | | 220,635 |
Oil States International, Inc. (a) (b) | | 13,088 | | | 414,628 |
Parker Drilling Co. (a) | | 31,977 | | | 346,311 |
RPC, Inc. | | 7,209 | | | 189,885 |
Seacor Smit, Inc. (a) (b) | | 6,596 | | | 449,188 |
Superior Energy Services, Inc. (b) | | 24,950 | | | 525,197 |
Tetra Technologies, Inc. (a) | | 11,697 | | | 356,992 |
Universal Compression Holdings, Inc. (a) (b) | | 6,796 | | | 279,452 |
Veritas DGC, Inc. (a) | | 12,528 | | | 444,619 |
W-H Energy Services, Inc. | | 9,021 | | | 298,415 |
| | | | |
|
|
| | | | | | 9,866,756 |
| | | | |
|
|
|
Food & Staples Retailing—0.9% |
Casey’s General Stores, Inc. | | 18,712 | | | 464,058 |
Central European Distribution Corp. (a) | | 4,487 | | | 180,108 |
Flowers Foods, Inc. | | 16,602 | | | 457,551 |
Great Atlantic & Pacific Tea Co., Inc. (a) | | 6,118 | | | 194,430 |
Ingles Markets, Inc. | | 4,330 | | | 67,764 |
Longs Drug Stores Corp. | | 10,271 | | | 373,762 |
Nash Finch Co. (a) | | 3,943 | | | 100,468 |
Pantry, Inc. | | 5,540 | | | 260,325 |
Pathmark Stores, Inc. | | 15,898 | | | 158,821 |
Performance Food Group Co. (a) (b) | | 12,351 | | | 350,398 |
Provide Commerce | | 3,127 | | | 103,535 |
Ruddick Corp. | | 11,747 | | | 249,976 |
Smart & Final, Inc. (b) | | 5,192 | | | 66,873 |
Spartan Stores, Inc. | | 7,601 | | | 79,202 |
Terra Industries, Inc. (a) | | 30,353 | | | 169,977 |
United Natural Foods, Inc. (a) (b) | | 14,937 | | | 394,337 |
Weis Markets, Inc. (a) | | 4,891 | | | 210,509 |
Wild Oats Markets, Inc. (a) | | 10,328 | | | 124,762 |
| | | | |
|
|
| | | | | | 4,006,856 |
| | | | |
|
|
|
Food Products—0.9% |
Central Garden & Pet Co. (b) | | 7,608 | | | 349,511 |
Chiquita Brands International, Inc. | | 13,367 | | | 267,474 |
Corn Products International, Inc. | | 26,668 | | | 637,098 |
Delta & Pine Land Co. | | 13,252 | | | 304,929 |
Gold Kist, Inc. | | 16,661 | | | 249,082 |
Hain Celestial Group, Inc. (b) | | 9,007 | | | 190,588 |
J & J Snack Foods Corp. | | 2,151 | | | 127,791 |
Lance, Inc. (a) | | 10,266 | | | 191,256 |
Ralcorp Holdings, Inc. (b) | | 9,719 | | | 387,885 |
Reddy Ice Holdings, Inc. | | 3,235 | | | 70,555 |
Sanderson Farms, Inc. (a) | | 6,025 | | | 183,943 |
Seabord Corp. (a) | | 140 | | | 211,540 |
Sensient Technologies Corp. (a) | | 15,249 | | | 272,957 |
Tejon Ranch Co. (a) | | 2,812 | | | 112,255 |
Tootsie Roll Industries, Inc. | | 8,417 | | | 243,504 |
USANA Health Sciences, Inc. (a) | | 3,582 | | | 137,406 |
| | | | |
|
|
| | | | | | 3,937,774 |
| | | | |
|
|
| | | | | |
| Security Description | | Shares | | Value* |
| | | | | | |
|
Gas Utilities—0.8% |
Cascade Natural Gas Corp. (a) | | 4,390 | | $ | 85,649 |
Energysouth, Inc. | | 2,311 | | | 61,888 |
Laclede Group, Inc. | | 7,405 | | | 216,300 |
New Jersey Resources Corp. (a) | | 9,103 | | | 381,325 |
Nicor, Inc. (a) | | 14,678 | | | 576,992 |
Northwest Natural Gas Co. (a) | | 9,122 | | | 311,790 |
Peoples Energy Corp. (a) | | 12,510 | | | 438,726 |
Petrohawk Energy Corp. (a) | | 17,225 | | | 227,714 |
South Jersey Industries, Inc. | | 9,712 | | | 283,008 |
Southwest Gas Corp. (a) | | 12,477 | | | 329,393 |
WGL Holdings, Inc. (a) | | 16,218 | | | 487,513 |
| | | | |
|
|
| | | | | | 3,400,298 |
| | | | |
|
|
|
Health Care Equipment & Supplies—3.5% |
Abaxis, Inc. (a) | | 6,884 | | | 113,448 |
Align Technology, Inc. (a) | | 20,358 | | | 131,716 |
American Medical Systems Holdings, Inc. (a) (b) | | 22,387 | | | 399,160 |
Animas Corp. | | 4,243 | | | 102,468 |
Arrow International, Inc. (a) | | 7,257 | | | 210,380 |
ArthroCare Corp. (a) (b) | | 7,932 | | | 334,254 |
Aspect Medical Systems, Inc. (b) | | 5,497 | | | 188,822 |
Bio-Rad Laboratories, Inc. (a) | | 6,561 | | | 429,352 |
Biosite Diagnostics, Inc. (a) | | 5,516 | | | 310,496 |
Caliper Life Sciences, Inc. | | 11,063 | | | 65,050 |
Candela Corp. | | 9,102 | | | 131,433 |
CNS, Inc. | | 4,796 | | | 105,080 |
Computer Programs & Systems, Inc. (a) | | 2,512 | | | 104,072 |
Conmed Corp. | | 10,292 | | | 243,509 |
Conor Medsystems, Inc. (a) | | 3,130 | | | 60,566 |
Cyberonics, Inc. (a) | | 6,939 | | | 224,130 |
Datascope Corp. | | 3,752 | | | 124,004 |
Diagnostic Products Corp. (a) | | 7,738 | | | 375,680 |
DJ Orthopedics, Inc. | | 7,169 | | | 197,721 |
Encore Medical Corp. (a) | | 18,840 | | | 93,258 |
Foxhollow Technologies, Inc. (a) (b) | | 4,597 | | | 136,945 |
Haemonetics Corp. | | 8,418 | | | 411,303 |
HealthTronics, Inc. (a) (b) | | 11,300 | | | 86,445 |
Hologic, Inc. (a) (b) | | 14,646 | | | 555,376 |
I Flow Corp. (a) | | 6,138 | | | 89,738 |
ICU Medical, Inc. (b) | | 4,620 | | | 181,150 |
Illumina, Inc. (a) | | 12,356 | | | 174,220 |
Immucor, Inc. (b) | | 15,128 | | | 353,390 |
Integra LifeSciences Holdings (a) (b) | | 7,005 | | | 248,397 |
IntraLase Corp. (a) | | 4,478 | | | 79,843 |
Intuitive Surgical, Inc. (a) (b) | | 11,551 | | | 1,354,586 |
Invacare Corp. (a) | | 9,889 | | | 311,405 |
Inverness Medical Innovations, Inc. (a) | | 6,977 | | | 165,425 |
Iris International, Inc. | | 5,607 | | | 122,569 |
Kensey Nash Corp. (a) | | 3,315 | | | 73,029 |
Kyphon, Inc. (b) | | 9,521 | | | 388,742 |
Laserscope (a) | | 8,601 | | | 193,178 |
LCA-Vision, Inc. (a) | | 6,630 | | | 314,991 |
Mentor Corp. (a) | | 10,450 | | | 481,536 |
Meridian Bioscience, Inc. | | 5,847 | | | 117,759 |
Merit Medical Systems, Inc. (a) (b) | | 11,890 | | | 144,345 |
Molecular Devices Corp. (a) (b) | | 5,790 | | | 167,505 |
*See accompanying notes to financial statements.
MSF-243
Metropolitan Series Fund, Inc.
Russell 2000 Index Portfolio
Schedule of Investments as of December 31, 2005
Common Stock—(Continued)
| | | | | |
| Security Description | | Shares | | Value* |
| | | | | | |
|
Health Care Equipment & Supplies—(Continued) |
Neurometrix, Inc. | | 2,119 | | $ | 57,806 |
NuVasive, Inc. (a) (b) | | 5,260 | | | 95,206 |
Palomar Medical Technologies, Inc. (a) (b) | | 5,660 | | | 198,326 |
Polymedica Corp. (a) | | 9,490 | | | 317,630 |
Somanetics Corp. (a) | | 3,514 | | | 112,448 |
Sonosite, Inc. (a) | | 6,353 | | | 222,419 |
STERIS Corp. | | 23,487 | | | 587,645 |
SurModics, Inc. (a) | | 6,054 | | | 223,937 |
Sybron Dental Specialties, Inc. (b) | | 13,032 | | | 518,804 |
Thoratec Corp. (b) | | 16,368 | | | 338,654 |
TriPath Imaging, Inc. (a) | | 13,168 | | | 79,535 |
Varian, Inc. (b) | | 10,830 | | | 430,926 |
Ventana Medical Systems, Inc. (a) | | 10,493 | | | 444,379 |
Viasys Healthcare, Inc. (a) | | 10,621 | | | 272,960 |
Vital Signs, Inc. | | 2,652 | | | 113,559 |
West Pharmaceutical Services, Inc. | | 11,942 | | | 298,908 |
Wright Medical Group, Inc. (a) (b) | | 11,673 | | | 238,129 |
Zoll Medical Corp. | | 2,810 | | | 70,784 |
| | | | |
|
|
| | | | | | 14,718,531 |
| | | | |
|
|
|
Health Care Providers & Services—2.7% |
Alderwoods Group, Inc. | | 13,386 | | | 212,436 |
Allied Healthcare International, Inc. | | 10,589 | | | 65,016 |
Amedisys, Inc. (a) (b) | | 5,310 | | | 224,294 |
America Service Group, Inc. (a) | | 3,592 | | | 56,969 |
American Dental Partners, Inc. (a) | | 4,183 | | | 75,629 |
American Healthways, Inc. (a) | | 12,125 | | | 548,656 |
American Retirement Corp. (a) | | 9,302 | | | 233,759 |
Amicas, Inc. (a) | | 15,807 | | | 78,403 |
AMN Healthcare Services, Inc. (a) | | 4,274 | | | 84,540 |
AmSurg Corp. (a) (b) | | 9,913 | | | 226,611 |
Apria Healthcare Group, Inc. (a) (b) | | 16,827 | | | 405,699 |
Beverly Enterprises, Inc. (a) | | 36,299 | | | 423,609 |
BIO-Reference Laboratories, Inc. | | 3,793 | | | 71,346 |
BioScrip, Inc. (a) | | 12,834 | | | 96,768 |
Cantel Medical Corp. | | 3,995 | | | 71,670 |
Centene Corp. (a) (b) | | 13,574 | | | 356,860 |
Chemed Corp. | | 8,490 | | | 421,783 |
Cross Country Healthcare, Inc. | | 11,102 | | | 197,394 |
eResearch Technology, Inc. (a) | | 16,605 | | | 250,735 |
First Horizon Pharmaceutical (a) | | 8,584 | | | 148,074 |
Genesis HealthCare Corp. (a) | | 6,463 | | | 236,029 |
Gentiva Health Services, Inc. (b) | | 8,301 | | | 122,357 |
Hooper Holmes, Inc. (a) | | 18,694 | | | 47,670 |
Horizon Health Corp. (a) (b) | | 3,631 | | | 82,170 |
Kindred Healthcare, Inc. (a) (b) | | 8,968 | | | 231,016 |
Lifeline Systems, Inc. (b) | | 4,276 | | | 156,331 |
Magellan Health Services, Inc. (a) | | 10,470 | | | 329,281 |
Matria Healthcare, Inc. (a) (b) | | 7,881 | | | 305,468 |
MAXIMUS, Inc. | | 7,015 | | | 257,380 |
Molina Healthcare, Inc. (b) | | 3,413 | | | 90,922 |
National Healthcare Corp. | | 2,378 | | | 88,890 |
Odyssey Healthcare, Inc. (a) | | 11,365 | | | 211,844 |
Option Care, Inc. (a) | | 9,739 | | | 130,113 |
Owens & Minor, Inc. | | 12,980 | | | 357,339 |
Parexel International Corp. (a) (b) | | 8,457 | | | 171,339 |
Pediatrix Medical Group, Inc. | | 7,657 | | | 678,180 |
| | | | | |
| Security Description | | Shares | | Value* |
| | | | | | |
|
Health Care Providers & Services—(Continued) |
Per-Se Technologies, Inc. (a) | | 9,446 | | $ | 220,659 |
PSS World Medical, Inc. (a) | | 23,469 | | | 348,280 |
Psychiatric Solutions, Inc. (a) (b) | | 9,077 | | | 533,183 |
Radiation Therapy Services, Inc. (b) | | 3,764 | | | 132,907 |
RehabCare Group, Inc. (b) | | 5,686 | | | 114,857 |
Res-Care, Inc. | | 5,924 | | | 102,900 |
Stewart Enterprises, Inc. | | 34,589 | | | 187,126 |
Sunrise Assisted Living, Inc. (a) | | 11,994 | | | 404,318 |
Symbion, Inc. (a) (b) | | 5,800 | | | 133,400 |
The Advisory Board Co. (b) | | 6,513 | | | 310,475 |
U.S. Physical Therapy, Inc. | | 4,137 | | | 76,410 |
United Surgical Partners International, Inc. (a) (b) | | 14,278 | | | 459,038 |
Ventiv Health, Inc. (b) | | 8,766 | | | 207,053 |
Vital Images, Inc. (b) | | 4,292 | | | 112,236 |
Wellcare Group, Inc. (a) | | 6,127 | | | 250,288 |
| | | | |
|
|
| | | | | | 11,339,710 |
| | | | |
|
|
|
Hotels, Restaurants & Leisure—2.5% |
AFC Enterprises, Inc. | | 6,656 | | | 100,639 |
Alliance Gaming Corp. (a) (b) | | 17,576 | | | 228,840 |
Ambassadors Group, Inc. | | 5,486 | | | 125,575 |
Ameristar Casinos, Inc. | | 8,422 | | | 191,179 |
Aztar Corp. (a) | | 12,995 | | | 394,918 |
BJ’s Restaurants, Inc. (a) (b) | | 5,028 | | | 114,940 |
Bob Evans Farms, Inc. | | 12,675 | | | 292,285 |
Buffalo Wild Wings, Inc. (a) | | 1,974 | | | 65,557 |
California Pizza Kitchen, Inc. | | 7,481 | | | 239,168 |
CEC Entertainment, Inc. (a) (b) | | 12,863 | | | 437,856 |
Churchill Downs, Inc. | | 2,600 | | | 95,498 |
CKE Restaurants, Inc. (a) | | 19,123 | | | 258,352 |
Dave & Buster’s, Inc. (a) | | 4,117 | | | 72,500 |
Denny’s Corp. (a) | | 29,921 | | | 120,582 |
Dominos Pizza, Inc. (a) | | 10,349 | | | 250,446 |
Gaylord Entertainment Co. (a) (b) | | 14,338 | | | 624,993 |
Great Wolf Resorts, Inc. (a) (b) | | 7,057 | | | 72,758 |
IHOP Corp. (a) | | 7,076 | | | 331,935 |
Isle of Capri Casinos, Inc. (a) | | 5,448 | | | 132,713 |
Jack in the Box, Inc. (a) | | 12,159 | | | 424,714 |
Krispy Kreme Doughnuts, Inc. (a) (b) | | 17,552 | | | 100,748 |
Landry’s Restaurants, Inc. (a) | | 5,380 | | | 143,700 |
Life Time Fitness, Inc. | | 7,612 | | | 289,941 |
Lodgian, Inc. | | 8,228 | | | 88,286 |
Lone Star Steakhouse & Saloon, Inc. | | 7,698 | | | 182,751 |
Luby’s, Inc. | | 7,616 | | | 101,293 |
Magna Entertainment Corp. (a) | | 12,790 | | | 91,321 |
Marcus Corp. | | 6,399 | | | 150,376 |
Mikohn Gaming Corp. (a) | | 7,654 | | | 75,545 |
Monarch Casino & Resort, Inc. | | 3,152 | | | 71,235 |
Multimedia Games, Inc. (a) | | 7,090 | | | 65,582 |
O’Charleys, Inc. | | 6,600 | | | 102,366 |
P.F. Chang’s China Bistro, Inc. (a) (b) | | 8,813 | | | 437,389 |
Papa John’s International, Inc. (a) | | 4,354 | | | 258,236 |
Pinnacle Entertainment, Inc. (a) (b) | | 13,153 | | | 325,011 |
Rare Hospitality International, Inc. (b) | | 11,393 | | | 346,233 |
Red Robin Gourmet Burgers, Inc. (a) (b) | | 4,601 | | | 234,467 |
Ruby Tuesday, Inc. (a) | | 23,355 | | | 604,661 |
*See accompanying notes to financial statements.
MSF-244
Metropolitan Series Fund, Inc.
Russell 2000 Index Portfolio
Schedule of Investments as of December 31, 2005
Common Stock—(Continued)
| | | | | |
| Security Description | | Shares | | Value* |
| | | | | | |
|
Hotels, Restaurants & Leisure—(Continued) |
Ruth’s Chris Steak House, Inc. | | 4,126 | | $ | 74,681 |
Ryan’s Restaurant Group, Inc. | | 14,640 | | | 176,558 |
Shuffle Master, Inc. (a) (b) | | 13,355 | | | 335,745 |
Six Flags, Inc. (a) | | 36,424 | | | 280,829 |
Speedway Motorsports, Inc. (a) | | 5,630 | | | 195,192 |
Sunterra Corp. (a) (b) | | 6,229 | | | 88,576 |
Texas Roadhouse, Inc. (a) | | 13,712 | | | 213,222 |
The Steak N Shake Co. (b) | | 8,968 | | | 152,008 |
Triarc Cos., Inc. (a) | | 15,033 | | | 223,240 |
Vail Resorts, Inc. (a) | | 9,979 | | | 329,606 |
WMS Industries, Inc. (a) (b) | | 6,932 | | | 173,924 |
| | | | |
|
|
| | | | | | 10,488,170 |
| | | | |
|
|
|
Household Durables—1.3% |
Bassett Furniture Industries, Inc. | | 3,669 | | | 67,877 |
Blyth, Inc. (a) | | 8,456 | | | 177,153 |
Champion Enterprises, Inc. (a) | | 25,302 | | | 344,613 |
CSS Industries, Inc. | | 2,329 | | | 71,570 |
Digital Theater Systems, Inc. (a) (b) | | 5,471 | | | 80,971 |
Ethan Allen Interiors, Inc. (a) | | 11,770 | | | 429,958 |
Fleetwood Enterprises, Inc. (a) | | 18,814 | | | 232,353 |
Furniture Brands International, Inc. (a) | | 16,624 | | | 371,214 |
Interface, Inc. (a) | | 15,557 | | | 127,879 |
Kimball International, Inc. (Class B) (a) | | 7,262 | | | 77,195 |
La-Z-Boy, Inc. (a) | | 16,845 | | | 228,418 |
Lancaster Colony Corp. (a) | | 8,557 | | | 317,037 |
M/I Schottenstein Homes, Inc. (a) | | 4,052 | | | 164,592 |
Mathews International Corp. | | 11,672 | | | 424,978 |
Maytag Corp. | | 25,737 | | | 484,370 |
National Presto Industries, Inc. (a) | | 1,747 | | | 77,480 |
Skyline Corp. (a) | | 2,168 | | | 78,915 |
Stanley Furniture, Inc. | | 5,050 | | | 117,059 |
Technical Olympic USA, Inc. (a) | | 5,446 | | | 114,856 |
The Topps Co., Inc. (a) | | 9,888 | | | 73,468 |
The Yankee Candle Co., Inc. (a) | | 15,360 | | | 393,216 |
Tupperware Corp. | | 18,401 | | | 412,182 |
Universal Electronics, Inc. | | 3,770 | | | 64,957 |
WCI Communities, Inc. (b) | | 13,224 | | | 355,064 |
William Lyon Homes, Inc. (a) | | 762 | | | 76,886 |
| | | | |
|
|
| | | | | | 5,364,261 |
| | | | |
|
|
|
Household Products—0.1% |
Prestige Brands Holdings, Inc. (a) | | 9,847 | | | 123,087 |
WD-40 Co. | | 6,572 | | | 172,581 |
| | | | |
|
|
| | | | | | 295,668 |
| | | | |
|
|
|
Industrial Conglomerates—0.1% |
Pioneer Companies, Inc. (a) | | 4,217 | | | 126,383 |
Raven Industries, Inc. (a) | | 4,516 | | | 130,287 |
Standex International Corp. | | 3,627 | | | 100,686 |
Tredegar Industries, Inc. (a) | | 10,102 | | | 130,215 |
| | | | |
|
|
| | | | | | 487,571 |
| | | | |
|
|
| | | | | |
| Security Description | | Shares | | Value* |
| | | | | | |
|
Insurance—2.3% |
21st Century Insurance Group | | 10,646 | | $ | 172,252 |
Alfa Corp. | | 11,623 | | | 187,130 |
American Equity Investment Life (a) | | 10,946 | | | 142,845 |
American Physicians Capital, Inc. | | 2,659 | | | 121,756 |
Argonaut Group, Inc. | | 10,151 | | | 332,648 |
Baldwin & Lyons, Inc. (Class B) | | 2,528 | | | 61,430 |
Bristol West Holdings, Inc. | | 4,982 | | | 94,807 |
Citizens, Inc. (a) | | 10,890 | | | 59,353 |
CNA Surety Corp. (a) | | 4,378 | | | 63,787 |
Delphi Financial Group, Inc. | | 9,336 | | | 429,549 |
Direct General Corp. (a) | | 5,117 | | | 86,477 |
Donega Group, Inc. | �� | 2,968 | | | 68,976 |
FBL Financial Group, Inc. | | 3,873 | | | 127,073 |
FPIC Insurance Group, Inc. | | 3,519 | | | 122,109 |
Fremont General Corp. (a) | | 20,974 | | | 487,226 |
Harleysville Group, Inc. | | 4,300 | | | 113,950 |
HealthExtras, Inc. (a) (b) | | 7,144 | | | 179,314 |
Hilb, Rogal & Hamilton Co. | | 10,747 | | | 413,867 |
Horace Mann Educators Corp. | | 13,954 | | | 264,568 |
Infinity Property & Casualty Corp. | | 6,646 | | | 247,298 |
Kansas City Life Insurance Co. | | 1,336 | | | 66,907 |
KMG America Corp. (b) | | 7,289 | | | 66,913 |
Landamerica Financial Group, Inc. (a) | | 6,365 | | | 397,176 |
Midland Co. | | 4,564 | | | 164,487 |
National Western Life Insurance Co. (a) | | 717 | | | 148,354 |
Odyssey Re Holdings Corp. (a) | | 3,992 | | | 100,119 |
Ohio Casualty Corp. (b) | | 20,908 | | | 592,115 |
Phoenix Cos., Inc. (a) | | 31,543 | | | 430,247 |
Pico Holdings, Inc. | | 2,706 | | | 87,296 |
PMA Capital Corp. (a) | | 10,782 | | | 98,440 |
Presidential Life Corp. (a) | | 6,818 | | | 129,815 |
ProAssurance Corp. (b) | | 9,361 | | | 455,319 |
RLI Corp. | | 8,244 | | | 411,128 |
Safety Insurance Group, Inc. (a) | | 3,999 | | | 161,440 |
Selective Insurance Group, Inc. (a) | | 10,056 | | | 533,974 |
State Auto Financial Corp. | | 4,247 | | | 154,846 |
Stewart Information Services Corp. | | 5,777 | | | 281,167 |
The Navigators Group, Inc. (a) (b) | | 3,750 | | | 163,537 |
Tower Group, Inc. (a) | | 4,605 | | | 101,218 |
Triad Guaranty, Inc. (b) | | 3,014 | | | 132,586 |
U.S.I. Holdings Corp. (a) | | 14,907 | | | 205,269 |
UICI | | 12,101 | | | 429,707 |
United Fire & Casualty Co. (a) | | 5,755 | | | 232,675 |
Universal American Financial Corp. (a) (b) | | 8,481 | | | 127,893 |
Zenith National Insurance Corp. (a) | | 8,739 | | | 403,043 |
| | | | |
|
|
| | | | | | 9,852,086 |
| | | | |
|
|
|
Internet & Catalog Retail—0.6% |
Blue Nile, Inc. (a) (b) | | 4,860 | | | 195,907 |
Coldwater Creek, Inc. (a) (b) | | 12,034 | | | 367,398 |
drugstore.com, Inc. (a) (b) | | 22,796 | | | 64,969 |
GSI Commerce, Inc. (a) (b) | | 10,126 | | | 152,801 |
Insight Enterprises, Inc. (b) | | 16,452 | | | 322,624 |
NutriSystem, Inc. (a) | | 9,109 | | | 328,106 |
Overstock.com, Inc. (a) | | 3,885 | | | 109,363 |
Priceline.com, Inc. | | 8,672 | | | 193,559 |
*See accompanying notes to financial statements.
MSF-245
Metropolitan Series Fund, Inc.
Russell 2000 Index Portfolio
Schedule of Investments as of December 31, 2005
Common Stock—(Continued)
| | | | | |
| Security Description | | Shares | | Value* |
| | | | | | |
|
Internet & Catalog Retail—(Continued) |
School Specialty, Inc. | | 8,915 | | $ | 324,862 |
Stamps.com, Inc. | | 6,134 | | | 140,837 |
The J. Jill Group, Inc. | | 6,618 | | | 125,940 |
ValueVision Media, Inc. | | 9,144 | | | 115,214 |
| | | | |
|
|
| | | | | | 2,441,580 |
| | | | |
|
|
|
Internet Software & Services—2.3% |
Allscripts Heathcare Solutions, Inc. (a) | | 11,119 | | | 148,995 |
Altiris, Inc. (b) | | 6,720 | | | 113,501 |
Applied Digital Solutions, Inc. (a) | | 22,585 | | | 64,819 |
Ariba, Inc. (a) | | 23,240 | | | 170,814 |
Audible, Inc. (a) | | 7,941 | | | 101,962 |
Autobytel, Inc. | | 11,911 | | | 58,840 |
Blue Coat Systems, Inc. (a) (b) | | 3,656 | | | 167,152 |
Click Commerce, Inc. (a) | | 2,850 | | | 59,907 |
CMG Information Services, Inc. (a) | | 146,642 | | | 222,896 |
CNET Networks, Inc. (a) (b) | | 43,303 | | | 636,121 |
Cybersource Corp. (a) (b) | | 9,466 | | | 62,476 |
Digital Insight Corp. (b) | | 13,076 | | | 418,693 |
Digital River, Inc. (a) | | 11,388 | | | 338,679 |
Digitas, Inc. (b) | | 28,925 | | | 362,141 |
EarthLink, Inc. (a) (b) | | 41,991 | | | 466,520 |
eCollege.com, Inc. (a) | | 5,048 | | | 91,015 |
Equinix, Inc. (a) | | 5,042 | | | 205,512 |
FileNET Corp. (b) | | 13,639 | | | 352,568 |
HomeStore, Inc. | | 46,751 | | | 238,430 |
InfoSpace, Inc. (b) | | 12,446 | | | 321,356 |
Internet Capital Group, Inc. (a) | | 12,665 | | | 104,106 |
Interwoven, Inc. | | 14,801 | | | 125,364 |
iPass, Inc. | | 14,401 | | | 94,471 |
Ivillage, Inc. (a) | | 15,842 | | | 127,053 |
j2 Global Communications, Inc. (a) (b) | | 7,720 | | | 329,953 |
Jupitermedia Corp. (a) (b) | | 9,114 | | | 134,705 |
Keynote Systems, Inc. | | 6,539 | | | 84,026 |
Marchex, Inc. (a) (b) | | 6,604 | | | 148,524 |
MatrixOne, Inc. (a) (b) | | 15,318 | | | 76,437 |
NETGEAR, Inc. (a) | | 10,411 | | | 200,412 |
NetIQ Corp. (a) (b) | | 18,957 | | | 232,981 |
Netratings, Inc. (a) | | 3,785 | | | 46,669 |
NIC, Inc. (a) (b) | | 10,636 | | | 65,518 |
Online Resources Corp. (b) | | 7,192 | | | 79,472 |
Openwave Systems, Inc. (a) (b) | | 24,421 | | | 426,635 |
Opsware, Inc. (a) | | 20,184 | | | 137,049 |
RealNetworks, Inc. (a) | | 36,191 | | | 280,842 |
RightNow Technologies, Inc. (a) (b) | | 4,122 | | | 76,092 |
S1 Corp. (a) | | 21,159 | | | 92,042 |
Sohu.com, Inc. | | 8,121 | | | 148,939 |
SonicWall, Inc. | | 15,353 | | | 121,596 |
Stellent, Inc. | | 6,155 | | | 61,119 |
Trizetto Group, Inc. (a) | | 13,889 | | | 235,974 |
United Online, Inc. (a) | | 19,949 | | | 283,675 |
ValueClick, Inc. (a) (b) | | 29,324 | | | 531,058 |
Vignette Corp. (a) | | 9,405 | | | 153,396 |
WebEx Communications, Inc. (a) | | 11,434 | | | 247,317 |
webMethods, Inc. (a) | | 15,045 | | | 115,997 |
Websense, Inc. (a) (b) | | 8,500 | | | 557,940 |
| | | | |
|
|
| | | | | | 9,921,759 |
| | | | |
|
|
| | | | | |
| Security Description | | Shares | | Value* |
| | | | | | |
|
IT Services—1.2% |
Acxiom Corp. | | 31,096 | | $ | 715,208 |
Agilysys, Inc. | | 9,974 | | | 181,726 |
Anteon International Corp. (a) (b) | | 9,932 | | | 539,804 |
BearingPoint, Inc. (a) (b) | | 59,294 | | | 466,051 |
Bell Microproducts, Inc. (a) | | 9,767 | | | 74,718 |
Ciber, Inc. (a) | | 16,935 | | | 111,771 |
Covansys Corp. | | 10,222 | | | 139,121 |
Exponent, Inc. | | 4,136 | | | 117,380 |
Forrester Research, Inc. (b) | | 5,604 | | | 105,075 |
IDX Systems Corp. (a) (b) | | 8,198 | | | 360,056 |
IHS, Inc. | | 4,971 | | | 102,005 |
Integral Systems, Inc. | | 3,532 | | | 66,613 |
Keane, Inc. (a) (b) | | 18,071 | | | 198,962 |
Lionbridge Technologies, Inc. (a) | | 15,341 | | | 107,694 |
Mantech International Corp. | | 5,770 | | | 160,752 |
MarketAxess Holdings, Inc. (a) | | 7,823 | | | 89,417 |
Ness Technologies, Inc. (a) | | 10,051 | | | 108,249 |
Packeteer, Inc. (b) | | 10,674 | | | 82,937 |
Perot Systems Corp. (Class A) (b) | | 25,993 | | | 367,541 |
Phase Forward, Inc. (a) | | 7,016 | | | 68,406 |
ProQuest Co. (b) | | 8,496 | | | 237,123 |
Resources Connection, Inc. (b) | | 17,185 | | | 447,841 |
Sapient Corp. (a) (b) | | 25,464 | | | 144,890 |
SI International, Inc. (a) (b) | | 3,402 | | | 103,999 |
Sykes Enterprises, Inc. | | 9,126 | | | 122,015 |
TNS, Inc. (b) | | 4,403 | | | 84,450 |
Tyler Technologies, Inc. (a) | | 13,466 | | | 118,231 |
Viisage Technology, Inc. (a) | | 4,589 | | | 80,809 |
| | | | |
|
|
| | | | | | 5,502,844 |
| | | | |
|
|
|
Leisure Equipment & Products—0.4% |
Arctic Cat, Inc. (a) | | 5,294 | | | 106,198 |
Build-A-Bear-Workshop, Inc. (a) | | 5,004 | | | 148,319 |
Callaway Golf Co. | | 25,755 | | | 356,449 |
JAKKS Pacific, Inc. (a) | | 8,157 | | | 170,808 |
K2, Inc. (b) | | 15,520 | | | 156,907 |
Leapfrog Enterprises, Inc. (a) | | 11,354 | | | 132,274 |
M & F Worldwide Corp. | | 4,195 | | | 68,462 |
Midway Games, Inc. (a) | | 6,065 | | | 115,053 |
Nautilus Group, Inc. (a) | | 10,789 | | | 201,323 |
Oakley, Inc. (a) | | 8,234 | | | 120,957 |
RC2 Corp. (a) (b) | | 6,165 | | | 218,981 |
| | | | |
|
|
| | | | | | 1,795,731 |
| | | | |
|
|
|
Machinery—3.2% |
3D Systems Corp. (a) | | 4,081 | | | 73,458 |
Actuant Corp. (a) | | 9,699 | | | 541,204 |
AGCO Corp. (a) (b) | | 29,091 | | | 482,038 |
Albany International Corp. (Class A) | | 9,539 | | | 344,930 |
American Science & Engineering, Inc. (b) | | 2,762 | | | 172,266 |
Applied Industrial Technologies, Inc. | | 10,064 | | | 339,056 |
Astec Industries, Inc. | | 6,009 | | | 196,254 |
ASV, Inc. (a) | | 7,026 | | | 175,509 |
Badger Meter, Inc. | | 1,881 | | | 73,810 |
*See accompanying notes to financial statements.
MSF-246
Metropolitan Series Fund, Inc.
Russell 2000 Index Portfolio
Schedule of Investments as of December 31, 2005
Common Stock—(Continued)
| | | | | |
| Security Description | | Shares | | Value* |
| | | | | | |
|
Machinery—(Continued) |
Barnes Group, Inc. (a) | | 5,706 | | $ | 188,298 |
Blount International, Inc. | | 9,744 | | | 155,222 |
Briggs & Stratton Corp. | | 18,295 | | | 709,663 |
Bucyrus International, Inc. | | 6,592 | | | 347,398 |
Cascade Corp. | | 4,127 | | | 193,598 |
Ceradyne, Inc. (a) (b) | | 9,065 | | | 397,047 |
Circor International, Inc. | | 6,251 | | | 160,401 |
CLARCOR, Inc. (a) | | 17,418 | | | 517,489 |
Dionex Corp. (a) (b) | | 6,793 | | | 333,400 |
Enpro Industries, Inc. (a) | | 6,808 | | | 183,476 |
ESCO Technologies, Inc. (b) | | 8,522 | | | 379,144 |
Esterline Technologies Corp. | | 8,043 | | | 299,119 |
Flowserve Corp. (b) | | 18,653 | | | 737,913 |
Freightcar America, Inc. | | 2,995 | | | 144,000 |
Gardner Denver, Inc. | | 8,122 | | | 400,415 |
Gehl Co. (a) | | 3,366 | | | 88,358 |
Gorman-Rupp Co. (a) | | 4,175 | | | 92,309 |
JLG Industries, Inc. (a) | | 16,611 | | | 758,458 |
Kadant, Inc. (a) (b) | | 4,243 | | | 78,496 |
Kaydon Corp. (a) | | 9,027 | | | 290,128 |
Kennametal, Inc. | | 12,617 | | | 643,972 |
Lincoln Electric Holdings, Inc. | | 12,227 | | | 484,923 |
Lindsay Manufacturing Co. (a) | | 3,885 | | | 74,709 |
Middleby Corp. (a) | | 2,244 | | | 194,106 |
Mueller Industries, Inc. | | 12,475 | | | 342,064 |
NACCO Industries, Inc. | | 2,067 | | | 242,149 |
Nordson Corp. | | 9,085 | | | 368,033 |
Robbins & Myers, Inc. (a) | | 3,590 | | | 73,057 |
Stewart & Stevenson Services, Inc. (a) | | 9,373 | | | 198,051 |
Tennant Co. (a) | | 3,300 | | | 171,600 |
The Manitowoc Co., Inc. (a) | | 10,888 | | | 546,795 |
Titan International, Inc. (a) | | 4,637 | | | 79,988 |
Trinity Industries, Inc. (a) | | 13,644 | | | 601,291 |
Valmont Industries, Inc. | | 5,834 | | | 195,206 |
Wabash National Corp. (a) | | 11,061 | | | 210,712 |
Watts Industries, Inc. (a) | | 9,829 | | | 297,720 |
| | | | |
|
|
| | | | | | 13,577,233 |
| | | | |
|
|
|
Marine—0.1% |
Kirby Corp. | | 8,106 | | | 422,890 |
Maritrans, Inc. | | 2,973 | | | 77,357 |
| | | | |
|
|
| | | | | | 500,247 |
| | | | |
|
|
|
Media—1.9% |
4Kids Entertainment, Inc. (a) | | 4,058 | | | 63,670 |
ADVO, Inc. | | 12,207 | | | 343,993 |
aQuantive, Inc. (a) (b) | | 18,346 | | | 463,053 |
Carmike Cinemas, Inc. (a) | | 4,069 | | | 103,190 |
Catalina Marketing Corp. (a) | | 16,724 | | | 423,953 |
Charter Communications, Inc. (a) | | 109,138 | | | 133,148 |
Citadel Broadcasting Corp. (a) | | 14,362 | | | 193,025 |
Courier Corp. | | 3,534 | | | 121,358 |
Cox Radio, Inc. (Class A) (b) | | 12,537 | | | 176,521 |
Cumulus Media, Inc. (a) | | 18,571 | | | 230,466 |
Emmis Communications Corp. (Class A) (a) (b) | | 10,202 | | | 203,122 |
| | | | | |
| Security Description | | Shares | | Value* |
| | | | | | |
|
Media—(Continued) |
Entercom Communications Corp. (b) | | 11,650 | | $ | 345,656 |
Entravision Communications Corp.
(Class A) (a) (b) | | 25,008 | | | 178,057 |
Fisher Communications, Inc. | | 2,146 | | | 88,909 |
Gemstar-TV Guide International, Inc. | | 79,853 | | | 208,416 |
Gray Television, Inc. | | 14,290 | | | 140,328 |
Harris Interactive, Inc. (a) | | 17,526 | | | 75,537 |
Hollinger International, Inc. (a) | | 18,396 | | | 164,828 |
Journal Communications, Inc. (a) | | 9,176 | | | 128,005 |
Journal Register Co. (b) | | 13,471 | | | 201,392 |
Liberty Corp. | | 5,899 | | | 276,132 |
LIN TV Corp. (a) | | 9,565 | | | 106,554 |
LodgeNet Entertainment Corp. (a) | | 4,834 | | | 67,386 |
Martha Stewart Living Omnimedia, Inc. (a) | | 7,312 | | | 127,448 |
Media General, Inc. (Class A) (a) | | 8,060 | | | 408,642 |
Mediacom Communications Corp. (a) | | 21,028 | | | 115,444 |
Netflix, Inc. | | 11,957 | | | 323,557 |
Playboy Enterprises, Inc. (Class B) (a) | | 9,152 | | | 127,121 |
Primedia, Inc. (a) (b) | | 43,698 | | | 70,354 |
Radio One, Inc. (Class D) (b) | | 27,058 | | | 280,050 |
Regent Communications, Inc. (b) | | 11,681 | | | 54,200 |
Saga Communications, Inc. (a) (b) | | 5,839 | | | 63,470 |
Salem Communications Corp. (Class A) (b) | | 3,659 | | | 63,996 |
Scholastic Corp. (a) (b) | | 10,630 | | | 303,061 |
Sinclair Broadcast Group, Inc. (a) | | 14,985 | | | 137,862 |
Sonic Solutions, Inc. (a) | | 7,967 | | | 120,381 |
Source Interlink Cos., Inc. (a) | | 10,894 | | | 121,141 |
Spanish Broadcasting Systems, Inc. (a) (b) | | 11,410 | | | 58,305 |
The Reader’s Digest Association, Inc. (Class A) | | 33,004 | | | 502,321 |
Thomas Nelson, Inc. | | 4,129 | | | 101,780 |
TiVo, Inc. (a) | | 20,917 | | | 107,095 |
Valassis Communications, Inc. (b) | | 17,716 | | | 515,004 |
World Wrestling Entertainment, Inc. | | 7,379 | | | 108,324 |
| | | | |
|
|
| | | | | | 8,146,255 |
| | | | |
|
|
|
Metals & Mining—2.2% |
A.M. Castle & Co. | | 3,723 | | | 81,310 |
AK Steel Holding Corp. (a) | | 35,208 | | | 279,904 |
Alpha Natural Resources, Inc. (b) | | 9,823 | | | 188,700 |
AMCOL International Corp. | | 6,834 | | | 140,234 |
Brush Engineered Material, Inc. | | 6,088 | | | 96,799 |
Carpenter Technology Corp. (a) | | 8,386 | | | 590,961 |
Century Aluminum Co. | | 9,357 | | | 245,247 |
Chaparral Steel Co. (b) | | 7,332 | | | 221,793 |
Cleveland Cliffs, Inc. (a) | | 7,412 | | | 656,481 |
Coeur D’Alene Mines Corp. (a) | | 77,483 | | | 309,932 |
Commercial Metals Co. | | 20,130 | | | 755,680 |
Compass Minerals International, Inc. (a) | | 6,626 | | | 162,602 |
Foundation Coal Holdings, Inc. (a) | | 7,901 | | | 300,238 |
Gibraltar Industries, Inc. (a) | | 7,619 | | | 174,780 |
GrafTech International, Ltd. (a) | | 29,803 | | | 185,375 |
Hecla Mining Co. (a) | | 38,880 | | | 157,853 |
James River Coal Co. | | 4,250 | | | 162,350 |
Metal Management, Inc. (a) | | 7,392 | | | 171,938 |
NN, Inc. | | 6,070 | | | 64,342 |
Oregon Steel Mills, Inc. (a) | | 11,138 | | | 327,680 |
*See accompanying notes to financial statements.
MSF-247
Metropolitan Series Fund, Inc.
Russell 2000 Index Portfolio
Schedule of Investments as of December 31, 2005
Common Stock—(Continued)
| | | | | |
| Security Description | | Shares | | Value* |
| | | | | | |
|
Metals & Mining—(Continued) |
Quanex Corp. (a) | | 9,044 | | $ | 451,929 |
Reliance Steel & Aluminum Co. | | 9,862 | | | 602,765 |
Roanoke Electric Steel Corp. | | 3,819 | | | 90,128 |
Royal Gold, Inc. (a) | | 7,873 | | | 273,429 |
RTI International Metals, Inc. | | 8,553 | | | 324,586 |
Ryerson Tull, Inc. (a) | | 7,775 | | | 189,088 |
Schnitzer Steel Industries, Inc. (a) | | 7,387 | | | 225,968 |
Steel Dynamics, Inc. (a) | | 13,508 | | | 479,669 |
Steel Technologies, Inc. (a) | | 3,366 | | | 94,214 |
Stillwater Mining Co. (a) | | 12,963 | | | 149,982 |
Titanium Metals Corp. (a) | | 4,406 | | | 278,724 |
USEC, Inc. | | 26,522 | | | 316,938 |
Worthington Industries, Inc. (a) | | 22,409 | | | 430,477 |
| | | | |
|
|
| | | | | | 9,182,096 |
| | | | |
|
|
|
Multi-Utilities—0.2% |
Aquila, Inc. (a) (b) | | 118,745 | | | 427,482 |
Avista Corp. | | 16,123 | | | 285,538 |
| | | | |
|
|
| | | | | | 713,020 |
| | | | |
|
|
|
Multiline Retail—0.3% |
99 Cents Only Stores (a) (b) | | 15,777 | | | 165,027 |
Big Lots, Inc. (a) (b) | | 36,605 | | | 439,626 |
Burlington Coat Factory Warehouse Corp. | | 6,057 | | | 243,552 |
Fred’s, Inc. (a) | | 13,765 | | | 223,957 |
Retail Ventures, Inc. (b) | | 5,647 | | | 70,249 |
Stein Mart, Inc. (a) | | 9,522 | | | 172,824 |
Tuesday Morning Corp. (a) | | 8,286 | | | 173,343 |
| | | | |
|
|
| | | | | | 1,488,578 |
| | | | |
|
|
|
Mutual Funds—1.9% |
iShares Russell 2000 Index Fund (a) | | 119,200 | | | 7,949,448 |
| | | | |
|
|
|
Office Electronics—0.1% |
IKON Office Solutions, Inc. | | 37,318 | | | 388,480 |
| | | | |
|
|
|
Oil, Gas & Consumable Fuels—3.1% |
Alon USA Energy, Inc. (a) | | 3,353 | | | 65,887 |
Atlas America, Inc. | | 3,833 | | | 230,823 |
ATP Oil & Gas Corp. (b) | | 5,899 | | | 218,322 |
Berry Petroleum Co. | | 5,627 | | | 321,864 |
Bill Barrett Corp. (a) (b) | | 4,375 | | | 168,919 |
Bois d’Arc Energy, Inc. (a) | | 4,448 | | | 70,545 |
Brigham Exploration Co. | | 7,247 | | | 85,949 |
Cabot Oil & Gas Corp. | | 16,363 | | | 737,971 |
Callon Petroleum Co. (a) | | 4,125 | | | 72,806 |
Carrizo Oil & Gas, Inc. (a) | | 6,126 | | | 151,374 |
Cheniere Energy, Inc. (a) | | 17,055 | | | 634,787 |
Cimarex Energy Co. (a) | | 26,928 | | | 1,158,173 |
Comstock Resources, Inc. (b) | | 13,099 | | | 399,651 |
Crosstex Energy, Inc. | | 2,013 | | | 126,940 |
Delta Petroleum Corp. (a) | | 12,281 | | | 267,357 |
Edge Petroleum Corp. | | 5,435 | | | 135,386 |
Encore Aquisition Co. | | 15,837 | | | 507,418 |
Endeavour International Corp. | | 18,499 | | | 61,047 |
| | | | | |
| Security Description | | Shares | | Value* |
| | | | | | |
|
Oil, Gas & Consumable Fuels—(Continued) |
Energy Partners, Ltd. (a) (b) | | 10,760 | | $ | 234,460 |
Frontier Oil Corp. | | 18,193 | | | 682,783 |
FX Energy, Inc. (a) | | 11,798 | | | 94,148 |
Gasco Energy, Inc. (a) | | 21,137 | | | 138,025 |
Giant Industries, Inc. | | 4,579 | | | 237,925 |
Goodrich Peteroleum Corp. (a) (b) | | 3,368 | | | 84,705 |
Harvest Natural Resources, Inc. (a) | | 12,513 | | | 111,115 |
Holly Corp. (a) | | 7,971 | | | 469,253 |
Houston Exploration Co. (a) | | 10,315 | | | 544,632 |
KCS Energy, Inc. (a) | | 16,452 | | | 398,468 |
McMoran Exploration Co. (a) | | 6,027 | | | 119,154 |
Meridian Resource Corp. (a) | | 28,080 | | | 117,936 |
Parallel Petroleum Corp. (a) | | 10,224 | | | 173,910 |
Penn Virginia Corp. | | 6,863 | | | 393,936 |
Petroleum Development Corp. (a) | | 5,229 | | | 174,335 |
PetroQuest Energy, Inc. | | 13,340 | | | 110,455 |
Pioneer Drilling Co. (a) (b) | | 6,451 | | | 115,666 |
Remington Oil & Gas Corp. (a) (b) | | 7,805 | | | 284,883 |
Resource America, Inc. | | 5,263 | | | 89,734 |
St. Mary Land & Exploration Co. (a) | | 19,080 | | | 702,335 |
Stone Energy Corp. (a) (b) | | 8,136 | | | 370,432 |
Swift Energy Co. (b) | | 10,119 | | | 456,063 |
Syntroleum Corp. (a) | | 12,692 | | | 114,609 |
Todco (Class A) | | 16,590 | | | 631,415 |
Toreador Resources Corp. (a) | | 4,634 | | | 97,638 |
TransMontaigne, Inc. | | 11,923 | | | 78,692 |
W&T Offshore, Inc. (a) | | 4,296 | | | 126,302 |
Warren Resources, Inc. (a) | | 5,791 | | | 91,614 |
Whiting Petroleum Corp. | | 11,960 | | | 478,400 |
Williams Clayton Energy, Inc. (a) | | 1,786 | | | 74,548 |
| | | | |
|
|
| | | | | | 13,212,790 |
| | | | |
|
|
|
Paper & Forest Products—0.4% |
Bowater, Inc. (a) | | 18,007 | | | 553,175 |
Buckeye Technologies, Inc. | | 8,960 | | | 72,128 |
Chesapeake Corp. | | 6,265 | | | 106,380 |
Deltic Timber Corp. | | 3,743 | | | 194,112 |
Glatfelter (a) | | 14,400 | | | 204,336 |
Mercer International, Inc. (a) | | 9,628 | | | 75,676 |
Neenah Paper, Inc. (a) | | 4,857 | | | 135,996 |
Wausau-Mosinee Paper Corp. (a) | | 14,665 | | | 173,780 |
| | | | |
|
|
| | | | | | 1,515,583 |
| | | | |
|
|
|
Personal Products—0.4% |
Chattem, Inc. (a) | | 7,156 | | | 260,407 |
Elizabeth Arden, Inc. (a) | | 8,835 | | | 177,230 |
Mannatech, Inc. (a) | | 4,832 | | | 66,730 |
Nature’s Sunshine Products, Inc. (a) | | 3,864 | | | 69,861 |
NBTY, Inc. (a) (b) | | 18,289 | | | 297,196 |
NU Skin Enterprises, Inc. | | 18,168 | | | 319,393 |
Playtex Products, Inc. (a) | | 15,273 | | | 208,782 |
Revlon, Inc. (a) | | 47,536 | | | 147,362 |
Water Pik Technologies, Inc. | | 3,495 | | | 75,038 |
| | | | |
|
|
| | | | | | 1,621,999 |
| | | | |
|
|
*See accompanying notes to financial statements.
MSF-248
Metropolitan Series Fund, Inc.
Russell 2000 Index Portfolio
Schedule of Investments as of December 31, 2005
Common Stock—(Continued)
| | | | | |
| Security Description | | Shares | | Value* |
| | | | | | |
|
Pharmaceuticals—1.6% |
Adams Respiratory Therapeutics, Inc. (b) | | 2,527 | | $ | 102,748 |
Adolor Corp. | | 13,429 | | | 196,063 |
Alpharma, Inc. (a) | | 13,761 | | | 392,326 |
Andrx Corp. (a) (b) | | 23,700 | | | 390,339 |
Ariad Pharmaceuticals, Inc. (a) | | 21,812 | | | 127,600 |
Atherogenics, Inc. (a) | | 12,957 | | | 259,270 |
Avanir Pharmaceuticals (Class A) (a) | | 36,746 | | | 126,406 |
Bentley Pharmaceuticals, Inc. (a) | | 6,371 | | | 104,548 |
Discovery Laboratories, Inc. (a) | | 16,615 | | | 110,988 |
Dov Pharmaceutical, Inc. (a) | | 7,754 | | | 113,829 |
Durect Corp., Inc. (a) | | 11,442 | | | 58,011 |
Hi-Tech Pharmacal Co., Inc. | | 1,904 | | | 84,328 |
Idenix Pharmaceuticals, Inc. (a) (b) | | 4,298 | | | 73,539 |
Inspire Pharmaceutical, Inc. | | 15,703 | | | 79,771 |
InterMune, Inc. (a) | | 10,030 | | | 168,504 |
K-V Pharmaceutical Co. (Class A) (a) | | 12,272 | | | 252,803 |
MannKind Corp. (a) (b) | | 8,062 | | | 90,778 |
Medicis Pharmaceutical Corp. (Class A) (a) | | 17,554 | | | 562,606 |
MGI Pharma, Inc. | | 25,788 | | | 442,522 |
Nastech Pharmaceutical, Inc. (a) | | 6,222 | | | 91,588 |
Nektar Therapeutics | | 27,502 | | | 452,683 |
New River Pharmaceuticals, Inc. (a) | | 2,146 | | | 111,335 |
Nitromed, Inc. (a) | | 5,572 | | | 77,729 |
Noven Pharmaceuticals, Inc. (a) (b) | | 6,880 | | | 104,094 |
NPS Pharmaceuticals, Inc. (a) | | 12,013 | | | 142,234 |
Pain Therapeutics, Inc. (a) | | 6,849 | | | 46,299 |
Palatin Technologies, Inc. | | 1 | | | 3 |
Par Pharmaceutical Companies, Inc. (a) (b) | | 12,917 | | | 404,819 |
Penwest Pharmaceuticals Co. (a) (b) | | 9,561 | | | 186,631 |
Perrigo Co. (a) | | 27,613 | | | 411,710 |
Pharmion Corp. (b) | | 8,108 | | | 144,079 |
Pozen, Inc. | | 8,412 | | | 80,671 |
Renovis, Inc. (a) | | 6,578 | | | 100,643 |
Rigel Pharmaceuticals, Inc. (a) (b) | | 8,154 | | | 68,168 |
Salix Pharmaceuticals, Ltd. | | 17,032 | | | 299,423 |
SFBC International, Inc. (a) (b) | | 6,279 | | | 100,527 |
Supergen, Inc. (a) | | 17,685 | | | 89,309 |
The Medicines Co. (a) (b) | | 16,504 | | | 287,995 |
Trimeris, Inc. (b) | | 4,867 | | | 55,922 |
| | | | |
|
|
| | | | | | 6,992,841 |
| | | | |
|
|
|
Real Estate—6.7% |
Aames Investment Corp. (REIT) (a) | | 16,861 | | | 108,922 |
Acadia Realty Trust (REIT) (a) | | 11,009 | | | 220,730 |
Affordable Residential Communities, Inc. (REIT) (a) | | 8,033 | | | 76,554 |
Agree Realty Corp. (REIT) | | 2,629 | | | 75,978 |
Alexander’s, Inc. (REIT) | | 712 | | | 174,796 |
Alexandria Real Estate Equities, Inc. (REIT) | | 6,840 | | | 550,620 |
American Campus Communities, Inc. (REIT) | | 5,731 | | | 142,129 |
American Home Mortgage Investment Corp. (REIT) | | 14,561 | | | 474,252 |
AMLI Residential Properties Trust (REIT) (a) | | 9,697 | | | 368,971 |
Anthracite Capital, Inc. (REIT) | | 17,065 | | | 179,694 |
Anworth Mortgage Asset Corp. (REIT) (a) | | 18,814 | | | 137,342 |
Arbor Realty Trust, Inc. (REIT) | | 4,285 | | | 111,067 |
Ashford Hospitality Trust, Inc. (REIT) | | 9,283 | | | 97,379 |
Avatar Holding, Inc. (a) | | 2,006 | | | 110,169 |
| | | | | |
| Security Description | | Shares | | Value* |
| | | | | | |
|
Real Estate—(Continued) |
Bedford Property Investors, Inc. (REIT) (a) | | 4,713 | | $ | 103,403 |
Bimini Mortgage Management, Inc. (REIT) (a) | | 6,579 | | | 59,540 |
BioMed Realty Trust, Inc. (REIT) (a) | | 14,187 | | | 346,163 |
Bluegreen Corp. (a) | | 9,075 | | | 143,385 |
Boykin Lodging Co. (REIT) | | 6,002 | | | 73,344 |
Brandywine Realty Trust (REIT) | | 18,061 | | | 504,082 |
Brookdale Senior Living, Inc. (a) (b) | | 3,634 | | | 108,330 |
Brookfield Homes Corp. (a) | | 5,206 | | | 258,894 |
California Coastal Communities, Inc. | | 2,667 | | | 104,626 |
Capital Lease Funding, Inc. (REIT) | | 7,524 | | | 79,228 |
Capital Trust, Inc. (REIT) (a) | | 4,803 | | | 140,632 |
Cedar Shopping Centers, Inc. (REIT) (a) | | 5,543 | | | 77,990 |
Colonial Properties Trust (REIT) | | 14,140 | | | 593,597 |
Columbia Equity Trust, Inc. (a) | | 5,014 | | | 80,976 |
Commercial Net Lease Realty (REIT) | | 18,295 | | | 372,669 |
Consolidated Tomoka Land Co. | | 2,042 | | | 144,778 |
Corporate Office Properties Trust (REIT) (a) | | 9,448 | | | 335,782 |
Correctional Properties Trust (REIT) | | 3,708 | | | 99,634 |
Corrections Corp. of America | | 13,049 | | | 586,813 |
Cousins Properties, Inc. (REIT) | | 12,745 | | | 360,683 |
CRIIMIi Mae, Inc. (REIT) | | 5,231 | | | 103,574 |
Deerfield Triarc Capital Corp. | | 7,937 | | | 108,737 |
Diamondrock Hospitality Co. (REIT) (a) | | 8,350 | | | 99,866 |
Digital Reality Trust, Inc. (REIT) | | 4,031 | | | 91,222 |
EastGroup Properties, Inc. (REIT) | | 7,662 | | | 346,016 |
Education Realty Trust, Inc. (REIT) (a) | | 6,499 | | | 83,772 |
Entertainment Properties Trust (REIT) | | 8,278 | | | 337,328 |
Equity Inns, Inc. (REIT) | | 16,699 | | | 226,271 |
Equity Lifestyle Properties, Inc. (REIT) (a) | | 6,932 | | | 308,474 |
Equity One, Inc. (REIT) (a) | | 12,479 | | | 288,514 |
Extra Space Storage, Inc. (REIT) (a) | | 12,789 | | | 196,951 |
FelCor Lodging Trust, Inc. (REIT) (a) | | 18,657 | | | 321,087 |
Fieldstone Investment Corp. (REIT) (a) | | 16,134 | | | 191,349 |
First Industrial Realty Trust, Inc. (REIT) (a) | | 14,343 | | | 552,205 |
First Potomac Realty Trust (REIT) (a) | | 6,710 | | | 178,486 |
Getty Realty Corp. (REIT) | | 6,406 | | | 168,414 |
Glenborough Realty Trust, Inc. (REIT) | | 10,576 | | | 191,426 |
Glimcher Realty Trust (REIT) (a) | | 12,905 | | | 313,850 |
GMH Communities Trust (REIT) (a) | | 13,528 | | | 209,819 |
Government Properties Trust, Inc. (REIT) (a) | | 6,482 | | | 60,477 |
Gramercy Capital Corp. (REIT) (a) | | 7,178 | | | 163,515 |
Heritage Property Investment Trust, Inc. (REIT) (a) | | 8,714 | | | 291,048 |
Hersha Hospitality Trust (REIT) (a) | | 7,032 | | | 63,358 |
Highland Hospitality Corp. (REIT) | | 15,896 | | | 175,651 |
Highwoods Properties, Inc. (REIT) (a) | | 17,855 | | | 507,975 |
Home Properties of New York, Inc. (REIT) | | 10,639 | | | 434,071 |
HomeBanc Corp. (REIT) (a) | | 18,606 | | | 139,173 |
IMPAC Mortage Holdings, Inc. (REIT) (a) | | 24,160 | | | 227,346 |
Inland Real Estate Corp. (REIT) (a) | | 21,831 | | | 322,880 |
Innkeepers USA Trust (REIT) | | 14,497 | | | 231,952 |
Investors Real Estate Trust (REIT) (a) | | 17,823 | | | 164,506 |
Jer Investors Trust, Inc. (REIT) | | 3,883 | | | 65,817 |
Jones Lang LaSalle, Inc. (a) (b) | | 11,373 | | | 572,631 |
Kilroy Realty Corp. (REIT) (a) | | 10,144 | | | 627,914 |
Kite Realty Group Trust (REIT) | | 9,572 | | | 148,079 |
La Quinta Corp. (b) | | 67,221 | | | 748,842 |
LaSalle Hotel Properties (REIT) | | 10,950 | | | 402,084 |
*See accompanying notes to financial statements.
MSF-249
Metropolitan Series Fund, Inc.
Russell 2000 Index Portfolio
Schedule of Investments as of December 31, 2005
Common Stock—(Continued)
| | | | | |
| Security Description | | Shares | | Value* |
| | | | | | |
|
Real Estate—(Continued) |
Levitt Corp. (Class A) (b) | | 5,017 | | $ | 114,087 |
Lexington Corporate Properties Trust (REIT) | | 17,179 | | | 365,913 |
LTC Properties, Inc. (REIT) | | 7,156 | | | 150,491 |
Luminent Mortgage Capital, Inc. (REIT) | | 11,837 | | | 88,896 |
Maguire Properties, Inc. (REIT) (a) | | 12,924 | | | 399,352 |
MeriStar Hospitality Corp. (REIT) | | 27,812 | | | 261,433 |
MFA Mortgage Investment, Inc. (REIT) | | 29,829 | | | 170,025 |
Mid-America Apartment Communities, Inc. (REIT) | | 6,376 | | | 309,236 |
National Health Investors, Inc. (REIT) | | 8,588 | | | 222,944 |
Nationwide Health Properties, Inc. (REIT) | | 22,143 | | | 473,860 |
Newcastle Investment Corp. (REIT) (a) | | 14,161 | | | 351,901 |
Novastar Financial, Inc. (REIT) (a) | | 8,758 | | | 246,187 |
Omega Healthcare Investors, Inc. (REIT) | | 19,318 | | | 243,214 |
Parkway Properties, Inc. (REIT) | | 4,727 | | | 189,742 |
Pennsylvania Real Estate Investment Trust (REIT) | | 11,776 | | | 439,951 |
Post Properties, Inc. (REIT) | | 14,108 | | | 563,615 |
Potlatch Corp. (REIT) (a) | | 9,339 | | | 476,102 |
Prentiss Properties Trust (REIT) (a) | | 15,516 | | | 631,191 |
PS Business Parks, Inc. (REIT) | | 6,192 | | | 304,646 |
RAIT Investment Trust (REIT) | | 9,571 | | | 248,080 |
Ramco-Gershenson Property Trust (REIT) | | 4,666 | | | 124,349 |
Redwood Trust, Inc. (REIT) | | 7,551 | | | 311,554 |
Saul Centers, Inc. (REIT) | | 3,616 | | | 130,538 |
Saxon Capital, Inc. (REIT) | | 17,480 | | | 198,048 |
Senior Housing Properties Trust (REIT) | | 19,341 | | | 327,056 |
Sizeler Property Investments, Inc. (REIT) | | 6,314 | | | 81,135 |
Sovran Self Storage, Inc. (REIT) | | 6,174 | | | 289,993 |
Spirit Finance Corp. (REIT) (a) | | 21,677 | | | 246,034 |
Strategic Hotel Capital, Inc. (REIT) | | 13,072 | | | 269,022 |
Sun Communities, Inc. (REIT) | | 6,120 | | | 192,168 |
Sunstone Hotel Investors, Inc. (REIT) | | 10,529 | | | 279,756 |
Tanger Factory Outlet Centers, Inc. (REIT) | | 10,384 | | | 298,436 |
Tarragon Corp. (a) | | 3,386 | | | 69,819 |
Taubman Centers, Inc. (REIT) | | 16,556 | | | 575,321 |
The Town & Country Trust (REIT) (a) | | 5,764 | | | 194,881 |
Trammell Crow Co. | | 11,326 | | | 290,512 |
Trustreet Properties, Inc. (REIT) (a) | | 19,005 | | | 277,853 |
U-Store-It Trust (REIT) (a) | | 14,075 | | | 296,279 |
Universal Health Realty Income Trust, Inc. (REIT) | | 3,614 | | | 113,263 |
Urstadt Biddle Properties, Inc. (REIT) | | 6,696 | | | 108,542 |
Washington Real Estate Investment Trust (REIT) | | 13,659 | | | 414,551 |
Williams Scotsman International, Inc. | | 5,073 | | | 87,814 |
Winston Hotels, Inc. (REIT) | | 7,812 | | | 77,339 |
| | | | |
|
|
| | | | | | 28,572,961 |
| | | | |
|
|
|
Road & Rail—1.2% |
AMERCO (a) | | 4,098 | | | 295,261 |
Arkansas Best Corp. | | 8,714 | | | 380,628 |
Dollar Thrifty Automotive Group, Inc. (b) | | 8,318 | | | 300,030 |
Florida East Coast Indiana, Inc. (a) | | 11,922 | | | 505,135 |
GATX Corp. (a) | | 15,791 | | | 569,739 |
Genesee & Wyoming, Inc. (b) | | 7,665 | | | 287,821 |
Heartland Express, Inc. (a) | | 14,851 | | | 301,327 |
Kansas City Southern Industries, Inc. (a) | | 26,993 | | | 659,439 |
Knight Transportation, Inc. | | 19,575 | | | 405,790 |
Marten Transport, Ltd. (b) | | 4,728 | | | 86,144 |
| | | | | |
| Security Description | | Shares | | Value* |
| | | | | | |
|
Road & Rail—(Continued) |
Old Dominion Freight Line, Inc. (b) | | 9,838 | | $ | 265,429 |
Pacer International, Inc. | | 12,230 | | | 318,714 |
RailAmerica, Inc. (b) | | 12,004 | | | 131,924 |
SCS Transportation, Inc. | | 4,969 | | | 105,591 |
SIRVA, Inc. (a) | | 7,934 | | | 63,472 |
Werner Enterprises, Inc. (a) | | 17,606 | | | 346,838 |
| | | | |
|
|
| | | | | | 5,023,282 |
| | | | |
|
|
|
Semiconductors & Semiconductor Equipment—4.1% |
Actel Corp. (a) (b) | | 8,453 | | | 107,607 |
Adaptec, Inc. | | 38,048 | | | 221,439 |
ADE Corp. (b) | | 3,170 | | | 76,270 |
Advanced Energy Industries, Inc. (a) (b) | | 10,550 | | | 124,807 |
AMIS Holdings, Inc. (a) (b) | | 14,418 | | | 153,552 |
Amkor Technology, Inc. (a) | | 33,013 | | | 184,873 |
Applied Micro Circuits Corp. (a) (b) | | 100,216 | | | 257,555 |
Asyst Technologies, Inc. | | 16,323 | | | 93,368 |
Atmel Corp. (a) (b) | | 136,160 | | | 420,734 |
ATMI, Inc. (a) (b) | | 11,995 | | | 335,500 |
August Technology Corp. | | 6,343 | | | 69,710 |
Axcelis Technologies, Inc. (a) (b) | | 34,912 | | | 166,530 |
Brooks Automation, Inc. (b) | | 25,649 | | | 321,382 |
Cabot Microelectronics Corp. (a) (b) | | 7,983 | | | 234,141 |
Cirrus Logic, Inc. | | 34,721 | | | 231,936 |
Cohu, Inc. | | 6,914 | | | 158,123 |
Conexant Systems, Inc. | | 153,507 | | | 346,926 |
Credence Systems Corp. (a) (b) | | 30,021 | | | 208,946 |
Cymer, Inc. (a) (b) | | 12,096 | | | 429,529 |
Cypress Semiconductor Corp. (a) (b) | | 46,130 | | | 657,353 |
Diodes, Inc. (a) (b) | | 5,726 | | | 177,792 |
Emcore Corp. (a) | | 11,756 | | | 87,230 |
Entegris, Inc. (b) | | 38,021 | | | 358,158 |
Exar Corp. (a) (b) | | 14,200 | | | 177,784 |
Fairchild Semiconductor International, Inc. (b) | | 42,228 | | | 714,075 |
FEI Co. (a) | | 7,395 | | | 141,762 |
FormFactor, Inc. (b) | | 10,987 | | | 268,412 |
Genesis Microchip, Inc. (a) | | 12,064 | | | 218,238 |
Integrated Device Technology, Inc. (a) (b) | | 66,828 | | | 880,793 |
Integrated Silicon Solution, Inc. (b) | | 12,062 | | | 77,679 |
IXYS Corp. (a) | | 6,862 | | | 80,217 |
Kulicke & Soffa Industries, Inc. (a) | | 17,667 | | | 156,176 |
Lattice Semiconductor Corp. (a) (b) | | 35,882 | | | 155,010 |
LTX Corp. (b) | | 20,347 | | | 91,562 |
Mattson Technology, Inc. (b) | | 13,025 | | | 131,032 |
Micrel, Inc. (a) (b) | | 21,960 | | | 254,736 |
Microsemi Corp. (b) | | 20,544 | | | 568,247 |
Microtune, Inc. (a) (b) | | 16,160 | | | 67,387 |
MIPS Technologies, Inc. (a) | | 13,635 | | | 77,447 |
MKS Instruments, Inc. | | 10,424 | | | 186,485 |
Monolithic Power Systems (a) | | 6,010 | | | 90,090 |
MPS Group, Inc. (b) | | 33,626 | | | 459,667 |
Netlogic Microsystems, Inc. (a) (b) | | 3,618 | | | 98,554 |
OmniVision Technologies, Inc. (a) (b) | | 18,388 | | | 367,024 |
ON Semiconductor Corp. (a) | | 46,738 | | | 258,461 |
PDF Solutions, Inc. | | 5,114 | | | 83,103 |
Pericom Semiconductor Corp. (b) | | 6,962 | | | 55,487 |
*See accompanying notes to financial statements.
MSF-250
Metropolitan Series Fund, Inc.
Russell 2000 Index Portfolio
Schedule of Investments as of December 31, 2005
Common Stock—(Continued)
| | | | | |
| Security Description | | Shares | | Value* |
| | | | | | |
|
Semiconductors & Semiconductor Equipment—(Continued) |
Photronics, Inc. (b) | | 12,688 | | $ | 191,081 |
Pixelworks, Inc. | | 13,479 | | | 68,473 |
PLX Technology, Inc. | | 8,321 | | | 71,561 |
PMC-Sierra, Inc. (a) (b) | | 58,185 | | | 448,606 |
PortalPlayer, Inc. (a) (b) | | 5,102 | | | 144,489 |
Power Integrations, Inc. (a) (b) | | 9,121 | | | 217,171 |
Rambus, Inc. (a) | | 32,143 | | | 520,395 |
RF Micro Devices, Inc. (a) (b) | | 60,946 | | | 329,718 |
Semtech Corp. (b) | | 23,840 | | | 435,318 |
Sigmatel, Inc. (a) | | 11,630 | | | 152,353 |
Silicon Image, Inc. | | 24,117 | | | 218,259 |
Silicon Laboratories, Inc. (a) (b) | | 15,406 | | | 564,784 |
Silicon Storage Technology, Inc. (a) (b) | | 28,215 | | | 142,486 |
Sirf Technology Holdings, Inc. (a) | | 11,511 | | | 343,028 |
Skyworks Solutions, Inc. (a) (b) | | 53,229 | | | 270,936 |
Standard Microsystems Corp. | | 7,078 | | | 203,068 |
Supertex, Inc. | | 3,144 | | | 139,122 |
Tessera Technologies, Inc. (b) | | 14,179 | | | 366,527 |
Trident Microsystems, Inc. (a) (b) | | 16,592 | | | 298,656 |
TriQuint Semiconductor, Inc. (a) (b) | | 47,255 | | | 210,285 |
Ultratech Stepper, Inc. (a) | | 7,164 | | | 117,633 |
Varian Semiconductor Equipment, Inc. (a) (b) | | 12,816 | | | 563,007 |
Vitesse Semiconductor Corp. (a) | | 72,887 | | | 139,943 |
Volterra Semiconductor Corp. (a) (b) | | 5,501 | | | 82,515 |
Zoran Corp. (b) | | 14,401 | | | 233,440 |
| | | | |
|
|
| | | | | | 17,555,743 |
| | | | |
|
|
|
Software—3.3% |
Advent Software, Inc. (b) | | 7,677 | | | 221,942 |
Agile Software Corp. (a) (b) | | 16,292 | | | 97,426 |
Ansoft Corp. (a) | | 2,320 | | | 78,996 |
ANSYS, Inc. | | 10,174 | | | 434,328 |
Aspen Technology, Inc. (a) | | 12,519 | | | 98,274 |
Blackbaud, Inc. | | 3,725 | | | 63,623 |
Blackboard, Inc. | | 6,033 | | | 174,836 |
Borland Software Corp. (a) (b) | | 30,430 | | | 198,708 |
Bottomline Technologies, Inc. (b) | | 4,425 | | | 48,764 |
Cognex Corp. | | 13,827 | | | 416,054 |
Concur Technologies, Inc. (a) | | 12,754 | | | 164,399 |
Dendrite International, Inc. | | 13,945 | | | 200,947 |
Eclipsys Corp. (a) | | 13,688 | | | 259,114 |
Emageon, Inc. (a) | | 5,185 | | | 82,442 |
Entrust, Inc. (b) | | 19,762 | | | 95,648 |
Epicor Software Corp. (a) | | 17,286 | | | 244,251 |
EPIQ System, Inc. (a) | | 4,544 | | | 84,246 |
Faro Technologies, Inc. (a) | | 3,508 | | | 70,160 |
Gartner, Inc. (Class A) (a) (b) | | 21,483 | | | 277,131 |
Informatica Corp. (a) (b) | | 27,709 | | | 332,508 |
Internet Security Systems, Inc. | | 15,185 | | | 318,126 |
Intervoice, Inc. (a) (b) | | 11,469 | | | 91,293 |
Jack Henry & Associates, Inc. | | 23,474 | | | 447,884 |
JDA Software Group, Inc. (a) | | 9,424 | | | 160,302 |
KFX, Inc. (a) | | 18,947 | | | 324,183 |
Kronos, Inc. | | 10,723 | | | 448,865 |
Lawson Software, Inc. (a) | | 18,216 | | | 133,888 |
Macrovision Corp. (a) (b) | | 17,819 | | | 298,112 |
| | | | | |
| Security Description | | Shares | | Value* |
| | | | | | |
|
Software—(Continued) |
Magma Design Automation, Inc. (a) | | 11,783 | | $ | 99,095 |
Manhattan Associates, Inc. | | 9,679 | | | 198,226 |
MapInfo Corp. (a) | | 6,753 | | | 85,155 |
Mentor Graphics Corp. (a) (b) | | 27,351 | | | 282,809 |
Merge Technologies, Inc. | | 6,036 | | | 151,141 |
Micromuse, Inc. (a) (b) | | 25,452 | | | 251,720 |
MICROS Systems, Inc. (a) (b) | | 13,491 | | | 651,885 |
MicroStrategy, Inc. (a) | | 5,300 | | | 438,522 |
MRO Software, Inc. (b) | | 6,430 | | | 90,277 |
Nuance Communications, Inc. | | 36,280 | | | 276,816 |
Open Solutions, Inc. (a) (b) | | 6,470 | | | 148,292 |
Parametric Technology Corp. (b) | | 90,003 | | | 549,018 |
Progress Software Corp. (b) | | 13,295 | | | 377,312 |
Quality Systems, Inc. | | 3,055 | | | 234,502 |
Quest Software, Inc. (a) (b) | | 20,843 | | | 304,099 |
Radiant Systems, Inc. (b) | | 7,742 | | | 94,143 |
RadiSys Corp. (a) | | 9,234 | | | 160,118 |
RSA Security, Inc. (b) | | 22,826 | | | 256,336 |
Saflink Corp. | | 1 | | | 1 |
SeaChange International, Inc. | | 7,904 | | | 62,442 |
Secure Computing Corp. (a) | | 12,086 | | | 148,174 |
Serena Software, Inc. (a) (b) | | 8,957 | | | 209,952 |
SPSS, Inc. | | 6,730 | | | 208,159 |
TALX Corp. | | 6,732 | | | 307,720 |
The Ultimate Software Group, Inc. (a) (b) | | 7,564 | | | 144,246 |
THQ, Inc. (a) (b) | | 20,838 | | | 496,986 |
TIBCO Software, Inc. (b) | | 69,682 | | | 520,525 |
TradeStation Group, Inc. | | 7,150 | | | 88,517 |
Transaction Systems Architects, Inc. (Class A) (b) | | 13,394 | | | 385,613 |
Vasco Data Security International, Inc. (a) | | 8,104 | | | 79,905 |
Verifone Holdings, Inc. (a) | | 8,244 | | | 208,573 |
Verint Systems, Inc. | | 5,380 | | | 185,449 |
Wind River Systems, Inc. (b) | | 22,271 | | | 328,943 |
Witness Systems, Inc. | | 8,377 | | | 164,776 |
| | | | |
|
|
| | | | | | 14,055,897 |
| | | | |
|
|
|
Specialty Retail—3.3% |
A.C. Moore Arts & Crafts, Inc. (a) (b) | | 4,205 | | | 61,183 |
Aaron Rents, Inc. (Class B) (a) | | 12,801 | | | 269,845 |
Aeropostale, Inc. (a) (b) | | 18,468 | | | 485,708 |
Asbury Automotive Group, Inc. | | 3,985 | | | 65,593 |
Big 5 Sporting Goods Corp. (a) | | 6,591 | | | 144,277 |
Blockbuster, Inc. (a) | | 61,306 | | | 229,897 |
Buckle, Inc. | | 3,295 | | | 106,231 |
Building Materials Holdings Corp. (a) | | 4,417 | | | 301,284 |
Cabelas, Inc. (a) | | 10,048 | | | 166,797 |
Cache, Inc. | | 4,177 | | | 72,346 |
Cato Corp. | | 9,699 | | | 208,044 |
Charlotte Russe Holding, Inc. (b) | | 4,248 | | | 88,486 |
Charming Shoppes, Inc. (a) | | 40,240 | | | 531,168 |
Christopher & Banks Corp. | | 11,991 | | | 225,191 |
Cost Plus, Inc. (a) (b) | | 7,641 | | | 131,043 |
CSK Auto Corp. | | 14,942 | | | 225,325 |
Dress Barn, Inc. (a) | | 8,168 | | | 315,366 |
DSW, Inc. (a) | | 3,628 | | | 95,126 |
GameStop Corp. (Class A) (a) (b) | | 17,871 | | | 568,655 |
*See accompanying notes to financial statements.
MSF-251
Metropolitan Series Fund, Inc.
Russell 2000 Index Portfolio
Schedule of Investments as of December 31, 2005
Common Stock—(Continued)
| | | | | |
| Security Description | | Shares | | Value* |
| | | | | | |
|
Specialty Retail—(Continued) |
Genesco, Inc. (a) | | 8,778 | | $ | 340,499 |
Group 1 Automotive, Inc. (b) | | 7,642 | | | 240,188 |
Guitar Center, Inc. (b) | | 8,639 | | | 432,036 |
Haverty Furniture Cos., Inc. | | 5,275 | | | 67,995 |
Hibbett Sporting Goods, Inc. (a) (b) | | 13,482 | | | 383,967 |
Hot Topic, Inc. (a) (b) | | 13,967 | | | 199,030 |
Jo Ann Stores, Inc. (a) | | 6,543 | | | 77,207 |
JoS. A. Bank Clothiers, Inc. (a) | | 4,389 | | | 190,526 |
Linens ‘N Things, Inc. (a) (b) | | 15,869 | | | 422,115 |
Lithia Motors, Inc. | | 6,487 | | | 203,951 |
MarineMax, Inc. (a) (b) | | 6,019 | | | 190,020 |
Monro Muffler Brake, Inc. | | 3,183 | | | 96,509 |
Pacific Sunwear of California, Inc. (b) | | 26,586 | | | 662,523 |
Payless Shoesource, Inc. (b) | | 22,806 | | | 572,431 |
Pep Boys-Manny Moe & Jack (a) | | 18,411 | | | 274,140 |
PETCO Animal Supplies, Inc. (a) | | 18,547 | | | 407,107 |
Pier 1 Imports, Inc. (a) | | 27,800 | | | 242,694 |
Rush Enterprises, Inc. | | 6,903 | | | 102,717 |
Select Comfort Corp. (a) | | 11,658 | | | 318,846 |
Sonic Automotive, Inc. (a) | | 9,745 | | | 217,119 |
Stage Stores, Inc. | | 9,046 | | | 269,390 |
The Children’s Place Retail Stores, Inc. (a) (b) | | 8,051 | | | 397,880 |
The Finish Line, Inc. (Class A) | | 13,612 | | | 237,121 |
The Gymboree Corp. (a) (b) | | 9,692 | | | 226,793 |
The Sports Authority, Inc. (a) (b) | | 8,398 | | | 261,430 |
The Talbots, Inc. | | 7,453 | | | 207,342 |
Too, Inc. | | 12,243 | | | 345,375 |
Tractor Supply Co. (b) | | 11,010 | | | 582,869 |
United Auto Group, Inc. (a) | | 8,673 | | | 331,309 |
United Rentals, Inc. (a) (b) | | 21,786 | | | 509,575 |
West Marine, Inc. (a) (b) | | 3,991 | | | 55,794 |
Wet Seal, Inc. | | 14,364 | | | 63,776 |
Zale Corp. | | 18,118 | | | 455,668 |
| | | | |
|
|
| | | | | | 13,877,507 |
| | | | |
|
|
|
Textiles, Apparel & Luxury Goods—1.2% |
Brown Shoe Co., Inc. | | 6,358 | | | 269,770 |
Carter’s, Inc. (a) (b) | | 6,924 | | | 407,477 |
Charles & Colvard, Ltd. (a) | | 4,112 | | | 83,062 |
Cherokee, Inc. | | 2,327 | | | 80,026 |
Deckers Outdoor Corp. (a) | | 3,013 | | | 83,219 |
Ellis Perry International, Inc. (a) | | 3,213 | | | 61,047 |
Fossil, Inc. (a) (b) | | 15,664 | | | 336,933 |
Guess?, Inc. (a) (b) | | 6,927 | | | 246,601 |
Hartmarx Corp. (a) | | 7,913 | | | 61,801 |
K-Swiss, Inc. (a) | | 9,537 | | | 309,380 |
Kellwood Co. (a) | | 9,059 | | | 216,329 |
Kenneth Cole Productions, Inc. | | 2,769 | | | 70,610 |
Movado Group, Inc. | | 6,074 | | | 111,154 |
New York & Co., Inc. (a) | | 6,941 | | | 147,149 |
Oxford Industries, Inc. (a) | | 5,594 | | | 305,992 |
Phillips-Van Heusen Corp. | | 12,223 | | | 396,025 |
Russell Corp. (a) | | 13,512 | | | 181,872 |
Skechers U. S. A., Inc. | | 6,446 | | | 98,753 |
Steven Madden, Ltd. | | 4,601 | | | 134,487 |
Stride Rite Corp. (a) | | 13,783 | | | 186,897 |
| | | | | |
| Security Description | | Shares | | Value* |
| | | | | | |
|
Textiles, Apparel & Luxury Goods—(Continued) |
The Warnaco Group, Inc. (b) | | 17,294 | | $ | 462,096 |
Under Armour, Inc. (a) (b) | | 3,766 | | | 144,275 |
UniFirst Corp. | | 3,018 | | | 93,860 |
Wolverine World Wide, Inc. (a) | | 19,941 | | | 447,875 |
| | | | |
|
|
| | | | | | 4,936,690 |
| | | | |
|
|
|
Tobacco—0.2% |
Alliance One International, Inc. (a) | | 28,481 | | | 111,076 |
Schweitzer-Mauduit International, Inc. | | 5,245 | | | 129,971 |
Universal Corp. | | 8,916 | | | 386,598 |
Vector Group, Ltd. (a) | | 9,335 | | | 169,617 |
| | | | |
|
|
| | | | | | 797,262 |
| | | | |
|
|
|
Trading Companies & Distributors—0.3% |
Hughes Supply, Inc. (a) | | 22,942 | | | 822,471 |
NuCo2, Inc. (b) | | 5,122 | | | 142,801 |
UAP Holdings Corp. (b) | | 10,963 | | | 223,864 |
| | | | |
|
|
| | | | | | 1,189,136 |
| | | | |
|
|
|
Water Utilities—0.2% |
American State Water Co. (a) | | 6,801 | | | 209,471 |
California Water Service Group | | 5,594 | | | 213,859 |
Connecticut Water Service, Inc. | | 2,736 | | | 67,059 |
Middlesex Water Co. (a) | | 3,736 | | | 64,782 |
SJW Corp. | | 2,310 | | | 105,105 |
Southwest Water Co. (a) | | 5,789 | | | 82,836 |
| | | | |
|
|
| | | | | | 743,112 |
| | | | |
|
|
|
Wireless Telecommunication Services—0.5% |
Centennial Communications Corp. (a) | | 7,173 | | | 111,325 |
Dobson Communications Corp. | | 37,234 | | | 279,255 |
JAMDAT Mobile, Inc. (b) | | 3,936 | | | 104,619 |
Novatel Wireless, Inc. (a) (b) | | 9,676 | | | 117,176 |
Price Communications Corp. (a) | | 14,751 | | | 219,348 |
SBA Communications Corp. (b) | | 28,406 | | | 508,468 |
Syniverse Holdings, Inc. | | 6,127 | | | 128,054 |
UbiquiTel, Inc. (b) | | 22,591 | | | 223,425 |
USA Mobility, Inc. (a) | | 8,939 | | | 247,789 |
Wireless Facilities, Inc. (a) (b) | | 15,443 | | | 78,759 |
| | | | |
|
|
| | | | | | 2,018,218 |
| | | | |
|
|
Total Common Stock
(Identified Cost $331,438,336) | | | | | 404,316,533 |
| | | | |
|
|
|
| Rights—0.0% |
| | |
Commercial Banks—0.0% | | | | | |
Bank United Corp. (d) | | 4,713 | | | 0 |
| | | | |
|
|
Total Rights
(Identified Cost $1,602) | | | | | 0 |
| | | | |
|
|
*See accompanying notes to financial statements.
MSF-252
Metropolitan Series Fund, Inc.
Russell 2000 Index Portfolio
Schedule of Investments as of December 31, 2005
Short Term Investments—4.6%
| | | | | | |
| Security Description | | Face
Amount | | Value* |
| | |
Discount Notes—4.6% | | | | | | |
Federal Home Loan Bank
3.350%, 01/03/06 | | $ | 1,800,000 | | $ | 1,799,665 |
Federal National Mortgage Association
0.010%, 03/22/06 | | | 17,500,000 | | | 17,332,389 |
4.310%, 03/22/06 | | | 400,000 | | | 396,169 |
| | | | | |
|
|
Total Short Term Investments
(Amortized Cost $19,528,223) | | | | | | 19,528,223 |
| | | | | |
|
|
Total Investments—99.8%
(Identified Cost $350,968,161) (e) | | | | | | 423,844,756 |
Other assets less liabilities | | | | | | 800,132 |
| | | | | |
|
|
| Total Net Assets—100% | | | | | $ | 424,644,888 |
| | | | | |
|
|
| (a) | A portion or all of the security was held on loan. As of December 31, 2005, the market value of securities loaned was $106,411,907 and the collateral received consisted of cash in the amount of $110,057,861 and securities with a market value of $9,576. |
| (c) | Non-Income Producing; issuer filed under Chapter 11 of the Federal Bankruptcy Code. |
| (e) | The aggregate cost of investments for federal income tax purposes as of December 31, 2005 was $350,532,245 and the composition of unrealized appreciation and depreciation of investment securities was $99,452,741 and $(26,140,230), respectively. |
| (REIT)— | A Real Estate Investment Trust is a pooled investment vehicle that invests primarily in income-producing real estate or real estate related loans or interest. |
Futures Contracts
| | | | | | | | | | | | | | |
Futures Contracts Long
| | Expiration Date
| | Number of
Contracts
| | Contract
Amount
| | Valuation as of
12/31/2005
| | Net
Unrealized
Depreciation
| |
Russell 2000 Index | | 3/16/2006 | | 57 | | $ | 19,630,985 | | $ | 19,331,550 | | $ | (299,435 | ) |
| | | | | | | | | | | | |
|
|
|
*See accompanying notes to financial statements.
MSF-253
Metropolitan Series Fund, Inc.
Russell 2000 Index Portfolio
Statement of Assets & Liabilities
December 31, 2005
| | | | | | |
Assets | | | | | | |
Investments at value | | | | | $ | 423,844,756 |
Cash | | | | | | 228,498 |
Collateral for securities loaned | | | | | | 110,057,861 |
Receivable for: | | | | | | |
Securities sold | | | | | | 555,763 |
Fund shares sold | | | | | | 962,645 |
Accrued interest and dividends | | | | | | 500,481 |
| | | | | |
|
|
Total Assets | | | | | | 536,150,004 |
Liabilities | | | | | | |
Payable for: | | | | | | |
Fund shares redeemed | | $ | 844,008 | | | |
Securities purchased | | | 336,000 | | | |
Futures variation margin | | | 52,155 | | | |
Withholding taxes | | | 293 | | | |
Return of collateral for securities loaned | | | 110,057,861 | | | |
Accrued expenses: | | | | | | |
Management fees | | | 88,958 | | | |
Service and distribution fees | | | 29,887 | | | |
Other expenses | | | 95,954 | | | |
| | |
|
| | | |
Total Liabilities | | | | | | 111,505,116 |
| | | | | |
|
|
Net Assets | | | | | $ | 424,644,888 |
| | | | | |
|
|
Net Assets Consists of: | | | | | | |
Capital paid in | | | | | $ | 329,615,810 |
Undistributed net investment income | | | | | | 3,591,625 |
Accumulated net realized gains | | | | | | 18,860,293 |
Unrealized appreciation on investments and futures contracts | | | | | | 72,577,160 |
| | | | | |
|
|
Net Assets | | | | | $ | 424,644,888 |
| | | | | |
|
|
| Computation of offering price: | | | | | | |
Class A | | | | | | |
Net asset value and redemption price per share ($266,467,356 divided by 19,139,155 shares outstanding) | | | | | $ | 13.92 |
| | | | | |
|
|
Class B | | | | | | |
Net asset value and redemption price per share ($108,688,968 divided by 7,918,039 shares outstanding) | | | | | $ | 13.73 |
| | | | | |
|
|
Class E | | | | | | |
Net asset value and redemption price per share ($49,488,564 divided by 3,568,758 shares outstanding) | | | | | $ | 13.87 |
| | | | | |
|
|
Identified cost of investments | | | | | $ | 350,968,161 |
| | | | | |
|
|
Statement of Operations
Year ended December 31, 2005
| | | | | | | | |
Investment Income | | | | | | | | |
Dividends | | | | | | $ | 4,828,468 | (a) |
Interest | | | | | | | 934,666 | (b) |
| | | | | | |
|
|
|
| | | | | | | | 5,763,134 | |
Expenses | | | | | | | | |
Management fees | | $ | 989,178 | | | | | |
Service and distribution fees—Class B | | | 230,757 | | | | | |
Service and distribution fees—Class E | | | 74,830 | | | | | |
Directors’ fees and expenses | | | 22,264 | | | | | |
Custodian | | | 251,964 | | | | | |
Audit and tax services | | | 20,631 | | | | | |
Legal | | | 10,271 | | | | | |
Printing | | | 101,219 | | | | | |
Insurance | | | 7,573 | | | | | |
Miscellaneous | | | 11,785 | | | | | |
| | |
|
|
| | | | |
Total expenses | | | 1,720,472 | | | | | |
Management fee waivers | | | (19,099 | ) | | | 1,701,373 | |
| | |
|
|
| |
|
|
|
Net Investment Income | | | | | | | 4,061,761 | |
| | | | | | |
|
|
|
Realized and Unrealized Gain (Loss) | | | | | | | | |
| Realized gain on: | | | | | | | | |
Investments—net | | | 17,300,043 | | | | | |
Futures contracts—net | | | 1,552,660 | | | | 18,852,703 | |
| | |
|
|
| | | | |
| Unrealized depreciation on: | | | | | | | | |
Investments—net | | | (2,926,860 | ) | | | | |
Futures contracts—net | | | (855,815 | ) | | | (3,782,675 | ) |
| | |
|
|
| |
|
|
|
Net gain | | | | | | | 15,070,028 | |
| | | | | | |
|
|
|
Net Increase in Net Assets
From Operations | | | | | | $ | 19,131,789 | |
| | | | | | |
|
|
|
| (a) | Net of foreign taxes of $2,545. |
| (b) | Includes income on securities loaned of $381,292. |
See accompanying notes to financial statements.
MSF-254
Metropolitan Series Fund, Inc.
Russell 2000 Index Portfolio
Statement of Changes in Net Assets
| | | | | | | | |
| | | Year ended
December 31,
2005
| | | Year ended
December 31,
2004
| |
From Operations | | | | | | | | |
Net investment income | | $ | 4,061,761 | | | $ | 3,056,080 | |
Net realized gain | | | 18,852,703 | | | | 17,957,817 | |
Unrealized appreciation (depreciation) | | | (3,782,675 | ) | | | 34,166,564 | |
| | |
|
|
| |
|
|
|
Increase in net assets from operations | | | 19,131,789 | | | | 55,180,461 | |
| | |
|
|
| |
|
|
|
From Distributions to Shareholders | | | | | | | | |
Net investment income | | | | | | | | |
Class A | | | (1,954,701 | ) | | | (1,105,498 | ) |
Class B | | | (488,212 | ) | | | (167,111 | ) |
Class E | | | (312,859 | ) | | | (228,581 | ) |
| | |
|
|
| |
|
|
|
| | | | (2,755,772 | ) | | | (1,501,190 | ) |
| | |
|
|
| |
|
|
|
Net realized gain | | | | | | | | |
Class A | | | (9,570,659 | ) | | | 0 | |
Class B | | | (3,378,427 | ) | | | 0 | |
Class E | | | (1,910,282 | ) | | | 0 | |
| | |
|
|
| |
|
|
|
| | | | (14,859,368 | ) | | | 0 | |
| | |
|
|
| |
|
|
|
Total distributions | | | (17,615,140 | ) | | | (1,501,190 | ) |
| | |
|
|
| |
|
|
|
Increase in net assets from capital share transactions | | | 40,847,816 | | | | 33,887,460 | |
| | |
|
|
| |
|
|
|
Total increase in net assets | | | 42,364,465 | | | | 87,566,731 | |
| | |
Net Assets | | | | | | | | |
Beginning of the period | | | 382,280,423 | | | | 294,713,692 | |
| | |
|
|
| |
|
|
|
End of the period | | $ | 424,644,888 | | | $ | 382,280,423 | |
| | |
|
|
| |
|
|
|
Undistributed Net Investment Income | | | | | | | | |
End of the period | | $ | 3,591,625 | | | $ | 2,698,147 | |
| | |
|
|
| |
|
|
|
Other Information:
Capital Shares
Transactions in capital shares were as follows:
| | | | | | | | | | | | | | |
| | | Year ended
December 31, 2005
| | | Year ended
December 31, 2004
| |
| | | Shares
| | | $
| | | Shares
| | | $
| |
Class A | | | | | | | | | | | | | | |
Sales | | 5,597,156 | | | $ | 75,005,236 | | | 5,366,732 | | | $ | 67,037,890 | |
Reinvestments | | 954,877 | | | | 11,525,360 | | | 87,116 | | | | 1,105,498 | |
Redemptions | | (5,607,025 | ) | | | (75,079,788 | ) | | (5,397,670 | ) | | | (67,177,189 | ) |
| | |
|
| |
|
|
| |
|
| |
|
|
|
Net increase | | 945,008 | | | $ | 11,450,808 | | | 56,178 | | | $ | 966,199 | |
| | |
|
| |
|
|
| |
|
| |
|
|
|
Class B | | | | | | | | | | | | | | |
Sales | | 3,691,555 | | | $ | 48,607,976 | | | 3,236,659 | | | $ | 40,091,574 | |
Reinvestments | | 324,382 | | | | 3,866,639 | | | 13,326 | | | | 167,111 | |
Redemptions | | (1,619,780 | ) | | | (21,494,922 | ) | | (1,109,001 | ) | | | (13,697,642 | ) |
| | |
|
| |
|
|
| |
|
| |
|
|
|
Net increase | | 2,396,157 | | | $ | 30,979,693 | | | 2,140,984 | | | $ | 26,561,043 | |
| | |
|
| |
|
|
| |
|
| |
|
|
|
Class E | | | | | | | | | | | | | | |
Sales | | 806,060 | | | $ | 10,769,340 | | | 2,523,456 | | | $ | 31,408,820 | |
Reinvestments | | 184,800 | | | | 2,223,141 | | | 18,070 | | | | 228,581 | |
Redemptions | | (1,081,292 | ) | | | (14,575,166 | ) | | (2,076,459 | ) | | | (25,277,183 | ) |
| | |
|
| |
|
|
| |
|
| |
|
|
|
Net increase (decrease) | | (90,432 | ) | | $ | (1,582,685 | ) | | 465,067 | | | $ | 6,360,218 | |
| | |
|
| |
|
|
| |
|
| |
|
|
|
Increase derived from capital share transactions | | 3,250,733 | | | $ | 40,847,816 | | | 2,662,229 | | | $ | 33,887,460 | |
| | |
|
| |
|
|
| |
|
| |
|
|
|
See accompanying notes to financial statements.
MSF-255
Metropolitan Series Fund, Inc.
Russell 2000 Index Portfolio
Financial Highlights
| | | | | | | | | | | | | | | | | | | | |
| | | Class A
| |
| | | Year ended December 31,
| |
| | | 2005
| | | 2004
| | | 2003
| | | 2002
| | | 2001
| |
Net Asset Value, Beginning of Period | | $ | 14.01 | | | $ | 11.95 | | | $ | 8.25 | | | $ | 10.43 | | | $ | 10.37 | |
| | |
|
|
| |
|
|
| |
|
|
| |
|
|
| |
|
|
|
Income From Investment Operations | | | | | | | | | | | | | | | | | | | | |
Net investment income | | | 0.14 | | | | 0.12 | | | | 0.08 | | | | 0.08 | | | | 0.10 | |
Net realized and unrealized gain (loss) of investments | | | 0.40 | | | | 2.00 | | | | 3.69 | | | | (2.20 | ) | | | (0.01 | ) |
| | |
|
|
| |
|
|
| |
|
|
| |
|
|
| |
|
|
|
Total from investment operations | | | 0.54 | | | | 2.12 | | | | 3.77 | | | | (2.12 | ) | | | 0.09 | |
| | |
|
|
| |
|
|
| |
|
|
| |
|
|
| |
|
|
|
Less Distributions | | | | | | | | �� | | | | | | | | | | | | |
Distributions from net investment income | | | (0.11 | ) | | | (0.06 | ) | | | (0.07 | ) | | | (0.05 | ) | | | (0.03 | ) |
Distributions from net realized capital gains | | | (0.52 | ) | | | 0.00 | | | | 0.00 | | | | (0.01 | ) | | | 0.00 | |
| | |
|
|
| |
|
|
| |
|
|
| |
|
|
| |
|
|
|
Total distributions | | | (0.63 | ) | | | (0.06 | ) | | | (0.07 | ) | | | (0.06 | ) | | | (0.03 | ) |
| | |
|
|
| |
|
|
| |
|
|
| |
|
|
| |
|
|
|
Net Asset Value, End of Period | | $ | 13.92 | | | $ | 14.01 | | | $ | 11.95 | | | $ | 8.25 | | | $ | 10.43 | |
| | |
|
|
| |
|
|
| |
|
|
| |
|
|
| |
|
|
|
Total Return (%) | | | 4.5 | | | | 17.8 | | | | 46.1 | | | | (20.5 | ) | | | 0.9 | |
Ratio of operating expenses to average net assets (%) | | | 0.35 | | | | 0.37 | | | | 0.47 | | | | 0.49 | | | | 0.55 | |
Ratio of operating expenses to average net assets without giving effect to the contractual expense agreement would have been (%) | | | 0.36 | | | | — | | | | — | | | | — | | | | 0.56 | |
Ratio of net investment income to average net assets (%) | | | 1.10 | | | | 0.97 | | | | 0.89 | | | | 0.99 | | | | 1.03 | |
Portfolio turnover rate (%) | | | 39 | | | | 39 | | | | 42 | | | | 53 | | | | 47 | |
Net assets, end of period (000) | | $ | 266,467 | | | $ | 254,898 | | | $ | 216,744 | | | $ | 131,184 | | | $ | 141,958 | |
| |
| | | Class B
| |
| | | Year ended December 31,
| | | January 2, 2001(a)
through
December 31,
2001
| |
| | | 2005
| | | 2004
| | | 2003
| | | 2002
| | |
Net Asset Value, Beginning of Period | | $ | 13.82 | | | $ | 11.80 | | | $ | 8.16 | | | $ | 10.33 | | | $ | 9.84 | |
| | |
|
|
| |
|
|
| |
|
|
| |
|
|
| |
|
|
|
Income From Investment Operations | | | | | | | | | | | | | | | | | | | | |
Net investment income | | | 0.10 | | | | 0.08 | | | | 0.05 | | | | 0.05 | | | | 0.06 | |
Net realized and unrealized gain (loss) of investments | | | 0.41 | | | | 1.98 | | | | 3.65 | | | | (2.17 | ) | | | 0.46 | |
| | |
|
|
| |
|
|
| |
|
|
| |
|
|
| |
|
|
|
Total from investment operations | | | 0.51 | | | | 2.06 | | | | 3.70 | | | | (2.12 | ) | | | 0.52 | |
| | |
|
|
| |
|
|
| |
|
|
| |
|
|
| |
|
|
|
Less Distributions | | | | | | | | | | | | | | | | | | | | |
Distributions from net investment income | | | (0.08 | ) | | | (0.04 | ) | | | (0.06 | ) | | | (0.04 | ) | | | (0.03 | ) |
Distributions from net realized capital gains | | | (0.52 | ) | | | 0.00 | | | | 0.00 | | | | (0.01 | ) | | | 0.00 | |
| | |
|
|
| |
|
|
| |
|
|
| |
|
|
| |
|
|
|
Total distributions | | | (0.60 | ) | | | (0.04 | ) | | | (0.06 | ) | | | (0.05 | ) | | | (0.03 | ) |
| | |
|
|
| |
|
|
| |
|
|
| |
|
|
| |
|
|
|
Net Asset Value, End of Period | | $ | 13.73 | | | $ | 13.82 | | | $ | 11.80 | | | $ | 8.16 | | | $ | 10.33 | |
| | |
|
|
| |
|
|
| |
|
|
| |
|
|
| |
|
|
|
Total Return (%) | | | 4.3 | | | | 17.4 | | | | 45.7 | | | | (20.6 | ) | | | 5.3 | (b) |
Ratio of operating expenses to average net assets (%) | | | 0.60 | | | | 0.62 | | | | 0.72 | | | | 0.74 | | | | 0.80 | (c) |
Ratio of operating expenses to average net assets without giving effect to the contractual expense agreement would have been (%) | | | 0.61 | | | | — | | | | — | | | | — | | | | 0.81 | (c) |
Ratio of net investment income to average net assets (%) | | | 0.87 | | | | 0.77 | | | | 0.64 | | | | 0.79 | | | | 0.83 | (c) |
Portfolio turnover rate (%) | | | 39 | | | | 39 | | | | 42 | | | | 53 | | | | 47 | |
Net assets, end of period (000) | | $ | 108,689 | | | $ | 76,322 | | | $ | 39,911 | | | $ | 13,267 | | | $ | 7,292 | |
| (a) | Commencement of operations. |
| (b) | Period less than one year is not computed on an annualized basis. |
| (c) | Computed on an annualized basis. |
See accompanying notes to financial statements.
MSF-256
Metropolitan Series Fund, Inc.
Russell 2000 Index Portfolio
Financial Highlights
| | | | | | | | | | | | | | | | | | | | |
| | | Class E
| |
| | | Year ended December 31,
| | | May 1, 2001(a) through December 31,
2001
| |
| | | 2005
| | | 2004
| | | 2003
| | | 2002
| | |
Net Asset Value, Beginning of Period | | $ | 13.95 | | | $ | 11.92 | | | $ | 8.23 | | | $ | 10.42 | | | $ | 10.46 | |
| | |
|
|
| |
|
|
| |
|
|
| |
|
|
| |
|
|
|
Income From Investment Operations | | | | | | | | | | | | | | | | | | | | |
Net investment income | | | 0.13 | | | | 0.09 | | | | 0.07 | | | | 0.07 | | | | 0.01 | |
Net realized and unrealized gain (loss) of investments | | | 0.40 | | | | 1.99 | | | | 3.69 | | | | (2.20 | ) | | | (0.05 | ) |
| | |
|
|
| |
|
|
| |
|
|
| |
|
|
| |
|
|
|
Total from investment operations | | | 0.53 | | | | 2.08 | | | | 3.76 | | | | (2.13 | ) | | | (0.04 | ) |
| | |
|
|
| |
|
|
| |
|
|
| |
|
|
| |
|
|
|
Less Distributions | | | | | | | | | | | | | | | | | | | | |
Distributions from net investment income | | | (0.09 | ) | | | (0.05 | ) | | | (0.07 | ) | | | (0.05 | ) | | | 0.00 | |
Distributions from net realized capital gains | | | (0.52 | ) | | | 0.00 | | | | 0.00 | | | | (0.01 | ) | | | 0.00 | |
| | |
|
|
| |
|
|
| |
|
|
| |
|
|
| |
|
|
|
Total distributions | | | (0.61 | ) | | | (0.05 | ) | | | (0.07 | ) | | | (0.06 | ) | | | 0.00 | |
| | |
|
|
| |
|
|
| |
|
|
| |
|
|
| |
|
|
|
Net Asset Value, End of Period | | $ | 13.87 | | | $ | 13.95 | | | $ | 11.92 | | | $ | 8.23 | | | $ | 10.42 | |
| | |
|
|
| |
|
|
| |
|
|
| |
|
|
| |
|
|
|
Total Return (%) | | | 4.4 | | | | 17.5 | | | | 46.0 | | | | (20.6 | ) | | | (0.4 | )(b) |
Ratio of operating expenses to average net assets (%) | | | 0.50 | | | | 0.52 | | | | 0.62 | | | | 0.64 | | | | 0.70 | (c) |
Ratio of operating expenses to average net assets without giving effect to the contractual expense agreement would have been (%) | | | 0.51 | | | | — | | | | — | | | | — | | | | 0.71 | (c) |
Ratio of net investment income to average net assets (%) | | | 0.95 | | | | 0.82 | | | | 0.74 | | | | 1.08 | | | | 1.58 | (c) |
Portfolio turnover rate (%) | | | 39 | | | | 39 | | | | 42 | | | | 53 | | | | 47 | |
Net assets, end of period (000) | | $ | 49,489 | | | $ | 51,061 | | | $ | 38,059 | | | $ | 6,259 | | | $ | 8 | |
| (a) | Commencement of operations. |
| (b) | Period less than one year is not computed on an annualized basis. |
| (c) | Computed on an annualized basis. |
See accompanying notes to financial statements.
MSF-257
Metropolitan Series Fund, Inc.
T. Rowe Price Small Cap Growth Portfolio
Schedule of Investments as of December 31, 2005
Common Stock—98.0% of Total Net Assets
| | | | | |
| Security Description | | Shares | | Value* |
| | | | | | |
|
Aerospace & Defense—2.1% |
Aeroflex, Inc. (a) | | 201,500 | | $ | 2,166,125 |
Armor Holdings, Inc. (a) (b) | | 25,700 | | | 1,096,105 |
Engineered Support Systems, Inc. | | 45,975 | | | 1,914,399 |
Herley Industries, Inc. (a) | | 17,800 | | | 293,878 |
Mercury Computer Systems, Inc. (a) | | 46,800 | | | 965,484 |
MTC Technologies, Inc. (a) (b) | | 44,500 | | | 1,218,410 |
| | | | |
|
|
| | | | | | 7,654,401 |
| | | | |
|
|
|
Air Freight & Logistics—1.4% |
Forward Air Corp. | | 36,900 | | | 1,352,385 |
UTI Worldwide, Inc. (b) | | 42,600 | | | 3,954,984 |
| | | | |
|
|
| | | | | | 5,307,369 |
| | | | |
|
|
|
Airlines—1.2% |
AirTran Holdings, Inc. (a) (b) | | 42,300 | | | 678,069 |
Frontier Airlines, Inc. (a) (b) | | 27,900 | | | 257,796 |
SkyWest, Inc. | | 133,400 | | | 3,583,124 |
| | | | |
|
|
| | | | | | 4,518,989 |
| | | | |
|
|
|
Auto Components—0.4% |
Gentex Corp. (b) | | 84,300 | | | 1,643,850 |
| | | | |
|
|
|
Automobiles—0.3% |
Thor Industries, Inc. (b) | | 31,500 | | | 1,262,205 |
| | | | |
|
|
|
Beverages—0.2% |
Boston Beer, Inc. (a) (b) | | 12,200 | | | 305,000 |
Peet’s Coffee & Tea, Inc. (a) (b) | | 16,100 | | | 488,635 |
| | | | |
|
|
| | | | | | 793,635 |
| | | | |
|
|
|
Biotechnology—5.8% |
Abgenix, Inc. (a) (b) | | 68,800 | | | 1,479,888 |
Alkermes, Inc. (a) (b) | | 53,200 | | | 1,017,184 |
Amylin Pharmaceuticals, Inc. (a) (b) | | 22,600 | | | 902,192 |
BioMarin Pharmaceutical, Inc. (a) | | 34,800 | | | 375,144 |
Cephalon, Inc. (a) (b) | | 12,173 | | | 788,080 |
Charles River Laboratories International,
Inc. (a) (b) | | 23,000 | | | 974,510 |
Digene Corp. (a) (b) | | 59,600 | | | 1,738,532 |
Exelixis, Inc. (a) (b) | | 42,800 | | | 403,176 |
Gen-Probe, Inc. (a) (b) | | 27,500 | | | 1,341,725 |
IDEXX Laboratories, Inc. (a) | | 10,400 | | | 748,592 |
Incyte Corp. (a) (b) | | 114,000 | | | 608,760 |
Invitrogen Corp. (a) | | 27,100 | | | 1,805,944 |
Martek Biosciences Corp. (a) (b) | | 37,200 | | | 915,492 |
Myogen, Inc. (a) (b) | | 21,100 | | | 636,376 |
Neurocrine Biosciences, Inc. (a) (b) | | 30,900 | | | 1,938,357 |
Protein Design Laboratories, Inc. (a) (b) | | 85,700 | | | 2,435,594 |
Senomyx, Inc. (a) | | 53,800 | | | 652,056 |
Techne Corp. (a) | | 28,300 | | | 1,589,045 |
Vertex Pharmaceuticals, Inc. (a) (b) | | 31,870 | | | 881,843 |
| | | | |
|
|
| | | | | | 21,232,490 |
| | | | |
|
|
|
Building Products—0.9% |
Color Kinetics, Inc. (a) (b) | | 117,100 | | | 1,685,069 |
Interline Brands, Inc. (a) (b) | | 8,800 | | | 200,200 |
| | | | | |
| Security Description | | Shares | | Value* |
| | | | | | |
|
Building Products—(Continued) |
Simpson Manufacturing, Inc. (b) | | 24,600 | | $ | 894,210 |
Trex Co., Inc. (a) (b) | | 18,800 | | | 527,340 |
| | | | |
|
|
| | | | | | 3,306,819 |
| | | | |
|
|
|
Capital Markets—2.3% |
Affiliated Managers Group, Inc. (a) (b) | | 36,349 | | | 2,917,007 |
Eaton Vance Corp. (b) | | 41,400 | | | 1,132,704 |
Greenhill & Co., Inc. (b) | | 17,800 | | | 999,648 |
IntercontinentalExchange, Inc. (a) | | 9,200 | | | 334,420 |
Investors Financial Services Corp. (b) | | 28,300 | | | 1,042,289 |
Raymond James Financial, Inc. | | 52,200 | | | 1,966,374 |
| | | | |
|
|
| | | | | | 8,392,442 |
| | | | |
|
|
|
Chemicals—0.4% |
Symyx Technologies, Inc. (a) (b) | | 58,300 | | | 1,591,007 |
| | | | |
|
|
|
Commercial Banks—1.6% |
Boston Private Financial Holdings, Inc. (b) | | 51,000 | | | 1,551,420 |
East West Bancorp, Inc. | | 41,600 | | | 1,517,984 |
SVB Financial Group (a) | | 22,400 | | | 1,049,216 |
UCBH Holdings, Inc. (b) | | 90,800 | | | 1,623,504 |
| | | | |
|
|
| | | | | | 5,742,124 |
| | | | |
|
|
|
Commercial Services & Supplies—5.4% |
ChoicePoint, Inc. (a) | | 48,133 | | | 2,142,400 |
FactSet Research Systems, Inc. (b) | | 32,100 | | | 1,321,236 |
Global Cash Access, Inc. (a) | | 34,100 | | | 497,519 |
Global Payments, Inc. | | 48,920 | | | 2,280,161 |
Heartland Payment Systems, Inc. (a) (b) | | 13,500 | | | 292,410 |
Iron Mountain, Inc. (a) (b) | | 36,975 | | | 1,561,085 |
Kenexa Corp. (a) | | 31,700 | | | 668,870 |
Mine Safety Appliances Co. (b) | | 33,400 | | | 1,209,414 |
MoneyGram International, Inc. (b) | | 44,100 | | | 1,150,128 |
Navigant Consulting, Inc. (a) (b) | | 36,800 | | | 808,864 |
Stericycle, Inc. (a) | | 29,900 | | | 1,760,512 |
The Corporate Executive Board Co. (b) | | 53,500 | | | 4,798,950 |
Waste Connections, Inc. (a) (b) | | 43,800 | | | 1,509,348 |
| | | | |
|
|
| | | | | | 20,000,897 |
| | | | |
|
|
|
Communications Equipment—2.6% |
ADTRAN, Inc. | | 60,700 | | | 1,805,218 |
Anaren, Inc. (a) | | 16,500 | | | 257,895 |
Avocent Corp. (a) | | 15,125 | | | 411,249 |
F5 Networks, Inc. (a) (b) | | 38,400 | | | 2,196,096 |
Inter-Tel, Inc. | | 86,400 | | | 1,690,848 |
Plantronics, Inc. (b) | | 62,000 | | | 1,754,600 |
Polycom, Inc. (a) (b) | | 39,993 | | | 611,893 |
Powerwave Technologies, Inc. (a) (b) | | 75,100 | | | 944,007 |
| | | | |
|
|
| | | | | | 9,671,806 |
| | | | |
|
|
|
Computers & Peripherals—1.5% |
Applied Films Corp. (a) (b) | | 18,500 | | | 384,245 |
Avid Technology, Inc. (a) (b) | | 78,920 | | | 4,321,659 |
Maxtor Corp. (a) (b) | | 70,200 | | | 487,188 |
SBS Technologies, Inc. (a) | | 48,400 | | | 487,388 |
| | | | |
|
|
| | | | | | 5,680,480 |
| | | | |
|
|
*See accompanying notes to financial statements.
MSF-258
Metropolitan Series Fund, Inc.
T. Rowe Price Small Cap Growth Portfolio
Schedule of Investments as of December 31, 2005
Common Stock—(Continued)
| | | | | |
| Security Description | | Shares | | Value* |
| | | | | | |
|
Construction & Engineering—0.2% |
Insituform Technologies, Inc. (a) (b) | | 29,000 | | $ | 561,730 |
| | | | |
|
|
|
Diversified Consumer Services—2.0% |
Bright Horizons Family Solutions, Inc. (a) (b) | | 58,400 | | | 2,163,720 |
Corinthian Colleges, Inc. (a) (b) | | 46,900 | | | 552,482 |
Education Management Corp. (a) | | 79,500 | | | 2,664,045 |
ITT Educational Services, Inc. (a) | | 36,700 | | | 2,169,337 |
| | | | |
|
|
| | | | | | 7,549,584 |
| | | | |
|
|
|
Diversified Financial Services—0.3% |
CapitalSource, Inc. (b) | | 15,500 | | | 347,200 |
Jackson Hewitt Tax Service, Inc. | | 23,100 | | | 640,101 |
| | | | |
|
|
| | | | | | 987,301 |
| | | | |
|
|
|
Electrical Equipment—0.2% |
II-VI, Inc. (a) | | 34,500 | | | 616,515 |
| | | | |
|
|
|
Electronic Equipment & Instruments—2.6% |
CyberOptics Corp. (a) | | 175,237 | | | 2,362,195 |
Daktronics, Inc. (b) | | 14,400 | | | 425,808 |
FLIR Systems, Inc. (a) | | 74,500 | | | 1,663,585 |
Itron, Inc. (a) | | 16,900 | | | 676,676 |
Orbotech, Ltd. (a) | | 37,700 | | | 903,669 |
ScanSource, Inc. (a) (b) | | 27,100 | | | 1,481,828 |
TTM Technologies, Inc. (a) | | 221,500 | | | 2,082,100 |
| | | | |
|
|
| | | | | | 9,595,861 |
| | | | |
|
|
|
Energy Equipment & Services—3.2% |
Atwood Oceanics, Inc. (a) (b) | | 6,500 | | | 507,195 |
Cal Dive International, Inc. (a) (b) | | 90,200 | | | 3,237,278 |
FMC Technologies, Inc. (a) (b) | | 20,900 | | | 897,028 |
Global Industries, Inc. (a) (b) | | 60,000 | | | 681,000 |
Grey Wolf, Inc. (a) (b) | | 56,500 | | | 436,745 |
Helmerich & Payne, Inc. (b) | | 12,000 | | | 742,920 |
Lone Star Technologies, Inc. (a) | | 3,800 | | | 196,308 |
Oil States International, Inc. (a) | | 44,500 | | | 1,409,760 |
Patterson-UTI Energy, Inc. | | 53,600 | | | 1,766,120 |
Unit Corp. (a) | | 38,500 | | | 2,118,655 |
| | | | |
|
|
| | | | | | 11,993,009 |
| | | | |
|
|
|
Food & Staples Retailing—0.5% |
United Natural Foods, Inc. (a) (b) | | 64,200 | | | 1,694,880 |
| | | | |
|
|
|
Food Products—0.5% |
SunOpta, Inc. (a) (b) | | 332,900 | | | 1,751,054 |
| | | | |
|
|
|
Health Care Equipment & Supplies—8.7% |
American Medical Systems Holdings, Inc. (a) | | 20,100 | | | 358,383 |
ArthroCare Corp. (a) (b) | | 41,800 | | | 1,761,452 |
Aspect Medical Systems, Inc. (a) (b) | | 69,400 | | | 2,383,890 |
Computer Programs & Systems, Inc. (b) | | 103,500 | | | 4,288,005 |
Cytyc Corp. (a) | | 56,500 | | | 1,594,995 |
Dentsply International, Inc. | | 25,450 | | | 1,366,410 |
Hologic, Inc. (a) | | 72,600 | | | 2,752,992 |
ICU Medical, Inc. (a) (b) | | 50,900 | | | 1,995,789 |
| | | | | |
| Security Description | | Shares | | Value* |
| | | | | | |
|
Health Care Equipment & Supplies—(Continued) |
Immucor, Inc. (a) (b) | | 7,600 | | $ | 177,536 |
INAMED Corp. (a) (b) | | 31,100 | | | 2,726,848 |
Integra LifeSciences Holdings (a) (b) | | 29,700 | | | 1,053,162 |
Kyphon, Inc. (a) | | 38,600 | | | 1,576,038 |
Mentor Corp. (b) | | 16,300 | | | 751,104 |
Merit Medical Systems, Inc. (a) | | 29,400 | | | 356,916 |
Patterson Cos., Inc. (a) (b) | | 27,900 | | | 931,860 |
Respironics, Inc. (a) | | 85,000 | | | 3,150,950 |
STERIS Corp. (b) | | 70,600 | | | 1,766,412 |
Thoratec Corp. (a) (b) | | 107,800 | | | 2,230,382 |
Varian, Inc. (a) | | 16,600 | | | 660,514 |
Wright Medical Group, Inc. (a) (b) | | 18,100 | | | 369,240 |
| | | | |
|
|
| | | | | | 32,252,878 |
| | | | |
|
|
|
Health Care Providers & Services—7.1% |
Amedisys, Inc. (a) (b) | | 35,700 | | | 1,507,968 |
AmSurg Corp. (a) (b) | | 10,500 | | | 240,030 |
Community Health Systems, Inc. (a) | | 24,900 | | | 954,666 |
Coventry Health Care, Inc. (a) | | 47,275 | | | 2,692,784 |
DaVita, Inc. (a) (b) | | 58,400 | | | 2,957,376 |
Gentiva Health Services, Inc. (a) | | 42,000 | | | 619,080 |
Henry Schein, Inc. (a) (b) | | 12,400 | | | 541,136 |
Lifeline Systems, Inc. (a) | | 8,300 | | | 303,448 |
LifePoint Hospitals, Inc. (a) | | 25,200 | | | 945,000 |
Manor Care, Inc. (b) | | 23,800 | | | 946,526 |
Matria Healthcare, Inc. (a) (b) | | 34,149 | | | 1,323,615 |
Omnicare, Inc. | | 41,100 | | | 2,351,742 |
Option Care, Inc. (b) | | 20,800 | | | 277,888 |
Pharmaceutical Product Development, Inc. | | 26,600 | | | 1,647,870 |
Renal Care Group, Inc. (a) | | 24,900 | | | 1,178,019 |
Symbion, Inc. (a) (b) | | 63,700 | | | 1,465,100 |
The Advisory Board Co. (a) (b) | | 81,700 | | | 3,894,639 |
Triad Hospitals, Inc. (a) | | 18,100 | | | 710,063 |
United Surgical Partners International, Inc. (a) (b) | | 46,900 | | | 1,507,835 |
| | | | |
|
|
| | | | | | 26,064,785 |
| | | | |
|
|
|
Hotels, Restaurants & Leisure—4.2% |
BJ’s Restaurants, Inc. (a) (b) | | 66,700 | | | 1,524,762 |
CEC Entertainment, Inc. (a) (b) | | 28,750 | | | 978,650 |
International Speedway Corp. (Class A) | | 6,200 | | | 296,980 |
Orient-Express Hotels, Ltd. (Class A) | | 5,900 | | | 185,968 |
P.F. Chang’s China Bistro, Inc. (a) (b) | | 39,400 | | | 1,955,422 |
Rare Hospitality International, Inc. (a) | | 62,975 | | | 1,913,810 |
Shuffle Master, Inc. (a) (b) | | 65,950 | | | 1,657,983 |
Sonic Corp. (a) (b) | | 47,575 | | | 1,403,463 |
Station Casinos, Inc. | | 50,800 | | | 3,444,240 |
The Cheesecake Factory, Inc. (a) (b) | | 29,749 | | | 1,112,315 |
WMS Industries, Inc. (a) (b) | | 46,600 | | | 1,169,194 |
| | | | |
|
|
| | | | | | 15,642,787 |
| | | | |
|
|
|
Household Durables—0.9% |
Harman International Industries, Inc. | | 7,400 | | | 724,090 |
M.D.C. Holdings, Inc. (b) | | 23,083 | | | 1,430,684 |
Toll Brothers, Inc. (a) (b) | | 34,000 | | | 1,177,760 |
| | | | |
|
|
| | | | | | 3,332,534 |
| | | | |
|
|
*See accompanying notes to financial statements.
MSF-259
Metropolitan Series Fund, Inc.
T. Rowe Price Small Cap Growth Portfolio
Schedule of Investments as of December 31, 2005
Common Stock—(Continued)
| | | | | |
| Security Description | | Shares | | Value* |
| | | | | | |
|
Insurance—1.5% |
Brown & Brown, Inc. (b) | | 38,200 | | $ | 1,166,628 |
Max Re Capital, Ltd. | | 44,900 | | | 1,166,053 |
RenaissanceRe Holdings, Ltd. (b) | | 12,800 | | | 564,608 |
StanCorp Financial Group, Inc. | | 36,400 | | | 1,818,180 |
Triad Guaranty, Inc. (a) | | 15,300 | | | 673,047 |
| | | | |
|
|
| | | | | | 5,388,516 |
| | | | |
|
|
|
Internet & Catalog Retail—1.1% |
Coldwater Creek, Inc. (a) (b) | | 72,600 | | | 2,216,478 |
drugstore.com, Inc. (a) (b) | | 128,400 | | | 365,940 |
Insight Enterprises, Inc. (a) (b) | | 41,636 | | | 816,482 |
The Sportsman’s Guide, Inc. (a) | | 30,900 | | | 736,965 |
| | | | |
|
|
| | | | | | 4,135,865 |
| | | | |
|
|
|
Internet Software & Services—3.5% |
Aptimus, Inc. (a) | | 44,600 | | | 352,786 |
Blue Coat Systems, Inc. (a) (b) | | 36,500 | | | 1,668,780 |
CNET Networks, Inc. (a) (b) | | 82,500 | | | 1,211,925 |
Cybersource Corp. (a) (b) | | 81,500 | | | 537,900 |
Digital Insight Corp. (a) | | 47,200 | | | 1,511,344 |
Digital River, Inc. (a) (b) | | 18,500 | | | 550,190 |
EarthLink, Inc. (a) | | 20,100 | | | 223,311 |
FileNET Corp. (a) (b) | | 27,400 | | | 708,290 |
Jupitermedia Corp. (a) (b) | | 74,800 | | | 1,105,544 |
MatrixOne, Inc. (a) | | 211,300 | | | 1,054,387 |
Motive, Inc. (a) (b) | | 74,700 | | | 230,823 |
NetIQ Corp. (a) (b) | | 17,100 | | | 210,159 |
RightNow Technologies, Inc. (a) (b) | | 85,300 | | | 1,574,638 |
SupportSoft, Inc. (a) (b) | | 82,600 | | | 348,572 |
Websense, Inc. (a) (b) | | 24,600 | | | 1,614,744 |
| | | | |
|
|
| | | | | | 12,903,393 |
| | | | |
|
|
|
IT Services—3.7% |
CACI International, Inc. (Class A) (a) | | 29,300 | | | 1,681,234 |
Cognizant Technology Solutions Corp.
(Class A) (a) | | 34,400 | | | 1,732,040 |
Inforte Corp. | | 307,500 | | | 1,214,625 |
NAVTEQ, Inc. (a) | | 16,900 | | | 741,403 |
NCI, Inc. (Class A) (a) | | 138,800 | | | 1,905,724 |
Packeteer, Inc. (a) | | 79,100 | | | 614,607 |
Resources Connection, Inc. (a) (b) | | 111,300 | | | 2,900,478 |
SI International, Inc. (a) (b) | | 11,200 | | | 342,384 |
SRA International, Inc. (a) (b) | | 78,700 | | | 2,403,498 |
| | | | |
|
|
| | | | | | 13,535,993 |
| | | | |
|
|
|
Leisure Equipment & Products—0.7% |
Marvel Entertainment, Inc. (b) | | 37,749 | | | 618,329 |
SCP Pool Corp. | | 54,225 | | | 2,018,254 |
| | | | |
|
|
| | | | | | 2,636,583 |
| | | | |
|
|
|
Machinery—2.4% |
Actuant Corp. (a) (b) | | 51,000 | | | 2,845,800 |
Ceradyne, Inc. (a) (b) | | 40,100 | | | 1,756,380 |
Dionex Corp. (a) | | 10,300 | | | 505,524 |
| | | | | |
| Security Description | | Shares | | Value* |
| | | | | | |
|
Machinery—(Continued) |
iRobot Corp. (a) (b) | | 20,000 | | $ | 666,600 |
Oshkosh Truck Corp. | | 68,600 | | | 3,058,874 |
| | | | |
|
|
| | | | | | 8,833,178 |
| | | | |
|
|
|
Media—1.9% |
Cox Radio, Inc. (Class A) (a) (b) | | 41,800 | | | 588,544 |
Dolby Laboratories, Inc. (Class A) (a) | | 25,000 | | | 426,250 |
Entercom Communications Corp. (a) (b) | | 22,900 | | | 679,443 |
Getty Images, Inc. (a) | | 24,500 | | | 2,187,115 |
Gray Television, Inc. | | 42,500 | | | 417,350 |
Macrovision Corp. (a) | | 39,100 | | | 654,143 |
Radio One, Inc. (Class D) (a) (b) | | 85,000 | | | 879,750 |
Regent Communications, Inc. (a) (b) | | 81,900 | | | 380,016 |
Scholastic Corp. (a) | | 9,900 | | | 282,249 |
Spanish Broadcasting Systems, Inc. (a) | | 64,100 | | | 327,551 |
Valassis Communications, Inc. (a) (b) | | 8,000 | | | 232,560 |
| | | | |
|
|
| | | | | | 7,054,971 |
| | | | |
|
|
|
Metals & Mining—0.3% |
Reliance Steel & Aluminum Co. | | 4,200 | | | 256,704 |
Steel Dynamics, Inc. (b) | | 19,000 | | | 674,690 |
| | | | |
|
|
| | | | | | 931,394 |
| | | | |
|
|
|
Multiline Retail—0.3% |
Fred’s, Inc. (b) | | 64,050 | | | 1,042,093 |
| | | | |
|
|
|
Office Electronics—0.6% |
Zebra Technologies Corp. (Class A) (a) | | 50,842 | | | 2,178,580 |
| | | | |
|
|
|
Oil, Gas & Consumable Fuels—2.7% |
Bill Barrett Corp. (a) (b) | | 62,800 | | | 2,424,708 |
Cabot Oil & Gas Corp. | | 50,200 | | | 2,264,020 |
Comstock Resources, Inc. (a) | | 101,000 | | | 3,081,510 |
Forest Oil Corp. (a) (b) | | 29,700 | | | 1,353,429 |
Stone Energy Corp. (a) (b) | | 22,700 | | | 1,033,531 |
| | | | |
|
|
| | | | | | 10,157,198 |
| | | | |
|
|
|
Pharmaceuticals—2.1% |
Andrx Corp. (a) (b) | | 18,300 | | | 301,401 |
Bradley Pharmaceuticals, Inc. (a) (b) | | 19,700 | | | 187,150 |
InterMune, Inc. (a) (b) | | 22,300 | | | 374,640 |
Medicis Pharmaceutical Corp. (Class A) (b) | | 46,400 | | | 1,487,120 |
Noven Pharmaceuticals, Inc. (a) (b) | | 71,600 | | | 1,083,308 |
Par Pharmaceutical Companies, Inc. (a) (b) | | 10,400 | | | 325,936 |
Rigel Pharmaceuticals, Inc. (a) (b) | | 48,800 | | | 407,968 |
Salix Pharmaceuticals, Ltd. (a) | | 81,260 | | | 1,428,551 |
Taro Pharmaceutical Industries, Ltd. (a) (b) | | 23,600 | | | 329,692 |
The Medicines Co. (a) | | 76,500 | | | 1,334,925 |
Valeant Pharmaceuticals International, Inc. (b) | | 22,000 | | | 397,760 |
| | | | |
|
|
| | | | | | 7,658,451 |
| | | | |
|
|
|
Road & Rail—1.2% |
Dollar Thrifty Automotive Group, Inc. (a) (b) | | 23,800 | | | 858,466 |
Old Dominion Freight Line, Inc. (a) | | 73,050 | | | 1,970,889 |
*See accompanying notes to financial statements.
MSF-260
Metropolitan Series Fund, Inc.
T. Rowe Price Small Cap Growth Portfolio
Schedule of Investments as of December 31, 2005
Common Stock—(Continued)
| | | | | |
| Security Description | | Shares | | Value* |
| | | | | | |
|
Road & Rail—(Continued) |
U.S. Xpress Enterprises, Inc. (a) (b) | | 32,900 | | $ | 571,802 |
Werner Enterprises, Inc. (b) | | 46,100 | | | 908,170 |
| | | | |
|
|
| | | | | | 4,309,327 |
| | | | |
|
|
|
Semiconductors & Semiconductor Equipment— 5.6% |
Advanced Energy Industries, Inc. (a) (b) | | 128,400 | | | 1,518,972 |
AMIS Holdings, Inc. (a) (b) | | 40,700 | | | 433,455 |
ATMI, Inc. (a) (b) | | 38,200 | | | 1,068,454 |
Brooks Automation, Inc. (a) (b) | | 16,800 | | | 210,504 |
Cohu, Inc. (b) | | 44,000 | | | 1,006,280 |
Cymer, Inc. (a) (b) | | 46,000 | | | 1,633,460 |
Entegris, Inc. (a) (b) | | 79,900 | | | 752,658 |
Exar Corp. (a) | | 45,700 | | | 572,164 |
Integrated Device Technology, Inc. (a) | | 59,150 | | | 779,597 |
Integrated Silicon Solution, Inc. (a) (b) | | 94,300 | | | 607,292 |
Intersil Corp. (Class A) | | 76,864 | | | 1,912,376 |
Micrel, Inc. (a) (b) | | 30,400 | | | 352,640 |
Microchip Technology, Inc. | | 7,350 | | | 236,303 |
Microsemi Corp. (a) | | 46,800 | | | 1,294,488 |
OmniVision Technologies, Inc. (a) (b) | | 34,200 | | | 682,632 |
ON Semiconductor Corp. | | 195,300 | | | 1,080,009 |
Pericom Semiconductor Corp. (a) | | 32,400 | | | 258,228 |
Semtech Corp. (a) | | 53,600 | | | 978,736 |
Silicon Storage Technology, Inc. (a) (b) | | 90,200 | | | 455,510 |
Tessera Technologies, Inc. (a) (b) | | 29,300 | | | 757,405 |
TriQuint Semiconductor, Inc. (a) (b) | | 94,520 | | | 420,614 |
Varian Semiconductor Equipment, Inc. (a) (b) | | 41,800 | | | 1,836,274 |
Virage Logic Corp. (a) (b) | | 68,700 | | | 678,756 |
Zoran Corp. (a) | | 80,791 | | | 1,309,622 |
| | | | |
|
|
| | | | | | 20,836,429 |
| | | | |
|
|
|
Software—5.1% |
Activision, Inc. (a) (b) | | 154,177 | | | 2,118,392 |
Actuate Corp. (a) | | 153,000 | | | 480,420 |
Agile Software Corp. (a) | | 145,800 | | | 871,884 |
Borland Software Corp. (a) (b) | | 94,400 | | | 616,432 |
Cognex Corp. (b) | | 42,200 | | | 1,269,798 |
Epicor Software Corp. (a) | | 25,600 | | | 361,728 |
Fair Isaac Corp. (b) | | 60,919 | | | 2,690,792 |
Hyperion Solutions Corp. (a) | | 78,113 | | | 2,797,990 |
Informatica Corp. (a) (b) | | 90,800 | | | 1,089,600 |
Jack Henry & Associates, Inc. (b) | | 41,700 | | | 795,636 |
Open Solutions, Inc. (a) | | 21,700 | | | 497,364 |
Quest Software, Inc. (a) (b) | | 27,200 | | | 396,848 |
Radiant Systems, Inc. (a) | | 111,350 | | | 1,354,016 |
Red Hat, Inc. (a) (b) | | 62,500 | | | 1,702,500 |
RSA Security, Inc. (a) | | 10,500 | | | 117,915 |
Serena Software, Inc. (a) (b) | | 44,400 | | | 1,040,736 |
Taleo Corp. (a) | | 58,400 | | | 775,552 |
| | | | |
|
|
| | | | | | 18,977,603 |
| | | | |
|
|
|
Specialty Retail—6.0% |
A.C. Moore Arts & Crafts, Inc. (a) (b) | | 120,900 | | | 1,759,095 |
Christopher & Banks Corp. (b) | | 42,650 | | | 800,967 |
GameStop Corp. (Class A) (a) (b) | | 27,700 | | | 881,414 |
| | | | | | |
| Security Description | | Shares | | Value* | |
| | | | | | | |
|
Specialty Retail—(Continued) | |
Hibbett Sporting Goods, Inc. (a) | | 69,650 | | $ | 1,983,632 | |
Hot Topic, Inc. (a) | | 62,900 | | | 896,325 | |
MarineMax, Inc. (a) (b) | | 45,000 | | | 1,420,650 | |
Michaels Stores, Inc. | | 36,700 | | | 1,298,079 | |
O’Reilly Automotive, Inc. (a) | | 94,200 | | | 3,015,342 | |
Pacific Sunwear of California, Inc. (a) | | 79,055 | | | 1,970,051 | |
Ross Stores, Inc. (b) | | 28,100 | | | 812,090 | |
The Gymboree Corp. (a) | | 81,500 | | | 1,907,100 | |
Tractor Supply Co. (a) | | 29,700 | | | 1,572,318 | |
Urban Outfitters, Inc. (a) (b) | | 75,800 | | | 1,918,498 | |
West Marine, Inc. (a) (b) | | 12,000 | | | 167,760 | |
Williams-Sonoma, Inc. (a) (b) | | 25,800 | | | 1,113,270 | |
Zumiez, Inc. (a) (b) | | 11,400 | | | 492,708 | |
| | | | |
|
|
|
| | | | | | 22,009,299 | |
| | | | |
|
|
|
|
Textiles, Apparel & Luxury Goods—1.2% | |
Fossil, Inc. (a) (b) | | 93,549 | | | 2,012,239 | |
Quiksilver, Inc. (a) (b) | | 123,500 | | | 1,709,240 | |
The Timberland Co. (Class A) (a) | | 24,600 | | | 800,730 | |
| | | | |
|
|
|
| | | | | | 4,522,209 | |
| | | | |
|
|
|
|
Trading Companies & Distributors—0.4% | |
Hughes Supply, Inc. | | 36,400 | | | 1,304,940 | |
| | | | |
|
|
|
|
Wireless Telecommunication Services—1.2% | |
JAMDAT Mobile, Inc. (a) | | 56,100 | | | 1,491,138 | |
NII Holdings, Inc. (Class B) (a) (b) | | 33,000 | | | 1,441,440 | |
Novatel Wireless, Inc. (a) (b) | | 10,500 | | | 127,155 | |
UbiquiTel, Inc. (a) | | 40,700 | | | 402,523 | |
Wireless Facilities, Inc. (a) (b) | | 176,900 | | | 902,190 | |
| | | | |
|
|
|
| | | | | | 4,364,446 | |
| | | | |
|
|
|
Total Common Stock
(Identified Cost $272,998,139) | | | | | 361,621,900 | |
| | | | |
|
|
|
|
| Short Term Investments—2.0% | |
|
Mutual Funds—2.0% | |
T. Rowe Price Reserve Investment Fund | | 7,502,512 | | | 7,502,512 | |
| | | | |
|
|
|
Total Short Term Investments
(Amortized Cost $7,502,512) | | | | | 7,502,512 | |
| | | | |
|
|
|
Total Investments—100.0%
(Identified Cost $280,500,651) (c) | | | | | 369,124,412 | |
Liabilities in excess of other assets | | | | | (12,068 | ) |
| | | | |
|
|
|
| Total Net Assets 100% | | | | $ | 369,112,344 | |
| | | | |
|
|
|
| (b) | A portion or all of the security was held on loan. As of December 31, 2005, the market value of securities loaned was $92,429,659 and the collateral received consisted of cash in the amount of $95,325,738. |
| (c) | The aggregate cost of investments for federal income tax purposes as of December 31, 2005 was $281,137,594 and the composition of unrealized appreciation and (depreciation) of investment securities was $112,149,138 and ($24,162,320), respectively. |
*See accompanying notes to financial statements.
MSF-261
Metropolitan Series Fund, Inc.
T. Rowe Price Small Cap Growth Portfolio
Statement of Assets & Liabilities
December 31, 2005
| | | | | | | |
Assets | | | | | | | |
Investments at value | | | | | $ | 369,124,412 | |
Collateral for securities loaned | | | | | | 95,325,738 | |
Receivable for: | | | | | | | |
Securities sold | | | | | | 3,803,854 | |
Fund shares sold | | | | | | 447,748 | |
Accrued interest and dividends | | | | | | 100,524 | |
| | | | | |
|
|
|
Total Assets | | | | | | 468,802,276 | |
Liabilities | | | | | | | |
Payable for: | | | | | | | |
Fund shares redeemed | | $ | 1,231,073 | | | | |
Securities purchased | | | 2,892,009 | | | | |
Return of collateral for securities loaned | | | 95,325,738 | | | | |
Accrued expenses: | | | | | | | |
Management fees | | | 159,534 | | | | |
Service and distribution fees | | | 8,923 | | | | |
Other expenses | | | 72,655 | | | | |
| | |
|
| | | | |
Total Liabilities | | | | | | 99,689,932 | |
| | | | | |
|
|
|
Net Assets | | | | | $ | 369,112,344 | |
| | | | | |
|
|
|
Net assets consists of: | | | | | | | |
Capital paid in | | | | | $ | 310,279,368 | |
Accumulated net realized losses | | | | | | (29,790,785 | ) |
Unrealized appreciation on investments | | | | | | 88,623,761 | |
| | | | | |
|
|
|
Net Assets | | | | | $ | 369,112,344 | |
| | | | | |
|
|
|
| Computation of offering price: | | | | | | | |
Class A | | | | | | | |
Net asset value and redemption price per share ($318,845,402 divided by 21,067,680 shares outstanding) | | | | | $ | 15.13 | |
| | | | | |
|
|
|
Class B | | | | | | | |
Net asset value and redemption price per share ($30,356,611 divided by 2,039,992 shares outstanding) | | | | | $ | 14.88 | |
| | | | | |
|
|
|
Class E | | | | | | | |
Net asset value and redemption price per share ($19,910,331 divided by 1,332,122 shares outstanding) | | | | | $ | 14.95 | |
| | | | | |
|
|
|
Identified cost of investments | | | | | $ | 280,500,651 | |
| | | | | |
|
|
|
Statement of Operations
For the Year Ended December 31, 2005
| | | | | | | | |
Investment Income | | | | | | | | |
Dividends | | | | | | $ | 1,278,970 | (a) |
Interest | | | | | | | 267,981 | (b) |
| | | | | | |
|
|
|
| | | | | | | | 1,546,951 | |
| | |
Expenses | | | | | | | | |
Management fees | | $ | 1,777,161 | | | | | |
Service and distribution fees—Class B | | | 54,121 | | | | | |
Service and distribution fees—Class E | | | 27,028 | | | | | |
Directors’ fees and expenses | | | 22,264 | | | | | |
Custodian | | | 149,967 | | | | | |
Audit and tax services | | | 20,440 | | | | | |
Legal | | | 8,756 | | | | | |
Printing | | | 87,835 | | | | | |
Insurance | | | 7,064 | | | | | |
Miscellaneous | | | 5,948 | | | | | |
| | |
|
|
| | | | |
Total expenses | | | 2,160,584 | | | | | |
Expense reductions | | | (5,906 | ) | | | | |
Management fee waivers | | | (25,660 | ) | | | 2,129,018 | |
| | |
|
|
| |
|
|
|
Net Investment Loss | | | | | | | (582,067 | ) |
| | | | | | |
|
|
|
Realized and Unrealized Gain | | | | | | | | |
| Realized gain on: | | | | | | | | |
Investments—net | | | | | | | 26,182,307 | |
| | |
| Unrealized appreciation on: | | | | | | | | |
Investments—net | | | | | | | 10,826,102 | |
| | | | | | |
|
|
|
Net gain | | | | | | | 37,008,409 | |
| | | | | | |
|
|
|
Net Increase in Net Assets From Operations | | | | | | $ | 36,426,342 | |
| | | | | | |
|
|
|
| (a) | Net of foreign taxes of $288. |
| (b) | Includes income on securities loaned of $97,789. |
See accompanying notes to financial statements.
MSF-262
Metropolitan Series Fund, Inc.
T. Rowe Price Small Cap Growth Portfolio
Statement of Changes in Net Assets
| | | | | | | | |
| | | Year ended
December 31,
2005
| | | Year ended
December 31,
2004
| |
From Operations | | | | | | | | |
Net investment loss | | $ | (582,067 | ) | | $ | (1,027,393 | ) |
Net realized gain | | | 26,182,307 | | | | 16,667,874 | |
Unrealized appreciation | | | 10,826,102 | | | | 18,677,046 | |
| | |
|
|
| |
|
|
|
Increase in net assets from operations | | | 36,426,342 | | | | 34,317,527 | |
| | |
|
|
| |
|
|
|
Increase (decrease) in net assets from capital share transactions | | | (13,985,171 | ) | | | 3,120,390 | |
| | |
|
|
| |
|
|
|
Total increase in net assets | | | 22,441,171 | | | | 37,437,917 | |
| | |
Net Assets | | | | | | | | |
Beginning of the period | | | 346,671,173 | | | | 309,233,256 | |
| | |
|
|
| |
|
|
|
End of the period | | $ | 369,112,344 | | | $ | 346,671,173 | |
| | |
|
|
| |
|
|
|
Undistributed Net Investment Loss | | | | | | | | |
End of the period | | $ | 0 | | | $ | 0 | |
| | |
|
|
| |
|
|
|
Other Information:
Capital Shares
Transactions in capital shares were as follows:
| | | | | | | | | | | | | | |
| | | Year ended
December 31, 2005
| | | Year ended
December 31, 2004
| |
| | | Shares
| | | $
| | | Shares
| | | $
| |
Class A | | | | | | | | | | | | | | |
Sales | | 2,482,008 | | | $ | 34,917,352 | | | 1,941,629 | | | $ | 24,466,037 | |
Redemptions | | (4,358,048 | ) | | | (60,850,447 | ) | | (3,263,743 | ) | | | (40,853,480 | ) |
| | |
|
| |
|
|
| |
|
| |
|
|
|
Net decrease | | (1,876,040 | ) | | $ | (25,933,095 | ) | | (1,322,114 | ) | | $ | (16,387,443 | ) |
| | |
|
| |
|
|
| |
|
| |
|
|
|
Class B | | | | | | | | | | | | | | |
Sales | | 1,181,972 | | | $ | 16,375,307 | | | 1,317,885 | | | $ | 16,243,534 | |
Redemptions | | (296,491 | ) | | | (4,116,561 | ) | | (175,899 | ) | | | (2,128,475 | ) |
| | |
|
| |
|
|
| |
|
| |
|
|
|
Net increase | | 885,481 | | | $ | 12,258,746 | | | 1,141,986 | | | $ | 14,115,059 | |
| | |
|
| |
|
|
| |
|
| |
|
|
|
Class E | | | | | | | | | | | | | | |
Sales | | 296,321 | | | $ | 4,126,882 | | | 791,916 | | | $ | 9,935,322 | |
Redemptions | | (322,762 | ) | | | (4,437,704 | ) | | (367,496 | ) | | | (4,542,548 | ) |
| | |
|
| |
|
|
| |
|
| |
|
|
|
Net increase (decrease) | | (26,441 | ) | | $ | (310,822 | ) | | 424,420 | | | $ | 5,392,774 | |
| | |
|
| |
|
|
| |
|
| |
|
|
|
Increase (decrease) derived from capital share transactions | | (1,017,000 | ) | | $ | (13,985,171 | ) | | 244,292 | | | $ | 3,120,390 | |
| | |
|
| |
|
|
| |
|
| |
|
|
|
See accompanying notes to financial statements.
MSF-263
Metropolitan Series Fund, Inc.
T. Rowe Price Small Cap Growth Portfolio
Financial Highlights
| | | | | | | | | | | | | | | | | | | | |
| | | Class A
| |
| | | Year ended December 31,
| |
| | | 2005
| | | 2004
| | | 2003
| | | 2002
| | | 2001
| |
Net Asset Value, Beginning of Period | | $ | 13.63 | | | $ | 12.27 | | | $ | 8.71 | | | $ | 11.89 | | | $ | 14.30 | |
| | |
|
|
| |
|
|
| |
|
|
| |
|
|
| |
|
|
|
Income From Investment Operations | | | | | | | | | | | | | | | | | | | | |
Net investment loss | | | (0.02 | ) | | | (0.04 | ) | | | (0.04 | ) | | | (0.04 | ) | | | (0.04 | ) |
Net realized and unrealized gain (loss) of investments | | | 1.52 | | | | 1.40 | | | | 3.60 | | | | (3.14 | ) | | | (1.27 | ) |
| | |
|
|
| |
|
|
| |
|
|
| |
|
|
| |
|
|
|
Total from investment operations | | | 1.50 | | | | 1.36 | | | | 3.56 | | | | (3.18 | ) | | | (1.31 | ) |
| | |
|
|
| |
|
|
| |
|
|
| |
|
|
| |
|
|
|
Less Distributions | | | | | | | | | | | | | | | | | | | | |
Distributions from net realized capital gains | | | 0.00 | | | | 0.00 | | | | 0.00 | | | | 0.00 | | | | (1.10 | ) |
| | |
|
|
| |
|
|
| |
|
|
| |
|
|
| |
|
|
|
Total distributions | | | 0.00 | | | | 0.00 | | | | 0.00 | | | | 0.00 | | | | (1.10 | ) |
| | |
|
|
| |
|
|
| |
|
|
| |
|
|
| |
|
|
|
Net Asset Value, End of Period | | $ | 15.13 | | | $ | 13.63 | | | $ | 12.27 | | | $ | 8.71 | | | $ | 11.89 | |
| | |
|
|
| |
|
|
| |
|
|
| |
|
|
| |
|
|
|
Total Return (%) | | | 11.0 | | | | 11.1 | | | | 40.9 | | | | (26.7 | ) | | | (9.0 | ) |
Ratio of operating expenses to average net assets before expense reductions (%) | | | 0.60 | | | | 0.60 | | | | 0.63 | | | | 0.61 | | | | 0.61 | |
Ratio of operating expenses to average net assets after expense reductions (%) (d) | | | 0.59 | | | | 0.60 | | | | 0.63 | | | | — | | | | — | |
Ratio of net investment loss to average net assets (%) | | | (0.14 | ) | | | (0.31 | ) | | | (0.39 | ) | | | (0.38 | ) | | | (0.34 | ) |
Portfolio turnover rate (%) | | | 31 | | | | 28 | | | | 25 | | | | 44 | | | | 38 | |
Net assets, end of period (000) | | $ | 318,845 | | | $ | 312,834 | | | $ | 297,728 | | | $ | 210,410 | | | $ | 298,699 | |
| | | | | | | | | | | | | | | | |
| | | Class B
| |
| | | Year ended December 31,
| | | July 30, 2002(a)
through
December 31, 2002
| |
| | | 2005
| | | 2004
| | | 2003
| | |
Net Asset Value, Beginning of Period | | $ | 13.44 | | | $ | 12.11 | | | $ | 8.59 | | | $ | 8.67 | |
| | |
|
|
| |
|
|
| |
|
|
| |
|
|
|
Income From Investment Operations | | | | | | | | | | | | | | | | |
Net investment loss | | | (0.04 | ) | | | (0.03 | ) | | | (0.01 | ) | | | (0.01 | ) |
Net realized and unrealized gain (loss) of investments | | | 1.48 | | | | 1.36 | | | | 3.53 | | | | (0.07 | ) |
| | |
|
|
| |
|
|
| |
|
|
| |
|
|
|
Total from investment operations | | | 1.44 | | | | 1.33 | | | | 3.52 | | | | (0.08 | ) |
| | |
|
|
| |
|
|
| |
|
|
| |
|
|
|
Net Asset Value, End of Period | | $ | 14.88 | | | $ | 13.44 | | | $ | 12.11 | | | $ | 8.59 | |
| | |
|
|
| |
|
|
| |
|
|
| |
|
|
|
Total Return (%) | | | 10.7 | | | | 11.0 | | | | 41.0 | | | | (0.9 | )(b) |
Ratio of operating expenses to average net assets before expense reductions (%) | | | 0.84 | | | | 0.85 | | | | 0.88 | | | | 0.86 | (c) |
Ratio of operating expenses to average net assets after expense reductions (%) (d) | | | 0.84 | | | | 0.85 | | | | 0.88 | | | | — | |
Ratio of net investment loss to average net assets (%) | | | (0.40 | ) | | | (0.52 | ) | | | (0.59 | ) | | | (0.63 | )(c) |
Portfolio turnover rate (%) | | | 31 | | | | 28 | | | | 25 | | | | 44 | |
Net assets, end of period (000) | | $ | 30,357 | | | $ | 15,516 | | | $ | 152 | | | $ | 3 | |
| (a) | Commencement of operations. |
| (b) | Period less than one year is not computed on an annualized basis. |
| (c) | Computed on an annualized basis. |
| (d) | The Portfolio has entered into arrangements with certain brokers who paid a portion of the Portfolio’s expenses. |
See accompanying notes to financial statements.
MSF-264
Metropolitan Series Fund, Inc.
T. Rowe Price Small Cap Growth Portfolio
Financial Highlights
| | | | | | | | | | | | | | | | | | | | |
| | | Class E
| |
| | | Year ended December 31,
| | | May 1, 2001(a)
through
December 31, 2001
| |
| | | 2005
| | | 2004
| | | 2003
| | | 2002
| | |
Net Asset Value, Beginning of Period | | $ | 13.49 | | | $ | 12.15 | | | $ | 8.64 | | | $ | 11.80 | | | $ | 12.22 | |
| | |
|
|
| |
|
|
| |
|
|
| |
|
|
| |
|
|
|
Income From Investment Operations | | | | | | | | | | | | | | | | | | | | |
Net investment income (loss) | | | (0.04 | ) | | | (0.05 | ) | | | (0.03 | ) | | | (0.02 | ) | | | 0.00 | |
Net realized and unrealized gain (loss) of investments | | | 1.50 | | | | 1.39 | | | | 3.54 | | | | (3.14 | ) | | | (0.42 | ) |
| | |
|
|
| |
|
|
| |
|
|
| |
|
|
| |
|
|
|
Total from investment operations | | | 1.46 | | | | 1.34 | | | | 3.51 | | | | (3.16 | ) | | | (0.42 | ) |
| | |
|
|
| |
|
|
| |
|
|
| |
|
|
| |
|
|
|
Net Asset Value, End of Period | | $ | 14.95 | | | $ | 13.49 | | | $ | 12.15 | | | $ | 8.64 | | | $ | 11.80 | |
| | |
|
|
| |
|
|
| |
|
|
| |
|
|
| |
|
|
|
Total Return (%) | | | 10.8 | | | | 11.0 | | | | 40.6 | | | | (26.8 | ) | | | (3.4 | )(b) |
Ratio of operating expenses to average net assets before expense reductions (%) | | | 0.74 | | | | 0.75 | | | | 0.78 | | | | 0.76 | | | | 0.76 | (c) |
Ratio of operating expenses to average net assets after expense reductions (%) (d) | | | 0.74 | | | | 0.75 | | | | 0.78 | | | | — | | | | — | |
Ratio of net investment loss to average net assets (%) | | | (0.30 | ) | | | (0.45 | ) | | | (0.52 | ) | | | (0.53 | ) | | | 0.00 | (c) |
Portfolio turnover rate (%) | | | 31 | | | | 28 | | | | 25 | | | | 44 | | | | 38 | |
Net assets, end of period (000) | | $ | 19,910 | | | $ | 18,321 | | | $ | 11,353 | | | $ | 1,809 | | | $ | 0.1 | |
| (a) | Commencement of operations. |
| (b) | Period less than one year is not computed on an annualized basis. |
| (c) | Computed on an annualized basis. |
| (d) | The Portfolio has entered into arrangements with certain brokers who paid a portion of the Portfolio’s expenses. |
See accompanying notes to financial statements.
MSF-265
Metropolitan Series Fund, Inc.
FI International Stock Portfolio
Schedule of Investments as of December 31, 2005
Common Stock—98.6% of Total Net Assets
| | | | | |
| Security Description | | Shares | | Value* |
| | | | | | |
| | | | | | |
| | |
Bermuda—0.0% | | | | | |
Regal Hotels International Holdings Ltd. | | 2,414,000 | | $ | 170,603 |
| | | | |
|
|
| | |
Brazil—0.5% | | | | | |
Banco Nossa Caixa S.A. (a) | | 12,000 | | | 179,319 |
Unibanco-Uniao de Banco Brasileiros S.A. (GDR) (b) | | 13,100 | | | 832,767 |
Votorantim Celulose Papel S.A. (ADR) (b) | | 130,450 | | | 1,603,231 |
| | | | |
|
|
| | | | | | 2,615,317 |
| | | | |
|
|
| | |
Canada—0.2% | | | | | |
ACE Aviation Holdings, Inc. (a) | | 33,700 | | | 1,098,332 |
| | | | |
|
|
| | |
Cayman Islands—0.5% | | | | | |
Foxconn International Holdings, Ltd. | | 1,451,000 | | | 2,333,147 |
The 9, Ltd. (ADR) (b) | | 32,300 | | | 493,867 |
| | | | |
|
|
| | | | | | 2,827,014 |
| | | | |
|
|
| | |
Denmark—0.8% | | | | | |
Coloplast (b) | | 26,400 | | | 1,638,524 |
Danske Bank A/S | | 70,410 | | | 2,482,275 |
| | | | |
|
|
| | | | | | 4,120,799 |
| | | | |
|
|
| | |
Finland—2.3% | | | | | |
Elisa Oyj (b) | | 85,700 | | | 1,587,532 |
Fortum Oyj | | 105,600 | | | 1,980,937 |
Metso Oyj | | 76,800 | | | 2,101,299 |
Neste Oil, Oyj (a) (b) | | 52,300 | | | 1,481,440 |
Nokia Corp. (ADR) | | 278,504 | | | 5,096,623 |
| | | | |
|
|
| | | | | | 12,247,831 |
| | | | |
|
|
| | |
France—12.8% | | | | | |
Accor S.A. (b) | | 65,700 | | | 3,613,312 |
AIR LIQUIDE (b) | | 10,400 | | | 2,001,298 |
Air Liquide S.A. | | 2,200 | | | 423,391 |
AXA S.A. (b) | | 196,900 | | | 6,365,046 |
BNP Paribas S.A. (b) | | 61,273 | | | 4,959,956 |
CNP Assurances S.A. (b) | | 41,500 | | | 3,272,951 |
Compagnie Generale de Geophysique S.A. (b) | | 112,300 | | | 1,987,710 |
Eiffage S.A. | | 14,567 | | | 1,575,054 |
Fimalac S.A. | | 5,100 | | | 311,841 |
France Telecom S.A. (ADR) (b) | | 61,293 | | | 1,522,518 |
Lagardere S.C.A. (b) | | 50,200 | | | 3,864,377 |
Nexity | | 44,600 | | | 2,269,803 |
NRJ Groupe (b) | | 77,800 | | | 1,904,786 |
Orpea (a)(b) | | 29,046 | | | 1,595,507 |
Sanef, Inc. | | 32,400 | | | 2,194,619 |
Sanofi-Aventis (ADR) (b) | | 88,300 | | | 3,876,370 |
Société Générale | | 28,300 | | | 3,482,373 |
Total S.A. (b) | | 40,551 | | | 10,208,412 |
Total S.A. (ADR) (b) | | 31,500 | | | 3,981,600 |
Vinci S.A. (b) | | 33,100 | | | 2,846,530 |
Vivendi Universal S.A. (ADR) | | 196,000 | | | 6,160,280 |
| | | | |
|
|
| | | | | | 68,417,734 |
| | | | |
|
|
| | | | | |
| Security Description | | Shares | | Value* |
| | | | | | |
| | | | | | |
| | |
Germany—13.0% | | | | | |
Aareal Bank AG (b) | | 18,137 | | $ | 688,796 |
Allianz AG | | 67,329 | | | 10,200,835 |
Axel Springer AG | | 1,268 | | | 161,850 |
Bayer AG | | 55,100 | | | 2,302,578 |
Bayer AG (ADR) (b) | | 32,600 | | | 1,361,376 |
Bilfinger & Berger Bau AG (b) | | 47,900 | | | 2,284,817 |
DAB Bank AG (b) | | 147,910 | | | 1,190,905 |
DaimlerChrysler AG (b) | | 48,100 | | | 2,454,543 |
Deutsche Post AG | | 71,400 | | | 1,731,446 |
Deutsche Postbank AG (b) | | 13,000 | | | 754,151 |
Deutsche Telekom AG (ADR) (b) | | 353,700 | | | 5,882,031 |
E.ON AG | | 35,500 | | | 3,675,116 |
E.ON AG (ADR) (b) | | 62,200 | | | 2,147,144 |
Heidelberger Druckmaschinen AG | | 59,800 | | | 2,288,071 |
Hochtief AG (b) | | 103,243 | | | 4,628,980 |
Hypo Real Estate Holding AG | | 95,008 | | | 4,947,162 |
Interhyp AG | | 6,300 | | | 566,997 |
IWKA Group AG (b) | | 68,200 | | | 1,473,648 |
MAN AG | | 30,455 | | | 1,625,815 |
MTU Aero Engines Holding AG (a) | | 31,200 | | | 970,974 |
Münchener Rückversicherungs–Gesellschaft AG | | 35,200 | | | 4,767,812 |
Q-Cells AG (a) | | 11,100 | | | 647,381 |
RWE AG (b) | | 29,481 | | | 2,183,725 |
SAP AG (ADR) (b) | | 50,300 | | | 2,267,021 |
SGL Carbon AG (b) | | 107,700 | | | 1,779,894 |
Siemens AG (ADR) | | 31,200 | | | 2,670,408 |
SolarWorld AG | | 14,600 | | | 1,953,722 |
United Internet AG | | 43,347 | | | 1,655,445 |
| | | | |
|
|
| | | | | | 69,262,643 |
| | | | |
|
|
| | |
Greece—0.3% | | | | | |
OPAP S.A. | | 53,630 | | | 1,846,989 |
| | | | |
|
|
| | |
Hong Kong—1.0% | | | | | |
Cheung Kong Holdings, Ltd. (b) | | 114,000 | | | 1,168,227 |
Hutchison Whampoa, Ltd. (b) | | 199,000 | | | 1,891,778 |
The Wharf Holdings, Ltd. | | 655,000 | | | 2,311,898 |
| | | | |
|
|
| | | | | | 5,371,903 |
| | | | |
|
|
| | |
Ireland—0.3% | | | | | |
C & C Group, Plc. | | 270,625 | | | 1,717,327 |
| | | | |
|
|
| | |
Israel—1.0% | | | | | |
Bank Hapoalim B.M. | | 361,200 | | | 1,672,420 |
Bank Leumi Le Israel | | 593,600 | | | 2,270,017 |
Teva Pharmaceutical Industries, Ltd. (ADR) (b) | | 32,800 | | | 1,410,728 |
| | | | |
|
|
| | | | | | 5,353,165 |
| | | | |
|
|
| | |
Italy—4.3% | | | | | |
Banca Intesa S.p.A.- RNC | | 923,998 | | | 4,566,903 |
Banche Popolari Unite S.c.ar.l. (b) | | 95,300 | | | 2,089,501 |
Banco Popolare di Verona e Novara S.c.ar.l. | | 52,300 | | | 1,058,236 |
Buzzi Unicem S.p.A. | | 33,000 | | | 361,431 |
Campari | | 164,370 | | | 1,215,681 |
Eni S.p.A. (ADR) (b) | | 17,900 | | | 2,496,334 |
*See accompanying notes to financial statements.
MSF-266
Metropolitan Series Fund, Inc.
FI International Stock Portfolio
Schedule of Investments as of December 31, 2005
Common Stock—(Continued)
| | | | | |
| Security Description | | Shares | | Value* |
| | | | | | |
| | | | | | |
| | |
Italy—(Continued) | | | | | |
Fastweb (a) | | 31,300 | | $ | 1,430,662 |
Lottomatica SpA (a) | | 39,400 | | | 1,424,453 |
Mediobanca S.p.A. | | 70,300 | | | 1,342,739 |
Telecom Italia S.p.A.–RNC | | 1,136,200 | | | 2,818,622 |
UniCredito Italiano S.p.A. | | 469,000 | | | 3,232,171 |
UniCredito Italiano S.p.A. (ADR) | | 98,100 | | | 702,104 |
| | | | |
|
|
| | | | | | 22,738,837 |
| | | | |
|
|
| | |
Japan—26.3% | | | | | |
Ajinomoto Co., Inc. | | 109,000 | | | 1,117,606 |
Aoyama Trading Co., Ltd. | | 63,400 | | | 2,140,749 |
Asahi Breweries, Ltd. (b) | | 116,600 | | | 1,430,073 |
Asics Corp. (b) | | 77,000 | | | 820,549 |
Bank of Nagoya | | 163,000 | | | 1,306,559 |
Canon Finetech, Inc. | | 200 | | | 4,423 |
Canon, Inc. (b) | | 47,700 | | | 2,806,199 |
Circle K Sunkus Co., Ltd. | | 22,800 | | | 579,269 |
Credit Saison Co., Ltd. | | 88,900 | | | 4,428,227 |
Daihatsu Motor Co., Ltd. (b) | | 197,000 | | | 2,147,768 |
Daiwa Securities Group, Inc. (b) | | 413,000 | | | 4,739,051 |
E Trade Securities | | 163 | | | 1,268,106 |
East Japan Railway Co. | | 411 | | | 2,820,193 |
FamilyMart Co., Ltd. (b) | | 41,700 | | | 1,408,553 |
Fujitsu, Ltd. (b) | | 325,000 | | | 2,476,563 |
Hokugin Financial Group, Inc. (b) | | 384,900 | | | 1,780,802 |
Isetan Co., Ltd. (b) | | 54,500 | | | 1,158,041 |
JAFCO Co., Ltd. (b) | | 33,000 | | | 2,979,373 |
JSR Corp. (b) | | 85,100 | | | 2,230,607 |
Juroku Bank | | 198,000 | | | 1,488,473 |
Kansai Paint Co. | | 16,000 | | | 136,277 |
Kawasaki Kisen Kaisha, Ltd. (b) | | 330,000 | | | 2,088,739 |
Kayaba Industry Co., Ltd. | | 154,000 | | | 522,491 |
Kirin Brewery Co., Ltd. (b) | | 66,000 | | | 774,911 |
Konica Minolta Holdings, Inc. | | 72,000 | | | 737,610 |
Marui Co., Ltd. | | 70,200 | | | 1,389,526 |
Matsushita Electric Industrial Co., Ltd. | | 145,000 | | | 2,808,132 |
Millea Holdings, Inc. | | 99 | | | 1,720,133 |
Mitsubishi Estate Co., Ltd. | | 144,000 | | | 3,018,649 |
Mitsubishi Securities (b) | | 129,000 | | | 1,601,726 |
Mitsui Fudosan Co., Ltd. (b) | | 140,000 | | | 2,861,695 |
Mitsui Trust Holdings, Inc. | | 191,000 | | | 2,314,042 |
Murata Manufacturing Co., Ltd. | | 44,600 | | | 2,887,806 |
NEC Corp. (b) | | 413,000 | | | 2,593,541 |
NEC Electronics Corp. | | 46,300 | | | 1,514,505 |
Nidec Corp. (b) | | 6,300 | | | 542,309 |
Nikko Cordial Corp. | | 528,000 | | | 8,490,322 |
Nikon Corp. (b) | | 14,000 | | | 220,136 |
Nippon Chemi-Con Corp. | | 211,000 | | | 1,302,109 |
Nippon Electronic, Inc. (b) | | 104,200 | | | 2,300,999 |
Nippon Express Co., Ltd. | | 228,000 | | | 1,398,805 |
Nissan Motor Co., Ltd. | | 145,500 | | | 1,485,359 |
Nitori Co., Ltd. | | 11,050 | | | 1,037,288 |
Nitto Denko Corp. | | 48,100 | | | 3,738,278 |
Nomura Holdings, Inc. | | 218,100 | | | 4,189,124 |
NTT Urban Development | | 194 | | | 1,294,530 |
| | | | | |
| Security Description | | Shares | | Value* |
| | | | | | |
| | | | | | |
| | |
Japan—(Continued) | | | | | |
Obayashi Corp. | | 89,000 | | $ | 653,450 |
Okamura Corp. | | 136,000 | | | 1,324,921 |
Omc Card, Inc. | | 18,000 | | | 382,210 |
ORIX Corp. (b) | | 14,500 | | | 3,744,644 |
Rakuten, Inc. | | 986 | | | 951,920 |
Ricoh Co., Ltd. | | 82,000 | | | 1,444,443 |
Seven & I Holdings Co., Ltd. | | 65,400 | | | 2,799,974 |
SFCG Co., Ltd. (b) | | 7,760 | | | 1,883,594 |
Shimizu Corp. | | 351,000 | | | 2,611,119 |
Sompo Japan Insurance, Inc. | | 92,000 | | | 1,232,310 |
Sony Corp. (ADR) | | 41,000 | | | 1,672,800 |
Sumco Corp. | | 18,900 | | | 992,458 |
Sumitomo Electric Industries, Ltd. | | 262,000 | | | 4,013,062 |
Sumitomo Forestry Co., Ltd. (b) | | 217,000 | | | 2,149,260 |
Sumitomo Mitsui Financial Group, Inc. (b) | | 697 | | | 7,470,237 |
Sumitomo Osaka Cement Co., Ltd. | | 686,000 | | | 1,996,699 |
T&D Holdings, Inc. | | 16,200 | | | 1,064,433 |
Taiheiyo Cement Corp. (b) | | 313,000 | | | 1,279,949 |
Takefuji Corp. | | 10,620 | | | 725,816 |
The Nishi-Nippon Bank, Ltd. | | 260,000 | | | 1,567,094 |
Tokyo Electron, Ltd. | | 77,900 | | | 4,870,329 |
Tokyo Star Bank, Ltd. | | 111 | | | 367,900 |
Tokyo Tomin Bank | | 30,400 | | | 1,181,083 |
Yamanouchi Pharmaceutical Co., Ltd. | | 51,000 | | | 1,979,610 |
| | | | |
|
|
| | | | | | 140,459,541 |
| | | | |
|
|
| | |
Luxembourg—1.4% | | | | | |
SES Global (FDR) | | 210,761 | | | 3,616,296 |
Stolt-Nielsen S.A. (ADR) (b) | | 118,700 | | | 3,919,474 |
Stolt-Nielsen S.A. (ADR) | | 5,000 | | | 165,517 |
| | | | |
|
|
| | | | | | 7,701,287 |
| | | | |
|
|
| | |
Mexico—0.3% | | | | | |
Fomento Economico Mexicano S.A. de C.V. (ADR) (b) | | 23,600 | | | 1,711,236 |
| | | | |
|
|
| | |
Netherlands—4.6% | | | | | |
ASM International NV (b) | | 57,600 | | | 968,832 |
ASML Holding NV (a) (b) | | 57,500 | | | 1,154,600 |
Axalto | | 44,400 | | | 1,223,088 |
ING Groep NV | | 34,200 | | | 1,190,844 |
ING Groep NV | | 132,492 | | | 4,596,752 |
Koninklijke Ahold NV (ADR) (b) | | 172,600 | | | 1,299,678 |
Koninklijke Philips Electronics NV (ADR) (b) | | 162,500 | | | 5,053,750 |
Koninklijke Wessanen NV | | 133,668 | | | 2,028,286 |
Nutreco Holdings NV | | 29,600 | | | 1,307,705 |
Reed Elsevier NV (ADR) (b) | | 72,200 | | | 2,017,268 |
Rodamco Europe NV | | 16,300 | | | 1,356,888 |
VNU NV | | 67,025 | | | 2,223,051 |
| | | | |
|
|
| | | | | | 24,420,742 |
| | | | |
|
|
| | |
Netherlands Antilles—0.3% | | | | | |
Schlumberger, Ltd. (b) | | 14,800 | | | 1,437,820 |
| | | | |
|
|
*See accompanying notes to financial statements.
MSF-267
Metropolitan Series Fund, Inc.
FI International Stock Portfolio
Schedule of Investments as of December 31, 2005
Common Stock—(Continued)
| | | | | |
| Security Description | | Shares | | Value* |
| | | | | | |
| | | | | | |
| | |
Norway—1.0% | | | | | |
DnB NOR ASA | | 152,600 | | $ | 1,629,226 |
Fred Olsen Energy ASA (b) | | 51,500 | | | 1,860,979 |
Odfjell ASA (Series A) (b) | | 2,500 | | | 50,740 |
Odfjell ASA (Series B) | | 73,100 | | | 1,267,874 |
Prosafe ASA (b) | | 17,450 | | | 742,590 |
| | | | |
|
|
| | | | | | 5,551,409 |
| | | | |
|
|
| | |
Portugal—0.5% | | | | | |
Brisa-Auto Estradas de Portugal S.A. (b) | | 201,700 | | | 1,710,117 |
Energias de Portugal S.A. | | 222,400 | | | 685,637 |
| | | | |
|
|
| | | | | | 2,395,754 |
| | | | |
|
|
| | |
Russia—0.0% | | | | | |
NovaTek OAO (GDR) | | 9,000 | | | 202,500 |
| | | | |
|
|
| | |
Singapore—0.6% | | | | | |
ASE Test Ltd. (a) (b) | | 175,100 | | | 1,374,535 |
STATS ChipPAC, Ltd. (ADR) (b) | | 257,500 | | | 1,751,000 |
| | | | |
|
|
| | | | | | 3,125,535 |
| | | | |
|
|
| | |
South Africa—1.6% | | | | | |
Edgar’s Consolidation Store | | 220,000 | | | 1,221,864 |
FirstRand | | 937,800 | | | 2,731,114 |
Massmart Holdings, Ltd. | | 85,545 | | | 698,642 |
Standard Bank, Ltd. | | 165,100 | | | 1,976,168 |
Steinhoff International Holdings, Inc. | | 523,400 | | | 1,552,164 |
Sun International, Ltd. | | 12,400 | | | 162,590 |
| | | | |
|
|
| | | | | | 8,342,542 |
| | | | |
|
|
| | |
South Korea—1.9% | | | | | |
Hyundai Heavy Industries Co., Ltd. | | 10,220 | | | 774,498 |
Hyundai Mipo Dock Yard Co., Ltd. | | 12,190 | | | 736,046 |
Kookmin Bank | | 31,290 | | | 2,338,816 |
LG Electronics, Inc. | | 16,520 | | | 1,444,445 |
LG.Philips LCD Co., Ltd. (ADR) (b) | | 29,400 | | | 630,924 |
Samsung Electronics Co., Ltd. | | 2,095 | | | 1,348,643 |
Samsung SDI Co. Ltd. | | 10,730 | | | 1,226,785 |
Shinhan Financial Group Co., Ltd. | | 35,060 | | | 1,409,323 |
| | | | |
|
|
| | | | | | 9,909,480 |
| | | | |
|
|
| | |
Spain—0.9% | | | | | |
Antena 3 TV (b) | | 67,744 | | | 1,616,819 |
Gestevision Telecino S.A. | | 47,270 | | | 1,193,126 |
Telefonica S.A. (ADR) (b) | | 46,467 | | | 2,091,944 |
| | | | |
|
|
| | | | | | 4,901,889 |
| | | | |
|
|
| | |
Sweden—2.5% | | | | | |
Boliden AB (a) (b) | | 148,000 | | | 1,211,444 |
Eniro AB (b) | | 188,600 | | | 2,375,060 |
| | | | | | |
Gambro AB (b) | | 170,450 | | | 1,862,758 |
OM HEX AB (b) | | 117,800 | | | 1,638,667 |
Securitas AB (b) | | 101,400 | | | 1,685,537 |
Telefonakitebolaget LM Ericsson (ADR) (b) | | 132,700 | | | 4,564,880 |
| | | | |
|
|
| | | | | | 13,338,346 |
| | | | |
|
|
| | | | | |
| Security Description | | Shares | | Value* |
| | | | | | |
| | | | | | |
| | |
Switzerland—7.2% | | | | | |
ABB, Ltd. | | 145,094 | | $ | 1,408,489 |
Actelion, Ltd. (b) | | 17,852 | | | 1,472,279 |
Credit Suisse Group | | 42,771 | | | 2,178,799 |
Nestle S.A. | | 18,786 | | | 5,605,697 |
Novartis AG | | 155,702 | | | 8,170,913 |
Novartis AG (ADR) (b) | | 46,800 | | | 2,456,064 |
Phonak Holding AG (b) | | 1,839 | | | 79,163 |
Roche Holding AG | | 64,594 | | | 9,692,681 |
Syngenta AG (ADR) (b) | | 152,500 | | | 3,798,775 |
UBS AG | | 22,115 | | | 2,104,148 |
Zurich Financial Services AG | | 8,110 | | | 1,728,813 |
| | | | |
|
|
| | | | | | 38,695,821 |
| | | | |
|
|
| | |
Taiwan—1.7% | | | | | |
Advanced Semicondtuctor, Inc. | | 3,384,149 | | | 3,109,183 |
AU Optronics Corp. (b) | | 106,400 | | | 1,597,064 |
AU Optronics Corp. | | 333,000 | | | 498,838 |
Chi Mei Optoelectro Co. | | 2,118,954 | | | 3,158,153 |
Compal Electronics, Inc. | | 349,000 | | | 311,780 |
Yuanta Core Pacific Securities Co. | | 846,000 | | | 588,699 |
| | | | |
|
|
| | | | | | 9,263,717 |
| | | | |
|
|
| | |
Turkey—0.5% | | | | | |
Finansbank AS | | 569,000 | | | 2,531,697 |
| | | | |
|
|
| | |
United Kingdom—8.3% | | | | | |
3i Group, Plc. | | 136,897 | | | 1,994,099 |
Babcock International Group | | 411,000 | | | 1,638,266 |
BAE Systems, Plc. | | 608,391 | | | 3,990,036 |
BP, Plc. (ADR) | | 166,700 | | | 10,705,474 |
Capita Group, Plc. | | 234,700 | | | 1,680,507 |
Dawnay Day Treveria, Plc (a) | | 525,200 | | | 646,819 |
HSBC Holdings, Plc. (b) | | 227,400 | | | 3,643,000 |
National Grid | | 215,300 | | | 2,103,735 |
Rank Group, Plc. | | 311,693 | | | 1,638,018 |
Serco Group, Plc. | | 330,000 | | | 1,781,717 |
Smiths Group, Plc. | | 96,100 | | | 1,727,687 |
Tesco, Plc. | | 453,500 | | | 2,582,026 |
Unilever, Plc. (ADR) (b) | | 97,900 | | | 3,927,748 |
Vodafone Group, Plc. | | 2,900,610 | | | 6,256,911 |
| | | | |
|
|
| | | | | | 44,316,043 |
| | | | |
|
|
| | |
United States—2.0% | | | | | |
Advanced Energy Industries, Inc. (a) (b) | | 19,100 | | | 225,953 |
Affiliated Computer Services, Inc.
(Class A) (a) (b) | | 22,000 | | | 1,301,960 |
Halliburton Co. | | 16,700 | | | 1,034,732 |
| | | | | | |
IntercontinentalExchange, Inc. (a) (b) | | 700 | | | 25,445 |
News Corp., Inc. (b) | | 124,470 | | | 2,067,447 |
Synthes, Inc. (a) | | 37,881 | | | 4,250,466 |
Wyeth | | 42,900 | | | 1,976,403 |
| | | | |
|
|
| | | | | | 10,882,406 |
| | | | |
|
|
Total Common Stock
(Identified Cost $431,540,659) | | | | | 526,976,259 |
| | | | |
|
|
*See accompanying notes to financial statements.
MSF-268
Metropolitan Series Fund, Inc.
FI International Stock Portfolio
Schedule of Investments as of December 31, 2005
Units—0.6%
| | | | | | | |
| Security Description | | Shares | | Value* | |
| | | | | | | | |
| | |
Switzerland—0.6% | | | | | | | |
Compagnie Financière Richemont AG | | | 79,394 | | $ | 3,453,906 | |
| | | | | |
|
|
|
Total Units
(Identified Cost $2,101,902) | | | | | | 3,453,906 | |
| | | | | |
|
|
|
| | |
| Preferred Stock—0.3% | | | | | | | |
| | |
Germany—0.3% | | | | | | | |
Fresenius Medical Care AG (b) | | | 8,600 | | | 1,167,613 | |
ProSieben SAT, I Media AG (b) | | | 13,800 | | | 266,997 | |
| | | | | |
|
|
|
Total Preferred Stock
(Identified Cost $1,031,225) | | | | | | 1,434,610 | |
| | | | | |
|
|
|
| | |
| Short Term Investments—0.8% | | | | | | | |
| Security Description | | Face
Amount | | Value* | |
| | |
United States—0.8% | | | | | | | |
State Street Repurchase Agreement dated 12/30/05 at 1.350% to be repurchased at $4,085,613 on 01/03/06, collateralized by $3,905,000 U.S. Treasury Note 6.000% due 08/15/09 with a value of $4,208,219. | | $ | 4,085,000 | | | 4,085,000 | |
| | | | | |
|
|
|
Total Short Term Investments
(Amortized Cost $4,085,000) | | | | | | 4,085,000 | |
| | | | | |
|
|
|
Total Investments—100.3%
(Identified Cost $438,758,786) (c) | | | | | | 535,949,775 | |
Liabilities in excess of other assets | | | | | | (1,529,326 | ) |
| | | | | |
|
|
|
| Total Net Assets—100% | | | | | $ | 534,420,449 | |
| | | | | |
|
|
|
| (b) | A portion or all of the security was held on loan. As of December 31, 2005, the market value of securities loaned was $95,675,127 and the collateral received consisted of cash in the amount of $99,609,710. |
| (c) | The aggregate cost of investments for federal income tax purposes as of December 31, 2005 was $442,707,198 and the composition of unrealized appreciation and depreciation of investment securities was $97,218,850 and $(3,976,273), respectively. |
| (ADR)— | An American Depositary Receipt is a certificate issued by a custodian bank representing the right to receive securities of the foreign issuer described. Trading on exchanges not located in the United States or Canada significantly influences the value of ADRs. |
| (FDR)— | Fudiciary Depository Receipt. |
| (GDR)— | Global Depository Receipt. |
| | |
Ten Largest Industries as of
December 31, 2005
| | Percentage of
Total Net Assets
|
Commercial Banks | | 11.5% |
Diversified Financial Services | | 10.6% |
Oil, Gas & Consumable Fuels | | 5.9% |
Insurance | | 5.7% |
Pharmaceuticals | | 5.5% |
Media | | 5.1% |
Diversified Telecommunication Services | | 3.7% |
Semiconductors & Semiconductor Equipment | | 3.6% |
Household Durables | | 2.8% |
Construction & Engineering | | 2.7% |
*See accompanying notes to financial statements.
MSF-269
Metropolitan Series Fund, Inc.
FI International Stock Portfolio
Statement of Assets & Liabilities
December 31, 2005
| | | | | | | |
Assets | | | | | | | |
Investments at value | | | | | $ | 535,949,775 | |
Cash | | | | | | 266 | |
Foreign cash at value | | | | | | 2,396,706 | |
Collateral for securities loaned | | | | | | 99,609,710 | |
Receivable for: | | | | | | | |
Securities sold | | | | | | 5,352,035 | |
Fund shares sold | | | | | | 1,660,260 | |
Accrued interest and dividends | | | | | | 425,126 | |
Foreign taxes | | | | | | 17,321 | |
| | | | | |
|
|
|
Total Assets | | | | | | 645,411,199 | |
Liabilities | | | | | | | |
Payable for: | | | | | | | |
Fund shares redeemed | | $ | 2,085,078 | | | | |
Securities purchased | | | 8,686,149 | | | | |
Withholding taxes | | | 21,961 | | | | |
Return of collateral for securities loaned | | | 99,609,710 | | | | |
Accrued expenses: | | | | | | | |
Management fees | | | 380,263 | | | | |
Service and distribution fees | | | 19,369 | | | | |
Other expenses | | | 188,220 | | | | |
| | |
|
| | | | |
Total Liabilities | | | | | | 110,990,750 | |
| | | | | |
|
|
|
Net Assets | | | | | $ | 534,420,449 | |
| | | | | |
|
|
|
Net assets consists of: | | | | | | | |
Capital paid in | | | | | $ | 461,967,658 | |
Undistributed net investment income | | | | | | 5,162,372 | |
Accumulated net realized losses | | | | | | (29,942,564 | ) |
Unrealized appreciation on investments and foreign currency | | | | | | 97,232,983 | |
| | | | | |
|
|
|
Net Assets | | | | | $ | 534,420,449 | |
| | | | | |
|
|
|
| Computation of offering price: | | | | | | | |
Class A | | | | | | | |
Net asset value and redemption price per share ($413,321,644 divided by 30,659,479 shares outstanding) | | | | | $ | 13.48 | |
| | | | | |
|
|
|
Class B | | | | | | | |
Net asset value and redemption price per share ($54,529,931 divided by 4,091,859 shares outstanding) | | | | | $ | 13.33 | |
| | | | | |
|
|
|
Class E | | | | | | | |
Net asset value and redemption price per share ($66,568,874 divided by 4,978,691 shares outstanding) | | | | | $ | 13.37 | |
| | | | | |
|
|
|
Identified cost of investments | | | | | $ | 438,758,786 | |
| | | | | |
|
|
|
Identified cost of foreign cash | | | | | $ | 2,347,174 | |
| | | | | |
|
|
|
Statement of Operations
Year Ended December 31, 2005
| | | | | | | | |
Investment Income | | | | | | | | |
Dividends | | | | | | $ | 9,925,845 | (a) |
Interest | | | | | | | 335,912 | (b) |
| | | | | | |
|
|
|
| | | | | | | | 10,261,757 | |
Expenses | | | | | | | | |
Management fees | | $ | 3,945,949 | | | | | |
Service and distribution fees—Class B | | | 92,468 | | | | | |
Service and distribution fees—Class E | | | 89,123 | | | | | |
Directors’ fees and expenses | | | 21,894 | | | | | |
Custodian | | | 736,955 | | | | | |
Audit and tax services | | | 25,149 | | | | | |
Legal | | | 12,014 | | | | | |
Printing | | | 112,823 | | | | | |
Insurance | | | 8,468 | | | | | |
Miscellaneous | | | 8,795 | | | | | |
| | |
|
|
| | | | |
Total expenses | | | 5,053,638 | | | | | |
Expense reductions | | | (221,610 | ) | | | 4,832,028 | |
| | |
|
|
| |
|
|
|
Net Investment Income | | | | | | | 5,429,728 | |
| | | | | | |
|
|
|
Realized and Unrealized Gain | | | | | | | | |
| Realized gain on: | | | | | | | | |
Investments—net | | | 44,561,780 | | | | | |
Foreign currency transactions—net | | | 50,815 | | | | 44,612,595 | |
| | |
|
|
| | | | |
| Unrealized appreciation (depreciation) on: | | | | | | | | |
Investments—net | | | 30,496,089 | | | | | |
Foreign currency transactions—net | | | (27,066 | ) | | | 30,469,023 | |
| | |
|
|
| |
|
|
|
Net gain | | | | | | | 75,081,618 | |
| | | | | | |
|
|
|
Net Increase in Net Assets
From Operations | | | | | | $ | 80,511,346 | |
| | | | | | |
|
|
|
| (a) | Net of foreign taxes of $1,133,401. |
| (b) | Includes income on securities loaned of $314,585. |
See accompanying notes to financial statements.
MSF-270
Metropolitan Series Fund, Inc.
FI International Stock Portfolio
Statement of Changes in Net Assets
| | | | | | | | |
| | | Year ended
December 31,
2005
| | | Year ended
December 31,
2004
| |
From Operations | | | | | | | | |
Net investment income | | $ | 5,429,728 | | | $ | 3,166,924 | |
Net realized gain | | | 44,612,595 | | | | 24,136,234 | |
Unrealized appreciation | | | 30,469,023 | | | | 39,361,549 | |
| | |
|
|
| |
|
|
|
Increase in net assets from operations | | | 80,511,346 | | | | 6,664,707 | |
| | |
|
|
| |
|
|
|
From Distributions to Shareholders | | | | | | | | |
Net investment income | | | | | | | | |
Class A | | | (2,301,454 | ) | | | (4,308,987 | ) |
Class B | | | (141,111 | ) | | | (202,168 | ) |
Class E | | | (300,332 | ) | | | (657,454 | ) |
| | |
|
|
| |
|
|
|
Total distributions | | | (2,742,897 | ) | | | (5,168,609 | ) |
| | |
|
|
| |
|
|
|
Increase (decrease) in net assets from capital share transactions | | | 28,988,684 | | | | (15,307,278 | ) |
| | |
|
|
| |
|
|
|
Total increase in net assets | | | 106,757,133 | | | | 46,188,820 | |
| | |
Net Assets | | | | | | | | |
Beginning of the period | | | 427,663,316 | | | | 381,474,496 | |
| | |
|
|
| |
|
|
|
End of the period | | $ | 534,420,449 | | | $ | 427,663,316 | |
| | |
|
|
| |
|
|
|
Undistributed Net Investment Income | | | | | | | | |
End of the period | | $ | 5,162,372 | | | $ | 2,325,330 | |
| | |
|
|
| |
|
|
|
Other Information:
Capital Shares
Transactions in capital shares were as follows:
| | | | | | | | | | | | | | |
| | | Year ended
December 31, 2005
| | | Year ended
December 31, 2004
| |
| | | Shares
| | | $
| | | Shares
| | | $
| |
Class A | | | | | | | | | | | | | | |
Sales | | 6,776,782 | | | $ | 80,921,158 | | | 3,561,865 | | | $ | 36,409,730 | |
Reinvestments | | 205,487 | | | | 2,301,454 | | | 420,800 | | | | 4,308,987 | |
Redemptions | | (6,255,844 | ) | | | (74,914,831 | ) | | (6,398,245 | ) | | | (65,387,799 | ) |
| | |
|
| |
|
|
| |
|
| |
|
|
|
Net increase (decrease) | | 726,425 | | | $ | 8,307,781 | | | (2,415,580 | ) | | $ | (24,669,082 | ) |
| | |
|
| |
|
|
| |
|
| |
|
|
|
Class B | | | | | | | | | | | | | | |
Sales | | 2,583,128 | | | $ | 30,523,623 | | | 1,233,538 | | | $ | 12,528,432 | |
Reinvestments | | 12,724 | | | | 141,111 | | | 19,938 | | | | 202,168 | |
Redemptions | | (667,349 | ) | | | (8,060,069 | ) | | (612,223 | ) | | | (6,095,461 | ) |
| | |
|
| |
|
|
| |
|
| |
|
|
|
Net increase | | 1,928,503 | | | $ | 22,604,665 | | | 641,253 | | | $ | 6,635,139 | |
| | |
|
| |
|
|
| |
|
| |
|
|
|
Class E | | | | | | | | | | | | | | |
Sales | | 725,367 | | | $ | 8,658,669 | | | 1,575,031 | | | $ | 15,945,725 | |
Reinvestments | | 27,008 | | | | 300,332 | | | 64,646 | | | | 657,454 | |
Redemptions | | (918,856 | ) | | | (10,882,763 | ) | | (1,359,015 | ) | | | (13,876,514 | ) |
| | |
|
| |
|
|
| |
|
| |
|
|
|
Net increase (decrease) | | (166,481 | ) | | $ | (1,923,762 | ) | | 280,662 | | | $ | 2,726,665 | |
| | |
|
| |
|
|
| |
|
| |
|
|
|
Increase (decrease) derived from capital share transactions | | 2,488,447 | | | $ | 28,988,684 | | | (1,493,665 | ) | | $ | (15,307,278 | ) |
| | |
|
| |
|
|
| |
|
| |
|
|
|
See accompanying notes to financial statements.
MSF-271
Metropolitan Series Fund, Inc.
FI International Stock Portfolio
Financial Highlights
| | | | | | | | | | | | | | | | | | | | |
| | | Class A
| |
| | | Year ended December 31,
| |
| | | 2005
| | | 2004
| | | 2003
| | | 2002
| | | 2001
| |
Net Asset Value, Beginning of Period | | $ | 11.50 | | | $ | 9.86 | | | $ | 7.76 | | | $ | 9.49 | | | $ | 12.39 | |
| | |
|
|
| |
|
|
| |
|
|
| |
|
|
| |
|
|
|
Income From Investment Operations | | | | | | | | | | | | | | | | | | | | |
Net investment income | | | 0.14 | | | | 0.10 | | | | 0.11 | | | | 0.08 | | | | 0.08 | |
Net realized and unrealized gain (loss) of investments | | | 1.92 | | | | 1.68 | | | | 2.05 | | | | (1.73 | ) | | | (2.57 | ) |
| | |
|
|
| |
|
|
| |
|
|
| |
|
|
| |
|
|
|
Total from investment operations | | | 2.06 | | | | 1.78 | | | | 2.16 | | | | (1.65 | ) | | | (2.49 | ) |
| | |
|
|
| |
|
|
| |
|
|
| |
|
|
| |
|
|
|
Less Distributions | | | | | | | | | | | | | | | | | | | | |
Distributions from net investment income | | | (0.08 | ) | | | (0.14 | ) | | | (0.06 | ) | | | (0.08 | ) | | | (0.03 | ) |
Distributions from net realized capital gains | | | 0.00 | | | | 0.00 | | | | 0.00 | | | | 0.00 | | | | (0.38 | ) |
| | |
|
|
| |
|
|
| |
|
|
| |
|
|
| |
|
|
|
Total distributions | | | (0.08 | ) | | | (0.14 | ) | | | (0.06 | ) | | | (0.08 | ) | | | (0.41 | ) |
| | |
|
|
| |
|
|
| |
|
|
| |
|
|
| |
|
|
|
Net Asset Value, End of Period | | $ | 13.48 | | | $ | 11.50 | | | $ | 9.86 | | | $ | 7.76 | | | $ | 9.49 | |
| | |
|
|
| |
|
|
| |
|
|
| |
|
|
| |
|
|
|
Total Return (%) | | | 18.0 | | | | 18.2 | | | | 28.0 | | | | (17.5 | ) | | | (20.6 | ) |
Ratio of operating expenses to average net assets before expense reductions (%) | | | 1.06 | | | | 1.08 | | | | 1.13 | | | | 1.12 | | | | 1.16 | |
Ratio of operating expenses to average net assets after expense reductions (%) (d) | | | 1.01 | | | | 1.06 | | | | 1.11 | | | | 1.12 | | | | 1.14 | |
Ratio of net investment income to average net assets (%) | | | 1.23 | | | | 0.85 | | | | 1.21 | | | | 0.90 | | | | 0.73 | |
Portfolio turnover rate (%) | | | 69 | | | | 90 | | | | 148 | | | | 50 | | | | 68 | |
Net assets, end of period (000) | | $ | 413,322 | | | $ | 344,340 | | | $ | 318,996 | | | $ | 271,015 | | | $ | 340,426 | |
| | | | | | | | | | | | | | | | |
| | | Class B
| |
| | | Year ended December 31,
| | | May 1, 2002(a)
through
December 31,
2002
| |
| | | 2005
| | | 2004
| | | 2003
| | |
Net Asset Value, Beginning of Period | | $ | 11.38 | | | $ | 9.76 | | | $ | 7.69 | | | $ | 9.39 | |
| | |
|
|
| |
|
|
| |
|
|
| |
|
|
|
Income From Investment Operations | | | | | | | | | | | | | | | | |
Net investment income | | | 0.12 | | | | 0.07 | | | | 0.03 | | | | 0.02 | |
Net realized and unrealized gain (loss) of investments | | | 1.88 | | | | 1.67 | | | | 2.09 | | | | (1.72 | ) |
| | |
|
|
| |
|
|
| |
|
|
| |
|
|
|
Total from investment operations | | | 2.00 | | | | 1.74 | | | | 2.12 | | | | (1.70 | ) |
| | |
|
|
| |
|
|
| |
|
|
| |
|
|
|
Less Distributions | | | | | | | | | | | | | | | | |
Distributions from net investment income | | | (0.05 | ) | | | (0.12 | ) | | | (0.05 | ) | | | 0.00 | |
| | |
|
|
| |
|
|
| |
|
|
| |
|
|
|
Total distributions | | | (0.05 | ) | | | (0.12 | ) | | | (0.05 | ) | | | 0.00 | |
| | |
|
|
| |
|
|
| |
|
|
| |
|
|
|
Net Asset Value, End of Period | | $ | 13.33 | | | $ | 11.38 | | | $ | 9.76 | | | $ | 7.69 | |
| | |
|
|
| |
|
|
| |
|
|
| |
|
|
|
Total Return (%) | | | 17.6 | | | | 18.0 | | | | 27.8 | | | | (18.1 | )(b) |
Ratio of operating expenses to average net assets before expense reductions (%) | | | 1.31 | | | | 1.33 | | | | 1.38 | | | | 1.37 | (c) |
Ratio of operating expenses to average net assets after expense reductions (%) (d) | | | 1.26 | | | | 1.31 | | | | 1.36 | | | | 1.37 | (c) |
Ratio of net investment income (loss) to average net assets (%) | | | 0.89 | | | | 0.56 | | | | (0.04 | ) | | | 0.35 | (c) |
Portfolio turnover rate (%) | | | 69 | | | | 90 | | | | 148 | | | | 50 | |
Net assets, end of period (000) | | $ | 54,530 | | | $ | 24,612 | | | $ | 14,859 | | | $ | 1 | |
| (a) | Commencement of operations. |
| (b) | Period less than one year is not computed on an annualized basis. |
| (c) | Computed on an annualized basis. |
| (d) | The Portfolio has entered into arrangements with certain brokers who paid a portion of the Portfolio’s expenses. |
See accompanying notes to financial statements.
MSF-272
Metropolitan Series Fund, Inc.
FI International Stock Portfolio
Financial Highlights
| | | | | | | | | | | | | | | | | | | | |
| | | Class E
| |
| | | Year ended December 31,
| | | May 1, 2001(a)
through
December 31,
2001
| |
| | | 2005
| | | 2004
| | | 2003
| | | 2002
| | |
Net Asset Value, Beginning of Period | | $ | 11.41 | | | $ | 9.79 | | | $ | 7.71 | | | $ | 9.43 | | | $ | 10.91 | |
| | |
|
|
| |
|
|
| |
|
|
| |
|
|
| |
|
|
|
Income From Investment Operations | | | | | | | | | | | | | | | | | | | | |
Net investment income | | | 0.13 | | | | 0.07 | | | | 0.08 | | | | 0.08 | | | | 0.00 | |
Net realized and unrealized gain (loss) of investments | | | 1.89 | | | | 1.68 | | | | 2.05 | | | | (1.73 | ) | | | (1.48 | ) |
| | |
|
|
| |
|
|
| |
|
|
| |
|
|
| |
|
|
|
Total from investment operations | | | 2.02 | | | | 1.75 | | | | 2.13 | | | | (1.65 | ) | | | (1.48 | ) |
| | |
|
|
| |
|
|
| |
|
|
| |
|
|
| |
|
|
|
Less Distributions | | | | | | | | | | | | | | | | | | | | |
Distributions from net investment income | | | (0.06 | ) | | | (0.13 | ) | | | (0.05 | ) | | | (0.07 | ) | | | 0.00 | |
| | |
|
|
| |
|
|
| |
|
|
| |
|
|
| |
|
|
|
Total distributions | | | (0.06 | ) | | | (0.13 | ) | | | (0.05 | ) | | | (0.07 | ) | | | 0.00 | |
| | |
|
|
| |
|
|
| |
|
|
| |
|
|
| |
|
|
|
Net Asset Value, End of Period | | $ | 13.37 | | | $ | 11.41 | | | $ | 9.79 | | | $ | 7.71 | | | $ | 9.43 | |
| | |
|
|
| |
|
|
| |
|
|
| |
|
|
| |
|
|
|
Total Return (%) | | | 17.8 | | | | 18.0 | | | | 27.9 | | | | (17.6 | ) | | | (13.6 | )(b) |
Ratio of operating expenses to average net assets before expense reductions (%) | | | 1.21 | | | | 1.23 | | | | 1.28 | | | | 1.27 | | | | 1.31 | (c) |
Ratio of operating expenses to average net assets after expense reductions (%) (d) | | | 1.16 | | | | 1.21 | | | | 1.26 | | | | 1.27 | | | | 1.30 | (c) |
Ratio of net investment income (loss) to average net assets (%) | | | 1.08 | | | | 0.70 | | | | 0.93 | | | | 0.57 | | | | (0.17 | )(c) |
Portfolio turnover rate (%) | | | 69 | | | | 90 | | | | 148 | | | | 50 | | | | 68 | |
Net assets, end of period (000) | | $ | 66,569 | | | $ | 58,712 | | | $ | 47,619 | | | $ | 17,262 | | | $ | 2,194 | |
| (a) | Commencement of operations. |
| (b) | Period less than one year is not computed on an annualized basis. |
| (c) | Computed on an annualized basis. |
| (d) | The Portfolio has entered into arrangements with certain brokers who paid a portion of the Portfolio’s expenses. |
See accompanying notes to financial statements.
MSF-273
Metropolitan Series Fund, Inc.
Morgan Stanley EAFE Index Portfolio
Schedule of Investments as of December 31, 2005
Common Stock—98.7% of Total Net Assets
| | | | | |
| Security Description | | Shares | | Value* |
| | | | | | |
| | |
Australia—4.8% | | | | | |
Alinta, Ltd. | | 11,816 | | $ | 96,121 |
Alumina, Ltd. | | 61,038 | | | 333,982 |
Amcor, Ltd. | | 44,742 | | | 245,027 |
AMP, Ltd. | | 82,208 | | | 462,326 |
Ansell, Ltd. | | 1 | | | 8 |
Aristocrat Leisure, Ltd. (a) | | 18,360 | | | 165,147 |
Australia & New Zealand Banking Group, Ltd. | | 79,055 | | | 1,384,962 |
Australia Gas & Light Co., Ltd. | | 21,537 | | | 271,023 |
Australian Stock Exchange, Ltd. | | 4,340 | | | 103,167 |
AXA Asia Pacific Holdings, Ltd. | | 39,352 | | | 146,182 |
Babcock & Brown, Ltd. | | 7,537 | | | 93,925 |
BHP Billiton, Ltd. | | 157,179 | | | 2,627,227 |
BlueScope Steel, Ltd. | | 29,000 | | | 148,158 |
Boral, Ltd. | | 26,326 | | | 155,892 |
Brambles Industries, Ltd. (a) | | 43,436 | | | 323,184 |
Caltex Australia | | 6,631 | | | 94,007 |
Coca-Cola Amatil, Ltd. | | 24,265 | | | 136,725 |
Cochlear, Ltd. | | 2,300 | | | 76,953 |
Coles Myer, Ltd. | | 53,075 | | | 396,886 |
Commonwealth Bank of Australia | | 56,267 | | | 1,763,655 |
Computershare, Ltd. | | 16,060 | | | 79,969 |
CSL, Ltd. | | 8,128 | | | 252,614 |
CSR, Ltd. | | 61,958 | | | 157,158 |
DB RREEF Trust (a) | | 161,255 | | | 164,107 |
Foster’s Group, Ltd. | | 89,550 | | | 366,383 |
Futuris Corp., Ltd. | | 1 | | | 1 |
Insurance Australia Group, Ltd. (a) | | 77,348 | | | 306,299 |
John Fairfax Holdings, Ltd. | | 42,720 | | | 125,583 |
Leighton Holdings, Ltd. (a) | | 6,847 | | | 89,752 |
Lend Lease Corp., Ltd. | | 15,118 | | | 160,049 |
Lion Nathan, Ltd. (a) | | 20,419 | | | 114,135 |
Macquarie Airports | | 30,135 | | | 69,730 |
Macquarie Bank, Ltd. | | 9,860 | | | 490,043 |
Macquarie Goodman Co. | | 62,824 | | | 219,949 |
Mayne Group, Ltd. | | 27,102 | | | 70,234 |
Mirvac Group (a) | | 35,667 | | | 107,566 |
Multiplex Group (a) | | 30,696 | | | 70,893 |
National Australia Bank, Ltd. | | 68,823 | | | 1,641,969 |
Newcrest Mining, Ltd. (a) | | 16,271 | | | 292,061 |
OneSteel | | 29,597 | | | 72,564 |
Orica, Ltd. (a) | | 12,587 | | | 187,975 |
Origin Energy, Ltd. | | 40,383 | | | 221,626 |
Patrick Corp., Ltd. | | 36,238 | | | 196,295 |
Perpetual Trustees Australia, Ltd. (a) | | 1,660 | | | 83,202 |
Publishing & Broadcasting, Ltd. | | 5,684 | | | 68,927 |
Qantas Airways | | 36,314 | | | 107,349 |
QBE Insurance Group, Ltd. | | 33,138 | | | 474,333 |
Rinker Group, Ltd. | | 44,300 | | | 532,442 |
Rio Tinto, Ltd. (a) | | 13,419 | | | 675,540 |
Santos, Ltd. | | 26,929 | | | 241,166 |
Sonic Healthcare, Ltd. | | 11,475 | | | 125,222 |
Suncorp-Metway, Ltd. | | 24,726 | | | 362,662 |
Symbion Health, Ltd. | | 27,102 | | | 50,497 |
TABCORP Holdings, Ltd. | | 23,353 | | | 266,121 |
Telstra Corp., Ltd. (a) | | 88,784 | | | 255,838 |
Toll Holdings, Ltd. | | 10,122 | | | 110,265 |
Transurban Group (a) | | 32,744 | | | 157,439 |
| | | | | |
| Security Description | | Shares | | Value* |
| | | | | | |
| | |
Australia—(Continued) | | | | | |
Wesfarmers, Ltd. | | 16,547 | | $ | 447,399 |
Westfield Group (a) | | 68,545 | | | 910,908 |
Westpac Banking Corp. | | 82,258 | | | 1,378,061 |
Woodside Petroleum, Ltd. | | 22,246 | | | 642,187 |
Woolworths, Ltd. | | 50,871 | | | 627,657 |
| | | | |
|
|
| | | | | | 21,998,727 |
| | | | |
|
|
| | |
Austria—0.4% | | | | | |
Boehler-Uddeholm AG | | 579 | | | 97,353 |
Erste Bank der oesterreichischen Sparkassen AG | | 6,035 | | | 333,675 |
IMMOFINANZ Immobilien Anlagen AG | | 14,515 | | | 138,751 |
Meinl European Land | | 4,933 | | | 86,762 |
OMV AG | | 7,170 | | | 416,431 |
Telekom Austria AG | | 14,882 | | | 332,952 |
Verbund-Oesterreichische Elektrizitaetswirtschafts AG | | 536 | | | 190,482 |
Voestalpine AG | | 1,121 | | | 112,269 |
Wienerberger AG | | 3,825 | | | 151,752 |
| | | | |
|
|
| | | | | | 1,860,427 |
| | | | |
|
|
| | |
Belgium—0.8% | | | | | |
AGFA-Gevaert NV | | 4,172 | | | 75,821 |
Belgacom S.A. | | 8,360 | | | 271,895 |
Colruyt S.A. | | 850 | | | 116,909 |
Delhaize Group, Plc. | | 3,500 | | | 227,844 |
Dexia S.A. (a) | | 24,396 | | | 560,588 |
Fortis Banque S.A. | | 5 | | | 0 |
Groupe Bruxelles Lambert S.A. | | 3,574 | | | 349,295 |
InBev NV | | 8,674 | | | 375,978 |
KBC Bancassurance Holding NV (a) | | 8,478 | | | 786,301 |
Mobistar S.A. (a) | | 1,299 | | | 102,665 |
Solvay S.A. | | 2,727 | | | 299,489 |
UCB S.A. | | 3,879 | | | 181,516 |
Umicore S.A. | | 1,128 | | | 132,485 |
| | | | |
|
|
| | | | | | 3,480,786 |
| | | | |
|
|
| | |
Bermuda—0.1% | | | | | |
Esprit Holdings, Ltd. | | 42,000 | | | 299,134 |
Frontline, Ltd. (a) | | 2,700 | | | 102,431 |
Li & Fung, Ltd. | | 88,000 | | | 169,204 |
Shangri-La Asia, Ltd. | | 52,000 | | | 86,966 |
| | | | |
|
|
| | | | | | 657,735 |
| | | | |
|
|
| | |
Cayman Islands—0.0% | | | | | |
Hutchison Tellecommunications | | 70,000 | | | 100,820 |
| | | | |
|
|
| | |
Denmark—0.8% | | | | | |
AP Moller-Maersk A/S | | 56 | | | 577,508 |
Carlsberg A/S (Class B) (a) | | 1,550 | | | 82,905 |
Danisco A/S (a) | | 2,600 | | | 198,601 |
Danske Bank A/S | | 20,400 | | | 716,435 |
DSV A/S (a) | | 1,100 | | | 135,325 |
GN Store Nord A/S (a) | | 13,000 | | | 169,586 |
Novo Nordisk A/S | | 11,075 | | | 621,463 |
Novozymes A/S (Series B) (a) | | 3,615 | | | 197,172 |
Ostasiatiske Kompagni (a) | | 1,050 | | | 98,646 |
*See accompanying notes to financial statements.
MSF-274
Metropolitan Series Fund, Inc.
Morgan Stanley EAFE Index Portfolio
Schedule of Investments as of December 31, 2005
Common Stock—(Continued)
| | | | | |
| Security Description | | Shares | | Value* |
| | |
Denmark—(Continued) | | | | | |
| | | | | | |
TDC A/S | | 9,238 | | $ | 551,537 |
Topdanmark A/S (a) | | 900 | | | 77,906 |
Vestas Wind Systems A/S (a) | | 9,300 | | | 152,427 |
| | | | |
|
|
| | | | | | 3,579,511 |
| | | | |
|
|
| | |
Finland—1.4% | | | | | |
Elisa Oyj (a) | | 10,100 | | | 186,361 |
Fortum Oyj | | 19,500 | | | 364,362 |
Kesko Oyj | | 3,500 | | | 98,923 |
Kone Oyj (a) | | 3,800 | | | 150,233 |
Metso Oyj | | 7,332 | | | 199,821 |
Neste Oil, Oyj (b) | | 5,874 | | | 165,732 |
Nokia Oyj | | 194,750 | | | 3,551,827 |
Rautaruukki, Oyj | | 4,200 | | | 101,775 |
Sampo Oyj | | 19,500 | | | 338,503 |
Stora Enso Oyj | | 31,300 | | | 422,294 |
Tietoenator Oyj | | 4,080 | | | 148,479 |
UPM-Kymmene Oyj (a) | | 24,200 | | | 472,395 |
Wartsila Oyj | | 3,251 | | | 95,878 |
Yit Yhtyma Oyj | | 2,950 | | | 125,796 |
| | | | |
|
|
| | | | | | 6,422,379 |
| | | | |
|
|
| | |
France—8.6% | | | | | |
Accor S.A. (a) | | 8,527 | | | 467,119 |
Air France S.A. (a) | | 4,923 | | | 105,055 |
Air Liquide S.A. (a) | | 4,907 | | | 940,646 |
Alcatel S.A. (a) | | 52,252 | | | 645,806 |
Alstom | | 5,490 | | | 314,761 |
Atos Origin S.A. | | 2,917 | | | 191,413 |
Autoroutes du Sud de la France S.A. (a) | | 2,708 | | | 159,647 |
Autoroutes Paris | | 1,415 | | | 100,807 |
AXA S.A. (a) | | 62,817 | | | 2,022,667 |
BNP Paribas S.A. (a) | | 34,255 | | | 2,762,002 |
Bouygues S.A. (a) | | 9,508 | | | 463,212 |
Business Objects S.A. | | 2,531 | | | 101,966 |
Cap Gemini S.A. (a) | | 5,888 | | | 235,396 |
Carrefour S.A. | | 24,165 | | | 1,128,283 |
Casino Guichard-Perrachon S.A. (a) | | 1,385 | | | 91,898 |
CNP Assurances S.A. (a) | | 2,058 | | | 161,669 |
Compagnie de Saint-Gobain S.A. (a) | | 13,215 | | | 783,154 |
Compagnie Générale des Etablissements Michelin (Class B) | | 6,187 | | | 346,196 |
Credit Agricole S.A. (a) | | 25,452 | | | 798,962 |
Dassault Systemes S.A. (a) | | 3,191 | | | 179,456 |
Essilor International S.A. | | 4,786 | | | 384,885 |
France Telecom S.A. | | 73,703 | | | 1,824,752 |
Groupe Danone (a) | | 10,303 | | | 1,077,893 |
Hermes International S.C.A. (a) | | 970 | | | 241,705 |
Imerys S.A. (a) | | 1,108 | | | 79,909 |
Klepierre S.A. (a) | | 1,393 | | | 130,342 |
L’Oreal S.A. (a) | | 13,007 | | | 962,238 |
Lafarge S.A. (a) | | 8,118 | | | 727,659 |
Lagardere S.C.A. (a) | | 4,929 | | | 377,943 |
LVMH Moet Hennessy Louis Vuitton S.A. | | 11,069 | | | 979,984 |
Neopost S.A. | | 1,324 | | | 132,313 |
Pagesjaunes Groupe | | 5,214 | | | 135,152 |
| | | | | |
| Security Description | | Shares | | Value* |
| | | | | | |
| | |
France—(Continued) | | | | | |
Pernod Ricard S.A. (a) | | 3,042 | | $ | 528,927 |
Peugoet S.A. (a) | | 6,652 | | | 381,406 |
Pinault-Printemps-Redoute S.A. (a) | | 3,195 | | | 358,610 |
Publicis Groupe (a) | | 6,168 | | | 213,915 |
Renault S.A. (a) | | 7,859 | | | 638,456 |
Sagem S.A. (a) | | 6,773 | | | 161,465 |
Sanef, Inc. | | 1,011 | | | 68,211 |
Sanofi-Aventis (a) | | 45,503 | | | 3,972,188 |
Schneider Electric S.A. (a) | | 9,740 | | | 865,324 |
Scor | | 29,144 | | | 62,570 |
Societe Television Francaise 1 S.A. | | 4,636 | | | 128,190 |
Société BIC S.A. | | 1,148 | | | 68,009 |
Société Générale (a) | | 15,370 | | | 1,883,883 |
Sodexho Alliance S.A. (a) | | 5,334 | | | 218,890 |
Suez S.A. | | 4,872 | | | 57 |
Suez S.A. (a) | | 40,009 | | | 1,240,710 |
Technip S.A. (a) | | 3,935 | | | 237,817 |
Thales S.A. (a) | | 3,003 | | | 135,679 |
Thomson S.A. (a) | | 10,757 | | | 224,606 |
Total S.A. (a) | | 24,563 | | | 6,159,271 |
Unibail S.A. | | 1,978 | | | 262,262 |
Valeo S.A. (a) | | 2,738 | | | 101,450 |
Veolia Environnement S.A. (a) | | 15,075 | | | 680,579 |
Vinci S.A. (a) | | 7,093 | | | 607,588 |
Vivendi Universal S.A. | | 46,127 | | | 1,443,955 |
Zodiac S.A. | | 1,406 | | | 89,935 |
| | | | |
|
|
| | | | | | 39,788,843 |
| | | | |
|
|
| | |
Germany—6.3% | | | | | |
Adidas-Salomon AG (a) | | 2,436 | | | 459,399 |
Allianz AG (a) | | 16,445 | | | 2,481,754 |
Altana AG (a) | | 2,783 | | | 150,974 |
BASF AG | | 23,364 | | | 1,783,272 |
Bayer AG | | 28,459 | | | 1,184,605 |
Beiersdorf AG | | 653 | | | 80,055 |
Celesio AG | | 2,068 | | | 177,257 |
Commerzbank AG | | 26,026 | | | 798,793 |
Continental AG | | 5,723 | | | 505,645 |
DaimlerChrysler AG | | 39,352 | | | 2,000,699 |
Deutsche Bank AG (a) | | 21,586 | | | 2,085,335 |
Deutsche Boerse AG (a) | | 4,460 | | | 455,538 |
Deutsche Lufthansa AG (a) | | 9,290 | | | 137,086 |
Deutsche Post AG | | 26,553 | | | 641,380 |
Deutsche Post AG | | 2,993 | | | 71,781 |
Deutsche Telekom AG | | 121,449 | | | 2,017,083 |
E.ON AG | | 27,227 | | | 2,807,590 |
Fresenius Medical Care AG (a) | | 1,889 | | | 198,139 |
Heidelberger Druckmaschinen AG | | 2,301 | | | 87,695 |
Hochtief AG | | 2,617 | | | 116,875 |
Hypo Real Estate Holding AG | | 6,570 | | | 340,763 |
Infineon Technologies AG | | 31,404 | | | 286,341 |
Linde AG (a) | | 3,930 | | | 304,868 |
MAN AG (a) | | 5,766 | | | 306,604 |
Merck KGaA | | 2,490 | | | 205,580 |
Metro AG (a) | | 6,117 | | | 294,213 |
Münchener Rückversicherungs-Gesellschaft AG | | 7,960 | | | 1,073,942 |
*See accompanying notes to financial statements.
MSF-275
Metropolitan Series Fund, Inc.
Morgan Stanley EAFE Index Portfolio
Schedule of Investments as of December 31, 2005
Common Stock—(Continued)
| | | | | |
| Security Description | | Shares | | Value* |
| | | | | | |
| | |
Germany—(Continued) | | | | | |
Premiere AG (a) | | 3,120 | | $ | 54,467 |
Puma AG | | 696 | | | 202,364 |
RWE AG | | 18,103 | | | 1,335,665 |
SAP AG | | 9,890 | | | 1,785,963 |
Schering AG | | 7,211 | | | 481,271 |
Siemens AG | | 35,056 | | | 2,993,301 |
ThyssenKrupp AG (a) | | 15,177 | | | 315,422 |
TUI AG (a) | | 10,215 | | | 208,379 |
Volkswagen AG (a) | | 7,827 | | | 411,506 |
Wincor Nixdorf AG | | 730 | | | 76,957 |
| | | | |
|
|
| | | | | | 28,918,561 |
| | | | |
|
|
| | |
Greece—0.6% | | | | | |
Alpha Bank A.E. | | 14,212 | | | 413,480 |
Coca-Cola Hellenic Bottling Co. S.A. | | 5,100 | | | 149,771 |
Commercial Bank of Greece | | 3,288 | | | 110,788 |
COSMOTE Mobile Telecommunications S.A. | | 5,940 | | | 131,785 |
EFG Eurobank Ergasias S.A. | | 8,560 | | | 268,163 |
Hellenic Petroleum | | 5,920 | | | 83,098 |
Hellenic Telecommunications Organization S.A. | | 13,660 | | | 290,213 |
National Bank of Greece S.A. | | 12,345 | | | 523,033 |
OPAP S.A. | | 10,390 | | | 356,421 |
Piraeus Bank S.A. | | 8,250 | | | 175,910 |
Public Power Corp. | | 4,890 | | | 106,547 |
Titan Cement Co. S.A. | | 3,060 | | | 124,651 |
| | | | |
|
|
| | | | | | 2,733,860 |
| | | | |
|
|
| | |
Hong Kong—1.4% | | | | | |
Bank of East Asia, Ltd. | | 60,400 | | | 182,582 |
BOC Hong Kong Holdings, Ltd. (a) | | 173,500 | | | 334,422 |
Cathay Pacific Airways, Ltd. (a) | | 54,000 | | | 94,946 |
Cheung Kong Holdings, Ltd. | | 66,000 | | | 676,342 |
CLP Holdings, Ltd. | | 79,600 | | | 462,174 |
Hang Lung Properties, Ltd. | | 85,000 | | | 133,006 |
Hang Seng Bank, Ltd. | | 33,700 | | | 439,851 |
Henderson Land Development Co. (a) | | 32,000 | | | 150,292 |
Hong Kong & China Gas Co., Ltd. | | 183,046 | | | 389,199 |
Hong Kong Electric Co., Ltd | | 72,500 | | | 358,166 |
Hong Kong Exchanges & Clearing, Ltd. | | 46,000 | | | 191,118 |
Hopewell Holdings, Ltd. | | 46,000 | | | 115,900 |
Hutchison Whampoa, Ltd. | | 93,000 | | | 884,097 |
Hysan Development Co., Ltd. | | 33,000 | | | 81,471 |
Johnson Electric Holdings, Ltd. (a) | | 80,500 | | | 76,133 |
MTR Corp. (a) | | 84,000 | | | 165,503 |
New World Development Co., Ltd. (a) | | 136,000 | | | 187,532 |
PCCW, Ltd. (a) | | 249,340 | | | 153,464 |
Sino Land Co. (a) | | 80,000 | | | 97,280 |
Sun Hung Kai Properties, Ltd. (a) | | 59,000 | | | 576,072 |
Swire Pacific, Ltd. | | 41,500 | | | 371,181 |
Techtronic Industries Co., Ltd. | | 46,500 | | | 110,664 |
Television Broadcasts, Ltd. | | 14,000 | | | 74,582 |
The Link | | 93,141 | | | 176,587 |
The Wharf Holdings, Ltd. | | 59,000 | | | 208,247 |
| | | | |
|
|
| | | | | | 6,690,811 |
| | | | |
|
|
| | | | | |
| Security Description | | Shares | | Value* |
| | | | | | |
| | |
Ireland—0.8% | | | | | |
Allied Irish Banks, Plc. | | 39,961 | | $ | 852,500 |
Bank of Ireland | | 42,306 | | | 664,321 |
C&C Group | | 14,200 | | | 90,476 |
CRH, Plc. | | 23,294 | | | 682,729 |
DCC, Plc. | | 5,274 | | | 112,610 |
Depfa Bank, Plc. | | 14,333 | | | 211,059 |
Eircom Group, Plc. | | 39,859 | | | 93,126 |
Elan Corp., Plc. | | 24,478 | | | 335,182 |
Iaws Group A | | 4,977 | | | 71,296 |
Independent News & Media, Plc. | | 35,107 | | | 105,244 |
Irish Life & Permanent, Plc. | | 11,864 | | | 241,538 |
Kerry Group, Plc. | | 6,210 | | | 137,082 |
| | | | |
|
|
| | | | | | 3,597,163 |
| | | | |
|
|
| | |
Italy—3.7% | | | | | |
Alleanza Assicurazioni S.p.A. (a) | | 19,805 | | | 243,925 |
Assicuraziono Generali S.p.A. (a) | | 42,422 | | | 1,477,062 |
Autogrill S.p.A. (a) | | 4,027 | | | 54,945 |
Autostrade S.p.A. | | 11,782 | | | 281,486 |
Banca Antonveneta S.p.A. | | 3,985 | | | 123,592 |
Banca Fideuram S.p.A. (a) | | 10,160 | | | 55,004 |
Banca Intesa S.p.A. (a) | | 140,100 | | | 739,476 |
Banca Intesa S.p.A.—RNC | | 37,628 | | | 185,248 |
Banca Monte dei Paschi di Siena S.p.A. (a) | | 59,270 | | | 275,963 |
Banca Nazionale del Lavoro S.p.A. (a) | | 47,963 | | | 157,598 |
Banca Popolare di Milano S.p.A. | | 15,605 | | | 170,290 |
Banche Popolari Unite S.c.ar.l. (a) | | 16,379 | | | 357,708 |
Banco Popolare di Verona e Novara S.c.ar.l. | | 18,247 | | | 367,759 |
Bulgari S.p.A. (a) | | 10,027 | | | 111,478 |
Capitalia S.p.A. | | 69,520 | | | 400,970 |
Enel S.p.A. (a) | | 193,020 | | | 1,510,195 |
Eni S.p.A. (a) | | 113,766 | | | 3,161,113 |
FIAT S.p.A. (a) | | 21,620 | | | 187,608 |
FinecoGroup S.p.A. (a) | | 7,131 | | | 68,380 |
Finmeccanica S.p.A. | | 12,746 | | | 245,735 |
Italcementi S.p.A. | | 1 | | | 19 |
Luxottica Group S.p.A. (a) | | 7,313 | | | 184,795 |
Mediaset S.p.A. (a) | | 34,780 | | | 367,157 |
Mediobanca S.p.A. (a) | | 23,327 | | | 443,799 |
Mediolanum S.p.A. (a) | | 8,934 | | | 58,693 |
Pirelli & Co. S.p.A. (a) | | 110,803 | | | 101,414 |
San Paolo IMI S.p.A. (a) | | 50,438 | | | 785,874 |
Seat Pagine Gialle S.p.A. (a) | | 174,380 | | | 81,113 |
Snam Rete Gas S.p.A. (a) | | 41,749 | | | 170,998 |
T.E.R.N.A (a) | | 52,360 | | | 128,850 |
Telecom Italia S.p.A. (a) | | 463,231 | | | 1,344,048 |
Telecom Italia S.p.A.—RNC | | 261,869 | | | 647,079 |
UniCredito Italiano S.p.A. | | 352,083 | | | 2,416,896 |
| | | | |
|
|
| | | | | | 16,906,270 |
| | | | |
|
|
| | |
Japan—24.7% | | | | | |
Acom Co., Ltd. | | 3,130 | | | 201,946 |
Advantest Corp. | | 3,700 | | | 376,474 |
AEON Co., Ltd. | | 27,800 | | | 710,370 |
Aeon Credit Service Co., Ltd. | | 1,800 | | | 171,271 |
Aiful Corp. | | 2,900 | | | 240,279 |
*See accompanying notes to financial statements.
MSF-276
Metropolitan Series Fund, Inc.
Morgan Stanley EAFE Index Portfolio
Schedule of Investments as of December 31, 2005
Common Stock—(Continued)
| | | | | |
| Security Description | | Shares | | Value* |
| | | | | | |
| | |
Japan—(Continued) | | | | | |
Aisin Seiki Co., Ltd. | | 8,500 | | $ | 314,163 |
Ajinomoto Co., Inc. | | 28,000 | | | 286,727 |
All Nippon Airways Co., Ltd. | | 20,000 | | | 81,264 |
Alps Electric Co., Ltd. | | 8,000 | | | 111,125 |
Amada Co., Ltd. | | 21,000 | | | 185,941 |
Aoyama Trading Co., Ltd. | | 2,600 | | | 87,679 |
Asahi Breweries, Ltd. (a) | | 18,500 | | | 226,610 |
Asahi Glass Co., Ltd. (a) | | 47,000 | | | 602,245 |
Asahi Kasei Corp. | | 62,000 | | | 421,854 |
Astellas Pharma, Inc. | | 23,500 | | | 911,014 |
Bank of Kyoto | | 12,000 | | | 146,010 |
Benesse Corp. | | 3,900 | | | 136,079 |
Bridgestone Corp. (a) | | 30,000 | | | 628,554 |
Cannon Sales Co., Inc. (a) | | 4,000 | | | 85,285 |
Canon, Inc. (a) | | 32,700 | | | 1,921,302 |
Casio Computer Co., Ltd. (a) | | 9,800 | | | 164,736 |
Central Japan Railway Co. | | 67 | | | 638,768 |
Chiyoda Corp. | | 7,000 | | | 160,023 |
Chubu Electric Power Co., Inc. (a) | | 24,900 | | | 592,133 |
Chugai Pharmaceutical Co., Ltd. (a) | | 12,900 | | | 277,852 |
Citizen Watch Co., Ltd. | | 21,100 | | | 175,771 |
Credit Saison Co., Ltd. | | 6,800 | | | 338,287 |
CSK Corp. (a) | | 2,500 | | | 123,992 |
Dai Nippon Printing Co., Ltd | | 27,000 | | | 479,404 |
Daicel Chemical Industries, Ltd. (a) | | 14,000 | | | 100,171 |
Daido Steel Co. | | 17,000 | | | 160,212 |
Daiichi Sankyo | | 30,344 | | | 584,683 |
Daikin Industries, Ltd. | | 10,300 | | | 299,456 |
Daimaru, Inc. | | 11,000 | | | 160,132 |
Dainippon Ink & Chemicals, Inc. | | 41,000 | | | 176,449 |
Dainippon Screen Manufacturing Co., Ltd. | | 9,000 | | | 75,761 |
Daito Trust Construction Co., Ltd. | | 3,400 | | | 175,386 |
Daiwa House Industry Co., Ltd. | | 25,000 | | | 393,231 |
Daiwa Securities Group, Inc. | | 56,000 | | | 641,767 |
Denki Kagaku Kogyo K.K. | | 23,000 | | | 101,340 |
Denso Corp. | | 24,700 | | | 858,987 |
Dentsu, Inc. | | 80 | | | 262,057 |
Dowa Mining Co., Ltd. (a) | | 16,000 | | | 174,888 |
E Trade Securities (a) | | 22 | | | 170,938 |
East Japan Railway Co. | | 150 | | | 1,027,959 |
Eisai Co., Ltd. (a) | | 11,200 | | | 472,043 |
Electric Power Development Co., Ltd. | | 6,000 | | | 207,111 |
FamilyMart Co., Ltd. | | 2,300 | | | 77,591 |
Fanuc, Ltd. | | 8,000 | | | 684,617 |
Fast Retailing Co., Ltd. (a) | | 2,400 | | | 236,297 |
Fuji Electric Holdings Co., Ltd. | | 24,000 | | | 128,071 |
Fuji Photo Film Co., Ltd. | | 22,400 | | | 735,775 |
Fujikura, Ltd. | | 23,000 | | | 187,531 |
Fujitsu, Ltd. | | 84,000 | | | 639,283 |
Hino Motors, Ltd. | | 9,000 | | | 56,767 |
Hirose Electric Co., Ltd. (a) | | 1,200 | | | 158,560 |
Hitachi Chemical Co., Ltd. | | 6,900 | | | 181,635 |
Hitachi Construction Machinary, Ltd. | | 5,000 | | | 117,927 |
Hitachi, Ltd. (a) | | 139,000 | | | 936,639 |
Hokkaido Electric Power Co., Inc. | | 7,300 | | | 148,293 |
Hokugin Financial Group, Inc. | | 60,000 | | | 277,247 |
Honda Motor Co., Ltd. | | 34,200 | | | 1,980,580 |
| | | | | |
| Security Description | | Shares | | Value* |
| | | | | | |
| | |
Japan—(Continued) | | | | | |
Hoya Corp. | | 19,000 | | $ | 686,462 |
Ibiden Co. (a) | | 4,300 | | | 232,497 |
Inpex Corp. | | 18 | | | 160,588 |
Isetan Co., Ltd. | | 10,300 | | | 218,581 |
Ishikawajima-Harima Heavy Industries Co., Ltd. (a) | | 69,000 | | | 220,549 |
Itochu Corp. | | 65,000 | | | 546,513 |
JAFCO Co., Ltd. (a) | | 1,300 | | | 117,220 |
Japan Airlines System Corp. (a) | | 39,000 | | | 105,804 |
Japan Real Estate Investment Corp. (REIT) | | 14 | | | 115,311 |
Japan Retail Fund Investment Corp. (REIT) (a) | | 9 | | | 69,841 |
Japan Tobacco, Inc. | | 39 | | | 567,624 |
JFE Holding, Inc. (a) | | 24,700 | | | 821,782 |
JGC Corp. (a) | | 10,000 | | | 192,099 |
JS Group Corp. | | 12,300 | | | 246,130 |
JSR Corp. (a) | | 8,400 | | | 219,898 |
JTEKT Corp. (a) | | 7,000 | | | 129,705 |
Kajima Corp. (a) | | 51,000 | | | 291,566 |
Kamigumi Co., Ltd. | | 10,000 | | | 88,419 |
Kaneka Corp. | | 16,000 | | | 193,211 |
Kansai Paint Co. (a) | | 12,000 | | | 102,078 |
Kao Corp. | | 23,000 | | | 614,210 |
Kawasaki Heavy Industries, Ltd. (a) | | 73,000 | | | 268,613 |
Kawasaki Kisen Kaisha, Ltd. (a) | | 19,000 | | | 120,108 |
KDDI Corp. | | 108 | | | 621,310 |
Keihin Electric Express Railway Co., Ltd. (a) | | 20,000 | | | 157,529 |
Keio Electric Railway Co., Ltd. | | 26,000 | | | 155,075 |
Keisei Electric Railway Co., Ltd. | | 13,000 | | | 89,215 |
Keyence Corp. | | 1,400 | | | 401,614 |
Kintetsu Corp. | | 80,120 | | | 319,534 |
Kirin Brewery Co., Ltd. (a) | | 34,000 | | | 398,689 |
Kobe Steel, Ltd. | | 118,000 | | | 376,868 |
KOMATSU, Ltd. | | 42,000 | | | 702,566 |
Konami Corp. (a) | | 3,400 | | | 75,097 |
Konica Minolta Holdings, Inc. | | 20,500 | | | 209,747 |
Kubota Corp. | | 48,000 | | | 405,602 |
Kuraray Co., Ltd. | | 19,000 | | | 196,285 |
Kurita Water Industries, Ltd. (a) | | 5,500 | | | 104,483 |
Kyocera Corp. | | 7,100 | | | 518,275 |
Kyowa Hakko Kogyo Co., Ltd. | | 16,000 | | | 111,240 |
Kyushu Electric Power Co., Inc. | | 16,600 | | | 360,577 |
Lawson, Inc. | | 2,400 | | | 98,675 |
Leopalace21 Corp. | | 6,600 | | | 238,035 |
Mabuchi Motor Co., Ltd. (a) | | 1,200 | | | 66,535 |
Makita Corp. (a) | | 7,000 | | | 172,746 |
Marubeni Corp. | | 55,000 | | | 292,342 |
Marui Co., Ltd. | | 14,000 | | | 276,761 |
Matsushita Electric Industrial Co., Ltd. | | 90,000 | | | 1,740,764 |
Matsushita Electric Works, Ltd. (a) | | 19,000 | | | 178,313 |
Mediceo Paltac Holdings Co., Ltd. | | 6,400 | | | 92,526 |
Meiji Seika Kaisha, Ltd. | | 14,000 | | | 74,566 |
Millea Holdings, Inc. | | 66 | | | 1,145,298 |
Mineba Co., Ltd. (a) | | 18,000 | | | 96,699 |
Mitsubishi Chemical Holdings | | 53,578 | | | 337,106 |
Mitsubishi Corp. | | 53,700 | | | 1,181,847 |
Mitsubishi Electric Corp. | | 82,000 | | | 585,911 |
Mitsubishi Estate Co., Ltd. (a) | | 47,000 | | | 984,001 |
Mitsubishi Gas & Chemical Co., Inc. | | 18,000 | | | 171,051 |
*See accompanying notes to financial statements.
MSF-277
Metropolitan Series Fund, Inc.
Morgan Stanley EAFE Index Portfolio
Schedule of Investments as of December 31, 2005
Common Stock—(Continued)
| | | | | |
| Security Description | | Shares | | Value* |
| | | | | | |
| | |
Japan—(Continued) | | | | | |
Mitsubishi Heavy Industries, Ltd. | | 132,000 | | $ | 586,047 |
Mitsubishi Materials Corp. | | 52,000 | | | 268,366 |
Mitsubishi Rayon Co., Ltd. | | 32,000 | | | 213,333 |
Mitsubishi Securities (a) | | 14,000 | | | 173,610 |
Mitsubishi Tokyo Financial Group, Inc. | | 320 | | | 4,368,284 |
Mitsui & Co., Ltd. (a) | | 63,000 | | | 814,197 |
Mitsui Chemicals, Inc. (a) | | 29,000 | | | 193,422 |
Mitsui Engineering & Shipbuilding Co., Ltd. (a) | | 32,000 | | | 104,075 |
Mitsui Fudosan Co., Ltd. (a) | | 35,000 | | | 714,515 |
Mitsui Mining & Smelting Co., Ltd. | | 30,000 | | | 187,409 |
Mitsui OSK Lines, Ltd. | | 47,000 | | | 413,356 |
Mitsui Sumitomo Insurance Co., Ltd. | | 53,000 | | | 655,310 |
Mitsui Trust Holdings, Inc. | | 24,000 | | | 290,400 |
Mitsukoshi, Ltd. (a) | | 18,000 | | | 117,098 |
Mizuho Financial Group, Inc. | | 420 | | | 3,314,688 |
Murata Manufacturing Co., Ltd. | | 8,900 | | | 575,534 |
Namco Bandai Holdings | | 9,800 | | | 143,057 |
NEC Corp. | | 84,000 | | | 526,829 |
NGK Insulators, Ltd. | | 13,000 | | | 192,470 |
NGK Spark Plug Co., Ltd. | | 11,000 | | | 236,067 |
NHK Spring Co., Ltd. | | 8,000 | | | 83,792 |
Nidec Corp. (a) | | 4,600 | | | 395,468 |
Nikko Cordial Corp. (a) | | 35,500 | | | 570,120 |
Nikon Corp. (a) | | 12,000 | | | 188,449 |
Nintendo Co., Ltd. | | 4,400 | | | 534,407 |
Nippon Building Fund, Inc. (REIT) | | 17 | | | 143,181 |
Nippon Electronic, Inc. | | 9,000 | | | 198,490 |
Nippon Express Co., Ltd. | | 38,000 | | | 232,838 |
Nippon Meat Packers, Inc. | | 11,000 | | | 115,234 |
Nippon Mining Holdings, Inc. | | 31,500 | | | 225,185 |
Nippon Oil Corp. | | 57,000 | | | 444,682 |
Nippon Sheet Glass Co., Ltd. (a) | | 24,000 | | | 105,233 |
Nippon Steel Corp. (a) | | 268,000 | | | 944,007 |
Nippon Telephone & Telegraph Corp. | | 226 | | | 1,029,811 |
Nippon Unipac Holding | | 49 | | | 195,536 |
Nippon Yusen Kabushiki Kaisha (a) | | 45,000 | | | 308,700 |
Nissan Chemical Industries, Ltd. (a) | | 8,000 | | | 113,114 |
Nissan Motor Co., Ltd. (a) | | 98,300 | | | 1,002,235 |
Nisshin Seifun Group, Inc. | | 13,000 | | | 137,739 |
Nisshin Steel Co., Ltd. (a) | | 54,000 | | | 175,819 |
Nisshinbo Industries, Inc. | | 8,000 | | | 86,948 |
Nissin Food Products Co., Ltd. (a) | | 5,000 | | | 144,158 |
Nitto Denko Corp. | | 7,800 | | | 605,437 |
NOK Corp. (a) | | 6,100 | | | 165,303 |
Nomura Holdings, Inc. | | 79,700 | | | 1,528,881 |
Nomura Research Institute, Ltd. | | 900 | | | 110,067 |
NSK, Ltd. | | 18,000 | | | 123,695 |
NTN Corp. (a) | | 20,000 | | | 157,432 |
NTT Data Corp. | | 62 | | | 311,453 |
NTT DoCoMo, Inc. | | 763 | | | 1,167,467 |
Obayashi Corp. | | 28,000 | | | 205,319 |
Odakyu Electric Railway Co., Ltd. (a) | | 27,000 | | | 160,264 |
OJI Paper Co., Ltd. | | 39,000 | | | 229,832 |
Oki Electric Industry Co., Ltd. | | 20,000 | | | 73,825 |
Olympus Corp. (a) | | 12,000 | | | 313,970 |
Omron Corp. | | 9,000 | | | 208,314 |
Onward Kashiyama Co., Ltd. | | 5,000 | | | 97,736 |
| | | | | |
| Security Description | | Shares | | Value* |
| | | | | | |
| | |
Japan—(Continued) | | | | | |
Oriental Land Co., Ltd. (a) | | 2,600 | | $ | 141,283 |
ORIX Corp. | | 3,700 | | | 954,315 |
Osaka Gas Co., Ltd. | | 84,000 | | | 288,519 |
Pioneer Corp. (a) | | 6,600 | | | 91,002 |
Promise Co., Ltd. | | 3,750 | | | 251,710 |
Rakuten, Inc. (a) | | 210 | | | 202,484 |
Resona Holdings, Inc. (a) | | 200 | | | 800,688 |
Ricoh Co., Ltd. | | 30,000 | | | 527,783 |
Rohm Co., Ltd. | | 4,700 | | | 515,957 |
Ryohin Keikaku Co., Ltd. | | 1,200 | | | 105,325 |
Sanken Electric Co., Ltd. | | 6,000 | | | 97,728 |
Sankyo Co., Ltd. | | 2,800 | | | 162,359 |
Santen Pharm Co. (a) | | 3,600 | | | 99,817 |
Sanyo Electric Co., Ltd. (a) | | 70,000 | | | 190,210 |
Sapporo Holdings, Ltd. (a) | | 15,000 | | | 83,698 |
SBI Holdings, Inc. (a) | | 244 | | | 163,524 |
Secom Co., Ltd. | | 9,000 | | | 468,304 |
Sega Sammy Holdings, Inc. | | 6,400 | | | 215,700 |
Seiko Epson Corp. (a) | | 5,000 | | | 124,539 |
Sekisui Chemical Co., Ltd. | | 20,000 | | | 136,184 |
Sekisui House, Ltd. | | 21,000 | | | 263,203 |
Seven & I Holdings Co., Ltd. (a) | | 35,560 | | | 1,520,498 |
Sharp Corp. | | 41,000 | | | 620,075 |
Shimamura Co., Ltd. (a) | | 900 | | | 125,174 |
Shimano, Inc. (a) | | 4,600 | | | 121,391 |
Shimizu Corp. | | 29,000 | | | 215,459 |
Shin-Etsu Chemical Co., Ltd. | | 17,000 | | | 897,433 |
Shinko Securities | | 24,000 | | | 122,153 |
Shinsei Bank, Ltd. | | 40,000 | | | 232,181 |
Shionogi & Co., Ltd. | | 15,000 | | | 211,568 |
Shiseido Co., Ltd. (a) | | 16,000 | | | 297,296 |
Showa Denko K.K. (a) | | 52,000 | | | 201,189 |
Showa Shell Sekiyu K.K. (a) | | 9,900 | | | 118,734 |
SMC Corp. | | 2,600 | | | 374,147 |
Softbank Corp. (a) | | 31,500 | | | 1,343,071 |
Sojitz Corp. (a) | | 16,800 | | | 100,257 |
Sompo Japan Insurance, Inc. | | 36,000 | | | 481,595 |
Sony Corp. (a) | | 43,300 | | | 1,766,617 |
Stanley Electric Co., Ltd. (a) | | 9,200 | | | 148,269 |
Sumitomo Chemical Co., Ltd. | | 64,000 | | | 442,669 |
Sumitomo Corp. | | 47,000 | | | 604,465 |
Sumitomo Electric Industries, Ltd. | | 31,000 | | | 474,225 |
Sumitomo Heavy Industries, Ltd. | | 25,000 | | | 208,879 |
Sumitomo Metal Industries, Ltd. | | 176,000 | | | 670,054 |
Sumitomo Metal Mining Co., Ltd. (a) | | 27,000 | | | 337,404 |
Sumitomo Mitsui Financial Group, Inc. (a) | | 208 | | | 2,226,449 |
Sumitomo Realty & Development Co., Ltd. (a) | | 16,000 | | | 351,154 |
Sumitomo Rubber | | 8,000 | | | 114,771 |
Suzuken Co., Ltd. | | 2,300 | | | 73,334 |
T&D Holdings, Inc. | | 9,750 | | | 639,817 |
Taiheiyo Cement Corp. (a) | | 42,000 | | | 171,532 |
Taisei Corp. | | 39,000 | | | 178,103 |
Taisho Pharmaceutical Co., Ltd. | | 8,000 | | | 149,018 |
Taiyo Nippon Sanso Corp. | | 14,000 | | | 93,225 |
Takashimaya Co., Ltd. (a) | | 12,000 | | | 193,028 |
Takeda Pharmaceutical Co., Ltd. | | 38,500 | | | 2,076,513 |
Takefuji Corp. | | 4,610 | | | 314,666 |
*See accompanying notes to financial statements.
MSF-278
Metropolitan Series Fund, Inc.
Morgan Stanley EAFE Index Portfolio
Schedule of Investments as of December 31, 2005
Common Stock—(Continued)
| | | | | |
| Security Description | | Shares | | Value* |
| | | | | | |
| | |
Japan—(Continued) | | | | | |
Tanabe Seiyaku Co. | | 11,000 | | $ | 106,884 |
TDK Corp. | | 5,300 | | | 366,679 |
Teijin, Ltd. | | 36,000 | | | 230,267 |
Teikoku Oil Co., Ltd. (a) | | 10,000 | | | 132,020 |
Terumo Corp. | | 8,100 | | | 240,628 |
The 77 Bank, Ltd. | | 16,000 | | | 122,012 |
The Bank of Fukuoka, Ltd. (a) | | 23,000 | | | 198,831 |
The Bank of Yokohama, Ltd. | | 54,000 | | | 445,350 |
The Chiba Bank, Ltd. | | 29,000 | | | 244,770 |
The Furukawa Electric Co., Ltd. (a) | | 30,000 | | | 237,496 |
The Gunma Bank, Ltd. | | 21,000 | | | 156,268 |
The Joyo Bank, Ltd. | | 32,000 | | | 191,771 |
The Kansai Electric Power Co., Inc. | | 35,300 | | | 756,801 |
The Nishi-Nippon Bank, Ltd. | | 22,000 | | | 132,432 |
The Shizuoka Bank, Ltd. (a) | | 27,000 | | | 269,462 |
The Sumitomo Trust & Banking Co., Ltd. | | 56,000 | | | 569,438 |
The Suruga Bank, Ltd. | | 13,000 | | | 163,571 |
The Tokyo Electric Power, Ltd. | | 49,900 | | | 1,214,022 |
THK Co., Ltd. (a) | | 6,000 | | | 157,378 |
Tobu Railway Co., Ltd. | | 31,000 | | | 162,889 |
Toho Co., Ltd. (a) | | 8,000 | | | 178,675 |
Tohoku Electric Power Co., Inc. | | 20,300 | | | 411,906 |
Tokuyama Corp. | | 10,000 | | | 129,202 |
Tokyo Electron, Ltd. | | 7,700 | | | 480,794 |
Tokyo Gas Co., Ltd. (a) | | 101,000 | | | 451,277 |
Tokyo Tatemono Co. (a) | | 11,000 | | | 110,164 |
Tokyu Corp. (a) | | 47,000 | | | 334,809 |
Tokyu Land Corp. | | 15,000 | | | 151,887 |
TonenGeneral Sekiyu K.K. (a) | | 12,000 | | | 128,610 |
Toppan Printing Co., Ltd. (a) | | 25,000 | | | 290,513 |
Toray Industries, Inc. | | 58,000 | | | 475,026 |
Toshiba Corp. (a) | | 128,000 | | | 770,495 |
Tosoh Corp. (a) | | 27,000 | | | 119,186 |
Toto, Ltd. (a) | | 12,000 | | | 101,016 |
Toyo Seikan Kaisha, Ltd. | | 8,000 | | | 129,786 |
Toyobo Co., Ltd. | | 27,000 | | | 90,969 |
Toyota Industries Corp. | | 8,100 | | | 292,242 |
Toyota Motor Corp. | | 126,100 | | | 6,592,048 |
Toyota Tsusho Corp. | | 7,000 | | | 160,283 |
Trend Micro, Inc. (a) | | 4,000 | | | 152,312 |
Ube Industries, Ltd. (a) | | 39,000 | | | 105,484 |
Uni-Charm Corp. (a) | | 2,400 | | | 107,695 |
UNY Co., Ltd. | | 6,000 | | | 94,944 |
Ushio, Inc. (a) | | 7,000 | | | 164,573 |
USS Co., Ltd. | | 1,070 | | | 68,153 |
Wacoal Corp. | | 5,000 | | | 67,591 |
West Japan Railway Co. | | 77 | | | 320,244 |
Yahoo! Japan Corp. (a) | | 336 | | | 510,480 |
Yakult Honsha Co., Ltd. (a) | | 7,000 | | | 145,752 |
Yamada Denki Co., Ltd. (a) | | 3,500 | | | 443,551 |
Yamaha Corp. (a) | | 8,100 | | | 134,524 |
Yamaha Motor Co., Ltd. | | 10,200 | | | 268,176 |
Yamato Holdings Co., Ltd. | | 17,000 | | | 283,201 |
Yaskawa Electric Corp. (a) | | 10,000 | | | 101,447 |
Yokogawa Electric Corp. (a) | | 8,100 | | | 138,845 |
Zeon Corp. (a) | | 8,000 | | | 106,108 |
| | | | |
|
|
| | | | | | 114,386,123 |
| | | | |
|
|
| | | | | |
| Security Description | | Shares | | Value* |
| | | | | | |
| | |
Luxembourg—0.1% | | | | | |
Arcelor S.A. | | 23,893 | | $ | 590,324 |
Stolt Offshore Co. (a) | | 9,600 | | | 111,636 |
| | | | |
|
|
| | | | | | 701,960 |
| | | | |
|
|
| | |
Netherlands—3.6% | | | | | |
ABN AMRO Holdings NV | | 78,051 | | | 2,033,575 |
Aegon NV | | 62,160 | | | 1,008,087 |
Akzo Nobel NV | | 11,384 | | | 525,677 |
ASML Holding NV (b) | | 23,308 | | | 464,571 |
Buhrmann NV (a) | | 5,632 | | | 82,570 |
Corio NV | | 2,452 | | | 132,740 |
DSM NV | | 6,294 | | | 256,121 |
Euronext NV | | 3,546 | | | 184,005 |
European Aeronautic Defense & Space Co. (a) | | 11,647 | | | 438,164 |
Getronics NV | | 5,753 | | | 77,085 |
Heineken NV | | 10,728 | | | 338,771 |
ING Groep NV | | 81,822 | | | 2,827,631 |
James Hardie Industries NV | | 27,250 | | | 179,031 |
Koninklijke Ahold NV | | 64,989 | | | 485,081 |
Koninklijke KPN NV | | 91,096 | | | 910,893 |
Koninklijke Numico NV | | 8,452 | | | 348,622 |
Koninklijke Philips Electronics NV | | 56,793 | | | 1,758,309 |
Qiagen NV | | 4,617 | | | 54,133 |
Randstad Holding NV | | 1,866 | | | 80,752 |
Reed Elsevier NV | | 30,654 | | | 426,645 |
Rodamco Europe NV | | 1,821 | | | 150,993 |
SBM Offshore NV | | 1,921 | | | 154,638 |
STMicroelectronics NV | | 29,883 | | | 534,317 |
TNT NV | | 18,198 | | | 566,657 |
Unilever NV | | 24,655 | | | 1,682,295 |
Vedior NV (a) | | 6,643 | | | 98,099 |
VNU NV | | 10,581 | | | 349,567 |
Wereldhave NV | | 1,209 | | | 113,623 |
Wolters Kluwer NV | | 14,000 | | | 282,039 |
| | | | |
|
|
| | | | | | 16,544,691 |
| | | | |
|
|
| | |
New Zealand—0.2% | | | | | |
Fletcher Building, Ltd. | | 57,403 | | | 295,063 |
Telecom Corp. of New Zealand, Ltd. (a) | | 133,363 | | | 545,506 |
| | | | |
|
|
| | | | | | 840,569 |
| | | | |
|
|
| | |
Norway—0.6% | | | | | |
DnB NOR ASA | | 32,130 | | | 341,740 |
Norsk Hydro ASA (a) | | 6,820 | | | 700,349 |
Norske Skogindustrier ASA (a) | | 9,200 | | | 145,738 |
Orkla ASA (a) | | 8,650 | | | 356,725 |
Petroleum Geo-Services (a) | | 3,340 | | | 103,049 |
Statoil ASA (a) | | 31,450 | | | 719,973 |
Storebrand ASA (a) | | 11,400 | | | 97,885 |
Telenor ASA | | 40,300 | | | 394,482 |
Yara International ASA | | 10,000 | | | 144,912 |
| | | | |
|
|
| | | | | | 3,004,853 |
| | | | |
|
|
| | |
Portugal—0.3% | | | | | |
Banco Comercial Portugues S.A. | | 90,981 | | | 250,064 |
Banco Espirito Santo S.A. (a) | | 5,129 | | | 82,280 |
*See accompanying notes to financial statements.
MSF-279
Metropolitan Series Fund, Inc.
Morgan Stanley EAFE Index Portfolio
Schedule of Investments as of December 31, 2005
Common Stock—(Continued)
| | | | | |
| Security Description | | Shares | | Value* |
| | | | | | |
| | |
Portugal—(Continued) | | | | | |
Brisa-Auto Estradas de Portugal S.A. (a) | | 19,503 | | $ | 164,707 |
Energias de Portugal S.A. | | 93,497 | | | 287,110 |
Portugal Telecom, SGPS, S.A. (a) | | 36,975 | | | 372,916 |
Sonae S.A. | | 55,237 | | | 76,876 |
| | | | |
|
|
| | | | | | 1,233,953 |
| | | | |
|
|
| | |
Singapore—0.8% | | | | | |
Capitaland, Ltd. (a) | | 66,000 | | | 136,127 |
City Developments, Ltd. | | 40,000 | | | 208,894 |
ComfortDelGro Corp., Ltd. | | 178,000 | | | 171,257 |
DBS Group Holdings, Inc. | | 52,978 | | | 525,472 |
Fraser & Neave, Ltd. | | 16,400 | | | 182,859 |
Keppel Corp., Ltd. (a) | | 29,000 | | | 192,177 |
Overseas Chinese Bank | | 122,880 | | | 494,136 |
Singapore Airlines, Ltd. | | 34,000 | | | 254,192 |
Singapore Press Holdings, Ltd. (a) | | 93,250 | | | 240,619 |
Singapore Technologies Engineering, Ltd. | | 117,000 | | | 201,539 |
Singapore Telecommunications, Ltd. | | 315,650 | | | 494,417 |
United Overseas Bank, Ltd. | | 55,392 | | | 487,368 |
Venture Corp., Ltd. | | 19,000 | | | 157,574 |
| | | | |
|
|
| | | | | | 3,746,631 |
| | | | |
|
|
| | |
Spain—3.5% | | | | | |
Abertis Infraestructuras S.A. (a) | | 9,909 | | | 248,564 |
Acciona S.A. (a) | | 1,601 | | | 178,513 |
Acerinox S.A. (a) | | 7,712 | | | 111,786 |
ACS, Actividades de Construccion &
Servicios S.A. (a) | | 10,808 | | | 346,901 |
Altadis S.A. | | 12,473 | | | 563,802 |
Antena 3 TV (a) | | 3,400 | | | 80,828 |
Azucarera Ebro S.A. | | 3,741 | | | 61,913 |
Banco Bilbao Vizcaya Argentaria S.A. | | 148,471 | | | 2,640,044 |
Banco Popular Espanol S.A. (a) | | 37,649 | | | 457,686 |
Banco Santander Central Hispano S.A. | | 259,913 | | | 3,418,624 |
Cintra Conces, Plc. (a) | | 8,063 | | | 92,930 |
Corporacion Mapfre S.A. | | 4,847 | | | 79,819 |
Endesa S.A. (a) | | 42,491 | | | 1,113,774 |
Fomento de Construcciones & Contratas S.A. | | 1,837 | | | 103,820 |
Gamesa Corporacion Tecnologica S.A. (a) | | 8,235 | | | 120,006 |
Gas Natural SDG S.A. (a) | | 7,562 | | | 211,276 |
Grupo Ferrovial S.A. (a) | | 3,394 | | | 234,506 |
Iberdrola S.A. (a) | | 35,053 | | | 954,344 |
Indra Sistemas S.A. | | 7,404 | | | 144,216 |
Industria de Diseno Textil S.A. | | 9,525 | | | 309,510 |
Inmobilia Colonial | | 1,359 | | | 76,765 |
Metrovacesa S.A. (a) | | 2,474 | | | 149,775 |
Repsol YPF S.A. | | 39,532 | | | 1,155,851 |
Sacyr Vallehermoso S.A. (a) | | 6,221 | | | 151,142 |
Sogecable S.A. (a) | | 2,047 | | | 81,764 |
Telefonica S.A. | | 193,915 | | | 2,907,349 |
Union Fenosa S.A. | | 10,887 | | | 403,930 |
| | | | |
|
|
| | | | | | 16,399,438 |
| | | | |
|
|
| | |
Sweden—2.3% | | | | | |
Alfa Laval AB (a) | | 4,300 | | | 92,899 |
Assa Abloy AB (Series B) (a) | | 15,700 | | | 246,537 |
| | | | | |
| Security Description | | Shares | | Value* |
| | | | | | |
| | |
Sweden—(Continued) | | | | | |
Atlas Copco AB (Series A) | | 14,700 | | $ | 326,959 |
Atlas Copco AB (Series B) | | 10,200 | | | 203,158 |
Electrolux AB (a) | | 13,400 | | | 347,568 |
Eniro AB | | 10,300 | | | 129,429 |
Gambro AB | | 10,800 | | | 117,772 |
Getinge AB (Class B) (a) | | 9,500 | | | 130,548 |
Hennes & Mauritz AB (Series B) (a) | | 22,550 | | | 764,706 |
Holmen AB (Series B) (a) | | 2,500 | | | 82,450 |
Lundin Petroleum (a) | | 9,000 | | | 95,205 |
Modern Times Group AB (Class B) (a) | | 2,450 | | | 102,055 |
Nordea Bank AB (a) | | 97,162 | | | 1,007,245 |
Sandvik AB (a) | | 9,350 | | | 434,607 |
Scania AB (Series B) (a) | | 4,300 | | | 155,344 |
Securitas AB (a) | | 13,000 | | | 215,627 |
Skandia Insurance Co., Ltd. (a) | | 55,300 | | | 330,930 |
Skandinaviska Enskilda Banken AB (a) | | 23,100 | | | 474,587 |
Skanska AB | | 19,700 | | | 299,532 |
SKF AB (a) | | 18,000 | | | 252,202 |
SSAB | | 3,000 | | | 108,925 |
Svenska Cellulosa AB (a) | | 9,100 | | | 339,506 |
Svenska Handelsbanken AB (a) | | 22,600 | | | 559,447 |
Swedish Match AB (a) | | 14,600 | | | 171,533 |
Tele2 AB (a) | | 18,100 | | | 193,805 |
Telefonaktiebolaget LM Ericsson (Class B) | | 653,800 | | | 2,243,815 |
TeliaSonera AB | | 86,764 | | | 465,356 |
Volvo AB | | 4,500 | | | 206,015 |
Volvo AB (Series B) (a) | | 10,200 | | | 480,018 |
| | | | |
|
|
| | | | | | 10,577,780 |
| | | | |
|
|
| | |
Switzerland—6.4% | | | | | |
ABB, Ltd. | | 86,906 | | | 841,713 |
Adecco S.A. | | 5,399 | | | 248,132 |
Ciba Specialty Chemicals AG | | 3,545 | | | 228,600 |
Clariant AG | | 12,901 | | | 189,379 |
Credit Suisse Group | | 53,116 | | | 2,699,625 |
Geberit AG | | 184 | | | 145,170 |
Givaudan AG | | 317 | | | 214,200 |
Holcim, Ltd. | | 7,740 | | | 525,519 |
Kuehne & Nagel International AG | | 509 | | | 143,206 |
Logitech International S.A. | | 4,790 | | | 223,706 |
Lonza Group AG (a) | | 1,509 | | | 92,064 |
Nestle S.A. | | 17,622 | | | 5,246,392 |
Nobel Biocare Holding AG | | 917 | | | 201,095 |
Novartis AG | | 101,619 | | | 5,320,612 |
Phonak Holding AG (a) | | 1,750 | | | 75,160 |
PSP Swiss Property | | 1,740 | | | 75,262 |
Roche Holding AG | | 30,690 | | | 4,594,718 |
Schindler Holding AG | | 194 | | | 76,757 |
Serono S.A. (Class B) | | 303 | | | 240,416 |
SGS S.A. (a) | | 176 | | | 147,974 |
Straumann Holding AG (a) | | 318 | | | 73,532 |
Sulzer AG | | 153 | | | 80,802 |
Swatch Group AG | | 3,574 | | | 107,802 |
Swatch Group AG (Class B) | | 1,638 | | | 242,374 |
Swiss Reinsurance Co. | | 13,985 | | | 1,020,865 |
Swisscom AG | | 1,060 | | | 333,615 |
*See accompanying notes to financial statements.
MSF-280
Metropolitan Series Fund, Inc.
Morgan Stanley EAFE Index Portfolio
Schedule of Investments as of December 31, 2005
Common Stock—(Continued)
| | | | | |
| Security Description | | Shares | | Value* |
| | | | | | |
| | |
Switzerland—(Continued) | | | | | |
Syngenta AG | | 4,682 | | $ | 580,864 |
UBS AG | | 45,159 | | | 4,286,906 |
Zurich Financial Services AG | | 6,239 | | | 1,326,943 |
| | | | |
|
|
| | | | | | 29,583,403 |
| | | | |
|
|
| | |
United Kingdom—23.1% | | | | | |
3i Group, Plc. | | 25,081 | | | 364,936 |
Aegis Group, Plc. | | 38,895 | | | 81,644 |
Alliance Unichem, Plc. | | 9,863 | | | 135,437 |
AMEC, Plc. | | 19,748 | | | 116,392 |
Amvescap, Plc. | | 28,888 | | | 219,118 |
Anglo American, Plc. | | 61,109 | | | 2,076,356 |
ARM Holdings, Plc. | | 54,960 | | | 114,113 |
Arriva, Plc. | | 7,903 | | | 79,042 |
Associated British Portfolios Holdings, Plc. | | 14,900 | | | 150,166 |
AstraZeneca, Plc. | | 70,252 | | | 3,411,305 |
Aviva, Plc. | | 102,001 | | | 1,234,610 |
BAA, Plc. | | 46,303 | | | 498,367 |
BAE Systems, Plc. | | 138,539 | | | 907,581 |
Balfour Beatty, Plc. | | 23,744 | | | 145,138 |
Barclays, Plc. | | 281,981 | | | 2,956,568 |
Barratt Developments, Plc. | | 11,202 | | | 189,388 |
BBA Group, Plc. | | 25,670 | | | 145,027 |
Bellway, Plc. | | 4,518 | | | 87,576 |
Berkeley Group Holdings | | 4,020 | | | 76,681 |
BG Group, Plc. | | 154,740 | | | 1,526,304 |
BHP Billiton, Plc. | | 108,601 | | | 1,769,152 |
BOC Group, Plc. | | 22,444 | | | 461,511 |
Boots Group, Plc. (a) | | 30,061 | | | 311,698 |
Bovis Homes Group | | 5,148 | | | 70,443 |
BP, Plc. | | 911,596 | | | 9,738,951 |
Brambles Industries, Plc. | | 29,427 | | | 210,601 |
British Airways, Plc. | | 21,657 | | | 124,190 |
British America Tobacco, Plc. | | 67,985 | | | 1,520,293 |
British Land Co., Plc. | | 24,653 | | | 451,194 |
British Sky Broadcasting Group, Plc. | | 57,002 | | | 485,905 |
Brixton, Plc. | | 11,049 | | | 82,045 |
BT Group, Plc. | | 366,866 | | | 1,403,262 |
Bunzl, Plc. | | 17,535 | | | 192,079 |
Burberry Group, Plc. | | 14,259 | | | 105,028 |
Cable & Wireless, Plc. | | 102,250 | | | 209,219 |
Cadbury Schweppes, Plc. | | 92,853 | | | 875,324 |
Capita Group, Plc. | | 31,881 | | | 228,023 |
Carnival, Plc. | | 7,379 | | | 418,133 |
Cattles, Plc. | | 11,534 | | | 65,163 |
Centrica, Plc. | | 162,561 | | | 711,003 |
Close Brothers Group, Plc. | | 5,056 | | | 78,774 |
Cobham, Plc. | | 45,040 | | | 131,020 |
Compass Group, Plc. | | 100,636 | | | 380,822 |
Corus Group, Plc. | | 232,233 | | | 235,095 |
Daily Mail & General Trust, Plc. | | 11,302 | | | 153,153 |
Diageo, Plc. | | 129,373 | | | 1,869,993 |
Dixons Group, Plc. | | 76,665 | | | 215,462 |
Electrocomponents, Plc. | | 16,808 | | | 81,180 |
EMAP, Plc. | | 9,884 | | | 146,352 |
EMI Group, Plc. | | 31,155 | | | 129,427 |
| | | | | |
| Security Description | | Shares | | Value* |
| | | | | | |
| | |
United Kingdom—(Continued) | | | | | |
Enterprise Inns, Plc. | | 16,706 | | $ | 268,682 |
First Choice Holidays | | 19,553 | | | 83,924 |
FirstGroup, Plc. | | 14,542 | | | 100,307 |
Friends Provident, Plc. | | 93,952 | | | 305,671 |
Gallaher Group | | 27,285 | | | 410,882 |
George Wimpey, Plc. | | 20,896 | | | 172,209 |
GKN, Plc. | | 39,679 | | | 196,362 |
GlaxoSmithKline, Plc. | | 254,458 | | | 6,411,871 |
Group for Securicor, Inc. | | 42,313 | | | 116,966 |
GUS, Plc. | | 40,206 | | | 711,445 |
Hammerson, Plc. | | 13,769 | | | 241,791 |
Hanson, Plc. | | 35,035 | | | 383,857 |
Hays, Plc. | | 70,144 | | | 151,142 |
HBOS, Plc. | | 168,884 | | | 2,881,203 |
Hilton Group, Plc. | | 72,907 | | | 455,395 |
HSBC Holdings, Plc. | | 492,710 | | | 7,892,330 |
ICAP, Plc. | | 18,682 | | | 129,844 |
IMI, Plc. | | 19,184 | | | 165,674 |
Imperial Chemical Industries, Plc. | | 58,839 | | | 335,392 |
Imperial Tobacco Group, Plc. | | 32,677 | | | 973,703 |
Inchcape, Plc. | | 3,038 | | | 118,915 |
Intercontinental Hotels | | 18,419 | | | 265,649 |
International Power, Plc. | | 73,371 | | | 301,695 |
Intertek Group, Plc. | | 6,257 | | | 74,957 |
Invensys, Plc. | | 256,503 | | | 81,451 |
Isoft Group | | 9,426 | | | 63,000 |
Johnson Matthey, Plc. | | 8,551 | | | 207,294 |
Kelda Group, Plc. | | 19,060 | | | 253,519 |
Kesa Electricals, Plc. | | 27,443 | | | 122,440 |
Kingfisher, Plc. | | 100,939 | | | 411,170 |
Land Securities Group, Plc. | | 20,412 | | | 583,237 |
Legal & General Group, Plc. | | 280,862 | | | 588,310 |
Liberty International, Plc. | | 9,441 | | | 158,928 |
Lloyds TSB Group, Plc. | | 248,635 | | | 2,085,280 |
LogicaCMG, Plc. | | 51,317 | | | 156,164 |
London Stock Exchange Plc. | | 10,312 | | | 109,889 |
Man Group, Plc. | | 13,407 | | | 440,094 |
Marks & Spencer Group, Plc. | | 72,166 | | | 625,690 |
Meggitt, Plc. | | 22,314 | | | 138,641 |
Misys, Plc. | | 21,309 | | | 87,363 |
Mitchells & Butlers, Plc. | | 19,201 | | | 137,801 |
National Express Group, Plc. | | 5,547 | | | 81,914 |
National Grid | | 119,454 | | | 1,165,916 |
Next, Plc. | | 10,683 | | | 281,151 |
Pearson, Plc. | | 37,340 | | | 440,746 |
Persimmon, Plc. | | 11,884 | | | 256,682 |
Pilkington, Plc. | | 60,503 | | | 154,725 |
Provident Financial, Plc. | | 13,879 | | | 130,614 |
Prudential, Plc. | | 108,297 | | | 1,023,566 |
Punch Taverns, Plc. | | 10,056 | | | 146,581 |
Rank Group, Plc. | | 33,378 | | | 175,215 |
Reckitt Benckiser, Plc. | | 26,545 | | | 874,038 |
Reed Elsevier, Plc. | | 55,180 | | | 516,695 |
Rentokil Initial, Plc. | | 76,753 | | | 215,345 |
Resolution, Plc. | | 8,490 | | | 94,457 |
Reuters Group, Plc. | | 62,100 | | | 459,008 |
Rexam, Plc. (a) | | 27,877 | | | 243,133 |
*See accompanying notes to financial statements.
MSF-281
Metropolitan Series Fund, Inc.
Morgan Stanley EAFE Index Portfolio
Schedule of Investments as of December 31, 2005
Common Stock—(Continued)
| | | | | |
| Security Description | | Shares | | Value* |
| | | | | | |
| | |
United Kingdom—(Continued) | | | | | |
Rio Tinto, Plc. | | 47,567 | | $ | 2,167,121 |
Rolls Royce Group | | 2,358,708 | | | 4,151 |
Rolls-Royce Group, Plc. | | 70,620 | | | 518,320 |
Royal & Sun Alliance Insurance Group, Plc. | | 150,184 | | | 324,960 |
Royal Bank of Scotland Group, Plc. | | 138,851 | | | 4,183,717 |
Royal Dutch Shell (A Shares) | | 178,172 | | | 5,454,239 |
Royal Dutch Shell (B Shares) | | 120,383 | | | 3,859,174 |
SABMiller, Plc. | | 38,439 | | | 699,344 |
Sage Group, Ltd. | | 61,607 | | | 272,892 |
Sainsbury Co. | | 61,769 | | | 334,322 |
Schroders, Plc. | | 4,373 | | | 71,327 |
Scottish & Newcastle, Plc. | | 31,697 | | | 264,526 |
Scottish & Southern Energy, Plc. | | 36,716 | | | 639,191 |
Scottish Power, Plc. | | 79,445 | | | 741,048 |
Serco Group, Plc. | | 26,863 | | | 144,877 |
Severn Trent, Plc. (a) | | 16,848 | | | 313,554 |
Signet Group, Plc. | | 90,531 | | | 167,001 |
Slough Estates, Plc. | | 21,877 | | | 225,011 |
Smith & Nephew, Plc. | | 43,712 | | | 401,581 |
Smiths Group, Plc. | | 25,283 | | | 454,036 |
Stagecoach Group, Plc. | | 29,429 | | | 58,315 |
Tate & Lyle, Plc. | | 20,205 | | | 195,142 |
Taylor Woodrow, Plc. | | 30,813 | | | 201,294 |
Tesco, Plc. | | 342,617 | | | 1,948,551 |
The Peninsular & Oriental Steam Navigation Co. | | 37,487 | | | 299,817 |
TI Automotive, Ltd. (c) | | 11,100 | | | 0 |
Tomkins, Plc. | | 30,300 | | | 155,940 |
Travis Perkins | | 4,822 | | | 115,974 |
Trinity Mirror, Plc. | | 11,804 | | | 116,128 |
Unilever, Plc. | | 122,763 | | | 1,215,060 |
United Utilities, Plc. | | 40,354 | | | 464,894 |
UTD Business Media | | 10,472 | | | 114,476 |
Vodafone Group, Plc. | | 2,755,033 | | | 5,936,316 |
Whitbread | | 10,230 | | | 166,499 |
William Hill, Plc. | | 16,542 | | | 152,083 |
Wolseley, Plc. | | 25,957 | | | 545,911 |
WPP Group, Plc. | | 51,215 | | | 553,084 |
Yell Group, Plc. | | 35,479 | | | 326,485 |
| | | | |
|
|
| | | | | | 106,836,528 |
| | | | |
|
|
| | |
United States—3.4% | | | | | |
iShares MSCI EAFE Index Fund | | 257,600 | | | 15,316,896 |
Synthes, Inc. (b) | | 1,887 | | | 211,250 |
| | | | |
|
|
| | | | | | 15,528,146 |
| | | | |
|
|
Total Common Stock
(Identified Cost $345,247,314) | | | | | 456,119,968 |
| | | | |
|
|
| | |
| Preferred Stock—0.5% | | | | | |
| | |
Australia—0.3% | | | | | |
Centro Properties Group (a) | | 32,700 | | | 151,545 |
CFS Gandel Retail Trust | | 100,244 | | | 146,840 |
General Property Trust | | 81,936 | | | 246,470 |
Investa Property Group | | 66,456 | | | 96,581 |
Macquarie Infrastructure Group (a) | | 107,767 | | | 279,813 |
Stockland | | 56,289 | | | 267,766 |
| | | | |
|
|
| | | | | | 1,189,015 |
| | | | |
|
|
| | | | | | | |
| Security Description | | Shares | | Value* | |
| | | | | | | | |
| | |
Germany—0.2% | | | | | | | |
Fresenius Medical Care AG | | | 924 | | $ | 85,939 | |
Henkel KGAA (a) | | | 2,804 | | | 280,982 | |
Porsche AG (a) | | | 387 | | | 276,897 | |
RWE AG | | | 1,372 | | | 88,103 | |
Volkswagen AG | | | 4,726 | | | 181,122 | |
| | | | | |
|
|
|
| | | | | | | 913,043 | |
| | | | | |
|
|
|
Total Preferred Stock
(Identified Cost $1,483,446) | | | | | | 2,102,058 | |
| | | | | |
|
|
|
| | |
| Rights— 0.3% | | | | | | | |
| | |
Belgium—0.3% | | | | | | | |
Fortis S.A.(a) | | | 50,928 | | | 1,618,471 | |
| | | | | |
|
|
|
| | |
Portugal—0.0% | | | | | | | |
Sonae SGPS S.A. | | | 55,237 | | | 28,403 | |
| | | | | |
|
|
|
Total Rights
(Identified Cost $1,174,010) | | | | | | 1,646,874 | |
| | | | | |
|
|
|
| | |
| Units—0.2% | | | | | | | |
| | | | | | | | |
| | |
Ireland—0.0% | | | | | | | |
Grafton Group, Plc. | | | 10,061 | | | 109,173 | |
| | | | | |
|
|
|
| | |
Switzerland—0.2% | | | | | | | |
Compagnie Financière Richemont AG | | | 22,334 | | | 969,392 | |
| | | | | |
|
|
|
Total Units
(Identified Cost $709,717) | | | | | | 1,078,565 | |
| | | | | |
|
|
|
|
| Short Term Investments—0.5% | |
| Security Description | | Face
Amount | | Value* | |
| | |
United States—0.5% | | | | | | | |
Federal Home Loan Bank | | $ | 2,050,000 | | $ | 2,049,618 | |
| | | | | |
|
|
|
Total Short Term Investments
(Amortized Cost $2,049,619) | | | | | | 2,049,618 | |
| | | | | |
|
|
|
Total Investments—100.2%
(Identified Cost $350,664,106) (d) | | | | | | 462,997,083 | |
Liabilities in excess of other assets | | | | | | (808,528 | ) |
| | | | | |
|
|
|
| Total Net Assets—100% | | | | | $ | 462,188,555 | |
| | | | | |
|
|
|
*See accompanying notes to financial statements.
MSF-282
Metropolitan Series Fund, Inc.
Morgan Stanley EAFE Index Portfolio
Schedule of Investments as of December 31, 2005
| (a) | A portion or all of the security was held on loan. As of December 31, 2005, the market value of securities loaned was $78,951,067 and the collateral received consisted of cash in the amount of $83,491,294. |
| (d) | The aggregate cost of investments for federal income tax purposes as of December 31, 2005 was $355,384,751 and the composition of unrealized appreciation and depreciation of investment securities was $115,421,057 and $(7,808,725), respectively. |
| (REIT)— | A Real Estate Investment Trust is a pooled investment vehicle that invests primarily in income-producing real estate or real estate related loans or interest. |
| | |
| |
Ten Largest Industries as of
December 31, 2005
| | Percentage of
Total Net Assets
|
Commercial Banks | | 17.6% |
Oil, Gas & Consumable Fuels | | 7.8% |
Pharmaceuticals | | 6.7% |
Metals & Mining | | 3.6% |
Diversified Financial Services | | 3.3% |
Mutual Funds | | 3.3% |
Food Products | | 2.6% |
Wireless Telecommunication Services | | 1.8% |
Food & Staples Retailing | | 1.6% |
Communications Equipment | | 1.4% |
See accompanying notes to financial statements.
MSF-283
Metropolitan Series Fund, Inc.
Morgan Stanley EAFE Index Portfolio
Statement of Assets & Liabilities
December 31, 2005
| | | | | | | |
Assets | | | | | | | |
Investments at value | | | | | $ | 462,997,083 | |
Cash | | | | | | 3,766 | |
Foreign cash at value | | | | | | 106,032 | |
Collateral for securities loaned | | | | | | 83,491,294 | |
Receivable for: | | | | | | | |
Securities sold | | | | | | 450,027 | |
Fund shares sold | | | | | | 1,205,565 | |
Accrued interest and dividends | | | | | | 500,951 | |
Foreign taxes | | | | | | 63,993 | |
| | | | | |
|
|
|
Total Assets | | | | | | 548,818,711 | |
Liabilities | | | | | | | |
Payable for: | | | | | | | |
Fund shares redeemed | | $ | 2,016,757 | | | | |
Securities purchased | | | 785,866 | | | | |
Withholding taxes | | | 22,305 | | | | |
Return of collateral for securities loaned | | | 83,491,294 | | | | |
Accrued expenses: | | | | | | | |
Management fees | | | 113,314 | | | | |
Service and distribution fees | | | 39,267 | | | | |
Other expenses | | | 161,353 | | | | |
| | |
|
| | | | |
Total Liabilities | | | | | | 86,630,156 | |
| | | | | |
|
|
|
Net Assets | | | | | $ | 462,188,555 | |
| | | | | |
|
|
|
Net assets consists of: | | | | | | | |
Capital paid in | | | | | $ | 347,199,880 | |
Undistributed net investment income | | | | | | 7,342,355 | |
Accumulated net realized losses | | | | | | (4,684,623 | ) |
Unrealized appreciation on investments, and foreign currency | | | | | | 112,330,943 | |
| | | | | |
|
|
|
Net Assets | | | | | $ | 462,188,555 | |
| | | | | |
|
|
|
| Computation of offering price: | | | | | | | |
Class A | | | | | | | |
Net asset value and redemption price per share ($242,622,831 divided by 18,735,295 shares outstanding) | | | | | $ | 12.95 | |
| | | | | |
|
|
|
Class B | | | | | | | |
Net asset value and redemption price per share ($145,076,989 divided by 11,365,734 shares outstanding) | | | | | $ | 12.76 | |
| | | | | |
|
|
|
Class E | | | | | | | |
Net asset value and redemption price per share ($74,488,735 divided by 5,776,251 shares outstanding) | | | | | $ | 12.90 | |
| | | | | |
|
|
|
Identified cost of investments | | | | | $ | 350,664,106 | |
| | | | | |
|
|
|
Identified cost of foreign cash | | | | | $ | 105,960 | |
| | | | | |
|
|
|
Statement of Operations
For the Year Ended December 31, 2005
| | | | | | | | |
Investment Income | | | | | | | | |
Dividends | | | | | | $ | 10,351,517 | (a) |
Interest | | | | | | | 332,178 | (b) |
| | | | | | |
|
|
|
| | | | | | | | 10,683,695 | |
Expenses | | | | | | | | |
Management fees | | $ | 1,195,152 | | | | | |
Service and distribution fees—Class B | | | 264,736 | | | | | |
Service and distribution fees—Class E | | | 106,886 | | | | | |
Directors’ fees and expenses | | | 22,257 | | | | | |
Custodian | | | 688,833 | | | | | |
Audit and tax services | | | 20,675 | | | | | |
Legal | | | 10,678 | | | | | |
Printing | | | 98,984 | | | | | |
Insurance | | | 6,958 | | | | | |
Miscellaneous | | | 17,150 | | | | | |
| | |
|
|
| | | | |
Total expenses | | | 2,432,309 | | | | | |
Management fee waivers | | | (19,437 | ) | | | 2,412,872 | |
| | |
|
|
| |
|
|
|
Net Investment Income | | | | | | | 8,270,823 | |
| | | | | | |
|
|
|
Realized and Unrealized Gain | | | | | | | | |
| Realized gain (loss) on: | | | | | | | | |
Investments—net | | | 2,774,801 | | | | | |
Foreign currency transactions—net | | | (161,211 | ) | | | 2,613,590 | |
| | |
|
|
| | | | |
| Unrealized appreciation (depreciation) on: | | | | | | | | |
Investments—net | | | 42,614,797 | | | | | |
Foreign currency transactions—net | | | (20,593 | ) | | | 42,594,204 | |
| | |
|
|
| |
|
|
|
Net gain | | | | | | | 45,207,794 | |
| | | | | | |
|
|
|
Net Increase in Net Assets
From Operations | | | | | | $ | 53,478,617 | |
| | | | | | |
|
|
|
| (a) | Net of foreign taxes of $1,063,667. |
| (b) | Includes income on securities loaned of $297,489. |
See accompanying notes to financial statements.
MSF-284
Metropolitan Series Fund, Inc.
Morgan Stanley EAFE Index Portfolio
Statement of Changes in Net Assets
| | | | | | | | |
| | | Year ended
December 31,
2005
| | | Year ended
December 31,
2004
| |
From Operations | | | | | | | | |
Net investment income | | $ | 8,270,823 | | | $ | 5,797,997 | |
Net realized gain | | | 2,613,590 | | | | 1,227,354 | |
Unrealized appreciation | | | 42,594,204 | | | | 50,156,469 | |
| | |
|
|
| |
|
|
|
Increase in net assets from operations | | | 53,478,617 | | | | 57,181,820 | |
| | |
|
|
| |
|
|
|
From Distributions to Shareholders | | | | | | | | |
Net investment income | | | | | | | | |
Class A | | | (3,703,883 | ) | | | (1,416,519 | ) |
Class B | | | (1,426,756 | ) | | | (198,859 | ) |
Class E | | | (1,116,278 | ) | | | (509,994 | ) |
| | |
|
|
| |
|
|
|
Total distributions | | | (6,246,917 | ) | | | (2,125,372 | ) |
| | |
|
|
| |
|
|
|
Increase in net assets from capital share transactions | | | 57,766,866 | | | | 43,096,448 | |
| | |
|
|
| |
|
|
|
Total increase in net assets | | | 104,998,566 | | | | 98,152,896 | |
| | |
Net Assets | | | | | | | | |
Beginning of the period | | | 357,189,989 | | | | 259,037,093 | |
| | |
|
|
| |
|
|
|
End of the period | | $ | 462,188,555 | | | $ | 357,189,989 | |
| | |
|
|
| |
|
|
|
Undistributed Net Investment Income | | | | | | | | |
End of the period | | $ | 7,342,355 | | | $ | 5,396,562 | |
| | |
|
|
| |
|
|
|
Other Information:
Capital Shares
Transactions in capital shares were as follows:
| | | | | | | | | | | | | | |
| | | Year ended
December 31, 2005
| | | Year ended
December 31, 2004
| |
| | | Shares
| | | $
| | | Shares
| | | $
| |
Class A | | | | | | | | | | | | | | |
Sales | | 4,463,238 | | | $ | 52,400,159 | | | 5,084,867 | | | $ | 51,552,442 | |
Reinvestments | | 331,295 | | | | 3,703,883 | | | 139,972 | | | | 1,416,519 | |
Redemptions | | (4,100,027 | ) | | | (48,753,325 | ) | | (5,223,467 | ) | | | (53,787,230 | ) |
| | |
|
| |
|
|
| |
|
| |
|
|
|
Net increase | | 694,506 | | | $ | 7,350,718 | | | 1,372 | | | $ | (818,269 | ) |
| | |
|
| |
|
|
| |
|
| |
|
|
|
Class B | | | | | | | | | | | | | | |
Sales | | 6,415,006 | | | $ | 74,509,829 | | | 4,436,365 | | | $ | 45,124,724 | |
Reinvestments | | 129,235 | | | | 1,426,756 | | | 19,886 | | | | 198,859 | |
Redemptions | | (1,596,614 | ) | | | (18,873,166 | ) | | (923,799 | ) | | | (9,445,172 | ) |
| | |
|
| |
|
|
| |
|
| |
|
|
|
Net increase | | 4,947,627 | | | $ | 57,063,419 | | | 3,532,452 | | | $ | 35,878,411 | |
| | |
|
| |
|
|
| |
|
| |
|
|
|
Class E | | | | | | | | | | | | | | |
Sales | | 942,419 | | | $ | 11,121,676 | | | 3,735,161 | | | $ | 37,694,618 | |
Reinvestments | | 100,204 | | | | 1,116,278 | | | 50,545 | | | | 509,994 | |
Redemptions | | (1,601,666 | ) | | | (18,885,225 | ) | | (3,004,659 | ) | | | (30,168,306 | ) |
| | |
|
| |
|
|
| |
|
| |
|
|
|
Net increase (decrease) | | (559,043 | ) | | $ | (6,647,271 | ) | | 781,047 | | | $ | 8,036,306 | |
| | |
|
| |
|
|
| |
|
| |
|
|
|
Increase derived from capital share transactions | | 5,083,090 | | | $ | 57,766,866 | | | 4,314,871 | | | $ | 43,096,448 | |
| | |
|
| |
|
|
| |
|
| |
|
|
|
See accompanying notes to financial statements.
MSF-285
Metropolitan Series Fund, Inc.
Morgan Stanley EAFE Index Portfolio
Financial Highlights
| | | | | | | | | | | | | | | | | | | | |
| | | Class A
| |
| | | Year ended December 31,
| |
| | | 2005
| | | 2004
| | | 2003
| | | 2002
| | | 2001
| |
Net Asset Value, Beginning of Period | | $ | 11.64 | | | $ | 9.80 | | | $ | 7.26 | | | $ | 8.75 | | | $ | 11.22 | |
| | |
|
|
| |
|
|
| |
|
|
| |
|
|
| |
|
|
|
Income From Investment Operations | | | | | | | | | | | | | | | | | | | | |
Net investment income | | | 0.25 | | | | 0.21 | | | | 0.14 | | | | 0.10 | | | | 0.09 | |
Net realized and unrealized gain (loss) of investments | | | 1.26 | | | | 1.70 | | | | 2.54 | | | | (1.55 | ) | | | (2.52 | ) |
| | |
|
|
| |
|
|
| |
|
|
| |
|
|
| |
|
|
|
Total from investment operations | | | 1.51 | | | | 1.91 | | | | 2.68 | | | | (1.45 | ) | | | (2.43 | ) |
| | |
|
|
| |
|
|
| |
|
|
| |
|
|
| |
|
|
|
Less Distributions | | | | | | | | | | | | | | | | | | | | |
Distributions from net investment income | | | (0.20 | ) | | | (0.07 | ) | | | (0.14 | ) | | | (0.04 | ) | | | (0.03 | ) |
Distributions from net realized capital gains | | | 0.00 | | | | 0.00 | | | | 0.00 | | | | 0.00 | | | | (0.01 | ) |
| | |
|
|
| |
|
|
| |
|
|
| |
|
|
| |
|
|
|
Total distributions | | | (0.20 | ) | | | (0.07 | ) | | | (0.14 | ) | | | (0.04 | ) | | | (0.04 | ) |
| | |
|
|
| |
|
|
| |
|
|
| |
|
|
| |
|
|
|
Net Asset Value, End of Period | | $ | 12.95 | | | $ | 11.64 | | | $ | 9.80 | | | $ | 7.26 | | | $ | 8.75 | |
| | |
|
|
| |
|
|
| |
|
|
| |
|
|
| |
|
|
|
Total Return (%) | | | 13.2 | | | | 19.6 | | | | 37.6 | | | | (16.6 | ) | | | (21.7 | ) |
Ratio of operating expenses to average net assets (%) | | | 0.51 | | | | 0.59 | | | | 0.71 | | | | 0.73 | | | | 0.70 | |
Ratio of operating expenses to average net assets without giving effect to the contractual expense agreement would have been (%) | | | 0.51 | | | | — | | | | — | | | | 0.79 | | | | 0.82 | |
Ratio of net investment income to average net assets (%) | | | 2.19 | | | | 2.01 | | | | 1.85 | | | | 1.43 | | | | 1.00 | |
Portfolio turnover rate (%) | | | 22 | | | | 38 | | | | 43 | | | | 23 | | | | 9 | |
Net assets, end of period (000) | | $ | 242,623 | | | $ | 210,034 | | | $ | 176,835 | | | $ | 112,325 | | | $ | 112,775 | |
| | | | | | | | | | | | | | | | | | | | |
| | | Class B
| |
| | | Year ended December 31,
| | | January 2, 2001(a)
through
December 31,
2001
| |
| | | 2005
| | | 2004
| | | 2003
| | | 2002
| | |
Net Asset Value, Beginning of Period | | $ | 11.48 | | | $ | 9.68 | | | $ | 7.18 | | | $ | 8.66 | | | $ | 11.12 | |
| | |
|
|
| |
|
|
| |
|
|
| |
|
|
| |
|
|
|
Income From Investment Operations | | | | | | | | | | | | | | | | | | | | |
Net investment income | | | 0.19 | | | | 0.12 | | | | 0.11 | | | | 0.06 | | | | 0.04 | |
Net realized and unrealized gain (loss) of investments | | | 1.27 | | | | 1.74 | | | | 2.51 | | | | (1.50 | ) | | | (2.46 | ) |
| | |
|
|
| |
|
|
| |
|
|
| |
|
|
| |
|
|
|
Total from investment operations | | | 1.46 | | | | 1.86 | | | | 2.62 | | | | (1.44 | ) | | | (2.42 | ) |
| | |
|
|
| |
|
|
| |
|
|
| |
|
|
| |
|
|
|
Less Distributions | | | | | | | | | | | | | | | | | | | | |
Distributions from net investment income | | | (0.18 | ) | | | (0.06 | ) | | | (0.12 | ) | | | (0.04 | ) | | | (0.03 | ) |
Distributions from net realized capital gains | | | 0.00 | | | | 0.00 | | | | 0.00 | | | | 0.00 | | | | (0.01 | ) |
| | |
|
|
| |
|
|
| |
|
|
| |
|
|
| |
|
|
|
Total distributions | | | (0.18 | ) | | | (0.06 | ) | | | (0.12 | ) | | | (0.04 | ) | | | (0.04 | ) |
| | |
|
|
| |
|
|
| |
|
|
| |
|
|
| |
|
|
|
Net Asset Value, End of Period | | $ | 12.76 | | | $ | 11.48 | | | $ | 9.68 | | | $ | 7.18 | | | $ | 8.66 | |
| | |
|
|
| |
|
|
| |
|
|
| |
|
|
| |
|
|
|
Total Return (%) | | | 12.9 | | | | 19.3 | | | | 37.2 | | | | (16.8 | ) | | | (21.8 | )(b) |
Ratio of operating expenses to average net assets (%) | | | 0.76 | | | | 0.84 | | | | 0.96 | | | | 0.98 | | | | 0.95 | (c) |
Ratio of operating expenses to average net assets without giving effect to the contractual expense agreement would have been (%) | | | 0.76 | | | | — | | | | — | | | | 1.04 | | | | 1.07 | (c) |
Ratio of net investment income to average net assets (%) | | | 1.86 | | | | 1.60 | | | | 1.45 | | | | 1.11 | | | | 0.46 | (c) |
Portfolio turnover rate (%) | | | 22 | | | | 38 | | | | 43 | | | | 23 | | | | 9 | |
Net assets, end of period (000) | | $ | 145,077 | | | $ | 73,707 | | | $ | 27,933 | | | $ | 9,654 | | | $ | 4,099 | |
| (a) | Commencement of operations. |
| (b) | Period less than one year is not computed on an annualized basis. |
| (c) | Computed on an annualized basis. |
See accompanying notes to financial statements.
MSF-286
Metropolitan Series Fund, Inc.
Morgan Stanley EAFE Index Portfolio
Financial Highlights
| | | | | | | | | | | | | | | | | | | | |
| | | Class E
| |
| | | Year ended December 31,
| | | May 1, 2001(a)
through
December 31,
2001
| |
| | | 2005
| | | 2004
| | | 2003
| | | 2002
| | |
Net Asset Value, Beginning of Period | | $ | 11.59 | | | $ | 9.77 | | | $ | 7.25 | | | $ | 8.74 | | | $ | 10.43 | |
| | |
|
|
| |
|
|
| |
|
|
| |
|
|
| |
|
|
|
Income From Investment Operations | | | | | | | | | | | | | | | | | | | | |
Net investment income | | | 0.26 | | | | 0.19 | | | | 0.13 | | | | 0.06 | | | | 0.00 | |
Net realized and unrealized gain (loss) of investments | | | 1.23 | | | | 1.70 | | | | 2.52 | | | | (1.51 | ) | | | (1.69 | ) |
| | |
|
|
| |
|
|
| |
|
|
| |
|
|
| |
|
|
|
Total from investment operations | | | 1.49 | | | | 1.89 | | | | 2.65 | | | | (1.45 | ) | | | (1.69 | ) |
| | |
|
|
| |
|
|
| |
|
|
| |
|
|
| |
|
|
|
Less Distributions | | | | | | | | | | | | | | | | | | | | |
Distributions from net investment income | | | (0.18 | ) | | | (0.07 | ) | | | (0.13 | ) | | | (0.04 | ) | | | 0.00 | |
| | |
|
|
| |
|
|
| |
|
|
| |
|
|
| |
|
|
|
Total distributions | | | (0.18 | ) | | | (0.07 | ) | | | (0.13 | ) | | | (0.04 | ) | | | 0.00 | |
| | |
|
|
| |
|
|
| |
|
|
| |
|
|
| |
|
|
|
Net Asset Value, End of Period | | $ | 12.90 | | | $ | 11.59 | | | $ | 9.77 | | | $ | 7.25 | | | $ | 8.74 | |
| | |
|
|
| |
|
|
| |
|
|
| |
|
|
| |
|
|
|
Total Return (%) | | | 13.0 | | | | 19.4 | | | | 37.3 | | | | (16.7 | ) | | | (16.2 | )(b) |
Ratio of operating expenses to average net assets (%) | | | 0.66 | | | | 0.74 | | | | 0.86 | | | | 0.88 | | | | 0.85 | (c) |
Ratio of operating expenses to average net assets without giving effect to the contractual expense agreement would have been (%) | | | 0.66 | | | | — | | | | — | | | | 0.94 | | | | 0.97 | (c) |
Ratio of net investment income to average net assets (%) | | | 2.05 | | | | 1.91 | | | | 1.42 | | | | 1.02 | | | | 0.00 | (c) |
Portfolio turnover rate (%) | | | 22 | | | | 38 | | | | 43 | | | | 23 | | | | 9 | |
Net assets, end of period (000) | | $ | 74,489 | | | $ | 73,449 | | | $ | 54,269 | | | $ | 9,838 | | | $ | 61 | |
| (a) | Commencement of operations. |
| (b) | Period less than one year is not computed on an annualized basis. |
| (c) | Computed on an annualized basis. |
See accompanying notes to financial statements.
MSF-287
Metropolitan Series Fund, Inc.
Oppenheimer Global Equity Portfolio
Schedule of Investments as of December 31, 2005
Common Stock—95.6% of Total Net Assets
| | | | | |
| Security Description | | Shares | | Value* |
| | | | | | |
| | |
Australia—0.5% | | | | | |
Australia & New Zealand Banking Group, Ltd. | | 35,222 | | $ | 617,559 |
Macquarie Airports | | 343,601 | | | 795,718 |
| | | | |
|
|
| | | | | | 1,413,277 |
| | | | |
|
|
| | |
Bermuda—0.4% | | | | | |
Everest Re Group, Ltd. | | 9,600 | | | 963,360 |
| | | | |
|
|
| | |
Brazil—1.0% | | | | | |
Empresa Brasileira de Aeronautica S.A. (ADR) (a) | | 72,200 | | | 2,823,020 |
| | | | |
|
|
| | |
Canada—1.8% | | | | | |
Husky Energy, Inc. | | 68,900 | | | 3,486,513 |
Manulife Financial Corp. | | 25,000 | | | 1,463,828 |
| | | | |
|
|
| | | | | | 4,950,341 |
| | | | |
|
|
| | |
Cayman Islands—3.4% | | | | | |
ACE, Ltd. | | 34,200 | | | 1,827,648 |
GlobalSantaFe Corp. | | 56,300 | | | 2,710,845 |
Transocean, Inc. (b) | | 54,400 | | | 3,791,136 |
XL Capital, Ltd. (Class A) | | 16,100 | | | 1,084,818 |
| | | | |
|
|
| | | | | | 9,414,447 |
| | | | |
|
|
| | |
Denmark—0.3% | | | | | |
Novo Nordisk A/S | | 12,200 | | | 687,227 |
| | | | |
|
|
| | |
Finland—0.5% | | | | | |
Fortum Oyj | | 65,900 | | | 1,236,210 |
| | | | |
|
|
| | |
France—5.9% | | | | | |
Essilor International S.A. | | 4,650 | | | 375,422 |
JC Decaux S.A. | | 36,869 | | | 860,321 |
LVMH Moet Hennessy Louis Vuitton S.A. | | 36,251 | | | 3,222,101 |
Sanofi-Aventis (a) | | 52,062 | | | 4,562,672 |
Société Générale | | 21,161 | | | 2,603,904 |
Technip S.A. | | 52,530 | | | 3,187,243 |
Total S.A. (a) | | 4,982 | | | 1,254,181 |
| | | | |
|
|
| | | | | | 16,065,844 |
| | | | |
|
|
| | |
Germany—3.8% | | | | | |
Allianz AG | | 20,570 | | | 3,116,505 |
Bayerische Motoren Werke AG | | 36,260 | | | 1,591,843 |
SAP AG | | 15,740 | | | 2,853,577 |
Siemens AG | | 34,525 | | | 2,959,582 |
| | | | |
|
|
| | | | | | 10,521,507 |
| | | | |
|
|
| | |
Hong Kong—1.3% | | | | | |
Hong Kong & China Gas Co., Ltd. | | 602,000 | | | 1,279,995 |
Hutchison Whampoa, Ltd. | | 106,000 | | | 1,007,681 |
Television Broadcasts, Ltd. | | 217,000 | | | 1,156,013 |
| | | | |
|
|
| | | | | | 3,443,689 |
| | | | |
|
|
| | |
India—0.4% | | | | | |
ICICI Bank, Ltd. (ADR) | | 37,900 | | | 1,091,520 |
| | | | |
|
|
| | | | | |
| Security Description | | Shares | | Value* |
| | | | | | |
| | |
Ireland—0.4% | | | | | |
Anglo Irish Bank Corp., Plc. | | 78,041 | | $ | 1,186,475 |
| | | | |
|
|
| | |
Japan—11.4% | | | | | |
Canon, Inc. (a) | | 15,600 | | | 917,751 |
Chugai Pharmaceutical Co., Ltd. (a) | | 56,700 | | | 1,222,810 |
Credit Saison Co., Ltd. | | 36,100 | | | 1,798,189 |
Fanuc, Ltd. | | 9,400 | | | 805,449 |
Hoya Corp. | | 49,000 | | | 1,772,603 |
JGC Corp. (a) | | 36,000 | | | 692,436 |
Kao Corp. | | 38,000 | | | 1,016,073 |
KDDI Corp. | | 568 | | | 3,271,788 |
Keyence Corp. | | 5,100 | | | 1,464,885 |
Murata Manufacturing Co., Ltd. | | 37,500 | | | 2,428,088 |
Nidec Corp. | | 12,300 | | | 1,058,793 |
Nintendo Co., Ltd. | | 8,000 | | | 972,886 |
Resona Holdings, Inc. | | 424 | | | 1,699,619 |
Shionogi & Co., Ltd. | | 143,000 | | | 2,019,516 |
Shiseido Co., Ltd. | | 74,130 | | | 1,379,164 |
Sony Corp. | | 84,447 | | | 3,449,776 |
Square Enix Co., Ltd. | | 37,800 | | | 1,064,882 |
Takeda Pharmaceutical Co., Ltd. | | 18,800 | | | 1,015,276 |
Toyota Motor Corp. | | 50,500 | | | 2,643,315 |
Yahoo! Japan Corp. | | 474 | | | 721,058 |
| | | | |
|
|
| | | | | | 31,414,357 |
| | | | |
|
|
| | |
Mexico—2.0% | | | | | |
Fomento Economico Mexicano S.A. de C.V. | | 215,500 | | | 1,561,190 |
Grupo Modelo S.A. de C.V. | | 292,600 | | | 1,059,871 |
Grupo Televisa S.A. (ADR) | | 34,500 | | | 2,777,250 |
| | | | |
|
|
| | | | | | 5,398,311 |
| | | | |
|
|
| | |
Netherlands—2.4% | | | | | |
European Aeronautic Defense & Space Co. | | 78,927 | | | 2,980,963 |
Koninklijke Philips Electronics NV | | 112,408 | | | 3,493,867 |
| | | | |
|
|
| | | | | | 6,474,830 |
| | | | |
|
|
| | |
Norway—0.2% | | | | | |
Tandberg ASA | | 105,500 | | | 643,593 |
| | | | |
|
|
| | |
Panama—0.9% | | | | | |
Carnival Corp. | | 45,700 | | | 2,443,579 |
| | | | |
|
|
| | |
Portugal—0.3% | | | | | |
Energias de Portugal S.A. | | 264,077 | | | 814,123 |
| | | | |
|
|
| | |
Singapore—0.4% | | | | | |
Singapore Press Holdings, Ltd. | | 444,000 | | | 1,145,478 |
| | | | |
|
|
| | |
South Korea—2.5% | | | | | |
Hyundai Heavy Industries Co., Ltd. | | 20,410 | | | 1,546,723 |
Samsung Electronics Co., Ltd. | | 4,645 | | | 2,990,189 |
SK Telecom Co., Ltd. (ADR) (a) | | 118,900 | | | 2,412,481 |
| | | | |
|
|
| | | | | | 6,949,393 |
| | | | |
|
|
*See accompanying notes to financial statements.
MSF-288
Metropolitan Series Fund, Inc.
Oppenheimer Global Equity Portfolio
Schedule of Investments as of December 31, 2005
Common Stock—(Continued)
| | | | | |
| Security Description | | Shares | | Value* |
| | | | | | |
| | |
Spain—0.7% | | | | | |
Industria de Diseno Textil S.A. | | 57,000 | | $ | 1,859,489 |
| | | | |
|
|
| | |
Sweden—4.7% | | | | | |
Hennes & Mauritz AB (Series B) (a) | | 130,000 | | | 4,418,050 |
Investor AB | | 59,167 | | | 1,035,706 |
Telefonaktiebolaget LM Ericsson (Class B) | | 2,173,300 | | | 7,474,833 |
| | | | |
|
|
| | | | | | 12,928,589 |
| | | | |
|
|
| | |
Switzerland—3.1% | | | | | |
Credit Suisse Group | | 59,565 | | | 3,034,303 |
Novartis AG | | 29,690 | | | 1,558,069 |
Roche Holding AG | | 23,362 | | | 3,505,595 |
Syngenta AG | | 4,109 | | | 510,939 |
| | | | |
|
|
| | | | | | 8,608,906 |
| | | | |
|
|
| | |
Taiwan—0.6% | | | | | |
Taiwan Semiconductor Manufacturing Co., Ltd. | | 903,097 | | | 1,709,861 |
| | | | |
|
|
| | |
United Kingdom—12.5% | | | | | |
3i Group, Plc. | | 83,735 | | | 1,219,719 |
BP, Plc. (ADR) | | 38,300 | | | 2,459,626 |
Burberry Group, Plc. | | 115,773 | | | 853,701 |
Cadbury Schweppes, Plc. | | 301,671 | | | 2,846,996 |
Diageo, Plc. | | 9,100 | | | 131,679 |
GUS, Plc. | | 52,313 | | | 926,703 |
HSBC Holdings, Plc. | | 164,836 | | | 2,640,711 |
Pearson, Plc. | | 128,572 | | | 1,519,292 |
Prudential, Plc. | | 226,012 | | | 2,138,511 |
Reckitt Benckiser, Plc. | | 152,858 | | | 5,038,674 |
Royal Bank of Scotland Group, Plc. | | 136,855 | | | 4,128,139 |
RT Group, Plc. (c) (d) | | 282,264 | | | 0 |
Smith & Nephew, Plc. | | 208,228 | | | 1,915,104 |
Tesco, Plc. | | 148,230 | | | 843,955 |
Vodafone Group, Plc. | | 3,165,592 | | | 6,828,504 |
WPP Group, Plc. | | 81,765 | | | 883,979 |
| | | | |
|
|
| | | | | | 34,375,293 |
| | | | |
|
|
| | |
United States—34.2% | | | | | |
3M Co. | | 28,200 | | | 2,185,500 |
Adobe Systems, Inc. (b) | | 47,200 | | | 1,744,512 |
Advanced Micro Devices, Inc. (b) | | 177,200 | | | 5,422,320 |
Affymetrix, Inc. (a) | | 28,900 | | | 1,379,975 |
Altera Corp. (b) | | 66,700 | | | 1,235,951 |
Altria Group, Inc. | | 9,800 | | | 732,256 |
Amazon.com, Inc. (a) (b) | | 21,100 | | | 994,865 |
American Express Co. | | 43,900 | | | 2,259,094 |
Amgen, Inc. (b) | | 34,500 | | | 2,720,670 |
Amylin Pharmaceuticals, Inc. (a) (b) | | 11,700 | | | 467,064 |
Avon Products, Inc. | | 24,300 | | | 693,765 |
Berkshire Hathaway, Inc. (Class B) (b) | | 540 | | | 1,585,170 |
Biomet, Inc. | | 27,500 | | | 1,005,675 |
Boston Scientific Corp. (b) | | 57,200 | | | 1,400,828 |
Burlington Resources, Inc. | | 32,800 | | | 2,827,360 |
Cadence Design Systems, Inc. (b) | | 51,100 | | | 864,612 |
Chevron Corp. | | 31,300 | | | 1,776,901 |
Cisco Systems, Inc. (b) | | 83,900 | | | 1,436,368 |
| | | | | |
| Security Description | | Shares | | Value* |
| | | | | | |
| | |
United States—(Continued) | | | | | |
Citigroup, Inc. | | 15,200 | | $ | 737,656 |
Coach, Inc. (b) | | 44,400 | | | 1,480,296 |
Corning, Inc. (b) | | 167,900 | | | 3,300,914 |
Cree, Inc. (a) (b) | | 51,600 | | | 1,302,384 |
eBay, Inc. (b) | | 86,800 | | | 3,754,100 |
Emerson Electric Co. | | 23,700 | | | 1,770,390 |
Express Scripts, Inc. (b) | | 20,900 | | | 1,751,420 |
Genentech, Inc. (b) | | 16,000 | | | 1,480,000 |
Gilead Sciences, Inc. (b) | | 40,300 | | | 2,120,989 |
ImClone Systems, Inc. (a) (b) | | 17,100 | | | 585,504 |
International Business Machines Corp. | | 25,400 | | | 2,087,880 |
International Game Technology | | 56,200 | | | 1,729,836 |
International Rectifier Corp. (a) (b) | | 37,600 | | | 1,199,440 |
Intuit, Inc. (b) | | 40,300 | | | 2,147,990 |
JPMorgan Chase & Co. | | 57,700 | | | 2,290,113 |
Juniper Networks, Inc. (b) | | 31,800 | | | 709,140 |
Lockheed Martin Corp. | | 20,200 | | | 1,285,326 |
Medtronic, Inc. | | 11,000 | | | 633,270 |
Microsoft Corp. | | 143,800 | | | 3,760,370 |
Morgan Stanley | | 53,000 | | | 3,007,220 |
Nektar Therapeutics (a) | | 17,900 | | | 294,634 |
Northern Trust Corp. | | 52,100 | | | 2,699,822 |
Northrop Grumman Corp. | | 22,300 | | | 1,340,453 |
Novell, Inc. (b) | | 200,400 | | | 1,769,532 |
Pfizer, Inc. | | 49,300 | | | 1,149,676 |
QUALCOMM, Inc. | | 51,900 | | | 2,235,852 |
Quest Diagnostics, Inc. | | 41,200 | | | 2,120,976 |
Raytheon Co. | | 43,300 | | | 1,738,495 |
Silicon Laboratories, Inc. (a) (b) | | 11,700 | | | 428,922 |
Sirius Satellite Radio, Inc. (a) | | 348,870 | | | 2,337,429 |
Starbucks Corp. (b) | | 43,000 | | | 1,290,430 |
Sun Microsystems, Inc. (b) | | 225,900 | | | 946,521 |
The Boeing Co. | | 24,000 | | | 1,685,760 |
The Gap, Inc. | | 39,300 | | | 693,252 |
The Procter & Gamble Co. | | 18,940 | | | 1,096,247 |
The Walt Disney Co. | | 65,800 | | | 1,577,226 |
Theravance, Inc. (b) | | 23,500 | | | 529,220 |
Tiffany & Co. | | 18,000 | | | 689,220 |
Wyeth | | 27,400 | | | 1,262,318 |
| | | | |
|
|
| | | | | | 93,753,109 |
| | | | |
|
|
Total Common Stock
(Identified Cost $227,235,982) | | | | | 262,315,828 |
| | | | |
|
|
| | |
| Preferred Stock—1.5% | | | | | |
| | |
Brazil—0.5% | | | | | |
Tele Norte Leste Participacoes S.A. | | 80,000 | | | 1,434,513 |
| | | | |
|
|
| | |
Germany—0.4% | | | | | |
Porsche AG | | 1,720 | | | 1,235,502 |
| | | | |
|
|
| | |
Mexico—0.6% | | | | | |
Companhia de Bebidas das Americas (ADR) (a) | | 42,400 | | | 1,613,320 |
| | | | |
|
|
Total Preferred Stock
(Identified Cost $3,623,359) | | | | | 4,283,335 |
| | | | |
|
|
*See accompanying notes to financial statements.
MSF-289
Metropolitan Series Fund, Inc.
Oppenheimer Global Equity Portfolio
Schedule of Investments as of December 31, 2005
Short Term Investments—3.1%
| | | | | | | |
| Security Description | | Face
Amount | | Value* | |
| | | | | | | | |
| | |
United States—3.1% | | | | | | | |
State Street Corp. Repurchase Agreement dated 12/30/05 at 2.500% to be repurchased at $8,572,381 on 01/03/06, collateralized by $8,890,000 U.S. Treasury Note 3.250% due 01/15/09 with a value of $8,745,475. | | $ | 8,570,000 | | $ | 8,570,000 | |
| | | | | |
|
|
|
Total Short Term Investments
(Amortized Cost $8,570,000) | | | | | | 8,570,000 | |
| | | | | |
|
|
|
Total Investments—100.2%
(Identified Cost $239,429,341) (e) | | | | | | 275,169,163 | |
Liabilities in excess of other assets | | | | | | (668,090 | ) |
| | | | | |
|
|
|
| Total Net Assets—100% | | | | | $ | 274,501,073 | |
| | | | | |
|
|
|
| (a) | A portion or all of the security was held on loan. As of December 31, 2005, the market value of securities loaned was $23,872,838 and the collateral received consisted of cash in the amount of $24,892,532. |
| (c) | Non-Income Producing; issuer filed under Chapter 11 of the Federal Bankruptcy Code. |
| (e) | The aggregate cost of investments for federal income tax purposes as of December 31, 2005 was $239,881,630 and the composition of unrealized appreciation and (depreciation) of investment securities was $41,097,476 and ($5,809,943), respectively. |
| (ADR)— | An American Depositary Receipt is a certificate issued by a custodian bank representing the right to receive securities of the foreign issuer described. Trading on exchanges not located in the United States or Canada significantly influences the value of ADRs. |
| | |
| |
Ten Largest Industries as of December 31, 2005
| | Percentage of
Total Net Assets
|
Commercial Banks | | 6.8% |
Wireless Telecommunication Services | | 4.5% |
Energy Equipment & Services | | 3.5% |
Diversified Financial Services | | 3.0% |
Electronic Equipment & Instruments | | 2.9% |
Household Durables | | 2.9% |
Internet & Catalog Retail | | 2.1% |
Capital Markets | | 1.1% |
Food Products | | 1.0% |
Consumer Finance | | 0.8% |
*See accompanying notes to financial statements.
MSF-290
Metropolitan Series Fund, Inc.
Oppenheimer Global Equity Portfolio
|
Statement of Assets & Liabilities
|
December 31, 2005
| | | | | | |
Assets | | | | | | |
Investments at value | | | | | $ | 275,169,163 |
Cash | | | | | | 766 |
Foreign cash at value | | | | | | 43,336 |
Collateral for securities loaned | | | | | | 24,892,532 |
Receivable for: | | | | | | |
Securities sold | | | | | | 88,490 |
Fund shares sold | | | | | | 383,964 |
Accrued interest and dividends | | | | | | 503,607 |
Foreign taxes | | | | | | 43,237 |
| | | | | |
|
|
Total Assets | | | | | | 301,125,095 |
Liabilities | | | | | | |
Payable for: | | | | | | |
Fund shares redeemed | | $ | 1,029,039 | | | |
Securities purchased | | | 108,082 | | | |
Withholding taxes | | | 39,206 | | | |
Return of collateral for securities loaned | | | 24,892,532 | | | |
Accrued expenses: | | | | | | |
Management fees | | | 134,393 | | | |
Service and distribution fees | | | 8,021 | | | |
Other expenses | | | 412,749 | | | |
| | |
|
| | | |
Total Liabilities | | | | | | 26,624,022 |
| | | | | |
|
|
Net Assets | | | | | $ | 274,501,073 |
| | | | | |
|
|
Net assets consists of: | | | | | | |
Capital paid in | | | | | $ | 225,423,884 |
Undistributed net investment income | | | | | | 7,339,997 |
Accumulated net realized gains | | | | | | 5,998,711 |
Unrealized appreciation on investments and foreign currency | | | | | | 35,738,481 |
| | | | | |
|
|
Net Assets | | | | | $ | 274,501,073 |
| | | | | |
|
|
| Computation of offering price: | | | | | | |
Class A | | | | | | |
Net asset value and redemption price per
share ($226,036,574 divided by 14,960,398 shares outstanding) | | | | | $ | 15.11 |
| | | | | |
|
|
Class B | | | | | | |
Net asset value and redemption price per share ($27,790,220 divided by 1,845,695 shares outstanding) | | | | | $ | 15.06 |
| | | | | |
|
|
Class E | | | | | | |
Net asset value and redemption price per share ($20,674,279 divided by 1,372,871 shares outstanding) | | | | | $ | 15.06 |
| | | | | |
|
|
Identified cost of investments | | | | | $ | 239,429,341 |
| | | | | |
|
|
Identified cost of foreign cash | | | | | $ | 43,409 |
| | | | | |
|
|
Year Ended December 31, 2005
| | | | | | | | |
Investment Income | | | | | | | | |
Dividends | | | | | | $ | 4,039,017 | (a) |
Interest | | | | | | | 166,493 | (b) |
| | | | | | |
|
|
|
| | | | | | | | 4,205,510 | |
Expenses | | | | | | | | |
Management fees | | $ | 1,397,667 | | | | | |
Service and distribution fees—Class B | | | 29,566 | | | | | |
Service and distribution fees—Class E | | | 25,866 | | | | | |
Directors’ fees and expenses | | | 22,264 | | | | | |
Custodian | | | 291,198 | | | | | |
Audit and tax services | | | 20,560 | | | | | |
Legal | | | 18,400 | | | | | |
Printing | | | 414,830 | | | | | |
Insurance | | | 4,265 | | | | | |
Miscellaneous | | | 6,547 | | | | | |
| | |
|
|
| | | | |
Total expenses | | | | | | | 2,231,163 | |
| | | | | | |
|
|
|
Net Investment Income | | | | | | | 1,974,347 | |
| | | | | | |
|
|
|
Realized and Unrealized Gain | | | | | | | | |
| Realized gain on: | | | | | | | | |
Investments—net | | | 26,349,002 | | | | | |
Foreign currency transactions—net | | | 5,378,127 | | | | | |
| | |
|
|
| | | | |
| | | | | | | | 31,727,129 | |
| Unrealized appreciation (depreciation) on: | | | | | | | | |
Investments—net | | | 2,596,468 | | | | | |
Foreign currency transactions—net | | | (8,555 | ) | | | | |
| | |
|
|
| | | | |
| | | | | | | | 2,587,913 | |
| | | | | | |
|
|
|
Net gain | | | | | | | 34,315,042 | |
| | | | | | |
|
|
|
Net Increase in Net Assets
From Operations | | | | | | $ | 36,289,389 | |
| | | | | | |
|
|
|
| (a) | Net of foreign taxes of $378,714. |
| (b) | Includes income on securities loaned of $7,916. |
See accompanying notes to financial statements.
MSF-291
Metropolitan Series Fund, Inc.
Oppenheimer Global Equity Portfolio
Statement of Changes in Net Assets
| | | | | | | | |
| | | Year ended
December 31,
2005
| | | Year ended
December 31,
2004
| |
From Operations | | | | | | | | |
Net investment income | | $ | 1,974,347 | | | $ | 1,815,918 | |
Net realized gain | | | 31,727,129 | | | | 18,990,663 | |
Unrealized appreciation | | | 2,587,913 | | | | 9,393,930 | |
| | |
|
|
| |
|
|
|
Increase in net assets from operations | | | 36,289,389 | | | | 30,200,511 | |
| | |
|
|
| |
|
|
|
From Distributions to Shareholders | | | | | | | | |
Net investment income | | | | | | | | |
Class A | | | (1,195,708 | ) | | | (2,956,330 | ) |
Class B | | | (28,384 | ) | | | 0 | |
Class E | | | (72,970 | ) | | | (195,665 | ) |
| | |
|
|
| |
|
|
|
Total distributions | | | (1,297,062 | ) | | | (3,151,995 | ) |
| | |
|
|
| |
|
|
|
Increase (decrease) in net assets from capital share transactions | | | 25,378,718 | | | | (2,767,603 | ) |
| | |
|
|
| |
|
|
|
Total increase in net assets | | | 60,371,045 | | | | 24,280,913 | |
Net Assets | | | | | | | | |
Beginning of the period | | | 214,130,028 | | | | 189,849,115 | |
| | |
|
|
| |
|
|
|
End of the period | | $ | 274,501,073 | | | $ | 214,130,028 | |
| | |
|
|
| |
|
|
|
Undistributed Net Investment Income | | | | | | | | |
End of the period | | $ | 7,339,997 | | | $ | 1,135,164 | |
| | |
|
|
| |
|
|
|
Other Information:
Capital Shares
Transactions in capital shares were as follows:
| | | | | | | | | | | | | | |
| | | Year ended December 31, 2005
| | | Year ended December 31, 2004
| |
| | | Shares
| | | $
| | | Shares
| | | $
| |
Class A | | | | | | | | | | | | | | |
Sales | | 2,951,153 | | | $ | 40,627,131 | | | 764,035 | | | $ | 8,928,820 | |
Reinvestments | | 93,269 | | | | 1,195,708 | | | 254,417 | | | | 2,956,330 | |
Redemptions | | (2,999,866 | ) | | | (41,159,654 | ) | | (1,786,716 | ) | | | (20,820,380 | ) |
| | |
|
| |
|
|
| |
|
| |
|
|
|
Net increase (decrease) | | 44,556 | | | $ | 663,185 | | | (768,264 | ) | | $ | (8,935,230 | ) |
| | |
|
| |
|
|
| |
|
| |
|
|
|
Class B | | | | | | | | | | | | | | |
Sales | | 1,767,004 | | | $ | 24,687,695 | | | 293,148 | | | $ | 3,437,984 | |
Reinvestments | | 2,219 | | | | 28,384 | | | 0 | | | | 0 | |
Redemptions | | (203,081 | ) | | | (2,819,690 | ) | | (13,595 | ) | | | (160,011 | ) |
| | |
|
| |
|
|
| |
|
| |
|
|
|
Net increase | | 1,566,142 | | | $ | 21,896,389 | | | 279,553 | | | $ | 3,277,973 | |
| | |
|
| |
|
|
| |
|
| |
|
|
|
Class E | | | | | | | | | | | | | | |
Sales | | 525,760 | | | $ | 7,300,604 | | | 521,138 | | | $ | 6,042,318 | |
Reinvestments | | 5,705 | | | | 72,970 | | | 16,882 | | | | 195,665 | |
Redemptions | | (331,933 | ) | | | (4,554,430 | ) | | (286,980 | ) | | | (3,348,329 | ) |
| | |
|
| |
|
|
| |
|
| |
|
|
|
Net increase | | 199,532 | | | $ | 2,819,144 | | | 251,040 | | | $ | 2,889,654 | |
| | |
|
| |
|
|
| |
|
| |
|
|
|
Increase (decrease) derived from capital share transactions | | 1,810,230 | | | $ | 25,378,718 | | | (237,671 | ) | | $ | (2,767,603 | ) |
| | |
|
| |
|
|
| |
|
| |
|
|
|
See accompanying notes to financial statements.
MSF-292
Metropolitan Series Fund, Inc.
Oppenheimer Global Equity Portfolio
Financial Highlights
| | | | | | | | | | | | | | | | | | | | |
| | | Class A
| |
| | | Year ended December 31,
| |
| | | 2005
| | | 2004
| | | 2003
| | | 2002
| | | 2001
| |
Net Asset Value, Beginning of Period | | $ | 13.09 | | | $ | 11.43 | | | $ | 8.98 | | | $ | 10.86 | | | $ | 14.62 | |
| | |
|
|
| |
|
|
| |
|
|
| |
|
|
| |
|
|
|
Income From Investment Operations | | | | | | | | | | | | | | | | | | | | |
Net investment income | | | 0.12 | | | | 0.11 | | | | 0.14 | | | | 0.13 | | | | 0.35 | |
Net realized and unrealized gain (loss) of investments | | | 1.98 | | | | 1.74 | | | | 2.52 | | | | (1.84 | ) | | | (2.55 | ) |
| | |
|
|
| |
|
|
| |
|
|
| |
|
|
| |
|
|
|
Total from investment operations | | | 2.10 | | | | 1.85 | | | | 2.66 | | | | (1.71 | ) | | | (2.20 | ) |
| | |
|
|
| |
|
|
| |
|
|
| |
|
|
| |
|
|
|
Less Distributions | | | | | | | | | | | | | | | | | | | | |
Distributions from net investment income | | | (0.08 | ) | | | (0.19 | ) | | | (0.21 | ) | | | (0.17 | ) | | | (0.31 | ) |
Distributions from net realized capital gains | | | 0.00 | | | | 0.00 | | | | 0.00 | | | | 0.00 | | | | (1.25 | ) |
| | |
|
|
| |
|
|
| |
|
|
| |
|
|
| |
|
|
|
Total distributions | | | (0.08 | ) | | | (0.19 | ) | | | (0.21 | ) | | | (0.17 | ) | | | (1.56 | ) |
| | |
|
|
| |
|
|
| |
|
|
| |
|
|
| |
|
|
|
Net Asset Value, End of Period | | $ | 15.11 | | | $ | 13.09 | | | $ | 11.43 | | | $ | 8.98 | | | $ | 10.86 | |
| | |
|
|
| |
|
|
| |
|
|
| |
|
|
| |
|
|
|
Total Return (%) | | | 16.2 | | | | 16.4 | | | | 30.5 | | | | (16.0 | ) | | | (16.1 | ) |
Ratio of operating expenses to average net assets (%) | | | 0.93 | | | | 0.81 | | | | 0.84 | | | | 0.81 | | | | 0.80 | |
Ratio of net investment income to average net assets (%) | | | 0.87 | | | | 0.95 | | | | 1.35 | | | | 1.27 | | | | 2.90 | |
Portfolio turnover rate (%) | | | 115 | | | | 79 | | | | 65 | | | | 45 | | | | 36 | |
Net assets, end of period (000) | | $ | 226,037 | | | $ | 195,181 | | | $ | 179,334 | | | $ | 143,518 | | | $ | 183,296 | |
| | | | | | | | |
| | | Class B
| |
| | | Year ended
December 31,
2005
| | | April 26, 2004(a)
through
December 31,
2004
| |
Net Asset Value, Beginning of Period | | $ | 13.04 | | | $ | 11.59 | |
| | |
|
|
| |
|
|
|
Income From Investment Operations | | | | | | | | |
Net investment income | | | 0.05 | | | | 0.02 | |
Net realized and unrealized gain of investments | | | 2.02 | | | | 1.43 | |
| | |
|
|
| |
|
|
|
Total from investment operations | | | 2.07 | | | | 1.45 | |
| | |
|
|
| |
|
|
|
Less Distributions | | | | | | | | |
Distributions from net investment income | | | (0.05 | ) | | | 0.00 | |
| | |
|
|
| |
|
|
|
Total distributions | | | (0.05 | ) | | | 0.00 | |
| | |
|
|
| |
|
|
|
Net Asset Value, End of Period | | $ | 15.06 | | | $ | 13.04 | |
| | |
|
|
| |
|
|
|
Total Return (%) | | | 16.0 | | | | 12.5 | (b) |
Ratio of operating expenses to average net assets (%) | | | 1.18 | | | | 1.06 | (c) |
Ratio of net investment income to average net assets (%) | | | 0.53 | | | | 0.54 | (c) |
Portfolio turnover rate (%) | | | 115 | | | | 79 | |
Net assets, end of period (000) | | $ | 27,790 | | | $ | 3,646 | |
| (a) | Commencement of operations. |
| (b) | Period less than one year is not computed on an annualized basis. |
| (c) | Computed on an annualized basis. |
See accompanying notes to financial statements.
MSF-293
Metropolitan Series Fund, Inc.
Oppenheimer Global Equity Portfolio
Financial Highlights
| | | | | | | | | | | | | | | | | | | | |
| | | Class E
| |
| | | Year ended December 31,
| | | May 1, 2001(a)
through
December 31,
2001
| |
| | | 2005
| | | 2004
| | | 2003
| | | 2002
| | |
Net Asset Value, Beginning of Period | | $ | 13.04 | | | $ | 11.40 | | | $ | 8.96 | | | $ | 10.85 | | | $ | 12.21 | |
| | |
|
|
| |
|
|
| |
|
|
| |
|
|
| |
|
|
|
Income From Investment Operations | | | | | | | | | | | | | | | | | | | | |
Net investment income | | | 0.11 | | | | 0.11 | | | | 0.13 | | | | 0.19 | | | | 0.00 | |
Net realized and unrealized gain (loss) of investments | | | 1.97 | | | | 1.71 | | | | 2.52 | | | | (1.91 | ) | | | (1.36 | ) |
| | |
|
|
| |
|
|
| |
|
|
| |
|
|
| |
|
|
|
Total from investment operations | | | 2.08 | | | | 1.82 | | | | 2.65 | | | | (1.72 | ) | | | (1.36 | ) |
| | |
|
|
| |
|
|
| |
|
|
| |
|
|
| |
|
|
|
Less Distributions | | | | | | | | | | | | | | | | | | | | |
Distributions from net investment income | | | (0.06 | ) | | | (0.18 | ) | | | (0.21 | ) | | | (0.17 | ) | | | 0.00 | |
| | |
|
|
| |
|
|
| |
|
|
| |
|
|
| |
|
|
|
Total distributions | | | (0.06 | ) | | | (0.18 | ) | | | (0.21 | ) | | | (0.17 | ) | | | 0.00 | |
| | |
|
|
| |
|
|
| |
|
|
| |
|
|
| |
|
|
|
Net Asset Value, End of Period | | $ | 15.06 | | | $ | 13.04 | | | $ | 11.40 | | | $ | 8.96 | | | $ | 10.85 | |
| | |
|
|
| |
|
|
| |
|
|
| |
|
|
| |
|
|
|
Total Return (%) | | | 16.1 | | | | 16.1 | | | | 30.4 | | | | (16.1 | ) | | | (11.1 | )(b) |
Ratio of operating expenses to average net assets (%) | | | 1.08 | | | | 0.96 | | | | 0.99 | | | | 0.96 | | | | 0.95 | (c) |
Ratio of net investment income to average net assets (%) | | | 0.71 | | | | 0.81 | | | | 1.08 | | | | 1.18 | | | | 0.95 | (c) |
Portfolio turnover rate (%) | | | 115 | | | | 79 | | | | 65 | | | | 45 | | | | 36 | |
Net assets, end of period (000) | | $ | 20,674 | | | $ | 15,303 | | | $ | 10,515 | | | $ | 2,870 | | | $ | 47 | |
| (a) | Commencement of operations. |
| (b) | Period less than one year is not computed on an annualized basis. |
| (c) | Computed on an annualized basis. |
See accompanying notes to financial statements.
MSF-294
Metropolitan Series Fund, Inc.
BlackRock Diversified Portfolio
Schedule of Investments as of December 31, 2005
Common Stock—64.1% of Total Net Assets
| | | | | |
| Security Description | | Shares | | Value* |
| | | | | | |
| | |
Aerospace & Defense—1.6% | | | | | |
General Dynamics Corp. | | 96,400 | | $ | 10,994,420 |
L-3 Communications Holdings, Inc. | | 139,300 | | | 10,356,955 |
Raytheon Co. | | 200,900 | | | 8,066,135 |
| | | | |
|
|
| | | | | | 29,417,510 |
| | | | |
|
|
| | |
Air Freight & Logistics—0.8% | | | | | |
CNF, Inc. | | 161,700 | | | 9,037,413 |
Ryder System, Inc. | | 151,800 | | | 6,226,836 |
| | | | |
|
|
| | | | | | 15,264,249 |
| | | | |
|
|
| | |
Automobiles—0.4% | | | | | |
Harley-Davidson, Inc. | | 145,400 | | | 7,486,646 |
| | | | |
|
|
| | |
Beverages—1.1% | | | | | |
PepsiCo, Inc. | | 227,600 | | | 13,446,608 |
The Pepsi Bottling Group, Inc. | | 240,900 | | | 6,892,149 |
| | | | |
|
|
| | | | | | 20,338,757 |
| | | | |
|
|
| | |
Biotechnology—1.0% | | | | | |
Amgen, Inc. (a) | | 135,800 | | | 10,709,188 |
Invitrogen Corp. (a) | | 106,800 | | | 7,117,152 |
| | | | |
|
|
| | | | | | 17,826,340 |
| | | | |
|
|
| | |
Capital Markets—1.9% | | | | | |
Ameriprise Financial, Inc. | | 51,720 | | | 2,120,520 |
Lehman Brothers Holdings, Inc. | | 114,900 | | | 14,726,733 |
State Street Corp. | | 167,200 | | | 9,269,568 |
The Bear Stearns Co., Inc. | | 79,100 | | | 9,138,423 |
| | | | |
|
|
| | | | | | 35,255,244 |
| | | | |
|
|
| | |
Chemicals—1.0% | | | | | |
Lyondell Chemical Co. (b) | | 152,000 | | | 3,620,640 |
The Dow Chemical Co. | | 171,100 | | | 7,497,602 |
The Lubrizol Corp. | | 167,800 | | | 7,287,554 |
| | | | |
|
|
| | | | | | 18,405,796 |
| | | | |
|
|
| | |
Commercial Banks—5.0% | | | | | |
Bank of America Corp. | | 658,800 | | | 30,403,620 |
BB&T Corp. | | 232,600 | | | 9,748,266 |
Comerica, Inc. | | 152,000 | | | 8,627,520 |
KeyCorp. | | 283,300 | | | 9,329,069 |
U.S. Bancorp. | | 459,900 | | | 13,746,411 |
Wachovia Corp. | | 374,700 | | | 19,806,642 |
| | | | |
|
|
| | | | | | 91,661,528 |
| | | | |
|
|
| | |
Commercial Services & Supplies—0.8% | | | | | |
Cendant Corp. | | 423,100 | | | 7,298,475 |
Checkfree Corp. (a) | | 168,300 | | | 7,724,970 |
| | | | |
|
|
| | | | | | 15,023,445 |
| | | | |
|
|
| | |
Communications Equipment—1.7% | | | | | |
Cisco Systems, Inc. (a) | | 581,900 | | | 9,962,128 |
Emulex Corp. (a) | | 291,900 | | | 5,776,701 |
Motorola, Inc. | | 658,200 | | | 14,868,738 |
| | | | |
|
|
| | | | | | 30,607,567 |
| | | | |
|
|
| | | | | |
| Security Description | | Shares | | Value* |
| | | | | | |
| | |
Computers & Peripherals—1.9% | | | | | |
Hewlett-Packard Co. | | 431,200 | | $ | 12,345,256 |
International Business Machines Corp. | | 268,300 | | | 22,054,260 |
| | | | |
|
|
| | | | | | 34,399,516 |
| | | | |
|
|
| | |
Consumer Finance—0.7% | | | | | |
American Express Co. | | 258,500 | | | 13,302,410 |
| | | | |
|
|
| | |
Diversified Financial Services—1.6% | | | | | |
CIT Group, Inc. | | 201,700 | | | 10,444,026 |
Citigroup, Inc. | | 247,700 | | | 12,020,881 |
Federated Investors, Inc. (Class B) | | 178,500 | | | 6,611,640 |
| | | | |
|
|
| | | | | | 29,076,547 |
| | | | |
|
|
|
Diversified Telecommunication Services—1.5% |
AT&T, Inc. | | 600,100 | | | 14,696,449 |
Verizon Communications, Inc. | | 397,907 | | | 11,984,959 |
| | | | |
|
|
| | | | | | 26,681,408 |
| | | | |
|
|
| | |
Electric Utilities—1.8% | | | | | |
FirstEnergy Corp. | | 163,500 | | | 8,009,865 |
PG&E Corp. | | 333,600 | | | 12,383,232 |
PPL Corp. | | 449,600 | | | 13,218,240 |
| | | | |
|
|
| | | | | | 33,611,337 |
| | | | |
|
|
| | |
Electronic Equipment & Instruments—0.3% | | | | | |
Technologies Data Corp. (a) | | 148,200 | | | 5,880,576 |
| | | | |
|
|
| | |
Energy Equipment & Services—1.0% | | | | | |
Nabors Industries, Ltd. (a) | | 89,300 | | | 6,764,475 |
Patterson-UTI Energy, Inc. | | 361,600 | | | 11,914,720 |
| | | | |
|
|
| | | | | | 18,679,195 |
| | | | |
|
|
| | |
Food & Staples Retailing—0.5% | | | | | |
The Kroger Co. (a) | | 284,500 | | | 5,371,360 |
Wal-Mart Stores, Inc. | | 94,300 | | | 4,413,240 |
| | | | |
|
|
| | | | | | 9,784,600 |
| | | | |
|
|
| | |
Food Products—0.8% | | | | | |
Archer-Daniels-Midland Co. | | 299,700 | | | 7,390,602 |
General Mills, Inc. | | 161,300 | | | 7,955,316 |
| | | | |
|
|
| | | | | | 15,345,918 |
| | | | |
|
|
| | |
Health Care Equipment & Supplies—0.8% | | | | | |
Bausch & Lomb, Inc. (b) | | 104,900 | | | 7,122,710 |
Becton, Dickinson & Co. | | 132,500 | | | 7,960,600 |
| | | | |
|
|
| | | | | | 15,083,310 |
| | | | |
|
|
| | |
Health Care Providers & Services—2.0% | | | | | |
Aetna, Inc. | | 119,200 | | | 11,241,752 |
Coventry Health Care, Inc. (a) | | 192,011 | | | 10,936,947 |
HCA, Inc. | | 152,000 | | | 7,676,000 |
McKesson Corp. | | 138,700 | | | 7,155,533 |
| | | | |
|
|
| | | | | | 37,010,232 |
| | | | |
|
|
*See accompanying notes to financial statements.
MSF-295
Metropolitan Series Fund, Inc.
BlackRock Diversified Portfolio
Schedule of Investments as of December 31, 2005
Common Stock—(Continued)
| | | | | |
| Security Description | | Shares | | Value* |
| | | | | | |
| | |
Hotels, Restaurants & Leisure—0.6% | | | | | |
McDonald’s Corp. | | 302,000 | | $ | 10,183,440 |
| | | | |
|
|
| | |
Household Durables—2.0% | | | | | |
Fortune Brands, Inc. | | 116,400 | | | 9,081,528 |
Newell Rubbermaid, Inc. (b) | | 239,200 | | | 5,688,176 |
Pulte Homes, Inc. | | 183,500 | | | 7,222,560 |
The Black & Decker Corp. | | 70,100 | | | 6,095,896 |
The Stanley Works (b) | | 184,800 | | | 8,877,792 |
| | | | |
|
|
| | | | | | 36,965,952 |
| | | | |
|
|
| | |
Household Products—0.9% | | | | | |
The Procter & Gamble Co. | | 281,900 | | | 16,316,372 |
| | | | |
|
|
| | |
Industrial Conglomerates—3.6% | | | | | |
Anacomp, Inc. (Class B) (a) | | 1 | | | 10 |
General Electric Co. | | 1,457,730 | | | 51,093,437 |
Textron, Inc. | | 75,700 | | | 5,827,386 |
Tyco International, Ltd. | | 281,800 | | | 8,132,748 |
| | | | |
|
|
| | | | | | 65,053,581 |
| | | | |
|
|
| | |
Insurance—3.3% | | | | | |
American International Group, Inc. | | 220,400 | | | 15,037,892 |
Genworth Financial, Inc. (Class A) | | 211,400 | | | 7,310,212 |
Prudential Financial, Inc. | | 116,000 | | | 8,490,040 |
The Allstate Corp. | | 117,200 | | | 6,337,004 |
The Chubb Corp. | | 92,100 | | | 8,993,565 |
The Hartford Financial Services Group, Inc. | | 87,000 | | | 7,472,430 |
W.R. Berkley Corp. | | 147,850 | | | 7,040,617 |
| | | | |
|
|
| | | | | | 60,681,760 |
| | | | |
|
|
| | |
Internet & Catalog Retail—0.4% | | | | | |
eBay, Inc. (a) | | 146,000 | | | 6,314,500 |
| | | | |
|
|
| | |
IT Services—0.4% | | | | | |
Computer Sciences Corp. (a) | | 132,400 | | | 6,704,736 |
| | | | |
|
|
| | |
Machinery—0.9% | | | | | |
Ingersoll-Rand Co., Ltd. (Class A) | | 176,900 | | | 7,141,453 |
PACCAR, Inc. | | 121,400 | | | 8,404,522 |
| | | | |
|
|
| | | | | | 15,545,975 |
| | | | |
|
|
| | |
Media—2.3% | | | | | |
Comcast Corp. (Special Class A) (a) | | 283,900 | | | 7,293,391 |
The McGraw-Hill Cos., Inc. | | 217,200 | | | 11,214,036 |
The Walt Disney Co. | | 545,000 | | | 13,063,650 |
Time Warner, Inc. | | 579,314 | | | 10,103,236 |
| | | | |
|
|
| | | | | | 41,674,313 |
| | | | |
|
|
| | |
Metals & Mining—0.4% | | | | | |
Nucor Corp. | | 110,200 | | | 7,352,544 |
| | | | |
|
|
| | |
Multi-Utilities—0.4% | | | | | |
Sempra Energy | | 156,600 | | | 7,021,944 |
| | | | |
|
|
| | | | | |
| Security Description | | Shares | | Value* |
| | | | | | |
| | |
Multiline Retail—1.4% | | | | | |
Federated Department Stores, Inc. | | 127,100 | | $ | 8,430,543 |
J.C. Penney Co., Inc. | | 152,400 | | | 8,473,440 |
Nordstrom, Inc. | | 230,200 | | | 8,609,480 |
| | | | |
|
|
| | | | | | 25,513,463 |
| | | | |
|
|
| | |
Oil, Gas & Consumable Fuels—4.9% | | | | | |
Burlington Resources, Inc. | | 123,300 | | | 10,628,460 |
ConocoPhillips | | 336,500 | | | 19,577,570 |
Devon Energy Corp. | | 180,700 | | | 11,300,978 |
Exxon Mobil Corp. | | 518,900 | | | 29,146,613 |
Kerr-McGee Corp. | | 121,100 | | | 11,003,146 |
Valero Energy Corp. | | 133,000 | | | 6,862,800 |
| | | | |
|
|
| | | | | | 88,519,567 |
| | | | |
|
|
| | |
Paper & Forest Products—0.5% | | | | | |
Louisiana-Pacific Corp. | | 332,100 | | | 9,122,787 |
| | | | |
|
|
| | |
Pharmaceuticals—4.5% | | | | | |
Hospira, Inc. (a) | | 121,100 | | | 5,180,658 |
Johnson & Johnson | | 260,100 | | | 15,632,010 |
Merck & Co., Inc. | | 482,400 | | | 15,345,144 |
Pfizer, Inc. | | 1,174,825 | | | 27,396,919 |
Wyeth | | 401,400 | | | 18,492,498 |
| | | | |
|
|
| | | | | | 82,047,229 |
| | | | |
|
|
| | |
Real Estate—0.4% | | | | | |
Simon Property Group, Inc. (REIT) | | 87,500 | | | 6,705,125 |
| | | | |
|
|
| | |
Road & Rail—0.6% | | | | | |
Burlington Northern Santa Fe Corp. | | 163,000 | | | 11,543,660 |
| | | | |
|
|
|
Semiconductors & Semiconductor Equipment—2.0% |
Freescale Semiconductor, Inc. (Class A) (a) (b) | | 124,750 | | | 3,142,452 |
Freescale Semiconductor, Inc. (Class B) (a) | | 124,750 | | | 3,139,958 |
Intel Corp. | | 1,191,800 | | | 29,747,328 |
| | | | |
|
|
| | | | | | 36,029,738 |
| | | | |
|
|
| | |
Software—2.5% | | | | | |
Adobe Systems, Inc. (a) | | 281,900 | | | 10,419,024 |
Microsoft Corp. | | 1,320,600 | | | 34,533,690 |
| | | | |
|
|
| | | | | | 44,952,714 |
| | | | |
|
|
| | |
Specialty Retail—1.4% | | | | | |
AutoNation, Inc. (a) | | 298,700 | | | 6,490,751 |
Barnes & Noble, Inc. | | 131,320 | | | 5,603,424 |
The Home Depot, Inc. | | 336,300 | | | 13,613,424 |
| | | | |
|
|
| | | | | | 25,707,599 |
| | | | |
|
|
| | |
Textiles, Apparel & Luxury Goods—0.3% | | | | | |
NIKE, Inc. (Class B) | | 68,500 | | | 5,945,115 |
| | | | |
|
|
| | |
Thrifts & Mortgage Finance—0.7% | | | | | |
Countrywide Financial Corp. | | 164,000 | | | 5,607,160 |
Washington Mutual, Inc. | | 160,600 | | | 6,986,100 |
| | | | |
|
|
| | | | | | 12,593,260 |
| | | | |
|
|
*See accompanying notes to financial statements.
MSF-296
Metropolitan Series Fund, Inc.
BlackRock Diversified Portfolio
Schedule of Investments as of December 31, 2005
Common Stock—(Continued)
| | | | | | |
Security Description | | Shares | | Value* |
| | | | | | | |
| | |
Tobacco—1.0% | | | | | | |
Altria Group, Inc. | | | 249,300 | | $ | 18,627,696 |
| | | | | |
|
|
|
Wireless Telecommunication Services—0.5% |
Sprint Nextel Corp. | | | 385,261 | | | 8,999,697 |
| | | | | |
|
|
Total Common Stock
(Identified Cost $1,082,527,953) | | | | | | 1,170,264,898 |
| | | | | |
|
|
|
| Fixed Income—37.9% |
| Security Description | | Face
Amount | | Value* |
| | |
Aerospace & Defense—0.1% | | | | | | |
L-3 Communications Corp. (144A)
6.375%, 10/15/15 | | $ | 75,000 | | | 74,813 |
Lockheed Martin Corp.
8.500%, 12/01/29 | | | 580,000 | | | 790,521 |
| | | | | |
|
|
| | | | | | | 865,334 |
| | | | | |
|
|
| | |
Asset Backed—3.8% | | | | | | |
Ares VIII CLO, Ltd. (144A)
7.040%, 02/26/16 (c) | | | 1,150,000 | | | 1,167,365 |
BMW Vehicle Owner Trust
4.040%, 02/25/09 (c) | | | 5,450,000 | | | 5,400,494 |
Capital Auto Receivables Asset
4.050%, 07/15/09 (c) | | | 4,950,000 | | | 4,895,530 |
Capital Transition Funding, LLC
5.010%, 01/15/10 | | | 3,466,872 | | | 3,465,037 |
Citibank Credit Card Issuance Trust
2.550%, 01/20/09 | | | 5,341,000 | | | 5,216,410 |
Countrywide Asset-Backed Certificates
5.529%, 12/25/31 | | | 651,171 | | | 652,243 |
CWABS, Inc.
1.000%, 12/25/35 (c) | | | 6,425,000 | | | 6,423,843 |
DaimlerChrysler Auto Owner Trust
3.490%, 12/08/08 | | | 6,900,000 | | | 6,809,035 |
Ford Credit Auto Owner Trust
4.170%, 01/15/09 (c) | | | 4,975,000 | | | 4,935,729 |
Hedged Mutual Fund Fee Trust (144A)
5.220%, 11/30/10 | | | 338,732 | | | 338,732 |
Knollwood CDO, Ltd. (144A)
7.315%, 02/08/39 (c) | | | 775,300 | | | 763,190 |
MBNA Credit Card Master Note Trust
3.300%, 07/15/10 | | | 4,475,000 | | | 4,341,951 |
6.550%, 12/15/08 | | | 3,325,000 | | | 3,355,334 |
Nissan Auto Receivables
2.700%, 12/17/07 | | | 4,247,000 | | | 4,203,384 |
RBS Capital Trust I
4.709%, 12/29/49 (c) | | | 230,000 | | | 218,601 |
Residential Asset Securities Corp.
4.240%, 10/25/28 (c) | | | 5,354,852 | | | 5,355,059 |
4.469%, 01/25/36 (c) | | | 4,800,000 | | | 4,800,000 |
Structured Asset Investment Loan Trust
6.329%, 04/25/33 (c) | | | 1,425,000 | | | 1,435,898 |
| | | | | | |
|
| Fixed Income—(Continued) |
| Security Description | | Face
Amount | | Value* |
| | | | | | | |
| | |
Asset Backed—(Continued) | | | | | | |
Structured Asset Securities Corp.
5.479%, 06/25/32 (c) | | $ | 587,807 | | $ | 594,194 |
Washington Mutual Assets Securities Corp.
4.240%, 05/25/36 | | | 4,742,635 | | | 4,659,853 |
| | | | | |
|
|
| | | | | | | 69,031,882 |
| | | | | |
|
|
| | |
Auto Components—0.0% | | | | | | |
Briggs & Stratton Corp.
8.875%, 03/15/11 | | | 100,000 | | | 112,036 |
Navistar International Corp.
6.250%, 03/01/12 | | | 50,000 | | | 44,750 |
| | | | | |
|
|
| | | | | | | 156,786 |
| | | | | |
|
|
| | |
Automobiles—0.0% | | | | | | |
DaimlerChrysler North America Holding Corp.
8.500%, 01/18/31 (b) | | | 395,000 | | | 477,957 |
| | | | | |
|
|
| | |
Capital Markets—0.4% | | | | | | |
JPMorgan Chase & Co.
5.350%, 03/01/07 | | | 4,285,000 | | | 4,301,797 |
Morgan Stanley Group, Inc.
5.050%, 01/21/11 | | | 3,000,000 | | | 3,000,888 |
6.750%, 04/15/11 (b) | | | 550,000 | | | 592,090 |
| | | | | |
|
|
| | | | | | | 7,894,775 |
| | | | | |
|
|
| | |
Commercial Banks—1.0% | | | | | | |
Bank of America Corp.
4.500%, 08/01/10 (b) | | | 2,740,000 | | | 2,692,579 |
Bank of New York
3.800%, 02/01/08 | | | 775,000 | | | 758,852 |
First National Bank of Boston
7.375%, 09/15/06 | | | 800,000 | | | 813,409 |
HBOS, Plc.
3.750%, 09/30/08 | | | 1,780,000 | | | 1,732,643 |
HSBC Bank USA, N.A.
3.870%, 06/07/07 | | | 3,850,000 | | | 3,793,848 |
U.S. Bank N.A.
2.850%, 11/15/06 (b) | | | 1,400,000 | | | 1,376,897 |
4.400%, 08/15/08 | | | 1,625,000 | | | 1,608,651 |
Wachovia Bank, National Association
4.375%, 08/15/08 | | | 1,160,000 | | | 1,146,861 |
Wells Fargo & Co.
4.000%, 08/15/08 (b) | | | 920,000 | | | 902,816 |
4.200%, 01/15/10 | | | 855,000 | | | 832,369 |
4.625%, 08/09/10 (b) | | | 1,710,000 | | | 1,688,702 |
| | | | | |
|
|
| | | | | | | 17,347,627 |
| | | | | |
|
|
|
Commercial Mortgage-Backed Securities—5.9% |
Bank of America Commercial Mortgage, Inc.
4.881%, 11/10/42 (c) | | | 3,630,000 | | | 3,617,473 |
5.118%, 07/11/43 | | | 5,365,000 | | | 5,374,992 |
Bear Stearns Commercial Mortgage Securities, Inc. 4.361%, 06/11/41 | | | 3,542,185 | | | 3,489,314 |
4.674%, 06/11/41 | | | 930,000 | | | 895,419 |
5.920%, 10/15/36 | | | 2,029,473 | | | 2,075,671 |
*See accompanying notes to financial statements.
MSF-297
Metropolitan Series Fund, Inc.
BlackRock Diversified Portfolio
Schedule of Investments as of December 31, 2005
Fixed Income—(Continued)
| | | | | | |
| Security Description | | Face
Amount | | Value* |
| | | | | | | |
|
Commercial Mortgage-Backed Securities—(Continued) |
Chase Commercial Mortgage Security Corp.
7.319%, 10/15/32 | | $ | 1,575,000 | | $ | 1,707,602 |
Credit Suisse First Boston Mortgage Trust
4.940%, 12/15/35 | | | 4,405,000 | | | 4,351,774 |
7.325%, 04/15/62 | | | 3,493,106 | | | 3,629,734 |
Discover Card Master Trust
4.399%, 04/16/10 | | | 6,550,000 | | | 6,554,136 |
GE Business Loan Trust (144A)
5.669%, 04/15/31 (c) | | | 916,284 | | | 938,715 |
GE Capital Commercial Mortgage Corp.
4.578%, 06/10/48 | | | 3,480,000 | | | 3,385,110 |
6.269%, 12/10/35 | | | 3,440,000 | | | 3,643,827 |
GGP Mall Properties Trust (144A)
5.558%, 11/15/11 | | | 2,598,610 | | | 2,611,670 |
GMAC Commercial Mortgage Services, Inc.
7.455%, 08/16/33 | | | 3,450,000 | | | 3,739,592 |
Harborview Mortgage Loan Trust
4.680%, 11/19/35 (c) | | | 4,070,471 | | | 4,073,809 |
Healthcare Finance Group, Inc. (144A)
5.411%, 06/05/07 (c) | | | 1,175,000 | | | 1,175,000 |
5.611%, 06/05/07 (c) | | | 550,000 | | | 548,647 |
IMPAC CMB Trust
6.760%, 01/25/33 (c) | | | 233,504 | | | 233,834 |
Indymac MBS, Inc.
5.159%, 09/25/35 (c) | | | 5,580,751 | | | 5,648,721 |
JPMorgan Chase Commercial Mortgage Trust
4.738%, 07/15/42 | | | 3,475,000 | | | 3,362,308 |
JPMorgan Commercial Mortgage Finance Corp. 6.658%, 10/15/35 (c) | | | 175,000 | | | 182,238 |
7.239%, 09/15/29 | | | 6,869,000 | | | 7,240,855 |
JPMorgan Commercial Mortgage Trust
7.351%, 09/15/29 | | | 3,945,000 | | | 4,266,999 |
LB-UBS Commercial Mortgage Trust
3.636%, 08/15/08 | | | 2,521,065 | | | 2,456,715 |
4.023%, 09/15/26 | | | 2,650,000 | | | 2,593,573 |
4.071%, 09/15/26 | | | 2,598,866 | | | 2,530,999 |
5.642%, 12/15/25 (c) | | | 4,010,583 | | | 4,065,631 |
5.934%, 12/15/25 | | | 1,600,000 | | | 1,648,122 |
7.950%, 05/15/25 (c) | | | 3,660,000 | | | 4,025,930 |
LB-UBS Commercial Mortgage Trust (144A)
6.155%, 07/14/16 | | | 3,527,187 | | | 3,641,228 |
Long Beach Mortgage Loan Trust
5.479%, 03/25/34 (c) | | | 1,375,000 | | | 1,386,869 |
Morgan Stanley Capital I, Inc.
6.630%, 07/15/30 | | | 1,025,000 | | | 1,062,771 |
Salomon Brothers Mortgage Securities VII, Inc.
6.499%, 10/13/11 | | | 3,920,000 | | | 4,175,502 |
Salomon Brothers Mortgage Securities VII, Inc.
(144A) 6.134%, 02/18/34 | | | 587,235 | | | 590,973 |
Washington Mutual, Inc.
3.423%, 04/25/33 (c) | | | 4,076,399 | | | 3,975,317 |
3.695%, 05/25/33 (c) | | | 2,700,000 | | | 2,604,996 |
| | | | | |
|
|
| | | | | | | 107,506,066 |
| | | | | |
|
|
| | |
Commercial Services & Supplies—0.0% | | | | | | |
United Rentals, Inc.
6.500%, 02/15/12 | | | 75,000 | | | 73,031 |
| | | | | |
|
|
| | | | | | |
| Security Description | | Face
Amount | | Value* |
| | | | | | | |
| | |
Communications Equipment—0.1% | | | | | | |
TCI Communications, Inc.
7.875%, 02/15/26 | | $ | 1,725,000 | | $ | 1,991,041 |
| | | | | |
|
|
| | |
Construction & Engineering—0.0% | | | | | | |
United Technologies Corp.
8.875%, 11/15/19 | | | 250,000 | | | 334,056 |
| | | | | |
|
|
| | |
Containers & Packaging—0.0% | | | | | | |
Ball Corp.
6.875%, 12/15/12 | | | 530,000 | | | 547,225 |
Crown Americas, LLC
7.750%, 11/15/15 | | | 125,000 | | | 129,375 |
| | | | | |
|
|
| | | | | | | 676,600 |
| | | | | |
|
|
| | |
Diversified Consumer Services—0.0% | | | | | | |
Service Corp. International
7.700%, 04/15/09 | | | 195,000 | | | 204,750 |
| | | | | |
|
|
| | |
Diversified Financial Services—2.0% | | | | | | |
BCP Crystal U.S. Holdings Corp.
9.625%, 06/15/14 (b) | | | 25,000 | | | 27,813 |
Citigroup, Inc.
3.500%, 02/01/08 | | | 9,835,000 | | | 9,574,953 |
4.125%, 02/22/10 (b) | | | 3,150,000 | | | 3,060,241 |
5.500%, 08/09/06 | | | 3,710,000 | | | 3,726,331 |
Devon Financing Corp.
7.875%, 09/30/31 (b) | | | 530,000 | | | 673,470 |
General Electric Capital Corp.
3.450%, 07/16/07 | | | 6,125,000 | | | 6,007,768 |
4.125%, 09/01/09 | | | 350,000 | | | 340,716 |
5.000%, 11/15/11 | | | 8,535,000 | | | 8,543,398 |
Household Finance Corp.
6.400%, 06/17/08 | | | 1,985,000 | | | 2,047,807 |
Sprint Capital Corp.
6.875%, 11/15/28 | | | 310,000 | | | 338,734 |
8.750%, 03/15/32 | | | 270,000 | | | 358,312 |
Verizon Global Funding Corp.
7.750%, 12/01/30 | | | 805,000 | | | 956,869 |
Wind Acquisition Finance, Inc.
10.750%, 12/01/15 | | | 295,000 | | | 304,587 |
| | | | | |
|
|
| | | | | | | 35,960,999 |
| | | | | |
|
|
|
Diversified Telecommunication Services—0.1% |
AT&T Broadband Corp.
8.375%, 03/15/13 | | | 650,000 | | | 752,360 |
Cincinnati Bell, Inc.
7.250%, 07/15/13 (b) | | | 50,000 | | | 52,000 |
GTE Corp.
6.940%, 04/15/28 | | | 100,000 | | | 107,020 |
Qwest Corp. (144A)
7.741%, 06/15/13 (c) | | | 285,000 | | | 307,444 |
SBC Communications, Inc.
6.450%, 06/15/34 (b) | | | 160,000 | | | 166,492 |
| | | | | |
|
|
| | | | | | | 1,385,316 |
| | | | | |
|
|
*See accompanying notes to financial statements.
MSF-298
Metropolitan Series Fund, Inc.
BlackRock Diversified Portfolio
Schedule of Investments as of December 31, 2005
Fixed Income—(Continued)
| | | | | | |
| Security Description | | Face
Amount | | Value* |
| | | | | | | |
| | |
Electric Utilities—0.2% | | | | | | |
AES Ironwood, LLC
8.857%, 11/30/25 | | $ | 130,871 | | $ | 144,613 |
Centerpoint Energy, Inc.
7.250%, 09/01/10 | | | 345,000 | | | 370,096 |
Dominion Resources, Inc.
7.195%, 09/15/14 | | | 625,000 | | | 694,354 |
8.125%, 06/15/10 | | | 1,200,000 | | | 1,333,773 |
Elwood Energy, LLC
8.159%, 07/05/26 | | | 260,109 | | | 279,904 |
First Energy Corp.
7.375%, 11/15/31 | | | 105,000 | | | 123,897 |
Florida Power & Light Co.
5.625%, 04/01/34 | | | 300,000 | | | 302,476 |
NorthWestern Corp.
5.875%, 11/01/14 | | | 120,000 | | | 120,226 |
Peco Energy Co.
4.750%, 10/01/12 | | | 650,000 | | | 638,348 |
Reliant Energy, Inc.
6.750%, 12/15/14 (b) | | | 280,000 | | | 244,300 |
| | | | | |
|
|
| | | | | | | 4,251,987 |
| | | | | |
|
|
| | |
Federal Agencies—16.3% | | | | | | |
Federal Home Loan Bank
3.935%, 06/01/34 (c) | | | 9,030,356 | | | 8,785,813 |
4.500%, 05/01/18 | | | 5,529,903 | | | 5,395,544 |
4.500%, 05/01/19 | | | 2,025,301 | | | 1,973,823 |
4.500%, 12/01/19 | | | 883,241 | | | 860,791 |
4.500%, 03/01/20 | | | 940,875 | | | 915,571 |
4.500%, 04/01/20 | | | 338,291 | | | 329,193 |
4.500%, 05/01/20 | | | 221,170 | | | 215,222 |
5.000%, 10/01/20 | | | 3,823,670 | | | 3,785,926 |
5.000%, 11/01/20 | | | 3,676,000 | | | 3,639,713 |
5.000%, 12/01/20 | | | 6,999,996 | | | 6,930,897 |
5.500%, 07/01/33 | | | 4,297,546 | | | 4,269,559 |
5.500%, 10/01/35 | | | 997,975 | | | 989,035 |
Federal Home Loan Mortgage Corp.
3.150%, 06/04/08 | | | 7,200,000 | | | 6,939,079 |
4.500%, 08/01/20 | | | 3,129,273 | | | 3,049,734 |
4.769%, 02/15/35 (c) | | | 3,788,014 | | | 3,759,095 |
5.000%, 12/15/17 | | | 3,840,000 | | | 3,791,928 |
5.000%, 04/01/20 | | | 740,433 | | | 733,124 |
5.000%, 05/01/20 | | | 1,038,028 | | | 1,027,781 |
5.000%, 07/01/20 | | | 2,576,659 | | | 2,551,224 |
5.000%, 09/01/20 (c) | | | 22,479,296 | | | 22,257,396 |
5.000%, 09/01/35 | | | 890,110 | | | 861,737 |
5.000%, TBA | | | 15,500,000 | | | 15,001,086 |
5.500%, 10/15/33 | | | 3,266,235 | | | 3,294,027 |
5.500%, 03/15/34 | | | 5,705,917 | | | 5,748,872 |
5.500%, 05/15/34 | | | 4,942,155 | | | 4,978,510 |
5.500%, TBA | | | 1,100,000 | | | 1,089,688 |
Federal National Mortgage Association
2.750%, 07/23/07 | | | 6,375,000 | | | 6,185,159 |
3.000%, 03/02/07 | | | 2,745,000 | | | 2,690,270 |
| | | | | | |
| Security Description | | Face
Amount | | Value* |
| | | | | | | |
| | |
Federal Agencies—(Continued) | | | | | | |
4.000%, 10/16/06 (b) | | $ | 5,050,000 | | $ | 5,021,366 |
4.000%, 01/26/09 | | | 10,000,000 | | | 9,789,780 |
4.500%, 10/01/18 | | | 1,456,697 | | | 1,420,742 |
4.500%, 03/01/20 | | | 2,488,258 | | | 2,426,839 |
4.500%, 07/01/35 | | | 148,740 | | | 140,079 |
4.500%, 09/01/35 | | | 1,438,724 | | | 1,354,948 |
4.500%, 10/01/35 | | | 992,513 | | | 934,719 |
4.500%, TBA | | | 30,700,000 | | | 29,693,453 |
5.000%, 06/01/18 | | | 1,858,368 | | | 1,841,157 |
5.000%, 06/01/23 | | | 2,086,797 | | | 2,042,409 |
5.000%, 11/01/33 | | | 11,691,179 | | | 11,368,750 |
5.000%, 07/01/35 | | | 4,477,022 | | | 4,338,047 |
5.000%, 11/01/35 | | | 3,293,049 | | | 3,190,827 |
5.000%, 12/01/35 | | | 400,000 | | | 387,474 |
5.000%, TBA | | | 13,700,000 | | | 13,550,149 |
5.500%, 03/01/19 | | | 41,844 | | | 42,122 |
5.500%, 01/01/24 | | | 1,222,889 | | | 1,223,131 |
5.500%, 05/25/27 | | | 1,975,047 | | | 1,988,333 |
5.500%, 04/25/30 | | | 3,630,881 | | | 3,658,588 |
5.500%, 04/01/33 | | | 2,737,012 | | | 2,716,940 |
5.500%, 11/01/33 | | | 3,564,170 | | | 3,538,032 |
5.500%, 02/01/34 | | | 7,713,712 | | | 7,657,144 |
5.500%, 04/01/34 | | | 756,755 | | | 751,205 |
5.500%, 05/25/34 | | | 3,500,262 | | | 3,518,664 |
5.500%, 11/01/34 | | | 7,282,861 | | | 7,218,521 |
5.500%, 02/01/35 | | | 11,719,000 | | | 11,636,484 |
5.500%, TBA | | | 18,700,000 | | | 18,811,041 |
6.000%, 02/01/34 | | | 3,708,700 | | | 3,747,421 |
6.500%, 01/01/14 | | | 691,015 | | | 710,891 |
6.500%, 08/01/16 | | | 3,767 | | | 3,876 |
6.500%, 09/01/16 | | | 542,956 | | | 558,559 |
6.500%, 02/01/17 | | | 109,137 | | | 112,273 |
6.952%, 12/01/29 (c) | | | 1,341,560 | | | 1,382,360 |
7.000%, 12/01/07 | | | 95,676 | | | 96,805 |
7.250%, 09/01/07 | | | 17,903 | | | 18,067 |
8.500%, 02/01/09 | | | 93,747 | | | 96,945 |
9.000%, 04/01/16 | | | 3,612 | | | 3,814 |
Government National Mortgage Association
5.000%, 10/20/33 | | | 7,820,381 | | | 7,697,092 |
5.500%, 04/15/33 | | | 647,832 | | | 652,923 |
6.000%, 02/15/09 | | | 145,299 | | | 147,839 |
6.000%, 09/20/33 | | | 1,362,441 | | | 1,393,641 |
6.000%, 10/20/33 | | | 2,172,374 | | | 2,229,593 |
6.000%, 11/20/33 | | | 3,025,346 | | | 3,094,628 |
6.000%, 02/20/34 | | | 2,210,263 | | | 2,258,684 |
6.500%, 07/15/14 | | | 52,109 | | | 53,837 |
7.500%, 12/15/14 | | | 918,032 | | | 968,003 |
7.500%, 03/15/32 | | | 443,423 | | | 466,451 |
| | | | | |
|
|
| | | | | | | 298,004,443 |
| | | | | |
|
|
| | |
Food & Staples Retailing—0.0% | | | | | | |
Delhaize America, Inc.
9.000%, 04/15/31 | | | 315,000 | | | 370,320 |
| | | | | |
|
|
*See accompanying notes to financial statements.
MSF-299
Metropolitan Series Fund, Inc.
BlackRock Diversified Portfolio
Schedule of Investments as of December 31, 2005
Fixed Income—(Continued)
| | | | | | |
| Security Description | | Face
Amount | | Value* |
| | | | | | | |
| | |
Food Products—0.0% | | | | | | |
Smithfield Foods, Inc.
7.000%, 08/01/11 (b) | | $ | 500,000 | | $ | 510,000 |
| | | | | |
|
|
| | |
Foreign Government—0.6% | | | | | | |
Federal Republic of Germany
4.000%, 01/04/37 (EUR) | | | 3,525,000 | | | 4,511,589 |
4.750%, 07/04/34 (EUR) | | | 875,000 | | | 1,248,220 |
State of Israel
5.500%, 12/04/23 (USD) | | | 3,175,000 | | | 3,421,612 |
United Mexican States
8.000%, 12/19/13 (MXN) | | | 13,300,000 | | | 1,233,679 |
8.300%, 08/15/31 (USD) (b) | | | 650,000 | | | 835,250 |
9.000%, 12/22/11 (MXN) | | | 1,360,000 | | | 133,380 |
9.500%, 12/18/14 (MXN) | | | 3,485,000 | | | 352,836 |
| | | | | |
|
|
| | | | | | | 11,736,566 |
| | | | | |
|
|
| | |
Gas Utilities—0.0% | | | | | | |
Targa Resources, Inc. (144A)
8.500%, 11/01/13 | | | 20,000 | | | 20,500 |
| | | | | |
|
|
|
Health Care Providers & Services—0.1% |
Bio-Rad Laboratories, Inc.
7.500%, 08/15/13 | | | 375,000 | | | 397,500 |
Omnicare, Inc.
6.875%, 12/15/15 (b) | | | 155,000 | | | 157,325 |
Wellpoint, Inc.
5.950%, 12/15/34 (b) | | | 675,000 | | | 695,837 |
| | | | | |
|
|
| | | | | | | 1,250,662 |
| | | | | |
|
|
| | |
Hotels, Restaurants & Leisure—0.1% | | | | | | |
Mashantucket Western Pequot (144A)
5.912%, 09/01/21 | | | 100,000 | | | 99,917 |
Mohegan Tribal Gaming Authority
6.125%, 02/15/13 (b) | | | 125,000 | | | 122,812 |
Park Place Entertainment Corp.
7.875%, 03/15/10 (b) | | | 950,000 | | | 1,021,250 |
Wynn Las Vegas, LLC
6.625%, 12/01/14 | | | 70,000 | | | 68,075 |
| | | | | |
|
|
| | | | | | | 1,312,054 |
| | | | | |
|
|
| | |
Household Durables—0.1% | | | | | | |
Beazer Homes USA, Inc.
8.375%, 04/15/12 | | | 175,000 | | | 182,000 |
D.R. Horton, Inc.
8.500%, 04/15/12 (b) | | | 675,000 | | | 721,175 |
Hovinanian Enterprises, Inc.
6.250%, 01/15/15 | | | 240,000 | | | 225,866 |
6.250%, 01/15/16 | | | 255,000 | | | 236,596 |
Lennar Corp.
5.600%, 05/31/15 | | | 140,000 | | | 135,173 |
Pulte Homes, Inc.
6.000%, 02/15/35 | | | 155,000 | | | 137,575 |
| | | | | |
|
|
| | | | | | | 1,638,385 |
| | | | | |
|
|
| | | | | | |
| Security Description | | Face
Amount | | Value* |
| | | | | | | |
|
Independent Power Producers & Energy Traders—0.1% |
Mirant North America, LLC (144A)
7.375%, 12/31/13 (b) | | $ | 185,000 | | $ | 187,081 |
TXU Corp.
4.800%, 11/15/09 (b) (c) | | | 2,075,000 | | | 1,995,885 |
| | | | | |
|
|
| | | | | | | 2,182,966 |
| | | | | |
|
|
| | |
Industrial Conglomerates—0.1% | | | | | | |
Tyco International Group, Ltd.
6.000%, 11/15/13 | | | 910,000 | | | 929,552 |
6.375%, 10/15/11 | | | 550,000 | | | 571,227 |
7.000%, 06/15/28 | | | 545,000 | | | 599,542 |
| | | | | |
|
|
| | | | | | | 2,100,321 |
| | | | | |
|
|
| | |
Insurance—0.2% | | | | | | |
Berkshire Hathaway Financial Corp.
3.375%, 10/15/08 | | | 2,850,000 | | | 2,746,058 |
| | | | | |
|
|
| | |
Leisure Equipment & Products—0.0% | | | | | | |
K2, Inc.
7.375%, 07/01/14 (b) | | | 280,000 | | | 278,600 |
Movie Gallery, Inc.
11.000%, 05/01/12 (b) | | | 160,000 | | | 124,800 |
| | | | | |
|
|
| | | | | | | 403,400 |
| | | | | |
|
|
| | |
Media—0.4% | | | | | | |
AOL Time Warner, Inc.
6.875%, 05/01/12 | | | 1,875,000 | | | 1,995,900 |
7.625%, 04/15/31 | | | 375,000 | | | 417,618 |
Comcast Corp.
6.500%, 11/15/35 | | | 850,000 | | | 866,198 |
7.050%, 03/15/33 (b) | | | 745,000 | | | 804,291 |
DIRECTV Holdings, LLC
6.375%, 06/15/15 | | | 165,000 | | | 161,288 |
EchoStar DBS Corp.
5.750%, 10/01/08 | | | 1,000,000 | | | 980,000 |
News America Holdings, Inc.
6.200%, 12/15/34 (b) | | | 1,515,000 | | | 1,504,849 |
News Corp.
6.400%, 12/15/35 | | | 500,000 | | | 503,969 |
Time Warner Entertainment Co., L.P.
8.375%, 03/15/23 | | | 350,000 | | | 404,710 |
Time Warner, Inc.
6.950%, 01/15/28 (b) | | | 365,000 | | | 378,160 |
| | | | | |
|
|
| | | | | | | 8,016,983 |
| | | | | |
|
|
| | |
Multiline Retail—0.0% | | | | | | |
Federated Department Stores, Inc.
6.790%, 07/15/27 | | | 160,000 | | | 168,196 |
The May Department Stores Co.
6.650%, 07/15/24 | | | 145,000 | | | 152,453 |
6.700%, 07/15/34 (b) | | | 105,000 | | | 111,835 |
7.875%, 03/01/30 | | | 125,000 | | | 149,073 |
| | | | | |
|
|
| | | | | | | 581,557 |
| | | | | |
|
|
*See accompanying notes to financial statements.
MSF-300
Metropolitan Series Fund, Inc.
BlackRock Diversified Portfolio
Schedule of Investments as of December 31, 2005
Fixed Income—(Continued)
| | | | | | |
| Security Description | | Face
Amount | | Value* |
| | | | | | | |
| | |
Office Electronics—0.1% | | | | | | |
Sungard Data Systems, Inc. (144A)
9.125%, 08/15/13 | | $ | 60,000 | | $ | 62,100 |
Xerox Corp.
6.875%, 08/15/11 (b) | | | 975,000 | | | 1,009,125 |
| | | | | |
|
|
| | | | | | | 1,071,225 |
| | | | | |
|
|
| | |
Oil, Gas & Consumable Fuels—0.2% | | | | | | |
Amerada Hess Corp.
7.125%, 03/15/33 (b) | | | 400,000 | | | 454,046 |
Chesapeake Energy Corp.
6.250%, 01/15/18 (b) | | | 290,000 | | | 284,200 |
7.500%, 06/15/14 | | | 125,000 | | | 132,500 |
Chesapeake Energy Corp. (144A)
6.875%, 11/15/20 | | | 95,000 | | | 96,188 |
Colorado Interstate Gas Co.
6.800%, 11/15/15 | | | 90,000 | | | 91,960 |
Dynegy Holdings, Inc. (144A)
10.125%, 07/15/13 | | | 375,000 | | | 423,750 |
Enterprise Products Partners, L.P.
5.600%, 10/15/14 | | | 650,000 | | | 649,492 |
KCS Energy, Inc.
7.125%, 04/01/12 | | | 75,000 | | | 74,813 |
Massey Energy Co. (144A)
6.875%, 12/15/13 (c) | | | 810,000 | | | 817,087 |
Newfield Exploration Co.
6.625%, 09/01/14 (b) | | | 770,000 | | | 783,475 |
Northwest Pipeline Corp.
8.125%, 03/01/10 | | | 320,000 | | | 339,200 |
Tenaska Alabama Partners, L.P. (144A)
7.000%, 06/30/21 | | | 99,664 | | | 100,266 |
Transcontinental Gas Pipe Line
8.875%, 07/15/12 | | | 100,000 | | | 114,500 |
| | | | | |
|
|
| | | | | | | 4,361,477 |
| | | | | |
|
|
| | |
Pharmaceuticals—0.1% | | | | | | |
Wyeth
6.000%, 02/15/36 (b) | | | 725,000 | | | 746,595 |
| | | | | |
|
|
| | |
Real Estate—0.3% | | | | | | |
American Real Estate Partners
8.125%, 06/01/12 | | | 145,000 | | | 150,438 |
American Real Estate Partners (144A)
7.125%, 02/15/13 | | | 80,000 | | | 80,000 |
EOP Operating, L.P.
6.584%, 04/13/15 (c) | | | 920,000 | | | 999,520 |
6.800%, 01/15/09 | | | 3,000,000 | | | 3,136,794 |
Rouse Co. (REIT)
5.375%, 11/26/13 | | | 1,635,000 | | | 1,551,973 |
| | | | | |
|
|
| | | | | | | 5,918,725 |
| | | | | |
|
|
| | |
Road & Rail—0.0% | | | | | | |
Hertz Corp. (144A)
8.875%, 01/01/14 (b) | | | 305,000 | | | 310,719 |
| | | | | |
|
|
| | | | | | |
| Security Description | | Face
Amount | | Value* |
| | | | | | | |
|
Semiconductors & Semiconductor Equipment—0.0% |
Magnachip Semiconductor S.A.
7.741%, 12/15/11 (c) | | $ | 145,000 | | $ | 147,175 |
| | | | | |
|
|
| | |
U.S. Treasury—5.0% | | | | | | |
United States Treasury Bonds
5.375%, 02/15/31 (b) | | | 1,660,000 | | | 1,864,646 |
6.250%, 08/15/23 | | | 9,895,000 | | | 11,816,025 |
8.500%, 02/15/20 (b) | | | 2,745,000 | | | 3,850,719 |
8.750%, 08/15/20 (b) | | | 950,000 | | | 1,366,664 |
8.875%, 02/15/19 (b) | | | 5,760,000 | | | 8,190,899 |
United States Treasury Bonds Strips
6.875%, 08/15/25 (b) | | | 7,300,000 | | | 2,951,105 |
United States Treasury Notes
0.875%, 04/15/10 (b) | | | 10,592,452 | | | 10,069,862 |
4.000%, 09/30/07 (b) | | | 27,900,000 | | | 27,706,011 |
4.125%, 08/15/08 | | | 3,640,000 | | | 3,619,951 |
4.250%, 11/30/07 (b) | | | 6,240,000 | | | 6,221,717 |
4.375%, 11/15/08 (b) | | | 2,140,000 | | | 2,140,334 |
4.500%, 11/15/15 (b) | | | 10,510,000 | | | 10,596,214 |
| | | | | |
|
|
| | | | | | | 90,394,147 |
| | | | | |
|
|
| | |
Yankee—0.6% | | | | | | |
BSkyB Finance PLC.
6.500%, 10/15/35 (b) (c) | | | 345,000 | | | 343,784 |
Deutsche Bank AG
3.843%, 03/15/07 (c) | | | 1,475,000 | | | 1,463,937 |
Deutsche Telekom International Finance
8.250%, 06/15/30 (c) | | | 1,150,000 | | | 1,462,649 |
EnCana Corp.
6.500%, 08/15/34 | | | 260,000 | | | 290,512 |
Ispat Inland ULC
9.750%, 04/01/14 (b) | | | 155,000 | | | 175,538 |
Landeskreditbank Baden
4.250%, 09/15/10 | | | 2,575,000 | | | 2,528,985 |
Norske Skof Canada, Ltd.
8.625%, 06/15/11 | | | 125,000 | | | 119,375 |
Rogers Wireless Communications, Inc.
6.375%, 03/01/14 | | | 550,000 | | | 551,375 |
7.500%, 03/15/15 (b) | | | 340,000 | | | 367,200 |
Teck Cominco, Ltd.
6.125%, 10/01/35 | | | 425,000 | | | 420,304 |
Vodafone Airtouch, Plc.
7.750%, 02/15/10 (b) | | | 1,540,000 | | | 1,686,710 |
Vodafone Group, Plc.
5.000%, 09/15/15 (b) | | | 325,000 | | | 316,553 |
| | | | | |
|
|
| | | | | | | 9,726,922 |
| | | | | |
|
|
Total Fixed Income
(Identified Cost $695,800,623) | | | | | | 691,709,407 |
| | | | | |
|
|
*See accompanying notes to financial statements.
MSF-301
Metropolitan Series Fund, Inc.
BlackRock Diversified Portfolio
Schedule of Investments as of December 31, 2005
Warrants—0.0%
| | | | | | | |
| | |
| Security Description | | Shares | | Value* | |
| | | | | | | | |
| |
Commercial Services & Supplies—0.0% | | | | |
Anacomp, Inc. (Class B) (a) | | | 316 | | $ | 16 | |
| | | | | |
|
|
|
Total Warrants
(Identified Cost $0) | | | | | | 16 | |
| | | | | |
|
|
|
|
| Short Term Investments—3.0% | |
| | |
Discount Notes—0.5% | | | | | | | |
Federal National Mortgage Association
3.020%, 06/01/06 | | $ | 9,925,000 | | | 9,861,222 | |
| | | | | |
|
|
|
| | |
U.S. Treasury—2.5% | | | | | | | |
United States Treasury Bills
3.300%, 01/12/06 | | | 45,800,000 | | | 45,753,818 | |
| | | | | |
|
|
|
Total Short Term Investments
(Amortized Cost $55,648,743) | | | | | | 55,615,040 | |
| | | | | |
|
|
|
Total Investments—105.0%
(Identified Cost $1,833,977,319) (d) | | | | | | 1,917,589,361 | |
Liabilities in excess of other assets | | | | | | (91,051,546 | ) |
| | | | | |
|
|
|
| Total Net Assets—100% | | | | | $ | 1,826,537,815 | |
| | | | | |
|
|
|
| (b) | A portion or all of the security was held on loan. As of December 31, 2005, the market value of securities loaned was $102,908,106 and the collateral received consisted of cash in the amount of $104,967,308. |
| (c) | Variable or Floating Rate Security. Rate disclosed is as of December 31, 2005. |
| (d) | The aggregate cost of investments for federal income tax purposes as of December 31, 2005 was $1,783,562,847 and the composition of unrealized appreciation and depreciation of investment securities was $170,259,063 and $(36,232,549), respectively. |
| (144A)— | Securities exempt from registration under Rule 144A of the Securities Act of 1933. These securities may be resold in transactions exempt from registration, normally to qualified institutional buyers. As of December 31, 2005, the market value of 144A securities was $14,355,385, which is 0.8% of total net assets. |
| (REIT)— | A Real Estate Investment Trust is a pooled investment vehicle that invests primarily in income-producing real estate or real estate related loans or interest. |
| (TBA)— | A contract for the purchase or sale of a Mortgage Backed Security to be delivered at a future date but does not include a specified pool or precise amount to be delivered. |
*See accompanying notes to financial statements.
MSF-302
Metropolitan Series Fund, Inc.
BlackRock Diversified Portfolio
Schedule of Investments as of December 31, 2005
Forward Contracts
| | | | | | | | | | | | | | |
Forward Currency Contracts
| | Delivery Date
| | Local
Currency
Amount
| | Aggregate
Face
Value
| | Valuation as of
12/31/2005
| | Unrealized
Appreciation/
(Depreciation)
| |
Euro (sold) | | 1/20/2006 | | 5,012,730 | | $ | 6,091,946 | | $ | 5,942,814 | | $ | 149,132 | |
Mexican Peso (sold) | | 1/27/2006 | | 11,312,301 | | | 1,027,812 | | | 1,060,629 | | | (32,817 | ) |
Mexican Peso (sold) | | 1/27/2006 | | 3,486,000 | | | 320,776 | | | 326,844 | | | (6,068 | ) |
| | | | | | | | | | | | |
|
|
|
Net Unrealized Appreciation | | $ | 110,247 | |
| | | | | | | | | | | | |
|
|
|
Futures Contracts
| | | | | | | | | | | | | | | | | |
Futures Contracts Long
| | Expiration Date
| | Number of
Contracts
| | | Contract
Amount
| | | Valuation as of
12/31/2005
| | | Unrealized
Appreciation/
(Depreciation)
| |
Eurodollar Futures | | 9/17/2006 | | 45 | | | $ | 10,707,745 | | | $ | 10,717,313 | | | $ | 9,568 | |
Eurodollar Futures | | 9/17/2006 | | 45 | | | | 10,708,741 | | | | 10,715,625 | | | | 6,884 | |
Eurodollar Futures | | 9/17/2006 | | 45 | | | | 10,708,703 | | | | 10,717,313 | | | | 8,610 | |
Interest Rate Swap 10 Year Futures | | 3/17/2006 | | 265 | | | | 28,312,106 | | | | 28,661,406 | | | | 349,300 | |
S&P 500 Index Futures | | 3/16/2006 | | 15 | | | | 4,771,817 | | | | 4,705,500 | | | | (66,317 | ) |
U.S. Treasury Bonds Futures | | 3/22/2006 | | 328 | | | | 36,766,496 | | | | 37,453,500 | | | | 687,004 | |
U.S. Treasury Notes 2 Year Futures | | 3/31/2006 | | 118 | | | | 24,190,483 | | | | 24,212,125 | | | | 21,642 | |
| | | | | |
Futures Contracts Short
| | | | | | | | | | | | | | |
Federal Republic of Germany 5 Year Futures | | 3/8/2006 | | (157 | ) | | | (20,994,996 | ) | | | (20,992,158 | ) | | | 2,838 | |
U.S. Treasury Notes 5 Year Futures | | 3/22/2006 | | (419 | ) | | | (44,437,475 | ) | | | (44,558,031 | ) | | | (120,556 | ) |
U.S. Treasury Notes 10 Year Futures | | 3/22/2006 | | (206 | ) | | | (22,274,848 | ) | | | (22,537,688 | ) | | | (262,840 | ) |
| | | | | | | | | | | | | | | |
|
|
|
Net Unrealized Appreciation | | | $ | 636,133 | |
| | | | | | | | | | | | | | | |
|
|
|
TBA Sales Commitments
| | | | | | | | |
Federal Agencies
| | Face
Amount
| | | Value
| |
Federal Home Loan Mortgage Corp.
4.500%, (15 Year TBA) | | $ | (4,200,000 | ) | | $ | (4,085,810 | ) |
5.000%, (15 Year TBA) | | | (7,700,000 | ) | | | (7,620,598 | ) |
Federal National Mortgage Association
5.000%, (30 Year TBA) | | | (14,400,000 | ) | | | (13,950,000 | ) |
5.500%, (30 Year TBA) | | | (25,100,000 | ) | | | (24,849,000 | ) |
6.000%, (30 Year TBA) | | | (3,700,000 | ) | | | (3,733,530 | ) |
6.500%, (30 Year TBA) | | | (1,000,000 | ) | | | (1,025,625 | ) |
| | | | | | |
|
|
|
Total TBA Sales Commitments
(Proceeds Cost $(54,907,588)) | | | $ | (55,264,563 | ) |
| | | | | | |
|
|
|
See accompanying notes to financial statements.
MSF-303
Metropolitan Series Fund, Inc.
BlackRock Diversified Portfolio
Statement of Assets & Liabilities
December 31, 2005
| | | | | | | |
Assets | | | | | | | |
Investments at value | | | | | $ | 1,917,589,361 | |
Cash | | | | | | 63,676 | |
Foreign cash at value | | | | | | 6,174,706 | |
Collateral for securities loaned | | | | | | 104,967,308 | |
Unrealized appreciation on forward currency contracts—net | | | | | | 110,247 | |
Receivable for: | | | | | | | |
Securities sold | | | | | | 115,051,643 | |
Fund shares sold | | | | | | 1,144,757 | |
Accrued interest and dividends | | | | | | 7,388,898 | |
Foreign taxes | | | | | | 1,628 | |
| | | | | |
|
|
|
Total Assets | | | | | | 2,151,462,224 | |
Liabilities | | | | | | | |
TBA sales commitments at value | | $ | 55,264,563 | | | | |
Payable for: | | | | | | | |
Fund shares redeemed | | | 1,884,305 | | | | |
Securities purchased | | | 162,656,861 | | | | |
Futures variation margin | | | 123,318 | | | | |
Return of collateral for securities loaned | | | 104,967,308 | | | | |
Interest | | | 105,261 | | | | |
Accrued expenses: | | | | | | | |
Management fees | | | 690,174 | | | | |
Service and distribution fees | | | 18,882 | | | | |
Other expenses | | | 243,737 | | | | |
| | |
|
| | | | |
Total Liabilities | | | | | | 324,924,409 | |
| | | | | |
|
|
|
Net Assets | | | | | $ | 1,826,537,815 | |
| | | | | |
|
|
|
Net assets consists of: | | | | | | | |
Capital paid in | | | | | $ | 1,834,212,844 | |
Undistributed net investment income | | | | | | 43,481,340 | |
Accumulated net realized losses | | | | | | (134,890,316 | ) |
Unrealized appreciation on investments, futures contracts and
foreign currency | | | | | | 83,733,947 | |
| | | | | |
|
|
|
Net Assets | | | | | $ | 1,826,537,815 | |
| | | | | |
|
|
|
| Computation of offering price: | | | | | | | |
Class A | | | | | | | |
Net asset value and redemption price per
share ($1,705,344,342 divided by
104,398,271 shares outstanding) | | | | | $ | 16.33 | |
| | | | | |
|
|
|
Class B | | | | | | | |
Net asset value and redemption price per
share ($40,749,004 divided by
2,507,429 shares outstanding) | | | | | $ | 16.25 | |
| | | | | |
|
|
|
Class E | | | | | | | |
Net asset value and redemption price per
share ($80,444,469 divided by
4,935,404 shares outstanding) | | | | | $ | 16.30 | |
| | | | | |
|
|
|
Identified cost of investments | | | | | $ | 1,833,977,319 | |
| | | | | |
|
|
|
Identified cost of foreign cash | | | | | $ | 6,419,863 | |
| | | | | |
|
|
|
Proceeds of TBA sales commitments | | | | | $ | (54,907,538 | ) |
| | | | | |
|
|
|
Statement of Operations
For the Year Ended December 31, 2005
| | | | | | | | |
Investment Income | | | | | | | | |
Dividends | | | | | | $ | 21,852,677 | |
Interest | | | | | | | 29,170,345 | (a) |
| | | | | | |
|
|
|
| | | | | | | | 51,023,022 | |
Expenses | | | | | | | | |
Management fees | | $ | 8,285,784 | | | | | |
Service and distribution fees—Class B | | | 78,412 | | | | | |
Service and distribution fees—Class E | | | 122,095 | | | | | |
Directors’ fees and expenses | | | 22,264 | | | | | |
Custodian | | | 494,038 | | | | | |
Audit and tax services | | | 20,917 | | | | | |
Legal | | | 45,859 | | | | | |
Printing | | | 488,590 | | | | | |
Insurance | | | 39,124 | | | | | |
Miscellaneous | | | 29,184 | | | | | |
| | |
|
|
| | | | |
Total expenses | | | 9,626,267 | | | | | |
Expense reductions | | | (206,917 | ) | | | 9,419,350 | |
| | |
|
|
| |
|
|
|
Net Investment Income | | | | | | | 41,603,672 | |
| | | | | | |
|
|
|
Realized and Unrealized Gain (Loss) | | | | | | | | |
| Realized gain (loss) on: | | | | | | | | |
Investments—net | | | 123,501,565 | | | | | |
Futures contracts—net | | | (258,348 | ) | | | | |
Foreign currency transactions—net | | | 322,550 | | | | | |
Options—net | | | 248,119 | | | | 123,813,886 | |
| | |
|
|
| | | | |
| Unrealized appreciation (depreciation) on: | | | | | | | | |
Investments—net | | | (110,413,633 | ) | | | | |
Futures contracts—net | | | 770,964 | | | | | |
Foreign currency transactions—net | | | 102,121 | | | | (109,540,548 | ) |
| | |
|
|
| |
|
|
|
Net gain | | | | | | | 14,273,338 | |
| | | | | | |
|
|
|
Net Increase in Net Assets From Operations | �� | | | | | $ | 55,877,010 | |
| | | | | | |
|
|
|
| (a) | Includes income on securities loaned of $177,828. |
See accompanying notes to financial statements.
MSF-304
Metropolitan Series Fund, Inc.
BlackRock Diversified Portfolio
Statement of Changes in Net Assets
| | | | | | | | |
| | | Year ended
December 31,
2005
| | | Year ended
December 31,
2004
| |
From Operations | | | | | | | | |
Net investment income | | $ | 41,603,672 | | | $ | 38,648,990 | |
Net realized gain | | | 123,813,886 | | | | 147,238,768 | |
Unrealized depreciation | | | (109,540,548 | ) | | | (28,574,115 | ) |
| | |
|
|
| |
|
|
|
Increase in net assets from operations | | | 55,877,010 | | | | 157,313,643 | |
| | |
|
|
| |
|
|
|
From Distributions to Shareholders | | | | | | | | |
Net investment income | | | | | | | | |
Class A | | | (28,678,892 | ) | | | (35,761,675 | ) |
Class B | | | (391,826 | ) | | | 0 | |
Class E | | | (1,177,698 | ) | | | (1,368,237 | ) |
| | |
|
|
| |
|
|
|
Total distributions | | | (30,248,416 | ) | | | (37,129,912 | ) |
| | |
|
|
| |
|
|
|
Decrease in net assets from capital share transactions | | | (179,922,534 | ) | | | (114,027,761 | ) |
| | |
|
|
| |
|
|
|
Total increase (decrease) in net assets | | | (154,293,940 | ) | | | 6,155,970 | |
| | |
Net Assets | | | | | | | | |
Beginning of the period | | | 1,980,831,755 | | | | 1,974,675,785 | |
| | |
|
|
| |
|
|
|
End of the period | | $ | 1,826,537,815 | | | $ | 1,980,831,755 | |
| | |
|
|
| |
|
|
|
| | |
Undistributed Net Investment Income | | | | | | | | |
End of the period | | $ | 43,481,340 | | | $ | 30,147,177 | |
| | |
|
|
| |
|
|
|
Other Information:
Capital Shares
Transactions in capital shares were as follows:
| | | | | | | | | | | | | | |
| | | Year ended
December 31, 2005
| | | Year ended
December 31, 2004
| |
| | | Shares
| | | $
| | | Shares
| | | $
| |
Class A | | | | | | | | | | | | | | |
Sales | | 4,850,377 | | | $ | 77,586,285 | | | 2,056,939 | | | $ | 31,322,434 | |
Reinvestments | | 1,861,057 | | | | 28,678,892 | | | 2,369,892 | | | | 35,761,675 | |
Redemptions | | (18,741,641 | ) | | | (299,844,456 | ) | | (15,018,684 | ) | | | (228,103,744 | ) |
| | |
|
| |
|
|
| |
|
| |
|
|
|
Net decrease | | (12,030,207 | ) | | $ | (193,579,279 | ) | | (10,591,853 | ) | | $ | (161,019,635 | ) |
| | |
|
| |
|
|
| |
|
| |
|
|
|
Class B | | | | | | | | | | | | | | |
Sales | | 1,543,192 | | | $ | 24,544,623 | | | 1,331,985 | | | $ | 20,049,295 | |
Reinvestments | | 25,526 | | | | 391,826 | | | 0 | | | | 0 | |
Redemptions | | (335,054 | ) | | | (5,357,103 | ) | | (58,221 | ) | | | (873,431 | ) |
| | |
|
| |
|
|
| |
|
| |
|
|
|
Net increase | | 1,233,664 | | | $ | 19,579,346 | | | 1,273,764 | | | $ | 19,175,864 | |
| | |
|
| |
|
|
| |
|
| |
|
|
|
Class E | | | | | | | | | | | | | | |
Sales | | 481,004 | | | $ | 7,687,529 | | | 2,847,828 | | | $ | 43,310,350 | |
Reinvestments | | 76,524 | | | | 1,177,698 | | | 90,792 | | | | 1,368,237 | |
Redemptions | | (925,763 | ) | | | (14,787,828 | ) | | (1,117,488 | ) | | | (16,862,577 | ) |
| | |
|
| |
|
|
| |
|
| |
|
|
|
Net increase (decrease) | | (368,235 | ) | | $ | (5,922,601 | ) | | 1,821,132 | | | $ | 27,816,010 | |
| | |
|
| |
|
|
| |
|
| |
|
|
|
Decrease derived from capital share transactions | | (11,164,778 | ) | | $ | (179,922,534 | ) | | (7,496,957 | ) | | $ | (114,027,761 | ) |
| | |
|
| |
|
|
| |
|
| |
|
|
|
See accompanying notes to financial statements.
MSF-305
Metropolitan Series Fund, Inc.
BlackRock Diversified Portfolio
Financial Highlights
| | | | | | | | | | | | | | | | | | | | |
| | | Class A
| |
| | | Year ended December 31,
| |
| | | 2005
| | | 2004
| | | 2003
| | | 2002
| | | 2001
| |
Net Asset Value, Beginning of Period | | $ | 16.11 | | | $ | 15.13 | | | $ | 13.07 | | | $ | 15.51 | | | $ | 18.38 | |
| | |
|
|
| |
|
|
| |
|
|
| |
|
|
| |
|
|
|
Income From Investment Operations | | | | | | | | | | | | | | | | | | | | |
Net investment income | | | 0.39 | | | | 0.32 | | | | 0.30 | | | | 0.42 | | | | 0.49 | |
Net realized and unrealized gain (loss) of investments | | | 0.09 | | | | 0.95 | | | | 2.30 | | | | (2.53 | ) | | | (1.62 | ) |
| | |
|
|
| |
|
|
| |
|
|
| |
|
|
| |
|
|
|
Total from investment operations | | | 0.48 | | | | 1.27 | | | | 2.60 | | | | (2.11 | ) | | | (1.13 | ) |
| | |
|
|
| |
|
|
| |
|
|
| |
|
|
| |
|
|
|
Less Distributions | | | | | | | | | | | | | | | | | | | | |
Distributions from net investment income | | | (0.26 | ) | | | (0.29 | ) | | | (0.54 | ) | | | (0.33 | ) | | | (0.78 | ) |
Distributions from net realized capital gains | | | 0.00 | | | | 0.00 | | | | 0.00 | | | | 0.00 | | | | (0.96 | ) |
| | |
|
|
| |
|
|
| |
|
|
| |
|
|
| |
|
|
|
Total distributions | | | (0.26 | ) | | | (0.29 | ) | | | (0.54 | ) | | | (0.33 | ) | | | (1.74 | ) |
| | |
|
|
| |
|
|
| |
|
|
| |
|
|
| |
|
|
|
Net Asset Value, End of Period | | $ | 16.33 | | | $ | 16.11 | | | $ | 15.13 | | | $ | 13.07 | | | $ | 15.51 | |
| | |
|
|
| |
|
|
| |
|
|
| |
|
|
| |
|
|
|
Total Return (%) | | | 3.1 | | | | 8.5 | | | | 20.6 | | | | (13.9 | ) | | | (6.3 | ) |
Ratio of operating expenses to average net assets before expense reductions (%) | | | 0.50 | | | | 0.50 | | | | 0.51 | | | | 0.49 | | | | 0.49 | |
Ratio of operating expenses to average net assets after expense reductions (%)(d) | | | 0.49 | | | | 0.49 | | | | 0.50 | | | | 0.48 | | | | 0.47 | |
Ratio of net investment income to average net assets (%) | | | 2.22 | | | | 1.99 | | | | 2.00 | | | | 2.68 | | | | 2.73 | |
Portfolio turnover rate (%) | | | 443 | | | | 232 | | | | 211 | | | | 112 | | | | 131 | |
Net assets, end of period (000) | | $ | 1,705,344 | | | $ | 1,875,196 | | | $ | 1,922,067 | | | $ | 1,688,913 | | | $ | 2,345,064 | |
| | | | | | | | |
| | | Class B
| |
| | | Year ended
December 31,
2005
| | | April 26, 2004(a)
through
December 31,
2004
| |
Net Asset Value, Beginning of Period | | $ | 16.03 | | | $ | 14.97 | |
| | |
|
|
| |
|
|
|
Income from Investment Operations | | | | | | | | |
Net investment income | | | 0.25 | | | | 0.11 | |
Net realized and unrealized gain of investments | | | 0.19 | | | | 0.95 | |
| | |
|
|
| |
|
|
|
Total from investment operations | | | 0.44 | | | | 1.06 | |
| | |
|
|
| |
|
|
|
Less Distributions | | | | | | | | |
Distributions from net investment income | | | (0.22 | ) | | | 0.00 | |
| | |
|
|
| |
|
|
|
Total distributions | | | (0.22 | ) | | | 0.00 | |
| | |
|
|
| |
|
|
|
Net Asset Value, End of Period | | $ | 16.25 | | | $ | 16.03 | |
| | |
|
|
| |
|
|
|
Total Return (%) | | | 2.8 | | | | 7.1 | (b) |
Ratio of operating expenses to average net assets before expense reductions (%) | | | 0.75 | | | | 0.75 | (c) |
Ratio of operating expenses to average net assets after expense reductions (%)(d) | | | 0.74 | | | | 0.74 | (c) |
Ratio of net investment income to average net assets (%) | | | 2.01 | | | | 2.27 | (c) |
Portfolio turnover rate (%) | | | 443 | | | | 232 | |
Net assets, end of period (000) | | $ | 40,749 | | | $ | 20,413 | |
| (a) | Commencement of operations. |
| (b) | Period less than one year is not computed on an annualized basis. |
| (c) | Computed on an annualized basis. |
| (d) | The Portfolio has entered into arrangements with certain brokers who paid a portion of the Portfolio’s expenses. |
See accompanying notes to financial statements.
MSF-306
Metropolitan Series Fund, Inc.
BlackRock Diversified Portfolio
Financial Highlights
| | | | | | | | | | | | | | | | | | | | |
| | | Class E
| |
| | | Year ended December 31,
| | | May 1, 2001(a)
through
December 31, 2001
| |
| | | 2005
| | | 2004
| | | 2003
| | | 2002
| | |
Net Asset Value, Beginning of Period | | $ | 16.07 | | | $ | 15.11 | | | $ | 13.06 | | | $ | 15.51 | | | $ | 16.18 | |
| | |
|
|
| |
|
|
| |
|
|
| |
|
|
| |
|
|
|
Income From Investment Operations | | | | | | | | | | | | | | | | | | | | |
Net investment income | | | 0.33 | | | | 0.29 | | | | 0.41 | | | | 0.40 | | | | 0.01 | |
Net realized and unrealized gain (loss) of investments | | | 0.13 | | | | 0.94 | | | | 2.17 | | | | (2.52 | ) | | | (0.68 | ) |
| | |
|
|
| |
|
|
| |
|
|
| |
|
|
| |
|
|
|
Total from investment operations | | | 0.46 | | | | 1.23 | | | | 2.58 | | | | (2.12 | ) | | | (0.67 | ) |
| | |
|
|
| |
|
|
| |
|
|
| |
|
|
| |
|
|
|
Less Distributions | | | | | | | | | | | | | | | | | | | | |
Distributions from net investment income | | | (0.23 | ) | | | (0.27 | ) | | | (0.53 | ) | | | (0.33 | ) | | | 0.00 | |
| | |
|
|
| |
|
|
| |
|
|
| |
|
|
| |
|
|
|
Total distributions | | | (0.23 | ) | | | (0.27 | ) | | | (0.53 | ) | | | (0.33 | ) | | | 0.00 | |
| | |
|
|
| |
|
|
| |
|
|
| |
|
|
| |
|
|
|
Net Asset Value, End of Period | | $ | 16.30 | | | $ | 16.07 | | | $ | 15.11 | | | $ | 13.06 | | | $ | 15.51 | |
| | |
|
|
| |
|
|
| |
|
|
| |
|
|
| |
|
|
|
Total Return (%) | | | 3.0 | | | | 8.3 | | | | 20.4 | | | | (13.9 | ) | | | (4.1 | )(b) |
Ratio of operating expenses to average net assets before expense reductions (%) | | | 0.65 | | | | 0.65 | | | | 0.66 | | | | 0.64 | | | | 0.64 | (c) |
Ratio of operating expenses to average net assets after expense reductions (%)(d) | | | 0.64 | | | | 0.64 | | | | 0.65 | | | | 0.63 | | | | 0.62 | (c) |
Ratio of net investment income to average net assets (%) | | | 2.07 | | | | 1.88 | | | | 1.80 | | | | 2.53 | | | | 2.58 | (c) |
Portfolio turnover rate (%) | | | 443 | | | | 232 | | | | 211 | | | | 112 | | | | 131 | |
Net assets, end of period (000) | | $ | 80,444 | | | $ | 85,223 | | | $ | 52,609 | | | $ | 11,490 | | | $ | 22 | |
| (a) | Commencement of operations. |
| (b) | Period less than one year is not computed on an annualized basis. |
| (c) | Computed on an annualized basis. |
| (d) | The Portfolio has entered into arrangements with certain brokers who paid a portion of the Portfolio’s expenses. |
See accompanying notes to financial statements.
MSF-307
Metropolitan Series Fund, Inc.
MFS Total Return Portfolio
Schedule of Investments as of December 31, 2005
Common Stock—59.8% of Total Net Assets
| | | | | |
| Security Description | | Shares | | Value* |
| | | | | |
| | |
Aerospace & Defense—1.6% | | | | | |
Lockheed Martin Corp. | | 62,399 | | $ | 3,970,448 |
Northrop Grumman Corp. | | 36,296 | | | 2,181,753 |
United Technologies Corp. | | 37,370 | | | 2,089,357 |
| | | | |
|
|
| | | | | | 8,241,558 |
| | | | |
|
|
| | |
Air Freight & Logistics—0.1% | | | | | |
CNF, Inc. | | 4,230 | | | 236,415 |
| | | | |
|
|
| | |
Auto Components—0.2% | | | | | |
Johnson Controls, Inc. | | 10,640 | | | 775,762 |
| | | | |
|
|
| | |
Beverages—0.9% | | | | | |
Diageo, Plc. (GBP) | | 110,013 | | | 1,591,918 |
Molson Coors Brewing Co. | | 9,240 | | | 618,988 |
PepsiCo, Inc. | | 21,835 | | | 1,290,012 |
The Coca-Cola Co. | | 29,310 | | | 1,181,486 |
| | | | |
|
|
| | | | | | 4,682,404 |
| | | | |
|
|
| | |
Biotechnology—0.1% | | | | | |
MedImmune, Inc. (a) | | 11,060 | | | 387,321 |
| | | | |
|
|
| | |
Building Products—1.3% | | | | | |
Masco Corp. | | 219,660 | | | 6,631,535 |
| | | | |
|
|
| | |
Capital Markets—2.6% | | | | | |
Ameriprise Financial, Inc. | | 7,908 | | | 324,228 |
Capital One Financial Corp. | | 12,820 | | | 1,107,648 |
Franklin Resources, Inc. | | 15,470 | | | 1,454,335 |
Lehman Brothers Holdings, Inc. | | 17,270 | | | 2,213,496 |
Merrill Lynch & Co., Inc. | | 53,780 | | | 3,642,519 |
Morgan Stanley | | 24,590 | | | 1,395,237 |
The Goldman Sachs Group, Inc. | | 24,330 | | | 3,107,184 |
| | | | |
|
|
| | | | | | 13,244,647 |
| | | | |
|
|
| | |
Chemicals—1.9% | | | | | |
Air Liquide S.A. (EUR) | | 500 | | | 96,225 |
Air Products & Chemicals, Inc. | | 28,094 | | | 1,662,884 |
E. I. du Pont de Nemours & Co. | | 61,381 | | | 2,608,692 |
Nalco Holding Co. (a) | | 66,560 | | | 1,178,778 |
PPG Industries, Inc. | | 30,390 | | | 1,759,581 |
Praxair, Inc. | | 6,220 | | | 329,411 |
Syngenta AG (CHF) | | 9,150 | | | 1,137,769 |
The Dow Chemical Co. | | 19,838 | | | 869,301 |
| | | | |
|
|
| | | | | | 9,642,641 |
| | | | |
|
|
| | |
Commercial Banks—6.6% | | | | | |
Bank of America Corp. | | 281,578 | | | 12,994,825 |
Mellon Financial Corp. | | 183,840 | | | 6,296,520 |
PNC Financial Services Group, Inc. | | 127,640 | | | 7,891,981 |
SunTrust Banks, Inc. | | 48,490 | | | 3,528,133 |
UBS AG (CHF) | | 9,669 | | | 919,964 |
Wells Fargo & Co. | | 30,200 | | | 1,897,466 |
| | | | |
|
|
| | | | | | 33,528,889 |
| | | | |
|
|
| | | | | |
| Security Description | | Shares | | Value* |
| | | | | |
| | |
Commercial Services & Supplies—0.3% | | | | | |
Cendant Corp. | | 72,390 | | $ | 1,248,728 |
| | | | |
|
|
| | |
Communications Equipment—1.7% | | | | | |
Cisco Systems, Inc. (a) | | 102,480 | | | 1,754,458 |
Nokia Corp. (ADR) | | 123,900 | | | 2,267,370 |
Nortel Networks Corp. (a) | | 1,450,550 | | | 4,438,683 |
| | | | |
|
|
| | | | | | 8,460,511 |
| | | | |
|
|
| | |
Computers & Peripherals—0.7% | | | | | |
International Business Machines Corp. | | 12,300 | | | 1,011,060 |
Sun Microsystems, Inc. (a) | | 608,570 | | | 2,549,908 |
| | | | |
|
|
| | | | | | 3,560,968 |
| | | | |
|
|
| | |
Consumer Finance—0.4% | | | | | |
American Express Co. | | 32,430 | | | 1,668,848 |
MBNA Corp. | | 18,964 | | | 514,872 |
| | | | |
|
|
| | | | | | 2,183,720 |
| | | | |
|
|
| | |
Containers & Packaging—0.9% | | | | | |
Owens-Illinois, Inc. (a) | | 211,550 | | | 4,451,012 |
Smurfit-Stone Container Corp. (a) | | 19,085 | | | 270,435 |
| | | | |
|
|
| | | | | | 4,721,447 |
| | | | |
|
|
| | |
Diversified Financial Services—2.7% | | | | | |
Citigroup, Inc. | | 135,088 | | | 6,555,820 |
JPMorgan Chase & Co. | | 185,372 | | | 7,357,415 |
| | | | |
|
|
| | | | | | 13,913,235 |
| | | | |
|
|
|
Diversified Telecommunication Services—1.5% |
AT&T, Inc. | | 56,680 | | | 1,388,093 |
Verizon Communications, Inc. | | 209,707 | | | 6,316,375 |
| | | | |
|
|
| | | | | | 7,704,468 |
| | | | |
|
|
| | |
Electric Utilities—2.0% | | | | | |
Allegheny Energy, Inc. (a) | | 4,400 | | | 139,260 |
Dominion Resources, Inc. | | 43,310 | | | 3,343,532 |
Entergy Corp. | | 15,860 | | | 1,088,789 |
Exelon Corp. | | 28,430 | | | 1,510,770 |
FirstEnergy Corp. | | 14,400 | | | 705,456 |
FPL Group, Inc. | | 31,840 | | | 1,323,271 |
PPL Corp. | | 48,980 | | | 1,440,012 |
Public Service Enterprise Group, Inc. | | 6,770 | | | 439,847 |
| | | | |
|
|
| | | | | | 9,990,937 |
| | | | |
|
|
| | |
Electrical Equipment—0.3% | | | | | |
Cooper Industries, Ltd. (Class A) | | 10,770 | | | 786,210 |
Emerson Electric Co. | | 1,320 | | | 98,604 |
Hubbell, Inc. (Class B) | | 9,850 | | | 444,432 |
| | | | |
|
|
| | | | | | 1,329,246 |
| | | | |
|
|
| | |
Electronic Equipment & Instruments—0.1% | | | | | |
Samsung Electronics Co., Ltd.
(London Traded Shares) (144A)(GDR) | | 100 | | | 32,953 |
*See accompanying notes to financial statements.
MSF-308
Metropolitan Series Fund, Inc.
MFS Total Return Portfolio
Schedule of Investments as of December 31, 2005
Common Stock—(Continued)
| | | | | |
| Security Description | | Shares | | Value* |
| | | | | |
|
Electronic Equipment & Instruments—(Continued) |
Samsung Electronics Co., Ltd.
(U.S. Traded Shares) (144A) (GDR) | | 1,790 | | $ | 589,805 |
| | | | |
|
|
| | | | | | 622,758 |
| | | | |
|
|
| | |
Energy Equipment & Services—2.0% | | | | | |
BJ Services Co. | | 36,900 | | | 1,353,123 |
Cooper Cameron Corp. (a) | | 32,260 | | | 1,335,564 |
GlobalSantaFe Corp. | | 77,475 | | | 3,730,421 |
Noble Corp. | | 51,660 | | | 3,644,097 |
| | | | |
|
|
| | | | | | 10,063,205 |
| | | | |
|
|
| | |
Food & Staples Retailing—0.6% | | | | | |
Wal-Mart Stores, Inc. | | 67,100 | | | 3,140,280 |
| | | | |
|
|
| | |
Food Products—0.9% | | | | | |
Archer-Daniels-Midland Co. | | 26,251 | | | 647,350 |
H.J. Heinz Co. | | 19,806 | | | 667,858 |
Kellogg Co. | | 31,890 | | | 1,378,286 |
Nestle S.A. (CHF) | | 3,613 | | | 1,078,110 |
Sara Lee Corp. | | 32,770 | | | 619,353 |
| | | | |
|
|
| | | | | | 4,390,957 |
| | | | |
|
|
| | |
Gas Utilities—0.1% | | | | | |
AGL Resources, Inc. | | 20,170 | | | 702,118 |
| | | | |
|
|
| | |
Health Care Equipment & Supplies—0.0% | | | | | |
Baxter International, Inc. | | 4,873 | | | 183,469 |
| | | | |
|
|
| | |
Health Care Providers & Services—0.5% | | | | | |
CIGNA Corp. | | 3,610 | | | 403,237 |
Tenet Healthcare Corp. (a) | | 297,490 | | | 2,278,773 |
| | | | |
|
|
| | | | | | 2,682,010 |
| | | | |
|
|
| | |
Hotels, Restaurants & Leisure—0.3% | | | | | |
International Game Technology | | 20,620 | | | 634,684 |
McDonald’s Corp. | | 29,480 | | | 994,065 |
| | | | |
|
|
| | | | | | 1,628,749 |
| | | | |
|
|
| | |
Household Products—0.3% | | | | | |
Colgate-Palmolive Co. | | 18,660 | | | 1,023,501 |
Kimberly-Clark Corp. | | 11,682 | | | 696,831 |
| | | | |
|
|
| | | | | | 1,720,332 |
| | | | |
|
|
|
Independent Power Producers & Energy Traders—0.2% |
NRG Energy, Inc. (a) | | 6,180 | | | 291,202 |
TXU Corp. | | 9,980 | | | 500,896 |
| | | | |
|
|
| | | | | | 792,098 |
| | | | |
|
|
| | |
Industrial Conglomerates—1.9% | | | | | |
3M Co. | | 16,250 | | | 1,259,375 |
General Electric Co. | | 85,345 | | | 2,991,342 |
Tyco International, Ltd. | | 189,589 | | | 5,471,539 |
| | | | |
|
|
| | | | | | 9,722,256 |
| | | | |
|
|
| | | | | |
| Security Description | | Shares | | Value* |
| | | | | |
| | |
Insurance—3.2% | | | | | |
ACE, Ltd. | | 16,130 | | $ | 861,987 |
AFLAC, Inc. | | 2,100 | | | 97,482 |
Conseco, Inc. (a) | | 112,520 | | | 2,607,088 |
Genworth Financial, Inc. (Class A) | | 48,740 | | | 1,685,429 |
Lincoln National Corp. | | 19,390 | | | 1,028,252 |
The Allstate Corp. | | 101,776 | | | 5,503,028 |
The Chubb Corp. | | 8,720 | | | 851,508 |
The Hartford Financial Services Group, Inc. | | 34,677 | | | 2,978,408 |
XL Capital, Ltd. (Class A) | | 7,700 | | | 518,826 |
| | | | |
|
|
| | | | | | 16,132,008 |
| | | | |
|
|
| | |
IT Services—0.5% | | | | | |
Accenture, Ltd. (Class A) (a) | | 81,660 | | | 2,357,524 |
| | | | |
|
|
| | |
Leisure Equipment & Products—0.3% | | | | | |
Hasbro, Inc. | | 18,480 | | | 372,926 |
Mattel, Inc. | | 86,490 | | | 1,368,272 |
| | | | |
|
|
| | | | | | 1,741,198 |
| | | | |
|
|
| | |
Machinery—0.7% | | | | | |
Deere & Co. | | 27,740 | | | 1,889,372 |
Illinois Tool Works, Inc. | | 20,560 | | | 1,809,074 |
| | | | |
|
|
| | | | | | 3,698,446 |
| | | | |
|
|
| | |
Media—2.7% | | | | | |
Knight-Ridder, Inc. | | 22,850 | | | 1,446,405 |
New York Times Co. (Class A) | | 24,920 | | | 659,134 |
Reed Elsevier, Plc. (GBP) | | 72,742 | | | 681,897 |
The Walt Disney Co. | | 185,899 | | | 4,455,999 |
Tribune Co. | | 14,480 | | | 438,165 |
Viacom, Inc. (Class B) | | 194,302 | | | 6,334,245 |
| | | | |
|
|
| | | | | | 14,015,845 |
| | | | |
|
|
| | |
Metals & Mining—0.2% | | | | | |
BHP Billiton, Plc. (GBP) | | 47,040 | | | 767,148 |
| | | | |
|
|
| | |
Multi-Utilities—0.1% | | | | | |
Sempra Energy | | 9,520 | | | 426,877 |
| | | | |
|
|
| | |
Multiline Retail—0.4% | | | | | |
Family Dollar Stores, Inc. | | 87,360 | | | 2,165,654 |
| | | | |
|
|
| | |
Oil, Gas & Consumable Fuels—4.8% | | | | | |
Amerada Hess Corp. | | 15,850 | | | 2,010,097 |
Apache Corp. | | 7,100 | | | 486,492 |
BP, Plc. (ADR) | | 19,061 | | | 1,224,097 |
Chevron Corp. | | 30,874 | | | 1,752,717 |
ConocoPhillips | | 62,070 | | | 3,611,233 |
Devon Energy Corp. | | 79,760 | | | 4,988,190 |
EnCana Corp. | | 12,790 | | | 577,596 |
EOG Resources, Inc. | | 17,670 | | | 1,296,448 |
Exxon Mobil Corp. | | 79,498 | | | 4,465,403 |
Total S.A. (ADR) | | 32,930 | | | 4,162,352 |
| | | | |
|
|
| | | | | | 24,574,625 |
| | | | |
|
|
*See accompanying notes to financial statements.
MSF-309
Metropolitan Series Fund, Inc.
MFS Total Return Portfolio
Schedule of Investments as of December 31, 2005
Common Stock—(Continued)
| | | | | |
| Security Description | | Shares | | Value* |
| | | | | |
| | |
Paper & Forest Products—0.7% | | | | | |
Bowater, Inc. | | 70,310 | | $ | 2,159,923 |
International Paper Co. | | 29,230 | | | 982,421 |
MeadWestvaco Corp. | | 21,670 | | | 607,410 |
| | | | |
|
|
| | | | | | 3,749,754 |
| | | | |
|
|
| | |
Personal Products—0.2% | | | | | |
The Estee Lauder Cos., Inc. (Class A) (a) | | 33,730 | | | 1,129,280 |
| | | | |
|
|
| | |
Pharmaceuticals—4.3% | | | | | |
Abbott Laboratories | | 48,314 | | | 1,905,021 |
Eli Lilly & Co. | | 13,590 | | | 769,058 |
Johnson & Johnson | | 87,098 | | | 5,234,590 |
Merck & Co., Inc. | | 185,998 | | | 5,916,597 |
Novartis AG (CHF) | | 1,716 | | | 90,052 |
Wyeth | | 171,990 | | | 7,923,579 |
| | | | |
|
|
| | | | | | 21,838,897 |
| | | | |
|
|
| | |
Road & Rail—0.5% | | | | | |
Burlington Northern Santa Fe Corp. | | 17,785 | | | 1,259,534 |
Norfolk Southern Corp. | | 24,920 | | | 1,117,163 |
| | | | |
|
|
| | | | | | 2,376,697 |
| | | | |
|
|
|
Semiconductors & Semiconductor Equipment—0.5% |
Analog Devices, Inc. | | 34,560 | | | 1,239,667 |
Intel Corp. | | 37,930 | | | 946,733 |
Xilinx, Inc. | | 21,030 | | | 530,166 |
| | | | |
|
|
| | | | | | 2,716,566 |
| | | | |
|
|
| | |
Software—2.4% | | | | | |
Compuware Corp. (a) | | 273,610 | | | 2,454,282 |
Microsoft Corp. | | 19,003 | | | 496,928 |
Oracle Corp. (a) | | 296,560 | | | 3,620,998 |
Symantec Corp. (a) | | 328,680 | | | 5,751,900 |
| | | | |
|
|
| | | | | | 12,324,108 |
| | | | |
|
|
| | |
Specialty Retail—1.8% | | | | | |
Circuit City Stores, Inc. | | 55,080 | | | 1,244,257 |
Lowe’s Cos., Inc. | | 7,930 | | | 528,614 |
OfficeMax, Inc. | | 67,440 | | | 1,710,278 |
The Gap, Inc. | | 265,170 | | | 4,677,599 |
The Sherwin-Williams Co. | | 6,870 | | | 312,035 |
TJX Cos., Inc. | | 38,690 | | | 898,769 |
| | | | |
|
|
| | | | | | 9,371,552 |
| | | | |
|
|
| | |
Thrifts & Mortgage Finance—0.5% | | | | | |
Countrywide Financial Corp. | | 22,610 | | | 773,036 |
Federal Home Loan Mortgage Corp. | | 7,710 | | | 503,848 |
Federal National Mortgage Association | | 29,158 | | | 1,423,202 |
| | | | |
|
|
| | | | | | 2,700,086 |
| | | | |
|
|
| | |
Tobacco—1.2% | | | | | |
Altria Group, Inc. | | 80,460 | | | 6,011,971 |
| | | | |
|
|
| | | | | | |
| Security Description | | Shares | | Value* |
| | | | | |
| | |
Trading Companies & Distributors—0.1% | | | | | | |
Finning International, Inc. (CAD) | | | 20 | | $ | 637 |
Finning International, Inc.
(Restricted Shares) (CAD) | | | 1,070 | | | 34,084 |
W.W. Grainger, Inc. | | | 7,670 | | | 545,337 |
| | | | | |
|
|
| | | | | | | 580,058 |
| | | | | |
|
|
|
Wireless Telecommunication Services— 2.0% |
Sprint Nextel Corp. | | | 348,810 | | | 8,148,202 |
Vodafone Group, Plc. (ADR) | | | 103,452 | | | 2,221,114 |
| | | | | |
|
|
| | | | | | | 10,369,316 |
| | | | | |
|
|
Total Common Stock
(Identified Cost $279,215,227) | | | | | | 305,180,274 |
| | | | | |
|
|
|
| Fixed Income—38.6% |
| Security Description | | Face
Amount | | Value* |
| | |
Aerospace & Defense—0.3% | | | | | | |
BAE Systems Holdings, Inc. (144A)
5.200%, 08/15/15 | | $ | 531,000 | | $ | 520,352 |
Northrop Grumman Corp.
7.750%, 02/15/31 | | | 510,000 | | | 652,011 |
Raytheon Co.
6.150%, 11/01/08 | | | 225,000 | | | 233,510 |
| | | | | |
|
|
| | | | | | | 1,405,873 |
| | | | | |
|
|
| | |
Asset Backed—0.8% | | | | | | |
AESOP Funding, LLC (144A)
2.860%, 08/20/09 | | | 220,000 | | | 209,739 |
AmeriCredit Automobile Receivables Co.
2.180%, 07/07/08 | | | 129,815 | | | 129,035 |
Capital One Auto Finance Trust
4.790%, 01/15/09 | | | 164,677 | | | 164,405 |
Capital One Master Trust
5.450%, 03/16/09 | | | 300,000 | | | 300,917 |
Connecticut RRB Special Purpose Trust
6.210%, 12/30/11 (b) | | | 300,000 | | | 314,704 |
Continental Airlines Pass Through
6.648%, 09/15/17 | | | 453,324 | | | 442,988 |
Countrywide Asset-Backed Certificates
4.575%, 07/25/35 | | | 20,000 | | | 19,731 |
4.823%, 08/25/35 | | | 185,000 | | | 183,134 |
Falcon Franchise Loan, LLC (144A)
7.382%, 05/05/10 | | | 103,250 | | | 107,270 |
Residential Asset Mortgage Products, Inc.
3.800%, 07/25/30 | | | 56,365 | | | 56,142 |
4.109%, 01/25/29 | | | 226,211 | | | 221,641 |
Residential Funding Mortgage Securities II, Inc. 5.320%, 12/25/35 | | | 340,000 | | | 339,651 |
Small Business Administration Participation Certificates
4.350%, 07/01/23 (b) | | | 39,684 | | | 38,270 |
4.950%, 03/01/25 | | | 585,319 | | | 582,928 |
4.990%, 09/01/24 (b) | | | 318,560 | | | 317,780 |
5.180%, 05/01/24 (b) | | | 166,261 | | | 167,513 |
5.520%, 06/01/24 (b) | | | 524,950 | | | 537,298 |
| | | | | |
|
|
| | | | | | | 4,133,146 |
| | | | | |
|
|
*See accompanying notes to financial statements.
MSF-310
Metropolitan Series Fund, Inc.
MFS Total Return Portfolio
Schedule of Investments as of December 31, 2005
Fixed Income—(Continued)
| | | | | | |
| Security Description | | Face
Amount | | Value* |
| | |
Automobiles—0.0% | | | | | | |
Ford Motor Co.
7.450%, 07/16/31 | | $ | 243,000 | | $ | 165,240 |
| | | | | |
|
|
| | |
Beverages—0.2% | | | | | | |
Coca-Cola Co.
5.125%, 09/17/13 | | | 200,000 | | | 201,040 |
Miller Brewing Co. (144A)
5.500%, 08/15/13 | | | 630,000 | | | 642,163 |
| | | | | |
|
|
| | | | | | | 843,203 |
| | | | | |
|
|
| | |
Capital Markets—0.6% | | | | | | |
Ameriprise Financial, Inc.
5.350%, 11/15/10 | | | 305,000 | | | 307,090 |
Credit Suisse First Boston USA, Inc.
4.125%, 01/15/10 | | | 340,000 | | | 328,807 |
4.875%, 08/15/10 | | | 306,000 | | | 303,653 |
JPMorgan Chase & Co.
5.125%, 09/15/14 | | | 498,000 | | | 492,976 |
Merrill Lynch & Co., Inc.
5.450%, 07/15/14 | | | 489,000 | | | 496,989 |
Morgan Stanley
4.750%, 04/01/14 | | | 32,000 | | | 30,690 |
Morgan Stanley Group, Inc.
6.750%, 04/15/11 | | | 316,000 | | | 340,183 |
The Goldman Sachs Group, Inc.
5.700%, 09/01/12 | | | 608,000 | | | 625,436 |
| | | | | |
|
|
| | | | | | | 2,925,824 |
| | | | | |
|
|
| | |
Chemicals—0.1% | | | | | | |
The Dow Chemical Co.
5.750%, 12/15/08 | | | 108,000 | | | 110,791 |
6.000%, 10/01/12 | | | 335,000 | | | 352,077 |
| | | | | |
|
|
| | | | | | | 462,868 |
| | | | | |
|
|
| | |
Commercial Banks—0.8% | | | | | | |
Bank of America Corp.
5.375%, 06/15/14 | | | 390,000 | | | 396,438 |
7.400%, 01/15/11 | | | 983,000 | | | 1,082,798 |
Bank One Corp.
8.000%, 04/29/27 | | | 100,000 | | | 126,274 |
Popular North America, Inc.
4.250%, 04/01/08 | | | 472,000 | | | 462,942 |
U.S. Bancorp
7.500%, 06/01/26 | | | 400,000 | | | 491,935 |
Wachovia Corp.
5.250%, 08/01/14 | | | 789,000 | | | 790,046 |
Wells Fargo Bank, National Association
6.450%, 02/01/11 | | | 750,000 | | | 799,300 |
| | | | | |
|
|
| | | | | | | 4,149,733 |
| | | | | |
|
|
|
Commercial Mortgage-Backed Securities—2.0% |
Banc of America Commercial Mortgage, Inc. 5.182%, 09/10/47 | | | 176,340 | | | 176,650 |
Greenwich Capital Commercial Funding Corp.
5.224%, 04/10/37 | | | 364,964 | | | 366,581 |
Chase Commercial Mortgage Securities Corp.
6.390%, 11/18/30 | | | 671,626 | | | 694,422 |
Citigroup/Deutsche Bank Commercial Mortgage Trust
5.225%, 07/15/44 | | | 270,000 | | | 271,525 |
| | | | | | |
| Security Description | | Face
Amount | | Value* |
|
Commercial Mortgage-Backed Securities—(Continued) |
Criimi Mae Commercial Mortgage Trust (144A)
7.000%, 06/02/33 | | $ | 181,807 | | $ | 184,306 |
CS First Boston Mortgage Securities Corp.
6.550%, 01/17/35 | | | 250,000 | | | 256,003 |
Deutsche Mortgage & Asset Receiving Corp.
6.538%, 06/15/31 | | | 149,153 | | | 152,787 |
General Electric Capital Assurance Co. (144A)
5.743%, 05/12/35 | | | 35,000 | | | 36,534 |
Greenwich Capital Commercial Funding Corp.
4.305%, 08/10/42 | | | 326,945 | | | 318,365 |
4.915%, 01/05/36 (b) | | | 500,000 | | | 493,677 |
5.317%, 06/10/36 (b) | | | 141,434 | | | 142,762 |
JPMorgan Chase Commercial Mortgage Securities Corp.
4.780%, 07/15/42 | | | 330,000 | | | 319,507 |
4.948%, 09/12/37 | | | 400,000 | | | 391,899 |
5.038%, 03/15/46 | | | 480,060 | | | 474,670 |
5.213%, 05/15/41 (b) | | | 92,933 | | | 93,589 |
Lehman Brothers Commercial Conduit Mortgage Trust
6.480%, 02/18/30 | | | 238,236 | | | 243,560 |
Morgan Stanley Capital I, Inc.
5.150%, 06/13/41 | | | 250,000 | | | 249,344 |
5.168%, 01/14/42 | | | 199,571 | | | 199,534 |
Morgan Stanley Capital I, Inc. (144A)
0.567%, 11/15/30 (b) | | | 5,566,398 | | | 99,043 |
Mortgage Capital Funding, Inc.
6.337%, 11/18/31 | | | 189,953 | | | 194,406 |
Multi-Family Capital Access One, Inc.
6.650%, 01/15/24 | | | 44,930 | | | 46,378 |
Residential Asset Mortgage Products, Inc.
4.971%, 09/25/34 | | | 204,000 | | | 199,589 |
Small Business Administration Participation Certificates
4.770%, 04/01/24 | | | 102,378 | | | 100,926 |
5.090%, 10/01/25 | | | 249,000 | | | 249,148 |
5.110%, 08/01/25 (b) | | | 762,000 | | | 763,616 |
5.390%, 12/01/25 | | | 269,000 | | | 273,429 |
Spirit Master Funding, LLC (144A)
5.050%, 07/20/23 | | | 392,957 | | | 384,354 |
Structured Asset Securities Corp.
4.670%, 03/25/35 | | | 794,929 | | | 787,134 |
The Bear Stearns Commercial Mortgage Securities, Inc.
4.680%, 08/13/39 | | | 150,000 | | | 145,959 |
5.116%, 02/11/41 | | | 286,663 | | | 285,595 |
TIAA Retail Commercial Mortgage Trust (144A)
7.170%, 01/15/32 | | | 165,915 | | | 169,151 |
Wachovia Bank Commercial Mortgage Trust
4.847%, 10/15/41 | | | 470,000 | | | 458,873 |
5.083%, 03/15/42 (b) | | | 488,241 | | | 484,466 |
5.155%, 12/15/44 | | | 246,000 | | | 250,180 |
5.190%, 10/15/44 | | | 347,000 | | | 348,052 |
| | | | | |
|
|
| | | | | | | 10,306,014 |
| | | | | |
|
|
| | |
Commercial Services & Supplies—0.2% | | | | | | |
Cendant Corp.
6.875%, 08/15/06 | | | 458,000 | | | 462,701 |
USA Waste Services, Inc.
7.000%, 07/15/28 | | | 196,000 | | | 220,824 |
Waste Management, Inc.
7.375%, 08/01/10 | | | 287,000 | | | 312,340 |
| | | | | |
|
|
| | | | | | | 995,865 |
| | | | | |
|
|
*See accompanying notes to financial statements.
MSF-311
Metropolitan Series Fund, Inc.
MFS Total Return Portfolio
Schedule of Investments as of December 31, 2005
Fixed Income—(Continued)
| | | | | | |
| Security Description | | Face
Amount | | Value* |
| | |
Construction & Engineering—0.1% | | | | | | |
CRH America, Inc.
6.950%, 03/15/12 | | $ | 309,000 | | $ | 336,201 |
| | | | | |
|
|
| | |
Consumer Finance—0.1% | | | | | | |
Dean Witter Discover & Co.
6.750%, 01/01/16 | | | 260,000 | | | 280,981 |
| | | | | |
|
|
| | |
Diversified Financial Services—1.4% | | | | | | |
Boeing Capital Corp.
6.500%, 02/15/12 | | | 676,000 | | | 729,690 |
Cadbury Schweppes U.S. Finance (144A)
5.125%, 10/01/13 | | | 600,000 | | | 596,638 |
Citigroup, Inc.
5.000%, 09/15/14 | | | 1,192,000 | | | 1,173,351 |
DBS Capital Funding Corp. (144A)
7.657%, 03/31/49 (b) | | | 318,000 | | | 351,852 |
Devon Financing Corp.
6.875%, 09/30/11 | | | 311,000 | | | 340,183 |
Duke Capital, LLC
8.000%, 10/01/19 | | | 375,000 | | | 447,580 |
Ford Motor Credit Co.
4.950%, 01/15/08 | | | 170,000 | | | 152,319 |
5.700%, 01/15/10 | | | 484,000 | | | 411,430 |
Foster’s Finance Corp. (144A)
5.875%, 06/15/35 | | | 352,000 | | | 342,809 |
General Electric Capital Corp.
5.450%, 01/15/13 | | | 250,000 | | | 256,085 |
6.750%, 03/15/32 | | | 424,000 | | | 497,713 |
General Motors Acceptance Corp.
5.850%, 01/14/09 | | | 353,000 | | | 315,803 |
7.250%, 03/02/11 | | | 212,000 | | | 194,857 |
HSBC Finance Corp.
5.250%, 01/14/11 | | | 370,000 | | | 370,189 |
MidAmerican Funding, LLC
6.927%, 03/01/29 | | | 100,000 | | | 111,891 |
RBS Capital Trust II
6.425%, 12/29/49 (b) | | | 300,000 | | | 314,835 |
Sprint Capital Corp.
6.875%, 11/15/28 | | | 329,000 | | | 359,495 |
TCI Communications Financing III
9.650%, 03/31/27 | | | 308,000 | | | 333,289 |
| | | | | |
|
|
| | | | | | | 7,300,009 |
| | | | | |
|
|
|
Diversified Telecommunication Services—0.4% |
BellSouth Corp.
6.550%, 06/15/34 | | | 360,000 | | | 383,458 |
SBC Communications, Inc.
5.100%, 09/15/14 | | | 575,000 | | | 561,707 |
6.150%, 09/15/34 | | | 170,000 | | | 170,759 |
Verizon New York, Inc.
6.875%, 04/01/12 | | | 702,000 | | | 731,786 |
| | | | | |
|
|
| | | | | | | 1,847,710 |
| | | | | |
|
|
| | |
Electric Utilities—0.4% | | | | | | |
Exelon Generation Co., LLC
6.950%, 06/15/11 | | | 518,000 | | | 558,527 |
FirstEnergy Corp. (Series B)
6.450%, 11/15/11 | | | 538,000 | | | 570,278 |
| | | | | | |
| Security Description | | Face
Amount | | Value* |
| | |
Electric Utilities—(Continued) | | | | | | |
Niagara Mohawk Power Corp.
7.750%, 05/15/06 | | $ | 68,000 | | $ | 68,727 |
Oncor Electric Delivery Co.
7.000%, 09/01/22 | | | 434,000 | | | 482,381 |
PPL Energy Supply, LLC
6.400%, 11/01/11 | | | 100,000 | | | 105,404 |
PSE&G Power, LLC
6.950%, 06/01/12 | | | 155,000 | | | 167,976 |
8.625%, 04/15/31 | | | 200,000 | | | 263,173 |
Virginia Electric & Power Co.
5.375%, 02/01/07 | | | 45,000 | | | 45,168 |
| | | | | |
|
|
| | | | | | | 2,261,634 |
| | | | | |
|
|
| | |
Energy Equipment & Services—0.4% | | | | | | |
Halliburton Co.
5.500%, 10/15/10 | | | 402,000 | | | 410,587 |
Kinder Morgan Energy Partners, L.P.
6.750%, 03/15/11 | | | 327,000 | | | 348,283 |
7.125%, 03/15/12 | | | 150,000 | | | 163,997 |
7.750%, 03/15/32 | | | 53,000 | | | 63,253 |
MidAmerican Energy Holdings Co.
3.500%, 05/15/08 | | | 150,000 | | | 144,727 |
5.875%, 10/01/12 | | | 500,000 | | | 516,181 |
System Energy Resources, Inc. (144A)
5.129%, 01/15/14 | | | 171,689 | | | 165,634 |
United Energy Distribution Holdings, Ltd. (144A) 5.450%, 04/15/16 | | | 50,000 | | | 51,237 |
| | | | | |
|
|
| | | | | | | 1,863,899 |
| | | | | |
|
|
| | |
Federal Agencies—17.3% | | | | | | |
A.I.D. Egypt
4.450%, 09/15/15 | | | 403,000 | | | 394,896 |
Federal Home Loan Bank
3.250%, 07/21/06 | | | 740,000 | | | 734,531 |
3.750%, 09/28/06 | | | 2,355,000 | | | 2,339,068 |
3.900%, 02/25/08 | | | 285,000 | | | 280,255 |
4.500%, 01/01/19 | | | 230,638 | | | 224,946 |
4.500%, 02/01/20 | | | 312,921 | | | 304,968 |
5.000%, 06/01/18 | | | 61,806 | | | 61,278 |
5.000%, 12/01/18 | | | 148,487 | | | 147,219 |
5.000%, 02/01/19 | | | 236,737 | | | 234,505 |
5.000%, 04/01/34 | | | 152,784 | | | 148,214 |
5.000%, 08/01/35 | | | 408,007 | | | 395,002 |
5.000%, 09/01/35 | | | 285,838 | | | 276,727 |
5.000%, 10/01/35 | | | 629,544 | | | 609,477 |
5.500%, 01/01/19 | | | 182,926 | | | 184,063 |
5.500%, 04/01/19 | | | 19,648 | | | 19,772 |
5.500%, 06/01/19 | | | 20,753 | | | 20,882 |
5.500%, 07/01/19 | | | 34,157 | | | 34,369 |
5.500%, 12/01/19 | | | 106,780 | | | 107,444 |
5.500%, 08/01/25 | | | 253,972 | | | 253,681 |
5.500%, 09/01/25 | | | 305,314 | | | 304,964 |
5.500%, 12/01/33 | | | 213,979 | | | 212,539 |
5.500%, 01/01/34 | | | 151,095 | | | 150,079 |
5.500%, 04/01/34 | | | 96,986 | | | 96,191 |
*See accompanying notes to financial statements.
MSF-312
Metropolitan Series Fund, Inc.
MFS Total Return Portfolio
Schedule of Investments as of December 31, 2005
Fixed Income—(Continued)
| | | | | | |
| Security Description | | Face
Amount | | Value* |
| | |
Federal Agencies—(Continued) | | | | | | |
5.500%, 11/01/34 | | $ | 117,881 | | $ | 116,914 |
6.000%, 04/01/16 | | | 62,839 | | | 64,147 |
6.000%, 04/01/17 | | | 87,728 | | | 89,549 |
6.000%, 05/01/17 | | | 31,919 | | | 32,583 |
6.000%, 06/01/17 | | | 51,514 | | | 52,583 |
6.000%, 07/01/17 | | | 51,589 | | | 52,660 |
6.000%, 10/01/17 | | | 65,580 | | | 66,942 |
6.000%, 08/01/19 | | | 230,404 | | | 235,122 |
6.000%, 09/01/19 | | | 103,796 | | | 105,921 |
6.000%, 11/01/19 | | | 54,033 | | | 55,157 |
6.000%, 02/01/23 | | | 173,124 | | | 176,254 |
6.000%, 04/01/34 | | | 91,682 | | | 92,606 |
6.000%, 07/01/34 | | | 426,971 | | | 431,275 |
6.000%, 08/01/34 | | | 1,939,055 | | | 1,958,602 |
6.000%, 09/01/34 | | | 100,950 | | | 101,967 |
6.500%, 05/01/34 | | | 73,791 | | | 75,627 |
6.500%, 06/01/34 | | | 90,537 | | | 92,791 |
6.500%, 08/01/34 | | | 355,621 | | | 364,473 |
6.500%, 10/01/34 | | | 406,959 | | | 417,796 |
Federal Home Loan Mortgage Corp.
3.750%, 11/15/06 | | | 419,000 | | | 415,516 |
4.125%, 11/18/09 | | | 245,000 | | | 239,842 |
4.125%, 07/12/10 | | | 787,000 | | | 767,445 |
4.500%, 08/01/19 | | | 86,932 | | | 84,722 |
4.500%, 04/01/35 | | | 434,931 | | | 409,468 |
4.875%, 11/15/13 | | | 3,637,000 | | | 3,654,203 |
5.000%, 12/01/17 | | | 45,660 | | | 45,282 |
5.000%, 09/01/33 | | | 557,381 | | | 541,558 |
5.000%, 11/01/33 | | | 258,050 | | | 250,725 |
5.000%, 05/01/35 | | | 192,282 | | | 186,153 |
5.000%, 08/01/35 | | | 233,802 | | | 226,350 |
5.000%, 10/01/35 | | | 417,800 | | | 404,483 |
5.500%, 08/01/19 | | | 89,234 | | | 89,789 |
5.500%, 02/01/20 | | | 43,261 | | | 43,523 |
5.500%, 06/01/25 | | | 526,488 | | | 525,720 |
5.500%, 07/01/25 | | | 193,380 | | | 193,098 |
5.500%, 05/01/33 | | | 159,338 | | | 158,265 |
5.500%, 05/01/35 | | | 53,381 | | | 52,902 |
5.500%, 07/01/35 | | | 477,189 | | | 472,914 |
5.500%, 09/01/35 | | | 153,926 | | | 152,547 |
6.000%, 07/01/35 | | | 231,015 | | | 233,350 |
6.000%, 08/01/35 | | | 303,181 | | | 306,245 |
6.500%, 11/01/34 | | | 555,512 | | | 569,340 |
Federal National Mortgage Association
3.000%, 03/02/07 | | | 585,000 | | | 573,336 |
3.250%, 07/31/06 | | | 350,000 | | | 347,185 |
4.010%, 08/01/13 | | | 41,921 | | | 39,479 |
4.500%, 04/01/18 | | | 116,357 | | | 113,485 |
4.500%, 06/01/18 | | | 228,633 | | | 222,990 |
4.500%, 07/01/18 | | | 1,204,842 | | | 1,175,103 |
4.500%, 06/01/19 | | | 1,751,367 | | | 1,706,826 |
4.500%, 04/01/20 | | | 384,581 | | | 374,800 |
4.500%, 05/01/20 | | | 155,121 | | | 150,949 |
4.500%, 07/01/20 | | | 127,237 | | | 124,001 |
4.500%, 02/01/35 | | | 168,027 | | | 158,605 |
4.500%, 03/01/35 | | | 441,830 | | | 416,103 |
| | | | | | |
| Security Description | | Face
Amount | | Value* |
| | |
Federal Agencies—(Continued) | | | | | | |
4.500%, 09/01/35 | | $ | 196,326 | | $ | 184,894 |
4.518%, 05/01/14 (b) | | | 364,760 | | | 353,699 |
4.625%, 10/15/14 | | | 538,000 | | | 531,660 |
4.630%, 04/01/14 | | | 103,465 | | | 100,692 |
4.845%, 06/01/13 | | | 96,429 | | | 95,208 |
4.846%, 08/01/14 (b) | | | 243,195 | | | 240,621 |
4.880%, 03/01/20 | | | 280,300 | | | 278,164 |
4.925%, 04/01/15 (b) | | | 671,407 | | | 667,298 |
4.940%, 08/01/15 | | | 50,000 | | | 49,689 |
5.000%, 11/01/17 | | | 51,140 | | | 50,675 |
5.000%, 02/01/18 | | | 214,582 | | | 212,628 |
5.000%, 11/01/18 | | | 96,626 | | | 95,731 |
5.000%, 12/01/18 | | | 221,830 | | | 219,775 |
5.000%, 06/01/19 | | | 2,112,121 | | | 2,090,630 |
5.000%, 07/01/19 | | | 754,173 | | | 746,500 |
5.000%, 09/01/19 | | | 195,744 | | | 193,752 |
5.000%, 11/01/19 | | | 326,006 | | | 322,689 |
5.000%, 12/01/19 | | | 95,908 | | | 94,932 |
5.000%, 01/01/20 | | | 114,257 | | | 113,040 |
5.000%, 05/01/20 | | | 181,219 | | | 179,291 |
5.000%, 07/01/20 | | | 125,284 | | | 123,951 |
5.000%, 11/01/33 | | | 559,631 | | | 544,197 |
5.000%, 03/01/34 | | | 135,751 | | | 131,800 |
5.000%, 04/01/34 | | | 552,746 | | | 536,657 |
5.000%, 05/01/34 | | | 158,998 | | | 154,370 |
5.000%, 06/01/34 | | | 126,236 | | | 122,562 |
5.000%, 08/01/34 | | | 169,098 | | | 164,176 |
5.000%, 09/01/34 | | | 714,473 | | | 693,677 |
5.000%, 12/01/34 | | | 78,459 | | | 76,175 |
5.000%, 06/01/35 | | | 134,792 | | | 130,650 |
5.000%, 07/01/35 | | | 414,555 | | | 401,727 |
5.000%, 08/01/35 | | | 298,450 | | | 289,186 |
5.250%, 04/15/07 | | | 1,866,000 | | | 1,876,918 |
5.500%, 11/01/17 | | | 153,560 | | | 154,621 |
5.500%, 12/01/17 | | | 321,299 | | | 323,519 |
5.500%, 01/01/18 | | | 107,016 | | | 107,756 |
5.500%, 02/01/18 | | | 86,597 | | | 87,171 |
5.500%, 12/01/18 | | | 399,990 | | | 402,646 |
5.500%, 06/01/19 | | | 969,425 | | | 975,775 |
5.500%, 07/01/19 | | | 354,481 | | | 356,801 |
5.500%, 08/01/19 | | | 57,070 | | | 57,444 |
5.500%, 09/01/19 | | | 421,102 | | | 423,859 |
5.500%, 11/01/19 | | | 113,232 | | | 113,973 |
5.500%, 05/01/25 | | | 279,555 | | | 278,973 |
5.500%, 06/01/25 | | | 187,490 | | | 187,099 |
5.500%, 02/01/33 | | | 172,592 | | | 171,326 |
5.500%, 04/01/33 | | | 335,505 | | | 333,044 |
5.500%, 05/01/33 | | | 71,488 | | | 70,963 |
5.500%, 06/01/33 | | | 754,224 | | | 748,693 |
5.500%, 07/01/33 | | | 458,610 | | | 455,247 |
5.500%, 11/01/33 | | | 756,926 | | | 751,375 |
5.500%, 12/01/33 | | | 64,291 | | | 63,819 |
5.500%, 01/01/34 | | | 563,644 | | | 559,511 |
5.500%, 02/01/34 | | | 361,295 | | | 358,645 |
5.500%, 03/01/34 | | | 76,694 | | | 76,076 |
*See accompanying notes to financial statements.
MSF-313
Metropolitan Series Fund, Inc.
MFS Total Return Portfolio
Schedule of Investments as of December 31, 2005
Fixed Income—(Continued)
| | | | | | |
| Security Description | | Face
Amount | | Value* |
| | |
Federal Agencies—(Continued) | | | | | | |
5.500%, 04/01/34 | | $ | 152,495 | | $ | 151,148 |
5.500%, 05/01/34 | | | 935,924 | | | 927,655 |
5.500%, 06/01/34 | | | 4,027,315 | | | 3,991,736 |
5.500%, 07/01/34 | | | 2,303,676 | | | 2,283,326 |
5.500%, 08/01/34 | | | 454,135 | | | 450,123 |
5.500%, 09/01/34 | | | 1,859,419 | | | 1,842,991 |
5.500%, 10/01/34 | | | 1,496,015 | | | 1,482,799 |
5.500%, 11/01/34 | | | 3,886,487 | | | 3,852,151 |
5.500%, 12/01/34 | | | 1,636,780 | | | 1,622,320 |
5.500%, 01/01/35 | | | 743,683 | | | 737,113 |
5.500%, 02/01/35 | | | 184,062 | | | 182,298 |
5.500%, 04/01/35 | | | 386,800 | | | 383,094 |
5.500%, 05/01/35 | | | 148,008 | | | 146,589 |
5.500%, 07/01/35 | | | 42,432 | | | 42,026 |
5.500%, 08/01/35 | | | 305,501 | | | 302,573 |
5.500%, 09/01/35 | | | 809,365 | | | 801,643 |
5.500%, 10/01/35 | | | 255,137 | | | 252,720 |
6.000%, 05/15/08 | | | 728,000 | | | 748,382 |
6.000%, 05/15/11 | | | 426,000 | | | 450,553 |
6.000%, 04/01/16 | | | 137,650 | | | 140,701 |
6.000%, 12/01/16 | | | 40,650 | | | 41,554 |
6.000%, 02/01/17 | | | 96,722 | | | 98,871 |
6.000%, 03/01/17 | | | 394,684 | | | 403,454 |
6.000%, 08/01/17 | | | 130,645 | | | 133,547 |
6.000%, 09/01/17 | | | 590,344 | | | 603,455 |
6.000%, 03/01/18 | | | 107,401 | | | 109,787 |
6.000%, 11/01/18 | | | 661,911 | | | 676,619 |
6.000%, 01/01/23 | | | 136,084 | | | 138,475 |
6.000%, 11/01/25 | | | 240,021 | | | 243,797 |
6.000%, 04/01/34 | | | 890,589 | | | 899,009 |
6.000%, 05/01/34 | | | 95,277 | | | 96,178 |
6.000%, 06/01/34 | | | 850,984 | | | 859,030 |
6.000%, 07/01/34 | | | 755,003 | | | 762,141 |
6.000%, 08/01/34 | | | 2,186,730 | | | 2,207,406 |
6.000%, 11/01/34 | | | 148,798 | | | 150,204 |
6.000%, 12/01/34 | | | 63,863 | | | 64,466 |
6.000%, 04/01/35 | | | 95,590 | | | 96,496 |
6.000%, 12/01/35 | | | 338,744 | | | 341,955 |
6.500%, 05/01/08 | | | 640,421 | | | 654,900 |
6.500%, 11/01/28 | | | 156,766 | | | 161,487 |
6.500%, 07/01/31 | | | 20,849 | | | 21,431 |
6.500%, 09/01/31 | | | 162,325 | | | 166,858 |
6.500%, 07/01/32 | | | 400,955 | | | 412,714 |
6.500%, 08/01/32 | | | 192,041 | | | 197,366 |
6.500%, 01/01/33 | | | 13,148 | | | 13,513 |
6.500%, 03/01/34 | | | 61,767 | | | 63,368 |
6.500%, 04/01/34 | | | 1,001,413 | | | 1,027,483 |
6.500%, 06/01/34 | | | 84,570 | | | 86,761 |
6.500%, 07/01/34 | | | 109,713 | | | 112,556 |
6.625%, 09/15/09 | | | 804,000 | | | 854,926 |
6.625%, 11/15/10 | | | 3,400,000 | | | 3,674,241 |
7.500%, 11/01/31 | | | 33,639 | | | 35,241 |
7.500%, 02/01/32 | | | 27,679 | | | 28,997 |
Financing Corp. (FICO)
9.650%, 11/02/18 | | | 120,000 | | | 172,643 |
Government National Mortgage Association
4.500%, 07/20/33 | | | 52,027 | | | 49,606 |
| | | | | | |
| Security Description | | Face
Amount | | Value* |
| | |
Federal Agencies—(Continued) | | | | | | |
4.500%, 09/15/33 | | $ | 198,565 | | $ | 190,567 |
4.500%, 09/20/33 | | | 94,954 | | | 90,536 |
4.500%, 12/20/34 | | | 90,824 | | | 86,583 |
5.000%, 06/15/34 | | | 240,309 | | | 237,438 |
5.000%, 06/15/35 | | | 124,449 | | | 122,894 |
5.500%, 11/15/32 | | | 188,106 | | | 189,608 |
5.500%, 08/15/33 | | | 850,868 | | | 857,556 |
5.500%, 09/15/34 | | | 1,449,068 | | | 1,459,024 |
5.500%, 10/15/35 | | | 45,701 | | | 46,015 |
6.000%, 12/15/28 | | | 294,377 | | | 301,911 |
6.000%, 12/15/31 | | | 327,081 | | | 335,237 |
6.000%, 03/15/32 | | | 14,790 | | | 15,162 |
6.000%, 01/15/33 | | | 233,916 | | | 239,783 |
6.000%, 02/15/33 | | | 14,451 | | | 14,814 |
6.000%, 04/15/33 | | | 245,365 | | | 251,519 |
6.000%, 08/15/33 | | | 12,403 | | | 12,714 |
6.000%, 07/15/34 | | | 541,983 | | | 555,039 |
6.500%, 08/15/28 | | | 40,995 | | | 42,926 |
6.500%, 10/15/28 | | | 148,738 | | | 155,741 |
6.500%, 12/15/28 | | | 78,340 | | | 82,031 |
6.500%, 05/15/32 | | | 33,540 | | | 35,047 |
6.500%, 08/15/34 | | | 16,322 | | | 17,039 |
U.S. Department of Housing & Urban Development
7.498%, 08/01/11 | | | 98,000 | | | 106,506 |
| | | | | |
|
|
| | | | | | | 88,568,457 |
| | | | | |
|
|
| | |
Food & Staples Retailing—0.1% | | | | | | |
Wal-Mart Stores, Inc.
5.250%, 09/01/35 | | | 482,000 | | | 467,866 |
| | | | | |
|
|
| | |
Food Products—0.1% | | | | | | |
General Mills, Inc.
6.000%, 02/15/12 | | | 23,000 | | | 24,071 |
Kraft Foods, Inc.
6.250%, 06/01/12 | | | 349,000 | | | 368,175 |
| | | | | |
|
|
| | | | | | | 392,246 |
| | | | | |
|
|
| | |
Foreign Government—0.2% | | | | | | |
State of Israel
4.625%, 06/15/13 | | | 95,000 | | | 91,854 |
United Mexican States
6.375%, 01/16/13 | | | 201,000 | | | 213,562 |
6.625%, 03/03/15 | | | 402,000 | | | 440,190 |
| | | | | |
|
|
| | | | | | | 745,606 |
| | | | | |
|
|
| | |
Health Care Providers & Services—0.1% | | | | | | |
HCA, Inc.
6.950%, 05/01/12 | | | 314,000 | | | 325,694 |
8.750%, 09/01/10 | | | 81,000 | | | 89,586 |
| | | | | |
|
|
| | | | | | | 415,280 |
| | | | | |
|
|
|
Independent Power Producers & Energy Traders—0.0% |
TXU Energy Co.
7.000%, 03/15/13 | | | 136,000 | | | 144,930 |
| | | | | |
|
|
*See accompanying notes to financial statements.
MSF-314
Metropolitan Series Fund, Inc.
MFS Total Return Portfolio
Schedule of Investments as of December 31, 2005
Fixed Income—(Continued)
| | | | | | |
| Security Description | | Face
Amount | | Value* |
| | |
Insurance—0.5% | | | | | | |
ACE INA Holdings, Inc.
5.875%, 06/15/14 | | $ | 450,000 | | $ | 465,497 |
American International Group, Inc.
4.250%, 05/15/13 | | | 847,000 | | | 805,606 |
Everest Reinsurance Holdings, Inc.
8.750%, 03/15/10 | | | 100,000 | | | 113,218 |
Fund American Cos., Inc.
5.875%, 05/15/13 | | | 105,000 | | | 105,952 |
Genworth Financial, Inc.
5.750%, 06/15/14 | | | 235,000 | | | 245,273 |
The Allstate Corp.
5.550%, 05/09/35 | | | 370,000 | | | 362,586 |
The St. Paul Travelers Cos., Inc.
5.500%, 12/01/15 | | | 252,000 | | | 253,814 |
5.750%, 03/15/07 | | | 85,000 | | | 85,447 |
Travelers Property Casualty Corp.
6.375%, 03/15/33 | | | 56,000 | | | 59,633 |
| | | | | |
|
|
| | | | | | | 2,497,026 |
| | | | | |
|
|
| | |
Machinery—0.1% | | | | | | |
Kennametal, Inc.
7.200%, 06/15/12 | | | 357,000 | | | 387,546 |
| | | | | |
|
|
| | |
Media—0.5% | | | | | | |
Cox Communications, Inc.
4.625%, 06/01/13 | | | 475,000 | | | 442,502 |
Hearst-Argyle Television, Inc.
7.500%, 11/15/27 | | | 200,000 | | | 211,085 |
News America Holdings, Inc.
6.200%, 12/15/34 | | | 295,000 | | | 293,023 |
7.750%, 01/20/24 | | | 125,000 | | | 140,919 |
8.500%, 02/23/25 | | | 150,000 | | | 180,473 |
The Walt Disney Co.
6.375%, 03/01/12 | | | 466,000 | | | 492,897 |
6.750%, 03/30/06 | | | 137,000 | | | 137,653 |
Time Warner Entertainment Co., L.P.
8.375%, 07/15/33 | | | 600,000 | | | 708,755 |
| | | | | |
|
|
| | | | | | | 2,607,307 |
| | | | | |
|
|
| | |
Metals & Mining—0.0% | | | | | | |
Alcan, Inc.
5.000%, 06/01/15 | | | 257,000 | | | 249,299 |
| | | | | |
|
|
| | |
Multi-Utilities—0.2% | | | | | | |
Centerpoint Energy Resources Corp.
7.875%, 04/01/13 | | | 191,000 | | | 218,426 |
Dominion Resources, Inc.
5.150%, 07/15/15 | | | 356,000 | | | 344,900 |
DTE Energy Co.
7.050%, 06/01/11 | | | 308,000 | | | 331,874 |
Pacific Gas & Electric Co.
4.800%, 03/01/14 | | | 427,000 | | | 416,123 |
| | | | | |
|
|
| | | | | | | 1,311,323 |
| | | | | |
|
|
| | | | | | |
| Security Description | | Face
Amount | | Value* |
| | |
Oil, Gas & Consumable Fuels—0.1% | | | | | | |
Amerada Hess Corp.
7.300%, 08/15/31 | | $ | 150,000 | | $ | 173,593 |
Ocean Energy, Inc.
7.250%, 10/01/11 | | | 200,000 | | | 220,868 |
Tosco Corp.
7.625%, 05/15/06 | | | 100,000 | | | 101,011 |
Valero Energy Corp.
6.875%, 04/15/12 | | | 286,000 | | | 312,035 |
| | | | | |
|
|
| | | | | | | 807,507 |
| | | | | |
|
|
| | |
Paper & Forest Products—0.1% | | | | | | |
MeadWestvaco Corp.
6.800%, 11/15/32 | | | 166,000 | | | 165,802 |
6.850%, 04/01/12 | | | 35,000 | | | 37,225 |
Weyerhaeuser Co.
6.750%, 03/15/12 | | | 377,000 | | | 400,143 |
| | | | | |
|
|
| | | | | | | 603,170 |
| | | | | |
|
|
| | |
Pharmaceuticals—0.1% | | | | | | |
Wyeth
5.500%, 03/15/13 (b) | | | 388,000 | | | 393,342 |
| | | | | |
|
|
| | |
Real Estate—0.6% | | | | | | |
Boston Properties, Inc. (REIT)
5.000%, 06/01/15 | | | 200,000 | | | 192,614 |
EOP Operating, L.P.
6.763%, 06/15/07 | | | 175,000 | | | 178,637 |
6.800%, 01/15/09 | | | 635,000 | | | 663,955 |
8.375%, 03/15/06 | | | 175,000 | | | 176,198 |
HRPT Properties Trust (REIT)
6.250%, 08/15/16 | | | 328,000 | | | 334,244 |
Simon Property Group L.P. (REIT)
5.100%, 06/15/15 | | | 208,000 | | | 201,168 |
6.375%, 11/15/07 | | | 309,000 | | | 315,750 |
Vornado Realty, L.P. (REIT)
4.750%, 12/01/10 | | | 182,000 | | | 176,647 |
5.625%, 06/15/07 | | | 650,000 | | | 654,547 |
| | | | | |
|
|
| | | | | | | 2,893,760 |
| | | | | |
|
|
| | |
Road & Rail—0.2% | | | | | | |
CSX Corp.
6.750%, 03/15/11 | | | 159,000 | | | 170,391 |
Norfolk Southern Corp.
7.050%, 05/01/37 | | | 360,000 | | | 429,597 |
Union Pacific Corp.
5.375%, 05/01/14 | | | 299,000 | | | 302,410 |
6.125%, 01/15/12 | | | 108,000 | | | 113,609 |
| | | | | |
|
|
| | | | | | | 1,016,007 |
| | | | | |
|
|
| | |
Thrifts & Mortgage Finance—0.0% | | | | | | |
Countrywide Home Loans, Inc.
5.500%, 08/01/06 | | | 167,000 | | | 167,681 |
| | | | | |
|
|
*See accompanying notes to financial statements.
MSF-315
Metropolitan Series Fund, Inc.
MFS Total Return Portfolio
Schedule of Investments as of December 31, 2005
Fixed Income—(Continued)
| | | | | | |
| Security Description | | Face
Amount | | Value* |
| | |
U.S. Treasury—9.7% | | | | | | |
United States Treasury Bonds
5.375%, 02/15/31 | | $ | 3,161,000 | | $ | 3,550,691 |
6.250%, 08/15/23 | | | 5,363,000 | | | 6,404,178 |
7.500%, 11/15/16 | | | 290,000 | | | 364,267 |
7.875%, 02/15/21 | | | 350,000 | | | 473,676 |
8.000%, 11/15/21 | | | 434,000 | | | 597,920 |
8.875%, 02/15/19 | | | 281,000 | | | 399,591 |
9.875%, 11/15/15 | | | 450,000 | | | 642,902 |
10.375%, 11/15/12 | | | 337,000 | | | 372,438 |
United States Treasury Notes
3.000%, 11/15/07 | | | 682,000 | | | 665,003 |
3.125%, 04/15/09 | | | 2,000,000 | | | 1,924,062 |
3.250%, 08/15/07 | | | 246,000 | | | 241,551 |
3.500%, 11/15/06 | | | 315,000 | | | 312,527 |
4.000%, 06/15/09 | | | 108,000 | | | 106,688 |
4.375%, 05/15/07 (b) | | | 586,000 | | | 585,520 |
4.750%, 11/15/08 | | | 86,000 | | | 86,826 |
4.750%, 05/15/14 | | | 370,000 | | | 379,004 |
5.000%, 02/15/11 | | | 97,000 | | | 99,906 |
5.500%, 02/15/08 | | | 753,000 | | | 769,854 |
5.625%, 05/15/08 | | | 19,919,000 | | | 20,462,112 |
6.000%, 02/15/26 | | | 2,217,000 | | | 2,614,329 |
6.625%, 05/15/07 | | | 1,292,000 | | | 1,329,548 |
7.000%, 07/15/06 | | | 3,183,000 | | | 3,225,149 |
United States Treasury Notes (TII)
3.000%, 07/15/12 | | | 2,116,910 | | | 2,238,302 |
4.250%, 01/15/10 | | | 1,704,715 | | | 1,848,017 |
| | | | | |
|
|
| | | | | | | 49,694,061 |
| | | | | |
|
|
|
Wireless Telecommunication Services—0.1% |
AT&T Wireless Services, Inc.
7.350%, 03/01/06 | | | 73,000 | | | 73,307 |
Cingular Wireless, LLC
6.500%, 12/15/11 | | | 250,000 | | | 267,520 |
| | | | | |
|
|
| | | | | | | 340,827 |
| | | | | |
|
|
| | |
Yankee—0.8% | | | | | | |
Consumers International, Inc.
10.250%, 04/01/49 (c) (d) | | | 50,000 | | | 0 |
Deutsche Telekom International Finance
8.250%, 06/15/30 (b) | | | 489,000 | | | 621,944 |
France Telecom S.A.
7.750%, 03/01/11 (b) | | | 134,000 | | | 149,670 |
Hydro-Quebec
6.300%, 05/11/11 | | | 350,000 | | | 373,348 |
ING Groep NV
5.775%, 12/29/49 | | | 809,000 | | | 819,923 |
Mizuho Financial Group Cayman, Ltd. (144A)
5.790%, 04/15/14 | | | 279,000 | | | 288,228 |
Norsk Hydro A/S
7.750%, 06/15/23 | | | 100,000 | | | 127,049 |
PCCW-HKTC Capital, Ltd. (144A)
6.000%, 07/15/13 | | | 129,000 | | | 131,766 |
Pemex Project Funding Master Trust
8.625%, 02/01/22 | | | 127,000 | | | 156,527 |
9.125%, 10/13/10 | | | 125,000 | | | 143,875 |
| | | | | | |
| Security Description | | Face
Amount | | Value* |
| | |
Yankee—(Continued) | | | | | | |
Telecom Italia Capital S.A.
5.250%, 11/15/13 | | $ | 208,000 | | $ | 204,105 |
6.000%, 09/30/34 | | | 244,000 | | | 235,059 |
TransCanada Pipelines, Ltd.
7.150%, 06/15/06 | | | 375,000 | | | 378,863 |
Tyco International Group S.A.
6.750%, 02/15/11 | | | 308,000 | | | 323,828 |
UFJ Finance Aruba AEC
6.750%, 07/15/13 | | | 360,000 | | | 393,071 |
| | | | | |
|
|
| | | | | | | 4,347,256 |
| | | | | |
|
|
Total Fixed Income
(Identified Cost $198,012,185) | | | | | | 197,328,697 |
| | | | | |
|
|
| | |
| Short Term Investments—1.4% | | | | | | |
| | |
Commercial Paper—1.4% | | | | | | |
Morgan Stanley Dean Witter
4.200%, 01/03/06 | | | 7,280,000 | | | 7,278,301 |
| | | | | |
|
|
Total Short Term Investments
(Amortized Cost $7,278,301) | | | | | | 7,278,301 |
| | | | | |
|
|
Total Investments—99.8%
(Identified Cost $484,505,713) (e) | | | | | | 509,787,272 |
Other assets less liabilities | | | | | | 1,031,072 |
| | | | | |
|
|
| Total Net Assets—100% | | | | | $ | 510,818,344 |
| | | | | |
|
|
| (b) | Variable or Floating Rate Security. Rate disclosed is as of December 31, 2005. |
| (c) | Non-Income Producing; Defaulted Bond. |
| (e) | The aggregate cost of investments for federal income tax purposes as of December 31, 2005 was $487,950,742 and the composition of unrealized appreciation and depreciation of investment securities was $35,557,743 and $(13,721,213), respectively. |
| (144A)— | Securities exempt from registration under Rule 144A of the Securities Act of 1933. These securities may be resold in transactions exempt from registration, normally to qualified institutional buyers. As of December 31, 2005, the market value of 144A securities was $4,903,834, which is 1.0% of total net assets. |
| (ADR)— | An American Depositary Receipt is a certificate issued by a custodian bank representing the right to receive securities of the foreign issuer described. Trading on exchanges not located in the United States or Canada significantly influences the value of ADRs. |
| (GDR)— | Global Depository Receipt. |
| (REIT)— | A Real Estate Investment Trust is a pooled investment vehicle that invests primarily in income-producing real estate or real estate related loans or interest. |
| (TII)— | A Treasury Inflation Index is a security with a fixed interest rate and the principal is adjusted for inflation. At maturity, the security will be redeemed at the greater of the inflation adjusted principal or par amount at original issue. |
*See accompanying notes to financial statements.
MSF-316
Metropolitan Series Fund, Inc.
MFS Total Return Portfolio
Statement of Assets & Liabilities
December 31, 2005
| | | | | | | |
Assets | | | | | | | |
Investments at value | | | | | $ | 509,787,272 | |
Cash | | | | | | 11,918 | |
Receivable for: | | | | | | | |
Securities sold | | | | | | 14,022 | |
Fund shares sold | | | | | | 564,159 | |
Accrued interest and dividends | | | | | | 2,455,951 | |
Foreign taxes | | | | | | 5,285 | |
| | | | | |
|
|
|
Total Assets | | | | | | 512,838,607 | |
Liabilities | | | | | | | |
Payable for: | | | | | | | |
Fund shares redeemed | | $ | 727,787 | | | | |
Securities purchased | | | 592,141 | | | | |
Accrued expenses: | | | | | | | |
Management fees | | | 217,987 | | | | |
Service and distribution fees | | | 45,185 | | | | |
Deferred directors’ fees | | | 83,685 | | | | |
Other expenses | | | 353,478 | | | | |
| | |
|
| | | | |
Total Liabilities | | | | | | 2,020,263 | |
| | | | | |
|
|
|
Net Assets | | | | | $ | 510,818,344 | |
| | | | | |
|
|
|
Net assets consists of: | | | | | | | |
Capital paid in | | | | | $ | 492,074,889 | |
Undistributed net investment income | | | | | | 13,413,276 | |
Accumulated net realized losses | | | | | | (19,950,758 | ) |
Unrealized appreciation on investments and foreign currency | | | | | | 25,280,937 | |
| | | | | |
|
|
|
Net Assets | | | | | $ | 510,818,344 | |
| | | | | |
|
|
|
| Computation of offering price: | | | | | | | |
Class A | | | | | | | |
Net asset value and redemption price per share ($261,653,100 divided by 1,768,077 shares outstanding) | | | | | $ | 147.99 | |
| | | | | |
|
|
|
Class B | | | | | | | |
Net asset value and redemption price per share ($158,527,756 divided by 1,081,486 shares outstanding) | | | | | $ | 146.58 | |
| | | | | |
|
|
|
Class E | | | | | | | |
Net asset value and redemption price per share ($90,637,488 divided by 615,072 shares outstanding) | | | | | $ | 147.36 | |
| | | | | |
|
|
|
Identified cost of investments | | | | | $ | 484,505,713 | |
| | | | | |
|
|
|
Statement of Operations
For the Year Ended December 31, 2005
| | | | | | | | |
Investment Income | | | | | | | | |
Dividends | | | | | | $ | 6,120,327 | (a) |
Interest | | | | | | | 9,543,318 | |
| | | | | | |
|
|
|
| | | | | | | | 15,663,645 | |
Expenses | | | | | | | | |
Management fees | | $ | 2,460,950 | | | | | |
Service and distribution fees—Class B | | | 336,228 | | | | | |
Service and distribution fees—Class E | | | 138,172 | | | | | |
Directors’ fees and expenses | | | 24,955 | | | | | |
Custodian | | | 333,096 | | | | | |
Audit and tax services | | | 26,950 | | | | | |
Legal | | | 13,113 | | | | | |
Printing | | | 362,410 | | | | | |
Insurance | | | 9,098 | | | | | |
Miscellaneous | | | 5,603 | | | | | |
| | |
|
|
| | | | |
Total expenses | | | 3,710,575 | | | | | |
Expense reductions | | | (45,903 | ) | | | 3,664,672 | |
| | |
|
|
| |
|
|
|
Net Investment Income | | | | | | | 11,998,973 | |
| | | | | | |
|
|
|
Realized and Unrealized Gain (Loss) | | | | | | | | |
| Realized gain (loss) on: | | | | | | | | |
Investments—net | | | 15,556,908 | | | | | |
Foreign currency transactions—net | | | (3,026 | ) | | | 15,553,882 | |
| | |
|
|
| | | | |
| Unrealized depreciation on: | | | | | | | | |
Investments—net | | | (12,762,032 | ) | | | | |
Foreign currency transactions—net | | | (2,574 | ) | | | (12,764,606 | ) |
| | |
|
|
| |
|
|
|
Net gain | | | | | | | 2,789,276 | |
| | | | | | |
|
|
|
Net Increase in Net Assets From Operations | | | | | | $ | 14,788,249 | |
| | | | | | |
|
|
|
| (a) | Net of foreign taxes of $53,920. |
See accompanying notes to financial statements.
MSF-317
Metropolitan Series Fund, Inc.
MFS Total Return Portfolio
Statement of Changes in Net Assets
| | | | | | | | |
| | | Year ended
December 31,
2005
| | | Year ended December 31,
2004
| |
From Operations | | | | | | | | |
Net investment income | | $ | 11,998,973 | | | $ | 8,657,806 | |
Net realized gain | | | 15,553,882 | | | | 16,968,720 | |
Unrealized appreciation (depreciation) | | | (12,764,606 | ) | | | 22,960,869 | |
| | |
|
|
| |
|
|
|
Increase in net assets from operations | | | 14,788,249 | | | | 48,587,395 | |
| | |
|
|
| |
|
|
|
From Distributions to Shareholders | | | | | | | | |
Net investment income | | | | | | | | |
Class A | | | (4,703,791 | ) | | | (4,731,075 | ) |
Class B | | | (1,973,530 | ) | | | (1,035,374 | ) |
Class E | | | (1,482,414 | ) | | | 0 | |
| | |
|
|
| |
|
|
|
| | | | (8,159,735 | ) | | | (5,766,449 | ) |
| | |
|
|
| |
|
|
|
Net realized gain | | | | | | | | |
Class A | | | (2,982,672 | ) | | | (811,699 | ) |
Class B | | | (1,444,579 | ) | | | (190,798 | ) |
Class E | | | (1,051,155 | ) | | | 0 | |
| | |
|
|
| |
|
|
|
| | | | (5,478,406 | ) | | | (1,002,497 | ) |
| | |
|
|
| |
|
|
|
Total Distributions | | | (13,638,141 | ) | | | (6,768,946 | ) |
| | |
|
|
| |
|
|
|
Increase in net assets from capital share transactions | | | 47,905,874 | | | | 241,760,896 | |
| | |
|
|
| |
|
|
|
Total increase in net assets | | | 49,055,982 | | | | 283,579,345 | |
| | |
Net Assets | | | | | | | | |
Beginning of the period | | | 461,762,362 | | | | 178,183,017 | |
| | |
|
|
| |
|
|
|
End of the period | | $ | 510,818,344 | | | $ | 461,762,362 | |
| | |
|
|
| |
|
|
|
Undistributed Net Investment Income | | | | | | | | |
End of the period | | $ | 13,413,276 | | | $ | 8,113,988 | |
| | |
|
|
| |
|
|
|
Other Information:
Capital Shares
Transactions in capital shares were as follows:
| | | | | | | | | | | | | | |
| | | Year ended
December 31, 2005
| | | Year ended
December 31, 2004
| |
| | | Shares
| | | $
| | | Shares
| | | $
| |
Class A | | | | | | | | | | | | | | |
Sales | | 331,621 | | | $ | 48,468,815 | | | 962,828 | | | $ | 130,384,480 | |
Shares issued through acquisition | | 0 | | | | 0 | | | 178,716 | | | | 23,379,079 | |
Reinvestments | | 54,421 | | | | 7,686,463 | | | 40,628 | | | | 5,542,774 | |
Redemptions | | (435,176 | ) | | | (63,611,821 | ) | | (440,746 | ) | | | (60,806,360 | ) |
| | |
|
| |
|
|
| |
|
| |
|
|
|
Net increase (decrease) | | (49,134 | ) | | $ | (7,456,543 | ) | | 741,426 | | | $ | 98,499,973 | |
| | |
|
| |
|
|
| |
|
| |
|
|
|
Class B | | | | | | | | | | | | | | |
Sales | | 568,687 | | | $ | 82,389,685 | | | 358,733 | | | $ | 49,425,208 | |
Shares issued through acquisition | | 0 | | | | 0 | | | 231,742 | | | | 28,384,889 | |
Reinvestments | | 24,392 | | | | 3,418,109 | | | 9,056 | | | | 1,226,172 | |
Redemptions | | (216,764 | ) | | | (31,402,693 | ) | | (110,400 | ) | | | (15,154,511 | ) |
| | |
|
| |
|
|
| |
|
| |
|
|
|
Net increase | | 376,315 | | | $ | 54,405,101 | | | 489,131 | | | $ | 63,881,758 | |
| | |
|
| |
|
|
| |
|
| |
|
|
|
Class E | | | | | | | | | | | | | | |
Sales | | 178,877 | | | $ | 26,041,200 | | | 116,224 | | | $ | 16,206,863 | |
Shares issued through acquisition | | 0 | | | | 0 | | | 618,249 | | | | 80,753,908 | |
Reinvestments | | 17,995 | | | | 2,533,569 | | | 0 | | | | 0 | |
Redemptions | | (189,586 | ) | | | (27,617,453 | ) | | (126,687 | ) | | | (17,581,606 | ) |
| | |
|
| |
|
|
| |
|
| |
|
|
|
Net increase | | 7,286 | | | $ | 957,316 | | | 607,786 | | | $ | 79,379,165 | |
| | |
|
| |
|
|
| |
|
| |
|
|
|
Increase derived from capital share transactions | | 334,467 | | | $ | 47,905,874 | | | 1,838,343 | | | $ | 241,760,896 | |
| | |
|
| |
|
|
| |
|
| |
|
|
|
See accompanying notes to financial statements.
MSF-318
Metropolitan Series Fund, Inc.
MFS Total Return Portfolio
Financial Highlights
| | | | | | | | | | | | | | | | | | | | |
| | | Class A
| |
| | | Year ended December 31,
| |
| | | 2005
| | | 2004
| | | 2003
| | | 2002
| | | 2001
| |
Net Asset Value, Beginning of Period | | $ | 147.96 | | | $ | 138.13 | | | $ | 119.83 | | | $ | 141.92 | | | $ | 185.92 | |
| | |
|
|
| |
|
|
| |
|
|
| |
|
|
| |
|
|
|
Income from Investment Operations | | | | | | | | | | | | | | | | | | | | |
Net investment income | | | 3.84 | | | | 3.60 | | | | 3.30 | | | | 3.89 | | | | 4.60 | |
Net realized and unrealized gain (loss) of investments | | | 0.46 | | | | 11.53 | | | | 16.79 | | | | (10.18 | ) | | | (11.61 | ) |
| | |
|
|
| |
|
|
| |
|
|
| |
|
|
| |
|
|
|
Total from investment operations | | | 4.30 | | | | 15.13 | | | | 20.09 | | | | (6.29 | ) | | | (7.01 | ) |
| | |
|
|
| |
|
|
| |
|
|
| |
|
|
| |
|
|
|
Less Distributions | | | | | | | | | | | | | | | | | | | | |
Distributions from net investment income | | | (2.61 | ) | | | (4.52 | ) | | | (1.79 | ) | | | (4.47 | ) | | | (6.60 | ) |
Distributions from net realized capital gains | | | (1.66 | ) | | | (0.78 | ) | | | 0.00 | | | | (11.33 | ) | | | (30.39 | ) |
| | |
|
|
| |
|
|
| |
|
|
| |
|
|
| |
|
|
|
Total distributions | | | (4.27 | ) | | | (5.30 | ) | | | (1.79 | ) | | | (15.80 | ) | | | (36.99 | ) |
| | |
|
|
| |
|
|
| |
|
|
| |
|
|
| |
|
|
|
Net Asset Value, End of Period | | $ | 147.99 | | | $ | 147.96 | | | $ | 138.13 | | | $ | 119.83 | | | $ | 141.92 | |
| | |
|
|
| |
|
|
| |
|
|
| |
|
|
| |
|
|
|
Total Return (%) | | | 3.1 | | | | 11.3 | | | | 17.0 | | | | (5.4 | ) | | | (3.8 | ) |
Ratio of operating expenses to average net assets before expense reductions (%) | | | 0.66 | | | | 0.64 | | | | 0.69 | | | | 0.66 | | | | 0.63 | |
Ratio of operating expenses to average net assets after expense reductions (%) (d) | | | 0.65 | | | | 0.63 | | | | 0.69 | | | | — | | | | — | |
Ratio of net investment income to average net assets (%) | | | 2.53 | | | | 2.60 | | | | 2.55 | | | | 2.98 | | | | 2.96 | |
Portfolio turnover rate (%) | | | 47 | | | | 89 | | | | 62 | | | | 91 | | | | 160 | |
Net assets, end of period (000) | | $ | 261,653 | | | $ | 268,870 | | | $ | 148,601 | | | $ | 133,092 | | | $ | 157,716 | |
| | | | | | | | | | | | | | | | |
| | | Class B
| |
| | | Year ended December 31,
| | | May 1, 2002(a)
through
December 31,
2002
| |
| | | 2005
| | | 2004
| | | 2003
| | |
Net Asset Value, Beginning of Period | | $ | 146.59 | | | $ | 136.93 | | | $ | 119.01 | | | $ | 129.24 | |
| | |
|
|
| |
|
|
| |
|
|
| |
|
|
|
Income from Investment Operations | | | | | | | | | | | | | | | | |
Net investment income | | | 2.75 | | | | 3.64 | | | | 2.53 | | | | 0.99 | |
Net realized and unrealized gain (loss) of investments | | | 1.16 | | | | 11.01 | | | | 17.11 | | | | (11.22 | ) |
| | |
|
|
| |
|
|
| |
|
|
| |
|
|
|
Total from investment operations | | | 3.91 | | | | 14.65 | | | | 19.64 | | | | (10.23 | ) |
| | |
|
|
| |
|
|
| |
|
|
| |
|
|
|
Less Distributions | | | | | | | | | | | | | | | | |
Distributions from net investment income | | | (2.26 | ) | | | (4.21 | ) | | | (1.72 | ) | | | 0.00 | |
Distributions from net realized capital gains | | | (1.66 | ) | | | (0.78 | ) | | | 0.00 | | | | 0.00 | |
| | |
|
|
| |
|
|
| |
|
|
| |
|
|
|
Total distributions | | | (3.92 | ) | | | (4.99 | ) | | | (1.72 | ) | | | 0.00 | |
| | |
|
|
| |
|
|
| |
|
|
| |
|
|
|
Net Asset Value, End of Period | | $ | 146.58 | | | $ | 146.59 | | | $ | 136.93 | | | $ | 119.01 | |
| | |
|
|
| |
|
|
| |
|
|
| |
|
|
|
Total Return (%) | | | 2.9 | | | | 11.0 | | | | 16.7 | | | | (7.9 | )(b) |
Ratio of operating expenses to average net assets before expense reductions (%) | | | 0.91 | | | | 0.89 | | | | 0.94 | | | | 0.91 | (c) |
Ratio of operating expenses to average net assets after expense reductions (%) (d) | | | 0.90 | | | | 0.88 | | | | 0.94 | | | | — | |
Ratio of net investment income to average net assets (%) | | | 2.29 | | | | 2.39 | | | | 2.30 | | | | 2.75 | (c) |
Portfolio turnover rate (%) | | | 47 | | | | 89 | | | | 62 | | | | 91 | |
Net assets, end of period (000) | | $ | 158,528 | | | $ | 103,373 | | | $ | 29,582 | | | $ | 7,168 | |
| (a) | Commencement of operations. |
| (b) | Period less than one year is not computed on an annualized basis. |
| (c) | Computed on an annualized basis. |
| (d) | The Portfolio has entered into arrangements with certain brokers who paid a portion of the Portfolio’s expenses. |
See accompanying notes to financial statements.
MSF-319
Metropolitan Series Fund, Inc.
MFS Total Return Portfolio
Financial Highlights
| | | | | | | | |
| | | Class E
| |
| | | Year ended
December 31,
2005
| | | April 26, 2004(a)
through
December 31,
2004
| |
Net Asset Value, Beginning of Period | | $ | 147.29 | | | $ | 135.61 | |
| | |
|
|
| |
|
|
|
Income from Investment Operations | | | | | | | | |
Net investment income | | | 3.46 | | | | 2.33 | |
Net realized and unrealized gain of investments | | | 0.60 | | | | 9.35 | |
| | |
|
|
| |
|
|
|
Total from investment operations | | | 4.06 | | | | 11.68 | |
| | |
|
|
| |
|
|
|
Less Distributions | | | | | | | | |
Distributions from net investment income | | | (2.33 | ) | | | 0.00 | |
Distributions from net realized capital gains | | | (1.66 | ) | | | 0.00 | |
| | |
|
|
| |
|
|
|
Total distributions | | | (3.99 | ) | | | 0.00 | |
| | |
|
|
| |
|
|
|
Net Asset Value, End of Period | | $ | 147.36 | | | $ | 147.29 | |
| | |
|
|
| |
|
|
|
Total Return (%) | | | 3.0 | | | | 8.6 | (b) |
Ratio of operating expenses to average net assets before expense reductions (%) | | | 0.81 | | | | 0.79 | (c) |
Ratio of operating expenses to average net assets after expense reductions (%) (d) | | | 0.80 | | | | 0.78 | (c) |
Ratio of net investment income to average net assets (%) | | | 2.38 | | | | 2.57 | (c) |
Portfolio turnover rate (%) | | | 47 | | | | 89 | |
Net assets, end of period (000) | | $ | 90,637 | | | $ | 89,519 | |
| (a) | Commencement of operations. |
| (b) | Period less than one year is not computed on an annualized basis. |
| (c) | Computed on an annualized basis. |
| (d) | The Portfolio has entered into arrangements with certain brokers who paid a portion of the Portfolio’s expenses. |
See accompanying notes to financial statements.
MSF-320
Metropolitan Series Fund, Inc.
BlackRock Bond Income Portfolio
Schedule of Investments as of December 31, 2005
Fixed Income—106.1% of Total Net Assets
| | | | | | |
| Security Description | | Face
Amount | | Value* |
| | | | | | | |
| | |
Aerospace & Defense—0.1% | | | | | | |
L-3 Communications Corp. (144A)
6.375%, 10/15/15 | | $ | 115,000 | | $ | 114,713 |
Lockheed Martin Corp.
8.500%, 12/01/29 | | | 50,000 | | | 68,148 |
Northrop Grumman Corp.
4.079%, 11/16/06 | | | 600,000 | | | 595,365 |
| | | | | |
|
|
| | | | | | | 778,226 |
| | | | | |
|
|
| | |
Asset Backed—12.0% | | | | | | |
Ares VIII CLO, Ltd. (144A)
7.040%, 02/26/16 (a) | | | 1,600,000 | | | 1,624,160 |
BMW Vehicle Owner Trust
4.040%, 02/25/09 (a) | | | 8,250,000 | | | 8,175,060 |
Capital Auto Receivables Asset
4.050%, 07/15/09 (a) | | | 7,775,000 | | | 7,689,443 |
Capital Transition Funding, LLC
5.010%, 01/15/10 | | | 5,200,308 | | | 5,197,555 |
Centex Home Equity Loan Trust
6.429%, 12/25/32 (a) | | | 2,600,000 | | | 2,622,824 |
Citibank Credit Card Issuance Trust
6.650%, 05/15/08 | | | 1,000,000 | | | 1,006,498 |
CWABS, Inc.
4.489%, 04/25/36 | | | 7,900,000 | | | 7,900,000 |
4.910%, 12/25/35 (a) | | | 10,300,000 | | | 10,298,146 |
DaimlerChrysler Auto Owner Trust
3.490%, 12/08/08 | | | 10,350,000 | | | 10,213,553 |
Ford Credit Auto Owner Trust
3.480%, 11/15/08 | | | 9,100,000 | | | 8,984,969 |
4.170%, 01/15/09 (a) | | | 7,700,000 | | | 7,639,219 |
Hedged Mutual Fund Fee Trust (144A)
5.220%, 11/30/10 (a) | | | 519,390 | | | 519,390 |
Knollwood CDO, Ltd. (144A)
7.315%, 02/08/39 (a) | | | 1,068,657 | | | 1,051,965 |
Long Beach Asset Holdings Corp. (144A) 4.940%, 06/25/34 | | | 3,285 | | | 3,285 |
MBNA Credit Card Master Note Trust
3.300%, 07/15/10 | | | 6,715,000 | | | 6,515,352 |
4.950%, 06/15/09 | | | 4,000,000 | | | 4,009,911 |
6.550%, 12/15/08 | | | 1,350,000 | | | 1,362,316 |
7.000%, 02/15/12 | | | 1,125,000 | | | 1,208,020 |
Option One Mortgage Loan Trust
5.129%, 01/25/33 (a) | | | 2,425,000 | | | 2,435,836 |
RBS Capital Trust I
4.709%, 12/29/49 (a) | | | 375,000 | | | 356,414 |
Residential Asset Securities Corp.
4.469%, 01/25/36 (a) | | | 7,725,000 | | | 7,725,000 |
SLM Corp.
4.525%, 04/25/12 (a) | | | 8,050,000 | | | 8,021,000 |
Structured Asset Investment Loan Trust
6.329%, 04/25/33 (a) | | | 3,900,000 | | | 3,930,766 |
USAA Auto Owner Trust
3.160%, 02/17/09 | | | 4,300,000 | | | 4,238,901 |
4.630%, 05/15/12 (a) | | | 7,875,000 | | | 7,832,892 |
Washington Mutual Asset Securities Corp. 5.150%, 05/25/36 | | | 7,380,000 | | | 7,375,220 |
| | | | | |
|
|
| | | | | | | 127,937,695 |
| | | | | |
|
|
| | | | | | |
| Security Description | | Face
Amount | | Value* |
| | | | | | | |
| | |
Auto Components—0.1% | | | | | | |
Briggs & Stratton Corp.
8.875%, 03/15/11 | | $ | 1,100,000 | | $ | 1,232,398 |
Navistar International Corp.
6.250%, 03/01/12 | | | 75,000 | | | 67,125 |
| | | | | |
|
|
| | | | | | | 1,299,523 |
| | | | | |
|
|
| | |
Automobiles—0.1% | | | | | | |
DaimlerChrysler North America Holding Corp. | | | | | | |
8.500%, 01/18/31 (b) | | | 590,000 | | | 713,910 |
| | | | | |
|
|
| | |
Capital Markets—1.2% | | | | | | |
JPMorgan Chase & Co.
5.350%, 03/01/07 | | | 6,520,000 | | | 6,545,558 |
Morgan Stanley Group, Inc.
5.050%, 01/21/11 | | | 5,525,000 | | | 5,526,635 |
6.750%, 04/15/11 | | | 225,000 | | | 242,219 |
| | | | | |
|
|
| | | | | | | 12,314,412 |
| | | | | |
|
|
| | |
Commercial Banks—3.7% | | | | | | |
Atlantic Marine Corp. (144A)
5.343%, 12/01/50 | | | 150,000 | | | 149,736 |
Bank of America Corp.
4.500%, 08/01/10 | | | 4,320,000 | | | 4,245,234 |
Bank of New York
3.800%, 02/01/08 | | | 1,250,000 | | | 1,223,955 |
First National Bank of Boston
7.375%, 09/15/06 | | | 1,750,000 | | | 1,779,333 |
General Electric Capital Corp.
3.125%, 11/09/06 | | | 4,850,000 | | | 4,778,273 |
HSBC Bank USA, N.A.
3.870%, 06/07/07 | | | 6,750,000 | | | 6,651,551 |
Huntington National Bank
2.750%, 10/16/06 | | | 675,000 | | | 663,910 |
Nationwide Building Society
2.625%, 01/30/07 | | | 1,325,000 | | | 1,294,447 |
Nationwide Building Society (144A)
4.250%, 02/01/10 | | | 1,370,000 | | | 1,334,977 |
Simon Debartolo Group, L.P.
6.875%, 11/15/06 | | | 4,150,000 | | | 4,213,155 |
U.S. Bank N.A.
2.850%, 11/15/06 (b) | | | 2,200,000 | | | 2,163,696 |
4.400%, 08/15/08 | | | 3,850,000 | | | 3,811,265 |
Wachovia Bank, National Association
4.375%, 08/15/08 | | | 1,875,000 | | | 1,853,762 |
Wells Fargo & Co.
4.000%, 08/15/08 | | | 1,465,000 | | | 1,437,637 |
4.200%, 01/15/10 | | | 1,335,000 | | | 1,299,664 |
4.625%, 08/09/10 | | | 2,765,000 | | | 2,730,562 |
| | | | | |
|
|
| | | | | | | 39,631,157 |
| | | | | |
|
|
| |
Commercial Mortgage-Backed Securities—14.9% | | | |
Asset Backed Funding Corp. (144A)
4.450%, 05/25/34 | | | 205,023 | | | 204,085 |
*See accompanying notes to financial statements.
MSF-321
Metropolitan Series Fund, Inc.
BlackRock Bond Income Portfolio
Schedule of Investments as of December 31, 2005
Fixed Income—(Continued)
| | | | |
| Security Description | | Face
Amount | | Value* |
| | | | | |
|
Commercial Mortgage-Backed Securities—(Continued) |
Bank of America Commercial Mortgage, Inc. 4.621%, 07/10/43 | | 5,225,000 | | 5,065,082 |
6.186%, 06/11/35 | | 5,530,000 | | 5,819,465 |
Bear Stearns Commercial Mortgage Securities, Inc.
4.361%, 06/11/41 | | 5,247,682 | | 5,169,354 |
7.080%, 06/15/09 | | 2,075,000 | | 2,195,881 |
Chase Commerical Mortgage Security Corp. 7.319%, 10/15/32 | | 2,370,000 | | 2,569,534 |
Credit Suisse First Boston Mortgage Trust
4.940%, 12/15/35 | | 7,295,000 | | 7,206,854 |
General Electric Commercial Mortgage Corp. 4.578%, 06/10/48 | | 5,200,000 | | 5,058,211 |
GGP Mall Properties Trust (144A)
5.558%, 11/15/11 | | 3,944,318 | | 3,964,142 |
GMAC Commercial Mortgage Services, Inc. 7.455%, 08/16/33 | | 5,150,000 | | 5,582,289 |
GS Mortgage Securities Corp.
4.751%, 07/10/39 | | 5,100,000 | | 4,948,596 |
Harborview Mortgage Loan Trust
4.680%, 11/19/35 (a) | | 6,586,762 | | 6,592,163 |
Indymac MBS, Inc.
5.159%, 09/25/35 (a) | | 9,059,660 | | 9,170,002 |
Irwin Land, LLC
5.400%, 12/15/47 | | 1,650,000 | | 1,608,007 |
JPMorgan Commercial Mortgage Finance Corp.
5.857%, 10/12/35 | | 5,710,000 | | 5,909,168 |
6.507%, 10/15/35 | | 5,197,174 | | 5,358,460 |
7.239%, 09/15/29 | | 2,300,000 | | 2,424,511 |
LB-UBS Commercial Mortgage Trust
3.881%, 08/15/29 (a) | | 4,015,068 | | 3,917,654 |
4.071%, 09/15/26 | | 4,694,727 | | 4,572,127 |
4.559%, 07/17/12 (a) | | 4,075,000 | | 3,979,243 |
5.642%, 12/15/25 | | 8,454,743 | | 8,570,789 |
7.950%, 05/15/25 (a) | | 5,480,000 | | 6,027,895 |
LB-UBS Commercial Mortgage Trust (144A) 6.155%, 07/14/16 | | 2,997,281 | | 3,094,189 |
Morgan Stanley Capital I, Inc. (144A)
7.220%, 05/15/07 | | 1,715,774 | | 1,746,958 |
Morgan Stanley Capital, Inc.
6.210%, 11/15/31 | | 1,505,599 | | 1,543,845 |
Mortgage Capital Funding, Inc.
6.423%, 06/18/30 | | 4,892,638 | | 5,019,900 |
NationsLink Funding Corp.
6.476%, 08/20/30 | | 1,509,889 | | 1,555,204 |
6.795%, 08/20/30 | | 1,325,000 | | 1,380,200 |
Nomura Asset Securities Corp.
6.590%, 03/15/30 | | 4,825,000 | | 4,986,758 |
Salomon Brothers Commercial Mortgage Trust 6.592%, 12/18/33 | | 5,750,000 | | 6,067,817 |
Salomon Brothers Mortgage Securities VII, Inc. 6.499%, 10/13/11 | | 5,860,000 | | 6,241,949 |
Salomon Brothers Mortgage Securities VII,
Inc. (144A)
6.134%, 02/18/34 | | 342,708 | | 344,890 |
Wachovia Bank Commercial Mortgage Trust 3.477%, 08/15/41 (a) | | 3,871,321 | | 3,770,644 |
4.935%, 04/15/42 | | 4,950,000 | | 4,862,852 |
| | | | | | |
| Security Description | | Face
Amount | | Value* |
| | | | | | | |
|
Commercial Mortgage-Backed Securities—(Continued) |
Washington Mutual, Inc.
3.423%, 04/25/33 (a) | | $ | 5,668,365 | | $ | 5,527,807 |
3.695%, 05/25/33 (a) | | | 4,750,000 | | | 4,582,863 |
4.511%, 06/25/33 (a) | | | 1,626,169 | | | 1,607,030 |
| | | | | |
|
|
| | | | | | | 158,246,418 |
| | | | | |
|
|
| | |
Commercial Services & Supplies—0.0% | | | | | | |
United Rentals, Inc.
6.500%, 02/15/12 | | | 125,000 | | | 121,719 |
| | | | | |
|
|
| | |
Construction & Engineering—0.1% | | | | | | |
United Technologies Corp.
8.875%, 11/15/19 | | | 400,000 | | | 534,489 |
| | | | | |
|
|
| | |
Containers & Packaging—0.1% | | | | | | |
Ball Corp.
6.875%, 12/15/12 | | | 815,000 | | | 841,487 |
Crown Americas, LLC
7.750%, 11/15/15 | | | 200,000 | | | 207,000 |
| | | | | |
|
|
| | | | | | | 1,048,487 |
| | | | | |
|
|
| |
Diversified Consumer Services—0.0% | | | |
Service Corp. International
7.700%, 04/15/09 | | | 305,000 | | | 320,250 |
| | | | | |
|
|
| |
Diversified Financial Services—5.2% | | | |
Allstate Financial Global Funding, LLC (144A) 5.250%, 02/01/07 | | | 1,500,000 | | | 1,503,458 |
BCP Crystal U.S. Holdings Corp.
9.625%, 06/15/14 (b) | | | 35,000 | | | 38,938 |
Citigroup, Inc.
3.500%, 02/01/08 | | | 17,715,000 | | | 17,246,598 |
4.125%, 02/22/10 | | | 2,500,000 | | | 2,428,762 |
5.500%, 08/09/06 | | | 6,065,000 | | | 6,091,698 |
5.850%, 12/11/34 | | | 525,000 | | | 546,757 |
Devon Financing Corp.
7.875%, 09/30/31 | | | 745,000 | | | 946,671 |
General Electric Capital Corp.
4.125%, 09/01/09 | | | 1,350,000 | | | 1,314,191 |
5.000%, 11/15/11 | | | 18,925,000 | | | 18,943,622 |
Household Finance Corp.
6.400%, 06/17/08 | | | 3,010,000 | | | 3,105,239 |
Sprint Capital Corp.
6.875%, 11/15/28 | | | 460,000 | | | 502,637 |
8.750%, 03/15/32 | | | 470,000 | | | 623,728 |
Verizon Global Funding Corp.
7.750%, 12/01/30 | | | 1,335,000 | | | 1,586,857 |
Wind Acquisition Finance, Inc.
10.750%, 12/01/15 | | | 475,000 | | | 490,438 |
| | | | | |
|
|
| | | | | | | 55,369,594 |
| | | | | |
|
|
| |
Diversified Telecommunication Services—0.9% | | | |
AT&T Broadband Corp.
8.375%, 03/15/13 | | | 1,330,000 | | | 1,539,444 |
BellSouth Corp. (144A)
4.258%, 04/26/21 (a) | | | 2,630,000 | | | 2,626,849 |
*See accompanying notes to financial statements.
MSF-322
Metropolitan Series Fund, Inc.
BlackRock Bond Income Portfolio
Schedule of Investments as of December 31, 2005
Fixed Income—(Continued)
| | | | | | |
| Security Description | | Face
Amount | | Value* |
| | | | | | | |
| |
Diversified Telecommunication Services—(Continued) | | | |
Cincinnati Bell, Inc.
7.250%, 07/15/13 | | $ | 80,000 | | $ | 83,200 |
GTE Corp.
6.940%, 04/15/28 | | | 225,000 | | | 240,794 |
Qwest Corp. (144A)
7.741%, 06/15/13 (a) | | | 415,000 | | | 447,681 |
SBC Communications, Inc.
6.450%, 06/15/34 (b) | | | 250,000 | | | 260,144 |
SBC Communications, Inc. (144A)
4.389%, 06/05/21 (a) | | | 3,900,000 | | | 3,891,576 |
| | | | | |
|
|
| | | | | | | 9,089,688 |
| | | | | |
|
|
| |
Electric Utilities—0.9% | | | |
AES Ironwood, LLC
8.857%, 11/30/25 | | | 186,959 | | | 206,590 |
Centerpoint Energy, Inc.
7.250%, 09/01/10 | | | 1,555,000 | | | 1,668,112 |
Dominion Resources, Inc.
7.195%, 09/15/14 | | | 875,000 | | | 972,096 |
8.125%, 06/15/10 | | | 1,900,000 | | | 2,111,808 |
Elwood Energy, LLC
8.159%, 07/05/26 | | | 455,191 | | | 489,832 |
First Energy Corp.
7.375%, 11/15/31 | | | 150,000 | | | 176,996 |
Florida Power & Light Co.
5.625%, 04/01/34 | | | 475,000 | | | 478,921 |
Indiana Michigan Power Co.
6.125%, 12/15/06 | | | 2,075,000 | | | 2,095,055 |
NorthWestern Corp.
5.875%, 11/01/14 | | | 190,000 | | | 190,357 |
Peco Energy Co.
4.750%, 10/01/12 | | | 947,000 | | | 930,024 |
Reliant Energy, Inc.
6.750%, 12/15/14 | | | 440,000 | | | 383,900 |
| | | | | |
|
|
| | | | | | | 9,703,691 |
| | | | | |
|
|
| |
Electronic Equipment & Instruments—0.1% | | | |
Loral Corp.
7.000%, 09/15/23 | | | 1,175,000 | | | 1,359,513 |
| | | | | |
|
|
| |
Federal Agencies—44.0% | | | |
Federal Home Loan Bank
4.500%, 05/01/18 | | | 9,189,398 | | | 8,966,125 |
4.500%, 03/01/19 | | | 140,283 | | | 136,717 |
4.500%, 05/01/19 | | | 2,480,968 | | | 2,417,475 |
4.500%, 07/01/19 | | | 1,846,957 | | | 1,800,012 |
4.500%, 12/01/19 | | | 2,545,514 | | | 2,480,813 |
5.000%, 06/01/20 | | | 1,359,625 | | | 1,346,204 |
5.000%, 07/01/20 | | | 2,176,790 | | | 2,155,303 |
5.000%, 08/01/20 | | | 1,442,183 | | | 1,427,947 |
5.000%, 09/01/20 | | | 100,000 | | | 99,013 |
5.000%, 10/01/20 | | | 4,775,106 | | | 4,727,968 |
5.000%, 11/01/20 | | | 5,740,171 | | | 5,683,509 |
5.000%, 12/01/20 | | | 16,557,521 | | | 16,394,076 |
5.000%, 01/01/21 | | | 400,000 | | | 396,051 |
5.500%, 07/01/33 | | | 6,271,628 | | | 6,230,786 |
| | | | | | |
| Security Description | | Face
Amount | | Value* |
| | | | | | | |
| |
Federal Agencies—(Continued) | | | |
Federal Home Loan Mortgage Corp. | | | | | | |
3.150%, 06/04/08 | | $ | 10,775,000 | | $ | 10,384,525 |
4.500%, 08/01/20 | | | 5,405,108 | | | 5,267,723 |
4.768%, 03/01/35 (a) | | | 15,250,859 | | | 15,093,258 |
4.769%, 02/15/35 (a) | | | 5,991,247 | | | 5,945,508 |
5.000%, 03/15/18 | | | 4,200,000 | | | 4,141,365 |
5.000%, 04/01/20 | | | 643,736 | | | 637,381 |
5.000%, 05/01/20 | | | 1,226,760 | | | 1,214,650 |
5.000%, 07/01/20 | | | 4,669,823 | | | 4,623,725 |
5.000%, 09/01/20 (a) | | | 29,371,726 | | | 29,081,789 |
5.000%, 09/01/35 | | | 2,868,131 | | | 2,776,709 |
5.000%, TBA | | | 23,300,000 | | | 22,550,020 |
5.500%, 03/15/34 | | | 8,577,096 | | | 8,641,666 |
5.500%, 05/15/34 | | | 7,418,030 | | | 7,472,598 |
5.500%, TBA | | | 4,300,000 | | | 4,259,687 |
9.000%, 12/01/09 | | | 42,817 | | | 44,512 |
Federal National Mortgage Association | | | | | | |
2.750%, 07/23/07 | | | 9,575,000 | | | 9,289,866 |
3.000%, 03/02/07 | | | 4,235,000 | | | 4,150,563 |
4.000%, 10/16/06 | | | 18,275,000 | | | 18,171,381 |
4.000%, 01/26/09 | | | 14,975,000 | | | 14,660,196 |
4.500%, 10/01/18 | | | 2,131,752 | | | 2,079,134 |
4.500%, 03/01/20 | | | 2,221,659 | | | 2,166,821 |
4.500%, 02/01/35 | | | 1,358,466 | | | 1,279,363 |
4.500%, 03/01/35 | | | 859,070 | | | 809,047 |
4.500%, 08/01/35 | | | 1,111,712 | | | 1,046,978 |
4.500%, 09/01/35 | | | 1,180,542 | | | 1,111,800 |
4.500%, TBA | | | 41,700,000 | | | 40,303,761 |
5.000%, 01/01/18 | | | 1,702,532 | | | 1,687,033 |
5.000%, 06/01/18 | | | 2,731,238 | | | 2,705,943 |
5.000%, 06/01/23 | | | 2,999,771 | | | 2,935,962 |
5.000%, 11/01/33 | | | 12,616,921 | | | 12,268,961 |
5.000%, 04/25/35 | | | 3,400,000 | | | 3,382,465 |
5.000%, 07/01/35 | | | 7,144,803 | | | 6,923,016 |
5.000%, 08/01/35 | | | 83,490 | | | 80,898 |
5.000%, 11/01/35 | | | 1,297,262 | | | 1,256,993 |
5.000%, 12/01/35 | | | 4,500,000 | | | 4,359,084 |
5.000%, TBA | | | 24,800,000 | | | 24,528,738 |
5.500%, 08/01/19 | | | 22,865 | | | 23,015 |
5.500%, 01/01/24 | | | 1,746,984 | | | 1,747,330 |
5.500%, 05/25/27 | | | 3,265,055 | | | 3,287,019 |
5.500%, 04/25/30 | | | 5,973,385 | | | 6,018,967 |
5.500%, 04/01/33 | | | 3,839,836 | | | 3,811,677 |
5.500%, 11/01/33 | | | 3,786,006 | | | 3,758,241 |
5.500%, 02/01/34 | | | 12,417,195 | | | 12,326,134 |
5.500%, 04/01/34 | | | 1,154,285 | | | 1,145,820 |
5.500%, 05/25/34 | | | 5,284,142 | | | 5,311,923 |
5.500%, 11/01/34 | | | 5,839,411 | | | 5,787,823 |
5.500%, 02/01/35 | | | 19,595,706 | | | 19,457,728 |
5.500%, 07/25/35 | | | 4,437,822 | | | 4,473,769 |
5.500%, TBA | | | 27,900,000 | | | 28,065,670 |
6.000%, 07/01/16 | | | 776,217 | | | 793,707 |
6.000%, 02/01/34 | | | 4,370,967 | | | 4,416,603 |
6.500%, 07/01/14 | | | 317,685 | | | 326,823 |
6.500%, 04/01/17 | | | 4,454,199 | | | 4,576,383 |
6.500%, 11/01/27 | | | 309,047 | | | 318,456 |
*See accompanying notes to financial statements.
MSF-323
Metropolitan Series Fund, Inc.
BlackRock Bond Income Portfolio
Schedule of Investments as of December 31, 2005
Fixed Income—(Continued)
| | | | | | |
| Security Description | | Face
Amount | | Value* |
| | | | | | | |
| |
Federal Agencies—(Continued) | | | |
6.500%, 12/01/29 (a) | | $ | 1,860,297 | | $ | 1,916,872 |
7.750%, 03/01/08 | | | 20,181 | | | 20,407 |
7.750%, 04/01/08 | | | 2,145 | | | 2,169 |
8.250%, 07/01/08 | | | 47,455 | | | 48,078 |
8.500%, 02/01/09 | | | 59,522 | | | 61,552 |
8.500%, 09/01/09 | | | 9,997 | | | 10,315 |
9.000%, 04/01/16 | | | 10,836 | | | 11,441 |
Government National Mortgage Association | | | |
5.000%, 10/20/33 | | | 11,063,857 | | | 10,889,434 |
5.500%, 04/15/33 | | | 597,790 | | | 602,488 |
6.000%, 09/20/33 | | | 1,895,031 | | | 1,938,428 |
6.000%, 10/20/33 | | | 3,058,802 | | | 3,139,370 |
6.000%, 11/20/33 | | | 4,256,903 | | | 4,354,388 |
6.000%, 02/20/34 | | | 3,097,184 | | | 3,165,035 |
6.500%, 07/15/28 | | | 166,613 | | | 174,457 |
6.500%, 05/15/29 | | | 341,795 | | | 357,850 |
6.500%, 12/15/29 | | | 6,711 | | | 7,026 |
6.500%, 07/15/32 | | | 123,617 | | | 129,169 |
6.500%, 02/15/33 | | | 733,298 | | | 766,084 |
6.500%, 04/15/33 | | | 874,813 | | | 913,926 |
6.500%, 09/15/34 | | | 66,856 | | | 69,791 |
6.500%, 07/15/35 | | | 927,805 | | | 968,513 |
7.500%, 05/15/07 | | | 2,691 | | | 2,740 |
7.500%, 12/15/14 | | | 514,870 | | | 542,896 |
8.000%, 11/15/29 | | | 48,775 | | | 52,231 |
8.500%, 01/15/17 | | | 18,858 | | | 20,386 |
8.500%, 02/15/17 | | | 13,295 | | | 14,372 |
8.500%, 03/15/17 | | | 26,068 | | | 28,179 |
8.500%, 05/15/17 | | | 23,105 | | | 24,977 |
8.500%, 10/15/21 | | | 2,491 | | | 2,710 |
8.500%, 11/15/21 | | | 4,583 | | | 4,986 |
8.500%, 05/15/22 | | | 5,415 | | | 5,898 |
9.000%, 10/15/16 | | | 9,937 | | | 10,757 |
| | | | | |
|
|
| | | | | | | 467,499,131 |
| | | | | |
|
|
| | |
Food & Staples Retailing—0.1% | | | | | | |
Delhaize America, Inc.
9.000%, 04/15/31 | | | 660,000 | | | 775,908 |
| | | | | |
|
|
| | |
Food Products—0.1% | | | | | | |
Smithfield Foods, Inc.
7.000%, 08/01/11 | | | 750,000 | | | 765,000 |
| | | | | |
|
|
| | |
Foreign Government—1.5% | | | | | | |
Federal Republic of Germany
4.000%, 01/04/37 (EUR) | | | 3,050,000 | | | 3,903,644 |
4.750%, 07/04/34 (EUR) | | | 3,575,000 | | | 5,099,870 |
State of Israel
5.500%, 12/04/23 (USD) | | | 4,725,000 | | | 5,092,005 |
United Mexican States
6.750%, 09/27/34 (b) (USD) | | | 600,000 | | | 656,250 |
8.300%, 08/15/31 (b) (USD) | | | 975,000 | | | 1,252,875 |
| | | | | |
|
|
| | | | | | | 16,004,644 |
| | | | | |
|
|
| | | | | | |
| Security Description | | Face
Amount | | Value* |
| | | | | | | |
| | |
Gas Utilities—0.0% | | | | | | |
Targa Resources, Inc. (144A)
8.500%, 11/01/13 | | $ | 35,000 | | $ | 35,875 |
| | | | | |
|
|
| |
Health Care Providers & Services—0.2% | | | |
Bio-Rad Laboratories, Inc.
7.500%, 08/15/13 | | | 585,000 | | | 620,100 |
Omnicare, Inc.
6.875%, 12/15/15 (b) | | | 250,000 | | | 253,750 |
Wellpoint, Inc.
5.950%, 12/15/34 | | | 1,010,000 | | | 1,041,179 |
| | | | | |
|
|
| | | | | | | 1,915,029 |
| | | | | |
|
|
| |
Hotels, Restaurants & Leisure—0.1% | | | |
Mashantucket Western Pequot (144A)
5.912%, 09/01/21 | | | 220,000 | | | 219,817 |
Mohegan Tribal Gaming Authority
6.125%, 02/15/13 (b) | | | 195,000 | | | 191,587 |
Wynn Las Vegas, LLC
6.625%, 12/01/14 (b) | | | 105,000 | | | 102,113 |
| | | | | |
|
|
| | | | | | | 513,517 |
| | | | | |
|
|
| |
Household Durables—0.3% | | | |
Beazer Homes USA, Inc.
8.375%, 04/15/12 | | | 235,000 | | | 244,400 |
D.R. Horton, Inc.
8.500%, 04/15/12 | | | 750,000 | | | 801,306 |
Hovnanian Enterprises, Inc.
6.250%, 01/15/16 (b) | | | 2,055,000 | | | 1,906,683 |
Lennar Corp.
5.600%, 05/31/15 | | | 210,000 | | | 202,760 |
Pulte Homes, Inc.
6.000%, 02/15/35 | | | 245,000 | | | 217,457 |
| | | | | |
|
|
| | | | | | | 3,372,606 |
| | | | | |
|
|
|
Independent Power Producers & Energy Traders—0.3% |
Mirant North America, LLC (144A)
7.375%, 12/31/13 (b) | | | 295,000 | | | 298,319 |
TXU Corp.
4.800%, 11/15/09 | | | 3,400,000 | | | 3,270,365 |
| | | | | |
|
|
| | | | | | | 3,568,684 |
| | | | | |
|
|
| | |
Industrial Conglomerates—0.3% | | | | | | |
Tyco International Group, Ltd.
6.000%, 11/15/13 | | | 1,460,000 | | | 1,491,370 |
6.375%, 10/15/11 | | | 925,000 | | | 960,700 |
7.000%, 06/15/28 | | | 870,000 | | | 957,067 |
| | | | | |
|
|
| | | | | | | 3,409,137 |
| | | | | |
|
|
| | |
Insurance—0.4% | | | | | | |
Berkshire Hathaway Financial Corp.
4.125%, 01/15/10 | | | 3,170,000 | | | 3,080,400 |
*See accompanying notes to financial statements.
MSF-324
Metropolitan Series Fund, Inc.
BlackRock Bond Income Portfolio
Schedule of Investments as of December 31, 2005
Fixed Income—(Continued)
| | | | | | |
| Security Description | | Face
Amount | | Value* |
| | |
Insurance—(Continued) | | | | | | |
Liberty Mutual Group, Inc. (144A)
6.500%, 03/15/35 | | $ | 750,000 | | $ | 731,723 |
Prudential Financial, Inc.
5.400%, 06/13/35 | | | 775,000 | | | 741,977 |
| | | | | |
|
|
| | | | | | | 4,554,100 |
| | | | | |
|
|
| | |
Leisure Equipment & Products—0.1% | | | | | | |
K2, Inc.
7.375%, 07/01/14 (b) | | | 410,000 | | | 407,950 |
Movie Gallery, Inc.
11.000%, 05/01/12 (b) | | | 225,000 | | | 175,500 |
| | | | | |
|
|
| | | | | | | 583,450 |
| | | | | |
|
|
| | |
Media—1.3% | | | | | | |
Comcast Corp.
6.500%, 11/15/35 | | | 1,525,000 | | | 1,554,062 |
7.050%, 03/15/33 (b) | | | 3,425,000 | | | 3,697,579 |
DIRECTV Holdings, LLC
6.375%, 06/15/15 | | | 255,000 | | | 249,262 |
EchoStar DBS Corp.
5.750%, 10/01/08 | | �� | 1,375,000 | | | 1,347,500 |
News America Holdings, Inc.
6.200%, 12/15/34 | | | 2,500,000 | | | 2,483,250 |
News Corp.
6.400%, 12/15/35 | | | 775,000 | | | 781,151 |
Time Warner Entertainment Co., L.P.
8.375%, 03/15/23 | | | 590,000 | | | 682,225 |
Time Warner, Inc.
6.950%, 01/15/28 | | | 565,000 | | | 585,371 |
7.700%, 05/01/32 | | | 1,810,000 | | | 2,035,633 |
| | | | | |
|
|
| | | | | | | 13,416,033 |
| | | | | |
|
|
| | |
Multiline Retail—0.1% | | | | | | |
Federated Department Stores, Inc.
6.790%, 07/15/27 | | | 270,000 | | | 283,831 |
The May Deptartment Stores Co.
6.650%, 07/15/24 | | | 220,000 | | | 231,308 |
6.700%, 07/15/34 | | | 165,000 | | | 175,740 |
7.875%, 03/01/30 | | | 235,000 | | | 280,257 |
| | | | | |
|
|
| | | | | | | 971,136 |
| | | | | |
|
|
| | |
Office Electronics—0.1% | | | | | | |
Sungard Data Systems, Inc. (144A)
9.125%, 08/15/13 | | | 65,000 | | | 67,275 |
Xerox Corp.
6.875%, 08/15/11 | | | 1,450,000 | | | 1,500,750 |
| | | | | |
|
|
| | | | | | | 1,568,025 |
| | | | | |
|
|
| | |
Oil, Gas & Consumable Fuels—0.7% | | | | | | |
Amerada Hess Corp.
7.125%, 03/15/33 | | | 675,000 | | | 766,203 |
Chesapeake Energy Corp.
6.250%, 01/15/18 | | | 450,000 | | | 441,000 |
7.500%, 06/15/14 | | | 210,000 | | | 222,600 |
| | | | |
| Security Description | | Face
Amount | | Value* |
| |
Oil, Gas & Consumable Fuels—(Continued) | | |
Chesapeake Energy Corp. (144A)
6.875%, 11/15/20 | | 150,000 | | 151,875 |
Colorado Interstate Gas Co.
6.800%, 11/15/15 | | 145,000 | | 148,157 |
Dynegy Holdings, Inc. (144A)
10.125%, 07/15/13 | | 605,000 | | 683,650 |
Enterprise Products Partners, L.P.
4.950%, 06/01/10 | | 25,000 | | 24,515 |
5.600%, 10/15/14 | | 950,000 | | 949,258 |
KCS Energy, Inc.
7.125%, 04/01/12 | | 110,000 | | 109,725 |
Massey Energy Co. (144A)
6.875%, 12/15/13 | | 1,310,000 | | 1,321,463 |
Newfield Exploration Co.
6.625%, 09/01/14 | | 1,145,000 | | 1,165,038 |
Northwest Pipeline Corp.
8.125%, 03/01/10 | | 515,000 | | 545,900 |
Petro CDA
5.950%, 05/15/35 | | 765,000 | | 776,037 |
Tenaska Alabama Partners, L.P. (144A)
7.000%, 06/30/21 | | 174,412 | | 175,465 |
Transcontinental Gas Pipe Line
8.875%, 07/15/12 | | 155,000 | | 177,475 |
| | | | |
|
| | | | | 7,658,361 |
| | | | |
|
| | |
Pharmaceuticals—0.1% | | | | |
Wyeth
6.000%, 02/15/36 | | 1,400,000 | | 1,441,700 |
| | | | |
|
| | |
Real Estate—0.6% | | | | |
American Real Estate Partners
8.125%, 06/01/12 | | 225,000 | | 233,438 |
American Real Estate Partners (144A)
7.125%, 02/15/13 | | 125,000 | | 125,000 |
Belvoir Land, LLC (144A)
5.270%, 12/15/47 | | 900,000 | | 873,909 |
EOP Operating, L.P.
6.584%, 04/13/15 (a) | | 1,410,000 | | 1,531,873 |
7.250%, 06/15/28 | | 670,000 | | 740,721 |
Rouse Co. (REIT)
5.375%, 11/26/13 | | 2,505,000 | | 2,377,794 |
| | | | |
|
| | | | | 5,882,735 |
| | | | |
|
| | |
Road & Rail—0.0% | | | | |
Hertz Corp. (144A)
8.875%, 01/01/14 | | 500,000 | | 509,375 |
| | | | |
|
|
Semiconductors & Semiconductor Equipment—0.0% |
Magnachip Semiconductor S.A.
7.741%, 12/15/11 (a) | | 220,000 | | 223,300 |
| | | | |
|
*See accompanying notes to financial statements.
MSF-325
Metropolitan Series Fund, Inc.
BlackRock Bond Income Portfolio
Schedule of Investments as of December 31, 2005
Fixed Income—(Continued)
| | | | | | |
| Security Description | | Face
Amount | | Value* |
|
U.S. Treasury—14.2% |
United States Treasury Bonds
5.375%, 02/15/31 (b) | | $ | 2,745,000 | | $ | 3,083,406 |
8.500%, 02/15/20 (b) | | | 4,420,000 | | | 6,200,429 |
8.875%, 02/15/19 (b) | | | 14,875,000 | | | 21,152,711 |
United States Treasury Bonds Strips Zero Coupon, 08/15/25 (b) | | | 9,075,000 | | | 3,668,669 |
United States Treasury Notes | | | | | | |
0.875%, 04/15/10 (b) | | | 16,438,014 | | | 15,627,028 |
3.625%, 06/30/07 (b) | | | 4,690,000 | | | 4,636,506 |
4.000%, 08/31/07 (b) | | | 270,000 | | | 268,207 |
4.000%, 09/30/07 (b) | | | 21,625,000 | | | 21,474,641 |
4.125%, 08/15/08 (b) | | | 615,000 | | | 611,613 |
4.250%, 10/31/07 (b) | | | 5,390,000 | | | 5,374,207 |
4.250%, 11/30/07 (b) | | | 32,675,000 | | | 32,579,262 |
4.375%, 11/15/08 (b) | | | 21,540,000 | | | 21,543,360 |
4.500%, 11/15/15 (b) | | | 14,340,000 | | | 14,457,631 |
| | | | | |
|
|
| | | | | | | 150,677,670 |
| | | | | |
|
|
| | |
Yankee—2.2% | | | | | | |
America Movil S.A. de C.V.
6.375%, 03/01/35 | | | 325,000 | | | 320,548 |
Barclays Bank, Plc. (144A)
6.860%, 09/29/49 (a) | | | 375,000 | | | 417,670 |
BSkyB Finance Plc.
6.500%, 10/15/35 | | | 560,000 | | | 558,027 |
DEPFA ACS Bank (144A)
4.250%, 08/16/10 | | | 5,700,000 | | | 5,599,543 |
Deutsche Bank AG
3.843%, 03/15/07 (a) | | | 2,225,000 | | | 2,208,312 |
Deutsche Telekom International Finance
8.250%, 06/15/30 (a) | | | 435,000 | | | 553,263 |
EnCana Corp.
6.500%, 08/15/34 | | | 425,000 | | | 474,876 |
France Telecom S.A.
8.500%, 03/01/31 (a) | | | 160,000 | | | 213,482 |
HBOS, Plc. (144A)
3.500%, 11/30/07 | | | 1,850,000 | | | 1,805,389 |
Ispat Inland ULC
9.750%, 04/01/14 (b) | | | 235,000 | | | 266,138 |
Landeskreditbank Baden
4.250%, 09/15/10 | | | 4,125,000 | | | 4,051,286 |
Norske Skof Canada, Ltd.
8.625%, 06/15/11 | | | 210,000 | | | 200,550 |
Rogers Wireless Communications, Inc.
6.375%, 03/01/14 | | | 775,000 | | | 776,937 |
7.500%, 03/15/15 (b) | | | 560,000 | | | 604,800 |
Sumitomo Mitsui Bank Corp. (144A)
5.625%, 12/31/49 (a) | | | 1,400,000 | | | 1,394,758 |
Teck Cominco, Ltd.
6.125%, 10/01/35 | | | 725,000 | | | 716,989 |
Vodafone Airtouch, Plc.
7.750%, 02/15/10 | | | 2,330,000 | | | 2,551,970 |
Vodafone Group, Plc.
5.000%, 09/15/15 | | | 650,000 | | | 633,105 |
| | | | | |
|
|
| | | | | | | 23,347,643 |
| | | | | |
|
|
Total Fixed Income
(Identified Cost $1,134,374,277) | | | | | | 1,127,161,831 |
| | | | | |
|
|
| | | | | | |
| | |
| Short Term Investments—4.0% | | | | | | |
| | |
| Security Description | | Face
Amount | | Value* | |
| | |
Discount Notes—4.0% | | | | | | |
Federal National Mortgage Association | | | | | | |
3.500%, 01/03/06 | | 42,600,000 | | $ | 42,591,717 | |
7.750%, 09/01/06 | | 45 | | | 45 | |
| | | | |
|
|
|
Total Short Term Investments
(Amortized Cost $42,591,759) | | | | | 42,591,762 | |
| | | | |
|
|
|
Total Investments—110.1%
(Identified Cost $1,176,966,036) (c) | | | | | 1,169,753,593 | |
Liabilities in excess of other assets | | | | | (107,095,412 | ) |
| | | | |
|
|
|
| Total Net Assets—100% | | | | $ | 1,062,658,181 | |
| | | | |
|
|
|
| (a) | Variable or Floating Rate Security. Rate disclosed is as of December 31, 2005. |
| (b) | A portion or all of the security was held on loan. As of December 31, 2005, the market value of securities loaned was $152,746,261 and the collateral received consisted of cash in the amount of $153,629,900 and securities with a market value of $ 2,252,288. |
| (c) | The aggregate cost of investments for federal income tax purposes as of December 31, 2005 was $1,178,886,656 and the composition of unrealized appreciation and depreciation of investment securities was $4,771,317 and $(13,904,380), respectively. |
| (144A)— | Securities exempt from registration under Rule 144A of the Securities Act of 1933. These securities may be resold in transactions exempt from registration, normally to qualified institutional buyers. As of December 31, 2005, the market value of 144A securities was $37,033,160, which is 3.5% of total net assets. |
| (REIT)— | A Real Estate Investment Trust is a pooled investment vehicle that invests primarily in income-producing real estate or real estate related loans or interest. |
| (TBA)— | A contract for the purchase or sale of a Mortgage Backed Security to be delivered at a future date but does not include a specified pool or precise amount to be delivered. |
*See accompanying notes to financial statements.
MSF-326
Metropolitan Series Fund, Inc.
BlackRock Bond Income Portfolio
Schedule of Investments as of December 31, 2005
Forward Contracts
| | | | | | | | | | | | | | | | |
Forward Currency Contracts
| | Delivery Date
| | Local
Currency
Amount
| | Aggregate
Face
Value
| | | Valuation as of
12/31/2005
| | | Net
Unrealized
Appreciation
| |
Euro (sold) | | 1/20/2006 | | 7,784,783 | | $ | 9,460,808 | | | $ | 9,228,869 | | | $ | 231,939 | |
| | | | | | | | | | | | | | |
|
|
|
Futures Contracts | | | | | | | | | | | | | | | | |
| | | | | |
Futures Contracts Long
| | Expiration Date
| | Number of
Contracts
| | Contract
Amount
| | | Valuation as of
12/31/2005
| | | Unrealized
Appreciation/
(Depreciation)
| |
Eurodollar Futures | | 3/19/2007 | | 74 | | $ | 17,609,872 | | | $ | 17,621,250 | | | $ | 11,378 | |
Eurodollar Futures | | 6/18/2007 | | 74 | | | 17,609,811 | | | | 17,624,025 | | | | 14,214 | |
Eurodollar Futures | | 9/17/2007 | | 74 | | | 17,608,240 | | | | 17,624,025 | | | | 15,785 | |
Interest Rate Swap 10 Year Futures | | 3/17/2006 | | 355 | | | 37,927,539 | | | | 38,395,469 | | | | 467,930 | |
U.S. Treasury Bonds Futures | | 3/22/2006 | | 612 | | | 68,597,343 | | | | 69,882,750 | | | | 1,285,407 | |
U.S. Treasury Notes Futures | | 3/31/2006 | | 180 | | | 36,882,363 | | | | 36,933,750 | | | | 51,387 | |
| | | | | |
Futures Contracts Short
| | | | | | | | | | | | | |
Federal Republic of Germany 5 Year Futures | | 3/8/2006 | | (244) | | | (32,629,056 | ) | | | (32,624,755 | ) | | | 4,301 | |
U.S. Treasury Notes 5 Year Futures | | 3/22/2006 | | (851) | | | (90,158,000 | ) | | | (90,498,531 | ) | | | (340,531 | ) |
U.S. Treasury Notes 10 Year Futures | | 3/22/2006 | | (195) | | | (21,183,299 | ) | | | (21,334,219 | ) | | | (150,920 | ) |
| | | | | | | | | | | | | | |
|
|
|
Net Unrealized Appreciation | | | $ | 1,358,951 | |
| | | | | | | | | | | | | | |
|
|
|
| | | | | |
| Options Written | | | | | | | | | | | | | | | | |
| | | | | |
Options Written-Calls
| | Expiration Date
| | Number of
Contracts
| | Contract
Amount
| | | Valuation as of
12/31/2005
| | | Unrealized
Appreciation
| |
U.S. Treasury Notes 10 Year Futures 113 | | 2/28/2006 | | (94) | | $ | (51,195 | ) | | $ | (23,500 | ) | | $ | 27,695 | |
| | | | | |
Options Written-Puts
| | | | | | | | | | | | | |
U.S. Treasury Notes 10 Year Futures 107 | | 2/28/2006 | | (94) | | | (50,628 | ) | | | (14,688 | ) | | | 35,940 | |
| | | | | | | | | | | | | | |
|
|
|
Net Unrealized Appreciation | | | $ | 63,635 | |
| | | | | | | | | | | | | | |
|
|
|
| | | | | |
| TBA Sales Commitments | | | | | | | | | | | | | | | | |
| | | | | |
Federal Agencies
| | | | | | | | | Face Amount
| | | Value*
| |
Federal Home Loan Mortgage Corp.
4.500%, (15 Year TBA) | | | $ | (7,100,000 | ) | | $ | (6,906,965 | ) |
5.000%, (15 Year TBA) | | | | (18,600,000 | ) | | | (18,408,197 | ) |
Federal National Mortgage Association
5.000%, (30 Year TBA) | | | | (17,000,000 | ) | | | (16,468,750 | ) |
5.500%, (30 Year TBA) | | | | (32,500,000 | ) | | | (32,175,000 | ) |
6.000%, (30 Year TBA) | | | | (4,100,000 | ) | | | (4,137,154 | ) |
6.500%, (30 Year TBA) | | | | (2,000,000 | ) | | | (2,051,250 | ) |
| | | | | | | | | | | | | | |
|
|
|
Total TBA Sales Commitments (Proceeds $(79,629,022)) | | | $ | (80,147,316 | ) |
| | | | | | | | | | | | | | |
|
|
|
*See accompanying notes to financial statements.
MSF-327
Metropolitan Series Fund, Inc.
BlackRock Bond Income Portfolio
Statement of Assets & Liabilities
December 31, 2005
| | | | | | | |
Assets | | | | | | | |
Investments at value | | | | | $ | 1,169,753,593 | |
Cash | | | | | | 69,099 | |
Foreign cash at value | | | | | | 10,732,594 | |
Collateral for securities loaned | | | | | | 155,882,188 | |
Receivable for: | | | | | | | |
Securities sold | | | | | | 168,692,626 | |
Fund shares sold | | | | | | 1,888,136 | |
Open forward currency contracts—net | | | | | | 231,939 | |
Accrued interest | | | | | | 7,765,073 | |
| | | | | |
|
|
|
Total Assets | | | | | | 1,515,015,248 | |
Liabilities | | | | | | | |
TBA sales commitments at value | | $ | 80,147,316 | | | | |
Payable for: | | | | | | | |
Fund shares redeemed | | | 1,399,892 | | | | |
Securities purchased | | | 213,869,305 | | | | |
Futures variation margin | | | 186,367 | | | | |
Return of collateral for securities loaned | | | 155,882,188 | | | | |
Options written, at fair value | | | 38,188 | | | | |
Interest | | | 202,814 | | | | |
Accrued expenses: | | | | | | | |
Management fees | | | 355,181 | | | | |
Service and distribution fees | | | 56,998 | | | | |
Deferred directors’ fees | | | 68,488 | | | | |
Other expenses | | | 150,330 | | | | |
| | |
|
| | | | |
Total Liabilities | | | | | | 452,357,067 | |
| | | | | |
|
|
|
Net Assets | | | | | $ | 1,062,658,181 | |
| | | | | |
|
|
|
Net assets consists of: | | | | | | | |
Capital paid in | | | | | $ | 1,029,528,527 | |
Undistributed net investment income | | | | | | 43,640,770 | |
Accumulated net realized losses | | | | | | (4,037,954 | ) |
Unrealized depreciation on investments, futures contracts, options and foreign currency | | | | | | (6,473,162 | ) |
| | | | | |
|
|
|
Net Assets | | | | | $ | 1,062,658,181 | |
| | | | | |
|
|
|
| Computation of offering price: | | | | �� | | | |
Class A | | | | | | | |
Net asset value and redemption price per share ($763,205,281 divided by 6,907,855 shares outstanding) | | | | | $ | 110.48 | |
| | | | | |
|
|
|
Class B | | | | | | | |
Net asset value and redemption price per share ($235,056,742 divided by 2,152,561 shares outstanding) | | | | | $ | 109.20 | |
| | | | | |
|
|
|
Class E | | | | | | | |
Net asset value and redemption price per share ($64,396,158 divided by 586,869 shares outstanding) | | | | | $ | 109.73 | |
| | | | | |
|
|
|
Identified cost of investments | | | | | $ | 1,176,966,036 | |
| | | | | |
|
|
|
Identified cost of foreign cash | | | | | $ | 11,109,975 | |
| | | | | |
|
|
|
Proceeds of TBA sales commitments | | | | | $ | (79,629,022 | ) |
| | | | | |
|
|
|
Statement of Operations
For the Year Ended December 31, 2005
| | | | | | | | |
Investment Income | | | | | | | | |
Interest | | | | | | $ | 46,187,900 | (a) |
| | | | | | |
|
|
|
| | | | | | | | 46,187,900 | |
Expenses | | | | | | | | |
Management fees | | $ | 4,147,455 | | | | | |
Service and distribution fees—Class B | | | 476,629 | | | | | |
Service and distribution fees—Class E | | | 96,934 | | | | | |
Directors’ fees and expenses | | | 24,335 | | | | | |
Custodian | | | 301,123 | | | | | |
Audit and tax services | | | 21,768 | | | | | |
Legal | | | 51,990 | | | | | |
Printing | | | 268,778 | | | | | |
Insurance | | | 20,510 | | | | | |
Miscellaneous | | | 36,866 | | | | | |
| | |
|
|
| | | | |
Total expenses | | | 5,446,388 | | | | | |
Management fee waivers | | | (9,987 | ) | | | 5,436,401 | |
| | |
|
|
| |
|
|
|
Net Investment Income | | | | | | | 40,751,499 | |
| | | | | | |
|
|
|
Realized and Unrealized Gain (Loss) | | | | | | | | |
| Realized gain (loss) on: | | | | | | | | |
Investments—net | | | 3,087,075 | | | | | |
Futures contracts—net | | | (1,475,038 | ) | | | | |
Foreign currency transactions—net | | | 289,989 | | | | | |
Options—net | | | 386,097 | | | | 2,288,123 | |
| | |
|
|
| | | | |
| Unrealized appreciation (depreciation) on: | | | | | | | | |
Investments—net | | | (20,722,839 | ) | | | | |
Futures contracts—net | | | 1,541,124 | | | | | |
Foreign currency transactions—net | | | 223,795 | | | | | |
Options—net | | | 63,635 | | | | (18,894,285 | ) |
| | |
|
|
| |
|
|
|
Net loss | | | | | | | (16,606,162 | ) |
| | | | | | |
|
|
|
Net Increase in Net Assets
From Operations | | | | | | $ | 24,145,337 | |
| | | | | | |
|
|
|
| (a) | Includes income on securities loaned of $162,166. |
See accompanying notes to financial statements.
MSF-328
Metropolitan Series Fund, Inc.
BlackRock Bond Income Portfolio
Statement of Changes in Net Assets
| | | | | | | | |
| | | Year ended
December 31,
2005
| | | Year ended
December 31,
2004
| |
From Operations | | | | | | | | |
Net investment income | | $ | 40,751,499 | | | $ | 35,668,981 | |
Net realized gain | | | 2,288,123 | | | | 16,880,606 | |
Unrealized depreciation | | | (18,894,285 | ) | | | (9,471,324 | ) |
| | |
|
|
| |
|
|
|
Increase in net assets from operations | | | 24,145,337 | | | | 43,078,263 | |
| | |
|
|
| |
|
|
|
From Distributions to Shareholders | | | | | | | | |
Net investment income | | | | | | | | |
Class A | | | (31,613,861 | ) | | | (34,576,323 | ) |
Class B | | | (6,590,078 | ) | | | (3,976,521 | ) |
Class E | | | (2,475,382 | ) | | | (2,362,593 | ) |
| | |
|
|
| |
|
|
|
| | | | (40,679,321 | ) | | | (40,915,437 | ) |
| | |
|
|
| |
|
|
|
Net realized gain | | | | | | | | |
Class A | | | (9,133,664 | ) | | | (14,435,269 | ) |
Class B | | | (2,022,515 | ) | | | (1,731,879 | ) |
Class E | | | (744,936 | ) | | | (1,006,674 | ) |
| | |
|
|
| |
|
|
|
| | | | (11,901,115 | ) | | | (17,173,822 | ) |
| | |
|
|
| |
|
|
|
Total distributions | | | (52,580,436 | ) | | | (58,089,259 | ) |
| | |
|
|
| |
|
|
|
Increase in net assets from capital share transactions | | | 68,151,248 | | | | 19,770,599 | |
| | |
|
|
| |
|
|
|
Total increase in net assets | | | 39,716,149 | | | | 4,759,603 | |
| | |
Net Assets | | | | | | | | |
Beginning of the period | | | 1,022,942,032 | | | | 1,018,182,429 | |
| | |
|
|
| |
|
|
|
End of the period | | $ | 1,062,658,181 | | | $ | 1,022,942,032 | |
| | |
|
|
| |
|
|
|
Undistributed Net Investment Income | | | | | | | | |
End of the period | | $ | 43,640,770 | | | $ | 40,623,739 | |
| | |
|
|
| |
|
|
|
Other Information:
Capital Shares
Transactions in capital shares were as follows:
| | | | | | | | | | | | | | |
| | | Year ended
December 31, 2005
| | | Year ended
December 31, 2004
| |
| | | Shares
| | | $
| | | Shares
| | | $
| |
Class A | | | | | | | | | | | | | | |
Sales | | 938,783 | | | $ | 103,999,742 | | | 792,346 | | | $ | 88,779,665 | |
Reinvestments | | 375,277 | | | | 40,747,525 | | | 448,290 | | | | 49,011,592 | |
Redemptions | | (1,568,910 | ) | | | (174,014,700 | ) | | (1,701,977 | ) | | | (191,608,040 | ) |
| | |
|
| |
|
|
| |
|
| |
|
|
|
Net decrease | | (254,850 | ) | | $ | (29,267,433 | ) | | (461,341 | ) | | $ | (53,816,783 | ) |
| | |
|
| |
|
|
| |
|
| |
|
|
|
Class B | | | | | | | | | | | | | | |
Sales | | 1,061,631 | | | $ | 116,546,998 | | | 610,575 | | | $ | 68,057,046 | |
Reinvestments | | 80,125 | | | | 8,612,593 | | | 52,700 | | | | 5,708,400 | |
Redemptions | | (261,643 | ) | | | (28,652,441 | ) | | (186,723 | ) | | | (20,811,316 | ) |
| | |
|
| |
|
|
| |
|
| |
|
|
|
Net increase | | 880,113 | | | $ | 96,507,150 | | | 476,552 | | | $ | 52,954,130 | |
| | |
|
| |
|
|
| |
|
| |
|
|
|
Class E | | | | | | | | | | | | | | |
Sales | | 81,194 | | | $ | 8,972,668 | | | 298,502 | | | $ | 33,713,876 | |
Reinvestments | | 29,834 | | | | 3,220,318 | | | 30,990 | | | | 3,369,267 | |
Redemptions | | (101,987 | ) | | | (11,281,455 | ) | | (147,691 | ) | | | (16,449,891 | ) |
| | |
|
| |
|
|
| |
|
| |
|
|
|
Net increase | | 9,041 | | | $ | 911,531 | | | 181,801 | | | $ | 20,633,252 | |
| | |
|
| |
|
|
| |
|
| |
|
|
|
Increase derived from capital share transactions | | 634,304 | | | $ | 68,151,248 | | | 197,012 | | | $ | 19,770,599 | |
| | |
|
| |
|
|
| |
|
| |
|
|
|
See accompanying notes to financial statements.
MSF-329
Metropolitan Series Fund, Inc.
BlackRock Bond Income Portfolio
Financial Highlights
| | | | | | | | | | | | | | | | | | | | |
| | | Class A
| |
| | | Year ended December 31,
| |
| | | 2005
| | | 2004
| | | 2003
| | | 2002
| | | 2001
| |
Net Asset Value, Beginning of Period | | $ | 113.72 | | | $ | 115.62 | �� | | $ | 112.74 | | | $ | 109.33 | | | $ | 109.66 | |
| | |
|
|
| |
|
|
| |
|
|
| |
|
|
| |
|
|
|
Income From Investment Operations | | | | | | | | | | | | | | | | | | | | |
Net investment income | | | 4.69 | | | | 4.44 | | | | 4.55 | | | | 5.30 | | | | 5.92 | |
Net realized and unrealized gain (loss) of investments | | | (2.06 | ) | | | 0.41 | | | | 1.93 | | | | 3.57 | | | | 3.20 | |
| | |
|
|
| |
|
|
| |
|
|
| |
|
|
| |
|
|
|
Total from investment operations | | | 2.63 | | | | 4.85 | | | | 6.48 | | | | 8.87 | | | | 9.12 | |
| | |
|
|
| |
|
|
| |
|
|
| |
|
|
| |
|
|
|
Less Distributions | | | | | | | | | | | | | | | | | | | | |
Distributions from net investment income | | | (4.55 | ) | | | (4.76 | ) | | | (3.60 | ) | | | (5.46 | ) | | | (9.45 | ) |
Distributions from net realized capital gains | | | (1.32 | ) | | | (1.99 | ) | | | 0.00 | | | | 0.00 | | | | 0.00 | |
| | |
|
|
| |
|
|
| |
|
|
| |
|
|
| |
|
|
|
Total distributions | | | (5.87 | ) | | | (6.75 | ) | | | (3.60 | ) | | | (5.46 | ) | | | (9.45 | ) |
| | |
|
|
| |
|
|
| |
|
|
| |
|
|
| |
|
|
|
Net Asset Value, End of Period | | $ | 110.48 | | | $ | 113.72 | | | $ | 115.62 | | | $ | 112.74 | | | $ | 109.33 | |
| | |
|
|
| |
|
|
| |
|
|
| |
|
|
| |
|
|
|
Total Return (%) | | | 2.4 | | | | 4.4 | | | | 5.9 | | | | 8.5 | | | | 8.8 | |
Ratio of operating expenses to average net assets (%) | | | 0.47 | | | | 0.46 | | | | 0.47 | | | | 0.51 | | | | 0.49 | |
Ratio of net investment income to average net assets (%) | | | 3.96 | | | | 3.57 | | | | 3.69 | | | | 4.53 | | | | 5.99 | |
Portfolio turnover rate (%) | | | 890 | | | | 458 | | | | 428 | | | | 356 | | | | 271 | |
Net assets, end of period (000) | | $ | 763,205 | | | $ | 814,560 | | | $ | 881,513 | | | $ | 939,369 | | | $ | 349,417 | |
| | | | | | | | | | | | | | | | | | | | |
| | | Class B
| |
| | | Year ended December 31,
| | | May 1, 2001(a)
through
December 31,
2001
| |
| | | 2005
| | | 2004
| | | 2003
| | | 2002
| | |
Net Asset Value, Beginning of Period | | $ | 112.47 | | | $ | 114.51 | | | $ | 111.84 | | | $ | 108.70 | | | $ | 103.37 | |
| | |
|
|
| |
|
|
| |
|
|
| |
|
|
| |
|
|
|
Income From Investment Operations | | | | | | | | | | | | | | | | | | | | |
Net investment income | | | 4.06 | | | | 3.78 | | | | 3.57 | | | | 5.41 | | | | 0.84 | |
Net realized and unrealized gain (loss) of investments | | | (1.72 | ) | | | 0.73 | | | | 2.58 | | | | 3.11 | | | | 4.49 | |
| | |
|
|
| |
|
|
| |
|
|
| |
|
|
| |
|
|
|
Total from investment operations | | | 2.34 | | | | 4.51 | | | | 6.15 | | | | 8.52 | | | | 5.33 | |
| | |
|
|
| |
|
|
| |
|
|
| |
|
|
| |
|
|
|
Less Distributions | | | | | | | | | | | | | | | | | | | | |
Distributions from net investment income | | | (4.29 | ) | | | (4.56 | ) | | | (3.48 | ) | | | (5.38 | ) | | | 0.00 | |
Distributions from net realized capital gains | | | (1.32 | ) | | | (1.99 | ) | | | 0.00 | | | | 0.00 | | | | 0.00 | |
| | |
|
|
| |
|
|
| |
|
|
| |
|
|
| |
|
|
|
Total distributions | | | (5.61 | ) | | | (6.55 | ) | | | (3.48 | ) | | | (5.38 | ) | | | 0.00 | |
| | |
|
|
| |
|
|
| |
|
|
| |
|
|
| |
|
|
|
Net Asset Value, End of Period | | $ | 109.20 | | | $ | 112.47 | | | $ | 114.51 | | | $ | 111.84 | | | $ | 108.70 | |
| | |
|
|
| |
|
|
| |
|
|
| |
|
|
| |
|
|
|
Total Return (%) | | | 2.2 | | | | 4.2 | | | | 5.6 | | | | 8.2 | | | | 5.2 | (b) |
Ratio of operating expenses to average net assets (%) | | | 0.72 | | | | 0.71 | | | | 0.72 | | | | 0.76 | | | | 0.74 | (c) |
Ratio of net investment income to average net assets (%) | | | 3.73 | | | | 3.35 | | | | 3.40 | | | | 4.28 | | | | 5.07 | (c) |
Portfolio turnover rate (%) | | | 890 | | | | 458 | | | | 428 | | | | 356 | | | | 271 | |
Net assets, end of period (000) | | $ | 235,057 | | | $ | 143,107 | | | $ | 91,135 | | | $ | 47,690 | | | $ | 7,931 | |
| (a) | Commencement of operations. |
| (b) | Period less than one year is not computed on an annualized basis. |
| (c) | Computed on an annualized basis. |
See accompanying notes to financial statements.
MSF-330
Metropolitan Series Fund, Inc.
BlackRock Bond Income Portfolio
Financial Highlights
| | | | | | | | | | | | | | | | |
| | | Class E
| |
| | | Year ended December 31,
| | | April 23, 2002(a)
through
December 31,
2002
| |
| | | 2005
| | | 2004
| | | 2003
| | |
Net Asset Value, Beginning of Period | | $ | 112.97 | | | $ | 114.98 | | | $ | 112.26 | | | $ | 105.14 | |
| | |
|
|
| |
|
|
| |
|
|
| |
|
|
|
Income From Investment Operations | | | | | | | | | | | | | | | | |
Net investment income | | | 4.34 | | | | 3.52 | | | | 3.19 | | | | 1.70 | |
Net realized and unrealized gain (loss) of investments | | | (1.89 | ) | | | 1.12 | | | | 3.09 | | | | 5.42 | |
| | |
|
|
| |
|
|
| |
|
|
| |
|
|
|
Total from investment operations | | | 2.45 | | | | 4.64 | | | | 6.28 | | | | 7.12 | |
| | |
|
|
| |
|
|
| |
|
|
| |
|
|
|
Less Distributions | | | | | | | | | | | | | | | | |
Distributions from net investment income | | | (4.37 | ) | | | (4.66 | ) | | | (3.56 | ) | | | 0.00 | |
Distributions from net realized capital gains | | | (1.32 | ) | | | (1.99 | ) | | | 0.00 | | | | 0.00 | |
| | |
|
|
| |
|
|
| |
|
|
| |
|
|
|
Total distributions | | | (5.69 | ) | | | (6.65 | ) | | | (3.56 | ) | | | 0.00 | |
| | |
|
|
| |
|
|
| |
|
|
| |
|
|
|
Net Asset Value, End of Period | | $ | 109.73 | | | $ | 112.97 | | | $ | 114.98 | | | $ | 112.26 | |
| | |
|
|
| |
|
|
| |
|
|
| |
|
|
|
Total Return (%) | | | 2.3 | | | | 4.3 | | | | 5.7 | | | | 6.8 | (b) |
Ratio of operating expenses to average net assets (%) | | | 0.62 | | | | 0.61 | | | | 0.62 | | | | 0.66 | (c) |
Ratio of net investment income to average net assets (%) | | | 3.81 | | | | 3.44 | | | | 3.48 | | | | 4.25 | (c) |
Portfolio turnover rate (%) | | | 890 | | | | 458 | | | | 428 | | | | 356 | |
Net assets, end of period (000) | | $ | 64,396 | | | $ | 65,275 | | | $ | 45,534 | | | $ | 18,318 | |
| (a) | Commencement of operations. |
| (b) | Period less than one year is not computed on an annualized basis. |
| (c) | Computed on an annualized basis. |
See accompanying notes to financial statements.
MSF-331
Metropolitan Series Fund, Inc.
Lehman Brothers Aggregate Bond Index Portfolio
Schedule of Investments as of December 31, 2005
Fixed Income—98.7% of Total Net Assets
| | | | | | |
| Security Description | | Face
Amount | | Value* |
| | | | | | | |
| | |
Aerospace & Defense—0.3% | | | | | | |
Lockheed Martin Corp.
7.375%, 04/15/13 | | $ | 900,000 | | $ | 1,021,408 |
8.200%, 12/01/09 (a) | | | 700,000 | | | 774,773 |
Raytheon Co.
6.750%, 08/15/07 | | | 233,000 | | | 239,434 |
The Boeing Co.
7.250%, 06/15/25 | | | 460,000 | | | 562,158 |
United Technologies Corp.
7.500%, 09/15/29 | | | 200,000 | | | 252,840 |
| | | | | |
|
|
| | | | | | | 2,850,613 |
| | | | | |
|
|
| | |
Air Freight & Logistics—0.0% | | | | | | |
FedEx Corp.
6.875%, 02/15/06 | | | 100,000 | | | 100,228 |
| | | | | |
|
|
| | |
Airlines—0.1% | | | | | | |
Southwest Airlines Co.
6.500%, 03/01/12 | | | 750,000 | | | 792,343 |
| | | | | |
|
|
| | |
Asset Backed—1.5% | | | | | | |
BMW Vehicle Owner Trust
3.320%, 02/25/09 | | | 1,500,000 | | | 1,469,267 |
4.280%, 02/25/10 | | | 2,700,000 | | | 2,668,464 |
California Infrastructure-Pacific
Gas & Electric Co.
6.480%, 12/26/09 | | | 190,000 | | | 194,294 |
Capital One Master Trust
4.900%, 03/15/10 | | | 3,000,000 | | | 3,003,753 |
CenterPoint Energy Transition
Bond Co., LLC
5.160%, 09/15/11 | | | 500,000 | | | 503,179 |
Centex Home Equity Loan Trust
3.750%, 12/25/31 | | | 263,939 | | | 259,043 |
Chase Funding Mortgage Loan
3.303%, 11/25/29 | | | 500,000 | | | 489,280 |
4.585%, 05/25/15 | | | 2,000,000 | | | 1,947,926 |
6.550%, 03/25/13 | | | 213,060 | | | 214,104 |
Chase Manhattan Auto Owner Trust
1.520%, 05/15/07 (b) | | | 41,521 | | | 41,439 |
Chemical Credit Card Master Trust I
5.980%, 09/15/08 | | | 125,000 | | | 125,067 |
Citibank Credit Card Master Trust I
6.100%, 05/15/08 | | | 600,000 | | | 602,891 |
Detroit Edison Co.
6.190%, 03/01/13 | | | 435,000 | | | 455,362 |
MBNA Credit Card Master Trust
4.200%, 09/15/10 | | | 2,300,000 | | | 2,271,365 |
Pemex Project Funding Master Trust (144A)
9.750%, 03/30/18 (b) | | | 1,000,000 | | | 1,271,000 |
Standard Credit Card Master Trust I
7.250%, 04/07/08 | | | 200,000 | | | 201,318 |
| | | | | |
|
|
| | | | | | | 15,717,752 |
| | | | | |
|
|
| | | | | | |
| Security Description | | Face
Amount | | Value* |
| | | | | | | |
| | |
Automobiles—0.4% | | | | | | |
DaimlerChrysler North America
Holdings Corp.
6.400%, 05/15/06 | | $ | 600,000 | | $ | 602,976 |
7.750%, 01/18/11 | | | 2,600,000 | | | 2,844,730 |
8.000%, 06/15/10 (a) | | | 350,000 | | | 382,973 |
| | | | | |
|
|
| | | | | | | 3,830,679 |
| | | | | |
|
|
| | |
Beverages—0.2% | | | | | | |
Anheuser Busch Cos., Inc.
5.000%, 01/15/15 | | | 1,950,000 | | | 1,940,265 |
Coca-Cola Enterprises, Inc.
6.950%, 11/15/26 | | | 300,000 | | | 347,320 |
Pepsi Bottling Group, Inc.
7.000%, 03/01/29 | | | 300,000 | | | 361,074 |
| | | | | |
|
|
| | | | | | | 2,648,659 |
| | | | | |
|
|
| | |
Capital Markets—1.3% | | | | | | |
Bear Stearns Co., Inc.
5.700%, 01/15/07 | | | 500,000 | | | 504,130 |
5.700%, 11/15/14 | | | 900,000 | | | 926,491 |
7.800%, 08/15/07 | | | 250,000 | | | 261,183 |
Donaldson Lufkin & Jenrette
6.500%, 06/01/08 | | | 300,000 | | | 310,511 |
JPMorgan Chase & Co.
5.250%, 05/30/07 | | | 500,000 | | | 502,527 |
5.350%, 03/01/07 | | | 350,000 | | | 351,927 |
6.750%, 02/01/11 (a) | | | 250,000 | | | 267,890 |
Lehman Brothers Holdings, Inc.
3.600%, 03/13/09 | | | 4,250,000 | | | 4,089,694 |
Merrill Lynch & Co.
6.375%, 10/15/08 | | | 250,000 | | | 259,535 |
6.500%, 07/15/18 | | | 200,000 | | | 219,098 |
Morgan Stanley
7.250%, 04/01/32 | | | 1,150,000 | | | 1,378,107 |
Paine Webber Group, Inc.
6.550%, 04/15/08 | | | 340,000 | | | 351,889 |
The Goldman Sachs Group, Inc.
5.700%, 09/01/12 | | | 1,000,000 | | | 1,028,964 |
6.125%, 02/15/33 | | | 2,075,000 | | | 2,177,752 |
6.650%, 05/15/09 | | | 750,000 | | | 788,351 |
| | | | | |
|
|
| | | | | | | 13,418,049 |
| | | | | |
|
|
| | |
Chemicals—0.3% | | | | | | |
Chevron Phillips Chemical Co., LLC
5.375%, 06/15/07 | | | 2,000,000 | | | 2,004,722 |
E. I. du Pont de Nemours
6.875%, 10/15/09 | | | 300,000 | | | 319,152 |
Praxair, Inc.
6.625%, 10/15/07 | | | 500,000 | | | 515,316 |
Rohm & Haas Co.
7.400%, 07/15/09 | | | 60,000 | | | 64,729 |
| | | | | |
|
|
| | | | | | | 2,903,919 |
| | | | | |
|
|
*See accompanying notes to financial statements.
MSF-332
Metropolitan Series Fund, Inc.
Lehman Brothers Aggregate Bond Index Portfolio
Schedule of Investments as of December 31, 2005
Fixed Income—(Continued)
| | | | | | |
| Security Description | | Face
Amount | | Value* |
| | | | | | | |
| | |
Commercial Banks—2.7% | | | | | | |
ABN-AMRO Bank NV (New York Branch)
7.125%, 10/15/93 | | $ | 500,000 | | $ | 598,101 |
7.750%, 05/15/23 | | | 230,000 | | | 286,738 |
American General Finance Corp.
5.375%, 10/01/12 | | | 1,000,000 | | | 1,004,239 |
Associates Corp. North America
6.250%, 11/01/08 | | | 600,000 | | | 620,949 |
6.950%, 11/01/18 | | | 1,700,000 | | | 1,955,309 |
Bank of America Corp.
4.750%, 08/15/13 | | | 1,000,000 | | | 976,883 |
5.125%, 11/15/14 | | | 1,000,000 | | | 996,120 |
5.250%, 02/01/07 | | | 500,000 | | | 502,156 |
7.400%, 01/15/11 | | | 300,000 | | | 330,572 |
7.800%, 02/15/10 | | | 150,000 | | | 165,744 |
Bank One Corp.
2.625%, 06/30/08 | | | 3,575,000 | | | 3,386,664 |
5.500%, 03/26/07 | | | 500,000 | | | 503,982 |
7.600%, 05/01/07 | | | 1,500,000 | | | 1,552,052 |
Bank One Texas
6.250%, 02/15/08 | | | 800,000 | | | 820,463 |
Chase Manhattan Corp.
7.125%, 02/01/07 | | | 151,000 | | | 154,570 |
Equitable Cos., Inc.
6.500%, 04/01/08 | | | 250,000 | | | 258,283 |
Fleet National Bank
5.750%, 01/15/09 | | | 500,000 | | | 511,974 |
FleetBoston Financial Corp.
4.875%, 12/01/06 | | | 500,000 | | | 500,168 |
Heller Financial, Inc.
6.375%, 03/15/06 | | | 1,500,000 | | | 1,505,071 |
7.375%, 11/01/09 | | | 350,000 | | | 380,526 |
MBNA America National Bank
7.125%, 11/15/12 | | | 1,000,000 | | | 1,113,672 |
Mellon Funding Corp.
6.400%, 05/14/11 | | | 250,000 | | | 265,901 |
SunTrust Bank (Atlanta)
7.250%, 09/15/06 | | | 500,000 | | | 506,165 |
Wachovia Bank National Association
4.800%, 11/01/14 | | | 3,100,000 | | | 3,015,156 |
Wachovia Corp.
4.950%, 11/01/06 | | | 500,000 | | | 500,039 |
Wells Fargo & Co.
5.000%, 11/15/14 | | | 2,000,000 | | | 1,982,414 |
5.125%, 02/15/07 | | | 500,000 | | | 501,551 |
5.125%, 09/01/12 | | | 500,000 | | | 502,649 |
5.900%, 05/21/06 | | | 300,000 | | | 301,163 |
Wells Fargo Bank N.A.
4.750%, 02/09/15 | | | 3,065,000 | | | 2,978,958 |
| | | | | |
|
|
| | | | | | | 28,678,232 |
| | | | | |
|
|
|
Commercial Mortgage-Backed Securities—4.2% |
Bear Stearns Commercial Mortgage Securities, Inc.
5.610%, 11/15/33 | | | 500,000 | | | 513,205 |
6.480%, 02/15/35 | | | 500,000 | | | 530,700 |
| | | | | | |
| Security Description | | Face
Amount | | Value* |
| | | | | | | |
|
Commercial Mortgage-Backed Securities—(Continued) |
7.080%, 06/15/09 | | $ | 800,000 | | $ | 847,403 |
7.780%, 02/15/32 | | | 200,000 | | | 218,043 |
7.890%, 02/15/32 (b) | | | 1,000,000 | | | 1,101,201 |
Chase Commercial Mortgage Securities Corp.
6.390%, 11/18/30 | | | 239,866 | | | 247,371 |
Citigroup Commercial Mortage Trust
5.291%, 04/15/40 (b) | | | 1,000,000 | | | 1,017,404 |
Citigroup/Deutsche Bank Commercial Mortgage Trust
5.224%, 07/15/44 | | | 2,000,000 | | | 2,020,845 |
Credit Suisse First Boston Mortgage
3.382%, 05/15/38 | | | 2,000,000 | | | 1,876,170 |
5.100%, 08/15/15 | | | 3,000,000 | | | 2,986,218 |
First Union Commercial Mortgage Trust
6.070%, 10/15/35 | | | 479,031 | | | 490,444 |
First Union Lehman Brothers Commercial Mortgage Trust
6.560%, 11/18/35 | | | 407,550 | | | 418,760 |
Greenwich Capital Commercial Funding Corp.
4.022%, 01/05/36 | | | 2,210,000 | | | 2,147,098 |
4.305%, 08/10/42 | | | 2,000,000 | | | 1,951,985 |
5.317%, 06/10/36 (b) | | | 1,000,000 | | | 1,010,087 |
JPMorgan Chase Commercial Mortgage
Securities Corp.
3.972%, 05/12/35 | | | 4,523,471 | | | 4,376,124 |
4.275%, 01/12/37 | | | 1,291,218 | | | 1,263,120 |
6.044%, 11/15/35 | | | 1,000,000 | | | 1,022,976 |
LB-UBS Commercial Mortgage Trust
4.254%, 07/15/27 | | | 1,650,000 | | | 1,589,219 |
4.367%, 03/15/36 | | | 3,000,000 | | | 2,846,969 |
6.462%, 03/15/31 | | | 500,000 | | | 535,777 |
6.653%, 11/15/27 | | | 2,000,000 | | | 2,142,133 |
Lehman Brothers Commercial Conduit
Mortgage Trust
6.210%, 10/15/35 | | | 250,000 | | | 257,168 |
Morgan Stanley Capital I, Inc.
4.989%, 08/13/42 | | | 1,000,000 | | | 986,281 |
6.540%, 07/15/30 | | | 760,138 | | | 782,018 |
6.550%, 03/15/30 | | | 529,576 | | | 542,862 |
Morgan Stanley Dean Witter Capital I Trust
4.800%, 09/15/37 | | | 500,000 | | | 494,750 |
7.200%, 10/15/33 | | | 700,000 | | | 754,441 |
Salomon Brothers Commercial Mortgage Trust
5.045%, 03/18/36 | | | 500,000 | | | 495,684 |
6.428%, 12/18/35 | | | 1,000,000 | | | 1,056,959 |
Structured Asset Securities Corp.
6.950%, 03/12/07 | | | 400,000 | | | 409,122 |
Trizechahn Office Properties Trust (144A)
6.211%, 03/15/13 | | | 1,000,000 | | | 1,024,061 |
Wachovia Bank Commercial
Mortgage Trust
5.083%, 03/15/42 (b) | | | 3,000,000 | | | 2,979,979 |
6.287%, 04/15/34 | | | 1,445,000 | | | 1,531,636 |
*See accompanying notes to financial statements.
MSF-333
Metropolitan Series Fund, Inc.
Lehman Brothers Aggregate Bond Index Portfolio
Schedule of Investments as of December 31, 2005
Fixed Income—(Continued)
| | | | | | |
| Security Description | | Face
Amount | | Value* |
| | | | | | | |
|
Commercial Mortgage-Backed Securities—(Continued) |
Wachovia Bank National Association
4.875%, 02/01/15 | | $ | 3,000,000 | | $ | 2,923,805 |
| | | | | |
|
|
| | | | | | | 45,392,018 |
| | | | | |
|
|
| |
Commercial Services & Supplies—0.1% | | | |
USA Waste Services, Inc.
7.000%, 07/15/28 | | | 1,265,000 | | | 1,421,422 |
| | | | | |
|
|
| | |
Communications Equipment—0.1% | | | | | | |
Motorola, Inc.
6.500%, 11/15/28 | | | 900,000 | | | 986,117 |
7.625%, 11/15/10 (a) | | | 135,000 | | | 150,444 |
| | | | | |
|
|
| | | | | | | 1,136,561 |
| | | | | |
|
|
| | |
Consumer Finance—0.5% | | | | | �� | |
Household Finance Corp.
4.750%, 05/15/09 | | | 2,500,000 | | | 2,472,725 |
5.750%, 01/30/07 | | | 500,000 | | | 504,489 |
7.000%, 05/15/12 | | | 100,000 | | | 109,427 |
8.000%, 07/15/10 | | | 300,000 | | | 333,546 |
SLM Corp.
5.050%, 11/14/14 | | | 1,950,000 | | | 1,921,253 |
| | | | | |
|
|
| | | | | | | 5,341,440 |
| | | | | |
|
|
| | |
Diversified Financial Services—3.0% | | | | | | |
AXA Financial, Inc.
7.750%, 08/01/10 | | | 500,000 | | | 552,841 |
Bell Atlantic Financial Services, Inc.
7.600%, 03/15/07 | | | 300,000 | | | 308,974 |
BellSouth Capital Funding Corp.
7.750%, 02/15/10 | | | 750,000 | | | 821,490 |
7.875%, 02/15/30 | | | 250,000 | | | 302,295 |
Boeing Capital Corp.
5.650%, 05/15/06 (a) | | | 173,000 | | | 173,771 |
CIT Group, Inc.
7.750%, 04/02/12 | | | 2,050,000 | | | 2,321,186 |
Citigroup, Inc.
3.500%, 02/01/08 | | | 500,000 | | | 486,780 |
5.750%, 05/10/06 | | | 2,000,000 | | | 2,007,160 |
6.200%, 03/15/09 | | | 750,000 | | | 778,951 |
7.250%, 10/01/10 | | | 250,000 | | | 272,928 |
Countrywide Funding Corp.
5.625%, 05/15/07 | | | 500,000 | | | 503,716 |
Devon Financing Corp.
6.875%, 09/30/11 (a) | | | 1,900,000 | | | 2,074,947 |
Duke Capital
7.500%, 10/01/09 | | | 3,925,000 | | | 4,221,422 |
General Electric Capital Corp.
5.375%, 03/15/07 | | | 400,000 | | | 402,621 |
5.450%, 01/15/13 | | | 1,800,000 | | | 1,843,808 |
6.000%, 06/15/12 | | | 1,000,000 | | | 1,054,048 |
6.750%, 03/15/32 (a) | | | 2,300,000 | | | 2,695,445 |
7.500%, 08/21/35 | | | 100,000 | | | 127,446 |
| | | | | | |
| Security Description | | Face
Amount | | Value* |
| | | | | | | |
| |
Diversified Financial Services—(Continued) | | | |
National Rural Utilities Cooperative
Finance Corp.
6.200%, 02/01/08 | | $ | 1,000,000 | | $ | 1,026,162 |
8.000%, 03/01/32 | | | 300,000 | | | 397,088 |
RBS Capital Trust II
6.425%, 12/29/49 (b) | | | 1,375,000 | | | 1,449,442 |
Southern Co. Capital Funding
5.300%, 02/01/07 | | | 500,000 | | | 502,050 |
Sprint Capital Corp.
6.900%, 05/01/19 | | | 1,500,000 | | | 1,650,232 |
7.625%, 01/30/11 | | | 400,000 | | | 440,898 |
8.375%, 03/15/12 (a) | | | 3,350,000 | | | 3,884,627 |
Unilever Capital Corp.
7.125%, 11/01/10 | | | 300,000 | | | 327,698 |
Verizon Global Funding Corp.
7.750%, 12/01/30 | | | 1,560,000 | | | 1,852,912 |
| | | | | |
|
|
| | | | | | | 32,480,938 |
| | | | | |
|
|
| |
Diversified Telecommunication Services—0.7% | | | |
Alltel Corp.
6.800%, 05/01/29 | | | 500,000 | | | 553,691 |
7.875%, 07/01/32 | | | 500,000 | | | 612,643 |
AT&T Broadband Corp.
8.375%, 03/15/13 | | | 976,000 | | | 1,130,937 |
BellSouth Corp.
6.550%, 06/15/34 | | | 1,850,000 | | | 1,971,488 |
SBC Communications, Inc.
5.750%, 05/02/06 | | | 300,000 | | | 300,759 |
5.875%, 02/01/12 | | | 2,400,000 | | | 2,473,451 |
Verizon New England, Inc.
6.500%, 09/15/11 | | | 400,000 | | | 412,386 |
Verizon New York, Inc.
7.375%, 04/01/32 | | | 500,000 | | | 527,753 |
| | | | | |
|
|
| | | | | | | 7,983,108 |
| | | | | |
|
|
| | |
Electric Utilities—0.9% | | | | | | |
Consolidated Edison Co. of New York, Inc.
6.450%, 12/01/07 | | | 150,000 | | | 154,190 |
7.500%, 09/01/10 | | | 1,000,000 | | | 1,107,131 |
Duke Energy Co.
6.250%, 01/15/12 | | | 500,000 | | | 527,183 |
Exelon Corp.
5.625%, 06/15/35 | | | 1,500,000 | | | 1,404,489 |
Exelon Generation Co., LLC
6.950%, 06/15/11 | | | 300,000 | | | 323,041 |
Oncor Electric Delivery Co.
7.000%, 05/01/32 (a) | | | 950,000 | | | 1,080,005 |
Progress Energy, Inc.
7.100%, 03/01/11 | | | 2,600,000 | | | 2,805,192 |
PSE&G Power, LLC
7.750%, 04/15/11 | | | 500,000 | | | 553,635 |
8.625%, 04/15/31 | | | 1,000,000 | | | 1,308,625 |
Virginia Electric & Power Co.
5.375%, 02/01/07 | | | 400,000 | | | 401,743 |
| | | | | |
|
|
| | | | | | | 9,665,234 |
| | | | | |
|
|
*See accompanying notes to financial statements.
MSF-334
Metropolitan Series Fund, Inc.
Lehman Brothers Aggregate Bond Index Portfolio
Schedule of Investments as of December 31, 2005
Fixed Income—(Continued)
| | | | | | |
| Security Description | | Face
Amount | | Value* |
| | | | | | | |
| | |
Energy Equipment & Services—0.1% | | | | | | |
Kinder Morgan Energy Partners, L.P.
6.750%, 03/15/11 | | $ | 750,000 | | $ | 802,726 |
| | | | | |
|
|
| | |
Federal Agencies—45.1% | | | | | | |
Federal Home Loan Bank
3.375%, 02/23/07 | | | 13,500,000 | | | 13,300,367 |
4.250%, 11/13/09 | | | 1,500,000 | | | 1,474,870 |
4.375%, 03/17/10 | | | 3,000,000 | | | 2,962,834 |
5.000%, 08/01/35 | | | 8,924,235 | | | 8,639,086 |
5.000%, 09/01/35 | | | 4,963,050 | | | 4,804,170 |
5.250%, 06/18/14 (a) | | | 9,500,000 | | | 9,804,678 |
5.500%, 12/01/35 | | | 7,500,000 | | | 7,431,777 |
Federal Home Loan Mortgage Corp.
3.500%, 09/15/07 | | | 6,500,000 | | | 6,380,377 |
3.875%, 06/15/08 (a) | | | 4,000,000 | | | 3,926,848 |
4.000%, 08/17/07 (a) | | | 9,000,000 | | | 8,904,340 |
4.000%, 12/15/09 (a) | | | 2,000,000 | | | 1,948,858 |
4.000%, 06/01/19 | | | 2,493,794 | | | 2,379,571 |
4.250%, 07/15/09 (a) | | | 8,630,000 | | | 8,502,985 |
4.500%, 01/15/15 | | | 3,000,000 | | | 2,943,403 |
4.500%, 09/01/18 | | | 3,539,921 | | | 3,453,405 |
4.500%, 10/01/18 | | | 5,287,803 | | | 5,157,294 |
4.500%, 04/01/19 | | | 7,786,265 | | | 7,588,884 |
4.500%, 06/01/19 | | | 4,084,494 | | | 3,980,968 |
4.500%, 08/01/19 | | | 1,180,096 | | | 1,150,100 |
4.500%, 11/01/35 (b) | | | 2,991,845 | | | 2,814,754 |
5.000%, 05/01/18 | | | 9,653,724 | | | 9,572,752 |
5.000%, 12/01/18 | | | 2,210,403 | | | 2,191,863 |
5.000%, 06/01/19 | | | 3,775,653 | | | 3,741,645 |
5.000%, 10/01/33 | | | 4,485,120 | | | 4,357,798 |
5.000%, 03/01/34 | | | 2,559,743 | | | 2,483,183 |
5.000%, 10/01/35 | | | 3,955,061 | | | 3,828,449 |
5.000%, TBA | | | 6,000,000 | | | 5,806,872 |
5.500%, 11/01/17 | | | 1,586,213 | | | 1,596,461 |
5.500%, 05/01/29 | | | 1,627,374 | | | 1,617,658 |
5.500%, 06/01/34 | | | 5,105,348 | | | 5,063,870 |
5.500%, 10/01/35 | | | 4,920,987 | | | 4,876,223 |
5.500%, TBA | | | 4,500,000 | | | 4,457,813 |
6.000%, 04/01/16 | | | 107,032 | | | 109,143 |
6.000%, 05/01/17 | | | 1,517,383 | | | 1,547,363 |
6.000%, 11/01/28 | | | 124,122 | | | 125,544 |
6.000%, 12/01/28 | | | 86,428 | | | 87,418 |
6.000%, 02/01/29 | | | 249,461 | | | 252,310 |
6.000%, 04/01/29 | | | 73,841 | | | 74,684 |
6.000%, 05/01/29 | | | 30,519 | | | 30,867 |
6.000%, 06/01/31 | | | 39,045 | | | 39,480 |
6.000%, 07/01/31 | | | 13,594 | | | 13,746 |
6.000%, 08/01/31 | | | 271,158 | | | 274,174 |
6.000%, 09/01/31 | | | 607,399 | | | 614,156 |
6.000%, 04/01/32 | | | 1,602,185 | | | 1,619,553 |
6.000%, 11/01/32 | | | 506,103 | | | 511,590 |
6.000%, 06/01/34 | | | 1,828,494 | | | 1,846,085 |
6.000%, 11/01/35 | | | 1,998,099 | | | 2,017,464 |
6.250%, 07/15/32 | | | 1,000,000 | | | 1,191,262 |
6.500%, 10/01/29 | | | 39,090 | | | 40,190 |
| | | | | | |
| Security Description | | Face
Amount | | Value* |
| | | | | | | |
| | |
Federal Agencies—(Continued) | | | | | | |
6.500%, 02/01/30 | | $ | 68,258 | | $ | 70,179 |
6.500%, 08/01/31 | | | 130,763 | | | 134,354 |
6.500%, 10/01/31 | | | 45,292 | | | 46,536 |
6.500%, 11/01/31 | | | 290,924 | | | 298,915 |
6.500%, 03/01/32 | | | 3,425,186 | | | 3,517,311 |
6.500%, 04/01/32 | | | 2,779,328 | | | 2,854,082 |
6.750%, 03/15/31 | | | 965,000 | | | 1,211,844 |
7.000%, 03/15/10 | | | 2,875,000 | | | 3,119,955 |
7.000%, 06/01/11 | | | 54,444 | | | 56,044 |
7.000%, 12/01/15 | | | 76,696 | | | 78,826 |
7.000%, 12/01/27 | | | 13,490 | | | 14,058 |
7.000%, 11/01/28 | | | 38,524 | | | 40,120 |
7.000%, 04/01/29 | | | 31,353 | | | 32,670 |
7.000%, 05/01/29 | | | 13,701 | | | 14,277 |
7.000%, 06/01/29 | | | 44,179 | | | 46,036 |
7.000%, 07/01/29 | | | 21,088 | | | 21,974 |
7.000%, 01/01/31 | | | 461,287 | | | 480,396 |
7.000%, 12/01/31 | | | 52,799 | | | 54,986 |
7.500%, 03/01/16 | | | 132,888 | | | 139,568 |
7.500%, 08/01/24 | | | 119,792 | | | 125,694 |
7.500%, 11/01/24 | | | 35,890 | | | 37,659 |
7.500%, 10/01/27 | | | 85,227 | | | 89,314 |
7.500%, 10/01/29 | | | 120,080 | | | 125,764 |
7.500%, 05/01/30 | | | 73,622 | | | 77,078 |
8.000%, 02/01/27 | | | 25,135 | | | 27,041 |
8.000%, 10/01/28 | | | 47,337 | | | 50,928 |
Federal National Mortgage Association
2.375%, 02/15/07 | | | 21,165,000 | | | 20,628,414 |
3.250%, 08/15/08 | | | 3,025,000 | | | 2,920,670 |
3.250%, 02/15/09 | | | 6,000,000 | | | 5,751,284 |
4.000%, 04/01/19 | | | 2,493,656 | | | 2,384,033 |
4.000%, 05/01/19 | | | 4,709,516 | | | 4,493,089 |
4.000%, 01/01/20 | | | 3,228,455 | | | 3,081,615 |
4.125%, 04/15/14 | | | 7,350,000 | | | 7,027,475 |
4.500%, 07/01/18 | | | 6,207,330 | | | 6,054,313 |
4.500%, 05/01/19 | | | 1,599,717 | | | 1,559,033 |
4.500%, 08/01/33 | | | 1,737,090 | | | 1,642,641 |
4.500%, 10/01/33 | | | 3,302,608 | | | 3,122,004 |
4.500%, 04/01/34 | | | 2,624,516 | | | 2,477,121 |
4.750%, 01/02/07 | | | 5,500,000 | | | 5,497,594 |
5.000%, 06/01/18 | | | 1,698,521 | | | 1,683,321 |
5.000%, 01/01/19 | | | 2,107,384 | | | 2,087,867 |
5.000%, 02/01/20 | | | 3,606,852 | | | 3,567,738 |
5.000%, 02/01/24 | | | 3,131,893 | | | 3,057,746 |
5.000%, 09/01/25 | | | 2,947,342 | | | 2,877,092 |
5.000%, 07/01/33 | | | 2,394,592 | | | 2,328,933 |
5.000%, 08/01/33 | | | 3,898,344 | | | 3,791,453 |
5.000%, 09/01/33 | | | 3,144,628 | | | 3,057,903 |
5.000%, 10/01/33 | | | 11,623,072 | | | 11,308,345 |
5.000%, 03/01/34 | | | 3,535,903 | | | 3,438,950 |
5.000%, 04/01/34 | | | 8,629,714 | | | 8,384,697 |
5.000%, 05/01/34 | | | 2,669,911 | | | 2,592,198 |
5.000%, 09/01/34 | | | 6,009,436 | | | 5,835,086 |
5.000%, 02/01/35 | | | 4,946,401 | | | 4,798,203 |
5.000%, 04/01/35 | | | 2,923,600 | | | 2,832,352 |
5.000%, 05/01/35 | | | 1,941,932 | | | 1,881,121 |
*See accompanying notes to financial statements.
MSF-335
Metropolitan Series Fund, Inc.
Lehman Brothers Aggregate Bond Index Portfolio
Schedule of Investments as of December 31, 2005
Fixed Income—(Continued)
| | | | | | |
| Security Description | | Face
Amount | | Value* |
| | | | | | | |
| | |
Federal Agencies—(Continued) | | | | | | |
5.000%, 11/01/35 | | $ | 2,983,645 | | $ | 2,890,213 |
5.500%, 03/15/11 | | | 950,000 | | | 981,799 |
5.500%, 11/01/17 | | | 2,134,106 | | | 2,148,329 |
5.500%, 02/01/18 | | | 805,834 | | | 810,708 |
5.500%, 04/01/18 | | | 4,138,155 | | | 4,163,185 |
5.500%, 07/01/23 | | | 1,865,599 | | | 1,865,969 |
5.500%, 01/01/24 | | | 973,175 | | | 969,586 |
5.500%, 07/01/24 | | | 3,142,996 | | | 3,138,824 |
5.500%, 10/01/32 | | | 1,137,719 | | | 1,129,853 |
5.500%, 02/01/33 | | | 2,774,255 | | | 2,752,532 |
5.500%, 03/01/33 | | | 5,390,764 | | | 5,348,552 |
5.500%, 05/01/33 | | | 10,078,986 | | | 10,000,063 |
5.500%, 08/01/33 | | | 7,167,478 | | | 7,111,354 |
5.500%, 10/01/33 | | | 1,128,232 | | | 1,119,958 |
5.500%, 12/01/33 | | | 9,130,503 | | | 9,059,007 |
5.500%, 02/01/34 | | | 4,689,795 | | | 4,648,363 |
5.500%, 03/01/34 | | | 2,497,235 | | | 2,475,174 |
5.500%, 04/01/34 | | | 1,866,289 | | | 1,849,801 |
5.500%, 05/01/34 | | | 2,914,843 | | | 2,889,092 |
5.500%, 09/01/34 | | | 3,500,414 | | | 3,469,759 |
5.500%, 12/01/34 | | | 9,347,393 | | | 9,265,010 |
5.500%, 01/01/35 | | | 2,591,302 | | | 2,568,609 |
5.500%, 02/01/35 | | | 5,540,141 | | | 5,491,197 |
5.500%, 04/01/35 | | | 3,656,797 | | | 3,621,753 |
5.500%, 06/01/35 | | | 10,458,366 | | | 10,356,631 |
5.500%, 06/13/35 (b) | | | 2,842,181 | | | 2,831,683 |
6.000%, 09/01/13 | | | 1,652,163 | | | 1,687,156 |
6.000%, 10/01/13 | | | 935,445 | | | 955,258 |
6.000%, 03/01/14 | | | 191,857 | | | 195,925 |
6.000%, 06/01/14 | | | 31,385 | | | 32,051 |
6.000%, 07/01/14 | | | 122,802 | | | 125,406 |
6.000%, 09/01/14 | | | 55,916 | | | 57,102 |
6.000%, 09/01/17 | | | 1,731,398 | | | 1,768,162 |
6.000%, 08/01/28 | | | 81,653 | | | 82,532 |
6.000%, 11/01/28 | | | 17,096 | | | 17,280 |
6.000%, 12/01/28 | | | 15,867 | | | 16,037 |
6.000%, 06/01/31 | | | 210,536 | | | 212,731 |
6.000%, 09/01/32 | | | 1,557,726 | | | 1,573,513 |
6.000%, 01/01/33 | | | 622,131 | | | 628,436 |
6.000%, 02/01/33 | | | 1,181,756 | | | 1,192,245 |
6.000%, 03/01/33 | | | 2,601,586 | | | 2,624,678 |
6.000%, 04/01/33 | | | 1,881,597 | | | 1,898,298 |
6.000%, 05/01/33 | | | 3,228,480 | | | 3,257,136 |
6.000%, 05/01/34 | | | 3,802,871 | | | 3,842,575 |
6.000%, 09/01/34 | | | 4,121,845 | | | 4,158,460 |
6.000%, 11/01/34 | | | 7,178,043 | | | 7,241,807 |
6.000%, 01/01/35 | | | 3,178,970 | | | 3,207,517 |
6.210%, 08/06/38 | | | 300,000 | | | 357,241 |
6.500%, 01/01/13 | | | 32,039 | | | 32,913 |
6.500%, 04/01/13 | | | 2,880 | | | 2,958 |
6.500%, 06/01/13 | | | 134,139 | | | 137,800 |
6.500%, 07/01/13 | | | 1,867 | | | 1,918 |
6.500%, 06/01/14 | | | 65,894 | | | 67,697 |
6.500%, 04/01/17 | | | 5,007,181 | | | 5,144,060 |
6.500%, 05/01/28 | | | 645,400 | | | 664,098 |
6.500%, 12/01/28 | | | 1,278,550 | | | 1,315,592 |
| | | | | | |
| Security Description | | Face
Amount | | Value* |
| | | | | | | |
| | |
Federal Agencies—(Continued) | | | | | | |
6.500%, 03/01/29 | | $ | 47,739 | | $ | 49,107 |
6.500%, 04/01/29 | | | 271,051 | | | 278,819 |
6.500%, 05/01/29 | | | 31,911 | | | 32,826 |
6.500%, 08/01/29 | | | 9,054 | | | 9,313 |
6.500%, 05/01/30 | | | 400,927 | | | 412,417 |
6.500%, 09/01/31 | | | 154,482 | | | 158,811 |
6.500%, 02/01/32 | | | 46,731 | | | 48,843 |
6.500%, 06/01/32 | | | 474,519 | | | 487,534 |
6.500%, 09/01/33 | | | 1,155,362 | | | 1,183,937 |
6.500%, 10/01/33 | | | 993,932 | | | 1,018,514 |
6.500%, 10/01/34 | | | 3,573,996 | | | 3,662,390 |
6.625%, 11/15/10 | | | 3,400,000 | | | 3,672,488 |
6.625%, 11/15/30 (a) | | | 2,450,000 | | | 3,027,003 |
7.000%, 04/01/12 | | | 59,311 | | | 61,048 |
7.000%, 02/01/14 | | | 60,155 | | | 61,916 |
7.000%, 10/01/21 | | | 144,366 | | | 151,164 |
7.000%, 06/01/26 | | | 3,282 | | | 3,426 |
7.000%, 06/01/28 | | | 110,709 | | | 115,408 |
7.000%, 09/01/29 | | | 134,062 | | | 139,846 |
7.000%, 10/01/29 | | | 96,225 | | | 100,376 |
7.000%, 12/01/29 | | | 7,592 | | | 7,920 |
7.000%, 01/01/32 | | | 792,599 | | | 826,235 |
7.000%, 04/01/32 | | | 154,780 | | | 161,240 |
7.000%, 06/01/32 | | | 675,360 | | | 703,544 |
7.250%, 05/15/30 | | | 2,675,000 | | | 3,534,372 |
7.500%, 08/01/15 | | | 49,425 | | | 51,974 |
7.500%, 09/01/25 | | | 36,138 | | | 37,898 |
7.500%, 06/01/26 | | | 39,408 | | | 41,325 |
7.500%, 09/01/27 | | | 4,447 | | | 4,661 |
7.500%, 11/01/27 | | | 2,034 | | | 2,132 |
7.500%, 03/01/28 | | | 27,912 | | | 29,240 |
7.500%, 08/01/28 | | | 1,301 | | | 1,363 |
7.500%, 07/01/29 | | | 97,156 | | | 101,845 |
7.500%, 10/01/29 | | | 36,465 | | | 38,194 |
7.500%, 07/01/30 | | | 7,188 | | | 7,529 |
8.000%, 10/01/26 | | | 2,558 | | | 2,753 |
8.000%, 11/01/29 | | | 1,547 | | | 1,662 |
8.000%, 05/01/30 | | | 42,513 | | | 45,682 |
8.000%, 11/01/30 | | | 30,824 | | | 33,121 |
8.000%, 01/01/31 | | | 26,477 | | | 28,444 |
8.000%, 02/01/31 | | | 53,202 | | | 57,168 |
Government National Mortgage Association
6.000%, 01/15/29 | | | 59,680 | | | 61,076 |
6.000%, 01/15/33 | | | 1,860,475 | | | 1,903,820 |
6.500%, 05/15/23 | | | 15,757 | | | 16,432 |
6.500%, 02/15/27 | | | 257,632 | | | 268,620 |
6.500%, 07/15/28 | | | 58,863 | | | 61,370 |
6.500%, 08/15/28 | | | 92,646 | | | 96,591 |
6.500%, 11/15/28 | | | 65,251 | | | 68,030 |
6.500%, 12/15/28 | | | 21,564 | | | 22,482 |
6.500%, 07/15/29 | | | 25,732 | | | 26,826 |
6.500%, 06/20/31 | | | 216,743 | | | 224,396 |
6.500%, 07/15/32 | | | 444,806 | | | 463,623 |
7.000%, 04/15/27 | | | 494 | | | 519 |
7.000%, 01/15/28 | | | 17,247 | | | 18,120 |
*See accompanying notes to financial statements.
MSF-336
Metropolitan Series Fund, Inc.
Lehman Brothers Aggregate Bond Index Portfolio
Schedule of Investments as of December 31, 2005
Fixed Income—(Continued)
| | | | | | |
| Security Description | | Face
Amount | | Value* |
| | | | | | | |
| | |
Federal Agencies—(Continued) | | | | | | |
7.000%, 04/15/28 | | $ | 20,397 | | $ | 21,430 |
7.000%, 05/15/28 | | | 50,669 | | | 53,235 |
7.000%, 06/15/28 | | | 39,362 | | | 41,355 |
7.000%, 10/15/28 | | | 30,445 | | | 31,986 |
7.000%, 06/15/29 | | | 20,761 | | | 21,813 |
7.000%, 09/15/29 | | | 46,530 | | | 48,888 |
7.000%, 01/15/31 | | | 1,696 | | | 1,782 |
7.000%, 03/15/31 | | | 59,472 | | | 62,475 |
7.000%, 08/15/31 | | | 466,414 | | | 489,969 |
7.000%, 02/15/32 | | | 341,659 | | | 358,873 |
7.000%, 07/15/32 | | | 256,711 | | | 269,646 |
7.500%, 02/20/28 | | | 23,138 | | | 24,244 |
7.500%, 08/15/29 | | | 45,269 | | | 47,728 |
7.500%, 04/15/30 | | | 30,893 | | | 32,570 |
8.000%, 09/15/16 | | | 6,643 | | | 7,093 |
8.000%, 08/15/26 | | | 12,505 | | | 13,450 |
8.000%, 09/15/26 | | | 22,877 | | | 24,605 |
8.000%, 05/15/27 | | | 12,975 | | | 13,954 |
8.000%, 06/15/29 | | | 85,357 | | | 91,784 |
9.000%, 11/15/24 | | | 72,504 | | | 79,003 |
Tennessee Valley Authority
6.000%, 03/15/13 | | | 1,000,000 | | | 1,071,993 |
| | | | | |
|
|
| | | | | | | 482,355,940 |
| | | | | |
|
|
| | |
Food & Staples Retailing—0.4% | | | | | | |
Kroger Co.
5.500%, 02/01/13 (a) | | | 950,000 | | | 935,789 |
Safeway, Inc.
6.150%, 03/01/06 | | | 750,000 | | | 750,287 |
Wal-Mart Stores, Inc.
4.550%, 05/01/13 | | | 2,075,000 | | | 2,024,443 |
6.875%, 08/10/09 | | | 500,000 | | | 532,580 |
| | | | | |
|
|
| | | | | | | 4,243,099 |
| | | | | |
|
|
| | |
Food Products—0.7% | | | | | | |
Archer-Daniels-Midland Co.
8.875%, 04/15/11 | | | 200,000 | | | 235,584 |
Campbell Soup Co.
5.500%, 03/15/07 (a) | | | 400,000 | | | 402,454 |
ConAgra Foods, Inc.
6.000%, 09/15/06 | | | 500,000 | | | 503,462 |
Fred Meyer, Inc.
7.450%, 03/01/08 | | | 300,000 | | | 312,623 |
General Mills, Inc.
5.125%, 02/15/07 | | | 400,000 | | | 400,721 |
6.000%, 02/15/12 | | | 2,000,000 | | | 2,087,180 |
Kellogg Co.
6.600%, 04/01/11 | | | 2,700,000 | | | 2,890,593 |
Kraft Foods, Inc.
6.250%, 06/01/12 | | | 900,000 | | | 949,486 |
| | | | | |
|
|
| | | | | | | 7,782,103 |
| | | | | |
|
|
| | | | | | |
| Security Description | | Face
Amount | | Value* |
| | | | | | | |
| | |
Foreign Government—2.0% | | | | | | |
Government of Canada
6.750%, 08/28/06 | | $ | 1,500,000 | | $ | 1,522,052 |
Province of Nova Scotia
9.250%, 03/01/20 | | | 250,000 | | | 353,962 |
Province of Ontario
5.125%, 07/17/12 (a) | | | 2,000,000 | | | 2,041,555 |
5.500%, 10/01/08 | | | 300,000 | | | 306,009 |
Province of Quebec
4.875%, 05/05/14 (a) | | | 1,925,000 | | | 1,925,635 |
7.500%, 07/15/23 (a) | | | 350,000 | | | 442,228 |
Republic of Italy
4.500%, 01/21/15 (a) | | | 2,975,000 | | | 2,884,660 |
5.250%, 04/05/06 | | | 500,000 | | | 500,916 |
5.625%, 06/15/12 | | | 3,650,000 | | | 3,786,473 |
6.000%, 05/29/08 | | | 300,000 | | | 308,715 |
Republic of Korea
8.875%, 04/15/08 (a) | | | 200,000 | | | 217,984 |
United Mexican States
8.000%, 09/24/22 (a) | | | 2,200,000 | | | 2,717,000 |
8.375%, 01/14/11 | | | 250,000 | | | 285,375 |
9.875%, 01/15/07 | | | 3,100,000 | | | 3,265,850 |
9.875%, 02/01/10 (a) | | | 500,000 | | | 586,000 |
| | | | | |
|
|
| | | | | | | 21,144,414 |
| | | | | |
|
|
| |
Health Care Providers & Services—0.2%
| | | |
Anthem, Inc.
6.800%, 08/01/12 | | | 2,200,000 | | | 2,410,764 |
| | | | | |
|
|
| | |
Household Durables—0.1% | | | | | | |
Centex Corp.
7.500%, 01/15/12 | | | 500,000 | | | 543,055 |
| | | | | |
|
|
| | |
Industrial Conglomerates—0.1% | | | | | | |
General Electric Co.
5.000%, 02/01/13 | | | 930,000 | | | 928,357 |
Honeywell International, Inc.
7.500%, 03/01/10 | | | 300,000 | | | 329,267 |
| | | | | |
|
|
| | | | | | | 1,257,624 |
| | | | | |
|
|
| | |
Insurance—0.5% | | | | | | |
Allstate Corp.
6.125%, 02/15/12 | | | 2,750,000 | | | 2,898,214 |
6.900%, 05/15/38 | | | 150,000 | | | 174,888 |
American General Capital II
8.500%, 07/01/30 | | | 250,000 | | | 333,961 |
Chubb Corp.
6.000%, 11/15/11 | | | 350,000 | | | 366,343 |
GE Global Insurance Holding Corp.
7.500%, 06/15/10 | | | 500,000 | | | 545,167 |
Hartford Financial Services Group, Inc.
6.375%, 11/01/08 | | | 105,000 | | | 108,915 |
Hartford Life, Inc.
7.650%, 06/15/27 | | | 780,000 | | | 964,386 |
| | | | | |
|
|
| | | | | | | 5,391,874 |
| | | | | |
|
|
*See accompanying notes to financial statements.
MSF-337
Metropolitan Series Fund, Inc.
Lehman Brothers Aggregate Bond Index Portfolio
Schedule of Investments as of December 31, 2005
Fixed Income—(Continued)
| | | | | | |
| Security Description | | Face
Amount | | Value* |
| | | | | | | |
| |
Leisure Equipment & Products—0.0% | | | |
Carnival Corp.
6.150%, 04/15/08 | | $ | 500,000 | | $ | 512,035 |
| | | | | |
|
|
| | |
Machinery—0.1% | | | | | | |
Caterpillar, Inc.
7.250%, 09/15/09 | | | 250,000 | | | 269,738 |
Deere & Co.
6.950%, 04/25/14 (a) | | | 850,000 | | | 956,082 |
7.850%, 05/15/10 (a) | | | 300,000 | | | 333,660 |
| | | | | |
|
|
| | | | | | | 1,559,480 |
| | | | | |
|
|
| | |
Media—1.3% | | | | | | |
AOL Time Warner, Inc.
6.150%, 05/01/07 | | | 4,650,000 | | | 4,705,649 |
7.625%, 04/15/31 | | | 300,000 | | | 333,448 |
Belo Corp.
8.000%, 11/01/08 | | | 500,000 | | | 531,494 |
Clear Channel Communications, Inc.
6.000%, 11/01/06 | | | 600,000 | | | 604,893 |
Comcast Cable Communications
8.375%, 05/01/07 | | | 250,000 | | | 260,717 |
Comcast Corp.
5.300%, 01/15/14 | | | 1,445,000 | | | 1,415,452 |
5.650%, 06/15/35 | | | 1,500,000 | | | 1,371,474 |
Cox Communications, Inc.
7.750%, 11/01/10 | | | 250,000 | | | 271,342 |
News America, Inc.
6.550%, 03/15/33 (a) | | | 1,950,000 | | | 2,005,616 |
The Walt Disney Co.
6.375%, 03/01/12 | | | 200,000 | | | 212,145 |
6.750%, 03/30/06 | | | 1,000,000 | | | 1,004,768 |
Time Warner Entertainment Co., L.P.
7.250%, 09/01/08 | | | 250,000 | | | 262,192 |
Time Warner, Inc.
9.125%, 01/15/13 | | | 418,000 | | | 495,007 |
| | | | | |
|
|
| | | | | | | 13,474,197 |
| | | | | |
|
|
| | |
Metals & Mining—0.2% | | | | | | |
Alcoa, Inc.
5.375%, 01/15/13 (a) | | | 1,000,000 | | | 1,011,989 |
6.000%, 01/15/12 | | | 400,000 | | | 418,728 |
6.500%, 06/01/11 | | | 300,000 | | | 319,909 |
| | | | | |
|
|
| | | | | | | 1,750,626 |
| | | | | |
|
|
| | |
Office Electronics—0.2% | | | | | | |
International Business Machines Corp.
4.750%, 11/29/12 (a) | | | 1,000,000 | | | 990,721 |
7.500%, 06/15/13 | | | 1,000,000 | | | 1,154,697 |
8.375%, 11/01/19 | | | 425,000 | | | 550,995 |
| | | | | |
|
|
| | | | | | | 2,696,413 |
| | | | | |
|
|
| | |
Oil, Gas & Consumable Fuels—0.4% | | | | | | |
Atlantic Richfield Co.
5.900%, 04/15/09 | | | 300,000 | | | 310,999 |
Conoco, Inc.
6.950%, 04/15/29 (a) | | | 300,000 | | | 361,971 |
Enterprise Products Operations, L.P.
5.000%, 03/01/15 (a) | | | 2,000,000 | | | 1,906,554 |
| | | | | | |
| Security Description | | Face
Amount | | Value* |
| | | | | | | |
| |
Oil, Gas & Consumable Fuels—(Continued) | | | |
Occidental Petroleum Corp.
7.375%, 11/15/08 | | $ | 300,000 | | $ | 320,874 |
Phillips Petroleum Co.
6.375%, 03/30/09 | | | 300,000 | | | 314,746 |
Southern California Gas Co.
4.800%, 10/01/12 | | | 1,000,000 | | | 988,828 |
Transocean Sedco Forex, Inc.
7.500%, 04/15/31 | | | 300,000 | | | 378,362 |
| | | | | |
|
|
| | | | | | | 4,582,334 |
| | | | | |
|
|
| | |
Paper & Forest Products—0.2% | | | | | | |
International Paper Co.
6.875%, 04/15/29 | | | 250,000 | | | 256,429 |
MeadWestvaco Corp.
6.850%, 04/01/12 | | | 1,000,000 | | | 1,064,542 |
Weyerhaeuser Co.
7.375%, 03/15/32 | | | 500,000 | | | 555,151 |
| | | | | |
|
|
| | | | | | | 1,876,122 |
| | | | | |
|
|
| | |
Personal Products—0.3% | | | | | | |
Procter & Gamble Co.
4.950%, 08/15/14 | | | 2,000,000 | | | 1,997,218 |
6.450%, 01/15/26 | | | 200,000 | | | 227,573 |
6.875%, 09/15/09 | | | 850,000 | | | 911,186 |
| | | | | |
|
|
| | | | | | | 3,135,977 |
| | | | | |
|
|
| | |
Pharmaceuticals—0.4% | | | | | | |
Abbott Laboratories
5.625%, 07/01/06 | | | 300,000 | | | 301,394 |
Johnson & Johnson
6.950%, 09/01/29 (a) | | | 250,000 | | | 312,221 |
Merck & Co., Inc.
5.950%, 12/01/28 | | | 300,000 | | | 306,317 |
Wyeth
5.500%, 02/01/14 | | | 3,000,000 | | | 3,039,040 |
| | | | | |
|
|
| | | | | | | 3,958,972 |
| | | | | |
|
|
| | |
Real Estate—0.6% | | | | | | |
EOP Operating, L.P.
4.750%, 03/15/14 | | | 4,050,000 | | | 3,828,414 |
5.875%, 01/15/13 | | | 1,500,000 | | | 1,528,988 |
8.375%, 03/15/06 | | | 1,000,000 | | | 1,006,846 |
| | | | | |
|
|
| | | | | | | 6,364,248 |
| | | | | |
|
|
| | |
Road & Rail—0.3% | | | | | | |
Burlington Northern Santa Fe Corp. 5.900%, 07/01/12 | | | 1,000,000 | | | 1,047,210 |
CSX Corp.
6.750%, 03/15/11 | | | 200,000 | | | 214,695 |
7.450%, 05/01/07 | | | 300,000 | | | 309,523 |
7.900%, 05/01/17 (a) | | | 500,000 | | | 600,661 |
Norfolk Southern Corp.
5.590%, 05/17/25 | | | 144,000 | | | 143,947 |
6.200%, 04/15/09 | | | 350,000 | | | 363,082 |
7.250%, 02/15/31 | | | 156,000 | | | 189,927 |
| | | | | |
|
|
| | | | | | | 2,869,045 |
| | | | | |
|
|
| | |
Specialty Retail—0.1% | | | | | | |
Lowe’s Cos., Inc.
6.875%, 02/15/28 | | | 1,000,000 | | | 1,182,874 |
| | | | | |
|
|
*See accompanying notes to financial statements.
MSF-338
Metropolitan Series Fund, Inc.
Lehman Brothers Aggregate Bond Index Portfolio
Schedule of Investments as of December 31, 2005
Fixed Income—(Continued)
| | | | | | |
| Security Description | | Face Amount | | Value* |
| | | | | | | |
| | |
Thrifts & Mortgage Finance—0.0% | | | | | | |
Washington Mutual, Inc.
5.625%, 01/15/07 | | $ | 500,000 | | $ | 503,453 |
| | | | | |
|
|
| | |
U.S. Treasury—25.5% | | | | | | |
United States Treasury Bonds
5.250%, 11/15/28 (a) | | | 2,700,000 | | | 2,946,942 |
5.375%, 02/15/31 (a) | | | 2,225,000 | | | 2,500,700 |
5.500%, 08/15/28 (a) | | | 2,420,000 | | | 2,723,032 |
6.125%, 11/15/27 (a) | | | 3,950,000 | | | 4,769,388 |
6.250%, 08/15/23 (a) | | | 7,750,000 | | | 9,256,367 |
6.500%, 11/15/26 (a) | | | 1,000,000 | | | 1,250,400 |
7.125%, 02/15/23 (a) | | | 3,030,000 | | | 3,920,759 |
7.250%, 08/15/22 (a) | | | 2,000,000 | | | 2,605,640 |
7.625%, 11/15/22 (a) | | | 5,600,000 | | | 7,557,760 |
7.875%, 02/15/21 (a) | | | 2,650,000 | | | 3,587,438 |
8.125%, 08/15/19 (a) | | | 1,895,000 | | | 2,571,496 |
8.500%, 02/15/20 | | | 1,400,000 | | | 1,964,732 |
8.875%, 02/15/19 (a) | | | 10,215,000 | | | 14,528,080 |
9.125%, 05/15/18 (a) | | | 1,600,000 | | | 2,288,896 |
9.250%, 02/15/16 (a) | | | 1,375,000 | | | 1,906,465 |
United States Treasury Notes
2.625%, 11/15/06 (a) | | | 7,700,000 | | | 7,581,805 |
3.125%, 01/31/07 (a) | | | 7,500,000 | | | 7,395,000 |
3.125%, 05/15/07 (a) | | | 16,680,000 | | | 16,392,104 |
3.250%, 08/15/08 (a) | | | 3,000,000 | | | 2,917,770 |
3.375%, 02/28/07 (a) | | | 7,000,000 | | | 6,914,460 |
3.375%, 02/15/08 (a) | | | 20,730,000 | | | 20,305,241 |
3.375%, 11/15/08 (a) | | | 15,820,000 | | | 15,395,455 |
3.375%, 10/15/09 (a) | | | 5,000,000 | | | 4,829,600 |
3.500%, 11/15/09 (a) | | | 4,000,000 | | | 3,877,600 |
3.500%, 12/15/09 (a) | | | 4,000,000 | | | 3,876,400 |
3.625%, 06/30/07 (a) | | | 6,000,000 | | | 5,932,200 |
3.625%, 07/15/09 (a) | | | 4,420,000 | | | 4,312,815 |
3.625%, 01/15/10 (a) | | | 4,000,000 | | | 3,892,040 |
3.625%, 06/15/10 (a) | | | 16,200,000 | | | 15,725,340 |
3.875%, 05/15/09 (a) | | | 4,000,000 | | | 3,937,188 |
4.000%, 09/30/07 (a) | | | 4,000,000 | | | 3,972,560 |
4.000%, 04/15/10 (a) | | | 6,000,000 | | | 5,914,080 |
4.000%, 11/15/12 (a) | | | 7,250,000 | | | 7,093,958 |
4.250%, 08/15/13 (a) | | | 14,380,000 | | | 14,257,770 |
4.250%, 11/15/13 (a) | | | 1,600,000 | | | 1,585,360 |
4.250%, 08/15/14 (a) | | | 6,730,000 | | | 6,660,008 |
4.250%, 11/15/14 (a) | | | 2,000,000 | | | 1,977,740 |
4.250%, 08/15/15 (a) | | | 3,000,000 | | | 2,962,860 |
4.375%, 08/15/12 (a) | | | 5,000,000 | | | 5,001,800 |
4.750%, 05/15/14 (a) | | | 5,900,000 | | | 6,046,497 |
4.875%, 02/15/12 (a) | | | 4,500,000 | | | 4,620,015 |
5.000%, 08/15/11 (a) | | | 3,500,000 | | | 3,613,610 |
5.625%, 05/15/08 (a) | | | 5,580,000 | | | 5,733,394 |
5.750%, 08/15/10 (a) | | | 7,120,000 | | | 7,532,462 |
6.250%, 02/15/07 (a) | | | 6,650,000 | | | 6,777,880 |
6.500%, 02/15/10 (a) | | | 1,710,000 | | | 1,845,124 |
| | | | | |
|
|
| | | | | | | 273,258,231 |
| | | | | |
|
|
| |
Wireless Telecommunication Services—0.1% | | | |
AT&T Wireless Services, Inc.
8.125%, 05/01/12 | | | 500,000 | | | 577,738 |
8.750%, 03/01/31 | | | 300,000 | | | 397,625 |
| | | | | | |
| Security Description | | Face
Amount | | Value* |
| | | | | | | |
| |
Wireless Telecommunication Services—(Continued) | | | |
Cingular Wireless, LLC
7.125%, 12/15/31 (a) | | $ | 100,000 | | $ | 113,802 |
| | | | | |
|
|
| | | | | | | 1,089,165 |
| | | | | |
|
|
| | |
Yankee—3.5% | | | | | | |
Apache Finance Canada Corp.
7.750%, 12/15/29 | | | 300,000 | | | 398,433 |
Asian Development Bank
4.875%, 02/05/07 | | | 4,650,000 | | | 4,664,165 |
BP Canada Finance Co.
3.375%, 10/31/07 | | | 500,000 | | | 488,551 |
British Telecommunications, Plc.
8.875%, 12/15/30 (b) | | | 1,000,000 | | | 1,341,730 |
Burlington Resources Finance Co.
5.700%, 03/01/07 | | | 600,000 | | | 606,063 |
Conoco Funding Co.
6.350%, 10/15/11 | | | 500,000 | | | 535,614 |
Deutsche Telekom International Finance
8.250%, 06/15/30 (b) | | | 1,000,000 | | | 1,271,869 |
Encana Corp.
4.750%, 10/15/13 | | | 2,000,000 | | | 1,961,709 |
HSBC Holdings, Plc.
5.250%, 12/12/12 | | | 5,050,000 | | | 5,090,983 |
7.500%, 07/15/09 | | | 2,200,000 | | | 2,374,726 |
Hydro-Quebec
7.500%, 04/01/16 | | | 1,350,000 | | | 1,613,259 |
8.400%, 01/15/22 | | | 1,000,000 | | | 1,352,838 |
Intermediate American Development Bank
5.375%, 11/18/08 | | | 700,000 | | | 714,788 |
6.800%, 10/15/25 | | | 500,000 | | | 596,944 |
7.000%, 06/15/25 | | | 200,000 | | | 245,332 |
8.875%, 06/01/09 | | | 400,000 | | | 453,313 |
International Bank for Reconstruction & Development
4.375%, 09/28/06 | | | 1,000,000 | | | 998,628 |
8.875%, 03/01/26 | | | 535,000 | | | 783,079 |
KFW International Finance, Inc.
4.750%, 01/24/07 | | | 500,000 | | | 500,537 |
8.000%, 02/15/10 | | | 1,000,000 | | | 1,122,226 |
Korea Development Bank
5.750%, 09/10/13 (a) | | | 2,000,000 | | | 2,071,830 |
Kreditanstalt Fuer Wiederaufbank
3.375%, 01/23/08 | | | 2,475,000 | | | 2,415,419 |
National Australia Bank, Ltd.
6.600%, 12/10/07 | | | 350,000 | | | 360,537 |
Norsk Hydro A/S
6.700%, 01/15/18 | | | 300,000 | | | 339,907 |
6.800%, 01/15/28 | | | 1,350,000 | | | 1,593,245 |
Telefonica Europe BV
8.250%, 09/15/30 | | | 1,000,000 | | | 1,240,667 |
Tyco International Group S.A.
6.875%, 01/15/29 | | | 1,275,000 | | | 1,380,989 |
Vodafone Airtouch, Plc.
7.750%, 02/15/10 | | | 1,150,000 | | | 1,260,958 |
| | | | | |
|
|
| | | | | | | 37,778,339 |
| | | | | |
|
|
Total Fixed Income
(Identified Cost $1,060,783,219) | | | | | | 1,056,884,305 |
| | | | | |
|
|
*See accompanying notes to financial statements.
MSF-339
Metropolitan Series Fund, Inc.
Lehman Brothers Aggregate Bond Index Portfolio
Schedule of Investments as of December 31, 2005
Short Term Investments—1.2%
| | | | | | |
| Security Description | | Face
Amount | | Value* |
| | | | | | | |
| | |
Discount Notes—1.2% | | | | | | |
Federal Home Loan Bank
3.350%, 01/03/06 | | $ | 12,600,000 | | $ | 12,597,655 |
| | | | | |
|
|
Total Short Term Investments
(Amortized Cost $12,597,655) | | | | | | 12,597,655 |
| | | | | |
|
|
Total Investments—99.9%
(Identified Cost $1,073,380,874) (c) | | | | | | 1,069,481,960 |
Other assets less liabilities | | | | | | 887,894 |
| | | | | |
|
|
| Total Net Assets—100% | | | | | $ | 1,070,369,854 |
| | | | | |
|
|
| (a) | A portion or all of the security was held on loan. As of December 31, 2005, the market value of securities loaned was $262,027,614 and the collateral received consisted of cash in the amount of $258,402,716 and securities with a market value of $9,128,275. |
| (b) | Variable or floating rate security. Rate disclosed is as of December 31, 2005. |
| (c) | The aggregate cost of investments for federal income tax purposes as of December 31, 2005 was $1,079,352,901 and the composition of unrealized appreciation and depreciation of investment securities was $2,954,407 and $(12,825,348), respectively. |
| (144A)— | Securities exempt from registration under Rule 144A of the Securities Act of 1933. These securities may be resold in transactions exempt from registration, normally to qualified institutional buyers. As of December 31, 2005, the market value of 144A securities was $2,295,061, which is 0.2% of total net assets. |
*See accompanying notes to financial statements.
MSF-340
Metropolitan Series Fund, Inc.
Lehman Brothers Aggregate Bond Index Portfolio
Statement of Assets & Liabilities
December 31, 2005
| | | | | | | |
Assets | | | | | | | |
Investments at value | | | | | $ | 1,069,481,960 | |
Cash | | | | | | 118,666 | |
Collateral for securities loaned | | | | | | 267,530,991 | |
Receivable for: | | | | | | | |
Securities sold | | | | | | 4,499,750 | |
Fund shares sold | | | | | | 4,716,069 | |
Accrued interest | | | | | | 10,491,850 | |
| | | | | |
|
|
|
Total Assets | | | | | | 1,356,839,286 | |
Liabilities | | | | | | | |
Payable for: | | | | | | | |
Fund shares redeemed | | $ | 681,565 | | | | |
Securities purchased | | | 17,803,174 | | | | |
Return of collateral for securities loaned | | | 267,530,991 | | | | |
Accrued expenses: | | | | | | | |
Management fees | | | 218,869 | | | | |
Service and distribution fees | | | 97,766 | | | | |
Other expenses | | | 137,067 | | | | |
| | |
|
| | | | |
Total Liabilities | | | | | | 286,469,432 | |
| | | | | |
|
|
|
Net Assets | | | | | $ | 1,070,369,854 | |
| | | | | |
|
|
|
Net assets consists of: | | | | | | | |
Capital paid in | | | | | $ | 1,040,047,814 | |
Undistributed net investment income | | | | | | 46,714,452 | |
Accumulated net realized losses | | | | | | (12,493,498 | ) |
Unrealized depreciation on investments | | | | | | (3,898,914 | ) |
| | | | | |
|
|
|
Net Assets | | | | | $ | 1,070,369,854 | |
| | | | | |
|
|
|
| Computation of offering price: | | | | | | | |
Class A | | | | | | | |
Net asset value and redemption price per share ($524,877,879 divided by 48,541,462 shares outstanding) | | | | | $ | 10.81 | |
| | | | | |
|
|
|
Class B | | | | | | | |
Net asset value and redemption price per share ($354,652,312 divided by 33,271,695 shares outstanding) | | | | | $ | 10.66 | |
| | | | | |
|
|
|
Class E | | | | | | | |
Net asset value and redemption price per share ($190,839,663 divided by 17,726,609 shares outstanding) | | | | | $ | 10.77 | |
| | | | | |
|
|
|
Identified cost of investments | | | | | $ | 1,073,380,874 | |
| | | | | |
|
|
|
Statement of Operations
Year Ended December 31, 2005
| | | | | | | | |
Investment Income | | | | | | | | |
Interest | | | | | | $ | 46,297,349 | (a) |
| | | | | | |
|
|
|
| | | | | | | | 46,297,349 | |
Expenses | | | | | | | | |
Management fees | | $ | 2,508,950 | | | | | |
Service and distribution fees—Class B | | | 667,808 | | | | | |
Service and distribution fees—Class E | | | 294,721 | | | | | |
Directors’ fees and expenses | | | 22,264 | | | | | |
Custodian | | | 267,158 | | | | | |
Audit and tax services | | | 20,705 | | | | | |
Legal | | | 26,487 | | | | | |
Printing | | | 259,241 | | | | | |
Insurance | | | 18,304 | | | | | |
Miscellaneous | | | 8,931 | | | | | |
| | |
|
|
| | | | |
Total expenses | | | 4,094,569 | | | | | |
Management fee waivers | | | (41,497 | ) | | | 4,053,072 | |
| | |
|
|
| |
|
|
|
Net Investment Income | | | | | | | 42,244,277 | |
| | | | | | |
|
|
|
Realized and Unrealized Gain | | | | | | | | |
| Realized loss on: | | | | | | | | |
Investments—net | | | | | | | (829,022 | ) |
| | | | | | | | | |
| Unrealized depreciation on: | | | | | | | | |
Investments—net | | | | | | | (21,296,430 | ) |
| | | | | | |
|
|
|
Net loss | | | | | | | (22,125,452 | ) |
| | | | | | |
|
|
|
Net Increase in Net Assets
From Operations | | | | | | $ | 20,118,825 | |
| | | | | | |
|
|
|
| (a) | Includes income on securities loaned of $304,498. |
See accompanying notes to financial statements.
MSF-341
Metropolitan Series Fund, Inc.
Lehman Brothers Aggregate Bond Index Portfolio
Statement of Changes in Net Assets
| | | | | | | | |
| | | Year ended December 31,
2005
| | | Year ended December 31,
2004
| |
From Operations | | | | | | | | |
Net investment income | | $ | 42,244,277 | | | $ | 34,354,438 | |
Net realized gain (loss) | | | (829,022 | ) | | | 1,267,742 | |
Unrealized depreciation | | | (21,296,430 | ) | | | (2,275,194 | ) |
| | |
|
|
| |
|
|
|
Increase in net assets from operations | | | 20,118,825 | | | | 33,346,986 | |
| | |
|
|
| |
|
|
|
From Distributions to Shareholders | | | | | | | | |
Net investment income | | | | | | | | |
Class A | | | (21,425,965 | ) | | | (15,454,454 | ) |
Class B | | | (8,685,574 | ) | | | (2,294,962 | ) |
Class E | | | (7,465,846 | ) | | | (4,599,518 | ) |
| | |
|
|
| |
|
|
|
Total distributions | | | (37,577,385 | ) | | | (22,348,934 | ) |
| | |
|
|
| |
|
|
|
Increase in net assets from capital share transactions | | | 166,143,938 | | | | 220,370,418 | |
| | |
|
|
| |
|
|
|
Total increase in net assets | | | 148,685,378 | | | | 231,368,470 | |
| | |
Net Assets | | | | | | | | |
Beginning of the period | | | 921,684,476 | | | | 690,316,006 | |
| | |
|
|
| |
|
|
|
End of the period | | $ | 1,070,369,854 | | | $ | 921,684,476 | |
| | |
|
|
| |
|
|
|
Undistributed Net Investment Income | | | | | | | | |
End of the period | | $ | 46,714,452 | | | $ | 37,565,243 | |
| | |
|
|
| |
|
|
|
Other Information:
Capital Shares
Transactions in capital shares were as follows:
| | | | | | | | | | | | | | |
| | | Year ended
December 31, 2005
| | | Year ended
December 31, 2004
| |
| | | Shares
| | | $
| | | Shares
| | | $
| |
Class A | | | | | | | | | | | | | | |
Sales | | 9,866,764 | | | $ | 106,886,054 | | | 14,092,053 | | | $ | 152,087,155 | |
Reinvestments | | 2,011,828 | | | | 21,425,965 | | | 1,451,122 | | | | 15,454,454 | |
Redemptions | | (13,294,212 | ) | | | (143,962,582 | ) | | (11,388,487 | ) | | | (123,987,784 | ) |
| | |
|
| |
|
|
| |
|
| |
|
|
|
Net increase (decrease) | | (1,415,620 | ) | | $ | (15,650,563 | ) | | 4,154,688 | | | $ | 43,553,825 | |
| | |
|
| |
|
|
| |
|
| |
|
|
|
Class B | | | | | | | | | | | | | | |
Sales | | 20,869,536 | | | $ | 223,146,587 | | | 11,166,953 | | | $ | 119,722,237 | |
Reinvestments | | 825,625 | | | | 8,685,574 | | | 218,152 | | | | 2,294,962 | |
Redemptions | | (4,151,285 | ) | | | (44,267,125 | ) | | (2,507,939 | ) | | | (26,951,090 | ) |
| | |
|
| |
|
|
| |
|
| |
|
|
|
Net increase | | 17,543,876 | | | $ | 187,565,036 | | | 8,877,166 | | | $ | 95,066,109 | |
| | |
|
| |
|
|
| |
|
| |
|
|
|
Class E | | | | | | | | | | | | | | |
Sales | | 2,038,741 | | | $ | 22,064,654 | | | 10,365,630 | | | $ | 111,521,521 | |
Reinvestments | | 703,661 | | | | 7,465,846 | | | 433,508 | | | | 4,599,518 | |
Redemptions | | (3,270,738 | ) | | | (35,301,035 | ) | | (3,169,955 | ) | | | (34,370,555 | ) |
| | |
|
| |
|
|
| |
|
| |
|
|
|
Net increase (decrease) | | (528,336 | ) | | $ | (5,770,535 | ) | | 7,629,183 | | | $ | 81,750,484 | |
| | |
|
| |
|
|
| |
|
| |
|
|
|
Increase derived from capital share transactions | | 15,599,920 | | | $ | 166,143,938 | | | 20,661,037 | | | $ | 220,370,418 | |
| | |
|
| |
|
|
| |
|
| |
|
|
|
See accompanying notes to financial statements.
MSF-342
Metropolitan Series Fund, Inc.
Lehman Brothers Aggregate Bond Index Portfolio
Financial Highlights
| | | | | | | | | | | | | | | | | | | | |
| | | Class A
| |
| | | Year ended December 31,
| |
| | | 2005
| | | 2004
| | | 2003
| | | 2002
| | | 2001
| |
Net Asset Value, Beginning of Period | | $ | 11.02 | | | $ | 10.93 | | | $ | 11.17 | | | $ | 10.46 | | | $ | 9.90 | |
| | |
|
|
| |
|
|
| |
|
|
| |
|
|
| |
|
|
|
Income from Investment Operations | | | | | | | | | | | | | | | | | | | | |
Net investment income | | | 0.49 | | | | 0.46 | | | | 0.45 | | | | 0.47 | | | | 0.54 | |
Net realized and unrealized gain (loss) of investments | | | (0.27 | ) | | | (0.02 | ) | | | (0.06 | ) | | | 0.57 | | | | 0.19 | |
| | |
|
|
| |
|
|
| |
|
|
| |
|
|
| |
|
|
|
Total from investment operations | | | 0.22 | | | | 0.44 | | | | 0.39 | | | | 1.04 | | | | 0.73 | |
| | |
|
|
| |
|
|
| |
|
|
| |
|
|
| |
|
|
|
Less Distributions | | | | | | | | | | | | | | | | | | | | |
Distributions from net investment income | | | (0.43 | ) | | | (0.35 | ) | | | (0.63 | ) | | | (0.33 | ) | | | (0.17 | ) |
| | |
|
|
| |
|
|
| |
|
|
| |
|
|
| |
|
|
|
Total distributions | | | (0.43 | ) | | | (0.35 | ) | | | (0.63 | ) | | | (0.33 | ) | | | (0.17 | ) |
| | |
|
|
| |
|
|
| |
|
|
| |
|
|
| |
|
|
|
Net Asset Value, End of Period | | $ | 10.81 | | | $ | 11.02 | | | $ | 10.93 | | | $ | 11.17 | | | $ | 10.46 | |
| | |
|
|
| |
|
|
| |
|
|
| |
|
|
| |
|
|
|
Total Return (%) | | | 2.1 | | | | 4.1 | | | | 3.6 | | | | 10.2 | | | | 7.4 | |
Ratio of operating expenses to average net assets (%) | | | 0.31 | | | | 0.32 | | | | 0.34 | | | | 0.34 | | | | 0.38 | |
Ratio of net investment income to average net assets (%) | | | 4.30 | | | | 4.42 | | | | 4.44 | | | | 5.14 | | | | 5.66 | |
Portfolio turnover rate (%) | | | 23 | | | | 27 | | | | 46 | | | | 48 | | | | 18 | |
Net assets, end of period (000) | | $ | 524,878 | | | $ | 550,456 | | | $ | 500,629 | | | $ | 346,774 | | | $ | 254,357 | |
| | | | | | | | | | | | | | | | | | | | |
| | | Class B
| |
| | | Year ended December 31,
| | | January 2, 2001(a)
through
December 31,
2001
| |
| | | 2005
| | | 2004
| | | 2003
| | | 2002
| | |
Net Asset Value, Beginning of Period | | $ | 10.87 | | | $ | 10.79 | | | $ | 11.04 | | | $ | 10.37 | | | $ | 9.93 | |
| | |
|
|
| |
|
|
| |
|
|
| |
|
|
| |
|
|
|
Income from Investment Operations | | | | | | | | | | | | | | | | | | | | |
Net investment income | | | 0.36 | | | | 0.36 | | | | 0.40 | | | | 0.38 | | | | 0.38 | |
Net realized and unrealized gain (loss) of investments | | | (0.16 | ) | | | 0.04 | | | | (0.04 | ) | | | 0.61 | | | | 0.23 | |
| | |
|
|
| |
|
|
| |
|
|
| |
|
|
| |
|
|
|
Total from investment operations | | | 0.20 | | | | 0.40 | | | | 0.36 | | | | 0.99 | | | | 0.61 | |
| | |
|
|
| |
|
|
| |
|
|
| |
|
|
| |
|
|
|
Less Distributions | | | | | | | | | | | | | | | | | | | | |
Distributions from net investment income | | | (0.41 | ) | | | (0.32 | ) | | | (0.61 | ) | | | (0.32 | ) | | | (0.17 | ) |
| | |
|
|
| |
|
|
| |
|
|
| |
|
|
| |
|
|
|
Total distributions | | | (0.41 | ) | | | (0.32 | ) | | | (0.61 | ) | | | (0.32 | ) | | | (0.17 | ) |
| | |
|
|
| |
|
|
| |
|
|
| |
|
|
| |
|
|
|
Net Asset Value, End of Period | | $ | 10.66 | | | $ | 10.87 | | | $ | 10.79 | | | $ | 11.04 | | | $ | 10.37 | |
| | |
|
|
| |
|
|
| |
|
|
| |
|
|
| |
|
|
|
Total Return (%) | | | 1.9 | | | | 3.8 | | | | 3.4 | | | | 9.9 | | | | 6.1 | (b) |
Ratio of operating expenses to average net assets (%) | | | 0.56 | | | | 0.57 | | | | 0.59 | | | | 0.59 | | | | 0.63 | (c) |
Ratio of net investment income to average net assets (%) | | | 4.06 | | | | 4.16 | | | | 4.20 | | | | 4.89 | | | | 5.33 | (c) |
Portfolio turnover rate (%) | | | 23 | | | | 27 | | | | 46 | | | | 48 | | | | 18 | |
Net assets, end of period (000) | | $ | 354,652 | | | $ | 170,958 | | | $ | 73,938 | | | $ | 45,788 | | | $ | 16,276 | |
| (a) | Commencement of operations. |
| (b) | Period less than one year is not computed on an annualized basis. |
| (c) | Computed on an annualized basis. |
See accompanying notes to financial statements.
MSF-343
Metropolitan Series Fund, Inc.
Lehman Brothers Aggregate Bond Index Portfolio
Financial Highlights
| | | | | | | | | | | | | | | | | | | | |
| | | Class E
| |
| | | Year ended December 31,
| | | May 1, 2001(a)
through
December 31,
2001
| |
| | | 2005
| | | 2004
| | | 2003
| | | 2002
| | |
Net Asset Value, Beginning of Period | | $ | 10.97 | | | $ | 10.89 | | | $ | 11.14 | | | $ | 10.45 | | | $ | 9.97 | |
| | |
|
|
| |
|
|
| |
|
|
| |
|
|
| |
|
|
|
Income from Investment Operations | | | | | | | | | | | | | | | | | | | | |
Net investment income | | | 0.46 | | | | 0.44 | | | | 0.52 | | | | 0.45 | | | | 0.02 | |
Net realized and unrealized gain (loss) of investments | | | (0.25 | ) | | | (0.02 | ) | | | (0.15 | ) | | | 0.57 | | | | 0.46 | |
| | |
|
|
| |
|
|
| |
|
|
| |
|
|
| |
|
|
|
Total from investment operations | | | 0.21 | | | | 0.42 | | | | 0.37 | | | | 1.02 | | | | 0.48 | |
| | |
|
|
| |
|
|
| |
|
|
| |
|
|
| |
|
|
|
Less Distributions | | | | | | | | | | | | | | | | | | | | |
Distributions from net investment income | | | (0.41 | ) | | | (0.34 | ) | | | (0.62 | ) | | | (0.33 | ) | | | 0.00 | |
| | |
|
|
| |
|
|
| |
|
|
| |
|
|
| |
|
|
|
Total distributions | | | (0.41 | ) | | | (0.34 | ) | | | (0.62 | ) | | | (0.33 | ) | | | 0.00 | |
| | |
|
|
| |
|
|
| |
|
|
| |
|
|
| |
|
|
|
Net Asset Value, End of Period | | $ | 10.77 | | | $ | 10.97 | | | $ | 10.89 | | | $ | 11.14 | | | $ | 10.45 | |
| | |
|
|
| |
|
|
| |
|
|
| |
|
|
| |
|
|
|
Total Return (%) | | | 2.0 | | | | 3.9 | | | | 3.5 | | | | 10.1 | | | | 4.8 | (b) |
Ratio of operating expenses to average net assets (%) | | | 0.46 | | | | 0.47 | | | | 0.49 | | | | 0.49 | | | | 0.53 | (c) |
Ratio of net investment income to average net assets (%) | | | 4.15 | | | | 4.26 | | | | 4.29 | | | | 4.90 | | | | 5.74 | (c) |
Portfolio turnover rate (%) | | | 23 | | | | 27 | | | | 46 | | | | 48 | | | | 18 | |
Net assets, end of period (000) | | $ | 190,840 | | | $ | 200,270 | | | $ | 115,749 | | | $ | 32,511 | | | $ | 87 | |
| (a) | Commencement of operations. |
| (b) | Period less than one year is not computed on an annualized basis. |
| (c) | Computed on an annualized basis. |
See accompanying notes to financial statements.
MSF-344
Metropolitan Series Fund, Inc.
Salomon Brothers Strategic Bond Opportunities Portfolio
Schedule of Investments as of December 31, 2005
Fixed Income—93.6% of Total Net Assets
| | | | | | |
| Security Description | | Face
Amount | | Value* |
| | | | | | | |
|
Aerospace & Defense—0.4% |
Alliant Techsystems, Inc.
8.500%, 05/15/11 | | $ | 200,000 | | $ | 210,000 |
DRS Technologies, Inc.
6.875%, 11/01/13 | | | 225,000 | | | 215,156 |
Goodrich Corp.
7.500%, 04/15/08 | | | 525,000 | | | 551,205 |
L-3 Communications Holdings, Inc.
7.625%, 06/15/12 | | | 375,000 | | | 394,688 |
Moog, Inc.
6.250%, 01/15/15 | | | 225,000 | | | 221,625 |
Sequa Corp.
9.000%, 08/01/09 | | | 525,000 | | | 557,813 |
| | | | | |
|
|
| | | | | | | 2,150,487 |
| | | | | |
|
|
|
Airlines—0.0% |
Continental Airlines, Inc.
6.541%, 09/15/08 | | | 52,518 | | | 49,884 |
| | | | | |
|
|
|
Asset Backed—1.6% |
Airplane Pass Through Trust
10.875%, 03/15/19 (a) (b) | | | 246,925 | | | 0 |
Ameriquest Mortgage Securities, Inc.
5.579%, 11/25/34 (c) | | | 590,000 | | | 600,055 |
Asset Backed Securities Corp.
6.269%, 04/15/33 (c) | | | 500,000 | | | 504,065 |
Bear Stearns Asset Backed Securities (144A)
5.250%, 08/25/34 | | | 116,812 | | | 116,312 |
CMO Holdings II, Ltd. (144A)
6.500%, 01/25/34 | | | 1,539 | | | 1,538 |
Countrywide Asset Backed Certificates
5.629%, 06/25/34 (c) | | | 800,000 | | | 811,328 |
Countrywide Asset Backed Certificates (144A)
5.500%, 10/25/35 | | | 108,319 | | | 107,953 |
First Consumers Master Trust
4.679%, 09/15/08 (c) | | | 137,612 | | | 136,745 |
Green Tree Financial Corp.
7.070%, 01/15/29 | | | 703,204 | | | 726,437 |
Merrill Lynch Mortgage Investors, Inc. (144A)
5.000%, 09/25/35 | | | 433,520 | | | 429,644 |
Metris Master Trust
5.450%, 11/20/09 (c) | | | 840,000 | | | 841,276 |
Mid-State Trust
7.340%, 07/01/35 | | | 704,897 | | | 736,875 |
Novastar Finance, Inc.
5.354%, 06/25/34 (c) | | | 580,000 | | | 582,251 |
Novastar Home Equity Loan Trust
6.004%, 02/25/34 (c) | | | 270,000 | | | 274,574 |
7.379%, 10/25/35 (c) | | | 670,000 | | | 592,443 |
Option One Mortgage Loan Trust
7.879%, 05/25/34 (c) | | | 530,000 | | | 512,522 |
Residential Asset Securities Corp.
5.479%, 04/25/32 (c) | | | 145,345 | | | 145,780 |
Sail Net Interest Margin Notes (144A)
4.750%, 01/27/35 | | | 158,442 | | | 157,534 |
5.000%, 04/27/34 | | | 72,264 | | | 72,176 |
5.000%, 12/27/34 | | | 299,462 | | | 298,777 |
| | | | | | |
| Security Description | | Face
Amount | | Value* |
| | | | | | | |
|
Asset Backed—(Continued) |
5.500%, 03/27/34 | | $ | 85,911 | | $ | 85,760 |
7.500%, 01/27/35 | | | 166,213 | | | 163,200 |
Varick Structured Asset Fund, Ltd. (144A)
2.511%, 11/01/35 | | | 1,000,000 | | | 10,000 |
| | | | | |
|
|
| | | | | | | 7,907,245 |
| | | | | |
|
|
|
Auto Components—0.2% |
BREED Technologies, Inc.
9.250%, 04/15/08 (a) (b) | | | 250,000 | | | 0 |
CSK Auto, Inc.
7.000%, 01/15/14 | | | 300,000 | | | 271,500 |
Dana Corp.
7.000%, 03/01/29 (d) | | | 300,000 | | | 215,250 |
Dura Operating Corp.
8.625%, 04/15/12 | | | 97,000 | | | 80,025 |
Key Plastics Holdings, Inc.
10.250%, 03/15/07 | | | 250,000 | | | 250 |
Tenneco Automotive, Inc.
8.625%, 11/15/14 (d) | | | 150,000 | | | 141,750 |
10.250%, 07/15/13 | | | 100,000 | | | 109,250 |
TRW Automotive, Inc.
9.375%, 02/15/13 | | | 201,000 | | | 217,582 |
| | | | | |
|
|
| | | | | | | 1,035,607 |
| | | | | |
|
|
|
Automobiles—0.6% |
DaimlerChrysler North America Holdings Corp.
4.050%, 06/04/08 | | | 1,650,000 | | | 1,606,267 |
Ford Motor Co.
6.625%, 10/01/28 | | | 125,000 | | | 80,625 |
7.450%, 07/16/31 (d) | | | 1,275,000 | | | 867,000 |
8.900%, 01/15/32 | | | 100,000 | | | 73,250 |
General Motors Corp.
8.250%, 07/15/23 (d) | | | 75,000 | | | 48,187 |
8.375%, 07/15/33 (d) | | | 625,000 | | | 412,500 |
| | | | | |
|
|
| | | | | | | 3,087,829 |
| | | | | |
|
|
|
Beverages—0.1% |
Constellation Brands, Inc.
8.125%, 01/15/12 | | | 275,000 | | | 286,000 |
| | | | | |
|
|
|
Building Products—0.3% |
Associated Materials, Inc.
0/11.250%, 03/01/14 (e) | | | 450,000 | | | 220,500 |
Collins & Aikman Floorcovering Corp.
10.000%, 01/15/07 | | | 250,000 | | | 251,650 |
KI Holdings, Inc.
0/9.785%, 11/15/14 (e) | | | 400,000 | | | 262,000 |
Norcraft Holdings, L.P.
0/9.750%, 09/01/12 (e) | | | 225,000 | | | 159,750 |
Nortek, Inc.
8.500%, 09/01/14 | | | 150,000 | | | 144,750 |
Texas Industries, Inc. (144A)
7.250%, 07/15/13 | | | 150,000 | | | 155,625 |
| | | | | |
|
|
| | | | | | | 1,194,275 |
| | | | | |
|
|
*See accompanying notes to financial statements.
MSF-345
Metropolitan Series Fund, Inc.
Salomon Brothers Strategic Bond Opportunities Portfolio
Schedule of Investments as of December 31, 2005
Fixed Income—(Continued)
| | | | | | |
| Security Description | | Face
Amount | | Value* |
| | | | | | | |
|
Capital Markets—1.1% |
JPMorgan Chase & Co.
6.625%, 03/15/12 | | $ | 1,600,000 | | $ | 1,724,171 |
Lehman Brothers Holdings, Inc.
4.500%, 07/26/10 (d) | | | 850,000 | | | 832,179 |
Morgan Stanley
4.750%, 04/01/14 | | | 2,700,000 | | | 2,589,481 |
| | | | | |
|
|
| | | | | | | 5,145,831 |
| | | | | |
|
|
|
Chemicals—0.7% |
Borden Chemicals & Plastics, L.P.
9.500%, 05/01/49 (b) | | | 140,000 | | | 2,450 |
Equistar Chemicals, L.P.
10.625%, 05/01/11 | | | 225,000 | | | 247,500 |
Ethyl Corp.
8.875%, 05/01/10 | | | 275,000 | | | 288,062 |
FMC Corp.
7.750%, 07/01/11 | | | 25,000 | | | 27,014 |
Huntsman ICI Chemicals, LLC
10.125%, 07/01/09 (d) | | | 30,000 | | | 30,975 |
Huntsman International Holdings, LLC
9.875%, 03/01/09 | | | 375,000 | | | 395,625 |
ISP Chemco, Inc.
10.250%, 07/01/11 | | | 500,000 | | | 532,500 |
Lyondell Chemical Co.
9.500%, 12/15/08 | | | 59,000 | | | 61,803 |
11.125%, 07/15/12 | | | 150,000 | | | 167,813 |
Methanex Corp.
8.750%, 08/15/12 | | | 200,000 | | | 222,500 |
Millennium America, Inc.
9.250%, 06/15/08 | | | 175,000 | | | 188,781 |
OM Group, Inc.
9.250%, 12/15/11 | | | 275,000 | | | 268,812 |
PQ Corp. (144A)
7.500%, 02/15/13 | | | 375,000 | | | 348,750 |
Resolution Performance Products, Inc.
9.500%, 04/15/10 | | | 125,000 | | | 126,563 |
13.500%, 11/15/10 (d) | | | 200,000 | | | 211,500 |
Westlake Chemical Corp.
8.750%, 07/15/11 | | | 412,000 | | | 440,840 |
| | | | | |
|
|
| | | | | | | 3,561,488 |
| | | | | |
|
|
|
Commercial Banks—1.3% |
Bank of America Corp.
7.400%, 01/15/11 | | | 1,950,000 | | | 2,147,972 |
Capital One Bank
5.750%, 09/15/10 | | | 1,225,000 | | | 1,254,213 |
Independence Community Bank Corp.
3.500%, 06/20/13 (c) | | | 600,000 | | | 577,709 |
Standard Chartered Bank (144A)
8.000%, 05/30/31 | | | 1,835,000 | | | 2,367,994 |
| | | | | |
|
|
| | | | | | | 6,347,888 |
| | | | | |
|
|
| | | | | | |
| Security Description | | Face
Amount | | Value* |
| | | | | | | |
|
Commercial Mortgage-Backed Securities—2.0% |
Amortizing Residential Collateral Trust
5.579%, 08/25/32 (c) | | $ | 747,951 | | $ | 751,571 |
Bank of America Large Loan, Inc. (144A)
5.269%, 11/15/15 (c) | | | 1,250,000 | | | 1,255,325 |
CMO Holdings II, Ltd. (144A)
5.000%, 05/25/34 | | | 79,320 | | | 78,940 |
Commerce 2001 J2 (144A)
5.447%, 07/16/34 | | | 776,310 | | | 785,279 |
Commercial Mortgage Asset Trust
7.350%, 01/17/32 | | | 475,000 | | | 537,650 |
Commercial Mortgage Pass-Through Certificate (144A)
5.369%, 11/15/15 (c) | | | 270,948 | | | 272,204 |
First Union National Bank Commercial Mortgage
0.526%, 05/17/32 (c) (g) | | | 11,215,917 | | | 303,476 |
Merit Securities Corp. (144A)
5.880%, 09/28/32 (c) | | | 1,719,999 | | | 1,677,527 |
Morgan Stanley ABS Capital I, Inc. (144A)
5.679%, 05/25/34 (c) | | | 2,000,000 | | | 1,999,977 |
Structured Asset Mortgage Investments II, Inc.
5.559%, 08/25/35 (c) | | | 2,233,910 | | | 2,275,796 |
| | | | | |
|
|
| | | | | | | 9,937,745 |
| | | | | |
|
|
|
Commercial Services & Supplies—0.4% |
Allied Waste North America, Inc.
7.250%, 03/15/15 | | | 275,000 | | | 277,750 |
7.375%, 04/15/14 | | | 150,000 | | | 145,875 |
7.875%, 04/15/13 (d) | | | 75,000 | | | 77,438 |
8.500%, 12/01/08 | | | 75,000 | | | 78,750 |
9.250%, 09/01/12 | | | 183,000 | | | 198,097 |
Cenveo, Inc.
7.875%, 12/01/13 (d) | | | 175,000 | | | 168,875 |
9.625%, 03/15/12 | | | 150,000 | | | 162,000 |
Corrections Corp. of America
6.250%, 03/15/13 | | | 150,000 | | | 148,500 |
Iron Mountain, Inc.
6.625%, 01/01/16 | | | 250,000 | | | 232,500 |
7.750%, 01/15/15 (d) | | | 125,000 | | | 125,937 |
8.250%, 07/01/11 | | | 125,000 | | | 126,875 |
8.625%, 04/01/13 | | | 50,000 | | | 52,125 |
Safety-Kleen Services, Inc.
9.250%, 06/01/08 (b) | | | 250,000 | | | 975 |
| | | | | |
|
|
| | | | | | | 1,795,697 |
| | | | | |
|
|
|
Communications Equipment—0.2% |
Intelsat Bermuda, Ltd. (144A)
8.695%, 01/15/12 (c) | | | 100,000 | | | 101,625 |
Lucent Technologies, Inc.
6.450%, 03/15/29 (d) | | | 875,000 | | | 750,312 |
PanAmSat Corp.
9.000%, 08/15/14 | | | 65,000 | | | 68,088 |
SBA Communications Corp.
0/9.750%, 12/15/11 (e) | | | 196,000 | | | 181,790 |
| | | | | |
|
|
| | | | | | | 1,101,815 |
| | | | | |
|
|
*See accompanying notes to financial statements.
MSF-346
Metropolitan Series Fund, Inc.
Salomon Brothers Strategic Bond Opportunities Portfolio
Schedule of Investments as of December 31, 2005
Fixed Income—(Continued)
| | | | | | |
| Security Description | | Face
Amount | | Value* |
| | | | | | | |
|
Computers & Peripherals—0.1% |
Seagate Technology HDD Holdings
8.000%, 05/15/09 | | $ | 225,000 | | $ | 236,250 |
| | | | | |
|
|
|
Consumer Finance—0.3% |
MBNA Corp.
4.625%, 09/15/08 | | | 900,000 | | | 893,469 |
6.250%, 01/17/07 | | | 425,000 | | | 429,840 |
| | | | | |
|
|
| | | | | | | 1,323,309 |
| | | | | |
|
|
|
Containers & Packaging—0.5% |
Berry Plastics Corp.
10.750%, 07/15/12 (d) | | | 325,000 | | | 349,375 |
Graphic Packaging International Corp.
8.500%, 08/15/11 | | | 100,000 | | | 100,250 |
9.500%, 08/15/13 | | | 300,000 | | | 286,500 |
Jefferson Smurfit Corp.
8.250%, 10/01/12 | | | 599,000 | | | 575,040 |
Owens-Brockway Glass Container, Inc.
7.750%, 05/15/11 | | | 225,000 | | | 234,844 |
8.250%, 05/15/13 (d) | | | 50,000 | | | 51,625 |
Owens-Illinois, Inc.
7.350%, 05/15/08 | | | 275,000 | | | 278,437 |
Plastipak Holdings, Inc. (144A)
8.500%, 12/15/15 | | | 200,000 | | | 202,000 |
Pliant Corp.
11.125%, 09/01/09 | | | 65,000 | | | 57,850 |
Radnor Holdings Corp.
11.000%, 03/15/10 (d) | | | 150,000 | | | 121,500 |
Stone Container Corp.
9.750%, 02/01/11 | | | 75,000 | | | 75,750 |
Tekni-Plex, Inc. (144A)
8.750%, 11/15/13 (d) | | | 250,000 | | | 220,000 |
| | | | | |
|
|
| | | | | | | 2,553,171 |
| | | | | |
|
|
|
Diversified Financial Services—3.3% |
Ahold Lease USA, Inc.
7.820%, 01/02/20 | | | 46,590 | | | 49,852 |
Alamosa Delaware, Inc.
11.000%, 07/31/10 | | | 146,000 | | | 164,615 |
12.000%, 07/31/09 | | | 118,000 | | | 129,062 |
BCP Crystal U.S. Holdings Corp.
9.625%, 06/15/14 | | | 227,000 | | | 252,537 |
Borden Finance Corp. (144A)
9.000%, 07/15/14 | | | 100,000 | | | 99,000 |
Burlington Resources Finance Co.
5.600%, 12/01/06 | | | 1,250,000 | | | 1,256,156 |
Chukchansi Economic Development Authority
8.000%, 11/15/13 | | | 100,000 | | | 102,625 |
CIT Group, Inc.
7.750%, 04/02/12 (d) | | | 2,150,000 | | | 2,438,382 |
Devon Financing Corp.
6.875%, 09/30/11 (d) | | | 1,475,000 | | | 1,613,407 |
Ford Motor Credit Co.
6.625%, 06/16/08 | | | 175,000 | | | 158,735 |
7.875%, 06/15/10 | | | 1,975,000 | | | 1,777,287 |
| | | | | | |
| Security Description | | Face
Amount | | Value* |
| | | | | | | |
|
Diversified Financial Services—(Continued) |
General Motors Acceptance Corp.
6.750%, 12/01/14 (d) | | $ | 645,000 | | $ | 580,256 |
6.875%, 09/15/11 | | | 1,325,000 | | | 1,208,327 |
7.250%, 03/02/11 | | | 40,000 | | | 36,766 |
8.000%, 11/01/31 | | | 75,000 | | | 71,841 |
HSBC Finance Corp.
5.250%, 04/15/15 | | | 2,075,000 | | | 2,056,144 |
Inergy Finance Corp.
6.875%, 12/15/14 | | | 400,000 | | | 364,000 |
International Lease Finance Corp.
5.875%, 05/01/13 | | | 2,250,000 | | | 2,328,390 |
Sprint Capital Corp.
8.375%, 03/15/12 | | | 925,000 | | | 1,072,041 |
Zeus Special Subsidiary, Ltd. (144A)
0/9.250%, 02/01/15 (e) | | | 275,000 | | | 180,812 |
| | | | | |
|
|
| | | | | | | 15,940,235 |
| | | | | |
|
|
|
Diversified Telecommunication Services—1.3% |
Advanstar Communications, Inc.
10.750%, 08/15/10 | | | 200,000 | | | 219,250 |
AT&T Broadband Corp.
8.375%, 03/15/13 | | | 1,375,000 | | | 1,591,531 |
MCI, Inc.
8.735%, 05/01/14 | | | 375,000 | | | 414,844 |
Mediacom Broadband, LLC
9.500%, 01/15/13 (d) | | | 50,000 | | | 48,813 |
11.000%, 07/15/13 (d) | | | 175,000 | | | 188,125 |
Mediacom Broadband, LLC (144A)
8.500%, 10/15/15 | | | 150,000 | | | 138,937 |
Qwest Communications International, Inc.
7.500%, 02/15/14 (d) | | | 87,000 | | | 89,393 |
Qwest Communications International, Inc. (144A)
7.500%, 02/15/14 | | | 291,000 | | | 299,002 |
Qwest Corp.
6.875%, 09/15/33 | | | 692,000 | | | 650,480 |
7.500%, 06/15/23 | | | 80,000 | | | 79,500 |
8.875%, 03/15/12 | | | 275,000 | | | 310,062 |
Verizon Florida, Inc.
6.125%, 01/15/13 (d) | | | 2,330,000 | | | 2,353,619 |
| | | | | |
|
|
| | | | | | | 6,383,556 |
| | | | | |
|
|
|
Electric Utilities—0.7% |
Appalachian Power Co.
5.950%, 05/15/33 | | | 1,350,000 | | | 1,356,067 |
Edison Mission Energy
7.730%, 06/15/09 | | | 25,000 | | | 25,813 |
9.875%, 04/15/11 | | | 450,000 | | | 524,812 |
Florida Power & Light Co.
5.625%, 04/01/34 (d) | | | 225,000 | | | 226,857 |
Reliant Resources, Inc.
9.500%, 07/15/13 (d) | | | 525,000 | | | 526,312 |
Texas Genco, LLC (144A)
6.875%, 12/15/14 | | | 125,000 | | | 135,312 |
Williams Cos., Inc.
7.125%, 09/01/11 | | | 50,000 | | | 51,938 |
*See accompanying notes to financial statements.
MSF-347
Metropolitan Series Fund, Inc.
Salomon Brothers Strategic Bond Opportunities Portfolio
Schedule of Investments as of December 31, 2005
Fixed Income—(Continued)
| | | | | | |
| Security Description | | Face
Amount | | Value* |
| | | | | | | |
|
Electric Utilities—(Continued) |
7.625%, 07/15/19 (d) | | $ | 100,000 | | $ | 107,250 |
7.875%, 09/01/21 (d) | | | 125,000 | | | 135,313 |
8.750%, 03/15/32 | | | 325,000 | | | 377,000 |
| | | | | |
|
|
| | | | | | | 3,466,674 |
| | | | | |
|
|
|
Energy Equipment & Services—0.1% |
Atlas Pipeline Partners, L.P. (144A)
8.125%, 12/15/15 | | | 200,000 | | | 201,750 |
Universal Compression, Inc.
7.250%, 05/15/10 | | | 275,000 | | | 279,125 |
| | | | | |
|
|
| | | | | | | 480,875 |
| | | | | |
|
|
|
Federal Agencies—38.6% |
Federal Home Loan Mortgage Corp.
5.000%, TBA | | | 29,600,000 | | | 28,647,235 |
5.500%, TBA | | | 6,000,000 | | | 5,943,750 |
11.565%, 06/15/21 (c) (g) | | | 149 | | | 291 |
Federal National Mortgage Association
4.000%, TBA | | | 13,000,000 | | | 12,410,944 |
4.500%, TBA | | | 8,100,000 | | | 7,626,652 |
5.000%, TBA | | | 41,875,000 | | | 40,566,406 |
5.500%, TBA | | | 72,000,000 | | | 71,280,000 |
6.000%, TBA | | | 10,000,000 | | | 10,090,620 |
6.500%, 03/01/26 | | | 35,520 | | | 36,602 |
6.500%, TBA | | | 10,000,000 | | | 10,256,250 |
7.000%, 05/01/26 | | | 7,136 | | | 7,450 |
7.500%, 12/01/29 | | | 11,475 | | | 12,020 |
7.500%, 06/01/30 | | | 25,188 | | | 26,378 |
7.500%, 08/01/30 | | | 9,508 | | | 9,956 |
7.500%, 11/01/30 | | | 70,822 | | | 74,223 |
7.500%, 01/01/31 | | | 23,536 | | | 24,646 |
7.500%, 02/01/31 | | | 11,397 | | | 11,944 |
7.500%, 03/01/31 | | | 15,187 | | | 15,900 |
8.000%, 08/01/27 | | | 9,387 | | | 10,022 |
8.000%, 01/01/31 | | | 339,378 | | | 362,551 |
8.500%, 08/01/19 | | | 230,135 | | | 248,726 |
10.400%, 04/25/19 | | | 7,213 | | | 7,918 |
| | | | | |
|
|
| | | | | | | 187,670,484 |
| | | | | |
|
|
|
Food & Staples Retailing—0.3% |
Rite Aid Corp.
7.500%, 01/15/15 | | | 225,000 | | | 212,625 |
8.125%, 05/01/10 | | | 50,000 | | | 50,875 |
Rite Aid Corp. (144A)
6.125%, 12/15/08 | | | 100,000 | | | 94,000 |
Safeway, Inc.
7.250%, 02/01/31 | | | 1,200,000 | | | 1,294,894 |
| | | | | |
|
|
| | | | | | | 1,652,394 |
| | | | | |
|
|
|
Food Products—0.7% |
del Monte Corp.
8.625%, 12/15/12 | | | 100,000 | | | 106,250 |
Doane Pet Care Co.
10.750%, 03/01/10 | | | 50,000 | | | 54,375 |
| | | | | | |
| Security Description | | Face
Amount | | Value* |
| | | | | | | |
|
Food Products—(Continued) |
Doane Pet Care Co. (144A)
10.625%, 11/15/15 | | $ | 150,000 | | $ | 156,375 |
Dole Foods Co.
7.250%, 06/15/10 | | | 250,000 | | | 242,500 |
8.750%, 07/15/13 | | | 125,000 | | | 128,750 |
Hines Nurseries, Inc.
10.250%, 10/01/11 (d) | | | 200,000 | | | 196,000 |
Kraft Foods, Inc.
5.625%, 11/01/11 | | | 2,125,000 | | | 2,180,244 |
Pilgrim’s Pride Corp.
9.250%, 11/15/13 | | | 150,000 | | | 160,125 |
Pinnacle Foods Holding Corp.
8.250%, 12/01/13 | | | 225,000 | | | 214,312 |
Swift & Co.
10.125%, 10/01/09 | | | 150,000 | | | 154,875 |
| | | | | |
|
|
| | | | | | | 3,593,806 |
| | | | | |
|
|
|
Foreign Government—4.9% |
Federative Republic of Brazil
5.250%, 04/15/12 (c) | | | 1,177,663 | | | 1,162,942 |
8.000%, 01/15/18 | | | 2,282,000 | | | 2,458,855 |
8.250%, 01/20/34 | | | 225,000 | | | 238,838 |
8.750%, 02/04/25 | | | 1,450,000 | | | 1,602,250 |
Government of Russia
11.000%, 07/24/18 | | | 1,225,000 | | | 1,814,592 |
Province of Quebec
4.600%, 05/26/15 | | | 2,075,000 | | | 2,024,528 |
Republic of Argentina
Zero Coupon, 12/15/35 (e) (g) | | | 1,087,594 | | | 56,555 |
Zero Coupon, 12/15/35 (ARS) (e) (g) | | | 2,818,991 | | | 43,315 |
5.830%, 12/31/33 (ARS) | | | 993,982 | | | 384,947 |
8.280%, 12/31/33 | | | 390,729 | | | 325,282 |
Republic of Bulgaria
8.250%, 01/15/15 | | | 175,000 | | | 211,566 |
Republic of Columbia
8.125%, 05/21/24 | | | 550,000 | | | 594,000 |
10.000%, 01/23/12 | | | 225,000 | | | 267,750 |
10.750%, 01/15/13 | | | 425,000 | | | 527,000 |
Republic of Ecuador
9.000%, 08/15/30 (c) | | | 425,000 | | | 382,500 |
Republic of Panama
7.250%, 03/15/15 | | | 375,000 | | | 399,000 |
9.375%, 01/16/23 | | | 250,000 | | | 313,125 |
Republic of Peru
5.000%, 03/07/17 (c) | | | 548,000 | | | 516,135 |
8.750%, 11/21/33 | | | 125,000 | | | 140,625 |
9.125%, 02/21/12 | | | 200,000 | | | 228,500 |
Republic of Philippines
8.375%, 03/12/09 | | | 200,000 | | | 213,500 |
8.875%, 03/17/15 | | | 300,000 | | | 331,875 |
9.500%, 02/02/30 | | | 300,000 | | | 352,500 |
9.875%, 01/15/19 | | | 425,000 | | | 504,156 |
10.625%, 03/16/25 | | | 425,000 | | | 539,750 |
*See accompanying notes to financial statements.
MSF-348
Metropolitan Series Fund, Inc.
Salomon Brothers Strategic Bond Opportunities Portfolio
Schedule of Investments as of December 31, 2005
Fixed Income—(Continued)
| | | | | | |
| Security Description | | Face
Amount | | Value* |
| | | | | | | |
|
Foreign Government—(Continued) |
Republic of South Africa
6.500%, 06/02/14 | | $ | 275,000 | | $ | 297,344 |
Republic of Turkey
7.375%, 02/05/25 | | | 325,000 | | | 335,562 |
9.000%, 06/30/11 | | | 500,000 | | | 570,000 |
11.500%, 01/23/12 | | | 250,000 | | | 317,188 |
11.875%, 01/15/30 | | | 500,000 | | | 768,750 |
Republic of Venezuela
9.375%, 01/13/34 | | | 425,000 | | | 503,625 |
10.750%, 09/19/13 | | | 750,000 | | | 922,500 |
Ukraine Government International Bond
6.875%, 03/04/11 | | | 175,000 | | | 180,784 |
United Mexican States
5.875%, 01/15/14 | | | 1,375,000 | | | 1,423,125 |
6.375%, 01/16/13 | | | 1,325,000 | | | 1,407,812 |
8.125%, 12/30/19 | | | 1,150,000 | | | 1,411,625 |
| | | | | |
|
|
| | | | | | | 23,772,401 |
| | | | | |
|
|
|
Gas Utilities—0.1% |
Targa Resources, Inc. (144A)
8.500%, 11/01/13 | | | 240,000 | | | 246,000 |
| | | | | |
|
|
|
Health Care Equipment & Supplies—0.3% |
Quest Diagnostics, Inc. (144A)
5.450%, 11/01/15 | | | 1,650,000 | | | 1,662,344 |
| | | | | |
|
|
|
Health Care Providers & Services—1.3% |
Ameripath, Inc.
10.500%, 04/01/13 | | | 275,000 | | | 291,500 |
Davita, Inc.
7.250%, 03/15/15 (d) | | | 375,000 | | | 379,687 |
Extendicare Health Services, Inc.
9.500%, 07/01/10 | | | 225,000 | | | 238,781 |
Genesis Healthcare Corp.
8.000%, 10/15/13 | | | 275,000 | | | 289,438 |
HCA, Inc.
6.375%, 01/15/15 (d) | | | 275,000 | | | 277,979 |
Humana, Inc.
6.300%, 08/01/18 | | | 1,650,000 | | | 1,737,910 |
IASIS Healthcare, LLC
8.750%, 06/15/14 | | | 350,000 | | | 367,500 |
Icon Health & Fitness, Inc.
11.250%, 04/01/12 (d) | | | 125,000 | | | 104,688 |
Insight Health Services Corp. (144A)
9.174%, 11/01/11 (c) | | | 150,000 | | | 145,125 |
National Mentor, Inc.
9.625%, 12/01/12 | | | 250,000 | | | 261,250 |
Omnicare, Inc.
6.875%, 12/15/15 | | | 200,000 | | | 203,000 |
Psychiatric Solutions, Inc.
7.750%, 07/15/15 | | | 200,000 | | | 206,500 |
10.625%, 06/15/13 (d) | | | 133,000 | | | 151,288 |
Tenet Healthcare Corp.
6.875%, 11/15/31 | | | 125,000 | | | 100,625 |
7.375%, 02/01/13 (d) | | | 325,000 | | | 299,812 |
9.875%, 07/01/14 | | | 50,000 | | | 50,625 |
| | | | | | |
| Security Description | | Face
Amount | | Value* |
| | | | | | | |
|
Health Care Providers & Services—(Continued) |
Triad Hospitals, Inc.
7.000%, 11/15/13 | | $ | 350,000 | | $ | 352,625 |
Vanguard Health Holdings Co. II, LLC
9.000%, 10/01/14 | | | 225,000 | | | 239,063 |
Vanguard Health Holdings Co., LLC
0/11.250%, 10/01/15 (e) | | | 200,000 | | | 146,000 |
Warner Chilcott Corp. (144A)
8.750%, 02/01/15 | | | 250,000 | | | 230,000 |
| | | | | |
|
|
| | | | | | | 6,073,396 |
| | | | | |
|
|
|
Hotels, Restaurants & Leisure—0.9% |
Caesars Entertainment, Inc.
8.125%, 05/15/11 (d) | | | 50,000 | | | 55,188 |
Carrols Corp.
9.000%, 01/15/13 (d) | | | 250,000 | | | 243,125 |
Chumash Casino & Resort Enterprises
9.520%, 07/15/10 | | | 75,000 | | | 79,687 |
Friendly Ice Cream Corp.
8.375%, 06/15/12 (d) | | | 125,000 | | | 111,250 |
Gaylord Entertainment Co.
6.750%, 11/15/14 (d) | | | 225,000 | | | 220,500 |
HMH Properties, Inc.
7.875%, 08/01/08 (d) | | | 31,000 | | | 31,349 |
Inn of the Mountain Gods Resort
12.000%, 11/15/10 (d) | | | 325,000 | | | 321,750 |
Isle of Capri Casinos, Inc.
7.000%, 03/01/14 | | | 325,000 | | | 316,875 |
Las Vegas Sands Corp.
6.375%, 02/15/15 | | | 225,000 | | | 216,562 |
MGM Mirage, Inc.
6.750%, 09/01/12 | | | 575,000 | | | 582,906 |
Mohegan Tribal Gaming Authority
6.875%, 02/15/15 | | | 150,000 | | | 151,125 |
7.125%, 08/15/14 | | | 125,000 | | | 127,969 |
Park Place Entertainment Corp.
9.375%, 02/15/07 | | | 225,000 | | | 234,281 |
Penn National Gaming, Inc.
6.875%, 12/01/11 | | | 100,000 | | | 101,000 |
SBarro, Inc.
11.000%, 09/15/09 (d) | | | 275,000 | | | 273,625 |
Six Flags, Inc.
9.625%, 06/01/14 | | | 100,000 | | | 97,250 |
9.750%, 04/15/13 | | | 100,000 | | | 98,125 |
Starwood Hotels & Resorts Worldwide, Inc.
7.875%, 05/01/12 | | | 350,000 | | | 385,875 |
Station Casinos, Inc.
6.875%, 03/01/16 | | | 300,000 | | | 306,750 |
Turning Stone Casino Resort Enterprise (144A)
9.125%, 12/15/10 | | | 250,000 | | | 257,500 |
| | | | | |
|
|
| | | | | | | 4,212,692 |
| | | | | |
|
|
|
Household Durables—0.1% |
Sealy Mattress Co.
8.250%, 06/15/14 (d) | | | 225,000 | | | 231,750 |
*See accompanying notes to financial statements.
MSF-349
Metropolitan Series Fund, Inc.
Salomon Brothers Strategic Bond Opportunities Portfolio
Schedule of Investments as of December 31, 2005
Fixed Income—(Continued)
| | | | | | |
| Security Description | | Face
Amount | | Value* |
| | | | | | | |
|
Household Durables—(Continued) |
Simmons Bedding Co.
7.875%, 01/15/14 (d) | | $ | 175,000 | | $ | 161,875 |
Tempur-Pedic, Inc.
10.250%, 08/15/10 (d) | | | 163,000 | | | 176,244 |
Windmere-Durable Holdings, Inc.
10.000%, 07/31/08 (d) | | | 36,000 | | | 34,920 |
| | | | | |
|
|
| | | | | | | 604,789 |
| | | | | |
|
|
|
Household Products—0.0% |
Home Interiors & Gifts, Inc.
10.125%, 06/01/08 | | | 265,000 | | | 185,500 |
| | | | | |
|
|
|
Independent Power Producers & Energy Traders—0.3% |
Duke Energy Co.
4.200%, 10/01/08 | | | 1,125,000 | | | 1,100,272 |
Mirant North America, LLC (144A)
7.375%, 12/31/13 | | | 275,000 | | | 278,094 |
| | | | | |
|
|
| | | | | | | 1,378,366 |
| | | | | |
|
|
|
Leisure Equipment & Products—0.4% |
Boyd Gaming Corp.
6.750%, 04/15/14 (d) | | | 400,000 | | | 397,000 |
Herbst Gaming, Inc.
8.125%, 06/01/12 | | | 225,000 | | | 234,000 |
Penn National Gaming, Inc.
6.750%, 03/01/15 | | | 300,000 | | | 294,750 |
Pinnacle Entertainment, Inc.
8.750%, 10/01/13 | | | 375,000 | | | 399,375 |
Riddell Bell Holdings, Inc.
8.375%, 10/01/12 | | | 225,000 | | | 208,688 |
Seneca Gaming Corp.
7.250%, 05/01/12 | | | 225,000 | | | 226,406 |
| | | | | |
|
|
| | | | | | | 1,760,219 |
| | | | | |
|
|
|
Machinery—0.3% |
Blount International, Inc.
8.875%, 08/01/12 | | | 100,000 | | | 105,500 |
Brand Services, Inc.
12.000%, 10/15/12 | | | 125,000 | | | 131,250 |
Case New Holland, Inc.
9.250%, 08/01/11 | | | 25,000 | | | 26,750 |
Dresser-Rand Group, Inc. (144A)
7.375%, 11/01/14 | | | 294,000 | | | 302,820 |
Hanover Compressor Co.
Zero Coupon, 03/31/07 | | | 225,000 | | | 201,937 |
NMHG Holding Co.
10.000%, 05/15/09 | | | 100,000 | | | 106,500 |
Sensus Metering Systems, Inc.
8.625%, 12/15/13 | | | 250,000 | | | 221,250 |
Terex Corp.
7.375%, 01/15/14 | | | 147,000 | | | 145,530 |
10.375%, 04/01/11 (d) | | | 225,000 | | | 238,500 |
| | | | | |
|
|
| | | | | | | 1,480,037 |
| | | | | |
|
|
| | | | | | |
| Security Description | | Face
Amount | | Value* |
| | | | | | | |
|
Media—2.1% |
AOL Time Warner, Inc.
7.625%, 04/15/31 | | $ | 1,200,000 | | $ | 1,336,379 |
Block Communications, Inc. (144A)
8.250%, 12/15/15 | | | 200,000 | | | 198,000 |
Cablevision Systems Corp.
8.716%, 04/01/09 (c) | | | 350,000 | | | 353,500 |
Cadmus Communications Corp.
8.375%, 06/15/14 | | | 250,000 | | | 256,875 |
CanWest Media, Inc.
8.000%, 09/15/12 | | | 373,767 | | | 381,710 |
CBD Media Holdings, LLC
9.250%, 07/15/12 (d) | | | 250,000 | | | 250,000 |
CCH I Holdings, LLC (144A)
0/11.750%, 05/15/14 (e) | | | 275,000 | | | 152,625 |
0/12.125%, 01/15/15 (e) | | | 75,000 | | | 35,438 |
10.000%, 05/15/14 | | | 35,000 | | | 19,863 |
11.000%, 10/01/15 | | | 940,000 | | | 789,600 |
Charter Communications Operating, LLC (144A)
8.375%, 04/30/14 | | | 250,000 | | | 248,750 |
Cinemark, Inc.
0/9.750%, 03/15/14 (e) | | | 425,000 | | | 314,500 |
CSC Holdings, Inc. (144A)
7.000%, 04/15/12 | | | 350,000 | | | 330,750 |
Dex Media West, LLC
0/9.000%, 11/15/13 (d) (e) | | | 375,000 | | | 298,125 |
9.875%, 08/15/13 | | | 244,000 | | | 270,840 |
Dex Media, Inc.
0/9.000%, 11/15/13 (d) (e) | | | 50,000 | | | 39,750 |
DIRECTV Holdings, LLC
6.375%, 06/15/15 | | | 450,000 | | | 439,875 |
8.375%, 03/15/13 | | | 146,000 | | | 156,950 |
EchoStar DBS Corp.
6.625%, 10/01/14 | | | 825,000 | | | 790,969 |
Emmis Communications Corp.
10.366%, 06/15/12 (c) (d) | | | 125,000 | | | 125,469 |
Houghton Mifflin Co.
0/11.500%, 10/15/13 (e) | | | 150,000 | | | 117,750 |
Insight Midwest, L.P.
10.500%, 11/01/10 (d) | | | 250,000 | | | 262,812 |
Interep National Radio Sales, Inc.
10.000%, 07/01/08 | | | 150,000 | | | 127,500 |
Lodgenet Entertainment Corp.
9.500%, 06/15/13 | | | 250,000 | | | 271,875 |
Loews Cineplex Entertainment Corp.
9.000%, 08/01/14 | | | 25,000 | | | 25,250 |
Muzak, LLC
9.875%, 03/15/09 (d) | | | 150,000 | | | 82,687 |
10.000%, 02/15/09 | | | 100,000 | | | 87,250 |
News America, Inc.
5.300%, 12/15/14 | | | 850,000 | | | 843,632 |
R.H. Donnelley, Inc. (144A)
10.875%, 12/15/12 | | | 200,000 | | | 225,500 |
Radio One, Inc.
8.875%, 07/01/11 | | | 200,000 | | | 211,000 |
Rainbow National Services, LLC (144A)
10.375%, 09/01/14 | | | 175,000 | | | 196,000 |
*See accompanying notes to financial statements.
MSF-350
Metropolitan Series Fund, Inc.
Salomon Brothers Strategic Bond Opportunities Portfolio
Schedule of Investments as of December 31, 2005
Fixed Income—(Continued)
| | | | | | |
| Security Description | | Face
Amount | | Value* |
| | | | | | | |
|
Media—(Continued) |
Sinclair Broadcast Group, Inc.
8.000%, 03/15/12 | | $ | 275,000 | | $ | 283,250 |
8.750%, 12/15/11 | | | 100,000 | | | 105,250 |
Vertis, Inc.
9.750%, 04/01/09 | | | 250,000 | | | 259,062 |
Young Broadcasting, Inc.
10.000%, 03/01/11 (d) | | | 250,000 | | | 234,062 |
| | | | | |
|
|
| | | | | | | 10,122,848 |
| | | | | |
|
|
|
Metals & Mining—0.1% |
Imco Recycling, Inc.
10.375%, 10/15/10 | | | 225,000 | | | 245,813 |
Mueller Holdings, Inc.
0/14.750%, 04/15/14 (e) | | | 375,000 | | | 282,187 |
| | | | | |
|
|
| | | | | | | 528,000 |
| | | | | |
|
|
|
Multi-Utilities—0.6% |
Calpine Corp. (144A)
8.500%, 07/15/10 (b) | | | 275,000 | | | 225,500 |
8.750%, 07/15/13 (b) | | | 40,000 | | | 32,800 |
Calpine Generating Co., LLC
13.216%, 04/01/11 (b) | | | 200,000 | | | 203,000 |
Dynegy Holdings, Inc.
7.125%, 05/15/18 | | | 250,000 | | | 222,500 |
7.625%, 10/15/26 | | | 575,000 | | | 511,750 |
Dynegy Holdings, Inc. (144A)
9.875%, 07/15/10 | | | 50,000 | | | 54,813 |
NRG Energy, Inc.
8.000%, 12/15/13 | | | 586,000 | | | 653,390 |
The AES Corp.
7.750%, 03/01/14 (d) | | | 200,000 | | | 209,750 |
8.875%, 02/15/11 (d) | | | 75,000 | | | 81,094 |
9.375%, 09/15/10 (d) | | | 375,000 | | | 409,687 |
9.500%, 06/01/09 (d) | | | 75,000 | | | 81,000 |
| | | | | |
|
|
| | | | | | | 2,685,284 |
| | | | | |
|
|
|
Mutual Funds—1.5% |
Targeted Return Index Securities Trust (144A)
7.562%, 06/15/15 (c) | | | 7,178,049 | | | 7,375,445 |
| | | | | |
|
|
|
Office Electronics—0.2% |
IKON Office Solutions, Inc. (144A)
7.750%, 09/15/15 | | | 150,000 | | | 146,250 |
Interface, Inc.
7.300%, 04/01/08 | | | 150,000 | | | 151,500 |
Sungard Data Systems, Inc. (144A)
9.125%, 08/15/13 | | | 100,000 | | | 103,500 |
Xerox Capital Trust I
8.000%, 02/01/27 | | | 525,000 | | | 540,750 |
| | | | | |
|
|
| | | | | | | 942,000 |
| | | | | |
|
|
|
Oil, Gas & Consumable Fuels—1.6% |
Chaparral Energy, Inc. (144A)
8.500%, 12/01/15 | | | 350,000 | | | 362,250 |
| | | | | | |
| Security Description | | Face
Amount | | Value* |
| | | | | | | |
|
Oil, Gas & Consumable Fuels—(Continued) |
Chesapeake Energy Corp.
6.375%, 06/15/15 | | $ | 425,000 | | $ | 425,000 |
Chesapeake Energy Corp. (144A)
6.875%, 11/15/20 | | | 325,000 | | | 329,062 |
El Paso Energy Corp.
7.750%, 01/15/32 (d) | | | 575,000 | | | 576,437 |
7.800%, 08/01/31 | | | 75,000 | | | 74,813 |
7.875%, 06/15/12 (d) | | | 200,000 | | | 206,000 |
Entergy Gulf Systems, Inc.
6.200%, 07/01/33 | | | 750,000 | | | 722,241 |
Exco Resources, Inc.
7.250%, 01/15/11 | | | 375,000 | | | 380,625 |
Forest Oil Corp.
8.000%, 12/15/11 | | | 325,000 | | | 355,062 |
Houston Exploration Co.
7.000%, 06/15/13 | | | 200,000 | | | 192,000 |
Kerr-McGee Corp.
7.000%, 11/01/11 (d) | | | 625,000 | | | 625,000 |
Magnum Hunter Resources, Inc.
9.600%, 03/15/12 | | | 260,000 | | | 282,100 |
Massey Energy Co.
6.625%, 11/15/10 | | | 200,000 | | | 203,250 |
Massey Energy Co. (144A)
6.875%, 12/15/13 | | | 75,000 | | | 75,656 |
Plains Exploration & Production Co.
7.125%, 06/15/14 (d) | | | 250,000 | | | 258,750 |
Pogo Producing Co. (144A)
6.875%, 10/01/17 | | | 200,000 | | | 195,000 |
Stone Energy Corp.
8.250%, 12/15/11 (d) | | | 275,000 | | | 283,938 |
Swift Energy Co.
7.625%, 07/15/11 | | | 350,000 | | | 357,000 |
Valero Energy Corp.
4.750%, 06/15/13 | | | 1,535,000 | | | 1,489,888 |
Vintage Petroleum, Inc.
7.875%, 05/15/11 | | | 125,000 | | | 130,625 |
Whiting Petroleum Corp.
7.250%, 05/01/13 (d) | | | 175,000 | | | 177,188 |
Whiting Petroleum Corp. (144A)
7.000%, 02/01/14 | | | 200,000 | | | 200,500 |
| | | | | |
|
|
| | | | | | | 7,902,385 |
| | | | | |
|
|
|
Paper & Forest Products—0.2% |
Appleton Papers, Inc.
9.750%, 06/15/14 (d) | | | 150,000 | | | 140,250 |
Boise Cascade, LLC
7.125%, 10/15/14 | | | 300,000 | | | 279,750 |
Bowater, Inc.
6.500%, 06/15/13 (d) | | | 25,000 | | | 22,375 |
Buckeye Technologies, Inc.
8.000%, 10/15/10 (d) | | | 75,000 | | | 71,250 |
8.500%, 10/01/13 | | | 150,000 | | | 150,000 |
9.250%, 09/15/08 (d) | | | 130,000 | | | 130,000 |
Newark Group, Inc.
9.750%, 03/15/14 | | | 250,000 | | | 220,000 |
| | | | | |
|
|
| | | | | | | 1,013,625 |
| | | | | |
|
|
*See accompanying notes to financial statements.
MSF-351
Metropolitan Series Fund, Inc.
Salomon Brothers Strategic Bond Opportunities Portfolio
Schedule of Investments as of December 31, 2005
Fixed Income—(Continued)
| | | | | | |
| Security Description | | Face
Amount | | Value* |
| | | | | | | |
|
Personal Products—0.1% |
del Laboratories, Inc.
8.000%, 02/01/12 (d) | | $ | 200,000 | | $ | 158,000 |
General Nutrition Centers, Inc.
8.500%, 12/01/10 | | | 225,000 | | | 193,500 |
Jafra Cosmetics International, Inc.
10.750%, 05/15/11 | | | 147,000 | | | 160,965 |
Playtex Products, Inc.
9.375%, 06/01/11 | | | 125,000 | | | 130,938 |
| | | | | |
|
|
| | | | | | | 643,403 |
| | | | | |
|
|
|
Pharmaceuticals—0.5% |
Valeant Pharmaceuticals International
7.000%, 12/15/11 | | | 400,000 | | | 393,000 |
Wyeth
5.500%, 03/15/13 | | | 1,975,000 | | | 2,002,192 |
| | | | | |
|
|
| | | | | | | 2,395,192 |
| | | | | |
|
|
|
Real Estate—0.9% |
Boston Properties, L.P. (REIT)
6.250%, 01/15/13 | | | 850,000 | | | 891,694 |
ERP Operating, L.P.
5.250%, 09/15/14 | | | 600,000 | | | 597,245 |
Felcor Lodging, L.P. (REIT)
9.000%, 06/01/11 (d) | | | 225,000 | | | 246,375 |
Host Marriot, L.P. (REIT)
6.375%, 03/15/15 (d) | | | 350,000 | | | 349,125 |
9.500%, 01/15/07 | | | 100,000 | | | 103,500 |
iStar Financial, Inc. (REIT)
5.150%, 03/01/12 | | | 1,475,000 | | | 1,428,468 |
Meristar Hospitality Operating Partnership, L.P. (REIT)
9.125%, 01/15/11 | | | 200,000 | | | 218,000 |
10.500%, 06/15/09 | | | 75,000 | | | 79,031 |
OMEGA Healthcare Investors, Inc. (REIT) (144A)
7.000%, 01/15/16 | | | 400,000 | | | 396,500 |
| | | | | |
|
|
| | | | | | | 4,309,938 |
| | | | | |
|
|
|
Road & Rail—0.3% |
Hertz Corp. (144A)
8.875%, 01/01/14 | | | 100,000 | | | 101,875 |
Union Pacific Corp.
3.625%, 06/01/10 (d) | | | 1,325,000 | | | 1,249,831 |
| | | | | |
|
|
| | | | | | | 1,351,706 |
| | | | | |
|
|
|
Semiconductors & Semiconductor Equipment— 0.1% |
Amkor Technologies, Inc.
7.125%, 03/15/11 | | | 50,000 | | | 44,000 |
7.750%, 05/15/13 | | | 97,000 | | | 84,390 |
9.250%, 02/15/08 | | | 275,000 | | | 266,750 |
10.500%, 05/01/09 (d) | | | 175,000 | | | 161,000 |
| | | | | |
|
|
| | | | | | | 556,140 |
| | | | | |
|
|
| | | | | | |
| Security Description | | Face
Amount | | Value* |
| | | | | | | |
|
Specialty Retail—0.4% |
Finlay Fine Jewelry Corp.
8.375%, 06/01/12 (d) | | $ | 125,000 | | $ | 112,500 |
Leslie’s Poolmart, Inc.
7.750%, 02/01/13 | | | 150,000 | | | 150,375 |
NEBCO Evans Holdings Co.
12.375%, 07/15/07 (a) (b) | | | 350,000 | | | 0 |
Neiman Marcus Group, Inc. (144A)
10.375%, 10/15/15 | | | 125,000 | | | 127,031 |
PETCO Animal Supplies, Inc.
10.750%, 11/01/11 | | | 125,000 | | | 135,313 |
The Limited, Inc.
6.950%, 03/01/33 (d) | | | 1,225,000 | | | 1,239,858 |
| | | | | |
|
|
| | | | | | | 1,765,077 |
| | | | | |
|
|
|
Textiles, Apparel & Luxury Goods—0.1% |
Levi Strauss & Co.
8.804%, 04/01/12 (c) | | | 50,000 | | | 50,375 |
9.750%, 01/15/15 (d) | | | 250,000 | | | 260,000 |
12.250%, 12/15/12 | | | 50,000 | | | 55,750 |
Oxford Industries, Inc.
8.875%, 06/01/11 | | | 150,000 | | | 152,813 |
| | | | | |
|
|
| | | | | | | 518,938 |
| | | | | |
|
|
|
Thrifts & Mortgage Finance—0.5% |
Countrywide Funding Corp.
4.000%, 03/22/11 (d) | | | 2,575,000 | | | 2,422,915 |
| | | | | |
|
|
|
Trading Companies & Distributors—0.0% |
Holt Group, Inc.
9.750%, 01/15/06 (a) (b) | | | 200,000 | | | 0 |
| | | | | |
|
|
|
U.S. Treasury—17.6% |
United States Treasury Bonds
5.250%, 11/15/28 (d) | | | 2,000,000 | | | 2,181,406 |
5.375%, 02/15/31 (d) | | | 125,000 | | | 140,410 |
5.500%, 08/15/28 (d) | | | 910,000 | | | 1,023,217 |
6.125%, 11/15/27 | | | 200,000 | | | 241,344 |
6.125%, 08/15/29 (d) | | | 1,000,000 | | | 1,218,086 |
United States Treasury Notes
3.625%, 01/15/10 (d) | | | 4,800,000 | | | 4,668,374 |
4.000%, 03/15/10 (d) | | | 3,500,000 | | | 3,449,824 |
4.000%, 04/15/10 (d) | | | 32,100,000 | | | 31,633,555 |
4.125%, 08/15/10 (d) | | | 6,000,000 | | | 5,940,936 |
4.125%, 05/15/15 (d) | | | 5,000,000 | | | 4,890,430 |
4.250%, 11/15/14 (d) | | | 2,330,000 | | | 2,302,876 |
4.250%, 08/15/15 (d) | | | 20,000,000 | | | 19,741,400 |
5.000%, 02/15/11 (d) | | | 8,000,000 | | | 8,239,688 |
| | | | | |
|
|
| | | | | | | 85,671,546 |
| | | | | |
|
|
|
Wireless Telecommunication Services—0.8% |
American Tower Corp.
7.500%, 05/01/12 (d) | | | 150,000 | | | 156,750 |
American Tower Escrow Corp.
Zero Coupon, 08/01/08 | | | 80,000 | | | 62,600 |
*See accompanying notes to financial statements.
MSF-352
Metropolitan Series Fund, Inc.
Salomon Brothers Strategic Bond Opportunities Portfolio
Schedule of Investments as of December 31, 2005
Fixed Income—(Continued)
| | | | | | |
| Security Description | | Face
Amount | | Value* |
| | | | | | | |
|
Wireless Telecommunication Services—(Continued) |
AT&T Wireless Services, Inc.
8.750%, 03/01/31 | | $ | 1,100,000 | | $ | 1,457,300 |
Centennial Communications Corp.
8.125%, 02/01/14 | | | 100,000 | | | 101,500 |
10.125%, 06/15/13 | | | 250,000 | | | 271,875 |
Centennial Communications Corp. (144A)
10.000%, 01/01/13 | | | 175,000 | | | 176,750 |
iPCS, Inc.
11.500%, 05/01/12 | | | 225,000 | | | 258,188 |
Nextel Communications, Inc.
6.875%, 10/31/13 | | | 250,000 | | | 260,803 |
7.375%, 08/01/15 (d) | | | 800,000 | | | 844,254 |
UbiquiTel Operating Co.
9.875%, 03/01/11 | | | 225,000 | | | 249,188 |
| | | | | |
|
|
| | | | | | | 3,839,208 |
| | | | | |
|
|
|
Yankee—2.6% |
Abitibi-Consolidated Co. of Canada
8.375%, 04/01/15 (d) | | | 200,000 | | | 191,500 |
Abitibi-Consolidated, Inc.
7.750%, 06/15/11 | | | 225,000 | | | 214,313 |
8.550%, 08/01/10 (d) | | | 175,000 | | | 177,188 |
Bowater Canada Finance Corp.
7.950%, 11/15/11 | | | 175,000 | | | 169,750 |
Corporacion Andina de Fomento
6.875%, 03/15/12 (d) | | | 1,500,000 | | | 1,631,787 |
EnCana Holdings Finance Corp.
5.800%, 05/01/14 | | | 1,650,000 | | | 1,719,901 |
Gaz Capital for Gazprom (144A)
8.625%, 04/28/34 | | | 800,000 | | | 1,012,000 |
JSG Funding, Plc.
9.625%, 10/01/12 | | | 250,000 | | | 250,000 |
Kerzner International, Ltd. (144A)
6.750%, 10/01/15 | | | 300,000 | | | 291,750 |
Lombardy Region
5.804%, 10/25/32 | | | 875,000 | | | 943,444 |
Norske Skof Canada, Ltd.
8.625%, 06/15/11 (d) | | | 200,000 | | | 191,000 |
Nova Chemicals Corp.
6.500%, 01/15/12 (d) | | | 275,000 | | | 266,406 |
Novelis, Inc. (144A)
7.250%, 02/15/15 | | | 425,000 | | | 396,312 |
Rhodia S.A.
7.625%, 06/01/10 (d) | | | 275,000 | | | 276,375 |
8.875%, 06/01/11 | | | 50,000 | | | 51,250 |
Smurfit Capital
7.500%, 11/20/25 | | | 275,000 | | | 242,000 |
Telecom Italia Capital, S.A.
5.250%, 10/01/15 | | | 1,675,000 | | | 1,629,951 |
The Jean Coutu Group, Inc.
8.500%, 08/01/14 (d) | | | 350,000 | | | 320,250 |
Tyco International Group S.A.
6.125%, 11/01/08 | | | 1,625,000 | | | 1,658,759 |
| | | | | | |
| Security Description | | Face
Amount | | Value* |
| | | | | | | |
|
Yankee—(Continued) |
United Utilities, Plc.
4.550%, 06/19/18 | | $ | 815,000 | | $ | 742,663 |
Videotron Ltee (144A)
6.375%, 12/15/15 | | | 250,000 | | | 248,437 |
Yell Finance BV
0/13.500%, 08/01/11 (d) (e) | | | 49,000 | | | 50,348 |
| | | | | |
|
|
| | | | | | | 12,675,384 |
| | | | | |
|
|
Total Fixed Income
(Identified Cost $456,602,950) | | | | | | 454,997,323 |
| | | | | |
|
|
|
| Common Stock—0.3% |
| Security Description | | Shares | | Value* |
|
Chemicals—0.0% |
Applied Extrusion Technologies, Inc. (Class B) (i) | | | 2,164 | | | 17,312 |
| | | | | |
|
|
|
Commercial Services & Supplies—0.0% |
Continental AFA Dispensing Co. (i) (j) | | | 8,621 | | | 47,415 |
| | | | | |
|
|
|
Diversified Financial Services—0.0% |
ContiFinancial Corp. (Liquidating Unit Trust) (i) (j) | | | 229,692 | | | 2,828 |
| | | | | |
|
|
|
Diversified Telecommunication Services—0.2% |
Liberty Global, Inc. (Series A) (i) | | | 7,929 | | | 178,403 |
NTL, Inc. (i) | | | 7,093 | | | 482,891 |
Telewest Global, Inc. (i) | | | 9,846 | | | 234,532 |
| | | | | |
|
|
| | | | | | | 895,826 |
| | | | | |
|
|
|
Media—0.0% |
Liberty Global, Inc. (Series C) (i) | | | 7,929 | | | 168,095 |
| | | | | |
|
|
|
Wireless Telecommunication Services—0.1% |
American Tower Corp. (Class A) (i) | | | 16,602 | | | 449,914 |
| | | | | |
|
|
Total Common Stock
(Identified Cost $1,276,388) | | | | | | 1,581,390 |
| | | | | |
|
|
|
| Preferred Stock—0.1% |
| | |
Diversified Financial Services—0.0% | | | | | | |
TCR Holdings (Class B) (i) | | | 840 | | | 1 |
TCR Holdings (Class C) (a) (i) | | | 462 | | | 0 |
TCR Holdings (Class D) (i) | | | 1,219 | | | 1 |
TCR Holdings (Class E) (i) | | | 2,521 | | | 3 |
| | | | | |
|
|
| | | | | | | 5 |
| | | | | |
|
|
|
Wireless Telecommunication Services—0.1% |
Alamosa Holdings, Inc. | | | 374 | | | 512,801 |
| | | | | |
|
|
Total Preferred Stock
(Identified Cost $110,256) | | | | | | 512,806 |
| | | | | |
|
|
*See accompanying notes to financial statements.
MSF-353
Metropolitan Series Fund, Inc.
Salomon Brothers Strategic Bond Opportunities Portfolio
Schedule of Investments as of December 31, 2005
Escrow Shares—0.0%
| | | | | | |
| Security Description | | Shares | | Value* |
|
Food Products—0.0% |
Vlasic Foods, Inc. (Escrow Receipt) (f) | | | 105,922 | | $ | 2,118 |
| | | | | |
|
|
Total Escrow Shares
(Identified Cost $0) | | | | | | 2,118 |
| | | | | |
|
|
|
| Warrants—0.0% |
|
Communications Equipment—0.0% |
American Tower Corp. (144A) (i) | | | 80 | | | 30,621 |
| | | | | |
|
|
|
Wireless Telecommunication Services—0.0% |
Leap Wireless International, Inc. (144A) (a) (i) | | | 125 | | | 0 |
| | | | | |
|
|
|
Yankee—0.0% |
Republic of Venezuela (h) (i) | | | 3,750 | | | 108,750 |
United Mexican States (i) | | | 5,000 | | | 20,000 |
| | | | | |
|
|
| | | | | | | 128,750 |
| | | | | |
|
|
Total Warrants
(Identified Cost $58,010) | | | | | | 159,371 |
| | | | | |
|
|
|
| Short Term Investments—43.4% |
| Security Description | | Face
Amount | | Value* |
|
Commercial Paper—13.4% |
Beethoven Funding Corp.
4.330%, 01/11/06 | | $ | 13,045,000 | | | 13,029,310 |
Belmont Funding, LLC
4.330%, 01/12/06 | | | 13,100,000 | | | 13,082,668 |
Berkeley Square Finance, LLC
4.330%, 01/11/06 | | | 12,675,000 | | | 12,659,755 |
DaimlerChrysler North America Holdings Corp.
4.450%, 01/11/06 | | | 6,592,000 | | | 6,583,852 |
Four Winds Funding Corp.
4.380%, 01/12/06 | | | 6,575,000 | | | 6,566,200 |
Mica Funding, LLC
4.330%, 01/12/06 | | | 13,100,000 | | | 13,082,668 |
| | | | | |
|
|
| | | | | | | 65,004,453 |
| | | | | |
|
|
|
Repurchase Agreement—28.0% |
Goldman Sachs Repurchase Agreement dated 12/30/05 at 4.260% to be repurchased at $75,035,500 on 01/03/06, collateralized by $77,575,000 Federal Home Loan Mortgage Corp. 4.110% due 02/16/10 with a value of $76,508,344 | | | 75,000,000 | | | 75,000,000 |
| | | | | | | |
| Security Description | | Face
Amount | | Value* | |
Greenwich Capital Repurchase Agreement dated 12/30/05 at 4.250% to be repurchased at $57,701,235 on 01/03/06, collateralized by $59,075,000 Federal National Mortgage Association Zero Coupon Discount Note due 02/03/06 with a value of $58,820,210 | | $ | 57,674,000 | | $ | 57,674,000 | |
State Street Corp. Repurchase Agreement dated 12/30/05 at 3.050% to be repurchased at $3,406,154 on 01/03/06, collateralized by $3,445,000 U.S. Treasury Note 3.875% due 07/31/07 with a value of $3,473,225 | | | 3,405,000 | | | 3,405,000 | |
| | | | | |
|
|
|
| | | | | | | 136,079,000 | |
| | | | | |
|
|
|
|
U.S. Treasury—2.0% | |
United States Treasury Bills
3.520%, 01/12/06 (d) | | | 2,000,000 | | | 1,997,849 | |
3.525%, 01/12/06 (d) | | | 2,000,000 | | | 1,997,846 | |
3.545%, 01/12/06 (d) | | | 4,000,000 | | | 3,995,667 | |
3.550%, 01/12/06 (d) | | | 2,000,000 | | | 1,997,830 | |
| | | | | |
|
|
|
| | | | | | | 9,989,192 | |
| | | | | |
|
|
|
Total Short Term Investments
(Amortized Cost $211,072,645) | | | | | | 211,072,645 | |
| | | | | |
|
|
|
Total Investments—137.4%
(Identified Cost $669,120,249) (k) | | | | | | 668,325,653 | |
Liabilities in excess of other assets | | | | | | (181,949,209 | ) |
| | | | | |
|
|
|
| Total Net Assets—100% | | | | | $ | 486,376,444 | |
| | | | | |
|
|
|
| (b) | Non-Income Producing; Defaulted Bond. |
| (c) | Variable or Floating Rate Security. Rate disclosed is as of December 31, 2005. |
| (d) | A portion or all of the security was held on loan. As of December 31, 2005, the market value of securities loaned was $108,569,936 and the collateral received consisted of cash in the amount of $110,833,511. |
| (e) | Step Bond: Coupon rate is set for an initial period and then increased to a higher coupon rate at a specified date. |
| (f) | Escrow Receipt is a certificate which guarantees that the securities underlying an option contract are on deposit and will be delivered in the event that the option is exercised. |
| (g) | Interest Only Certificate. This security receives monthly interest payments but is not entitled to principal payments. |
| (h) | Security was valued in good faith under procedures established by the Board of Directors. |
| (j) | Non-Income Producing; issuer filed under Chapter 11 of the Federal Bankruptcy Code. |
| (k) | The aggregate cost of investments for federal income tax purposes as of December 31, 2005 was $669,831,685 and the composition of unrealized appreciation and (depreciation) of investment securities was $6,319,192 and ($7,825,224), respectively. |
*See accompanying notes to financial statements.
MSF-354
Metropolitan Series Fund, Inc.
Salomon Brothers Strategic Bond Opportunities Portfolio
Schedule of Investments as of December 31, 2005
| (144A)— | Securities exempt from registration under Rule 144A of the Securities Act of 1933. These securities may be resold in transactions exempt from registration, normally to qualified institutional buyers. As of December 31, 2005, the market value of 144A securities was $29,706,182, which is 6.1% of total net assets. |
| (REIT)— | A Real Estate Investment Trust is a pooled investment vehicle that invests primarily in income-producing real estate or real estate related loans or interest. |
| (TBA)— | A contract for the purchase or sale of a Mortgage Backed Security to be delivered at a future date but does not include a specified pool or precise amount to be delivered. |
Futures Contracts
| | | | | | | | | | | | | | | | | |
Futures Contracts Long
| | Expiration Date
| | Number of
Contracts
| | | Contract
Amount
| | | Valuation as of
12/31/2005
| | | Unrealized
Appreciation/
Depreciation
| |
U.S. Treasury Notes 10 Year Futures | | 3/22/2006 | | 167 | | | $ | 18,121,434 | | | $ | 18,270,844 | | | $ | 149,410 | |
| | | | | |
Futures Contracts Short
| | | | | | | | | | | | | | |
U.S. Treasury Notes 2 Year Futures | | 3/31/2006 | | (107 | ) | | | (21,927,909 | ) | | | (21,955,062 | ) | | | (27,153 | ) |
U.S. Treasury Notes 5 Year Futures | | 3/22/2006 | | (7 | ) | | | (740,825 | ) | | | (744,406 | ) | | | (3,581 | ) |
| | | | | | | | | | | | | | | |
|
|
|
Net Unrealized Appreciation | | | $ | 118,676 | |
| | | | | | | | | | | | | | | |
|
|
|
See accompanying notes to financial statements.
MSF-355
Metropolitan Series Fund, Inc.
Salomon Brothers Strategic Bond Opportunities Portfolio
Statement of Assets & Liabilities
December 31, 2005
| | | | | | | |
Assets | | | | | | | |
Investments at value | | | | | $ | 532,246,653 | |
Investments in repurchase agreements | | | | | | 136,079,000 | |
Cash | | | | | | 976 | |
Foreign cash at value | | | | | | 3 | |
Collateral for securities loaned | | | | | | 110,833,511 | |
Receivable for: | | | | | | | |
Securities sold | | | | | | 1,400 | |
Fund shares sold | | | | | | 1,324,560 | |
Accrued interest and dividends | | | | | | 4,490,478 | |
| | | | | |
|
|
|
Total Assets | | | | | | 784,976,581 | |
Liabilities | | | | | | | |
Payable for: | | | | | | | |
Fund shares redeemed | | $ | 744,905 | | | | |
Securities purchased | | | 186,588,712 | | | | |
Futures variation margin | | | 20,015 | | | | |
Return of collateral for securities loaned | | | 110,833,511 | | | | |
Accrued expenses: | | | | | | | |
Management fees | | | 262,400 | | | | |
Service and distribution fees | | | 43,661 | | | | |
Deferred directors’ fees | | | 15,670 | | | | |
Other expenses | | | 91,263 | | | | |
| | |
|
| | | | |
Total Liabilities | | | | | | 298,600,137 | |
| | | | | |
|
|
|
Net Assets | | | | | $ | 486,376,444 | |
| | | | | |
|
|
|
Net assets consists of: | | | | | | | |
Capital paid in | | | | | $ | 465,683,874 | |
Undistributed net investment income | | | | | | 19,019,295 | |
Accumulated net realized gains | | | | | | 2,349,472 | |
Unrealized depreciation on investments, futures contracts and foreign currency | | | | | | (676,197 | ) |
| | | | | |
|
|
|
Net Assets | | | | | $ | 486,376,444 | |
| | | | | |
|
|
|
| Computation of offering price: | | | | | | | |
Class A | | | | | | | |
Net asset value and redemption price per share ($213,905,500 divided by 16,821,424 shares outstanding) | | | | | $ | 12.72 | |
| | | | | |
|
|
|
Class B | | | | | | | |
Net asset value and redemption price per share ($120,589,660 divided by 9,526,792 shares outstanding) | | | | | $ | 12.66 | |
| | | | | |
|
|
|
Class E | | | | | | | |
Net asset value and redemption price per share ($151,881,284 divided by 11,981,131 shares outstanding) | | | | | $ | 12.68 | |
| | | | | |
|
|
|
Identified cost of investments | | | | | $ | 669,120,249 | |
| | | | | |
|
|
|
Identified cost of foreign cash | | | | | $ | 3 | |
| | | | | |
|
|
|
Statement of Operations
For the Year Ended December 31, 2005
| | | | | | | | |
Investment Income | | | | | | | | |
Dividends | | | | | | $ | 34,845 | |
Interest | | | | | | | 19,672,420 | (a) |
| | | | | | |
|
|
|
| | | | | | | | 19,707,265 | |
Expenses | | | | | | | | |
Management fees | | $ | 2,634,095 | | | | | |
Service and distribution fees—Class B | | | 184,413 | | | | | |
Service and distribution fees—Class E | | | 222,614 | | | | | |
Directors’ fees and expenses | | | 22,695 | | | | | |
Custodian | | | 228,323 | | | | | |
Audit and tax services | | | 21,768 | | | | | |
Legal | | | 10,657 | | | | | |
Printing | | | 101,675 | | | | | |
Insurance | | | 7,075 | | | | | |
Miscellaneous | | | 5,748 | | | | | |
| | |
|
|
| | | | |
Total expenses | | | | | | | 3,439,063 | |
| | | | | | |
|
|
|
Net Investment Income | | | | | | | 16,268,202 | |
| | | | | | |
|
|
|
Realized and Unrealized Loss | | | | | | | | |
| Realized gain on: | | | | | | | | |
Investments—net | | | 3,663,014 | | | | | |
Futures contracts—net | | | 747,167 | | | | | |
Foreign currency transactions—net | | | 1,302,224 | | | | 5,712,405 | |
| | |
|
|
| | | | |
| Unrealized appreciation (depreciation) on: | | | | | | | | |
Investments—net | | | (11,079,142 | ) | | | | |
Futures contracts—net | | | (107,605 | ) | | | | |
Foreign currency transactions—net | | | 337,088 | | | | (10,849,659 | ) |
| | |
|
|
| |
|
|
|
Net loss | | | | | | | (5,137,254 | ) |
| | | | | | |
|
|
|
Net Increase in Net Assets From Operations | | | | | | $ | 11,130,948 | |
| | | | | | |
|
|
|
| (a) | Includes income on securities loaned of $51,891. |
See accompanying notes to financial statements.
MSF-356
Metropolitan Series Fund, Inc.
Salomon Brothers Strategic Bond Opportunities Portfolio
Statement of Changes in Net Assets
| | | | | | | | |
| | | Year ended
December 31,
2005
| | | Year ended
December 31,
2004
| |
From Operations | | | | | | | | |
Net investment income | | $ | 16,268,202 | | | $ | 11,167,311 | |
Net realized gain | | | 5,712,405 | | | | 7,054,719 | |
Unrealized appreciation (depreciation) | | | (10,849,659 | ) | | | 1,515,000 | |
| | |
|
|
| |
|
|
|
Increase in net assets from operations | | | 11,130,948 | | | | 19,737,030 | |
| | |
|
|
| |
|
|
|
From Distributions to Shareholders | | | | | | | | |
Net investment income | | | | | | | | |
Class A | | | (5,423,779 | ) | | | (4,722,566 | ) |
Class B | | | (1,713,034 | ) | | | (18,942 | ) |
Class E | | | (4,417,235 | ) | | | (3,832,724 | ) |
| | |
|
|
| |
|
|
|
| | | | (11,554,048 | ) | | | (8,574,232 | ) |
| | |
|
|
| |
|
|
|
Net realized gain | | | | | | | | |
Class A | | | (3,345,753 | ) | | | 0 | |
Class B | | | (1,124,453 | ) | | | 0 | |
Class E | | | (2,870,082 | ) | | | 0 | |
| | |
|
|
| |
|
|
|
| | | | (7,340,288 | ) | | | 0 | |
| | |
|
|
| |
|
|
|
Total distributions | | | (18,894,336 | ) | | | (8,574,232 | ) |
| | |
|
|
| |
|
|
|
Increase in net assets from capital share transactions | | | 148,976,048 | | | | 84,158,016 | |
| | |
|
|
| |
|
|
|
Total increase in net assets | | | 141,212,660 | | | | 95,320,814 | |
| | |
Net Assets | | | | | | | | |
Beginning of the period | | | 345,163,784 | | | | 249,842,970 | |
| | |
|
|
| |
|
|
|
End of the period | | $ | 486,376,444 | | | $ | 345,163,784 | |
| | |
|
|
| |
|
|
|
Undistributed Net Investment Income | | | | | | | | |
End of the period | | $ | 19,019,295 | | | $ | 11,956,037 | |
| | |
|
|
| |
|
|
|
Other Information:
Capital Shares
Transactions in capital shares were as follows:
| | | | | | | | | | | | | | |
| | | Year ended
December 31, 2005
| | | Year ended
December 31, 2004
| |
| | | Shares
| | | $
| | | Shares
| | | $
| |
Class A | | | | | | | | | | | | | | |
Sales | | 7,365,345 | | | $ | 93,430,873 | | | 3,067,925 | | | $ | 38,773,578 | |
Reinvestments | | 708,363 | | | | 8,769,532 | | | 384,887 | | | | 4,722,566 | |
Redemptions | | (3,847,414 | ) | | | (48,916,740 | ) | | (3,034,308 | ) | | | (38,149,788 | ) |
| | |
|
| |
|
|
| |
|
| |
|
|
|
Net increase | | 4,226,294 | | | $ | 53,283,665 | | | 418,504 | | | $ | 5,346,356 | |
| | |
|
| |
|
|
| |
|
| |
|
|
|
Class B | | | | | | | | | | | | | | |
Sales | | 7,228,893 | | | $ | 91,416,951 | | | 3,102,534 | | | $ | 38,776,362 | |
Reinvestments | | 229,942 | | | | 2,837,487 | | | 1,545 | | | | 18,942 | |
Redemptions | | (730,461 | ) | | | (9,224,205 | ) | | (326,958 | ) | | | (4,063,471 | ) |
| | |
|
| |
|
|
| |
|
| |
|
|
|
Net increase | | 6,728,374 | | | $ | 85,030,233 | | | 2,777,121 | | | $ | 34,731,833 | |
| | |
|
| |
|
|
| |
|
| |
|
|
|
Class E | | | | | | | | | | | | | | |
Sales | | 2,115,532 | | | $ | 26,862,474 | | | 5,689,453 | | | $ | 71,523,828 | |
Reinvestments | | 590,066 | | | | 7,287,317 | | | 312,875 | | | | 3,832,724 | |
Redemptions | | (1,850,232 | ) | | | (23,487,641 | ) | | (2,508,165 | ) | | | (31,276,725 | ) |
| | |
|
| |
|
|
| |
|
| |
|
|
|
Net increase | | 855,366 | | | $ | 10,662,150 | | | 3,494,163 | | | $ | 44,079,827 | |
| | |
|
| |
|
|
| |
|
| |
|
|
|
Increase derived from capital share transactions | | 11,810,034 | | | $ | 148,976,048 | | | 6,689,788 | | | $ | 84,158,016 | |
| | |
|
| |
|
|
| |
|
| |
|
|
|
See accompanying notes to financial statements.
MSF-357
Metropolitan Series Fund, Inc.
Salomon Brothers Strategic Bond Opportunities Portfolio
Financial Highlights
| | | | | | | | | | | | | | | | | | | | |
| | | Class A
| |
| | | Year ended December 31,
| |
| | | 2005
| | | 2004
| | | 2003
| | | 2002
| | | 2001
| |
Net Asset Value, Beginning of Period | | $ | 13.04 | | | $ | 12.61 | | | $ | 11.44 | | | $ | 11.20 | | | $ | 11.42 | |
| | |
|
|
| |
|
|
| |
|
|
| |
|
|
| |
|
|
|
Income From Investment Operations | | | | | | | | | | | | | | | | | | | | |
Net investment income | | | 0.36 | | | | 0.46 | | | | 0.51 | | | | 0.69 | | | | 0.70 | |
Net realized and unrealized gain (loss) of investments | | | (0.01 | ) | | | 0.35 | | | | 0.92 | | | | 0.35 | | | | 0.04 | |
| | |
|
|
| |
|
|
| |
|
|
| |
|
|
| |
|
|
|
Total from investment operations | | | 0.35 | | | | 0.81 | | | | 1.43 | | | | 1.04 | | | | 0.74 | |
| | |
|
|
| |
|
|
| |
|
|
| |
|
|
| |
|
|
|
Less Distributions | | | | | | | | | | | | | | | | | | | | |
Distributions from net investment income | | | (0.41 | ) | | | (0.38 | ) | | | (0.26 | ) | | | (0.80 | ) | | | (0.96 | ) |
Distributions from net realized capital gains | | | (0.26 | ) | | | 0.00 | | | | 0.00 | | | | 0.00 | | | | 0.00 | |
| | |
|
|
| |
|
|
| |
|
|
| |
|
|
| |
|
|
|
Total distributions | | | (0.67 | ) | | | (0.38 | ) | | | (0.26 | ) | | | (0.80 | ) | | | (0.96 | ) |
| | |
|
|
| |
|
|
| |
|
|
| |
|
|
| |
|
|
|
Net Asset Value, End of Period | | $ | 12.72 | | | $ | 13.04 | | | $ | 12.61 | | | $ | 11.44 | | | $ | 11.20 | |
| | |
|
|
| |
|
|
| |
|
|
| |
|
|
| |
|
|
|
Total Return (%) | | | 2.8 | | | | 6.6 | | | | 12.6 | | | | 9.6 | | | | 6.6 | |
Ratio of operating expenses to average net assets (%) | | | 0.75 | | | | 0.77 | | | | 0.81 | | | | 0.85 | | | | 0.84 | |
Ratio of net investment income to average net assets (%) | | | 4.11 | | | | 3.79 | | | | 4.66 | | | | 6.25 | | | | 6.44 | |
Portfolio turnover rate (%) | | | 507 | | | | 393 | | | | 329 | | | | 239 | | | | 248 | |
Net assets, end of period (000) | | $ | 213,906 | | | $ | 164,213 | | | $ | 153,549 | | | $ | 122,023 | | | $ | 109,448 | |
| | | | | | | | | | | | | | | | |
| | | Class B
| |
| | | Year ended December 31,
| | | July 30, 2002(a)
through
December 31,
2002
| |
| | | 2005
| | | 2004
| | | 2003
| | |
Net Asset Value, Beginning of Period | | $ | 12.99 | | | $ | 12.58 | | | $ | 11.41 | | | $ | 10.43 | |
| | |
|
|
| |
|
|
| |
|
|
| |
|
|
|
Income From Investment Operations | | | | | | | | | | | | | | | | |
Net investment income | | | 0.40 | | | | 0.39 | | | | 0.23 | | | | 0.14 | |
Net realized and unrealized gain (loss) of investments | | | (0.08 | ) | | | 0.38 | | | | 1.19 | | | | 0.84 | |
| | |
|
|
| |
|
|
| |
|
|
| |
|
|
|
Total from investment operations | | | 0.32 | | | | 0.77 | | | | 1.42 | | | | 0.98 | |
| | |
|
|
| |
|
|
| |
|
|
| |
|
|
|
Less Distributions | | | | | | | | | | | | | | | | |
Distributions from net investment income | | | (0.39 | ) | | | (0.36 | ) | | | (0.25 | ) | | | 0.00 | |
Distributions from net realized capital gains | | | (0.26 | ) | | | 0.00 | | | | 0.00 | | | | 0.00 | |
| | |
|
|
| |
|
|
| |
|
|
| |
|
|
|
Total distributions | | | (0.65 | ) | | | (0.36 | ) | | | (0.25 | ) | | | 0.00 | |
| | |
|
|
| |
|
|
| |
|
|
| |
|
|
|
Net Asset Value, End of Period | | $ | 12.66 | | | $ | 12.99 | | | $ | 12.58 | | | $ | 11.41 | |
| | |
|
|
| |
|
|
| |
|
|
| |
|
|
|
Total Return (%) | | | 2.6 | | | | 6.3 | | | | 12.6 | | | | 9.4 | (b) |
Ratio of operating expenses to average net assets (%) | | | 1.00 | | | | 1.02 | | | | 1.06 | | | | 1.10 | (c) |
Ratio of net investment income to average net assets (%) | | | 3.92 | | | | 3.66 | | | | 3.95 | | | | 5.66 | (c) |
Portfolio turnover rate (%) | | | 507 | | | | 393 | | | | 329 | | | | 239 | |
Net assets, end of period (000) | | $ | 120,590 | | | $ | 36,346 | | | $ | 268 | | | $ | 2 | |
| (a) | Commencement of operations. |
| (b) | Period less than one year is not computed on an annualized basis. |
| (c) | Computed on an annualized basis. |
See accompanying notes to financial statements.
MSF-358
Metropolitan Series Fund, Inc.
Salomon Brothers Strategic Bond Opportunities Portfolio
Financial Highlights
| | | | | | | | | | | | | | | | | | | | |
| | | Class E
| |
| | | Year ended December 31,
| | | May 1, 2001(a)
through
December 31,
2001
| |
| | | 2005
| | | 2004
| | | 2003
| | | 2002
| | |
Net Asset Value, Beginning of Period | | $ | 13.00 | | | $ | 12.58 | | | $ | 11.42 | | | $ | 11.20 | | | $ | 10.80 | |
| | |
|
|
| |
|
|
| |
|
|
| |
|
|
| |
|
|
|
Income From Investment Operations | | | | | | | | | | | | | | | | | | | | |
Net investment income | | | 0.50 | | | | 0.38 | | | | 0.42 | | | | 0.73 | | | | 0.10 | |
Net realized and unrealized gain (loss) of investments | | | (0.17 | ) | | | 0.41 | | | | 0.99 | | | | 0.29 | | | | 0.30 | |
| | |
|
|
| |
|
|
| |
|
|
| |
|
|
| |
|
|
|
Total from investment operations | | | 0.33 | | | | 0.79 | | | | 1.41 | | | | 1.02 | | | | 0.40 | |
| | |
|
|
| |
|
|
| |
|
|
| |
|
|
| |
|
|
|
Less Distributions | | | | | | | | | | | | | | | | | | | | |
Distributions from net investment income | | | (0.39 | ) | | | (0.37 | ) | | | (0.25 | ) | | | (0.80 | ) | | | 0.00 | |
Distributions from net realized capital gains | | | (0.26 | ) | | | 0.00 | | | | 0.00 | | | | 0.00 | | | | 0.00 | |
| | |
|
|
| |
|
|
| |
|
|
| |
|
|
| |
|
|
|
Total distributions | | | (0.65 | ) | | | (0.37 | ) | | | (0.25 | ) | | | (0.80 | ) | | | 0.00 | |
| | |
|
|
| |
|
|
| |
|
|
| |
|
|
| |
|
|
|
Net Asset Value, End of Period | | $ | 12.68 | | | $ | 13.00 | | | $ | 12.58 | | | $ | 11.42 | | | $ | 11.20 | |
| | |
|
|
| |
|
|
| |
|
|
| |
|
|
| |
|
|
|
Total Return (%) | | | 2.7 | | | | 6.5 | | | | 12.5 | | | | 9.4 | | | | 3.7 | (b) |
Ratio of operating expenses to average net assets (%) | | | 0.90 | | | | 0.92 | | | | 0.96 | | | | 1.00 | | | | 0.99 | (c) |
Ratio of net investment income to average net assets (%) | | | 3.95 | | | | 3.64 | | | | 4.34 | | | | 6.03 | | | | 5.50 | (c) |
Portfolio turnover rate (%) | | | 507 | | | | 393 | | | | 329 | | | | 239 | | | | 248 | |
Net assets, end of period (000) | | $ | 151,881 | | | $ | 144,605 | | | $ | 96,026 | | | $ | 26,060 | | | $ | 2,476 | |
| (a) | Commencement of operations. |
| (b) | Period less than one year is not computed on an annualized basis. |
| (c) | Computed on an annualized basis. |
See accompanying notes to financial statements.
MSF-359
Metropolitan Series Fund, Inc.
Salomon Brothers U.S. Government Portfolio
Schedule of Investments as of December 31, 2005
Fixed Income—91.2% of Total Net Assets
| | | | | | |
| Security Description | | Face Amount | | Value* |
| | | | | | | |
|
Federal Agencies—73.0% |
Federal Home Loan Bank | | | | | | |
5.800%, 09/02/08 | | $ | 1,000,000 | | $ | 1,025,080 |
Federal Home Loan Mortgage Corp. | | | | | | |
4.500%, 04/15/32 | | | 182,747 | | | 166,171 |
5.000%, TBA | | | 87,000,000 | | | 84,199,644 |
5.500%, 01/15/23 (a) | | | 6,708,206 | | | 259,662 |
5.500%, TBA | | | 50,000,000 | | | 49,531,250 |
6.000%, 10/01/10 | | | 430 | | | 438 |
6.000%, 10/01/28 | | | 126,526 | | | 127,975 |
6.000%, 11/01/28 | | | 150,935 | | | 152,937 |
6.000%, TBA | | | 27,900,000 | | | 28,170,295 |
6.500%, 08/01/13 | | | 29,977 | | | 30,723 |
6.500%, 03/01/26 | | | 2,173 | | | 2,236 |
6.500%, 07/01/26 | | | 54,412 | | | 56,009 |
7.000%, 07/01/11 | | | 10,631 | | | 11,033 |
7.500%, 05/01/07 | | | 2,810 | | | 2,866 |
8.000%, 12/01/19 | | | 15,931 | | | 16,966 |
8.000%, 07/01/20 | | | 52,664 | | | 56,025 |
8.250%, 04/01/17 | | | 2,135 | | | 2,283 |
9.000%, 10/01/17 | | | 12,939 | | | 13,498 |
Federal National Mortgage Association | | | | | | |
4.819%, 01/25/43 (b) | | | 1,858,740 | | | 1,886,466 |
5.000%, TBA | | | 113,325,000 | | | 109,783,594 |
5.500%, 04/01/35 | | | 4,761,197 | | | 4,715,569 |
5.500%, TBA | | | 133,000,000 | | | 132,068,450 |
5.827%, 02/17/09 (b) | | | 2,000,000 | | | 1,947,100 |
6.000%, TBA | | | 62,000,000 | | | 62,622,784 |
6.500%, 06/01/08 | | | 10,054 | | | 10,322 |
6.500%, 12/01/10 | | | 5,026 | | | 5,168 |
6.500%, 04/01/13 | | | 89,238 | | | 91,673 |
6.500%, 07/01/13 | | | 51,877 | | | 53,292 |
6.500%, 06/01/17 | | | 715,979 | | | 735,620 |
6.500%, 03/01/26 | | | 10,401 | | | 10,718 |
6.500%, 04/01/29 | | | 317,565 | | | 326,666 |
6.500%, TBA | | | 32,000,000 | | | 32,820,000 |
6.527%, 05/25/30 (b) | | | 595,826 | | | 614,515 |
7.000%, 12/01/14 | | | 47,429 | | | 49,297 |
7.000%, 07/01/15 | | | 7,343 | | | 7,559 |
7.000%, 11/01/23 | | | 5,732 | | | 5,992 |
7.000%, 02/01/28 | | | 30,479 | | | 31,795 |
7.000%, 10/01/28 | | | 135,356 | | | 141,100 |
7.000%, 11/01/28 | | | 15,444 | | | 16,099 |
7.000%, 02/01/29 | | | 50,520 | | | 52,796 |
7.000%, 01/01/30 | | | 14,032 | | | 14,656 |
7.000%, 01/01/34 | | | 1,400,854 | | | 1,461,643 |
7.500%, 11/01/30 | | | 53,116 | | | 55,667 |
7.500%, 01/01/31 | | | 23,716 | | | 24,855 |
8.000%, 05/01/28 | | | 13,212 | | | 14,122 |
8.000%, 07/01/30 | | | 1,853 | | | 1,980 |
8.000%, 08/01/30 | | | 25,571 | | | 27,315 |
8.000%, 10/01/30 | | | 21,820 | | | 23,308 |
8.000%, 02/01/31 | | | 672,920 | | | 719,338 |
8.000%, 08/01/31 | | | 5,097 | | | 5,444 |
8.000%, 07/01/32 | | | 2,989 | | | 3,192 |
11.500%, 09/01/19 | | | 1,047 | | | 1,147 |
12.000%, 10/01/15 | | | 47,265 | | | 53,929 |
| | | | | | |
| Security Description | | Face Amount | | Value* |
| | | | | | | |
| | |
Federal Agencies—(Continued) | | | | | | |
12.000%, 01/15/16 | | $ | 3,670 | | $ | 4,148 |
12.500%, 09/20/15 | | | 4,862 | | | 5,379 |
12.500%, 01/15/16 | | | 41,611 | | | 46,037 |
62.090%, 12/28/28 (a) (b) | | | 43 | | | 43 |
Government National Mortgage Association | | | | | | |
6.500%, 08/15/34 | | | 1,074,536 | | | 1,121,719 |
7.500%, 01/15/29 | | | 26,626 | | | 28,069 |
7.500%, 09/15/29 | | | 24,051 | | | 25,308 |
7.500%, 02/15/30 | | | 28,193 | | | 29,725 |
7.500%, 04/15/30 | | | 31,592 | | | 33,308 |
7.500%, 05/15/30 | | | 14,105 | | | 14,837 |
7.500%, 09/15/30 | | | 32,411 | | | 34,171 |
8.500%, 06/15/25 | | | 210,879 | | | 229,627 |
9.000%, 12/15/16 | | | 32,759 | | | 35,460 |
| | | | | |
|
|
| | | | | | | 515,836,093 |
| | | | | |
|
|
| | |
U.S. Treasury—18.2% | | | | | | |
United States Treasury Notes | | | | | | |
2.875%, 11/30/06 | | | 15,000,000 | | | 14,791,995 |
3.375%, 11/15/08 | | | 16,500,000 | | | 16,057,206 |
3.375%, 10/15/09 | | | 5,000,000 | | | 4,828,320 |
4.000%, 04/15/10 | | | 50,000,000 | | | 49,273,450 |
4.250%, 08/15/15 | | | 30,000,000 | | | 29,612,100 |
4.500%, 11/15/15 | | | 14,000,000 | | | 14,114,842 |
| | | | | |
|
|
| | | | | | | 128,677,913 |
| | | | | |
|
|
Total Fixed Income
(Identified Cost $642,906,555) | | | | | | 644,514,006 |
| | | | | |
|
|
| | |
| Short Term Investments—78.9% | | | | | | |
| | |
Discount Notes—32.6% | | | | | | |
Federal Farm Credit Bank | | | | | | |
3.400%, 01/03/06 | | | 50,000,000 | | | 49,990,555 |
3.520%, 01/05/06 | | | 35,000,000 | | | 34,986,311 |
3.620%, 01/10/06 | | | 20,000,000 | | | 19,981,900 |
3.750%, 01/12/06 | | | 25,000,000 | | | 24,971,354 |
4.120%, 01/12/06 | | | 50,000,000 | | | 49,937,056 |
Federal Home Loan Bank | | | | | | |
4.150%, 01/12/06 | | | 50,000,000 | | | 49,936,597 |
| | | | | |
|
|
| | | | | | | 229,803,773 |
| | | | | |
|
|
| | |
Repurchase Agreement—21.9% | | | | | | |
Goldman Sachs Repurchase Agreement dated 12/30/05 at 4.260% to be repurchased at $154,922,295 on 01/03/06, collateralized by $160,000,000 Federal Home Loan Mortgage Corp. 4.110% due
02/16/10 with a value of $157,800,000. | | | 154,849,000 | | | 154,849,000 |
| | | | | |
|
|
| | |
U.S. Treasury—24.4% | | | | | | |
United States Treasury Bills | | | | | | |
3.525%, 01/12/06 | | | 13,200,000 | | | 13,185,782 |
3.545%, 01/12/06 | | | 72,700,000 | | | 72,621,252 |
*See accompanying notes to financial statements.
MSF-360
Metropolitan Series Fund, Inc.
Salomon Brothers U.S. Government Portfolio
Schedule of Investments as of December 31, 2005
Short Term Investments—(Continued)
| | | | | | | |
| Security Description | | Face Amount | | Value* | |
| | | | | | | | |
| | |
U.S. Treasury—(Continued) | | | | | | | |
3.550%, 01/12/06 | | $ | 31,600,000 | | $ | 31,565,723 | |
4.000%, 01/12/06 | | | 55,000,000 | | | 54,932,778 | |
| | | | | |
|
|
|
| | | | | | | 172,305,535 | |
| | | | | |
|
|
|
Total Short Term Investments
(Amortized Cost $556,958,308) | | | | | | 556,958,308 | |
Total Investments—170.1%
(Identified Cost $1,199,864,863) (c) | | | | | | 1,201,472,314 | |
Liabilities in excess of other assets | | | | | | (495,102,448 | ) |
| | | | | |
|
|
|
| Total Net Assets—100% | | | | | $ | 706,369,866 | |
| | | | | |
|
|
|
| (a) | Interest Only Certificate. This security receives monthly interest payments but is not entitled to principal payments. |
| (b) | Variable or Floating Rate Security. Rate disclosed is as of December 31, 2005. |
| (c) | The aggregate cost of investments for federal income tax purposes as of December 31, 2005 was $1,199,901,534 and the composition of unrealized appreciation and (depreciation) of investment securities was $3,442,609 and ($1,871,829), respectively. |
| (TBA)— | A contract for the purchase or sale of a Mortgage Backed Security to be delivered at a future date but does not include a specified pool or precise amount to be delivered. |
Futures Contracts
| | | | | | | | | | | | | | | | | |
Futures Contracts Long
| | Expiration Date
| | Number of
Contracts
| | | Contract
Amount
| | | Valuation as of
12/31/2005
| | | Unrealized
Appreciation/
Depreciation
| |
U.S. Treasury Notes 2 Year Futures | | 3/31/2006 | | 82 | | | $ | 16,816,343 | | | $ | 16,825,375 | | | $ | 9,032 | |
| | | | | |
Futures Contracts Short
| | | | | | | | | | | | | | |
U.S. Treasury Notes 5 Year Futures | | 3/22/2006 | | (49 | ) | | | (5,210,843 | ) | | | (5,185,776 | ) | | | (25,067 | ) |
U.S. Treasury Notes 10 Year Futures | | 3/22/2006 | | (177 | ) | | | (19,364,906 | ) | | | (19,187,239 | ) | | | (177,667 | ) |
| | | | | | | | | | | | | | | |
|
|
|
Net Unrealized Depreciation | | | $ | (193,702 | ) |
| | | | | | | | | | | | | | | |
|
|
|
*See accompanying notes to financial statements.
MSF-361
Metropolitan Series Fund, Inc.
Salomon Brothers U.S. Government Portfolio
Statement of Assets & Liabilities
December 31, 2005
| | | | | | | |
Assets | | | | | | | |
Investments at value | | | | | $ | 1,046,623,314 | |
Investments in repurchase agreements | | | | | | 154,849,000 | |
Cash | | | | | | 973 | |
Receivable for: | | | | | | | |
Fund shares sold | | | | | | 1,269,867 | |
Accrued interest | | | | | | 2,167,747 | |
Futures variation margin | | | | | | 26,312 | |
| | | | | |
|
|
|
Total Assets | | | | | | 1,204,937,213 | |
Liabilities | | | | | | | |
Payable for: | | | | | | | |
Fund shares redeemed | | $ | 656,930 | | | | |
Securities purchased | | | 497,457,914 | | | | |
Accrued expenses: | | | | | | | |
Management fees | | | 279,567 | | | | |
Service and distribution fees | | | 39,022 | | | | |
Deferred directors’ fees | | | 12,944 | | | | |
Other expenses | | | 120,970 | | | | |
| | |
|
| | | | |
Total Liabilities | | | | | | 498,567,347 | |
| | | | | |
|
|
|
Net Assets | | | | | $ | 706,369,866 | |
| | | | | |
|
|
|
Net assets consists of: | | | | | | | |
Capital paid in | | | | | $ | 698,341,214 | |
Undistributed net investment income | | | | | | 15,645,558 | |
Accumulated net realized losses | | | | | | (9,030,655 | ) |
Unrealized appreciation on investments and futures contracts | | | | | | 1,413,749 | |
| | | | | |
|
|
|
Net Assets | | | | | $ | 706,369,866 | |
| | | | | |
|
|
|
| Computation of offering price: | | | | | | | |
Class A | | | | | | | |
Net asset value and redemption price per share ($471,703,210 divided by 38,585,374 shares outstanding) | | | | | $ | 12.22 | |
| | | | | |
|
|
|
Class B | | | | | | | |
Net asset value and redemption price per share ($117,257,865 divided by 9,639,567 shares outstanding) | | | | | $ | 12.16 | |
| | | | | |
|
|
|
Class E | | | | | | | |
Net asset value and redemption price per share ($117,408,791 divided by 9,637,716 shares outstanding) | | | | | $ | 12.18 | |
| | | | | |
|
|
|
Identified cost of investments | | | | | $ | 1,199,864,863 | |
| | | | | |
|
|
|
Statement of Operations
Year Ended December 31, 2005
| | | | | | | | |
Investment Income | | | | | | | | |
Interest | | | | | | $ | 19,043,475 | |
| | | | | | |
|
|
|
Expenses | | | | | | | | |
Management fees | | $ | 2,890,435 | | | | | |
Service and distribution fees—Class B | | | 188,791 | | | | | |
Service and distribution fees—Class E | | | 181,208 | | | | | |
Directors’ fees and expenses | | | 22,483 | | | | | |
Custodian | | | 138,899 | | | | | |
Audit and tax services | | | 21,767 | | | | | |
Legal | | | 12,317 | | | | | |
Printing | | | 139,780 | | | | | |
Insurance | | | 8,266 | | | | | |
Miscellaneous | | | 6,421 | | | | | |
| | |
|
|
| | | | |
Total expenses | | | | | | | 3,610,367 | |
| | | | | | |
|
|
|
Net Investment Income | | | | | | | 15,433,108 | |
| | | | | | |
|
|
|
Realized and Unrealized Gain (Loss) | | | | | | | | |
| Realized gain (loss) on: | | | | | | | | |
Investments—net | | | (8,840,371 | ) | | | | |
Futures contracts—net | | | 467,184 | | | | (8,373,187 | ) |
| | |
|
|
| | | | |
| Unrealized appreciation (depreciation) on: | | | | | | | | |
Investments—net | | | 1,392,704 | | | | | |
Futures contracts—net | | | (164,450 | ) | | | 1,228,254 | |
| | |
|
|
| |
|
|
|
Net loss | | | | | | | (7,144,933 | ) |
| | | | | | |
|
|
|
Net Increase in Net Assets From Operations | | | | | | $ | 8,288,175 | |
| | | | | | |
|
|
|
See accompanying notes to financial statements.
MSF-362
Metropolitan Series Fund, Inc.
Salomon Brothers U.S. Government Portfolio
Statement of Changes in Net Assets
| | | | | | | | |
| | | Year ended
December 31,
2005
| | | Year ended
December 31,
2004
| |
From Operations | | | | | | | | |
Net investment income | | $ | 15,433,108 | | | $ | 4,182,419 | |
Net realized gain (loss) | | | (8,373,187 | ) | | | 6,238,114 | |
Unrealized appreciation (depreciation) | | | 1,228,254 | | | | (2,323,904 | ) |
| | |
|
|
| |
|
|
|
Increase in net assets from operations | | | 8,288,175 | | | | 8,096,629 | |
| | |
|
|
| |
|
|
|
From Distributions to Shareholders | | | | | | | | |
Net investment income | | | | | | | | |
Class A | | | (2,064,428 | ) | | | (1,897,186 | ) |
Class B | | | (723,628 | ) | | | (4,095 | ) |
Class E | | | (1,518,429 | ) | | | (1,424,326 | ) |
| | |
|
|
| |
|
|
|
| | | | (4,306,485 | ) | | | (3,325,607 | ) |
| | |
|
|
| |
|
|
|
Net realized gain | | | | | | | | |
Class A | | | (2,816,213 | ) | | | (1,500,939 | ) |
Class B | | | (1,123,528 | ) | | | (3,938 | ) |
Class E | | | (2,311,931 | ) | | | (1,245,040 | ) |
| | |
|
|
| |
|
|
|
| | | | (6,251,672 | ) | | | (2,749,917 | ) |
| | |
|
|
| |
|
|
|
Total distributions | | | (10,558,157 | ) | | | (6,075,524 | ) |
| | |
|
|
| |
|
|
|
Increase in net assets from capital share transactions | | | 402,065,193 | | | | 35,747,393 | |
| | |
|
|
| |
|
|
|
Total increase in net assets | | | 399,795,211 | | | | 37,768,498 | |
| | |
Net Assets | | | | | | | | |
Beginning of the period | | | 306,574,655 | | | | 268,806,157 | |
| | |
|
|
| |
|
|
|
End of the period | | $ | 706,369,866 | | | $ | 306,574,655 | |
| | |
|
|
| |
|
|
|
Undistributed Net Investment Income | | | | | | | | |
End of the period | | $ | 15,645,558 | | | $ | 4,286,414 | |
| | |
|
|
| |
|
|
|
Other Information:
Capital Shares
Transactions in capital shares were as follows:
| | | | | | | | | | | | | | |
| | | Year ended December 31, 2005
| | | Year ended December 31, 2004
| |
| | | Shares
| | | $
| | | Shares
| | | $
| |
Class A | | | | | | | | | | | | | | |
Sales | | 31,209,963 | | | $ | 378,680,852 | | | 3,337,129 | | | $ | 41,058,920 | |
Reinvestments | | 404,361 | | | | 4,880,641 | | | 281,302 | | | | 3,398,125 | |
Redemptions | | (4,944,025 | ) | | | (60,383,842 | ) | | (4,180,028 | ) | | | (51,363,844 | ) |
| | |
|
| |
|
|
| |
|
| |
|
|
|
Net increase (decrease) | | 26,670,299 | | | $ | 323,177,651 | | | (561,597 | ) | | $ | (6,906,799 | ) |
| | |
|
| |
|
|
| |
|
| |
|
|
|
Class B | | | | | | | | | | | | | | |
Sales | | 7,506,965 | | | $ | 91,490,409 | | | 2,928,993 | | | $ | 35,894,571 | |
Reinvestments | | 153,546 | | | | 1,847,156 | | | 666 | | | | 8,033 | |
Redemptions | | (854,703 | ) | | | (10,390,388 | ) | | (124,061 | ) | | | (1,516,051 | ) |
| | |
|
| |
|
|
| |
|
| |
|
|
|
Net increase | | 6,805,808 | | | $ | 82,947,177 | | | 2,805,598 | | | $ | 34,386,553 | |
| | |
|
| |
|
|
| |
|
| |
|
|
|
Class E | | | | | | | | | | | | | | |
Sales | | 1,266,995 | | | $ | 15,501,720 | | | 3,344,596 | | | $ | 41,085,629 | |
Reinvestments | | 318,136 | | | | 3,830,360 | | | 221,524 | | | | 2,669,366 | |
Redemptions | | (1,915,941 | ) | | | (23,391,715 | ) | | (2,896,812 | ) | | | (35,487,356 | ) |
| | |
|
| |
|
|
| |
|
| |
|
|
|
Net increase (decrease) | | (330,810 | ) | | $ | (4,059,635 | ) | | 669,308 | | | $ | 8,267,639 | |
| | |
|
| |
|
|
| |
|
| |
|
|
|
Increase derived from capital share transactions | | 33,145,297 | | | $ | 402,065,193 | | | 2,913,309 | | | $ | 35,747,393 | |
| | |
|
| |
|
|
| |
|
| |
|
|
|
See accompanying notes to financial statements.
MSF-363
Metropolitan Series Fund, Inc.
Salomon Brothers U.S. Government Portfolio
Financial Highlights
| | | | | | | | | | | | | | | | | | | | |
| | | Class A
| |
| | | Year ended December 31,
| |
| | | 2005
| | | 2004
| | | 2003
| | | 2002
| | | 2001
| |
Net Asset Value, Beginning of Period | | $ | 12.43 | | | $ | 12.34 | | | $ | 12.34 | | | $ | 11.97 | | | $ | 11.94 | |
| | |
|
|
| |
|
|
| |
|
|
| |
|
|
| |
|
|
|
Income from Investment Operations | | | | | | | | | | | | | | | | | | | | |
Net investment income | | | 0.19 | | | | 0.20 | | | | 0.18 | | | | 0.38 | | | | 0.37 | |
Net realized and unrealized gain of investments | | | 0.01 | | | | 0.18 | | | | 0.02 | | | | 0.54 | | | | 0.41 | |
| | |
|
|
| |
|
|
| |
|
|
| |
|
|
| |
|
|
|
Total from investment operations | | | 0.20 | | | | 0.38 | | | | 0.20 | | | | 0.92 | | | | 0.78 | |
| | |
|
|
| |
|
|
| |
|
|
| |
|
|
| |
|
|
|
Less Distributions | | | | | | | | | | | | | | | | | | | | |
Distributions from net investment income | | | (0.17 | ) | | | (0.16 | ) | | | (0.08 | ) | | | (0.38 | ) | | | (0.75 | ) |
Distributions from net realized capital gains | | | (0.24 | ) | | | (0.13 | ) | | | (0.12 | ) | | | (0.17 | ) | | | 0.00 | |
| | |
|
|
| |
|
|
| |
|
|
| |
|
|
| |
|
|
|
Total distributions | | | (0.41 | ) | | | (0.29 | ) | | | (0.20 | ) | | | (0.55 | ) | | | (0.75 | ) |
| | |
|
|
| |
|
|
| |
|
|
| |
|
|
| |
|
|
|
Net Asset Value, End of Period | | $ | 12.22 | | | $ | 12.43 | | | $ | 12.34 | | | $ | 12.34 | | | $ | 11.97 | |
| | |
|
|
| |
|
|
| |
|
|
| |
|
|
| |
|
|
|
Total Return (%) | | | 1.7 | | | | 3.0 | | | | 1.7 | | | | 7.9 | | | | 6.7 | |
Ratio of operating expenses to average net assets (%) | | | 0.61 | | | | 0.64 | | | | 0.65 | | | | 0.70 | | | | 0.70 | |
Ratio of operating expenses to average net assets without giving effect to the contractual expense agreement would have been (%) | | | 0.61 | | | | 0.64 | | | | 0.65 | | | | 0.70 | | | | 0.73 | |
Ratio of net investment income to average net assets (%) | | | 3.00 | | | | 1.56 | | | | 1.22 | | | | 2.20 | | | | 4.49 | |
Portfolio turnover rate (%) | | | 964 | | | | 977 | | | | 882 | | | | 672 | | | | 362 | |
Net assets, end of period (000) | | $ | 471,703 | | | $ | 148,047 | | | $ | 154,010 | | | $ | 180,989 | | | $ | 102,066 | |
| | | | | | | | | | | | | | | | |
| | | Class B
| |
| | | Year ended December 31,
| | | July 30, 2002(a)
through
December 31, 2002
| |
| | | 2005
| | | 2004
| | | 2003
| | |
Net Asset Value, Beginning of Period | | $ | 12.38 | | | $ | 12.31 | | | $ | 12.31 | | | $ | 11.88 | |
| | |
|
|
| |
|
|
| |
|
|
| |
|
|
|
Income from Investment Operations | | | | | | | | | | | | | | | | |
Net investment income | | | 0.25 | | | | 0.16 | | | | 0.06 | | | | 0.04 | |
Net realized and unrealized gain (loss) of investments | | | (0.08 | ) | | | 0.17 | | | | 0.14 | | | | 0.39 | |
| | |
|
|
| |
|
|
| |
|
|
| |
|
|
|
Total from investment operations | | | 0.17 | | | | 0.33 | | | | 0.20 | | | | 0.43 | |
| | |
|
|
| |
|
|
| |
|
|
| |
|
|
|
Less Distributions | | | | | | | | | | | | | | | | |
Distributions from net investment income | | | (0.15 | ) | | | (0.13 | ) | | | (0.08 | ) | | | 0.00 | |
Distributions from net realized capital gains | | | (0.24 | ) | | | (0.13 | ) | | | (0.12 | ) | | | 0.00 | |
| | |
|
|
| |
|
|
| |
|
|
| |
|
|
|
Total distributions | | | (0.39 | ) | | | (0.26 | ) | | | (0.20 | ) | | | 0.00 | |
| | |
|
|
| |
|
|
| |
|
|
| |
|
|
|
Net Asset Value, End of Period | | $ | 12.16 | | | $ | 12.38 | | | $ | 12.31 | | | $ | 12.31 | |
| | |
|
|
| |
|
|
| |
|
|
| |
|
|
|
Total Return (%) | | | 1.4 | | | | 2.7 | | | | 1.6 | | | | 3.6 | (b) |
Ratio of operating expenses to average net assets (%) | | | 0.86 | | | | 0.89 | | | | 0.90 | | | | 0.95 | (c) |
Ratio of operating expenses to average net assets without giving effect to the contractual expense agreement would have been (%) | | | 0.86 | | | | 0.89 | | | | 0.90 | | | | 0.95 | (c) |
Ratio of net investment income to average net assets (%) | | | 2.76 | | | | 1.81 | | | | 0.79 | | | | 1.34 | (c) |
Portfolio turnover rate (%) | | | 964 | | | | 977 | | | | 882 | | | | 672 | |
Net assets, end of period (000) | | $ | 117,258 | | | $ | 35,073 | | | $ | 347 | | | $ | 2 | |
| (a) | Commencement of operations. |
| (b) | Period less than one year is not computed on an annualized basis. |
| (c) | Computed on an annualized basis. |
See accompanying notes to financial statements.
MSF-364
Metropolitan Series Fund, Inc.
Salomon Brothers U.S. Government Portfolio
Financial Highlights
| | | | | | | | | | | | | | | | | | | | |
| | | Class E
| |
| | | Year ended December 31,
| | | May 1, 2001(a)
through
December 31, 2001
| |
| | | 2005
| | | 2004
| | | 2003
| | | 2002
| | |
Net Asset Value, Beginning of Period | | $ | 12.38 | | | $ | 12.31 | | | $ | 12.32 | | | $ | 11.96 | | | $ | 11.45 | |
| | |
|
|
| |
|
|
| |
|
|
| |
|
|
| |
|
|
|
Income from Investment Operations | | | | | | | | | | | | | | | | | | | | |
Net investment income | | | 0.34 | | | | 0.17 | | | | 0.12 | | | | 0.31 | | | | 0.07 | |
Net realized and unrealized gain (loss) of investments | | | (0.15 | ) | | | 0.17 | | | | 0.07 | | | | 0.42 | | | | 0.44 | |
| | |
|
|
| |
|
|
| |
|
|
| |
|
|
| |
|
|
|
Total from investment operations | | | 0.19 | | | | 0.34 | | | | 0.19 | | | | 0.73 | | | | 0.51 | |
| | |
|
|
| |
|
|
| |
|
|
| |
|
|
| |
|
|
|
Less Distributions | | | | | | | | | | | | | | | | | | | | |
Distributions from net investment income | | | (0.15 | ) | | | (0.14 | ) | | | (0.08 | ) | | | (0.20 | ) | | | 0.00 | |
Distributions from net realized capital gains | | | (0.24 | ) | | | (0.13 | ) | | | (0.12 | ) | | | (0.17 | ) | | | 0.00 | |
| | |
|
|
| |
|
|
| |
|
|
| |
|
|
| |
|
|
|
Total distributions | | | (0.39 | ) | | | (0.27 | ) | | | (0.20 | ) | | | (0.37 | ) | | | 0.00 | |
| | |
|
|
| |
|
|
| |
|
|
| |
|
|
| |
|
|
|
Net Asset Value, End of Period | | $ | 12.18 | | | $ | 12.38 | | | $ | 12.31 | | | $ | 12.32 | | | $ | 11.96 | |
| | |
|
|
| |
|
|
| |
|
|
| |
|
|
| |
|
|
|
Total Return (%) | | | 1.6 | | | | 2.8 | | | | 1.5 | | | | 7.7 | | | | 4.5 | (b) |
Ratio of operating expenses to average net assets (%) | | | 0.76 | | | | 0.79 | | | | 0.80 | | | | 0.85 | | | | 0.85 | (c) |
Ratio of operating expenses to average net assets without giving effect to the contractual expense agreement would have been (%) | | | 0.76 | | | | 0.79 | | | | 0.80 | | | | 0.85 | | | | 0.88 | (c) |
Ratio of net investment income to average net assets (%) | | | 2.74 | | | | 1.42 | | | | 1.03 | | | | 2.05 | | | | 3.39 | (c) |
Portfolio turnover rate (%) | | | 964 | | | | 977 | | | | 882 | | | | 672 | | | | 362 | |
Net assets, end of period (000) | | $ | 117,409 | | | $ | 123,455 | | | $ | 114,450 | | | $ | 67,262 | | | $ | 6,289 | |
| (a) | Commencement of operations. |
| (b) | Period less than one year is not computed on an annualized basis. |
| (c) | Computed on an annualized basis. |
See accompanying notes to financial statements.
MSF-365
Metropolitan Series Fund, Inc.
BlackRock Money Market Portfolio
Schedule of Investments as of December 31, 2005
Commercial Paper—85.2% of Total Net Assets
| | | | | | |
| Security Description | | Face
Amount | | Value* |
| | | | | | | |
|
Asset Backed—38.3% |
Allstate Life Global Funding II (144A)
4.369%, 06/27/06 | | $ | 10,000,000 | | $ | 10,000,000 |
Amstel Funding Corp.
4.350%, 03/02/06 | | | 20,000,000 | | | 19,855,000 |
Barclays U.S. Funding, LLC
4.195%, 02/03/06 | | | 37,000,000 | | | 36,857,720 |
Greenwich Capital Holdings, Inc.
4.339%, 06/23/06 (a) | | | 25,000,000 | | | 25,000,000 |
Lake Con Funding
4.300%, 01/12/06 | | | 32,000,000 | | | 31,957,955 |
Landdale Funding, LLC
4.420%, 03/10/06 | | | 15,000,000 | | | 14,874,767 |
4.440%, 03/20/06 | | | 20,130,000 | | | 19,936,349 |
Lockhart Funding, LLC
4.260%, 01/17/06 | | | 35,000,000 | | | 34,933,733 |
MBNA Credit Card Master Trust
4.390%, 02/21/06 | | | 30,000,000 | | | 29,813,425 |
Restructured Asset Certificates
4.390%, 08/21/06 | | | 15,000,000 | | | 15,000,000 |
Victory Receivable Corp.
4.280%, 01/10/06 | | | 34,000,000 | | | 33,963,620 |
| | | | | |
|
|
| | | | | | | 272,192,569 |
| | | | | |
|
|
|
Capital Markets—9.1% |
Merrill Lynch & Co., Inc.
4.386%, 10/27/06 | | | 10,000,000 | | | 10,020,290 |
4.697%, 06/06/06 | | | 7,800,000 | | | 7,811,497 |
4.697%, 09/18/06 | | | 5,425,000 | | | 5,433,035 |
Morgan Stanley
4.330%, 08/04/06 (a) | | | 35,000,000 | | | 35,000,000 |
The Goldman Sachs Group, Inc
4.290%, 01/12/06 | | | 6,500,000 | | | 6,491,480 |
| | | | | |
|
|
| | | | | | | 64,756,302 |
| | | | | |
|
|
|
Commercial Banks—7.4% |
Bank of America Corp.
4.213%, 01/31/06 | | | 35,000,000 | | | 34,877,121 |
National City Bank
4.281%, 07/07/06 | | | 6,000,000 | | | 5,999,707 |
U.S. Bank National Association
4.313%, 09/29/06 | | | 12,000,000 | | | 11,998,000 |
| | | | | |
|
|
| | | | | | | 52,874,828 |
| | | | | |
|
|
|
Diversified Financial Services—30.4% |
Atomium Funding Corp.
4.280%, 01/31/06 | | | 14,104,000 | | | 14,053,696 |
Credit Suisse First Boston USA, Inc.
4.150%, 01/26/06 | | | 26,475,000 | | | 26,398,701 |
Cullinan Financial, Ltd. (144A)
4.456%, 09/15/06 | | | 25,000,000 | | | 24,997,385 |
Irish Life & Permanent, Plc.
4.370%, 12/22/06 | | | 20,000,000 | | | 20,000,000 |
Lexington Parker Capital Corp.
4.340%, 01/06/06 | | | 11,182,000 | | | 11,175,260 |
Links Finance, LLC
4.380%, 03/08/06 | | | 2,885,000 | | | 2,861,833 |
| | | | | | |
| Security Description | | Face
Amount | | Value* |
| | | | | | | |
|
Diversified Financial Services—(Continued) |
Monument Garden Funding
4.260%, 01/23/06 | | $ | 20,000,000 | | $ | 19,947,933 |
Nordea North America, Inc.
4.380%, 03/09/06 | | | 14,450,000 | | | 14,332,208 |
Prudential Financial
4.270%, 01/20/06 | | | 3,400,000 | | | 3,392,338 |
Sigma Finance, Inc.
4.230%, 01/31/06 | | | 35,000,000 | | | 34,876,625 |
Thames Asset Global Services
4.260%, 01/23/06 | | | 16,399,000 | | | 16,356,308 |
Transamerica IDEX
4.250%, 01/03/06 | | | 27,352,000 | | | 27,345,542 |
| | | | | |
|
|
| | | | | | | 215,737,829 |
| | | | | |
|
|
Total Commercial Paper
(Amortized Cost $605,561,528) | | | | | | 605,561,528 |
| | | | | |
|
|
|
| Certificate of Deposit—14.7% |
|
Commercial Banks— 14.7% |
BNP Paribas
4.505%, 10/19/06 | | | 7,500,000 | | | 7,500,000 |
CitiBank N.A.
4.475%, 03/29/06 | | | 13,000,000 | | | 13,000,000 |
DEPFA Bank, Plc.
4.525%, 10/16/06 | | | 8,300,000 | | | 8,300,000 |
Royal Bank of Scotland, Plc.
4.518%, 10/20/06 | | | 4,400,000 | | | 4,400,086 |
Societe Generale
4.780%, 12/06/06 | | | 7,000,000 | | | 7,000,000 |
Washington Mutual Bank, F.A.
4.460%, 03/28/06 | | | 30,000,000 | | | 30,000,000 |
Wells Fargo Bank N.A.
4.290%, 01/23/06 | | | 34,000,000 | | | 34,000,000 |
| | | | | |
|
|
Total Certificate of Deposit
(Amortized Cost $104,200,086) | | | | | | 104,200,086 |
| | | | | |
|
|
Total Investments—99.9%
(Amortized Cost $709,761,614) (b) | | | | | | 709,761,614 |
Other assets less liabilities | | | | | | 878,202 |
| | | | | |
|
|
| Total Net Assets—100% | | | | | $ | 710,639,816 |
| | | | | |
|
|
| (a) | Variable or Floating Rate Security. Rate disclosed is as of December 31, 2005. |
| (b) | The aggregate cost of investments for federal income tax purposes as of December 31, 2005 was $709,761,614. |
| (144A)— | Securities exempt from registration under Rule 144A of the Securities Act of 1933. These securities may be resold in transactions exempt from registration, normally to qualified institutional buyers. As of December 31, 2005, the market value of 144A securities was $34,997,385, which is 4.9% of total net assets. |
*See accompanying notes to financial statements.
MSF-366
Metropolitan Series Fund, Inc.
BlackRock Money Market Portfolio
Statement of Assets & Liabilities
December 31, 2005
| | | | | | | |
Assets | | | | | | | |
Investments at value | | | | | $ | 709,761,614 | |
Cash | | | | | | 1,843 | |
Receivable for: | | | | | | | |
Fund shares sold | | | | | | 2,445,643 | |
Accrued interest | | | | | | 778,581 | |
| | | | | |
|
|
|
Total Assets | | | | | | 712,987,681 | |
Liabilities | | | | | | | |
Payable for: | | | | | | | |
Fund shares redeemed | | $ | 1,860,189 | | | | |
Accrued expenses: | | | | | | | |
Management fees | | | 201,658 | | | | |
Service and distribution fees | | | 93,479 | | | | |
Deferred directors’ fees | | | 119,066 | | | | |
Other expenses | | | 73,473 | | | | |
| | |
|
| | | | |
Total Liabilities | | | | | | 2,347,865 | |
| | | | | |
|
|
|
Net Assets | | | | | $ | 710,639,816 | |
| | | | | |
|
|
|
Net assets consists of: | | | | | | | |
Capital paid in | | | | | $ | 710,651,198 | |
Undistributed net investment income | | | | | | 16,296 | |
Accumulated net realized losses | | | | | | (27,678 | ) |
| | | | | |
|
|
|
Net Assets | | | | | $ | 710,639,816 | |
| | | | | |
|
|
|
| Computation of offering price: | | | | | | | |
Class A | | | | | | | |
Net asset value and redemption price per share ($429,018,868 divided by 4,290,252 shares outstanding) | | | | | $ | 100.00 | |
| | | | | |
|
|
|
Class B | | | | | | | |
Net asset value and redemption price per share ($273,052,114 divided by 2,730,614 shares outstanding) | | | | | $ | 100.00 | |
| | | | | |
|
|
|
Class E | | | | | | | |
Net asset value and redemption price per share ($8,568,834 divided by 85,689 shares outstanding) | | | | | $ | 100.00 | |
| | | | | |
|
|
|
Amortized cost of investments | | | | | $ | 709,761,614 | |
| | | | | |
|
|
|
Statement of Operations
Year Ended December 31, 2005
| | | | | | | | |
Investment Income | | | | | | | | |
Interest | | | | | | $ | 21,808,467 | |
| | | | | | |
|
|
|
Expenses | | | | | | | | |
Management fees | | $ | 2,303,372 | | | | | |
Service and distribution fees—Class B | | | 510,300 | | | | | |
Service and distribution fees—Class E | | | 14,423 | | | | | |
Directors’ fees and expenses | | | 25,702 | | | | | |
Custodian | | | 140,768 | | | | | |
Audit and tax services | | | 23,767 | | | | | |
Legal | | | 25,341 | | | | | |
Printing | | | 177,142 | | | | | |
Insurance | | | 12,315 | | | | | |
Miscellaneous | | | 38,004 | | | | | |
| | |
|
|
| | | | |
Total expenses | | | 3,271,134 | | | | | |
Management fee waivers | | | (45,308 | ) | | | 3,225,826 | |
| | |
|
|
| |
|
|
|
Net Investment Income | | | | | | | 18,582,641 | |
| | | | | | |
|
|
|
Realized and Unrealized Loss | | | | | | | | |
| Realized loss on: | | | | | | | | |
Investments—net | | | | | | | (5,442 | ) |
| | | | | | |
|
|
|
Net loss | | | | | | | (5,442 | ) |
| | | | | | |
|
|
|
Net Increase in Net Assets From Operations | | | | | | $ | 18,577,199 | |
| | | | | | |
|
|
|
See accompanying notes to financial statements.
MSF-367
Metropolitan Series Fund, Inc.
BlackRock Money Market Portfolio
Statement of Changes in Net Assets
| | | | | | | | |
| | | Year ended
December 31,
2005
| | | Year ended
December 31,
2004
| |
From Operations | | | | | | | | |
Net investment income | | $ | 18,582,641 | | | $ | 5,383,855 | |
Net realized gain (loss) | | | (5,442 | ) | | | 0 | |
| | |
|
|
| |
|
|
|
Increase in net assets from operations | | | 18,577,199 | | | | 5,383,855 | |
| | |
|
|
| |
|
|
|
From Distributions to Shareholders | | | | | | | | |
Net investment income | | | | | | | | |
Class A | | | (12,538,591 | ) | | | (4,758,832 | ) |
Class B | | | (5,788,298 | ) | | | (546,831 | ) |
Class E | | | (255,753 | ) | | | (78,192 | ) |
| | |
|
|
| |
|
|
|
Total distributions | | | (18,582,641 | ) | | | (5,383,855 | ) |
| | |
|
|
| |
|
|
|
Increase (decrease) in net assets from capital share transactions | | | 150,543,141 | | | | (132,257,191 | ) |
| | |
|
|
| |
|
|
|
Total increase (decrease) in net assets | | | 150,537,699 | | | | (132,257,191 | ) |
| | |
Net Assets | | | | | | | | |
Beginning of the period | | | 560,102,117 | | | | 692,359,308 | |
| | |
|
|
| |
|
|
|
End of the period | | $ | 710,639,816 | | | $ | 560,102,117 | |
| | |
|
|
| |
|
|
|
Other Information:
Capital Shares
Transactions in capital shares were as follows:
| | | | | | | | | | | | | | |
| | | Year ended
December 31, 2005
| | | Year ended
December 31, 2004
| |
| | | Shares
| | | $
| | | Shares
| | | $
| |
Class A | | | | | | | | | | | | | | |
Sales | | 4,517,531 | | | $ | 451,759,744 | | | 7,617,875 | | | $ | 761,784,717 | |
Shares issued through acquisition | | 31,414 | | | | 3,141,378 | | | 0 | | | | 0 | |
Reinvestments | | 125,453 | | | | 12,538,591 | | | 47,589 | | | | 4,758,832 | |
Redemptions | | (5,080,912 | ) | | | (508,091,177 | ) | | (9,072,882 | ) | | | (907,288,288 | ) |
| | |
|
| |
|
|
| |
|
| |
|
|
|
Net decrease | | (406,514 | ) | | $ | (40,651,464 | ) | | (1,407,418 | ) | | $ | (140,744,739 | ) |
| | |
|
| |
|
|
| |
|
| |
|
|
|
Class B | | | | | | | | | | | | | | |
Sales | | 2,922,644 | | | $ | 292,561,401 | | | 831,966 | | | $ | 83,196,625 | |
Shares issued through acquisition | | 1,944,828 | | | | 194,482,841 | | | 0 | | | | 0 | |
Reinvestments | | 60,927 | | | | 5,788,298 | | | 5,468 | | | | 546,831 | |
Redemptions | | (2,985,875 | ) | | | (298,587,522 | ) | | (800,176 | ) | | | (80,017,602 | ) |
| | |
|
| |
|
|
| |
|
| |
|
|
|
Net increase | | 1,942,524 | | | $ | 194,245,018 | | | 37,258 | | | $ | 3,725,854 | |
| | |
|
| |
|
|
| |
|
| |
|
|
|
Class E | | | | | | | | | | | | | | |
Sales | | 32,849 | | | $ | 3,284,948 | | | 283,220 | | | $ | 28,321,972 | |
Reinvestments | | 2,558 | | | | 255,753 | | | 782 | | | | 78,192 | |
Redemptions | | (65,911 | ) | | | (6,591,114 | ) | | (236,385 | ) | | | (23,638,470 | ) |
| | |
|
| |
|
|
| |
|
| |
|
|
|
Net decrease | | (30,504 | ) | | $ | (3,050,413 | ) | | 47,617 | | | $ | 4,761,694 | |
| | |
|
| |
|
|
| |
|
| |
|
|
|
Increase derived from capital share transactions | | 1,505,506 | | | $ | 150,543,141 | | | (1,322,543 | ) | | $ | (132,257,191 | ) |
| | |
|
| |
|
|
| |
|
| |
|
|
|
See accompanying notes to financial statements.
MSF-368
Metropolitan Series Fund, Inc.
BlackRock Money Market Portfolio
Financial Highlights
| | | | | | | | | | | | | | | | | | | | |
| | | Class A
| |
| | | Year ended December 31,
| |
| | | 2005
| | | 2004
| | | 2003
| | | 2002
| | | 2001
| |
Net Asset Value, Beginning of Period | | $ | 100.00 | | | $ | 100.00 | | | $ | 100.00 | | | $ | 100.00 | | | $ | 100.00 | |
| | |
|
|
| |
|
|
| |
|
|
| |
|
|
| |
|
|
|
Income From Investment Operations | | | | | | | | | | | | | | | | | | | | |
Net investment income | | | 2.85 | | | | 0.98 | | | | 0.80 | | | | 1.41 | | | | 3.88 | |
| | |
|
|
| |
|
|
| |
|
|
| |
|
|
| |
|
|
|
Total from investment operations | | | 2.85 | | | | 0.98 | | | | 0.00 | | | | 1.41 | | | | 3.88 | |
| | |
|
|
| |
|
|
| |
|
|
| |
|
|
| |
|
|
|
Less Distributions | | | | | | | | | | | | | | | | | | | | |
Distributions from net investment income | | | (2.85 | ) | | | (0.98 | ) | | | (0.80 | ) | | | (1.41 | ) | | | (3.88 | ) |
| | |
|
|
| |
|
|
| |
|
|
| |
|
|
| |
|
|
|
Total distributions | | | (2.85 | ) | | | (0.98 | ) | | | (0.80 | ) | | | (1.41 | ) | | | (3.88 | ) |
| | |
|
|
| |
|
|
| |
|
|
| |
|
|
| |
|
|
|
Net Asset Value, End of Period | | $ | 100.00 | | | $ | 100.00 | | | $ | 100.00 | | | $ | 100.00 | | | $ | 100.00 | |
| | |
|
|
| |
|
|
| |
|
|
| |
|
|
| |
|
|
|
Total Return (%) | | | 2.9 | | | | 1.0 | | | | 0.8 | | | | 1.4 | | | | 4.0 | |
Ratio of operating expenses to average net assets (%) | | | 0.41 | | | | 0.42 | | | | 0.40 | | | | 0.43 | | | | 0.42 | |
Ratio of net investment income to average net assets (%) | | | 2.83 | | | | 0.97 | | | | 0.78 | | | | 1.40 | | | | 3.80 | |
Net assets, end of period (000) | | $ | 429,019 | | | $ | 469,674 | | | $ | 610,419 | | | $ | 332,151 | | | $ | 277,381 | |
| | | | | | | | | | | | | | | | | | | | |
| | | Class B
| |
| | | Year ended December 31,
| | | May 1, 2001(a)
through
December 31,
2001
| |
| | | 2005
| | | 2004
| | | 2003
| | | 2002
| | |
Net Asset Value, Beginning of Period | | $ | 100.00 | | | $ | 100.00 | | | $ | 100.00 | | | $ | 100.00 | | | $ | 100.00 | |
| | |
|
|
| |
|
|
| |
|
|
| |
|
|
| |
|
|
|
Income From Investment Operations | | | | | | | | | | | | | | | | | | | | |
Net investment income | | | 2.60 | | | | 0.73 | | | | 0.55 | | | | 1.16 | | | | 1.95 | |
| | |
|
|
| |
|
|
| |
|
|
| |
|
|
| |
|
|
|
Total from investment operations | | | 2.60 | | | | 0.73 | | | | 0.55 | | | | 1.16 | | | | 1.95 | |
| | |
|
|
| |
|
|
| |
|
|
| |
|
|
| |
|
|
|
Less Distributions | | | | | | | | | | | | | | | | | | | | |
Distributions from net investment income | | | (2.60 | | | | (0.73 | ) | | | (0.55 | ) | | | (1.16 | ) | | | (1.95 | ) |
| | |
|
|
| |
|
|
| |
|
|
| |
|
|
| |
|
|
|
Total distributions | | | (2.60 | ) | | | (0.73 | ) | | | (0.55 | ) | | | (1.16 | ) | | | (1.95 | ) |
| | |
|
|
| |
|
|
| |
|
|
| |
|
|
| |
|
|
|
Net Asset Value, End of Period | | $ | 100.00 | | | $ | 100.00 | | | $ | 100.00 | | | $ | 100.00 | | | $ | 100.00 | |
| | |
|
|
| |
|
|
| |
|
|
| |
|
|
| |
|
|
|
Total Return (%) | | | 2.6 | | | | 0.7 | | | | 0.6 | | | | 1.2 | | | | 2.0 | (b) |
Ratio of operating expenses to average net assets (%) | | | 0.66 | | | | 0.67 | | | | 0.65 | | | | 0.68 | | | | 0.67 | (c) |
Ratio of net investment income to average net assets (%) | | | 2.84 | | | | 0.74 | | | | 0.65 | | | | 1.15 | | | | 1.65 | (c) |
Net assets, end of period (000) | | $ | 273,052 | | | $ | 78,809 | | | $ | 75,083 | | | $ | 57,260 | | | $ | 15,407 | |
| (a) | Commencement of operations. |
| (b) | Period less than one year is not computed on an annualized basis. |
| (c) | Computed on an annualized basis. |
See accompanying notes to financial statements.
MSF-369
Metropolitan Series Fund, Inc.
BlackRock Money Market Portfolio
Financial Highlights
| | | | | | | | | | | | |
| | | Class E
| |
| | | Year ended
December 31,
| | | April 23, 2003(a)
through
December 31,
2003
| |
| | | 2005
| | | 2004
| | |
Net Asset Value, Beginning of Period | | $ | 100.00 | | | $ | 100.00 | | | $ | 100.00 | |
| | |
|
|
| |
|
|
| |
|
|
|
Income From Investment Operations | | | | | | | | | | | | |
Net investment income | | | 2.70 | | | | 0.83 | | | | 0.42 | |
| | |
|
|
| |
|
|
| |
|
|
|
Total from investment operations | | | 2.70 | | | | 0.83 | | | | 0.42 | |
| | |
|
|
| |
|
|
| |
|
|
|
Less Distributions | | | | | | | | | | | | |
Distributions from net investment income | | | (2.70 | ) | | | (0.83 | ) | | | (0.42 | ) |
| | |
|
|
| |
|
|
| |
|
|
|
Total distributions | | | (2.70 | ) | | | (0.83 | ) | | | (0.42 | ) |
| | |
|
|
| |
|
|
| |
|
|
|
Net Asset Value, End of Period | | $ | 100.00 | | | $ | 100.00 | | | $ | 100.00 | |
| | |
|
|
| |
|
|
| |
|
|
|
Total Return (%) | | | 2.7 | | | | 0.8 | | | | 0.4 | (b) |
Ratio of operating expenses to average net assets (%) | | | 0.56 | | | | 0.57 | | | | 0.55 | (c) |
Ratio of net investment income to average net assets (%) | | | 2.66 | | | | 0.88 | | | | 0.58 | (c) |
Net assets, end of period (000) | | $ | 8,569 | | | $ | 11,619 | | | $ | 6,858 | |
| (a) | Commencement of operations. |
| (b) | Period less than one year is not computed on an annualized basis. |
| (c) | Computed on an annualized basis. |
See accompanying notes to financial statements.
MSF-370
Metropolitan Series Fund, Inc.
Notes to Financial Statements—December 31, 2005
| 1. | SIGNIFICANT ACCOUNTING POLICIES: |
Metropolitan Series Fund, Inc. (the “Fund”) is organized as a corporation under the laws of Maryland pursuant to Articles of Incorporation filed on November 23, 1982, as amended, and registered under the Investment Company Act of 1940, as amended (the “1940 Act”), as an open-end investment company. Each Portfolio of the Fund other than Harris Oakmark Focused Value and each of the Fund’s five Asset Allocation Portfolios (each, an “Asset Allocation Portfolio,” and, collectively, the “Asset Allocation Portfolios”) is diversified. Harris Oakmark Focused Value and the Asset Allocation Portfolios are non-diversified. The Fund is a “series” type of mutual fund, which issues separate series of stock. Each series represents an interest in a separate portfolio of Fund investments (“Portfolio”). Shares in the Fund are not offered directly to the general public and are currently available only to separate accounts established by Metropolitan Life Insurance Company, New England Life Insurance Company, General American Life Insurance Company, The MetLife Investors Group of Insurance Companies and other affiliated insurance companies (collectively, the “Insurance Companies”), as an investment vehicle for variable life insurance, group annuity or variable annuity products, although not all Portfolios are available to all such separate accounts. Each Portfolio’s shares may be divided into different classes. Currently the classes being offered by some or all Portfolios are named Class A, Class B, and Class E. The classes of a given Portfolio’s shares are identical, except that certain additional charges (Rule 12b-1 fees) are made against Class B and Class E shares. Investment income, realized and unrealized capital gains and losses, the common expenses of each Portfolio and certain Portfolio-level expense reductions, if any, are allocated on a pro rata basis to each class based on the relative net asset of each class to the total net assets of each Portfolio. Each class of shares differs in its respective distribution expenses. The following is a summary of significant accounting policies consistently followed by the Fund in the preparation of its financial statements. The policies are in conformity with accounting principles generally accepted in the United States of America (“GAAP”).
Investment Valuation:
As permitted under Rule 2a-7 of the 1940 Act, and subject to certain conditions therein, the BlackRock Money Market Portfolio employs the amortized cost method of security valuation that the Fund’s Board of Directors (the “Board”) has determined approximates the fair market net asset value per share of the Portfolio. The Board monitors the deviations between the Portfolio’s net asset value per share, as determined by using available market quotations, and its amortized cost price per share. If the deviation exceeds 1/2 of 1%, the Board will consider what action, if any, should be initiated.
Debt securities (other than short term obligations with a remaining maturity of sixty days or less) are valued on the basis of valuations furnished by independent pricing services selected by the relevant subadviser pursuant to authorization of the Board. Short term obligations with a remaining maturity of sixty days or less are stated at amortized cost value that approximates fair market value.
Equity securities traded on a national securities exchange or exchanges are valued at their last sale price on the principal trading market. Equity securities traded on the NASDAQ National Market System are valued at the NASDAQ Official Closing Price (the “NOCP”). The NOCP is the last sale price if it falls between the spread of the last reported bid and asked prices. If the last reported bid and asked prices are above the last reported sale price, the NOCP will be the last reported bid price. If the last reported bid and asked prices are below the last reported sale price, the NOCP will be the last reported asked price. Equity securities traded on a national securities exchange or exchanges or on the NASDAQ National Market System for which there is no reported sale during the day, are valued at the last reported bid price. A security that is listed or traded on more than one exchange is valued at the quotation on the exchange determined to be the primary market for that security by the Board or its delegates. If no closing price is available, then such securities are valued by using the last reported bid price. Equity securities traded over-the-counter are valued at the last reported sales price.
If no current market value quotation is readily available or reliable for a portfolio security, fair value will be determined in accordance with procedures established by and under the general supervision of the Board. When the Fund uses fair value pricing, it may take into account any factors it deems appropriate. The value of securities used by the Fund to calculate its net asset value may differ from quoted or published prices for the same securities. Fair value pricing involves subjective judgments and the fair value determined for a security may be materially different than the value that could be realized upon the sale of that security.
The Fund expects to use fair value pricing for securities primarily traded on U.S. exchanges only under very limited circumstances. For example, the Fund may use fair value pricing if the exchange on which a security is traded closes early or trading in the security is suspended.
MSF-371
Metropolitan Series Fund, Inc.
Notes to Financial Statements—December 31, 2005—(Continued)
Securities traded primarily on an exchange outside of the United States which closes before the close of the New York Stock Exchange will be valued at the last sales price on that non-U.S. exchange. Securities traded primarily on an exchange outside of the United States for which there is no reported sale during the day are valued at the mean between the last reported bid and asked prices. However, because most foreign markets close well before the Fund values its securities (typically at 4 p.m. Eastern Time), the earlier close of these foreign markets gives rise to the possibility that significant events, including broad market moves, may have occurred after these foreign markets close but before the Fund values its securities. For example, foreign security values may be affected by activity that occurs after the close of foreign securities markets. To account for this, the Fund may frequently value many of the Portfolios’ foreign equity securities using fair value prices based on third party vendor modeling tools.
Forward foreign currency exchange contracts are valued based on the mean between closing bid and ask prices of the forward currency contract rates in the London foreign exchange markets on a daily basis as provided by a reliable bank or dealer.
Options, whether on securities, indices, or futures contracts, are valued at the last sales price available as of the close of business on the day of valuation or, if no sale, at the mean between the bid and asked prices. Options on currencies are valued at the spot price each day. As a general matter, futures contracts are marked-to-market daily.
The value of futures contracts will be the sum of the margin deposit plus or minus the difference between the value of the futures contract on each day the net asset value is calculated and the value on the date the futures contract originated, value being that established on a recognized commodity exchange, or by reference to other customary sources, with gain or loss being realized when the futures contract closes or expires.
Subject to the Board’s oversight, the Board has delegated day-to-day responsibility for valuing Portfolio assets to MetLife Advisers, LLC (“MetLife Advisers”) or the subadvisers of the Portfolios, who value such assets as described above and operate under procedures approved by the Board.
The net asset value of each Asset Allocation Portfolio and the Zenith Equity Portfolio is calculated based on the net asset values of the underlying portfolios in which such Portfolios invests. The underlying portfolios that are Portfolios of the Fund will use fair value pricing in the circumstances and manner described above. For more information about the use of fair value pricing by the underlying portfolios that are Portfolios of Met Investors Series Trust (“MIST”), please refer to the prospectus for such underlying portfolios.
Investment Transactions and Related Investment Income:
Portfolio security transactions are recorded on the trade date. Securities denominated in foreign currencies are translated at exchange rates prevailing on the respective dates traded. Dividend income is recorded on the ex-dividend date or, for certain foreign securities, when notified. Interest income, which includes amortization of premium and accretion of discount on debt securities, is recorded on the accrual basis. Transactions denominated in foreign currencies are recorded at the rate prevailing when earned or incurred. Realized gains and losses on investments and unrealized appreciation and depreciation are determined on the identified cost basis, which is the same basis used for federal income tax purposes. Asset and liability accounts that are denominated in foreign currencies are adjusted to reflect current exchange rates prevailing on the respective dates traded.
Repurchase Agreements:
Each Portfolio, through the custodian or a subcustodian, receives delivery of the underlying securities collateralizing repurchase agreements. The Fund requires the custodian to take possession, to have legally segregated in the Federal Reserve Book Entry System, or to have segregated within the custodian’s vault, all securities held as collateral for repurchase agreements. It is the Fund’s policy that the market value of the collateral be at least equal to 100% of the repurchase price in the case of a repurchase agreement of one-day duration and 102% on all other repurchase agreements. Each Portfolio’s subadviser is responsible for determining that the value of the collateral is at all times at least equal to the repurchase price. In connection with transactions in repurchase agreements, if the seller defaults and the value of the collateral declines or if the seller enters an insolvency proceeding, realization of the collateral by the Portfolio may be delayed or limited.
Foreign Currency Translation:
The books and records of the Fund are maintained in U.S. dollars. The values of securities, currencies and other assets and liabilities denominated in currencies other than U.S. dollars are translated into U.S. dollars based upon foreign exchange rates prevailing at the end of the period. Purchases and sales of investment securities, income and expenses are translated on the
MSF-372
Metropolitan Series Fund, Inc.
Notes to Financial Statements—December 31, 2005—(Continued)
respective dates of such transactions. Since the values of investment securities are presented at the foreign exchange rates prevailing at the end of the period, it is not practical to isolate that portion of the results of operations arising from changes in exchange rates from that portion of the results of operations reflecting fluctuations arising from changes in market prices of the investment securities. Such fluctuations are included with the net realized and unrealized gain or loss on investments.
Net realized foreign exchange gains or losses arise from sales of foreign currency, currency gains or losses realized between the trade and settlement dates on securities transactions, and the difference between the amounts of dividends, interest, and foreign withholding taxes recorded by each Portfolio and the U.S. dollar equivalent of the amounts actually received or paid by each Portfolio. Net unrealized foreign exchange gains and losses arise from changes in the value of assets and liabilities, other than investment securities, resulting from changes in the exchange rate.
Forward Foreign Currency Exchange Contracts:
Certain Portfolios may enter into forward foreign currency exchange contracts primarily to hedge against foreign currency exchange rate risks on their non-U.S. dollar denominated investment securities. When entering into a forward currency contract, such a Portfolio agrees to receive or deliver a fixed quantity of foreign currency for an agreed-upon price on an agreed future date. These contracts are valued daily and the Portfolio’s net equity therein, representing unrealized gain or loss on the contracts as measured by the difference between the foreign exchange rates at the dates of entry into the contracts and the forward rates at the settlement date, is included in the statement of assets and liabilities. Realized and unrealized gains and losses are included in the statement of operations. These instruments involve market and/or credit risk in excess of the amount recognized in the statement of assets and liabilities. Risks arise from the possible inability of counter parties to meet the terms of their contracts and from movement in currency and securities values and interest rates.
Futures Contracts:
Certain Portfolios may buy and sell futures contracts (on recognized exchanges) on equity securities or stock indices as a hedge or to enhance return. Futures contracts are agreements to buy or sell a security, or deliver a final cash settlement price in connection with an index, interest rate, currency, or other contracts not calling for physical delivery, for a set price in the future. A Portfolio must post an amount equal to a portion of the total market value of the futures contract as futures variation margin, which is returned when a Portfolio’s obligations under the contract have been satisfied. From time to time thereafter, the Portfolio may have to post variation margin to maintain this amount as the market value of the contract fluctuates. Risks of entering into futures contracts (and related options) include the possibility that there may be an illiquid market and that a change in the value of the contract or option may not correlate with changes in the value of the underlying securities.
Options:
Certain Portfolios may use options to hedge against changes in values of securities the Portfolio owns or expects to purchase. Writing puts or buying calls tends to increase the Portfolio’s exposure to the underlying instrument and writing calls or buying puts tends to decrease the Portfolio’s exposure to the underlying instrument, or hedge other Portfolio investments.
For options purchased to hedge the Portfolio’s investments, the potential risk to the Portfolio is that the change in value of options contracts may not correspond to the change in value of the hedged instruments. In addition, losses may arise from changes in the value of the underlying instruments, if there is an illiquid secondary market, or if the counterparty is unable to perform. The maximum loss for purchased options is limited to the premium initially paid for the option. For options written by the Portfolio, the maximum loss is not limited to the premium initially received for the option.
Mortgage Dollar Rolls:
The Salomon Brothers Strategic Bond Opportunities Portfolio, Salomon Brothers U.S. Government Portfolio and BlackRock Bond Income Portfolio may enter into mortgage “dollar rolls” in which a Portfolio sells mortgage-backed securities for delivery in the current month and simultaneously contracts to repurchase substantially similar (same type, coupon and maturity) securities on a specified future date. Dollar rolls are accounted for as purchase and sale transactions; gain/loss is recognized at the end of the term of the dollar roll. The average monthly balance of dollar rolls outstanding during the year ended December 31, 2005 was approximately $131,880,135, $352,643,717 and $259,916,128 for the Salomon Brothers Strategic Bond Opportunities Portfolio, Salomon Brothers U.S. Government Portfolio and BlackRock Bond Income Portfolio, respectively.
Portfolios that enter into mortgage dollar rolls are subject to the risk that the market value of the securities the Portfolio is obligated to repurchase under the agreement may decline below the repurchase price. In the event the buyer of securities under
MSF-373
Metropolitan Series Fund, Inc.
Notes to Financial Statements—December 31, 2005—(Continued)
a mortgage dollar roll files for bankruptcy or becomes insolvent, the Portfolio’s use of proceeds of the dollar roll may be restricted pending a determination by the other party, or its trustee or receiver, whether to enforce the Portfolio’s obligation to repurchase the securities.
“When-Issued” Securities:
Purchasing securities “when-issued” is a commitment by a Portfolio to buy a security before the security is actually issued. The amount of the Portfolio’s payment obligation and the security’s interest rate are determined when the commitment is made, even though no interest accrues until the security is issued, which is generally 15 to 120 days later. The Portfolio will segregate liquid assets with its custodian sufficient at all times to satisfy these commitments. If the value of the security is less when delivered than when the commitment was made, the Portfolio will suffer a loss.
Estimates and Assumptions:
The preparation of financial statements in conformity with GAAP requires management to make estimates and assumptions that affect the reported amounts of assets and liabilities and disclosure of contingent assets and liabilities as of the date of the financial statements and the reported amounts of income and expenses during the reporting period. Actual results could differ from those estimates.
Federal Income Taxes:
It is the Fund’s policy to comply with the requirements of the Internal Revenue Code of 1986, as amended, and regulations there under applicable to regulated investment companies and to distribute all of its taxable income to shareholders. Therefore, no federal income tax provision is required. As of December 31, 2005, the following Portfolios had capital loss carryovers.
| | | | | | | | | | | | | | | | | | | | | | | | | | | |
Portfolio
| | Total
| | Expiring
12/31/13
| | Expiring
12/31/12
| | Expiring
12/31/11
| | Expiring
12/31/10
| | Expiring
12/31/09
| | Expiring
12/31/08
| | Expiring
12/31/07
| | Expiring
12/31/06
|
BlackRock Aggressive Growth | | $ | 309,086,773 | | $ | 0 | | $ | 0 | | $ | 0 | | $ | 201,096,876 | | $ | 1,188,639 | | $ | 104,064,382 | | $ | 2,736,876 | | $ | 0 |
BlackRock Diversified | | | 129,763,906 | | | 0 | | | 0 | | | 0 | | | 125,483,248 | | | 4,280,658 | | | 0 | | | 0 | | | 0 |
BlackRock Investment Trust | | | 321,551,043 | | | 0 | | | 0 | | | 14,588,867 | | | 306,962,176 | | | 0 | | | 0 | | | 0 | | | 0 |
BlackRock Large Cap Value | | | 1,937,297 | | | 0 | | | 0 | | | 0 | | | 557,986 | | | 1,379,311 | | | 0 | | | 0 | | | 0 |
BlackRock Legacy Large Cap Growth | | | 224,315,221 | | | 0 | | | 0 | | | 0 | | | 205,405,850 | | | 18,909,371 | | | 0 | | | 0 | | | 0 |
BlackRock Money Market | | | 27,589 | | | 5,353 | | | 3,013 | | | 946 | | | 1,430 | | | 16,281 | | | 474 | | | 32 | | | 60 |
Capital Guardian U.S. Equity | | | 23,472,193 | | | 0 | | | 0 | | | 0 | | | 11,190,563 | | | 12,281,630 | | | 0 | | | 0 | | | 0 |
Davis Venture Value | | | 124,069,852 | | | 13,892,996 | | | 4,821,033 | | | 25,334,924 | | | 49,957,026 | | | 30,063,873 | | | 0 | | | 0 | | | 0 |
FI International Stock | | | 29,254,477 | | | 0 | | | 0 | | | 0 | | | 29,254,477 | | | 0 | | | 0 | | | 0 | | | 0 |
FI Mid Cap Opportunities | | | 706,797,053 | | | 0 | | | 0 | | | 16,477,953 | | | 376,464,857 | | | 313,854,243 | | | 0 | | | 0 | | | 0 |
FI Value Leaders | | | 9,192,088 | | | 0 | | | 0 | | | 9,192,088 | | | 0 | | | 0 | | | 0 | | | 0 | | | 0 |
Harris Oakmark Large Cap Value | | | 2,217,415 | | | 0 | | | 723,150 | | | 1,494,265 | | | 0 | | | 0 | | | 0 | | | 0 | | | 0 |
Lehman Brothers Aggregate Bond Index | | | 5,614,476 | | | 3,790,866 | | | 499,465 | | | 0 | | | 449,093 | | | 612,878 | | | 223,967 | | | 38,207 | | | 0 |
MFS Investors Trust | | | 17,642,595 | | | 0 | | | 0 | | | 0 | | | 9,265,962 | | | 8,376,633 | | | 0 | | | 0 | | | 0 |
MFS Total Return | | | 23,435,321 | | | 0 | | | 0 | | | 0 | | | 5,467,027 | | | 13,005,887 | | | 4,962,407 | | | 0 | | | 0 |
Morgan Stanley EAFE Index | | | 1,410,854 | | | 0 | | | 0 | | | 0 | | | 1,410,854 | | | 0 | | | 0 | | | 0 | | | 0 |
Salomon Brothers U.S. Government | | | 3,234,233 | | | 3,234,233 | | | 0 | | | 0 | | | 0 | | | 0 | | | 0 | | | 0 | | | 0 |
T. Rowe Price Large Cap Growth | | | 24,763,122 | | | 0 | | | 0 | | | 4,593,031 | | | 16,388,306 | | | 3,781,785 | | | 0 | | | 0 | | | 0 |
T. Rowe Price Small Cap Growth | | | 29,159,749 | | | 0 | | | 0 | | | 9,886,767 | | | 19,272,982 | | | 0 | | | 0 | | | 0 | | | 0 |
Zenith Equity | | | 149,347,303 | | | 0 | | | 0 | | | 14,363,795 | | | 0 | | | 134,983,508 | | | 0 | | | 0 | | | 0 |
MSF-374
Metropolitan Series Fund, Inc.
Notes to Financial Statements—December 31, 2005—(Continued)
Dividends and Distributions to Shareholders:
BlackRock Money Market Portfolio dividends are declared daily to shareholders of record at the time and are paid monthly. All other Portfolios record dividends and distributions on the ex-dividend date. Net realized gains from security transactions (if any) are generally distributed annually to shareholders. The timing and characterization of certain income and capital gains distributions are determined in accordance with federal tax regulations that may differ from GAAP. Permanent book and tax basis differences relating to shareholder distributions will result in reclassification between under/over distributed net investment income, accumulated net realized gains/losses and paid in capital. These differences primarily relate to tax equalization, investments in mortgage backed securities and investments in foreign securities.
The tax character of distributions paid for the period ended December 31, 2005 and 2004 were as follows:
| | | | | | | | | | | | | | | | | | | | | | | |
| | | Ordinary Income
| | Long Term Gain
| | Return of Capital
| | Total
|
Portfolio
| | 2005
| | 2004
| | 2005
| | 2004
| | 2005
| | 2004
| | 2005
| | 2004
|
BlackRock Aggressive Growth | | | — | | | — | | | — | | | — | | — | | | — | | | — | | | — |
BlackRock Bond Income | | $ | 46,837,876 | | $ | 42,480,623 | | $ | 5,742,559 | | $ | 15,608,636 | | — | | | — | | $ | 52,580,435 | | $ | 58,089,259 |
BlackRock Diversified | | | 30,248,416 | | | 37,147,177 | | | — | | | — | | — | | | — | | | 30,248,416 | | | 37,147,177 |
BlackRock Investment Trust | | | 20,621,302 | | | 14,065,241 | | | — | | | — | | — | | | — | | | 20,621,302 | | | 14,065,241 |
BlackRock Large Cap Value | | | 1,058,611 | | | — | | | 1,263,456 | | | — | | — | | | — | | | 2,322,067 | | | 0 |
BlackRock Legacy Large Cap Growth | | | 2,174,752 | | | — | | | — | | | — | | — | | | — | | | 2,174,752 | | | 0 |
BlackRock Money Market | | | 18,582,642 | | | 5,383,855 | | | — | | | — | | — | | | — | | | 18,582,642 | | | 5,383,855 |
BlackRock Strategic Value | | | 4,492,905 | | | — | | | 61,041,533 | | | — | | — | | | — | | | 65,534,438 | | | 0 |
Capital Guardian U.S. Equity | | | 112,272 | | | 4,941,578 | | | — | | | — | | — | | | — | | | 112,272 | | | 4,941,578 |
Davis Venture Value | | | 18,493,308 | | | 10,181,323 | | | — | | | — | | — | | | — | | | 18,493,308 | | | 10,181,323 |
FI International Stock | | | 2,742,897 | | | 5,168,609 | | | — | | | — | | — | | | — | | | 2,742,897 | | | 5,168,609 |
FI Mid Cap Opportunities | | | — | | | 4,781,351 | | | — | | | — | | — | | $ | 83,260 | | | 0 | | | 4,781,351 |
FI Value Leaders | | | 6,582,101 | | | 7,401,342 | | | — | | | — | | — | | | — | | | 6,582,101 | | | 7,401,342 |
Franklin Templeton Small Cap Growth | | | — | | | — | | | 3,093,451 | | | — | | — | | | — | | | 3,093,451 | | | 0 |
Harris Oakmark Focused Value | | | 663,863 | | | 268,573 | | | 17,918,250 | | | 16,558,074 | | — | | | — | | | 18,582,113 | | | 16,826,647 |
Harris Oakmark Large Cap Value | | | 3,500,576 | | | 2,128,118 | | | — | | | — | | — | | | — | | | 3,500,576 | | | 2,128,118 |
Jennison Growth | | | 2,443,886 | | | 370,406 | | | 130,293 | | | — | | — | | | — | | | 2,574,179 | | | 0 |
Lehman Brothers Aggregate Bond Index | | | 37,577,385 | | | 22,348,934 | | | — | | | — | | — | | | — | | | 37,577,385 | | | 22,348,934 |
Loomis Sayles Small Cap | | | — | | | — | | | 5,078,557 | | | — | | — | | | — | | | 5,078,557 | | | 0 |
MetLife Aggressive Allocation | | | 60,929 | | | — | | | — | | | — | | — | | | — | | | 60,929 | | | 0 |
MetLife Conservative Allocation | | | 56,923 | | | — | | | — | | | — | | — | | | — | | | 56,923 | | | 0 |
MetLife Conservative to Moderate Allocation | | | 209,716 | | | — | | | — | | | — | | — | | | — | | | 209,716 | | | 0 |
MetLife Mid Cap Stock Index | | | 5,048,633 | | | 1,434,377 | | | 15,228,603 | | | 788,114 | | — | | | — | | | 20,277,236 | | | 2,222,491 |
MetLife Moderate Allocation | | | 453,403 | | | — | | | — | | | — | | — | | | — | | | 453,403 | | | 0 |
MetLife Moderate to Aggressive Allocation | | | 307,176 | | | — | | | — | | | — | | — | | | — | | | 307,176 | | | 0 |
MetLife Stock Index | | | 77,452,113 | | | 38,558,216 | | | — | | | — | | — | | | — | | | 77,452,113 | | | 38,558,216 |
MFS Investors Trust | | | 414,321 | | | 396,926 | | | — | | | — | | — | | | — | | | 414,321 | | | 396,926 |
MFS Total Return | | | 8,159,735 | | | 5,766,449 | | | 5,478,406 | | | 1,002,497 | | — | | | — | | | 13,638,141 | | | 6,768,946 |
Morgan Stanley EAFE Index | | | 6,246,917 | | | 2,125,372 | | | — | | | — | | — | | | — | | | 6,246,917 | | | 2,125,372 |
MSF-375
Metropolitan Series Fund, Inc.
Notes to Financial Statements—December 31, 2005—(Continued)
| | | | | | | | | | | | | | | | | | | | | | |
| | | Ordinary Income
| | Long Term Gain
| | Return of Capital
| | Total
|
Portfolio
| | 2005
| | 2004
| | 2005
| | 2004
| | 2005
| | 2004
| | 2005
| | 2004
|
Neuberger Berman Mid Cap Value | | $ | 22,015,796 | | $ | 2,417,615 | | $ | 29,010,138 | | $ | 7,702,339 | | — | | — | | $ | 51,025,934 | | $ | 10,119,954 |
Oppenheimer Global Equity | | | 1,297,062 | | | 3,151,995 | | | — | | | — | | — | | — | | | 1,297,062 | | | 3,151,995 |
Russell 2000 Index | | | 6,162,833 | | | 1,501,190 | | | 11,452,307 | | | — | | — | | — | | | 17,615,141 | | | 1,501,190 |
Salomon Brothers Strategic Bond Opportunities | | | 15,252,865 | | | 8,574,232 | | | 3,641,471 | | | — | | — | | — | | | 18,894,336 | | | 8,574,232 |
Salomon Brothers U.S. Government | | | 10,558,157 | | | 5,369,789 | | | — | | | 705,734 | | — | | — | | | 10,558,157 | | | 6,075,523 |
T. Rowe Price Large Cap Growth | | | 1,487,546 | | | 392,986 | | | — | | | — | | — | | — | | | 1,487,546 | | | 392,986 |
T. Rowe Price Small Cap Growth | | | — | | | — | | | — | | | — | | — | | — | | | 0 | | | 0 |
Zenith Equity | | | 9,105,003 | | | 4,637,824 | | | — | | | — | | — | | — | | | 9,105,003 | | | 4,637,824 |
As of December 31, 2005, the components of distributable earnings (accumulated losses) on a federal income tax basis were as follows:
| | | | | | | | | | | | | | | | | | |
Portfolio
| | Undistributed
Ordinary
Income
| | Undistributed
Long Term
Gain
| | Unrealized
Appreciation/
(Depreciation)
| | | Loss
Carryforwards
and Deferrals
| | | Total
| |
BlackRock Aggressive Growth | | | — | | | — | | $ | 186,861,225 | | | $ | (309,086,773 | ) | | $ | (122,225,548 | ) |
BlackRock Bond Income | | $ | 43,996,428 | | $ | 936,708 | | | (7,996,832 | ) | | | — | | | | 36,936,304 | |
BlackRock Diversified | | | 43,591,586 | | | — | | | 78,761,952 | | | | (129,763,906 | ) | | | (7,410,369 | ) |
BlackRock Investment Trust | | | 23,209,724 | | | — | | | 126,698,562 | | | | (321,551,043 | ) | | | (171,642,757 | ) |
BlackRock Large Cap Value | | | 2,147,008 | | | 9,238,150 | | | 10,382,759 | | | | (1,937,297 | ) | | | 19,830,620 | |
BlackRock Legacy Large Cap Growth | | | 518,038 | | | — | | | 82,532,010 | | | | (224,315,221 | ) | | | (141,265,173 | ) |
BlackRock Money Market | | | 46,145 | | | — | | | — | | | | (27,589 | ) | | | 18,556 | |
BlackRock Strategic Value | | | 26,546,848 | | | 164,054,425 | | | 46,967,547 | | | | — | | | | 237,568,820 | |
Capital Guardian U.S. Equity | | | 3,454,395 | | | 19,733,905 | | | 66,229,973 | | | | (23,472,193 | ) | | | 65,946,080 | |
Davis Venture Value | | | 27,249,240 | | | — | | | 737,718,518 | | | | (124,069,852 | ) | | | 640,897,906 | |
FI International Stock | | | 8,420,179 | | | — | | | 93,242,576 | | | | (29,254,477 | ) | | | 72,408,278 | |
FI Mid Cap Opportunities | | | 44,156 | | | — | | | 72,901,936 | | | | (706,797,053 | ) | | | (633,850,961 | ) |
FI Value Leaders | | | 5,292,043 | | | — | | | 63,097,978 | | | | (9,192,088 | ) | | | 59,197,933 | |
Franklin Templeton Small Cap Growth | | | — | | | 6,034,354 | | | — | | | | 13,158,729 | | | | 19,193,083 | |
Harris Oakmark Focused Value | | | 7,420,606 | | | 184,502,080 | | | 369,490,230 | | | | — | | | | 561,412,916 | |
Harris Oakmark Large Cap Value | | | 4,374,524 | | | — | | | 77,101,686 | | | | (2,217,415 | ) | | | 79,258,795 | |
Jennison Growth | | | — | | | 31,736,199 | | | 196,170,862 | | | | — | | | | 227,907,061 | |
Lehman Brothers Aggregate Bond Index | | | 46,714,452 | | | — | | | (9,870,940 | ) | | | (5,614,476 | ) | | | 31,229,036 | |
Loomis Sayles Small Cap | | | 8,998,429 | | | 31,543,787 | | | 76,972,598 | | | | — | | | | 117,514,814 | |
MetLife Aggressive Allocation | | | 15,649 | | | 54,075 | | | 220,147 | | | | — | | | | 289,870 | |
MetLife Conservative Allocation | | | 6,140 | | | 43,835 | | | 72,512 | | | | — | | | | 122,487 | |
MetLife Conservative to Moderate Allocation | | | 615 | | | 187,983 | | | 669,340 | | | | — | | | | 857,938 | |
MetLife Mid Cap Stock Index | | | 5,820,039 | | | 22,803,031 | | | 71,148,345 | | | | — | | | | 99,771,416 | |
MetLife Moderate Allocation | | | 670 | | | 559,444 | | | 1,833,273 | | | | — | | | | 2,393,387 | |
MetLife Moderate to Aggressive Allocation | | | 10,877 | | | 460,247 | | | 1,782,274 | | | | — | | | | 2,253,398 | |
MetLife Stock Index | | | 78,033,045 | | | 107,498,842 | | | (7,897,276 | ) | | | — | | | | 177,634,611 | |
MFS Investors Trust | | | 698,718 | | | 7,864,229 | | | 15,320,978 | | | | (17,642,595 | ) | | | 6,241,331 | |
MFS Total Return | | | 13,445,747 | | | 8,052,847 | | | 21,836,530 | | | | (23,435,321 | ) | | | 19,899,803 | |
Morgan Stanley EAFE Index | | | 8,789,231 | | | — | | | 107,610,226 | | | | (1,410,853 | ) | | | 114,988,604 | |
Neuberger Berman Mid Cap Value | | | 11,598,043 | | | 63,943,165 | | | 74,481,434 | | | | — | | | | 150,022,641 | |
Oppenheimer Global Equity | | | 7,708,706 | | | 6,082,291 | | | 35,286,264 | | | | — | | | | 49,077,261 | |
Russell 2000 Index | | | 4,309,684 | | | 17,717,058 | | | 73,013,072 | | | | — | | | | 95,039,814 | |
Salomon Brothers Strategic Bond Opportunities | | | 21,224,610 | | | 2,232,446 | | | (1,387,357 | ) | | | — | | | | 22,069,700 | |
Salomon Brothers U.S. Government | | | 15,657,594 | | | — | | | 1,377,078 | | | | (3,234,233 | ) | | | 13,800,439 | |
T. Rowe Price Large Cap Growth | | | 1,079,026 | | | — | | | 45,004,554 | | | | (24,763,122 | ) | | | 21,320,459 | |
T. Rowe Price Small Cap Growth | | | — | | | — | | | 87,986,818 | | | | (29,159,749 | ) | | | 58,827,069 | |
Zenith Equity | | | 5,155,938 | | | — | | | 197,888,929 | | | | (149,347,303 | ) | | | 53,697,564 | |
The difference between book basis and tax basis is attributable primarily to the tax deferral of losses on wash sales.
MSF-376
Metropolitan Series Fund, Inc.
Notes to Financial Statements—December 31, 2005—(Continued)
Expense Reductions:
Certain Portfolio trades are directed to brokers who paid a portion of the Portfolio’s expenses. Amounts paid for each Portfolio are shown as expense reductions in the Statement of Operations of the respective Portfolio.
For the year ended December 31, 2005, purchases and sales of securities (excluding short—term investments) for each of the Portfolios were as follows:
| | | | | | | | | | | | |
| | | Purchases
| | Sales
|
Portfolio
| | U.S.
Government
| | Other
| | U.S.
Government
| | Other
|
BlackRock Aggressive Growth | | $ | 0 | | $ | 661,217,875 | | $ | 0 | | $ | 758,339,263 |
BlackRock Bond Income | | | 8,640,112,784 | | | 583,015,823 | | | 8,535,506,983 | | | 496,296,424 |
BlackRock Diversified | | | 6,748,372,345 | | | 1,471,875,915 | | | 6,699,806,180 | | | 1,590,144,459 |
BlackRock Investment Trust | | | 0 | | | 1,694,874,754 | | | 0 | | | 1,857,640,174 |
BlackRock Large Cap Value | | | 0 | | | 146,826,898 | | | 0 | | | 130,968,950 |
BlackRock Legacy Large Cap Growth | | | 0 | | | 411,818,366 | | | 0 | | | 487,002,600 |
BlackRock Strategic Value | | | 0 | | | 1,648,323,870 | | | 0 | | | 1,701,621,375 |
Capital Guardian U.S. Equity | | | 0 | | | 145,478,089 | | | 0 | | | 166,683,966 |
Davis Venture Value | | | 0 | | | 1,074,580,462 | | | 0 | | | 741,209,968 |
FI International Stock | | | 0 | | | 346,626,868 | | | 0 | | | 314,067,237 |
FI Mid Cap Opportunities | | | 0 | | | 1,474,950,348 | | | 0 | | | 1,569,786,099 |
FI Value Leaders | | | 0 | | | 546,517,902 | | | 0 | | | 581,372,388 |
Franklin Templeton Small Cap Growth | | | 0 | | | 69,081,788 | | | 0 | | | 47,951,771 |
Harris Oakmark Focused Value | | | 0 | | | 537,269,199 | | | 0 | | | 407,222,655 |
Harris Oakmark Large Cap Value | | | 0 | | | 145,339,814 | | | 0 | | | 64,793,155 |
Jennison Growth | | | 0 | | | 625,354,810 | | | 0 | | | 548,526,817 |
Lehman Brothers Aggregate Bond Index | | | 317,632,268 | | | 86,598,274 | | | 191,570,271 | | | 35,779,162 |
Loomis Sayles Small Cap | | | 0 | | | 407,367,856 | | | 0 | | | 429,135,023 |
MetLife Aggressive Allocation | | | 0 | | | 11,559,506 | | | 0 | | | 1,591,753 |
MetLife Conservative Allocation | | | 0 | | | 16,900,573 | | | 0 | | | 1,588,420 |
MetLife Conservative to Moderate Allocation | | | 0 | | | 58,690,748 | | | 0 | | | 539,362 |
MetLife Moderate Allocation | | | 0 | | | 120,653,373 | | | 0 | | | 236,033 |
MetLife Moderate to Aggressive Allocation | | | 0 | | | 86,929,004 | | | 0 | | | 451,604 |
MetLife Mid Cap Stock Index | | | 0 | | | 161,343,552 | | | 0 | | | 115,725,252 |
MetLife Stock Index | | | 0 | | | 362,175,228 | | | 0 | | | 386,083,776 |
MFS Investors Trust | | | 0 | | | 57,195,001 | | | 0 | | | 66,985,668 |
MFS Total Return | | | 91,140,784 | | | 189,367,338 | | | 74,326,067 | | | 153,475,902 |
Morgan Stanley EAFE Index | | | 0 | | | 143,516,146 | | | 0 | | | 85,606,082 |
Neuberger Berman Mid Cap Value | | | 0 | | | 660,638,598 | | | 0 | | | 521,309,489 |
Oppenheimer Global Equity | | | 0 | | | 287,310,892 | | | 0 | | | 263,255,687 |
Russell 2000 Index | | | | | | 170,402,474 | | | 0 | | | 147,804,240 |
Salomon Brothers Strategic Bond Opportunities | | | 1,800,091,029 | | | 231,666,982 | | | 1,628,136,581 | | | 261,571,069 |
Salomon Brothers U.S. Government | | | 4,812,688,805 | | | 0 | | | 4,438,099,369 | | | 0 |
T. Rowe Price Large Cap Growth | | | 0 | | | 173,868,458 | | | 0 | | | 105,918,422 |
T. Rowe Price Small Cap Growth | | | 0 | | | 107,023,212 | | | 0 | | | 126,598,700 |
Zenith Equity | | | 0 | | | 44,457,189 | | | 0 | | | 165,739,668 |
Options Written:
The BlackRock Bond Income Portfolio transactions in options written during the year ended December 31, 2005 were as follows:
| | | | | | | |
| | | Number of
contracts
| | | Premiums
received
| |
Options outstanding at December 31, 2004 | | 0 | | | $ | 0 | |
Options written | | 251 | | | | 247,721 | |
Options closed | | (251 | ) | | | (247,721 | ) |
| | |
|
| |
|
|
|
Options outstanding at December 31, 2005 | | 0 | | | $ | 0 | |
| | |
|
| |
|
|
|
MSF-377
Metropolitan Series Fund, Inc.
Notes to Financial Statements—December 31, 2005—(Continued)
The BlackRock Diversified Portfolio transactions in options written during the year ended December 31, 2005 were as follows:
| | | | | | | |
| | | Number of
contracts
| | | Premiums
received
| |
Options outstanding at December 31, 2004 | | 0 | | | $ | 0 | |
Options written | | 80 | | | | 44,776 | |
Options closed | | (80 | ) | | | (44,776 | ) |
| | |
|
| |
|
|
|
Options outstanding at December 31, 2005 | | 0 | | | $ | 0 | |
| | |
|
| |
|
|
|
| 3. | INVESTMENT MANAGEMENT FEES AND OTHER TRANSACTIONS WITH AFFILIATES: |
Investment Management Agreements:
MetLife Advisers, is the investment adviser to the Portfolios. The Fund has entered into investment management agreements with MetLife Advisers. For providing investment management services to the Fund, MetLife Advisers receives monthly compensation at the following annual rates of:
| | | | | | |
Portfolio
| | Management
Fees earned by
MetLife Advisers for the period ended
December 31, 2005
| | Annual
percentage
rates paid to
MetLife Advisers
| | Based on Portfolios average daily net asset value levels
|
BlackRock Aggressive Growth | | 6,869,382 | | 0.750% | | Of the first $500 million |
| | | | | 0.700% | | Of the next $500 million |
| | | | | 0.650% | | On amounts in excess of $1 billion |
BlackRock Bond Income | | 4,137,468 | | 0.400% | | Of the first $1 billion |
| | | | | 0.350% | | Of the next $1 billion |
| | | | | 0.300% | | Of the next $1 billion |
| | | | | 0.250% | | On amounts in excess of $3 billion |
BlackRock Diversified | | 8,285,784 | | 0.500% | | Of the first $500 million |
| | | | | 0.450% | | Of the next $500 million |
| | | | | 0.400% | | On amounts in excess of $1 billion |
BlackRock Investment Trust | | 9,042,281 | | 0.550% | | Of the first $500 million |
| | | | | 0.500% | | Of the next $500 million |
| | | | | 0.450% | | On amounts in excess of $1 billion |
BlackRock Large Cap Value | | 863,508 | | 0.700% | | Of the first $250 million |
| | | | | 0.650% | | Of the next $500 million |
| | | | | 0.600% | | On amounts in excess of $750 million |
BlackRock Legacy Large Cap Growth | | 3,980,761 | | 0.730% | | Of the first $1 billion |
| | | | | 0.650% | | On amounts in excess of $1 billion |
BlackRock Money Market | | 2,258,065 | | 0.350% | | Of the first $1 billion |
| | | | | 0.300% | | Of the next $1 billion |
| | | | | 0.250% | | On amounts in excess of $2 billion |
BlackRock Strategic Value | | 8,006,721 | | 0.850% | | Of the first $500 million |
| | | | | 0.800% | | Of the next $500 million |
| | | | | 0.750% | | On amounts in excess of $1 billion |
Capital Guardian U.S. Equity | | 3,372,518 | | 0.700% | | Of the first $200 million |
| | | | | 0.650% | | Of the next $300 million |
| | | | | 0.600% | | Of the next $1.5 billion |
| | | | | 0.550% | | On amounts in excess of $2 billion |
Davis Venture Value | | 20,216,812 | | 0.750% | | Of the first $1 billion |
| | | | | 0.700% | | Of the next $2 billion |
| | | | | 0.675% | | On amounts in excess of $3 billion |
FI International Stock | | 3,945,949 | | 0.860% | | Of the first $500 million |
| | | | | 0.800% | | Of the next $500 million |
| | | | | 0.750% | | On amounts in excess of $1 billion |
FI Mid Cap Opportunities | | 6,730,379 | | 0.750% | | Of the first $100 million |
| | | | | 0.700% | | Of the next $400 million |
| | | | | 0.650% | | On amounts in excess of $500 million |
FI Value Leaders | | 3,856,710 | | 0.700% | | Of the first $200 million |
| | | | | 0.650% | | Of the next $300 million |
| | | | | 0.600% | | Of the next $1.5 billion |
| | | | | 0.550% | | On amounts in excess of $2 billion |
MSF-378
Metropolitan Series Fund, Inc.
Notes to Financial Statements—December 31, 2005—(Continued)
| | | | | | |
Portfolio
| | Management
Fees earned by
MetLife Advisers for the period ended
December 31, 2005
| | Annual
percentage
rates paid to
MetLife Advisers
| | Based on Portfolios average daily net asset value levels
|
Franklin Templeton Small Cap Growth | | 852,255 | | 0.900% | | Of the first $500 million |
| | | | | 0.850% | | On amounts in excess of $500 million |
Harris Oakmark Focused Value | | 12,936,022 | | 0.750% | | Of the first $1 billion |
| | | | | 0.700% | | On amounts in excess of $1 billion |
Harris Oakmark Large Cap Value | | 4,028,986 | | 0.750% | | Of the first $250 million |
| | | | | 0.700% | | On amounts in excess of $250 million |
Jennison Growth | | 5,898,199 | | 0.700% | | Of the first $200 million |
| | | | | 0.650% | | Of the next $300 million |
| | | | | 0.600% | | Of the next $1.5 billion |
| | | | | 0.550% | | On amounts in excess of $2 billion |
Lehman Brothers Aggregate Bond Index | | 2,467,453 | | 0.250% | | Of all assets |
Loomis Sayles Small Cap | | 3,580,773 | | 0.900% | | Of the first $500 million |
| | | | | 0.850% | | On amounts in excess of $500 million |
MetLife Aggressive Allocation* | | 2,325 | | 0.100% | | Of all assets |
MetLife Conservative Allocation* | | 4,197 | | 0.100% | | Of all assets |
MetLife Conservative to Moderate Allocation* | | 15,111 | | 0.100% | | Of all assets |
MetLife Moderate Allocation* | | 29,279 | | 0.100% | | Of all assets |
MetLife Moderate to Aggressive Allocation* | | 21,846 | | 0.100% | | Of all assets |
MetLife Mid Cap Stock Index | | 884,327 | | 0.250% | | Of all assets |
MetLife Stock Index | | 12,015,175 | | 0.250% | | Of all assets |
MFS Investors Trust | | 947,619 | | 0.750% | | Of all assets |
MFS Total Return | | 2,460,950 | | 0.500% | | Of all assets |
Morgan Stanley EAFE Index | | 1,175,715 | | 0.300% | | Of all assets |
Neuberger Berman Mid Cap Value | | 4,044,482 | | 0.700% | | Of the first $100 million |
| | | | | 0.675% | | Of the next $250 million |
| | | | | 0.650% | | Of the next $500 million |
| | | | | 0.625% | | Of the next $750 million |
| | | | | 0.600% | | On amounts in excess of $1.6 billion |
Oppenheimer Global Equity | | 1,397,667 | | 0.900% | | Of the first $50 million |
| | | | | 0.550% | | Of the next $50 million |
| | | | | 0.500% | | Of the next $400 million |
| | | | | 0.475% | | On amounts in excess of $500 million |
Russell 2000 Index | | 970,079 | | 0.250% | | Of all assets |
Salomon Brothers Strategic Bond Opportunities | | 2,634,096 | | 0.650% | | Of the first $500 million |
| | | | | 0.550% | | On amounts in excess of $500 million |
Salomon Brothers U.S. Government | | 2,890,435 | | 0.550% | | Of the first $500 million |
| | | | | 0.450% | | On amounts in excess of $500 million |
T. Rowe Price Large Cap Growth | | 1,857,536 | | 0.650% | | Of the first $50 million |
| | | | | 0.600% | | On amounts in excess of $50 million |
T. Rowe Price Small Cap Growth | | 1,751,500 | | 0.550% | | Of the first $100 million |
| | | | | 0.500% | | Of the next $300 million |
| | | | | 0.450% | | On amounts in excess of $400 million |
Zenith Equity** | | 0 | | 0.000% | | Of all assets |
| * | The Portfolio operates as a fund of funds by investing its assets in other Portfolios of the Fund and series of Met Investors Series Trust (the “Underlying Portfolios”). In addition to the above Management Fee paid to MetLife Advisers, the Portfolio indirectly pays MetLife Advisers an investment advisory fee through its investments in certain Underlying Portfolios. |
| ** | The Portfolio operates as a fund of funds by investing its assets in other Portfolios of the Fund (the “Zenith Underlying Portfolios”). The Portfolio does not directly pay MetLife Advisers an investment advisory fee for its services, but indirectly pays MetLife Advisers an investment advisory fee through its investments in the Zenith Underlying Portfolios. |
MSF-379
Metropolitan Series Fund, Inc.
Notes to Financial Statements—December 31, 2005—(Continued)
Certain officers and directors of the Fund may also be officers of MetLife Advisers; however, such officers and directors receive no compensation from the Fund.
MetLife Advisers has entered into various investment subadvisory agreements with respect to the Portfolios. Prior to January 31, 2005, State Street Research & Management Company (“State Street Research”), which until then was a subsidiary of MetLife, Inc., was compensated by MetLife Advisers to provide subadvisory services for BlackRock Bond Income, BlackRock Money Market, BlackRock Investment Trust, BlackRock Diversified, BlackRock Aggressive Growth, BlackRock Strategic Value, BlackRock Large Cap Value and BlackRock Legacy Large Cap Growth. The following table shows the fees earned by State Street Research for providing subadvisory services to these Portfolios for the period January 1, 2005 through January 31, 2005.
| | | |
Portfolio
| | Fees earned by State Street Research &
Management Company for the
period January 1 through 31, 2005
|
BlackRock Aggressive Growth (formerly State Street Research Aggressive Growth) | | $ | 323,437 |
BlackRock Bond Income (formerly State Street Research Bond Income) | | | 141,082 |
BlackRock Diversified (formerly State Street Research Diversified) | | | 445,021 |
BlackRock Investment Trust (formerly State Street Research Investment Trust) | | | 516,495 |
BlackRock Large Cap Value (formerly State Street Research Large Cap Value) | | | 41,896 |
BlackRock Legacy Large Cap Growth (formerly State Street Research Large Cap Growth) | | | 180,972 |
BlackRock Money Market (formerly State Street Research Money Market) | | | 42,164 |
BlackRock Strategic Value (formerly State Street Research Aurora) | | | 386,906 |
On January 31, 2005 BlackRock Advisors, Inc. (“BlackRock”) succeeded State Street Research as subadviser to these Portfolios and receives compensation for providing subadvisory services thereto.
MetLife is the investment subadviser for MetLife Stock Index, Lehman Brothers Aggregate Bond Index, Russell 2000 Index, Morgan Stanley EAFE Index and MetLife Mid Cap Stock Index (the “Index Portfolios”). MetLife Advisers pays MetLife an investment subadvisory fee for each such Index Portfolio equal to the costs incurred by MetLife in providing subadvisory services to the Portfolio.
| | | |
Portfolio
| | Fees earned by
MetLife for the
year ended December 31, 2005
|
Lehman Brothers Aggregate Bond Index | | $ | 240,764 |
MetLife Mid Cap Stock Index | | | 82,826 |
MetLife Stock Index | | | 1,127,182 |
Morgan Stanley EAFE Index | | | 91,375 |
Russell 2000 Index | | | 91,003 |
Fidelity Management & Research Company receives compensation for providing subadvisory services for FI Mid Cap Opportunities, FI International Stock and FI Value Leaders. T. Rowe Price Associates Inc. is compensated to provide subadvisory services for T. Rowe Price Small Cap Growth and T. Rowe Price Large Cap Growth. Deutsche Investment Management Americas Inc. was compensated to provide subadvisory services for Scudder Global Equity from January 1, 2005 through April 30, 2005. Effective May 1, 2005, OppenheimerFunds, Inc. became subadviser to this Portfolio, which was renamed Oppenheimer Global Equity and receives compensation for providing subadvisory services thereto. Harris Associates L.P. is compensated to provide subadvisory services for Harris Oakmark Focused Value and Harris Oakmark Large Cap Value. Neuberger Berman Management Inc. is compensated to provide subadvisory services for Neuberger Berman Mid Cap Value, which until May 2005 was named Neuberger Berman Partners Mid Cap Value Portfolio. Franklin Advisers, Inc. is compensated to provide subadvisory services for Franklin Templeton Small Cap Growth. Salomon Brothers Asset Management Inc is compensated to provide subadvisory services for Salomon Brothers Strategic Bond Opportunities and Salomon Brothers U.S. Government. Loomis, Sayles & Company, L.P. is compensated to provide subadvisory services for Loomis Sayles Small Cap. Davis Selected Advisers, L.P. is compensated to provide subadvisory services for Davis Venture Value. Massachusetts Financial Services Company is compensated to provide subadvisory services for MFS Investors Trust and MFS Total Return. Capital Guardian Trust Company is compensated to provide subadvisory services for Capital Guardian U.S. Equity. Jennison Associates LLC is compensated to provide subadvisory services for Jennison Growth.
Service and Distribution Fees:
The Fund has adopted Distribution Plans under Rule 12b-1 of the 1940 Act for the Fund’s Class B and Class E shares. Under the Distribution Plans, the Class B and Class E shares of the Fund pay a fee to compensate the Insurance Companies (or their
MSF-380
Metropolitan Series Fund, Inc.
Notes to Financial Statements—December 31, 2005—(Continued)
affiliates) and other broker-dealers and financial intermediaries involved in the offer and sale of Fund shares for promoting or selling, and servicing, the Class B and Class E shares of the Portfolio. The fees under the Distribution Plans for each applicable class of a Portfolio’s shares are calculated as a percentage of that Portfolio’s average daily net assets that are attributable to that Class. Currently, the fee is 0.25% per year for the Class B shares and 0.15% per year for the Class E shares. Amounts paid by each Portfolio for the year ended December 31, 2005 are shown as Service and Distribution fees in the Statement of Operations of the respective Portfolios.
Expense Agreement:
Pursuant to an expense agreement relating to each class of BlackRock Large Cap Value, Franklin Templeton Small Cap Growth, MetLife Conservative Allocation, MetLife Conservative to Moderate Allocation, MetLife Moderate Allocation, MetLife Moderate to Aggressive Allocation, MetLife Aggressive Allocation and MFS Investors Trust, MetLife Advisers has agreed, from May 1, 2005 to April 30, 2006, to waive a portion of its advisory fees or pay a portion of the other operating expenses (not including brokerage costs, interest, taxes, or extraordinary expenses) to the extent total operating expenses exceed stated annual expense limits (based on a Portfolio’s then-current fiscal year, which limits vary from Portfolio to Portfolio). This subsidy, and similar subsidies in effect in earlier periods, are subject to the obligation of each class of such Portfolios to repay MetLife Advisers in future years, if any, when a class’ expenses fall below the stated expense limit pertaining to that class that was in effect at the time of the subsidy in question. Such deferred expenses may be charged to a class in a subsequent year to the extent that the charge does not cause the total expenses in such subsequent year to exceed the class’ stated expense limit that was in effect at the time of the subsidy in question; provided, however, that no class of a Portfolio is obligated to repay any expense paid by MetLife Advisers more than three years in the case of Franklin Templeton Small Cap Growth and MFS Investors Trust and five years in the case of BlackRock Large Cap Value, MetLife Conservative Allocation, MetLife Conservative to Moderate Allocation, MetLife Moderate Allocation, MetLife Moderate to Aggressive Allocation and MetLife Aggressive Allocation after the end of the fiscal year in which such expense was incurred. The expense limits (annual rates as a percentage of each class of each Portfolio’s net average daily net assets) in effect from May 1, 2005 to April 30, 2006 are as follows:
| | | | | | | | | |
Portfolio
| | Expense Limit Agreement
| |
| | | Class A
| | | Class B
| | | Class E
| |
BlackRock Large Cap Value | | 0.95 | % | | 1.20 | % | | 1.10 | % |
Franklin Templeton Small Cap Growth | | 1.15 | % | | 1.40 | % | | 1.30 | % |
MetLife Conservative Allocation | | 0.10 | % | | 0.35 | % | | 0.25 | % |
MetLife Conservative to Moderate Allocation | | 0.10 | % | | 0.35 | % | | 0.25 | % |
MetLife Moderate Allocation | | 0.10 | % | | 0.35 | % | | 0.25 | % |
MetLife Moderate to Aggressive Allocation | | 0.10 | % | | 0.35 | % | | 0.25 | % |
MetLife Aggressive Allocation | | 0.10 | % | | 0.35 | % | | 0.25 | % |
MFS Investors Trust | | 1.00 | % | | 1.25 | % | | 1.15 | % |
As of December 31, 2005, the amounts of expenses deferred in prior years subject to repayment for each Portfolio are as follows:
| | | | | | |
| | | Expenses Deferred
in
|
| | | 2002
| | 2003
|
| |
| | | (Subject to repayment
until December 31,)
|
Portfolio
| | 2007
| | 2006
|
Franklin Templeton Small Cap Growth | | | — | | $ | 69,953 |
BlackRock Large Cap Value | | $ | 40,701 | | | — |
For the year ended December 31, 2005, MetLife Advisers recovered $24,000 from BlackRock Large Cap Value and $30,000 from Franklin Templeton Small Cap Growth.
MSF-381
Metropolitan Series Fund, Inc.
Notes to Financial Statements—December 31, 2005—(Continued)
Management Fee Waivers:
Pursuant to an expense agreement, MetLife Advisers has agreed, for the period May 1, 2005 to April 30, 2006; to reduce its advisory fees set out above under “Investment Management Agreements” for each class of the Portfolios listed below as follows:
| | | | | |
Portfolio
| | Annual
Percentage
Rate
Reduction
| | | Average Daily Net Asset
Value Levels
|
BlackRock Bond Income | | 0.025 | % | | Over $1 billion and less than $2 billion |
BlackRock Money Market | | 0.005 | % | | First $500 million |
| | | 0.015 | % | | Next $500 million |
Loomis Sayles Small Cap | | 0.050 | % | | All Assets |
Lehman Brothers Aggregate Bond Index | | 0.006 | % | | All Assets |
MetLife Mid Cap Stock Index | | 0.007 | % | | All Assets |
MetLife Stock Index | | 0.007 | % | | All Assets |
Morgan Stanley EAFE Index | | 0.007 | % | | All Assets |
Russell 2000 Index | | 0.007 | % | | All Assets |
T. Rowe Price Large Cap Growth | | 0.015 | % | | First $50 million |
Effective February 17, 2005, T. Rowe Price agreed to a voluntary subadvisory fee waiver that applies if (i) assets under management by T. Rowe Price for the Fund and Met Investor Series Trust (“MIST”), in the aggregate exceed $750,000,000, (ii) T. Rowe Price subadvises three or more portfolios of the Fund and MIST in the aggregate, and (iii) at least one of those portfolios is a large cap domestic equity portfolio. MetLife Advisers has voluntarily agreed to reduce its advisory fee for T. Rowe Price Large Cap and T. Rowe Price Small Cap by the amount waived (if any) by T. Rowe Price for the relevant Portfolio pursuant to this voluntary subadvisory fee waiver.
If the aforementioned conditions are met, T. Rowe Price will waive its subadvisory fee paid by MetLife Advisers by 5% for combined Fund and MIST average daily net assets over $750,000,000, 7.5% for the next $1,500,000,000 of combined assets, and 10% for amounts over $3,000,000,000. Any amounts waived pursuant to this subadvisory fee waiver will be allocated with respect to the Fund and MIST portfolios in proportion to such portfolios’ net assets. MetLife Advisers has voluntarily agreed to reduce its advisory fee for T. Rowe Price Large Cap and T. Rowe Price Small Cap by the amount waived (if any) by T. Rowe Price for the relevant Portfolio(s) pursuant to this voluntary subadvisory fee waiver. Because these fee waivers are voluntary, and not contractual, they may be discontinued by T. Rowe Price and MetLife Advisers at any time.
Amounts waived for the period ended December 31, 2005 are shown as management fee waiver in the Statement of Operations of the respective Portfolios.
The Fund has entered into a securities lending arrangement with the Fund’s custodian, State Street Bank and Trust Company (the “custodian”). Under the agreement, the custodian is authorized to loan securities on the Portfolios’ behalf. In exchange, the Portfolio receives either cash or securities collateral against the loaned securities. Each Portfolio receives collateral at least equal to 102% of the market value of the loaned securities (105% for foreign securities), at each loan’s inception. Collateral must be maintained at least at 100% of the market value of the loaned securities for the duration of the loan. The cash collateral is invested in the Navigator Securities Lending Prime Portfolio, which invests in a variety of high quality U.S. dollar-denominated instruments. If the market value of the collateral at the close of trading on a business day is less than 100% of the market value of the loaned securities at the close of trading on that day, the borrower shall be required to deliver, by the close of business on the following business day, an additional amount of collateral, equal to at least 100% of the market value of all the loaned securities as of such preceding day. The Fund receives 70% of the annual net income from securities lending transactions, which is included in interest income of the respective Portfolios. The remaining 30% is paid to the custodian as compensation for its securities lending services. The Fund bears the risk of any deficiency in the amount of collateral available for return to a borrower due to a loss in an approved investment. Portfolios with outstanding loans at December 31, 2005 are footnoted in the Notes to the Schedule of Investments.
Regulatory bodies have contacted MetLife Advisers and certain other affiliates of MetLife, Inc. (MetLife, Inc. and its affiliates, the “Company”) and have requested information relating to market timing and late trading of mutual funds and variable insurance products and, generally, the marketing of products. The Company believes that many of these inquiries are similar to
MSF-382
Metropolitan Series Fund, Inc.
Notes to Financial Statements—December 31, 2005—(Continued)
those made to many financial service companies as part of industry-wide investigations by various regulatory agencies. The Company at the present time is not aware of any systemic problems with respect to such matters that may have a material adverse effect on MetLife, Inc.’s consolidated financial position. The SEC has commenced an investigation with respect to market timing and late trading in a limited number of privately-placed variable insurance contracts that were sold through General American. In May 2004, General American received a so-called “Wells Notice” stating that the SEC staff is considering recommending that the SEC bring a civil action alleging violations of the U.S. securities laws against General American. Under the SEC procedures, General American can avail itself of the opportunity to respond to the SEC staff before it makes a formal recommendation regarding whether any action alleging violations of the U.S. securities laws should be considered. General American has responded to the Wells Notice. The Company is fully cooperating with regard to these information requests and investigations. The Company has also advised the Metropolitan Series Fund Board of Directors that, while certain exceptions to the Fund’s policies have been noted, no situations have been identified that would have a material impact on the financial position of the Fund.
On April 30, 2005, BlackRock Money Market acquired all of the assets of MIST’s Money Market Portfolio pursuant to a plan of reorganization approved on April 30, 2005. The acquisition was accomplished by a tax free exchange of 31,414 Class A shares of BlackRock Money Market (valued at $3.1 million) in exchange for 3,141,377 Class A shares of MIST’s Money Market Portfolio (valued at $3.1 million) and 1,944,828 Class B shares of BlackRock Money Market (valued at $194.5 million) in exchange for 194,482,841 Class B shares of MIST’s Money Market Portfolio (valued at $194.5 million).
The Aggregate net assets of BlackRock Money Market and MIST’s Money Market Portfolio immediately before the acquisition were $522,346,978 and $197,624,218, respectively. The aggregate net assets of BlackRock Money Market immediately after the acquisition were $719,971,196.
On April 30, 2005, Jennison Growth acquired all of the assets of Met/Putnam Voyager pursuant to a plan of reorganization approved on April 30, 2005. The acquisition was accomplished by a tax free exchange of 4,750,559 Class A shares of Jennison Growth (valued at $48.3 million) in exchange for 11,080,448 Class A shares of Met/Putnam Voyager (valued at $48.3 million); 860,671 Class B shares of Jennison Growth (valued at $8.7 million) in exchange for 2,011,547 Class B shares of Met/Putnam Voyager (valued at $8.7 million) and 1,035,812 Class E shares of Jennison Growth (valued at $10.5 million) in exchange for 2,421,535 Class E shares of Met/Putnam Voyager (valued at $10.5 million).
The Aggregate net assets of Jennison Growth and Met/Putnam Voyager immediately before the acquisition were $802,773,484 and $67,506,371, respectively. The aggregate net assets of Jennison Growth immediately after the acquisition were $870,279,855.
On February 1, 2006, the Board of Directors of the Fund approved new Subadvisory Agreements (the “Agreements”) with respect to Salomon Brothers Strategic Bond Opportunities and Salomon Brothers U.S. Government (collectively, the “Salomon Brothers Portfolios”) between MetLife Advisers and Western Asset Management Company (“Western Asset”). The Agreements are not subject to shareholder approval and will become effective May 1, 2006. The Advisory Agreements between the Fund, with respect to the Salomon Brothers Portfolios, and MetLife Advisers will remain in effect and fees payable thereunder to MetLife Advisers will not change.
Under the Agreements, Western Asset will become subadviser to the Salomon Brothers Portfolios, succeeding its affiliate, Salomon Brothers Asset Management Inc (“SBAM”), and will become responsible for the day-to-day management of the Salomon Brothers Portfolios’ investment operations under the oversight of MetLife Advisers and the Board. The names of the Salomon Brothers Portfolios will be changed to the “Western Asset Management U.S. Government Portfolio” and “Western Asset Management Strategic Bond Opportunities Portfolio” at the time the Agreements take effect.
On December 13, 2005, the Board approved the acquisition of MFS Investors Trust by the Legg Mason Value Equity Portfolio, a series of MIST, subject to the approval of shareholders of MFS Investors Trust. On or about April 28, 2006, the shareholders of MFS Investors Trust will consider the approval of a proposed Agreement and Plan of Reorganization providing for the acquisition of all the assets of MFS Investors Trust by the Legg Mason Value Equity Portfolio in exchange for shares of the Legg Mason Value Equity Portfolio and the assumption by the Legg Mason Value Equity Portfolio of the liabilities of MFS Investors Trust. If approved by shareholders, the reorganization will close on or about May 1, 2006.
At meetings held on December 13, 2005 and February 1, 2006, as the case may be, the Board approved the acquisition of certain managed separate accounts and mutual funds that are part of the Travelers business of the MetLife organization (each, a
MSF-383
Metropolitan Series Fund, Inc.
Notes to Financial Statements—December 31, 2005—(Continued)
“Travelers Acquired Fund,” and, collectively, the “Travelers Acquired Funds”) by certain Portfolios of the Fund (the “Acquiring Portfolios”), subject to the approval of shareholders/unitholders of the Travelers Acquired Funds, as described below. During March or April as set forth in the prospectus/proxy statement of each Travelers Acquired Funds, shareholders/unitholders of the Travelers Acquired Funds will consider the approval of proposed Agreements and Plans of Reorganization providing for the acquisition of all the assets of the Travelers Acquired Portfolios by the Acquiring Portfolios in exchange for shares of the Acquiring Portfolios and the assumption by the Acquiring Portfolios of the liabilities of the Travelers Acquired Portfolios. If approved by such shareholders/unitholders, the reorganizations will close on or about May 1, 2006.
| | |
| |
Travelers Acquired Funds
| | Acquiring Portfolios
|
MFS Total Return1 | | MFS Total Return |
MFS Mid Cap Growth1 | | BlackRock Aggressive Growth |
Salomon Brothers Strategic Total Return Bond1 | | Salomon Brothers Strategic Bond Opportunities |
Van Kampen Enterprise1 | | Capital Guardian U.S. Equity |
Travelers Managed Income1 | | BlackRock Bond Income |
Travelers Quality Bond1 | | BlackRock Bond Income |
Managed Allocation Series: Conservative1 | | MetLife Conservative Allocation |
Managed Allocation Series: Moderate-Conservative1 | | MetLife Conservative to Moderate Allocation |
Managed Allocation Series: Moderate1 | | MetLife Moderate Allocation |
Managed Allocation Series: Moderate-Aggressive1 | | MetLife Moderate to Aggressive Allocation |
Managed Allocation Series: Aggressive1 | | MetLife Aggressive Allocation |
Equity Income | | FI Value Leaders |
Money Market2 | | BlackRock Money Market |
Tactical Growth and Income Stock Account for Variable Annuities3 | | MetLife Stock Index |
Tactical Aggressive Stock Account for Variable Annuities3 | | Mid Cap Stock Index |
Tactical Short-Term Bond Account for Variable Annuities3 | | BlackRock Money Market |
Travelers Money Market Account for Variable Annuities3 | | BlackRock Money Market |
Travelers Quality Bond Account for Variable Annuities3 | | BlackRock Bond Income |
Large Cap1 | | FI Large Cap4 |
Strategic Equity1 | | FI Large Cap4 |
High Yield Bond Trust2 | | Western Asset Management High Yield Bond4 |
On November 3, 2005, the Board approved an advisory fee increase for MFS Total Return, subject to approval by shareholders of MFS Total Return. On February 1, 2006, the Board approved a subadvisory fee increase for MFS Total Return. The subadvisory and advisory fee increases are contingent on the consummation of the proposed reorganization of the MFS Total Return Portfolio (the “TST Portfolio”) of the TST into the Fund’s MFS Total Return Portfolio. On or about April 28, 2006, the shareholders of the Fund’s MFS Total Return Portfolio will consider the approval of a proposed amendment to the Advisory Agreement between the Fund, on behalf MFS Total Return, and MetLife Advisers providing for the increase in advisory fee. If the amendment is approved by shareholders and the merger is consummated, the new advisory and subadvisory fee rates will be effective May 1, 2006.
1 The Travelers Acquired Fund is a series of The Travelers Series Trust (the “TST”).
2 The Travelers Acquired Fund is a stand-alone open-end investment company.
3 The Travelers Acquired Fund is a stand-alone managed separate account.
4 The Acquiring Portfolio will be a newly-established series of the Fund.
MSF-384
Metropolitan Series Fund, Inc.
Report of Independent Registered Public Accounting Firm
To the Board of Directors and Shareholders of the Metropolitan Series Fund, Inc.:
We have audited the accompanying statements of assets and liabilities, including the schedules of investments, of BlackRock Aggressive Growth Portfolio, BlackRock Bond Income Portfolio, BlackRock Diversified Portfolio, BlackRock Investment Trust Portfolio, BlackRock Large Cap Value Portfolio, BlackRock Legacy Large Cap Growth Portfolio, BlackRock Money Market Portfolio, BlackRock Strategic Value Portfolio, Capital Guardian U.S. Equity Portfolio, Davis Venture Value Portfolio, FI International Stock Portfolio, FI Mid Cap Opportunities Portfolio, FI Value Leaders Portfolio, Franklin Templeton Small Cap Growth Portfolio, Harris Oakmark Focused Value Portfolio, Harris Oakmark Large Cap Value Portfolio, Jennison Growth Portfolio, Lehman Brothers Aggregate Bond Index Portfolio, Loomis Sayles Small Cap Portfolio, MetLife Aggressive Allocation Portfolio, MetLife Conservative Allocation Portfolio, MetLife Conservative to Moderate Allocation Portfolio, MetLife Mid Cap Stock Index Portfolio, MetLife Moderate Allocation Portfolio, MetLife Moderate to Aggressive Allocation Portfolio, MetLife Stock Index Portfolio, MFS Investors Trust Portfolio, MFS Total Return Portfolio, Morgan Stanley EAFE Index Portfolio, Neuberger Berman Mid Cap Value Portfolio, Oppenheimer Global Equity Portfolio, Russell 2000 Index Portfolio, Salomon Brothers Strategic Bond Opportunities Portfolio, Salomon Brothers U.S. Government Portfolio, T. Rowe Price Large Cap Growth Portfolio, T. Rowe Price Small Cap Growth Portfolio, and Zenith Equity Portfolio (the “Portfolios”), of the Metropolitan Series Fund, Inc. (the “Fund”), as of December 31, 2005, and the related statements of operations for the year then ended, and the statements of changes in net assets and financial highlights for the periods presented. These financial statements and financial highlights are the responsibility of the Fund’s management. Our responsibility is to express an opinion on these financial statements and financial highlights based on our audits.
We conducted our audits in accordance with the standards of the Public Company Accounting Oversight Board (United States). Those standards require that we plan and perform the audit to obtain reasonable assurance about whether the financial statements and financial highlights are free of material misstatement. The Fund is not required to have, nor were we engaged to perform, an audit of their internal control over financial reporting. Our audits included consideration of internal control over financial reporting as a basis for designing audit procedures that are appropriate in the circumstances, but not for the purpose of expressing an opinion on the effectiveness of the Fund’s internal control over financial reporting. Accordingly, we express no such opinion. An audit also includes examining, on a test basis, evidence supporting the amounts and disclosures in the financial statements, assessing the accounting principles used and significant estimates made by management, as well as evaluating the overall financial statement presentation. Our procedures included confirmation of securities owned as of December 31, 2005, by correspondence with the custodian and brokers; where replies were not received from brokers, we performed other auditing procedures. We believe that our audits provide a reasonable basis for our opinion.
In our opinion, the financial statements and financial highlights referred to above present fairly, in all material respects, the financial position of each Portfolio of the Metropolitan Series Fund as of December 31, 2005, the results of their operations for the year then ended, and the changes in their net assets and the financial highlights for the respective periods presented in conformity with accounting principles generally accepted in the United States of America.
Deloitte & Touche LLP
Boston, Massachusetts
February 17, 2006
MSF-385
Metropolitan Series Fund, Inc.
Shareholder Votes
At a Special Meeting of Shareholders of the Portfolios listed below held on January 18, 2005, the respective shareholders voted for the following proposals:
| | | | | | | | |
| | | For
| | Against
| | Abstain
| | Total
|
1. To approve, with respect to the BlackRock Aggressive Growth Portfolio (formerly State Street Research Aggressive Growth Portfolio), a new advisory agreement between MetLife Advisers, LLC and Metropolitan Series Fund, Inc. | | 44,355,791 | | 1,991,761 | | 3,330,752 | | 49,678,304 |
2. To approve, with respect to the BlackRock Aggressive Growth Portfolio (formerly State Street Research Aggressive Growth Portfolio), a new subadvisory agreement between MetLife Advisers, LLC and BlackRock Advisors, Inc. | | 44,225,435 | | 2,055,700 | | 3,397,169 | | 49,678,304 |
3. To approve, with respect to the BlackRock Diversified Portfolio (formerly State Street Research Diversified Portfolio), a new advisory agreement between MetLife Advisers, LLC and Metropolitan Series Fund, Inc. | | 113,487,407 | | 4,495,415 | | 7,708,906 | | 125,691,729 |
4. To approve, with respect to the BlackRock Diversified Portfolio (formerly State Street Research Diversified Portfolio), a new subadvisory agreement between MetLife Advisers, LLC and BlackRock Advisors, Inc. | | 113,282,430 | | 4,588,705 | | 7,820,594 | | 125,691,729 |
5. To approve, with respect to the BlackRock Large Cap Value Portfolio (formerly State Street Research Large Cap Value Portfolio), a new advisory agreement between MetLife Advisers, LLC and Metropolitan Series Fund, Inc. | | 7,915,308 | | 227,791 | | 347,809 | | 8,490,908 |
6. To approve, with respect to the BlackRock Large Cap Value Portfolio (formerly State Street Research Large Cap Value), a new subadvisory agreement between MetLife Advisers, LLC and BlackRock Advisors, Inc. | | 7,859,406 | | 269,482 | | 362,020 | | 8,490,908 |
7. To approve, with respect to the BlackRock Strategic Value Portfolio (formerly State Street Research Aurora Portfolio), a new advisory agreement between MetLife Advisers, LLC and Metropolitan Series Fund, Inc. | | 47,524,910 | | 2,039,216 | | 2,169,045 | | 51,733,171 |
8. To approve, with respect to the BlackRock Strategic Value Portfolio (formerly State Street Research Aurora Portfolio), a new subadvisory agreement between MetLife Advisers, LLC and BlackRock Advisors, Inc. | | 47,017,409 | | 2,163,000 | | 2,552,763 | | 51,733,171 |
9. To approve, with respect to the BlackRock Investment Trust Portfolio (formerly State Street Research Investment Trust Portfolio), a new advisory agreement between MetLife Advisers, LLC and Metropolitan Series Fund, Inc. | | 65,652,698 | | 3,116,097 | | 4,808,317 | | 73,577,112 |
10. To approve, with respect to the BlackRock Investment Trust Portfolio (formerly State Street Research Investment Trust Portfolio), a new subadvisory agreement between MetLife Advisers, LLC and BlackRock Advisors, Inc. | | 65,446,060 | | 3,221,430 | | 4,949,622 | | 73,617,112 |
11. To approve, with respect to the BlackRock Bond Income Portfolio (formerly State Street Research Bond Income Portfolio), a new subadvisory agreement between MetLife Advisers, LLC and BlackRock Advisors, Inc. | | 8,050,317 | | 255,325 | | 635,059 | | 8,940,701 |
MSF-386
Metropolitan Series Fund, Inc.
Shareholder Votes—(Continued)
| | | | | | | | |
| | | For
| | Against
| | Abstain
| | Total
|
12. To approve, with respect to the BlackRock Legacy Large Cap Growth Portfolio (formerly State Street Research Large Cap Growth Portfolio), a new subadvisory agreement between MetLife Advisers, LLC and BlackRock Advisors, Inc. | | 25,955,422 | | 1,032,724 | | 2,053,809 | | 29,041,955 |
13. To approve, with respect to the BlackRock Money Market Portfolio (formerly State Street Research Money Market Portfolio), a new subadvisory agreement between MetLife Advisers, LLC and BlackRock Advisors, Inc. | | 5,118,585 | | 130,666 | | 347,371 | | 5,596,622 |
At a Special Meeting of Shareholders of the Met/Putnam Voyager Portfolio held on April 29, 2005, the shareholders voted for the following proposal:
| | | | | | | | |
| | | For
| | Against
| | Abstain
| | Total
|
1. To approve an Agreement and Plan of Reorganization with respect to the acquisition of Met/Putnam Voyager Portfolio by Jennison Growth Portfolio, each a Portfolio of the Metropolitan Series Fund, Inc. | | 14,236,536 | | 248,767 | | 655,504 | | 15,140,807 |
MSF-387
Metropolitan Series Fund, Inc.
Directors and Officers
The Fund’s Directors review actions of the Fund’s investment adviser and subadvisers, and decide upon matters of general policy. The Fund’s officers supervise the daily business operations of the Fund. The Board of Directors and the Fund’s officers are listed below. Each Director is responsible for overseeing all 37 Portfolios of the Fund. There is no limit to the term a Director may serve. Directors serve until their resignation, retirement or removal in accordance with the Fund’s organizational documents and policies adopted by the Board from time to time. Officers hold office at the pleasure of the Board or until the election or appointment and the qualification of a successor.
Interested Directors(1)
Each Director below is an “interested person” (as defined by the 1940 Act) in that Mr. McHaffie is an employee of MetLife, and Mr. Typermass is a former employee of MetLife, which is an affiliate of MetLife Advisers, the investment adviser of the Fund.
| | | | | | | | | | |
Name, Address and Age
| | | | Current
position(s)
with Fund
| | Position(s)
held since
| | Principal occupations
over past five years, including other directorships(2)
| | Number of
Portfolios in
Fund
Complex
Overseen by
Director(3)
|
Hugh C. McHaffie Metropolitan Life Insurance Company 501 Boylston Street Boston, MA 02116 Age: 47 | | | | Director, Chairman of
the Board, President and
Chief Executive Officer | | 2003 | | Senior Vice President, MetLife (since 2000), MetLife Group, Inc. (since 2003); Manager, Chair of the Board of Managers, President and Chief Executive Officer, MetLife Advisers, since 2003; Chairman of the Board (since 2004) and Director (since 2003), Enterprise General Insurance Agency, Inc.; Director (since 2002) and Executive Vice President (since 2003), First MetLife Investors Insurance Company, MetLife Investors Insurance Company, MetLife Investors Insurance Company of California, MetLife Investors; Director (since 2004) and Senior Vice President (since 1999), NELICO; Director, Cova Corporation (since 2000), General American (since 2004), Omega Reinsurance Corporation (since 2003); Director (since 2005), Travelers Asset Management International Company LLC, Travelers Investment Adviser, Inc.; Director and Chairman (since 2005), CitiStreet Funds, Inc.; Senior Vice President (since 2005), The Travelers Insurance Company, The Travelers Life and Annuity Company, Citicorp Life Insurance Company, First Citicorp Life Insurance Company; formerly, Senior Vice President, New England Zenith Fund (“Zenith Fund”)**. | | 38 |
Arthur G. Typermass 43 Chestnut Street Garden City, NY 11530 Age: 68 | | | | Director | | 1998 | | Formerly, Senior Vice-President and Treasurer, MetLife, 1997-1998. | | 38 |
Non-Interested Directors(1)
Each Director below is not an “interested person” (as defined by the 1940 Act).
| | | | | | | | | | |
Name, Address and Age
| |
| | Current
position(s)
with Fund
| | Position(s)
held since
| | Principal occupations
over past five years, including other directorships(2)
| | Number of
Portfolios in
Fund
Complex
Overseen by
Director(3)
|
Steve A. Garban† 226 Harris Drive State College, PA 16801 Age: 68 | | | | Director | | 1993 | | Formerly, Chief Financial Officer, Senior Vice President Finance and Operations and Treasurer (Emeritus), The Pennsylvania State University. | | 38 |
Linda B. Strumpf Ford Foundation 320 E. 43rd Street New York, NY 10017 Age: 58 | | | | Director | | 2000 | | Vice President and Chief Investment Officer, Ford Foundation. | | 38 |
MSF-388
Metropolitan Series Fund, Inc.
Directors and Officers—(Continued)
| | | | | | | | | | |
Name, Address and Age
| | | | Current
position(s)
with Fund
| | Position(s)
held since
| | Principal occupations
over past five years, including other directorships(2)
| | Number of
Portfolios in
Fund
Complex
Overseen by
Director(3)
|
Michael S. Scott Morton† Massachusetts Institute of Technology (“MIT”) 50 Memorial Drive Cambridge, MA 02138 Age: 68 | | | | Director | | 1993 | | Jay W. Forrester Professor of Management (Emeritus) at Sloan School of Management, MIT. | | 38 |
H. Jesse Arnelle 400 Urbano Drive San Francisco, CA 94127 Age: 72 | | | | Director | | 2001 | | Counsel, Womble Carlyle Sandrie & Rice; Director, Textron Inc. (global multi-industry company)*; formerly, Director, Gannet Co. Inc. (diversified news and information company)*; formerly, Director, Eastman Chemical Company (global chemical company)*; formerly, Director, Waste Management, Inc.*; Director, Armstrong Holdings Inc. (parent company of floor and ceiling products business)*; Director, FPL Group Inc. (public utility holding company)*; Director, URS Corporation (engineering design services firm)*. | | 38 |
Nancy Hawthorne 60 Hyslop Road Brookline, MA 02445 Age: 54 | | | | Director | | 2003 | | Director and Chairman of the Board, Avid Technologies (computer software company)*; formerly, Board of Advisors, L. Knife & Sons, Inc. (beverage distributor); Chief Executive Officer, Clerestory LLC (corporate financial advisor); formerly, Trustee, Zenith Fund**; formerly, Chief Executive Officer and Managing Partner, Hawthorne, Krauss and Associates (corporate financial advisor); formerly, Chief Financial Officer and Executive Vice President, Continental Cablevision, subsequently renamed MediaOne (cable television company); formerly, Director, Life F/X, Inc.; formerly, Chairman of the Board, WorldClinic (distance medicine company); formerly, Director, Perini Corporation (construction)*; formerly, Director, CGU (property and casualty insurance company); formerly, Director, Beacon Power Corporation (energy)*. | | 38 |
John T. Ludes 57 Water Street Marion, MA 02738 Age: 69 | | | | Director | | 2003 | | Formerly, Trustee, Zenith Fund**; formerly, Vice Chairman, President and Chief Operating Officer, Fortune Brands/American Brands (global conglomerate); formerly, President and CEO, Acushnet Company (athletic equipment). | | 38 |
Officers(1)
| | | | | | | | |
Name and address
| | Age
| | Current
position(s)
with Fund
| | Position(s)
held since
| | Principal occupations over past five years(2)
|
Jeffrey P. Halperin Metropolitan Life Insurance Company One MetLife Plaza 27-01 Queens Plaza North Long Island City, NY 11101 | | 38 | | Interim
Chief
Compliance
Officer | | 2005 | | Assistant Vice President, MetLife Group, Inc., since 2003; Assistant Vice President, MetLife, since 2002. |
John F. Guthrie, Jr. MetLife Advisers, LLC 501 Boylston Street Boston, MA 02116 | | 62 | | Senior Vice
President | | 2002 | | Manager and Senior Vice President, MetLife Advisers; Vice President, MetLife; Vice President, NELICO; Vice President, Met Investors Advisory, LLC, since 2005; Vice President, CitiStreet Funds, Inc., since 2005; formerly, Senior Vice President, Zenith Fund**. |
Alan C. Leland MetLife Advisers, LLC 501 Boylston Street Boston, MA 02116 | | 53 | | Senior Vice
President | | 2005 | | Treasurer and Chief Financial Officer, MetLife Advisers, LLC; Treasurer, Met Investors Advisory, LLC, since 2002; Vice President, MetLife Group, Inc., since 2003; Vice President, MetLife; Senior Vice President, NELICO; President, CitiStreet Funds, Inc., since 2005. Assistant Treasurer, Travelers Asset Management International Company LLC and Travelers Investment Adviser, Inc., since 2005. |
MSF-389
Metropolitan Series Fund, Inc.
Directors and Officers—(Continued)
| | | | | | | | |
Name and address
| | Age
| | Current
position(s)
with Fund
| | Position(s)
held since
| | Principal occupations over past five years(2)
|
Peter Duffy MetLife Advisers, LLC 501 Boylston Street Boston, MA 02116 | | 50 | | Vice
President
and
Treasurer | | 2000 | | Senior Vice President, MetLife Advisers, since December 1998; Senior Vice President; NELICO; Vice President, MetLife; Vice President, Travelers Asset Management International Company LLC and Travelers Investment Adviser, Inc., since 2005; Treasurer and Chief Financial Officer, Travelers Series Trust, since 2005; Treasurer, Chief Financial Officer and Chief Accounting Officer, CitiStreet Funds, Inc., since 2005; formerly, Vice President and Treasurer, Zenith Fund**. |
Thomas M. Lenz MetLife Advisers, LLC 501 Boylston Street Boston, MA 02116 | | 47 | | Vice
President
and
Secretary | | 2002 | | General Counsel and Secretary, MetLife Advisers, since 1998; Assistant General Counsel, MetLife; Secretary and Chief Legal Officer, CitiStreet Funds, Inc., since 2005; formerly, Vice President and Secretary, Zenith Fund**. |
Thomas C. McDevitt MetLife Advisers, LLC 501 Boylston Street Boston, MA 02116 | | 50 | | Vice
President | | 2002 | | Vice President, CitiStreet Funds, Inc., since 2005. Formerly, Vice President, Zenith Fund**. |
Daphne Thomas-Jones Metropolitan Life Insurance Company One MetLife Plaza 27-01 Queens Plaza North Long Island City, NY 11101 | | 50 | | Vice
President | | 2000 | | Assistant Vice President, since 1998; formerly, Director, MetLife. |
| * | Indicates a directorship with a registered investment company or a company subject to the reporting requirements of the Securities Exchange Act of 1934, as amended. |
| ** | Following its merger into the Fund on May 1, 2003, the Zenith Fund deregistered as an investment company with the SEC on January 29, 2004. |
| (†) | Served as a trustee, director and/or officer of one or more of the following companies, each of which had a direct or indirect advisory relationship with MetLife Advisers or its affiliates prior to January 31, 2005: State Street Research Financial Trust, State Street Research Income Trust, State Street Research Money Market Trust, State Street Research Institutional Funds, State Street Research Capital Trust, State Street Research Master Investment Trust, State Street Research Equity Trust, State Street Research Securities Trust and State Street Research Exchange Trust (the “State Street Research Funds”). |
| (1) | Each Director of the Fund also serves as trustee of Metropolitan Series Fund II (“Met Series Fund II”), a registered investment company advised by MetLife Advisers. Each officer of the Fund serves in the same position with Met Series Fund II, which consists of one portfolio. |
| (2) | Positions during the past five years with the Fund, MetLife, MetLife Advisers, Zenith Fund, NELICO, New England Financial, New England Funds, L.P., or New England Securities Corporation (“NES”) are omitted if not materially different. |
| (3) | The Fund Complex includes the Fund (37 Portfolios) and Met Series Fund II (1 Portfolio). |
MSF-390
Metropolitan Series Fund, Inc.
Board Approval of Advisory and Subadvisory Agreements—Unaudited
The Fund’s Contract Review Committees of the Board of Directors typically meet once each year, usually in early fall, to review the Portfolios’ advisory agreements (the “Advisory Agreements”) and sub-advisory agreements (the “Subadvisory Agreements,” and, together with the Advisory Agreement, the “Agreements”) and determine whether to recommend that the full Board approve the continuation of the Agreements for an additional one-year period. (Subsequent to the initial approval of an Agreement for a new Portfolio or with a new adviser or Subadviser, such annual reviews are not required until 2 years following the execution of such Agreement.) After each Committee has made its recommendations, the full Board, including the Independent Directors, determines whether to approve the continuation of the Agreements. In addition, the Board, including the Independent Directors, considers matters bearing on the Agreements at most of its other meetings throughout the year and interviews regularly various individuals at MetLife Advisers responsible for the management of the Portfolios. The Directors also interview selected investment managers and other professionals at the Subadvisers at various times throughout the year.
The Directors receive all materials that they or MetLife Advisers, the Funds’ investment adviser, believe to be reasonably necessary for the Directors to evaluate the Agreements and determine whether to approve the continuation of the Agreements. These materials generally include, among other items, (i) information on the investment performance of the Portfolios and the performance of peer groups of funds and the Portfolios’ performance benchmarks, (ii) information on the Portfolios’ advisory and subadvisory fees and other expenses, including information comparing the Portfolios’ expenses to those of peer groups of funds and information about any applicable expense caps and fee “breakpoints,” (iii) sales and redemption data, (iv) information related to the profitability of the Agreements to MetLife Advisers and the Subadvisers, and potential “fall-out” or ancillary benefits that MetLife Advisers, the Subadvisers or their affiliates may receive as a result of their relationships with the Fund and (v) information obtained through the Subadvisers’ responses to certain requests from MetLife Advisers and the Directors and MetLife Advisers’ responses to requests from the Directors. The Directors may also consider other information such as (vi) MetLife Advisers’ and the Subadvisers’ financial results and condition, (vii) each Portfolio’s investment objectives and strategies and the size, education and experience of the investment staffs of MetLife Advisers and the relevant Subadvisers and their use of technology and external research, (viii) the allocation of the Portfolios’ brokerage, if any, including allocations to brokers affiliated with the Subadvisers and the use of “soft” commission dollars to pay Portfolio expenses and to pay for research and other similar services, (ix) the resources devoted to, and the record of compliance with, the Portfolios’ investment policies and restrictions, policies on personal securities transactions and other compliance policies, (x) the responses of MetLife Advisers, the Subadvisers and/or their affiliates to certain legal and regulatory proceedings and (xi) the economic outlook generally and for the mutual fund industry in particular. Throughout the process, the Directors have the opportunity to ask questions of and request additional materials from MetLife Advisers and the Subadvisers.
Following meetings of each Contract Review Committee in October, 2005, at its November 3, 2005 meeting, the Board of Directors approved the continuation of the Advisory Agreements for each Portfolio of the Fund and the Subadvisory Agreements (together with the Advisory Agreements, the “Continued Agreements”) for each of the following Portfolios:
|
Portfolios for which Continuation of Subadvisory Agreements Approved at November 3, 2005 Meeting
|
|
Capital Guardian U.S. Equity |
Davis Venture Value |
FI International Stock |
FI Mid Cap Opportunities |
FI Value Leaders |
Franklin Templeton Small Cap Growth |
Harris Oakmark Focused Value |
Harris Oakmark Large Cap Value |
Jennison Growth |
Lehman Brothers Aggregate Bond Index |
Loomis Sayles Small Cap |
MetLife Mid Cap Stock Index |
MetLife Stock Index |
MFS Investors Trust |
MFS Total Return |
Morgan Stanley EAFE Index |
Neuberger Berman Mid Cap Value |
Russell 2000 Index |
T. Rowe Price Large Cap Growth |
T. Rowe Price Small Cap Growth |
MSF-391
Metropolitan Series Fund, Inc.
Board Approval of Advisory and Subadvisory Agreements—Unaudited—(Continued)
In considering whether to approve the continuation of the Continued Agreements, the Directors, including the Independent Directors, did not identify any single factor as determinative, and each weighed the various factors as he or she deemed appropriate. The Directors considered the following matters in connection with their approval of the Continued Agreements:
The nature, extent and quality of the services provided to the relevant Portfolios under the Continued Agreements. The Directors considered the nature, extent and quality of the services provided by MetLife Advisers, the relevant Subadvisers (if any) and their affiliates (each, an “Adviser,” and, collectively, the “Advisers”) to the relevant Portfolios pursuant to the Continued Agreements and the resources dedicated to these Portfolios by the Advisers. In particular, the Directors considered the Advisers’ abilities to attract and retain highly qualified investment professionals. With respect to MetLife Advisers, the Directors considered (for each Portfolio other than Zenith Equity and the Asset Allocation Portfolios) that MetLife Advisers is (i) ultimately responsible for the performance of such Portfolios; (ii) ultimately responsible for the establishment of the investment strategies of each such Portfolio, primarily through its recommendations to the Board regarding the hiring and selection of Subadvisers; (iii) responsible for the hiring and selection, subject to Board approval, of Subadvisers; and (iv) responsible for maintaining a program of Subadviser oversight reasonably designed to ensure that the Subadvisers have reasonable compliance policies and procedures in place. The Directors also considered that MetLife Advisers provides a full range of day-to-day administrative services for the Portfolios involving all aspects of such Portfolios’ day-to-day operations (other than portfolio management). With respect to Zenith Equity and the Asset Allocation Portfolios, the Directors considered the portfolio management services of MetLife Advisers. After reviewing these and related factors, the Directors concluded, within the context of their overall conclusions regarding each of the Continued Agreements, that the nature, extent and quality of services provided supported the renewal of these Agreements.
Investment performance of the relevant Portfolios. The Directors reviewed information about the performance of the relevant Portfolios over various time periods, including information prepared by an independent third party that compared the performance of the Portfolios to the performance of peer groups of funds and performance benchmarks. The Directors also reviewed a description of the third party’s methodology for identifying a Portfolio’s peer group(s) for purposes of performance and expense comparisons.
In the case of each relevant Portfolio (if any) that had performance that lagged its peer group(s) for certain periods, the Directors concluded that other factors relevant to performance were sufficient, in light of other considerations, to warrant renewal of such Portfolio’s Advisory and/or Subadvisory Agreements. These factors varied from Portfolio to Portfolio, but included one or more of the following: (i) that such Portfolio’s performance, although lagging in certain recent periods, was stronger over the longer term; (ii) that the underperformance was attributable, to a significant extent, to investment decisions that were reasonable and consistent with the Portfolio’s investment objective(s) and policies and that the Portfolio was performing as expected, given market conditions and the Portfolio’s investment objective(s) and policies; (iii) that the Portfolio’s performance was competitive when compared to other relevant performance benchmarks or peer groups; and (iv) that MetLife Advisers and/or the relevant Subadviser (if any) had taken or was taking steps designed to help improve the Portfolio’s investment performance.
The Directors also considered the investment performance of the Advisers and their reputations generally, the historical responsiveness of the Advisers to Director concerns about performance and the willingness of the Advisers to take steps intended to improve performance.
After reviewing these and related factors, the Directors concluded, within the context of their overall conclusions regarding each of the Continued Agreements, that the investment performance of each relevant Portfolio and Adviser was sufficient, in light of other considerations, to warrant the renewal of the Continued Agreements.
The costs of the services to be provided and profits to be realized by the Advisers and their affiliates from their relationships with the Portfolios. The Directors considered the fees charged by MetLife Advisers to the Portfolios for advisory services and, with respect to the subadvised Portfolios for which the Board considered the relevant Subadvisory Agreements, by such Subadvisers to MetLife Advisers for subadvisory services (such advisory and subadvisory fees (if any), collectively, “Fees”), as well as the total expense levels of the Portfolios. This information included comparisons (provided by an independent third party) of the Portfolios’ advisory fees and total expense levels to those of their peer groups. In evaluating Fees for the relevant Portfolios, the Directors also took into account the demands, complexity and quality of the investment management services provided to the Portfolio. The Directors considered MetLife Advisers’ recommendations regarding reductions in Fee rates, implementation of Fee breakpoints and institution of Fee waivers and expense caps.
The Directors also considered the compensation directly or indirectly received by the Advisers and their affiliates from their relationships with the relevant Portfolios. The Directors reviewed information relating to the profits received by MetLife Advisers, certain of the Subadvisers and their affiliates as a result of their relationships with the relevant Portfolios, and information about the allocation of expenses used to calculate profitability. When reviewing profitability, the Directors also considered the performance of
MSF-392
Metropolitan Series Fund, Inc.
Board Approval of Advisory and Subadvisory Agreements—Unaudited—(Continued)
the relevant Portfolios, the expense levels of such Portfolios, and whether the relevant Advisers had implemented breakpoints, Fee waivers and/or expense caps with respect to such Portfolios.
After reviewing these and related factors, the Directors concluded, within the context of their overall conclusions regarding each of the Continued Agreements, that the Fees charged to each of the relevant Portfolios were fair and reasonable, and that the information provided regarding costs of these services generally and the related profitability to the relevant Advisers of their relationships with the relevant Portfolios, supported the renewal of the Continued Agreements.
Economies of Scale. The Directors considered the existence of any economies of scale in the provision of services by the Advisers and whether those economies were shared with the relevant Portfolios through breakpoints in their advisory fees or other means, such as expense caps or fee waivers. The Directors noted that most of the relevant Portfolios benefited or will benefit from breakpoints, expense caps and/or fee waivers with respect to their advisory fees. In considering these issues, the Directors also took into consideration information relating to the costs of the services provided and the profitability to MetLife Advisers, the relevant Subadvisers (if any) and each of their affiliates of their relationships with the relevant Portfolios, as discussed above.
After reviewing these and related factors, the Directors concluded, within the context of their overall conclusions regarding each of the Continued Agreements, that the extent to which economies of scale were shared with the relevant Portfolios supported the renewal of such Agreements.
Other Factors. The Directors also considered other factors, which included but were not limited to the following:
| | • | | the extent to which each relevant Portfolio operated in accordance with its investment objective, and its record of compliance with its investment restrictions and the compliance programs of the Fund and the Advisers. They also considered the compliance-related resources the Advisers and their affiliates provide to the relevant Portfolios; |
| | • | | the nature, quality, cost and extent of administrative and shareholder services performed by MetLife Advisers and its affiliates under the Advisory Agreements; and |
| | • | | so-called “fall-out benefits” to the Advisers, such as the engagement of their affiliates to provide distribution, brokerage and transfer agency services to the Portfolios, and the benefits of research made available to the relevant Advisers and by reason of brokerage commissions generated by the relevant Portfolios’ securities transactions. The Directors also considered the possible conflicts of interest associated with these fall-out and other benefits, and the reporting, disclosure and other processes in place to disclose and monitor these possible conflicts of interest. |
Based on their evaluation of all factors that they deemed to be material, including those factors described above, and assisted by the advice of independent counsel, the Directors, including the Independent Directors, concluded that each of the Continued Agreements should be continued through November 30, 2006.
Certain Matters Relating to the Salomon Brothers Strategic Bond Opportunities Portfolio and Salomon Brothers U.S. Government Portfolio. On June 23, 2005, Citigroup Inc., the parent company of SBAM, agreed to sell substantially all of its asset management business, including SBAM, to Legg Mason Inc. (“Legg Mason”). SBAM is the subadviser to the Salomon Brothers Portfolios, and the consummation of the aforementioned transaction would result in a change of control of SBAM and the automatic termination of the Salomon Brothers Portfolios’ subadvisory agreements. In connection with the anticipated change of control of SBAM, the Board approved new subadvisory agreements between MetLife Advisers and SBAM for the Salomon Brothers Portfolios at a special meeting of the Board held on October 6, 2005. In considering the new subadvisory agreements for the Salomon Brothers Portfolios, the Board met with a representative from SBAM and received information regarding the proposed transaction, Legg Mason and its asset management affiliates, and Legg Mason’s plans for SBAM after the closing of the transaction. In approving the new subadvisory agreements, the Board considered the factors described above with respect to the Portfolios, as relevant. In addition to these factors, the Board also considered:
| | • | | that the new subadvisory agreements are substantially similar to the Salomon Brothers Portfolios’ previous subadvisory agreement; and |
| | • | | the business, experience and reputation of Legg Mason and its asset management affiliates and the prominence of the Legg Mason name in the marketplace for investment advice. |
Based on their evaluation of all factors that they deemed to be material, including those factors described above, and assisted by the advice of independent counsel, the Directors, including the Independent Directors, unanimously voted to approve the new subadvisory agreements between MetLife Advisers and SBAM for the Salomon Brothers Portfolios.
MSF-393
Metropolitan Series Fund, Inc.
Board Approval of Advisory and Subadvisory Agreements—Unaudited—(Continued)
Certain Matters Relating to the MFS Total Return Portfolio. On December 13, 2005, the Board approved the proposed reorganization of the MFS Total Return Portfolio (the “TST Portfolio”) of the TST into the Fund’s MFS Total Return Portfolio (the “Acquiring Portfolio”) (the “MFS Total Return Reorganization”). The TST’s Board of Trustees approved the MFS Total Return Reorganization on behalf of the TST Portfolio at a meeting held on November 10, 2005 and recommended that the MFS Total Return Reorganization be submitted to the TST Portfolio’s shareholders for approval. The Acquiring Portfolio’s shareholders are not required to approve the MFS Total Return Reorganization. If approved by the TST Portfolio’s shareholders, the MFS Total Return Reorganization is expected to close on May 1, 2006.
Massachusetts Financial Services Company (“MFS”), subadviser to both the TST Portfolio and the Acquiring Portfolio, has informed the Fund that it is not willing to subadvise the Acquiring Portfolio at its current subadvisory fee schedule past May 1, 2006. In connection therewith, MFS informed the Fund that, should the MFS Total Return Reorganization be consummated, it would be willing to continue to subadvise the Acquiring Portfolio after May 1, 2006 at the new subadvisory fee rates shown in the table below. At the same time, MetLife Advisers informed the Fund that, should the subadvisory fee schedule for the Acquiring Portfolio be increased as described below, MetLife Advisers would seek an increase in the advisory fee schedule for the Acquiring Portfolio after May 1, 2006 to the levels shown below.
| | | | | | |
Subadvisory Fee Schedule
Prior to May 1, 2006
| | Subadvisory Fee Schedule
Effective May 1, 2006(1)
|
Annual
Percentage Rate
| | Average Daily Net
Asset Value Levels
| | Annual
Percentage Rate
| | Average Daily Net
Asset Value Levels
|
| 0.25% | | First $50 million | | 0.35% | | First $250 million |
| 0.20% | | Over $50 million | | 0.30% | | Next $1 billion |
| | | | | 0.25% | | Next $250 million |
| | | | | 0.20% | | Over $1.5 billion |
| | | | | | |
Advisory Fee Schedule
Prior to May 1, 2006
| | Advisory Fee Schedule
Effective May 1, 2006(2)
|
Annual
Percentage Rate
| | Average Daily Net
Asset Value Levels
| | Annual
Percentage Rate
| | Average Daily Net
Asset Value Levels
|
| 0.50% | | All Assets | | 0.60% | | First $250 million |
| | | | | 0.55% | | Next $500 million |
| | | | | 0.50% | | Over $750 million |
(1) Subject to consummation of the MFS Total Return Reorganization.
(2) Subject to consummation of the MFS Total Return Reorganization and shareholder approval of the advisory fee increase.
In order to retain MFS as subadviser to the Acquiring Portfolio, at meetings held on November 3, 2005 and February 1, 2006, the Board approved the subadvisory fee increase and, subject to the approval of shareholders of the Acquiring Portfolio, the advisory fee increase, for the Acquiring Portfolio, as described above. The subadvisory and advisory fee increases are contingent on the consummation of the MFS Total Return Reorganization. On or about April 28, 2006, the shareholders of the Acquiring Portfolio will consider the approval of a proposed amendment to the Advisory Agreement between the Fund, on behalf the Acquiring Portfolio, and MetLife Advisers providing for the increase in advisory fee. If the amendment is approved by shareholders and the MFS Total Return Reorganization is consummated, the new advisory and subadvisory fee rates will take effect May 1, 2006.
In approving amended advisory and subadvisory agreements for the Acquiring Portfolio, which include the increased advisory and subadvisory fee schedules and under which MetLife Advisers and MFS would continue to act as adviser and subadviser to the Acquiring Portfolio, the Board considered the factors described above with respect to the Portfolios, as relevant. In addition to these factors, the Board also considered:
| | • | | That, in order to retain MFS as subadviser to the Acquiring Portfolio following the consummation of the MFS Total Return Reorganization, the subadvisory fee increase was necessary and that, in order to avoid penalizing MetLife Advisers for such increase, the advisory fee should be adjusted as described above; |
| | • | | That the advisory and subadvisory fee schedules under the Acquiring Portfolio’s current advisory and subadvisory agreements are below market levels; |
| | • | | That, following the MFS Total Return Reorganization, total expenses for the Acquiring Portfolio are expected to decrease by a greater amount than the advisory fee increase under the amended advisory agreement, though no assurances can be given that any such expense decrease will in fact be realized; and |
MSF-394
Metropolitan Series Fund, Inc.
Board Approval of Advisory and Subadvisory Agreements—Unaudited—(Continued)
| | • | | That, other than the fee schedule changes, the amended advisory and subadvisory agreements are substantially similar to the Acquiring Portfolio’s current advisory and subadvisory agreements. |
Based on their evaluation of all factors that they deemed to be material, including those factors described above, and assisted by the advice of independent counsel, the Directors, including the Independent Directors, unanimously voted to approve (i) the amended subadvisory agreement with respect to the Acquiring Portfolio, to take effect May 1, 2006, subject to consummation of the MFS Total Return Reorganization, and (ii) the amended advisory agreement with respect to the Acquiring Portfolio, to take effect May 1, 2006, subject to approval by shareholders of the Acquiring Portfolio and consummation of the MFS Total Return Reorganization.
MSF-395
A description of the policies and procedures that the Fund uses to determine how to vote proxies relating to portfolio securities is available (i) without charge, upon request, by calling (800) 638-7732 and (ii) on the Securities and Exchange Commission’s (the “SEC”) website at http://www.sec.gov.
Information regarding how the Fund voted proxies relating to portfolio securities during the most recent twelve-month period ended December 31, 2005 is available (i) without charge, upon request, by calling (800) 638-7732 and (ii) on the SEC’s website at http://www.sec.gov.
The Fund files with the SEC a complete schedule of its portfolio holdings, as of the close of the first and third quarters of its fiscal year, on “Form N-Q”. These filings are available on the SEC’s website at www.sec.gov and may be reviewed and copied at the SEC’s Public Reference Room in Washington, DC. (Call 1-800-SEC-0330 for information on the operation of the Public Reference Room.)
MSF-396
Item 2. Code of Ethics.
As of December 31, 2005, the registrant has adopted a “code of ethics” (as such term is defined in the instructions to Item 2 of Form N-CSR) that applies to the registrant’s principal executive officer and principal financial and accounting officer. There were no substantive amendments or waivers to this code of ethics during the period covered by this report.
Item 3. Audit Committee Financial Expert.
The registrant’s Board of Directors has determined that Steve A. Garban, John T. Ludes and Linda B. Strumpf are “audit committee financial experts” (as such term is defined in the instructions to Item 3 of Form N-CSR). Each of these individuals is “independent” for purposes of Item 3 of Form N-CSR.
Item 4. Principal Accountant Fees and Services.
(a) – (d)
Fees for Services Rendered to the Registrant
| | | | | | | | | | | | |
Fiscal Year
| | Audit Fees
| | Audit - Related Fees
| | Tax Fees
| | All Other Fees
|
2004 | | $ | 660,970 | | $ | 57,000 | | $ | 66,971 | | $ | 0 |
2005 | | $ | 718,900 | | $ | 41,000 | | $ | 77,900 | | $ | 0 |
Audit-Related Fees represent fees for services rendered to the registrant (i) for security valuation testing in connection with the registrant’s semi-annual report for the periods ended June 30, 2004 and June 30, 2005, respectively; and (ii) related to reorganizations involving certain portfolios of the registrant (in the case of (ii), such fees were paid by the registrant’s investment adviser).
Tax Fees represent fees for services rendered to the registrant for tax return preparation and review of and participation in determining required income and capital gains distributions.
There were no fees required to be approved pursuant to paragraph (c)(7)(ii) of Rule 2-01 of Regulation S-X.
(e)(1) The registrant’s Audit Committee has established pre-approval procedures pursuant to paragraph (c)(7)(i)(B) of Rule 2-01 of Regulation S-X, which include regular pre-approval procedures and interim pre-approval procedures. Under the regular pre-approval procedures, the Audit Committee pre-approves at its regularly scheduled meetings audit and non-audit services that are required to be pre-approved under paragraph (c)(7) of Rule 2-01 of Regulation S-X. Under the interim pre-approval procedures, any member of the Audit Committee who is an independent Director is authorized to pre-approve proposed services that arise between regularly scheduled Audit Committee meetings and that need to commence prior to the next regularly scheduled Audit Committee meeting. Such Audit Committee member must report to the Audit Committee at its next regularly scheduled meeting on the pre-approval decision.
(e)(2) Not applicable.
(f) Not applicable.
(g)
| | | |
Fiscal Year
| | Aggregate Non-Audit Fees
|
2004 | | $ | 9,845,411 |
2005 | | $ | 12,450,000 |
The amounts set out above represent the aggregate non-audit fees billed by the registrant’s accountant to MetLife, Inc., and include, among other non-audit fees, non-audit fees for services rendered to the registrant and rendered to the registrant’s investment adviser (not including any subadviser whose role is primarily portfolio management and is subcontracted with or overseen by another investment adviser) and any entity controlling, controlled by, or under common control with the adviser that provides ongoing services to the registrant.
(h) The Audit Committee of the registrant’s Board of Directors considered the provision of non-audit services that were rendered to the registrant’s investment adviser (not including any subadviser whose role is primarily portfolio management and is subcontracted with or overseen by another investment adviser), and any entity controlling, controlled by or under common control with the investment adviser that provides ongoing services to the registrant that were not pre-approved pursuant to paragraph (c)(7)(ii) of Rule 2-01 of Regulation S-X and concluded that such services are compatible with maintaining the principal accountant’s independence.
Item 5. Audit Committee of Listed Registrants
Not applicable.
Item 6. Schedule of Investments.
Included in reports to stockholders under Item 1.
Item 7. Disclosure of Proxy Voting Policies and Procedures for Closed-End Management Investment Companies.
Not applicable.
Item 8. Portfolio Managers of Closed-End Management Investment Companies.
Not applicable.
Item 9. Purchases of Equity Securities by Closed-End Management Investment Company and Affiliated Purchasers.
Not applicable.
Item 10. Submission of Matters to a Vote of Security Holders.
There have been no material changes to the procedures by which shareholders may recommend nominees to the Board of Directors since the registrant last provided disclosure in response to this Item.
Item 11. Controls and Procedures.
(a) The President and Treasurer of the registrant have concluded, based on their evaluation of the effectiveness of the registrant’s disclosure controls and procedures (as defined in Rule 30a-3(c) under the Act) as of a date within 90 days of the filing date of this report on Form N-CSR, that the design and operation of such procedures provide reasonable assurance that information required to be disclosed by the registrant in this report on Form N-CSR is recorded, processed, summarized, and reported within the time periods specified in the Securities and Exchange Commission’s rules and forms.
(b) There has been no change in the registrant’s internal controls over financial reporting (as defined in Rule 30a-3(d) under the Act) that occurred during the second fiscal quarter of the period covered by this report that has materially affected, or is reasonably likely to materially affect, the registrant’s internal control over financial reporting.
Item 12. Exhibits.
| | | | |
(a) | | (1) | | Code of Ethics (as defined in Item 2(b) of Form N-CSR). |
| | |
| | | (2) | | Certifications required by Rule 30a-2(a) under the Act. |
| | |
| | | (3) | | Not applicable. |
| | |
(b) | | | | Certification required by Rule 30a-2(b) under the Act. |
SIGNATURES
Pursuant to the requirements of the Securities Exchange Act of 1934 and the Investment Company Act of 1940, the registrant has duly caused this report to be signed on its behalf by the undersigned, thereunto duly authorized.
| | |
METROPOLITAN SERIES FUND, INC. |
| |
| By: | | /s/ Hugh C. McHaffie
|
| Name: | | Hugh C. McHaffie |
| Title: | | President |
| Date: | | February 23, 2006 |
Pursuant to the requirements of the Securities Exchange Act of 1934 and the Investment Company Act of 1940, this report has been signed below by the following persons on behalf of the registrant and in the capacities and on the dates indicated.
| | |
| By: | | /s/ Hugh C. McHaffie
|
| Name: | | Hugh C. McHaffie |
| Title: | | President |
| Date: | | February 23, 2006 |
| |
| By: | | /s/ Peter H. Duffy
|
| Name: | | Peter H. Duffy |
| Title: | | Treasurer |
| Date: | | February 23, 2006 |
EXHIBIT LIST
| | |
| Exhibit 12(a)(1): | | Code of Ethics |
| |
| Exhibit 12(a)(2)(a): | | Certification of the Principal Executive Officer required by Rule 30a-2(a) under the Act |
| |
| Exhibit 12(a)(2)(b): | | Certification of the Principal Financial Officer required by Rule 30a-2(a) under the Act |
| |
| Exhibit 12(b): | | Certification required by Rule 30a-2(b) under the Act |