UNITED STATES
SECURITIES AND EXCHANGE COMMISSION
Washington, D.C. 20549
FORM N-CSR
CERTIFIED SHAREHOLDER REPORT OF REGISTERED
MANAGEMENT INVESTMENT COMPANIES
Investment Company Act file number: 811-3618
Metropolitan Series Fund, Inc.
(Exact name of registrant as specified in charter)
501 Boylston Street
Boston, Massachusetts 02116
(Address of Principal Executive Office)
THOMAS M. LENZ, ESQ.
MetLife Advisers, LLC
501 Boylston Street
Boston, Massachusetts 02116
(Name and address of agent for service)
Copy to:
JOHN M. LODER
One Financial Center
Boston, Massachusetts 02111
Registrant’s telephone number, including area code: 617-578-3104
Date of fiscal year end: December 31
Date of reporting period: December 31, 2007
Form N-CSR is to be used by management investment companies to file reports with the Commission not later than 10 days after the transmission to stockholders of any report that is required to be transmitted to stockholders under Rule 30e-1 under the Investment Company Act of 1940 (17 CFR 270.30e-1). The Commission may use the information provided on Form N-CSR in its regulatory, disclosure review, inspection, and policymaking roles.
A registrant is required to disclose the information specified by Form N-CSR, and the Commission will make this information public. A registrant is not required to respond to the collection of information contained in Form N-CSR unless the Form displays a currently valid Office of Management and Budget (“OMB”) control number. Please direct comments concerning the accuracy of the information collection burden estimate and any suggestions for reducing the burden to Secretary, Securities and Exchange Commission, 450 Fifth Street, NW, Washington, DC 20549-0609. The OMB has reviewed this collection of information under the clearance requirements of 44 U.S.C. §3507.
Item 1. Reports to Stockholders.
The following is a copy of the report transmitted to stockholders pursuant to Rule 30e-1 under the Investment Company Act of 1940 (the “Act”):

| | |
Metropolitan Series Fund, Inc. BlackRock Aggressive Growth Portfolio Annual Report | | December 31, 2007 |
Letter from the President
February 1, 2008
Letter to Policy Holders:
2007 was a tumultuous year in the financial markets driven by concerns in the credit markets surrounding sub-prime mortgages and fears of recession in the U.S. Economy. The broad markets were mixed, with the Dow Jones Industrial Average up 8.9% and the MSCI EAFE Index, which measures the performance of international equities, up 11.2% for the year, while the Russell 2000 Index, which measures the performance of small capitalization stocks, was down 1.6%.
In the fixed income markets, credit spreads increased as a result of the pressure from sub-prime mortgage crisis and the Federal Reserve lowered interest rates by a total of 1% during the year. The Lehman Brothers Aggregate Bond Index posted a 7.0% return for the year.
On the following pages, you will find a complete review of your Portfolio and its investment performance.
MetLife is committed to building your financial freedom. We appreciate your trust and will continue to focus our efforts on meeting your investment needs.
Sincerely,

Elizabeth Forget
President, Metropolitan Series Fund, Inc.
Metropolitan Series Fund, Inc.
BlackRock Aggressive Growth Portfolio
Managed by BlackRock Advisors, LLC
Portfolio Manager Commentary*
PORTFOLIO PERFORMANCE
For the year ended December 31, 2007, the Class A shares of the BlackRock Aggressive Growth Portfolio returned 20.6%, compared to its benchmark, the Russell Midcap Growth Index1, which returned 11.4%. The average return of its peer group, the Lipper Variable Insurance Products Mid-Cap Growth Funds Universe2 , was 16.5% over the same period.
PORTFOLIO REVIEW
2007 began largely where 2006 left off. A slowdown in U.S. growth occurred following Fed tightening, rising oil prices, and the beginning of concerns around credit and slower spending by the U.S. consumer. Earnings growth remained strong on the back of solid export growth, a declining dollar and share buybacks. A transition in leadership from small, value and domestic to large, growth and multinational became evident as the year began. During the second half of 2007, the benign fundamentals of 2003-2006, namely strong global growth, rising profitability levels, and falling risk premiums, were replaced by credit stress; pressures on the capital position of the financial system; questions about the sustainability of the business cycle; and rising energy and food prices. Reflecting these woes, market prices moved considerably. Government bond yields plummeted, the dollar fell faster than in earlier years, credit spreads widened and equities became trendless and volatile. The financial and consumer discretionary sectors experienced drops of one-quarter to one-third. Commodity and industrial-related multinational companies performed the best. Emerging market economies and equity markets performed well yet again. The Federal Reserve moved from an attitude of vigilance about inflation to one of providing liquidity and lowering rates to shore up the functioning of credit markets and fight economic weakness.
BlackRock Aggressive Growth Portfolio had positive returns for the fifth consecutive year and significantly outperformed the Russell Midcap Growth Index. Strong stock selection in consumer discretionary, financials and healthcare, along with sector positioning in consumer discretionary and energy, helped returns.
The largest change in sector positioning during the year came in information technology (IT), where we notably reduced our overweight versus the benchmark Russell Midcap Growth Index. This shift resulted from a combination of our eliminating some IT holdings from the Portfolio while the benchmark’s sector weighting increased. We eliminated a number of names within the sector, including CACI International and Ingram Micro, in order to pursue more attractive opportunities. Sizeable holding Alliance Data Systems, a private label credit card processing service provider, was sold after the company announced it was being taken private by Blackstone. Additionally, video conference provider Polycom was sold due to high valuation. Cash generated from the selling of these names allowed us to increase our exposure in healthcare from a slight underweight to an overweight position. Notable additions included Medicis Pharmaceutical, Hologic Inc. and Magellan Health Services. At year-end, our largest overweights were concentrated in the healthcare and information technology sectors, while our most significant underweight was in the utilities sector. We continue to look for names with good growth opportunities, regardless of sector or market conditions.
A combination of strong stock selection and a relative underweight in the consumer discretionary sector proved to be the greatest contributors to both absolute and relative returns for the period. Stock selection in the specialty retail industry, in particular, accounted for the largest part of the success. Sizeable Portfolio holding GameStop more than doubled in price as the video game retailer continued to report strong financial results. Dick’s Sporting Goods was also a positive contributor within specialty retail, as the company consistently executed in a tough retail environment. Elsewhere in consumer discretionary, hotel chain Orient-Express Hotels appreciated more than 20% on strong international results and takeover speculation.
Although the financials sector generated limited returns for the period, strong stock selection within the Portfolio helped both relative and absolute returns. CME Group was the top contributor in the sector, benefiting from increased trading activity in addition to its successful merger with the Chicago Board of Trade. Our underweight in utilities had a slightly negative effect on the Portfolio, as the sector accounts for only a small part of the Russell Midcap Growth Index.
Consistent with the Portfolio’s investment process and discipline, its structure at any given time reflects our bottom-up analysis of what we believe are the most promising investment opportunities in the mid cap growth universe. We do not make macroeconomic, sector, or thematic predictions.
* The views expressed above are those of the subadvisory firm as of December 31, 2007 and are subject to change based on market and other conditions. Information about the Portfolio’s holdings, asset allocation, industry allocation, or country diversification is historical and is not an indication of future Portfolio composition, which will vary. The performance of any index mentioned in this commentary has not been adjusted for ongoing management, distribution and operating expenses, and sales charges applicable to mutual fund investments. Direct investment in the Index is not possible.
1 The Russell Midcap® Growth Index is an unmanaged measure of performance of those Russell Midcap companies (the 800 smallest companies in the Russell 1000 Index) with higher price-to-book ratios and higher forecasted growth values.
2 The Lipper Variable Insurance Products Fund Average is an average of the total return performance (calculated on the basis of net asset value) of variable product funds with similar investment objectives to those of the subject Portfolio as calculated by Lipper Analytical Services, an independent mutual fund ranking service.
MSF-2
Metropolitan Series Fund, Inc.
BlackRock Aggressive Growth Portfolio
A $10,000 INVESTMENT COMPARED TO
THE RUSSELL MIDCAP GROWTH INDEX
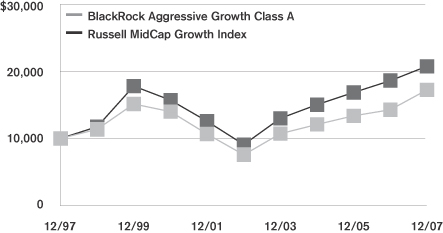
Average Annual Returns as of December 31, 2007
| | | | | | | | | | | | | | | |
| | | BlackRock Aggressive
Growth Portfolio | | | Russell
MidCap
Growth Index | |
| | | Class A | | | Class B | | | Class D | | | Class E | | |
| 1 Year | | 20.6 | % | | 20.2 | % | | 20.4 | % | | 20.4 | % | | 11.4 | % |
| 5 Year | | 17.8 | | | — | | | — | | | 17.6 | | | 17.9 | |
| 10 Year | | 5.6 | | | — | | | — | | | — | | | 7.6 | |
| Since Inception | | — | | | 12.0 | | | 10.9 | | | 5.0 | | | — | |
Performance numbers are net of all Portfolio expenses but do not include any insurance, sales, or administrative charges of variable annuity or life insurance contracts. If these charges were included, the returns would be lower.
Inception dates of the Class A, Class B, Class D and Class E shares are: 4/29/88, 4/26/04, 5/2/06 and 5/1/01, respectively.
This information represents past performance and is not indicative of future results. Investment return and principal value may fluctuate so that shares, upon redemption, may be worth more or less than the original cost.
PORTFOLIO COMPOSITION as of December 31, 2007
Top Holdings
| | |
| | | % of Total
Net Assets |
GameStop Corp. (Class A) | | 2.9% |
Thermo Fisher Scientific, Inc. | | 2.6% |
Ametek, Inc. | | 2.5% |
CME Group, Inc. | | 2.5% |
Harris Corp. | | 2.4% |
Oshkosh Truck Corp. | | 2.3% |
Pediatrix Medical Group, Inc. | | 2.2% |
Medco Health Solutions, Inc. | | 2.2% |
Agrium, Inc. | | 2.2% |
Amphenol Corp. (Class A) | | 2.2% |
Top Sectors
| | |
| | | % of Total
Market Value |
Information Technology | | 21.7% |
Industrials | | 16.7% |
Health Care | | 15.6% |
Consumer Discretionary | | 14.8% |
Energy | | 13.4% |
Materials | | 6.7% |
Financials | | 5.9% |
Cash | | 2.2% |
Consumer Staples | | 1.6% |
Telecommunication Services | | 1.4% |
MSF-3
Metropolitan Series Fund, Inc.
Shareholder Expense Example
As a shareholder of the Portfolio, you incur ongoing costs, including management fees; distribution and service (12b-1) fees; and other Portfolio expenses. This example is intended to help you understand your ongoing costs (in dollars) (referred to as “expenses”) of investing in the Portfolio and compare these costs with the ongoing costs of investing in other mutual funds. The example is based on an investment of $1,000 invested at the beginning of the period and held for the entire period, July 1, 2007 through December 31, 2007.
Actual Expenses
The first line for each share class of the Portfolio in the table below provides information about actual account values and actual expenses. You may use the information in this line, together with the amount you invested in the particular share class of the Portfolio, to estimate the expenses that you paid over the period. Simply divide your account value by $1,000 (for example, an $8,600 account value divided by $1,000=8.6), then multiply the result by the number in the first line under the heading entitled “Expenses Paid During Period” to estimate the expenses you paid on your account during this period.
Hypothetical Example for Comparison Purposes
The second line for each share class of the Portfolio in the table below provides information about hypothetical account values and hypothetical expenses based on the Portfolio’s actual expense ratio and an assumed rate of return of 5% per year before expenses, which is not the Portfolio’s actual return. The hypothetical account values and expenses may not be used to estimate the actual ending account balance or expenses you paid for the period. You may use this information to compare the ongoing costs of investing in the Portfolio and other funds. To do so, compare this 5% hypothetical example with the 5% hypothetical examples that appear in the shareholder reports of the other funds.
Please note that the expenses shown in the table are meant to highlight your ongoing costs only and do not reflect any fees or charges of your variable insurance product or any additional expenses that participants in certain eligible qualified plans may bear relating to the operations of their plan. Therefore, the second line for each share class in the table is useful in comparing ongoing costs only, and will not help you determine the relative total costs of owning different funds. In addition, if these other costs were included, your costs would have been higher.
| | | | | | | | | | | | | | |
Portfolio | | | | Annualized
Expense
Ratio | | | Beginning
Account Value
July 1,
2007 | | Ending
Account Value
December 31,
2007 | | Expenses Paid
During Period*
July 1, 2007
to
December 31,
2007 |
BlackRock Aggressive Growth—Class A | | Actual | | 0.76 | % | | $ | 1,000.00 | | $ | 1,071.20 | | $ | 3.97 |
| | Hypothetical | | 0.76 | % | | $ | 1,000.00 | | $ | 1,021.33 | | $ | 3.87 |
| | | | | |
BlackRock Aggressive Growth—Class B | | Actual | | 1.01 | % | | $ | 1,000.00 | | $ | 1,069.60 | | $ | 5.27 |
| | Hypothetical | | 1.01 | % | | $ | 1,000.00 | | $ | 1,020.05 | | $ | 5.14 |
| | | | | |
BlackRock Aggressive Growth—Class D | | Actual | | 0.86 | % | | $ | 1,000.00 | | $ | 1,070.20 | | $ | 4.49 |
| | Hypothetical | | 0.86 | % | | $ | 1,000.00 | | $ | 1,020.82 | | $ | 4.38 |
| | | | | |
BlackRock Aggressive Growth—Class E | | Actual | | 0.91 | % | | $ | 1,000.00 | | $ | 1,070.30 | | $ | 4.75 |
| | Hypothetical | | 0.91 | % | | $ | 1,000.00 | | $ | 1,020.56 | | $ | 4.63 |
* Expenses paid are equal to the Portfolio’s annualized expense ratio for the most recent six month period, as shown above, multiplied by the average account value over the period, multiplied by the number of days in the most recent fiscal half-year, divided by 365 (to reflect the one-half year period).
MSF-4
Metropolitan Series Fund, Inc.
BlackRock Aggressive Growth Portfolio
Schedule of Investments as of December 31, 2007
Common Stock—96.9% of Total Net Assets
| | | | | |
| Security Description | | Shares | | Value* |
| | | | | |
|
Aerospace & Defense—4.4% |
BE Aerospace, Inc. (a) | | 420,500 | | $ | 22,244,450 |
Goodrich Corp. | | 307,300 | | | 21,698,453 |
Precision Castparts Corp. | | 85,480 | | | 11,856,076 |
| | | | | |
| | | | | 55,798,979 |
| | | | | |
|
Air Freight & Logistics—0.5% |
UTi Worldwide, Inc. | | 313,800 | | | 6,150,480 |
| | | | | |
|
Biotechnology—1.0% |
Martek Biosciences Corp. (a) (b) | | 445,000 | | | 13,163,100 |
| | | | | |
|
Capital Markets—2.3% |
Affiliated Managers Group, Inc. (a) (b) | | 79,000 | | | 9,279,340 |
Invesco, Ltd. (b) | | 268,400 | | | 8,422,392 |
T. Rowe Price Group, Inc. | | 181,800 | | | 11,067,984 |
| | | | | |
| | | | | 28,769,716 |
| | | | | |
|
Chemicals—4.0% |
Agrium, Inc. | | 386,100 | | | 27,880,281 |
Celanese Corp. | | 548,700 | | | 23,220,984 |
| | | | | |
| | | | | 51,101,265 |
| | | | | |
|
Commercial Services & Supplies—3.8% |
Employee Solutions, Inc. (a) (b) (c) | | 484 | | | 0 |
Genpact, Ltd. (b) | | 397,700 | | | 6,056,971 |
IHS, Inc. (a) (b) | | 383,200 | | | 23,206,593 |
TeleTech Holdings, Inc. (a) (b) | | 912,000 | | | 19,398,240 |
| | | | | |
| | | | | 48,661,804 |
| | | | | |
|
Communications Equipment—4.6% |
Foundry Networks, Inc. (a) | | 853,600 | | | 14,955,072 |
Harris Corp. | | 483,320 | | | 30,294,498 |
Juniper Networks, Inc. (a) | | 393,300 | | | 13,057,560 |
| | | | | |
| | | | | 58,307,130 |
| | | | | |
|
Construction & Engineering—0.5% |
Quanta Services, Inc. (a) | | 255,000 | �� | | 6,691,200 |
| | | | | |
|
Diversified Consumer Services—0.9% |
DeVry, Inc. | | 213,302 | | | 11,083,172 |
| | | | | |
|
Diversified Financial Services—2.8% |
CME Group, Inc. | | 47,030 | | | 32,262,580 |
MSCI, Inc. (a) | | 78,900 | | | 3,029,760 |
| | | | | |
| | | | | 35,292,340 |
| | | | | |
|
Electrical Equipment—2.5% |
Ametek, Inc. (a) | | 691,800 | | | 32,403,912 |
| | | | | |
| | |
Electronic Equipment & Instruments—2.2% | | | | | |
Amphenol Corp. (Class A) | | 592,300 | | | 27,464,951 |
| | | | | |
| | |
Energy Equipment & Services—4.3% | | | | | |
Acergy S.A. (ADR) (a) | | 678,700 | | | 14,911,039 |
| | | | | |
| Security Description | | Shares | | Value* |
| | | | | |
|
Energy Equipment & Services—(Continued) |
BJ Services Co. | | 273,800 | | $ | 6,642,388 |
Noble Corp. | | 317,100 | | | 17,919,321 |
Transocean, Inc. | | 104,996 | | | 15,030,177 |
| | | | | |
| | | | | 54,502,925 |
| | | | | |
| | |
Health Care Equipment & Supplies—1.6% | | | | | |
Hologic, Inc. (a) | | 300,800 | | | 20,646,912 |
| | | | | |
| | |
Health Care Providers & Services—6.5% | | | | | |
Coventry Health Care, Inc. (a) | | 233,100 | | | 13,811,175 |
Magellan Health Services, Inc. (a) | | 275,000 | | | 12,823,250 |
Medco Health Solutions, Inc. (a) | | 276,200 | | | 28,006,680 |
Pediatrix Medical Group, Inc. (a) | | 411,000 | | | 28,009,650 |
| | | | | |
| | | | | 82,650,755 |
| | | | | |
| | |
Hotels, Restaurants & Leisure—6.6% | | | | | |
International Game Technology | | 390,240 | | | 17,143,243 |
Life Time Fitness, Inc. (a) (b) | | 205,800 | | | 10,224,144 |
Orient-Express Hotels, Ltd. (Class A) (b) | | 258,500 | | | 14,868,920 |
Panera Bread Co. (a) (b) | | 271,700 | | | 9,732,294 |
Pinnacle Entertainment, Inc. (a) (b) | | 321,900 | | | 7,583,964 |
Scientific Games Corp. (a) (b) | | 716,500 | | | 23,823,625 |
| | | | | |
| | | | | 83,376,190 |
| | | | | |
| | |
IT Services—3.4% | | | | | |
Fidelity National Information Services, Inc. | | 497,600 | | | 20,695,184 |
Iron Mountain, Inc. (a) (b) | | 624,300 | | | 23,111,586 |
| | | | | |
| | | | | 43,806,770 |
| | | | | |
| | |
Life Sciences Tools & Services—2.6% | | | | | |
Thermo Fisher Scientific, Inc. (a) (b) | | 583,800 | | | 33,673,584 |
| | | | | |
| | |
Machinery—5.4% | | | | | |
IDEX Corp. | | 527,700 | | | 19,065,801 |
Joy Global, Inc. | | 323,500 | | | 21,292,770 |
Oshkosh Truck Corp. (b) | | 608,900 | | | 28,776,614 |
| | | | | |
| | | | | 69,135,185 |
| | | | | |
|
Media—2.4% |
CKX, Inc. (a) (b) | | 1,069,400 | | | 12,832,800 |
DreamWorks Animation SKG, Inc. (a) | | 675,800 | | | 17,259,932 |
| | | | | |
| | | | | 30,092,732 |
| | | | | |
|
Metals & Mining—2.7% |
Century Aluminum Co. (a) (b) | | 298,100 | | | 16,079,514 |
Quanex Corp. (b) | | 355,500 | | | 18,450,450 |
| | | | | |
| | | | | 34,529,964 |
| | | | | |
|
Oil, Gas & Consumable Fuels—9.1% |
Chesapeake Energy Corp. (b) | | 368,300 | | | 14,437,360 |
Consol Energy, Inc. | | 363,200 | | | 25,976,064 |
EOG Resources, Inc. | | 225,300 | | | 20,108,025 |
Massey Energy Co. (b) | | 600,900 | | | 21,482,175 |
Newfield Exploration Co. (a) | | 444,139 | | | 23,406,125 |
*See accompanying notes to financial statements.
MSF-5
Metropolitan Series Fund, Inc.
BlackRock Aggressive Growth Portfolio
Schedule of Investments as of December 31, 2007
Common Stock—(Continued)
| | | | | |
| Security Description | |
Shares | | Value* |
| | | | | |
|
Oil, Gas & Consumable Fuels—(Continued) |
Plains Exploration & Production Co. (a) (b) | | 185,000 | | $ | 9,990,000 |
| | | | | |
| | | | | 115,399,749 |
| | | | | |
|
Personal Products—1.6% |
Bare Escentuals, Inc. (a) (b) | | 846,200 | | | 20,520,350 |
| | | | | |
|
Pharmaceuticals—3.8% |
Endo Pharmaceuticals Holdings, Inc. (a) | | 411,200 | | | 10,966,704 |
Forest Laboratories, Inc. (a) | | 166,100 | | | 6,054,345 |
Medicis Pharmaceutical Corp. (a) (b) | | 484,900 | | | 12,592,853 |
Shire, Plc. (ADR) (b) | | 279,300 | | | 19,257,735 |
| | | | | |
| | | | | 48,871,637 |
| | | | | |
|
Semiconductors & Semiconductor Equipment—3.2% |
Broadcom Corp. (a) | | 396,800 | | | 10,372,352 |
Intersil Corp. | | 451,300 | | | 11,047,824 |
Lam Research Corp. (a) | | 143,317 | | | 6,195,594 |
PMC-Sierra, Inc. (a) (b) | | 2,030,790 | | | 13,281,366 |
| | | | | |
| | | | | 40,897,136 |
| | | | | |
|
Software—7.8% |
ACI Worldwide, Inc. (a) (b) | | 474,400 | | | 9,032,576 |
Activision, Inc. (a) | | 263,400 | | | 7,822,980 |
Adobe Systems, Inc. (a) | | 626,640 | | | 26,776,327 |
Amdocs, Ltd. (a) | | 470,250 | | | 16,209,518 |
Intuit, Inc. (a) | | 204,600 | | | 6,467,406 |
Jack Henry & Associates, Inc. (b) | | 495,400 | | | 12,058,036 |
MICROS Systems, Inc. (a) | | 296,100 | | | 20,774,376 |
| | | | | |
| | | | | 99,141,219 |
| | | | | |
|
Specialty Retail—4.4% |
GameStop Corp. (Class A) (a) | | 592,700 | | | 36,812,597 |
TJX Cos., Inc. | | 655,400 | | | 18,829,642 |
| | | | | |
| | | | | 55,642,239 |
| | | | | |
|
Textiles, Apparel & Luxury Goods—0.6% |
Phillips-Van Heusen Corp. | | 210,900 | | | 7,773,774 |
| | | | | |
|
Wireless Telecommunication Services—1.4% |
American Tower Corp. (Class A) (a) | | 413,227 | | | 17,603,470 |
| | | | | |
Total Common Stock
(Identified Cost $988,221,356) | | | | | 1,233,152,640 |
| | | | | |
| | |
| Units—0.9% | | | | | |
|
Capital Markets—0.9% |
AllianceBernstein Holding, L.P. (b) | | 144,200 | | | 10,851,050 |
| | | | | |
Total Units
(Identified Cost $12,865,849) | | | | | 10,851,050 |
| | | | | |
| | | | | | | |
|
| Short Term Investments—17.5% | |
| Security Description | | Face Amount/
Shares | | Value* | |
| | | | | | | |
|
Discount Notes—2.3% | |
Federal Home Loan Bank
4.150%, 01/11/08 | | $ | 19,333,000 | | $ | 19,318,232 | |
4.150%, 01/14/08 | | | 9,700,000 | | | 9,688,616 | |
| | | | | | | |
| | | | | | 29,006,848 | |
| | | | | | | |
|
Mutual Funds—15.2% | |
State Street Navigator Securities Lending Prime Portfolio (d) | | | 193,153,898 | | | 193,153,898 | |
| | | | | | | |
Total Short Term Investments
(Identified Cost $222,160,746) | | | | | | 222,160,746 | |
| | | | | | | |
Total Investments—115.3%
(Identified Cost $1,223,247,951) (e) | | | | | | 1,466,164,436 | |
Liabilities in excess of other assets | | | | | | (194,167,959 | ) |
| | | | | | | |
| Total Net Assets—100% | | | | | $ | 1,271,996,477 | |
| | | | | | | |
| (b) | A portion or all of the security was held on loan. As of December 31, 2007, the market value of securities loaned was $191,842,361 and the collateral received consisted of cash in the amount of $193,153,898 and non cash collateral with a value of $4,693,182. The cash collateral is invested in a money market fund managed by an affiliate of the custodian. The non cash collateral received consists primarily of government securities and bank letters of credit, and are held for the benefit of the Portfolio at the Portfolio’s custodian. |
| (d) | Represents investment of cash collateral received from securities lending transactions. |
| (e) | The aggregate cost of investments for federal income tax purposes as of December 31, 2007 was $1,223,277,407 and the composition of unrealized appreciation and depreciation of investment securities was $307,147,934 and $(64,260,905), respectively. |
| (ADR)— | An American Depositary Receipt is a certificate issued by a custodian bank representing the right to receive securities of the foreign issuer described. Trading on exchanges not located in the United States or Canada significantly influences the value of ADRs. |
*See accompanying notes to financial statements.
MSF-6
Metropolitan Series Fund, Inc.
BlackRock Aggressive Growth Portfolio
Statement of Assets & Liabilities
December 31, 2007
| | | | | | | |
Assets | | | | | | | |
Investments at value (a) (b) | | | | | $ | 1,466,164,436 | |
Receivable for: | | | | | | | |
Fund shares sold | | | | | | 206,986 | |
Accrued interest and dividends | | | | | | 293,468 | |
Foreign taxes | | | | | | 18 | |
| | | | | | | |
Total Assets | | | | | | 1,466,664,908 | |
Liabilities | | | | | | | |
Payable for: | | | | | | | |
Fund shares redeemed | | $ | 550,352 | | | | |
Withholding taxes | | | 3,185 | | | | |
Collateral for securities loaned | | | 193,153,898 | | | | |
Due to custodian bank | | | 111,701 | | | | |
Accrued expenses: | | | | | | | |
Management fees | | | 764,665 | | | | |
Service and distribution fees | | | 34,543 | | | | |
Other expenses | | | 50,087 | | | | |
| | | | | | | |
Total Liabilities | | | | | | 194,668,431 | |
| | | | | | | |
Net Assets | | | | | $ | 1,271,996,477 | |
| | | | | | | |
Net assets consists of: | | | | | | | |
Capital paid in | | | | | $ | 1,383,716,923 | |
Accumulated net realized losses | | | | | | (354,636,931 | ) |
Unrealized appreciation on investments | | | | | | 242,916,485 | |
| | | | | | | |
Net Assets | | | | | $ | 1,271,996,477 | |
| | | | | | | |
| Computation of offering price: | | | | | | | |
Class A | | | | | | | |
Net asset value and redemption price per share ($937,655,136 divided by 32,459,575 shares outstanding) | | | | | $ | 28.89 | |
| | | | | | | |
Class B | | | | | | | |
Net asset value and redemption price per share ($45,242,801 divided by 1,644,427 shares outstanding) | | | | | $ | 27.51 | |
| | | | | | | |
Class D | | | | | | | |
Net asset value and redemption price per share ($268,927,920 divided by 9,382,887 shares outstanding) | | | | | $ | 28.66 | |
| | | | | | | |
Class E | | | | | | | |
Net asset value and redemption price per share ($20,170,620 divided by 704,204 shares outstanding) | | | | | $ | 28.64 | |
| | | | | | | |
(a) Identified cost of investments | | | | | $ | 1,223,247,951 | |
| | | | | | | |
| (b) | Includes cash collateral for securities loaned of $193,153,898. |
Statement of Operations
For the Year Ended December 31, 2007
| | | | | | | | |
Investment Income | | | | | | | | |
Dividends | | | | | | $ | 4,661,657 | (a) |
Interest | | | | | | | 1,514,399 | (b) |
| | | | | | | | |
| | | | | | | 6,176,056 | |
Expenses | | | | | | | | |
Management fees | | $ | 8,765,974 | | | | | |
Service and distribution fees—Class B | | | 75,946 | | | | | |
Service and distribution fees—Class D | | | 270,773 | | | | | |
Service and distribution fees—Class E | | | 25,313 | | | | | |
Directors’ fees and expenses | | | 23,669 | | | | | |
Custodian | | | 102,094 | | | | | |
Audit and tax services | | | 31,739 | | | | | |
Legal | | | 13,679 | | | | | |
Printing | | | 365,749 | | | | | |
Insurance | | | 13,682 | | | | | |
Miscellaneous | | | 5,322 | | | | | |
| | | | | | | | |
Total expenses | | | 9,693,940 | | | | | |
Expense reductions | | | (151,402 | ) | | | 9,542,538 | |
| | | | | | | | |
Net Investment Loss | | | | | | | (3,366,482 | ) |
| | | | | | | | |
Realized and Unrealized Gain | | | | | | | | |
| Realized gain on: | | | | | | | | |
Investments—net | | | | | | | 137,208,639 | |
| Change in unrealized appreciation on: | | | | | | | | |
Investments—net | | | | | | | 94,696,186 | |
| | | | | | | | |
Net gain | | | | | | | 231,904,825 | |
| | | | | | | | |
Net Increase in Net Assets From Operations | | | | | | $ | 228,538,343 | |
| | | | | | | | |
| (a) | Net of foreign taxes of $23,458. |
| (b) | Includes net income on securities loaned of $392,874. |
See accompanying notes to financial statements.
MSF-7
Metropolitan Series Fund, Inc.
BlackRock Aggressive Growth Portfolio
Statements of Changes in Net Assets
| | | | | | | | |
| | | Year ended
December 31,
2007 | | | Year ended
December 31,
2006 | |
From Operations | | | | | | | | |
Net investment loss | | $ | (3,366,482 | ) | | $ | (3,482,278 | ) |
Net realized gain | | | 137,208,639 | | | | 149,589,198 | |
Unrealized appreciation (depreciation) | | | 94,696,186 | | | | (90,804,620 | ) |
| | | | | | | | |
Increase in net assets from operations | | | 228,538,343 | | | | 55,302,300 | |
| | | | | | | | |
Increase (decrease) in net assets from capital share transactions | | | (145,603,986 | ) | | | 165,794,896 | |
| | | | | | | | |
Total increase in net assets | | | 82,934,357 | | | | 221,097,196 | |
| | | | | | | | |
| | |
Net Assets | | | | | | | | |
Beginning of the period | | | 1,189,062,120 | | | | 967,964,924 | |
| | | | | | | | |
End of the period | | $ | 1,271,996,477 | | | $ | 1,189,062,120 | |
| | | | | | | | |
Other Information:
Capital Shares
Transactions in capital shares were as follows:
| | | | | | | | | | | | | | |
| | | Year ended
December 31, 2007 | | | Year ended
December 31, 2006 | |
| | | Shares | | | $ | | | Shares | | | $ | |
Class A | | | | | | | | | | | | | | |
Sales | | 2,125,807 | | | $ | 56,726,170 | | | 2,769,960 | | | $ | 64,053,615 | |
Redemptions | | (6,434,262 | ) | | | (170,180,611 | ) | | (7,807,106 | ) | | | (180,666,319 | ) |
| | | | | | | | | | | | | | |
Net decrease | | (4,308,455 | ) | | $ | (113,454,441 | ) | | (5,037,146 | ) | | $ | (116,612,704 | ) |
| | | | | | | | | | | | | | |
Class B | | | | | | | | | | | | | | |
Sales | | 1,107,249 | | | $ | 28,952,558 | | | 736,878 | | | $ | 16,153,676 | |
Redemptions | | (408,530 | ) | | | (10,419,375 | ) | | (338,527 | ) | | | (7,544,279 | ) |
| | | | | | | | | | | | | | |
Net increase | | 698,719 | | | $ | 18,533,183 | | | 398,351 | | | $ | 8,609,397 | |
| | | | | | | | | | | | | | |
Class D | | | | | | | | | | | | | | |
Sales | | 468,353 | | | $ | 12,656,593 | | | 480,560 | | | $ | 11,117,841 | |
Shares issued through acquisition | | 0 | | | | 0 | | | 13,830,963 | | | | 333,602,824 | |
Redemptions | | (2,438,024 | ) | | | (64,215,232 | ) | | (2,958,965 | ) | | | (68,527,661 | ) |
| | | | | | | | | | | | | | |
Net increase (decrease) | | (1,969,671 | ) | | $ | (51,558,639 | ) | | 11,352,558 | | | $ | 276,193,004 | |
| | | | | | | | | | | | | | |
Class E | | | | | | | | | | | | | | |
Sales | | 205,002 | | | $ | 5,675,736 | | | 153,720 | | | $ | 3,523,213 | |
Redemptions | | (186,065 | ) | | | (4,799,825 | ) | | (259,103 | ) | | | (5,918,014 | ) |
| | | | | | | | | | | | | | |
Net increase (decrease) | | 18,937 | | | $ | 875,911 | | | (105,383 | ) | | $ | (2,394,801 | ) |
| | | | | | | | | | | | | | |
Increase (decrease) derived from capital share transactions | | | | | $ | (145,603,986 | ) | | | | | $ | 165,794,896 | |
| | | | | | | | | | | | | | |
See accompanying notes to financial statements.
MSF-8
Metropolitan Series Fund, Inc.
BlackRock Aggressive Growth Portfolio
Financial Highlights
| | | | | | | | | | | | | | | | | | | | |
| | | Class A | |
| | | Year ended December 31, | |
| | | 2007 | | | 2006 | | | 2005 | | | 2004 | | | 2003 | |
Net Asset Value, Beginning of Period | | $ | 23.96 | | | $ | 22.45 | | | $ | 20.28 | | | $ | 17.95 | | | $ | 12.75 | |
| | | | | | | | | | | | | | | | | | | | |
Income From Investment Operations | | | | | | | | | | | | | | | | | | | | |
Net investment loss | | | (0.06 | )(a) | | | (0.07 | ) | | | (0.07 | ) | | | (0.07 | ) | | | (0.06 | ) |
Net realized and unrealized gain on investments | | | 4.99 | | | | 1.58 | | | | 2.24 | | | | 2.40 | | | | 5.26 | |
| | | | | | | | | | | | | | | | | | | | |
Total from investment operations | | | 4.93 | | | | 1.51 | | | | 2.17 | | | | 2.33 | | | | 5.20 | |
| | | | | | | | | | | | | | | | | | | | |
Net Asset Value, End of Period | | $ | 28.89 | | | $ | 23.96 | | | $ | 22.45 | | | $ | 20.28 | | | $ | 17.95 | |
| | | | | | | | | | | | | | | | | | | | |
Total Return (%) | | | 20.6 | | | | 6.7 | | | | 10.7 | | | | 13.0 | | | | 40.8 | |
Ratio of operating expenses to average net assets before expense reductions (%) | | | 0.76 | | | | 0.79 | | | | 0.79 | | | | 0.79 | | | | 0.81 | |
Ratio of operating expenses to average net assets after expense reductions (%) (b) | | | 0.74 | | | | 0.77 | | | | 0.77 | | | | 0.78 | | | | 0.79 | |
Ratio of net investment loss to average net assets (%) | | | (0.24 | ) | | | (0.29 | ) | | | (0.33 | ) | | | (0.38 | ) | | | (0.38 | ) |
Portfolio turnover rate (%) | | | 49 | | | | 91 | | | | 71 | | | | 95 | | | | 98 | |
Net assets, end of period (000) | | $ | 937,655 | | | $ | 880,965 | | | $ | 938,550 | | | $ | 954,736 | | | $ | 926,897 | |
| | | | | | | | | | | | | | | | |
| | | Class B | |
| | | Year ended December 31, | |
| | | 2007 | | | 2006 | | | 2005 | | | 2004(c) | |
Net Asset Value, Beginning of Period | | $ | 22.88 | | | $ | 21.49 | | | $ | 19.46 | | | $ | 18.12 | |
| | | | | | | | | | | | | | | | |
Income From Investment Operations | | | | | | | | | | | | | | | | |
Net investment loss | | | (0.12 | )(a) | | | (0.09 | ) | | | (0.08 | ) | | | (0.03 | ) |
Net realized and unrealized gain on investments | | | 4.75 | | | | 1.48 | | | | 2.11 | | | | 1.37 | |
| | | | | | | | | | | | | | | | |
Total from investment operations | | | 4.63 | | | | 1.39 | | | | 2.03 | | | | 1.34 | |
| | | | | | | | | | | | | | | | |
Net Asset Value, End of Period | | $ | 27.51 | | | $ | 22.88 | | | $ | 21.49 | | | $ | 19.46 | |
| | | | | | | | | | | | | | | | |
Total Return (%) | | | 20.2 | | | | 6.5 | | | | 10.4 | | | | 7.4 | (d) |
Ratio of operating expenses to average net assets before expense reductions (%) | | | 1.01 | | | | 1.04 | | | | 1.04 | | | | 1.04 | (e) |
Ratio of operating expenses to average net assets after expense reductions (%) (b) | | | 0.99 | | | | 1.02 | | | | 1.01 | | | | 1.03 | (e) |
Ratio of net investment loss to average net assets (%) | | | (0.48 | ) | | | (0.53 | ) | | | (0.56 | ) | | | (0.56 | )(e) |
Portfolio turnover rate (%) | | | 49 | | | | 91 | | | | 71 | | | | 95 | |
Net assets, end of period (000) | | $ | 45,243 | | | $ | 21,634 | | | $ | 11,761 | | | $ | 4,165 | |
| (a) | Per share amount is based on average shares outstanding during the period. |
| (b) | The Portfolio has entered into arrangements with certain brokers who paid a portion of the Portfolio’s expenses. |
| (c) | Commencement of operations was April 26, 2004 and May 2, 2006 for Classes B and D, respectively. |
| (d) | Periods less than one year are not computed on an annualized basis. |
| (e) | Computed on an annualized basis. |
See accompanying notes to financial statements.
MSF-9
Metropolitan Series Fund, Inc.
BlackRock Aggressive Growth Portfolio
Financial Highlights
| | | | | | | | |
| | | Class D | |
| | | Year ended December 31, | |
| | | 2007 | | | 2006(c) | |
Net Asset Value, Beginning of Period | | $ | 23.80 | | | $ | 24.12 | |
| | | | | | | | |
Income From Investment Operations | | | | | | | | |
Net investment loss | | | (0.09 | )(a) | | | (0.06 | ) |
Net realized and unrealized gain (loss) of investments | | | 4.95 | | | | (0.26 | ) |
| | | | | | | | |
Total from investment operations | | | 4.86 | | | | (0.32 | ) |
| | | | | | | | |
Net Asset Value, End of Period | | $ | 28.66 | | | $ | 23.80 | |
| | | | | | | | |
Total Return (%) | | | 20.4 | | | | (1.3 | )(d) |
Ratio of operating expenses to average net assets before expense reductions (%) | | | 0.86 | | | | 0.89 | (e) |
Ratio of operating expenses to average net assets after expense reductions (%) (b) | | | 0.84 | | | | 0.87 | (e) |
Ratio of net investment loss to average net assets (%) | | | (0.34 | ) | | | (0.36 | )(e) |
Portfolio turnover rate (%) | | | 49 | | | | 91 | |
Net assets, end of period (000) | | $ | 268,928 | | | $ | 270,158 | |
| | | | | | | | | | | | | | | | | | | | |
| | | Class E | |
| | | Year ended December 31, | |
| | | 2007 | | | 2006 | | | 2005 | | | 2004 | | | 2003 | |
Net Asset Value, Beginning of Period | | $ | 23.79 | | | $ | 22.33 | | | $ | 20.20 | | | $ | 17.90 | | | $ | 12.74 | |
| | | | | | | | | | | | | | | | | | | | |
Income From Investment Operations | | | | | | | | | | | | | | | | | | | | |
Net investment loss | | | (0.10 | )(a) | | | (0.12 | ) | | | (0.11 | ) | | | (0.09 | ) | | | (0.04 | ) |
Net realized and unrealized gain on investments | | | 4.95 | | | | 1.58 | | | | 2.24 | | | | 2.39 | | | | 5.20 | |
| | | | | | | | | | | | | | | | | | | | |
Total from investment operations | | | 4.85 | | | | 1.46 | | | | 2.13 | | | | 2.30 | | | | 5.16 | |
| | | | | | | | | | | | | | | | | | | | |
Net Asset Value, End of Period | | $ | 28.64 | | | $ | 23.79 | | | $ | 22.33 | | | $ | 20.20 | | | $ | 17.90 | |
| | | | | | | | | | | | | | | | | | | | |
Total Return (%) | | | 20.4 | | | | 6.5 | | | | 10.5 | | | | 12.8 | | | | 40.6 | |
Ratio of operating expenses to average net assets before expense reductions (%) | | | 0.91 | | | | 0.94 | | | | 0.94 | | | | 0.94 | | | | 0.96 | |
Ratio of operating expenses to average net assets after expense reductions (%) (b) | | | 0.89 | | | | 0.92 | | | | 0.92 | | | | 0.93 | | | | 0.94 | |
Ratio of net investment loss to average net assets (%) | | | (0.39 | ) | | | (0.44 | ) | | | (0.48 | ) | | | (0.52 | ) | | | (0.52 | ) |
Portfolio turnover rate (%) | | | 49 | | | | 91 | | | | 71 | | | | 95 | | | | 98 | |
Net assets, end of period (000) | | $ | 20,171 | | | $ | 16,305 | | | $ | 17,653 | | | $ | 17,893 | | | $ | 11,286 | |
| (a) | Per share amount is based on average shares outstanding during the period. |
| (b) | The Portfolio has entered into arrangements with certain brokers who paid a portion of the Portfolio’s expenses. |
| (c) | Commencement of operations was April 26, 2004 and May 2, 2006 for Classes B and D, respectively. |
| (d) | Periods less than one year are not computed on an annualized basis. |
| (e) | Computed on an annualized basis. |
See accompanying notes to financial statements.
MSF-10
Metropolitan Series Fund, Inc.
BlackRock Aggressive Growth Portfolio
Notes to Financial Statements—December 31, 2007
Metropolitan Series Fund, Inc. (the “Fund”) is organized as a corporation under the laws of Maryland pursuant to Articles of Incorporation filed on November 23, 1982, as amended, and registered under the Investment Company Act of 1940, as amended (the “1940 Act”), as an open-end investment company. The Fund is a “series” type of mutual fund, which issues separate series of stock. Each series represents an interest in a separate portfolio of Fund investments. The BlackRock Aggressive Growth Portfolio (the “Portfolio”) is a diversified series of the Fund. Shares in the Fund are not offered directly to the general public and are currently available only to separate accounts established by Metropolitan Life Insurance Company (“MetLife”), New England Life Insurance Company, General American Life Insurance Company (“General American”), The MetLife Investors Group of Insurance Companies, MetLife Insurance Company of Connecticut and other affiliated insurance companies (collectively, the “Insurance Companies”), as an investment vehicle for variable life insurance, group annuity or variable annuity products, although the Portfolio is not available to all such separate accounts. The Portfolio’s shares may be divided into different classes. Currently, the classes being offered by the Portfolio are named Class A, Class B, Class D and Class E. The classes of the Portfolio’s shares are identical, except that certain additional charges (Rule 12b-1 fees) are made against Class B, Class D and Class E shares. Investment income, realized and unrealized capital gains and losses, the common expenses of the Portfolio and certain Portfolio-level expense reductions, if any, are allocated on a pro rata basis to each class based on the relative net assets of each class to the total net assets of the Portfolio.
| 2. | SIGNIFICANT ACCOUNTING POLICIES: |
The preparation of financial statements in conformity with accounting principles generally accepted in the United States of America (“GAAP”) requires management to make estimates and assumptions that affect the reported amounts of assets and liabilities and disclosure of contingent assets and liabilities as of the date of the financial statements and the reported amounts of income and expenses during the reporting period. Actual results could differ from those estimates.
The following is a summary of significant accounting policies consistently followed by the Portfolio in the preparation of its financial statements. The policies are in conformity with GAAP.
Investment Valuation:
Debt securities (other than short term obligations with a remaining maturity of sixty days or less) are valued by independent pricing services selected by the relevant subadviser pursuant to authorization of the Board of Directors of the Fund (the “Board” or “Directors”). Short term obligations with a remaining maturity of sixty days or less are valued at amortized cost which approximates fair market value.
Equity securities traded on a national securities exchange or exchanges are valued at their last sale price on the principal trading market. Equity securities traded on the NASDAQ National Market System are valued at the NASDAQ Official Closing Price (the “NOCP”). The NOCP is the last sale price if it falls between the spread of the last reported bid and asked prices. If the last reported bid and asked prices are above the last reported sale price, the NOCP will be the last reported bid price. If the last reported bid and asked prices are below the last reported sale price, the NOCP will be the last reported asked price. Equity securities traded on a national securities exchange or exchanges or on the NASDAQ National Market System for which there is no reported sale during the day are valued at the last reported bid price. A security that is listed or traded on more than one exchange is valued at the quotation on the exchange determined to be the primary market for that security by the Board or its delegates. If no closing price is available, then such securities are valued by using the last reported bid price. Equity securities traded over-the-counter are valued at the last reported sales price.
If no current market value quotation is readily available or reliable for a portfolio security, fair value will be determined in accordance with procedures established by and under the general supervision of the Board. When the Portfolio uses fair value pricing, it may take into account any factors it deems appropriate. The value of securities used by the Portfolio to calculate its net asset value may differ from quoted or published prices for the same securities. Fair value pricing involves subjective judgments and the fair value determined for a security may be materially different than the value that could be realized upon the sale of that security.
The Portfolio expects to use fair value pricing for securities primarily traded on U.S. exchanges only under very limited circumstances. For example, the Portfolio may use fair value pricing if the exchange on which a security is traded closes early or trading in the security is suspended.
MSF-11
Metropolitan Series Fund, Inc.
BlackRock Aggressive Growth Portfolio
Notes to Financial Statements—December 31, 2007—(Continued)
Securities traded primarily on an exchange outside of the United States which closes before the close of the New York Stock Exchange will be valued at the last sales price on that non-U.S. exchange. Securities traded primarily on an exchange outside of the United States for which there is no reported sale during the day are valued at the mean between the last reported bid and asked prices. However, because most foreign markets close well before the Portfolio values its securities (typically at 4 p.m. Eastern Time), the earlier close of these foreign markets gives rise to the possibility that significant events, including broad market moves, may have occurred after these foreign markets close but before the Portfolio values its securities. To account for this, the Portfolio may frequently value many of its foreign equity securities using fair value prices based on third party vendor modeling tools.
Forward foreign currency exchange contracts are valued based on the mean between closing bid and asked prices of the forward currency contract rates in the London foreign exchange markets on a daily basis as provided by a reliable bank or dealer.
Options, whether on securities, indices, futures contracts, or otherwise, are valued at the last sales price available as of the close of business on the day of valuation or, if there is no such sale price available, at the mean between the bid and asked prices. Options on currencies are valued at the spot price each day.
The value of futures contracts will be the sum of the margin deposit plus or minus the difference between the value of the futures contract on each day the net asset value is calculated and the value on the date the futures contract originated, value being that established on a recognized commodity exchange, or by reference to other customary sources, with gain or loss being realized when the futures contract closes or expires.
Subject to the Board’s oversight, the Board has delegated day-to-day responsibility for valuing Portfolio assets to the subadviser of the Portfolio, who values such assets as described above and operates under procedures approved by the Board.
Investment Transactions and Related Investment Income:
Portfolio security transactions are recorded on the trade date. Dividend income is recorded on the ex-dividend date or, for certain foreign securities, when notified. Interest income, which includes amortization of premium and accretion of discount on debt securities, is recorded on the accrual basis. Realized gains and losses on investments and unrealized appreciation and depreciation are determined on the identified cost basis, which is the same basis used for federal income tax purposes.
Repurchase Agreements:
The Portfolio, through the custodian or a subcustodian, receives delivery of the underlying securities collateralizing repurchase agreements. The Portfolio requires the custodian to take possession, to have legally segregated in the Federal Reserve Book Entry System, or to have segregated within the custodian’s vault, all securities held as collateral for repurchase agreements. It is the Portfolio’s policy that the market value of the collateral be at least equal to 100% of the repurchase price in the case of a repurchase agreement of one-day duration and 102% on all other repurchase agreements. The Portfolio’s subadviser is responsible for determining that the value of the collateral is at all times at least equal to the repurchase price. In connection with transactions in repurchase agreements, if the seller defaults and the value of the collateral declines or if the seller enters an insolvency proceeding, realization of the collateral by the Portfolio may be delayed, limited or wholly denied.
Foreign Currency Translation:
The books and records of the Portfolio are maintained in U.S. dollars. The values of securities, currencies and other assets and liabilities denominated in currencies other than U.S. dollars are translated into U.S. dollars based upon foreign exchange rates prevailing at the end of the period. Purchases and sales of investment securities, income and expenses are translated on the respective dates of such transactions. Since the values of investment securities are presented at the foreign exchange rates prevailing at the end of the period, it is not practical to isolate that portion of the results of operations arising from changes in exchange rates from that portion of the results of operations reflecting fluctuations arising from changes in market prices of the investment securities. Such fluctuations are included in the net realized and unrealized gain or loss on investments.
Net realized foreign exchange gains or losses arise from sales of foreign currency, currency gains or losses realized between the trade and settlement dates on securities transactions, and the difference between the amounts of dividends, interest, and foreign withholding taxes recorded by the Portfolio and the U.S. dollar equivalent of the amounts actually received or paid by the Portfolio. Net unrealized foreign exchange gains and losses arise from changes in the value of assets and liabilities, other than investment securities, resulting from changes in the exchange rate.
MSF-12
Metropolitan Series Fund, Inc.
BlackRock Aggressive Growth Portfolio
Notes to Financial Statements—December 31, 2007—(Continued)
Forward Foreign Currency Exchange Contracts:
The Portfolio may enter into forward foreign currency exchange contracts primarily to hedge against foreign currency exchange rate risks on its non-U.S. dollar denominated investment securities. When entering into a forward currency contract, the Portfolio agrees to receive or deliver a fixed quantity of foreign currency for an agreed-upon price on an agreed future date. These contracts are valued daily and the Portfolio’s net equity therein, representing unrealized gain or loss on the contracts as measured by the difference between the foreign exchange rates at the dates of entry into the contracts and the forward rates at the settlement date, is included in the Statement of Assets and Liabilities. Realized and unrealized gains and losses are included in the Statement of Operations. These instruments involve market and/or credit risk in excess of the amount recognized in the Statement of Assets and Liabilities. Risks arise from the possible inability of counterparties to meet the terms of their contracts and from movement in currency and securities values and interest rates.
Futures Contracts:
The Portfolio may buy and sell futures contracts (on recognized exchanges) as a hedge or to enhance return. Futures contracts are agreements to buy or sell a security, or deliver a final cash settlement price in connection with an index, interest rate, currency, or other contracts not calling for physical delivery, for a set price in the future. The Portfolio must post an amount equal to a portion of the total market value of the futures contract as futures variation margin, which is returned when the Portfolio’s obligations under the contract have been satisfied. From time to time thereafter, the Portfolio may have to post variation margin to maintain this amount as the market value of the contract fluctuates. Risks of entering into futures contracts (and related options) include the possibility that there may be an illiquid market and that a change in the value of the contract or option may not correlate with changes in the value of the underlying securities.
Options:
The Portfolio may use options to hedge against changes in values of securities the Portfolio owns or expects to purchase. Writing puts or buying calls tends to increase the Portfolio’s exposure to the underlying instrument and writing calls or buying puts tends to decrease the Portfolio’s exposure to the underlying instrument, and can be used to hedge other Portfolio investments. For options purchased to hedge the Portfolio’s investments, the potential risk to the Portfolio is that the change in value of options contracts may not correspond to the change in value of the hedged instruments. In addition, losses may arise from changes in the value of the underlying instruments, if there is an illiquid secondary market, or if the counterparty is unable to perform. The maximum loss for purchased options is limited to the premium initially paid for the option. For options written by the Portfolio, the maximum loss is not limited to the premium initially received for the option.
The main risk associated with purchasing an option is that the option expires without being exercised. In this case, the option expires worthless and the premium paid for the option is considered the loss. The risk associated with writing a call option is that the Portfolio may forgo the opportunity for a profit if the market value of the underlying position increases and the option is exercised. The risk in writing a put option is that the Portfolio may incur a loss if the market value of the underlying position decreases and the option is exercised. In addition, the Portfolio risks not being able to enter into a closing transaction for the written option as the result of an illiquid market.
“When-Issued” Securities:
Purchasing securities “when-issued” is a forward commitment by the Portfolio to buy a security. The estimated amount of the Portfolio’s payment obligation and the security’s interest rate are determined when the commitment is made, even though no interest accrues until the security is issued, which is generally 15 to 120 days later. The Portfolio will segregate liquid assets with its custodian sufficient at all times to satisfy these commitments. If the value of the security is less when delivered than when the commitment was made, the Portfolio will suffer a loss.
Federal Income Taxes:
It is the Portfolio’s policy to comply with the requirements of the Internal Revenue Code of 1986, as amended, and regulations thereunder, applicable to regulated investment companies and to distribute all of its taxable income to shareholders. Therefore, no federal income tax provision is required.
MSF-13
Metropolitan Series Fund, Inc.
BlackRock Aggressive Growth Portfolio
Notes to Financial Statements—December 31, 2007—(Continued)
As of December 31, 2007, the Portfolio had capital loss carryovers as follows:
| | | | | | | | | | |
Expiring
12/31/08 | | Expiring
12/31/09 | | Expiring
12/31/10 | | Total |
| $ | 82,277,708 | | $ | 227,553,754 | | $ | 44,776,015 | | $ | 354,607,477 |
The utilization of the capital loss carryforward acquired as part of a merger may be limited under section 382 of the Internal Revenue Code.
As of December 31, 2007, the components of distributable earnings (accumulated losses) on a federal income tax basis were as follows:
| | | | | | | | | | | | | |
Undistributed
Ordinary
Income | | Undistributed
Long Term
Gain | | Unrealized
Appreciation | | Loss
Carryforwards | | | Total | |
| $— | | $— | | $ | 242,887,029 | | $ | (354,607,477 | ) | | $ | (111,720,448 | ) |
Dividends and Distributions to Shareholders:
The Portfolio records dividends and distributions on the ex-dividend date. Net realized gains from security transactions (if any) are generally distributed annually to shareholders. The timing and characterization of certain income and capital gains distributions are determined in accordance with federal tax regulations that may differ from GAAP. Permanent book and tax basis differences relating to shareholder distributions will result in reclassification between under/over distributed net investment income, accumulated net realized gains/losses and paid in capital.
Expense Reductions:
Certain Portfolio trades are directed to brokers who paid a portion of the Portfolio’s expenses. Amounts paid for the Portfolio are shown as expense reductions in the Statement of Operations.
| 3. | INVESTMENT TRANSACTIONS: |
For the year ended December 31, 2007, purchases and sales of securities (excluding short term investments) for the Portfolio were as follows:
| | | | | | | | | | |
| Purchases | | Sales |
| U.S. Government | | Other | | U.S. Government | | Other |
| $ | 0 | | $ | 591,672,850 | | $ | 0 | | $ | 756,284,950 |
| 4. | INVESTMENT MANAGEMENT FEES AND OTHER TRANSACTIONS WITH AFFILIATES: |
Investment Management Agreement:
MetLife Advisers, LLC (“MetLife Advisers”) is the investment adviser to the Portfolio. The Fund has entered into an investment management agreement with MetLife Advisers with respect to the Portfolio. For providing investment management services to the Portfolio, MetLife Advisers receives monthly compensation at the following annual rates:
| | | | | | | |
| | | Management
Fees earned by
MetLife Advisers
for the year ended
December 31, 2007 | | Annual
percentage
rates paid to
MetLife Advisers | | Based on Portfolios average daily net asset levels |
| | $ | 8,765,974 | | 0.750% | | Of the first $500 million |
| | | | | 0.700% | | Of the next $500 million |
| | | | | 0.650% | | On amounts in excess of $1 billion |
Certain officers and directors of the Fund may also be officers of MetLife Advisers; however, such officers and directors receive no compensation from the Fund.
MetLife Advisers has entered into an investment subadvisory agreement with respect to the Portfolio. BlackRock Advisors, LLC is compensated by MetLife Advisers to provide subadvisory services for the Portfolio.
MSF-14
Metropolitan Series Fund, Inc.
BlackRock Aggressive Growth Portfolio
Notes to Financial Statements—December 31, 2007—(Continued)
Service and Distribution Fees:
The Fund has adopted a Distribution and Service Plan under Rule 12b-1 of the 1940 Act for the Portfolio’s Class B, D and E shares. Under the Distribution and Service Plan, the Class B, D and E shares of the Portfolio pay a fee to compensate the Insurance Companies (or their affiliates) and other broker-dealers and financial intermediaries involved in the offer and sale of Portfolio shares for promoting or selling and servicing, the Class B, D and E shares. The fees under the Distribution and Service Plan for each class of the Portfolio’s shares are calculated as a percentage of the Portfolio’s average daily net assets that are attributable to that Class. Currently, the fee is 0.25% per year for Class B shares, 0.10% per year for Class D shares and 0.15% per year for Class E shares. Amounts paid by the Portfolio for the year ended December 31, 2007 are shown as Service and Distribution fees in the Statement of Operations.
The Fund has entered into a securities lending arrangement with the Fund’s custodian, State Street Bank and Trust Company (the “custodian”). Under the agreement, the custodian is authorized to loan securities on the Portfolios’ behalf. In exchange, the Portfolio receives either cash or securities as collateral against the loaned securities. The Portfolio receives collateral at least equal to 102% of the market value of the loaned securities (105% for foreign securities), at each loan’s inception. Collateral must be maintained at least at 100% of the market value of the loaned securities for the duration of the loan. The cash collateral is invested in the Navigator Securities Lending Prime Portfolio, an affiliate of the custodian, which invests in a variety of high quality U.S. dollar-denominated instruments. If the market value of the collateral at the close of trading on a business day is less than 100% of the market value of the loaned securities at the close of trading on that day, the borrower shall be required to deliver, by the close of business on the following business day, an additional amount of collateral, equal to at least 100% of the market value of all the loaned securities as of such preceding day. The Portfolio receives 80% of the annual net income from securities lending transactions, which is included in interest income of the Portfolio. The remaining 20% is paid to the custodian as compensation for its securities lending services. The Portfolio bears the risk of any deficiency in the amount of collateral available for return to a borrower due to a loss in an approved investment. Any outstanding loans by the Portfolio at December 31, 2007 are footnoted in the Schedule of Investments.
As previously reported, in May 2004, General American received a Wells Notice stating that the SEC staff was considering recommending that the SEC bring a civil action alleging violations of the U.S. securities laws against General American with respect to market timing and late trading in a limited number of privately-placed variable insurance contracts that were sold through General American. General American responded to the SEC staff and cooperated with the investigation. On August 9, 2007, the SEC announced that it had settled an enforcement action regarding late trading against General American with, among other things, General American agreeing to pay a civil penalty and to comply with certain undertakings. General American consented to the SEC’s order without admitting or denying the findings. MetLife Advisers has also advised the Fund’s Board of Directors that, while certain exceptions to the Fund’s policies have been noted, no situations have been identified that would have a material impact on the financial position of the Fund.
| 7. | RECENT ACCOUNTING PRONOUNCEMENTS: |
Effective June 29, 2007, the Fund implemented Financial Accounting Standards Board (“FASB”) Interpretation No. 48, “Accounting for Uncertainty in Income Taxes—an interpretation of FASB Statement No. 109” (“FIN 48”). FIN 48 prescribes the minimum recognition threshold a tax position must meet in connection with accounting for uncertainties in income tax positions taken or expected to be taken by an entity, including investment companies, before being measured and recognized in the financial statements. Management has evaluated the application of FIN 48 to the Fund, and has determined that the adoption of FIN 48 does not have a material impact on the Fund’s financial statements. The Fund files U.S. tax returns. No income tax returns are currently under examination. The statute of limitations on the Fund’s tax returns remains open for the years ended December 31, 2004 through December 31, 2006.
In September 2006, Statement of Financial Accounting Standards No. 157, Fair Value Measurements (SFAS 157) was issued and is effective for fiscal years beginning after November 15, 2007. SFAS 157 defines fair value, establishes a framework for measuring fair value and expands disclosures about fair value measurements. Management is currently evaluating the impact the adoption of SFAS 157 will have on the Portfolio’s financial statement disclosures.
MSF-15
Metropolitan Series Fund, Inc.
BlackRock Aggressive Growth Portfolio
Report of Independent Registered Public Accounting Firm
To the Shareholders and Board of Directors of the Metropolitan Series Fund, Inc.:
We have audited the accompanying statement of assets and liabilities, including the schedule of investments, of the BlackRock Aggressive Growth Portfolio, one of the portfolios constituting the Metropolitan Series Fund, Inc. (the “Fund”) as of December 31, 2007, and the related statement of operations for the year then ended, the statements of changes in net assets for each of the two years in the period then ended, and the financial highlights for each of the five year in the period ended. These financial statements and financial highlights are the responsibility of the Fund’s management. Our responsibility is to express an opinion on these financial statements and financial highlights based on our audits.
We conducted our audits in accordance with the standards of the Public Company Accounting Oversight Board (United States). Those standards require that we plan and perform the audit to obtain reasonable assurance about whether the financial statements and financial highlights are free of material misstatement. The Fund is not required to have, nor were we engaged to perform, an audit of its internal control over financial reporting. Our audits included consideration of internal control over financial reporting as a basis for designing audit procedures that are appropriate in the circumstances, but not for the purpose of expressing an opinion on the effectiveness of the Fund’s internal control over financial reporting. Accordingly, we express no such opinion. An audit also includes examining, on a test basis, evidence supporting the amounts and disclosures in the financial statements, assessing the accounting principles used and significant estimates made by management, as well as evaluating the overall financial statement presentation. Our procedures included confirmation of securities owned as of December 31, 2007, by correspondence with the custodian and brokers; where replies were not received from brokers, we performed other auditing procedures. We believe that our audits provide a reasonable basis for our opinion.
In our opinion, the financial statements and financial highlights referred to above present fairly, in all material respects, the financial position of the BlackRock Aggressive Growth Portfolio of the Metropolitan Series Fund, Inc. as of December 31, 2007, the results of its operations for the year then ended, and the changes in its net assets for each of the two years in the period then ended, and the financial highlights for each of the five year in the period ended, in conformity with accounting principles generally accepted in the United States of America.
Deloitte & Touche LLP
Boston, Massachusetts
February 21, 2008
MSF-16
Metropolitan Series Fund, Inc.
Directors and Officers
The Fund’s Directors review actions of the Fund’s investment adviser and subadvisers, and decide upon matters of general policy. The Fund’s officers supervise the daily business operations of the Fund. The Board of Directors and the Fund’s officers are listed below. Each Director is responsible for overseeing all 36 Portfolios of the Fund. There is no limit to the term a Director may serve. Directors serve until their resignation, retirement or removal in accordance with the Fund’s organizational documents and policies adopted by the Board from time to time. Officers hold office at the pleasure of the Board or until the election or appointment and the qualification of a successor. The address of the directors and officers is c/o Metropolitan Series Fund, Inc., 501 Boylston Street, Boston, MA 02116.
Interested Directors(1)
Each Director below is an “interested person” (as defined by the 1940 Act) with respect to the Fund in that Ms. Forget is an employee of MetLife and Mr. Typermass is a former employee of MetLife and owns securities issued by MetLife, Inc., the ultimate parent company of MetLife Advisers.
| | | | | | | | |
Name, Address and Age | | Current
position(s)
with Fund | | Position(s)
held since | | Principal occupations
over past five years, including other directorships(2) | | Number of
Portfolios in
Fund Complex
Overseen by
Director(3) |
Elizabeth M. Forget Age: 41 | | Director, Chairman of the Board, President and Chief Executive Officer | | 2006 | | Senior Vice President (since 2007), MetLife, Inc.; President, Met Investors Advisory, LLC (“MIA”); Trustee and President, Met Investors Series Trust (“MIST”); Executive Vice President, MetLife Investors Group, Inc.; President (since 2006), MetLife Advisers. | | 81 |
| | | | |
Arthur G. Typermass Age: 70 | | Director | | 1998 | | Formerly, Senior Vice President and Treasurer, MetLife. | | 37 |
Non-Interested Directors(1)
Each Director below is not an “interested person” (as defined by the 1940 Act) with respect to the Fund (collectively, the “Independent Directors”).
| | | | | | | | |
Name, Address and Age | | Current
position(s)
with Fund | | Position(s)
held since | | Principal occupations
over past five years, including other directorships(2) | | Number of
Portfolios in
Fund Complex
Overseen by
Director(3) |
Steve A. Garban† Age: 70 | | Director | | 1985 | | Formerly, Chief Financial Officer, Senior Vice President Finance and Operations and Treasurer (Emeritus), The Pennsylvania State University. | | 37 |
| | | | |
Linda B. Strumpf Age: 60 | | Director | | 2000 | | Vice President and Chief Investment Officer, Ford Foundation. | | 37 |
| | | | |
Michael S. Scott Morton† Age: 70 | | Director | | 1993 | | Jay W. Forrester Professor of Management (Emeritus) at Sloan School of Management, MIT. | | 37 |
| | | | |
H. Jesse Arnelle Age: 74 | | Director | | 2001 | | Formerly, Counsel, Womble Carlyle Sandrie & Rice; Director, Textron Inc. (global multi-industry company)*; formerly, Director, Gannet Co. Inc. (diversified news and information company)*; formerly, Director, Eastman Chemical Company (global chemical company)*; formerly, Director, Waste Management, Inc.*; formerly, Director, Armstrong Holdings Inc. (parent company of floor and ceiling products business)*; formerly, Director, FPL Group Inc. (public utility holding company)*; Director, URS Corporation (engineering design services firm)*. | | 37 |
| | | | |
Nancy Hawthorne Age: 56 | | Director | | 2003 | | Director, Avid Technologies (computer software company)*; formerly, Chairman of the Board of Avid Technologies; formerly, Board of Advisors, L. Knife & Sons, Inc. (beverage distributor); Chief Executive Officer, Clerestory LLC (corporate financial advisor); formerly, Trustee, New England Zenith Fund (“Zenith Fund”)**; formerly, Chief Executive Officer and Managing Partner, Hawthorne, Krauss and Associates (corporate financial advisor); formerly, Chief Financial Officer and Executive Vice President, Continental Cablevision, subsequently renamed MediaOne (cable television company); formerly, Director, Life F/X, Inc.; formerly, Chairman of the Board, WorldClinic (distance medicine company); formerly, Director, Perini Corporation (construction company)*; formerly, Director, CGU (property and casualty insurance company); formerly, Director, Beacon Power Corporation (energy company )*. | | 37 |
MSF-17
Metropolitan Series Fund, Inc.
Directors and Officers—(Continued)
| | | | | | | | |
Name, Address and Age | | Current
position(s)
with Fund | | Position(s)
held since | | Principal occupations
over past five years, including other directorships(2) | | Number of
Portfolios in
Fund Complex
Overseen by
Director(3) |
John T. Ludes Age: 71 | | Director | | 2003 | | President, LFP Properties (consulting firm); Formerly, Trustee, Zenith Fund**; formerly, Vice Chairman, President and Chief Operating Officer, Fortune Brands/American Brands (global conglomerate); formerly, President and CEO, Acushnet Company (athletic equipment company). | | 37 |
Officers(1)
| | | | | | | | |
Name and address | | Age | | Current
position(s)
with Fund | | Position(s)
held since | | Principal occupations over past five years(2) |
| Jeffrey P. Halperin | | 40 | | Chief Compliance Officer | | 2006 | | Vice President (since 2006), Corporate Ethics and Compliance Department, MetLife, Inc.; Chief Compliance Officer (since 2006), MetLife Advisers, MIA and MIST. |
| | | | |
| John F. Guthrie, Jr. | | 64 | | Senior Vice President | | 2002 | | Manager and Senior Vice President, MetLife Advisers; Vice President, MetLife; Vice President (since 2003), MetLife Group, Inc.; Vice President, NELICO; Vice President (since 2005), MIA; formerly, Senior Vice President, Zenith Fund**. |
| | | | |
| Alan C. Leland | | 55 | | Senior Vice President | | 2005 | | Treasurer and Chief Financial Officer, MetLife Advisers, LLC; Treasurer (since 2005), Met Investors Advisory, LLC; Vice President (since 2004), MIA; Vice President (since 2003), MetLife Group, Inc.; Vice President, MetLife; Senior Vice President, NELICO |
| | | | |
| Peter Duffy | | 52 | | Vice President and Treasurer | | 2000 | | Senior Vice President, MetLife Advisers (since 1998); Second Vice President (since 2003), NELICO; Vice President, MetLife (since 2004); Vice President (since 2004), MetLife Group, Inc.; formerly, Vice President and Treasurer, Zenith Fund**. |
| | | | |
| Thomas M. Lenz | | 49 | | Vice President and Secretary | | 2002 | | General Counsel and Secretary, MetLife Advisers; Assistant General Counsel, MetLife; formerly, Vice President and Secretary, Zenith Fund**. |
| * | Indicates a directorship with a registered investment company or a company subject to the reporting requirements of the Securities Exchange Act of 1934, as amended. |
| ** | The Zenith Fund deregistered with the Securities and Exchange Commission (“SEC”) in 2004. |
| (†) | Served as a trustee, director and/or officer of one or more of the following companies, each of which had a direct or indirect advisory relationship with MetLife Advisers or its affiliates prior to January 31, 2005: State Street Research Financial Trust, State Street Research Income Trust, State Street Research Money Market Trust, State Street Research Institutional Funds, State Street Research Capital Trust, State Street Research Master Investment Trust, State Street Research Equity Trust, State Street Research Securities Trust and State Street Research Exchange Trust (collectively, the “State Street Research Funds”). |
| (1) | Each Director of the Fund also serves as trustee of Metropolitan Series Fund II (“Met Series Fund II”), a registered investment company advised by MetLife Advisers. Each officer of the Fund serves in the same position with Met Series Fund II, which consists of one portfolio. |
| (2) | Previous positions during the past five years with the Fund, MIST, MetLife, MetLife Advisers, MIA, Zenith Fund, NELICO or New England Securities Corporation are omitted if not materially different. |
| (3) | The Fund Complex includes the Fund (36 portfolios), Met Series Fund II (1 portfolio) and MIST (44 portfolios) |
MSF-18
Metropolitan Series Fund, Inc.
BlackRock Aggressive Growth Portfolio
Board Approval of Advisory and Subadvisory Agreements
The Fund’s Contract Review Committees of the Board of Directors (the “Board”) typically meet in early fall to review the Portfolios’ advisory agreements (the “Advisory Agreements”) and subadvisory agreements (collectively, the “Subadvisory Agreements,” and, together with the Advisory Agreements, the “Agreements”) and determine whether to recommend that the full Board approve the continuation of the Agreements for an additional one-year period. (Following the initial approval of an Agreement for a new Portfolio or with a new adviser or subadviser, such annual reviews are not required until 2 years following the execution of such Agreement.) After each Committee has made its recommendations, the full Board, including the Independent Directors, determines whether to approve the continuation of each of the Agreements. In addition, the Board, including the Independent Directors, considers matters bearing on the Agreements at most of its other meetings throughout the year and regularly interviews various individuals at MetLife Advisers responsible for the management of the Portfolios. The Directors also interview selected investment managers and other professionals at the subadvisers at various times throughout the year.
The Directors receive all materials that they or MetLife Advisers, the Fund’s investment adviser, and the subadvisers believe to be reasonably necessary for the Directors to evaluate the Agreements and determine whether to approve the continuation of the Agreements. These materials generally include, among other items, (i) information on the investment performance of the Portfolios and the performance of peer groups of funds and the Portfolios’ performance benchmarks, (ii) information on the Portfolios’ advisory and subadvisory fees and other expenses, including information comparing the Portfolios’ expenses to those of peer groups of funds and information about any applicable expense caps and fee “breakpoints,” (iii) sales and redemption data, (iv) information related to the profitability of the Agreements to MetLife Advisers and the subadvisers, and potential “fall-out” or ancillary benefits that MetLife Advisers, the subadvisers or their affiliates may receive as a result of their relationships with the Fund and (v) information obtained through the subadvisers’ responses to certain requests from MetLife Advisers and the Directors and MetLife Advisers’ responses to requests from the Directors. The Directors may also consider other information such as (vi) MetLife Advisers’ and the subadvisers’ financial results and condition, (vii) each Portfolio’s investment objectives and strategies and the size, education and experience of the investment staffs of MetLife Advisers and the relevant subadvisers and their use of technology and external research, (viii) the allocation of the Portfolios’ brokerage, if any, including allocations to brokers affiliated with the subadvisers and the use of “soft” commission dollars to pay Portfolio expenses and to pay for research and other similar services, (ix) the resources devoted to, and the record of compliance with, the Portfolios’ investment policies and restrictions, policies on personal securities transactions and other compliance policies, (x) the responses of MetLife Advisers, the subadvisers and/or their affiliates to certain legal and regulatory proceedings and (xi) the economic outlook generally and for the mutual fund industry in particular. Throughout the process, the Directors have the opportunity to ask questions of and request additional materials from MetLife Advisers and the subadvisers.
Following meetings of each Contract Review Committee on September 12, 2007, the Board, at its November 15, 2007 meeting, approved the continuation through December 31, 2008 of the Advisory Agreements for each Portfolio of the Fund and the Subadvisory Agreements for each Portfolio of the Fund. The Agreements approved for continuation are referred to below as the “Continued Agreements.”
In considering whether to approve the continuation of the Continued Agreements, the Directors, including the Independent Directors, did not identify any single factor as determinative, and each weighed the various factors as he or she deemed appropriate. The Directors considered the following matters in connection with their approval of the Continued Agreements:
The nature, extent and quality of the services provided to the relevant Portfolios under the Continued Agreements. The Directors considered the nature, extent and quality of the services provided by MetLife Advisers, the relevant subadvisers (if any) and their affiliates (each, an “Adviser,” and, collectively, the “Advisers”) to the relevant Portfolios pursuant to the Continued Agreements and the resources dedicated to these Portfolios by the Advisers. In particular, the Directors considered the Advisers’ abilities to attract and retain highly qualified investment professionals. With respect to MetLife Advisers, the Directors considered that MetLife Advisers is (i) ultimately responsible for the performance of such Portfolios; (ii) ultimately responsible for the establishment of the investment strategies of each such Portfolio, primarily through its recommendations to the Board regarding the hiring and selection of subadvisers; (iii) responsible for the hiring and selection, subject to Board approval, of subadvisers; and (iv) responsible for maintaining a program of Subadviser oversight reasonably designed to ensure that the subadvisers have reasonable compliance policies and procedures in place. The Directors also considered that MetLife Advisers provides a full range of day-to-day administrative services for the Portfolios involving all aspects of such Portfolios’ day-to-day operations (other than portfolio management). After reviewing these and related factors, the Directors concluded, within the context of their overall conclusions regarding each of the Continued Agreements, that the nature, extent and quality of services provided supported the renewal of these Agreements.
Investment performance of the relevant Portfolios. The Directors reviewed information about the performance of the relevant Portfolios over various time periods, including information prepared by an independent third party that compared the performance of the Portfolios to the performance of peer groups of funds and performance benchmarks. The Directors also reviewed a description of the third party’s methodology for identifying a Portfolio’s peer group(s) for purposes of performance and expense comparisons.
MSF-19
Metropolitan Series Fund, Inc.
BlackRock Aggressive Growth Portfolio
Board Approval of Advisory and Subadvisory Agreements—(Continued)
In the case of each relevant Portfolio that had performance that lagged its peer group(s) for certain periods, the Directors concluded that other factors relevant to performance were sufficient, in light of other considerations, to warrant renewal of the Continued Agreements relating to such Portfolio. These factors varied from Portfolio to Portfolio, but included one or more of the following: (i) that such Portfolio’s performance, although lagging in certain recent periods, was stronger over the longer term; (ii) that the underperformance was attributable, to a significant extent, to investment decisions that were reasonable and consistent with the Portfolio’s investment objective(s) and policies and that the Portfolio was performing within the range of reasonable expectations, given market conditions and the Portfolio’s investment objective(s) and policies; (iii) that the Portfolio’s performance was competitive when compared to other relevant performance benchmarks or peer groups; and (iv) that MetLife Advisers and/or the relevant subadviser (if any) had taken or was taking steps designed to help improve the Portfolio’s investment performance.
The Directors also considered the investment performance of the Advisers and their reputations generally, the historical responsiveness of the Advisers to Director concerns about performance and the willingness of the Advisers to take steps intended to improve performance.
After reviewing these and related factors, the Directors concluded, within the context of their overall conclusions regarding each of the Continued Agreements, that the investment performance of each relevant Portfolio and Adviser was sufficient, in light of other considerations, to warrant the renewal of the Continued Agreements.
The costs of the services to be provided and profits to be realized by the Advisers and their affiliates from their relationships with the Portfolios. The Directors considered the fees charged by MetLife Advisers to the Portfolios for advisory services and, with respect to the subadvised Portfolios, by such subadvisers to MetLife Advisers for subadvisory services (such advisory and subadvisory fees (if any), collectively, “Fees”), as well as the total expense levels of the Portfolios. This information included comparisons (provided by an independent third party) of the Portfolios’ advisory fees and total expense levels to those of their peer groups. In evaluating Fees for the relevant Portfolios, the Directors also took into account the demands, complexity and quality of the investment management services provided to each Portfolio. The Directors considered MetLife Advisers’ recommendations regarding reductions in Fee rates, implementation of Fee breakpoints and institution of Fee waivers and expense caps.
The Directors also considered the compensation directly or indirectly received by the Advisers and their affiliates from their relationships with the relevant Portfolios. The Directors reviewed information relating to the profits received by MetLife Advisers, certain of the subadvisers and their affiliates as a result of their relationships with the relevant Portfolios, and information about the allocation of expenses used to calculate profitability. When reviewing profitability, the Directors also considered the performance of the relevant Portfolios, the expense levels of such Portfolios and whether the relevant Advisers had implemented breakpoints, fee waivers and/or expense caps with respect to such Portfolios.
After reviewing these and related factors, the Directors concluded, within the context of their overall conclusions regarding each of the Continued Agreements, that the Fees charged to each of the relevant Portfolios were fair and reasonable, and that the information provided regarding costs of these services generally, and the related profitability (if known) to the relevant Advisers of their relationships with the relevant Portfolios, supported the renewal of the Continued Agreements.
Economies of Scale. The Directors considered the existence of any economies of scale in the provision of services by the Advisers and whether those economies were shared with the relevant Portfolios through breakpoints in their advisory fees or other means, such as expense caps, fee waivers or relatively low levels of fees. The Directors noted that most of the relevant Portfolios benefited or will benefit from breakpoints, expense caps and/or fee waivers with respect to their advisory fees. In considering these issues, the Directors also took into consideration information relating to the costs of the services provided and the profitability to MetLife Advisers, the relevant subadvisers (if any) and each of their affiliates of their relationships with the relevant Portfolios, as discussed above.
After reviewing these and related factors, the Directors concluded, within the context of their overall conclusions regarding each of the Continued Agreements, that the extent to which economies of scale were shared with the relevant Portfolios supported the renewal of such Agreements.
Other Factors. The Directors also considered other factors, which included but were not limited to the following:
| | • | | the extent to which each relevant Portfolio operated in accordance with its investment objective, and its record of compliance with its investment restrictions and the compliance programs of the Fund and the Advisers. They also considered the compliance-related resources the Advisers and their affiliates provide to the relevant Portfolios; |
| | • | | the nature, quality, cost and extent of administrative and shareholder services performed by MetLife Advisers and its affiliates under the Advisory Agreements; and |
MSF-20
Metropolitan Series Fund, Inc.
BlackRock Aggressive Growth Portfolio
Board Approval of Advisory and Subadvisory Agreements—(Continued)
| | • | | so-called “fall-out benefits” to the Advisers, such as the engagement of their affiliates to provide distribution, brokerage and transfer agency services to the Portfolios, and the benefits of research made available to the relevant Advisers by reason of brokerage commissions generated by the relevant Portfolios’ securities transactions. The Directors also considered the possible conflicts of interest associated with these fall-out and other benefits, and the reporting and other processes in place to disclose and monitor these possible conflicts of interest. |
Based on their evaluation of all factors that they deemed to be material, including those factors described above, and assisted by the advice of independent counsel, the Directors, including the Independent Directors, concluded that each of the Continued Agreements should be continued through December 31, 2008.
MSF-21
A description of the policies and procedures that the Fund uses to determine how to vote proxies relating to portfolio securities is available (i) without charge, upon request, by calling (800) 638-7732 and (ii) on the Securities and Exchange Commission’s (the “SEC”) website at http://www.sec.gov.
Information regarding how the Fund voted proxies relating to portfolio securities during the most recent twelve-month period ended December 31, 2007 is available (i) without charge, upon request, by calling (800) 638-7732 and (ii) on the SEC’s website at http://www.sec.gov.
The Fund files with the SEC a complete schedule of its portfolio holdings, as of the close of the first and third quarters of its fiscal year, on “Form N-Q”. These filings are available on the SEC’s website at www.sec.gov and may be reviewed and copied at the SEC’s Public Reference Room in Washington, DC. (Call 1-800-SEC-0330 for information on the operation of the Public Reference Room.)
MSF-22
| | |
Metropolitan Series Fund, Inc. BlackRock Bond Income Portfolio Annual Report | | December 31, 2007 |
Letter from the President
February 1, 2008
Letter to Policy Holders:
2007 was a tumultuous year in the financial markets driven by concerns in the credit markets surrounding sub-prime mortgages and fears of recession in the U.S. Economy. The broad markets were mixed, with the Dow Jones Industrial Average up 8.9% and the MSCI EAFE Index, which measures the performance of international equities, up 11.2% for the year, while the Russell 2000 Index, which measures the performance of small capitalization stocks, was down 1.6%.
In the fixed income markets, credit spreads increased as a result of the pressure from sub-prime mortgage crisis and the Federal Reserve lowered interest rates by a total of 1% during the year. The Lehman Brothers Aggregate Bond Index posted a 7.0% return for the year.
On the following pages, you will find a complete review of your Portfolio and its investment performance.
MetLife is committed to building your financial freedom. We appreciate your trust and will continue to focus our efforts on meeting your investment needs.
Sincerely,
Elizabeth Forget
President, Metropolitan Series Fund, Inc.
Metropolitan Series Fund, Inc.
BlackRock Bond Income Portfolio
Managed by BlackRock Advisors, LLC
Portfolio Manager Commentary*
PORTFOLIO PERFORMANCE
For the year ended December 31, 2007, the Class A shares of the BlackRock Bond Income Portfolio returned 6.3%, compared to its benchmark, the Lehman Brothers Aggregate Bond Index1, which returned 7.0%. The average return of its peer group, the Lipper Variable Insurance Products Corporate Debt A Rated Funds Universe2, was 5.1% over the same period.
PORTFOLIO REVIEW
When 2007 began, it looked as if it would be a year similar to the previous few. The market had a nearly insatiable appetite for risk of any type. While rewarding risk was becoming the market norm, we felt investors were not being adequately compensated. We moved to a corporate underweight as we judged spreads had become too tight, trading at historically thin levels. We subsequently moved into high-quality agency mortgage-backed securities (MBS), which were still expensive, but we believed they offered better risk-adjusted returns. The markets would soon realize that 2007 would be nothing like the previous few years.
As the first quarter came to an end, the first signs of trouble were beginning to emerge in the subprime mortgage market. This occurred on the heels of a large round of leveraged buyout (LBO) activity, which already had markets weary of the new-issue supply that was building. As data emerged pointing to a slowing housing market and defaults began to rise in subprime, the market’s once insatiable appetite for risk was satisfied. Investors went on strike and bids were nowhere to be found. Spreads retreated from their tight levels rapidly as hedge funds, which owned much of the subprime mortgages in the form of collateralized debt obligations (CDOs), became forced sellers to meet margin calls and investor redemptions. Unable to sell their illiquid, lower quality holdings and in need of cash, hedge funds dumped high-quality products, spreading the pain to other sectors which were fundamentally safe. This had a big impact on the Portfolio.
Driving Portfolio performance versus the benchmark, the Lehman Brothers Aggregate Bond Index, on the positive side was an underweight exposure to corporate bonds, and successful security selection within the corporate sector. In addition, we had positioned the Portfolio for a steeper yield curve in the second half of the year, a move that proved advantageous as short-term rates fell more than long-term rates and the curve steepened. An underweight in agency debentures benefited the Portfolio as well.
One of the largest detractors from performance was our overweight position in high-quality spread assets, particularly AAA-rated commercial mortgage-backed securities (CMBS), as well as agency mortgage pass-throughs, asset-backed securities (ABS), and other mortgage-related products. Despite their high quality, these assets suffered amid fallout from the subprime mortgage scare. Generalized concerns over the mortgage market, coupled with lack of liquidity and the liquidation by investors of all mortgage-related assets, caused the underperformance. Our exposure to European government bonds also hindered the Portfolio’s relative results for the year.
At year-end, the Portfolio was underweight in U.S. Treasury issues and U.S. agency securities. As spreads on high-quality corporate paper reached levels not seen since 2003, creating attractive relative value opportunities, we reduced our underweight to the corporate sector. The Portfolio maintained its notable overweights in high-quality, short-duration spread products, including mortgage pass-through securities, CMBS and ABS. We also held a modest weighting in high yield and emerging market debt issues. We continued to tactically trade both duration and curve positioning and the Portfolio ended the year with a modestly short duration position versus the benchmark, which was primarily attributable to the five-year part of the curve.
* The views expressed above are those of the subadvisory firm as of December 31, 2007 and are subject to change based on market and other conditions. Information about the Portfolio’s holdings, asset allocation, industry allocation, or country diversification is historical and is not an indication of future Portfolio composition, which will vary. The performance of any index mentioned in this commentary has not been adjusted for ongoing management, distribution and operating expenses, and sales charges applicable to mutual fund investments. Direct investment in the Index is not possible.
1 Lehman Brothers® Aggregate Bond Index includes most obligations of the U.S. Treasury, agencies and quasi-federal corporations, most publicly issued investment grade corporate bonds and most bonds backed by mortgage pools of GNMA, FNMA and FHLMC.
2 The Lipper Variable Insurance Products Fund Average is an average of the total return performance (calculated on the basis of net asset value) of variable product funds with similar investment objectives to those of the subject Portfolio as calculated by Lipper Analytical Services, an independent mutual fund ranking service.
MSF-2
Metropolitan Series Fund, Inc.
BlackRock Bond Income Portfolio
A $10,000 INVESTMENT COMPARED TO
THE LEHMAN BROTHERS AGGREGATE BOND INDEX
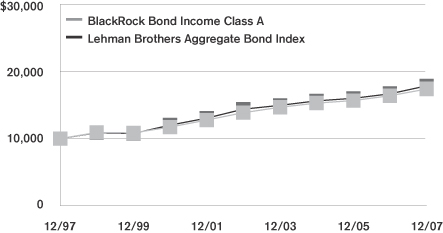
Average Annual Returns as of December 31, 2007
| | | | | | | | | | | | |
| | | BlackRock Bond
Income Portfolio | | | Lehman Brothers
Aggregate
Bond Index | |
| | | Class A | | | Class B | | | Class E | | |
| 1 Year | | 6.3 | % | | 6.0 | % | | 6.1 | % | | 7.0 | % |
| 5 Year | | 4.7 | | | 4.4 | | | 4.5 | | | 4.4 | |
| 10 Year | | 5.7 | | | — | | | — | | | 6.0 | |
| Since Inception | | — | | | 5.3 | | | 5.2 | | | — | |
Performance numbers are net of all Portfolio expenses but do not include any insurance, sales, or administrative charges of variable annuity or life insurance contracts. If these charges were included, the returns would be lower.
Inception dates of the Class A, Class B and Class E shares are: 8/26/83, 5/1/01 and 4/23/02, respectively.
This information represents past performance and is not indicative of future results. Investment return and principal value may fluctuate so that shares, upon redemption, may be worth more or less than the original cost.
PORTFOLIO COMPOSITION
as of December 31, 2007
Top Holdings
| | |
| | | % of Total
Net Assets |
Federal National Mortgage Association | | 41.1% |
Federal Home Loan Mortgage Corp. | | 19.7% |
Government National Mortgage Association | | 5.8% |
Lehman Brothers Holdings, Inc. | | 4.5% |
Bank of America Corp. | | 4.0% |
Wachovia Corp. | | 3.5% |
JPMorgan Commercial Mortgage Finance Corp. | | 3.0% |
Morgan Stanley Capital I | | 2.5% |
Citigroup/Deutsche Bank Commercial Mortgage Trust | | 2.3% |
General Electric Capital Corp. | | 2.1% |
Top Sectors
| | |
| | | % of
Market Value |
Mortgage | | 46.1% |
Investment Grade Corporates | | 23.7% |
Commercial Mortgage-Backed | | 20.2% |
Asset Backed | | 3.0% |
Agency Issues | | 2.4% |
High Yield Corporates | | 1.5% |
Non-Dollar | | 1.2% |
U.S. Treasury | | 1.1% |
Other | | 0.5% |
MSF-3
Metropolitan Series Fund, Inc.
Shareholder Expense Example
As a shareholder of the Portfolio, you incur ongoing costs, including management fees; distribution and service (12b-1) fees; and other Portfolio expenses. This example is intended to help you understand your ongoing costs (in dollars) (referred to as “expenses”) of investing in the Portfolio and compare these costs with the ongoing costs of investing in other mutual funds. The example is based on an investment of $1,000 invested at the beginning of the period and held for the entire period, July 1, 2007 through December 31, 2007.
Actual Expenses
The first line for each share class of the Portfolio in the table below provides information about actual account values and actual expenses. You may use the information in this line, together with the amount you invested in the particular share class of the Portfolio, to estimate the expenses that you paid over the period. Simply divide your account value by $1,000 (for example, an $8,600 account value divided by $1,000=8.6), then multiply the result by the number in the first line under the heading entitled “Expenses Paid During Period” to estimate the expenses you paid on your account during this period.
Hypothetical Example for Comparison Purposes
The second line for each share class of the Portfolio in the table below provides information about hypothetical account values and hypothetical expenses based on the Portfolio’s actual expense ratio and an assumed rate of return of 5% per year before expenses, which is not the Portfolio’s actual return. The hypothetical account values and expenses may not be used to estimate the actual ending account balance or expenses you paid for the period. You may use this information to compare the ongoing costs of investing in the Portfolio and other funds. To do so, compare this 5% hypothetical example with the 5% hypothetical examples that appear in the shareholder reports of the other funds.
Please note that the expenses shown in the table are meant to highlight your ongoing costs only and do not reflect any fees or charges of your variable insurance product or any additional expenses that participants in certain eligible qualified plans may bear relating to the operations of their plan. Therefore, the second line for each share class in the table is useful in comparing ongoing costs only, and will not help you determine the relative total costs of owning different funds. In addition, if these other costs were included, your costs would have been higher.
| | | | | | | | | | | | | | |
Portfolio | | | | Annualized
Expense
Ratio | | | Beginning
Account Value
July 1,
2007 | | Ending
Account Value
December 31,
2007 | | Expenses Paid
During Period*
July 1, 2007
to
December 31,
2007 |
BlackRock Bond Income—Class A(a) | | Actual | | 0.43 | % | | $ | 1,000.00 | | $ | 1,058.60 | | $ | 2.23 |
| | Hypothetical | | 0.43 | % | | $ | 1,000.00 | | $ | 1,023.02 | | $ | 2.19 |
| | | | | |
BlackRock Bond Income—Class B(a) | | Actual | | 0.68 | % | | $ | 1,000.00 | | $ | 1,057.30 | | $ | 3.53 |
| | Hypothetical | | 0.68 | % | | $ | 1,000.00 | | $ | 1,021.74 | | $ | 3.47 |
| | | | | |
BlackRock Bond Income—Class E(a) | | Actual | | 0.58 | % | | $ | 1,000.00 | | $ | 1,057.90 | | $ | 3.01 |
| | Hypothetical | | 0.58 | % | | $ | 1,000.00 | | $ | 1,022.25 | | $ | 2.96 |
* Expenses paid are equal to the Portfolio’s annualized expense ratio for the most recent six month period, as shown above, multiplied by the average account value over the period, multiplied by the number of days in the most recent fiscal half-year, divided by 365 (to reflect the one-half year period).
(a) The annualized expense ratio shown reflects the impact of the management fee waiver as described in Note 4 to the Financial Statements.
MSF-4
Metropolitan Series Fund, Inc.
BlackRock Bond Income Portfolio
Schedule of Investments as of December 31, 2007
Fixed Income—118.0% of Total Net Assets
| | | | | | |
| Security Description | | Face
Amount | | Value* |
| | | | | | |
|
Aerospace & Defense—0.1% |
L-3 Communications Corp.
6.375%, 10/15/15 | | $ | 650,000 | | $ | 640,250 |
Northrop Grumman Corp.
7.125%, 02/15/11 | | | 1,000,000 | | | 1,065,746 |
| | | | | | |
| | | | | | 1,705,996 |
| | | | | | |
|
Asset Backed—2.7% |
Ares VIII CLO, Ltd. (144A)
7.665%, 02/26/16 (a) | | | 1,600,000 | | | 1,563,520 |
BA Master Credit Card Trust
7.000%, 02/15/12 | | | 1,125,000 | | | 1,177,998 |
Bank One Issuance Trust
5.138%, 12/15/10 (a) | | | 2,000,000 | | | 2,000,643 |
Capital Auto Receivables Asset Trust
4.050%, 07/15/09 (a) | | | 1,772,744 | | | 1,771,143 |
Capital One Multi-Asset Execution Trust
5.208%, 09/15/11 (a) | | | 1,000,000 | | | 1,000,174 |
Capital Transition Funding, LLC
5.010%, 01/15/10 | | | 1,123,043 | | | 1,123,159 |
Centex Home Equity Loan Trust
6.915%, 12/25/32 (a) | | | 714,659 | | | 470,293 |
Chase Funding Mortgage Loan Asset-Backed Certificates
5.833%, 04/25/32 (a) | | | 1,616,208 | | | 1,612,008 |
Chase Issuance Trust
4.230%, 01/15/13 (a) | | | 2,115,000 | | | 2,116,889 |
5.120%, 10/15/14 | | | 10,100,000 | | | 10,344,279 |
Chase Manhattan Auto Owner Trust
5.340%, 07/15/10 | | | 10,266,102 | | | 10,305,474 |
Hedged Mutual Fund Fee Trust (144A)
5.220%, 11/30/10 (a) | | | 59,573 | | | 58,978 |
Knollwood CDO, Ltd. (144A)
8.322%, 02/08/39 (a) | | | 563,417 | | | 5,634 |
Option One Mortgage Loan Trust
5.990%, 01/25/33 (a) | | | 452,997 | | | 447,563 |
Structured Asset Investment Loan Trust
6.815%, 04/25/33 (a) | | | 191,248 | | | 64,412 |
7.790%, 04/25/33 (a) | | | 59,325 | | | 38,038 |
Wachovia Auto Owner Trust
5.380%, 03/20/13 | | | 8,900,000 | | | 9,025,326 |
| | | | | | |
| | | | | | 43,125,531 |
| | | | | | |
| | |
Automobiles—0.3% | | | | | | |
DaimlerChrysler N.A. Holding Corp.
7.300%, 01/15/12 | | | 3,800,000 | | | 4,051,229 |
| | | | | | |
| | |
Biotechnology—0.0% | | | | | | |
Bio-Rad Laboratories, Inc.
7.500%, 08/15/13 | | | 585,000 | | | 590,850 |
| | | | | | |
| | |
Capital Markets—4.2% | | | | | | |
Credit Suisse USA, Inc.
3.875%, 01/15/09 | | | 3,600,000 | | | 3,570,062 |
6.125%, 11/15/11 | | | 1,600,000 | | | 1,664,866 |
| | | | | | |
| Security Description | | Face
Amount | | Value* |
| | | | | | |
| | |
Capital Markets—(Continued) | | | | | | |
Lehman Brothers Holdings, Inc.
4.800%, 03/13/14 | | $ | 3,700,000 | | $ | 3,443,579 |
5.170%, 05/25/10 (a) | | | 9,300,000 | | | 8,939,867 |
6.750%, 12/28/17 | | | 4,775,000 | | | 4,921,588 |
7.000%, 09/27/27 | | | 3,350,000 | | | 3,400,093 |
Morgan Stanley
5.050%, 01/21/11 | | | 6,800,000 | | | 6,799,238 |
5.550%, 04/27/17 | | | 2,140,000 | | | 2,086,859 |
5.625%, 01/09/12 | | | 2,890,000 | | | 2,939,844 |
6.250%, 08/28/17 (b) | | | 9,650,000 | | | 9,810,219 |
The Bear Stearns Cos., Inc.
5.599%, 07/19/10 (a) | | | 2,040,000 | | | 1,917,174 |
6.400%, 10/02/17 | | | 2,875,000 | | | 2,777,710 |
6.950%, 08/10/12 | | | 5,575,000 | | | 5,732,215 |
The Goldman Sachs Group, Inc.
5.250%, 10/15/13 | | | 10,015,000 | | | 10,018,435 |
| | | | | | |
| | | | | | 68,021,749 |
| | | | | | |
| | |
Chemicals—0.1% | | | | | | |
Momentive Performance Materials, Inc. (144A)
10.125%, 12/01/14 (b) | | | 895,000 | | | 818,925 |
| | | | | | |
| | |
Commercial Banks—2.6% | | | | | | |
Barclays Bank, Plc.
7.434%, 09/29/49 (a) (b) | | | 3,755,000 | | | 3,902,012 |
HSBC Bank USA, N.A.
5.875%, 11/01/34 | | | 2,300,000 | | | 2,110,653 |
JPMorgan Chase Bank, N.A.
6.000%, 07/05/17 | | | 6,325,000 | | | 6,404,840 |
Royal Bank of Scotland Group, Plc.
5.050%, 01/08/15 (b) | | | 2,300,000 | | | 2,243,379 |
Royal Bank of Scotland Group, Plc. (144A)
6.990%, 10/29/49 (a) | | | 4,650,000 | | | 4,636,013 |
The Bank of New York
3.800%, 02/01/08 | | | 1,250,000 | | | 1,249,570 |
U.S. Bank, N.A.
4.950%, 10/30/14 | | | 2,300,000 | | | 2,242,783 |
| | | | | | |
UBS AG Stamford Branch
5.875%, 12/20/17 | | | 7,760,000 | | | 7,814,669 |
Wachovia Bank, N.A.
6.600%, 01/15/38 | | | 6,750,000 | | | 6,783,885 |
Wells Fargo & Co.
4.200%, 01/15/10 | | | 1,335,000 | | | 1,326,565 |
4.625%, 08/09/10 | | | 2,765,000 | | | 2,767,143 |
4.875%, 01/12/11 (b) | | | 940,000 | | | 952,637 |
| | | | | | |
| | | | | | 42,434,149 |
| | | | | | |
|
Commercial Mortgage-Backed Securities—25.3% |
Banc of America Alternative Loan Trust
5.500%, 10/25/35 | | | 9,668,173 | | | 9,585,792 |
Banc of America Commercial Mortgage, Inc. 4.621%, 07/10/43 | | | 5,225,000 | | | 5,102,485 |
4.870%, 12/10/42 (a) | | | 8,450,000 | | | 7,913,327 |
5.356%, 12/10/16 | | | 8,305,000 | | | 8,324,525 |
6.186%, 06/11/35 | | | 5,530,000 | | | 5,797,959 |
*See accompanying notes to financial statements.
MSF-5
Metropolitan Series Fund, Inc.
BlackRock Bond Income Portfolio
Schedule of Investments as of December 31, 2007
Fixed Income—(Continued)
| | | | | | |
| Security Description | | Face
Amount | | Value* |
| | | | | | |
|
Commercial Mortgage-Backed Securities—(Continued) |
Banc of America Commercial Mortgage, Inc. | | | | | | |
7.333%, 10/15/09 | | $ | 6,315,000 | | $ | 6,527,611 |
Bear Stearns Commercial Mortgage Securities, Inc.
4.361%, 06/11/41 | | | 3,521,753 | | | 3,502,180 |
5.694%, 06/11/50 (a) | | | 7,350,000 | | | 7,504,873 |
5.742%, 09/11/42 | | | 8,775,000 | | | 8,989,150 |
Chase Commerical Mortgage Securities Corp.
7.319%, 10/15/32 | | | 2,370,000 | | | 2,497,899 |
Citigroup Mortgage Loan Trust, Inc.
5.700%, 06/10/17 (a) | | | 3,975,000 | | | 3,985,533 |
5.767%, 03/25/37 (a) | | | 12,840,294 | | | 12,946,536 |
Citigroup/Deutsche Bank Commercial Mortgage Trust
5.886%, 11/15/44 | | | 4,050,000 | | | 4,185,128 |
CitiMortgage Alternative Loan Trust
6.000%, 10/25/37 | | | 10,403,241 | | | 10,357,726 |
Cobalt Commercial Mortgage Trust
5.820%, 05/15/46 (a) | | | 5,700,000 | | | 5,902,388 |
Commercial Mortgage Pass Through Certificates
5.167%, 06/10/44 (a) | | | 7,050,000 | | | 6,957,737 |
5.816%, 12/10/49 (a) | | | 11,120,000 | | | 11,523,803 |
Commercial Mortgage Trust
5.736%, 12/10/49 | | | 8,825,000 | | | 9,039,106 |
Countrywide Alternative Loan Trust
4.955%, 11/25/36 (a) | | | 2,403,744 | | | 2,363,791 |
Countrywide Home Loan Mortgage Pass Through Trust
6.500%, 10/25/37 | | | 6,430,991 | | | 6,518,922 |
CS First Boston Mortgage Securities Corp.
3.936%, 05/15/38 (a) | | | 10,000,000 | | | 9,543,971 |
4.889%, 11/15/37 (a) | | | 2,220,000 | | | 2,077,179 |
4.940%, 12/15/35 | | | 7,295,000 | | | 7,302,769 |
DLJ Commercial Mortgage Corp.
7.180%, 11/10/33 | | | 6,038,490 | | | 6,361,343 |
First Union National Bank Commercial Mortgage Trust
7.390%, 12/15/31 | | | 9,175,556 | | | 9,551,000 |
First Union National Bank Commercial Mortgage Trust (144A)
7.793%, 12/15/31 (a) | | | 9,412,000 | | | 9,930,204 |
GE Capital Commercial Mortgage Corp.
4.578%, 06/10/48 | | | 5,200,000 | | | 5,093,985 |
GMAC Commercial Mortgage Securities, Inc.
5.134%, 08/10/38 (a) | | | 3,000,000 | | | 3,028,125 |
6.465%, 04/15/34 | | | 6,492,591 | | | 6,783,172 |
6.957%, 09/15/35 | | | 7,345,000 | | | 7,754,333 |
7.455%, 08/16/33 | | | 4,587,220 | | | 4,836,548 |
GSR Mortgage Loan Trust
5.251%, 11/25/35 (a) | | | 5,312,223 | | | 5,129,532 |
Harborview Mortgage Loan Trust
5.135%, 12/19/36 (a) | | | 9,772,331 | | | 9,216,212 |
5.275%, 11/19/35 (a) | | | 3,526,833 | | | 3,300,969 |
JPMorgan Chase Commercial Mortgage Securities Corp.
4.922%, 01/15/42 (a) | | | 8,600,000 | | | 8,062,728 |
| | | | | | |
| Security Description | | Face
Amount | | Value* |
| | | | | | |
|
Commercial Mortgage-Backed Securities—(Continued) |
4.996%, 08/15/42 (a) | | $ | 2,300,000 | | $ | 2,240,975 |
4.999%, 10/15/42 (a) | | | 2,580,000 | | | 2,466,658 |
5.432%, 08/25/35 (a) | | | 3,513,044 | | | 3,415,838 |
5.804%, 06/15/49 (a) | | | 3,825,000 | | | 3,909,560 |
5.827%, 02/15/51 (a) | | | 3,125,000 | | | 3,188,295 |
5.857%, 10/12/35 | | | 5,710,000 | | | 5,913,623 |
JPMorgan Commercial Mortgage Finance Corp.
6.507%, 10/15/35 | | | 2,173,632 | | | 2,184,414 |
LB-UBS Commercial Mortgage Trust
4.071%, 09/15/26 | | | 2,883,707 | | | 2,854,825 |
4.559%, 07/17/12 (a) | | | 4,075,000 | | | 4,061,939 |
4.806%, 02/15/40 (a) | | | 3,600,000 | | | 3,272,902 |
5.205%, 04/15/30 (a) | | | 3,575,000 | | | 3,333,755 |
5.430%, 02/17/40 (a) | | | 16,920,000 | | | 16,994,563 |
5.642%, 12/15/25 | | | 4,434,636 | | | 4,490,661 |
5.866%, 09/15/45 | | | 8,820,000 | | | 9,123,337 |
7.950%, 05/15/25 (a) | | | 5,394,006 | | | 5,696,058 |
LB-UBS Commercial Mortgage Trust (144A)
6.155%, 07/14/16 | | | 2,118,332 | | | 2,180,232 |
Merrill Lynch First Franklin Mortgage Loan Trust
4.985%, 04/25/37 (a) | | | 5,229,337 | | | 5,064,024 |
Morgan Stanley Capital I
5.633%, 04/12/49 (a) | | | 1,390,000 | | | 1,412,003 |
5.651%, 06/11/42 (a) | | | 10,415,000 | | | 10,686,256 |
5.809%, 12/12/49 | | | 5,345,000 | | | 5,467,500 |
6.210%, 11/15/31 | | | 1,127,731 | | | 1,131,052 |
Mortgage Capital Funding, Inc.
6.423%, 06/18/30 | | | 1,830,701 | | | 1,827,617 |
NationsLink Funding Corp.
6.795%, 08/20/30 | | | 1,325,000 | | | 1,331,922 |
Nomura Asset Securities Corp.
6.590%, 03/15/30 | | | 2,226,822 | | | 2,231,991 |
Salomon Brothers Mortgage Securities VII, Inc.
6.499%, 10/13/11 | | | 5,860,000 | | | 6,159,616 |
6.592%, 12/18/33 | | | 5,750,000 | | | 5,978,656 |
TIAA Seasoned Commercial Mortgage Trust
6.097%, 08/15/39 (a) | | | 3,755,000 | | | 3,866,965 |
Wachovia Bank Commercial Mortgage Trust
4.935%, 04/15/42 | | | 4,950,000 | | | 4,793,878 |
5.742%, 05/15/43 (a) | | | 9,000,000 | | | 9,298,709 |
5.803%, 05/15/46 | | | 7,055,000 | | | 7,195,197 |
5.903%, 02/15/51 (a) | | | 4,300,000 | | | 4,489,740 |
WaMu Commercial Mortgage Securities
Trust (144A)
5.150%, 05/25/36 | | | 7,380,000 | | | 7,384,660 |
Washington Mutual, Inc.
3.423%, 04/25/33 (a) | | | 3,688,672 | | | 3,687,956 |
3.695%, 05/25/33 (a) | | | 4,344,046 | | | 4,330,166 |
4.494%, 06/25/33 (a) | | | 1,146,142 | | | 1,069,889 |
Wells Fargo Mortgage Backed Securities Trust
5.773%, 04/25/36 (a) | | | 2,903,000 | | | 2,858,162 |
6.101%, 09/25/36 (a) | | | 3,759,504 | | | 3,764,808 |
| | | | | | |
| | | | | | 406,856,943 |
| | | | | | |
*See accompanying notes to financial statements.
MSF-6
Metropolitan Series Fund, Inc.
BlackRock Bond Income Portfolio
Schedule of Investments as of December 31, 2007
Fixed Income—(Continued)
| | | | | | |
| Security Description | | Face
Amount | | Value* |
| | | | | | |
|
Computers & Peripherals—0.2% |
IBM Corp.
5.700%, 09/14/17 | | $ | 3,185,000 | | $ | 3,292,532 |
| | | | | | |
|
Consumer Finance—0.4% |
SLM Corp.
5.244%, 07/26/10 (a) | | | 5,145,000 | | | 4,735,823 |
5.400%, 10/25/11 | | | 2,470,000 | | | 2,251,148 |
| | | | | | |
| | | | | | 6,986,971 |
| | | | | | |
|
Containers & Packaging—0.1% |
Ball Corp.
6.875%, 12/15/12 | | | 815,000 | | | 827,225 |
| | | | | | |
| | | | | | |
|
Diversified Financial Services—6.8% |
AES Ironwood, LLC
8.857%, 11/30/25 | | | 176,399 | | | 193,157 |
AES Red Oak, LLC
9.200%, 11/30/29 | | | 85,000 | | | 94,350 |
AIG SunAmerica Global Financing VII (144A)
5.850%, 08/01/08 | | | 2,900,000 | | | 2,907,824 |
Anadarko Finance Co.
6.750%, 05/01/11 | | | 1,900,000 | | | 2,008,897 |
Atlantic Marine Corps Communities,
LLC (144A)
5.343%, 12/01/50 | | | 150,000 | | | 136,925 |
Bank of America Corp.
5.300%, 03/15/17 | | | 625,000 | | | 607,735 |
5.375%, 06/15/14 (b) | | | 3,100,000 | | | 3,132,181 |
5.750%, 12/01/17 | | | 11,245,000 | | | 11,270,796 |
6.000%, 09/01/17 | | | 2,550,000 | | | 2,605,264 |
6.100%, 06/15/17 | | | 3,425,000 | | | 3,500,312 |
Belvoir Land, LLC (144A)
5.270%, 12/15/47 | | | 900,000 | | | 797,994 |
Citigroup Capital XXI
8.300%, 12/21/57 (a) | | | 5,125,000 | | | 5,351,479 |
Citigroup, Inc.
5.300%, 10/17/12 | | | 7,375,000 | | | 7,470,949 |
6.125%, 08/25/36 | | | 2,350,000 | | | 2,224,251 |
Compton Petroleum Finance Corp.
7.625%, 12/01/13 (b) | | | 95,000 | | | 88,350 |
Credit Suisse Guernsey, Ltd.
5.860%, 05/29/49 (a) | | | 5,320,000 | | | 4,762,453 |
Devon Financing Corp., U.L.C.
6.875%, 09/30/11 | | | 2,800,000 | | | 2,998,495 |
Gaz Capital for Gazprom (144A)
7.288%, 08/16/37 | | | 2,710,000 | | | 2,735,203 |
General Electric Capital Corp.
5.000%, 11/15/11 (b) | | | 16,940,000 | | | 17,145,211 |
5.000%, 04/10/12 | | | 2,135,000 | | | 2,161,295 |
6.150%, 08/01/37 | | | 4,310,000 | | | 4,579,069 |
6.375%, 11/15/67 (a) | | | 3,875,000 | | | 4,000,868 |
Goldman Sachs Capital II
5.793%, 12/29/49 (a) | | | 2,435,000 | | | 2,167,941 |
Irwin Land, LLC (144A)
5.400%, 12/15/47 | | | 1,650,000 | | | 1,493,992 |
| | | | | | |
| Security Description | | Face
Amount | | Value* |
| | | | | | |
|
Diversified Financial Services—(Continued) |
JPMorgan Chase Capital
6.800%, 10/01/37 | | $ | 10,350,000 | | $ | 9,951,225 |
Mellon Capital
6.244%, 06/29/49 (a) | | | 2,325,000 | | | 2,157,886 |
Nationwide Building Society (144A)
4.250%, 02/01/10 | | | 1,370,000 | | | 1,368,757 |
Petrobras International Finance Co.
5.875%, 03/01/18 | | | 1,295,000 | | | 1,287,877 |
Rabobank Capital Funding Trust (144A)
5.254%, 12/29/49 (a) | | | 1,000,000 | | | 895,030 |
Sprint Capital Corp.
8.375%, 03/15/12 | | | 200,000 | | | 216,605 |
SunTrust Capital VIII
6.100%, 12/01/66 (a) (b) | | | 2,025,000 | | | 1,685,248 |
Telecom Italia Capital S.A.
4.000%, 01/15/10 | | | 2,000,000 | | | 1,958,868 |
5.250%, 11/15/13 | | | 850,000 | | | 840,081 |
5.250%, 10/01/15 | | | 1,100,000 | | | 1,071,674 |
Wind Acquisition Finance S.A. (144A)
10.750%, 12/01/15 | | | 475,000 | | | 517,750 |
ZFS Finance USA Trust I (144A)
6.500%, 05/09/37 (a) | | | 2,130,000 | | | 1,966,390 |
| | | | | | |
| | | | | | 108,352,382 |
| | | | | | |
| |
Diversified Telecommunication Services—0.7% | | | |
AT&T, Inc.
6.500%, 09/01/37 | | | 7,275,000 | | | 7,607,307 |
Cincinnati Bell, Inc.
7.250%, 07/15/13 | | | 80,000 | | | 80,200 |
Qwest Communications International, Inc.
7.500%, 02/15/14 | | | 810,000 | | | 807,975 |
Qwest Communications International, Inc.
(Series B)
7.500%, 02/15/14 | | | 350,000 | | | 349,125 |
Qwest Corp.
8.241%, 06/15/13 (a) | | | 415,000 | | | 423,300 |
Windstream Corp.
8.125%, 08/01/13 | | | 1,030,000 | | | 1,066,050 |
8.625%, 08/01/16 | | | 440,000 | | | 462,000 |
| | | | | | |
| | | | | | 10,795,957 |
| | | | | | |
| |
Electric Utilities—0.5% | | | |
Elwood Energy, LLC
8.159%, 07/05/26 | | | 220,835 | | | 220,761 |
Florida Power & Light Co.
5.625%, 04/01/34 | | | 475,000 | | | 459,964 |
MidAmerican Energy Holdings Co.
5.950%, 05/15/37 | | | 1,650,000 | | | 1,600,464 |
6.500%, 09/15/37 | | | 1,900,000 | | | 1,984,143 |
PECO Energy Co.
4.750%, 10/01/12 (b) | | | 947,000 | | | 937,085 |
Texas Competitive Electric Holdings Co. LLC.
10.250%, 11/01/15 (b) | | | 3,130,000 | | | 3,098,700 |
| | | | | | |
| | | | | | 8,301,117 |
| | | | | | |
*See accompanying notes to financial statements.
MSF-7
Metropolitan Series Fund, Inc.
BlackRock Bond Income Portfolio
Schedule of Investments as of December 31, 2007
Fixed Income—(Continued)
| | | | | | |
| Security Description | | Face
Amount | | Value* |
| | | | | | |
| |
Energy Equipment & Services—0.1% | | | |
Colorado Interstate Gas Co.
6.800%, 11/15/15 | | $ | 145,000 | | $ | 150,939 |
Kinder Morgan Energy Partners, L.P.
5.125%, 11/15/14 | | | 1,000,000 | | | 974,349 |
Tennessee Gas Pipeline Co.
7.000%, 10/15/28 (b) | | | 500,000 | | | 504,742 |
| | | | | | |
| | | | | | 1,630,030 |
| | | | | | |
| |
Federal Agencies—65.2% | | | |
Federal Home Loan Mortgage Corp.
1.523%, 10/15/33 (a) (c) | | | 87,591,041 | | | 7,950,885 |
4.500%, 05/01/18 | | | 6,695,110 | | | 6,589,301 |
4.500%, 03/01/19 | | | 104,110 | | | 102,330 |
4.500%, 05/01/19 | | | 1,887,239 | | | 1,855,503 |
4.500%, 07/01/19 | | | 1,390,270 | | | 1,366,497 |
4.500%, 12/01/19 | | | 1,904,893 | | | 1,872,320 |
4.500%, 08/01/20 | | | 4,085,415 | | | 4,015,555 |
4.776%, 03/01/35 (a) | | | 9,982,243 | | | 9,983,039 |
5.000%, 03/15/18 | | | 4,200,000 | | | 4,195,917 |
5.000%, 04/01/18 | | | 4,287,971 | | | 4,298,530 |
5.000%, 12/01/18 | | | 1,663,159 | | | 1,667,256 |
5.000%, 11/01/20 | | | 16,695,656 | | | 16,712,034 |
5.000%, 02/01/36 | | | 969,245 | | | 946,305 |
5.000%, TBA | | | 21,000,000 | | | 21,019,698 |
5.125%, 11/17/17 (b) | | | 25,575,000 | | | 26,686,004 |
5.500%, 09/01/21 | | | 52,858,065 | | | 53,505,134 |
5.500%, 07/01/33 | | | 4,781,000 | | | 4,784,788 |
5.500%, TBA | | | 58,400,000 | | | 58,272,221 |
5.686%, 01/01/37 (a) | | | 7,310,852 | | | 7,423,993 |
6.000%, 03/15/29 | | | 6,596,457 | | | 6,696,589 |
6.000%, TBA | | | 66,400,000 | | | 67,420,283 |
9.000%, 12/01/09 | | | 9,901 | | | 9,990 |
Federal National Mortgage Association
4.000%, 05/01/19 | | | 3,674,112 | | | 3,524,165 |
4.000%, 06/01/19 | | | 5,338,130 | | | 5,120,271 |
4.500%, 10/01/18 | | | 1,548,928 | | | 1,524,026 |
4.500%, 02/01/35 | | | 1,086,005 | | | 1,028,412 |
4.500%, 03/01/35 | | | 722,204 | | | 683,904 |
4.500%, 09/01/35 | | | 1,050,815 | | | 995,089 |
4.500%, 07/01/36 | | | 7,849,668 | | | 7,432,779 |
4.500%, TBA | | | 21,100,000 | | | 20,763,708 |
5.000%, 01/01/18 | | | 1,249,867 | | | 1,252,877 |
5.000%, 06/01/18 | | | 1,928,386 | | | 1,933,207 |
5.000%, 01/01/21 | | | 9,772,496 | | | 9,796,928 |
5.000%, 06/01/23 | | | 2,264,939 | | | 2,235,344 |
5.000%, 01/01/26 (a) | | | 7,760,125 | | | 7,779,526 |
5.000%, 09/01/33 | | | 76,106,250 | | | 74,371,333 |
5.000%, 11/01/33 | | | 10,172,815 | | | 9,940,916 |
5.000%, 04/01/34 | | | 18,170,301 | | | 17,749,028 |
5.000%, 04/25/35 | | | 2,911,597 | | | 2,935,761 |
5.000%, 07/01/35 | | | 397,685 | | | 388,249 |
5.000%, 12/01/35 | | | 3,691,090 | | | 3,603,509 |
5.000%, 05/01/36 | | | 65,037,168 | | | 63,493,995 |
5.000%, 07/01/36 (c) | | | 16,507,138 | | | 3,513,534 |
5.125%, 01/02/14 (b) | | | 7,600,000 | | | 7,871,236 |
| | | | | | |
| Security Description | | Face
Amount | | Value* |
| | | | | | |
| | |
Federal Agencies—(Continued) | | | | | | |
5.250%, 08/01/12 | | $ | 3,100,000 | | $ | 3,222,416 |
5.370%, 05/01/37 (a) | | | 7,721,494 | | | 7,810,973 |
5.500%, 04/01/17 | | | 123,627 | | | 125,496 |
5.500%, 05/01/19 | | | 31,569,138 | | | 32,046,445 |
5.500%, 08/01/19 | | | 16,299 | | | 16,527 |
5.500%, 03/01/20 | | | 519,524 | | | 526,456 |
5.500%, 05/01/20 | | | 127,925 | | | 129,632 |
5.500%, 06/01/20 | | | 1,583,188 | | | 1,607,125 |
5.500%, 10/01/20 | | | 405,645 | | | 411,057 |
5.500%, 02/01/21 | | | 109,473 | | | 110,934 |
5.500%, 03/01/21 | | | 690,591 | | | 699,630 |
5.500%, 01/01/24 | | | 1,264,063 | | | 1,271,998 |
5.500%, 06/25/28 | | | 2,281,433 | | | 2,307,992 |
5.500%, 04/01/33 | | | 2,947,236 | | | 2,949,421 |
5.500%, 11/01/33 | | | 2,884,813 | | | 2,886,953 |
5.500%, 02/01/34 | | | 9,319,504 | | | 9,326,414 |
5.500%, 04/01/34 | | | 26,225,237 | | | 26,257,304 |
5.500%, 11/01/34 | | | 4,484,874 | | | 4,485,122 |
5.500%, 02/01/35 | | | 14,855,882 | | | 14,882,331 |
5.500%, 06/01/35 | | | 2,648,881 | | | 2,647,265 |
5.500%, 08/01/35 | | | 7,295,949 | | | 7,293,234 |
5.500%, 11/01/35 (c) | | | 8,378,404 | | | 2,027,463 |
5.500%, 11/01/35 | | | 1,892,042 | | | 1,890,887 |
5.500%, 12/01/35 | | | 12,114,785 | | | 12,107,395 |
5.500%, 01/01/36 | | | 56,733,395 | | | 56,698,788 |
5.500%, 01/25/36 (c) | | | 7,639,041 | | | 1,850,867 |
5.500%, 06/01/36 | | | 207,040 | | | 206,816 |
5.500%, 12/01/36 (a) | | | 32,586,597 | | | 32,544,589 |
6.000%, 04/01/16 | | | 659,109 | | | 675,592 |
6.000%, 03/25/27 | | | 8,111,057 | | | 8,219,599 |
6.000%, 02/01/34 | | | 2,990,404 | | | 3,042,708 |
6.000%, 08/01/34 | | | 2,495,121 | | | 2,538,762 |
6.000%, 04/01/35 | | | 15,300,901 | | | 15,588,388 |
6.000%, 05/01/36 | | | 109,159 | | | 110,872 |
6.000%, 06/01/36 | | | 8,330,665 | | | 8,461,403 |
6.000%, 09/01/36 | | | 10,095,319 | | | 10,253,751 |
6.000%, 04/01/37 | | | 112,890 | | | 114,646 |
6.000%, 08/01/37 | | | 2,953,260 | | | 2,999,209 |
6.000%, 09/01/37 | | | 2,669,002 | | | 2,688,109 |
6.000%, TBA | | | 24,600,000 | | | 24,976,675 |
6.500%, 07/01/14 | | | 176,694 | | | 183,117 |
6.500%, 04/01/17 | | | 2,775,321 | | | 2,870,977 |
6.500%, 11/01/27 | | | 203,126 | | | 211,030 |
6.500%, 12/01/29 (a) | | | 1,298,359 | | | 1,348,101 |
6.500%, 03/01/36 | | | 603,705 | | | 620,635 |
6.500%, 08/01/36 | | | 2,434,193 | | | 2,502,455 |
6.500%, 09/01/36 | | | 2,164,504 | | | 2,225,202 |
6.500%, TBA | | | 78,700,000 | | | 80,888,804 |
7.750%, 03/01/08 | | | 112 | | | 112 |
8.250%, 07/01/08 | | | 3,013 | | | 3,038 |
8.500%, 02/01/09 | | | 5,818 | | | 5,878 |
8.500%, 09/01/09 | | | 495 | | | 503 |
9.000%, 04/01/16 | | | 2,073 | | | 2,141 |
Government National Mortgage Association
5.000%, 10/20/33 | | | 8,159,002 | | | 7,970,737 |
5.500%, 04/15/33 | | | 398,348 | | | 401,461 |
*See accompanying notes to financial statements.
MSF-8
Metropolitan Series Fund, Inc.
BlackRock Bond Income Portfolio
Schedule of Investments as of December 31, 2007
Fixed Income—(Continued)
| | | | | | |
| Security Description | | Face
Amount | | Value* |
| | | | | | |
| | |
Federal Agencies—(Continued) | | | | | | |
Government National Mortgage Association | | | | | | |
5.500%, TBA | | $ | 7,000,000 | | $ | 7,025,157 |
6.000%, 09/20/33 | | | 1,266,181 | | | 1,293,579 |
6.000%, 10/20/33 | | | 2,076,452 | | | 2,126,757 |
6.000%, 11/20/33 | | | 2,838,691 | | | 2,900,116 |
6.000%, TBA | | | 67,400,000 | | | 68,737,472 |
6.500%, 07/15/28 | | | 109,309 | | | 113,453 |
6.500%, 05/15/29 | | | 218,948 | | | 227,243 |
6.500%, 12/15/29 | | | 4,314 | | | 4,477 |
6.500%, 07/15/32 | | | 70,161 | | | 72,740 |
6.500%, 02/15/33 | | | 636,475 | | | 659,494 |
6.500%, 04/15/33 | | | 268,138 | | | 277,835 |
6.500%, 09/15/34 | | | 27,475 | | | 28,443 |
6.500%, 07/15/35 | | | 416,059 | | | 430,377 |
7.500%, 12/15/14 | | | 265,318 | | | 277,814 |
8.000%, 11/15/29 | | | 47,092 | | | 50,955 |
8.500%, 01/15/17 | | | 11,259 | | | 12,195 |
8.500%, 02/15/17 | | | 11,756 | | | 12,733 |
8.500%, 03/15/17 | | | 8,473 | | | 9,177 |
8.500%, 05/15/17 | | | 13,487 | | | 14,609 |
8.500%, 10/15/21 | | | 1,763 | | | 1,918 |
8.500%, 11/15/21 | | | 4,295 | | | 4,673 |
8.500%, 05/15/22 | | | 3,428 | | | 3,734 |
9.000%, 10/15/16 | | | 7,706 | | | 8,295 |
| | | | | | |
| | | | | | 1,046,850,650 |
| | | | | | |
|
Food & Staples Retailing—0.1% |
Delhaize America, Inc.
9.000%, 04/15/31 | | | 1,000,000 | | | 1,156,176 |
| | | | | | |
|
Food Products—0.6% |
Kraft Foods, Inc.
6.125%, 02/01/18 | | | 5,925,000 | | | 5,970,297 |
6.500%, 08/11/17 (a) | | | 2,855,000 | | | 2,953,629 |
| | | | | | |
| | | | | | 8,923,926 |
| | | | | | |
|
Foreign Government—2.7% |
Argentina Government International Bond 5.475%, 08/03/12 (a) | | | 5,250,000 | | | 2,966,250 |
Colombia Government International Bond 7.375%, 09/18/37 (b) | | | 2,525,000 | | | 2,809,063 |
Emirate of Abu Dhabi (144A)
5.500%, 08/02/12 | | | 11,600,000 | | | 11,930,159 |
Federal Republic of Germany
4.250%, 07/04/39 (EUR) | | | 2,100,000 | | | 2,891,949 |
Israel Government AID Bond
5.500%, 12/04/23 | | | 4,725,000 | | | 5,087,785 |
Japan 15 Year Government Bond
1.170%, 11/20/21 (JPY) (a) | | | 1,893,000,000 | | | 16,892,558 |
Peruvian Government International Bond 6.550%, 03/14/37 | | | 1,325,000 | | | 1,384,625 |
| | | | | | |
| | | | | | 43,962,389 |
| | | | | | |
|
Health Care Providers & Services—0.1% |
WellPoint, Inc.
5.950%, 12/15/34 | | | 1,750,000 | | | 1,647,275 |
| | | | | | |
| | | | | | |
| | | | | | |
| Security Description | | Face
Amount | | Value* |
| | | | | | |
|
Independent Power Producers & Energy Traders—0.0% |
NRG Energy, Inc.
7.375%, 02/01/16 | | $ | 275,000 | | $ | 268,125 |
| | | | | | |
|
Insurance—1.0% |
Berkshire Hathaway Finance Corp.
4.125%, 01/15/10 | | | 3,170,000 | | | 3,181,447 |
4.750%, 05/15/12 | | | 2,100,000 | | | 2,126,328 |
4.938%, 05/16/08 (a) | | | 1,000,000 | | | 1,000,504 |
Chubb Corp.
6.375%, 03/29/67 (a) | | | 2,775,000 | | | 2,706,768 |
Lincoln National Corp.
7.000%, 05/17/66 (a) | | | 1,735,000 | | | 1,741,980 |
The Progressive Corp.
6.700%, 06/15/37 (a) | | | 2,640,000 | | | 2,450,894 |
The Travelers Cos., Inc.
6.250%, 03/15/67 (a) | | | 3,075,000 | | | 2,883,695 |
| | | | | | |
| | | | | | 16,091,616 |
| | | | | | |
|
Media—1.5% |
Comcast Cable Communications Holdings, Inc. 8.375%, 03/15/13 | | | 1,330,000 | | | 1,492,104 |
Comcast Cable Communications, LLC
8.500%, 05/01/27 | | | 2,400,000 | | | 2,889,970 |
Comcast Corp.
6.500%, 01/15/17 | | | 1,200,000 | | | 1,251,182 |
6.950%, 08/15/37 | | | 4,250,000 | | | 4,586,906 |
7.050%, 03/15/33 | | | 1,775,000 | | | 1,938,946 |
COX Communications, Inc.
7.125%, 10/01/12 | | | 4,600,000 | | | 4,905,767 |
CSC Holdings, Inc.
8.125%, 07/15/09 | | | 350,000 | | | 355,688 |
Idearc, Inc.
8.000%, 11/15/16 | | | 800,000 | | | 734,000 |
News America, Inc.
6.200%, 12/15/34 | | | 1,500,000 | | | 1,478,685 |
Time Warner Cable, Inc.
5.850%, 05/01/17 | | | 3,975,000 | | | 3,984,810 |
Time Warner Entertainment Co., L.P.
8.375%, 03/15/23 | | | 590,000 | | | 694,958 |
| | | | | | |
| | | | | | 24,313,016 |
| | | | | | |
|
Metals & Mining—0.3% |
Freeport-McMoRan Copper & Gold, Inc.
8.250%, 04/01/15 | | | 1,250,000 | | | 1,325,000 |
8.375%, 04/01/17 | | | 2,410,000 | | | 2,584,725 |
Ispat Inland, U.L.C.
9.750%, 04/01/14 | | | 235,000 | | | 254,614 |
| | | | | | |
| | | | | | 4,164,339 |
| | | | | | |
| | |
Office Electronics—0.1% | | | | | | |
Xerox Corp.
6.875%, 08/15/11 | | | 1,450,000 | | | 1,516,887 |
| | | | | | |
*See accompanying notes to financial statements.
MSF-9
Metropolitan Series Fund, Inc.
BlackRock Bond Income Portfolio
Schedule of Investments as of December 31, 2007
Fixed Income—(Continued)
| | | | | | |
| Security Description | | Face
Amount | | Value* |
| | | | | | |
| | |
Oil, Gas & Consumable Fuels—0.8% | | | | | | |
Anadarko Petroleum Corp.
5.950%, 09/15/16 | | $ | 2,900,000 | | $ | 2,952,867 |
6.450%, 09/15/36 | | | 3,005,000 | | | 3,060,100 |
Enterprise Products Operating, L.P.
4.950%, 06/01/10 | | | 25,000 | | | 25,017 |
KCS Energy, Inc.
7.125%, 04/01/12 | | | 105,000 | | | 101,062 |
Newfield Exploration Co.
6.625%, 09/01/14 (b) | | | 590,000 | | | 584,100 |
6.625%, 04/15/16 | | | 555,000 | | | 543,900 |
Sabine Pass LNG, L.P.
7.500%, 11/30/16 | | | 1,900,000 | | | 1,814,500 |
Transocean, Inc.
6.800%, 03/15/38 | | | 1,250,000 | | | 1,275,435 |
XTO Energy, Inc.
6.750%, 08/01/37 | | | 2,500,000 | | | 2,681,575 |
| | | | | | |
| | | | | | 13,038,556 |
| | | | | | |
| | |
Pharmaceuticals—0.5% | | | | | | |
Bristol-Myers Squibb Co.
5.875%, 11/15/36 | | | 2,525,000 | | | 2,509,156 |
Wyeth
5.500%, 02/01/14 | | | 6,000,000 | | | 6,093,990 |
| | | | | | |
| | | | | | 8,603,146 |
| | | | | | |
| | |
Real Estate Investment Trusts—0.4% | | | | | | |
AvalonBay Communities, Inc.
4.950%, 03/15/13 | | | 400,000 | | | 386,258 |
Simon Property Group, L.P.
4.600%, 06/15/10 | | | 1,000,000 | | | 994,063 |
5.100%, 06/15/15 | | | 1,000,000 | | | 940,189 |
The Rouse Co.
5.375%, 11/26/13 | | | 2,505,000 | | | 2,163,433 |
| | | | | | |
The Rouse Co., L.P./TRC Co-Issuer, Inc. (144A)
6.750%, 05/01/13 | | | 2,525,000 | | | 2,345,579 |
| | | | | | |
| | | | | | 6,829,522 |
| | | | | | |
| |
Real Estate Management & Development—0.0% | | | |
American Real Estate Partners, L.P.
8.125%, 06/01/12 | | | 225,000 | | | 217,969 |
| | | | | | |
| |
Wireless Telecommunication Services—0.5% | | | |
America Movil S.A. de C.V.
6.375%, 03/01/35 | | | 325,000 | | | 321,366 |
Rogers Wireless, Inc.
7.500%, 03/15/15 | | | 385,000 | | | 421,030 |
Sprint Nextel Corp.
6.000%, 12/01/16 | | | 1,100,000 | | | 1,053,572 |
Telefonica Emisiones, S.A.U.
7.045%, 06/20/36 | | | 2,450,000 | | | 2,738,576 |
Vodafone Group, Plc.
7.750%, 02/15/10 | | | 2,570,000 | | | 2,711,065 |
| | | | | | |
| | | | | | 7,245,609 |
| | | | | | |
| | | | | | | |
| Security Description | | Face
Amount | | Value* | |
| | | | | | | |
| |
Yankee—0.1% | | | | |
Barclays Bank, Plc.
5.926%, 12/31/49 | | $ | 2,540,000 | | $ | 2,363,427 | |
| | | | | | | |
Total Fixed Income
(Identified Cost $1,877,293,512) | | | | | | 1,894,984,214 | |
| | | | | | | |
| | |
| Preferred Stock—2.3% | | | | | | | |
| Security Description | | Shares | | Value* | |
| | |
Commercial Banks—0.9% | | | | | | | |
Wachovia Corp. | | | 600,000 | | | 15,180,000 | |
| | | | | | | |
| | |
Thrifts & Mortgage Finance—1.4% | | | | | | | |
Federal Home Loan Mortgage Corp. | | | 347,700 | | | 9,092,355 | |
Federal National Mortgage Association | | | 487,075 | | | 12,542,181 | |
| | | | | | | |
| | | | | | 21,634,536 | |
| | | | | | | |
Total Preferred Stock
(Identified Cost $35,869,375) | | | | | | 36,814,536 | |
| | | | | | | |
| | |
| Warrants—0.0% | | | | | | | |
| | | | | | | |
| | |
Communications Equipment—0.0% | | | | | | | |
Loral Orion Network Systems, Inc. (d) (e) | | | 150 | | | 0 | |
| | | | | | | |
Total Warrants
(Identified Cost $105) | | | | | | 0 | |
| | | | | | | |
| |
| Short Term Investments—2.7% | | | | |
| Security Description | | Face Amount/
Shares | | Value* | |
| | |
Discount Notes—0.9% | | | | | | | |
Federal Home Loan Bank
3.250%, 01/02/08 | | $ | 13,400,000 | | | 13,398,791 | |
| | | | | | | |
| | |
Mutual Funds—1.8% | | | | | | | |
State Street Navigator Securities Lending Prime Portfolio (f) | | | 28,919,481 | | | 28,919,481 | |
| | | | | | | |
Total Short Term Investments
(Identified Cost $42,318,272) | | | | | | 42,318,272 | |
| | | | | | | |
Total Investments—123.0%
(Identified Cost $1,955,481,264) (g) | | | | | | 1,974,117,022 | |
Liabilities in excess of other assets | | | | | | (368,654,360 | ) |
| | | | | | | |
| Total Net Assets—100% | | | | | $ | 1,605,462,662 | |
| | | | | | | |
| (a) | Variable or Floating Rate Security. Rate disclosed is as of December 31, 2007. |
| (b) | A portion or all of the security was held on loan. As of December 31, 2007, the market value of securities loaned was $28,416,772 and the collateral received consisted of cash in the amount of $28,919,481. The cash collateral is invested in a money market fund managed by an affiliate of the custodian. |
*See accompanying notes to financial statements.
MSF-10
Metropolitan Series Fund, Inc.
BlackRock Bond Income Portfolio
Schedule of Investments as of December 31, 2007
| (c) | Interest Only Certificate. This security receives monthly interest payments but is not entitled to principal payments. |
| (e) | Security was valued in good faith under procedures established by the Board of Directors. |
| (f) | Represents investment of cash collateral received from securities lending transactions. |
| (g) | The aggregate cost of investments for federal income tax purposes as of December 31, 2007 was $1,959,777,216 and the composition of unrealized appreciation and depreciation of investment securities was $29,092,474 and $(14,752,668), respectively. |
| (144A)— | Securities exempt from registration under Rule 144A of the Securities Act of 1933. These securities may be resold in transactions exempt from registration, normally to qualified institutional buyers. As of December 31, 2007, the market value of 144A securities was $53,673,769, which is 3.3% of total net assets. |
| (TBA)— | A contract for the purchase or sale of a Mortgage Backed Security to be delivered at a future date but does not include a specified pool or precise amount to be delivered. |
Forward Contracts
| | | | | | | | | | | | | | |
Forward Currency Contracts | | Delivery Date | | Local
Currency
Amount | | Aggregate
Face
Value | | Valuation as of
12/31/2007 | | Unrealized
Appreciation/
Depreciation | |
Euro (Sold) | | 1/23/2008 | | 4,335,500 | | $ | 6,143,403 | | $ | 6,332,092 | | $ | (188,689 | ) |
Euro (Bought) | | 1/23/2008 | | 2,395,989 | | | 3,552,684 | | | 3,499,394 | | | (53,290 | ) |
Japanese Yen (Sold) | | 1/15/2008 | | 1,850,413,500 | | | 17,137,267 | | | 16,589,680 | | | 547,587 | |
Japanese Yen (Bought) | | 1/15/2008 | | 834,305,000 | | | 7,524,375 | | | 7,479,870 | | | (44,505 | ) |
Japanese Yen (Bought) | | 1/15/2008 | | 834,305,000 | | | 7,461,730 | | | 7,479,870 | | | 18,140 | |
Japanese Yen (Bought) | | 1/15/2008 | | 1,782,871,000 | | | 15,452,435 | | | 15,984,135 | | | 531,700 | |
Mexican Peso (Sold) | | 1/23/2008 | | 2,156,631 | | | 200,238 | | | 197,182 | | | 3,056 | |
Mexican Peso (Sold) | | 1/23/2008 | | 97,511,169 | | | 8,967,699 | | | 8,915,517 | | | 52,182 | |
Mexican Peso (Bought) | | 1/23/2008 | | 99,667,800 | | | 9,228,500 | | | 9,112,700 | | | (115,800 | ) |
| | | | | | | | | | | | | | |
Net Unrealized Appreciation | | $ | 750,381 | |
| | | | | | | | | | | | | | |
Futures Contracts
| | | | | | | | | | | | | | | | | |
Futures Contracts—Long | | Expiration Date | | Number of
Contracts | | | Contract
Amount | | | Valuation as of
12/31/2007 | | | Unrealized
Appreciation/
Depreciation | |
Euribor Futures | | 3/17/2008 | | 127 | | | $ | 44,292,197 | | | $ | 44,252,115 | | | $ | (40,082 | ) |
Eurodollar Futures | | 9/15/2008 | | 233 | | | | 56,199,072 | | | | 56,217,075 | | | | 18,003 | |
Eurodollar Futures | | 12/15/2008 | | 406 | | | | 96,364,779 | | | | 98,079,450 | | | | 1,714,671 | |
German Government Bond 5 Year Futures | | 3/6/2008 | | 126 | | | | 20,150,751 | | | | 19,855,295 | | | | (295,456 | ) |
German Government Bond 10 Year Futures | | 3/6/2008 | | 275 | | | | 46,432,068 | | | | 45,410,583 | | | | (1,021,486 | ) |
U.S. Treasury Bond Futures | | 3/19/2008 | | 616 | | | | 72,299,218 | | | | 71,687,000 | | | | (612,218 | ) |
U.S. Treasury Notes 5 Year Futures | | 3/31/2008 | | 1,048 | | | | 115,201,240 | | | | 115,574,750 | | | | 373,510 | |
| | | | | |
Futures Contracts—Short | | | | | | | | | | | | | | |
Eurodollar Futures | | 9/14/2009 | | (233 | ) | | | (56,123,896 | ) | | | (56,123,875 | ) | | | 21 | |
U.S. Treasury Notes 2 Year Futures | | 3/31/2008 | | (102 | ) | | | (21,443,592 | ) | | | (21,445,500 | ) | | | (1,908 | ) |
U.S. Treasury Notes 10 Year Futures | | 3/19/2008 | | (1,399 | ) | | | (159,025,344 | ) | | | (158,633,484 | ) | | | 391,860 | |
| | | | | | | | | | | | | | | | | |
Net Unrealized Appreciation | | | $ | 526,915 | |
| | | | | | | | | | | | | | | | | |
Written Options
| | | | | | | | | | | | | | | | |
Written Options—Calls | | Expiration Date | | Number of
Contracts | | | Premiums
Received | | | Valuation as of
12/31/2007 | | | Unrealized
Appreciation |
U.S. Treasury Notes 5 Year Futures 112 | | 2/22/2008 | | (156 | ) | | $ | (89,121 | ) | | $ | (68,250 | ) | | $ | 20,871 |
| | | | | | | | | | | | | | | | |
*See accompanying notes to financial statements.
MSF-11
Metropolitan Series Fund, Inc.
BlackRock Bond Income Portfolio
Schedule of Investments as of December 31, 2007
TBA Sale Commitments
| | | | | | | |
Federal Agencies | | Face
Amount | | | Value | |
Federal National Mortgage Association | | | | | | | |
5.000% (15 Year TBA) | | (20,700,000 | ) | | $ | (20,719,417 | ) |
5.000% (30 Year TBA) | | (109,700,000 | ) | | | (107,026,063 | ) |
5.000% (30 Year TBA) | | (26,800,000 | ) | | | (26,130,000 | ) |
5.500% (15 Year TBA) | | (35,100,000 | ) | | | (35,549,701 | ) |
5.500% (30 Year TBA) | | (97,200,000 | ) | | | (97,078,500 | ) |
5.500% (30 Year TBA) | | (64,600,000 | ) | | | (64,478,875 | ) |
| Government National Mortgage Association | | | | | | | |
5.500% (30 Year TBA) | | (300,000 | ) | | | (302,156 | ) |
| | | | | | | |
Total TBA Sale Commitments (Proceeds Cost $(351,181,320)) | | | | | $ | (351,284,712 | ) |
| | | | | | | |
*See accompanying notes to financial statements.
MSF-12
Metropolitan Series Fund, Inc.
BlackRock Bond Income Portfolio
Statement of Assets & Liabilities
December 31, 2007
| | | | | | | |
Assets | | | | | | | |
Investments at value (a) (d) | | | | | $ | 1,974,117,022 | |
Cash | | | | | | 63,483 | |
Foreign cash at value (b) | | | | | | 102,697 | |
Receivable for: | | | | | | | |
Securities sold | | | | | | 657,451,522 | |
Fund shares sold | | | | | | 539,365 | |
Open forward currency contracts | | | | | | 1,152,665 | |
Accrued interest and dividends | | | | | | 12,222,910 | |
Foreign taxes | | | | | | 52,340 | |
Futures variation margin | | | | | | 126,995 | |
| | | | | | | |
Total Assets | | | | | | 2,645,828,999 | |
Liabilities | | | | | | | |
TBA sales commitments at value (c) | | $ | 351,284,712 | | | | |
Payable for: | | | | | | | |
Securities purchased | | | 655,804,584 | | | | |
Open forward currency contracts | | | 402,284 | | | | |
Fund shares redeemed | | | 2,238,799 | | | | |
Collateral for securities loaned | | | 28,919,481 | | | | |
Options written, at fair value (e) | | | 68,250 | | | | |
Interest (Short) | | | 909,604 | | | | |
Accrued expenses: | | | | | | | |
Management fees | | | 505,123 | | | | |
Service and distribution fees | | | 105,605 | | | | |
Deferred directors’ fees | | | 46,245 | | | | |
Other expenses | | | 81,650 | | | | |
| | | | | | | |
Total Liabilities | | | | | | 1,040,366,337 | |
| | | | | | | |
Net Assets | | | | | $ | 1,605,462,662 | |
| | | | | | | |
Net assets consists of: | | | | | | | |
Capital paid in | | | | | $ | 1,552,161,087 | |
Undistributed net investment income | | | | | | 77,250,999 | |
Accumulated net realized losses | | | | | | (43,781,040 | ) |
Unrealized appreciation on investments, foreign currency, futures contracts and options | | | | | | 19,831,616 | |
| | | | | | | |
Net Assets | | | | | $ | 1,605,462,662 | |
| | | | | | | |
| Computation of offering price: | | | | | | | |
Class A | | | | | | | |
Net asset value and redemption price per share ($983,685,741 divided by 8,805,617 shares outstanding) | | | | | $ | 111.71 | |
| | | | | | | |
Class B | | | | | | | |
Net asset value and redemption price per share ($315,737,220 divided by 2,860,145 shares outstanding) | | | | | $ | 110.39 | |
| | | | | | | |
Class E | | | | | | | |
Net asset value and redemption price per share ($306,039,701 divided by 2,757,867 shares outstanding) | | | | | $ | 110.97 | |
| | | | | | | |
(a) Identified cost of investments | | | | | $ | 1,955,481,264 | |
| | | | | | | |
(b) Identified cost of foreign cash | | | | | $ | 100,690 | |
| | | | | | | |
(c) Proceeds from TBA sales commitments | | | | | $ | (351,181,320 | ) |
| | | | | | | |
(e) Premiums received on written options | | | | | $ | (89,121 | ) |
| | | | | | | |
| (d) | Includes cash collateral for securities loaned of $28,919,481. |
Statement of Operations
For the Year Ended December 31, 2007
| | | | | | | | |
Investment Income | | | | | | | | |
Interest | | | | | | $ | 84,620,502 | (a) |
| | | | | | | | |
Expenses | | | | | | | | |
Management fees | | $ | 6,014,290 | | | | | |
Service and distribution fees—Class B | | | 744,925 | | | | | |
Service and distribution fees—Class E | | | 458,682 | | | | | |
Directors’ fees and expenses | | | 26,407 | | | | | |
Custodian | | | 233,020 | | | | | |
Audit and tax services | | | 36,239 | | | | | |
Legal | | | 2,298 | | | | | |
Printing | | | 470,620 | | | | | |
Insurance | | | 18,039 | | | | | |
Miscellaneous | | | 42,304 | | | | | |
| | | | | | | | |
Total expenses | | | 8,046,824 | | | | | |
Management fee waivers | | | (143,878 | ) | | | 7,902,946 | |
| | | | | | | | |
Net Investment Income | | | | | | | 76,717,556 | |
| | | | | | | | |
Realized and Unrealized Gain (Loss) | | | | | | | | |
| Realized loss on: | | | | | | | | |
Investments—net | | | (5,527,394 | ) | | | | |
Futures contracts—net | | | (5,101,282 | ) | | | | |
Foreign currency transactions—net | | | (1,021,383 | ) | | | | |
Options—net | | | (192,572 | ) | | | (11,842,631 | ) |
| | | | | | | | |
| Change in unrealized appreciation on: | | | | | | | | |
Investments—net | | | 25,636,071 | | | | | |
Futures contracts—net | | | 3,171,772 | | | | | |
Foreign currency transactions—net | | | 1,588,254 | | | | | |
Options—net | | | 20,871 | | | | 30,416,968 | |
| | | | | | | | |
Net gain | | | | | | | 18,574,337 | |
| | | | | | | | |
Net Increase in Net Assets From Operations | | | | | | $ | 95,291,893 | |
| | | | | | | | |
| (a) | Includes net income on securities loaned of $63,089. |
See accompanying notes to financial statements.
MSF-13
Metropolitan Series Fund, Inc.
BlackRock Bond Income Portfolio
Statements of Changes in Net Assets
| | | | | | | | |
| | | Year ended
December 31,
2007 | | | Year ended
December 31,
2006 | |
From Operations | | | | | | | | |
Net investment income | | $ | 76,717,556 | | | $ | 58,657,875 | |
Net realized loss | | | (11,842,631 | ) | | | (1,303,278 | ) |
Unrealized appreciation | | | 30,416,968 | | | | 2,988,782 | |
| | | | | | | | |
Increase in net assets from operations | | | 95,291,893 | | | | 60,343,379 | |
| | | | | | | | |
From Distributions to Shareholders | | | | | | | | |
Net investment income | | | | | | | | |
Class A | | | (31,735,232 | ) | | | (42,386,161 | ) |
Class B | | | (8,796,845 | ) | | | (14,020,445 | ) |
Class E | | | (9,494,875 | ) | | | (3,473,175 | ) |
| | | | | | | | |
| | | (50,026,952 | ) | | | (59,879,781 | ) |
| | | | | | | | |
Net realized gain | | | | | | | | |
Class A | | | 0 | | | | (725,124 | ) |
Class B | | | 0 | | | | (254,703 | ) |
Class E | | | 0 | | | | (61,563 | ) |
| | | | | | | | |
| | | 0 | | | | (1,041,390 | ) |
| | | | | | | | |
Total distributions | | | (50,026,952 | ) | | | (60,921,171 | ) |
| | | | | | | | |
Increase (decrease) in net assets from capital share transactions | | | (3,850,293 | ) | | | 501,967,625 | |
| | | | | | | | |
Total increase in net assets | | | 41,414,648 | | | | 501,389,833 | |
| | |
Net Assets | | | | | | | | |
Beginning of the period | | | 1,564,048,014 | | | | 1,062,658,181 | |
| | | | | | | | |
End of the period | | $ | 1,605,462,662 | | | $ | 1,564,048,014 | |
| | | | | | | | |
Undistributed Net Investment Income | | | | | | | | |
End of the period | | $ | 77,250,999 | | | $ | 49,523,443 | |
| | | | | | | | |
Other Information:
Capital Shares
Transactions in capital shares were as follows:
| | | | | | | | | | | | | | |
| | | Year ended
December 31, 2007 | | | Year ended
December 31, 2006 | |
| | | Shares | | | $ | | | Shares | | | $ | |
Class A | | | | | | | | | | | | | | |
Sales | | 1,687,659 | | | $ | 182,728,894 | | | 1,309,616 | | | $ | 149,052,217 | |
Shares issued through acquisition | | 0 | | | | 0 | | | 2,439,488 | | | | 252,316,286 | |
Reinvestments | | 296,508 | | | | 31,735,232 | | | 417,583 | | | | 43,111,285 | |
Redemptions | | (2,042,297 | ) | | | (221,110,438 | ) | | (2,210,795 | ) | | | (235,921,903 | ) |
| | | | | | | | | | | | | | |
Net increase (decrease) | | (58,130 | ) | | $ | (6,646,312 | ) | | 1,955,892 | | | $ | 208,557,885 | |
| | | | | | | | | | | | | | |
Class B | | | | | | | | | | | | | | |
Sales | | 741,024 | | | $ | 79,187,847 | | | 961,570 | | | $ | 101,978,890 | |
Reinvestments | | 83,028 | | | | 8,796,845 | | | 139,651 | | | | 14,275,148 | |
Redemptions | | (687,193 | ) | | | (73,627,604 | ) | | (530,496 | ) | | | (56,296,346 | ) |
| | | | | | | | | | | | | | |
Net increase | | 136,859 | | | $ | 14,357,088 | | | 570,725 | | | $ | 59,957,692 | |
| | | | | | | | | | | | | | |
Class E | | | | | | | | | | | | | | |
Sales | | 409,838 | | | $ | 44,043,744 | | | 190,228 | | | $ | 20,158,770 | |
Shares issued through acquisition | | 0 | | | | 0 | | | 2,526,230 | | | �� | 259,797,530 | |
Reinvestments | | 89,212 | | | | 9,494,875 | | | 34,435 | | | | 3,534,738 | |
Redemptions | | (604,310 | ) | | | (65,099,688 | ) | | (474,636 | ) | | | (50,038,990 | ) |
| | | | | | | | | | | | | | |
Net increase (decrease) | | (105,260 | ) | | $ | (11,561,069 | ) | | 2,276,257 | | | $ | 233,452,048 | |
| | | | | | | | | | | | | | |
Increase (decrease) derived from capital share transactions | | | | | $ | (3,850,293 | ) | | | | | $ | 501,967,625 | |
| | | | | | | | | | | | | | |
See accompanying notes to financial statements.
MSF-14
Metropolitan Series Fund, Inc.
BlackRock Bond Income Portfolio
Financial Highlights
| | | | | | | | | | | | | | | | | | | | |
| | | Class A | |
| | | Year ended December 31, | |
| | | 2007 | | | 2006 | | | 2005 | | | 2004 | | | 2003 | |
Net Asset Value, Beginning of Period | | $ | 108.62 | | | $ | 110.48 | | | $ | 113.72 | | | $ | 115.62 | | | $ | 112.74 | |
| | | | | | | | | | | | | | | | | | | | |
Income From Investment Operations | | | | | | | | | | | | | | | | | | | | |
Net investment income | | | 5.36 | (a) | | | 4.55 | | | | 4.69 | | | | 4.44 | | | | 4.55 | |
Net realized and unrealized gain (loss) of investments | | | 1.31 | | | | 0.01 | | | | (2.06 | ) | | | 0.41 | | | | 1.93 | |
| | | | | | | | | | | | | | | | | | | | |
Total from investment operations | | | 6.67 | | | | 4.56 | | | | 2.63 | | | | 4.85 | | | | 6.48 | |
| | | | | | | | | | | | | | | | | | | | |
Less Distributions | | | | | | | | | | | | | | | | | | | | |
Distributions from net investment income | | | (3.58 | ) | | | (6.31 | ) | | | (4.55 | ) | | | (4.76 | ) | | | (3.60 | ) |
Distributions from net realized capital gains | | | 0.00 | | | | (0.11 | ) | | | (1.32 | ) | | | (1.99 | ) | | | 0.00 | |
| | | | | | | | | | | | | | | | | | | | |
Total distributions | | | (3.58 | ) | | | (6.42 | ) | | | (5.87 | ) | | | (6.75 | ) | | | (3.60 | ) |
| | | | | | | | | | | | | | | | | | | | |
Net Asset Value, End of Period | | $ | 111.71 | | | $ | 108.62 | | | $ | 110.48 | | | $ | 113.72 | | | $ | 115.62 | |
| | | | | | | | | | | | | | | | | | | | |
Total Return (%) | | | 6.3 | | | | 4.4 | | | | 2.4 | | | | 4.4 | | | | 5.9 | |
Ratio of operating expenses to average net assets (%) | | | 0.43 | | | | 0.46 | | | | 0.47 | | | | 0.46 | | | | 0.47 | |
Ratio of operating expenses to average net assets without giving effect to the contractual expense agreement would have been (%) (b) | | | 0.43 | | | | N/A | | | | N/A | | | | N/A | | | | N/A | |
Ratio of net investment income to average net assets (%) | | | 4.95 | | | | 4.28 | | | | 3.96 | | | | 3.57 | | | | 3.69 | |
Portfolio turnover rate (%) | | | 931 | | | | 503 | | | | 890 | | | | 458 | | | | 428 | |
Net assets, end of period (000) | | $ | 983,686 | | | $ | 962,770 | | | $ | 763,205 | | | $ | 814,560 | | | $ | 881,513 | |
| | | | | | | | | | | | | | | | | | | | |
| | | Class B | |
| | | Year ended December 31, | |
| | | 2007 | | | 2006 | | | 2005 | | | 2004 | | | 2003 | |
Net Asset Value, Beginning of Period | | $ | 107.36 | | | $ | 109.20 | | | $ | 112.47 | | | $ | 114.51 | | | $ | 111.84 | |
| | | | | | | | | | | | | | | | | | | | |
Income From Investment Operations | | | | | | | | | | | | | | | | | | | | |
Net investment income | | | 5.03 | (a) | | | 4.54 | | | | 4.06 | | | | 3.78 | | | | 3.57 | |
Net realized and unrealized gain (loss) of investments | | | 1.30 | | | | (0.32 | ) | | | (1.72 | ) | | | 0.73 | | | | 2.58 | |
| | | | | | | | | | | | | | | | | | | | |
Total from investment operations | | | 6.33 | | | | 4.22 | | | | 2.34 | | | | 4.51 | | | | 6.15 | |
| | | | | | | | | | | | | | | | | | | | |
Less Distributions | | | | | | | | | | | | | | | | | | | | |
Distributions from net investment income | | | (3.30 | ) | | | (5.95 | ) | | | (4.29 | ) | | | (4.56 | ) | | | (3.48 | ) |
Distributions from net realized capital gains | | | 0.00 | | | | (0.11 | ) | | | (1.32 | ) | | | (1.99 | ) | | | 0.00 | |
| | | | | | | | | | | | | | | | | | | | |
Total distributions | | | (3.30 | ) | | | (6.06 | ) | | | (5.61 | ) | | | (6.55 | ) | | | (3.48 | ) |
| | | | | | | | | | | | | | | | | | | | |
Net Asset Value, End of Period | | $ | 110.39 | | | $ | 107.36 | | | $ | 109.20 | | | $ | 112.47 | | | $ | 114.51 | |
| | | | | | | | | | | | | | | | | | | | |
Total Return (%) | | | 6.0 | | | | 4.1 | | | | 2.2 | | | | 4.2 | | | | 5.6 | |
Ratio of operating expenses to average net assets (%) | | | 0.68 | | | | 0.71 | | | | 0.72 | | | | 0.71 | | | | 0.72 | |
Ratio of operating expenses to average net assets without giving effect to the contractual expense agreement would have been (%) (b) | | | 0.68 | | | | N/A | | | | N/A | | | | N/A | | | | N/A | |
Ratio of net investment income to average net assets (%) | | | 4.70 | | | | 4.04 | | | | 3.73 | | | | 3.35 | | | | 3.40 | |
Portfolio turnover rate (%) | | | 931 | | | | 503 | | | | 890 | | | | 458 | | | | 428 | |
Net assets, end of period (000) | | $ | 315,737 | | | $ | 292,377 | | | $ | 235,057 | | | $ | 143,107 | | | $ | 91,135 | |
| (a) | Per share amount is based on average shares outstanding during the period. |
| (b) | See Note 4 in the Notes to Financial Statements. |
See accompanying notes to financial statements.
MSF-15
Metropolitan Series Fund, Inc.
BlackRock Bond Income Portfolio
Financial Highlights
| | | | | | | | | | | | | | | | | | | | |
| | | Class E | |
| | | Year ended December 31, | |
| | | 2007 | | | 2006 | | | 2005 | | | 2004 | | | 2003 | |
Net Asset Value, Beginning of Period | | $ | 107.89 | | | $ | 109.73 | | | $ | 112.97 | | | $ | 114.98 | | | $ | 112.26 | |
| | | | | | | | | | | | | | | | | | | | |
Income From Investment Operations | | | | | | | | | | | | | | | | | | | | |
Net investment income | | | 5.16 | (a) | | | 7.07 | | | | 4.34 | | | | 3.52 | | | | 3.19 | |
Net realized and unrealized gain (loss) of investments | | | 1.31 | | | | (2.71 | ) | | | (1.89 | ) | | | 1.12 | | | | 3.09 | |
| | | | | | | | | | | | | | | | | | | | |
Total from investment operations | | | 6.47 | | | | 4.36 | | | | 2.45 | | | | 4.64 | | | | 6.28 | |
| | | | | | | | | | | | | | | | | | | | |
Less Distributions | | | | | | | | | | | | | | | | | | | | |
Distributions from net investment income | | | (3.39 | ) | | | (6.09 | ) | | | (4.37 | ) | | | (4.66 | ) | | | (3.56 | ) |
Distributions from net realized capital gains | | | 0.00 | | | | (0.11 | ) | | | (1.32 | ) | | | (1.99 | ) | | | 0.00 | |
| | | | | | | | | | | | | | | | | | | | |
Total distributions | | | (3.39 | ) | | | (6.20 | ) | | | (5.69 | ) | | | (6.65 | ) | | | (3.56 | ) |
| | | | | | | | | | | | | | | | | | | | |
Net Asset Value, End of Period | | $ | 110.97 | | | $ | 107.89 | | | $ | 109.73 | | | $ | 112.97 | | | $ | 114.98 | |
| | | | | | | | | | | | | | | | | | | | |
Total Return (%) | | | 6.1 | | | | 4.3 | | | | 2.3 | | | | 4.3 | | | | 5.7 | |
Ratio of operating expenses to average net assets (%) | | | 0.58 | | | | 0.61 | | | | 0.62 | | | | 0.61 | | | | 0.62 | |
Ratio of operating expenses to average net assets without giving effect to the contractual expense agreement would have been (%) (b) | | | 0.58 | | | | N/A | | | | N/A | | | | N/A | | | | N/A | |
Ratio of net investment income to average net assets (%) | | | 4.79 | | | | 4.16 | | | | 3.81 | | | | 3.44 | | | | 3.48 | |
Portfolio turnover rate (%) | | | 931 | | | | 503 | | | | 890 | | | | 458 | | | | 428 | |
Net assets, end of period (000) | | $ | 306,040 | | | $ | 308,901 | | | $ | 64,396 | | | $ | 65,275 | | | $ | 45,534 | |
| (a) | Per share amount is based on average shares outstanding during the period. |
| (b) | See Note 4 in the Notes to Financial Statements. |
See accompanying notes to financial statements.
MSF-16
Metropolitan Series Fund, Inc.
BlackRock Bond Income Portfolio
Notes to Financial Statements—December 31, 2007
Metropolitan Series Fund, Inc. (the “Fund”) is organized as a corporation under the laws of Maryland pursuant to Articles of Incorporation filed on November 23, 1982, as amended, and registered under the Investment Company Act of 1940, as amended (the “1940 Act”), as an open-end investment company. The Fund is a “series” type of mutual fund, which issues separate series of stock. Each series represents an interest in a separate portfolio of Fund investments. The BlackRock Bond Income Portfolio (the “Portfolio”) is a diversified series of the Fund. Shares in the Fund are not offered directly to the general public and are currently available only to separate accounts established by Metropolitan Life Insurance Company (“MetLife”), New England Life Insurance Company, General American Life Insurance Company (“General American”), The MetLife Investors Group of Insurance Companies, MetLife Insurance Company of Connecticut and other affiliated insurance companies (collectively, the “Insurance Companies”), as an investment vehicle for variable life insurance, group annuity or variable annuity products, although the Portfolio is not available to all such separate accounts. The Portfolio’s shares may be divided into different classes. Currently, the classes being offered by the Portfolio are named Class A, Class B and Class E. The classes of the Portfolio’s shares are identical, except that certain additional charges (Rule 12b-1 fees) are made against Class B and Class E shares. Investment income, realized and unrealized capital gains and losses, the common expenses of the Portfolio and certain Portfolio-level expense reductions, if any, are allocated on a pro rata basis to each class based on the relative net assets of each class to the total net assets of the Portfolio.
| 2. | SIGNIFICANT ACCOUNTING POLICIES: |
The preparation of financial statements in conformity with accounting principles generally accepted in the United States of America (“GAAP”) requires management to make estimates and assumptions that affect the reported amounts of assets and liabilities and disclosure of contingent assets and liabilities as of the date of the financial statements and the reported amounts of income and expenses during the reporting period. Actual results could differ from those estimates.
The following is a summary of significant accounting policies consistently followed by the Portfolio in the preparation of its financial statements. The policies are in conformity with GAAP.
Investment Valuation:
Debt securities (other than short term obligations with a remaining maturity of sixty days or less) are valued by independent pricing services selected by the relevant subadviser pursuant to authorization of the Board of Directors of the Fund (the “Board” or “Directors”). Short term obligations with a remaining maturity of sixty days or less are valued at amortized cost, which approximates fair market value.
Equity securities traded on a national securities exchange or exchanges are valued at their last sale price on the principal trading market. Equity securities traded on the NASDAQ National Market System are valued at the NASDAQ Official Closing Price (the “NOCP”). The NOCP is the last sale price if it falls between the spread of the last reported bid and asked prices. If the last reported bid and asked prices are above the last reported sale price, the NOCP will be the last reported bid price. If the last reported bid and asked prices are below the last reported sale price, the NOCP will be the last reported asked price. Equity securities traded on a national securities exchange or exchanges or on the NASDAQ National Market System for which there is no reported sale during the day are valued at the last reported bid price. A security that is listed or traded on more than one exchange is valued at the quotation on the exchange determined to be the primary market for that security by the Board or its delegates. If no closing price is available, then such securities are valued by using the last reported bid price. Equity securities traded over-the-counter are valued at the last reported sales price.
If no current market value quotation is readily available or reliable for a portfolio security, fair value will be determined in accordance with procedures established by and under the general supervision of the Board. When the Portfolio uses fair value pricing, it may take into account any factors it deems appropriate. The value of securities used by the Portfolio to calculate its net asset value may differ from quoted or published prices for the same securities. Fair value pricing involves subjective judgments and the fair value determined for a security may be materially different than the value that could be realized upon the sale of that security.
The Portfolio expects to use fair value pricing for securities primarily traded on U.S. exchanges only under very limited circumstances. For example, the Portfolio may use fair value pricing if the exchange on which a security is traded closes early or trading in the security is suspended.
MSF-17
Metropolitan Series Fund, Inc.
BlackRock Bond Income Portfolio
Notes to Financial Statements—December 31, 2007—(Continued)
Securities traded primarily on an exchange outside of the United States, which closes before the close of the New York Stock Exchange, will be valued at the last sales price on that non-U.S. exchange. Securities traded primarily on an exchange outside of the United States for which there is no reported sale during the day are valued at the mean between the last reported bid and asked prices. However, because most foreign markets close well before the Portfolio values its securities (typically at 4 p.m. Eastern Time), the earlier close of these foreign markets gives rise to the possibility that significant events, including broad market moves, may have occurred after these foreign markets close but before the Portfolio values its securities. To account for this, the Portfolio may frequently value many of its foreign equity securities using fair value prices based on third party vendor modeling tools.
Forward foreign currency exchange contracts are valued based on the mean between closing bid and asked prices of the forward currency contract rates in the London foreign exchange markets on a daily basis as provided by a reliable bank or dealer.
Options, whether on securities, indices, futures contracts, or otherwise, are valued at the last sales price available as of the close of business on the day of valuation or, if there is no such sale price available, at the mean between the bid and asked prices. Options on currencies are valued at the spot price each day.
The value of futures contracts will be the sum of the margin deposit plus or minus the difference between the value of the futures contract on each day the net asset value is calculated and the value on the date the futures contract originated, value being that established on a recognized commodity exchange, or by reference to other customary sources, with gain or loss being realized when the futures contract closes or expires.
Subject to the Board’s oversight, the Board has delegated day-to-day responsibility for valuing Portfolio assets to the subadviser of the Portfolio, who values such assets as described above and operates under procedures approved by the Board.
Investment Transactions and Related Investment Income:
Portfolio security transactions are recorded on the trade date. Dividend income is recorded on the ex-dividend date or, for certain foreign securities, when notified. Interest income, which includes amortization of premium and accretion of discount on debt securities, is recorded on the accrual basis. Realized gains and losses on investments and unrealized appreciation and depreciation are determined on the identified cost basis, which is the same basis used for federal income tax purposes.
Repurchase Agreements:
The Portfolio, through the custodian or a subcustodian, receives delivery of the underlying securities collateralizing repurchase agreements. The Portfolio requires the custodian to take possession, to have legally segregated in the Federal Reserve Book Entry System, or to have segregated within the custodian’s vault, all securities held as collateral for repurchase agreements. It is the Portfolio’s policy that the market value of the collateral be at least equal to 100% of the repurchase price in the case of a repurchase agreement of one-day duration and 102% on all other repurchase agreements. The Portfolio’s subadviser is responsible for determining that the value of the collateral is at all times at least equal to the repurchase price. In connection with transactions in repurchase agreements, if the seller defaults and the value of the collateral declines or if the seller enters an insolvency proceeding, realization of the collateral by the Portfolio may be delayed, limited or wholly denied.
Foreign Currency Translation:
The books and records of the Portfolio are maintained in U.S. dollars. The values of securities, currencies and other assets and liabilities denominated in currencies other than U.S. dollars are translated into U.S. dollars based upon foreign exchange rates prevailing at the end of the period. Purchases and sales of investment securities, income and expenses are translated on the respective dates of such transactions. Since the values of investment securities are presented at the foreign exchange rates prevailing at the end of the period, it is not practical to isolate that portion of the results of operations arising from changes in exchange rates from that portion of the results of operations reflecting fluctuations arising from changes in market prices of the investment securities. Such fluctuations are included in the net realized and unrealized gain or loss on investments.
Net realized foreign exchange gains or losses arise from sales of foreign currency, currency gains or losses realized between the trade and settlement dates on securities transactions, and the difference between the amounts of dividends, interest, and foreign withholding taxes recorded by the Portfolio and the U.S. dollar equivalent of the amounts actually received or paid by the Portfolio. Net unrealized foreign exchange gains and losses arise from changes in the value of assets and liabilities, other than investment securities, resulting from changes in the exchange rate.
MSF-18
Metropolitan Series Fund, Inc.
BlackRock Bond Income Portfolio
Notes to Financial Statements—December 31, 2007—(Continued)
Forward Foreign Currency Exchange Contracts:
The Portfolio may enter into forward foreign currency exchange contracts primarily to hedge against foreign currency exchange rate risks on its non-U.S. dollar denominated investment securities. When entering into a forward currency contract, the Portfolio agrees to receive or deliver a fixed quantity of foreign currency for an agreed-upon price on an agreed future date. These contracts are valued daily and the Portfolio’s net equity therein, representing unrealized gain or loss on the contracts as measured by the difference between the foreign exchange rates at the dates of entry into the contracts and the forward rates at the settlement date, is included in the Statement of Assets and Liabilities. Realized and unrealized gains and losses are included in the Statement of Operations. These instruments involve market and/or credit risk in excess of the amount recognized in the Statement of Assets and Liabilities. Risks arise from the possible inability of counterparties to meet the terms of their contracts and from movement in currency and securities values and interest rates.
Futures Contracts:
The Portfolio may buy and sell futures contracts (on recognized exchanges) as a hedge or to enhance return. Futures contracts are agreements to buy or sell a security, or deliver a final cash settlement price in connection with an index, interest rate, currency, or other contracts not calling for physical delivery, for a set price in the future. The Portfolio must post an amount equal to a portion of the total market value of the futures contract as futures variation margin, which is returned when the Portfolio’s obligations under the contract have been satisfied. From time to time thereafter, the Portfolio may have to post variation margin to maintain this amount as the market value of the contract fluctuates. Risks of entering into futures contracts (and related options) include the possibility that there may be an illiquid market and that a change in the value of the contract or option may not correlate with changes in the value of the underlying securities.
Options:
The Portfolio may use options to hedge against changes in values of securities the Portfolio owns or expects to purchase. Writing puts or buying calls tends to increase the Portfolio’s exposure to the underlying instrument and writing calls or buying puts tends to decrease the Portfolio’s exposure to the underlying instrument, and can be used to hedge other Portfolio investments. For options purchased to hedge the Portfolio’s investments, the potential risk to the Portfolio is that the change in value of options contracts may not correspond to the change in value of the hedged instruments. In addition, losses may arise from changes in the value of the underlying instruments, if there is an illiquid secondary market, or if the counterparty is unable to perform. The maximum loss for purchased options is limited to the premium initially paid for the option. For options written by the Portfolio, the maximum loss is not limited to the premium initially received for the option.
The main risk associated with purchasing an option is that the option expires without being exercised. In this case, the option expires worthless and the premium paid for the option is considered the loss. The risk associated with writing a call option is that the Portfolio may forgo the opportunity for a profit if the market value of the underlying position increases and the option is exercised. The risk in writing a put option is that the Portfolio may incur a loss if the market value of the underlying position decreases and the option is exercised. In addition, the Portfolio risks not being able to enter into a closing transaction for the written option as the result of an illiquid market.
Mortgage Dollar Rolls:
The Portfolio may enter into mortgage “dollar rolls” in which a Portfolio sells mortgage-backed securities for delivery in the current month and simultaneously contracts to repurchase substantially similar (same type, coupon and maturity) securities on a specified future date. Dollar rolls are accounted for as purchase and sale transactions; gain/loss is recognized at the end of the term of the dollar roll. The average monthly balance of dollar rolls outstanding during the year ended December 31, 2007 was $955,430,951.
A Portfolio that enters into mortgage dollar rolls is subject to the risk that the market value of the securities the Portfolio is obligated to repurchase under the agreement may decline below the repurchase price. In the event the buyer of securities under a mortgage dollar roll files for bankruptcy or becomes insolvent, the Portfolio’s use of proceeds from the dollar roll may be restricted pending a court determination, a determination by the other party, or its trustee or receiver, whether to enforce the Portfolio’s obligation to repurchase the securities.
MSF-19
Metropolitan Series Fund, Inc.
BlackRock Bond Income Portfolio
Notes to Financial Statements—December 31, 2007—(Continued)
“When-Issued” Securities:
Purchasing securities “when-issued” is a forward commitment by the Portfolio to buy a security. The estimated amount of the Portfolio’s payment obligation and the security’s interest rate are determined when the commitment is made, even though no interest accrues until the security is issued, which is generally 15 to 120 days later. The Portfolio will segregate liquid assets with its custodian sufficient at all times to satisfy these commitments. If the value of the security is less when delivered than when the commitment was made, the Portfolio will suffer a loss.
Credit and Market Risk:
The Portfolio may invest in high yield instruments that are subject to certain credit and market risks. The yields of high yield instruments reflect, among other things, perceived credit risk. The Portfolio’s investments in securities rated below investment grade typically involve risks not associated with higher rated securities including, among others, greater risk related to timely and ultimate payment of interest and principal, greater market price volatility and less liquid secondary market trading.
Credit Risk:
The Portfolio invests a significant portion of its assets in securities of issuers that hold mortgage and asset backed securities and direct investments in securities backed by commercial and residential mortgage loans and other financial assets. The value and related income of these securities are sensitive to changes in economic conditions, including delinquencies and/or defaults. Continuing shifts in the market’s perception of credit quality on securities backed by commercial and residential mortgage loans and other financial assets may result in increased volatility of market price and periods of illiquidity that can negatively impact the valuation of certain issuers held by the Portfolio. At December 31, 2007, the Portfolio held securities of issuers that hold mortgage and asset backed securities and direct investments in mortgage and asset backed securities with an aggregate value of $449,982,474 (representing 28.0% of the Portfolio’s total assets).
Federal Income Taxes:
It is the Portfolio’s policy to comply with the requirements of the Internal Revenue Code of 1986, as amended, and regulations thereunder, applicable to regulated investment companies and to distribute all of its taxable income to shareholders. Therefore, no federal income tax provision is required.
As of December 31, 2007, the Portfolio had capital loss carryovers as follows:
| | | | | | | | | | | | | |
Expiring
12/31/15 | | Expiring
12/31/14 | | Expiring
12/31/13 | | Expiring
12/31/12 | | Expiring
12/31/11 | | Expiring
12/31/10 | | Total |
| $13,263,486 | | $11,623,394 | | $3,820,752 | | $3,630,067 | | $985,198 | | $6,029,135 | | $ | 39,352,032 |
The utilization of the capital loss carryforward acquired as part of a merger may be limited under section 382 of the Internal Revenue Code.
The tax character of distributions paid for the periods ended December 31, 2007 and 2006 was as follows:
| | | | | | | | | | | | | | | | | | | | | |
| Ordinary Income | | Long Term Gain | | Return of Capital | | Total |
| 2007 | | 2006 | | 2007 | | 2006 | | 2007 | | 2006 | | 2007 | | 2006 |
| $50,026,952 | | $ | 59,985,989 | | $ | — | | $ | 935,182 | | $ | — | | $ | — | | $ | 50,026,952 | | $ | 60,921,171 |
As of December 31, 2007, the components of distributable earnings (accumulated losses) on a federal income tax basis were as follows:
| | | | | | | | | | | | | |
Undistributed
Ordinary
Income | | Undistributed
Long Term
Gain | | Unrealized
Appreciation | | Loss
Carryforwards | | | Total |
| $78,042,170 | | $ | — | | $ | 14,652,227 | | $ | (39,352,032 | ) | | $ | 53,342,365 |
Dividends and Distributions to Shareholders:
The Portfolio records dividends and distributions on the ex-dividend date. Net realized gains from security transactions (if any) are generally distributed annually to shareholders. The timing and characterization of certain income and capital gains distributions are determined in accordance with federal tax regulations that may differ from GAAP. Permanent book and tax basis differences relating to shareholder distributions will result in reclassification between under/over distributed net investment income, accumulated net realized gains/losses and paid in capital.
MSF-20
Metropolitan Series Fund, Inc.
BlackRock Bond Income Portfolio
Notes to Financial Statements—December 31, 2007—(Continued)
| 3. | INVESTMENT TRANSACTIONS: |
For the year ended December 31, 2007, purchases and sales of securities (excluding short term investments) for the Portfolio were as follows:
| | | | | | | | | |
| Purchases | | Sales |
| U.S. Government | | Other | | U.S. Government | | Other |
| $14,513,194,068 | | $ | 604,084,740 | | $ | 14,545,265,425 | | $ | 33,770,823 |
Options Written:
The Portfolio transactions in options written during the year ended December 31, 2007 were as follows:
| | | | | |
Call Options | | Number of
contracts | | Premiums
received |
Options outstanding December 31, 2006 | | 0 | | $ | 0 |
Options written | | 156 | | | 89,121 |
Options closed | | 0 | | | 0 |
Options expired | | 0 | | | 0 |
| | | | | |
Options outstanding December 31, 2007 | | 156 | | $ | 89,121 |
| | | | | |
| 4. | INVESTMENT MANAGEMENT FEES AND OTHER TRANSACTIONS WITH AFFILIATES: |
Investment Management Agreement:
MetLife Advisers, LLC (“MetLife Advisers”) is the investment adviser to the Portfolio. The Fund has entered into an investment management agreement with MetLife Advisers with respect to the Portfolio. For providing investment management services to the Portfolio, MetLife Advisers receives monthly compensation at the following annual rates:
| | | | | | |
| | | Management
Fees earned by
MetLife Advisers
for the year ended
December, 2007 | | Annual
percentage
rates paid to
MetLife Advisers | | Based on Portfolios
average daily net asset levels |
| | $6,014,290 | | 0.400% | | Of the first $1 billion |
| | | | 0.350% | | Of the next $1 billion |
| | | | 0.300% | | Of the next $1 billion |
| | | | 0.250% | | On amounts in excess of $3 billion |
Certain officers and directors of the Fund may also be officers of MetLife Advisers; however, such officers and directors receive no compensation from the Fund.
MetLife Advisers has entered into an investment subadvisory agreement with respect to the Portfolio. BlackRock Advisors, LLC is compensated by MetLife Advisers to provide subadvisory services for the Portfolio.
Service and Distribution Fees:
The Fund has adopted a Distribution and Service Plan under Rule 12b-1 of the 1940 Act for the Portfolio’s Class B and E shares. Under the Distribution and Service Plan, the Class B and E shares of the Portfolio pay a fee to compensate the Insurance Companies (or their affiliates) and other broker-dealers and financial intermediaries involved in the offer and sale of Portfolio shares for promoting or selling and servicing, the Class B and E. The fees under the Distribution and Service Plan for each class of the Portfolio’s shares are calculated as a percentage of the Portfolio’s average daily net assets that are attributable to that Class. Currently, the fee is 0.25% per year for Class B shares and 0.15% per year for Class E shares. Amounts paid by the Portfolio for the year ended December 31, 2007 are shown as Service and Distribution fees in the Statement of Operations.
MSF-21
Metropolitan Series Fund, Inc.
BlackRock Bond Income Portfolio
Notes to Financial Statements—December 31, 2007—(Continued)
Management Fee Waivers:
Pursuant to an expense agreement, MetLife Advisers has agreed, for the period May 1, 2007 to April 30, 2008, to reduce its advisory fees set out above under “Investment Management Agreement” for each class of the Portfolio as follows:
| | | | | | | |
| | | Annual Percentage
Rate Reduction | | Average Daily Net Asset
Value Levels | | |
| | 0.025% | | Over $ | 1 billion and less than $2 billion | | |
Amounts waived for the year ended December 31, 2007 are shown as management fee waivers in the Statement of Operations.
The Fund has entered into a securities lending arrangement with the Fund’s custodian, State Street Bank and Trust Company (the “custodian”). Under the agreement, the custodian is authorized to loan securities on the Portfolios’ behalf. In exchange, the Portfolio receives either cash or securities as collateral against the loaned securities. The Portfolio receives collateral at least equal to 102% of the market value of the loaned securities (105% for foreign securities), at each loan’s inception. Collateral must be maintained at least at 100% of the market value of the loaned securities for the duration of the loan. The cash collateral is invested in the Navigator Securities Lending Prime Portfolio, an affiliate of the custodian, which invests in a variety of high quality U.S. dollar-denominated instruments. If the market value of the collateral at the close of trading on a business day is less than 100% of the market value of the loaned securities at the close of trading on that day, the borrower shall be required to deliver, by the close of business on the following business day, an additional amount of collateral, equal to at least 100% of the market value of all the loaned securities as of such preceding day. The Portfolio receives 80% of the annual net income from securities lending transactions, which is included in interest income of the Portfolio. The remaining 20% is paid to the custodian as compensation for its securities lending services. The Portfolio bears the risk of any deficiency in the amount of collateral available for return to a borrower due to a loss in an approved investment. Any outstanding loans by the Portfolio at December 31, 2007 are footnoted in the Schedule of Investments.
As previously reported, in May 2004, General American received a Wells Notice stating that the SEC staff was considering recommending that the SEC bring a civil action alleging violations of the U.S. securities laws against General American with respect to market timing and late trading in a limited number of privately-placed variable insurance contracts that were sold through General American. General American responded to the SEC staff and cooperated with the investigation. On August 9, 2007, the SEC announced that it had settled an enforcement action regarding late trading against General American with, among other things, General American agreeing to pay a civil penalty and to comply with certain undertakings. General American consented to the SEC’s order without admitting or denying the findings. MetLife Advisers has also advised the Fund’s Board of Directors that, while certain exceptions to the Fund’s policies have been noted, no situations have been identified that would have a material impact on the financial position of the Fund.
| 7. | RECENT ACCOUNTING PRONOUNCEMENTS: |
Effective June 29, 2007, the Fund implemented Financial Accounting Standards Board (“FASB”) Interpretation No. 48, “Accounting for Uncertainty in Income Taxes—an interpretation of FASB Statement No. 109” (“FIN 48”). FIN 48 prescribes the minimum recognition threshold a tax position must meet in connection with accounting for uncertainties in income tax positions taken or expected to be taken by an entity, including investment companies, before being measured and recognized in the financial statements. Management has evaluated the application of FIN 48 to the Fund, and has determined that the adoption of FIN 48 does not have a material impact on the Fund’s financial statements. The Fund files U.S. tax returns. No income tax returns are currently under examination. The statute of limitations on the Fund’s tax returns remains open for the years ended December 31, 2004 through December 31, 2006.
In September 2006, Statement of Financial Accounting Standards No. 157, Fair Value Measurements (SFAS 157) was issued and is effective for fiscal years beginning after November 15, 2007. SFAS 157 defines fair value, establishes a framework for measuring fair value and expands disclosures about fair value measurements. Management is currently evaluating the impact the adoption of SFAS 157 will have on the Portfolio’s financial statement disclosures.
MSF-22
Metropolitan Series Fund, Inc.
BlackRock Bond Income Portfolio
Report of Independent Registered Public Accounting Firm
To the Shareholders and Board of Directors of the Metropolitan Series Fund, Inc.:
We have audited the accompanying statement of assets and liabilities, including the schedule of investments, of the BlackRock Bond Income Portfolio, one of the portfolios constituting the Metropolitan Series Fund, Inc. (the “Fund”) as of December 31, 2007, and the related statement of operations for the year then ended, the statements of changes in net assets for each of the two years in the period then ended, and the financial highlights for each of the five years in the period then ended. These financial statements and financial highlights are the responsibility of the Fund’s management. Our responsibility is to express an opinion on these financial statements and financial highlights based on our audits.
We conducted our audits in accordance with the standards of the Public Company Accounting Oversight Board (United States). Those standards require that we plan and perform the audit to obtain reasonable assurance about whether the financial statements and financial highlights are free of material misstatement. The Fund is not required to have, nor were we engaged to perform, an audit of its internal control over financial reporting. Our audits included consideration of internal control over financial reporting as a basis for designing audit procedures that are appropriate in the circumstances, but not for the purpose of expressing an opinion on the effectiveness of the Fund’s internal control over financial reporting. Accordingly, we express no such opinion. An audit also includes examining, on a test basis, evidence supporting the amounts and disclosures in the financial statements, assessing the accounting principles used and significant estimates made by management, as well as evaluating the overall financial statement presentation. Our procedures included confirmation of securities owned as of December 31, 2007, by correspondence with the custodian and brokers; where replies were not received from brokers, we performed other auditing procedures. We believe that our audits provide a reasonable basis for our opinion.
In our opinion, the financial statements and financial highlights referred to above present fairly, in all material respects, the financial position of the BlackRock Bond Income Portfolio of the Metropolitan Series Fund, Inc. as of December 31, 2007, the results of its operations for the year then ended, the changes in its net assets for each of the two years in the period then ended, and the financial highlights for each of the five years in the period then ended, in conformity with accounting principles generally accepted in the United States of America.
Deloitte & Touche LLP
Boston, Massachusetts
February 28, 2008
MSF-23
Metropolitan Series Fund, Inc.
Directors and Officers
The Fund’s Directors review actions of the Fund’s investment adviser and subadvisers, and decide upon matters of general policy. The Fund’s officers supervise the daily business operations of the Fund. The Board of Directors and the Fund’s officers are listed below. Each Director is responsible for overseeing all 36 Portfolios of the Fund. There is no limit to the term a Director may serve. Directors serve until their resignation, retirement or removal in accordance with the Fund’s organizational documents and policies adopted by the Board from time to time. Officers hold office at the pleasure of the Board or until the election or appointment and the qualification of a successor. The address of the directors and officers is c/o Metropolitan Series Fund, Inc., 501 Boylston Street, Boston, MA 02116.
Interested Directors(1)
Each Director below is an “interested person” (as defined by the 1940 Act) with respect to the Fund in that Ms. Forget is an employee of MetLife and Mr. Typermass is a former employee of MetLife and owns securities issued by MetLife, Inc., the ultimate parent company of MetLife Advisers.
| | | | | | | | |
Name, Address and Age | | Current
position(s)
with Fund | | Position(s)
held since | | Principal occupations
over past five years, including other directorships(2) | | Number of
Portfolios in
Fund Complex
Overseen by
Director(3) |
Elizabeth M. Forget Age: 41 | | Director, Chairman of the Board, President and Chief Executive Officer | | 2006 | | Senior Vice President (since 2007), MetLife, Inc.; President, Met Investors Advisory, LLC (“MIA”); Trustee and President, Met Investors Series Trust (“MIST”); Executive Vice President, MetLife Investors Group, Inc.; President (since 2006), MetLife Advisers. | | 81 |
| | | | |
Arthur G. Typermass Age: 70 | | Director | | 1998 | | Formerly, Senior Vice President and Treasurer, MetLife. | | 37 |
Non-Interested Directors(1)
Each Director below is not an “interested person” (as defined by the 1940 Act) with respect to the Fund (collectively, the “Independent Directors”).
| | | | | | | | |
Name, Address and Age | | Current
position(s)
with Fund | | Position(s)
held since | | Principal occupations
over past five years, including other directorships(2) | | Number of
Portfolios in
Fund Complex
Overseen by
Director(3) |
Steve A. Garban† Age: 70 | | Director | | 1985 | | Formerly, Chief Financial Officer, Senior Vice President Finance and Operations and Treasurer (Emeritus), The Pennsylvania State University. | | 37 |
| | | | |
Linda B. Strumpf Age: 60 | | Director | | 2000 | | Vice President and Chief Investment Officer, Ford Foundation. | | 37 |
| | | | |
Michael S. Scott Morton† Age: 70 | | Director | | 1993 | | Jay W. Forrester Professor of Management (Emeritus) at Sloan School of Management, MIT. | | 37 |
| | | | |
H. Jesse Arnelle Age: 74 | | Director | | 2001 | | Formerly, Counsel, Womble Carlyle Sandrie & Rice; Director, Textron Inc. (global multi-industry company)*; formerly, Director, Gannet Co. Inc. (diversified news and information company)*; formerly, Director, Eastman Chemical Company (global chemical company)*; formerly, Director, Waste Management, Inc.*; formerly, Director, Armstrong Holdings Inc. (parent company of floor and ceiling products business)*; formerly, Director, FPL Group Inc. (public utility holding company)*; Director, URS Corporation (engineering design services firm)*. | | 37 |
| | | | |
Nancy Hawthorne Age: 56 | | Director | | 2003 | | Director, Avid Technologies (computer software company)*; formerly, Chairman of the Board of Avid Technologies; formerly, Board of Advisors, L. Knife & Sons, Inc. (beverage distributor); Chief Executive Officer, Clerestory LLC (corporate financial advisor); formerly, Trustee, New England Zenith Fund (“Zenith Fund”)**; formerly, Chief Executive Officer and Managing Partner, Hawthorne, Krauss and Associates (corporate financial advisor); formerly, Chief Financial Officer and Executive Vice President, Continental Cablevision, subsequently renamed MediaOne (cable television company); formerly, Director, Life F/X, Inc.; formerly, Chairman of the Board, WorldClinic (distance medicine company); formerly, Director, Perini Corporation (construction company)*; formerly, Director, CGU (property and casualty insurance company); formerly, Director, Beacon Power Corporation (energy company )*. | | 37 |
MSF-24
Metropolitan Series Fund, Inc.
Directors and Officers—(Continued)
| | | | | | | | |
Name, Address and Age | | Current
position(s)
with Fund | | Position(s)
held since | | Principal occupations
over past five years, including other directorships(2) | | Number of
Portfolios in
Fund Complex
Overseen by
Director(3) |
John T. Ludes Age: 71 | | Director | | 2003 | | President, LFP Properties (consulting firm); Formerly, Trustee, Zenith Fund**; formerly, Vice Chairman, President and Chief Operating Officer, Fortune Brands/American Brands (global conglomerate); formerly, President and CEO, Acushnet Company (athletic equipment company). | | 37 |
Officers(1)
| | | | | | | | |
Name and address | | Age | | Current
position(s)
with Fund | | Position(s)
held since | | Principal occupations over past five years(2) |
| Jeffrey P. Halperin | | 40 | | Chief Compliance Officer | | 2006 | | Vice President (since 2006), Corporate Ethics and Compliance Department, MetLife, Inc.; Chief Compliance Officer (since 2006), MetLife Advisers, MIA and MIST. |
| | | | |
| John F. Guthrie, Jr. | | 64 | | Senior Vice President | | 2002 | | Manager and Senior Vice President, MetLife Advisers; Vice President, MetLife; Vice President (since 2003), MetLife Group, Inc.; Vice President, NELICO; Vice President (since 2005), MIA; formerly, Senior Vice President, Zenith Fund**. |
| | | | |
| Alan C. Leland | | 55 | | Senior Vice President | | 2005 | | Treasurer and Chief Financial Officer, MetLife Advisers, LLC; Treasurer (since 2005), Met Investors Advisory, LLC; Vice President (since 2004), MIA; Vice President (since 2003), MetLife Group, Inc.; Vice President, MetLife; Senior Vice President, NELICO |
| | | | |
| Peter Duffy | | 52 | | Vice President and Treasurer | | 2000 | | Senior Vice President, MetLife Advisers (since 1998); Second Vice President (since 2003), NELICO; Vice President, MetLife (since 2004); Vice President (since 2004), MetLife Group, Inc.; formerly, Vice President and Treasurer, Zenith Fund**. |
| | | | |
| Thomas M. Lenz | | 49 | | Vice President and Secretary | | 2002 | | General Counsel and Secretary, MetLife Advisers; Assistant General Counsel, MetLife; formerly, Vice President and Secretary, Zenith Fund**. |
| * | Indicates a directorship with a registered investment company or a company subject to the reporting requirements of the Securities Exchange Act of 1934, as amended. |
| ** | The Zenith Fund deregistered with the Securities and Exchange Commission (“SEC”) in 2004. |
| (†) | Served as a trustee, director and/or officer of one or more of the following companies, each of which had a direct or indirect advisory relationship with MetLife Advisers or its affiliates prior to January 31, 2005: State Street Research Financial Trust, State Street Research Income Trust, State Street Research Money Market Trust, State Street Research Institutional Funds, State Street Research Capital Trust, State Street Research Master Investment Trust, State Street Research Equity Trust, State Street Research Securities Trust and State Street Research Exchange Trust (collectively, the “State Street Research Funds”). |
| (1) | Each Director of the Fund also serves as trustee of Metropolitan Series Fund II (“Met Series Fund II”), a registered investment company advised by MetLife Advisers. Each officer of the Fund serves in the same position with Met Series Fund II, which consists of one portfolio. |
| (2) | Previous positions during the past five years with the Fund, MIST, MetLife, MetLife Advisers, MIA, Zenith Fund, NELICO or New England Securities Corporation are omitted if not materially different. |
| (3) | The Fund Complex includes the Fund (36 portfolios), Met Series Fund II (1 portfolio) and MIST (44 portfolios) |
MSF-25
Metropolitan Series Fund, Inc.
BlackRock Bond Income Portfolio
Board Approval of Advisory and Subadvisory Agreements
The Fund’s Contract Review Committees of the Board of Directors (the “Board”) typically meet in early fall to review the Portfolios’ advisory agreements (the “Advisory Agreements”) and subadvisory agreements (collectively, the “Subadvisory Agreements,” and, together with the Advisory Agreements, the “Agreements”) and determine whether to recommend that the full Board approve the continuation of the Agreements for an additional one-year period. (Following the initial approval of an Agreement for a new Portfolio or with a new adviser or subadviser, such annual reviews are not required until 2 years following the execution of such Agreement.) After each Committee has made its recommendations, the full Board, including the Independent Directors, determines whether to approve the continuation of each of the Agreements. In addition, the Board, including the Independent Directors, considers matters bearing on the Agreements at most of its other meetings throughout the year and regularly interviews various individuals at MetLife Advisers responsible for the management of the Portfolios. The Directors also interview selected investment managers and other professionals at the subadvisers at various times throughout the year.
The Directors receive all materials that they or MetLife Advisers, the Fund’s investment adviser, and the subadvisers believe to be reasonably necessary for the Directors to evaluate the Agreements and determine whether to approve the continuation of the Agreements. These materials generally include, among other items, (i) information on the investment performance of the Portfolios and the performance of peer groups of funds and the Portfolios’ performance benchmarks, (ii) information on the Portfolios’ advisory and subadvisory fees and other expenses, including information comparing the Portfolios’ expenses to those of peer groups of funds and information about any applicable expense caps and fee “breakpoints,” (iii) sales and redemption data, (iv) information related to the profitability of the Agreements to MetLife Advisers and the subadvisers, and potential “fall-out” or ancillary benefits that MetLife Advisers, the subadvisers or their affiliates may receive as a result of their relationships with the Fund and (v) information obtained through the subadvisers’ responses to certain requests from MetLife Advisers and the Directors and MetLife Advisers’ responses to requests from the Directors. The Directors may also consider other information such as (vi) MetLife Advisers’ and the subadvisers’ financial results and condition, (vii) each Portfolio’s investment objectives and strategies and the size, education and experience of the investment staffs of MetLife Advisers and the relevant subadvisers and their use of technology and external research, (viii) the allocation of the Portfolios’ brokerage, if any, including allocations to brokers affiliated with the subadvisers and the use of “soft” commission dollars to pay Portfolio expenses and to pay for research and other similar services, (ix) the resources devoted to, and the record of compliance with, the Portfolios’ investment policies and restrictions, policies on personal securities transactions and other compliance policies, (x) the responses of MetLife Advisers, the subadvisers and/or their affiliates to certain legal and regulatory proceedings and (xi) the economic outlook generally and for the mutual fund industry in particular. Throughout the process, the Directors have the opportunity to ask questions of and request additional materials from MetLife Advisers and the subadvisers.
Following meetings of each Contract Review Committee on September 12, 2007, the Board, at its November 15, 2007 meeting, approved the continuation through December 31, 2008 of the Advisory Agreements for each Portfolio of the Fund and the Subadvisory Agreements for each Portfolio of the Fund. The Agreements approved for continuation are referred to below as the “Continued Agreements.”
In considering whether to approve the continuation of the Continued Agreements, the Directors, including the Independent Directors, did not identify any single factor as determinative, and each weighed the various factors as he or she deemed appropriate. The Directors considered the following matters in connection with their approval of the Continued Agreements:
The nature, extent and quality of the services provided to the relevant Portfolios under the Continued Agreements. The Directors considered the nature, extent and quality of the services provided by MetLife Advisers, the relevant subadvisers (if any) and their affiliates (each, an “Adviser,” and, collectively, the “Advisers”) to the relevant Portfolios pursuant to the Continued Agreements and the resources dedicated to these Portfolios by the Advisers. In particular, the Directors considered the Advisers’ abilities to attract and retain highly qualified investment professionals. With respect to MetLife Advisers, the Directors considered that MetLife Advisers is (i) ultimately responsible for the performance of such Portfolios; (ii) ultimately responsible for the establishment of the investment strategies of each such Portfolio, primarily through its recommendations to the Board regarding the hiring and selection of subadvisers; (iii) responsible for the hiring and selection, subject to Board approval, of subadvisers; and (iv) responsible for maintaining a program of Subadviser oversight reasonably designed to ensure that the subadvisers have reasonable compliance policies and procedures in place. The Directors also considered that MetLife Advisers provides a full range of day-to-day administrative services for the Portfolios involving all aspects of such Portfolios’ day-to-day operations (other than portfolio management). After reviewing these and related factors, the Directors concluded, within the context of their overall conclusions regarding each of the Continued Agreements, that the nature, extent and quality of services provided supported the renewal of these Agreements.
Investment performance of the relevant Portfolios. The Directors reviewed information about the performance of the relevant Portfolios over various time periods, including information prepared by an independent third party that compared the performance of the Portfolios to the performance of peer groups of funds and performance benchmarks. The Directors also reviewed a description of the third party’s methodology for identifying a Portfolio’s peer group(s) for purposes of performance and expense comparisons.
MSF-26
Metropolitan Series Fund, Inc.
BlackRock Bond Income Portfolio
Board Approval of Advisory and Subadvisory Agreements—(Continued)
In the case of each relevant Portfolio that had performance that lagged its peer group(s) for certain periods, the Directors concluded that other factors relevant to performance were sufficient, in light of other considerations, to warrant renewal of the Continued Agreements relating to such Portfolio. These factors varied from Portfolio to Portfolio, but included one or more of the following: (i) that such Portfolio’s performance, although lagging in certain recent periods, was stronger over the longer term; (ii) that the underperformance was attributable, to a significant extent, to investment decisions that were reasonable and consistent with the Portfolio’s investment objective(s) and policies and that the Portfolio was performing within the range of reasonable expectations, given market conditions and the Portfolio’s investment objective(s) and policies; (iii) that the Portfolio’s performance was competitive when compared to other relevant performance benchmarks or peer groups; and (iv) that MetLife Advisers and/or the relevant subadviser (if any) had taken or was taking steps designed to help improve the Portfolio’s investment performance.
The Directors also considered the investment performance of the Advisers and their reputations generally, the historical responsiveness of the Advisers to Director concerns about performance and the willingness of the Advisers to take steps intended to improve performance.
After reviewing these and related factors, the Directors concluded, within the context of their overall conclusions regarding each of the Continued Agreements, that the investment performance of each relevant Portfolio and Adviser was sufficient, in light of other considerations, to warrant the renewal of the Continued Agreements.
The costs of the services to be provided and profits to be realized by the Advisers and their affiliates from their relationships with the Portfolios. The Directors considered the fees charged by MetLife Advisers to the Portfolios for advisory services and, with respect to the subadvised Portfolios, by such subadvisers to MetLife Advisers for subadvisory services (such advisory and subadvisory fees (if any), collectively, “Fees”), as well as the total expense levels of the Portfolios. This information included comparisons (provided by an independent third party) of the Portfolios’ advisory fees and total expense levels to those of their peer groups. In evaluating Fees for the relevant Portfolios, the Directors also took into account the demands, complexity and quality of the investment management services provided to each Portfolio. The Directors considered MetLife Advisers’ recommendations regarding reductions in Fee rates, implementation of Fee breakpoints and institution of Fee waivers and expense caps.
The Directors also considered the compensation directly or indirectly received by the Advisers and their affiliates from their relationships with the relevant Portfolios. The Directors reviewed information relating to the profits received by MetLife Advisers, certain of the subadvisers and their affiliates as a result of their relationships with the relevant Portfolios, and information about the allocation of expenses used to calculate profitability. When reviewing profitability, the Directors also considered the performance of the relevant Portfolios, the expense levels of such Portfolios and whether the relevant Advisers had implemented breakpoints, fee waivers and/or expense caps with respect to such Portfolios.
After reviewing these and related factors, the Directors concluded, within the context of their overall conclusions regarding each of the Continued Agreements, that the Fees charged to each of the relevant Portfolios were fair and reasonable, and that the information provided regarding costs of these services generally, and the related profitability (if known) to the relevant Advisers of their relationships with the relevant Portfolios, supported the renewal of the Continued Agreements.
Economies of Scale. The Directors considered the existence of any economies of scale in the provision of services by the Advisers and whether those economies were shared with the relevant Portfolios through breakpoints in their advisory fees or other means, such as expense caps, fee waivers or relatively low levels of fees. The Directors noted that most of the relevant Portfolios benefited or will benefit from breakpoints, expense caps and/or fee waivers with respect to their advisory fees. In considering these issues, the Directors also took into consideration information relating to the costs of the services provided and the profitability to MetLife Advisers, the relevant subadvisers (if any) and each of their affiliates of their relationships with the relevant Portfolios, as discussed above.
After reviewing these and related factors, the Directors concluded, within the context of their overall conclusions regarding each of the Continued Agreements, that the extent to which economies of scale were shared with the relevant Portfolios supported the renewal of such Agreements.
Other Factors. The Directors also considered other factors, which included but were not limited to the following:
| | • | | the extent to which each relevant Portfolio operated in accordance with its investment objective, and its record of compliance with its investment restrictions and the compliance programs of the Fund and the Advisers. They also considered the compliance-related resources the Advisers and their affiliates provide to the relevant Portfolios; |
| | • | | the nature, quality, cost and extent of administrative and shareholder services performed by MetLife Advisers and its affiliates under the Advisory Agreements; and |
MSF-27
Metropolitan Series Fund, Inc.
BlackRock Bond Income Portfolio
Board Approval of Advisory and Subadvisory Agreements—(Continued)
| | • | | so-called “fall-out benefits” to the Advisers, such as the engagement of their affiliates to provide distribution, brokerage and transfer agency services to the Portfolios, and the benefits of research made available to the relevant Advisers by reason of brokerage commissions generated by the relevant Portfolios’ securities transactions. The Directors also considered the possible conflicts of interest associated with these fall-out and other benefits, and the reporting and other processes in place to disclose and monitor these possible conflicts of interest. |
Based on their evaluation of all factors that they deemed to be material, including those factors described above, and assisted by the advice of independent counsel, the Directors, including the Independent Directors, concluded that each of the Continued Agreements should be continued through December 31, 2008.
MSF-28
A description of the policies and procedures that the Fund uses to determine how to vote proxies relating to portfolio securities is available (i) without charge, upon request, by calling (800) 638-7732 and (ii) on the Securities and Exchange Commission’s (the “SEC”) website at http://www.sec.gov.
Information regarding how the Fund voted proxies relating to portfolio securities during the most recent twelve-month period ended December 31, 2007 is available (i) without charge, upon request, by calling (800) 638-7732 and (ii) on the SEC’s website at http://www.sec.gov.
The Fund files with the SEC a complete schedule of its portfolio holdings, as of the close of the first and third quarters of its fiscal year, on “Form N-Q”. These filings are available on the SEC’s website at www.sec.gov and may be reviewed and copied at the SEC’s Public Reference Room in Washington, DC. (Call 1-800-SEC-0330 for information on the operation of the Public Reference Room.)
MSF-29
| | |
Metropolitan Series Fund, Inc. BlackRock Diversified Portfolio Annual Report | | December 31, 2007 |
Letter from the President
February 1, 2008
Letter to Policy Holders:
2007 was a tumultuous year in the financial markets driven by concerns in the credit markets surrounding sub-prime mortgages and fears of recession in the U.S. Economy. The broad markets were mixed, with the Dow Jones Industrial Average up 8.9% and the MSCI EAFE Index, which measures the performance of international equities, up 11.2% for the year, while the Russell 2000 Index, which measures the performance of small capitalization stocks, was down 1.6%.
In the fixed income markets, credit spreads increased as a result of the pressure from sub-prime mortgage crisis and the Federal Reserve lowered interest rates by a total of 1% during the year. The Lehman Brothers Aggregate Bond Index posted a 7.0% return for the year.
On the following pages, you will find a complete review of your Portfolio and its investment performance.
MetLife is committed to building your financial freedom. We appreciate your trust and will continue to focus our efforts on meeting your investment needs.
Sincerely,
Elizabeth Forget
President, Metropolitan Series Fund, Inc.
Metropolitan Series Fund, Inc.
BlackRock Diversified Portfolio
Managed by BlackRock Advisors, LLC
Portfolio Manager Commentary*
PORTFOLIO PERFORMANCE
For the year ended December 31, 2007, the Class A shares of the BlackRock Diversified Portfolio returned 5.9%, compared to its benchmark, a blend of the Russell 1000 Index1 (60%) and the Lehman Brothers Aggregate Bond Index2 (40%), which returned 6.4%. The average return of its peer group, the Lipper Variable Insurance Products Mixed-Asset Target Allocation Growth Funds Universe3, was 6.8% over the same period.
PORTFOLIO REVIEW
2007 began largely where 2006 left off. A slowdown in U.S. growth occurred following Fed tightening, rising oil prices, and the beginning of concerns around credit and slower spending by the U.S. consumer. Earnings growth remained strong on the back of solid export growth, a declining dollar and share buybacks. A transition in leadership from small, value and domestic to large, growth and multinational became evident as the year began. During the second half of 2007, the benign fundamentals of 2003-2006, namely strong global growth, rising profitability levels, and falling risk premiums, were replaced by credit stress; pressures on the capital position of the financial system; questions about the sustainability of the business cycle; and rising energy and food prices. Reflecting these woes, market prices moved considerably. Government bond yields plummeted, the dollar fell faster than in earlier years, credit spreads widened and equities became trendless and volatile. The financial and consumer discretionary sectors experienced drops of one-quarter to one-third. Commodity- and industrial-related multinational companies performed the best. Emerging market economies and equity markets performed well yet again. The Federal Reserve moved from an attitude of vigilance about inflation to one of providing liquidity and lowering rates to shore up the functioning of credit markets and fight economic weakness.
We began the year overweight equities and underweight bonds relative to the neutral 60/40 benchmark mix. Though U.S. growth was slowing, we favored equities based on solid earnings, significant economic strength outside the U.S. and high margins.
However, things began to change in the spring and summer. Specifically, the subprime credit crisis began to spread to all forms of credit. Both consumers and businesses were confronted with tighter credit conditions and higher costs for attaining credit. As a result, our view changed. We started worrying that scarcer credit would impact consumer spending and business profits. Consequently, we flattened out our equity overweight during the summer and have since maintained a relatively neutral asset allocation versus the benchmark mix.
For the year ended December 31, 2007, positive performance in the fixed income portion of the Portfolio versus the Lehman Brothers Aggregate Bond Index, was due to an underweight exposure to corporate bonds, and successful security selection within the corporate sector. In addition, we had positioned the fixed income portfolio for a steeper yield curve in the second half of the year, a move that proved advantageous as short-term rates fell more than long-term rates and the curve steepened. An underweight in agency debentures benefited the fixed income portfolio as well.
One of the largest detractors from performance was our overweight position in high-quality spread assets, particularly AAA-rated commercial mortgage-backed securities (CMBS), as well as agency mortgage pass-throughs, asset-backed securities (ABS) and other mortgage-related product. Despite their high quality, these assets suffered amid fallout from the subprime mortgage scare. Generalized concerns over the mortgage market, coupled with lack of liquidity and the liquidation by investors of all mortgage-related assets, contributed to the underperformance. Our exposure to European government bonds also hindered the fixed income portfolio’s relative results for the year.
At year-end, the fixed income portfolio was underweight in U.S. Treasury issues and U.S. agency securities. As spreads on high-quality corporate paper reached levels not seen since 2003, creating attractive relative value opportunities, we reduced our underweight to the corporate sector. The fixed income portfolio maintained its notable overweights in high-quality, short-duration spread products, including mortgage pass-through securities, CMBS and ABS. We also held a modest weighting in high yield and emerging market debt issues. We will continued to tactically trade both duration and curve positioning, and the fixed income portfolio ended the year with a modestly short duration position versus the benchmark, which was primarily attributable to the five-year part of the curve.
For the year ended December 31, 2007, the equity portion of the Portfolio outperformed relative to its equity benchmark, the Russell 1000 Index. The equity portfolio’s outperformance versus the benchmark was attributable to an overweight and, more significantly, good stock selection within the healthcare sector. Also contributing notably to performance was our underweight in weak performing financials. Within healthcare, our long-standing preference for service providers (such as Medco Health Solutions, Express Scripts and Aetna) over product companies continued to generate outperformance versus the benchmark. In financials, not holding any commercial banks added to performance. Also additive was our select exposure to diversified financials, as well as holding Goldman Sachs and Morgan Stanley in the capital markets industry instead of companies that suffered significant setbacks related to the mortgage crisis.
Detracting from performance was our stock selection in information technology. Our valuation discipline hurt us during the period when “growth at any price” proved to be a more successful strategy, particularly following the August market melt-down. Notably, Google (priced over 50 times earnings on December 29, 2006) returned more than 50% during the year. We stuck to our disciplined approach, believing that buying better-than-market growth opportunities for better-than-market valuations is, in the long term, a recipe for success. Also detracting from performance was our underweight and stock selection in the industrials sector. Within the sector, airlines hurt performance the most, led by our positions in AMR Corp. and Continental Airlines, which combined for almost all of the negative performance in the sector.
The biggest theme for the year was global growth, and we benefited from our two-pronged portfolio approach: one prong invested in cyclicals with a global emphasis and the other in higher quality companies with predictable earnings. Holdings that were in line with global growth were our positions in Cummins and Deere & Co. in the industrials sector, as well as Southern Copper Corp. and Monsanto in the materials sector.
The biggest event, however, was the mortgage debacle, and our early exit from names like Countrywide Financial and Morgan Stanley, plus our overall underweight in financials, proved very beneficial. While the equity portfolio suffered during the summer’s market turmoil and quantitative investment meltdown, we went into the fourth quarter with solid sector positioning, which helped us to end the quarter ahead of the equity benchmark.
At year-end, the largest overweights in the equity portfolio were in information technology, healthcare and energy. The largest underweights were in financials, consumer staples and utilities.
* The views expressed above are those of the subadvisory firm as of December 31, 2007 and are subject to change based on market and other conditions. Information about the Portfolio’s holdings, asset allocation, industry allocation, or country diversification is historical and is not an indication of future Portfolio composition, which will vary. The performance of any index mentioned in this commentary has not been adjusted for ongoing management, distribution and operating expenses, and sales charges applicable to mutual fund investments. Direct investment in the Index is not possible.
1 The Russell 1000® Index is an unmanaged measure of the 1,000 largest companies in the Russell 3000® Index, which represents approximately 90% of the investable U.S. equity market.
2 Lehman Brothers® Aggregate Bond Index includes most obligations of the U.S. Treasury, agencies and quasi-federal corporations, most publicly issued investment grade corporate bonds and most bonds backed by mortgage pools of GNMA, FNMA and FHLMC.
3 The Lipper Variable Insurance Products Fund Average is an average of the total return performance (calculated on the basis of net asset value) of variable product funds with similar investment objectives to those of the subject Portfolio as calculated by Lipper Analytical Services, an independent mutual fund ranking service.
MSF-2
Metropolitan Series Fund, Inc.
BlackRock Diversified Portfolio
A $10,000 INVESTMENT COMPARED TO
THE RUSSELL 100 INDEX AND THE LEHMAN BROTHERS
AGGREGATE BOND INDEX
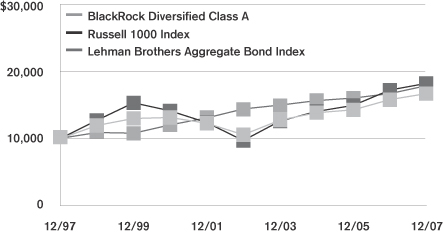
Average Annual Returns as of December 31, 2007
| | | | | | | | | | | | | | | |
| | | BlackRock Diversified Portfolio | | | Russell 1000
Index | | | Lehman Brothers
Aggregate Index | |
| | | Class A | | | Class B | | | Class E | | | |
| 1 Year | | 5.9 | % | | 5.6 | % | | 5.7 | % | | 5.8 | % | | 7.0 | % |
| 5 Year | | 9.6 | | | — | | | 9.4 | | | 13.4 | | | 4.4 | |
| 10 Year | | 5.3 | | | — | | | — | | | 6.2 | | | 6.0 | |
| Since Inception | | — | | | 7.0 | | | 3.9 | | | — | | | — | |
Performance numbers are net of all Portfolio expenses but do not include any insurance, sales, or administrative charges of variable annuity or life insurance contracts. If these charges were included, the returns would be lower.
Inception dates of the Class A, Class B and Class E shares are: 7/25/86, 4/26/04 and 5/1/01, respectively.
This information represents past performance and is not indicative of future results. Investment return and principal value may
fluctuate so that shares, upon redemption, may be worth more or less than the original cost.
PORTFOLIO COMPOSITION
as of December 31, 2007
Top Holdings
| | |
| | | % of Total
Net Assets |
Federal National Mortgage Association | | 13.3% |
Federal Home Loan Mortgage Corp. | | 8.7% |
JPMorgan Mortgage Trust | | 2.4% |
General Electric Co. | | 2.3% |
Government National Mortgage Association | | 2.1% |
Lehman Brothers Holdings, Inc. | | 1.7% |
Morgan Stanley Capital I | | 1.5% |
Bank of America Corp. | | 1.3% |
CS First Boston Mortgage Securities Corp. | | 1.2% |
The Bear Stearns Cos., Inc. | | 1.0% |
Top Equity Sectors
| | |
| | | % of Equity
Market Value |
Information Technology | | 26.2% |
Health Care | | 20.0% |
Energy | | 18.4% |
Industrials | | 12.3% |
Financials | | 7.5% |
|
| Top Fixed Income Sectors |
| | | % of Fixed Income
Market Value |
Mortgage | | 51.3% |
Investment Grade Corporates | | 20.8% |
Commercial Mortgage-Backed | | 19.5% |
Agency Issues | | 2.7% |
Asset Backed | | 2.0% |
MSF-3
Metropolitan Series Fund, Inc.
Shareholder Expense Example
As a shareholder of the Portfolio, you incur ongoing costs, including management fees; distribution and service (12b-1) fees; and other Portfolio expenses. This example is intended to help you understand your ongoing costs (in dollars) (referred to as “expenses”) of investing in the Portfolio and compare these costs with the ongoing costs of investing in other mutual funds. The example is based on an investment of $1,000 invested at the beginning of the period and held for the entire period, July 1, 2007 through December 31, 2007.
Actual Expenses
The first line for each share class of the Portfolio in the table below provides information about actual account values and actual expenses. You may use the information in this line, together with the amount you invested in the particular share class of the Portfolio, to estimate the expenses that you paid over the period. Simply divide your account value by $1,000 (for example, an $8,600 account value divided by $1,000=8.6), then multiply the result by the number in the first line under the heading entitled “Expenses Paid During Period” to estimate the expenses you paid on your account during this period.
Hypothetical Example for Comparison Purposes
The second line for each share class of the Portfolio in the table below provides information about hypothetical account values and hypothetical expenses based on the Portfolio’s actual expense ratio and an assumed rate of return of 5% per year before expenses, which is not the Portfolio’s actual return. The hypothetical account values and expenses may not be used to estimate the actual ending account balance or expenses you paid for the period. You may use this information to compare the ongoing costs of investing in the Portfolio and other funds. To do so, compare this 5% hypothetical example with the 5% hypothetical examples that appear in the shareholder reports of the other funds.
Please note that the expenses shown in the table are meant to highlight your ongoing costs only and do not reflect any fees or charges of your variable insurance product or any additional expenses that participants in certain eligible qualified plans may bear relating to the operations of their plan. Therefore, the second line for each share class in the table is useful in comparing ongoing costs only, and will not help you determine the relative total costs of owning different funds. In addition, if these other costs were included, your costs would have been higher.
| | | | | | | | | | | | | | |
Portfolio | | | | Annualized
Expense
Ratio | | | Beginning
Account Value
July 1,
2007 | | Ending
Account Value
December 31,
2007 | | Expenses Paid
During Period*
July 1, 2007
to
December 31,
2007 |
BlackRock Diversified—Class A | | Actual | | 0.51 | % | | $ | 1,000.00 | | $ | 1,014.50 | | $ | 2.59 |
| | Hypothetical | | 0.51 | % | | $ | 1,000.00 | | $ | 1,022.61 | | $ | 2.60 |
| | | | | |
BlackRock Diversified—Class B | | Actual | | 0.76 | % | | $ | 1,000.00 | | $ | 1,012.90 | | $ | 3.86 |
| | Hypothetical | | 0.76 | % | | $ | 1,000.00 | | $ | 1,021.33 | | $ | 3.87 |
| | | | | |
BlackRock Diversified—Class E | | Actual | | 0.66 | % | | $ | 1,000.00 | | $ | 1,013.40 | | $ | 3.35 |
| | Hypothetical | | 0.66 | % | | $ | 1,000.00 | | $ | 1,021.84 | | $ | 3.36 |
* Expenses paid are equal to the Portfolio’s annualized expense ratio for the most recent six month period, as shown above, multiplied by the average account value over the period, multiplied by the number of days in the most recent fiscal half-year, divided by 365 (to reflect the one-half year period).
MSF-4
Metropolitan Series Fund, Inc.
BlackRock Diversified Portfolio
Schedule of Investments as of December 31, 2007
Common Stock—62.2% of Total Net Assets
| | | | | |
| Security Description | | Shares | | Value* |
| | | | | |
|
Aerospace & Defense—2.0% |
Honeywell International, Inc. | | 250,000 | | $ | 15,392,500 |
L-3 Communications Holdings, Inc. | | 17,200 | | | 1,822,168 |
Lockheed Martin Corp. | | 18,400 | | | 1,936,784 |
Raytheon Co. | | 220,000 | | | 13,354,000 |
United Technologies Corp. | | 50,000 | | | 3,827,000 |
| | | | | |
| | | | | 36,332,452 |
| | | | | |
|
Airlines—0.4% |
Continental Airlines, Inc. (Class B) (a) (b) | | 331,000 | | | 7,364,750 |
| | | | | |
| | |
Biotechnology—0.5% | | | | | |
Biogen Idec, Inc. (b) | | 170,000 | | | 9,676,400 |
| | | | | |
| | |
Capital Markets—1.1% | | | | | |
Janus Capital Group, Inc. (a) | | 59,700 | | | 1,961,145 |
The Charles Schwab Corp. | | 530,000 | | | 13,541,500 |
The Goldman Sachs Group, Inc. | | 20,000 | | | 4,301,000 |
| | | | | |
| | | | | 19,803,645 |
| | | | | |
| | |
Chemicals—2.1% | | | | | |
E. I. du Pont de Nemours & Co. (a) | | 130,000 | | | 5,731,700 |
Monsanto Co. | | 160,000 | | | 17,870,400 |
The Dow Chemical Co. (a) | | 130,000 | | | 5,124,600 |
The Lubrizol Corp. | | 180,000 | | | 9,748,800 |
| | | | | |
| | | | | 38,475,500 |
| | | | | |
| | |
Commercial Services & Supplies—0.3% | | | | | |
Anacomp, Inc. (Class B) (b) | | 1 | | | 2 |
R.R. Donnelley & Sons Co. | | 140,000 | | | 5,283,600 |
| | | | | |
| | | | | 5,283,602 |
| | | | | |
| | |
Communications Equipment—2.3% | | | | | |
ADC Telecommunications, Inc. (b) | | 140,000 | | | 2,177,000 |
Ciena Corp. (b) | | 130,000 | | | 4,434,300 |
Cisco Systems, Inc. (b) | | 870,000 | | | 23,550,900 |
Juniper Networks, Inc. (b) | | 380,000 | | | 12,616,000 |
| | | | | |
| | | | | 42,778,200 |
| | | | | |
| | |
Computers & Peripherals—4.4% | | | | | |
Apple, Inc. (b) | | 10,000 | | | 1,980,800 |
Dell, Inc. (b) | | 590,000 | | | 14,460,900 |
EMC Corp. (b) | | 770,000 | | | 14,268,100 |
Hewlett-Packard Co. | | 430,000 | | | 21,706,400 |
International Business Machines Corp. | | 220,000 | | | 23,782,000 |
Sun Microsystems, Inc. (b) | | 260,000 | | | 4,713,800 |
| | | | | |
| | | | | 80,912,000 |
| | | | | |
| | |
Construction & Engineering—1.3% | | | | | |
Fluor Corp. | | 80,000 | | | 11,657,600 |
Jacobs Engineering Group, Inc. | | 130,000 | | | 12,429,300 |
| | | | | |
| | | | | 24,086,900 |
| | | | | |
| | |
Containers & Packaging—0.3% | | | | | |
Packaging Corp. of America | | 230,000 | | | 6,486,000 |
| | | | | |
| | | | | |
| Security Description | | Shares | | Value* |
| | | | | |
| | |
Diversified Financial Services—1.0% | | | | | |
Bank of America Corp. | | 90,000 | | $ | 3,713,400 |
JPMorgan Chase & Co. | | 350,000 | | | 15,277,500 |
| | | | | |
| | | | | 18,990,900 |
| | | | | |
|
Diversified Telecommunication Services—0.6% |
AT&T, Inc. | | 210,000 | | | 8,727,600 |
CenturyTel, Inc. | | 40,000 | | | 1,658,400 |
Qwest Communications International, Inc. | | 178,300 | | | 1,249,883 |
| | | | | |
| | | | | 11,635,883 |
| | | | | |
| | |
Electrical Equipment—0.7% | | | | | |
Rockwell Automation, Inc. (a) | | 140,000 | | | 9,654,400 |
Roper Industries, Inc. | | 40,000 | | | 2,501,600 |
| | | | | |
| | | | | 12,156,000 |
| | | | | |
|
Electronic Equipment & Instruments—0.3% |
Avnet, Inc. | | 36,300 | | | 1,269,411 |
Dolby Laboratories, Inc. (Class A) (b) | | 40,000 | | | 1,988,800 |
Mettler-Toledo International, Inc. (b) | | 14,700 | | | 1,672,860 |
| | | | | |
| | | | | 4,931,071 |
| | | | | |
| | |
Energy Equipment & Services—1.3% | | | | | |
ENSCO International, Inc. (a) | | 200,000 | | | 11,924,000 |
National Oilwell Varco, Inc. (b) | | 70,000 | | | 5,142,200 |
Tidewater, Inc. (a) | | 130,000 | | | 7,131,800 |
| | | | | |
| | | | | 24,198,000 |
| | | | | |
| | |
Food & Staples Retailing—0.4% | | | | | |
The Kroger Co. | | 309,800 | | | 8,274,758 |
| | | | | |
|
Health Care Equipment & Supplies—1.0% |
Intuitive Surgical, Inc. (b) | | 30,000 | | | 9,735,000 |
Kinetic Concepts, Inc. (a) (b) | | 149,700 | | | 8,017,932 |
| | | | | |
| | | | | 17,752,932 |
| | | | | |
| |
Health Care Providers & Services—5.6% | | | |
Aetna, Inc. | | 240,000 | | | 13,855,200 |
AmerisourceBergen Corp. | | 30,700 | | | 1,377,509 |
CIGNA Corp. | | 90,000 | | | 4,835,700 |
Coventry Health Care, Inc. (b) | | 171,411 | | | 10,156,101 |
Express Scripts, Inc. (b) | | 180,000 | | | 13,140,000 |
Health Net, Inc. (b) | | 80,000 | | | 3,864,000 |
McKesson Corp. | | 151,800 | | | 9,944,418 |
Medco Health Solutions, Inc. (b) | | 130,000 | | | 13,182,000 |
UnitedHealth Group, Inc. | | 300,000 | | | 17,460,000 |
WellPoint, Inc. (b) | | 180,000 | | | 15,791,400 |
| | | | | |
| | | | | 103,606,328 |
| | | | | |
| |
Hotels, Restaurants & Leisure—0.9% | | | |
McDonald’s Corp. | | 290,000 | | | 17,083,900 |
| | | | | |
| | |
Household Products—1.0% | | | | | |
Energizer Holdings, Inc. (a) (b) | | 101,700 | | | 11,403,621 |
Procter & Gamble Co. | | 90,000 | | | 6,607,800 |
| | | | | |
| | | | | 18,011,421 |
| | | | | |
*See accompanying notes to financial statements.
MSF-5
Metropolitan Series Fund, Inc.
BlackRock Diversified Portfolio
Schedule of Investments as of December 31, 2007
Common Stock—(Continued)
| | | | | |
| Security Description | | Shares | | Value* |
| | | | | |
| | |
Industrial Conglomerates—1.0% | | | | | |
General Electric Co. | | 500,000 | | $ | 18,535,000 |
| | | | | |
| | |
Insurance—2.6% | | | | | |
American International Group, Inc. | | 130,000 | | | 7,579,000 |
The Chubb Corp. | | 164,500 | | | 8,978,410 |
The Hartford Financial Services Group, Inc. | | 130,000 | | | 11,334,700 |
The Travelers Cos., Inc. | | 252,100 | | | 13,562,980 |
Transatlantic Holdings, Inc. | | 21,400 | | | 1,555,138 |
W.R. Berkley Corp. | | 144,275 | | | 4,300,838 |
| | | | | |
| | | | | 47,311,066 |
| | | | | |
| | |
Internet & Catalog Retail—0.8% | | | | | |
Amazon.com, Inc. (b) | | 150,000 | | | 13,896,000 |
| | | | | |
| | |
Internet Software & Services—0.8% | | | | | |
eBay, Inc. (b) | | 440,000 | | | 14,603,600 |
| | | | | |
| | |
IT Services—0.9% | | | | | |
Automatic Data Processing, Inc. | | 300,000 | | | 13,359,000 |
Computer Sciences Corp. (a) (b) | | 54,500 | | | 2,696,115 |
| | | | | |
| | | | | 16,055,115 |
| | | | | |
| | |
Leisure Equipment & Products—0.1% | | | | | |
Hasbro, Inc. (a) | | 47,700 | | | 1,220,166 |
| | | | | |
| | |
Life Sciences Tools & Services—0.4% | | | | | |
Waters Corp. (b) | | 85,200 | | | 6,736,764 |
| | | | | |
| | |
Machinery—1.5% | | | | | |
Cummins, Inc. | | 100,000 | | | 12,737,000 |
Deere & Co. | | 160,000 | | | 14,899,200 |
| | | | | |
| | | | | 27,636,200 |
| | | | | |
| | |
Media—0.9% | | | | | |
The Walt Disney Co. (a) | | 500,000 | | | 16,140,000 |
| | | | | |
| | |
Metals & Mining—0.7% | | | | | |
Southern Copper Corp. (a) | | 120,000 | | | 12,615,600 |
| | | | | |
| | |
Office Electronics—0.1% | | | | | |
Xerox Corp. | | 89,100 | | | 1,442,529 |
| | | | | |
| | |
Oil, Gas & Consumable Fuels—10.2% | | | | | |
Chevron Corp. | | 290,000 | | | 27,065,700 |
ConocoPhillips | | 270,000 | | | 23,841,000 |
Exxon Mobil Corp. | | 560,000 | | | 52,466,400 |
Marathon Oil Corp. | | 240,000 | | | 14,606,400 |
Noble Energy, Inc. | | 160,000 | | | 12,723,200 |
Occidental Petroleum Corp. | | 210,000 | | | 16,167,900 |
Sunoco, Inc. | | 180,000 | | | 13,039,200 |
Tesoro Corp. (a) | | 250,000 | | | 11,925,000 |
Valero Energy Corp. | | 210,000 | | | 14,706,300 |
| | | | | |
| | | | | 186,541,100 |
| | | | | |
| | | | | | |
| Security Description | | Shares | | Value* |
| | | | | | |
| | |
Pharmaceuticals—4.9% | | | | | | |
Bristol-Myers Squibb Co. | | | 530,000 | | $ | 14,055,600 |
Eli Lilly & Co. | | | 280,000 | | | 14,949,200 |
Johnson & Johnson | | | 60,000 | | | 4,002,000 |
Merck & Co., Inc. | | | 360,000 | | | 20,919,600 |
Pfizer, Inc. | | | 1,050,000 | | | 23,866,500 |
Schering-Plough Corp. | | | 490,000 | | | 13,053,600 |
| | | | | | |
| | | | | | 90,846,500 |
| | | | | | |
|
Semiconductors & Semiconductor Equipment—3.8% |
Applied Materials, Inc. | | | 710,000 | | | 12,609,600 |
| | | | | | |
Integrated Device Technology, Inc. (b) | | | 460,000 | | | 5,202,600 |
Intel Corp. | | | 300,000 | | | 7,998,000 |
KLA-Tencor Corp. (a) | | | 250,000 | | | 12,040,000 |
NVIDIA Corp. (b) | | | 370,000 | | | 12,587,400 |
Silicon Laboratories, Inc. (b) | | | 110,000 | | | 4,117,300 |
Texas Instruments, Inc. | | | 450,000 | | | 15,030,000 |
| | | | | | |
| | | | | | 69,584,900 |
| | | | | | |
| | |
Software—3.8% | | | | | | |
Autodesk, Inc. | | | 210,000 | | | 10,449,600 |
BMC Software, Inc. (b) | | | 46,100 | | | 1,643,004 |
CA, Inc. | | | 57,200 | | | 1,427,140 |
McAfee, Inc. (b) | | | 46,100 | | | 1,728,750 |
Microsoft Corp. | | | 960,000 | | | 34,176,000 |
Oracle Corp. (b) | | | 810,000 | | | 18,289,800 |
Synopsys, Inc. (b) | | | 53,100 | | | 1,376,883 |
| | | | | | |
| | | | | | 69,091,177 |
| | | | | | |
| | |
Specialty Retail—1.0% | | | | | | |
AutoZone, Inc. (b) | | | 21,400 | | | 2,566,074 |
GameStop Corp. (Class A) (b) | | | 100,000 | | | 6,211,000 |
Tiffany & Co. | | | 230,000 | | | 10,586,900 |
| | | | | | |
| | | | | | 19,363,974 |
| | | | | | |
|
Textiles, Apparel & Luxury Goods—0.7% |
Nike, Inc. (a) | | | 200,000 | | | 12,848,000 |
| | | | | | |
| |
Trading Companies & Distributors—0.5% | | | |
W.W. Grainger, Inc. (a) | | | 100,000 | | | 8,752,000 |
| | | | | | |
Total Common Stock
(Identified Cost $1,023,647,367) | | | | | | 1,141,060,333 |
| | | | | | |
| | |
| Fixed Income—44.3% | | | | | | |
| Security Description | | Face
Amount | | Value* |
| | |
Aerospace & Defense—0.0% | | | | | | |
L-3 Communications Corp.
6.375%, 10/15/15 | | $ | 75,000 | | | 73,875 |
| | | | | | |
| | |
Asset Backed—0.8% | | | | | | |
Amortizing Residential Collateral Trust
5.965%, 06/25/32 (c) | | | 248,607 | | | 112,326 |
*See accompanying notes to financial statements.
MSF-6
Metropolitan Series Fund, Inc.
BlackRock Diversified Portfolio
Schedule of Investments as of December 31, 2007
Fixed Income—(Continued)
| | | | | | |
| Security Description | | Face
Amount | | Value* |
| | | | | | |
| | |
Asset Backed—(Continued) | | | | | | |
Ares VIII CLO, Ltd. (144A)
7.665%, 02/26/16 (c) | | $ | 1,150,000 | | $ | 1,123,780 |
Chase Issuance Trust
5.120%, 10/15/14 | | | 4,500,000 | | | 4,608,837 |
Countrywide Asset-Backed Certificates
6.590%, 12/25/31 (c) | | | 101,994 | | | 92,597 |
Ford Credit Auto Owner Trust
5.070%, 12/15/10 | | | 4,150,000 | | | 4,178,590 |
GE Business Loan Trust (144A)
6.328%, 04/15/31 (c) | | | 545,924 | | | 530,153 |
Hedged Mutual Fund Fee Trust (144A)
5.220%, 11/30/10 | | | 38,852 | | | 38,464 |
Home Equity Asset Trust
4.975%, 07/25/37 (c) | | | 2,204,124 | | | 2,097,865 |
Knollwood CDO, Ltd. (144A)
8.322%, 02/08/39 (c) | | | 413,443 | | | 4,135 |
Long Beach Mortgage Loan Trust
5.965%, 03/25/34 (c) | | | 1,375,000 | | | 1,038,020 |
Structured Asset Investment Loan Trust
7.790%, 04/25/33 (c) | | | 40,741 | | | 26,122 |
| | | | | | |
| | | | | | 13,850,889 |
| | | | | | |
| | |
Biotechnology—0.0% | | | | | | |
Bio-Rad Laboratories, Inc.
7.500%, 08/15/13 | | | 375,000 | | | 378,750 |
| | | | | | |
| | |
Capital Markets—1.6% | | | | | | |
Lehman Brothers Holdings Capital Trust V
5.857%, 11/29/49 (c) | | | 305,000 | | | 271,831 |
Lehman Brothers Holdings, Inc.
5.170%, 05/25/10 (c) | | | 3,375,000 | | | 3,244,307 |
5.250%, 02/06/12 | | | 1,310,000 | | | 1,296,229 |
5.500%, 04/04/16 | | | 975,000 | | | 932,923 |
6.750%, 12/28/17 | | | 2,075,000 | | | 2,138,700 |
7.000%, 09/27/27 | | | 1,110,000 | | | 1,126,598 |
Morgan Stanley
5.050%, 01/21/11 | | | 1,580,000 | | | 1,579,823 |
5.493%, 01/09/12 (c) | | | 8,540,000 | | | 8,252,962 |
6.250%, 08/28/17 | | | 2,050,000 | | | 2,084,036 |
6.750%, 04/15/11 | | | 550,000 | | | 576,478 |
The Bear Stearns Cos., Inc.
5.599%, 07/19/10 (c) | | | 790,000 | | | 742,435 |
6.400%, 10/02/17 | | | 1,500,000 | | | 1,449,240 |
6.950%, 08/10/12 | | | 2,165,000 | | | 2,226,053 |
The Goldman Sachs Group, Inc.
5.250%, 10/15/13 | | | 3,620,000 | | | 3,621,242 |
| | | | | | |
| | | | | | 29,542,857 |
| | | | | | |
| | |
Chemicals—0.0% | | | | | | |
Momentive Performance Materials, Inc. (144A) 10.125%, 12/01/14 | | | 340,000 | | | 311,100 |
| | | | | | |
| | |
Commercial Banks—1.0% | | | | | | |
Barclays Bank, Plc.
7.434%, 09/29/49 (c) | | | 2,585,000 | | | 2,686,205 |
| | | | | | |
| Security Description | | Face
Amount | | Value* |
| | | | | | |
| | |
Commercial Banks—(Continued) | | | | | | |
JPMorgan Chase Bank, N.A.
6.000%, 07/05/17 | | $ | 2,500,000 | | $ | 2,531,558 |
NationsBank Corp.
7.800%, 09/15/16 | | | 925,000 | | | 1,048,436 |
Royal Bank of Scotland Group, Plc.
7.640%, 03/31/49 (c) | | | 2,000,000 | | | 2,056,186 |
UBS AG Stamford Branch
5.875%, 12/20/17 | | | 3,375,000 | | | 3,398,777 |
Wachovia Bank, N.A.
6.000%, 11/15/17 | | | 2,050,000 | | | 2,063,698 |
6.600%, 01/15/38 | | | 2,150,000 | | | 2,160,793 |
Wells Fargo & Co.
4.200%, 01/15/10 | | | 855,000 | | | 849,598 |
4.625%, 08/09/10 | | | 1,710,000 | | | 1,711,325 |
4.875%, 01/12/11 | | | 590,000 | | | 597,932 |
| | | | | | |
| | | | | | 19,104,508 |
| | | | | | |
| |
Commercial Mortgage-Backed Securities—9.5% | | | |
Banc of America Commercial Mortgage, Inc.
4.871%, 11/10/42 (c) | | | 3,630,000 | | | 3,622,346 |
5.118%, 07/11/43 | | | 5,365,000 | | | 5,427,718 |
7.333%, 10/15/09 | | | 3,785,000 | | | 3,912,432 |
Bear Stearns Commercial Mortgage Securities, Inc.
4.361%, 06/11/41 | | | 2,377,183 | | | 2,363,971 |
4.674%, 06/11/41 | | | 930,000 | | | 888,715 |
5.742%, 09/11/42 (c) | | | 3,875,000 | | | 3,969,568 |
5.920%, 10/15/36 | | | 1,263,436 | | | 1,284,643 |
6.007%, 06/25/47 (c) | | | 4,714,723 | | | 4,650,581 |
Chase Commercial Mortgage Securities Corp.
7.319%, 10/15/32 | | | 1,575,000 | | | 1,659,996 |
Citigroup Mortgage Loan Trust, Inc.
5.700%, 06/10/17 (c) | | | 1,750,000 | | | 1,754,637 |
Citigroup/Deutsche Bank Commercial
Mortgage Trust
5.886%, 11/15/44 | | | 1,750,000 | | | 1,808,389 |
CitiMortgage Alternative Loan Trust
6.000%, 10/25/37 | | | 4,612,758 | | | 4,592,577 |
Cobalt Commercial Mortgage Trust
5.820%, 05/15/46 (c) | | | 2,525,000 | | | 2,614,654 |
Commercial Mortgage Pass Through Certificates
5.816%, 12/10/49 (c) | | | 4,310,000 | | | 4,466,510 |
Countrywide Home Loan Mortgage Pass
Through Trust
6.500%, 10/25/37 | | | 2,533,421 | | | 2,568,060 |
Credit Suisse Mortgage Capital Certificates
5.311%, 12/15/39 | | | 4,000,000 | | | 3,986,089 |
CS First Boston Mortgage Securities Corp.
3.936%, 05/15/38 (c) | | | 4,000,000 | | | 3,817,588 |
4.940%, 12/15/35 | | | 4,405,000 | | | 4,409,691 |
5.183%, 11/15/36 | | | 2,890,000 | | | 2,925,396 |
5.603%, 07/15/35 | | | 3,850,000 | | | 3,961,981 |
7.325%, 04/15/62 | | | 448,474 | | | 450,114 |
First Union National Bank Commercial Mortgage
6.663%, 01/12/43 | | | 3,710,000 | | | 3,903,983 |
*See accompanying notes to financial statements.
MSF-7
Metropolitan Series Fund, Inc.
BlackRock Diversified Portfolio
Schedule of Investments as of December 31, 2007
Fixed Income—(Continued)
| | | | | | |
| Security Description | | Face
Amount | | Value* |
| | | | | | |
|
Commercial Mortgage-Backed Securities—(Continued) |
First Union National Bank Commercial Mortgage Trust (144A)
7.793%, 12/15/31 (c) | | $ | 3,700,000 | | $ | 3,903,714 |
G.S. Mortgage Securities Corp. II
5.560%, 11/10/39 (c) | | | 1,455,000 | | | 1,477,690 |
GE Capital Commercial Mortgage Corp.
4.578%, 06/10/48 | | | 3,480,000 | | | 3,409,052 |
4.996%, 12/10/37 | | | 4,340,000 | | | 4,375,594 |
6.269%, 12/10/35 | | | 3,440,000 | | | 3,622,149 |
GMAC Commercial Mortgage Securities, Inc.
7.455%, 08/16/33 | | | 3,072,992 | | | 3,240,018 |
Greenwich Capital Commercial Funding Corp.
5.301%, 04/10/37 (c) | | | 1,120,000 | | | 1,056,602 |
5.911%, 07/10/38 (c) | | | 3,280,000 | | | 3,427,726 |
GSR Mortgage Loan Trust
5.251%, 11/25/35 (c) | | | 2,090,055 | | | 2,018,177 |
Harborview Mortgage Loan Trust
5.275%, 11/19/35 (c) | | | 1,987,457 | | | 1,860,178 |
JPMorgan Chase Commercial Mortgage Securities Corp.
5.336%, 05/15/47 | | | 1,835,000 | | | 1,828,159 |
5.432%, 08/25/35 (c) | | | 10,773,334 | | | 10,475,235 |
5.804%, 06/15/49 (c) | | | 1,700,000 | | | 1,737,582 |
5.827%, 02/15/51 (c) | | | 1,390,000 | | | 1,418,154 |
JPMorgan Commercial Mortgage Finance Corp. 6.658%, 10/15/35 (c) | | | 175,000 | | | 176,534 |
7.351%, 09/15/29 | | | 1,503,303 | | | 1,543,640 |
JPMorgan Mortgage Trust
3.887%, 08/25/34 (c) | | | 4,201,708 | | | 4,160,926 |
LB-UBS Commercial Mortgage Trust
3.636%, 08/15/08 | | | 1,626,327 | | | 1,612,345 |
4.023%, 09/15/26 | | | 1,273,527 | | | 1,263,277 |
4.071%, 09/15/26 | | | 1,596,338 | | | 1,580,350 |
5.372%, 09/15/39 | | | 1,570,000 | | | 1,575,408 |
5.430%, 02/15/40 (c) | | | 2,800,000 | | | 2,812,339 |
5.642%, 12/15/25 (c) | | | 2,103,609 | | | 2,130,185 |
5.866%, 09/15/45 | | | 3,850,000 | | | 3,982,409 |
5.934%, 12/15/25 | | | 1,600,000 | | | 1,631,598 |
7.950%, 05/15/25 (c) | | | 3,602,566 | | | 3,804,301 |
LB-UBS Commercial Mortgage Trust (144A)
6.155%, 07/14/16 | | | 2,492,844 | | | 2,565,687 |
Morgan Stanley Capital I
5.633%, 04/12/49 (c) | | | 620,000 | | | 629,815 |
5.803%, 06/11/42 (c) | | | 5,925,000 | | | 6,079,315 |
5.809%, 12/12/49 | | | 2,345,000 | | | 2,398,744 |
5.882%, 06/11/49 (c) | | | 4,550,000 | | | 4,739,341 |
6.630%, 07/15/30 | | | 1,025,000 | | | 1,025,076 |
Salomon Brothers Mortgage Securities VII, Inc.
6.499%, 10/13/11 | | | 3,920,000 | | | 4,120,426 |
Wachovia Bank Commercial Mortgage Trust
5.678%, 05/15/46 (c) | | | 3,115,000 | | | 3,176,901 |
5.903%, 02/15/51 | | | 1,895,000 | | | 1,978,618 |
WaMu Mortgage Pass-Through Certificates
5.670%, 03/25/37 (c) | | | 6,106,640 | | | 6,132,596 |
| | | | | | |
| Security Description | | Face
Amount | | Value* |
| | | | | | |
|
Commercial Mortgage-Backed Securities—(Continued) |
Wells Fargo Mortgage Backed Securities Trust
5.773%, 09/25/36 | | $ | 1,622,523 | | $ | 1,624,812 |
| | | | | | |
| | | | | | 173,634,312 |
| | | | | | |
| | |
Computers & Peripherals—0.1% | | | | | | |
IBM Corp.
5.700%, 09/14/17 | | | 1,420,000 | | | 1,467,942 |
| | | | | | |
|
Consumer Finance—0.1% |
SLM Corp.
5.125%, 08/27/12 | | | 1,700,000 | | | 1,520,543 |
5.400%, 10/25/11 | | | 890,000 | | | 811,142 |
| | | | | | |
| | | | | | 2,331,685 |
| | | | | | |
|
Containers & Packaging—0.0% |
Ball Corp.
6.875%, 12/15/12 | | | 530,000 | | | 537,950 |
| | | | | | |
|
Diversified Financial Services—2.2% |
AES Ironwood, LLC
8.857%, 11/30/25 | | | 123,480 | | | 135,210 |
AES Red Oak, LLC
9.200%, 11/30/29 | | | 50,000 | | | 55,500 |
Bank of America Corp.
5.300%, 03/15/17 | | | 975,000 | | | 948,067 |
5.750%, 12/01/17 | | | 4,470,000 | | | 4,480,254 |
6.000%, 09/01/17 | | | 825,000 | | | 842,879 |
6.100%, 06/15/17 | | | 1,600,000 | | | 1,635,182 |
Citigroup Capital XXI
8.300%, 12/21/57 (c) | | | 2,230,000 | | | 2,328,546 |
Citigroup, Inc.
4.125%, 02/22/10 | | | 2,000,000 | | | 1,970,734 |
5.300%, 10/17/12 | | | 4,075,000 | | | 4,128,016 |
6.125%, 08/25/36 | | | 125,000 | | | 118,311 |
Compton Petroleum Finance Corp.
7.625%, 12/01/13 | | | 35,000 | | | 32,550 |
Credit Suisse Guernsey, Ltd.
5.860%, 05/29/49 (c) | | | 2,460,000 | | | 2,202,187 |
Gaz Capital for Gazprom (144A)
7.288%, 08/16/37 | | | 1,060,000 | | | 1,069,858 |
General Electric Capital Corp.
5.000%, 11/15/11 | | | 7,320,000 | | | 7,408,675 |
5.000%, 04/10/12 | | | 1,080,000 | | | 1,093,301 |
6.150%, 08/01/37 | | | 1,610,000 | | | 1,710,511 |
6.375%, 11/15/67 (c) | | | 1,700,000 | | | 1,755,219 |
Goldman Sachs Capital II
5.793%, 12/29/49 (c) | | | 1,510,000 | | | 1,344,391 |
JPMorgan Chase Capital
6.800%, 10/01/37 | | | 4,675,000 | | | 4,494,877 |
Mellon Capital
6.244%, 06/29/49 (c) | | | 900,000 | | | 835,311 |
Telecom Italia Capital S.A.
5.250%, 10/01/15 | | | 975,000 | | | 949,893 |
*See accompanying notes to financial statements.
MSF-8
Metropolitan Series Fund, Inc.
BlackRock Diversified Portfolio
Schedule of Investments as of December 31, 2007
Fixed Income—(Continued)
| | | | | | |
| Security Description | | Face
Amount | | Value* |
| | | | | | |
|
Diversified Financial Services—(Continued) |
Wind Acquisition Finance S.A. (144A)
10.750%, 12/01/15 | | $ | 295,000 | | $ | 321,550 |
ZFS Finance USA Trust I (144A)
6.500%, 05/09/37 (c) | | | 900,000 | | | 830,869 |
| | | | | | |
| | | | | | 40,691,891 |
| | | | | | |
|
Diversified Telecommunication Services—0.2% |
AT&T, Inc.
6.500%, 09/01/37 | | | 2,850,000 | | | 2,980,182 |
Cincinnati Bell, Inc.
7.250%, 07/15/13 | | | 50,000 | | | 50,125 |
GTE Corp.
6.940%, 04/15/28 | | | 100,000 | | | 107,115 |
Qwest Communications International, Inc.
7.500%, 02/15/14 (a) | | | 315,000 | | | 314,212 |
Qwest Communications International, Inc. (Series B)
7.500%, 02/15/14 | | | 155,000 | | | 154,613 |
Qwest Corp.
8.241%, 06/15/13 (c) | | | 285,000 | | | 290,700 |
Windstream Corp.
8.125%, 08/01/13 | | | 410,000 | | | 424,350 |
8.625%, 08/01/16 | | | 170,000 | | | 178,500 |
| | | | | | |
| | | | | | 4,499,797 |
| | | | | | |
| | |
Electric Utilities—0.3% | | | | | | |
CenterPoint Energy, Inc.
7.250%, 09/01/10 | | | 345,000 | | | 365,582 |
Elwood Energy, LLC
8.159%, 07/05/26 | | | 123,978 | | | 123,936 |
Florida Power & Light Co.
5.625%, 04/01/34 | | | 300,000 | | | 290,504 |
MidAmerican Energy Holdings Co.
5.950%, 05/15/37 | | | 1,125,000 | | | 1,091,225 |
6.500%, 09/15/37 (c) | | | 725,000 | | | 757,107 |
PECO Energy Co.
4.750%, 10/01/12 | | | 650,000 | | | 643,195 |
Texas Competitive Electric Holdings Co. LLC.
10.250%, 11/01/15 | | | 1,365,000 | | | 1,351,350 |
| | | | | | |
| | | | | | 4,622,899 |
| | | | | | |
| | |
Energy Equipment & Services—0.0% | | | | | | |
Colorado Interstate Gas Co.
6.800%, 11/15/15 | | | 90,000 | | | 93,686 |
Tennessee Gas Pipeline Co.
7.000%, 10/15/28 (a) | | | 190,000 | | | 191,802 |
| | | | | | |
| | | | | | 285,488 |
| | | | | | |
| | |
Federal Agencies—25.8% | | | | | | |
Federal Home Loan Mortgage Corp.
1.523%, 09/15/33 (c) (d) | | | 37,770,693 | | | 2,663,631 |
3.914%, 06/01/34 (c) | | | 6,077,258 | | | 6,016,418 |
4.500%, 05/01/18 | | | 4,028,916 | | | 3,965,243 |
4.500%, 05/01/19 | | | 1,558,241 | | | 1,531,595 |
| | | | | | |
| Security Description | | Face
Amount | | Value* |
| | | | | | |
| | |
Federal Agencies—(Continued) | | | | | | |
4.500%, 12/01/19 | | $ | 660,958 | | $ | 649,656 |
4.500%, 03/01/20 | | | 770,796 | | | 757,458 |
4.500%, 04/01/20 | | | 252,743 | | | 248,369 |
4.500%, 05/01/20 | | | 159,902 | | | 157,135 |
4.500%, 08/01/20 | | | 2,365,240 | | | 2,324,795 |
4.500%, 01/01/21 | | | 978,087 | | | 961,162 |
5.000%, 12/15/17 | | | 4,340,000 | | | 4,340,227 |
5.000%, 12/01/18 | | | 554,386 | | | 555,752 |
5.000%, 04/01/20 | | | 481,336 | | | 481,809 |
5.000%, 10/01/20 | | | 659,815 | | | 660,462 |
5.000%, 11/01/20 | | | 6,885,589 | | | 6,892,344 |
5.000%, 06/01/36 | | | 958,708 | | | 935,626 |
5.000%, TBA | | | 9,000,000 | | | 9,008,442 |
5.125%, 11/17/17 (a) | | | 13,600,000 | | | 14,190,798 |
5.500%, 04/15/26 | | | 3,030,828 | | | 3,055,722 |
5.500%, 02/15/27 | | | 3,790,097 | | | 3,833,625 |
5.500%, 07/15/27 | | | 4,361,652 | | | 4,424,129 |
5.500%, 05/15/29 | | | 9,777,349 | | | 9,883,672 |
5.500%, 07/01/33 | | | 3,276,114 | | | 3,278,709 |
5.500%, 10/01/35 | | | 715,153 | | | 713,954 |
5.500%, 03/01/37 | | | 5,688,715 | | | 5,676,971 |
5.500%, 06/01/37 | | | 485,753 | | | 484,751 |
5.500%, TBA | | | 15,600,000 | | | 15,565,867 |
5.686%, 01/01/37 (c) | | | 2,929,027 | | | 2,974,356 |
5.748%, 04/01/37 (c) | | | 3,294,739 | | | 3,344,416 |
6.000%, TBA | | | 45,400,000 | | | 46,081,835 |
Federal National Mortgage Association
4.000%, 06/01/19 | | | 4,126,398 | | | 3,957,992 |
4.500%, 10/01/18 | | | 1,058,434 | | | 1,041,418 |
4.500%, 08/01/35 | | | 3,220,798 | | | 3,049,994 |
4.500%, TBA | | | 1,100,000 | | | 1,082,468 |
5.000%, 06/01/18 | | | 1,312,097 | | | 1,315,378 |
5.000%, 01/01/21 | | | 3,580,762 | | | 3,589,714 |
5.000%, 06/01/23 | | | 1,575,610 | | | 1,555,022 |
5.000%, 11/01/33 | | | 9,437,138 | | | 9,222,009 |
5.000%, 03/01/34 | | | 24,151,392 | | | 23,600,837 |
5.000%, 08/01/34 | | | 5,149,440 | | | 5,032,054 |
5.000%, 07/01/35 | | | 218,719 | | | 213,530 |
5.000%, 12/01/35 | | | 328,097 | | | 320,312 |
5.000%, 05/01/36 | | | 29,789,122 | | | 29,082,299 |
5.000%, 07/01/36 (d) | | | 6,308,892 | | | 1,342,844 |
5.125%, 01/02/14 | | | 1,350,000 | | | 1,398,180 |
5.375%, 06/12/17 (a) | | | 2,525,000 | | | 2,682,242 |
5.500%, 10/01/18 | | | 1,087,208 | | | 1,103,364 |
5.500%, 12/01/18 | | | 753,604 | | | 764,803 |
5.500%, 01/01/19 | | | 1,247,028 | | | 1,265,560 |
5.500%, 03/01/19 | | | 28,143 | | | 28,561 |
5.500%, 05/01/19 | | | 1,576,555 | | | 1,600,391 |
5.500%, 07/01/19 | | | 512,322 | | | 519,493 |
5.500%, 09/01/19 | | | 11,677,438 | | | 11,852,754 |
5.500%, 06/01/20 | | | 1,583,188 | | | 1,607,125 |
5.500%, 07/01/20 | | | 3,961,295 | | | 4,020,165 |
5.500%, 01/01/21 | | | 109,648 | | | 111,083 |
5.500%, 02/01/21 | | | 190,037 | | | 192,523 |
5.500%, 01/01/24 | | | 884,844 | | | 890,398 |
5.500%, 05/25/27 | | | 1,063,839 | | | 1,070,802 |
*See accompanying notes to financial statements.
MSF-9
Metropolitan Series Fund, Inc.
BlackRock Diversified Portfolio
Schedule of Investments as of December 31, 2007
Fixed Income—(Continued)
| | | | | | |
| Security Description | | Face
Amount | | Value* |
| | | | | | |
| | |
Federal Agencies—(Continued) | | | | | | |
Federal National Mortgage Association | | | | | | |
5.500%, 04/25/30 | | $ | 2,292,784 | | $ | 2,319,722 |
5.500%, 04/01/33 | | | 2,100,771 | | | 2,102,329 |
5.500%, 11/01/33 | | | 2,715,781 | | | 2,717,795 |
5.500%, 02/01/34 | | | 5,789,389 | | | 5,793,682 |
5.500%, 04/01/34 | | | 7,887,638 | | | 7,897,127 |
5.500%, 11/01/34 | | | 5,593,495 | | | 5,593,804 |
5.500%, 04/01/35 | | | 1,711,905 | | | 1,710,861 |
5.500%, 06/01/35 | | | 1,701,616 | | | 1,700,578 |
5.500%, 11/01/35 (d) | | | 5,106,836 | | | 1,235,787 |
5.500%, 12/01/35 | | | 8,775,384 | | | 8,773,350 |
5.500%, 01/01/36 | | | 14,222,857 | | | 14,214,181 |
5.500%, 01/25/36 (d) | | | 1,992,793 | | | 482,835 |
5.500%, 12/01/36 (c) | | | 16,647,086 | | | 16,625,626 |
6.000%, 04/01/16 | | | 462,692 | | | 474,263 |
6.000%, 03/01/21 | | | 166,210 | | | 170,196 |
6.000%, 05/01/21 | | | 913,872 | | | 935,786 |
6.000%, 06/01/21 | | | 95,431 | | | 97,720 |
6.000%, 07/01/21 | | | 1,291,886 | | | 1,322,866 |
6.000%, 08/01/21 | | | 1,481,489 | | | 1,517,015 |
6.000%, 02/01/34 | | | 2,537,313 | | | 2,581,691 |
6.000%, 08/01/34 | | | 1,504,994 | | | 1,531,317 |
6.000%, 04/01/35 | | | 6,011,068 | | | 6,124,010 |
6.000%, 02/01/36 | | | 1,724,560 | | | 1,751,624 |
6.000%, 05/01/36 | | | 2,361,176 | | | 2,398,231 |
6.000%, 06/01/36 | | | 4,355,635 | | | 4,423,991 |
6.000%, 07/01/36 | | | 7,934,517 | | | 8,059,038 |
6.000%, 09/01/36 | | | 5,258,781 | | | 5,341,310 |
6.000%, 10/01/36 | | | 4,874,293 | | | 4,950,788 |
6.000%, 09/01/37 | | | 562,351 | | | 571,100 |
6.000%, 10/01/37 | | | 3,986,852 | | | 4,046,390 |
6.000%, TBA | | | 11,100,000 | | | 11,269,963 |
6.500%, 01/01/14 | | | 380,210 | | | 394,031 |
6.500%, 08/01/16 | | | 2,110 | | | 2,184 |
6.500%, 09/01/16 | | | 348,240 | | | 360,586 |
6.500%, 02/01/17 | | | 64,582 | | | 66,871 |
6.500%, 12/01/29 (c) | | | 936,316 | | | 972,188 |
6.500%, 08/01/36 | | | 877,537 | | | 902,145 |
6.500%, 09/01/36 | | | 1,560,164 | | | 1,603,915 |
6.500%, TBA | | | 31,500,000 | | | 32,376,078 |
8.500%, 02/01/09 | | | 9,164 | | | 9,259 |
9.000%, 04/01/16 | | | 691 | | | 714 |
Government National Mortgage Association
5.000%, 10/20/33 | | | 5,767,112 | | | 5,634,039 |
5.500%, 04/15/33 | | | 431,695 | | | 435,067 |
5.500%, TBA | | | 3,000,000 | | | 3,010,781 |
6.000%, 02/15/09 | | | 28,848 | | | 29,042 |
6.000%, 09/20/33 | | | 910,326 | | | 930,024 |
6.000%, 10/20/33 | | | 1,474,704 | | | 1,510,432 |
6.000%, 11/20/33 | | | 2,017,434 | | | 2,061,089 |
6.000%, TBA | | | 24,400,000 | | | 24,884,189 |
6.500%, 07/15/14 | | | 24,588 | | | 25,483 |
7.500%, 12/15/14 | | | 473,071 | | | 495,352 |
| | | | | | |
| | | | | | 473,610,689 |
| | | | | | |
| | | | | | |
| Security Description | | Face
Amount | | Value* |
| | | | | | |
| | |
Food Products—0.2% | | | | | | |
Kraft Foods, Inc.
6.125%, 02/01/18 | | $ | 1,950,000 | | $ | 1,964,908 |
6.500%, 08/11/17 | | | 1,830,000 | | | 1,893,219 |
| | | | | | |
| | | | | | 3,858,127 |
| | | | | | |
| | |
Foreign Government—1.0% | | | | | | |
Argentina Government International Bond
5.475%, 08/03/12 (c) | | | 2,430,000 | | | 1,372,950 |
Colombia Government International Bond
7.375%, 09/18/37 (a) | | | 1,225,000 | | | 1,362,813 |
Emirate of Abu Dhabi (144A)
5.500%, 08/02/12 | | | 4,600,000 | | | 4,730,925 |
Federal Republic of Germany
4.250%, 07/04/39 (EUR) | | | 850,000 | | | 1,170,551 |
Israel Government AID Bond
5.500%, 12/04/23 | | | 3,175,000 | | | 3,418,776 |
Japan 15 Year Government Bond
1.170%, 11/20/21 (JPY) (c) | | | 715,000,000 | | | 6,380,443 |
Peruvian Government International Bond
6.550%, 03/14/37 | | | 525,000 | | | 548,625 |
| | | | | | |
| | | | | | 18,985,083 |
| | | | | | |
| |
Health Care Providers & Services—0.0% | | | |
WellPoint, Inc.
5.950%, 12/15/34 | | | 700,000 | | | 658,910 |
| | | | | | |
| | |
Hotels, Restaurants & Leisure—0.1% | | | | | | |
Caesars Entertainment, Inc.
7.875%, 03/15/10 (a) | | | 950,000 | | | 893,000 |
| | | | | | |
|
Independent Power Producers & Energy Traders—0.0% |
NRG Energy, Inc.
7.375%, 02/01/16 | | | 170,000 | | | 165,750 |
| | | | | | |
| | |
Insurance—0.2% | | | | | | |
Chubb Corp.
6.375%, 03/29/67 (c) | | | 1,100,000 | | | 1,072,953 |
Lincoln National Corp.
6.050%, 04/20/67 | | | 675,000 | | | 630,152 |
7.000%, 05/17/66 (c) | | | 640,000 | | | 642,575 |
The Progressive Corp.
6.700%, 06/15/37 (c) | | | 1,040,000 | | | 965,504 |
The Travelers Cos., Inc.
6.250%, 03/15/67 (c) | | | 735,000 | | | 689,273 |
| | | | | | |
| | | | | | 4,000,457 |
| | | | | | |
| | |
Media—0.4% | | | | | | |
Comcast Cable Communications Holdings, Inc.
8.375%, 03/15/13 | | | 650,000 | | | 729,224 |
Comcast Corp.
6.500%, 11/15/35 | | | 555,000 | | | 566,344 |
6.950%, 08/15/37 | | | 1,150,000 | | | 1,241,163 |
7.050%, 03/15/33 | | | 275,000 | | | 300,400 |
*See accompanying notes to financial statements.
MSF-10
Metropolitan Series Fund, Inc.
BlackRock Diversified Portfolio
Schedule of Investments as of December 31, 2007
Fixed Income—(Continued)
| | | | | | |
| Security Description | | Face
Amount | | Value* |
| | | | | | |
| | |
Media—(Continued) | | | | | | |
CSC Holdings, Inc.
8.125%, 07/15/09 | | $ | 135,000 | | $ | 137,194 |
Idearc, Inc.
8.000%, 11/15/16 | | | 305,000 | | | 279,837 |
News America, Inc.
6.200%, 12/15/34 | | | 640,000 | | | 630,905 |
TCI Communications, Inc.
7.875%, 02/15/26 | | | 1,300,000 | | | 1,469,069 |
Time Warner Entertainment Co., L.P.
8.375%, 03/15/23 | | | 350,000 | | | 412,263 |
Time Warner, Inc.
6.875%, 05/01/12 | | | 1,875,000 | | | 1,974,392 |
| | | | | | |
| | | | | | 7,740,791 |
| | | | | | |
| | |
Metals & Mining—0.1% | | | | | | |
Freeport-McMoRan Copper & Gold, Inc.
8.250%, 04/01/15 | | | 485,000 | | | 514,100 |
8.375%, 04/01/17 | | | 965,000 | | | 1,034,962 |
Ispat Inland, U.L.C.
9.750%, 04/01/14 | | | 155,000 | | | 167,937 |
| | | | | | |
| | | | | | 1,716,999 |
| | | | | | |
| | |
Office Electronics—0.1% | | | | | | |
Xerox Corp.
6.875%, 08/15/11 | | | 975,000 | | | 1,019,976 |
| | | | | | |
| | |
Oil, Gas & Consumable Fuels—0.2% | | | | | | |
KCS Energy, Inc.
7.125%, 04/01/12 | | | 70,000 | | | 67,375 |
Newfield Exploration Co.
6.625%, 09/01/14 | | | 395,000 | | | 391,050 |
6.625%, 04/15/16 | | | 375,000 | | | 367,500 |
Petrobras International Finance Co.
5.875%, 03/01/18 | | | 570,000 | | | 566,865 |
Sabine Pass LNG, L.P.
7.500%, 11/30/16 | | | 700,000 | | | 668,500 |
Transocean, Inc.
6.800%, 03/15/38 | | | 550,000 | | | 561,191 |
XTO Energy, Inc.
6.750%, 08/01/37 | | | 900,000 | | | 965,367 |
| | | | | | |
| | | | | | 3,587,848 |
| | | | | | |
| | |
Pharmaceuticals—0.1% | | | | | | |
Bristol-Myers Squibb Co.
5.875%, 11/15/36 | | | 950,000 | | | 944,039 |
| | | | | | |
| | |
Real Estate Investment Trusts—0.1% | | | | | | |
The Rouse Co.
5.375%, 11/26/13 | | | 1,635,000 | | | 1,412,061 |
The Rouse Co., L.P./TRC Co-Issuer, Inc. (144A)
6.750%, 05/01/13 | | | 350,000 | | | 325,130 |
| | | | | | |
| | | | | | 1,737,191 |
| | | | | | |
|
Real Estate Management & Development—0.0% |
American Real Estate Partners, L.P.
8.125%, 06/01/12 | | | 145,000 | | | 140,469 |
| | | | | | |
| | | | | | | |
| Security Description | | Face
Amount | | Value* | |
| | | | | | | |
|
Wireless Telecommunication Services—0.2% | |
Rogers Wireless, Inc.
7.500%, 03/15/15 | | $ | 240,000 | | $ | 262,461 | |
Sprint Nextel Corp.
6.000%, 12/01/16 | | | 825,000 | | | 790,179 | |
Telefonica Emisiones, S.A.U.
7.045%, 06/20/36 | | | 1,025,000 | | | 1,145,731 | |
Vodafone Group, Plc.
7.750%, 02/15/10 | | | 665,000 | | | 701,501 | |
| | | | | | | |
| | | | | | 2,899,872 | |
| | | | | | | |
| | |
Yankee—0.0% | | | | | | | |
Vodafone Group, Plc.
6.150%, 02/27/37 | | | 650,000 | | | 641,953 | |
| | | | | | | |
Total Fixed Income
(Identified Cost $807,509,359) | | | | | | 813,935,097 | |
| | | | | | | |
| | |
| Preferred Stock—0.9% | | | | | | | |
| Security Description | | Shares | | Value* | |
| | |
Commercial Banks—0.4% | | | | | | | |
Wachovia Corp. | | | 250,000 | | | 6,325,000 | |
| | | | | | | |
|
Thrifts & Mortgage Finance—0.5% | |
Federal Home Loan Mortgage Corp. | | | 151,400 | | | 3,959,110 | |
Federal National Mortgage Association | | | 211,950 | | | 5,457,713 | |
| | | | | | | |
| | | | | | 9,416,823 | |
| | | | | | | |
Total Preferred Stock
(Identified Cost $15,333,750) | | | | | | 15,741,823 | |
| | | | | | | |
|
| Short Term Investments—2.3% | |
| Security Description | | Face Amount/
Shares | | Value* | |
| | |
Discount Notes—0.2% | | | | | | | |
Federal Home Loan Bank
4.150%, 01/14/08 | | $ | 3,100,000 | | | 3,096,362 | |
| | | | | | | |
| | |
Mutual Funds—2.0% | | | | | | | |
State Street Navigator Securities Lending Prime Portfolio (e) | | | 37,347,032 | | | 37,347,032 | |
| | | | | | | |
| | |
Repurchase Agreement—0.1% | | | | | | | |
State Street Repurchase Agreement dated
12/31/07 at 1.200% to be repurchased at $1,089,073 on 1/02/08, collateralized by $785,000 U.S. Treasury Bond 9.125% due 5/15/18 with a value of $1,117,644. | | | 1,089,000 | | | 1,089,000 | |
| | | | | | | |
Total Short Term Investments
(Identified Cost $41,532,394) | | | | | | 41,532,394 | |
| | | | | | | |
Total Investments—109.7%
(Identified Cost $1,888,022,870) (f) | | | | | | 2,012,269,647 | |
Liabilities in excess of other assets | | | | | | (177,285,304 | ) |
| | | | | | | |
| Total Net Assets—100% | | | | | $ | 1,834,984,343 | |
| | | | | | | |
*See accompanying notes to financial statements.
MSF-11
Metropolitan Series Fund, Inc.
BlackRock Diversified Portfolio
Schedule of Investments as of December 31, 2007
| (a) | A portion or all of the security was held on loan. As of December 31, 2007, the market value of securities loaned was $69,259,715 and the collateral received consisted of cash in the amount of $37,347,032 and non cash collateral with a value of $33,771,958. The cash collateral is invested in a money market fund managed by an affiliate of the custodian. The non cash collateral received consists primarily of government securities and bank letters of credit, and are held for the benefit of the Portfolio at the Portfolio’s custodian. |
| (c) | Variable or Floating Rate Security. Rate disclosed is as of December 31, 2007. |
| (d) | Interest Only Certificate. This security receives monthly interest payments but is not entitled to principal payments. |
| (e) | Represents investment of cash collateral received from securities lending transactions. |
| (f) | The aggregate cost of investments for federal income tax purposes as of December 31, 2007 was $1,890,884,625 and the composition of unrealized appreciation and depreciation of investment securities was $158,227,125 and $(36,842,103), respectively. |
| (144A)— | Securities exempt from registration under Rule 144A of the Securities Act of 1933. These securities may be resold in transactions exempt from registration, normally to qualified institutional buyers. As of December 31, 2007, the market value of 144A securities was $15,755,365, which is 0.9% of total net assets. |
| (TBA)— | A contract for the purchase or sale of a Mortgage Backed Security to be delivered at a future date but does not include a specified pool or precise amount to be delivered. |
Forward Contracts
| | | | | | | | | | | | | | |
Forward Currency Contracts | | Delivery Date | | Local
Currency
Amount | | Aggregate
Face
Value | | Valuation as of
12/31/2007 | | Unrealized
Appreciation/
Depreciation | |
Euro (Sold) | | 1/23/2008 | | 1,767,500 | | $ | 2,504,548 | | $ | 2,581,509 | | $ | (76,961 | ) |
Euro (Bought) | | 1/23/2008 | | 982,825 | | | 1,457,297 | | | 1,435,458 | | | (21,839 | ) |
Mexican Peso (Sold) | | 1/23/2008 | | 866,732 | | | 80,474 | | | 79,241 | | | 1,233 | |
Mexican Peso (Sold) | | 1/23/2008 | | 38,276,968 | | | 3,520,174 | | | 3,499,499 | | | 20,675 | |
Mexican Peso (Bought) | | 1/23/2008 | | 39,143,700 | | | 3,624,417 | | | 3,578,741 | | | (45,676 | ) |
| | | | | | | | | | | | | | |
Net Unrealized Depreciation | | $ | (122,568 | ) |
| | | | | | | | | | | | | | |
Futures Contracts
| | | | | | | | | | | | | | | | | |
Futures Contracts—Long | | Expiration Date | | Number of
Contracts | | | Contract
Amount | | | Valuation as of
12/31/2007 | | | Unrealized
Appreciation/
Depreciation | |
Euribor Futures | | 3/17/2008 | | 56 | | | $ | 19,530,414 | | | $ | 19,512,743 | | | $ | (17,671 | ) |
Eurodollar Futures | | 6/16/2008 | | 73 | | | | 17,284,805 | | | | 17,566,538 | | | | 281,733 | |
Eurodollar Futures | | 9/15/2008 | | 101 | | | | 24,360,837 | | | | 24,368,775 | | | | 7,938 | |
Eurodollar Futures | | 12/15/2008 | | 271 | | | | 64,322,303 | | | | 65,466,825 | | | | 1,144,522 | |
German Government Bond 5 Year Futures | | 3/6/2008 | | 77 | | | | 12,314,347 | | | | 12,133,791 | | | | (180,556 | ) |
German Government Bond 10 Year Futures | | 3/6/2008 | | 108 | | | | 18,231,584 | | | | 17,833,974 | | | | (397,610 | ) |
U.S. Treasury Bonds Futures | | 3/19/2008 | | 265 | | | | 31,275,041 | | | | 30,839,375 | | | | (435,666 | ) |
U.S. Treasury Notes 5 Year Futures | | 3/31/2008 | | 199 | | | | 21,905,738 | | | | 21,945,969 | | | | 40,231 | |
| | | | | |
Futures Contracts—Short | | | | | | | | | | | | | | |
Eurodollar Futures | | 9/14/2009 | | (101 | ) | | | (24,328,241 | ) | | | (24,328,375 | ) | | | (134 | ) |
U.S. Treasury Notes 2 Year Futures | | 3/31/2008 | | (84 | ) | | | (17,661,963 | ) | | | (17,661,000 | ) | | | 963 | |
U.S. Treasury Notes 10 Year Futures | | 3/19/2008 | | (362 | ) | | | (41,014,306 | ) | | | (41,047,406 | ) | | | (33,100 | ) |
| | | | | | | | | | | | | | | | | |
Net Unrealized Appreciation | | | $ | 410,650 | |
| | | | | | | | | | | | | | | | | |
Written Options
| | | | | | | | | | | | | | | | |
Written Options—Calls | | Expiration Date | | Number of
Contracts | | | Premiums
Received | | | Valuation as of
12/31/2007 | | | Unrealized
Appreciation |
U.S. Treasury Notes 5 Year Futures 112 | | 2/22/2008 | | (68 | ) | | $ | (38,848 | ) | | $ | (29,750 | ) | | $ | 9,098 |
| | | | | | | | | | | | | | | | |
*See accompanying notes to financial statements.
MSF-12
Metropolitan Series Fund, Inc.
BlackRock Diversified Portfolio
Schedule of Investments as of December 31, 2007
TBA Sale Commitments
| | | | | | | |
Federal Agencies | | Face
Amount | | | Value | |
| Federal National Mortgage Association | | | | | | | |
5.000% (15 Year TBA) | | (4,800,000 | ) | | $ | (4,804,502 | ) |
5.000% (30 Year TBA) | | (54,000,000 | ) | | | (52,683,750 | ) |
5.500% (15 Year TBA) | | (15,100,000 | ) | | | (15,293,461 | ) |
5.500% (30 Year TBA) | | (46,100,000 | ) | | | (46,042,375 | ) |
5.500% (30 Year TBA) | | (15,600,000 | ) | | | (15,570,750 | ) |
6.000% (15 Year TBA) | | (3,900,000 | ) | | | (3,990,188 | ) |
| Government National Mortgage Association | | | | | | | |
5.500% (30 Year TBA) | | (400,000 | ) | | | (402,875 | ) |
| | | | | | | |
Total TBA Sale Commitments (Proceeds Cost $(138,655,873)) | | | $ | (138,787,901 | ) |
| | | | | | | |
*See accompanying notes to financial statements.
MSF-13
Metropolitan Series Fund, Inc.
BlackRock Diversified Portfolio
Statement of Assets & Liabilities
December 31, 2007
| | | | | | | |
Assets | | | | | | | |
Investments at value (a) (e) | | | | | $ | 2,012,269,647 | |
Foreign cash at value (b) | | | | | | 7,379,320 | |
Receivable for: | | | | | | | |
Securities sold | | | | | | 236,637,165 | |
Fund shares sold | | | | | | 129,374 | |
Accrued interest and dividends | | | | | | 6,189,234 | |
Foreign taxes | | | | | | 20,347 | |
Futures variation margin | | | | | | 103,694 | |
| | | | | | | |
Total Assets | | | | | | 2,262,728,781 | |
Liabilities | | | | | | | |
TBA sales commitments at value (c) | | $ | 138,787,901 | | | | |
Payable for: | | | | | | | |
Securities purchased | | | 249,318,863 | | | | |
Fund shares redeemed | | | 840,155 | | | | |
Open forward currency contracts-net | | | 122,568 | | | | |
Collateral for securities loaned | | | 37,347,032 | | | | |
Due to custodian bank | | | 112,299 | | | | |
Options written, at fair value (d) | | | 29,750 | | | | |
Interest (Short) | | | 406,676 | | | | |
Accrued expenses: | | | | | | | |
Management fees | | | 689,673 | | | | |
Service and distribution fees | | | 24,960 | | | | |
Other expenses | | | 64,561 | | | | |
| | | | | | | |
Total Liabilities | | | | | | 427,744,438 | |
| | | | | | | |
Net Assets | | | | | $ | 1,834,984,343 | |
| | | | | | | |
Net assets consists of: | | | | | | | |
Capital paid in | | | | | $ | 1,654,701,855 | |
Undistributed net investment income | | | | | | 42,985,221 | |
Accumulated net realized gains | | | | | | 12,898,292 | |
Unrealized appreciation on investments, foreign currency, futures contracts and options | | | | | | 124,398,975 | |
| | | | | | | |
Net Assets | | | | | $ | 1,834,984,343 | |
| | | | | | | |
| Computation of offering price: | | | | | | | |
Class A | | | | | | | |
Net asset value and redemption price per share ($1,688,043,894 divided by 92,875,948 shares outstanding) | | | | | $ | 18.18 | |
| | | | | | | |
Class B | | | | | | | |
Net asset value and redemption price per share ($75,109,092 divided by 4,155,073 shares outstanding) | | | | | $ | 18.08 | |
| | | | | | | |
Class E | | | | | | | |
Net asset value and redemption price per share ($71,831,357 divided by 3,961,798 shares outstanding) | | | | | $ | 18.13 | |
| | | | | | | |
(a) Identified cost of investments | | | | | $ | 1,888,022,870 | |
| | | | | | | |
(b) Identified cost of foreign cash | | | | | $ | 7,403,489 | |
| | | | | | | |
(c) Proceeds of TBA sales commitments | | | | | $ | (138,655,873 | ) |
| | | | | | | |
(d) Premiums received on written options | | | | | $ | (38,848 | ) |
| | | | | | | |
| (e) | Includes cash collateral for securities loaned of $37,347,032. |
Statement of Operations
For the Year Ended December 31, 2007
| | | | | | | | |
Investment Income | | | | | | | | |
Dividends | | | | | | $ | 16,595,597 | (a) |
Interest | | | | | | | 35,331,501 | (b) |
| | | | | | | | |
| | | | | | | 51,927,098 | |
Expenses | | | | | | | | |
Management fees | | $ | 8,131,030 | | | | | |
Service and distribution fees—Class B | | | 167,000 | | | | | |
Service and distribution fees—Class E | | | 111,634 | | | | | |
Directors’ fees and expenses | | | 23,669 | | | | | |
Custodian | | | 258,725 | | | | | |
Audit and tax services | | | 40,739 | | | | | |
Legal | | | 20,089 | | | | | |
Printing | | | 679,480 | | | | | |
Insurance | | | 27,418 | | | | | |
Miscellaneous | | | 25,384 | | | | | |
| | | | | | | | |
Total expenses | | | | | | | 9,485,168 | |
| | | | | | | | |
Net Investment Income | | | | | | | 42,441,930 | |
| | | | | | | | |
Realized and Unrealized Gain (Loss) | | | | | | | | |
| Realized gain (loss) on: | | | | | | | | |
Investments—net | | | 67,466,710 | | | | | |
Futures contracts—net | | | (3,074,075 | ) | | | | |
Foreign currency transactions—net | | | 119,206 | | | | | |
Options—net | | | (74,707 | ) | | | 64,437,134 | |
| | | | | | | | |
Change in unrealized appreciation (depreciation) on: | | | | | | | | |
Investments—net | | | (8,769,493 | ) | | | | |
Futures contracts—net | | | 2,052,530 | | | | | |
Foreign currency transactions—net | | | 290,785 | | | | | |
Options—net | | | 9,098 | | | | (6,417,080 | ) |
| | | | | | | | |
Net gain | | | | | | | 58,020,054 | |
| | | | | | | | |
Net Increase in Net Assets From Operations | | | | | | $ | 100,461,984 | |
| | | | | | | | |
| (a) | Net of foreign taxes of $1,628. |
| (b) | Includes net income on securities loaned of $371,077. |
See accompanying notes to financial statements.
MSF-14
Metropolitan Series Fund, Inc.
BlackRock Diversified Portfolio
Statements of Changes in Net Assets
| | | | | | | | |
| | | Year ended
December 31,
2007 | | | Year ended
December 31,
2006 | |
From Operations | | | | | | | | |
Net investment income | | $ | 42,441,930 | | | $ | 43,278,244 | |
Net realized gain | | | 64,437,134 | | | | 84,545,041 | |
Unrealized appreciation (depreciation) | | | (6,417,080 | ) | | | 47,082,108 | |
| | | | | | | | |
Increase in net assets from operations | | | 100,461,984 | | | | 174,905,393 | |
| | | | | | | | |
From Distributions to Shareholders | | | | | | | | |
Net investment income | | | | | | | | |
Class A | | | (40,533,989 | ) | | | (40,698,763 | ) |
Class B | | | (1,503,984 | ) | | | (1,066,750 | ) |
Class E | | | (1,827,170 | ) | | | (1,779,204 | ) |
| | | | | | | | |
Total distributions | | | (43,865,143 | ) | | | (43,544,717 | ) |
| | | | | | | | |
Increase (decrease) in net assets from capital share transactions | | | 22,239,497 | | | | (201,750,486 | ) |
| | | | | | | | |
Total increase (decrease) in net assets | | | 78,836,338 | | | | (70,389,810 | ) |
| | |
Net Assets | | | | | | | | |
Beginning of the period | | | 1,756,148,005 | | | | 1,826,537,815 | |
| | | | | | | | |
End of the period | | $ | 1,834,984,343 | | | $ | 1,756,148,005 | |
| | | | | | | | |
Undistributed Net Investment Income | | | | | | | | |
End of the period | | $ | 42,985,221 | | | $ | 43,549,629 | |
| | | | | | | | |
Other Information:
Capital Shares
Transactions in capital shares were as follows:
| | | | | | | | | | | | | | |
| | | Year ended
December 31, 2007 | | | Year ended
December 31, 2006 | |
| | | Shares | | | $ | | | Shares | | | $ | |
Class A | | | | | | | | | | | | | | |
Sales | | 15,428,384 | | | $ | 276,471,148 | | | 4,148,078 | | | $ | 69,010,042 | |
Reinvestments | | 2,270,812 | | | | 40,533,989 | | | 2,496,857 | | | | 40,698,763 | |
Redemptions | | (16,923,992 | ) | | | (303,258,831 | ) | | (18,942,461 | ) | | | (314,590,632 | ) |
| | | | | | | | | | | | | | |
Net increase (decrease) | | 775,204 | | | $ | 13,746,306 | | | (12,297,526 | ) | | $ | (204,881,827 | ) |
| | | | | | | | | | | | | | |
Class B | | | | | | | | | | | | | | |
Sales | | 1,483,082 | | | $ | 26,479,747 | | | 1,500,884 | | | $ | 24,829,662 | |
Reinvestments | | 84,589 | | | | 1,503,984 | | | 65,687 | | | | 1,066,750 | |
Redemptions | | (721,595 | ) | | | (12,859,245 | ) | | (765,003 | ) | | | (12,740,179 | ) |
| | | | | | | | | | | | | | |
Net increase | | 846,076 | | | $ | 15,124,486 | | | 801,568 | | | $ | 13,156,233 | |
| | | | | | | | | | | | | | |
Class E | | | | | | | | | | | | | | |
Sales | | 289,023 | | | $ | 5,161,012 | | | 339,111 | | | $ | 5,620,030 | |
Reinvestments | | 102,535 | | | | 1,827,170 | | | 109,288 | | | | 1,779,204 | |
Redemptions | | (761,913 | ) | | | (13,619,477 | ) | | (1,051,650 | ) | | | (17,424,126 | ) |
| | | | | | | | | | | | | | |
Net decrease | | (370,355 | ) | | $ | (6,631,295 | ) | | (603,251 | ) | | $ | (10,024,892 | ) |
| | | | | | | | | | | | | | |
Increase (decrease) derived from capital share transactions | | | | | $ | 22,239,497 | | | | | | $ | (201,750,486 | ) |
| | | | | | | | | | | | | | |
See accompanying notes to financial statements.
MSF-15
Metropolitan Series Fund, Inc.
BlackRock Diversified Portfolio
Financial Highlights
| | | | | | | | | | | | | | | | | | | | |
| | | Class A | |
| | | Year ended December 31, | |
| | | 2007 | | | 2006 | | | 2005 | | | 2004 | | | 2003 | |
Net Asset Value, Beginning of Period | | $ | 17.61 | | | $ | 16.33 | | | $ | 16.11 | | | $ | 15.13 | | | $ | 13.07 | |
| | | | | | | | | | | | | | | | | | | | |
Income From Investment Operations | | | | | | | | | | | | | | | | | | | | |
Net investment income | | | 0.41 | (a) | | | 0.46 | | | | 0.39 | | | | 0.32 | | | | 0.30 | |
Net realized and unrealized gain on investments | | | 0.62 | | | | 1.23 | | | | 0.09 | | | | 0.95 | | | | 2.30 | |
| | | | | | | | | | | | | | | | | | | | |
Total from investment operations | | | 1.03 | | | | 1.69 | | | | 0.48 | | | | 1.27 | | | | 2.60 | |
| | | | | | | | | | | | | | | | | | | | |
Less Distributions | | | | | | | | | | | | | | | | | | | | |
Distributions from net investment income | | | (0.46 | ) | | | (0.41 | ) | | | (0.26 | ) | | | (0.29 | ) | | | (0.54 | ) |
| | | | | | | | | | | | | | | | | | | | |
Total distributions | | | (0.46 | ) | | | (0.41 | ) | | | (0.26 | ) | | | (0.29 | ) | | | (0.54 | ) |
| | | | | | | | | | | | | | | | | | | | |
Net Asset Value, End of Period | | $ | 18.18 | | | $ | 17.61 | | | $ | 16.33 | | | $ | 16.11 | | | $ | 15.13 | |
| | | | | | | | | | | | | | | | | | | | |
Total Return (%) | | | 5.9 | | | | 10.5 | | | | 3.1 | | | | 8.5 | | | | 20.6 | |
Ratio of operating expenses to average net assets before expense reductions (%) | | | 0.50 | | | | 0.52 | | | | 0.50 | | | | 0.50 | | | | 0.51 | |
Ratio of operating expenses to average net assets after expense reductions (%) (b) | | | N/A | | | | 0.51 | | | | 0.49 | | | | 0.49 | | | | 0.50 | |
Ratio of net investment income to average net assets (%) | | | 2.32 | | | | 2.46 | | | | 2.22 | | | | 1.99 | | | | 2.00 | |
Portfolio turnover rate (%) | | | 372 | | | | 265 | | | | 443 | | | | 232 | | | | 211 | |
Net assets, end of period (000) | | $ | 1,688,044 | | | $ | 1,622,051 | | | $ | 1,705,344 | | | $ | 1,875,196 | | | $ | 1,922,067 | |
| | | | | | | | | | | | | | | | |
| | | Class B | |
| | | Year ended December 31, | |
| | | 2007 | | | 2006 | | | 2005 | | | 2004(c) | |
Net Asset Value, Beginning of Period | | $ | 17.52 | | | $ | 16.25 | | | $ | 16.03 | | | $ | 14.97 | |
| | | | | | | | | | | | | | | | |
Income From Investment Operations | | | | | | | | | | | | | | | | |
Net investment income | | | 0.37 | (a) | | | 0.34 | | | | 0.25 | | | | 0.11 | |
Net realized and unrealized gain on investments | | | 0.61 | | | | 1.30 | | | | 0.19 | | | | 0.95 | |
| | | | | | | | | | | | | | | | |
Total from investment operations | | | 0.98 | | | | 1.64 | | | | 0.44 | | | | 1.06 | |
| | | | | | | | | | | | | | | | |
Less Distributions | | | | | | | | | | | | | | | | |
Distributions from net investment income | | | (0.42 | ) | | | (0.37 | ) | | | (0.22 | ) | | | 0.00 | |
| | | | | | | | | | | | | | | | |
Total distributions | | | (0.42 | ) | | | (0.37 | ) | | | (0.22 | ) | | | 0.00 | |
| | | | | | | | | | | | | | | | |
Net Asset Value, End of Period | | $ | 18.08 | | | $ | 17.52 | | | $ | 16.25 | | | $ | 16.03 | |
| | | | | | | | | | | | | | | | |
Total Return (%) | | | 5.6 | | | | 10.3 | | | | 2.8 | | | | 7.1 | (d) |
Ratio of operating expenses to average net assets before expense reductions (%) | | | 0.75 | | | | 0.77 | | | | 0.75 | | | | 0.75 | (e) |
Ratio of operating expenses to average net assets after expense reductions (%) (b) | | | N/A | | | | 0.76 | | | | 0.74 | | | | 0.74 | (e) |
Ratio of net investment income to average net assets (%) | | | 2.07 | | | | 2.22 | | | | 2.01 | | | | 2.27 | (e) |
Portfolio turnover rate (%) | | | 372 | | | | 265 | | | | 443 | | | | 232 | |
Net assets, end of period (000) | | $ | 75,109 | | | $ | 57,973 | | | $ | 40,749 | | | $ | 20,413 | |
| (a) | Per share amount is based on average shares outstanding during the period. |
| (b) | The Portfolio has entered into arrangements with certain brokers who paid a portion of the Portfolio’s expenses. |
| (c) | Commencement of operations was April 26, 2004 for Class B. |
| (d) | Periods less than one year are not computed on an annualized basis. |
| (e) | Computed on an annualized basis. |
See accompanying notes to financial statements.
MSF-16
Metropolitan Series Fund, Inc.
BlackRock Diversified Portfolio
Financial Highlights
| | | | | | | | | | | | | | | | | | | | |
| | | Class E | |
| | | Year ended December 31, | |
| | | 2007 | | | 2006 | | | 2005 | | | 2004 | | | 2003 | |
Net Asset Value, Beginning of Period | | $ | 17.57 | | | $ | 16.30 | | | $ | 16.07 | | | $ | 15.11 | | | $ | 13.06 | |
| | | | | | | | | | | | | | | | | | | | |
Income From Investment Operations | | | | | | | | | | | | | | | | | | | | |
Net investment income | | | 0.39 | (a) | | | 0.40 | | | | 0.33 | | | | 0.29 | | | | 0.41 | |
Net realized and unrealized gain on investments | | | 0.61 | | | | 1.25 | | | | 0.13 | | | | 0.94 | | | | 2.17 | |
| | | | | | | | | | | | | | | | | | | | |
Total from investment operations | | | 1.00 | | | | 1.65 | | | | 0.46 | | | | 1.23 | | | | 2.58 | |
| | | | | | | | | | | | | | | | | | | | |
Less Distributions | | | | | | | | | | | | | | | | | | | | |
Distributions from net investment income | | | (0.44 | ) | | | (0.38 | ) | | | (0.23 | ) | | | (0.27 | ) | | | (0.53 | ) |
| | | | | | | | | | | | | | | | | | | | |
Total distributions | | | (0.44 | ) | | | (0.38 | ) | | | (0.23 | ) | | | (0.27 | ) | | | (0.53 | ) |
| | | | | | | | | | | | | | | | | | | | |
Net Asset Value, End of Period | | $ | 18.13 | | | $ | 17.57 | | | $ | 16.30 | | | $ | 16.07 | | | $ | 15.11 | |
| | | | | | | | | | | | | | | | | | | | |
Total Return (%) | | | 5.7 | | | | 10.3 | | | | 3.0 | | | | 8.3 | | | | 20.4 | |
Ratio of operating expenses to average net assets before expense reductions (%) | | | 0.65 | | | | 0.67 | | | | 0.65 | | | | 0.65 | | | | 0.66 | |
Ratio of operating expenses to average net assets after expense reductions (%) (b) | | | N/A | | | | 0.66 | | | | 0.64 | | | | 0.64 | | | | 0.65 | |
Ratio of net investment income to average net assets (%) | | | 2.16 | | | | 2.31 | | | | 2.07 | | | | 1.88 | | | | 1.80 | |
Portfolio turnover rate (%) | | | 372 | | | | 265 | | | | 443 | | | | 232 | | | | 211 | |
Net assets, end of period (000) | | $ | 71,831 | | | $ | 76,124 | | | $ | 80,444 | | | $ | 85,223 | | | $ | 52,609 | |
| (a) | Per share amount is based on average shares outstanding during the period. |
| (b) | The Portfolio has entered into arrangements with certain brokers who paid a portion of the Portfolio’s expenses. |
| (c) | Commencement of operations was April 26, 2004 for Class B. |
| (d) | Periods less than one year are not computed on an annualized basis. |
| (e) | Computed on an annualized basis. |
See accompanying notes to financial statements.
MSF-17
Metropolitan Series Fund, Inc.
BlackRock Diversified Portfolio
Notes to Financial Statements—December 31, 2007
Metropolitan Series Fund, Inc. (the “Fund”) is organized as a corporation under the laws of Maryland pursuant to Articles of Incorporation filed on November 23, 1982, as amended, and registered under the Investment Company Act of 1940, as amended (the “1940 Act”), as an open-end investment company. The Fund is a “series” type of mutual fund, which issues separate series of stock. Each series represents an interest in a separate portfolio of Fund investments. The BlackRock Diversified Portfolio (the “Portfolio”) is a diversified series of the Fund. Shares in the Fund are not offered directly to the general public and are currently available only to separate accounts established by Metropolitan Life Insurance Company (“MetLife”), New England Life Insurance Company, General American Life Insurance Company (“General American”), The MetLife Investors Group of Insurance Companies, MetLife Insurance Company of Connecticut and other affiliated insurance companies (collectively, the “Insurance Companies”), as an investment vehicle for variable life insurance, group annuity or variable annuity products, although the Portfolio is not available to all such separate accounts. The Portfolio’s shares may be divided into different classes. Currently, the classes being offered by the Portfolio are named Class A, Class B and Class E. The classes of the Portfolio’s shares are identical, except that certain additional charges (Rule 12b-1 fees) are made against Class B and Class E shares. Investment income, realized and unrealized capital gains and losses, the common expenses of the Portfolio and certain Portfolio-level expense reductions, if any, are allocated on a pro rata basis to each class based on the relative net assets of each class to the total net assets of the Portfolio.
| 2. | SIGNIFICANT ACCOUNTING POLICIES: |
The preparation of financial statements in conformity with accounting principles generally accepted in the United States of America (“GAAP”) requires management to make estimates and assumptions that affect the reported amounts of assets and liabilities and disclosure of contingent assets and liabilities as of the date of the financial statements and the reported amounts of income and expenses during the reporting period. Actual results could differ from those estimates.
The following is a summary of significant accounting policies consistently followed by the Portfolio in the preparation of its financial statements. The policies are in conformity with GAAP.
Investment Valuation:
Debt securities (other than short term obligations with a remaining maturity of sixty days or less) are valued by independent pricing services selected by the relevant subadviser pursuant to authorization of the Board of Directors of the Fund (the “Board” or “Directors”). Short term obligations with a remaining maturity of sixty days or less are valued at amortized cost which approximates fair market value.
Equity securities traded on a national securities exchange or exchanges are valued at their last sale price on the principal trading market. Equity securities traded on the NASDAQ National Market System are valued at the NASDAQ Official Closing Price (the “NOCP”). The NOCP is the last sale price if it falls between the spread of the last reported bid and asked prices. If the last reported bid and asked prices are above the last reported sale price, the NOCP will be the last reported bid price. If the last reported bid and asked prices are below the last reported sale price, the NOCP will be the last reported asked price. Equity securities traded on a national securities exchange or exchanges or on the NASDAQ National Market System for which there is no reported sale during the day are valued at the last reported bid price. A security that is listed or traded on more than one exchange is valued at the quotation on the exchange determined to be the primary market for that security by the Board or its delegates. If no closing price is available, then such securities are valued by using the last reported bid price. Equity securities traded over-the-counter are valued at the last reported sales price.
If no current market value quotation is readily available or reliable for a portfolio security, fair value will be determined in accordance with procedures established by and under the general supervision of the Board. When the Portfolio uses fair value pricing, it may take into account any factors it deems appropriate. The value of securities used by the Portfolio to calculate its net asset value may differ from quoted or published prices for the same securities. Fair value pricing involves subjective judgments and the fair value determined for a security may be materially different than the value that could be realized upon the sale of that security.
The Portfolio expects to use fair value pricing for securities primarily traded on U.S. exchanges only under very limited circumstances. For example, the Portfolio may use fair value pricing if the exchange on which a security is traded closes early or trading in the security is suspended.
MSF-18
Metropolitan Series Fund, Inc.
BlackRock Diversified Portfolio
Notes to Financial Statements—December 31, 2007—(Continued)
Securities traded primarily on an exchange outside of the United States which closes before the close of the New York Stock Exchange will be valued at the last sales price on that non-U.S. exchange. Securities traded primarily on an exchange outside of the United States for which there is no reported sale during the day are valued at the mean between the last reported bid and asked prices. However, because most foreign markets close well before the Portfolio values its securities (typically at 4 p.m. Eastern Time), the earlier close of these foreign markets gives rise to the possibility that significant events, including broad market moves, may have occurred after these foreign markets close but before the Portfolio values its securities. To account for this, the Portfolio may frequently value many of its foreign equity securities using fair value prices based on third party vendor modeling tools.
Forward foreign currency exchange contracts are valued based on the mean between closing bid and asked prices of the forward currency contract rates in the London foreign exchange markets on a daily basis as provided by a reliable bank or dealer.
Options, whether on securities, indices, futures contracts, or otherwise, are valued at the last sales price available as of the close of business on the day of valuation or, if there is no such sale price available, at the mean between the bid and asked prices. Options on currencies are valued at the spot price each day.
The value of futures contracts will be the sum of the margin deposit plus or minus the difference between the value of the futures contract on each day the net asset value is calculated and the value on the date the futures contract originated, value being that established on a recognized commodity exchange, or by reference to other customary sources, with gain or loss being realized when the futures contract closes or expires.
Subject to the Board’s oversight, the Board has delegated day-to-day responsibility for valuing Portfolio assets to the subadviser of the Portfolio, who values such assets as described above and operates under procedures approved by the Board.
Investment Transactions and Related Investment Income:
Portfolio security transactions are recorded on the trade date. Dividend income is recorded on the ex-dividend date or, for certain foreign securities, when notified. Interest income, which includes amortization of premium and accretion of discount on debt securities, is recorded on the accrual basis. Realized gains and losses on investments and unrealized appreciation and depreciation are determined on the identified cost basis, which is the same basis used for federal income tax purposes.
Repurchase Agreements:
The Portfolio, through the custodian or a subcustodian, receives delivery of the underlying securities collateralizing repurchase agreements. The Portfolio requires the custodian to take possession, to have legally segregated in the Federal Reserve Book Entry System, or to have segregated within the custodian’s vault, all securities held as collateral for repurchase agreements. It is the Portfolio’s policy that the market value of the collateral be at least equal to 100% of the repurchase price in the case of a repurchase agreement of one-day duration and 102% on all other repurchase agreements. The Portfolio’s subadviser is responsible for determining that the value of the collateral is at all times at least equal to the repurchase price. In connection with transactions in repurchase agreements, if the seller defaults and the value of the collateral declines or if the seller enters an insolvency proceeding, realization of the collateral by the Portfolio may be delayed, limited or wholly denied.
Foreign Currency Translation:
The books and records of the Portfolio are maintained in U.S. dollars. The values of securities, currencies and other assets and liabilities denominated in currencies other than U.S. dollars are translated into U.S. dollars based upon foreign exchange rates prevailing at the end of the period. Purchases and sales of investment securities, income and expenses are translated on the respective dates of such transactions. Since the values of investment securities are presented at the foreign exchange rates prevailing at the end of the period, it is not practical to isolate that portion of the results of operations arising from changes in exchange rates from that portion of the results of operations reflecting fluctuations arising from changes in market prices of the investment securities. Such fluctuations are included in the net realized and unrealized gain or loss on investments.
Net realized foreign exchange gains or losses arise from sales of foreign currency, currency gains or losses realized between the trade and settlement dates on securities transactions, and the difference between the amounts of dividends, interest, and foreign withholding taxes recorded by the Portfolio and the U.S. dollar equivalent of the amounts actually received or paid by the Portfolio. Net unrealized foreign exchange gains and losses arise from changes in the value of assets and liabilities, other than investment securities, resulting from changes in the exchange rate.
MSF-19
Metropolitan Series Fund, Inc.
BlackRock Diversified Portfolio
Notes to Financial Statements—December 31, 2007—(Continued)
Forward Foreign Currency Exchange Contracts:
The Portfolio may enter into forward foreign currency exchange contracts primarily to hedge against foreign currency exchange rate risks on its non-U.S. dollar denominated investment securities. When entering into a forward currency contract, the Portfolio agrees to receive or deliver a fixed quantity of foreign currency for an agreed-upon price on an agreed future date. These contracts are valued daily and the Portfolio’s net equity therein, representing unrealized gain or loss on the contracts as measured by the difference between the foreign exchange rates at the dates of entry into the contracts and the forward rates at the settlement date, is included in the Statement of Assets and Liabilities. Realized and unrealized gains and losses are included in the Statement of Operations. These instruments involve market and/or credit risk in excess of the amount recognized in the Statement of Assets and Liabilities. Risks arise from the possible inability of counterparties to meet the terms of their contracts and from movement in currency and securities values and interest rates.
Futures Contracts:
The Portfolio may buy and sell futures contracts (on recognized exchanges) as a hedge or to enhance return. Futures contracts are agreements to buy or sell a security, or deliver a final cash settlement price in connection with an index, interest rate, currency, or other contracts not calling for physical delivery, for a set price in the future. The Portfolio must post an amount equal to a portion of the total market value of the futures contract as futures variation margin, which is returned when the Portfolio’s obligations under the contract have been satisfied. From time to time thereafter, the Portfolio may have to post variation margin to maintain this amount as the market value of the contract fluctuates. Risks of entering into futures contracts (and related options) include the possibility that there may be an illiquid market and that a change in the value of the contract or option may not correlate with changes in the value of the underlying securities.
Options:
The Portfolio may use options to hedge against changes in values of securities the Portfolio owns or expects to purchase. Writing puts or buying calls tends to increase the Portfolio’s exposure to the underlying instrument and writing calls or buying puts tends to decrease the Portfolio’s exposure to the underlying instrument, and can be used to hedge other Portfolio investments. For options purchased to hedge the Portfolio’s investments, the potential risk to the Portfolio is that the change in value of options contracts may not correspond to the change in value of the hedged instruments. In addition, losses may arise from changes in the value of the underlying instruments, if there is an illiquid secondary market, or if the counterparty is unable to perform. The maximum loss for purchased options is limited to the premium initially paid for the option. For options written by the Portfolio, the maximum loss is not limited to the premium initially received for the option.
The main risk associated with purchasing an option is that the option expires without being exercised. In this case, the option expires worthless and the premium paid for the option is considered the loss. The risk associated with writing a call option is that the Portfolio may forgo the opportunity for a profit if the market value of the underlying position increases and the option is exercised. The risk in writing a put option is that the Portfolio may incur a loss if the market value of the underlying position decreases and the option is exercised. In addition, the Portfolio risks not being able to enter into a closing transaction for the written option as the result of an illiquid market.
“When-Issued” Securities:
Purchasing securities “when-issued” is a forward commitment by the Portfolio to buy a security. The estimated amount of the Portfolio’s payment obligation and the security’s interest rate are determined when the commitment is made, even though no interest accrues until the security is issued, which is generally 15 to 120 days later. The Portfolio will segregate liquid assets with its custodian sufficient at all times to satisfy these commitments. If the value of the security is less when delivered than when the commitment was made, the Portfolio will suffer a loss.
Credit and Market Risk:
The Portfolio may invest in high yield instruments that are subject to certain credit and market risks. The yields of high yield instruments reflect, among other things, perceived credit risk. The Portfolio’s investments in securities rated below investment grade typically involve risks not associated with higher rated securities including, among others, greater risk related to timely and ultimate payment of interest and principal, greater market price volatility and less liquid secondary market trading.
MSF-20
Metropolitan Series Fund, Inc.
BlackRock Diversified Portfolio
Notes to Financial Statements—December 31, 2007—(Continued)
Credit Risk:
The Portfolio invests a significant portion of its assets in securities of issuers that hold mortgage and asset backed securities and direct investments in securities backed by commercial and residential mortgage loans and other financial assets. The value and related income of these securities are sensitive to changes in economic conditions, including delinquencies and/or defaults. Continuing shifts in the market’s perception of credit quality on securities backed by commercial and residential mortgage loans and other financial assets may result in increased volatility of market price and periods of illiquidity that can negatively impact the valuation of certain issuers held by the Portfolio. At December 31, 2007, the Portfolio held securities of issuers that hold mortgage and asset backed securities and direct investments in mortgage and asset backed securities with an aggregate value of $187,485,201 (representing 10.3% of the Portfolio’s total assets).
Federal Income Taxes:
It is the Portfolio’s policy to comply with the requirements of the Internal Revenue Code of 1986, as amended, and regulations thereunder, applicable to regulated investment companies and to distribute all of its taxable income to shareholders. Therefore, no federal income tax provision is required.
As of December 31, 2007, the Portfolio had no capital loss carryovers.
The tax character of distributions paid for the periods ended December 31, 2007 and 2006 was as follows:
| | | | | | | | | | | | | | | | | | | | | |
| Ordinary Income | | Long Term Gain | | Return of Capital | | Total |
| 2007 | | 2006 | | 2007 | | 2006 | | 2007 | | 2006 | | 2007 | | 2006 |
| $43,865,143 | | $ | 43,544,717 | | $ | — | | $ | — | | $ | — | | $ | — | | $ | 43,865,143 | | $ | 43,544,717 |
As of December 31, 2007, the components of distributable earnings (accumulated losses) on a federal income tax basis were as follows:
| | | | | | | | | | | | |
Undistributed
Ordinary
Income | | Undistributed
Long Term
Gain | | Unrealized
Appreciation | | Loss
Carryforwards | | Total |
| $42,862,653 | | $ | 16,775,633 | | $ | 120,644,202 | | $ | — | | $ | 180,282,488 |
Dividends and Distributions to Shareholders:
The Portfolio records dividends and distributions on the ex-dividend date. Net realized gains from security transactions (if any) are generally distributed annually to shareholders. The timing and characterization of certain income and capital gains distributions are determined in accordance with federal tax regulations that may differ from GAAP. Permanent book and tax basis differences relating to shareholder distributions will result in reclassification between under/over distributed net investment income, accumulated net realized gains/losses and paid in capital.
| 3. | INVESTMENT TRANSACTIONS: |
For the year ended December 31, 2007, purchases and sales of securities (excluding short term investments) for the Portfolio were as follows:
| | | | | | | | | |
| Purchases | | Sales |
| U.S. Government | | Other | | U.S. Government | | Other |
| $5,641,619,575 | | $ | 1,348,191,038 | | $ | 5,570,856,768 | | $ | 1,157,991,284 |
Options Written:
The Portfolio transactions in options written during the year ended December 31, 2007 were as follows:
| | | | | |
Call Options | | Number of
contracts | | Premiums
received |
Options outstanding December 31, 2006 | | 0 | | $ | 0 |
Options written | | 68 | | | 38,848 |
Options closed | | 0 | | | 0 |
Options expired | | 0 | | | 0 |
| | | | | |
Options outstanding December 31, 2007 | | 68 | | $ | 38,848 |
| | | | | |
MSF-21
Metropolitan Series Fund, Inc.
BlackRock Diversified Portfolio
Notes to Financial Statements—December 31, 2007—(Continued)
| 4. | INVESTMENT MANAGEMENT FEES AND OTHER TRANSACTIONS WITH AFFILIATES: |
Investment Management Agreement:
MetLife Advisers, LLC (“MetLife Advisers”) is the investment adviser to the Portfolio. The Fund has entered into an investment management agreement with MetLife Advisers with respect to the Portfolio. For providing investment management services to the Portfolio, MetLife Advisers receives monthly compensation at the following annual rates:
| | | | | | |
| | | Management
Fees earned by
MetLife Advisers
for the year ended
December 31, 2007 | | Annual
percentage
rates paid to
MetLife Advisers | | Based on Portfolios
average daily net asset levels |
| | $8,131,030 | | 0.500% | | Of the first $500 million |
| | | | 0.450% | | Of the next $500 million |
| | | | 0.400% | | On amounts in excess of $1 billion |
Certain officers and directors of the Fund may also be officers of MetLife Advisers; however, such officers and directors receive no compensation from the Fund.
MetLife Advisers has entered into an investment subadvisory agreement with respect to the Portfolio. BlackRock Advisors, LLC is compensated by MetLife Advisers to provide subadvisory services for the BlackRock Diversified Portfolio.
Service and Distribution Fees:
The Fund has adopted a Distribution and Service Plan under Rule 12b-1 of the 1940 Act for the Portfolio’s Class B and E shares. Under the Distribution and Service Plan, the Class B and E shares of the Portfolio pay a fee to compensate the Insurance Companies (or their affiliates) and other broker-dealers and financial intermediaries involved in the offer and sale of Portfolio shares for promoting or selling and servicing, the Class B and E shares. The fees under the Distribution and Service Plan for each class of the Portfolio’s shares are calculated as a percentage of the Portfolio’s average daily net assets that are attributable to that Class. Currently, the fee is 0.25% per year for Class B shares and 0.15% per year for Class E shares. Amounts paid by the Portfolio for the year ended December 31, 2007 are shown as Service and Distribution fees in the Statement of Operations.
The Fund has entered into a securities lending arrangement with the Fund’s custodian, State Street Bank and Trust Company (the “custodian”). Under the agreement, the custodian is authorized to loan securities on the Portfolios’ behalf. In exchange, the Portfolio receives either cash or securities as collateral against the loaned securities. The Portfolio receives collateral at least equal to 102% of the market value of the loaned securities (105% for foreign securities), at each loan’s inception. Collateral must be maintained at least at 100% of the market value of the loaned securities for the duration of the loan. The cash collateral is invested in the Navigator Securities Lending Prime Portfolio, an affiliate of the custodian, which invests in a variety of high quality U.S. dollar-denominated instruments. If the market value of the collateral at the close of trading on a business day is less than 100% of the market value of the loaned securities at the close of trading on that day, the borrower shall be required to deliver, by the close of business on the following business day, an additional amount of collateral, equal to at least 100% of the market value of all the loaned securities as of such preceding day. The Portfolio receives 80% of the annual net income from securities lending transactions, which is included in interest income of the Portfolio. The remaining 20% is paid to the custodian as compensation for its securities lending services. The Portfolio bears the risk of any deficiency in the amount of collateral available for return to a borrower due to a loss in an approved investment. Any outstanding loans by the Portfolio at December 31, 2007 are footnoted in the Schedule of Investments.
As previously reported, in May 2004, General American received a Wells Notice stating that the SEC staff was considering recommending that the SEC bring a civil action alleging violations of the U.S. securities laws against General American with respect to market timing and late trading in a limited number of privately-placed variable insurance contracts that were sold through General American. General American responded to the SEC staff and cooperated with the investigation. On August 9, 2007, the SEC announced that it had settled an enforcement action regarding late trading against General American with, among other things, General American agreeing to pay a civil penalty and to comply with certain undertakings. General American
MSF-22
Metropolitan Series Fund, Inc.
BlackRock Diversified Portfolio
Notes to Financial Statements—December 31, 2007—(Continued)
consented to the SEC’s order without admitting or denying the findings. MetLife Advisers has also advised the Fund’s Board of Directors that, while certain exceptions to the Fund’s policies have been noted, no situations have been identified that would have a material impact on the financial position of the Fund.
| 7. | RECENT ACCOUNTING PRONOUNCEMENTS: |
Effective June 29, 2007, the Fund implemented Financial Accounting Standards Board (“FASB”) Interpretation No. 48, “Accounting for Uncertainty in Income Taxes—an interpretation of FASB Statement No. 109” (“FIN 48”). FIN 48 prescribes the minimum recognition threshold a tax position must meet in connection with accounting for uncertainties in income tax positions taken or expected to be taken by an entity, including investment companies, before being measured and recognized in the financial statements. Management has evaluated the application of FIN 48 to the Fund, and has determined that the adoption of FIN 48 does not have a material impact on the Fund’s financial statements. The Fund files U.S. tax returns. No income tax returns are currently under examination. The statute of limitations on the Fund’s tax returns remains open for the years ended December 31, 2004 through December 31, 2006.
In September 2006, Statement of Financial Accounting Standards No. 157, Fair Value Measurements (SFAS 157) was issued and is effective for fiscal years beginning after November 15, 2007. SFAS 157 defines fair value, establishes a framework for measuring fair value and expands disclosures about fair value measurements. Management is currently evaluating the impact the adoption of SFAS 157 will have on the Portfolio’s financial statement disclosures.
MSF-23
Metropolitan Series Fund, Inc.
BlackRock Diversified Portfolio
Report of Independent Registered Public Accounting Firm
To the Shareholders and Board of Directors of the Metropolitan Series Fund, Inc.:
We have audited the accompanying statement of assets and liabilities, including the schedule of investments, of the BlackRock Diversified Portfolio, one of the portfolios constituting the Metropolitan Series Fund, Inc. (the “Fund”) as of December 31, 2007, and the related statement of operations for the year then ended, the statements of changes in net assets for each of the two years in the period then ended, and the financial highlights for each of the five years in the period then ended. These financial statements and financial highlights are the responsibility of the Fund’s management. Our responsibility is to express an opinion on these financial statements and financial highlights based on our audits.
We conducted our audits in accordance with the standards of the Public Company Accounting Oversight Board (United States). Those standards require that we plan and perform the audit to obtain reasonable assurance about whether the financial statements and financial highlights are free of material misstatement. The Fund is not required to have, nor were we engaged to perform, an audit of its internal control over financial reporting. Our audits included consideration of internal control over financial reporting as a basis for designing audit procedures that are appropriate in the circumstances, but not for the purpose of expressing an opinion on the effectiveness of the Fund’s internal control over financial reporting. Accordingly, we express no such opinion. An audit also includes examining, on a test basis, evidence supporting the amounts and disclosures in the financial statements, assessing the accounting principles used and significant estimates made by management, as well as evaluating the overall financial statement presentation. Our procedures included confirmation of securities owned as of December 31, 2007, by correspondence with the custodian and brokers; where replies were not received from brokers, we performed other auditing procedures. We believe that our audits provide a reasonable basis for our opinion.
In our opinion, the financial statements and financial highlights referred to above present fairly, in all material respects, the financial position of the BlackRock Diversified Portfolio of the Metropolitan Series Fund, Inc. as of December 31, 2007, the results of its operations for the year then ended, the changes in its net assets for each of the two years in the period then ended, and the financial highlights for each of the five years in the period then ended, in conformity with accounting principles generally accepted in the United States of America.
Deloitte & Touche LLP
Boston, Massachusetts
February 28, 2008
MSF-24
Metropolitan Series Fund, Inc.
Directors and Officers
The Fund’s Directors review actions of the Fund’s investment adviser and subadvisers, and decide upon matters of general policy. The Fund’s officers supervise the daily business operations of the Fund. The Board of Directors and the Fund’s officers are listed below. Each Director is responsible for overseeing all 36 Portfolios of the Fund. There is no limit to the term a Director may serve. Directors serve until their resignation, retirement or removal in accordance with the Fund’s organizational documents and policies adopted by the Board from time to time. Officers hold office at the pleasure of the Board or until the election or appointment and the qualification of a successor. The address of the directors and officers is c/o Metropolitan Series Fund, Inc., 501 Boylston Street, Boston, MA 02116.
Interested Directors(1)
Each Director below is an “interested person” (as defined by the 1940 Act) with respect to the Fund in that Ms. Forget is an employee of MetLife and Mr. Typermass is a former employee of MetLife and owns securities issued by MetLife, Inc., the ultimate parent company of MetLife Advisers.
| | | | | | | | |
Name, Address and Age | | Current
position(s)
with Fund | | Position(s)
held since | | Principal occupations
over past five years, including other directorships(2) | | Number of
Portfolios in
Fund Complex
Overseen by
Director(3) |
Elizabeth M. Forget Age: 41 | | Director, Chairman of the Board, President and Chief Executive Officer | | 2006 | | Senior Vice President (since 2007), MetLife, Inc.; President, Met Investors Advisory, LLC (“MIA”); Trustee and President, Met Investors Series Trust (“MIST”); Executive Vice President, MetLife Investors Group, Inc.; President (since 2006), MetLife Advisers. | | 81 |
| | | | |
Arthur G. Typermass Age: 70 | | Director | | 1998 | | Formerly, Senior Vice President and Treasurer, MetLife. | | 37 |
Non-Interested Directors(1)
Each Director below is not an “interested person” (as defined by the 1940 Act) with respect to the Fund (collectively, the “Independent Directors”).
| | | | | | | | |
Name, Address and Age | | Current
position(s)
with Fund | | Position(s)
held since | | Principal occupations
over past five years, including other directorships(2) | | Number of
Portfolios in
Fund Complex
Overseen by
Director(3) |
Steve A. Garban† Age: 70 | | Director | | 1985 | | Formerly, Chief Financial Officer, Senior Vice President Finance and Operations and Treasurer (Emeritus), The Pennsylvania State University. | | 37 |
| | | | |
Linda B. Strumpf Age: 60 | | Director | | 2000 | | Vice President and Chief Investment Officer, Ford Foundation. | | 37 |
| | | | |
Michael S. Scott Morton† Age: 70 | | Director | | 1993 | | Jay W. Forrester Professor of Management (Emeritus) at Sloan School of Management, MIT. | | 37 |
| | | | |
H. Jesse Arnelle Age: 74 | | Director | | 2001 | | Formerly, Counsel, Womble Carlyle Sandrie & Rice; Director, Textron Inc. (global multi-industry company)*; formerly, Director, Gannet Co. Inc. (diversified news and information company)*; formerly, Director, Eastman Chemical Company (global chemical company)*; formerly, Director, Waste Management, Inc.*; formerly, Director, Armstrong Holdings Inc. (parent company of floor and ceiling products business)*; formerly, Director, FPL Group Inc. (public utility holding company)*; Director, URS Corporation (engineering design services firm)*. | | 37 |
| | | | |
Nancy Hawthorne Age: 56 | | Director | | 2003 | | Director, Avid Technologies (computer software company)*; formerly, Chairman of the Board of Avid Technologies; formerly, Board of Advisors, L. Knife & Sons, Inc. (beverage distributor); Chief Executive Officer, Clerestory LLC (corporate financial advisor); formerly, Trustee, New England Zenith Fund (“Zenith Fund”)**; formerly, Chief Executive Officer and Managing Partner, Hawthorne, Krauss and Associates (corporate financial advisor); formerly, Chief Financial Officer and Executive Vice President, Continental Cablevision, subsequently renamed MediaOne (cable television company); formerly, Director, Life F/X, Inc.; formerly, Chairman of the Board, WorldClinic (distance medicine company); formerly, Director, Perini Corporation (construction company)*; formerly, Director, CGU (property and casualty insurance company); formerly, Director, Beacon Power Corporation (energy company )*. | | 37 |
MSF-25
Metropolitan Series Fund, Inc.
Directors and Officers—(Continued)
| | | | | | | | |
Name, Address and Age | | Current
position(s)
with Fund | | Position(s)
held since | | Principal occupations
over past five years, including other directorships(2) | | Number of
Portfolios in
Fund Complex
Overseen by
Director(3) |
John T. Ludes Age: 71 | | Director | | 2003 | | President, LFP Properties (consulting firm); Formerly, Trustee, Zenith Fund**; formerly, Vice Chairman, President and Chief Operating Officer, Fortune Brands/American Brands (global conglomerate); formerly, President and CEO, Acushnet Company (athletic equipment company). | | 37 |
Officers(1)
| | | | | | | | |
Name and address | | Age | | Current
position(s)
with Fund | | Position(s)
held since | | Principal occupations over past five years(2) |
| Jeffrey P. Halperin | | 40 | | Chief Compliance Officer | | 2006 | | Vice President (since 2006), Corporate Ethics and Compliance Department, MetLife, Inc.; Chief Compliance Officer (since 2006), MetLife Advisers, MIA and MIST. |
| | | | |
| John F. Guthrie, Jr. | | 64 | | Senior Vice President | | 2002 | | Manager and Senior Vice President, MetLife Advisers; Vice President, MetLife; Vice President (since 2003), MetLife Group, Inc.; Vice President, NELICO; Vice President (since 2005), MIA; formerly, Senior Vice President, Zenith Fund**. |
| | | | |
| Alan C. Leland | | 55 | | Senior Vice President | | 2005 | | Treasurer and Chief Financial Officer, MetLife Advisers, LLC; Treasurer (since 2005), Met Investors Advisory, LLC; Vice President (since 2004), MIA; Vice President (since 2003), MetLife Group, Inc.; Vice President, MetLife; Senior Vice President, NELICO |
| | | | |
| Peter Duffy | | 52 | | Vice President and Treasurer | | 2000 | | Senior Vice President, MetLife Advisers (since 1998); Second Vice President (since 2003), NELICO; Vice President, MetLife (since 2004); Vice President (since 2004), MetLife Group, Inc.; formerly, Vice President and Treasurer, Zenith Fund**. |
| | | | |
| Thomas M. Lenz | | 49 | | Vice President and Secretary | | 2002 | | General Counsel and Secretary, MetLife Advisers; Assistant General Counsel, MetLife; formerly, Vice President and Secretary, Zenith Fund**. |
| * | Indicates a directorship with a registered investment company or a company subject to the reporting requirements of the Securities Exchange Act of 1934, as amended. |
| ** | The Zenith Fund deregistered with the Securities and Exchange Commission (“SEC”) in 2004. |
| (†) | Served as a trustee, director and/or officer of one or more of the following companies, each of which had a direct or indirect advisory relationship with MetLife Advisers or its affiliates prior to January 31, 2005: State Street Research Financial Trust, State Street Research Income Trust, State Street Research Money Market Trust, State Street Research Institutional Funds, State Street Research Capital Trust, State Street Research Master Investment Trust, State Street Research Equity Trust, State Street Research Securities Trust and State Street Research Exchange Trust (collectively, the “State Street Research Funds”). |
| (1) | Each Director of the Fund also serves as trustee of Metropolitan Series Fund II (“Met Series Fund II”), a registered investment company advised by MetLife Advisers. Each officer of the Fund serves in the same position with Met Series Fund II, which consists of one portfolio. |
| (2) | Previous positions during the past five years with the Fund, MIST, MetLife, MetLife Advisers, MIA, Zenith Fund, NELICO or New England Securities Corporation are omitted if not materially different. |
| (3) | The Fund Complex includes the Fund (36 portfolios), Met Series Fund II (1 portfolio) and MIST (44 portfolios) |
MSF-26
Metropolitan Series Fund, Inc.
BlackRock Diversified Portfolio
Board Approval of Advisory and Subadvisory Agreements
The Fund’s Contract Review Committees of the Board of Directors (the “Board”) typically meet in early fall to review the Portfolios’ advisory agreements (the “Advisory Agreements”) and subadvisory agreements (collectively, the “Subadvisory Agreements,” and, together with the Advisory Agreements, the “Agreements”) and determine whether to recommend that the full Board approve the continuation of the Agreements for an additional one-year period. (Following the initial approval of an Agreement for a new Portfolio or with a new adviser or subadviser, such annual reviews are not required until 2 years following the execution of such Agreement.) After each Committee has made its recommendations, the full Board, including the Independent Directors, determines whether to approve the continuation of each of the Agreements. In addition, the Board, including the Independent Directors, considers matters bearing on the Agreements at most of its other meetings throughout the year and regularly interviews various individuals at MetLife Advisers responsible for the management of the Portfolios. The Directors also interview selected investment managers and other professionals at the subadvisers at various times throughout the year.
The Directors receive all materials that they or MetLife Advisers, the Fund’s investment adviser, and the subadvisers believe to be reasonably necessary for the Directors to evaluate the Agreements and determine whether to approve the continuation of the Agreements. These materials generally include, among other items, (i) information on the investment performance of the Portfolios and the performance of peer groups of funds and the Portfolios’ performance benchmarks, (ii) information on the Portfolios’ advisory and subadvisory fees and other expenses, including information comparing the Portfolios’ expenses to those of peer groups of funds and information about any applicable expense caps and fee “breakpoints,” (iii) sales and redemption data, (iv) information related to the profitability of the Agreements to MetLife Advisers and the subadvisers, and potential “fall-out” or ancillary benefits that MetLife Advisers, the subadvisers or their affiliates may receive as a result of their relationships with the Fund and (v) information obtained through the subadvisers’ responses to certain requests from MetLife Advisers and the Directors and MetLife Advisers’ responses to requests from the Directors. The Directors may also consider other information such as (vi) MetLife Advisers’ and the subadvisers’ financial results and condition, (vii) each Portfolio’s investment objectives and strategies and the size, education and experience of the investment staffs of MetLife Advisers and the relevant subadvisers and their use of technology and external research, (viii) the allocation of the Portfolios’ brokerage, if any, including allocations to brokers affiliated with the subadvisers and the use of “soft” commission dollars to pay Portfolio expenses and to pay for research and other similar services, (ix) the resources devoted to, and the record of compliance with, the Portfolios’ investment policies and restrictions, policies on personal securities transactions and other compliance policies, (x) the responses of MetLife Advisers, the subadvisers and/or their affiliates to certain legal and regulatory proceedings and (xi) the economic outlook generally and for the mutual fund industry in particular. Throughout the process, the Directors have the opportunity to ask questions of and request additional materials from MetLife Advisers and the subadvisers.
Following meetings of each Contract Review Committee on September 12, 2007, the Board, at its November 15, 2007 meeting, approved the continuation through December 31, 2008 of the Advisory Agreements for each Portfolio of the Fund and the Subadvisory Agreements for each Portfolio of the Fund. The Agreements approved for continuation are referred to below as the “Continued Agreements.”
In considering whether to approve the continuation of the Continued Agreements, the Directors, including the Independent Directors, did not identify any single factor as determinative, and each weighed the various factors as he or she deemed appropriate. The Directors considered the following matters in connection with their approval of the Continued Agreements:
The nature, extent and quality of the services provided to the relevant Portfolios under the Continued Agreements. The Directors considered the nature, extent and quality of the services provided by MetLife Advisers, the relevant subadvisers (if any) and their affiliates (each, an “Adviser,” and, collectively, the “Advisers”) to the relevant Portfolios pursuant to the Continued Agreements and the resources dedicated to these Portfolios by the Advisers. In particular, the Directors considered the Advisers’ abilities to attract and retain highly qualified investment professionals. With respect to MetLife Advisers, the Directors considered that MetLife Advisers is (i) ultimately responsible for the performance of such Portfolios; (ii) ultimately responsible for the establishment of the investment strategies of each such Portfolio, primarily through its recommendations to the Board regarding the hiring and selection of subadvisers; (iii) responsible for the hiring and selection, subject to Board approval, of subadvisers; and (iv) responsible for maintaining a program of Subadviser oversight reasonably designed to ensure that the subadvisers have reasonable compliance policies and procedures in place. The Directors also considered that MetLife Advisers provides a full range of day-to-day administrative services for the Portfolios involving all aspects of such Portfolios’ day-to-day operations (other than portfolio management). After reviewing these and related factors, the Directors concluded, within the context of their overall conclusions regarding each of the Continued Agreements, that the nature, extent and quality of services provided supported the renewal of these Agreements.
Investment performance of the relevant Portfolios. The Directors reviewed information about the performance of the relevant Portfolios over various time periods, including information prepared by an independent third party that compared the performance of the Portfolios to the performance of peer groups of funds and performance benchmarks. The Directors also reviewed a description of the third party’s methodology for identifying a Portfolio’s peer group(s) for purposes of performance and expense comparisons.
MSF-27
Metropolitan Series Fund, Inc.
BlackRock Diversified Portfolio
Board Approval of Advisory and Subadvisory Agreements—(Continued)
In the case of each relevant Portfolio that had performance that lagged its peer group(s) for certain periods, the Directors concluded that other factors relevant to performance were sufficient, in light of other considerations, to warrant renewal of the Continued Agreements relating to such Portfolio. These factors varied from Portfolio to Portfolio, but included one or more of the following: (i) that such Portfolio’s performance, although lagging in certain recent periods, was stronger over the longer term; (ii) that the underperformance was attributable, to a significant extent, to investment decisions that were reasonable and consistent with the Portfolio’s investment objective(s) and policies and that the Portfolio was performing within the range of reasonable expectations, given market conditions and the Portfolio’s investment objective(s) and policies; (iii) that the Portfolio’s performance was competitive when compared to other relevant performance benchmarks or peer groups; and (iv) that MetLife Advisers and/or the relevant subadviser (if any) had taken or was taking steps designed to help improve the Portfolio’s investment performance.
The Directors also considered the investment performance of the Advisers and their reputations generally, the historical responsiveness of the Advisers to Director concerns about performance and the willingness of the Advisers to take steps intended to improve performance.
After reviewing these and related factors, the Directors concluded, within the context of their overall conclusions regarding each of the Continued Agreements, that the investment performance of each relevant Portfolio and Adviser was sufficient, in light of other considerations, to warrant the renewal of the Continued Agreements.
The costs of the services to be provided and profits to be realized by the Advisers and their affiliates from their relationships with the Portfolios. The Directors considered the fees charged by MetLife Advisers to the Portfolios for advisory services and, with respect to the subadvised Portfolios, by such subadvisers to MetLife Advisers for subadvisory services (such advisory and subadvisory fees (if any), collectively, “Fees”), as well as the total expense levels of the Portfolios. This information included comparisons (provided by an independent third party) of the Portfolios’ advisory fees and total expense levels to those of their peer groups. In evaluating Fees for the relevant Portfolios, the Directors also took into account the demands, complexity and quality of the investment management services provided to each Portfolio. The Directors considered MetLife Advisers’ recommendations regarding reductions in Fee rates, implementation of Fee breakpoints and institution of Fee waivers and expense caps.
The Directors also considered the compensation directly or indirectly received by the Advisers and their affiliates from their relationships with the relevant Portfolios. The Directors reviewed information relating to the profits received by MetLife Advisers, certain of the subadvisers and their affiliates as a result of their relationships with the relevant Portfolios, and information about the allocation of expenses used to calculate profitability. When reviewing profitability, the Directors also considered the performance of the relevant Portfolios, the expense levels of such Portfolios and whether the relevant Advisers had implemented breakpoints, fee waivers and/or expense caps with respect to such Portfolios.
After reviewing these and related factors, the Directors concluded, within the context of their overall conclusions regarding each of the Continued Agreements, that the Fees charged to each of the relevant Portfolios were fair and reasonable, and that the information provided regarding costs of these services generally, and the related profitability (if known) to the relevant Advisers of their relationships with the relevant Portfolios, supported the renewal of the Continued Agreements.
Economies of Scale. The Directors considered the existence of any economies of scale in the provision of services by the Advisers and whether those economies were shared with the relevant Portfolios through breakpoints in their advisory fees or other means, such as expense caps, fee waivers or relatively low levels of fees. The Directors noted that most of the relevant Portfolios benefited or will benefit from breakpoints, expense caps and/or fee waivers with respect to their advisory fees. In considering these issues, the Directors also took into consideration information relating to the costs of the services provided and the profitability to MetLife Advisers, the relevant subadvisers (if any) and each of their affiliates of their relationships with the relevant Portfolios, as discussed above.
After reviewing these and related factors, the Directors concluded, within the context of their overall conclusions regarding each of the Continued Agreements, that the extent to which economies of scale were shared with the relevant Portfolios supported the renewal of such Agreements.
Other Factors. The Directors also considered other factors, which included but were not limited to the following:
| | • | | the extent to which each relevant Portfolio operated in accordance with its investment objective, and its record of compliance with its investment restrictions and the compliance programs of the Fund and the Advisers. They also considered the compliance-related resources the Advisers and their affiliates provide to the relevant Portfolios; |
| | • | | the nature, quality, cost and extent of administrative and shareholder services performed by MetLife Advisers and its affiliates under the Advisory Agreements; and |
MSF-28
Metropolitan Series Fund, Inc.
BlackRock Diversified Portfolio
Board Approval of Advisory and Subadvisory Agreements—(Continued)
| | • | | so-called “fall-out benefits” to the Advisers, such as the engagement of their affiliates to provide distribution, brokerage and transfer agency services to the Portfolios, and the benefits of research made available to the relevant Advisers by reason of brokerage commissions generated by the relevant Portfolios’ securities transactions. The Directors also considered the possible conflicts of interest associated with these fall-out and other benefits, and the reporting and other processes in place to disclose and monitor these possible conflicts of interest. |
Based on their evaluation of all factors that they deemed to be material, including those factors described above, and assisted by the advice of independent counsel, the Directors, including the Independent Directors, concluded that each of the Continued Agreements should be continued through December 31, 2008.
MSF-29
A description of the policies and procedures that the Fund uses to determine how to vote proxies relating to portfolio securities is available (i) without charge, upon request, by calling (800) 638-7732 and (ii) on the Securities and Exchange Commission’s (the “SEC”) website at http://www.sec.gov.
Information regarding how the Fund voted proxies relating to portfolio securities during the most recent twelve-month period ended December 31, 2007 is available (i) without charge, upon request, by calling (800) 638-7732 and (ii) on the SEC’s website at http://www.sec.gov.
The Fund files with the SEC a complete schedule of its portfolio holdings, as of the close of the first and third quarters of its fiscal year, on “Form N-Q”. These filings are available on the SEC’s website at www.sec.gov and may be reviewed and copied at the SEC’s Public Reference Room in Washington, DC. (Call 1-800-SEC-0330 for information on the operation of the Public Reference Room.)
MSF-30
| | |
Metropolitan Series Fund, Inc. BlackRock Large Cap Value Portfolio Annual Report | | December 31, 2007 |
Letter from the President
February 1, 2008
Letter to Policy Holders:
2007 was a tumultuous year in the financial markets driven by concerns in the credit markets surrounding sub-prime mortgages and fears of recession in the U.S. Economy. The broad markets were mixed, with the Dow Jones Industrial Average up 8.9% and the MSCI EAFE Index, which measures the performance of international equities, up 11.2% for the year, while the Russell 2000 Index, which measures the performance of small capitalization stocks, was down 1.6%.
In the fixed income markets, credit spreads increased as a result of the pressure from sub-prime mortgage crisis and the Federal Reserve lowered interest rates by a total of 1% during the year. The Lehman Brothers Aggregate Bond Index posted a 7.0% return for the year.
On the following pages, you will find a complete review of your Portfolio and its investment performance.
MetLife is committed to building your financial freedom. We appreciate your trust and will continue to focus our efforts on meeting your investment needs.
Sincerely,
Elizabeth Forget
President, Metropolitan Series Fund, Inc.
Metropolitan Series Fund, Inc.
BlackRock Large Cap Value Portfolio
Managed by BlackRock Advisors, LLC
Portfolio Manager Commentary*
PORTFOLIO PERFORMANCE
For the year ended December 31, 2007, the Class A shares of the BlackRock Large Cap Value Portfolio returned 3.4%, compared to its benchmark, the Russell 1000 Value Index1, which returned -0.2%. The average return of its peer group, the Lipper Variable Insurance Products Large-Cap Value Funds Universe2, was 1.7% over the same period.
PORTFOLIO REVIEW
2007 began largely where 2006 left off. A slowdown in U.S. growth occurred following Fed tightening, rising oil prices, and the beginning of concerns around credit and slower spending by the U.S. consumer. Earnings growth remained strong on the back of solid export growth, a declining dollar and share buybacks. A transition in leadership from small, value and domestic to large, growth and multinational became evident as the year began. During the second half of 2007, the benign fundamentals of 2003-2006, namely strong global growth, rising profitability levels, and falling risk premiums, were replaced by credit stress; pressures on the capital position of the financial system; questions about the sustainability of the business cycle; and rising energy and food prices. Reflecting these woes, market prices moved considerably. Government bond yields plummeted, the dollar fell faster than in earlier years, credit spreads widened and equities became trendless and volatile. The financial and consumer discretionary sectors experienced drops of one-quarter to one-third. Commodity- and industrial-related multinational companies performed the best. Emerging market economies and equity markets performed well yet again. The Federal Reserve moved from an attitude of vigilance about inflation to one of providing liquidity and lowering rates to shore up the functioning of credit markets and fight economic weakness.
The Portfolio’s outperformance versus its benchmark was attributable to an underweight and stock selection within the financials sector. Within financials, an underweight in commercial banks and thrifts & mortgage finance names contributed notably to performance. Also additive was select exposure to the capital markets industry (including Goldman Sachs and Janus Capital Group) and the insurance industry (most notably Prudential Financial and Chubb Corp.).
Also contributing to performance was an overweight and stock selection within the industrials sector. Selected U.S. and multinational companies, especially those with exposure to agriculture and developing economies, have been strong contributors to our performance. Within industrials, Deere & Co. and AGCO have benefited from the agriculture boom brought on by increased demand for corn-based ethanol and from emerging markets that need to feed growing and increasingly prosperous populations. We were also able to put this trend to work for us in the materials sector, with fertilizer producer Monsanto contributing heavily to performance.
Detracting from performance was an underweight and stock selection in consumer staples, as well as an overweight and stock selection within information technology. In consumer staples, we either did not hold or had only a modest weighting in a few select names that did well, such as Procter & Gamble and Altria. In information technology, semiconductor holdings such as Teradyne and Integrated Device Technology and IT service holdings such as Unisys detracted most from performance. Though our holdings in computers & peripherals performed well on the whole, Sun Microsystems was the Portfolio’s worst performer during the period on both an absolute and relative basis.
The biggest theme for the year was global growth, and we benefited from our two-pronged portfolio approach: one prong invested in cyclicals with a global emphasis and the other in higher quality companies with predictable earnings. Holdings that were in line with global growth were our positions in Cummins and Honeywell International in the industrials sector, as well as FMC Corp. in the materials sector.
The biggest event of the year, however, was the mortgage debacle, and our early exit from names like Countrywide Financial and Lehman Brothers, plus our overall underweight in financials, proved beneficial. While the Portfolio suffered during the summer’s market turmoil and quantitative investment meltdown, we went into the fourth quarter with solid sector positioning, which helped us to end the year ahead of the benchmark.
At year-end, the largest overweights in the Portfolio were in information technology, healthcare and energy. The largest underweights were in financials, consumer staples and utilities.
* The views expressed above are those of the subadvisory firm as of December 31, 2007 and are subject to change based on market and other conditions. Information about the Portfolio’s holdings, asset allocation, industry allocation, or country diversification is historical and is not an indication of future Portfolio composition, which will vary. The performance of any index mentioned in this commentary has not been adjusted for ongoing management, distribution and operating expenses, and sales charges applicable to mutual fund investments. Direct investment in the Index is not possible.
1 The Russell 1000® Value Index is an unmanaged measure of the largest capitalized U.S. domiciled companies with a less than average growth orientation. Companies in this Index generally have a low price-to-book and price-to-earnings ratio, higher divided yields and lower forecasted growth values.
2 The Lipper Variable Insurance Products Fund Average is an average of the total return performance (calculated on the basis of net asset value) of variable product funds with similar investment objectives to those of the subject Portfolio as calculated by Lipper Analytical Services, an independent mutual fund ranking service.
MSF-2
Metropolitan Series Fund, Inc.
BlackRock Large Cap Value Portfolio
A $10,000 INVESTMENT COMPARED TO
THE RUSSELL 1000 VALUE INDEX

Average Annual Returns as of December 31, 2007
| | | | | | | | | | | | |
| | | BlackRock Large Cap
Value Portfolio | | | Russell 1000
Value Index | |
| | | Class A | | | Class B | | | Class E | | |
| 1 Year | | 3.4 | % | | 3.1 | % | | 3.3 | % | | -0.2 | % |
| 5 Year | | 15.0 | | | 14.7 | | | 14.8 | | | 14.6 | |
| Since Inception | | 8.8 | | | 12.7 | | | 8.6 | | | 9.4 | |
Performance numbers are net of all Portfolio expenses but do not include any insurance, sales, or administrative charges of variable annuity or life insurance contracts. If these charges were included, the returns would be lower.
Inception dates of the Class A, Class B and Class E shares are: 5/1/02, 7/30/02, 5/1/02 respectively. Index since inception return is based on the Class A inception date.
This information represents past performance and is not indicative of future results. Investment return and principal value may fluctuate so that shares, upon redemption, may be worth more or less than the original cost.
PORTFOLIO COMPOSITION
as of December 31, 2007
Top Holdings
| | |
| | | % of Total
Net Assets |
Exxon Mobil Corp. | | 7.0% |
Chevron Corp. | | 3.9% |
Pfizer, Inc. | | 3.3% |
ConocoPhillips | | 3.1% |
General Electric Co. | | 2.8% |
American International Group, Inc. | | 2.6% |
JPMorgan Chase & Co. | | 2.2% |
Occidental Petroleum Corp. | | 2.0% |
McDonald’s Corp. | | 1.8% |
AT&T, Inc. | | 1.7% |
Top Sectors
| | |
| | | % of Total
Market Value |
Energy | | 22.8% |
Financials | | 18.9% |
Industrials | | 12.8% |
Health Care | | 12.3% |
Information Technology | | 11.9% |
Materials | | 6.7% |
Consumer Discretionary | | 5.9% |
Telecommunication Services | | 3.6% |
Consumer Staples | | 3.2% |
Utilities | | 1.7% |
MSF-3
Metropolitan Series Fund, Inc.
Shareholder Expense Example
As a shareholder of the Portfolio, you incur ongoing costs, including management fees; distribution and service (12b-1) fees; and other Portfolio expenses. This example is intended to help you understand your ongoing costs (in dollars) (referred to as “expenses”) of investing in the Portfolio and compare these costs with the ongoing costs of investing in other mutual funds. The example is based on an investment of $1,000 invested at the beginning of the period and held for the entire period, July 1, 2007 through December 31, 2007.
Actual Expenses
The first line for each share class of the Portfolio in the table below provides information about actual account values and actual expenses. You may use the information in this line, together with the amount you invested in the particular share class of the Portfolio, to estimate the expenses that you paid over the period. Simply divide your account value by $1,000 (for example, an $8,600 account value divided by $1,000=8.6), then multiply the result by the number in the first line under the heading entitled “Expenses Paid During Period” to estimate the expenses you paid on your account during this period.
Hypothetical Example for Comparison Purposes
The second line for each share class of the Portfolio in the table below provides information about hypothetical account values and hypothetical expenses based on the Portfolio’s actual expense ratio and an assumed rate of return of 5% per year before expenses, which is not the Portfolio’s actual return. The hypothetical account values and expenses may not be used to estimate the actual ending account balance or expenses you paid for the period. You may use this information to compare the ongoing costs of investing in the Portfolio and other funds. To do so, compare this 5% hypothetical example with the 5% hypothetical examples that appear in the shareholder reports of the other funds.
Please note that the expenses shown in the table are meant to highlight your ongoing costs only and do not reflect any fees or charges of your variable insurance product or any additional expenses that participants in certain eligible qualified plans may bear relating to the operations of their plan. Therefore, the second line for each share class in the table is useful in comparing ongoing costs only, and will not help you determine the relative total costs of owning different funds. In addition, if these other costs were included, your costs would have been higher.
| | | | | | | | | | | | | | |
Portfolio | | | | Annualized
Expense
Ratio | | | Beginning
Account Value
July 1,
2007 | | Ending
Account Value
December 31,
2007 | | Expenses Paid
During Period*
July 1, 2007
to
December 31,
2007 |
BlackRock Large Cap Value—Class A | | Actual | | 0.74 | % | | $ | 1,000.00 | | $ | 958.50 | | $ | 3.65 |
| | Hypothetical | | 0.74 | % | | $ | 1,000.00 | | $ | 1,021.43 | | $ | 3.77 |
| | | | | |
BlackRock Large Cap Value—Class B | | Actual | | 0.99 | % | | $ | 1,000.00 | | $ | 957.60 | | $ | 4.88 |
| | Hypothetical | | 0.99 | % | | $ | 1,000.00 | | $ | 1,020.16 | | $ | 5.04 |
| | | | | |
BlackRock Large Cap Value—Class E | | Actual | | 0.89 | % | | $ | 1,000.00 | | $ | 957.70 | | $ | 4.39 |
| | Hypothetical | | 0.89 | % | | $ | 1,000.00 | | $ | 1,020.67 | | $ | 4.53 |
* Expenses paid are equal to the Portfolio’s annualized expense ratio for the most recent six month period, as shown above, multiplied by the average account value over the period, multiplied by the number of days in the most recent fiscal half-year, divided by 365 (to reflect the one-half year period).
MSF-4
Metropolitan Series Fund, Inc.
BlackRock Large Cap Value Portfolio
Schedule of Investments as of December 31, 2007
Common Stock—99.8% of Total Net Assets
| | | | | |
| Security Description | | Shares | | Value* |
| | | | | |
| | |
Aerospace & Defense—5.1% | | | | | |
Honeywell International, Inc. | | 117,000 | | $ | 7,203,690 |
L-3 Communications Holdings, Inc. | | 31,000 | | | 3,284,140 |
Lockheed Martin Corp. | | 13,100 | | | 1,378,906 |
Northrop Grumman Corp. | | 111,000 | | | 8,729,040 |
Raytheon Co. | | 57,400 | | | 3,484,180 |
United Technologies Corp. | | 116,000 | | | 8,878,640 |
| | | | | |
| | | | | 32,958,596 |
| | | | | |
| | |
Auto Components—0.8% | | | | | |
Gentex Corp. | | 182,800 | | | 3,248,356 |
Johnson Controls, Inc. | | 49,000 | | | 1,765,960 |
| | | | | |
| | | | | 5,014,316 |
| | | | | |
| | |
Biotechnology—1.2% | | | | | |
Biogen Idec, Inc. (a) | | 134,000 | | | 7,627,280 |
| | | | | |
| | |
Capital Markets—1.2% | | | | | |
Janus Capital Group, Inc. | | 61,800 | | | 2,030,130 |
The Goldman Sachs Group, Inc. | | 26,000 | | | 5,591,300 |
| | | | | |
| | | | | 7,621,430 |
| | | | | |
| | |
Chemicals—4.4% | | | | | |
E. I. du Pont de Nemours & Co. | | 197,000 | | | 8,685,730 |
FMC Corp. | | 67,000 | | | 3,654,850 |
Mosaic Co. (a) | | 76,000 | | | 7,169,840 |
The Dow Chemical Co. | | 85,000 | | | 3,350,700 |
The Lubrizol Corp. | | 109,000 | | | 5,903,440 |
| | | | | |
| | | | | 28,764,560 |
| | | | | |
| | |
Commercial Banks—1.1% | | | | | |
Comerica, Inc. | | 162,000 | | | 7,051,860 |
| | | | | |
| |
Commercial Services & Supplies—0.7% | | | |
Republic Services, Inc. | | 103,000 | | | 3,229,050 |
Steelcase, Inc. | | 77,800 | | | 1,234,686 |
| | | | | |
| | | | | 4,463,736 |
| | | | | |
| | |
Communications Equipment—2.1% | | | | | |
ADC Telecommunications, Inc. (a) | | 421,000 | | | 6,546,550 |
Juniper Networks, Inc. (a) | | 206,000 | | | 6,839,200 |
| | | | | |
| | | | | 13,385,750 |
| | | | | |
| | |
Computers & Peripherals—3.7% | | | | | |
EMC Corp. (a) | | 257,000 | | | 4,762,210 |
Hewlett-Packard Co. | | 115,000 | | | 5,805,200 |
International Business Machines Corp. | | 86,000 | | | 9,296,600 |
Western Digital Corp. (a) | | 128,000 | | | 3,866,880 |
| | | | | |
| | | | | 23,730,890 |
| | | | | |
| | |
Construction & Engineering—0.4% | | | | | |
The Shaw Group, Inc. (a) | | 48,000 | | | 2,901,120 |
| | | | | |
| | |
Diversified Financial Services—4.1% | | | | | |
Bank of America Corp. | | 101,000 | | | 4,167,260 |
| | | | | |
| Security Description | | Shares | | Value* |
| | | | | |
| |
Diversified Financial Services—(Continued) | | | |
Citigroup, Inc. | | 34,000 | | $ | 1,000,960 |
JPMorgan Chase & Co. | | 327,000 | | | 14,273,550 |
The Nasdaq Stock Market, Inc. (a) | | 143,000 | | | 7,077,070 |
| | | | | |
| | | | | 26,518,840 |
| | | | | |
| |
Diversified Telecommunication Services—3.0% | | | |
AT&T, Inc. | | 262,000 | | | 10,888,720 |
CenturyTel, Inc. | | 106,000 | | | 4,394,760 |
Qwest Communications International, Inc. | | 601,200 | | | 4,214,412 |
| | | | | |
| | | | | 19,497,892 |
| | | | | |
| |
Electronic Equipment & Instruments—0.8% | | | |
Arrow Electronics, Inc. (a) | | 100,000 | | | 3,928,000 |
Avnet, Inc. | | 37,700 | | | 1,318,369 |
| | | | | |
| | | | | 5,246,369 |
| | | | | |
| |
Energy Equipment & Services—1.1% | | | |
ENSCO International, Inc. | | 116,000 | | | 6,915,920 |
| | | | | |
| |
Food & Staples Retailing—1.6% | | | |
BJ’s Wholesale Club, Inc. (a) | | 99,000 | | | 3,349,170 |
The Kroger Co. | | 252,000 | | | 6,730,920 |
| | | | | |
| | | | | 10,080,090 |
| | | | | |
| |
Health Care Providers & Services—5.1% | | | |
Aetna, Inc. | | 107,300 | | | 6,194,429 |
AmerisourceBergen Corp. | | 94,900 | | | 4,258,163 |
Coventry Health Care, Inc. (a) | | 19,600 | | | 1,161,300 |
McKesson Corp. | | 91,000 | | | 5,961,410 |
Medco Health Solutions, Inc. (a) | | 61,000 | | | 6,185,400 |
WellPoint, Inc. (a) | | 103,000 | | | 9,036,190 |
| | | | | |
| | | | | 32,796,892 |
| | | | | |
| |
Hotels, Restaurants & Leisure—1.8% | | | |
McDonald’s Corp. | | 197,000 | | | 11,605,270 |
| | | | | |
| | | | | |
|
Household Products—1.6% |
Colgate-Palmolive Co. | | 86,000 | | | 6,704,560 |
Energizer Holdings, Inc. (a) | | 33,000 | | | 3,700,290 |
| | | | | |
| | | | | 10,404,850 |
| | | | | |
|
Independent Power Producers & Energy Traders—1.0% |
NRG Energy, Inc. (a) | | 155,000 | | | 6,717,700 |
| | | | | |
|
Industrial Conglomerates—2.8% |
General Electric Co. | | 495,000 | | | 18,349,650 |
| | | | | |
|
Insurance—12.6% |
ACE, Ltd. | | 136,000 | | | 8,402,080 |
Aflac, Inc. | | 26,000 | | | 1,628,380 |
Alleghany Corp. (a) | | 4,000 | | | 1,608,000 |
American Financial Group, Inc. | | 51,000 | | | 1,472,880 |
American International Group, Inc. | | 286,000 | | | 16,673,800 |
Aon Corp. | | 58,000 | | | 2,766,020 |
*See accompanying notes to financial statements.
MSF-5
Metropolitan Series Fund, Inc.
BlackRock Large Cap Value Portfolio
Schedule of Investments as of December 31, 2007
Common Stock—(Continued)
| | | | | |
| Security Description | | Shares | | Value* |
| | | | | |
|
Insurance—(Continued) |
CNA Financial Corp. | | 32,800 | | $ | 1,106,016 |
HCC Insurance Holdings, Inc. | | 109,000 | | | 3,126,120 |
Loews Corp. | | 171,000 | | | 8,608,140 |
Nationwide Financial Services, Inc. | | 24,000 | | | 1,080,240 |
Prudential Financial, Inc. | | 53,000 | | | 4,931,120 |
SAFECO Corp. | | 25,800 | | | 1,436,544 |
The Chubb Corp. | | 158,000 | | | 8,623,640 |
The Travelers Cos., Inc. | | 162,000 | | | 8,715,600 |
Transatlantic Holdings, Inc. | | 16,500 | | | 1,199,055 |
UnumProvident Corp. | | 62,600 | | | 1,489,254 |
W.R. Berkley Corp. | | 35,450 | | | 1,056,765 |
XL Capital, Ltd. (Class A) | | 145,000 | | | 7,294,950 |
| | | | | |
| | | | | 81,218,604 |
| | | | | |
|
IT Services—0.3% |
Computer Sciences Corp. (a) | | 9,000 | | | 445,230 |
Electronic Data Systems Corp. | | 66,700 | | | 1,382,691 |
| | | | | |
| | | | | 1,827,921 |
| | | | | |
|
Leisure Equipment & Products—0.2% |
Hasbro, Inc. | | 49,000 | | | 1,253,420 |
| | | | | |
|
Machinery—2.6% |
AGCO Corp. | | 97,000 | | | 6,594,060 |
Deere & Co. | | 112,000 | | | 10,429,440 |
| | | | | |
| | | | | 17,023,500 |
| | | | | |
|
Media—1.5% |
The Walt Disney Co. | | 295,000 | | | 9,522,600 |
| | | | | |
| | | | | |
|
Metals & Mining—1.5% |
Carpenter Technology Corp. | | 60,000 | | | 4,510,200 |
Reliance Steel & Aluminum Co. | | 91,000 | | | 4,932,200 |
| | | | | |
| | | | | 9,442,400 |
| | | | | |
|
Multi-Utilities—0.6% |
CMS Energy Corp. | | 232,000 | | | 4,032,160 |
| | | | | |
|
Multiline Retail—0.3% |
Dollar Tree Stores, Inc. (a) | | 40,400 | | | 1,047,168 |
Family Dollar Stores, Inc. | | 48,000 | | | 923,040 |
| | | | | |
| | | | | 1,970,208 |
| | | | | |
|
Office Electronics—0.3% |
Xerox Corp. | | 105,100 | | | 1,701,569 |
| | | | | |
|
Oil, Gas & Consumable Fuels—21.7% |
Chevron Corp. | | 267,000 | | | 24,919,110 |
ConocoPhillips | | 226,000 | | | 19,955,800 |
Exxon Mobil Corp. | | 483,000 | | | 45,252,270 |
Frontier Oil Corp. | | 118,000 | | | 4,788,440 |
Marathon Oil Corp. | | 175,000 | | | 10,650,500 |
Noble Energy, Inc. | | 88,000 | | | 6,997,760 |
Occidental Petroleum Corp. | | 166,000 | | | 12,780,340 |
Sunoco, Inc. | | 68,000 | | | 4,925,920 |
| | | | | |
| Security Description | | Shares | | Value* |
| | | | | |
| |
Oil, Gas & Consumable Fuels—(Continued) | | | |
Tesoro Corp. | | 85,000 | | $ | 4,054,500 |
Valero Energy Corp. | | 89,000 | | | 6,232,670 |
| | | | | |
| | | | | 140,557,310 |
| | | | | |
|
Paper & Forest Products—0.8% |
International Paper Co. | | 157,000 | | | 5,083,660 |
| | | | | |
|
Pharmaceuticals—6.1% |
Eli Lilly & Co. | | 165,000 | | | 8,809,350 |
King Pharmaceuticals, Inc. (a) | | 77,900 | | | 797,696 |
Merck & Co., Inc. | | 145,000 | | | 8,425,950 |
Pfizer, Inc. | | 931,000 | | | 21,161,630 |
| | | | | |
| | | | | 39,194,626 |
| | | | | |
|
Road & Rail—1.0% |
CSX Corp. | | 155,000 | | | 6,816,900 |
| | | | | |
|
Semiconductors & Semiconductor Equipment—2.6% |
Integrated Device Technology, Inc. (a) | | 215,000 | | | 2,431,650 |
Intersil Corp. | | 259,000 | | | 6,340,320 |
| | | | | |
KLA-Tencor Corp. | | 87,000 | | | 4,189,920 |
Novellus Systems, Inc. (a) | | 143,000 | | | 3,942,510 |
| | | | | |
| | | | | 16,904,400 |
| | | | | |
| | |
Software—2.2% | | | | | |
CA, Inc. | | 26,000 | | | 648,700 |
Cadence Design Systems, Inc. (a) | | 91,000 | | | 1,547,910 |
Fair Isaac Corp. | | 65,000 | | | 2,089,750 |
McAfee, Inc. (a) | | 126,600 | | | 4,747,500 |
Novell, Inc. (a) | | 555,000 | | | 3,812,850 |
Synopsys, Inc. (a) | | 57,400 | | | 1,488,382 |
| | | | | |
| | | | | 14,335,092 |
| | | | | |
| | |
Specialty Retail—1.3% | | | | | |
Barnes & Noble, Inc. | | 91,000 | | | 3,134,950 |
RadioShack Corp. | | 334,000 | | | 5,631,240 |
| | | | | |
| | | | | 8,766,190 |
| | | | | |
|
Wireless Telecommunication Services—0.6% |
Telephone & Data Systems, Inc. | | 61,000 | | | 3,818,600 |
| | | | | |
Total Common Stock
(Identified Cost $621,857,112) | | | | | 645,122,171 |
| | | | | |
Total Investments—99.8%
(Identified Cost $621,857,112) (b) | | | | | 645,122,171 |
Other assets less liabilities | | | | | 1,514,288 |
| | | | | |
| Total Net Assets—100% | | | | $ | 646,636,459 |
| | | | | |
| (b) | The aggregate cost of investments for federal income tax purposes as of December 31, 2007 was $622,652,183 and the composition of unrealized appreciation and depreciation of investment securities was $50,366,406 and $(27,896,418), respectively. |
*See accompanying notes to financial statements.
MSF-6
Metropolitan Series Fund, Inc.
BlackRock Large Cap Value Portfolio
Statement of Assets & Liabilities
December 31, 2007
| | | | | | |
Assets | | | | | | |
Investments at value (a) | | | | | $ | 645,122,171 |
Cash | | | | | | 140,660 |
Receivable for: | | | | | | |
Securities sold | | | | | | 4,226,514 |
Fund shares sold | | | | | | 463,663 |
Accrued dividends | | | | | | 815,331 |
| | | | | | |
Total Assets | | | | | | 650,768,339 |
Liabilities | | | | | | |
Payable for: | | | | | | |
Securities purchased | | $ | 3,306,872 | | | |
Fund shares redeemed | | | 369,756 | | | |
Accrued expenses: | | | | | | |
Management fees | | | 366,684 | | | |
Service and distribution fees | | | 49,223 | | | |
Other expenses | | | 39,345 | | | |
| | | | | | |
Total Liabilities | | | | | | 4,131,880 |
| | | | | | |
Net Assets | | | | | $ | 646,636,459 |
| | | | | | |
Net assets consists of: | | | | | | |
Capital paid in | | | | | $ | 616,723,626 |
Undistributed net investment income | | | | | | 4,290,705 |
Accumulated net realized gains | | | | | | 2,357,069 |
Unrealized appreciation on investments | | | | | | 23,265,059 |
| | | | | | |
Net Assets | | | | | $ | 646,636,459 |
| | | | | | |
| Computation of offering price: | | | | | | |
Class A | | | | | | |
Net asset value and redemption price per share ($370,864,905 divided by 27,240,442 shares outstanding) | | | | | $ | 13.61 |
| | | | | | |
Class B | | | | | | |
Net asset value and redemption price per share ($164,375,665 divided by 12,134,987 shares outstanding) | | | | | $ | 13.55 |
| | | | | | |
Class E | | | | | | |
Net asset value and redemption price per share ($111,395,889 divided by 8,204,929 shares outstanding) | | | | | $ | 13.58 |
| | | | | | |
(a) Identified cost of investments | | | | | $ | 621,857,112 |
| | | | | | |
Statement of Operations
For the Year Ended December 31, 2007
| | | | | | | |
Investment Income | | | | | | | |
Dividends | | | | | $ | 8,068,028 | |
Interest | | | | | | 306,188 | |
| | | | | | | |
| | | | | | 8,374,216 | |
Expenses | | | | | | | |
Management fees | | $ | 3,158,034 | | | | |
Service and distribution fees—Class B | | | 370,328 | | | | |
Service and distribution fees—Class E | | | 179,709 | | | | |
Directors’ fees and expenses | | | 23,669 | | | | |
Custodian | | | 59,586 | | | | |
Audit and tax services | | | 31,739 | | | | |
Legal | | | 5,455 | | | | |
Printing | | | 138,118 | | | | |
Insurance | | | 3,733 | | | | |
Miscellaneous | | | 25,704 | | | | |
| | | | | | | |
Total expenses | | | | | | 3,996,075 | |
| | | | | | | |
Net Investment Income | | | | | | 4,378,141 | |
| | | | | | | |
Realized and Unrealized Gain (Loss) | | | | | | | |
| Realized gain on: | | | | | | | |
Investments—net | | | 2,852,568 | | | | |
Futures contracts—net | | | 455,164 | | | 3,307,732 | |
| | | | | | | |
| Change in unrealized depreciation on: | | | | | | | |
Investments—net | | | | | | (4,793,424 | ) |
| | | | | | | |
Net loss | | | | | | (1,485,692 | ) |
| | | | | | | |
Net Increase in Net Assets From Operations | | | | | $ | 2,892,449 | |
| | | | | | | |
See accompanying notes to financial statements.
MSF-7
Metropolitan Series Fund, Inc.
BlackRock Large Cap Value Portfolio
Statements of Changes in Net Assets
| | | | | | | | |
| | | Year ended
December 31,
2007 | | | Year ended
December 31,
2006 | |
From Operations | | | | | | | | |
Net investment income | | $ | 4,378,141 | | | $ | 2,739,613 | |
Net realized gain | | | 3,307,732 | | | | 13,069,677 | |
Unrealized appreciation (depreciation) | | | (4,793,424 | ) | | | 17,477,654 | |
| | | | | | | | |
Increase in net assets from operations | | | 2,892,449 | | | | 33,286,944 | |
| | | | | | | | |
From Distributions to Shareholders | | | | | | | | |
Net investment income | | | | | | | | |
Class A | | | (518,185 | ) | | | (515,159 | ) |
Class B | | | (1,134,029 | ) | | | (516,442 | ) |
Class E | | | (1,065,888 | ) | | | (736,583 | ) |
| | | | | | | | |
| | | (2,718,102 | ) | | | (1,768,184 | ) |
| | | | | | | | |
Net realized gain | | | | | | | | |
Class A | | | (1,970,563 | ) | | | (2,523,701 | ) |
Class B | | | (5,371,717 | ) | | | (3,063,517 | ) |
Class E | | | (4,641,772 | ) | | | (4,039,624 | ) |
| | | | | | | | |
| | | (11,984,052 | ) | | | (9,626,842 | ) |
| | | | | | | | |
Total distributions | | | (14,702,154 | ) | | | (11,395,026 | ) |
| | | | | | | | |
Increase in net assets from capital share transactions | | | 389,343,171 | | | | 113,366,353 | |
| | | | | | | | |
Total increase in net assets | | | 377,533,466 | | | | 135,258,271 | |
| | |
Net Assets | | | | | | | | |
Beginning of the period | | | 269,102,993 | | | | 133,844,722 | |
| | | | | | | | |
End of the period | | $ | 646,636,459 | | | $ | 269,102,993 | |
| | | | | | | | |
Undistributed Net Investment Income | | | | | | | | |
End of the period | | $ | 4,290,705 | | | $ | 2,650,492 | |
| | | | | | | | |
Other Information:
Capital Shares
Transactions in capital shares were as follows:
| | | | | | | | | | | | | | |
| | | Year ended
December 31, 2007 | | | Year ended
December 31, 2006 | |
| | | Shares | | | $ | | | Shares | | | $ | |
Class A | | | | | | | | | | | | | | |
Sales | | 25,075,646 | | | $ | 347,828,727 | | | 1,208,320 | | | $ | 15,607,642 | |
Reinvestments | | 179,305 | | | | 2,488,748 | | | 246,661 | | | | 3,038,860 | |
Redemptions | | (1,502,776 | ) | | | (20,751,708 | ) | | (1,060,528 | ) | | | (13,718,015 | ) |
| | | | | | | | | | | | | | |
Net increase | | 23,752,175 | | | $ | 329,565,767 | | | 394,453 | | | $ | 4,928,487 | |
| | | | | | | | | | | | | | |
Class B | | | | | | | | | | | | | | |
Sales | | 5,888,414 | | | $ | 81,721,981 | | | 5,565,701 | | | $ | 71,712,404 | |
Reinvestments | | 470,408 | | | | 6,505,746 | | | 291,528 | | | | 3,579,959 | |
Redemptions | | (2,299,463 | ) | | | (31,784,678 | ) | | (718,780 | ) | | | (9,306,425 | ) |
| | | | | | | | | | | | | | |
Net increase | | 4,059,359 | | | $ | 56,443,049 | | | 5,138,449 | | | $ | 65,985,938 | |
| | | | | | | | | | | | | | |
Class E | | | | | | | | | | | | | | |
Sales | | 3,380,179 | | | $ | 47,119,568 | | | 4,675,956 | | | $ | 60,037,459 | |
Reinvestments | | 412,105 | | | | 5,707,660 | | | 388,309 | | | | 4,776,207 | |
Redemptions | | (3,569,274 | ) | | | (49,492,873 | ) | | (1,735,050 | ) | | | (22,361,738 | ) |
| | | | | | | | | | | | | | |
Net increase | | 223,010 | | | $ | 3,334,355 | | | 3,329,215 | | | $ | 42,451,928 | |
| | | | | | | | | | | | | | |
Increase derived from capital share transactions | | | | | $ | 389,343,171 | | | | | | $ | 113,366,353 | |
| | | | | | | | | | | | | | |
See accompanying notes to financial statements.
MSF-8
Metropolitan Series Fund, Inc.
BlackRock Large Cap Value Portfolio
Financial Highlights
| | | | | | | | | | | | | | | | | | | |
| | | Class A | |
| | | Year ended December 31, | |
| | | 2007 | | | 2006 | | | 2005 | | | 2004 | | 2003 | |
Net Asset Value, Beginning of Period | | $ | 13.81 | | | $ | 12.56 | | | $ | 12.11 | | | $ | 10.67 | | $ | 7.95 | |
| | | | | | | | | | | | | | | | | | | |
Income From Investment Operations | | | | | | | | | | | | | | | | | | | |
Net investment income | | | 0.15 | (a) | | | 0.20 | | | | 0.19 | | | | 0.15 | | | 0.11 | |
Net realized and unrealized gain on investments | | | 0.33 | | | | 2.10 | | | | 0.51 | | | | 1.29 | | | 2.71 | |
| | | | | | | | | | | | | | | | | | | |
Total from investment operations | | | 0.48 | | | | 2.30 | | | | 0.70 | | | | 1.44 | | | 2.82 | |
| | | | | | | | | | | | | | | | | | | |
Less Distributions | | | | | | | | | | | | | | | | | | | |
Distributions from net investment income | | | (0.14 | ) | | | (0.18 | ) | | | (0.12 | ) | | | 0.00 | | | (0.10 | ) |
Distributions from net realized capital gains | | | (0.54 | ) | | | (0.87 | ) | | | (0.13 | ) | | | 0.00 | | | 0.00 | |
| | | | | | | | | | | | | | | | | | | |
Total distributions | | | (0.68 | ) | | | (1.05 | ) | | | (0.25 | ) | | | 0.00 | | | (0.10 | ) |
| | | | | | | | | | | | | | | | | | | |
Net Asset Value, End of Period | | $ | 13.61 | | | $ | 13.81 | | | $ | 12.56 | | | $ | 12.11 | | $ | 10.67 | |
| | | | | | | | | | | | | | | | | | | |
Total Return (%) | | | 3.4 | | | | 19.3 | | | | 6.0 | | | | 13.4 | | | 35.7 | |
Ratio of operating expenses to average net assets before expense reductions (%) | | | 0.74 | | | | 0.84 | | | | 0.85 | | | | 0.93 | | | 0.94 | |
Ratio of operating expenses to average net assets after expense reductions (%) (b) | | | N/A | | | | 0.82 | | | | 0.83 | | | | 0.89 | | | N/A | |
Ratio of operating expenses to average net assets without giving effect to the contractual expense agreement would have been (%) | | | N/A | | | | N/A | | | | N/A | | | | N/A | | | 1.05 | |
Ratio of net investment income to average net assets (%) | | | 1.10 | | | | 1.69 | | | | 1.59 | | | | 1.31 | | | 1.28 | |
Portfolio turnover rate (%) | | | 66 | | | | 96 | | | | 109 | | | | 31 | | | 51 | |
Net assets, end of period (000) | | $ | 370,865 | | | $ | 48,176 | | | $ | 38,850 | | | $ | 37,259 | | $ | 33,113 | |
| | | | | | | | | | | | | | | | | | | |
| | | Class B | |
| | | Year ended December 31, | |
| | | 2007 | | | 2006 | | | 2005 | | | 2004 | | 2003 | |
Net Asset Value, Beginning of Period | | $ | 13.75 | | | $ | 12.50 | | | $ | 12.07 | | | $ | 10.66 | | $ | 7.95 | |
| | | | | | | | | | | | | | | | | | | |
Income From Investment Operations | | | | | | | | | | | | | | | | | | | |
Net investment income | | | 0.11 | (a) | | | 0.14 | | | | 0.13 | | | | 0.08 | | | 0.04 | |
Net realized and unrealized gain on investments | | | 0.34 | | | | 2.13 | | | | 0.53 | | | | 1.33 | | | 2.76 | |
| | | | | | | | | | | | | | | | | | | |
Total from investment operations | | | 0.45 | | | | 2.27 | | | | 0.66 | | | | 1.41 | | | 2.80 | |
| | | | | | | | | | | | | | | | | | | |
Less Distributions | | | | | | | | | | | | | | | | | | | |
Distributions from net investment income | | | (0.11 | ) | | | (0.15 | ) | | | (0.10 | ) | | | 0.00 | | | (0.09 | ) |
Distributions from net realized capital gains | | | (0.54 | ) | | | (0.87 | ) | | | (0.13 | ) | | | 0.00 | | | 0.00 | |
| | | | | | | | | | | | | | | | | | | |
Total distributions | | | (0.65 | ) | | | (1.02 | ) | | | (0.23 | ) | | | 0.00 | | | (0.09 | ) |
| | | | | | | | | | | | | | | | | | | |
Net Asset Value, End of Period | | $ | 13.55 | | | $ | 13.75 | | | $ | 12.50 | | | $ | 12.07 | | $ | 10.66 | |
| | | | | | | | | | | | | | | | | | | |
Total Return (%) | | | 3.1 | | | | 19.1 | | | | 5.6 | | | | 13.2 | | | 35.4 | |
Ratio of operating expenses to average net assets before expense reductions (%) | | | 0.99 | | | | 1.09 | | | | 1.10 | | | | 1.18 | | | 1.19 | |
Ratio of operating expenses to average net assets after expense reductions (%) (b) | | | N/A | | | | 1.07 | | | | 1.08 | | | | 1.14 | | | N/A | |
Ratio of operating expenses to average net assets without giving effect to the contractual expense agreement would have been (%) | | | N/A | | | | N/A | | | | N/A | | | | N/A | | | 1.30 | |
Ratio of net investment income to average net assets (%) | | | 0.78 | | | | 1.46 | | | | 1.38 | | | | 1.46 | | | 1.02 | |
Portfolio turnover rate (%) | | | 66 | | | | 96 | | | | 109 | | | | 31 | | | 51 | |
Net assets, end of period (000) | | $ | 164,376 | | | $ | 111,007 | | | $ | 36,725 | | | $ | 15,880 | | $ | 61 | |
| (a) | Per share amount is based on average shares outstanding during the period. |
| (b) | The Portfolio has entered into arrangements with certain brokers who paid a portion of the Portfolio’s expenses. |
See accompanying notes to financial statements.
MSF-9
Metropolitan Series Fund, Inc.
BlackRock Large Cap Value Portfolio
Financial Highlights
| | | | | | | | | | | | | | | | | | | |
| | | Class E | |
| | | Year ended December 31, | |
| | | 2007 | | | 2006 | | | 2005 | | | 2004 | | 2003 | |
Net Asset Value, Beginning of Period | | $ | 13.77 | | | $ | 12.52 | | | $ | 12.08 | | | $ | 10.66 | | $ | 7.95 | |
| | | | | | | | | | | | | | | | | | | |
Income From Investment Operations | | | | | | | | | | | | | | | | | | | |
Net investment income | | | 0.12 | (a) | | | 0.14 | | | | 0.18 | | | | 0.12 | | | 0.08 | |
Net realized and unrealized gain on investments | | | 0.35 | | | | 2.14 | | | | 0.49 | | | | 1.30 | | | 2.72 | |
| | | | | | | | | | | | | | | | | | | |
Total from investment operations | | | 0.47 | | | | 2.28 | | | | 0.67 | | | | 1.42 | | | 2.80 | |
| | | | | | | | | | | | | | | | | | | |
Less Distributions | | | | | | | | | | | | | | | | | | | |
Distributions from net investment income | | | (0.12 | ) | | | (0.16 | ) | | | (0.10 | ) | | | 0.00 | | | (0.09 | ) |
Distributions from net realized capital gains | | | (0.54 | ) | | | (0.87 | ) | | | (0.13 | ) | | | 0.00 | | | 0.00 | |
| | | | | | | | | | | | | | | | | | | |
Total distributions | | | (0.66 | ) | | | (1.03 | ) | | | (0.23 | ) | | | 0.00 | | | (0.09 | ) |
| | | | | | | | | | | | | | | | | | | |
Net Asset Value, End of Period | | $ | 13.58 | | | $ | 13.77 | | | $ | 12.52 | | | $ | 12.08 | | $ | 10.66 | |
| | | | | | | | | | | | | | | | | | | |
Total Return (%) | | | 3.3 | | | | 19.2 | | | | 5.7 | | | | 13.3 | | | 35.4 | |
Ratio of operating expenses to average net assets before expense reductions (%) | | | 0.89 | | | | 0.99 | | | | 1.00 | | | | 1.08 | | | 1.09 | |
Ratio of operating expenses to average net assets after expense reductions (%) (b) | | | N/A | | | | 0.97 | | | | 0.98 | | | | 1.04 | | | N/A | |
Ratio of operating expenses to average net assets without giving effect to the contractual expense agreement would have been (%) | | | N/A | | | | N/A | | | | N/A | | | | N/A | | | 1.20 | |
Ratio of net investment income to average net assets (%) | | | 0.87 | | | | 1.55 | | | | 1.44 | | | | 1.21 | | | 1.14 | |
Portfolio turnover rate (%) | | | 66 | | | | 96 | | | | 109 | | | | 31 | | | 51 | |
Net assets, end of period (000) | | $ | 111,396 | | | $ | 109,920 | | | $ | 58,269 | | | $ | 59,449 | | $ | 29,051 | |
| (a) | Per share amount is based on average shares outstanding during the period. |
| (b) | The Portfolio has entered into arrangements with certain brokers who paid a portion of the Portfolio’s expenses. |
See accompanying notes to financial statements.
MSF-10
Metropolitan Series Fund, Inc.
BlackRock Large Cap Value Portfolio
Notes to Financial Statements—December 31, 2007
Metropolitan Series Fund, Inc. (the “Fund”) is organized as a corporation under the laws of Maryland pursuant to Articles of Incorporation filed on November 23, 1982, as amended, and registered under the Investment Company Act of 1940, as amended (the “1940 Act”), as an open-end investment company. The Fund is a “series” type of mutual fund, which issues separate series of stock. Each series represents an interest in a separate portfolio of Fund investments. The BlackRock Large Cap Value Portfolio (the “Portfolio”) is a diversified series of the Fund. Shares in the Fund are not offered directly to the general public and are currently available only to separate accounts established by Metropolitan Life Insurance Company (“MetLife”), New England Life Insurance Company, General American Life Insurance Company (“General American”), The MetLife Investors Group of Insurance Companies, MetLife Insurance Company of Connecticut and other affiliated insurance companies (collectively, the “Insurance Companies”), as an investment vehicle for variable life insurance, group annuity or variable annuity products, although the Portfolio is not available to all such separate accounts. The Portfolio’s shares may be divided into different classes. Currently, the classes being offered by the Portfolio are named Class A, Class B and Class E. The classes of the Portfolio’s shares are identical, except that certain additional charges (Rule 12b-1 fees) are made against Class B and Class E shares. Investment income, realized and unrealized capital gains and losses, the common expenses of the Portfolio and certain Portfolio-level expense reductions, if any, are allocated on a pro rata basis to each class based on the relative net assets of each class to the total net assets of the Portfolio.
| 2. | SIGNIFICANT ACCOUNTING POLICIES: |
The preparation of financial statements in conformity with accounting principles generally accepted in the United States of America (“GAAP”) requires management to make estimates and assumptions that affect the reported amounts of assets and liabilities and disclosure of contingent assets and liabilities as of the date of the financial statements and the reported amounts of income and expenses during the reporting period. Actual results could differ from those estimates.
The following is a summary of significant accounting policies consistently followed by the Portfolio in the preparation of its financial statements. The policies are in conformity with GAAP.
Investment Valuation:
Debt securities (other than short term obligations with a remaining maturity of sixty days or less) are valued by independent pricing services selected by the relevant subadviser pursuant to authorization of the Board of Directors of the Fund (the “Board” or “Directors”). Short term obligations with a remaining maturity of sixty days or less are valued at amortized cost which approximates fair market value.
Equity securities traded on a national securities exchange or exchanges are valued at their last sale price on the principal trading market. Equity securities traded on the NASDAQ National Market System are valued at the NASDAQ Official Closing Price (the “NOCP”). The NOCP is the last sale price if it falls between the spread of the last reported bid and asked prices. If the last reported bid and asked prices are above the last reported sale price, the NOCP will be the last reported bid price. If the last reported bid and asked prices are below the last reported sale price, the NOCP will be the last reported asked price. Equity securities traded on a national securities exchange or exchanges or on the NASDAQ National Market System for which there is no reported sale during the day are valued at the last reported bid price. A security that is listed or traded on more than one exchange is valued at the quotation on the exchange determined to be the primary market for that security by the Board or its delegates. If no closing price is available, then such securities are valued by using the last reported bid price. Equity securities traded over-the-counter are valued at the last reported sales price.
If no current market value quotation is readily available or reliable for a portfolio security, fair value will be determined in accordance with procedures established by and under the general supervision of the Board. When the Portfolio uses fair value pricing, it may take into account any factors it deems appropriate. The value of securities used by the Portfolio to calculate its net asset value may differ from quoted or published prices for the same securities. Fair value pricing involves subjective judgments and the fair value determined for a security may be materially different than the value that could be realized upon the sale of that security.
The Portfolio expects to use fair value pricing for securities primarily traded on U.S. exchanges only under very limited circumstances. For example, the Portfolio may use fair value pricing if the exchange on which a security is traded closes early or trading in the security is suspended.
MSF-11
Metropolitan Series Fund, Inc.
BlackRock Large Cap Value Portfolio
Notes to Financial Statements—December 31, 2007—(Continued)
Securities traded primarily on an exchange outside of the United States which closes before the close of the New York Stock Exchange will be valued at the last sales price on that non-U.S. exchange. Securities traded primarily on an exchange outside of the United States for which there is no reported sale during the day are valued at the mean between the last reported bid and asked prices. However, because most foreign markets close well before the Portfolio values its securities (typically at 4 p.m. Eastern Time), the earlier close of these foreign markets gives rise to the possibility that significant events, including broad market moves, may have occurred after these foreign markets close but before the Portfolio values its securities. To account for this, the Portfolio may frequently value many of its foreign equity securities using fair value prices based on third party vendor modeling tools.
Forward foreign currency exchange contracts are valued based on the mean between closing bid and asked prices of the forward currency contract rates in the London foreign exchange markets on a daily basis as provided by a reliable bank or dealer.
Options, whether on securities, indices, futures contracts, or otherwise, are valued at the last sales price available as of the close of business on the day of valuation or, if there is no such sale price available, at the mean between the bid and asked prices. Options on currencies are valued at the spot price each day.
The value of futures contracts will be the sum of the margin deposit plus or minus the difference between the value of the futures contract on each day the net asset value is calculated and the value on the date the futures contract originated, value being that established on a recognized commodity exchange, or by reference to other customary sources, with gain or loss being realized when the futures contract closes or expires.
Subject to the Board’s oversight, the Board has delegated day-to-day responsibility for valuing Portfolio assets to the subadviser of the Portfolio, who values such assets as described above and operates under procedures approved by the Board.
Investment Transactions and Related Investment Income:
Portfolio security transactions are recorded on the trade date. Dividend income is recorded on the ex-dividend date or, for certain foreign securities, when notified. Interest income, which includes amortization of premium and accretion of discount on debt securities, is recorded on the accrual basis. Realized gains and losses on investments and unrealized appreciation and depreciation are determined on the identified cost basis, which is the same basis used for federal income tax purposes.
Repurchase Agreements:
The Portfolio, through the custodian or a subcustodian, receives delivery of the underlying securities collateralizing repurchase agreements. The Portfolio requires the custodian to take possession, to have legally segregated in the Federal Reserve Book Entry System, or to have segregated within the custodian’s vault, all securities held as collateral for repurchase agreements. It is the Portfolio’s policy that the market value of the collateral be at least equal to 100% of the repurchase price in the case of a repurchase agreement of one-day duration and 102% on all other repurchase agreements. The Portfolio’s subadviser is responsible for determining that the value of the collateral is at all times at least equal to the repurchase price. In connection with transactions in repurchase agreements, if the seller defaults and the value of the collateral declines or if the seller enters an insolvency proceeding, realization of the collateral by the Portfolio may be delayed, limited or wholly denied.
Foreign Currency Translation:
The books and records of the Portfolio are maintained in U.S. dollars. The values of securities, currencies and other assets and liabilities denominated in currencies other than U.S. dollars are translated into U.S. dollars based upon foreign exchange rates prevailing at the end of the period. Purchases and sales of investment securities, income and expenses are translated on the respective dates of such transactions. Since the values of investment securities are presented at the foreign exchange rates prevailing at the end of the period, it is not practical to isolate that portion of the results of operations arising from changes in exchange rates from that portion of the results of operations reflecting fluctuations arising from changes in market prices of the investment securities. Such fluctuations are included in the net realized and unrealized gain or loss on investments.
Net realized foreign exchange gains or losses arise from sales of foreign currency, currency gains or losses realized between the trade and settlement dates on securities transactions, and the difference between the amounts of dividends, interest, and foreign withholding taxes recorded by the Portfolio and the U.S. dollar equivalent of the amounts actually received or paid by the Portfolio. Net unrealized foreign exchange gains and losses arise from changes in the value of assets and liabilities, other than investment securities, resulting from changes in the exchange rate.
MSF-12
Metropolitan Series Fund, Inc.
BlackRock Large Cap Value Portfolio
Notes to Financial Statements—December 31, 2007—(Continued)
Forward Foreign Currency Exchange Contracts:
The Portfolio may enter into forward foreign currency exchange contracts primarily to hedge against foreign currency exchange rate risks on its non-U.S. dollar denominated investment securities. When entering into a forward currency contract, the Portfolio agrees to receive or deliver a fixed quantity of foreign currency for an agreed-upon price on an agreed future date. These contracts are valued daily and the Portfolio’s net equity therein, representing unrealized gain or loss on the contracts as measured by the difference between the foreign exchange rates at the dates of entry into the contracts and the forward rates at the settlement date, is included in the Statement of Assets and Liabilities. Realized and unrealized gains and losses are included in the Statement of Operations. These instruments involve market and/or credit risk in excess of the amount recognized in the Statement of Assets and Liabilities. Risks arise from the possible inability of counterparties to meet the terms of their contracts and from movement in currency and securities values and interest rates.
Futures Contracts:
The Portfolio may buy and sell futures contracts (on recognized exchanges) as a hedge or to enhance return. Futures contracts are agreements to buy or sell a security, or deliver a final cash settlement price in connection with an index, interest rate, currency, or other contracts not calling for physical delivery, for a set price in the future. The Portfolio must post an amount equal to a portion of the total market value of the futures contract as futures variation margin, which is returned when the Portfolio’s obligations under the contract have been satisfied. From time to time thereafter, the Portfolio may have to post variation margin to maintain this amount as the market value of the contract fluctuates. Risks of entering into futures contracts (and related options) include the possibility that there may be an illiquid market and that a change in the value of the contract or option may not correlate with changes in the value of the underlying securities.
Options:
The Portfolio may use options to hedge against changes in values of securities the Portfolio owns or expects to purchase. Writing puts or buying calls tends to increase the Portfolio’s exposure to the underlying instrument and writing calls or buying puts tends to decrease the Portfolio’s exposure to the underlying instrument, and can be used to hedge other Portfolio investments. For options purchased to hedge the Portfolio’s investments, the potential risk to the Portfolio is that the change in value of options contracts may not correspond to the change in value of the hedged instruments. In addition, losses may arise from changes in the value of the underlying instruments, if there is an illiquid secondary market, or if the counterparty is unable to perform. The maximum loss for purchased options is limited to the premium initially paid for the option. For options written by the Portfolio, the maximum loss is not limited to the premium initially received for the option.
The main risk associated with purchasing an option is that the option expires without being exercised. In this case, the option expires worthless and the premium paid for the option is considered the loss. The risk associated with writing a call option is that the Portfolio may forgo the opportunity for a profit if the market value of the underlying position increases and the option is exercised. The risk in writing a put option is that the Portfolio may incur a loss if the market value of the underlying position decreases and the option is exercised. In addition, the Portfolio risks not being able to enter into a closing transaction for the written option as the result of an illiquid market.
“When-Issued” Securities:
Purchasing securities “when-issued” is a forward commitment by the Portfolio to buy a security. The estimated amount of the Portfolio’s payment obligation and the security’s interest rate are determined when the commitment is made, even though no interest accrues until the security is issued, which is generally 15 to 120 days later. The Portfolio will segregate liquid assets with its custodian sufficient at all times to satisfy these commitments. If the value of the security is less when delivered than when the commitment was made, the Portfolio will suffer a loss.
Federal Income Taxes:
It is the Portfolio’s policy to comply with the requirements of the Internal Revenue Code of 1986, as amended, and regulations thereunder, applicable to regulated investment companies and to distribute all of its taxable income to shareholders. Therefore, no federal income tax provision is required.
MSF-13
Metropolitan Series Fund, Inc.
BlackRock Large Cap Value Portfolio
Notes to Financial Statements—December 31, 2007—(Continued)
As of December 31, 2007, the Portfolio had no capital loss carryovers.
The tax character of distributions paid for the periods ended December 31, 2007 and 2006 was as follows:
| | | | | | | | | | | | | | | | | | | | | | |
| Ordinary Income | | Long Term Gain | | Return of Capital | | Total |
| 2007 | | 2006 | | 2007 | | 2006 | | 2007 | | 2006 | | 2007 | | 2006 |
| $ | 3,228,534 | | $ | 2,142,668 | | $ | 11,473,620 | | $ | 9,252,358 | | $ | — | | $ | — | | $ | 14,702,154 | | $ | 11,395,026 |
As of December 31, 2007, the components of distributable earnings (accumulated losses) on a federal income tax basis were as follows:
| | | | | | | | | | | | |
Undistributed
Ordinary
Income | | Undistributed
Long Term
Gain | | Unrealized
Appreciation | | Loss
Carryforwards | | Total |
| $4,290,705 | | $ | 9,425,592 | | $ | 22,469,988 | | $ | — | | $ | 36,186,285 |
Dividends and Distributions to Shareholders:
The Portfolio records dividends and distributions on the ex-dividend date. Net realized gains from security transactions (if any) are generally distributed annually to shareholders. The timing and characterization of certain income and capital gains distributions are determined in accordance with federal tax regulations that may differ from GAAP. Permanent book and tax basis differences relating to shareholder distributions will result in reclassification between under/over distributed net investment income, accumulated net realized gains/losses and paid in capital.
| 3. | INVESTMENT TRANSACTIONS: |
For the year ended December 31, 2007, purchases and sales of securities (excluding short term investments) for the Portfolio were as follows:
| | | | | | | | | |
| Purchases | | Sales |
| U.S. Government | | Other | | U.S. Government | | Other |
| $0 | | $ | 683,537,542 | | $ | 0 | | $ | 302,865,199 |
| 4. | INVESTMENT MANAGEMENT FEES AND OTHER TRANSACTIONS WITH AFFILIATES: |
Investment Management Agreement:
MetLife Advisers, LLC (“MetLife Advisers”) is the investment adviser to the Portfolio. The Fund has entered into an investment management agreement with MetLife Advisers with respect to the Portfolio. For providing investment management services to the Portfolio, MetLife Advisers receives monthly compensation at the following annual rates:
| | | | | | |
| | | Management
Fees earned by
MetLife Advisers
for the year ended
December 31, 2007 | | Annual
percentage
rates paid to
MetLife Advisers | | Based on Portfolios average daily net asset levels |
| | $3,158,034 | | 0.700% | | Of the first $250 million |
| | | | 0.650% | | Of the next $500 million |
| | | | 0.600% | | On amounts in excess of $750 million |
Certain officers and directors of the Fund may also be officers of MetLife Advisers; however, such officers and directors receive no compensation from the Fund.
MetLife Advisers has entered into an investment subadvisory agreement with respect to the Portfolio. BlackRock Advisors, LLC is compensated by MetLife Advisers to provide subadvisory services for the Portfolio.
MSF-14
Metropolitan Series Fund, Inc.
BlackRock Large Cap Value Portfolio
Notes to Financial Statements—December 31, 2007—(Continued)
Service and Distribution Fees:
The Fund has adopted a Distribution and Service Plan under Rule 12b-1 of the 1940 Act for the Portfolio’s Class B and E shares. Under the Distribution and Service Plan, the Class B and E shares of the Portfolio pay a fee to compensate the Insurance Companies (or their affiliates) and other broker-dealers and financial intermediaries involved in the offer and sale of Portfolio shares for promoting or selling and servicing, the Class B and E shares. The fees under the Distribution and Service Plan for each class of the Portfolio’s shares are calculated as a percentage of the Portfolio’s average daily net assets that are attributable to that Class. Currently, the fee is 0.25% per year for Class B shares and 0.15% per year for Class E shares. Amounts paid by the Portfolio for the year ended December 31, 2007 are shown as Service and Distribution fees in the Statement of Operations.
As previously reported, in May 2004, General American received a Wells Notice stating that the SEC staff was considering recommending that the SEC bring a civil action alleging violations of the U.S. securities laws against General American with respect to market timing and late trading in a limited number of privately-placed variable insurance contracts that were sold through General American. General American responded to the SEC staff and cooperated with the investigation. On August 9, 2007, the SEC announced that it had settled an enforcement action regarding late trading against General American with, among other things, General American agreeing to pay a civil penalty and to comply with certain undertakings. General American consented to the SEC’s order without admitting or denying the findings. MetLife Advisers has also advised the Fund’s Board of Directors that, while certain exceptions to the Fund’s policies have been noted, no situations have been identified that would have a material impact on the financial position of the Fund.
| 6. | RECENT ACCOUNTING PRONOUNCEMENTS: |
Effective June 29, 2007, the Fund implemented Financial Accounting Standards Board (“FASB”) Interpretation No. 48, “Accounting for Uncertainty in Income Taxes—an interpretation of FASB Statement No. 109” (“FIN 48”). FIN 48 prescribes the minimum recognition threshold a tax position must meet in connection with accounting for uncertainties in income tax positions taken or expected to be taken by an entity, including investment companies, before being measured and recognized in the financial statements. Management has evaluated the application of FIN 48 to the Fund, and has determined that the adoption of FIN 48 does not have a material impact on the Fund’s financial statements. The Fund files U.S. tax returns. No income tax returns are currently under examination. The statute of limitations on the Fund’s tax returns remains open for the years ended December 31, 2004 through December 31, 2006.
In September 2006, Statement of Financial Accounting Standards No. 157, Fair Value Measurements (SFAS 157) was issued and is effective for fiscal years beginning after November 15, 2007. SFAS 157 defines fair value, establishes a framework for measuring fair value and expands disclosures about fair value measurements. Management is currently evaluating the impact the adoption of SFAS 157 will have on the Portfolio’s financial statement disclosures.
MSF-15
Metropolitan Series Fund, Inc.
BlackRock Large Cap Value Portfolio
Report of Independent Registered Public Accounting Firm
To the Shareholders and Board of Directors of the Metropolitan Series Fund, Inc.:
We have audited the accompanying statement of assets and liabilities, including the schedule of investments, of the BlackRock Large Cap Value Portfolio, one of the portfolios constituting the Metropolitan Series Fund, Inc. (the “Fund”) as of December 31, 2007, and the related statement of operations for the year then ended, the statements of changes in net assets for each of the two years in the period then ended, and the financial highlights for each of the five years in the period then ended. These financial statements and financial highlights are the responsibility of the Fund’s management. Our responsibility is to express an opinion on these financial statements and financial highlights based on our audits.
We conducted our audits in accordance with the standards of the Public Company Accounting Oversight Board (United States). Those standards require that we plan and perform the audit to obtain reasonable assurance about whether the financial statements and financial highlights are free of material misstatement. The Fund is not required to have, nor were we engaged to perform, an audit of its internal control over financial reporting. Our audits included consideration of internal control over financial reporting as a basis for designing audit procedures that are appropriate in the circumstances, but not for the purpose of expressing an opinion on the effectiveness of the Fund’s internal control over financial reporting. Accordingly, we express no such opinion. An audit also includes examining, on a test basis, evidence supporting the amounts and disclosures in the financial statements, assessing the accounting principles used and significant estimates made by management, as well as evaluating the overall financial statement presentation. Our procedures included confirmation of securities owned as of December 31, 2007, by correspondence with the custodian and brokers; where replies were not received from brokers, we performed other auditing procedures. We believe that our audits provide a reasonable basis for our opinion.
In our opinion, the financial statements and financial highlights referred to above present fairly, in all material respects, the financial position of the BlackRock Large Cap Value Portfolio of the Metropolitan Series Fund, Inc. as of December 31, 2007, the results of its operations for the year then ended, the changes in its net assets for each of the two years in the period then ended, and the financial highlights for each of the five years in the period then ended, in conformity with accounting principles generally accepted in the United States of America.
Deloitte & Touche LLP
Boston, Massachusetts
February 21, 2008
MSF-16
Metropolitan Series Fund, Inc.
Directors and Officers
The Fund’s Directors review actions of the Fund’s investment adviser and subadvisers, and decide upon matters of general policy. The Fund’s officers supervise the daily business operations of the Fund. The Board of Directors and the Fund’s officers are listed below. Each Director is responsible for overseeing all 36 Portfolios of the Fund. There is no limit to the term a Director may serve. Directors serve until their resignation, retirement or removal in accordance with the Fund’s organizational documents and policies adopted by the Board from time to time. Officers hold office at the pleasure of the Board or until the election or appointment and the qualification of a successor. The address of the directors and officers is c/o Metropolitan Series Fund, Inc., 501 Boylston Street, Boston, MA 02116.
Interested Directors(1)
Each Director below is an “interested person” (as defined by the 1940 Act) with respect to the Fund in that Ms. Forget is an employee of MetLife and Mr. Typermass is a former employee of MetLife and owns securities issued by MetLife, Inc., the ultimate parent company of MetLife Advisers.
| | | | | | | | |
Name, Address and Age | | Current
position(s)
with Fund | | Position(s)
held since | | Principal occupations
over past five years, including other directorships(2) | | Number of
Portfolios in
Fund Complex
Overseen by
Director(3) |
Elizabeth M. Forget Age: 41 | | Director, Chairman of the Board, President and Chief Executive Officer | | 2006 | | Senior Vice President (since 2007), MetLife, Inc.; President, Met Investors Advisory, LLC (“MIA”); Trustee and President, Met Investors Series Trust (“MIST”); Executive Vice President, MetLife Investors Group, Inc.; President (since 2006), MetLife Advisers. | | 81 |
| | | | |
Arthur G. Typermass Age: 70 | | Director | | 1998 | | Formerly, Senior Vice President and Treasurer, MetLife. | | 37 |
Non-Interested Directors(1)
Each Director below is not an “interested person” (as defined by the 1940 Act) with respect to the Fund (collectively, the “Independent Directors”).
| | | | | | | | |
Name, Address and Age | | Current
position(s)
with Fund | | Position(s)
held since | | Principal occupations
over past five years, including other directorships(2) | | Number of
Portfolios in
Fund Complex
Overseen by
Director(3) |
Steve A. Garban† Age: 70 | | Director | | 1985 | | Formerly, Chief Financial Officer, Senior Vice President Finance and Operations and Treasurer (Emeritus), The Pennsylvania State University. | | 37 |
| | | | |
Linda B. Strumpf Age: 60 | | Director | | 2000 | | Vice President and Chief Investment Officer, Ford Foundation. | | 37 |
| | | | |
Michael S. Scott Morton† Age: 70 | | Director | | 1993 | | Jay W. Forrester Professor of Management (Emeritus) at Sloan School of Management, MIT. | | 37 |
| | | | |
H. Jesse Arnelle Age: 74 | | Director | | 2001 | | Formerly, Counsel, Womble Carlyle Sandrie & Rice; Director, Textron Inc. (global multi-industry company)*; formerly, Director, Gannet Co. Inc. (diversified news and information company)*; formerly, Director, Eastman Chemical Company (global chemical company)*; formerly, Director, Waste Management, Inc.*; formerly, Director, Armstrong Holdings Inc. (parent company of floor and ceiling products business)*; formerly, Director, FPL Group Inc. (public utility holding company)*; Director, URS Corporation (engineering design services firm)*. | | 37 |
| | | | |
Nancy Hawthorne Age: 56 | | Director | | 2003 | | Director, Avid Technologies (computer software company)*; formerly, Chairman of the Board of Avid Technologies; formerly, Board of Advisors, L. Knife & Sons, Inc. (beverage distributor); Chief Executive Officer, Clerestory LLC (corporate financial advisor); formerly, Trustee, New England Zenith Fund (“Zenith Fund”)**; formerly, Chief Executive Officer and Managing Partner, Hawthorne, Krauss and Associates (corporate financial advisor); formerly, Chief Financial Officer and Executive Vice President, Continental Cablevision, subsequently renamed MediaOne (cable television company); formerly, Director, Life F/X, Inc.; formerly, Chairman of the Board, WorldClinic (distance medicine company); formerly, Director, Perini Corporation (construction company)*; formerly, Director, CGU (property and casualty insurance company); formerly, Director, Beacon Power Corporation (energy company )*. | | 37 |
MSF-17
Metropolitan Series Fund, Inc.
Directors and Officers—(Continued)
| | | | | | | | |
Name, Address and Age | | Current
position(s)
with Fund | | Position(s)
held since | | Principal occupations
over past five years, including other directorships(2) | | Number of
Portfolios in
Fund Complex
Overseen by
Director(3) |
John T. Ludes Age: 71 | | Director | | 2003 | | President, LFP Properties (consulting firm); Formerly, Trustee, Zenith Fund**; formerly, Vice Chairman, President and Chief Operating Officer, Fortune Brands/American Brands (global conglomerate); formerly, President and CEO, Acushnet Company (athletic equipment company). | | 37 |
Officers(1)
| | | | | | | | |
Name and address | | Age | | Current
position(s)
with Fund | | Position(s)
held since | | Principal occupations over past five years(2) |
| Jeffrey P. Halperin | | 40 | | Chief Compliance Officer | | 2006 | | Vice President (since 2006), Corporate Ethics and Compliance Department, MetLife, Inc.; Chief Compliance Officer (since 2006), MetLife Advisers, MIA and MIST. |
| | | | |
| John F. Guthrie, Jr. | | 64 | | Senior Vice President | | 2002 | | Manager and Senior Vice President, MetLife Advisers; Vice President, MetLife; Vice President (since 2003), MetLife Group, Inc.; Vice President, NELICO; Vice President (since 2005), MIA; formerly, Senior Vice President, Zenith Fund**. |
| | | | |
| Alan C. Leland | | 55 | | Senior Vice President | | 2005 | | Treasurer and Chief Financial Officer, MetLife Advisers, LLC; Treasurer (since 2005), Met Investors Advisory, LLC; Vice President (since 2004), MIA; Vice President (since 2003), MetLife Group, Inc.; Vice President, MetLife; Senior Vice President, NELICO |
| | | | |
| Peter Duffy | | 52 | | Vice President and Treasurer | | 2000 | | Senior Vice President, MetLife Advisers (since 1998); Second Vice President (since 2003), NELICO; Vice President, MetLife (since 2004); Vice President (since 2004), MetLife Group, Inc.; formerly, Vice President and Treasurer, Zenith Fund**. |
| | | | |
| Thomas M. Lenz | | 49 | | Vice President and Secretary | | 2002 | | General Counsel and Secretary, MetLife Advisers; Assistant General Counsel, MetLife; formerly, Vice President and Secretary, Zenith Fund**. |
| * | Indicates a directorship with a registered investment company or a company subject to the reporting requirements of the Securities Exchange Act of 1934, as amended. |
| ** | The Zenith Fund deregistered with the Securities and Exchange Commission (“SEC”) in 2004. |
| (†) | Served as a trustee, director and/or officer of one or more of the following companies, each of which had a direct or indirect advisory relationship with MetLife Advisers or its affiliates prior to January 31, 2005: State Street Research Financial Trust, State Street Research Income Trust, State Street Research Money Market Trust, State Street Research Institutional Funds, State Street Research Capital Trust, State Street Research Master Investment Trust, State Street Research Equity Trust, State Street Research Securities Trust and State Street Research Exchange Trust (collectively, the “State Street Research Funds”). |
| (1) | Each Director of the Fund also serves as trustee of Metropolitan Series Fund II (“Met Series Fund II”), a registered investment company advised by MetLife Advisers. Each officer of the Fund serves in the same position with Met Series Fund II, which consists of one portfolio. |
| (2) | Previous positions during the past five years with the Fund, MIST, MetLife, MetLife Advisers, MIA, Zenith Fund, NELICO or New England Securities Corporation are omitted if not materially different. |
| (3) | The Fund Complex includes the Fund (36 portfolios), Met Series Fund II (1 portfolio) and MIST (44 portfolios) |
MSF-18
Metropolitan Series Fund, Inc.
BlackRock Large Cap Value Portfolio
Board Approval of Advisory and Subadvisory Agreements
The Fund’s Contract Review Committees of the Board of Directors (the “Board”) typically meet in early fall to review the Portfolios’ advisory agreements (the “Advisory Agreements”) and subadvisory agreements (collectively, the “Subadvisory Agreements,” and, together with the Advisory Agreements, the “Agreements”) and determine whether to recommend that the full Board approve the continuation of the Agreements for an additional one-year period. (Following the initial approval of an Agreement for a new Portfolio or with a new adviser or subadviser, such annual reviews are not required until 2 years following the execution of such Agreement.) After each Committee has made its recommendations, the full Board, including the Independent Directors, determines whether to approve the continuation of each of the Agreements. In addition, the Board, including the Independent Directors, considers matters bearing on the Agreements at most of its other meetings throughout the year and regularly interviews various individuals at MetLife Advisers responsible for the management of the Portfolios. The Directors also interview selected investment managers and other professionals at the subadvisers at various times throughout the year.
The Directors receive all materials that they or MetLife Advisers, the Fund’s investment adviser, and the subadvisers believe to be reasonably necessary for the Directors to evaluate the Agreements and determine whether to approve the continuation of the Agreements. These materials generally include, among other items, (i) information on the investment performance of the Portfolios and the performance of peer groups of funds and the Portfolios’ performance benchmarks, (ii) information on the Portfolios’ advisory and subadvisory fees and other expenses, including information comparing the Portfolios’ expenses to those of peer groups of funds and information about any applicable expense caps and fee “breakpoints,” (iii) sales and redemption data, (iv) information related to the profitability of the Agreements to MetLife Advisers and the subadvisers, and potential “fall-out” or ancillary benefits that MetLife Advisers, the subadvisers or their affiliates may receive as a result of their relationships with the Fund and (v) information obtained through the subadvisers’ responses to certain requests from MetLife Advisers and the Directors and MetLife Advisers’ responses to requests from the Directors. The Directors may also consider other information such as (vi) MetLife Advisers’ and the subadvisers’ financial results and condition, (vii) each Portfolio’s investment objectives and strategies and the size, education and experience of the investment staffs of MetLife Advisers and the relevant subadvisers and their use of technology and external research, (viii) the allocation of the Portfolios’ brokerage, if any, including allocations to brokers affiliated with the subadvisers and the use of “soft” commission dollars to pay Portfolio expenses and to pay for research and other similar services, (ix) the resources devoted to, and the record of compliance with, the Portfolios’ investment policies and restrictions, policies on personal securities transactions and other compliance policies, (x) the responses of MetLife Advisers, the subadvisers and/or their affiliates to certain legal and regulatory proceedings and (xi) the economic outlook generally and for the mutual fund industry in particular. Throughout the process, the Directors have the opportunity to ask questions of and request additional materials from MetLife Advisers and the subadvisers.
Following meetings of each Contract Review Committee on September 12, 2007, the Board, at its November 15, 2007 meeting, approved the continuation through December 31, 2008 of the Advisory Agreements for each Portfolio of the Fund and the Subadvisory Agreements for each Portfolio of the Fund. The Agreements approved for continuation are referred to below as the “Continued Agreements.”
In considering whether to approve the continuation of the Continued Agreements, the Directors, including the Independent Directors, did not identify any single factor as determinative, and each weighed the various factors as he or she deemed appropriate. The Directors considered the following matters in connection with their approval of the Continued Agreements:
The nature, extent and quality of the services provided to the relevant Portfolios under the Continued Agreements. The Directors considered the nature, extent and quality of the services provided by MetLife Advisers, the relevant subadvisers (if any) and their affiliates (each, an “Adviser,” and, collectively, the “Advisers”) to the relevant Portfolios pursuant to the Continued Agreements and the resources dedicated to these Portfolios by the Advisers. In particular, the Directors considered the Advisers’ abilities to attract and retain highly qualified investment professionals. With respect to MetLife Advisers, the Directors considered that MetLife Advisers is (i) ultimately responsible for the performance of such Portfolios; (ii) ultimately responsible for the establishment of the investment strategies of each such Portfolio, primarily through its recommendations to the Board regarding the hiring and selection of subadvisers; (iii) responsible for the hiring and selection, subject to Board approval, of subadvisers; and (iv) responsible for maintaining a program of Subadviser oversight reasonably designed to ensure that the subadvisers have reasonable compliance policies and procedures in place. The Directors also considered that MetLife Advisers provides a full range of day-to-day administrative services for the Portfolios involving all aspects of such Portfolios’ day-to-day operations (other than portfolio management). After reviewing these and related factors, the Directors concluded, within the context of their overall conclusions regarding each of the Continued Agreements, that the nature, extent and quality of services provided supported the renewal of these Agreements.
Investment performance of the relevant Portfolios. The Directors reviewed information about the performance of the relevant Portfolios over various time periods, including information prepared by an independent third party that compared the performance of the Portfolios to the performance of peer groups of funds and performance benchmarks. The Directors also reviewed a description of the third party’s methodology for identifying a Portfolio’s peer group(s) for purposes of performance and expense comparisons.
MSF-19
Metropolitan Series Fund, Inc.
BlackRock Large Cap Value Portfolio
Board Approval of Advisory and Subadvisory Agreements—(Continued)
In the case of each relevant Portfolio that had performance that lagged its peer group(s) for certain periods, the Directors concluded that other factors relevant to performance were sufficient, in light of other considerations, to warrant renewal of the Continued Agreements relating to such Portfolio. These factors varied from Portfolio to Portfolio, but included one or more of the following: (i) that such Portfolio’s performance, although lagging in certain recent periods, was stronger over the longer term; (ii) that the underperformance was attributable, to a significant extent, to investment decisions that were reasonable and consistent with the Portfolio’s investment objective(s) and policies and that the Portfolio was performing within the range of reasonable expectations, given market conditions and the Portfolio’s investment objective(s) and policies; (iii) that the Portfolio’s performance was competitive when compared to other relevant performance benchmarks or peer groups; and (iv) that MetLife Advisers and/or the relevant subadviser (if any) had taken or was taking steps designed to help improve the Portfolio’s investment performance.
The Directors also considered the investment performance of the Advisers and their reputations generally, the historical responsiveness of the Advisers to Director concerns about performance and the willingness of the Advisers to take steps intended to improve performance.
After reviewing these and related factors, the Directors concluded, within the context of their overall conclusions regarding each of the Continued Agreements, that the investment performance of each relevant Portfolio and Adviser was sufficient, in light of other considerations, to warrant the renewal of the Continued Agreements.
The costs of the services to be provided and profits to be realized by the Advisers and their affiliates from their relationships with the Portfolios. The Directors considered the fees charged by MetLife Advisers to the Portfolios for advisory services and, with respect to the subadvised Portfolios, by such subadvisers to MetLife Advisers for subadvisory services (such advisory and subadvisory fees (if any), collectively, “Fees”), as well as the total expense levels of the Portfolios. This information included comparisons (provided by an independent third party) of the Portfolios’ advisory fees and total expense levels to those of their peer groups. In evaluating Fees for the relevant Portfolios, the Directors also took into account the demands, complexity and quality of the investment management services provided to each Portfolio. The Directors considered MetLife Advisers’ recommendations regarding reductions in Fee rates, implementation of Fee breakpoints and institution of Fee waivers and expense caps.
The Directors also considered the compensation directly or indirectly received by the Advisers and their affiliates from their relationships with the relevant Portfolios. The Directors reviewed information relating to the profits received by MetLife Advisers, certain of the subadvisers and their affiliates as a result of their relationships with the relevant Portfolios, and information about the allocation of expenses used to calculate profitability. When reviewing profitability, the Directors also considered the performance of the relevant Portfolios, the expense levels of such Portfolios and whether the relevant Advisers had implemented breakpoints, fee waivers and/or expense caps with respect to such Portfolios.
After reviewing these and related factors, the Directors concluded, within the context of their overall conclusions regarding each of the Continued Agreements, that the Fees charged to each of the relevant Portfolios were fair and reasonable, and that the information provided regarding costs of these services generally, and the related profitability (if known) to the relevant Advisers of their relationships with the relevant Portfolios, supported the renewal of the Continued Agreements.
Economies of Scale. The Directors considered the existence of any economies of scale in the provision of services by the Advisers and whether those economies were shared with the relevant Portfolios through breakpoints in their advisory fees or other means, such as expense caps, fee waivers or relatively low levels of fees. The Directors noted that most of the relevant Portfolios benefited or will benefit from breakpoints, expense caps and/or fee waivers with respect to their advisory fees. In considering these issues, the Directors also took into consideration information relating to the costs of the services provided and the profitability to MetLife Advisers, the relevant subadvisers (if any) and each of their affiliates of their relationships with the relevant Portfolios, as discussed above.
After reviewing these and related factors, the Directors concluded, within the context of their overall conclusions regarding each of the Continued Agreements, that the extent to which economies of scale were shared with the relevant Portfolios supported the renewal of such Agreements.
Other Factors. The Directors also considered other factors, which included but were not limited to the following:
| | • | | the extent to which each relevant Portfolio operated in accordance with its investment objective, and its record of compliance with its investment restrictions and the compliance programs of the Fund and the Advisers. They also considered the compliance-related resources the Advisers and their affiliates provide to the relevant Portfolios; |
| | • | | the nature, quality, cost and extent of administrative and shareholder services performed by MetLife Advisers and its affiliates under the Advisory Agreements; and |
MSF-20
Metropolitan Series Fund, Inc.
BlackRock Large Cap Value Portfolio
Board Approval of Advisory and Subadvisory Agreements—(Continued)
| | • | | so-called “fall-out benefits” to the Advisers, such as the engagement of their affiliates to provide distribution, brokerage and transfer agency services to the Portfolios, and the benefits of research made available to the relevant Advisers by reason of brokerage commissions generated by the relevant Portfolios’ securities transactions. The Directors also considered the possible conflicts of interest associated with these fall-out and other benefits, and the reporting and other processes in place to disclose and monitor these possible conflicts of interest. |
Based on their evaluation of all factors that they deemed to be material, including those factors described above, and assisted by the advice of independent counsel, the Directors, including the Independent Directors, concluded that each of the Continued Agreements should be continued through December 31, 2008.
MSF-21
A description of the policies and procedures that the Fund uses to determine how to vote proxies relating to portfolio securities is available (i) without charge, upon request, by calling (800) 638-7732 and (ii) on the Securities and Exchange Commission’s (the “SEC”) website at http://www.sec.gov.
Information regarding how the Fund voted proxies relating to portfolio securities during the most recent twelve-month period ended December 31, 2007 is available (i) without charge, upon request, by calling (800) 638-7732 and (ii) on the SEC’s website at http://www.sec.gov.
The Fund files with the SEC a complete schedule of its portfolio holdings, as of the close of the first and third quarters of its fiscal year, on “Form N-Q”. These filings are available on the SEC’s website at www.sec.gov and may be reviewed and copied at the SEC’s Public Reference Room in Washington, DC. (Call 1-800-SEC-0330 for information on the operation of the Public Reference Room.)
MSF-22
| | |
Metropolitan Series Fund, Inc. BlackRock Legacy Large Cap Growth Portfolio Annual Report | | December 31, 2007 |
Letter from the President
February 1, 2008
Letter to Policy Holders:
2007 was a tumultuous year in the financial markets driven by concerns in the credit markets surrounding sub-prime mortgages and fears of recession in the U.S. Economy. The broad markets were mixed, with the Dow Jones Industrial Average up 8.9% and the MSCI EAFE Index, which measures the performance of international equities, up 11.2% for the year, while the Russell 2000 Index, which measures the performance of small capitalization stocks, was down 1.6%.
In the fixed income markets, credit spreads increased as a result of the pressure from sub-prime mortgage crisis and the Federal Reserve lowered interest rates by a total of 1% during the year. The Lehman Brothers Aggregate Bond Index posted a 7.0% return for the year.
On the following pages, you will find a complete review of your Portfolio and its investment performance.
MetLife is committed to building your financial freedom. We appreciate your trust and will continue to focus our efforts on meeting your investment needs.
Sincerely,
Elizabeth Forget
President, Metropolitan Series Fund, Inc.
Metropolitan Series Fund, Inc.
BlackRock Legacy Large Cap Growth Portfolio
Managed by BlackRock Advisors, LLC
Portfolio Manager Commentary*
PORTFOLIO PERFORMANCE
For the year ended December 31, 2007, the Class A shares of the BlackRock Legacy Large Cap Growth Portfolio returned 18.7%, compared to its benchmark, the Russell 1000 Growth Index1, which returned 11.8%. The average return of its peer group, the Lipper Variable Insurance Products Large-Cap Growth Funds Universe2, was 12.8% over the same period.
PORTFOLIO REVIEW
Equities experienced a setback in the final quarter of 2007, as market headwinds proved too severe for stocks to muster a sustainable rally. Weakness in the housing market, ongoing credit issues, and disappointing earnings results all contributed to a volatile fourth quarter that sent the major indices into the red for the quarter. Despite a difficult fourth quarter, equities were remarkably resilient throughout the year and only a handful of small capitalization and value indices ended the year in negative territory. As the year progressed, a transition in leadership from small and value to large and growth clearly took hold. Large cap growth stocks as measured by the Russell 1000 Growth Index posted impressive gains during the 12-months ended December 31, 2007, rising 11.8%. The Portfolio outperformed the benchmark in this environment, posting strong absolute and relative returns.
Consistent with our bottom-up investment process, stock selection was the predominant positive return factor for the Portfolio during the 12-month period, as sector allocations had a minimal net impact on performance. Selection decisions in the consumer discretionary, industrials, materials and information technology sectors had the largest positive influence on comparative performance during the period. Weakness within the financials and telecommunication services sectors created a drag on performance.
Selection gains were greatest in the consumer discretionary sector, as our holdings significantly outperformed those in the benchmark. Additionally, an underweight to the group aided returns as it was the worst-performing sector within the benchmark. At the stock level, positions in casino operator Las Vegas Sands and Chinese outdoor media firm Focus Media Holding fueled gains. Additionally, avoidance of Home Depot proved beneficial as the weak housing sector hurt home-improvement retailers during the year.
Within industrials, the most notable contribution stemmed from a position in Foster Wheeler. Foster Wheeler engineers and constructs oil & gas processing and refining facilities as well as natural gas liquefaction facilities and receiving terminals. The firm has continued to capitalize on the global infrastructure build-out as global economic growth continues to drive investment in new and existing facilities. Likewise, good stock picking led to favorable results in the materials sector as the top individual contributor during the 12-month period came from this group. Our long-time position in agricultural biotechnology firm Monsanto led to healthy gains as the company has continued to benefit from sales of its genetically modified corn seed. In information technology, a position in Apple was a meaningful contributor, as the firm has continued to see large market share gains from both computer and iPhone sales.
In contrast, relative weakness within the financials sector was the result of stock selection. Our position in NYSE Euronext hurt performance during the first half of 2007 as shares of the global exchange drifted down throughout the second quarter. An overweight to the poorly performing telecommunication services sector also dampened comparative performance. At the company level, an overweight to wireless telecommunications firm NII Holdings created a drag on performance during the fourth quarter.
At year-end, the Portfolio was emphasizing a number of the larger, mature companies in our universe for their more predictable earnings streams and global business orientations. As we approached the end of the year, we did take measures to further reduce the cyclicality of the overall Portfolio by increasing exposure to both the healthcare and consumer staples sectors and paring back exposure to information technology. At year-end, our most meaningful overweights were in the healthcare, telecommunication services and consumer staples sectors, while our most substantial underweights were in the energy and consumer discretionary sectors.
* The views expressed above are those of the subadvisory firm as of December 31, 2007 and are subject to change based on market and other conditions. Information about the Portfolio’s holdings, asset allocation, industry allocation, or country diversification is historical and is not an indication of future Portfolio composition, which will vary. The performance of any index mentioned in this commentary has not been adjusted for ongoing management, distribution and operating expenses, and sales charges applicable to mutual fund investments. Direct investment in the Index is not possible.
1 The Russell 1000® Growth Index is an unmanaged measure of performance of the largest capitalized U.S. companies, within the Russell 1000 companies, that have higher price-to-book ratios and forecasted growth values.
2 The Lipper Variable Insurance Products Fund Average is an average of the total return performance (calculated on the basis of net asset value) of variable product funds with similar investment objectives to those of the subject Portfolio as calculated by Lipper Analytical Services, an independent mutual fund ranking service.
MSF-2
Metropolitan Series Fund, Inc.
BlackRock Legacy Large Cap Growth Portfolio
A $10,000 INVESTMENT COMPARED TO
THE RUSSELL 1000 GROWTH INDEX
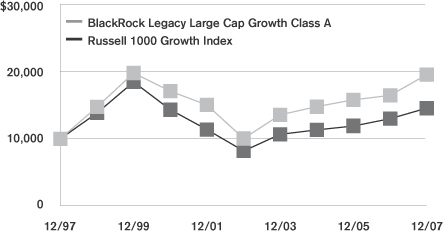
Average Annual Returns as of December 31, 2007
| | | | | | | | | | | | |
| | | BlackRock Legacy
Large Cap
Growth Portfolio | | | Russell 1000
Growth Index | |
| | | Class A | | | Class B | | | Class E | | |
| 1 Year | | 18.7 | % | | 18.4 | % | | 18.5 | % | | 11.8 | % |
| 5 Year | | 14.2 | | | 14.0 | | | 14.1 | | | 12.1 | |
| 10 Year | | 6.9 | | | — | | | — | | | 3.8 | |
| Since Inception | | — | | | 11.4 | | | 1.9 | | | — | |
Performance numbers are net of all Portfolio expenses but do not include any insurance, sales, or administrative charges of variable annuity or life insurance contracts. If these charges were included, the returns would be lower.
Inception dates of the Class A, Class B and Class E shares are: 10/31/94, 7/30/02, 5/1/01, respectively.
This information represents past performance and is not indicative of future results. Investment return and principal value may fluctuate so that shares, upon redemption, may be worth more or less than the original cost.
PORTFOLIO COMPOSITION
as of December 31, 2007
Top Holdings
| | | |
| | | % of Total
Net Assets | |
Apple, Inc. | | 4.1 | % |
Google, Inc. (Class A) | | 3.8 | % |
Microsoft Corp. | | 3.7 | % |
The Coca-Cola Co. | | 3.4 | % |
Altria Group, Inc. | | 3.3 | % |
Adobe Systems, Inc. | | 3.1 | % |
Consol Energy, Inc. | | 3.0 | % |
Monsanto Co. | | 2.7 | % |
Cisco Systems, Inc. | | 2.6 | % |
Honeywell International, Inc. | | 2.6 | % |
Top Sectors
| | | |
| | | % of Total
Market Value | |
Information Technology | | 26.9 | % |
Health Care | | 19.6 | % |
Industrials | | 13.2 | % |
Consumer Staples | | 12.6 | % |
Energy | | 6.2 | % |
Financials | | 5.4 | % |
Consumer Discretionary | | 5.2 | % |
Materials | | 4.2 | % |
Telecommunication Services | | 4.0 | % |
Utilities | | 0.8 | % |
MSF-3
Metropolitan Series Fund, Inc.
Shareholder Expense Example
As a shareholder of the Portfolio, you incur ongoing costs, including management fees; distribution and service (12b-1) fees; and other Portfolio expenses. This example is intended to help you understand your ongoing costs (in dollars) (referred to as “expenses”) of investing in the Portfolio and compare these costs with the ongoing costs of investing in other mutual funds. The example is based on an investment of $1,000 invested at the beginning of the period and held for the entire period, July 1, 2007 through December 31, 2007.
Actual Expenses
The first line for each share class of the Portfolio in the table below provides information about actual account values and actual expenses. You may use the information in this line, together with the amount you invested in the particular share class of the Portfolio, to estimate the expenses that you paid over the period. Simply divide your account value by $1,000 (for example, an $8,600 account value divided by $1,000=8.6), then multiply the result by the number in the first line under the heading entitled “Expenses Paid During Period” to estimate the expenses you paid on your account during this period.
Hypothetical Example for Comparison Purposes
The second line for each share class of the Portfolio in the table below provides information about hypothetical account values and hypothetical expenses based on the Portfolio’s actual expense ratio and an assumed rate of return of 5% per year before expenses, which is not the Portfolio’s actual return. The hypothetical account values and expenses may not be used to estimate the actual ending account balance or expenses you paid for the period. You may use this information to compare the ongoing costs of investing in the Portfolio and other funds. To do so, compare this 5% hypothetical example with the 5% hypothetical examples that appear in the shareholder reports of the other funds.
Please note that the expenses shown in the table are meant to highlight your ongoing costs only and do not reflect any fees or charges of your variable insurance product or any additional expenses that participants in certain eligible qualified plans may bear relating to the operations of their plan. Therefore, the second line for each share class in the table is useful in comparing ongoing costs only, and will not help you determine the relative total costs of owning different funds. In addition, if these other costs were included, your costs would have been higher.
| | | | | | | | | | | | | | |
Portfolio | | | | Annualized
Expense
Ratio | | | Beginning
Account Value
July 1,
2007 | | Ending
Account Value
December 31,
2007 | | Expenses Paid
During Period*
July 1, 2007
to
December 31,
2007 |
BlackRock Legacy Large Cap Growth—Class A | | Actual | | 0.80 | % | | $ | 1,000.00 | | $ | 1,084.30 | | $ | 4.20 |
| | Hypothetical | | 0.80 | % | | $ | 1,000.00 | | $ | 1,021.13 | | $ | 4.08 |
| | | | | |
BlackRock Legacy Large Cap Growth—Class B | | Actual | | 1.05 | % | | $ | 1,000.00 | | $ | 1,083.30 | | $ | 5.51 |
| | Hypothetical | | 1.05 | % | | $ | 1,000.00 | | $ | 1,019.85 | | $ | 5.35 |
| | | | | |
BlackRock Legacy Large Cap Growth—Class E | | Actual | | 0.95 | % | | $ | 1,000.00 | | $ | 1,083.80 | | $ | 4.99 |
| | Hypothetical | | 0.95 | % | | $ | 1,000.00 | | $ | 1,020.36 | | $ | 4.84 |
* Expenses paid are equal to the Portfolio’s annualized expense ratio for the most recent six month period, as shown above, multiplied by the average account value over the period, multiplied by the number of days in the most recent fiscal half-year, divided by 365 (to reflect the one-half year period).
MSF-4
Metropolitan Series Fund, Inc.
BlackRock Legacy Large Cap Growth Portfolio
Schedule of Investments as of December 31, 2007
Common Stock—98.3% of Total Net Assets
| | | | | |
| Security Description | | Shares | | Value* |
| | | | | |
| | | | | |
| | |
Aerospace & Defense—4.5% | | | | | |
Honeywell International, Inc. | | 217,623 | | $ | 13,399,048 |
Northrop Grumman Corp. | | 78,800 | | | 6,196,832 |
United Technologies Corp. | | 43,300 | | | 3,314,182 |
| | | | | |
| | | | | 22,910,062 |
| | | | | |
| | |
Air Freight & Logistics—1.1% | | | | | |
Expeditors International of Washington, Inc. | | 122,385 | | | 5,468,162 |
| | | | | |
| | |
Beverages—4.4% | | | | | |
PepsiCo, Inc. | | 65,500 | | | 4,971,450 |
The Coca-Cola Co. | | 284,700 | | | 17,472,039 |
| | | | | |
| | | | | 22,443,489 |
| | | | | |
| | |
Biotechnology—2.1% | | | | | |
Celgene Corp. (a) | | 51,000 | | | 2,356,710 |
Gilead Sciences, Inc. (a) | | 181,200 | | | 8,337,012 |
| | | | | |
| | | | | 10,693,722 |
| | | | | |
| | |
Capital Markets—2.6% | | | | | |
Janus Capital Group, Inc. (b) | | 292,202 | | | 9,598,836 |
The Goldman Sachs Group, Inc. | | 16,900 | | | 3,634,345 |
| | | | | |
| | | | | 13,233,181 |
| | | | | |
| | |
Chemicals—3.3% | | | | | |
Monsanto Co. | | 124,092 | | | 13,859,835 |
Potash Corp. of Saskatchewan, Inc. | | 21,060 | | | 3,031,798 |
| | | | | |
| | | | | 16,891,633 |
| | | | | |
| | |
Communications Equipment—6.3% | | | | | |
Cisco Systems, Inc. (a) | | 496,108 | | | 13,429,644 |
Corning, Inc. (a) | | 281,183 | | | 6,745,580 |
QUALCOMM, Inc. | | 238,877 | | | 9,399,810 |
Research In Motion, Ltd. (a) | | 22,940 | | | 2,601,396 |
| | | | | |
| | | | | 32,176,430 |
| | | | | |
| | |
Computers & Peripherals—4.8% | | | | | |
Apple, Inc. (a) | | 104,944 | | | 20,787,308 |
Sun Microsystems, Inc. (a) | | 214,725 | | | 3,892,964 |
| | | | | |
| | | | | 24,680,272 |
| | | | | |
| | |
Construction & Engineering—2.4% | | | | | |
Fluor Corp. | | 17,500 | | | 2,550,100 |
Foster Wheeler, Ltd. | | 63,801 | | | 9,890,431 |
| | | | | |
| | | | | 12,440,531 |
| | | | | |
| | |
Diversified Financial Services—1.5% | | | | | |
JPMorgan Chase & Co. | | 86,200 | | | 3,762,630 |
NYSE Euronext | | 46,500 | | | 4,081,305 |
| | | | | |
| | | | | 7,843,935 |
| | | | | |
|
Diversified Telecommunication Services—3.1% |
AT&T, Inc. | | 237,933 | | | 9,888,495 |
Verizon Communications, Inc. | | 140,700 | | | 6,147,183 |
| | | | | |
| | | | | 16,035,678 |
| | | | | |
| | | | | |
| Security Description | | Shares | | Value* |
| | | | | |
| | |
Electric Utilities—0.7% | | | | | |
Exelon Corp. | | 46,900 | | $ | 3,828,916 |
| | | | | |
| | |
Energy Equipment & Services—2.0% | | | | | |
Schlumberger, Ltd. | | 54,200 | | | 5,331,654 |
Transocean, Inc. | | 36,063 | | | 5,162,418 |
| | | | | |
| | | | | 10,494,072 |
| | | | | |
| | |
Food & Staples Retailing—2.3% | | | | | |
Wal-Mart Stores, Inc. | | 252,856 | | | 12,018,246 |
| | | | | |
| | |
Health Care Equipment & Supplies—3.4% | | | | | |
C.R. Bard, Inc. | | 45,400 | | | 4,303,920 |
Hologic, Inc. (a) (b) | | 189,800 | | | 13,027,872 |
| | | | | |
| | | | | 17,331,792 |
| | | | | |
| | |
Health Care Providers & Services—4.6% | | | | | |
Henry Schein, Inc. (a) | | 106,400 | | | 6,532,960 |
Medco Health Solutions, Inc. (a) | | 72,870 | | | 7,389,018 |
WellPoint, Inc. (a) | | 107,900 | | | 9,466,067 |
| | | | | |
| | | | | 23,388,045 |
| | | | | |
| | |
Hotels, Restaurants & Leisure—0.6% | | | | | |
Las Vegas Sands Corp. (a) (b) | | 29,537 | | | 3,043,788 |
| | | | | |
| | |
Household Products—1.9% | | | | | |
Procter & Gamble Co. | | 132,400 | | | 9,720,808 |
| | | | | |
| | |
Industrial Conglomerates—1.4% | | | | | |
General Electric Co. | | 194,513 | | | 7,210,597 |
| | | | | |
| | |
Insurance—1.3% | | | | | |
American International Group, Inc. | | 109,900 | | | 6,407,170 |
| | | | | |
| | |
Internet & Catalog Retail—1.6% | | | | | |
Amazon.com, Inc. (a) (b) | | 90,472 | | | 8,381,326 |
| | | | | |
| | |
Internet Software & Services—3.8% | | | | | |
Google, Inc. (Class A) (a) | | 28,255 | | | 19,537,767 |
| | | | | |
| | |
Life Sciences Tools & Services—2.1% | | | | | |
Thermo Fisher Scientific, Inc. (a) | | 183,800 | | | 10,601,584 |
| | | | | |
| | |
Machinery—3.9% | | | | | |
Danaher Corp. | | 129,200 | | | 11,336,008 |
Joy Global, Inc. | | 130,400 | | | 8,582,928 |
| | | | | |
| | | | | 19,918,936 |
| | | | | |
| | |
Media—0.3% | | | | | |
Focus Media Holding, Ltd. (ADR) (a) (b) | | 31,000 | | | 1,761,110 |
| | | | | |
| | |
Metals & Mining—0.9% | | | | | |
Freeport-McMoRan Copper & Gold, Inc. | | 46,625 | | | 4,776,265 |
| | | | | |
| | |
Multiline Retail—2.0% | | | | | |
Kohl’s Corp. (a) | | 165,900 | | | 7,598,220 |
Nordstrom, Inc. (b) | | 72,600 | | | 2,666,598 |
| | | | | |
| | | | | 10,264,818 |
| | | | | |
*See accompanying notes to financial statements.
MSF-5
Metropolitan Series Fund, Inc.
BlackRock Legacy Large Cap Growth Portfolio
Schedule of Investments as of December 31, 2007
Common Stock—(Continued)
| | | | | |
| Security Description | |
Shares | | Value* |
| | | | | |
| | |
Oil, Gas & Consumable Fuels—4.2% | | | | | |
Consol Energy, Inc. | | 215,600 | | $ | 15,419,712 |
EOG Resources, Inc. | | 68,600 | | | 6,122,550 |
| | | | | |
| | | | | 21,542,262 |
| | | | | |
| | |
Personal Products—0.8% | | | | | |
Avon Products, Inc. | | 100,400 | | | 3,968,812 |
| | | | | |
| | |
Pharmaceuticals—7.5% | | | | | |
Abbott Laboratories | | 194,600 | | | 10,926,790 |
Elan Corp., Plc. (ADR) (a) | | 351,000 | | | 7,714,980 |
Johnson & Johnson | | 146,000 | | | 9,738,200 |
Merck & Co., Inc. | | 173,723 | | | 10,095,044 |
| | | | | |
| | | | | 38,475,014 |
| | | | | |
|
Semiconductors & Semiconductor Equipment—1.9% |
Broadcom Corp. (a) | | 151,200 | | | 3,952,368 |
PMC-Sierra, Inc. (a) (b) | | 857,300 | | | 5,606,742 |
| | | | | |
| | | | | 9,559,110 |
| | | | | |
| | |
Software—10.2% | | | | | |
Adobe Systems, Inc. (a) | | 366,999 | | | 15,681,867 |
Electronic Arts, Inc. (a) | | 87,000 | | | 5,081,670 |
Microsoft Corp. | | 536,820 | | | 19,110,792 |
Salesforce.com, Inc. (a) (b) | | 155,700 | | | 9,760,833 |
VMware, Inc. (a) (b) | | 32,890 | | | 2,795,321 |
| | | | | |
| | | | | 52,430,483 |
| | | | | |
|
Textiles, Apparel & Luxury Goods—0.7% |
CROCS, Inc. (a) (b) | | 92,300 | | | 3,397,563 |
| | | | | |
| | |
Tobacco—3.3% | | | | | |
Altria Group, Inc. | | 222,180 | | | 16,792,364 |
| | | | | |
|
Wireless Telecommunication Services—0.8% |
NII Holdings, Inc. (a) | | 89,084 | | | 4,304,539 |
| | | | | |
Total Common Stock
(Identified Cost $432,839,202) | | | | | 503,972,482 |
| | | | | |
| | | | | | | |
|
| Short Term Investments—8.0% | |
| Security Description | | Face Amount/
Shares | | Value* | |
| | | | | | | |
| | |
Discount Notes—2.1% | | | | | | | |
Federal Home Loan Bank
4.15%, 01/14/08 | | $ | 10,600,000 | | $ | 10,587,560 | |
| | | | | | | |
| | |
Mutual Funds—5.9% | | | | | | | |
State Street Navigator Securities Lending Prime Portfolio (c) | | | 30,140,499 | | | 30,140,499 | |
| | | | | | | |
Total Short Term Investments
(Identified Cost $40,728,059) | | | | | | 40,728,059 | |
| | | | | | | |
Total Investments—106.3%
(Identified Cost $473,567,261) (d) | | | | | | 544,700,541 | |
Liabilities in excess of other assets | | | | | | (32,127,888 | ) |
| | | | | | | |
| Total Net Assets—100% | | | | | $ | 512,572,653 | |
| | | | | | | |
| (b) | A portion or all of the security was held on loan. As of December 31, 2007, the market value of securities loaned was $28,896,531 and the collateral received consisted of cash in the amount of $30,140,499. The cash collateral is invested in a money market fund managed by an affiliate of the custodian. |
| (c) | Represents investment of cash collateral received from securities lending transactions. |
| (d) | The aggregate cost of investments for federal income tax purposes as of December 31, 2007 was $475,457,964 and the composition of unrealized appreciation and depreciation of investment securities was $81,473,883 and $(12,231,306), respectively. |
| (ADR)— | An American Depositary Receipt is a certificate issued by a custodian bank representing the right to receive securities of the foreign issuer described. Trading on exchanges not located in the United States or Canada significantly influences the value of ADRs. |
*See accompanying notes to financial statements.
MSF-6
Metropolitan Series Fund, Inc.
BlackRock Legacy Large Cap Growth Portfolio
Statement of Assets & Liabilities
December 31, 2007
| | | | | | | |
Assets | | | | | | | |
Investments at value (a) (b) | | | | | $ | 544,700,541 | |
Receivable for: | | | | | | | |
Fund shares sold | | | | | | 666,926 | |
Accrued interest and dividends | | | | | | 423,443 | |
Foreign taxes | | | | | | 13,331 | |
| | | | | | | |
Total Assets | | | | | | 545,804,241 | |
Liabilities | | | | | | | |
Payable for: | | | | | | | |
Fund shares redeemed | | $ | 1,777,252 | | | | |
Collateral for securities loaned | | | 30,140,499 | | | | |
Due to custodian bank | | | 909,183 | | | | |
Accrued expenses: | | | | | | | |
Management fees | | | 319,012 | | | | |
Service and distribution fees | | | 21,128 | | | | |
Deferred directors’ fees | | | 27,186 | | | | |
Other expenses | | | 37,328 | | | | |
| | | | | | | |
Total Liabilities | | | | | | 33,231,588 | |
| | | | | | | |
Net Assets | | | | | $ | 512,572,653 | |
| | | | | | | |
Net assets consists of: | | | | | | | |
Capital paid in | | | | | $ | 551,749,892 | |
Undistributed net investment income | | | | | | 1,490,946 | |
Accumulated net realized losses | | | | | | (111,801,465 | ) |
Unrealized appreciation on investments | | | | | | 71,133,280 | |
| | | | | | | |
Net Assets | | | | | $ | 512,572,653 | |
| | | | | | | |
| Computation of offering price: | | | | | | | |
Class A | | | | | | | |
Net asset value and redemption price per share ($390,685,776 divided by 14,609,334 shares outstanding) | | | | | $ | 26.74 | |
| | | | | | | |
Class B | | | | | | | |
Net asset value and redemption price per share ($71,838,328 divided by 2,733,801 shares outstanding) | | | | | $ | 26.28 | |
| | | | | | | |
Class E | | | | | | | |
Net asset value and redemption price per share ($50,048,549 divided by 1,888,602 shares outstanding) | | | | | $ | 26.50 | |
| | | | | | | |
(a) Identified cost of investments | | | | | $ | 473,567,261 | |
| | | | | | | |
| (b) | Includes cash collateral for securities loaned of $30,140,499. |
Statement of Operations
For the Year Ended December 31, 2007
| | | | | | | | |
Investment Income | | | | | | | | |
Dividends | | | | | | $ | 5,021,272 | (a) |
Interest | | | | | | | 542,997 | (b) |
| | | | | | | | |
| | | | | | | 5,564,269 | |
Expenses | | | | | | | | |
Management fees | | $ | 3,601,184 | | | | | |
Service and distribution fees—Class B | | | 126,915 | | | | | |
Service and distribution fees—Class E | | | 68,270 | | | | | |
Directors’ fees and expenses | | | 27,955 | | | | | |
Custodian | | | 60,064 | | | | | |
Audit and tax services | | | 31,738 | | | | | |
Legal | | | 4,094 | | | | | |
Printing | | | 153,606 | | | | | |
Insurance | | | 5,558 | | | | | |
Miscellaneous | | | 30,120 | | | | | |
| | | | | | | | |
Total expenses | | | 4,109,504 | | | | | |
Expense reductions | | | (177,151 | ) | | | 3,932,353 | |
| | | | | | | | |
Net Investment Income | | | | | | | 1,631,916 | |
| | | | | | | | |
Realized and Unrealized Gain | | | | | | | | |
| Realized gain on: | | | | | | | | |
Investments—net | | | | | | | 67,216,679 | |
| Change in unrealized appreciation on: | | | | | | | | |
Investments—net | | | | | | | 14,975,300 | |
| | | | | | | | |
Net gain | | | | | | | 82,191,979 | |
| | | | | | | | |
Net Increase in Net Assets From Operations | | | | | | $ | 83,823,895 | |
| | | | | | | | |
| (a) | Net of foreign taxes of $33,206. |
| (b) | Includes net income on securities loaned of $343,822. |
See accompanying notes to financial statements.
MSF-7
Metropolitan Series Fund, Inc.
BlackRock Legacy Large Cap Growth Portfolio
Statements of Changes in Net Assets
| | | | | | | | |
| | | Year ended
December 31,
2007 | | | Year ended
December 31,
2006 | |
From Operations | | | | | | | | |
Net investment income | | $ | 1,631,916 | | | $ | 1,068,863 | |
Net realized gain | | | 67,216,679 | | | | 45,601,868 | |
Unrealized appreciation (depreciation) | | | 14,975,300 | | | | (27,179,820 | ) |
| | | | | | | | |
Increase in net assets from operations | | | 83,823,895 | | | | 19,490,911 | |
| | | | | | | | |
From Distributions to Shareholders | | | | | | | | |
Net investment income | | | | | | | | |
Class A | | | (800,699 | ) | | | (527,711 | ) |
Class E | | | (29,877 | ) | | | 0 | |
| | | | | | | | |
Total distributions | | | (830,576 | ) | | | (527,711 | ) |
| | | | | | | | |
Decrease in net assets from capital share transactions | | | (58,806,350 | ) | | | (81,070,421 | ) |
| | | | | | | | |
Total increase (decrease) in net assets | | | 24,186,969 | | | | (62,107,221 | ) |
| | |
Net Assets | | | | | | | | |
Beginning of the period | | | 488,385,684 | | | | 550,492,905 | |
| | | | | | | | |
End of the period | | $ | 512,572,653 | | | $ | 488,385,684 | |
| | | | | | | | |
Undistributed Net Investment Income | | | | | | | | |
End of the period | | $ | 1,490,946 | | | $ | 775,286 | |
| | | | | | | | |
Other Information:
Capital Shares
Transactions in capital shares were as follows:
| | | | | | | | | | | | | | |
| | | Year ended
December 31, 2007 | | | Year ended
December 31, 2006 | |
| | | Shares | | | $ | | | Shares | | | $ | |
Class A | | | | | | | | | | | | | | |
Sales | | 2,849,706 | | | $ | 69,031,420 | | | 2,705,744 | | | $ | 59,054,218 | |
Reinvestments | | 33,685 | | | | 800,699 | | | 23,696 | | | | 527,711 | |
Redemptions | | (6,056,174 | ) | | | (147,825,954 | ) | | (6,538,793 | ) | | | (142,375,680 | ) |
| | | | | | | | | | | | | | |
Net decrease | | (3,172,783 | ) | | $ | (77,993,835 | ) | | (3,809,353 | ) | | $ | (82,793,751 | ) |
| | | | | | | | | | | | | | |
Class B | | | | | | | | | | | | | | |
Sales | | 1,506,472 | | | $ | 37,679,464 | | | 748,700 | | | $ | 16,014,402 | |
Redemptions | | (725,368 | ) | | | (17,341,934 | ) | | (518,641 | ) | | | (11,115,064 | ) |
| | | | | | | | | | | | | | |
Net increase | | 781,104 | | | $ | 20,337,530 | | | 230,059 | | | $ | 4,899,338 | |
| | | | | | | | | | | | | | |
Class E | | | | | | | | | | | | | | |
Sales | | 639,544 | | | $ | 16,008,631 | | | 355,389 | | | $ | 7,712,716 | |
Reinvestments | | 1,267 | | | | 29,877 | | | 0 | | | | 0 | |
Redemptions | | (703,392 | ) | | | (17,188,553 | ) | | (503,433 | ) | | | (10,888,724 | ) |
| | | | | | | | | | | | | | |
Net decrease | | (62,581 | ) | | $ | (1,150,045 | ) | | (148,044 | ) | | $ | (3,176,008 | ) |
| | | | | | | | | | | | | | |
Decrease derived from capital share transactions | | | | | $ | (58,806,350 | ) | | | | | $ | (81,070,421 | ) |
| | | | | | | | | | | | | | |
See accompanying notes to financial statements.
MSF-8
Metropolitan Series Fund, Inc.
BlackRock Legacy Large Cap Growth Portfolio
Financial Highlights
| | | | | | | | | | | | | | | | | | | |
| | | Class A | |
| | | Year ended December 31, | |
| | | 2007 | | | 2006 | | | 2005 | | | 2004 | | 2003 | |
Net Asset Value, Beginning of Period | | $ | 22.57 | | | $ | 21.70 | | | $ | 20.37 | | | $ | 18.72 | | $ | 13.86 | |
| | | | | | | | | | | | | | | | | | | |
Income From Investment Operations | | | | | | | | | | | | | | | | | | | |
Net investment income | | | 0.09 | (a) | | | 0.06 | | | | 0.04 | | | | 0.08 | | | 0.00 | |
Net realized and unrealized gain on investments | | | 4.13 | | | | 0.84 | | | | 1.37 | | | | 1.57 | | | 4.87 | |
| | | | | | | | | | | | | | | | | | | |
Total from investment operations | | | 4.22 | | | | 0.90 | | | | 1.41 | | | | 1.65 | | | 4.87 | |
| | | | | | | | | | | | | | | | | | | |
Less Distributions | | | | | | | | | | | | | | | | | | | |
Distributions from net investment income | | | (0.05 | ) | | | (0.03 | ) | | | (0.08 | ) | | | 0.00 | | | (0.01 | ) |
| | | | | | | | | | | | | | | | | | | |
Total distributions | | | (0.05 | ) | | | (0.03 | ) | | | (0.08 | ) | | | 0.00 | | | (0.01 | ) |
| | | | | | | | | | | | | | | | | | | |
Net Asset Value, End of Period | | $ | 26.74 | | | $ | 22.57 | | | $ | 21.70 | | | $ | 20.37 | | $ | 18.72 | |
| | | | | | | | | | | | | | | | | | | |
Total Return (%) | | | 18.7 | | | | 4.1 | | | | 7.0 | | | | 8.8 | | | 35.2 | |
Ratio of operating expenses to average net assets before expense reductions (%) | | | 0.79 | | | | 0.81 | | | | 0.80 | | | | 0.80 | | | 0.82 | |
Ratio of operating expenses to average net assets after expense reductions (%) (b) | | | 0.76 | | | | 0.76 | | | | 0.76 | | | | 0.76 | | | 0.80 | |
Ratio of net investment income to average net assets (%) | | | 0.37 | | | | 0.24 | | | | 0.15 | | | | 0.39 | | | 0.00 | |
Portfolio turnover rate (%) | | | 99 | | | | 104 | | | | 76 | | | | 190 | | | 167 | |
Net assets, end of period (000) | | $ | 390,686 | | | $ | 401,398 | | | $ | 468,532 | | | $ | 510,771 | | $ | 539,840 | |
| | | | | | | | | | | | | | | | | | |
| | | Class B | |
| | | Year ended December 31, | |
| | | 2007 | | | 2006 | | 2005 | | | 2004 | | 2003 | |
Net Asset Value, Beginning of Period | | $ | 22.19 | | | $ | 21.36 | | $ | 20.04 | | | $ | 18.46 | | $ | 13.65 | |
| | | | | | | | | | | | | | | | | | |
Income From Investment Operations | | | | | | | | | | | | | | | | | | |
Net investment income (loss) | | | 0.03 | (a) | | | 0.00 | | | (0.03 | ) | | | 0.07 | | | 0.00 | |
Net realized and unrealized gain on investments | | | 4.06 | | | | 0.83 | | | 1.38 | | | | 1.51 | | | 4.81 | |
| | | | | | | | | | | | | | | | | | |
Total from investment operations | | | 4.09 | | | | 0.83 | | | 1.35 | | | | 1.58 | | | 4.81 | |
| | | | | | | | | | | | | | | | | | |
Less Distributions | | | | | | | | | | | | | | | | | | |
Distributions from net investment income | | | 0.00 | | | | 0.00 | | | (0.03 | ) | | | 0.00 | | | 0.00 | |
| | | | | | | | | | | | | | | | | | |
Total distributions | | | 0.00 | | | | 0.00 | | | (0.03 | ) | | | 0.00 | | | 0.00 | |
| | | | | | | | | | | | | | | | | | |
Net Asset Value, End of Period | | $ | 26.28 | | | $ | 22.19 | | $ | 21.36 | | | $ | 20.04 | | $ | 18.46 | |
| | | | | | | | | | | | | | | | | | |
Total Return (%) | | | 18.4 | | | | 3.9 | | | 6.8 | | | | 8.6 | | | 35.2 | |
Ratio of operating expenses to average net assets before expense reductions (%) | | | 1.04 | | | | 1.06 | | | 1.05 | | | | 1.05 | | | 1.07 | |
Ratio of operating expenses to average net assets after expense reductions (%) (b) | | | 1.01 | | | | 1.01 | | | 1.01 | | | | 1.01 | | | 1.05 | |
Ratio of net investment income (loss) to average net assets (%) | | | 0.12 | | | | 0.00 | | | (0.10 | ) | | | 0.59 | | | (0.04 | ) |
Portfolio turnover rate (%) | | | 99 | | | | 104 | | | 76 | | | | 190 | | | 167 | |
Net assets, end of period (000) | | $ | 71,838 | | | $ | 43,334 | | $ | 36,798 | | | $ | 28,818 | | $ | 89 | |
| (a) | Per share amount is based on average shares outstanding during the period. |
| (b) | The Portfolio has entered into arrangements with certain brokers who paid a portion of the Portfolio’s expenses. |
See accompanying notes to financial statements.
MSF-9
Metropolitan Series Fund, Inc.
BlackRock Legacy Large Cap Growth Portfolio
Financial Highlights
| | | | | | | | | | | | | | | | | | |
| | | Class E | |
| | | Year ended December 31, | |
| | | 2007 | | | 2006 | | 2005 | | | 2004 | | 2003 | |
Net Asset Value, Beginning of Period | | $ | 22.37 | | | $ | 21.51 | | $ | 20.19 | | | $ | 18.59 | | $ | 13.78 | |
| | | | | | | | | | | | | | | | | | |
Income From Investment Operations | | | | | | | | | | | | | | | | | | |
Net investment income (loss) | | | 0.05 | (a) | | | 0.02 | | | 0.00 | | | | 0.06 | | | (0.02 | ) |
Net realized and unrealized gain on investments | | | 4.10 | | | | 0.84 | | | 1.38 | | | | 1.54 | | | 4.83 | |
| | | | | | | | | | | | | | | | | | |
Total from investment operations | | | 4.15 | | | | 0.86 | | | 1.38 | | | | 1.60 | | | 4.81 | |
| | | | | | | | | | | | | | | | | | |
Less Distributions | | | | | | | | | | | | | | | | | | |
Distributions from net investment income | | | (0.02 | ) | | | 0.00 | | | (0.06 | ) | | | 0.00 | | | 0.00 | |
| | | | | | | | | | | | | | | | | | |
Total distributions | | | (0.02 | ) | | | 0.00 | | | (0.06 | ) | | | 0.00 | | | 0.00 | |
| | | | | | | | | | | | | | | | | | |
Net Asset Value, End of Period | | $ | 26.50 | | | $ | 22.37 | | $ | 21.51 | | | $ | 20.19 | | $ | 18.59 | |
| | | | | | | | | | | | | | | | | | |
Total Return (%) | | | 18.5 | | | | 4.0 | | | 6.9 | | | | 8.6 | | | 34.9 | |
Ratio of operating expenses to average net assets before expense reductions (%) | | | 0.94 | | | | 0.96 | | | 0.95 | | | | 0.95 | | | 0.97 | |
Ratio of operating expenses to average net assets after expense reductions (%) (b) | | | 0.91 | | | | 0.91 | | | 0.91 | | | | 0.91 | | | 0.95 | |
Ratio of net investment income (loss) to average net assets (%) | | | 0.22 | | | | 0.09 | | | 0.00 | | | | 0.29 | | | (0.14 | ) |
Portfolio turnover rate (%) | | | 99 | | | | 104 | | | 76 | | | | 190 | | | 167 | |
Net assets, end of period (000) | | $ | 50,049 | | | $ | 43,653 | | $ | 45,163 | | | $ | 47,251 | | $ | 37,288 | |
| (a) | Per share amount is based on average shares outstanding during the period. |
| (b) | The Portfolio has entered into arrangements with certain brokers who paid a portion of the Portfolio’s expenses. |
See accompanying notes to financial statements.
MSF-10
Metropolitan Series Fund, Inc.
BlackRock Legacy Large Cap Growth Portfolio
Notes to Financial Statements—December 31, 2007
Metropolitan Series Fund, Inc. (the “Fund”) is organized as a corporation under the laws of Maryland pursuant to Articles of Incorporation filed on November 23, 1982, as amended, and registered under the Investment Company Act of 1940, as amended (the “1940 Act”), as an open-end investment company. The Fund is a “series” type of mutual fund, which issues separate series of stock. Each series represents an interest in a separate portfolio of Fund investments. The BlackRock Legacy Large Cap Growth Portfolio (the “Portfolio”) is a diversified series of the Fund. Shares in the Fund are not offered directly to the general public and are currently available only to separate accounts established by Metropolitan Life Insurance Company (“MetLife”), New England Life Insurance Company, General American Life Insurance Company (“General American”), The MetLife Investors Group of Insurance Companies, MetLife Insurance Company of Connecticut and other affiliated insurance companies (collectively, the “Insurance Companies”), as an investment vehicle for variable life insurance, group annuity or variable annuity products, although the Portfolio is not available to all such separate accounts. The Portfolio’s shares may be divided into different classes. Currently, the classes being offered by the Portfolio are named Class A, Class B and Class E. The classes of the Portfolio’s shares are identical, except that certain additional charges (Rule 12b-1 fees) are made against Class B and Class E shares. Investment income, realized and unrealized capital gains and losses, the common expenses of the Portfolio and certain Portfolio-level expense reductions, if any, are allocated on a pro rata basis to each class based on the relative net assets of each class to the total net assets of the Portfolio.
| 2. | SIGNIFICANT ACCOUNTING POLICIES: |
The preparation of financial statements in conformity with accounting principles generally accepted in the United States of America (“GAAP”) requires management to make estimates and assumptions that affect the reported amounts of assets and liabilities and disclosure of contingent assets and liabilities as of the date of the financial statements and the reported amounts of income and expenses during the reporting period. Actual results could differ from those estimates.
The following is a summary of significant accounting policies consistently followed by the Portfolio in the preparation of its financial statements. The policies are in conformity with GAAP.
Investment Valuation:
Debt securities (other than short term obligations with a remaining maturity of sixty days or less) are valued by independent pricing services selected by the relevant subadviser pursuant to authorization of the Board of Directors of the Fund (the “Board” or “Directors”). Short term obligations with a remaining maturity of sixty days or less are valued at amortized cost which approximates fair market value.
Equity securities traded on a national securities exchange or exchanges are valued at their last sale price on the principal trading market. Equity securities traded on the NASDAQ National Market System are valued at the NASDAQ Official Closing Price (the “NOCP”). The NOCP is the last sale price if it falls between the spread of the last reported bid and asked prices. If the last reported bid and asked prices are above the last reported sale price, the NOCP will be the last reported bid price. If the last reported bid and asked prices are below the last reported sale price, the NOCP will be the last reported asked price. Equity securities traded on a national securities exchange or exchanges or on the NASDAQ National Market System for which there is no reported sale during the day are valued at the last reported bid price. A security that is listed or traded on more than one exchange is valued at the quotation on the exchange determined to be the primary market for that security by the Board or its delegates. If no closing price is available, then such securities are valued by using the last reported bid price. Equity securities traded over-the-counter are valued at the last reported sales price.
If no current market value quotation is readily available or reliable for a portfolio security, fair value will be determined in accordance with procedures established by and under the general supervision of the Board. When the Portfolio uses fair value pricing, it may take into account any factors it deems appropriate. The value of securities used by the Portfolio to calculate its net asset value may differ from quoted or published prices for the same securities. Fair value pricing involves subjective judgments and the fair value determined for a security may be materially different than the value that could be realized upon the sale of that security.
The Portfolio expects to use fair value pricing for securities primarily traded on U.S. exchanges only under very limited circumstances. For example, the Portfolio may use fair value pricing if the exchange on which a security is traded closes early or trading in the security is suspended.
MSF-11
Metropolitan Series Fund, Inc.
BlackRock Legacy Large Cap Growth Portfolio
Notes to Financial Statements—December 31, 2007—(Continued)
Securities traded primarily on an exchange outside of the United States which closes before the close of the New York Stock Exchange will be valued at the last sales price on that non-U.S. exchange. Securities traded primarily on an exchange outside of the United States for which there is no reported sale during the day are valued at the mean between the last reported bid and asked prices. However, because most foreign markets close well before the Portfolio values its securities (typically at 4 p.m. Eastern Time), the earlier close of these foreign markets gives rise to the possibility that significant events, including broad market moves, may have occurred after these foreign markets close but before the Portfolio values its securities. To account for this, the Portfolio may frequently value many of its foreign equity securities using fair value prices based on third party vendor modeling tools.
Forward foreign currency exchange contracts are valued based on the mean between closing bid and asked prices of the forward currency contract rates in the London foreign exchange markets on a daily basis as provided by a reliable bank or dealer.
Options, whether on securities, indices, futures contracts, or otherwise, are valued at the last sales price available as of the close of business on the day of valuation or, if there is no such sale price available, at the mean between the bid and asked prices. Options on currencies are valued at the spot price each day.
The value of futures contracts will be the sum of the margin deposit plus or minus the difference between the value of the futures contract on each day the net asset value is calculated and the value on the date the futures contract originated, value being that established on a recognized commodity exchange, or by reference to other customary sources, with gain or loss being realized when the futures contract closes or expires.
Subject to the Board’s oversight, the Board has delegated day-to-day responsibility for valuing Portfolio assets to the subadviser of the Portfolio, who values such assets as described above and operates under procedures approved by the Board.
Investment Transactions and Related Investment Income:
Portfolio security transactions are recorded on the trade date. Dividend income is recorded on the ex-dividend date or, for certain foreign securities, when notified. Interest income, which includes amortization of premium and accretion of discount on debt securities, is recorded on the accrual basis. Realized gains and losses on investments and unrealized appreciation and depreciation are determined on the identified cost basis, which is the same basis used for federal income tax purposes.
Repurchase Agreements:
The Portfolio, through the custodian or a subcustodian, receives delivery of the underlying securities collateralizing repurchase agreements. The Portfolio requires the custodian to take possession, to have legally segregated in the Federal Reserve Book Entry System, or to have segregated within the custodian’s vault, all securities held as collateral for repurchase agreements. It is the Portfolio’s policy that the market value of the collateral be at least equal to 100% of the repurchase price in the case of a repurchase agreement of one-day duration and 102% on all other repurchase agreements. The Portfolio’s subadviser is responsible for determining that the value of the collateral is at all times at least equal to the repurchase price. In connection with transactions in repurchase agreements, if the seller defaults and the value of the collateral declines or if the seller enters an insolvency proceeding, realization of the collateral by the Portfolio may be delayed, limited or wholly denied.
Foreign Currency Translation:
The books and records of the Portfolio are maintained in U.S. dollars. The values of securities, currencies and other assets and liabilities denominated in currencies other than U.S. dollars are translated into U.S. dollars based upon foreign exchange rates prevailing at the end of the period. Purchases and sales of investment securities, income and expenses are translated on the respective dates of such transactions. Since the values of investment securities are presented at the foreign exchange rates prevailing at the end of the period, it is not practical to isolate that portion of the results of operations arising from changes in exchange rates from that portion of the results of operations reflecting fluctuations arising from changes in market prices of the investment securities. Such fluctuations are included in the net realized and unrealized gain or loss on investments.
Net realized foreign exchange gains or losses arise from sales of foreign currency, currency gains or losses realized between the trade and settlement dates on securities transactions, and the difference between the amounts of dividends, interest, and foreign withholding taxes recorded by the Portfolio and the U.S. dollar equivalent of the amounts actually received or paid by the Portfolio. Net unrealized foreign exchange gains and losses arise from changes in the value of assets and liabilities, other than investment securities, resulting from changes in the exchange rate.
MSF-12
Metropolitan Series Fund, Inc.
BlackRock Legacy Large Cap Growth Portfolio
Notes to Financial Statements—December 31, 2007—(Continued)
Forward Foreign Currency Exchange Contracts:
The Portfolio may enter into forward foreign currency exchange contracts primarily to hedge against foreign currency exchange rate risks on its non-U.S. dollar denominated investment securities. When entering into a forward currency contract, the Portfolio agrees to receive or deliver a fixed quantity of foreign currency for an agreed-upon price on an agreed future date. These contracts are valued daily and the Portfolio’s net equity therein, representing unrealized gain or loss on the contracts as measured by the difference between the foreign exchange rates at the dates of entry into the contracts and the forward rates at the settlement date, is included in the Statement of Assets and Liabilities. Realized and unrealized gains and losses are included in the Statement of Operations. These instruments involve market and/or credit risk in excess of the amount recognized in the Statement of Assets and Liabilities. Risks arise from the possible inability of counterparties to meet the terms of their contracts and from movement in currency and securities values and interest rates.
Futures Contracts:
The Portfolio may buy and sell futures contracts (on recognized exchanges) as a hedge or to enhance return. Futures contracts are agreements to buy or sell a security, or deliver a final cash settlement price in connection with an index, interest rate, currency, or other contracts not calling for physical delivery, for a set price in the future. The Portfolio must post an amount equal to a portion of the total market value of the futures contract as futures variation margin, which is returned when the Portfolio’s obligations under the contract have been satisfied. From time to time thereafter, the Portfolio may have to post variation margin to maintain this amount as the market value of the contract fluctuates. Risks of entering into futures contracts (and related options) include the possibility that there may be an illiquid market and that a change in the value of the contract or option may not correlate with changes in the value of the underlying securities.
Options:
The Portfolio may use options to hedge against changes in values of securities the Portfolio owns or expects to purchase. Writing puts or buying calls tends to increase the Portfolio’s exposure to the underlying instrument and writing calls or buying puts tends to decrease the Portfolio’s exposure to the underlying instrument, and can be used to hedge other Portfolio investments. For options purchased to hedge the Portfolio’s investments, the potential risk to the Portfolio is that the change in value of options contracts may not correspond to the change in value of the hedged instruments. In addition, losses may arise from changes in the value of the underlying instruments, if there is an illiquid secondary market, or if the counterparty is unable to perform. The maximum loss for purchased options is limited to the premium initially paid for the option. For options written by the Portfolio, the maximum loss is not limited to the premium initially received for the option.
The main risk associated with purchasing an option is that the option expires without being exercised. In this case, the option expires worthless and the premium paid for the option is considered the loss. The risk associated with writing a call option is that the Portfolio may forgo the opportunity for a profit if the market value of the underlying position increases and the option is exercised. The risk in writing a put option is that the Portfolio may incur a loss if the market value of the underlying position decreases and the option is exercised. In addition, the Portfolio risks not being able to enter into a closing transaction for the written option as the result of an illiquid market.
“When-Issued” Securities:
Purchasing securities “when-issued” is a forward commitment by the Portfolio to buy a security. The estimated amount of the Portfolio’s payment obligation and the security’s interest rate are determined when the commitment is made, even though no interest accrues until the security is issued, which is generally 15 to 120 days later. The Portfolio will segregate liquid assets with its custodian sufficient at all times to satisfy these commitments. If the value of the security is less when delivered than when the commitment was made, the Portfolio will suffer a loss.
Federal Income Taxes:
It is the Portfolio’s policy to comply with the requirements of the Internal Revenue Code of 1986, as amended, and regulations thereunder, applicable to regulated investment companies and to distribute all of its taxable income to shareholders. Therefore, no federal income tax provision is required.
MSF-13
Metropolitan Series Fund, Inc.
BlackRock Legacy Large Cap Growth Portfolio
Notes to Financial Statements—December 31, 2007—(Continued)
As of December 31, 2007, the Portfolio had capital loss carryovers as follows:
| | | |
Expiring
12/31/10 | | Total |
| $110,044,174 | | $ | 110,044,174 |
The tax character of distributions paid for the periods ended December 31, 2007 and 2006 was as follows:
| | | | | | | | | | | | | | | | | | | | | | |
| Ordinary Income | | Long Term Gain | | Return of Capital | | Total |
| 2007 | | 2006 | | 2007 | | 2006 | | 2007 | | 2006 | | 2007 | | 2006 |
| $ | 830,576 | | $ | 527,711 | | $ | — | | $ | — | | $ | — | | $ | — | | $ | 830,576 | | $ | 527,711 |
As of December 31, 2007, the components of distributable earnings (accumulated losses) on a federal income tax basis were as follows:
| | | | | | | | | | | | | | |
Undistributed
Ordinary
Income | | Undistributed
Long Term
Gain | | Unrealized
Appreciation | | Loss
Carryforwards | | | Total | |
| $1,652,344 | | $ | — | | $ | 69,242,577 | | $ | (110,044,174 | ) | | $ | (39,149,253 | ) |
Dividends and Distributions to Shareholders:
The Portfolio records dividends and distributions on the ex-dividend date. Net realized gains from security transactions (if any) are generally distributed annually to shareholders. The timing and characterization of certain income and capital gains distributions are determined in accordance with federal tax regulations that may differ from GAAP. Permanent book and tax basis differences relating to shareholder distributions will result in reclassification between under/over distributed net investment income, accumulated net realized gains/losses and paid in capital.
Expense Reductions:
Certain Portfolio trades are directed to brokers who paid a portion of the Portfolio’s expenses. Amounts paid for the Portfolio are shown as expense reductions in the Statement of Operations.
| 3. | INVESTMENT TRANSACTIONS: |
For the year ended December 31, 2007, purchases and sales of securities (excluding short term investments) for the Portfolio were as follows:
| | | | | | | | | |
| Purchases | | Sales |
| U.S. Government | | Other | | U.S. Government | | Other |
| $0 | | $ | 485,579,852 | | $ | 0 | | $ | 548,929,524 |
| 4. | INVESTMENT MANAGEMENT FEES AND OTHER TRANSACTIONS WITH AFFILIATES: |
Investment Management Agreement:
MetLife Advisers, LLC (“MetLife Advisers”) is the investment adviser to the Portfolio. The Fund has entered into an investment management agreement with MetLife Advisers with respect to the Portfolio. For providing investment management services to the Portfolio, MetLife Advisers receives monthly compensation at the following annual rates:
| | | | | | |
| | | Management
Fees earned by
MetLife Advisers
for the year ended
December 31, 2007 | | Annual
percentage
rates paid to
MetLife Advisers | | Based on Portfolios average
daily net asset levels |
| | $3,601,184 | | 0.730% | | Of the first $1 billion |
| | | | 0.650% | | On amounts in excess of $1 billion |
Certain officers and directors of the Fund may also be officers of MetLife Advisers; however, such officers and directors receive no compensation from the Fund.
MetLife Advisers has entered into an investment subadvisory agreement with respect to the Portfolio. BlackRock Advisors, LLC is compensated by MetLife Advisers to provide subadvisory services for the Portfolio.
MSF-14
Metropolitan Series Fund, Inc.
BlackRock Legacy Large Cap Growth Portfolio
Notes to Financial Statements—December 31, 2007—(Continued)
Service and Distribution Fees:
The Fund has adopted a Distribution and Service Plan under Rule 12b-1 of the 1940 Act for the Portfolio’s Class B and E shares. Under the Distribution and Service Plan, the Class B and E shares of the Portfolio pay a fee to compensate the Insurance Companies (or their affiliates) and other broker-dealers and financial intermediaries involved in the offer and sale of Portfolio shares for promoting or selling and servicing, the Class B and E shares. The fees under the Distribution and Service Plan for each class of the Portfolio’s shares are calculated as a percentage of the Portfolio’s average daily net assets that are attributable to that Class. Currently, the fee is 0.25% per year for Class B shares and 0.15% per year for Class E shares. Amounts paid by the Portfolio for the year ended December 31, 2007 are shown as Service and Distribution fees in the Statement of Operations.
The Fund has entered into a securities lending arrangement with the Fund’s custodian, State Street Bank and Trust Company (the “custodian”). Under the agreement, the custodian is authorized to loan securities on the Portfolios’ behalf. In exchange, the Portfolio receives either cash or securities as collateral against the loaned securities. The Portfolio receives collateral at least equal to 102% of the market value of the loaned securities (105% for foreign securities), at each loan’s inception. Collateral must be maintained at least at 100% of the market value of the loaned securities for the duration of the loan. The cash collateral is invested in the Navigator Securities Lending Prime Portfolio, an affiliate of the custodian, which invests in a variety of high quality U.S. dollar-denominated instruments. If the market value of the collateral at the close of trading on a business day is less than 100% of the market value of the loaned securities at the close of trading on that day, the borrower shall be required to deliver, by the close of business on the following business day, an additional amount of collateral, equal to at least 100% of the market value of all the loaned securities as of such preceding day. The Portfolio receives 80% of the annual net income from securities lending transactions, which is included in interest income of the Portfolio. The remaining 20% is paid to the custodian as compensation for its securities lending services. The Portfolio bears the risk of any deficiency in the amount of collateral available for return to a borrower due to a loss in an approved investment. Any outstanding loans by the Portfolio at December 31, 2007 are footnoted in the Schedule of Investments.
As previously reported, in May 2004, General American received a Wells Notice stating that the SEC staff was considering recommending that the SEC bring a civil action alleging violations of the U.S. securities laws against General American with respect to market timing and late trading in a limited number of privately-placed variable insurance contracts that were sold through General American. General American responded to the SEC staff and cooperated with the investigation. On August 9, 2007, the SEC announced that it had settled an enforcement action regarding late trading against General American with, among other things, General American agreeing to pay a civil penalty and to comply with certain undertakings. General American consented to the SEC’s order without admitting or denying the findings. MetLife Advisers has also advised the Fund’s Board of Directors that, while certain exceptions to the Fund’s policies have been noted, no situations have been identified that would have a material impact on the financial position of the Fund.
| 7. | RECENT ACCOUNTING PRONOUNCEMENTS: |
Effective June 29, 2007, the Fund implemented Financial Accounting Standards Board (“FASB”) Interpretation No. 48, “Accounting for Uncertainty in Income Taxes—an interpretation of FASB Statement No. 109” (“FIN 48”). FIN 48 prescribes the minimum recognition threshold a tax position must meet in connection with accounting for uncertainties in income tax positions taken or expected to be taken by an entity, including investment companies, before being measured and recognized in the financial statements. Management has evaluated the application of FIN 48 to the Fund, and has determined that the adoption of FIN 48 does not have a material impact on the Fund’s financial statements. The Fund files U.S. tax returns. No income tax returns are currently under examination. The statute of limitations on the Fund’s tax returns remains open for the years ended December 31, 2004 through December 31, 2006.
In September 2006, Statement of Financial Accounting Standards No. 157, Fair Value Measurements (SFAS 157) was issued and is effective for fiscal years beginning after November 15, 2007. SFAS 157 defines fair value, establishes a framework for measuring fair value and expands disclosures about fair value measurements. Management is currently evaluating the impact the adoption of SFAS 157 will have on the Portfolio’s financial statement disclosures.
MSF-15
Metropolitan Series Fund, Inc.
BlackRock Legacy Large Cap Growth Portfolio
Report of Independent Registered Public Accounting Firm
To the Shareholders and Board of Directors of the Metropolitan Series Fund, Inc.:
We have audited the accompanying statement of assets and liabilities, including the schedule of investments, of the BlackRock Legacy Large Cap Growth Portfolio, one of the portfolios constituting the Metropolitan Series Fund, Inc. (the “Fund”) as of December 31, 2007, and the related statement of operations for the year then ended, the statements of changes in net assets for each of the two years in the period then ended, and the financial highlights for each of the five years in the period then ended. These financial statements and financial highlights are the responsibility of the Fund’s management. Our responsibility is to express an opinion on these financial statements and financial highlights based on our audits.
We conducted our audits in accordance with the standards of the Public Company Accounting Oversight Board (United States). Those standards require that we plan and perform the audit to obtain reasonable assurance about whether the financial statements and financial highlights are free of material misstatement. The Fund is not required to have, nor were we engaged to perform, an audit of its internal control over financial reporting. Our audits included consideration of internal control over financial reporting as a basis for designing audit procedures that are appropriate in the circumstances, but not for the purpose of expressing an opinion on the effectiveness of the Fund’s internal control over financial reporting. Accordingly, we express no such opinion. An audit also includes examining, on a test basis, evidence supporting the amounts and disclosures in the financial statements, assessing the accounting principles used and significant estimates made by management, as well as evaluating the overall financial statement presentation. Our procedures included confirmation of securities owned as of December 31, 2007, by correspondence with the custodian and brokers; where replies were not received from brokers, we performed other auditing procedures. We believe that our audits provide a reasonable basis for our opinion.
In our opinion, the financial statements and financial highlights referred to above present fairly, in all material respects, the financial position of the BlackRock Legacy Large Cap Growth Portfolio of the Metropolitan Series Fund, Inc. as of December 31, 2007, the results of its operations for the year then ended, the changes in its net assets for each of the two years in the period then ended, and the financial highlights for each of the five years in the period then ended, in conformity with accounting principles generally accepted in the United States of America.
Deloitte & Touche LLP
Boston, Massachusetts
February 21, 2008
MSF-16
Metropolitan Series Fund, Inc.
Directors and Officers
The Fund’s Directors review actions of the Fund’s investment adviser and subadvisers, and decide upon matters of general policy. The Fund’s officers supervise the daily business operations of the Fund. The Board of Directors and the Fund’s officers are listed below. Each Director is responsible for overseeing all 36 Portfolios of the Fund. There is no limit to the term a Director may serve. Directors serve until their resignation, retirement or removal in accordance with the Fund’s organizational documents and policies adopted by the Board from time to time. Officers hold office at the pleasure of the Board or until the election or appointment and the qualification of a successor. The address of the directors and officers is c/o Metropolitan Series Fund, Inc., 501 Boylston Street, Boston, MA 02116.
Interested Directors(1)
Each Director below is an “interested person” (as defined by the 1940 Act) with respect to the Fund in that Ms. Forget is an employee of MetLife and Mr. Typermass is a former employee of MetLife and owns securities issued by MetLife, Inc., the ultimate parent company of MetLife Advisers.
| | | | | | | | |
Name, Address and Age | | Current
position(s)
with Fund | | Position(s)
held since | | Principal occupations
over past five years, including other directorships(2) | | Number of
Portfolios in
Fund Complex
Overseen by
Director(3) |
Elizabeth M. Forget Age: 41 | | Director, Chairman of the Board, President and Chief Executive Officer | | 2006 | | Senior Vice President (since 2007), MetLife, Inc.; President, Met Investors Advisory, LLC (“MIA”); Trustee and President, Met Investors Series Trust (“MIST”); Executive Vice President, MetLife Investors Group, Inc.; President (since 2006), MetLife Advisers. | | 81 |
| | | | |
Arthur G. Typermass Age: 70 | | Director | | 1998 | | Formerly, Senior Vice President and Treasurer, MetLife. | | 37 |
Non-Interested Directors(1)
Each Director below is not an “interested person” (as defined by the 1940 Act) with respect to the Fund (collectively, the “Independent Directors”).
| | | | | | | | |
Name, Address and Age | | Current
position(s)
with Fund | | Position(s)
held since | | Principal occupations
over past five years, including other directorships(2) | | Number of
Portfolios in
Fund Complex
Overseen by
Director(3) |
Steve A. Garban† Age: 70 | | Director | | 1985 | | Formerly, Chief Financial Officer, Senior Vice President Finance and Operations and Treasurer (Emeritus), The Pennsylvania State University. | | 37 |
| | | | |
Linda B. Strumpf Age: 60 | | Director | | 2000 | | Vice President and Chief Investment Officer, Ford Foundation. | | 37 |
| | | | |
Michael S. Scott Morton† Age: 70 | | Director | | 1993 | | Jay W. Forrester Professor of Management (Emeritus) at Sloan School of Management, MIT. | | 37 |
| | | | |
H. Jesse Arnelle Age: 74 | | Director | | 2001 | | Formerly, Counsel, Womble Carlyle Sandrie & Rice; Director, Textron Inc. (global multi-industry company)*; formerly, Director, Gannet Co. Inc. (diversified news and information company)*; formerly, Director, Eastman Chemical Company (global chemical company)*; formerly, Director, Waste Management, Inc.*; formerly, Director, Armstrong Holdings Inc. (parent company of floor and ceiling products business)*; formerly, Director, FPL Group Inc. (public utility holding company)*; Director, URS Corporation (engineering design services firm)*. | | 37 |
| | | | |
Nancy Hawthorne Age: 56 | | Director | | 2003 | | Director, Avid Technologies (computer software company)*; formerly, Chairman of the Board of Avid Technologies; formerly, Board of Advisors, L. Knife & Sons, Inc. (beverage distributor); Chief Executive Officer, Clerestory LLC (corporate financial advisor); formerly, Trustee, New England Zenith Fund (“Zenith Fund”)**; formerly, Chief Executive Officer and Managing Partner, Hawthorne, Krauss and Associates (corporate financial advisor); formerly, Chief Financial Officer and Executive Vice President, Continental Cablevision, subsequently renamed MediaOne (cable television company); formerly, Director, Life F/X, Inc.; formerly, Chairman of the Board, WorldClinic (distance medicine company); formerly, Director, Perini Corporation (construction company)*; formerly, Director, CGU (property and casualty insurance company); formerly, Director, Beacon Power Corporation (energy company )*. | | 37 |
MSF-17
Metropolitan Series Fund, Inc.
Directors and Officers—(Continued)
| | | | | | | | |
Name, Address and Age | | Current
position(s)
with Fund | | Position(s)
held since | | Principal occupations
over past five years, including other directorships(2) | | Number of
Portfolios in
Fund Complex
Overseen by
Director(3) |
John T. Ludes Age: 71 | | Director | | 2003 | | President, LFP Properties (consulting firm); Formerly, Trustee, Zenith Fund**; formerly, Vice Chairman, President and Chief Operating Officer, Fortune Brands/American Brands (global conglomerate); formerly, President and CEO, Acushnet Company (athletic equipment company). | | 37 |
Officers(1)
| | | | | | | | |
Name and address | | Age | | Current
position(s)
with Fund | | Position(s)
held since | | Principal occupations over past five years(2) |
| Jeffrey P. Halperin | | 40 | | Chief Compliance Officer | | 2006 | | Vice President (since 2006), Corporate Ethics and Compliance Department, MetLife, Inc.; Chief Compliance Officer (since 2006), MetLife Advisers, MIA and MIST. |
| | | | |
| John F. Guthrie, Jr. | | 64 | | Senior Vice President | | 2002 | | Manager and Senior Vice President, MetLife Advisers; Vice President, MetLife; Vice President (since 2003), MetLife Group, Inc.; Vice President, NELICO; Vice President (since 2005), MIA; formerly, Senior Vice President, Zenith Fund**. |
| | | | |
| Alan C. Leland | | 55 | | Senior Vice President | | 2005 | | Treasurer and Chief Financial Officer, MetLife Advisers, LLC; Treasurer (since 2005), Met Investors Advisory, LLC; Vice President (since 2004), MIA; Vice President (since 2003), MetLife Group, Inc.; Vice President, MetLife; Senior Vice President, NELICO |
| | | | |
| Peter Duffy | | 52 | | Vice President and Treasurer | | 2000 | | Senior Vice President, MetLife Advisers (since 1998); Second Vice President (since 2003), NELICO; Vice President, MetLife (since 2004); Vice President (since 2004), MetLife Group, Inc.; formerly, Vice President and Treasurer, Zenith Fund**. |
| | | | |
| Thomas M. Lenz | | 49 | | Vice President and Secretary | | 2002 | | General Counsel and Secretary, MetLife Advisers; Assistant General Counsel, MetLife; formerly, Vice President and Secretary, Zenith Fund**. |
| * | Indicates a directorship with a registered investment company or a company subject to the reporting requirements of the Securities Exchange Act of 1934, as amended. |
| ** | The Zenith Fund deregistered with the Securities and Exchange Commission (“SEC”) in 2004. |
| (†) | Served as a trustee, director and/or officer of one or more of the following companies, each of which had a direct or indirect advisory relationship with MetLife Advisers or its affiliates prior to January 31, 2005: State Street Research Financial Trust, State Street Research Income Trust, State Street Research Money Market Trust, State Street Research Institutional Funds, State Street Research Capital Trust, State Street Research Master Investment Trust, State Street Research Equity Trust, State Street Research Securities Trust and State Street Research Exchange Trust (collectively, the “State Street Research Funds”). |
| (1) | Each Director of the Fund also serves as trustee of Metropolitan Series Fund II (“Met Series Fund II”), a registered investment company advised by MetLife Advisers. Each officer of the Fund serves in the same position with Met Series Fund II, which consists of one portfolio. |
| (2) | Previous positions during the past five years with the Fund, MIST, MetLife, MetLife Advisers, MIA, Zenith Fund, NELICO or New England Securities Corporation are omitted if not materially different. |
| (3) | The Fund Complex includes the Fund (36 portfolios), Met Series Fund II (1 portfolio) and MIST (44 portfolios) |
MSF-18
Metropolitan Series Fund, Inc.
BlackRock Legacy Large Cap Growth Portfolio
Board Approval of Advisory and Subadvisory Agreements
The Fund’s Contract Review Committees of the Board of Directors (the “Board”) typically meet in early fall to review the Portfolios’ advisory agreements (the “Advisory Agreements”) and subadvisory agreements (collectively, the “Subadvisory Agreements,” and, together with the Advisory Agreements, the “Agreements”) and determine whether to recommend that the full Board approve the continuation of the Agreements for an additional one-year period. (Following the initial approval of an Agreement for a new Portfolio or with a new adviser or subadviser, such annual reviews are not required until 2 years following the execution of such Agreement.) After each Committee has made its recommendations, the full Board, including the Independent Directors, determines whether to approve the continuation of each of the Agreements. In addition, the Board, including the Independent Directors, considers matters bearing on the Agreements at most of its other meetings throughout the year and regularly interviews various individuals at MetLife Advisers responsible for the management of the Portfolios. The Directors also interview selected investment managers and other professionals at the subadvisers at various times throughout the year.
The Directors receive all materials that they or MetLife Advisers, the Fund’s investment adviser, and the subadvisers believe to be reasonably necessary for the Directors to evaluate the Agreements and determine whether to approve the continuation of the Agreements. These materials generally include, among other items, (i) information on the investment performance of the Portfolios and the performance of peer groups of funds and the Portfolios’ performance benchmarks, (ii) information on the Portfolios’ advisory and subadvisory fees and other expenses, including information comparing the Portfolios’ expenses to those of peer groups of funds and information about any applicable expense caps and fee “breakpoints,” (iii) sales and redemption data, (iv) information related to the profitability of the Agreements to MetLife Advisers and the subadvisers, and potential “fall-out” or ancillary benefits that MetLife Advisers, the subadvisers or their affiliates may receive as a result of their relationships with the Fund and (v) information obtained through the subadvisers’ responses to certain requests from MetLife Advisers and the Directors and MetLife Advisers’ responses to requests from the Directors. The Directors may also consider other information such as (vi) MetLife Advisers’ and the subadvisers’ financial results and condition, (vii) each Portfolio’s investment objectives and strategies and the size, education and experience of the investment staffs of MetLife Advisers and the relevant subadvisers and their use of technology and external research, (viii) the allocation of the Portfolios’ brokerage, if any, including allocations to brokers affiliated with the subadvisers and the use of “soft” commission dollars to pay Portfolio expenses and to pay for research and other similar services, (ix) the resources devoted to, and the record of compliance with, the Portfolios’ investment policies and restrictions, policies on personal securities transactions and other compliance policies, (x) the responses of MetLife Advisers, the subadvisers and/or their affiliates to certain legal and regulatory proceedings and (xi) the economic outlook generally and for the mutual fund industry in particular. Throughout the process, the Directors have the opportunity to ask questions of and request additional materials from MetLife Advisers and the subadvisers.
Following meetings of each Contract Review Committee on September 12, 2007, the Board, at its November 15, 2007 meeting, approved the continuation through December 31, 2008 of the Advisory Agreements for each Portfolio of the Fund and the Subadvisory Agreements for each Portfolio of the Fund. The Agreements approved for continuation are referred to below as the “Continued Agreements.”
In considering whether to approve the continuation of the Continued Agreements, the Directors, including the Independent Directors, did not identify any single factor as determinative, and each weighed the various factors as he or she deemed appropriate. The Directors considered the following matters in connection with their approval of the Continued Agreements:
The nature, extent and quality of the services provided to the relevant Portfolios under the Continued Agreements. The Directors considered the nature, extent and quality of the services provided by MetLife Advisers, the relevant subadvisers (if any) and their affiliates (each, an “Adviser,” and, collectively, the “Advisers”) to the relevant Portfolios pursuant to the Continued Agreements and the resources dedicated to these Portfolios by the Advisers. In particular, the Directors considered the Advisers’ abilities to attract and retain highly qualified investment professionals. With respect to MetLife Advisers, the Directors considered that MetLife Advisers is (i) ultimately responsible for the performance of such Portfolios; (ii) ultimately responsible for the establishment of the investment strategies of each such Portfolio, primarily through its recommendations to the Board regarding the hiring and selection of subadvisers; (iii) responsible for the hiring and selection, subject to Board approval, of subadvisers; and (iv) responsible for maintaining a program of Subadviser oversight reasonably designed to ensure that the subadvisers have reasonable compliance policies and procedures in place. The Directors also considered that MetLife Advisers provides a full range of day-to-day administrative services for the Portfolios involving all aspects of such Portfolios’ day-to-day operations (other than portfolio management). After reviewing these and related factors, the Directors concluded, within the context of their overall conclusions regarding each of the Continued Agreements, that the nature, extent and quality of services provided supported the renewal of these Agreements.
Investment performance of the relevant Portfolios. The Directors reviewed information about the performance of the relevant Portfolios over various time periods, including information prepared by an independent third party that compared the performance of the Portfolios to the performance of peer groups of funds and performance benchmarks. The Directors also reviewed a description of the third party’s methodology for identifying a Portfolio’s peer group(s) for purposes of performance and expense comparisons.
MSF-19
Metropolitan Series Fund, Inc.
BlackRock Legacy Large Cap Growth Portfolio
Board Approval of Advisory and Subadvisory Agreements—(Continued)
In the case of each relevant Portfolio that had performance that lagged its peer group(s) for certain periods, the Directors concluded that other factors relevant to performance were sufficient, in light of other considerations, to warrant renewal of the Continued Agreements relating to such Portfolio. These factors varied from Portfolio to Portfolio, but included one or more of the following: (i) that such Portfolio’s performance, although lagging in certain recent periods, was stronger over the longer term; (ii) that the underperformance was attributable, to a significant extent, to investment decisions that were reasonable and consistent with the Portfolio’s investment objective(s) and policies and that the Portfolio was performing within the range of reasonable expectations, given market conditions and the Portfolio’s investment objective(s) and policies; (iii) that the Portfolio’s performance was competitive when compared to other relevant performance benchmarks or peer groups; and (iv) that MetLife Advisers and/or the relevant subadviser (if any) had taken or was taking steps designed to help improve the Portfolio’s investment performance.
The Directors also considered the investment performance of the Advisers and their reputations generally, the historical responsiveness of the Advisers to Director concerns about performance and the willingness of the Advisers to take steps intended to improve performance.
After reviewing these and related factors, the Directors concluded, within the context of their overall conclusions regarding each of the Continued Agreements, that the investment performance of each relevant Portfolio and Adviser was sufficient, in light of other considerations, to warrant the renewal of the Continued Agreements.
The costs of the services to be provided and profits to be realized by the Advisers and their affiliates from their relationships with the Portfolios. The Directors considered the fees charged by MetLife Advisers to the Portfolios for advisory services and, with respect to the subadvised Portfolios, by such subadvisers to MetLife Advisers for subadvisory services (such advisory and subadvisory fees (if any), collectively, “Fees”), as well as the total expense levels of the Portfolios. This information included comparisons (provided by an independent third party) of the Portfolios’ advisory fees and total expense levels to those of their peer groups. In evaluating Fees for the relevant Portfolios, the Directors also took into account the demands, complexity and quality of the investment management services provided to each Portfolio. The Directors considered MetLife Advisers’ recommendations regarding reductions in Fee rates, implementation of Fee breakpoints and institution of Fee waivers and expense caps.
The Directors also considered the compensation directly or indirectly received by the Advisers and their affiliates from their relationships with the relevant Portfolios. The Directors reviewed information relating to the profits received by MetLife Advisers, certain of the subadvisers and their affiliates as a result of their relationships with the relevant Portfolios, and information about the allocation of expenses used to calculate profitability. When reviewing profitability, the Directors also considered the performance of the relevant Portfolios, the expense levels of such Portfolios and whether the relevant Advisers had implemented breakpoints, fee waivers and/or expense caps with respect to such Portfolios.
After reviewing these and related factors, the Directors concluded, within the context of their overall conclusions regarding each of the Continued Agreements, that the Fees charged to each of the relevant Portfolios were fair and reasonable, and that the information provided regarding costs of these services generally, and the related profitability (if known) to the relevant Advisers of their relationships with the relevant Portfolios, supported the renewal of the Continued Agreements.
Economies of Scale. The Directors considered the existence of any economies of scale in the provision of services by the Advisers and whether those economies were shared with the relevant Portfolios through breakpoints in their advisory fees or other means, such as expense caps, fee waivers or relatively low levels of fees. The Directors noted that most of the relevant Portfolios benefited or will benefit from breakpoints, expense caps and/or fee waivers with respect to their advisory fees. In considering these issues, the Directors also took into consideration information relating to the costs of the services provided and the profitability to MetLife Advisers, the relevant subadvisers (if any) and each of their affiliates of their relationships with the relevant Portfolios, as discussed above.
After reviewing these and related factors, the Directors concluded, within the context of their overall conclusions regarding each of the Continued Agreements, that the extent to which economies of scale were shared with the relevant Portfolios supported the renewal of such Agreements.
Other Factors. The Directors also considered other factors, which included but were not limited to the following:
| | • | | the extent to which each relevant Portfolio operated in accordance with its investment objective, and its record of compliance with its investment restrictions and the compliance programs of the Fund and the Advisers. They also considered the compliance-related resources the Advisers and their affiliates provide to the relevant Portfolios; |
| | • | | the nature, quality, cost and extent of administrative and shareholder services performed by MetLife Advisers and its affiliates under the Advisory Agreements; and |
MSF-20
Metropolitan Series Fund, Inc.
BlackRock Legacy Large Cap Growth Portfolio
Board Approval of Advisory and Subadvisory Agreements—(Continued)
| | • | | so-called “fall-out benefits” to the Advisers, such as the engagement of their affiliates to provide distribution, brokerage and transfer agency services to the Portfolios, and the benefits of research made available to the relevant Advisers by reason of brokerage commissions generated by the relevant Portfolios’ securities transactions. The Directors also considered the possible conflicts of interest associated with these fall-out and other benefits, and the reporting and other processes in place to disclose and monitor these possible conflicts of interest. |
Based on their evaluation of all factors that they deemed to be material, including those factors described above, and assisted by the advice of independent counsel, the Directors, including the Independent Directors, concluded that each of the Continued Agreements should be continued through December 31, 2008.
MSF-21
A description of the policies and procedures that the Fund uses to determine how to vote proxies relating to portfolio securities is available (i) without charge, upon request, by calling (800) 638-7732 and (ii) on the Securities and Exchange Commission’s (the “SEC”) website at http://www.sec.gov.
Information regarding how the Fund voted proxies relating to portfolio securities during the most recent twelve-month period ended December 31, 2007 is available (i) without charge, upon request, by calling (800) 638-7732 and (ii) on the SEC’s website at http://www.sec.gov.
The Fund files with the SEC a complete schedule of its portfolio holdings, as of the close of the first and third quarters of its fiscal year, on “Form N-Q”. These filings are available on the SEC’s website at www.sec.gov and may be reviewed and copied at the SEC’s Public Reference Room in Washington, DC. (Call 1-800-SEC-0330 for information on the operation of the Public Reference Room.)
MSF-22
| | |
Metropolitan Series Fund, Inc. BlackRock Money Market Portfolio Annual Report | | December 31, 2007 |
Letter from the President
February 1, 2008
Letter to Policy Holders:
2007 was a tumultuous year in the financial markets driven by concerns in the credit markets surrounding sub-prime mortgages and fears of recession in the U.S. Economy. The broad markets were mixed, with the Dow Jones Industrial Average up 8.9% and the MSCI EAFE Index, which measures the performance of international equities, up 11.2% for the year, while the Russell 2000 Index, which measures the performance of small capitalization stocks, was down 1.6%.
In the fixed income markets, credit spreads increased as a result of the pressure from sub-prime mortgage crisis and the Federal Reserve lowered interest rates by a total of 1% during the year. The Lehman Brothers Aggregate Bond Index posted a 7.0% return for the year.
On the following pages, you will find a complete review of your Portfolio and its investment performance.
MetLife is committed to building your financial freedom. We appreciate your trust and will continue to focus our efforts on meeting your investment needs.
Sincerely,
Elizabeth Forget
President, Metropolitan Series Fund, Inc.
Metropolitan Series Fund, Inc.
BlackRock Money Market Portfolio
Managed by BlackRock Advisors, LLC
Portfolio Manager Commentary*
PORTFOLIO PERFORMANCE
For the year ended December 31, 2007, the Class A shares of the BlackRock Money Market Portfolio returned 5.1%; the Class B shares returned 4.8%; and the Class E shares returned 4.9%. The average return of its peer group, the Lipper Variable Insurance Products Money Market Funds Universe1, was 4.8% over the same period.
PORTFOLIO REVIEW
The Federal Open Market Committee (FOMC) maintained the federal funds target rate at 5.25% until September, when significant volatility in the liquidity markets due to a series of events related to the U.S. subprime mortgage sector spurred them to ease interest rates by 50 basis points. After September, the FOMC lowered the federal funds target rate by 25 basis points on two more occasions, finishing the year at 4.25%. The committee acknowledged at its December 11, 2007 meeting that economic growth is slowing due to “intensification of the housing correction” and weakening business and consumer spending. At the same time, it was noted that energy and commodity prices remain elevated, and inflation remains a threat. The slope of the London Interbank Offered Rate (LIBOR) curve began the year at positive 2 basis points, and LIBOR settings declined by 65 to 111 basis points as an uncertain economic outlook and a more accommodative FOMC prompted lower rates. The slope of the LIBOR curve stood at negative 38 basis points at the end of the year. At year-end, contracts for Federal Funds futures were priced for a rate cut of 25 basis points at the January 30, 2008 FOMC meeting, and additional cuts totaling 50 basis points by the middle of 2008.[editors note: The FOMC in fact moved more quickly than had been expected and cut the fed target rate by 1.25% in January 2008 to a level of 3.00%.]
As the outlook for interest rates developed throughout the year, a laddered maturity structure for the Portfolio was maintained. During the first half, assets were primarily deployed in the 30- to 90-day area at a premium of approximately 1–11 basis points over the federal funds target rate of 5.25%. In a departure from the previously employed strategy, investments with maturity dates longer than 3 months began to be incrementally added. Investments were made in the 135- to 180-day sector at yields near the federal funds target rate to maintain the average weighted maturity of the Portfolio as the outlook for monetary policy evolved. Variable rate obligations based on the monthly LIBOR index were also added during the first half of the year. Later, as the FOMC became more dovish, incremental purchases of commercial paper and certificates of deposit (CDs) due in approximately six-months were also made in anticipation of additional monetary stimulus from the FOMC. Yields on such obligations ranged from 4.50% to 6.30%. In addition, two modest purchases were made in the one-year area at 5.09% and 4.81%, respectively. The average weighted maturity was generally targeted in a 42- to 60-day range, which was typically longer than the average for the peer group.
* The views expressed above are those of the subadvisory firm as of December 31, 2007 and are subject to change based on market and other conditions. Information about the Portfolio’s holdings, asset allocation, industry allocation, or country diversification is historical and is not an indication of future Portfolio composition, which will vary. The performance of any index mentioned in this commentary has not been adjusted for ongoing management, distribution and operating expenses, and sales charges applicable to mutual fund investments. Direct investment in the Index is not possible.
1 The Lipper Variable Insurance Products Fund Average is an average of the total return performance (calculated on the basis of net asset value) of variable product funds with similar investment objectives to those of the subject Portfolio as calculated by Lipper Analytical Services, an independent mutual fund ranking service.
MSF-2
Metropolitan Series Fund, Inc.
Shareholder Expense Example
As a shareholder of the Portfolio, you incur ongoing costs, including management fees; distribution and service (12b-1) fees; and other Portfolio expenses. This example is intended to help you understand your ongoing costs (in dollars) (referred to as “expenses”) of investing in the Portfolio and compare these costs with the ongoing costs of investing in other mutual funds. The example is based on an investment of $1,000 invested at the beginning of the period and held for the entire period, July 1, 2007 through December 31, 2007.
Actual Expenses
The first line for each share class of the Portfolio in the table below provides information about actual account values and actual expenses. You may use the information in this line, together with the amount you invested in the particular share class of the Portfolio, to estimate the expenses that you paid over the period. Simply divide your account value by $1,000 (for example, an $8,600 account value divided by $1,000=8.6), then multiply the result by the number in the first line under the heading entitled “Expenses Paid During Period” to estimate the expenses you paid on your account during this period.
Hypothetical Example for Comparison Purposes
The second line for each share class of the Portfolio in the table below provides information about hypothetical account values and hypothetical expenses based on the Portfolio’s actual expense ratio and an assumed rate of return of 5% per year before expenses, which is not the Portfolio’s actual return. The hypothetical account values and expenses may not be used to estimate the actual ending account balance or expenses you paid for the period. You may use this information to compare the ongoing costs of investing in the Portfolio and other funds. To do so, compare this 5% hypothetical example with the 5% hypothetical examples that appear in the shareholder reports of the other funds.
Please note that the expenses shown in the table are meant to highlight your ongoing costs only and do not reflect any fees or charges of your variable insurance product or any additional expenses that participants in certain eligible qualified plans may bear relating to the operations of their plan. Therefore, the second line for each share class in the table is useful in comparing ongoing costs only, and will not help you determine the relative total costs of owning different funds. In addition, if these other costs were included, your costs would have been higher.
| | | | | | | | | | | | | | |
Portfolio | | | | Annualized
Expense
Ratio | | | Beginning
Account Value
July 1,
2007 | | Ending
Account Value
December 31,
2007 | | Expenses Paid
During Period*
July 1, 2007
to
December 31,
2007 |
BlackRock Money Market—Class A(a) | | Actual | | 0.39 | % | | $ | 1,000.00 | | $ | 1,025.20 | | $ | 1.99 |
| | Hypothetical | | 0.39 | % | | $ | 1,000.00 | | $ | 1,023.22 | | $ | 1.99 |
| | | | | |
BlackRock Money Market—Class B(a) | | Actual | | 0.64 | % | | $ | 1,000.00 | | $ | 1,023.90 | | $ | 3.26 |
| | Hypothetical | | 0.64 | % | | $ | 1,000.00 | | $ | 1,021.94 | | $ | 3.26 |
| | | | | |
BlackRock Money Market—Class E(a) | | Actual | | 0.54 | % | | $ | 1,000.00 | | $ | 1,024.50 | | $ | 2.76 |
| | Hypothetical | | 0.54 | % | | $ | 1,000.00 | | $ | 1,022.45 | | $ | 2.75 |
* Expenses paid are equal to the Portfolio’s annualized expense ratio for the most recent six month period, as shown above, multiplied by the average account value over the period, multiplied by the number of days in the most recent fiscal half-year, divided by 365 (to reflect the one-half year period).
(a) The annualized expense ratio shown reflects the impact of the management fee waiver as described in Note 4 to the Financial Statements.
MSF-3
Metropolitan Series Fund, Inc.
BlackRock Money Market Portfolio
Schedule of Investments as of December 31, 2007
Commercial Paper—59.9% of Total Net Assets
| | | | | | |
| Security Description | | Face
Amount | | Value* |
| | | | | | |
| | | | | | |
|
Asset Backed—24.9% |
Windmill Funding Corp.
5.520%, 01/24/08 | | $ | 9,000,000 | | $ | 8,968,260 |
Atlantic Asset Securitization Corp.
5.550%, 01/18/08 | | | 52,000,000 | | | 51,863,717 |
5.430%, 02/19/08 | | | 15,000,000 | | | 14,889,137 |
CAFCO, LLC
4.920%, 01/24/08 | | | 25,000,000 | | | 24,921,417 |
4.950%, 03/14/08 | | | 20,000,000 | | | 19,799,250 |
Chariot Funding, LLC
5.930%, 01/28/08 | | | 7,000,000 | | | 6,968,868 |
Charta Corp.
4.880%, 02/12/08 | | | 50,000,000 | | | 49,715,333 |
Concord Minutemen Capital Co., LLC
5.300%, 01/11/08 | | | 11,000,000 | | | 10,983,806 |
5.900%, 02/04/08 | | | 35,000,000 | | | 34,804,972 |
CRC Funding, LLC
4.970%, 01/14/08 | | | 25,000,000 | | | 24,955,132 |
4.920%, 01/25/08 | | | 25,000,000 | | | 24,918,000 |
4.850%, 02/01/08 | | | 15,000,000 | | | 14,937,354 |
Edison Asset Securitization, LLC
5.125%, 01/30/08 | | | 12,000,000 | | | 11,950,458 |
Galleon Capital, LLC
4.600%, 01/02/08 | | | 16,000,000 | | | 15,997,956 |
Lexington Parker Capital Co.
5.000%, 01/14/08 | | | 4,500,000 | | | 4,491,875 |
Old Line Funding Corp.
5.840%, 02/08/08 | | | 25,000,000 | | | 24,845,889 |
Regency Markets No.1, LLC
5.130%, 02/15/08 | | | 38,000,000 | | | 37,756,325 |
Windmill Funding Corp.
5.060%, 01/15/08 | | | 5,000,000 | | | 4,990,161 |
Yorktown Capital, LLC
4.880%, 02/14/08 | | | 20,000,000 | | | 19,880,711 |
| | | | | | |
| | | | | | 407,638,621 |
| | | | | | |
|
Asset Backed—Other—11.5% |
Amstel Funding Corp.
5.650%, 03/11/08 | | | 20,000,000 | | | 19,780,278 |
5.430%, 03/12/08 | | | 5,000,000 | | | 4,946,454 |
5.270%, 03/17/08 | | | 5,000,000 | | | 4,944,372 |
Atlantis One Funding Corp.
5.180%, 01/04/08 | | | 50,200,000 | | | 50,178,331 |
4.800%, 01/25/08 | | | 25,000,000 | | | 24,920,000 |
LONG Lane Master Trust
5.530%, 03/10/08 | | | 25,000,000 | | | 24,735,021 |
Scaldis Capital, LLC
5.100%, 03/03/08 | | | 40,000,000 | | | 39,648,667 |
Ticonderoga Funding, LLC
5.120%, 01/25/08 | | | 20,000,000 | | | 19,931,733 |
| | | | | | |
| | | | | | 189,084,856 |
| | | | | | |
|
Capital Markets—6.6% |
Lehman Brothers Holdings, Inc.
4.250%, 01/02/08 | | | 62,988,000 | | | 62,980,564 |
| | | | | | |
| Security Description | | Face
Amount | | Value* |
| | | | | | |
| | | | | | |
|
Capital Markets—(Continued) |
The Goldman Sachs Group, Inc. (144A)
5.370%, 08/22/08 (a) | | $ | 29,150,000 | | $ | 29,150,000 |
UBS Finance Delaware, LLC
5.250%, 03/18/08 | | | 15,500,000 | | | 15,325,948 |
| | | | | | |
| | | | | | 107,456,512 |
| | | | | | |
|
Diversified Financial Services—5.2% |
ABN AMRO, N.A.
5.070%, 01/17/08 | | | 25,500,000 | | | 25,442,540 |
Bank of America Corp.
5.320%, 02/08/08 | | | 15,000,000 | | | 14,915,767 |
Citigroup Funding, Inc.
4.730%, 05/02/08 | | | 7,285,000 | | | 7,168,225 |
General Electric Capital Corp.
4.780%, 03/17/08 | | | 20,000,000 | | | 19,798,178 |
Royal Bank of Scotland Group
4.790%, 06/04/08 | | | 17,820,000 | | | 17,452,487 |
| | | | | | |
| | | | | | 84,777,197 |
| | | | | | |
|
Insurance—1.3% |
ING America Insurance Holdings, Inc. 4.850%, 02/05/08 | | | 9,000,000 | | | 8,957,562 |
New York Life Insurance Co.
5.773%, 04/14/08 (a) | | | 5,000,000 | | | 5,000,000 |
Prudential Funding, LLC
4.470%, 02/19/08 | | | 7,000,000 | | | 6,957,411 |
| | | | | | |
| | | | | | 20,914,973 |
| | | | | | |
|
Yankee—10.4% |
Calyon North America, Inc.
4.750%, 02/27/08 | | | 50,000,000 | | | 49,623,958 |
Raiffeisen Zentralbank
4.990%, 01/22/08 | | | 25,000,000 | | | 24,927,229 |
Société Générale N.A.
5.140%, 01/10/08 | | | 30,000,000 | | | 29,961,450 |
5.165%, 02/08/08 | | | 12,000,000 | | | 11,934,577 |
The Bank of Ireland
5.080%, 01/15/08 | | | 25,000,000 | | | 24,950,611 |
4.890%, 01/23/08 | | | 20,000,000 | | | 19,940,233 |
UniCredito Italiano Bank (Ireland)
5.245%, 03/20/08 | | | 8,350,000 | | | 8,253,893 |
| | | | | | |
| | | | | | 169,591,951 |
| | | | | | |
Total Commercial Paper
(Identified Cost $979,464,110) | | | | | | 979,464,110 |
| | | | | | |
|
| Certificate of Deposit—32.8% |
|
Capital Markets—1.2% |
State Street Bank & Trust Co.
4.890%, 03/17/08 (a) | | | 10,000,000 | | | 10,000,000 |
UBS AG
5.050%, 03/20/08 | | | 5,000,000 | | | 5,000,000 |
4.895%, 06/04/08 | | | 4,545,000 | | | 4,545,000 |
| | | | | | |
| | | | | | 19,545,000 |
| | | | | | |
*See accompanying notes to financial statements.
MSF-4
Metropolitan Series Fund, Inc.
BlackRock Money Market Portfolio
Schedule of Investments as of December 31, 2007
Certificate of Deposit—(Continued)
| | | | | | |
| Security Description | | Face
Amount | | Value* |
| | | | | | |
|
Commercial Banks—30.7% |
ABN AMRO Bank NV (Chicago)
4.905%, 01/24/08 | | $ | 25,000,000 | | $ | 25,000,000 |
American Express Bank, FSB
5.300%, 01/08/08 | | | 15,000,000 | | | 15,000,000 |
Banco Bilbao Vizcaya (NY)
5.220%, 01/10/08 | | | 25,500,000 | | | 25,500,000 |
5.065%, 04/02/08 | | | 5,870,000 | | | 5,870,146 |
Bank of Montreal (Chicago)
5.100%, 04/01/08 | | | 5,720,000 | | | 5,720,000 |
4.870%, 06/02/08 | | | 3,640,000 | | | 3,640,000 |
4.996%, 11/10/08 | | | 14,710,000 | | | 14,710,000 |
Bank of Nova Scotia (Portland)
4.820%, 01/31/08 | | | 30,000,000 | | | 30,000,000 |
BNP Paribas (NY)
5.100%, 02/27/08 | | | 23,278,000 | | | 23,278,000 |
4.494%, 03/19/08 | | | 35,000,000 | | | 35,000,000 |
4.800%, 06/05/08 | | | 18,370,000 | | | 18,370,000 |
Branch Banking & Trust Co.
4.500%, 01/22/08 | | | 5,000,000 | | | 5,000,000 |
Canadian Imperial Bank of Commerce 5.090%, 04/01/08 | | | 16,240,000 | | | 16,240,000 |
4.870%, 06/10/08 | | | 13,364,000 | | | 13,364,000 |
Chase Bank USA, N.A.
5.130%, 04/15/08 | | | 9,000,000 | | | 9,000,000 |
5.130%, 04/16/08 | | | 8,000,000 | | | 8,000,000 |
4.700%, 05/07/08 | | | 17,380,000 | | | 17,380,000 |
Deutsche Bank AG (NY)
5.385%, 03/11/08 | | | 16,270,000 | | | 16,270,000 |
Natixis Institutional Bank (NY)
5.420%, 07/10/08 | | | 5,145,000 | | | 5,155,125 |
Nordea Bank Finland, Plc. (NY)
4.910%, 06/23/08 | | | 5,545,000 | | | 5,545,258 |
4.820%, 10/17/08 | | | 17,485,000 | | | 17,486,344 |
Royal Bank of Scotland, Plc. (NY)
5.331%, 10/27/08 (a) | | | 10,000,000 | | | 10,000,000 |
Svenska Handelsbanken (NY)
5.270%, 02/07/08 | | | 12,255,000 | | | 12,255,000 |
Toronto-Dominion Bank (NY)
5.000%, 03/25/08 | | | 15,000,000 | | | 15,000,000 |
5.050%, 03/25/08 | | | 25,000,000 | | | 25,000,000 |
4.860%, 05/30/08 | | | 1,800,000 | | | 1,800,000 |
4.850%, 06/06/08 | | | 13,640,000 | | | 13,640,000 |
Unicredito Italiano (NY)
5.385%, 03/20/08 | | | 10,010,000 | | | 10,010,107 |
5.015%, 03/27/08 | | | 50,000,000 | | | 50,000,000 |
Wachovia Bank, N.A.
5.320%, 02/06/08 | | | 50,000,000 | | | 50,000,000 |
| | | | | | |
| | | | | | 503,233,980 |
| | | | | | |
|
Yankee—0.9% |
Bank of Nova Scotia
5.170%, 07/03/08 (a) | | | 14,410,000 | | | 14,407,106 |
| | | | | | |
Total Certificate of Deposit
(Identified Cost $537,186,086) | | | | | | 537,186,086 |
| | | | | | |
| | | | | | |
|
| Medium Term Notes—7.1% |
| Security Description | | Face
Amount | | Value* |
| | | | | | |
|
Asset Backed—Other—0.6% |
Cullinan Finance Corp. (144A)
4.845%, 06/25/08 (a) | | $ | 10,060,000 | | $ | 10,058,994 |
| | | | | | |
|
Diversified Financial Services—0.5% |
General Electric Capital Corp.
4.916%, 08/22/08 (a) | | | 7,500,000 | | | 7,500,000 |
| | | | | | |
|
Insurance—1.8% |
Allstate Life Global Funding Trust (144A)
4.895%, 09/26/08 (a) | | | 10,000,000 | | | 10,000,000 |
Irish Life & Permanent, Plc. (144A)
4.885%, 09/19/08 (a) | | | 20,000,000 | | | 20,000,000 |
| | | | | | |
| | | | | | 30,000,000 |
| | | | | | |
|
Yankee—4.2% |
Commonwealth Bank of Australia (144A)
4.960%, 01/31/08 (a) | | | 40,000,000 | | | 40,001,282 |
DnB NOR Bank ASA (144A)
4.865%, 09/24/08 (a) | | | 28,425,000 | | | 28,425,000 |
| | | | | | |
| | | | | | 68,426,282 |
| | | | | | |
Total Medium Term Notes
(Identified Cost $115,985,276) | | | | | | 115,985,276 |
| | | | | | |
Total Investments—99.8%
(Identified Cost $1,632,635,472) (b) | | | | | | 1,632,635,472 |
Other assets less liabilities | | | | | | 3,202,795 |
| | | | | | |
| Total Net Assets—100% | | | | | $ | 1,635,838,267 |
| | | | | | |
| (a) | Variable or Floating Rate Security. Rate disclosed is as of December 31, 2007. |
| (b) | The aggregate cost of investments for federal income tax purposes as of December 31, 2007 was $1,632,635,472. |
| (144A)— | Securities exempt from registration under Rule 144A of the Securities Act of 1933. These securities may be resold in transactions exempt from registration, normally to qualified institutional buyers. As of December 31, 2007, the market value of 144A securities was $137,635,276, which is 8.4% of total net assets. |
*See accompanying notes to financial statements.
MSF-5
Metropolitan Series Fund, Inc.
BlackRock Money Market Portfolio
Statement of Assets & Liabilities
December 31, 2007
| | | | | | | |
Assets | | | | | | | |
Investments at amortized cost | | | | | $ | 1,632,635,472 | |
Cash | | | | | | 216 | |
Receivable for: | | | | | | | |
Fund shares sold | | | | | | 2,808,318 | |
Accrued interest | | | | | | 5,503,108 | |
| | | | | | | |
Total Assets | | | | | | 1,640,947,114 | |
Liabilities | | | | | | | |
Payable for: | | | | | | | |
Fund shares redeemed | | $ | 4,147,386 | | | | |
Accrued expenses: | | | | | | | |
Management fees | | | 447,655 | | | | |
Service and distribution fees | | | 106,552 | | | | |
Deferred directors’ fees | | | 76,371 | | | | |
Other expenses | | | 330,883 | | | | |
| | | | | | | |
Total Liabilities | | | | | | 5,108,847 | |
| | | | | | | |
Net Assets | | | | | $ | 1,635,838,267 | |
| | | | | | | |
Net assets consists of: | | | | | | | |
Capital paid in | | | | | $ | 1,635,855,317 | |
Undistributed net investment income | | | | | | 27,950 | |
Accumulated net realized losses | | | | | | (45,000 | ) |
| | | | | | | |
Net Assets | | | | | $ | 1,635,838,267 | |
| | | | | | | |
| Computation of offering price: | | | | | | | |
Class A | | | | | | | |
Net asset value and redemption price per share ($1,128,411,182 divided by 11,284,112 shares outstanding) | | | | | $ | 100.00 | |
| | | | | | | |
Class B | | | | | | | |
Net asset value and redemption price per share ($496,228,150 divided by 4,962,282 shares outstanding) | | | | | $ | 100.00 | |
| | | | | | | |
Class E | | | | | | | |
Net asset value and redemption price per share ($11,198,935 divided by 111,989 shares outstanding) | | | | | $ | 100.00 | |
| | | | | | | |
Statement of Operations
For the Year Ended December 31, 2007
| | | | | | | |
Investment Income | | | | | | | |
Interest | | | | | | $ | 80,186,539 |
| | | | | | | |
Expenses | | | | | | | |
Management fees | | $ | 4,987,190 | | | | |
Service and distribution fees—Class B | | | 1,148,322 | | | | |
Service and distribution fees—Class E | | | 16,566 | | | | |
Directors’ fees and expenses | | | 27,352 | | | | |
Custodian | | | 228,527 | | | | |
Audit and tax services | | | 36,738 | | | | |
Legal | | | 53,712 | | | | |
Printing | | | 594,864 | | | | |
Insurance | | | 24,090 | | | | |
Miscellaneous | | | 64,531 | | | | |
| | | | | | | |
Total expenses | | | 7,181,892 | | | | |
Management fee waivers | | | (100,000 | ) | | | 7,081,892 |
| | | | | | | |
Net Investment Income | | | | | | | 73,104,647 |
| | | | | | | |
Net Increase in Net Assets From Operations | | | | | | $ | 73,104,647 |
| | | | | | | |
See accompanying notes to financial statements.
MSF-6
Metropolitan Series Fund, Inc.
BlackRock Money Market Portfolio
Statements of Changes in Net Assets
| | | | | | | | |
| | | Year ended
December 31,
2007 | | | Year ended
December 31,
2006 | |
From Operations | | | | | | | | |
Net investment income | | $ | 73,104,647 | | | $ | 50,472,100 | |
Net realized gain (loss) | | | 0 | | | | (11,763 | ) |
| | | | | | | | |
Increase in net assets from operations | | | 73,104,647 | | | | 50,460,337 | |
| | | | | | | | |
From Distributions to Shareholders | | | | | | | | |
Net investment income | | | | | | | | |
Class A | | | (50,923,892 | ) | | | (34,245,645 | ) |
Class B | | | (21,649,891 | ) | | | (15,774,535 | ) |
Class E | | | (530,864 | ) | | | (440,266 | ) |
| | | | | | | | |
Total distributions | | | (73,104,647 | ) | | | (50,460,446 | ) |
| | | | | | | | |
Increase in net assets from capital share transactions | | | 356,010,434 | | | | 569,188,126 | |
| | | | | | | | |
Total increase in net assets | | | 356,010,434 | | | | 569,188,017 | |
| | |
Net Assets | | | | | | | | |
Beginning of the period | | | 1,279,827,833 | | | | 710,639,816 | |
| | | | | | | | |
End of the period | | $ | 1,635,838,267 | | | $ | 1,279,827,833 | |
| | | | | | | | |
Undistributed Net Investment Income | | | | | | | | |
End of the period | | $ | 27,950 | | | $ | 27,950 | |
| | | | | | | | |
Other Information:
Capital Shares
Transactions in capital shares were as follows:
| | | | | | | | | | | | | | |
| | | Year ended
December 31, 2007 | | | Year ended
December 31, 2006 | |
| | | Shares | | | $ | | | Shares | | | $ | |
Class A | | | | | | | | | | | | | | |
Sales | | 11,717,171 | | | $ | 1,171,715,791 | | | 7,453,514 | | | $ | 746,628,745 | |
Shares issued through acquisition | | 0 | | | | 0 | | | 4,077,220 | | | | 407,713,843 | |
Reinvestments | | 509,081 | | | | 50,923,892 | | | 355,311 | | | | 34,245,645 | |
Redemptions | | (9,696,563 | ) | | | (969,656,339 | ) | | (7,421,792 | ) | | | (742,179,238 | ) |
| | | | | | | | | | | | | | |
Net increase | | 2,529,689 | | | $ | 252,983,344 | | | 4,464,253 | | | $ | 446,408,995 | |
| | | | | | | | | | | | | | |
Class B | | | | | | | | | | | | | | |
Sales | | 9,686,387 | | | $ | 968,637,226 | | | 6,560,238 | | | $ | 656,023,779 | |
Reinvestments | | 216,391 | | | | 21,649,891 | | | 157,745 | | | | 15,774,535 | |
Redemptions | | (8,883,191 | ) | | | (888,319,060 | ) | | (5,505,903 | ) | | | (550,590,251 | ) |
| | | | | | | | | | | | | | |
Net increase | | 1,019,587 | | | $ | 101,968,057 | | | 1,212,080 | | | $ | 121,208,063 | |
| | | | | | | | | | | | | | |
Class E | | | | | | | | | | | | | | |
Sales | | 45,750 | | | $ | 4,575,018 | | | 50,137 | | | $ | 5,013,719 | |
Reinvestments | | 5,308 | | | | 530,864 | | | 4,403 | | | | 440,266 | |
Redemptions | | (40,468 | ) | | | (4,046,849 | ) | | (38,829 | ) | | | (3,882,917 | ) |
| | | | | | | | | | | | | | |
Net increase | | 10,590 | | | $ | 1,059,033 | | | 15,711 | | | $ | 1,571,068 | |
| | | | | | | | | | | | | | |
Increase derived from capital share transactions | | | | | $ | 356,010,434 | | | | | | $ | 569,188,126 | |
| | | | | | | | | | | | | | |
See accompanying notes to financial statements.
MSF-7
Metropolitan Series Fund, Inc.
BlackRock Money Market Portfolio
Financial Highlights
| | | | | | | | | | | | | | | | | | | | |
| | | Class A | |
| | | Year ended December 31, | |
| | | 2007 | | | 2006 | | | 2005 | | | 2004 | | | 2003 | |
Net Asset Value, Beginning of Period | | $ | 100.00 | | | $ | 100.00 | | | $ | 100.00 | | | $ | 100.00 | | | $ | 100.00 | |
| | | | | | | | | | | | | | | | | | | | |
Income From Investment Operations | | | | | | | | | | | | | | | | | | | | |
Net investment income | | | 4.95 | | | | 4.70 | | | | 2.85 | | | | 0.98 | | | | 0.80 | |
| | | | | | | | | | | | | | | | | | | | |
Total from investment operations | | | 4.95 | | | | 4.70 | | | | 2.85 | | | | 0.98 | | | | 0.80 | |
| | | | | | | | | | | | | | | | | | | | |
Less Distributions | | | | | | | | | | | | | | | | | | | | |
Distributions from net investment income | | | (4.95 | ) | | | (4.70 | ) | | | (2.85 | ) | | | (0.98 | ) | | | (0.80 | ) |
| | | | | | | | | | | | | | | | | | | | |
Total distributions | | | (4.95 | ) | | | (4.70 | ) | | | (2.85 | ) | | | (0.98 | ) | | | (0.80 | ) |
| | | | | | | | | | | | | | | | | | | | |
Net Asset Value, End of Period | | $ | 100.00 | | | $ | 100.00 | | | $ | 100.00 | | | $ | 100.00 | | | $ | 100.00 | |
| | | | | | | | | | | | | | | | | | | | |
Total Return (%) | | | 5.1 | | | | 4.8 | | | | 2.9 | | | | 1.0 | | | | 0.8 | |
Ratio of operating expenses to average net assets (%) | | | 0.40 | | | | 0.38 | | | | 0.41 | | | | 0.42 | | | | 0.40 | |
Ratio of operating expenses to average net assets without giving effect to the contractual expense agreement would have been (%) (a) | | | 0.40 | | | | N/A | | | | N/A | | | | N/A | | | | N/A | |
Ratio of net investment income to average net assets (%) | | | 4.97 | | | | 4.79 | | | | 2.83 | | | | 0.97 | | | | 0.78 | |
Net assets, end of period (000) | | $ | 1,128,411 | | | $ | 875,428 | | | $ | 429,019 | | | $ | 469,674 | | | $ | 610,419 | |
| | | | | | | | | | | | | | | | | | | | |
| | | Class B | |
| | | Year ended December 31, | |
| | | 2007 | | | 2006 | | | 2005 | | | 2004 | | | 2003 | |
Net Asset Value, Beginning of Period | | $ | 100.00 | | | $ | 100.00 | | | $ | 100.00 | | | $ | 100.00 | | | $ | 100.00 | |
| | | | | | | | | | | | | | | | | | | | |
Income From Investment Operations | | | | | | | | | | | | | | | | | | | | |
Net investment income | | | 4.70 | | | | 4.45 | | | | 2.60 | | | | 0.73 | | | | 0.55 | |
| | | | | | | | | | | | | | | | | | | | |
Total from investment operations | | | 4.70 | | | | 4.45 | | | | 2.60 | | | | 0.73 | | | | 0.55 | |
| | | | | | | | | | | | | | | | | | | | |
Less Distributions | | | | | | | | | | | | | | | | | | | | |
Distributions from net investment income | | | (4.70 | ) | | | (4.45 | ) | | | (2.60 | ) | | | (0.73 | ) | | | (0.55 | ) |
| | | | | | | | | | | | | | | | | | | | |
Total distributions | | | (4.70 | ) | | | (4.45 | ) | | | (2.60 | ) | | | (0.73 | ) | | | (0.55 | ) |
| | | | | | | | | | | | | | | | | | | | |
Net Asset Value, End of Period | | $ | 100.00 | | | $ | 100.00 | | | $ | 100.00 | | | $ | 100.00 | | | $ | 100.00 | |
| | | | | | | | | | | | | | | | | | | | |
Total Return (%) | | | 4.8 | | | | 4.5 | | | | 2.6 | | | | 0.7 | | | | 0.6 | |
Ratio of operating expenses to average net assets (%) | | | 0.65 | | | | 0.63 | | | | 0.66 | | | | 0.67 | | | | 0.65 | |
Ratio of operating expenses to average net assets without giving effect to the contractual expense agreement would have been (%) (a) | | | 0.65 | | | | N/A | | | | N/A | | | | N/A | | | | N/A | |
Ratio of net investment income to average net assets (%) | | | 4.71 | | | | 4.50 | | | | 2.84 | | | | 0.74 | | | | 0.65 | |
Net assets, end of period (000) | | $ | 496,228 | | | $ | 394,260 | | | $ | 273,052 | | | $ | 78,809 | | | $ | 75,083 | |
| (a) | See Note 4 in the Notes to Financial Statements. |
See accompanying notes to financial statements.
MSF-8
Metropolitan Series Fund, Inc.
BlackRock Money Market Portfolio
Financial Highlights
| | | | | | | | | | | | | | | | | | | | |
| | | Class E | |
| | | Year ended December 31, | |
| | | 2007 | | | 2006 | | | 2005 | | | 2004 | | | 2003(a) | |
Net Asset Value, Beginning of Period | | $ | 100.00 | | | $ | 100.00 | | | $ | 100.00 | | | $ | 100.00 | | | $ | 100.00 | |
| | | | | | | | | | | | | | | | | | | | |
Income From Investment Operations | | | | | | | | | | | | | | | | | | | | |
Net investment income | | | 4.80 | | | | 4.55 | | | | 2.70 | | | | 0.83 | | | | 0.42 | |
| | | | | | | | | | | | | | | | | | | | |
Total from investment operations | | | 4.80 | | | | 4.55 | | | | 2.70 | | | | 0.83 | | | | 0.42 | |
| | | | | | | | | | | | | | | | | | | | |
Less Distributions | | | | | | | | | | | | | | | | | | | | |
Distributions from net investment income | | | (4.80 | ) | | | (4.55 | ) | | | (2.70 | ) | | | (0.83 | ) | | | (0.42 | ) |
| | | | | | | | | | | | | | | | | | | | |
Total distributions | | | (4.80 | ) | | | (4.55 | ) | | | (2.70 | ) | | | (0.83 | ) | | | (0.42 | ) |
| | | | | | | | | | | | | | | | | | | | |
Net Asset Value, End of Period | | $ | 100.00 | | | $ | 100.00 | | | $ | 100.00 | | | $ | 100.00 | | | $ | 100.00 | |
| | | | | | | | | | | | | | | | | | | | |
Total Return (%) | | | 4.9 | | | | 4.7 | | | | 2.7 | | | | 0.8 | | | | 0.4 | (b) |
Ratio of operating expenses to average net assets (%) | | | 0.55 | | | | 0.53 | | | | 0.56 | | | | 0.57 | | | | 0.55 | (c) |
Ratio of operating expenses to average net assets without giving effect to the contractual expense agreement would have been (%) (d) | | | 0.55 | | | | N/A | | | | N/A | | | | N/A | | | | N/A | |
Ratio of net investment income to average net assets (%) | | | 4.81 | | | | 4.57 | | | | 2.66 | | | | 0.88 | | | | 0.58 | (c) |
Net assets, end of period (000) | | $ | 11,199 | | | $ | 10,140 | | | $ | 8,569 | | | $ | 11,619 | | | $ | 6,858 | |
| (a) | Commencement of operations was April 23, 2003 for Class E. |
| (b) | Periods less than one year are not computed on an annualized basis. |
| (c) | Computed on an annualized basis. |
| (d) | See Note 4 in the Notes to Financial Statements. |
See accompanying notes to financial statements.
MSF-9
Metropolitan Series Fund, Inc.
BlackRock Money Market Portfolio
Notes to Financial Statements—December 31, 2007
Metropolitan Series Fund, Inc. (the “Fund”) is organized as a corporation under the laws of Maryland pursuant to Articles of Incorporation filed on November 23, 1982, as amended, and registered under the Investment Company Act of 1940, as amended (the “1940 Act”), as an open-end investment company. The Fund is a “series” type of mutual fund, which issues separate series of stock. Each series represents an interest in a separate portfolio of Fund investments. The BlackRock Money Market Portfolio (the “Portfolio”) is a diversified series of the Fund. Shares in the Fund are not offered directly to the general public and are currently available only to separate accounts established by Metropolitan Life Insurance Company (“MetLife”), New England Life Insurance Company, General American Life Insurance Company (“General American”), The MetLife Investors Group of Insurance Companies, MetLife Insurance Company of Connecticut and other affiliated insurance companies (collectively, the “Insurance Companies”), as an investment vehicle for variable life insurance, group annuity or variable annuity products, although the Portfolio is not available to all such separate accounts. The Portfolio’s shares may be divided into different classes. Currently, the classes being offered by the Portfolio are named Class A, Class B and Class E. The classes of the Portfolio’s shares are identical, except that certain additional charges (Rule 12b-1 fees) are made against Class B and Class E shares. Investment income, realized and unrealized capital gains and losses, the common expenses of the Portfolio and certain Portfolio-level expense reductions, if any, are allocated on a pro rata basis to each class based on the relative net assets of each class to the total net assets of the Portfolio.
| 2. | SIGNIFICANT ACCOUNTING POLICIES: |
The preparation of financial statements in conformity with accounting principles generally accepted in the United States of America (“GAAP”) requires management to make estimates and assumptions that affect the reported amounts of assets and liabilities and disclosure of contingent assets and liabilities as of the date of the financial statements and the reported amounts of income and expenses during the reporting period. Actual results could differ from those estimates.
The following is a summary of significant accounting policies consistently followed by the Portfolio in the preparation of its financial statements. The policies are in conformity with GAAP.
Investment Valuation:
As permitted by Rule 2a-7 under the 1940 Act, and subject to certain conditions therein, the Portfolio employs the amortized cost method of security valuation that the Fund’s Board of Directors (the “Board” or “Directors”) has determined approximates the fair market net asset value per share of the Portfolio. The Board monitors the deviations between the Portfolio’s net asset value per share, as determined by using available market quotations, and its amortized cost price per share. If the deviation exceeds 1/2 of 1%, the Board will consider what action, if any, should be initiated.
Subject to the Board’s oversight, the Board has delegated day-to-day responsibility for valuing Portfolio assets to the subadviser of the Portfolio, who values such assets as described above and operates under procedures approved by the Board.
Investment Transactions and Related Investment Income:
Portfolio security transactions are recorded on the trade date. Interest income, which includes amortization of premium and accretion of discount on debt securities, is recorded on the accrual basis. Realized gains and losses on investments and unrealized appreciation and depreciation are determined on the identified cost basis, which is the same basis used for federal income tax purposes.
Repurchase Agreements:
The Portfolio, through the custodian or a subcustodian, receives delivery of the underlying securities collateralizing repurchase agreements. The Portfolio requires the custodian to take possession, to have legally segregated in the Federal Reserve Book Entry System, or to have segregated within the custodian’s vault, all securities held as collateral for repurchase agreements. It is the Portfolio’s policy that the market value of the collateral be at least equal to 100% of the repurchase price in the case of a repurchase agreement of one-day duration and 102% on all other repurchase agreements. The Portfolio’s subadviser is responsible for determining that the value of the collateral is at all times at least equal to the repurchase price. In connection with transactions in repurchase agreements, if the seller defaults and the value of the collateral declines or if the seller enters an insolvency proceeding, realization of the collateral by the Portfolio may be delayed, limited or wholly denied.
MSF-10
Metropolitan Series Fund, Inc.
BlackRock Money Market Portfolio
Notes to Financial Statements—December 31, 2007—(Continued)
“When-Issued” Securities:
Purchasing securities “when-issued” is a forward commitment by the Portfolio to buy a security. The estimated amount of the Portfolio’s payment obligation and the security’s interest rate are determined when the commitment is made, even though no interest accrues until the security is issued, which is generally 15 to 120 days later. The Portfolio will segregate liquid assets with its custodian sufficient at all times to satisfy these commitments. If the value of the security is less when delivered than when the commitment was made, the Portfolio will suffer a loss.
Federal Income Taxes:
It is the Portfolio’s policy to comply with the requirements of the Internal Revenue Code of 1986, as amended, and regulations thereunder, applicable to regulated investment companies and to distribute all of its taxable income to shareholders. Therefore, no federal income tax provision is required.
As of December 31, 2007, the Portfolio had capital loss carryovers as follows:
| | | | | | | | | | | | | | | | | | | |
Expiring
12/31/14 | | Expiring
12/31/13 | | Expiring
12/31/12 | | Expiring
12/31/11 | | Expiring
12/31/10 | | Expiring
12/31/09 | | Total |
| $ | 11,851 | | $ | 5,353 | | $ | 8,633 | | $ | 28 | | $ | 918 | | $ | 12,851 | | $ | 39,634 |
The utilization of the capital loss carryforward acquired as part of a merger may be limited under section 382 of the Internal Revenue Code.
The tax character of distributions paid for the periods ended December 31, 2007 and 2006 was as follows:
| | | | | | | | | | | | | | | | | | | | | | |
| Ordinary Income | | Long Term Gain | | Return of Capital | | Total |
| 2007 | | 2006 | | 2007 | | 2006 | | 2007 | | 2006 | | 2007 | | 2006 |
| $ | 73,104,647 | | $ | 50,460,446 | | $ | — | | $ | — | | $ | — | | $ | — | | $ | 73,104,647 | | $ | 50,460,446 |
As of December 31, 2007, the components of distributable earnings (accumulated losses) on a federal income tax basis were as follows:
| | | | | | | | | | | | | |
Undistributed
Ordinary
Income | | Undistributed
Long Term
Gain | | Unrealized
Appreciation/
(Depreciation) | | Loss
Carryforwards | | | Total |
| $66,000 | | $ | — | | $ | — | | $ | (39,634 | ) | | $ | 26,366 |
Dividends and Distributions to Shareholders:
The BlackRock Money Market Portfolio dividends are declared daily to shareholders of record at the time and are paid monthly. Net realized gains from security transactions (if any) are generally distributed annually to shareholders. The timing and characterization of certain income and capital gains distributions are determined in accordance with federal tax regulations that may differ from GAAP. Permanent book and tax basis differences relating to shareholder distributions will result in reclassification between under/over distributed net investment income, accumulated net realized gains/losses and paid in capital.
| 3. | INVESTMENT MANAGEMENT FEES AND OTHER TRANSACTIONS WITH AFFILIATES: |
Investment Management Agreement:
MetLife Advisers, LLC (“MetLife Advisers”) is the investment adviser to the Portfolio. The Fund has entered into an investment management agreement with MetLife Advisers with respect to the Portfolio. For providing investment management services to the Portfolio, MetLife Advisers receives monthly compensation at the following annual rates:
| | | | | | |
| | | Management
Fees earned by
MetLife Advisers
for the year ended
December 31, 2007 | | Annual
percentage
rates paid to
MetLife Advisers | | Based on Portfolios average
daily net asset levels |
| | $4,987,190 | | 0.350% | | Of the first $1 billion |
| | | | 0.300% | | Of the next $1 billion |
| | | | 0.250% | | On amounts in excess of $2 billion |
MSF-11
Metropolitan Series Fund, Inc.
BlackRock Money Market Portfolio
Notes to Financial Statements—December 31, 2007—(Continued)
Certain officers and directors of the Fund may also be officers of MetLife Advisers; however, such officers and directors receive no compensation from the Fund.
MetLife Advisers has entered into an investment subadvisory agreement with respect to the Portfolio. BlackRock Advisors, LLC is compensated by MetLife Advisers to provide subadvisory services for the Portfolio.
Service and Distribution Fees:
The Fund has adopted a Distribution and Service Plan under Rule 12b-1 of the 1940 Act for the Portfolio’s Class B and E shares. Under the Distribution and Service Plan, the Class B and E shares of the Portfolio pay a fee to compensate the Insurance Companies (or their affiliates) and other broker-dealers and financial intermediaries involved in the offer and sale of Portfolio shares for promoting or selling and servicing, the Class B and E shares. The fees under the Distribution and Service Plan for each class of the Portfolio’s shares are calculated as a percentage of the Portfolio’s average daily net assets that are attributable to that Class. Currently, the fee is 0.25% per year for Class B shares and 0.15% per year for Class E shares. Amounts paid by the Portfolio for the year ended December 31, 2007 are shown as Service and Distribution fees in the Statement of Operations.
Management Fee Waivers:
Pursuant to an expense agreement, MetLife Advisers has agreed, for the period May 1, 2007 to April 30, 2008, to reduce its advisory fees set out above under “Investment Management Agreement” for each class of the Portfolio as follows:
| | | |
Annual Percentage Rate Reduction | | Average Daily Net Asset Value Levels |
| 0.005% | | First $ | 500 million |
| 0.015% | | Next $ | 500 million |
Amounts waived for the year ended December 31, 2007 are shown as management fee waivers in the Statement of Operations.
As previously reported, in May 2004, General American received a Wells Notice stating that the SEC staff was considering recommending that the SEC bring a civil action alleging violations of the U.S. securities laws against General American with respect to market timing and late trading in a limited number of privately-placed variable insurance contracts that were sold through General American. General American responded to the SEC staff and cooperated with the investigation. On August 9, 2007, the SEC announced that it had settled an enforcement action regarding late trading against General American with, among other things, General American agreeing to pay a civil penalty and to comply with certain undertakings. General American consented to the SEC’s order without admitting or denying the findings. MetLife Advisers has also advised the Fund’s Board of Directors that, while certain exceptions to the Fund’s policies have been noted, no situations have been identified that would have a material impact on the financial position of the Fund.
| 5. | RECENT ACCOUNTING PRONOUNCEMENTS: |
Effective June 29, 2007, the Fund implemented Financial Accounting Standards Board (“FASB”) Interpretation No. 48, “Accounting for Uncertainty in Income Taxes—an interpretation of FASB Statement No. 109” (“FIN 48”). FIN 48 prescribes the minimum recognition threshold a tax position must meet in connection with accounting for uncertainties in income tax positions taken or expected to be taken by an entity, including investment companies, before being measured and recognized in the financial statements. Management has evaluated the application of FIN 48 to the Fund, and has determined that the adoption of FIN 48 does not have a material impact on the Fund’s financial statements. The Fund files U.S. tax returns. No income tax returns are currently under examination. The statute of limitations on the Fund’s tax returns remains open for the years ended December 31, 2004 through December 31, 2006.
In September 2006, Statement of Financial Accounting Standards No. 157, Fair Value Measurements (SFAS 157) was issued and is effective for fiscal years beginning after November 15, 2007. SFAS 157 defines fair value, establishes a framework for measuring fair value and expands disclosures about fair value measurements. Management is currently evaluating the impact the adoption of SFAS 157 will have on the Portfolio’s financial statement disclosures.
MSF-12
Metropolitan Series Fund, Inc.
BlackRock Money Market Portfolio
Report of Independent Registered Public Accounting Firm
To the Shareholders and Board of Directors of the Metropolitan Series Fund, Inc.:
We have audited the accompanying statement of assets and liabilities, including the schedule of investments, of the BlackRock Money Market Portfolio, one of the portfolios constituting the Metropolitan Series Fund, Inc. (the “Fund”) as of December 31, 2007, and the related statement of operations for the year then ended, the statements of changes in net assets for each of the two years in the period then ended, and the financial highlights for each of the five years in the period then ended. These financial statements and financial highlights are the responsibility of the Fund’s management. Our responsibility is to express an opinion on these financial statements and financial highlights based on our audits.
We conducted our audits in accordance with the standards of the Public Company Accounting Oversight Board (United States). Those standards require that we plan and perform the audit to obtain reasonable assurance about whether the financial statements and financial highlights are free of material misstatement. The Fund is not required to have, nor were we engaged to perform, an audit of its internal control over financial reporting. Our audits included consideration of internal control over financial reporting as a basis for designing audit procedures that are appropriate in the circumstances, but not for the purpose of expressing an opinion on the effectiveness of the Fund’s internal control over financial reporting. Accordingly, we express no such opinion. An audit also includes examining, on a test basis, evidence supporting the amounts and disclosures in the financial statements, assessing the accounting principles used and significant estimates made by management, as well as evaluating the overall financial statement presentation. Our procedures included confirmation of securities owned as of December 31, 2007, by correspondence with the custodian and brokers; where replies were not received from brokers, we performed other auditing procedures. We believe that our audits provide a reasonable basis for our opinion.
In our opinion, the financial statements and financial highlights referred to above present fairly, in all material respects, the financial position of the BlackRock Money Market Portfolio of the Metropolitan Series Fund, Inc. as of December 31, 2007, the results of its operations for the year then ended, the changes in its net assets for each of the two years in the period then ended, and the financial highlights for each of the five years in the period then ended, in conformity with accounting principles generally accepted in the United States of America.
Deloitte & Touche LLP
Boston, Massachusetts
February 21, 2008
MSF-13
Metropolitan Series Fund, Inc.
Directors and Officers
The Fund’s Directors review actions of the Fund’s investment adviser and subadvisers, and decide upon matters of general policy. The Fund’s officers supervise the daily business operations of the Fund. The Board of Directors and the Fund’s officers are listed below. Each Director is responsible for overseeing all 36 Portfolios of the Fund. There is no limit to the term a Director may serve. Directors serve until their resignation, retirement or removal in accordance with the Fund’s organizational documents and policies adopted by the Board from time to time. Officers hold office at the pleasure of the Board or until the election or appointment and the qualification of a successor. The address of the directors and officers is c/o Metropolitan Series Fund, Inc., 501 Boylston Street, Boston, MA 02116.
Interested Directors(1)
Each Director below is an “interested person” (as defined by the 1940 Act) with respect to the Fund in that Ms. Forget is an employee of MetLife and Mr. Typermass is a former employee of MetLife and owns securities issued by MetLife, Inc., the ultimate parent company of MetLife Advisers.
| | | | | | | | |
Name, Address and Age | | Current
position(s)
with Fund | | Position(s)
held since | | Principal occupations
over past five years, including other directorships(2) | | Number of
Portfolios in
Fund Complex
Overseen by
Director(3) |
Elizabeth M. Forget Age: 41 | | Director, Chairman of the Board, President and Chief Executive Officer | | 2006 | | Senior Vice President (since 2007), MetLife, Inc.; President, Met Investors Advisory, LLC (“MIA”); Trustee and President, Met Investors Series Trust (“MIST”); Executive Vice President, MetLife Investors Group, Inc.; President (since 2006), MetLife Advisers. | | 81 |
| | | | |
Arthur G. Typermass Age: 70 | | Director | | 1998 | | Formerly, Senior Vice President and Treasurer, MetLife. | | 37 |
Non-Interested Directors(1)
Each Director below is not an “interested person” (as defined by the 1940 Act) with respect to the Fund (collectively, the “Independent Directors”).
| | | | | | | | |
Name, Address and Age | | Current
position(s)
with Fund | | Position(s)
held since | | Principal occupations
over past five years, including other directorships(2) | | Number of
Portfolios in
Fund Complex
Overseen by
Director(3) |
Steve A. Garban† Age: 70 | | Director | | 1985 | | Formerly, Chief Financial Officer, Senior Vice President Finance and Operations and Treasurer (Emeritus), The Pennsylvania State University. | | 37 |
| | | | |
Linda B. Strumpf Age: 60 | | Director | | 2000 | | Vice President and Chief Investment Officer, Ford Foundation. | | 37 |
| | | | |
Michael S. Scott Morton† Age: 70 | | Director | | 1993 | | Jay W. Forrester Professor of Management (Emeritus) at Sloan School of Management, MIT. | | 37 |
| | | | |
H. Jesse Arnelle Age: 74 | | Director | | 2001 | | Formerly, Counsel, Womble Carlyle Sandrie & Rice; Director, Textron Inc. (global multi-industry company)*; formerly, Director, Gannet Co. Inc. (diversified news and information company)*; formerly, Director, Eastman Chemical Company (global chemical company)*; formerly, Director, Waste Management, Inc.*; formerly, Director, Armstrong Holdings Inc. (parent company of floor and ceiling products business)*; formerly, Director, FPL Group Inc. (public utility holding company)*; Director, URS Corporation (engineering design services firm)*. | | 37 |
| | | | |
Nancy Hawthorne Age: 56 | | Director | | 2003 | | Director, Avid Technologies (computer software company)*; formerly, Chairman of the Board of Avid Technologies; formerly, Board of Advisors, L. Knife & Sons, Inc. (beverage distributor); Chief Executive Officer, Clerestory LLC (corporate financial advisor); formerly, Trustee, New England Zenith Fund (“Zenith Fund”)**; formerly, Chief Executive Officer and Managing Partner, Hawthorne, Krauss and Associates (corporate financial advisor); formerly, Chief Financial Officer and Executive Vice President, Continental Cablevision, subsequently renamed MediaOne (cable television company); formerly, Director, Life F/X, Inc.; formerly, Chairman of the Board, WorldClinic (distance medicine company); formerly, Director, Perini Corporation (construction company)*; formerly, Director, CGU (property and casualty insurance company); formerly, Director, Beacon Power Corporation (energy company )*. | | 37 |
MSF-14
Metropolitan Series Fund, Inc.
Directors and Officers—(Continued)
| | | | | | | | |
Name, Address and Age | | Current
position(s)
with Fund | | Position(s)
held since | | Principal occupations
over past five years, including other directorships(2) | | Number of
Portfolios in
Fund Complex
Overseen by
Director(3) |
John T. Ludes Age: 71 | | Director | | 2003 | | President, LFP Properties (consulting firm); Formerly, Trustee, Zenith Fund**; formerly, Vice Chairman, President and Chief Operating Officer, Fortune Brands/American Brands (global conglomerate); formerly, President and CEO, Acushnet Company (athletic equipment company). | | 37 |
Officers(1)
| | | | | | | | |
Name and address | | Age | | Current
position(s)
with Fund | | Position(s)
held since | | Principal occupations over past five years(2) |
| Jeffrey P. Halperin | | 40 | | Chief Compliance Officer | | 2006 | | Vice President (since 2006), Corporate Ethics and Compliance Department, MetLife, Inc.; Chief Compliance Officer (since 2006), MetLife Advisers, MIA and MIST. |
| | | | |
| John F. Guthrie, Jr. | | 64 | | Senior Vice President | | 2002 | | Manager and Senior Vice President, MetLife Advisers; Vice President, MetLife; Vice President (since 2003), MetLife Group, Inc.; Vice President, NELICO; Vice President (since 2005), MIA; formerly, Senior Vice President, Zenith Fund**. |
| | | | |
| Alan C. Leland | | 55 | | Senior Vice President | | 2005 | | Treasurer and Chief Financial Officer, MetLife Advisers, LLC; Treasurer (since 2005), Met Investors Advisory, LLC; Vice President (since 2004), MIA; Vice President (since 2003), MetLife Group, Inc.; Vice President, MetLife; Senior Vice President, NELICO |
| | | | |
| Peter Duffy | | 52 | | Vice President and Treasurer | | 2000 | | Senior Vice President, MetLife Advisers (since 1998); Second Vice President (since 2003), NELICO; Vice President, MetLife (since 2004); Vice President (since 2004), MetLife Group, Inc.; formerly, Vice President and Treasurer, Zenith Fund**. |
| | | | |
| Thomas M. Lenz | | 49 | | Vice President and Secretary | | 2002 | | General Counsel and Secretary, MetLife Advisers; Assistant General Counsel, MetLife; formerly, Vice President and Secretary, Zenith Fund**. |
| * | Indicates a directorship with a registered investment company or a company subject to the reporting requirements of the Securities Exchange Act of 1934, as amended. |
| ** | The Zenith Fund deregistered with the Securities and Exchange Commission (“SEC”) in 2004. |
| (†) | Served as a trustee, director and/or officer of one or more of the following companies, each of which had a direct or indirect advisory relationship with MetLife Advisers or its affiliates prior to January 31, 2005: State Street Research Financial Trust, State Street Research Income Trust, State Street Research Money Market Trust, State Street Research Institutional Funds, State Street Research Capital Trust, State Street Research Master Investment Trust, State Street Research Equity Trust, State Street Research Securities Trust and State Street Research Exchange Trust (collectively, the “State Street Research Funds”). |
| (1) | Each Director of the Fund also serves as trustee of Metropolitan Series Fund II (“Met Series Fund II”), a registered investment company advised by MetLife Advisers. Each officer of the Fund serves in the same position with Met Series Fund II, which consists of one portfolio. |
| (2) | Previous positions during the past five years with the Fund, MIST, MetLife, MetLife Advisers, MIA, Zenith Fund, NELICO or New England Securities Corporation are omitted if not materially different. |
| (3) | The Fund Complex includes the Fund (36 portfolios), Met Series Fund II (1 portfolio) and MIST (44 portfolios) |
MSF-15
Metropolitan Series Fund, Inc.
BlackRock Money Market Portfolio
Board Approval of Advisory and Subadvisory Agreements
The Fund’s Contract Review Committees of the Board of Directors (the “Board”) typically meet in early fall to review the Portfolios’ advisory agreements (the “Advisory Agreements”) and subadvisory agreements (collectively, the “Subadvisory Agreements,” and, together with the Advisory Agreements, the “Agreements”) and determine whether to recommend that the full Board approve the continuation of the Agreements for an additional one-year period. (Following the initial approval of an Agreement for a new Portfolio or with a new adviser or subadviser, such annual reviews are not required until 2 years following the execution of such Agreement.) After each Committee has made its recommendations, the full Board, including the Independent Directors, determines whether to approve the continuation of each of the Agreements. In addition, the Board, including the Independent Directors, considers matters bearing on the Agreements at most of its other meetings throughout the year and regularly interviews various individuals at MetLife Advisers responsible for the management of the Portfolios. The Directors also interview selected investment managers and other professionals at the subadvisers at various times throughout the year.
The Directors receive all materials that they or MetLife Advisers, the Fund’s investment adviser, and the subadvisers believe to be reasonably necessary for the Directors to evaluate the Agreements and determine whether to approve the continuation of the Agreements. These materials generally include, among other items, (i) information on the investment performance of the Portfolios and the performance of peer groups of funds and the Portfolios’ performance benchmarks, (ii) information on the Portfolios’ advisory and subadvisory fees and other expenses, including information comparing the Portfolios’ expenses to those of peer groups of funds and information about any applicable expense caps and fee “breakpoints,” (iii) sales and redemption data, (iv) information related to the profitability of the Agreements to MetLife Advisers and the subadvisers, and potential “fall-out” or ancillary benefits that MetLife Advisers, the subadvisers or their affiliates may receive as a result of their relationships with the Fund and (v) information obtained through the subadvisers’ responses to certain requests from MetLife Advisers and the Directors and MetLife Advisers’ responses to requests from the Directors. The Directors may also consider other information such as (vi) MetLife Advisers’ and the subadvisers’ financial results and condition, (vii) each Portfolio’s investment objectives and strategies and the size, education and experience of the investment staffs of MetLife Advisers and the relevant subadvisers and their use of technology and external research, (viii) the allocation of the Portfolios’ brokerage, if any, including allocations to brokers affiliated with the subadvisers and the use of “soft” commission dollars to pay Portfolio expenses and to pay for research and other similar services, (ix) the resources devoted to, and the record of compliance with, the Portfolios’ investment policies and restrictions, policies on personal securities transactions and other compliance policies, (x) the responses of MetLife Advisers, the subadvisers and/or their affiliates to certain legal and regulatory proceedings and (xi) the economic outlook generally and for the mutual fund industry in particular. Throughout the process, the Directors have the opportunity to ask questions of and request additional materials from MetLife Advisers and the subadvisers.
Following meetings of each Contract Review Committee on September 12, 2007, the Board, at its November 15, 2007 meeting, approved the continuation through December 31, 2008 of the Advisory Agreements for each Portfolio of the Fund and the Subadvisory Agreements for each Portfolio of the Fund. The Agreements approved for continuation are referred to below as the “Continued Agreements.”
In considering whether to approve the continuation of the Continued Agreements, the Directors, including the Independent Directors, did not identify any single factor as determinative, and each weighed the various factors as he or she deemed appropriate. The Directors considered the following matters in connection with their approval of the Continued Agreements:
The nature, extent and quality of the services provided to the relevant Portfolios under the Continued Agreements. The Directors considered the nature, extent and quality of the services provided by MetLife Advisers, the relevant subadvisers (if any) and their affiliates (each, an “Adviser,” and, collectively, the “Advisers”) to the relevant Portfolios pursuant to the Continued Agreements and the resources dedicated to these Portfolios by the Advisers. In particular, the Directors considered the Advisers’ abilities to attract and retain highly qualified investment professionals. With respect to MetLife Advisers, the Directors considered that MetLife Advisers is (i) ultimately responsible for the performance of such Portfolios; (ii) ultimately responsible for the establishment of the investment strategies of each such Portfolio, primarily through its recommendations to the Board regarding the hiring and selection of subadvisers; (iii) responsible for the hiring and selection, subject to Board approval, of subadvisers; and (iv) responsible for maintaining a program of Subadviser oversight reasonably designed to ensure that the subadvisers have reasonable compliance policies and procedures in place. The Directors also considered that MetLife Advisers provides a full range of day-to-day administrative services for the Portfolios involving all aspects of such Portfolios’ day-to-day operations (other than portfolio management). After reviewing these and related factors, the Directors concluded, within the context of their overall conclusions regarding each of the Continued Agreements, that the nature, extent and quality of services provided supported the renewal of these Agreements.
Investment performance of the relevant Portfolios. The Directors reviewed information about the performance of the relevant Portfolios over various time periods, including information prepared by an independent third party that compared the performance of the Portfolios to the performance of peer groups of funds and performance benchmarks. The Directors also reviewed a description of the third party’s methodology for identifying a Portfolio’s peer group(s) for purposes of performance and expense comparisons.
MSF-16
Metropolitan Series Fund, Inc.
BlackRock Money Market Portfolio
Board Approval of Advisory and Subadvisory Agreements—(Continued)
In the case of each relevant Portfolio that had performance that lagged its peer group(s) for certain periods, the Directors concluded that other factors relevant to performance were sufficient, in light of other considerations, to warrant renewal of the Continued Agreements relating to such Portfolio. These factors varied from Portfolio to Portfolio, but included one or more of the following: (i) that such Portfolio’s performance, although lagging in certain recent periods, was stronger over the longer term; (ii) that the underperformance was attributable, to a significant extent, to investment decisions that were reasonable and consistent with the Portfolio’s investment objective(s) and policies and that the Portfolio was performing within the range of reasonable expectations, given market conditions and the Portfolio’s investment objective(s) and policies; (iii) that the Portfolio’s performance was competitive when compared to other relevant performance benchmarks or peer groups; and (iv) that MetLife Advisers and/or the relevant subadviser (if any) had taken or was taking steps designed to help improve the Portfolio’s investment performance.
The Directors also considered the investment performance of the Advisers and their reputations generally, the historical responsiveness of the Advisers to Director concerns about performance and the willingness of the Advisers to take steps intended to improve performance.
After reviewing these and related factors, the Directors concluded, within the context of their overall conclusions regarding each of the Continued Agreements, that the investment performance of each relevant Portfolio and Adviser was sufficient, in light of other considerations, to warrant the renewal of the Continued Agreements.
The costs of the services to be provided and profits to be realized by the Advisers and their affiliates from their relationships with the Portfolios. The Directors considered the fees charged by MetLife Advisers to the Portfolios for advisory services and, with respect to the subadvised Portfolios, by such subadvisers to MetLife Advisers for subadvisory services (such advisory and subadvisory fees (if any), collectively, “Fees”), as well as the total expense levels of the Portfolios. This information included comparisons (provided by an independent third party) of the Portfolios’ advisory fees and total expense levels to those of their peer groups. In evaluating Fees for the relevant Portfolios, the Directors also took into account the demands, complexity and quality of the investment management services provided to each Portfolio. The Directors considered MetLife Advisers’ recommendations regarding reductions in Fee rates, implementation of Fee breakpoints and institution of Fee waivers and expense caps.
The Directors also considered the compensation directly or indirectly received by the Advisers and their affiliates from their relationships with the relevant Portfolios. The Directors reviewed information relating to the profits received by MetLife Advisers, certain of the subadvisers and their affiliates as a result of their relationships with the relevant Portfolios, and information about the allocation of expenses used to calculate profitability. When reviewing profitability, the Directors also considered the performance of the relevant Portfolios, the expense levels of such Portfolios and whether the relevant Advisers had implemented breakpoints, fee waivers and/or expense caps with respect to such Portfolios.
After reviewing these and related factors, the Directors concluded, within the context of their overall conclusions regarding each of the Continued Agreements, that the Fees charged to each of the relevant Portfolios were fair and reasonable, and that the information provided regarding costs of these services generally, and the related profitability (if known) to the relevant Advisers of their relationships with the relevant Portfolios, supported the renewal of the Continued Agreements.
Economies of Scale. The Directors considered the existence of any economies of scale in the provision of services by the Advisers and whether those economies were shared with the relevant Portfolios through breakpoints in their advisory fees or other means, such as expense caps, fee waivers or relatively low levels of fees. The Directors noted that most of the relevant Portfolios benefited or will benefit from breakpoints, expense caps and/or fee waivers with respect to their advisory fees. In considering these issues, the Directors also took into consideration information relating to the costs of the services provided and the profitability to MetLife Advisers, the relevant subadvisers (if any) and each of their affiliates of their relationships with the relevant Portfolios, as discussed above.
After reviewing these and related factors, the Directors concluded, within the context of their overall conclusions regarding each of the Continued Agreements, that the extent to which economies of scale were shared with the relevant Portfolios supported the renewal of such Agreements.
Other Factors. The Directors also considered other factors, which included but were not limited to the following:
| | • | | the extent to which each relevant Portfolio operated in accordance with its investment objective, and its record of compliance with its investment restrictions and the compliance programs of the Fund and the Advisers. They also considered the compliance-related resources the Advisers and their affiliates provide to the relevant Portfolios; |
| | • | | the nature, quality, cost and extent of administrative and shareholder services performed by MetLife Advisers and its affiliates under the Advisory Agreements; and |
MSF-17
Metropolitan Series Fund, Inc.
BlackRock Money Market Portfolio
Board Approval of Advisory and Subadvisory Agreements—(Continued)
| | • | | so-called “fall-out benefits” to the Advisers, such as the engagement of their affiliates to provide distribution, brokerage and transfer agency services to the Portfolios, and the benefits of research made available to the relevant Advisers by reason of brokerage commissions generated by the relevant Portfolios’ securities transactions. The Directors also considered the possible conflicts of interest associated with these fall-out and other benefits, and the reporting and other processes in place to disclose and monitor these possible conflicts of interest. |
Based on their evaluation of all factors that they deemed to be material, including those factors described above, and assisted by the advice of independent counsel, the Directors, including the Independent Directors, concluded that each of the Continued Agreements should be continued through December 31, 2008.
MSF-18
A description of the policies and procedures that the Fund uses to determine how to vote proxies relating to portfolio securities is available (i) without charge, upon request, by calling (800) 638-7732 and (ii) on the Securities and Exchange Commission’s (the “SEC”) website at http://www.sec.gov.
Information regarding how the Fund voted proxies relating to portfolio securities during the most recent twelve-month period ended December 31, 2007 is available (i) without charge, upon request, by calling (800) 638-7732 and (ii) on the SEC’s website at http://www.sec.gov.
The Fund files with the SEC a complete schedule of its portfolio holdings, as of the close of the first and third quarters of its fiscal year, on “Form N-Q”. These filings are available on the SEC’s website at www.sec.gov and may be reviewed and copied at the SEC’s Public Reference Room in Washington, DC. (Call 1-800-SEC-0330 for information on the operation of the Public Reference Room.)
MSF-19
| | |
Metropolitan Series Fund, Inc. BlackRock Strategic Value Portfolio Annual Report | | December 31, 2007 |
Letter from the President
February 1, 2008
Letter to Policy Holders:
2007 was a tumultuous year in the financial markets driven by concerns in the credit markets surrounding sub-prime mortgages and fears of recession in the U.S. Economy. The broad markets were mixed, with the Dow Jones Industrial Average up 8.9% and the MSCI EAFE Index, which measures the performance of international equities, up 11.2% for the year, while the Russell 2000 Index, which measures the performance of small capitalization stocks, was down 1.6%.
In the fixed income markets, credit spreads increased as a result of the pressure from sub-prime mortgage crisis and the Federal Reserve lowered interest rates by a total of 1% during the year. The Lehman Brothers Aggregate Bond Index posted a 7.0% return for the year.
On the following pages, you will find a complete review of your Portfolio and its investment performance.
MetLife is committed to building your financial freedom. We appreciate your trust and will continue to focus our efforts on meeting your investment needs.
Sincerely,
Elizabeth Forget
President, Metropolitan Series Fund, Inc.
Metropolitan Series Fund, Inc.
BlackRock Strategic Value Portfolio
Managed by BlackRock Advisors, LLC
Portfolio Manager Commentary*
PORTFOLIO PERFORMANCE
For the year ended December 31, 2007, the Class A shares of the BlackRock Strategic Value Portfolio returned -3.5%, compared to its benchmark, the Russell 2000 Value Index1, which returned -9.8%. The average return of its peer group, the Lipper Variable Insurance Products Small-Cap Value Funds Universe2, was -6.6% over the same period.
PORTFOLIO REVIEW
The U.S. equity markets were volatile in 2007, as the slowing domestic economy, a recession in residential housing, turmoil in the subprime mortgage market, and evaporating credit roiled stock prices. Despite accommodative action by the Federal Reserve to cut the federal funds target rate by a total of 100 basis points to 4.25%, investor optimism remained low. For the year, large caps outperformed small caps while growth significantly outpaced value across the market capitalization spectrum. The style disparity was most pronounced in the small cap end of the market as small cap growth stocks trumped their value counterparts by 16.8%. Not since 1999 has small cap growth beaten value by such a wide margin. In this environment, the Russell 2000 Value Index stumbled 9.8% as steep declines in the consumer discretionary and financials sectors overshadowed gains in materials, healthcare and energy. Against this backdrop, BlackRock Strategic Value Portfolio significantly outpaced the benchmark as relative strength in the consumer discretionary, financials and healthcare sectors overcame weakness in materials and energy.
Consumer discretionary stocks pulled back sharply as the meltdown in the housing market, a decelerating economy and rising energy prices tainted the outlook for consumer spending. In this environment, solid stock selection, particularly among hotel & gaming names, contributed to favorable comparisons. Luxury hotel operators Orient-Express Hotels and Vail Resorts and gaming machine maker WMS Industries all added significant value. LKQ Corp. was another key contributor in the sector as shares of the recycled automotive parts producer gained 49%. Financial services stocks also came under significant selling pressure during the year as fear surrounding the impact of subprime mortgage write-downs, turmoil in the credit markets and a lower interest rate environment prompted a growing number of investors to move money out of the sector. On a relative basis, outperformance was driven by underweights and stock selection among real estate investment trusts (REITs) and thrift & mortgage finance names. Relative returns were also buoyed by positive stock selection among insurance names. In healthcare, overweights and stock selection among pharmaceuticals and healthcare providers drove favorable sector comparisons. Key individual contributors included Magellan Health Services, a provider of behavioral healthcare, and home healthcare nursing services provider Amedisys. Axcan Pharma was another significant contributor as shares of the gastrointestinal pharmaceutical maker spiked following a November takeover announcement by private equity firm TPG Capital.
Although an overweight in the materials sector proved advantageous, these gains were overshadowed by disappointing stock selection, particularly within the chemicals and metals & mining sub-sectors. Most notably, shares of benchmark holding CF Industries gained 330%. Our lack of exposure to this producer of nitrogen and phosphate fertilizer products proved to be among the most significant sources of relative underperformance within the sector. Stocks in the volatile energy sector moved higher on the back of rising crude oil and natural gas prices. Although the move in natural gas prices was somewhat modest, crude oil prices moved markedly to the upside. After beginning the year slightly above $61/barrel, prices spiked toward the $100/barrel mark before closing 2007 at $96/barrel. In this environment, disappointing stock selection hampered performance comparisons given our energy sector focus on U.S. natural gas exploration & production and oil service companies.
During the year, we increased Portfolio exposure in the healthcare, consumer staples and information technology sectors, while reducing weightings in financials and industrials. At year-end, the most notable sector positioning relative to the Russell 2000 Value Index included overweights in consumer discretionary, consumer staples and healthcare and underweights in utilities and financials, primarily driven by our underweight exposure to REITs and banks.
* The views expressed above are those of the subadvisory firm as of December 31, 2007 and are subject to change based on market and other conditions. Information about the Portfolio’s holdings, asset allocation, industry allocation, or country diversification is historical and is not an indication of future Portfolio composition, which will vary. The performance of any index mentioned in this commentary has not been adjusted for ongoing management, distribution and operating expenses, and sales charges applicable to mutual fund investments. Direct investment in the Index is not possible.
1 The Russell 2000® Value Index is an unmanaged measure of performance of those Russell 2000® companies that have lower price-to-book ratios and lower forecasted growth values.
2 The Lipper Variable Insurance Products Fund Average is an average of the total return performance (calculated on the basis of net asset value) of variable product funds with similar investment objectives to those of the subject Portfolio as calculated by Lipper Analytical Services, an independent mutual fund ranking service.
MSF-2
Metropolitan Series Fund, Inc.
BlackRock Strategic Value Portfolio
A $10,000 INVESTMENT COMPARED TO
THE RUSSELL 2000 VALUE INDEX
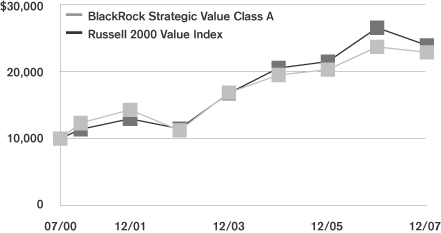
Average Annual Returns as of December 31, 2007
| | | | | | | | | | | | |
| | | BlackRock Strategic
Value Portfolio | | | Russell 2000
Value Index | |
| | | Class A | | | Class B | | | Class E | | |
| 1 Year | | (3.5 | )% | | (3.7 | )% | | (3.6 | )% | | (9.8 | )% |
| 5 Year | | 15.2 | | | 14.8 | | | 15.1 | | | 15.8 | |
| Since Inception | | 11.7 | | | 7.0 | | | 7.2 | | | 12.3 | |
Performance numbers are net of all Portfolio expenses but do not include any insurance, sales, or administrative charges of variable annuity or life insurance contracts. If these charges were included, the returns would be lower.
Inception dates of the Class A, Class B and Class E shares are: 7/5/00, 5/1/01 and 5/1/01, respectively. Index since inception return is based on the Class A inception date.
This information represents past performance and is not indicative of future results. Investment return and principal value may fluctuate so that shares, upon redemption, may be worth more or less than the original cost.
PORTFOLIO COMPOSITION as of December 31, 2007
Top Holdings
| | |
| | | % of Total
Net Assets |
BJ’s Wholesale Club, Inc. | | 3.2% |
Axcan Pharma, Inc. | | 3.1% |
Magellan Health Services, Inc. | | 2.9% |
The Brinks Co. | | 2.9% |
Sybase, Inc. | | 2.6% |
Texas Industries, Inc. | | 2.6% |
Ruddick Corp. | | 2.6% |
Piper Jaffray Co. | | 2.2% |
Silgan Holdings, Inc. | | 2.1% |
Hain Celestial Group, Inc. | | 2.1% |
Top Sectors
| | |
| | | % of Total
Market Value |
Consumer Discretionary | | 16.8% |
Information Technology | | 15.3% |
Financials | | 15.2% |
Industrials | | 12.1% |
Consumer Staples | | 10.4% |
Health Care | | 9.8% |
Materials | | 8.8% |
Energy | | 5.3% |
Cash | | 4.1% |
Utilities | | 2.2% |
MSF-3
Metropolitan Series Fund, Inc.
Shareholder Expense Example
As a shareholder of the Portfolio, you incur ongoing costs, including management fees; distribution and service (12b-1) fees; and other Portfolio expenses. This example is intended to help you understand your ongoing costs (in dollars) (referred to as “expenses”) of investing in the Portfolio and compare these costs with the ongoing costs of investing in other mutual funds. The example is based on an investment of $1,000 invested at the beginning of the period and held for the entire period, July 1, 2007 through December 31, 2007.
Actual Expenses
The first line for each share class of the Portfolio in the table below provides information about actual account values and actual expenses. You may use the information in this line, together with the amount you invested in the particular share class of the Portfolio, to estimate the expenses that you paid over the period. Simply divide your account value by $1,000 (for example, an $8,600 account value divided by $1,000=8.6), then multiply the result by the number in the first line under the heading entitled “Expenses Paid During Period” to estimate the expenses you paid on your account during this period.
Hypothetical Example for Comparison Purposes
The second line for each share class of the Portfolio in the table below provides information about hypothetical account values and hypothetical expenses based on the Portfolio’s actual expense ratio and an assumed rate of return of 5% per year before expenses, which is not the Portfolio’s actual return. The hypothetical account values and expenses may not be used to estimate the actual ending account balance or expenses you paid for the period. You may use this information to compare the ongoing costs of investing in the Portfolio and other funds. To do so, compare this 5% hypothetical example with the 5% hypothetical examples that appear in the shareholder reports of the other funds.
Please note that the expenses shown in the table are meant to highlight your ongoing costs only and do not reflect any fees or charges of your variable insurance product or any additional expenses that participants in certain eligible qualified plans may bear relating to the operations of their plan. Therefore, the second line for each share class in the table is useful in comparing ongoing costs only, and will not help you determine the relative total costs of owning different funds. In addition, if these other costs were included, your costs would have been higher.
| | | | | | | | | | | | | | |
Portfolio | | | | Annualized
Expense
Ratio | | | Beginning
Account Value
July 1,
2007 | | Ending
Account Value
December 31,
2007 | | Expenses Paid
During Period*
July 1, 2007
to
December 31,
2007 |
BlackRock Strategic Value—Class A | | Actual | | 0.88 | % | | $ | 1,000.00 | | $ | 911.70 | | $ | 4.24 |
| | Hypothetical | | 0.88 | % | | $ | 1,000.00 | | $ | 1,020.72 | | $ | 4.48 |
| | | | | |
BlackRock Strategic Value—Class B | | Actual | | 1.13 | % | | $ | 1,000.00 | | $ | 910.50 | | $ | 5.44 |
| | Hypothetical | | 1.13 | % | | $ | 1,000.00 | | $ | 1,019.44 | | $ | 5.75 |
| | | | | |
BlackRock Strategic Value—Class E | | Actual | | 1.03 | % | | $ | 1,000.00 | | $ | 911.40 | | $ | 4.96 |
| | Hypothetical | | 1.03 | % | | $ | 1,000.00 | | $ | 1,019.95 | | $ | 5.24 |
* Expenses paid are equal to the Portfolio’s annualized expense ratio for the most recent six month period, as shown above, multiplied by the average account value over the period,
multiplied by the number of days in the most recent fiscal half-year, divided by 365 (to reflect the one-half year period).
MSF-4
Metropolitan Series Fund, Inc.
BlackRock Strategic Value Portfolio
Schedule of Investments as of December 31, 2007
Common Stock—95.8% of Total Net Assets
| | | | | |
| Security Description | | Shares | | Value* |
| | | | | |
| | |
Aerospace & Defense—1.7% | | | | | |
Orbital Sciences Corp. (a) (b) | | 603,000 | | $ | 14,785,560 |
| | | | | |
| | |
Capital Markets—3.7% | | | | | |
KBW, Inc. (a) (b) | | 303,500 | | | 7,766,565 |
Piper Jaffray Co. (b) | | 424,868 | | | 19,679,886 |
TradeStation Group, Inc. (a) (b) | | 397,700 | | | 5,651,317 |
| | | | | |
| | | | | 33,097,768 |
| | | | | |
| | |
Chemicals—2.8% | | | | | |
H.B. Fuller Co. (a) | | 570,300 | | | 12,803,235 |
Sensient Technologies Corp. | | 425,900 | | | 12,044,452 |
| | | | | |
| | | | | 24,847,687 |
| | | | | |
| | |
Commercial Banks—3.7% | | | | | |
First Midwest Bancorp, Inc. (a) | | 327,000 | | | 10,006,200 |
Sterling Bancshares, Inc. | | 774,464 | | | 8,643,018 |
United Bankshares, Inc. (a) | | 295,310 | | | 8,274,586 |
Wintrust Financial Corp. (a) | | 173,515 | | | 5,748,552 |
| | | | | |
| | | | | 32,672,356 |
| | | | | |
| | |
Commercial Services & Supplies—4.9% | | | | | |
The Brinks Co. | | 428,200 | | | 25,580,668 |
Waste Connections, Inc. (b) | | 290,650 | | | 8,981,085 |
Watson Wyatt & Co. Holdings | | 195,500 | | | 9,073,155 |
| | | | | |
| | | | | 43,634,908 |
| | | | | |
| | |
Communications Equipment —2.7% | | | | | |
Dycom Industries, Inc. (a) (b) | | 521,275 | | | 13,891,979 |
Polycom, Inc. (b) | | 366,500 | | | 10,181,370 |
| | | | | |
| | | | | 24,073,349 |
| | | | | |
| | |
Computers & Peripherals—1.2% | | | | | |
Electronics for Imaging, Inc. (b) | | 493,600 | | | 11,096,128 |
| | | | | |
| | |
Construction & Engineering—1.1% | | | | | |
Perini Corp. (b) | | 244,187 | | | 10,114,226 |
| | | | | |
| | |
Construction Materials—2.6% | | | | | |
Texas Industries, Inc. (a) | | 325,000 | | | 22,782,500 |
| | | | | |
| | |
Containers & Packaging—2.7% | | | | | |
Rock Tennessee Co. | | 210,352 | | | 5,345,044 |
Silgan Holdings, Inc. | | 361,900 | | | 18,797,086 |
| | | | | |
| | | | | 24,142,130 |
| | | | | |
| | | | | |
| | |
Distributors—1.8% | | | | | |
LKQ Corp. (a) (b) | | 744,600 | | | 15,651,492 |
| | | | | |
| | |
Electric Utilities—1.2% | | | | | |
UIL Holdings Corp. (a) | | 299,200 | | | 11,055,440 |
| | | | | |
| | |
Electronic Equipment & Instruments—1.5% | | | | | |
Tech Data Corp. (b) | | 358,200 | | | 13,511,304 |
| | | | | |
| | | | | |
| Security Description | | Shares | | Value* |
| | |
Energy Equipment & Services—3.3% | | | | | |
Cal Dive International, Inc. (a) (b) | | 466,700 | | $ | 6,179,108 |
Lufkin Industries, Inc. (a) | | 108,200 | | | 6,198,778 |
North American Energy Partners, Inc. (b) | | 358,200 | | | 4,853,610 |
Oil States International, Inc. (b) | | 152,100 | | | 5,189,652 |
W-H Energy Services, Inc. (b) | | 119,000 | | | 6,688,990 |
| | | | | |
| | | | | 29,110,138 |
| | | | | |
| | |
Food & Staples Retailing—7.2% | | | | | |
BJ’s Wholesale Club, Inc. (b) | | 837,800 | | | 28,342,774 |
Longs Drug Stores Corp. | | 284,400 | | | 13,366,800 |
Ruddick Corp. | | 655,300 | | | 22,719,251 |
| | | | | |
| | | | | 64,428,825 |
| | | | | |
| | |
Food Products—2.1% | | | | | |
Hain Celestial Group, Inc. (a) (b) | | 571,200 | | | 18,278,400 |
| | | | | |
| | |
Gas Utilities—1.0% | | | | | |
Southwest Gas Corp. | | 296,879 | | | 8,838,088 |
| | | | | |
| | |
Health Care Providers & Services—6.7% | | | | | |
Amedisys, Inc. (a) (b) | | 253,400 | | | 12,294,968 |
AmSurg Corp. (b) | | 247,300 | | | 6,691,938 |
Kindred Healthcare, Inc. (a) (b) | | 573,966 | | | 14,337,671 |
Magellan Health Services, Inc. (b) | | 558,861 | | | 26,059,688 |
PharMerica Corp. (a) (b) | | 11 | | | 153 |
| | | | | |
| | | | | 59,384,418 |
| | | | | |
| | |
Hotels, Restaurants & Leisure—7.6% | | | | | |
Morgans Hotel Group Co. (a) (b) | | 745,510 | | | 14,373,433 |
Orient-Express Hotels, Ltd. (Class A) (a) | | 220,800 | | | 12,700,416 |
Pinnacle Entertainment, Inc. (b) | | 618,000 | | | 14,560,080 |
Vail Resorts, Inc. (a) (b) | | 211,700 | | | 11,391,577 |
WMS Industries, Inc. (b) | | 408,200 | | | 14,956,448 |
| | | | | |
| | | | | 67,981,954 |
| | | | | |
| | |
Insurance—4.2% | | | | | |
Aspen Insurance Holdings, Ltd. | | 136,400 | | | 3,933,776 |
Endurance Specialty Holdings, Ltd. (a) | | 186,896 | | | 7,799,170 |
IPC Holdings, Ltd. (a) | | 545,200 | | | 15,739,924 |
Platinum Underwriters Holdings, Ltd. | | 190,407 | | | 6,770,873 |
The Navigators Group, Inc. (b) | | 43,258 | | | 2,811,770 |
| | | | | |
| | | | | 37,055,513 |
| | | | | |
| | |
Internet Software & Services—0.9% | | | | | |
SkillSoft, Plc. (ADR) (b) | | 807,580 | | | 7,720,465 |
| | | | | |
| | |
IT Services—0.8% | | | | | |
Forrester Research, Inc. (b) | | 241,700 | | | 6,772,434 |
| | | | | |
| | |
Leisure Equipment & Products—0.6% | | | | | |
Leapfrog Enterprises, Inc. (a) (b) | | 753,826 | | | 5,073,249 |
| | | | | |
*See accompanying notes to financial statements.
MSF-5
Metropolitan Series Fund, Inc.
BlackRock Strategic Value Portfolio
Schedule of Investments as of December 31, 2007
Common Stock—(Continued)
| | | | | |
| Security Description | | Shares | | Value* |
| | |
Machinery—2.3% | | | | | |
Actuant Corp. | | 97,100 | | $ | 3,302,371 |
Albany International Corp. (Class A) (a) | | 166,200 | | | 6,166,020 |
Astec Industries, Inc. (b) | | 116,200 | | | 4,321,478 |
Chart Industries, Inc. (b) | | 219,500 | | | 6,782,550 |
| | | | | |
| | | | | 20,572,419 |
| | | | | |
| | |
Marine—1.2% | | | | | |
Great Lakes Dredge & Dock Corp. | | 325,556 | | | 2,838,848 |
Kirby Corp. (b) | | 164,700 | | | 7,655,256 |
| | | | | |
| | | | | 10,494,104 |
| | | | | |
| | |
Metals & Mining—0.7% | | | | | |
A.M. Castle & Co. (a) | | 225,700 | | | 6,136,783 |
| | | | | |
| | |
Oil, Gas & Consumable Fuels—2.0% | | | | | |
Delta Petroleum Corp. (a) (b) | | 474,300 | | | 8,940,555 |
Swift Energy Co. (b) | | 203,500 | | | 8,960,105 |
| | | | | |
| | | | | 17,900,660 |
| | | | | |
| | |
Personal Products—1.0% | | | | | |
Elizabeth Arden, Inc. (b) | | 453,600 | | | 9,230,760 |
| | | | | |
| | |
Pharmaceuticals—3.1% | | | | | |
Axcan Pharma, Inc. (a) (b) | | 1,202,048 | | | 27,647,104 |
| | | | | |
| | |
Real Estate Investment Trusts—3.1% | | | | | |
Arbor Realty Trust, Inc. (a) | | 714,374 | | | 11,508,565 |
Gramercy Capital Corp. (a) | | 676,100 | | | 16,435,991 |
| | | | | |
| | | | | 27,944,556 |
| | | | | |
|
Semiconductors & Semiconductor Equipment—3.2% |
Cirrus Logic, Inc. (b) | | 1,321,100 | | | 6,975,408 |
PMC-Sierra, Inc. (a) (b) | | 1,329,800 | | | 8,696,892 |
RF Micro Devices, Inc. (a) (b) | | 2,257,100 | | | 12,888,041 |
| | | | | |
| | | | | 28,560,341 |
| | | | | |
| | |
Software—5.0% | | | | | |
Epicor Software Corp. (b) | | 443,700 | | | 5,226,786 |
Guidance Software, Inc. (a) | | 279,141 | | | 3,891,225 |
Lawson Software, Inc. (a) (b) | | 740,500 | | | 7,582,720 |
Quality Systems, Inc. (a) | | 155,700 | | | 4,747,293 |
Sybase, Inc. (b) | | 873,400 | | | 22,787,006 |
| | | | | |
| | | | | 44,235,030 |
| | | | | |
| | |
Specialty Retail—5.5% | | | | | |
AnnTaylor Stores Corp. (b) | | 279,500 | | | 7,144,020 |
Sally Beauty Holdings, Inc. (a) (b) | | 1,052,011 | | | 9,520,700 |
The Children’s Place Retail Stores,
Inc. (a) (b) | | 484,200 | | | 12,555,306 |
The Dress Barn, Inc. (a) (b) | | 606,000 | | | 7,581,060 |
The Talbots, Inc. (a) | | 999,644 | | | 11,815,792 |
| | | | | |
| | | | | 48,616,878 |
| | | | | |
| | | | | | | |
| Security Description | | Shares | | Value* | |
| |
Textiles, Apparel & Luxury Goods—1.3% | | | | |
Carter’s, Inc. (a) (b) | | | 590,500 | | $ | 11,426,175 | |
| | | | | | | |
| |
Thrifts & Mortgage Finance—0.5% | | | | |
First Niagara Financial Group, Inc. (a) | | | 357,900 | | | 4,309,116 | |
| | | | | | | |
| |
Trading Companies & Distributors—0.9% | | | | |
H&E Equipment Services, Inc. (a) (b) | | | 410,344 | | | 7,747,295 | |
| | | | | | | |
Total Common Stock
(Identified Cost $855,408,151) | | | | | | 850,929,553 | |
| | | | | | | |
| |
| Short Term Investments—28.3% | | | | |
| Security Description | | Face Amount/
Shares | | Value* | |
| |
Discount Notes—4.1% | | | | |
Federal Home Loan Bank
4.150%, 01/11/08 | | $ | 36,400,000 | | | 36,372,194 | |
| | | | | | | |
| |
Mutual Funds—24.2% | | | | |
State Street Navigator Securities Lending Prime Portfolio (c) | | | 214,665,616 | | | 214,665,616 | |
| | | | | | | |
Total Short Term Investments
(Identified Cost $251,037,810) | | | | | | 251,037,810 | |
| | | | | | | |
Total Investments—124.1%
(Identified Cost $1,106,445,961) (d) | | | | | | 1,101,967,363 | |
Liabilities in excess of other assets | | | | | | (214,052,630 | ) |
| | | | | | | |
| Total Net Assets—100% | | | | | $ | 887,914,733 | |
| | | | | | | |
| (a) | A portion or all of the security was held on loan. As of December 31, 2007, the market value of securities loaned was $210,945,145 and the collateral received consisted of cash in the amount of $214,665,616 and non cash collateral with a value of $1,016,842. The cash collateral is invested in a money market fund managed by an affiliate of the custodian. The non cash collateral received consists primarily of government securities and bank letters of credit, and are held for the benefit of the Portfolio at the Portfolio’s custodian. |
| (c) | Represents investment of cash collateral received from securities lending transactions. |
| (d) | The aggregate cost of investments for federal income tax purposes as of December 31, 2007 was $1,107,243,029 and the composition of unrealized appreciation and depreciation of investment securities was $59,894,447 and $(65,170,113), respectively. |
| (ADR)— | An American Depositary Receipt is a certificate issued by a custodian bank representing the right to receive securities of the foreign issuer described. Trading on exchanges not located in the United States or Canada significantly influences the value of ADRs. |
*See accompanying notes to financial statements.
MSF-6
Metropolitan Series Fund, Inc.
BlackRock Strategic Value Portfolio
Statement of Assets & Liabilities
December 31, 2007
| | | | | | | |
Assets | | | | | | | |
Investments at value (a) (b) | | | | | $ | 1,101,967,363 | |
Receivable for: | | | | | | | |
Securities sold | | | | | | 9,484,094 | |
Fund shares sold | | | | | | 2,651,942 | |
Accrued interest and dividends | | | | | | 2,284,729 | |
| | | | | | | |
Total Assets | | | | | | 1,116,388,128 | |
Liabilities | | | | | | | |
Payable for: | | | | | | | |
Securities purchased | | $ | 9,187,105 | | | | |
Fund shares redeemed | | | 899,049 | | | | |
Collateral for securities loaned | | | 214,665,616 | | | | |
Due to custodian bank | | | 2,984,353 | | | | |
Accrued expenses: | | | | | | | |
Management fees | | | 633,011 | | | | |
Service and distribution fees | | | 63,413 | | | | |
Other expenses | | | 40,848 | | | | |
| | | | | | | |
Total Liabilities | | | | | | 228,473,395 | |
| | | | | | | |
Net Assets | | | | | $ | 887,914,733 | |
| | | | | | | |
Net assets consists of: | | | | | | | |
Capital paid in | | | | | $ | 837,734,255 | |
Undistributed net investment income | | | | | | 4,343,874 | |
Accumulated net realized gains | | | | | | 50,315,202 | |
Unrealized depreciation on investments | | | | | | (4,478,598 | ) |
| | | | | | | |
Net Assets | | | | | $ | 887,914,733 | |
| | | | | | | |
| Computation of offering price: | | | | | | | |
Class A | | | | | | | |
Net asset value and redemption price per share ($509,331,984 divided by 33,572,574 shares outstanding) | | | | | $ | 15.17 | |
| | | | | | | |
Class B | | | | | | | |
Net asset value and redemption price per share ($171,141,212 divided by 11,446,432 shares outstanding) | | | | | $ | 14.95 | |
| | | | | | | |
Class E | | | | | | | |
Net asset value and redemption price per share ($207,441,537 divided by 13,816,743 shares outstanding) | | | | | $ | 15.01 | |
| | | | | | | |
(a) Identified cost of investments | | | | | $ | 1,106,445,961 | |
| | | | | | | |
| (b) | Includes cash collateral for securities loaned of $214,665,616. |
Statement of Operations
For the Year Ended December 31, 2007
| | | | | | | | |
Investment Income | | | | | | | | |
Dividends | | | | | | $ | 12,832,751 | |
Interest | | | | | | | 1,810,086 | (a) |
| | | | | | | | |
| | | | | | | 14,642,837 | |
Expenses | | | | | | | | |
Management fees | | $ | 8,214,631 | | | | | |
Service and distribution fees—Class B | | | 443,670 | | | | | |
Service and distribution fees—Class E | | | 354,800 | | | | | |
Directors’ fees and expenses | | | 23,669 | | | | | |
Custodian | | | 106,923 | | | | | |
Audit and tax services | | | 31,738 | | | | | |
Legal | | | 10,902 | | | | | |
Printing | | | 315,940 | | | | | |
Insurance | | | 10,946 | | | | | |
Miscellaneous | | | 24,657 | | | | | |
| | | | | | | | |
Total expenses | | | 9,537,876 | | | | | |
Expense reductions | | | (300,226 | ) | | | 9,237,650 | |
| | | | | | | | |
Net Investment Income | | | | | | | 5,405,187 | |
| | | | | | | | |
Realized and Unrealized Gain (Loss) | | | | | | | | |
| Realized gain on: | | | | | | | | |
Investments—net | | | | | | | 51,593,377 | |
| Change in unrealized depreciation on: | | | | | | | | |
Investments—net | | | | | | | (88,014,608 | ) |
| | | | | | | | |
Net loss | | | | | | | (36,421,231 | ) |
| | | | | | | | |
Net Decrease in Net Assets From Operations | | | | | | $ | (31,016,044 | ) |
| | | | | | | | |
| (a) | Includes net income on securities loaned of $891,109. |
See accompanying notes to financial statements.
MSF-7
Metropolitan Series Fund, Inc.
BlackRock Strategic Value Portfolio
Statements of Changes in Net Assets
| | | | | | | | |
| | �� | Year ended
December 31,
2007 | | | Year ended
December 31,
2006 | |
From Operations | | | | | | | | |
Net investment income | | $ | 5,405,187 | | | $ | 4,042,013 | |
Net realized gain | | | 51,593,377 | | | | 113,811,788 | |
Unrealized appreciation (depreciation) | | | (88,014,608 | ) | | | 36,617,809 | |
| | | | | | | | |
Increase (decrease) in net assets from operations | | | (31,016,044 | ) | | | 154,471,610 | |
| | | | | | | | |
From Distributions to Shareholders | | | | | | | | |
Net investment income | | | | | | | | |
Class A | | | (1,793,872 | ) | | | (1,945,245 | ) |
Class B | | | (99,321 | ) | | | (102,941 | ) |
Class E | | | (369,395 | ) | | | (458,488 | ) |
| | | | | | | | |
| | | (2,262,588 | ) | | | (2,506,674 | ) |
| | | | | | | | |
Net realized gain | | | | | | | | |
Class A | | | (68,897,991 | ) | | | (115,020,430 | ) |
Class B | | | (20,599,114 | ) | | | (25,158,754 | ) |
Class E | | | (28,374,988 | ) | | | (48,023,370 | ) |
| | | | | | | | |
| | | (117,872,093 | ) | | | (188,202,554 | ) |
| | | | | | | | |
Total distributions | | | (120,134,681 | ) | | | (190,709,228 | ) |
| | | | | | | | |
Increase in net assets from capital share transactions | | | 7,479,154 | | | | 93,355,982 | |
| | | | | | | | |
Total increase (decrease) in net assets | | | (143,671,571 | ) | | | 57,118,364 | |
| | |
Net Assets | | | | | | | | |
Beginning of the period | | | 1,031,586,304 | | | | 974,467,940 | |
| | | | | | | | |
End of the period | | $ | 887,914,733 | | | $ | 1,031,586,304 | |
| | | | | | | | |
Undistributed Net Investment Income | | | | | | | | |
End of the period | | $ | 4,343,874 | | | $ | 3,453,639 | |
| | | | | | | | |
Other Information:
Capital Shares
Transactions in capital shares were as follows:
| | | | | | | | | | | | | | |
| | | Year ended
December 31, 2007 | | | Year ended
December 31, 2006 | |
| | | Shares | | | $ | | | Shares | | | $ | |
Class A | | | | | | | | | | | | | | |
Sales | | 4,125,452 | | | $ | 69,435,674 | | | 5,017,240 | | | $ | 88,564,317 | |
Reinvestments | | 4,286,954 | | | | 70,691,863 | | | 6,941,583 | | | | 116,965,675 | |
Redemptions | | (9,213,618 | ) | | | (152,838,244 | ) | | (10,145,321 | ) | | | (176,493,943 | ) |
| | | | | | | | | | | | | | |
Net increase (decrease) | | (801,212 | ) | | $ | (12,710,707 | ) | | 1,813,502 | | | $ | 29,036,049 | |
| | | | | | | | | | | | | | |
Class B | | | | | | | | | | | | | | |
Sales | | 2,362,092 | | | $ | 38,933,096 | | | 3,173,425 | | | $ | 54,320,433 | |
Reinvestments | | 1,271,403 | | | | 20,698,435 | | | 1,516,308 | | | | 25,261,695 | |
Redemptions | | (1,837,032 | ) | | | (29,976,931 | ) | | (1,406,157 | ) | | | (24,130,240 | ) |
| | | | | | | | | | | | | | |
Net increase | | 1,796,463 | | | $ | 29,654,600 | | | 3,283,576 | | | $ | 55,451,888 | |
| | | | | | | | | | | | | | |
Class E | | | | | | | | | | | | | | |
Sales | | 856,416 | | | $ | 13,920,361 | | | 909,735 | | | $ | 15,909,769 | |
Reinvestments | | 1,759,142 | | | | 28,744,383 | | | 2,901,368 | | | | 48,481,858 | |
Redemptions | | (3,175,252 | ) | | | (52,129,483 | ) | | (3,204,769 | ) | | | (55,523,582 | ) |
| | | | | | | | | | | | | | |
Net increase (decrease) | | (559,694 | ) | | $ | (9,464,739 | ) | | 606,334 | | | $ | 8,868,045 | |
| | | | | | | | | | | | | | |
Increase derived from capital share transactions | | | | | $ | 7,479,154 | | | | | | $ | 93,355,982 | |
| | | | | | | | | | | | | | |
See accompanying notes to financial statements.
MSF-8
Metropolitan Series Fund, Inc.
BlackRock Strategic Value Portfolio
Financial Highlights
| | | | | | | | | | | | | | | | | | | | |
| | | Class A | |
| | | Year ended December 31, | |
| | | 2007 | | | 2006 | | | 2005 | | | 2004 | | | 2003 | |
Net Asset Value, Beginning of Period | | $ | 17.74 | | | $ | 18.55 | | | $ | 19.17 | | | $ | 16.62 | | | $ | 11.07 | |
| | | | | | | | | | | | | | | | | | | | |
Income From Investment Operations | | | | | | | | | | | | | | | | | | | | |
Net investment income (loss) | | | 0.10 | (a) | | | 0.08 | | | | 0.08 | | | | 0.00 | | | | (0.01 | ) |
Net realized and unrealized gain (loss) of investments | | | (0.55 | ) | | | 2.84 | | | | 0.57 | | | | 2.55 | | | | 5.56 | |
| | | | | | | | | | | | | | | | | | | | |
Total from investment operations | | | (0.45 | ) | | | 2.92 | | | | 0.65 | | | | 2.55 | | | | 5.55 | |
| | | | | | | | | | | | | | | | | | | | |
Less Distributions | | | | | | | | | | | | | | | | | | | | |
Distributions from net investment income | | | (0.05 | ) | | | (0.06 | ) | | | 0.00 | | | | 0.00 | | | | 0.00 | |
Distributions from net realized capital gains | | | (2.07 | ) | | | (3.67 | ) | | | (1.27 | ) | | | 0.00 | | | | 0.00 | |
| | | | | | | | | | | | | | | | | | | | |
Total distributions | | | (2.12 | ) | | | (3.73 | ) | | | (1.27 | ) | | | 0.00 | | | | 0.00 | |
| | | | | | | | | | | | | | | | | | | | |
Net Asset Value, End of Period | | $ | 15.17 | | | $ | 17.74 | | | $ | 18.55 | | | $ | 19.17 | | | $ | 16.62 | |
| | | | | | | | | | | | | | | | | | | | |
Total Return (%) | | | (3.5 | ) | | | 16.7 | | | | 4.2 | | | | 15.3 | | | | 50.1 | |
Ratio of operating expenses to average net assets before expense reductions (%) | | | 0.88 | | | | 0.89 | | | | 0.89 | | | | 0.89 | | | | 0.93 | |
Ratio of operating expenses to average net assets after expense reductions (%) (b) | | | 0.85 | | | | 0.85 | | | | 0.84 | | | | 0.87 | | | | N/A | |
Ratio of net investment income (loss) to average net assets (%) | | | 0.62 | | | | 0.48 | | | | 0.42 | | | | (0.03 | ) | | | (0.10 | ) |
Portfolio turnover rate (%) | | | 121 | | | | 141 | | | | 175 | | | | 33 | | | | 44 | |
Net assets, end of period (000) | | $ | 509,332 | | | $ | 609,877 | | | $ | 604,086 | | | $ | 666,800 | | | $ | 561,245 | |
| | | | | | | | | | | | | | | | | | | | |
| | | Class B | |
| | | Year ended December 31, | |
| | | 2007 | | | 2006 | | | 2005 | | | 2004 | | | 2003 | |
Net Asset Value, Beginning of Period | | $ | 17.51 | | | $ | 18.35 | | | $ | 19.02 | | | $ | 16.53 | | | $ | 11.04 | |
| | | | | | | | | | | | | | | | | | | | |
Income From Investment Operations | | | | | | | | | | | | | | | | | | | | |
Net investment income (loss) | | | 0.06 | (a) | | | 0.04 | | | | 0.03 | | | | 0.00 | | | | (0.01 | ) |
Net realized and unrealized gain (loss) of investments | | | (0.54 | ) | | | 2.81 | | | | 0.57 | | | | 2.49 | | | | 5.50 | |
| | | | | | | | | | | | | | | | | | | | |
Total from investment operations | | | (0.48 | ) | | | 2.85 | | | | 0.60 | | | | 2.49 | | | | 5.49 | |
| | | | | | | | | | | | | | | | | | | | |
Less Distributions | | | | | | | | | | | | | | | | | | | | |
Distributions from net investment income | | | (0.01 | ) | | | (0.02 | ) | | | 0.00 | | | | 0.00 | | | | 0.00 | |
Distributions from net realized capital gains | | | (2.07 | ) | | | (3.67 | ) | | | (1.27 | ) | | | 0.00 | | | | 0.00 | |
| | | | | | | | | | | | | | | | | | | | |
Total distributions | | | (2.08 | ) | | | (3.69 | ) | | | (1.27 | ) | | | 0.00 | | | | 0.00 | |
| | | | | | | | | | | | | | | | | | | | |
Net Asset Value, End of Period | | $ | 14.95 | | | $ | 17.51 | | | $ | 18.35 | | | $ | 19.02 | | | $ | 16.53 | |
| | | | | | | | | | | | | | | | | | | | |
Total Return (%) | | | (3.7 | ) | | | 16.4 | | | | 3.9 | | | | 15.1 | | | | 49.7 | |
Ratio of operating expenses to average net assets before expense reductions (%) | | | 1.13 | | | | 1.14 | | | | 1.14 | | | | 1.14 | | | | 1.18 | |
Ratio of operating expenses to average net assets after expense reductions (%) (b) | | | 1.10 | | | | 1.10 | | | | 1.09 | | | | 1.12 | | | | N/A | |
Ratio of net investment income (loss) to average net assets (%) | | | 0.39 | | | | 0.26 | | | | 0.20 | | | | (0.09 | ) | | | (0.26 | ) |
Portfolio turnover rate (%) | | | 121 | | | | 141 | | | | 175 | | | | 33 | | | | 44 | |
Net assets, end of period (000) | | $ | 171,141 | | | $ | 169,004 | | | $ | 116,849 | | | $ | 58,676 | | | $ | 1,120 | |
| (a) | Per share amount is based on average shares outstanding during the period. |
| (b) | The Portfolio has entered into arrangements with certain brokers who paid a portion of the Portfolio’s expenses. |
See accompanying notes to financial statements.
MSF-9
Metropolitan Series Fund, Inc.
BlackRock Strategic Value Portfolio
Financial Highlights
| | | | | | | | | | | | | | | | | | | | |
| | | Class E | |
| | | Year ended December 31, | |
| | | 2007 | | | 2006 | | | 2005 | | | 2004 | | | 2003 | |
Net Asset Value, Beginning of Period | | $ | 17.58 | | | $ | 18.41 | | | $ | 19.06 | | | $ | 16.55 | | | $ | 11.04 | |
| | | | | | | | | | | | | | | | | | | | |
Income From Investment Operations | | | | | | | | | | | | | | | | | | | | |
Net investment income (loss) | | | 0.08 | (a) | | | 0.06 | | | | 0.05 | | | | (0.02 | ) | | | (0.02 | ) |
Net realized and unrealized gain (loss) of investments | | | (0.55 | ) | | | 2.82 | | | | 0.57 | | | | 2.53 | | | | 5.53 | |
| | | | | | | | | | | | | | | | | | | | |
Total from investment operations | | | (0.47 | ) | | | 2.88 | | | | 0.62 | | | | 2.51 | | | | 5.51 | |
| | | | | | | | | | | | | | | | | | | | |
Less Distributions | | | | | | | | | | | | | | | | | | | | |
Distributions from net investment income | | | (0.03 | ) | | | (0.04 | ) | | | 0.00 | | | | 0.00 | | | | 0.00 | |
Distributions from net realized capital gains | | | (2.07 | ) | | | (3.67 | ) | | | (1.27 | ) | | | 0.00 | | | | 0.00 | |
| | | | | | | | | | | | | | | | | | | | |
Total distributions | | | (2.10 | ) | | | (3.71 | ) | | | (1.27 | ) | | | 0.00 | | | | 0.00 | |
| | | | | | | | | | | | | | | | | | | | |
Net Asset Value, End of Period | | $ | 15.01 | | | $ | 17.58 | | | $ | 18.41 | | | $ | 19.06 | | | $ | 16.55 | |
| | | | | | | | | | | | | | | | | | | | |
Total Return (%) | | | (3.6 | ) | | | 16.6 | | | | 4.0 | | | | 15.2 | | | | 49.9 | |
Ratio of operating expenses to average net assets before expense reductions (%) | | | 1.03 | | | | 1.04 | | | | 1.04 | | | | 1.04 | | | | 1.08 | |
Ratio of operating expenses to average net assets after expense reductions (%) (b) | | | 1.00 | | | | 1.00 | | | | 0.99 | | | | 1.02 | | | | N/A | |
Ratio of net investment income (loss) to average net assets (%) | | | 0.47 | | | | 0.32 | | | | 0.27 | | | | (0.16 | ) | | | (0.22 | ) |
Portfolio turnover rate (%) | | | 121 | | | | 141 | | | | 175 | | | | 33 | | | | 44 | |
Net assets, end of period (000) | | $ | 207,442 | | | $ | 252,705 | | | $ | 253,532 | | | $ | 273,771 | | | $ | 178,240 | |
| (a) | Per share amount is based on average shares outstanding during the period. |
| (b) | The Portfolio has entered into arrangements with certain brokers who paid a portion of the Portfolio’s expenses. |
See accompanying notes to financial statements.
MSF-10
Metropolitan Series Fund, Inc.
BlackRock Strategic Value Portfolio
Notes to Financial Statements—December 31, 2007
Metropolitan Series Fund, Inc. (the “Fund”) is organized as a corporation under the laws of Maryland pursuant to Articles of Incorporation filed on November 23, 1982, as amended, and registered under the Investment Company Act of 1940, as amended (the “1940 Act”), as an open-end investment company. The Fund is a “series” type of mutual fund, which issues separate series of stock. Each series represents an interest in a separate portfolio of Fund investments. The BlackRock Strategic Value Portfolio (the “Portfolio”) is a diversified series of the Fund. Shares in the Fund are not offered directly to the general public and are currently available only to separate accounts established by Metropolitan Life Insurance Company (“MetLife”), New England Life Insurance Company, General American Life Insurance Company (“General American”), The MetLife Investors Group of Insurance Companies, MetLife Insurance Company of Connecticut and other affiliated insurance companies (collectively, the “Insurance Companies”), as an investment vehicle for variable life insurance, group annuity or variable annuity products, although the Portfolio is not available to all such separate accounts. The Portfolio’s shares may be divided into different classes. Currently, the classes being offered by the Portfolio are named Class A, Class B and Class E. The classes of the Portfolio’s shares are identical, except that certain additional charges (Rule 12b-1 fees) are made against Class B and Class E shares. Investment income, realized and unrealized capital gains and losses, the common expenses of the Portfolio and certain Portfolio-level expense reductions, if any, are allocated on a pro rata basis to each class based on the relative net assets of each class to the total net assets of the Portfolio.
| 2. | SIGNIFICANT ACCOUNTING POLICIES: |
The preparation of financial statements in conformity with accounting principles generally accepted in the United States of America (“GAAP”) requires management to make estimates and assumptions that affect the reported amounts of assets and liabilities and disclosure of contingent assets and liabilities as of the date of the financial statements and the reported amounts of income and expenses during the reporting period. Actual results could differ from those estimates.
The following is a summary of significant accounting policies consistently followed by the Portfolio in the preparation of its financial statements. The policies are in conformity with GAAP.
Investment Valuation:
Debt securities (other than short term obligations with a remaining maturity of sixty days or less) are valued by independent pricing services selected by the relevant subadviser pursuant to authorization of the Board of Directors of the Fund (the “Board” or “Directors”). Short term obligations with a remaining maturity of sixty days or less are valued at amortized cost which approximates fair market value.
Equity securities traded on a national securities exchange or exchanges are valued at their last sale price on the principal trading market. Equity securities traded on the NASDAQ National Market System are valued at the NASDAQ Official Closing Price (the “NOCP”). The NOCP is the last sale price if it falls between the spread of the last reported bid and asked prices. If the last reported bid and asked prices are above the last reported sale price, the NOCP will be the last reported bid price. If the last reported bid and asked prices are below the last reported sale price, the NOCP will be the last reported asked price. Equity securities traded on a national securities exchange or exchanges or on the NASDAQ National Market System for which there is no reported sale during the day are valued at the last reported bid price. A security that is listed or traded on more than one exchange is valued at the quotation on the exchange determined to be the primary market for that security by the Board or its delegates. If no closing price is available, then such securities are valued by using the last reported bid price. Equity securities traded over-the-counter are valued at the last reported sales price.
If no current market value quotation is readily available or reliable for a portfolio security, fair value will be determined in accordance with procedures established by and under the general supervision of the Board. When the Portfolio uses fair value pricing, it may take into account any factors it deems appropriate. The value of securities used by the Portfolio to calculate its net asset value may differ from quoted or published prices for the same securities. Fair value pricing involves subjective judgments and the fair value determined for a security may be materially different than the value that could be realized upon the sale of that security.
The Portfolio expects to use fair value pricing for securities primarily traded on U.S. exchanges only under very limited circumstances. For example, the Portfolio may use fair value pricing if the exchange on which a security is traded closes early or trading in the security is suspended.
MSF-11
Metropolitan Series Fund, Inc.
BlackRock Strategic Value Portfolio
Notes to Financial Statements—December 31, 2007—(Continued)
Securities traded primarily on an exchange outside of the United States which closes before the close of the New York Stock Exchange will be valued at the last sales price on that non-U.S. exchange. Securities traded primarily on an exchange outside of the United States for which there is no reported sale during the day are valued at the mean between the last reported bid and asked prices. However, because most foreign markets close well before the Portfolio values its securities (typically at 4 p.m. Eastern Time), the earlier close of these foreign markets gives rise to the possibility that significant events, including broad market moves, may have occurred after these foreign markets close but before the Portfolio values its securities. To account for this, the Portfolio may frequently value many of its foreign equity securities using fair value prices based on third party vendor modeling tools.
Forward foreign currency exchange contracts are valued based on the mean between closing bid and asked prices of the forward currency contract rates in the London foreign exchange markets on a daily basis as provided by a reliable bank or dealer.
Options, whether on securities, indices, futures contracts, or otherwise, are valued at the last sales price available as of the close of business on the day of valuation or, if there is no such sale price available, at the mean between the bid and asked prices. Options on currencies are valued at the spot price each day.
The value of futures contracts will be the sum of the margin deposit plus or minus the difference between the value of the futures contract on each day the net asset value is calculated and the value on the date the futures contract originated, value being that established on a recognized commodity exchange, or by reference to other customary sources, with gain or loss being realized when the futures contract closes or expires.
Subject to the Board’s oversight, the Board has delegated day-to-day responsibility for valuing Portfolio assets to the subadviser of the Portfolio, who values such assets as described above and operates under procedures approved by the Board.
Investment Transactions and Related Investment Income:
Portfolio security transactions are recorded on the trade date. Dividend income is recorded on the ex-dividend date or, for certain foreign securities, when notified. Interest income, which includes amortization of premium and accretion of discount on debt securities, is recorded on the accrual basis. Realized gains and losses on investments and unrealized appreciation and depreciation are determined on the identified cost basis, which is the same basis used for federal income tax purposes.
Repurchase Agreements:
The Portfolio, through the custodian or a subcustodian, receives delivery of the underlying securities collateralizing repurchase agreements. The Portfolio requires the custodian to take possession, to have legally segregated in the Federal Reserve Book Entry System, or to have segregated within the custodian’s vault, all securities held as collateral for repurchase agreements. It is the Portfolio’s policy that the market value of the collateral be at least equal to 100% of the repurchase price in the case of a repurchase agreement of one-day duration and 102% on all other repurchase agreements. The Portfolio’s subadviser is responsible for determining that the value of the collateral is at all times at least equal to the repurchase price. In connection with transactions in repurchase agreements, if the seller defaults and the value of the collateral declines or if the seller enters an insolvency proceeding, realization of the collateral by the Portfolio may be delayed, limited or wholly denied.
Foreign Currency Translation:
The books and records of the Portfolio are maintained in U.S. dollars. The values of securities, currencies and other assets and liabilities denominated in currencies other than U.S. dollars are translated into U.S. dollars based upon foreign exchange rates prevailing at the end of the period. Purchases and sales of investment securities, income and expenses are translated on the respective dates of such transactions. Since the values of investment securities are presented at the foreign exchange rates prevailing at the end of the period, it is not practical to isolate that portion of the results of operations arising from changes in exchange rates from that portion of the results of operations reflecting fluctuations arising from changes in market prices of the investment securities. Such fluctuations are included in the net realized and unrealized gain or loss on investments.
Net realized foreign exchange gains or losses arise from sales of foreign currency, currency gains or losses realized between the trade and settlement dates on securities transactions, and the difference between the amounts of dividends, interest, and foreign withholding taxes recorded by the Portfolio and the U.S. dollar equivalent of the amounts actually received or paid by the Portfolio. Net unrealized foreign exchange gains and losses arise from changes in the value of assets and liabilities, other than investment securities, resulting from changes in the exchange rate.
MSF-12
Metropolitan Series Fund, Inc.
BlackRock Strategic Value Portfolio
Notes to Financial Statements—December 31, 2007—(Continued)
Forward Foreign Currency Exchange Contracts:
The Portfolio may enter into forward foreign currency exchange contracts primarily to hedge against foreign currency exchange rate risks on its non-U.S. dollar denominated investment securities. When entering into a forward currency contract, the Portfolio agrees to receive or deliver a fixed quantity of foreign currency for an agreed-upon price on an agreed future date. These contracts are valued daily and the Portfolio’s net equity therein, representing unrealized gain or loss on the contracts as measured by the difference between the foreign exchange rates at the dates of entry into the contracts and the forward rates at the settlement date, is included in the Statement of Assets and Liabilities. Realized and unrealized gains and losses are included in the Statement of Operations. These instruments involve market and/or credit risk in excess of the amount recognized in the Statement of Assets and Liabilities. Risks arise from the possible inability of counterparties to meet the terms of their contracts and from movement in currency and securities values and interest rates.
Futures Contracts:
The Portfolio may buy and sell futures contracts (on recognized exchanges) as a hedge or to enhance return. Futures contracts are agreements to buy or sell a security, or deliver a final cash settlement price in connection with an index, interest rate, currency, or other contracts not calling for physical delivery, for a set price in the future. The Portfolio must post an amount equal to a portion of the total market value of the futures contract as futures variation margin, which is returned when the Portfolio’s obligations under the contract have been satisfied. From time to time thereafter, the Portfolio may have to post variation margin to maintain this amount as the market value of the contract fluctuates. Risks of entering into futures contracts (and related options) include the possibility that there may be an illiquid market and that a change in the value of the contract or option may not correlate with changes in the value of the underlying securities.
Options:
The Portfolio may use options to hedge against changes in values of securities the Portfolio owns or expects to purchase. Writing puts or buying calls tends to increase the Portfolio’s exposure to the underlying instrument and writing calls or buying puts tends to decrease the Portfolio’s exposure to the underlying instrument, and can be used to hedge other Portfolio investments. For options purchased to hedge the Portfolio’s investments, the potential risk to the Portfolio is that the change in value of options contracts may not correspond to the change in value of the hedged instruments. In addition, losses may arise from changes in the value of the underlying instruments, if there is an illiquid secondary market, or if the counterparty is unable to perform. The maximum loss for purchased options is limited to the premium initially paid for the option. For options written by the Portfolio, the maximum loss is not limited to the premium initially received for the option.
The main risk associated with purchasing an option is that the option expires without being exercised. In this case, the option expires worthless and the premium paid for the option is considered the loss. The risk associated with writing a call option is that the Portfolio may forgo the opportunity for a profit if the market value of the underlying position increases and the option is exercised. The risk in writing a put option is that the Portfolio may incur a loss if the market value of the underlying position decreases and the option is exercised. In addition, the Portfolio risks not being able to enter into a closing transaction for the written option as the result of an illiquid market.
“When-Issued” Securities:
Purchasing securities “when-issued” is a forward commitment by the Portfolio to buy a security. The estimated amount of the Portfolio’s payment obligation and the security’s interest rate are determined when the commitment is made, even though no interest accrues until the security is issued, which is generally 15 to 120 days later. The Portfolio will segregate liquid assets with its custodian sufficient at all times to satisfy these commitments. If the value of the security is less when delivered than when the commitment was made, the Portfolio will suffer a loss.
Federal Income Taxes:
It is the Portfolio’s policy to comply with the requirements of the Internal Revenue Code of 1986, as amended, and regulations thereunder, applicable to regulated investment companies and to distribute all of its taxable income to shareholders. Therefore, no federal income tax provision is required.
As of December 31, 2007, the Portfolio had no capital loss carryovers.
MSF-13
Metropolitan Series Fund, Inc.
BlackRock Strategic Value Portfolio
Notes to Financial Statements—December 31, 2007—(Continued)
The tax character of distributions paid for the periods ended December 31, 2007 and 2006 was as follows:
| | | | | | | | | | | | | | | | | | | | | | |
| Ordinary Income | | Long Term Gain | | Return of Capital | | Total |
| 2007 | | 2006 | | 2007 | | 2006 | | 2007 | | 2006 | | 2007 | | 2006 |
| $ | 75,634,272 | | $ | 26,429,853 | | $ | 44,500,409 | | $ | 164,279,375 | | $ | — | | $ | — | | $ | 120,134,681 | | $ | 190,709,228 |
As of December 31, 2007, the components of distributable earnings (accumulated losses) on a federal income tax basis were as follows:
| | | | | | | | | | | | | |
Undistributed
Ordinary
Income | | Undistributed
Long Term
Gain | | Unrealized
Depreciation | | | Loss
Carryforwards | | Total |
| $32,815,305 | | $ | 39,528,635 | | $ | (5,275,666 | ) | | $ | — | | $ | 67,068,274 |
Dividends and Distributions to Shareholders:
The Portfolio records dividends and distributions on the ex-dividend date. Net realized gains from security transactions (if any) are generally distributed annually to shareholders. The timing and characterization of certain income and capital gains distributions are determined in accordance with federal tax regulations that may differ from GAAP. Permanent book and tax basis differences relating to shareholder distributions will result in reclassification between under/over distributed net investment income, accumulated net realized gains/losses and paid in capital.
Expense Reductions:
Certain Portfolio trades are directed to brokers who paid a portion of the Portfolio’s expenses. Amounts paid for the Portfolio are shown as expense reductions in the Statement of Operations.
| 3. | INVESTMENT TRANSACTIONS: |
For the year ended December 31, 2007, purchases and sales of securities (excluding short term investments) for the Portfolio were as follows:
| | | | | | | | | |
| Purchases | | Sales |
U.S. Government | | Other | | U.S. Government | | Other |
| $0 | | $ | 1,180,530,715 | | $ | 0 | | $ | 1,299,259,175 |
| 4. | INVESTMENT MANAGEMENT FEES AND OTHER TRANSACTIONS WITH AFFILIATES: |
Investment Management Agreement:
MetLife Advisers, LLC (“MetLife Advisers”) is the investment adviser to the Portfolio. The Fund has entered into an investment management agreement with MetLife Advisers with respect to the Portfolio. For providing investment management services to the Portfolio, MetLife Advisers receives monthly compensation at the following annual rates:
| | | | | | |
| | | Management
Fees earned by
MetLife Advisers
for the year ended
December 31, 2007 | | Annual
percentage
rates paid to
MetLife Advisers | | Based on Portfolios
average daily net asset levels |
| | $8,214,631 | | 0.850% | | Of the first $500 million |
| | | | 0.800% | | Of the next $500 million |
| | | | 0.750% | | On amounts in excess of $1 billion |
Certain officers and directors of the Fund may also be officers of MetLife Advisers; however, such officers and directors receive no compensation from the Fund.
MetLife Advisers has entered into an investment subadvisory agreement with respect to the Portfolio. BlackRock Advisors, LLC is compensated by MetLife Advisers to provide subadvisory services for the Portfolio.
MSF-14
Metropolitan Series Fund, Inc.
BlackRock Strategic Value Portfolio
Notes to Financial Statements—December 31, 2007—(Continued)
Service and Distribution Fees:
The Fund has adopted a Distribution and Service Plan under Rule 12b-1 of the 1940 Act for the Portfolio’s Class B and E shares. Under the Distribution and Service Plan, the Class B and E shares of the Portfolio pay a fee to compensate the Insurance Companies (or their affiliates) and other broker-dealers and financial intermediaries involved in the offer and sale of Portfolio shares for promoting or selling and servicing, the Class B and E shares. The fees under the Distribution and Service Plan for each class of the Portfolio’s shares are calculated as a percentage of the Portfolio’s average daily net assets that are attributable to that Class. Currently, the fee is 0.25% per year for Class B shares and 0.15% per year for Class E shares. Amounts paid by the Portfolio for the year ended December 31, 2007 are shown as Service and Distribution fees in the Statement of Operations.
The Fund has entered into a securities lending arrangement with the Fund’s custodian, State Street Bank and Trust Company (the “custodian”). Under the agreement, the custodian is authorized to loan securities on the Portfolios’ behalf. In exchange, the Portfolio receives either cash or securities as collateral against the loaned securities. The Portfolio receives collateral at least equal to 102% of the market value of the loaned securities (105% for foreign securities), at each loan’s inception. Collateral must be maintained at least at 100% of the market value of the loaned securities for the duration of the loan. The cash collateral is invested in the Navigator Securities Lending Prime Portfolio, an affiliate of the custodian, which invests in a variety of high quality U.S. dollar-denominated instruments. If the market value of the collateral at the close of trading on a business day is less than 100% of the market value of the loaned securities at the close of trading on that day, the borrower shall be required to deliver, by the close of business on the following business day, an additional amount of collateral, equal to at least 100% of the market value of all the loaned securities as of such preceding day. The Portfolio receives 80% of the annual net income from securities lending transactions, which is included in interest income of the Portfolio. The remaining 20% is paid to the custodian as compensation for its securities lending services. The Portfolio bears the risk of any deficiency in the amount of collateral available for return to a borrower due to a loss in an approved investment. Any outstanding loans by the Portfolio at December 31, 2007 are footnoted in the Schedule of Investments.
As previously reported, in May 2004, General American received a Wells Notice stating that the SEC staff was considering recommending that the SEC bring a civil action alleging violations of the U.S. securities laws against General American with respect to market timing and late trading in a limited number of privately-placed variable insurance contracts that were sold through General American. General American responded to the SEC staff and cooperated with the investigation. On August 9, 2007, the SEC announced that it had settled an enforcement action regarding late trading against General American with, among other things, General American agreeing to pay a civil penalty and to comply with certain undertakings. General American consented to the SEC’s order without admitting or denying the findings. MetLife Advisers has also advised the Fund’s Board of Directors that, while certain exceptions to the Fund’s policies have been noted, no situations have been identified that would have a material impact on the financial position of the Fund.
| 7. | RECENT ACCOUNTING PRONOUNCEMENTS: |
Effective June 29, 2007, the Fund implemented Financial Accounting Standards Board (“FASB”) Interpretation No. 48, “Accounting for Uncertainty in Income Taxes—an interpretation of FASB Statement No. 109” (“FIN 48”). FIN 48 prescribes the minimum recognition threshold a tax position must meet in connection with accounting for uncertainties in income tax positions taken or expected to be taken by an entity, including investment companies, before being measured and recognized in the financial statements. Management has evaluated the application of FIN 48 to the Fund, and has determined that the adoption of FIN 48 does not have a material impact on the Fund’s financial statements. The Fund files U.S. tax returns. No income tax returns are currently under examination. The statute of limitations on the Fund’s tax returns remains open for the years ended December 31, 2004 through December 31, 2006.
In September 2006, Statement of Financial Accounting Standards No. 157, Fair Value Measurements (SFAS 157) was issued and is effective for fiscal years beginning after November 15, 2007. SFAS 157 defines fair value, establishes a framework for measuring fair value and expands disclosures about fair value measurements. Management is currently evaluating the impact the adoption of SFAS 157 will have on the Portfolio’s financial statement disclosures.
MSF-15
Metropolitan Series Fund, Inc.
BlackRock Strategic Value Portfolio
Report of Independent Registered Public Accounting Firm
To the Shareholders and Board of Directors of the Metropolitan Series Fund, Inc.:
We have audited the accompanying statement of assets and liabilities, including the schedule of investments, of the BlackRock Strategic Value Portfolio, one of the portfolios constituting the Metropolitan Series Fund, Inc. (the “Fund”) as of December 31, 2007, and the related statement of operations for the year then ended, the statements of changes in net assets for each of the two years in the period then ended, and the financial highlights for each of the five years in the period then ended. These financial statements and financial highlights are the responsibility of the Fund’s management. Our responsibility is to express an opinion on these financial statements and financial highlights based on our audits.
We conducted our audits in accordance with the standards of the Public Company Accounting Oversight Board (United States). Those standards require that we plan and perform the audit to obtain reasonable assurance about whether the financial statements and financial highlights are free of material misstatement. The Fund is not required to have, nor were we engaged to perform, an audit of its internal control over financial reporting. Our audits included consideration of internal control over financial reporting as a basis for designing audit procedures that are appropriate in the circumstances, but not for the purpose of expressing an opinion on the effectiveness of the Fund’s internal control over financial reporting. Accordingly, we express no such opinion. An audit also includes examining, on a test basis, evidence supporting the amounts and disclosures in the financial statements, assessing the accounting principles used and significant estimates made by management, as well as evaluating the overall financial statement presentation. Our procedures included confirmation of securities owned as of December 31, 2007, by correspondence with the custodian and brokers; where replies were not received from brokers, we performed other auditing procedures. We believe that our audits provide a reasonable basis for our opinion.
In our opinion, the financial statements and financial highlights referred to above present fairly, in all material respects, the financial position of the BlackRock Strategic Value Portfolio of the Metropolitan Series Fund, Inc. as of December 31, 2007, the results of its operations for the year then ended, the changes in its net assets for each of the two years in the period then ended, and the financial highlights for each of the five years in the period then ended, in conformity with accounting principles generally accepted in the United States of America.
Deloitte & Touche LLP
Boston, Massachusetts
February 21, 2008
MSF-16
Metropolitan Series Fund, Inc.
Directors and Officers
The Fund’s Directors review actions of the Fund’s investment adviser and subadvisers, and decide upon matters of general policy. The Fund’s officers supervise the daily business operations of the Fund. The Board of Directors and the Fund’s officers are listed below. Each Director is responsible for overseeing all 36 Portfolios of the Fund. There is no limit to the term a Director may serve. Directors serve until their resignation, retirement or removal in accordance with the Fund’s organizational documents and policies adopted by the Board from time to time. Officers hold office at the pleasure of the Board or until the election or appointment and the qualification of a successor. The address of the directors and officers is c/o Metropolitan Series Fund, Inc., 501 Boylston Street, Boston, MA 02116.
Interested Directors(1)
Each Director below is an “interested person” (as defined by the 1940 Act) with respect to the Fund in that Ms. Forget is an employee of MetLife and Mr. Typermass is a former employee of MetLife and owns securities issued by MetLife, Inc., the ultimate parent company of MetLife Advisers.
| | | | | | | | |
Name, Address and Age | | Current
position(s)
with Fund | | Position(s)
held since | | Principal occupations
over past five years, including other directorships(2) | | Number of
Portfolios in
Fund Complex
Overseen by
Director(3) |
Elizabeth M. Forget Age: 41 | | Director, Chairman of the Board, President and Chief Executive Officer | | 2006 | | Senior Vice President (since 2007), MetLife, Inc.; President, Met Investors Advisory, LLC (“MIA”); Trustee and President, Met Investors Series Trust (“MIST”); Executive Vice President, MetLife Investors Group, Inc.; President (since 2006), MetLife Advisers. | | 81 |
| | | | |
Arthur G. Typermass Age: 70 | | Director | | 1998 | | Formerly, Senior Vice President and Treasurer, MetLife. | | 37 |
Non-Interested Directors(1)
Each Director below is not an “interested person” (as defined by the 1940 Act) with respect to the Fund (collectively, the “Independent Directors”).
| | | | | | | | |
Name, Address and Age | | Current
position(s)
with Fund | | Position(s)
held since | | Principal occupations
over past five years, including other directorships(2) | | Number of
Portfolios in
Fund Complex
Overseen by
Director(3) |
Steve A. Garban† Age: 70 | | Director | | 1985 | | Formerly, Chief Financial Officer, Senior Vice President Finance and Operations and Treasurer (Emeritus), The Pennsylvania State University. | | 37 |
| | | | |
Linda B. Strumpf Age: 60 | | Director | | 2000 | | Vice President and Chief Investment Officer, Ford Foundation. | | 37 |
| | | | |
Michael S. Scott Morton† Age: 70 | | Director | | 1993 | | Jay W. Forrester Professor of Management (Emeritus) at Sloan School of Management, MIT. | | 37 |
| | | | |
H. Jesse Arnelle Age: 74 | | Director | | 2001 | | Formerly, Counsel, Womble Carlyle Sandrie & Rice; Director, Textron Inc. (global multi-industry company)*; formerly, Director, Gannet Co. Inc. (diversified news and information company)*; formerly, Director, Eastman Chemical Company (global chemical company)*; formerly, Director, Waste Management, Inc.*; formerly, Director, Armstrong Holdings Inc. (parent company of floor and ceiling products business)*; formerly, Director, FPL Group Inc. (public utility holding company)*; Director, URS Corporation (engineering design services firm)*. | | 37 |
| | | | |
Nancy Hawthorne Age: 56 | | Director | | 2003 | | Director, Avid Technologies (computer software company)*; formerly, Chairman of the Board of Avid Technologies; formerly, Board of Advisors, L. Knife & Sons, Inc. (beverage distributor); Chief Executive Officer, Clerestory LLC (corporate financial advisor); formerly, Trustee, New England Zenith Fund (“Zenith Fund”)**; formerly, Chief Executive Officer and Managing Partner, Hawthorne, Krauss and Associates (corporate financial advisor); formerly, Chief Financial Officer and Executive Vice President, Continental Cablevision, subsequently renamed MediaOne (cable television company); formerly, Director, Life F/X, Inc.; formerly, Chairman of the Board, WorldClinic (distance medicine company); formerly, Director, Perini Corporation (construction company)*; formerly, Director, CGU (property and casualty insurance company); formerly, Director, Beacon Power Corporation (energy company )*. | | 37 |
MSF-17
Metropolitan Series Fund, Inc.
Directors and Officers—(Continued)
| | | | | | | | |
Name, Address and Age | | Current
position(s)
with Fund | | Position(s)
held since | | Principal occupations
over past five years, including other directorships(2) | | Number of
Portfolios in
Fund Complex
Overseen by
Director(3) |
John T. Ludes Age: 71 | | Director | | 2003 | | President, LFP Properties (consulting firm); Formerly, Trustee, Zenith Fund**; formerly, Vice Chairman, President and Chief Operating Officer, Fortune Brands/American Brands (global conglomerate); formerly, President and CEO, Acushnet Company (athletic equipment company). | | 37 |
Officers(1)
| | | | | | | | |
Name and address | | Age | | Current
position(s)
with Fund | | Position(s)
held since | | Principal occupations over past five years(2) |
| Jeffrey P. Halperin | | 40 | | Chief Compliance Officer | | 2006 | | Vice President (since 2006), Corporate Ethics and Compliance Department, MetLife, Inc.; Chief Compliance Officer (since 2006), MetLife Advisers, MIA and MIST. |
| | | | |
| John F. Guthrie, Jr. | | 64 | | Senior Vice President | | 2002 | | Manager and Senior Vice President, MetLife Advisers; Vice President, MetLife; Vice President (since 2003), MetLife Group, Inc.; Vice President, NELICO; Vice President (since 2005), MIA; formerly, Senior Vice President, Zenith Fund**. |
| | | | |
| Alan C. Leland | | 55 | | Senior Vice President | | 2005 | | Treasurer and Chief Financial Officer, MetLife Advisers, LLC; Treasurer (since 2005), Met Investors Advisory, LLC; Vice President (since 2004), MIA; Vice President (since 2003), MetLife Group, Inc.; Vice President, MetLife; Senior Vice President, NELICO |
| | | | |
| Peter Duffy | | 52 | | Vice President and Treasurer | | 2000 | | Senior Vice President, MetLife Advisers (since 1998); Second Vice President (since 2003), NELICO; Vice President, MetLife (since 2004); Vice President (since 2004), MetLife Group, Inc.; formerly, Vice President and Treasurer, Zenith Fund**. |
| | | | |
| Thomas M. Lenz | | 49 | | Vice President and Secretary | | 2002 | | General Counsel and Secretary, MetLife Advisers; Assistant General Counsel, MetLife; formerly, Vice President and Secretary, Zenith Fund**. |
| * | Indicates a directorship with a registered investment company or a company subject to the reporting requirements of the Securities Exchange Act of 1934, as amended. |
| ** | The Zenith Fund deregistered with the Securities and Exchange Commission (“SEC”) in 2004. |
| (†) | Served as a trustee, director and/or officer of one or more of the following companies, each of which had a direct or indirect advisory relationship with MetLife Advisers or its affiliates prior to January 31, 2005: State Street Research Financial Trust, State Street Research Income Trust, State Street Research Money Market Trust, State Street Research Institutional Funds, State Street Research Capital Trust, State Street Research Master Investment Trust, State Street Research Equity Trust, State Street Research Securities Trust and State Street Research Exchange Trust (collectively, the “State Street Research Funds”). |
| (1) | Each Director of the Fund also serves as trustee of Metropolitan Series Fund II (“Met Series Fund II”), a registered investment company advised by MetLife Advisers. Each officer of the Fund serves in the same position with Met Series Fund II, which consists of one portfolio. |
| (2) | Previous positions during the past five years with the Fund, MIST, MetLife, MetLife Advisers, MIA, Zenith Fund, NELICO or New England Securities Corporation are omitted if not materially different. |
| (3) | The Fund Complex includes the Fund (36 portfolios), Met Series Fund II (1 portfolio) and MIST (44 portfolios) |
MSF-18
Metropolitan Series Fund, Inc.
BlackRock Strategic Value Portfolio
Board Approval of Advisory and Subadvisory Agreements
The Fund’s Contract Review Committees of the Board of Directors (the “Board”) typically meet in early fall to review the Portfolios’ advisory agreements (the “Advisory Agreements”) and subadvisory agreements (collectively, the “Subadvisory Agreements,” and, together with the Advisory Agreements, the “Agreements”) and determine whether to recommend that the full Board approve the continuation of the Agreements for an additional one-year period. (Following the initial approval of an Agreement for a new Portfolio or with a new adviser or subadviser, such annual reviews are not required until 2 years following the execution of such Agreement.) After each Committee has made its recommendations, the full Board, including the Independent Directors, determines whether to approve the continuation of each of the Agreements. In addition, the Board, including the Independent Directors, considers matters bearing on the Agreements at most of its other meetings throughout the year and regularly interviews various individuals at MetLife Advisers responsible for the management of the Portfolios. The Directors also interview selected investment managers and other professionals at the subadvisers at various times throughout the year.
The Directors receive all materials that they or MetLife Advisers, the Fund’s investment adviser, and the subadvisers believe to be reasonably necessary for the Directors to evaluate the Agreements and determine whether to approve the continuation of the Agreements. These materials generally include, among other items, (i) information on the investment performance of the Portfolios and the performance of peer groups of funds and the Portfolios’ performance benchmarks, (ii) information on the Portfolios’ advisory and subadvisory fees and other expenses, including information comparing the Portfolios’ expenses to those of peer groups of funds and information about any applicable expense caps and fee “breakpoints,” (iii) sales and redemption data, (iv) information related to the profitability of the Agreements to MetLife Advisers and the subadvisers, and potential “fall-out” or ancillary benefits that MetLife Advisers, the subadvisers or their affiliates may receive as a result of their relationships with the Fund and (v) information obtained through the subadvisers’ responses to certain requests from MetLife Advisers and the Directors and MetLife Advisers’ responses to requests from the Directors. The Directors may also consider other information such as (vi) MetLife Advisers’ and the subadvisers’ financial results and condition, (vii) each Portfolio’s investment objectives and strategies and the size, education and experience of the investment staffs of MetLife Advisers and the relevant subadvisers and their use of technology and external research, (viii) the allocation of the Portfolios’ brokerage, if any, including allocations to brokers affiliated with the subadvisers and the use of “soft” commission dollars to pay Portfolio expenses and to pay for research and other similar services, (ix) the resources devoted to, and the record of compliance with, the Portfolios’ investment policies and restrictions, policies on personal securities transactions and other compliance policies, (x) the responses of MetLife Advisers, the subadvisers and/or their affiliates to certain legal and regulatory proceedings and (xi) the economic outlook generally and for the mutual fund industry in particular. Throughout the process, the Directors have the opportunity to ask questions of and request additional materials from MetLife Advisers and the subadvisers.
Following meetings of each Contract Review Committee on September 12, 2007, the Board, at its November 15, 2007 meeting, approved the continuation through December 31, 2008 of the Advisory Agreements for each Portfolio of the Fund and the Subadvisory Agreements for each Portfolio of the Fund. The Agreements approved for continuation are referred to below as the “Continued Agreements.”
In considering whether to approve the continuation of the Continued Agreements, the Directors, including the Independent Directors, did not identify any single factor as determinative, and each weighed the various factors as he or she deemed appropriate. The Directors considered the following matters in connection with their approval of the Continued Agreements:
The nature, extent and quality of the services provided to the relevant Portfolios under the Continued Agreements. The Directors considered the nature, extent and quality of the services provided by MetLife Advisers, the relevant subadvisers (if any) and their affiliates (each, an “Adviser,” and, collectively, the “Advisers”) to the relevant Portfolios pursuant to the Continued Agreements and the resources dedicated to these Portfolios by the Advisers. In particular, the Directors considered the Advisers’ abilities to attract and retain highly qualified investment professionals. With respect to MetLife Advisers, the Directors considered that MetLife Advisers is (i) ultimately responsible for the performance of such Portfolios; (ii) ultimately responsible for the establishment of the investment strategies of each such Portfolio, primarily through its recommendations to the Board regarding the hiring and selection of subadvisers; (iii) responsible for the hiring and selection, subject to Board approval, of subadvisers; and (iv) responsible for maintaining a program of Subadviser oversight reasonably designed to ensure that the subadvisers have reasonable compliance policies and procedures in place. The Directors also considered that MetLife Advisers provides a full range of day-to-day administrative services for the Portfolios involving all aspects of such Portfolios’ day-to-day operations (other than portfolio management). After reviewing these and related factors, the Directors concluded, within the context of their overall conclusions regarding each of the Continued Agreements, that the nature, extent and quality of services provided supported the renewal of these Agreements.
Investment performance of the relevant Portfolios. The Directors reviewed information about the performance of the relevant Portfolios over various time periods, including information prepared by an independent third party that compared the performance of
MSF-19
Metropolitan Series Fund, Inc.
BlackRock Strategic Value Portfolio
Board Approval of Advisory and Subadvisory Agreements—(Continued)
the Portfolios to the performance of peer groups of funds and performance benchmarks. The Directors also reviewed a description of the third party’s methodology for identifying a Portfolio’s peer group(s) for purposes of performance and expense comparisons.
In the case of each relevant Portfolio that had performance that lagged its peer group(s) for certain periods, the Directors concluded that other factors relevant to performance were sufficient, in light of other considerations, to warrant renewal of the Continued Agreements relating to such Portfolio. These factors varied from Portfolio to Portfolio, but included one or more of the following: (i) that such Portfolio’s performance, although lagging in certain recent periods, was stronger over the longer term; (ii) that the underperformance was attributable, to a significant extent, to investment decisions that were reasonable and consistent with the Portfolio’s investment objective(s) and policies and that the Portfolio was performing within the range of reasonable expectations, given market conditions and the Portfolio’s investment objective(s) and policies; (iii) that the Portfolio’s performance was competitive when compared to other relevant performance benchmarks or peer groups; and (iv) that MetLife Advisers and/or the relevant subadviser (if any) had taken or was taking steps designed to help improve the Portfolio’s investment performance.
The Directors also considered the investment performance of the Advisers and their reputations generally, the historical responsiveness of the Advisers to Director concerns about performance and the willingness of the Advisers to take steps intended to improve performance.
After reviewing these and related factors, the Directors concluded, within the context of their overall conclusions regarding each of the Continued Agreements, that the investment performance of each relevant Portfolio and Adviser was sufficient, in light of other considerations, to warrant the renewal of the Continued Agreements.
The costs of the services to be provided and profits to be realized by the Advisers and their affiliates from their relationships with the Portfolios. The Directors considered the fees charged by MetLife Advisers to the Portfolios for advisory services and, with respect to the subadvised Portfolios, by such subadvisers to MetLife Advisers for subadvisory services (such advisory and subadvisory fees (if any), collectively, “Fees”), as well as the total expense levels of the Portfolios. This information included comparisons (provided by an independent third party) of the Portfolios’ advisory fees and total expense levels to those of their peer groups. In evaluating Fees for the relevant Portfolios, the Directors also took into account the demands, complexity and quality of the investment management services provided to each Portfolio. The Directors considered MetLife Advisers’ recommendations regarding reductions in Fee rates, implementation of Fee breakpoints and institution of Fee waivers and expense caps.
The Directors also considered the compensation directly or indirectly received by the Advisers and their affiliates from their relationships with the relevant Portfolios. The Directors reviewed information relating to the profits received by MetLife Advisers, certain of the subadvisers and their affiliates as a result of their relationships with the relevant Portfolios, and information about the allocation of expenses used to calculate profitability. When reviewing profitability, the Directors also considered the performance of the relevant Portfolios, the expense levels of such Portfolios and whether the relevant Advisers had implemented breakpoints, fee waivers and/or expense caps with respect to such Portfolios.
After reviewing these and related factors, the Directors concluded, within the context of their overall conclusions regarding each of the Continued Agreements, that the Fees charged to each of the relevant Portfolios were fair and reasonable, and that the information provided regarding costs of these services generally, and the related profitability (if known) to the relevant Advisers of their relationships with the relevant Portfolios, supported the renewal of the Continued Agreements.
Economies of Scale. The Directors considered the existence of any economies of scale in the provision of services by the Advisers and whether those economies were shared with the relevant Portfolios through breakpoints in their advisory fees or other means, such as expense caps, fee waivers or relatively low levels of fees. The Directors noted that most of the relevant Portfolios benefited or will benefit from breakpoints, expense caps and/or fee waivers with respect to their advisory fees. In considering these issues, the Directors also took into consideration information relating to the costs of the services provided and the profitability to MetLife Advisers, the relevant subadvisers (if any) and each of their affiliates of their relationships with the relevant Portfolios, as discussed above.
After reviewing these and related factors, the Directors concluded, within the context of their overall conclusions regarding each of the Continued Agreements, that the extent to which economies of scale were shared with the relevant Portfolios supported the renewal of such Agreements.
Other Factors. The Directors also considered other factors, which included but were not limited to the following:
| | • | | the extent to which each relevant Portfolio operated in accordance with its investment objective, and its record of compliance with its investment restrictions and the compliance programs of the Fund and the Advisers. They also considered the compliance-related resources the Advisers and their affiliates provide to the relevant Portfolios; |
MSF-20
Metropolitan Series Fund, Inc.
BlackRock Strategic Value Portfolio
Board Approval of Advisory and Subadvisory Agreements—(Continued)
| | • | | the nature, quality, cost and extent of administrative and shareholder services performed by MetLife Advisers and its affiliates under the Advisory Agreements; and |
| | • | | so-called “fall-out benefits” to the Advisers, such as the engagement of their affiliates to provide distribution, brokerage and transfer agency services to the Portfolios, and the benefits of research made available to the relevant Advisers by reason of brokerage commissions generated by the relevant Portfolios’ securities transactions. The Directors also considered the possible conflicts of interest associated with these fall-out and other benefits, and the reporting and other processes in place to disclose and monitor these possible conflicts of interest. |
Based on their evaluation of all factors that they deemed to be material, including those factors described above, and assisted by the advice of independent counsel, the Directors, including the Independent Directors, concluded that each of the Continued Agreements should be continued through December 31, 2008.
MSF-21
A description of the policies and procedures that the Fund uses to determine how to vote proxies relating to portfolio securities is available (i) without charge, upon request, by calling (800) 638-7732 and (ii) on the Securities and Exchange Commission’s (the “SEC”) website at http://www.sec.gov.
Information regarding how the Fund voted proxies relating to portfolio securities during the most recent twelve-month period ended December 31, 2007 is available (i) without charge, upon request, by calling (800) 638-7732 and (ii) on the SEC’s website at http://www.sec.gov.
The Fund files with the SEC a complete schedule of its portfolio holdings, as of the close of the first and third quarters of its fiscal year, on “Form N-Q”. These filings are available on the SEC’s website at www.sec.gov and may be reviewed and copied at the SEC’s Public Reference Room in Washington, DC. (Call 1-800-SEC-0330 for information on the operation of the Public Reference Room.)
MSF-22
| | |
Metropolitan Series Fund, Inc. Capital Guardian U.S. Equity Portfolio Annual Report | | December 31, 2007 |
Letter from the President
February 1, 2008
Letter to Policy Holders:
2007 was a tumultuous year in the financial markets driven by concerns in the credit markets surrounding sub-prime mortgages and fears of recession in the U.S. Economy. The broad markets were mixed, with the Dow Jones Industrial Average up 8.9% and the MSCI EAFE Index, which measures the performance of international equities, up 11.2% for the year, while the Russell 2000 Index, which measures the performance of small capitalization stocks, was down 1.6%.
In the fixed income markets, credit spreads increased as a result of the pressure from sub-prime mortgage crisis and the Federal Reserve lowered interest rates by a total of 1% during the year. The Lehman Brothers Aggregate Bond Index posted a 7.0% return for the year.
On the following pages, you will find a complete review of your Portfolio and its investment performance.
MetLife is committed to building your financial freedom. We appreciate your trust and will continue to focus our efforts on meeting your investment needs.
Sincerely,
Elizabeth Forget
President, Metropolitan Series Fund, Inc.
Metropolitan Series Fund, Inc.
Capital Guardian U.S. Equity Portfolio
Managed by Capital Guardian Trust Company
Portfolio Manager Commentary*
PORTFOLIO PERFORMANCE
For the year ended December 31, 2007, the Class A shares of the Capital Guardian U.S. Equity Portfolio returned -0.1%, compared to its benchmark, the Standard & Poor’s 500 Index1, which returned 5.5%. The average return of its peer group, the Lipper Variable Insurance Products Multi-Cap Core Funds Universe2, was 6.2% over the same period.
PORTFOLIO REVIEW
U.S. equities made small gains in a year dominated by fluctuating liquidity levels and corporate profits. Stocks soared to new highs earlier in the year on record Mergers & Acquisitions (M&A) activity and strong earning reports, then dropped dramatically as the tap of cheap money dried up in the wake of the subprime mortgage crisis. By year’s end, earnings had begun to slide and investors grew concerned about the possibility of an economic recession.
Stocks soared for much of the year as easy money supported a record $4.7 trillion in worldwide deals, companies reported strong corporate earnings, and the economy accelerated. But ripples of subprime mortgage trouble appeared in February and June before bursting open in the third quarter. The fallout incorporated two main elements: the lower value of subprime mortgages and related investments, and the effect of the crisis on financial institutions that wrote down the value of their mortgage assets and subsequently faced severe financing constraints. Though the Federal Reserve cut interest rates three times and worked with other central banks to inject liquidity into the system, earnings began to decline and the outlook for economic growth looked bleak by December, while much of 2007’s stock market gains were erased. The S&P 500 Index ended the year up 5.5%.
The equity sell-off was most acutely felt by financial companies, which had their worst year since 1990. Citigroup was the biggest drag on the S&P 500 Index after it announced staggering losses. Consumer discretionary stocks slid as concerns about the economy grew. Other sectors posted double-digit gains, however. Energy stocks climbed as oil futures rose by nearly 60%, materials advanced on demand from the emerging markets and utilities benefited both from the M&A boom and the flight to safety amid the turmoil. Information technology stocks also jumped, led by Apple after the unveiling of its iPhone.
Economic data showed that while the housing market was at its weakest level in decades, other critical measures of the economy, including employment, held up well throughout most of the year. Real GDP growth accelerated to 4.9% in the third quarter, though by the end of 2007 durable goods data and other economic indicators showed signs of strain.
The Portfolio’s underperformance relative to the Index was due primarily to stock selection in the information technology and financials sectors during the fourth quarter. Rising investor concern about the U.S. economy and capital spending negatively impacted some of the Portfolio’s technology holdings, including contract manufacturers and semiconductor memory companies SanDisk, Micron Technology, and Jabil Circuit.
We added to our financial holdings among thrifts, mortgage lenders, and insurers in the third quarter as valuations declined, but we did so too early as the credit crunch further intensified in the fourth quarter. Washington Mutual was the biggest detractor to Portfolio returns. The largest U.S. savings and loan saw its shares tumble as the housing and credit markets deteriorated and after regulators began investigating how the company set values for mortgages sold to investors. Other decliners in the financials area included Wachovia, Ambac Financial Group, MBIA, and Sallie Mae, which sank after a $25 billion proposed takeover collapsed. Selection in health care and the underweight position in energy also hurt returns. The choice of materials stocks, especially Potash Corp. of Saskatchewan, was positive for the Portfolio. The stock gained as demand for fertilizers increased throughout the year. Google was the top contributor to returns as the company posted consistently solid results.
* The views expressed above are those of the subadvisory firm as of December 31, 2007 and are subject to change based on market and other conditions. Information about the Portfolio’s holdings, asset allocation, industry allocation, or country diversification is historical and is not an indication of future Portfolio composition, which will vary. The performance of any index mentioned in this commentary has not been adjusted for ongoing management, distribution and operating expenses, and sales charges applicable to mutual fund investments. Direct investment in the Index is not possible.
1 The Standard & Poor’s (S&P) 500® Composite Stock Price Index is an unmanaged index representing the performance of 500 major companies, most of which are listed on the New York Stock Exchange.
2 The Lipper Variable Insurance Products Fund Average is an average of the total return performance (calculated on the basis of net asset value) of variable product funds with similar investment objectives to those of the subject Portfolio as calculated by Lipper Analytical Services, an independent mutual fund ranking service.
MSF-2
Metropolitan Series Fund, Inc.
Capital Guardian U.S. Equity Portfolio
A $10,000 INVESTMENT COMPARED TO
THE S&P 500 INDEX
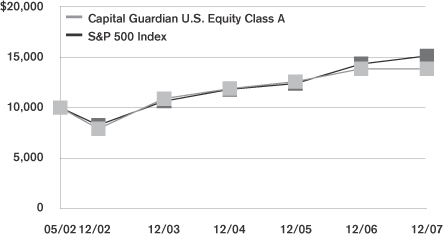
Average Annual Returns as of December 31, 2007
| | | | | | | | | |
| | | Capital Guardian
U.S. Equity Portfolio | | | S&P 500 | |
| | | Class A | | | Class B | | | Index | |
| 1 Year | | -0.1 | % | | -0.3 | % | | 5.5 | % |
| 5 Year | | 11.9 | | | 11.6 | | | 12.8 | |
| Since Inception | | 5.9 | | | 5.7 | | | 7.6 | |
Performance numbers are net of all Portfolio expenses but do not include any insurance, sales, or administrative charges of variable annuity or life insurance contracts. If these charges were included, the returns would be lower.
Inception date of the Class A and Class B shares is 5/1/02. Index since inception return is based on the Class A inception date.
This information represents past performance and is not indicative of future results. Investment return and principal value may fluctuate so that shares, upon redemption, may be worth more or less than the original cost.
PORTFOLIO COMPOSITION
as of December 31, 2007
Top Holdings
| | |
| | | % of Total
Net Assets |
Google, Inc. | | 2.9% |
UnitedHealth Group, Inc. | | 2.2% |
General Electric Co. | | 2.2% |
JPMorgan Chase & Co. | | 2.1% |
Genentech, Inc. | | 1.9% |
Royal Dutch Shell, Plc. (ADR) | | 1.8% |
Target Corp. | | 1.8% |
Wachovia Corp. | | 1.7% |
United Parcel Service, Inc. | | 1.7% |
The Goldman Sachs Group, Inc. | | 1.5% |
Top Sectors
| | |
| | | % of Total
Market Value |
Information Technology | | 20.1% |
Financials | | 17.3% |
Health Care | | 14.9% |
Consumer Discretionary | | 12.1% |
Industrials | | 10.1% |
Energy | | 8.2% |
Consumer Staples | | 6.9% |
Materials | | 4.3% |
Telecommunication Services | | 2.7% |
Utilities | | 1.5% |
MSF-3
Metropolitan Series Fund, Inc.
Shareholder Expense Example
As a shareholder of the Portfolio, you incur ongoing costs, including management fees; distribution and service (12b-1) fees; and other Portfolio expenses. This example is intended to help you understand your ongoing costs (in dollars) (referred to as “expenses”) of investing in the Portfolio and compare these costs with the ongoing costs of investing in other mutual funds. The example is based on an investment of $1,000 invested at the beginning of the period and held for the entire period, July 1, 2007 through December 31, 2007.
Actual Expenses
The first line for each share class of the Portfolio in the table below provides information about actual account values and actual expenses. You may use the information in this line, together with the amount you invested in the particular share class of the Portfolio, to estimate the expenses that you paid over the period. Simply divide your account value by $1,000 (for example, an $8,600 account value divided by $1,000=8.6), then multiply the result by the number in the first line under the heading entitled “Expenses Paid During Period” to estimate the expenses you paid on your account during this period.
Hypothetical Example for Comparison Purposes
The second line for each share class of the Portfolio in the table below provides information about hypothetical account values and hypothetical expenses based on the Portfolio’s actual expense ratio and an assumed rate of return of 5% per year before expenses, which is not the Portfolio’s actual return. The hypothetical account values and expenses may not be used to estimate the actual ending account balance or expenses you paid for the period. You may use this information to compare the ongoing costs of investing in the Portfolio and other funds. To do so, compare this 5% hypothetical example with the 5% hypothetical examples that appear in the shareholder reports of the other funds.
Please note that the expenses shown in the table are meant to highlight your ongoing costs only and do not reflect any fees or charges of your variable insurance product or any additional expenses that participants in certain eligible qualified plans may bear relating to the operations of their plan. Therefore, the second line for each share class in the table is useful in comparing ongoing costs only, and will not help you determine the relative total costs of owning different funds. In addition, if these other costs were included, your costs would have been higher.
| | | | | | | | | | | | | | |
Portfolio | | | | Annualized
Expense
Ratio | | | Beginning
Account Value
July 1,
2007 | | Ending
Account Value
December 31,
2007 | | Expenses Paid
During Period*
July 1, 2007
to
December 31,
2007 |
Capital Guardian U.S. Equity—Class A | | Actual | | 0.72 | % | | $ | 1,000.00 | | $ | 934.60 | | $ | 3.51 |
| | Hypothetical | | 0.72 | % | | $ | 1,000.00 | | $ | 1,021.53 | | $ | 3.67 |
| | | | | |
Capital Guardian U.S. Equity—Class B | | Actual | | 0.97 | % | | $ | 1,000.00 | | $ | 932.90 | | $ | 4.73 |
| | Hypothetical | | 0.97 | % | | $ | 1,000.00 | | $ | 1,020.26 | | $ | 4.94 |
* Expenses paid are equal to the Portfolio’s annualized expense ratio for the most recent six month period, as shown above, multiplied by the average account value over the period, multiplied by the number of days in the most recent fiscal half-year, divided by 365 (to reflect the one-half year period).
MSF-4
Metropolitan Series Fund, Inc.
Capital Guardian U.S. Equity Portfolio
Schedule of Investments as of December 31, 2007
Common Stock—98.3% of Total Net Assets
| | | | | |
| Security Description | | Shares | | Value* |
| | | | | |
|
Aerospace & Defense—1.7% |
Boeing Co. | | 49,800 | | $ | 4,355,508 |
United Technologies Corp. | | 57,090 | | | 4,369,669 |
| | | | | |
| | | | | 8,725,177 |
| | | | | |
|
Air Freight & Logistics—2.1% |
FedEx Corp. | | 22,580 | | | 2,013,459 |
United Parcel Service, Inc. (Class B) | | 126,000 | | | 8,910,720 |
| | | | | |
| | | | | 10,924,179 |
| | | | | |
|
Airlines—0.2% |
Southwest Airlines Co. | | 86,000 | | | 1,049,200 |
| | | | | |
|
Auto Components—0.4% |
Johnson Controls, Inc. | | 27,200 | | | 980,288 |
WABCO Holdings, Inc. | | 17,366 | | | 869,863 |
| | | | | |
| | | | | 1,850,151 |
| | | | | |
|
Automobiles—0.8% |
Ford Motor Co. (a) | | 438,300 | | | 2,949,759 |
General Motors Corp. | | 43,300 | | | 1,077,737 |
| | | | | |
| | | | | 4,027,496 |
| | | | | |
|
Beverages—2.2% |
Anheuser-Busch Cos., Inc. | | 20,300 | | | 1,062,502 |
PepsiCo, Inc. | | 86,180 | | | 6,541,062 |
The Coca-Cola Co. | | 60,100 | | | 3,688,337 |
| | | | | |
| | | | | 11,291,901 |
| | | | | |
|
Biotechnology—3.2% |
Genentech, Inc. (a) | | 150,300 | | | 10,080,621 |
ImClone Systems, Inc. (a) | | 90,800 | | | 3,904,400 |
Millennium Pharmaceuticals, Inc. (a) | | 176,600 | | | 2,645,468 |
| | | | | |
| | | | | 16,630,489 |
| | | | | |
|
Building Products—0.1% |
Owens Corning, Inc. (a) | | 30,500 | | | 616,710 |
| | | | | |
|
Capital Markets—2.6% |
American Capital Strategies, Ltd. | | 47,000 | | | 1,549,120 |
Lehman Brothers Holdings, Inc. | | 60,400 | | | 3,952,576 |
The Goldman Sachs Group, Inc. | | 37,180 | | | 7,995,559 |
| | | | | |
| | | | | 13,497,255 |
| | | | | |
|
Chemicals—1.9% |
Celanese Corp. | | 26,900 | | | 1,138,408 |
Monsanto Co. | | 19,200 | | | 2,144,448 |
Potash Corp. of Saskatchewan, Inc. | | 45,900 | | | 6,607,764 |
| | | | | |
| | | | | 9,890,620 |
| | | | | |
|
Commercial Banks—3.1% |
Fifth Third Bancorp | | 56,900 | | | 1,429,897 |
SunTrust Banks, Inc. | | 30,300 | | | 1,893,447 |
Wachovia Corp. | | 238,247 | | | 9,060,533 |
Wells Fargo & Co. | | 132,700 | | | 4,006,213 |
| | | | | |
| | | | | 16,390,090 |
| | | | | |
| | | | | |
| Security Description | | Shares | | Value* |
| | | | | |
|
Commercial Services & Supplies—0.1% |
Monster Worldwide, Inc. (a) | | 23,000 | | $ | 745,200 |
| | | | | |
|
Communications Equipment—3.2% |
Ciena Corp. (a) | | 17,400 | | | 593,514 |
Cisco Systems, Inc. (a) | | 282,340 | | | 7,642,944 |
Corning, Inc. (a) | | 48,150 | | | 1,155,118 |
Polycom, Inc. (a) | | 41,900 | | | 1,163,982 |
QUALCOMM, Inc. | | 152,860 | | | 6,015,041 |
| | | | | |
| | | | | 16,570,599 |
| | | | | |
|
Computers & Peripherals—3.2% |
Brocade Communications Systems, Inc. (a) | | 223,900 | | | 1,643,426 |
Dell, Inc. (a) | | 89,400 | | | 2,191,194 |
Hewlett-Packard Co. | | 51,020 | | | 2,575,490 |
Network Appliance, Inc. (a) | | 23,200 | | | 579,072 |
SanDisk Corp. (a) | | 177,200 | | | 5,877,724 |
Seagate Technology (a) | | 97,300 | | | 2,481,150 |
Sun Microsystems, Inc. (a) | | 83,325 | | | 1,510,682 |
| | | | | |
| | | | | 16,858,738 |
| | | | | |
|
Construction & Engineering—1.1% |
Fluor Corp. | | 38,500 | | | 5,610,220 |
| | | | | |
|
Construction Materials—0.2% |
Vulcan Materials Co. | | 12,900 | | | 1,020,261 |
| | | | | |
|
Consumer Finance—1.3% |
AmeriCredit Corp. (a) | | 54,900 | | | 702,171 |
Capital One Financial Corp. | | 40,300 | | | 1,904,578 |
SLM Corp. | | 216,900 | | | 4,368,366 |
| | | | | |
| | | | | 6,975,115 |
| | | | | |
|
Diversified Financial Services—2.3% |
JPMorgan Chase & Co. | | 246,372 | | | 10,754,138 |
Moody’s Corp. | | 35,400 | | | 1,263,780 |
| | | | | |
| | | | | 12,017,918 |
| | | | | |
|
Diversified Telecommunication Services—2.3% |
AT&T, Inc. | | 127,877 | | | 5,314,568 |
Level 3 Communications, Inc. (a) | | 414,500 | | | 1,260,080 |
Time Warner Telecom, Inc. (Class A) (a) | | 177,200 | | | 3,595,388 |
Verizon Communications, Inc. | | 46,638 | | | 2,037,614 |
| | | | | |
| | | | | 12,207,650 |
| | | | | |
|
Electric Utilities—1.0% |
Edison International | | 66,800 | | | 3,565,116 |
Pinnacle West Capital Corp. | | 36,000 | | | 1,526,760 |
| | | | | |
| | | | | 5,091,876 |
| | | | | |
|
Electrical Equipment—0.6% |
Cooper Industries, Ltd. (Class A) | | 30,400 | | | 1,607,552 |
Emerson Electric Co. | | 23,400 | | | 1,325,844 |
| | | | | |
| | | | | 2,933,396 |
| | | | | |
*See accompanying notes to financial statements.
MSF-5
Metropolitan Series Fund, Inc.
Capital Guardian U.S. Equity Portfolio
Schedule of Investments as of December 31, 2007
Common Stock—(Continued)
| | | | | |
| Security Description | | Shares | | Value* |
| | | | | |
|
Electronic Equipment & Instruments—1.2% |
Agilent Technologies, Inc. (a) | | 45,005 | | $ | 1,653,484 |
Flextronics International, Ltd. (a) | | 136,400 | | | 1,644,984 |
Jabil Circuit, Inc. | | 199,010 | | | 3,038,882 |
| | | | | |
| | | | | 6,337,350 |
| | | | | |
|
Energy Equipment & Services—3.4% |
Baker Hughes, Inc. | | 32,910 | | | 2,669,001 |
BJ Services Co. | | 127,200 | | | 3,085,872 |
Schlumberger, Ltd. | | 81,200 | | | 7,987,644 |
Weatherford International, Ltd. (a) | | 60,100 | | | 4,122,860 |
| | | | | |
| | | | | 17,865,377 |
| | | | | |
|
Food & Staples Retailing—0.3% |
Costco Wholesale Corp. | | 25,000 | | | 1,744,000 |
| | | | | |
|
Food Products—2.6% |
Campbell Soup Co. | | 39,500 | | | 1,411,335 |
General Mills, Inc. | | 14,200 | | | 809,400 |
Kraft Foods, Inc. (Class A) | | 157,336 | | | 5,133,874 |
Sara Lee Corp. | | 231,700 | | | 3,721,102 |
Unilever NV (NY Shares) | | 63,600 | | | 2,318,856 |
| | | | | |
| | | | | 13,394,567 |
| | | | | |
|
Health Care Equipment & Supplies—2.3% |
Baxter International, Inc. | | 130,700 | | | 7,587,135 |
Lumenis, Ltd. (a) | | 520 | | | 546 |
Medtronic, Inc. | | 86,600 | | | 4,353,382 |
| | | | | |
| | | | | 11,941,063 |
| | | | | |
|
Health Care Providers & Services—2.8% |
DaVita, Inc. (a) | | 53,500 | | | 3,014,725 |
UnitedHealth Group, Inc. | | 201,800 | | | 11,744,760 |
| | | | | |
| | | | | 14,759,485 |
| | | | | |
|
Health Care Technology—0.2% |
Cerner Corp. (a) | | 16,500 | | | 930,600 |
| | | | | |
|
Hotels, Restaurants & Leisure—1.3% |
Carnival Corp. | | 17,300 | | | 769,677 |
Las Vegas Sands Corp. (a) | | 28,000 | | | 2,885,400 |
McDonald’s Corp. | | 23,600 | | | 1,390,276 |
Starbucks Corp. (a) | | 50,700 | | | 1,037,829 |
Starwood Hotels & Resorts Worldwide, Inc. (a) | | 15,635 | | | 688,409 |
| | | | | |
| | | | | 6,771,591 |
| | | | | |
|
Household Durables—0.4% |
Fortune Brands, Inc. | | 13,800 | | | 998,568 |
Jarden Corp. (a) | | 24,100 | | | 569,001 |
Lennar Corp. (Class A) | | 39,100 | | | 699,499 |
| | | | | |
| | | | | 2,267,068 |
| | | | | |
|
Household Products—0.3% |
Energizer Holdings, Inc. (a) | | 13,400 | | | 1,502,542 |
| | | | | |
| | | | | |
| Security Description | | Shares | | Value* |
| | | | | |
|
Independent Power Producers & Energy Traders—0.2% |
The AES Corp. (a) | | 56,300 | | $ | 1,204,257 |
| | | | | |
|
Industrial Conglomerates—2.6% |
General Electric Co. | | 311,300 | | | 11,539,891 |
Siemens AG (ADR) | | 9,100 | | | 1,431,976 |
Tyco International, Ltd. | | 19,800 | | | 785,070 |
| | | | | |
| | | | | 13,756,937 |
| | | | | |
|
Insurance—4.4% |
Aflac, Inc. | | 30,000 | | | 1,878,900 |
AMBAC Financial Group, Inc. | | 84,000 | | | 2,164,680 |
American International Group, Inc. | | 119,800 | | | 6,984,340 |
Berkshire Hathaway, Inc. (Class A) (a) | | 27 | | | 3,823,200 |
Marsh & McLennan Cos., Inc. | | 112,500 | | | 2,977,875 |
MBIA, Inc. | | 108,800 | | | 2,026,944 |
The Progressive Corp. | | 73,800 | | | 1,414,008 |
XL Capital, Ltd. (Class A) | | 33,200 | | | 1,670,292 |
| | | | | |
| | | | | 22,940,239 |
| | | | | |
| | |
Internet Software & Services—5.0% | | | | | |
eBay, Inc. (a) | | 205,320 | | | 6,814,571 |
Google, Inc. (Class A) (a) | | 22,030 | | | 15,233,304 |
Yahoo!, Inc. (a) | | 168,180 | | | 3,911,867 |
| | | | | |
| | | | | 25,959,742 |
| | | | | |
| | |
IT Services—0.7% | | | | | |
Affiliated Computer Services, Inc. (Class A) (a) | | 17,100 | | | 771,210 |
Paychex, Inc. | | 45,300 | | | 1,640,766 |
Verifone Holdings, Inc. (a) | | 59,900 | | | 1,392,675 |
| | | | | |
| | | | | 3,804,651 |
| | | | | |
| | |
Machinery—1.5% | | | | | |
Danaher Corp. | | 33,500 | | | 2,939,290 |
Illinois Tool Works, Inc. | | 84,100 | | | 4,502,714 |
Parker-Hannifin Corp. | | 7,500 | | | 564,825 |
| | | | | |
| | | | | 8,006,829 |
| | | | | |
| | |
Media—2.9% | | | | | |
CBS Corp. (Class B) | | 94,050 | | | 2,562,862 |
Comcast Corp. (Class A) | | 50,100 | | | 914,826 |
Gannett Co., Inc. | | 34,900 | | | 1,361,100 |
Omnicom Group, Inc. | | 28,600 | | | 1,359,358 |
The Walt Disney Co. | | 146,200 | | | 4,719,336 |
Time Warner Cable, Inc. (Class A) (a) | | 45,500 | | | 1,255,800 |
Time Warner, Inc. | | 92,300 | | | 1,523,873 |
Viacom, Inc. (Class B) (a) | | 37,650 | | | 1,653,588 |
| | | | | |
| | | | | 15,350,743 |
| | | | | |
| | |
Metals & Mining—2.2% | | | | | |
Allegheny Technologies, Inc. | | 8,200 | | | 708,480 |
Barrick Gold Corp. | | 149,100 | | | 6,269,655 |
Cleveland-Cliffs, Inc. | | 9,600 | | | 967,680 |
Freeport-McMoRan Copper & Gold, Inc. | | 15,600 | | | 1,598,064 |
Newmont Mining Corp. | | 33,000 | | | 1,611,390 |
Nucor Corp. | | 9,100 | | | 538,902 |
| | | | | |
| | | | | 11,694,171 |
| | | | | |
*See accompanying notes to financial statements.
MSF-6
Metropolitan Series Fund, Inc.
Capital Guardian U.S. Equity Portfolio
Schedule of Investments as of December 31, 2007
Common Stock—(Continued)
| | | | | |
| Security Description | | Shares | | Value* |
| | | | | |
| | |
Multi-Utilities—0.3% | | | | | |
CMS Energy Corp. | | 91,700 | | $ | 1,593,746 |
| | | | | |
| | |
Multiline Retail—2.0% | | | | | |
Nordstrom, Inc. | | 31,100 | | | 1,142,303 |
Target Corp. | | 189,400 | | | 9,470,000 |
| | | | | |
| | | | | 10,612,303 |
| | | | | |
| | |
Mutual Funds—1.0% | | | | | |
SPDR Trust | | 36,600 | | | 5,351,286 |
| | | | | |
| | |
Oil, Gas & Consumable Fuels—4.8% | | | | | |
Anadarko Petroleum Corp. | | 23,200 | | | 1,524,008 |
Arch Coal, Inc. | | 33,600 | | | 1,509,648 |
Chevron Corp. | | 24,973 | | | 2,330,730 |
ConocoPhillips | | 29,100 | | | 2,569,530 |
EOG Resources, Inc. | | 13,000 | | | 1,160,250 |
Exxon Mobil Corp. | | 49,199 | | | 4,609,454 |
Peabody Energy Corp. | | 30,800 | | | 1,898,512 |
Royal Dutch Shell, Plc. (ADR) (A Shares) | | 95,900 | | | 8,074,780 |
Royal Dutch Shell, Plc. (ADR) (B Shares) | | 19,307 | | | 1,602,481 |
| | | | | |
| | | | | 25,279,393 |
| | | | | |
| | |
Personal Products—0.4% | | | | | |
Avon Products, Inc. | | 24,300 | | | 960,579 |
Bare Escentuals, Inc. (a) | | 40,000 | | | 970,000 |
| | | | | |
| | | | | 1,930,579 |
| | | | | |
| | |
Pharmaceuticals—6.5% | | | | | |
Abbott Laboratories | | 41,100 | | | 2,307,765 |
Allergan, Inc. | | 66,860 | | | 4,295,086 |
AstraZeneca, Plc. (ADR) | | 124,600 | | | 5,335,372 |
Bristol-Myers Squibb Co. | | 102,700 | | | 2,723,604 |
Forest Laboratories, Inc. (a) | | 150,760 | | | 5,495,202 |
Pfizer, Inc. | | 143,700 | | | 3,266,301 |
Sanofi-Aventis (ADR) | | 110,600 | | | 5,035,618 |
Sepracor, Inc. (a) | | 77,790 | | | 2,041,988 |
Teva Pharmaceutical Industries, Ltd. (ADR) | | 49,100 | | | 2,282,168 |
Wyeth | | 31,900 | | | 1,409,661 |
| | | | | |
| | | | | 34,192,765 |
| | | | | |
| | |
Real Estate Investment Trusts—0.3% | | | | | |
Douglas Emmett, Inc. | | 29,800 | | | 673,778 |
General Growth Properties, Inc. | | 11,380 | | | 468,628 |
Host Hotels & Resorts, Inc. | | 16,676 | | | 284,159 |
| | | | | |
| | | | | 1,426,565 |
| | | | | |
| |
Semiconductors & Semiconductor Equipment—4.9% | | | |
Altera Corp. (a) | | 171,300 | | | 3,309,516 |
Applied Materials, Inc. | | 370,401 | | | 6,578,322 |
ASML Holding NV | | 13,075 | | | 409,117 |
Intel Corp. | | 108,600 | | | 2,895,276 |
KLA-Tencor Corp. | | 128,900 | | | 6,207,824 |
Lam Research Corp. (a) | | 23,800 | | | 1,028,874 |
Micron Technology, Inc. (a) | | 425,600 | | | 3,085,600 |
Qimonda AG (ADR) (a) | | 102,700 | | | 734,305 |
| | | | | |
| Security Description | | Shares | | Value* |
| | | | | |
|
Semiconductors & Semiconductor Equipment—(Continued) |
Silicon Laboratories, Inc. (a) | | 7,200 | | $ | 269,496 |
Xilinx, Inc. | | 40,600 | | | 887,922 |
| | | | | |
| | | | | 25,406,252 |
| | | | | |
| | |
Software—2.0% | | | | | |
Microsoft Corp. | | 208,230 | | | 7,412,988 |
Oracle Corp. (a) | | 82,100 | | | 1,853,818 |
SAP AG (ADR) | | 24,655 | | | 1,258,638 |
| | | | | |
| | | | | 10,525,444 |
| | | | | |
| | |
Specialty Retail—3.2% | | | | | |
Best Buy Co., Inc. | | 121,100 | | | 6,375,915 |
Lowe’s Cos., Inc. | | 291,900 | | | 6,602,778 |
The Home Depot, Inc. | | 71,458 | | | 1,925,079 |
Urban Outfitters, Inc. (a) | | 68,500 | | | 1,867,310 |
| | | | | |
| | | | | 16,771,082 |
| | | | | |
| |
Textiles, Apparel & Luxury Goods—0.7% | | | |
Coach, Inc. (a) | | 22,900 | | | 700,282 |
Hanesbrands, Inc. (a) | | 107,687 | | | 2,925,856 |
| | | | | |
| | | | | 3,626,138 |
| | | | | |
| | |
Thrifts & Mortgage Finance—2.7% | | | | | |
Federal Home Loan Mortgage Corp. | | 87,900 | | | 2,994,753 |
Federal National Mortgage Association | | 89,400 | | | 3,574,212 |
Hudson City Bancorp, Inc. | | 220,700 | | | 3,314,914 |
IndyMac Bancorp, Inc. | | 109,400 | | | 650,930 |
Washington Mutual, Inc. | | 264,300 | | | 3,597,123 |
| | | | | |
| | | | | 14,131,932 |
| | | | | |
| | |
Tobacco—1.2% | | | | | |
Altria Group, Inc. | | 81,400 | | | 6,152,212 |
| | | | | |
| |
Wireless Telecommunication Services—0.4% | | | |
American Tower Corp. (Class A) (a) | | 48,370 | | | 2,060,562 |
| | | | | |
Total Common Stock
(Identified Cost $497,644,270) | | | | | 514,215,712 |
| | | | | |
| | |
| Preferred Stock—0.7% | | | | | |
| | |
Consumer Finance—0.1% | | | | | |
SLM Corp. | | 320 | | | 331,760 |
| | | | | |
| | |
Pharmaceuticals—0.2% | | | | | |
Schering-Plough Corp. | | 5,000 | | | 1,214,375 |
| | | | | |
| | |
Thrifts & Mortgage Finance—0.4% | | | | | |
Washington Mutual, Inc. | | 2,420 | | | 2,141,700 |
| | | | | |
Total Preferred Stock
(Identified Cost $3,960,212) | | | | | 3,687,835 |
| | | | | |
*See accompanying notes to financial statements.
MSF-7
Metropolitan Series Fund, Inc.
Capital Guardian U.S. Equity Portfolio
Schedule of Investments as of December 31, 2007
Fixed Income—Convertible—0.2%
| | | | | | | |
| Security Description | | Face
Amount | | Value* | |
| | | | | | | |
| | |
Automobiles—0.2% | | | | | | | |
Ford Motor Co.
4.250%, 12/15/36 | | $ | 1,284,000 | | $ | 1,275,975 | |
| | | | | | | |
Total Fixed Income—Convertible
(Identified Cost $1,291,979) | | | | | | 1,275,975 | |
| | | | | | | |
| | |
| Short Term Investments—1.0% | | | | | | | |
| | |
Repurchase Agreement—1.0% | | | | | | | |
State Street Corp. Repurchase Agreement dated 12/31/07 at 1.70% to be repurchased at $5,182,489 on 1/02/08, collateralized by $3,780,000 U.S. Treasury Bond 8.50% due 2/15/20 with a value of $5,287,275. | | | 5,182,000 | | | 5,182,000 | |
| | | | | | | |
Total Short Term Investments
(Identified Cost $5,182,000) | | | | | | 5,182,000 | |
| | | | | | | |
Total Investments—100.2%
(Identified Cost $508,078,461) (b) | | | | | | 524,361,522 | |
Liabilities in excess of other assets | | | | | | (1,243,413 | ) |
| | | | | | | |
| Total Net Assets—100% | | | | | $ | 523,118,109 | |
| | | | | | | |
| (b) | The aggregate cost of investments for federal income tax purposes as of December 31, 2007 was $509,272,729 and the composition of unrealized appreciation and depreciation of investment securities was $71,918,869 and $(56,830,076), respectively. |
| (ADR)— | An American Depositary Receipt is a certificate issued by a custodian bank representing the right to receive securities of the foreign issuer described. Trading on exchanges not located in the United States or Canada significantly influences the value of ADRs. |
*See accompanying notes to financial statements.
MSF-8
Metropolitan Series Fund, Inc.
Capital Guardian U.S. Equity Portfolio
Statement of Assets & Liabilities
December 31, 2007
| | | | | | |
Assets | | | | | | |
Investments at value (a) | | | | | $ | 524,361,522 |
Cash | | | | | | 650 |
Receivable for: | | | | | | |
Securities sold | | | | | | 687,381 |
Fund shares sold | | | | | | 48,664 |
Accrued interest and dividends | | | | | | 748,035 |
Foreign taxes | | | | | | 11,986 |
| | | | | | |
Total Assets | | | | | | 525,858,238 |
Liabilities | | | | | | |
Payable for: | | | | | | |
Securities purchased | | $ | 1,897,305 | | | |
Fund shares redeemed | | | 468,928 | | | |
Accrued expenses: | | | | | | |
Management fees | | | 302,774 | | | |
Service and distribution fees | | | 23,654 | | | |
Deferred directors’ fees | | | 3,474 | | | |
Other expenses | | | 43,994 | | | |
| | | | | | |
Total Liabilities | | | | | | 2,740,129 |
| | | | | | |
Net Assets | | | | | $ | 523,118,109 |
| | | | | | |
Net assets consists of: | | | | | | |
Capital paid in | | | | | $ | 489,762,277 |
Undistributed net investment income | | | | | | 4,674,866 |
Accumulated net realized gains | | | | | | 12,397,905 |
Unrealized appreciation on investments | | | | | | 16,283,061 |
| | | | | | |
Net Assets | | | | | $ | 523,118,109 |
| | | | | | |
| Computation of offering price: | | | | | | |
Class A | | | | | | |
Net asset value and redemption price per share ($414,065,434 divided by 33,287,194 shares outstanding) | | | | | $ | 12.44 |
| | | | | | |
Class B | | | | | | |
Net asset value and redemption price per share ($109,052,675 divided by 8,817,004 shares outstanding) | | | | | $ | 12.37 |
| | | | | | |
(a) Identified cost of investments | | | | | $ | 508,078,461 |
| | | | | | |
Statement of Operations
For the Year Ended December 31, 2007
| | | | | | | | |
Investment Income | | | | | | | | |
Dividends | | | | | | $ | 8,836,805 | (a) |
Interest | | | | | | | 266,911 | |
| | | | | | | | |
| | | | | | | 9,103,716 | |
Expenses | | | | | | | | |
Management fees | | $ | 3,770,032 | | | | | |
Service and distribution fees—Class B | | | 289,286 | | | | | |
Directors’ fees and expenses | | | 23,669 | | | | | |
Custodian | | | 64,593 | | | | | |
Audit and tax services | | | 31,738 | | | | | |
Legal | | | 5,216 | | | | | |
Printing | | | 129,350 | | | | | |
Insurance | | | 6,475 | | | | | |
Miscellaneous | | | 22,466 | | | | | |
| | | | | | | | |
Total expenses | | | 4,342,825 | | | | | |
Expense reductions | | | (15,107 | ) | | | 4,327,718 | |
| | | | | | | | |
Net Investment Income | | | | | | | 4,775,998 | |
| | | | | | | | |
Realized and Unrealized Gain (Loss) | | | | | | | | |
| Realized gain (loss) on: | | | | | | | | |
Investments—net | | | 61,537,604 | | | | | |
Futures contracts—net | | | (178,119 | ) | | | | |
Foreign currency transactions—net | | | 7 | | | | 61,359,492 | |
| | | | | | | | |
| Change in unrealized depreciation on: | | | | | | | | |
Investments—net | | | | | | | (65,773,349 | ) |
| | | | | | | | |
Net loss | | | | | | | (4,413,857 | ) |
| | | | | | | | |
Net Increase in Net Assets From Operations | | | | | | $ | 362,141 | |
| | | | | | | | |
| (a) | Net of foreign taxes of $117,455. |
See accompanying notes to financial statements.
MSF-9
Metropolitan Series Fund, Inc.
Capital Guardian U.S. Equity Portfolio
Statements of Changes in Net Assets
| | | | | | | | |
| | | Year ended
December 31,
2007 | | | Year ended
December 31,
2006 | |
From Operations | | | | | | | | |
Net investment income | | $ | 4,775,998 | | | $ | 3,909,548 | |
Net realized gain | | | 61,359,492 | | | | 41,900,969 | |
Unrealized appreciation (depreciation) | | | (65,773,349 | ) | | | 4,370,028 | |
| | | | | | | | |
Increase in net assets from operations | | | 362,141 | | | | 50,180,545 | |
| | | | | | | | |
From Distributions to Shareholders | | | | | | | | |
Net investment income | | | | | | | | |
Class A | | | (2,110,792 | ) | | | (4,202,600 | ) |
Class B | | | (268,916 | ) | | | (767,845 | ) |
| | | | | | | | |
| | | (2,379,708 | ) | | | (4,970,445 | ) |
| | | | | | | | |
Net realized gain | | | | | | | | |
Class A | | | (26,256,976 | ) | | | (4,498,095 | ) |
Class B | | | (6,493,530 | ) | | | (1,062,574 | ) |
| | | | | | | | |
| | | (32,750,506 | ) | | | (5,560,669 | ) |
| | | | | | | | |
Total distributions | | | (35,130,214 | ) | | | (10,531,114 | ) |
| | | | | | | | |
Increase (decrease) in net assets from capital share transactions | | | 4,604,611 | | | | (3,063,753 | ) |
| | | | | | | | |
Total increase (decrease) in net assets | | | (30,163,462 | ) | | | 36,585,678 | |
| | |
Net Assets | | | | | | | | |
Beginning of the period | | | 553,281,571 | | | | 516,695,893 | |
| | | | | | | | |
End of the period | | $ | 523,118,109 | | | $ | 553,281,571 | |
| | | | | | | | |
Undistributed Net Investment Income | | | | | | | | |
End of the period | | $ | 4,674,866 | | | $ | 2,314,425 | |
| | | | | | | | |
Other Information:
Capital Shares
Transactions in capital shares were as follows:
| | | | | | | | | | | | | | |
| | | Year ended
December 31, 2007 | | | Year ended
December 31, 2006 | |
| | | Shares | | | $ | | | Shares | | | $ | |
Class A | | | | | | | | | | | | | | |
Sales | | 4,411,021 | | | $ | 57,665,708 | | | 417,463 | | | $ | 5,307,415 | |
Shares issued through acquisition | | 0 | | | | 0 | | | 5,107,411 | | | | 65,374,860 | |
Reinvestments | | 2,183,816 | | | | 28,367,768 | | | 685,094 | | | | 8,700,695 | |
Redemptions | | (6,902,715 | ) | | | (91,386,169 | ) | | (7,232,639 | ) | | | (91,768,076 | ) |
| | | | | | | | | | | | | | |
Net decrease | | (307,878 | ) | | $ | (5,352,693 | ) | | (1,022,671 | ) | | $ | (12,385,106 | ) |
| | | | | | | | | | | | | | |
Class B | | | | | | | | | | | | | | |
Sales | | 1,765,336 | | | $ | 23,167,316 | | | 1,613,530 | | | $ | 20,382,709 | |
Reinvestments | | 522,600 | | | | 6,762,446 | | | 144,583 | | | | 1,830,419 | |
Redemptions | | (1,517,326 | ) | | | (19,972,458 | ) | | (1,023,205 | ) | | | (12,891,775 | ) |
| | | | | | | | | | | | | | |
Net increase | | 770,610 | | | $ | 9,957,304 | | | 734,908 | | | $ | 9,321,353 | |
| | | | | | | | | | | | | | |
Increase (decrease) derived from capital share transactions | | | | | $ | 4,604,611 | | | | | | $ | (3,063,753 | ) |
| | | | | | | | | | | | | | |
See accompanying notes to financial statements.
MSF-10
Metropolitan Series Fund, Inc.
Capital Guardian U.S. Equity Portfolio
Financial Highlights
| | | | | | | | | | | | | | | | | | | | |
| | | Class A | |
| | | Year ended December 31, | |
| | | 2007 | | | 2006 | | | 2005 | | | 2004 | | | 2003 | |
Net Asset Value, Beginning of Period | | $ | 13.30 | | | $ | 12.33 | | | $ | 11.66 | | | $ | 10.81 | | | $ | 7.90 | |
| | | | | | | | | | | | | | | | | | | | |
Income From Investment Operations | | | | | | | | | | | | | | | | | | | | |
Net investment income | | | 0.12 | (a) | | | 0.11 | | | | 0.09 | | | | 0.09 | | | | 0.07 | |
Net realized and unrealized gain (loss) of investments | | | (0.09 | ) | | | 1.13 | | | | 0.58 | | | | 0.91 | | | | 2.89 | |
| | | | | | | | | | | | | | | | | | | | |
Total from investment operations | | | 0.03 | | | | 1.24 | | | | 0.67 | | | | 1.00 | | | | 2.96 | |
| | | | | | | | | | | | | | | | | | | | |
Less Distributions | | | | | | | | | | | | | | | | | | | | |
Distributions from net investment income | | | (0.07 | ) | | | (0.13 | ) | | | (0.00 | )(b) | | | (0.15 | ) | | | (0.05 | ) |
Distributions from net realized capital gains | | | (0.82 | ) | | | (0.14 | ) | | | 0.00 | | | | 0.00 | | | | 0.00 | |
| | | | | | | | | | | | | | | | | | | | |
Total distributions | | | (0.89 | ) | | | (0.27 | ) | | | 0.00 | | | | (0.15 | ) | | | (0.05 | ) |
| | | | | | | | | | | | | | | | | | | | |
Net Asset Value, End of Period | | $ | 12.44 | | | $ | 13.30 | | | $ | 12.33 | | | $ | 11.66 | | | $ | 10.81 | |
| | | | | | | | | | | | | | | | | | | | |
Total Return (%) | | | (0.1 | ) | | | 10.1 | | | | 5.8 | | | | 9.3 | | | | 37.7 | |
Ratio of operating expenses to average net assets before expense reductions (%) | | | 0.71 | | | | 0.73 | | | | 0.73 | | | | 0.75 | | | | 0.76 | |
Ratio of operating expenses to average net assets after expense reductions (%) (c) | | | 0.71 | | | | 0.73 | | | | 0.73 | | | | 0.74 | | | | 0.74 | |
Ratio of net investment income to average net assets (%) | | | 0.89 | | | | 0.76 | | | | 0.73 | | | | 0.77 | | | | 0.65 | |
Portfolio turnover rate (%) | | | 45 | | | | 42 | | | | 29 | | | | 45 | | | | 27 | |
Net assets, end of period (000) | | $ | 414,065 | | | $ | 446,828 | | | $ | 426,968 | | | $ | 455,938 | | | $ | 351,867 | |
| |
| | | Class B | |
| | | Year ended December 31, | |
| | | 2007 | | | 2006 | | | 2005 | | | 2004 | | | 2003 | |
Net Asset Value, Beginning of Period | | $ | 13.23 | | | $ | 12.27 | | | $ | 11.63 | | | $ | 10.78 | | | $ | 7.89 | |
| | | | | | | | | | | | | | | | | | | | |
Income From Investment Operations | | | | | | | | | | | | | | | | | | | | |
Net investment income | | | 0.08 | (a) | | | 0.06 | | | | 0.06 | | | | 0.07 | | | | 0.04 | |
Net realized and unrealized gain (loss) of investments | | | (0.09 | ) | | | 1.14 | | | | 0.58 | | | | 0.90 | | | | 2.90 | |
| | | | | | | | | | | | | | | | | | | | |
Total from investment operations | | | (0.01 | ) | | | 1.20 | | | | 0.64 | | | | 0.97 | | | | 2.94 | |
| | | | | | | | | | | | | | | | | | | | |
Less Distributions | | | | | | | | | | | | | | | | | | | | |
Distributions from net investment income | | | (0.03 | ) | | | (0.10 | ) | | | 0.00 | | | | (0.12 | ) | | | (0.05 | ) |
Distributions from net realized capital gains | | | (0.82 | ) | | | (0.14 | ) | | | 0.00 | | | | 0.00 | | | | 0.00 | |
| | | | | | | | | | | | | | | | | | | | |
Total distributions | | | (0.85 | ) | | | (0.24 | ) | | | 0.00 | | | | (0.12 | ) | | | (0.05 | ) |
| | | | | | | | | | | | | | | | | | | | |
Net Asset Value, End of Period | | $ | 12.37 | | | $ | 13.23 | | | $ | 12.27 | | | $ | 11.63 | | | $ | 10.78 | |
| | | | | | | | | | | | | | | | | | | | |
Total Return (%) | | | (0.3 | ) | | | 9.8 | | | | 5.5 | | | | 9.0 | | | | 37.4 | |
Ratio of operating expenses to average net assets before expense reductions (%) | | | 0.96 | | | | 0.98 | | | | 0.98 | | | | 1.00 | | | | 1.01 | |
Ratio of operating expenses to average net assets after expense reductions (%) (c) | | | 0.96 | | | | 0.98 | | | | 0.98 | | | | 0.99 | | | | 0.99 | |
Ratio of net investment income to average net assets (%) | | | 0.64 | | | | 0.51 | | | | 0.48 | | | | 0.56 | | | | 0.39 | |
Portfolio turnover rate (%) | | | 45 | | | | 42 | | | | 29 | | | | 45 | | | | 27 | |
Net assets, end of period (000) | | $ | 109,053 | | | $ | 106,454 | | | $ | 89,728 | | | $ | 68,440 | | | $ | 28,420 | |
| (a) | Per share amount is based on average shares outstanding during the period. |
| (b) | Distributions for the period were less than $0.01. |
| (c) | The Portfolio has entered into arrangements with certain brokers who paid a portion of the Portfolio’s expenses. |
See accompanying notes to financial statements.
MSF-11
Metropolitan Series Fund, Inc.
Capital Guardian U.S. Equity Portfolio
Notes to Financial Statements—December 31, 2007
Metropolitan Series Fund, Inc. (the “Fund”) is organized as a corporation under the laws of Maryland pursuant to Articles of Incorporation filed on November 23, 1982, as amended, and registered under the Investment Company Act of 1940, as amended (the “1940 Act”), as an open-end investment company. The Fund is a “series” type of mutual fund, which issues separate series of stock. Each series represents an interest in a separate portfolio of Fund investments. The Capital Guardian U.S. Equity Portfolio (the “Portfolio”) is a diversified series of the Fund. Shares in the Fund are not offered directly to the general public and are currently available only to separate accounts established by Metropolitan Life Insurance Company (“MetLife”), New England Life Insurance Company, General American Life Insurance Company (“General American”), The MetLife Investors Group of Insurance Companies, MetLife Insurance Company of Connecticut and other affiliated insurance companies (collectively, the “Insurance Companies”), as an investment vehicle for variable life insurance, group annuity or variable annuity products, although the Portfolio is not available to all such separate accounts. The Portfolio’s shares may be divided into different classes. Currently, the classes being offered by the Portfolio are named Class A and Class B. The classes of the Portfolio’s shares are identical, except that certain additional charges (Rule 12b-1 fees) are made against Class B shares. Investment income, realized and unrealized capital gains and losses, the common expenses of the Portfolio and certain Portfolio-level expense reductions, if any, are allocated on a pro rata basis to each class based on the relative net assets of each class to the total net assets of the Portfolio.
| 2. | SIGNIFICANT ACCOUNTING POLICIES: |
The preparation of financial statements in conformity with accounting principles generally accepted in the United States of America (“GAAP”) requires management to make estimates and assumptions that affect the reported amounts of assets and liabilities and disclosure of contingent assets and liabilities as of the date of the financial statements and the reported amounts of income and expenses during the reporting period. Actual results could differ from those estimates.
The following is a summary of significant accounting policies consistently followed by the Portfolio in the preparation of its financial statements. The policies are in conformity with GAAP.
Investment Valuation:
Debt securities (other than short term obligations with a remaining maturity of sixty days or less) are valued by independent pricing services selected by the relevant subadviser pursuant to authorization of the Board of Directors of the Fund (the “Board” or “Directors”). Short term obligations with a remaining maturity of sixty days or less are valued at amortized cost which approximates fair market value.
Equity securities traded on a national securities exchange or exchanges are valued at their last sale price on the principal trading market. Equity securities traded on the NASDAQ National Market System are valued at the NASDAQ Official Closing Price (the “NOCP”). The NOCP is the last sale price if it falls between the spread of the last reported bid and asked prices. If the last reported bid and asked prices are above the last reported sale price, the NOCP will be the last reported bid price. If the last reported bid and asked prices are below the last reported sale price, the NOCP will be the last reported asked price. Equity securities traded on a national securities exchange or exchanges or on the NASDAQ National Market System for which there is no reported sale during the day are valued at the last reported bid price. A security that is listed or traded on more than one exchange is valued at the quotation on the exchange determined to be the primary market for that security by the Board or its delegates. If no closing price is available, then such securities are valued by using the last reported bid price. Equity securities traded over-the-counter are valued at the last reported sales price.
If no current market value quotation is readily available or reliable for a portfolio security, fair value will be determined in accordance with procedures established by and under the general supervision of the Board. When the Portfolio uses fair value pricing, it may take into account any factors it deems appropriate. The value of securities used by the Portfolio to calculate its net asset value may differ from quoted or published prices for the same securities. Fair value pricing involves subjective judgments and the fair value determined for a security may be materially different than the value that could be realized upon the sale of that security.
The Portfolio expects to use fair value pricing for securities primarily traded on U.S. exchanges only under very limited circumstances. For example, the Portfolio may use fair value pricing if the exchange on which a security is traded closes early or trading in the security is suspended.
MSF-12
Metropolitan Series Fund, Inc.
Capital Guardian U.S. Equity Portfolio
Notes to Financial Statements—December 31, 2007—(Continued)
Securities traded primarily on an exchange outside of the United States which closes before the close of the New York Stock Exchange will be valued at the last sales price on that non-U.S. exchange. Securities traded primarily on an exchange outside of the United States for which there is no reported sale during the day are valued at the mean between the last reported bid and asked prices. However, because most foreign markets close well before the Portfolio values its securities (typically at 4 p.m. Eastern Time), the earlier close of these foreign markets gives rise to the possibility that significant events, including broad market moves, may have occurred after these foreign markets close but before the Portfolio values its securities. To account for this, the Portfolio may frequently value many of its foreign equity securities using fair value prices based on third party vendor modeling tools.
Forward foreign currency exchange contracts are valued based on the mean between closing bid and asked prices of the forward currency contract rates in the London foreign exchange markets on a daily basis as provided by a reliable bank or dealer.
Options, whether on securities, indices, futures contracts, or otherwise, are valued at the last sales price available as of the close of business on the day of valuation or, if there is no such sale price available, at the mean between the bid and asked prices. Options on currencies are valued at the spot price each day.
The value of futures contracts will be the sum of the margin deposit plus or minus the difference between the value of the futures contract on each day the net asset value is calculated and the value on the date the futures contract originated, value being that established on a recognized commodity exchange, or by reference to other customary sources, with gain or loss being realized when the futures contract closes or expires.
Subject to the Board’s oversight, the Board has delegated day-to-day responsibility for valuing Portfolio assets to the subadviser of the Portfolio, who values such assets as described above and operates under procedures approved by the Board.
Investment Transactions and Related Investment Income:
Portfolio security transactions are recorded on the trade date. Dividend income is recorded on the ex-dividend date or, for certain foreign securities, when notified. Interest income, which includes amortization of premium and accretion of discount on debt securities, is recorded on the accrual basis. Realized gains and losses on investments and unrealized appreciation and depreciation are determined on the identified cost basis, which is the same basis used for federal income tax purposes.
Repurchase Agreements:
The Portfolio, through the custodian or a subcustodian, receives delivery of the underlying securities collateralizing repurchase agreements. The Portfolio requires the custodian to take possession, to have legally segregated in the Federal Reserve Book Entry System, or to have segregated within the custodian’s vault, all securities held as collateral for repurchase agreements. It is the Portfolio’s policy that the market value of the collateral be at least equal to 100% of the repurchase price in the case of a repurchase agreement of one-day duration and 102% on all other repurchase agreements. The Portfolio’s subadviser is responsible for determining that the value of the collateral is at all times at least equal to the repurchase price. In connection with transactions in repurchase agreements, if the seller defaults and the value of the collateral declines or if the seller enters an insolvency proceeding, realization of the collateral by the Portfolio may be delayed, limited or wholly denied.
Foreign Currency Translation:
The books and records of the Portfolio are maintained in U.S. dollars. The values of securities, currencies and other assets and liabilities denominated in currencies other than U.S. dollars are translated into U.S. dollars based upon foreign exchange rates prevailing at the end of the period. Purchases and sales of investment securities, income and expenses are translated on the respective dates of such transactions. Since the values of investment securities are presented at the foreign exchange rates prevailing at the end of the period, it is not practical to isolate that portion of the results of operations arising from changes in exchange rates from that portion of the results of operations reflecting fluctuations arising from changes in market prices of the investment securities. Such fluctuations are included in the net realized and unrealized gain or loss on investments.
Net realized foreign exchange gains or losses arise from sales of foreign currency, currency gains or losses realized between the trade and settlement dates on securities transactions, and the difference between the amounts of dividends, interest, and foreign withholding taxes recorded by the Portfolio and the U.S. dollar equivalent of the amounts actually received or paid by the Portfolio. Net unrealized foreign exchange gains and losses arise from changes in the value of assets and liabilities, other than investment securities, resulting from changes in the exchange rate.
MSF-13
Metropolitan Series Fund, Inc.
Capital Guardian U.S. Equity Portfolio
Notes to Financial Statements—December 31, 2007—(Continued)
Forward Foreign Currency Exchange Contracts:
The Portfolio may enter into forward foreign currency exchange contracts primarily to hedge against foreign currency exchange rate risks on its non-U.S. dollar denominated investment securities. When entering into a forward currency contract, the Portfolio agrees to receive or deliver a fixed quantity of foreign currency for an agreed-upon price on an agreed future date. These contracts are valued daily and the Portfolio’s net equity therein, representing unrealized gain or loss on the contracts as measured by the difference between the foreign exchange rates at the dates of entry into the contracts and the forward rates at the settlement date, is included in the Statement of Assets and Liabilities. Realized and unrealized gains and losses are included in the Statement of Operations. These instruments involve market and/or credit risk in excess of the amount recognized in the Statement of Assets and Liabilities. Risks arise from the possible inability of counterparties to meet the terms of their contracts and from movement in currency and securities values and interest rates.
Futures Contracts:
The Portfolio may buy and sell futures contracts (on recognized exchanges) as a hedge or to enhance return. Futures contracts are agreements to buy or sell a security, or deliver a final cash settlement price in connection with an index, interest rate, currency, or other contracts not calling for physical delivery, for a set price in the future. The Portfolio must post an amount equal to a portion of the total market value of the futures contract as futures variation margin, which is returned when the Portfolio’s obligations under the contract have been satisfied. From time to time thereafter, the Portfolio may have to post variation margin to maintain this amount as the market value of the contract fluctuates. Risks of entering into futures contracts (and related options) include the possibility that there may be an illiquid market and that a change in the value of the contract or option may not correlate with changes in the value of the underlying securities.
Options:
The Portfolio may use options to hedge against changes in values of securities the Portfolio owns or expects to purchase. Writing puts or buying calls tends to increase the Portfolio’s exposure to the underlying instrument and writing calls or buying puts tends to decrease the Portfolio’s exposure to the underlying instrument, and can be used to hedge other Portfolio investments. For options purchased to hedge the Portfolio’s investments, the potential risk to the Portfolio is that the change in value of options contracts may not correspond to the change in value of the hedged instruments. In addition, losses may arise from changes in the value of the underlying instruments, if there is an illiquid secondary market, or if the counterparty is unable to perform. The maximum loss for purchased options is limited to the premium initially paid for the option. For options written by the Portfolio, the maximum loss is not limited to the premium initially received for the option.
The main risk associated with purchasing an option is that the option expires without being exercised. In this case, the option expires worthless and the premium paid for the option is considered the loss. The risk associated with writing a call option is that the Portfolio may forgo the opportunity for a profit if the market value of the underlying position increases and the option is exercised. The risk in writing a put option is that the Portfolio may incur a loss if the market value of the underlying position decreases and the option is exercised. In addition, the Portfolio risks not being able to enter into a closing transaction for the written option as the result of an illiquid market.
“When-Issued” Securities:
Purchasing securities “when-issued” is a forward commitment by the Portfolio to buy a security. The estimated amount of the Portfolio’s payment obligation and the security’s interest rate are determined when the commitment is made, even though no interest accrues until the security is issued, which is generally 15 to 120 days later. The Portfolio will segregate liquid assets with its custodian sufficient at all times to satisfy these commitments. If the value of the security is less when delivered than when the commitment was made, the Portfolio will suffer a loss.
Federal Income Taxes:
It is the Portfolio’s policy to comply with the requirements of the Internal Revenue Code of 1986, as amended, and regulations thereunder, applicable to regulated investment companies and to distribute all of its taxable income to shareholders. Therefore, no federal income tax provision is required.
MSF-14
Metropolitan Series Fund, Inc.
Capital Guardian U.S. Equity Portfolio
Notes to Financial Statements—December 31, 2007—(Continued)
As of December 31, 2007, the Portfolio had capital loss carryovers as follows:
| | | | | | |
Expiring
12/31/09 | | Expiring
12/31/08 | | Total |
| $8,209,090 | | $ | 34,687,599 | | $ | 42,896,689 |
The utilization of the capital loss carryforward acquired as part of a merger may be limited under section 382 of the Internal Revenue Code.
The tax character of distributions paid for the periods ended December 31, 2007 and 2006 was as follows:
| | | | | | | | | | | | | | | | | | | | | | |
| Ordinary Income | | Long Term Gain | | Return of Capital | | Total |
| 2007 | | 2006 | | 2007 | | 2006 | | 2007 | | 2006 | | 2007 | | 2006 |
| $ | 5,251,860 | | $ | 4,970,445 | | $ | 29,878,354 | | $ | 5,560,669 | | $ | — | | $ | — | | $ | 35,130,214 | | $ | 10,531,114 |
As of December 31, 2007, the components of distributable earnings (accumulated losses) on a federal income tax basis were as follows:
| | | | | | | | | | | | | |
Undistributed
Ordinary
Income | | Undistributed
Long Term
Gain | | Unrealized
Appreciation | | Loss
Carryforwards | | | Total |
| $4,824,890 | | $ | 56,343,609 | | $ | 15,088,793 | | $ | (42,896,689 | ) | | $ | 33,360,603 |
Dividends and Distributions to Shareholders:
The Portfolio records dividends and distributions on the ex-dividend date. Net realized gains from security transactions (if any) are generally distributed annually to shareholders. The timing and characterization of certain income and capital gains distributions are determined in accordance with federal tax regulations that may differ from GAAP. Permanent book and tax basis differences relating to shareholder distributions will result in reclassification between under/over distributed net investment income, accumulated net realized gains/losses and paid in capital.
Expense Reductions:
Certain Portfolio trades are directed to brokers who paid a portion of the Portfolio’s expenses. Amounts paid for the Portfolio are shown as expense reductions in the Statement of Operations.
| 3. | INVESTMENT TRANSACTIONS: |
For the year ended December 31, 2007, purchases and sales of securities (excluding short term investments) for the Portfolio were as follows:
| | | | | | | | | |
| Purchases | | Sales |
| U.S. Government | | Other | | U.S. Government | | Other |
| $0 | | $ | 254,422,527 | | $ | 0 | | $ | 281,721,289 |
| 4. | INVESTMENT MANAGEMENT FEES AND OTHER TRANSACTIONS WITH AFFILIATES: |
Investment Management Agreement:
MetLife Advisers, LLC (“MetLife Advisers”) is the investment adviser to the Portfolio. The Fund has entered into an investment management agreement with MetLife Advisers with respect to the Portfolio. For providing investment management services to the Portfolio, MetLife Advisers receives monthly compensation at the following annual rates:
| | | | | | |
| | | Management
Fees earned by
MetLife Advisers
for the year ended
December 31, 2007 | | Annual
percentage
rates paid to
MetLife Advisers | | Based on Portfolios
average daily net asset levels |
| | $3,770,032 | | 0.700% | | Of the first $200 million |
| | | | 0.650% | | Of the next $300 million |
| | | | 0.600% | | Of the next $1.5 billion |
| | | | 0.550% | | On amounts in excess of $2 billion |
MSF-15
Metropolitan Series Fund, Inc.
Capital Guardian U.S. Equity Portfolio
Notes to Financial Statements—December 31, 2007—(Continued)
Certain officers and directors of the Fund may also be officers of MetLife Advisers; however, such officers and directors receive no compensation from the Fund.
MetLife Advisers has entered into an investment subadvisory agreement with respect to the Portfolio. Capital Guardian Trust Company is compensated by MetLife Advisers to provide subadvisory services for the Portfolio.
Service and Distribution Fees:
The Fund has adopted a Distribution and Service Plan under Rule 12b-1 of the 1940 Act for the Portfolio’s Class B shares. Under the Distribution and Service Plan, the Class B shares of the Portfolio pay a fee to compensate the Insurance Companies (or their affiliates) and other broker-dealers and financial intermediaries involved in the offer and sale of Portfolio shares for promoting or selling and servicing, the Class B shares. The fees under the Distribution and Service Plan for each class of the Portfolio’s shares are calculated as a percentage of the Portfolio’s average daily net assets that are attributable to that Class. Currently, the fee is 0.25% per year for Class B shares. Amounts paid by the Portfolio for the year ended December 31, 2007 are shown as Service and Distribution fees in the Statement of Operations.
As previously reported, in May 2004, General American received a Wells Notice stating that the SEC staff was considering recommending that the SEC bring a civil action alleging violations of the U.S. securities laws against General American with respect to market timing and late trading in a limited number of privately-placed variable insurance contracts that were sold through General American. General American responded to the SEC staff and cooperated with the investigation. On August 9, 2007, the SEC announced that it had settled an enforcement action regarding late trading against General American with, among other things, General American agreeing to pay a civil penalty and to comply with certain undertakings. General American consented to the SEC’s order without admitting or denying the findings. MetLife Advisers has also advised the Fund’s Board of Directors that, while certain exceptions to the Fund’s policies have been noted, no situations have been identified that would have a material impact on the financial position of the Fund.
| 6. | RECENT ACCOUNTING PRONOUNCEMENTS: |
Effective June 29, 2007, the Fund implemented Financial Accounting Standards Board (“FASB”) Interpretation No. 48, “Accounting for Uncertainty in Income Taxes—an interpretation of FASB Statement No. 109” (“FIN 48”). FIN 48 prescribes the minimum recognition threshold a tax position must meet in connection with accounting for uncertainties in income tax positions taken or expected to be taken by an entity, including investment companies, before being measured and recognized in the financial statements. Management has evaluated the application of FIN 48 to the Fund, and has determined that the adoption of FIN 48 does not have a material impact on the Fund’s financial statements. The Fund files U.S. tax returns. No income tax returns are currently under examination. The statute of limitations on the Fund’s tax returns remains open for the years ended December 31, 2004 through December 31, 2006.
In September 2006, Statement of Financial Accounting Standards No. 157, Fair Value Measurements (SFAS 157) was issued and is effective for fiscal years beginning after November 15, 2007. SFAS 157 defines fair value, establishes a framework for measuring fair value and expands disclosures about fair value measurements. Management is currently evaluating the impact the adoption of SFAS 157 will have on the Portfolio financial statement disclosures.
MSF-16
Metropolitan Series Fund, Inc.
Capital Guardian U.S. Equity Portfolio
Report of Independent Registered Public Accounting Firm
To the Shareholders and Board of Directors of the Metropolitan Series Fund, Inc.:
We have audited the accompanying statement of assets and liabilities, including the schedule of investments, of the Capital Guardian U.S. Equity Portfolio, one of the portfolios constituting the Metropolitan Series Fund, Inc. (the “Fund”) as of December 31, 2007, and the related statement of operations for the year then ended, the statements of changes in net assets for each of the two years in the period then ended, and the financial highlights for each of the five years in the period then ended. These financial statements and financial highlights are the responsibility of the Fund’s management. Our responsibility is to express an opinion on these financial statements and financial highlights based on our audits.
We conducted our audits in accordance with the standards of the Public Company Accounting Oversight Board (United States). Those standards require that we plan and perform the audit to obtain reasonable assurance about whether the financial statements and financial highlights are free of material misstatement. The Fund is not required to have, nor were we engaged to perform, an audit of its internal control over financial reporting. Our audits included consideration of internal control over financial reporting as a basis for designing audit procedures that are appropriate in the circumstances, but not for the purpose of expressing an opinion on the effectiveness of the Fund’s internal control over financial reporting. Accordingly, we express no such opinion. An audit also includes examining, on a test basis, evidence supporting the amounts and disclosures in the financial statements, assessing the accounting principles used and significant estimates made by management, as well as evaluating the overall financial statement presentation. Our procedures included confirmation of securities owned as of December 31, 2007, by correspondence with the custodian and brokers; where replies were not received from brokers, we performed other auditing procedures. We believe that our audits provide a reasonable basis for our opinion.
In our opinion, the financial statements and financial highlights referred to above present fairly, in all material respects, the financial position of the Capital Guardian U.S. Equity Portfolio of the Metropolitan Series Fund, Inc. as of December 31, 2007, the results of its operations for the year then ended, the changes in its net assets for each of the two years in the period then ended, and the financial highlights for each of the five years in the period then ended, in conformity with accounting principles generally accepted in the United States of America.
Deloitte & Touche LLP
Boston, Massachusetts
February 21, 2008
MSF-17
Metropolitan Series Fund, Inc.
Directors and Officers
The Fund’s Directors review actions of the Fund’s investment adviser and subadvisers, and decide upon matters of general policy. The Fund’s officers supervise the daily business operations of the Fund. The Board of Directors and the Fund’s officers are listed below. Each Director is responsible for overseeing all 36 Portfolios of the Fund. There is no limit to the term a Director may serve. Directors serve until their resignation, retirement or removal in accordance with the Fund’s organizational documents and policies adopted by the Board from time to time. Officers hold office at the pleasure of the Board or until the election or appointment and the qualification of a successor. The address of the directors and officers is c/o Metropolitan Series Fund, Inc., 501 Boylston Street, Boston, MA 02116.
Interested Directors(1)
Each Director below is an “interested person” (as defined by the 1940 Act) with respect to the Fund in that Ms. Forget is an employee of MetLife and Mr. Typermass is a former employee of MetLife and owns securities issued by MetLife, Inc., the ultimate parent company of MetLife Advisers.
| | | | | | | | |
Name, Address and Age | | Current
position(s)
with Fund | | Position(s)
held since | | Principal occupations
over past five years, including other directorships(2) | | Number of
Portfolios in
Fund Complex
Overseen by
Director(3) |
Elizabeth M. Forget Age: 41 | | Director, Chairman of the Board, President and Chief Executive Officer | | 2006 | | Senior Vice President (since 2007), MetLife, Inc.; President, Met Investors Advisory, LLC (“MIA”); Trustee and President, Met Investors Series Trust (“MIST”); Executive Vice President, MetLife Investors Group, Inc.; President (since 2006), MetLife Advisers. | | 81 |
| | | | |
Arthur G. Typermass Age: 70 | | Director | | 1998 | | Formerly, Senior Vice President and Treasurer, MetLife. | | 37 |
Non-Interested Directors(1)
Each Director below is not an “interested person” (as defined by the 1940 Act) with respect to the Fund (collectively, the “Independent Directors”).
| | | | | | | | |
Name, Address and Age | | Current
position(s)
with Fund | | Position(s)
held since | | Principal occupations
over past five years, including other directorships(2) | | Number of
Portfolios in
Fund Complex
Overseen by
Director(3) |
Steve A. Garban† Age: 70 | | Director | | 1985 | | Formerly, Chief Financial Officer, Senior Vice President Finance and Operations and Treasurer (Emeritus), The Pennsylvania State University. | | 37 |
| | | | |
Linda B. Strumpf Age: 60 | | Director | | 2000 | | Vice President and Chief Investment Officer, Ford Foundation. | | 37 |
| | | | |
Michael S. Scott Morton† Age: 70 | | Director | | 1993 | | Jay W. Forrester Professor of Management (Emeritus) at Sloan School of Management, MIT. | | 37 |
| | | | |
H. Jesse Arnelle Age: 74 | | Director | | 2001 | | Formerly, Counsel, Womble Carlyle Sandrie & Rice; Director, Textron Inc. (global multi-industry company)*; formerly, Director, Gannet Co. Inc. (diversified news and information company)*; formerly, Director, Eastman Chemical Company (global chemical company)*; formerly, Director, Waste Management, Inc.*; formerly, Director, Armstrong Holdings Inc. (parent company of floor and ceiling products business)*; formerly, Director, FPL Group Inc. (public utility holding company)*; Director, URS Corporation (engineering design services firm)*. | | 37 |
| | | | |
Nancy Hawthorne Age: 56 | | Director | | 2003 | | Director, Avid Technologies (computer software company)*; formerly, Chairman of the Board of Avid Technologies; formerly, Board of Advisors, L. Knife & Sons, Inc. (beverage distributor); Chief Executive Officer, Clerestory LLC (corporate financial advisor); formerly, Trustee, New England Zenith Fund (“Zenith Fund”)**; formerly, Chief Executive Officer and Managing Partner, Hawthorne, Krauss and Associates (corporate financial advisor); formerly, Chief Financial Officer and Executive Vice President, Continental Cablevision, subsequently renamed MediaOne (cable television company); formerly, Director, Life F/X, Inc.; formerly, Chairman of the Board, WorldClinic (distance medicine company); formerly, Director, Perini Corporation (construction company)*; formerly, Director, CGU (property and casualty insurance company); formerly, Director, Beacon Power Corporation (energy company )*. | | 37 |
MSF-18
Metropolitan Series Fund, Inc.
Directors and Officers—(Continued)
| | | | | | | | |
Name, Address and Age | | Current
position(s)
with Fund | | Position(s)
held since | | Principal occupations
over past five years, including other directorships(2) | | Number of
Portfolios in
Fund Complex
Overseen by
Director(3) |
John T. Ludes Age: 71 | | Director | | 2003 | | President, LFP Properties (consulting firm); Formerly, Trustee, Zenith Fund**; formerly, Vice Chairman, President and Chief Operating Officer, Fortune Brands/American Brands (global conglomerate); formerly, President and CEO, Acushnet Company (athletic equipment company). | | 37 |
Officers(1)
| | | | | | | | |
Name and address | | Age | | Current
position(s)
with Fund | | Position(s)
held since | | Principal occupations over past five years(2) |
| Jeffrey P. Halperin | | 40 | | Chief Compliance Officer | | 2006 | | Vice President (since 2006), Corporate Ethics and Compliance Department, MetLife, Inc.; Chief Compliance Officer (since 2006), MetLife Advisers, MIA and MIST. |
| | | | |
| John F. Guthrie, Jr. | | 64 | | Senior Vice President | | 2002 | | Manager and Senior Vice President, MetLife Advisers; Vice President, MetLife; Vice President (since 2003), MetLife Group, Inc.; Vice President, NELICO; Vice President (since 2005), MIA; formerly, Senior Vice President, Zenith Fund**. |
| | | | |
| Alan C. Leland | | 55 | | Senior Vice President | | 2005 | | Treasurer and Chief Financial Officer, MetLife Advisers, LLC; Treasurer (since 2005), Met Investors Advisory, LLC; Vice President (since 2004), MIA; Vice President (since 2003), MetLife Group, Inc.; Vice President, MetLife; Senior Vice President, NELICO |
| | | | |
| Peter Duffy | | 52 | | Vice President and Treasurer | | 2000 | | Senior Vice President, MetLife Advisers (since 1998); Second Vice President (since 2003), NELICO; Vice President, MetLife (since 2004); Vice President (since 2004), MetLife Group, Inc.; formerly, Vice President and Treasurer, Zenith Fund**. |
| | | | |
| Thomas M. Lenz | | 49 | | Vice President and Secretary | | 2002 | | General Counsel and Secretary, MetLife Advisers; Assistant General Counsel, MetLife; formerly, Vice President and Secretary, Zenith Fund**. |
| * | Indicates a directorship with a registered investment company or a company subject to the reporting requirements of the Securities Exchange Act of 1934, as amended. |
| ** | The Zenith Fund deregistered with the Securities and Exchange Commission (“SEC”) in 2004. |
| (†) | Served as a trustee, director and/or officer of one or more of the following companies, each of which had a direct or indirect advisory relationship with MetLife Advisers or its affiliates prior to January 31, 2005: State Street Research Financial Trust, State Street Research Income Trust, State Street Research Money Market Trust, State Street Research Institutional Funds, State Street Research Capital Trust, State Street Research Master Investment Trust, State Street Research Equity Trust, State Street Research Securities Trust and State Street Research Exchange Trust (collectively, the “State Street Research Funds”). |
| (1) | Each Director of the Fund also serves as trustee of Metropolitan Series Fund II (“Met Series Fund II”), a registered investment company advised by MetLife Advisers. Each officer of the Fund serves in the same position with Met Series Fund II, which consists of one portfolio. |
| (2) | Previous positions during the past five years with the Fund, MIST, MetLife, MetLife Advisers, MIA, Zenith Fund, NELICO or New England Securities Corporation are omitted if not materially different. |
| (3) | The Fund Complex includes the Fund (36 portfolios), Met Series Fund II (1 portfolio) and MIST (44 portfolios) |
MSF-19
Metropolitan Series Fund, Inc.
Capital Guardian U.S. Equity Portfolio
Board Approval of Advisory and Subadvisory Agreements
The Fund’s Contract Review Committees of the Board of Directors (the “Board”) typically meet in early fall to review the Portfolios’ advisory agreements (the “Advisory Agreements”) and subadvisory agreements (collectively, the “Subadvisory Agreements,” and, together with the Advisory Agreements, the “Agreements”) and determine whether to recommend that the full Board approve the continuation of the Agreements for an additional one-year period. (Following the initial approval of an Agreement for a new Portfolio or with a new adviser or subadviser, such annual reviews are not required until 2 years following the execution of such Agreement.) After each Committee has made its recommendations, the full Board, including the Independent Directors, determines whether to approve the continuation of each of the Agreements. In addition, the Board, including the Independent Directors, considers matters bearing on the Agreements at most of its other meetings throughout the year and regularly interviews various individuals at MetLife Advisers responsible for the management of the Portfolios. The Directors also interview selected investment managers and other professionals at the subadvisers at various times throughout the year.
The Directors receive all materials that they or MetLife Advisers, the Fund’s investment adviser, and the subadvisers believe to be reasonably necessary for the Directors to evaluate the Agreements and determine whether to approve the continuation of the Agreements. These materials generally include, among other items, (i) information on the investment performance of the Portfolios and the performance of peer groups of funds and the Portfolios’ performance benchmarks, (ii) information on the Portfolios’ advisory and subadvisory fees and other expenses, including information comparing the Portfolios’ expenses to those of peer groups of funds and information about any applicable expense caps and fee “breakpoints,” (iii) sales and redemption data, (iv) information related to the profitability of the Agreements to MetLife Advisers and the subadvisers, and potential “fall-out” or ancillary benefits that MetLife Advisers, the subadvisers or their affiliates may receive as a result of their relationships with the Fund and (v) information obtained through the subadvisers’ responses to certain requests from MetLife Advisers and the Directors and MetLife Advisers’ responses to requests from the Directors. The Directors may also consider other information such as (vi) MetLife Advisers’ and the subadvisers’ financial results and condition, (vii) each Portfolio’s investment objectives and strategies and the size, education and experience of the investment staffs of MetLife Advisers and the relevant subadvisers and their use of technology and external research, (viii) the allocation of the Portfolios’ brokerage, if any, including allocations to brokers affiliated with the subadvisers and the use of “soft” commission dollars to pay Portfolio expenses and to pay for research and other similar services, (ix) the resources devoted to, and the record of compliance with, the Portfolios’ investment policies and restrictions, policies on personal securities transactions and other compliance policies, (x) the responses of MetLife Advisers, the subadvisers and/or their affiliates to certain legal and regulatory proceedings and (xi) the economic outlook generally and for the mutual fund industry in particular. Throughout the process, the Directors have the opportunity to ask questions of and request additional materials from MetLife Advisers and the subadvisers.
Following meetings of each Contract Review Committee on September 12, 2007, the Board, at its November 15, 2007 meeting, approved the continuation through December 31, 2008 of the Advisory Agreements for each Portfolio of the Fund and the Subadvisory Agreements for each Portfolio of the Fund. The Agreements approved for continuation are referred to below as the “Continued Agreements.”
In considering whether to approve the continuation of the Continued Agreements, the Directors, including the Independent Directors, did not identify any single factor as determinative, and each weighed the various factors as he or she deemed appropriate. The Directors considered the following matters in connection with their approval of the Continued Agreements:
The nature, extent and quality of the services provided to the relevant Portfolios under the Continued Agreements. The Directors considered the nature, extent and quality of the services provided by MetLife Advisers, the relevant subadvisers (if any) and their affiliates (each, an “Adviser,” and, collectively, the “Advisers”) to the relevant Portfolios pursuant to the Continued Agreements and the resources dedicated to these Portfolios by the Advisers. In particular, the Directors considered the Advisers’ abilities to attract and retain highly qualified investment professionals. With respect to MetLife Advisers, the Directors considered that MetLife Advisers is (i) ultimately responsible for the performance of such Portfolios; (ii) ultimately responsible for the establishment of the investment strategies of each such Portfolio, primarily through its recommendations to the Board regarding the hiring and selection of subadvisers; (iii) responsible for the hiring and selection, subject to Board approval, of subadvisers; and (iv) responsible for maintaining a program of Subadviser oversight reasonably designed to ensure that the subadvisers have reasonable compliance policies and procedures in place. The Directors also considered that MetLife Advisers provides a full range of day-to-day administrative services for the Portfolios involving all aspects of such Portfolios’ day-to-day operations (other than portfolio management). After reviewing these and related factors, the Directors concluded, within the context of their overall conclusions regarding each of the Continued Agreements, that the nature, extent and quality of services provided supported the renewal of these Agreements.
Investment performance of the relevant Portfolios. The Directors reviewed information about the performance of the relevant Portfolios over various time periods, including information prepared by an independent third party that compared the performance of
MSF-20
Metropolitan Series Fund, Inc.
Capital Guardian U.S. Equity Portfolio
Board Approval of Advisory and Subadvisory Agreements—(Continued)
the Portfolios to the performance of peer groups of funds and performance benchmarks. The Directors also reviewed a description of the third party’s methodology for identifying a Portfolio’s peer group(s) for purposes of performance and expense comparisons.
In the case of each relevant Portfolio that had performance that lagged its peer group(s) for certain periods, the Directors concluded that other factors relevant to performance were sufficient, in light of other considerations, to warrant renewal of the Continued Agreements relating to such Portfolio. These factors varied from Portfolio to Portfolio, but included one or more of the following: (i) that such Portfolio’s performance, although lagging in certain recent periods, was stronger over the longer term; (ii) that the underperformance was attributable, to a significant extent, to investment decisions that were reasonable and consistent with the Portfolio’s investment objective(s) and policies and that the Portfolio was performing within the range of reasonable expectations, given market conditions and the Portfolio’s investment objective(s) and policies; (iii) that the Portfolio’s performance was competitive when compared to other relevant performance benchmarks or peer groups; and (iv) that MetLife Advisers and/or the relevant subadviser (if any) had taken or was taking steps designed to help improve the Portfolio’s investment performance.
The Directors also considered the investment performance of the Advisers and their reputations generally, the historical responsiveness of the Advisers to Director concerns about performance and the willingness of the Advisers to take steps intended to improve performance.
After reviewing these and related factors, the Directors concluded, within the context of their overall conclusions regarding each of the Continued Agreements, that the investment performance of each relevant Portfolio and Adviser was sufficient, in light of other considerations, to warrant the renewal of the Continued Agreements.
The costs of the services to be provided and profits to be realized by the Advisers and their affiliates from their relationships with the Portfolios. The Directors considered the fees charged by MetLife Advisers to the Portfolios for advisory services and, with respect to the subadvised Portfolios, by such subadvisers to MetLife Advisers for subadvisory services (such advisory and subadvisory fees (if any), collectively, “Fees”), as well as the total expense levels of the Portfolios. This information included comparisons (provided by an independent third party) of the Portfolios’ advisory fees and total expense levels to those of their peer groups. In evaluating Fees for the relevant Portfolios, the Directors also took into account the demands, complexity and quality of the investment management services provided to each Portfolio. The Directors considered MetLife Advisers’ recommendations regarding reductions in Fee rates, implementation of Fee breakpoints and institution of Fee waivers and expense caps.
The Directors also considered the compensation directly or indirectly received by the Advisers and their affiliates from their relationships with the relevant Portfolios. The Directors reviewed information relating to the profits received by MetLife Advisers, certain of the subadvisers and their affiliates as a result of their relationships with the relevant Portfolios, and information about the allocation of expenses used to calculate profitability. When reviewing profitability, the Directors also considered the performance of the relevant Portfolios, the expense levels of such Portfolios and whether the relevant Advisers had implemented breakpoints, fee waivers and/or expense caps with respect to such Portfolios.
After reviewing these and related factors, the Directors concluded, within the context of their overall conclusions regarding each of the Continued Agreements, that the Fees charged to each of the relevant Portfolios were fair and reasonable, and that the information provided regarding costs of these services generally, and the related profitability (if known) to the relevant Advisers of their relationships with the relevant Portfolios, supported the renewal of the Continued Agreements.
Economies of Scale. The Directors considered the existence of any economies of scale in the provision of services by the Advisers and whether those economies were shared with the relevant Portfolios through breakpoints in their advisory fees or other means, such as expense caps, fee waivers or relatively low levels of fees. The Directors noted that most of the relevant Portfolios benefited or will benefit from breakpoints, expense caps and/or fee waivers with respect to their advisory fees. In considering these issues, the Directors also took into consideration information relating to the costs of the services provided and the profitability to MetLife Advisers, the relevant subadvisers (if any) and each of their affiliates of their relationships with the relevant Portfolios, as discussed above.
After reviewing these and related factors, the Directors concluded, within the context of their overall conclusions regarding each of the Continued Agreements, that the extent to which economies of scale were shared with the relevant Portfolios supported the renewal of such Agreements.
Other Factors. The Directors also considered other factors, which included but were not limited to the following:
| | • | | the extent to which each relevant Portfolio operated in accordance with its investment objective, and its record of compliance with its investment restrictions and the compliance programs of the Fund and the Advisers. They also considered the compliance-related resources the Advisers and their affiliates provide to the relevant Portfolios; |
MSF-21
Metropolitan Series Fund, Inc.
Capital Guardian U.S. Equity Portfolio
Board Approval of Advisory and Subadvisory Agreements—(Continued)
| | • | | the nature, quality, cost and extent of administrative and shareholder services performed by MetLife Advisers and its affiliates under the Advisory Agreements; and |
| | • | | so-called “fall-out benefits” to the Advisers, such as the engagement of their affiliates to provide distribution, brokerage and transfer agency services to the Portfolios, and the benefits of research made available to the relevant Advisers by reason of brokerage commissions generated by the relevant Portfolios’ securities transactions. The Directors also considered the possible conflicts of interest associated with these fall-out and other benefits, and the reporting and other processes in place to disclose and monitor these possible conflicts of interest. |
Based on their evaluation of all factors that they deemed to be material, including those factors described above, and assisted by the advice of independent counsel, the Directors, including the Independent Directors, concluded that each of the Continued Agreements should be continued through December 31, 2008.
MSF-22
A description of the policies and procedures that the Fund uses to determine how to vote proxies relating to portfolio securities is available (i) without charge, upon request, by calling (800) 638-7732 and (ii) on the Securities and Exchange Commission’s (the “SEC”) website at http://www.sec.gov.
Information regarding how the Fund voted proxies relating to portfolio securities during the most recent twelve-month period ended December 31, 2007 is available (i) without charge, upon request, by calling (800) 638-7732 and (ii) on the SEC’s website at http://www.sec.gov.
The Fund files with the SEC a complete schedule of its portfolio holdings, as of the close of the first and third quarters of its fiscal year, on “Form N-Q”. These filings are available on the SEC’s website at www.sec.gov and may be reviewed and copied at the SEC’s Public Reference Room in Washington, DC. (Call 1-800-SEC-0330 for information on the operation of the Public Reference Room.)
MSF-23
| | |
Davis Venture Value Portfolio Metropolitan Series Fund, Inc. Annual Report | | December 31, 2007 |
Letter from the President
February 1, 2008
Letter to Policy Holders:
2007 was a tumultuous year in the financial markets driven by concerns in the credit markets surrounding sub-prime mortgages and fears of recession in the U.S. Economy. The broad markets were mixed, with the Dow Jones Industrial Average up 8.9% and the MSCI EAFE Index, which measures the performance of international equities, up 11.2% for the year, while the Russell 2000 Index, which measures the performance of small capitalization stocks, was down 1.6%.
In the fixed income markets, credit spreads increased as a result of the pressure from sub-prime mortgage crisis and the Federal Reserve lowered interest rates by a total of 1% during the year. The Lehman Brothers Aggregate Bond Index posted a 7.0% return for the year.
On the following pages, you will find a complete review of your Portfolio and its investment performance.
MetLife is committed to building your financial freedom. We appreciate your trust and will continue to focus our efforts on meeting your investment needs.
Sincerely,
Elizabeth Forget
President, Metropolitan Series Fund, Inc.
Metropolitan Series Fund, Inc.
Davis Venture Value Portfolio
Managed by Davis Selected Advisers, L.P.
Portfolio Manager Commentary*
PORTFOLIO PERFORMANCE
For the year ended December 31, 2007, the Class A shares of the Davis Venture Value Portfolio returned 4.6%, compared to its benchmark, the Standard & Poor’s 500 Index1, which returned 5.5%. The average return of its peer group, the Lipper Variable Insurance Products Large-Cap Value Funds Universe2, was 1.7% over the same period.
PORTFOLIO REVIEW
The energy, material, and utility sectors within the S&P 500 Index turned in the strongest performance over the 12-month period. The financial and consumer discretionary sectors turned in the weakest performance over the 12-month period.
The energy sector was the top-performing sector of the S&P 500 Index. Energy companies were also the most important contributor to the Portfolio’s performance over the year. The Portfolio’s energy companies out-performed the corresponding sector within the S&P 500 Index (up 45% versus 34% for the S&P 500) and the Portfolio also benefited from a higher relative average weighting in this sector (13% versus 11% for the S&P 500). ConocoPhillips, Occidental Petroleum, China Coal Energy, Devon Energy, and EOG Resources were among the top contributors to performance.
The Portfolio made a significant investment in consumer staple companies, and they were the second most important contributor to performance. The Portfolio’s consumer staple companies out-performed the corresponding sector within the S&P 500 Index (up 21% for the Portfolio’s consumer staple holdings versus 14% for consumer staple sector of the S&P 500), and the Portfolio also benefited from a higher relative average weighting in this sector (14% versus 10% for the S&P 500). Altria and Costco were among the top contributors to performance.
The Portfolio managers identified a number of investment opportunities in foreign companies. The Portfolio ended the period with approximately 13% of its assets invested in foreign companies (including American Depositary Receipts). As a group, the foreign companies owned by the Portfolio out-performed the S&P 500 Index over the period.
The most important detractors from performance relative to the S&P 500 Index over the year were that the Portfolio had a higher weighting in financial companies, which was a poorly performing sector; a lower weighting in information technology companies, which was a strongly performing sector; and poor stock selection among material companies.
The financial sector was the worst performing sector of the S&P 500 Index. The Portfolio’s financial companies out-performed the corresponding sector within the S&P 500 Index (down 9% versus down 19% for the S&P 500), but were still the largest detractors from performance. A higher relative average weighting in this sector (38% versus 21% for the S&P 500) detracted from both absolute and relative performance. While Berkshire Hathaway was among the top contributors to performance, Citigroup, American International Group, Wachovia, American Express, Moody’s, Ambac Financial Group, and E-Trade Financial were among the top detractors from performance.
The weak performance of the Portfolio’s consumer discretionary companies (down 14% versus down 13% for the S&P 500), along with a higher relative average weighting in this poor performing sector (11% versus 10% for the S&P 500) detracted from both absolute and relative performance. While Amazon.com was among the top contributors to performance, Comcast and Harley Davidson were among the top detractors from performance.
* The views expressed above are those of the subadvisory firm as of December 31, 2007 and are subject to change based on market and other conditions. Information about the Portfolio’s holdings, asset allocation, industry allocation, or country diversification is historical and is not an indication of future Portfolio composition, which will vary. The performance of any index mentioned in this commentary has not been adjusted for ongoing management, distribution and operating expenses, and sales charges applicable to mutual fund investments. Direct investment in the Index is not possible.
1 The Standard & Poor’s (S&P) 500® Stock Index is an unmanaged index representing the performance of 500 major companies, most of which are listed on the New York Stock Exchange.
2 The Lipper Variable Insurance Products Fund Average is an average of the total return performance (calculated on the basis of net asset value) of variable product funds with similar investment objectives to those of the subject Portfolio as calculated by Lipper Analytical Services, an independent mutual fund ranking service.
MSF-2
Metropolitan Series Fund, Inc.
Davis Venture Value Portfolio
A $10,000 INVESTMENT COMPARED TO
THE S&P 500 INDEX
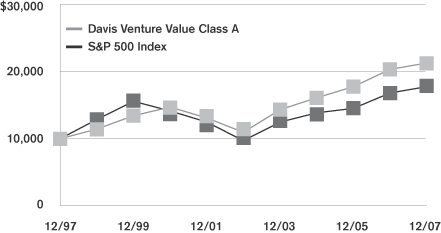
Average Annual Returns as of December 31, 2007
| | | | | | | | | | | | |
| | | Davis Venture
Value Portfolio | | | S&P 500
Index | |
| | | Class A | | | Class B | | | Class E | | |
| 1 Year | | 4.6 | % | | 4.3 | % | | 4.4 | % | | 5.5 | % |
| 5 Year | | 14.2 | | | 13.9 | | | 14.0 | | | 12.8 | |
| 10 Year | | 7.8 | | | — | | | — | | | 5.9 | |
| Since Inception | | — | | | 12.5 | | | 6.0 | | | — | |
Performance numbers are net of all Portfolio expenses but do not include any insurance, sales, or administrative charges of variable annuity or life insurance contracts. If these charges were included, the returns would be lower.
Inception dates of the Class A, Class B and Class E shares are: 10/31/94, 7/30/02, 2/20/01 respectively.
This information represents past performance and is not indicative of future results. Investment return and principal value may fluctuate so that shares, upon redemption, may be worth more or less than the original cost.
PORTFOLIO COMPOSITION
as of December 31, 2007
Top Holdings
| | |
| | | % of Total
Net Assets |
ConocoPhillips | | 4.6% |
American Express Co. | | 4.0% |
Altria Group, Inc. | | 3.8% |
Costco Wholesale Corp. | | 3.8% |
American International Group, Inc. | | 3.5% |
Berkshire Hathaway, Inc. | | 3.3% |
JPMorgan Chase & Co. | | 3.0% |
Devon Energy Corp. | | 2.6% |
Loews Corp. | | 2.3% |
Microsoft Corp. | | 2.3% |
Top Sectors
| | |
| | | % of Equity
Market Value |
Financials | | 35.6% |
Energy | | 15.7% |
Consumer Staples | | 15.1% |
Consumer Discretionary | | 10.1% |
Information Technology | | 9.3% |
Industrials | | 4.5% |
Materials | | 4.3% |
Health Care | | 4.2% |
Telecommunication Services | | 1.2% |
MSF-3
Metropolitan Series Fund, Inc.
Shareholder Expense Example
As a shareholder of the Portfolio, you incur ongoing costs, including management fees; distribution and service (12b-1) fees; and other Portfolio expenses. This example is intended to help you understand your ongoing costs (in dollars) (referred to as “expenses”) of investing in the Portfolio and compare these costs with the ongoing costs of investing in other mutual funds. The example is based on an investment of $1,000 invested at the beginning of the period and held for the entire period, July 1, 2007 through December 31, 2007.
Actual Expenses
The first line for each share class of the Portfolio in the table below provides information about actual account values and actual expenses. You may use the information in this line, together with the amount you invested in the particular share class of the Portfolio, to estimate the expenses that you paid over the period. Simply divide your account value by $1,000 (for example, an $8,600 account value divided by $1,000=8.6), then multiply the result by the number in the first line under the heading entitled “Expenses Paid During Period” to estimate the expenses you paid on your account during this period.
Hypothetical Example for Comparison Purposes
The second line for each share class of the Portfolio in the table below provides information about hypothetical account values and hypothetical expenses based on the Portfolio’s actual expense ratio and an assumed rate of return of 5% per year before expenses, which is not the Portfolio’s actual return. The hypothetical account values and expenses may not be used to estimate the actual ending account balance or expenses you paid for the period. You may use this information to compare the ongoing costs of investing in the Portfolio and other funds. To do so, compare this 5% hypothetical example with the 5% hypothetical examples that appear in the shareholder reports of the other funds.
Please note that the expenses shown in the table are meant to highlight your ongoing costs only and do not reflect any fees or charges of your variable insurance product or any additional expenses that participants in certain eligible qualified plans may bear relating to the operations of their plan. Therefore, the second line for each share class in the table is useful in comparing ongoing costs only, and will not help you determine the relative total costs of owning different funds. In addition, if these other costs were included, your costs would have been higher.
| | | | | | | | | | | | | | |
Portfolio | | | | Annualized
Expense
Ratio | | | Beginning
Account Value
July 1,
2007 | | Ending
Account Value
December 31,
2007 | | Expenses Paid
During Period*
July 1, 2007
to
December 31,
2007 |
Davis Venture Value—Class A | | Actual | | 0.74 | % | | $ | 1,000.00 | | $ | 975.60 | | $ | 3.68 |
| | Hypothetical | | 0.74 | % | | $ | 1,000.00 | | $ | 1,021.43 | | $ | 3.77 |
| | | | | |
Davis Venture Value—Class B | | Actual | | 0.99 | % | | $ | 1,000.00 | | $ | 974.40 | | $ | 4.93 |
| | Hypothetical | | 0.99 | % | | $ | 1,000.00 | | $ | 1,020.16 | | $ | 5.04 |
| | | | | |
Davis Venture Value—Class E | | Actual | | 0.89 | % | | $ | 1,000.00 | | $ | 975.00 | | $ | 4.43 |
| | Hypothetical | | 0.89 | % | | $ | 1,000.00 | | $ | 1,020.67 | | $ | 4.53 |
* Expenses paid are equal to the Portfolio’s annualized expense ratio for the most recent six month period, as shown above, multiplied by the average account value over the period, multiplied by the number of days in the most recent fiscal half-year, divided by 365 (to reflect the one-half year period).
MSF-4
Metropolitan Series Fund, Inc.
Davis Venture Value Portfolio
Schedule of Investments as of December 31, 2007
Common Stock—95.8% of Total Net Assets
| | | | | |
| Security Description | | Shares | | Value* |
| | | | | |
|
Air Freight & Logistics—0.5% |
Toll Holdings, Ltd. (AUD) (a) | | 647,173 | | $ | 6,476,851 |
United Parcel Service, Inc. (Class B) | | 278,800 | | | 19,716,736 |
| | | | | |
| | | | | 26,193,587 |
| | | | | |
|
Automobiles—0.8% |
Harley-Davidson, Inc. (a) | | 813,900 | | | 38,017,269 |
| | | | | |
|
Beverages—2.3% |
Diageo, Plc. (ADR) | | 785,900 | | | 67,453,797 |
Heineken Holding NV (EUR) | | 775,143 | | | 43,607,694 |
| | | | | |
| | | | | 111,061,491 |
| | | �� | | |
|
Capital Markets—5.0% |
Ameriprise Financial, Inc. | | 737,380 | | | 40,637,012 |
E*TRADE Financial Corp. (a) (b) | | 958,200 | | | 3,401,610 |
Merrill Lynch & Co., Inc. (Private Placement) (c) | | 1,376,700 | | | 64,294,093 |
Morgan Stanley | | 383,510 | | | 20,368,216 |
State Street Corp. | | 198,800 | | | 16,142,560 |
The Bank of New York Mellon Corp. | | 2,016,064 | | | 98,303,280 |
| | | | | |
| | | | | 243,146,771 |
| | | | | |
|
Commercial Banks—4.9% |
Commerce Bancorp, Inc. (a) | | 1,058,700 | | | 40,378,818 |
HSBC Holdings, Plc. (GBP) | | 2,323,371 | | | 38,856,010 |
Wachovia Corp. (a) | | 1,740,020 | | | 66,172,961 |
Wells Fargo & Co. | | 3,173,500 | | | 95,807,965 |
| | | | | |
| | | | | 241,215,754 |
| | | | | |
|
Commercial Services & Supplies—0.6% |
The Dun & Bradstreet Corp. | | 333,800 | | | 29,584,694 |
| | | | | |
|
Computers & Peripherals—1.8% |
Dell, Inc. (b) | | 1,936,200 | | | 47,456,262 |
Hewlett-Packard Co. | | 768,300 | | | 38,783,784 |
| | | | | |
| | | | | 86,240,046 |
| | | | | |
|
Construction Materials—1.8% |
Martin Marietta Materials, Inc. (a) | | 384,700 | | | 51,011,220 |
Vulcan Materials Co. (a) | | 440,300 | | | 34,823,327 |
| | | | | |
| | | | | 85,834,547 |
| | | | | |
|
Consumer Finance—4.0% |
American Express Co. | | 3,706,000 | | | 192,786,120 |
Discover Financial Services | | 281,535 | | | 4,245,548 |
| | | | | |
| | | | | 197,031,668 |
| | | | | |
|
Containers & Packaging—1.3% |
Sealed Air Corp. (a) | | 2,724,100 | | | 63,035,674 |
| | | | | |
|
Diversified Consumer Services—0.9% |
H&R Block, Inc. (a) | | 2,269,330 | | | 42,141,458 |
| | | | | |
| | | | | |
| Security Description | | Shares | | Value* |
| | | | | |
|
Diversified Financial Services—4.8% |
Citigroup, Inc. | | 2,040,073 | | $ | 60,059,749 |
JPMorgan Chase & Co. | | 3,299,508 | | | 144,023,524 |
Moody’s Corp. (a) | | 892,100 | | | 31,847,970 |
| | | | | |
| | | | | 235,931,243 |
| | | | | |
|
Electronic Equipment & Instruments—1.5% |
Agilent Technologies, Inc. (b) | | 756,470 | | | 27,792,708 |
Tyco Electronics, Ltd. | | 1,289,322 | | | 47,872,526 |
| | | | | |
| | | | | 75,665,234 |
| | | | | |
|
Energy Equipment & Services—0.9% |
Transocean, Inc. (b) | | 305,164 | | | 43,684,227 |
| | | | | |
|
Food & Staples Retailing—6.5% |
Costco Wholesale Corp. | | 2,655,700 | | | 185,261,632 |
CVS Caremark Corp. | | 1,675,691 | | | 66,608,717 |
Wal-Mart Stores, Inc. | | 1,322,600 | | | 62,863,178 |
| | | | | |
| | | | | 314,733,527 |
| | | | | |
|
Food Products—0.2% |
Hershey Co. (a) | | 235,352 | | | 9,272,869 |
| | | | | |
|
Health Care Equipment & Supplies—1.2% |
Covidien, Ltd. | | 1,328,822 | | | 58,853,526 |
| | | | | |
|
Health Care Providers & Services—2.9% |
Cardinal Health, Inc. | | 505,100 | | | 29,169,525 |
Express Scripts, Inc. (b) | | 617,400 | | | 45,070,200 |
UnitedHealth Group, Inc. | | 1,116,400 | | | 64,974,480 |
| | | | | |
| | | | | 139,214,205 |
| | | | | |
|
Household Durables—0.2% |
Hunter Douglas NV (EUR) (a) | | 112,851 | | | 8,311,220 |
| | | | | |
|
Household Products—1.3% |
Procter & Gamble Co. | | 874,300 | | | 64,191,106 |
| | | | | |
| | |
Industrial Conglomerates—1.3% | | | | | |
Siemens AG (EUR) (a) | | 77,600 | | | 12,164,460 |
Tyco International, Ltd. | | 1,285,022 | | | 50,951,122 |
| | | | | |
| | | | | 63,115,582 |
| | | | | |
| | |
Insurance—15.0% | | | | | |
AMBAC Financial Group, Inc. (a) | | 670,690 | | | 17,283,681 |
American International Group, Inc. | | 2,914,507 | | | 169,915,758 |
Aon Corp. | | 859,900 | | | 41,008,631 |
Berkshire Hathaway, Inc. (Class A) (b) | | 1,123 | | | 159,016,800 |
Berkshire Hathaway, Inc. (Class B) (b) | | 1,326 | | | 6,279,936 |
Everest Re Group, Ltd. | | 61,800 | | | 6,204,720 |
Loews Corp. | | 2,250,700 | | | 113,300,238 |
Markel Corp. (b) | | 8,600 | | | 4,223,460 |
MBIA, Inc. (a) | | 340,130 | | | 6,336,622 |
Millea Holdings, Inc. (JPY) | | 1,157,500 | | | 39,118,523 |
NIPPONKOA Insurance Co., Ltd. (JPY) (a) | | 2,408,300 | | | 21,834,516 |
Principal Financial Group, Inc. | | 258,500 | | | 17,795,140 |
*See accompanying notes to financial statements.
MSF-5
Metropolitan Series Fund, Inc.
Davis Venture Value Portfolio
Schedule of Investments as of December 31, 2007
Common Stock—(Continued)
| | | | | |
| Security Description | | Shares | | Value* |
| | | | | |
| | |
Insurance—(Continued) | | | | | |
Sun Life Financial, Inc. | | 149,200 | | $ | 8,346,248 |
The Progressive Corp. (a) | | 3,919,400 | | | 75,095,704 |
Transatlantic Holdings, Inc. | | 593,256 | | | 43,111,914 |
| | | | | |
| | | | | 728,871,891 |
| | | | | |
| | |
Internet & Catalog Retail—0.6% | | | | | |
Amazon.com, Inc. (a) (b) | | 178,500 | | | 16,536,240 |
Liberty Media Interactive (Class A) (b) | | 618,150 | | | 11,794,302 |
| | | | | |
| | | | | 28,330,542 |
| | | | | |
| | |
Internet Software & Services—1.0% | | | | | |
Google, Inc. (Class A) (b) | | 67,823 | | | 46,898,248 |
| | | | | |
| | |
IT Services—1.5% | | | | | |
Iron Mountain, Inc. (a) (b) | | 1,921,550 | | | 71,135,781 |
| | | | | |
| | |
Machinery—0.0% | | | | | |
Paccar, Inc. | | 5,800 | | | 315,984 |
| | | | | |
| | |
Marine—0.3% | | | | | |
China Shipping Development Co., Ltd. (HKD) | | 5,782,000 | | | 15,076,153 |
| | | | | |
| | |
Media—5.3% | | | | | |
Comcast Corp. (Special Class A) (a) (b) | | 4,617,522 | | | 83,669,499 |
Grupo Televisa S.A. (ADR) | | 711,990 | | | 16,924,002 |
Lagardere S.C.A. (EUR) (a) | | 333,874 | | | 24,858,674 |
Liberty Media Capital (Series A) (b) | | 124,390 | | | 14,490,191 |
News Corp. (Class A) | | 3,411,400 | | | 69,899,586 |
Virgin Media, Inc. (a) | | 762,957 | | | 13,077,083 |
WPP Group, Plc. (ADR) (a) | | 556,800 | | | 35,796,672 |
| | | | | |
| | | | | 258,715,707 |
| | | | | |
| | |
Metals & Mining—0.7% | | | | | |
BHP Billiton, Plc. (GBP) | | 438,822 | | | 13,475,825 |
Rio Tinto, Plc. (GBP) | | 195,300 | | | 20,399,437 |
| | | | | |
| | | | | 33,875,262 |
| | | | | |
| | |
Multiline Retail—0.3% | | | | | |
Sears Holdings Corp. (a) (b) | | 148,730 | | | 15,177,896 |
| | | | | |
| | |
Oil, Gas & Consumable Fuels—14.1% | | | | | |
Canadian Natural Resources, Ltd. (a) | | 1,154,000 | | | 84,403,560 |
China Coal Energy Co. (H Shares) (HKD) (a) (b) | | 14,156,900 | | | 43,577,003 |
ConocoPhillips | | 2,555,008 | | | 225,607,206 |
Devon Energy Corp. | | 1,442,716 | | | 128,271,880 |
EOG Resources, Inc. | | 1,152,100 | | | 102,824,925 |
Occidental Petroleum Corp. | | 1,356,400 | | | 104,429,236 |
| | | | | |
| | | | | 689,113,810 |
| | | | | |
| | |
Paper & Forest Products—0.4% | | | | | |
Sino-Forest Corp. (CAD) | | 848,900 | | | 18,421,474 |
| | | | | |
| | | | | | |
| Security Description | | Shares | | Value* |
| | | | | | |
| | |
Personal Products—0.4% | | | | | | |
Avon Products, Inc. | | | 533,800 | | $ | 21,101,114 |
| | | | | | |
| |
Real Estate Management & Development—0.3% | | | |
Hang Lung Group, Ltd. (HKD) (a) | | | 3,123,000 | | | 16,921,191 |
| | | | | | |
| | |
Road & Rail—0.4% | | | | | | |
Asciano Group, Ltd. (AUD) (a) | | | 481,729 | | | 2,946,532 |
Kuehne & Nagel International AG (CHF) | | | 177,555 | | | 16,913,660 |
| | | | | | |
| | | | | | 19,860,192 |
| | | | | | |
|
Semiconductors & Semiconductor Equipment—0.9% |
Texas Instruments, Inc. | | | 1,250,010 | | | 41,750,334 |
| | | | | | |
| | |
Software—2.3% | | | | | | |
Microsoft Corp. | | | 3,137,900 | | | 111,709,240 |
| | | | | | |
| | |
Specialty Retail—1.6% | | | | | | |
Bed Bath & Beyond, Inc. (a) (b) | | | 1,008,500 | | | 29,639,815 |
Carmax, Inc. (a) (b) | | | 1,750,520 | | | 34,572,770 |
Lowe’s Cos., Inc. | | | 661,800 | | | 14,969,916 |
| | | | | | |
| | | | | | 79,182,501 |
| | | | | | |
|
Tobacco—3.8% |
Altria Group, Inc. | | | 2,452,800 | | | 185,382,624 |
| | | | | | |
| | |
Transportation Infrastructure—1.1% | | | | | | |
China Merchants Holdings International Co., Ltd. (HKD) (a) | | | 6,959,782 | | | 42,551,568 |
Cosco Pacific, Ltd. (HKD) | | | 4,487,900 | | | 11,740,170 |
| | | | | | |
| | | | | | 54,291,738 |
| | | | | | |
|
Wireless Telecommunication Services—1.1% |
SK Telecom Co., Ltd. (ADR) | | | 816,400 | | | 24,361,376 |
Sprint Nextel Corp. (a) | | | 2,307,200 | | | 30,293,536 |
| | | | | | |
| | | | | | 54,654,912 |
| | | | | | |
Total Common Stock
(Identified Cost $3,475,590,749) | | | | | | 4,667,262,292 |
| | | | | | |
|
| Short Term Investments—11.2% |
| Security Description | | Face Amount | | Value* |
| | |
Commercial Paper—4.3% | | | | | | |
San Paolo U.S. Financial Corp.
4.530%, 01/02/08 | | $ | 50,000,000 | | | 49,993,708 |
Societe Generale
3.650%, 01/02/08 | | | 10,438,000 | | | 10,436,942 |
4.300%, 01/04/08 | | | 50,000,000 | | | 49,982,083 |
UBS Finance, Inc.
4.000%, 01/02/08 | | | 36,949,000 | | | 36,944,895 |
4.230%, 01/02/08 | | | 22,688,000 | | | 22,685,334 |
4.230%, 01/03/08 | | | 40,000,000 | | | 39,990,600 |
| | | | | | |
| | | | | | 210,033,562 |
| | | | | | |
*See accompanying notes to financial statements.
MSF-6
Metropolitan Series Fund, Inc.
Davis Venture Value Portfolio
Schedule of Investments as of December 31, 2007
Short Term Investments—(Continued)
| | | | | | |
| Security Description | | Shares | | Value* | |
| | | | | | |
| | |
Mutual Funds—6.9% | | | | | | |
State Street Navigator Securities Lending Prime Portfolio (d) | | 338,164,836 | | $ | 338,164,836 | |
| | | | | | |
Total Short Term Investments
(Identified Cost $548,198,398) | | | | | 548,198,398 | |
| | | | | | |
Total Investments—107.0%
(Identified Cost $4,023,789,147) (e) | | | | | 5,215,460,690 | |
Liabilities in excess of other assets | | | | | (341,194,912 | ) |
| | | | | | |
| Total Net Assets—100% | | | | $ | 4,874,265,778 | |
| | | | | | |
| (a) | A portion or all of the security was held on loan. As of December 31, 2007, the market value of securities loaned was $391,098,351 and the collateral received consisted of cash in the amount of $338,164,836 and non cash collateral with a value of $61,309,897. The cash collateral is invested in a money market fund managed by an affiliate of the custodian. The non cash collateral received consists primarily of government securities and bank letters of credit, and are held for the benefit of the Portfolio at the Portfolio’s custodian. |
| (c) | Security was valued in good faith under procedures established by the Board of Directors. |
| (d) | Represents investment of cash collateral received from securities lending transactions. |
| (e) | The aggregate cost of investments for federal income tax purposes as of December 31, 2007 was $4,025,099,029 and the composition of unrealized appreciation and depreciation of investment securities was $1,354,248,340 and $(163,886,679), respectively. |
| (ADR)— | An American Depositary Receipt is a certificate issued by a custodian bank representing the right to receive securities of the foreign issuer described. Trading on exchanges not located in the United States or Canada significantly influences the value of ADRs. |
*See accompanying notes to financial statements.
MSF-7
Metropolitan Series Fund, Inc.
Davis Venture Value Portfolio
Statement of Assets & Liabilities
December 31, 2007
| | | | | | |
Assets | | | | | | |
Investments at value (a) (b) | | | | | $ | 5,215,460,690 |
Cash | | | | | | 215 |
Receivable for: | | | | | | |
Securities sold | | | | | | 215,771 |
Fund shares sold | | | | | | 2,668,678 |
Accrued interest and dividends | | | | | | 4,693,263 |
Foreign taxes | | | | | | 47,010 |
| | | | | | |
Total Assets | | | | | | 5,223,085,627 |
Liabilities | | | | | | |
Payable for: | | | | | | |
Securities purchased | | $ | 4,613,753 | | | |
Fund shares redeemed | | | 2,754,790 | | | |
Withholding taxes | | | 21,929 | | | |
Collateral for securities loaned | | | 338,164,836 | | | |
Accrued expenses: | | | | | | |
Management fees | | | 2,868,475 | | | |
Service and distribution fees | | | 258,765 | | | |
Deferred directors’ fees | | | 36,123 | | | |
Other expenses | | | 101,178 | | | |
| | | | | | |
Total Liabilities | | | | | | 348,819,849 |
| | | | | | |
Net Assets | | | | | $ | 4,874,265,778 |
| | | | | | |
Net assets consists of: | | | | | | |
Capital paid in | | | | | $ | 3,608,173,816 |
Undistributed net investment income | | | | | | 52,593,236 |
Accumulated net realized gains | | | | | | 21,822,559 |
Unrealized appreciation on investments and foreign currency | | | | | | 1,191,676,167 |
| | | | | | |
Net Assets | | | | | $ | 4,874,265,778 |
| | | | | | |
| Computation of offering price: | | | | | | |
Class A | | | | | | |
Net asset value and redemption price per share ($3,183,428,682 divided by 87,356,197 shares outstanding) | | | | | $ | 36.44 |
| | | | | | |
Class B | | | | | | |
Net asset value and redemption price per share ($491,271,187 divided by 13,572,788 shares outstanding) | | | | | $ | 36.20 |
| | | | | | |
Class E | | | | | | |
Net asset value and redemption price per share ($1,199,565,909 divided by 33,090,066 shares outstanding) | | | | | $ | 36.25 |
| | | | | | |
(a) Identified cost of investments | | | | | $ | 4,023,789,147 |
| | | | | | |
| (b) | Includes cash collateral for securities loaned of $338,164,836. |
Statement of Operations
For the Year Ended December 31, 2007
| | | | | | | | |
Investment Income | | | | | | | | |
Dividends | | | | | | $ | 81,566,684 | (a) |
Interest | | | | | | | 8,694,477 | (b) |
| | | | | | | | |
| | | | | | | 90,261,161 | |
Expenses | | | | | | | | |
Management fees | | $ | 31,542,861 | | | | | |
Service and distribution fees—Class B | | | 1,131,705 | | | | | |
Service and distribution fees—Class E | | | 1,898,159 | | | | | |
Directors’ fees and expenses | | | 25,250 | | | | | |
Custodian | | | 470,012 | | | | | |
Audit and tax services | | | 31,739 | | | | | |
Legal | | | 51,587 | | | | | |
Printing | | | 1,130,558 | | | | | |
Insurance | | | 46,393 | | | | | |
Miscellaneous | | | 30,701 | | | | | |
| | | | | | | | |
Total expenses | | | 36,358,965 | | | | | |
Expense reductions | | | (40,111 | ) | | | 36,318,854 | |
| | | | | | | | |
Net Investment Income | | | | | | | 53,942,307 | |
| | | | | | | | |
Realized and Unrealized Gain (Loss) | | | | | | | | |
| Realized gain (loss) on: | | | | | | | | |
Investments—net | | | 134,877,250 | | | | | |
Foreign currency transactions—net | | | (565,176 | ) | | | 134,312,074 | |
| | | | | | | | |
Change in unrealized appreciation (depreciation) on: | | | | | | | | |
Investments—net | | | (3,439,970 | ) | | | | |
Foreign currency transactions—net | | | 4,091 | | | | (3,435,879 | ) |
| | | | | | | | |
Net gain | | | | | | | 130,876,195 | |
| | | | | | | | |
Net Increase in Net Assets From Operations | | | | | | $ | 184,818,502 | |
| | | | | | | | |
| (a) | Net of foreign taxes of $542,549. |
| (b) | Includes net income on securities loaned of $521,749. |
See accompanying notes to financial statements.
MSF-8
Metropolitan Series Fund, Inc.
Davis Venture Value Portfolio
Statements of Changes in Net Assets
| | | | | | | | |
| | | Year ended
December 31,
2007 | | | Year ended
December 31,
2006 | |
From Operations | | | | | | | | |
Net investment income | | $ | 53,942,307 | | | $ | 32,543,391 | |
Net realized gain | | | 134,312,074 | | | | 10,707,733 | |
Unrealized appreciation (depreciation) | | | (3,435,879 | ) | | | 455,873,843 | |
| | | | | | | | |
Increase in net assets from operations | | | 184,818,502 | | | | 499,124,967 | |
| | | | | | | | |
From Distributions to Shareholders | | | | | | | | |
Net investment income | | | | | | | | |
Class A | | | (21,061,873 | ) | | | (16,267,052 | ) |
Class B | | | (2,489,165 | ) | | | (1,627,642 | ) |
Class E | | | (8,444,356 | ) | | | (8,798,448 | ) |
| | | | | | | | |
Total distributions | | | (31,995,394 | ) | | | (26,693,142 | ) |
| | | | | | | | |
Increase in net assets from capital share transactions | | | 624,349,038 | | | | 483,544,453 | |
| | | | | | | | |
Total increase in net assets | | | 777,172,146 | | | | 955,976,278 | |
| | |
Net Assets | | | | | | | | |
Beginning of the period | | | 4,097,093,632 | | | | 3,141,117,354 | |
| | | | | | | | |
End of the period | | $ | 4,874,265,778 | | | $ | 4,097,093,632 | |
| | | | | | | | |
Undistributed Net Investment Income | | | | | | | | |
End of the period | | $ | 52,593,236 | | | $ | 32,937,099 | |
| | | | | | | | |
Other Information:
Capital Shares
Transactions in capital shares were as follows:
| | | | | | | | | | | | | | |
| | | Year ended
December 31, 2007 | | | Year ended
December 31, 2006 | |
| | | Shares | | | $ | | | Shares | | | $ | |
Class A | | | | | | | | | | | | | | |
Sales | | 29,142,259 | | | $ | 1,061,299,488 | | | 22,089,595 | | | $ | 714,452,678 | |
Reinvestments | | 577,512 | | | | 21,061,873 | | | 512,671 | | | | 16,267,052 | |
Redemptions | | (11,011,385 | ) | | | (400,478,491 | ) | | (10,886,690 | ) | | | (350,548,080 | ) |
| | | | | | | | | | | | | | |
Net increase | | 18,708,386 | | | $ | 681,882,870 | | | 11,715,576 | | | $ | 380,171,650 | |
| | | | | | | | | | | | | | |
Class B | | | | | | | | | | | | | | |
Sales | | 3,829,951 | | | $ | 138,472,695 | | | 5,408,366 | | | $ | 172,998,348 | |
Reinvestments | | 68,610 | | | | 2,489,165 | | | 51,540 | | | | 1,627,642 | |
Redemptions | | (1,466,918 | ) | | | (53,162,469 | ) | | (902,837 | ) | | | (28,967,557 | ) |
| | | | | | | | | | | | | | |
Net increase | | 2,431,643 | | | $ | 87,799,391 | | | 4,557,069 | | | $ | 145,658,433 | |
| | | | | | | | | | | | | | |
Class E | | | | | | | | | | | | | | |
Sales | | 4,143,510 | | | $ | 149,983,783 | | | 6,223,545 | | | $ | 198,421,099 | |
Reinvestments | | 232,563 | | | | 8,444,356 | | | 278,432 | | | | 8,798,448 | |
Redemptions | | (8,417,359 | ) | | | (303,761,362 | ) | | (7,716,040 | ) | | | (249,505,177 | ) |
| | | | | | | | | | | | | | |
Net decrease | | (4,041,286 | ) | | $ | (145,333,223 | ) | | (1,214,063 | ) | | $ | (42,285,630 | ) |
| | | | | | | | | | | | | | |
Increase derived from capital share transactions | | | | | $ | 624,349,038 | | | | | | $ | 483,544,453 | |
| | | | | | | | | | | | | | |
See accompanying notes to financial statements.
MSF-9
Metropolitan Series Fund, Inc.
Davis Venture Value Portfolio
Financial Highlights
| | | | | | | | | | | | | | | | | | | | |
| | | Class A | |
| | | Year ended December 31, | |
| | | 2007 | | | 2006 | | | 2005 | | | 2004 | | | 2003 | |
Net Asset Value, Beginning of Period | | $ | 35.12 | | | $ | 30.91 | | | $ | 28.23 | | | $ | 25.27 | | | $ | 19.39 | |
| | | | | | | | | | | | | | | | | | | | |
Income From Investment Operations | | | | | | | | | | | | | | | | | | | | |
Net investment income | | | 0.46 | (a) | | | 0.32 | (a) | | | 0.25 | | | | 0.15 | | | | 0.21 | |
Net realized and unrealized gain on investments | | | 1.15 | | | | 4.16 | | | | 2.63 | | | | 2.96 | | | | 5.75 | |
| | | | | | | | | | | | | | | | | | | | |
Total from investment operations | | | 1.61 | | | | 4.48 | | | | 2.88 | | | | 3.11 | | | | 5.96 | |
| | | | | | | | | | | | | | | | | | | | |
Less Distributions | | | | | | | | | | | | | | | | | | | | |
Distributions from net investment income | | | (0.29 | ) | | | (0.27 | ) | | | (0.20 | ) | | | (0.15 | ) | | | (0.08 | ) |
| | | | | | | | | | | | | | | | | | | | |
Total distributions | | | (0.29 | ) | | | (0.27 | ) | | | (0.20 | ) | | | (0.15 | ) | | | (0.08 | ) |
| | | | | | | | | | | | | | | | | | | | |
Net Asset Value, End of Period | | $ | 36.44 | | | $ | 35.12 | | | $ | 30.91 | | | $ | 28.23 | | | $ | 25.27 | |
| | | | | | | | | | | | | | | | | | | | |
Total Return (%) | | | 4.6 | | | | 14.6 | | | | 10.3 | | | | 12.4 | | | | 30.9 | |
Ratio of operating expenses to average net assets before expense reductions (%) | | | 0.73 | | | | 0.76 | | | | 0.76 | | | | 0.78 | | | | 0.79 | |
Ratio of operating expenses to average net assets after expense reductions (%) (b) | | | 0.73 | | | | 0.76 | | | | 0.76 | | | | 0.77 | | | | 0.79 | |
Ratio of net investment income to average net assets (%) | | | 1.25 | | | | 0.99 | | | | 1.05 | | | | 0.97 | | | | 0.95 | |
Portfolio turnover rate (%) | | | 11 | | | | 20 | | | | 27 | | | | 5 | | | | 12 | |
Net assets, end of period (000) | | $ | 3,183,429 | | | $ | 2,410,877 | | | $ | 1,759,491 | | | $ | 1,413,953 | | | $ | 844,547 | |
| |
| | | Class B | |
| | | Year ended December 31, | |
| | | 2007 | | | 2006 | | | 2005 | | | 2004 | | | 2003 | |
Net Asset Value, Beginning of Period | | $ | 34.89 | | | $ | 30.71 | | | $ | 28.07 | | | $ | 25.18 | | | $ | 19.33 | |
| | | | | | | | | | | | | | | | | | | | |
Income From Investment Operations | | | | | | | | | | | | | | | | | | | | |
Net investment income | | | 0.36 | (a) | | | 0.24 | (a) | | | 0.17 | | | | 0.14 | | | | 0.07 | |
Net realized and unrealized gain on investments | | | 1.16 | | | | 4.14 | | | | 2.62 | | | | 2.86 | | | | 5.85 | |
| | | | | | | | | | | | | | | | | | | | |
Total from investment operations | | | 1.52 | | | | 4.38 | | | | 2.79 | | | | 3.00 | | | | 5.92 | |
| | | | | | | | | | | | | | | | | | | | |
Less Distributions | | | | | | | | | | | | | | | | | | | | |
Distributions from net investment income | | | (0.21 | ) | | | (0.20 | ) | | | (0.15 | ) | | | (0.11 | ) | | | (0.07 | ) |
| | | | | | | | | | | | | | | | | | | | |
Total distributions | | | (0.21 | ) | | | (0.20 | ) | | | (0.15 | ) | | | (0.11 | ) | | | (0.07 | ) |
| | | | | | | | | | | | | | | | | | | | |
Net Asset Value, End of Period | | $ | 36.20 | | | $ | 34.89 | | | $ | 30.71 | | | $ | 28.07 | | | $ | 25.18 | |
| | | | | | | | | | | | | | | | | | | | |
Total Return (%) | | | 4.3 | | | | 14.3 | | | | 10.0 | | | | 12.0 | | | | 30.7 | |
Ratio of operating expenses to average net assets before expense reductions (%) | | | 0.98 | | | | 1.01 | | | | 1.02 | | | | 1.03 | | | | 1.04 | |
Ratio of operating expenses to average net assets after expense reductions (%) (b) | | | 0.98 | | | | 1.01 | | | | 1.01 | | | | 1.02 | | | | 1.04 | |
Ratio of net investment income to average net assets (%) | | | 1.00 | | | | 0.74 | | | | 0.77 | | | | 0.92 | | | | 0.73 | |
Portfolio turnover rate (%) | | | 11 | | | | 20 | | | | 27 | | | | 5 | | | | 12 | |
Net assets, end of period (000) | | $ | 491,271 | | | $ | 388,739 | | | $ | 202,221 | | | $ | 56,301 | | | $ | 547 | |
| (a) | Per share amount is based on average shares outstanding during the period. |
| (b) | The Portfolio has entered into arrangements with certain brokers who paid a portion of the Portfolio’s expenses. |
See accompanying notes to financial statements.
MSF-10
Metropolitan Series Fund, Inc.
Davis Venture Value Portfolio
Financial Highlights
| | | | | | | | | | | | | | | | | | | | |
| | | Class E | |
| | | Year ended December 31, | |
| | | 2007 | | | 2006 | | | 2005 | | | 2004 | | | 2003 | |
Net Asset Value, Beginning of Period | | $ | 34.94 | | | $ | 30.76 | | | $ | 28.09 | | | $ | 25.18 | | | $ | 19.33 | |
| | | | | | | | | | | | | | | | | | | | |
Income From Investment Operations | | | | | | | | | | | | | | | | | | | | |
Net investment income | | | 0.40 | (a) | | | 0.27 | (a) | | | 0.27 | | | | 0.23 | | | | 0.14 | |
Net realized and unrealized gain on investments | | | 1.15 | | | | 4.14 | | | | 2.56 | | | | 2.82 | | | | 5.78 | |
| | | | | | | | | | | | | | | | | | | | |
Total from investment operations | | | 1.55 | | | | 4.41 | | | | 2.83 | | | | 3.05 | | | | 5.92 | |
| | | | | | | | | | | | | | | | | | | | |
Less Distributions | | | | | | | | | | | | | | | | | | | | |
Distributions from net investment income | | | (0.24 | ) | | | (0.23 | ) | | | (0.16 | ) | | | (0.14 | ) | | | (0.07 | ) |
| | | | | | | | | | | | | | | | | | | | |
Total distributions | | | (0.24 | ) | | | (0.23 | ) | | | (0.16 | ) | | | (0.14 | ) | | | (0.07 | ) |
| | | | | | | | | | | | | | | | | | | | |
Net Asset Value, End of Period | | $ | 36.25 | | | $ | 34.94 | | | $ | 30.76 | | | $ | 28.09 | | | $ | 25.18 | |
| | | | | | | | | | | | | | | | | | | | |
Total Return (%) | | | 4.4 | | | | 14.4 | | | | 10.1 | | | | 12.1 | | | | 30.7 | |
Ratio of operating expenses to average net assets before expense reductions (%) | | | 0.88 | | | | 0.91 | | | | 0.91 | | | | 0.93 | | | | 0.94 | |
Ratio of operating expenses to average net assets after expense reductions (%) (b) | | | 0.88 | | | | 0.91 | | | | 0.91 | | | | 0.92 | | | | 0.94 | |
Ratio of net investment income to average net assets (%) | | | 1.11 | | | | 0.84 | | | | 0.88 | | | | 0.85 | | | | 0.81 | |
Portfolio turnover rate (%) | | | 11 | | | | 20 | | | | 27 | | | | 5 | | | | 12 | |
Net assets, end of period (000) | | $ | 1,199,566 | | | $ | 1,297,477 | | | $ | 1,179,405 | | | $ | 1,189,119 | | | $ | 754,011 | |
| (a) | Per share amount is based on average shares outstanding during the period. |
| (b) | The Portfolio has entered into arrangements with certain brokers who paid a portion of the Portfolio’s expenses. |
See accompanying notes to financial statements.
MSF-11
Metropolitan Series Fund, Inc.
Davis Venture Value Portfolio
Notes to Financial Statements—December 31, 2007
Metropolitan Series Fund, Inc. (the “Fund”) is organized as a corporation under the laws of Maryland pursuant to Articles of Incorporation filed on November 23, 1982, as amended, and registered under the Investment Company Act of 1940, as amended (the “1940 Act”), as an open-end investment company. The Fund is a “series” type of mutual fund, which issues separate series of stock. Each series represents an interest in a separate portfolio of Fund investments. The Davis Venture Value Portfolio (the “Portfolio”) is a diversified series of the Fund. Shares in the Fund are not offered directly to the general public and are currently available only to separate accounts established by Metropolitan Life Insurance Company (“MetLife”), New England Life Insurance Company, General American Life Insurance Company (“General American”), The MetLife Investors Group of Insurance Companies, MetLife Insurance Company of Connecticut and other affiliated insurance companies (collectively, the “Insurance Companies”), as an investment vehicle for variable life insurance, group annuity or variable annuity products, although the Portfolio is not available to all such separate accounts. The Portfolio’s shares may be divided into different classes. Currently, the classes being offered by the Portfolio are named Class A, Class B and Class E. The classes of the Portfolio’s shares are identical, except that certain additional charges (Rule 12b-1 fees) are made against Class B and Class E shares. Investment income, realized and unrealized capital gains and losses, the common expenses of the Portfolio and certain Portfolio-level expense reductions, if any, are allocated on a pro rata basis to each class based on the relative net assets of each class to the total net assets of the Portfolio.
| 2. | SIGNIFICANT ACCOUNTING POLICIES: |
The preparation of financial statements in conformity with accounting principles generally accepted in the United States of America (“GAAP”) requires management to make estimates and assumptions that affect the reported amounts of assets and liabilities and disclosure of contingent assets and liabilities as of the date of the financial statements and the reported amounts of income and expenses during the reporting period. Actual results could differ from those estimates.
The following is a summary of significant accounting policies consistently followed by the Portfolio in the preparation of its financial statements. The policies are in conformity with GAAP.
Investment Valuation:
Debt securities (other than short term obligations with a remaining maturity of sixty days or less) are valued by independent pricing services selected by the relevant subadviser pursuant to authorization of the Board of Directors of the Fund (the “Board” or “Directors”). Short term obligations with a remaining maturity of sixty days or less are valued at amortized cost which approximates fair market value.
Equity securities traded on a national securities exchange or exchanges are valued at their last sale price on the principal trading market. Equity securities traded on the NASDAQ National Market System are valued at the NASDAQ Official Closing Price (the “NOCP”). The NOCP is the last sale price if it falls between the spread of the last reported bid and asked prices. If the last reported bid and asked prices are above the last reported sale price, the NOCP will be the last reported bid price. If the last reported bid and asked prices are below the last reported sale price, the NOCP will be the last reported asked price. Equity securities traded on a national securities exchange or exchanges or on the NASDAQ National Market System for which there is no reported sale during the day are valued at the last reported bid price. A security that is listed or traded on more than one exchange is valued at the quotation on the exchange determined to be the primary market for that security by the Board or its delegates. If no closing price is available, then such securities are valued by using the last reported bid price. Equity securities traded over-the-counter are valued at the last reported sales price.
If no current market value quotation is readily available or reliable for a portfolio security, fair value will be determined in accordance with procedures established by and under the general supervision of the Board. When the Portfolio uses fair value pricing, it may take into account any factors it deems appropriate. The value of securities used by the Portfolio to calculate its net asset value may differ from quoted or published prices for the same securities. Fair value pricing involves subjective judgments and the fair value determined for a security may be materially different than the value that could be realized upon the sale of that security.
The Portfolio expects to use fair value pricing for securities primarily traded on U.S. exchanges only under very limited circumstances. For example, the Portfolio may use fair value pricing if the exchange on which a security is traded closes early or trading in the security is suspended.
MSF-12
Metropolitan Series Fund, Inc.
Davis Venture Value Portfolio
Notes to Financial Statements—December 31, 2007—(Continued)
Securities traded primarily on an exchange outside of the United States which closes before the close of the New York Stock Exchange will be valued at the last sales price on that non-U.S. exchange. Securities traded primarily on an exchange outside of the United States for which there is no reported sale during the day are valued at the mean between the last reported bid and asked prices. However, because most foreign markets close well before the Portfolio values its securities (typically at 4 p.m. Eastern Time), the earlier close of these foreign markets gives rise to the possibility that significant events, including broad market moves, may have occurred after these foreign markets close but before the Portfolio values its securities. To account for this, the Portfolio may frequently value many of its foreign equity securities using fair value prices based on third party vendor modeling tools.
Forward foreign currency exchange contracts are valued based on the mean between closing bid and asked prices of the forward currency contract rates in the London foreign exchange markets on a daily basis as provided by a reliable bank or dealer.
Options, whether on securities, indices, futures contracts, or otherwise, are valued at the last sales price available as of the close of business on the day of valuation or, if there is no such sale price available, at the mean between the bid and asked prices. Options on currencies are valued at the spot price each day.
The value of futures contracts will be the sum of the margin deposit plus or minus the difference between the value of the futures contract on each day the net asset value is calculated and the value on the date the futures contract originated, value being that established on a recognized commodity exchange, or by reference to other customary sources, with gain or loss being realized when the futures contract closes or expires.
Subject to the Board’s oversight, the Board has delegated day-to-day responsibility for valuing Portfolio assets to the subadviser of the Portfolio, who values such assets as described above and operates under procedures approved by the Board.
Investment Transactions and Related Investment Income:
Portfolio security transactions are recorded on the trade date. Dividend income is recorded on the ex-dividend date or, for certain foreign securities, when notified. Interest income, which includes amortization of premium and accretion of discount on debt securities, is recorded on the accrual basis. Realized gains and losses on investments and unrealized appreciation and depreciation are determined on the identified cost basis, which is the same basis used for federal income tax purposes.
Repurchase Agreements:
The Portfolio, through the custodian or a subcustodian, receives delivery of the underlying securities collateralizing repurchase agreements. The Portfolio requires the custodian to take possession, to have legally segregated in the Federal Reserve Book Entry System, or to have segregated within the custodian’s vault, all securities held as collateral for repurchase agreements. It is the Portfolio’s policy that the market value of the collateral be at least equal to 100% of the repurchase price in the case of a repurchase agreement of one-day duration and 102% on all other repurchase agreements. The Portfolio’s subadviser is responsible for determining that the value of the collateral is at all times at least equal to the repurchase price. In connection with transactions in repurchase agreements, if the seller defaults and the value of the collateral declines or if the seller enters an insolvency proceeding, realization of the collateral by the Portfolio may be delayed, limited or wholly denied.
Foreign Currency Translation:
The books and records of the Portfolio are maintained in U.S. dollars. The values of securities, currencies and other assets and liabilities denominated in currencies other than U.S. dollars are translated into U.S. dollars based upon foreign exchange rates prevailing at the end of the period. Purchases and sales of investment securities, income and expenses are translated on the respective dates of such transactions. Since the values of investment securities are presented at the foreign exchange rates prevailing at the end of the period, it is not practical to isolate that portion of the results of operations arising from changes in exchange rates from that portion of the results of operations reflecting fluctuations arising from changes in market prices of the investment securities. Such fluctuations are included in the net realized and unrealized gain or loss on investments.
Net realized foreign exchange gains or losses arise from sales of foreign currency, currency gains or losses realized between the trade and settlement dates on securities transactions, and the difference between the amounts of dividends, interest, and foreign withholding taxes recorded by the Portfolio and the U.S. dollar equivalent of the amounts actually received or paid by the Portfolio. Net unrealized foreign exchange gains and losses arise from changes in the value of assets and liabilities, other than investment securities, resulting from changes in the exchange rate.
MSF-13
Metropolitan Series Fund, Inc.
Davis Venture Value Portfolio
Notes to Financial Statements—December 31, 2007—(Continued)
Forward Foreign Currency Exchange Contracts:
The Portfolio may enter into forward foreign currency exchange contracts primarily to hedge against foreign currency exchange rate risks on its non-U.S. dollar denominated investment securities. When entering into a forward currency contract, the Portfolio agrees to receive or deliver a fixed quantity of foreign currency for an agreed-upon price on an agreed future date. These contracts are valued daily and the Portfolio’s net equity therein, representing unrealized gain or loss on the contracts as measured by the difference between the foreign exchange rates at the dates of entry into the contracts and the forward rates at the settlement date, is included in the Statement of Assets and Liabilities. Realized and unrealized gains and losses are included in the Statement of Operations. These instruments involve market and/or credit risk in excess of the amount recognized in the Statement of Assets and Liabilities. Risks arise from the possible inability of counterparties to meet the terms of their contracts and from movement in currency and securities values and interest rates.
Futures Contracts:
The Portfolio may buy and sell futures contracts (on recognized exchanges) as a hedge or to enhance return. Futures contracts are agreements to buy or sell a security, or deliver a final cash settlement price in connection with an index, interest rate, currency, or other contracts not calling for physical delivery, for a set price in the future. The Portfolio must post an amount equal to a portion of the total market value of the futures contract as futures variation margin, which is returned when the Portfolio’s obligations under the contract have been satisfied. From time to time thereafter, the Portfolio may have to post variation margin to maintain this amount as the market value of the contract fluctuates. Risks of entering into futures contracts (and related options) include the possibility that there may be an illiquid market and that a change in the value of the contract or option may not correlate with changes in the value of the underlying securities.
Options:
The Portfolio may use options to hedge against changes in values of securities the Portfolio owns or expects to purchase. Writing puts or buying calls tends to increase the Portfolio’s exposure to the underlying instrument and writing calls or buying puts tends to decrease the Portfolio’s exposure to the underlying instrument, and can be used to hedge other Portfolio investments. For options purchased to hedge the Portfolio’s investments, the potential risk to the Portfolio is that the change in value of options contracts may not correspond to the change in value of the hedged instruments. In addition, losses may arise from changes in the value of the underlying instruments, if there is an illiquid secondary market, or if the counterparty is unable to perform. The maximum loss for purchased options is limited to the premium initially paid for the option. For options written by the Portfolio, the maximum loss is not limited to the premium initially received for the option.
The main risk associated with purchasing an option is that the option expires without being exercised. In this case, the option expires worthless and the premium paid for the option is considered the loss. The risk associated with writing a call option is that the Portfolio may forgo the opportunity for a profit if the market value of the underlying position increases and the option is exercised. The risk in writing a put option is that the Portfolio may incur a loss if the market value of the underlying position decreases and the option is exercised. In addition, the Portfolio risks not being able to enter into a closing transaction for the written option as the result of an illiquid market.
“When-Issued” Securities:
Purchasing securities “when-issued” is a forward commitment by the Portfolio to buy a security. The estimated amount of the Portfolio’s payment obligation and the security’s interest rate are determined when the commitment is made, even though no interest accrues until the security is issued, which is generally 15 to 120 days later. The Portfolio will segregate liquid assets with its custodian sufficient at all times to satisfy these commitments. If the value of the security is less when delivered than when the commitment was made, the Portfolio will suffer a loss.
Federal Income Taxes:
It is the Portfolio’s policy to comply with the requirements of the Internal Revenue Code of 1986, as amended, and regulations thereunder, applicable to regulated investment companies and to distribute all of its taxable income to shareholders. Therefore, no federal income tax provision is required.
MSF-14
Metropolitan Series Fund, Inc.
Davis Venture Value Portfolio
Notes to Financial Statements—December 31, 2007—(Continued)
As of December 31, 2007, the Portfolio had no capital loss carryovers.
The tax character of distributions paid for the periods ended December 31, 2007 and 2006 was as follows:
| | | | | | | | | | | | | | | | | | | | | |
| Ordinary Income | | Long Term Gain | | Return of Capital | | Total |
| 2007 | | 2006 | | 2007 | | 2006 | | 2007 | | 2006 | | 2007 | | 2006 |
| $31,995,394 | | $ | 26,693,142 | | $ | — | | $ | — | | $ | — | | $ | — | | $ | 31,995,394 | | $ | 26,693,142 |
As of December 31, 2007, the components of distributable earnings (accumulated losses) on a federal income tax basis were as follows:
| | | | | | | | | | | | |
Undistributed
Ordinary
Income | | Undistributed
Long Term
Gain | | Unrealized
Appreciation | | Loss
Carryforwards | | Total |
| $52,636,502 | | $ | 23,132,443 | | $ | 1,190,366,285 | | $ | — | | $ | 1,266,135,230 |
Dividends and Distributions to Shareholders:
The Portfolio records dividends and distributions on the ex-dividend date. Net realized gains from security transactions (if any) are generally distributed annually to shareholders. The timing and characterization of certain income and capital gains distributions are determined in accordance with federal tax regulations that may differ from GAAP. Permanent book and tax basis differences relating to shareholder distributions will result in reclassification between under/over distributed net investment income, accumulated net realized gains/losses and paid in capital.
| 3. | INVESTMENT TRANSACTIONS: |
For the year ended December 31, 2007, purchases and sales of securities (excluding short term investments) for the Portfolio were as follows:
| | | | | | | | | |
| Purchases | | Sales |
| U.S. Government | | Other | | U.S. Government | | Other |
| $0 | | $ | 1,033,124,770 | | $ | 0 | | $ | 475,389,531 |
| 4. | INVESTMENT MANAGEMENT FEES AND OTHER TRANSACTIONS WITH AFFILIATES: |
Investment Management Agreement:
MetLife Advisers, LLC (“MetLife Advisers”) is the investment adviser to the Portfolio. The Fund has entered into an investment management agreement with MetLife Advisers with respect to the Portfolio. For providing investment management services to the Portfolio, MetLife Advisers receives monthly compensation at the following annual rates:
| | | | | | |
| | | Management
Fees earned by
MetLife Advisers
for the year ended
December 31, 2007 | | Annual
percentage
rates paid to
MetLife Advisers | | Based on Portfolios
average daily net asset levels |
| | $31,542,861 | | 0.750% | | Of the first $1 billion |
| | | | 0.700% | | On the next $2 billion |
| | | | 0.650% | | On amounts in excess of $3 billion |
Certain officers and directors of the Fund may also be officers of MetLife Advisers; however, such officers and directors receive no compensation from the Fund.
MetLife Advisers has entered into an investment subadvisory agreement with respect to the Portfolio. Davis Selected Advisers, L.P. is compensated by MetLife Advisers to provide subadvisory services for the Portfolio.
MSF-15
Metropolitan Series Fund, Inc.
Davis Venture Value Portfolio
Notes to Financial Statements—December 31, 2007—(Continued)
Service and Distribution Fees:
The Fund has adopted a Distribution and Service Plan under Rule 12b-1 of the 1940 Act for the Portfolio’s Class B and E shares. Under the Distribution and Service Plan, the Class B and E shares of the Portfolio pay a fee to compensate the Insurance Companies (or their affiliates) and other broker-dealers and financial intermediaries involved in the offer and sale of Portfolio shares for promoting or selling and servicing, the Class B and E shares. The fees under the Distribution and Service Plan for each class of the Portfolio’s shares are calculated as a percentage of the Portfolio’s average daily net assets that are attributable to that Class. Currently, the fee is 0.25% per year for Class B shares and 0.15% per year for Class E shares. Amounts paid by the Portfolio for the year ended December 31, 2007 are shown as Service and Distribution fees in the Statement of Operations.
The Fund has entered into a securities lending arrangement with the Fund’s custodian, State Street Bank and Trust Company (the “custodian”). Under the agreement, the custodian is authorized to loan securities on the Portfolios’ behalf. In exchange, the Portfolio receives either cash or securities as collateral against the loaned securities. The Portfolio receives collateral at least equal to 102% of the market value of the loaned securities (105% for foreign securities), at each loan’s inception. Collateral must be maintained at least at 100% of the market value of the loaned securities for the duration of the loan. The cash collateral is invested in the Navigator Securities Lending Prime Portfolio, an affiliate of the custodian, which invests in a variety of high quality U.S. dollar-denominated instruments. If the market value of the collateral at the close of trading on a business day is less than 100% of the market value of the loaned securities at the close of trading on that day, the borrower shall be required to deliver, by the close of business on the following business day, an additional amount of collateral, equal to at least 100% of the market value of all the loaned securities as of such preceding day. The Portfolio receives 80% of the annual net income from securities lending transactions, which is included in interest income of the Portfolio. The remaining 20% is paid to the custodian as compensation for its securities lending services. The Portfolio bears the risk of any deficiency in the amount of collateral available for return to a borrower due to a loss in an approved investment. Any outstanding loans by the Portfolio at December 31, 2007 are footnoted in the Schedule of Investments.
As previously reported, in May 2004, General American received a Wells Notice stating that the SEC staff was considering recommending that the SEC bring a civil action alleging violations of the U.S. securities laws against General American with respect to market timing and late trading in a limited number of privately-placed variable insurance contracts that were sold through General American. General American responded to the SEC staff and cooperated with the investigation. On August 9, 2007, the SEC announced that it had settled an enforcement action regarding late trading against General American with, among other things, General American agreeing to pay a civil penalty and to comply with certain undertakings. General American consented to the SEC’s order without admitting or denying the findings. MetLife Advisers has also advised the Fund’s Board of Directors that, while certain exceptions to the Fund’s policies have been noted, no situations have been identified that would have a material impact on the financial position of the Fund.
| 7. | RECENT ACCOUNTING PRONOUNCEMENTS: |
Effective June 29, 2007, the Fund implemented Financial Accounting Standards Board (“FASB”) Interpretation No. 48, “Accounting for Uncertainty in Income Taxes—an interpretation of FASB Statement No. 109” (“FIN 48”). FIN 48 prescribes the minimum recognition threshold a tax position must meet in connection with accounting for uncertainties in income tax positions taken or expected to be taken by an entity, including investment companies, before being measured and recognized in the financial statements. Management has evaluated the application of FIN 48 to the Fund, and has determined that the adoption of FIN 48 does not have a material impact on the Fund’s financial statements. The Fund files U.S. tax returns. No income tax returns are currently under examination. The statute of limitations on the Fund’s tax returns remains open for the years ended December 31, 2004 through December 31, 2006.
In September 2006, Statement of Financial Accounting Standards No. 157, Fair Value Measurements (SFAS 157) was issued and is effective for fiscal years beginning after November 15, 2007. SFAS 157 defines fair value, establishes a framework for measuring fair value and expands disclosures about fair value measurements. Management is currently evaluating the impact the adoption of SFAS 157 will have on the Portfolio’s financial statement disclosures.
MSF-16
Metropolitan Series Fund, Inc.
Davis Venture Value Portfolio
Report of Independent Registered Public Accounting Firm
To the Shareholders and Board of Directors of the Metropolitan Series Fund, Inc.:
We have audited the accompanying statement of assets and liabilities, including the schedule of investments, of the Davis Venture Value Portfolio, one of the portfolios constituting the Metropolitan Series Fund, Inc. (the “Fund”) as of December 31, 2007, and the related statement of operations for the year then ended, the statements of changes in net assets for each of the two years in the period then ended, and the financial highlights for each of the five years in the period then ended. These financial statements and financial highlights are the responsibility of the Fund’s management. Our responsibility is to express an opinion on these financial statements and financial highlights based on our audits.
We conducted our audits in accordance with the standards of the Public Company Accounting Oversight Board (United States). Those standards require that we plan and perform the audit to obtain reasonable assurance about whether the financial statements and financial highlights are free of material misstatement. The Fund is not required to have, nor were we engaged to perform, an audit of its internal control over financial reporting. Our audits included consideration of internal control over financial reporting as a basis for designing audit procedures that are appropriate in the circumstances, but not for the purpose of expressing an opinion on the effectiveness of the Fund’s internal control over financial reporting. Accordingly, we express no such opinion. An audit also includes examining, on a test basis, evidence supporting the amounts and disclosures in the financial statements, assessing the accounting principles used and significant estimates made by management, as well as evaluating the overall financial statement presentation. Our procedures included confirmation of securities owned as of December 31, 2007, by correspondence with the custodian and brokers; where replies were not received from brokers, we performed other auditing procedures. We believe that our audits provide a reasonable basis for our opinion.
In our opinion, the financial statements and financial highlights referred to above present fairly, in all material respects, the financial position of the Davis Venture Value Portfolio of the Metropolitan Series Fund, Inc. as of December 31, 2007, the results of its operations for the year then ended, the changes in its net assets for each of the two years in the period then ended, and the financial highlights for each of the five years in the period then ended, in conformity with accounting principles generally accepted in the United States of America.
Deloitte & Touche LLP
Boston, Massachusetts
February 21, 2008
MSF-17
Metropolitan Series Fund, Inc.
Directors and Officers
The Fund’s Directors review actions of the Fund’s investment adviser and subadvisers, and decide upon matters of general policy. The Fund’s officers supervise the daily business operations of the Fund. The Board of Directors and the Fund’s officers are listed below. Each Director is responsible for overseeing all 36 Portfolios of the Fund. There is no limit to the term a Director may serve. Directors serve until their resignation, retirement or removal in accordance with the Fund’s organizational documents and policies adopted by the Board from time to time. Officers hold office at the pleasure of the Board or until the election or appointment and the qualification of a successor. The address of the directors and officers is c/o Metropolitan Series Fund, Inc., 501 Boylston Street, Boston, MA 02116.
Interested Directors(1)
Each Director below is an “interested person” (as defined by the 1940 Act) with respect to the Fund in that Ms. Forget is an employee of MetLife and Mr. Typermass is a former employee of MetLife and owns securities issued by MetLife, Inc., the ultimate parent company of MetLife Advisers.
| | | | | | | | |
Name, Address and Age | | Current
position(s)
with Fund | | Position(s)
held since | | Principal occupations
over past five years, including other directorships(2) | | Number of
Portfolios in
Fund Complex
Overseen by
Director(3) |
Elizabeth M. Forget Age: 41 | | Director, Chairman of the Board, President and Chief Executive Officer | | 2006 | | Senior Vice President (since 2007), MetLife, Inc.; President, Met Investors Advisory, LLC (“MIA”); Trustee and President, Met Investors Series Trust (“MIST”); Executive Vice President, MetLife Investors Group, Inc.; President (since 2006), MetLife Advisers. | | 81 |
| | | | |
Arthur G. Typermass Age: 70 | | Director | | 1998 | | Formerly, Senior Vice President and Treasurer, MetLife. | | 37 |
Non-Interested Directors(1)
Each Director below is not an “interested person” (as defined by the 1940 Act) with respect to the Fund (collectively, the “Independent Directors”).
| | | | | | | | |
Name, Address and Age | | Current
position(s)
with Fund | | Position(s)
held since | | Principal occupations
over past five years, including other directorships(2) | | Number of
Portfolios in
Fund Complex
Overseen by
Director(3) |
Steve A. Garban† Age: 70 | | Director | | 1985 | | Formerly, Chief Financial Officer, Senior Vice President Finance and Operations and Treasurer (Emeritus), The Pennsylvania State University. | | 37 |
| | | | |
Linda B. Strumpf Age: 60 | | Director | | 2000 | | Vice President and Chief Investment Officer, Ford Foundation. | | 37 |
| | | | |
Michael S. Scott Morton† Age: 70 | | Director | | 1993 | | Jay W. Forrester Professor of Management (Emeritus) at Sloan School of Management, MIT. | | 37 |
| | | | |
H. Jesse Arnelle Age: 74 | | Director | | 2001 | | Formerly, Counsel, Womble Carlyle Sandrie & Rice; Director, Textron Inc. (global multi-industry company)*; formerly, Director, Gannet Co. Inc. (diversified news and information company)*; formerly, Director, Eastman Chemical Company (global chemical company)*; formerly, Director, Waste Management, Inc.*; formerly, Director, Armstrong Holdings Inc. (parent company of floor and ceiling products business)*; formerly, Director, FPL Group Inc. (public utility holding company)*; Director, URS Corporation (engineering design services firm)*. | | 37 |
| | | | |
Nancy Hawthorne Age: 56 | | Director | | 2003 | | Director, Avid Technologies (computer software company)*; formerly, Chairman of the Board of Avid Technologies; formerly, Board of Advisors, L. Knife & Sons, Inc. (beverage distributor); Chief Executive Officer, Clerestory LLC (corporate financial advisor); formerly, Trustee, New England Zenith Fund (“Zenith Fund”)**; formerly, Chief Executive Officer and Managing Partner, Hawthorne, Krauss and Associates (corporate financial advisor); formerly, Chief Financial Officer and Executive Vice President, Continental Cablevision, subsequently renamed MediaOne (cable television company); formerly, Director, Life F/X, Inc.; formerly, Chairman of the Board, WorldClinic (distance medicine company); formerly, Director, Perini Corporation (construction company)*; formerly, Director, CGU (property and casualty insurance company); formerly, Director, Beacon Power Corporation (energy company )*. | | 37 |
MSF-18
Metropolitan Series Fund, Inc.
Directors and Officers—(Continued)
| | | | | | | | |
Name, Address and Age | | Current
position(s)
with Fund | | Position(s)
held since | | Principal occupations
over past five years, including other directorships(2) | | Number of
Portfolios in
Fund Complex
Overseen by
Director(3) |
John T. Ludes Age: 71 | | Director | | 2003 | | President, LFP Properties (consulting firm); Formerly, Trustee, Zenith Fund**; formerly, Vice Chairman, President and Chief Operating Officer, Fortune Brands/American Brands (global conglomerate); formerly, President and CEO, Acushnet Company (athletic equipment company). | | 37 |
Officers(1)
| | | | | | | | |
Name and address | | Age | | Current
position(s)
with Fund | | Position(s)
held since | | Principal occupations over past five years(2) |
| Jeffrey P. Halperin | | 40 | | Chief Compliance Officer | | 2006 | | Vice President (since 2006), Corporate Ethics and Compliance Department, MetLife, Inc.; Chief Compliance Officer (since 2006), MetLife Advisers, MIA and MIST. |
| | | | |
| John F. Guthrie, Jr. | | 64 | | Senior Vice President | | 2002 | | Manager and Senior Vice President, MetLife Advisers; Vice President, MetLife; Vice President (since 2003), MetLife Group, Inc.; Vice President, NELICO; Vice President (since 2005), MIA; formerly, Senior Vice President, Zenith Fund**. |
| | | | |
| Alan C. Leland | | 55 | | Senior Vice President | | 2005 | | Treasurer and Chief Financial Officer, MetLife Advisers, LLC; Treasurer (since 2005), Met Investors Advisory, LLC; Vice President (since 2004), MIA; Vice President (since 2003), MetLife Group, Inc.; Vice President, MetLife; Senior Vice President, NELICO |
| | | | |
| Peter Duffy | | 52 | | Vice President and Treasurer | | 2000 | | Senior Vice President, MetLife Advisers (since 1998); Second Vice President (since 2003), NELICO; Vice President, MetLife (since 2004); Vice President (since 2004), MetLife Group, Inc.; formerly, Vice President and Treasurer, Zenith Fund**. |
| | | | |
| Thomas M. Lenz | | 49 | | Vice President and Secretary | | 2002 | | General Counsel and Secretary, MetLife Advisers; Assistant General Counsel, MetLife; formerly, Vice President and Secretary, Zenith Fund**. |
| * | Indicates a directorship with a registered investment company or a company subject to the reporting requirements of the Securities Exchange Act of 1934, as amended. |
| ** | The Zenith Fund deregistered with the Securities and Exchange Commission (“SEC”) in 2004. |
| (†) | Served as a trustee, director and/or officer of one or more of the following companies, each of which had a direct or indirect advisory relationship with MetLife Advisers or its affiliates prior to January 31, 2005: State Street Research Financial Trust, State Street Research Income Trust, State Street Research Money Market Trust, State Street Research Institutional Funds, State Street Research Capital Trust, State Street Research Master Investment Trust, State Street Research Equity Trust, State Street Research Securities Trust and State Street Research Exchange Trust (collectively, the “State Street Research Funds”). |
| (1) | Each Director of the Fund also serves as trustee of Metropolitan Series Fund II (“Met Series Fund II”), a registered investment company advised by MetLife Advisers. Each officer of the Fund serves in the same position with Met Series Fund II, which consists of one portfolio. |
| (2) | Previous positions during the past five years with the Fund, MIST, MetLife, MetLife Advisers, MIA, Zenith Fund, NELICO or New England Securities Corporation are omitted if not materially different. |
| (3) | The Fund Complex includes the Fund (36 portfolios), Met Series Fund II (1 portfolio) and MIST (44 portfolios) |
MSF-19
Metropolitan Series Fund, Inc.
Davis Venture Value Portfolio
Board Approval of Advisory and Subadvisory Agreements
The Fund’s Contract Review Committees of the Board of Directors (the “Board”) typically meet in early fall to review the Portfolios’ advisory agreements (the “Advisory Agreements”) and subadvisory agreements (collectively, the “Subadvisory Agreements,” and, together with the Advisory Agreements, the “Agreements”) and determine whether to recommend that the full Board approve the continuation of the Agreements for an additional one-year period. (Following the initial approval of an Agreement for a new Portfolio or with a new adviser or subadviser, such annual reviews are not required until 2 years following the execution of such Agreement.) After each Committee has made its recommendations, the full Board, including the Independent Directors, determines whether to approve the continuation of each of the Agreements. In addition, the Board, including the Independent Directors, considers matters bearing on the Agreements at most of its other meetings throughout the year and regularly interviews various individuals at MetLife Advisers responsible for the management of the Portfolios. The Directors also interview selected investment managers and other professionals at the subadvisers at various times throughout the year.
The Directors receive all materials that they or MetLife Advisers, the Fund’s investment adviser, and the subadvisers believe to be reasonably necessary for the Directors to evaluate the Agreements and determine whether to approve the continuation of the Agreements. These materials generally include, among other items, (i) information on the investment performance of the Portfolios and the performance of peer groups of funds and the Portfolios’ performance benchmarks, (ii) information on the Portfolios’ advisory and subadvisory fees and other expenses, including information comparing the Portfolios’ expenses to those of peer groups of funds and information about any applicable expense caps and fee “breakpoints,” (iii) sales and redemption data, (iv) information related to the profitability of the Agreements to MetLife Advisers and the subadvisers, and potential “fall-out” or ancillary benefits that MetLife Advisers, the subadvisers or their affiliates may receive as a result of their relationships with the Fund and (v) information obtained through the subadvisers’ responses to certain requests from MetLife Advisers and the Directors and MetLife Advisers’ responses to requests from the Directors. The Directors may also consider other information such as (vi) MetLife Advisers’ and the subadvisers’ financial results and condition, (vii) each Portfolio’s investment objectives and strategies and the size, education and experience of the investment staffs of MetLife Advisers and the relevant subadvisers and their use of technology and external research, (viii) the allocation of the Portfolios’ brokerage, if any, including allocations to brokers affiliated with the subadvisers and the use of “soft” commission dollars to pay Portfolio expenses and to pay for research and other similar services, (ix) the resources devoted to, and the record of compliance with, the Portfolios’ investment policies and restrictions, policies on personal securities transactions and other compliance policies, (x) the responses of MetLife Advisers, the subadvisers and/or their affiliates to certain legal and regulatory proceedings and (xi) the economic outlook generally and for the mutual fund industry in particular. Throughout the process, the Directors have the opportunity to ask questions of and request additional materials from MetLife Advisers and the subadvisers.
Following meetings of each Contract Review Committee on September 12, 2007, the Board, at its November 15, 2007 meeting, approved the continuation through December 31, 2008 of the Advisory Agreements for each Portfolio of the Fund and the Subadvisory Agreements for each Portfolio of the Fund. The Agreements approved for continuation are referred to below as the “Continued Agreements.”
In considering whether to approve the continuation of the Continued Agreements, the Directors, including the Independent Directors, did not identify any single factor as determinative, and each weighed the various factors as he or she deemed appropriate. The Directors considered the following matters in connection with their approval of the Continued Agreements:
The nature, extent and quality of the services provided to the relevant Portfolios under the Continued Agreements. The Directors considered the nature, extent and quality of the services provided by MetLife Advisers, the relevant subadvisers (if any) and their affiliates (each, an “Adviser,” and, collectively, the “Advisers”) to the relevant Portfolios pursuant to the Continued Agreements and the resources dedicated to these Portfolios by the Advisers. In particular, the Directors considered the Advisers’ abilities to attract and retain highly qualified investment professionals. With respect to MetLife Advisers, the Directors considered that MetLife Advisers is (i) ultimately responsible for the performance of such Portfolios; (ii) ultimately responsible for the establishment of the investment strategies of each such Portfolio, primarily through its recommendations to the Board regarding the hiring and selection of subadvisers; (iii) responsible for the hiring and selection, subject to Board approval, of subadvisers; and (iv) responsible for maintaining a program of Subadviser oversight reasonably designed to ensure that the subadvisers have reasonable compliance policies and procedures in place. The Directors also considered that MetLife Advisers provides a full range of day-to-day administrative services for the Portfolios involving all aspects of such Portfolios’ day-to-day operations (other than portfolio management). After reviewing these and related factors, the Directors concluded, within the context of their overall conclusions regarding each of the Continued Agreements, that the nature, extent and quality of services provided supported the renewal of these Agreements.
Investment performance of the relevant Portfolios. The Directors reviewed information about the performance of the relevant Portfolios over various time periods, including information prepared by an independent third party that compared the performance of
MSF-20
Metropolitan Series Fund, Inc.
Davis Venture Value Portfolio
Board Approval of Advisory and Subadvisory Agreements—(Continued)
the Portfolios to the performance of peer groups of funds and performance benchmarks. The Directors also reviewed a description of the third party’s methodology for identifying a Portfolio’s peer group(s) for purposes of performance and expense comparisons.
In the case of each relevant Portfolio that had performance that lagged its peer group(s) for certain periods, the Directors concluded that other factors relevant to performance were sufficient, in light of other considerations, to warrant renewal of the Continued Agreements relating to such Portfolio. These factors varied from Portfolio to Portfolio, but included one or more of the following: (i) that such Portfolio’s performance, although lagging in certain recent periods, was stronger over the longer term; (ii) that the underperformance was attributable, to a significant extent, to investment decisions that were reasonable and consistent with the Portfolio’s investment objective(s) and policies and that the Portfolio was performing within the range of reasonable expectations, given market conditions and the Portfolio’s investment objective(s) and policies; (iii) that the Portfolio’s performance was competitive when compared to other relevant performance benchmarks or peer groups; and (iv) that MetLife Advisers and/or the relevant subadviser (if any) had taken or was taking steps designed to help improve the Portfolio’s investment performance.
The Directors also considered the investment performance of the Advisers and their reputations generally, the historical responsiveness of the Advisers to Director concerns about performance and the willingness of the Advisers to take steps intended to improve performance.
After reviewing these and related factors, the Directors concluded, within the context of their overall conclusions regarding each of the Continued Agreements, that the investment performance of each relevant Portfolio and Adviser was sufficient, in light of other considerations, to warrant the renewal of the Continued Agreements.
The costs of the services to be provided and profits to be realized by the Advisers and their affiliates from their relationships with the Portfolios. The Directors considered the fees charged by MetLife Advisers to the Portfolios for advisory services and, with respect to the subadvised Portfolios, by such subadvisers to MetLife Advisers for subadvisory services (such advisory and subadvisory fees (if any), collectively, “Fees”), as well as the total expense levels of the Portfolios. This information included comparisons (provided by an independent third party) of the Portfolios’ advisory fees and total expense levels to those of their peer groups. In evaluating Fees for the relevant Portfolios, the Directors also took into account the demands, complexity and quality of the investment management services provided to each Portfolio. The Directors considered MetLife Advisers’ recommendations regarding reductions in Fee rates, implementation of Fee breakpoints and institution of Fee waivers and expense caps.
The Directors also considered the compensation directly or indirectly received by the Advisers and their affiliates from their relationships with the relevant Portfolios. The Directors reviewed information relating to the profits received by MetLife Advisers, certain of the subadvisers and their affiliates as a result of their relationships with the relevant Portfolios, and information about the allocation of expenses used to calculate profitability. When reviewing profitability, the Directors also considered the performance of the relevant Portfolios, the expense levels of such Portfolios and whether the relevant Advisers had implemented breakpoints, fee waivers and/or expense caps with respect to such Portfolios.
After reviewing these and related factors, the Directors concluded, within the context of their overall conclusions regarding each of the Continued Agreements, that the Fees charged to each of the relevant Portfolios were fair and reasonable, and that the information provided regarding costs of these services generally, and the related profitability (if known) to the relevant Advisers of their relationships with the relevant Portfolios, supported the renewal of the Continued Agreements.
Economies of Scale. The Directors considered the existence of any economies of scale in the provision of services by the Advisers and whether those economies were shared with the relevant Portfolios through breakpoints in their advisory fees or other means, such as expense caps, fee waivers or relatively low levels of fees. The Directors noted that most of the relevant Portfolios benefited or will benefit from breakpoints, expense caps and/or fee waivers with respect to their advisory fees. In considering these issues, the Directors also took into consideration information relating to the costs of the services provided and the profitability to MetLife Advisers, the relevant subadvisers (if any) and each of their affiliates of their relationships with the relevant Portfolios, as discussed above.
After reviewing these and related factors, the Directors concluded, within the context of their overall conclusions regarding each of the Continued Agreements, that the extent to which economies of scale were shared with the relevant Portfolios supported the renewal of such Agreements.
Other Factors. The Directors also considered other factors, which included but were not limited to the following:
| | • | | the extent to which each relevant Portfolio operated in accordance with its investment objective, and its record of compliance with its investment restrictions and the compliance programs of the Fund and the Advisers. They also considered the compliance-related resources the Advisers and their affiliates provide to the relevant Portfolios; |
MSF-21
Metropolitan Series Fund, Inc.
Davis Venture Value Portfolio
Board Approval of Advisory and Subadvisory Agreements—(Continued)
| | • | | the nature, quality, cost and extent of administrative and shareholder services performed by MetLife Advisers and its affiliates under the Advisory Agreements; and |
| | • | | so-called “fall-out benefits” to the Advisers, such as the engagement of their affiliates to provide distribution, brokerage and transfer agency services to the Portfolios, and the benefits of research made available to the relevant Advisers by reason of brokerage commissions generated by the relevant Portfolios’ securities transactions. The Directors also considered the possible conflicts of interest associated with these fall-out and other benefits, and the reporting and other processes in place to disclose and monitor these possible conflicts of interest. |
Based on their evaluation of all factors that they deemed to be material, including those factors described above, and assisted by the advice of independent counsel, the Directors, including the Independent Directors, concluded that each of the Continued Agreements should be continued through December 31, 2008.
MSF-22
A description of the policies and procedures that the Fund uses to determine how to vote proxies relating to portfolio securities is available (i) without charge, upon request, by calling (800) 638-7732 and (ii) on the Securities and Exchange Commission’s (the “SEC”) website at http://www.sec.gov.
Information regarding how the Fund voted proxies relating to portfolio securities during the most recent twelve-month period ended December 31, 2007 is available (i) without charge, upon request, by calling (800) 638-7732 and (ii) on the SEC’s website at http://www.sec.gov.
The Fund files with the SEC a complete schedule of its portfolio holdings, as of the close of the first and third quarters of its fiscal year, on “Form N-Q”. These filings are available on the SEC’s website at www.sec.gov and may be reviewed and copied at the SEC’s Public Reference Room in Washington, DC. (Call 1-800-SEC-0330 for information on the operation of the Public Reference Room.)
MSF-23
| | |
Metropolitan Series Fund, Inc. FI Large Cap Portfolio Annual Report | | December 31, 2007 |
Letter from the President
February 1, 2008
Letter to Policy Holders:
2007 was a tumultuous year in the financial markets driven by concerns in the credit markets surrounding sub-prime mortgages and fears of recession in the U.S. Economy. The broad markets were mixed, with the Dow Jones Industrial Average up 8.9% and the MSCI EAFE Index, which measures the performance of international equities, up 11.2% for the year, while the Russell 2000 Index, which measures the performance of small capitalization stocks, was down 1.6%.
In the fixed income markets, credit spreads increased as a result of the pressure from sub-prime mortgage crisis and the Federal Reserve lowered interest rates by a total of 1% during the year. The Lehman Brothers Aggregate Bond Index posted a 7.0% return for the year.
On the following pages, you will find a complete review of your Portfolio and its investment performance.
MetLife is committed to building your financial freedom. We appreciate your trust and will continue to focus our efforts on meeting your investment needs.
Sincerely,
Elizabeth Forget
President, Metropolitan Series Fund, Inc.
Metropolitan Series Fund, Inc.
FI Large Cap Portfolio
Managed by Fidelity Management & Research Company
Portfolio Manager Commentary*
PORTFOLIO PERFORMANCE
For the year ended December 31, 2007, the Class A shares of the FI Large Cap Portfolio returned 3.9%, compared to its benchmark, the Russell 1000 Growth Index1, which returned 11.8%. The average return of its peer group, the Lipper Variable Insurance Products Large-Cap Growth Funds Universe2, was 12.8% over the same period.
PORTFOLIO REVIEW
Amidst turmoil in the credit markets and conflicting economic data, equity prices witnessed increased volatility throughout the year. Early in the year, stock prices advanced to continual new highs, but as mounting credit concerns, a lingering weak housing market, increasing energy and commodity prices, and slow earnings growth weighed on investors, volatility in the stock market returned. However, these concerns were partially offset by continued robust global economic growth and strong, albeit tempering, consumer spending trends. For the 12-month period ending December 31, 2007, the Russell 1000 Growth® Index returned 11.8%.
For the 12-month period, the Portfolio underperformed the Russell 1000 Growth Index. The Consumer Discretionary and Industrial sectors finished as the two largest detractors, while Energy and Consumer Staples provided the majority of positive returns for the year. Underperformance within the Consumer Discretionary sector stemmed largely from our holdings of national homebuilder stocks. These stocks suffered from downward revisions to 2007 earnings estimates due to a slowdown in the U.S. housing market as well as tighter lending standards in the wake of the subprime mortgage market meltdown. KB Home and DR Horton were the largest detractors of the home builder stocks. The Industrials sector was negatively affected by holdings in airline companies that lagged the benchmark due largely to concerns over rising jet fuel costs and a possible recessionary economic environment. US Airways Group and AMR Corp. were the two biggest drags on Portfolio performance for 2007. Information Technology was the next largest detractor on a sector basis. This was driven primarily by an overweight position in Brocade Communications Systems, a hardware and equipment company. Also an underweight position in Google detracted from performance. Conversely, the Energy sector posted positive returns due to our holdings of offshore drilling rig equipment providers that benefited from increased spending on oil exploration and record backlogs for drilling rigs. Top 10 holding National-Oilwell Varco as well as Tesoro were examples of stocks in the Energy sector that worked well. Additionally, stock selection in the Food & Staples Retailing industry led to positive contributions.
* The views expressed above are those of the subadvisory firm as of December 31, 2007 and are subject to change based on market and other conditions. Information about the Portfolio’s holdings, asset allocation, industry allocation, or country diversification is historical and is not an indication of future Portfolio composition, which will vary. The performance of any index mentioned in this commentary has not been adjusted for ongoing management, distribution and operating expenses, and sales charges applicable to mutual fund investments. Direct investment in the Index is not possible.
1 The Russell 1000® Growth Index is an unmanaged measure of performance of the largest capitalized U.S. companies, within the Russell 1000 companies, that have higher price-to-book ratios and forecasted growth values.
2 The Lipper Variable Insurance Products Fund Average is an average of the total return performance (calculated on the basis of net asset value) of variable product funds with similar investment objectives to those of the subject Portfolio as calculated by Lipper Analytical Services, an independent mutual fund ranking service.
MSF-2
Metropolitan Series Fund, Inc.
FI Large Cap Portfolio
A $10,000 INVESTMENT COMPARED TO
THE RUSSELL 1000 GROWTH INDEX
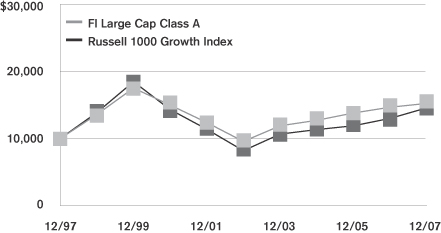
Average Annual Returns as of December 31, 2007
| | | | | | | | | | | | |
| | | FI Large Cap Portfolio | | | Russell 1000
Growth Index | |
| | | Class A | | | Class B | | | Class E | | |
| 1 Year | | 3.9 | % | | 3.7 | % | | 3.8 | % | | 11.8 | % |
| 5 Year | | 9.8 | | | — | | | — | | | 12.1 | |
| 10 Year | | 4.3 | | | — | | | — | | | 3.8 | |
| Since Inception | | — | | | 3.6 | | | 3.7 | | | — | |
Performance numbers are net of all Portfolio expenses but do not include any insurance, sales, or administrative charges of variable annuity or life insurance contracts. If these charges were included, the returns would be lower.
Inception dates of the Class A, Class B and Class E shares are: 8/30/96, 5/2/06, 5/2/06, respectively.
This information represents past performance and is not indicative of future results. Investment return and principal value may fluctuate so that shares, upon redemption, may be worth more or less than the original cost.
PORTFOLIO COMPOSITION
as of December 31, 2007
Top Holdings
| | |
| | | % of Total
Net Assets |
Apple, Inc. | | 5.3% |
Cisco Systems, Inc. | | 3.6% |
Hewlett-Packard Co. | | 3.4% |
Altria Group, Inc. | | 3.0% |
Monsanto Co. | | 2.9% |
National Oilwell Varco, Inc. | | 2.6% |
Baxter International, Inc. | | 2.3% |
The Manitowoc Co., Inc. | | 2.3% |
Microsoft Corp. | | 2.1% |
Nike, Inc. | | 2.1% |
Top Sectors
| | |
| | | % of Total
Market Value |
Information Technology | | 26.9% |
Health Care | | 15.1% |
Industrials | | 13.8% |
Consumer Discretionary | | 9.3% |
Energy | | 8.8% |
Consumer Staples | | 8.3% |
Financials | | 7.1% |
Materials | | 4.4% |
Telecommunication Services | | 2.2% |
Utilities | | 1.7% |
MSF-3
Metropolitan Series Fund, Inc.
Shareholder Expense Example
As a shareholder of the Portfolio, you incur ongoing costs, including management fees; distribution and service (12b-1) fees; and other Portfolio expenses. This example is intended to help you understand your ongoing costs (in dollars) (referred to as “expenses”) of investing in the Portfolio and compare these costs with the ongoing costs of investing in other mutual funds. The example is based on an investment of $1,000 invested at the beginning of the period and held for the entire period, July 1, 2007 through December 31, 2007.
Actual Expenses
The first line for each share class of the Portfolio in the table below provides information about actual account values and actual expenses. You may use the information in this line, together with the amount you invested in the particular share class of the Portfolio, to estimate the expenses that you paid over the period. Simply divide your account value by $1,000 (for example, an $8,600 account value divided by $1,000=8.6), then multiply the result by the number in the first line under the heading entitled “Expenses Paid During Period” to estimate the expenses you paid on your account during this period.
Hypothetical Example for Comparison Purposes
The second line for each share class of the Portfolio in the table below provides information about hypothetical account values and hypothetical expenses based on the Portfolio’s actual expense ratio and an assumed rate of return of 5% per year before expenses, which is not the Portfolio’s actual return. The hypothetical account values and expenses may not be used to estimate the actual ending account balance or expenses you paid for the period. You may use this information to compare the ongoing costs of investing in the Portfolio and other funds. To do so, compare this 5% hypothetical example with the 5% hypothetical examples that appear in the shareholder reports of the other funds.
Please note that the expenses shown in the table are meant to highlight your ongoing costs only and do not reflect any fees or charges of your variable insurance product or any additional expenses that participants in certain eligible qualified plans may bear relating to the operations of their plan. Therefore, the second line for each share class in the table is useful in comparing ongoing costs only, and will not help you determine the relative total costs of owning different funds. In addition, if these other costs were included, your costs would have been higher.
| | | | | | | | | | | | | | |
Portfolio | | | | Annualized
Expense
Ratio | | | Beginning
Account Value
July 1,
2007 | | Ending
Account Value
December 31,
2007 | | Expenses Paid
During Period*
July 1, 2007
to
December 31,
2007 |
FI Large Cap—Class A | | Actual | | 0.85 | % | | $ | 1,000.00 | | $ | 1,006.20 | | $ | 4.30 |
| | Hypothetical | | 0.85 | % | | $ | 1,000.00 | | $ | 1,020.87 | | $ | 4.33 |
| | | | | |
FI Large Cap—Class B | | Actual | | 1.10 | % | | $ | 1,000.00 | | $ | 1,004.80 | | $ | 5.56 |
| | Hypothetical | | 1.10 | % | | $ | 1,000.00 | | $ | 1,019.59 | | $ | 5.60 |
| | | | | |
FI Large Cap—Class E | | Actual | | 1.00 | % | | $ | 1,000.00 | | $ | 1,004.80 | | $ | 5.05 |
| | Hypothetical | | 1.00 | % | | $ | 1,000.00 | | $ | 1,020.11 | | $ | 5.09 |
* Expenses paid are equal to the Portfolio’s annualized expense ratio for the most recent six month period, as shown above, multiplied by the average account value over the period, multiplied by the number of days in the most recent fiscal half-year, divided by 365 (to reflect the one-half year period).
MSF-4
Metropolitan Series Fund, Inc.
FI Large Cap Portfolio
Schedule of Investments as of December 31, 2007
Common Stock—98.0% of Total Net Assets
| | | | | |
| Security Description | | Shares | | Value* |
| | | | | |
| | | | | |
| | |
Aerospace & Defense—4.2% | | | | | |
General Dynamics Corp. | | 26,400 | | $ | 2,349,336 |
Lockheed Martin Corp. | | 64,200 | | | 6,757,692 |
Precision Castparts Corp. | | 26,200 | | | 3,633,940 |
Raytheon Co. | | 131,100 | | | 7,957,770 |
| | | | | |
| | | | | 20,698,738 |
| | | | | |
| | |
Airlines—1.5% | | | | | |
AMR Corp. (a) (b) | | 204,900 | | | 2,874,747 |
Continental Airlines, Inc. (Class B) (a) (b) | | 87,200 | | | 1,940,200 |
US Airways Group, Inc. (a) (b) | | 180,400 | | | 2,653,684 |
| | | | | |
| | | | | 7,468,631 |
| | | | | |
| | |
Biotechnology—4.2% | | | | | |
Biogen Idec, Inc. (a) (b) | | 179,077 | | | 10,193,063 |
Theravance, Inc. (a) (b) | | 225,442 | | | 4,396,119 |
United Therapeutics Corp. (a) (b) | | 65,900 | | | 6,435,135 |
| | | | | |
| | | | | 21,024,317 |
| | | | | |
| | |
Capital Markets—3.0% | | | | | |
Ameriprise Financial, Inc. | | 47,400 | | | 2,612,214 |
The Bank of New York Mellon Corp. | | 121,800 | | | 5,938,968 |
The Goldman Sachs Group, Inc. | | 29,500 | | | 6,343,975 |
| | | | | |
| | | | | 14,895,157 |
| | | | | |
| | |
Chemicals—2.9% | | | | | |
Monsanto Co. | | 128,918 | | | 14,398,851 |
| | | | | |
| | |
Communications Equipment—7.5% | | | | | |
Ciena Corp. (a) (b) | | 214,900 | | | 7,330,239 |
Cisco Systems, Inc. (b) | | 668,000 | | | 18,082,760 |
Polycom, Inc. (b) | | 293,200 | | | 8,145,096 |
QUALCOMM, Inc. | | 94,900 | | | 3,734,315 |
| | | | | |
| | | | | 37,292,410 |
| | | | | |
| | |
Computers & Peripherals—10.1% | | | | | |
Apple, Inc. (b) | | 132,100 | | | 26,166,368 |
EMC Corp. (b) | | 284,000 | | | 5,262,520 |
Hewlett-Packard Co. | | 335,775 | | | 16,949,922 |
International Business Machines Corp. | | 16,800 | | | 1,816,080 |
| | | | | |
| | | | | 50,194,890 |
| | | | | |
| | |
Construction & Engineering—1.6% | | | | | |
Jacobs Engineering Group, Inc. | | 83,700 | | | 8,002,557 |
| | | | | |
| | |
Diversified Consumer Services—1.1% | | | | | |
Apollo Group, Inc. (Class A) (b) | | 80,100 | | | 5,619,015 |
| | | | | |
| |
Diversified Telecommunication Services—1.6% | | | |
AT&T, Inc. | | 186,300 | | | 7,742,628 |
| | | | | |
| | |
Electric Utilities—1.7% | | | | | |
PPL Corp. | | 164,500 | | | 8,568,805 |
| | | | | |
| | | | | |
| Security Description | | Shares | | Value* |
| | | | | |
| | |
Electrical Equipment—0.6% | | | | | |
Energy Conversion Devices, Inc. (a) (b) | | 83,384 | | $ | 2,805,872 |
| | | | | |
| |
Electronic Equipment & Instruments—0.9% | | | |
Avnet, Inc. | | 130,700 | | | 4,570,579 |
| | | | | |
| | |
Energy Equipment & Services—3.7% | | | | | |
National Oilwell Varco, Inc. (b) | | 174,500 | | | 12,818,770 |
Transocean, Inc. | | 37,996 | | | 5,439,127 |
| | | | | |
| | | | | 18,257,897 |
| | | | | |
| | |
Food & Staples Retailing—4.8% | | | | | |
CVS Caremark Corp. | | 87,100 | | | 3,462,225 |
Great Atlantic & Pacific Tea Co., Inc. (b) | | 105,930 | | | 3,318,787 |
Safeway, Inc. | | 238,000 | | | 8,141,980 |
The Kroger Co. | | 171,900 | | | 4,591,449 |
Wal-Mart Stores, Inc. | | 89,600 | | | 4,258,688 |
| | | | | |
| | | | | 23,773,129 |
| | | | | |
| |
Health Care Equipment & Supplies—2.3% | | | |
Baxter International, Inc. | | 196,700 | | | 11,418,435 |
| | | | | |
|
Health Care Providers & Services—3.9% |
Cardinal Health, Inc. | | 39,200 | | | 2,263,800 |
McKesson Corp. | | 50,400 | | | 3,301,704 |
Medco Health Solutions, Inc. (b) | | 39,235 | | | 3,978,429 |
UnitedHealth Group, Inc. | | 43,200 | | | 2,514,240 |
WellPoint, Inc. (b) | | 83,300 | | | 7,307,909 |
| | | | | |
| | | | | 19,366,082 |
| | | | | |
|
Hotels, Restaurants & Leisure—1.5% |
Boyd Gaming Corp. (a) | | 39,700 | | | 1,352,579 |
Burger King Holdings, Inc. (a) | | 220,600 | | | 6,289,306 |
| | | | | |
| | | | | 7,641,885 |
| | | | | |
|
Household Products—0.5% |
Energizer Holdings, Inc. (a) (b) | | 24,200 | | | 2,713,546 |
| | | | | |
| | |
Insurance—4.1% | | | | | |
ACE, Ltd. (a) | | 56,600 | | | 3,496,748 |
PartnerRe, Ltd. | | 15,700 | | | 1,295,721 |
Prudential Financial, Inc. | | 61,747 | | | 5,744,941 |
The Chubb Corp. | | 179,200 | | | 9,780,736 |
| | | | | |
| | | | | 20,318,146 |
| | | | | |
|
Internet Software & Services—1.3% |
Google, Inc. (Class A) (b) | | 9,300 | | | 6,430,764 |
| | | | | |
|
Life Sciences Tools & Services—1.6% |
PerkinElmer, Inc. | | 306,300 | | | 7,969,926 |
| | | | | |
| | |
Machinery—6.0% | | | | | |
AGCO Corp. (a) | | 138,100 | | | 9,388,038 |
Cummins, Inc. | | 73,900 | | | 9,412,643 |
The Manitowoc Co., Inc. | | 231,790 | | | 11,318,306 |
| | | | | |
| | | | | 30,118,987 |
| | | | | |
*See accompanying notes to financial statements.
MSF-5
Metropolitan Series Fund, Inc.
FI Large Cap Portfolio
Schedule of Investments as of December 31, 2007
Common Stock—(Continued)
| | | | | |
| Security Description | | Shares | | Value* |
| | | | | |
| | |
Media—2.7% | | | | | |
Discovery Holding Co. (Class A) (b) | | 204,995 | | $ | 5,153,574 |
EchoStar Communications Corp.
(Class A) (b) | | 101,800 | | | 3,839,896 |
The Walt Disney Co. | | 144,700 | | | 4,670,916 |
| | | | | |
| | | | | 13,664,386 |
| | | | | |
| | |
Metals & Mining—1.5% | | | | | |
Allegheny Technologies, Inc. | | 58,163 | | | 5,025,283 |
RTI International Metals, Inc. (a) (b) | | 34,900 | | | 2,405,657 |
| | | | | |
| | | | | 7,430,940 |
| | | | | |
| | |
Oil, Gas & Consumable Fuels—5.2% | | | | | |
Exxon Mobil Corp. | | 102,700 | | | 9,621,963 |
Frontier Oil Corp. | | 127,700 | | | 5,182,066 |
Holly Corp. | | 68,000 | | | 3,460,520 |
Tesoro Corp. | | 116,400 | | | 5,552,280 |
Western Refining, Inc. (a) | | 82,800 | | | 2,004,588 |
| | | | | |
| | | | | 25,821,417 |
| | | | | |
| | |
Pharmaceuticals—3.1% | | | | | |
Endo Pharmaceuticals Holdings, Inc. (b) | | 197,100 | | | 5,256,657 |
Schering-Plough Corp. | | 388,000 | | | 10,336,320 |
| | | | | |
| | | | | 15,592,977 |
| | | | | |
|
Semiconductors & Semiconductor Equipment—4.7% |
Applied Materials, Inc. | | 449,100 | | | 7,976,016 |
Cypress Semiconductor Corp. (b) | | 38,100 | | | 1,372,743 |
Formfactor, Inc. (a) (b) | | 175,485 | | | 5,808,554 |
Intel Corp. | | 85,900 | | | 2,290,094 |
MEMC Electronic Materials, Inc. (b) | | 66,150 | | | 5,853,613 |
| | | | | |
| | | | | 23,301,020 |
| | | | | |
| | |
Software—2.5% | | | | | |
McAfee, Inc. (b) | | 54,900 | | | 2,058,750 |
Microsoft Corp. | | 298,500 | | | 10,626,600 |
| | | | | |
| | | | | 12,685,350 |
| | | | | |
| | |
Specialty Retail—1.2% | | | | | |
Advance Auto Parts, Inc. | | 150,700 | | | 5,725,093 |
| | | | | |
| |
Textiles, Apparel & Luxury Goods—2.8% | | | |
Coach, Inc. (b) | | 117,675 | | | 3,598,502 |
Nike, Inc. | | 161,400 | | | 10,368,336 |
| | | | | |
| | | | | 13,966,838 |
| | | | | |
| | |
Tobacco—3.0% | | | | | |
Altria Group, Inc. | | 200,900 | | | 15,184,022 |
| | | | | |
| |
Wireless Telecommunication Services—0.7% | | | |
American Tower Corp. (Class A) (b) | | 62,000 | | | 2,641,200 |
NII Holdings, Inc. (a) (b) | | 16,900 | | | 816,608 |
| | | | | |
| | | | | 3,457,808 |
| | | | | |
Total Common Stock
(Identified Cost $481,061,411) | | | | | 488,121,098 |
| | | | | |
| | | | | | | |
|
| Short Term Investments—12.1% | |
| Security Description | | Shares/
Face Amount | | Value* | |
| | |
Mutual Funds—9.7% | | | | | | | |
State Street Navigator Securities Lending Prime Portfolio (c) | | | 48,589,263 | | $ | 48,589,263 | |
| | | | | | | |
| | |
Repurchase Agreement—2.4% | | | | | | | |
State Street Corp. Repurchase Agreement dated 12/31/07 at 2.60% to be repurchased at $11,739,695 on 1/02/08, collateralized by $8,560,000 U.S. Treasury Bond 8.50% due 2/15/20 with a value of $11,973,300. | | $ | 11,738,000 | | | 11,738,000 | |
| | | | | | | |
Total Short Term Investments
(Identified Cost $60,327,263) | | | | | | 60,327,263 | |
| | | | | | | |
Total Investments—110.1%
(Identified Cost $541,388,674) (d) | | | | | | 548,448,361 | |
Liabilities in excess of other assets | | | | | | (50,227,835 | ) |
| | | | | | | |
| Total Net Assets—100% | | | | | $ | 498,220,526 | |
| | | | | | | |
| (a) | A portion or all of the security was held on loan. As of December 31, 2007, the market value of securities loaned was $48,524,287 and the collateral received consisted of cash in the amount of $48,589,263 and non cash collateral with a value of $1,337,651. The cash collateral is invested in a money market fund managed by an affiliate of the custodian. The non cash collateral received consists primarily of government securities and bank letters of credit, and are held for the benefit of the Portfolio at the Portfolio’s custodian. |
| (c) | Represents investment of cash collateral received from securities lending transactions. |
| (d) | The aggregate cost of investments for federal income tax purposes as of December 31, 2007 was $542,673,696 and the composition of unrealized appreciation and depreciation of investment securities was $42,180,046 and $(36,405,381), respectively. |
*See accompanying notes to financial statements.
MSF-6
Metropolitan Series Fund, Inc.
FI Large Cap Portfolio
Statement of Assets & Liabilities
December 31, 2007
| | | | | | | |
Assets | | | | | | | |
Investments at value (a) (c) | | | | | $ | 548,448,361 | |
Cash | | | | | | 562 | |
Foreign cash at value (b) | | | | | | 116,950 | |
Receivable for: | | | | | | | |
Securities sold | | | | | | 9,845,443 | |
Fund shares sold | | | | | | 202,125 | |
Accrued interest and dividends | | | | | | 571,925 | |
Foreign taxes | | | | | | 7,732 | |
| | | | | | | |
Total Assets | | | | | | 559,193,098 | |
Liabilities | | | | | | | |
Payable for: | | | | | | | |
Securities purchased | | $ | 10,662,881 | | | | |
Fund shares redeemed | | | 1,344,411 | | | | |
Collateral for securities loaned | | | 48,589,263 | | | | |
Accrued expenses: | | | | | | | |
Management fees | | | 335,685 | | | | |
Service and distribution fees | | | 1,438 | | | | |
Other expenses | | | 38,894 | | | | |
| | | | | | | |
Total Liabilities | | | | | | 60,972,572 | |
| | | | | | | |
Net Assets | | | | | $ | 498,220,526 | |
| | | | | | | |
Net assets consists of: | | | | | | | |
Capital paid in | | | | | $ | 731,141,203 | |
Accumulated net realized losses | | | | | | (239,977,181 | ) |
Unrealized appreciation on investments and foreign currency | | | | | | 7,056,504 | |
| | | | | | | |
Net Assets | | | | | $ | 498,220,526 | |
| | | | | | | |
| Computation of offering price: | | | | | | | |
Class A | | | | | | | |
Net asset value and redemption price per
share ($490,617,276 divided by 33,474,792 shares outstanding) | | | | | $ | 14.66 | |
| | | | | | | |
Class B | | | | | | | |
Net asset value and redemption price per
share ($5,986,909 divided by 411,514 shares outstanding) | | | | | $ | 14.55 | |
| | | | | | | |
Class E | | | | | | | |
Net asset value and redemption price per
share ($1,616,341 divided by 110,549 shares outstanding) | | | | | $ | 14.62 | |
| | | | | | | |
(a) Identified cost of investments | | | | | $ | 541,388,674 | |
| | | | | | | |
(b) Identified cost of foreign cash | | | | | $ | 122,037 | |
| | | | | | | |
| (c) | Includes cash collateral for securities loaned of $48,589,263. |
Statement of Operations
For the Year Ended December 31, 2007
| | | | | | | | |
Investment Income | | | | | | | | |
Dividends | | | | | | $ | 4,153,371 | (a) |
Interest | | | | | | | 370,844 | (b) |
| | | | | | | | |
| | | | | | | 4,524,215 | |
Expenses | | | | | | | | |
Management fees | | $ | 4,269,996 | | | | | |
Service and distribution fees—Class B | | | 11,403 | | | | | |
Service and distribution fees—Class E | | | 1,964 | | | | | |
Directors’ fees and expenses | | | 23,669 | | | | | |
Custodian | | | 80,022 | | | | | |
Audit and tax services | | | 31,737 | | | | | |
Legal | | | 5,837 | | | | | |
Printing | | | 210,294 | | | | | |
Insurance | | | 6,409 | | | | | |
Miscellaneous | | | 26,585 | | | | | |
| | | | | | | | |
Total expenses | | | 4,667,916 | | | | | |
Expense reductions | | | (2,185 | ) | | | 4,665,731 | |
| | | | | | | | |
Net Investment Loss | | | | | | | (141,516 | ) |
| | | | | | | | |
Realized and Unrealized Gain | | | | | | | | |
| Realized gain (loss) on: | | | | | | | | |
Investments—net | | | 14,209,817 | | | | | |
Foreign currency transactions—net | | | (13 | ) | | | 14,209,804 | |
| | | | | | | | |
| Change in unrealized appreciation on: | | | | | | | | |
Investments—net | | | 8,660,868 | | | | | |
Foreign currency transactions—net | | | 1,441 | | | | 8,662,309 | |
| | | | | | | | |
Net gain | | | | | | | 22,872,113 | |
| | | | | | | | |
Net Increase in Net Assets From Operations | | | | | | $ | 22,730,597 | |
| | | | | | | | |
| (a) | Net of foreign taxes of $128. |
| (b) | Includes net income on securities loaned of $265,362. |
See accompanying notes to financial statements.
MSF-7
Metropolitan Series Fund, Inc.
FI Large Cap Portfolio
Statements of Changes in Net Assets
| | | | | | | | |
| | | Year ended
December 31,
2007 | | | Year ended
December 31,
2006 | |
From Operations | | | | | | | | |
Net investment income (loss) | | $ | (141,516 | ) | | $ | 1,797,135 | |
Net realized gain | | | 14,209,804 | | | | 53,696,903 | |
Unrealized appreciation (depreciation) | | | 8,662,309 | | | | (35,793,539 | ) |
| | | | | | | | |
Increase in net assets from operations | | | 22,730,597 | | | | 19,700,499 | |
| | | | | | | | |
From Distributions to Shareholders | | | | | | | | |
Net investment income | | | | | | | | |
Class A | | | (911,557 | ) | | | (1,152,460 | ) |
Class E | | | (770 | ) | | | 0 | |
| | | | | | | | |
| | | (912,327 | ) | | | (1,152,460 | ) |
| | | | | | | | |
Net realized gain | | | | | | | | |
Class A | | | (37,811,399 | ) | | | (14,103,384 | ) |
Class B | | | (256,994 | ) | | | 0 | |
Class E | | | (79,878 | ) | | | 0 | |
| | | | | | | | |
| | | (38,148,271 | ) | | | (14,103,384 | ) |
| | | | | | | | |
Total distributions | | | (39,060,598 | ) | | | (15,255,844 | ) |
| | | | | | | | |
Increase (decrease) in net assets from capital share transactions | | | (77,075,870 | ) | | | 321,322,000 | |
| | | | | | | | |
Total increase (decrease) in net assets | | | (93,405,871 | ) | | | 325,766,655 | |
| | |
Net Assets | | | | | | | | |
Beginning of the period | | | 591,626,397 | | | | 265,859,742 | |
| | | | | | | | |
End of the period | | $ | 498,220,526 | | | $ | 591,626,397 | |
| | | | | | | | |
Undistributed Net Investment Income (Loss) | | | | | | | | |
End of the period | | $ | 0 | | | $ | 810,298 | |
| | | | | | | | |
Other Information:
Capital Shares
Transactions in capital shares were as follows:
| | | | | | | | | | | | | | |
| | | Year ended
December 31, 2007 | | | Year ended
December 31, 2006 | |
| | | Shares | | | $ | | | Shares | | | $ | |
Class A | | | | | | | | | | | | | | |
Sales | | 982,880 | | | $ | 14,622,824 | | | 1,993,002 | | | $ | 29,040,577 | |
Shares issued through acquisition | | 0 | | �� | | 0 | | | 29,696,833 | | | | 438,221,310 | |
Reinvestments | | 2,627,066 | | | | 38,722,956 | | | 1,026,638 | | | | 15,255,844 | |
Redemptions | | (9,041,192 | ) | | | (134,743,307 | ) | | (11,357,605 | ) | | | (164,439,136 | ) |
| | | | | | | | | | | | | | |
Net increase (decrease) | | (5,431,246 | ) | | $ | (81,397,527 | ) | | 21,358,868 | | | $ | 318,078,595 | |
| | | | | | | | | | | | | | |
Class B | | | | | | | | | | | | | | |
Sales | | 369,937 | | | $ | 5,486,910 | | | 212,387 | | | $ | 2,967,028 | |
Reinvestments | | 17,530 | | | | 256,994 | | | 0 | | | | 0 | |
Redemptions | | (143,296 | ) | | | (2,124,761 | ) | | (45,044 | ) | | | (639,546 | ) |
| | | | | | | | | | | | | | |
Net increase | | 244,171 | | | $ | 3,619,143 | | | 167,343 | | | $ | 2,327,482 | |
| | | | | | | | | | | | | | |
Class E | | | | | | | | | | | | | | |
Sales | | 162,105 | | | $ | 2,414,931 | | | 109,575 | | | $ | 1,553,650 | |
Reinvestments | | 5,479 | | | | 80,648 | | | 0 | | | | 0 | |
Redemptions | | (121,278 | ) | | | (1,793,065 | ) | | (45,332 | ) | | | (637,727 | ) |
| | | | | | | | | | | | | | |
Net increase | | 46,306 | | | $ | 702,514 | | | 64,243 | | | $ | 915,923 | |
| | | | | | | | | | | | | | |
Increase (decrease) derived from capital share transactions | | | | | $ | (77,075,870 | ) | | | | | $ | 321,322,000 | |
| | | | | | | | | | | | | | |
See accompanying notes to financial statements.
MSF-8
Metropolitan Series Fund, Inc.
FI Large Cap Portfolio
Financial Highlights
| | | | | | | | | | | | | | | | | | | |
| | | Class A | |
| | | Year ended December 31, | |
| | | 2007 | | | 2006 | | | 2005 | | 2004(a) | | | 2003(a) | |
Net Asset Value, Beginning of Period | | $ | 15.12 | | | $ | 15.15 | | | $ | 13.93 | | $ | 13.18 | | | $ | 10.61 | |
| | | | | | | | | | | | | | | | | | | |
Income From Investment Operations | | | | | | | | | | | | | | | | | | | |
Net investment income | | | (0.00 | )(b) | | | 0.08 | | | | 0.02 | | | 0.10 | | | | 0.05 | |
Net realized and unrealized gain on investments | | | 0.61 | | | | 0.82 | | | | 1.20 | | | 0.76 | | | | 2.57 | |
| | | | | | | | | | | | | | | | | | | |
Total from investment operations | | | 0.61 | | | | 0.90 | | | | 1.22 | | | 0.86 | | | | 2.62 | |
| | | | | | | | | | | | | | | | | | | |
Less Distributions | | | | | | | | | | | | | | | | | | | |
Distributions from net investment income | | | (0.03 | ) | | | (0.07 | ) | | | 0.00 | | | (0.11 | ) | | | (0.05 | ) |
Distributions from net realized capital gains | | | (1.04 | ) | | | (0.86 | ) | | | 0.00 | | | 0.00 | | | | 0.00 | |
| | | | | | | | | | | | | | | | | | | |
Total distributions | | | (1.07 | ) | | | (0.93 | ) | | | 0.00 | | | (0.11 | ) | | | (0.05 | ) |
| | | | | | | | | | | | | | | | | | | |
Net Asset Value, End of Period | | $ | 14.66 | | | $ | 15.12 | | | $ | 15.15 | | $ | 13.93 | | | $ | 13.18 | |
| | | | | | | | | | | | | | | | | | | |
Total Return (%) | | | 3.9 | | | | 6.1 | | | | 8.7 | | | 6.5 | | | | 24.7 | |
Ratio of operating expenses to average net assets before expense reductions (%) | | | 0.84 | | | | 0.85 | | | | 0.86 | | | 0.86 | (c) | | | 0.86 | |
Ratio of operating expenses to average net assets after expense reductions (%) (d) | | | 0.84 | | | | 0.84 | | | | 0.86 | | | 0.86 | | | | 0.86 | |
Ratio of net investment income (loss) to average net assets (%) | | | (0.02 | ) | | | 0.37 | | | | 0.11 | | | 0.81 | | | | 0.43 | |
Portfolio turnover rate (%) | | | 250 | | | | 245 | | | | 217 | | | 56 | | | | 60 | |
Net assets, end of period (000) | | $ | 490,617 | | | $ | 588,143 | | | $ | 265,860 | | $ | 268,160 | | | $ | 227,800 | |
| | | | | | | | |
| | | Class B | |
| | | Year ended
December 31, | |
| | | 2007 | | | 2006(e) | |
Net Asset Value, Beginning of Period | | $ | 15.02 | | | $ | 14.68 | |
| | | | | | | | |
Income From Investment Operations | | | | | | | | |
Net investment loss | | | (0.03 | )(b) | | | (0.01 | ) |
Net realized and unrealized gain on investments | | | 0.60 | | | | 0.35 | |
| | | | | | | | |
Total from investment operations | | | 0.57 | | | | 0.34 | |
| | | | | | | | |
Less Distributions | | | | | | | | |
Distributions from net realized capital gains | | | (1.04 | ) | | | 0.00 | |
| | | | | | | | |
Total distributions | | | (1.04 | ) | | | 0.00 | |
| | | | | | | | |
Net Asset Value, End of Period | | $ | 14.55 | | | $ | 15.02 | |
| | | | | | | | |
Total Return (%) | | | 3.7 | | | | 2.3 | (f) |
Ratio of operating expenses to average net assets before expense reductions (%) | | | 1.09 | | | | 1.10 | (g) |
Ratio of operating expenses to average net assets after expense reductions (%) (d) | | | 1.09 | | | | 1.09 | (g) |
Ratio of net investment loss to average net assets (%) | | | (0.24 | ) | | | (0.13 | )(g) |
Portfolio turnover rate (%) | | | 250 | | | | 245 | |
Net assets, end of period (000) | | $ | 5,987 | | | $ | 2,514 | |
| (a) | Audited by other Independent Registered Public Accounting Firm. |
| (b) | Per share amount is based on average shares outstanding during the period. |
| (c) | The investment manager waived a portion of its management fee for the year. |
| (d) | The Portfolio has entered into arrangements with certain brokers who paid a portion of the Portfolio’s expenses. |
| (e) | Commencement of operations was May 2, 2006 for Classes B and E. |
| (f) | Periods less than one year are not computed on an annualized basis. |
| (g) | Computed on an annualized basis. |
| (h) | Net investment loss per share was less than $(0.01). |
See accompanying notes to financial statements.
MSF-9
Metropolitan Series Fund, Inc.
FI Large Cap Portfolio
Financial Highlights
| | | | | | | | |
| | | Class E | |
| | | Year ended
December 31, | |
| | | 2007 | | | 2006(e) | |
Net Asset Value, Beginning of Period | | $ | 15.09 | | | $ | 14.74 | |
| | | | | | | | |
Income From Investment Operations | | | | | | | | |
Net investment loss | | | (0.02 | )(b) | | | 0.00 | (h) |
Net realized and unrealized gain on investments | | | 0.60 | | | | 0.35 | |
| | | | | | | | |
Total from investment operations | | | 0.58 | | | | 0.35 | |
| | | | | | | | |
Less Distributions | | | | | | | | |
Distributions from net investment income | | | (0.01 | ) | | | 0.00 | |
Distributions from net realized capital gains | | | (1.04 | ) | | | 0.00 | |
| | | | | | | | |
Total distributions | | | (1.05 | ) | | | 0.00 | |
| | | | | | | | |
Net Asset Value, End of Period | | $ | 14.62 | | | $ | 15.09 | |
| | | | | | | | |
Total Return (%) | | | 3.8 | | | | 2.4 | (f) |
Ratio of operating expenses to average net assets before expense reductions (%) | | | 0.99 | | | | 1.00 | (g) |
Ratio of operating expenses to average net assets after expense reductions (%) (d) | | | 0.99 | | | | 0.99 | (g) |
Ratio of net investment loss to average net assets (%) | | | (0.15 | ) | | | (0.02 | )(g) |
Portfolio turnover rate (%) | | | 250 | | | | 245 | |
Net assets, end of period (000) | | $ | 1,616 | | | $ | 969 | |
| (a) | Audited by other Independent Registered Public Accounting Firm. |
| (b) | Per share amount is based on average shares outstanding during the period. |
| (c) | The investment manager waived a portion of its management fee for the year. |
| (d) | The Portfolio has entered into arrangements with certain brokers who paid a portion of the Portfolio’s expenses. |
| (e) | Commencement of operations was May 2, 2006 for Classes B and E. |
| (f) | Periods less than one year are not computed on an annualized basis. |
| (g) | Computed on an annualized basis. |
| (h) | Net investment loss per share was less than $(0.01). |
See accompanying notes to financial statements.
MSF-10
Metropolitan Series Fund, Inc.
FI Large Cap Portfolio
Notes to Financial Statements—December 31, 2007
Metropolitan Series Fund, Inc. (the “Fund”) is organized as a corporation under the laws of Maryland pursuant to Articles of Incorporation filed on November 23, 1982, as amended, and registered under the Investment Company Act of 1940, as amended (the “1940 Act”), as an open-end investment company. The Fund is a “series” type of mutual fund, which issues separate series of stock. Each series represents an interest in a separate portfolio of Fund investments. The FI Large Cap Portfolio (the “Portfolio”) is a diversified series of the Fund. Shares in the Fund are not offered directly to the general public and are currently available only to separate accounts established by Metropolitan Life Insurance Company (“MetLife”), New England Life Insurance Company, General American Life Insurance Company (“General American”), The MetLife Investors Group of Insurance Companies, MetLife Insurance Company of Connecticut and other affiliated insurance companies (collectively, the “Insurance Companies”), as an investment vehicle for variable life insurance, group annuity or variable annuity products, although the Portfolio is not available to all such separate accounts. The Portfolio’s shares may be divided into three different classes. Currently, the classes being offered by the Portfolio are named Class A, Class B and Class E. The classes of the Portfolio’s shares are identical, except that certain additional charges (Rule 12b-1 fees) are made against Class B and Class E shares. Investment income, realized and unrealized capital gains and losses, the common expenses of the Portfolio and certain Portfolio-level expense reductions, if any, are allocated on a pro rata basis to each class based on the relative net assets of each class to the total net assets of the Portfolio.
| 2. | SIGNIFICANT ACCOUNTING POLICIES: |
The preparation of financial statements in conformity with accounting principles generally accepted in the United States of America (“GAAP”) requires management to make estimates and assumptions that affect the reported amounts of assets and liabilities and disclosure of contingent assets and liabilities as of the date of the financial statements and the reported amounts of income and expenses during the reporting period. Actual results could differ from those estimates.
The following is a summary of significant accounting policies consistently followed by the Portfolio in the preparation of its financial statements. The policies are in conformity with GAAP.
Investment Valuation:
Debt securities (other than short term obligations with a remaining maturity of sixty days or less) are valued by independent pricing services selected by the relevant subadviser pursuant to authorization of the Board of Directors of the Fund (the “Board” or “Directors”). Short term obligations with a remaining maturity of sixty days or less are valued at amortized cost which approximates fair market value.
Equity securities traded on a national securities exchange or exchanges are valued at their last sale price on the principal trading market. Equity securities traded on the NASDAQ National Market System are valued at the NASDAQ Official Closing Price (the “NOCP”). The NOCP is the last sale price if it falls between the spread of the last reported bid and asked prices. If the last reported bid and asked prices are above the last reported sale price, the NOCP will be the last reported bid price. If the last reported bid and asked prices are below the last reported sale price, the NOCP will be the last reported asked price. Equity securities traded on a national securities exchange or exchanges or on the NASDAQ National Market System for which there is no reported sale during the day are valued at the last reported bid price. A security that is listed or traded on more than one exchange is valued at the quotation on the exchange determined to be the primary market for that security by the Board or its delegates. If no closing price is available, then such securities are valued by using the last reported bid price. Equity securities traded over-the-counter are valued at the last reported sales price.
If no current market value quotation is readily available or reliable for a portfolio security, fair value will be determined in accordance with procedures established by and under the general supervision of the Board. When the Portfolio uses fair value pricing, it may take into account any factors it deems appropriate. The value of securities used by the Portfolio to calculate its net asset value may differ from quoted or published prices for the same securities. Fair value pricing involves subjective judgments and the fair value determined for a security may be materially different than the value that could be realized upon the sale of that security.
The Portfolio expects to use fair value pricing for securities primarily traded on U.S. exchanges only under very limited circumstances. For example, the Portfolio may use fair value pricing if the exchange on which a security is traded closes early or trading in the security is suspended.
MSF-11
Metropolitan Series Fund, Inc.
FI Large Cap Portfolio
Notes to Financial Statements—December 31, 2007—(Continued)
Securities traded primarily on an exchange outside of the United States which closes before the close of the New York Stock Exchange will be valued at the last sales price on that non-U.S. exchange. Securities traded primarily on an exchange outside of the United States for which there is no reported sale during the day are valued at the mean between the last reported bid and asked prices. However, because most foreign markets close well before the Portfolio values its securities (typically at 4 p.m. Eastern Time), the earlier close of these foreign markets gives rise to the possibility that significant events, including broad market moves, may have occurred after these foreign markets close but before the Portfolio values its securities. To account for this, the Portfolio may frequently value many of its foreign equity securities using fair value prices based on third party vendor modeling tools.
Forward foreign currency exchange contracts are valued based on the mean between closing bid and asked prices of the forward currency contract rates in the London foreign exchange markets on a daily basis as provided by a reliable bank or dealer.
Options, whether on securities, indices, futures contracts, or otherwise, are valued at the last sales price available as of the close of business on the day of valuation or, if there is no such sale price available, at the mean between the bid and asked prices. Options on currencies are valued at the spot price each day.
The value of futures contracts will be the sum of the margin deposit plus or minus the difference between the value of the futures contract on each day the net asset value is calculated and the value on the date the futures contract originated, value being that established on a recognized commodity exchange, or by reference to other customary sources, with gain or loss being realized when the futures contract closes or expires.
Subject to the Board’s oversight, the Board has delegated day-to-day responsibility for valuing Portfolio assets to MetLife Advisers, LLC (“MetLife Advisers” or the “Adviser”) who values such assets as described above and operates under procedures approved by the Board.
Investment Transactions and Related Investment Income:
Portfolio security transactions are recorded on the trade date. Dividend income is recorded on the ex-dividend date or, for certain foreign securities, when notified. Interest income, which includes amortization of premium and accretion of discount on debt securities, is recorded on the accrual basis. Realized gains and losses on investments and unrealized appreciation and depreciation are determined on the identified cost basis, which is the same basis used for federal income tax purposes.
Repurchase Agreements:
The Portfolio, through the custodian or a subcustodian, receives delivery of the underlying securities collateralizing repurchase agreements. The Portfolio requires the custodian to take possession, to have legally segregated in the Federal Reserve Book Entry System, or to have segregated within the custodian’s vault, all securities held as collateral for repurchase agreements. It is the Portfolio’s policy that the market value of the collateral be at least equal to 100% of the repurchase price in the case of a repurchase agreement of one-day duration and 102% on all other repurchase agreements. The Portfolio’s subadviser is responsible for determining that the value of the collateral is at all times at least equal to the repurchase price. In connection with transactions in repurchase agreements, if the seller defaults and the value of the collateral declines or if the seller enters an insolvency proceeding, realization of the collateral by the Portfolio may be delayed, limited or wholly denied.
Foreign Currency Translation:
The books and records of the Portfolio are maintained in U.S. dollars. The values of securities, currencies and other assets and liabilities denominated in currencies other than U.S. dollars are translated into U.S. dollars based upon foreign exchange rates prevailing at the end of the period. Purchases and sales of investment securities, income and expenses are translated on the respective dates of such transactions. Since the values of investment securities are presented at the foreign exchange rates prevailing at the end of the period, it is not practical to isolate that portion of the results of operations arising from changes in exchange rates from that portion of the results of operations reflecting fluctuations arising from changes in market prices of the investment securities. Such fluctuations are included in the net realized and unrealized gain or loss on investments.
Net realized foreign exchange gains or losses arise from sales of foreign currency, currency gains or losses realized between the trade and settlement dates on securities transactions, and the difference between the amounts of dividends, interest, and foreign withholding taxes recorded by the Portfolio and the U.S. dollar equivalent of the amounts actually received or paid by the Portfolio. Net unrealized foreign exchange gains and losses arise from changes in the value of assets and liabilities, other than investment securities, resulting from changes in the exchange rate.
MSF-12
Metropolitan Series Fund, Inc.
FI Large Cap Portfolio
Notes to Financial Statements—December 31, 2007—(Continued)
Forward Foreign Currency Exchange Contracts:
The Portfolio may enter into forward foreign currency exchange contracts primarily to hedge against foreign currency exchange rate risks on its non-U.S. dollar denominated investment securities. When entering into a forward currency contract, the Portfolio agrees to receive or deliver a fixed quantity of foreign currency for an agreed-upon price on an agreed future date. These contracts are valued daily and the Portfolio’s net equity therein, representing unrealized gain or loss on the contracts as measured by the difference between the foreign exchange rates at the dates of entry into the contracts and the forward rates at the settlement date, is included in the Statement of Assets and Liabilities. Realized and unrealized gains and losses are included in the Statement of Operations. These instruments involve market and/or credit risk in excess of the amount recognized in the Statement of Assets and Liabilities. Risks arise from the possible inability of counterparties to meet the terms of their contracts and from movement in currency and securities values and interest rates.
Futures Contracts:
The Portfolio may buy and sell futures contracts (on recognized exchanges) as a hedge or to enhance return. Futures contracts are agreements to buy or sell a security, or deliver a final cash settlement price in connection with an index, interest rate, currency, or other contracts not calling for physical delivery, for a set price in the future. The Portfolio must post an amount equal to a portion of the total market value of the futures contract as futures variation margin, which is returned when the Portfolio’s obligations under the contract have been satisfied. From time to time thereafter, the Portfolio may have to post variation margin to maintain this amount as the market value of the contract fluctuates. Risks of entering into futures contracts (and related options) include the possibility that there may be an illiquid market and that a change in the value of the contract or option may not correlate with changes in the value of the underlying securities.
Options:
The Portfolio may use options to hedge against changes in values of securities the Portfolio owns or expects to purchase. Writing puts or buying calls tends to increase the Portfolio’s exposure to the underlying instrument and writing calls or buying puts tends to decrease the Portfolio’s exposure to the underlying instrument, and can be used to hedge other Portfolio investments. For options purchased to hedge the Portfolio’s investments, the potential risk to the Portfolio is that the change in value of options contracts may not correspond to the change in value of the hedged instruments. In addition, losses may arise from changes in the value of the underlying instruments, if there is an illiquid secondary market, or if the counterparty is unable to perform. The maximum loss for purchased options is limited to the premium initially paid for the option. For options written by the Portfolio, the maximum loss is not limited to the premium initially received for the option.
The main risk associated with purchasing an option is that the option expires without being exercised. In this case, the option expires worthless and the premium paid for the option is considered the loss. The risk associated with writing a call option is that the Portfolio may forgo the opportunity for a profit if the market value of the underlying position increases and the option is exercised. The risk in writing a put option is that the Portfolio may incur a loss if the market value of the underlying position decreases and the option is exercised. In addition, the Portfolio risks not being able to enter into a closing transaction for the written option as the result of an illiquid market.
“When-Issued” Securities:
Purchasing securities “when-issued” is a forward commitment by the Portfolio to buy a security. The estimated amount of the Portfolio’s payment obligation and the security’s interest rate are determined when the commitment is made, even though no interest accrues until the security is issued, which is generally 15 to 120 days later. The Portfolio will segregate liquid assets with its custodian sufficient at all times to satisfy these commitments. If the value of the security is less when delivered than when the commitment was made, the Portfolio will suffer a loss.
Federal Income Taxes:
It is the Portfolio’s policy to comply with the requirements of the Internal Revenue Code of 1986, as amended, and regulations thereunder, applicable to regulated investment companies and to distribute all of its taxable income to shareholders. Therefore, no federal income tax provision is required.
MSF-13
Metropolitan Series Fund, Inc.
FI Large Cap Portfolio
Notes to Financial Statements—December 31, 2007—(Continued)
As of December 31, 2007, the Portfolio had capital loss carryovers as follows:
| | | | | | | |
Expiring
12/31/09 | | Expiring
12/31/08 | | Total |
| $ | 14,415,260 | | $ | 217,761,704 | | $ | 232,176,964 |
The utilization of the capital loss carryforward acquired as part of a merger may be limited under section 382 of the Internal Revenue Code.
The tax character of distributions paid for the periods ended December 31, 2007 and 2006 was as follows:
| | | | | | | | | | | | | | | | | | | | | |
| Ordinary Income | | Long Term Gain | | Return of Capital | | Total |
| 2007 | | 2006 | | 2007 | | 2006 | | 2007 | | 2006 | | 2007 | | 2006 |
| $5,785,132 | | $ | 9,497,748 | | $ | 18,265,368 | | $ | 5,758,096 | | $ | 15,010,098 | | $ | — | | $ | 39,060,598 | | $ | 15,255,844 |
As of December 31, 2007, the components of distributable earnings (accumulated losses) on a federal income tax basis were as follows:
| | | | | | | | | | | | | | |
Undistributed
Ordinary
Income | | Undistributed
Long Term
Gain | | Unrealized
Appreciation | | Loss
Carryforwards | | | Total | |
| $— | | $ | — | | $ | 5,771,482 | | $ | (232,176,964 | ) | | $ | (226,405,482 | ) |
Dividends and Distributions to Shareholders:
The Portfolio records dividends and distributions on the ex-dividend date. Net realized gains from security transactions (if any) are generally distributed annually to shareholders. The timing and characterization of certain income and capital gains distributions are determined in accordance with federal tax regulations that may differ from GAAP. Permanent book and tax basis differences relating to shareholder distributions will result in reclassification between under/over distributed net investment income, accumulated net realized gains/losses and paid in capital.
Expense Reductions:
Certain Portfolio trades are directed to brokers who paid a portion of the Portfolio’s expenses. Amounts paid for the Portfolio are shown as expense reductions in the Statement of Operations.
| 3. | INVESTMENT TRANSACTIONS: |
For the year ended December 31, 2007, purchases and sales of securities (excluding short term investments) for the Portfolio were as follows:
| | | | | | | | | | |
| Purchases | | Sales |
| U.S. Government | | Other | | U.S. Government | | Other |
| $ | 0 | | $ | 1,367,944,160 | | $ | 0 | | $ | 1,487,834,898 |
| 4. | INVESTMENT MANAGEMENT FEES AND OTHER TRANSACTIONS WITH AFFILIATES: |
Investment Management Agreement:
MetLife Advisers, LLC (“MetLife Advisers”) is the investment adviser to the Portfolio. The Fund has entered into an investment management agreement with MetLife Advisers with respect to the Portfolio. For providing investment management services to the Portfolio, MetLife Advisers receives monthly compensation at the following annual rates:
| | | | | | |
| | | Management
Fees earned by
MetLife Advisers
for the year ended
December 31, 2007 | | Annual
percentage
rates paid to
MetLife Advisers | | Based on Portfolios average daily net asset levels |
| | $4,269,996 | | 0.800% | | Of the first $250 million |
| | | | 0.750% | | Of the next $500 million |
| | | | 0.700% | | On amounts in excess of $750 million |
MSF-14
Metropolitan Series Fund, Inc.
FI Large Cap Portfolio
Notes to Financial Statements—December 31, 2007—(Continued)
Certain officers and directors of the Fund may also be officers of MetLife Advisers; however, such officers and directors receive no compensation from the Fund.
MetLife Advisers has entered into an investment subadvisory agreement with respect to the Portfolio. Fidelity Management & Research Company (“FMR”) was compensated by MetLife Advisers to provide subadvisory services for the FI Large Cap Portfolio in 2007.
Service and Distribution Fees:
The Fund has adopted a Distribution and Service Plan under Rule 12b-1 of the 1940 Act for the Portfolio’s Class B and E shares. Under the Distribution and Service Plan, the Class B and E shares of the Portfolio pay a fee to compensate the Insurance Companies (or their affiliates) and other broker-dealers and financial intermediaries involved in the offer and sale of Portfolio shares for promoting or selling and servicing, the Class B and E shares. The fees under the Distribution and Service Plan for each class of the Portfolio’s shares are calculated as a percentage of the Portfolio’s average daily net assets that are attributable to that Class. Currently, the fee is 0.25% per year for Class B shares and 0.15% per year for Class E shares. Amounts paid by the Portfolio for the year ended December 31, 2007 are shown as Service and Distribution fees in the Statement of Operations.
The Fund has entered into a securities lending arrangement with the Fund’s custodian, State Street Bank and Trust Company (the “custodian”). Under the agreement, the custodian is authorized to loan securities on the Portfolios’ behalf. In exchange, the Portfolio receives either cash or securities as collateral against the loaned securities. The Portfolio receives collateral at least equal to 102% of the market value of the loaned securities (105% for foreign securities), at each loan’s inception. Collateral must be maintained at least at 100% of the market value of the loaned securities for the duration of the loan. The cash collateral is invested in the Navigator Securities Lending Prime Portfolio, an affiliate of the custodian, which invests in a variety of high quality U.S. dollar-denominated instruments. If the market value of the collateral at the close of trading on a business day is less than 100% of the market value of the loaned securities at the close of trading on that day, the borrower shall be required to deliver, by the close of business on the following business day, an additional amount of collateral, equal to at least 100% of the market value of all the loaned securities as of such preceding day. The Portfolio receives 80% of the annual net income from securities lending transactions, which is included in interest income of the Portfolio. The remaining 20% is paid to the custodian as compensation for its securities lending services. The Portfolio bears the risk of any deficiency in the amount of collateral available for return to a borrower due to a loss in an approved investment. Any outstanding loans by the Portfolio at December 31, 2007 are footnoted in the Schedule of Investments.
As previously reported, in May 2004, General American received a Wells Notice stating that the SEC staff was considering recommending that the SEC bring a civil action alleging violations of the U.S. securities laws against General American with respect to market timing and late trading in a limited number of privately-placed variable insurance contracts that were sold through General American. General American responded to the SEC staff and cooperated with the investigation. On August 9, 2007, the SEC announced that it had settled an enforcement action regarding late trading against General American with, among other things, General American agreeing to pay a civil penalty and to comply with certain undertakings. General American consented to the SEC’s order without admitting or denying the findings. MetLife Advisers has also advised the Fund’s Board of Directors that, while certain exceptions to the Fund’s policies have been noted, no situations have been identified that would have a material impact on the financial position of the Fund.
On February 7, 2008 the Board approved a new investment subadvisory agreement (the “Agreement”) with respect to the Portfolio between MetLife Advisers and Pyramis Global Advisors, LLC (“Pyramis”), a wholly-owned subsidiary of the Portfolio’s former subadviser, FMR. The Agreement is not subject to shareholder approval and will become effective April 28, 2008. The Advisory Agreement between the Fund, with respect to the Portfolio, and MetLife Advisers will remain in effect and fees payable thereunder to MetLife Advisers will not change. Under the Agreement, Pyramis will become subadviser to the Portfolio, succeeding FMR, and will become responsible for the day-to-day management of the Portfolio’s investment operations under the oversight of MetLife Advisers and the Board.
MSF-15
Metropolitan Series Fund, Inc.
FI Large Cap Portfolio
Notes to Financial Statements—December 31, 2007—(Continued)
| 8. | RECENT ACCOUNTING PRONOUNCEMENTS: |
Effective June 29, 2007, the Fund implemented Financial Accounting Standards Board (“FASB”) Interpretation No. 48, “Accounting for Uncertainty in Income Taxes—an interpretation of FASB Statement No. 109” (“FIN 48”). FIN 48 prescribes the minimum recognition threshold a tax position must meet in connection with accounting for uncertainties in income tax positions taken or expected to be taken by an entity, including investment companies, before being measured and recognized in the financial statements. Management has evaluated the application of FIN 48 to the Fund, and has determined that the adoption of FIN 48 does not have a material impact on the Fund’s financial statements. The Fund files U.S. tax returns. No income tax returns are currently under examination. The statute of limitations on the Fund’s tax returns remains open for the years ended December 31, 2004 through December 31, 2006.
In September 2006, Statement of Financial Accounting Standards No. 157, Fair Value Measurements (SFAS 157) was issued and is effective for fiscal years beginning after November 15, 2007. SFAS 157 defines fair value, establishes a framework for measuring fair value and expands disclosures about fair value measurements. Management is currently evaluating the impact the adoption of SFAS 157 will have on the Portfolio’s financial statement disclosures.
MSF-16
Metropolitan Series Fund, Inc.
FI Large Cap Portfolio
Report of Independent Registered Public Accounting Firm
To the Shareholders and Board of Directors of the Metropolitan Series Fund, Inc. :
We have audited the accompanying statement of assets and liabilities, including the schedule of investments, of the FI Large Cap Portfolio, one of the portfolios constituting the Metropolitan Series Fund, Inc. (the “Fund”) as of December 31, 2007, and the related statement of operations for the year then ended, the statements of changes in net assets for each of the two years in the period then ended and the financial highlights for each of the three years in the period then ended. The financial highlights for each of the two years in the period ended December 31, 2004 were audited by other auditors whose report, dated February 18, 2005, expressed an unqualified opinion on those financial highlights. These financial statements and financial highlights are the responsibility of the Fund’s management. Our responsibility is to express an opinion on these financial statements and financial highlights based on our audits.
We conducted our audits in accordance with the standards of the Public Company Accounting Oversight Board (United States). Those standards require that we plan and perform the audit to obtain reasonable assurance about whether the financial statements and financial highlights are free of material misstatement. The Fund is not required to have, nor were we engaged to perform, an audit of its internal control over financial reporting. Our audits included consideration of internal control over financial reporting as a basis for designing audit procedures that are appropriate in the circumstances, but not for the purpose of expressing an opinion on the effectiveness of the Fund’s internal control over financial reporting. Accordingly, we express no such opinion. An audit also includes examining, on a test basis, evidence supporting the amounts and disclosures in the financial statements, assessing the accounting principles used and significant estimates made by management, as well as evaluating the overall financial statement presentation. Our procedures included confirmation of securities owned as of December 31, 2007, by correspondence with the custodian and brokers; where replies were not received from brokers, we performed other auditing procedures. We believe that our audits provide a reasonable basis for our opinion.
In our opinion, the financial statements and financial highlights referred to above present fairly, in all material respects, the financial position of the FI Large Cap Portfolio of the Metropolitan Series Fund, Inc. as of December 31, 2007, the results of its operations for the year then ended, the changes in its net assets for each of two year in the period then ended and the financial highlights for each of the three years in the period then ended, in conformity with accounting principles generally accepted in the United States of America.
Deloitte & Touche LLP
Boston, Massachusetts
February 21, 2008
MSF-17
Metropolitan Series Fund, Inc.
Directors and Officers
The Fund’s Directors review actions of the Fund’s investment adviser and subadvisers, and decide upon matters of general policy. The Fund’s officers supervise the daily business operations of the Fund. The Board of Directors and the Fund’s officers are listed below. Each Director is responsible for overseeing all 36 Portfolios of the Fund. There is no limit to the term a Director may serve. Directors serve until their resignation, retirement or removal in accordance with the Fund’s organizational documents and policies adopted by the Board from time to time. Officers hold office at the pleasure of the Board or until the election or appointment and the qualification of a successor. The address of the directors and officers is c/o Metropolitan Series Fund, Inc., 501 Boylston Street, Boston, MA 02116.
Interested Directors(1)
Each Director below is an “interested person” (as defined by the 1940 Act) with respect to the Fund in that Ms. Forget is an employee of MetLife and Mr. Typermass is a former employee of MetLife and owns securities issued by MetLife, Inc., the ultimate parent company of MetLife Advisers.
| | | | | | | | |
Name, Address and Age | | Current
position(s)
with Fund | | Position(s)
held since | | Principal occupations
over past five years, including other directorships(2) | | Number of
Portfolios in
Fund Complex
Overseen by
Director(3) |
Elizabeth M. Forget Age: 41 | | Director, Chairman of the Board, President and Chief Executive Officer | | 2006 | | Senior Vice President (since 2007), MetLife, Inc.; President, Met Investors Advisory, LLC (“MIA”); Trustee and President, Met Investors Series Trust (“MIST”); Executive Vice President, MetLife Investors Group, Inc.; President (since 2006), MetLife Advisers. | | 81 |
| | | | |
Arthur G. Typermass Age: 70 | | Director | | 1998 | | Formerly, Senior Vice President and Treasurer, MetLife. | | 37 |
Non-Interested Directors(1)
Each Director below is not an “interested person” (as defined by the 1940 Act) with respect to the Fund (collectively, the “Independent Directors”).
| | | | | | | | |
Name, Address and Age | | Current
position(s)
with Fund | | Position(s)
held since | | Principal occupations
over past five years, including other directorships(2) | | Number of
Portfolios in
Fund Complex
Overseen by
Director(3) |
Steve A. Garban† Age: 70 | | Director | | 1985 | | Formerly, Chief Financial Officer, Senior Vice President Finance and Operations and Treasurer (Emeritus), The Pennsylvania State University. | | 37 |
| | | | |
Linda B. Strumpf Age: 60 | | Director | | 2000 | | Vice President and Chief Investment Officer, Ford Foundation. | | 37 |
| | | | |
Michael S. Scott Morton† Age: 70 | | Director | | 1993 | | Jay W. Forrester Professor of Management (Emeritus) at Sloan School of Management, MIT. | | 37 |
| | | | |
H. Jesse Arnelle Age: 74 | | Director | | 2001 | | Formerly, Counsel, Womble Carlyle Sandrie & Rice; Director, Textron Inc. (global multi-industry company)*; formerly, Director, Gannet Co. Inc. (diversified news and information company)*; formerly, Director, Eastman Chemical Company (global chemical company)*; formerly, Director, Waste Management, Inc.*; formerly, Director, Armstrong Holdings Inc. (parent company of floor and ceiling products business)*; formerly, Director, FPL Group Inc. (public utility holding company)*; Director, URS Corporation (engineering design services firm)*. | | 37 |
| | | | |
Nancy Hawthorne Age: 56 | | Director | | 2003 | | Director, Avid Technologies (computer software company)*; formerly, Chairman of the Board of Avid Technologies; formerly, Board of Advisors, L. Knife & Sons, Inc. (beverage distributor); Chief Executive Officer, Clerestory LLC (corporate financial advisor); formerly, Trustee, New England Zenith Fund (“Zenith Fund”)**; formerly, Chief Executive Officer and Managing Partner, Hawthorne, Krauss and Associates (corporate financial advisor); formerly, Chief Financial Officer and Executive Vice President, Continental Cablevision, subsequently renamed MediaOne (cable television company); formerly, Director, Life F/X, Inc.; formerly, Chairman of the Board, WorldClinic (distance medicine company); formerly, Director, Perini Corporation (construction company)*; formerly, Director, CGU (property and casualty insurance company); formerly, Director, Beacon Power Corporation (energy company )*. | | 37 |
MSF-18
Metropolitan Series Fund, Inc.
Directors and Officers—(Continued)
| | | | | | | | |
Name, Address and Age | | Current
position(s)
with Fund | | Position(s)
held since | | Principal occupations
over past five years, including other directorships(2) | | Number of
Portfolios in
Fund Complex
Overseen by
Director(3) |
John T. Ludes Age: 71 | | Director | | 2003 | | President, LFP Properties (consulting firm); Formerly, Trustee, Zenith Fund**; formerly, Vice Chairman, President and Chief Operating Officer, Fortune Brands/American Brands (global conglomerate); formerly, President and CEO, Acushnet Company (athletic equipment company). | | 37 |
Officers(1)
| | | | | | | | |
Name and address | | Age | | Current
position(s)
with Fund | | Position(s)
held since | | Principal occupations over past five years(2) |
| Jeffrey P. Halperin | | 40 | | Chief Compliance Officer | | 2006 | | Vice President (since 2006), Corporate Ethics and Compliance Department, MetLife, Inc.; Chief Compliance Officer (since 2006), MetLife Advisers, MIA and MIST. |
| | | | |
| John F. Guthrie, Jr. | | 64 | | Senior Vice President | | 2002 | | Manager and Senior Vice President, MetLife Advisers; Vice President, MetLife; Vice President (since 2003), MetLife Group, Inc.; Vice President, NELICO; Vice President (since 2005), MIA; formerly, Senior Vice President, Zenith Fund**. |
| | | | |
| Alan C. Leland | | 55 | | Senior Vice President | | 2005 | | Treasurer and Chief Financial Officer, MetLife Advisers, LLC; Treasurer (since 2005), Met Investors Advisory, LLC; Vice President (since 2004), MIA; Vice President (since 2003), MetLife Group, Inc.; Vice President, MetLife; Senior Vice President, NELICO |
| | | | |
| Peter Duffy | | 52 | | Vice President and Treasurer | | 2000 | | Senior Vice President, MetLife Advisers (since 1998); Second Vice President (since 2003), NELICO; Vice President, MetLife (since 2004); Vice President (since 2004), MetLife Group, Inc.; formerly, Vice President and Treasurer, Zenith Fund**. |
| | | | |
| Thomas M. Lenz | | 49 | | Vice President and Secretary | | 2002 | | General Counsel and Secretary, MetLife Advisers; Assistant General Counsel, MetLife; formerly, Vice President and Secretary, Zenith Fund**. |
| * | Indicates a directorship with a registered investment company or a company subject to the reporting requirements of the Securities Exchange Act of 1934, as amended. |
| ** | The Zenith Fund deregistered with the Securities and Exchange Commission (“SEC”) in 2004. |
| (†) | Served as a trustee, director and/or officer of one or more of the following companies, each of which had a direct or indirect advisory relationship with MetLife Advisers or its affiliates prior to January 31, 2005: State Street Research Financial Trust, State Street Research Income Trust, State Street Research Money Market Trust, State Street Research Institutional Funds, State Street Research Capital Trust, State Street Research Master Investment Trust, State Street Research Equity Trust, State Street Research Securities Trust and State Street Research Exchange Trust (collectively, the “State Street Research Funds”). |
| (1) | Each Director of the Fund also serves as trustee of Metropolitan Series Fund II (“Met Series Fund II”), a registered investment company advised by MetLife Advisers. Each officer of the Fund serves in the same position with Met Series Fund II, which consists of one portfolio. |
| (2) | Previous positions during the past five years with the Fund, MIST, MetLife, MetLife Advisers, MIA, Zenith Fund, NELICO or New England Securities Corporation are omitted if not materially different. |
| (3) | The Fund Complex includes the Fund (36 portfolios), Met Series Fund II (1 portfolio) and MIST (44 portfolios) |
MSF-19
Metropolitan Series Fund, Inc.
FI Large Cap Portfolio
Board Approval of Advisory and Subadvisory Agreements
The Fund’s Contract Review Committees of the Board of Directors (the “Board”) typically meet in early fall to review the Portfolios’ advisory agreements (the “Advisory Agreements”), subadvisory agreements and sub-subadvisory agreements (collectively, the “Subadvisory Agreements,” and, together with the Advisory Agreements, the “Agreements”) and determine whether to recommend that the full Board approve the continuation of the Agreements for an additional one-year period. (Following the initial approval of an Agreement for a new Portfolio or with a new adviser or subadviser, such annual reviews are not required until 2 years following the execution of such Agreement.) After each Committee has made its recommendations, the full Board, including the Independent Directors, determines whether to approve the continuation of each of the Agreements. In addition, the Board, including the Independent Directors, considers matters bearing on the Agreements at most of its other meetings throughout the year and regularly interviews various individuals at MetLife Advisers responsible for the management of the Portfolios. The Directors also interview selected investment managers and other professionals at the subadvisers at various times throughout the year.
The Directors receive all materials that they or MetLife Advisers, the Fund’s investment adviser, and the subadvisers believe to be reasonably necessary for the Directors to evaluate the Agreements and determine whether to approve the continuation of the Agreements. These materials generally include, among other items, (i) information on the investment performance of the Portfolios and the performance of peer groups of funds and the Portfolios’ performance benchmarks, (ii) information on the Portfolios’ advisory and subadvisory fees and other expenses, including information comparing the Portfolios’ expenses to those of peer groups of funds and information about any applicable expense caps and fee “breakpoints,” (iii) sales and redemption data, (iv) information related to the profitability of the Agreements to MetLife Advisers and the subadvisers, and potential “fall-out” or ancillary benefits that MetLife Advisers, the subadvisers or their affiliates may receive as a result of their relationships with the Fund and (v) information obtained through the subadvisers’ responses to certain requests from MetLife Advisers and the Directors and MetLife Advisers’ responses to requests from the Directors. The Directors may also consider other information such as (vi) MetLife Advisers’ and the subadvisers’ financial results and condition, (vii) each Portfolio’s investment objectives and strategies and the size, education and experience of the investment staffs of MetLife Advisers and the relevant subadvisers and their use of technology and external research, (viii) the allocation of the Portfolios’ brokerage, if any, including allocations to brokers affiliated with the subadvisers and the use of “soft” commission dollars to pay Portfolio expenses and to pay for research and other similar services, (ix) the resources devoted to, and the record of compliance with, the Portfolios’ investment policies and restrictions, policies on personal securities transactions and other compliance policies, (x) the responses of MetLife Advisers, the subadvisers and/or their affiliates to certain legal and regulatory proceedings and (xi) the economic outlook generally and for the mutual fund industry in particular. Throughout the process, the Directors have the opportunity to ask questions of and request additional materials from MetLife Advisers and the subadvisers.
Following meetings of each Contract Review Committee on September 12, 2007, the Board, at its November 15, 2007 meeting, approved the continuation through December 31, 2008 of the Advisory Agreements for each Portfolio of the Fund and the Subadvisory Agreements for each Portfolio of the Fund. The Agreements approved for continuation are referred to below as the “Continued Agreements.”
In considering whether to approve the continuation of the Continued Agreements, the Directors, including the Independent Directors, did not identify any single factor as determinative, and each weighed the various factors as he or she deemed appropriate. The Directors considered the following matters in connection with their approval of the Continued Agreements:
The nature, extent and quality of the services provided to the relevant Portfolios under the Continued Agreements. The Directors considered the nature, extent and quality of the services provided by MetLife Advisers, the relevant subadvisers (if any) and their affiliates (each, an “Adviser,” and, collectively, the “Advisers”) to the relevant Portfolios pursuant to the Continued Agreements and the resources dedicated to these Portfolios by the Advisers. In particular, the Directors considered the Advisers’ abilities to attract and retain highly qualified investment professionals. With respect to MetLife Advisers, the Directors considered (for each Portfolio other than Zenith Equity and the Asset Allocation Portfolios) that MetLife Advisers is (i) ultimately responsible for the performance of such Portfolios; (ii) ultimately responsible for the establishment of the investment strategies of each such Portfolio, primarily through its recommendations to the Board regarding the hiring and selection of subadvisers; (iii) responsible for the hiring and selection, subject to Board approval, of subadvisers; and (iv) responsible for maintaining a program of Subadviser oversight reasonably designed to ensure that the subadvisers have reasonable compliance policies and procedures in place. The Directors also considered that MetLife Advisers provides a full range of day-to-day administrative services for the Portfolios involving all aspects of such Portfolios’ day-to-day operations (other than portfolio management). With respect to Zenith Equity and the Asset Allocation Portfolios, the Directors considered both the portfolio management services and the administrative services provided by MetLife Advisers. After reviewing these and related factors, the Directors concluded, within the context of their overall conclusions regarding each of the Continued Agreements, that the nature, extent and quality of services provided supported the renewal of these Agreements.
MSF-20
Metropolitan Series Fund, Inc.
FI Large Cap Portfolio
Board Approval of Advisory and Subadvisory Agreements—(Continued)
Investment performance of the relevant Portfolios. The Directors reviewed information about the performance of the relevant Portfolios over various time periods, including information prepared by an independent third party that compared the performance of the Portfolios to the performance of peer groups of funds and performance benchmarks. The Directors also reviewed a description of the third party’s methodology for identifying a Portfolio’s peer group(s) for purposes of performance and expense comparisons.
In the case of each relevant Portfolio that had performance that lagged its peer group(s) for certain periods, the Directors concluded that other factors relevant to performance were sufficient, in light of other considerations, to warrant renewal of the Continued Agreements relating to such Portfolio. These factors varied from Portfolio to Portfolio, but included one or more of the following: (i) that such Portfolio’s performance, although lagging in certain recent periods, was stronger over the longer term; (ii) that the underperformance was attributable, to a significant extent, to investment decisions that were reasonable and consistent with the Portfolio’s investment objective(s) and policies and that the Portfolio was performing within the range of reasonable expectations, given market conditions and the Portfolio’s investment objective(s) and policies; (iii) that the Portfolio’s performance was competitive when compared to other relevant performance benchmarks or peer groups; and (iv) that MetLife Advisers and/or the relevant subadviser (if any) had taken or was taking steps designed to help improve the Portfolio’s investment performance.
The Directors also considered the investment performance of the Advisers and their reputations generally, the historical responsiveness of the Advisers to Director concerns about performance and the willingness of the Advisers to take steps intended to improve performance.
After reviewing these and related factors, the Directors concluded, within the context of their overall conclusions regarding each of the Continued Agreements, that the investment performance of each relevant Portfolio and Adviser was sufficient, in light of other considerations, to warrant the renewal of the Continued Agreements.
The costs of the services to be provided and profits to be realized by the Advisers and their affiliates from their relationships with the Portfolios. The Directors considered the fees charged by MetLife Advisers to the Portfolios for advisory services and, with respect to the subadvised Portfolios, by such subadvisers to MetLife Advisers for subadvisory services (such advisory and subadvisory fees (if any), collectively, “Fees”), as well as the total expense levels of the Portfolios. This information included comparisons (provided by an independent third party) of the Portfolios’ advisory fees and total expense levels to those of their peer groups. In evaluating Fees for the relevant Portfolios, the Directors also took into account the demands, complexity and quality of the investment management services provided to each Portfolio. The Directors considered MetLife Advisers’ recommendations regarding reductions in Fee rates, implementation of Fee breakpoints and institution of Fee waivers and expense caps.
The Directors also considered the compensation directly or indirectly received by the Advisers and their affiliates from their relationships with the relevant Portfolios. The Directors reviewed information relating to the profits received by MetLife Advisers, certain of the subadvisers and their affiliates as a result of their relationships with the relevant Portfolios, and information about the allocation of expenses used to calculate profitability. When reviewing profitability, the Directors also considered the performance of the relevant Portfolios, the expense levels of such Portfolios and whether the relevant Advisers had implemented breakpoints, fee waivers and/or expense caps with respect to such Portfolios.
After reviewing these and related factors, the Directors concluded, within the context of their overall conclusions regarding each of the Continued Agreements, that the Fees charged to each of the relevant Portfolios were fair and reasonable, and that the information provided regarding costs of these services generally, and the related profitability (if known) to the relevant Advisers of their relationships with the relevant Portfolios, supported the renewal of the Continued Agreements.
Economies of Scale. The Directors considered the existence of any economies of scale in the provision of services by the Advisers and whether those economies were shared with the relevant Portfolios through breakpoints in their advisory fees or other means, such as expense caps, fee waivers or relatively low levels of fees. The Directors noted that most of the relevant Portfolios benefited or will benefit from breakpoints, expense caps and/or fee waivers with respect to their advisory fees. In considering these issues, the Directors also took into consideration information relating to the costs of the services provided and the profitability to MetLife Advisers, the relevant subadvisers (if any) and each of their affiliates of their relationships with the relevant Portfolios, as discussed above.
After reviewing these and related factors, the Directors concluded, within the context of their overall conclusions regarding each of the Continued Agreements, that the extent to which economies of scale were shared with the relevant Portfolios supported the renewal of such Agreements.
MSF-21
Metropolitan Series Fund, Inc.
FI Large Cap Portfolio
Board Approval of Advisory and Subadvisory Agreements—(Continued)
Other Factors. The Directors also considered other factors, which included but were not limited to the following:
| | • | | the extent to which each relevant Portfolio operated in accordance with its investment objective, and its record of compliance with its investment restrictions and the compliance programs of the Fund and the Advisers. They also considered the compliance-related resources the Advisers and their affiliates provide to the relevant Portfolios; |
| | • | | the nature, quality, cost and extent of administrative and shareholder services performed by MetLife Advisers and its affiliates under the Advisory Agreements; and |
| | • | | so-called “fall-out benefits” to the Advisers, such as the engagement of their affiliates to provide distribution, brokerage and transfer agency services to the Portfolios, and the benefits of research made available to the relevant Advisers by reason of brokerage commissions generated by the relevant Portfolios’ securities transactions. The Directors also considered the possible conflicts of interest associated with these fall-out and other benefits, and the reporting and other processes in place to disclose and monitor these possible conflicts of interest. |
Based on their evaluation of all factors that they deemed to be material, including those factors described above, and assisted by the advice of independent counsel, the Directors, including the Independent Directors, concluded that each of the Continued Agreements should be continued through December 31, 2008.
MSF-22
A description of the policies and procedures that the Fund uses to determine how to vote proxies relating to portfolio securities is available (i) without charge, upon request, by calling (800) 638-7732 and (ii) on the Securities and Exchange Commission’s (the “SEC”) website at http://www.sec.gov.
Information regarding how the Fund voted proxies relating to portfolio securities during the most recent twelve-month period ended December 31, 2007 is available (i) without charge, upon request, by calling (800) 638-7732 and (ii) on the SEC’s website at http://www.sec.gov.
The Fund files with the SEC a complete schedule of its portfolio holdings, as of the close of the first and third quarters of its fiscal year, on “Form N-Q”. These filings are available on the SEC’s website at www.sec.gov and may be reviewed and copied at the SEC’s Public Reference Room in Washington, DC. (Call 1-800-SEC-0330 for information on the operation of the Public Reference Room.)
MSF-23
| | |
Metropolitan Series Fund, Inc. FI Mid Cap Opportunities Portfolio Annual Report | | December 31, 2007 |
Letter from the President
February 1, 2008
Letter to Policy Holders:
2007 was a tumultuous year in the financial markets driven by concerns in the credit markets surrounding sub-prime mortgages and fears of recession in the U.S. Economy. The broad markets were mixed, with the Dow Jones Industrial Average up 8.9% and the MSCI EAFE Index, which measures the performance of international equities, up 11.2% for the year, while the Russell 2000 Index, which measures the performance of small capitalization stocks, was down 1.6%.
In the fixed income markets, credit spreads increased as a result of the pressure from sub-prime mortgage crisis and the Federal Reserve lowered interest rates by a total of 1% during the year. The Lehman Brothers Aggregate Bond Index posted a 7.0% return for the year.
On the following pages, you will find a complete review of your Portfolio and its investment performance.
MetLife is committed to building your financial freedom. We appreciate your trust and will continue to focus our efforts on meeting your investment needs.
Sincerely,
Elizabeth Forget
President, Metropolitan Series Fund, Inc.
Metropolitan Series Fund, Inc.
FI Mid Cap Opportunities Portfolio
Managed by Fidelity Management & Research Company
Portfolio Manager Commentary*
PORTFOLIO PERFORMANCE
For the year ended December 31, 2007, the Class A shares of the FI Mid Cap Opportunities Portfolio returned 8.3%, compared to its benchmark, the Standard & Poor’s MidCap 400 Index1, which returned 8.0%. The average return of its peer group, the Lipper Variable Insurance Products Mid-Cap Growth Funds Universe2, was 16.5% over the same period.
PORTFOLIO REVIEW
Amidst turmoil in the credit markets and conflicting economic data, equity prices witnessed increased volatility throughout the year. Early in the year, stock prices advanced to continual new highs, but mounting credit concerns and a lingering weak housing market, increasing energy and commodity prices, and slow earnings growth weighed on investors, and volatility in the stock market returned. However, these concerns were partially offset by continued robust global economic growth and strong, albeit tempering, consumer spending trends. For the year, the Standard & Poor’s (S&P) MidCap 400® Index returned 8.0%. Within the mid-cap market, as measured by the S&P MidCap 400® Index, eight of the ten sectors posted positive returns with the strongest advances coming from the energy and materials sectors. The consumer discretionary and financial sectors were the only two posting negative performance during the period.
Against this backdrop, the FI Mid Cap Opportunities Portfolio outperformed the S&P MidCap 400® Index. Strong stock selection within the information technology sector was a leading contributor to the Portfolio’s performance. Within this sector, NAVTEQ, a digital map provider, and Juniper Networks, a network communications equipment maker, were the largest individual contributors. Both companies advanced after announcing strong second quarter results. Additionally, NAVTEQ shares rose on takeover rumors before eventually being acquired by Nokia. The Portfolio also benefited from a focus on stocks that benefited from the ongoing video gaming product cycle (Nintendo, Electronic Arts). A significant underweight in the financial services sector, particularly among smaller, more regional banks and insurance companies, also benefited performance. However, nearly every name in this sector was somehow affected as the credit cycle continued to unfold throughout the year. On the negative side, overweighting the consumer discretionary sector, specifically media and consumer durables & apparel stocks, hurt performance. During the year, investors became more concerned about the resiliency of consumer spending. In particular, top Portfolio holding Harman International, which had agreed to be bought by a private equity firm, witnessed its deal fall apart due to issues in the credit market. The stock lost over 24% during the year and was the largest single detractor in the Portfolio. Additionally, an underweighted position coupled with poor security selection in the energy sector also hurt performance. The sector performed well over the 12-month period amidst strong demand for energy, high oil prices, and supply constraints.
* The views expressed above are those of the subadvisory firm as of December 31, 2007 and are subject to change based on market and other conditions. Information about the Portfolio’s holdings, asset allocation, industry allocation, or country diversification is historical and is not an indication of future Portfolio composition, which will vary. The performance of any index mentioned in this commentary has not been adjusted for ongoing management, distribution and operating expenses, and sales charges applicable to mutual fund investments. Direct investment in the Index is not possible.
1 The Standard & Poor’s MidCap 400® Index is an unmanaged index measuring the performance of the mid-size company segment of the U.S. market. The Index consists of 400 domestic stocks chosen for market size, liquidity, and industry group representation.
2 The Lipper Variable Insurance Products Fund Average is an average of the total return performance (calculated on the basis of net asset value) of variable product funds with similar investment objectives to those of the subject Portfolio as calculated by Lipper Analytical Services, an independent mutual fund ranking service.
MSF-2
Metropolitan Series Fund, Inc.
FI Mid Cap Opportunities Portfolio
A $10,000 INVESTMENT COMPARED TO
THE S&P MIDCAP 400 INDEX
Average Annual Returns as of December 31, 2007
| | | | | | | | | | | | |
| | | FI Mid Cap
Opportunities Portfolio | | | S&P
MidCap
400 Index | |
| | | Class A | | | Class B | | | Class E | | |
| 1 Year | | 8.3 | % | | 8.1 | % | | 8.2 | % | | 8.0 | % |
| 5 Year | | 15.4 | | | 15.1 | | | 15.2 | | | 16.2 | |
| 10 Year | | 6.7 | | | — | | | — | | | 11.2 | |
| Since Inception | | — | | | -0.5 | | | 1.5 | | | — | |
Performance numbers are net of all Portfolio expenses but do not include any insurance, sales, or administrative charges of variable annuity or life insurance contracts. If these charges were included, the returns would be lower.
Inception dates of the Class A, Class B and Class E shares are: 3/3/97, 1/2/01 and 5/1/01, respectively.
This information represents past performance and is not indicative of future results. Investment return and principal value may fluctuate so that shares, upon redemption, may be worth more or less than the original cost.
PORTFOLIO COMPOSITION
as of December 31, 2007
Top Holdings
| | |
| | | % of Total
Net Assets |
Harman International Industries, Inc. | | 5.1% |
Juniper Networks, Inc. | | 4.9% |
AT&T, Inc. | | 4.6% |
Flowserve Corp. | | 4.5% |
DeVry, Inc. | | 4.3% |
Agilent Technologies, Inc. | | 3.8% |
Molson Coors Brewing Co. | | 3.7% |
Electronic Arts, Inc. | | 3.4% |
Time Warner, Inc. | | 3.2% |
The Walt Disney Co. | | 3.0% |
Top Sectors
| | |
| | | % of Total
Market Value |
Industrials | | 23.8% |
Consumer Discretionary | | 22.7% |
Information Technology | | 21.4% |
Telecommunication Services | | 11.5% |
Financials | | 9.0% |
Consumer Staples | | 4.9% |
Energy | | 4.5% |
Health Care | | 0.5% |
MSF-3
Metropolitan Series Fund, Inc.
Shareholder Expense Example
As a shareholder of the Portfolio, you incur ongoing costs, including management fees; distribution and service (12b-1) fees; and other Portfolio expenses. This example is intended to help you understand your ongoing costs (in dollars) (referred to as “expenses”) of investing in the Portfolio and compare these costs with the ongoing costs of investing in other mutual funds. The example is based on an investment of $1,000 invested at the beginning of the period and held for the entire period, July 1, 2007 through December 31, 2007.
Actual Expenses
The first line for each share class of the Portfolio in the table below provides information about actual account values and actual expenses. You may use the information in this line, together with the amount you invested in the particular share class of the Portfolio, to estimate the expenses that you paid over the period. Simply divide your account value by $1,000 (for example, an $8,600 account value divided by $1,000=8.6), then multiply the result by the number in the first line under the heading entitled “Expenses Paid During Period” to estimate the expenses you paid on your account during this period.
Hypothetical Example for Comparison Purposes
The second line for each share class of the Portfolio in the table below provides information about hypothetical account values and hypothetical expenses based on the Portfolio’s actual expense ratio and an assumed rate of return of 5% per year before expenses, which is not the Portfolio’s actual return. The hypothetical account values and expenses may not be used to estimate the actual ending account balance or expenses you paid for the period. You may use this information to compare the ongoing costs of investing in the Portfolio and other funds. To do so, compare this 5% hypothetical example with the 5% hypothetical examples that appear in the shareholder reports of the other funds.
Please note that the expenses shown in the table are meant to highlight your ongoing costs only and do not reflect any fees or charges of your variable insurance product or any additional expenses that participants in certain eligible qualified plans may bear relating to the operations of their plan. Therefore, the second line for each share class in the table is useful in comparing ongoing costs only, and will not help you determine the relative total costs of owning different funds. In addition, if these other costs were included, your costs would have been higher.
| | | | | | | | | | | | | | |
Portfolio | | | | Annualized
Expense
Ratio | | | Beginning
Account Value
July 1,
2007 | | Ending
Account Value
December 31,
2007 | | Expenses Paid
During Period*
July 1, 2007
to
December 31,
2007 |
FI Mid Cap Opportunities—Class A | | Actual | | 0.74 | % | | $ | 1,000.00 | | $ | 974.20 | | $ | 3.68 |
| | Hypothetical | | 0.74 | % | | $ | 1,000.00 | | $ | 1,021.43 | | $ | 3.77 |
| | | | | |
FI Mid Cap Opportunities—Class B | | Actual | | 0.99 | % | | $ | 1,000.00 | | $ | 973.60 | | $ | 4.92 |
| | Hypothetical | | 0.99 | % | | $ | 1,000.00 | | $ | 1,020.16 | | $ | 5.04 |
| | | | | |
FI Mid Cap Opportunities—Class E | | Actual | | 0.89 | % | | $ | 1,000.00 | | $ | 973.90 | | $ | 4.43 |
| | Hypothetical | | 0.89 | % | | $ | 1,000.00 | | $ | 1,020.67 | | $ | 4.53 |
* Expenses paid are equal to the Portfolio’s annualized expense ratio for the most recent six month period, as shown above, multiplied by the average account value over the period, multiplied by the number of days in the most recent fiscal half-year, divided by 365 (to reflect the one-half year period).
MSF-4
Metropolitan Series Fund, Inc.
FI Mid Cap Opportunities Portfolio
Schedule of Investments as of December 31, 2007
Common Stock—98.3% of Total Net Assets
| | | | | |
| Security Description | | Shares | | Value* |
| | | | | |
| | |
Airlines—1.2% | | | | | |
AirAsia Berhad (MYR) (a) | | 10,761,600 | | $ | 5,175,532 |
Delta Air Lines, Inc. (a) (b) | | 637,900 | | | 9,498,331 |
| | | | | |
| | | | | 14,673,863 |
| | | | | |
| | |
Auto Components—1.7% | | | | | |
WABCO Holdings, Inc. | | 398,713 | | | 19,971,534 |
| | | | | |
| | |
Beverages—5.0% | | | | | |
Coca-Cola Hellenic Bottling Co. S.A. (ADR) (b) | | 350,762 | | | 14,991,568 |
Molson Coors Brewing Co. | | 842,530 | | | 43,491,399 |
| | | | | |
| | | | | 58,482,967 |
| | | | | |
| | |
Capital Markets—3.5% | | | | | |
Ashmore Group, Plc. (GBP) | | 3,806,673 | | | 20,139,807 |
EFG International (CHF) | | 526,360 | | | 21,200,876 |
| | | | | |
| | | | | 41,340,683 |
| | | | | |
| | |
Commercial Banks—0.8% | | | | | |
East West Bancorp, Inc. (b) | | 399,496 | | | 9,679,788 |
| | | | | |
| |
Commercial Services & Supplies—2.7% | | | |
Knoll, Inc. | | 1,122,700 | | | 18,445,961 |
Waste Management, Inc. | | 414,300 | | | 13,535,181 |
| | | | | |
| | | | | 31,981,142 |
| | | | | |
| |
Communications Equipment—6.5% | | | |
Harris Corp. | | 93,937 | | | 5,887,971 |
Juniper Networks, Inc. (a) | | 1,728,460 | | | 57,384,872 |
Research In Motion, Ltd. (a) | | 118,100 | | | 13,392,540 |
| | | | | |
| | | | | 76,665,383 |
| | | | | |
|
Construction & Engineering—0.9% |
Quanta Services, Inc. (a) (b) | | 406,261 | | | 10,660,289 |
| | | | | |
|
Diversified Consumer Services—7.9% |
DeVry, Inc. (b) | | 972,600 | | | 50,536,296 |
Service Corp. International | | 670,200 | | | 9,416,310 |
Weight Watchers International, Inc. (b) | | 740,794 | | | 33,469,073 |
| | | | | |
| | | | | 93,421,679 |
| | | | | |
| |
Diversified Financial Services—3.8% | | | |
Agrenco, Ltd. (BRL) (a) | | 364,600 | | | 1,970,478 |
Apollo Global Management, LLC (144A) | | 423,300 | | | 9,312,600 |
Bolsa de Mercadorias e Futuros (BRL) (a) | | 1,807,100 | | | 25,380,618 |
Bovespa Holding S.A. (BRL) (a) | | 416,000 | | | 8,016,180 |
| | | | | |
| | | | | 44,679,876 |
| | | | | |
|
Diversified Telecommunication Services—5.8% |
AT&T, Inc. | | 1,310,808 | | | 54,477,181 |
Time Warner Telecom, Inc. (Class A) (a) (b) | | 702,707 | | | 14,257,925 |
| | | | | |
| | | | | 68,735,106 |
| | | | | |
| | | | | |
| Security Description | | Shares | | Value* |
| | | | | |
| | |
Electrical Equipment—10.4% | | | | | |
ABB, Ltd. (ADR) | | 1,020,000 | | $ | 29,376,000 |
Alstom (EUR) (b) | | 163,700 | | | 34,735,968 |
Nexans S.A. (EUR) | | 200,181 | | | 24,755,694 |
Prysmian S.p.A. (EUR) (a) | | 1,407,296 | | | 34,408,539 |
| | | | | |
| | | | | 123,276,201 |
| | | | | |
|
Electronic Equipment & Instruments—3.8% |
Agilent Technologies, Inc. (a) | | 1,222,662 | | | 44,920,602 |
| | | | | |
|
Energy Equipment & Services—1.3% |
Diamond Offshore Drilling, Inc. (b) | | 13,600 | | | 1,931,200 |
SEACOR Holdings, Inc. (a) (b) | | 148,200 | | | 13,744,068 |
| | | | | |
| | | | | 15,675,268 |
| | | | | |
|
Health Care Equipment & Supplies—0.5% |
Advanced Medical Optics, Inc. (a) (b) | | 239,611 | | | 5,877,658 |
| | | | | |
|
Hotels, Restaurants & Leisure—0.6% |
Starbucks Corp. (a) | | 346,928 | | | 7,101,616 |
| | | | | |
| | |
Household Durables—5.1% | | | | | |
Harman International Industries, Inc. | | 812,995 | | | 59,925,861 |
| | | | | |
|
Internet Software & Services—3.0% |
Akamai Technologies, Inc. (a) (b) | | 1,010,088 | | | 34,949,045 |
| | | | | |
| | |
IT Services—2.6% | | | | | |
Fiserv, Inc. (a) (b) | | 431,389 | | | 23,937,776 |
Global Cash Access, Inc. (a) (b) | | 1,067,934 | | | 6,471,680 |
| | | | | |
| | | | | 30,409,456 |
| | | | | |
|
Life Sciences Tools & Services—0.0% |
Pharmaceutical Product Development, Inc. | | 2,900 | | | 117,073 |
| | | | | |
|
Machinery—5.8% |
Flowserve Corp. | | 556,002 | | | 53,487,392 |
Sulzer AG (CHF) | | 10,080 | | | 14,621,869 |
| | | | | |
| | | | | 68,109,261 |
| | | | | |
|
Media—6.2% |
The Walt Disney Co. | | 1,090,969 | | | 35,216,479 |
Time Warner, Inc. | | 2,307,129 | | | 38,090,700 |
| | | | | |
| | | | | 73,307,179 |
| | | | | |
|
Oil, Gas & Consumable Fuels—3.1% |
Chesapeake Energy Corp. (b) | | 225,900 | | | 8,855,280 |
EOG Resources, Inc. | | 178,514 | | | 15,932,374 |
EXCO Resources, Inc. (a) (b) | | 646,300 | | | 10,004,724 |
Goodrich Petroleum Corp. (a) (b) | | 83,516 | | | 1,889,132 |
Sunoco, Inc. | | 3,900 | | | 282,516 |
| | | | | |
| | | | | 36,964,026 |
| | | | | |
*See accompanying notes to financial statements.
MSF-5
Metropolitan Series Fund, Inc.
FI Mid Cap Opportunities Portfolio
Schedule of Investments as of December 31, 2007
Common Stock—(Continued)
| | | | | |
| Security Description | | Shares | | Value* |
| | | | | |
|
Real Estate Management & Development—1.1% |
Indiabulls Real Estate, Ltd. (INR) (a) | | 697,239 | | $ | 13,248,574 |
| | | | | |
|
Road & Rail—2.5% |
Hertz Global Holdings, Inc. (a) (b) | | 1,853,500 | | | 29,452,115 |
| | | | | |
|
Semiconductors & Semiconductor Equipment—2.2% |
Marvell Technology Group, Ltd. (a) | | 719,834 | | | 10,063,279 |
SiRF Technology Holdings, Inc. (a) (b) | | 649,352 | | | 16,318,216 |
| | | | | |
| | | | | 26,381,495 |
| | | | | |
|
Software—3.4% |
Electronic Arts, Inc. (a) | | 688,400 | | | 40,209,444 |
| | | | | |
|
Textiles, Apparel & Luxury Goods—1.2% |
Phillips-Van Heusen Corp. | | 394,465 | | | 14,539,980 |
| | | | | |
|
Wireless Telecommunication Services—5.7% |
American Tower Corp. (Class A) (a) | | 771,119 | | | 32,849,669 |
Bharti Airtel, Ltd.(INR) | | 758,345 | | | 18,993,637 |
NII Holdings, Inc. (a) | | 322,955 | | | 15,605,186 |
| | | | | |
| | | | | 67,448,492 |
| | | | | |
Total Common Stock
(Identified Cost $1,102,104,902) | | | | | 1,162,205,656 |
| | | | | |
| | | | | | | |
|
| Short Term Investments—14.4% | |
| Security Description | | Shares/ Face Amount | | Value* | |
|
Mutual Funds—12.0% | |
State Street Navigator Securities Lending Prime Portfolio (c) | | | 141,557,074 | | $ | 141,557,074 | |
| | | | | | | |
|
Repurchase Agreement—2.4% | |
State Street Repurchase Agreement dated 12/31/07 at 1.200% to be repurchased at $28,836,922 on 1/2/08, collateralized by $9,770,000 U.S. Treasury Bond 8.125% due 8/15/21 with a value of $13,714,638; and by $12,055,000 U.S. Treasury Bond 7.625% due 11/15/22 with a value of $15,987,944. | | $ | 28,835,000 | | | 28,835,000 | |
| | | | | | | |
Total Short Term Investments
(Identified Cost $170,392,074) | | | | | | 170,392,074 | |
| | | | | | | |
Total Investments—112.7%
(Identified Cost $1,272,496,976) (d) | | | | | | 1,332,597,730 | |
Liabilities in excess of other assets | | | | | | (150,569,699 | ) |
| | | | | | | |
| Total Net Assets—100% | | | | | $ | 1,182,028,031 | |
| | | | | | | |
| (b) | A portion or all of the security was held on loan. As of December 31, 2007, the market value of securities loaned was $165,979,514 and the collateral received consisted of cash in the amount of $141,557,074 and non cash collateral with a value of $ 28,979,281. The cash collateral is invested in a money market fund managed by an affiliate of the custodian. The non cash collateral received consists primarily of government securities and bank letters of credit, and are held for the benefit of the Portfolio at the Portfolio’s custodian. |
| (c) | Represents investment of cash collateral received from securities lending transactions. |
| (d) | The aggregate cost of investments for federal income tax purposes as of December 31, 2007 was $1,280,482,952 and the composition of unrealized appreciation and depreciation of investment securities was $131,588,454 and $(79,473,676), respectively. |
| (144A)— | Securities exempt from registration under Rule 144A of the Securities Act of 1933. These securities may be resold in transactions exempt from registration, normally to qualified institutional buyers. As of December 31, 2007, the market value of 144A securities was $9,312,600, which is 0.8% of total net assets. |
| (ADR)— | An American Depositary Receipt is a certificate issued by a custodian bank representing the right to receive securities of the foreign issuer described. Trading on exchanges not located in the United States or Canada significantly influences the value of ADRs. |
*See accompanying notes to financial statements.
MSF-6
Metropolitan Series Fund, Inc.
FI Mid Cap Opportunities Portfolio
Statement of Assets & Liabilities
December 31, 2007
| | | | | | | |
Assets | | | | | | | |
Investments at value (a) (c) | | | | | $ | 1,332,597,730 | |
Cash | | | | | | 554 | |
Foreign cash at value (b) | | | | | | 33 | |
Receivable for: | | | | | | | |
Securities sold | | | | | | 1,478,203 | |
Fund shares sold | | | | | | 534,181 | |
Accrued interest and dividends | | | | | | 669,480 | |
Foreign taxes | | | | | | 16,643 | |
| | | | | | | |
Total Assets | | | | | | 1,335,296,824 | |
Liabilities | | | | | | | |
Payable for: | | | | | | | |
Securities purchased | | $ | 10,241,553 | | | | |
Fund shares redeemed | | | 513,743 | | | | |
Withholding taxes | | | 156,537 | | | | |
Collateral for securities loaned | | | 141,557,074 | | | | |
Accrued expenses: | | | | | | | |
Management fees | | | 683,301 | | | | |
Service and distribution fees | | | 22,207 | | | | |
Deferred directors’ fees | | | 1,849 | | | | |
Other expenses | | | 92,529 | | | | |
| | | | | | | |
Total Liabilities | | | | | | 153,268,793 | |
| | | | | | | |
Net Assets | | | | | $ | 1,182,028,031 | |
| | | | | | | |
Net assets consists of: | | | | | | | |
Capital paid in | | | | | $ | 1,613,196,396 | |
Undistributed net investment income | | | | | | 1,794,246 | |
Accumulated net realized losses | | | | | | (492,899,034 | ) |
Unrealized appreciation on investments and foreign currency | | | | | | 59,936,423 | |
| | | | | | | |
Net Assets | | | | | $ | 1,182,028,031 | |
| | | | | | | |
| Computation of offering price: | | | | | | | |
Class A | | | | | | | |
Net asset value and redemption price per share ($1,063,016,731 divided by 50,278,407 shares outstanding) | | | | | $ | 21.14 | |
| | | | | | | |
Class B | | | | | | | |
Net asset value and redemption price per share ($82,674,591 divided by 4,002,441 shares outstanding) | | | | | $ | 20.66 | |
| | | | | | | |
Class E | | | | | | | |
Net asset value and redemption price per share ($36,336,709 divided by 1,739,499 shares outstanding) | | | | | $ | 20.89 | |
| | | | | | | |
(a) Identified cost of investments | | | | | $ | 1,272,496,976 | |
| | | | | | | |
(b) Identified cost of foreign cash | | | | | $ | 32 | |
| | | | | | | |
| (c) | Includes cash collateral for securities loaned of $141,557,074. |
Statement of Operations
For the Year Ended December 31, 2007
| | | | | | | | |
Investment Income | | | | | | | | |
Dividends | | | | | | $ | 7,834,952 | (a) |
Interest | | | | | | | 1,136,180 | (b) |
| | | | | | | | |
| | | | | | | 8,971,132 | |
Expenses | | | | | | | | |
Management fees | | $ | 7,914,306 | | | | | |
Service and distribution fees—Class B | | | 190,021 | | | | | |
Service and distribution fees—Class E | | | 57,513 | | | | | |
Directors’ fees and expenses | | | 23,856 | | | | | |
Custodian | | | 222,751 | | | | | |
Audit and tax services | | | 31,738 | | | | | |
Legal | | | 13,228 | | | | | |
Printing | | | 348,368 | | | | | |
Insurance | | | 12,329 | | | | | |
Miscellaneous | | | 18,193 | | | | | |
| | | | | | | | |
Total expenses | | | 8,832,303 | | | | | |
Expense reductions | | | (33,344 | ) | | | 8,798,959 | |
| | | | | | | | |
Net Investment Income | | | | | | | 172,173 | |
| | | | | | | | |
Realized and Unrealized Gain (Loss) | | | | | | | | |
| Realized gain on: | | | | | | | | |
Investments—net | | | 128,209,702 | | | | | |
Foreign currency transactions—net | | | 2,416,767 | | | | 130,626,469 | |
| | | | | | | | |
| Change in unrealized depreciation on: | | | | | | | | |
Investments—net | | | (40,914,241 | ) | | | | |
Foreign currency transactions—net | | | (5,991 | ) | | | (40,920,232 | ) |
| | | | | | | | |
Net gain | | | | | | | 89,706,237 | |
| | | | | | | | |
Net Increase in Net Assets From Operations | | | | | | $ | 89,878,410 | |
| | | | | | | | |
| (a) | Net of foreign taxes of $89,138. |
| (b) | Includes net income on securities loaned of $480,938. |
See accompanying notes to financial statements.
MSF-7
Metropolitan Series Fund, Inc.
FI Mid Cap Opportunities Portfolio
Statements of Changes in Net Assets
| | | | | | | | |
| | | Year ended
December 31,
2007 | | | Year ended
December 31,
2006 | |
From Operations | | | | | | | | |
Net investment income | | $ | 172,173 | | | $ | 491,904 | |
Net realized gain | | | 130,626,469 | | | | 92,380,358 | |
Unrealized appreciation (depreciation) | | | (40,920,232 | ) | | | 21,473,574 | |
| | | | | | | | |
Increase in net assets from operations | | | 89,878,410 | | | | 114,345,836 | |
| | | | | | | | |
From Distributions to Shareholders | | | | | | | | |
Net investment income | | | | | | | | |
Class A | | | (1,400,249 | ) | | | (51,396 | ) |
Class E | | | (1,896 | ) | | | 0 | |
| | | | | | | | |
Total distributions | | | (1,402,145 | ) | | | (51,396 | ) |
| | | | | | | | |
Increase (decrease) in net assets from capital share transactions | | | 5,575,867 | | | | (36,812,835 | ) |
| | | | | | | | |
Total increase in net assets | | | 94,052,132 | | | | 77,481,605 | |
| | |
Net Assets | | | | | | | | |
Beginning of the period | | | 1,087,975,899 | | | | 1,010,494,294 | |
| | | | | | | | |
End of the period | | $ | 1,182,028,031 | | | $ | 1,087,975,899 | |
| | | | | | | | |
Undistributed Net Investment Income | | | | | | | | |
End of the period | | $ | 1,794,246 | | | $ | 546,458 | |
| | | | | | | | |
Other Information:
Capital Shares
Transactions in capital shares were as follows:
| | | | | | | | | | | | | | |
| | | Year ended
December 31, 2007 | | | Year ended
December 31, 2006 | |
| | | Shares | | | $ | | | Shares | | | $ | |
Class A | | | | | | | | | | | | | | |
Sales | | 8,542,036 | | | $ | 181,035,488 | | | 7,337,683 | | | $ | 135,629,659 | |
Reinvestments | | 66,112 | | | | 1,400,249 | | | 2,664 | | | | 51,396 | |
Redemptions | | (8,578,550 | ) | | | (181,458,569 | ) | | (10,008,666 | ) | | | (182,453,421 | ) |
| | | | | | | | | | | | | | |
Net increase (decrease) | | 29,598 | | | $ | 977,168 | | | (2,668,319 | ) | | $ | (46,772,366 | ) |
| | | | | | | | | | | | | | |
Class B | | | | | | | | | | | | | | |
Sales | | 1,373,277 | | | $ | 28,773,800 | | | 1,497,924 | | | $ | 26,935,996 | |
Redemptions | | (894,020 | ) | | | (18,596,495 | ) | | (758,959 | ) | | | (13,536,422 | ) |
| | | | | | | | | | | | | | |
Net increase | | 479,257 | | | $ | 10,177,305 | | | 738,965 | | | $ | 13,399,574 | |
| | | | | | | | | | | | | | |
Class E | | | | | | | | | | | | | | |
Sales | | 250,970 | | | $ | 5,322,439 | | | 324,263 | | | $ | 5,917,226 | |
Reinvestments | | 90 | | | | 1,896 | | | 0 | | | | 0 | |
Redemptions | | (522,976 | ) | | | (10,902,941 | ) | | (521,495 | ) | | | (9,357,269 | ) |
| | | | | | | | | | | | | | |
Net decrease | | (271,916 | ) | | $ | (5,578,606 | ) | | (197,232 | ) | | $ | (3,440,043 | ) |
| | | | | | | | | | | | | | |
Increase (decrease) derived from capital share transactions | | | | | $ | 5,575,867 | | | | | | $ | (36,812,835 | ) |
| | | | | | | | | | | | | | |
See accompanying notes to financial statements.
MSF-8
Metropolitan Series Fund, Inc.
FI Mid Cap Opportunities Portfolio
Financial Highlights
| | | | | | | | | | | | | | | | | | | | |
| | | Class A | |
| | | Year ended December 31, | |
| | | 2007 | | | 2006 | | | 2005 | | | 2004 | | | 2003 | |
Net Asset Value, Beginning of Period | | $ | 19.54 | | | $ | 17.47 | | | $ | 16.34 | | | $ | 14.01 | | | $ | 10.41 | |
| | | | | | | | | | | | | | | | | | | | |
Income From Investment Operations | | | | | | | | | | | | | | | | | | | | |
Net investment income (loss) | | | 0.01 | (a) | | | 0.01 | | | | 0.02 | | | | 0.08 | | | | (0.03 | ) |
Net realized and unrealized gain on investments | | | 1.62 | | | | 2.06 | | | | 1.11 | | | | 2.33 | | | | 3.63 | |
| | | | | | | | | | | | | | | | | | | | |
Total from investment operations | | | 1.63 | | | | 2.07 | | | | 1.13 | | | | 2.41 | | | | 3.60 | |
| | | | | | | | | | | | | | | | | | | | |
Less Distributions | | | | | | | | | | | | | | | | | | | | |
Distributions from net investment income | | | (0.03 | ) | | | (0.00 | )(b) | | | 0.00 | | | | (0.08 | ) | | | 0.00 | |
| | | | | | | | | | | | | | | | | | | | |
Total distributions | | | (0.03 | ) | | | (0.00 | ) | | | 0.00 | | | | (0.08 | ) | | | 0.00 | |
| | | | | | | | | | | | | | | | | | | | |
Net Asset Value, End of Period | | $ | 21.14 | | | $ | 19.54 | | | $ | 17.47 | | | $ | 16.34 | | | $ | 14.01 | |
| | | | | | | | | | | | | | | | | | | | |
Total Return (%) | | | 8.3 | | | | 11.9 | | | | 6.9 | | | | 17.2 | | | | 34.6 | |
Ratio of operating expenses to average net assets before expense reductions (%) | | | 0.73 | | | | 0.75 | | | | 0.75 | | | | 0.75 | | | | 0.77 | |
Ratio of operating expenses to average net assets after expense reductions (%) (c) | | | 0.73 | | | | 0.73 | | | | 0.68 | | | | 0.70 | | | | 0.76 | |
Ratio of net investment income (loss) to average net assets (%) | | | 0.04 | | | | 0.07 | | | | 0.11 | | | | 0.53 | | | | (0.24 | ) |
Portfolio turnover rate (%) | | | 113 | | | | 153 | | | | 149 | | | | 217 | | | | 39 | |
Net assets, end of period (000) | | $ | 1,063,017 | | | $ | 981,804 | | | $ | 924,602 | | | $ | 963,074 | | | $ | 873,202 | |
| |
| | | Class B | |
| | | Year ended December 31, | |
| | | 2007 | | | 2006 | | | 2005 | | | 2004 | | | 2003 | |
Net Asset Value, Beginning of Period | | $ | 19.11 | | | $ | 17.13 | | | $ | 16.06 | | | $ | 13.79 | | | $ | 10.27 | |
| | | | | | | | | | | | | | | | | | | | |
Income From Investment Operations | | | | | | | | | | | | | | | | | | | | |
Net investment income (loss) | | | (0.04 | )(a) | | | (0.02 | ) | | | (0.01 | ) | | | 0.09 | | | | (0.05 | ) |
Net realized and unrealized gain on investments | | | 1.59 | | | | 2.00 | | | | 1.08 | | | | 2.23 | | | | 3.57 | |
| | | | | | | | | | | | | | | | | | | | |
Total from investment operations | | | 1.55 | | | | 1.98 | | | | 1.07 | | | | 2.32 | | | | 3.52 | |
| | | | | | | | | | | | | | | | | | | | |
Less Distributions | | | | | | | | | | | | | | | | | | | | |
Distributions from net investment income | | | 0.00 | | | | 0.00 | | | | 0.00 | | | | (0.05 | ) | | | 0.00 | |
| | | | | | | | | | | | | | | | | | | | |
Total distributions | | | 0.00 | | | | 0.00 | | | | 0.00 | | | | (0.05 | ) | | | 0.00 | |
| | | | | | | | | | | | | | | | | | | | |
Net Asset Value, End of Period | | $ | 20.66 | | | $ | 19.11 | | | $ | 17.13 | | | $ | 16.06 | | | $ | 13.79 | |
| | | | | | | | | | | | | | | | | | | | |
Total Return (%) | | | 8.1 | | | | 11.6 | | | | 6.7 | | | | 16.8 | | | | 34.2 | |
Ratio of operating expenses to average net assets before expense reductions (%) | | | 0.98 | | | | 1.00 | | | | 1.00 | | | | 1.00 | | | | 1.02 | |
Ratio of operating expenses to average net assets after expense reductions (%) (c) | | | 0.98 | | | | 0.98 | | | | 0.93 | | | | 0.95 | | | | 1.01 | |
Ratio of net investment income (loss) to average net assets (%) | | | (0.21 | ) | | | (0.18 | ) | | | (0.13 | ) | | | 0.44 | | | | (0.48 | ) |
Portfolio turnover rate (%) | | | 113 | | | | 153 | | | | 149 | | | | 217 | | | | 39 | |
Net assets, end of period (000) | | $ | 82,675 | | | $ | 67,334 | | | $ | 47,699 | | | $ | 36,819 | | | $ | 13,849 | |
| (a) | Per share amount is based on average shares outstanding during the period. |
| (b) | Distributions for the period were less than $0.01. |
| (c) | The Portfolio has entered into arrangements with certain brokers who paid a portion of the Portfolio’s expenses. |
See accompanying notes to financial statements.
MSF-9
Metropolitan Series Fund, Inc.
FI Mid Cap Opportunities Portfolio
Financial Highlights
| | | | | | | | | | | | | | | | | | | | |
| | | Class E | |
| | | Year ended December 31, | |
| | | 2007 | | | 2006 | | | 2005 | | | 2004 | | | 2003 | |
Net Asset Value, Beginning of Period | | $ | 19.31 | | | $ | 17.29 | | | $ | 16.19 | | | $ | 13.90 | | | $ | 10.33 | |
| | | | | | | | | | | | | | | | | | | | |
Income From Investment Operations | | | | | | | | | | | | | | | | | | | | |
Net investment income (loss) | | | (0.02 | )(a) | | | (0.02 | ) | | | (0.01 | ) | | | 0.07 | | | | (0.03 | ) |
Net realized and unrealized gain on investments | | | 1.60 | | | | 2.04 | | | | 1.11 | | | | 2.28 | | | | 3.60 | |
| | | | | | | | | | | | | | | | | | | | |
Total from investment operations | | | 1.58 | | | | 2.02 | | | | 1.10 | | | | 2.35 | | | | 3.57 | |
| | | | | | | | | | | | | | | | | | | | |
Less Distributions | | | | | | | | | | | | | | | | | | | | |
Distributions from net investment income | | | (0.00 | )(b) | | | 0.00 | | | | 0.00 | | | | (0.06 | ) | | | 0.00 | |
| | | | | | | | | | | | | | | | | | | | |
Total distributions | | | (0.00 | ) | | | 0.00 | | | | 0.00 | | | | (0.06 | ) | | | 0.00 | |
| | | | | | | | | | | | | | | | | | | | |
Net Asset Value, End of Period | | $ | 20.89 | | | $ | 19.31 | | | $ | 17.29 | | | $ | 16.19 | | | $ | 13.90 | |
| | | | | | | | | | | | | | | | | | | | |
Total Return (%) | | | 8.2 | | | | 11.7 | | | | 6.7 | | | | 17.0 | | | | 34.6 | |
Ratio of operating expenses to average net assets before expense reductions (%) | | | 0.88 | | | | 0.90 | | | | 0.90 | | | | 0.90 | | | | 0.92 | |
Ratio of operating expenses to average net assets after expense reductions (%) (c) | | | 0.88 | | | | 0.88 | | | | 0.83 | | | | 0.85 | | | | 0.91 | |
Ratio of net investment income (loss) to average net assets (%) | | | (0.12 | ) | | | (0.08 | ) | | | (0.04 | ) | | | 0.55 | | | | (0.37 | ) |
Portfolio turnover rate (%) | | | 113 | | | | 153 | | | | 149 | | | | 217 | | | | 39 | |
Net assets, end of period (000) | | $ | 36,337 | | | $ | 38,839 | | | $ | 38,193 | | | $ | 40,402 | | | $ | 12,991 | |
| (a) | Per share amount is based on average shares outstanding during the period. |
| (b) | Distributions for the period were less than $0.01. |
| (c) | The Portfolio has entered into arrangements with certain brokers who paid a portion of the Portfolio’s expenses. |
See accompanying notes to financial statements.
MSF-10
Metropolitan Series Fund, Inc.
FI Mid Cap Opportunities Portfolio
Notes to Financial Statements—December 31, 2007
Metropolitan Series Fund, Inc. (the “Fund”) is organized as a corporation under the laws of Maryland pursuant to Articles of Incorporation filed on November 23, 1982, as amended, and registered under the Investment Company Act of 1940, as amended (the “1940 Act”), as an open-end investment company. The Fund is a “series” type of mutual fund, which issues separate series of stock. Each series represents an interest in a separate portfolio of Fund investments. The FI Mid Cap Opportunities Portfolio (the “Portfolio”) is a diversified series of the Fund. Shares in the Fund are not offered directly to the general public and are currently available only to separate accounts established by Metropolitan Life Insurance Company (“MetLife”), New England Life Insurance Company, General American Life Insurance Company (“General American”), The MetLife Investors Group of Insurance Companies, MetLife Insurance Company of Connecticut and other affiliated insurance companies (collectively, the “Insurance Companies”), as an investment vehicle for variable life insurance, group annuity or variable annuity products, although the Portfolio is not available to all such separate accounts. The Portfolio’s shares may be divided into different classes. Currently, the classes being offered by the Portfolio are named Class A, Class B and Class E. The classes of the Portfolio’s shares are identical, except that certain additional charges (Rule 12b-1 fees) are made against Class B and Class E shares. Investment income, realized and unrealized capital gains and losses, the common expenses of the Portfolio and certain Portfolio-level expense reductions, if any, are allocated on a pro rata basis to each class based on the relative net assets of each class to the total net assets of the Portfolio.
| 2. | SIGNIFICANT ACCOUNTING POLICIES: |
The preparation of financial statements in conformity with accounting principles generally accepted in the United States of America (“GAAP”) requires management to make estimates and assumptions that affect the reported amounts of assets and liabilities and disclosure of contingent assets and liabilities as of the date of the financial statements and the reported amounts of income and expenses during the reporting period. Actual results could differ from those estimates.
The following is a summary of significant accounting policies consistently followed by the Portfolio in the preparation of its financial statements. The policies are in conformity with GAAP.
Investment Valuation:
Debt securities (other than short term obligations with a remaining maturity of sixty days or less) are valued by independent pricing services selected by the relevant subadviser pursuant to authorization of the Board of Directors of the Fund (the “Board” or “Directors”). Short term obligations with a remaining maturity of sixty days or less are valued at amortized cost which approximates fair market value.
Equity securities traded on a national securities exchange or exchanges are valued at their last sale price on the principal trading market. Equity securities traded on the NASDAQ National Market System are valued at the NASDAQ Official Closing Price (the “NOCP”). The NOCP is the last sale price if it falls between the spread of the last reported bid and asked prices. If the last reported bid and asked prices are above the last reported sale price, the NOCP will be the last reported bid price. If the last reported bid and asked prices are below the last reported sale price, the NOCP will be the last reported asked price. Equity securities traded on a national securities exchange or exchanges or on the NASDAQ National Market System for which there is no reported sale during the day are valued at the last reported bid price. A security that is listed or traded on more than one exchange is valued at the quotation on the exchange determined to be the primary market for that security by the Board or its delegates. If no closing price is available, then such securities are valued by using the last reported bid price. Equity securities traded over-the-counter are valued at the last reported sales price.
If no current market value quotation is readily available or reliable for a portfolio security, fair value will be determined in accordance with procedures established by and under the general supervision of the Board. When the Portfolio uses fair value pricing, it may take into account any factors it deems appropriate. The value of securities used by the Portfolio to calculate its net asset value may differ from quoted or published prices for the same securities. Fair value pricing involves subjective judgments and the fair value determined for a security may be materially different than the value that could be realized upon the sale of that security.
The Portfolio expects to use fair value pricing for securities primarily traded on U.S. exchanges only under very limited circumstances. For example, the Portfolio may use fair value pricing if the exchange on which a security is traded closes early or trading in the security is suspended.
MSF-11
Metropolitan Series Fund, Inc.
FI Mid Cap Opportunities Portfolio
Notes to Financial Statements—December 31, 2007—(Continued)
Securities traded primarily on an exchange outside of the United States which closes before the close of the New York Stock Exchange will be valued at the last sales price on that non-U.S. exchange. Securities traded primarily on an exchange outside of the United States for which there is no reported sale during the day are valued at the mean between the last reported bid and asked prices. However, because most foreign markets close well before the Portfolio values its securities (typically at 4 p.m. Eastern Time), the earlier close of these foreign markets gives rise to the possibility that significant events, including broad market moves, may have occurred after these foreign markets close but before the Portfolio values its securities. To account for this, the Portfolio may frequently value many of its foreign equity securities using fair value prices based on third party vendor modeling tools.
Forward foreign currency exchange contracts are valued based on the mean between closing bid and asked prices of the forward currency contract rates in the London foreign exchange markets on a daily basis as provided by a reliable bank or dealer.
Options, whether on securities, indices, futures contracts, or otherwise, are valued at the last sales price available as of the close of business on the day of valuation or, if there is no such sale price available, at the mean between the bid and asked prices. Options on currencies are valued at the spot price each day.
The value of futures contracts will be the sum of the margin deposit plus or minus the difference between the value of the futures contract on each day the net asset value is calculated and the value on the date the futures contract originated, value being that established on a recognized commodity exchange, or by reference to other customary sources, with gain or loss being realized when the futures contract closes or expires.
Subject to the Board’s oversight, the Board has delegated day-to-day responsibility for valuing Portfolio assets to MetLife Advisers, LLC (“MetLife Advisers” or the “Adviser”) who values such assets as described above and operates under procedures approved by the Board.
Investment Transactions and Related Investment Income:
Portfolio security transactions are recorded on the trade date. Dividend income is recorded on the ex-dividend date or, for certain foreign securities, when notified. Interest income, which includes amortization of premium and accretion of discount on debt securities, is recorded on the accrual basis. Realized gains and losses on investments and unrealized appreciation and depreciation are determined on the identified cost basis, which is the same basis used for federal income tax purposes.
Repurchase Agreements:
The Portfolio, through the custodian or a subcustodian, receives delivery of the underlying securities collateralizing repurchase agreements. The Portfolio requires the custodian to take possession, to have legally segregated in the Federal Reserve Book Entry System, or to have segregated within the custodian’s vault, all securities held as collateral for repurchase agreements. It is the Portfolio’s policy that the market value of the collateral be at least equal to 100% of the repurchase price in the case of a repurchase agreement of one-day duration and 102% on all other repurchase agreements. The Portfolio’s subadviser is responsible for determining that the value of the collateral is at all times at least equal to the repurchase price. In connection with transactions in repurchase agreements, if the seller defaults and the value of the collateral declines or if the seller enters an insolvency proceeding, realization of the collateral by the Portfolio may be delayed, limited or wholly denied.
Foreign Currency Translation:
The books and records of the Portfolio are maintained in U.S. dollars. The values of securities, currencies and other assets and liabilities denominated in currencies other than U.S. dollars are translated into U.S. dollars based upon foreign exchange rates prevailing at the end of the period. Purchases and sales of investment securities, income and expenses are translated on the respective dates of such transactions. Since the values of investment securities are presented at the foreign exchange rates prevailing at the end of the period, it is not practical to isolate that portion of the results of operations arising from changes in exchange rates from that portion of the results of operations reflecting fluctuations arising from changes in market prices of the investment securities. Such fluctuations are included in the net realized and unrealized gain or loss on investments.
Net realized foreign exchange gains or losses arise from sales of foreign currency, currency gains or losses realized between the trade and settlement dates on securities transactions, and the difference between the amounts of dividends, interest, and foreign withholding taxes recorded by the Portfolio and the U.S. dollar equivalent of the amounts actually received or paid by the Portfolio. Net unrealized foreign exchange gains and losses arise from changes in the value of assets and liabilities, other than investment securities, resulting from changes in the exchange rate.
MSF-12
Metropolitan Series Fund, Inc.
FI Mid Cap Opportunities Portfolio
Notes to Financial Statements—December 31, 2007—(Continued)
Forward Foreign Currency Exchange Contracts:
The Portfolio may enter into forward foreign currency exchange contracts primarily to hedge against foreign currency exchange rate risks on its non-U.S. dollar denominated investment securities. When entering into a forward currency contract, the Portfolio agrees to receive or deliver a fixed quantity of foreign currency for an agreed-upon price on an agreed future date. These contracts are valued daily and the Portfolio’s net equity therein, representing unrealized gain or loss on the contracts as measured by the difference between the foreign exchange rates at the dates of entry into the contracts and the forward rates at the settlement date, is included in the Statement of Assets and Liabilities. Realized and unrealized gains and losses are included in the Statement of Operations. These instruments involve market and/or credit risk in excess of the amount recognized in the Statement of Assets and Liabilities. Risks arise from the possible inability of counterparties to meet the terms of their contracts and from movement in currency and securities values and interest rates.
Futures Contracts:
The Portfolio may buy and sell futures contracts (on recognized exchanges) as a hedge or to enhance return. Futures contracts are agreements to buy or sell a security, or deliver a final cash settlement price in connection with an index, interest rate, currency, or other contracts not calling for physical delivery, for a set price in the future. The Portfolio must post an amount equal to a portion of the total market value of the futures contract as futures variation margin, which is returned when the Portfolio’s obligations under the contract have been satisfied. From time to time thereafter, the Portfolio may have to post variation margin to maintain this amount as the market value of the contract fluctuates. Risks of entering into futures contracts (and related options) include the possibility that there may be an illiquid market and that a change in the value of the contract or option may not correlate with changes in the value of the underlying securities.
Options:
The Portfolio may use options to hedge against changes in values of securities the Portfolio owns or expects to purchase. Writing puts or buying calls tends to increase the Portfolio’s exposure to the underlying instrument and writing calls or buying puts tends to decrease the Portfolio’s exposure to the underlying instrument, and can be used to hedge other Portfolio investments. For options purchased to hedge the Portfolio’s investments, the potential risk to the Portfolio is that the change in value of options contracts may not correspond to the change in value of the hedged instruments. In addition, losses may arise from changes in the value of the underlying instruments, if there is an illiquid secondary market, or if the counterparty is unable to perform. The maximum loss for purchased options is limited to the premium initially paid for the option. For options written by the Portfolio, the maximum loss is not limited to the premium initially received for the option.
The main risk associated with purchasing an option is that the option expires without being exercised. In this case, the option expires worthless and the premium paid for the option is considered the loss. The risk associated with writing a call option is that the Portfolio may forgo the opportunity for a profit if the market value of the underlying position increases and the option is exercised. The risk in writing a put option is that the Portfolio may incur a loss if the market value of the underlying position decreases and the option is exercised. In addition, the Portfolio risks not being able to enter into a closing transaction for the written option as the result of an illiquid market.
“When-Issued” Securities:
Purchasing securities “when-issued” is a forward commitment by the Portfolio to buy a security. The estimated amount of the Portfolio’s payment obligation and the security’s interest rate are determined when the commitment is made, even though no interest accrues until the security is issued, which is generally 15 to 120 days later. The Portfolio will segregate liquid assets with its custodian sufficient at all times to satisfy these commitments. If the value of the security is less when delivered than when the commitment was made, the Portfolio will suffer a loss.
Federal Income Taxes:
It is the Portfolio’s policy to comply with the requirements of the Internal Revenue Code of 1986, as amended, and regulations thereunder, applicable to regulated investment companies and to distribute all of its taxable income to shareholders. Therefore, no federal income tax provision is required.
MSF-13
Metropolitan Series Fund, Inc.
FI Mid Cap Opportunities Portfolio
Notes to Financial Statements—December 31, 2007—(Continued)
As of December 31, 2007, the Portfolio had capital loss carryovers as follows:
| | | | | | | | | |
Expiring
12/31/11 | | Expiring
12/31/10 | | Expiring
12/31/09 | | Total |
| $16,477,953 | | $ | 376,464,857 | | $ | 33,105,061 | | $ | 426,047,871 |
The tax character of distributions paid for the periods ended December 31, 2007 and 2006 was as follows:
| | | | | | | | | | | | | | | | | | | | | |
| Ordinary Income | | Long Term Gain | | Return of Capital | | Total |
2007 | | 2006 | | 2007 | | 2006 | | 2007 | | 2006 | | 2007 | | 2006 |
| $1,402,145 | | $ | 51,396 | | $ | — | | $ | — | | $ | — | | $ | — | | $ | 1,402,145 | | $ | 51,396 |
As of December 31, 2007, the components of distributable earnings (accumulated losses) on a federal income tax basis were as follows:
| | | | | | | | | | | | | | |
Undistributed Ordinary Income | | Undistributed
Long Term
Gain | | Unrealized
Appreciation | | Loss
Carryforwards | | | Total | |
| $3,550,596 | | $ | — | | $ | 51,950,447 | | $ | (426,047,871 | ) | | $ | (370,546,828 | ) |
Dividends and Distributions to Shareholders:
The Portfolio records dividends and distributions on the ex-dividend date. Net realized gains from security transactions (if any) are generally distributed annually to shareholders. The timing and characterization of certain income and capital gains distributions are determined in accordance with federal tax regulations that may differ from GAAP. Permanent book and tax basis differences relating to shareholder distributions will result in reclassification between under/over distributed net investment income, accumulated net realized gains/losses and paid in capital.
Expense Reductions:
Certain Portfolio trades are directed to brokers who paid a portion of the Portfolio’s expenses. Amounts paid for the Portfolio are shown as expense reductions in the Statement of Operations.
| 3. | INVESTMENT TRANSACTIONS: |
For the year ended December 31, 2007, purchases and sales of securities (excluding short term investments) for the Portfolio were as follows:
| | | | | | | | | |
| Purchases | | Sales |
U.S. Government | | Other | | U.S. Government | | Other |
| $0 | | $ | 1,310,324,075 | | $ | 0 | | $ | 1,279,092,451 |
| 4. | INVESTMENT MANAGEMENT FEES AND OTHER TRANSACTIONS WITH AFFILIATES: |
Investment Management Agreement:
MetLife Advisers, LLC (“MetLife Advisers”) is the investment adviser to the Portfolio. The Fund has entered into an investment management agreement with MetLife Advisers with respect to the Portfolio. For providing investment management services to the Portfolio, MetLife Advisers receives monthly compensation at the following annual rates:
| | | | | | | |
| | | Management
Fees earned by
MetLife Advisers
for the year ended
December 31, 2007 | | Annual
percentage
rates paid to
MetLife Advisers | | Based on Portfolios
average daily net asset levels |
| | $ | 7,914,306 | | 0.750% | | Of the first $100 million |
| | | | | 0.700% | | Of the next $400 million |
| | | | | 0.650% | | On amounts in excess of $500 million |
Certain officers and directors of the Fund may also be officers of MetLife Advisers; however, such officers and directors receive no compensation from the Fund.
MSF-14
Metropolitan Series Fund, Inc.
FI Mid Cap Opportunities Portfolio
Notes to Financial Statements—December 31, 2007—(Continued)
MetLife Advisers has entered into an investment subadvisory agreement with respect to the Portfolio. Fidelity Research & Management Company (“FMR”) was compensated by MetLife Advisers to provide subadvisory services for the FI Mid Cap Opportunities Portfolio in 2007.
Service and Distribution Fees:
The Fund has adopted a Distribution and Service Plan under Rule 12b-1 of the 1940 Act for the Portfolio’s Class B and E shares. Under the Distribution and Service Plan, the Class B and E shares of the Portfolio pay a fee to compensate the Insurance Companies (or their affiliates) and other broker-dealers and financial intermediaries involved in the offer and sale of Portfolio shares for promoting or selling and servicing, the Class B and E shares. The fees under the Distribution and Service Plan for each class of the Portfolio’s shares are calculated as a percentage of the Portfolio’s average daily net assets that are attributable to that Class. Currently, the fee is 0.25% per year for Class B shares and 0.15% per year for Class E shares. Amounts paid by the Portfolio for the year ended December 31, 2007 are shown as Service and Distribution fees in the Statement of Operations.
The Fund has entered into a securities lending arrangement with the Fund’s custodian, State Street Bank and Trust Company (the “custodian”). Under the agreement, the custodian is authorized to loan securities on the Portfolios’ behalf. In exchange, the Portfolio receives either cash or securities as collateral against the loaned securities. The Portfolio receives collateral at least equal to 102% of the market value of the loaned securities (105% for foreign securities), at each loan’s inception. Collateral must be maintained at least at 100% of the market value of the loaned securities for the duration of the loan. The cash collateral is invested in the Navigator Securities Lending Prime Portfolio, an affiliate of the custodian, which invests in a variety of high quality U.S. dollar-denominated instruments. If the market value of the collateral at the close of trading on a business day is less than 100% of the market value of the loaned securities at the close of trading on that day, the borrower shall be required to deliver, by the close of business on the following business day, an additional amount of collateral, equal to at least 100% of the market value of all the loaned securities as of such preceding day. The Portfolio receives 80% of the annual net income from securities lending transactions, which is included in interest income of the Portfolio. The remaining 20% is paid to the custodian as compensation for its securities lending services. The Portfolio bears the risk of any deficiency in the amount of collateral available for return to a borrower due to a loss in an approved investment. Any outstanding loans by the Portfolio at December 31, 2007 are footnoted in the Schedule of Investments.
As previously reported, in May 2004, General American received a Wells Notice stating that the SEC staff was considering recommending that the SEC bring a civil action alleging violations of the U.S. securities laws against General American with respect to market timing and late trading in a limited number of privately-placed variable insurance contracts that were sold through General American. General American responded to the SEC staff and cooperated with the investigation. On August 9, 2007, the SEC announced that it had settled an enforcement action regarding late trading against General American with, among other things, General American agreeing to pay a civil penalty and to comply with certain undertakings. General American consented to the SEC’s order without admitting or denying the findings. MetLife Advisers has also advised the Fund’s Board of Directors that, while certain exceptions to the Fund’s policies have been noted, no situations have been identified that would have a material impact on the financial position of the Fund.
On February 7, 2008 the Board approved a new investment subadvisory agreement (the “Agreement”) with respect to the Portfolio between MetLife Advisers and Pyramis Global Advisors, LLC (“Pyramis”), a wholly-owned subsidiary of the Portfolio’s former subadviser, FMR. The Agreement is not subject to shareholder approval and will become effective April 28, 2008. The Advisory Agreement between the Fund, with respect to the Portfolio, and MetLife Advisers will remain in effect and fees payable thereunder to MetLife Advisers will not change. Under the Agreement, Pyramis will become subadviser to the Portfolio, succeeding FMR, and will become responsible for the day-to-day management of the Portfolio’s investment operations under the oversight of MetLife Advisers and the Board.
MSF-15
Metropolitan Series Fund, Inc.
FI Mid Cap Opportunities Portfolio
Notes to Financial Statements—December 31, 2007—(Continued)
| 8. | RECENT ACCOUNTING PRONOUNCEMENTS: |
Effective June 29, 2007, the Fund implemented Financial Accounting Standards Board (“FASB”) Interpretation No. 48, “Accounting for Uncertainty in Income Taxes—an interpretation of FASB Statement No. 109” (“FIN 48”). FIN 48 prescribes the minimum recognition threshold a tax position must meet in connection with accounting for uncertainties in income tax positions taken or expected to be taken by an entity, including investment companies, before being measured and recognized in the financial statements. Management has evaluated the application of FIN 48 to the Fund, and has determined that the adoption of FIN 48 does not have a material impact on the Fund’s financial statements. The Fund files U.S. tax returns. No income tax returns are currently under examination. The statute of limitations on the Fund’s tax returns remains open for the years ended December 31, 2004 through December 31, 2006.
In September 2006, Statement of Financial Accounting Standards No. 157, Fair Value Measurements (SFAS 157) was issued and is effective for fiscal years beginning after November 15, 2007. SFAS 157 defines fair value, establishes a framework for measuring fair value and expands disclosures about fair value measurements. Management is currently evaluating the impact the adoption of SFAS 157 will have on the Portfolio’s financial statement disclosures.
MSF-16
Metropolitan Series Fund, Inc.
FI Mid Cap Opportunities Portfolio
Report of Independent Registered Public Accounting Firm
To the Shareholders and Board of Directors of the Metropolitan Series Fund, Inc. :
We have audited the accompanying statement of assets and liabilities, including the schedule of investments, of the FI Mid Cap Opportunities Portfolio, one of the portfolios constituting the Metropolitan Series Fund, Inc. (the “Fund”) as of December 31, 2007, and the related statement of operations for the year then ended, the statements of changes in net assets for each of the two years in the period then ended, and the financial highlights for each of the five years in the period then ended. These financial statements and financial highlights are the responsibility of the Fund’s management. Our responsibility is to express an opinion on these financial statements and financial highlights based on our audits.
We conducted our audits in accordance with the standards of the Public Company Accounting Oversight Board (United States). Those standards require that we plan and perform the audit to obtain reasonable assurance about whether the financial statements and financial highlights are free of material misstatement. The Fund is not required to have, nor were we engaged to perform, an audit of its internal control over financial reporting. Our audits included consideration of internal control over financial reporting as a basis for designing audit procedures that are appropriate in the circumstances, but not for the purpose of expressing an opinion on the effectiveness of the Fund’s internal control over financial reporting. Accordingly, we express no such opinion. An audit also includes examining, on a test basis, evidence supporting the amounts and disclosures in the financial statements, assessing the accounting principles used and significant estimates made by management, as well as evaluating the overall financial statement presentation. Our procedures included confirmation of securities owned as of December 31, 2007, by correspondence with the custodian and brokers; where replies were not received from brokers, we performed other auditing procedures. We believe that our audits provide a reasonable basis for our opinion.
In our opinion, the financial statements and financial highlights referred to above present fairly, in all material respects, the financial position of the FI Mid Cap Opportunities Portfolio of the Metropolitan Series Fund, Inc. as of December 31, 2007, the results of its operations for the year then ended, the changes in its net assets for each of the two years in the period then ended, and the financial highlights for each of the five years in the period then ended, in conformity with accounting principles generally accepted in the United States of America.
Deloitte & Touche LLP
Boston, Massachusetts
February 21, 2008
MSF-17
Metropolitan Series Fund, Inc.
Directors and Officers
The Fund’s Directors review actions of the Fund’s investment adviser and subadvisers, and decide upon matters of general policy. The Fund’s officers supervise the daily business operations of the Fund. The Board of Directors and the Fund’s officers are listed below. Each Director is responsible for overseeing all 36 Portfolios of the Fund. There is no limit to the term a Director may serve. Directors serve until their resignation, retirement or removal in accordance with the Fund’s organizational documents and policies adopted by the Board from time to time. Officers hold office at the pleasure of the Board or until the election or appointment and the qualification of a successor. The address of the directors and officers is c/o Metropolitan Series Fund, Inc., 501 Boylston Street, Boston, MA 02116.
Interested Directors(1)
Each Director below is an “interested person” (as defined by the 1940 Act) with respect to the Fund in that Ms. Forget is an employee of MetLife and Mr. Typermass is a former employee of MetLife and owns securities issued by MetLife, Inc., the ultimate parent company of MetLife Advisers.
| | | | | | | | |
Name, Address and Age | | Current
position(s)
with Fund | | Position(s)
held since | | Principal occupations
over past five years, including other directorships(2) | | Number of
Portfolios in
Fund Complex
Overseen by
Director(3) |
Elizabeth M. Forget Age: 41 | | Director, Chairman of the Board, President and Chief Executive Officer | | 2006 | | Senior Vice President (since 2007), MetLife, Inc.; President, Met Investors Advisory, LLC (“MIA”); Trustee and President, Met Investors Series Trust (“MIST”); Executive Vice President, MetLife Investors Group, Inc.; President (since 2006), MetLife Advisers. | | 81 |
| | | | |
Arthur G. Typermass Age: 70 | | Director | | 1998 | | Formerly, Senior Vice President and Treasurer, MetLife. | | 37 |
Non-Interested Directors(1)
Each Director below is not an “interested person” (as defined by the 1940 Act) with respect to the Fund (collectively, the “Independent Directors”).
| | | | | | | | |
Name, Address and Age | | Current
position(s)
with Fund | | Position(s)
held since | | Principal occupations
over past five years, including other directorships(2) | | Number of
Portfolios in
Fund Complex
Overseen by
Director(3) |
Steve A. Garban† Age: 70 | | Director | | 1985 | | Formerly, Chief Financial Officer, Senior Vice President Finance and Operations and Treasurer (Emeritus), The Pennsylvania State University. | | 37 |
| | | | |
Linda B. Strumpf Age: 60 | | Director | | 2000 | | Vice President and Chief Investment Officer, Ford Foundation. | | 37 |
| | | | |
Michael S. Scott Morton† Age: 70 | | Director | | 1993 | | Jay W. Forrester Professor of Management (Emeritus) at Sloan School of Management, MIT. | | 37 |
| | | | |
H. Jesse Arnelle Age: 74 | | Director | | 2001 | | Formerly, Counsel, Womble Carlyle Sandrie & Rice; Director, Textron Inc. (global multi-industry company)*; formerly, Director, Gannet Co. Inc. (diversified news and information company)*; formerly, Director, Eastman Chemical Company (global chemical company)*; formerly, Director, Waste Management, Inc.*; formerly, Director, Armstrong Holdings Inc. (parent company of floor and ceiling products business)*; formerly, Director, FPL Group Inc. (public utility holding company)*; Director, URS Corporation (engineering design services firm)*. | | 37 |
| | | | |
Nancy Hawthorne Age: 56 | | Director | | 2003 | | Director, Avid Technologies (computer software company)*; formerly, Chairman of the Board of Avid Technologies; formerly, Board of Advisors, L. Knife & Sons, Inc. (beverage distributor); Chief Executive Officer, Clerestory LLC (corporate financial advisor); formerly, Trustee, New England Zenith Fund (“Zenith Fund”)**; formerly, Chief Executive Officer and Managing Partner, Hawthorne, Krauss and Associates (corporate financial advisor); formerly, Chief Financial Officer and Executive Vice President, Continental Cablevision, subsequently renamed MediaOne (cable television company); formerly, Director, Life F/X, Inc.; formerly, Chairman of the Board, WorldClinic (distance medicine company); formerly, Director, Perini Corporation (construction company)*; formerly, Director, CGU (property and casualty insurance company); formerly, Director, Beacon Power Corporation (energy company )*. | | 37 |
MSF-18
Metropolitan Series Fund, Inc.
Directors and Officers—(Continued)
| | | | | | | | |
Name, Address and Age | | Current
position(s)
with Fund | | Position(s)
held since | | Principal occupations
over past five years, including other directorships(2) | | Number of
Portfolios in
Fund Complex
Overseen by
Director(3) |
John T. Ludes Age: 71 | | Director | | 2003 | | President, LFP Properties (consulting firm); Formerly, Trustee, Zenith Fund**; formerly, Vice Chairman, President and Chief Operating Officer, Fortune Brands/American Brands (global conglomerate); formerly, President and CEO, Acushnet Company (athletic equipment company). | | 37 |
Officers(1)
| | | | | | | | |
Name and address | | Age | | Current
position(s)
with Fund | | Position(s)
held since | | Principal occupations over past five years(2) |
| Jeffrey P. Halperin | | 40 | | Chief Compliance Officer | | 2006 | | Vice President (since 2006), Corporate Ethics and Compliance Department, MetLife, Inc.; Chief Compliance Officer (since 2006), MetLife Advisers, MIA and MIST. |
| | | | |
| John F. Guthrie, Jr. | | 64 | | Senior Vice President | | 2002 | | Manager and Senior Vice President, MetLife Advisers; Vice President, MetLife; Vice President (since 2003), MetLife Group, Inc.; Vice President, NELICO; Vice President (since 2005), MIA; formerly, Senior Vice President, Zenith Fund**. |
| | | | |
| Alan C. Leland | | 55 | | Senior Vice President | | 2005 | | Treasurer and Chief Financial Officer, MetLife Advisers, LLC; Treasurer (since 2005), Met Investors Advisory, LLC; Vice President (since 2004), MIA; Vice President (since 2003), MetLife Group, Inc.; Vice President, MetLife; Senior Vice President, NELICO |
| | | | |
| Peter Duffy | | 52 | | Vice President and Treasurer | | 2000 | | Senior Vice President, MetLife Advisers (since 1998); Second Vice President (since 2003), NELICO; Vice President, MetLife (since 2004); Vice President (since 2004), MetLife Group, Inc.; formerly, Vice President and Treasurer, Zenith Fund**. |
| | | | |
| Thomas M. Lenz | | 49 | | Vice President and Secretary | | 2002 | | General Counsel and Secretary, MetLife Advisers; Assistant General Counsel, MetLife; formerly, Vice President and Secretary, Zenith Fund**. |
| * | Indicates a directorship with a registered investment company or a company subject to the reporting requirements of the Securities Exchange Act of 1934, as amended. |
| ** | The Zenith Fund deregistered with the Securities and Exchange Commission (“SEC”) in 2004. |
| (†) | Served as a trustee, director and/or officer of one or more of the following companies, each of which had a direct or indirect advisory relationship with MetLife Advisers or its affiliates prior to January 31, 2005: State Street Research Financial Trust, State Street Research Income Trust, State Street Research Money Market Trust, State Street Research Institutional Funds, State Street Research Capital Trust, State Street Research Master Investment Trust, State Street Research Equity Trust, State Street Research Securities Trust and State Street Research Exchange Trust (collectively, the “State Street Research Funds”). |
| (1) | Each Director of the Fund also serves as trustee of Metropolitan Series Fund II (“Met Series Fund II”), a registered investment company advised by MetLife Advisers. Each officer of the Fund serves in the same position with Met Series Fund II, which consists of one portfolio. |
| (2) | Previous positions during the past five years with the Fund, MIST, MetLife, MetLife Advisers, MIA, Zenith Fund, NELICO or New England Securities Corporation are omitted if not materially different. |
| (3) | The Fund Complex includes the Fund (36 portfolios), Met Series Fund II (1 portfolio) and MIST (44 portfolios) |
MSF-19
Metropolitan Series Fund, Inc.
FI Mid Cap Opportunities Portfolio
Board Approval of Advisory and Subadvisory Agreements
The Fund’s Contract Review Committees of the Board of Directors (the “Board”) typically meet in early fall to review the Portfolios’ advisory agreements (the “Advisory Agreements”), subadvisory agreements and sub-subadvisory agreements (collectively, the “Subadvisory Agreements,” and, together with the Advisory Agreements, the “Agreements”) and determine whether to recommend that the full Board approve the continuation of the Agreements for an additional one-year period. (Following the initial approval of an Agreement for a new Portfolio or with a new adviser or subadviser, such annual reviews are not required until 2 years following the execution of such Agreement.) After each Committee has made its recommendations, the full Board, including the Independent Directors, determines whether to approve the continuation of each of the Agreements. In addition, the Board, including the Independent Directors, considers matters bearing on the Agreements at most of its other meetings throughout the year and regularly interviews various individuals at MetLife Advisers responsible for the management of the Portfolios. The Directors also interview selected investment managers and other professionals at the subadvisers at various times throughout the year.
The Directors receive all materials that they or MetLife Advisers, the Fund’s investment adviser, and the subadvisers believe to be reasonably necessary for the Directors to evaluate the Agreements and determine whether to approve the continuation of the Agreements. These materials generally include, among other items, (i) information on the investment performance of the Portfolios and the performance of peer groups of funds and the Portfolios’ performance benchmarks, (ii) information on the Portfolios’ advisory and subadvisory fees and other expenses, including information comparing the Portfolios’ expenses to those of peer groups of funds and information about any applicable expense caps and fee “breakpoints,” (iii) sales and redemption data, (iv) information related to the profitability of the Agreements to MetLife Advisers and the subadvisers, and potential “fall-out” or ancillary benefits that MetLife Advisers, the subadvisers or their affiliates may receive as a result of their relationships with the Fund and (v) information obtained through the subadvisers’ responses to certain requests from MetLife Advisers and the Directors and MetLife Advisers’ responses to requests from the Directors. The Directors may also consider other information such as (vi) MetLife Advisers’ and the subadvisers’ financial results and condition, (vii) each Portfolio’s investment objectives and strategies and the size, education and experience of the investment staffs of MetLife Advisers and the relevant subadvisers and their use of technology and external research, (viii) the allocation of the Portfolios’ brokerage, if any, including allocations to brokers affiliated with the subadvisers and the use of “soft” commission dollars to pay Portfolio expenses and to pay for research and other similar services, (ix) the resources devoted to, and the record of compliance with, the Portfolios’ investment policies and restrictions, policies on personal securities transactions and other compliance policies, (x) the responses of MetLife Advisers, the subadvisers and/or their affiliates to certain legal and regulatory proceedings and (xi) the economic outlook generally and for the mutual fund industry in particular. Throughout the process, the Directors have the opportunity to ask questions of and request additional materials from MetLife Advisers and the subadvisers.
Following meetings of each Contract Review Committee on September 12, 2007, the Board, at its November 15, 2007 meeting, approved the continuation through December 31, 2008 of the Advisory Agreements for each Portfolio of the Fund and the Subadvisory Agreements for each Portfolio of the Fund. The Agreements approved for continuation are referred to below as the “Continued Agreements.”
In considering whether to approve the continuation of the Continued Agreements, the Directors, including the Independent Directors, did not identify any single factor as determinative, and each weighed the various factors as he or she deemed appropriate. The Directors considered the following matters in connection with their approval of the Continued Agreements:
The nature, extent and quality of the services provided to the relevant Portfolios under the Continued Agreements. The Directors considered the nature, extent and quality of the services provided by MetLife Advisers, the relevant subadvisers (if any) and their affiliates (each, an “Adviser,” and, collectively, the “Advisers”) to the relevant Portfolios pursuant to the Continued Agreements and the resources dedicated to these Portfolios by the Advisers. In particular, the Directors considered the Advisers’ abilities to attract and retain highly qualified investment professionals. With respect to MetLife Advisers, the Directors considered that MetLife Advisers is (i) ultimately responsible for the performance of such Portfolios; (ii) ultimately responsible for the establishment of the investment strategies of each such Portfolio, primarily through its recommendations to the Board regarding the hiring and selection of subadvisers; (iii) responsible for the hiring and selection, subject to Board approval, of subadvisers; and (iv) responsible for maintaining a program of Subadviser oversight reasonably designed to ensure that the subadvisers have reasonable compliance policies and procedures in place. The Directors also considered that MetLife Advisers provides a full range of day-to-day administrative services for the Portfolios involving all aspects of such Portfolios’ day-to-day operations (other than portfolio management). After reviewing these and related factors, the Directors concluded, within the context of their overall conclusions regarding each of the Continued Agreements, that the nature, extent and quality of services provided supported the renewal of these Agreements.
Investment performance of the relevant Portfolios. The Directors reviewed information about the performance of the relevant Portfolios over various time periods, including information prepared by an independent third party that compared the performance of
MSF-20
Metropolitan Series Fund, Inc.
FI Mid Cap Opportunities Portfolio
Board Approval of Advisory and Subadvisory Agreements—(Continued)
the Portfolios to the performance of peer groups of funds and performance benchmarks. The Directors also reviewed a description of the third party’s methodology for identifying a Portfolio’s peer group(s) for purposes of performance and expense comparisons.
In the case of each relevant Portfolio that had performance that lagged its peer group(s) for certain periods, the Directors concluded that other factors relevant to performance were sufficient, in light of other considerations, to warrant renewal of the Continued Agreements relating to such Portfolio. These factors varied from Portfolio to Portfolio, but included one or more of the following: (i) that such Portfolio’s performance, although lagging in certain recent periods, was stronger over the longer term; (ii) that the underperformance was attributable, to a significant extent, to investment decisions that were reasonable and consistent with the Portfolio’s investment objective(s) and policies and that the Portfolio was performing within the range of reasonable expectations, given market conditions and the Portfolio’s investment objective(s) and policies; (iii) that the Portfolio’s performance was competitive when compared to other relevant performance benchmarks or peer groups; and (iv) that MetLife Advisers and/or the relevant subadviser (if any) had taken or was taking steps designed to help improve the Portfolio’s investment performance.
The Directors also considered the investment performance of the Advisers and their reputations generally, the historical responsiveness of the Advisers to Director concerns about performance and the willingness of the Advisers to take steps intended to improve performance.
After reviewing these and related factors, the Directors concluded, within the context of their overall conclusions regarding each of the Continued Agreements, that the investment performance of each relevant Portfolio and Adviser was sufficient, in light of other considerations, to warrant the renewal of the Continued Agreements.
The costs of the services to be provided and profits to be realized by the Advisers and their affiliates from their relationships with the Portfolios. The Directors considered the fees charged by MetLife Advisers to the Portfolios for advisory services and, with respect to the subadvised Portfolios, by such subadvisers to MetLife Advisers for subadvisory services (such advisory and subadvisory fees (if any), collectively, “Fees”), as well as the total expense levels of the Portfolios. This information included comparisons (provided by an independent third party) of the Portfolios’ advisory fees and total expense levels to those of their peer groups. In evaluating Fees for the relevant Portfolios, the Directors also took into account the demands, complexity and quality of the investment management services provided to each Portfolio. The Directors considered MetLife Advisers’ recommendations regarding reductions in Fee rates, implementation of Fee breakpoints and institution of Fee waivers and expense caps.
The Directors also considered the compensation directly or indirectly received by the Advisers and their affiliates from their relationships with the relevant Portfolios. The Directors reviewed information relating to the profits received by MetLife Advisers, certain of the subadvisers and their affiliates as a result of their relationships with the relevant Portfolios, and information about the allocation of expenses used to calculate profitability. When reviewing profitability, the Directors also considered the performance of the relevant Portfolios, the expense levels of such Portfolios and whether the relevant Advisers had implemented breakpoints, fee waivers and/or expense caps with respect to such Portfolios.
After reviewing these and related factors, the Directors concluded, within the context of their overall conclusions regarding each of the Continued Agreements, that the Fees charged to each of the relevant Portfolios were fair and reasonable, and that the information provided regarding costs of these services generally, and the related profitability (if known) to the relevant Advisers of their relationships with the relevant Portfolios, supported the renewal of the Continued Agreements.
Economies of Scale. The Directors considered the existence of any economies of scale in the provision of services by the Advisers and whether those economies were shared with the relevant Portfolios through breakpoints in their advisory fees or other means, such as expense caps, fee waivers or relatively low levels of fees. The Directors noted that most of the relevant Portfolios benefited or will benefit from breakpoints, expense caps and/or fee waivers with respect to their advisory fees. In considering these issues, the Directors also took into consideration information relating to the costs of the services provided and the profitability to MetLife Advisers, the relevant subadvisers (if any) and each of their affiliates of their relationships with the relevant Portfolios, as discussed above.
After reviewing these and related factors, the Directors concluded, within the context of their overall conclusions regarding each of the Continued Agreements, that the extent to which economies of scale were shared with the relevant Portfolios supported the renewal of such Agreements.
Other Factors. The Directors also considered other factors, which included but were not limited to the following:
| | • | | the extent to which each relevant Portfolio operated in accordance with its investment objective, and its record of compliance with its investment restrictions and the compliance programs of the Fund and the Advisers. They also considered the compliance-related resources the Advisers and their affiliates provide to the relevant Portfolios; |
MSF-21
Metropolitan Series Fund, Inc.
FI Mid Cap Opportunities Portfolio
Board Approval of Advisory and Subadvisory Agreements—(Continued)
| | • | | the nature, quality, cost and extent of administrative and shareholder services performed by MetLife Advisers and its affiliates under the Advisory Agreements; and |
| | • | | so-called “fall-out benefits” to the Advisers, such as the engagement of their affiliates to provide distribution, brokerage and transfer agency services to the Portfolios, and the benefits of research made available to the relevant Advisers by reason of brokerage commissions generated by the relevant Portfolios’ securities transactions. The Directors also considered the possible conflicts of interest associated with these fall-out and other benefits, and the reporting and other processes in place to disclose and monitor these possible conflicts of interest. |
Based on their evaluation of all factors that they deemed to be material, including those factors described above, and assisted by the advice of independent counsel, the Directors, including the Independent Directors, concluded that each of the Continued Agreements should be continued through December 31, 2008.
MSF-22
A description of the policies and procedures that the Fund uses to determine how to vote proxies relating to portfolio securities is available (i) without charge, upon request, by calling (800) 638-7732 and (ii) on the Securities and Exchange Commission’s (the “SEC”) website at http://www.sec.gov.
Information regarding how the Fund voted proxies relating to portfolio securities during the most recent twelve-month period ended December 31, 2007 is available (i) without charge, upon request, by calling (800) 638-7732 and (ii) on the SEC’s website at http://www.sec.gov.
The Fund files with the SEC a complete schedule of its portfolio holdings, as of the close of the first and third quarters of its fiscal year, on “Form N-Q”. These filings are available on the SEC’s website at www.sec.gov and may be reviewed and copied at the SEC’s Public Reference Room in Washington, DC. (Call 1-800-SEC-0330 for information on the operation of the Public Reference Room.)
MSF-23
| | |
Metropolitan Series Fund, Inc. FI Value Leaders Portfolio Annual Report | | December 31, 2007 |
Letter from the President
February 1, 2008
Letter to Policy Holders:
2007 was a tumultuous year in the financial markets driven by concerns in the credit markets surrounding sub-prime mortgages and fears of recession in the U.S. Economy. The broad markets were mixed, with the Dow Jones Industrial Average up 8.9% and the MSCI EAFE Index, which measures the performance of international equities, up 11.2% for the year, while the Russell 2000 Index, which measures the performance of small capitalization stocks, was down 1.6%.
In the fixed income markets, credit spreads increased as a result of the pressure from sub-prime mortgage crisis and the Federal Reserve lowered interest rates by a total of 1% during the year. The Lehman Brothers Aggregate Bond Index posted a 7.0% return for the year.
On the following pages, you will find a complete review of your Portfolio and its investment performance.
MetLife is committed to building your financial freedom. We appreciate your trust and will continue to focus our efforts on meeting your investment needs.
Sincerely,
Elizabeth Forget
President, Metropolitan Series Fund, Inc.
Metropolitan Series Fund, Inc.
FI Value Leaders Portfolio
Managed by Fidelity Management & Research Company
Portfolio Manager Commentary*
PORTFOLIO PERFORMANCE
For the year ended December 31, 2007, the Class A shares of the FI Value Leaders Portfolio returned 4.2%, compared to its benchmark, the Russell 1000 Value Index1, which returned -0.2%. The average return of its peer group, the Lipper Variable Insurance Products Multi-Cap Value Funds Universe2, was -0.4% over the same period.
PORTFOLIO REVIEW
Amidst turmoil in the credit markets and conflicting economic data, equity prices witnessed increased volatility throughout the year. Early in the year, stock prices advanced to continual new highs, but with mounting credit concerns and a lingering weak housing market, increasing energy and commodity prices, and slow earnings growth weighed on investors, and volatility in the stock market returned. However, these concerns were partially offset by continued robust global economic growth and strong, albeit tempering, consumer spending trends. For the period, the Standard & Poor’s 500® Index3 returned 5.5%. The consumer discretionary and financial sectors were the only two posting negative performance during the period. Growth stocks generally did better than value style stocks for the year.
Nine of ten sectors contributed positively to the Portfolio’s relative performance. Stock selection in the Financials and Industrials sectors added to relative performance, while Telecommunication Services was the lone sector detractor. In the Financials sector, underweights in commercial banks and real estate investment trust (REIT) stocks were the largest contributors. Among commercial banks, the underweight in Wachovia was a significant contributor. Wachovia shares fell nearly 30%, largely due to losses and asset write-downs resulting from the problems in the subprime mortgage and credit markets. Not owning many REIT shares added to performance when the group fell more than 18% in aggregate during the year after several years of strong performance. REIT valuations were stretched after the long period of outperformance, and rising interest rates earlier in the year made Treasury securities more attractive because of their higher yields relative to REITs. Among Industrials, the overweight in farm equipment maker Agco added to performance. Agco shares gained almost 120% thanks to strong global demand for agricultural and farming equipment. Among individual holdings, the overweight in refiner Tesoro was the largest Portfolio contributor. Tesoro shares gained 67% during the first half of the year. The company’s shares rose thanks to rising oil prices and unusually tight gasoline and distillate inventories earlier in the year, which placed upward pressure on gasoline prices and helped refining margins.
In the Telecommunication Services sector, the underweight in diversified telecommunications firm Verizon Communications was a significant Portfolio detractor. Verizon shares gained 22%, mostly earlier in the year, due to strong wireless subscriber trends and share gains, primarily at the expense of rival Sprint Nextel. Among individual holdings, the overweight in mortgage finance firm Countrywide Financial and the underweight in oil & gas producer Occidental Petroleum were the largest Portfolio detractors. Countrywide shares fell more than 70% amid the subprime mortgage problems and ensuing liquidity crunch. Occidental Petroleum shares gained 60% as oil prices rose more than 50% during the year.
* The views expressed above are those of the subadvisory firm as of December 31, 2007 and are subject to change based on market and other conditions. Information about the Portfolio’s holdings, asset allocation, industry allocation, or country diversification is historical and is not an indication of future Portfolio composition, which will vary. The performance of any index mentioned in this commentary has not been adjusted for ongoing management, distribution and operating expenses, and sales charges applicable to mutual fund investments. Direct investment in the Index is not possible.
1 The Russell 1000® Value Index is an unmanaged measure of the largest capitalized U.S. domiciled companies with a less than average growth orientation. Companies in this Index generally have a low price-to-book and price-to-earnings ratio, higher divided yields and lower forecasted growth values.
2 The Lipper Variable Insurance Products Fund Average is an average of the total return performance (calculated on the basis of net asset value) of variable product funds with similar investment objectives to those of the subject Portfolio as calculated by Lipper Analytical Services, an independent mutual fund ranking service.
3 The Standard & Poor’s (S&P) 500® Stock Index is an unmanaged index representing the performance of 500 major companies, most of which are listed on the New York Stock Exchange.
MSF-2
Metropolitan Series Fund, Inc.
FI Value Leaders Portfolio
A $10,000 INVESTMENT COMPARED TO
THE RUSSELL 1000 VALUE INDEX
Average Annual Returns as of December 31, 2007
| | | | | | | | | | | | | | | |
| | | FI Value Leaders Portfolio | | | Russell 1000
Value Index | |
| | | Class A | | | Class B | | | Class D | | | Class E | | |
| 1 Year | | 4.2 | % | | 3.9 | % | | 4.1 | % | | 4.0 | % | | -0.2 | % |
| 5 Year | | 13.3 | | | 13.0 | | | — | | | 13.1 | | | 14.6 | |
| 10 Year | | 5.3 | | | — | | | — | | | — | | | 7.7 | |
| Since Inception | | — | | | 11.7 | | | 4.7 | | | 4.2 | | | — | |
Performance numbers are net of all Portfolio expenses but do not include any insurance, sales, or administrative charges of variable annuity or life insurance contracts. If these charges were included, the returns would be lower.
Inception dates of the Class A, Class B, Class D and Class E shares are: 4/30/93, 7/30/02, 5/2/06, 5/1/01 respectively.
This information represents past performance and is not indicative of future results. Investment return and principal value may fluctuate so that shares, upon redemption, may be worth more or less than the original cost.
PORTFOLIO COMPOSITION as of December 31, 2007
Top Holdings
| | |
| | | % of Total
Net Assets |
Exxon Mobil Corp. | | 5.3% |
AT&T, Inc. | | 4.7% |
General Electric Co. | | 3.5% |
Bank of America Corp. | | 2.9% |
Altria Group, Inc. | | 2.9% |
Citigroup, Inc. | | 2.5% |
American International Group, Inc. | | 2.4% |
Hewlett-Packard Co. | | 2.1% |
Federal National Mortgage Association | | 1.8% |
Chevron Corp. | | 1.8% |
Top Sectors
| | |
| | | % of Total
Market Value |
Financials | | 28.2% |
Energy | | 16.2% |
Industrials | | 11.3% |
Consumer Staples | | 8.6% |
Health Care | | 7.7% |
Telecommunication Services | | 6.7% |
Utilities | | 6.4% |
Consumer Discretionary | | 6.2% |
Materials | | 4.1% |
Information Technology | | 3.9% |
MSF-3
Metropolitan Series Fund, Inc.
Shareholder Expense Example
As a shareholder of the Portfolio, you incur ongoing costs, including management fees; distribution and service (12b-1) fees; and other Portfolio expenses. This example is intended to help you understand your ongoing costs (in dollars) (referred to as “expenses”) of investing in the Portfolio and compare these costs with the ongoing costs of investing in other mutual funds. The example is based on an investment of $1,000 invested at the beginning of the period and held for the entire period, July 1, 2007 through December 31, 2007.
Actual Expenses
The first line for each share class of the Portfolio in the table below provides information about actual account values and actual expenses. You may use the information in this line, together with the amount you invested in the particular share class of the Portfolio, to estimate the expenses that you paid over the period. Simply divide your account value by $1,000 (for example, an $8,600 account value divided by $1,000=8.6), then multiply the result by the number in the first line under the heading entitled “Expenses Paid During Period” to estimate the expenses you paid on your account during this period.
Hypothetical Example for Comparison Purposes
The second line for each share class of the Portfolio in the table below provides information about hypothetical account values and hypothetical expenses based on the Portfolio’s actual expense ratio and an assumed rate of return of 5% per year before expenses, which is not the Portfolio’s actual return. The hypothetical account values and expenses may not be used to estimate the actual ending account balance or expenses you paid for the period. You may use this information to compare the ongoing costs of investing in the Portfolio and other funds. To do so, compare this 5% hypothetical example with the 5% hypothetical examples that appear in the shareholder reports of the other funds.
Please note that the expenses shown in the table are meant to highlight your ongoing costs only and do not reflect any fees or charges of your variable insurance product or any additional expenses that participants in certain eligible qualified plans may bear relating to the operations of their plan. Therefore, the second line for each share class in the table is useful in comparing ongoing costs only, and will not help you determine the relative total costs of owning different funds. In addition, if these other costs were included, your costs would have been higher.
| | | | | | | | | | | | | | |
Portfolio | | | | Annualized
Expense
Ratio | | | Beginning
Account Value
July 1,
2007 | | Ending
Account Value
December 31,
2007 | | Expenses Paid
During Period*
July 1, 2007
to
December 31,
2007 |
FI Value Leaders—Class A | | Actual | | 0.70 | % | | $ | 1,000.00 | | $ | 963.60 | | $ | 3.46 |
| | Hypothetical | | 0.70 | % | | $ | 1,000.00 | | $ | 1,021.64 | | $ | 3.57 |
| | | | | |
FI Value Leaders—Class B | | Actual | | 0.95 | % | | $ | 1,000.00 | | $ | 962.50 | | $ | 4.70 |
| | Hypothetical | | 0.95 | % | | $ | 1,000.00 | | $ | 1,020.36 | | $ | 4.84 |
| | | | | |
FI Value Leaders—Class D | | Actual | | 0.80 | % | | $ | 1,000.00 | | $ | 963.20 | | $ | 3.96 |
| | Hypothetical | | 0.80 | % | | $ | 1,000.00 | | $ | 1,021.13 | | $ | 4.08 |
| | | | | |
FI Value Leaders—Class E | | Actual | | 0.85 | % | | $ | 1,000.00 | | $ | 962.90 | | $ | 4.21 |
| | Hypothetical | | 0.85 | % | | $ | 1,000.00 | | $ | 1,020.87 | | $ | 4.33 |
* Expenses paid are equal to the Portfolio’s annualized expense ratio for the most recent six month period, as shown above, multiplied by the average account value over the period, multiplied by the number of days in the most recent fiscal half-year, divided by 365 (to reflect the one-half year period).
MSF-4
Metropolitan Series Fund, Inc.
FI Value Leaders Portfolio
Schedule of Investments as of December 31, 2007
Common Stock—99.6% of Total Net Assets
| | | | | |
| Security Description | | Shares | | Value* |
| | | | | |
| | |
Aerospace & Defense—3.1% | | | | | |
Lockheed Martin Corp. | | 68,400 | | $ | 7,199,784 |
Precision Castparts Corp. | | 74,200 | | | 10,291,540 |
Raytheon Co. | | 138,600 | | | 8,413,020 |
| | | | | |
| | | | | 25,904,344 |
| | | | | |
| | |
Biotechnology—0.8% | | | | | |
Biogen Idec, Inc. (a) | | 125,400 | | | 7,137,768 |
| | | | | |
| | |
Capital Markets—3.1% | | | | | |
Ameriprise Financial, Inc. | | 102,200 | | | 5,632,242 |
MF Global, Ltd. (a) | | 226,700 | | | 7,134,249 |
The Bank of New York Mellon Corp. | | 280,900 | | | 13,696,684 |
| | | | | |
| | | | | 26,463,175 |
| | | | | |
| | |
Chemicals—2.4% | | | | | |
Albemarle Corp. | | 112,015 | | | 4,620,619 |
Celanese Corp. | | 177,100 | | | 7,494,872 |
Mosaic Co. (a) | | 52,500 | | | 4,952,850 |
The Lubrizol Corp. | | 53,119 | | | 2,876,925 |
| | | | | |
| | | | | 19,945,266 |
| | | | | |
| | |
Commercial Banks—3.2% | | | | | |
PNC Financial Services Group, Inc. | | 148,300 | | | 9,735,895 |
Regions Financial Corp. (b) | | 312,700 | | | 7,395,355 |
SunTrust Banks, Inc. | | 157,700 | | | 9,854,673 |
| | | | | |
| | | | | 26,985,923 |
| | | | | |
| | |
Computers & Peripherals—3.4% | | | | | |
Apple, Inc. (a) | | 34,700 | | | 6,873,376 |
EMC Corp. (a) | | 218,636 | | | 4,051,325 |
Hewlett-Packard Co. | | 355,400 | | | 17,940,592 |
| | | | | |
| | | | | 28,865,293 |
| | | | | |
| | |
Construction & Engineering—1.3% | | | | | |
KBR, Inc. (a) | | 105,500 | | | 4,093,400 |
The Shaw Group, Inc. (a) | | 116,900 | | | 7,065,436 |
| | | | | |
| | | | | 11,158,836 |
| | | | | |
| | |
Consumer Finance—1.0% | | | | | |
American Express Co. | | 155,000 | | | 8,063,100 |
| | | | | |
| | |
Diversified Financial Services—6.0% | | | | | |
Bank of America Corp. | | 593,804 | | | 24,500,353 |
Citigroup, Inc. | | 705,066 | | | 20,757,143 |
JPMorgan Chase & Co. | | 118,528 | | | 5,173,747 |
| | | | | |
| | | | | 50,431,243 |
| | | | | |
| |
Diversified Telecommunication Services—6.7% | | | |
AT&T, Inc. | | 953,200 | | | 39,614,993 |
CenturyTel, Inc. | | 144,500 | | | 5,990,970 |
Embarq Corp. | | 143,400 | | | 7,102,602 |
Verizon Communications, Inc. | | 99,600 | | | 4,351,524 |
| | | | | |
| | | | | 57,060,089 |
| | | | | |
| | | | | |
| Security Description | | Shares | | Value* |
| | | | | |
| | |
Electric Utilities—2.8% | | | | | |
Edison International | | 203,100 | | $ | 10,839,447 |
PPL Corp. | | 248,200 | | | 12,928,738 |
| | | | | |
| | | | | 23,768,185 |
| | | | | |
| | |
Energy Equipment & Services—3.8% | | | | | |
Cameron International Corp. | | 88,200 | | | 4,245,066 |
Diamond Offshore Drilling, Inc. (b) | | 57,500 | | | 8,165,000 |
National Oilwell Varco, Inc. (a) | | 129,900 | | | 9,542,454 |
Transocean, Inc. | | 71,572 | | | 10,245,532 |
| | | | | |
| | | | | 32,198,052 |
| | | | | |
| | |
Food & Staples Retailing—3.2% | | | | | |
CVS Caremark Corp. | | 134,800 | | | 5,358,300 |
Great Atlantic & Pacific Tea Co., Inc. (a) | | 179,800 | | | 5,633,134 |
Safeway, Inc. | | 224,600 | | | 7,683,566 |
The Kroger Co. | | 328,700 | | | 8,779,577 |
| | | | | |
| | | | | 27,454,577 |
| | | | | |
| | |
Food Products—0.3% | | | | | |
Corn Products International, Inc. | | 61,100 | | | 2,245,425 |
| | | | | |
| | |
Gas Utilities—0.7% | | | | | |
Energen Corp. | | 96,400 | | | 6,191,772 |
| | | | | |
| | |
Health Care Equipment & Supplies—0.9% | | | | | |
Baxter International, Inc. | | 129,300 | | | 7,505,865 |
| | | | | |
| | |
Health Care Providers & Services—2.4% | | | | | |
McKesson Corp. | | 109,100 | | | 7,147,141 |
Medco Health Solutions, Inc. (a) | | 58,500 | | | 5,931,900 |
WellPoint, Inc. (a) | | 82,800 | | | 7,264,044 |
| | | | | |
| | | | | 20,343,085 |
| | | | | |
| | |
Hotels, Restaurants & Leisure—1.3% | | | | | |
McDonald’s Corp. | | 185,400 | | | 10,921,914 |
| | | | | |
| | |
Household Products—1.6% | | | | | |
Energizer Holdings, Inc. (a) (b) | | 52,494 | | | 5,886,152 |
Procter & Gamble Co. | | 107,500 | | | 7,892,650 |
| | | | | |
| | | | | 13,778,802 |
| | | | | |
|
Independent Power Producers & Energy Traders—1.9% |
Mirant Corp. (a) (b) | | 131,800 | | | 5,137,564 |
NRG Energy, Inc. (a) (b) | | 248,400 | | | 10,765,656 |
| | | | | |
| | | | | 15,903,220 |
| | | | | |
| | |
Industrial Conglomerates—4.2% | | | | | |
General Electric Co. | | 791,000 | | | 29,322,369 |
Textron, Inc. | | 93,300 | | | 6,652,290 |
| | | | | |
| | | | | 35,974,659 |
| | | | | |
| | |
Insurance—10.9% | | | | | |
ACE, Ltd. | | 193,504 | | | 11,954,677 |
American International Group, Inc. | | 345,200 | | | 20,125,160 |
*See accompanying notes to financial statements.
MSF-5
Metropolitan Series Fund, Inc.
FI Value Leaders Portfolio
Schedule of Investments as of December 31, 2007
Common Stock—(Continued)
| | | | | |
| Security Description | | Shares | | Value* |
| | | | | |
| | |
Insurance—(Continued) | | | | | |
Assurant, Inc. (b) | | 62,800 | | $ | 4,201,320 |
Berkshire Hathaway, Inc. (Class B) (a) | | 2,690 | | | 12,739,840 |
Lincoln National Corp. | | 87,331 | | | 5,084,411 |
Loews Corp. | | 196,900 | | | 9,911,946 |
MBIA, Inc. (b) | | 85,300 | | | 1,589,139 |
Principal Financial Group, Inc. | | 118,700 | | | 8,171,308 |
Prudential Financial, Inc. | | 94,200 | | | 8,764,368 |
The Chubb Corp. | | 181,100 | | | 9,884,438 |
| | | | | |
| | | | | 92,426,607 |
| | | | | |
| | |
Life Sciences Tools & Services—1.4% | | | | | |
PerkinElmer, Inc. | | 69,200 | | | 1,800,584 |
Thermo Fisher Scientific, Inc. (a) | | 168,100 | | | 9,696,008 |
| | | | | |
| | | | | 11,496,592 |
| | | | | |
| | |
Machinery—2.7% | | | | | |
AGCO Corp. (b) | | 103,000 | | | 7,001,940 |
Cummins, Inc. | | 36,350 | | | 4,629,900 |
Deere & Co. | | 121,800 | | | 11,342,016 |
| | | | | |
| | | | | 22,973,856 |
| | | | | |
| | |
Media—3.3% | | | | | |
Discovery Holding Co. (Class A) (a) | | 288,975 | | | 7,264,831 |
E.W. Scripps Co. (Class A) (b) | | 80,000 | | | 3,600,800 |
Liberty Media Capital (Series A) (a) (b) | | 64,600 | | | 7,525,254 |
The Walt Disney Co. | | 288,800 | | | 9,322,464 |
| | | | | |
| | | | | 27,713,349 |
| | | | | |
| | |
Metals & Mining—1.8% | | | | | |
Allegheny Technologies, Inc. | | 89,200 | | | 7,706,880 |
Nucor Corp. | | 127,300 | | | 7,538,706 |
| | | | | |
| | | | | 15,245,586 |
| | | | | |
| | |
Multi-Utilities—1.0% | | | | | |
Public Service Enterprise Group, Inc. | | 87,900 | | | 8,635,296 |
| | | | | |
| | |
Oil, Gas & Consumable Fuels—12.4% | | | | | |
Chevron Corp. | | 158,900 | | | 14,830,137 |
ConocoPhillips | | 83,795 | | | 7,399,098 |
Exxon Mobil Corp. | | 480,890 | | | 45,054,585 |
Marathon Oil Corp. | | 238,800 | | | 14,533,368 |
Southwestern Energy Co. (a) | | 103,000 | | | 5,739,160 |
Valero Energy Corp. | | 142,290 | | | 9,964,569 |
Western Refining, Inc. (b) | | 104,300 | | | 2,525,103 |
XTO Energy, Inc. | | 101,625 | | | 5,219,460 |
| | | | | |
| | | | | 105,265,480 |
| | | | | |
| | |
Personal Products—0.6% | | | | | |
Alberto-Culver Co. | | 197,155 | | | 4,838,184 |
| | | | | |
| | |
Pharmaceuticals—2.2% | | | | | |
Merck & Co., Inc. | | 157,300 | | | 9,140,703 |
Pfizer, Inc. | | 422,100 | | | 9,594,333 |
| | | | | |
| | | | | 18,735,036 |
| | | | | |
| | | | | | | |
| Security Description | | Shares | | Value* | |
| | | | | | | |
| | |
Real Estate Investment Trusts—0.7% | | | | | | | |
Annaly Capital Management, Inc. | | | 340,100 | | $ | 6,183,018 | |
| | | | | | | |
| |
Semiconductors & Semiconductor Equipment—0.5% | | | | |
Applied Materials, Inc. | | | 226,700 | | | 4,026,192 | |
| | | | | | | |
| | |
Specialty Retail—0.7% | | | | | | | |
The Home Depot, Inc. | | | 208,600 | | | 5,619,684 | |
| | | | | | | |
| |
Textiles, Apparel & Luxury Goods—1.0% | | | | |
Nike, Inc. | | | 133,100 | | | 8,550,344 | |
| | | | | | | |
| | |
Thrifts & Mortgage Finance—3.4% | | | | | | | |
Countrywide Financial Corp. (b) | | | 385,400 | | | 3,445,476 | |
Downey Financial Corp. (b) | | | 123,900 | | | 3,854,529 | |
Federal National Mortgage Association | | | 386,300 | | | 15,444,274 | |
People’s United Financial, Inc. (b) | | | 357,900 | | | 6,370,620 | |
| | | | | | | |
| | | | | | 29,114,899 | |
| | | | | | | |
| | |
Tobacco—2.9% | | | | | | | |
Altria Group, Inc. | | | 321,700 | | | 24,314,086 | |
| | | | | | | |
Total Common Stock
(Identified Cost $818,467,196) | | | | | | 843,438,801 | |
| | | | | | | |
| |
| Short Term Investments—6.8% | | | | |
| Security Description | | Shares/
Face Amount | | Value* | |
| | |
Mutual Funds—6.7% | | | | | | | |
State Street Navigator Securities Lending Prime Portfolio (c) | | | 56,520,043 | | | 56,520,043 | |
| | | | | | | |
| | |
Repurchase Agreement—0.1% | | | | | | | |
State Street Corp. Repurchase Agreement dated 12/31/07 at 1.70% to be repurchased at $1,307,123 on 1/02/08, collateralized by $955,000 U.S. Treasury Bond 8.50% due 2/15/08 with a value of $1,335,806. | | $ | 1,307,000 | | | 1,307,000 | |
| | | | | | | |
Total Short Term Investments
(Identified Cost $57,827,043) | | | | | | 57,827,043 | |
| | | | | | | |
Total Investments—106.4%
(Identified Cost $876,294,239) (d) | | | | | | 901,265,845 | |
Liabilities in excess of other assets | | | | | | (54,062,258 | ) |
| | | | | | | |
| Total Net Assets—100% | | | | | $ | 847,203,587 | |
| | | | | | | |
| (b) | A portion or all of the security was held on loan. As of December 31, 2007, the market value of securities loaned was $61,579,256 and the collateral received consisted of cash in the amount of $56,520,043 and non cash collateral with a value of $6,557,829. The cash collateral is invested in a money market fund managed by an affiliate of the custodian. The non cash collateral received consists primarily of government securities and bank letters of credit, and are held for the benefit of the Portfolio at the Portfolio’s custodian. |
| (c) | Represents investment of cash collateral received from securities lending transactions. |
| (d) | The aggregate cost of investments for federal income tax purposes as of December 31, 2007 was $887,945,647 and the composition of unrealized appreciation and depreciation of investment securities was $58,903,941 and $(45,583,743), respectively. |
*See accompanying notes to financial statements.
MSF-6
Metropolitan Series Fund, Inc.
FI Value Leaders Portfolio
Statement of Assets & Liabilities
December 31, 2007
| | | | | | |
Assets | | | | | | |
Investments at value (a) (c) | | | | | $ | 901,265,845 |
Cash | | | | | | 764 |
Foreign cash at value (b) | | | | | | 57 |
Receivable for: | | | | | | |
Securities sold | | | | | | 6,980,791 |
Fund shares sold | | | | | | 162,222 |
Accrued interest and dividends | | | | | | 1,498,461 |
Foreign taxes | | | | | | 3,646 |
| | | | | | |
Total Assets | | | | | | 909,911,786 |
Liabilities | | | | | | |
Payable for: | | | | | | |
Securities purchased | | $ | 4,611,871 | | | |
Fund shares redeemed | | | 996,760 | | | |
Collateral for securities loaned | | | 56,520,043 | | | |
Accrued expenses: | | | | | | |
Management fees | | | 465,681 | | | |
Service and distribution fees | | | 46,049 | | | |
Deferred directors’ fees | | | 21,472 | | | |
Other expenses | | | 46,323 | | | |
| | | | | | |
Total Liabilities | | | | | | 62,708,199 |
| | | | | | |
Net Assets | | | | | $ | 847,203,587 |
| | | | | | |
Net assets consists of: | | | | | | |
Capital paid in | | | | | $ | 752,809,326 |
Undistributed net investment income | | | | | | 12,206,109 |
Accumulated net realized gains | | | | | | 57,216,255 |
Unrealized appreciation on investments and foreign currency | | | | | | 24,971,897 |
| | | | | | |
Net Assets | | | | | $ | 847,203,587 |
| | | | | | |
| Computation of offering price: | | | | | | |
Class A | | | | | | |
Net asset value and redemption price per share ($447,662,623 divided by 2,282,056 shares outstanding) | | | | | $ | 196.17 |
| | | | | | |
Class B | | | | | | |
Net asset value and redemption price per share ($75,733,524 divided by 387,654 shares outstanding) | | | | | $ | 195.36 |
| | | | | | |
Class D | | | | | | |
Net asset value and redemption price per share ($272,190,352 divided by 1,390,304 shares outstanding) | | | | | $ | 195.78 |
| | | | | | |
Class E | | | | | | |
Net asset value and redemption price per share ($51,617,088 divided by 264,037 shares outstanding) | | | | | $ | 195.49 |
| | | | | | |
(a) Identified cost of investments | | | | | $ | 876,294,239 |
| | | | | | |
(b) Identified cost of foreign cash | | | | | $ | 58 |
| | | | | | |
| (c) | Includes cash collateral for securities loaned of $56,520,043. |
Statement of Operations
For the Year Ended December 31, 2007
| | | | | | | | |
Investment Income | | | | | | | | |
Dividends | | | | | | $ | 19,151,095 | (a) |
Interest | | | | | | | 210,700 | (b) |
| | | | | | | | |
| | | | | | | 19,361,795 | |
Expenses | | | | | | | | |
Management fees | | $ | 5,931,664 | | | | | |
Service and distribution fees—Class B | | | 183,356 | | | | | |
Service and distribution fees—Class D | | | 314,616 | | | | | |
Service and distribution fees—Class E | | | 86,876 | | | | | |
Directors’ fees and expenses | | | 24,535 | | | | | |
Custodian | | | 89,713 | | | | | |
Audit and tax services | | | 31,738 | | | | | |
Legal | | | 10,105 | | | | | |
Printing | | | 458,295 | | | | | |
Insurance | | | 10,729 | | | | | |
Miscellaneous | | | 19,589 | | | | | |
| | | | | | | | |
Total expenses | | | | | | | 7,161,216 | |
| | | | | | | | |
Net Investment Income | | | | | | | 12,200,579 | |
| | | | | | | | |
Realized and Unrealized Gain (Loss) | | | | | | | | |
| Realized gain on: | | | | | | | | |
Investments—net | | | 62,214,401 | | | | | |
Foreign currency transactions—net | | | 2,526 | | | | 62,216,927 | |
| | | | | | | | |
| Change in unrealized depreciation on: | | | | | | | | |
Investments—net | | | (33,125,706 | ) | | | | |
Foreign currency transactions—net | | | (4,426 | ) | | | (33,130,132 | ) |
| | | | | | | | |
Net gain | | | | | | | 29,086,795 | |
| | | | | | | | |
Net Increase in Net Assets From Operations | | | | | | $ | 41,287,374 | |
| | | | | | | | |
| (a) | Net of foreign taxes of $2,883. |
| (b) | Includes net income on securities loaned of $75,571. |
See accompanying notes to financial statements.
MSF-7
Metropolitan Series Fund, Inc.
FI Value Leaders Portfolio
Statements of Changes in Net Assets
| | | | | | | | |
| | | Year ended
December 31,
2007 | | | Year ended
December 31,
2006 | |
From Operations | | | | | | | | |
Net investment income | | $ | 12,200,579 | | | $ | 10,064,837 | |
Net realized gain | | | 62,216,927 | | | | 110,898,470 | |
Unrealized depreciation | | | (33,130,132 | ) | | | (39,521,796 | ) |
| | | | | | | | |
Increase in net assets from operations | | | 41,287,374 | | | | 81,441,511 | |
| | | | | | | | |
From Distributions to Shareholders | | | | | | | | |
Net investment income | | | | | | | | |
Class A | | | (4,672,405 | ) | | | (5,909,431 | ) |
Class B | | | (503,782 | ) | | | (334,265 | ) |
Class D | | | (2,754,011 | ) | | | 0 | |
Class E | | | (460,718 | ) | | | (526,931 | ) |
| | | | | | | | |
| | | (8,390,916 | ) | | | (6,770,627 | ) |
| | | | | | | | |
Net realized gain | | | | | | | | |
Class A | | | (44,234,373 | ) | | | (13,648,284 | ) |
Class B | | | (6,426,938 | ) | | | (1,065,905 | ) |
Class D | | | (29,815,958 | ) | | | 0 | |
Class E | | | (5,232,496 | ) | | | (1,464,953 | ) |
| | | | | | | | |
| | | (85,709,765 | ) | | | (16,179,142 | ) |
| | | | | | | | |
Total distributions | | | (94,100,681 | ) | | | (22,949,769 | ) |
| | | | | | | | |
Increase (decrease) in net assets from capital share transactions | | | (69,648,099 | ) | | | 303,448,386 | |
| | | | | | | | |
Total increase (decrease) in net assets | | | (122,461,406 | ) | | | 361,940,128 | |
| | |
Net Assets | | | | | | | | |
Beginning of the period | | | 969,664,993 | | | | 607,724,865 | |
| | | | | | | | |
End of the period | | $ | 847,203,587 | | | $ | 969,664,993 | |
| | | | | | | | |
Undistributed Net Investment Income | | | | | | | | |
End of the period | | $ | 12,206,109 | | | $ | 8,320,521 | |
| | | | | | | | |
Other Information:
Capital Shares
Transactions in capital shares were as follows:
| | | | | | | | | | | | | | |
| | | Year ended
December 31, 2007 | | | Year ended
December 31, 2006 | |
| | | Shares | | | $ | | | Shares | | | $ | |
Class A | | | | | | | | | | | | | | |
Sales | | 185,630 | | | $ | 37,252,583 | | | 152,490 | | | $ | 30,299,248 | |
Reinvestments | | 242,689 | | | | 48,906,778 | | | 97,980 | | | | 19,557,715 | |
Redemptions | | (567,453 | ) | | | (116,169,360 | ) | | (593,592 | ) | | | (117,892,650 | ) |
| | | | | | | | | | | | | | |
Net decrease | | (139,134 | ) | | $ | (30,009,999 | ) | | (343,122 | ) | | $ | (68,035,687 | ) |
| | | | | | | | | | | | | | |
Class B | | | | | | | | | | | | | | |
Sales | | 116,244 | | | $ | 23,663,095 | | | 219,335 | | | $ | 43,372,515 | |
Reinvestments | | 34,474 | | | | 6,930,720 | | | 7,029 | | | | 1,400,170 | |
Redemptions | | (85,250 | ) | | | (17,333,521 | ) | | (45,346 | ) | | | (8,961,298 | ) |
| | | | | | | | | | | | | | |
Net increase | | 65,468 | | | $ | 13,260,294 | | | 181,018 | | | $ | 35,811,387 | |
| | | | | | | | | | | | | | |
Class D | | | | | | | | | | | | | | |
Sales | | 85,700 | | | $ | 17,391,469 | | | 183,771 | | | $ | 36,605,906 | |
Shares issued through acquisition | | 0 | | | | 0 | | | 1,873,171 | | | | 375,664,416 | |
Reinvestments | | 161,830 | | | | 32,569,969 | | | 0 | | | | 0 | |
Redemptions | | (480,052 | ) | | | (96,968,365 | ) | | (434,116 | ) | | | (86,477,360 | ) |
| | | | | | | | | | | | | | |
Net increase (decrease) | | (232,522 | ) | | $ | (47,006,927 | ) | | 1,622,826 | | | $ | 325,792,962 | |
| | | | | | | | | | | | | | |
Class E | | | | | | | | | | | | | | |
Sales | | 53,198 | | | $ | 10,867,925 | | | 145,593 | | | $ | 28,869,970 | |
Reinvestments | | 28,319 | | | | 5,693,214 | | | 10,001 | | | | 1,991,884 | |
Redemptions | | (110,393 | ) | | | (22,452,606 | ) | | (106,207 | ) | | | (20,982,130 | ) |
| | | | | | | | | | | | | | |
Net increase (decrease) | | (28,876 | ) | | $ | (5,891,467 | ) | | 49,387 | | | $ | 9,879,724 | |
| | | | | | | | | | | | | | |
Increase (decrease) derived from capital share transactions | | | | | $ | (69,648,099 | ) | | | | | $ | 303,448,386 | |
| | | | | | | | | | | | | | |
See accompanying notes to financial statements.
MSF-8
Metropolitan Series Fund, Inc.
FI Value Leaders Portfolio
Financial Highlights
| | | | | | | | | | | | | | | | | | | | |
| | | Class A | |
| | | Year ended December 31, | |
| | | 2007 | | | 2006 | | | 2005 | | | 2004 | | | 2003 | |
Net Asset Value, Beginning of Period | | $ | 208.36 | | | $ | 193.08 | | | $ | 176.54 | | | $ | 157.24 | | | $ | 124.89 | |
| | | | | | | | | | | | | | | | | | | | |
Income From Investment Operations | | | | | | | | | | | | | | | | | | | | |
Net investment income | | | 2.81 | (a) | | | 2.58 | | | | 1.92 | | | | 2.21 | | | | 2.13 | |
Net realized and unrealized gain on investments | | | 6.52 | | | | 20.14 | | | | 16.67 | | | | 19.15 | | | | 31.23 | |
| | | | | | | | | | | | | | | | | | | | |
Total from investment operations | | | 9.33 | | | | 22.72 | | | | 18.59 | | | | 21.36 | | | | 33.36 | |
| | | | | | | | | | | | | | | | | | | | |
Less Distributions | | | | | | | | | | | | | | | | | | | | |
Distributions from net investment income | | | (2.06 | ) | | | (2.25 | ) | | | (2.05 | ) | | | (2.06 | ) | | | (1.01 | ) |
Distributions from net realized capital gains | | | (19.46 | ) | | | (5.19 | ) | | | 0.00 | | | | 0.00 | | | | 0.00 | |
| | | | | | | | | | | | | | | | | | | | |
Total distributions | | | (21.52 | ) | | | (7.44 | ) | | | (2.05 | ) | | | (2.06 | ) | | | (1.01 | ) |
| | | | | | | | | | | | | | | | | | | | |
Net Asset Value, End of Period | | $ | 196.17 | | | $ | 208.36 | | | $ | 193.08 | | | $ | 176.54 | | | $ | 157.24 | |
| | | | | | | | | | | | | | | | | | | | |
Total Return (%) | | | 4.2 | | | | 11.9 | | | | 10.7 | | | | 13.7 | | | | 26.9 | |
Ratio of operating expenses to average net assets before expense reductions (%) | | | 0.71 | | | | 0.72 | | | | 0.73 | | | | 0.74 | | | | 0.74 | |
Ratio of operating expenses to average net assets after expense reductions (%) (b) | | | N/A | | | | 0.71 | | | | 0.69 | | | | 0.72 | | | | N/A | |
Ratio of net investment income to average net assets (%) | | | 1.38 | | | | 1.18 | | | | 0.92 | | | | 1.23 | | | | 1.49 | |
Portfolio turnover rate (%) | | | 145 | | | | 213 | | | | 94 | | | | 161 | | | | 53 | |
Net assets, end of period (000) | | $ | 447,663 | | | $ | 504,489 | | | $ | 533,729 | | | $ | 552,323 | | | $ | 563,979 | |
| |
| | | Class B | |
| | | Year ended December 31, | |
| | | 2007 | | | 2006 | | | 2005 | | | 2004 | | | 2003 | |
Net Asset Value, Beginning of Period | | $ | 207.58 | | | $ | 192.26 | | | $ | 175.91 | | | $ | 156.72 | | | $ | 124.47 | |
| | | | | | | | | | | | | | | | | | | | |
Income From Investment Operations | | | | | | | | | | | | | | | | | | | | |
Net investment income | | | 2.30 | (a) | | | 2.10 | | | | 1.26 | | | | 1.88 | | | | 1.22 | |
Net realized and unrealized gain on investments | | | 6.47 | | | | 20.04 | | | | 16.86 | | | | 19.12 | | | | 31.95 | |
| | | | | | | | | | | | | | | | | | | | |
Total from investment operations | | | 8.77 | | | | 22.14 | | | | 18.12 | | | | 21.00 | | | | 33.17 | |
| | | | | | | | | | | | | | | | | | | | |
Less Distributions | | | | | | | | | | | | | | | | | | | | |
Distributions from net investment income | | | (1.53 | ) | | | (1.63 | ) | | | (1.77 | ) | | | (1.81 | ) | | | (0.92 | ) |
Distributions from net realized capital gains | | | (19.46 | ) | | | (5.19 | ) | | | 0.00 | | | | 0.00 | | | | 0.00 | |
| | | | | | | | | | | | | | | | | | | | |
Total distributions | | | (20.99 | ) | | | (6.82 | ) | | | (1.77 | ) | | | (1.81 | ) | | | (0.92 | ) |
| | | | | | | | | | | | | | | | | | | | |
Net Asset Value, End of Period | | $ | 195.36 | | | $ | 207.58 | | | $ | 192.26 | | | $ | 175.91 | | | $ | 156.72 | |
| | | | | | | | | | | | | | | | | | | | |
Total Return (%) | | | 3.9 | | | | 11.7 | | | | 10.4 | | | | 13.5 | | | | 26.9 | |
Ratio of operating expenses to average net assets before expense reductions (%) | | | 0.96 | | | | 0.97 | | | | 0.98 | | | | 0.99 | | | | 0.99 | |
Ratio of operating expenses to average net assets after expense reductions (%) (b) | | | N/A | | | | 0.96 | | | | 0.94 | | | | 0.97 | | | | N/A | |
Ratio of net investment income to average net assets (%) | | | 1.14 | | | | 1.00 | | | | 0.70 | | | | 1.41 | | | | 1.15 | |
Portfolio turnover rate (%) | | | 145 | | | | 213 | | | | 94 | | | | 161 | | | | 53 | |
Net assets, end of period (000) | | $ | 75,734 | | | $ | 66,879 | | | $ | 27,141 | | | $ | 5,311 | | | $ | 128 | |
| (a) | Per share amount is based on average shares outstanding during the period. |
| (b) | The Portfolio has entered into arrangements with certain brokers who paid a portion of the Portfolio’s expenses. |
| (c) | Commencement of operations was May 2, 2006 for Class D. |
| (d) | Periods less than one year are not computed on an annualized basis. |
| (e) | Computed on an annualized basis. |
See accompanying notes to financial statements.
MSF-9
Metropolitan Series Fund, Inc.
FI Value Leaders Portfolio
Financial Highlights
| | | | | | | | |
| | | Class D | |
| | | Year ended December 31, | |
| | | 2007 | | | 2006(c) | |
Net Asset Value, Beginning of Period | | $ | 207.95 | | | $ | 200.55 | |
| | | | | | | | |
Income From Investment Operations | | | | | | | | |
Net investment income | | | 2.60 | (a) | | | 1.80 | |
Net realized and unrealized gain on investments | | | 6.49 | | | | 5.60 | |
| | | | | | | | |
Total from investment operations | | | 9.09 | | | | 7.40 | |
| | | | | | | | |
Less Distributions | | | | | | | | |
Distributions from net investment income | | | (1.80 | ) | | | 0.00 | |
Distributions from net realized capital gains | | | (19.46 | ) | | | 0.00 | |
| | | | | | | | |
Total distributions | | | (21.26 | ) | | | 0.00 | |
| | | | | | | | |
Net Asset Value, End of Period | | $ | 195.78 | | | $ | 207.95 | |
| | | | | | | | |
Total Return (%) | | | 4.1 | | | | 3.7 | (d) |
Ratio of operating expenses to average net assets before expense reductions (%) | | | 0.81 | | | | 0.82 | (e) |
Ratio of operating expenses to average net assets after expense reductions (%) (b) | | | N/A | | | | 0.81 | (e) |
Ratio of net investment income to average net assets (%) | | | 1.27 | | | | 1.25 | (e) |
Portfolio turnover rate (%) | | | 145 | | | | 213 | |
Net assets, end of period (000) | | $ | 272,190 | | | $ | 337,462 | |
| | | | | | | | | | | | | | | | | | | | |
| | | Class E | |
| | | Year ended December 31, | |
| | | 2007 | | | 2006 | | | 2005 | | | 2004 | | | 2003 | |
Net Asset Value, Beginning of Period | | $ | 207.69 | | | $ | 192.40 | | | $ | 175.93 | | | $ | 156.83 | | | $ | 124.66 | |
| | | | | | | | | | | | | | | | | | | | |
Income From Investment Operations | | | | | | | | | | | | | | | | | | | | |
Net investment income | | | 2.49 | (a) | | | 2.17 | | | | 1.29 | | | | 1.58 | | | | 1.41 | |
Net realized and unrealized gain on investments | | | 6.48 | | | | 20.18 | | | | 16.98 | | | | 19.48 | | | | 31.68 | |
| | | | | | | | | | | | | | | | | | | | |
Total from investment operations | | | 8.97 | | | | 22.35 | | | | 18.27 | | | | 21.06 | | | | 33.09 | |
| | | | | | | | | | | | | | | | | | | | |
Less Distributions | | | | | | | | | | | | | | | | | | | | |
Distributions from net investment income | | | (1.71 | ) | | | (1.87 | ) | | | (1.80 | ) | | | (1.96 | ) | | | (0.92 | ) |
Distributions from net realized capital gains | | | (19.46 | ) | | | (5.19 | ) | | | 0.00 | | | | 0.00 | | | | 0.00 | |
| | | | | | | | | | | | | | | | | | | | |
Total distributions | | | (21.17 | ) | | | (7.06 | ) | | | (1.80 | ) | | | (1.96 | ) | | | (0.92 | ) |
| | | | | | | | | | | | | | | | | | | | |
Net Asset Value, End of Period | | $ | 195.49 | | | $ | 207.69 | | | $ | 192.40 | | | $ | 175.93 | | | $ | 156.83 | |
| | | | | | | | | | | | | | | | | | | | |
Total Return (%) | | | 4.0 | | | | 11.8 | | | | 10.5 | | | | 13.6 | | | | 26.7 | |
Ratio of operating expenses to average net assets before expense reductions (%) | | | 0.86 | | | | 0.87 | | | | 0.88 | | | | 0.89 | | | | 0.89 | |
Ratio of operating expenses to average net assets after expense reductions (%) (b) | | | N/A | | | | 0.86 | | | | 0.84 | | | | 0.87 | | | | N/A | |
Ratio of net investment income to average net assets (%) | | | 1.22 | | | | 1.05 | | | | 0.78 | | | | 1.12 | | | | 1.31 | |
Portfolio turnover rate (%) | | | 145 | | | | 213 | | | | 94 | | | | 161 | | | | 53 | |
Net assets, end of period (000) | | $ | 51,617 | | | $ | 60,835 | | | $ | 46,855 | | | $ | 31,192 | | | $ | 18,891 | |
| (a) | Per share amount is based on average shares outstanding during the period. |
| (b) | The Portfolio has entered into arrangements with certain brokers who paid a portion of the Portfolio’s expenses. |
| (c) | Commencement of operations was May 2, 2006 for Class D. |
| (d) | Periods less than one year are not computed on an annualized basis. |
| (e) | Computed on an annualized basis. |
See accompanying notes to financial statements.
MSF-10
Metropolitan Series Fund, Inc.
FI Value Leaders Portfolio
Notes to Financial Statements—December 31, 2007
Metropolitan Series Fund, Inc. (the “Fund”) is organized as a corporation under the laws of Maryland pursuant to Articles of Incorporation filed on November 23, 1982, as amended, and registered under the Investment Company Act of 1940, as amended (the “1940 Act”), as an open-end investment company. The Fund is a “series” type of mutual fund, which issues separate series of stock. Each series represents an interest in a separate portfolio of Fund investments. The FI Value Leaders Portfolio (the “Portfolio”) is a diversified series of the Fund. Shares in the Fund are not offered directly to the general public and are currently available only to separate accounts established by Metropolitan Life Insurance Company (“MetLife”), New England Life Insurance Company, General American Life Insurance Company (“General American”), The MetLife Investors Group of Insurance Companies, MetLife Insurance Company of Connecticut and other affiliated insurance companies (collectively, the “Insurance Companies”), as an investment vehicle for variable life insurance, group annuity or variable annuity products, although the Portfolio is not available to all such separate accounts. The Portfolio’s shares may be divided into different classes. Currently, the classes being offered by the Portfolio are named Class A, Class B, Class D and Class E. The classes of the Portfolio’s shares are identical, except that certain additional charges (Rule 12b-1 fees) are made against Class B, Class D and Class E shares. Investment income, realized and unrealized capital gains and losses, the common expenses of the Portfolio and certain Portfolio-level expense reductions, if any, are allocated on a pro rata basis to each class based on the relative net assets of each class to the total net assets of the Portfolio.
| 2. | SIGNIFICANT ACCOUNTING POLICIES: |
The preparation of financial statements in conformity with accounting principles generally accepted in the United States of America (“GAAP”) requires management to make estimates and assumptions that affect the reported amounts of assets and liabilities and disclosure of contingent assets and liabilities as of the date of the financial statements and the reported amounts of income and expenses during the reporting period. Actual results could differ from those estimates.
The following is a summary of significant accounting policies consistently followed by the Portfolio in the preparation of its financial statements. The policies are in conformity with GAAP.
Investment Valuation:
Debt securities (other than short term obligations with a remaining maturity of sixty days or less) are valued by independent pricing services selected by the relevant subadviser pursuant to authorization of the Board of Directors of the Fund (the “Board” or “Directors”). Short term obligations with a remaining maturity of sixty days or less are valued at amortized cost which approximates fair market value.
Equity securities traded on a national securities exchange or exchanges are valued at their last sale price on the principal trading market. Equity securities traded on the NASDAQ National Market System are valued at the NASDAQ Official Closing Price (the “NOCP”). The NOCP is the last sale price if it falls between the spread of the last reported bid and asked prices. If the last reported bid and asked prices are above the last reported sale price, the NOCP will be the last reported bid price. If the last reported bid and asked prices are below the last reported sale price, the NOCP will be the last reported asked price. Equity securities traded on a national securities exchange or exchanges or on the NASDAQ National Market System for which there is no reported sale during the day are valued at the last reported bid price. A security that is listed or traded on more than one exchange is valued at the quotation on the exchange determined to be the primary market for that security by the Board or its delegates. If no closing price is available, then such securities are valued by using the last reported bid price. Equity securities traded over-the-counter are valued at the last reported sales price.
If no current market value quotation is readily available or reliable for a portfolio security, fair value will be determined in accordance with procedures established by and under the general supervision of the Board. When the Portfolio uses fair value pricing, it may take into account any factors it deems appropriate. The value of securities used by the Portfolio to calculate its net asset value may differ from quoted or published prices for the same securities. Fair value pricing involves subjective judgments and the fair value determined for a security may be materially different than the value that could be realized upon the sale of that security.
The Portfolio expects to use fair value pricing for securities primarily traded on U.S. exchanges only under very limited circumstances. For example, the Portfolio may use fair value pricing if the exchange on which a security is traded closes early or trading in the security is suspended.
MSF-11
Metropolitan Series Fund, Inc.
FI Value Leaders Portfolio
Notes to Financial Statements—December 31, 2007—(Continued)
Securities traded primarily on an exchange outside of the United States which closes before the close of the New York Stock Exchange will be valued at the last sales price on that non-U.S. exchange. Securities traded primarily on an exchange outside of the United States for which there is no reported sale during the day are valued at the mean between the last reported bid and asked prices. However, because most foreign markets close well before the Portfolio values its securities (typically at 4 p.m. Eastern Time), the earlier close of these foreign markets gives rise to the possibility that significant events, including broad market moves, may have occurred after these foreign markets close but before the Portfolio values its securities. To account for this, the Portfolio may frequently value many of its foreign equity securities using fair value prices based on third party vendor modeling tools.
Forward foreign currency exchange contracts are valued based on the mean between closing bid and asked prices of the forward currency contract rates in the London foreign exchange markets on a daily basis as provided by a reliable bank or dealer.
Options, whether on securities, indices, futures contracts, or otherwise, are valued at the last sales price available as of the close of business on the day of valuation or, if there is no such sale price available, at the mean between the bid and asked prices. Options on currencies are valued at the spot price each day.
The value of futures contracts will be the sum of the margin deposit plus or minus the difference between the value of the futures contract on each day the net asset value is calculated and the value on the date the futures contract originated, value being that established on a recognized commodity exchange, or by reference to other customary sources, with gain or loss being realized when the futures contract closes or expires.
Subject to the Board’s oversight, the Board has delegated day-to-day responsibility for valuing Portfolio assets to MetLife Advisers, LLC (“MetLife Advisers” or the “Adviser”) who values such assets as described above and operates under procedures approved by the Board.
Investment Transactions and Related Investment Income:
Portfolio security transactions are recorded on the trade date. Dividend income is recorded on the ex-dividend date or, for certain foreign securities, when notified. Interest income, which includes amortization of premium and accretion of discount on debt securities, is recorded on the accrual basis. Realized gains and losses on investments and unrealized appreciation and depreciation are determined on the identified cost basis, which is the same basis used for federal income tax purposes.
Repurchase Agreements:
The Portfolio, through the custodian or a subcustodian, receives delivery of the underlying securities collateralizing repurchase agreements. The Portfolio requires the custodian to take possession, to have legally segregated in the Federal Reserve Book Entry System, or to have segregated within the custodian’s vault, all securities held as collateral for repurchase agreements. It is the Portfolio’s policy that the market value of the collateral be at least equal to 100% of the repurchase price in the case of a repurchase agreement of one-day duration and 102% on all other repurchase agreements. The Portfolio’s subadviser is responsible for determining that the value of the collateral is at all times at least equal to the repurchase price. In connection with transactions in repurchase agreements, if the seller defaults and the value of the collateral declines or if the seller enters an insolvency proceeding, realization of the collateral by the Portfolio may be delayed, limited or wholly denied.
Foreign Currency Translation:
The books and records of the Portfolio are maintained in U.S. dollars. The values of securities, currencies and other assets and liabilities denominated in currencies other than U.S. dollars are translated into U.S. dollars based upon foreign exchange rates prevailing at the end of the period. Purchases and sales of investment securities, income and expenses are translated on the respective dates of such transactions. Since the values of investment securities are presented at the foreign exchange rates prevailing at the end of the period, it is not practical to isolate that portion of the results of operations arising from changes in exchange rates from that portion of the results of operations reflecting fluctuations arising from changes in market prices of the investment securities. Such fluctuations are included in the net realized and unrealized gain or loss on investments.
Net realized foreign exchange gains or losses arise from sales of foreign currency, currency gains or losses realized between the trade and settlement dates on securities transactions, and the difference between the amounts of dividends, interest, and foreign withholding taxes recorded by the Portfolio and the U.S. dollar equivalent of the amounts actually received or paid by the Portfolio. Net unrealized foreign exchange gains and losses arise from changes in the value of assets and liabilities, other than investment securities, resulting from changes in the exchange rate.
MSF-12
Metropolitan Series Fund, Inc.
FI Value Leaders Portfolio
Notes to Financial Statements—December 31, 2007—(Continued)
Forward Foreign Currency Exchange Contracts:
The Portfolio may enter into forward foreign currency exchange contracts primarily to hedge against foreign currency exchange rate risks on its non-U.S. dollar denominated investment securities. When entering into a forward currency contract, the Portfolio agrees to receive or deliver a fixed quantity of foreign currency for an agreed-upon price on an agreed future date. These contracts are valued daily and the Portfolio’s net equity therein, representing unrealized gain or loss on the contracts as measured by the difference between the foreign exchange rates at the dates of entry into the contracts and the forward rates at the settlement date, is included in the Statement of Assets and Liabilities. Realized and unrealized gains and losses are included in the Statement of Operations. These instruments involve market and/or credit risk in excess of the amount recognized in the Statement of Assets and Liabilities. Risks arise from the possible inability of counterparties to meet the terms of their contracts and from movement in currency and securities values and interest rates.
Futures Contracts:
The Portfolio may buy and sell futures contracts (on recognized exchanges) as a hedge or to enhance return. Futures contracts are agreements to buy or sell a security, or deliver a final cash settlement price in connection with an index, interest rate, currency, or other contracts not calling for physical delivery, for a set price in the future. The Portfolio must post an amount equal to a portion of the total market value of the futures contract as futures variation margin, which is returned when the Portfolio’s obligations under the contract have been satisfied. From time to time thereafter, the Portfolio may have to post variation margin to maintain this amount as the market value of the contract fluctuates. Risks of entering into futures contracts (and related options) include the possibility that there may be an illiquid market and that a change in the value of the contract or option may not correlate with changes in the value of the underlying securities.
Options:
The Portfolio may use options to hedge against changes in values of securities the Portfolio owns or expects to purchase. Writing puts or buying calls tends to increase the Portfolio’s exposure to the underlying instrument and writing calls or buying puts tends to decrease the Portfolio’s exposure to the underlying instrument, and can be used to hedge other Portfolio investments. For options purchased to hedge the Portfolio’s investments, the potential risk to the Portfolio is that the change in value of options contracts may not correspond to the change in value of the hedged instruments. In addition, losses may arise from changes in the value of the underlying instruments, if there is an illiquid secondary market, or if the counterparty is unable to perform. The maximum loss for purchased options is limited to the premium initially paid for the option. For options written by the Portfolio, the maximum loss is not limited to the premium initially received for the option.
The main risk associated with purchasing an option is that the option expires without being exercised. In this case, the option expires worthless and the premium paid for the option is considered the loss. The risk associated with writing a call option is that the Portfolio may forgo the opportunity for a profit if the market value of the underlying position increases and the option is exercised. The risk in writing a put option is that the Portfolio may incur a loss if the market value of the underlying position decreases and the option is exercised. In addition, the Portfolio risks not being able to enter into a closing transaction for the written option as the result of an illiquid market.
“When-Issued” Securities:
Purchasing securities “when-issued” is a forward commitment by the Portfolio to buy a security. The estimated amount of the Portfolio’s payment obligation and the security’s interest rate are determined when the commitment is made, even though no interest accrues until the security is issued, which is generally 15 to 120 days later. The Portfolio will segregate liquid assets with its custodian sufficient at all times to satisfy these commitments. If the value of the security is less when delivered than when the commitment was made, the Portfolio will suffer a loss.
Federal Income Taxes:
It is the Portfolio’s policy to comply with the requirements of the Internal Revenue Code of 1986, as amended, and regulations thereunder, applicable to regulated investment companies and to distribute all of its taxable income to shareholders. Therefore, no federal income tax provision is required.
As of December 31, 2007, the Portfolio had no capital loss carryovers.
MSF-13
Metropolitan Series Fund, Inc.
FI Value Leaders Portfolio
Notes to Financial Statements—December 31, 2007—(Continued)
The tax character of distributions paid for the periods ended December 31, 2007 and 2006 was as follows:
| | | | | | | | | | | | | | | | | | | | | | |
| Ordinary Income | | Long Term Gain | | Return of Capital | | Total |
| 2007 | | 2006 | | 2007 | | 2006 | | 2007 | | 2006 | | 2007 | | 2006 |
| $ | 41,560,220 | | $ | 6,770,627 | | $ | 52,540,461 | | $ | 16,179,142 | | $ | — | | $ | — | | $ | 94,100,681 | | $ | 22,949,769 |
As of December 31, 2007, the components of distributable earnings (accumulated losses) on a federal income tax basis were as follows:
| | | | | | | | | | | | |
Undistributed
Ordinary
Income | | Undistributed
Long Term
Gain | | Unrealized
Appreciation | | Loss
Carryforwards | | Total |
| $53,415,968 | | $ | 27,683,566 | | $ | 13,320,490 | | $ | — | | $ | 94,420,024 |
Dividends and Distributions to Shareholders:
The Portfolio records dividends and distributions on the ex-dividend date. Net realized gains from security transactions (if any) are generally distributed annually to shareholders. The timing and characterization of certain income and capital gains distributions are determined in accordance with federal tax regulations that may differ from GAAP. Permanent book and tax basis differences relating to shareholder distributions will result in reclassification between under/over distributed net investment income, accumulated net realized gains/losses and paid in capital.
| 3. | INVESTMENT TRANSACTIONS: |
For the year ended December 31, 2007, purchases and sales of securities (excluding short term investments) for the Portfolio were as follows:
| | | | | | | | | |
| Purchases | | Sales |
| U.S. Government | | Other | | U.S. Government | | Other |
| $0 | | $ | 1,337,889,344 | | $ | 0 | | $ | 1,489,210,758 |
| 4. | INVESTMENT MANAGEMENT FEES AND OTHER TRANSACTIONS WITH AFFILIATES: |
Investment Management Agreement:
MetLife Advisers, LLC (“MetLife Advisers”) is the investment adviser to the Portfolio. The Fund has entered into an investment management agreement with MetLife Advisers with respect to the Portfolio. For providing investment management services to the Portfolio, MetLife Advisers receives monthly compensation at the following annual rates:
| | | | | | |
| | | Management
Fees earned by
MetLife Advisers
for the year ended
December 31, 2007 | | Annual
percentage
rates paid to
MetLife Advisers | | Based on Portfolios
average daily net asset levels |
| | $5,931,664 | | 0.700% | | Of the first $200 million |
| | | | 0.650% | | Of the next $300 million |
| | | | 0.600% | | Of the next $1.5 billion |
| | | | 0.550% | | On amounts in excess of $2 billion |
Certain officers and directors of the Fund may also be officers of MetLife Advisers; however, such officers and directors receive no compensation from the Fund.
MetLife Advisers has entered into an investment subadvisory agreement with respect to the Portfolio. Fidelity Research & Management Company (“FMR”) was compensated by MetLife Advisers to provide subadvisory services for the FI Value Leaders Portfolio in 2007.
Service and Distribution Fees:
The Fund has adopted a Distribution and Service Plan under Rule 12b-1 of the 1940 Act for the Portfolio’s Class B, D and E shares. Under the Distribution and Service Plan, the Class B, D and E shares of the Portfolio pay a fee to compensate the Insurance Companies (or their affiliates) and other broker-dealers and financial intermediaries involved in the offer and sale of Portfolio shares for promoting or selling and servicing, the Class B, D and E shares. The fees under the Distribution and Service Plan for each applicable class of the Portfolio’s shares are calculated as a percentage of the Portfolio’s average daily net assets
MSF-14
Metropolitan Series Fund, Inc.
FI Value Leaders Portfolio
Notes to Financial Statements—December 31, 2007—(Continued)
that are attributable to that Class. Currently, the fee is 0.25% per year for Class B shares, 0.10% per year for Class D shares and 0.15% per year for Class E shares. Amounts paid by the Portfolio for the year ended December 31, 2007 are shown as Service and Distribution fees in the Statement of Operations.
The Fund has entered into a securities lending arrangement with the Fund’s custodian, State Street Bank and Trust Company (the “custodian”). Under the agreement, the custodian is authorized to loan securities on the Portfolios’ behalf. In exchange, the Portfolio receives either cash or securities as collateral against the loaned securities. The Portfolio receives collateral at least equal to 102% of the market value of the loaned securities (105% for foreign securities), at each loan’s inception. Collateral must be maintained at least at 100% of the market value of the loaned securities for the duration of the loan. The cash collateral is invested in the Navigator Securities Lending Prime Portfolio, an affiliate of the custodian, which invests in a variety of high quality U.S. dollar-denominated instruments. If the market value of the collateral at the close of trading on a business day is less than 100% of the market value of the loaned securities at the close of trading on that day, the borrower shall be required to deliver, by the close of business on the following business day, an additional amount of collateral, equal to at least 100% of the market value of all the loaned securities as of such preceding day. The Portfolio receives 80% of the annual net income from securities lending transactions, which is included in interest income of the Portfolio. The remaining 20% is paid to the custodian as compensation for its securities lending services. The Portfolio bears the risk of any deficiency in the amount of collateral available for return to a borrower due to a loss in an approved investment. Any outstanding loans by the Portfolio at December 31, 2007 are footnoted in the Schedule of Investments.
As previously reported, in May 2004, General American received a Wells Notice stating that the SEC staff was considering recommending that the SEC bring a civil action alleging violations of the U.S. securities laws against General American with respect to market timing and late trading in a limited number of privately-placed variable insurance contracts that were sold through General American. General American responded to the SEC staff and cooperated with the investigation. On August 9, 2007, the SEC announced that it had settled an enforcement action regarding late trading against General American with, among other things, General American agreeing to pay a civil penalty and to comply with certain undertakings. General American consented to the SEC’s order without admitting or denying the findings. MetLife Advisers has also advised the Fund’s Board of Directors that, while certain exceptions to the Fund’s policies have been noted, no situations have been identified that would have a material impact on the financial position of the Fund.
On February 7, 2008 the Board approved a new investment subadvisory agreement (the “Agreement”) with respect to the Portfolio between MetLife Advisers and Pyramis Global Advisors, LLC (“Pyramis”), a wholly-owned subsidiary of the Portfolio’s former subadviser, FMR. The Agreement is not subject to shareholder approval and will become effective April 28, 2008. The Advisory Agreement between the Fund, with respect to the Portfolio, and MetLife Advisers will remain in effect and fees payable thereunder to MetLife Advisers will not change. Under the Agreement, Pyramis will become subadviser to the Portfolio, succeeding FMR, and will become responsible for the day-to-day management of the Portfolio’s investment operations under the oversight of MetLife Advisers and the Board.
| 8. | RECENT ACCOUNTING PRONOUNCEMENTS: |
Effective June 29, 2007, the Fund implemented Financial Accounting Standards Board (“FASB”) Interpretation No. 48, “Accounting for Uncertainty in Income Taxes—an interpretation of FASB Statement No. 109” (“FIN 48”). FIN 48 prescribes the minimum recognition threshold a tax position must meet in connection with accounting for uncertainties in income tax positions taken or expected to be taken by an entity, including investment companies, before being measured and recognized in the financial statements. Management has evaluated the application of FIN 48 to the Fund, and has determined that the adoption of FIN 48 does not have a material impact on the Fund’s financial statements. The Fund files U.S. tax returns. No income tax returns are currently under examination. The statute of limitations on the Fund’s tax returns remains open for the years ended December 31, 2004 through December 31, 2006.
In September 2006, Statement of Financial Accounting Standards No. 157, Fair Value Measurements (SFAS 157) was issued and is effective for fiscal years beginning after November 15, 2007. SFAS 157 defines fair value, establishes a framework for measuring fair value and expands disclosures about fair value measurements. Management is currently evaluating the impact the adoption of SFAS 157 will have on the Portfolio’s financial statement disclosures.
MSF-15
Metropolitan Series Fund, Inc.
FI Value Leaders Portfolio
Report of Independent Registered Public Accounting Firm
To the Shareholders and Board of Directors of the Metropolitan Series Fund, Inc.:
We have audited the accompanying statement of assets and liabilities, including the schedule of investments, of the FI Value Leaders Portfolio, one of the portfolios constituting the Metropolitan Series Fund, Inc. (the “Fund”) as of December 31, 2007, and the related statement of operations for the year then ended, the statements of changes in net assets for each of the two years in the period then ended, and the financial highlights for each of the five years in the period then ended. These financial statements and financial highlights are the responsibility of the Fund’s management. Our responsibility is to express an opinion on these financial statements and financial highlights based on our audits.
We conducted our audits in accordance with the standards of the Public Company Accounting Oversight Board (United States). Those standards require that we plan and perform the audit to obtain reasonable assurance about whether the financial statements and financial highlights are free of material misstatement. The Fund is not required to have, nor were we engaged to perform, an audit of its internal control over financial reporting. Our audits included consideration of internal control over financial reporting as a basis for designing audit procedures that are appropriate in the circumstances, but not for the purpose of expressing an opinion on the effectiveness of the Fund’s internal control over financial reporting. Accordingly, we express no such opinion. An audit also includes examining, on a test basis, evidence supporting the amounts and disclosures in the financial statements, assessing the accounting principles used and significant estimates made by management, as well as evaluating the overall financial statement presentation. Our procedures included confirmation of securities owned as of December 31, 2007, by correspondence with the custodian and brokers; where replies were not received from brokers, we performed other auditing procedures. We believe that our audits provide a reasonable basis for our opinion.
In our opinion, the financial statements and financial highlights referred to above present fairly, in all material respects, the financial position of the FI Value Leaders Portfolio of the Metropolitan Series Fund, Inc. as of December 31, 2007, the results of its operations for the year then ended, the changes in its net assets for each of the two years in the period then ended, and the financial highlights for each of the five years in the period then ended, in conformity with accounting principles generally accepted in the United States of America.
Deloitte & Touche LLP
Boston, Massachusetts
February 21, 2008
MSF-16
Metropolitan Series Fund, Inc.
Directors and Officers
The Fund’s Directors review actions of the Fund’s investment adviser and subadvisers, and decide upon matters of general policy. The Fund’s officers supervise the daily business operations of the Fund. The Board of Directors and the Fund’s officers are listed below. Each Director is responsible for overseeing all 36 Portfolios of the Fund. There is no limit to the term a Director may serve. Directors serve until their resignation, retirement or removal in accordance with the Fund’s organizational documents and policies adopted by the Board from time to time. Officers hold office at the pleasure of the Board or until the election or appointment and the qualification of a successor. The address of the directors and officers is c/o Metropolitan Series Fund, Inc., 501 Boylston Street, Boston, MA 02116.
Interested Directors(1)
Each Director below is an “interested person” (as defined by the 1940 Act) with respect to the Fund in that Ms. Forget is an employee of MetLife and Mr. Typermass is a former employee of MetLife and owns securities issued by MetLife, Inc., the ultimate parent company of MetLife Advisers.
| | | | | | | | |
Name, Address and Age | | Current
position(s)
with Fund | | Position(s)
held since | | Principal occupations
over past five years, including other directorships(2) | | Number of
Portfolios in
Fund Complex
Overseen by
Director(3) |
Elizabeth M. Forget Age: 41 | | Director, Chairman of the Board, President and Chief Executive Officer | | 2006 | | Senior Vice President (since 2007), MetLife, Inc.; President, Met Investors Advisory, LLC (“MIA”); Trustee and President, Met Investors Series Trust (“MIST”); Executive Vice President, MetLife Investors Group, Inc.; President (since 2006), MetLife Advisers. | | 81 |
| | | | |
Arthur G. Typermass Age: 70 | | Director | | 1998 | | Formerly, Senior Vice President and Treasurer, MetLife. | | 37 |
Non-Interested Directors(1)
Each Director below is not an “interested person” (as defined by the 1940 Act) with respect to the Fund (collectively, the “Independent Directors”).
| | | | | | | | |
Name, Address and Age | | Current
position(s)
with Fund | | Position(s)
held since | | Principal occupations
over past five years, including other directorships(2) | | Number of
Portfolios in
Fund Complex
Overseen by
Director(3) |
Steve A. Garban† Age: 70 | | Director | | 1985 | | Formerly, Chief Financial Officer, Senior Vice President Finance and Operations and Treasurer (Emeritus), The Pennsylvania State University. | | 37 |
| | | | |
Linda B. Strumpf Age: 60 | | Director | | 2000 | | Vice President and Chief Investment Officer, Ford Foundation. | | 37 |
| | | | |
Michael S. Scott Morton† Age: 70 | | Director | | 1993 | | Jay W. Forrester Professor of Management (Emeritus) at Sloan School of Management, MIT. | | 37 |
| | | | |
H. Jesse Arnelle Age: 74 | | Director | | 2001 | | Formerly, Counsel, Womble Carlyle Sandrie & Rice; Director, Textron Inc. (global multi-industry company)*; formerly, Director, Gannet Co. Inc. (diversified news and information company)*; formerly, Director, Eastman Chemical Company (global chemical company)*; formerly, Director, Waste Management, Inc.*; formerly, Director, Armstrong Holdings Inc. (parent company of floor and ceiling products business)*; formerly, Director, FPL Group Inc. (public utility holding company)*; Director, URS Corporation (engineering design services firm)*. | | 37 |
| | | | |
Nancy Hawthorne Age: 56 | | Director | | 2003 | | Director, Avid Technologies (computer software company)*; formerly, Chairman of the Board of Avid Technologies; formerly, Board of Advisors, L. Knife & Sons, Inc. (beverage distributor); Chief Executive Officer, Clerestory LLC (corporate financial advisor); formerly, Trustee, New England Zenith Fund (“Zenith Fund”)**; formerly, Chief Executive Officer and Managing Partner, Hawthorne, Krauss and Associates (corporate financial advisor); formerly, Chief Financial Officer and Executive Vice President, Continental Cablevision, subsequently renamed MediaOne (cable television company); formerly, Director, Life F/X, Inc.; formerly, Chairman of the Board, WorldClinic (distance medicine company); formerly, Director, Perini Corporation (construction company)*; formerly, Director, CGU (property and casualty insurance company); formerly, Director, Beacon Power Corporation (energy company )*. | | 37 |
MSF-17
Metropolitan Series Fund, Inc.
Directors and Officers—(Continued)
| | | | | | | | |
Name, Address and Age | | Current
position(s)
with Fund | | Position(s)
held since | | Principal occupations
over past five years, including other directorships(2) | | Number of
Portfolios in
Fund Complex
Overseen by
Director(3) |
John T. Ludes Age: 71 | | Director | | 2003 | | President, LFP Properties (consulting firm); Formerly, Trustee, Zenith Fund**; formerly, Vice Chairman, President and Chief Operating Officer, Fortune Brands/American Brands (global conglomerate); formerly, President and CEO, Acushnet Company (athletic equipment company). | | 37 |
Officers(1)
| | | | | | | | |
Name and address | | Age | | Current
position(s)
with Fund | | Position(s)
held since | | Principal occupations over past five years(2) |
| Jeffrey P. Halperin | | 40 | | Chief Compliance Officer | | 2006 | | Vice President (since 2006), Corporate Ethics and Compliance Department, MetLife, Inc.; Chief Compliance Officer (since 2006), MetLife Advisers, MIA and MIST. |
| | | | |
| John F. Guthrie, Jr. | | 64 | | Senior Vice President | | 2002 | | Manager and Senior Vice President, MetLife Advisers; Vice President, MetLife; Vice President (since 2003), MetLife Group, Inc.; Vice President, NELICO; Vice President (since 2005), MIA; formerly, Senior Vice President, Zenith Fund**. |
| | | | |
| Alan C. Leland | | 55 | | Senior Vice President | | 2005 | | Treasurer and Chief Financial Officer, MetLife Advisers, LLC; Treasurer (since 2005), Met Investors Advisory, LLC; Vice President (since 2004), MIA; Vice President (since 2003), MetLife Group, Inc.; Vice President, MetLife; Senior Vice President, NELICO |
| | | | |
| Peter Duffy | | 52 | | Vice President and Treasurer | | 2000 | | Senior Vice President, MetLife Advisers (since 1998); Second Vice President (since 2003), NELICO; Vice President, MetLife (since 2004); Vice President (since 2004), MetLife Group, Inc.; formerly, Vice President and Treasurer, Zenith Fund**. |
| | | | |
| Thomas M. Lenz | | 49 | | Vice President and Secretary | | 2002 | | General Counsel and Secretary, MetLife Advisers; Assistant General Counsel, MetLife; formerly, Vice President and Secretary, Zenith Fund**. |
| * | Indicates a directorship with a registered investment company or a company subject to the reporting requirements of the Securities Exchange Act of 1934, as amended. |
| ** | The Zenith Fund deregistered with the Securities and Exchange Commission (“SEC”) in 2004. |
| (†) | Served as a trustee, director and/or officer of one or more of the following companies, each of which had a direct or indirect advisory relationship with MetLife Advisers or its affiliates prior to January 31, 2005: State Street Research Financial Trust, State Street Research Income Trust, State Street Research Money Market Trust, State Street Research Institutional Funds, State Street Research Capital Trust, State Street Research Master Investment Trust, State Street Research Equity Trust, State Street Research Securities Trust and State Street Research Exchange Trust (collectively, the “State Street Research Funds”). |
| (1) | Each Director of the Fund also serves as trustee of Metropolitan Series Fund II (“Met Series Fund II”), a registered investment company advised by MetLife Advisers. Each officer of the Fund serves in the same position with Met Series Fund II, which consists of one portfolio. |
| (2) | Previous positions during the past five years with the Fund, MIST, MetLife, MetLife Advisers, MIA, Zenith Fund, NELICO or New England Securities Corporation are omitted if not materially different. |
| (3) | The Fund Complex includes the Fund (36 portfolios), Met Series Fund II (1 portfolio) and MIST (44 portfolios) |
MSF-18
Metropolitan Series Fund, Inc.
FI Value Leaders Portfolio
Board Approval of Advisory and Subadvisory Agreements
The Fund’s Contract Review Committees of the Board of Directors (the “Board”) typically meet in early fall to review the Portfolios’ advisory agreements (the “Advisory Agreements”), subadvisory agreements and sub-subadvisory agreements (collectively, the “Subadvisory Agreements,” and, together with the Advisory Agreements, the “Agreements”) and determine whether to recommend that the full Board approve the continuation of the Agreements for an additional one-year period. (Following the initial approval of an Agreement for a new Portfolio or with a new adviser or subadviser, such annual reviews are not required until 2 years following the execution of such Agreement.) After each Committee has made its recommendations, the full Board, including the Independent Directors, determines whether to approve the continuation of each of the Agreements. In addition, the Board, including the Independent Directors, considers matters bearing on the Agreements at most of its other meetings throughout the year and regularly interviews various individuals at MetLife Advisers responsible for the management of the Portfolios. The Directors also interview selected investment managers and other professionals at the subadvisers at various times throughout the year.
The Directors receive all materials that they or MetLife Advisers, the Fund’s investment adviser, and the subadvisers believe to be reasonably necessary for the Directors to evaluate the Agreements and determine whether to approve the continuation of the Agreements. These materials generally include, among other items, (i) information on the investment performance of the Portfolios and the performance of peer groups of funds and the Portfolios’ performance benchmarks, (ii) information on the Portfolios’ advisory and subadvisory fees and other expenses, including information comparing the Portfolios’ expenses to those of peer groups of funds and information about any applicable expense caps and fee “breakpoints,” (iii) sales and redemption data, (iv) information related to the profitability of the Agreements to MetLife Advisers and the subadvisers, and potential “fall-out” or ancillary benefits that MetLife Advisers, the subadvisers or their affiliates may receive as a result of their relationships with the Fund and (v) information obtained through the subadvisers’ responses to certain requests from MetLife Advisers and the Directors and MetLife Advisers’ responses to requests from the Directors. The Directors may also consider other information such as (vi) MetLife Advisers’ and the subadvisers’ financial results and condition, (vii) each Portfolio’s investment objectives and strategies and the size, education and experience of the investment staffs of MetLife Advisers and the relevant subadvisers and their use of technology and external research, (viii) the allocation of the Portfolios’ brokerage, if any, including allocations to brokers affiliated with the subadvisers and the use of “soft” commission dollars to pay Portfolio expenses and to pay for research and other similar services, (ix) the resources devoted to, and the record of compliance with, the Portfolios’ investment policies and restrictions, policies on personal securities transactions and other compliance policies, (x) the responses of MetLife Advisers, the subadvisers and/or their affiliates to certain legal and regulatory proceedings and (xi) the economic outlook generally and for the mutual fund industry in particular. Throughout the process, the Directors have the opportunity to ask questions of and request additional materials from MetLife Advisers and the subadvisers.
Following meetings of each Contract Review Committee on September 12, 2007, the Board, at its November 15, 2007 meeting, approved the continuation through December 31, 2008 of the Advisory Agreements for each Portfolio of the Fund and the Subadvisory Agreements for each Portfolio of the Fund. The Agreements approved for continuation are referred to below as the “Continued Agreements.”
In considering whether to approve the continuation of the Continued Agreements, the Directors, including the Independent Directors, did not identify any single factor as determinative, and each weighed the various factors as he or she deemed appropriate. The Directors considered the following matters in connection with their approval of the Continued Agreements:
The nature, extent and quality of the services provided to the relevant Portfolios under the Continued Agreements. The Directors considered the nature, extent and quality of the services provided by MetLife Advisers, the relevant subadvisers (if any) and their affiliates (each, an “Adviser,” and, collectively, the “Advisers”) to the relevant Portfolios pursuant to the Continued Agreements and the resources dedicated to these Portfolios by the Advisers. In particular, the Directors considered the Advisers’ abilities to attract and retain highly qualified investment professionals. With respect to MetLife Advisers, the Directors considered that MetLife Advisers is (i) ultimately responsible for the performance of such Portfolios; (ii) ultimately responsible for the establishment of the investment strategies of each such Portfolio, primarily through its recommendations to the Board regarding the hiring and selection of subadvisers; (iii) responsible for the hiring and selection, subject to Board approval, of subadvisers; and (iv) responsible for maintaining a program of Subadviser oversight reasonably designed to ensure that the subadvisers have reasonable compliance policies and procedures in place. The Directors also considered that MetLife Advisers provides a full range of day-to-day administrative services for the Portfolios involving all aspects of such Portfolios’ day-to-day operations (other than portfolio management). After reviewing these and related factors, the Directors concluded, within the context of their overall conclusions regarding each of the Continued Agreements, that the nature, extent and quality of services provided supported the renewal of these Agreements.
Investment performance of the relevant Portfolios. The Directors reviewed information about the performance of the relevant Portfolios over various time periods, including information prepared by an independent third party that compared the performance of
MSF-19
Metropolitan Series Fund, Inc.
FI Value Leaders Portfolio
Board Approval of Advisory and Subadvisory Agreements—(Continued)
the Portfolios to the performance of peer groups of funds and performance benchmarks. The Directors also reviewed a description of the third party’s methodology for identifying a Portfolio’s peer group(s) for purposes of performance and expense comparisons.
In the case of each relevant Portfolio that had performance that lagged its peer group(s) for certain periods, the Directors concluded that other factors relevant to performance were sufficient, in light of other considerations, to warrant renewal of the Continued Agreements relating to such Portfolio. These factors varied from Portfolio to Portfolio, but included one or more of the following: (i) that such Portfolio’s performance, although lagging in certain recent periods, was stronger over the longer term; (ii) that the underperformance was attributable, to a significant extent, to investment decisions that were reasonable and consistent with the Portfolio’s investment objective(s) and policies and that the Portfolio was performing within the range of reasonable expectations, given market conditions and the Portfolio’s investment objective(s) and policies; (iii) that the Portfolio’s performance was competitive when compared to other relevant performance benchmarks or peer groups; and (iv) that MetLife Advisers and/or the relevant subadviser (if any) had taken or was taking steps designed to help improve the Portfolio’s investment performance.
The Directors also considered the investment performance of the Advisers and their reputations generally, the historical responsiveness of the Advisers to Director concerns about performance and the willingness of the Advisers to take steps intended to improve performance.
After reviewing these and related factors, the Directors concluded, within the context of their overall conclusions regarding each of the Continued Agreements, that the investment performance of each relevant Portfolio and Adviser was sufficient, in light of other considerations, to warrant the renewal of the Continued Agreements.
The costs of the services to be provided and profits to be realized by the Advisers and their affiliates from their relationships with the Portfolios. The Directors considered the fees charged by MetLife Advisers to the Portfolios for advisory services and, with respect to the subadvised Portfolios, by such subadvisers to MetLife Advisers for subadvisory services (such advisory and subadvisory fees (if any), collectively, “Fees”), as well as the total expense levels of the Portfolios. This information included comparisons (provided by an independent third party) of the Portfolios’ advisory fees and total expense levels to those of their peer groups. In evaluating Fees for the relevant Portfolios, the Directors also took into account the demands, complexity and quality of the investment management services provided to each Portfolio. The Directors considered MetLife Advisers’ recommendations regarding reductions in Fee rates, implementation of Fee breakpoints and institution of Fee waivers and expense caps.
The Directors also considered the compensation directly or indirectly received by the Advisers and their affiliates from their relationships with the relevant Portfolios. The Directors reviewed information relating to the profits received by MetLife Advisers, certain of the subadvisers and their affiliates as a result of their relationships with the relevant Portfolios, and information about the allocation of expenses used to calculate profitability. When reviewing profitability, the Directors also considered the performance of the relevant Portfolios, the expense levels of such Portfolios and whether the relevant Advisers had implemented breakpoints, fee waivers and/or expense caps with respect to such Portfolios.
After reviewing these and related factors, the Directors concluded, within the context of their overall conclusions regarding each of the Continued Agreements, that the Fees charged to each of the relevant Portfolios were fair and reasonable, and that the information provided regarding costs of these services generally, and the related profitability (if known) to the relevant Advisers of their relationships with the relevant Portfolios, supported the renewal of the Continued Agreements.
Economies of Scale. The Directors considered the existence of any economies of scale in the provision of services by the Advisers and whether those economies were shared with the relevant Portfolios through breakpoints in their advisory fees or other means, such as expense caps, fee waivers or relatively low levels of fees. The Directors noted that most of the relevant Portfolios benefited or will benefit from breakpoints, expense caps and/or fee waivers with respect to their advisory fees. In considering these issues, the Directors also took into consideration information relating to the costs of the services provided and the profitability to MetLife Advisers, the relevant subadvisers (if any) and each of their affiliates of their relationships with the relevant Portfolios, as discussed above.
After reviewing these and related factors, the Directors concluded, within the context of their overall conclusions regarding each of the Continued Agreements, that the extent to which economies of scale were shared with the relevant Portfolios supported the renewal of such Agreements.
Other Factors. The Directors also considered other factors, which included but were not limited to the following:
| | • | | the extent to which each relevant Portfolio operated in accordance with its investment objective, and its record of compliance with its investment restrictions and the compliance programs of the Fund and the Advisers. They also considered the compliance-related resources the Advisers and their affiliates provide to the relevant Portfolios; |
MSF-20
Metropolitan Series Fund, Inc.
FI Value Leaders Portfolio
Board Approval of Advisory and Subadvisory Agreements—(Continued)
| | • | | the nature, quality, cost and extent of administrative and shareholder services performed by MetLife Advisers and its affiliates under the Advisory Agreements; and |
| | • | | so-called “fall-out benefits” to the Advisers, such as the engagement of their affiliates to provide distribution, brokerage and transfer agency services to the Portfolios, and the benefits of research made available to the relevant Advisers by reason of brokerage commissions generated by the relevant Portfolios’ securities transactions. The Directors also considered the possible conflicts of interest associated with these fall-out and other benefits, and the reporting and other processes in place to disclose and monitor these possible conflicts of interest. |
Based on their evaluation of all factors that they deemed to be material, including those factors described above, and assisted by the advice of independent counsel, the Directors, including the Independent Directors, concluded that each of the Continued Agreements should be continued through December 31, 2008.
MSF-21
A description of the policies and procedures that the Fund uses to determine how to vote proxies relating to portfolio securities is available (i) without charge, upon request, by calling (800) 638-7732 and (ii) on the Securities and Exchange Commission’s (the “SEC”) website at http://www.sec.gov.
Information regarding how the Fund voted proxies relating to portfolio securities during the most recent twelve-month period ended December 31, 2007 is available (i) without charge, upon request, by calling (800) 638-7732 and (ii) on the SEC’s website at http://www.sec.gov.
The Fund files with the SEC a complete schedule of its portfolio holdings, as of the close of the first and third quarters of its fiscal year, on “Form N-Q”. These filings are available on the SEC’s website at www.sec.gov and may be reviewed and copied at the SEC’s Public Reference Room in Washington, DC. (Call 1-800-SEC-0330 for information on the operation of the Public Reference Room.)
MSF-22
| | |
Metropolitan Series Fund, Inc. Franklin Templeton Small Cap Growth Portfolio Annual Report | | December 31, 2007 |
Letter from the President
February 1, 2008
Letter to Policy Holders:
2007 was a tumultuous year in the financial markets driven by concerns in the credit markets surrounding sub-prime mortgages and fears of recession in the U.S. Economy. The broad markets were mixed, with the Dow Jones Industrial Average up 8.9% and the MSCI EAFE Index, which measures the performance of international equities, up 11.2% for the year, while the Russell 2000 Index, which measures the performance of small capitalization stocks, was down 1.6%.
In the fixed income markets, credit spreads increased as a result of the pressure from sub-prime mortgage crisis and the Federal Reserve lowered interest rates by a total of 1% during the year. The Lehman Brothers Aggregate Bond Index posted a 7.0% return for the year.
On the following pages, you will find a complete review of your Portfolio and its investment performance.
MetLife is committed to building your financial freedom. We appreciate your trust and will continue to focus our efforts on meeting your investment needs.
Sincerely,
Elizabeth Forget
President, Metropolitan Series Fund, Inc.
Metropolitan Series Fund, Inc.
Franklin Templeton Small Cap Growth Portfolio
Managed by Franklin Advisers, Inc.
Portfolio Manager Commentary*
PORTFOLIO PERFORMANCE
For the year ended December 31, 2007, the Class A shares of the Franklin Templeton Small Cap Growth Portfolio returned 4.5%, compared to its benchmark, the Russell 2000 Growth Index1, which returned 7.0%. The average return of its peer group, the Lipper Variable Insurance Products Small-Cap Growth Funds Universe2, was 9.1% over the same period.
PORTFOLIO REVIEW
The domestic equity market was volatile during calendar year 2007, with the Russell 3000 Index3 delivering a 5.1% total return. The market dipped in the first quarter following a sharp but short-lived sell-off in the Chinese market. Stocks rebounded in the second quarter, then contracted in June and July mainly due to rising oil prices, subprime mortgage woes, and the slumping U.S. housing market. After short-term stimulus from the Federal Reserve Board, investors seemed to regain confidence in the third quarter. However, fears of widespread contagion from the subprime mortgage crisis and signs of slowing economic growth contributed to market volatility in the fourth quarter. Large-cap stocks outperformed small caps during the year, while growth stocks significantly outperformed their value counterparts across the capitalization spectrum.
From a sector perspective, stock selection in the electronic technology, energy minerals and consumer services sectors helped the Portfolio’s performance relative to the Russell 2000 Growth Index during the period. In the electronic technology sector, significant performers were thermal imaging systems designer FLIR Systems, power-converting semiconductor manufacturer Power Integrations (not an index component) and packet processor and memory chips company NetLogic Microsystems. Additional key contributors included oil and gas production companies Bill Barrett and Denbury Resources (not an index component) in the energy minerals sector, and restaurant chain Chipotle Mexican Grill and horse racing and casino gaming operator Penn National Gaming (not an index component) in the consumer services sector.
By contrast, the health technology, finance and technology services sectors weighed negatively on relative performance for the period under review. In the health technology sector, stock selection and an underweighted allocation hurt the Portfolio’s relative performance, and significant detractors included Angiotech Pharmaceuticals (not an index component) and Penwest Pharmaceuticals. In the finance sector, stock selection and an overweighted allocation negatively impacted relative Portfolio performance, and technology-based operations and risk management vendor Clayton Holdings and diversified real estate finance company RAIT Investment Trust (not an index component) hindered results. Stock selection in the technology services sector detracted from performance relative to the index. Sector holdings that hurt performance included Internet solutions provider Internap Network Services and management consulting and systems integration firm BearingPoint.
Our sector and industry weightings changed incrementally throughout the period, and, in line with our investment strategy, we invested in companies we believed provided the best trade-off between growth opportunity, business and financial risk, and valuation.
* The views expressed above are those of the subadvisory firm as of December 31, 2007 and are subject to change based on market and other conditions. Information about the Portfolio’s holdings, asset allocation, industry allocation, or country diversification is historical and is not an indication of future Portfolio composition, which will vary. The performance of any index mentioned in this commentary has not been adjusted for ongoing management, distribution and operating expenses, and sales charges applicable to mutual fund investments. Direct investment in the Index is not possible.
1 The Russell 2000® Growth Index is an unmanaged measure of performance of those Russell 2000® companies (small capitalization companies) that have higher price-to book ratios and higher forecasted growth values.
2 The Lipper Variable Insurance Products Fund Average is an average of the total return performance (calculated on the basis of net asset value) of variable product funds with similar investment objectives to those of the subject Portfolio as calculated by Lipper Analytical Services, an independent mutual fund ranking service.
3 The Russell 3000® Index measures the performance of the 3,000 largest U.S. companies based on total market capitalization. The index represents approximately 98% of the U.S. equity market.
MSF-2
Metropolitan Series Fund, Inc.
Franklin Templeton Small Cap Growth Portfolio
A $10,000 INVESTMENT COMPARED TO
THE RUSSELL 2000 GROWTH INDEX
Average Annual Returns as of December 31, 2007
| | | | | | | | | | | | |
| | | Franklin Templeton Small Cap Growth Portfolio | | | Russell 2000
Growth Index | |
| | | Class A | | | Class B | | | Class E | | |
| 1 Year | | 4.5 | % | | 4.3 | % | | 4.5 | % | | 7.0 | % |
| 5 Year | | 14.2 | | | 13.9 | | | 14.0 | | | 16.5 | |
| Since Inception | | 3.4 | | | 3.1 | | | 3.2 | | | 5.5 | |
Performance numbers are net of all Portfolio expenses but do not include any insurance, sales, or administrative charges of variable annuity or life insurance contracts. If these charges were included, the returns would be lower.
Inception date of the Class A, Class B and Class E shares is 5/1/01. Index since inception return is based on the Class A inception date.
This information represents past performance and is not indicative of future results. Investment return and principal value may fluctuate so that shares, upon redemption, may be worth more or less than the original cost.
PORTFOLIO COMPOSITION
as of December 31, 2007
Top Holdings
| | |
| | | % of Total
Net Assets |
Power Integrations, Inc. | | 2.4% |
Microsemi Corp. | | 2.2% |
ViaSat, Inc. | | 2.2% |
Parexel International Corp. | | 2.1% |
Adams Respiratory Therapeutics, Inc. | | 2.1% |
Sapient Corp. | | 2.0% |
NetLogic Microsystems, Inc. | | 1.9% |
Penn National Gaming, Inc. | | 1.9% |
Quest Software, Inc. | | 1.8% |
Huron Consulting Group, Inc. | | 1.8% |
Top Sectors
| | |
| | | % of Total
Net Assets |
Information Technology | | 38.1% |
Health Care | | 18.1% |
Consumer Discretionary | | 17.4% |
Industrials | | 7.3% |
Energy | | 6.7% |
Financials | | 6.2% |
Materials | | 2.5% |
Cash/Other | | 1.5% |
Consumer Staples | | 1.3% |
Telecommunication Services | | 0.9% |
MSF-3
Metropolitan Series Fund, Inc.
Shareholder Expense Example
As a shareholder of the Portfolio, you incur ongoing costs, including management fees; distribution and service (12b-1) fees; and other Portfolio expenses. This example is intended to help you understand your ongoing costs (in dollars) (referred to as “expenses”) of investing in the Portfolio and compare these costs with the ongoing costs of investing in other mutual funds. The example is based on an investment of $1,000 invested at the beginning of the period and held for the entire period, July 1, 2007 through December 31, 2007.
Actual Expenses
The first line for each share class of the Portfolio in the table below provides information about actual account values and actual expenses. You may use the information in this line, together with the amount you invested in the particular share class of the Portfolio, to estimate the expenses that you paid over the period. Simply divide your account value by $1,000 (for example, an $8,600 account value divided by $1,000=8.6), then multiply the result by the number in the first line under the heading entitled “Expenses Paid During Period” to estimate the expenses you paid on your account during this period.
Hypothetical Example for Comparison Purposes
The second line for each share class of the Portfolio in the table below provides information about hypothetical account values and hypothetical expenses based on the Portfolio’s actual expense ratio and an assumed rate of return of 5% per year before expenses, which is not the Portfolio’s actual return. The hypothetical account values and expenses may not be used to estimate the actual ending account balance or expenses you paid for the period. You may use this information to compare the ongoing costs of investing in the Portfolio and other funds. To do so, compare this 5% hypothetical example with the 5% hypothetical examples that appear in the shareholder reports of the other funds.
Please note that the expenses shown in the table are meant to highlight your ongoing costs only and do not reflect any fees or charges of your variable insurance product or any additional expenses that participants in certain eligible qualified plans may bear relating to the operations of their plan. Therefore, the second line for each share class in the table is useful in comparing ongoing costs only, and will not help you determine the relative total costs of owning different funds. In addition, if these other costs were included, your costs would have been higher.
| | | | | | | | | | | | | | |
Portfolio | | | | Annualized
Expense
Ratio | | | Beginning
Account Value
July 1,
2007 | | Ending
Account Value
December 31,
2007 | | Expenses Paid
During Period*
July 1, 2007
to
December 31,
2007 |
Franklin Templeton Small Cap Growth—Class A | | Actual | | 1.02 | % | | $ | 1,000.00 | | $ | 947.60 | | $ | 5.01 |
| | Hypothetical | | 1.02 | % | | $ | 1,000.00 | | $ | 1,020.00 | | $ | 5.19 |
| | | | | |
Franklin Templeton Small Cap Growth—Class B | | Actual | | 1.27 | % | | $ | 1,000.00 | | $ | 946.80 | | $ | 6.23 |
| | Hypothetical | | 1.27 | % | | $ | 1,000.00 | | $ | 1,018.73 | | $ | 6.46 |
| | | | | |
Franklin Templeton Small Cap Growth—Class E | | Actual | | 1.17 | % | | $ | 1,000.00 | | $ | 947.20 | | $ | 5.74 |
| | Hypothetical | | 1.17 | % | | $ | 1,000.00 | | $ | 1,019.24 | | $ | 5.95 |
* Expenses paid are equal to the Portfolio’s annualized expense ratio for the most recent six month period, as shown above, multiplied by the average account value over the period, multiplied by the number of days in the most recent fiscal half-year, divided by 365 (to reflect the one-half year period).
MSF-4
Metropolitan Series Fund, Inc.
Franklin Templeton Small Cap Growth Portfolio
Schedule of Investments as of December 31, 2007
Common Stock—98.3% of Total Net Assets
| | | | | |
| Security Description | | Shares | | Value* |
| | | | | |
| | |
Aerospace & Defense—2.2% | | | | | |
Orbital Sciences Corp. (a) (b) | | 93,800 | | $ | 2,299,976 |
Stanley, Inc. (b) | | 38,493 | | | 1,232,546 |
| | | | | |
| | | | | 3,532,522 |
| | | | | |
| | |
Airlines—1.1% | | | | | |
Allegiant Travel Co. (b) | | 53,000 | | | 1,703,420 |
| | | | | |
| | |
Auto Components—2.0% | | | | | |
Drew Industries, Inc. (a) (b) | | 70,300 | | | 1,926,220 |
Tenneco, Inc. (b) | | 44,700 | | | 1,165,329 |
| | | | | |
| | | | | 3,091,549 |
| | | | | |
| | |
Biotechnology—3.0% | | | | | |
Angiotech Pharmaceuticals, Inc. (a) (b) | | 352,400 | | | 1,226,352 |
Keryx Biopharmaceuticals, Inc. (a) (b) | | 81,700 | | | 686,280 |
MannKind Corp. (a) (b) | | 79,000 | | | 628,840 |
Myriad Genetics, Inc. (a) (b) | | 47,600 | | | 2,209,592 |
| | | | | |
| | | | | 4,751,064 |
| | | | | |
| | |
Capital Markets—2.1% | | | | | |
Kohlberg Capital Corp. | | 53,739 | | | 644,868 |
optionsXpress Holdings, Inc. (a) | | 79,900 | | | 2,702,218 |
| | | | | |
| | | | | 3,347,086 |
| | | | | |
| | |
Chemicals—2.5% | | | | | |
FMC Corp. | | 47,100 | | | 2,569,305 |
Minerals Technologies, Inc. | | 21,300 | | | 1,426,035 |
| | | | | |
| | | | | 3,995,340 |
| | | | | |
| | |
Commercial Banks—1.1% | | | | | |
East West Bancorp, Inc. (a) | | 44,100 | | | 1,068,543 |
UCBH Holdings, Inc. (a) | | 49,200 | | | 696,672 |
| | | | | |
| | | | | 1,765,215 |
| | | | | |
| | |
Commercial Services & Supplies—2.7% | | | | | |
Huron Consulting Group, Inc. (b) | | 34,700 | | | 2,797,861 |
Mobile Mini, Inc. (a) (b) | | 76,900 | | | 1,425,726 |
| | | | | |
| | | | | 4,223,587 |
| | | | | |
| | |
Communications Equipment—5.5% | | | | | |
Arris Group, Inc. (b) | | 102,700 | | | 1,024,946 |
Ixia (b) | | 263,000 | | | 2,493,240 |
OpNext, Inc. (b) | | 71,000 | | | 628,350 |
Riverbed Technology, Inc. | | 44,200 | | | 1,181,908 |
ViaSat, Inc. (b) | | 99,600 | | | 3,429,228 |
| | | | | |
| | | | | 8,757,672 |
| | | | | |
| | |
Computers & Peripherals—1.0% | | | | | |
3PAR, Inc. | | 9,500 | | | 121,600 |
Compellent Technologies, Inc. (a) (b) | | 35,000 | | | 421,050 |
Xyratex, Ltd. (b) | | 66,800 | | | 1,055,440 |
| | | | | |
| | | | | 1,598,090 |
| | | | | |
| | | | | |
| Security Description | | Shares | | Value* |
| | | | | |
| | |
Diversified Consumer Services—1.9% | | | | | |
Strayer Education, Inc. | | 9,900 | | $ | 1,688,742 |
Universal Technical Institute, Inc. (a) (b) | | 82,200 | | | 1,397,400 |
| | | | | |
| | | | | 3,086,142 |
| | | | | |
| | |
Diversified Financial Services—1.0% | | | | | |
MSCI, Inc. (b) | | 20,700 | | | 794,880 |
NewStar Financial, Inc. (a) (b) | | 99,300 | | | 822,204 |
| | | | | |
| | | | | 1,617,084 |
| | | | | |
| |
Electronic Equipment & Instruments—5.8% | | | |
Coherent, Inc. (b) | | 33,900 | | | 849,873 |
FARO Technologies, Inc. (a) (b) | | 61,500 | | | 1,671,570 |
FLIR Systems, Inc. (a) (b) | | 83,600 | | | 2,616,680 |
National Instruments Corp. | | 61,200 | | | 2,039,796 |
Trimble Navigation, Ltd. (b) | | 67,300 | | | 2,035,152 |
| | | | | |
| | | | | 9,213,071 |
| | | | | |
| | |
Energy Equipment & Services—2.9% | | | | | |
Dril-Quip, Inc. (b) | | 18,100 | | | 1,007,446 |
Helix Energy Solutions Group, Inc. (b) | | 37,100 | | | 1,539,650 |
Superior Energy Services, Inc. (b) | | 58,700 | | | 2,020,454 |
| | | | | |
| | | | | 4,567,550 |
| | | | | |
| | |
Food Products—1.2% | | | | | |
Hain Celestial Group, Inc. (a) (b) | | 61,700 | | | 1,974,400 |
| | | | | |
| |
Health Care Equipment & Supplies—2.4% | | | |
American Medical Systems Holdings, Inc. (a) (b) | | 115,600 | | | 1,671,576 |
DexCom, Inc. (a) (b) | | 125,400 | | | 1,107,282 |
TomoTherapy, Inc. (a) (b) | | 51,100 | | | 999,516 |
| | | | | |
| | | | | 3,778,374 |
| | | | | |
| | |
Health Care Providers & Services—3.3% | | | | | |
Healthways, Inc. (a) (b) | | 18,900 | | | 1,104,516 |
Psychiatric Solutions, Inc. (a) (b) | | 63,300 | | | 2,057,250 |
VCA Antech, Inc. (b) | | 46,000 | | | 2,034,580 |
| | | | | |
| | | | | 5,196,346 |
| | | | | |
| | |
Health Care Technology—2.2% | | | | | |
Allscripts Heathcare Solutions, Inc. (a) (b) | | 88,400 | | | 1,716,728 |
The TriZetto Group, Inc. (a) (b) | | 101,300 | | | 1,759,581 |
| | | | | |
| | | | | 3,476,309 |
| | | | | |
| | |
Hotels, Restaurants & Leisure—8.5% | | | | | |
BJ’s Restaurants, Inc. (a) (b) | | 62,400 | | | 1,014,624 |
Chipotle Mexican Grill, Inc. (a) (b) | | 21,100 | | | 2,596,355 |
Gaylord Entertainment Co. (a) (b) | | 15,000 | | | 607,050 |
Orient-Express Hotels, Ltd. (Class A) | | 36,700 | | | 2,110,984 |
Panera Bread Co. (a) (b) | | 44,200 | | | 1,583,244 |
Penn National Gaming, Inc. (b) | | 49,500 | | | 2,947,725 |
Red Lion Hotels Corp. (b) | | 37,380 | | | 371,931 |
Ruth’s Chris Steak House, Inc. (a) (b) | | 87,000 | | | 777,780 |
Shuffle Master, Inc. (a) (b) | | 126,200 | | | 1,513,138 |
| | | | | |
| | | | | 13,522,831 |
| | | | | |
*See accompanying notes to financial statements.
MSF-5
Metropolitan Series Fund, Inc.
Franklin Templeton Small Cap Growth Portfolio
Schedule of Investments as of December 31, 2007
Common Stock—(Continued)
| | | | | |
| Security Description | | Shares | | Value* |
| | | | | |
| | |
Internet & Catalog Retail—0.6% | | | | | |
Shutterfly, Inc. (b) | | 35,600 | | $ | 912,072 |
| | | | | |
| | |
Internet Software & Services—2.9% | | | | | |
DealerTrack Holdings, Inc. (b) | | 34,200 | | | 1,144,674 |
Entrust, Inc. (b) | | 134,800 | | | 260,164 |
Internap Network Services Corp. (a) (b) | | 116,288 | | | 968,679 |
Marchex, Inc. (a) | | 112,000 | | | 1,216,320 |
Omniture, Inc. (b) | | 31,200 | | | 1,038,648 |
| | | | | |
| | | | | 4,628,485 |
| | | | | |
| | |
IT Services—3.8% | | | | | |
Heartland Payment Systems, Inc. (a) | | 49,600 | | | 1,329,280 |
RightNow Technologies, Inc. (b) | | 90,000 | | | 1,426,500 |
Sapient Corp. (b) | | 367,800 | | | 3,240,318 |
| | | | | |
| | | | | 5,996,098 |
| | | | | |
| | |
Life Sciences Tools & Services—3.3% | | | | | |
Parexel International Corp. (b) | | 68,200 | | | 3,294,060 |
Varian, Inc. (b) | | 28,900 | | | 1,887,170 |
| | | | | |
| | | | | 5,181,230 |
| | | | | |
| | |
Machinery—1.3% | | | | | |
Force Protection, Inc. (b) | | 76,100 | | | 356,353 |
The Manitowoc Co., Inc. | | 36,000 | | | 1,757,880 |
| | | | | |
| | | | | 2,114,233 |
| | | | | |
| | |
Media—1.1% | | | | | |
Lions Gate Entertainment Corp. (a) (b) | | 178,300 | | | 1,679,586 |
| | | | | |
| | |
Oil, Gas & Consumable Fuels—3.8% | | | | | |
Bill Barrett Corp. (a) (b) | | 56,600 | | | 2,369,842 |
Mariner Energy, Inc. (b) | | 99,900 | | | 2,285,712 |
McMoran Exploration Co. (a) (b) | | 102,200 | | | 1,337,798 |
| | | | | |
| | | | | 5,993,352 |
| | | | | |
| | |
Pharmaceuticals—4.0% | | | | | |
Adams Respiratory Therapeutics, Inc. (a) (b) | | 54,300 | | | 3,243,882 |
Cadence Pharmaceuticals, Inc. (a) (b) | | 70,094 | | | 1,041,597 |
Impax Laboratories, Inc. (b) | | 35,400 | | | 392,940 |
Penwest Pharmaceuticals Co. (a) (b) | | 98,300 | | | 575,055 |
The Medicines Co. (b) | | 52,700 | | | 1,009,732 |
| | | | | |
| | | | | 6,263,206 |
| | | | | |
| | |
Real Estate Investment Trusts—1.4% | | | | | |
FelCor Lodging Trust, Inc. | | 96,000 | | | 1,496,640 |
RAIT Investment Trust (a) | | 84,400 | | | 727,528 |
| | | | | |
| | | | | 2,224,168 |
| | | | | |
|
Semiconductors & Semiconductor Equipment—12.6% |
Atheros Communications, Inc. (a) (b) | | 70,600 | | | 2,156,124 |
Formfactor, Inc. (a) (b) | | 54,500 | | | 1,803,950 |
Microsemi Corp. (a) (b) | | 159,220 | | | 3,525,131 |
Microtune, Inc. (b) | | 191,700 | | | 1,251,801 |
NetLogic Microsystems, Inc. (a) (b) | | 95,200 | | | 3,065,440 |
| | | | | | | |
| Security Description | | Shares | | Value* | |
| | | | | | | |
|
Semiconductors & Semiconductor Equipment—(Continued) | |
Power Integrations, Inc. (b) | | | 109,700 | | $ | 3,776,971 | |
Silicon Laboratories, Inc. (b) | | | 66,900 | | | 2,504,067 | |
Varian Semiconductor Equipment Associates, Inc. (b) | | | 51,000 | | | 1,887,000 | |
| | | | | | | |
| | | | | | 19,970,484 | |
| | | | | | | |
| | |
Software—6.4% | | | | | | | |
Bottomline Technologies, Inc. (b) | | | 50,330 | | | 704,620 | |
MICROS Systems, Inc. (b) | | | 32,200 | | | 2,259,152 | |
Nuance Communications, Inc. (a) (b) | | | 113,200 | | | 2,114,576 | |
Quest Software, Inc. (b) | | | 155,800 | | | 2,872,952 | |
THQ, Inc. (a) (b) | | | 59,150 | | | 1,667,439 | |
Voltaire, Ltd. (a) (b) | | | 76,700 | | | 470,938 | |
| | | | | | | |
| | | | | | 10,089,677 | |
| | | | | | | |
|
Specialty Retail—2.6% | |
Big 5 Sporting Goods Corp. (a) | | | 55,686 | | | 802,992 | |
Hibbett Sports, Inc. (a) (b) | | | 53,800 | | | 1,074,924 | |
Tractor Supply Co. (a) (b) | | | 34,100 | | | 1,225,554 | |
Zumiez, Inc. (a) (b) | | | 42,700 | | | 1,040,172 | |
| | | | | | | |
| | | | | | 4,143,642 | |
| | | | | | | |
|
Textiles, Apparel & Luxury Goods—0.6% | |
FGX International Holdings, Ltd. (b) | | | 86,000 | | | 1,019,100 | |
| | | | | | | |
|
Thrifts & Mortgage Finance—0.6% | |
Clayton Holdings, Inc. (a) (b) | | | 169,000 | | | 873,730 | |
| | | | | | | |
|
Wireless Telecommunication Services—0.9% | |
SBA Communications Corp. (b) | | | 40,000 | | | 1,353,600 | |
| | | | | | | |
Total Common Stock
(Identified Cost $149,065,106) | | | | | | 155,640,315 | |
| | | | | | | |
|
| Short Term Investments—22.9% | |
| Security Description | | Face Amount/
Shares | | Value* | |
|
Discount Notes—1.9% | |
Federal Home Loan Bank
4.08%, 01/02/08 | | $ | 3,000,000 | | | 2,999,729 | |
| | | | | | | |
|
Mutual Funds—21.0% | |
State Street Navigator Securities Lending
Prime Portfolio (c) | | | 33,149,322 | | | 33,149,322 | |
| | | | | | | |
Total Short Term Investments
(Identified Cost $36,149,051) | | | | | | 36,149,051 | |
| | | | | | | |
Total Investments—121.2%
(Identified Cost $185,214,157) (d) | | | | | | 191,789,366 | |
Liabilities in excess of other assets | | | | | | (33,515,539 | ) |
| | | | | | | |
| Total Net Assets—100% | | | | | $ | 158,273,827 | |
| | | | | | | |
*See accompanying notes to financial statements.
MSF-6
Metropolitan Series Fund, Inc.
Franklin Templeton Small Cap Growth Portfolio
Schedule of Investments as of December 31, 2007
| (a) | A portion or all of the security was held on loan. As of December 31, 2007, the market value of securities loaned was $32,320,642 and the collateral received consisted of cash in the amount of $33,149,322 and non cash collateral with a value of $149,454. The cash collateral is invested in a money market fund managed by an affiliate of the custodian. The non cash collateral received consists primarily of government securities and bank letters of credit, and are held for the benefit of the Portfolio at the Portfolio’s custodian. |
| (c) | Represents investment of cash collateral received from securities lending transactions. |
| (d) | The aggregate cost of investments for federal income tax purposes as of December 31, 2007 was $185,377,440 and the composition of unrealized appreciation and depreciation of investment securities was $26,701,198 and $(20,289,272), respectively. |
*See accompanying notes to financial statements.
MSF-7
Metropolitan Series Fund, Inc.
Franklin Templeton Small Cap Growth Portfolio
Statement of Assets & Liabilities
December 31, 2007
| | | | | | |
Assets | | | | | | |
Investments at value (a) (b) | | | | | $ | 191,789,366 |
Cash | | | | | | 116,664 |
Receivable for: | | | | | | |
Securities sold | | | | | | 329,886 |
Fund shares sold | | | | | | 219,506 |
Accrued interest and dividends | | | | | | 118,824 |
| | | | | | |
Total Assets | | | | | | 192,574,246 |
Liabilities | | | | | | |
Payable for: | | | | | | |
Securities purchased | | $ | 949,614 | | | |
Fund shares redeemed | | | 29,224 | | | |
Collateral for securities loaned | | | 33,149,322 | | | |
Accrued expenses: | | | | | | |
Management fees | | | 121,096 | | | |
Service and distribution fees | | | 15,940 | | | |
Other expenses | | | 35,223 | | | |
| | | | | | |
Total Liabilities | | | | | | 34,300,419 |
| | | | | | |
Net Assets | | | | | $ | 158,273,827 |
| | | | | | |
Net assets consists of: | | | | | | |
Capital paid in | | | | | $ | 138,537,595 |
Undistributed net investment income | | | | | | 80,296 |
Accumulated net realized gains | | | | | | 13,080,727 |
Unrealized appreciation on investments | | | | | | 6,575,209 |
| | | | | | |
Net Assets | | | | | $ | 158,273,827 |
| | | | | | |
| Computation of offering price: | | | | | | |
Class A | | | | | | |
Net asset value and redemption price per share ($78,028,638 divided by 7,308,427 shares outstanding) | | | | | $ | 10.68 |
| | | | | | |
Class B | | | | | | |
Net asset value and redemption price per share ($67,487,182 divided by 6,431,540 shares outstanding) | | | | | $ | 10.49 |
| | | | | | |
Class E | | | | | | |
Net asset value and redemption price per share ($12,758,007 divided by 1,205,973 shares outstanding) | | | | | $ | 10.58 |
| | | | | | |
(a) Identified cost of investments | | | | | $ | 185,214,157 |
| | | | | | |
| (b) | Includes cash collateral for securities loaned of $33,149,322. |
Statement of Operations
For the Year Ended December 31, 2007
| | | | | | | | |
Investment Income | | | | | | | | |
Dividends | | | | | | $ | 664,957 | |
Interest | | | | | | | 398,466 | (a) |
| | | | | | | | |
| | | | | | | 1,063,423 | |
Expenses | | | | | | | | |
Management fees | | $ | 1,435,004 | | | | | |
Service and distribution fees—Class B | | | 172,153 | | | | | |
Service and distribution fees—Class E | | | 20,884 | | | | | |
Directors’ fees and expenses | | | 23,669 | | | | | |
Custodian | | | 36,556 | | | | | |
Audit and tax services | | | 31,738 | | | | | |
Legal | | | 1,818 | | | | | |
Printing | | | 65,562 | | | | | |
Insurance | | | 1,578 | | | | | |
Miscellaneous | | | 12,840 | | | | | |
| | | | | | | | |
Total expenses | | | 1,801,802 | | | | | |
Expense reductions | | | (6,819 | ) | | | 1,794,983 | |
| | | | | | | | |
Net Investment Loss | | | | | | | (731,560 | ) |
| | | | | | | | |
Realized and Unrealized Gain (Loss) | | | | | | | | |
| Realized gain on: | | | | | | | | |
Investments—net | | | | | | | 14,137,156 | |
| Change in unrealized depreciation on: | | | | | | | | |
Investments—net | | | | | | | (6,937,321 | ) |
| | | | | | | | |
Net gain | | | | | | | 7,199,835 | |
| | | | | | | | |
Net Increase in Net Assets From Operations | | | | | | $ | 6,468,275 | |
| | | | | | | | |
| (a) | Includes net income on securities loaned of $152,687. |
See accompanying notes to financial statements.
MSF-8
Metropolitan Series Fund, Inc.
Franklin Templeton Small Cap Growth Portfolio
Statements of Changes in Net Assets
| | | | | | | | |
| | | Year ended
December 31,
2007 | | | Year ended
December 31,
2006 | |
From Operations | | | | | | | | |
Net investment loss | | $ | (731,560 | ) | | $ | (787,216 | ) |
Net realized gain | | | 14,137,156 | | | | 11,677,868 | |
Unrealized appreciation (depreciation) | | | (6,937,321 | ) | | | 201,558 | |
| | | | | | | | |
Increase in net assets from operations | | | 6,468,275 | | | | 11,092,210 | |
| | | | | | | | |
From Distributions to Shareholders | | | | | | | | |
Net realized gain | | | | | | | | |
Class A | | | (5,293,797 | ) | | | (1,777,360 | ) |
Class B | | | (4,633,068 | ) | | | (3,557,737 | ) |
Class E | | | (1,001,053 | ) | | | (727,182 | ) |
| | | | | | | | |
Total distributions | | | (10,927,918 | ) | | | (6,062,279 | ) |
| | | | | | | | |
Increase in net assets from capital share transactions | | | 22,309,401 | | | | 26,541,759 | |
| | | | | | | | |
Total increase in net assets | | | 17,849,758 | | | | 31,571,690 | |
| | |
Net Assets | | | | | | | | |
Beginning of the period | | | 140,424,069 | | | | 108,852,379 | |
| | | | | | | | |
End of the period | | $ | 158,273,827 | | | $ | 140,424,069 | |
| | | | | | | | |
Undistributed Net Investment Income | | | | | | | | |
End of the period | | $ | 80,296 | | | $ | 0 | |
| | | | | | | | |
Other Information:
Capital Shares
Transactions in capital shares were as follows:
| | | | | | | | | | | | | | |
| | | Year ended
December 31, 2007 | | | Year ended
December 31, 2006 | |
| | | Shares | | | $ | | | Shares | | | $ | |
Class A | | | | | | | | | | | | | | |
Sales | | 3,263,897 | | | $ | 36,568,942 | | | 2,626,480 | | | $ | 28,651,135 | |
Reinvestments | | 482,131 | | | | 5,293,797 | | | 158,977 | | | | 1,777,360 | |
Redemptions | | (1,330,391 | ) | | | (14,836,222 | ) | | (1,060,508 | ) | | | (11,295,022 | ) |
| | | | | | | | | | | | | | |
Net increase | | 2,415,637 | | | $ | 27,026,517 | | | 1,724,949 | | | $ | 19,133,473 | |
| | | | | | | | | | | | | | |
Class B | | | | | | | | | | | | | | |
Sales | | 1,530,985 | | | $ | 16,749,341 | | | 2,812,661 | | | $ | 29,566,546 | |
Reinvestments | | 428,591 | | | | 4,633,068 | | | 321,967 | | | | 3,557,737 | |
Redemptions | | (2,318,673 | ) | | | (25,544,811 | ) | | (2,329,457 | ) | | | (24,751,078 | ) |
| | | | | | | | | | | | | | |
Net increase (decrease) | | (359,097 | ) | | $ | (4,162,402 | ) | | 805,171 | | | $ | 8,373,205 | |
| | | | | | | | | | | | | | |
Class E | | | | | | | | | | | | | | |
Sales | | 192,468 | | | $ | 2,141,471 | | | 326,836 | | | $ | 3,527,871 | |
Reinvestments | | 91,924 | | | | 1,001,053 | | | 65,453 | | | | 727,182 | |
Redemptions | | (334,403 | ) | | | (3,697,238 | ) | | (490,912 | ) | | | (5,219,972 | ) |
| | | | | | | | | | | | | | |
Net decrease | | (50,011 | ) | | $ | (554,714 | ) | | (98,623 | ) | | $ | (964,919 | ) |
| | | | | | | | | | | | | | |
Increase derived from capital share transactions | | | | | $ | 22,309,401 | | | | | | $ | 26,541,759 | |
| | | | | | | | | | | | | | |
See accompanying notes to financial statements.
MSF-9
Metropolitan Series Fund, Inc.
Franklin Templeton Small Cap Growth Portfolio
Financial Highlights
| | | | | | | | | | | | | | | | | | | | |
| | | Class A | |
| | | Year ended December 31, | |
| | | 2007 | | | 2006 | | | 2005 | | | 2004 | | | 2003 | |
Net Asset Value, Beginning of Period | | $ | 10.94 | | | $ | 10.43 | | | $ | 10.35 | | | $ | 9.29 | | | $ | 6.41 | |
| | | | | | | | | | | | | | | | | | | | |
Income From Investment Operations | | | | | | | | | | | | | | | | | | | | |
Net investment loss | | | (0.04 | )(a) | | | (0.05 | ) | | | (0.05 | ) | | | (0.08 | ) | | | (0.04 | ) |
Net realized and unrealized gain on investments | | | 0.57 | | | | 1.11 | | | | 0.48 | | | | 1.14 | | | | 2.92 | |
| | | | | | | | | | | | | | | | | | | | |
Total from investment operations | | | 0.53 | | | | 1.06 | | | | 0.43 | | | | 1.06 | | | | 2.88 | |
| | | | | | | | | | | | | | | | | | | | |
Less Distributions | | | | | | | | | | | | | | | | | | | | |
Distributions from net realized capital gains | | | (0.79 | ) | | | (0.55 | ) | | | (0.35 | ) | | | 0.00 | | | | 0.00 | |
| | | | | | | | | | | | | | | | | | | | |
Total distributions | | | (0.79 | ) | | | (0.55 | ) | | | (0.35 | ) | | | 0.00 | | | | 0.00 | |
| | | | | | | | | | | | | | | | | | | | |
Net Asset Value, End of Period | | $ | 10.68 | | | $ | 10.94 | | | $ | 10.43 | | | $ | 10.35 | | | $ | 9.29 | |
| | | | | | | | | | | | | | | | | | | | |
Total Return (%) | | | 4.5 | | | | 10.0 | | | | 4.7 | | | | 11.4 | | | | 44.9 | |
Ratio of operating expenses to average net assets before expense reductions (%) | | | 1.01 | | | | 1.09 | | | | 1.13 | | | | 1.15 | | | | 1.13 | |
Ratio of operating expenses to average net assets after expense reductions (%) (b) | | | 1.01 | | | | 1.07 | | | | 1.11 | | | | 1.15 | | | | N/A | |
Ratio of operating expenses to average net assets without giving effect to the contractual expense agreement would have been (%) | | | N/A | | | | 1.09 | | | | 1.13 | | | | 1.15 | | | | 1.32 | |
Ratio of net investment loss to average net assets (%) | | | (0.33 | ) | | | (0.45 | ) | | | (0.52 | ) | | | (0.80 | ) | | | (0.68 | ) |
Portfolio turnover rate (%) | | | 60 | | | | 68 | | | | 52 | | | | 50 | | | | 38 | |
Net assets, end of period (000) | | $ | 78,029 | | | $ | 53,521 | | | $ | 33,042 | | | $ | 31,892 | | | $ | 25,762 | |
| |
| | | Class B | |
| | | Year ended December 31, | |
| | | 2007 | | | 2006 | | | 2005 | | | 2004 | | | 2003 | |
Net Asset Value, Beginning of Period | | $ | 10.79 | | | $ | 10.32 | | | $ | 10.27 | | | $ | 9.24 | | | $ | 6.39 | |
| | | | | | | | | | | | | | | | | | | | |
Income From Investment Operations | | | | | | | | | | | | | | | | | | | | |
Net investment loss | | | (0.07 | )(a) | | | (0.08 | ) | | | (0.05 | ) | | | (0.08 | ) | | | (0.05 | ) |
Net realized and unrealized gain on investments | | | 0.56 | | | | 1.10 | | | | 0.45 | | | | 1.11 | | | | 2.90 | |
| | | | | | | | | | | | | | | | | | | | |
Total from investment operations | | | 0.49 | | | | 1.02 | | | | 0.40 | | | | 1.03 | | | | 2.85 | |
| | | | | | | | | | | | | | | | | | | | |
Less Distributions | | | | | | | | | | | | | | | | | | | | |
Distributions from net realized capital gains | | | (0.79 | ) | | | (0.55 | ) | | | (0.35 | ) | | | 0.00 | | | | 0.00 | |
| | | | | | | | | | | | | | | | | | | | |
Total distributions | | | (0.79 | ) | | | (0.55 | ) | | | (0.35 | ) | | | 0.00 | | | | 0.00 | |
| | | | | | | | | | | | | | | | | | | | |
Net Asset Value, End of Period | | $ | 10.49 | | | $ | 10.79 | | | $ | 10.32 | | | $ | 10.27 | | | $ | 9.24 | |
| | | | | | | | | | | | | | | | | | | | |
Total Return (%) | | | 4.3 | | | | 9.7 | | | | 4.4 | | | | 11.1 | | | | 44.6 | |
Ratio of operating expenses to average net assets before expense reductions (%) | | | 1.26 | | | | 1.34 | | | | 1.38 | | | | 1.40 | | | | 1.38 | |
Ratio of operating expenses to average net assets after expense reductions (%) (b) | | | 1.26 | | | | 1.32 | | | | 1.36 | | | | 1.40 | | | | N/A | |
Ratio of operating expenses to average net assets without giving effect to the contractual expense agreement would have been (%) | | | N/A | | | | 1.34 | | | | 1.38 | | | | 1.40 | | | | 1.57 | |
Ratio of net investment loss to average net assets (%) | | | (0.59 | ) | | | (0.72 | ) | | | (0.73 | ) | | | (1.05 | ) | | | (0.93 | ) |
Portfolio turnover rate (%) | | | 60 | | | | 68 | | | | 52 | | | | 50 | | | | 38 | |
Net assets, end of period (000) | | $ | 67,487 | | | $ | 73,262 | | | $ | 61,746 | | | $ | 34,664 | | | $ | 22,385 | |
| (a) | Per share amount is based on average shares outstanding during the period. |
| (b) | The Portfolio has entered into arrangements with certain brokers who paid a portion of the Portfolio’s expenses. |
See accompanying notes to financial statements.
MSF-10
Metropolitan Series Fund, Inc.
Franklin Templeton Small Cap Growth Portfolio
Financial Highlights
| | | | | | | | | | | | | | | | | | | | |
| | | Class E | |
| | | Year ended December 31, | |
| | | 2007 | | | 2006 | | | 2005 | | | 2004 | | | 2003 | |
Net Asset Value, Beginning of Period | | $ | 10.86 | | | $ | 10.37 | | | $ | 10.31 | | | $ | 9.27 | | | $ | 6.41 | |
| | | | | | | | | | | | | | | | | | | | |
Income From Investment Operations | | | | | | | | | | | | | | | | | | | | |
Net investment loss | | | (0.05 | )(a) | | | (0.07 | ) | | | (0.07 | ) | | | (0.09 | ) | | | (0.04 | ) |
Net realized and unrealized gain on investments | | | 0.56 | | | | 1.11 | | | | 0.48 | | | | 1.13 | | | | 2.90 | |
| | | | | | | | | | | | | | | | | | | | |
Total from investment operations | | | 0.51 | | | | 1.04 | | | | 0.41 | | | | 1.04 | | | | 2.86 | |
| | | | | | | | | | | | | | | | | | | | |
Less Distributions | | | | | | | | | | | | | | | | | | | | |
Distributions from net realized capital gains | | | (0.79 | ) | | | (0.55 | ) | | | (0.35 | ) | | | 0.00 | | | | 0.00 | |
| | | | | | | | | | | | | | | | | | | | |
Total distributions | | | (0.79 | ) | | | (0.55 | ) | | | (0.35 | ) | | | 0.00 | | | | 0.00 | |
| | | | | | | | | | | | | | | | | | | | |
Net Asset Value, End of Period | | $ | 10.58 | | | $ | 10.86 | | | $ | 10.37 | | | $ | 10.31 | | | $ | 9.27 | |
| | | | | | | | | | | | | | | | | | | | |
Total Return (%) | | | 4.5 | | | | 9.9 | | | | 4.5 | | | | 11.2 | | | | 44.6 | |
Ratio of operating expenses to average net assets before expense reductions (%) | | | 1.16 | | | | 1.24 | | | | 1.28 | | | | 1.30 | | | | 1.28 | |
Ratio of operating expenses to average net assets after expense reductions (%) (b) | | | 1.16 | | | | 1.22 | | | | 1.26 | | | | 1.30 | | | | N/A | |
Ratio of operating expenses to average net assets without giving effect to the contractual expense agreement would have been (%) | | | N/A | | | | 1.24 | | | | 1.28 | | | | 1.30 | | | | 1.47 | |
Ratio of net investment loss to average net assets (%) | | | (0.50 | ) | | | (0.62 | ) | | | (0.67 | ) | | | (0.95 | ) | | | (0.84 | ) |
Portfolio turnover rate (%) | | | 60 | | | | 68 | | | | 52 | | | | 50 | | | | 38 | |
Net assets, end of period (000) | | $ | 12,758 | | | $ | 13,641 | | | $ | 14,051 | | | $ | 14,545 | | | $ | 10,029 | |
| (a) | Per share amount is based on average shares outstanding during the period. |
| (b) | The Portfolio has entered into arrangements with certain brokers who paid a portion of the Portfolio’s expenses. |
See accompanying notes to financial statements.
MSF-11
Metropolitan Series Fund, Inc.
Franklin Templeton Small Cap Growth Portfolio
Notes to Financial Statements—December 31, 2007
Metropolitan Series Fund, Inc. (the “Fund”) is organized as a corporation under the laws of Maryland pursuant to Articles of Incorporation filed on November 23, 1982, as amended, and registered under the Investment Company Act of 1940, as amended (the “1940 Act”), as an open-end investment company. The Fund is a “series” type of mutual fund, which issues separate series of stock. Each series represents an interest in a separate portfolio of Fund investments. The Franklin Templeton Small Cap Growth Portfolio (the “Portfolio”) is a diversified series of the Fund. Shares in the Fund are not offered directly to the general public and are currently available only to separate accounts established by Metropolitan Life Insurance Company (“MetLife”), New England Life Insurance Company, General American Life Insurance Company (“General American”), The MetLife Investors Group of Insurance Companies, MetLife Insurance Company of Connecticut and other affiliated insurance companies (collectively, the “Insurance Companies”), as an investment vehicle for variable life insurance, group annuity or variable annuity products, although the Portfolio is not available to all such separate accounts. The Portfolio’s shares may be divided into different classes. Currently, the classes being offered by the Portfolio are named Class A, Class B and Class E. The classes of the Portfolio’s shares are identical, except that certain additional charges (Rule 12b-1 fees) are made against Class B and Class E shares. Investment income, realized and unrealized capital gains and losses, the common expenses of the Portfolio and certain Portfolio-level expense reductions, if any, are allocated on a pro rata basis to each class based on the relative net assets of each class to the total net assets of the Portfolio.
| 2. | SIGNIFICANT ACCOUNTING POLICIES: |
The preparation of financial statements in conformity with accounting principles generally accepted in the United States of America (“GAAP”) requires management to make estimates and assumptions that affect the reported amounts of assets and liabilities and disclosure of contingent assets and liabilities as of the date of the financial statements and the reported amounts of income and expenses during the reporting period. Actual results could differ from those estimates.
The following is a summary of significant accounting policies consistently followed by the Portfolio in the preparation of its financial statements. The policies are in conformity with GAAP.
Investment Valuation:
Debt securities (other than short term obligations with a remaining maturity of sixty days or less) are valued by independent pricing services selected by the relevant subadviser pursuant to authorization of the Board of Directors of the Fund (the “Board” or “Directors”). Short term obligations with a remaining maturity of sixty days or less are valued at amortized cost which approximates fair market value.
Equity securities traded on a national securities exchange or exchanges are valued at their last sale price on the principal trading market. Equity securities traded on the NASDAQ National Market System are valued at the NASDAQ Official Closing Price (the “NOCP”). The NOCP is the last sale price if it falls between the spread of the last reported bid and asked prices. If the last reported bid and asked prices are above the last reported sale price, the NOCP will be the last reported bid price. If the last reported bid and asked prices are below the last reported sale price, the NOCP will be the last reported asked price. Equity securities traded on a national securities exchange or exchanges or on the NASDAQ National Market System for which there is no reported sale during the day are valued at the last reported bid price. A security that is listed or traded on more than one exchange is valued at the quotation on the exchange determined to be the primary market for that security by the Board or its delegates. If no closing price is available, then such securities are valued by using the last reported bid price. Equity securities traded over-the-counter are valued at the last reported sales price.
If no current market value quotation is readily available or reliable for a portfolio security, fair value will be determined in accordance with procedures established by and under the general supervision of the Board. When the Portfolio uses fair value pricing, it may take into account any factors it deems appropriate. The value of securities used by the Portfolio to calculate its net asset value may differ from quoted or published prices for the same securities. Fair value pricing involves subjective judgments and the fair value determined for a security may be materially different than the value that could be realized upon the sale of that security.
The Portfolio expects to use fair value pricing for securities primarily traded on U.S. exchanges only under very limited circumstances. For example, the Portfolio may use fair value pricing if the exchange on which a security is traded closes early or trading in the security is suspended.
MSF-12
Metropolitan Series Fund, Inc.
Franklin Templeton Small Cap Growth Portfolio
Notes to Financial Statements—December 31, 2007—(Continued)
Securities traded primarily on an exchange outside of the United States which closes before the close of the New York Stock Exchange will be valued at the last sales price on that non-U.S. exchange. Securities traded primarily on an exchange outside of the United States for which there is no reported sale during the day are valued at the mean between the last reported bid and asked prices. However, because most foreign markets close well before the Portfolio values its securities (typically at 4 p.m. Eastern Time), the earlier close of these foreign markets gives rise to the possibility that significant events, including broad market moves, may have occurred after these foreign markets close but before the Portfolio values its securities. To account for this, the Portfolio may frequently value many of its foreign equity securities using fair value prices based on third party vendor modeling tools.
Forward foreign currency exchange contracts are valued based on the mean between closing bid and asked prices of the forward currency contract rates in the London foreign exchange markets on a daily basis as provided by a reliable bank or dealer.
Options, whether on securities, indices, futures contracts, or otherwise, are valued at the last sales price available as of the close of business on the day of valuation or, if there is no such sale price available, at the mean between the bid and asked prices. Options on currencies are valued at the spot price each day.
The value of futures contracts will be the sum of the margin deposit plus or minus the difference between the value of the futures contract on each day the net asset value is calculated and the value on the date the futures contract originated, value being that established on a recognized commodity exchange, or by reference to other customary sources, with gain or loss being realized when the futures contract closes or expires.
Subject to the Board’s oversight, the Board has delegated day-to-day responsibility for valuing Portfolio assets to the subadviser of the Portfolio, who values such assets as described above and operates under procedures approved by the Board.
Investment Transactions and Related Investment Income:
Portfolio security transactions are recorded on the trade date. Dividend income is recorded on the ex-dividend date or, for certain foreign securities, when notified. Interest income, which includes amortization of premium and accretion of discount on debt securities, is recorded on the accrual basis. Realized gains and losses on investments and unrealized appreciation and depreciation are determined on the identified cost basis, which is the same basis used for federal income tax purposes.
Repurchase Agreements:
The Portfolio, through the custodian or a subcustodian, receives delivery of the underlying securities collateralizing repurchase agreements. The Portfolio requires the custodian to take possession, to have legally segregated in the Federal Reserve Book Entry System, or to have segregated within the custodian’s vault, all securities held as collateral for repurchase agreements. It is the Portfolio’s policy that the market value of the collateral be at least equal to 100% of the repurchase price in the case of a repurchase agreement of one-day duration and 102% on all other repurchase agreements. The Portfolio’s subadviser is responsible for determining that the value of the collateral is at all times at least equal to the repurchase price. In connection with transactions in repurchase agreements, if the seller defaults and the value of the collateral declines or if the seller enters an insolvency proceeding, realization of the collateral by the Portfolio may be delayed, limited or wholly denied.
Foreign Currency Translation:
The books and records of the Portfolio are maintained in U.S. dollars. The values of securities, currencies and other assets and liabilities denominated in currencies other than U.S. dollars are translated into U.S. dollars based upon foreign exchange rates prevailing at the end of the period. Purchases and sales of investment securities, income and expenses are translated on the respective dates of such transactions. Since the values of investment securities are presented at the foreign exchange rates prevailing at the end of the period, it is not practical to isolate that portion of the results of operations arising from changes in exchange rates from that portion of the results of operations reflecting fluctuations arising from changes in market prices of the investment securities. Such fluctuations are included in the net realized and unrealized gain or loss on investments.
Net realized foreign exchange gains or losses arise from sales of foreign currency, currency gains or losses realized between the trade and settlement dates on securities transactions, and the difference between the amounts of dividends, interest, and foreign withholding taxes recorded by the Portfolio and the U.S. dollar equivalent of the amounts actually received or paid by the Portfolio. Net unrealized foreign exchange gains and losses arise from changes in the value of assets and liabilities, other than investment securities, resulting from changes in the exchange rate.
See accompanying notes to financial statements.
MSF-13
Metropolitan Series Fund, Inc.
Franklin Templeton Small Cap Growth Portfolio
Notes to Financial Statements—December 31, 2007—(Continued)
Forward Foreign Currency Exchange Contracts:
The Portfolio may enter into forward foreign currency exchange contracts primarily to hedge against foreign currency exchange rate risks on its non-U.S. dollar denominated investment securities. When entering into a forward currency contract, the Portfolio agrees to receive or deliver a fixed quantity of foreign currency for an agreed-upon price on an agreed future date. These contracts are valued daily and the Portfolio’s net equity therein, representing unrealized gain or loss on the contracts as measured by the difference between the foreign exchange rates at the dates of entry into the contracts and the forward rates at the settlement date, is included in the Statement of Assets and Liabilities. Realized and unrealized gains and losses are included in the Statement of Operations. These instruments involve market and/or credit risk in excess of the amount recognized in the Statement of Assets and Liabilities. Risks arise from the possible inability of counterparties to meet the terms of their contracts and from movement in currency and securities values and interest rates.
Futures Contracts:
The Portfolio may buy and sell futures contracts (on recognized exchanges) as a hedge or to enhance return. Futures contracts are agreements to buy or sell a security, or deliver a final cash settlement price in connection with an index, interest rate, currency, or other contracts not calling for physical delivery, for a set price in the future. The Portfolio must post an amount equal to a portion of the total market value of the futures contract as futures variation margin, which is returned when the Portfolio’s obligations under the contract have been satisfied. From time to time thereafter, the Portfolio may have to post variation margin to maintain this amount as the market value of the contract fluctuates. Risks of entering into futures contracts (and related options) include the possibility that there may be an illiquid market and that a change in the value of the contract or option may not correlate with changes in the value of the underlying securities.
Options:
The Portfolio may use options to hedge against changes in values of securities the Portfolio owns or expects to purchase. Writing puts or buying calls tends to increase the Portfolio’s exposure to the underlying instrument and writing calls or buying puts tends to decrease the Portfolio’s exposure to the underlying instrument, and can be used to hedge other Portfolio investments. For options purchased to hedge the Portfolio’s investments, the potential risk to the Portfolio is that the change in value of options contracts may not correspond to the change in value of the hedged instruments. In addition, losses may arise from changes in the value of the underlying instruments, if there is an illiquid secondary market, or if the counterparty is unable to perform. The maximum loss for purchased options is limited to the premium initially paid for the option. For options written by the Portfolio, the maximum loss is not limited to the premium initially received for the option.
The main risk associated with purchasing an option is that the option expires without being exercised. In this case, the option expires worthless and the premium paid for the option is considered the loss. The risk associated with writing a call option is that the Portfolio may forgo the opportunity for a profit if the market value of the underlying position increases and the option is exercised. The risk in writing a put option is that the Portfolio may incur a loss if the market value of the underlying position decreases and the option is exercised. In addition, the Portfolio risks not being able to enter into a closing transaction for the written option as the result of an illiquid market.
“When-Issued” Securities:
Purchasing securities “when-issued” is a forward commitment by the Portfolio to buy a security. The estimated amount of the Portfolio’s payment obligation and the security’s interest rate are determined when the commitment is made, even though no interest accrues until the security is issued, which is generally 15 to 120 days later. The Portfolio will segregate liquid assets with its custodian sufficient at all times to satisfy these commitments. If the value of the security is less when delivered than when the commitment was made, the Portfolio will suffer a loss.
Federal Income Taxes:
It is the Portfolio’s policy to comply with the requirements of the Internal Revenue Code of 1986, as amended, and regulations thereunder, applicable to regulated investment companies and to distribute all of its taxable income to shareholders. Therefore, no federal income tax provision is required.
As of December 31, 2007, the Portfolio had no capital loss carryovers.
MSF-14
Metropolitan Series Fund, Inc.
Franklin Templeton Small Cap Growth Portfolio
Notes to Financial Statements—December 31, 2007—(Continued)
The tax character of distributions paid for the periods ended December 31, 2007 and 2006 was as follows:
| | | | | | | | | | | | | | | | | | | | | | |
| Ordinary Income | | Long Term Gain | | Return of Capital | | Total |
| 2007 | | 2006 | | 2007 | | 2006 | | 2007 | | 2006 | | 2007 | | 2006 |
| $ | 2,576,163 | | $ | — | | $ | 8,351,755 | | $ | 6,062,279 | | $ | — | | $ | — | | $ | 10,927,918 | | $ | 6,062,279 |
As of December 31, 2007, the components of distributable earnings (accumulated losses) on a federal income tax basis were as follows:
| | | | | | | | | | | | |
Undistributed Ordinary Income | | Undistributed
Long Term
Gain | | Unrealized
Appreciation | | Loss
Carryforwards | | Total |
| $1,905,135 | | $ | 11,419,171 | | $ | 6,411,926 | | $ | — | | $ | 19,736,232 |
Dividends and Distributions to Shareholders:
The Portfolio records dividends and distributions on the ex-dividend date. Net realized gains from security transactions (if any) are generally distributed annually to shareholders. The timing and characterization of certain income and capital gains distributions are determined in accordance with federal tax regulations that may differ from GAAP. Permanent book and tax basis differences relating to shareholder distributions will result in reclassification between under/over distributed net investment income, accumulated net realized gains/losses and paid in capital.
Expense Reductions:
Certain Portfolio trades are directed to brokers who paid a portion of the Portfolio’s expenses. Amounts paid for the Portfolio are shown as expense reductions in the Statement of Operations.
| 3. | INVESTMENT TRANSACTIONS: |
For the year ended December 31, 2007, purchases and sales of securities (excluding short term investments) for the Portfolio were as follows:
| | | | | | | | | |
| Purchases | | Sales |
| U.S. Government | | Other | | U.S. Government | | Other |
| $0 | | $ | 106,563,405 | | $ | 0 | | $ | 92,038,116 |
| 4. | INVESTMENT MANAGEMENT FEES AND OTHER TRANSACTIONS WITH AFFILIATES: |
Investment Management Agreement:
MetLife Advisers, LLC (“MetLife Advisers”) is the investment adviser to the Portfolio. The Fund has entered into an investment management agreement with MetLife Advisers with respect to the Portfolio. For providing investment management services to the Portfolio, MetLife Advisers receives monthly compensation at the following annual rates:
| | | | | | |
| | | Management
Fees earned by
MetLife Advisers
for the year ended
December 31, 2007 | | Annual
percentage
rates paid to
MetLife Advisers | | Based on Portfolios average daily net asset levels |
| | $1,435,004 | | 0.900% | | Of the first $500 million |
| | | | 0.850% | | On amounts in excess of $500 million |
Certain officers and directors of the Fund may also be officers of MetLife Advisers; however, such officers and directors receive no compensation from the Fund.
MetLife Advisers has entered into an investment subadvisory agreement with respect to the Portfolio. Franklin Advisors, Inc. is compensated by MetLife Advisers to provide subadvisory services for the Portfolio.
MSF-15
Metropolitan Series Fund, Inc.
Franklin Templeton Small Cap Growth Portfolio
Notes to Financial Statements—December 31, 2007—(Continued)
Service and Distribution Fees:
The Fund has adopted a Distribution and Service Plan under Rule 12b-1 of the 1940 Act for the Portfolio’s Class B and E shares. Under the Distribution and Service Plan, the Class B and E shares of the Portfolio pay a fee to compensate the Insurance Companies (or their affiliates) and other broker-dealers and financial intermediaries involved in the offer and sale of Portfolio shares for promoting or selling and servicing, the Class B and E shares. The fees under the Distribution and Service Plan for each class of the Portfolio’s shares are calculated as a percentage of the Portfolio’s average daily net assets that are attributable to that Class. Currently, the fee is 0.25% per year for Class B shares and 0.15% per year for Class E shares. Amounts paid by the Portfolio for the year ended December 31, 2007 are shown as Service and Distribution fees in the Statement of Operations.
The Fund has entered into a securities lending arrangement with the Fund’s custodian, State Street Bank and Trust Company (the “custodian”). Under the agreement, the custodian is authorized to loan securities on the Portfolios’ behalf. In exchange, the Portfolio receives either cash or securities as collateral against the loaned securities. The Portfolio receives collateral at least equal to 102% of the market value of the loaned securities (105% for foreign securities), at each loan’s inception. Collateral must be maintained at least at 100% of the market value of the loaned securities for the duration of the loan. The cash collateral is invested in the Navigator Securities Lending Prime Portfolio, an affiliate of the custodian, which invests in a variety of high quality U.S. dollar-denominated instruments. If the market value of the collateral at the close of trading on a business day is less than 100% of the market value of the loaned securities at the close of trading on that day, the borrower shall be required to deliver, by the close of business on the following business day, an additional amount of collateral, equal to at least 100% of the market value of all the loaned securities as of such preceding day. The Portfolio receives 80% of the annual net income from securities lending transactions, which is included in interest income of the Portfolio. The remaining 20% is paid to the custodian as compensation for its securities lending services. The Portfolio bears the risk of any deficiency in the amount of collateral available for return to a borrower due to a loss in an approved investment. Any outstanding loans by the Portfolio at December 31, 2007 are footnoted in the Schedule of Investments.
As previously reported, in May 2004, General American received a Wells Notice stating that the SEC staff was considering recommending that the SEC bring a civil action alleging violations of the U.S. securities laws against General American with respect to market timing and late trading in a limited number of privately-placed variable insurance contracts that were sold through General American. General American responded to the SEC staff and cooperated with the investigation. On August 9, 2007, the SEC announced that it had settled an enforcement action regarding late trading against General American with, among other things, General American agreeing to pay a civil penalty and to comply with certain undertakings. General American consented to the SEC’s order without admitting or denying the findings. MetLife Advisers has also advised the Fund’s Board of Directors that, while certain exceptions to the Fund’s policies have been noted, no situations have been identified that would have a material impact on the financial position of the Fund.
| 7. | RECENT ACCOUNTING PRONOUNCEMENTS: |
Effective June 29, 2007, the Fund implemented Financial Accounting Standards Board (“FASB”) Interpretation No. 48, “Accounting for Uncertainty in Income Taxes—an interpretation of FASB Statement No. 109” (“FIN 48”). FIN 48 prescribes the minimum recognition threshold a tax position must meet in connection with accounting for uncertainties in income tax positions taken or expected to be taken by an entity, including investment companies, before being measured and recognized in the financial statements. Management has evaluated the application of FIN 48 to the Fund, and has determined that the adoption of FIN 48 does not have a material impact on the Fund’s financial statements. The Fund files U.S. tax returns. No income tax returns are currently under examination. The statute of limitations on the Fund’s tax returns remains open for the years ended December 31, 2004 through December 31, 2006.
In September 2006, Statement of Financial Accounting Standards No. 157, Fair Value Measurements (SFAS 157) was issued and is effective for fiscal years beginning after November 15, 2007. SFAS 157 defines fair value, establishes a framework for measuring fair value and expands disclosures about fair value measurements. Management is currently evaluating the impact the adoption of SFAS 157 will have on the Portfolio’s financial statement disclosures.
MSF-16
Metropolitan Series Fund, Inc.
Franklin Templeton Small Cap Growth Portfolio
Report of Independent Registered Public Accounting Firm
To the Shareholders and Board of Directors of the Metropolitan Series Fund, Inc.:
We have audited the accompanying statement of assets and liabilities, including the schedule of investments, of the Franklin Templeton Small Cap Growth, one of the portfolios constituting the Metropolitan Series Fund, Inc. (the “Fund”) as of December 31, 2007, and the related statement of operations for the year then ended, the statements of changes in net assets for each of the two years in the period then ended, and the financial highlights for each of the five years in the period then ended. These financial statements and financial highlights are the responsibility of the Fund’s management. Our responsibility is to express an opinion on these financial statements and financial highlights based on our audits.
We conducted our audits in accordance with the standards of the Public Company Accounting Oversight Board (United States). Those standards require that we plan and perform the audit to obtain reasonable assurance about whether the financial statements and financial highlights are free of material misstatement. The Fund is not required to have, nor were we engaged to perform, an audit of its internal control over financial reporting. Our audits included consideration of internal control over financial reporting as a basis for designing audit procedures that are appropriate in the circumstances, but not for the purpose of expressing an opinion on the effectiveness of the Fund’s internal control over financial reporting. Accordingly, we express no such opinion. An audit also includes examining, on a test basis, evidence supporting the amounts and disclosures in the financial statements, assessing the accounting principles used and significant estimates made by management, as well as evaluating the overall financial statement presentation. Our procedures included confirmation of securities owned as of December 31, 2007, by correspondence with the custodian and brokers; where replies were not received from brokers, we performed other auditing procedures. We believe that our audits provide a reasonable basis for our opinion.
In our opinion, the financial statements and financial highlights referred to above present fairly, in all material respects, the financial position of the Franklin Templeton Small Cap Growth Portfolio of the Metropolitan Series Fund, Inc. as of December 31, 2007, the results of its operations for the year then ended, the changes in its net assets for each of the two years in the period then ended, and the financial highlights for each of the five years in the period then ended, in conformity with accounting principles generally accepted in the United States of America.
Deloitte & Touche LLP
Boston, Massachusetts
February 21, 2008
MSF-17
Metropolitan Series Fund, Inc.
Directors and Officers
The Fund’s Directors review actions of the Fund’s investment adviser and subadvisers, and decide upon matters of general policy. The Fund’s officers supervise the daily business operations of the Fund. The Board of Directors and the Fund’s officers are listed below. Each Director is responsible for overseeing all 36 Portfolios of the Fund. There is no limit to the term a Director may serve. Directors serve until their resignation, retirement or removal in accordance with the Fund’s organizational documents and policies adopted by the Board from time to time. Officers hold office at the pleasure of the Board or until the election or appointment and the qualification of a successor. The address of the directors and officers is c/o Metropolitan Series Fund, Inc., 501 Boylston Street, Boston, MA 02116.
Interested Directors(1)
Each Director below is an “interested person” (as defined by the 1940 Act) with respect to the Fund in that Ms. Forget is an employee of MetLife and Mr. Typermass is a former employee of MetLife and owns securities issued by MetLife, Inc., the ultimate parent company of MetLife Advisers.
| | | | | | | | |
Name, Address and Age | | Current
position(s)
with Fund | | Position(s)
held since | | Principal occupations
over past five years, including other directorships(2) | | Number of
Portfolios in
Fund Complex
Overseen by
Director(3) |
Elizabeth M. Forget Age: 41 | | Director, Chairman of the Board, President and Chief Executive Officer | | 2006 | | Senior Vice President (since 2007), MetLife, Inc.; President, Met Investors Advisory, LLC (“MIA”); Trustee and President, Met Investors Series Trust (“MIST”); Executive Vice President, MetLife Investors Group, Inc.; President (since 2006), MetLife Advisers. | | 81 |
| | | | |
Arthur G. Typermass Age: 70 | | Director | | 1998 | | Formerly, Senior Vice President and Treasurer, MetLife. | | 37 |
Non-Interested Directors(1)
Each Director below is not an “interested person” (as defined by the 1940 Act) with respect to the Fund (collectively, the “Independent Directors”).
| | | | | | | | |
Name, Address and Age | | Current
position(s)
with Fund | | Position(s)
held since | | Principal occupations
over past five years, including other directorships(2) | | Number of
Portfolios in
Fund Complex
Overseen by
Director(3) |
Steve A. Garban† Age: 70 | | Director | | 1985 | | Formerly, Chief Financial Officer, Senior Vice President Finance and Operations and Treasurer (Emeritus), The Pennsylvania State University. | | 37 |
| | | | |
Linda B. Strumpf Age: 60 | | Director | | 2000 | | Vice President and Chief Investment Officer, Ford Foundation. | | 37 |
| | | | |
Michael S. Scott Morton† Age: 70 | | Director | | 1993 | | Jay W. Forrester Professor of Management (Emeritus) at Sloan School of Management, MIT. | | 37 |
| | | | |
H. Jesse Arnelle Age: 74 | | Director | | 2001 | | Formerly, Counsel, Womble Carlyle Sandrie & Rice; Director, Textron Inc. (global multi-industry company)*; formerly, Director, Gannet Co. Inc. (diversified news and information company)*; formerly, Director, Eastman Chemical Company (global chemical company)*; formerly, Director, Waste Management, Inc.*; formerly, Director, Armstrong Holdings Inc. (parent company of floor and ceiling products business)*; formerly, Director, FPL Group Inc. (public utility holding company)*; Director, URS Corporation (engineering design services firm)*. | | 37 |
| | | | |
Nancy Hawthorne Age: 56 | | Director | | 2003 | | Director, Avid Technologies (computer software company)*; formerly, Chairman of the Board of Avid Technologies; formerly, Board of Advisors, L. Knife & Sons, Inc. (beverage distributor); Chief Executive Officer, Clerestory LLC (corporate financial advisor); formerly, Trustee, New England Zenith Fund (“Zenith Fund”)**; formerly, Chief Executive Officer and Managing Partner, Hawthorne, Krauss and Associates (corporate financial advisor); formerly, Chief Financial Officer and Executive Vice President, Continental Cablevision, subsequently renamed MediaOne (cable television company); formerly, Director, Life F/X, Inc.; formerly, Chairman of the Board, WorldClinic (distance medicine company); formerly, Director, Perini Corporation (construction company)*; formerly, Director, CGU (property and casualty insurance company); formerly, Director, Beacon Power Corporation (energy company )*. | | 37 |
MSF-18
Metropolitan Series Fund, Inc.
Directors and Officers—(Continued)
| | | | | | | | |
Name, Address and Age | | Current
position(s)
with Fund | | Position(s)
held since | | Principal occupations
over past five years, including other directorships(2) | | Number of
Portfolios in
Fund Complex
Overseen by
Director(3) |
John T. Ludes Age: 71 | | Director | | 2003 | | President, LFP Properties (consulting firm); Formerly, Trustee, Zenith Fund**; formerly, Vice Chairman, President and Chief Operating Officer, Fortune Brands/American Brands (global conglomerate); formerly, President and CEO, Acushnet Company (athletic equipment company). | | 37 |
Officers(1)
| | | | | | | | |
Name and address | | Age | | Current
position(s)
with Fund | | Position(s)
held since | | Principal occupations over past five years(2) |
| Jeffrey P. Halperin | | 40 | | Chief Compliance Officer | | 2006 | | Vice President (since 2006), Corporate Ethics and Compliance Department, MetLife, Inc.; Chief Compliance Officer (since 2006), MetLife Advisers, MIA and MIST. |
| | | | |
| John F. Guthrie, Jr. | | 64 | | Senior Vice President | | 2002 | | Manager and Senior Vice President, MetLife Advisers; Vice President, MetLife; Vice President (since 2003), MetLife Group, Inc.; Vice President, NELICO; Vice President (since 2005), MIA; formerly, Senior Vice President, Zenith Fund**. |
| | | | |
| Alan C. Leland | | 55 | | Senior Vice President | | 2005 | | Treasurer and Chief Financial Officer, MetLife Advisers, LLC; Treasurer (since 2005), Met Investors Advisory, LLC; Vice President (since 2004), MIA; Vice President (since 2003), MetLife Group, Inc.; Vice President, MetLife; Senior Vice President, NELICO |
| | | | |
| Peter Duffy | | 52 | | Vice President and Treasurer | | 2000 | | Senior Vice President, MetLife Advisers (since 1998); Second Vice President (since 2003), NELICO; Vice President, MetLife (since 2004); Vice President (since 2004), MetLife Group, Inc.; formerly, Vice President and Treasurer, Zenith Fund**. |
| | | | |
| Thomas M. Lenz | | 49 | | Vice President and Secretary | | 2002 | | General Counsel and Secretary, MetLife Advisers; Assistant General Counsel, MetLife; formerly, Vice President and Secretary, Zenith Fund**. |
| * | Indicates a directorship with a registered investment company or a company subject to the reporting requirements of the Securities Exchange Act of 1934, as amended. |
| ** | The Zenith Fund deregistered with the Securities and Exchange Commission (“SEC”) in 2004. |
| (†) | Served as a trustee, director and/or officer of one or more of the following companies, each of which had a direct or indirect advisory relationship with MetLife Advisers or its affiliates prior to January 31, 2005: State Street Research Financial Trust, State Street Research Income Trust, State Street Research Money Market Trust, State Street Research Institutional Funds, State Street Research Capital Trust, State Street Research Master Investment Trust, State Street Research Equity Trust, State Street Research Securities Trust and State Street Research Exchange Trust (collectively, the “State Street Research Funds”). |
| (1) | Each Director of the Fund also serves as trustee of Metropolitan Series Fund II (“Met Series Fund II”), a registered investment company advised by MetLife Advisers. Each officer of the Fund serves in the same position with Met Series Fund II, which consists of one portfolio. |
| (2) | Previous positions during the past five years with the Fund, MIST, MetLife, MetLife Advisers, MIA, Zenith Fund, NELICO or New England Securities Corporation are omitted if not materially different. |
| (3) | The Fund Complex includes the Fund (36 portfolios), Met Series Fund II (1 portfolio) and MIST (44 portfolios) |
MSF-19
Metropolitan Series Fund, Inc.
Franklin Templeton Small Cap Growth Portfolio
Board Approval of Advisory and Subadvisory Agreements
The Fund’s Contract Review Committees of the Board of Directors (the “Board”) typically meet in early fall to review the Portfolios’ advisory agreements (the “Advisory Agreements”) and subadvisory agreements (collectively, the “Subadvisory Agreements,” and, together with the Advisory Agreements, the “Agreements”) and determine whether to recommend that the full Board approve the continuation of the Agreements for an additional one-year period. (Following the initial approval of an Agreement for a new Portfolio or with a new adviser or subadviser, such annual reviews are not required until 2 years following the execution of such Agreement.) After each Committee has made its recommendations, the full Board, including the Independent Directors, determines whether to approve the continuation of each of the Agreements. In addition, the Board, including the Independent Directors, considers matters bearing on the Agreements at most of its other meetings throughout the year and regularly interviews various individuals at MetLife Advisers responsible for the management of the Portfolios. The Directors also interview selected investment managers and other professionals at the subadvisers at various times throughout the year.
The Directors receive all materials that they or MetLife Advisers, the Fund’s investment adviser, and the subadvisers believe to be reasonably necessary for the Directors to evaluate the Agreements and determine whether to approve the continuation of the Agreements. These materials generally include, among other items, (i) information on the investment performance of the Portfolios and the performance of peer groups of funds and the Portfolios’ performance benchmarks, (ii) information on the Portfolios’ advisory and subadvisory fees and other expenses, including information comparing the Portfolios’ expenses to those of peer groups of funds and information about any applicable expense caps and fee “breakpoints,” (iii) sales and redemption data, (iv) information related to the profitability of the Agreements to MetLife Advisers and the subadvisers, and potential “fall-out” or ancillary benefits that MetLife Advisers, the subadvisers or their affiliates may receive as a result of their relationships with the Fund and (v) information obtained through the subadvisers’ responses to certain requests from MetLife Advisers and the Directors and MetLife Advisers’ responses to requests from the Directors. The Directors may also consider other information such as (vi) MetLife Advisers’ and the subadvisers’ financial results and condition, (vii) each Portfolio’s investment objectives and strategies and the size, education and experience of the investment staffs of MetLife Advisers and the relevant subadvisers and their use of technology and external research, (viii) the allocation of the Portfolios’ brokerage, if any, including allocations to brokers affiliated with the subadvisers and the use of “soft” commission dollars to pay Portfolio expenses and to pay for research and other similar services, (ix) the resources devoted to, and the record of compliance with, the Portfolios’ investment policies and restrictions, policies on personal securities transactions and other compliance policies, (x) the responses of MetLife Advisers, the subadvisers and/or their affiliates to certain legal and regulatory proceedings and (xi) the economic outlook generally and for the mutual fund industry in particular. Throughout the process, the Directors have the opportunity to ask questions of and request additional materials from MetLife Advisers and the subadvisers.
Following meetings of each Contract Review Committee on September 12, 2007, the Board, at its November 15, 2007 meeting, approved the continuation through December 31, 2008 of the Advisory Agreements for each Portfolio of the Fund and the Subadvisory Agreements for each Portfolio of the Fund. The Agreements approved for continuation are referred to below as the “Continued Agreements.”
In considering whether to approve the continuation of the Continued Agreements, the Directors, including the Independent Directors, did not identify any single factor as determinative, and each weighed the various factors as he or she deemed appropriate. The Directors considered the following matters in connection with their approval of the Continued Agreements:
The nature, extent and quality of the services provided to the relevant Portfolios under the Continued Agreements. The Directors considered the nature, extent and quality of the services provided by MetLife Advisers, the relevant subadvisers (if any) and their affiliates (each, an “Adviser,” and, collectively, the “Advisers”) to the relevant Portfolios pursuant to the Continued Agreements and the resources dedicated to these Portfolios by the Advisers. In particular, the Directors considered the Advisers’ abilities to attract and retain highly qualified investment professionals. With respect to MetLife Advisers, the Directors considered that MetLife Advisers is (i) ultimately responsible for the performance of such Portfolios; (ii) ultimately responsible for the establishment of the investment strategies of each such Portfolio, primarily through its recommendations to the Board regarding the hiring and selection of subadvisers; (iii) responsible for the hiring and selection, subject to Board approval, of subadvisers; and (iv) responsible for maintaining a program of Subadviser oversight reasonably designed to ensure that the subadvisers have reasonable compliance policies and procedures in place. The Directors also considered that MetLife Advisers provides a full range of day-to-day administrative services for the Portfolios involving all aspects of such Portfolios’ day-to-day operations (other than portfolio management). After reviewing these and related factors, the Directors concluded, within the context of their overall conclusions regarding each of the Continued Agreements, that the nature, extent and quality of services provided supported the renewal of these Agreements.
MSF-20
Metropolitan Series Fund, Inc.
Franklin Templeton Small Cap Growth Portfolio
Board Approval of Advisory and Subadvisory Agreements—(Continued)
Investment performance of the relevant Portfolios. The Directors reviewed information about the performance of the relevant Portfolios over various time periods, including information prepared by an independent third party that compared the performance of the Portfolios to the performance of peer groups of funds and performance benchmarks. The Directors also reviewed a description of the third party’s methodology for identifying a Portfolio’s peer group(s) for purposes of performance and expense comparisons.
In the case of each relevant Portfolio that had performance that lagged its peer group(s) for certain periods, the Directors concluded that other factors relevant to performance were sufficient, in light of other considerations, to warrant renewal of the Continued Agreements relating to such Portfolio. These factors varied from Portfolio to Portfolio, but included one or more of the following: (i) that such Portfolio’s performance, although lagging in certain recent periods, was stronger over the longer term; (ii) that the underperformance was attributable, to a significant extent, to investment decisions that were reasonable and consistent with the Portfolio’s investment objective(s) and policies and that the Portfolio was performing within the range of reasonable expectations, given market conditions and the Portfolio’s investment objective(s) and policies; (iii) that the Portfolio’s performance was competitive when compared to other relevant performance benchmarks or peer groups; and (iv) that MetLife Advisers and/or the relevant subadviser (if any) had taken or was taking steps designed to help improve the Portfolio’s investment performance.
The Directors also considered the investment performance of the Advisers and their reputations generally, the historical responsiveness of the Advisers to Director concerns about performance and the willingness of the Advisers to take steps intended to improve performance.
After reviewing these and related factors, the Directors concluded, within the context of their overall conclusions regarding each of the Continued Agreements, that the investment performance of each relevant Portfolio and Adviser was sufficient, in light of other considerations, to warrant the renewal of the Continued Agreements.
The costs of the services to be provided and profits to be realized by the Advisers and their affiliates from their relationships with the Portfolios. The Directors considered the fees charged by MetLife Advisers to the Portfolios for advisory services and, with respect to the subadvised Portfolios, by such subadvisers to MetLife Advisers for subadvisory services (such advisory and subadvisory fees (if any), collectively, “Fees”), as well as the total expense levels of the Portfolios. This information included comparisons (provided by an independent third party) of the Portfolios’ advisory fees and total expense levels to those of their peer groups. In evaluating Fees for the relevant Portfolios, the Directors also took into account the demands, complexity and quality of the investment management services provided to each Portfolio. The Directors considered MetLife Advisers’ recommendations regarding reductions in Fee rates, implementation of Fee breakpoints and institution of Fee waivers and expense caps.
The Directors also considered the compensation directly or indirectly received by the Advisers and their affiliates from their relationships with the relevant Portfolios. The Directors reviewed information relating to the profits received by MetLife Advisers, certain of the subadvisers and their affiliates as a result of their relationships with the relevant Portfolios, and information about the allocation of expenses used to calculate profitability. When reviewing profitability, the Directors also considered the performance of the relevant Portfolios, the expense levels of such Portfolios and whether the relevant Advisers had implemented breakpoints, fee waivers and/or expense caps with respect to such Portfolios.
After reviewing these and related factors, the Directors concluded, within the context of their overall conclusions regarding each of the Continued Agreements, that the Fees charged to each of the relevant Portfolios were fair and reasonable, and that the information provided regarding costs of these services generally, and the related profitability (if known) to the relevant Advisers of their relationships with the relevant Portfolios, supported the renewal of the Continued Agreements.
Economies of Scale. The Directors considered the existence of any economies of scale in the provision of services by the Advisers and whether those economies were shared with the relevant Portfolios through breakpoints in their advisory fees or other means, such as expense caps, fee waivers or relatively low levels of fees. The Directors noted that most of the relevant Portfolios benefited or will benefit from breakpoints, expense caps and/or fee waivers with respect to their advisory fees. In considering these issues, the Directors also took into consideration information relating to the costs of the services provided and the profitability to MetLife Advisers, the relevant subadvisers (if any) and each of their affiliates of their relationships with the relevant Portfolios, as discussed above.
After reviewing these and related factors, the Directors concluded, within the context of their overall conclusions regarding each of the Continued Agreements, that the extent to which economies of scale were shared with the relevant Portfolios supported the renewal of such Agreements.
MSF-21
Metropolitan Series Fund, Inc.
Franklin Templeton Small Cap Growth Portfolio
Board Approval of Advisory and Subadvisory Agreements—(Continued)
Other Factors. The Directors also considered other factors, which included but were not limited to the following:
| | • | | the extent to which each relevant Portfolio operated in accordance with its investment objective, and its record of compliance with its investment restrictions and the compliance programs of the Fund and the Advisers. They also considered the compliance-related resources the Advisers and their affiliates provide to the relevant Portfolios; |
| | • | | the nature, quality, cost and extent of administrative and shareholder services performed by MetLife Advisers and its affiliates under the Advisory Agreements; and |
| | • | | so-called “fall-out benefits” to the Advisers, such as the engagement of their affiliates to provide distribution, brokerage and transfer agency services to the Portfolios, and the benefits of research made available to the relevant Advisers by reason of brokerage commissions generated by the relevant Portfolios’ securities transactions. The Directors also considered the possible conflicts of interest associated with these fall-out and other benefits, and the reporting and other processes in place to disclose and monitor these possible conflicts of interest. |
Based on their evaluation of all factors that they deemed to be material, including those factors described above, and assisted by the advice of independent counsel, the Directors, including the Independent Directors, concluded that each of the Continued Agreements should be continued through December 31, 2008.
MSF-22
A description of the policies and procedures that the Fund uses to determine how to vote proxies relating to portfolio securities is available (i) without charge, upon request, by calling (800) 638-7732 and (ii) on the Securities and Exchange Commission’s (the “SEC”) website at http://www.sec.gov.
Information regarding how the Fund voted proxies relating to portfolio securities during the most recent twelve-month period ended December 31, 2007 is available (i) without charge, upon request, by calling (800) 638-7732 and (ii) on the SEC’s website at http://www.sec.gov.
The Fund files with the SEC a complete schedule of its portfolio holdings, as of the close of the first and third quarters of its fiscal year, on “Form N-Q”. These filings are available on the SEC’s website at www.sec.gov and may be reviewed and copied at the SEC’s Public Reference Room in Washington, DC. (Call 1-800-SEC-0330 for information on the operation of the Public Reference Room.)
MSF-23
| | |
Metropolitan Series Fund, Inc. Harris Oakmark Focused Value Portfolio Annual Report | | December 31, 2007 |
Letter from the President
February 1, 2008
Letter to Policy Holders:
2007 was a tumultuous year in the financial markets driven by concerns in the credit markets surrounding sub-prime mortgages and fears of recession in the U.S. Economy. The broad markets were mixed, with the Dow Jones Industrial Average up 8.9% and the MSCI EAFE Index, which measures the performance of international equities, up 11.2% for the year, while the Russell 2000 Index, which measures the performance of small capitalization stocks, was down 1.6%.
In the fixed income markets, credit spreads increased as a result of the pressure from sub-prime mortgage crisis and the Federal Reserve lowered interest rates by a total of 1% during the year. The Lehman Brothers Aggregate Bond Index posted a 7.0% return for the year.
On the following pages, you will find a complete review of your Portfolio and its investment performance.
MetLife is committed to building your financial freedom. We appreciate your trust and will continue to focus our efforts on meeting your investment needs.
Sincerely,
Elizabeth Forget
President, Metropolitan Series Fund, Inc.
Metropolitan Series Fund, Inc.
Harris Oakmark Focused Value Portfolio
Managed by Harris Associates, L.P.
Portfolio Manager Commentary*
PORTFOLIO PERFORMANCE
For the year ended December 31, 2007, the Class A shares of the Harris Oakmark Focused Value Portfolio returned -6.8%, compared to its benchmark, the Russell Midcap Index1, which returned 5.6%. The average return of its peer group, the Lipper Variable Insurance Products Mid-Cap Value Funds Universe2, was 2.8% over the same period.
PORTFOLIO REVIEW
The Standard & Poor’s 500 Index3 gained 5.5% during 2007, but a single number fails to describe the increasing divergence between the market’s winners and losers (the statistical performance spread between the top and bottom performers widened substantially in the last half of 2007, frustrating value-minded investors who expect valuation excesses to eventually correct).
As of December 31, 2007, the Portfolio held 26 securities across a variety of industries. During the year, there were a number of changes to the composition of the Portfolio. We initiated positions in Avon Products, Dell, Hospira, Liberty Capital Group, Liberty Interactive Group, MDS Inc., Merrill Lynch, Micron Technology, PerkinElmer, Robert Half International, Teradata Corporation, Tiffany & Company, and Virgin Media. Other Portfolio activity during the period includes the receipt of shares in Discover Financial Services, which was spun off from current holding Morgan Stanley. We eliminated our positions in Bausch & Lomb, Black & Decker, Conseco, D.R. Horton, EnCana, Harrah’s Entertainment, Estee Lauder, Liz Claiborne, Molson Coors, Omnicare, PartnerRe, E.W. Scripps, Tyco International, and Washington Mutual during the period. Additionally, CDW and Huntsman were acquired and are no longer held in the portfolio.
Intel, McDonald’s, and Yum! Brands had the most positive impact on performance during the period. Intel delivered solid positive performance throughout the year. The firm consistently reported better than expected earnings during 2007, and in the most recent quarter reported strong quarterly earnings (up 41%) with gross margins expected to be around 52% for the full year. We believe Intel will benefit from the explosion of processor power needed at the client level and the internet service level. The trend toward mobile computing should also be a positive for the company.
McDonald’s produced solid earnings as it continued to successfully execute its strategy for operational improvements. The big drivers of future earnings will be menu-driven in the U.S. and kitchen-driven in Europe. In the U.S., the company will be rolling out its premium beverages along with new menu items, while in Europe the focus will be on kitchen remodels required for premium chicken products.
Yum! Brands continued to show strong international growth, especially in China. Management expects to increase franchise ownership in the U.S. to over 90% by 2010, which we think should increase overall growth for the company.
Timberland, Micron Technology, and Virgin Media had the most negative impact on performance during the period. Revenue estimates for Timberland were lowered for the year, as the company responded to weak Fall/Winter season orders. The company does expect to see some unit growth in the struggling urban youth boot segment by spring. We view Timberland as an exceptional franchise with an extremely attractive valuation.
Lower memory chip prices continue to hurt Micron’s results. Weak prices for both DRAM and NAND chips overwhelmed good progress the company has made on controlling expenses. Given Micron’s strong technology position, improved cost structure, and cash position, we believe the stock is poised to be a good performer once the chip supply/demand situation becomes more balanced.
Virgin Media continues to be for sale, but with less liquidity in the system the buyout potential has lessened, in our opinion. We continue to believe it is an attractive acquisition candidate and is selling at a significant discount to underlying business value.
* The views expressed above are those of the subadvisory firm as of December 31, 2007 and are subject to change based on market and other conditions. Information about the Portfolio’s holdings, asset allocation, industry allocation, or country diversification is historical and is not an indication of future Portfolio composition, which will vary. The performance of any index mentioned in this commentary has not been adjusted for ongoing management, distribution and operating expenses, and sales charges applicable to mutual fund investments. Direct investment in the Index is not possible.
1 The Russell Midcap® Index is an unmanaged measure of performance of the 800 smallest companies in the Russell 1000 Index.
2 The Lipper Variable Insurance Products Fund Average is an average of the total return performance (calculated on the basis of net asset value) of variable product funds with similar investment objectives to those of the subject Portfolio as calculated by Lipper Analytical Services, an independent mutual fund ranking service.
3 The Standard & Poor’s (S&P) 500® Stock Index is an unmanaged index representing the performance of 500 major companies, most of which are listed on the New York Stock Exchange.
MSF-2
Metropolitan Series Fund, Inc.
Harris Oakmark Focused Value Portfolio
A $10,000 INVESTMENT COMPARED TO
THE RUSSELL MIDCAP INDEX
Average Annual Returns as of December 31, 2007
| | | | | | | | | | | | |
| | | Harris Oakmark
Focused Value Portfolio | | | Russell
MidCap Index | |
| | | Class A | | | Class B | | | Class E | | |
| 1 Year | | -6.8 | % | | -7.1 | % | | -7.0 | % | | 5.6 | % |
| 5 Year | | 10.9 | | | 10.7 | | | 10.8 | | | 18.2 | |
| 10 Year | | 8.4 | | | — | | | — | | | 9.9 | |
| Since Inception | | — | | | 8.5 | | | 8.4 | | | — | |
Performance numbers are net of all Portfolio expenses but do not include any insurance, sales, or administrative charges of variable annuity or life insurance contracts. If these charges were included, the returns would be lower.
Inception dates of the Class A, Class B and Class E shares are: 4/30/93, 2/20/01 and 5/1/01, respectively.
This information represents past performance and is not indicative of future results. Investment return and principal value may fluctuate so that shares, upon redemption, may be worth more or less than the original cost.
PORTFOLIO COMPOSITION as of December 31, 2007
Top Holdings
| | |
| | | % of Total
Net Assets |
Intel Corp. | | 8.1% |
Liberty Media Capital (Series A) | | 5.8% |
National Semiconductor Corp. | | 5.6% |
PerkinElmer, Inc. | | 5.2% |
Liberty Media Interactive (Class A) | | 5.1% |
Virgin Media, Inc. | | 4.8% |
Yum! Brands, Inc. | | 4.7% |
Robert Half International, Inc. | | 4.7% |
Hospira, Inc. | | 4.7% |
Avon Products, Inc. | | 4.5% |
Top Sectors
| | |
| | | % of Equity
Market Value |
Consumer Discretionary | | 35.5% |
Information Technology | | 25.7% |
Health Care | | 17.1% |
Financials | | 8.6% |
Industrials | | 5.1% |
Consumer Staples | | 4.9% |
Materials | | 3.1% |
MSF-3
Metropolitan Series Fund, Inc.
Shareholder Expense Example
As a shareholder of the Portfolio, you incur ongoing costs, including management fees; distribution and service (12b-1) fees; and other Portfolio expenses. This example is intended to help you understand your ongoing costs (in dollars) (referred to as “expenses”) of investing in the Portfolio and compare these costs with the ongoing costs of investing in other mutual funds. The example is based on an investment of $1,000 invested at the beginning of the period and held for the entire period, July 1, 2007 through December 31, 2007.
Actual Expenses
The first line for each share class of the Portfolio in the table below provides information about actual account values and actual expenses. You may use the information in this line, together with the amount you invested in the particular share class of the Portfolio, to estimate the expenses that you paid over the period. Simply divide your account value by $1,000 (for example, an $8,600 account value divided by $1,000=8.6), then multiply the result by the number in the first line under the heading entitled “Expenses Paid During Period” to estimate the expenses you paid on your account during this period.
Hypothetical Example for Comparison Purposes
The second line for each share class of the Portfolio in the table below provides information about hypothetical account values and hypothetical expenses based on the Portfolio’s actual expense ratio and an assumed rate of return of 5% per year before expenses, which is not the Portfolio’s actual return. The hypothetical account values and expenses may not be used to estimate the actual ending account balance or expenses you paid for the period. You may use this information to compare the ongoing costs of investing in the Portfolio and other funds. To do so, compare this 5% hypothetical example with the 5% hypothetical examples that appear in the shareholder reports of the other funds.
Please note that the expenses shown in the table are meant to highlight your ongoing costs only and do not reflect any fees or charges of your variable insurance product or any additional expenses that participants in certain eligible qualified plans may bear relating to the operations of their plan. Therefore, the second line for each share class in the table is useful in comparing ongoing costs only, and will not help you determine the relative total costs of owning different funds. In addition, if these other costs were included, your costs would have been higher.
| | | | | | | | | | | | | | |
Portfolio | | | | Annualized
Expense
Ratio | | | Beginning
Account Value
July 1,
2007 | | Ending
Account Value
December 31,
2007 | | Expenses Paid
During Period*
July 1, 2007
to
December 31,
2007 |
Harris Oakmark Focused Value—Class A(a) | | Actual | | 0.76 | % | | $ | 1,000.00 | | $ | 875.40 | | $ | 3.59 |
| | Hypothetical | | 0.76 | % | | $ | 1,000.00 | | $ | 1,021.33 | | $ | 3.87 |
| | | | | |
Harris Oakmark Focused Value—Class B(a) | | Actual | | 1.01 | % | | $ | 1,000.00 | | $ | 874.30 | | $ | 4.77 |
| | Hypothetical | | 1.01 | % | | $ | 1,000.00 | | $ | 1,020.05 | | $ | 5.14 |
| | | | | |
Harris Oakmark Focused Value—Class E(a) | | Actual | | 0.91 | % | | $ | 1,000.00 | | $ | 874.70 | | $ | 4.30 |
| | Hypothetical | | 0.91 | % | | $ | 1,000.00 | | $ | 1,020.56 | | $ | 4.63 |
* Expenses paid are equal to the Portfolio’s annualized expense ratio for the most recent six month period, as shown above, multiplied by the average account value over the period, multiplied by the number of days in the most recent fiscal half-year, divided by 365 (to reflect the one-half year period).
(a) The annualized expense ratio shown reflects the impact of the management fee waiver as described in Note 4 to the Financial Statements.
MSF-4
Metropolitan Series Fund, Inc.
Harris Oakmark Focused Value Portfolio
Schedule of Investments as of December 31, 2007
Common Stock—93.0% of Total Net Assets
| | | | | |
| Security Description | | Shares | | Value* |
| | | | | |
| | |
Capital Markets—4.7% | | | | | |
Merrill Lynch & Co., Inc. | | 763,100 | | $ | 40,963,208 |
Morgan Stanley | | 997,300 | | | 52,966,603 |
| | | | | |
| | | | | 93,929,811 |
| | | | | |
| | |
Chemicals—2.9% | | | | | |
International Flavors & Fragrances, Inc. (a) | | 1,200,000 | | | 57,756,000 |
| | | | | |
| |
Commercial Services & Supplies—4.7% | | | |
Robert Half International, Inc. | | 3,500,000 | | | 94,640,000 |
| | | | | |
| | |
Computers & Peripherals—4.7% | | | | | |
Dell, Inc. (b) | | 2,785,700 | | | 68,277,507 |
Teradata Corp. (b) | | 973,670 | | | 26,688,295 |
| | | | | |
| | | | | 94,965,802 |
| | | | | |
| | |
Consumer Finance—2.8% | | | | | |
Discover Financial Services | | 3,742,599 | | | 56,438,393 |
| | | | | |
| |
Health Care Equipment & Supplies—4.6% | | | |
Hospira, Inc. (b) | | 2,200,000 | | | 93,808,000 |
| | | | | |
| |
Health Care Providers & Services—3.1% | | | |
Tenet Healthcare Corp. (a) (b) | | 12,500,300 | | | 63,501,524 |
| | | | | |
| | |
Hotels, Restaurants & Leisure—6.5% | | | | | |
McDonald’s Corp. | | 600,000 | | | 35,346,000 |
Yum! Brands, Inc. | | 2,500,000 | | | 95,675,000 |
| | | | | |
| | | | | 131,021,000 |
| | | | | |
| | |
Internet & Catalog Retail—5.1% | | | | | |
Liberty Media Interactive (Class A) (b) | | 5,353,300 | | | 102,140,964 |
| | | | | |
| | |
Life Sciences Tools & Services—8.0% | | | | | |
MDS, Inc. | | 3,000,000 | | | 58,350,000 |
PerkinElmer, Inc. | | 4,000,000 | | | 104,080,000 |
| | | | | |
| | | | | 162,430,000 |
| | | | | |
| | |
Media—15.4% | | | | | |
Cablevision Systems Corp. (Class A) (b) | | 1,600,000 | | | 39,200,000 |
Liberty Media Capital (Series A) (b) | | 1,000,000 | | | 116,490,000 |
Time Warner, Inc. | | 3,455,200 | | | 57,045,352 |
Virgin Media, Inc. (a) | | 5,700,000 | | | 97,698,000 |
| | | | | |
| | | | | 310,433,352 |
| | | | | |
| | |
Personal Products—4.5% | | | | | |
Avon Products, Inc. | | 2,300,000 | | | 90,919,000 |
| | | | | |
|
Semiconductors & Semiconductor Equipment—19.3% |
Intel Corp. | | 6,100,000 | | | 162,626,000 |
International Rectifier Corp. (b) | | 1,355,082 | | | 46,032,135 |
Micron Technology, Inc. (a) (b) | | 9,200,000 | | | 66,700,000 |
National Semiconductor Corp. | | 5,000,000 | | | 113,200,000 |
| | | | | |
| | | | | 388,558,135 |
| | | | | |
| | | | | | | |
| Security Description | | Shares | | Value* | |
| | | | | | | |
| | |
Specialty Retail—2.7% | | | | | | | |
Tiffany & Co. | | | 1,183,100 | | $ | 54,458,093 | |
| | | | | | | |
| |
Textiles, Apparel & Luxury Goods—3.5% | | | | |
Timberland Co. (Class A) (a) (b) | | | 3,900,000 | | | 70,512,000 | |
| | | | | | | |
| | |
Thrifts & Mortgage Finance—0.5% | | | | | | | |
Sovereign Bancorp, Inc. (a) | | | 899,021 | | | 10,248,840 | |
| | | | | | | |
Total Common Stock
(Identified Cost $1,883,895,592) | | | | | | 1,875,760,914 | |
| | | | | | | |
| |
| Short Term Investments—13.4% | | | | |
| Security Description | | Shares/ Face Amount | | Value* | |
| |
Mutual Funds—4.8% | | | | |
State Street Navigator Securities Lending Prime Portfolio (c) | | | 96,874,291 | | | 96,874,291 | |
| | | | | | | |
| |
Repurchase Agreement—8.6% | | | | |
State Street Repurchase Agreement dated 12/31/07 at 1.700% to be repurchased at $174,234,454 on 1/2/08, collateralized by $60,540,000 U.S. Treasury Bond 7.625% due 11/15/22 with a value of $80,291,175; by $50,000,000 U.S. Treasury Bond 7.125% due 2/15/23 with a value of $64,500,000; by $24,715,000 U.S. Treasury Bond 6.25% due 8/15/23 with a value of $30,148,445; and by $2,350,000 U.S. Treasury Bond 6.00% due 2/15/26 with a value of $2,767,125. | | $ | 174,218,000 | | | 174,218,000 | |
| | | | | | | |
Total Short Term Investments
(Identified Cost $271,092,291) | | | | | | 271,092,291 | |
| | | | | | | |
Total Investments—106.4%
(Identified Cost $2,154,987,883) (d) | | | | | | 2,146,853,205 | |
Liabilities in excess of other assets | | | | | | (129,983,100 | ) |
| | | | | | | |
| Total Net Assets—100% | | | | | $ | 2,016,870,105 | |
| | | | | | | |
| (a) | A portion or all of the security was held on loan. As of December 31, 2007, the market value of securities loaned was $130,930,486 and the collateral received consisted of cash in the amount of $ 96,874,291 and non cash collateral with a value of $37,640,487. The cash collateral is invested in a money market fund managed by an affiliate of the custodian. The non cash collateral received consists primarily of government securities and bank letters of credit, and are held for the benefit of the Portfolio at the Portfolio’s custodian. |
| (c) | Represent investment of cash collateral received from securities lending. |
| (d) | The aggregate cost of investments for federal income tax purposes as of December 31, 2007 was $2,154,987,883 and the composition of unrealized appreciation and depreciation of investment securities was $183,216,554 and $(191,351,232), respectively. |
*See accompanying notes to financial statements.
MSF-5
Metropolitan Series Fund, Inc.
Harris Oakmark Focused Value Portfolio
Statement of Assets & Liabilities
December 31, 2007
| | | | | | | |
Assets | | | | | | | |
Investments at value (a) (b) | | | | | $ | 2,146,853,205 | |
Receivable for: | | | | | | | |
Securities sold | | | | | | 6,887,600 | |
Fund shares sold | | | | | | 6,049,661 | |
Accrued interest and dividends | | | | | | 959,453 | |
| | | | | | | |
Total Assets | | | | | | 2,160,749,919 | |
Liabilities | | | | | | | |
Payable for: | | | | | | | |
Securities purchased | | $ | 44,361,883 | | | | |
Fund shares redeemed | | | 1,100,628 | | | | |
Collateral for securities loaned | | | 96,874,291 | | | | |
Due to custodian bank | | | 87,489 | | | | |
Accrued expenses: | | | | | | | |
Management fees | | | 1,240,129 | | | | |
Service and distribution fees | | | 147,321 | | | | |
Deferred directors’ fees | | | 23,461 | | | | |
Other expenses | | | 44,612 | | | | |
| | | | | | | |
Total Liabilities | | | | | | 143,879,814 | |
| | | | | | | |
Net Assets | | | | | $ | 2,016,870,105 | |
| | | | | | | |
Net assets consists of: | | | | | | | |
Capital paid in | | | | | $ | 1,833,223,057 | |
Undistributed net investment income | | | | | | 4,251,884 | |
Accumulated net realized gains | | | | | | 187,529,842 | |
Unrealized depreciation on investments | | | | | | (8,134,678 | ) |
| | | | | | | |
Net Assets | | | | | $ | 2,016,870,105 | |
| | | | | | | |
| Computation of offering price: | | | | | | | |
Class A | | | | | | | |
Net asset value and redemption price per share ($1,249,121,831 divided by 5,692,502 shares outstanding) | | | | | $ | 219.43 | |
| | | | | | | |
Class B | | | | | | | |
Net asset value and redemption price per share ($549,779,244 divided by 2,564,829 shares outstanding) | | | | | $ | 214.35 | |
| | | | | | | |
Class E | | | | | | | |
Net asset value and redemption price per share ($217,969,030 divided by 1,005,708 shares outstanding) | | | | | $ | 216.73 | |
| | | | | | | |
(a) Identified cost of investments | | | | | $ | 2,154,987,883 | |
| | | | | | | |
| (b) | Includes cash collateral for securities loaned of $96,874,291. |
Statement of Operations
For the Year Ended December 31, 2007
| | | | | | | | |
Investment Income | | | | | | | | |
Dividends | | | | | | $ | 19,203,163 | |
Interest | | | | | | | 3,460,140 | (a) |
| | | | | | | | |
| | | | | | | 22,663,303 | |
Expenses | | | | | | | | |
Management fees | | $ | 15,680,582 | | | | | |
Service and distribution fees—Class B | | | 1,585,331 | | | | | |
Service and distribution fees—Class E | | | 381,178 | | | | | |
Directors’ fees and expenses | | | 21,948 | | | | | |
Custodian | | | 142,942 | | | | | |
Audit and tax services | | | 31,738 | | | | | |
Legal | | | 23,754 | | | | | |
Printing | | | 665,719 | | | | | |
Insurance | | | 23,791 | | | | | |
Miscellaneous | | | 23,010 | | | | | |
| | | | | | | | |
Total expenses | | | 18,579,993 | | | | | |
Expense reductions | | | (33,907 | ) | | | | |
Management fee waivers | | | (292,767 | ) | | | 18,253,319 | |
| | | | | | | | |
Net Investment Income | | | | | | | 4,409,984 | |
| | | | | | | | |
Realized and Unrealized Gain (Loss) | | | | | | | | |
| Realized gain on: | | | | | | | | |
Investments—net | | | | | | | 187,656,215 | |
| Change in unrealized depreciation on: | | | | | | | | |
Investments—net | | | | | | | (339,762,441 | ) |
| | | | | | | | |
Net loss | | | | | | | (152,106,226 | ) |
| | | | | | | | |
Net Decrease in Net Assets From Operations | | | | | | $ | (147,696,242 | ) |
| | | | | | | | |
| (a) | Includes net income on securities loaned of $301,120. |
See accompanying notes to financial statements.
MSF-6
Metropolitan Series Fund, Inc.
Harris Oakmark Focused Value Portfolio
Statements of Changes in Net Assets
| | | | | | | | |
| | | Year ended
December 31,
2007 | | | Year ended
December 31,
2006 | |
From Operations | | | | | | | | |
Net investment income | | $ | 4,409,984 | | | $ | 10,146,408 | |
Net realized gain | | | 187,656,215 | | | | 266,743,318 | |
Unrealized depreciation | | | (339,762,441 | ) | | | (37,862,467 | ) |
| | | | | | | | |
Increase (decrease) in net assets from operations | | | (147,696,242 | ) | | | 239,027,259 | |
| | | | | | | | |
From Distributions to Shareholders | | | | | | | | |
Net investment income | | | | | | | | |
Class A | | | (6,924,948 | ) | | | (3,223,554 | ) |
Class B | | | (2,104,620 | ) | | | (577,292 | ) |
Class E | | | (1,101,719 | ) | | | (480,243 | ) |
| | | | | | | | |
| | | (10,131,287 | ) | | | (4,281,089 | ) |
| | | | | | | | |
Net realized gain | | | | | | | | |
Class A | | | (152,693,942 | ) | | | (99,464,113 | ) |
Class B | | | (81,495,708 | ) | | | (61,092,741 | ) |
Class E | | | (32,760,337 | ) | | | (27,150,150 | ) |
| | | | | | | | |
| | | (266,949,987 | ) | | | (187,707,004 | ) |
| | | | | | | | |
Total distributions | | | (277,081,274 | ) | | | (191,988,093 | ) |
| | | | | | | | |
Increase in net assets from capital share transactions | | | 271,078,146 | | | | 195,435,838 | |
| | | | | | | | |
Total increase (decrease) in net assets | | | (153,699,370 | ) | | | 242,475,004 | |
| | |
Net Assets | | | | | | | | |
Beginning of the period | | | 2,170,569,475 | | | | 1,928,094,471 | |
| | | | | | | | |
End of the period | | $ | 2,016,870,105 | | | $ | 2,170,569,475 | |
| | | | | | | | |
Undistributed Net Investment Income | | | | | | | | |
End of the period | | $ | 4,251,884 | | | $ | 10,007,094 | |
| | | | | | | | |
Other Information:
Capital Shares
Transactions in capital shares were as follows:
| | | | | | | | | | | | | | |
| | | Year ended
December 31, 2007 | | | Year ended
December 31, 2006 | |
| | | Shares | | | $ | | | Shares | | | $ | |
Class A | | | | | | | | | | | | | | |
Sales | | 1,469,045 | | | $ | 360,559,728 | | | 1,241,146 | | | $ | 315,875,278 | |
Reinvestments | | 658,195 | | | | 159,618,890 | | | 417,633 | | | | 102,687,667 | |
Redemptions | | (1,004,853 | ) | | | (251,059,673 | ) | | (952,674 | ) | | | (243,985,721 | ) |
| | | | | | | | | | | | | | |
Net increase | | 1,122,387 | | | $ | 269,118,945 | | | 706,105 | | | $ | 174,577,224 | |
| | | | | | | | | | | | | | |
Class B | | | | | | | | | | | | | | |
Sales | | 353,452 | | | $ | 86,105,779 | | | 508,057 | | | $ | 127,861,002 | |
Reinvestments | | 352,283 | | | | 83,600,328 | | | 255,585 | | | | 61,670,033 | |
Redemptions | | (663,348 | ) | | | (160,295,991 | ) | | (596,683 | ) | | | (149,277,177 | ) |
| | | | | | | | | | | | | | |
Net increase | | 42,387 | | | $ | 9,410,116 | | | 166,959 | | | $ | 40,253,858 | |
| | | | | | | | | | | | | | |
Class E | | | | | | | | | | | | | | |
Sales | | 78,053 | | | $ | 18,644,557 | | | 72,438 | | | $ | 18,537,553 | |
Reinvestments | | 141,221 | | | | 33,862,056 | | | 113,481 | | | | 27,630,393 | |
Redemptions | | (245,487 | ) | | | (59,957,528 | ) | | (259,395 | ) | | | (65,563,190 | ) |
| | | | | | | | | | | | | | |
Net decrease | | (26,213 | ) | | $ | (7,450,915 | ) | | (73,476 | ) | | $ | (19,395,244 | ) |
| | | | | | | | | | | | | | |
Increase derived from capital share transactions | | | | | $ | 271,078,146 | | | | | | $ | 195,435,838 | |
| | | | | | | | | | | | | | |
See accompanying notes to financial statements.
MSF-7
Metropolitan Series Fund, Inc.
Harris Oakmark Focused Value Portfolio
Financial Highlights
| | | | | | | | | | | | | | | | | | | | |
| | | Class A | |
| | | Year ended December 31, | |
| | | 2007 | | | 2006 | | | 2005 | | | 2004 | | | 2003 | |
Net Asset Value, Beginning of Period | | $ | 269.23 | | | $ | 265.37 | | | $ | 243.86 | | | $ | 224.26 | | | $ | 169.33 | |
| | | | | | | | | | | | | | | | | | | | |
Income (Loss) From Investment Operations | | | | | | | | | | | | | | | | | | | | |
Net investment income | | | 0.73 | (a) | | | 1.41 | | | | 0.78 | | | | 0.23 | | | | 0.24 | |
Net realized and unrealized gain (loss) of investments | | | (15.83 | ) | | | 28.89 | | | | 23.48 | | | | 21.85 | | | | 54.97 | |
| | | | | | | | | | | | | | | | | | | | |
Total from investment operations | | | (15.10 | ) | | | 30.30 | | | | 24.26 | | | | 22.08 | | | | 55.21 | |
| | | | | | | | | | | | | | | | | | | | |
Less Distributions | | | | | | | | | | | | | | | | | | | | |
Distributions from net investment income | | | (1.51 | ) | | | (0.83 | ) | | | (0.11 | ) | | | (0.10 | ) | | | (0.28 | ) |
Distributions from net realized capital gains | | | (33.19 | ) | | | (25.61 | ) | | | (2.64 | ) | | | (2.38 | ) | | | 0.00 | |
| | | | | | | | | | | | | | | | | | | | |
Total distributions | | | (34.70 | ) | | | (26.44 | ) | | | (2.75 | ) | | | (2.48 | ) | | | (0.28 | ) |
| | | | | | | | | | | | | | | | | | | | |
Net Asset Value, End of Period | | $ | 219.43 | | | $ | 269.23 | | | $ | 265.37 | | | $ | 243.86 | | | $ | 224.26 | |
| | | | | | | | | | | | | | | | | | | | |
Total Return (%) | | | (6.8 | ) | | | 12.5 | | | | 10.0 | | | | 9.9 | | | | 32.7 | |
Ratio of operating expenses to average net assets before expense reductions (%) | | | 0.75 | | | | 0.78 | | | | 0.77 | | | | 0.78 | | | | 0.80 | |
Ratio of operating expenses to average net assets after expense reductions (%) (b) | | | 0.75 | | | | 0.78 | | | | 0.77 | | | | 0.78 | | | | 0.78 | |
Ratio of operating expenses to average net assets without giving effect to the management fee waiver would have been (%) (c) | | | 0.76 | | | | N/A | | | | N/A | | | | N/A | | | | N/A | |
Ratio of net investment income to average net assets (%) | | | 0.30 | | | | 0.60 | | | | 0.35 | | | | 0.15 | | | | 0.14 | |
Portfolio turnover rate (%) | | | 68 | | | | 50 | | | | 25 | | | | 16 | | | | 16 | |
Net assets, end of period (000) | | $ | 1,249,122 | | | $ | 1,230,429 | | | $ | 1,024,615 | | | $ | 809,906 | | | $ | 614,742 | |
| |
| | | Class B | |
| | | Year ended December 31, | |
| | | 2007 | | | 2006 | | | 2005 | | | 2004 | | | 2003 | |
Net Asset Value, Beginning of Period | | $ | 263.76 | | | $ | 260.34 | | | $ | 239.96 | | | $ | 221.17 | | | $ | 167.26 | |
| | | | | | | | | | | | | | | | | | | | |
Income (Loss) From Investment Operations | | | | | | | | | | | | | | | | | | | | |
Net investment income (loss) | | | 0.10 | (a) | | | 0.91 | | | | 0.22 | | | | (0.24 | ) | | | 0.01 | |
Net realized and unrealized gain (loss) of investments | | | (15.46 | ) | | | 28.36 | | | | 22.80 | | | | 21.41 | | | | 54.02 | |
| | | | | | | | | | | | | | | | | | | | |
Total from investment operations | | | (15.36 | ) | | | 29.27 | | | | 23.02 | | | | 21.17 | | | | 54.03 | |
| | | | | | | | | | | | | | | | | | | | |
Less Distributions | | | | | | | | | | | | | | | | | | | | |
Distributions from net investment income | | | (0.86 | ) | | | (0.24 | ) | | | 0.00 | | | | 0.00 | | | | (0.12 | ) |
Distributions from net realized capital gains | | | (33.19 | ) | | | (25.61 | ) | | | (2.64 | ) | | | (2.38 | ) | | | 0.00 | |
| | | | | | | | | | | | | | | | | | | | |
Total distributions | | | (34.05 | ) | | | (25.85 | ) | | | (2.64 | ) | | | (2.38 | ) | | | (0.12 | ) |
| | | | | | | | | | | | | | | | | | | | |
Net Asset Value, End of Period | | $ | 214.35 | | | $ | 263.76 | | | $ | 260.34 | | | $ | 239.96 | | | $ | 221.17 | |
| | | | | | | | | | | | | | | | | | | | |
Total Return (%) | | | (7.1 | ) | | | 12.2 | | | | 9.7 | | | | 9.7 | | | | 32.3 | |
Ratio of operating expenses to average net assets before expense reductions (%) | | | 1.00 | | | | 1.03 | | | | 1.02 | | | | 1.03 | | | | 1.05 | |
Ratio of operating expenses to average net assets after expense reductions (%) (b) | | | 1.00 | | | | 1.03 | | | | 1.02 | | | | 1.03 | | | | 1.03 | |
Ratio of operating expenses to average net assets without giving effect to the management fee waiver would have been (%) (c) | | | 1.01 | | | | N/A | | | | N/A | | | | N/A | | | | N/A | |
Ratio of net investment income (loss) to average net assets (%) | | | 0.04 | | | | 0.35 | | | | 0.10 | | | | (0.09 | ) | | | (0.13 | ) |
Portfolio turnover rate (%) | | | 68 | | | | 50 | | | | 25 | | | | 16 | | | | 16 | |
Net assets, end of period (000) | | $ | 549,779 | | | $ | 665,313 | | | $ | 613,215 | | | $ | 578,991 | | | $ | 540,656 | |
| (a) | Per share amount is based on average shares outstanding during the period. |
| (b) | The Portfolio has entered into arrangements with certain brokers who paid a portion of the Portfolio’s expenses. |
| (c) | See Note 4 in the Notes to Financial Statements. |
See accompanying notes to financial statements.
MSF-8
Metropolitan Series Fund, Inc.
Harris Oakmark Focused Value Portfolio
Financial Highlights
| | | | | | | | | | | | | | | | | | | | |
| | | Class E | |
| | | Year ended December 31, | |
| | | 2007 | | | 2006 | | | 2005 | | | 2004 | | | 2003 | |
Net Asset Value, Beginning of Period | | $ | 266.33 | | | $ | 262.59 | | | $ | 241.77 | | | $ | 222.60 | | | $ | 168.22 | |
| | | | | | | | | | | | | | | | | | | | |
Income (Loss) From Investment Operations | | | | | | | | | | | | | | | | | | | | |
Net investment income | | | 0.34 | (a) | | | 1.21 | | | | 0.49 | | | | 0.04 | | | | 0.07 | |
Net realized and unrealized gain (loss) of investments | �� | | (15.63 | ) | | | 28.59 | | | | 22.97 | | | | 21.51 | | | | 54.47 | |
| | | | | | | | | | | | | | | | | | | | |
Total from investment operations | | | (15.29 | ) | | | 29.80 | | | | 23.46 | | | | 21.55 | | | | 54.54 | |
| | | | | | | | | | | | | | | | | | | | |
Less Distributions | | | | | | | | | | | | | | | | | | | | |
Distributions from net investment income | | | (1.12 | ) | | | (0.45 | ) | | | 0.00 | | | | 0.00 | | | | (0.16 | ) |
Distributions from net realized capital gains | | | (33.19 | ) | | | (25.61 | ) | | | (2.64 | ) | | | (2.38 | ) | | | 0.00 | |
| | | | | | | | | | | | | | | | | | | | |
Total distributions | | | (34.31 | ) | | | (26.06 | ) | | | (2.64 | ) | | | (2.38 | ) | | | (0.16 | ) |
| | | | | | | | | | | | | | | | | | | | |
Net Asset Value, End of Period | | $ | 216.73 | | | $ | 266.33 | | | $ | 262.59 | | | $ | 241.77 | | | $ | 222.60 | |
| | | | | | | | | | | | | | | | | | | | |
Total Return (%) | | | (7.0 | ) | | | 12.3 | | | | 9.8 | | | | 9.8 | | | | 32.5 | |
Ratio of operating expenses to average net assets before expense reductions (%) | | | 0.90 | | | | 0.93 | | | | 0.92 | | | | 0.93 | | | | 0.95 | |
Ratio of operating expenses to average net assets after expense reductions (%) (b) | | | 0.90 | | | | 0.93 | | | | 0.92 | | | | 0.93 | | | | 0.93 | |
Ratio of operating expenses to average net assets without giving effect to the management fee waiver would have been (%) (c) | | | 0.91 | | | | N/A | | | | N/A | | | | N/A | | | | N/A | |
Ratio of net investment income (loss) to average net assets (%) | | | 0.14 | | | | 0.44 | | | | 0.19 | | | | 0.00 | | | | (0.03 | ) |
Portfolio turnover rate (%) | | | 68 | | | | 50 | | | | 25 | | | | 16 | | | | 16 | |
Net assets, end of period (000) | | $ | 217,969 | | | $ | 274,828 | | | $ | 290,264 | | | $ | 280,856 | | | $ | 204,755 | |
| (a) | Per share amount is based on average shares outstanding during the period. |
| (b) | The Portfolio has entered into arrangements with certain brokers who paid a portion of the Portfolio’s expenses. |
| (c) | See Note 4 in the Notes to Financial Statements. |
See accompanying notes to financial statements.
MSF-9
Metropolitan Series Fund, Inc.
Harris Oakmark Focused Value Portfolio
Notes to Financial Statements—December 31, 2007
Metropolitan Series Fund, Inc. (the “Fund”) is organized as a corporation under the laws of Maryland pursuant to Articles of Incorporation filed on November 23, 1982, as amended, and registered under the Investment Company Act of 1940, as amended (the “1940 Act”), as an open-end investment company. The Fund is a “series” type of mutual fund, which issues separate series of stock. Each series represents an interest in a separate portfolio of Fund investments. The Harris Oakmark Focused Value Portfolio (the “Portfolio”) is a non-diversified series of the Fund. Shares in the Fund are not offered directly to the general public and are currently available only to separate accounts established by Metropolitan Life Insurance Company (“MetLife”), New England Life Insurance Company, General American Life Insurance Company (“General American”), The MetLife Investors Group of Insurance Companies, MetLife Insurance Company of Connecticut and other affiliated insurance companies (collectively, the “Insurance Companies”), as an investment vehicle for variable life insurance, group annuity or variable annuity products, although the Portfolio is not available to all such separate accounts. The Portfolio’s shares may be divided into different classes. Currently, the classes being offered by the Portfolio are named Class A, Class B and Class E. The classes of the Portfolio’s shares are identical, except that certain additional charges (Rule 12b-1 fees) are made against Class B and Class E shares. Investment income, realized and unrealized capital gains and losses, the common expenses of the Portfolio and certain Portfolio-level expense reductions, if any, are allocated on a pro rata basis to each class based on the relative net assets of each class to the total net assets of the Portfolio.
| 2. | SIGNIFICANT ACCOUNTING POLICIES: |
The preparation of financial statements in conformity with accounting principles generally accepted in the United States of America (“GAAP”) requires management to make estimates and assumptions that affect the reported amounts of assets and liabilities and disclosure of contingent assets and liabilities as of the date of the financial statements and the reported amounts of income and expenses during the reporting period. Actual results could differ from those estimates.
The following is a summary of significant accounting policies consistently followed by the Portfolio in the preparation of its financial statements. The policies are in conformity with GAAP.
Investment Valuation:
Debt securities (other than short term obligations with a remaining maturity of sixty days or less) are valued by independent pricing services selected by the relevant subadviser pursuant to authorization of the Board of Directors of the Fund (the “Board” or “Directors”). Short term obligations with a remaining maturity of sixty days or less are valued at amortized cost which approximates fair market value.
Equity securities traded on a national securities exchange or exchanges are valued at their last sale price on the principal trading market. Equity securities traded on the NASDAQ National Market System are valued at the NASDAQ Official Closing Price (the “NOCP”). The NOCP is the last sale price if it falls between the spread of the last reported bid and asked prices. If the last reported bid and asked prices are above the last reported sale price, the NOCP will be the last reported bid price. If the last reported bid and asked prices are below the last reported sale price, the NOCP will be the last reported asked price. Equity securities traded on a national securities exchange or exchanges or on the NASDAQ National Market System for which there is no reported sale during the day are valued at the last reported bid price. A security that is listed or traded on more than one exchange is valued at the quotation on the exchange determined to be the primary market for that security by the Board or its delegates. If no closing price is available, then such securities are valued by using the last reported bid price. Equity securities traded over-the-counter are valued at the last reported sales price.
If no current market value quotation is readily available or reliable for a portfolio security, fair value will be determined in accordance with procedures established by and under the general supervision of the Board. When the Portfolio uses fair value pricing, it may take into account any factors it deems appropriate. The value of securities used by the Portfolio to calculate its net asset value may differ from quoted or published prices for the same securities. Fair value pricing involves subjective judgments and the fair value determined for a security may be materially different than the value that could be realized upon the sale of that security.
The Portfolio expects to use fair value pricing for securities primarily traded on U.S. exchanges only under very limited circumstances. For example, the Portfolio may use fair value pricing if the exchange on which a security is traded closes early or trading in the security is suspended.
MSF-10
Metropolitan Series Fund, Inc.
Harris Oakmark Focused Value Portfolio
Notes to Financial Statements—December 31, 2007—(Continued)
Securities traded primarily on an exchange outside of the United States which closes before the close of the New York Stock Exchange will be valued at the last sales price on that non-U.S. exchange. Securities traded primarily on an exchange outside of the United States for which there is no reported sale during the day are valued at the mean between the last reported bid and asked prices. However, because most foreign markets close well before the Portfolio values its securities (typically at 4 p.m. Eastern Time), the earlier close of these foreign markets gives rise to the possibility that significant events, including broad market moves, may have occurred after these foreign markets close but before the Portfolio values its securities. To account for this, the Portfolio may frequently value many of its foreign equity securities using fair value prices based on third party vendor modeling tools.
Forward foreign currency exchange contracts are valued based on the mean between closing bid and asked prices of the forward currency contract rates in the London foreign exchange markets on a daily basis as provided by a reliable bank or dealer.
Options, whether on securities, indices, futures contracts, or otherwise, are valued at the last sales price available as of the close of business on the day of valuation or, if there is no such sale price available, at the mean between the bid and asked prices. Options on currencies are valued at the spot price each day.
Subject to the Board’s oversight, the Board has delegated day-to-day responsibility for valuing Portfolio assets to the subadviser of the Portfolio, who values such assets as described above and operates under procedures approved by the Board.
Investment Transactions and Related Investment Income:
Portfolio security transactions are recorded on the trade date. Dividend income is recorded on the ex-dividend date or, for certain foreign securities, when notified. Interest income, which includes amortization of premium and accretion of discount on debt securities, is recorded on the accrual basis. Realized gains and losses on investments and unrealized appreciation and depreciation are determined on the identified cost basis, which is the same basis used for federal income tax purposes.
Repurchase Agreements:
The Portfolio, through the custodian or a subcustodian, receives delivery of the underlying securities collateralizing repurchase agreements. The Portfolio requires the custodian to take possession, to have legally segregated in the Federal Reserve Book Entry System, or to have segregated within the custodian’s vault, all securities held as collateral for repurchase agreements. It is the Portfolio’s policy that the market value of the collateral be at least equal to 100% of the repurchase price in the case of a repurchase agreement of one-day duration and 102% on all other repurchase agreements. The Portfolio’s subadviser is responsible for determining that the value of the collateral is at all times at least equal to the repurchase price. In connection with transactions in repurchase agreements, if the seller defaults and the value of the collateral declines or if the seller enters an insolvency proceeding, realization of the collateral by the Portfolio may be delayed, limited or wholly denied.
Foreign Currency Translation:
The books and records of the Portfolio are maintained in U.S. dollars. The values of securities, currencies and other assets and liabilities denominated in currencies other than U.S. dollars are translated into U.S. dollars based upon foreign exchange rates prevailing at the end of the period. Purchases and sales of investment securities, income and expenses are translated on the respective dates of such transactions. Since the values of investment securities are presented at the foreign exchange rates prevailing at the end of the period, it is not practical to isolate that portion of the results of operations arising from changes in exchange rates from that portion of the results of operations reflecting fluctuations arising from changes in market prices of the investment securities. Such fluctuations are included in the net realized and unrealized gain or loss on investments.
Net realized foreign exchange gains or losses arise from sales of foreign currency, currency gains or losses realized between the trade and settlement dates on securities transactions, and the difference between the amounts of dividends, interest, and foreign withholding taxes recorded by the Portfolio and the U.S. dollar equivalent of the amounts actually received or paid by the Portfolio. Net unrealized foreign exchange gains and losses arise from changes in the value of assets and liabilities, other than investment securities, resulting from changes in the exchange rate.
Forward Foreign Currency Exchange Contracts:
The Portfolio may enter into forward foreign currency exchange contracts primarily to hedge against foreign currency exchange rate risks on its non-U.S. dollar denominated investment securities. When entering into a forward currency contract, the Portfolio
MSF-11
Metropolitan Series Fund, Inc.
Harris Oakmark Focused Value Portfolio
Notes to Financial Statements—December 31, 2007—(Continued)
agrees to receive or deliver a fixed quantity of foreign currency for an agreed-upon price on an agreed future date. These contracts are valued daily and the Portfolio’s net equity therein, representing unrealized gain or loss on the contracts as measured by the difference between the foreign exchange rates at the dates of entry into the contracts and the forward rates at the settlement date, is included in the Statement of Assets and Liabilities. Realized and unrealized gains and losses are included in the Statement of Operations. These instruments involve market and/or credit risk in excess of the amount recognized in the Statement of Assets and Liabilities. Risks arise from the possible inability of counterparties to meet the terms of their contracts and from movement in currency and securities values and interest rates.
Options:
The Portfolio may use options to hedge against changes in values of securities the Portfolio owns or expects to purchase. Writing puts or buying calls tends to increase the Portfolio’s exposure to the underlying instrument and writing calls or buying puts tends to decrease the Portfolio’s exposure to the underlying instrument, and can be used to hedge other Portfolio investments. For options purchased to hedge the Portfolio’s investments, the potential risk to the Portfolio is that the change in value of options contracts may not correspond to the change in value of the hedged instruments. In addition, losses may arise from changes in the value of the underlying instruments, if there is an illiquid secondary market, or if the counterparty is unable to perform. The maximum loss for purchased options is limited to the premium initially paid for the option. For options written by the Portfolio, the maximum loss is not limited to the premium initially received for the option.
The main risk associated with purchasing an option is that the option expires without being exercised. In this case, the option expires worthless and the premium paid for the option is considered the loss. The risk associated with writing a call option is that the Portfolio may forgo the opportunity for a profit if the market value of the underlying position increases and the option is exercised. The risk in writing a put option is that the Portfolio may incur a loss if the market value of the underlying position decreases and the option is exercised. In addition, the Portfolio risks not being able to enter into a closing transaction for the written option as the result of an illiquid market.
“When-Issued” Securities:
Purchasing securities “when-issued” is a forward commitment by the Portfolio to buy a security. The estimated amount of the Portfolio’s payment obligation and the security’s interest rate are determined when the commitment is made, even though no interest accrues until the security is issued, which is generally 15 to 120 days later. The Portfolio will segregate liquid assets with its custodian sufficient at all times to satisfy these commitments. If the value of the security is less when delivered than when the commitment was made, the Portfolio will suffer a loss.
Federal Income Taxes:
It is the Portfolio’s policy to comply with the requirements of the Internal Revenue Code of 1986, as amended, and regulations thereunder, applicable to regulated investment companies and to distribute all of its taxable income to shareholders. Therefore, no federal income tax provision is required.
As of December 31, 2007, the Portfolio had no capital loss carryovers.
The tax character of distributions paid for the periods ended December 31, 2007 and 2006 was as follows:
| | | | | | | | | | | | | | | | | | | | | | |
| Ordinary Income | | Long Term Gain | | Return of Capital | | Total |
| 2007 | | 2006 | | 2007 | | 2006 | | 2007 | | 2006 | | 2007 | | 2006 |
| $ | 10,227,819 | | $ | 7,475,862 | | $ | 266,853,455 | | $ | 184,512,231 | | $ | — | | $ | — | | $ | 277,081,274 | | $ | 191,988,093 |
As of December 31, 2007, the components of distributable earnings (accumulated losses) on a federal income tax basis were as follows:
| | | | | | | | | | | | | |
Undistributed
Ordinary
Income | | Undistributed
Long Term
Gain | | Unrealized
Depreciation | | | Loss
Carryforwards | | Total |
| $57,271,918 | | $ | 134,538,824 | | $ | (8,134,678 | ) | | $ | — | | $ | 183,676,064 |
MSF-12
Metropolitan Series Fund, Inc.
Harris Oakmark Focused Value Portfolio
Notes to Financial Statements—December 31, 2007—(Continued)
Dividends and Distributions to Shareholders:
The Portfolio records dividends and distributions on the ex-dividend date. Net realized gains from security transactions (if any) are generally distributed annually to shareholders. The timing and characterization of certain income and capital gains distributions are determined in accordance with federal tax regulations that may differ from GAAP. Permanent book and tax basis differences relating to shareholder distributions will result in reclassification between under/over distributed net investment income, accumulated net realized gains/losses and paid in capital.
Expense Reductions:
Certain Portfolio trades are directed to brokers who paid a portion of the Portfolio’s expenses. Amounts paid for the Portfolio are shown as expense reductions in the Statement of Operations.
| 3. | INVESTMENT TRANSACTIONS: |
For the year ended December 31, 2007, purchases and sales of securities (excluding short term investments) for the Portfolio were as follows:
| | | | | | | | | |
| Purchases | | Sales |
| U.S. Government | | Other | | U.S. Government | | Other |
| $0 | | $ | 1,377,181,637 | | $ | 0 | | $ | 1,456,323,248 |
| 4. | INVESTMENT MANAGEMENT FEES AND OTHER TRANSACTIONS WITH AFFILIATES: |
Investment Management Agreement:
MetLife Advisers, LLC (“MetLife Advisers”) is the investment adviser to the Portfolio. The Fund has entered into an investment management agreement with MetLife Advisers with respect to the Portfolio. For providing investment management services to the Portfolio, MetLife Advisers receives monthly compensation at the following annual rates:
| | | | | | |
| | | Management
Fees earned by
MetLife Advisers
for the year ended
December 31, 2007 | | Annual
percentage
rates paid to
MetLife Advisers | | Based on Portfolios average daily net asset levels |
| | $15,680,582 | | 0.750% | | Of the first $1 billion |
| | | | 0.700% | | Of the next $1.5 billion |
| | | | 0.675% | | Of the next $2.5 billion |
| | | | 0.650% | | On amounts in excess of $5 billion |
Certain officers and directors of the Fund may also be officers of MetLife Advisers; however, such officers and directors receive no compensation from the Fund.
Management Fee Waivers:
Effective January 1, 2007 to January 6, 2008, a new subadvisory fee schedule was adopted for the Portfolio, under which the subadvisory fee for the Portfolio is calculated based on the combined average daily net assets for the Portfolio and the Harris Oakmark Large Cap Value Portfolio (collectively, the “Harris Portfolios”). In connection with this change in the subadvisory fee schedule, MetLife Advisers has agreed, pursuant to an expense agreement effective January 1, 2007 to January 6, 2008, to reduce its advisory fees set out above under “Investment Management Agreement” for each class of the Portfolio by the following amount: the difference between (i) the subadvisory fee that MetLife Advisers actually pays Harris Associates, L.P. with respect to such class of the Portfolio; and (ii) the subadvisory fee that MetLife Advisers would pay Harris Associates, L.P. with respect to such class of the Portfolio after applying the new subadvisory fee schedule for the Portfolio that took effect January 1, 2007 but without combining the assets of the Harris Portfolios for purposes of calculating such fee. This combined subadvisory fee schedule and corresponding fee waiver was discontinued effective January 7, 2008.
Amounts waived for the year ended December 31, 2007 are shown as management fee waivers in the Statement of Operations.
MSF-13
Metropolitan Series Fund, Inc.
Harris Oakmark Focused Value Portfolio
Notes to Financial Statements—December 31, 2007—(Continued)
Service and Distribution Fees:
The Fund has adopted a Distribution and Service Plan under Rule 12b-1 of the 1940 Act for the Portfolio’s Class B and E shares. Under the Distribution and Service Plan, the Class B and E shares of the Portfolio pay a fee to compensate the Insurance Companies (or their affiliates) and other broker-dealers and financial intermediaries involved in the offer and sale of Portfolio shares for promoting or selling and servicing, the Class B and E shares. The fees under the Distribution and Service Plan for each class of the Portfolio’s shares are calculated as a percentage of the Portfolio’s average daily net assets that are attributable to that Class. Currently, the fee is 0.25% per year for Class B shares and 0.15% per year for Class E shares. Amounts paid by the Portfolio for the year ended December 31, 2007 are shown as Service and Distribution fees in the Statement of Operations.
The Fund has entered into a securities lending arrangement with the Fund’s custodian, State Street Bank and Trust Company (the “custodian”). Under the agreement, the custodian is authorized to loan securities on the Portfolios’ behalf. In exchange, the Portfolio receives either cash or securities as collateral against the loaned securities. The Portfolio receives collateral at least equal to 102% of the market value of the loaned securities (105% for foreign securities), at each loan’s inception. Collateral must be maintained at least at 100% of the market value of the loaned securities for the duration of the loan. The cash collateral is invested in the Navigator Securities Lending Prime Portfolio, an affiliate of the custodian, which invests in a variety of high quality U.S. dollar-denominated instruments. If the market value of the collateral at the close of trading on a business day is less than 100% of the market value of the loaned securities at the close of trading on that day, the borrower shall be required to deliver, by the close of business on the following business day, an additional amount of collateral, equal to at least 100% of the market value of all the loaned securities as of such preceding day. The Portfolio receives 80% of the annual net income from securities lending transactions, which is included in interest income of the Portfolio. The remaining 20% is paid to the custodian as compensation for its securities lending services. The Portfolio bears the risk of any deficiency in the amount of collateral available for return to a borrower due to a loss in an approved investment. Any outstanding loans by the Portfolio at December 31, 2007 are footnoted in the Schedule of Investments.
As previously reported, in May 2004, General American received a Wells Notice stating that the SEC staff was considering recommending that the SEC bring a civil action alleging violations of the U.S. securities laws against General American with respect to market timing and late trading in a limited number of privately-placed variable insurance contracts that were sold through General American. General American responded to the SEC staff and cooperated with the investigation. On August 9, 2007, the SEC announced that it had settled an enforcement action regarding late trading against General American with, among other things, General American agreeing to pay a civil penalty and to comply with certain undertakings. General American consented to the SEC’s order without admitting or denying the findings. MetLife Advisers has also advised the Fund’s Board of Directors that, while certain exceptions to the Fund’s policies have been noted, no situations have been identified that would have a material impact on the financial position of the Fund.
| 7. | RECENT ACCOUNTING PRONOUNCEMENTS: |
Effective June 29, 2007, the Fund implemented Financial Accounting Standards Board (“FASB”) Interpretation No. 48, “Accounting for Uncertainty in Income Taxes—an interpretation of FASB Statement No. 109” (“FIN 48”). FIN 48 prescribes the minimum recognition threshold a tax position must meet in connection with accounting for uncertainties in income tax positions taken or expected to be taken by an entity, including investment companies, before being measured and recognized in the financial statements. Management has evaluated the application of FIN 48 to the Fund, and has determined that the adoption of FIN 48 does not have a material impact on the Fund’s financial statements. The Fund files U.S. tax returns. No income tax returns are currently under examination. The statute of limitations on the Fund’s tax returns remains open for the years ended December 31, 2004 through December 31, 2006.
In September 2006, Statement of Financial Accounting Standards No. 157, Fair Value Measurements (SFAS 157) was issued and is effective for fiscal years beginning after November 15, 2007. SFAS 157 defines fair value, establishes a framework for measuring fair value and expands disclosures about fair value measurements. Management is currently evaluating the impact the adoption of SFAS 157 will have on the Portfolio’s financial statement disclosures.
MSF-14
Metropolitan Series Fund, Inc.
Harris Oakmark Focused Value Portfolio
Report of Independent Registered Public Accounting Firm
To the Shareholders and Board of Directors of the Metropolitan Series Fund, Inc.:
We have audited the accompanying statement of assets and liabilities, including the schedule of investments, of the Harris Oakmark Focused Value Portfolio, one of the portfolios constituting the Metropolitan Series Fund, Inc. (the “Fund”) as of December 31, 2007, and the related statement of operations for the year then ended, the statements of changes in net assets for each of the two years in the period then ended, and the financial highlights for each of the five years in the period then ended. These financial statements and financial highlights are the responsibility of the Fund’s management. Our responsibility is to express an opinion on these financial statements and financial highlights based on our audits.
We conducted our audits in accordance with the standards of the Public Company Accounting Oversight Board (United States). Those standards require that we plan and perform the audit to obtain reasonable assurance about whether the financial statements and financial highlights are free of material misstatement. The Fund is not required to have, nor were we engaged to perform, an audit of its internal control over financial reporting. Our audits included consideration of internal control over financial reporting as a basis for designing audit procedures that are appropriate in the circumstances, but not for the purpose of expressing an opinion on the effectiveness of the Fund’s internal control over financial reporting. Accordingly, we express no such opinion. An audit also includes examining, on a test basis, evidence supporting the amounts and disclosures in the financial statements, assessing the accounting principles used and significant estimates made by management, as well as evaluating the overall financial statement presentation. Our procedures included confirmation of securities owned as of December 31, 2007, by correspondence with the custodian and brokers; where replies were not received from brokers, we performed other auditing procedures. We believe that our audits provide a reasonable basis for our opinion.
In our opinion, the financial statements and financial highlights referred to above present fairly, in all material respects, the financial position of the Harris Oakmark Focused Value Portfolio of the Metropolitan Series Fund, Inc. as of December 31, 2007, the results of its operations for the year then ended, the changes in its net assets for each of the two years in the period then ended, and the financial highlights for each of the five years in the period then ended, in conformity with accounting principles generally accepted in the United States of America.
Deloitte & Touche LLP
Boston, Massachusetts
February 21, 2008
MSF-15
Metropolitan Series Fund, Inc.
Directors and Officers
The Fund’s Directors review actions of the Fund’s investment adviser and subadvisers, and decide upon matters of general policy. The Fund’s officers supervise the daily business operations of the Fund. The Board of Directors and the Fund’s officers are listed below. Each Director is responsible for overseeing all 36 Portfolios of the Fund. There is no limit to the term a Director may serve. Directors serve until their resignation, retirement or removal in accordance with the Fund’s organizational documents and policies adopted by the Board from time to time. Officers hold office at the pleasure of the Board or until the election or appointment and the qualification of a successor. The address of the directors and officers is c/o Metropolitan Series Fund, Inc., 501 Boylston Street, Boston, MA 02116.
Interested Directors(1)
Each Director below is an “interested person” (as defined by the 1940 Act) with respect to the Fund in that Ms. Forget is an employee of MetLife and Mr. Typermass is a former employee of MetLife and owns securities issued by MetLife, Inc., the ultimate parent company of MetLife Advisers.
| | | | | | | | |
Name, Address and Age | | Current
position(s)
with Fund | | Position(s)
held since | | Principal occupations
over past five years, including other directorships(2) | | Number of
Portfolios in
Fund Complex
Overseen by
Director(3) |
Elizabeth M. Forget Age: 41 | | Director, Chairman of the Board, President and Chief Executive Officer | | 2006 | | Senior Vice President (since 2007), MetLife, Inc.; President, Met Investors Advisory, LLC (“MIA”); Trustee and President, Met Investors Series Trust (“MIST”); Executive Vice President, MetLife Investors Group, Inc.; President (since 2006), MetLife Advisers. | | 81 |
| | | | |
Arthur G. Typermass Age: 70 | | Director | | 1998 | | Formerly, Senior Vice President and Treasurer, MetLife. | | 37 |
Non-Interested Directors(1)
Each Director below is not an “interested person” (as defined by the 1940 Act) with respect to the Fund (collectively, the “Independent Directors”).
| | | | | | | | |
Name, Address and Age | | Current
position(s)
with Fund | | Position(s)
held since | | Principal occupations
over past five years, including other directorships(2) | | Number of
Portfolios in
Fund Complex
Overseen by
Director(3) |
Steve A. Garban† Age: 70 | | Director | | 1985 | | Formerly, Chief Financial Officer, Senior Vice President Finance and Operations and Treasurer (Emeritus), The Pennsylvania State University. | | 37 |
| | | | |
Linda B. Strumpf Age: 60 | | Director | | 2000 | | Vice President and Chief Investment Officer, Ford Foundation. | | 37 |
| | | | |
Michael S. Scott Morton† Age: 70 | | Director | | 1993 | | Jay W. Forrester Professor of Management (Emeritus) at Sloan School of Management, MIT. | | 37 |
| | | | |
H. Jesse Arnelle Age: 74 | | Director | | 2001 | | Formerly, Counsel, Womble Carlyle Sandrie & Rice; Director, Textron Inc. (global multi-industry company)*; formerly, Director, Gannet Co. Inc. (diversified news and information company)*; formerly, Director, Eastman Chemical Company (global chemical company)*; formerly, Director, Waste Management, Inc.*; formerly, Director, Armstrong Holdings Inc. (parent company of floor and ceiling products business)*; formerly, Director, FPL Group Inc. (public utility holding company)*; Director, URS Corporation (engineering design services firm)*. | | 37 |
| | | | |
Nancy Hawthorne Age: 56 | | Director | | 2003 | | Director, Avid Technologies (computer software company)*; formerly, Chairman of the Board of Avid Technologies; formerly, Board of Advisors, L. Knife & Sons, Inc. (beverage distributor); Chief Executive Officer, Clerestory LLC (corporate financial advisor); formerly, Trustee, New England Zenith Fund (“Zenith Fund”)**; formerly, Chief Executive Officer and Managing Partner, Hawthorne, Krauss and Associates (corporate financial advisor); formerly, Chief Financial Officer and Executive Vice President, Continental Cablevision, subsequently renamed MediaOne (cable television company); formerly, Director, Life F/X, Inc.; formerly, Chairman of the Board, WorldClinic (distance medicine company); formerly, Director, Perini Corporation (construction company)*; formerly, Director, CGU (property and casualty insurance company); formerly, Director, Beacon Power Corporation (energy company )*. | | 37 |
MSF-16
Metropolitan Series Fund, Inc.
Directors and Officers—(Continued)
| | | | | | | | |
Name, Address and Age | | Current
position(s)
with Fund | | Position(s)
held since | | Principal occupations
over past five years, including other directorships(2) | | Number of
Portfolios in
Fund Complex
Overseen by
Director(3) |
John T. Ludes Age: 71 | | Director | | 2003 | | President, LFP Properties (consulting firm); Formerly, Trustee, Zenith Fund**; formerly, Vice Chairman, President and Chief Operating Officer, Fortune Brands/American Brands (global conglomerate); formerly, President and CEO, Acushnet Company (athletic equipment company). | | 37 |
Officers(1)
| | | | | | | | |
Name and address | | Age | | Current
position(s)
with Fund | | Position(s)
held since | | Principal occupations over past five years(2) |
| Jeffrey P. Halperin | | 40 | | Chief Compliance Officer | | 2006 | | Vice President (since 2006), Corporate Ethics and Compliance Department, MetLife, Inc.; Chief Compliance Officer (since 2006), MetLife Advisers, MIA and MIST. |
| | | | |
| John F. Guthrie, Jr. | | 64 | | Senior Vice President | | 2002 | | Manager and Senior Vice President, MetLife Advisers; Vice President, MetLife; Vice President (since 2003), MetLife Group, Inc.; Vice President, NELICO; Vice President (since 2005), MIA; formerly, Senior Vice President, Zenith Fund**. |
| | | | |
| Alan C. Leland | | 55 | | Senior Vice President | | 2005 | | Treasurer and Chief Financial Officer, MetLife Advisers, LLC; Treasurer (since 2005), Met Investors Advisory, LLC; Vice President (since 2004), MIA; Vice President (since 2003), MetLife Group, Inc.; Vice President, MetLife; Senior Vice President, NELICO |
| | | | |
| Peter Duffy | | 52 | | Vice President and Treasurer | | 2000 | | Senior Vice President, MetLife Advisers (since 1998); Second Vice President (since 2003), NELICO; Vice President, MetLife (since 2004); Vice President (since 2004), MetLife Group, Inc.; formerly, Vice President and Treasurer, Zenith Fund**. |
| | | | |
| Thomas M. Lenz | | 49 | | Vice President and Secretary | | 2002 | | General Counsel and Secretary, MetLife Advisers; Assistant General Counsel, MetLife; formerly, Vice President and Secretary, Zenith Fund**. |
| * | Indicates a directorship with a registered investment company or a company subject to the reporting requirements of the Securities Exchange Act of 1934, as amended. |
| ** | The Zenith Fund deregistered with the Securities and Exchange Commission (“SEC”) in 2004. |
| (†) | Served as a trustee, director and/or officer of one or more of the following companies, each of which had a direct or indirect advisory relationship with MetLife Advisers or its affiliates prior to January 31, 2005: State Street Research Financial Trust, State Street Research Income Trust, State Street Research Money Market Trust, State Street Research Institutional Funds, State Street Research Capital Trust, State Street Research Master Investment Trust, State Street Research Equity Trust, State Street Research Securities Trust and State Street Research Exchange Trust (collectively, the “State Street Research Funds”). |
| (1) | Each Director of the Fund also serves as trustee of Metropolitan Series Fund II (“Met Series Fund II”), a registered investment company advised by MetLife Advisers. Each officer of the Fund serves in the same position with Met Series Fund II, which consists of one portfolio. |
| (2) | Previous positions during the past five years with the Fund, MIST, MetLife, MetLife Advisers, MIA, Zenith Fund, NELICO or New England Securities Corporation are omitted if not materially different. |
| (3) | The Fund Complex includes the Fund (36 portfolios), Met Series Fund II (1 portfolio) and MIST (44 portfolios) |
MSF-17
Metropolitan Series Fund, Inc.
Harris Oakmark Focused Value Portfolio
Board Approval of Advisory and Subadvisory Agreements
The Fund’s Contract Review Committees of the Board of Directors (the “Board”) typically meet in early fall to review the Portfolios’ advisory agreements (the “Advisory Agreements”) and subadvisory agreements (collectively, the “Subadvisory Agreements,” and, together with the Advisory Agreements, the “Agreements”) and determine whether to recommend that the full Board approve the continuation of the Agreements for an additional one-year period. (Following the initial approval of an Agreement for a new Portfolio or with a new adviser or subadviser, such annual reviews are not required until 2 years following the execution of such Agreement.) After each Committee has made its recommendations, the full Board, including the Independent Directors, determines whether to approve the continuation of each of the Agreements. In addition, the Board, including the Independent Directors, considers matters bearing on the Agreements at most of its other meetings throughout the year and regularly interviews various individuals at MetLife Advisers responsible for the management of the Portfolios. The Directors also interview selected investment managers and other professionals at the subadvisers at various times throughout the year.
The Directors receive all materials that they or MetLife Advisers, the Fund’s investment adviser, and the subadvisers believe to be reasonably necessary for the Directors to evaluate the Agreements and determine whether to approve the continuation of the Agreements. These materials generally include, among other items, (i) information on the investment performance of the Portfolios and the performance of peer groups of funds and the Portfolios’ performance benchmarks, (ii) information on the Portfolios’ advisory and subadvisory fees and other expenses, including information comparing the Portfolios’ expenses to those of peer groups of funds and information about any applicable expense caps and fee “breakpoints,” (iii) sales and redemption data, (iv) information related to the profitability of the Agreements to MetLife Advisers and the subadvisers, and potential “fall-out” or ancillary benefits that MetLife Advisers, the subadvisers or their affiliates may receive as a result of their relationships with the Fund and (v) information obtained through the subadvisers’ responses to certain requests from MetLife Advisers and the Directors and MetLife Advisers’ responses to requests from the Directors. The Directors may also consider other information such as (vi) MetLife Advisers’ and the subadvisers’ financial results and condition, (vii) each Portfolio’s investment objectives and strategies and the size, education and experience of the investment staffs of MetLife Advisers and the relevant subadvisers and their use of technology and external research, (viii) the allocation of the Portfolios’ brokerage, if any, including allocations to brokers affiliated with the subadvisers and the use of “soft” commission dollars to pay Portfolio expenses and to pay for research and other similar services, (ix) the resources devoted to, and the record of compliance with, the Portfolios’ investment policies and restrictions, policies on personal securities transactions and other compliance policies, (x) the responses of MetLife Advisers, the subadvisers and/or their affiliates to certain legal and regulatory proceedings and (xi) the economic outlook generally and for the mutual fund industry in particular. Throughout the process, the Directors have the opportunity to ask questions of and request additional materials from MetLife Advisers and the subadvisers.
Following meetings of each Contract Review Committee on September 12, 2007, the Board, at its November 15, 2007 meeting, approved the continuation through December 31, 2008 of the Advisory Agreements for each Portfolio of the Fund and the Subadvisory Agreements for each Portfolio of the Fund. The Agreements approved for continuation are referred to below as the “Continued Agreements.”
In considering whether to approve the continuation of the Continued Agreements, the Directors, including the Independent Directors, did not identify any single factor as determinative, and each weighed the various factors as he or she deemed appropriate. The Directors considered the following matters in connection with their approval of the Continued Agreements:
The nature, extent and quality of the services provided to the relevant Portfolios under the Continued Agreements. The Directors considered the nature, extent and quality of the services provided by MetLife Advisers, the relevant subadvisers (if any) and their affiliates (each, an “Adviser,” and, collectively, the “Advisers”) to the relevant Portfolios pursuant to the Continued Agreements and the resources dedicated to these Portfolios by the Advisers. In particular, the Directors considered the Advisers’ abilities to attract and retain highly qualified investment professionals. With respect to MetLife Advisers, the Directors considered that MetLife Advisers is (i) ultimately responsible for the performance of such Portfolios; (ii) ultimately responsible for the establishment of the investment strategies of each such Portfolio, primarily through its recommendations to the Board regarding the hiring and selection of subadvisers; (iii) responsible for the hiring and selection, subject to Board approval, of subadvisers; and (iv) responsible for maintaining a program of Subadviser oversight reasonably designed to ensure that the subadvisers have reasonable compliance policies and procedures in place. The Directors also considered that MetLife Advisers provides a full range of day-to-day administrative services for the Portfolios involving all aspects of such Portfolios’ day-to-day operations (other than portfolio management). After reviewing these and related factors, the Directors concluded, within the context of their overall conclusions regarding each of the Continued Agreements, that the nature, extent and quality of services provided supported the renewal of these Agreements.
Investment performance of the relevant Portfolios. The Directors reviewed information about the performance of the relevant Portfolios over various time periods, including information prepared by an independent third party that compared the performance of
MSF-18
Metropolitan Series Fund, Inc.
Harris Oakmark Focused Value Portfolio
Board Approval of Advisory and Subadvisory Agreements—(Continued)
the Portfolios to the performance of peer groups of funds and performance benchmarks. The Directors also reviewed a description of the third party’s methodology for identifying a Portfolio’s peer group(s) for purposes of performance and expense comparisons.
In the case of each relevant Portfolio that had performance that lagged its peer group(s) for certain periods, the Directors concluded that other factors relevant to performance were sufficient, in light of other considerations, to warrant renewal of the Continued Agreements relating to such Portfolio. These factors varied from Portfolio to Portfolio, but included one or more of the following: (i) that such Portfolio’s performance, although lagging in certain recent periods, was stronger over the longer term; (ii) that the underperformance was attributable, to a significant extent, to investment decisions that were reasonable and consistent with the Portfolio’s investment objective(s) and policies and that the Portfolio was performing within the range of reasonable expectations, given market conditions and the Portfolio’s investment objective(s) and policies; (iii) that the Portfolio’s performance was competitive when compared to other relevant performance benchmarks or peer groups; and (iv) that MetLife Advisers and/or the relevant subadviser (if any) had taken or was taking steps designed to help improve the Portfolio’s investment performance.
The Directors also considered the investment performance of the Advisers and their reputations generally, the historical responsiveness of the Advisers to Director concerns about performance and the willingness of the Advisers to take steps intended to improve performance.
After reviewing these and related factors, the Directors concluded, within the context of their overall conclusions regarding each of the Continued Agreements, that the investment performance of each relevant Portfolio and Adviser was sufficient, in light of other considerations, to warrant the renewal of the Continued Agreements.
The costs of the services to be provided and profits to be realized by the Advisers and their affiliates from their relationships with the Portfolios. The Directors considered the fees charged by MetLife Advisers to the Portfolios for advisory services and, with respect to the subadvised Portfolios, by such subadvisers to MetLife Advisers for subadvisory services (such advisory and subadvisory fees (if any), collectively, “Fees”), as well as the total expense levels of the Portfolios. This information included comparisons (provided by an independent third party) of the Portfolios’ advisory fees and total expense levels to those of their peer groups. In evaluating Fees for the relevant Portfolios, the Directors also took into account the demands, complexity and quality of the investment management services provided to each Portfolio. The Directors considered MetLife Advisers’ recommendations regarding reductions in Fee rates, implementation of Fee breakpoints and institution of Fee waivers and expense caps.
The Directors also considered the compensation directly or indirectly received by the Advisers and their affiliates from their relationships with the relevant Portfolios. The Directors reviewed information relating to the profits received by MetLife Advisers, certain of the subadvisers and their affiliates as a result of their relationships with the relevant Portfolios, and information about the allocation of expenses used to calculate profitability. When reviewing profitability, the Directors also considered the performance of the relevant Portfolios, the expense levels of such Portfolios and whether the relevant Advisers had implemented breakpoints, fee waivers and/or expense caps with respect to such Portfolios.
After reviewing these and related factors, the Directors concluded, within the context of their overall conclusions regarding each of the Continued Agreements, that the Fees charged to each of the relevant Portfolios were fair and reasonable, and that the information provided regarding costs of these services generally, and the related profitability (if known) to the relevant Advisers of their relationships with the relevant Portfolios, supported the renewal of the Continued Agreements.
Economies of Scale. The Directors considered the existence of any economies of scale in the provision of services by the Advisers and whether those economies were shared with the relevant Portfolios through breakpoints in their advisory fees or other means, such as expense caps, fee waivers or relatively low levels of fees. The Directors noted that most of the relevant Portfolios benefited or will benefit from breakpoints, expense caps and/or fee waivers with respect to their advisory fees. In considering these issues, the Directors also took into consideration information relating to the costs of the services provided and the profitability to MetLife Advisers, the relevant subadvisers (if any) and each of their affiliates of their relationships with the relevant Portfolios, as discussed above.
After reviewing these and related factors, the Directors concluded, within the context of their overall conclusions regarding each of the Continued Agreements, that the extent to which economies of scale were shared with the relevant Portfolios supported the renewal of such Agreements.
Other Factors. The Directors also considered other factors, which included but were not limited to the following:
| | • | | the extent to which each relevant Portfolio operated in accordance with its investment objective, and its record of compliance with its investment restrictions and the compliance programs of the Fund and the Advisers. They also considered the compliance-related resources the Advisers and their affiliates provide to the relevant Portfolios; |
MSF-19
Metropolitan Series Fund, Inc.
Harris Oakmark Focused Value Portfolio
Board Approval of Advisory and Subadvisory Agreements—(Continued)
| | • | | the nature, quality, cost and extent of administrative and shareholder services performed by MetLife Advisers and its affiliates under the Advisory Agreements; and |
| | • | | so-called “fall-out benefits” to the Advisers, such as the engagement of their affiliates to provide distribution, brokerage and transfer agency services to the Portfolios, and the benefits of research made available to the relevant Advisers by reason of brokerage commissions generated by the relevant Portfolios’ securities transactions. The Directors also considered the possible conflicts of interest associated with these fall-out and other benefits, and the reporting and other processes in place to disclose and monitor these possible conflicts of interest. |
Based on their evaluation of all factors that they deemed to be material, including those factors described above, and assisted by the advice of independent counsel, the Directors, including the Independent Directors, concluded that each of the Continued Agreements should be continued through December 31, 2008.
Certain Matters Relating to MFS Value Portfolio (formerly known as Harris Oakmark Large Cap Value Portfolio) (the “Value Portfolio”) and Harris Oakmark Focused Value Portfolio (the “Focused Value Portfolio”). At the November 15, 2007 Board meeting, the Board approved a change of subadviser for the Value Portfolio from Harris Associates L.P. (“Harris”) to Massachusetts Financial Services Company (“MFS”) and an amendment to the Subadvisory Agreement relating to the Focused Value Portfolio, each to be effective on January 7, 2008. The Board also approved a merger of the Value Portfolio with the MFS Value Portfolio, a series of the Met Investors Series Trust (“MIST”), to be effective on April 28, 2008 (the “Merger).
In making the determination to approve the change in subadviser for the Value Portfolio, the Board carefully considered those factors described above with respect to the continuation of the Continued Agreements, as relevant to both the existing Subadvisory Agreement with Harris and the proposed Subadvisory Agreement with MFS. In addition to these factors, the Board also considered as relevant:
| | • | | the experience, investment style and investment performance history of MFS as portfolio manager; |
| | • | | that the form of the proposed Subadvisory Agreement with MFS was substantially similar to the Value Portfolio’s existing Subadvisory Agreement with Harris; |
| | • | | that the subadvisory fee schedule for MFS set forth in the proposed Subadvisory Agreement was lower than the fee schedule in the existing Subadvisory Agreement and that MetLife Advisers had agreed to reduce its advisory fee, through a contractual fee waiver, by an amount corresponding to such savings; |
| | • | | the expected transition costs of the change of subadviser and the fact that MetLife Advisers had agreed to pay a portion of those costs; |
| | • | | the impact of the Merger on the Value Portfolio, including any potential costs savings; |
| | • | | that the preferred date of the change of subadviser for the Value Portfolio was January 7, 2008 and the desirability, in order to facilitate an orderly transition of subadvising functions, of extending the existing Subadvisory Agreement with Harris from its scheduled expiration date of December 31, 2007 until January 7, 2008; |
| | • | | that the existing Subadvisory Agreement with Harris for the Focused Value Portfolio contained a subadvisory fee schedule based on the combined average daily net assets for the Value Portfolio and the Focused Value Portfolio and that, as a result of the subadviser change for the Value Portfolio, the subadvisory fees for the Focused Value Portfolio may increase slightly; and |
| | • | | that MetLife Adviser’s voluntary advisory fee waiver currently in effect with respect to the Focused Value Portfolio would be discontinued following the subadviser change and that, as a result, the advisory fees for the Focused Value Portfolio may increase slightly. |
Following such consideration, and assisted by the advice of independent counsel, the Directors, including the Independent Directors, unanimously voted to approve (i) the continuation of the existing Subadvisory Agreement relating to the Value Portfolio through January 7, 2008 (ii) an amendment to the Subadvisory Agreement relating to the Focused Value Portfolio, effective January 7, 2008, and (iii) the proposed Subadvisory Agreement relating to the Value Portfolio with MFS, effective January 7, 2008 through January 6, 2010.
MSF-20
A description of the policies and procedures that the Fund uses to determine how to vote proxies relating to portfolio securities is available (i) without charge, upon request, by calling (800) 638-7732 and (ii) on the Securities and Exchange Commission’s (the “SEC”) website at http://www.sec.gov.
Information regarding how the Fund voted proxies relating to portfolio securities during the most recent twelve-month period ended December 31, 2007 is available (i) without charge, upon request, by calling (800) 638-7732 and (ii) on the SEC’s website at http://www.sec.gov.
The Fund files with the SEC a complete schedule of its portfolio holdings, as of the close of the first and third quarters of its fiscal year, on “Form N-Q”. These filings are available on the SEC’s website at www.sec.gov and may be reviewed and copied at the SEC’s Public Reference Room in Washington, DC. (Call 1-800-SEC-0330 for information on the operation of the Public Reference Room.)
MSF-21
| | |
Metropolitan Series Fund, Inc. Jennison Growth Portfolio Annual Report | | December 31, 2007 |
Letter from the President
February 1, 2008
Letter to Policy Holders:
2007 was a tumultuous year in the financial markets driven by concerns in the credit markets surrounding sub-prime mortgages and fears of recession in the U.S. Economy. The broad markets were mixed, with the Dow Jones Industrial Average up 8.9% and the MSCI EAFE Index, which measures the performance of international equities, up 11.2% for the year, while the Russell 2000 Index, which measures the performance of small capitalization stocks, was down 1.6%.
In the fixed income markets, credit spreads increased as a result of the pressure from sub-prime mortgage crisis and the Federal Reserve lowered interest rates by a total of 1% during the year. The Lehman Brothers Aggregate Bond Index posted a 7.0% return for the year.
On the following pages, you will find a complete review of your Portfolio and its investment performance.
MetLife is committed to building your financial freedom. We appreciate your trust and will continue to focus our efforts on meeting your investment needs.
Sincerely,
Elizabeth Forget
President, Metropolitan Series Fund, Inc.
Metropolitan Series Fund, Inc.
Jennison Growth Portfolio
Managed by Jennison Associates, LLC
Portfolio Manager Commentary*
PORTFOLIO PERFORMANCE
For the year ended December 31, 2007, the Class A shares of the Jennison Growth Portfolio returned 11.7%, compared to its benchmark, the Russell 1000 Growth Index1, which returned 11.8%. The average return of its peer group, the Lipper Variable Insurance Products Large-Cap Growth Funds Universe2, was 12.8% over the same period.
PORTFOLIO REVIEW
Strong US economic growth began to slow in 2007, but continued strength overseas, especially in emerging markets, helped drive US expansion. Reflecting in part the rapid development of emerging economies, the prices of commodities, such as metals and agricultural products, hit new cycle highs. Oil prices rose to record highs and closed 2007 just shy of $100 per barrel. At the same time, the US dollar weakened against most major currencies. Inflation, while largely contained through the year, remained a risk. Corporate earnings growth began to slow, with S&P 500 earnings growth failing to break into the double digits for the first time in several years in 2007’s third quarter. Negative earnings revisions became more common, with financial, retail, and homebuilding companies, along with some energy names, bearing the brunt. Employment, however, remained essentially healthy. Problems in the subprime mortgage market, evident early in the year, spread as 2007 progressed. The ensuing credit crunch led to heightened market volatility. Major financial institutions with balance sheets exposed to structured investment vehicles were forced to take write-offs, resulting in substantial losses, management changes, and moves to raise capital. In September, the Federal Open Market Committee began lowering the fed funds rate for the first time since June 2003. Rising energy prices, higher mortgage payments, and reduced home equity combined to help bring on a slowdown in consumer spending. Slowing economic growth and the prospect of recession in 2008 caused retail sales to tail off further into the important year-end holiday season.
The Russell 1000® Growth Index advanced 11.8% in the fiscal year ended December 31, 2007, substantially outperforming the Standard & Poor’s 500 Index3 5.5% gain and marking the first time in several years that growth stocks outperformed the broader market. Benchmark returns were greatest in materials, energy, utilities, and information technology. The consumer discretionary and financials sectors declined.
The Portfolio is built from the bottom up, with stocks selected one at a time, based on the fundamentals of individual companies rather than on overarching themes. The Portfolio’s security selection was strong in information technology, led by triple-digit gains in Research in Motion (RIMM) and Apple. Google, NVIDIA, and Juniper Networks posted 50%-plus advances, as well. RIMM advanced on the strength of the BlackBerry brand, as new subscribers grew at a solid pace and existing users embraced new product designs. Apple’s growth has been driven by the strength of iPod sales and a resurgence in Macintosh computer sales. Juniper’s investments in products, and sales force and channel strategy are yielding operating leverage, spurring an acceleration in revenue and EPS growth at the telecom equipment provider.
In the materials sector, Monsanto advanced more than 100%. The agricultural-seed and biotechnology company’s leading market share position, brand strength, first-mover advantage, operational performance, and technological innovation are helping Monsanto benefit from a bullish agriculture cycle.
Top performers in energy included Occidental Petroleum and Schlumberger. Schlumberger benefited from a resurgence in capital spending on energy-producing activity and from its business and geographic mix, while Occidental, unlike most other oil companies, is increasing production through acquisitions and operations in areas such as Oman and Libya.
The greatest detractor from performance came in the consumer discretionary sector, where retailers, including Coach and Kohl’s, were weak. Declines in other consumer names, such as Starbucks, reflected the company transitioning from stages of rapid expansion and high growth to more modest growth. We still like Coach’s rising traffic-to-sales conversion and proactive steps to manage the business in a changing external environment. We eliminated our position in Starbucks in June and exited Kohl’s in October.
Worries about subprime mortgage exposure and the impact of the credit crunch hurt the financials sector, including Portfolio holdings UBS and Merrill Lynch. We began trimming our position in UBS in July and exited the stock in November. After selling out of Merrill Lynch shares in June, we reinstituted a position in November on the belief that the company is positioned for a rebound under new leadership.
The selection of individual securities based on company-specific fundamentals drives the Portfolio’s sector allocations. Over the year, we reduced exposure to the consumer discretionary and financials sectors and increased weights in consumer staples, energy, health care, industrials, and materials.
* The views expressed above are those of the subadvisory firm as of December 31, 2007 and are subject to change based on market and other conditions. Information about the Portfolio’s holdings, asset allocation, industry allocation, or country diversification is historical and is not an indication of future Portfolio composition, which will vary. The performance of any index mentioned in this commentary has not been adjusted for ongoing management, distribution and operating expenses, and sales charges applicable to mutual fund investments. Direct investment in the Index is not possible.
1 The Russell 1000® Growth Index is an unmanaged measure of performance of the largest capitalized U.S. companies, within the Russell 1000 companies, that have higher price-to-book ratios and forecasted growth values.
2 The Lipper Variable Insurance Products Fund Average is an average of the total return performance (calculated on the basis of net asset value) of variable product funds with similar investment objectives to those of the subject Portfolio as calculated by Lipper Analytical Services, an independent mutual fund ranking service.
3 The Standard & Poor’s (S&P) 500® Composite Stock Price Index is an unmanaged index representing the performance of 500 major companies, most of which are listed on the New York Stock Exchange.
MSF-2
Metropolitan Series Fund, Inc.
Jennison Growth Portfolio
A $10,000 INVESTMENT COMPARED TO
THE RUSSELL 1000 GROWTH INDEX
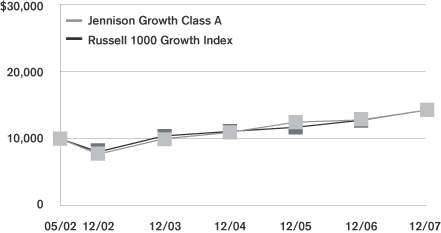
Average Annual Returns as of December 31, 2007
| | | | | | | | | | | | |
| | | Jennison Growth Portfolio | | | Russell 1000
Growth Index | |
| | | Class A | | | Class B | | | Class E | | |
| 1 Year | | 11.7 | % | | 11.4 | % | | 11.5 | % | | 11.8 | % |
| 5 Year | | 13.2 | | | 12.9 | | | — | | | 12.1 | |
| Since Inception | | 6.5 | | | 6.3 | | | 13.2 | | | 6.5 | |
Performance numbers are net of all Portfolio expenses but do not include any insurance, sales, or administrative charges of variable annuity or life insurance contracts. If these charges were included, the returns would be lower.
Inception dates of the Class A, Class B and Class E shares are: 5/1/02, 5/1/02 and 4/27/05, respectively. Index since inception return is based on the Class A inception date.
This information represents past performance and is not indicative of future results. Investment return and principal value may fluctuate so that shares, upon redemption, may be worth more or less than the original cost.
PORTFOLIO COMPOSITION
as of December 31, 2007
Top Holdings
| | |
| | | % of Total
Net Assets |
Google, Inc. (Class A) | | 4.7% |
Gilead Sciences, Inc. | | 3.8% |
Microsoft Corp. | | 3.5% |
Apple, Inc. | | 3.5% |
Research In Motion, Ltd. | | 3.1% |
Monsanto Co. | | 2.9% |
Cisco Systems, Inc. | | 2.6% |
The Walt Disney Co. | | 2.6% |
General Electric Co. | | 2.6% |
Colgate-Palmolive Co. | | 2.6% |
Top Sectors
| | |
| | | % of Equity
Market Value |
Information Technology | | 30.1% |
Health Care | | 24.8% |
Consumer Discretionary | | 9.3% |
Consumer Staples | | 8.7% |
Financials | | 8.7% |
Industrials | | 8.6% |
Energy | | 5.1% |
Materials | | 4.6% |
Telecommunication Services | | 0.1% |
MSF-3
Metropolitan Series Fund, Inc.
Shareholder Expense Example
As a shareholder of the Portfolio, you incur ongoing costs, including management fees; distribution and service (12b-1) fees; and other Portfolio expenses. This example is intended to help you understand your ongoing costs (in dollars) (referred to as “expenses”) of investing in the Portfolio and compare these costs with the ongoing costs of investing in other mutual funds. The example is based on an investment of $1,000 invested at the beginning of the period and held for the entire period, July 1, 2007 through December 31, 2007.
Actual Expenses
The first line for each share class of the Portfolio in the table below provides information about actual account values and actual expenses. You may use the information in this line, together with the amount you invested in the particular share class of the Portfolio, to estimate the expenses that you paid over the period. Simply divide your account value by $1,000 (for example, an $8,600 account value divided by $1,000=8.6), then multiply the result by the number in the first line under the heading entitled “Expenses Paid During Period” to estimate the expenses you paid on your account during this period.
Hypothetical Example for Comparison Purposes
The second line for each share class of the Portfolio in the table below provides information about hypothetical account values and hypothetical expenses based on the Portfolio’s actual expense ratio and an assumed rate of return of 5% per year before expenses, which is not the Portfolio’s actual return. The hypothetical account values and expenses may not be used to estimate the actual ending account balance or expenses you paid for the period. You may use this information to compare the ongoing costs of investing in the Portfolio and other funds. To do so, compare this 5% hypothetical example with the 5% hypothetical examples that appear in the shareholder reports of the other funds.
Please note that the expenses shown in the table are meant to highlight your ongoing costs only and do not reflect any fees or charges of your variable insurance product or any additional expenses that participants in certain eligible qualified plans may bear relating to the operations of their plan. Therefore, the second line for each share class in the table is useful in comparing ongoing costs only, and will not help you determine the relative total costs of owning different funds. In addition, if these other costs were included, your costs would have been higher.
| | | | | | | | | | | | | | |
Portfolio | | | | Annualized
Expense
Ratio | | | Beginning
Account Value
July 1,
2007 | | Ending
Account Value
December 31,
2007 | | Expenses Paid
During Period*
July 1, 2007
to
December 31,
2007 |
Jennison Growth—Class A | | Actual | | 0.67 | % | | $ | 1,000.00 | | $ | 1,064.90 | | $ | 3.49 |
| | Hypothetical | | 0.67 | % | | $ | 1,000.00 | | $ | 1,021.79 | | $ | 3.41 |
| | | | | |
Jennison Growth—Class B | | Actual | | 0.92 | % | | $ | 1,000.00 | | $ | 1,063.70 | | $ | 4.79 |
| | Hypothetical | | 0.92 | % | | $ | 1,000.00 | | $ | 1,020.51 | | $ | 4.69 |
| | | | | |
Jennison Growth—Class E | | Actual | | 0.82 | % | | $ | 1,000.00 | | $ | 1,064.30 | | $ | 4.27 |
| | Hypothetical | | 0.82 | % | | $ | 1,000.00 | | $ | 1,021.02 | | $ | 4.18 |
* Expenses paid are equal to the Portfolio’s annualized expense ratio for the most recent six month period, as shown above, multiplied by the average account value over the period, multiplied by the number of days in the most recent fiscal half-year, divided by 365 (to reflect the one-half year period).
MSF-4
Metropolitan Series Fund, Inc.
Jennison Growth Portfolio
Schedule of Investments as of December 31, 2007
Common Stock—98.8% of Total Net Assets
| | | | | |
| Security Description | | Shares | | Value* |
| | | | | |
| | |
Aerospace & Defense—3.1% | | | | | |
Boeing Co. | | 153,100 | | $ | 13,390,126 |
United Technologies Corp. | | 351,800 | | | 26,926,772 |
| | | | | |
| | | | | 40,316,898 |
| | | | | |
| | |
Beverages—2.2% | | | | | |
PepsiCo, Inc. | | 391,300 | | | 29,699,670 |
| | | | | |
| | |
Biotechnology—5.9% | | | | | |
Amgen, Inc. (a) | | 175,700 | | | 8,159,508 |
Genentech, Inc. (a) | | 288,700 | | | 19,363,109 |
Gilead Sciences, Inc. (a) | | 1,102,500 | | | 50,726,025 |
| | | | | |
| | | | | 78,248,642 |
| | | | | |
| | |
Capital Markets—5.5% | | | | | |
Lazard, Ltd. (b) | | 276,800 | | | 11,260,224 |
Merrill Lynch & Co., Inc. | | 217,600 | | | 11,680,768 |
The Charles Schwab Corp. | | 1,194,100 | | | 30,509,255 |
The Goldman Sachs Group, Inc. | | 92,500 | | | 19,892,125 |
| | | | | |
| | | | | 73,342,372 |
| | | | | |
| | |
Chemicals—4.6% | | | | | |
Monsanto Co. | | 342,300 | | | 38,231,487 |
Mosaic Co. (a) | | 62,300 | | | 5,877,382 |
Potash Corp. of Saskatchewan, Inc. | | 113,800 | | | 16,382,648 |
| | | | | |
| | | | | 60,491,517 |
| | | | | |
| | |
Communications Equipment—10.3% | | | | | |
Ciena Corp. (a) | | 287,000 | | | 9,789,570 |
Cisco Systems, Inc. (a) | | 1,285,400 | | | 34,795,778 |
Juniper Networks, Inc. (a) | | 427,500 | | | 14,193,000 |
Motorola, Inc. | | 1,041,600 | | | 16,707,264 |
QUALCOMM, Inc. | | 493,000 | | | 19,399,550 |
Research In Motion, Ltd. (a) | | 359,900 | | | 40,812,660 |
| | | | | |
| | | | | 135,697,822 |
| | | | | |
| | |
Computers & Peripherals—6.0% | | | | | |
Apple, Inc. (a) | | 232,400 | | | 46,033,792 |
Hewlett-Packard Co. | | 646,700 | | | 32,645,416 |
| | | | | |
| | | | | 78,679,208 |
| | | | | |
| | |
Consumer Finance—1.0% | | | | | |
American Express Co. | | 256,100 | | | 13,322,322 |
| | | | | |
| | |
Diversified Financial Services—2.1% | | | | | |
CME Group, Inc. | | 20,000 | | | 13,720,000 |
NYSE Euronext | | 156,100 | | | 13,700,897 |
| | | | | |
| | | | | 27,420,897 |
| | | | | |
| | |
Electrical Equipment—2.8% | | | | | |
ABB, Ltd. (ADR) | | 516,300 | | | 14,869,440 |
First Solar, Inc. (a) | | 60,200 | | | 16,081,828 |
SunPower Corp. (a) (b) | | 55,000 | | | 7,171,450 |
| | | | | |
| | | | | 38,122,718 |
| | | | | |
| | | | | |
| Security Description | | Shares | | Value* |
| | | | | |
| | |
Energy Equipment & Services—1.8% | | | | | |
Schlumberger, Ltd. | | 245,800 | | $ | 24,179,346 |
| | | | | |
| | |
Food & Staples Retailing—2.8% | | | | | |
Costco Wholesale Corp. | | 208,300 | | | 14,531,008 |
CVS Caremark Corp. | | 333,300 | | | 13,248,675 |
Whole Foods Market, Inc. (b) | | 217,600 | | | 8,878,080 |
| | | | | |
| | | | | 36,657,763 |
| | | | | |
| |
Health Care Equipment & Supplies—5.6% | | | |
Alcon, Inc. | | 176,600 | | | 25,260,864 |
Baxter International, Inc. | | 413,500 | | | 24,003,675 |
Hologic, Inc. (a) | | 161,400 | | | 11,078,496 |
St. Jude Medical, Inc. (a) | | 324,000 | | | 13,167,360 |
| | | | | |
| | | | | 73,510,395 |
| | | | | |
| | |
Hotels, Restaurants & Leisure—1.4% | | | | | |
Marriott International, Inc. | | 527,100 | | | 18,016,278 |
| | | | | |
| | |
Household Products—3.6% | | | | | |
Colgate-Palmolive Co. | | 435,200 | | | 33,928,192 |
Procter & Gamble Co. | | 190,900 | | | 14,015,878 |
| | | | | |
| | | | | 47,944,070 |
| | | | | |
| | |
Industrial Conglomerates—2.6% | | | | | |
General Electric Co. | | 920,100 | | | 34,108,107 |
| | | | | |
| | |
Internet Software & Services—6.1% | | | | | |
Akamai Technologies, Inc. (a) (b) | | 374,800 | | | 12,968,080 |
eBay, Inc. (a) | | 177,500 | | | 5,891,225 |
Google, Inc. (Class A) (a) | | 90,200 | | | 62,371,496 |
| | | | | |
| | | | | 81,230,801 |
| | | | | |
| | |
Life Sciences Tools & Services—1.7% | | | | | |
Thermo Fisher Scientific, Inc. (a) (b) | | 386,600 | | | 22,299,088 |
| | | | | |
| | |
Media—3.9% | | | | | |
News Corp. (Class A) | | 862,200 | | | 17,666,478 |
The Walt Disney Co. | | 1,061,200 | | | 34,255,536 |
| | | | | |
| | | | | 51,922,014 |
| | | | | |
| | |
Multiline Retail—0.8% | | | | | |
Saks, Inc. (a) (b) | | 518,700 | | | 10,768,212 |
| | | | | |
| | |
Oil, Gas & Consumable Fuels—3.3% | | | | | |
Marathon Oil Corp. | | 328,000 | | | 19,962,080 |
Occidental Petroleum Corp. | | 243,700 | | | 18,762,463 |
Southwestern Energy Co. (a) | | 77,700 | | | 4,329,444 |
| | | | | |
| | | | | 43,053,987 |
| | | | | |
| | |
Pharmaceuticals—11.3% | | | | | |
Abbott Laboratories | | 542,700 | | | 30,472,605 |
Elan Corp, Plc. (ADR) (a) | | 347,200 | | | 7,631,456 |
Merck & Co., Inc. | | 354,300 | | | 20,588,373 |
Mylan, Inc. (b) | | 461,400 | | | 6,487,284 |
*See accompanying notes to financial statements.
MSF-5
Metropolitan Series Fund, Inc.
Jennison Growth Portfolio
Schedule of Investments as of December 31, 2007
Common Stock—(Continued)
| | | | | |
| Security Description | | Shares | | Value* |
| | | | | |
| | |
Pharmaceuticals—(Continued) | | | | | |
Roche Holding AG (ADR) | | 290,500 | | $ | 24,808,700 |
Schering-Plough Corp. | | 605,400 | | | 16,127,856 |
Teva Pharmaceutical Industries, Ltd. (ADR) | | 516,900 | | | 24,025,512 |
Wyeth | | 446,600 | | | 19,735,254 |
| | | | | |
| | | | | 149,877,040 |
| | | | | |
|
Semiconductors & Semiconductor Equipment—1.4% |
Intel Corp. | | 425,300 | | | 11,338,498 |
NVIDIA Corp. (a) | | 204,000 | | | 6,940,080 |
| | | | | |
| | | | | 18,278,578 |
| | | | | |
| | |
Software—6.0% | | | | | |
Adobe Systems, Inc. (a) | | 736,600 | | | 31,474,918 |
Microsoft Corp. | | 1,301,900 | | | 46,347,640 |
VMware, Inc. (a) (b) | | 17,900 | | | 1,521,321 |
| | | | | |
| | | | | 79,343,879 |
| | | | | |
| | |
Specialty Retail—0.2% | | | | | |
Urban Outfitters, Inc. (a) (b) | | 112,600 | | | 3,069,476 |
| | | | | |
| |
Textiles, Apparel & Luxury Goods—2.8% | | | |
Coach, Inc. (a) | | 540,900 | | | 16,540,722 |
Nike, Inc. (b) | | 324,000 | | | 20,813,760 |
| | | | | |
| | | | | 37,354,482 |
| | | | | |
Total Common Stock
(Identified Cost $1,092,959,529) | | | | | 1,306,955,582 |
| | | | | |
| | | | | | | |
|
| Short Term Investments—4.6% | |
| Security Description | | Shares/
Face Amount | | Value* | |
| | |
Mutual Funds—3.4% | | | | | | | |
State Street Navigator Securities Lending Prime Portfolio (c) | | | 44,958,822 | | $ | 44,958,822 | |
| | | | | | | |
| |
Repurchase Agreement—1.2% | | | | |
State Street Repurchase Agreement dated 12/31/07 at 1.70% to be repurchased at $15,388,453 on 1/2/08, collateralized by $13,330,000 U.S. Treasury Bond 6.000% due 02/15/26 with a value of $15,696,075. | | $ | 15,387,000 | | | 15,387,000 | |
| | | | | | | |
Total Short Term Investments
(Identified Cost $60,345,822) | | | | | | 60,345,822 | |
| | | | | | | |
Total Investments—103.4%
(Identified Cost $1,153,305,351) (d) | | | | | | 1,367,301,404 | |
Liabilities in excess of other assets | | | | | | (44,973,775 | ) |
| | | | | | | |
| Total Net Assets—100% | | | | | $ | 1,322,327,629 | |
| | | | | | | |
| (b) | A portion or all of the security was held on loan. As of December 31, 2007, the market value of securities loaned was $ 71,393,895 and the collateral received consisted of cash in the amount of $44,958,822 and non cash collateral with a value of $28,426,765. The cash collateral is invested in a money market fund managed by an affiliate of the custodian. The non cash collateral received consists primarily of government securities and bank letters of credit, and are held for the benefit of the Portfolio at the Portfolio’s custodian. |
| (c) | Represents investment of cash collateral received from securities lending transactions. |
| (d) | The aggregate cost of investments for federal income tax purposes as of December 31, 2007 was $1,173,602,751 and the composition of unrealized appreciation and depreciation of investment securities was $220,258,157 and $(26,559,504), respectively. |
| (ADR)— | An American Depositary Receipt is a certificate issued by a custodian bank representing the right to receive securities of the foreign issuer described. Trading on exchanges not located in the United States or Canada significantly influences the value of ADRs. |
*See accompanying notes to financial statements.
MSF-6
Metropolitan Series Fund, Inc.
Jennison Growth Portfolio
Statement of Assets & Liabilities
December 31, 2007
| | | | | | |
Assets | | | | | | |
Investments at value (a) (b) | | | | | $ | 1,367,301,404 |
Cash | | | | | | 60 |
Receivable for: | | | | | | |
Securities sold | | | | | | 1,273,564 |
Fund shares sold | | | | | | 563,784 |
Accrued interest and dividends | | | | | | 1,412,819 |
Foreign taxes | | | | | | 7,569 |
| | | | | | |
Total Assets | | | | | | 1,370,559,200 |
Liabilities | | | | | | |
Payable for: | | | | | | |
Securities purchased | | $ | 1,334,703 | | | |
Fund shares redeemed | | | 1,122,568 | | | |
Collateral for securities loaned | | | 44,958,822 | | | |
Accrued expenses: | | | | | | |
Management fees | | | 704,315 | | | |
Service and distribution fees | | | 64,303 | | | |
Deferred directors’ fees | | | 3,902 | | | |
Other expenses | | | 42,958 | | | |
| | | | | | |
Total Liabilities | | | | | | 48,231,571 |
| | | | | | |
Net Assets | | | | | $ | 1,322,327,629 |
| | | | | | |
Net assets consists of: | | | | | | |
Capital paid in | | | | | $ | 1,003,750,130 |
Undistributed net investment income | | | | | | 7,671,258 |
Accumulated net realized gains | | | | | | 96,910,188 |
Unrealized appreciation on investments | | | | | | 213,996,053 |
| | | | | | |
Net Assets | | | | | $ | 1,322,327,629 |
| | | | | | |
| Computation of offering price: | | | | | | |
Class A | | | | | | |
Net asset value and redemption price per share ($1,016,211,970 divided by 74,620,725 shares outstanding) | | | | | $ | 13.62 |
| | | | | | |
Class B | | | | | | |
Net asset value and redemption price per share ($293,807,964 divided by 21,716,145 shares outstanding) | | | | | $ | 13.53 |
| | | | | | |
Class E | | | | | | |
Net asset value and redemption price per share ($12,307,695 divided by 906,585 shares outstanding) | | | | | $ | 13.58 |
| | | | | | |
(a) Identified cost of investments | | | | | $ | 1,153,305,351 |
| | | | | | |
| (b) | Includes cash collateral for securities loaned of $44,958,822. |
Statement of Operations
For the Year Ended December 31, 2007
| | | | | | | | |
Investment Income | | | | | | | | |
Dividends | | | | | | $ | 12,817,094 | (a) |
Interest | | | | | | | 1,175,570 | (b) |
| | | | | | | | |
| | | | | | | 13,992,664 | |
Expenses | | | | | | | | |
Management fees | | $ | 8,041,420 | | | | | |
Service and distribution fees—Class B | | | 727,619 | | | | | |
Service and distribution fees—Class E | | | 19,070 | | | | | |
Directors’ fees and expenses | | | 24,077 | | | | | |
Custodian | | | 95,099 | | | | | |
Audit and tax services | | | 31,738 | | | | | |
Legal | | | 14,598 | | | | | |
Printing | | | 343,868 | | | | | |
Insurance | | | 13,221 | | | | | |
Miscellaneous | | | 18,127 | | | | | |
| | | | | | | | |
Total expenses | | | 9,328,837 | | | | | |
Expense reductions | | | (171,641 | ) | | | 9,157,196 | |
| | | | | | | | |
Net Investment Income | | | | | | | 4,835,468 | |
| | | | | | | | |
Realized and Unrealized Gain | | | | | | | | |
| Realized gain on: | | | | | | | | |
Investments—net | | | 103,255,501 | | | | | |
Futures contracts—net | | | 1,305,645 | | | | 104,561,146 | |
| | | | | | | | |
| Change in unrealized appreciation on: | | | | | | | | |
Investments—net | | | | | | | 31,562,822 | |
| | | | | | | | |
Net gain | | | | | | | 136,123,968 | |
| | | | | | | | |
Net Increase in Net Assets From Operations | | | | | | $ | 140,959,436 | |
| | | | | | | | |
| (a) | Net of foreign taxes of $351,873. |
| (b) | Includes net income on securities loaned of $540,739. |
See accompanying notes to financial statements.
MSF-7
Metropolitan Series Fund, Inc.
Jennison Growth Portfolio
Statements of Changes in Net Assets
| | | | | | | | |
| | | Year ended
December 31,
2007 | | | Year ended
December 31,
2006 | |
From Operations | | | | | | | | |
Net investment income | | $ | 4,835,468 | | | $ | 2,820,454 | |
Net realized gain | | | 104,561,146 | | | | 52,229,378 | |
Unrealized appreciation (depreciation) | | | 31,562,822 | | | | (14,447,465 | ) |
| | | | | | | | |
Increase in net assets from operations | | | 140,959,436 | | | | 40,602,367 | |
| | | | | | | | |
From Distributions to Shareholders | | | | | | | | |
Net investment income | | | | | | | | |
Class A | | | (4,884,260 | ) | | | 0 | |
Class B | | | (553,650 | ) | | | 0 | |
Class E | | | (36,590 | ) | | | 0 | |
| | | | | | | | |
| | | (5,474,500 | ) | | | 0 | |
| | | | | | | | |
Net realized gain | | | | | | | | |
Class A | | | (40,959,234 | ) | | | (707,216 | ) |
Class B | | | (10,585,783 | ) | | | (274,942 | ) |
Class E | | | (460,264 | ) | | | (11,628 | ) |
| | | | | | | | |
| | | (52,005,281 | ) | | | (993,786 | ) |
| | | | | | | | |
Total distributions | | | (57,479,781 | ) | | | (993,786 | ) |
| | | | | | | | |
Increase (decrease) in net assets from capital share transactions | | | (86,492,553 | ) | | | 218,479,071 | |
| | | | | | | | |
Total increase (decrease) in net assets | | | (3,012,898 | ) | | | 258,087,652 | |
| | |
Net Assets | | | | | | | | |
Beginning of the period | | | 1,325,340,527 | | | | 1,067,252,875 | |
| | | | | | | | |
End of the period | | $ | 1,322,327,629 | | | $ | 1,325,340,527 | |
| | | | | | | | |
Undistributed Net Investment Income | | | | | | | | |
End of the period | | $ | 7,671,258 | | | $ | 2,583,384 | |
| | | | | | | | |
Other Information:
Capital Shares
Transactions in capital shares were as follows:
| | | | | | | | | | | | | | |
| | | Year ended
December 31, 2007 | | | Year ended
December 31, 2006 | |
| | | Shares | | | $ | | | Shares | | | $ | |
Class A | | | | | | | | | | | | | | |
Sales | | 24,553,315 | | | $ | 320,738,335 | | | 26,232,431 | | | $ | 318,021,193 | |
Reinvestments | | 3,609,724 | | | | 45,843,494 | | | 56,896 | | | | 707,216 | |
Redemptions | | (33,189,050 | ) | | | (425,024,047 | ) | | (7,907,561 | ) | | | (96,449,068 | ) |
| | | | | | | | | | | | | | |
Net increase (decrease) | | (5,026,011 | ) | | $ | (58,442,218 | ) | | 18,381,766 | | | $ | 222,279,341 | |
| | | | | | | | | | | | | | |
Class B | | | | | | | | | | | | | | |
Sales | | 3,811,957 | | | $ | 49,898,866 | | | 7,138,513 | | | $ | 86,369,123 | |
Reinvestments | | 881,284 | | | | 11,139,433 | | | 22,209 | | | | 274,942 | |
Redemptions | | (6,734,065 | ) | | | (87,424,644 | ) | | (7,419,983 | ) | | | (90,496,527 | ) |
| | | | | | | | | | | | | | |
Net decrease | | (2,040,824 | ) | | $ | (26,386,345 | ) | | (259,261 | ) | | $ | (3,852,462 | ) |
| | | | | | | | | | | | | | |
Class E | | | | | | | | | | | | | | |
Sales | | 138,345 | | | $ | 1,794,703 | | | 338,542 | | | $ | 4,114,419 | |
Reinvestments | | 39,184 | | | | 496,854 | | | 937 | | | | 11,628 | |
Redemptions | | (304,173 | ) | | | (3,955,547 | ) | | (338,412 | ) | | | (4,073,855 | ) |
| | | | | | | | | | | | | | |
Net increase (decrease) | | (126,644 | ) | | $ | (1,663,990 | ) | | 1,067 | | | $ | 52,192 | |
| | | | | | | | | | | | | | |
Increase (decrease) derived from capital share transactions | | | | | $ | (86,492,553 | ) | | | | | $ | 218,479,071 | |
| | | | | | | | | | | | | | |
See accompanying notes to financial statements.
MSF-8
Metropolitan Series Fund, Inc.
Jennison Growth Portfolio
Financial Highlights
| | | | | | | | | | | | | | | | | | | | |
| | | Class A | |
| | | Year ended December 31, | |
| | | 2007 | | | 2006 | | | 2005 | | | 2004 | | | 2003 | |
Net Asset Value, Beginning of Period | | $ | 12.71 | | | $ | 12.38 | | | $ | 10.92 | | | $ | 10.01 | | | $ | 7.71 | |
| | | | | | | | | | | | | | | | | | | | |
Income From Investment Operations | | | | | | | | | | | | | | | | | | | | |
Net investment income | | | 0.06 | (a) | | | 0.03 | | | | 0.00 | | | | 0.03 | | | | 0.02 | |
Net realized and unrealized gain on investments | | | 1.39 | | | | 0.31 | | | | 1.51 | | | | 0.89 | | | | 2.30 | |
| | | | | | | | | | | | | | | | | | | | |
Total from investment operations | | | 1.45 | | | | 0.34 | | | | 1.51 | | | | 0.92 | | | | 2.32 | |
| | | | | | | | | | | | | | | | | | | | |
Less Distributions | | | | | | | | | | | | | | | | | | | | |
Distributions from net investment income | | | (0.06 | ) | | | 0.00 | | | | (0.05 | ) | | | (0.01 | ) | | | (0.02 | ) |
Distributions from net realized capital gains | | | (0.48 | ) | | | (0.01 | ) | | | 0.00 | | | | 0.00 | | | | 0.00 | |
| | | | | | | | | | | | | | | | | | | | |
Total distributions | | | (0.54 | ) | | | (0.01 | ) | | | (0.05 | ) | | | (0.01 | ) | | | (0.02 | ) |
| | | | | | | | | | | | | | | | | | | | |
Net Asset Value, End of Period | | $ | 13.62 | | | $ | 12.71 | | | $ | 12.38 | | | $ | 10.92 | | | $ | 10.01 | |
| | | | | | | | | | | | | | | | | | | | |
Total Return (%) | | | 11.7 | | | | 2.8 | | | | 13.9 | | | | 9.2 | | | | 30.1 | |
Ratio of operating expenses to average net assets before expense reductions (%) | | | 0.67 | | | | 0.69 | | | | 0.69 | | | | 0.71 | | | | 0.73 | |
Ratio of operating expenses to average net assets after expense reductions (%) (b) | | | 0.66 | | | | 0.67 | | | | 0.68 | | | | 0.69 | | | | 0.70 | |
Ratio of net investment income to average net assets (%) | | | 0.44 | | | | 0.31 | | | | 0.04 | | | | 0.41 | | | | 0.17 | |
Portfolio turnover rate (%) | | | 71 | | | | 66 | | | | 60 | | | | 68 | | | | 68 | |
Net assets, end of period (000) | | $ | 1,016,212 | | | $ | 1,012,196 | | | $ | 758,316 | | | $ | 504,940 | | | $ | 343,253 | |
| | | Class B | |
| | | Year ended December 31, | |
| | | 2007 | | | 2006 | | | 2005 | | | 2004 | | | 2003 | |
Net Asset Value, Beginning of Period | | $ | 12.63 | | | $ | 12.33 | | | $ | 10.86 | | | $ | 9.97 | | | $ | 7.70 | |
| | | | | | | | | | | | | | | | | | | | |
Income From Investment Operations | | | | | | | | | | | | | | | | | | | | |
Net investment income (loss) | | | 0.02 | (a) | | | 0.01 | | | | (0.02 | ) | | | 0.04 | | | | 0.00 | |
Net realized and unrealized gain on investments | | | 1.39 | | | | 0.30 | | | | 1.49 | | | | 0.85 | | | | 2.28 | |
| | | | | | | | | | | | | | | | | | | | |
Total from investment operations | | | 1.41 | | | | 0.31 | | | | 1.47 | | | | 0.89 | | | | 2.28 | |
| | | | | | | | | | | | | | | | | | | | |
Less Distributions | | | | | | | | | | | | | | | | | | | | |
Distributions from net investment income | | | (0.03 | ) | | | 0.00 | | | | 0.00 | | | | 0.00 | | | | (0.01 | ) |
Distributions from net realized capital gains | | | (0.48 | ) | | | (0.01 | ) | | | 0.00 | | | | 0.00 | | | | 0.00 | |
| | | | | | | | | | | | | | | | | | | | |
Total distributions | | | (0.51 | ) | | | (0.01 | ) | | | 0.00 | | | | 0.00 | | | | (0.01 | ) |
| | | | | | | | | | | | | | | | | | | | |
Net Asset Value, End of Period | | $ | 13.53 | | | $ | 12.63 | | | $ | 12.33 | | | $ | 10.86 | | | $ | 9.97 | |
| | | | | | | | | | | | | | | | | | | | |
Total Return (%) | | | 11.4 | | | | 2.5 | | | | 13.5 | | | | 8.9 | | | | 29.7 | |
Ratio of operating expenses to average net assets before expense reductions (%) | | | 0.92 | | | | 0.94 | | | | 0.94 | | | | 0.96 | | | | 0.98 | |
Ratio of operating expenses to average net assets after expense reductions (%) (b) | | | 0.91 | | | | 0.92 | | | | 0.93 | | | | 0.94 | | | | 0.95 | |
Ratio of net investment income (loss) to average net assets (%) | | | 0.18 | | | | 0.06 | | | | (0.21 | ) | | | 0.29 | | | | (0.11 | ) |
Portfolio turnover rate (%) | | | 71 | | | | 66 | | | | 60 | | | | 68 | | | | 68 | |
Net assets, end of period (000) | | $ | 293,808 | | | $ | 300,052 | | | $ | 296,178 | | | $ | 330,349 | | | $ | 256,079 | |
| (a) | Per share amount is based on average shares outstanding during the period. |
| (b) | The Portfolio has entered into arrangements with certain brokers who paid a portion of the Portfolio’s expenses. |
| (c) | Commencement of operations was April 27, 2005 for Class E. |
| (d) | Periods less than one year are not computed on an annualized basis. |
| (e) | Computed on an annualized basis. |
See accompanying notes to financial statements.
MSF-9
Metropolitan Series Fund, Inc.
Jennison Growth Portfolio
Financial Highlights
| | | | | | | | | | | | |
| | | Class E | |
| | | Year ended December 31, | |
| | | 2007 | | | 2006 | | | 2005(c) | |
Net Asset Value, Beginning of Period | | $ | 12.67 | | | $ | 12.36 | | | $ | 10.16 | |
| | | | | | | | | | | | |
Income From Investment Operations | | | | | | | | | | | | |
Net investment income (loss) | | | 0.04 | (a) | | | 0.02 | | | | (0.01 | ) |
Net realized and unrealized gain on investments | | | 1.39 | | | | 0.30 | | | | 2.21 | |
| | | | | | | | | | | | |
Total from investment operations | | | 1.43 | | | | 0.32 | | | | 2.20 | |
| | | | | | | | | | | | |
Less Distributions | | | | | | | | | | | | |
Distributions from net investment income | | | (0.04 | ) | | | 0.00 | | | | 0.00 | |
Distributions from net realized capital gains | | | (0.48 | ) | | | (0.01 | ) | | | 0.00 | |
| | | | | | | | | | | | |
Total distributions | | | (0.52 | ) | | | (0.01 | ) | | | 0.00 | |
| | | | | | | | | | | | |
Net Asset Value, End of Period | | $ | 13.58 | | | $ | 12.67 | | | $ | 12.36 | |
| | | | | | | | | | | | |
Total Return (%) | | | 11.5 | | | | 2.6 | | | | 3.0 | (d) |
Ratio of operating expenses to average net assets before expense reductions (%) | | | 0.82 | | | | 0.84 | | | | 0.84 | (e) |
Ratio of operating expenses to average net assets after expense reductions (%) (b) | | | 0.81 | | | | 0.82 | | | | 0.82 | (e) |
Ratio of net investment income (loss) to average net assets (%) | | | 0.28 | | | | 0.24 | | | | (0.15 | )(e) |
Portfolio turnover rate (%) | | | 71 | | | | 66 | | | | 60 | |
Net assets, end of period (000) | | $ | 12,308 | | | $ | 13,093 | | | $ | 12,758 | |
| (a) | Per share amount is based on average shares outstanding during the period. |
| (b) | The Portfolio has entered into arrangements with certain brokers who paid a portion of the Portfolio’s expenses. |
| (c) | Commencement of operations was April 27, 2005 for Class E. |
| (d) | Periods less than one year are not computed on an annualized basis. |
| (e) | Computed on an annualized basis. |
See accompanying notes to financial statements.
MSF-10
Metropolitan Series Fund, Inc.
Jennison Growth Portfolio
Notes to Financial Statements—December 31, 2007
Metropolitan Series Fund, Inc. (the “Fund”) is organized as a corporation under the laws of Maryland pursuant to Articles of Incorporation filed on November 23, 1982, as amended, and registered under the Investment Company Act of 1940, as amended (the “1940 Act”), as an open-end investment company. The Fund is a “series” type of mutual fund, which issues separate series of stock. Each series represents an interest in a separate portfolio of Fund investments. The Jennison Growth Portfolio (the “Portfolio”) is a diversified series of the Fund. Shares in the Fund are not offered directly to the general public and are currently available only to separate accounts established by Metropolitan Life Insurance Company (“MetLife”), New England Life Insurance Company, General American Life Insurance Company (“General American”), The MetLife Investors Group of Insurance Companies, MetLife Insurance Company of Connecticut and other affiliated insurance companies (collectively, the “Insurance Companies”), as an investment vehicle for variable life insurance, group annuity or variable annuity products, although the Portfolio is not available to all such separate accounts. The Portfolio’s shares may be divided into different classes. Currently, the classes being offered by the Portfolio are named Class A, Class B and Class E. The classes of the Portfolio’s shares are identical, except that certain additional charges (Rule 12b-1 fees) are made against Class B and Class E shares. Investment income, realized and unrealized capital gains and losses, the common expenses of the Portfolio and certain Portfolio-level expense reductions, if any, are allocated on a pro rata basis to each class based on the relative net assets of each class to the total net assets of the Portfolio.
| 2. | SIGNIFICANT ACCOUNTING POLICIES: |
The preparation of financial statements in conformity with accounting principles generally accepted in the United States of America (“GAAP”) requires management to make estimates and assumptions that affect the reported amounts of assets and liabilities and disclosure of contingent assets and liabilities as of the date of the financial statements and the reported amounts of income and expenses during the reporting period. Actual results could differ from those estimates.
The following is a summary of significant accounting policies consistently followed by the Portfolio in the preparation of its financial statements. The policies are in conformity with GAAP.
Investment Valuation:
Debt securities (other than short term obligations with a remaining maturity of sixty days or less) are valued by independent pricing services selected by the relevant subadviser pursuant to authorization of the Board of Directors of the Fund (the “Board” or “Directors”). Short term obligations with a remaining maturity of sixty days or less are valued at amortized cost which approximates fair market value.
Equity securities traded on a national securities exchange or exchanges are valued at their last sale price on the principal trading market. Equity securities traded on the NASDAQ National Market System are valued at the NASDAQ Official Closing Price (the “NOCP”). The NOCP is the last sale price if it falls between the spread of the last reported bid and asked prices. If the last reported bid and asked prices are above the last reported sale price, the NOCP will be the last reported bid price. If the last reported bid and asked prices are below the last reported sale price, the NOCP will be the last reported asked price. Equity securities traded on a national securities exchange or exchanges or on the NASDAQ National Market System for which there is no reported sale during the day are valued at the last reported bid price. A security that is listed or traded on more than one exchange is valued at the quotation on the exchange determined to be the primary market for that security by the Board or its delegates. If no closing price is available, then such securities are valued by using the last reported bid price. Equity securities traded over-the-counter are valued at the last reported sales price.
If no current market value quotation is readily available or reliable for a portfolio security, fair value will be determined in accordance with procedures established by and under the general supervision of the Board. When the Portfolio uses fair value pricing, it may take into account any factors it deems appropriate. The value of securities used by the Portfolio to calculate its net asset value may differ from quoted or published prices for the same securities. Fair value pricing involves subjective judgments and the fair value determined for a security may be materially different than the value that could be realized upon the sale of that security.
The Portfolio expects to use fair value pricing for securities primarily traded on U.S. exchanges only under very limited circumstances. For example, the Portfolio may use fair value pricing if the exchange on which a security is traded closes early or trading in the security is suspended.
MSF-11
Metropolitan Series Fund, Inc.
Jennison Growth Portfolio
Notes to Financial Statements—December 31, 2007—(Continued)
Securities traded primarily on an exchange outside of the United States which closes before the close of the New York Stock Exchange will be valued at the last sales price on that non-U.S. exchange. Securities traded primarily on an exchange outside of the United States for which there is no reported sale during the day are valued at the mean between the last reported bid and asked prices. However, because most foreign markets close well before the Portfolio values its securities (typically at 4 p.m. Eastern Time), the earlier close of these foreign markets gives rise to the possibility that significant events, including broad market moves, may have occurred after these foreign markets close but before the Portfolio values its securities. To account for this, the Portfolio may frequently value many of its foreign equity securities using fair value prices based on third party vendor modeling tools.
Forward foreign currency exchange contracts are valued based on the mean between closing bid and asked prices of the forward currency contract rates in the London foreign exchange markets on a daily basis as provided by a reliable bank or dealer.
Options, whether on securities, indices, futures contracts, or otherwise, are valued at the last sales price available as of the close of business on the day of valuation or, if there is no such sale price available, at the mean between the bid and asked prices. Options on currencies are valued at the spot price each day.
The value of futures contracts will be the sum of the margin deposit plus or minus the difference between the value of the futures contract on each day the net asset value is calculated and the value on the date the futures contract originated, value being that established on a recognized commodity exchange, or by reference to other customary sources, with gain or loss being realized when the futures contract closes or expires.
Subject to the Board’s oversight, the Board has delegated day-to-day responsibility for valuing Portfolio assets to the subadviser of the Portfolio, who values such assets as described above and operates under procedures approved by the Board.
Investment Transactions and Related Investment Income:
Portfolio security transactions are recorded on the trade date. Dividend income is recorded on the ex-dividend date or, for certain foreign securities, when notified. Interest income, which includes amortization of premium and accretion of discount on debt securities, is recorded on the accrual basis. Realized gains and losses on investments and unrealized appreciation and depreciation are determined on the identified cost basis, which is the same basis used for federal income tax purposes.
Repurchase Agreements:
The Portfolio, through the custodian or a subcustodian, receives delivery of the underlying securities collateralizing repurchase agreements. The Portfolio requires the custodian to take possession, to have legally segregated in the Federal Reserve Book Entry System, or to have segregated within the custodian’s vault, all securities held as collateral for repurchase agreements. It is the Portfolio’s policy that the market value of the collateral be at least equal to 100% of the repurchase price in the case of a repurchase agreement of one-day duration and 102% on all other repurchase agreements. The Portfolio’s subadviser is responsible for determining that the value of the collateral is at all times at least equal to the repurchase price. In connection with transactions in repurchase agreements, if the seller defaults and the value of the collateral declines or if the seller enters an insolvency proceeding, realization of the collateral by the Portfolio may be delayed, limited or wholly denied.
Foreign Currency Translation:
The books and records of the Portfolio are maintained in U.S. dollars. The values of securities, currencies and other assets and liabilities denominated in currencies other than U.S. dollars are translated into U.S. dollars based upon foreign exchange rates prevailing at the end of the period. Purchases and sales of investment securities, income and expenses are translated on the respective dates of such transactions. Since the values of investment securities are presented at the foreign exchange rates prevailing at the end of the period, it is not practical to isolate that portion of the results of operations arising from changes in exchange rates from that portion of the results of operations reflecting fluctuations arising from changes in market prices of the investment securities. Such fluctuations are included in the net realized and unrealized gain or loss on investments.
Net realized foreign exchange gains or losses arise from sales of foreign currency, currency gains or losses realized between the trade and settlement dates on securities transactions, and the difference between the amounts of dividends, interest, and foreign withholding taxes recorded by the Portfolio and the U.S. dollar equivalent of the amounts actually received or paid by the Portfolio. Net unrealized foreign exchange gains and losses arise from changes in the value of assets and liabilities, other than investment securities, resulting from changes in the exchange rate.
MSF-12
Metropolitan Series Fund, Inc.
Jennison Growth Portfolio
Notes to Financial Statements—December 31, 2007—(Continued)
Forward Foreign Currency Exchange Contracts:
The Portfolio may enter into forward foreign currency exchange contracts primarily to hedge against foreign currency exchange rate risks on its non-U.S. dollar denominated investment securities. When entering into a forward currency contract, the Portfolio agrees to receive or deliver a fixed quantity of foreign currency for an agreed-upon price on an agreed future date. These contracts are valued daily and the Portfolio’s net equity therein, representing unrealized gain or loss on the contracts as measured by the difference between the foreign exchange rates at the dates of entry into the contracts and the forward rates at the settlement date, is included in the Statement of Assets and Liabilities. Realized and unrealized gains and losses are included in the Statement of Operations. These instruments involve market and/or credit risk in excess of the amount recognized in the Statement of Assets and Liabilities. Risks arise from the possible inability of counterparties to meet the terms of their contracts and from movement in currency and securities values and interest rates.
Futures Contracts:
The Portfolio may buy and sell futures contracts (on recognized exchanges) as a hedge or to enhance return. Futures contracts are agreements to buy or sell a security, or deliver a final cash settlement price in connection with an index, interest rate, currency, or other contracts not calling for physical delivery, for a set price in the future. The Portfolio must post an amount equal to a portion of the total market value of the futures contract as futures variation margin, which is returned when the Portfolio’s obligations under the contract have been satisfied. From time to time thereafter, the Portfolio may have to post variation margin to maintain this amount as the market value of the contract fluctuates. Risks of entering into futures contracts (and related options) include the possibility that there may be an illiquid market and that a change in the value of the contract or option may not correlate with changes in the value of the underlying securities.
Options:
The Portfolio may use options to hedge against changes in values of securities the Portfolio owns or expects to purchase. Writing puts or buying calls tends to increase the Portfolio’s exposure to the underlying instrument and writing calls or buying puts tends to decrease the Portfolio’s exposure to the underlying instrument, and can be used to hedge other Portfolio investments. For options purchased to hedge the Portfolio’s investments, the potential risk to the Portfolio is that the change in value of options contracts may not correspond to the change in value of the hedged instruments. In addition, losses may arise from changes in the value of the underlying instruments, if there is an illiquid secondary market, or if the counterparty is unable to perform. The maximum loss for purchased options is limited to the premium initially paid for the option. For options written by the Portfolio, the maximum loss is not limited to the premium initially received for the option.
The main risk associated with purchasing an option is that the option expires without being exercised. In this case, the option expires worthless and the premium paid for the option is considered the loss. The risk associated with writing a call option is that the Portfolio may forgo the opportunity for a profit if the market value of the underlying position increases and the option is exercised. The risk in writing a put option is that the Portfolio may incur a loss if the market value of the underlying position decreases and the option is exercised. In addition, the Portfolio risks not being able to enter into a closing transaction for the written option as the result of an illiquid market.
“When-Issued” Securities:
Purchasing securities “when-issued” is a forward commitment by the Portfolio to buy a security. The estimated amount of the Portfolio’s payment obligation and the security’s interest rate are determined when the commitment is made, even though no interest accrues until the security is issued, which is generally 15 to 120 days later. The Portfolio will segregate liquid assets with its custodian sufficient at all times to satisfy these commitments. If the value of the security is less when delivered than when the commitment was made, the Portfolio will suffer a loss.
Federal Income Taxes:
It is the Porfolio’s policy to comply with the requirements of the Internal Revenue Code of 1986, as amended, and regulations thereunder, applicable to regulated investment companies and to distribute all of its taxable income to shareholders. Therefore, no federal income tax provision is required.
As of December 31, 2007, the Portfolio had no capital loss carryovers.
MSF-13
Metropolitan Series Fund, Inc.
Jennison Growth Portfolio
Notes to Financial Statements—December 31, 2007—(Continued)
The tax character of distributions paid for the periods ended December 31, 2007 and 2006 was as follows:
| | | | | | | | | | | | | | | | | | | | | |
Ordinary Income | | Long Term Gain | | Return of Capital | | Total |
2007 | | 2006 | | 2007 | | 2006 | | 2007 | | 2006 | | 2007 | | 2006 |
$6,018,488 | | $ | — | | $ | 51,461,293 | | $ | 993,786 | | $ | — | | $ | — | | $ | 57,479,781 | | $ | 993,786 |
As of December 31, 2007, the components of distributable earnings (accumulated losses) on a federal income tax basis were as follows:
| | | | | | | | | | | | |
Undistributed
Ordinary
Income | | Undistributed
Long Term
Gain | | Unrealized
Appreciation | | Loss
Carryforwards | | Total |
| $27,450,290 | | $ | 97,433,870 | | $ | 193,698,653 | | $ | — | | $ | 318,582,813 |
Dividends and Distributions to Shareholders:
The Portfolio records dividends and distributions on the ex-dividend date. Net realized gains from security transactions (if any) are generally distributed annually to shareholders. The timing and characterization of certain income and capital gains distributions are determined in accordance with federal tax regulations that may differ from GAAP. Permanent book and tax basis differences relating to shareholder distributions will result in reclassification between under/over distributed net investment income, accumulated net realized gains/losses and paid in capital.
Expense Reductions:
Certain Portfolio trades are directed to brokers who paid a portion of the Portfolio’s expenses. Amounts paid for the Portfolio are shown as expense reductions in the Statement of Operations.
| 3. | INVESTMENT TRANSACTIONS: |
For the year ended December 31, 2007, purchases and sales of securities (excluding short term investments) for the Portfolio were as follows:
| | | | | | | | | | |
| Purchases | | Sales |
| U.S. Government | | Other | | U.S. Government | | Other |
| $ | 0 | | $ | 893,952,844 | | $ | 0 | | $ | 1,013,576,904 |
| 4. | INVESTMENT MANAGEMENT FEES AND OTHER TRANSACTIONS WITH AFFILIATES: |
Investment Management Agreement:
MetLife Advisers, LLC (“MetLife Advisers”) is the investment adviser to the Portfolio. The Fund has entered into an investment management agreement with MetLife Advisers with respect to the Portfolio. For providing investment management services to the Portfolio, MetLife Advisers receives monthly compensation at the following annual rates:
| | | | | | | |
| | | Management
Fees earned by
MetLife Advisers
for the year ended
December 31, 2007 | | Annual
percentage
rates paid to
MetLife Advisers | | Based on Portfolios
average daily net asset levels |
| | $ | 8,041,420 | | 0.700% | | Of the first $200 million |
| | | | | 0.650% | | Of the next $300 million |
| | | | | 0.600% | | Of the next $1.5 billion |
| | | | | 0.550% | | On amounts in excess of $2 billion |
Certain officers and directors of the Fund may also be officers of MetLife Advisers; however, such officers and directors receive no compensation from the Fund.
MetLife Advisers has entered into an investment subadvisory agreement with respect to the Portfolio. Jennison Associates, LLC is compensated by MetLife Advisers to provide subadvisory services for the Portfolio.
MSF-14
Metropolitan Series Fund, Inc.
Jennison Growth Portfolio
Notes to Financial Statements—December 31, 2007—(Continued)
Service and Distribution Fees:
The Fund has adopted a Distribution and Service Plan under Rule 12b-1 of the 1940 Act for the Portfolio’s Class B and E shares. Under the Distribution and Service Plan, the Class B and E shares of the Portfolio pay a fee to compensate the Insurance Companies (or their affiliates) and other broker-dealers and financial intermediaries involved in the offer and sale of Portfolio shares for promoting or selling and servicing, the Class B and E shares. The fees under the Distribution and Service Plan for each class of the Portfolio’s shares are calculated as a percentage of the Portfolio’s average daily net assets that are attributable to that Class. Currently, the fee is 0.25% per year for Class B shares and 0.15% per year for Class E shares. Amounts paid by the Portfolio for the year ended December 31, 2007 are shown as Service and Distribution fees in the Statement of Operations.
The Fund has entered into a securities lending arrangement with the Fund’s custodian, State Street Bank and Trust Company (the “custodian”). Under the agreement, the custodian is authorized to loan securities on the Portfolios’ behalf. In exchange, the Portfolio receives either cash or securities as collateral against the loaned securities. The Portfolio receives collateral at least equal to 102% of the market value of the loaned securities (105% for foreign securities), at each loan’s inception. Collateral must be maintained at least at 100% of the market value of the loaned securities for the duration of the loan. The cash collateral is invested in the Navigator Securities Lending Prime Portfolio, an affiliate of the custodian, which invests in a variety of high quality U.S. dollar-denominated instruments. If the market value of the collateral at the close of trading on a business day is less than 100% of the market value of the loaned securities at the close of trading on that day, the borrower shall be required to deliver, by the close of business on the following business day, an additional amount of collateral, equal to at least 100% of the market value of all the loaned securities as of such preceding day. The Portfolio receives 80% of the annual net income from securities lending transactions, which is included in interest income of the Portfolio. The remaining 20% is paid to the custodian as compensation for its securities lending services. The Portfolio bears the risk of any deficiency in the amount of collateral available for return to a borrower due to a loss in an approved investment. Any outstanding loans by the Portfolio at December 31, 2007 are footnoted in the Schedule of Investments.
As previously reported, in May 2004, General American received a Wells Notice stating that the SEC staff was considering recommending that the SEC bring a civil action alleging violations of the U.S. securities laws against General American with respect to market timing and late trading in a limited number of privately-placed variable insurance contracts that were sold through General American. General American responded to the SEC staff and cooperated with the investigation. On August 9, 2007, the SEC announced that it had settled an enforcement action regarding late trading against General American with, among other things, General American agreeing to pay a civil penalty and to comply with certain undertakings. General American consented to the SEC’s order without admitting or denying the findings. MetLife Advisers has also advised the Fund’s Board of Directors that, while certain exceptions to the Fund’s policies have been noted, no situations have been identified that would have a material impact on the financial position of the Fund.
| 7. | RECENT ACCOUNTING PRONOUNCEMENTS: |
Effective June 29, 2007, the Fund implemented Financial Accounting Standards Board (“FASB”) Interpretation No. 48, “Accounting for Uncertainty in Income Taxes—an interpretation of FASB Statement No. 109” (“FIN 48”). FIN 48 prescribes the minimum recognition threshold a tax position must meet in connection with accounting for uncertainties in income tax positions taken or expected to be taken by an entity, including investment companies, before being measured and recognized in the financial statements. Management has evaluated the application of FIN 48 to the Fund, and has determined that the adoption of FIN 48 does not have a material impact on the Fund’s financial statements. The Fund files U.S. tax returns. No income tax returns are currently under examination. The statute of limitations on the Fund’s tax returns remains open for the years ended December 31, 2004 through December 31, 2006.
In September 2006, Statement of Financial Accounting Standards No. 157, Fair Value Measurements (SFAS 157) was issued and is effective for fiscal years beginning after November 15, 2007. SFAS 157 defines fair value, establishes a framework for measuring fair value and expands disclosures about fair value measurements. Management is currently evaluating the impact the adoption of SFAS 157 will have on the Portfolio’s financial statement disclosures.
MSF-15
Metropolitan Series Fund, Inc.
Jennison Growth Portfolio
Report of Independent Registered Public Accounting Firm
To the Shareholders and Board of Directors of the Metropolitan Series Fund, Inc.:
We have audited the accompanying statement of assets and liabilities, including the schedule of investments, of the Jennison Growth Portfolio, one of the portfolios constituting the Metropolitan Series Fund, Inc. (the “Fund”) as of December 31, 2007, and the related statement of operations for the year then ended, the statements of changes in net assets for each of the two years in the period then ended, and the financial highlights for each of the five years in the period then ended. These financial statements and financial highlights are the responsibility of the Fund’s management. Our responsibility is to express an opinion on these financial statements and financial highlights based on our audits.
We conducted our audits in accordance with the standards of the Public Company Accounting Oversight Board (United States). Those standards require that we plan and perform the audit to obtain reasonable assurance about whether the financial statements and financial highlights are free of material misstatement. The Fund is not required to have, nor were we engaged to perform, an audit of its internal control over financial reporting. Our audits included consideration of internal control over financial reporting as a basis for designing audit procedures that are appropriate in the circumstances, but not for the purpose of expressing an opinion on the effectiveness of the Fund’s internal control over financial reporting. Accordingly, we express no such opinion. An audit also includes examining, on a test basis, evidence supporting the amounts and disclosures in the financial statements, assessing the accounting principles used and significant estimates made by management, as well as evaluating the overall financial statement presentation. Our procedures included confirmation of securities owned as of December 31, 2007, by correspondence with the custodian and brokers; where replies were not received from brokers, we performed other auditing procedures. We believe that our audits provide a reasonable basis for our opinion.
In our opinion, the financial statements and financial highlights referred to above present fairly, in all material respects, the financial position of the Jennison Growth Portfolio of the Metropolitan Series Fund, Inc. as of December 31, 2007, the results of its operations for the year then ended, the changes in its net assets for each of the two years in the period then ended, and the financial highlights for each of the five years in the period then ended, in conformity with accounting principles generally accepted in the United States of America.
Deloitte & Touche LLP
Boston, Massachusetts
February 21, 2008
MSF-16
Metropolitan Series Fund, Inc.
Directors and Officers
The Fund’s Directors review actions of the Fund’s investment adviser and subadvisers, and decide upon matters of general policy. The Fund’s officers supervise the daily business operations of the Fund. The Board of Directors and the Fund’s officers are listed below. Each Director is responsible for overseeing all 36 Portfolios of the Fund. There is no limit to the term a Director may serve. Directors serve until their resignation, retirement or removal in accordance with the Fund’s organizational documents and policies adopted by the Board from time to time. Officers hold office at the pleasure of the Board or until the election or appointment and the qualification of a successor. The address of the directors and officers is c/o Metropolitan Series Fund, Inc., 501 Boylston Street, Boston, MA 02116.
Interested Directors(1)
Each Director below is an “interested person” (as defined by the 1940 Act) with respect to the Fund in that Ms. Forget is an employee of MetLife and Mr. Typermass is a former employee of MetLife and owns securities issued by MetLife, Inc., the ultimate parent company of MetLife Advisers.
| | | | | | | | |
Name, Address and Age | | Current
position(s)
with Fund | | Position(s)
held since | | Principal occupations
over past five years, including other directorships(2) | | Number of
Portfolios in
Fund Complex
Overseen by
Director(3) |
Elizabeth M. Forget Age: 41 | | Director, Chairman of the Board, President and Chief Executive Officer | | 2006 | | Senior Vice President (since 2007), MetLife, Inc.; President, Met Investors Advisory, LLC (“MIA”); Trustee and President, Met Investors Series Trust (“MIST”); Executive Vice President, MetLife Investors Group, Inc.; President (since 2006), MetLife Advisers. | | 81 |
| | | | |
Arthur G. Typermass Age: 70 | | Director | | 1998 | | Formerly, Senior Vice President and Treasurer, MetLife. | | 37 |
Non-Interested Directors(1)
Each Director below is not an “interested person” (as defined by the 1940 Act) with respect to the Fund (collectively, the “Independent Directors”).
| | | | | | | | |
Name, Address and Age | | Current
position(s)
with Fund | | Position(s)
held since | | Principal occupations
over past five years, including other directorships(2) | | Number of
Portfolios in
Fund Complex
Overseen by
Director(3) |
Steve A. Garban† Age: 70 | | Director | | 1985 | | Formerly, Chief Financial Officer, Senior Vice President Finance and Operations and Treasurer (Emeritus), The Pennsylvania State University. | | 37 |
| | | | |
Linda B. Strumpf Age: 60 | | Director | | 2000 | | Vice President and Chief Investment Officer, Ford Foundation. | | 37 |
| | | | |
Michael S. Scott Morton† Age: 70 | | Director | | 1993 | | Jay W. Forrester Professor of Management (Emeritus) at Sloan School of Management, MIT. | | 37 |
| | | | |
H. Jesse Arnelle Age: 74 | | Director | | 2001 | | Formerly, Counsel, Womble Carlyle Sandrie & Rice; Director, Textron Inc. (global multi-industry company)*; formerly, Director, Gannet Co. Inc. (diversified news and information company)*; formerly, Director, Eastman Chemical Company (global chemical company)*; formerly, Director, Waste Management, Inc.*; formerly, Director, Armstrong Holdings Inc. (parent company of floor and ceiling products business)*; formerly, Director, FPL Group Inc. (public utility holding company)*; Director, URS Corporation (engineering design services firm)*. | | 37 |
| | | | |
Nancy Hawthorne Age: 56 | | Director | | 2003 | | Director, Avid Technologies (computer software company)*; formerly, Chairman of the Board of Avid Technologies; formerly, Board of Advisors, L. Knife & Sons, Inc. (beverage distributor); Chief Executive Officer, Clerestory LLC (corporate financial advisor); formerly, Trustee, New England Zenith Fund (“Zenith Fund”)**; formerly, Chief Executive Officer and Managing Partner, Hawthorne, Krauss and Associates (corporate financial advisor); formerly, Chief Financial Officer and Executive Vice President, Continental Cablevision, subsequently renamed MediaOne (cable television company); formerly, Director, Life F/X, Inc.; formerly, Chairman of the Board, WorldClinic (distance medicine company); formerly, Director, Perini Corporation (construction company)*; formerly, Director, CGU (property and casualty insurance company); formerly, Director, Beacon Power Corporation (energy company )*. | | 37 |
MSF-17
Metropolitan Series Fund, Inc.
Directors and Officers—(Continued)
| | | | | | | | |
Name, Address and Age | | Current
position(s)
with Fund | | Position(s)
held since | | Principal occupations
over past five years, including other directorships(2) | | Number of
Portfolios in
Fund Complex
Overseen by
Director(3) |
John T. Ludes Age: 71 | | Director | | 2003 | | President, LFP Properties (consulting firm); Formerly, Trustee, Zenith Fund**; formerly, Vice Chairman, President and Chief Operating Officer, Fortune Brands/American Brands (global conglomerate); formerly, President and CEO, Acushnet Company (athletic equipment company). | | 37 |
Officers(1)
| | | | | | | | |
Name and address | | Age | | Current
position(s)
with Fund | | Position(s)
held since | | Principal occupations over past five years(2) |
| Jeffrey P. Halperin | | 40 | | Chief Compliance Officer | | 2006 | | Vice President (since 2006), Corporate Ethics and Compliance Department, MetLife, Inc.; Chief Compliance Officer (since 2006), MetLife Advisers, MIA and MIST. |
| | | | |
| John F. Guthrie, Jr. | | 64 | | Senior Vice President | | 2002 | | Manager and Senior Vice President, MetLife Advisers; Vice President, MetLife; Vice President (since 2003), MetLife Group, Inc.; Vice President, NELICO; Vice President (since 2005), MIA; formerly, Senior Vice President, Zenith Fund**. |
| | | | |
| Alan C. Leland | | 55 | | Senior Vice President | | 2005 | | Treasurer and Chief Financial Officer, MetLife Advisers, LLC; Treasurer (since 2005), Met Investors Advisory, LLC; Vice President (since 2004), MIA; Vice President (since 2003), MetLife Group, Inc.; Vice President, MetLife; Senior Vice President, NELICO |
| | | | |
| Peter Duffy | | 52 | | Vice President and Treasurer | | 2000 | | Senior Vice President, MetLife Advisers (since 1998); Second Vice President (since 2003), NELICO; Vice President, MetLife (since 2004); Vice President (since 2004), MetLife Group, Inc.; formerly, Vice President and Treasurer, Zenith Fund**. |
| | | | |
| Thomas M. Lenz | | 49 | | Vice President and Secretary | | 2002 | | General Counsel and Secretary, MetLife Advisers; Assistant General Counsel, MetLife; formerly, Vice President and Secretary, Zenith Fund**. |
| * | Indicates a directorship with a registered investment company or a company subject to the reporting requirements of the Securities Exchange Act of 1934, as amended. |
| ** | The Zenith Fund deregistered with the Securities and Exchange Commission (“SEC”) in 2004. |
| (†) | Served as a trustee, director and/or officer of one or more of the following companies, each of which had a direct or indirect advisory relationship with MetLife Advisers or its affiliates prior to January 31, 2005: State Street Research Financial Trust, State Street Research Income Trust, State Street Research Money Market Trust, State Street Research Institutional Funds, State Street Research Capital Trust, State Street Research Master Investment Trust, State Street Research Equity Trust, State Street Research Securities Trust and State Street Research Exchange Trust (collectively, the “State Street Research Funds”). |
| (1) | Each Director of the Fund also serves as trustee of Metropolitan Series Fund II (“Met Series Fund II”), a registered investment company advised by MetLife Advisers. Each officer of the Fund serves in the same position with Met Series Fund II, which consists of one portfolio. |
| (2) | Previous positions during the past five years with the Fund, MIST, MetLife, MetLife Advisers, MIA, Zenith Fund, NELICO or New England Securities Corporation are omitted if not materially different. |
| (3) | The Fund Complex includes the Fund (36 portfolios), Met Series Fund II (1 portfolio) and MIST (44 portfolios) |
MSF-18
Metropolitan Series Fund, Inc.
Jennison Growth Portfolio
Board Approval of Advisory and Subadvisory Agreements
The Fund’s Contract Review Committees of the Board of Directors (the “Board”) typically meet in early fall to review the Portfolios’ advisory agreements (the “Advisory Agreements”) and subadvisory agreements (collectively, the “Subadvisory Agreements,” and, together with the Advisory Agreements, the “Agreements”) and determine whether to recommend that the full Board approve the continuation of the Agreements for an additional one-year period. (Following the initial approval of an Agreement for a new Portfolio or with a new adviser or subadviser, such annual reviews are not required until 2 years following the execution of such Agreement.) After each Committee has made its recommendations, the full Board, including the Independent Directors, determines whether to approve the continuation of each of the Agreements. In addition, the Board, including the Independent Directors, considers matters bearing on the Agreements at most of its other meetings throughout the year and regularly interviews various individuals at MetLife Advisers responsible for the management of the Portfolios. The Directors also interview selected investment managers and other professionals at the subadvisers at various times throughout the year.
The Directors receive all materials that they or MetLife Advisers, the Fund’s investment adviser, and the subadvisers believe to be reasonably necessary for the Directors to evaluate the Agreements and determine whether to approve the continuation of the Agreements. These materials generally include, among other items, (i) information on the investment performance of the Portfolios and the performance of peer groups of funds and the Portfolios’ performance benchmarks, (ii) information on the Portfolios’ advisory and subadvisory fees and other expenses, including information comparing the Portfolios’ expenses to those of peer groups of funds and information about any applicable expense caps and fee “breakpoints,” (iii) sales and redemption data, (iv) information related to the profitability of the Agreements to MetLife Advisers and the subadvisers, and potential “fall-out” or ancillary benefits that MetLife Advisers, the subadvisers or their affiliates may receive as a result of their relationships with the Fund and (v) information obtained through the subadvisers’ responses to certain requests from MetLife Advisers and the Directors and MetLife Advisers’ responses to requests from the Directors. The Directors may also consider other information such as (vi) MetLife Advisers’ and the subadvisers’ financial results and condition, (vii) each Portfolio’s investment objectives and strategies and the size, education and experience of the investment staffs of MetLife Advisers and the relevant subadvisers and their use of technology and external research, (viii) the allocation of the Portfolios’ brokerage, if any, including allocations to brokers affiliated with the subadvisers and the use of “soft” commission dollars to pay Portfolio expenses and to pay for research and other similar services, (ix) the resources devoted to, and the record of compliance with, the Portfolios’ investment policies and restrictions, policies on personal securities transactions and other compliance policies, (x) the responses of MetLife Advisers, the subadvisers and/or their affiliates to certain legal and regulatory proceedings and (xi) the economic outlook generally and for the mutual fund industry in particular. Throughout the process, the Directors have the opportunity to ask questions of and request additional materials from MetLife Advisers and the subadvisers.
Following meetings of each Contract Review Committee on September 12, 2007, the Board, at its November 15, 2007 meeting, approved the continuation through December 31, 2008 of the Advisory Agreements for each Portfolio of the Fund and the Subadvisory Agreements for each Portfolio of the Fund. The Agreements approved for continuation are referred to below as the “Continued Agreements.”
In considering whether to approve the continuation of the Continued Agreements, the Directors, including the Independent Directors, did not identify any single factor as determinative, and each weighed the various factors as he or she deemed appropriate. The Directors considered the following matters in connection with their approval of the Continued Agreements:
The nature, extent and quality of the services provided to the relevant Portfolios under the Continued Agreements. The Directors considered the nature, extent and quality of the services provided by MetLife Advisers, the relevant subadvisers (if any) and their affiliates (each, an “Adviser,” and, collectively, the “Advisers”) to the relevant Portfolios pursuant to the Continued Agreements and the resources dedicated to these Portfolios by the Advisers. In particular, the Directors considered the Advisers’ abilities to attract and retain highly qualified investment professionals. With respect to MetLife Advisers, the Directors considered that MetLife Advisers is (i) ultimately responsible for the performance of such Portfolios; (ii) ultimately responsible for the establishment of the investment strategies of each such Portfolio, primarily through its recommendations to the Board regarding the hiring and selection of subadvisers; (iii) responsible for the hiring and selection, subject to Board approval, of subadvisers; and (iv) responsible for maintaining a program of Subadviser oversight reasonably designed to ensure that the subadvisers have reasonable compliance policies and procedures in place. The Directors also considered that MetLife Advisers provides a full range of day-to-day administrative services for the Portfolios involving all aspects of such Portfolios’ day-to-day operations (other than portfolio management). After reviewing these and related factors, the Directors concluded, within the context of their overall conclusions regarding each of the Continued Agreements, that the nature, extent and quality of services provided supported the renewal of these Agreements.
MSF-19
Metropolitan Series Fund, Inc.
Jennison Growth Portfolio
Board Approval of Advisory and Subadvisory Agreements—(Continued)
Investment performance of the relevant Portfolios. The Directors reviewed information about the performance of the relevant Portfolios over various time periods, including information prepared by an independent third party that compared the performance of the Portfolios to the performance of peer groups of funds and performance benchmarks. The Directors also reviewed a description of the third party’s methodology for identifying a Portfolio’s peer group(s) for purposes of performance and expense comparisons.
In the case of each relevant Portfolio that had performance that lagged its peer group(s) for certain periods, the Directors concluded that other factors relevant to performance were sufficient, in light of other considerations, to warrant renewal of the Continued Agreements relating to such Portfolio. These factors varied from Portfolio to Portfolio, but included one or more of the following: (i) that such Portfolio’s performance, although lagging in certain recent periods, was stronger over the longer term; (ii) that the underperformance was attributable, to a significant extent, to investment decisions that were reasonable and consistent with the Portfolio’s investment objective(s) and policies and that the Portfolio was performing within the range of reasonable expectations, given market conditions and the Portfolio’s investment objective(s) and policies; (iii) that the Portfolio’s performance was competitive when compared to other relevant performance benchmarks or peer groups; and (iv) that MetLife Advisers and/or the relevant subadviser (if any) had taken or was taking steps designed to help improve the Portfolio’s investment performance.
The Directors also considered the investment performance of the Advisers and their reputations generally, the historical responsiveness of the Advisers to Director concerns about performance and the willingness of the Advisers to take steps intended to improve performance.
After reviewing these and related factors, the Directors concluded, within the context of their overall conclusions regarding each of the Continued Agreements, that the investment performance of each relevant Portfolio and Adviser was sufficient, in light of other considerations, to warrant the renewal of the Continued Agreements.
The costs of the services to be provided and profits to be realized by the Advisers and their affiliates from their relationships with the Portfolios. The Directors considered the fees charged by MetLife Advisers to the Portfolios for advisory services and, with respect to the subadvised Portfolios, by such subadvisers to MetLife Advisers for subadvisory services (such advisory and subadvisory fees (if any), collectively, “Fees”), as well as the total expense levels of the Portfolios. This information included comparisons (provided by an independent third party) of the Portfolios’ advisory fees and total expense levels to those of their peer groups. In evaluating Fees for the relevant Portfolios, the Directors also took into account the demands, complexity and quality of the investment management services provided to each Portfolio. The Directors considered MetLife Advisers’ recommendations regarding reductions in Fee rates, implementation of Fee breakpoints and institution of Fee waivers and expense caps.
The Directors also considered the compensation directly or indirectly received by the Advisers and their affiliates from their relationships with the relevant Portfolios. The Directors reviewed information relating to the profits received by MetLife Advisers, certain of the subadvisers and their affiliates as a result of their relationships with the relevant Portfolios, and information about the allocation of expenses used to calculate profitability. When reviewing profitability, the Directors also considered the performance of the relevant Portfolios, the expense levels of such Portfolios and whether the relevant Advisers had implemented breakpoints, fee waivers and/or expense caps with respect to such Portfolios.
After reviewing these and related factors, the Directors concluded, within the context of their overall conclusions regarding each of the Continued Agreements, that the Fees charged to each of the relevant Portfolios were fair and reasonable, and that the information provided regarding costs of these services generally, and the related profitability (if known) to the relevant Advisers of their relationships with the relevant Portfolios, supported the renewal of the Continued Agreements.
Economies of Scale. The Directors considered the existence of any economies of scale in the provision of services by the Advisers and whether those economies were shared with the relevant Portfolios through breakpoints in their advisory fees or other means, such as expense caps, fee waivers or relatively low levels of fees. The Directors noted that most of the relevant Portfolios benefited or will benefit from breakpoints, expense caps and/or fee waivers with respect to their advisory fees. In considering these issues, the Directors also took into consideration information relating to the costs of the services provided and the profitability to MetLife Advisers, the relevant subadvisers (if any) and each of their affiliates of their relationships with the relevant Portfolios, as discussed above.
After reviewing these and related factors, the Directors concluded, within the context of their overall conclusions regarding each of the Continued Agreements, that the extent to which economies of scale were shared with the relevant Portfolios supported the renewal of such Agreements.
MSF-20
Metropolitan Series Fund, Inc.
Jennison Growth Portfolio
Board Approval of Advisory and Subadvisory Agreements—(Continued)
Other Factors. The Directors also considered other factors, which included but were not limited to the following:
| | • | | the extent to which each relevant Portfolio operated in accordance with its investment objective, and its record of compliance with its investment restrictions and the compliance programs of the Fund and the Advisers. They also considered the compliance-related resources the Advisers and their affiliates provide to the relevant Portfolios; |
| | • | | the nature, quality, cost and extent of administrative and shareholder services performed by MetLife Advisers and its affiliates under the Advisory Agreements; and |
| | • | | so-called “fall-out benefits” to the Advisers, such as the engagement of their affiliates to provide distribution, brokerage and transfer agency services to the Portfolios, and the benefits of research made available to the relevant Advisers by reason of brokerage commissions generated by the relevant Portfolios’ securities transactions. The Directors also considered the possible conflicts of interest associated with these fall-out and other benefits, and the reporting and other processes in place to disclose and monitor these possible conflicts of interest. |
Based on their evaluation of all factors that they deemed to be material, including those factors described above, and assisted by the advice of independent counsel, the Directors, including the Independent Directors, concluded that each of the Continued Agreements should be continued through December 31, 2008.
MSF-21
A description of the policies and procedures that the Fund uses to determine how to vote proxies relating to portfolio securities is available (i) without charge, upon request, by calling (800) 638-7732 and (ii) on the Securities and Exchange Commission’s (the “SEC”) website at http://www.sec.gov.
Information regarding how the Fund voted proxies relating to portfolio securities during the most recent twelve-month period ended December 31, 2007 is available (i) without charge, upon request, by calling (800) 638-7732 and (ii) on the SEC’s website at http://www.sec.gov.
The Fund files with the SEC a complete schedule of its portfolio holdings, as of the close of the first and third quarters of its fiscal year, on “Form N-Q”. These filings are available on the SEC’s website at www.sec.gov and may be reviewed and copied at the SEC’s Public Reference Room in Washington, DC. (Call 1-800-SEC-0330 for information on the operation of the Public Reference Room.)
MSF-22
| | |
Metropolitan Series Fund, Inc. Julius Baer International Stock Portfolio (formerly FI International Stock Portfolio) Annual Report | | December 31, 2007 |
Letter from the President
February 1, 2008
Letter to Policy Holders:
2007 was a tumultuous year in the financial markets driven by concerns in the credit markets surrounding sub-prime mortgages and fears of recession in the U.S. Economy. The broad markets were mixed, with the Dow Jones Industrial Average up 8.9% and the MSCI EAFE Index, which measures the performance of international equities, up 11.2% for the year, while the Russell 2000 Index, which measures the performance of small capitalization stocks, was down 1.6%.
In the fixed income markets, credit spreads increased as a result of the pressure from sub-prime mortgage crisis and the Federal Reserve lowered interest rates by a total of 1% during the year. The Lehman Brothers Aggregate Bond Index posted a 7.0% return for the year.
On the following pages, you will find a complete review of your Portfolio and its investment performance.
MetLife is committed to building your financial freedom. We appreciate your trust and will continue to focus our efforts on meeting your investment needs.
Sincerely,
Elizabeth Forget
President, Metropolitan Series Fund, Inc.
Metropolitan Series Fund, Inc.
Julius Baer International Stock Portfolio (formerly FI International Stock Portfolio)
Currently managed by Julius Baer Investment Management, LLC
Formerly managed by Fidelity Management & Research Company*
Portfolio Manager Commentary
Fidelity Management & Research Company (“Fidelity”), the Portfolio’s subadviser prior to January 7, 2008, prepared this commentary, which addresses the Portfolio’s performance for the one year period ended December 31, 2007. On January 7, 2008, Julius Baer Investment Management, LLC (“Julius Baer”) succeeded Fidelity as the subadviser to the Portfolio and the name of the Portfolio was changed from the FI International Stock Portfolio to the Julius Baer International Stock Portfolio. This commentary and performance does not reflect the management of Julius Baer.
PORTFOLIO PERFORMANCE
For the year ended December 31, 2007, the Class A shares of the Portfolio returned 10.3%, compared to its benchmark, the Morgan Stanley Capital International (MSCI) EAFE Index1, which returned 11.2%. The average return of its peer group, the Lipper Variable Insurance Products International Core Funds Universe2, was 12.6% over the same period.
PORTFOLIO REVIEW
Foreign developed country stocks, as represented by the MSCI EAFE Index, returned double digits for the fifth consecutive year in 2007. This return was helped by strong GDP growth outside the U.S. and the associated strengthening of currencies versus the U.S. dollar that made the values of foreign stocks higher in U.S. dollar terms. Performance amongst developed countries varied, with Japan declining 4%, the United Kingdom returning 8%, and Germany returning 36%, as examples. It was a volatile year, with foreign markets reacting to events in the U.S., including the housing declines, sub-prime fallout, and fears of an associated recession. While global demand has become more diversified, providing some stability in non-U.S. markets, U.S. economic growth is still important to markets around the world.
In this environment, the Portfolio underperformed the MSCI EAFE benchmark. The largest contributors to relative performance were capital goods names, primarily those in Germany including top ten name Siemens. These names were helped by strong performance in the German market supported by a rebound in domestic economic activity, as well as strong demand from Eastern Europe and other emerging markets for manufactured goods. Other capital goods names within Europe were driven higher by demand for upgrades to power generation capability around the world. This demand is coming from developing countries, as well as developed countries needing to upgrade their grid to comply with environmental legislation. Strong stock selection in healthcare, including an Australian biotech company that produces vaccines, also helped performance. Top ten holding E.ON AG also contributed to relative performance as it is executing well. During the year E.ON expanded its scope and signed agreements to stabilize its supply of gas, as well as being the beneficiary of high energy prices.
The Portfolio was hurt on a relative basis by holdings in Japan, specifically diversified financial names. These names were hurt by a delay in the anticipated revival of that economy, as well as government legislation. This legislation has required issuers of credit cards to reimburse consumers for what the government determined was excessive interest charges over many years. The Portfolio was also hurt by underweighting in certain European automobile manufacturers that outperformed due to restructuring and exposure to strong sales in emerging markets, particularly Russia and China.
* The views expressed above are those of the subadvisory firm as of December 31, 2007 and are subject to change based on market and other conditions. Information about the Portfolio’s holdings, asset allocation, industry allocation, or country diversification is historical and is not an indication of future Portfolio composition, which will vary. The performance of any index mentioned in this commentary has not been adjusted for ongoing management, distribution and operating expenses, and sales charges applicable to mutual fund investments. Direct investment in the Index is not possible.
1 The Morgan Stanley Capital International Europe, Australasia and Far East Index (“MSCI EAFE Index”) is an unmanaged free float-adjusted market capitalization index that is designed to measure developed market equity performance, excluding the U.S. & Canada.
2 The Lipper Variable Insurance Products Fund Average is an average of the total return performance (calculated on the basis of net asset value) of variable product funds with similar investment objectives to those of the subject Portfolio as calculated by Lipper Analytical Services, an independent mutual fund ranking service.
MSF-2
Metropolitan Series Fund, Inc.
Julius Baer International Stock Portfolio (formerly FI International Stock Portfolio)
A $10,000 INVESTMENT COMPARED TO
THE MSCI EAFE INDEX
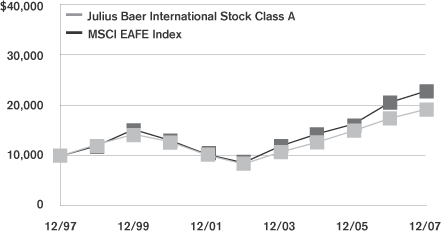
Average Annual Returns as of December 31, 2007
| | | | | | | | | | | | |
| | | Julius Baer International
Stock Portfolio | | | MSCI EAFE
Index | |
| | | Class A | | | Class B | | | Class E | | |
| 1 Year | | 10.3 | % | | 10.1 | % | | 10.2 | % | | 11.2 | % |
| 5 Year | | 18.1 | | | 17.8 | | | 17.9 | | | 21.6 | |
| 10 Year | | 6.8 | | | — | | | — | | | 8.7 | |
| Since Inception | | — | | | 11.6 | | | 7.5 | | | — | |
Performance numbers are net of all Portfolio expenses but do not include any insurance, sales, or administrative charges of variable annuity or life insurance contracts. If these charges were included, the returns would be lower.
Inception dates of the Class A, Class B and Class E shares are: 5/1/91, 5/1/02 and 5/1/01, respectively.
This information represents past performance and is not indicative of future results. Investment return and principal value may fluctuate so that shares, upon redemption, may be worth more or less than the original cost.
PORTFOLIO COMPOSITION
as of December 31, 2007
Top Holdings
| | |
| | | % of Total
Net Assets |
Vodafone Group, Plc. | | 3.5% |
Allianz SE | | 2.6% |
Siemens AG | | 2.4% |
E.ON AG | | 2.1% |
Nestle S.A. | | 2.0% |
Müenchener Rüeckversicherungs AG | | 1.7% |
Total S.A. | | 1.7% |
Alstom | | 1.7% |
Canon, Inc. | | 1.7% |
Royal Dutch Shell, Plc. | | 1.6% |
Top Countries
| | |
| | | % of Total
Net Assets |
Japan | | 24.0% |
Germany | | 15.7% |
France | | 9.6% |
United Kingdom | | 9.5% |
Switzerland | | 7.8% |
Netherlands | | 4.2% |
Australia | | 3.5% |
Italy | | 2.8% |
Finland | | 2.8% |
Spain | | 1.6% |
MSF-3
Metropolitan Series Fund, Inc.
Shareholder Expense Example
As a shareholder of the Portfolio, you incur ongoing costs, including management fees; distribution and service (12b-1) fees; and other Portfolio expenses. This example is intended to help you understand your ongoing costs (in dollars) (referred to as “expenses”) of investing in the Portfolio and compare these costs with the ongoing costs of investing in other mutual funds. The example is based on an investment of $1,000 invested at the beginning of the period and held for the entire period, July 1, 2007 through December 31, 2007.
Actual Expenses
The first line for each share class of the Portfolio in the table below provides information about actual account values and actual expenses. You may use the information in this line, together with the amount you invested in the particular share class of the Portfolio, to estimate the expenses that you paid over the period. Simply divide your account value by $1,000 (for example, an $8,600 account value divided by $1,000=8.6), then multiply the result by the number in the first line under the heading entitled “Expenses Paid During Period” to estimate the expenses you paid on your account during this period.
Hypothetical Example for Comparison Purposes
The second line for each share class of the Portfolio in the table below provides information about hypothetical account values and hypothetical expenses based on the Portfolio’s actual expense ratio and an assumed rate of return of 5% per year before expenses, which is not the Portfolio’s actual return. The hypothetical account values and expenses may not be used to estimate the actual ending account balance or expenses you paid for the period. You may use this information to compare the ongoing costs of investing in the Portfolio and other funds. To do so, compare this 5% hypothetical example with the 5% hypothetical examples that appear in the shareholder reports of the other funds.
Please note that the expenses shown in the table are meant to highlight your ongoing costs only and do not reflect any fees or charges of your variable insurance product or any additional expenses that participants in certain eligible qualified plans may bear relating to the operations of their plan. Therefore, the second line for each share class in the table is useful in comparing ongoing costs only, and will not help you determine the relative total costs of owning different funds. In addition, if these other costs were included, your costs would have been higher.
| | | | | | | | | | | | | | |
Portfolio | | | | Annualized
Expense
Ratio | | | Beginning
Account Value
July 1,
2007 | | Ending
Account value
December 31,
2007 | | Expenses Paid
During Period*
July 1, 2007
to
December 31,
2007 |
Julius Baer International Stock—Class A | | Actual | | 0.96 | % | | $ | 1,000.00 | | $ | 996.30 | | $ | 4.83 |
| | Hypothetical | | 0.96 | % | | $ | 1,000.00 | | $ | 1,020.31 | | $ | 4.89 |
| | | | | |
Julius Baer International Stock—Class B | | Actual | | 1.21 | % | | $ | 1,000.00 | | $ | 995.00 | | $ | 6.08 |
| | Hypothetical | | 1.21 | % | | $ | 1,000.00 | | $ | 1,019.03 | | $ | 6.16 |
| | | | | |
Julius Baer International Stock—Class E | | Actual | | 1.11 | % | | $ | 1,000.00 | | $ | 995.60 | | $ | 5.58 |
| | Hypothetical | | 1.11 | % | | $ | 1,000.00 | | $ | 1,019.54 | | $ | 5.65 |
* Expenses paid are equal to the Portfolio’s annualized expense ratio for the most recent six month period, as shown above, multiplied by the average account value over the period, multiplied by the number of days in the most recent fiscal half-year, divided by 365 (to reflect the one-half year period).
MSF-4
Metropolitan Series Fund, Inc.
Julius Baer International Stock Portfolio (formerly FI International Stock Portfolio)
Schedule of Investments as of December 31, 2007
Common Stock—93.4% of Total Net Assets
| | | | | |
| Security Description | | Shares | | Value* |
| | | | | |
| | |
Australia—3.5% | | | | | |
Aristocrat Leisure, Ltd. | | 211,596 | | $ | 2,079,975 |
Babcock & Brown, Ltd. | | 3,429 | | | 80,820 |
BHP Billiton, Ltd. (ADR) | | 174,000 | | | 12,186,960 |
Computershare, Ltd. | | 229,488 | | | 1,986,906 |
CSL, Ltd. | | 353,468 | | | 11,225,280 |
Downer EDI, Ltd. | | 188,640 | | | 886,747 |
Rio Tinto, Ltd. (a) | | 20,062 | | | 2,340,504 |
Woolworths, Ltd. | | 39,400 | | | 1,168,633 |
| | | | | |
| | | | | 31,955,825 |
| | | | | |
| | |
Austria—0.5% | | | | | |
Voestalpine AG | | 63,000 | | | 4,503,845 |
| | | | | |
| | |
Bermuda—0.3% | | | | | |
Catlin Group, Ltd. (GBP) | | 56,000 | | | 424,353 |
Hiscox, Ltd. (GBP) | | 209,900 | | | 1,185,923 |
TPV Technology, Ltd. (HKD) | | 1,038,000 | | | 749,877 |
| | | | | |
| | | | | 2,360,153 |
| | | | | |
| | |
Brazil—0.6% | | | | | |
Banco do Brasil S.A. | | 110,600 | | | 1,864,502 |
Bolsa de Mercadorias e Futuros (b) | | 66,900 | | | 939,607 |
Bovespa Holding S.A. (b) | | 70,000 | | | 1,348,876 |
Medial Saude S.A. (b) | | 89,000 | | | 1,163,571 |
| | | | | |
| | | | | 5,316,556 |
| | | | | |
| | |
Canada—2.6% | | | | | |
Canadian Natural Resources, Ltd. | | 90,000 | | | 6,611,539 |
Canadian Natural Resources, Ltd. (USD) | | 24,600 | | | 1,799,244 |
EnCana Corp. | | 65,600 | | | 4,481,781 |
EnCana Corp. (USD) | | 6,000 | | | 407,760 |
Open Text Corp. (b) | | 2,700 | | | 85,755 |
Open Text Corp. (USD) (b) | | 71,000 | | | 2,232,950 |
OPTI Canada, Inc. | | 122,200 | | | 2,053,158 |
Suncor Energy, Inc. | | 12,600 | | | 1,376,180 |
Suncor Energy, Inc. (USD) | | 5,700 | | | 619,761 |
Talisman Energy, Inc. | | 89,000 | | | 1,656,589 |
Talisman Energy, Inc. (USD) | | 132,400 | | | 2,452,048 |
WesternZagros Resources, Ltd. | | 21,300 | | | 51,741 |
| | | | | |
| | | | | 23,828,506 |
| | | | | |
| | |
Cayman Islands—0.0% | | | | | |
Subsea 7, Inc. (NOK) | | 11,500 | | | 254,708 |
| | | | | |
| | |
China—0.1% | | | | | |
Zhejiang Expressway Co., Ltd. | | 814,000 | | | 1,281,468 |
| | | | | |
| | |
Denmark—0.5% | | | | | |
William Demant Holding (a) | | 55,200 | | | 5,055,945 |
| | | | | |
| | |
Finland—2.8% | | | | | |
Cargotec Corp. | | 28,220 | | | 1,295,493 |
Metso Oyj | | 72,700 | | | 3,917,760 |
Neste Oil Oyj | | 50,700 | | | 1,775,294 |
Nokia Corp. (ADR) | | 373,404 | | | 14,334,979 |
| | | | | |
| Security Description | | Shares | | Value* |
| | | | | |
| | |
Finland—(Continued) | | | | | |
Nokia Oyj | | 88,000 | | $ | 3,383,410 |
Wartsila Oyj | | 13,400 | | | 1,011,857 |
| | | | | |
| | | | | 25,718,793 |
| | | | | |
| | |
France—9.6% | | | | | |
Air Liquide S.A. | | 4,840 | | | 719,240 |
Air Liquide/Prime de Fidelite | | 22,880 | | | 3,400,044 |
Alcatel-Lucent (ADR) | | 758,100 | | | 5,549,292 |
Alstom | | 73,000 | | | 15,490,077 |
BNP Paribas | | 24,700 | | | 2,651,222 |
Bureau Veritas S.A. | | 12,900 | | | 761,497 |
Carbone Lorraine | | 13,200 | | | 908,226 |
CNP Assurances | | 27,100 | | | 3,508,632 |
Gaz de France S.A. | | 106,700 | | | 6,204,015 |
Lagardere S.C.A. | | 33,400 | | | 2,486,805 |
Neuf Cegetel | | 70,000 | | | 3,519,866 |
Orpea (a) (b) | | 58,092 | | | 3,808,421 |
Pernod-Ricard S.A. (a) | | 6,640 | | | 1,527,045 |
Remy Cointreau S.A. | | 70,900 | | | 5,031,735 |
Renault S.A. | | 46,200 | | | 6,472,946 |
Sanofi-Aventis (ADR) | | 39,900 | | | 1,816,647 |
Société Générale | | 8,354 | | | 1,192,156 |
Sodexho Alliance S.A. | | 29,100 | | | 1,781,338 |
Total S.A. | | 39,600 | | | 3,281,557 |
Total S.A. (ADR) | | 149,500 | | | 12,348,700 |
Unibail-Rodamco (REIT) | | 8,200 | | | 1,782,299 |
Vivendi | | 98,753 | | | 4,493,296 |
| | | | | |
| | | | | 88,735,056 |
| | | | | |
| | |
Germany—15.5% | | | | | |
Aareal Bank AG | | 86,754 | | | 3,972,496 |
Adidas AG | | 6,700 | | | 498,127 |
Allianz SE | | 100,929 | | | 21,556,037 |
Allianz SE (ADR) | | 100,000 | | | 2,125,000 |
Bayer AG | | 132,500 | | | 12,062,865 |
Bayerische Motoren Werke AG | | 51,100 | | | 3,150,841 |
Bilfinger Berger AG | | 51,000 | | | 3,864,090 |
Compugroup Holding AG | | 60,600 | | | 1,117,065 |
DAB Bank AG (a) | | 147,910 | | | 1,294,481 |
Daimler AG | | 45,800 | | | 4,429,773 |
Duetz AG (b) | | 13,400 | | | 134,452 |
E.ON AG | | 21,400 | | | 4,537,093 |
E.ON AG (ADR) | | 205,400 | | | 14,388,270 |
GFK AG | | 10,300 | | | 411,906 |
Heidelberger Druckmaschinen AG | | 100,500 | | | 3,344,581 |
Henkel KGaA | | 43,219 | | | 2,202,785 |
Hochtief AG | | 7,100 | | | 943,449 |
K&S AG | | 2,300 | | | 541,662 |
Linde AG | | 32,014 | | | 4,210,231 |
MAN AG | | 16,200 | | | 2,661,764 |
Merck KGaA | | 17,100 | | | 2,193,423 |
Müenchener Rüeckversicherungs AG | | 81,400 | | | 15,712,392 |
Patrizia Immobilien AG | | 55,100 | | | 416,056 |
RWE AG | | 66,900 | | | 9,360,869 |
SAP AG (ADR) | | 37,000 | | | 1,888,850 |
Siemens AG | | 45,900 | | | 7,195,216 |
*See accompanying notes to financial statements.
MSF-5
Metropolitan Series Fund, Inc.
Julius Baer International Stock Portfolio (formerly FI International Stock Portfolio)
Schedule of Investments as of December 31, 2007
Common Stock—(Continued)
| | | | | |
| Security Description | | Shares | | Value* |
| | | | | |
| | |
Germany—(Continued) | | | | | |
Siemens AG (ADR) | | 95,400 | | $ | 15,012,144 |
SolarWorld AG | | 12,200 | | | 731,170 |
Wacker Chemie AG | | 11,200 | | | 3,207,661 |
| | | | | |
| | | | | 143,164,749 |
| | | | | |
| | |
Greece—0.6% | | | | | |
Hellenic Exchanges S.A. Holding Clearing Settlement & Registry | | 29,100 | | | 1,018,161 |
Public Power Corp. S.A. | | 94,000 | | | 4,925,790 |
| | | | | |
| | | | | 5,943,951 |
| | | | | |
| | |
Hong Kong—0.8% | | | | | |
New World Development, Ltd. | | 685,000 | | | 2,412,669 |
Sun Hung Kai Properties, Ltd. | | 193,000 | | | 4,054,662 |
Wharf Holdings, Ltd. | | 264,000 | | | 1,362,382 |
| | | | | |
| | | | | 7,829,713 |
| | | | | |
| | |
Ireland—0.1% | | | | | |
Smurfit Kappa Group, Plc. | | 74,500 | | | 1,211,289 |
| | | | | |
| | |
Isle of Man—0.1% | | | | | |
Dawnay Day Treveria, Plc. (b) | | 516,800 | | | 610,271 |
| | | | | |
| | |
Israel—0.4% | | | | | |
Mizrahi Tefahot Bank, Ltd. | | 469,600 | | | 3,644,342 |
| | | | | |
| | |
Italy—2.8% | | | | | |
ASM S.p.A. (a) | | 328,400 | | | 2,383,250 |
Buzzi Unicem S.p.A.- RNC | | 79,500 | | | 1,439,719 |
Eni S.p.A. | | 182,600 | | | 6,643,546 |
FIAT S.p.A. | | 148,800 | | | 3,818,790 |
Finmeccanica S.p.A. | | 61,400 | | | 1,943,295 |
Fondiaria-Sai S.p.A | | 17,500 | | | 491,336 |
Milano Assicurazioni S.p.A. | | 54,800 | | | 426,000 |
Prysmian S.p.A. (b) | | 92,300 | | | 2,256,745 |
UniCredito Italiano S.p.A. | | 734,300 | | | 6,102,190 |
| | | | | |
| | | | | 25,504,871 |
| | | | | |
| | |
Japan—24.0% | | | | | |
ABC-Mart, Inc. | | 58,100 | | | 1,270,770 |
Acom Co., Ltd. | | 3,640 | | | 73,949 |
Aeon Co., Ltd. | | 439,200 | | | 6,410,366 |
Aeon Mall Co., Ltd. | | 97,500 | | | 2,559,053 |
Aioi Insurance Co., Ltd. | | 172,000 | | | 809,223 |
Aoyama Trading Co., Ltd. | | 93,900 | | | 2,441,612 |
Arealink Co., Ltd. (a) | | 5,049 | | | 1,652,988 |
Asahi Glass Co., Ltd. | | 183,000 | | | 2,426,536 |
Asics Corp. | | 186,000 | | | 2,669,645 |
Bridgestone Corp. | | 116,400 | | | 2,049,902 |
Canon Finetech, Inc. | | 21,500 | | | 302,940 |
Canon, Inc. | | 200,600 | | | 9,164,658 |
Canon, Inc. (ADR) | | 135,500 | | | 6,209,965 |
Daiwa House Industry Co., Ltd. | | 219,000 | | | 2,816,954 |
Daiwa Securities Group, Inc. | | 1,220,000 | | | 11,239,720 |
DCM Japan Holdings Co., Ltd. | | 151,420 | | | 1,035,898 |
| | | | | |
| Security Description | | Shares | | Value* |
| | | | | |
| | |
Japan—(Continued) | | | | | |
Fuji Machine Manufacturing Co., Ltd. | | 112,700 | | $ | 2,444,590 |
Fukuoka Financial Group, Inc. | | 585,000 | | | 3,488,848 |
Hokuhoku Financial Group, Inc. | | 817,900 | | | 2,348,875 |
Ibiden Co., Ltd. | | 49,600 | | | 3,425,645 |
Inpex Holdings, Inc. | | 478 | | | 5,141,305 |
Isetan Co., Ltd. | | 122,200 | | | 1,652,593 |
Kansai Paint Co. (a) | | 208,000 | | | 1,508,600 |
Konica Minolta Holdings, Inc. | | 227,500 | | | 4,003,855 |
Marubeni Corp. | | 325,000 | | | 2,282,531 |
Marui Group Co., Ltd. | | 227,000 | | | 2,244,317 |
Matsui Securities Co., Ltd. | | 631,800 | | | 4,979,208 |
Millea Holdings, Inc. | | 82,000 | | | 2,771,247 |
MISUMI Group, Inc. | | 79,100 | | | 1,382,477 |
Mitsubishi Corp. | | 215,200 | | | 5,861,326 |
Mitsubishi Estate Co., Ltd. | | 163,000 | | | 3,906,906 |
Mitsui & Co., Ltd. | | 317,000 | | | 6,724,886 |
Mitsui Fudosan Co., Ltd. | | 126,000 | | | 2,722,860 |
Monex Beans Holdings, Inc. | | 626 | | | 415,629 |
Murata Manufacturing Co., Ltd. | | 114,400 | | | 6,652,626 |
Namco Bandai Holdings, Inc. | | 132,000 | | | 2,090,301 |
NGK Insulators, Ltd. | | 57,000 | | | 1,537,825 |
Nidec Corp. | | 76,900 | | | 5,708,333 |
Nintendo Co., Ltd. | | 1,600 | | | 971,349 |
Nippon Chemi-Con Corp. | | 211,000 | | | 1,282,782 |
Nippon Electric Glass Co., Ltd. | | 440,300 | | | 7,150,659 |
Nomura Holdings, Inc. | | 465,400 | | | 7,779,221 |
Nomura Holdings, Inc. (ADR) | | 183,300 | | | 3,070,275 |
NSK, Ltd. | | 352,000 | | | 3,653,243 |
Okamura Corp. (a) | | 254,000 | | | 2,147,069 |
Okinawa Cellular Telephone Co. | | 362 | | | 794,701 |
OMC Card, Inc. (a) | | 658,600 | | | 2,261,734 |
ORIX Corp. | | 14,030 | | | 2,345,968 |
SBI E*Trade Securities Co., Ltd. | | 2,810 | | | 2,649,268 |
Sekisui House, Ltd. | | 248,000 | | | 2,685,978 |
Seven & I Holdings Co., Ltd. | | 45,300 | | | 1,317,227 |
SFCG Co., Ltd. (a) | | 21,670 | | | 2,994,800 |
SMC Corp. | | 24,500 | | | 2,915,670 |
Sompo Japan Insurance, Inc. | | 574,000 | | | 5,170,469 |
Sony Corp. | | 40,000 | | | 2,170,529 |
Sony Corp. (ADR) | | 18,700 | | | 1,015,410 |
Sony Financial Holdings, Inc. | | 68 | | | 258,425 |
Sumitomo Corp. | | 439,400 | | | 6,256,190 |
Sumitomo Electric Industries, Ltd. | | 278,000 | | | 4,427,890 |
Sumitomo Mitsui Financial Group, Inc. | | 72 | | | 535,713 |
Sumitomo Osaka Cement Co., Ltd. | | 932,000 | | | 1,788,891 |
Takeda Pharmaceutical Co., Ltd. | | 47,000 | | | 2,747,248 |
The Bank of Nagoya, Ltd. | | 355,000 | | | 2,147,457 |
The Chiba Bank, Ltd. | | 268,000 | | | 2,171,116 |
The Daiei, Inc. | | 206,800 | | | 1,103,512 |
The Juroku Bank, Ltd. | | 546,000 | | | 3,020,514 |
The Tokyo Tomin Bank, Ltd. | | 108,300 | | | 3,067,599 |
Tokai Carbon Co., Ltd. | | 533,000 | | | 4,763,916 |
Tokuyama Corp. | | 254,000 | | | 2,541,070 |
Toyota Motor Corp. | | 82,800 | | | 4,456,321 |
Yamada Denki Co., Ltd. | | 8,050 | | | 916,192 |
Yamaguchi Financial Group, Inc. | | 182,000 | | | 2,111,610 |
| | | | | |
| | | | | 221,118,978 |
| | | | | |
*See accompanying notes to financial statements.
MSF-6
Metropolitan Series Fund, Inc.
Julius Baer International Stock Portfolio (formerly FI International Stock Portfolio)
Schedule of Investments as of December 31, 2007
Common Stock—(Continued)
| | | | | |
| Security Description | | Shares | | Value* |
| | | | | |
| | |
Luxembourg—0.2% | | | | | |
ArcelorMittal | | 22,700 | | $ | 1,755,845 |
| | | | | |
| | |
Malaysia—0.7% | | | | | |
Digi.Com BHD | | 39,300 | | | 293,676 |
Gamuda BHD | | 2,577,200 | | | 3,726,646 |
Public Bank BHD | | 439,300 | | | 1,454,873 |
YTL Corp. BHD | | 362,600 | | | 863,803 |
| | | | | |
| | | | | 6,338,998 |
| | | | | |
| | |
Netherlands—4.2% | | | | | |
Akzo Nobel NV | | 20,800 | | | 1,653,955 |
Heineken NV | | 152,900 | | | 9,833,021 |
Koninklijke Philips Electronics NV (ADR) | | 22,600 | | | 966,150 |
Reed Elsevier NV (ADR) | | 163,900 | | | 6,498,635 |
Royal KPN NV | | 304,800 | | | 5,504,331 |
Unilever NV | | 141,262 | | | 5,164,371 |
Unilever NV (USD) | | 251,200 | | | 9,158,752 |
| | | | | |
| | | | | 38,779,215 |
| | | | | |
| | |
Norway—0.8% | | | | | |
Aker Kvaerner ASA | | 197,450 | | | 5,203,261 |
Hafslund ASA | | 58,300 | | | 1,664,834 |
Odfjell SE | | 4,950 | | | 64,759 |
| | | | | |
| | | | | 6,932,854 |
| | | | | |
| | |
Singapore—0.1% | | | | | |
ASE Test, Ltd. (b) | | 50,900 | | | 722,271 |
| | | | | |
| | |
South Korea—0.4% | | | | | |
Daewoo Shipbuliding & Marine Engineering Co., Ltd. | | 42,620 | | | 2,346,763 |
Kookmin Bank | | 19,170 | | | 1,409,088 |
| | | | | |
| | | | | 3,755,851 |
| | | | | |
| | |
Spain—1.6% | | | | | |
Banco Santander S.A. (ADR) | | 52,300 | | | 1,126,542 |
Inditex S.A. | | 19,200 | | | 1,165,681 |
Telefonica S.A. (ADR) | | 129,300 | | | 12,618,387 |
| | | | | |
| | | | | 14,910,610 |
| | | | | |
| | |
Sweden—0.8% | | | | | |
Scania AB | | 234,800 | | | 5,553,279 |
SSAB Svenskt Stal AB (Series A) | | 11,200 | | | 300,812 |
SSAB Svenskt Stal AB (Series B) | | 34,400 | | | 834,781 |
Telefonaktiebolaget LM Ericsson (ADR) | | 14,885 | | | 347,565 |
| | | | | |
| | | | | 7,036,437 |
| | | | | |
| | |
Switzerland—7.8% | | | | | |
ABB, Ltd. | | 286,732 | | | 8,260,109 |
ABB, Ltd. (ADR) | | 109,200 | | | 3,144,960 |
Actelion, Ltd. (b) | | 42,492 | | | 1,934,742 |
Basilea Pharmaceuticals | | 13,240 | | | 2,560,927 |
Credit Suisse Group (ADR) | | 88,100 | | | 5,294,810 |
Julius Baer Holding AG | | 55,709 | | | 4,524,434 |
| | | | | |
| Security Description | | Shares | | Value* |
| | | | | |
| | |
Switzerland—(Continued) | | | | | |
Nestle S.A. | | 24,390 | | $ | 11,166,461 |
Nestle S.A. (ADR) | | 61,900 | | | 7,087,550 |
Novartis AG (ADR) | | 40,500 | | | 2,199,555 |
Roche Holding AG | | 70,422 | | | 12,120,115 |
SGS S.A. | | 5,643 | | | 6,642,465 |
Sonova Holding AG | | 796 | | | 88,966 |
Swiss Life Holding | | 6,628 | | | 1,639,453 |
Swisscom AG | | 1,175 | | | 456,090 |
Zurich Financial Services AG | | 17,866 | | | 5,253,296 |
| | | | | |
| | | | | 72,373,933 |
| | | | | |
| | |
Taiwan—2.0% | | | | | |
Advanced Semiconductor Engineering, Inc. | | 3,991,531 | | | 3,965,227 |
Hon Hai Precision Industry Co., Ltd. | | 321,000 | | | 1,982,872 |
Siliconware Precision Industries Co. (ADR) | | 339,971 | | | 3,022,342 |
Taiwan Mobile Co., Ltd. | | 2,108,000 | | | 2,813,856 |
Taiwan Semiconductor Manufacturing Co., Ltd. | | 1,802,864 | | | 3,428,817 |
Taiwan Semiconductor Manufacturing Co., Ltd. (ADR) | | 153,663 | | | 1,530,484 |
Wistron Corp. | | 820,928 | | | 1,514,675 |
| | | | | |
| | | | | 18,258,273 |
| | | | | |
| | |
United Kingdom—9.5% | | | | | |
Anglo American, Plc. (ADR) | | 101,798 | | | 3,091,605 |
BP, Plc. | | 379,200 | | | 4,623,477 |
BP, Plc. (ADR) | | 128,900 | | | 9,431,613 |
GlaxoSmithKline, Plc. | | 31,300 | | | 791,900 |
Intertek Group, Plc. | | 87,000 | | | 1,700,573 |
NETeller, Plc. (b) (c) | | 229,000 | | | 242,882 |
Punch Taverns, Plc. | | 11,000 | | | 166,006 |
Rentokil Initial, Plc. | | 1,080,300 | | | 2,572,247 |
Rio Tinto, Plc. | | 26,700 | | | 2,788,863 |
Rio Tinto, Plc. (ADR) | | 11,000 | | | 4,618,900 |
Royal Dutch Shell, Plc. (ADR) (A Shares) | | 172,800 | | | 14,549,760 |
Serco Group, Plc. | | 60,400 | | | 550,455 |
Tesco, Plc. | | 659,544 | | | 6,209,096 |
Unilever, Plc. | | 31,200 | | | 1,166,532 |
Unilever, Plc. (ADR) | | 86,820 | | | 3,248,805 |
Vodafone Group, Plc. | | 574,500 | | | 2,134,713 |
Vodafone Group, Plc. (ADR) | | 804,200 | | | 30,012,744 |
| | | | | |
| | | | | 87,900,171 |
| | | | | |
| | |
United States—0.5% | | | | | |
Affiliated Computer Services, Inc. (Class A) (b) | | 22,000 | | | 992,200 |
Microsoft Corp. | | 97,000 | | | 3,453,200 |
| | | | | |
| | | | | 4,445,400 |
| | | | | |
Total Common Stock
(Identified Cost $793,266,193) | | | | | 861,248,877 |
| | | | | |
*See accompanying notes to financial statements.
MSF-7
Metropolitan Series Fund, Inc.
Julius Baer International Stock Portfolio (formerly FI International Stock Portfolio)
Schedule of Investments as of December 31, 2007
Preferred Stock—0.2%
| | | | | | | |
| Security Description | | Shares | | Value* | |
| | | | | | | |
| | |
Germany—0.2% | | | | | | | |
Fresenius SE | | | 5,100 | | $ | 422,806 | |
Volkswagen AG | | | 11,700 | | | 1,696,698 | |
| | | | | | | |
Total Preferred Stock
(Identified Cost $2,228,155) | | | | | | 2,119,504 | |
| | | | | | | |
| | |
| Warrants—0.0% | | | | | | | |
| | |
Canada—0.0% | | | | | | | |
WesternZagros Resources, Ltd. | | | 2,130 | | | 323 | |
| | | | | | | |
Total Warrants
(Identified Cost $1,650) | | | | | | 323 | |
| | | | | | | |
| |
| Short Term Investments—7.2% | | | | |
| Security Description | | Shares/
Face Amount | | Value* | |
| | |
United States—7.2% | | | | | | | |
State Street Navigator Securities Lending Prime Portfolio (d) | | | 13,646,564 | | | 13,646,564 | |
State Street Corp. Repurchase Agreement dated 12/31/07 at 1.20% to be repurchased at $53,182,545 on 1/02/08, collateralized by $44,905,000 U.S. Treasury Bond 6.25% due 8/15/23 with a value of $54,777,095. | | $ | 53,179,000 | | | 53,179,000 | |
| | | | | | | |
Total Short Term Investments
(Identified Cost $66,825,564) | | | | | | 66,825,564 | |
| | | | | | | |
Total Investments—100.8%
(Identified Cost $862,321,562) (e) | | | | | | 930,194,268 | |
Liabilities in excess of other assets | | | | | | (7,573,643 | ) |
| | | | | | | |
| Total Net Assets—100% | | | | | $ | 922,620,625 | |
| | | | | | | |
| (a) | A portion or all of the security was held on loan. As of December 31, 2007, the market value of securities loaned was $13,057,082 and the collateral received consisted of cash in the amount of $13,646,564 and non cash collateral with a value of $109,500. The cash collateral is invested in a money market fund managed by an affiliate of the custodian. The non cash collateral received consists primarily of government securities and bank letters of credit, and are held for the benefit of the Portfolio at the Portfolio’s custodian. |
| (c) | Security was valued in good faith under procedures established by the Board of Directors. |
| (d) | Represents investment of cash collateral received from securities lending transactions. |
| (e) | The aggregate cost of investments for federal income tax purposes as of December 31, 2007 was $864,428,005 and the composition of unrealized appreciation and depreciation of investment securities was $110,247,696 and $(44,481,433), respectively. |
| (ADR)— | An American Depositary Receipt is a certificate issued by a custodian bank representing the right to receive securities of the foreign issuer described. Trading on exchanges not located in the United States or Canada significantly influences the value of ADRs. |
| (REIT)— | A Real Estate Investment Trust is a pooled investment vehicle that invests primarily in income-producing real estate or real estate related loans or interest. |
| (USD)— | United States Dollar |
| | |
Ten Largest Industries as of December 31, 2007 | | Percentage of
Total Net Assets |
Oil, Gas & Consumable Fuels | | 8.7% |
Insurance | | 6.6% |
Commercial Banks | | 4.6% |
Capital Markets | | 4.5% |
Food Products | | 4.0% |
Wireless Telecommunication Services | | 3.9% |
Chemicals | | 3.8% |
Electrical Equipment | | 3.7% |
Metals & Mining | | 3.5% |
Machinery | | 3.3% |
*See accompanying notes to financial statements.
MSF-8
Metropolitan Series Fund, Inc.
Julius Baer International Stock Portfolio (formerly FI International Stock Portfolio)
Statement of Assets & Liabilities
December 31, 2007
| | | | | | |
Assets | | | | | | |
Investments at value (a) (c) | | | | | $ | 930,194,268 |
Cash | | | | | | 153 |
Foreign cash at value (b) | | | | | | 4,880,753 |
Receivable for: | | | | | | |
Securities sold | | | | | | 1,408,164 |
Fund shares sold | | | | | | 689,169 |
Accrued interest and dividends | | | | | | 862,689 |
Foreign taxes | | | | | | 48,497 |
| | | | | | |
Total Assets | | | | | | 938,083,693 |
Liabilities | | | | | | |
Payable for: | | | | | | |
Fund shares redeemed | | $ | 964,270 | | | |
Withholding taxes | | | 32,077 | | | |
Collateral for securities loaned | | | 13,646,564 | | | |
Accrued expenses: | | | | | | |
Management fees | | | 651,693 | | | |
Service and distribution fees | | | 34,394 | | | |
Other expenses | | | 134,070 | | | |
| | | | | | |
Total Liabilities | | | | | | 15,463,068 |
| | | | | | |
Net Assets | | | | | $ | 922,620,625 |
| | | | | | |
Net assets consists of: | | | | | | |
Capital paid in | | | | | $ | 739,356,218 |
Undistributed net investment income | | | | | | 23,850,095 |
Accumulated net realized gains | | | | | | 91,513,106 |
Unrealized appreciation on investments and foreign currency | | | | | | 67,901,206 |
| | | | | | |
Net Assets | | | | | $ | 922,620,625 |
| | | | | | |
| Computation of offering price: | | | | | | |
Class A | | | | | | |
Net asset value and redemption price per share ($732,642,534 divided by 45,682,023 shares outstanding) | | | | | $ | 16.04 |
| | | | | | |
Class B | | | | | | |
Net asset value and redemption price per share ($119,072,768 divided by 7,522,697 shares outstanding) | | | | | $ | 15.83 |
| | | | | | |
Class E | | | | | | |
Net asset value and redemption price per share ($70,905,323 divided by 4,462,328 shares outstanding) | | | | | $ | 15.89 |
| | | | | | |
(a) Identified cost of investments | | | | | $ | 862,321,562 |
| | | | | | |
(b) Identified cost of foreign cash | | | | | $ | 4,858,701 |
| | | | | | |
| (c) | Includes cash collateral for securities loaned of $13,646,564. |
Statement of Operations
For the Year Ended December 31, 2007
| | | | | | | | |
Investment Income | | | | | | | | |
Dividends | | | | | | $ | 15,828,802 | (a) |
Interest | | | | | | | 1,454,680 | (b) |
| | | | | | | | |
| | | | | | | 17,283,482 | |
Expenses | | | | | | | | |
Management fees | | $ | 6,758,154 | | | | | |
Service and distribution fees—Class B | | | 266,756 | | | | | |
Service and distribution fees—Class E | | | 109,151 | | | | | |
Directors’ fees and expenses | | | 23,669 | | | | | |
Custodian | | | 618,067 | | | | | |
Audit and tax services | | | 36,238 | | | | | |
Legal | | | 9,350 | | | | | |
Printing | | | 241,088 | | | | | |
Insurance | | | 8,042 | | | | | |
Miscellaneous | | | 15,981 | | | | | |
| | | | | | | | |
Total expenses | | | 8,086,496 | | | | | |
Expense reductions | | | (306,575 | ) | | | 7,779,921 | |
| | | | | | | | |
Net Investment Income | | | | | | | 9,503,561 | |
| | | | | | | | |
Realized and Unrealized Gain (Loss) | | | | | | | | |
| Realized gain on: | | | | | | | | |
Investments—net | | | 95,381,567 | | | | | |
Foreign currency transactions—net | | | 15,570,508 | | | | 110,952,075 | |
| | | | | | | | |
Change in unrealized appreciation (depreciation) on: | | | | | | | | |
Investments—net | | | (46,144,830 | ) | | | | |
Foreign currency transactions—net | | | 24,100 | | | | (46,120,730 | ) |
| | | | | | | | |
Net gain | | | | | | | 64,831,345 | |
| | | | | | | | |
Net Increase in Net Assets From Operations | | | | | | $ | 74,334,906 | |
| | | | | | | | |
| (a) | Net of foreign taxes of $2,053,480. |
| (b) | Includes net income on securities loaned of $878,938. |
See accompanying notes to financial statements.
MSF-9
Metropolitan Series Fund, Inc.
Julius Baer International Stock Portfolio (formerly FI International Stock Portfolio)
Statements of Changes in Net Assets
| | | | | | | | |
| | | Year ended
December 31,
2007 | | | Year ended
December 31,
2006 | |
From Operations | | | | | | | | |
Net investment income | | $ | 9,503,561 | | | $ | 5,940,516 | |
Net realized gain | | | 110,952,075 | | | | 71,414,751 | |
Unrealized appreciation (depreciation) | | | (46,120,730 | ) | | | 16,788,953 | |
| | | | | | | | |
Increase in net assets from operations | | | 74,334,906 | | | | 94,144,220 | |
| | | | | | | | |
From Distributions to Shareholders | | | | | | | | |
Net investment income | | | | | | | | |
Class A | | | (6,573,819 | ) | | | (6,634,593 | ) |
Class B | | | (868,894 | ) | | | (880,784 | ) |
Class E | | | (684,687 | ) | | | (943,442 | ) |
| | | | | | | | |
| | | (8,127,400 | ) | | | (8,458,819 | ) |
| | | | | | | | |
Net realized gain | | | | | | | | |
Class A | | | (31,935,315 | ) | | | 0 | |
Class B | | | (5,344,633 | ) | | | 0 | |
Class E | | | (3,801,346 | ) | | | 0 | |
| | | | | | | | |
| | | (41,081,294 | ) | | | 0 | |
| | | | | | | | |
Total distributions | | | (49,208,694 | ) | | | (8,458,819 | ) |
| | | | | | | | |
Increase in net assets from capital share transactions | | | 181,504,573 | | | | 95,883,990 | |
| | | | | | | | |
Total increase in net assets | | | 206,630,785 | | | | 181,569,391 | |
| | |
Net Assets | | | | | | | | |
Beginning of the period | | | 715,989,840 | | | | 534,420,449 | |
| | | | | | | | |
End of the period | | $ | 922,620,625 | | | $ | 715,989,840 | |
| | | | | | | | |
Undistributed Net Investment Income | | | | | | | | |
End of the period | | $ | 23,850,095 | | | $ | 4,751,665 | |
| | | | | | | | |
Other Information:
Capital Shares
Transactions in capital shares were as follows:
| | | | | | | | | | | | | | |
| | | Year ended
December 31, 2007 | | | Year ended
December 31, 2006 | |
| | | Shares | | | $ | | | Shares | | | $ | |
Class A | | | | | | | | | | | | | | |
Sales | | 16,846,288 | | | $ | 270,473,730 | | | 11,895,720 | | | $ | 172,359,417 | |
Reinvestments | | 2,445,024 | | | | 38,509,134 | | | 442,306 | | | | 6,634,593 | |
Redemptions | | (8,950,622 | ) | | | (142,801,144 | ) | | (7,656,172 | ) | | | (110,636,037 | ) |
| | | | | | | | | | | | | | |
Net increase | | 10,340,690 | | | $ | 166,181,720 | | | 4,681,854 | | | $ | 68,357,973 | |
| | | | | | | | | | | | | | |
Class B | | | | | | | | | | | | | | |
Sales | | 2,842,370 | | | $ | 44,791,023 | | | 4,286,221 | | | $ | 60,756,388 | |
Reinvestments | | 399,070 | | | | 6,213,527 | | | 59,352 | | | | 880,784 | |
Redemptions | | (1,958,960 | ) | | | (30,811,895 | ) | | (2,197,215 | ) | | | (31,185,457 | ) |
| | | | | | | | | | | | | | |
Net increase | | 1,282,480 | | | $ | 20,192,655 | | | 2,148,358 | | | $ | 30,451,715 | |
| | | | | | | | | | | | | | |
Class E | | | | | | | | | | | | | | |
Sales | | 557,684 | | | $ | 8,839,481 | | | 982,019 | | | $ | 14,002,927 | |
Reinvestments | | 287,198 | | | | 4,486,033 | | | 63,403 | | | | 943,442 | |
Redemptions | | (1,148,836 | ) | | | (18,195,316 | ) | | (1,257,831 | ) | | | (17,872,067 | ) |
| | | | | | | | | | | | | | |
Net decrease | | (303,954 | ) | | $ | (4,869,802 | ) | | (212,409 | ) | | $ | (2,925,698 | ) |
| | | | | | | | | | | | | | |
Increase derived from capital share transactions | | | | | $ | 181,504,573 | | | | | | $ | 95,883,990 | |
| | | | | | | | | | | | | | |
See accompanying notes to financial statements.
MSF-10
Metropolitan Series Fund, Inc.
Julius Baer International Stock Portfolio (formerly FI International Stock Portfolio)
Financial Highlights
| | | | | | | | | | | | | | | | | | | | |
| | | Class A | |
| | | Year ended December 31, | |
| | | 2007 | | | 2006 | | | 2005 | | | 2004 | | | 2003 | |
Net Asset Value, Beginning of Period | | $ | 15.49 | | | $ | 13.48 | | | $ | 11.50 | | | $ | 9.86 | | | $ | 7.76 | |
| | | | | | | | | | | | | | | | | | | | |
Income From Investment Operations | | | | | | | | | | | | | | | | | | | | |
Net investment income | | | 0.20 | (a) | | | 0.13 | | | | 0.14 | | | | 0.10 | | | | 0.11 | |
Net realized and unrealized gain on investments | | | 1.38 | | | | 2.09 | | | | 1.92 | | | | 1.68 | | | | 2.05 | |
| | | | | | | | | | | | | | | | | | | | |
Total from investment operations | | | 1.58 | | | | 2.22 | | | | 2.06 | | | | 1.78 | | | | 2.16 | |
| | | | | | | | | | | | | | | | | | | | |
Less Distributions | | | | | | | | | | | | | | | | | | | | |
Distributions from net investment income | | | (0.17 | ) | | | (0.21 | ) | | | (0.08 | ) | | | (0.14 | ) | | | (0.06 | ) |
Distributions from net realized capital gains | | | (0.86 | ) | | | 0.00 | | | | 0.00 | | | | 0.00 | | | | 0.00 | |
| | | | | | | | | | | | | | | | | | | | |
Total distributions | | | (1.03 | ) | | | (0.21 | ) | | | (0.08 | ) | | | (0.14 | ) | | | (0.06 | ) |
| | | | | | | | | | | | | | | | | | | | |
Net Asset Value, End of Period | | $ | 16.04 | | | $ | 15.49 | | | $ | 13.48 | | | $ | 11.50 | | | $ | 9.86 | |
| | | | | | | | | | | | | | | | | | | | |
Total Return (%) | | | 10.3 | | | | 16.5 | | | | 18.0 | | | | 18.2 | | | | 28.0 | |
Ratio of operating expenses to average net assets before expense reductions (%) | | | 0.96 | | | | 1.05 | | | | 1.06 | | | | 1.08 | | | | 1.13 | |
Ratio of operating expenses to average net assets after expense reductions (%) (b) | | | 0.92 | | | | 1.00 | | | | 1.01 | | | | 1.06 | | | | 1.11 | |
Ratio of net investment income to average net assets (%) | | | 1.22 | | | | 1.00 | | | | 1.23 | | | | 0.85 | | | | 1.21 | |
Portfolio turnover rate (%) | | | 100 | | | | 86 | | | | 69 | | | | 90 | | | | 148 | |
Net assets, end of period (000) | | $ | 732,643 | | | $ | 547,335 | | | $ | 413,322 | | | $ | 344,340 | | | $ | 318,996 | |
| |
| | | Class B | |
| | | Year ended December 31, | |
| | | 2007 | | | 2006 | | | 2005 | | | 2004 | | | 2003 | |
Net Asset Value, Beginning of Period | | $ | 15.30 | | | $ | 13.33 | | | $ | 11.38 | | | $ | 9.76 | | | $ | 7.69 | |
| | | | | | | | | | | | | | | | | | | | |
Income From Investment Operations | | | | | | | | | | | | | | | | | | | | |
Net investment income | | | 0.15 | (a) | | | 0.12 | | | | 0.12 | | | | 0.07 | | | | 0.03 | |
Net realized and unrealized gain on investments | | | 1.37 | | | | 2.03 | | | | 1.88 | | | | 1.67 | | | | 2.09 | |
| | | | | | | | | | | | | | | | | | | | |
Total from investment operations | | | 1.52 | | | | 2.15 | | | | 2.00 | | | | 1.74 | | | | 2.12 | |
| | | | | | | | | | | | | | | | | | | | |
Less Distributions | | | | | | | | | | | | | | | | | | | | |
Distributions from net investment income | | | (0.13 | ) | | | (0.18 | ) | | | (0.05 | ) | | | (0.12 | ) | | | (0.05 | ) |
Distributions from net realized capital gains | | | (0.86 | ) | | | 0.00 | | | | 0.00 | | | | 0.00 | | | | 0.00 | |
| | | | | | | | | | | | | | | | | | | | |
Total distributions | | | (0.99 | ) | | | (0.18 | ) | | | (0.05 | ) | | | (0.12 | ) | | | (0.05 | ) |
| | | | | | | | | | | | | | | | | | | | |
Net Asset Value, End of Period | | $ | 15.83 | | | $ | 15.30 | | | $ | 13.33 | | | $ | 11.38 | | | $ | 9.76 | |
| | | | | | | | | | | | | | | | | | | | |
Total Return (%) | | | 10.1 | | | | 16.2 | | | | 17.6 | | | | 18.0 | | | | 27.8 | |
Ratio of operating expenses to average net assets before expense reductions (%) | | | 1.21 | | | | 1.30 | | | | 1.31 | | | | 1.33 | | | | 1.38 | |
Ratio of operating expenses to average net assets after expense reductions (%) (b) | | | 1.17 | | | | 1.25 | | | | 1.26 | | | | 1.31 | | | | 1.36 | |
Ratio of net investment income (loss) to average net assets (%) | | | 0.96 | | | | 0.72 | | | | 0.89 | | | | 0.56 | | | | (0.04 | ) |
Portfolio turnover rate (%) | | | 100 | | | | 86 | | | | 69 | | | | 90 | | | | 148 | |
Net assets, end of period (000) | | $ | 119,073 | | | $ | 95,473 | | | $ | 54,530 | | | $ | 24,612 | | | $ | 14,859 | |
| (a) | Per share amount is based on average shares outstanding during the period. |
| (b) | The Portfolio has entered into arrangements with certain brokers who paid a portion of the Portfolio’s expenses. |
See accompanying notes to financial statements.
MSF-11
Metropolitan Series Fund, Inc.
Julius Baer International Stock Portfolio (formerly FI International Stock Portfolio)
Financial Highlights
| | | | | | | | | | | | | | | | | | | | |
| | | Class E | |
| | | Year ended December 31, | |
| | | 2007 | | | 2006 | | | 2005 | | | 2004 | | | 2003 | |
Net Asset Value, Beginning of Period | | $ | 15.35 | | | $ | 13.37 | | | $ | 11.41 | | | $ | 9.79 | | | $ | 7.71 | |
| | | | | | | | | | | | | | | | | | | | |
Income From Investment Operations | | | | | | | | | | | | | | | | | | | | |
Net investment income | | | 0.18 | (a) | | | 0.12 | | | | 0.13 | | | | 0.07 | | | | 0.08 | |
Net realized and unrealized gain on investments | | | 1.37 | | | | 2.05 | | | | 1.89 | | | | 1.68 | | | | 2.05 | |
| | | | | | | | | | | | | | | | | | | | |
Total from investment operations | | | 1.55 | | | | 2.17 | | | | 2.02 | | | | 1.75 | | | | 2.13 | |
| | | | | | | | | | | | | | | | | | | | |
Less Distributions | | | | | | | | | | | | | | | | | | | | |
Distributions from net investment income | | | (0.15 | ) | | | (0.19 | ) | | | (0.06 | ) | | | (0.13 | ) | | | (0.05 | ) |
Distributions from net realized capital gains | | | (0.86 | ) | | | 0.00 | | | | 0.00 | | | | 0.00 | | | | 0.00 | |
| | | | | | | | | | | | | | | | | | | | |
Total distributions | | | (1.01 | ) | | | (0.19 | ) | | | (0.06 | ) | | | (0.13 | ) | | | (0.05 | ) |
| | | | | | | | | | | | | | | | | | | | |
Net Asset Value, End of Period | | $ | 15.89 | | | $ | 15.35 | | | $ | 13.37 | | | $ | 11.41 | | | $ | 9.79 | |
| | | | | | | | | | | | | | | | | | | | |
Total Return (%) | | | 10.2 | | | | 16.3 | | | | 17.8 | | | | 18.0 | | | | 27.9 | |
Ratio of operating expenses to average net assets before expense reductions (%) | | | 1.11 | | | | 1.20 | | | | 1.21 | | | | 1.23 | | | | 1.28 | |
Ratio of operating expenses to average net assets after expense reductions (%) (b) | | | 1.07 | | | | 1.15 | | | | 1.16 | | | | 1.21 | | | | 1.26 | |
Ratio of net investment income to average net assets (%) | | | 1.10 | | | | 0.89 | | | | 1.08 | | | | 0.70 | | | | 0.93 | |
Portfolio turnover rate (%) | | | 100 | | | | 86 | | | | 69 | | | | 90 | | | | 148 | |
Net assets, end of period (000) | | $ | 70,905 | | | $ | 73,182 | | | $ | 66,569 | | | $ | 58,712 | | | $ | 47,619 | |
| (a) | Per share amount is based on average shares outstanding during the period. |
| (b) | The Portfolio has entered into arrangements with certain brokers who paid a portion of the Portfolio’s expenses. |
See accompanying notes to financial statements.
MSF-12
Metropolitan Series Fund, Inc.
Julius Baer International Stock Portfolio (formerly FI International Stock Portfolio)
Notes to Financial Statements—December 31, 2007
Metropolitan Series Fund, Inc. (the “Fund”) is organized as a corporation under the laws of Maryland pursuant to Articles of Incorporation filed on November 23, 1982, as amended, and registered under the Investment Company Act of 1940, as amended (the “1940 Act”), as an open-end investment company. The Fund is a “series” type of mutual fund, which issues separate series of stock. Each series represents an interest in a separate portfolio of Fund investments. The Julius Baer International Stock Portfolio (formerly FI International Stock) (the “Portfolio”) is a diversified series of the Fund. Shares in the Fund are not offered directly to the general public and are currently available only to separate accounts established by Metropolitan Life Insurance Company (“MetLife”), New England Life Insurance Company, General American Life Insurance Company (“General American”), The MetLife Investors Group of Insurance Companies, MetLife Insurance Company of Connecticut and other affiliated insurance companies (collectively, the “Insurance Companies”), as an investment vehicle for variable life insurance, group annuity or variable annuity products, although the Portfolio is not available to all such separate accounts. The Portfolio’s shares may be divided into different classes. Currently, the classes being offered by the Portfolio are named Class A, Class B and Class E. The classes of the Portfolio’s shares are identical, except that certain additional charges (Rule 12b-1 fees) are made against Class B and Class E shares. Investment income, realized and unrealized capital gains and losses, the common expenses of the Portfolio and certain Portfolio-level expense reductions, if any, are allocated on a pro rata basis to each class based on the relative net assets of each class to the total net assets of the Portfolio.
| 2. | SIGNIFICANT ACCOUNTING POLICIES: |
The preparation of financial statements in conformity with accounting principles generally accepted in the United States of America (“GAAP”) requires management to make estimates and assumptions that affect the reported amounts of assets and liabilities and disclosure of contingent assets and liabilities as of the date of the financial statements and the reported amounts of income and expenses during the reporting period. Actual results could differ from those estimates.
The following is a summary of significant accounting policies consistently followed by the Portfolio in the preparation of its financial statements. The policies are in conformity with GAAP.
Investment Valuation:
Debt securities (other than short term obligations with a remaining maturity of sixty days or less) are valued by independent pricing services selected by the relevant subadviser pursuant to authorization of the Board of Directors of the Fund (the “Board” or “Directors”). Short term obligations with a remaining maturity of sixty days or less are valued at amortized cost which approximates fair market value.
Equity securities traded on a national securities exchange or exchanges are valued at their last sale price on the principal trading market. Equity securities traded on the NASDAQ National Market System are valued at the NASDAQ Official Closing Price (the “NOCP”). The NOCP is the last sale price if it falls between the spread of the last reported bid and asked prices. If the last reported bid and asked prices are above the last reported sale price, the NOCP will be the last reported bid price. If the last reported bid and asked prices are below the last reported sale price, the NOCP will be the last reported asked price. Equity securities traded on a national securities exchange or exchanges or on the NASDAQ National Market System for which there is no reported sale during the day are valued at the last reported bid price. A security that is listed or traded on more than one exchange is valued at the quotation on the exchange determined to be the primary market for that security by the Board or its delegates. If no closing price is available, then such securities are valued by using the last reported bid price. Equity securities traded over-the-counter are valued at the last reported sales price.
If no current market value quotation is readily available or reliable for a portfolio security, fair value will be determined in accordance with procedures established by and under the general supervision of the Board. When the Portfolio uses fair value pricing, it may take into account any factors it deems appropriate. The value of securities used by the Portfolio to calculate its net asset value may differ from quoted or published prices for the same securities. Fair value pricing involves subjective judgments and the fair value determined for a security may be materially different than the value that could be realized upon the sale of that security.
The Portfolio expects to use fair value pricing for securities primarily traded on U.S. exchanges only under very limited circumstances. For example, the Portfolio may use fair value pricing if the exchange on which a security is traded closes early or trading in the security is suspended.
MSF-13
Metropolitan Series Fund, Inc.
Julius Baer International Stock Portfolio (formerly FI International Stock Portfolio)
Notes to Financial Statements—December 31, 2007—(Continued)
Securities traded primarily on an exchange outside of the United States which closes before the close of the New York Stock Exchange will be valued at the last sales price on that non-U.S. exchange. Securities traded primarily on an exchange outside of the United States for which there is no reported sale during the day are valued at the mean between the last reported bid and asked prices. However, because most foreign markets close well before the Portfolio values its securities (typically at 4 p.m. Eastern Time), the earlier close of these foreign markets gives rise to the possibility that significant events, including broad market moves, may have occurred after these foreign markets close but before the Portfolio values its securities. To account for this, the Portfolio may frequently value many of its foreign equity securities using fair value prices based on third party vendor modeling tools.
Forward foreign currency exchange contracts are valued based on the mean between closing bid and asked prices of the forward currency contract rates in the London foreign exchange markets on a daily basis as provided by a reliable bank or dealer.
Options, whether on securities, indices, futures contracts, or otherwise, are valued at the last sales price available as of the close of business on the day of valuation or, if there is no such sale price available, at the mean between the bid and asked prices. Options on currencies are valued at the spot price each day.
The value of futures contracts will be the sum of the margin deposit plus or minus the difference between the value of the futures contract on each day the net asset value is calculated and the value on the date the futures contract originated, value being that established on a recognized commodity exchange, or by reference to other customary sources, with gain or loss being realized when the futures contract closes or expires.
Subject to the Board’s oversight, the Board has delegated day-to-day responsibility for valuing Portfolio assets to MetLife Advisers, LLC (“MetLife Advisers” or the “Adviser”) who values such assets as described above and operates under procedures approved by the Board.
Investment Transactions and Related Investment Income:
Portfolio security transactions are recorded on the trade date. Dividend income is recorded on the ex-dividend date or, for certain foreign securities, when notified. Interest income, which includes amortization of premium and accretion of discount on debt securities, is recorded on the accrual basis. Realized gains and losses on investments and unrealized appreciation and depreciation are determined on the identified cost basis, which is the same basis used for federal income tax purposes.
Repurchase Agreements:
The Portfolio, through the custodian or a subcustodian, receives delivery of the underlying securities collateralizing repurchase agreements. The Portfolio requires the custodian to take possession, to have legally segregated in the Federal Reserve Book Entry System, or to have segregated within the custodian’s vault, all securities held as collateral for repurchase agreements. It is the Portfolio’s policy that the market value of the collateral be at least equal to 100% of the repurchase price in the case of a repurchase agreement of one-day duration and 102% on all other repurchase agreements. The Portfolio’s subadviser is responsible for determining that the value of the collateral is at all times at least equal to the repurchase price. In connection with transactions in repurchase agreements, if the seller defaults and the value of the collateral declines or if the seller enters an insolvency proceeding, realization of the collateral by the Portfolio may be delayed, limited or wholly denied.
Foreign Currency Translation:
The books and records of the Portfolio are maintained in U.S. dollars. The values of securities, currencies and other assets and liabilities denominated in currencies other than U.S. dollars are translated into U.S. dollars based upon foreign exchange rates prevailing at the end of the period. Purchases and sales of investment securities, income and expenses are translated on the respective dates of such transactions. Since the values of investment securities are presented at the foreign exchange rates prevailing at the end of the period, it is not practical to isolate that portion of the results of operations arising from changes in exchange rates from that portion of the results of operations reflecting fluctuations arising from changes in market prices of the investment securities. Such fluctuations are included in the net realized and unrealized gain or loss on investments.
Net realized foreign exchange gains or losses arise from sales of foreign currency, currency gains or losses realized between the trade and settlement dates on securities transactions, and the difference between the amounts of dividends, interest, and foreign withholding taxes recorded by the Portfolio and the U.S. dollar equivalent of the amounts actually received or paid by the Portfolio. Net unrealized foreign exchange gains and losses arise from changes in the value of assets and liabilities, other than investment securities, resulting from changes in the exchange rate.
MSF-14
Metropolitan Series Fund, Inc.
Julius Baer International Stock Portfolio (formerly FI International Stock Portfolio)
Notes to Financial Statements—December 31, 2007—(Continued)
Forward Foreign Currency Exchange Contracts:
The Portfolio may enter into forward foreign currency exchange contracts primarily to hedge against foreign currency exchange rate risks on its non-U.S. dollar denominated investment securities. When entering into a forward currency contract, the Portfolio agrees to receive or deliver a fixed quantity of foreign currency for an agreed-upon price on an agreed future date. These contracts are valued daily and the Portfolio’s net equity therein, representing unrealized gain or loss on the contracts as measured by the difference between the foreign exchange rates at the dates of entry into the contracts and the forward rates at the settlement date, is included in the Statement of Assets and Liabilities. Realized and unrealized gains and losses are included in the Statement of Operations. These instruments involve market and/or credit risk in excess of the amount recognized in the Statement of Assets and Liabilities. Risks arise from the possible inability of counterparties to meet the terms of their contracts and from movement in currency and securities values and interest rates.
Futures Contracts:
The Portfolio may buy and sell futures contracts (on recognized exchanges) as a hedge or to enhance return. Futures contracts are agreements to buy or sell a security, or deliver a final cash settlement price in connection with an index, interest rate, currency, or other contracts not calling for physical delivery, for a set price in the future. The Portfolio must post an amount equal to a portion of the total market value of the futures contract as futures variation margin, which is returned when the Portfolio’s obligations under the contract have been satisfied. From time to time thereafter, the Portfolio may have to post variation margin to maintain this amount as the market value of the contract fluctuates. Risks of entering into futures contracts (and related options) include the possibility that there may be an illiquid market and that a change in the value of the contract or option may not correlate with changes in the value of the underlying securities.
Options:
The Portfolio may use options to hedge against changes in values of securities the Portfolio owns or expects to purchase. Writing puts or buying calls tends to increase the Portfolio’s exposure to the underlying instrument and writing calls or buying puts tends to decrease the Portfolio’s exposure to the underlying instrument, and can be used to hedge other Portfolio investments. For options purchased to hedge the Portfolio’s investments, the potential risk to the Portfolio is that the change in value of options contracts may not correspond to the change in value of the hedged instruments. In addition, losses may arise from changes in the value of the underlying instruments, if there is an illiquid secondary market, or if the counterparty is unable to perform. The maximum loss for purchased options is limited to the premium initially paid for the option. For options written by the Portfolio, the maximum loss is not limited to the premium initially received for the option.
The main risk associated with purchasing an option is that the option expires without being exercised. In this case, the option expires worthless and the premium paid for the option is considered the loss. The risk associated with writing a call option is that the Portfolio may forgo the opportunity for a profit if the market value of the underlying position increases and the option is exercised. The risk in writing a put option is that the Portfolio may incur a loss if the market value of the underlying position decreases and the option is exercised. In addition, the Portfolio risks not being able to enter into a closing transaction for the written option as the result of an illiquid market.
“When-Issued” Securities:
Purchasing securities “when-issued” is a forward commitment by the Portfolio to buy a security. The estimated amount of the Portfolio’s payment obligation and the security’s interest rate are determined when the commitment is made, even though no interest accrues until the security is issued, which is generally 15 to 120 days later. The Portfolio will segregate liquid assets with its custodian sufficient at all times to satisfy these commitments. If the value of the security is less when delivered than when the commitment was made, the Portfolio will suffer a loss.
Fund Concentration:
The investments by the Portfolio in foreign securities may involve risks not present in domestic investments. Since securities may be denominated in foreign currencies and may require settlement in foreign currencies and pay interest or dividends in foreign currencies, changes in the relationship of these foreign currencies to the U.S. dollar can significantly affect the value of the investments and earnings of the Portfolio. Foreign investments may also subject the Portfolio to foreign government exchange
MSF-15
Metropolitan Series Fund, Inc.
Julius Baer International Stock Portfolio (formerly FI International Stock Portfolio)
Notes to Financial Statements—December 31, 2007—(Continued)
restrictions, expropriation, taxation or other political, social or economic developments, all of which could affect the market and/or credit risk of the investments. In addition to the risks described above, risks may arise from forward foreign currency contracts with respect to the potential inability of counterparties to meet the terms of their contracts.
Federal Income Taxes:
It is the Portfolio’s policy to comply with the requirements of the Internal Revenue Code of 1986, as amended, and regulations thereunder, applicable to regulated investment companies and to distribute all of its taxable income to shareholders. Therefore, no federal income tax provision is required.
As of December 31, 2007, the Portfolio had no capital loss carryovers.
The tax character of distributions paid for the periods ended December 31, 2007 and 2006 was as follows:
| | | | | | | | | | | | | | | | | | | | | | |
| Ordinary Income | | Long Term Gain | | Return of Capital | | Total |
| 2007 | | 2006 | | 2007 | | 2006 | | 2007 | | 2006 | | 2007 | | 2006 |
| $ | 8,127,400 | | $ | 8,458,819 | | $ | 41,081,294 | | $ | — | | $ | — | | $ | — | | $ | 49,208,694 | | $ | 8,458,819 |
As of December 31, 2007, the components of distributable earnings (accumulated losses) on a federal income tax basis were as follows:
| | | | | | | | | | | | |
Undistributed
Ordinary
Income | | Undistributed
Long Term
Gain | | Unrealized
Appreciation | | Loss
Carryforwards | | Total |
| $43,129,517 | | $ | 74,341,988 | | $ | 65,792,902 | | $ | — | | $ | 183,264,407 |
Dividends and Distributions to Shareholders:
The Portfolio records dividends and distributions on the ex-dividend date. Net realized gains from security transactions (if any) are generally distributed annually to shareholders. The timing and characterization of certain income and capital gains distributions are determined in accordance with federal tax regulations that may differ from GAAP. Permanent book and tax basis differences relating to shareholder distributions will result in reclassification between under/over distributed net investment income, accumulated net realized gains/losses and paid in capital.
Expense Reductions:
Certain Portfolio trades are directed to brokers who paid a portion of the Portfolio’s expenses. Amounts paid for the Portfolio are shown as expense reductions in the Statement of Operations.
| 3. | INVESTMENT TRANSACTIONS: |
For the year ended December 31, 2007, purchases and sales of securities (excluding short term investments) for the Portfolio were as follows:
| | | | | | | | | |
Purchases | | Sales |
U.S. Government | | Other | | U.S. Government | | Other |
$0 | | $ | 895,123,092 | | $ | 0 | | $ | 782,836,242 |
| 4. | INVESTMENT MANAGEMENT FEES AND OTHER TRANSACTIONS WITH AFFILIATES: |
Investment Management Agreement:
MetLife Advisers, LLC (“MetLife Advisers”) is the investment adviser to the Portfolio. The Fund has entered into an investment management agreement with MetLife Advisers with respect to the Portfolio. For providing investment management services to the Portfolio, MetLife Advisers receives monthly compensation at the following annual rates:
| | | | | | |
| | | Management
Fees earned by
MetLife Advisers
for the year ended
December 31, 2007 | | Annual
percentage
rates paid to
MetLife Advisers | | Based on Portfolios
average daily net asset levels |
| | $6,758,154 | | 0.860% | | Of the first $500 million |
| | | | 0.800% | | Of the next $500 million |
| | | | 0.750% | | On amounts in excess of $1 billion |
MSF-16
Metropolitan Series Fund, Inc.
Julius Baer International Stock Portfolio (formerly FI International Stock Portfolio)
Notes to Financial Statements—December 31, 2007—(Continued)
Certain officers and directors of the Fund may also be officers of MetLife Advisers; however, such officers and directors receive no compensation from the Fund.
MetLife Advisers has entered into an investment subadvisory agreement with respect to the Portfolio. Fidelity Research & Management Company (“Fidelity”) was compensated by MetLife Advisers to provide subadvisory services for the Portfolio in 2007.
Service and Distribution Fees:
The Fund has adopted a Distribution and Service Plan under Rule 12b-1 of the 1940 Act for the Portfolio’s Class B and E shares. Under the Distribution and Service Plan, the Class B and E shares of the Portfolio pay a fee to compensate the Insurance Companies (or their affiliates) and other broker-dealers and financial intermediaries involved in the offer and sale of Portfolio shares for promoting or selling and servicing, the Class B and E shares. The fees under the Distribution and Service Plan for each class of the Portfolio’s shares are calculated as a percentage of the Portfolio’s average daily net assets that are attributable to that Class. Currently, the fee is 0.25% per year for Class B shares and 0.15% per year for Class E shares. Amounts paid by the Portfolio for the year ended December 31, 2007 are shown as Service and Distribution fees in the Statement of Operations.
The Fund has entered into a securities lending arrangement with the Fund’s custodian, State Street Bank and Trust Company (the “custodian”). Under the agreement, the custodian is authorized to loan securities on the Portfolios’ behalf. In exchange, the Portfolio receives either cash or securities as collateral against the loaned securities. The Portfolio receives collateral at least equal to 102% of the market value of the loaned securities (105% for foreign securities), at each loan’s inception. Collateral must be maintained at least at 100% of the market value of the loaned securities for the duration of the loan. The cash collateral is invested in the Navigator Securities Lending Prime Portfolio, an affiliate of the custodian, which invests in a variety of high quality U.S. dollar-denominated instruments. If the market value of the collateral at the close of trading on a business day is less than 100% of the market value of the loaned securities at the close of trading on that day, the borrower shall be required to deliver, by the close of business on the following business day, an additional amount of collateral, equal to at least 100% of the market value of all the loaned securities as of such preceding day. The Portfolio receives 80% of the annual net income from securities lending transactions, which is included in interest income of the Portfolio. The remaining 20% is paid to the custodian as compensation for its securities lending services. The Portfolio bears the risk of any deficiency in the amount of collateral available for return to a borrower due to a loss in an approved investment. Any outstanding loans by the Portfolio at December 31, 2007 are footnoted in the Schedule of Investments.
As previously reported, in May 2004, General American received a Wells Notice stating that the SEC staff was considering recommending that the SEC bring a civil action alleging violations of the U.S. securities laws against General American with respect to market timing and late trading in a limited number of privately-placed variable insurance contracts that were sold through General American. General American responded to the SEC staff and cooperated with the investigation. On August 9, 2007, the SEC announced that it had settled an enforcement action regarding late trading against General American with, among other things, General American agreeing to pay a civil penalty and to comply with certain undertakings. General American consented to the SEC’s order without admitting or denying the findings. MetLife Advisers has also advised the Fund’s Board of Directors that, while certain exceptions to the Fund’s policies have been noted, no situations have been identified that would have a material impact on the financial position of the Fund.
On November 15, 2007, the Board of Directors of the Fund approved a new Subadvisory Agreement (the “Agreement”) with respect to the Portfolio between MetLife Advisers and Julius Baer. The Agreement is not subject to shareholder approval and became effective January 7, 2008. The Advisory Agreement between the Fund, with respect to the Portfolio, and MetLife Advisers will remain in effect and fees payable thereunder to MetLife Advisers will not change. Under the Agreement, Julius Baer became subadviser to the Portfolio, succeeding Fidelity, and is responsible for the day-to-day management of the Portfolio’s investment operations under the oversight of MetLife Advisers and the Board. The name of the FI International Stock Portfolio changed to the “Julius Baer International Stock Portfolio” at the time the Agreement became effective.
MSF-17
Metropolitan Series Fund, Inc.
Julius Baer International Stock Portfolio (formerly FI International Stock Portfolio)
Notes to Financial Statements—December 31, 2007—(Continued)
| 8. | RECENT ACCOUNTING PRONOUNCEMENTS: |
Effective June 29, 2007, the Fund implemented Financial Accounting Standards Board (“FASB”) Interpretation No. 48, “Accounting for Uncertainty in Income Taxes—an interpretation of FASB Statement No. 109” (“FIN 48”). FIN 48 prescribes the minimum recognition threshold a tax position must meet in connection with accounting for uncertainties in income tax positions taken or expected to be taken by an entity, including investment companies, before being measured and recognized in the financial statements. Management has evaluated the application of FIN 48 to the Fund, and has determined that the adoption of FIN 48 does not have a material impact on the Fund’s financial statements. The Fund files U.S. tax returns. No income tax returns are currently under examination. The statute of limitations on the Fund’s tax returns remains open for the years ended December 31, 2004 through December 31, 2006.
In September 2006, Statement of Financial Accounting Standards No. 157, Fair Value Measurements (SFAS 157) was issued and is effective for fiscal years beginning after November 15, 2007. SFAS 157 defines fair value, establishes a framework for measuring fair value and expands disclosures about fair value measurements. Management is currently evaluating the impact the adoption of SFAS 157 will have on the Portfolio’s financial statement disclosures.
MSF-18
Metropolitan Series Fund, Inc.
Julius Baer International Stock Portfolio (formerly FI International Stock Portfolio)
Report of Independent Registered Public Accounting Firm
To the Shareholders and Board of Directors of the Metropolitan Series Fund, Inc.:
We have audited the accompanying statement of assets and liabilities, including the schedule of investments, of the Julius Baer International Stock Portfolio (formerly FI International Stock Portfolio), one of the portfolios constituting the Metropolitan Series Fund, Inc. (the “Fund”) as of December 31, 2007, and the related statement of operations for the year then ended, the statements of changes in net assets for each of the two years in the period then ended, and the financial highlights for each of the five years in the period then ended. These financial statements and financial highlights are the responsibility of the Fund’s management. Our responsibility is to express an opinion on these financial statements and financial highlights based on our audits.
We conducted our audits in accordance with the standards of the Public Company Accounting Oversight Board (United States). Those standards require that we plan and perform the audit to obtain reasonable assurance about whether the financial statements and financial highlights are free of material misstatement. The Fund is not required to have, nor were we engaged to perform, an audit of its internal control over financial reporting. Our audits included consideration of internal control over financial reporting as a basis for designing audit procedures that are appropriate in the circumstances, but not for the purpose of expressing an opinion on the effectiveness of the Fund’s internal control over financial reporting. Accordingly, we express no such opinion. An audit also includes examining, on a test basis, evidence supporting the amounts and disclosures in the financial statements, assessing the accounting principles used and significant estimates made by management, as well as evaluating the overall financial statement presentation. Our procedures included confirmation of securities owned as of December 31, 2007, by correspondence with the custodian and brokers; where replies were not received from brokers, we performed other auditing procedures. We believe that our audits provide a reasonable basis for our opinion.
In our opinion, the financial statements and financial highlights referred to above present fairly, in all material respects, the financial position of the Julius Baer International Stock Portfolio (formerly FI International Stock Portfolio) of the Metropolitan Series Fund, Inc. as of December 31, 2007, the results of its operations for the year then ended, the changes in its net assets for each of the two years in the period then ended, and the financial highlights for each of the five years in the period then ended, in conformity with accounting principles generally accepted in the United States of America.
Deloitte & Touche LLP
Boston, Massachusetts
February 21, 2008
MSF-19
Metropolitan Series Fund, Inc.
Directors and Officers
The Fund’s Directors review actions of the Fund’s investment adviser and subadvisers, and decide upon matters of general policy. The Fund’s officers supervise the daily business operations of the Fund. The Board of Directors and the Fund’s officers are listed below. Each Director is responsible for overseeing all 36 Portfolios of the Fund. There is no limit to the term a Director may serve. Directors serve until their resignation, retirement or removal in accordance with the Fund’s organizational documents and policies adopted by the Board from time to time. Officers hold office at the pleasure of the Board or until the election or appointment and the qualification of a successor. The address of the directors and officers is c/o Metropolitan Series Fund, Inc., 501 Boylston Street, Boston, MA 02116.
Interested Directors(1)
Each Director below is an “interested person” (as defined by the 1940 Act) with respect to the Fund in that Ms. Forget is an employee of MetLife and Mr. Typermass is a former employee of MetLife and owns securities issued by MetLife, Inc., the ultimate parent company of MetLife Advisers.
| | | | | | | | |
Name, Address and Age | | Current
position(s)
with Fund | | Position(s)
held since | | Principal occupations
over past five years, including other directorships(2) | | Number of
Portfolios in
Fund Complex
Overseen by
Director(3) |
Elizabeth M. Forget Age: 41 | | Director, Chairman of the Board, President and Chief Executive Officer | | 2006 | | Senior Vice President (since 2007), MetLife, Inc.; President, Met Investors Advisory, LLC (“MIA”); Trustee and President, Met Investors Series Trust (“MIST”); Executive Vice President, MetLife Investors Group, Inc.; President (since 2006), MetLife Advisers. | | 81 |
| | | | |
Arthur G. Typermass Age: 70 | | Director | | 1998 | | Formerly, Senior Vice President and Treasurer, MetLife. | | 37 |
Non-Interested Directors(1)
Each Director below is not an “interested person” (as defined by the 1940 Act) with respect to the Fund (collectively, the “Independent Directors”).
| | | | | | | | |
Name, Address and Age | | Current
position(s)
with Fund | | Position(s)
held since | | Principal occupations
over past five years, including other directorships(2) | | Number of
Portfolios in
Fund Complex
Overseen by
Director(3) |
Steve A. Garban† Age: 70 | | Director | | 1985 | | Formerly, Chief Financial Officer, Senior Vice President Finance and Operations and Treasurer (Emeritus), The Pennsylvania State University. | | 37 |
| | | | |
Linda B. Strumpf Age: 60 | | Director | | 2000 | | Vice President and Chief Investment Officer, Ford Foundation. | | 37 |
| | | | |
Michael S. Scott Morton† Age: 70 | | Director | | 1993 | | Jay W. Forrester Professor of Management (Emeritus) at Sloan School of Management, MIT. | | 37 |
| | | | |
H. Jesse Arnelle Age: 74 | | Director | | 2001 | | Formerly, Counsel, Womble Carlyle Sandrie & Rice; Director, Textron Inc. (global multi-industry company)*; formerly, Director, Gannet Co. Inc. (diversified news and information company)*; formerly, Director, Eastman Chemical Company (global chemical company)*; formerly, Director, Waste Management, Inc.*; formerly, Director, Armstrong Holdings Inc. (parent company of floor and ceiling products business)*; formerly, Director, FPL Group Inc. (public utility holding company)*; Director, URS Corporation (engineering design services firm)*. | | 37 |
| | | | |
Nancy Hawthorne Age: 56 | | Director | | 2003 | | Director, Avid Technologies (computer software company)*; formerly, Chairman of the Board of Avid Technologies; formerly, Board of Advisors, L. Knife & Sons, Inc. (beverage distributor); Chief Executive Officer, Clerestory LLC (corporate financial advisor); formerly, Trustee, New England Zenith Fund (“Zenith Fund”)**; formerly, Chief Executive Officer and Managing Partner, Hawthorne, Krauss and Associates (corporate financial advisor); formerly, Chief Financial Officer and Executive Vice President, Continental Cablevision, subsequently renamed MediaOne (cable television company); formerly, Director, Life F/X, Inc.; formerly, Chairman of the Board, WorldClinic (distance medicine company); formerly, Director, Perini Corporation (construction company)*; formerly, Director, CGU (property and casualty insurance company); formerly, Director, Beacon Power Corporation (energy company )*. | | 37 |
MSF-20
Metropolitan Series Fund, Inc.
Directors and Officers—(Continued)
| | | | | | | | |
Name, Address and Age | | Current
position(s)
with Fund | | Position(s)
held since | | Principal occupations
over past five years, including other directorships(2) | | Number of
Portfolios in
Fund Complex
Overseen by
Director(3) |
John T. Ludes Age: 71 | | Director | | 2003 | | President, LFP Properties (consulting firm); Formerly, Trustee, Zenith Fund**; formerly, Vice Chairman, President and Chief Operating Officer, Fortune Brands/American Brands (global conglomerate); formerly, President and CEO, Acushnet Company (athletic equipment company). | | 37 |
Officers(1)
| | | | | | | | |
Name and address | | Age | | Current
position(s)
with Fund | | Position(s)
held since | | Principal occupations over past five years(2) |
| Jeffrey P. Halperin | | 40 | | Chief Compliance Officer | | 2006 | | Vice President (since 2006), Corporate Ethics and Compliance Department, MetLife, Inc.; Chief Compliance Officer (since 2006), MetLife Advisers, MIA and MIST. |
| | | | |
| John F. Guthrie, Jr. | | 64 | | Senior Vice President | | 2002 | | Manager and Senior Vice President, MetLife Advisers; Vice President, MetLife; Vice President (since 2003), MetLife Group, Inc.; Vice President, NELICO; Vice President (since 2005), MIA; formerly, Senior Vice President, Zenith Fund**. |
| | | | |
| Alan C. Leland | | 55 | | Senior Vice President | | 2005 | | Treasurer and Chief Financial Officer, MetLife Advisers, LLC; Treasurer (since 2005), Met Investors Advisory, LLC; Vice President (since 2004), MIA; Vice President (since 2003), MetLife Group, Inc.; Vice President, MetLife; Senior Vice President, NELICO |
| | | | |
| Peter Duffy | | 52 | | Vice President and Treasurer | | 2000 | | Senior Vice President, MetLife Advisers (since 1998); Second Vice President (since 2003), NELICO; Vice President, MetLife (since 2004); Vice President (since 2004), MetLife Group, Inc.; formerly, Vice President and Treasurer, Zenith Fund**. |
| | | | |
| Thomas M. Lenz | | 49 | | Vice President and Secretary | | 2002 | | General Counsel and Secretary, MetLife Advisers; Assistant General Counsel, MetLife; formerly, Vice President and Secretary, Zenith Fund**. |
| * | Indicates a directorship with a registered investment company or a company subject to the reporting requirements of the Securities Exchange Act of 1934, as amended. |
| ** | The Zenith Fund deregistered with the Securities and Exchange Commission (“SEC”) in 2004. |
| (†) | Served as a trustee, director and/or officer of one or more of the following companies, each of which had a direct or indirect advisory relationship with MetLife Advisers or its affiliates prior to January 31, 2005: State Street Research Financial Trust, State Street Research Income Trust, State Street Research Money Market Trust, State Street Research Institutional Funds, State Street Research Capital Trust, State Street Research Master Investment Trust, State Street Research Equity Trust, State Street Research Securities Trust and State Street Research Exchange Trust (collectively, the “State Street Research Funds”). |
| (1) | Each Director of the Fund also serves as trustee of Metropolitan Series Fund II (“Met Series Fund II”), a registered investment company advised by MetLife Advisers. Each officer of the Fund serves in the same position with Met Series Fund II, which consists of one portfolio. |
| (2) | Previous positions during the past five years with the Fund, MIST, MetLife, MetLife Advisers, MIA, Zenith Fund, NELICO or New England Securities Corporation are omitted if not materially different. |
| (3) | The Fund Complex includes the Fund (36 portfolios), Met Series Fund II (1 portfolio) and MIST (44 portfolios) |
MSF-21
Metropolitan Series Fund, Inc.
Julius Baer International Stock Portfolio (formerly FI International Stock Portfolio)
Board Approval of Advisory and Subadvisory Agreements
The Fund’s Contract Review Committees of the Board of Directors (the “Board”) typically meet in early fall to review the Portfolios’ advisory agreements (the “Advisory Agreements”) and subadvisory agreements (collectively, the “Subadvisory Agreements,” and, together with the Advisory Agreements, the “Agreements”) and determine whether to recommend that the full Board approve the continuation of the Agreements for an additional one-year period. (Following the initial approval of an Agreement for a new Portfolio or with a new adviser or subadviser, such annual reviews are not required until 2 years following the execution of such Agreement.) After each Committee has made its recommendations, the full Board, including the Independent Directors, determines whether to approve the continuation of each of the Agreements. In addition, the Board, including the Independent Directors, considers matters bearing on the Agreements at most of its other meetings throughout the year and regularly interviews various individuals at MetLife Advisers responsible for the management of the Portfolios. The Directors also interview selected investment managers and other professionals at the subadvisers at various times throughout the year.
The Directors receive all materials that they or MetLife Advisers, the Fund’s investment adviser, and the subadvisers believe to be reasonably necessary for the Directors to evaluate the Agreements and determine whether to approve the continuation of the Agreements. These materials generally include, among other items, (i) information on the investment performance of the Portfolios and the performance of peer groups of funds and the Portfolios’ performance benchmarks, (ii) information on the Portfolios’ advisory and subadvisory fees and other expenses, including information comparing the Portfolios’ expenses to those of peer groups of funds and information about any applicable expense caps and fee “breakpoints,” (iii) sales and redemption data, (iv) information related to the profitability of the Agreements to MetLife Advisers and the subadvisers, and potential “fall-out” or ancillary benefits that MetLife Advisers, the subadvisers or their affiliates may receive as a result of their relationships with the Fund and (v) information obtained through the subadvisers’ responses to certain requests from MetLife Advisers and the Directors and MetLife Advisers’ responses to requests from the Directors. The Directors may also consider other information such as (vi) MetLife Advisers’ and the subadvisers’ financial results and condition, (vii) each Portfolio’s investment objectives and strategies and the size, education and experience of the investment staffs of MetLife Advisers and the relevant subadvisers and their use of technology and external research, (viii) the allocation of the Portfolios’ brokerage, if any, including allocations to brokers affiliated with the subadvisers and the use of “soft” commission dollars to pay Portfolio expenses and to pay for research and other similar services, (ix) the resources devoted to, and the record of compliance with, the Portfolios’ investment policies and restrictions, policies on personal securities transactions and other compliance policies, (x) the responses of MetLife Advisers, the subadvisers and/or their affiliates to certain legal and regulatory proceedings and (xi) the economic outlook generally and for the mutual fund industry in particular. Throughout the process, the Directors have the opportunity to ask questions of and request additional materials from MetLife Advisers and the subadvisers.
Following meetings of each Contract Review Committee on September 12, 2007, the Board, at its November 15, 2007 meeting, approved the continuation through December 31, 2008 of the Advisory Agreements for each Portfolio of the Fund and the Subadvisory Agreements for each Portfolio of the Fund other than the Julius Baer International Stock Portfolio (formerly known as the FI International Stock Portfolio). The Agreements approved for continuation are referred to below as the “Continued Agreements.”
In considering whether to approve the continuation of the Continued Agreements, the Directors, including the Independent Directors, did not identify any single factor as determinative, and each weighed the various factors as he or she deemed appropriate. The Directors considered the following matters in connection with their approval of the Continued Agreements:
The nature, extent and quality of the services provided to the relevant Portfolios under the Continued Agreements. The Directors considered the nature, extent and quality of the services provided by MetLife Advisers, the relevant subadvisers (if any) and their affiliates (each, an “Adviser,” and, collectively, the “Advisers”) to the relevant Portfolios pursuant to the Continued Agreements and the resources dedicated to these Portfolios by the Advisers. In particular, the Directors considered the Advisers’ abilities to attract and retain highly qualified investment professionals. With respect to MetLife Advisers, the Directors considered that MetLife Advisers is (i) ultimately responsible for the performance of such Portfolios; (ii) ultimately responsible for the establishment of the investment strategies of each such Portfolio, primarily through its recommendations to the Board regarding the hiring and selection of subadvisers; (iii) responsible for the hiring and selection, subject to Board approval, of subadvisers; and (iv) responsible for maintaining a program of Subadviser oversight reasonably designed to ensure that the subadvisers have reasonable compliance policies and procedures in place. The Directors also considered that MetLife Advisers provides a full range of day-to-day administrative services for the Portfolios involving all aspects of such Portfolios’ day-to-day operations (other than portfolio management). After reviewing these and related factors, the Directors concluded, within the context of their overall conclusions regarding each of the Continued Agreements, that the nature, extent and quality of services provided supported the renewal of these Agreements.
Investment performance of the relevant Portfolios. The Directors reviewed information about the performance of the relevant Portfolios over various time periods, including information prepared by an independent third party that compared the performance of
MSF-22
Metropolitan Series Fund, Inc.
Julius Baer International Stock Portfolio (formerly FI International Stock Portfolio)
Board Approval of Advisory and Subadvisory Agreements—(Continued)
the Portfolios to the performance of peer groups of funds and performance benchmarks. The Directors also reviewed a description of the third party’s methodology for identifying a Portfolio’s peer group(s) for purposes of performance and expense comparisons.
In the case of each relevant Portfolio that had performance that lagged its peer group(s) for certain periods, the Directors concluded that other factors relevant to performance were sufficient, in light of other considerations, to warrant renewal of the Continued Agreements relating to such Portfolio. These factors varied from Portfolio to Portfolio, but included one or more of the following: (i) that such Portfolio’s performance, although lagging in certain recent periods, was stronger over the longer term; (ii) that the underperformance was attributable, to a significant extent, to investment decisions that were reasonable and consistent with the Portfolio’s investment objective(s) and policies and that the Portfolio was performing within the range of reasonable expectations, given market conditions and the Portfolio’s investment objective(s) and policies; (iii) that the Portfolio’s performance was competitive when compared to other relevant performance benchmarks or peer groups; and (iv) that MetLife Advisers and/or the relevant subadviser (if any) had taken or was taking steps designed to help improve the Portfolio’s investment performance.
The Directors also considered the investment performance of the Advisers and their reputations generally, the historical responsiveness of the Advisers to Director concerns about performance and the willingness of the Advisers to take steps intended to improve performance.
After reviewing these and related factors, the Directors concluded, within the context of their overall conclusions regarding each of the Continued Agreements, that the investment performance of each relevant Portfolio and Adviser was sufficient, in light of other considerations, to warrant the renewal of the Continued Agreements.
The costs of the services to be provided and profits to be realized by the Advisers and their affiliates from their relationships with the Portfolios. The Directors considered the fees charged by MetLife Advisers to the Portfolios for advisory services and, with respect to the subadvised Portfolios, by such subadvisers to MetLife Advisers for subadvisory services (such advisory and subadvisory fees (if any), collectively, “Fees”), as well as the total expense levels of the Portfolios. This information included comparisons (provided by an independent third party) of the Portfolios’ advisory fees and total expense levels to those of their peer groups. In evaluating Fees for the relevant Portfolios, the Directors also took into account the demands, complexity and quality of the investment management services provided to each Portfolio. The Directors considered MetLife Advisers’ recommendations regarding reductions in Fee rates, implementation of Fee breakpoints and institution of Fee waivers and expense caps.
The Directors also considered the compensation directly or indirectly received by the Advisers and their affiliates from their relationships with the relevant Portfolios. The Directors reviewed information relating to the profits received by MetLife Advisers, certain of the subadvisers and their affiliates as a result of their relationships with the relevant Portfolios, and information about the allocation of expenses used to calculate profitability. When reviewing profitability, the Directors also considered the performance of the relevant Portfolios, the expense levels of such Portfolios and whether the relevant Advisers had implemented breakpoints, fee waivers and/or expense caps with respect to such Portfolios.
After reviewing these and related factors, the Directors concluded, within the context of their overall conclusions regarding each of the Continued Agreements, that the Fees charged to each of the relevant Portfolios were fair and reasonable, and that the information provided regarding costs of these services generally, and the related profitability (if known) to the relevant Advisers of their relationships with the relevant Portfolios, supported the renewal of the Continued Agreements.
Economies of Scale. The Directors considered the existence of any economies of scale in the provision of services by the Advisers and whether those economies were shared with the relevant Portfolios through breakpoints in their advisory fees or other means, such as expense caps, fee waivers or relatively low levels of fees. The Directors noted that most of the relevant Portfolios benefited or will benefit from breakpoints, expense caps and/or fee waivers with respect to their advisory fees. In considering these issues, the Directors also took into consideration information relating to the costs of the services provided and the profitability to MetLife Advisers, the relevant subadvisers (if any) and each of their affiliates of their relationships with the relevant Portfolios, as discussed above.
After reviewing these and related factors, the Directors concluded, within the context of their overall conclusions regarding each of the Continued Agreements, that the extent to which economies of scale were shared with the relevant Portfolios supported the renewal of such Agreements.
Other Factors. The Directors also considered other factors, which included but were not limited to the following:
| | • | | the extent to which each relevant Portfolio operated in accordance with its investment objective, and its record of compliance with its investment restrictions and the compliance programs of the Fund and the Advisers. They also considered the compliance-related resources the Advisers and their affiliates provide to the relevant Portfolios; |
MSF-23
Metropolitan Series Fund, Inc.
Julius Baer International Stock Portfolio (formerly FI International Stock Portfolio)
Board Approval of Advisory and Subadvisory Agreements—(Continued)
| | • | | the nature, quality, cost and extent of administrative and shareholder services performed by MetLife Advisers and its affiliates under the Advisory Agreements; and |
| | • | | so-called “fall-out benefits” to the Advisers, such as the engagement of their affiliates to provide distribution, brokerage and transfer agency services to the Portfolios, and the benefits of research made available to the relevant Advisers by reason of brokerage commissions generated by the relevant Portfolios’ securities transactions. The Directors also considered the possible conflicts of interest associated with these fall-out and other benefits, and the reporting and other processes in place to disclose and monitor these possible conflicts of interest. |
Based on their evaluation of all factors that they deemed to be material, including those factors described above, and assisted by the advice of independent counsel, the Directors, including the Independent Directors, concluded that each of the Continued Agreements should be continued through December 31, 2008.
Certain Matters Relating to Julius Baer International Stock Portfolio (formerly known as the FI International Stock Portfolio) (the “International Stock Portfolio”). At the November 15, 2007 Board meeting, the Board approved a change of subadviser for the International Stock Portfolio from Fidelity Management & Research Company (“FMR”) to Julius Baer Investment Management LLC (“Julius Baer”).
In making the determination to approve the change in subadviser for the International Stock Portfolio, the Board carefully considered those factors described above with respect to the continuation of the Continued Agreements, as relevant to both the existing Subadvisory Agreement with FMR and the proposed Subadvisory Agreement with Julius Baer. In addition to these factors, the Board also considered as relevant:
| | • | | the experience, investment style and investment performance history of Julius Baer as portfolio manager; |
| | • | | that the form of the proposed Subadvisory Agreement with Julius Baer was substantially similar to the International Stock Portfolio’s existing Subadvisory Agreement with FMR; |
| | • | | that the subadvisory fee schedule for Julius Baer set forth in the proposed Subadvisory Agreement was lower than the fee schedule in the existing Subadvisory Agreement and that MetLife Advisers had agreed to reduce its advisory fee, through a contractual fee waiver, by an amount corresponding to such savings; |
| | • | | the expected transition costs of the change of subadviser; and |
| | • | | that the preferred date of the change of subadviser was January 7, 2008 and the desirability, in order to facilitate an orderly transition of subadvising functions, of extending the existing Subadvisory Agreement with FMR from its scheduled expiration date of December 31, 2007 until January 7, 2008. |
Following such consideration, and assisted by the advice of independent counsel, the Directors, including the Independent Directors, unanimously voted to approve the continuation of the existing Subadvisory Agreement relating to the International Stock Portfolio through January 7, 2008 and to approve the proposed Subadvisory Agreement relating to such Portfolio with Julius Baer, effective January 7, 2008 through January 6, 2010.
MSF-24
A description of the policies and procedures that the Fund uses to determine how to vote proxies relating to portfolio securities is available (i) without charge, upon request, by calling (800) 638-7732 and (ii) on the Securities and Exchange Commission’s (the “SEC”) website at http://www.sec.gov.
Information regarding how the Fund voted proxies relating to portfolio securities during the most recent twelve-month period ended December 31, 2007 is available (i) without charge, upon request, by calling (800) 638-7732 and (ii) on the SEC’s website at http://www.sec.gov.
The Fund files with the SEC a complete schedule of its portfolio holdings, as of the close of the first and third quarters of its fiscal year, on “Form N-Q”. These filings are available on the SEC’s website at www.sec.gov and may be reviewed and copied at the SEC’s Public Reference Room in Washington, DC. (Call 1-800-SEC-0330 for information on the operation of the Public Reference Room.)
MSF-25
| | |
Metropolitan Series Fund, Inc. Lehman Brothers Aggregate Bond
Index Portfolio Annual Report | | December 31, 2007 |
Letter from the President
February 1, 2008
Letter to Policy Holders:
2007 was a tumultuous year in the financial markets driven by concerns in the credit markets surrounding sub-prime mortgages and fears of recession in the U.S. Economy. The broad markets were mixed, with the Dow Jones Industrial Average up 8.9% and the MSCI EAFE Index, which measures the performance of international equities, up 11.2% for the year, while the Russell 2000 Index, which measures the performance of small capitalization stocks, was down 1.6%.
In the fixed income markets, credit spreads increased as a result of the pressure from sub-prime mortgage crisis and the Federal Reserve lowered interest rates by a total of 1% during the year. The Lehman Brothers Aggregate Bond Index posted a 7.0% return for the year.
On the following pages, you will find a complete review of your Portfolio and its investment performance.
MetLife is committed to building your financial freedom. We appreciate your trust and will continue to focus our efforts on meeting your investment needs.
Sincerely,
Elizabeth Forget
President, Metropolitan Series Fund, Inc.
Metropolitan Series Fund, Inc.
Lehman Brothers Aggregate Bond Index Portfolio
Managed by MetLife Investment Advisors Company, LLC
Portfolio Manager Commentary*
PORTFOLIO PERFORMANCE
For the year ended December 31, 2007, the Class A shares of the Lehman Brothers Aggregate Bond Index Portfolio1 returned 6.9%, compared to its benchmark, the Lehman Brothers Aggregate Bond Index1, which returned 7.0% over the same period.
PORTFOLIO REVIEW
The 2007 fixed income markets were overwhelmed with the subprime mortgage contagion, a weakening housing market, the liquidity crisis, Federal Reserve (Fed) actions, oil price volatility, and a deteriorating U.S. Dollar. News about problems within the subprime mortgage market dominated the headlines during the year. Investors struggled with the ramifications of borrower defaults, lender bankruptcies, and subprime-induced losses in the Credit sector. The fragile housing market yielded sluggish home appreciation, an oversupply of houses for sale, and an increase in foreclosures for borrowers with weak credit. By August, the subprime meltdown triggered a liquidity crisis, as news emerged that some Asset-Backed Commercial Paper (ABCP) and Structured Investment Vehicles (SIVs) were backed by subprime loans. These short-term investment products were previously perceived as high quality, money market vehicles. After questions regarding the value, quality and perceived risk of the underlying assets emerged, investors shunned the short-term investments and instead sought the safety of Agency Discount Notes. The Fed responded to the crisis by easing rates and providing liquidity. The Fed decreased the Fed Funds rate, lowered the discount rate, encouraged member banks to borrow at the discount window, and injected money into the banking system by buying repurchase agreements (repos).
The Fed cut the Fed Funds interest rate three times during the year for a total of 1.00%. By year-end, the Fed Funds rate was 4.25%, and interest rates were down an average of 1.25% along the yield curve. The yield curve steepened significantly, with the 2-year Treasury closing at 3.05% (down from 4.81% on 12/31/2006) and the 30-year Treasury closing at 4.45% (down from 4.81% on 12/31/2006).
Oil prices closed 2007 at $95.98 a barrel (versus $61.05 on 12/31/06), after hitting a high of $98.18 during the year. Middle Eastern and African tensions, supply disruptions, and increased demand contributed to crude oil price volatility over the period. The U.S. dollar endured a volatile year, falling to record lows against the Euro for the first time since that currency debuted in 1999 and the Canadian dollar by the greatest amount since Canada allowed its currency to float in 1950.
All spread sectors posted negative excess returns, indicating underperformance versus comparable duration Treasuries, and all experienced significant spread widening over the period. Excess returns for the sectors were: -0.72% for Government-Related, -1.78% for Mortgage-Backed Securities (MBS), -4.35% for Commercial Mortgage-Backed Securities (CMBS), -5.23% for Corporate and -6.34% for Asset-Backed Securities (ABS). While both the Government-Related and MBS sectors posted negative excess returns, they were the strongest relative performers for the year and were buoyed by the flight to quality that dominated the fixed income markets.
The Corporate sector was severely impacted by questionable transparency from subprime-related losses within the Financial Institutions subsector, the deteriorating housing picture (including the below investment grade rating cuts of several Home Construction companies), and increased supply. The Financial Institutions subsector had the weakest relative performance for the period on both total and excess return bases.
The ABS sector suffered from ongoing subprime concerns and weakness in the housing market. All ABS subsectors posted negative excess returns for the year, with the Home Equity subsector experiencing the most significant devastation of all subsectors. Home Equity posted -17.07% and -8.25% excess and total returns, respectively, for the 12-month period. The CMBS sector was plagued by lingering subprime-related fears as investors expressed concern that the contagion would spread to the broader securitized sectors.
* The views expressed above are those of the subadvisory firm as of December 31, 2007 and are subject to change based on market and other conditions. Information about the Portfolio’s holdings, asset allocation, industry allocation, or country diversification is historical and is not an indication of future Portfolio composition, which will vary. The performance of any index mentioned in this commentary has not been adjusted for ongoing management, distribution and operating expenses, and sales charges applicable to mutual fund investments. Direct investment in the Index is not possible.
1 Lehman Brothers® Aggregate Bond Index includes most obligations of the U.S. Treasury, agencies and quasi-federal corporations, most publicly issued investment grade corporate bonds and most bonds backed by mortgage pools of GNMA, FNMA and FHLMC.
MSF-2
Metropolitan Series Fund, Inc.
Lehman Brothers Aggregate Bond Index Portfolio
A $10,000 INVESTMENT COMPARED TO
THE LEHMAN BROTHERS AGGREGATE BOND INDEX
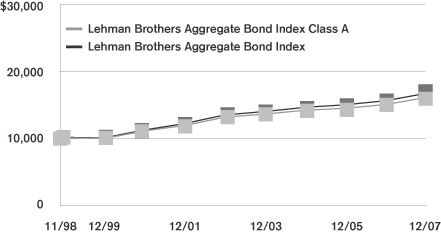
Average Annual Returns as of December 31, 2007
| | | | | | | | | | | | |
| | | Lehman Brothers Aggregate
Bond Index Portfolio | | | Lehman Brothers Aggregate Bond Index | |
| | | Class A | | | Class B | | | Class E | | |
| 1 Year | | 6.9 | % | | 6.7 | % | | 6.7 | % | | 7.0 | % |
| 5 Year | | 4.2 | | | 3.9 | | | 4.0 | | | 4.4 | |
| Since Inception | | 5.4 | | | 5.1 | | | 5.2 | | | 5.8 | |
Performance numbers are net of all Portfolio expenses but do not include any insurance, sales, or administrative charges of variable annuity or life insurance contracts. If these charges were included, the returns would be lower.
Inception dates of the Class A, Class B and Class E shares are: 11/9/98, 1/2/01 and 5/1/01, respectively. Index since inception return is based on the Class A inception date.
This information represents past performance and is not indicative of future results. Investment return and principal value may fluctuate so that shares, upon redemption, may be worth more or less than the original cost.
PORTFOLIO COMPOSITION
as of December 31, 2007
Top Holdings
| | |
| | | % of Total
Net Assets |
Federal National Mortgage Association | | 22.0% |
Federal Home Loan Mortgage Corp. | | 17.3% |
U.S. Treasury Notes | | 16.7% |
U.S. Treasury Bonds | | 5.8% |
Federal Home Loan Bank | | 4.3% |
Government National Mortgage Association | | 4.1% |
Citigroup Commercial Mortgage Trust | | 1.6% |
Wachovia Bank Commercial Mortgage Trust | | 1.0% |
General Electric Capital Corp. | | 0.7% |
JPMorgan Chase Commercial Mortgage Securities Corp. | | 0.6% |
Top Sectors
| | |
| | | % of Total
Market Value |
Mortgage-Backed | | 37.8% |
U.S. Treasury | | 22.8% |
Government Related | | 13.2% |
Industrials | | 9.5% |
Financials | | 8.0% |
Commercial Mortgage-Backed | | 5.7% |
Utilities | | 2.2% |
Asset Backed | | 0.7% |
Cash/Other | | 0.1% |
MSF-3
Metropolitan Series Fund, Inc.
Shareholder Expense Example
As a shareholder of the Portfolio, you incur ongoing costs, including management fees; distribution and service (12b-1) fees; and other Portfolio expenses. This example is intended to help you understand your ongoing costs (in dollars) (referred to as “expenses”) of investing in the Portfolio and compare these costs with the ongoing costs of investing in other mutual funds. The example is based on an investment of $1,000 invested at the beginning of the period and held for the entire period, July 1, 2007 through December 31, 2007.
Actual Expenses
The first line for each share class of the Portfolio in the table below provides information about actual account values and actual expenses. You may use the information in this line, together with the amount you invested in the particular share class of the Portfolio, to estimate the expenses that you paid over the period. Simply divide your account value by $1,000 (for example, an $8,600 account value divided by $1,000=8.6), then multiply the result by the number in the first line under the heading entitled “Expenses Paid During Period” to estimate the expenses you paid on your account during this period.
Hypothetical Example for Comparison Purposes
The second line for each share class of the Portfolio in the table below provides information about hypothetical account values and hypothetical expenses based on the Portfolio’s actual expense ratio and an assumed rate of return of 5% per year before expenses, which is not the Portfolio’s actual return. The hypothetical account values and expenses may not be used to estimate the actual ending account balance or expenses you paid for the period. You may use this information to compare the ongoing costs of investing in the Portfolio and other funds. To do so, compare this 5% hypothetical example with the 5% hypothetical examples that appear in the shareholder reports of the other funds.
Please note that the expenses shown in the table are meant to highlight your ongoing costs only and do not reflect any fees or charges of your variable insurance product or any additional expenses that participants in certain eligible qualified plans may bear relating to the operations of their plan. Therefore, the second line for each share class in the table is useful in comparing ongoing costs only, and will not help you determine the relative total costs of owning different funds. In addition, if these other costs were included, your costs would have been higher.
| | | | | | | | | | | | | | |
Portfolio | | | | Annualized
Expense
Ratio | | | Beginning
Account Value
July 1,
2007 | | Ending
Account Value
December 31,
2007 | | Expenses Paid
During Period*
July 1, 2007
to
December 31,
2007 |
Lehman Brothers Aggregate Bond Index—Class A(a) | | Actual | | 0.29 | % | | $ | 1,000.00 | | $ | 1,059.90 | | $ | 1.51 |
| | Hypothetical | | 0.29 | % | | $ | 1,000.00 | | $ | 1,023.73 | | $ | 1.48 |
| | | | | |
Lehman Brothers Aggregate Bond Index—Class B(a) | | Actual | | 0.54 | % | | $ | 1,000.00 | | $ | 1,058.80 | | $ | 2.80 |
| | Hypothetical | | 0.54 | % | | $ | 1,000.00 | | $ | 1,022.45 | | $ | 2.75 |
| | | | | |
Lehman Brothers Aggregate Bond Index—Class E(a) | | Actual | | 0.44 | % | | $ | 1,000.00 | | $ | 1,059.20 | | $ | 2.28 |
| | Hypothetical | | 0.44 | % | | $ | 1,000.00 | | $ | 1,022.96 | | $ | 2.24 |
* Expenses paid are equal to the Portfolio’s annualized expense ratio for the most recent six month period, as shown above, multiplied by the average account value over the period, multiplied by the number of days in the most recent fiscal half-year, divided by 365 (to reflect the one-half year period).
(a) The annualized expense ratio shown reflects the impact of the management fee waiver as described in Note 4 to the Financial Statements.
MSF-4
Metropolitan Series Fund, Inc.
Lehman Brothers Aggregate Bond Index Portfolio
Schedule of Investments as of December 31, 2007
Fixed Income—99.0% of Total Net Assets
| | | | | | |
| Security Description | | Face
Amount | | Value* |
| | | | | | |
|
Aerospace & Defense—0.2% |
Lockheed Martin Corp.
7.375%, 04/15/13 | | $ | 900,000 | | $ | 991,068 |
8.200%, 12/01/09 (a) | | | 700,000 | | | 747,992 |
The Boeing Co.
7.250%, 06/15/25 | | | 460,000 | | | 539,272 |
United Technologies Corp.
7.500%, 09/15/29 | | | 200,000 | | | 237,145 |
| | | | | | |
| | | | | | 2,515,477 |
| | | | | | |
|
Airlines—0.1% |
Southwest Airlines Co.
6.500%, 03/01/12 | | | 750,000 | | | 787,611 |
| | | | | | |
|
Asset Backed—0.8% |
BMW Vehicle Owner Trust
4.280%, 02/25/10 | | | 2,700,000 | | | 2,694,778 |
Capital One Multi-Asset Execution Trust 4.850%, 11/15/13 | | | 3,000,000 | | | 3,019,140 |
CenterPoint Energy Transition Bond Co., LLC 5.160%, 09/15/11 | | | 496,037 | | | 497,714 |
Centex Home Equity Loan Trust
3.750%, 12/25/31 | | | 75,223 | | | 74,476 |
Chase Funding Mortgage Loan
3.303%, 11/25/29 | | | 115,714 | | | 114,197 |
4.585%, 05/25/15 | | | 1,851,303 | | | 1,750,536 |
Detroit Edison Co.
6.190%, 03/01/13 | | | 435,000 | | | 448,511 |
MBNA Credit Card Master Trust
4.200%, 09/15/10 | | | 2,300,000 | | | 2,296,504 |
| | | | | | |
| | | | | | 10,895,856 |
| | | | | | |
|
Automobiles—0.2% |
DaimlerChrysler North America Holdings Corp.
7.750%, 01/18/11 | | | 2,600,000 | | | 2,769,836 |
8.000%, 06/15/10 (a) | | | 350,000 | | | 372,088 |
| | | | | | |
| | | | | | 3,141,924 |
| | | | | | |
|
Beverages—0.2% |
Anheuser Busch Cos., Inc.
5.000%, 01/15/15 (a) | | | 1,950,000 | | | 1,923,507 |
Coca-Cola Enterprises, Inc.
6.950%, 11/15/26 | | | 300,000 | | | 331,464 |
Pepsi Bottling Group, Inc.
7.000%, 03/01/29 | | | 300,000 | | | 341,052 |
| | | | | | |
| | | | | | 2,596,023 |
| | | | | | |
|
Building Products—0.2% |
Masco Corp.
6.125%, 10/03/16 | | | 2,950,000 | | | 2,909,567 |
| | | | | | |
|
Capital Markets—1.7% |
Credit Suisse USA, Inc.
5.375%, 03/02/16 (a) | | | 3,550,000 | | | 3,513,281 |
| | | | | | |
| Security Description | | Face
Amount | | Value* |
| | | | | | |
|
Capital Markets—(Continued) |
Donaldson Lufkin & Jenrette
6.500%, 06/01/08 | | $ | 300,000 | | $ | 301,571 |
JPMorgan Chase & Co.
5.125%, 09/15/14 | | | 850,000 | | | 830,726 |
6.750%, 02/01/11 | | | 250,000 | | | 262,381 |
Lehman Brothers Holdings, Inc.
3.600%, 03/13/09 | | | 2,250,000 | | | 2,206,566 |
Merrill Lynch & Co., Inc.
6.050%, 05/16/16 | | | 3,000,000 | | | 2,945,238 |
6.375%, 10/15/08 | | | 250,000 | | | 252,231 |
6.500%, 07/15/18 | | | 200,000 | | | 203,304 |
Morgan Stanley
4.750%, 04/01/14 | | | 1,515,000 | | | 1,424,678 |
7.250%, 04/01/32 | | | 3,850,000 | | | 4,168,631 |
Paine Webber Group, Inc.
6.550%, 04/15/08 | | | 340,000 | | | 340,926 |
The Bear Stearns Co., Inc.
5.700%, 11/15/14 | | | 900,000 | | | 854,181 |
The Goldman Sachs Group, Inc.
5.700%, 09/01/12 (a) | | | 1,000,000 | | | 1,033,147 |
6.125%, 02/15/33 (a) | | | 2,075,000 | | | 2,026,180 |
6.250%, 09/01/17 (a) | | | 760,000 | | | 789,929 |
6.450%, 05/01/36 | | | 2,000,000 | | | 1,887,873 |
6.650%, 05/15/09 (a) | | | 750,000 | | | 771,413 |
| | | | | | |
| | | | | | 23,812,256 |
| | | | | | |
|
Chemicals—0.1% |
E. I. du Pont de Nemours & Co.
5.600%, 12/15/36 | | | 1,000,000 | | | 941,424 |
6.875%, 10/15/09 | | | 300,000 | | | 313,527 |
| | | | | | |
| | | | | | 1,254,951 |
| | | | | | |
|
Commercial Banks—2.8% |
ABN-AMRO Bank NV (New York Branch)
7.125%, 10/15/93 | | | 500,000 | | | 522,981 |
7.750%, 05/15/23 | | | 230,000 | | | 254,989 |
Bank of America Corp.
4.750%, 08/15/13 (a) | | | 1,000,000 | | | 976,108 |
5.125%, 11/15/14 (a) | | | 1,000,000 | | | 982,475 |
5.420%, 03/15/17 | | | 900,000 | | | 870,630 |
5.750%, 08/15/16 | | | 2,850,000 | | | 2,853,079 |
7.400%, 01/15/11 | | | 300,000 | | | 320,537 |
7.800%, 02/15/10 | | | 150,000 | | | 159,662 |
Bank One Corp.
2.625%, 06/30/08 | | | 3,575,000 | | | 3,533,602 |
Bank One Texas
6.250%, 02/15/08 | | | 800,000 | | | 801,027 |
BB&T Corp.
5.200%, 12/23/15 | | | 4,100,000 | | | 3,898,661 |
Equitable Cos., Inc.
6.500%, 04/01/08 | | | 250,000 | | | 251,132 |
Fleet National Bank
5.750%, 01/15/09 | | | 500,000 | | | 506,383 |
HSBC Holdings, Plc.
5.250%, 12/12/12 | | | 5,050,000 | | | 5,072,742 |
7.500%, 07/15/09 | | | 2,200,000 | | | 2,292,807 |
*See accompanying notes to financial statements.
MSF-5
Metropolitan Series Fund, Inc.
Lehman Brothers Aggregate Bond Index Portfolio
Schedule of Investments as of December 31, 2007
Fixed Income—(Continued)
| | | | | | |
| Security Description | | Face
Amount | | Value* |
| | | | | | |
|
Commercial Banks—(Continued) |
Kreditanstalt fuer Wiederaufbau
4.875%, 01/17/17 | | $ | 2,900,000 | | $ | 2,991,756 |
MBNA America National Bank
7.125%, 11/15/12 | | | 1,000,000 | | | 1,091,031 |
RBS Capital Trust II
6.425%, 12/29/49 (b) | | | 1,375,000 | | | 1,241,274 |
Wachovia Bank, N.A.
4.800%, 11/01/14 | | | 3,100,000 | | | 2,938,156 |
4.875%, 02/01/15 | | | 3,000,000 | | | 2,843,390 |
Wachovia Corp.
5.750%, 06/15/17 | | | 700,000 | | | 693,306 |
Wells Fargo & Co.
5.000%, 11/15/14 (a) | | | 2,000,000 | | | 1,939,632 |
5.125%, 09/01/12 | | | 500,000 | | | 501,609 |
Wells Fargo Bank, N.A.
4.750%, 02/09/15 | | | 3,065,000 | | | 2,934,112 |
| | | | | | |
| | | | | | 40,471,081 |
| | | | | | |
|
Commercial Mortgage-Backed Securities—5.5% |
Bear Stearns Commercial Mortgage Securities, Inc.
5.540%, 09/11/41 | | | 3,000,000 | | | 3,045,780 |
5.610%, 11/15/33 | | | 500,000 | | | 509,329 |
6.480%, 02/15/35 | | | 500,000 | | | 519,743 |
7.080%, 06/15/09 | | | 763,393 | | | 777,393 |
7.780%, 02/15/32 | | | 200,000 | | | 207,885 |
Chase Commercial Mortgage Securities Corp.
6.390%, 11/18/30 | | | 220,097 | | | 221,471 |
Citigroup Commercial Mortgage Trust
4.860%, 05/15/43 | | | 3,600,000 | | | 3,536,314 |
5.225%, 07/15/44 (b) | | | 2,000,000 | | | 2,015,087 |
5.322%, 12/11/49 | | | 7,000,000 | | | 6,979,332 |
5.356%, 04/15/40 (b) | | | 1,000,000 | | | 1,023,182 |
5.362%, 01/15/46 (b) | | | 4,000,000 | | | 4,046,459 |
5.723%, 03/15/49 (b) | | | 3,800,000 | | | 3,928,922 |
Credit Suisse First Boston Mortgage
3.382%, 05/15/38 | | | 2,000,000 | | | 1,943,527 |
5.100%, 08/15/15 | | | 3,000,000 | | | 2,981,663 |
5.827%, 06/15/38 (b) | | | 3,000,000 | | | 3,118,913 |
Credit Suisse Mortgage Capital Certificates
5.467%, 09/15/39 | | | 3,500,000 | | | 3,527,348 |
First Union Lehman Brothers Commercial Mortgage Trust
6.560%, 11/18/35 | | | 252,759 | | | 252,572 |
Greenwich Capital Commercial Funding Corp.
4.022%, 01/05/36 | | | 2,210,000 | | | 2,181,705 |
4.305%, 08/10/42 | | | 2,000,000 | | | 1,974,985 |
5.317%, 06/10/36 (b) | | | 1,000,000 | | | 1,015,882 |
JPMorgan Chase Commercial Mortgage Securities Corp.
3.972%, 05/12/35 | | | 3,886,043 | | | 3,824,747 |
4.275%, 01/12/37 | | | 888,319 | | | 874,681 |
4.393%, 07/12/37 | | | 3,255,971 | | | 3,207,923 |
6.044%, 11/15/35 | | | 464,656 | | | 472,295 |
| | | | | | |
| Security Description | | Face
Amount | | Value* |
| | | | | | |
|
Commercial Mortgage-Backed Securities—(Continued) |
LB-UBS Commercial Mortgage Trust
4.254%, 07/15/27 (b) | | $ | 1,650,000 | | $ | 1,619,570 |
4.367%, 03/15/36 | | | 3,000,000 | | | 2,898,511 |
6.462%, 03/15/31 | | | 500,000 | | | 523,667 |
6.653%, 11/15/27 | | | 2,000,000 | | | 2,091,908 |
Lehman Brothers Commercial Conduit Mortgage Trust
6.210%, 10/15/35 | | | 224,009 | | | 224,874 |
Morgan Stanley Capital I, Inc.
4.989%, 08/13/42 | | | 1,000,000 | | | 988,402 |
6.540%, 07/15/30 | | | 186,854 | | | 186,659 |
Morgan Stanley Dean Witter Capital I Trust
4.800%, 09/15/37 | | | 330,285 | | | 329,475 |
7.200%, 10/15/33 | | | 630,147 | | | 656,391 |
Salomon Brothers Commercial Mortgage Trust
5.045%, 03/18/36 | | | 500,000 | | | 502,794 |
6.428%, 12/18/35 | | | 1,000,000 | | | 1,034,794 |
Wachovia Bank Commercial Mortgage Trust 5.083%, 03/15/42 (b) | | | 3,000,000 | | | 2,987,800 |
5.308%, 11/15/48 | | | 4,000,000 | | | 3,983,424 |
5.572%, 10/15/48 | | | 3,000,000 | | | 3,045,344 |
5.742%, 05/15/43 | | | 3,000,000 | | | 3,099,570 |
6.287%, 04/15/34 | | | 1,445,000 | | | 1,503,785 |
| | | | | | |
| | | | | | 77,864,106 |
| | | | | | |
| | |
Commercial Services & Supplies—0.1% | | | | | | |
USA Waste Services, Inc.
7.000%, 07/15/28 | | | 1,265,000 | | | 1,334,288 |
| | | | | | |
| | |
Communications Equipment—0.1% | | | | | | |
Motorola, Inc.
6.500%, 11/15/28 (a) | | | 900,000 | | | 868,845 |
7.625%, 11/15/10 | | | 135,000 | | | 144,077 |
| | | | | | |
| | | | | | 1,012,922 |
| | | | | | |
| | |
Computers & Peripherals—0.2% | | | | | | |
International Business Machines Corp.
4.750%, 11/29/12 | | | 1,000,000 | | | 1,006,706 |
7.500%, 06/15/13 | | | 1,000,000 | | | 1,104,866 |
8.375%, 11/01/19 | | | 425,000 | | | 531,778 |
| | | | | | |
| | | | | | 2,643,350 |
| | | | | | |
| | |
Consumer Finance—0.3% | | | | | | |
American Express Co.
6.800%, 09/01/66 | | | 330,000 | | | 332,472 |
Household Finance Corp.
4.750%, 05/15/09 | | | 2,500,000 | | | 2,502,290 |
7.000%, 05/15/12 | | | 100,000 | | | 107,577 |
8.000%, 07/15/10 | | | 300,000 | | | 322,858 |
SLM Corp.
5.050%, 11/14/14 | | | 1,950,000 | | | 1,686,285 |
| | | | | | |
| | | | | | 4,951,482 |
| | | | | | |
*See accompanying notes to financial statements.
MSF-6
Metropolitan Series Fund, Inc.
Lehman Brothers Aggregate Bond Index Portfolio
Schedule of Investments as of December 31, 2007
Fixed Income—(Continued)
| | | | | | |
| Security Description | | Face
Amount | | Value* |
| | | | | | |
| | |
Diversified Financial Services—4.4% | | | | | | |
American General Capital II
8.500%, 07/01/30 (a) | | $ | 250,000 | | $ | 308,263 |
American General Finance Co.
5.375%, 10/01/12 (a) | | | 6,500,000 | | | 6,257,058 |
5.400%, 12/01/15 | | | 1,340,000 | | | 1,220,181 |
Asian Development Bank
5.500%, 06/27/16 | | | 3,850,000 | | | 4,153,496 |
Associates Corp. North America
6.250%, 11/01/08 | | | 600,000 | | | 605,564 |
6.950%, 11/01/18 | | | 1,700,000 | | | 1,843,643 |
BellSouth Capital Funding Corp.
7.750%, 02/15/10 | | | 750,000 | | | 797,562 |
7.875%, 02/15/30 | | | 250,000 | | | 292,885 |
Citigroup, Inc.
3.500%, 02/01/08 | | | 500,000 | | | 499,357 |
5.500%, 08/27/12 | | | 840,000 | | | 857,367 |
5.850%, 08/02/16 | | | 500,000 | | | 507,284 |
6.200%, 03/15/09 | | | 750,000 | | | 763,621 |
7.250%, 10/01/10 | | | 250,000 | | | 264,414 |
Conoco Funding Co.
6.350%, 10/15/11 | | | 500,000 | | | 531,046 |
ConocoPhillips Canada Funding Co.
5.950%, 10/15/36 | | | 3,050,000 | | | 3,108,075 |
Deutsche Telekom International Finance BV 5.750%, 03/23/16 (a) | | | 460,000 | | | 461,963 |
8.250%, 06/15/30 (b) | | | 1,000,000 | | | 1,253,468 |
Devon Financing Corp., U.L.C.
6.875%, 09/30/11 | | | 1,900,000 | | | 2,030,535 |
Duke Capital
7.500%, 10/01/09 | | | 3,925,000 | | | 4,095,308 |
European Investment Bank
3.375%, 03/16/09 | | | 4,200,000 | | | 4,195,590 |
General Electric Capital Corp.
5.000%, 11/15/11 | | | 4,000,000 | | | 4,056,654 |
5.450%, 01/15/13 | | | 1,800,000 | | | 1,852,994 |
6.000%, 06/15/12 | | | 1,000,000 | | | 1,050,253 |
6.750%, 03/15/32 | | | 2,450,000 | | | 2,763,508 |
7.500%, 08/21/35 | | | 100,000 | | | 122,587 |
Heller Financial, Inc.
7.375%, 11/01/09 | | | 350,000 | | | 367,007 |
KFW International Finance, Inc.
3.375%, 01/23/08 | | | 2,475,000 | | | 2,472,970 |
8.000%, 02/15/10 | | | 1,000,000 | | | 1,086,363 |
Korea Development Bank
5.750%, 09/10/13 (a) | | | 2,000,000 | | | 2,029,330 |
Mellon Funding Corp.
6.400%, 05/14/11 | | | 250,000 | | | 261,934 |
National Rural Utilities Cooperative Finance Corp.
8.000%, 03/01/32 | | | 300,000 | | | 360,184 |
Petrobras International Finance Co.
6.125%, 10/06/16 | | | 600,000 | | | 612,750 |
Sprint Capital Corp.
6.900%, 05/01/19 | | | 1,500,000 | | | 1,495,983 |
7.625%, 01/30/11 | | | 400,000 | | | 415,789 |
8.375%, 03/15/12 | | | 3,350,000 | | | 3,609,855 |
| | | | | | |
| Security Description | | Face
Amount | | Value* |
| | | | | | |
| |
Diversified Financial Services—(Continued) | | | |
SunTrust Capital VIII
6.100%, 12/15/36 | | $ | 820,000 | | $ | 688,213 |
Unilever Capital Corp.
7.125%, 11/01/10 | | | 300,000 | | | 322,553 |
Verizon Global Funding Corp.
7.750%, 12/01/30 | | | 2,390,000 | | | 2,812,883 |
Washington Mutual Bank/Henderson NV
5.500%, 01/15/13 | | | 1,690,000 | | | 1,478,750 |
| | | | | | |
| | | | | | 61,907,240 |
| | | | | | |
| |
Diversified Telecommunication Services—0.6% | | | |
BellSouth Corp.
6.550%, 06/15/34 | | | 1,850,000 | | | 1,906,142 |
British Telecommunications, Plc.
9.125%, 12/15/30 (b) | | | 1,000,000 | | | 1,328,092 |
SBC Communications, Inc.
5.875%, 02/01/12 | | | 2,400,000 | | | 2,468,109 |
Telefonica Europe BV
8.250%, 09/15/30 | | | 1,000,000 | | | 1,238,994 |
Verizon New England, Inc.
6.500%, 09/15/11 | | | 400,000 | | | 419,409 |
Verizon New York, Inc.
7.375%, 04/01/32 | | | 500,000 | | | 552,164 |
| | | | | | |
| | | | | | 7,912,910 |
| | | | | | |
| | |
Electric Utilities—0.9% | | | | | | |
Consolidated Edison Co. of New York, Inc. 7.500%, 09/01/10 | | | 1,000,000 | | | 1,075,124 |
Duke Energy Co.
6.250%, 01/15/12 | | | 500,000 | | | 527,351 |
Exelon Corp.
4.900%, 06/15/15 | | | 2,060,000 | | | 1,939,113 |
5.625%, 06/15/35 | | | 1,500,000 | | | 1,348,341 |
Exelon Generation Co., LLC
6.950%, 06/15/11 | | | 300,000 | | | 313,079 |
Oncor Electric Delivery Co.
7.000%, 05/01/32 | | | 950,000 | | | 994,148 |
Progress Energy, Inc.
5.625%, 01/15/16 | | | 3,900,000 | | | 3,885,497 |
7.100%, 03/01/11 | | | 1,221,000 | | | 1,298,980 |
PSE&G Power, LLC
7.750%, 04/15/11 | | | 500,000 | | | 538,109 |
8.625%, 04/15/31 | | | 1,000,000 | | | 1,230,404 |
| | | | | | |
| | | | | | 13,150,146 |
| | | | | | |
| | |
Energy Equipment & Services—0.1% | | | | | | |
Kinder Morgan Energy Partners, L.P.
6.750%, 03/15/11 | | | 750,000 | | | 782,830 |
| | | | | | |
| | |
Federal Agencies—47.8% | | | | | | |
Federal Home Loan Bank
4.250%, 11/13/09 | | | 1,500,000 | | | 1,513,950 |
4.375%, 03/17/10 (a) | | | 3,000,000 | | | 3,050,268 |
4.625%, 02/18/11 | | | 6,070,000 | | | 6,240,150 |
4.750%, 12/16/16 | | | 3,850,000 | | | 3,932,962 |
*See accompanying notes to financial statements.
MSF-7
Metropolitan Series Fund, Inc.
Lehman Brothers Aggregate Bond Index Portfolio
Schedule of Investments as of December 31, 2007
Fixed Income—(Continued)
| | | | | | |
| Security Description | | Face
Amount | | Value* |
| | | | | | |
| | |
Federal Agencies—(Continued) | | | | | | |
Federal Home Loan Bank
5.000%, 09/18/09 (a) | | $ | 6,900,000 | | $ | 7,059,485 |
5.000%, 10/13/11 | | | 1,000,000 | | | 1,038,869 |
5.000%, 08/01/35 | | | 3,266,198 | | | 3,189,250 |
5.000%, 09/01/35 | | | 4,226,269 | | | 4,126,702 |
5.250%, 06/18/14 (a) | | | 9,500,000 | | | 10,103,351 |
5.375%, 07/17/09 | | | 5,850,000 | | | 6,003,658 |
5.375%, 05/18/16 (a) | | | 2,900,000 | | | 3,103,594 |
5.500%, 12/01/35 | | | 6,443,300 | | | 6,432,929 |
6.500%, 09/01/36 | | | 4,864,973 | | | 5,002,408 |
Federal Home Loan Mortgage Corp.
4.000%, 12/15/09 (a) | | | 2,000,000 | | | 2,017,676 |
4.000%, 06/01/19 | | | 1,913,826 | | | 1,843,300 |
4.250%, 07/15/09 (a) | | | 8,630,000 | | | 8,713,396 |
4.401%, 02/01/36 (b) | | | 2,686,250 | | | 2,656,719 |
4.500%, 01/15/15 | | | 3,000,000 | | | 3,052,454 |
4.500%, 09/01/18 | | | 2,618,908 | | | 2,582,688 |
4.500%, 10/01/18 | | | 3,862,514 | | | 3,809,094 |
4.500%, 04/01/19 | | | 5,824,878 | | | 5,735,282 |
4.500%, 06/01/19 | | | 3,230,015 | | | 3,180,332 |
4.500%, 08/01/19 | | | 887,583 | | | 873,931 |
4.500%, 10/01/35 | | | 5,508,645 | | | 5,210,089 |
4.500%, 11/01/35 (b) | | | 2,638,197 | | | 2,490,951 |
4.650%, 10/10/13 | | | 2,570,000 | | | 2,535,012 |
4.750%, 03/05/12 (a) | | | 12,000,000 | | | 12,391,198 |
5.000%, 06/11/09 (a) | | | 7,000,000 | | | 7,132,189 |
5.000%, 05/01/18 | | | 7,088,353 | | | 7,116,247 |
5.000%, 12/01/18 | | | 1,495,184 | | | 1,501,068 |
5.000%, 06/01/19 | | | 2,611,788 | | | 2,619,259 |
5.000%, 03/01/27 | | | 2,874,697 | | | 2,833,626 |
5.000%, 10/01/33 | | | 3,679,842 | | | 3,597,137 |
5.000%, 03/01/34 | | | 1,828,803 | | | 1,786,862 |
5.000%, 08/01/35 | | | 4,214,015 | | | 4,114,737 |
5.000%, 10/01/35 | | | 3,250,279 | | | 3,173,705 |
5.000%, 01/01/36 | | | 6,721,306 | | | 6,562,959 |
5.125%, 10/18/16 | | | 4,000,000 | | | 4,196,608 |
5.130%, 08/01/36 (b) | | | 2,746,551 | | | 2,746,742 |
5.131%, 01/01/36 (b) | | | 4,532,009 | | | 4,560,127 |
5.165%, 09/01/35 (b) | | | 4,607,811 | | | 4,634,088 |
5.300%, 05/12/20 | | | 710,000 | | | 701,949 |
5.375%, 08/19/11 (a) | | | 5,800,000 | | | 6,119,835 |
5.451%, 01/01/37 (b) | | | 11,043,508 | | | 11,186,736 |
5.474%, 02/01/37 (b) | | | 1,631,403 | | | 1,634,509 |
5.500%, 11/01/17 | | | 1,060,876 | | | 1,078,372 |
5.500%, 05/01/29 | | | 1,151,110 | | | 1,150,148 |
5.500%, 06/01/34 | | | 3,894,875 | | | 3,891,617 |
5.500%, 10/01/35 | | | 4,000,638 | | | 3,994,198 |
5.500%, 01/01/36 | | | 12,123,715 | | | 12,104,200 |
5.500%, 07/01/37 | | | 6,910,259 | | | 6,895,993 |
5.500%, 10/01/37 | | | 17,000,000 | | | 16,964,736 |
5.625%, 11/23/35 | | | 1,040,000 | | | 1,028,526 |
5.660%, 02/01/37 (b) | | | 7,025,124 | | | 7,107,018 |
6.000%, 04/01/16 | | | 68,391 | | | 70,038 |
6.000%, 05/01/17 | | | 898,086 | | | 919,895 |
6.000%, 11/01/28 | | | 92,377 | | | 94,332 |
6.000%, 12/01/28 | | | 61,397 | | | 62,696 |
6.000%, 02/01/29 | | | 151,060 | | | 154,075 |
| | | | | | |
| Security Description | | Face
Amount | | Value* |
| | | | | | |
| | |
Federal Agencies—(Continued) | | | | | | |
6.000%, 04/01/29 | | $ | 46,125 | | $ | 47,046 |
6.000%, 05/01/29 | | | 19,421 | | | 19,809 |
6.000%, 06/01/31 | | | 24,944 | | | 25,411 |
6.000%, 07/01/31 | | | 9,667 | | | 9,848 |
6.000%, 08/01/31 | | | 191,907 | | | 195,498 |
6.000%, 09/01/31 | | | 539,623 | | | 549,721 |
6.000%, 04/01/32 | | | 1,146,217 | | | 1,166,609 |
6.000%, 11/01/32 | | | 376,837 | | | 383,541 |
6.000%, 06/01/34 | | | 1,228,639 | | | 1,248,790 |
6.000%, 11/01/35 | | | 1,397,624 | | | 1,419,236 |
6.000%, 02/01/36 | | | 2,426,049 | | | 2,462,502 |
6.000%, 10/01/36 | | | 6,063,479 | | | 6,154,586 |
6.000%, 11/01/36 | | | 5,411,680 | | | 5,493,050 |
6.000%, 01/01/37 | | | 7,498,048 | | | 7,610,788 |
6.000%, 06/01/37 | | | 5,847,707 | | | 5,935,035 |
6.089%, 04/01/36 | | | 2,131,518 | | | 2,156,963 |
6.250%, 07/15/32 (a) | | | 3,250,000 | | | 3,878,308 |
6.500%, 10/01/29 | | | 37,570 | | | 38,902 |
6.500%, 02/01/30 | | | 54,191 | | | 56,111 |
6.500%, 08/01/31 | | | 87,565 | | | 90,557 |
6.500%, 10/01/31 | | | 36,323 | | | 37,565 |
6.500%, 11/01/31 | | | 201,752 | | | 208,646 |
6.500%, 03/01/32 | | | 2,260,222 | | | 2,334,735 |
6.500%, 04/01/32 | | | 1,924,767 | | | 1,988,221 |
6.500%, 11/01/37 | | | 10,000,001 | | | 10,283,678 |
6.750%, 03/15/31 (a) | | | 965,000 | | | 1,212,149 |
7.000%, 03/15/10 (a) | | | 2,875,000 | | | 3,081,795 |
7.000%, 06/01/11 | | | 26,448 | | | 27,347 |
7.000%, 12/01/15 | | | 43,986 | | | 45,900 |
7.000%, 12/01/27 | | | 8,824 | | | 9,285 |
7.000%, 11/01/28 | | | 24,899 | | | 26,233 |
7.000%, 04/01/29 | | | 19,785 | | | 20,758 |
7.000%, 05/01/29 | | | 5,796 | | | 6,082 |
7.000%, 06/01/29 | | | 42,057 | | | 44,126 |
7.000%, 07/01/29 | | | 13,943 | | | 14,629 |
7.000%, 01/01/31 | | | 242,161 | | | 253,629 |
7.000%, 12/01/31 | | | 51,314 | | | 53,744 |
7.500%, 03/01/16 | | | 73,311 | | | 76,725 |
7.500%, 08/01/24 | | | 87,444 | | | 93,599 |
7.500%, 11/01/24 | | | 31,760 | | | 33,996 |
7.500%, 10/01/27 | | | 53,204 | | | 57,497 |
7.500%, 10/01/29 | | | 78,836 | | | 83,222 |
7.500%, 05/01/30 | | | 34,691 | | | 36,617 |
8.000%, 02/01/27 | | | 16,263 | | | 17,035 |
8.000%, 10/01/28 | | | 30,595 | | | 32,047 |
Federal National Mortgage Association
3.250%, 08/15/08 | | | 3,025,000 | | | 3,005,226 |
3.250%, 02/15/09 (a) | | | 6,000,000 | | | 5,968,098 |
4.000%, 04/01/19 | | | 2,051,682 | | | 1,979,399 |
4.000%, 05/01/19 | | | 3,706,985 | | | 3,576,384 |
4.000%, 01/01/20 | | | 2,328,909 | | | 2,241,150 |
4.125%, 04/15/14 (a) | | | 2,350,000 | | | 2,350,520 |
4.500%, 07/01/18 | | | 4,400,993 | | | 4,339,350 |
4.500%, 05/01/19 | | | 1,152,359 | | | 1,134,790 |
4.500%, 08/01/33 | | | 1,509,562 | | | 1,430,475 |
4.500%, 10/01/33 | | | 2,777,751 | | | 2,632,223 |
*See accompanying notes to financial statements.
MSF-8
Metropolitan Series Fund, Inc.
Lehman Brothers Aggregate Bond Index Portfolio
Schedule of Investments as of December 31, 2007
Fixed Income—(Continued)
| | | | | | |
| Security Description | | Face
Amount | | Value* |
| | | | | | |
| | |
Federal Agencies—(Continued) | | | | | | |
Federal National Mortgage Association
4.500%, 04/01/34 | | $ | 2,182,321 | | $ | 2,066,353 |
4.610%, 10/10/13 | | | 2,370,000 | | | 2,364,560 |
4.821%, 09/01/35 (b) | | | 2,719,405 | | | 2,716,367 |
5.000%, 06/01/18 | | | 1,093,567 | | | 1,098,520 |
5.000%, 01/01/19 | | | 1,642,080 | | | 1,646,492 |
5.000%, 02/01/20 | | | 2,624,768 | | | 2,628,184 |
5.000%, 01/01/22 | | | 5,686,655 | | | 5,691,476 |
5.000%, 02/01/24 | | | 2,444,238 | | | 2,409,444 |
5.000%, 09/01/25 | | | 2,380,733 | | | 2,346,818 |
5.000%, 07/01/33 | | | 1,953,495 | | | 1,909,273 |
5.000%, 08/01/33 | | | 3,036,204 | | | 2,967,471 |
5.000%, 09/01/33 | | | 2,520,140 | | | 2,463,090 |
5.000%, 10/01/33 | | | 9,263,301 | | | 9,053,601 |
5.000%, 03/01/34 | | | 2,845,802 | | | 2,781,380 |
5.000%, 04/01/34 | | | 6,811,526 | | | 6,655,641 |
5.000%, 05/01/34 | | | 2,275,717 | | | 2,223,130 |
5.000%, 09/01/34 | | | 4,783,673 | | | 4,673,134 |
5.000%, 02/01/35 | | | 4,307,860 | | | 4,208,315 |
5.000%, 04/01/35 | | | 2,395,593 | | | 2,338,753 |
5.000%, 05/01/35 | | | 1,555,331 | | | 1,518,428 |
5.000%, 11/01/35 | | | 2,548,135 | | | 2,487,675 |
5.000%, 05/01/37 | | | 10,000,000 | | | 9,758,892 |
5.125%, 04/15/11 (a) | | | 7,200,000 | | | 7,506,533 |
5.178%, 11/01/36 (b) | | | 1,752,497 | | | 1,735,615 |
5.375%, 06/12/17 | | | 12,250,000 | | | 13,044,892 |
5.422%, 03/01/36 (b) | | | 4,621,989 | | | 4,619,805 |
5.500%, 03/15/11 | | | 950,000 | | | 1,000,502 |
5.500%, 11/01/17 | | | 1,507,914 | | | 1,531,847 |
5.500%, 02/01/18 | | | 553,015 | | | 561,458 |
5.500%, 04/01/18 | | | 2,791,727 | | | 2,834,346 |
5.500%, 12/01/22 | | | 10,000,000 | | | 10,128,837 |
5.500%, 07/01/23 | | | 1,383,225 | | | 1,388,334 |
5.500%, 01/01/24 | | | 707,498 | | | 710,111 |
5.500%, 07/01/24 | | | 2,284,749 | | | 2,293,171 |
5.500%, 10/01/32 | | | 814,955 | | | 815,711 |
5.500%, 02/01/33 | | | 2,155,386 | | | 2,156,051 |
5.500%, 03/01/33 | | | 3,719,710 | | | 3,720,856 |
5.500%, 05/01/33 | | | 6,261,746 | | | 6,263,675 |
5.500%, 08/01/33 | | | 5,485,513 | | | 5,487,203 |
5.500%, 10/01/33 | | | 736,984 | | | 737,211 |
5.500%, 12/01/33 | | | 6,432,289 | | | 6,434,272 |
5.500%, 02/01/34 | | | 3,723,538 | | | 3,722,381 |
5.500%, 03/01/34 | | | 1,984,151 | | | 1,983,535 |
5.500%, 04/01/34 | | | 1,454,771 | | | 1,454,319 |
5.500%, 05/01/34 | | | 2,139,762 | | | 2,139,097 |
5.500%, 09/01/34 | | | 2,642,358 | | | 2,641,536 |
5.500%, 12/01/34 | | | 7,360,507 | | | 7,358,219 |
5.500%, 01/01/35 | | | 2,027,493 | | | 2,026,863 |
5.500%, 02/01/35 | | | 4,473,131 | | | 4,471,741 |
5.500%, 04/01/35 | | | 2,805,744 | | | 2,803,134 |
5.500%, 06/01/35 | | | 8,308,717 | | | 8,300,990 |
5.500%, 06/13/35 (b) | | | 2,054,639 | | | 2,062,217 |
5.500%, 01/01/37 | | | 8,663,097 | | | 8,653,736 |
5.500%, 05/01/37 | | | 4,978,918 | | | 4,973,307 |
6.000%, 09/01/13 | | | 982,247 | | | 1,005,236 |
6.000%, 10/01/13 | | | 505,780 | | | 517,617 |
| | | | | | |
| Security Description | | Face
Amount | | Value* |
| | | | | | |
| | |
Federal Agencies—(Continued) | | | | | | |
6.000%, 03/01/14 | | $ | 109,051 | | $ | 111,647 |
6.000%, 06/01/14 | | | 13,957 | | | 14,289 |
6.000%, 07/01/14 | | | 76,650 | | | 78,475 |
6.000%, 09/01/14 | | | 38,646 | | | 39,566 |
6.000%, 09/01/17 | | | 1,100,998 | | | 1,128,742 |
6.000%, 08/01/28 | | | 36,369 | | | 37,166 |
6.000%, 11/01/28 | | | 10,843 | | | 11,081 |
6.000%, 12/01/28 | | | 11,251 | | | 11,497 |
6.000%, 06/01/31 | | | 195,708 | | | 199,638 |
6.000%, 09/01/32 | | | 1,106,790 | | | 1,126,975 |
6.000%, 01/01/33 | | | 421,211 | | | 428,893 |
6.000%, 02/01/33 | | | 852,405 | | | 867,415 |
6.000%, 03/01/33 | | | 1,764,849 | | | 1,795,927 |
6.000%, 04/01/33 | | | 813,070 | | | 827,388 |
6.000%, 05/01/33 | | | 2,108,303 | | | 2,145,428 |
6.000%, 05/01/34 | | | 2,494,626 | | | 2,537,005 |
6.000%, 09/01/34 | | | 2,799,647 | | | 2,847,207 |
6.000%, 11/01/34 | | | 4,954,457 | | | 5,038,623 |
6.000%, 01/01/35 | | | 1,538,176 | | | 1,563,113 |
6.000%, 07/01/36 | | | 4,236,010 | | | 4,302,872 |
6.000%, 07/01/37 | | | 3,882,144 | | | 3,942,545 |
6.000%, 08/01/37 | | | 7,365,840 | | | 7,482,581 |
6.000%, 09/01/37 | | | 18,000,000 | | | 18,285,281 |
6.210%, 08/06/38 | | | 300,000 | | | 362,437 |
6.500%, 01/01/13 | | | 8,561 | | | 8,813 |
6.500%, 04/01/13 | | | 1,611 | | | 1,658 |
6.500%, 06/01/13 | | | 69,562 | | | 71,612 |
6.500%, 07/01/13 | | | 422 | | | 434 |
6.500%, 06/01/14 | | | 34,617 | | | 35,660 |
6.500%, 04/01/17 | | | 3,255,909 | | | 3,356,773 |
6.500%, 05/01/28 | | | 427,969 | | | 443,449 |
6.500%, 12/01/28 | | | 779,910 | | | 808,120 |
6.500%, 03/01/29 | | | 33,632 | | | 34,807 |
6.500%, 04/01/29 | | | 197,216 | | | 204,108 |
6.500%, 05/01/29 | | | 23,676 | | | 24,503 |
6.500%, 08/01/29 | | | 5,173 | | | 5,354 |
6.500%, 05/01/30 | | | 241,337 | | | 249,772 |
6.500%, 09/01/31 | | | 88,110 | | | 91,107 |
6.500%, 02/01/32 | | | 20,712 | | | 21,474 |
6.500%, 06/01/32 | | | 310,562 | | | 320,934 |
6.500%, 09/01/33 | | | 743,395 | | | 767,495 |
6.500%, 10/01/33 | | | 643,989 | | | 664,866 |
6.500%, 10/01/34 | | | 2,205,115 | | | 2,276,600 |
6.625%, 11/15/10 (a) | | | 3,400,000 | | | 3,674,755 |
6.625%, 11/15/30 (a) | | | 2,450,000 | | | 3,031,697 |
7.000%, 04/01/12 | | | 27,624 | | | 28,588 |
7.000%, 02/01/14 | | | 27,709 | | | 28,675 |
7.000%, 10/01/21 | | | 90,843 | | | 95,740 |
7.000%, 06/01/26 | | | 2,535 | | | 2,656 |
7.000%, 06/01/28 | | | 95,223 | | | 100,185 |
7.000%, 09/01/29 | | | 48,982 | | | 51,422 |
7.000%, 10/01/29 | | | 64,372 | | | 67,579 |
7.000%, 12/01/29 | | | 4,796 | | | 5,035 |
7.000%, 01/01/32 | | | 653,342 | | | 684,688 |
7.000%, 04/01/32 | | | 88,047 | | | 92,190 |
7.000%, 06/01/32 | | | 310,369 | | | 324,974 |
*See accompanying notes to financial statements.
MSF-9
Metropolitan Series Fund, Inc.
Lehman Brothers Aggregate Bond Index Portfolio
Schedule of Investments as of December 31, 2007
Fixed Income—(Continued)
| | | | | | |
| Security Description | | Face
Amount | | Value* |
| | | | | | |
| | |
Federal Agencies—(Continued) | | | | | | |
Federal National Mortgage Association
7.000%, 10/01/37 | | $ | 3,894,020 | | $ | 4,048,310 |
7.500%, 08/01/15 | | | 26,996 | | | 28,194 |
7.500%, 09/01/25 | | | 23,070 | | | 24,362 |
7.500%, 06/01/26 | | | 25,535 | | | 26,961 |
7.500%, 09/01/27 | | | 4,280 | | | 4,526 |
7.500%, 11/01/27 | | | 570 | | | 603 |
7.500%, 08/01/28 | | | 1,255 | | | 1,343 |
7.500%, 07/01/29 | | | 63,911 | | | 67,573 |
7.500%, 10/01/29 | | | 24,211 | | | 25,605 |
7.500%, 07/01/30 | | | 6,966 | | | 7,367 |
8.000%, 10/01/26 | | | 1,740 | | | 1,839 |
8.000%, 11/01/29 | | | 916 | | | 982 |
8.000%, 05/01/30 | | | 38,711 | | | 40,543 |
8.000%, 11/01/30 | | | 15,246 | | | 15,967 |
8.000%, 01/01/31 | | | 18,583 | | | 19,840 |
8.000%, 02/01/31 | | | 30,296 | | | 31,730 |
Government National Mortgage Association
5.000%, 10/15/20 | | | 2,480,835 | | | 2,486,299 |
5.000%, 01/15/21 | | | 2,069,950 | | | 2,074,509 |
5.000%, 12/15/35 | | | 2,577,545 | | | 2,540,725 |
5.000%, 12/15/36 | | | 4,821,474 | | | 4,752,477 |
5.500%, 03/15/36 | | | 3,614,184 | | | 3,641,224 |
5.500%, 01/15/37 | | | 5,606,084 | | | 5,647,460 |
5.500%, 11/15/37 | | | 9,989,585 | | | 10,063,313 |
6.000%, 01/15/29 | | | 47,599 | | | 48,930 |
6.000%, 01/15/33 | | | 1,277,503 | | | 1,311,562 |
6.000%, 03/15/35 | | | 2,070,432 | | | 2,119,869 |
6.000%, 12/15/35 | | | 2,413,076 | | | 2,470,695 |
6.000%, 06/15/36 | | | 4,233,810 | | | 4,335,261 |
6.000%, 09/01/36 | | | 4,403,498 | | | 4,472,605 |
6.000%, 09/15/36 | | | 4,638,950 | | | 4,750,109 |
6.500%, 05/15/23 | | | 10,538 | | | 10,959 |
6.500%, 02/15/27 | | | 175,090 | | | 182,007 |
6.500%, 07/15/28 | | | 36,253 | | | 37,679 |
6.500%, 08/15/28 | | | 64,741 | | | 67,287 |
6.500%, 11/15/28 | | | 40,795 | | | 42,400 |
6.500%, 12/15/28 | | | 13,984 | | | 14,534 |
6.500%, 07/15/29 | | | 21,971 | | | 22,834 |
6.500%, 06/20/31 | | | 128,862 | | | 133,683 |
6.500%, 07/15/32 | | | 238,130 | | | 246,563 |
6.500%, 05/15/36 | | | 2,775,372 | | | 2,866,142 |
6.700%, 04/15/34 | | | 3,000,000 | | | 3,139,253 |
7.000%, 01/15/28 | | | 10,715 | | | 11,362 |
7.000%, 04/15/28 | | | 8,163 | | | 8,656 |
7.000%, 05/15/28 | | | 36,454 | | | 38,658 |
7.000%, 06/15/28 | | | 25,982 | | | 27,552 |
7.000%, 10/15/28 | | | 20,228 | | | 21,450 |
7.000%, 06/15/29 | | | 8,636 | | | 9,158 |
7.000%, 09/15/29 | | | 40,369 | | | 42,808 |
7.000%, 01/15/31 | | | 1,646 | | | 1,732 |
7.000%, 03/15/31 | | | 49,742 | | | 52,330 |
7.000%, 07/15/31 | | | 2,043,381 | | | 2,149,755 |
7.000%, 08/15/31 | | | 278,809 | | | 293,323 |
7.000%, 02/15/32 | | | 187,567 | | | 196,177 |
7.000%, 07/15/32 | | | 137,906 | | | 144,236 |
7.500%, 02/20/28 | | | 13,286 | | | 14,130 |
| | | | | | |
| Security Description | | Face
Amount | | Value* |
| | | | | | |
| | |
Federal Agencies—(Continued) | | | | | | |
7.500%, 08/15/29 | | $ | 37,216 | | $ | 39,431 |
7.500%, 04/15/30 | | | 10,305 | | | 10,927 |
8.000%, 09/15/16 | | | 5,777 | | | 6,185 |
8.000%, 08/15/26 | | | 7,828 | | | 8,240 |
8.000%, 09/15/26 | | | 17,624 | | | 18,551 |
8.000%, 05/15/27 | | | 5,512 | | | 5,961 |
8.000%, 06/15/29 | | | 82,859 | | | 89,656 |
9.000%, 11/15/24 | | | 48,581 | | | 52,557 |
Tennessee Valley Authority
6.000%, 03/15/13 | | | 1,000,000 | | | 1,091,807 |
| | | | | | |
| | | | | | 679,314,746 |
| | | | | | |
| | |
Food & Staples Retailing—0.5% | | | | | | |
CVS Corp.
5.750%, 06/01/17 | | | 3,500,000 | | | 3,522,526 |
Kroger Co.
5.500%, 02/01/13 | | | 950,000 | | | 942,373 |
Wal-Mart Stores, Inc.
4.550%, 05/01/13 | | | 2,075,000 | | | 2,028,514 |
6.875%, 08/10/09 | | | 500,000 | | | 521,543 |
| | | | | | |
| | | | | | 7,014,956 |
| | | | | | |
| | |
Food Products—0.6% | | | | | | |
ConAgra Foods, Inc.
5.819%, 06/15/17 | | | 2,000,000 | | | 2,005,540 |
Fred Meyer, Inc.
7.450%, 03/01/08 | | | 300,000 | | | 301,051 |
General Mills, Inc.
6.000%, 02/15/12 | | | 2,000,000 | | | 2,051,463 |
Kellogg Co.
6.600%, 04/01/11 | | | 2,700,000 | | | 2,848,954 |
Kraft Foods, Inc.
6.250%, 06/01/12 | | | 900,000 | | | 933,406 |
Tyson Foods, Inc.
6.850%, 04/01/16 | | | 670,000 | | | 702,872 |
| | | | | | |
| | | | | | 8,843,286 |
| | | | | | |
| | |
Foreign Government—1.2% | | | | | | |
Mexico Government International Bond
6.750%, 09/27/34 | | | 1,050,000 | | | 1,159,757 |
8.375%, 01/14/11 | | | 250,000 | | | 274,000 |
Province of Nova Scotia
9.250%, 03/01/20 | | | 250,000 | | | 346,442 |
Province of Ontario
5.125%, 07/17/12 (a) | | | 2,000,000 | | | 2,092,188 |
5.500%, 10/01/08 (a) | | | 300,000 | | | 302,325 |
Province of Quebec
4.875%, 05/05/14 (a) | | | 1,925,000 | | | 1,979,680 |
7.500%, 07/15/23 (a) | | | 350,000 | | | 438,420 |
Republic of Italy
4.500%, 01/21/15 | | | 2,975,000 | | | 3,013,050 |
5.625%, 06/15/12 | | | 3,650,000 | | | 3,888,345 |
Republic of Korea
8.875%, 04/15/08 (a) | | | 200,000 | | | 201,863 |
*See accompanying notes to financial statements.
MSF-10
Metropolitan Series Fund, Inc.
Lehman Brothers Aggregate Bond Index Portfolio
Schedule of Investments as of December 31, 2007
Fixed Income—(Continued)
| | | | | | |
| Security Description | | Face
Amount | | Value* |
| | | | | | |
| | |
Foreign Government—(Continued) | | | | | | |
United Mexican States
8.000%, 09/24/22 | | $ | 2,200,000 | | $ | 2,806,210 |
9.875%, 02/01/10 (a) | | | 500,000 | | | 548,695 |
| | | | | | |
| | | | | | 17,050,975 |
| | | | | | |
| | |
Gas Utilities—0.0% | | | | | | |
El Paso Natural Gas Co.
8.375%, 06/15/32 | | | 220,000 | | | 260,649 |
| | | | | | |
| |
Health Care Providers & Services—0.2% | | | |
Anthem, Inc.
6.800%, 08/01/12 | | | 2,200,000 | | | 2,346,860 |
| | | | | | |
| | |
Household Durables—0.0% | | | | | | |
Centex Corp.
7.500%, 01/15/12 | | | 500,000 | | | 475,000 |
| | | | | | |
| | |
Industrial Conglomerates—0.1% | | | | | | |
General Electric Co.
5.000%, 02/01/13 | | | 930,000 | | | 943,498 |
Honeywell International, Inc.
7.500%, 03/01/10 | | | 300,000 | | | 318,506 |
| | | | | | |
| | | | | | 1,262,004 |
| | | | | | |
| | |
Insurance—0.9% | | | | | | |
Allied World Assurance Co. Holdings, Ltd. 7.500%, 08/01/16 | | | 910,000 | | | 960,943 |
Allstate Corp.
6.125%, 02/15/12 | | | 2,750,000 | | | 2,848,767 |
6.900%, 05/15/38 | | | 150,000 | | | 158,673 |
AXA Financial, Inc.
7.750%, 08/01/10 | | | 500,000 | | | 536,961 |
AXA S.A.
8.600%, 12/15/30 | | | 1,165,000 | | | 1,452,640 |
Chubb Corp.
6.000%, 11/15/11 | | | 350,000 | | | 362,221 |
GE Global Insurance Holding Corp.
7.500%, 06/15/10 | | | 500,000 | | | 526,232 |
Hartford Financial Services Group, Inc.
6.100%, 10/01/41 | | | 780,000 | | | 731,175 |
6.375%, 11/01/08 | | | 105,000 | | | 106,146 |
Marsh & McLennan Cos., Inc.
5.750%, 09/15/15 | | | 4,000,000 | | | 3,954,886 |
Prudential Financial, Inc.
5.700%, 12/14/36 | | | 1,525,000 | | | 1,337,705 |
| | | | | | |
| | | | | | 12,976,349 |
| | | | | | |
|
IT Services—0.1% |
Electronic Data Systems Corp.
7.125%, 10/15/09 | | | 1,695,000 | | | 1,768,233 |
| | | | | | |
|
Machinery—0.1% |
Caterpillar, Inc.
7.250%, 09/15/09 | | | 250,000 | | | 261,032 |
| | | | | | |
| Security Description | | Face
Amount | | Value* |
| | | | | | |
|
Machinery—(Continued) |
Deere & Co.
6.950%, 04/25/14 (a) | | $ | 850,000 | | $ | 932,351 |
7.850%, 05/15/10 | | | 300,000 | | | 323,568 |
| | | | | | |
| | | | | | 1,516,951 |
| | | | | | |
|
Media—1.2% |
Comcast Cable Communications Holdings, Inc. 8.375%, 03/15/13 | | | 1,700,000 | | | 1,903,518 |
Comcast Corp.
5.300%, 01/15/14 | | | 1,445,000 | | | 1,413,413 |
5.650%, 06/15/35 | | | 1,500,000 | | | 1,371,143 |
Cox Communications, Inc.
7.750%, 11/01/10 | | | 250,000 | | | 267,408 |
News America, Inc.
6.550%, 03/15/33 (a) | | | 1,950,000 | | | 1,983,110 |
Thomson Corp.
6.200%, 01/05/12 | | | 3,700,000 | | | 3,853,413 |
Time Warner Cable, Inc.
5.850%, 05/01/17 | | | 100,000 | | | 99,970 |
6.550%, 05/01/37 | | | 100,000 | | | 102,067 |
Time Warner Entertainment Co., L.P.
7.250%, 09/01/08 | | | 250,000 | | | 253,355 |
8.375%, 03/15/23 | | | 380,000 | | | 450,472 |
Time Warner, Inc.
7.625%, 04/15/31 | | | 2,000,000 | | | 2,220,808 |
7.700%, 05/01/32 | | | 685,000 | | | 768,158 |
9.125%, 01/15/13 | | | 418,000 | | | 476,343 |
Turner Broadcasting System, Inc.
8.375%, 07/01/13 | | | 660,000 | | | 741,275 |
Viacom, Inc.
6.250%, 04/30/16 | | | 770,000 | | | 775,736 |
Walt Disney Co.
6.375%, 03/01/12 | | | 200,000 | | | 212,178 |
| | | | | | |
| | | | | | 16,892,367 |
| | | | | | |
|
Metals & Mining—0.5% |
Alcan, Inc.
5.000%, 06/01/15 | | | 1,050,000 | | | 1,017,160 |
Alcoa, Inc.
5.375%, 01/15/13 (a) | | | 1,000,000 | | | 986,648 |
5.720%, 02/23/19 | | | 523,000 | | | 514,097 |
5.870%, 02/23/22 | | | 101,000 | | | 97,606 |
Vale Overseas, Ltd.
6.250%, 01/23/17 | | | 3,810,000 | | | 3,793,541 |
6.875%, 11/21/36 | | | 1,100,000 | | | 1,093,422 |
| | | | | | |
| | | | | | 7,502,474 |
| | | | | | |
|
Multi-Utilities—0.6% |
Dominion Resources, Inc.
5.150%, 07/15/15 | | | 3,600,000 | | | 3,483,475 |
Pacific Gas & Electric Co.
4.800%, 03/01/14 | | | 3,125,000 | | | 3,046,248 |
6.050%, 03/01/34 | | | 2,195,000 | | | 2,177,047 |
| | | | | | |
| | | | | | 8,706,770 |
| | | | | | |
*See accompanying notes to financial statements.
MSF-11
Metropolitan Series Fund, Inc.
Lehman Brothers Aggregate Bond Index Portfolio
Schedule of Investments as of December 31, 2007
Fixed Income—(Continued)
| | | | | | |
| Security Description | | Face
Amount | | Value* |
| | | | | | |
|
Multiline Retail—0.2% |
Macy’s Retail Holdings, Inc.
5.875%, 01/15/13 | | $ | 1,030,000 | | $ | 1,026,885 |
Target Corp.
6.350%, 11/01/32 (a) | | | 2,300,000 | | | 2,213,109 |
| | | | | | |
| | | | | | 3,239,994 |
| | | | | | |
|
Oil, Gas & Consumable Fuels—0.7% |
Anadarko Petroleum Corp.
5.950%, 09/15/16 | | | 2,900,000 | | | 2,942,400 |
Atlantic Richfield Co.
5.900%, 04/15/09 | | | 300,000 | | | 306,970 |
ConocoPhillips Holding Co.
6.950%, 04/15/29 | | | 700,000 | | | 796,475 |
Enterprise Products Operations, L.P.
5.000%, 03/01/15 | | | 2,000,000 | | | 1,897,791 |
Pemex Project Funding Master Trust
6.625%, 06/15/35 | | | 1,080,000 | | | 1,125,187 |
Phillips Petroleum Co.
6.375%, 03/30/09 | | | 300,000 | | | 307,359 |
Southern California Gas Co.
4.800%, 10/01/12 | | | 1,000,000 | | | 1,006,291 |
Transocean Sedco Forex, Inc.
7.500%, 04/15/31 | | | 300,000 | | | 327,596 |
XTO Energy, Inc.
7.500%, 04/15/12 | | | 715,000 | | | 781,861 |
| | | | | | |
| | | | | | 9,491,930 |
| | | | | | |
| |
Paper & Forest Products—0.1% | | | |
MeadWestvaco Corp.
6.850%, 04/01/12 | | | 1,000,000 | | | 1,056,435 |
Weyerhaeuser Co.
7.375%, 03/15/32 | | | 500,000 | | | 495,064 |
| | | | | | |
| | | | | | 1,551,499 |
| | | | | | |
| |
Personal Products—0.2% | | | |
Procter & Gamble Co.
4.950%, 08/15/14 (a) | | | 2,000,000 | | | 2,018,679 |
6.450%, 01/15/26 (a) | | | 200,000 | | | 217,656 |
6.875%, 09/15/09 | | | 850,000 | | | 890,175 |
| | | | | | |
| | | | | | 3,126,510 |
| | | | | | |
| |
Pharmaceuticals—0.5% | | | |
Bristol-Myers Squibb Co.
5.875%, 11/15/36 | | | 2,000,000 | | | 1,975,934 |
Johnson & Johnson
6.950%, 09/01/29 | | | 250,000 | | | 295,107 |
Merck & Co., Inc.
5.950%, 12/01/28 (a) | | | 300,000 | | | 308,624 |
Schering-Plough Corp.
6.550%, 09/15/37 | | | 1,000,000 | | | 1,052,436 |
Wyeth
5.500%, 02/01/14 | | | 3,000,000 | | | 3,048,961 |
| | | | | | |
| | | | | | 6,681,062 |
| | | | | | |
| | | | | | |
| Security Description | | Face
Amount | | Value* |
| | | | | | |
| |
Real Estate Investment Trusts—0.3% | | | |
Brandywine Operating Partnership, L.P.
5.750%, 04/01/12 | | $ | 680,000 | | $ | 681,325 |
Developers Diversified Realty Corp.
5.375%, 10/15/12 | | | 520,000 | | | 514,132 |
Regency Centers, L.P.
5.250%, 08/01/15 | | | 850,000 | | | 802,525 |
Simon Property Group, L.P.
5.250%, 12/01/16 | | | 3,000,000 | | | 2,790,743 |
| | | | | | |
| | | | | | 4,788,725 |
| | | | | | |
| |
Road & Rail—0.4% | | | |
Burlington Northern Santa Fe Corp.
5.900%, 07/01/12 (a) | | | 1,000,000 | | | 1,032,011 |
CSX Corp.
6.750%, 03/15/11 | | | 200,000 | | | 209,055 |
7.900%, 05/01/17 | | | 500,000 | | | 558,255 |
Norfolk Southern Corp.
5.590%, 05/17/25 | | | 144,000 | | | 132,396 |
6.200%, 04/15/09 | | | 350,000 | | | 356,214 |
7.250%, 02/15/31 | | | 156,000 | | | 171,628 |
7.700%, 05/15/17 | | | 3,400,000 | | | 3,866,211 |
| | | | | | |
| | | | | | 6,325,770 |
| | | | | | |
| |
Software—0.1% | | | |
Oracle Corp.
5.250%, 01/15/16 | | | 2,000,000 | | | 1,989,235 |
| | | | | | |
| |
Specialty Retail—0.1% | | | |
Lowe’s Cos., Inc.
6.875%, 02/15/28 | | | 1,000,000 | | | 1,017,719 |
| | | | | | |
| |
U.S. Treasury—22.5% | | | |
U.S. Treasury Bonds
4.500%, 02/15/36 (a) | | | 7,175,000 | | | 7,213,816 |
5.250%, 11/15/28 (a) | | | 2,700,000 | | | 2,970,297 |
5.250%, 02/15/29 (a) | | | 750,000 | | | 825,090 |
5.375%, 02/15/31 (a) | | | 2,225,000 | | | 2,506,485 |
5.500%, 08/15/28 (a) | | | 2,420,000 | | | 2,740,868 |
6.125%, 11/15/27 (a) | | | 3,950,000 | | | 4,782,857 |
6.250%, 08/15/23 (a) | | | 8,450,000 | | | 10,117,354 |
6.375%, 08/15/27 (a) | | | 2,800,000 | | | 3,474,380 |
6.500%, 11/15/26 (a) | | | 1,000,000 | | | 1,251,330 |
6.875%, 08/15/25 (a) | | | 2,450,000 | | | 3,150,259 |
7.125%, 02/15/23 (a) | | | 3,030,000 | | | 3,910,003 |
7.875%, 02/15/21 (a) | | | 4,450,000 | | | 5,985,651 |
8.125%, 08/15/19 (a) | | | 2,645,000 | | | 3,565,513 |
8.125%, 08/15/21 (a) | | | 1,250,000 | | | 1,722,238 |
8.500%, 02/15/20 (a) | | | 6,700,000 | | | 9,317,824 |
8.750%, 08/15/20 (a) | | | 1,000,000 | | | 1,423,980 |
8.875%, 02/15/19 (a) | | | 10,215,000 | | | 14,367,397 |
9.125%, 05/15/18 | | | 1,600,000 | | | 2,262,080 |
9.250%, 02/15/16 (a) | | | 1,375,000 | | | 1,877,274 |
U.S. Treasury Notes
2.625%, 03/15/09 (a) | | | 1,800,000 | | | 1,789,110 |
3.125%, 04/15/09 | | | 1,500,000 | | | 1,500,525 |
*See accompanying notes to financial statements.
MSF-12
Metropolitan Series Fund, Inc.
Lehman Brothers Aggregate Bond Index Portfolio
Schedule of Investments as of December 31, 2007
Fixed Income—(Continued)
| | | | | | |
| Security Description | | Face
Amount | | Value* |
| | | | | | |
| |
U.S. Treasury—(Continued) | | | |
U.S. Treasury Notes
3.250%, 01/15/09 (a) | | $ | 1,500,000 | | $ | 1,502,340 |
3.375%, 11/15/08 (a) | | | 10,820,000 | | | 10,816,213 |
3.375%, 10/15/09 (a) | | | 5,000,000 | | | 5,030,600 |
3.375%, 11/30/12 (a) | | | 7,010,000 | | | 6,987,848 |
3.500%, 11/15/09 (a) | | | 4,000,000 | | | 4,034,920 |
3.500%, 12/15/09 (a) | | | 4,000,000 | | | 4,033,600 |
3.625%, 07/15/09 (a) | | | 5,520,000 | | | 5,563,332 |
3.625%, 01/15/10 (a) | | | 4,000,000 | | | 4,046,560 |
3.625%, 06/15/10 (a) | | | 16,200,000 | | | 16,421,778 |
3.875%, 05/15/09 (a) | | | 4,000,000 | | | 4,040,320 |
4.000%, 09/30/09 (a) | | | 5,000,000 | | | 5,078,650 |
4.000%, 04/15/10 (a) | | | 6,000,000 | | | 6,122,520 |
4.000%, 11/15/12 (a) | | | 7,250,000 | | | 7,446,185 |
4.000%, 02/15/14 (a) | | | 600,000 | | | 612,714 |
4.125%, 08/15/10 (a) | | | 1,000,000 | | | 1,026,930 |
4.125%, 05/15/15 (a) | | | 7,640,000 | | | 7,788,216 |
4.250%, 10/15/10 (a) | | | 5,000,000 | | | 5,159,400 |
4.250%, 09/30/12 (a) | | | 5,000,000 | | | 5,174,650 |
4.250%, 08/15/13 (a) | | | 14,980,000 | | | 15,521,676 |
4.250%, 08/15/14 (a) | | | 18,430,000 | | | 19,052,014 |
4.250%, 08/15/15 (a) | | | 3,000,000 | | | 3,078,990 |
4.375%, 08/15/12 (a) | | | 5,000,000 | | | 5,216,850 |
4.500%, 02/15/09 (a) | | | 16,000,000 | | | 16,235,680 |
4.500%, 11/15/15 (a) | | | 8,950,000 | | | 9,321,604 |
4.625%, 11/15/09 (a) | | | 17,700,000 | | | 18,209,761 |
4.750%, 12/31/08 (a) | | | 1,000,000 | | | 1,013,750 |
4.750%, 08/15/17 (a) | | | 5,000,000 | | | 5,280,450 |
4.875%, 08/15/09 (a) | | | 13,900,000 | | | 14,283,362 |
4.875%, 02/15/12 (a) | | | 4,500,000 | | | 4,774,320 |
5.000%, 02/15/11 (a) | | | 1,000,000 | | | 1,056,310 |
5.000%, 08/15/11 (a) | | | 3,500,000 | | | 3,712,030 |
5.125%, 05/15/16 (a) | | | 4,830,000 | | | 5,227,171 |
5.750%, 08/15/10 (a) | | | 7,120,000 | | | 7,598,749 |
6.500%, 02/15/10 (a) | | | 1,710,000 | | | 1,828,760 |
| | | | | | |
| | | | | | 319,052,584 |
| | | | | | |
|
Wireless Telecommunication Services—0.5% |
AT&T Wireless Services, Inc.
8.125%, 05/01/12 | | | 500,000 | | | 553,079 |
Cingular Wireless Services, Inc.
7.875%, 03/01/11 | | | 890,000 | | | 961,422 |
8.750%, 03/01/31 | | | 300,000 | | | 386,159 |
Cingular Wireless, LLC
7.125%, 12/15/31 | | | 100,000 | | | 110,627 |
France Telecom S.A.
7.750%, 03/01/11 (b) | | | 3,600,000 | | | 3,869,370 |
Vodafone Group, Plc.
7.750%, 02/15/10 | | | 1,150,000 | | | 1,212,210 |
| | | | | | |
| | | | | | 7,092,867 |
| | | | | | |
| | |
Yankee—1.1% | | | | | | |
Apache Finance Canada Corp.
7.750%, 12/15/29 | | | 300,000 | | | 352,852 |
Carnival Corp.
6.150%, 04/15/08 | | | 500,000 | | | 501,251 |
Encana Corp.
4.750%, 10/15/13 | | | 2,000,000 | | | 1,923,185 |
| | | | | | | |
| Security Description | | Face
Amount | | Value* | |
| | | | | | | |
| | |
Yankee—(Continued) | | | | | | | |
Hydro-Quebec
7.500%, 04/01/16 | | $ | 1,350,000 | | $ | 1,604,597 | |
8.400%, 01/15/22 | | | 1,000,000 | | | 1,328,874 | |
Intermediate American Development Bank
5.375%, 11/18/08 | | | 700,000 | | | 707,215 | |
6.800%, 10/15/25 | | | 500,000 | | | 609,987 | |
7.000%, 06/15/25 | | | 200,000 | | | 244,297 | |
8.875%, 06/01/09 | | | 400,000 | | | 428,429 | |
International Bank for
Reconstruction & Development
8.875%, 03/01/26 | | | 535,000 | | | 780,763 | |
Norsk Hydro A/S
6.700%, 01/15/18 | | | 300,000 | | | 329,110 | |
6.800%, 01/15/28 | | | 1,350,000 | | | 1,489,593 | |
Province of Quebec Canada
6.125%, 01/22/11 | | | 2,700,000 | | | 2,862,348 | |
Telecom Italia Capital S.A.
6.200%, 07/18/11 | | | 1,020,000 | | | 1,049,464 | |
Tyco International Group S.A.
6.875%, 01/15/29 | | | 1,275,000 | | | 1,269,719 | |
| | | | | | | |
| | | | | | 15,481,684 | |
| | | | | | | |
Total Fixed Income
(Identified Cost $1,389,296,266) | | | | | | 1,405,715,219 | |
| | | | | | | |
|
| Short Term Investments—24.6% | |
| | |
Discount Notes—0.5% | | | | | | | |
Federal Home Loan Bank
4.15%, 01/14/08 | | | 7,300,000 | | | 7,291,432 | |
| | | | | | | |
| | |
Mutual Funds—24.1% | | | | | | | |
State Street Navigator Securities Lending Prime Portfolio (c) | | | 341,934,008 | | | 341,934,008 | |
| | | | | | | |
Total Short Term Investments
(Identified Cost $349,225,440) | | | | | | 349,225,440 | |
| | | | | | | |
Total Investments—123.6%
(Identified Cost $1,738,521,706) (d) | | | | | | 1,754,940,659 | |
Liabilities in excess of other assets | | | | | | (335,033,382 | ) |
| | | | | | | |
| Total Net Assets—100% | | | | | $ | 1,419,907,277 | |
| | | | | | | |
| (a) | A portion or all of the security was held on loan. As of December 31, 2007, the market value of securities loaned was $356,031,432 and the collateral received consisted of cash in the amount of $341,934,008 and non cash collateral with a value of $19,675,193. The cash collateral is invested in a money market fund managed by an affiliate of the custodian. The non cash collateral received consists primarily of government securities and bank letters of credit, and are held for the benefit of the Portfolio at the Portfolio’s custodian. |
| (b) | Variable or Floating Rate Security. Rate disclosed is as of December 31, 2007. |
| (c) | Represents investment of cash collateral received from securities lending transactions. |
| (d) | The aggregate cost of investments for federal income tax purposes as of December 31, 2007 was $1,746,106,931 and the composition of unrealized appreciation and depreciation of investment securities was $21,557,736 and $(12,724,008), respectively. |
*See accompanying notes to financial statements.
MSF-13
Metropolitan Series Fund, Inc.
Lehman Brothers Aggregate Bond Index Portfolio
Statement of Assets & Liabilities
December 31, 2007
| | | | | | | |
Assets | | | | | | | |
Investments at value (a) (b) | | | | | $ | 1,754,940,659 | |
Cash | | | | | | 456,535 | |
Receivable for: | | | | | | | |
Fund shares sold | | | | | | 494,866 | |
Accrued interest | | | | | | 14,330,473 | |
| | | | | | | |
Total Assets | | | | | | 1,770,222,533 | |
Liabilities | | | | | | | |
Payable for: | | | | | | | |
Securities purchased | | $ | 3,950,081 | | | | |
Fund shares redeemed | | | 3,930,226 | | | | |
Withholding taxes | | | 11,215 | | | | |
Collateral for securities loaned | | | 341,934,008 | | | | |
Accrued expenses: | | | | | | | |
Management fees | | | 294,870 | | | | |
Service and distribution fees | | | 141,815 | | | | |
Other expenses | | | 53,041 | | | | |
| | | | | | | |
Total Liabilities | | | | | | 350,315,256 | |
| | | | | | | |
Net Assets | | | | | $ | 1,419,907,277 | |
| | | | | | | |
Net assets consists of: | | | | | | | |
Capital paid in | | | | | $ | 1,364,529,291 | |
Undistributed net investment income | | | | | | 60,944,314 | |
Accumulated net realized losses | | | | | | (21,985,281 | ) |
Unrealized appreciation on investments | | | | | | 16,418,953 | |
| | | | | | | |
Net Assets | | | | | $ | 1,419,907,277 | |
| | | | | | | |
| Computation of offering price: | | | | | | | |
Class A | | | | | | | |
Net asset value and redemption price per share ($678,192,882 divided by 61,818,653 shares outstanding) | | | | | $ | 10.97 | |
| | | | | | | |
Class B | | | | | | | |
Net asset value and redemption price per share ($568,789,681 divided by 52,629,030 shares outstanding) | | | | | $ | 10.81 | |
| | | | | | | |
Class E | | | | | | | |
Net asset value and redemption price per share ($172,924,714 divided by 15,832,357 shares outstanding) | | | | | $ | 10.92 | |
| | | | | | | |
(a) Identified cost of investments | | | | | $ | 1,738,521,706 | |
| | | | | | | |
| (b) | Includes cash collateral for securities loaned of $341,934,008. |
Statement of Operations
For the Year Ended December 31, 2007
| | | | | | | | |
Investment Income | | | | | | | | |
Interest | | | | | | $ | 63,427,451 | (a) |
| | | | | | | | |
Expenses | | | | | | | | |
Management fees | | $ | 3,081,763 | | | | | |
Service and distribution fees—Class B | | | 1,304,725 | | | | | |
Service and distribution fees—Class E | | | 262,572 | | | | | |
Directors’ fees and expenses | | | 23,669 | | | | | |
Custodian | | | 147,302 | | | | | |
Audit and tax services | | | 31,737 | | | | | |
Legal | | | 13,778 | | | | | |
Printing | | | 309,355 | | | | | |
Insurance | | | 13,263 | | | | | |
Miscellaneous | | | 17,971 | | | | | |
| | | | | | | | |
Total expenses | | | 5,206,135 | | | | | |
Management fee waivers | | | (73,962 | ) | | | 5,132,173 | |
| | | | | | | | |
Net Investment Income | | | | | | | 58,295,278 | |
| | | | | | | | |
Realized and Unrealized Gain (Loss) | | | | | | | | |
| Realized loss on: | | | | | | | | |
Investments—net | | | | | | | (586,292 | ) |
| Change in unrealized appreciation on: | | | | | | | | |
Investments—net | | | | | | | 24,687,327 | |
| | | | | | | | |
Net gain | | | | | | | 24,101,035 | |
| | | | | | | | |
Net Increase in Net Assets From Operations | | | | | | $ | 82,396,313 | |
| | | | | | | | |
| (a) | Includes net income on securities loaned of $669,145. |
See accompanying notes to financial statements.
MSF-14
Metropolitan Series Fund, Inc.
Lehman Brothers Aggregate Bond Index Portfolio
Statements of Changes in Net Assets
| | | | | | | | |
| | | Year ended
December 31,
2007 | | | Year ended
December 31,
2006 | |
From Operations | | | | | | | | |
Net investment income | | $ | 58,295,278 | | | $ | 49,514,990 | |
Net realized loss | | | (586,292 | ) | | | (2,107,113 | ) |
Unrealized appreciation (depreciation) | | | 24,687,327 | | | | (4,369,460 | ) |
| | | | | | | | |
Increase in net assets from operations | | | 82,396,313 | | | | 43,038,417 | |
| | | | | | | | |
From Distributions to Shareholders | | | | | | | | |
Net investment income | | | | | | | | |
Class A | | | (23,636,498 | ) | | | (22,640,441 | ) |
Class B | | | (22,205,073 | ) | | | (16,460,107 | ) |
Class E | | | (7,821,668 | ) | | | (7,653,204 | ) |
| | | | | | | | |
Total distributions | | | (53,663,239 | ) | | | (46,753,752 | ) |
| | | | | | | | |
Increase in net assets from capital share transactions | | | 234,272,891 | | | | 90,246,793 | |
| | | | | | | | |
Total increase in net assets | | | 263,005,965 | | | | 86,531,458 | |
| | |
Net Assets | | | | | | | | |
Beginning of the period | | | 1,156,901,312 | | | | 1,070,369,854 | |
| | | | | | | | |
End of the period | | $ | 1,419,907,277 | | | $ | 1,156,901,312 | |
| | | | | | | | |
Undistributed Net Investment Income | | | | | | | | |
End of the period | | $ | 60,944,314 | | | $ | 53,161,491 | |
| | | | | | | | |
Other Information:
Capital Shares
Transactions in capital shares were as follows:
| | | | | | | | | | | | | | |
| | | Year ended
December 31, 2007 | | | Year ended
December 31, 2006 | |
| | | Shares | | | $ | | | Shares | | | $ | |
Class A | | | | | | | | | | | | | | |
Sales | | 24,762,938 | | | $ | 265,871,474 | | | 11,035,391 | | | $ | 117,421,224 | |
Reinvestments | | 2,259,703 | | | | 23,636,498 | | | 2,215,307 | | | | 22,640,441 | |
Redemptions | | (12,750,873 | ) | | | (135,946,003 | ) | | (14,245,276 | ) | | | (150,836,696 | ) |
| | | | | | | | | | | | | | |
Net increase (decrease) | | 14,271,768 | | | $ | 153,561,969 | | | (994,578 | ) | | $ | (10,775,031 | ) |
| | | | | | | | | | | | | | |
Class B | | | | | | | | | | | | | | |
Sales | | 15,528,857 | | | $ | 162,731,989 | | | 16,664,194 | | | $ | 174,229,859 | |
Reinvestments | | 2,149,571 | | | | 22,205,073 | | | 1,631,329 | | | | 16,460,107 | |
Redemptions | | (9,310,951 | ) | | | (97,531,567 | ) | | (7,305,666 | ) | | | (76,005,012 | ) |
| | | | | | | | | | | | | | |
Net increase | | 8,367,477 | | | $ | 87,405,495 | | | 10,989,857 | | | $ | 114,684,954 | |
| | | | | | | | | | | | | | |
Class E | | | | | | | | | | | | | | |
Sales | | 1,900,274 | | | $ | 19,994,422 | | | 1,912,590 | | | $ | 20,218,456 | |
Reinvestments | | 749,920 | | | | 7,821,668 | | | 751,050 | | | | 7,653,204 | |
Redemptions | | (3,264,496 | ) | | | (34,510,663 | ) | | (3,943,590 | ) | | | (41,534,790 | ) |
| | | | | | | | | | | | | | |
Net decrease | | (614,302 | ) | | $ | (6,694,573 | ) | | (1,279,950 | ) | | $ | (13,663,130 | ) |
| | | | | | | | | | | | | | |
Increase derived from capital share transactions | | | | | $ | 234,272,891 | | | | | | $ | 90,246,793 | |
| | | | | | | | | | | | | | |
See accompanying notes to financial statements.
MSF-15
Metropolitan Series Fund, Inc.
Lehman Brothers Aggregate Bond Index Portfolio
Financial Highlights
| | | | | | | | | | | | | | | | | | | | |
| | | Class A | |
| | | Year ended December 31, | |
| | | 2007 | | | 2006 | | | 2005 | | | 2004 | | | 2003 | |
Net Asset Value, Beginning of Period | | $ | 10.76 | | | $ | 10.81 | | | $ | 11.02 | | | $ | 10.93 | | | $ | 11.17 | |
| | | | | | | | | | | | | | | | | | | | |
Income From Investment Operations | | | | | | | | | | | | | | | | | | | | |
Net investment income | | | 0.52 | (a) | | | 0.49 | (a) | | | 0.49 | | | | 0.46 | | | | 0.45 | |
Net realized and unrealized gain (loss) of investments | | | 0.20 | | | | (0.07 | ) | | | (0.27 | ) | | | (0.02 | ) | | | (0.06 | ) |
| | | | | | | | | | | | | | | | | | | | |
Total from investment operations | | | 0.72 | | | | 0.42 | | | | 0.22 | | | | 0.44 | | | | 0.39 | |
| | | | | | | | | | | | | | | | | | | | |
Less Distributions | | | | | | | | | | | | | | | | | | | | |
Distributions from net investment income | | | (0.51 | ) | | | (0.47 | ) | | | (0.43 | ) | | | (0.35 | ) | | | (0.63 | ) |
| | | | | | | | | | | | | | | | | | | | |
Total distributions | | | (0.51 | ) | | | (0.47 | ) | | | (0.43 | ) | | | (0.35 | ) | | | (0.63 | ) |
| | | | | | | | | | | | | | | | | | | | |
Net Asset Value, End of Period | | $ | 10.97 | | | $ | 10.76 | | | $ | 10.81 | | | $ | 11.02 | | | $ | 10.93 | |
| | | | | | | | | | | | | | | | | | | | |
Total Return (%) | | | 6.9 | | | | 4.1 | | | | 2.1 | | | | 4.1 | | | | 3.6 | |
Ratio of operating expenses to average net assets (%) | | | 0.29 | | | | 0.31 | | | | 0.31 | | | | 0.32 | | | | 0.34 | |
Ratio of operating expenses to average net assets without giving effect to the contractual expense agreement would have been (%) (b) | | | 0.30 | | | | 0.32 | | | | 0.31 | | | | N/A | | | | N/A | |
Ratio of net investment income to average net assets (%) | | | 4.86 | | | | 4.64 | | | | 4.30 | | | | 4.42 | | | | 4.44 | |
Portfolio turnover rate (%) | | | 15 | | | | 18 | | | | 23 | | | | 27 | | | | 46 | |
Net assets, end of period (000) | | $ | 678,193 | | | $ | 511,541 | | | $ | 524,878 | | | $ | 550,456 | | | $ | 500,629 | |
| |
| | | Class B | |
| | | Year ended December 31, | |
| | | 2007 | | | 2006 | | | 2005 | | | 2004 | | | 2003 | |
Net Asset Value, Beginning of Period | | $ | 10.60 | | | $ | 10.66 | | | $ | 10.87 | | | $ | 10.79 | | | $ | 11.04 | |
| | | | | | | | | | | | | | | | | | | | |
Income From Investment Operations | | | | | | | | | | | | | | | | | | | | |
Net investment income | | | 0.48 | (a) | | | 0.46 | (a) | | | 0.36 | | | | 0.36 | | | | 0.40 | |
Net realized and unrealized gain (loss) of investments | | | 0.20 | | | | (0.08 | ) | | | (0.16 | ) | | | 0.04 | | | | (0.04 | ) |
| | | | | | | | | | | | | | | | | | | | |
Total from investment operations | | | 0.68 | | | | 0.38 | | | | 0.20 | | | | 0.40 | | | | 0.36 | |
| | | | | | | | | | | | | | | | | | | | |
Less Distributions | | | | | | | | | | | | | | | | | | | | |
Distributions from net investment income | | | (0.47 | ) | | | (0.44 | ) | | | (0.41 | ) | | | (0.32 | ) | | | (0.61 | ) |
| | | | | | | | | | | | | | | | | | | | |
Total distributions | | | (0.47 | ) | | | (0.44 | ) | | | (0.41 | ) | | | (0.32 | ) | | | (0.61 | ) |
| | | | | | | | | | | | | | | | | | | | |
Net Asset Value, End of Period | | $ | 10.81 | | | $ | 10.60 | | | $ | 10.66 | | | $ | 10.87 | | | $ | 10.79 | |
| | | | | | | | | | | | | | | | | | | | |
Total Return (%) | | | 6.7 | | | | 3.8 | | | | 1.9 | | | | 3.8 | | | | 3.4 | |
Ratio of operating expenses to average net assets (%) | | | 0.54 | | | | 0.56 | | | | 0.56 | | | | 0.57 | | | | 0.59 | |
Ratio of operating expenses to average net assets without giving effect to the contractual expense agreement would have been (%) (b) | | | 0.55 | | | | 0.57 | | | | 0.56 | | | | N/A | | | | N/A | |
Ratio of net investment income to average net assets (%) | | | 4.60 | | | | 4.40 | | | | 4.06 | | | | 4.16 | | | | 4.20 | |
Portfolio turnover rate (%) | | | 15 | | | | 18 | | | | 23 | | | | 27 | | | | 46 | |
Net assets, end of period (000) | | $ | 568,790 | | | $ | 469,212 | | | $ | 354,652 | | | $ | 170,958 | | | $ | 73,938 | |
| (a) | Per share amount is based on average shares outstanding during the period. |
| (b) | See Note 4 in the Notes to Financial Statements. |
See accompanying notes to financial statements.
MSF-16
Metropolitan Series Fund, Inc.
Lehman Brothers Aggregate Bond Index Portfolio
Financial Highlights
| | | | | | | | | | | | | | | | | | | | |
| | | Class E | |
| | | Year ended December 31, | |
| | | 2007 | | | 2006 | | | 2005 | | | 2004 | | | 2003 | |
Net Asset Value, Beginning of Period | | $ | 10.71 | | | $ | 10.77 | | | $ | 10.97 | | | $ | 10.89 | | | $ | 11.14 | |
| | | | | | | | | | | | | | | | | | | | |
Income From Investment Operations | | | | | | | | | | | | | | | | | | | | |
Net investment income | | | 0.50 | (a) | | | 0.47 | (a) | | | 0.46 | | | | 0.44 | | | | 0.52 | |
Net realized and unrealized gain (loss) of investments | | | 0.20 | | | | (0.07 | ) | | | (0.25 | ) | | | (0.02 | ) | | | (0.15 | ) |
| | | | | | | | | | | | | | | | | | | | |
Total from investment operations | | | 0.70 | | | | 0.40 | | | | 0.21 | | | | 0.42 | | | | 0.37 | |
| | | | | | | | | | | | | | | | | | | | |
Less Distributions | | | | | | | | | | | | | | | | | | | | |
Distributions from net investment income | | | (0.49 | ) | | | (0.46 | ) | | | (0.41 | ) | | | (0.34 | ) | | | (0.62 | ) |
| | | | | | | | | | | | | | | | | | | | |
Total distributions | | | (0.49 | ) | | | (0.46 | ) | | | (0.41 | ) | | | (0.34 | ) | | | (0.62 | ) |
| | | | | | | | | | | | | | | | | | | | |
Net Asset Value, End of Period | | $ | 10.92 | | | $ | 10.71 | | | $ | 10.77 | | | $ | 10.97 | | | $ | 10.89 | |
| | | | | | | | | | | | | | | | | | | | |
Total Return (%) | | | 6.7 | | | | 3.9 | | | | 2.0 | | | | 3.9 | | | | 3.5 | |
Ratio of operating expenses to average net assets (%) | | | 0.44 | | | | 0.46 | | | | 0.46 | | | | 0.47 | | | | 0.49 | |
Ratio of operating expenses to average net assets without giving effect to the contractual expense agreement would have been (%) (b) | | | 0.45 | | | | 0.47 | | | | 0.46 | | | | N/A | | | | N/A | |
Ratio of net investment income to average net assets (%) | | | 4.70 | | | | 4.49 | | | | 4.15 | | | | 4.26 | | | | 4.29 | |
Portfolio turnover rate (%) | | | 15 | | | | 18 | | | | 23 | | | | 27 | | | | 46 | |
Net assets, end of period (000) | | $ | 172,925 | | | $ | 176,149 | | | $ | 190,840 | | | $ | 200,270 | | | $ | 115,749 | |
| (a) | Per share amount is based on average shares outstanding during the period. |
| (b) | See Note 4 in the Notes to Financial Statements. |
See accompanying notes to financial statements.
MSF-17
Metropolitan Series Fund, Inc.
Lehman Brothers Aggregate Bond Index Portfolio
Notes to Financial Statements—December 31, 2007
Metropolitan Series Fund, Inc. (the “Fund”) is organized as a corporation under the laws of Maryland pursuant to Articles of Incorporation filed on November 23, 1982, as amended, and registered under the Investment Company Act of 1940, as amended (the “1940 Act”), as an open-end investment company. The Fund is a “series” type of mutual fund, which issues separate series of stock. Each series represents an interest in a separate portfolio of Fund investments. The Lehman Brothers Aggregate Bond Index Portfolio (the “Portfolio”) is a diversified series of the Fund. Shares in the Fund are not offered directly to the general public and are currently available only to separate accounts established by Metropolitan Life Insurance Company (“MetLife”), New England Life Insurance Company, General American Life Insurance Company (“General American”), The MetLife Investors Group of Insurance Companies, MetLife Insurance Company of Connecticut and other affiliated insurance companies (collectively, the “Insurance Companies”), as an investment vehicle for variable life insurance, group annuity or variable annuity products, although the Portfolio is not available to all such separate accounts. The Portfolio’s shares may be divided into different classes. Currently, the classes being offered by the Portfolio are named Class A, Class B and Class E. The classes of the Portfolio’s shares are identical, except that certain additional charges (Rule 12b-1 fees) are made against Class B and Class E shares. Investment income, realized and unrealized capital gains and losses, the common expenses of the Portfolio and certain Portfolio-level expense reductions, if any, are allocated on a pro rata basis to each class based on the relative net assets of each class to the total net assets of the Portfolio.
| 2. | SIGNIFICANT ACCOUNTING POLICIES: |
The preparation of financial statements in conformity with accounting principles generally accepted in the United States of America (“GAAP”) requires management to make estimates and assumptions that affect the reported amounts of assets and liabilities and disclosure of contingent assets and liabilities as of the date of the financial statements and the reported amounts of income and expenses during the reporting period. Actual results could differ from those estimates.
The following is a summary of significant accounting policies consistently followed by the Portfolio in the preparation of its financial statements. The policies are in conformity with GAAP.
Investment Valuation:
Debt securities (other than short term obligations with a remaining maturity of sixty days or less) are valued by independent pricing services selected by the relevant subadviser pursuant to authorization of the Board of Directors of the Fund (the “Board” or “Directors”). Short term obligations with a remaining maturity of sixty days or less are valued at amortized cost which approximates fair market value.
Forward foreign currency exchange contracts are valued based on the mean between closing bid and asked prices of the forward currency contract rates in the London foreign exchange markets on a daily basis as provided by a reliable bank or dealer.
Options, whether on securities, indices, futures contracts, or otherwise, are valued at the last sales price available as of the close of business on the day of valuation or, if there is no such sale price available, at the mean between the bid and asked prices. Options on currencies are valued at the spot price each day.
The value of futures contracts will be the sum of the margin deposit plus or minus the difference between the value of the futures contract on each day the net asset value is calculated and the value on the date the futures contract originated, value being that established on a recognized commodity exchange, or by reference to other customary sources, with gain or loss being realized when the futures contract closes or expires.
Subject to the Board’s oversight, the Board has delegated day-to-day responsibility for valuing Portfolio assets to the subadviser of the Portfolio, who values such assets as described above and operates under procedures approved by the Board.
Investment Transactions and Related Investment Income:
Portfolio security transactions are recorded on the trade date. Dividend income is recorded on the ex-dividend date or, for certain foreign securities, when notified. Interest income, which includes amortization of premium and accretion of discount on debt securities, is recorded on the accrual basis. Realized gains and losses on investments and unrealized appreciation and depreciation are determined on the identified cost basis, which is the same basis used for federal income tax purposes.
MSF-18
Metropolitan Series Fund, Inc.
Lehman Brothers Aggregate Bond Index Portfolio
Notes to Financial Statements—December 31, 2007—(Continued)
Repurchase Agreements:
The Portfolio, through the custodian or a subcustodian, receives delivery of the underlying securities collateralizing repurchase agreements. The Portfolio requires the custodian to take possession, to have legally segregated in the Federal Reserve Book Entry System, or to have segregated within the custodian’s vault, all securities held as collateral for repurchase agreements. It is the Portfolio’s policy that the market value of the collateral be at least equal to 100% of the repurchase price in the case of a repurchase agreement of one-day duration and 102% on all other repurchase agreements. The Portfolio’s subadviser is responsible for determining that the value of the collateral is at all times at least equal to the repurchase price. In connection with transactions in repurchase agreements, if the seller defaults and the value of the collateral declines or if the seller enters an insolvency proceeding, realization of the collateral by the Portfolio may be delayed, limited or wholly denied.
Foreign Currency Translation:
The books and records of the Portfolio are maintained in U.S. dollars. The values of securities, currencies and other assets and liabilities denominated in currencies other than U.S. dollars are translated into U.S. dollars based upon foreign exchange rates prevailing at the end of the period. Purchases and sales of investment securities, income and expenses are translated on the respective dates of such transactions. Since the values of investment securities are presented at the foreign exchange rates prevailing at the end of the period, it is not practical to isolate that portion of the results of operations arising from changes in exchange rates from that portion of the results of operations reflecting fluctuations arising from changes in market prices of the investment securities. Such fluctuations are included in the net realized and unrealized gain or loss on investments.
Net realized foreign exchange gains or losses arise from sales of foreign currency, currency gains or losses realized between the trade and settlement dates on securities transactions, and the difference between the amounts of dividends, interest, and foreign withholding taxes recorded by the Portfolio and the U.S. dollar equivalent of the amounts actually received or paid by the Portfolio. Net unrealized foreign exchange gains and losses arise from changes in the value of assets and liabilities, other than investment securities, resulting from changes in the exchange rate.
Forward Foreign Currency Exchange Contracts:
The Portfolio may enter into forward foreign currency exchange contracts primarily to hedge against foreign currency exchange rate risks on its non-U.S. dollar denominated investment securities. When entering into a forward currency contract, the Portfolio agrees to receive or deliver a fixed quantity of foreign currency for an agreed-upon price on an agreed future date. These contracts are valued daily and the Portfolio’s net equity therein, representing unrealized gain or loss on the contracts as measured by the difference between the foreign exchange rates at the dates of entry into the contracts and the forward rates at the settlement date, is included in the Statement of Assets and Liabilities. Realized and unrealized gains and losses are included in the Statement of Operations. These instruments involve market and/or credit risk in excess of the amount recognized in the Statement of Assets and Liabilities. Risks arise from the possible inability of counterparties to meet the terms of their contracts and from movement in currency and securities values and interest rates.
Futures Contracts:
The Portfolio may buy and sell futures contracts (on recognized exchanges) as a hedge or to enhance return. Futures contracts are agreements to buy or sell a security, or deliver a final cash settlement price in connection with an index, interest rate, currency, or other contracts not calling for physical delivery, for a set price in the future. The Portfolio must post an amount equal to a portion of the total market value of the futures contract as futures variation margin, which is returned when the Portfolio’s obligations under the contract have been satisfied. From time to time thereafter, the Portfolio may have to post variation margin to maintain this amount as the market value of the contract fluctuates. Risks of entering into futures contracts (and related options) include the possibility that there may be an illiquid market and that a change in the value of the contract or option may not correlate with changes in the value of the underlying securities.
Options:
The Portfolio may use options to hedge against changes in values of securities the Portfolio owns or expects to purchase. Writing puts or buying calls tends to increase the Portfolio’s exposure to the underlying instrument and writing calls or buying puts tends to decrease the Portfolio’s exposure to the underlying instrument, and can be used to hedge other Portfolio investments. For options purchased to hedge the Portfolio’s investments, the potential risk to the Portfolio is that the change in value of options
MSF-19
Metropolitan Series Fund, Inc.
Lehman Brothers Aggregate Bond Index Portfolio
Notes to Financial Statements—December 31, 2007—(Continued)
contracts may not correspond to the change in value of the hedged instruments. In addition, losses may arise from changes in the value of the underlying instruments, if there is an illiquid secondary market, or if the counterparty is unable to perform. The maximum loss for purchased options is limited to the premium initially paid for the option. For options written by the Portfolio, the maximum loss is not limited to the premium initially received for the option.
The main risk associated with purchasing an option is that the option expires without being exercised. In this case, the option expires worthless and the premium paid for the option is considered the loss. The risk associated with writing a call option is that the Portfolio may forgo the opportunity for a profit if the market value of the underlying position increases and the option is exercised. The risk in writing a put option is that the Portfolio may incur a loss if the market value of the underlying position decreases and the option is exercised. In addition, the Portfolio risks not being able to enter into a closing transaction for the written option as the result of an illiquid market.
“When-Issued” Securities:
Purchasing securities “when-issued” is a forward commitment by the Portfolio to buy a security. The estimated amount of the Portfolio’s payment obligation and the security’s interest rate are determined when the commitment is made, even though no interest accrues until the security is issued, which is generally 15 to 120 days later. The Portfolio will segregate liquid assets with its custodian sufficient at all times to satisfy these commitments. If the value of the security is less when delivered than when the commitment was made, the Portfolio will suffer a loss.
Federal Income Taxes:
It is the Portfolio’s policy to comply with the requirements of the Internal Revenue Code of 1986, as amended, and regulations thereunder, applicable to regulated investment companies and to distribute all of its taxable income to shareholders. Therefore, no federal income tax provision is required.
As of December 31, 2007, the Portfolio had capital loss carryovers as follows:
| | | | | | | | | | | | | | | | | | | | |
Expiring
12/31/15 | | Expiring
12/31/14 | | Expiring
12/31/13 | | Expiring
12/31/12 | | Expiring
12/31/10 | | Expiring
12/31/09 | | Expiring
12/31/08 | | Total |
| $4,015,637 | | $4,808,149 | | $ | 3,790,866 | | $ | 499,465 | | $ | 449,093 | | $ | 612,878 | | $ | 223,967 | | $ | 14,400,055 |
The utilization of the capital loss carryforward acquired as part of a merger may be limited under section 382 of the Internal Revenue Code.
The tax character of distributions paid for the periods ended December 31, 2007 and 2006 was as follows:
| | | | | | | | | | | | | | | | | | | | | | |
| Ordinary Income | | Long Term Gain | | Return of Capital | | Total |
| 2007 | | 2006 | | 2007 | | 2006 | | 2007 | | 2006 | | 2007 | | 2006 |
| $ | 53,663,239 | | $ | 46,753,752 | | $ | — | | $ | — | | $ | — | | $ | — | | $ | 53,663,239 | | $ | 46,753,752 |
As of December 31, 2007, the components of distributable earnings (accumulated losses) on a federal income tax basis were as follows:
| | | | | | | | | | | | | |
Undistributed
Ordinary
Income | | Undistributed
Long Term
Gain | | Unrealized
Appreciation | | Loss
Carryforwards | | | Total |
| $60,944,314 | | $ | — | | $ | 8,833,728 | | $ | (14,400,055 | ) | | $ | 55,377,987 |
Dividends and Distributions to Shareholders:
The Portfolio records dividends and distributions on the ex-dividend date. Net realized gains from security transactions (if any) are generally distributed annually to shareholders. The timing and characterization of certain income and capital gains distributions are determined in accordance with federal tax regulations that may differ from GAAP. Permanent book and tax basis differences relating to shareholder distributions will result in reclassification between under/over distributed net investment income, accumulated net realized gains/losses and paid in capital.
MSF-20
Metropolitan Series Fund, Inc.
Lehman Brothers Aggregate Bond Index Portfolio
Notes to Financial Statements—December 31, 2007—(Continued)
| 3. | INVESTMENT TRANSACTIONS: |
For the year ended December 31, 2007, purchases and sales of securities (excluding short term investments) for the Portfolio were as follows:
| | | | | | | | | | |
| Purchases | | Sales |
| U.S. Government | | Other | | U.S. Government | | Other |
| $ | 347,417,439 | | $ | 54,597,650 | | $ | 113,051,211 | | $ | 65,321,665 |
| 4. | INVESTMENT MANAGEMENT FEES AND OTHER TRANSACTIONS WITH AFFILIATES: |
Investment Management Agreement:
MetLife Advisers, LLC (“MetLife Advisers”) is the investment adviser to the Portfolio. The Fund has entered into an investment management agreement with MetLife Advisers with respect to the Portfolio. For providing investment management services to the Portfolio, MetLife Advisers receives monthly compensation at the annual rate of 0.25% of average daily net assets. Fees earned by MetLife Advisers with respect to the Portfolio for the year ended December 31, 2007 were $3,081,763.
Certain officers and directors of the Fund may also be officers of MetLife Advisers; however, such officers and directors receive no compensation from the Fund.
Effective April 30, 2007, MetLife Advisers entered into an investment subadvisory agreement with MetLife Investment Advisors, LLC (“MLIAC”) with respect to the Portfolio. MetLife Advisers pays MLIAC an investment subadvisory fee for the Portfolio equal to the costs incurred by MLIAC in providing subadvisory services to the Portfolio. Fees earned by MLIAC with respect to the Portfolio for the period ended December 31, 2007 were $197,760. Prior to April 30, 2007, MetLife served as subadviser to the Portfolio and for the period January 1, 2007 through April 30, 2007, fees earned by MetLife were $92,667.
Management Fee Waivers:
Pursuant to an expense agreement, MetLife Advisers has agreed, for the period May 1, 2007 to April 30, 2008, to reduce its advisory fees set out above under “Investment Management Agreement” for each class of the Portfolio at the annual rate of 0.006% of average daily net assets. Amounts waived for the year ended December 31, 2007 are shown as management fee waivers in the Statement of Operations.
Service and Distribution Fees:
The Fund has adopted a Distribution and Service Plan under Rule 12b-1 of the 1940 Act for the Portfolio’s Class B and E shares. Under the Distribution and Service Plan, the Class B and E shares of the Portfolio pay a fee to compensate the Insurance Companies (or their affiliates) and other broker-dealers and financial intermediaries involved in the offer and sale of Portfolio shares for promoting or selling and servicing, the Class B and E shares. The fees under the Distribution and Service Plan for each class of the Portfolio’s shares are calculated as a percentage of the Portfolio’s average daily net assets that are attributable to that Class. Currently, the fee is 0.25% per year for Class B shares and 0.15% per year for Class E shares. Amounts paid by the Portfolio for the year ended December 31, 2007 are shown as Service and Distribution fees in the Statement of Operations.
Substitution:
On November 9, 2007, the Lehman Brothers Aggregate Bond Index Portfolio received and recorded a share subscription for 15,987,027 shares of Class A amounting to $172,819,764 from various shareholder accounts previously invested in the MetLife Investment Funds, Inc. (“MLIF”), an affiliated investment company of the Fund. A portion of the assets received from MLIF were investment securities with a market value of $80,632,276, and transferred in-kind pursuant to a substitution order received from the Securities and Exchange Commission. The balance of the assets was paid in cash. This transaction resulted from the planned liquidation of MLIF, pursuant to a Plan of Liquidation approved by the MLIF Board of Directors on August 16, 2007. The securities received were recorded at value and have been excluded from the calculation of portfolio turnover reported in the Portfolio’s financial highlights. The shares issued in this transaction are included in Sales in the Capital Shares schedule on the Statements of Changes in Net Assets.
MSF-21
Metropolitan Series Fund, Inc.
Lehman Brothers Aggregate Bond Index Portfolio
Notes to Financial Statements—December 31, 2007—(Continued)
The Fund has entered into a securities lending arrangement with the Fund’s custodian, State Street Bank and Trust Company (the “custodian”). Under the agreement, the custodian is authorized to loan securities on the Portfolios’ behalf. In exchange, the Portfolio receives either cash or securities as collateral against the loaned securities. The Portfolio receives collateral at least equal to 102% of the market value of the loaned securities (105% for foreign securities), at each loan’s inception. Collateral must be maintained at least at 100% of the market value of the loaned securities for the duration of the loan. The cash collateral is invested in the Navigator Securities Lending Prime Portfolio, an affiliate of the custodian, which invests in a variety of high quality U.S. dollar-denominated instruments. If the market value of the collateral at the close of trading on a business day is less than 100% of the market value of the loaned securities at the close of trading on that day, the borrower shall be required to deliver, by the close of business on the following business day, an additional amount of collateral, equal to at least 100% of the market value of all the loaned securities as of such preceding day. The Portfolio receives 80% of the annual net income from securities lending transactions, which is included in interest income of the Portfolio. The remaining 20% is paid to the custodian as compensation for its securities lending services. The Portfolio bears the risk of any deficiency in the amount of collateral available for return to a borrower due to a loss in an approved investment. Any outstanding loans by the Portfolio at December 31, 2007 are footnoted in the Schedule of Investments.
As previously reported, in May 2004, General American received a Wells Notice stating that the SEC staff was considering recommending that the SEC bring a civil action alleging violations of the U.S. securities laws against General American with respect to market timing and late trading in a limited number of privately-placed variable insurance contracts that were sold through General American. General American responded to the SEC staff and cooperated with the investigation. On August 9, 2007, the SEC announced that it had settled an enforcement action regarding late trading against General American with, among other things, General American agreeing to pay a civil penalty and to comply with certain undertakings. General American consented to the SEC’s order without admitting or denying the findings. MetLife Advisers has also advised the Fund’s Board of Directors that, while certain exceptions to the Fund’s policies have been noted, no situations have been identified that would have a material impact on the financial position of the Fund.
| 7. | RECENT ACCOUNTING PRONOUNCEMENTS: |
Effective June 29, 2007, the Fund implemented Financial Accounting Standards Board (“FASB”) Interpretation No. 48, “Accounting for Uncertainty in Income Taxes—an interpretation of FASB Statement No. 109” (“FIN 48”). FIN 48 prescribes the minimum recognition threshold a tax position must meet in connection with accounting for uncertainties in income tax positions taken or expected to be taken by an entity, including investment companies, before being measured and recognized in the financial statements. Management has evaluated the application of FIN 48 to the Fund, and has determined that the adoption of FIN 48 does not have a material impact on the Fund’s financial statements. The Fund files U.S. tax returns. No income tax returns are currently under examination. The statute of limitations on the Fund’s tax returns remains open for the years ended December 31, 2004 through December 31, 2006.
In September 2006, Statement of Financial Accounting Standards No. 157, Fair Value Measurements (SFAS 157) was issued and is effective for fiscal years beginning after November 15, 2007. SFAS 157 defines fair value, establishes a framework for measuring fair value and expands disclosures about fair value measurements. Management is currently evaluating the impact the adoption of SFAS 157 will have on the Portfolio’s financial statement disclosures.
MSF-22
Metropolitan Series Fund, Inc.
Lehman Brothers Aggregate Bond Index Portfolio
Report of Independent Registered Public Accounting Firm
To the Shareholders and Board of Directors of the Metropolitan Series Fund, Inc.:
We have audited the accompanying statement of assets and liabilities, including the schedule of investments, of the Lehman Brothers Aggregate Bond Index Portfolio, one of the portfolios constituting the Metropolitan Series Fund, Inc. (the “Fund”) as of December 31, 2007, and the related statement of operations for the year then ended, the statements of changes in net assets for each of the two years in the period then ended, and the financial highlights for each of the five years in the period then ended. These financial statements and financial highlights are the responsibility of the Fund’s management. Our responsibility is to express an opinion on these financial statements and financial highlights based on our audits.
We conducted our audits in accordance with the standards of the Public Company Accounting Oversight Board (United States). Those standards require that we plan and perform the audit to obtain reasonable assurance about whether the financial statements and financial highlights are free of material misstatement. The Fund is not required to have, nor were we engaged to perform, an audit of its internal control over financial reporting. Our audits included consideration of internal control over financial reporting as a basis for designing audit procedures that are appropriate in the circumstances, but not for the purpose of expressing an opinion on the effectiveness of the Fund’s internal control over financial reporting. Accordingly, we express no such opinion. An audit also includes examining, on a test basis, evidence supporting the amounts and disclosures in the financial statements, assessing the accounting principles used and significant estimates made by management, as well as evaluating the overall financial statement presentation. Our procedures included confirmation of securities owned as of December 31, 2007, by correspondence with the custodian and brokers; where replies were not received from brokers, we performed other auditing procedures. We believe that our audits provide a reasonable basis for our opinion.
In our opinion, the financial statements and financial highlights referred to above present fairly, in all material respects, the financial position of the Lehman Brothers Aggregate Bond Index Portfolio of the Metropolitan Series Fund, Inc. as of December 31, 2007, the results of its operations for the year then ended, the changes in its net assets for each of the two years in the period then ended, and the financial highlights for each of the five years in the period then ended, in conformity with accounting principles generally accepted in the United States of America.
Deloitte & Touche LLP
Boston, Massachusetts
February 28, 2008
MSF-23
Metropolitan Series Fund, Inc.
Directors and Officers
The Fund’s Directors review actions of the Fund’s investment adviser and subadvisers, and decide upon matters of general policy. The Fund’s officers supervise the daily business operations of the Fund. The Board of Directors and the Fund’s officers are listed below. Each Director is responsible for overseeing all 36 Portfolios of the Fund. There is no limit to the term a Director may serve. Directors serve until their resignation, retirement or removal in accordance with the Fund’s organizational documents and policies adopted by the Board from time to time. Officers hold office at the pleasure of the Board or until the election or appointment and the qualification of a successor. The address of the directors and officers is c/o Metropolitan Series Fund, Inc., 501 Boylston Street, Boston, MA 02116.
Interested Directors(1)
Each Director below is an “interested person” (as defined by the 1940 Act) with respect to the Fund in that Ms. Forget is an employee of MetLife and Mr. Typermass is a former employee of MetLife and owns securities issued by MetLife, Inc., the ultimate parent company of MetLife Advisers.
| | | | | | | | |
Name, Address and Age | | Current
position(s)
with Fund | | Position(s)
held since | | Principal occupations
over past five years, including other directorships(2) | | Number of
Portfolios in
Fund Complex
Overseen by
Director(3) |
Elizabeth M. Forget Age: 41 | | Director, Chairman of the Board, President and Chief Executive Officer | | 2006 | | Senior Vice President (since 2007), MetLife, Inc.; President, Met Investors Advisory, LLC (“MIA”); Trustee and President, Met Investors Series Trust (“MIST”); Executive Vice President, MetLife Investors Group, Inc.; President (since 2006), MetLife Advisers. | | 81 |
| | | | |
Arthur G. Typermass Age: 70 | | Director | | 1998 | | Formerly, Senior Vice President and Treasurer, MetLife. | | 37 |
Non-Interested Directors(1)
Each Director below is not an “interested person” (as defined by the 1940 Act) with respect to the Fund (collectively, the “Independent Directors”).
| | | | | | | | |
Name, Address and Age | | Current
position(s)
with Fund | | Position(s)
held since | | Principal occupations
over past five years, including other directorships(2) | | Number of
Portfolios in
Fund Complex
Overseen by
Director(3) |
Steve A. Garban† Age: 70 | | Director | | 1985 | | Formerly, Chief Financial Officer, Senior Vice President Finance and Operations and Treasurer (Emeritus), The Pennsylvania State University. | | 37 |
| | | | |
Linda B. Strumpf Age: 60 | | Director | | 2000 | | Vice President and Chief Investment Officer, Ford Foundation. | | 37 |
| | | | |
Michael S. Scott Morton† Age: 70 | | Director | | 1993 | | Jay W. Forrester Professor of Management (Emeritus) at Sloan School of Management, MIT. | | 37 |
| | | | |
H. Jesse Arnelle Age: 74 | | Director | | 2001 | | Formerly, Counsel, Womble Carlyle Sandrie & Rice; Director, Textron Inc. (global multi-industry company)*; formerly, Director, Gannet Co. Inc. (diversified news and information company)*; formerly, Director, Eastman Chemical Company (global chemical company)*; formerly, Director, Waste Management, Inc.*; formerly, Director, Armstrong Holdings Inc. (parent company of floor and ceiling products business)*; formerly, Director, FPL Group Inc. (public utility holding company)*; Director, URS Corporation (engineering design services firm)*. | | 37 |
| | | | |
Nancy Hawthorne Age: 56 | | Director | | 2003 | | Director, Avid Technologies (computer software company)*; formerly, Chairman of the Board of Avid Technologies; formerly, Board of Advisors, L. Knife & Sons, Inc. (beverage distributor); Chief Executive Officer, Clerestory LLC (corporate financial advisor); formerly, Trustee, New England Zenith Fund (“Zenith Fund”)**; formerly, Chief Executive Officer and Managing Partner, Hawthorne, Krauss and Associates (corporate financial advisor); formerly, Chief Financial Officer and Executive Vice President, Continental Cablevision, subsequently renamed MediaOne (cable television company); formerly, Director, Life F/X, Inc.; formerly, Chairman of the Board, WorldClinic (distance medicine company); formerly, Director, Perini Corporation (construction company)*; formerly, Director, CGU (property and casualty insurance company); formerly, Director, Beacon Power Corporation (energy company )*. | | 37 |
MSF-24
Metropolitan Series Fund, Inc.
Directors and Officers—(Continued)
| | | | | | | | |
Name, Address and Age | | Current
position(s)
with Fund | | Position(s)
held since | | Principal occupations
over past five years, including other directorships(2) | | Number of
Portfolios in
Fund Complex
Overseen by
Director(3) |
John T. Ludes Age: 71 | | Director | | 2003 | | President, LFP Properties (consulting firm); Formerly, Trustee, Zenith Fund**; formerly, Vice Chairman, President and Chief Operating Officer, Fortune Brands/American Brands (global conglomerate); formerly, President and CEO, Acushnet Company (athletic equipment company). | | 37 |
Officers(1)
| | | | | | | | |
Name and address | | Age | | Current
position(s)
with Fund | | Position(s)
held since | | Principal occupations over past five years(2) |
| Jeffrey P. Halperin | | 40 | | Chief Compliance Officer | | 2006 | | Vice President (since 2006), Corporate Ethics and Compliance Department, MetLife, Inc.; Chief Compliance Officer (since 2006), MetLife Advisers, MIA and MIST. |
| | | | |
| John F. Guthrie, Jr. | | 64 | | Senior Vice President | | 2002 | | Manager and Senior Vice President, MetLife Advisers; Vice President, MetLife; Vice President (since 2003), MetLife Group, Inc.; Vice President, NELICO; Vice President (since 2005), MIA; formerly, Senior Vice President, Zenith Fund**. |
| | | | |
| Alan C. Leland | | 55 | | Senior Vice President | | 2005 | | Treasurer and Chief Financial Officer, MetLife Advisers, LLC; Treasurer (since 2005), Met Investors Advisory, LLC; Vice President (since 2004), MIA; Vice President (since 2003), MetLife Group, Inc.; Vice President, MetLife; Senior Vice President, NELICO |
| | | | |
| Peter Duffy | | 52 | | Vice President and Treasurer | | 2000 | | Senior Vice President, MetLife Advisers (since 1998); Second Vice President (since 2003), NELICO; Vice President, MetLife (since 2004); Vice President (since 2004), MetLife Group, Inc.; formerly, Vice President and Treasurer, Zenith Fund**. |
| | | | |
| Thomas M. Lenz | | 49 | | Vice President and Secretary | | 2002 | | General Counsel and Secretary, MetLife Advisers; Assistant General Counsel, MetLife; formerly, Vice President and Secretary, Zenith Fund**. |
| * | Indicates a directorship with a registered investment company or a company subject to the reporting requirements of the Securities Exchange Act of 1934, as amended. |
| ** | The Zenith Fund deregistered with the Securities and Exchange Commission (“SEC”) in 2004. |
| (†) | Served as a trustee, director and/or officer of one or more of the following companies, each of which had a direct or indirect advisory relationship with MetLife Advisers or its affiliates prior to January 31, 2005: State Street Research Financial Trust, State Street Research Income Trust, State Street Research Money Market Trust, State Street Research Institutional Funds, State Street Research Capital Trust, State Street Research Master Investment Trust, State Street Research Equity Trust, State Street Research Securities Trust and State Street Research Exchange Trust (collectively, the “State Street Research Funds”). |
| (1) | Each Director of the Fund also serves as trustee of Metropolitan Series Fund II (“Met Series Fund II”), a registered investment company advised by MetLife Advisers. Each officer of the Fund serves in the same position with Met Series Fund II, which consists of one portfolio. |
| (2) | Previous positions during the past five years with the Fund, MIST, MetLife, MetLife Advisers, MIA, Zenith Fund, NELICO or New England Securities Corporation are omitted if not materially different. |
| (3) | The Fund Complex includes the Fund (36 portfolios), Met Series Fund II (1 portfolio) and MIST (44 portfolios) |
MSF-25
Metropolitan Series Fund, Inc.
Lehman Brothers Aggregate Bond Index Portfolio
Board Approval of Advisory and Subadvisory Agreements
The Fund’s Contract Review Committees of the Board of Directors (the “Board”) typically meet in early fall to review the Portfolios’ advisory agreements (the “Advisory Agreements”) and subadvisory agreements (collectively, the “Subadvisory Agreements,” and, together with the Advisory Agreements, the “Agreements”) and determine whether to recommend that the full Board approve the continuation of the Agreements for an additional one-year period. (Following the initial approval of an Agreement for a new Portfolio or with a new adviser or subadviser, such annual reviews are not required until 2 years following the execution of such Agreement.) After each Committee has made its recommendations, the full Board, including the Independent Directors, determines whether to approve the continuation of each of the Agreements. In addition, the Board, including the Independent Directors, considers matters bearing on the Agreements at most of its other meetings throughout the year and regularly interviews various individuals at MetLife Advisers responsible for the management of the Portfolios. The Directors also interview selected investment managers and other professionals at the subadvisers at various times throughout the year.
The Directors receive all materials that they or MetLife Advisers, the Fund’s investment adviser, and the subadvisers believe to be reasonably necessary for the Directors to evaluate the Agreements and determine whether to approve the continuation of the Agreements. These materials generally include, among other items, (i) information on the investment performance of the Portfolios and the performance of peer groups of funds and the Portfolios’ performance benchmarks, (ii) information on the Portfolios’ advisory and subadvisory fees and other expenses, including information comparing the Portfolios’ expenses to those of peer groups of funds and information about any applicable expense caps and fee “breakpoints,” (iii) sales and redemption data, (iv) information related to the profitability of the Agreements to MetLife Advisers and the subadvisers, and potential “fall-out” or ancillary benefits that MetLife Advisers, the subadvisers or their affiliates may receive as a result of their relationships with the Fund and (v) information obtained through the subadvisers’ responses to certain requests from MetLife Advisers and the Directors and MetLife Advisers’ responses to requests from the Directors. The Directors may also consider other information such as (vi) MetLife Advisers’ and the subadvisers’ financial results and condition, (vii) each Portfolio’s investment objectives and strategies and the size, education and experience of the investment staffs of MetLife Advisers and the relevant subadvisers and their use of technology and external research, (viii) the allocation of the Portfolios’ brokerage, if any, including allocations to brokers affiliated with the subadvisers and the use of “soft” commission dollars to pay Portfolio expenses and to pay for research and other similar services, (ix) the resources devoted to, and the record of compliance with, the Portfolios’ investment policies and restrictions, policies on personal securities transactions and other compliance policies, (x) the responses of MetLife Advisers, the subadvisers and/or their affiliates to certain legal and regulatory proceedings and (xi) the economic outlook generally and for the mutual fund industry in particular. Throughout the process, the Directors have the opportunity to ask questions of and request additional materials from MetLife Advisers and the subadvisers.
Following meetings of each Contract Review Committee on September 12, 2007, the Board, at its November 15, 2007 meeting, approved the continuation through December 31, 2008 of the Advisory Agreements for each Portfolio of the Fund and the Subadvisory Agreements for each Portfolio of the Fund. The Agreements approved for continuation are referred to below as the “Continued Agreements.”
In considering whether to approve the continuation of the Continued Agreements, the Directors, including the Independent Directors, did not identify any single factor as determinative, and each weighed the various factors as he or she deemed appropriate. The Directors considered the following matters in connection with their approval of the Continued Agreements:
The nature, extent and quality of the services provided to the relevant Portfolios under the Continued Agreements. The Directors considered the nature, extent and quality of the services provided by MetLife Advisers, the relevant subadvisers (if any) and their affiliates (each, an “Adviser,” and, collectively, the “Advisers”) to the relevant Portfolios pursuant to the Continued Agreements and the resources dedicated to these Portfolios by the Advisers. In particular, the Directors considered the Advisers’ abilities to attract and retain highly qualified investment professionals. With respect to MetLife Advisers, the Directors considered that MetLife Advisers is (i) ultimately responsible for the performance of such Portfolios; (ii) ultimately responsible for the establishment of the investment strategies of each such Portfolio, primarily through its recommendations to the Board regarding the hiring and selection of subadvisers; (iii) responsible for the hiring and selection, subject to Board approval, of subadvisers; and (iv) responsible for maintaining a program of Subadviser oversight reasonably designed to ensure that the subadvisers have reasonable compliance policies and procedures in place. The Directors also considered that MetLife Advisers provides a full range of day-to-day administrative services for the Portfolios involving all aspects of such Portfolios’ day-to-day operations (other than portfolio management). After reviewing these and related factors, the Directors concluded, within the context of their overall conclusions regarding each of the Continued Agreements, that the nature, extent and quality of services provided supported the renewal of these Agreements.
MSF-26
Metropolitan Series Fund, Inc.
Lehman Brothers Aggregate Bond Index Portfolio
Board Approval of Advisory and Subadvisory Agreements—(Continued)
Investment performance of the relevant Portfolios. The Directors reviewed information about the performance of the relevant Portfolios over various time periods, including information prepared by an independent third party that compared the performance of the Portfolios to the performance of peer groups of funds and performance benchmarks. The Directors also reviewed a description of the third party’s methodology for identifying a Portfolio’s peer group(s) for purposes of performance and expense comparisons.
In the case of each relevant Portfolio that had performance that lagged its peer group(s) for certain periods, the Directors concluded that other factors relevant to performance were sufficient, in light of other considerations, to warrant renewal of the Continued Agreements relating to such Portfolio. These factors varied from Portfolio to Portfolio, but included one or more of the following: (i) that such Portfolio’s performance, although lagging in certain recent periods, was stronger over the longer term; (ii) that the underperformance was attributable, to a significant extent, to investment decisions that were reasonable and consistent with the Portfolio’s investment objective(s) and policies and that the Portfolio was performing within the range of reasonable expectations, given market conditions and the Portfolio’s investment objective(s) and policies; (iii) that the Portfolio’s performance was competitive when compared to other relevant performance benchmarks or peer groups; and (iv) that MetLife Advisers and/or the relevant subadviser (if any) had taken or was taking steps designed to help improve the Portfolio’s investment performance.
The Directors also considered the investment performance of the Advisers and their reputations generally, the historical responsiveness of the Advisers to Director concerns about performance and the willingness of the Advisers to take steps intended to improve performance.
After reviewing these and related factors, the Directors concluded, within the context of their overall conclusions regarding each of the Continued Agreements, that the investment performance of each relevant Portfolio and Adviser was sufficient, in light of other considerations, to warrant the renewal of the Continued Agreements.
The costs of the services to be provided and profits to be realized by the Advisers and their affiliates from their relationships with the Portfolios. The Directors considered the fees charged by MetLife Advisers to the Portfolios for advisory services and, with respect to the subadvised Portfolios, by such subadvisers to MetLife Advisers for subadvisory services (such advisory and subadvisory fees (if any), collectively, “Fees”), as well as the total expense levels of the Portfolios. This information included comparisons (provided by an independent third party) of the Portfolios’ advisory fees and total expense levels to those of their peer groups. In evaluating Fees for the relevant Portfolios, the Directors also took into account the demands, complexity and quality of the investment management services provided to each Portfolio. The Directors considered MetLife Advisers’ recommendations regarding reductions in Fee rates, implementation of Fee breakpoints and institution of Fee waivers and expense caps.
The Directors also considered the compensation directly or indirectly received by the Advisers and their affiliates from their relationships with the relevant Portfolios. The Directors reviewed information relating to the profits received by MetLife Advisers, certain of the subadvisers and their affiliates as a result of their relationships with the relevant Portfolios, and information about the allocation of expenses used to calculate profitability. When reviewing profitability, the Directors also considered the performance of the relevant Portfolios, the expense levels of such Portfolios and whether the relevant Advisers had implemented breakpoints, fee waivers and/or expense caps with respect to such Portfolios.
After reviewing these and related factors, the Directors concluded, within the context of their overall conclusions regarding each of the Continued Agreements, that the Fees charged to each of the relevant Portfolios were fair and reasonable, and that the information provided regarding costs of these services generally, and the related profitability (if known) to the relevant Advisers of their relationships with the relevant Portfolios, supported the renewal of the Continued Agreements.
Economies of Scale. The Directors considered the existence of any economies of scale in the provision of services by the Advisers and whether those economies were shared with the relevant Portfolios through breakpoints in their advisory fees or other means, such as expense caps, fee waivers or relatively low levels of fees. The Directors noted that most of the relevant Portfolios benefited or will benefit from breakpoints, expense caps and/or fee waivers with respect to their advisory fees. In considering these issues, the Directors also took into consideration information relating to the costs of the services provided and the profitability to MetLife Advisers, the relevant subadvisers (if any) and each of their affiliates of their relationships with the relevant Portfolios, as discussed above.
After reviewing these and related factors, the Directors concluded, within the context of their overall conclusions regarding each of the Continued Agreements, that the extent to which economies of scale were shared with the relevant Portfolios supported the renewal of such Agreements.
MSF-27
Metropolitan Series Fund, Inc.
Lehman Brothers Aggregate Bond Index Portfolio
Board Approval of Advisory and Subadvisory Agreements—(Continued)
Other Factors. The Directors also considered other factors, which included but were not limited to the following:
| | • | | the extent to which each relevant Portfolio operated in accordance with its investment objective, and its record of compliance with its investment restrictions and the compliance programs of the Fund and the Advisers. They also considered the compliance-related resources the Advisers and their affiliates provide to the relevant Portfolios; |
| | • | | the nature, quality, cost and extent of administrative and shareholder services performed by MetLife Advisers and its affiliates under the Advisory Agreements; and |
| | • | | so-called “fall-out benefits” to the Advisers, such as the engagement of their affiliates to provide distribution, brokerage and transfer agency services to the Portfolios, and the benefits of research made available to the relevant Advisers by reason of brokerage commissions generated by the relevant Portfolios’ securities transactions. The Directors also considered the possible conflicts of interest associated with these fall-out and other benefits, and the reporting and other processes in place to disclose and monitor these possible conflicts of interest. |
Based on their evaluation of all factors that they deemed to be material, including those factors described above, and assisted by the advice of independent counsel, the Directors, including the Independent Directors, concluded that each of the Continued Agreements should be continued through December 31, 2008.
MSF-28
A description of the policies and procedures that the Fund uses to determine how to vote proxies relating to portfolio securities is available (i) without charge, upon request, by calling (800) 638-7732 and (ii) on the Securities and Exchange Commission’s (the “SEC”) website at http://www.sec.gov.
Information regarding how the Fund voted proxies relating to portfolio securities during the most recent twelve-month period ended December 31, 2007 is available (i) without charge, upon request, by calling (800) 638-7732 and (ii) on the SEC’s website at http://www.sec.gov.
The Fund files with the SEC a complete schedule of its portfolio holdings, as of the close of the first and third quarters of its fiscal year, on “Form N-Q”. These filings are available on the SEC’s website at www.sec.gov and may be reviewed and copied at the SEC’s Public Reference Room in Washington, DC. (Call 1-800-SEC-0330 for information on the operation of the Public Reference Room.)
MSF-29
| | |
Metropolitan Series Fund, Inc. Loomis Sayles Small Cap Portfolio Annual Report | | December 31, 2007 |
Letter from the President
February 1, 2008
Letter to Policy Holders:
2007 was a tumultuous year in the financial markets driven by concerns in the credit markets surrounding sub-prime mortgages and fears of recession in the U.S. Economy. The broad markets were mixed, with the Dow Jones Industrial Average up 8.9% and the MSCI EAFE Index, which measures the performance of international equities, up 11.2% for the year, while the Russell 2000 Index, which measures the performance of small capitalization stocks, was down 1.6%.
In the fixed income markets, credit spreads increased as a result of the pressure from sub-prime mortgage crisis and the Federal Reserve lowered interest rates by a total of 1% during the year. The Lehman Brothers Aggregate Bond Index posted a 7.0% return for the year.
On the following pages, you will find a complete review of your Portfolio and its investment performance.
MetLife is committed to building your financial freedom. We appreciate your trust and will continue to focus our efforts on meeting your investment needs.
Sincerely,
Elizabeth Forget
President, Metropolitan Series Fund, Inc.
Metropolitan Series Fund, Inc.
Loomis Sayles Small Cap Portfolio
Managed by Loomis, Sayles & Company, L.P.
Portfolio Manager Commentary*
PORTFOLIO PERFORMANCE
For the year ended December 31, 2007, the Class A shares of the Loomis Sayles Small Cap Portfolio returned 11.9%, compared to its benchmark, the Russell 2000 Index1, which returned -1.6%. The average return of its peer group, the Lipper Variable Insurance Products Small-Cap Core Funds Universe2, was -1.6% over the same period.
PORTFOLIO REVIEW
2007 was a year in which the Portfolio’s focus on quality and earnings growth, from both the value and growth perspective, was well rewarded due to the decelerating economy, full margin structures across the market, and the change in the credit markets. Because growth was less abundant in the general market, with the Standard & Poor’s 500 Index earnings barely advancing over 2006, companies that were able to grow their revenues and earnings were provided a premium. Clean balance sheets were also well rewarded as the credit markets shut down mid-year, penalizing businesses that require capital to grow. Healthcare, with good organic growth and generally strong balance sheets, exemplifies how quality growth was rewarded, as it had the largest positive contribution to the Russell 2000’s return. Conversely, financials were by far the worst performing stocks in the market due to the increased default rates and challenging credit markets.
The Portfolio is built stock-by-stock from the bottom up, from growth and value perspectives, while a close eye remains on the larger economic landscape to supplement fundamental research. The value segment of the Portfolio remains focused on misunderstood, underfollowed, or undervalued small-cap stocks, and the growth portion continues to seek out superior earnings growth that the market under appreciates. The period’s positive stock selection was enhanced by sector weight changes. Company and macro analysis led to reductions in both the consumer discretionary and financial sectors. Funds were redeployed predominantly into the technology and energy sectors.
The Portfolio’s concentration on quality stock selection was well rewarded for the period, as the Portfolio outperformed the Russell 2000 benchmark for the one-year period ended December 31, 2007. Reflecting the bottom-up process, the majority of outperformance was driven by stock selection, with all sectors having favorable security selection attribution.
Particularly strong were the technology and healthcare sectors. Performance in technology was driven by a diverse group of stocks, including Commscope, a communications equipment company that designs and manufactures cable and connectivity solutions, which benefited from continued network and communications infrastructure build-out. First Solar, a leading solar company, has meaningfully expanded its capacity in response to expanding customer demand, leading to financial results ahead of investor expectations. Opsware, a leading player in the fast growing data center market, was acquired by Hewlett Packard for a premium. Healthcare sector performance was also broad-based and included Viasys, which was acquired during the year by Cardinal Health; Pharmion, a developer of cancer treatment pharmaceuticals, also announced it would be acquired by Celgene; and Nuvasive, a spinal company with a minimally invaisive method, experiencing 40% growth per annum.
Financials, not surprisingly, was the only sector that had a negative absolute impact on the Portfolio, although it was the sector with the best relative performance. While an underweight position in the sector was a key positive, Portfolio stock selection was helped by our cautious stance toward the unfolding credit crisis.
Changes in sector weights made a meaningful contribution to performance for the period, as fundamental and macro analysis pointed to a weakening consumer and financial environment. Weightings in these sectors were reduced by mid-year, while additional investments were made in the energy sector, which continued it’s multi-year run, as well as the technology sector, which experienced resurgence in 2007. These sector shifts had a positive impact on performance.
* The views expressed above are those of the subadvisory firm as of December 31, 2007 and are subject to change based on market and other conditions. Information about the Portfolio’s holdings, asset allocation, industry allocation, or country diversification is historical and is not an indication of future Portfolio composition, which will vary. The performance of any index mentioned in this commentary has not been adjusted for ongoing management, distribution and operating expenses, and sales charges applicable to mutual fund investments. Direct investment in the Index is not possible.
1 The Russell 2000® Index is an unmanaged measure of performance of the 2,000 smallest companies in the Russell 3000® Index.
2 The Lipper Variable Insurance Products Fund Average is an average of the total return performance (calculated on the basis of net asset value) of variable product funds with similar investment objectives to those of the subject Portfolio as calculated by Lipper Analytical Services, an independent mutual fund ranking service.
MSF-2
Metropolitan Series Fund, Inc.
Loomis Sayles Small Cap Portfolio
A $10,000 INVESTMENT COMPARED TO
THE RUSSELL 2000 INDEX
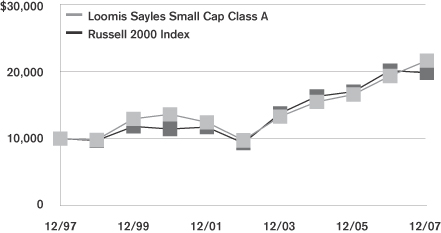
Average Annual Returns as of December 31, 2007
| | | | | | | | | | | |
| | | Loomis Sayles Small Cap Portfolio | | | Russell 2000
Index |
| | | Class A | | | Class B | | | Class E | | |
| 1 Year | | 11.9 | % | | 11.6 | % | | 11.7 | % | | -1.6% |
| 5 Year | | 17.3 | | | 17.1 | | | 17.1 | | | 16.2 |
| 10 Year | | 8.0 | | | — | | | — | | | 7.1 |
| Since Inception | | — | | | 14.6 | | | 8.3 | | | — |
Performance numbers are net of all Portfolio expenses but do not include any insurance, sales, or administrative charges of variable annuity or life insurance contracts. If these charges were included, the returns would be lower.
Inception dates of the Class A, Class B and Class E shares are: 5/2/94, 7/30/02 and 5/1/01, respectively.
This information represents past performance and is not indicative of future results. Investment return and principal value may fluctuate so that shares, upon redemption, may be worth more or less than the original cost.
PORTFOLIO COMPOSITION
as of December 31, 2007
Top Holdings
| | |
| | | % of Total
Net Assets |
Moog, Inc. | | 1.3% |
National Financial Partners Corp. | | 1.1% |
Waste Connections, Inc. | | 1.1% |
RBC Bearings, Inc. | | 1.0% |
Helix Energy Solutions Group, Inc. | | 1.0% |
INVESTools, Inc. | | 1.0% |
ITC Holdings Corp. | | 0.9% |
Rollins, Inc. | | 0.9% |
Exterran Holdings, Inc. | | 0.9% |
Orthofix International NV | | 0.8% |
Top Sectors
| | | |
| | | % of Total
Market Value | |
Industrials | | 21.1 | % |
Information Technology | | 20.6 | % |
Financials | | 13.1 | % |
Consumer Discretionary | | 12.8 | % |
Health Care | | 11.2 | % |
Energy | | 7.3 | % |
Materials | | 3.5 | % |
Utilities | | 3.0 | % |
Consumer Staples | | 2.5 | % |
Telecommunication Services | | 1.9 | % |
MSF-3
Metropolitan Series Fund, Inc.
Shareholder Expense Example
As a shareholder of the Portfolio, you incur ongoing costs, including management fees; distribution and service (12b-1) fees; and other Portfolio expenses. This example is intended to help you understand your ongoing costs (in dollars) (referred to as “expenses”) of investing in the Portfolio and compare these costs with the ongoing costs of investing in other mutual funds. The example is based on an investment of $1,000 invested at the beginning of the period and held for the entire period, July 1, 2007 through December 31, 2007.
Actual Expenses
The first line for each share class of the Portfolio in the table below provides information about actual account values and actual expenses. You may use the information in this line, together with the amount you invested in the particular share class of the Portfolio, to estimate the expenses that you paid over the period. Simply divide your account value by $1,000 (for example, an $8,600 account value divided by $1,000=8.6), then multiply the result by the number in the first line under the heading entitled “Expenses Paid During Period” to estimate the expenses you paid on your account during this period.
Hypothetical Example for Comparison Purposes
The second line for each share class of the Portfolio in the table below provides information about hypothetical account values and hypothetical expenses based on the Portfolio’s actual expense ratio and an assumed rate of return of 5% per year before expenses, which is not the Portfolio’s actual return. The hypothetical account values and expenses may not be used to estimate the actual ending account balance or expenses you paid for the period. You may use this information to compare the ongoing costs of investing in the Portfolio and other funds. To do so, compare this 5% hypothetical example with the 5% hypothetical examples that appear in the shareholder reports of the other funds.
Please note that the expenses shown in the table are meant to highlight your ongoing costs only and do not reflect any fees or charges of your variable insurance product or any additional expenses that participants in certain eligible qualified plans may bear relating to the operations of their plan. Therefore, the second line for each share class in the table is useful in comparing ongoing costs only, and will not help you determine the relative total costs of owning different funds. In addition, if these other costs were included, your costs would have been higher.
| | | | | | | | | | | | | | |
Portfolio | | | | Annualized
Expense
Ratio | | | Beginning
Account Value
July 1,
2007 | | Ending
Account Value
December 31,
2007 | | Expenses Paid
During Period*
July 1, 2007
to
December 31,
2007 |
Loomis Sayles Small Cap—Class A(a) | | Actual | | 0.91 | % | | $ | 1,000.00 | | $ | 990.40 | | $ | 4.57 |
| | Hypothetical | | 0.91 | % | | $ | 1,000.00 | | $ | 1,020.56 | | $ | 4.63 |
| | | | | |
Loomis Sayles Small Cap—Class B(a) | | Actual | | 1.16 | % | | $ | 1,000.00 | | $ | 989.10 | | $ | 5.82 |
| | Hypothetical | | 1.16 | % | | $ | 1,000.00 | | $ | 1,019.29 | | $ | 5.90 |
| | | | | |
Loomis Sayles Small Cap—Class E(a) | | Actual | | 1.06 | % | | $ | 1,000.00 | | $ | 989.60 | | $ | 5.32 |
| | Hypothetical | | 1.06 | % | | $ | 1,000.00 | | $ | 1,019.80 | | $ | 5.40 |
* Expenses paid are equal to the Portfolio’s annualized expense ratio for the most recent six month period, as shown above, multiplied by the average account value over the period, multiplied by the number of days in the most recent fiscal half-year, divided by 365 (to reflect the one-half year period).
(a) The annualized expense ratio shown reflects the impact of the management fee waiver as described in Note 4 to the Financial Statements.
MSF-4
Metropolitan Series Fund, Inc.
Loomis Sayles Small Cap Portfolio
Schedule of Investments as of December 31, 2007
Common Stock—97.1% of Total Net Assets
| | | | | |
| Security Description | | Shares | | Value* |
| | | | | |
| | | | | |
|
Aerospace & Defense—2.7% |
AAR Corp. (a) (b) | | 69,185 | | $ | 2,631,106 |
American Science & Engineering, Inc. (a) | | 31,243 | | | 1,773,040 |
Moog, Inc. (b) | | 147,349 | | | 6,750,059 |
Teledyne Technologies, Inc. (b) | | 61,674 | | | 3,289,074 |
| | | | | |
| | | | | 14,443,279 |
| | | | | |
|
Air Freight & Logistics—0.3% |
HUB Group, Inc. (Class A) (b) | | 67,342 | | | 1,789,950 |
| | | | | |
|
Auto Components—0.3% |
Gentex Corp. | | 92,850 | | | 1,649,944 |
| | | | | |
|
Automobiles—0.1% |
Winnebago Industries, Inc. (a) | | 37,175 | | | 781,419 |
| | | | | |
|
Biotechnology—1.4% |
BioMarin Pharmaceutical, Inc. (b) | | 51,798 | | | 1,833,649 |
Indevus Pharmaceuticals, Inc. (a) (b) | | 252,527 | | | 1,755,063 |
Metabolix, Inc. (a) (b) | | 76,583 | | | 1,822,675 |
Myriad Genetics, Inc. (a) (b) | | 33,559 | | | 1,557,809 |
Theravance, Inc. (a) (b) | | 42,561 | | | 829,940 |
| | | | | |
| | | | | 7,799,136 |
| | | | | |
|
Building Products—0.5% |
Armstrong World Industries, Inc. (b) | | 60,971 | | | 2,445,547 |
| | | | | |
|
Capital Markets—1.7% |
FCStone Group, Inc. (a) (b) | | 61,683 | | | 2,839,269 |
GFI Group, Inc. (a) (b) | | 28,602 | | | 2,737,783 |
Investment Technology Group, Inc. | | 22,918 | | | 1,090,668 |
JMP Group, Inc. (a) | | 104,717 | | | 888,000 |
Stifel Financial Corp. (a) | | 33,714 | | | 1,772,345 |
| | | | | |
| | | | | 9,328,065 |
| | | | | |
|
Chemicals—1.8% |
Cytec Industries, Inc. | | 47,959 | | | 2,953,315 |
FMC Corp. | | 43,350 | | | 2,364,743 |
Minerals Technologies, Inc. | | 27,249 | | | 1,824,321 |
Penford Corp. | | 53,694 | | | 1,374,029 |
The Scotts Miracle-Gro Co. | | 25,965 | | | 971,610 |
ZEP, Inc. (a) (b) | | 26,355 | | | 365,544 |
| | | | | |
| | | | | 9,853,562 |
| | | | | |
|
Commercial Banks—3.9% |
CVB Financial Corp. (a) | | 126,266 | | | 1,305,590 |
East West Bancorp, Inc. (a) | | 44,084 | | | 1,068,155 |
First Community Bancorp, Inc. (a) | | 37,348 | | | 1,540,232 |
First Midwest Bancorp, Inc. (a) | | 57,104 | | | 1,747,382 |
First State Bancorp | | 87,928 | | | 1,222,199 |
Hancock Holding Co. (a) | | 44,357 | | | 1,694,437 |
IBERIABANK Corp. (a) | | 44,621 | | | 2,086,032 |
Pennsylvania Commerce Bancorp, Inc. (a) (b) | | 34,100 | | | 949,685 |
Prosperity Bancshares, Inc. (a) | | 70,168 | | | 2,062,238 |
Signature Bank (b) | | 71,439 | | | 2,411,066 |
Sterling Bancshares, Inc. (a) | | 212,453 | | | 2,370,976 |
| | | | | |
| Security Description | | Shares | | Value* |
| | | | | |
|
Commercial Banks—(Continued) |
The Colonial BancGroup, Inc. (a) | | 108,806 | | $ | 1,473,233 |
United Community Bank, Inc. (a) | | 59,027 | | | 932,627 |
| | | | | |
| | | | | 20,863,852 |
| | | | | |
|
Commercial Services & Supplies—8.4% |
ABM Industries, Inc. | | 77,402 | | | 1,578,227 |
American Ecology Corp. | | 63,907 | | | 1,500,536 |
Angelica Corp. (a) | | 4,520 | | | 86,332 |
FTI Consulting, Inc. (b) | | 57,573 | | | 3,548,800 |
Huron Consulting Group, Inc. (a) (b) | | 31,570 | | | 2,545,489 |
ICF International, Inc. | | 61,809 | | | 1,561,295 |
IHS, Inc. (b) | | 47,270 | | | 2,862,671 |
Innerworkings, Inc. (a) (b) | | 166,780 | | | 2,878,623 |
Interface, Inc. | | 107,028 | | | 1,746,697 |
McGrath Rentcorp | | 83,611 | | | 2,152,983 |
Rollins, Inc. | | 242,794 | | | 4,661,645 |
Standard Parking Corp. (a) (b) | | 71,410 | | | 3,462,671 |
Team, Inc. (a) | | 77,100 | | | 2,820,318 |
The Advisory Board Co. (b) | | 63,321 | | | 4,064,575 |
The Geo Group, Inc. (b) | | 132,987 | | | 3,723,636 |
Waste Connections, Inc. (b) | | 186,181 | | | 5,752,993 |
| | | | | |
| | | | | 44,947,491 |
| | | | | |
|
Communications Equipment—2.2% |
Adtran, Inc. | | 56,409 | | | 1,206,024 |
Anaren, Inc. (a) (b) | | 97,990 | | | 1,615,855 |
CommScope, Inc. (a) (b) | | 21,243 | | | 1,045,368 |
Foundry Networks, Inc. (b) | | 146,301 | | | 2,563,194 |
Harmonic, Inc. (a) (b) | | 158,511 | | | 1,661,195 |
Harris Stratex Networks, Inc. (a) (b) | | 117,801 | | | 1,967,277 |
Sonus Networks, Inc. (a) (b) | | 277,950 | | | 1,620,449 |
| | | | | |
| | | | | 11,679,362 |
| | | | | |
|
Computers & Peripherals—0.7% |
Brocade Communications Systems, Inc. (b) | | 273,947 | | | 2,010,771 |
Electronics for Imaging, Inc. (b) | | 81,321 | | | 1,828,096 |
| | | | | |
| | | | | 3,838,867 |
| | | | | |
|
Construction & Engineering—0.7% |
Michael Baker Corp. (b) | | 20,008 | | | 822,329 |
Northwest Pipe Co. (a) (b) | | 78,950 | | | 3,090,103 |
| | | | | |
| | | | | 3,912,432 |
| | | | | |
|
Construction Materials—0.4% |
Texas Industries, Inc. (a) | | 29,080 | | | 2,038,508 |
| | | | | |
|
Consumer Finance—0.8% |
Dollar Financial Corp. (a) (b) | | 90,033 | | | 2,763,113 |
First Cash Financial Services (b) | | 114,406 | | | 1,679,480 |
| | | | | |
| | | | | 4,442,593 |
| | | | | |
|
Containers & Packaging—0.6% |
Greif, Inc. | | 25,242 | | | 1,650,069 |
Rock Tennessee Co. | | 66,363 | | | 1,686,284 |
| | | | | |
| | | | | 3,336,353 |
| | | | | |
*See accompanying notes to financial statements.
MSF-5
Metropolitan Series Fund, Inc.
Loomis Sayles Small Cap Portfolio
Schedule of Investments as of December 31, 2007
Common Stock—(Continued)
| | | | | |
| Security Description | | Shares | | Value* |
| | | | | |
|
Distributors—0.8% |
Core-Mark Holding Co., Inc. (a) (b) | | 16,201 | | $ | 465,293 |
LKQ Corp. (a) (b) | | 179,614 | | | 3,775,486 |
| | | | | |
| | | | | 4,240,779 |
| | | | | |
|
Diversified Consumer Services—3.5% |
Bright Horizons Family Solutions, Inc. (b) | | 54,314 | | | 1,876,006 |
Capella Education Co. (a) (b) | | 31,938 | | | 2,090,661 |
Corinthian Colleges, Inc. (a) (b) | | 135,972 | | | 2,093,969 |
DeVry, Inc. | | 60,453 | | | 3,141,138 |
INVESTools, Inc. (a) (b) | | 308,999 | | | 5,481,642 |
Jackson Hewitt Tax Service, Inc. (a) | | 77,050 | | | 2,446,338 |
New Oriental Education & Technology Group, Inc. (ADR) (b) | | 24,065 | | | 1,939,398 |
| | | | | |
| | | | | 19,069,152 |
| | | | | |
|
Diversified Financial Services—0.3% |
Portfolio Recovery Associates, Inc. (a) (b) | | 34,475 | | | 1,367,623 |
| | | | | |
|
Diversified Telecommunication Services—1.4% |
Cbeyond, Inc. (a) (b) | | 58,371 | | | 2,275,885 |
Cogent Communications Group, Inc. (b) | | 64,173 | | | 1,521,542 |
NTELOS Holdings Corp. | | 102,451 | | | 3,041,770 |
SureWest Communications (a) | | 25,329 | | | 433,126 |
| | | | | |
| | | | | 7,272,323 |
| | | | | |
|
Electric Utilities—1.5% |
Allete, Inc. (a) | | 48,140 | | | 1,905,381 |
ITC Holdings Corp. | | 85,086 | | | 4,800,552 |
Portland General Electric Co. | | 50,250 | | | 1,395,945 |
| | | | | |
| | | | | 8,101,878 |
| | | | | |
|
Electrical Equipment—2.0% |
Acuity Brands, Inc. | | 39,468 | | | 1,776,060 |
Belden, Inc. (a) | | 33,868 | | | 1,507,126 |
General Cable Corp. (a) | | 37,946 | | | 2,780,683 |
Hubbell, Inc. (Class B) | | 19,732 | | | 1,018,171 |
II-VI, Inc. (b) | | 72,882 | | | 2,226,545 |
Polypore International, Inc. | | 69,332 | | | 1,213,310 |
| | | | | |
| | | | | 10,521,895 |
| | | | | |
|
Electronic Equipment & Instruments—3.0% |
Agilysys, Inc. (a) | | 126,779 | | | 1,916,898 |
Anixter International, Inc. (a) (b) | | 26,818 | | | 1,669,957 |
Excel Technology, Inc. (b) | | 45,693 | | | 1,238,280 |
Ingram Micro, Inc. | | 113,178 | | | 2,041,731 |
IPG Photonics Corp. (a) (b) | | 111,079 | | | 2,220,469 |
Littelfuse, Inc. (b) | | 91,627 | | | 3,020,026 |
Rofin-Sinar Technologies, Inc. (b) | | 26,450 | | | 1,272,510 |
Vishay Intertechnology, Inc. (b) | | 135,251 | | | 1,543,214 |
X-Rite, Inc. (a) (b) | | 91,277 | | | 1,060,639 |
| | | | | |
| | | | | 15,983,724 |
| | | | | |
|
Energy Equipment & Services—4.0% |
Dresser-Rand Group, Inc. (b) | | 58,625 | | | 2,289,306 |
Exterran Holdings, Inc. (a) (b) | | 56,442 | | | 4,616,956 |
| | | | | |
| Security Description | | Shares | | Value* |
| | | | | |
|
Energy Equipment & Services—(Continued) |
Helix Energy Solutions Group, Inc. (a) (b) | | 133,472 | | $ | 5,539,088 |
Mitcham Industries, Inc. (b) | | 90,181 | | | 1,854,121 |
Oceaneering International, Inc. (b) | | 29,129 | | | 1,961,838 |
T-3 Energy Services, Inc. (b) | | 48,473 | | | 2,278,716 |
Tesco Corp. (b) | | 65,361 | | | 1,873,900 |
Tetra Technologies, Inc. (a) (b) | | 54,666 | | | 851,150 |
| | | | | |
| | | | | 21,265,075 |
| | | | | |
|
Food & Staples Retailing—1.1% |
Casey’s General Stores, Inc. | | 57,675 | | | 1,707,757 |
Spartan Stores, Inc. | | 106,759 | | | 2,439,443 |
Winn-Dixie Stores, Inc. (b) | | 95,395 | | | 1,609,314 |
| | | | | |
| | | | | 5,756,514 |
| | | | | |
|
Food Products—0.8% |
J&J Snack Foods Corp. | | 49,179 | | | 1,538,319 |
Ralcorp Holdings, Inc. (b) | | 42,446 | | | 2,580,292 |
| | | | | |
| | | | | 4,118,611 |
| | | | | |
| | |
Gas Utilities—0.8% | | | | | |
UGI Corp. | | 156,596 | | | 4,267,241 |
| | | | | |
|
Health Care Equipment & Supplies—3.3% |
Conceptus, Inc. (a) (b) | | 101,062 | | | 1,944,433 |
Inverness Medical Innovations, Inc. (a) (b) | | 57,919 | | | 3,253,890 |
Masimo Corp. (a) (b) | | 60,711 | | | 2,395,049 |
Meridian Bioscience, Inc. | | 51,636 | | | 1,553,211 |
NuVasive, Inc. (b) | | 47,905 | | | 1,893,206 |
Orthofix International NV (b) | | 75,087 | | | 4,352,793 |
West Pharmaceutical Services, Inc. (a) | | 57,438 | | | 2,331,408 |
| | | | | |
| | | | | 17,723,990 |
| | | | | |
|
Health Care Providers & Services—3.1% |
Corvel Corp. (b) | | 61,229 | | | 1,409,492 |
HealthExtras, Inc. (b) | | 88,085 | | | 2,297,257 |
Healthspring, Inc. (b) | | 53,732 | | | 1,023,595 |
inVentiv Health, Inc. (b) | | 60,674 | | | 1,878,467 |
Psychiatric Solutions, Inc. (a) (b) | | 84,820 | | | 2,756,650 |
RadNet, Inc. | | 270,269 | | | 2,743,230 |
Skilled Healthcare Group, Inc. (b) | | 60,964 | | | 891,903 |
Sun Healthcare Group, Inc. (b) | | 228,976 | | | 3,931,518 |
| | | | | |
| | | | | 16,932,112 |
| | | | | |
|
Health Care Technology—0.5% |
Phase Forward, Inc. (b) | | 114,180 | | | 2,483,415 |
| | | | | |
|
Hotels, Restaurants & Leisure—1.5% |
Ambassadors Intenational, Inc. (a) | | 41,984 | | | 612,127 |
Bob Evans Farms, Inc. (a) | | 63,008 | | | 1,696,806 |
CEC Entertainment, Inc. (b) | | 74,355 | | | 1,930,256 |
Cosi, Inc. (a) (b) | | 388,872 | | | 871,073 |
Life Time Fitness, Inc. (a) (b) | | 53,755 | | | 2,670,548 |
McCormick & Schmick’s Seafood Restaurants, Inc. (a) (b) | | 18,901 | | | 225,489 |
| | | | | |
| | | | | 8,006,299 |
| | | | | |
*See accompanying notes to financial statements.
MSF-6
Metropolitan Series Fund, Inc.
Loomis Sayles Small Cap Portfolio
Schedule of Investments as of December 31, 2007
Common Stock—(Continued)
| | | | | |
| Security Description | | Shares | | Value* |
| | | | | |
|
Household Durables—0.3% |
Jarden Corp. (a) (b) | | 62,694 | | $ | 1,480,205 |
| | | | | |
|
Industrial Conglomerates—0.4% |
Teleflex, Inc. | | 21,767 | | | 1,371,539 |
Walter Industries, Inc. | | 23,580 | | | 847,229 |
| | | | | |
| | | | | 2,218,768 |
| | | | | |
|
Insurance—5.0% |
American Equity Investment Life (a) | | 171,625 | | | 1,422,771 |
American Physicians Capital, Inc. | | 24,522 | | | 1,016,682 |
Arch Capital Group, Ltd. (b) | | 36,550 | | | 2,571,293 |
Delphi Financial Group, Inc. | | 66,043 | | | 2,329,997 |
eHealth, Inc. (b) | | 37,767 | | | 1,212,698 |
Employers Holdings, Inc. | | 75,695 | | | 1,264,864 |
First Mercury Financial Corp. (b) | | 72,300 | | | 1,764,120 |
Midland Co. (a) | | 36,167 | | | 2,339,643 |
National Financial Partners Corp. (a) | | 127,084 | | | 5,796,300 |
ProAssurance Corp. (b) | | 62,578 | | | 3,436,784 |
RLI Corp. (a) | | 36,518 | | | 2,073,857 |
The Navigators Group, Inc. (b) | | 29,161 | | | 1,895,465 |
| | | | | |
| | | | | 27,124,474 |
| | | | | |
| | |
Internet Software & Services—2.1% | | | | | |
Ariba, Inc. (a) (b) | | 213,509 | | | 2,380,625 |
DealerTrack Holdings, Inc. (b) | | 56,019 | | | 1,874,956 |
United Online, Inc. | | 100,610 | | | 1,189,210 |
VistaPrint, Ltd. (a) (b) | | 78,840 | | | 3,378,294 |
Vocus, Inc. (b) | | 70,539 | | | 2,435,712 |
| | | | | |
| | | | | 11,258,797 |
| | | | | |
| | |
IT Services—2.4% | | | | | |
Broadridge Financial Solutions, Inc. | | 147,986 | | | 3,319,326 |
Information Services Group, Inc. (a) (b) | | 247,229 | | | 1,693,519 |
Perot Systems Corp. (Class A) (b) | | 99,404 | | | 1,341,954 |
Syntel, Inc. (a) | | 58,522 | | | 2,254,267 |
Wright Express Corp. (b) | | 116,470 | | | 4,133,520 |
| | | | | |
| | | | | 12,742,586 |
| | | | | |
| | |
Leisure Equipment & Products—0.2% | | | | | |
Steinway Musical Instruments, Inc. (a) (b) | | 48,226 | | | 1,329,591 |
| | | | | |
| | |
Life Sciences Tools & Services—1.7% | | | | | |
Affymetrix, Inc. (b) | | 59,780 | | | 1,383,309 |
Exelixis, Inc. (a) (b) | | 158,992 | | | 1,372,101 |
Parexel International Corp. (b) | | 56,362 | | | 2,722,285 |
PerkinElmer, Inc. | | 79,559 | | | 2,070,125 |
Third Wave Technologies, Inc. | | 168,087 | | | 1,622,039 |
| | | | | |
| | | | | 9,169,859 |
| | | | | |
| | |
Machinery—4.5% | | | | | |
Actuant Corp. (a) | | 78,946 | | | 2,684,953 |
Barnes Group, Inc. (a) | | 44,386 | | | 1,482,049 |
CLARCOR, Inc. (a) | | 43,286 | | | 1,643,569 |
Commercial Vehicle Group, Inc. (a) (b) | | 67,200 | | | 974,400 |
Harsco Corp. | | 38,197 | | | 2,447,282 |
| | | | | |
| Security Description | | Shares | | Value* |
| | | | | |
| | |
Machinery—(Continued) | | | | | |
Kadant, Inc. (b) | | 95,490 | | $ | 2,833,188 |
Mueller Water Products, Inc. (a) | | 106,923 | | | 1,017,907 |
Nordson Corp. | | 28,897 | | | 1,674,870 |
RBC Bearings, Inc. (b) | | 128,067 | | | 5,565,792 |
The Middleby Corp. (a) | | 28,898 | | | 2,214,165 |
Wabtec Corp. | | 52,743 | | | 1,816,469 |
| | | | | |
| | | | | 24,354,644 |
| | | | | |
| | |
Media—2.2% | | | | | |
Alloy, Inc. (b) | | 67,259 | | | 633,580 |
Belo Corp. (Class A) | | 85,320 | | | 1,487,981 |
Interactive Data Corp. | | 75,045 | | | 2,477,235 |
John Wiley & Sons, Inc. | | 86,731 | | | 3,715,556 |
Knology, Inc. (a) (b) | | 156,433 | | | 1,999,214 |
Live Nation, Inc. (a) (b) | | 45,885 | | | 666,250 |
National CineMedia, Inc. | | 38,495 | | | 970,459 |
| | | | | |
| | | | | 11,950,275 |
| | | | | |
| | |
Metals & Mining—0.7% | | | | | |
Haynes International, Inc. (b) | | 15,335 | | | 1,065,782 |
Reliance Steel & Aluminum Co. | | 49,100 | | | 2,661,220 |
| | | | | |
| | | | | 3,727,002 |
| | | | | |
| | |
Multi-Utilities—0.3% | | | | | |
NorthWestern Corp. | | 50,447 | | | 1,488,186 |
| | | | | |
| | |
Multiline Retail—0.4% | | | | | |
Dollar Tree Stores, Inc. (b) | | 86,591 | | | 2,244,439 |
| | | | | |
|
Oil, Gas & Consumable Fuels—3.4% |
Arena Resources, Inc. (b) | | 50,773 | | | 2,117,742 |
ATP Oil & Gas Corp. (b) | | 25,810 | | | 1,304,437 |
Carrizo Oil & Gas, Inc. (a) (b) | | 41,575 | | | 2,276,231 |
Mariner Energy, Inc. (b) | | 84,803 | | | 1,940,293 |
Parallel Petroleum Corp. (b) | | 86,919 | | | 1,532,382 |
Penn Virginia Corp. | | 58,926 | | | 2,570,941 |
PetroHawk Energy Corp. (a) (b) | | 126,251 | | | 2,185,405 |
Petroleum Development Corp. (a) (b) | | 20,617 | | | 1,219,083 |
St. Mary Land & Exploration Co. | | 32,916 | | | 1,270,887 |
TXCO Resources, Inc. (a) (b) | | 140,978 | | | 1,700,195 |
| | | | | |
| | | | | 18,117,596 |
| | | | | |
| | |
Personal Products—0.6% | | | | | |
Alberto-Culver Co. | | 135,810 | | | 3,332,777 |
| | | | | |
| | |
Pharmaceuticals—1.1% | | | | | |
KV Pharmaceutical Co. (a) (b) | | 57,909 | | | 1,652,723 |
Perrigo Co. | | 66,940 | | | 2,343,569 |
Sciele Pharma, Inc. (b) | | 91,941 | | | 1,880,194 |
| | | | | |
| | | | | 5,876,486 |
| | | | | |
|
Real Estate Investment Trusts—1.4% |
Corporate Office Properties Trust | | 38,290 | | | 1,206,135 |
Health Care REIT, Inc. | | 37,570 | | | 1,679,003 |
Kite Realty Group Trust | | 114,948 | | | 1,755,256 |
*See accompanying notes to financial statements.
MSF-7
Metropolitan Series Fund, Inc.
Loomis Sayles Small Cap Portfolio
Schedule of Investments as of December 31, 2007
Common Stock—(Continued)
| | | | | |
| Security Description | | Shares | | Value* |
| | | | | |
|
Real Estate Investment Trusts—(Continued) |
LaSalle Hotel Properties | | 36,302 | | $ | 1,158,034 |
Potlatch Corp. (a) | | 38,108 | | | 1,693,520 |
| | | | | |
| | | | | 7,491,948 |
| | | | | |
| | |
Road & Rail—0.5% | | | | | |
Avis Budget Group, Inc. (b) | | 65,937 | | | 857,181 |
Genesee & Wyoming, Inc. (a) (b) | | 46,975 | | | 1,135,386 |
Ryder System, Inc. | | 17,149 | | | 806,174 |
| | | | | |
| | | | | 2,798,741 |
| | | | | |
|
Semiconductors & Semiconductor Equipment—4.1% |
ATMI, Inc. (b) | | 63,243 | | | 2,039,587 |
Cavium Networks, Inc. (a) (b) | | 76,148 | | | 1,752,927 |
Cohu, Inc. (a) | | 78,773 | | | 1,205,227 |
Cypress Semiconductor Corp. (b) | | 69,923 | | | 2,519,326 |
Diodes, Inc. (a) (b) | | 38,750 | | | 1,165,213 |
Exar Corp. (a) (b) | | 116,270 | | | 926,672 |
Fairchild Semiconductor International, Inc. (b) | | 85,089 | | | 1,227,834 |
Monolithic Power Systems (b) | | 85,250 | | | 1,830,317 |
NetLogic Microsystems, Inc. (a) (b) | | 78,087 | | | 2,514,401 |
Tessera Technologies, Inc. (b) | | 76,905 | | | 3,199,248 |
Verigy, Ltd. (b) | | 86,000 | | | 2,336,620 |
Volterra Semiconductor Corp. (a) (b) | | 137,991 | | | 1,522,041 |
| | | | | |
| | | | | 22,239,413 |
| | | | | |
| | |
Software—6.2% | | | | | |
Blackbaud, Inc. | | 86,104 | | | 2,414,356 |
Blackboard, Inc. (b) | | 64,474 | | | 2,595,079 |
BladeLogic, Inc. (b) | | 89,755 | | | 2,654,055 |
Epicor Software Corp. (a) (b) | | 141,187 | | | 1,663,183 |
Informatica Corp. (b) | | 174,489 | | | 3,144,292 |
Interactive Intelligence, Inc. (b) | | 68,412 | | | 1,802,656 |
Intervoice, Inc. (b) | | 136,017 | | | 1,086,776 |
MicroStrategy, Inc. (Class A) (b) | | 12,866 | | | 1,223,557 |
Parametric Technology Corp. (b) | | 61,901 | | | 1,104,933 |
Progress Software Corp. (b) | | 76,144 | | | 2,564,530 |
Quest Software, Inc. (b) | | 94,964 | | | 1,751,136 |
Radiant Systems, Inc. (b) | | 95,397 | | | 1,643,690 |
Sybase, Inc. (b) | | 71,255 | | | 1,859,043 |
Taleo Corp. (a) (b) | | 88,412 | | | 2,632,909 |
The Ultimate Software Group, Inc. (a) (b) | | 77,419 | | | 2,436,376 |
Tyler Technologies, Inc. (a) | | 197,011 | | | 2,539,472 |
| | | | | |
| | | | | 33,116,043 |
| | | | | |
| | |
Specialty Retail—1.6% | | | | | |
Borders Group, Inc. (a) | | 128,793 | | | 1,371,645 |
Dick’s Sporting Goods, Inc. (b) | | 75,739 | | | 2,102,515 |
Jo-Ann Stores, Inc. (a) (b) | | 58,846 | | | 769,706 |
Sally Beauty Holdings, Inc. (a) (b) | | 215,231 | | | 1,947,840 |
Sonic Automotive, Inc. (a) | | 115,517 | | | 2,236,409 |
| | | | | |
| | | | | 8,428,115 |
| | | | | |
|
Textiles, Apparel & Luxury Goods—1.8% |
Carter’s, Inc. (a) (b) | | 53,970 | | | 1,044,319 |
FGX International Holdings, Ltd. (b) | | 32,069 | | | 380,018 |
Fossil, Inc. (b) | | 89,323 | | | 3,749,780 |
Hanesbrands, Inc. (b) | | 98,337 | | | 2,671,816 |
| | | | | | | |
| Security Description | | Shares | | Value* | |
| | | | | | | |
|
Textiles, Apparel & Luxury Goods—(Continued) | |
Movado Group, Inc. | | | 72,406 | | $ | 1,831,148 | |
| | | | | | | |
| | | | | | 9,677,081 | |
| | | | | | | |
|
Trading Companies & Distributors—1.1% | |
Aircastle, Ltd. (a) | | | 74,490 | | | 1,961,322 | |
Genesis Lease, Ltd. (ADR) | | | 82,475 | | | 1,547,231 | |
Kaman Corp. | | | 66,709 | | | 2,455,558 | |
| | | | | | | |
| | | | | | 5,964,111 | |
| | | | | | | |
| | |
Water Utilities—0.4% | | | | | | | |
American State Water Co. (a) | | | 31,662 | | | 1,193,024 | |
Middlesex Water Co. | | | 55,171 | | | 1,045,491 | |
| | | | | | | |
| | | | | | 2,238,515 | |
| | | | | | | |
|
Wireless Telecommunication Services—0.6% | |
SBA Communications Corp. (b) | | | 90,341 | | | 3,057,139 | |
| | | | | | | |
Total Common Stock
(Identified Cost $446,409,368) | | | | | | 521,687,782 | |
| | | | | | | |
| | |
| Short Term Investments—26.8% | | | | | | | |
| Security Description | | Face
Amount/
Shares | | Value* | |
| | |
Commercial Paper—3.3% | | | | | | | |
State Street Boston Corp.
1.500%, 01/02/08 | | $ | 17,430,000 | | | 17,429,274 | |
| | | | | | | |
| | |
Mutual Funds—23.5% | | | | | | | |
State Street Navigator Securities Lending
Prime Portfolio (c) | | | 126,348,157 | | | 126,348,157 | |
| | | | | | | |
Total Short Term Investments
(Identified Cost $143,777,431) | | | | | | 143,777,431 | |
| | | | | | | |
Total Investments—123.9%
(Identified Cost $590,186,799) (d) | | | | | | 665,465,213 | |
Liabilities in excess of other assets | | | | | | (128,453,963 | ) |
| | | | | | | |
| Total Net Assets—100% | | | | | $ | 537,011,250 | |
| | | | | | | |
| (a) | A portion or all of the security was held on loan. As of December 31, 2007, the market value of securities loaned was $127,388,536 and the collateral received consisted of cash in the amount of $126,348,157 and non cash collateral with a value of $5,130,699. The cash collateral is invested in a money market fund managed by an affiliate of the custodian. The non cash collateral received consists primarily of government securities and bank letters of credit, and are held for the benefit of the Portfolio at the Portfolio’s custodian. |
| (c) | Represents investment of cash collateral received from securities lending transactions. |
| (d) | The aggregate cost of investments for federal income tax purposes as of December 31, 2007 was $590,098,353 and the composition of unrealized appreciation and depreciation of investment securities was $98,135,769 and $(22,768,909), respectively. |
| (ADR)— | An American Depositary Receipt is a certificate issued by a custodian bank representing the right to receive securities of the foreign issuer described. Trading on exchanges not located in the United States or Canada significantly influences the value of ADRs. |
*See accompanying notes to financial statements.
MSF-8
Metropolitan Series Fund, Inc.
Loomis Sayles Small Cap Portfolio
Statement of Assets & Liabilities
December 31, 2007
| | | | | | | |
Assets | | | | | | | |
Investments at value (a) (b) | | | | | $ | 665,465,213 | |
Cash | | | | | | 963 | |
Receivable for: | | | | | | | |
Securities sold | | | | | | 154,526 | |
Fund shares sold | | | | | | 357,273 | |
Accrued interest and dividends | | | | | | 337,688 | |
| | | | | | | |
Total Assets | | | | | | 666,315,663 | |
Liabilities | | | | | | | |
Payable for: | | | | | | | |
Securities purchased | | $ | 1,143,508 | | | | |
Fund shares redeemed | | | 1,328,700 | | | | |
Collateral for securities loaned | | | 126,348,157 | | | | |
Accrued expenses: | | | | | | | |
Management fees | | | 388,993 | | | | |
Service and distribution fees | | | 31,008 | | | | |
Deferred directors’ fees | | | 25,384 | | | | |
Other expenses | | | 38,663 | | | | |
| | | | | | | |
Total Liabilities | | | | | | 129,304,413 | |
| | | | | | | |
Net Assets | | | | | $ | 537,011,250 | |
| | | | | | | |
Net assets consists of: | | | | | | | |
Capital paid in | | | | | $ | 392,106,882 | |
Overdistributed net investment income | | | | | | (28,803 | ) |
Accumulated net realized gains | | | | | | 69,654,757 | |
Unrealized appreciation on investments | | | | | | 75,278,414 | |
| | | | | | | |
Net Assets | | | | | $ | 537,011,250 | |
| | | | | | | |
| Computation of offering price: | | | | | | | |
Class A | | | | | | | |
Net asset value and redemption price per share ($365,435,442 divided by 1,475,546 shares outstanding) | | | | | $ | 247.66 | |
| | | | | | | |
Class B | | | | | | | |
Net asset value and redemption price per share ($108,141,760 divided by 443,393 shares outstanding) | | | | | $ | 243.90 | |
| | | | | | | |
Class E | | | | | | | |
Net asset value and redemption price per share ($63,434,048 divided by 258,723 shares outstanding) | | | | | $ | 245.18 | |
| | | | | | | |
(a) Identified cost of investments | | | | | $ | 590,186,799 | |
| | | | | | | |
| (b) | Includes cash collateral for securities loaned of $126,348,157. |
Statement of Operations
For the Year Ended December 31, 2007
| | | | | | | | |
Investment Income | | | | | | | | |
Dividends | | | | | | $ | 3,512,677 | |
Interest | | | | | | | 1,095,276 | (a) |
| | | | | | | | |
| | | | | | | 4,607,953 | |
Expenses | | | | | | | | |
Management fees | | $ | 4,791,224 | | | | | |
Service and distribution fees—Class B | | | 221,983 | | | | | |
Service and distribution fees—Class E | | | 95,053 | | | | | |
Directors’ fees and expenses | | | 26,369 | | | | | |
Custodian | | | 59,771 | | | | | |
Audit and tax services | | | 31,738 | | | | | |
Legal | | | 5,968 | | | | | |
Printing | | | 161,796 | | | | | |
Insurance | | | 5,642 | | | | | |
Miscellaneous | | | 14,518 | | | | | |
| | | | | | | | |
Total expenses | | | 5,414,062 | | | | | |
Expense reductions | | | (53,473 | ) | | | | |
Management fee waivers | | | (267,142 | ) | | | 5,093,447 | |
| | | | | | | | |
Net Investment Loss | | | | | | | (485,494 | ) |
| | | | | | | | |
Realized and Unrealized Gain (Loss) | | | | | | | | |
| Realized gain on: | | | | | | | | |
Investments—net | | | | | | | 70,495,073 | |
| Change in unrealized depreciation on: | | | | | | | | |
Investments—net | | | | | | | (12,514,559 | ) |
| | | | | | | | |
Net gain | | | | | | | 57,980,514 | |
| | | | | | | | |
Net Increase in Net Assets From Operations | | | | | | $ | 57,495,020 | |
| | | | | | | | |
| (a) | Includes net income on securities loaned of $381,762. |
See accompanying notes to financial statements.
MSF-9
Metropolitan Series Fund, Inc.
Loomis Sayles Small Cap Portfolio
Statements of Changes in Net Assets
| | | | | | | | |
| | | Year ended
December 31,
2007 | | | Year ended
December 31,
2006 | |
From Operations | | | | | | | | |
Net investment income (loss) | | $ | (485,494 | ) | | $ | 672,037 | |
Net realized gain | | | 70,495,073 | | | | 59,329,511 | |
Unrealized appreciation (depreciation) | | | (12,514,559 | ) | | | 10,378,151 | |
| | | | | | | | |
Increase in net assets from operations | | | 57,495,020 | | | | 70,379,699 | |
| | | | | | | | |
From Distributions to Shareholders | | | | | | | | |
Net investment income | | | | | | | | |
Class A | | | (315,188 | ) | | | 0 | |
| | | | | | | | |
| | | (315,188 | ) | | | 0 | |
| | | | | | | | |
Net realized gain | | | | | | | | |
Class A | | | (43,303,902 | ) | | | (32,197,782 | ) |
Class B | | | (9,064,930 | ) | | | (3,394,432 | ) |
Class E | | | (7,088,373 | ) | | | (5,098,161 | ) |
| | | | | | | | |
| | | (59,457,205 | ) | | | (40,690,375 | ) |
| | | | | | | | |
Total distributions | | | (59,772,393 | ) | | | (40,690,375 | ) |
| | | | | | | | |
Increase in net assets from capital share transactions | | | 40,143,772 | | | | 42,258,597 | |
| | | | | | | | |
Total increase in net assets | | | 37,866,399 | | | | 71,947,921 | |
| | |
Net Assets | | | | | | | | |
Beginning of the period | | | 499,144,851 | | | | 427,196,930 | |
| | | | | | | | |
End of the period | | $ | 537,011,250 | | | $ | 499,144,851 | |
| | | | | | | | |
Undistributed (Overdistributed) Net Investment Income | | | | | | | | |
End of the period | | $ | (28,803 | ) | | $ | 357,774 | |
| | | | | | | | |
Other Information:
Capital Shares
Transactions in capital shares were as follows:
| | | | | | | | | | | | | | |
| | | Year ended
December 31, 2007 | | | Year ended
December 31, 2006 | |
| | | Shares | | | $ | | | Shares | | | $ | |
Class A | | | | | | | | | | | | | | |
Sales | | 359,286 | | | $ | 91,646,470 | | | 334,929 | | | $ | 81,454,033 | |
Reinvestments | | 181,587 | | | | 43,619,090 | | | 131,468 | | | | 32,197,782 | |
Redemptions | | (556,927 | ) | | | (140,977,220 | ) | | (483,757 | ) | | | (116,923,162 | ) |
| | | | | | | | | | | | | | |
Net decrease | | (16,054 | ) | | $ | (5,711,660 | ) | | (17,360 | ) | | $ | (3,271,347 | ) |
| | | | | | | | | | | | | | |
Class B | | | | | | | | | | | | | | |
Sales | | 211,111 | | | $ | 52,345,787 | | | 184,495 | | | $ | 44,212,938 | |
Reinvestments | | 38,255 | | | | 9,064,930 | | | 14,005 | | | | 3,394,432 | |
Redemptions | | (79,387 | ) | | | (19,520,838 | ) | | (35,004 | ) | | | (8,256,711 | ) |
| | | | | | | | | | | | | | |
Net increase | | 169,979 | | | $ | 41,889,879 | | | 163,496 | | | $ | 39,350,659 | |
| | | | | | | | | | | | | | |
Class E | | | | | | | | | | | | | | |
Sales | | 58,013 | | | $ | 14,543,308 | | | 61,619 | | | $ | 15,109,940 | |
Reinvestments | | 29,777 | | | | 7,088,373 | | | 20,970 | | | | 5,098,161 | |
Redemptions | | (70,970 | ) | | | (17,666,128 | ) | | (59,214 | ) | | | (14,028,816 | ) |
| | | | | | | | | | | | | | |
Net increase | | 16,820 | | | $ | 3,965,553 | | | 23,375 | | | $ | 6,179,285 | |
| | | | | | | | | | | | | | |
Increase derived from capital share transactions | | | | | $ | 40,143,772 | | | | | | $ | 42,258,597 | |
| | | | | | | | | | | | | | |
See accompanying notes to financial statements.
MSF-10
Metropolitan Series Fund, Inc.
Loomis Sayles Small Cap Portfolio
Financial Highlights
| | | | | | | | | | | | | | | | | | | | |
| | | Class A | |
| | | Year ended December 31, | |
| | | 2007 | | | 2006 | | | 2005 | | | 2004 | | | 2003 | |
Net Asset Value, Beginning of Period | | $ | 249.37 | | | $ | 232.80 | | | $ | 220.60 | | | $ | 189.55 | | | $ | 138.89 | |
| | | | | | | | | | | | | | | | | | | | |
Income From Investment Operations | | | | | | | | | | | | | | | | | | | | |
Net investment income (loss) | | | (0.08 | )(a) | | | 0.45 | | | | 0.11 | | | | (0.27 | ) | | | (0.34 | ) |
Net realized and unrealized gain on investments | | | 28.82 | | | | 37.97 | | | | 14.79 | | | | 31.32 | | | | 51.00 | |
| | | | | | | | | | | | | | | | | | | | |
Total from investment operations | | | 28.74 | | | | 38.42 | | | | 14.90 | | | | 31.05 | | | | 50.66 | |
| | | | | | | | | | | | | | | | | | | | |
Less Distributions | | | | | | | | | | | | | | | | | | | | |
Distributions from net investment income | | | (0.22 | ) | | | 0.00 | | | | 0.00 | | | | 0.00 | | | | 0.00 | |
Distributions from net realized capital gains | | | (30.23 | ) | | | (21.85 | ) | | | (2.70 | ) | | | 0.00 | | | | 0.00 | |
| | | | | | | | | | | | | | | | | | | | |
Total distributions | | | (30.45 | ) | | | (21.85 | ) | | | (2.70 | ) | | | 0.00 | | | | 0.00 | |
| | | | | | | | | | | | | | | | | | | | |
Net Asset Value, End of Period | | $ | 247.66 | | | $ | 249.37 | | | $ | 232.80 | | | $ | 220.60 | | | $ | 189.55 | |
| | | | | | | | | | | | | | | | | | | | |
Total Return (%) | | | 11.9 | | | | 16.7 | | | | 6.9 | | | | 16.4 | | | | 36.5 | |
Ratio of operating expenses to average net assets before expense reductions (%) | | | 0.90 | | | | 0.93 | | | | 0.94 | | | | 0.98 | | | | 0.99 | |
Ratio of operating expenses to average net assets after expense reductions (%) (b) | | | 0.89 | | | | 0.92 | | | | 0.91 | | | | 0.95 | | | | N/A | |
Ratio of operating expenses to average net assets without giving effect to the contractual expense agreement would have been (%) (c) | | | 0.95 | | | | 0.98 | | | | 0.94 | | | | 0.98 | | | | 0.99 | |
Ratio of net investment income (loss) to average net assets (%) | | | (0.03 | ) | | | 0.18 | | | | 0.05 | | | | (0.13 | ) | | | (0.21 | ) |
Portfolio turnover rate (%) | | | 64 | | | | 76 | | | | 101 | | | | 135 | | | | 118 | |
Net assets, end of period (000) | | $ | 365,435 | | | $ | 371,963 | | | $ | 351,279 | | | $ | 368,666 | | | $ | 348,406 | |
| | | | | | | | | | | | | | | | | | | | |
| | | Class B | |
| | | Year ended December 31, | |
| | | 2007 | | | 2006 | | | 2005 | | | 2004 | | | 2003 | |
Net Asset Value, Beginning of Period | | $ | 246.37 | | | $ | 230.75 | | | $ | 219.20 | | | $ | 188.59 | | | $ | 138.20 | |
| | | | | | | | | | | | | | | | | | | | |
Income From Investment Operations | | | | | | | | | | | | | | | | | | | | |
Net investment income (loss) | | | (0.67 | )(a) | | | 0.12 | | | | (0.25 | ) | | | 0.08 | | | | (0.24 | ) |
Net realized and unrealized gain on investments | | | 28.43 | | | | 37.35 | | | | 14.50 | | | | 30.53 | | | | 50.63 | |
| | | | | | | | | | | | | | | | | | | | |
Total from investment operations | | | 27.76 | | | | 37.47 | | | | 14.25 | | | | 30.61 | | | | 50.39 | |
| | | | | | | | | | | | | | | | | | | | |
Less Distributions | | | | | | | | | | | | | | | | | | | | |
Distributions from net realized capital gains | | | (30.23 | ) | | | (21.85 | ) | | | (2.70 | ) | | | 0.00 | | | | 0.00 | |
| | | | | | | | | | | | | | | | | | | | |
Total distributions | | | (30.23 | ) | | | (21.85 | ) | | | (2.70 | ) | | | 0.00 | | | | 0.00 | |
| | | | | | | | | | | | | | | | | | | | |
Net Asset Value, End of Period | | $ | 243.90 | | | $ | 246.37 | | | $ | 230.75 | | | $ | 219.20 | | | $ | 188.59 | |
| | | | | | | | | | | | | | | | | | | | |
Total Return (%) | | | 11.6 | | | | 16.4 | | | | 6.7 | | | | 16.2 | | | | 36.5 | |
Ratio of operating expenses to average net assets before expense reductions (%) | | | 1.15 | | | | 1.18 | | | | 1.19 | | | | 1.23 | | | | 1.24 | |
Ratio of operating expenses to average net assets after expense reductions (%) (b) | | | 1.14 | | | | 1.17 | | | | 1.17 | | | | 1.20 | | | | N/A | |
Ratio of operating expenses to average net assets without giving effect to the contractual expense agreement would have been (%) (c) | | | 1.20 | | | | 1.23 | | | | 1.19 | | | | 1.23 | | | | 1.24 | |
Ratio of net investment loss to average net assets (%) | | | (0.27 | ) | | | (0.02 | ) | | | (0.16 | ) | | | (0.07 | ) | | | (0.46 | ) |
Portfolio turnover rate (%) | | | 64 | | | | 76 | | | | 101 | | | | 135 | | | | 118 | |
Net assets, end of period (000) | | $ | 108,142 | | | $ | 67,360 | | | $ | 25,364 | | | $ | 6,440 | | | $ | 98 | |
| (a) | Per share amount is based on average shares outstanding during the period. |
| (b) | The Portfolio has entered into arrangements with certain brokers who paid a portion of the Portfolio’s expenses. |
| (c) | See Note 4 in the Notes to Financial Statements. |
See accompanying notes to financial statements.
MSF-11
Metropolitan Series Fund, Inc.
Loomis Sayles Small Cap Portfolio
Financial Highlights
| | | | | | | | | | | | | | | | | | | | |
| | | Class E | |
| | | Year ended December 31, | |
| | | 2007 | | | 2006 | | | 2005 | | | 2004 | | | 2003 | |
Net Asset Value, Beginning of Period | | $ | 247.29 | | | $ | 231.34 | | | $ | 219.57 | | | $ | 188.95 | | | $ | 138.65 | |
| | | | | | | | | | | | | | | | | | | | |
Income From Investment Operations | | | | | | | | | | | | | | | | | | | | |
Net investment income (loss) | | | (0.45 | )(a) | | | 0.14 | | | | (0.21 | ) | | | (0.45 | ) | | | (0.37 | ) |
Net realized and unrealized gain on investments | | | 28.57 | | | | 37.66 | | | | 14.68 | | | | 31.07 | | | | 50.67 | |
| | | | | | | | | | | | | | | | | | | | |
Total from investment operations | | | 28.12 | | | | 37.80 | | | | 14.47 | | | | 30.62 | | | | 50.30 | |
| | | | | | | | | | | | | | | | | | | | |
Less Distributions | | | | | | | | | | | | | | | | | | | | |
Distributions from net realized capital gains | | | (30.23 | ) | | | (21.85 | ) | | | (2.70 | ) | | | 0.00 | | | | 0.00 | |
| | | | | | | | | | | | | | | | | | | | |
Total distributions | | | (30.23 | ) | | | (21.85 | ) | | | (2.70 | ) | | | 0.00 | | | | 0.00 | |
| | | | | | | | | | | | | | | | | | | | |
Net Asset Value, End of Period | | $ | 245.18 | | | $ | 247.29 | | | $ | 231.34 | | | $ | 219.57 | | | $ | 188.95 | |
| | | | | | | | | | | | | | | | | | | | |
Total Return (%) | | | 11.7 | | | | 16.5 | | | | 6.8 | | | | 16.2 | | | | 36.3 | |
Ratio of operating expenses to average net assets before expense reductions (%) | | | 1.05 | | | | 1.08 | | | | 1.09 | | | | 1.13 | | | | 1.14 | |
Ratio of operating expenses to average net assets after expense reductions (%) (b) | | | 1.04 | | | | 1.07 | | | | 1.06 | | | | 1.10 | | | | N/A | |
Ratio of operating expenses to average net assets without giving effect to the contractual expense agreement would have been (%) (c) | | | 1.10 | | | | 1.13 | | | | 1.09 | | | | 1.13 | | | | 1.14 | |
Ratio of net investment income (loss) to average net assets (%) | | | (0.18 | ) | | | 0.03 | | | | (0.10 | ) | | | (0.26 | ) | | | (0.37 | ) |
Portfolio turnover rate (%) | | | 64 | | | | 76 | | | | 101 | | | | 135 | | | | 118 | |
Net assets, end of period (000) | | $ | 63,434 | | | $ | 59,821 | | | $ | 50,554 | | | $ | 47,131 | | | $ | 31,759 | |
| (a) | Per share amount is based on average shares outstanding during the period. |
| (b) | The Portfolio has entered into arrangements with certain brokers who paid a portion of the Portfolio’s expenses. |
| (c) | See Note 4 in the Notes to Financial Statements. |
See accompanying notes to financial statements.
MSF-12
Metropolitan Series Fund, Inc.
Loomis Sayles Small Cap Portfolio
Notes to Financial Statements—December 31, 2007
Metropolitan Series Fund, Inc. (the “Fund”) is organized as a corporation under the laws of Maryland pursuant to Articles of Incorporation filed on November 23, 1982, as amended, and registered under the Investment Company Act of 1940, as amended (the “1940 Act”), as an open-end investment company. The Fund is a “series” type of mutual fund, which issues separate series of stock. Each series represents an interest in a separate portfolio of Fund investments. The Loomis Sayles Small Cap Portfolio (the “Portfolio”) is a diversified series of the Fund. Shares in the Fund are not offered directly to the general public and are currently available only to separate accounts established by Metropolitan Life Insurance Company (“MetLife”), New England Life Insurance Company, General American Life Insurance Company (“General American”), The MetLife Investors Group of Insurance Companies, MetLife Insurance Company of Connecticut and other affiliated insurance companies (collectively, the “Insurance Companies”), as an investment vehicle for variable life insurance, group annuity or variable annuity products, although the Portfolio is not available to all such separate accounts. The Portfolio’s shares may be divided into different classes. Currently, the classes being offered by the Portfolio are named Class A, Class B and Class E. The classes of the Portfolio’s shares are identical, except that certain additional charges (Rule 12b-1 fees) are made against Class B and Class E shares. Investment income, realized and unrealized capital gains and losses, the common expenses of the Portfolio and certain Portfolio-level expense reductions, if any, are allocated on a pro rata basis to each class based on the relative net assets of each class to the total net assets of the Portfolio.
| 2. | SIGNIFICANT ACCOUNTING POLICIES: |
The preparation of financial statements in conformity with accounting principles generally accepted in the United States of America (“GAAP”) requires management to make estimates and assumptions that affect the reported amounts of assets and liabilities and disclosure of contingent assets and liabilities as of the date of the financial statements and the reported amounts of income and expenses during the reporting period. Actual results could differ from those estimates.
The following is a summary of significant accounting policies consistently followed by the Portfolio in the preparation of its financial statements. The policies are in conformity with GAAP.
Investment Valuation:
Debt securities (other than short term obligations with a remaining maturity of sixty days or less) are valued by independent pricing services selected by the relevant subadviser pursuant to authorization of the Board of Directors of the Fund (the “Board” or “Directors”). Short term obligations with a remaining maturity of sixty days or less are valued at amortized cost which approximates fair market value.
Equity securities traded on a national securities exchange or exchanges are valued at their last sale price on the principal trading market. Equity securities traded on the NASDAQ National Market System are valued at the NASDAQ Official Closing Price (the “NOCP”). The NOCP is the last sale price if it falls between the spread of the last reported bid and asked prices. If the last reported bid and asked prices are above the last reported sale price, the NOCP will be the last reported bid price. If the last reported bid and asked prices are below the last reported sale price, the NOCP will be the last reported asked price. Equity securities traded on a national securities exchange or exchanges or on the NASDAQ National Market System for which there is no reported sale during the day are valued at the last reported bid price. A security that is listed or traded on more than one exchange is valued at the quotation on the exchange determined to be the primary market for that security by the Board or its delegates. If no closing price is available, then such securities are valued by using the last reported bid price. Equity securities traded over-the-counter are valued at the last reported sales price.
If no current market value quotation is readily available or reliable for a portfolio security, fair value will be determined in accordance with procedures established by and under the general supervision of the Board. When the Portfolio uses fair value pricing, it may take into account any factors it deems appropriate. The value of securities used by the Portfolio to calculate its net asset value may differ from quoted or published prices for the same securities. Fair value pricing involves subjective judgments and the fair value determined for a security may be materially different than the value that could be realized upon the sale of that security.
The Portfolio expects to use fair value pricing for securities primarily traded on U.S. exchanges only under very limited circumstances. For example, the Portfolio may use fair value pricing if the exchange on which a security is traded closes early or trading in the security is suspended.
MSF-13
Metropolitan Series Fund, Inc.
Loomis Sayles Small Cap Portfolio
Notes to Financial Statements—December 31, 2007—(Continued)
Securities traded primarily on an exchange outside of the United States which closes before the close of the New York Stock Exchange will be valued at the last sales price on that non-U.S. exchange. Securities traded primarily on an exchange outside of the United States for which there is no reported sale during the day are valued at the mean between the last reported bid and asked prices. However, because most foreign markets close well before the Portfolio values its securities (typically at 4 p.m. Eastern Time), the earlier close of these foreign markets gives rise to the possibility that significant events, including broad market moves, may have occurred after these foreign markets close but before the Portfolio values its securities. To account for this, the Portfolio may frequently value many of its foreign equity securities using fair value prices based on third party vendor modeling tools.
Forward foreign currency exchange contracts are valued based on the mean between closing bid and asked prices of the forward currency contract rates in the London foreign exchange markets on a daily basis as provided by a reliable bank or dealer.
Options, whether on securities, indices, futures contracts, or otherwise, are valued at the last sales price available as of the close of business on the day of valuation or, if there is no such sale price available, at the mean between the bid and asked prices. Options on currencies are valued at the spot price each day.
The value of futures contracts will be the sum of the margin deposit plus or minus the difference between the value of the futures contract on each day the net asset value is calculated and the value on the date the futures contract originated, value being that established on a recognized commodity exchange, or by reference to other customary sources, with gain or loss being realized when the futures contract closes or expires.
Subject to the Board’s oversight, the Board has delegated day-to-day responsibility for valuing Portfolio assets to the subadviser of the Portfolio, who values such assets as described above and operates under procedures approved by the Board.
Investment Transactions and Related Investment Income:
Portfolio security transactions are recorded on the trade date. Dividend income is recorded on the ex-dividend date or, for certain foreign securities, when notified. Interest income, which includes amortization of premium and accretion of discount on debt securities, is recorded on the accrual basis. Realized gains and losses on investments and unrealized appreciation and depreciation are determined on the identified cost basis, which is the same basis used for federal income tax purposes.
Repurchase Agreements:
The Portfolio, through the custodian or a subcustodian, receives delivery of the underlying securities collateralizing repurchase agreements. The Portfolio requires the custodian to take possession, to have legally segregated in the Federal Reserve Book Entry System, or to have segregated within the custodian’s vault, all securities held as collateral for repurchase agreements. It is the Portfolio’s policy that the market value of the collateral be at least equal to 100% of the repurchase price in the case of a repurchase agreement of one-day duration and 102% on all other repurchase agreements. The Portfolio’s subadviser is responsible for determining that the value of the collateral is at all times at least equal to the repurchase price. In connection with transactions in repurchase agreements, if the seller defaults and the value of the collateral declines or if the seller enters an insolvency proceeding, realization of the collateral by the Portfolio may be delayed, limited or wholly denied.
Foreign Currency Translation:
The books and records of the Portfolio are maintained in U.S. dollars. The values of securities, currencies and other assets and liabilities denominated in currencies other than U.S. dollars are translated into U.S. dollars based upon foreign exchange rates prevailing at the end of the period. Purchases and sales of investment securities, income and expenses are translated on the respective dates of such transactions. Since the values of investment securities are presented at the foreign exchange rates prevailing at the end of the period, it is not practical to isolate that portion of the results of operations arising from changes in exchange rates from that portion of the results of operations reflecting fluctuations arising from changes in market prices of the investment securities. Such fluctuations are included in the net realized and unrealized gain or loss on investments.
Net realized foreign exchange gains or losses arise from sales of foreign currency, currency gains or losses realized between the trade and settlement dates on securities transactions, and the difference between the amounts of dividends, interest, and foreign withholding taxes recorded by the Portfolio and the U.S. dollar equivalent of the amounts actually received or paid by the Portfolio. Net unrealized foreign exchange gains and losses arise from changes in the value of assets and liabilities, other than investment securities, resulting from changes in the exchange rate.
MSF-14
Metropolitan Series Fund, Inc.
Loomis Sayles Small Cap Portfolio
Notes to Financial Statements—December 31, 2007—(Continued)
Forward Foreign Currency Exchange Contracts:
The Portfolio may enter into forward foreign currency exchange contracts primarily to hedge against foreign currency exchange rate risks on its non-U.S. dollar denominated investment securities. When entering into a forward currency contract, the Portfolio agrees to receive or deliver a fixed quantity of foreign currency for an agreed-upon price on an agreed future date. These contracts are valued daily and the Portfolio’s net equity therein, representing unrealized gain or loss on the contracts as measured by the difference between the foreign exchange rates at the dates of entry into the contracts and the forward rates at the settlement date, is included in the Statement of Assets and Liabilities. Realized and unrealized gains and losses are included in the Statement of Operations. These instruments involve market and/or credit risk in excess of the amount recognized in the Statement of Assets and Liabilities. Risks arise from the possible inability of counterparties to meet the terms of their contracts and from movement in currency and securities values and interest rates.
Futures Contracts:
The Portfolio may buy and sell futures contracts (on recognized exchanges) as a hedge or to enhance return. Futures contracts are agreements to buy or sell a security, or deliver a final cash settlement price in connection with an index, interest rate, currency, or other contracts not calling for physical delivery, for a set price in the future. The Portfolio must post an amount equal to a portion of the total market value of the futures contract as futures variation margin, which is returned when the Portfolio’s obligations under the contract have been satisfied. From time to time thereafter, the Portfolio may have to post variation margin to maintain this amount as the market value of the contract fluctuates. Risks of entering into futures contracts (and related options) include the possibility that there may be an illiquid market and that a change in the value of the contract or option may not correlate with changes in the value of the underlying securities.
Options:
The Portfolio may use options to hedge against changes in values of securities the Portfolio owns or expects to purchase. Writing puts or buying calls tends to increase the Portfolio’s exposure to the underlying instrument and writing calls or buying puts tends to decrease the Portfolio’s exposure to the underlying instrument, and can be used to hedge other Portfolio investments. For options purchased to hedge the Portfolio’s investments, the potential risk to the Portfolio is that the change in value of options contracts may not correspond to the change in value of the hedged instruments. In addition, losses may arise from changes in the value of the underlying instruments, if there is an illiquid secondary market, or if the counterparty is unable to perform. The maximum loss for purchased options is limited to the premium initially paid for the option. For options written by the Portfolio, the maximum loss is not limited to the premium initially received for the option.
The main risk associated with purchasing an option is that the option expires without being exercised. In this case, the option expires worthless and the premium paid for the option is considered the loss. The risk associated with writing a call option is that the Portfolio may forgo the opportunity for a profit if the market value of the underlying position increases and the option is exercised. The risk in writing a put option is that the Portfolio may incur a loss if the market value of the underlying position decreases and the option is exercised. In addition, the Portfolio risks not being able to enter into a closing transaction for the written option as the result of an illiquid market.
“When-Issued” Securities:
Purchasing securities “when-issued” is a forward commitment by the Portfolio to buy a security. The estimated amount of the Portfolio’s payment obligation and the security’s interest rate are determined when the commitment is made, even though no interest accrues until the security is issued, which is generally 15 to 120 days later. The Portfolio will segregate liquid assets with its custodian sufficient at all times to satisfy these commitments. If the value of the security is less when delivered than when the commitment was made, the Portfolio will suffer a loss.
Federal Income Taxes:
It is the Portfolio’s policy to comply with the requirements of the Internal Revenue Code of 1986, as amended, and regulations thereunder, applicable to regulated investment companies and to distribute all of its taxable income to shareholders. Therefore, no federal income tax provision is required.
As of December 31, 2007, the Portfolio had no capital loss carryovers.
MSF-15
Metropolitan Series Fund, Inc.
Loomis Sayles Small Cap Portfolio
Notes to Financial Statements—December 31, 2007—(Continued)
The tax character of distributions paid for the periods ended December 31, 2007 and 2006 was as follows:
| | | | | | | | | | | | | | | | | | | | | |
| Ordinary Income | | Long Term Gain | | Return of Capital | | Total |
| 2007 | | 2006 | | 2007 | | 2006 | | 2007 | | 2006 | | 2007 | | 2006 |
| $10,856,813 | | $ | 8,987,266 | | $ | 48,915,580 | | $ | 31,703,109 | | $ | — | | $ | — | | $ | 59,772,393 | | $ | 40,690,375 |
As of December 31, 2007, the components of distributable earnings (accumulated losses) on a federal income tax basis were as follows:
| | | | | | | | | | | | |
Undistributed
Ordinary
Income | | Undistributed
Long Term
Gain | | Unrealized
Appreciation | | Loss
Carryforwards | | Total |
| $19,099,788 | | $ | 50,466,523 | | $ | 75,366,860 | | $ | — | | $ | 144,933,171 |
Dividends and Distributions to Shareholders:
The Portfolio records dividends and distributions on the ex-dividend date. Net realized gains from security transactions (if any) are generally distributed annually to shareholders. The timing and characterization of certain income and capital gains distributions are determined in accordance with federal tax regulations that may differ from GAAP. Permanent book and tax basis differences relating to shareholder distributions will result in reclassification between under/over distributed net investment income, accumulated net realized gains/losses and paid in capital.
Expense Reductions:
Certain Portfolio trades are directed to brokers who paid a portion of the Portfolio’s expenses. Amounts paid for the Portfolio are shown as expense reductions in the Statement of Operations.
| 3. | INVESTMENT TRANSACTIONS: |
For the year ended December 31, 2007, purchases and sales of securities (excluding short term investments) for the Portfolio were as follows:
| | | | | | | | | |
| Purchases | | Sales |
| U.S. Government | | Other | | U.S. Government | | Other |
| $0 | | $ | 328,703,186 | | $ | 0 | | $ | 347,225,198 |
| 4. | INVESTMENT MANAGEMENT FEES AND OTHER TRANSACTIONS WITH AFFILIATES: |
Investment Management Agreement:
MetLife Advisers, LLC (“MetLife Advisers”) is the investment adviser to the Portfolio. The Fund has entered into an investment management agreement with MetLife Advisers with respect to the Portfolio. For providing investment management services to the Portfolio, MetLife Advisers receives monthly compensation at the following annual rates:
| | | | | | |
| | | Management
Fees earned by
MetLife Advisers
for the year ended
December 31, 2007 | | Annual
percentage
rates paid to
MetLife Advisers | | Based on Portfolios
average daily net asset levels |
| | $4,791,224 | | 0.900% | | Of the first $500 million |
| | | | 0.850% | | On amounts in excess of $500 million |
Certain officers and directors of the Fund may also be officers of MetLife Advisers; however, such officers and directors receive no compensation from the Fund.
MetLife Advisers has entered into an investment subadvisory agreement with respect to the Portfolio. Loomis, Sayles & Co., L.P. is compensated by MetLife Advisers to provide subadvisory services for the Portfolio.
Management Fee Waivers:
Pursuant to an expense agreement, MetLife Advisers has agreed, for the period May 1, 2007 to April 30, 2008, to reduce its advisory fees set out above under “Investment Management Agreement” for each class of the Portfolio at the annual rate of 0.05% of average daily net assets. Amounts waived for the year ended December 31, 2007 are shown as management fee waivers in the Statement of Operations.
MSF-16
Metropolitan Series Fund, Inc.
Loomis Sayles Small Cap Portfolio
Notes to Financial Statements—December 31, 2007—(Continued)
Service and Distribution Fees:
The Fund has adopted a Distribution and Service Plan under Rule 12b-1 of the 1940 Act for the Portfolio’s Class B and E shares. Under the Distribution and Service Plan, the Class B and E shares of the Portfolio pay a fee to compensate the Insurance Companies (or their affiliates) and other broker-dealers and financial intermediaries involved in the offer and sale of Portfolio shares for promoting or selling and servicing, the Class B and E shares. The fees under the Distribution and Service Plan for each class of the Portfolio’s shares are calculated as a percentage of the Portfolio’s average daily net assets that are attributable to that Class. Currently, the fee is 0.25% per year for Class B shares and 0.15% per year for Class E shares. Amounts paid by the Portfolio for the year ended December 31, 2007 are shown as Service and Distribution fees in the Statement of Operations.
The Fund has entered into a securities lending arrangement with the Fund’s custodian, State Street Bank and Trust Company (the “custodian”). Under the agreement, the custodian is authorized to loan securities on the Portfolios’ behalf. In exchange, the Portfolio receives either cash or securities as collateral against the loaned securities. The Portfolio receives collateral at least equal to 102% of the market value of the loaned securities (105% for foreign securities), at each loan’s inception. Collateral must be maintained at least at 100% of the market value of the loaned securities for the duration of the loan. The cash collateral is invested in the Navigator Securities Lending Prime Portfolio, an affiliate of the custodian, which invests in a variety of high quality U.S. dollar-denominated instruments. If the market value of the collateral at the close of trading on a business day is less than 100% of the market value of the loaned securities at the close of trading on that day, the borrower shall be required to deliver, by the close of business on the following business day, an additional amount of collateral, equal to at least 100% of the market value of all the loaned securities as of such preceding day. The Portfolio receives 80% of the annual net income from securities lending transactions, which is included in interest income of the Portfolio. The remaining 20% is paid to the custodian as compensation for its securities lending services. The Portfolio bears the risk of any deficiency in the amount of collateral available for return to a borrower due to a loss in an approved investment. Any outstanding loans by the Portfolio at December 31, 2007 are footnoted in the Schedule of Investments.
As previously reported, in May 2004, General American received a Wells Notice stating that the SEC staff was considering recommending that the SEC bring a civil action alleging violations of the U.S. securities laws against General American with respect to market timing and late trading in a limited number of privately-placed variable insurance contracts that were sold through General American. General American responded to the SEC staff and cooperated with the investigation. On August 9, 2007, the SEC announced that it had settled an enforcement action regarding late trading against General American with, among other things, General American agreeing to pay a civil penalty and to comply with certain undertakings. General American consented to the SEC’s order without admitting or denying the findings. MetLife Advisers has also advised the Fund’s Board of Directors that, while certain exceptions to the Fund’s policies have been noted, no situations have been identified that would have a material impact on the financial position of the Fund.
| 7. | RECENT ACCOUNTING PRONOUNCEMENTS: |
Effective June 29, 2007, the Fund implemented Financial Accounting Standards Board (“FASB”) Interpretation No. 48, “Accounting for Uncertainty in Income Taxes—an interpretation of FASB Statement No. 109” (“FIN 48”). FIN 48 prescribes the minimum recognition threshold a tax position must meet in connection with accounting for uncertainties in income tax positions taken or expected to be taken by an entity, including investment companies, before being measured and recognized in the financial statements. Management has evaluated the application of FIN 48 to the Fund, and has determined that the adoption of FIN 48 does not have a material impact on the Fund’s financial statements. The Fund files U.S. tax returns. No income tax returns are currently under examination. The statute of limitations on the Fund’s tax returns remains open for the years ended December 31, 2004 through December 31, 2006.
In September 2006, Statement of Financial Accounting Standards No. 157, Fair Value Measurements (SFAS 157) was issued and is effective for fiscal years beginning after November 15, 2007. SFAS 157 defines fair value, establishes a framework for measuring fair value and expands disclosures about fair value measurements. Management is currently evaluating the impact the adoption of SFAS 157 will have on the Portfolio’s financial statement disclosures.
MSF-17
Metropolitan Series Fund, Inc.
Loomis Sayles Small Cap Portfolio
Report of Independent Registered Public Accounting Firm
To the Shareholders and Board of Directors of the Metropolitan Series Fund, Inc.:
We have audited the accompanying statement of assets and liabilities, including the schedule of investments, of the Loomis Sayles Small Cap Portfolio, one of the portfolios constituting the Metropolitan Series Fund, Inc. (the “Fund”) as of December 31, 2007, and the related statement of operations for the year then ended, the statements of changes in net assets for each of the two years in the period then ended, and the financial highlights for each of the five years in the period then ended. These financial statements and financial highlights are the responsibility of the Fund’s management. Our responsibility is to express an opinion on these financial statements and financial highlights based on our audits.
We conducted our audits in accordance with the standards of the Public Company Accounting Oversight Board (United States). Those standards require that we plan and perform the audit to obtain reasonable assurance about whether the financial statements and financial highlights are free of material misstatement. The Fund is not required to have, nor were we engaged to perform, an audit of its internal control over financial reporting. Our audits included consideration of internal control over financial reporting as a basis for designing audit procedures that are appropriate in the circumstances, but not for the purpose of expressing an opinion on the effectiveness of the Fund’s internal control over financial reporting. Accordingly, we express no such opinion. An audit also includes examining, on a test basis, evidence supporting the amounts and disclosures in the financial statements, assessing the accounting principles used and significant estimates made by management, as well as evaluating the overall financial statement presentation. Our procedures included confirmation of securities owned as of December 31, 2007, by correspondence with the custodian and brokers; where replies were not received from brokers, we performed other auditing procedures. We believe that our audits provide a reasonable basis for our opinion.
In our opinion, the financial statements and financial highlights referred to above present fairly, in all material respects, the financial position of the Loomis Sayles Small Cap Portfolio of the Metropolitan Series Fund, Inc. as of December 31, 2007, the results of its operations for the year then ended, the changes in its net assets for each of the two years in the period then ended, and the financial highlights for each of the five years in the period then ended, in conformity with accounting principles generally accepted in the United States of America.
Deloitte & Touche LLP
Boston, Massachusetts
February 21, 2008
MSF-18
Metropolitan Series Fund, Inc.
Directors and Officers
The Fund’s Directors review actions of the Fund’s investment adviser and subadvisers, and decide upon matters of general policy. The Fund’s officers supervise the daily business operations of the Fund. The Board of Directors and the Fund’s officers are listed below. Each Director is responsible for overseeing all 36 Portfolios of the Fund. There is no limit to the term a Director may serve. Directors serve until their resignation, retirement or removal in accordance with the Fund’s organizational documents and policies adopted by the Board from time to time. Officers hold office at the pleasure of the Board or until the election or appointment and the qualification of a successor. The address of the directors and officers is c/o Metropolitan Series Fund, Inc., 501 Boylston Street, Boston, MA 02116.
Interested Directors(1)
Each Director below is an “interested person” (as defined by the 1940 Act) with respect to the Fund in that Ms. Forget is an employee of MetLife and Mr. Typermass is a former employee of MetLife and owns securities issued by MetLife, Inc., the ultimate parent company of MetLife Advisers.
| | | | | | | | |
Name, Address and Age | | Current
position(s)
with Fund | | Position(s)
held since | | Principal occupations
over past five years, including other directorships(2) | | Number of
Portfolios in
Fund Complex
Overseen by
Director(3) |
Elizabeth M. Forget Age: 41 | | Director, Chairman of the Board, President and Chief Executive Officer | | 2006 | | Senior Vice President (since 2007), MetLife, Inc.; President, Met Investors Advisory, LLC (“MIA”); Trustee and President, Met Investors Series Trust (“MIST”); Executive Vice President, MetLife Investors Group, Inc.; President (since 2006), MetLife Advisers. | | 81 |
| | | | |
Arthur G. Typermass Age: 70 | | Director | | 1998 | | Formerly, Senior Vice President and Treasurer, MetLife. | | 37 |
Non-Interested Directors(1)
Each Director below is not an “interested person” (as defined by the 1940 Act) with respect to the Fund (collectively, the “Independent Directors”).
| | | | | | | | |
Name, Address and Age | | Current
position(s)
with Fund | | Position(s)
held since | | Principal occupations
over past five years, including other directorships(2) | | Number of
Portfolios in
Fund Complex
Overseen by
Director(3) |
Steve A. Garban† Age: 70 | | Director | | 1985 | | Formerly, Chief Financial Officer, Senior Vice President Finance and Operations and Treasurer (Emeritus), The Pennsylvania State University. | | 37 |
| | | | |
Linda B. Strumpf Age: 60 | | Director | | 2000 | | Vice President and Chief Investment Officer, Ford Foundation. | | 37 |
| | | | |
Michael S. Scott Morton† Age: 70 | | Director | | 1993 | | Jay W. Forrester Professor of Management (Emeritus) at Sloan School of Management, MIT. | | 37 |
| | | | |
H. Jesse Arnelle Age: 74 | | Director | | 2001 | | Formerly, Counsel, Womble Carlyle Sandrie & Rice; Director, Textron Inc. (global multi-industry company)*; formerly, Director, Gannet Co. Inc. (diversified news and information company)*; formerly, Director, Eastman Chemical Company (global chemical company)*; formerly, Director, Waste Management, Inc.*; formerly, Director, Armstrong Holdings Inc. (parent company of floor and ceiling products business)*; formerly, Director, FPL Group Inc. (public utility holding company)*; Director, URS Corporation (engineering design services firm)*. | | 37 |
| | | | |
Nancy Hawthorne Age: 56 | | Director | | 2003 | | Director, Avid Technologies (computer software company)*; formerly, Chairman of the Board of Avid Technologies; formerly, Board of Advisors, L. Knife & Sons, Inc. (beverage distributor); Chief Executive Officer, Clerestory LLC (corporate financial advisor); formerly, Trustee, New England Zenith Fund (“Zenith Fund”)**; formerly, Chief Executive Officer and Managing Partner, Hawthorne, Krauss and Associates (corporate financial advisor); formerly, Chief Financial Officer and Executive Vice President, Continental Cablevision, subsequently renamed MediaOne (cable television company); formerly, Director, Life F/X, Inc.; formerly, Chairman of the Board, WorldClinic (distance medicine company); formerly, Director, Perini Corporation (construction company)*; formerly, Director, CGU (property and casualty insurance company); formerly, Director, Beacon Power Corporation (energy company )*. | | 37 |
MSF-19
Metropolitan Series Fund, Inc.
Directors and Officers—(Continued)
| | | | | | | | |
Name, Address and Age | | Current
position(s)
with Fund | | Position(s)
held since | | Principal occupations
over past five years, including other directorships(2) | | Number of
Portfolios in
Fund Complex
Overseen by
Director(3) |
John T. Ludes Age: 71 | | Director | | 2003 | | President, LFP Properties (consulting firm); Formerly, Trustee, Zenith Fund**; formerly, Vice Chairman, President and Chief Operating Officer, Fortune Brands/American Brands (global conglomerate); formerly, President and CEO, Acushnet Company (athletic equipment company). | | 37 |
Officers(1)
| | | | | | | | |
Name and address | | Age | | Current
position(s)
with Fund | | Position(s)
held since | | Principal occupations over past five years(2) |
| Jeffrey P. Halperin | | 40 | | Chief Compliance Officer | | 2006 | | Vice President (since 2006), Corporate Ethics and Compliance Department, MetLife, Inc.; Chief Compliance Officer (since 2006), MetLife Advisers, MIA and MIST. |
| | | | |
| John F. Guthrie, Jr. | | 64 | | Senior Vice President | | 2002 | | Manager and Senior Vice President, MetLife Advisers; Vice President, MetLife; Vice President (since 2003), MetLife Group, Inc.; Vice President, NELICO; Vice President (since 2005), MIA; formerly, Senior Vice President, Zenith Fund**. |
| | | | |
| Alan C. Leland | | 55 | | Senior Vice President | | 2005 | | Treasurer and Chief Financial Officer, MetLife Advisers, LLC; Treasurer (since 2005), Met Investors Advisory, LLC; Vice President (since 2004), MIA; Vice President (since 2003), MetLife Group, Inc.; Vice President, MetLife; Senior Vice President, NELICO |
| | | | |
| Peter Duffy | | 52 | | Vice President and Treasurer | | 2000 | | Senior Vice President, MetLife Advisers (since 1998); Second Vice President (since 2003), NELICO; Vice President, MetLife (since 2004); Vice President (since 2004), MetLife Group, Inc.; formerly, Vice President and Treasurer, Zenith Fund**. |
| | | | |
| Thomas M. Lenz | | 49 | | Vice President and Secretary | | 2002 | | General Counsel and Secretary, MetLife Advisers; Assistant General Counsel, MetLife; formerly, Vice President and Secretary, Zenith Fund**. |
| * | Indicates a directorship with a registered investment company or a company subject to the reporting requirements of the Securities Exchange Act of 1934, as amended. |
| ** | The Zenith Fund deregistered with the Securities and Exchange Commission (“SEC”) in 2004. |
| (†) | Served as a trustee, director and/or officer of one or more of the following companies, each of which had a direct or indirect advisory relationship with MetLife Advisers or its affiliates prior to January 31, 2005: State Street Research Financial Trust, State Street Research Income Trust, State Street Research Money Market Trust, State Street Research Institutional Funds, State Street Research Capital Trust, State Street Research Master Investment Trust, State Street Research Equity Trust, State Street Research Securities Trust and State Street Research Exchange Trust (collectively, the “State Street Research Funds”). |
| (1) | Each Director of the Fund also serves as trustee of Metropolitan Series Fund II (“Met Series Fund II”), a registered investment company advised by MetLife Advisers. Each officer of the Fund serves in the same position with Met Series Fund II, which consists of one portfolio. |
| (2) | Previous positions during the past five years with the Fund, MIST, MetLife, MetLife Advisers, MIA, Zenith Fund, NELICO or New England Securities Corporation are omitted if not materially different. |
| (3) | The Fund Complex includes the Fund (36 portfolios), Met Series Fund II (1 portfolio) and MIST (44 portfolios) |
MSF-20
Metropolitan Series Fund, Inc.
Loomis Sayles Small Cap Portfolio
Board Approval of Advisory and Subadvisory Agreements
The Fund’s Contract Review Committees of the Board of Directors (the “Board”) typically meet in early fall to review the Portfolios’ advisory agreements (the “Advisory Agreements”) and subadvisory agreements (collectively, the “Subadvisory Agreements,” and, together with the Advisory Agreements, the “Agreements”) and determine whether to recommend that the full Board approve the continuation of the Agreements for an additional one-year period. (Following the initial approval of an Agreement for a new Portfolio or with a new adviser or subadviser, such annual reviews are not required until 2 years following the execution of such Agreement.) After each Committee has made its recommendations, the full Board, including the Independent Directors, determines whether to approve the continuation of each of the Agreements. In addition, the Board, including the Independent Directors, considers matters bearing on the Agreements at most of its other meetings throughout the year and regularly interviews various individuals at MetLife Advisers responsible for the management of the Portfolios. The Directors also interview selected investment managers and other professionals at the subadvisers at various times throughout the year.
The Directors receive all materials that they or MetLife Advisers, the Fund’s investment adviser, and the subadvisers believe to be reasonably necessary for the Directors to evaluate the Agreements and determine whether to approve the continuation of the Agreements. These materials generally include, among other items, (i) information on the investment performance of the Portfolios and the performance of peer groups of funds and the Portfolios’ performance benchmarks, (ii) information on the Portfolios’ advisory and subadvisory fees and other expenses, including information comparing the Portfolios’ expenses to those of peer groups of funds and information about any applicable expense caps and fee “breakpoints,” (iii) sales and redemption data, (iv) information related to the profitability of the Agreements to MetLife Advisers and the subadvisers, and potential “fall-out” or ancillary benefits that MetLife Advisers, the subadvisers or their affiliates may receive as a result of their relationships with the Fund and (v) information obtained through the subadvisers’ responses to certain requests from MetLife Advisers and the Directors and MetLife Advisers’ responses to requests from the Directors. The Directors may also consider other information such as (vi) MetLife Advisers’ and the subadvisers’ financial results and condition, (vii) each Portfolio’s investment objectives and strategies and the size, education and experience of the investment staffs of MetLife Advisers and the relevant subadvisers and their use of technology and external research, (viii) the allocation of the Portfolios’ brokerage, if any, including allocations to brokers affiliated with the subadvisers and the use of “soft” commission dollars to pay Portfolio expenses and to pay for research and other similar services, (ix) the resources devoted to, and the record of compliance with, the Portfolios’ investment policies and restrictions, policies on personal securities transactions and other compliance policies, (x) the responses of MetLife Advisers, the subadvisers and/or their affiliates to certain legal and regulatory proceedings and (xi) the economic outlook generally and for the mutual fund industry in particular. Throughout the process, the Directors have the opportunity to ask questions of and request additional materials from MetLife Advisers and the subadvisers.
Following meetings of each Contract Review Committee on September 12, 2007, the Board, at its November 15, 2007 meeting, approved the continuation through December 31, 2008 of the Advisory Agreements for each Portfolio of the Fund and the Subadvisory Agreements for each Portfolio of the Fund. The Agreements approved for continuation are referred to below as the “Continued Agreements.”
In considering whether to approve the continuation of the Continued Agreements, the Directors, including the Independent Directors, did not identify any single factor as determinative, and each weighed the various factors as he or she deemed appropriate. The Directors considered the following matters in connection with their approval of the Continued Agreements:
The nature, extent and quality of the services provided to the relevant Portfolios under the Continued Agreements. The Directors considered the nature, extent and quality of the services provided by MetLife Advisers, the relevant subadvisers (if any) and their affiliates (each, an “Adviser,” and, collectively, the “Advisers”) to the relevant Portfolios pursuant to the Continued Agreements and the resources dedicated to these Portfolios by the Advisers. In particular, the Directors considered the Advisers’ abilities to attract and retain highly qualified investment professionals. With respect to MetLife Advisers, the Directors considered that MetLife Advisers is (i) ultimately responsible for the performance of such Portfolios; (ii) ultimately responsible for the establishment of the investment strategies of each such Portfolio, primarily through its recommendations to the Board regarding the hiring and selection of subadvisers; (iii) responsible for the hiring and selection, subject to Board approval, of subadvisers; and (iv) responsible for maintaining a program of Subadviser oversight reasonably designed to ensure that the subadvisers have reasonable compliance policies and procedures in place. The Directors also considered that MetLife Advisers provides a full range of day-to-day administrative services for the Portfolios involving all aspects of such Portfolios’ day-to-day operations (other than portfolio management). After reviewing these and related factors, the Directors concluded, within the context of their overall conclusions regarding each of the Continued Agreements, that the nature, extent and quality of services provided supported the renewal of these Agreements.
Investment performance of the relevant Portfolios. The Directors reviewed information about the performance of the relevant Portfolios over various time periods, including information prepared by an independent third party that compared the performance of the Portfolios to the performance of peer groups of funds and performance benchmarks. The Directors also reviewed a description of the third party’s methodology for identifying a Portfolio’s peer group(s) for purposes of performance and expense comparisons.
MSF-21
Metropolitan Series Fund, Inc.
Loomis Sayles Small Cap Portfolio
Board Approval of Advisory and Subadvisory Agreements—(Continued)
In the case of each relevant Portfolio that had performance that lagged its peer group(s) for certain periods, the Directors concluded that other factors relevant to performance were sufficient, in light of other considerations, to warrant renewal of the Continued Agreements relating to such Portfolio. These factors varied from Portfolio to Portfolio, but included one or more of the following: (i) that such Portfolio’s performance, although lagging in certain recent periods, was stronger over the longer term; (ii) that the underperformance was attributable, to a significant extent, to investment decisions that were reasonable and consistent with the Portfolio’s investment objective(s) and policies and that the Portfolio was performing within the range of reasonable expectations, given market conditions and the Portfolio’s investment objective(s) and policies; (iii) that the Portfolio’s performance was competitive when compared to other relevant performance benchmarks or peer groups; and (iv) that MetLife Advisers and/or the relevant subadviser (if any) had taken or was taking steps designed to help improve the Portfolio’s investment performance.
The Directors also considered the investment performance of the Advisers and their reputations generally, the historical responsiveness of the Advisers to Director concerns about performance and the willingness of the Advisers to take steps intended to improve performance.
After reviewing these and related factors, the Directors concluded, within the context of their overall conclusions regarding each of the Continued Agreements, that the investment performance of each relevant Portfolio and Adviser was sufficient, in light of other considerations, to warrant the renewal of the Continued Agreements.
The costs of the services to be provided and profits to be realized by the Advisers and their affiliates from their relationships with the Portfolios. The Directors considered the fees charged by MetLife Advisers to the Portfolios for advisory services and, with respect to the subadvised Portfolios, by such subadvisers to MetLife Advisers for subadvisory services (such advisory and subadvisory fees (if any), collectively, “Fees”), as well as the total expense levels of the Portfolios. This information included comparisons (provided by an independent third party) of the Portfolios’ advisory fees and total expense levels to those of their peer groups. In evaluating Fees for the relevant Portfolios, the Directors also took into account the demands, complexity and quality of the investment management services provided to each Portfolio. The Directors considered MetLife Advisers’ recommendations regarding reductions in Fee rates, implementation of Fee breakpoints and institution of Fee waivers and expense caps.
The Directors also considered the compensation directly or indirectly received by the Advisers and their affiliates from their relationships with the relevant Portfolios. The Directors reviewed information relating to the profits received by MetLife Advisers, certain of the subadvisers and their affiliates as a result of their relationships with the relevant Portfolios, and information about the allocation of expenses used to calculate profitability. When reviewing profitability, the Directors also considered the performance of the relevant Portfolios, the expense levels of such Portfolios and whether the relevant Advisers had implemented breakpoints, fee waivers and/or expense caps with respect to such Portfolios.
After reviewing these and related factors, the Directors concluded, within the context of their overall conclusions regarding each of the Continued Agreements, that the Fees charged to each of the relevant Portfolios were fair and reasonable, and that the information provided regarding costs of these services generally, and the related profitability (if known) to the relevant Advisers of their relationships with the relevant Portfolios, supported the renewal of the Continued Agreements.
Economies of Scale. The Directors considered the existence of any economies of scale in the provision of services by the Advisers and whether those economies were shared with the relevant Portfolios through breakpoints in their advisory fees or other means, such as expense caps, fee waivers or relatively low levels of fees. The Directors noted that most of the relevant Portfolios benefited or will benefit from breakpoints, expense caps and/or fee waivers with respect to their advisory fees. In considering these issues, the Directors also took into consideration information relating to the costs of the services provided and the profitability to MetLife Advisers, the relevant subadvisers (if any) and each of their affiliates of their relationships with the relevant Portfolios, as discussed above.
After reviewing these and related factors, the Directors concluded, within the context of their overall conclusions regarding each of the Continued Agreements, that the extent to which economies of scale were shared with the relevant Portfolios supported the renewal of such Agreements.
Other Factors. The Directors also considered other factors, which included but were not limited to the following:
| | • | | the extent to which each relevant Portfolio operated in accordance with its investment objective, and its record of compliance with its investment restrictions and the compliance programs of the Fund and the Advisers. They also considered the compliance-related resources the Advisers and their affiliates provide to the relevant Portfolios; |
| | • | | the nature, quality, cost and extent of administrative and shareholder services performed by MetLife Advisers and its affiliates under the Advisory Agreements; and |
MSF-22
Metropolitan Series Fund, Inc.
Loomis Sayles Small Cap Portfolio
Board Approval of Advisory and Subadvisory Agreements—(Continued)
| | • | | so-called “fall-out benefits” to the Advisers, such as the engagement of their affiliates to provide distribution, brokerage and transfer agency services to the Portfolios, and the benefits of research made available to the relevant Advisers by reason of brokerage commissions generated by the relevant Portfolios’ securities transactions. The Directors also considered the possible conflicts of interest associated with these fall-out and other benefits, and the reporting and other processes in place to disclose and monitor these possible conflicts of interest. |
Based on their evaluation of all factors that they deemed to be material, including those factors described above, and assisted by the advice of independent counsel, the Directors, including the Independent Directors, concluded that each of the Continued Agreements should be continued through December 31, 2008.
MSF-23
A description of the policies and procedures that the Fund uses to determine how to vote proxies relating to portfolio securities is available (i) without charge, upon request, by calling (800) 638-7732 and (ii) on the Securities and Exchange Commission’s (the “SEC”) website at http://www.sec.gov.
Information regarding how the Fund voted proxies relating to portfolio securities during the most recent twelve-month period ended December 31, 2007 is available (i) without charge, upon request, by calling (800) 638-7732 and (ii) on the SEC’s website at http://www.sec.gov.
The Fund files with the SEC a complete schedule of its portfolio holdings, as of the close of the first and third quarters of its fiscal year, on “Form N-Q”. These filings are available on the SEC’s website at www.sec.gov and may be reviewed and copied at the SEC’s Public Reference Room in Washington, DC. (Call 1-800-SEC-0330 for information on the operation of the Public Reference Room.)
MSF-24
| | |
Metropolitan Series Fund, Inc. MetLife Aggressive Allocation Portfolio Annual Report | | December 31, 2007 |
Letter from the President
February 1, 2008
Letter to Policy Holders:
2007 was a tumultuous year in the financial markets driven by concerns in the credit markets surrounding sub-prime mortgages and fears of recession in the U.S. Economy. The broad markets were mixed, with the Dow Jones Industrial Average up 8.9% and the MSCI EAFE Index, which measures the performance of international equities, up 11.2% for the year, while the Russell 2000 Index, which measures the performance of small capitalization stocks, was down 1.6%.
In the fixed income markets, credit spreads increased as a result of the pressure from sub-prime mortgage crisis and the Federal Reserve lowered interest rates by a total of 1% during the year. The Lehman Brothers Aggregate Bond Index posted a 7.0% return for the year.
On the following pages, you will find a complete review of your Portfolio and its investment performance.
MetLife is committed to building your financial freedom. We appreciate your trust and will continue to focus our efforts on meeting your investment needs.
Sincerely,
Elizabeth Forget
President, Metropolitan Series Fund, Inc.
Metropolitan Series Fund, Inc.
MetLife Aggressive Allocation Portfolio
Managed by MetLife Advisers, LLC
Portfolio Manager Commentary*
PORTFOLIO PERFORMANCE
For the year ended December 31, 2007, the Class A shares of the MetLife Aggressive Allocation Portfolio returned 3.5% compared to the 5.7% return of the Wilshire 5000 Index1 and the 6.5% return of the Lehman Brothers U.S. Universal Bond Index2. Considering that no single index or benchmark can accurately capture the multiple asset class design of the Portfolio, we have created a blended benchmark comprised of several indices for use in portfolio design and evaluation purposes. Specifically, the blended benchmark for the MetLife Aggressive Allocation Portfolio consists of an 80% allocation to the Wilshire 5000 Index and a 20% allocation to the Morgan Stanley Capital International EAFE Index3. During the twelve-month period ended December 31, 2007, the blended benchmark returned 6.8%.
PORTFOLIO REVIEW
Concerns about subprime mortgages and the strength of the overall economy initially surfaced in the first half of 2007, but they were mostly brushed off. It was not until the second half of the year that those concerns intensified. Most economic statistics at the end of 2007 indicated a weakening economy: a sharp decrease in New and Existing Home Sales, a drop in Consumer Confidence, a rise in the Unemployment Rate, and a decline in the Purchasing Managers Index.
During 2007, large cap stocks, as measured by the Standard & Poor’s 500 Index4 return of 5.5%, did better than small cap stocks, as measured by the -1.6% return of the Russell 2000 Index5. Growth style stocks generally held up better than value style stocks. There was a wide dispersion among the various sectors of the S&P Index: Energy and Materials were up 34% and 22% respectively, while Financials (-19%) and Consumer Discretionary (-13%) were down sharply. On a local basis, foreign stocks were also up modestly for the year, but U.S. based investors benefited from a weak dollar to receive an 11.2% return as measured by the MSCI EAFE Index.
Investment grade bonds, as measured by the Lehman Brothers Aggregate Bond Index6, posted a 7.0% return in response to a decline in interest rates across the yield curve. Below investment grade bonds, while still eking out a positive return for the year, were adversely impacted by credit concerns brought about by the subprime mortgage crisis. Treasuries and Treasury Inflation Protected Securities (TIPS) were the best performing investment grade sectors, while the credit based sectors lagged.
The MetLife Aggressive Allocation Portfolio is a “fund of funds” that invests in other Portfolios of the Metropolitan Series Fund, Inc. and the Met Investors Series Trust. The Portfolio’s initial target allocations were 100% in equity investments and 0% in fixed income investments, although we expect that there may be some cash held by the equity Portfolios. The MetLife Aggressive Allocation Portfolio is considered the most aggressive of the five Asset Allocation Portfolios.
The only change in the Portfolio during the period was a slight adjustment for the underlying Portfolios as of May 1, 2007. We also rebalanced the Portfolio on a quarterly basis to bring it back into line with the underlying Portfolio targets and the desired risk level.
The largest source of underperformance over the past year was poor security selection within several of the underlying equity Portfolios. This impact was intensified by the large (100%) weighting to equities in general. These Portfolios did not perform as well as we would have expected given their asset allocation among the segments of the capital markets. Detracting the most from performance were the Harris Oakmark International Portfolio, which was down 1% for the year compared to an 11% return of foreign stocks overall, as measured by the MSCI EAFE Index, and the Legg Mason Value Equity Portfolio, which fell nearly 6% compared to the 5.5% return of the S&P 500 Index. Although its position was relatively small (2%) and its performance was in line with the real estate indices, the Neuberger Berman Real Estate Portfolio was down sharply for the year (-14.8%) relative to the broad equity market. This had an adverse impact on the Portfolio’s performance.
Among the underlying Portfolios that had positive security selection and added to relative performance were the Met/AIM Small Cap Growth Portfolio, the Jennison Growth Portfolio, and the T. Rowe Price Large Cap Growth Portfolio. Among the equity funds, growth oriented funds like these performed better than the broad equity market and added relative value to the Portfolio’s performance.
* The views expressed above are those of the advisory firm as of December 31, 2007 and are subject to change based on market and other conditions. Information about the Portfolio’s holdings, asset allocation, industry allocation, or country diversification is historical and is not an indication of future Portfolio composition, which will vary. The performance of any index mentioned in this commentary has not been adjusted for ongoing management, distribution and operating expenses, and sales charges applicable to mutual fund investments. Direct investment in the Index is not possible.
1 The Wilshire 5000 Index measures the performance of all U.S. headquartered equity securities with readily available price data.
2 The Lehman Brothers U.S. Universal Bond Index represents the union of the U.S. Aggregate Index, the U.S. High-Yield Corporate Index, the 144A Index, the Eurodollar Index, the Emerging Markets Index, the non-EIRSA portion of the Commercial Mortgage Backed Securities Index and the Commercial Mortgage Backed Securities High Yield Index.
3 The Morgan Stanley Capital International Europe, Australasia and Far East Index (“MSCI EAFE Index”) is an unmanaged free float-adjusted market capitalization index that is designed to measure developed market equity performance, excluding the U.S. & Canada.
4 The Standard & Poor’s (S&P) 500® Stock Index is an unmanaged index representing the performance of 500 major companies, most of which are listed on the New York Stock Exchange.
5 The Russell 2000® Index is an unmanaged measure of performance of the 2,000 smallest companies in the Russell 3000® Index.
6 Lehman Brothers® Aggregate Bond Index includes most obligations of the U.S. Treasury, agencies and quasi-federal corporations, most publicly issued investment grade corporate bonds and most bonds backed by mortgage pools of GNMA, FNMA and FHLMC.
MSF-2
Metropolitan Series Fund, Inc.
MetLife Aggressive Allocation Portfolio
A $10,000 INVESTMENT COMPARED TO
THE WILSHIRE 5000 STOCK INDEX AND THE LEHMAN BROTHERS
UNIVERSAL BOND INDEX
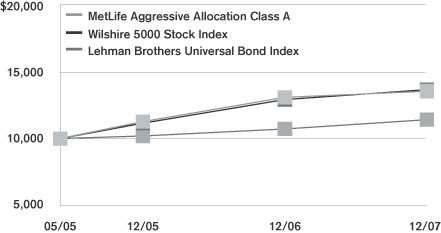
Average Annual Returns as of December 31, 2007
| | | | | | | | | | | | |
| | | MetLife Aggressive
Allocation Portfolio | | | Wilshire 5000
Stock Index | | | Lehman Brothers
Universal Bond Index | |
| | | Class A | | | Class B | | | |
| 1 Year | | 3.5 | % | | 3.3 | % | | 5.7 | % | | 6.5 | % |
| Since Inception | | 12.0 | | | 11.7 | | | 12.4 | | | 5.1 | |
Performance numbers are net of all Portfolio expenses but do not include any insurance, sales, or administrative charges of variable annuity or life insurance contracts. If these charges were included, the returns would be lower.
Inception date of the Class A and Class B shares is 5/2/05. Index since inception return is based on the Portfolio’s inception date.
This information represents past performance and is not indicative of future results. Investment return and principal value may fluctuate so that shares, upon redemption, may be worth more or less than the original cost.
PORTFOLIO COMPOSITION as of December 31, 2007
Top Holdings
| | |
| | | % of Total
Net Assets |
Metropolitan Series Fund, Inc.—Davis Venture Value Portfolio, (Class A) | | 12.1% |
Metropolitan Series Fund, Inc.—Neuberger Berman Mid Cap Value Portfolio, (Class A) | | 9.3% |
Metropolitan Series Fund, Inc.—BlackRock Large Cap Value Portfolio, (Class A) | | 9.2% |
Metropolitan Series Fund, Inc.—T. Rowe Price Large Cap Growth Portfolio, (Class A) | | 9.1% |
Met Investors Series Trust—Harris Oakmark International Portfolio, (Class A) | | 8.9% |
Metropolitan Series Fund, Inc.—Julius Baer International Stock Portfolio, (Class A) | | 8.9% |
Met Investors Series Trust—Legg Mason Value Equity Portfolio, (Class A) | | 6.9% |
Met Investors Series Trust—Lazard Mid-Cap Portfolio, (Class A) | | 5.8% |
Metropolitan Series Fund, Inc.—Jennison Growth Portfolio, (Class A) | | 5.1% |
Met Investors Series Trust—Dreman Small Cap Value Portfolio, (Class A) | | 4.9% |
MSF-3
Metropolitan Series Fund, Inc.
Shareholder Expense Example
As a shareholder of the Fund, you incur ongoing costs, including management fees; distribution and service (12b-1) fees; and other fund expenses. This example is intended to help you understand your ongoing costs (in dollars) (referred to as “expenses”) of investing in the Portfolio and compare these costs with the ongoing costs of investing in other mutual funds. The example is based on an investment of $1,000 invested at the beginning of the period and held for the entire period, July 1, 2007 through December 31, 2007.
Actual Expenses
The first line for each share class of the Portfolio in the table below provides information about actual account values and actual expenses. You may use the information in this line, together with the amount you invested in the particular share class of the Portfolio, to estimate the expenses that you paid over the period. Simply divide your account value by $1,000 (for example, an $8,600 account value divided by $1,000=8.6), then multiply the result by the number in the first line under the heading entitled “Expenses Paid During Period” to estimate the expenses you paid on your account during this period.
Hypothetical Example for Comparison Purposes
The second line for each share class of the Portfolio in the table below provides information about hypothetical account values and hypothetical expenses based on the Portfolio’s actual expense ratio and an assumed rate of return of 5% per year before expenses, which is not the Portfolio’s actual return. The hypothetical account values and expenses may not be used to estimate the actual ending account balance or expenses you paid for the period. You may use this information to compare the ongoing costs of investing in the Portfolio and other funds. To do so, compare this 5% hypothetical example with the 5% hypothetical examples that appear in the shareholder reports of the other funds.
Please note that the expenses shown in the table are meant to highlight your ongoing costs only and do not reflect any fees or charges of your variable insurance product or any additional expenses that participants in certain eligible qualified plans may bear relating to the operations of their plan. Therefore, the second line for each share class in the table is useful in comparing ongoing costs only, and will not help you determine the relative total costs of owning different funds. In addition, if these other costs were included, your costs would have been higher.
| | | | | | | | | | | | | | |
Portfolio | | | | Annualized
Expense
Ratio | | | Beginning
Account Value
July 1,
2007 | | Ending
Account Value
December 31,
2007 | | Expenses Paid
During Period*
July 1, 2007
to
December 31,
2007 |
MetLife Aggressive Allocation—Class A(a)(b) | | Actual | | 0.85 | % | | $ | 1,000.00 | | $ | 958.40 | | $ | 4.20 |
| | Hypothetical | | 0.85 | % | | $ | 1,000.00 | | $ | 1,020.87 | | $ | 4.33 |
| | | | | |
MetLife Aggressive Allocation—Class B(a)(b) | | Actual | | 1.10 | % | | $ | 1,000.00 | | $ | 956.80 | | $ | 5.43 |
| | Hypothetical | | 1.10 | % | | $ | 1,000.00 | | $ | 1,019.59 | | $ | 5.60 |
* Expenses paid are equal to the Portfolio’s annualized expense ratio for the most recent six month period, as shown above, multiplied by the average account value over the period, multiplied by the number of days in the most recent fiscal half-year, divided by 365 (to reflect the one-half year period).
(a) The annualized expense ratio shown reflects an expense agreement between MetLife Advisers, LLC and the Portfolio as described under Expense Agreement in Note 4 to the Financial Statements.
(b) The annualized expense ratio reflects the expenses of both the Portfolio and the underlying Portfolios in which it invests.
MSF-4
Metropolitan Series Fund, Inc.
MetLife Aggressive Allocation Portfolio
Schedule of Investments as of December 31, 2007
Mutual Funds—100.0%
| | | | | | |
| Security Description | | Shares | | Value* | |
| | |
Affiliated Investment Companies—100.0% | | | | | | |
Met Investors Series Trust—BlackRock Large Cap Core Portfolio, (Class A) | | 654,715 | | $ | 7,293,526 | |
Met Investors Series Trust—Dreman Small Cap Value Portfolio, (Class A) | | 849,706 | | | 11,530,516 | |
Met Investors Series Trust—Harris Oakmark International Portfolio, (Class A) | | 1,223,694 | | | 21,133,191 | |
Met Investors Series Trust—Lazard Mid-Cap Portfolio, (Class A) | | 1,127,095 | | | 13,716,746 | |
Met Investors Series Trust—Legg Mason Value Equity Portfolio, (Class A) | | 1,552,046 | | | 16,296,478 | |
Met Investors Series Trust—Met/AIM Small Cap Growth Portfolio, (Class A) | | 631,867 | | | 9,389,545 | |
Met Investors Series Trust—Neuberger Berman Real Estate Portfolio, (Class A) | | 322,079 | | | 4,534,878 | |
Metropolitan Series Fund, Inc.—BlackRock Large Cap Value Portfolio, (Class A) | | 1,597,668 | | | 21,744,262 | |
Metropolitan Series Fund, Inc.—Davis Venture Value Portfolio, (Class A) | | 784,911 | | | 28,602,167 | |
Metropolitan Series Fund, Inc.—Julius Baer International Stock Portfolio, (Class A) | | 1,315,667 | | | 21,103,294 | |
Metropolitan Series Fund, Inc.—FI Mid Cap Opportunities Portfolio, (Class A) | | 439,400 | | | 9,288,913 | |
Metropolitan Series Fund, Inc.—Jennison Growth Portfolio, (Class A) | | 892,547 | | | 12,156,493 | |
Metropolitan Series Fund, Inc.—MetLife Stock Index Portfolio, (Class A) | | 258,550 | | | 9,566,345 | |
Metropolitan Series Fund, Inc.—Neuberger Berman Mid Cap Value Portfolio, (Class A) | | 1,033,563 | | | 21,973,545 | |
Metropolitan Series Fund, Inc.—Russell 2000 Index Portfolio, (Class A) | | 495,720 | | | 7,029,313 | |
Metropolitan Series Fund, Inc.—T. Rowe Price Large Cap Growth Portfolio, (Class A) | | 1,314,893 | | | 21,669,437 | |
| | | | | | |
Total Mutual Funds
(Identified Cost $236,328,856) | | | | | 237,028,649 | |
| | | | | | |
Total Investments—100.0%
(Identified Cost $236,328,856)(a) | | | | | 237,028,649 | |
Liabilities in excess of other assets | | | | | (49,197 | ) |
| | | | | | |
| Total Net Assets—100% | | | | $ | 236,979,452 | |
| | | | | | |
| (a) | The aggregate cost of investments for federal income tax purposes as of December 31, 2007 was $236,646,390 and the composition of unrealized appreciation and depreciation of investment securities was $4,136,908 and $(3,754,649), respectively. |
*See accompanying notes to financial statements.
MSF-5
Metropolitan Series Fund, Inc.
MetLife Aggressive Allocation Portfolio
Statement of Assets & Liabilities
December 31, 2007
| | | | | | |
Assets | | | | | | |
Investments at value (a) | | | | | $ | 237,028,649 |
Receivable for: | | | | | | |
Securities sold | | | | | | 63,978 |
Fund shares sold | | | | | | 633,481 |
Due from investment adviser | | | | | | 21,378 |
| | | | | | |
Total Assets | | | | | | 237,747,486 |
Liabilities | | | | | | |
Payable for: | | | | | | |
Fund shares redeemed | | $ | 697,460 | | | |
Due to custodian bank | | | 12 | | | |
Accrued expenses: | | | | | | |
Service and distribution fees | | | 42,400 | | | |
Other expenses | | | 28,162 | | | |
| | | | | | |
Total Liabilities | | | | | | 768,034 |
| | | | | | |
Net Assets | | | | | $ | 236,979,452 |
| | | | | | |
Net assets consists of: | | | | | | |
Capital paid in | | | | | $ | 229,590,881 |
Undistributed net investment income | | | | | | 1,099,563 |
Accumulated net realized gains | | | | | | 5,589,215 |
Unrealized appreciation on investments | | | | | | 699,793 |
| | | | | | |
Net Assets | | | | | $ | 236,979,452 |
| | | | | | |
| Computation of offering price: | | | | | | |
Class A | | | | | | |
Net asset value and redemption price per share ($37,714,855 divided by 2,978,010 shares outstanding) | | | | | $ | 12.66 |
| | | | | | |
Class B | | | | | | |
Net asset value and redemption price per share ($199,264,597 divided by 15,798,733 shares outstanding) | | | | | $ | 12.61 |
| | | | | | |
(a) Identified cost of investments | | | | | $ | 236,328,856 |
| | | | | | |
Statement of Operations
For the Year Ended December 31, 2007
| | | | | | | | |
Investment Income | | | | | | | | |
Dividends from Underlying Portfolios | | | | | | $ | 783,007 | |
| | | | | | | | |
Expenses | | | | | | | | |
Management fees | | $ | 149,301 | | | | | |
Service and distribution fees—Class B | | | 296,825 | | | | | |
Directors’ fees and expenses | | | 811 | | | | | |
Custodian | | | 28,091 | | | | | |
Audit and tax services | | | 18,574 | | | | | |
Legal | | | 2,034 | | | | | |
Miscellaneous | | | 9,656 | | | | | |
| | | | | | | | |
Total expenses | | | 505,292 | | | | | |
Expense reimbursements | | | (59,166 | ) | | | 446,126 | |
| | | | | | | | |
Net Investment Income | | | | | | | 336,881 | |
| | | | | | | | |
Realized and Unrealized Gain (Loss) | | | | | | | | |
| Realized gain on: | | | | | | | | |
Investments—net | | | 2,714,882 | | | | | |
Capital gain distributions from Underlying Portfolios | | | 3,868,440 | | | | 6,583,322 | |
| | | | | | | | |
| Change in unrealized depreciation on: | | | | | | | | |
Investments—net | | | | | | | (5,112,445 | ) |
| | | | | | | | |
Net gain | | | | | | | 1,470,877 | |
| | | | | | | | |
Net Increase in Net Assets From Operations | | | | | | $ | 1,807,758 | |
| | | | | | | | |
See accompanying notes to financial statements.
MSF-6
Metropolitan Series Fund, Inc.
MetLife Aggressive Allocation Portfolio
Statements of Changes in Net Assets
| | | | | | | | |
| | | Year ended
December 31,
2007 | | | Year ended
December 31,
2006 | |
From Operations | | | | | | | | |
Net investment income | | $ | 336,881 | | | $ | 199,452 | |
Net realized gain | | | 6,583,322 | | | | 1,419,233 | |
Unrealized appreciation (depreciation) | | | (5,112,445 | ) | | | 5,934,835 | |
| | | | | | | | |
Increase in net assets from operations | | | 1,807,758 | | | | 7,553,520 | |
| | | | | | | | |
From Distributions to Shareholders | | | | | | | | |
Net investment income | | | | | | | | |
Class A | | | (77,815 | ) | | | (95,705 | ) |
Class B | | | (60,916 | ) | | | (195,268 | ) |
| | | | | | | | |
| | | (138,731 | ) | | | (290,973 | ) |
| | | | | | | | |
Net realized gain | | | | | | | | |
Class A | | | (49,715 | ) | | | (401,661 | ) |
Class B | | | (175,134 | ) | | | (860,147 | ) |
| | | | | | | | |
| | | (224,849 | ) | | | (1,261,808 | ) |
| | | | | | | | |
Total distributions | | | (363,580 | ) | | | (1,552,781 | ) |
| | | | | | | | |
Increase in net assets from capital share transactions | | | 148,801,089 | | | | 70,483,007 | |
| | | | | | | | |
Total increase in net assets | | | 150,245,267 | | | | 76,483,746 | |
| | |
Net Assets | | | | | | | | |
Beginning of the period | | | 86,734,185 | | | | 10,250,439 | |
| | | | | | | | |
End of the period | | $ | 236,979,452 | | | $ | 86,734,185 | |
| | | | | | | | |
Undistributed Net Investment Income | | | | | | | | |
End of the period | | $ | 1,099,563 | | | $ | 114,329 | |
| | | | | | | | |
Other Information:
Capital Shares
Transactions in capital shares were as follows:
| | | | | | | | | | | | | | |
| | | Year ended
December 31, 2007 | | | Year ended
December 31, 2006 | |
| | | Shares | | | $ | | | Shares | | | $ | |
Class A | | | | | | | | | | | | | | |
Sales | | 2,177,073 | | | $ | 28,039,123 | | | 1,879,417 | | | $ | 21,558,817 | |
Reinvestments | | 9,818 | | | | 127,530 | | | 43,514 | | | | 497,366 | |
Redemptions | | (790,860 | ) | | | (10,188,504 | ) | | (596,785 | ) | | | (6,765,139 | ) |
| | | | | | | | | | | | | | |
Net increase | | 1,396,031 | | | $ | 17,978,149 | | | 1,326,146 | | | $ | 15,291,044 | |
| | | | | | | | | | | | | | |
Class B | | | | | | | | | | | | | | |
Sales | | 13,383,674 | | | $ | 170,207,545 | | | 5,162,802 | | | $ | 58,794,816 | |
Shares issued through acquisition | | 0 | | | | 0 | | | 631,555 | | | | 7,224,995 | |
Reinvestments | | 18,214 | | | | 236,050 | | | 92,580 | | | | 1,055,415 | |
Redemptions | | (3,098,906 | ) | | | (39,620,655 | ) | | (1,051,226 | ) | | | (11,883,263 | ) |
| | | | | | | | | | | | | | |
Net increase | | 10,302,982 | | | $ | 130,822,940 | | | 4,835,711 | | | $ | 55,191,963 | |
| | | | | | | | | | | | | | |
Increase derived from capital share transactions | | | | | $ | 148,801,089 | | | | | | $ | 70,483,007 | |
| | | | | | | | | | | | | | |
See accompanying notes to financial statements.
MSF-7
Metropolitan Series Fund, Inc.
MetLife Aggressive Allocation Portfolio
Financial Highlights
| | | | | | | | | | | | |
| | | Class A | |
| | | Year ended December 31, | |
| | | 2007 | | | 2006 | | | 2005(a) | |
Net Asset Value, Beginning of Period | | $ | 12.29 | | | $ | 11.21 | | | $ | 10.00 | |
| | | | | | | | | | | | |
Income From Investment Operations | | | | | | | | | | | | |
Net investment income | | | 0.06 | (b) | | | 0.12 | | | | 0.04 | |
Net realized and unrealized gain on investments | | | 0.37 | | | | 1.62 | | | | 1.24 | |
| | | | | | | | | | | | |
Total from investment operations | | | 0.43 | | | | 1.74 | | | | 1.28 | |
| | | | | | | | | | | | |
Less Distributions | | | | | | | | | | | | |
Distributions from net investment income | | | (0.04 | ) | | | (0.13 | ) | | | (0.04 | ) |
Distributions from net realized capital gains | | | (0.02 | ) | | | (0.53 | ) | | | (0.03 | ) |
| | | | | | | | | | | | |
Total distributions | | | (0.06 | ) | | | (0.66 | ) | | | (0.07 | ) |
| | | | | | | | | | | | |
Net Asset Value, End of Period | | $ | 12.66 | | | $ | 12.29 | | | $ | 11.21 | |
| | | | | | | | | | | | |
Total Return (%) | | | 3.5 | | | | 16.1 | | | | 12.7 | (c) |
Ratio of operating expenses to average net assets (%) (e) | | | 0.10 | | | | 0.10 | | | | 0.10 | (d) |
Ratio of operating expenses to average net assets without giving effect to the contractual expense agreement would have been (%) (g) | | | 0.14 | | | | 0.17 | | | | 1.76 | (d) |
Ratio of net investment income to average net assets (%) (f) | | | 0.47 | | | | 0.83 | | | | 1.53 | (d) |
Portfolio turnover rate (%) | | | 25 | | | | 37 | | | | 57 | (d) |
Net assets, end of period (000) | | $ | 37,715 | | | $ | 19,444 | | | $ | 2,867 | |
| | | | | | | | | | | | |
| | | Class B | |
| | | Year ended December 31, | |
| | | 2007 | | | 2006 | | | 2005(a) | |
Net Asset Value, Beginning of Period | | $ | 12.24 | | | $ | 11.19 | | | $ | 10.00 | |
| | | | | | | | | | | | |
Income From Investment Operations | | | | | | | | | | | | |
Net investment income | | | 0.02 | (b) | | | 0.10 | | | | 0.03 | |
Net realized and unrealized gain on investments | | | 0.38 | | | | 1.60 | | | | 1.23 | |
| | | | | | | | | | | | |
Total from investment operations | | | 0.40 | | | | 1.70 | | | | 1.26 | |
| | | | | | | | | | | | |
Less Distributions | | | | | | | | | | | | |
Distributions from net investment income | | | (0.01 | ) | | | (0.12 | ) | | | (0.04 | ) |
Distributions from net realized capital gains | | | (0.02 | ) | | | (0.53 | ) | | | (0.03 | ) |
| | | | | | | | | | | | |
Total distributions | | | (0.03 | ) | | | (0.65 | ) | | | (0.07 | ) |
| | | | | | | | | | | | |
Net Asset Value, End of Period | | $ | 12.61 | | | $ | 12.24 | | | $ | 11.19 | |
| | | | | | | | | | | | |
Total Return (%) | | | 3.3 | | | | 15.7 | | | | 12.6 | (c) |
Ratio of operating expenses to average net assets (%) (e) | | | 0.35 | | | | 0.35 | | | | 0.35 | (d) |
Ratio of operating expenses to average net assets without giving effect to the contractual expense agreement would have been (%) (g) | | | 0.39 | | | | 0.42 | | | | 2.01 | (d) |
Ratio of net investment income to average net assets (%) (f) | | | 0.16 | | | | 0.31 | | | | 1.29 | (d) |
Portfolio turnover rate (%) | | | 25 | | | | 37 | | | | 57 | (d) |
Net assets, end of period (000) | | $ | 199,265 | | | $ | 67,290 | | | $ | 7,384 | |
| (a) | Commencement of operations was May 2, 2005. |
| (b) | Per share amount is based on average shares outstanding during the period. |
| (c) | Periods less than one year are not computed on an annualized basis. |
| (d) | Computed on an annualized basis. |
| (e) | The ratio of operating expenses to average net assets does not include expenses of investment companies in which the Portfolio invests. |
| (f) | Recognition of net investment income by the Portfolio is affected by the timing of the declaration of dividends by the underlying Portfolios in which it invests. |
| (g) | See Note 4 in the Notes to Financial Statements. |
See accompanying notes to financial statements.
MSF-8
Metropolitan Series Fund, Inc.
MetLife Aggressive Allocation Portfolio
Notes to Financial Statements—December 31, 2007
Metropolitan Series Fund, Inc. (the “Fund”) is organized as a corporation under the laws of Maryland pursuant to Articles of Incorporation filed on November 23, 1982, as amended, and registered under the Investment Company Act of 1940, as amended (the “1940 Act”), as an open-end investment company. The Fund is a “series” type of mutual fund, which issues separate series of stock. Each series represents an interest in a separate portfolio of Fund investments. The MetLife Aggressive Allocation Portfolio (the “Asset Allocation Portfolio”) is a non-diversified series of the fund. The Asset Allocation Portfolio operates under a “fund of funds” structure, investing substantially all of its assets in other Portfolios advised by MetLife Advisers, LLC (“MetLife Advisers”) or its affiliates (each, an “Underlying Portfolio,” and, collectively, the “Underlying Portfolios”). Shares in the Fund are not offered directly to the general public and are currently available only to separate accounts established by Metropolitan Life Insurance Company (“MetLife”), New England Life Insurance Company, General American Life Insurance Company (“General American”), The MetLife Investors Group of Insurance Companies, MetLife Insurance Company of Connecticut and other affiliated insurance companies (collectively, the “Insurance Companies”), as an investment vehicle for variable life insurance, group annuity or variable annuity products, although not all Portfolios are available to all such separate accounts. The Asset Allocation Portfolio’s shares may be divided into different classes. Currently, the classes being offered by the Asset Allocation Portfolio are named Class A and Class B. The classes of the Asset Allocation Portfolio’s shares are identical, except that certain additional charges (Rule 12b-1 fees) are made against Class B shares. Investment income, realized and unrealized capital gains and losses, the common expenses of the Asset Allocation Portfolio and certain Portfolio-level expense reductions, if any, are allocated on a pro rata basis to each class based on the relative net assets of each class to the total net assets of the Asset Allocation Portfolio.
| 2. | SIGNIFICANT ACCOUNTING POLICIES: |
The preparation of financial statements in conformity with accounting principles generally accepted in the United States of America (“GAAP”) requires management to make estimates and assumptions that affect the reported amounts of assets and liabilities and disclosure of contingent assets and liabilities as of the date of the financial statements and the reported amounts of income and expenses during the reporting period. Actual results could differ from those estimates.
The following is a summary of significant accounting policies consistently followed by the Asset Allocation Portfolio in the preparation of its financial statements. The policies are in conformity with GAAP.
Investment Valuation:
The net asset value of the Asset Allocation Portfolio is calculated based on the net asset values of the Underlying Portfolios in which the Asset Allocation Portfolio invests. The Underlying Portfolios that are series of the Fund will use fair value pricing in the circumstances and manner described below. For more information about the use of fair value pricing by the Underlying Portfolios that are series of Met Investors Series Trust (“MIST”), please refer to the prospectus for such Underlying Portfolios.
The Underlying Portfolios that are series of the Fund are valued as follows:
Debt securities (other than short term obligations with a remaining maturity of sixty days or less) are valued on the basis of valuations furnished by independent pricing services selected by the relevant subadviser pursuant to authorization of the Board of Directors of the Fund (the “Board” or “Directors”). Short term obligations with a remaining maturity of sixty days or less are valued at amortized cost which approximates fair market value.
Equity securities traded on a national securities exchange or exchanges are valued at their last sale price on the principal trading market. Equity securities traded on the NASDAQ National Market System are valued at the NASDAQ Official Closing Price (the “NOCP”). The NOCP is the last sale price if it falls between the spread of the last reported bid and asked prices. If the last reported bid and asked prices are above the last reported sale price, the NOCP will be the last reported bid price. If the last reported bid and asked prices are below the last reported sale price, the NOCP will be the last reported asked price. Equity securities traded on a national securities exchange or exchanges or on the NASDAQ National Market System for which there is no reported sale during the day are valued at the last reported bid price. A security that is listed or traded on more than one exchange is valued at the quotation on the exchange determined to be the primary market for that security by the Board or its delegates. If no closing price is available, then such securities are valued by using the last reported bid price. Equity securities traded over-the-counter are valued at the last reported sales price.
If no current market value quotation is readily available or reliable for a portfolio security, fair value will be determined in accordance with procedures established by and under the general supervision of the Board. When an Underlying Portfolio uses
MSF-9
Metropolitan Series Fund, Inc.
MetLife Aggressive Allocation Portfolio
Notes to Financial Statements—December 31, 2007—(Continued)
fair value pricing, it may take into account any factors it deems appropriate. The value of securities used by the Underlying Portfolio to calculate its net asset value may differ from quoted or published prices for the same securities. Fair value pricing involves subjective judgments and the fair value determined for a security may be materially different than the value that could be realized upon the sale of that security.
The Underlying Portfolios expect to use fair value pricing for securities primarily traded on U.S. exchanges only under very limited circumstances. For example, the Underlying Portfolio may use fair value pricing if the exchange on which a security is traded closes early or trading in the security is suspended.
Securities traded primarily on an exchange outside of the United States which closes before the close of the New York Stock Exchange will be valued at the last sales price on that non-U.S. exchange. Securities traded primarily on an exchange outside of the United States for which there is no reported sale during the day are valued at the mean between the last reported bid and asked prices. However, because most foreign markets close well before the Underlying Portfolio values its securities (typically at 4 p.m. Eastern Time), the earlier close of these foreign markets gives rise to the possibility that significant events, including broad market moves, may have occurred after these foreign markets close but before the Underlying Portfolio values its securities. For example, foreign security values may be affected by activity that occurs after the close of foreign securities markets. To account for this, the Underlying Portfolio may frequently value many of its foreign equity securities using fair value prices based on third party vendor modeling tools.
Forward foreign currency exchange contracts are valued based on the mean between closing bid and asked prices of the forward currency contract rates in the London foreign exchange markets on a daily basis as provided by a reliable bank or dealer.
Options, whether on securities, indices, futures contracts, or otherwise, are valued at the last sales price available as of the close of business on the day of valuation or, if there is no such sale price available, at the mean between the bid and asked prices. Options on currencies are valued at the spot price each day.
The value of futures contracts will be the sum of the margin deposit plus or minus the difference between the value of the futures contract on each day the net asset value is calculated and the value on the date the futures contract originated, value being that established on a recognized commodity exchange, or by reference to other customary sources, with gain or loss being realized when the futures contract closes or expires.
Subject to the Board’s oversight, the Board has delegated day-to-day responsibility for valuing Underlying Portfolio assets to MetLife Advisers, LLC (“MetLife Advisers” or the “Adviser”) or the subadviser of the Underlying Portfolio, as applicable, who values such assets as described above and operates under procedures approved by the Board.
Investment Transactions and Related Investment Income:
Portfolio security transactions are recorded on the trade date. Dividend income is recorded on the ex-dividend date. Interest income is recorded on the accrual basis. Realized gains and losses on investments and unrealized appreciation and depreciation are determined on the identified cost basis, which is the same basis used for federal income tax purposes.
Federal Income Taxes:
It is the Fund’s policy to comply with the requirements of the Internal Revenue Code of 1986, as amended, and regulations thereunder, applicable to regulated investment companies and to distribute all of its taxable income to shareholders. Therefore, no federal income tax provision is required.
As of December 31, 2007, the Asset Allocation Portfolio had no capital loss carryovers.
The tax character of distributions paid for the periods ended December 31, 2007 and 2006 was as follows:
| | | | | | | | | | | | | | | | | | | | | |
Ordinary Income | | Long Term Gain | | Return of Capital | | Total |
2007 | | 2006 | | 2007 | | 2006 | | 2007 | | 2006 | | 2007 | | 2006 |
$363,580 | | $ | 678,179 | | $ | — | | $ | 874,602 | | $ | — | | $ | — | | $ | 363,580 | | $ | 1,552,781 |
As of December 31, 2007, the components of distributable earnings (accumulated losses) on a federal income tax basis were as follows:
| | | | | | | | | | | | |
Undistributed
Ordinary
Income | | Undistributed
Long Term
Gain | | Unrealized
Appreciation | | Loss
Carryforwards | | Total |
| $2,154,583 | | $ | 4,851,731 | | $ | 382,259 | | $ | — | | $ | 7,388,573 |
MSF-10
Metropolitan Series Fund, Inc.
MetLife Aggressive Allocation Portfolio
Notes to Financial Statements—December 31, 2007—(Continued)
Dividends and Distributions to Shareholders:
The Asset Allocation Portfolio records dividends and distributions on the ex-dividend date. Net realized gains from security transactions (if any) are generally distributed annually to shareholders. The timing and characterization of certain income and capital gains distributions are determined in accordance with federal tax regulations that may differ from GAAP. Permanent book and tax basis differences relating to shareholder distributions will result in reclassification between under/over distributed net investment income, accumulated net realized gains/losses and paid in capital.
| 3. | INVESTMENT TRANSACTIONS: |
For the year ended December 31, 2007, purchases and sales of Underlying Portfolios by the Asset Allocation Portfolio were $190,273,717 and $37,644,192, respectively.
| 4. | INVESTMENT MANAGEMENT FEES AND OTHER TRANSACTIONS WITH AFFILIATES: |
Investment Management Agreement:
MetLife Advisers, LLC (“MetLife Advisers”) is the investment adviser to the Asset Allocation Portfolio. The Fund has entered into an investment management agreement with MetLife Advisers with respect to the Portfolio. For providing investment management services to the Portfolio, MetLife Advisers receives monthly compensation at the following annual rates:
| | | | | | | |
| | | Management
Fees earned by
MetLife Advisers
for the year ended
December 31, 2007 | | Annual
percentage
rates paid to
MetLife Advisers | | Based on Portfolios
average daily net asset levels |
| | $ | 149,301 | | 0.100% | | Of the first $500 million |
| | | | | 0.075% | | Of the next $500 million |
| | | | | 0.050% | | On amounts in excess of $1 billion |
In addition to the above Management Fee paid to MetLife Advisers, the Portfolio indirectly pays MetLife Advisers an investment advisory fee through its investments in certain Underlying Portfolios.
Certain officers and directors of the Fund may also be officers of MetLife Advisers; however, such officers and directors receive no compensation from the Fund.
Service and Distribution Fees:
The Fund has adopted a Distribution and Service Plan under Rule 12b-1 of the 1940 Act for the Asset Allocation Portfolio’s Class B shares. Under the Distribution and Service Plan, the Class B shares of the Asset Allocation Portfolio pay a fee to compensate the Insurance Companies (or their affiliates) and other broker-dealers and financial intermediaries involved in the offer and sale of Asset Allocation Portfolio shares for promoting or selling and servicing, the Class B shares of the Asset Allocation Portfolio. The fees under the Distribution and Service Plan for each class of the Asset Allocation Portfolio’s shares are calculated as a percentage of the Asset Allocation Portfolio’s average daily net assets that are attributable to that Class. Currently, the fee is 0.25% per year for Class B shares. Amounts paid by the Asset Allocation Portfolio for the year ended December 31, 2007 are shown as Service and Distribution fees in the Statement of Operations.
Expense Agreement:
Pursuant to an expense agreement relating to each class of the Asset Allocation Portfolio, MetLife Advisers has agreed, from May 1, 2007 to April 30, 2008, to waive a portion of its advisory fees or pay a portion of the other operating expenses (not including brokerage costs, interest, taxes, or extraordinary expenses) to the extent total operating expenses exceed stated annual expense limits (based on the Asset Allocation Portfolio’s then current fiscal year). For the Asset Allocation Portfolio, this subsidy, and similar subsidies in effect in earlier periods, are subject to the obligation of each class of the Asset Allocation Portfolio to repay MetLife Advisers in future years, if any, when a class’ expenses fall below the stated expense limit pertaining to that class that was in effect at the time of the subsidy in question. Such deferred expenses may be charged to a class in a subsequent year to the
MSF-11
Metropolitan Series Fund, Inc.
MetLife Aggressive Allocation Portfolio
Notes to Financial Statements—December 31, 2007—(Continued)
extent that the charge does not cause the total expenses in such subsequent year to exceed the class’ stated expense limit that was in effect at the time of the subsidy in question; provided, however, that no class of the Asset Allocation Portfolio is obligated to repay any expense paid by MetLife Advisers more than five years after the end of the fiscal year in which such expense was incurred.
The expense limits (annual rates as a percentage of each class of the Asset Allocation Portfolio’s net average daily net assets) in effect from May 1, 2007 to April 30, 2008 are 0.10% and 0.35% for Class A and B, respectively.
As of December 31, 2007, the amount of expenses deferred in 2005 subject to repayment until December 31, 2010 was $38,508 for the Asset Allocation Portfolio. The amount of expenses deferred in 2006 subject to repayment until December 31, 2011 was $33,960. The amount of expenses deferred in 2007 subject to repayment until December 31, 2012 was $59,166.
As previously reported, in May 2004, General American received a Wells Notice stating that the SEC staff was considering recommending that the SEC bring a civil action alleging violations of the U.S. securities laws against General American with respect to market timing and late trading in a limited number of privately-placed variable insurance contracts that were sold through General American. General American responded to the SEC staff and cooperated with the investigation. On August 9, 2007, the SEC announced that it had settled an enforcement action regarding late trading against General American with, among other things, General American agreeing to pay a civil penalty and to comply with certain undertakings. General American consented to the SEC’s order without admitting or denying the findings. MetLife Advisers has also advised the Fund’s Board of Directors that, while certain exceptions to the Fund’s policies have been noted, no situations have been identified that would have a material impact on the financial position of the Fund.
| 6. | RECENT ACCOUNTING PRONOUNCEMENTS: |
Effective June 29, 2007, the Fund implemented Financial Accounting Standards Board (“FASB”) Interpretation No. 48, “Accounting for Uncertainty in Income Taxes—an interpretation of FASB Statement No. 109” (“FIN 48”). FIN 48 prescribes the minimum recognition threshold a tax position must meet in connection with accounting for uncertainties in income tax positions taken or expected to be taken by an entity, including investment companies, before being measured and recognized in the financial statements. Management has evaluated the application of FIN 48 to the Fund, and has determined that the adoption of FIN 48 does not have a material impact on the Fund’s financial statements. The Fund files U.S. tax returns. No income tax returns are currently under examination. The statute of limitations on the Fund’s tax returns remains open for the years ended December 31, 2004 through December 31, 2006.
In September 2006, Statement of Financial Accounting Standards No. 157, Fair Value Measurements (SFAS 157) was issued and is effective for fiscal years beginning after November 15, 2007. SFAS 157 defines fair value, establishes a framework for measuring fair value and expands disclosures about fair value measurements. Management is currently evaluating the impact the adoption of SFAS 157 will have on the Portfolio’s financial statement disclosures.
| 7. | TRANSACTIONS IN SECURITIES OF AFFILIATED ISSUERS: |
The Asset Allocation Portfolio does not invest in the Underlying Portfolios for the purpose of exercising management or control; however, investments by the Asset Allocation Portfolio within its principal investment strategies may represent a significant portion of the Underlying Portfolio’s net assets. Transactions in the Underlying Portfolios during the year ended December 31, 2007 in which the Asset Allocation Portfolio had ownership of at least 5% of the outstanding voting securities at the end of the period are as follows:
| | | | | | | | |
Underlying Portfolio (Class A) | | Beginning Shares
as of 12/30/2006 | | Shares Purchased
During Period | | Shares
Sold During
Period | | Ending Shares
as of 12/31/2007 |
MIST—Dreman Small Cap Value | | 320,081 | | 575,285 | | 45,660 | | 849,706 |
| | | | |
Underlying Portfolio (Class A) | | Realized Gain
During Period | | Capital Gains
Distributions During
Period | | Dividend
Income During
Period | | Ending Value as
of 12/31/2007 |
MIST—Dreman Small Cap Value | | $47,735 | | $30,657 | | $0 | | $11,530,516 |
MSF-12
Metropolitan Series Fund, Inc.
MetLife Aggressive Allocation Portfolio
Report of Independent Registered Public Accounting Firm
To the Shareholders and Board of Directors of the Metropolitan Series Fund, Inc.:
We have audited the accompanying statement of assets and liabilities, including the schedule of investments, of the MetLife Aggressive Allocation Portfolio, one of the portfolios constituting the Metropolitan Series Fund, Inc. (the “Fund”) as of December 31, 2007, and the related statement of operations for the year then ended, the statements of changes in net assets for each of the two years in the period then ended, and the financial highlights for each of the two years ended December 31, 2007 and the period from May 2, 2005 (commencement of operations ) through December 31, 2005. These financial statements and financial highlights are the responsibility of the Fund’s management. Our responsibility is to express an opinion on these financial statements and financial highlights based on our audits.
We conducted our audits in accordance with the standards of the Public Company Accounting Oversight Board (United States). Those standards require that we plan and perform the audit to obtain reasonable assurance about whether the financial statements and financial highlights are free of material misstatement. The Fund is not required to have, nor were we engaged to perform, an audit of its internal control over financial reporting. Our audits included consideration of internal control over financial reporting as a basis for designing audit procedures that are appropriate in the circumstances, but not for the purpose of expressing an opinion on the effectiveness of the Fund’s internal control over financial reporting. Accordingly, we express no such opinion. An audit also includes examining, on a test basis, evidence supporting the amounts and disclosures in the financial statements, assessing the accounting principles used and significant estimates made by management, as well as evaluating the overall financial statement presentation. Our procedures included confirmation of securities owned as of December 31, 2007, by correspondence with the custodian and transfer agent. We believe that our audits provide a reasonable basis for our opinion.
In our opinion, the financial statements and financial highlights referred to above present fairly, in all material respects, the financial position of the MetLife Aggressive Allocation Portfolio of the Metropolitan Series Fund, Inc. as of December 31, 2007, the results of its operations for the year then ended, the changes in its net assets for each of the two years in the period then ended, and the financial highlights for each of the two years ended December 31, 2007 and the period from May 2, 2005 (commencement of operations) through December 31, 2005, in conformity with accounting principles generally accepted in the United States of America.
Deloitte & Touche LLP
Boston, Massachusetts
February 21, 2008
MSF-13
Metropolitan Series Fund, Inc.
Directors and Officers
The Fund’s Directors review actions of the Fund’s investment adviser and subadvisers, and decide upon matters of general policy. The Fund’s officers supervise the daily business operations of the Fund. The Board of Directors and the Fund’s officers are listed below. Each Director is responsible for overseeing all 36 Portfolios of the Fund. There is no limit to the term a Director may serve. Directors serve until their resignation, retirement or removal in accordance with the Fund’s organizational documents and policies adopted by the Board from time to time. Officers hold office at the pleasure of the Board or until the election or appointment and the qualification of a successor. The address of the directors and officers is c/o Metropolitan Series Fund, Inc., 501 Boylston Street, Boston, MA 02116.
Interested Directors(1)
Each Director below is an “interested person” (as defined by the 1940 Act) with respect to the Fund in that Ms. Forget is an employee of MetLife and Mr. Typermass is a former employee of MetLife and owns securities issued by MetLife, Inc., the ultimate parent company of MetLife Advisers.
| | | | | | | | |
Name, Address and Age | | Current
position(s)
with Fund | | Position(s)
held since | | Principal occupations
over past five years, including other directorships(2) | | Number of
Portfolios in
Fund Complex
Overseen by
Director(3) |
Elizabeth M. Forget Age: 41 | | Director, Chairman of the Board, President and Chief Executive Officer | | 2006 | | Senior Vice President (since 2007), MetLife, Inc.; President, Met Investors Advisory, LLC (“MIA”); Trustee and President, Met Investors Series Trust (“MIST”); Executive Vice President, MetLife Investors Group, Inc.; President (since 2006), MetLife Advisers. | | 81 |
| | | | |
Arthur G. Typermass Age: 70 | | Director | | 1998 | | Formerly, Senior Vice President and Treasurer, MetLife. | | 37 |
Non-Interested Directors(1)
Each Director below is not an “interested person” (as defined by the 1940 Act) with respect to the Fund (collectively, the “Independent Directors”).
| | | | | | | | |
Name, Address and Age | | Current
position(s)
with Fund | | Position(s)
held since | | Principal occupations
over past five years, including other directorships(2) | | Number of
Portfolios in
Fund Complex
Overseen by
Director(3) |
Steve A. Garban† Age: 70 | | Director | | 1985 | | Formerly, Chief Financial Officer, Senior Vice President Finance and Operations and Treasurer (Emeritus), The Pennsylvania State University. | | 37 |
| | | | |
Linda B. Strumpf Age: 60 | | Director | | 2000 | | Vice President and Chief Investment Officer, Ford Foundation. | | 37 |
| | | | |
Michael S. Scott Morton† Age: 70 | | Director | | 1993 | | Jay W. Forrester Professor of Management (Emeritus) at Sloan School of Management, MIT. | | 37 |
| | | | |
H. Jesse Arnelle Age: 74 | | Director | | 2001 | | Formerly, Counsel, Womble Carlyle Sandrie & Rice; Director, Textron Inc. (global multi-industry company)*; formerly, Director, Gannet Co. Inc. (diversified news and information company)*; formerly, Director, Eastman Chemical Company (global chemical company)*; formerly, Director, Waste Management, Inc.*; formerly, Director, Armstrong Holdings Inc. (parent company of floor and ceiling products business)*; formerly, Director, FPL Group Inc. (public utility holding company)*; Director, URS Corporation (engineering design services firm)*. | | 37 |
| | | | |
Nancy Hawthorne Age: 56 | | Director | | 2003 | | Director, Avid Technologies (computer software company)*; formerly, Chairman of the Board of Avid Technologies; formerly, Board of Advisors, L. Knife & Sons, Inc. (beverage distributor); Chief Executive Officer, Clerestory LLC (corporate financial advisor); formerly, Trustee, New England Zenith Fund (“Zenith Fund”)**; formerly, Chief Executive Officer and Managing Partner, Hawthorne, Krauss and Associates (corporate financial advisor); formerly, Chief Financial Officer and Executive Vice President, Continental Cablevision, subsequently renamed MediaOne (cable television company); formerly, Director, Life F/X, Inc.; formerly, Chairman of the Board, WorldClinic (distance medicine company); formerly, Director, Perini Corporation (construction company)*; formerly, Director, CGU (property and casualty insurance company); formerly, Director, Beacon Power Corporation (energy company )*. | | 37 |
MSF-14
Metropolitan Series Fund, Inc.
Directors and Officers—(Continued)
| | | | | | | | |
Name, Address and Age | | Current
position(s)
with Fund | | Position(s)
held since | | Principal occupations
over past five years, including other directorships(2) | | Number of
Portfolios in
Fund Complex
Overseen by
Director(3) |
John T. Ludes Age: 71 | | Director | | 2003 | | President, LFP Properties (consulting firm); Formerly, Trustee, Zenith Fund**; formerly, Vice Chairman, President and Chief Operating Officer, Fortune Brands/American Brands (global conglomerate); formerly, President and CEO, Acushnet Company (athletic equipment company). | | 37 |
Officers(1)
| | | | | | | | |
Name and address | | Age | | Current
position(s)
with Fund | | Position(s)
held since | | Principal occupations over past five years(2) |
| Jeffrey P. Halperin | | 40 | | Chief Compliance Officer | | 2006 | | Vice President (since 2006), Corporate Ethics and Compliance Department, MetLife, Inc.; Chief Compliance Officer (since 2006), MetLife Advisers, MIA and MIST. |
| | | | |
| John F. Guthrie, Jr. | | 64 | | Senior Vice President | | 2002 | | Manager and Senior Vice President, MetLife Advisers; Vice President, MetLife; Vice President (since 2003), MetLife Group, Inc.; Vice President, NELICO; Vice President (since 2005), MIA; formerly, Senior Vice President, Zenith Fund**. |
| | | | |
| Alan C. Leland | | 55 | | Senior Vice President | | 2005 | | Treasurer and Chief Financial Officer, MetLife Advisers, LLC; Treasurer (since 2005), Met Investors Advisory, LLC; Vice President (since 2004), MIA; Vice President (since 2003), MetLife Group, Inc.; Vice President, MetLife; Senior Vice President, NELICO |
| | | | |
| Peter Duffy | | 52 | | Vice President and Treasurer | | 2000 | | Senior Vice President, MetLife Advisers (since 1998); Second Vice President (since 2003), NELICO; Vice President, MetLife (since 2004); Vice President (since 2004), MetLife Group, Inc.; formerly, Vice President and Treasurer, Zenith Fund**. |
| | | | |
| Thomas M. Lenz | | 49 | | Vice President and Secretary | | 2002 | | General Counsel and Secretary, MetLife Advisers; Assistant General Counsel, MetLife; formerly, Vice President and Secretary, Zenith Fund**. |
| * | Indicates a directorship with a registered investment company or a company subject to the reporting requirements of the Securities Exchange Act of 1934, as amended. |
| ** | The Zenith Fund deregistered with the Securities and Exchange Commission (“SEC”) in 2004. |
| (†) | Served as a trustee, director and/or officer of one or more of the following companies, each of which had a direct or indirect advisory relationship with MetLife Advisers or its affiliates prior to January 31, 2005: State Street Research Financial Trust, State Street Research Income Trust, State Street Research Money Market Trust, State Street Research Institutional Funds, State Street Research Capital Trust, State Street Research Master Investment Trust, State Street Research Equity Trust, State Street Research Securities Trust and State Street Research Exchange Trust (collectively, the “State Street Research Funds”). |
| (1) | Each Director of the Fund also serves as trustee of Metropolitan Series Fund II (“Met Series Fund II”), a registered investment company advised by MetLife Advisers. Each officer of the Fund serves in the same position with Met Series Fund II, which consists of one portfolio. |
| (2) | Previous positions during the past five years with the Fund, MIST, MetLife, MetLife Advisers, MIA, Zenith Fund, NELICO or New England Securities Corporation are omitted if not materially different. |
| (3) | The Fund Complex includes the Fund (36 portfolios), Met Series Fund II (1 portfolio) and MIST (44 portfolios) |
MSF-15
Metropolitan Series Fund, Inc.
MetLife Aggressive Allocation Portfolio
Board Approval of Advisory and Subadvisory Agreements
The Fund’s Contract Review Committees of the Board of Directors (the “Board”) typically meet in early fall to review the Portfolios’ advisory agreements (the “Advisory Agreements”) and subadvisory agreements (collectively, the “Subadvisory Agreements,” and, together with the Advisory Agreements, the “Agreements”) and determine whether to recommend that the full Board approve the continuation of the Agreements for an additional one-year period. (Following the initial approval of an Agreement for a new Portfolio or with a new adviser or subadviser, such annual reviews are not required until 2 years following the execution of such Agreement.) After each Committee has made its recommendations, the full Board, including the Independent Directors, determines whether to approve the continuation of each of the Agreements. In addition, the Board, including the Independent Directors, considers matters bearing on the Agreements at most of its other meetings throughout the year and regularly interviews various individuals at MetLife Advisers responsible for the management of the Portfolios. The Directors also interview selected investment managers and other professionals at the subadvisers at various times throughout the year.
The Directors receive all materials that they or MetLife Advisers, the Fund’s investment adviser, and the subadvisers believe to be reasonably necessary for the Directors to evaluate the Agreements and determine whether to approve the continuation of the Agreements. These materials generally include, among other items, (i) information on the investment performance of the Portfolios and the performance of peer groups of funds and the Portfolios’ performance benchmarks, (ii) information on the Portfolios’ advisory and subadvisory fees and other expenses, including information comparing the Portfolios’ expenses to those of peer groups of funds and information about any applicable expense caps and fee “breakpoints,” (iii) sales and redemption data, (iv) information related to the profitability of the Agreements to MetLife Advisers and the subadvisers, and potential “fall-out” or ancillary benefits that MetLife Advisers, the subadvisers or their affiliates may receive as a result of their relationships with the Fund and (v) information obtained through the subadvisers’ responses to certain requests from MetLife Advisers and the Directors and MetLife Advisers’ responses to requests from the Directors. The Directors may also consider other information such as (vi) MetLife Advisers’ and the subadvisers’ financial results and condition, (vii) each Portfolio’s investment objectives and strategies and the size, education and experience of the investment staffs of MetLife Advisers and the relevant subadvisers and their use of technology and external research, (viii) the allocation of the Portfolios’ brokerage, if any, including allocations to brokers affiliated with the subadvisers and the use of “soft” commission dollars to pay Portfolio expenses and to pay for research and other similar services, (ix) the resources devoted to, and the record of compliance with, the Portfolios’ investment policies and restrictions, policies on personal securities transactions and other compliance policies, (x) the responses of MetLife Advisers, the subadvisers and/or their affiliates to certain legal and regulatory proceedings and (xi) the economic outlook generally and for the mutual fund industry in particular. Throughout the process, the Directors have the opportunity to ask questions of and request additional materials from MetLife Advisers and the subadvisers.
Following meetings of each Contract Review Committee on September 12, 2007, the Board, at its November 15, 2007 meeting, approved the continuation through December 31, 2008 of the Advisory Agreements for each Portfolio of the Fund and the Subadvisory Agreements for each Portfolio of the Fund. The Agreements approved for continuation are referred to below as the “Continued Agreements.”
In considering whether to approve the continuation of the Continued Agreements, the Directors, including the Independent Directors, did not identify any single factor as determinative, and each weighed the various factors as he or she deemed appropriate. The Directors considered the following matters in connection with their approval of the Continued Agreements:
The nature, extent and quality of the services provided to the relevant Portfolios under the Continued Agreements. The Directors considered the nature, extent and quality of the services provided by MetLife Advisers, the relevant subadvisers (if any) and their affiliates (each, an “Adviser,” and, collectively, the “Advisers”) to the relevant Portfolios pursuant to the Continued Agreements and the resources dedicated to these Portfolios by the Advisers. In particular, the Directors considered the Advisers’ abilities to attract and retain highly qualified investment professionals. With respect to MetLife Advisers, the Directors considered (for each Portfolio other than Zenith Equity and the Asset Allocation Portfolios) that MetLife Advisers is (i) ultimately responsible for the performance of such Portfolios; (ii) ultimately responsible for the establishment of the investment strategies of each such Portfolio, primarily through its recommendations to the Board regarding the hiring and selection of subadvisers; (iii) responsible for the hiring and selection, subject to Board approval, of subadvisers; and (iv) responsible for maintaining a program of Subadviser oversight reasonably designed to ensure that the subadvisers have reasonable compliance policies and procedures in place. The Directors also considered that MetLife Advisers provides a full range of day-to-day administrative services for the Portfolios involving all aspects of such Portfolios’ day-to-day operations (other than portfolio management). With respect to Zenith Equity and the Asset Allocation Portfolios, the Directors considered both the portfolio management services and the administrative services provided by MetLife Advisers. After reviewing these and related factors, the Directors concluded, within the context of their overall conclusions regarding each of the Continued Agreements, that the nature, extent and quality of services provided supported the renewal of these Agreements.
MSF-16
Metropolitan Series Fund, Inc.
MetLife Aggressive Allocation Portfolio
Board Approval of Advisory and Subadvisory Agreements—(Continued)
Investment performance of the relevant Portfolios. The Directors reviewed information about the performance of the relevant Portfolios over various time periods, including information prepared by an independent third party that compared the performance of the Portfolios to the performance of peer groups of funds and performance benchmarks. The Directors also reviewed a description of the third party’s methodology for identifying a Portfolio’s peer group(s) for purposes of performance and expense comparisons.
In the case of each relevant Portfolio that had performance that lagged its peer group(s) for certain periods, the Directors concluded that other factors relevant to performance were sufficient, in light of other considerations, to warrant renewal of the Continued Agreements relating to such Portfolio. These factors varied from Portfolio to Portfolio, but included one or more of the following: (i) that such Portfolio’s performance, although lagging in certain recent periods, was stronger over the longer term; (ii) that the underperformance was attributable, to a significant extent, to investment decisions that were reasonable and consistent with the Portfolio’s investment objective(s) and policies and that the Portfolio was performing within the range of reasonable expectations, given market conditions and the Portfolio’s investment objective(s) and policies; (iii) that the Portfolio’s performance was competitive when compared to other relevant performance benchmarks or peer groups; and (iv) that MetLife Advisers and/or the relevant subadviser (if any) had taken or was taking steps designed to help improve the Portfolio’s investment performance.
The Directors also considered the investment performance of the Advisers and their reputations generally, the historical responsiveness of the Advisers to Director concerns about performance and the willingness of the Advisers to take steps intended to improve performance.
After reviewing these and related factors, the Directors concluded, within the context of their overall conclusions regarding each of the Continued Agreements, that the investment performance of each relevant Portfolio and Adviser was sufficient, in light of other considerations, to warrant the renewal of the Continued Agreements.
The costs of the services to be provided and profits to be realized by the Advisers and their affiliates from their relationships with the Portfolios. The Directors considered the fees charged by MetLife Advisers to the Portfolios for advisory services and, with respect to the subadvised Portfolios, by such subadvisers to MetLife Advisers for subadvisory services (such advisory and subadvisory fees (if any), collectively, “Fees”), as well as the total expense levels of the Portfolios. This information included comparisons (provided by an independent third party) of the Portfolios’ advisory fees and total expense levels to those of their peer groups. In evaluating Fees for the relevant Portfolios, the Directors also took into account the demands, complexity and quality of the investment management services provided to each Portfolio. The Directors considered MetLife Advisers’ recommendations regarding reductions in Fee rates, implementation of Fee breakpoints and institution of Fee waivers and expense caps.
The Directors also considered the compensation directly or indirectly received by the Advisers and their affiliates from their relationships with the relevant Portfolios. The Directors reviewed information relating to the profits received by MetLife Advisers, certain of the subadvisers and their affiliates as a result of their relationships with the relevant Portfolios, and information about the allocation of expenses used to calculate profitability. When reviewing profitability, the Directors also considered the performance of the relevant Portfolios, the expense levels of such Portfolios and whether the relevant Advisers had implemented breakpoints, fee waivers and/or expense caps with respect to such Portfolios.
After reviewing these and related factors, the Directors concluded, within the context of their overall conclusions regarding each of the Continued Agreements, that the Fees charged to each of the relevant Portfolios were fair and reasonable, and that the information provided regarding costs of these services generally, and the related profitability (if known) to the relevant Advisers of their relationships with the relevant Portfolios, supported the renewal of the Continued Agreements.
Economies of Scale. The Directors considered the existence of any economies of scale in the provision of services by the Advisers and whether those economies were shared with the relevant Portfolios through breakpoints in their advisory fees or other means, such as expense caps, fee waivers or relatively low levels of fees. The Directors noted that most of the relevant Portfolios benefited or will benefit from breakpoints, expense caps and/or fee waivers with respect to their advisory fees. In considering these issues, the Directors also took into consideration information relating to the costs of the services provided and the profitability to MetLife Advisers, the relevant subadvisers (if any) and each of their affiliates of their relationships with the relevant Portfolios, as discussed above.
After reviewing these and related factors, the Directors concluded, within the context of their overall conclusions regarding each of the Continued Agreements, that the extent to which economies of scale were shared with the relevant Portfolios supported the renewal of such Agreements.
Other Factors. The Directors also considered other factors, which included but were not limited to the following:
| | • | | the extent to which each relevant Portfolio operated in accordance with its investment objective, and its record of compliance with its investment restrictions and the compliance programs of the Fund and the Advisers. They also considered the compliance-related resources the Advisers and their affiliates provide to the relevant Portfolios; |
MSF-17
Metropolitan Series Fund, Inc.
MetLife Aggressive Allocation Portfolio
Board Approval of Advisory and Subadvisory Agreements—(Continued)
| | • | | the nature, quality, cost and extent of administrative and shareholder services performed by MetLife Advisers and its affiliates under the Advisory Agreements; and |
| | • | | so-called “fall-out benefits” to the Advisers, such as the engagement of their affiliates to provide distribution, brokerage and transfer agency services to the Portfolios, and the benefits of research made available to the relevant Advisers by reason of brokerage commissions generated by the relevant Portfolios’ securities transactions. The Directors also considered the possible conflicts of interest associated with these fall-out and other benefits, and the reporting and other processes in place to disclose and monitor these possible conflicts of interest. |
Based on their evaluation of all factors that they deemed to be material, including those factors described above, and assisted by the advice of independent counsel, the Directors, including the Independent Directors, concluded that each of the Continued Agreements should be continued through December 31, 2008.
Certain Matters Relating to Julius Baer International Stock Portfolio (formerly known as the FI International Stock Portfolio) (the “International Stock Portfolio”). At the November 15, 2007 Board meeting, the Board approved a change of subadviser for the International Stock Portfolio from Fidelity Management & Research Company (“FMR”) to Julius Baer Investment Management LLC (“Julius Baer”).
In making the determination to approve the change in subadviser for the International Stock Portfolio, the Board carefully considered those factors described above with respect to the continuation of the Continued Agreements, as relevant to both the existing Subadvisory Agreement with FMR and the proposed Subadvisory Agreement with Julius Baer. In addition to these factors, the Board also considered as relevant:
| | • | | the experience, investment style and investment performance history of Julius Baer as portfolio manager; |
| | • | | that the form of the proposed Subadvisory Agreement with Julius Baer was substantially similar to the International Stock Portfolio’s existing Subadvisory Agreement with FMR; |
| | • | | that the subadvisory fee schedule for Julius Baer set forth in the proposed Subadvisory Agreement was lower than the fee schedule in the existing Subadvisory Agreement and that MetLife Advisers had agreed to reduce its advisory fee, through a contractual fee waiver, by an amount corresponding to such savings; |
| | • | | the expected transition costs of the change of subadviser; and |
| | • | | that the preferred date of the change of subadviser was January 7, 2008 and the desirability, in order to facilitate an orderly transition of subadvising functions, of extending the existing Subadvisory Agreement with FMR from its scheduled expiration date of December 31, 2007 until January 7, 2008. |
Following such consideration, and assisted by the advice of independent counsel, the Directors, including the Independent Directors, unanimously voted to approve the continuation of the existing Subadvisory Agreement relating to the International Stock Portfolio through January 7, 2008 and to approve the proposed Subadvisory Agreement relating to such Portfolio with Julius Baer, effective January 7, 2008 through January 6, 2010.
MSF-18
A description of the policies and procedures that the Fund uses to determine how to vote proxies relating to portfolio securities is available (i) without charge, upon request, by calling (800) 638-7732 and (ii) on the Securities and Exchange Commission’s (the “SEC”) website at http://www.sec.gov.
Information regarding how the Fund voted proxies relating to portfolio securities during the most recent twelve-month period ended December 31, 2007 is available (i) without charge, upon request, by calling (800) 638-7732 and (ii) on the SEC’s website at http://www.sec.gov.
The Fund files with the SEC a complete schedule of its portfolio holdings, as of the close of the first and third quarters of its fiscal year, on “Form N-Q”. These filings are available on the SEC’s website at www.sec.gov and may be reviewed and copied at the SEC’s Public Reference Room in Washington, DC. (Call 1-800-SEC-0330 for information on the operation of the Public Reference Room.)
MSF-19
| | |
Metropolitan Series Fund, Inc. MetLife Conservative Allocation Portfolio Annual Report | | December 31, 2007 |
Letter from the President
February 1, 2008
Letter to Policy Holders:
2007 was a tumultuous year in the financial markets driven by concerns in the credit markets surrounding sub-prime mortgages and fears of recession in the U.S. Economy. The broad markets were mixed, with the Dow Jones Industrial Average up 8.9% and the MSCI EAFE Index, which measures the performance of international equities, up 11.2% for the year, while the Russell 2000 Index, which measures the performance of small capitalization stocks, was down 1.6%.
In the fixed income markets, credit spreads increased as a result of the pressure from sub-prime mortgage crisis and the Federal Reserve lowered interest rates by a total of 1% during the year. The Lehman Brothers Aggregate Bond Index posted a 7.0% return for the year.
On the following pages, you will find a complete review of your Portfolio and its investment performance.
MetLife is committed to building your financial freedom. We appreciate your trust and will continue to focus our efforts on meeting your investment needs.
Sincerely,
Elizabeth Forget
President, Metropolitan Series Fund, Inc.
Metropolitan Series Fund, Inc.
MetLife Conservative Allocation Portfolio
Managed by MetLife Advisers, LLC
Portfolio Manager Commentary*
PORTFOLIO PERFORMANCE
For the year ended December 31, 2007, the Class A shares of the MetLife Conservative Allocation Portfolio returned 5.7% compared to the 5.7% return of the Wilshire 5000 Index1 and the 6.5% return of the Lehman Brothers U.S. Universal Bond Index2. Considering that no single index or benchmark can accurately capture the multiple asset class design of the Portfolio, we have created a blended benchmark comprised of several indices for use in portfolio design and evaluation purposes. Specifically, the blended benchmark for the MetLife Conservative Allocation Portfolio consists of a 16% allocation to the Lehman Brothers 1 to 3 Year Government Bond Index3 , a 64% allocation to the Lehman Brothers U.S. Universal Bond Index, a 16% allocation to the Wilshire 5000 Index, and a 4% allocation to the Morgan Stanley Capital International EAFE Index4. During the twelve-month period ended December 31, 2007, the blended benchmark returned 6.8%.
PORTFOLIO REVIEW
Concerns about subprime mortgages and the strength of the overall economy initially surfaced in the first half of 2007, but they were mostly brushed off. It was not until the second half of the year that those concerns intensified. Most economic statistics at the end of 2007 indicated a weakening economy: a sharp decrease in New and Existing Home Sales, a drop in Consumer Confidence, a rise in the Unemployment Rate, and a decline in the Purchasing Managers Index.
During 2007, large cap stocks, as measured by the Standard & Poor’s 500 Index5 return of 5.5%, did better than small cap stocks, as measured by the -1.6% return of the Russell 2000 Index6. Growth style stocks generally held up better than value style stocks. There was a wide dispersion among the various sectors of the S&P 500 Index: Energy and Materials were up 34% and 22% respectively, while Financials (-19%) and Consumer Discretionary (-13%) were down sharply. On a local basis, foreign stocks were also up modestly for the year, but U.S. based investors benefited from a weak dollar to receive an 11.2% return as measured by the MSCI EAFE Index.
Investment grade bonds, as measured by the Lehman Brothers Aggregate Bond Index7, posted a 7.0% return in response to a decline in interest rates across the yield curve. Below investment grade bonds, while still eking out a positive return for the year, were adversely impacted by credit concerns brought about by the subprime mortgage crisis. Treasuries and Treasury Inflation Protected Securities (TIPS) were the best performing investment grade sectors, while the credit based sectors lagged.
The MetLife Conservative Allocation Portfolio is a “fund of funds” that invests in other Portfolios of the Metropolitan Series Fund, Inc. and the Met Investors Series Trust. The Portfolio’s initial target allocations were 20% in equity investments and 80% in fixed income investments. The MetLife Conservative Allocation Portfolio is considered the most conservative of the five Asset Allocation Portfolios as measured by it potential risk.
The only change in the Portfolio during the period was a slight adjustment for the underlying Portfolios as of May 1, 2007. We also rebalanced the Portfolio on a quarterly basis to bring it back into line with the underlying Portfolio targets and the desired risk level.
Collectively, the performance of the underlying fixed income Portfolios essentially matched that of the Lehman Brothers U.S. Universal Bond Index. The PIMCO Total Return Portfolio and the PIMCO Inflation Protected Bond Portfolio beat the Index, but this good performance was offset by the Western Asset Strategic Bond Opportunities and Western Asset U.S. Government Portfolios, which lagged the Index due to exposure to holdings of spread product, which includes mortgage backed securities and corporate bonds.
Poor security selection within several of the underlying equity Portfolios detracted from performance over the past year, although this impact was dampened by a small (20%) overall exposure to equities. These Portfolios did not perform as well as we would have expected given their asset allocation among the segments of the capital markets.
Among the underlying Portfolios that had positive security selection and added to relative performance were the Met/AIM Small Cap Growth Portfolio, the Jennison Growth Portfolio, the PIMCO Total Return Portfolio, and the T. Rowe Price Large Cap Growth Portfolio. Among the equity funds, growth oriented funds like these performed better than the broad equity market and added relative value to the Portfolio’s performance.
* The views expressed above are those of the advisory firm as of December 31, 2007 and are subject to change based on market and other conditions. Information about the Portfolio’s holdings, asset allocation, industry allocation, or country diversification is historical and is not an indication of future Portfolio composition, which will vary. The performance of any index mentioned in this commentary has not been adjusted for ongoing management, distribution and operating expenses, and sales charges applicable to mutual fund investments. Direct investment in the Index is not possible.
1 The Wilshire 5000 Index measures the performance of all U.S. headquartered equity securities with readily available price data.
2 The Lehman Brothers U.S. Universal Bond Index represents the union of the U.S. Aggregate Index, the U.S. High-Yield Corporate Index, the 144A Index, the Eurodollar Index, the Emerging Markets Index, the non-EIRSA portion of the Commercial Mortgage Backed Securities Index and the Commercial Mortgage Backed Securities High Yield Index.
3 The Lehman Brothers 1 to 3 Year Government Bond Index includes most obligations of the U.S Treasury, agencies and quasi-federal corporations having maturities between one to three years.
4 The Morgan Stanley Capital International Europe, Australasia and Far East Index (“MSCI EAFE Index”) is an unmanaged free float-adjusted market capitalization index that is designed to measure developed market equity performance, excluding the U.S. & Canada.
5 The Standard & Poor’s (S&P) 500® Stock Index is an unmanaged index representing the performance of 500 major companies, most of which are listed on the New York Stock Exchange.
6 The Russell 2000® Index is an unmanaged measure of performance of the 2,000 smallest companies in the Russell 3000® Index.
7 Lehman Brothers® Aggregate Bond Index includes most obligations of the U.S. Treasury, agencies and quasi-federal corporations, most publicly issued investment grade corporate bonds and most bonds backed by mortgage pools of GNMA, FNMA and FHLMC.
MSF-2
Metropolitan Series Fund, Inc.
MetLife Conservative Allocation Portfolio
A $10,000 INVESTMENT COMPARED TO
THE WILSHIRE 5000 STOCK INDEX AND THE LEHMAN BROTHERS
UNIVERSAL BOND INDEX

Average Annual Returns as of December 31, 2007
| | | | | | | | | | | | |
| | | MetLife Conservative
Allocation Portfolio | | | Wilshire 5000
Stock Index | | | Lehman Brothers
Universal Bond Index | |
| | | Class A | | | Class B | | | |
| 1 Year | | 5.7 | % | | 5.6 | % | | 5.7 | % | | 6.5 | % |
| Since Inception | | 6.4 | | | 6.2 | | | 12.4 | | | 5.1 | |
Performance numbers are net of all Portfolio expenses but do not include any insurance, sales, or administrative charges of variable annuity or life insurance contracts. If these charges were included, the returns would be lower.
Inception date of the Class A and Class B shares is 5/2/05. Index since inception return is based on the Portfolio’s inception date.
This information represents past performance and is not indicative of future results. Investment return and principal value may fluctuate so that shares, upon redemption, may be worth more or less than the original cost.
PORTFOLIO COMPOSITION as of December 31, 2007
Top Holdings
| | |
| | | % of Total
Net Assets |
Met Investors Series Trust—PIMCO Total Return Portfolio, (Class A) | | 27.1% |
Metropolitan Series Fund, Inc.—Western Asset Mgt. Strategic Bond Opportunities Portfolio, (Class A) | | 17.8% |
Metropolitan Series Fund, Inc.—BlackRock Bond Income Portfolio, (Class A) | | 17.0% |
Met Investors Series Trust—PIMCO Inflation Protected Bond Portfolio, (Class A) | | 6.0% |
Metropolitan Series Fund, Inc.—Western Asset Mgt. U.S. Government Portfolio, (Class A) | | 6.0% |
Metropolitan Series Fund, Inc.—Davis Venture Value Portfolio, (Class A) | | 3.0% |
Met Investors Series Trust—Lord Abbett Bond Debenture Portfolio, (Class A) | | 3.0% |
Metropolitan Series Fund, Inc.—Neuberger Berman Mid Cap Value Portfolio, (Class A) | | 2.1% |
Metropolitan Series Fund, Inc.—BlackRock Large Cap Value Portfolio, (Class A) | | 2.0% |
Metropolitan Series Fund, Inc.—T. Rowe Price Large Cap Growth Portfolio, (Class A) | | 2.0% |
MSF-3
Metropolitan Series Fund, Inc.
Shareholder Expense Example
As a shareholder of the Fund, you incur ongoing costs, including management fees; distribution and service (12b-1) fees; and other fund expenses. This example is intended to help you understand your ongoing costs (in dollars) (referred to as “expenses”) of investing in the Portfolio and compare these costs with the ongoing costs of investing in other mutual funds. The example is based on an investment of $1,000 invested at the beginning of the period and held for the entire period, July 1, 2007 through December 31, 2007.
Actual Expenses
The first line for each share class of the Portfolio in the table below provides information about actual account values and actual expenses. You may use the information in this line, together with the amount you invested in the particular share class of the Portfolio, to estimate the expenses that you paid over the period. Simply divide your account value by $1,000 (for example, an $8,600 account value divided by $1,000=8.6), then multiply the result by the number in the first line under the heading entitled “Expenses Paid During Period” to estimate the expenses you paid on your account during this period.
Hypothetical Example for Comparison Purposes
The second line for each share class of the Portfolio in the table below provides information about hypothetical account values and hypothetical expenses based on the Portfolio’s actual expense ratio and an assumed rate of return of 5% per year before expenses, which is not the Portfolio’s actual return. The hypothetical account values and expenses may not be used to estimate the actual ending account balance or expenses you paid for the period. You may use this information to compare the ongoing costs of investing in the Portfolio and other funds. To do so, compare this 5% hypothetical example with the 5% hypothetical examples that appear in the shareholder reports of the other funds.
Please note that the expenses shown in the table are meant to highlight your ongoing costs only and do not reflect any fees or charges of your variable insurance product or any additional expenses that participants in certain eligible qualified plans may bear relating to the operations of their plan. Therefore, the second line for each share class in the table is useful in comparing ongoing costs only, and will not help you determine the relative total costs of owning different funds. In addition, if these other costs were included, your costs would have been higher.
| | | | | | | | | | | | | | |
Portfolio | | | | Annualized
Expense
Ratio | | | Beginning
Account Value
July 1,
2007 | | Ending
Account Value
December 31,
2007 | | Expenses Paid
During Period*
July 1, 2007
to
December 31,
2007 |
MetLife Conservative Allocation—Class A(a)(b) | | Actual | | 0.69 | % | | $ | 1,000.00 | | $ | 1,036.10 | | $ | 3.54 |
| | Hypothetical | | 0.69 | % | | $ | 1,000.00 | | $ | 1,021.69 | | $ | 3.52 |
| | | | | |
MetLife Conservative Allocation—Class B(a)(b) | | Actual | | 0.94 | % | | $ | 1,000.00 | | $ | 1,035.40 | | $ | 4.82 |
| | Hypothetical | | 0.94 | % | | $ | 1,000.00 | | $ | 1,020.41 | | $ | 4.79 |
* Expenses paid are equal to the Portfolio’s annualized expense ratio for the most recent six month period, as shown above, multiplied by the average account value over the period, multiplied by the number of days in the most recent fiscal half-year, divided by 365 (to reflect the one-half year period).
(a) The annualized expense ratio shown reflects an expense agreement between MetLife Advisers, LLC and the Portfolio as described under Expense Agreement in Note 4 to the Financial Statements.
(b) The annualized expense ratio reflects the expenses of both the Portfolio and the underlying Portfolios in which it invests.
MSF-4
Metropolitan Series Fund, Inc.
MetLife Conservative Allocation Portfolio
Schedule of Investments as of December 31, 2007
Mutual Funds—100.0%
| | | | | | |
| Security Description | | Shares | | Value* | |
| | | | | | |
| | |
Affiliated Investment Companies—100.0% | | | | | | |
Met Investors Series Trust—BlackRock High Yield Portfolio, (Class A) | | 410,861 | | $ | 3,385,494 | |
Met Investors Series Trust—BlackRock Large Cap Core Portfolio, (Class A) | | 158,599 | | | 1,766,796 | |
Met Investors Series Trust—Dreman Small Cap Value Portfolio, (Class A) | | 123,597 | | | 1,677,207 | |
Met Investors Series Trust—Harris Oakmark International Portfolio, (Class A) | | 197,648 | | | 3,413,387 | |
Met Investors Series Trust—Lazard Mid-Cap Portfolio, (Class A) | | 136,617 | | | 1,662,634 | |
Met Investors Series Trust—Legg Mason Value Equity Portfolio, (Class A) | | 161,189 | | | 1,692,486 | |
Met Investors Series Trust—Lord Abbett Bond Debenture Portfolio, (Class A) | | 405,786 | | | 5,125,075 | |
Met Investors Series Trust—Met/AIM Small Cap Growth Portfolio, (Class A) | | 114,853 | | | 1,706,718 | |
Met Investors Series Trust—PIMCO Inflation Protected Bond Portfolio, (Class A) | | 942,090 | | | 10,325,305 | |
Met Investors Series Trust—PIMCO Total Return Portfolio, (Class A) | | 3,800,462 | | | 46,707,676 | |
Metropolitan Series Fund, Inc.—BlackRock Bond Income Portfolio, (Class A) | | 262,646 | | | 29,340,195 | |
Metropolitan Series Fund, Inc.—BlackRock Large Cap Value Portfolio, (Class A) | | 258,056 | | | 3,512,146 | |
Metropolitan Series Fund, Inc.—Davis Venture Value Portfolio, (Class A) | | 142,630 | | | 5,197,446 | |
Metropolitan Series Fund, Inc.—Julius Baer International Stock Portfolio, (Class A) | | 106,265 | | | 1,704,485 | |
Metropolitan Series Fund, Inc.—FI Mid Cap Opportunities Portfolio, (Class A) | | 79,881 | | | 1,688,675 | |
Metropolitan Series Fund, Inc.—Jennison Growth Portfolio, (Class A) | | 129,696 | | | 1,766,460 | |
Metropolitan Series Fund, Inc.—MetLife Stock Index Portfolio, (Class A) | | 46,978 | | | 1,738,191 | |
Metropolitan Series Fund, Inc.—Neuberger Berman Mid Cap Value Portfolio, (Class A) | | 166,962 | | | 3,549,606 | |
Metropolitan Series Fund, Inc.—Russell 2000 Index Portfolio, (Class A) | | 120,163 | | | 1,703,906 | |
Metropolitan Series Fund, Inc.—T. Rowe Price Large Cap Growth Portfolio, (Class A) | | 212,331 | | | 3,499,214 | |
Metropolitan Series Fund, Inc.—Western Asset Mgt. Strategic Bond Opportunities Portfolio, (Class A) | | 2,414,482 | | | 30,712,208 | |
Metropolitan Series Fund, Inc.—Western Asset Mgt. U.S. Government Portfolio, (Class A) | | 822,904 | | | 10,278,072 | |
| | | | | | |
Total Mutual Funds
(Identified Cost $167,413,958) | | | | | 172,153,382 | |
| | | | | | |
Total Investments—100.0%
(Identified Cost $167,413,958) (a) | | | | | 172,153,382 | |
Liabilities in excess of other assets | | | | | (49,806 | ) |
| | | | | | |
| Total Net Assets—100% | | | | $ | 172,103,576 | |
| | | | | | |
| (a) | The aggregate cost of investments for federal income tax purposes as of December 31, 2007 was $167,875,509 and the composition of unrealized appreciation and depreciation of investment securities was $4,868,370 and $(590,497), respectively. |
*See accompanying notes to financial statements.
MSF-5
Metropolitan Series Fund, Inc.
MetLife Conservative Allocation Portfolio
Statement of Assets & Liabilities
December 31, 2007
| | | | | | |
Assets | | | | | | |
Investments at value (a) | | | | | $ | 172,153,382 |
Receivable for: | | | | | | |
Fund shares sold | | | | | | 72,645 |
Due from investment adviser | | | | | | 8,258 |
| | | | | | |
Total Assets | | | | | | 172,234,285 |
Liabilities | | | | | | |
Payable for: | | | | | | |
Securities purchased | | $ | 53,481 | | | |
Fund shares redeemed | | | 19,164 | | | |
Due to custodian bank | | | 12 | | | |
Accrued expenses: | | | | | | |
Service and distribution fees | | | 30,478 | | | |
Other expenses | | | 27,574 | | | |
| | | | | | |
Total Liabilities | | | | | | 130,709 |
| | | | | | |
Net Assets | | | | | $ | 172,103,576 |
| | | | | | |
Net assets consists of: | | | | | | |
Capital paid in | | | | | $ | 163,642,817 |
Undistributed net investment income | | | | | | 2,225,429 |
Accumulated net realized gains | | | | | | 1,495,906 |
Unrealized appreciation on investments | | | | | | 4,739,424 |
| | | | | | |
Net Assets | | | | | $ | 172,103,576 |
| | | | | | |
| Computation of offering price: | | | | | | |
Class A | | | | | | |
Net asset value and redemption price per share ($25,446,889 divided by 2,275,401 shares outstanding) | | | | | $ | 11.18 |
| | | | | | |
Class B | | | | | | |
Net asset value and redemption price per share ($146,656,687 divided by 13,186,188 shares outstanding) | | | | | $ | 11.12 |
| | | | | | |
(a) Identified cost of investments | | | | | $ | 167,413,958 |
| | | | | | |
Statement of Operations
For the Year Ended December 31, 2007
| | | | | | | |
Investment Income | | | | | | | |
Dividends from Underlying Portfolios | | | | | | $ | 2,473,802 |
| | | | | | | |
Expenses | | | | | | | |
Management fees | | $ | 116,378 | | | | |
Service and distribution fees—Class B | | | 243,812 | | | | |
Directors’ fees and expenses | | | 811 | | | | |
Custodian | | | 28,091 | | | | |
Audit and tax services | | | 18,574 | | | | |
Legal | | | 1,567 | | | | |
Miscellaneous | | | 9,071 | | | | |
| | | | | | | |
Total expenses | | | 418,304 | | | | |
Expense reimbursements | | | (58,112 | ) | | | 360,192 |
| | | | | | | |
Net Investment Income | | | | | | | 2,113,610 |
| | | | | | | |
Realized and Unrealized Gain | | | | | | | |
| Realized gain on: | | | | | | | |
Investments—net | | | 1,208,046 | | | | |
Capital gains distributions from Underlying Portfolios | | | 577,992 | | | | 1,786,038 |
| | | | | | | |
| Change in unrealized appreciation on: | | | | | | | |
Investments—net | | | | | | | 2,731,609 |
| | | | | | | |
Net gain | | | | | | | 4,517,647 |
| | | | | | | |
Net Increase in Net Assets From Operations | | | | | | $ | 6,631,257 |
| | | | | | | |
See accompanying notes to financial statements.
MSF-6
Metropolitan Series Fund, Inc.
MetLife Conservative Allocation Portfolio
Statements of Changes in Net Assets
| | | | | | | | |
| | | Year ended
December 31,
2007 | | | Year ended
December 31,
2006 | |
From Operations | | | | | | | | |
Net investment income | | $ | 2,113,610 | | | $ | 784,689 | |
Net realized gain | | | 1,786,038 | | | | 273,098 | |
Unrealized appreciation | | | 2,731,609 | | | | 2,135,725 | |
| | | | | | | | |
Increase in net assets from operations | | | 6,631,257 | | | | 3,193,512 | |
| | | | | | | | |
From Distributions to Shareholders | | | | | | | | |
Net investment income | | | | | | | | |
Class A | | | 0 | | | | (199,657 | ) |
Class B | | | 0 | | | | (680,243 | ) |
| | | | | | | | |
| | | 0 | | | | (879,900 | ) |
| | | | | | | | |
Net realized gain | | | | | | | | |
Class A | | | (9,649 | ) | | | (76,625 | ) |
Class B | | | (49,328 | ) | | | (266,100 | ) |
| | | | | | | | |
| | | (58,977 | ) | | | (342,725 | ) |
| | | | | | | | |
Total distributions | | | (58,977 | ) | | | (1,222,625 | ) |
| | | | | | | | |
Increase in net assets from capital share transactions | | | 98,254,027 | | | | 49,884,003 | |
| | | | | | | | |
Total increase in net assets | | | 104,826,307 | | | | 51,854,890 | |
| | |
Net Assets | | | | | | | | |
Beginning of the period | | | 67,277,269 | | | | 15,422,379 | |
| | | | | | | | |
End of the period | | $ | 172,103,576 | | | $ | 67,277,269 | |
| | | | | | | | |
| | |
Undistributed Net Investment Income | | | | | | | | |
End of the period | | $ | 2,225,429 | | | $ | 0 | |
| | | | | | | | |
Other Information:
Capital Shares
Transactions in capital shares were as follows:
| | | | | | | | | | | | | | |
| | | Year ended
December 31, 2007 | | | Year ended
December 31, 2006 | |
| | | Shares | | | $ | | | Shares | | | $ | |
Class A | | | | | | | | | | | | | | |
Sales | | 2,039,673 | | | $ | 22,155,271 | | | 1,359,531 | | | $ | 13,957,228 | |
Reinvestments | | 886 | | | | 9,649 | | | 27,656 | | | | 276,282 | |
Redemptions | | (808,139 | ) | | | (8,800,183 | ) | | (612,657 | ) | | | (6,280,677 | ) |
| | | | | | | | | | | | | | |
Net increase | | 1,232,420 | | | $ | 13,364,737 | | | 774,530 | | | $ | 7,952,833 | |
| | | | | | | | | | | | | | |
Class B | | | | | | | | | | | | | | |
Sales | | 13,942,100 | | | $ | 150,674,842 | | | 5,023,684 | | | $ | 51,348,971 | |
Shares issued through acquisition | | 0 | | | | 0 | | | 466,162 | | | | 4,666,278 | |
Reinvestments | | 4,551 | | | | 49,328 | | | 94,919 | | | | 946,343 | |
Redemptions | | (6,096,389 | ) | | | (65,834,880 | ) | | (1,468,796 | ) | | | (15,030,422 | ) |
| | | | | | | | | | | | | | |
Net increase | | 7,850,262 | | | $ | 84,889,290 | | | 4,115,969 | | | $ | 41,931,170 | |
| | | | | | | | | | | | | | |
Increase derived from capital share transactions | | | | | $ | 98,254,027 | | | | | | $ | 49,884,003 | |
| | | | | | | | | | | | | | |
See accompanying notes to financial statements.
MSF-7
Metropolitan Series Fund, Inc.
MetLife Conservative Allocation Portfolio
Financial Highlights
| | | | | | | | | | | | |
| | | Class A | |
| | | Year ended December 31, | |
| | | 2007 | | | 2006 | | | 2005(a) | |
Net Asset Value, Beginning of Period | | $ | 10.58 | | | $ | 10.37 | | | $ | 10.00 | |
| | | | | | | | | | | | |
Income From Investment Operations | | | | | | | | | | | | |
Net investment income | | | 0.22 | (b) | | | 0.36 | | | | 0.03 | |
Net realized and unrealized gain on investments | | | 0.39 | | | | 0.36 | | | | 0.38 | |
| | | | | | | | | | | | |
Total from investment operations | | | 0.61 | | | | 0.72 | | | | 0.41 | |
| | | | | | | | | | | | |
Less Distributions | | | | | | | | | | | | |
Distributions from net investment income | | | 0.00 | | | | (0.37 | ) | | | (0.03 | ) |
Distributions from net realized capital gains | | | (0.01 | ) | | | (0.14 | ) | | | (0.01 | ) |
| | | | | | | | | | | | |
Total distributions | | | (0.01 | ) | | | (0.51 | ) | | | (0.04 | ) |
| | | | | | | | | | | | |
Net Asset Value, End of Period | | $ | 11.18 | | | $ | 10.58 | | | $ | 10.37 | |
| | | | | | | | | | | | |
Total Return (%) | | | 5.7 | | | | 7.3 | | | | 4.1 | (c) |
Ratio of operating expenses to average net assets (%) (d) | | | 0.10 | | | | 0.10 | | | | 0.10 | (e) |
Ratio of operating expenses to average net assets without giving effect to the contractual expense agreement would have been (%) (g) | | | 0.15 | | | | 0.19 | | | | 1.05 | (e) |
Ratio of net investment income to average net assets (%) (f) | | | 2.05 | | | | 2.75 | | | | 0.96 | (e) |
Portfolio turnover rate (%) | | | 40 | | | | 24 | | | | 32 | (e) |
Net assets, end of period (000) | | $ | 25,447 | | | $ | 11,030 | | | $ | 2,785 | |
| | | | | | | | | | | | |
| | | Class B | |
| | | Year ended December 31, | |
| | | 2007 | | | 2006 | | | 2005(a) | |
Net Asset Value, Beginning of Period | | $ | 10.54 | | | $ | 10.36 | | | $ | 10.00 | |
| | | | | | | | | | | | |
Income From Investment Operations | | | | | | | | | | | | |
Net investment income | | | 0.19 | (b) | | | 0.34 | | | | 0.03 | |
Net realized and unrealized gain on investments | | | 0.40 | | | | 0.34 | | | | 0.37 | |
| | | | | | | | | | | | |
Total from investment operations | | | 0.59 | | | | 0.68 | | | | 0.40 | |
| | | | | | | | | | | | |
Less Distributions | | | | | | | | | | | | |
Distributions from net investment income | | | 0.00 | | | | (0.36 | ) | | | (0.03 | ) |
Distributions from net realized capital gains | | | (0.01 | ) | | | (0.14 | ) | | | (0.01 | ) |
| | | | | | | | | | | | |
Total distributions | | | (0.01 | ) | | | (0.50 | ) | | | (0.04 | ) |
| | | | | | | | | | | | |
Net Asset Value, End of Period | | $ | 11.12 | | | $ | 10.54 | | | $ | 10.36 | |
| | | | | | | | | | | | |
Total Return (%) | | | 5.6 | | | | 6.9 | | | | 4.0 | (c) |
Ratio of operating expenses to average net assets (%) (d) | | | 0.35 | | | | 0.35 | | | | 0.35 | (e) |
Ratio of operating expenses to average net assets without giving effect to the contractual expense agreement would have been (%) (g) | | | 0.40 | | | | 0.44 | | | | 1.30 | (e) |
Ratio of net investment income to average net assets (%) (f) | | | 1.77 | | | | 1.89 | | | | 1.00 | (e) |
Portfolio turnover rate (%) | | | 40 | | | | 24 | | | | 32 | (e) |
Net assets, end of period (000) | | $ | 146,657 | | | $ | 56,247 | | | $ | 12,638 | |
| (a) | Commencement of operations was May 2, 2005. |
| (b) | Per share amount is based on average shares outstanding during the period. |
| (c) | Periods less than one year are not computed on an annualized basis. |
| (d) | The ratio of operating expenses to average net assets does not include expenses of investment companies in which the Portfolio invests. |
| (e) | Computed on an annualized basis. |
| (f) | Recognition of net investment income by the Portfolio is affected by the timing of the declaration of dividends by the underlying Portfolios in which it invests. |
| (g) | See Note 4 in the Notes to Financial Statements. |
See accompanying notes to financial statements.
MSF-8
Metropolitan Series Fund, Inc.
MetLife Conservative Allocation Portfolio
Notes to Financial Statements—December 31, 2007
Metropolitan Series Fund, Inc. (the “Fund”) is organized as a corporation under the laws of Maryland pursuant to Articles of Incorporation filed on November 23, 1982, as amended, and registered under the Investment Company Act of 1940, as amended (the “1940 Act”), as an open-end investment company. The Fund is a “series” type of mutual fund, which issues separate series of stock. Each series represents an interest in a separate portfolio of Fund investments. The MetLife Conservative Allocation Portfolio (the “Asset Allocation Portfolio”) is a non-diversified series of the fund. The Asset Allocation Portfolio operates under a “fund of funds” structure, investing substantially all of its assets in other Portfolios advised by MetLife Advisers, LLC (“MetLife Advisers”) or its affiliates (each, an “Underlying Portfolio,” and, collectively, the “Underlying Portfolios”). Shares in the Fund are not offered directly to the general public and are currently available only to separate accounts established by Metropolitan Life Insurance Company (“MetLife”), New England Life Insurance Company, General American Life Insurance Company (“General American”), The MetLife Investors Group of Insurance Companies, MetLife Insurance Company of Connecticut and other affiliated insurance companies (collectively, the “Insurance Companies”), as an investment vehicle for variable life insurance, group annuity or variable annuity products, although not all Portfolios are available to all such separate accounts. The Asset Allocation Portfolio’s shares may be divided into different classes. Currently, the classes being offered by the Asset Allocation Portfolio are named Class A and Class B. The classes of the Asset Allocation Portfolio’s shares are identical, except that certain additional charges (Rule 12b-1 fees) are made against Class B shares. Investment income, realized and unrealized capital gains and losses, the common expenses of the Asset Allocation Portfolio and certain Portfolio-level expense reductions, if any, are allocated on a pro rata basis to each class based on the relative net assets of each class to the total net assets of the Asset Allocation Portfolio.
| 2. | SIGNIFICANT ACCOUNTING POLICIES: |
The preparation of financial statements in conformity with accounting principles generally accepted in the United States of America (“GAAP”) requires management to make estimates and assumptions that affect the reported amounts of assets and liabilities and disclosure of contingent assets and liabilities as of the date of the financial statements and the reported amounts of income and expenses during the reporting period. Actual results could differ from those estimates.
The following is a summary of significant accounting policies consistently followed by the Asset Allocation Portfolio in the preparation of its financial statements. The policies are in conformity with GAAP.
Investment Valuation:
The net asset value of the Asset Allocation Portfolio is calculated based on the net asset values of the Underlying Portfolios in which the Asset Allocation Portfolio invests. The Underlying Portfolios that are series of the Fund will use fair value pricing in the circumstances and manner described below. For more information about the use of fair value pricing by the Underlying Portfolios that are series of Met Investors Series Trust (“MIST”), please refer to the prospectus for such Underlying Portfolios.
The Underlying Portfolios that are series of the Fund are valued as follows:
Debt securities (other than short term obligations with a remaining maturity of sixty days or less) are valued on the basis of valuations furnished by independent pricing services selected by the relevant subadviser pursuant to authorization of the Board of Directors of the Fund (the “Board” or “Directors”). Short term obligations with a remaining maturity of sixty days or less are valued at amortized cost which approximates fair market value.
Equity securities traded on a national securities exchange or exchanges are valued at their last sale price on the principal trading market. Equity securities traded on the NASDAQ National Market System are valued at the NASDAQ Official Closing Price (the “NOCP”). The NOCP is the last sale price if it falls between the spread of the last reported bid and asked prices. If the last reported bid and asked prices are above the last reported sale price, the NOCP will be the last reported bid price. If the last reported bid and asked prices are below the last reported sale price, the NOCP will be the last reported asked price. Equity securities traded on a national securities exchange or exchanges or on the NASDAQ National Market System for which there is no reported sale during the day are valued at the last reported bid price. A security that is listed or traded on more than one exchange is valued at the quotation on the exchange determined to be the primary market for that security by the Board or its delegates. If no closing price is available, then such securities are valued by using the last reported bid price. Equity securities traded over-the-counter are valued at the last reported sales price.
MSF-9
Metropolitan Series Fund, Inc.
MetLife Conservative Allocation Portfolio
Notes to Financial Statements—December 31, 2007—(Continued)
If no current market value quotation is readily available or reliable for a portfolio security, fair value will be determined in accordance with procedures established by and under the general supervision of the Board. When an Underlying Portfolio uses fair value pricing, it may take into account any factors it deems appropriate. The value of securities used by the Underlying Portfolio to calculate its net asset value may differ from quoted or published prices for the same securities. Fair value pricing involves subjective judgments and the fair value determined for a security may be materially different than the value that could be realized upon the sale of that security.
The Underlying Portfolio expects to use fair value pricing for securities primarily traded on U.S. exchanges only under very limited circumstances. For example, the Underlying Portfolio may use fair value pricing if the exchange on which a security is traded closes early or trading in the security is suspended.
Securities traded primarily on an exchange outside of the United States which closes before the close of the New York Stock Exchange will be valued at the last sales price on that non-U.S. exchange. Securities traded primarily on an exchange outside of the United States for which there is no reported sale during the day are valued at the mean between the last reported bid and asked prices. However, because most foreign markets close well before the Underlying Portfolio values its securities (typically at 4 p.m. Eastern Time), the earlier close of these foreign markets gives rise to the possibility that significant events, including broad market moves, may have occurred after these foreign markets close but before the Underlying Portfolio values its securities. For example, foreign security values may be affected by activity that occurs after the close of foreign securities markets. To account for this, the Underlying Portfolio may frequently value many of its foreign equity securities using fair value prices based on third party vendor modeling tools.
Forward foreign currency exchange contracts are valued based on the mean between closing bid and asked prices of the forward currency contract rates in the London foreign exchange markets on a daily basis as provided by a reliable bank or dealer.
Options, whether on securities, indices, futures contracts, or otherwise, are valued at the last sales price available as of the close of business on the day of valuation or, if there is no such sale price available, at the mean between the bid and asked prices. Options on currencies are valued at the spot price each day.
The value of futures contracts will be the sum of the margin deposit plus or minus the difference between the value of the futures contract on each day the net asset value is calculated and the value on the date the futures contract originated, value being that established on a recognized commodity exchange, or by reference to other customary sources, with gain or loss being realized when the futures contract closes or expires.
Subject to the Board’s oversight, the Board has delegated day-to-day responsibility for valuing Underlying Portfolio assets to MetLife Advisers, LLC (“MetLife Advisers” or the “Adviser”) or the subadviser of the Underlying Portfolio, as applicable, who values such assets as described above and operates under procedures approved by the Board.
Investment Transactions and Related Investment Income:
Portfolio security transactions are recorded on the trade date. Dividend income is recorded on the ex-dividend date. Interest income is recorded on the accrual basis. Realized gains and losses on investments and unrealized appreciation and depreciation are determined on the identified cost basis, which is the same basis used for federal income tax purpose.
Federal Income Taxes:
It is the Portfolio’s policy to comply with the requirements of the Internal Revenue Code of 1986, as amended, and regulations thereunder, applicable to regulated investment companies and to distribute all of its taxable income to shareholders. Therefore, no federal income tax provision is required.
As of December 31, 2007, the Asset Allocation Portfolio had no capital loss carryovers.
The tax character of distributions paid for the periods ended December 31, 2007 and 2006 was as follows:
| | | | | | | | | | | | | | | | | | | | | |
Ordinary Income | | Long Term Gain | | Return of Capital | | Total |
2007 | | 2006 | | 2007 | | 2006 | | 2007 | | 2006 | | 2007 | | 2006 |
| $58,977 | | $ | 1,081,219 | | $ | — | | $ | 141,406 | | $ | — | | $ | — | | $ | 58,977 | | $ | 1,222,625 |
MSF-10
Metropolitan Series Fund, Inc.
MetLife Conservative Allocation Portfolio
Notes to Financial Statements—December 31, 2007—(Continued)
As of December 31, 2007, the components of distributable earnings (accumulated losses) on a federal income tax basis were as follows:
| | | | | | | | | | | | |
Undistributed
Ordinary
Income | | Undistributed
Long Term
Gain | | Unrealized
Appreciation | | Loss
Carryforwards | | Total |
$2,727,933 | | $ | 1,454,953 | | $ | 4,277,873 | | $ | — | | $ | 8,460,759 |
Dividends and Distributions to Shareholders:
The Asset Allocation Portfolio records dividends and distributions on the ex-dividend date. Net realized gains from security transactions (if any) are generally distributed annually to shareholders. The timing and characterization of certain income and capital gains distributions are determined in accordance with federal tax regulations that may differ from GAAP. Permanent book and tax basis differences relating to shareholder distributions will result in reclassification between under/over distributed net investment income, accumulated net realized gains/losses and paid in capital.
| 3. | INVESTMENT TRANSACTIONS: |
For the year ended December 31, 2007, purchases and sales of Underlying Portfolios by the Asset Allocation Portfolio were $147,607,547 and $46,728,141, respectively.
| 4. | INVESTMENT MANAGEMENT FEES AND OTHER TRANSACTIONS WITH AFFILIATES: |
Investment Management Agreement:
MetLife Advisers, LLC (“MetLife Advisers”) is the investment adviser to the Asset Allocation Portfolio. The Fund has entered into an investment management agreement with MetLife Advisers with respect to the Portfolio. For providing investment management services to the Portfolio, MetLife Advisers receives monthly compensation at the following annual rates:
| | | | | | |
| | | Management
Fees earned by
MetLife Advisers
for the year ended
December 31, 2007 | | Annual
percentage
rates paid to
MetLife Advisers | | Based on Portfolios
average daily net asset levels |
| | $116,378 | | 0.100% | | Of the first $500 million |
| | | | 0.075% | | Of the next $500 million |
| | | | 0.050% | | On amounts in excess of $1 billion |
In addition to the above Management Fee paid to MetLife Advisers, the Portfolio indirectly pays MetLife Advisers an investment advisory fee through its investments in certain Underlying Portfolios.
Certain officers and directors of the Fund may also be officers of MetLife Advisers; however, such officers and directors receive no compensation from the Fund.
Service and Distribution Fees:
The Fund has adopted a Distribution and Service Plan under Rule 12b-1 of the 1940 Act for the Asset Allocation Portfolio’s Class B shares. Under the Distribution and Service Plan, the Class B shares of the Asset Allocation Portfolio pay a fee to compensate the Insurance Companies (or their affiliates) and other broker-dealers and financial intermediaries involved in the offer and sale of Asset Allocation Portfolio shares for promoting or selling and servicing, the Class B shares. The fees under the Distribution and Service Plan for each class of the Asset Allocation Portfolio’s shares are calculated as a percentage of the Asset Allocation Portfolio’s average daily net assets that are attributable to that Class. Currently, the fee is 0.25% per year for Class B shares. Amounts paid by the Asset Allocation Portfolio for the year ended December 31, 2007 are shown as Service and Distribution fees in the Statement of Operations.
MSF-11
Metropolitan Series Fund, Inc.
MetLife Conservative Allocation Portfolio
Notes to Financial Statements—December 31, 2007—(Continued)
Expense Agreement:
Pursuant to an expense agreement relating to each class of the MetLife Conservative Allocation Portfolio, MetLife Advisers has agreed, from May 1, 2007 to April 30, 2008, to waive a portion of its advisory fees or pay a portion of the other operating expenses (not including brokerage costs, interest, taxes, or extraordinary expenses) to the extent total operating expenses exceed stated annual expense limits (based on the Asset Allocation Portfolio’s then current fiscal year). For the Asset Allocation Portfolio, this subsidy, and similar subsidies in effect in earlier periods, are subject to the obligation of each class of the Asset Allocation Portfolio to repay MetLife Advisers in future years, if any, when a class’ expenses fall below the stated expense limit pertaining to that class that was in effect at the time of the subsidy in question. Such deferred expenses may be charged to a class in a subsequent year to the extent that the charge does not cause the total expenses in such subsequent year to exceed the class’ stated expense limit that was in effect at the time of the subsidy in question; provided, however, that no class of the Asset Allocation Portfolio is obligated to repay any expense paid by MetLife Advisers more than five years after the end of the fiscal year in which such expense was incurred.
The expense limits (annual rates as a percentage of each class of the Asset Allocation Portfolio’s net average daily net assets) in effect from May 1, 2007 to April 30, 2008 are 0.10% and 0.35% for Class A and B, respectively.
As of December 31, 2007, the amount of expenses deferred in 2005 subject to repayment until December 31, 2010 was $39,997. The amount of expenses deferred in 2006 subject to repayment until December 31, 2011 was $32,823. The amount of expenses deferred in 2007 subject to repayment until December 31, 2012 was $52,647.
As previously reported, in May 2004, General American received a Wells Notice stating that the SEC staff was considering recommending that the SEC bring a civil action alleging violations of the U.S. securities laws against General American with respect to market timing and late trading in a limited number of privately-placed variable insurance contracts that were sold through General American. General American responded to the SEC staff and cooperated with the investigation. On August 9, 2007, the SEC announced that it had settled an enforcement action regarding late trading against General American with, among other things, General American agreeing to pay a civil penalty and to comply with certain undertakings. General American consented to the SEC’s order without admitting or denying the findings. MetLife Advisers has also advised the Fund’s Board of Directors that, while certain exceptions to the Fund’s policies have been noted, no situations have been identified that would have a material impact on the financial position of the Fund.
| 6. | RECENT ACCOUNTING PRONOUNCEMENTS: |
Effective June 29, 2007, the Fund implemented Financial Accounting Standards Board (“FASB”) Interpretation No. 48, “Accounting for Uncertainty in Income Taxes—an interpretation of FASB Statement No. 109” (“FIN 48”). FIN 48 prescribes the minimum recognition threshold a tax position must meet in connection with accounting for uncertainties in income tax positions taken or expected to be taken by an entity, including investment companies, before being measured and recognized in the financial statements. Management has evaluated the application of FIN 48 to the Fund, and has determined that the adoption of FIN 48 does not have a material impact on the Fund’s financial statements. The Fund files U.S. tax returns. No income tax returns are currently under examination. The statute of limitations on the Fund’s tax returns remains open for the years ended December 31, 2004 through December 31, 2006.
In September 2006, Statement of Financial Accounting Standards No. 157, Fair Value Measurements (SFAS 157) was issued and is effective for fiscal years beginning after November 15, 2007. SFAS 157 defines fair value, establishes a framework for measuring fair value and expands disclosures about fair value measurements. Management is currently evaluating the impact the adoption of SFAS 157 will have on the Portfolio’s financial statement disclosures.
| 7. | TRANSACTIONS IN SECURITIES OF AFFILIATED ISSUERS: |
The Asset Allocation Portfolio does not invest in the Underlying Portfolios for the purpose of exercising management or control; however, investments by the Asset Allocation Portfolio within its principal investment strategies may represent a significant portion of the Underlying Portfolio’s net assets. As of December 31, 2007, the Asset Allocation Portfolio had no ownership of at least 5% of the outstanding voting securities of any Underlying Portfolio.
MSF-12
Metropolitan Series Fund, Inc.
MetLife Conservative Allocation Portfolio
Report of Independent Registered Public Accounting Firm
To the Shareholders and Board of Directors of the Metropolitan Series Fund, Inc.:
We have audited the accompanying statement of assets and liabilities, including the schedule of investments, of the MetLife Conservative Allocation Portfolio, one of the portfolios constituting the Metropolitan Series Fund, Inc. (the “Fund”) as of December 31, 2007, and the related statement of operations for the year then ended, the statements of changes in net assets for each of the two years in the period then ended, and the financial highlights for each of the two years ended December 31, 2007 and the period from May 2, 2005 (commencement of operations) through December 31, 2005. These financial statements and financial highlights are the responsibility of the Fund’s management. Our responsibility is to express an opinion on these financial statements and financial highlights based on our audits.
We conducted our audits in accordance with the standards of the Public Company Accounting Oversight Board (United States). Those standards require that we plan and perform the audit to obtain reasonable assurance about whether the financial statements and financial highlights are free of material misstatement. The Fund is not required to have, nor were we engaged to perform, an audit of its internal control over financial reporting. Our audits included consideration of internal control over financial reporting as a basis for designing audit procedures that are appropriate in the circumstances, but not for the purpose of expressing an opinion on the effectiveness of the Fund’s internal control over financial reporting. Accordingly, we express no such opinion. An audit also includes examining, on a test basis, evidence supporting the amounts and disclosures in the financial statements, assessing the accounting principles used and significant estimates made by management, as well as evaluating the overall financial statement presentation. Our procedures included confirmation of securities owned as of December 31, 2007, by correspondence with the custodian and transfer agent. We believe that our audits provide a reasonable basis for our opinion.
In our opinion, the financial statements and financial highlights referred to above present fairly, in all material respects, the financial position of the MetLife Conservative Allocation Portfolio of the Metropolitan Series Fund, Inc. as of December 31, 2007, the results of its operations for the year then ended, the changes in its net assets for each of the two years in the period then ended and the financial highlights for each of the two years ended December 31, 2007 and the period from May 2, 2005 (commencement of operations) through December 31, 2005, in conformity with accounting principles generally accepted in the United States of America.
Deloitte & Touche LLP
Boston, Massachusetts
February 21, 2008
MSF-13
Metropolitan Series Fund, Inc.
Directors and Officers
The Fund’s Directors review actions of the Fund’s investment adviser and subadvisers, and decide upon matters of general policy. The Fund’s officers supervise the daily business operations of the Fund. The Board of Directors and the Fund’s officers are listed below. Each Director is responsible for overseeing all 36 Portfolios of the Fund. There is no limit to the term a Director may serve. Directors serve until their resignation, retirement or removal in accordance with the Fund’s organizational documents and policies adopted by the Board from time to time. Officers hold office at the pleasure of the Board or until the election or appointment and the qualification of a successor. The address of the directors and officers is c/o Metropolitan Series Fund, Inc., 501 Boylston Street, Boston, MA 02116.
Interested Directors(1)
Each Director below is an “interested person” (as defined by the 1940 Act) with respect to the Fund in that Ms. Forget is an employee of MetLife and Mr. Typermass is a former employee of MetLife and owns securities issued by MetLife, Inc., the ultimate parent company of MetLife Advisers.
| | | | | | | | |
Name, Address and Age | | Current
position(s)
with Fund | | Position(s)
held since | | Principal occupations
over past five years, including other directorships(2) | | Number of
Portfolios in
Fund Complex
Overseen by
Director(3) |
Elizabeth M. Forget Age: 41 | | Director, Chairman of the Board, President and Chief Executive Officer | | 2006 | | Senior Vice President (since 2007), MetLife, Inc.; President, Met Investors Advisory, LLC (“MIA”); Trustee and President, Met Investors Series Trust (“MIST”); Executive Vice President, MetLife Investors Group, Inc.; President (since 2006), MetLife Advisers. | | 81 |
| | | | |
Arthur G. Typermass Age: 70 | | Director | | 1998 | | Formerly, Senior Vice President and Treasurer, MetLife. | | 37 |
Non-Interested Directors(1)
Each Director below is not an “interested person” (as defined by the 1940 Act) with respect to the Fund (collectively, the “Independent Directors”).
| | | | | | | | |
Name, Address and Age | | Current
position(s)
with Fund | | Position(s)
held since | | Principal occupations
over past five years, including other directorships(2) | | Number of
Portfolios in
Fund Complex
Overseen by
Director(3) |
Steve A. Garban† Age: 70 | | Director | | 1985 | | Formerly, Chief Financial Officer, Senior Vice President Finance and Operations and Treasurer (Emeritus), The Pennsylvania State University. | | 37 |
| | | | |
Linda B. Strumpf Age: 60 | | Director | | 2000 | | Vice President and Chief Investment Officer, Ford Foundation. | | 37 |
| | | | |
Michael S. Scott Morton† Age: 70 | | Director | | 1993 | | Jay W. Forrester Professor of Management (Emeritus) at Sloan School of Management, MIT. | | 37 |
| | | | |
H. Jesse Arnelle Age: 74 | | Director | | 2001 | | Formerly, Counsel, Womble Carlyle Sandrie & Rice; Director, Textron Inc. (global multi-industry company)*; formerly, Director, Gannet Co. Inc. (diversified news and information company)*; formerly, Director, Eastman Chemical Company (global chemical company)*; formerly, Director, Waste Management, Inc.*; formerly, Director, Armstrong Holdings Inc. (parent company of floor and ceiling products business)*; formerly, Director, FPL Group Inc. (public utility holding company)*; Director, URS Corporation (engineering design services firm)*. | | 37 |
| | | | |
Nancy Hawthorne Age: 56 | | Director | | 2003 | | Director, Avid Technologies (computer software company)*; formerly, Chairman of the Board of Avid Technologies; formerly, Board of Advisors, L. Knife & Sons, Inc. (beverage distributor); Chief Executive Officer, Clerestory LLC (corporate financial advisor); formerly, Trustee, New England Zenith Fund (“Zenith Fund”)**; formerly, Chief Executive Officer and Managing Partner, Hawthorne, Krauss and Associates (corporate financial advisor); formerly, Chief Financial Officer and Executive Vice President, Continental Cablevision, subsequently renamed MediaOne (cable television company); formerly, Director, Life F/X, Inc.; formerly, Chairman of the Board, WorldClinic (distance medicine company); formerly, Director, Perini Corporation (construction company)*; formerly, Director, CGU (property and casualty insurance company); formerly, Director, Beacon Power Corporation (energy company )*. | | 37 |
MSF-14
Metropolitan Series Fund, Inc.
Directors and Officers—(Continued)
| | | | | | | | |
Name, Address and Age | | Current
position(s)
with Fund | | Position(s)
held since | | Principal occupations
over past five years, including other directorships(2) | | Number of
Portfolios in
Fund Complex
Overseen by
Director(3) |
John T. Ludes Age: 71 | | Director | | 2003 | | President, LFP Properties (consulting firm); Formerly, Trustee, Zenith Fund**; formerly, Vice Chairman, President and Chief Operating Officer, Fortune Brands/American Brands (global conglomerate); formerly, President and CEO, Acushnet Company (athletic equipment company). | | 37 |
Officers(1)
| | | | | | | | |
Name and address | | Age | | Current
position(s)
with Fund | | Position(s)
held since | | Principal occupations over past five years(2) |
| Jeffrey P. Halperin | | 40 | | Chief Compliance Officer | | 2006 | | Vice President (since 2006), Corporate Ethics and Compliance Department, MetLife, Inc.; Chief Compliance Officer (since 2006), MetLife Advisers, MIA and MIST. |
| | | | |
| John F. Guthrie, Jr. | | 64 | | Senior Vice President | | 2002 | | Manager and Senior Vice President, MetLife Advisers; Vice President, MetLife; Vice President (since 2003), MetLife Group, Inc.; Vice President, NELICO; Vice President (since 2005), MIA; formerly, Senior Vice President, Zenith Fund**. |
| | | | |
| Alan C. Leland | | 55 | | Senior Vice President | | 2005 | | Treasurer and Chief Financial Officer, MetLife Advisers, LLC; Treasurer (since 2005), Met Investors Advisory, LLC; Vice President (since 2004), MIA; Vice President (since 2003), MetLife Group, Inc.; Vice President, MetLife; Senior Vice President, NELICO |
| | | | |
| Peter Duffy | | 52 | | Vice President and Treasurer | | 2000 | | Senior Vice President, MetLife Advisers (since 1998); Second Vice President (since 2003), NELICO; Vice President, MetLife (since 2004); Vice President (since 2004), MetLife Group, Inc.; formerly, Vice President and Treasurer, Zenith Fund**. |
| | | | |
| Thomas M. Lenz | | 49 | | Vice President and Secretary | | 2002 | | General Counsel and Secretary, MetLife Advisers; Assistant General Counsel, MetLife; formerly, Vice President and Secretary, Zenith Fund**. |
| * | Indicates a directorship with a registered investment company or a company subject to the reporting requirements of the Securities Exchange Act of 1934, as amended. |
| ** | The Zenith Fund deregistered with the Securities and Exchange Commission (“SEC”) in 2004. |
| (†) | Served as a trustee, director and/or officer of one or more of the following companies, each of which had a direct or indirect advisory relationship with MetLife Advisers or its affiliates prior to January 31, 2005: State Street Research Financial Trust, State Street Research Income Trust, State Street Research Money Market Trust, State Street Research Institutional Funds, State Street Research Capital Trust, State Street Research Master Investment Trust, State Street Research Equity Trust, State Street Research Securities Trust and State Street Research Exchange Trust (collectively, the “State Street Research Funds”). |
| (1) | Each Director of the Fund also serves as trustee of Metropolitan Series Fund II (“Met Series Fund II”), a registered investment company advised by MetLife Advisers. Each officer of the Fund serves in the same position with Met Series Fund II, which consists of one portfolio. |
| (2) | Previous positions during the past five years with the Fund, MIST, MetLife, MetLife Advisers, MIA, Zenith Fund, NELICO or New England Securities Corporation are omitted if not materially different. |
| (3) | The Fund Complex includes the Fund (36 portfolios), Met Series Fund II (1 portfolio) and MIST (44 portfolios) |
MSF-15
Metropolitan Series Fund, Inc.
MetLife Conservative Allocation Portfolio
Board Approval of Advisory and Subadvisory Agreements
The Fund’s Contract Review Committees of the Board of Directors (the “Board”) typically meet in early fall to review the Portfolios’ advisory agreements (the “Advisory Agreements”) and subadvisory agreements (collectively, the “Subadvisory Agreements,” and, together with the Advisory Agreements, the “Agreements”) and determine whether to recommend that the full Board approve the continuation of the Agreements for an additional one-year period. (Following the initial approval of an Agreement for a new Portfolio or with a new adviser or subadviser, such annual reviews are not required until 2 years following the execution of such Agreement.) After each Committee has made its recommendations, the full Board, including the Independent Directors, determines whether to approve the continuation of each of the Agreements. In addition, the Board, including the Independent Directors, considers matters bearing on the Agreements at most of its other meetings throughout the year and regularly interviews various individuals at MetLife Advisers responsible for the management of the Portfolios. The Directors also interview selected investment managers and other professionals at the subadvisers at various times throughout the year.
The Directors receive all materials that they or MetLife Advisers, the Fund’s investment adviser, and the subadvisers believe to be reasonably necessary for the Directors to evaluate the Agreements and determine whether to approve the continuation of the Agreements. These materials generally include, among other items, (i) information on the investment performance of the Portfolios and the performance of peer groups of funds and the Portfolios’ performance benchmarks, (ii) information on the Portfolios’ advisory and subadvisory fees and other expenses, including information comparing the Portfolios’ expenses to those of peer groups of funds and information about any applicable expense caps and fee “breakpoints,” (iii) sales and redemption data, (iv) information related to the profitability of the Agreements to MetLife Advisers and the subadvisers, and potential “fall-out” or ancillary benefits that MetLife Advisers, the subadvisers or their affiliates may receive as a result of their relationships with the Fund and (v) information obtained through the subadvisers’ responses to certain requests from MetLife Advisers and the Directors and MetLife Advisers’ responses to requests from the Directors. The Directors may also consider other information such as (vi) MetLife Advisers’ and the subadvisers’ financial results and condition, (vii) each Portfolio’s investment objectives and strategies and the size, education and experience of the investment staffs of MetLife Advisers and the relevant subadvisers and their use of technology and external research, (viii) the allocation of the Portfolios’ brokerage, if any, including allocations to brokers affiliated with the subadvisers and the use of “soft” commission dollars to pay Portfolio expenses and to pay for research and other similar services, (ix) the resources devoted to, and the record of compliance with, the Portfolios’ investment policies and restrictions, policies on personal securities transactions and other compliance policies, (x) the responses of MetLife Advisers, the subadvisers and/or their affiliates to certain legal and regulatory proceedings and (xi) the economic outlook generally and for the mutual fund industry in particular. Throughout the process, the Directors have the opportunity to ask questions of and request additional materials from MetLife Advisers and the subadvisers.
Following meetings of each Contract Review Committee on September 12, 2007, the Board, at its November 15, 2007 meeting, approved the continuation through December 31, 2008 of the Advisory Agreements for each Portfolio of the Fund and the Subadvisory Agreements for each Portfolio of the Fund. The Agreements approved for continuation are referred to below as the “Continued Agreements.”
In considering whether to approve the continuation of the Continued Agreements, the Directors, including the Independent Directors, did not identify any single factor as determinative, and each weighed the various factors as he or she deemed appropriate. The Directors considered the following matters in connection with their approval of the Continued Agreements:
The nature, extent and quality of the services provided to the relevant Portfolios under the Continued Agreements. The Directors considered the nature, extent and quality of the services provided by MetLife Advisers, the relevant subadvisers (if any) and their affiliates (each, an “Adviser,” and, collectively, the “Advisers”) to the relevant Portfolios pursuant to the Continued Agreements and the resources dedicated to these Portfolios by the Advisers. In particular, the Directors considered the Advisers’ abilities to attract and retain highly qualified investment professionals. With respect to MetLife Advisers, the Directors considered (for each Portfolio other than Zenith Equity and the Asset Allocation Portfolios) that MetLife Advisers is (i) ultimately responsible for the performance of such Portfolios; (ii) ultimately responsible for the establishment of the investment strategies of each such Portfolio, primarily through its recommendations to the Board regarding the hiring and selection of subadvisers; (iii) responsible for the hiring and selection, subject to Board approval, of subadvisers; and (iv) responsible for maintaining a program of Subadviser oversight reasonably designed to ensure that the subadvisers have reasonable compliance policies and procedures in place. The Directors also considered that MetLife Advisers provides a full range of day-to-day administrative services for the Portfolios involving all aspects of such Portfolios’ day-to-day operations (other than portfolio management). With respect to Zenith Equity and the Asset Allocation Portfolios, the Directors considered both the portfolio management services and the administrative services provided by MetLife Advisers. After reviewing these and related factors, the Directors concluded, within the context of their overall conclusions regarding each of the Continued Agreements, that the nature, extent and quality of services provided supported the renewal of these Agreements.
MSF-16
Metropolitan Series Fund, Inc.
MetLife Conservative Allocation Portfolio
Board Approval of Advisory and Subadvisory Agreements—(Continued)
Investment performance of the relevant Portfolios. The Directors reviewed information about the performance of the relevant Portfolios over various time periods, including information prepared by an independent third party that compared the performance of the Portfolios to the performance of peer groups of funds and performance benchmarks. The Directors also reviewed a description of the third party’s methodology for identifying a Portfolio’s peer group(s) for purposes of performance and expense comparisons.
In the case of each relevant Portfolio that had performance that lagged its peer group(s) for certain periods, the Directors concluded that other factors relevant to performance were sufficient, in light of other considerations, to warrant renewal of the Continued Agreements relating to such Portfolio. These factors varied from Portfolio to Portfolio, but included one or more of the following: (i) that such Portfolio’s performance, although lagging in certain recent periods, was stronger over the longer term; (ii) that the underperformance was attributable, to a significant extent, to investment decisions that were reasonable and consistent with the Portfolio’s investment objective(s) and policies and that the Portfolio was performing within the range of reasonable expectations, given market conditions and the Portfolio’s investment objective(s) and policies; (iii) that the Portfolio’s performance was competitive when compared to other relevant performance benchmarks or peer groups; and (iv) that MetLife Advisers and/or the relevant subadviser (if any) had taken or was taking steps designed to help improve the Portfolio’s investment performance.
The Directors also considered the investment performance of the Advisers and their reputations generally, the historical responsiveness of the Advisers to Director concerns about performance and the willingness of the Advisers to take steps intended to improve performance.
After reviewing these and related factors, the Directors concluded, within the context of their overall conclusions regarding each of the Continued Agreements, that the investment performance of each relevant Portfolio and Adviser was sufficient, in light of other considerations, to warrant the renewal of the Continued Agreements.
The costs of the services to be provided and profits to be realized by the Advisers and their affiliates from their relationships with the Portfolios. The Directors considered the fees charged by MetLife Advisers to the Portfolios for advisory services and, with respect to the subadvised Portfolios, by such subadvisers to MetLife Advisers for subadvisory services (such advisory and subadvisory fees (if any), collectively, “Fees”), as well as the total expense levels of the Portfolios. This information included comparisons (provided by an independent third party) of the Portfolios’ advisory fees and total expense levels to those of their peer groups. In evaluating Fees for the relevant Portfolios, the Directors also took into account the demands, complexity and quality of the investment management services provided to each Portfolio. The Directors considered MetLife Advisers’ recommendations regarding reductions in Fee rates, implementation of Fee breakpoints and institution of Fee waivers and expense caps.
The Directors also considered the compensation directly or indirectly received by the Advisers and their affiliates from their relationships with the relevant Portfolios. The Directors reviewed information relating to the profits received by MetLife Advisers, certain of the subadvisers and their affiliates as a result of their relationships with the relevant Portfolios, and information about the allocation of expenses used to calculate profitability. When reviewing profitability, the Directors also considered the performance of the relevant Portfolios, the expense levels of such Portfolios and whether the relevant Advisers had implemented breakpoints, fee waivers and/or expense caps with respect to such Portfolios.
After reviewing these and related factors, the Directors concluded, within the context of their overall conclusions regarding each of the Continued Agreements, that the Fees charged to each of the relevant Portfolios were fair and reasonable, and that the information provided regarding costs of these services generally, and the related profitability (if known) to the relevant Advisers of their relationships with the relevant Portfolios, supported the renewal of the Continued Agreements.
Economies of Scale. The Directors considered the existence of any economies of scale in the provision of services by the Advisers and whether those economies were shared with the relevant Portfolios through breakpoints in their advisory fees or other means, such as expense caps, fee waivers or relatively low levels of fees. The Directors noted that most of the relevant Portfolios benefited or will benefit from breakpoints, expense caps and/or fee waivers with respect to their advisory fees. In considering these issues, the Directors also took into consideration information relating to the costs of the services provided and the profitability to MetLife Advisers, the relevant subadvisers (if any) and each of their affiliates of their relationships with the relevant Portfolios, as discussed above.
After reviewing these and related factors, the Directors concluded, within the context of their overall conclusions regarding each of the Continued Agreements, that the extent to which economies of scale were shared with the relevant Portfolios supported the renewal of such Agreements.
MSF-17
Metropolitan Series Fund, Inc.
MetLife Conservative Allocation Portfolio
Board Approval of Advisory and Subadvisory Agreements—(Continued)
Other Factors. The Directors also considered other factors, which included but were not limited to the following:
| | • | | the extent to which each relevant Portfolio operated in accordance with its investment objective, and its record of compliance with its investment restrictions and the compliance programs of the Fund and the Advisers. They also considered the compliance-related resources the Advisers and their affiliates provide to the relevant Portfolios; |
| | • | | the nature, quality, cost and extent of administrative and shareholder services performed by MetLife Advisers and its affiliates under the Advisory Agreements; and |
| | • | | so-called “fall-out benefits” to the Advisers, such as the engagement of their affiliates to provide distribution, brokerage and transfer agency services to the Portfolios, and the benefits of research made available to the relevant Advisers by reason of brokerage commissions generated by the relevant Portfolios’ securities transactions. The Directors also considered the possible conflicts of interest associated with these fall-out and other benefits, and the reporting and other processes in place to disclose and monitor these possible conflicts of interest. |
Based on their evaluation of all factors that they deemed to be material, including those factors described above, and assisted by the advice of independent counsel, the Directors, including the Independent Directors, concluded that each of the Continued Agreements should be continued through December 31, 2008.
Certain Matters Relating to Julius Baer International Stock Portfolio (formerly known as the FI International Stock Portfolio) (the “International Stock Portfolio”). At the November 15, 2007 Board meeting, the Board approved a change of subadviser for the International Stock Portfolio from Fidelity Management & Research Company (“FMR”) to Julius Baer Investment Management LLC (“Julius Baer”).
In making the determination to approve the change in subadviser for the International Stock Portfolio, the Board carefully considered those factors described above with respect to the continuation of the Continued Agreements, as relevant to both the existing Subadvisory Agreement with FMR and the proposed Subadvisory Agreement with Julius Baer. In addition to these factors, the Board also considered as relevant:
| | • | | the experience, investment style and investment performance history of Julius Baer as portfolio manager; |
| | • | | that the form of the proposed Subadvisory Agreement with Julius Baer was substantially similar to the International Stock Portfolio’s existing Subadvisory Agreement with FMR; |
| | • | | that the subadvisory fee schedule for Julius Baer set forth in the proposed Subadvisory Agreement was lower than the fee schedule in the existing Subadvisory Agreement and that MetLife Advisers had agreed to reduce its advisory fee, through a contractual fee waiver, by an amount corresponding to such savings; |
| | • | | the expected transition costs of the change of subadviser; and |
| | • | | that the preferred date of the change of subadviser was January 7, 2008 and the desirability, in order to facilitate an orderly transition of subadvising functions, of extending the existing Subadvisory Agreement with FMR from its scheduled expiration date of December 31, 2007 until January 7, 2008. |
Following such consideration, and assisted by the advice of independent counsel, the Directors, including the Independent Directors, unanimously voted to approve the continuation of the existing Subadvisory Agreement relating to the International Stock Portfolio through January 7, 2008 and to approve the proposed Subadvisory Agreement relating to such Portfolio with Julius Baer, effective January 7, 2008 through January 6, 2010.
MSF-18
A description of the policies and procedures that the Fund uses to determine how to vote proxies relating to portfolio securities is available (i) without charge, upon request, by calling (800) 638-7732 and (ii) on the Securities and Exchange Commission’s (the “SEC”) website at http://www.sec.gov.
Information regarding how the Fund voted proxies relating to portfolio securities during the most recent twelve-month period ended December 31, 2007 is available (i) without charge, upon request, by calling (800) 638-7732 and (ii) on the SEC’s website at http://www.sec.gov.
The Fund files with the SEC a complete schedule of its portfolio holdings, as of the close of the first and third quarters of its fiscal year, on “Form N-Q”. These filings are available on the SEC’s website at www.sec.gov and may be reviewed and copied at the SEC’s Public Reference Room in Washington, DC. (Call 1-800-SEC-0330 for information on the operation of the Public Reference Room.)
MSF-19
| | |
Metropolitan Series Fund, Inc. MetLife Conservative to Moderate Allocation Portfolio Annual Report | | December 31, 2007 |
Letter from the President
February 1, 2008
Letter to Policy Holders:
2007 was a tumultuous year in the financial markets driven by concerns in the credit markets surrounding sub-prime mortgages and fears of recession in the U.S. Economy. The broad markets were mixed, with the Dow Jones Industrial Average up 8.9% and the MSCI EAFE Index, which measures the performance of international equities, up 11.2% for the year, while the Russell 2000 Index, which measures the performance of small capitalization stocks, was down 1.6%.
In the fixed income markets, credit spreads increased as a result of the pressure from sub-prime mortgage crisis and the Federal Reserve lowered interest rates by a total of 1% during the year. The Lehman Brothers Aggregate Bond Index posted a 7.0% return for the year.
On the following pages, you will find a complete review of your Portfolio and its investment performance.
MetLife is committed to building your financial freedom. We appreciate your trust and will continue to focus our efforts on meeting your investment needs.
Sincerely,
Elizabeth Forget
President, Metropolitan Series Fund, Inc.
Metropolitan Series Fund, Inc.
MetLife Conservative to Moderate Allocation Portfolio
Managed by MetLife Advisers, LLC
Portfolio Manager Commentary*
PORTFOLIO PERFORMANCE
For the year ended December 31, 2007, the Class A shares of the MetLife Conservative to Moderate Allocation Portfolio returned 5.1% compared to the 5.7% return of the Wilshire 5000 Index1 and the 6.5% return of the Lehman Brothers U.S. Universal Bond Index2. Considering that no single index or benchmark can accurately capture the multiple asset class design of the Portfolio, we have created a blended benchmark comprised of several indices for use in portfolio design and evaluation purposes. Specifically, the blended benchmark for the MetLife Conservative to Moderate Allocation Portfolio consists of a 12% allocation to the Lehman Brothers 1 to 3 Year Government Bond Index3, a 48% allocation to the Lehman Brothers U.S. Universal Bond Index, a 32% allocation to the Wilshire 5000 Index, and an 8% allocation to the Morgan Stanley Capital International EAFE Index4. During the twelve-month period ended December 31, 2007, the blended benchmark returned 6.8%.
PORTFOLIO REVIEW
Concerns about subprime mortgages and the strength of the overall economy initially surfaced in the first half of 2007, but they were mostly brushed off. It was not until the second half of the year that those concerns intensified. Most economic statistics at the end of 2007 indicated a weakening economy: a sharp decrease in New and Existing Home Sales, a drop in Consumer Confidence, a rise in the Unemployment Rate, and a decline in the Purchasing Managers Index.
During 2007, large cap stocks, as measured by the Standard & Poor’s 500 Index5 return of 5.5%, did better than small cap stocks, as measured by the -1.6% return of the Russell 2000 Index6. Growth style stocks generally held up better than value style stocks. There was a wide dispersion among the various sectors of the S&P 500 Index: Energy and Materials were up 34% and 22% respectively, while Financials (-19%) and Consumer Discretionary (-13%) were down sharply. On a local basis, foreign stocks were also up modestly for the year, but U.S. based investors benefited from a weak dollar to receive an 11.2% return as measured by the MSCI EAFE Index.
Investment grade bonds, as measured by the Lehman Brothers Aggregate Bond Index7, posted a 7.0% return in response to a decline in interest rates across the yield curve. Below investment grade bonds, while still eking out a positive return for the year, were adversely impacted by credit concerns brought about by the subprime mortgage crisis. Treasuries and Treasury Inflation Protected Securities (TIPS) were the best performing investment grade sectors, while the credit based sectors lagged.
The MetLife Conservative to Moderate Allocation Portfolio is a “fund of funds” that invests in other Portfolios of the Metropolitan Series Fund, Inc. and the Met Investors Series Trust. The Portfolio’s initial target allocations were 40% in equity investments and 60% in fixed income investments. The MetLife Conservative to Moderate Allocation Portfolio is considered the second most conservative of the five Asset Allocation Portfolios by potential risk.
The only change in the Portfolio during the period was a slight adjustment for the underlying Portfolios as of May 1, 2007. We also rebalanced the Portfolio on a quarterly basis to bring it back into line with the underlying Portfolio targets and the desired risk level.
Collectively, the performance of the underlying fixed income Portfolios essentially matched that of the Lehman Brothers U.S. Universal Bond Index. The PIMCO Total Return Portfolio and the PIMCO Inflation Protected Bond Portfolio beat the Index, but this good performance was offset by the Western Asset Strategic Bond Opportunities and Western Asset U.S. Government Portfolios, which lagged the Index due to exposure to holdings of spread product, which includes mortgage backed securities and corporate bonds.
Poor security selection within several of the underlying equity Portfolios detracted from performance over the past year, although this impact was dampened by a modest (40%) overall exposure to equities. These Portfolios did not perform as well as we would have expected given their asset allocation among the segments of the capital markets. Although its position was small (1%) and its performance was in line with the real estate indices, the Neuberger Berman Real Estate Portfolio was down sharply for the year (-14.8%) relative to the broad equity market. This had an adverse impact on the Portfolio’s performance.
Among the underlying Portfolios that had positive security selection and added to relative performance were the Met/AIM Small Cap Growth Portfolio, the Jennison Growth Portfolio, the PIMCO Total Return Portfolio, and the T. Rowe Price Large Cap Growth Portfolio. Among the equity funds, growth oriented funds like these performed better than the broad equity market and added relative value to the Portfolio’s performance.
* The views expressed above are those of the advisory firm as of December 31, 2007 and are subject to change based on market and other conditions. Information about the Portfolio’s holdings, asset allocation, industry allocation, or country diversification is historical and is not an indication of future Portfolio composition, which will vary. The performance of any index mentioned in this commentary has not been adjusted for ongoing management, distribution and operating expenses, and sales charges applicable to mutual fund investments. Direct investment in the Index is not possible.
1 The Wilshire 5000 Index measures the performance of all U.S. headquartered equity securities with readily available price data.
2 The Lehman Brothers U.S. Universal Bond Index represents the union of the U.S. Aggregate Index, the U.S. High-Yield Corporate Index, the 144A Index, the Eurodollar Index, the Emerging Markets Index, the non-EIRSA portion of the Commercial Mortgage Backed Securities Index and the Commercial Mortgage Backed Securities High Yield Index.
3 The Lehman Brothers 1 to 3 Year Government Bond Index includes most obligations of the U.S Treasury, agencies and quasi-federal corporations having maturities between one to three years.
4 The Morgan Stanley Capital International Europe, Australasia and Far East Index (“MSCI EAFE Index”) is an unmanaged free float-adjusted market capitalization index that is designed to measure developed market equity performance, excluding the U.S. & Canada.
5 The Standard & Poor’s (S&P) 500® Stock Index is an unmanaged index representing the performance of 500 major companies, most of which are listed on the New York Stock Exchange.
6 The Russell 2000® Index is an unmanaged measure of performance of the 2,000 smallest companies in the Russell 3000® Index.
7 Lehman Brothers® Aggregate Bond Index includes most obligations of the U.S. Treasury, agencies and quasi-federal corporations, most publicly issued investment grade corporate bonds and most bonds backed by mortgage pools of GNMA, FNMA and FHLMC.
MSF-2
Metropolitan Series Fund, Inc.
MetLife Conservative to Moderate Allocation Portfolio
A $10,000 INVESTMENT COMPARED TO
THE WILSHIRE 5000 STOCK INDEX AND THE LEHMAN BROTHERS
UNIVERSAL BOND INDEX
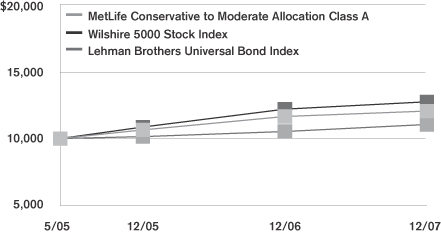
Average Annual Returns as of December 31, 2007
| | | | | | | | | | | | |
| | | MetLife Conservative
to Moderate
Allocation Portfolio | | | Wilshire 5000
Stock Index | | | Lehman Brothers
Universal Bond Index | |
| | | Class A | | | Class B | | | |
| 1 Year | | 5.1 | % | | 4.8 | % | | 5.7 | % | | 6.5 | % |
| Since Inception | | 8.0 | | | 7.7 | | | 12.4 | | | 5.1 | |
Performance numbers are net of all Portfolio expenses but do not include any insurance, sales, or administrative charges of variable annuity or life insurance contracts. If these charges were included, the returns would be lower.
Inception date of the Class A and Class B shares is 5/2/05. Index since inception return is based on the Portfolio’s inception date.
This information represents past performance and is not indicative of future results. Investment return and principal value may fluctuate so that shares, upon redemption, may be worth more or less than the original cost.
PORTFOLIO COMPOSITION
as of December 31, 2007
Top Holdings
| | |
| | | % of Total
Net Assets |
Met Investors Series Trust—PIMCO Total Return Portfolio, (Class A) | | 22.1% |
Metropolitan Series Fund, Inc.—Western Asset Mgt. Strategic Bond Opportunities Portfolio, (Class A) | | 14.8% |
Metropolitan Series Fund, Inc.—BlackRock Bond Income Portfolio, (Class A) | | 11.0% |
Metropolitan Series Fund, Inc.—Davis Venture Value Portfolio, (Class A) | | 5.0% |
Metropolitan Series Fund, Inc.—Neuberger Berman Mid Cap Value Portfolio, (Class A) | | 4.1% |
Metropolitan Series Fund, Inc.—BlackRock Large Cap Value Portfolio, (Class A) | | 4.1% |
Metropolitan Series Fund, Inc.—Western Asset Mgt. U.S. Government Portfolio, (Class A) | | 4.0% |
Met Investors Series Trust—Harris Oakmark International Portfolio, (Class A) | | 4.0% |
Metropolitan Series Fund, Inc.—T. Rowe Price Large Cap Growth Portfolio, (Class A) | | 3.0% |
Met Investors Series Trust—PIMCO Inflation Protected Bond Portfolio, (Class A) | | 3.0% |
MSF-3
Metropolitan Series Fund, Inc.
Shareholder Expense Example
As a shareholder of the Fund, you incur ongoing costs, including management fees; distribution and service (12b-1) fees; and other fund expenses. This example is intended to help you understand your ongoing costs (in dollars) (referred to as “expenses”) of investing in the Portfolio and compare these costs with the ongoing costs of investing in other mutual funds. The example is based on an investment of $1,000 invested at the beginning of the period and held for the entire period, July 1, 2007 through December 31, 2007.
Actual Expenses
The first line for each share class of the Portfolio in the table below provides information about actual account values and actual expenses. You may use the information in this line, together with the amount you invested in the particular share class of the Portfolio, to estimate the expenses that you paid over the period. Simply divide your account value by $1,000 (for example, an $8,600 account value divided by $1,000=8.6), then multiply the result by the number in the first line under the heading entitled “Expenses Paid During Period” to estimate the expenses you paid on your account during this period.
Hypothetical Example for Comparison Purposes
The second line for each share class of the Portfolio in the table below provides information about hypothetical account values and hypothetical expenses based on the Portfolio’s actual expense ratio and an assumed rate of return of 5% per year before expenses, which is not the Portfolio’s actual return. The hypothetical account values and expenses may not be used to estimate the actual ending account balance or expenses you paid for the period. You may use this information to compare the ongoing costs of investing in the Portfolio and other funds. To do so, compare this 5% hypothetical example with the 5% hypothetical examples that appear in the shareholder reports of the other funds.
Please note that the expenses shown in the table are meant to highlight your ongoing costs only and do not reflect any fees or charges of your variable insurance product or any additional expenses that participants in certain eligible qualified plans may bear relating to the operations of their plan. Therefore, the second line for each share class in the table is useful in comparing ongoing costs only, and will not help you determine the relative total costs of owning different funds. In addition, if these other costs were included, your costs would have been higher.
| | | | | | | | | | | | | | |
Portfolio | | | | Annualized
Expense
Ratio | | | Beginning
Account Value
July 1,
2007 | | Ending
Account Value
December 31,
2007 | | Expenses Paid
During Period*
July 1, 2007
to
December 31,
2007 |
MetLife Conservative to Moderate Allocation—Class A(a)(b) | | Actual | | 0.74 | % | | $ | 1,000.00 | | $ | 1,015.70 | | $ | 3.76 |
| | Hypothetical | | 0.74 | % | | $ | 1,000.00 | | $ | 1,021.43 | | $ | 3.77 |
| | | | | |
MetLife Conservative to Moderate Allocation—Class B(a)(b) | | Actual | | 0.99 | % | | $ | 1,000.00 | | $ | 1,014.10 | | $ | 5.03 |
| | Hypothetical | | 0.99 | % | | $ | 1,000.00 | | $ | 1,020.16 | | $ | 5.04 |
* Expenses paid are equal to the Portfolio’s annualized expense ratio for the most recent six month period, as shown above, multiplied by the average account value over the period, multiplied by the number of days in the most recent fiscal half-year, divided by 365 (to reflect the one-half year period).
(a) The annualized expense ratio shown reflects an expense agreement between MetLife Advisers, LLC and the Portfolio as described under Expense Agreement in Note 4 to the Financial Statements.
(b) The annualized expense ratio reflects the expenses of both the Portfolio and the underlying Portfolios in which it invests.
MSF-4
Metropolitan Series Fund, Inc.
MetLife Conservative to Moderate Allocation Portfolio
Schedule of Investments as of December 31, 2007
Mutual Funds—100.0%
| | | | | |
| Security Description | | Shares | | Value* |
| | |
Affiliated Investment Companies—100.0% | | | | | |
Met Investors Series Trust—BlackRock High Yield Portfolio, (Class A) | | 1,711,246 | | $ | 14,100,670 |
Met Investors Series Trust—BlackRock Large Cap Core Portfolio, (Class A) | | 659,957 | | | 7,351,920 |
Met Investors Series Trust—Dreman Small Cap Value Portfolio, (Class A) | | 1,028,616 | | | 13,958,320 |
Met Investors Series Trust—Harris Oakmark International Portfolio, (Class A) | | 1,645,537 | | | 28,418,425 |
Met Investors Series Trust—Lazard Mid-Cap Portfolio, (Class A) | | 1,137,339 | | | 13,841,416 |
Met Investors Series Trust—Legg Mason Value Equity Portfolio, (Class A) | | 2,012,467 | | | 21,130,902 |
Met Investors Series Trust—Lord Abbett Bond Debenture Portfolio, (Class A) | | 1,126,717 | | | 14,230,432 |
Met Investors Series Trust—Met/AIM Small Cap Growth Portfolio, (Class A) | | 955,965 | | | 14,205,646 |
Met Investors Series Trust—Neuberger Berman Real Estate Portfolio, (Class A) | | 487,437 | | | 6,863,112 |
Met Investors Series Trust—PIMCO Inflation Protected Bond Portfolio, (Class A) | | 1,962,792 | | | 21,512,195 |
Met Investors Series Trust—PIMCO Total Return Portfolio, (Class A) | | 12,900,522 | | | 158,547,415 |
Metropolitan Series Fund, Inc.—BlackRock Bond Income Portfolio, (Class A) | | 708,054 | | | 79,096,758 |
Metropolitan Series Fund, Inc.—BlackRock Large Cap Value Portfolio, (Class A) | | 2,147,573 | | | 29,228,466 |
Metropolitan Series Fund, Inc.—Davis Venture Value Portfolio, (Class A) | | 989,296 | | | 36,049,951 |
Metropolitan Series Fund, Inc.—Julius Baer International Stock Portfolio, (Class A) | | 1,327,190 | | | 21,288,120 |
Metropolitan Series Fund, Inc.—FI Mid Cap Opportunities Portfolio, (Class A) | | 664,957 | | | 14,057,183 |
Metropolitan Series Fund, Inc.—Jennison Growth Portfolio, (Class A) | | 1,079,609 | | | 14,704,279 |
Metropolitan Series Fund, Inc.—MetLife Stock Index Portfolio, (Class A) | | 391,017 | | | 14,467,617 |
Metropolitan Series Fund, Inc.—Neuberger Berman Mid Cap Value Portfolio, (Class A) | | 1,389,087 | | | 29,531,988 |
Metropolitan Series Fund, Inc.—Russell 2000 Index Portfolio, (Class A) | | 499,994 | | | 7,089,909 |
Metropolitan Series Fund, Inc.—T. Rowe Price Large Cap Growth Portfolio, (Class A) | | 1,325,671 | | | 21,847,056 |
Metropolitan Series Fund, Inc.—Western Asset Mgt. Strategic Bond Opportunities Portfolio, (Class A) | | 8,383,014 | | | 106,631,940 |
| | | | | | |
| Security Description | | Shares | | Value* | |
| |
Affiliated Investment Companies—(Continued) | | | | |
Metropolitan Series Fund, Inc.—Western Asset Mgt. U.S. Government Portfolio, (Class A) | | 2,285,551 | | $ | 28,546,537 | |
| | | | | | |
Total Mutual Funds
(Identified Cost $702,097,800) | | | | | 716,700,257 | |
| | | | | | |
Total Investments—100.0%
(Identified Cost $702,097,800) (a) | | | | | 716,700,257 | |
Liabilities in excess of other assets | | | | | (230,109 | ) |
| | | | | | |
| Total Net Assets—100% | | | | $ | 716,470,148 | |
| | | | | | |
| (a) | The aggregate cost of investments for federal income tax purposes as of December 31, 2007 was $702,714,404 and the composition of unrealized appreciation and depreciation of investment securities was $19,221,676 and $(5,235,823), respectively. |
*See accompanying notes to financial statements.
MSF-5
Metropolitan Series Fund, Inc.
MetLife Conservative to Moderate Allocation Portfolio
Statement of Assets & Liabilities
December 31, 2007
| | | | | | |
Assets | | | | | | |
Investments at value (a) | | | | | $ | 716,700,257 |
Receivable for: | | | | | | |
Fund shares sold | | | | | | 1,559,233 |
| | | | | | |
Total Assets | | | | | | 718,259,490 |
Liabilities | | | | | | |
Payable for: | | | | | | |
Securities purchased | | $ | 1,428,558 | | | |
Fund shares redeemed | | | 130,675 | | | |
Due to custodian bank | | | 12 | | | |
Accrued expenses: | | | | | | |
Management fees | | | 66,034 | | | |
Service and distribution fees | | | 135,436 | | | |
Other expenses | | | 28,627 | | | |
| | | | | | |
Total Liabilities | | | | | | 1,789,342 |
| | | | | | |
Net Assets | | | | | $ | 716,470,148 |
| | | | | | |
Net assets consists of: | | | | | | |
Capital paid in | | | | | $ | 685,674,533 |
Undistributed net investment income | | | | | | 8,234,157 |
Accumulated net realized gains | | | | | | 7,959,001 |
Unrealized appreciation on investments | | | | | | 14,602,457 |
| | | | | | |
Net Assets | | | | | $ | 716,470,148 |
| | | | | | |
| Computation of offering price: | | | | | | |
Class A | | | | | | |
Net asset value and redemption price per
share ($63,055,065 divided by
5,432,829 shares outstanding) | | | | | $ | 11.61 |
| | | | | | |
Class B | | | | | | |
Net asset value and redemption price per
share ($653,415,083 divided by 56,660,820 shares outstanding) | | | | | $ | 11.53 |
| | | | | | |
(a) Identified cost of investments | | | | | $ | 702,097,800 |
| | | | | | |
Statement of Operations
For the Year Ended December 31, 2007
| | | | | | | |
Investment Income | | | | | | | |
Dividends from Underlying Portfolios | | | | | | $ | 8,768,781 |
| | | | | | | |
Expenses | | | | | | | |
Management fees | | $ | 466,330 | | | | |
Service and distribution fees—Class B | | | 1,062,732 | | | | |
Directors’ fees and expenses | | | 811 | | | | |
Custodian | | | 28,091 | | | | |
Audit and tax services | | | 18,574 | | | | |
Legal | | | 6,487 | | | | |
Miscellaneous | | | 9,567 | | | | |
| | | | | | | |
Total expenses | | | 1,592,592 | | | | |
Expense reimbursements | | | (53,497 | ) | | | 1,539,095 |
| | | | | | | |
Net Investment Income | | | | | | | 7,229,686 |
| | | | | | | |
Realized and Unrealized Gain | | | | | | | |
| Realized gain on: | | | | | | | |
Investments—net | | | 4,397,800 | | | | |
Capital gains distributions from Underlying Portfolios | | | 4,951,780 | | | | 9,349,580 |
| | �� | | | | | |
| Change in unrealized appreciation on: | | | | | | | |
Investments—net | | | | | | | 2,755,959 |
| | | | | | | |
Net gain | | | | | | | 12,105,539 |
| | | | | | | |
Net Increase in Net Assets From Operations | | | | | | $ | 19,335,225 |
| | | | | | | |
See accompanying notes to financial statements.
MSF-6
Metropolitan Series Fund, Inc.
MetLife Conservative to Moderate Allocation Portfolio
Statements of Changes in Net Assets
| | | | | | | | |
| | | Year ended
December 31,
2007 | | | Year ended
December 31,
2006 | |
From Operations | | | | | | | | |
Net investment income | | $ | 7,229,686 | | | $ | 2,753,313 | |
Net realized gain | | | 9,349,580 | | | | 2,680,788 | |
Unrealized appreciation | | | 2,755,959 | | | | 11,426,020 | |
| | | | | | | | |
Increase in net assets from operations | | | 19,335,225 | | | | 16,860,121 | |
| | | | | | | | |
From Distributions to Shareholders | | | | | | | | |
Net investment income | | | | | | | | |
Class A | | | 0 | | | | (590,104 | ) |
Class B | | | 0 | | | | (2,533,725 | ) |
| | | | | | | | |
| | | 0 | | | | (3,123,829 | ) |
| | | | | | | | |
Net realized gain | | | | | | | | |
Class A | | | (80,079 | ) | | | (404,643 | ) |
Class B | | | (623,334 | ) | | | (1,776,898 | ) |
| | | | | | | | |
| | | (703,413 | ) | | | (2,181,541 | ) |
| | | | | | | | |
Total distributions | | | (703,413 | ) | | | (5,305,370 | ) |
| | | | | | | | |
Increase in net assets from capital share transactions | | | 406,953,460 | | | | 220,484,878 | |
| | | | | | | | |
Total increase in net assets | | | 425,585,272 | | | | 232,039,629 | |
| | |
Net Assets | | | | | | | | |
Beginning of the period | | | 290,884,876 | | | | 58,845,247 | |
| | | | | | | | |
End of the period | | $ | 716,470,148 | | | $ | 290,884,876 | |
| | | | | | | | |
Undistributed Net Investment Income | | | | | | | | |
End of the period | | $ | 8,234,157 | | | $ | 0 | |
| | | | | | | | |
Other Information:
Capital Shares
Transactions in capital shares were as follows:
| | | | | | | | | | | | | | |
| | | Year ended
December 31, 2007 | | | Year ended
December 31, 2006 | |
| | | Shares | | | $ | | | Shares | | | $ | |
Class A | | | | | | | | | | | | | | |
Sales | | 3,514,656 | | | $ | 40,139,033 | | | 3,075,955 | | | $ | 32,731,897 | |
Reinvestments | | 6,982 | | | | 80,079 | | | 95,649 | | | | 994,747 | |
Redemptions | | (1,330,474 | ) | | | (15,161,664 | ) | | (916,210 | ) | | | (9,630,196 | ) |
| | | | | | | | | | | | | | |
Net increase | | 2,191,164 | | | $ | 25,057,448 | | | 2,255,394 | | | $ | 24,096,448 | |
| | | | | | | | | | | | | | |
Class B | | | | | | | | | | | | | | |
Sales | | 41,920,624 | | | $ | 476,801,515 | | | 20,240,511 | | | $ | 214,379,158 | |
Shares issued through acquisition | | 0 | | | | 0 | | | 546,716 | | | | 5,691,315 | |
Reinvestments | | 54,583 | | | | 623,334 | | | 415,682 | | | | 4,310,623 | |
Redemptions | | (8,448,865 | ) | | | (95,528,837 | ) | | (2,641,425 | ) | | | (27,992,666 | ) |
| | | | | | | | | | | | | | |
Net increase | | 33,526,342 | | | $ | 381,896,012 | | | 18,561,484 | | | $ | 196,388,430 | |
| | | | | | | | | | | | | | |
Increase derived from capital share transactions | | | | | $ | 406,953,460 | | | | | | $ | 220,484,878 | |
| | | | | | | | | | | | | | |
See accompanying notes to financial statements.
MSF-7
Metropolitan Series Fund, Inc.
MetLife Conservative to Moderate Allocation Portfolio
Financial Highlights
| | | | | | | | | | | | |
| | | Class A | |
| | | Year ended December 31, | |
| | | 2007 | | | 2006 | | | 2005(a) | |
Net Asset Value, Beginning of Period | | $ | 11.07 | | | $ | 10.60 | | | $ | 10.00 | |
| | | | | | | | | | | | |
Income From Investment Operations | | | | | | | | | | | | |
Net investment income | | | 0.21 | (b) | | | 0.31 | | | | 0.04 | |
Net realized and unrealized gain on investments | | | 0.35 | | | | 0.70 | | | | 0.60 | |
| | | | | | | | | | | | |
Total from investment operations | | | 0.56 | | | | 1.01 | | | | 0.64 | |
| | | | | | | | | | | | |
Less Distributions | | | | | | | | | | | | |
Distributions from net investment income | | | 0.00 | | | | (0.32 | ) | | | (0.04 | ) |
Distributions from net realized capital gains | | | (0.02 | ) | | | (0.22 | ) | | | 0.00 | |
| | | | | | | | | | | | |
Total distributions | | | (0.02 | ) | | | (0.54 | ) | | | (0.04 | ) |
| | | | | | | | | | | | |
Net Asset Value, End of Period | | $ | 11.61 | | | $ | 11.07 | | | $ | 10.60 | |
| | | | | | | | | | | | |
Total Return (%) | | | 5.1 | | | | 9.8 | | | | 6.4 | (c) |
Ratio of operating expenses to average net assets (%) (d) | | | 0.10 | | | | 0.10 | | | | 0.10 | (e) |
Ratio of operating expenses to average net assets without giving effect to the
contractual expense agreement would have been (%) (g) | | | 0.11 | | | | 0.12 | | | | 0.41 | (e) |
Ratio of net investment income to average net assets (%) (f) | | | 1.86 | | | | 2.45 | | | | 1.28 | (e) |
Portfolio turnover rate (%) | | | 19 | | | | 18 | | | | 3 | (e) |
Net assets, end of period (000) | | $ | 63,055 | | | $ | 35,874 | | | $ | 10,457 | |
| | | | | | | | | | | | |
| | | Class B | |
| | | Year ended December 31, | |
| | | 2007 | | | 2006 | | | 2005(a) | |
Net Asset Value, Beginning of Period | | $ | 11.02 | | | $ | 10.58 | | | $ | 10.00 | |
| | | | | | | | | | | | |
Income From Investment Operations | | | | | | | | | | | | |
Net investment income | | | 0.17 | (b) | | | 0.29 | | | | 0.03 | |
Net realized and unrealized gain on investments | | | 0.36 | | | | 0.68 | | | | 0.59 | |
| | | | | | | | | | | | |
Total from investment operations | | | 0.53 | | | | 0.97 | | | | 0.62 | |
| | | | | | | | | | | | |
Less Distributions | | | | | | | | | | | | |
Distributions from net investment income | | | 0.00 | | | | (0.31 | ) | | | (0.04 | ) |
Distributions from net realized capital gains | | | (0.02 | ) | | | (0.22 | ) | | | 0.00 | |
| | | | | | | | | | | | |
Total distributions | | | (0.02 | ) | | | (0.53 | ) | | | (0.04 | ) |
| | | | | | | | | | | | |
Net Asset Value, End of Period | | $ | 11.53 | | | $ | 11.02 | | | $ | 10.58 | |
| | | | | | | | | | | | |
Total Return (%) | | | 4.8 | | | | 9.4 | | | | 6.2 | (c) |
Ratio of operating expenses to average net assets (%) (d) | | | 0.35 | | | | 0.35 | | | | 0.35 | (e) |
Ratio of operating expenses to average net assets without giving effect to the
contractual expense agreement would have been (%) (g) | | | 0.36 | | | | 0.37 | | | | 0.66 | (e) |
Ratio of net investment income to average net assets (%) (f) | | | 1.48 | | | | 1.64 | | | | 1.27 | (e) |
Portfolio turnover rate (%) | | | 19 | | | | 18 | | | | 3 | (e) |
Net assets, end of period (000) | | $ | 653,415 | | | $ | 255,011 | | | $ | 48,388 | |
| (a) | Commencement of operations was May 2, 2005. |
| (b) | Per share amount is based on average shares outstanding during the period. |
| (c) | Periods less than one year are not computed on an annualized basis. |
| (d) | The ratio of operating expenses to average net assets does not include expenses of investment companies in which the Portfolio invests. |
| (e) | Computed on an annualized basis. |
| (f) | Recognition of net investment income by the Portfolio is affected by the timing of the declaration of dividends by the underlying Portfolios in which it invests. |
| (g) | See Note 4 in the Notes to Financial Statements. |
See accompanying notes to financial statements.
MSF-8
Metropolitan Series Fund, Inc.
MetLife Conservative to Moderate Allocation Portfolio
Notes to Financial Statements—December 31, 2007
Metropolitan Series Fund, Inc. (the “Fund”) is organized as a corporation under the laws of Maryland pursuant to Articles of Incorporation filed on November 23, 1982, as amended, and registered under the Investment Company Act of 1940, as amended (the “1940 Act”), as an open-end investment company. The Fund is a “series” type of mutual fund, which issues separate series of stock. Each series represents an interest in a separate portfolio of Fund investments. The MetLife Conservative to Moderate Allocation Portfolio (the “Asset Allocation Portfolio”) is a non-diversified series of the fund. The Asset Allocation Portfolio operates under a “fund of funds” structure, investing substantially all of its assets in other Portfolios advised by MetLife Advisers, LLC (“MetLife Advisers”) or its affiliates (each, an “Underlying Portfolio,” and, collectively, the “Underlying Portfolios”). Shares in the Fund are not offered directly to the general public and are currently available only to separate accounts established by Metropolitan Life Insurance Company (“MetLife”), New England Life Insurance Company, General American Life Insurance Company (“General American”), The MetLife Investors Group of Insurance Companies, MetLife Insurance Company of Connecticut and other affiliated insurance companies (collectively, the “Insurance Companies”), as an investment vehicle for variable life insurance, group annuity or variable annuity products, although not all Portfolios are available to all such separate accounts. The Asset Allocation Portfolio’s shares may be divided into different classes. Currently, the classes being offered by the Asset Allocation Portfolio are named Class A and Class B. The classes of the Asset Allocation Portfolio’s shares are identical, except that certain additional charges (Rule 12b-1 fees) are made against Class B shares. Investment income, realized and unrealized capital gains and losses, the common expenses of the Asset Allocation Portfolio and certain Portfolio-level expense reductions, if any, are allocated on a pro rata basis to each class based on the relative net assets of each class to the total net assets of the Asset Allocation Portfolio.
| 2. | SIGNIFICANT ACCOUNTING POLICIES: |
The preparation of financial statements in conformity with accounting principles generally accepted in the United States of America (“GAAP”) requires management to make estimates and assumptions that affect the reported amounts of assets and liabilities and disclosure of contingent assets and liabilities as of the date of the financial statements and the reported amounts of income and expenses during the reporting period. Actual results could differ from those estimates.
The following is a summary of significant accounting policies consistently followed by the Asset Allocation Portfolio in the preparation of its financial statements. The policies are in conformity with GAAP.
Investment Valuation:
The net asset value of the Asset Allocation Portfolio is calculated based on the net asset values of the Underlying Portfolios in which the Asset Allocation Portfolio invests. The Underlying Portfolios that are series of the Fund will use fair value pricing in the circumstances and manner described below. For more information about the use of fair value pricing by the underlying portfolios that are series of Met Investors Series Trust (“MIST”), please refer to the prospectus for such underlying portfolios.
The Underlying Portfolios that are series of the Fund are valued as follows:
Debt securities (other than short term obligations with a remaining maturity of sixty days or less) are valued on the basis of valuations furnished by independent pricing services selected by the relevant subadviser pursuant to authorization of the Board of Directors of the Fund (the “Board” or “Directors”). Short term obligations with a remaining maturity of sixty days or less are valued at amortized cost which approximates fair market value.
Equity securities traded on a national securities exchange or exchanges are valued at their last sale price on the principal trading market. Equity securities traded on the NASDAQ National Market System are valued at the NASDAQ Official Closing Price (the “NOCP”). The NOCP is the last sale price if it falls between the spread of the last reported bid and asked prices. If the last reported bid and asked prices are above the last reported sale price, the NOCP will be the last reported bid price. If the last reported bid and asked prices are below the last reported sale price, the NOCP will be the last reported asked price. Equity securities traded on a national securities exchange or exchanges or on the NASDAQ National Market System for which there is no reported sale during the day are valued at the last reported bid price. A security that is listed or traded on more than one exchange is valued at the quotation on the exchange determined to be the primary market for that security by the Board or its delegates. If no closing price is available, then such securities are valued by using the last reported bid price. Equity securities traded over-the-counter are valued at the last reported sales price.
MSF-9
Metropolitan Series Fund, Inc.
MetLife Conservative to Moderate Allocation Portfolio
Notes to Financial Statements—December 31, 2007—(Continued)
If no current market value quotation is readily available or reliable for a portfolio security, fair value will be determined in accordance with procedures established by and under the general supervision of the Board. When an Underlying Portfolio uses fair value pricing, it may take into account any factors it deems appropriate. The value of securities used by the Underlying Portfolio to calculate its net asset value may differ from quoted or published prices for the same securities. Fair value pricing involves subjective judgments and the fair value determined for a security may be materially different than the value that could be realized upon the sale of that security.
The Underlying Portfolios expect to use fair value pricing for securities primarily traded on U.S. exchanges only under very limited circumstances. For example, the Underlying Portfolio may use fair value pricing if the exchange on which a security is traded closes early or trading in the security is suspended.
Securities traded primarily on an exchange outside of the United States which closes before the close of the New York Stock Exchange will be valued at the last sales price on that non-U.S. exchange. Securities traded primarily on an exchange outside of the United States for which there is no reported sale during the day are valued at the mean between the last reported bid and asked prices. However, because most foreign markets close well before the Underlying Portfolio values its securities (typically at 4 p.m. Eastern Time), the earlier close of these foreign markets gives rise to the possibility that significant events, including broad market moves, may have occurred after these foreign markets close but before the Underlying Portfolio values its securities. For example, foreign security values may be affected by activity that occurs after the close of foreign securities markets. To account for this, the Underlying Portfolio may frequently value many of its foreign equity securities using fair value prices based on third party vendor modeling tools.
Forward foreign currency exchange contracts are valued based on the mean between closing bid and asked prices of the forward currency contract rates in the London foreign exchange markets on a daily basis as provided by a reliable bank or dealer.
Options, whether on securities, indices, futures contracts, or otherwise, are valued at the last sales price available as of the close of business on the day of valuation or, if there is no such sale price available, at the mean between the bid and asked prices. Options on currencies are valued at the spot price each day.
The value of futures contracts will be the sum of the margin deposit plus or minus the difference between the value of the futures contract on each day the net asset value is calculated and the value on the date the futures contract originated, value being that established on a recognized commodity exchange, or by reference to other customary sources, with gain or loss being realized when the futures contract closes or expires.
Subject to the Board’s oversight, the Board has delegated day-to-day responsibility for valuing Underlying Portfolio assets to MetLife Advisers, LLC (“MetLife Advisers” or the “Adviser”) or the subadviser of the Underlying Portfolio, as applicable, who values such assets as described above and operates under procedures approved by the Board.
Investment Transactions and Related Investment Income:
Portfolio security transactions are recorded on the trade date. Dividend income is recorded on the ex-dividend date. Interest income is recorded on the accrual basis. Realized gains and losses on investments and unrealized appreciation and depreciation are determined on the identified cost basis, which is the same basis used for federal income tax purposes.
Federal Income Taxes:
It is the Fund’s policy to comply with the requirements of the Internal Revenue Code of 1986, as amended, and regulations thereunder, applicable to regulated investment companies and to distribute all of its taxable income to shareholders. Therefore, no federal income tax provision is required.
As of December 31, 2007, the Asset Allocation Portfolio had no capital loss carryovers.
The tax character of distributions paid for the periods ended December 31, 2007 and 2006 was as follows:
| | | | | | | | | | | | | | | | | | | | | |
| Ordinary Income | | Long Term Gain | | Return of Capital | | Total |
| 2007 | | 2006 | | 2007 | | 2006 | | 2007 | | 2006 | | 2007 | | 2006 |
| $527,560 | | $ | 3,598,532 | | $ | 175,853 | | $ | 1,706,838 | | $ | — | | $ | — | | $ | 703,413 | | $ | 5,305,370 |
MSF-10
Metropolitan Series Fund, Inc.
MetLife Conservative to Moderate Allocation Portfolio
Notes to Financial Statements—December 31, 2007—(Continued)
As of December 31, 2007, the components of distributable earnings (accumulated losses) on a federal income tax basis were as follows:
| | | | | | | | | | | | |
Undistributed
Ordinary
Income | | Undistributed
Long Term
Gain | | Unrealized
Appreciation | | Loss
Carryforwards | | Total |
| $10,007,422 | | $ | 6,802,340 | | $ | 13,985,853 | | $ | — | | $ | 30,795,615 |
Dividends and Distributions to Shareholders:
The Asset Allocation Portfolios record dividends and distributions on the ex-dividend date. Net realized gains from security transactions (if any) are generally distributed annually to shareholders. The timing and characterization of certain income and capital gains distributions are determined in accordance with federal tax regulations that may differ from GAAP. Permanent book and tax basis differences relating to shareholder distributions will result in reclassification between under/over distributed net investment income, accumulated net realized gains/losses and paid in capital.
| 3. | INVESTMENT TRANSACTIONS: |
For the year ended December 31, 2007, purchases and sales of Underlying Portfolios by the Asset Allocation Portfolio were $509,370,380 and $90,812,451, respectively.
| 4. | INVESTMENT MANAGEMENT FEES AND OTHER TRANSACTIONS WITH AFFILIATES: |
Investment Management Agreement:
MetLife Advisers, LLC (“MetLife Advisers”) is the investment adviser to the Asset Allocation Portfolio. The Fund has entered into an investment management agreement with MetLife Advisers with respect to the Portfolio. For providing investment management services to the Portfolio, MetLife Advisers receives monthly compensation at the following annual rates:
| | | | | | |
| | | Management
Fees earned by
MetLife Advisers
for the year ended
December 31, 2007 | | Annual
percentage
rates paid to
MetLife Advisers | | Based on Portfolios
average daily net asset levels |
| | $466,330 | | 0.100% | | Of the first $500 million |
| | | | 0.075% | | Of the next $500 million |
| | | | 0.050% | | On amounts in excess of $1 billion |
In addition to the above Management Fee paid to MetLife Advisers, the Asset Allocation Portfolio indirectly pays MetLife Advisers an investment advisory fee through its investments in certain Underlying Portfolios.
Certain officers and directors of the Fund may also be officers of MetLife Advisers; however, such officers and directors receive no compensation from the Fund.
Service and Distribution Fees:
The Fund has adopted a Distribution and Service Plan under Rule 12b-1 of the 1940 Act for the Asset Allocation Portfolio’s Class B shares. Under the Distribution and Service Plan, the Class B shares of the Asset Allocation Portfolio pay a fee to compensate the Insurance Companies (or their affiliates) and other broker-dealers and financial intermediaries involved in the offer and sale of Asset Allocation Portfolio shares for promoting or selling and servicing, the Class B shares of the Asset Allocation Portfolio. The fees under the Distribution and Service Plan for each class of the Asset Allocation Portfolio’s shares are calculated as a percentage of the Asset Allocation Portfolio’s average daily net assets that are attributable to that Class. Currently, the fee is 0.25% per year for Class B shares. Amounts paid by the Asset Allocation Portfolio for the year ended December 31, 2007 are shown as Service and Distribution fees in the Statement of Operations.
MSF-11
Metropolitan Series Fund, Inc.
MetLife Conservative to Moderate Allocation Portfolio
Notes to Financial Statements—December 31, 2007—(Continued)
Expense Agreement:
Pursuant to an expense agreement relating to each class of the Asset Allocation Portfolio, MetLife Advisers has agreed, from May 1, 2007 to April 30, 2008, to waive a portion of its advisory fees or pay a portion of the other operating expenses (not including brokerage costs, interest, taxes, or extraordinary expenses) to the extent total operating expenses exceed stated annual expense limits (based on the Asset Allocation Portfolio’s then current fiscal year). For the Asset Allocation Portfolio, this subsidy, and similar subsidies in effect in earlier periods, are subject to the obligation of each class of the Asset Allocation Portfolio to repay MetLife Advisers in future years, if any, when a class’ expenses fall below the stated expense limit pertaining to that class that was in effect at the time of the subsidy in question. Such deferred expenses may be charged to a class in a subsequent year to the extent that the charge does not cause the total expenses in such subsequent year to exceed the class’ stated expense limit that was in effect at the time of the subsidy in question; provided, however, that no class of the Asset Allocation Portfolio is obligated to repay any expense paid by MetLife Advisers more than five years after the end of the fiscal year in which such expense was incurred.
The expense limits (annual rates as a percentage of each class of the Asset Allocation Portfolio’s net average daily net assets) in effect from May 1, 2007 to April 30, 2008 are 0.10% and 0.35% for Class A and B, respectively.
As of December 31, 2007, the amount of expenses deferred in 2005 subject to repayment until December 31, 2010 was $47,344 for the Asset Allocation Portfolio. The amount of expenses deferred in 2006 subject to repayment until December 31, 2011 was $35,780. The amount of expenses deferred in 2007 subject to repayment until December 31, 2012 was $53,497.
As previously reported, in May 2004, General American received a Wells Notice stating that the SEC staff was considering recommending that the SEC bring a civil action alleging violations of the U.S. securities laws against General American with respect to market timing and late trading in a limited number of privately-placed variable insurance contracts that were sold through General American. General American responded to the SEC staff and cooperated with the investigation. On August 9, 2007, the SEC announced that it had settled an enforcement action regarding late trading against General American with, among other things, General American agreeing to pay a civil penalty and to comply with certain undertakings. General American consented to the SEC’s order without admitting or denying the findings. MetLife Advisers has also advised the Fund’s Board of Directors that, while certain exceptions to the Fund’s policies have been noted, no situations have been identified that would have a material impact on the financial position of the Fund.
| 6. | RECENT ACCOUNTING PRONOUNCEMENTS: |
Effective June 29, 2007, the Fund implemented Financial Accounting Standards Board (“FASB”) Interpretation No. 48, “Accounting for Uncertainty in Income Taxes—an interpretation of FASB Statement No. 109” (“FIN 48”). FIN 48 prescribes the minimum recognition threshold a tax position must meet in connection with accounting for uncertainties in income tax positions taken or expected to be taken by an entity, including investment companies, before being measured and recognized in the financial statements. Management has evaluated the application of FIN 48 to the Fund, and has determined that the adoption of FIN 48 does not have a material impact on the Fund’s financial statements. The Fund files U.S. tax returns. No income tax returns are currently under examination. The statute of limitations on the Fund’s tax returns remains open for the years ended December 31, 2004 through December 31, 2006.
In September 2006, Statement of Financial Accounting Standards No. 157, Fair Value Measurements (SFAS 157) was issued and is effective for fiscal years beginning after November 15, 2007. SFAS 157 defines fair value, establishes a framework for measuring fair value and expands disclosures about fair value measurements. Management is currently evaluating the impact the adoption of SFAS 157 will have on the Portfolio’s financial statement disclosures.
MSF-12
Metropolitan Series Fund, Inc.
MetLife Conservative to Moderate Allocation Portfolio
Notes to Financial Statements—December 31, 2007—(Continued)
| 7. | TRANSACTIONS IN SECURITIES OF AFFILIATED ISSUERS: |
The Asset Allocation Portfolio does not invest in the Underlying Portfolios for the purpose of exercising management or control; however, investments by the Asset Allocation Portfolio within its principal investment strategies may represent a significant portion of the Underlying Portfolio’s net assets. Transactions in the Underlying Portfolios during the six months ended December 31, 2007 in which the Asset Allocation Portfolio had ownership of at least 5% of the outstanding voting securities at the end of the period are as follows:
| | | | | | | | |
Underlying Portfolio (Class A) | | Beginning Shares
as of
12/30/2006 | | Shares
Purchased
during Period | | Shares Sold
during Period | | Ending Shares
as of
12/31/2007 |
MIST—Dreman Small Cap Value | | 439,238 | | 643,341 | | 53,963 | | 1,028,616 |
MSF—Western Asset Mgmt. Strategic Bond Opportunities | | 3,414,485 | | 5,384,367 | | 415,838 | | 8,383,014 |
| | | | | | | | | | | | | |
Underlying Portfolio (Class A) | | Realized Gain/(Loss)
during Period | | | Capital Gains
Distributions
during Period | | Dividend
Income during
Period | | Ending Value
as of
12/31/2007 |
MIST—Dreman Small Cap Value | | $ | 47,641 | | | $ | 39,157 | | $ | 0 | | $ | 13,958,320 |
MSF—Western Asset Mgmt. Strategic Bond Opportunities | | | (56,479 | ) | | | 56,036 | | | 1,625,036 | | | 106,631,940 |
MSF-13
Metropolitan Series Fund, Inc.
MetLife Conservative To Moderate Allocation Portfolio
Report of Independent Registered Public Accounting Firm
To the Shareholders and Board of Directors of the Metropolitan Series Fund, Inc.:
We have audited the accompanying statement of assets and liabilities, including the schedule of investments, of the MetLife Conservative to Moderate Allocation Portfolio, one of the portfolios constituting the Metropolitan Series Fund, Inc. (the “Fund”) as of December 31, 2007, and the related statement of operations for the year then ended, the statements of changes in net assets for each of the two years in the period then ended, and the financial highlights for each of the two years ended December 31, 2007 and the period from May 2, 2005 (commencement of operations) through December 31, 2005. These financial statements and financial highlights are the responsibility of the Fund’s management. Our responsibility is to express an opinion on these financial statements and financial highlights based on our audits.
We conducted our audits in accordance with the standards of the Public Company Accounting Oversight Board (United States). Those standards require that we plan and perform the audit to obtain reasonable assurance about whether the financial statements and financial highlights are free of material misstatement. The Fund is not required to have, nor were we engaged to perform, an audit of its internal control over financial reporting. Our audits included consideration of internal control over financial reporting as a basis for designing audit procedures that are appropriate in the circumstances, but not for the purpose of expressing an opinion on the effectiveness of the Fund’s internal control over financial reporting. Accordingly, we express no such opinion. An audit also includes examining, on a test basis, evidence supporting the amounts and disclosures in the financial statements, assessing the accounting principles used and significant estimates made by management, as well as evaluating the overall financial statement presentation. Our procedures included confirmation of securities owned as of December 31, 2007, by correspondence with the custodian and transfer agent. We believe that our audits provide a reasonable basis for our opinion.
In our opinion, the financial statements and financial highlights referred to above present fairly, in all material respects, the financial position of the MetLife Conservative to Moderate Allocation Portfolio of the Metropolitan Series Fund, Inc. as of December 31, 2007, the results of its operations for the year then ended, and the changes in its net assets for each of the two years in the period then ended, and the financial highlights for each of the two years ended December 31, 2007 and the period from May 2, 2005 (commencement of operations) through December 31, 2005, in conformity with accounting principles generally accepted in the United States of America.
Deloitte & Touche LLP
Boston, Massachusetts
February 21, 2008
MSF-14
Metropolitan Series Fund, Inc.
Directors and Officers
The Fund’s Directors review actions of the Fund’s investment adviser and subadvisers, and decide upon matters of general policy. The Fund’s officers supervise the daily business operations of the Fund. The Board of Directors and the Fund’s officers are listed below. Each Director is responsible for overseeing all 36 Portfolios of the Fund. There is no limit to the term a Director may serve. Directors serve until their resignation, retirement or removal in accordance with the Fund’s organizational documents and policies adopted by the Board from time to time. Officers hold office at the pleasure of the Board or until the election or appointment and the qualification of a successor. The address of the directors and officers is c/o Metropolitan Series Fund, Inc., 501 Boylston Street, Boston, MA 02116.
Interested Directors(1)
Each Director below is an “interested person” (as defined by the 1940 Act) with respect to the Fund in that Ms. Forget is an employee of MetLife and Mr. Typermass is a former employee of MetLife and owns securities issued by MetLife, Inc., the ultimate parent company of MetLife Advisers.
| | | | | | | | |
Name, Address and Age | | Current
position(s)
with Fund | | Position(s)
held since | | Principal occupations
over past five years, including other directorships(2) | | Number of
Portfolios in
Fund Complex
Overseen by
Director(3) |
Elizabeth M. Forget Age: 41 | | Director, Chairman of the Board, President and Chief Executive Officer | | 2006 | | Senior Vice President (since 2007), MetLife, Inc.; President, Met Investors Advisory, LLC (“MIA”); Trustee and President, Met Investors Series Trust (“MIST”); Executive Vice President, MetLife Investors Group, Inc.; President (since 2006), MetLife Advisers. | | 81 |
| | | | |
Arthur G. Typermass Age: 70 | | Director | | 1998 | | Formerly, Senior Vice President and Treasurer, MetLife. | | 37 |
Non-Interested Directors(1)
Each Director below is not an “interested person” (as defined by the 1940 Act) with respect to the Fund (collectively, the “Independent Directors”).
| | | | | | | | |
Name, Address and Age | | Current
position(s)
with Fund | | Position(s)
held since | | Principal occupations
over past five years, including other directorships(2) | | Number of
Portfolios in
Fund Complex
Overseen by
Director(3) |
Steve A. Garban† Age: 70 | | Director | | 1985 | | Formerly, Chief Financial Officer, Senior Vice President Finance and Operations and Treasurer (Emeritus), The Pennsylvania State University. | | 37 |
| | | | |
Linda B. Strumpf Age: 60 | | Director | | 2000 | | Vice President and Chief Investment Officer, Ford Foundation. | | 37 |
| | | | |
Michael S. Scott Morton† Age: 70 | | Director | | 1993 | | Jay W. Forrester Professor of Management (Emeritus) at Sloan School of Management, MIT. | | 37 |
| | | | |
H. Jesse Arnelle Age: 74 | | Director | | 2001 | | Formerly, Counsel, Womble Carlyle Sandrie & Rice; Director, Textron Inc. (global multi-industry company)*; formerly, Director, Gannet Co. Inc. (diversified news and information company)*; formerly, Director, Eastman Chemical Company (global chemical company)*; formerly, Director, Waste Management, Inc.*; formerly, Director, Armstrong Holdings Inc. (parent company of floor and ceiling products business)*; formerly, Director, FPL Group Inc. (public utility holding company)*; Director, URS Corporation (engineering design services firm)*. | | 37 |
| | | | |
Nancy Hawthorne Age: 56 | | Director | | 2003 | | Director, Avid Technologies (computer software company)*; formerly, Chairman of the Board of Avid Technologies; formerly, Board of Advisors, L. Knife & Sons, Inc. (beverage distributor); Chief Executive Officer, Clerestory LLC (corporate financial advisor); formerly, Trustee, New England Zenith Fund (“Zenith Fund”)**; formerly, Chief Executive Officer and Managing Partner, Hawthorne, Krauss and Associates (corporate financial advisor); formerly, Chief Financial Officer and Executive Vice President, Continental Cablevision, subsequently renamed MediaOne (cable television company); formerly, Director, Life F/X, Inc.; formerly, Chairman of the Board, WorldClinic (distance medicine company); formerly, Director, Perini Corporation (construction company)*; formerly, Director, CGU (property and casualty insurance company); formerly, Director, Beacon Power Corporation (energy company )*. | | 37 |
MSF-15
Metropolitan Series Fund, Inc.
Directors and Officers—(Continued)
| | | | | | | | |
Name, Address and Age | | Current
position(s)
with Fund | | Position(s)
held since | | Principal occupations
over past five years, including other directorships(2) | | Number of
Portfolios in
Fund Complex
Overseen by
Director(3) |
John T. Ludes Age: 71 | | Director | | 2003 | | President, LFP Properties (consulting firm); Formerly, Trustee, Zenith Fund**; formerly, Vice Chairman, President and Chief Operating Officer, Fortune Brands/American Brands (global conglomerate); formerly, President and CEO, Acushnet Company (athletic equipment company). | | 37 |
Officers(1)
| | | | | | | | |
Name and address | | Age | | Current
position(s)
with Fund | | Position(s)
held since | | Principal occupations over past five years(2) |
| Jeffrey P. Halperin | | 40 | | Chief Compliance Officer | | 2006 | | Vice President (since 2006), Corporate Ethics and Compliance Department, MetLife, Inc.; Chief Compliance Officer (since 2006), MetLife Advisers, MIA and MIST. |
| | | | |
| John F. Guthrie, Jr. | | 64 | | Senior Vice President | | 2002 | | Manager and Senior Vice President, MetLife Advisers; Vice President, MetLife; Vice President (since 2003), MetLife Group, Inc.; Vice President, NELICO; Vice President (since 2005), MIA; formerly, Senior Vice President, Zenith Fund**. |
| | | | |
| Alan C. Leland | | 55 | | Senior Vice President | | 2005 | | Treasurer and Chief Financial Officer, MetLife Advisers, LLC; Treasurer (since 2005), Met Investors Advisory, LLC; Vice President (since 2004), MIA; Vice President (since 2003), MetLife Group, Inc.; Vice President, MetLife; Senior Vice President, NELICO |
| | | | |
| Peter Duffy | | 52 | | Vice President and Treasurer | | 2000 | | Senior Vice President, MetLife Advisers (since 1998); Second Vice President (since 2003), NELICO; Vice President, MetLife (since 2004); Vice President (since 2004), MetLife Group, Inc.; formerly, Vice President and Treasurer, Zenith Fund**. |
| | | | |
| Thomas M. Lenz | | 49 | | Vice President and Secretary | | 2002 | | General Counsel and Secretary, MetLife Advisers; Assistant General Counsel, MetLife; formerly, Vice President and Secretary, Zenith Fund**. |
| * | Indicates a directorship with a registered investment company or a company subject to the reporting requirements of the Securities Exchange Act of 1934, as amended. |
| ** | The Zenith Fund deregistered with the Securities and Exchange Commission (“SEC”) in 2004. |
| (†) | Served as a trustee, director and/or officer of one or more of the following companies, each of which had a direct or indirect advisory relationship with MetLife Advisers or its affiliates prior to January 31, 2005: State Street Research Financial Trust, State Street Research Income Trust, State Street Research Money Market Trust, State Street Research Institutional Funds, State Street Research Capital Trust, State Street Research Master Investment Trust, State Street Research Equity Trust, State Street Research Securities Trust and State Street Research Exchange Trust (collectively, the “State Street Research Funds”). |
| (1) | Each Director of the Fund also serves as trustee of Metropolitan Series Fund II (“Met Series Fund II”), a registered investment company advised by MetLife Advisers. Each officer of the Fund serves in the same position with Met Series Fund II, which consists of one portfolio. |
| (2) | Previous positions during the past five years with the Fund, MIST, MetLife, MetLife Advisers, MIA, Zenith Fund, NELICO or New England Securities Corporation are omitted if not materially different. |
| (3) | The Fund Complex includes the Fund (36 portfolios), Met Series Fund II (1 portfolio) and MIST (44 portfolios) |
MSF-16
Metropolitan Series Fund, Inc.
MetLife Conservative to Moderate Allocation Portfolio
Board Approval of Advisory and Subadvisory Agreements
The Fund’s Contract Review Committees of the Board of Directors (the “Board”) typically meet in early fall to review the Portfolios’ advisory agreements (the “Advisory Agreements”) and subadvisory agreements (collectively, the “Subadvisory Agreements,” and, together with the Advisory Agreements, the “Agreements”) and determine whether to recommend that the full Board approve the continuation of the Agreements for an additional one-year period. (Following the initial approval of an Agreement for a new Portfolio or with a new adviser or subadviser, such annual reviews are not required until 2 years following the execution of such Agreement.) After each Committee has made its recommendations, the full Board, including the Independent Directors, determines whether to approve the continuation of each of the Agreements. In addition, the Board, including the Independent Directors, considers matters bearing on the Agreements at most of its other meetings throughout the year and regularly interviews various individuals at MetLife Advisers responsible for the management of the Portfolios. The Directors also interview selected investment managers and other professionals at the subadvisers at various times throughout the year.
The Directors receive all materials that they or MetLife Advisers, the Fund’s investment adviser, and the subadvisers believe to be reasonably necessary for the Directors to evaluate the Agreements and determine whether to approve the continuation of the Agreements. These materials generally include, among other items, (i) information on the investment performance of the Portfolios and the performance of peer groups of funds and the Portfolios’ performance benchmarks, (ii) information on the Portfolios’ advisory and subadvisory fees and other expenses, including information comparing the Portfolios’ expenses to those of peer groups of funds and information about any applicable expense caps and fee “breakpoints,” (iii) sales and redemption data, (iv) information related to the profitability of the Agreements to MetLife Advisers and the subadvisers, and potential “fall-out” or ancillary benefits that MetLife Advisers, the subadvisers or their affiliates may receive as a result of their relationships with the Fund and (v) information obtained through the subadvisers’ responses to certain requests from MetLife Advisers and the Directors and MetLife Advisers’ responses to requests from the Directors. The Directors may also consider other information such as (vi) MetLife Advisers’ and the subadvisers’ financial results and condition, (vii) each Portfolio’s investment objectives and strategies and the size, education and experience of the investment staffs of MetLife Advisers and the relevant subadvisers and their use of technology and external research, (viii) the allocation of the Portfolios’ brokerage, if any, including allocations to brokers affiliated with the subadvisers and the use of “soft” commission dollars to pay Portfolio expenses and to pay for research and other similar services, (ix) the resources devoted to, and the record of compliance with, the Portfolios’ investment policies and restrictions, policies on personal securities transactions and other compliance policies, (x) the responses of MetLife Advisers, the subadvisers and/or their affiliates to certain legal and regulatory proceedings and (xi) the economic outlook generally and for the mutual fund industry in particular. Throughout the process, the Directors have the opportunity to ask questions of and request additional materials from MetLife Advisers and the subadvisers.
Following meetings of each Contract Review Committee on September 12, 2007, the Board, at its November 15, 2007 meeting, approved the continuation through December 31, 2008 of the Advisory Agreements for each Portfolio of the Fund and the Subadvisory Agreements for each Portfolio of the Fund. The Agreements approved for continuation are referred to below as the “Continued Agreements.”
In considering whether to approve the continuation of the Continued Agreements, the Directors, including the Independent Directors, did not identify any single factor as determinative, and each weighed the various factors as he or she deemed appropriate. The Directors considered the following matters in connection with their approval of the Continued Agreements:
The nature, extent and quality of the services provided to the relevant Portfolios under the Continued Agreements. The Directors considered the nature, extent and quality of the services provided by MetLife Advisers, the relevant subadvisers (if any) and their affiliates (each, an “Adviser,” and, collectively, the “Advisers”) to the relevant Portfolios pursuant to the Continued Agreements and the resources dedicated to these Portfolios by the Advisers. In particular, the Directors considered the Advisers’ abilities to attract and retain highly qualified investment professionals. With respect to MetLife Advisers, the Directors considered (for each Portfolio other than Zenith Equity and the Asset Allocation Portfolios) that MetLife Advisers is (i) ultimately responsible for the performance of such Portfolios; (ii) ultimately responsible for the establishment of the investment strategies of each such Portfolio, primarily through its recommendations to the Board regarding the hiring and selection of subadvisers; (iii) responsible for the hiring and selection, subject to Board approval, of subadvisers; and (iv) responsible for maintaining a program of Subadviser oversight reasonably designed to ensure that the subadvisers have reasonable compliance policies and procedures in place. The Directors also considered that MetLife Advisers provides a full range of day-to-day administrative services for the Portfolios involving all aspects of such Portfolios’ day-to-day operations (other than portfolio management). With respect to Zenith Equity and the Asset Allocation Portfolios, the Directors considered both the portfolio management services and the administrative services provided by MetLife Advisers. After reviewing these and related factors, the Directors concluded, within the context of their overall conclusions regarding each of the Continued Agreements, that the nature, extent and quality of services provided supported the renewal of these Agreements.
MSF-17
Metropolitan Series Fund, Inc.
MetLife Conservative to Moderate Allocation Portfolio
Board Approval of Advisory and Subadvisory Agreements—(Continued)
Investment performance of the relevant Portfolios. The Directors reviewed information about the performance of the relevant Portfolios over various time periods, including information prepared by an independent third party that compared the performance of the Portfolios to the performance of peer groups of funds and performance benchmarks. The Directors also reviewed a description of the third party’s methodology for identifying a Portfolio’s peer group(s) for purposes of performance and expense comparisons.
In the case of each relevant Portfolio that had performance that lagged its peer group(s) for certain periods, the Directors concluded that other factors relevant to performance were sufficient, in light of other considerations, to warrant renewal of the Continued Agreements relating to such Portfolio. These factors varied from Portfolio to Portfolio, but included one or more of the following: (i) that such Portfolio’s performance, although lagging in certain recent periods, was stronger over the longer term; (ii) that the underperformance was attributable, to a significant extent, to investment decisions that were reasonable and consistent with the Portfolio’s investment objective(s) and policies and that the Portfolio was performing within the range of reasonable expectations, given market conditions and the Portfolio’s investment objective(s) and policies; (iii) that the Portfolio’s performance was competitive when compared to other relevant performance benchmarks or peer groups; and (iv) that MetLife Advisers and/or the relevant subadviser (if any) had taken or was taking steps designed to help improve the Portfolio’s investment performance.
The Directors also considered the investment performance of the Advisers and their reputations generally, the historical responsiveness of the Advisers to Director concerns about performance and the willingness of the Advisers to take steps intended to improve performance.
After reviewing these and related factors, the Directors concluded, within the context of their overall conclusions regarding each of the Continued Agreements, that the investment performance of each relevant Portfolio and Adviser was sufficient, in light of other considerations, to warrant the renewal of the Continued Agreements.
The costs of the services to be provided and profits to be realized by the Advisers and their affiliates from their relationships with the Portfolios. The Directors considered the fees charged by MetLife Advisers to the Portfolios for advisory services and, with respect to the subadvised Portfolios, by such subadvisers to MetLife Advisers for subadvisory services (such advisory and subadvisory fees (if any), collectively, “Fees”), as well as the total expense levels of the Portfolios. This information included comparisons (provided by an independent third party) of the Portfolios’ advisory fees and total expense levels to those of their peer groups. In evaluating Fees for the relevant Portfolios, the Directors also took into account the demands, complexity and quality of the investment management services provided to each Portfolio. The Directors considered MetLife Advisers’ recommendations regarding reductions in Fee rates, implementation of Fee breakpoints and institution of Fee waivers and expense caps.
The Directors also considered the compensation directly or indirectly received by the Advisers and their affiliates from their relationships with the relevant Portfolios. The Directors reviewed information relating to the profits received by MetLife Advisers, certain of the subadvisers and their affiliates as a result of their relationships with the relevant Portfolios, and information about the allocation of expenses used to calculate profitability. When reviewing profitability, the Directors also considered the performance of the relevant Portfolios, the expense levels of such Portfolios and whether the relevant Advisers had implemented breakpoints, fee waivers and/or expense caps with respect to such Portfolios.
After reviewing these and related factors, the Directors concluded, within the context of their overall conclusions regarding each of the Continued Agreements, that the Fees charged to each of the relevant Portfolios were fair and reasonable, and that the information provided regarding costs of these services generally, and the related profitability (if known) to the relevant Advisers of their relationships with the relevant Portfolios, supported the renewal of the Continued Agreements.
Economies of Scale. The Directors considered the existence of any economies of scale in the provision of services by the Advisers and whether those economies were shared with the relevant Portfolios through breakpoints in their advisory fees or other means, such as expense caps, fee waivers or relatively low levels of fees. The Directors noted that most of the relevant Portfolios benefited or will benefit from breakpoints, expense caps and/or fee waivers with respect to their advisory fees. In considering these issues, the Directors also took into consideration information relating to the costs of the services provided and the profitability to MetLife Advisers, the relevant subadvisers (if any) and each of their affiliates of their relationships with the relevant Portfolios, as discussed above.
After reviewing these and related factors, the Directors concluded, within the context of their overall conclusions regarding each of the Continued Agreements, that the extent to which economies of scale were shared with the relevant Portfolios supported the renewal of such Agreements.
Other Factors. The Directors also considered other factors, which included but were not limited to the following:
| | • | | the extent to which each relevant Portfolio operated in accordance with its investment objective, and its record of compliance with its investment restrictions and the compliance programs of the Fund and the Advisers. They also considered the compliance-related resources the Advisers and their affiliates provide to the relevant Portfolios; |
MSF-18
Metropolitan Series Fund, Inc.
MetLife Conservative to Moderate Allocation Portfolio
Board Approval of Advisory and Subadvisory Agreements—(Continued)
| | • | | the nature, quality, cost and extent of administrative and shareholder services performed by MetLife Advisers and its affiliates under the Advisory Agreements; and |
| | • | | so-called “fall-out benefits” to the Advisers, such as the engagement of their affiliates to provide distribution, brokerage and transfer agency services to the Portfolios, and the benefits of research made available to the relevant Advisers by reason of brokerage commissions generated by the relevant Portfolios’ securities transactions. The Directors also considered the possible conflicts of interest associated with these fall-out and other benefits, and the reporting and other processes in place to disclose and monitor these possible conflicts of interest. |
Based on their evaluation of all factors that they deemed to be material, including those factors described above, and assisted by the advice of independent counsel, the Directors, including the Independent Directors, concluded that each of the Continued Agreements should be continued through December 31, 2008.
Certain Matters Relating to MFS Value Portfolio (formerly known as Harris Oakmark Large Cap Value Portfolio) (the “Value Portfolio”) and Harris Oakmark Focused Value Portfolio (the “Focused Value Portfolio”). At the November 15, 2007 Board meeting, the Board approved a change of subadviser for the Value Portfolio from Harris Associates L.P. (“Harris”) to Massachusetts Financial Services Company (“MFS”) and an amendment to the Subadvisory Agreement relating to the Focused Value Portfolio, each to be effective on January 7, 2008. The Board also approved a merger of the Value Portfolio with the MFS Value Portfolio, a series of the Met Investors Series Trust (“MIST”), to be effective on April 28, 2008 (the “Merger).
In making the determination to approve the change in subadviser for the Value Portfolio, the Board carefully considered those factors described above with respect to the continuation of the Continued Agreements, as relevant to both the existing Subadvisory Agreement with Harris and the proposed Subadvisory Agreement with MFS. In addition to these factors, the Board also considered as relevant:
| | • | | the experience, investment style and investment performance history of MFS as portfolio manager; |
| | • | | that the form of the proposed Subadvisory Agreement with MFS was substantially similar to the Value Portfolio’s existing Subadvisory Agreement with Harris; |
| | • | | that the subadvisory fee schedule for MFS set forth in the proposed Subadvisory Agreement was lower than the fee schedule in the existing Subadvisory Agreement and that MetLife Advisers had agreed to reduce its advisory fee, through a contractual fee waiver, by an amount corresponding to such savings; |
| | • | | the expected transition costs of the change of subadviser and the fact that MetLife Advisers had agreed to pay a portion of those costs; |
| | • | | the impact of the Merger on the Value Portfolio, including any potential costs savings; |
| | • | | that the preferred date of the change of subadviser for the Value Portfolio was January 7, 2008 and the desirability, in order to facilitate an orderly transition of subadvising functions, of extending the existing Subadvisory Agreement with Harris from its scheduled expiration date of December 31, 2007 until January 7, 2008; |
| | • | | that the existing Subadvisory Agreement with Harris for the Focused Value Portfolio contained a subadvisory fee schedule based on the combined average daily net assets for the Value Portfolio and the Focused Value Portfolio and that, as a result of the subadviser change for the Value Portfolio, the subadvisory fees for the Focused Value Portfolio may increase slightly; and |
| | • | | that MetLife Adviser’s voluntary advisory fee waiver currently in effect with respect to the Focused Value Portfolio would be discontinued following the subadviser change and that, as a result, the advisory fees for the Focused Value Portfolio may increase slightly. |
Following such consideration, and assisted by the advice of independent counsel, the Directors, including the Independent Directors, unanimously voted to approve (i) the continuation of the existing Subadvisory Agreement relating to the Value Portfolio through January 7, 2008 (ii) an amendment to the Subadvisory Agreement relating to the Focused Value Portfolio, effective January 7, 2008, and (iii) the proposed Subadvisory Agreement relating to the Value Portfolio with MFS, effective January 7, 2008 through January 6, 2010.
Certain Matters Relating to Julius Baer International Stock Portfolio (formerly known as the FI International Stock Portfolio) (the “International Stock Portfolio”). At the November 15, 2007 Board meeting, the Board approved a change of subadviser for the International Stock Portfolio from Fidelity Management & Research Company (“FMR”) to Julius Baer Investment Management LLC (“Julius Baer”).
MSF-19
Metropolitan Series Fund, Inc.
MetLife Conservative to Moderate Allocation Portfolio
Board Approval of Advisory and Subadvisory Agreements—Unaudited—(Continued)
In making the determination to approve the change in subadviser for the International Stock Portfolio, the Board carefully considered those factors described above with respect to the continuation of the Continued Agreements, as relevant to both the existing Subadvisory Agreement with FMR and the proposed Subadvisory Agreement with Julius Baer. In addition to these factors, the Board also considered as relevant:
| | • | | the experience, investment style and investment performance history of Julius Baer as portfolio manager; |
| | • | | that the form of the proposed Subadvisory Agreement with Julius Baer was substantially similar to the International Stock Portfolio’s existing Subadvisory Agreement with FMR; |
| | • | | that the subadvisory fee schedule for Julius Baer set forth in the proposed Subadvisory Agreement was lower than the fee schedule in the existing Subadvisory Agreement and that MetLife Advisers had agreed to reduce its advisory fee, through a contractual fee waiver, by an amount corresponding to such savings; |
| | • | | the expected transition costs of the change of subadviser; and |
| | • | | that the preferred date of the change of subadviser was January 7, 2008 and the desirability, in order to facilitate an orderly transition of subadvising functions, of extending the existing Subadvisory Agreement with FMR from its scheduled expiration date of December 31, 2007 until January 7, 2008. |
Following such consideration, and assisted by the advice of independent counsel, the Directors, including the Independent Directors, unanimously voted to approve the continuation of the existing Subadvisory Agreement relating to the International Stock Portfolio through January 7, 2008 and to approve the proposed Subadvisory Agreement relating to such Portfolio with Julius Baer, effective January 7, 2008 through January 6, 2010.
MSF-20
A description of the policies and procedures that the Fund uses to determine how to vote proxies relating to portfolio securities is available (i) without charge, upon request, by calling (800) 638-7732 and (ii) on the Securities and Exchange Commission’s (the “SEC”) website at http://www.sec.gov.
Information regarding how the Fund voted proxies relating to portfolio securities during the most recent twelve-month period ended December 31, 2007 is available (i) without charge, upon request, by calling (800) 638-7732 and (ii) on the SEC’s website at http://www.sec.gov.
The Fund files with the SEC a complete schedule of its portfolio holdings, as of the close of the first and third quarters of its fiscal year, on “Form N-Q”. These filings are available on the SEC’s website at www.sec.gov and may be reviewed and copied at the SEC’s Public Reference Room in Washington, DC. (Call 1-800-SEC-0330 for information on the operation of the Public Reference Room.)
MSF-21
| | |
Metropolitan Series Fund, Inc. MetLife Mid Cap Stock Index Portfolio Annual Report | | December 31, 2007 |
Letter from the President
February 1, 2008
Letter to Policy Holders:
2007 was a tumultuous year in the financial markets driven by concerns in the credit markets surrounding sub-prime mortgages and fears of recession in the U.S. Economy. The broad markets were mixed, with the Dow Jones Industrial Average up 8.9% and the MSCI EAFE Index, which measures the performance of international equities, up 11.2% for the year, while the Russell 2000 Index, which measures the performance of small capitalization stocks, was down 1.6%.
In the fixed income markets, credit spreads increased as a result of the pressure from sub-prime mortgage crisis and the Federal Reserve lowered interest rates by a total of 1% during the year. The Lehman Brothers Aggregate Bond Index posted a 7.0% return for the year.
On the following pages, you will find a complete review of your Portfolio and its investment performance.
MetLife is committed to building your financial freedom. We appreciate your trust and will continue to focus our efforts on meeting your investment needs.
Sincerely,
Elizabeth Forget
President, Metropolitan Series Fund, Inc.
Metropolitan Series Fund, Inc.
MetLife Mid Cap Stock Index Portfolio
Managed by MetLife Investment Advisors Company, LLC
Portfolio Manager Commentary*
PORTFOLIO PERFORMANCE
For the year ended December 31, 2007, the Class A shares of the MetLife Mid Cap Stock Index Portfolio returned 7.8%, compared to its benchmark, the Standard & Poor’s MidCap 400 Index1, which returned 8.0%.
PORTFOLIO REVIEW
The S&P MidCap 400 Index had a positive annual return for the fifth consecutive year. Over the five-year period ending December 31, 2007, the S&P MidCap 400 Index returned 16.2% annualized. Mid-cap stocks outperformed large-cap stocks, beating the S&P 500 Index2 by 2.5%, in 2007. During the first half of 2007, the S&P MidCap 400 Index returned 12.0% despite mixed earnings and macroeconomic reports. However, during the second half of 2007, the S&P MidCap 400 Index returned -3.6%. This second half decline was largely attributable to the subprime mortgage crisis. The subprime contagion contributed to the weakening housing market, a liquidity crisis, lender bankruptcies, and large write-downs at several major financial institutions. During the first half of 2007, the Federal Reserve maintained the Fed Funds Rate at 5.25%. However, during the second half of 2007, the Federal Reserve began lowering the Fed Funds Rate, dropping the target by 100 basis points to 4.25% at year-end. The Federal Reserve lowered the Fed Funds Rate primarily due to concerns that the risk of slower economic growth outweighed the risk of inflation. The price of oil surged from $61 to $96 per barrel through December, up 57% from the beginning of the year. Increasing global demand, weakness in refinery utilization, and global geopolitical unrest contributed to supply concerns, increasing oil prices over the period. Some of the factors driving the equity markets included geopolitical concerns, energy prices, Federal Reserve interest rate policy, corporate earnings, employment data, and unemployment rates.
Eight out of ten sectors comprising the S&P MidCap 400 Index experienced positive returns for the year. Industrials (15.8% beginning-of-year weight) returned 19.7%, and had the largest positive impact on the benchmark return this year. Energy (7.5% beginning weight) was the best performing sector, up 41.4%. The second-best performing sector was Materials (5.7% beginning weight), up 27.4%. Other strong performing sectors were Consumer Staples, Health Care, and Telecomm Services, up 15.8%, 12.6%, and 10.8%, respectively. Financials (the largest sector with a benchmark weight of 18.4%) was the worst-performing sector, down 12.8%. Consumer Discretionary (15.3% beginning weight), down 9.7%, was the only other sector with a negative return for the year.
The stocks with the largest positive impact on the benchmark return for the year were Intuitive Surgical, up 238.4%; Jacobs Engineering Group, up 105.1%; and Precision Castparts, up 52.8%. The stocks with the largest negative impact were Radian Group, down 78.3%; The PMI Group, down 71.6%; and Sepracor, down 57.4%.
There were fifty-five additions and fifty-five deletions to the benchmark in 2007, compared to thirty-three additions and thirty-three deletions in 2006.
* The views expressed above are those of the subadvisory firm as of December 31, 2007 and are subject to change based on market and other conditions. Information about the Portfolio’s holdings, asset allocation, industry allocation, or country diversification is historical and is not an indication of future Portfolio composition, which will vary. The performance of any index mentioned in this commentary has not been adjusted for ongoing management, distribution and operating expenses, and sales charges applicable to mutual fund investments. Direct investment in the Index is not possible.
1 The Standard & Poor’s (S&P) MidCap 400® Index is an unmanaged index measuring the performance of the mid-size company segment of the U.S. market. The Index consists of 400 domestic stocks chosen for market size, liquidity, and industry group representation.
2 The Standard & Poor’s (S&P) 500® Stock Index is an unmanaged index representing the performance of 500 major companies, most of which are listed on the New York Stock Exchange.
MSF-2
Metropolitan Series Fund, Inc.
MetLife Mid Cap Stock Index Portfolio
A $10,000 INVESTMENT COMPARED TO
THE S&P MIDCAP 400 INDEX
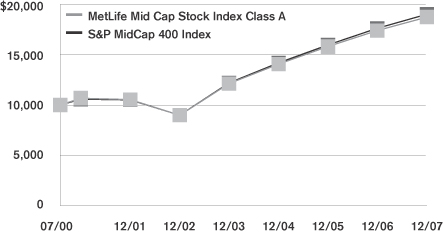
Average Annual Returns as of December 31, 2007
| | | | | | | | | | | | |
| | | MetLife Mid Cap
Stock Index Portfolio | | | S&P MidCap
400 Index | |
| | | Class A | | | Class B | | | Class E | | |
| 1 Year | | 7.8 | % | | 7.5 | % | | 7.7 | % | | 8.0 | % |
| 5 Year | | 15.9 | | | 15.6 | | | 15.7 | | | 16.2 | |
| Since Inception | | 8.8 | | | 8.8 | | | 8.7 | | | 9.0 | |
Performance numbers are net of all Portfolio expenses but do not include any insurance, sales, or administrative charges of variable annuity or life insurance contracts. If these charges were included, the returns would be lower.
Inception dates of the Class A, Class B and Class E shares are: 7/5/00, 1/2/01 and 5/1/01, respectively. Index since inception return is based on the Class A inception date.
This information represents past performance and is not indicative of future results. Investment return and principal value may fluctuate so that shares, upon redemption, may be worth more or less than the original cost.
PORTFOLIO COMPOSITION
as of December 31, 2007
Top Holdings
| | |
| | | % of Total
Net Assets |
MidCap SPDR Trust, Series 1 | | 2.4% |
Intuitive Surgical, Inc. | | 1.0% |
Cameron International Corp. | | 0.9% |
Southwestern Energy Co. | | 0.8% |
Activision, Inc. | | 0.7% |
Hologic, Inc. | | 0.7% |
Harris Corp. | | 0.7% |
Amphenol Corp. (Class A) | | 0.7% |
FMC Technologies, Inc. | | 0.6% |
Denbury Resources, Inc. | | 0.6% |
Top Sectors
| | |
| | | % of Equity
Market Value |
Industrials | | 15.5% |
Financials | | 15.4% |
Information Technology | | 15.0% |
Health Care | | 12.8% |
Consumer Discretionary | | 12.5% |
Energy | | 9.9% |
Utilities | | 7.9% |
Materials | | 7.1% |
Consumer Staples | | 3.2% |
Telecommunication Services | | 0.7% |
MSF-3
Metropolitan Series Fund, Inc.
Shareholder Expense Example
As a shareholder of the Portfolio, you incur ongoing costs, including management fees; distribution and service (12b-1) fees; and other Portfolio expenses. This example is intended to help you understand your ongoing costs (in dollars) (referred to as “expenses”) of investing in the Portfolio and compare these costs with the ongoing costs of investing in other mutual funds. The example is based on an investment of $1,000 invested at the beginning of the period and held for the entire period, July 1, 2007 through December 31, 2007.
Actual Expenses
The first line for each share class of the Portfolio in the table below provides information about actual account values and actual expenses. You may use the information in this line, together with the amount you invested in the particular share class of the Portfolio, to estimate the expenses that you paid over the period. Simply divide your account value by $1,000 (for example, an $8,600 account value divided by $1,000=8.6), then multiply the result by the number in the first line under the heading entitled “Expenses Paid During Period” to estimate the expenses you paid on your account during this period.
Hypothetical Example for Comparison Purposes
The second line for each share class of the Portfolio in the table below provides information about hypothetical account values and hypothetical expenses based on the Portfolio’s actual expense ratio and an assumed rate of return of 5% per year before expenses, which is not the Portfolio’s actual return. The hypothetical account values and expenses may not be used to estimate the actual ending account balance or expenses you paid for the period. You may use this information to compare the ongoing costs of investing in the Portfolio and other funds. To do so, compare this 5% hypothetical example with the 5% hypothetical examples that appear in the shareholder reports of the other funds.
Please note that the expenses shown in the table are meant to highlight your ongoing costs only and do not reflect any fees or charges of your variable insurance product or any additional expenses that participants in certain eligible qualified plans may bear relating to the operations of their plan. Therefore, the second line for each share class in the table is useful in comparing ongoing costs only, and will not help you determine the relative total costs of owning different funds. In addition, if these other costs were included, your costs would have been higher.
| | | | | | | | | | | | | | |
Portfolio | | | | Annualized
Expense
Ratio | | | Beginning
Account Value
July 1,
2007 | | Ending
Account Value
December 31,
2007 | | Expenses Paid
During Period*
July 1, 2007
to
December 31,
2007 |
MetLife Mid Cap Stock Index—Class A | | Actual | | 0.32 | % | | $ | 1,000.00 | | $ | 964.10 | | $ | 1.58 |
| | Hypothetical | | 0.32 | % | | $ | 1,000.00 | | $ | 1,023.58 | | $ | 1.63 |
| | | | | |
MetLife Mid Cap Stock Index—Class B | | Actual | | 0.57 | % | | $ | 1,000.00 | | $ | 962.60 | | $ | 2.82 |
| | Hypothetical | | 0.57 | % | | $ | 1,000.00 | | $ | 1,022.30 | | $ | 2.91 |
| | | | | |
MetLife Mid Cap Stock Index—Class E | | Actual | | 0.47 | % | | $ | 1,000.00 | | $ | 963.30 | | $ | 2.33 |
| | Hypothetical | | 0.47 | % | | $ | 1,000.00 | | $ | 1,022.81 | | $ | 2.40 |
* Expenses paid are equal to the Portfolio’s annualized expense ratio for the most recent six month period, as shown above, multiplied by the average account value over the period, multiplied by the number of days in the most recent fiscal half-year, divided by 365 (to reflect the one-half year period).
(a) The annualized expense ratio shown reflects the impact of the management fee waiver as described in Note 4 to the Financial Statements.
MSF-4
Metropolitan Series Fund, Inc.
MetLife Mid Cap Stock Index Portfolio
Schedule of Investments as of December 31, 2007
Common Stock—96.6% of Total Net Assets
| | | | | |
| Security Description | | Shares | | Value* |
| | | | | |
| | |
Aerospace & Defense—0.9% | | | | | |
Alliant Techsystems, Inc. (a) (b) | | 14,685 | | $ | 1,670,566 |
BE Aerospace, Inc. (b) | | 41,568 | | | 2,198,947 |
DRS Technologies, Inc. | | 18,502 | | | 1,004,103 |
| | | | | |
| | | | | 4,873,616 |
| | | | | |
| | |
Airlines—0.2% | | | | | |
AirTran Holdings, Inc. (a) (b) | | 41,175 | | | 294,813 |
Alaska Air Group, Inc. (a) (b) | | 18,100 | | | 452,681 |
JetBlue Airways Corp. (a) (b) | | 80,942 | | | 477,558 |
| | | | | |
| | | | | 1,225,052 |
| | | | | |
| | |
Auto Components—1.0% | | | | | |
ArvinMeritor, Inc. (a) | | 32,588 | | | 382,257 |
BorgWarner, Inc. | | 52,071 | | | 2,520,757 |
Gentex Corp. (a) | | 64,885 | | | 1,153,006 |
Lear Corp. (b) | | 34,616 | | | 957,479 |
Modine Manufacturing Co. (a) | | 14,556 | | | 240,320 |
| | | | | |
| | | | | 5,253,819 |
| | | | | |
| | |
Automobiles—0.1% | | | | | |
Thor Industries, Inc. (a) | | 15,554 | | | 591,208 |
| | | | | |
| | |
Beverages—0.4% | | | | | |
Hansen Natural Corp. (a) (b) | | 26,928 | | | 1,192,641 |
PepsiAmericas, Inc. | | 26,888 | | | 895,908 |
| | | | | |
| | | | | 2,088,549 |
| | | | | |
| | |
Biotechnology—1.2% | | | | | |
Cephalon, Inc. (a) (b) | | 30,107 | | | 2,160,478 |
Millennium Pharmaceuticals, Inc. (b) | | 144,971 | | | 2,171,666 |
PDL BioPharma, Inc. (a) (b) | | 52,581 | | | 921,219 |
Vertex Pharmaceuticals, Inc. (a) (b) | | 59,403 | | | 1,379,932 |
| | | | | |
| | | | | 6,633,295 |
| | | | | |
| | |
Capital Markets—1.5% | | | | | |
Eaton Vance Corp. (a) | | 55,495 | | | 2,520,028 |
Jefferies Group, Inc. (a) | | 50,180 | | | 1,156,649 |
Raymond James Financial, Inc. | | 42,584 | | | 1,390,793 |
SEI Investments Co. | | 56,721 | | | 1,824,715 |
Waddell & Reed Financial, Inc. (Class A) | | 37,467 | | | 1,352,184 |
| | | | | |
| | | | | 8,244,369 |
| | | | | |
| | |
Chemicals—3.6% | | | | | |
Airgas, Inc. | | 36,934 | | | 1,924,631 |
Albemarle Corp. | | 35,714 | | | 1,473,202 |
Cabot Corp. | | 29,318 | | | 977,462 |
CF Industries Holdings, Inc. | | 21,574 | | | 2,374,434 |
Chemtura Corp. | | 108,311 | | | 844,826 |
Cytec Industries, Inc. | | 18,888 | | | 1,163,123 |
Ferro Corp. | | 19,538 | | | 405,023 |
FMC Corp. | | 33,950 | | | 1,851,972 |
Minerals Technologies, Inc. | | 8,646 | | | 578,850 |
Olin Corp. | | 33,313 | | | 643,940 |
RPM International, Inc. | | 54,509 | | | 1,106,533 |
| | | | | |
| Security Description | | Shares | | Value* |
| | | | | |
| | |
Chemicals—(Continued) | | | | | |
Sensient Technologies Corp. | | 21,107 | | $ | 596,906 |
Terra Industries, Inc. (b) | | 41,689 | | | 1,991,067 |
The Lubrizol Corp. | | 30,797 | | | 1,667,965 |
The Scotts Miracle-Gro Co. | | 19,902 | | | 744,733 |
Valspar Corp. (a) | | 45,151 | | | 1,017,704 |
| | | | | |
| | | | | 19,362,371 |
| | | | | |
| | |
Commercial Banks—2.4% | | | | | |
Associated Banc-Corp (a) | | 57,055 | | | 1,545,620 |
Bank Hawaii Corp. | | 22,001 | | | 1,125,131 |
Cathay General Bancorp (a) | | 22,367 | | | 592,502 |
City National Corp. | | 18,149 | | | 1,080,773 |
Cullen/Frost Bankers, Inc. | | 26,258 | | | 1,330,230 |
First Community Bancorp, Inc. (a) | | 11,302 | | | 466,095 |
FirstMerit Corp. (a) | | 36,133 | | | 723,021 |
SVB Financial Group (a) (b) | | 14,902 | | | 751,061 |
Synovus Financial Corp (b) | | 147,756 | | | 1,555,900 |
TCF Financial Corp. | | 48,919 | | | 877,118 |
The Colonial BancGroup, Inc. (a) | | 70,664 | | | 956,791 |
WestAmerica Bancorp (a) | | 13,177 | | | 587,035 |
Wilmington Trust Corp. (a) | | 30,857 | | | 1,086,166 |
| | | | | |
| | | | | 12,677,443 |
| | | | | |
| | |
Commercial Services & Supplies—3.3% | | | | | |
ChoicePoint, Inc. (b) | | 32,120 | | | 1,169,810 |
Copart, Inc. (b) | | 31,589 | | | 1,344,112 |
Deluxe Corp. | | 23,407 | | | 769,856 |
Herman Miller, Inc. | | 27,375 | | | 886,676 |
HNI Corp. (a) | | 20,656 | | | 724,199 |
Kelly Services, Inc. (Class A) | | 10,369 | | | 193,486 |
Korn/Ferry International (a) (b) | | 20,944 | | | 394,166 |
Manpower, Inc. | | 36,378 | | | 2,069,908 |
Mine Safety Appliances Co. (a) | | 13,124 | | | 680,742 |
Navigant Consulting, Inc. (a) (b) | | 20,519 | | | 280,495 |
Republic Services, Inc. | | 72,159 | | | 2,262,185 |
Rollins, Inc. | | 19,084 | | | 366,413 |
Stericycle, Inc. (b) | | 39,022 | | | 2,317,907 |
The Brinks Co. | | 21,773 | | | 1,300,719 |
The Corporate Executive Board Co. (a) | | 15,922 | | | 956,912 |
The Dun & Bradstreet Corp. | | 26,028 | | | 2,306,862 |
| | | | | |
| | | | | 18,024,448 |
| | | | | |
| | |
Communications Equipment—2.3% | | | | | |
3Com Corp. (b) | | 178,076 | | | 804,904 |
ADC Telecommunications, Inc. (a) (b) | | 52,759 | | | 820,402 |
Adtran, Inc. (a) | | 26,217 | | | 560,519 |
Avocent Corp. (a) (b) | | 22,441 | | | 523,100 |
CommScope, Inc. (a) (b) | | 29,914 | | | 1,472,060 |
Dycom Industries, Inc. (a) (b) | | 18,395 | | | 490,227 |
F5 Networks, Inc. (a) (b) | | 38,121 | | | 1,087,211 |
Foundry Networks, Inc. (b) | | 67,492 | | | 1,182,460 |
Harris Corp. | | 61,539 | | | 3,857,264 |
Plantronics, Inc. (a) | | 21,819 | | | 567,294 |
Polycom, Inc. (b) | | 40,756 | | | 1,132,202 |
| | | | | |
| | | | | 12,497,643 |
| | | | | |
*See accompanying notes to financial statements.
MSF-5
Metropolitan Series Fund, Inc.
MetLife Mid Cap Stock Index Portfolio
Schedule of Investments as of December 31, 2007
Common Stock—(Continued)
| | | | | |
| Security Description | | Shares | | Value* |
| | | | | |
| | |
Computers & Peripherals—1.2% | | | | | |
Diebold, Inc. (a) | | 29,542 | | $ | 856,127 |
Imation Corp. (a) | | 14,647 | | | 307,587 |
NCR Corp. (a) (b) | | 81,270 | | | 2,039,877 |
Palm, Inc. (a) (b) | | 47,076 | | | 298,462 |
Western Digital Corp. (b) | | 98,827 | | | 2,985,564 |
| | | | | |
| | | | | 6,487,617 |
| | | | | |
| | |
Construction & Engineering—1.4% | | | | | |
Granite Construction, Inc. | | 15,810 | | | 572,006 |
KBR, Inc. (b) | | 76,072 | | | 2,951,594 |
Quanta Services, Inc. (a) (b) | | 76,746 | | | 2,013,815 |
URS Corp. | | 35,858 | | | 1,948,165 |
| | | | | |
| | | | | 7,485,580 |
| | | | | |
| | |
Construction Materials—0.5% | | | | | |
Martin Marietta Materials, Inc. (a) | | 18,796 | | | 2,492,350 |
| | | | | |
| | |
Consumer Finance—0.1% | | | | | |
AmeriCredit Corp. (a) (b) | | 51,259 | | | 655,603 |
| | | | | |
| | |
Containers & Packaging—0.7% | | | | | |
Packaging Corp. of America | | 41,730 | | | 1,176,786 |
Sonoco Products Co. | | 44,643 | | | 1,458,933 |
Temple-Inland, Inc. (b) | | 47,717 | | | 994,900 |
| | | | | |
| | | | | 3,630,619 |
| | | | | |
| | |
Diversified Consumer Services—1.8% | | | | | |
Career Education Corp. (a) (b) | | 40,892 | | | 1,028,025 |
Corinthian Colleges, Inc. (a) (b) | | 38,084 | | | 586,494 |
DeVry, Inc. | | 26,898 | | | 1,397,620 |
ITT Educational Services, Inc. (b) | | 13,209 | | | 1,126,332 |
Matthews International Corp. | | 13,926 | | | 652,712 |
Regis Corp. | | 19,791 | | | 553,356 |
Service Corp. International | | 129,361 | | | 1,817,522 |
Sotheby’s Holdings, Inc. (Class A) (a) | | 29,881 | | | 1,138,466 |
Strayer Education, Inc. | | 6,511 | | | 1,110,646 |
| | | | | |
| | | | | 9,411,173 |
| | | | | |
|
Diversified Telecommunication Services—0.1% |
Cincinnati Bell, Inc. (a) (b) | | 111,407 | | | 529,183 |
| | | | | |
| | |
Electric Utilities—1.7% | | | | | |
DPL, Inc. (a) | | 50,986 | | | 1,511,735 |
Great Plains Energy, Inc. (a) | | 38,690 | | | 1,134,391 |
Hawaiian Electric Industries, Inc. (a) | | 37,286 | | | 849,002 |
IDACORP, Inc. (a) (b) | | 20,203 | | | 711,550 |
Northeast Utilities | | 69,598 | | | 2,179,113 |
Sierra Pacific Resources (b) | | 104,936 | | | 1,781,813 |
Westar Energy, Inc. | | 41,465 | | | 1,075,602 |
| | | | | |
| | | | | 9,243,206 |
| | | | | |
| | |
Electrical Equipment—1.3% | | | | | |
Ametek, Inc. (b) | | 47,924 | | | 2,244,760 |
Hubbell, Inc. (Class B) | | 26,026 | | | 1,342,942 |
Roper Industries, Inc. | | 39,639 | | | 2,479,023 |
Thomas & Betts Corp. (b) | | 22,896 | | | 1,122,820 |
| | | | | |
| | | | | 7,189,545 |
| | | | | |
| | | | | |
| Security Description | | Shares | | Value* |
| | | | | |
| | |
Electronic Equipment & Instruments—2.3% | | | | | |
Amphenol Corp. (Class A) | | 80,045 | | $ | 3,711,687 |
Arrow Electronics, Inc. (b) | | 55,111 | | | 2,164,760 |
Avnet, Inc. | | 67,370 | | | 2,355,929 |
Ingram Micro, Inc. | | 65,850 | | | 1,187,934 |
Kemet Corp. (a) (b) | | 37,705 | | | 249,984 |
National Instruments Corp. | | 25,735 | | | 857,747 |
Technologies Data Corp. (b) | | 24,901 | | | 939,266 |
Vishay Intertechnology, Inc. (b) | | 83,020 | | | 947,258 |
| | | | | |
| | | | | 12,414,565 |
| | | | | |
| | |
Energy Equipment & Services—4.1% | | | | | |
Cameron International Corp. | | 98,210 | | | 4,726,847 |
Exterran Holdings, Inc. (a) (b) | | 29,511 | | | 2,414,000 |
FMC Technologies, Inc. (b) | | 58,411 | | | 3,311,904 |
Grant Prideco, Inc. (b) | | 57,033 | | | 3,165,902 |
Helmerich & Payne, Inc. | | 46,474 | | | 1,862,213 |
Patterson-UTI Energy, Inc. (a) | | 69,571 | | | 1,358,026 |
Pride International, Inc. (b) | | 74,944 | | | 2,540,602 |
Superior Energy Services, Inc. (b) | | 36,144 | | | 1,244,076 |
Tidewater, Inc. (a) | | 24,635 | | | 1,351,476 |
| | | | | |
| | | | | 21,975,046 |
| | | | | |
| | |
Food & Staples Retailing—0.3% | | | | | |
BJ’s Wholesale Club, Inc. (b) | | 28,776 | | | 973,492 |
Ruddick Corp. | | 16,714 | | | 579,474 |
| | | | | |
| | | | | 1,552,966 |
| | | | | |
| | |
Food Products—1.1% | | | | | |
Corn Products International, Inc. | | 33,602 | | | 1,234,873 |
Hormel Foods Corp. | | 32,490 | | | 1,315,195 |
Lancaster Colony Corp. (a) | | 9,663 | | | 383,621 |
Smithfield Foods, Inc. (a) (b) | | 52,462 | | | 1,517,201 |
The J. M. Smucker Co. | | 25,833 | | | 1,328,850 |
Tootsie Roll Industries, Inc. (a) | | 12,087 | | | 331,426 |
| | | | | |
| | | | | 6,111,166 |
| | | | | |
| | |
Gas Utilities—2.0% | | | | | |
AGL Resources, Inc. | | 34,384 | | | 1,294,214 |
Energen Corp. | | 32,233 | | | 2,070,326 |
Equitable Resources, Inc. | | 54,628 | | | 2,910,580 |
National Fuel Gas Co. (a) | | 37,480 | | | 1,749,566 |
ONEOK, Inc. | | 46,579 | | | 2,085,342 |
WGL Holdings, Inc. | | 22,203 | | | 727,370 |
| | | | | |
| | | | | 10,837,398 |
| | | | | |
| | |
Health Care Equipment & Supplies—4.3% | | | | | |
Advanced Medical Optics, Inc. (a) (b) | | 27,173 | | | 666,554 |
Beckman Coulter, Inc. | | 28,167 | | | 2,050,558 |
Dentsply International, Inc. | | 68,003 | | | 3,061,495 |
Edwards Lifesciences Corp. (a) (b) | | 25,461 | | | 1,170,951 |
Gen-Probe, Inc. (b) | | 24,155 | | | 1,520,074 |
Hillenbrand Industries, Inc. (a) | | 27,835 | | | 1,551,245 |
Hologic, Inc. (b) | | 56,281 | | | 3,863,103 |
Intuitive Surgical, Inc. (b) | | 17,157 | | | 5,567,446 |
Kinetic Concepts, Inc. (a) (b) | | 24,263 | | | 1,299,526 |
*See accompanying notes to financial statements.
MSF-6
Metropolitan Series Fund, Inc.
MetLife Mid Cap Stock Index Portfolio
Schedule of Investments as of December 31, 2007
Common Stock—(Continued)
| | | | | |
| Security Description | | Shares | | Value* |
| | | | | |
|
Health Care Equipment & Supplies—(Continued) |
ResMed, Inc. (a) | | 34,709 | | $ | 1,823,264 |
STERIS Corp. | | 28,474 | | | 821,190 |
| | | | | |
| | | | | 23,395,406 |
| | | | | |
| | |
Health Care Providers & Services—3.4% | | | | | |
Apria Healthcare Group, Inc. (a) (b) | | 19,631 | | | 423,441 |
Community Health Systems, Inc. (a) (b) | | 42,923 | | | 1,582,142 |
Covance, Inc. (b) | | 28,666 | | | 2,483,049 |
Health Management Associates, Inc. (Class A) (a) | | 108,961 | | | 651,587 |
Health Net, Inc. (b) | | 49,485 | | | 2,390,125 |
Henry Schein, Inc. (b) | | 40,204 | | | 2,468,526 |
Kindred Healthcare, Inc. (a) (b) | | 13,410 | | | 334,982 |
LifePoint Hospitals, Inc. (b) | | 26,088 | | | 775,857 |
Lincare Holdings, Inc. (b) | | 35,997 | | | 1,265,654 |
Omnicare, Inc. (a) | | 54,571 | | | 1,244,764 |
Psychiatric Solutions, Inc. (a) (b) | | 24,675 | | | 801,937 |
Universal Health Services, Inc. (Class B) | | 24,181 | | | 1,238,067 |
VCA Antech, Inc. (b) | | 37,830 | | | 1,673,221 |
Wellcare Group, Inc. (a) (b) | | 18,726 | | | 794,170 |
| | | | | |
| | | | | 18,127,522 |
| | | | | |
| | |
Health Care Technology—0.3% | | | | | |
Cerner Corp. (a) (b) | | 29,798 | | | 1,680,607 |
| | | | | |
| | |
Hotels, Restaurants & Leisure—1.5% | | | | | |
Bob Evans Farms, Inc. (a) | | 14,861 | | | 400,207 |
Boyd Gaming Corp. (a) | | 25,215 | | | 859,075 |
Brinker International, Inc. | | 47,267 | | | 924,543 |
CBRL Group, Inc. | | 10,666 | | | 345,472 |
Chipotle Mexican Grill, Inc. (Class A) (a) (b) | | 14,776 | | | 2,173,106 |
International Speedway Corp. (Class A) | | 13,889 | | | 571,949 |
Life Time Fitness, Inc. (a) (b) | | 15,099 | | | 750,118 |
Ruby Tuesday, Inc. (a) | | 23,213 | | | 226,327 |
Scientific Games Corp. (a) (b) | | 29,187 | | | 970,468 |
The Cheesecake Factory, Inc. (a) (b) | | 32,016 | | | 759,099 |
| | | | | |
| | | | | 7,980,364 |
| | | | | |
| | |
Household Durables—1.4% | | | | | |
American Greetings Corp. (Class A) (a) | | 24,922 | | | 505,917 |
Blyth, Inc. | | 10,837 | | | 237,764 |
Furniture Brands International, Inc. (a) | | 21,776 | | | 219,067 |
Hovnanian Enterprises, Inc. (Class A) (a) (b) | | 16,479 | | | 118,154 |
M.D.C. Holdings, Inc. (a) | | 15,642 | | | 580,787 |
Mohawk Industries, Inc. (a) (b) | | 24,855 | | | 1,849,212 |
NVR, Inc. (a) (b) | | 2,307 | | | 1,208,868 |
The Ryland Group, Inc. (a) | | 18,896 | | | 520,585 |
Toll Brothers, Inc. (a) (b) | | 57,008 | | | 1,143,580 |
Tupperware Corp. | | 27,660 | | | 913,610 |
| | | | | |
| | | | | 7,297,544 |
| | | | | |
| | |
Household Products—0.8% | | | | | |
Church & Dwight Co., Inc. | | 29,623 | | | 1,601,716 |
Energizer Holdings, Inc. (b) | | 25,765 | | | 2,889,029 |
| | | | | |
| | | | | 4,490,745 |
| | | | | |
| | | | | |
| Security Description | | Shares | | Value* |
| | | | | |
| | |
Industrial Conglomerates—0.4% | | | | | |
Carisle Cos., Inc. | | 27,844 | | $ | 1,031,063 |
Teleflex, Inc. | | 17,735 | | | 1,117,483 |
| | | | | |
| | | | | 2,148,546 |
| | | | | |
| | |
Insurance—3.8% | | | | | |
American Financial Group, Inc. | | 32,648 | | | 942,874 |
Arthur J. Gallagher & Co. (a) | | 42,162 | | | 1,019,899 |
Brown & Brown, Inc. (a) | | 51,175 | | | 1,202,613 |
Commerce Group, Inc. (a) | | 19,438 | | | 699,379 |
Everest Re Group, Ltd. | | 28,368 | | | 2,848,147 |
Fidelity National Financial, Inc. (a) | | 96,846 | | | 1,414,920 |
First American Corp. (a) | | 41,157 | | | 1,404,277 |
Hanover Insurance Group, Inc. | | 23,313 | | | 1,067,735 |
HCC Insurance Holdings, Inc. | | 51,591 | | | 1,479,630 |
Horace Mann Educators Corp. | | 19,461 | | | 368,591 |
Mercury General Corp. (a) | | 15,971 | | | 795,516 |
Old Republic International Corp. | | 103,453 | | | 1,594,211 |
Protective Life Corp. | | 31,497 | | | 1,292,007 |
StanCorp Financial Group, Inc. | | 22,235 | | | 1,120,199 |
Unitrin, Inc. (a) | | 23,264 | | | 1,116,439 |
W.R. Berkley Corp. | | 72,348 | | | 2,156,694 |
| | | | | |
| | | | | 20,523,131 |
| | | | | |
| | |
Internet & Catalog Retail—0.1% | | | | | |
Netflix, Inc. (a) (b) | | 21,560 | | | 573,927 |
| | | | | |
| | |
Internet Software & Services—0.3% | | | | | |
Digital River, Inc. (a) (b) | | 18,146 | | | 600,088 |
ValueClick, Inc. (a) (b) | | 44,077 | | | 965,287 |
| | | | | |
| | | | | 1,565,375 |
| | | | | |
| | |
IT Services—2.3% | | | | | |
Acxiom Corp. | | 31,977 | | | 375,090 |
Alliance Data Systems Corp. (b) | | 35,356 | | | 2,651,346 |
Broadridge Financial Solutions, Inc. | | 62,600 | | | 1,404,118 |
CSG Systems International, Inc. (b) | | 15,946 | | | 234,725 |
DST Systems, Inc. (a) (b) | | 23,179 | | | 1,913,427 |
Gartner, Inc. (Class A) (a) (b) | | 30,922 | | | 542,990 |
Global Payments, Inc. | | 35,430 | | | 1,648,204 |
Metavante Technologies, Inc. (b) | | 38,486 | | | 897,494 |
MoneyGram International, Inc. (a) | | 37,109 | | | 570,365 |
MPS Group, Inc. (b) | | 45,198 | | | 494,466 |
NeuStar, Inc. (Class A) (a) (b) | | 34,531 | | | 990,349 |
SRA International, Inc. (a) (b) | | 19,127 | | | 563,290 |
| | | | | |
| | | | | 12,285,864 |
| | | | | |
| | |
Leisure Equipment & Products—0.1% | | | | | |
Callaway Golf Co. (a) | | 29,763 | | | 518,769 |
| | | | | |
| | |
Life Sciences Tools & Services—1.8% | | | | | |
Affymetrix, Inc. (b) | | 30,996 | | | 717,248 |
Charles River Laboratories International, Inc. (b) | | 30,498 | | | 2,006,768 |
Invitrogen Corp. (b) | | 20,909 | | | 1,953,110 |
Pharmaceutical Product Development, Inc. | | 46,981 | | | 1,896,623 |
Techne Corp. (b) | | 17,741 | | | 1,171,793 |
Varian, Inc. (b) | | 13,668 | | | 892,520 |
Ventana Medical Systems, Inc. (b) | | 13,385 | | | 1,167,574 |
| | | | | |
| | | | | 9,805,636 |
| | | | | |
*See accompanying notes to financial statements.
MSF-7
Metropolitan Series Fund, Inc.
MetLife Mid Cap Stock Index Portfolio
Schedule of Investments as of December 31, 2007
Common Stock—(Continued)
| | | | | |
| Security Description | | Shares | | Value* |
| | | | | |
| | |
Machinery—5.2% | | | | | |
AGCO Corp. | | 41,123 | | $ | 2,795,541 |
Crane Co. | | 22,944 | | | 984,298 |
Donaldson Co., Inc. (a) | | 32,005 | | | 1,484,392 |
Federal Signal Corp. | | 21,514 | | | 241,387 |
Flowserve Corp. | | 25,656 | | | 2,468,107 |
Graco, Inc. (a) | | 28,239 | | | 1,052,185 |
Harsco Corp. | | 37,813 | | | 2,422,679 |
IDEX Corp. | | 36,591 | | | 1,322,033 |
Joy Global, Inc. | | 48,514 | | | 3,193,191 |
Kennametal, Inc. | | 35,102 | | | 1,328,962 |
Lincoln Electric Holdings, Inc. | | 19,361 | | | 1,378,116 |
Nordson Corp. | | 15,159 | | | 878,616 |
Oshkosh Truck Corp. (a) | | 33,323 | | | 1,574,845 |
Pentair, Inc. | | 44,663 | | | 1,554,719 |
SPX Corp. | | 23,526 | | | 2,419,649 |
Timkin Co. | | 43,009 | | | 1,412,846 |
Trinity Industries, Inc. (a) | | 36,591 | | | 1,015,766 |
Wabtec Corp. | | 21,893 | | | 753,995 |
| | | | | |
| | | | | 28,281,327 |
| | | | | |
| | |
Marine—0.2% | | | | | |
Alexander & Baldwin, Inc. (a) | | 19,214 | | | 992,595 |
| | | | | |
| | |
Media—1.0% | | | | | |
Belo Corp. (Class A) (a) | | 39,478 | | | 688,496 |
Entercom Communications Corp. (a) | | 11,827 | | | 161,912 |
Getty Images, Inc. (a) (b) | | 21,392 | | | 620,368 |
Harte-Hanks, Inc. (a) | | 21,523 | | | 372,348 |
John Wiley & Sons, Inc. (a) | | 20,203 | | | 865,496 |
Lamar Advertising Co. (Class A) (a) | | 35,638 | | | 1,713,119 |
Lee Enterprises, Inc. (a) | | 17,835 | | | 261,283 |
Media General, Inc. (a) | | 10,151 | | | 215,709 |
Scholastic Corp. (b) | | 11,735 | | | 409,434 |
Valassis Communications, Inc. (a) (b) | | 21,521 | | | 251,580 |
| | | | | |
| | | | | 5,559,745 |
| | | | | |
| | |
Metals & Mining—1.8% | | | | | |
Carpenter Technology Corp. (a) | | 22,068 | | | 1,658,852 |
Cleveland-Cliffs, Inc. (a) | | 18,784 | | | 1,893,427 |
Commercial Metals Co. | | 53,258 | | | 1,568,448 |
Reliance Steel & Aluminum Co. | | 29,232 | | | 1,584,375 |
Steel Dynamics, Inc. (a) | | 43,348 | | | 2,582,240 |
Worthington Industries, Inc. (a) | | 29,530 | | | 527,996 |
| | | | | |
| | | | | 9,815,338 |
| | | | | |
| | |
Multi-Utilities—3.5% | | | | | |
Alliant Energy Corp. | | 49,533 | | | 2,015,498 |
Aquila, Inc. (a) (b) | | 168,788 | | | 629,579 |
Black Hills Corp. (a) | | 16,954 | | | 747,671 |
Energy East Corp. (a) | | 71,068 | | | 1,933,760 |
MDU Resources Group, Inc. | | 81,894 | | | 2,261,093 |
NSTAR | | 47,958 | | | 1,737,039 |
OGE Energy Corp. | | 41,216 | | | 1,495,729 |
PNM Resources, Inc. | | 34,473 | | | 739,446 |
Puget Energy, Inc. | | 52,613 | | | 1,443,175 |
| | | | | |
| Security Description | | Shares | | Value* |
| | | | | |
| | |
Multi-Utilities—(Continued) | | | | | |
SCANA Corp. (a) | | 52,384 | | $ | 2,207,986 |
Vectren Corp. (a) | | 34,357 | | | 996,696 |
Wisconsin Energy Corp. | | 52,509 | | | 2,557,713 |
| | | | | |
| | | | | 18,765,385 |
| | | | | |
| | |
Multiline Retail—0.5% | | | | | |
99 Cents Only Stores (a) (b) | | 21,076 | | | 167,765 |
Dollar Tree Stores, Inc. (b) | | 41,285 | | | 1,070,107 |
Saks, Inc. (a) (b) | | 63,642 | | | 1,321,208 |
| | | | | |
| | | | | 2,559,080 |
| | | | | |
| | |
Mutual Funds—2.4% | | | | | |
MidCap SPDR Trust, Series 1 (a) | | 84,200 | | | 13,059,420 |
| | | | | |
| | |
Office Electronics—0.2% | | | | | |
Zebra Technologies Corp. (Class A) (b) | | 30,540 | | | 1,059,738 |
| | | | | |
| | |
Oil, Gas & Consumable Fuels—5.2% | | | | | |
Arch Coal, Inc. (a) | | 64,249 | | | 2,886,708 |
Bill Barrett Corp. (a) (b) | | 15,135 | | | 633,702 |
Cimarex Energy Co. (a) | | 37,038 | | | 1,575,226 |
Denbury Resources, Inc. (b) | | 109,679 | | | 3,262,950 |
Encore Aquisition Co. (b) | | 24,353 | | | 812,660 |
Forest Oil Corp. (b) | | 39,088 | | | 1,987,234 |
Frontier Oil Corp. | | 47,340 | | | 1,921,057 |
Newfield Exploration Co. (b) | | 58,778 | | | 3,097,601 |
Overseas Shipholding Group, Inc. (a) | | 12,978 | | | 965,953 |
Pioneer Natural Resources Co. | | 53,650 | | | 2,620,266 |
Plains Exploration & Production Co. (b) | | 50,650 | | | 2,735,100 |
Quicksilver Resources, Inc. (a) (b) | | 23,072 | | | 1,374,860 |
Southwestern Energy Co. (b) | | 76,527 | | | 4,264,084 |
| | | | | |
| | | | | 28,137,401 |
| | | | | |
| | |
Paper & Forest Products—0.1% | | | | | |
Louisiana-Pacific Corp. (a) | | 46,455 | | | 635,504 |
| | | | | |
| | |
Personal Products—0.3% | | | | | |
Alberto-Culver Co. | | 37,615 | | | 923,072 |
NBTY, Inc. (b) | | 25,203 | | | 690,562 |
| | | | | |
| | | | | 1,613,634 |
| | | | | |
| | |
Pharmaceuticals—1.1% | | | | | |
Endo Pharmaceuticals Holdings, Inc. (b) | | 60,217 | | | 1,605,988 |
Medicis Pharmaceutical Corp. (a) (b) | | 25,263 | | | 656,080 |
Par Pharmaceutical Companies, Inc. (a) (b) | | 15,187 | | | 364,488 |
Perrigo Co. | | 34,835 | | | 1,219,573 |
Sepracor, Inc. (a) (b) | | 50,155 | | | 1,316,569 |
Valeant Pharmaceuticals International, Inc. (a) | | 40,854 | | | 489,022 |
| | | | | |
| | | | | 5,651,720 |
| | | | | |
| | |
Real Estate Investment Trusts—5.2% | | | | | |
Alexandria Real Estate Equities, Inc. (a) | | 14,314 | | | 1,455,304 |
AMB Property Corp. | | 44,468 | | | 2,559,578 |
BRE Properties, Inc. (a) | | 22,801 | | | 924,125 |
Camden Property Trust | | 24,941 | | | 1,200,909 |
*See accompanying notes to financial statements.
MSF-8
Metropolitan Series Fund, Inc.
MetLife Mid Cap Stock Index Portfolio
Schedule of Investments as of December 31, 2007
Common Stock—(Continued)
| | | | | |
| Security Description | | Shares | | Value* |
| | | | | |
|
Real Estate Investment Trusts—(Continued) |
Cousins Properties, Inc. (a) | | 16,765 | | $ | 370,506 |
Duke Realty Corp | | 65,375 | | | 1,704,980 |
Equity One, Inc. (a) | | 16,588 | | | 382,022 |
Federal Realty Investment Trust | | 25,426 | | | 2,088,746 |
Health Care REIT, Inc. | | 38,114 | | | 1,703,315 |
Highwoods Properties, Inc. | | 25,664 | | | 754,008 |
Hospitality Properties Trust | | 42,157 | | | 1,358,299 |
Liberty Property Trust (a) | | 41,099 | | | 1,184,062 |
Mack-Cali Realty Corp. | | 30,493 | | | 1,036,762 |
Nationwide Health Properties, Inc. | | 41,729 | | | 1,309,039 |
Potlatch Corp. | | 17,596 | | | 781,966 |
Rayonier, Inc. | | 35,042 | | | 1,655,384 |
Realty Income Corp. (a) | | 45,382 | | | 1,226,222 |
Regency Centers Corp. | | 31,258 | | | 2,015,828 |
The Macerich Co. | | 32,561 | | | 2,313,785 |
UDR, Inc. (a) | | 60,245 | | | 1,195,863 |
Weingarten Realty Investors (a) | | 34,002 | | | 1,069,023 |
| | | | | |
| | | | | 28,289,726 |
| | | | | |
| |
Real Estate Management & Development—0.2% | | | |
Jones Lang LaSalle, Inc. (a) | | 16,628 | | | 1,183,248 |
| | | | | |
| | |
Road & Rail—0.8% | | | | | |
Avis Budget Group, Inc. (b) | | 46,619 | | | 606,047 |
Con-way, Inc. (a) | | 20,273 | | | 842,140 |
J.B. Hunt Transport Services, Inc. (a) | | 39,309 | | | 1,082,963 |
Kansas City Southern, Inc. (b) | | 34,521 | | | 1,185,106 |
Werner Enterprises, Inc. (a) | | 20,255 | | | 344,943 |
YRC Worldwide, Inc. (a) | | 25,428 | | | 434,564 |
| | | �� | | |
| | | | | 4,495,763 |
| | | | | |
| |
Semiconductors & Semiconductor Equipment—2.6% | | | |
Atmel Corp. (b) | | 201,653 | | | 871,141 |
Cree, Inc. (a) (b) | | 38,290 | | | 1,051,826 |
Cypress Semiconductor Corp. (b) | | 71,478 | | | 2,575,353 |
Fairchild Semiconductor International, Inc. (b) | | 55,867 | | | 806,161 |
Integrated Device Technology, Inc. (b) | | 85,370 | | | 965,535 |
International Rectifier Corp. (a) (b) | | 32,560 | | | 1,106,063 |
Intersil Corp. | | 58,784 | | | 1,439,032 |
Lam Research Corp. (b) | | 60,649 | | | 2,621,856 |
RF Micro Devices, Inc. (a) (b) | | 130,166 | | | 743,248 |
Semtech Corp. (b) | | 28,837 | | | 447,550 |
Silicon Laboratories, Inc. (b) | | 24,751 | | | 926,430 |
TriQuint Semiconductor, Inc. (b) | | 63,495 | | | 420,972 |
| | | | | |
| | | | | 13,975,167 |
| | | | | |
| | |
Software—2.9% | | | | | |
ACI Worldwide, Inc. (a) (b) | | 16,058 | | | 305,744 |
Activision, Inc. (b) | | 130,801 | | | 3,884,790 |
Advent Software, Inc. (a) (b) | | 8,033 | | | 434,585 |
Cadence Design Systems, Inc. (b) | | 120,699 | | | 2,053,090 |
Fair Isaac Corp. (a) | | 22,584 | | | 726,076 |
Jack Henry & Associates, Inc. | | 35,370 | | | 860,906 |
Macrovision Corp. (a) (b) | | 23,812 | | | 436,474 |
McAfee, Inc. (b) | | 71,506 | | | 2,681,475 |
| | | | | |
| Security Description | | Shares | | Value* |
| | | | | |
| | |
Software—(Continued) | | | | | |
Mentor Graphics Corp. (a) (b) | | 40,293 | | $ | 434,358 |
Parametric Technology Corp. (b) | | 52,053 | | | 929,146 |
Sybase, Inc. (b) | | 40,262 | | | 1,050,435 |
Synopsys, Inc. (b) | | 65,071 | | | 1,687,291 |
Wind River Systems, Inc. (b) | | 34,491 | | | 308,005 |
| | | | | |
| | | | | 15,792,375 |
| | | | | |
| | |
Specialty Retail—3.8% | | | | | |
Advance Auto Parts, Inc. | | 44,968 | | | 1,708,334 |
Aeropostale, Inc. (b) | | 30,054 | | | 796,431 |
American Eagle Outfitters, Inc. (a) | | 96,071 | | | 1,995,395 |
AnnTaylor Stores Corp. (a) (b) | | 27,549 | | | 704,152 |
Barnes & Noble, Inc. | | 21,601 | | | 744,155 |
Borders Group, Inc. (a) | | 26,380 | | | 280,947 |
Carmax, Inc. (a) (b) | | 97,858 | | | 1,932,696 |
Charming Shoppes, Inc. (a) (b) | | 52,396 | | | 283,462 |
Chico’s FAS, Inc. (b) | | 79,093 | | | 714,210 |
Coldwater Creek, Inc. (a) (b) | | 26,883 | | | 179,847 |
Collective Brands, Inc. (a) (b) | | 29,412 | | | 511,475 |
Dick’s Sporting Goods, Inc. (a) (b) | | 37,382 | | | 1,037,724 |
Foot Locker, Inc. | | 69,360 | | | 947,458 |
Guess?, Inc. | | 24,551 | | | 930,237 |
O’Reilly Automotive, Inc. (b) | | 51,666 | | | 1,675,528 |
Pacific Sunwear of California, Inc. (a) (b) | | 31,757 | | | 448,091 |
PetSmart, Inc. | | 57,767 | | | 1,359,258 |
Rent-A-Center, Inc. (b) | | 30,032 | | | 436,065 |
Ross Stores, Inc. | | 60,830 | | | 1,555,423 |
Urban Outfitters, Inc. (a) (b) | | 50,689 | | | 1,381,782 |
Williams-Sonoma, Inc. (a) | | 39,532 | | | 1,023,879 |
| | | | | |
| | | | | 20,646,549 |
| | | | | |
|
Textiles, Apparel & Luxury Goods—0.6% |
Hanesbrands, Inc. (a) (b) | | 42,750 | | | 1,161,518 |
Phillips-Van Heusen Corp. | | 25,354 | | | 934,548 |
The Warnaco Group, Inc. (b) | | 20,461 | | | 712,043 |
Timberland Co. (Class A) (a) (b) | | 22,275 | | | 402,732 |
| | | | | |
| | | | | 3,210,841 |
| | | | | |
|
Thrifts & Mortgage Finance—1.2% |
Astoria Financial Corp. | | 36,652 | | | 852,892 |
First Niagara Financial Group, Inc. (a) | | 47,355 | | | 570,154 |
IndyMac Bancorp, Inc. (a) | | 36,140 | | | 215,033 |
New York Community Bancorp, Inc. (a) | | 145,300 | | | 2,554,374 |
Radian Group, Inc. (a) | | 36,099 | | | 421,636 |
The PMI Group, Inc. (a) | | 36,423 | | | 483,697 |
Washington Federal, Inc. (a) | | 39,259 | | | 828,758 |
Webster Finanical Corp. | | 24,017 | | | 767,824 |
| | | | | |
| | | | | 6,694,368 |
| | | | | |
|
Tobacco—0.1% |
Universal Corp. (a) | | 12,283 | | | 629,135 |
| | | | | |
|
Trading Companies & Distributors—0.9% |
Fastenal Co. (a) | | 56,583 | | | 2,287,085 |
GATX Corp. | | 21,515 | | | 789,170 |
*See accompanying notes to financial statements.
MSF-9
Metropolitan Series Fund, Inc.
MetLife Mid Cap Stock Index Portfolio
Schedule of Investments as of December 31, 2007
Common Stock—(Continued)
| | | | | | |
| Security Description | | Shares | | Value* |
| | | | | | |
|
Trading Companies & Distributors—(Continued) |
MSC Industrial Direct Co., Inc. (Class A) | | | 21,352 | | $ | 864,115 |
United Rentals, Inc. (b) | | | 33,896 | | | 622,331 |
| | | | | | |
| | | | | | 4,562,701 |
| | | | | | |
|
Water Utilities—0.2% |
Aqua America, Inc. (a) | | | 59,830 | | | 1,268,396 |
| | | | | | |
|
Wireless Telecommunication Services—0.6% |
Telephone & Data Systems, Inc. | | | 47,715 | | | 2,986,959 |
| | | | | | |
Total Common Stock
(Identified Cost $448,995,290) | | | | | | 521,747,381 |
| | | | | | |
|
| Short Term Investments—28.2% |
| Security Description | | Face
Amount | | Value* |
|
Discount Notes—3.4% |
Federal Home Loan Bank
4.15%, 01/14/08 | | $ | 18,525,000 | | | 18,503,259 |
| | | | | | |
| | | | | | |
| Security Description | | Shares | | Value* | |
| | | | | | |
|
Mutual Funds—24.8% | |
State Street Navigator Securities Lending Prime Portfolio (c) | | 133,508,232 | | $ | 133,508,232 | |
| | | | | | |
Total Short Term Investments
(Identified Cost $152,011,491) | | | | | 152,011,491 | |
| | | | | | |
Total Investments—124.8%
(Identified Cost $601,006,781) (d) | | | | | 673,758,872 | |
Liabilities in excess of other assets | | | | | (133,977,739 | ) |
| | | | | | |
| Total Net Assets—100% | | | | $ | 539,781,133 | |
| | | | | | |
| (a) | A portion or all of the security was held on loan. As of December 31, 2007, the market value of securities loaned was $134,918,687 and the collateral received consisted of cash in the amount of $133,508,232 and non cash collateral with a value of $5,478,450. The cash collateral is invested in a money market fund managed by an affiliate of the custodian. The non cash collateral received consists primarily of government securities and bank letters of credit, and are held for the benefit of the Portfolio at the Portfolio’s custodian. |
| (c) | Represents investment of cash collateral received from securities lending transactions. |
| (d) | The aggregate cost of investments for federal income tax purposes as of December 31, 2007 was $604,617,911 and the composition of unrealized appreciation and depreciation of investment securities was $111,278,605 and $(42,137,644), respectively. |
Futures Contracts
| | | | | | | | | | | | | | |
Futures Contracts—Long | | Expiration Date | | Number of
Contracts | | Contract
Amount | | Valuation as of
12/31/2007 | | Net
Unrealized
Depreciation | |
S&P 400 Index Futures | | 3/19/2008 | | 41 | | $ | 18,474,805 | | $ | 17,728,400 | | $ | (746,405 | ) |
| | | | | | | | | | | | | | |
*See accompanying notes to financial statements.
MSF-10
Metropolitan Series Fund, Inc.
MetLife Mid Cap Stock Index Portfolio
Statement of Assets & Liabilities
December 31, 2007
| | | | | | |
Assets | | | | | | |
Investments at value (a) (b) | | | | | $ | 673,758,872 |
Cash | | | | | | 73,250 |
Receivable for: | | | | | | |
Securities sold | | | | | | 3,689,907 |
Fund shares sold | | | | | | 220,086 |
Accrued interest and dividends | | | | | | 416,870 |
| | | | | | |
Total Assets | | | | | | 678,158,985 |
Liabilities | | | | �� | | |
Payable for: | | | | | | |
Securities purchased | | $ | 4,358,306 | | | |
Fund shares redeemed | | | 233,026 | | | |
Futures variation margin | | | 73,800 | | | |
Collateral for securities loaned | | | 133,508,232 | | | |
Accrued expenses: | | | | | | |
Management fees | | | 112,348 | | | |
Service and distribution fees | | | 50,049 | | | |
Other expenses | | | 42,091 | | | |
| | | | | | |
Total Liabilities | | | | | | 138,377,852 |
| | | | | | |
Net Assets | | | | | $ | 539,781,133 |
| | | | | | |
Net assets consists of: | | | | | | |
Capital paid in | | | | | $ | 421,282,002 |
Undistributed net investment income | | | | | | 6,173,508 |
Accumulated net realized gains | | | | | | 40,319,937 |
Unrealized appreciation on investments and futures contracts | | | | | | 72,005,686 |
| | | | | | |
Net Assets | | | | | $ | 539,781,133 |
| | | | | | |
| Computation of offering price: | | | | | | |
Class A | | | | | | |
Net asset value and redemption price per share ($277,838,556 divided by 18,489,838 shares outstanding) | | | | | $ | 15.03 |
| | | | | | |
Class B | | | | | | |
Net asset value and redemption price per share ($192,044,301 divided by 12,883,188 shares outstanding) | | | | | $ | 14.91 |
| | | | | | |
Class E | | | | | | |
Net asset value and redemption price per share ($69,898,276 divided by 4,673,439 shares outstanding) | | | | | $ | 14.96 |
| | | | | | |
(a) Identified cost of investments | | | | | $ | 601,006,781 |
| | | | | | |
| (b) | Includes cash collateral for securities loaned of $133,508,232. |
Statement of Operations
For the Year Ended December 31, 2007
| | | | | | | | |
Investment Income | | | | | | | | |
Dividends | | | | | | $ | 7,573,916 | |
Interest | | | | | | | 1,247,580 | (a) |
| | | | | | | | |
| | | | | | | 8,821,496 | |
Expenses | | | | | | | | |
Management fees | | $ | 1,350,639 | | | | | |
Service and distribution fees—Class B | | | 458,496 | | | | | |
Service and distribution fees—Class E | | | 110,254 | | | | | |
Directors’ fees and expenses | | | 23,669 | | | | | |
Custodian | | | 77,758 | | | | | |
Audit and tax services | | | 31,737 | | | | | |
Legal | | | 6,068 | | | | | |
Printing | | | 168,648 | | | | | |
Insurance | | | 5,604 | | | | | |
Miscellaneous | | | 39,415 | | | | | |
| | | | | | | | |
Total expenses | | | 2,272,288 | | | | | |
Management fee waivers | | | (37,818 | ) | | | 2,234,470 | |
| | | | | | | | |
Net Investment Income | | | | | | | 6,587,026 | |
| | | | | | | | |
Realized and Unrealized Gain (Loss) | | | | | | | | |
| Realized gain on: | | | | | | | | |
Investments—net | | | 42,481,755 | | | | | |
Futures contracts—net | | | 885,485 | | | | 43,367,240 | |
| | | | | | | | |
| Change in unrealized depreciation on: | | | | | | | | |
Investments—net | | | (12,275,292 | ) | | | | |
Futures contracts—net | | | (468,995 | ) | | | (12,744,287 | ) |
| | | | | | | | |
Net gain | | | | | | | 30,622,953 | |
| | | | | | | | |
Net Increase in Net Assets From Operations | | | | | | $ | 37,209,979 | |
| | | | | | | | |
| (a) | Includes net income on securities loaned of $330,159. |
See accompanying notes to financial statements.
MSF-11
Metropolitan Series Fund, Inc.
MetLife Mid Cap Stock Index Portfolio
Statements of Changes in Net Assets
| | | | | | | | |
| | | Year ended
December 31,
2007 | | | Year ended
December 31,
2006 | |
From Operations | | | | | | | | |
Net investment income | | $ | 6,587,026 | | | $ | 5,345,936 | |
Net realized gain | | | 43,367,240 | | | | 27,247,116 | |
Unrealized appreciation (depreciation) | | | (12,744,287 | ) | | | 10,234,038 | |
| | | | | | | | |
Increase in net assets from operations | | | 37,209,979 | | | | 42,827,090 | |
| | | | | | | | |
From Distributions to Shareholders | | | | | | | | |
Net investment income | | | | | | | | |
Class A | | | (2,158,318 | ) | | | (3,033,150 | ) |
Class B | | | (960,456 | ) | | | (1,184,116 | ) |
Class E | | | (460,789 | ) | | | (707,784 | ) |
| | | | | | | | |
| | | (3,579,563 | ) | | | (4,925,050 | ) |
| | | | | | | | |
Net realized gain | | | | | | | | |
Class A | | | (11,564,986 | ) | | | (17,215,175 | ) |
Class B | | | (7,352,063 | ) | | | (9,009,575 | ) |
Class E | | | (3,023,339 | ) | | | (4,763,930 | ) |
| | | | | | | | |
| | | (21,940,388 | ) | | | (30,988,680 | ) |
| | | | | | | | |
Total distributions | | | (25,519,951 | ) | | | (35,913,730 | ) |
| | | | | | | | |
Increase in net assets from capital share transactions | | | 38,567,976 | | | | 72,076,397 | |
| | | | | | | | |
Total increase in net assets | | | 50,258,004 | | | | 78,989,757 | |
| | |
Net Assets | | | | | | | | |
Beginning of the period | | | 489,523,129 | | | | 410,533,372 | |
| | | | | | | | |
End of the period | | $ | 539,781,133 | | | $ | 489,523,129 | |
| | | | | | | | |
Undistributed Net Investment Income | | | | | | | | |
End of the period | | $ | 6,173,508 | | | $ | 3,641,262 | |
| | | | | | | | |
Other Information:
Capital Shares
Transactions in capital shares were as follows:
| | | | | | | | | | | | | | |
| | | Year ended
December 31, 2007 | | | Year ended
December 31, 2006 | |
| | | Shares | | | $ | | | Shares | | | $ | |
Class A | | | | | | | | | | | | | | |
Sales | | 4,340,848 | | | $ | 66,856,252 | | | 4,780,829 | | | $ | 68,696,012 | |
Shares issued through acquisition | | 0 | | | | 0 | | | 263,230 | | | | 3,819,469 | |
Reinvestments | | 896,362 | | | | 13,723,304 | | | 1,396,436 | | | | 20,248,325 | |
Redemptions | | (4,618,014 | ) | | | (70,812,369 | ) | | (4,675,547 | ) | | | (67,013,457 | ) |
| | | | | | | | | | | | | | |
Net increase | | 619,196 | | | $ | 9,767,187 | | | 1,764,948 | | | $ | 25,750,349 | |
| | | | | | | | | | | | | | |
Class B | | | | | | | | | | | | | | |
Sales | | 3,748,247 | | | $ | 57,206,524 | | | 4,030,601 | | | $ | 57,193,345 | |
Reinvestments | | 546,158 | | | | 8,312,519 | | | 706,913 | | | | 10,193,691 | |
Redemptions | | (2,270,652 | ) | | | (34,591,355 | ) | | (1,652,078 | ) | | | (23,375,593 | ) |
| | | | | | | | | | | | | | |
Net increase | | 2,023,753 | | | $ | 30,927,688 | | | 3,085,436 | | | $ | 44,011,443 | |
| | | | | | | | | | | | | | |
Class E | | | | | | | | | | | | | | |
Sales | | 632,527 | | | $ | 9,674,075 | | | 798,882 | | | $ | 11,221,749 | |
Reinvestments | | 228,318 | | | | 3,484,128 | | | 378,665 | | | | 5,471,714 | |
Redemptions | | (1,001,707 | ) | | | (15,285,102 | ) | | (1,006,065 | ) | | | (14,378,858 | ) |
| | | | | | | | | | | | | | |
Net increase (decrease) | | (140,862 | ) | | $ | (2,126,899 | ) | | 171,482 | | | $ | 2,314,605 | |
| | | | | | | | | | | | | | |
Increase derived from capital share transactions | | | | | $ | 38,567,976 | | | | | | $ | 72,076,397 | |
| | | | | | | | | | | | | | |
See accompanying notes to financial statements.
MSF-12
Metropolitan Series Fund, Inc.
MetLife Mid Cap Stock Index Portfolio
Financial Highlights
| | | | | | | | | | | | | | | | | | | | |
| | | Class A | |
| | | Year ended December 31, | |
| | | 2007 | | | 2006 | | | 2005 | | | 2004 | | | 2003 | |
Net Asset Value, Beginning of Period | | $ | 14.64 | | | $ | 14.43 | | | $ | 13.71 | | | $ | 11.90 | | | $ | 8.87 | |
| | | | | | | | | | | | | | | | | | | | |
Income From Investment Operations | | | | | | | | | | | | | | | | | | | | |
Net investment income | | | 0.20 | (a) | | | 0.18 | | | | 0.15 | | | | 0.11 | | | | 0.08 | |
Net realized and unrealized gain on investments | | | 0.95 | | | | 1.27 | | | | 1.40 | | | | 1.79 | | | | 3.00 | |
| | | | | | | | | | | | | | | | | | | | |
Total from investment operations | | | 1.15 | | | | 1.45 | | | | 1.55 | | | | 1.90 | | | | 3.08 | |
| | | | | | | | | | | | | | | | | | | | |
Less Distributions | | | | | | | | | | | | | | | | | | | | |
Distributions from net investment income | | | (0.12 | ) | | | (0.19 | ) | | | (0.10 | ) | | | (0.06 | ) | | | (0.05 | ) |
Distributions from net realized capital gains | | | (0.64 | ) | | | (1.05 | ) | | | (0.73 | ) | | | (0.03 | ) | | | 0.00 | |
| | | | | | | | | | | | | | | | | | | | |
Total distributions | | | (0.76 | ) | | | (1.24 | ) | | | (0.83 | ) | | | (0.09 | ) | | | (0.05 | ) |
| | | | | | | | | | | | | | | | | | | | |
Net Asset Value, End of Period | | $ | 15.03 | | | $ | 14.64 | | | $ | 14.43 | | | $ | 13.71 | | | $ | 11.90 | |
| | | | | | | | | | | | | | | | | | | | |
Total Return (%) | | | 7.8 | | | | 10.1 | | | | 12.3 | | | | 16.0 | | | | 35.0 | |
Ratio of operating expenses to average net assets (%) | | | 0.31 | | | | 0.33 | | | | 0.34 | | | | 0.35 | | | | 0.40 | |
Ratio of operating expenses to average net assets without giving effect to the contractual expense agreement would have been (%) (b) | | | 0.32 | | | | 0.34 | | | | 0.34 | | | | N/A | | | | N/A | |
Ratio of net investment income to average net assets (%) | | | 1.33 | | | | 1.28 | | | | 1.18 | | | | 0.85 | | | | 0.85 | |
Portfolio turnover rate (%) | | | 37 | | | | 34 | | | | 33 | | | | 42 | | | | 22 | |
Net assets, end of period (000) | | $ | 277,839 | | | $ | 261,588 | | | $ | 232,461 | | | $ | 197,642 | | | $ | 180,211 | |
| | | | | | | | | | | | | | | | | | | | |
| | | Class B | |
| | | Year ended December 31, | |
| | | 2007 | | | 2006 | | | 2005 | | | 2004 | | | 2003 | |
Net Asset Value, Beginning of Period | | $ | 14.53 | | | $ | 14.32 | | | $ | 13.61 | | | $ | 11.83 | | | $ | 8.83 | |
| | | | | | | | | | | | | | | | | | | | |
Income From Investment Operations | | | | | | | | | | | | | | | | | | | | |
Net investment income | | | 0.16 | (a) | | | 0.14 | | | | 0.11 | | | | 0.06 | | | | 0.05 | |
Net realized and unrealized gain on investments | | | 0.94 | | | | 1.26 | | | | 1.40 | | | | 1.79 | | | | 2.99 | |
| | | | | | | | | | | | | | | | | | | | |
Total from investment operations | | | 1.10 | | | | 1.40 | | | | 1.51 | | | | 1.85 | | | | 3.04 | |
| | | | | | | | | | | | | | | | | | | | |
Less Distributions | | | | | | | | | | | | | | | | | | | | |
Distributions from net investment income | | | (0.08 | ) | | | (0.14 | ) | | | (0.07 | ) | | | (0.04 | ) | | | (0.04 | ) |
Distributions from net realized capital gains | | | (0.64 | ) | | | (1.05 | ) | | | (0.73 | ) | | | (0.03 | ) | | | 0.00 | |
| | | | | | | | | | | | | | | | | | | | |
Total distributions | | | (0.72 | ) | | | (1.19 | ) | | | (0.80 | ) | | | (0.07 | ) | | | (0.04 | ) |
| | | | | | | | | | | | | | | | | | | | |
Net Asset Value, End of Period | | $ | 14.91 | | | $ | 14.53 | | | $ | 14.32 | | | $ | 13.61 | | | $ | 11.83 | |
| | | | | | | | | | | | | | | | | | | | |
Total Return (%) | | | 7.5 | | | | 9.8 | | | | 12.0 | | | | 15.7 | | | | 34.5 | |
Ratio of operating expenses to average net assets (%) | | | 0.56 | | | | 0.58 | | | | 0.59 | | | | 0.60 | | | | 0.65 | |
Ratio of operating expenses to average net assets without giving effect to the contractual expense agreement would have been (%) (b) | | | 0.57 | | | | 0.59 | | | | 0.59 | | | | N/A | | | | N/A | |
Ratio of net investment income to average net assets (%) | | | 1.07 | | | | 1.03 | | | | 0.94 | | | | 0.61 | | | | 0.61 | |
Portfolio turnover rate (%) | | | 37 | | | | 34 | | | | 33 | | | | 42 | | | | 22 | |
Net assets, end of period (000) | | $ | 192,044 | | | $ | 157,773 | | | $ | 111,361 | | | $ | 64,207 | | | $ | 31,858 | |
| (a) | Per share amount is based on average shares outstanding during the period. |
| (b) | See Note 4 in the Notes to Financial Statements. |
See accompanying notes to financial statements.
MSF-13
Metropolitan Series Fund, Inc.
MetLife Mid Cap Stock Index Portfolio
Financial Highlights
| | | | | | | | | | | | | | | | | | | | |
| | | Class E | |
| | | Year ended December 31, | |
| | | 2007 | | | 2006 | | | 2005 | | | 2004 | | | 2003 | |
Net Asset Value, Beginning of Period | | $ | 14.57 | | | $ | 14.37 | | | $ | 13.65 | | | $ | 11.86 | | | $ | 8.85 | |
| | | | | | | | | | | | | | | | | | | | |
Income From Investment Operations | | | | | | | | | | | | | | | | | | | | |
Net investment income | | | 0.18 | (a) | | | 0.17 | | | | 0.14 | | | | 0.08 | | | | 0.06 | |
Net realized and unrealized gain on investments | | | 0.95 | | | | 1.24 | | | | 1.39 | | | | 1.79 | | | | 3.00 | |
| | | | | | | | | | | | | | | | | | | | |
Total from investment operations | | | 1.13 | | | | 1.41 | | | | 1.53 | | | | 1.87 | | | | 3.06 | |
| | | | | | | | | | | | | | | | | | | | |
Less Distributions | | | | | | | | | | | | | | | | | | | | |
Distributions from net investment income | | | (0.10 | ) | | | (0.16 | ) | | | (0.08 | ) | | | (0.05 | ) | | | (0.05 | ) |
Distributions from net realized capital gains | | | (0.64 | ) | | | (1.05 | ) | | | (0.73 | ) | | | (0.03 | ) | | | 0.00 | |
| | | | | | | | | | | | | | | | | | | | |
Total distributions | | | (0.74 | ) | | | (1.21 | ) | | | (0.81 | ) | | | (0.08 | ) | | | (0.05 | ) |
| | | | | | | | | | | | | | | | | | | | |
Net Asset Value, End of Period | | $ | 14.96 | | | $ | 14.57 | | | $ | 14.37 | | | $ | 13.65 | | | $ | 11.86 | |
| | | | | | | | | | | | | | | | | | | | |
Total Return (%) | | | 7.7 | | | | 9.9 | | | | 12.2 | | | | 15.9 | | | | 34.8 | |
Ratio of operating expenses to average net assets (%) | | | 0.46 | | | | 0.48 | | | | 0.49 | | | | 0.50 | | | | 0.55 | |
Ratio of operating expenses to average net assets without giving effect to the contractual expense agreement would have been (%) (b) | | | 0.47 | | | | 0.49 | | | | 0.49 | | | | N/A | | | | N/A | |
Ratio of net investment income to average net assets (%) | | | 1.18 | | | | 1.12 | | | | 1.03 | | | | 0.71 | | | | 0.71 | |
Portfolio turnover rate (%) | | | 37 | | | | 34 | | | | 33 | | | | 42 | | | | 22 | |
Net assets, end of period (000) | | $ | 69,898 | | | $ | 70,162 | | | $ | 66,712 | | | $ | 62,530 | | | $ | 49,881 | |
| (a) | Per share amount is based on average shares outstanding during the period. |
| (b) | See Note 4 in the Notes to Financial Statements. |
See accompanying notes to financial statements.
MSF-14
Metropolitan Series Fund, Inc.
MetLife Mid Cap Stock Index Portfolio
Notes to Financial Statements—December 31, 2007
Metropolitan Series Fund, Inc. (the “Fund”) is organized as a corporation under the laws of Maryland pursuant to Articles of Incorporation filed on November 23, 1982, as amended, and registered under the Investment Company Act of 1940, as amended (the “1940 Act”), as an open-end investment company. The Fund is a “series” type of mutual fund, which issues separate series of stock. Each series represents an interest in a separate portfolio of Fund investments. The MetLife Mid Cap Stock Index Portfolio (the “Portfolio”) is a diversified series of the Fund. Shares in the Fund are not offered directly to the general public and are currently available only to separate accounts established by Metropolitan Life Insurance Company (“MetLife”), New England Life Insurance Company, General American Life Insurance Company (“General American”), The MetLife Investors Group of Insurance Companies, MetLife Insurance Company of Connecticut and other affiliated insurance companies (collectively, the “Insurance Companies”), as an investment vehicle for variable life insurance, group annuity or variable annuity products, although the Portfolio is not available to all such separate accounts. The Portfolio’s shares may be divided into different classes. Currently, the classes being offered by the Portfolio are named Class A, Class B and Class E. The classes of the Portfolio’s shares are identical, except that certain additional charges (Rule 12b-1 fees) are made against Class B and Class E shares. Investment income, realized and unrealized capital gains and losses, the common expenses of the Portfolio and certain Portfolio-level expense reductions, if any, are allocated on a pro rata basis to each class based on the relative net assets of each class to the total net assets of the Portfolio.
| 2. | SIGNIFICANT ACCOUNTING POLICIES: |
The preparation of financial statements in conformity with accounting principles generally accepted in the United States of America (“GAAP”) requires management to make estimates and assumptions that affect the reported amounts of assets and liabilities and disclosure of contingent assets and liabilities as of the date of the financial statements and the reported amounts of income and expenses during the reporting period. Actual results could differ from those estimates.
The following is a summary of significant accounting policies consistently followed by the Portfolio in the preparation of its financial statements. The policies are in conformity with GAAP.
Investment Valuation:
Debt securities (other than short term obligations with a remaining maturity of sixty days or less) are valued by independent pricing services selected by the relevant subadviser pursuant to authorization of the Board of Directors of the Fund (the “Board” or “Directors”). Short term obligations with a remaining maturity of sixty days or less are valued at amortized cost which approximates fair market value.
Equity securities traded on a national securities exchange or exchanges are valued at their last sale price on the principal trading market. Equity securities traded on the NASDAQ National Market System are valued at the NASDAQ Official Closing Price (the “NOCP”). The NOCP is the last sale price if it falls between the spread of the last reported bid and asked prices. If the last reported bid and asked prices are above the last reported sale price, the NOCP will be the last reported bid price. If the last reported bid and asked prices are below the last reported sale price, the NOCP will be the last reported asked price. Equity securities traded on a national securities exchange or exchanges or on the NASDAQ National Market System for which there is no reported sale during the day are valued at the last reported bid price. A security that is listed or traded on more than one exchange is valued at the quotation on the exchange determined to be the primary market for that security by the Board or its delegates. If no closing price is available, then such securities are valued by using the last reported bid price. Equity securities traded over-the-counter are valued at the last reported sales price.
If no current market value quotation is readily available or reliable for a portfolio security, fair value will be determined in accordance with procedures established by and under the general supervision of the Board. When the Portfolio uses fair value pricing, it may take into account any factors it deems appropriate. The value of securities used by the Portfolio to calculate its net asset value may differ from quoted or published prices for the same securities. Fair value pricing involves subjective judgments and the fair value determined for a security may be materially different than the value that could be realized upon the sale of that security.
The Portfolio expects to use fair value pricing for securities primarily traded on U.S. exchanges only under very limited circumstances. For example, the Portfolio may use fair value pricing if the exchange on which a security is traded closes early or trading in the security is suspended.
MSF-15
Metropolitan Series Fund, Inc.
MetLife Mid Cap Stock Index Portfolio
Notes to Financial Statements—December 31, 2007—(Continued)
Securities traded primarily on an exchange outside of the United States which closes before the close of the New York Stock Exchange will be valued at the last sales price on that non-U.S. exchange. Securities traded primarily on an exchange outside of the United States for which there is no reported sale during the day are valued at the mean between the last reported bid and asked prices. However, because most foreign markets close well before the Portfolio values its securities (typically at 4 p.m. Eastern Time), the earlier close of these foreign markets gives rise to the possibility that significant events, including broad market moves, may have occurred after these foreign markets close but before the Portfolio values its securities. To account for this, the Portfolio may frequently value many of its foreign equity securities using fair value prices based on third party vendor modeling tools.
Options, whether on securities, indices, futures contracts, or otherwise, are valued at the last sales price available as of the close of business on the day of valuation or, if there is no such sale price available, at the mean between the bid and asked prices. Options on currencies are valued at the spot price each day.
The value of futures contracts will be the sum of the margin deposit plus or minus the difference between the value of the futures contract on each day the net asset value is calculated and the value on the date the futures contract originated, value being that established on a recognized commodity exchange, or by reference to other customary sources, with gain or loss being realized when the futures contract closes or expires.
Subject to the Board’s oversight, the Board has delegated day-to-day responsibility for valuing Portfolio assets to the subadviser of the Portfolio, who values such assets as described above and operates under procedures approved by the Board.
Investment Transactions and Related Investment Income:
Portfolio security transactions are recorded on the trade date. Dividend income is recorded on the ex-dividend date or, for certain foreign securities, when notified. Interest income, which includes amortization of premium and accretion of discount on debt securities, is recorded on the accrual basis. Realized gains and losses on investments and unrealized appreciation and depreciation are determined on the identified cost basis, which is the same basis used for federal income tax purposes.
Repurchase Agreements:
The Portfolio, through the custodian or a subcustodian, receives delivery of the underlying securities collateralizing repurchase agreements. The Portfolio requires the custodian to take possession, to have legally segregated in the Federal Reserve Book Entry System, or to have segregated within the custodian’s vault, all securities held as collateral for repurchase agreements. It is the Portfolio’s policy that the market value of the collateral be at least equal to 100% of the repurchase price in the case of a repurchase agreement of one-day duration and 102% on all other repurchase agreements. The Portfolio’s subadviser is responsible for determining that the value of the collateral is at all times at least equal to the repurchase price. In connection with transactions in repurchase agreements, if the seller defaults and the value of the collateral declines or if the seller enters an insolvency proceeding, realization of the collateral by the Portfolio may be delayed, limited or wholly denied.
Futures Contracts:
The Portfolio may buy and sell futures contracts (on recognized exchanges) as a hedge or to enhance return. Futures contracts are agreements to buy or sell a security, or deliver a final cash settlement price in connection with an index, interest rate, currency, or other contracts not calling for physical delivery, for a set price in the future. The Portfolio must post an amount equal to a portion of the total market value of the futures contract as futures variation margin, which is returned when the Portfolio’s obligations under the contract have been satisfied. From time to time thereafter, the Portfolio may have to post variation margin to maintain this amount as the market value of the contract fluctuates. Risks of entering into futures contracts (and related options) include the possibility that there may be an illiquid market and that a change in the value of the contract or option may not correlate with changes in the value of the underlying securities.
Options:
The Portfolio may use options to hedge against changes in values of securities the Portfolio owns or expects to purchase. Writing puts or buying calls tends to increase the Portfolio’s exposure to the underlying instrument and writing calls or buying puts tends to decrease the Portfolio’s exposure to the underlying instrument, and can be used to hedge other Portfolio investments. For options purchased to hedge the Portfolio’s investments, the potential risk to the Portfolio is that the change in value of options
MSF-16
Metropolitan Series Fund, Inc.
MetLife Mid Cap Stock Index Portfolio
Notes to Financial Statements—December 31, 2007—(Continued)
contracts may not correspond to the change in value of the hedged instruments. In addition, losses may arise from changes in the value of the underlying instruments, if there is an illiquid secondary market, or if the counterparty is unable to perform. The maximum loss for purchased options is limited to the premium initially paid for the option. For options written by the Portfolio, the maximum loss is not limited to the premium initially received for the option.
The main risk associated with purchasing an option is that the option expires without being exercised. In this case, the option expires worthless and the premium paid for the option is considered the loss. The risk associated with writing a call option is that the Portfolio may forgo the opportunity for a profit if the market value of the underlying position increases and the option is exercised. The risk in writing a put option is that the Portfolio may incur a loss if the market value of the underlying position decreases and the option is exercised. In addition, the Portfolio risks not being able to enter into a closing transaction for the written option as the result of an illiquid market.
“When-Issued” Securities:
Purchasing securities “when-issued” is a forward commitment by the Portfolio to buy a security. The estimated amount of the Portfolio’s payment obligation and the security’s interest rate are determined when the commitment is made, even though no interest accrues until the security is issued, which is generally 15 to 120 days later. The Portfolio will segregate liquid assets with its custodian sufficient at all times to satisfy these commitments. If the value of the security is less when delivered than when the commitment was made, the Portfolio will suffer a loss.
Federal Income Taxes:
It is the Portfolio’s policy to comply with the requirements of the Internal Revenue Code of 1986, as amended, and regulations thereunder, applicable to regulated investment companies and to distribute all of its taxable income to shareholders. Therefore, no federal income tax provision is required.
As of December 31, 2007, the Portfolio had no capital loss carryovers.
The tax character of distributions paid for the periods ended December 31, 2007 and 2006 was as follows:
| | | | | | | | | | | | | | | | | | | | | |
| Ordinary Income | | Long Term Gain | | Return of Capital | | Total |
| 2007 | | 2006 | | 2007 | | 2006 | | 2007 | | 2006 | | 2007 | | 2006 |
| $5,524,511 | | $ | 8,910,194 | | $ | 19,995,440 | | $ | 27,003,536 | | $ | — | | $ | — | | $ | 25,519,951 | | $ | 35,913,730 |
As of December 31, 2007, the components of distributable earnings (accumulated losses) on a federal income tax basis were as follows:
| | | | | | | | | | | | |
Undistributed
Ordinary
Income | | Undistributed
Long Term
Gain | | Unrealized
Appreciation | | Loss
Carryforwards | | Total |
| $9,540,911 | | $ | 39,817,259 | | $ | 69,140,961 | | $ | — | | $ | 118,499,131 |
Dividends and Distributions to Shareholders:
The Portfolio records dividends and distributions on the ex-dividend date. Net realized gains from security transactions (if any) are generally distributed annually to shareholders. The timing and characterization of certain income and capital gains distributions are determined in accordance with federal tax regulations that may differ from GAAP. Permanent book and tax basis differences relating to shareholder distributions will result in reclassification between under/over distributed net investment income, accumulated net realized gains/losses and paid in capital.
| 3. | INVESTMENT TRANSACTIONS: |
For the year ended December 31, 2007, purchases and sales of securities (excluding short term investments) for the Portfolio were as follows:
| | | | | | | | | |
| Purchases | | Sales |
U.S. Government | | Other | | U.S. Government | | Other |
| $0 | | $ | 211,172,881 | | $ | 0 | | $ | 191,460,283 |
MSF-17
Metropolitan Series Fund, Inc.
MetLife Mid Cap Stock Index Portfolio
Notes to Financial Statements—December 31, 2007—(Continued)
| 4. | INVESTMENT MANAGEMENT FEES AND OTHER TRANSACTIONS WITH AFFILIATES: |
Investment Management Agreement:
MetLife Advisers, LLC (“MetLife Advisers”) is the investment adviser to the Portfolio. The Fund has entered into an investment management agreement with MetLife Advisers with respect to the Portfolio. For providing investment management services to the Portfolio, MetLife Advisers receives monthly compensation at the annual rate of 0.25% of average daily net assets. Fees earned by MetLife Advisers with respect to the Portfolio for the year ended December 31, 2007 were $1,350,639.
Certain officers and directors of the Fund may also be officers of MetLife Advisers; however, such officers and directors receive no compensation from the Fund.
Effective April 30, 2007, MetLife Advisers entered into an investment subadvisory agreement with MetLife Investment Advisors, LLC (“MLIAC”) with respect to the Portfolio. MetLife Advisers pays MLIAC an investment subadvisory fee for the Portfolio equal to the costs incurred by MLIAC in providing subadvisory services to the Portfolio. Fees earned by MLIAC with respect to the Portfolio for the period ended December 31, 2007 were $85,253. Prior to April 30, 2007, MetLife served as the subadviser to the Portfolio and for the period January 1, 2007 through April 30, 2007, fees earned by MetLife were $39,006.
Management Fee Waivers:
Pursuant to an expense agreement, MetLife Advisers has agreed, for the period May 1, 2007 to April 30, 2008, to reduce its advisory fees set out above under “Investment Management Agreement” for each class of the Portfolio at the annual rate of 0.007% of average daily net assets. Amounts waived for the year ended December 31, 2007 are shown as management fee waivers in the Statement of Operations.
Service and Distribution Fees:
The Fund has adopted a Distribution and Service Plan under Rule 12b-1 of the 1940 Act for the Portfolio’s Class B and E shares. Under the Distribution and Service Plan, the Class B and E shares of the Portfolio pay a fee to compensate the Insurance Companies (or their affiliates) and other broker-dealers and financial intermediaries involved in the offer and sale of Portfolio shares for promoting or selling and servicing, the Class B and E shares. The fees under the Distribution and Service Plan for each class of the Portfolio’s shares are calculated as a percentage of the Portfolio’s average daily net assets that are attributable to that Class. Currently, the fee is 0.25% per year for Class B shares and 0.15% per year for Class E shares. Amounts paid by the Portfolio for the year ended December 31, 2007 are shown as Service and Distribution fees in the Statement of Operations.
The Fund has entered into a securities lending arrangement with the Fund’s custodian, State Street Bank and Trust Company (the “custodian”). Under the agreement, the custodian is authorized to loan securities on the Portfolios’ behalf. In exchange, the Portfolio receives either cash or securities as collateral against the loaned securities. The Portfolio receives collateral at least equal to 102% of the market value of the loaned securities (105% for foreign securities), at each loan’s inception. Collateral must be maintained at least at 100% of the market value of the loaned securities for the duration of the loan. The cash collateral is invested in the Navigator Securities Lending Prime Portfolio, an affiliate of the custodian, which invests in a variety of high quality U.S. dollar-denominated instruments. If the market value of the collateral at the close of trading on a business day is less than 100% of the market value of the loaned securities at the close of trading on that day, the borrower shall be required to deliver, by the close of business on the following business day, an additional amount of collateral, equal to at least 100% of the market value of all the loaned securities as of such preceding day. The Portfolio receives 80% of the annual net income from securities lending transactions, which is included in interest income of the Portfolio. The remaining 20% is paid to the custodian as compensation for its securities lending services. The Portfolio bears the risk of any deficiency in the amount of collateral available for return to a borrower due to a loss in an approved investment. Any outstanding loans by the Portfolio at December 31, 2007 are footnoted in the Schedule of Investments.
As previously reported, in May 2004, General American received a Wells Notice stating that the SEC staff was considering recommending that the SEC bring a civil action alleging violations of the U.S. securities laws against General American with respect to market timing and late trading in a limited number of privately-placed variable insurance contracts that were sold
MSF-18
Metropolitan Series Fund, Inc.
MetLife Mid Cap Stock Index Portfolio
Notes to Financial Statements—December 31, 2007—(Continued)
through General American. General American responded to the SEC staff and cooperated with the investigation. On August 9, 2007, the SEC announced that it had settled an enforcement action regarding late trading against General American with, among other things, General American agreeing to pay a civil penalty and to comply with certain undertakings. General American consented to the SEC’s order without admitting or denying the findings. MetLife Advisers has also advised the Fund’s Board of Directors that, while certain exceptions to the Fund’s policies have been noted, no situations have been identified that would have a material impact on the financial position of the Fund.
| 7. | RECENT ACCOUNTING PRONOUNCEMENTS: |
Effective June 29, 2007, the Fund implemented Financial Accounting Standards Board (“FASB”) Interpretation No. 48, “Accounting for Uncertainty in Income Taxes—an interpretation of FASB Statement No. 109” (“FIN 48”). FIN 48 prescribes the minimum recognition threshold a tax position must meet in connection with accounting for uncertainties in income tax positions taken or expected to be taken by an entity, including investment companies, before being measured and recognized in the financial statements. Management has evaluated the application of FIN 48 to the Fund, and has determined that the adoption of FIN 48 does not have a material impact on the Fund’s financial statements. The Fund files U.S. tax returns. No income tax returns are currently under examination. The statute of limitations on the Fund’s tax returns remains open for the years ended December 31, 2004 through December 31, 2006.
In September 2006, Statement of Financial Accounting Standards No. 157, Fair Value Measurements (SFAS 157) was issued and is effective for fiscal years beginning after November 15, 2007. SFAS 157 defines fair value, establishes a framework for measuring fair value and expands disclosures about fair value measurements. Management is currently evaluating the impact the adoption of SFAS 157 will have on the Portfolio’s financial statement disclosures.
MSF-19
Metropolitan Series Fund, Inc.
MetLife Mid Cap Stock Index Portfolio
Report of Independent Registered Public Accounting Firm
To the Shareholders and Board of Directors of the Metropolitan Series Fund, Inc.:
We have audited the accompanying statement of assets and liabilities, including the schedule of investments, of the MetLife Mid Cap Stock Index Portfolio, one of the portfolios constituting the Metropolitan Series Fund, Inc. (the “Fund”) as of December 31, 2007, and the related statement of operations for the year then ended, the statements of changes in net assets for each of the two years in the period then ended, and the financial highlights for each of the five years in the period then ended. These financial statements and financial highlights are the responsibility of the Fund’s management. Our responsibility is to express an opinion on these financial statements and financial highlights based on our audits.
We conducted our audits in accordance with the standards of the Public Company Accounting Oversight Board (United States). Those standards require that we plan and perform the audit to obtain reasonable assurance about whether the financial statements and financial highlights are free of material misstatement. The Fund is not required to have, nor were we engaged to perform, an audit of its internal control over financial reporting. Our audits included consideration of internal control over financial reporting as a basis for designing audit procedures that are appropriate in the circumstances, but not for the purpose of expressing an opinion on the effectiveness of the Fund’s internal control over financial reporting. Accordingly, we express no such opinion. An audit also includes examining, on a test basis, evidence supporting the amounts and disclosures in the financial statements, assessing the accounting principles used and significant estimates made by management, as well as evaluating the overall financial statement presentation. Our procedures included confirmation of securities owned as of December 31, 2007, by correspondence with the custodian and brokers; where replies were not received from brokers, we performed other auditing procedures. We believe that our audits provide a reasonable basis for our opinion.
In our opinion, the financial statements and financial highlights referred to above present fairly, in all material respects, the financial position of the MetLife Mid Cap Stock Index Portfolio of the Metropolitan Series Fund, Inc. as of December 31, 2007, the results of its operations for the year then ended, the changes in its net assets for each of the two years in the period then ended, and the financial highlights for each of the five years in the period then ended, in conformity with accounting principles generally accepted in the United States of America.
Deloitte & Touche LLP
Boston, Massachusetts
February 21, 2008
MSF-20
Metropolitan Series Fund, Inc.
Directors and Officers
The Fund’s Directors review actions of the Fund’s investment adviser and subadvisers, and decide upon matters of general policy. The Fund’s officers supervise the daily business operations of the Fund. The Board of Directors and the Fund’s officers are listed below. Each Director is responsible for overseeing all 36 Portfolios of the Fund. There is no limit to the term a Director may serve. Directors serve until their resignation, retirement or removal in accordance with the Fund’s organizational documents and policies adopted by the Board from time to time. Officers hold office at the pleasure of the Board or until the election or appointment and the qualification of a successor. The address of the directors and officers is c/o Metropolitan Series Fund, Inc., 501 Boylston Street, Boston, MA 02116.
Interested Directors(1)
Each Director below is an “interested person” (as defined by the 1940 Act) with respect to the Fund in that Ms. Forget is an employee of MetLife and Mr. Typermass is a former employee of MetLife and owns securities issued by MetLife, Inc., the ultimate parent company of MetLife Advisers.
| | | | | | | | |
Name, Address and Age | | Current
position(s)
with Fund | | Position(s)
held since | | Principal occupations
over past five years, including other directorships(2) | | Number of
Portfolios in
Fund Complex
Overseen by
Director(3) |
Elizabeth M. Forget Age: 41 | | Director, Chairman of the Board, President and Chief Executive Officer | | 2006 | | Senior Vice President (since 2007), MetLife, Inc.; President, Met Investors Advisory, LLC (“MIA”); Trustee and President, Met Investors Series Trust (“MIST”); Executive Vice President, MetLife Investors Group, Inc.; President (since 2006), MetLife Advisers. | | 81 |
| | | | |
Arthur G. Typermass Age: 70 | | Director | | 1998 | | Formerly, Senior Vice President and Treasurer, MetLife. | | 37 |
Non-Interested Directors(1)
Each Director below is not an “interested person” (as defined by the 1940 Act) with respect to the Fund (collectively, the “Independent Directors”).
| | | | | | | | |
Name, Address and Age | | Current
position(s)
with Fund | | Position(s)
held since | | Principal occupations
over past five years, including other directorships(2) | | Number of
Portfolios in
Fund Complex
Overseen by
Director(3) |
Steve A. Garban† Age: 70 | | Director | | 1985 | | Formerly, Chief Financial Officer, Senior Vice President Finance and Operations and Treasurer (Emeritus), The Pennsylvania State University. | | 37 |
| | | | |
Linda B. Strumpf Age: 60 | | Director | | 2000 | | Vice President and Chief Investment Officer, Ford Foundation. | | 37 |
| | | | |
Michael S. Scott Morton† Age: 70 | | Director | | 1993 | | Jay W. Forrester Professor of Management (Emeritus) at Sloan School of Management, MIT. | | 37 |
| | | | |
H. Jesse Arnelle Age: 74 | | Director | | 2001 | | Formerly, Counsel, Womble Carlyle Sandrie & Rice; Director, Textron Inc. (global multi-industry company)*; formerly, Director, Gannet Co. Inc. (diversified news and information company)*; formerly, Director, Eastman Chemical Company (global chemical company)*; formerly, Director, Waste Management, Inc.*; formerly, Director, Armstrong Holdings Inc. (parent company of floor and ceiling products business)*; formerly, Director, FPL Group Inc. (public utility holding company)*; Director, URS Corporation (engineering design services firm)*. | | 37 |
| | | | |
Nancy Hawthorne Age: 56 | | Director | | 2003 | | Director, Avid Technologies (computer software company)*; formerly, Chairman of the Board of Avid Technologies; formerly, Board of Advisors, L. Knife & Sons, Inc. (beverage distributor); Chief Executive Officer, Clerestory LLC (corporate financial advisor); formerly, Trustee, New England Zenith Fund (“Zenith Fund”)**; formerly, Chief Executive Officer and Managing Partner, Hawthorne, Krauss and Associates (corporate financial advisor); formerly, Chief Financial Officer and Executive Vice President, Continental Cablevision, subsequently renamed MediaOne (cable television company); formerly, Director, Life F/X, Inc.; formerly, Chairman of the Board, WorldClinic (distance medicine company); formerly, Director, Perini Corporation (construction company)*; formerly, Director, CGU (property and casualty insurance company); formerly, Director, Beacon Power Corporation (energy company )*. | | 37 |
MSF-21
Metropolitan Series Fund, Inc.
Directors and Officers—(Continued)
| | | | | | | | |
Name, Address and Age | | Current
position(s)
with Fund | | Position(s)
held since | | Principal occupations
over past five years, including other directorships(2) | | Number of
Portfolios in
Fund Complex
Overseen by
Director(3) |
John T. Ludes Age: 71 | | Director | | 2003 | | President, LFP Properties (consulting firm); Formerly, Trustee, Zenith Fund**; formerly, Vice Chairman, President and Chief Operating Officer, Fortune Brands/American Brands (global conglomerate); formerly, President and CEO, Acushnet Company (athletic equipment company). | | 37 |
Officers(1)
| | | | | | | | |
Name and address | | Age | | Current
position(s)
with Fund | | Position(s)
held since | | Principal occupations over past five years(2) |
| Jeffrey P. Halperin | | 40 | | Chief Compliance Officer | | 2006 | | Vice President (since 2006), Corporate Ethics and Compliance Department, MetLife, Inc.; Chief Compliance Officer (since 2006), MetLife Advisers, MIA and MIST. |
| | | | |
| John F. Guthrie, Jr. | | 64 | | Senior Vice President | | 2002 | | Manager and Senior Vice President, MetLife Advisers; Vice President, MetLife; Vice President (since 2003), MetLife Group, Inc.; Vice President, NELICO; Vice President (since 2005), MIA; formerly, Senior Vice President, Zenith Fund**. |
| | | | |
| Alan C. Leland | | 55 | | Senior Vice President | | 2005 | | Treasurer and Chief Financial Officer, MetLife Advisers, LLC; Treasurer (since 2005), Met Investors Advisory, LLC; Vice President (since 2004), MIA; Vice President (since 2003), MetLife Group, Inc.; Vice President, MetLife; Senior Vice President, NELICO |
| | | | |
| Peter Duffy | | 52 | | Vice President and Treasurer | | 2000 | | Senior Vice President, MetLife Advisers (since 1998); Second Vice President (since 2003), NELICO; Vice President, MetLife (since 2004); Vice President (since 2004), MetLife Group, Inc.; formerly, Vice President and Treasurer, Zenith Fund**. |
| | | | |
| Thomas M. Lenz | | 49 | | Vice President and Secretary | | 2002 | | General Counsel and Secretary, MetLife Advisers; Assistant General Counsel, MetLife; formerly, Vice President and Secretary, Zenith Fund**. |
| * | Indicates a directorship with a registered investment company or a company subject to the reporting requirements of the Securities Exchange Act of 1934, as amended. |
| ** | The Zenith Fund deregistered with the Securities and Exchange Commission (“SEC”) in 2004. |
| (†) | Served as a trustee, director and/or officer of one or more of the following companies, each of which had a direct or indirect advisory relationship with MetLife Advisers or its affiliates prior to January 31, 2005: State Street Research Financial Trust, State Street Research Income Trust, State Street Research Money Market Trust, State Street Research Institutional Funds, State Street Research Capital Trust, State Street Research Master Investment Trust, State Street Research Equity Trust, State Street Research Securities Trust and State Street Research Exchange Trust (collectively, the “State Street Research Funds”). |
| (1) | Each Director of the Fund also serves as trustee of Metropolitan Series Fund II (“Met Series Fund II”), a registered investment company advised by MetLife Advisers. Each officer of the Fund serves in the same position with Met Series Fund II, which consists of one portfolio. |
| (2) | Previous positions during the past five years with the Fund, MIST, MetLife, MetLife Advisers, MIA, Zenith Fund, NELICO or New England Securities Corporation are omitted if not materially different. |
| (3) | The Fund Complex includes the Fund (36 portfolios), Met Series Fund II (1 portfolio) and MIST (44 portfolios) |
MSF-22
Metropolitan Series Fund, Inc.
MetLife Mid Cap Stock Index Portfolio
Board Approval of Advisory and Subadvisory Agreements
The Fund’s Contract Review Committees of the Board of Directors (the “Board”) typically meet in early fall to review the Portfolios’ advisory agreements (the “Advisory Agreements”) and subadvisory agreements (collectively, the “Subadvisory Agreements,” and, together with the Advisory Agreements, the “Agreements”) and determine whether to recommend that the full Board approve the continuation of the Agreements for an additional one-year period. (Following the initial approval of an Agreement for a new Portfolio or with a new adviser or subadviser, such annual reviews are not required until 2 years following the execution of such Agreement.) After each Committee has made its recommendations, the full Board, including the Independent Directors, determines whether to approve the continuation of each of the Agreements. In addition, the Board, including the Independent Directors, considers matters bearing on the Agreements at most of its other meetings throughout the year and regularly interviews various individuals at MetLife Advisers responsible for the management of the Portfolios. The Directors also interview selected investment managers and other professionals at the subadvisers at various times throughout the year.
The Directors receive all materials that they or MetLife Advisers, the Fund’s investment adviser, and the subadvisers believe to be reasonably necessary for the Directors to evaluate the Agreements and determine whether to approve the continuation of the Agreements. These materials generally include, among other items, (i) information on the investment performance of the Portfolios and the performance of peer groups of funds and the Portfolios’ performance benchmarks, (ii) information on the Portfolios’ advisory and subadvisory fees and other expenses, including information comparing the Portfolios’ expenses to those of peer groups of funds and information about any applicable expense caps and fee “breakpoints,” (iii) sales and redemption data, (iv) information related to the profitability of the Agreements to MetLife Advisers and the subadvisers, and potential “fall-out” or ancillary benefits that MetLife Advisers, the subadvisers or their affiliates may receive as a result of their relationships with the Fund and (v) information obtained through the subadvisers’ responses to certain requests from MetLife Advisers and the Directors and MetLife Advisers’ responses to requests from the Directors. The Directors may also consider other information such as (vi) MetLife Advisers’ and the subadvisers’ financial results and condition, (vii) each Portfolio’s investment objectives and strategies and the size, education and experience of the investment staffs of MetLife Advisers and the relevant subadvisers and their use of technology and external research, (viii) the allocation of the Portfolios’ brokerage, if any, including allocations to brokers affiliated with the subadvisers and the use of “soft” commission dollars to pay Portfolio expenses and to pay for research and other similar services, (ix) the resources devoted to, and the record of compliance with, the Portfolios’ investment policies and restrictions, policies on personal securities transactions and other compliance policies, (x) the responses of MetLife Advisers, the subadvisers and/or their affiliates to certain legal and regulatory proceedings and (xi) the economic outlook generally and for the mutual fund industry in particular. Throughout the process, the Directors have the opportunity to ask questions of and request additional materials from MetLife Advisers and the subadvisers.
Following meetings of each Contract Review Committee on September 12, 2007, the Board, at its November 15, 2007 meeting, approved the continuation through December 31, 2008 of the Advisory Agreements for each Portfolio of the Fund and the Subadvisory Agreements for each Portfolio of the Fund. The Agreements approved for continuation are referred to below as the “Continued Agreements.”
In considering whether to approve the continuation of the Continued Agreements, the Directors, including the Independent Directors, did not identify any single factor as determinative, and each weighed the various factors as he or she deemed appropriate. The Directors considered the following matters in connection with their approval of the Continued Agreements:
The nature, extent and quality of the services provided to the relevant Portfolios under the Continued Agreements. The Directors considered the nature, extent and quality of the services provided by MetLife Advisers, the relevant subadvisers (if any) and their affiliates (each, an “Adviser,” and, collectively, the “Advisers”) to the relevant Portfolios pursuant to the Continued Agreements and the resources dedicated to these Portfolios by the Advisers. In particular, the Directors considered the Advisers’ abilities to attract and retain highly qualified investment professionals. With respect to MetLife Advisers, the Directors considered that MetLife Advisers is (i) ultimately responsible for the performance of such Portfolios; (ii) ultimately responsible for the establishment of the investment strategies of each such Portfolio, primarily through its recommendations to the Board regarding the hiring and selection of subadvisers; (iii) responsible for the hiring and selection, subject to Board approval, of subadvisers; and (iv) responsible for maintaining a program of Subadviser oversight reasonably designed to ensure that the subadvisers have reasonable compliance policies and procedures in place. The Directors also considered that MetLife Advisers provides a full range of day-to-day administrative services for the Portfolios involving all aspects of such Portfolios’ day-to-day operations (other than portfolio management). After reviewing these and related factors, the Directors concluded, within the context of their overall conclusions regarding each of the Continued Agreements, that the nature, extent and quality of services provided supported the renewal of these Agreements.
Investment performance of the relevant Portfolios. The Directors reviewed information about the performance of the relevant Portfolios over various time periods, including information prepared by an independent third party that compared the performance of
MSF-23
Metropolitan Series Fund, Inc.
MetLife Mid Cap Stock Index Portfolio
Board Approval of Advisory and Subadvisory Agreements—(Continued)
the Portfolios to the performance of peer groups of funds and performance benchmarks. The Directors also reviewed a description of the third party’s methodology for identifying a Portfolio’s peer group(s) for purposes of performance and expense comparisons.
In the case of each relevant Portfolio that had performance that lagged its peer group(s) for certain periods, the Directors concluded that other factors relevant to performance were sufficient, in light of other considerations, to warrant renewal of the Continued Agreements relating to such Portfolio. These factors varied from Portfolio to Portfolio, but included one or more of the following: (i) that such Portfolio’s performance, although lagging in certain recent periods, was stronger over the longer term; (ii) that the underperformance was attributable, to a significant extent, to investment decisions that were reasonable and consistent with the Portfolio’s investment objective(s) and policies and that the Portfolio was performing within the range of reasonable expectations, given market conditions and the Portfolio’s investment objective(s) and policies; (iii) that the Portfolio’s performance was competitive when compared to other relevant performance benchmarks or peer groups; and (iv) that MetLife Advisers and/or the relevant subadviser (if any) had taken or was taking steps designed to help improve the Portfolio’s investment performance.
The Directors also considered the investment performance of the Advisers and their reputations generally, the historical responsiveness of the Advisers to Director concerns about performance and the willingness of the Advisers to take steps intended to improve performance.
After reviewing these and related factors, the Directors concluded, within the context of their overall conclusions regarding each of the Continued Agreements, that the investment performance of each relevant Portfolio and Adviser was sufficient, in light of other considerations, to warrant the renewal of the Continued Agreements.
The costs of the services to be provided and profits to be realized by the Advisers and their affiliates from their relationships with the Portfolios. The Directors considered the fees charged by MetLife Advisers to the Portfolios for advisory services and, with respect to the subadvised Portfolios, by such subadvisers to MetLife Advisers for subadvisory services (such advisory and subadvisory fees (if any), collectively, “Fees”), as well as the total expense levels of the Portfolios. This information included comparisons (provided by an independent third party) of the Portfolios’ advisory fees and total expense levels to those of their peer groups. In evaluating Fees for the relevant Portfolios, the Directors also took into account the demands, complexity and quality of the investment management services provided to each Portfolio. The Directors considered MetLife Advisers’ recommendations regarding reductions in Fee rates, implementation of Fee breakpoints and institution of Fee waivers and expense caps.
The Directors also considered the compensation directly or indirectly received by the Advisers and their affiliates from their relationships with the relevant Portfolios. The Directors reviewed information relating to the profits received by MetLife Advisers, certain of the subadvisers and their affiliates as a result of their relationships with the relevant Portfolios, and information about the allocation of expenses used to calculate profitability. When reviewing profitability, the Directors also considered the performance of the relevant Portfolios, the expense levels of such Portfolios and whether the relevant Advisers had implemented breakpoints, fee waivers and/or expense caps with respect to such Portfolios.
After reviewing these and related factors, the Directors concluded, within the context of their overall conclusions regarding each of the Continued Agreements, that the Fees charged to each of the relevant Portfolios were fair and reasonable, and that the information provided regarding costs of these services generally, and the related profitability (if known) to the relevant Advisers of their relationships with the relevant Portfolios, supported the renewal of the Continued Agreements.
Economies of Scale. The Directors considered the existence of any economies of scale in the provision of services by the Advisers and whether those economies were shared with the relevant Portfolios through breakpoints in their advisory fees or other means, such as expense caps, fee waivers or relatively low levels of fees. The Directors noted that most of the relevant Portfolios benefited or will benefit from breakpoints, expense caps and/or fee waivers with respect to their advisory fees. In considering these issues, the Directors also took into consideration information relating to the costs of the services provided and the profitability to MetLife Advisers, the relevant subadvisers (if any) and each of their affiliates of their relationships with the relevant Portfolios, as discussed above.
After reviewing these and related factors, the Directors concluded, within the context of their overall conclusions regarding each of the Continued Agreements, that the extent to which economies of scale were shared with the relevant Portfolios supported the renewal of such Agreements.
Other Factors. The Directors also considered other factors, which included but were not limited to the following:
| | • | | the extent to which each relevant Portfolio operated in accordance with its investment objective, and its record of compliance with its investment restrictions and the compliance programs of the Fund and the Advisers. They also considered the compliance-related resources the Advisers and their affiliates provide to the relevant Portfolios; |
MSF-24
Metropolitan Series Fund, Inc.
MetLife Mid Cap Stock Index Portfolio
Board Approval of Advisory and Subadvisory Agreements—(Continued)
| | • | | the nature, quality, cost and extent of administrative and shareholder services performed by MetLife Advisers and its affiliates under the Advisory Agreements; and |
| | • | | so-called “fall-out benefits” to the Advisers, such as the engagement of their affiliates to provide distribution, brokerage and transfer agency services to the Portfolios, and the benefits of research made available to the relevant Advisers by reason of brokerage commissions generated by the relevant Portfolios’ securities transactions. The Directors also considered the possible conflicts of interest associated with these fall-out and other benefits, and the reporting and other processes in place to disclose and monitor these possible conflicts of interest. |
Based on their evaluation of all factors that they deemed to be material, including those factors described above, and assisted by the advice of independent counsel, the Directors, including the Independent Directors, concluded that each of the Continued Agreements should be continued through December 31, 2008.
MSF-25
A description of the policies and procedures that the Fund uses to determine how to vote proxies relating to portfolio securities is available (i) without charge, upon request, by calling (800) 638-7732 and (ii) on the Securities and Exchange Commission’s (the “SEC”) website at http://www.sec.gov.
Information regarding how the Fund voted proxies relating to portfolio securities during the most recent twelve-month period ended December 31, 2007 is available (i) without charge, upon request, by calling (800) 638-7732 and (ii) on the SEC’s website at http://www.sec.gov.
The Fund files with the SEC a complete schedule of its portfolio holdings, as of the close of the first and third quarters of its fiscal year, on “Form N-Q”. These filings are available on the SEC’s website at www.sec.gov and may be reviewed and copied at the SEC’s Public Reference Room in Washington, DC. (Call 1-800-SEC-0330 for information on the operation of the Public Reference Room.)
MSF-26
| | |
Metropolitan Series Fund, Inc. MetLife Moderate Allocation Portfolio Annual Report | | December 31, 2007 |
Letter from the President
February 1, 2008
Letter to Policy Holders:
2007 was a tumultuous year in the financial markets driven by concerns in the credit markets surrounding sub-prime mortgages and fears of recession in the U.S. Economy. The broad markets were mixed, with the Dow Jones Industrial Average up 8.9% and the MSCI EAFE Index, which measures the performance of international equities, up 11.2% for the year, while the Russell 2000 Index, which measures the performance of small capitalization stocks, was down 1.6%.
In the fixed income markets, credit spreads increased as a result of the pressure from sub-prime mortgage crisis and the Federal Reserve lowered interest rates by a total of 1% during the year. The Lehman Brothers Aggregate Bond Index posted a 7.0% return for the year.
On the following pages, you will find a complete review of your Portfolio and its investment performance.
MetLife is committed to building your financial freedom. We appreciate your trust and will continue to focus our efforts on meeting your investment needs.
Sincerely,
Elizabeth Forget
President, Metropolitan Series Fund, Inc.
Metropolitan Series Fund, Inc.
MetLife Moderate Allocation Portfolio
Managed by MetLife Advisers, LLC
Portfolio Manager Commentary*
PORTFOLIO PERFORMANCE
For the year ended December 31, 2007, the Class A shares of the MetLife Moderate Allocation Portfolio returned 4.5% compared to the 5.7% return of the Wilshire 5000 Index1 and the 6.5% return of the Lehman Brothers U.S. Universal Bond Index2. Considering that no single index or benchmark can accurately capture the multiple asset class design of the Portfolio, we have created a blended benchmark comprised of several indices for use in portfolio design and evaluation purposes. Specifically, the blended benchmark for the MetLife Moderate Allocation Portfolio consists of an 8% allocation to the Lehman Brothers 1 to 3 Year Government Bond Index3, a 32% allocation to the Lehman Brothers U.S. Universal Bond Index , a 48% allocation to the Wilshire 5000 Index, and a 12% allocation to the Morgan Stanley Capital International EAFE Index4. During the twelve-month period ended December 31, 2007, the blended benchmark returned 6.9%.
PORTFOLIO REVIEW
Concerns about subprime mortgages and the strength of the overall economy initially surfaced in the first half of 2007, but they were mostly brushed off. It was not until the second half of the year that those concerns intensified. Most economic statistics at the end of 2007 indicated a weakening economy: a sharp decrease in New and Existing Home Sales, a drop in Consumer Confidence, a rise in the Unemployment Rate, and a decline in the Purchasing Managers Index.
During 2007, large cap stocks, as measured by the Standard & Poor’s 500 Index5 return of 5.5%, did better than small cap stocks, as measured by the -1.6% return of the Russell 2000 Index6. Growth style stocks generally held up better than value style stocks. There was a wide dispersion among the various sectors of the S&P 500 Index: Energy and Materials were up 34% and 22% respectively, while Financials (-19%) and Consumer Discretionary (-13%) were down sharply. On a local basis, foreign stocks were also up modestly for the year, but U.S. based investors benefited from a weak dollar to receive an 11.2% return as measured by the MSCI EAFE Index.
Investment grade bonds, as measured by the Lehman Brothers Aggregate Bond Index7, posted a 7.0% return in response to a decline in interest rates across the yield curve. Below investment grade bonds, while still eking out a positive return for the year, were adversely impacted by credit concerns brought about by the subprime mortgage crisis. Treasuries and Treasury Inflation Protected Securities (TIPS) were the best performing investment grade sectors, while the credit based sectors lagged.
The MetLife Moderate Allocation Portfolio is a “fund of funds” that invests in other Portfolios of the Metropolitan Series Fund, Inc. and the Met Investors Series Trust. The Portfolio’s initial target allocations were 60% in equity investments and 40% in fixed income investments. The MetLife Moderate Allocation Portfolio is considered the “middle” of the five Asset Allocation Portfolios as measured by its potential risk.
The only change in the Portfolio during the period was a slight adjustment for the underlying Portfolios as of May 1, 2007. We also rebalanced the Portfolio on a quarterly basis to bring it back into line with the underlying Portfolio targets and the desired risk level.
Collectively, the performance of the underlying fixed income Portfolios essentially matched that of the Lehman Brothers U.S. Universal Bond Index. The PIMCO Total Return Portfolio and the PIMCO Inflation Protected Bond Portfolio beat the Index, but this good performance was offset by the Western Asset Strategic Bond Opportunities and Western Asset U.S. Government Portfolios, which lagged the Index due to exposure to holdings of spread product, which includes mortgage backed securities and corporate bonds.
The largest source of underperformance over the past year was poor security selection within several of the underlying equity Portfolios. These Portfolios did not perform as well as we would have expected given their asset allocation among the segments of the capital markets. Detracting the most from performance were the Harris Oakmark International Portfolio, which was down 1% for the year compared to an 11% return of foreign stocks overall, as measured by the MSCI EAFE Index, and the Legg Mason Value Equity Portfolio, which fell nearly 6% compared to the 5.5% return of the S&P 500 Index. Although its position was small (1%) and its performance was in line with the real estate indices, the Neuberger Berman Real Estate Portfolio was down sharply for the year (-14.8%) relative to the broad equity market. This had an adverse impact on the Portfolio’s performance.
Among the underlying Portfolios that had positive security selection and added to relative performance were the Met/AIM Small Cap Growth Portfolio, the Jennison Growth Portfolio, the PIMCO Total Return Portfolio, and the T. Rowe Price Large Cap Growth Portfolio. Among the equity funds, growth oriented funds like these performed better than the broad equity market and added relative value to the Portfolio’s performance.
* The views expressed above are those of the advisory firm as of December 31, 2007 and are subject to change based on market and other conditions. Information about the Portfolio’s holdings, asset allocation, industry allocation, or country diversification is historical and is not an indication of future Portfolio composition, which will vary. The performance of any index mentioned in this commentary has not been adjusted for ongoing management, distribution and operating expenses, and sales charges applicable to mutual fund investments. Direct investment in the Index is not possible.
1 The Wilshire 5000 Index measures the performance of all U.S. headquartered equity securities with readily available price data.
2 The Lehman Brothers U.S. Universal Bond Index represents the union of the U.S. Aggregate Index, the U.S. High-Yield Corporate Index, the 144A Index, the Eurodollar Index, the Emerging Markets Index, the non-EIRSA portion of the Commercial Mortgage Backed Securities Index and the Commercial Mortgage Backed Securities High Yield Index.
3 The Lehman Brothers 1 to 3 Year Government Bond Index includes most obligations of the U.S Treasury, agencies and quasi-federal corporations having maturities between one to three years.
4 The Morgan Stanley Capital International Europe, Australasia and Far East Index (“MSCI EAFE Index”) is an unmanaged free float-adjusted market capitalization index that is designed to measure developed market equity performance, excluding the U.S. & Canada.
5 The Standard & Poor’s (S&P) 500® Stock Index is an unmanaged index representing the performance of 500 major companies, most of which are listed on the New York Stock Exchange.
6 The Russell 2000® Index is an unmanaged measure of performance of the 2,000 smallest companies in the Russell 3000® Index.
7 Lehman Brothers® Aggregate Bond Index includes most obligations of the U.S. Treasury, agencies and quasi-federal corporations, most publicly issued investment grade corporate bonds and most bonds backed by mortgage pools of GNMA, FNMA and FHLMC.
MSF-2
Metropolitan Series Fund, Inc.
MetLife Moderate Allocation Portfolio
A $10,000 INVESTMENT COMPARED TO
THE WILSHIRE 5000 STOCK INDEX AND THE LEHMAN BROTHERS
UNIVERSAL BOND INDEX

Average Annual Returns as of December 31, 2007
| | | | | | | | | | | | |
| | | MetLife Moderate
Allocation Portfolio | | | Wilshire 5000
Stock Index | | | Lehman Brothers
Universal Bond Index | |
| | | Class A | | | Class B | | | |
| 1 Year | | 4.5 | % | | 4.4 | % | | 5.7 | % | | 6.5 | % |
| Since Inception | | 9.5 | | | 9.3 | | | 12.4 | | | 5.1 | |
Performance numbers are net of all Portfolio expenses but do not include any insurance, sales, or administrative charges of variable annuity or life insurance contracts. If these charges were included, the returns would be lower.
Inception date of the Class A and Class B shares is 5/2/05. Index since inception return is based on the Portfolio’s inception date.
This information represents past performance and is not indicative of future results. Investment return and principal value may fluctuate so that shares, upon redemption, may be worth more or less than the original cost.
PORTFOLIO COMPOSITION as of December 31, 2007
Top Holdings
| | |
| | | % of Total
Net Assets |
Met Investors Series Trust—PIMCO Total Return Portfolio, (Class A) | | 21.1% |
Metropolitan Series Fund, Inc.—Western Asset Mgt. Strategic Bond Opportunities Portfolio, (Class A) | | 11.9% |
Metropolitan Series Fund, Inc.—Davis Venture Value Portfolio, (Class A) | | 7.0% |
Metropolitan Series Fund, Inc.—Neuberger Berman Mid Cap Value Portfolio, (Class A) | | 6.2% |
Met Investors Series Trust—Harris Oakmark International Portfolio, (Class A) | | 5.9% |
Metropolitan Series Fund, Inc.—BlackRock Large Cap Value Portfolio, (Class A) | | 5.1% |
Metropolitan Series Fund, Inc.—T. Rowe Price Large Cap Growth Portfolio, (Class A) | | 5.1% |
Metropolitan Series Fund, Inc.—Julius Baer International Stock Portfolio, (Class A) | | 4.9% |
Metropolitan Series Fund, Inc.—MetLife Stock Index Portfolio, (Class A) | | 4.0% |
Met Investors Series Trust—Legg Mason Value Equity Portfolio, (Class A) | | 3.9% |
MSF-3
Metropolitan Series Fund, Inc.
Shareholder Expense Example
As a shareholder of the Fund, you incur ongoing costs, including management fees; distribution and service (12b-1) fees; and other fund expenses. This example is intended to help you understand your ongoing costs (in dollars) (referred to as “expenses”) of investing in the Portfolio and compare these costs with the ongoing costs of investing in other mutual funds. The example is based on an investment of $1,000 invested at the beginning of the period and held for the entire period, July 1, 2007 through December 31, 2007.
Actual Expenses
The first line for each share class of the Portfolio in the table below provides information about actual account values and actual expenses. You may use the information in this line, together with the amount you invested in the particular share class of the Portfolio, to estimate the expenses that you paid over the period. Simply divide your account value by $1,000 (for example, an $8,600 account value divided by $1,000=8.6), then multiply the result by the number in the first line under the heading entitled “Expenses Paid During Period” to estimate the expenses you paid on your account during this period.
Hypothetical Example for Comparison Purposes
The second line for each share class of the Portfolio in the table below provides information about hypothetical account values and hypothetical expenses based on the Portfolio’s actual expense ratio and an assumed rate of return of 5% per year before expenses, which is not the Portfolio’s actual return. The hypothetical account values and expenses may not be used to estimate the actual ending account balance or expenses you paid for the period. You may use this information to compare the ongoing costs of investing in the Portfolio and other funds. To do so, compare this 5% hypothetical example with the 5% hypothetical examples that appear in the shareholder reports of the other funds.
Please note that the expenses shown in the table are meant to highlight your ongoing costs only and do not reflect any fees or charges of your variable insurance product or any additional expenses that participants in certain eligible qualified plans may bear relating to the operations of their plan. Therefore, the second line for each share class in the table is useful in comparing ongoing costs only, and will not help you determine the relative total costs of owning different funds. In addition, if these other costs were included, your costs would have been higher.
| | | | | | | | | | | | | | |
Portfolio | | | | Annualized
Expense
Ratio | | | Beginning
Account Value
July 1,
2007 | | Ending
Account Value
December 31,
2007 | | Expenses Paid
During Period*
July 1, 2007
to
December 31,
2007 |
MetLife Moderate Allocation—Class A(a)(b) | | Actual | | 0.78 | % | | $ | 1,000.00 | | $ | 995.90 | | $ | 3.92 |
| | Hypothetical | | 0.78 | % | | $ | 1,000.00 | | $ | 1,021.23 | | $ | 3.97 |
| | | | | |
MetLife Moderate Allocation—Class B(a)(b) | | Actual | | 1.03 | % | | $ | 1,000.00 | | $ | 994.20 | | $ | 5.18 |
| | Hypothetical | | 1.03 | % | | $ | 1,000.00 | | $ | 1,019.95 | | $ | 5.24 |
* Expenses paid are equal to the Portfolio’s annualized expense ratio for the most recent six month period, as shown above, multiplied by the average account value over the period, multiplied by the number of days in the most recent fiscal half-year, divided by 365 (to reflect the one-half year period).
(a) The annualized expense ratio shown reflects an expense agreement between MetLife Advisers, LLC and the Portfolio as described under Expense Agreement in Note 4 to the Financial Statements.
(b) The annualized expense ratio reflects the expenses of both the Portfolio and the underlying Portfolios in which it invests.
MSF-4
Metropolitan Series Fund, Inc.
MetLife Moderate Allocation Portfolio
Schedule of Investments as of December 31, 2007
Mutual Funds—100.0%
| | | | | |
| Security Description | | Shares | | Value* |
| | | | | |
| |
Affiliated Investment Companies—100.0% | | | |
Met Investors Series Trust—BlackRock High Yield Portfolio, (Class A) | | 2,744,823 | | $ | 22,617,338 |
Met Investors Series Trust—BlackRock Large Cap Core Portfolio, (Class A) | | 4,234,803 | | | 47,175,703 |
Met Investors Series Trust—Dreman Small Cap Value Portfolio, (Class A) | | 4,950,321 | | | 67,175,861 |
Met Investors Series Trust—Harris Oakmark International Portfolio, (Class A) | | 7,918,887 | | | 136,759,176 |
Met Investors Series Trust—Lazard Mid-Cap Portfolio, (Class A) | | 7,297,891 | | | 88,815,337 |
Met Investors Series Trust—Legg Mason Value Equity Portfolio, (Class A) | | 8,608,838 | | | 90,392,802 |
Met Investors Series Trust—Lord Abbett Bond Debenture Portfolio, (Class A) | | 3,614,492 | | | 45,651,034 |
Met Investors Series Trust—Met/AIM Small Cap Growth Portfolio, (Class A) | | 3,067,174 | | | 45,578,208 |
Met Investors Series Trust—Neuberger Berman Real Estate Portfolio, (Class A) | | 1,564,032 | | | 22,021,566 |
Met Investors Series Trust—PIMCO Inflation Protected Bond Portfolio, (Class A) | | 2,098,809 | | | 23,002,951 |
Met Investors Series Trust—PIMCO Total Return Portfolio, (Class A) | | 39,502,717 | | | 485,488,394 |
Metropolitan Series Fund, Inc.—BlackRock Large Cap Value Portfolio, (Class A) | | 8,612,871 | | | 117,221,173 |
Metropolitan Series Fund, Inc.—Davis Venture Value Portfolio, (Class A) | | 4,443,725 | | | 161,929,352 |
Metropolitan Series Fund, Inc.—Julius Baer International Stock Portfolio, (Class A) | | 7,096,552 | | | 113,828,697 |
Metropolitan Series Fund, Inc.—FI Mid Cap Opportunities Portfolio, (Class A) | | 2,133,360 | | | 45,099,227 |
| | | | | | |
| Security Description | | Shares | | Value* | |
| | | | | | |
| |
Affiliated Investment Companies—(Continued) | | | | |
Metropolitan Series Fund, Inc.—Jennison Growth Portfolio, (Class A) | | 5,195,685 | | $ | 70,765,225 | |
Metropolitan Series Fund, Inc.—MetLife Stock Index Portfolio, (Class A) | | 2,509,050 | | | 92,834,865 | |
Metropolitan Series Fund, Inc.—Neuberger Berman Mid Cap Value Portfolio, (Class A) | | 6,685,247 | | | 142,128,356 | |
Metropolitan Series Fund, Inc.—Russell 2000 Index Portfolio, (Class A) | | 3,208,555 | | | 45,497,317 | |
Metropolitan Series Fund, Inc.—T. Rowe Price Large Cap Growth Portfolio, (Class A) | | 7,088,764 | | | 116,822,833 | |
Metropolitan Series Fund, Inc.—Western Asset Mgt. Strategic Bond Opportunities Portfolio, (Class A) | | 21,513,247 | | | 273,648,502 | |
Metropolitan Series Fund, Inc.—Western Asset Mgt. U.S. Government Portfolio, (Class A) | | 3,665,866 | | | 45,786,670 | |
| | | | | | |
Total Mutual Funds
(Identified Cost $2,272,528,813) | | | | | 2,300,240,587 | |
| | | | | | |
Total Investments—100.0%
(Identified Cost $2,272,528,813) (a) | | | | | 2,300,240,587 | |
Liabilities in excess of other assets | | | | | (692,146 | ) |
| | | | | | |
| Total Net Assets—100% | | | | $ | 2,299,548,441 | |
| | | | | | |
| (a) | The aggregate cost of investments for federal income tax purposes as of December 31, 2007 was $2,273,304,210 and the composition of unrealized appreciation and depreciation of investment securities was $51,355,465 and $(24,419,088), respectively. |
*See accompanying notes to financial statements.
MSF-5
Metropolitan Series Fund, Inc.
MetLife Moderate Allocation Portfolio
Statement of Assets & Liabilities
December 31, 2007
| | | | | | |
Assets | | | | | | |
Investments at value (a) | | | | | $ | 2,300,240,587 |
Receivable for: | | | | | | |
Fund shares sold | | | | | | 2,865,238 |
| | | | | | |
Total Assets | | | | | | 2,303,105,825 |
Liabilities | | | | | | |
Payable for: | | | | | | |
Securities purchased | | $ | 1,579,739 | | | |
Fund shares redeemed | | | 1,285,499 | | | |
Due to custodian bank | | | 12 | | | |
Accrued expenses: | | | | | | |
Management fees | | | 218,282 | | | |
Service and distribution fees | | | 442,934 | | | |
Other expenses | | | 30,918 | | | |
| | | | | | |
Total Liabilities | | | | | | 3,557,384 |
| | | | | | |
Net Assets | | | | | $ | 2,299,548,441 |
| | | | | | |
Net assets consists of: | | | | | | |
Capital paid in | | | | | $ | 2,224,640,337 |
Undistributed net investment income | | | | | | 18,365,862 |
Accumulated net realized gains | | | | | | 28,830,468 |
Unrealized appreciation on investments | | | | | | 27,711,774 |
| | | | | | |
Net Assets | | | | | $ | 2,299,548,441 |
| | | | | | |
| Computation of offering price: | | | | | | |
Class A | | | | | | |
Net asset value and redemption price per share ($171,934,162 divided by 14,325,693 shares outstanding) | | | | | $ | 12.00 |
| | | | | | |
Class B | | | | | | |
Net asset value and redemption price per share ($2,127,614,279 divided by 177,891,576 shares outstanding) | | | | | $ | 11.96 |
| | | | | | |
(a) Identified cost of investments | | | | | $ | 2,272,528,813 |
| | | | | | |
Statement of Operations
For the Year Ended December 31, 2007
| | | | | | | |
Investment Income | | | | | | | |
Dividends from Underlying Portfolios | | | | | $ | 18,279,739 | |
| | | | | | | |
Expenses | | | | | | | |
Management fees | | $ | 1,045,949 | | | | |
Deferred expense reimbursement | | | 90,595 | | | | |
Service and distribution fees—Class B | | | 3,055,786 | | | | |
Directors’ fees and expenses | | | 811 | | | | |
Custodian | | | 28,091 | | | | |
Audit and tax services | | | 18,574 | | | | |
Legal | | | 18,568 | | | | |
Miscellaneous | | | 10,206 | | | | |
| | | | | | | |
Total expenses | | | | | | 4,268,580 | |
| | | | | | | |
Net Investment Income | | | | | | 14,011,159 | |
| | | | | | | |
Realized and Unrealized Gain (Loss) | | | | | | | |
| Realized gain on: | | | | | | | |
Investments—net | | | 12,722,105 | | | | |
Capital gains distributions from Underlying Portfolios | | | 20,991,453 | | | 33,713,558 | |
| | | | | | | |
| Change in unrealized depreciation on: | | | | | | | |
Investments—net | | | | | | (8,525,018 | ) |
| | | | | | | |
Net gain | | | | | | 25,188,540 | |
| | | | | | | |
Net Increase in Net Assets From Operations | | | | | $ | 39,199,699 | |
| | | | | | | |
See accompanying notes to financial statements.
MSF-6
Metropolitan Series Fund, Inc.
MetLife Moderate Allocation Portfolio
Statements of Changes in Net Assets
| | | | | | | | |
| | | Year ended
December 31,
2007 | | | Year ended
December 31,
2006 | |
From Operations | | | | | | | | |
Net investment income | | $ | 14,011,159 | | | $ | 4,015,517 | |
Net realized gain | | | 33,713,558 | | | | 8,739,622 | |
Unrealized appreciation (depreciation) | | | (8,525,018 | ) | | | 35,943,069 | |
| | | | | | | | |
Increase in net assets from operations | | | 39,199,699 | | | | 48,698,208 | |
| | | | | | | | |
From Distributions to Shareholders | | | | | | | | |
Net investment income | | | | | | | | |
Class A | | | (269,562 | ) | | | (951,464 | ) |
Class B | | | (80,033 | ) | | | (3,927,962 | ) |
| | | | | | | | |
| | | (349,595 | ) | | | (4,879,426 | ) |
| | | | | | | | |
Net realized gain | | | | | | | | |
Class A | | | (186,620 | ) | | | (1,330,470 | ) |
Class B | | | (1,440,592 | ) | | | (5,656,937 | ) |
| | | | | | | | |
| | | (1,627,212 | ) | | | (6,987,407 | ) |
| | | | | | | | |
Total distributions | | | (1,976,807 | ) | | | (11,866,833 | ) |
| | | | | | | | |
Increase in net assets from capital share transactions | | | 1,521,410,561 | | | | 581,821,010 | |
| | | | | | | | |
Total increase in net assets | | | 1,558,633,453 | | | | 618,652,385 | |
| | |
Net Assets | | | | | | | | |
Beginning of the period | | | 740,914,988 | | | | 122,262,603 | |
| | | | | | | | |
End of the period | | $ | 2,299,548,441 | | | $ | 740,914,988 | |
| | | | | | | | |
Undistributed Net Investment Income | | | | | | | | |
End of the period | | $ | 18,365,862 | | | $ | 312,995 | |
| | | | | | | | |
Other Information:
Capital Shares
Transactions in capital shares were as follows:
| | | | | | | | | | | | | | |
| | | Year ended
December 31, 2007 | | | Year ended
December 31, 2006 | |
| | | Shares | | | $ | | | Shares | | | $ | |
Class A | | | | | | | | | | | | | | |
Sales | | 9,488,879 | | | $ | 113,112,140 | | | 7,552,833 | | | $ | 82,679,374 | |
Reinvestments | | 37,983 | | | | 456,182 | | | 211,879 | | | | 2,281,934 | |
Redemptions | | (3,027,315 | ) | | | (36,051,074 | ) | | (1,901,403 | ) | | | (20,819,359 | ) |
| | | | | | | | | | | | | | |
Net increase | | 6,499,547 | | | $ | 77,517,248 | | | 5,863,309 | | | $ | 64,141,949 | |
| | | | | | | | | | | | | | |
Class B | | | | | | | | | | | | | | |
Sales | | 132,914,022 | | | $ | 1,582,814,963 | | | 47,323,820 | | | $ | 518,077,257 | |
Shares issued through acquisition | | 0 | | | | 0 | | | 3,184,564 | | | | 34,361,445 | |
Reinvestments | | 126,824 | | | | 1,520,625 | | | 891,619 | | | | 9,584,899 | |
Redemptions | | (11,830,433 | ) | | | (140,442,275 | ) | | (4,061,903 | ) | | | (44,344,540 | ) |
| | | | | | | | | | | | | | |
Net increase | | 121,210,413 | | | $ | 1,443,893,313 | | | 47,338,100 | | | $ | 517,679,061 | |
| | | | | | | | | | | | | | |
Increase derived from capital share transactions | | | | | $ | 1,521,410,561 | | | | | | $ | 581,821,010 | |
| | | | | | | | | | | | | | |
See accompanying notes to financial statements.
MSF-7
Metropolitan Series Fund, Inc.
MetLife Moderate Allocation Portfolio
Financial Highlights
| | | | | | | | | | | | |
| | | Class A | |
| | | Year ended December 31, | |
| | | 2007 | | | 2006 | | | 2005(a) | |
Net Asset Value, Beginning of Period | | $ | 11.52 | | | $ | 10.82 | | | $ | 10.00 | |
| | | | | | | | | | | | |
Income From Investment Operations | | | | | | | | | | | | |
Net investment income | | | 0.17 | (b) | | | 0.24 | | | | 0.04 | |
Net realized and unrealized gain on investments | | | 0.36 | | | | 1.04 | | | | 0.83 | |
| | | | | | | | | | | | |
Total from investment operations | | | 0.53 | | | | 1.28 | | | | 0.87 | |
| | | | | | | | | | | | |
Less Distributions | | | | | | | | | | | | |
Distributions from net investment income | | | (0.03 | ) | | | (0.24 | ) | | | (0.05 | ) |
Distributions from net realized capital gains | | | (0.02 | ) | | | (0.34 | ) | | | 0.00 | |
| | | | | | | | | | | | |
Total distributions | | | (0.05 | ) | | | (0.58 | ) | | | (0.05 | ) |
| | | | | | | | | | | | |
Net Asset Value, End of Period | | $ | 12.00 | | | $ | 11.52 | | | $ | 10.82 | |
| | | | | | | | | | | | |
Total Return (%) | | | 4.5 | | | | 12.2 | | | | 8.7 | (c) |
Ratio of operating expenses to average net assets (%) (d) | | | 0.09 | | | | 0.10 | | | | 0.10 | (e) |
Ratio of operating expenses to average net assets without giving effect to the contractual expense agreement would have been (%) (h) | | | 0.09 | | | | 0.11 | | | | 0.29 | (e) |
Ratio of net investment income to average net assets (%) (f) | | | 1.44 | | | | 1.67 | | | | 1.57 | (e) |
Portfolio turnover rate (%) | | | 14 | | | | 19 | | | | 1 | (e) |
Net assets, end of period (000) | | $ | 171,934 | | | $ | 90,126 | | | $ | 21,245 | |
| | | | | | | | | | | | |
| | | Class B | |
| | | Year ended December 31, | |
| | | 2007 | | | 2006 | | | 2005(a) | |
Net Asset Value, Beginning of Period | | $ | 11.48 | | | $ | 10.81 | | | $ | 10.00 | |
| | | | | | | | | | | | |
Income From Investment Operations | | | | | | | | | | | | |
Net investment income | | | 0.12 | (b) | | | 0.22 | | | | 0.04 | |
Net realized and unrealized gain on investments | | | 0.38 | | | | 1.02 | | | | 0.81 | |
| | | | | | | | | | | | |
Total from investment operations | | | 0.50 | | | | 1.24 | | | | 0.85 | |
| | | | | | | | | | | | |
Less Distributions | | | | | | | | | | | | |
Distributions from net investment income | | | (0.00 | )(g) | | | (0.23 | ) | | | (0.04 | ) |
Distributions from net realized capital gains | | | (0.02 | ) | | | (0.34 | ) | | | 0.00 | |
| | | | | | | | | | | | |
Total distributions | | | (0.02 | ) | | | (0.57 | ) | | | (0.04 | ) |
| | | | | | | | | | | | |
Net Asset Value, End of Period | | $ | 11.96 | | | $ | 11.48 | | | $ | 10.81 | |
| | | | | | | | | | | | |
Total Return (%) | | | 4.4 | | | | 11.8 | | | | 8.5 | (c) |
Ratio of operating expenses to average net assets (%) (d) | | | 0.34 | | | | 0.35 | | | | 0.35 | (e) |
Ratio of operating expenses to average net assets without giving effect to the contractual expense agreement would have been (%) (h) | | | 0.34 | | | | 0.36 | | | | 0.54 | (e) |
Ratio of net investment income to average net assets (%) (f) | | | 0.98 | | | | 0.98 | | | | 1.45 | (e) |
Portfolio turnover rate (%) | | | 14 | | | | 19 | | | | 1 | (e) |
Net assets, end of period (000) | | $ | 2,127,614 | | | $ | 650,789 | | | $ | 101,018 | |
| (a) | Commencement of operations was May 2, 2005. |
| (b) | Per share amount is based on average shares outstanding during the period. |
| (c) | Periods less than one year are not computed on an annualized basis. |
| (d) | The ratio of operating expenses to average net assets does not include expenses of investment companies in which the Portfolio invests. |
| (e) | Computed on an annualized basis. |
| (f) | Recognition of net investment income by the Portfolio is affected by the timing of the declaration of dividends by the underlying Portfolios in which it invests. |
| (g) | Distributions for the period were less than $0.01. |
| (h) | See Note 4 in the Notes to Financial Statements. |
See accompanying notes to financial statements.
MSF-8
Metropolitan Series Fund, Inc.
MetLife Moderate Allocation Portfolio
Notes to Financial Statements—December 31, 2007
Metropolitan Series Fund, Inc. (the “Fund”) is organized as a corporation under the laws of Maryland pursuant to Articles of Incorporation filed on November 23, 1982, as amended, and registered under the Investment Company Act of 1940, as amended (the “1940 Act”), as an open-end investment company. The Fund is a “series” type of mutual fund, which issues separate series of stock. Each series represents an interest in a separate portfolio of Fund investments. The MetLife Moderate Allocation Portfolio (the “Asset Allocation Portfolio”) is a non-diversified series of the fund. The Asset Allocation Portfolio operates under a “fund of funds” structure, investing substantially all of its assets in other Portfolios advised by MetLife Advisers, LLC (“MetLife Advisers”) or its affiliates (each, an “Underlying Portfolio,” and, collectively, the “Underlying Portfolios”). Shares in the Fund are not offered directly to the general public and are currently available only to separate accounts established by Metropolitan Life Insurance Company (“MetLife”), New England Life Insurance Company, General American Life Insurance Company (“General American”), The MetLife Investors Group of Insurance Companies, MetLife Insurance Company of Connecticut and other affiliated insurance companies (collectively, the “Insurance Companies”), as an investment vehicle for variable life insurance, group annuity or variable annuity products, although not all Asset Allocation Portfolios are available to all such separate accounts. The Asset Allocation Portfolio’s shares may be divided into different classes. Currently, the classes being offered by the Asset Allocation Portfolio are named Class A and Class B. The classes of the Asset Allocation Portfolio’s shares are identical, except that certain additional charges (Rule 12b-1 fees) are made against Class B shares. Investment income, realized and unrealized capital gains and losses, the common expenses of the Asset Allocation Portfolio and certain Portfolio-level expense reductions, if any, are allocated on a pro rata basis to each class based on the relative net assets of each class to the total net assets of the Portfolio.
| 2. | SIGNIFICANT ACCOUNTING POLICIES: |
The preparation of financial statements in conformity with accounting principles generally accepted in the United States of America (“GAAP”) requires management to make estimates and assumptions that affect the reported amounts of assets and liabilities and disclosure of contingent assets and liabilities as of the date of the financial statements and the reported amounts of income and expenses during the reporting period. Actual results could differ from those estimates.
The following is a summary of significant accounting policies consistently followed by the Asset Allocation Portfolio in the preparation of its financial statements. The policies are in conformity with GAAP.
Investment Valuation:
The net asset value of the Asset Allocation Portfolio is calculated based on the net asset values of the Underlying Portfolios in which the Asset Allocation Portfolio invests. The Underlying Portfolios that are Series of the Fund will use fair value pricing in the circumstances and manner described below. For more information about the use of fair value pricing by the Underlying Portfolios that are Series of Met Investors Series Trust (“MIST”), please refer to the prospectus for such Underlying Portfolios.
The Underlying Portfolios that are series of the Fund are valued as follows:
Debt securities (other than short term obligations with a remaining maturity of sixty days or less) are valued on the basis of valuations furnished by independent pricing services selected by the relevant subadviser pursuant to authorization of the Board of Directors of the Fund (the “Board” or “Directors”). Short term obligations with a remaining maturity of sixty days or less are valued at amortized cost which approximates fair market value.
Equity securities traded on a national securities exchange or exchanges are valued at their last sale price on the principal trading market. Equity securities traded on the NASDAQ National Market System are valued at the NASDAQ Official Closing Price (the “NOCP”). The NOCP is the last sale price if it falls between the spread of the last reported bid and asked prices. If the last reported bid and asked prices are above the last reported sale price, the NOCP will be the last reported bid price. If the last reported bid and asked prices are below the last reported sale price, the NOCP will be the last reported asked price. Equity securities traded on a national securities exchange or exchanges or on the NASDAQ National Market System for which there is no reported sale during the day are valued at the last reported bid price. A security that is listed or traded on more than one exchange is valued at the quotation on the exchange determined to be the primary market for that security by the Board or its delegates. If no closing price is available, then such securities are valued by using the last reported bid price. Equity securities traded over-the-counter are valued at the last reported sales price.
MSF-9
Metropolitan Series Fund, Inc.
MetLife Moderate Allocation Portfolio
Notes to Financial Statements—December 31, 2007—(Continued)
If no current market value quotation is readily available or reliable for a portfolio security, fair value will be determined in accordance with procedures established by and under the general supervision of the Board. When an Underlying Portfolio uses fair value pricing, it may take into account any factors it deems appropriate. The value of securities used by the Fund to calculate its net asset value may differ from quoted or published prices for the same securities. Fair value pricing involves subjective judgments and the fair value determined for a security may be materially different than the value that could be realized upon the sale of that security.
The Underlying Portfolios expect to use fair value pricing for securities primarily traded on U.S. exchanges only under very limited circumstances. For example, the Underlying Portfolios may use fair value pricing if the exchange on which a security is traded closes early or trading in the security is suspended.
Securities traded primarily on an exchange outside of the United States which closes before the close of the New York Stock Exchange will be valued at the last sales price on that non-U.S. exchange. Securities traded primarily on an exchange outside of the United States for which there is no reported sale during the day are valued at the mean between the last reported bid and asked prices. However, because most foreign markets close well before the Underlying Portfolio values its securities (typically at 4 p.m. Eastern Time), the earlier close of these foreign markets gives rise to the possibility that significant events, including broad market moves, may have occurred after these foreign markets close but before the Underlying Portfolio values its securities. For example, foreign security values may be affected by activity that occurs after the close of foreign securities markets. To account for this, the Underlying Portfolio may frequently value many of its foreign equity securities using fair value prices based on third party vendor modeling tools.
Forward foreign currency exchange contracts are valued based on the mean between closing bid and asked prices of the forward currency contract rates in the London foreign exchange markets on a daily basis as provided by a reliable bank or dealer.
Options, whether on securities, indices, futures contracts, or otherwise, are valued at the last sales price available as of the close of business on the day of valuation or, if there is no such sale price available, at the mean between the bid and asked prices. Options on currencies are valued at the spot price each day.
The value of futures contracts will be the sum of the margin deposit plus or minus the difference between the value of the futures contract on each day the net asset value is calculated and the value on the date the futures contract originated, value being that established on a recognized commodity exchange, or by reference to other customary sources, with gain or loss being realized when the futures contract closes or expires.
Subject to the Board’s oversight, the Board has delegated day-to-day responsibility for valuing Underlying Portfolio assets to MetLife Advisers, LLC (“MetLife Advisers” or the “Adviser”) or the subadviser of the Underlying Portfolio, as applicable, who values such assets as described above and operates under procedures approved by the Board.
Investment Transactions and Related Investment Income:
Portfolio security transactions are recorded on the trade date. Dividend income is recorded on the ex-dividend date. Interest income is recorded on the accrual basis. Realized gains and losses on investments and unrealized appreciation and depreciation are determined on the identified cost basis, which is the same basis used for federal income tax purposes.
Federal Income Taxes:
It is the Fund’s policy to comply with the requirements of the Internal Revenue Code of 1986, as amended, and regulations thereunder, applicable to regulated investment companies and to distribute all of its taxable income to shareholders. Therefore, no federal income tax provision is required.
As of December 31, 2007, the Asset Allocation Portfolio had no capital loss carryovers.
The tax character of distributions paid for the periods ended December 31, 2007 and 2006 was as follows:
| | | | | | | | | | | | | | | | | | | | | |
Ordinary Income | | Long Term Gain | | Return of Capital | | Total |
2007 | | 2006 | | 2007 | | 2006 | | 2007 | | 2006 | | 2007 | | 2006 |
$1,253,602 | | $ | 6,186,071 | | $ | 723,205 | | $ | 5,680,762 | | $ | — | | $ | — | | $ | 1,976,807 | | $ | 11,866,833 |
MSF-10
Metropolitan Series Fund, Inc.
MetLife Moderate Allocation Portfolio
Notes to Financial Statements—December 31, 2007—(Continued)
As of December 31, 2007, the components of distributable earnings (accumulated losses) on a federal income tax basis were as follows:
| | | | | | | | | | | | |
Undistributed
Ordinary
Income | | Undistributed
Long Term
Gain | | Unrealized
Appreciation | | Loss
Carryforwards | | Total |
$22,883,196 | | $ | 25,088,531 | | $ | 26,936,377 | | $ | — | | $ | 74,908,104 |
Dividends and Distributions to Shareholders:
The Asset Allocation Portfolio records dividends and distributions on the ex-dividend date. Net realized gains from security transactions (if any) are generally distributed annually to shareholders. The timing and characterization of certain income and capital gains distributions are determined in accordance with federal tax regulations that may differ from GAAP. Permanent book and tax basis differences relating to shareholder distributions will result in reclassification between under/over distributed net investment income, accumulated net realized gains/losses and paid in capital.
| 3. | INVESTMENT TRANSACTIONS: |
For the year ended December 31, 2007, purchases and sales of Underlying portfolios by the Asset Allocation Portfolio were $1,744,473,972 and $189,570,734, respectively.
| 4. | INVESTMENT MANAGEMENT FEES AND OTHER TRANSACTIONS WITH AFFILIATES: |
Investment Management Agreement:
MetLife Advisers, LLC (“MetLife Advisers”) is the investment adviser to the Asset Allocation Portfolio. The Fund has entered into an investment management agreement with MetLife Advisers with respect to the Portfolio. For providing investment management services to the Portfolio, MetLife Advisers receives monthly compensation at the following annual rates:
| | | | | | | |
| | | Management
Fees earned by
MetLife Advisers
for the year ended
December 31, 2007 | | Annual
percentage
rates paid to
MetLife Advisers | | Based on Portfolios
average daily net asset levels |
| | $ | 1,045,949 | | 0.100% | | Of the first $500 million |
| | | | | 0.075% | | Of the next $500 million |
| | | | | 0.050% | | On amounts in excess of $1 billion |
In addition to the above Management Fee paid to MetLife Advisers, the Asset Allocation Portfolio indirectly pays MetLife Advisers an investment advisory fee through its investments in certain Underlying Portfolios.
Certain officers and directors of the Fund may also be officers of MetLife Advisers; however, such officers and directors receive no compensation from the Fund.
Service and Distribution Fees:
The Fund has adopted a Distribution and Service Plan under Rule 12b-1 of the 1940 Act for the Asset Allocation Portfolio’s Class B shares. Under the Distribution and Service Plan, the Class B shares of the Asset Allocation Portfolio pay a fee to compensate the Insurance Companies (or their affiliates) and other broker-dealers and financial intermediaries involved in the offer and sale of Asset Allocation Portfolio shares for promoting or selling and servicing, the Class B shares of the Asset Allocation Portfolio. The fees under the Distribution and Service Plan for each class of the Asset Allocation Portfolio’s shares are calculated as a percentage of the Asset Allocation Portfolio’s average daily net assets that are attributable to that Class. Currently, the fee is 0.25% per year for Class B shares. Amounts paid by the Asset Allocation Portfolio for the year ended December 31, 2007 are shown as Service and Distribution fees in the Statement of Operations.
Expense Agreement:
Pursuant to an expense agreement relating to each class of the Asset Allocation Portfolio, MetLife Advisers has agreed, from May 1, 2007 to April 30, 2008, to waive a portion of its advisory fees or pay a portion of the other operating expenses (not including
MSF-11
Metropolitan Series Fund, Inc.
MetLife Moderate Allocation Portfolio
Notes to Financial Statements—December 31, 2007—(Continued)
brokerage costs, interest, taxes, or extraordinary expenses) to the extent total operating expenses exceed stated annual expense limits (based on the Asset Allocation Portfolio’s then current fiscal year). For the Asset Allocation Portfolio, this subsidy, and similar subsidies in effect in earlier periods, are subject to the obligation of each class of the Asset Allocation Portfolio to repay MetLife Advisers in future years, if any, when a class’ expenses fall below the stated expense limit pertaining to that class that was in effect at the time of the subsidy in question. Such deferred expenses may be charged to a class in a subsequent year to the extent that the charge does not cause the total expenses in such subsequent year to exceed the class’ stated expense limit that was in effect at the time of the subsidy in question; provided, however, that no class of the Asset Allocation Portfolio is obligated to repay any expense paid by MetLife Advisers more than five years after the end of the fiscal year in which such expense was incurred.
The expense limits (annual rates as a percentage of each class of the Asset Allocation Portfolio’s net average daily net assets) in effect from May 1, 2007 to April 30, 2008 are 0.10% and 0.35% for Class A and B, respectively.
For the year ended December 31, 2007, MetLife Advisers recovered $90,595 in deferred expenses. As of December 31, 2007, there are no expenses deferred in prior years that are subject to repayment by the Portfolio.
As previously reported, in May 2004, General American received a Wells Notice stating that the SEC staff was considering recommending that the SEC bring a civil action alleging violations of the U.S. securities laws against General American with respect to market timing and late trading in a limited number of privately-placed variable insurance contracts that were sold through General American. General American responded to the SEC staff and cooperated with the investigation. On August 9, 2007, the SEC announced that it had settled an enforcement action regarding late trading against General American with, among other things, General American agreeing to pay a civil penalty and to comply with certain undertakings. General American consented to the SEC’s order without admitting or denying the findings. MetLife Advisers has also advised the Fund’s Board of Directors that, while certain exceptions to the Fund’s policies have been noted, no situations have been identified that would have a material impact on the financial position of the Fund.
| 6. | RECENT ACCOUNTING PRONOUNCEMENTS: |
Effective June 29, 2007, the Fund implemented Financial Accounting Standards Board (“FASB”) Interpretation No. 48, “Accounting for Uncertainty in Income Taxes—an interpretation of FASB Statement No. 109” (“FIN 48”). FIN 48 prescribes the minimum recognition threshold a tax position must meet in connection with accounting for uncertainties in income tax positions taken or expected to be taken by an entity, including investment companies, before being measured and recognized in the financial statements. Management has evaluated the application of FIN 48 to the Fund, and has determined that the adoption of FIN 48 does not have a material impact on the Fund’s financial statements. The Fund files U.S. tax returns. No income tax returns are currently under examination. The statute of limitations on the Fund’s tax returns remains open for the years ended December 31, 2004 through December 31, 2006.
In September 2006, Statement of Financial Accounting Standards No. 157, Fair Value Measurements (SFAS 157) was issued and is effective for fiscal years beginning after November 15, 2007. SFAS 157 defines fair value, establishes a framework for measuring fair value and expands disclosures about fair value measurements. Management is currently evaluating the impact the adoption of SFAS 157 will have on the Portfolio’s financial statement disclosures.
MSF-12
Metropolitan Series Fund, Inc.
MetLife Moderate Allocation Portfolio
Notes to Financial Statements—December 31, 2007—(Continued)
| 7. | TRANSACTIONS IN SECURITIES OF AFFILIATED ISSUERS: |
The Asset Allocation Portfolio does not invest in the Underlying Portfolios for the purpose of exercising management or control; however, investments by the Asset Allocation Portfolio within its principal investment strategies may represent a significant portion of the Underlying Portfolio’s net assets. Transactions in the Underlying Portfolios during the year ended December 31, 2007 in which the Asset Allocation Portfolio had ownership of at least 5% of the outstanding voting securities at the end of the period are as follows:
| | | | | | | | |
Underlying Portfolio (Class A) | | Beginning Shares
as of
12/30/2006 | | Shares
Purchased
during Period | | Shares Sold
during Period | | Ending Shares
as of
12/31/2007 |
MIST—BlackRock High Yield | | 0 | | 2,819,679 | | 74,856 | | 2,744,823 |
MIST—Dreman Small Cap Value | | 1,663,493 | | 3,358,390 | | 71,562 | | 4,950,321 |
MIST—Harris Oakmark International | | 2,397,795 | | 5,735,096 | | 214,004 | | 7,918,887 |
MIST—Lazard Mid-Cap | | 2,193,032 | | 5,272,506 | | 167,647 | | 7,297,891 |
MIST—Legg Mason Value Equity | | 2,699,572 | | 5,998,919 | | 89,653 | | 8,608,838 |
MIST—PIMCO Total Return | | 12,828,978 | | 28,545,913 | | 1,872,174 | | 39,502,717 |
MIST—Met/AIM Small Cap Growth | | 0 | | 3,114,766 | | 47,592 | | 3,067,174 |
MSF—BlackRock Large Cap Value | | 0 | | 8,664,426 | | 51,555 | | 8,612,871 |
MSF—Julius Baer International Stock | | 2,918,593 | | 5,170,786 | | 992,827 | | 7,096,552 |
MSF—Jennison Growth | | 1,749,512 | | 3,591,636 | | 145,463 | | 5,195,685 |
MSF—Neuberger Berman Mid Cap Value | | 2,151,607 | | 4,749,432 | | 215,792 | | 6,685,247 |
MSF—Russell 2000 Index | | 956,008 | | 2,295,217 | | 42,670 | | 3,208,555 |
MSF—T. Rowe Price Large Cap Growth | | 2,454,768 | | 4,775,074 | | 141,078 | | 7,088,764 |
MSF—Western Asset Mgmt. Strategic Bond Opportunities | | 6,906,272 | | 15,303,843 | | 696,868 | | 21,513,247 |
| | | | | | | | | | | | | |
Underlying Portfolio (Class A) | | Realized
Gain/(Loss)
during Period | | | Capital Gains
Distributions
during Period | | Dividend
Income during
Period | | Ending Value
as of
12/31/2007 |
MIST—BlackRock High Yield | | $ | (12,500 | ) | | $ | 0 | | $ | 0 | | $ | 22,617,338 |
MIST—Dreman Small Cap Value | | | 66,948 | | | | 157,930 | | | 0 | | | 67,175,861 |
MIST—Harris Oakmark International | | | 611,636 | | | | 5,116,674 | | | 596,322 | | | 136,759,176 |
MIST—Lazard Mid-Cap | | | (158,461 | ) | | | 3,759,320 | | | 274,300 | | | 88,815,337 |
MIST—Legg Mason Value Equity | | | 62,448 | | | | 47,392 | | | 1,405 | | | 90,392,802 |
MIST—PIMCO Total Return | | | 511,304 | | | | 0 | | | 7,945,174 | | | 485,488,394 |
MIST—Met/AIM Small Cap Growth | | | (3,490 | ) | | | 0 | | | 0 | | | 45,578,208 |
MSF—BlackRock Large Cap Value | | | (40,728 | ) | | | 0 | | | 0 | | | 117,221,173 |
MSF—Julius Baer International Stock | | | 2,247,052 | | | | 3,408,191 | | | 701,569 | | | 113,828,697 |
MSF—Jennison Growth | | | 61,035 | | | | 1,165,906 | | | 139,031 | | | 70,765,225 |
MSF—Neuberger Berman Mid Cap Value | | | 382,549 | | | | 1,892,682 | | | 351,661 | | | 142,128,356 |
MSF—Russell 2000 Index | | | 59,403 | | | | 1,571,364 | | | 192,012 | | | 45,497,317 |
MSF—T. Rowe Price Large Cap Growth | | | 286,564 | | | | 483,994 | | | 243,690 | | | 116,822,833 |
MSF—Western Asset Mgmt. Strategic Bond Opportunities | | | (51,709 | ) | | | 120,510 | | | 3,494,789 | | | 273,648,502 |
MSF-13
Metropolitan Series Fund, Inc.
MetLife Moderate Allocation Portfolio
Report of Independent Registered Public Accounting Firm
To the Shareholders and Board of Directors of the Metropolitan Series Fund, Inc.:
We have audited the accompanying statement of assets and liabilities, including the schedule of investments, of the MetLife Moderate Allocation Portfolio, one of the portfolios constituting the Metropolitan Series Fund, Inc. (the “Fund”) as of December 31, 2007, and the related statement of operations for the year then ended, the statements of changes in net assets for each of the two years in the period then ended, and the financial highlights for each of the two years ended December 31, 2007 and the period from May 2, 2005 (commencement of operations) through December 31, 2005. These financial statements and financial highlights are the responsibility of the Fund’s management. Our responsibility is to express an opinion on these financial statements and financial highlights based on our audits.
We conducted our audits in accordance with the standards of the Public Company Accounting Oversight Board (United States). Those standards require that we plan and perform the audit to obtain reasonable assurance about whether the financial statements and financial highlights are free of material misstatement. The Fund is not required to have, nor were we engaged to perform, an audit of its internal control over financial reporting. Our audits included consideration of internal control over financial reporting as a basis for designing audit procedures that are appropriate in the circumstances, but not for the purpose of expressing an opinion on the effectiveness of the Fund’s internal control over financial reporting. Accordingly, we express no such opinion. An audit also includes examining, on a test basis, evidence supporting the amounts and disclosures in the financial statements, assessing the accounting principles used and significant estimates made by management, as well as evaluating the overall financial statement presentation. Our procedures included confirmation of securities owned as of December 31, 2007, by correspondence with the custodian and transfer agent. We believe that our audits provide a reasonable basis for our opinion.
In our opinion, the financial statements and financial highlights referred to above present fairly, in all material respects, the financial position of the MetLife Moderate Allocation Portfolio of the Metropolitan Series Fund, Inc. as of December 31, 2007, the results of its operations for the year then ended, the changes in its net assets for each of the two years in the period then ended, and the financial highlights for each of the two years ended December 31, 2007 and the period from May 2, 2005 (commencement of operations) through December 31, 2005, in conformity with accounting principles generally accepted in the United States of America.
Deloitte & Touche LLP
Boston, Massachusetts
February 21, 2008
MSF-14
Metropolitan Series Fund, Inc.
Directors and Officers
The Fund’s Directors review actions of the Fund’s investment adviser and subadvisers, and decide upon matters of general policy. The Fund’s officers supervise the daily business operations of the Fund. The Board of Directors and the Fund’s officers are listed below. Each Director is responsible for overseeing all 36 Portfolios of the Fund. There is no limit to the term a Director may serve. Directors serve until their resignation, retirement or removal in accordance with the Fund’s organizational documents and policies adopted by the Board from time to time. Officers hold office at the pleasure of the Board or until the election or appointment and the qualification of a successor. The address of the directors and officers is c/o Metropolitan Series Fund, Inc., 501 Boylston Street, Boston, MA 02116.
Interested Directors(1)
Each Director below is an “interested person” (as defined by the 1940 Act) with respect to the Fund in that Ms. Forget is an employee of MetLife and Mr. Typermass is a former employee of MetLife and owns securities issued by MetLife, Inc., the ultimate parent company of MetLife Advisers.
| | | | | | | | |
Name, Address and Age | | Current
position(s)
with Fund | | Position(s)
held since | | Principal occupations
over past five years, including other directorships(2) | | Number of
Portfolios in
Fund Complex
Overseen by
Director(3) |
Elizabeth M. Forget Age: 41 | | Director, Chairman of the Board, President and Chief Executive Officer | | 2006 | | Senior Vice President (since 2007), MetLife, Inc.; President, Met Investors Advisory, LLC (“MIA”); Trustee and President, Met Investors Series Trust (“MIST”); Executive Vice President, MetLife Investors Group, Inc.; President (since 2006), MetLife Advisers. | | 81 |
| | | | |
Arthur G. Typermass Age: 70 | | Director | | 1998 | | Formerly, Senior Vice President and Treasurer, MetLife. | | 37 |
Non-Interested Directors(1)
Each Director below is not an “interested person” (as defined by the 1940 Act) with respect to the Fund (collectively, the “Independent Directors”).
| | | | | | | | |
Name, Address and Age | | Current
position(s)
with Fund | | Position(s)
held since | | Principal occupations
over past five years, including other directorships(2) | | Number of
Portfolios in
Fund Complex
Overseen by
Director(3) |
Steve A. Garban† Age: 70 | | Director | | 1985 | | Formerly, Chief Financial Officer, Senior Vice President Finance and Operations and Treasurer (Emeritus), The Pennsylvania State University. | | 37 |
| | | | |
Linda B. Strumpf Age: 60 | | Director | | 2000 | | Vice President and Chief Investment Officer, Ford Foundation. | | 37 |
| | | | |
Michael S. Scott Morton† Age: 70 | | Director | | 1993 | | Jay W. Forrester Professor of Management (Emeritus) at Sloan School of Management, MIT. | | 37 |
| | | | |
H. Jesse Arnelle Age: 74 | | Director | | 2001 | | Formerly, Counsel, Womble Carlyle Sandrie & Rice; Director, Textron Inc. (global multi-industry company)*; formerly, Director, Gannet Co. Inc. (diversified news and information company)*; formerly, Director, Eastman Chemical Company (global chemical company)*; formerly, Director, Waste Management, Inc.*; formerly, Director, Armstrong Holdings Inc. (parent company of floor and ceiling products business)*; formerly, Director, FPL Group Inc. (public utility holding company)*; Director, URS Corporation (engineering design services firm)*. | | 37 |
| | | | |
Nancy Hawthorne Age: 56 | | Director | | 2003 | | Director, Avid Technologies (computer software company)*; formerly, Chairman of the Board of Avid Technologies; formerly, Board of Advisors, L. Knife & Sons, Inc. (beverage distributor); Chief Executive Officer, Clerestory LLC (corporate financial advisor); formerly, Trustee, New England Zenith Fund (“Zenith Fund”)**; formerly, Chief Executive Officer and Managing Partner, Hawthorne, Krauss and Associates (corporate financial advisor); formerly, Chief Financial Officer and Executive Vice President, Continental Cablevision, subsequently renamed MediaOne (cable television company); formerly, Director, Life F/X, Inc.; formerly, Chairman of the Board, WorldClinic (distance medicine company); formerly, Director, Perini Corporation (construction company)*; formerly, Director, CGU (property and casualty insurance company); formerly, Director, Beacon Power Corporation (energy company )*. | | 37 |
MSF-15
Metropolitan Series Fund, Inc.
Directors and Officers—(Continued)
| | | | | | | | |
Name, Address and Age | | Current
position(s)
with Fund | | Position(s)
held since | | Principal occupations
over past five years, including other directorships(2) | | Number of
Portfolios in
Fund Complex
Overseen by
Director(3) |
John T. Ludes Age: 71 | | Director | | 2003 | | President, LFP Properties (consulting firm); Formerly, Trustee, Zenith Fund**; formerly, Vice Chairman, President and Chief Operating Officer, Fortune Brands/American Brands (global conglomerate); formerly, President and CEO, Acushnet Company (athletic equipment company). | | 37 |
Officers(1)
| | | | | | | | |
Name and address | | Age | | Current
position(s)
with Fund | | Position(s)
held since | | Principal occupations over past five years(2) |
| Jeffrey P. Halperin | | 40 | | Chief Compliance Officer | | 2006 | | Vice President (since 2006), Corporate Ethics and Compliance Department, MetLife, Inc.; Chief Compliance Officer (since 2006), MetLife Advisers, MIA and MIST. |
| | | | |
| John F. Guthrie, Jr. | | 64 | | Senior Vice President | | 2002 | | Manager and Senior Vice President, MetLife Advisers; Vice President, MetLife; Vice President (since 2003), MetLife Group, Inc.; Vice President, NELICO; Vice President (since 2005), MIA; formerly, Senior Vice President, Zenith Fund**. |
| | | | |
| Alan C. Leland | | 55 | | Senior Vice President | | 2005 | | Treasurer and Chief Financial Officer, MetLife Advisers, LLC; Treasurer (since 2005), Met Investors Advisory, LLC; Vice President (since 2004), MIA; Vice President (since 2003), MetLife Group, Inc.; Vice President, MetLife; Senior Vice President, NELICO |
| | | | |
| Peter Duffy | | 52 | | Vice President and Treasurer | | 2000 | | Senior Vice President, MetLife Advisers (since 1998); Second Vice President (since 2003), NELICO; Vice President, MetLife (since 2004); Vice President (since 2004), MetLife Group, Inc.; formerly, Vice President and Treasurer, Zenith Fund**. |
| | | | |
| Thomas M. Lenz | | 49 | | Vice President and Secretary | | 2002 | | General Counsel and Secretary, MetLife Advisers; Assistant General Counsel, MetLife; formerly, Vice President and Secretary, Zenith Fund**. |
| * | Indicates a directorship with a registered investment company or a company subject to the reporting requirements of the Securities Exchange Act of 1934, as amended. |
| ** | The Zenith Fund deregistered with the Securities and Exchange Commission (“SEC”) in 2004. |
| (†) | Served as a trustee, director and/or officer of one or more of the following companies, each of which had a direct or indirect advisory relationship with MetLife Advisers or its affiliates prior to January 31, 2005: State Street Research Financial Trust, State Street Research Income Trust, State Street Research Money Market Trust, State Street Research Institutional Funds, State Street Research Capital Trust, State Street Research Master Investment Trust, State Street Research Equity Trust, State Street Research Securities Trust and State Street Research Exchange Trust (collectively, the “State Street Research Funds”). |
| (1) | Each Director of the Fund also serves as trustee of Metropolitan Series Fund II (“Met Series Fund II”), a registered investment company advised by MetLife Advisers. Each officer of the Fund serves in the same position with Met Series Fund II, which consists of one portfolio. |
| (2) | Previous positions during the past five years with the Fund, MIST, MetLife, MetLife Advisers, MIA, Zenith Fund, NELICO or New England Securities Corporation are omitted if not materially different. |
| (3) | The Fund Complex includes the Fund (36 portfolios), Met Series Fund II (1 portfolio) and MIST (44 portfolios) |
MSF-16
Metropolitan Series Fund, Inc.
MetLife Moderate Allocation Portfolio
Board Approval of Advisory and Subadvisory Agreements
The Fund’s Contract Review Committees of the Board of Directors (the “Board”) typically meet in early fall to review the Portfolios’ advisory agreements (the “Advisory Agreements”) and subadvisory agreements (collectively, the “Subadvisory Agreements,” and, together with the Advisory Agreements, the “Agreements”) and determine whether to recommend that the full Board approve the continuation of the Agreements for an additional one-year period. (Following the initial approval of an Agreement for a new Portfolio or with a new adviser or subadviser, such annual reviews are not required until 2 years following the execution of such Agreement.) After each Committee has made its recommendations, the full Board, including the Independent Directors, determines whether to approve the continuation of each of the Agreements. In addition, the Board, including the Independent Directors, considers matters bearing on the Agreements at most of its other meetings throughout the year and regularly interviews various individuals at MetLife Advisers responsible for the management of the Portfolios. The Directors also interview selected investment managers and other professionals at the subadvisers at various times throughout the year.
The Directors receive all materials that they or MetLife Advisers, the Fund’s investment adviser, and the subadvisers believe to be reasonably necessary for the Directors to evaluate the Agreements and determine whether to approve the continuation of the Agreements. These materials generally include, among other items, (i) information on the investment performance of the Portfolios and the performance of peer groups of funds and the Portfolios’ performance benchmarks, (ii) information on the Portfolios’ advisory and subadvisory fees and other expenses, including information comparing the Portfolios’ expenses to those of peer groups of funds and information about any applicable expense caps and fee “breakpoints,” (iii) sales and redemption data, (iv) information related to the profitability of the Agreements to MetLife Advisers and the subadvisers, and potential “fall-out” or ancillary benefits that MetLife Advisers, the subadvisers or their affiliates may receive as a result of their relationships with the Fund and (v) information obtained through the subadvisers’ responses to certain requests from MetLife Advisers and the Directors and MetLife Advisers’ responses to requests from the Directors. The Directors may also consider other information such as (vi) MetLife Advisers’ and the subadvisers’ financial results and condition, (vii) each Portfolio’s investment objectives and strategies and the size, education and experience of the investment staffs of MetLife Advisers and the relevant subadvisers and their use of technology and external research, (viii) the allocation of the Portfolios’ brokerage, if any, including allocations to brokers affiliated with the subadvisers and the use of “soft” commission dollars to pay Portfolio expenses and to pay for research and other similar services, (ix) the resources devoted to, and the record of compliance with, the Portfolios’ investment policies and restrictions, policies on personal securities transactions and other compliance policies, (x) the responses of MetLife Advisers, the subadvisers and/or their affiliates to certain legal and regulatory proceedings and (xi) the economic outlook generally and for the mutual fund industry in particular. Throughout the process, the Directors have the opportunity to ask questions of and request additional materials from MetLife Advisers and the subadvisers.
Following meetings of each Contract Review Committee on September 12, 2007, the Board, at its November 15, 2007 meeting, approved the continuation through December 31, 2008 of the Advisory Agreements for each Portfolio of the Fund and the Subadvisory Agreements for each Portfolio of the Fund. The Agreements approved for continuation are referred to below as the “Continued Agreements.”
In considering whether to approve the continuation of the Continued Agreements, the Directors, including the Independent Directors, did not identify any single factor as determinative, and each weighed the various factors as he or she deemed appropriate. The Directors considered the following matters in connection with their approval of the Continued Agreements:
The nature, extent and quality of the services provided to the relevant Portfolios under the Continued Agreements. The Directors considered the nature, extent and quality of the services provided by MetLife Advisers, the relevant subadvisers (if any) and their affiliates (each, an “Adviser,” and, collectively, the “Advisers”) to the relevant Portfolios pursuant to the Continued Agreements and the resources dedicated to these Portfolios by the Advisers. In particular, the Directors considered the Advisers’ abilities to attract and retain highly qualified investment professionals. With respect to MetLife Advisers, the Directors considered (for each Portfolio other than Zenith Equity and the Asset Allocation Portfolios) that MetLife Advisers is (i) ultimately responsible for the performance of such Portfolios; (ii) ultimately responsible for the establishment of the investment strategies of each such Portfolio, primarily through its recommendations to the Board regarding the hiring and selection of subadvisers; (iii) responsible for the hiring and selection, subject to Board approval, of subadvisers; and (iv) responsible for maintaining a program of Subadviser oversight reasonably designed to ensure that the subadvisers have reasonable compliance policies and procedures in place. The Directors also considered that MetLife Advisers provides a full range of day-to-day administrative services for the Portfolios involving all aspects of such Portfolios’ day-to-day operations (other than portfolio management). With respect to Zenith Equity and the Asset Allocation Portfolios, the Directors considered both the portfolio management services and the administrative services provided by MetLife Advisers. After reviewing these and related factors, the Directors concluded, within the context of their overall conclusions regarding each of the Continued Agreements, that the nature, extent and quality of services provided supported the renewal of these Agreements.
MSF-17
Metropolitan Series Fund, Inc.
MetLife Moderate Allocation Portfolio
Board Approval of Advisory and Subadvisory Agreements—(Continued)
Investment performance of the relevant Portfolios. The Directors reviewed information about the performance of the relevant Portfolios over various time periods, including information prepared by an independent third party that compared the performance of the Portfolios to the performance of peer groups of funds and performance benchmarks. The Directors also reviewed a description of the third party’s methodology for identifying a Portfolio’s peer group(s) for purposes of performance and expense comparisons.
In the case of each relevant Portfolio that had performance that lagged its peer group(s) for certain periods, the Directors concluded that other factors relevant to performance were sufficient, in light of other considerations, to warrant renewal of the Continued Agreements relating to such Portfolio. These factors varied from Portfolio to Portfolio, but included one or more of the following: (i) that such Portfolio’s performance, although lagging in certain recent periods, was stronger over the longer term; (ii) that the underperformance was attributable, to a significant extent, to investment decisions that were reasonable and consistent with the Portfolio’s investment objective(s) and policies and that the Portfolio was performing within the range of reasonable expectations, given market conditions and the Portfolio’s investment objective(s) and policies; (iii) that the Portfolio’s performance was competitive when compared to other relevant performance benchmarks or peer groups; and (iv) that MetLife Advisers and/or the relevant subadviser (if any) had taken or was taking steps designed to help improve the Portfolio’s investment performance.
The Directors also considered the investment performance of the Advisers and their reputations generally, the historical responsiveness of the Advisers to Director concerns about performance and the willingness of the Advisers to take steps intended to improve performance.
After reviewing these and related factors, the Directors concluded, within the context of their overall conclusions regarding each of the Continued Agreements, that the investment performance of each relevant Portfolio and Adviser was sufficient, in light of other considerations, to warrant the renewal of the Continued Agreements.
The costs of the services to be provided and profits to be realized by the Advisers and their affiliates from their relationships with the Portfolios. The Directors considered the fees charged by MetLife Advisers to the Portfolios for advisory services and, with respect to the subadvised Portfolios, by such subadvisers to MetLife Advisers for subadvisory services (such advisory and subadvisory fees (if any), collectively, “Fees”), as well as the total expense levels of the Portfolios. This information included comparisons (provided by an independent third party) of the Portfolios’ advisory fees and total expense levels to those of their peer groups. In evaluating Fees for the relevant Portfolios, the Directors also took into account the demands, complexity and quality of the investment management services provided to each Portfolio. The Directors considered MetLife Advisers’ recommendations regarding reductions in Fee rates, implementation of Fee breakpoints and institution of Fee waivers and expense caps.
The Directors also considered the compensation directly or indirectly received by the Advisers and their affiliates from their relationships with the relevant Portfolios. The Directors reviewed information relating to the profits received by MetLife Advisers, certain of the subadvisers and their affiliates as a result of their relationships with the relevant Portfolios, and information about the allocation of expenses used to calculate profitability. When reviewing profitability, the Directors also considered the performance of the relevant Portfolios, the expense levels of such Portfolios and whether the relevant Advisers had implemented breakpoints, fee waivers and/or expense caps with respect to such Portfolios.
After reviewing these and related factors, the Directors concluded, within the context of their overall conclusions regarding each of the Continued Agreements, that the Fees charged to each of the relevant Portfolios were fair and reasonable, and that the information provided regarding costs of these services generally, and the related profitability (if known) to the relevant Advisers of their relationships with the relevant Portfolios, supported the renewal of the Continued Agreements.
Economies of Scale. The Directors considered the existence of any economies of scale in the provision of services by the Advisers and whether those economies were shared with the relevant Portfolios through breakpoints in their advisory fees or other means, such as expense caps, fee waivers or relatively low levels of fees. The Directors noted that most of the relevant Portfolios benefited or will benefit from breakpoints, expense caps and/or fee waivers with respect to their advisory fees. In considering these issues, the Directors also took into consideration information relating to the costs of the services provided and the profitability to MetLife Advisers, the relevant subadvisers (if any) and each of their affiliates of their relationships with the relevant Portfolios, as discussed above.
After reviewing these and related factors, the Directors concluded, within the context of their overall conclusions regarding each of the Continued Agreements, that the extent to which economies of scale were shared with the relevant Portfolios supported the renewal of such Agreements.
MSF-18
Metropolitan Series Fund, Inc.
MetLife Moderate Allocation Portfolio
Board Approval of Advisory and Subadvisory Agreements—(Continued)
Other Factors. The Directors also considered other factors, which included but were not limited to the following:
| | • | | the extent to which each relevant Portfolio operated in accordance with its investment objective, and its record of compliance with its investment restrictions and the compliance programs of the Fund and the Advisers. They also considered the compliance-related resources the Advisers and their affiliates provide to the relevant Portfolios; |
| | • | | the nature, quality, cost and extent of administrative and shareholder services performed by MetLife Advisers and its affiliates under the Advisory Agreements; and |
| | • | | so-called “fall-out benefits” to the Advisers, such as the engagement of their affiliates to provide distribution, brokerage and transfer agency services to the Portfolios, and the benefits of research made available to the relevant Advisers by reason of brokerage commissions generated by the relevant Portfolios’ securities transactions. The Directors also considered the possible conflicts of interest associated with these fall-out and other benefits, and the reporting and other processes in place to disclose and monitor these possible conflicts of interest. |
Based on their evaluation of all factors that they deemed to be material, including those factors described above, and assisted by the advice of independent counsel, the Directors, including the Independent Directors, concluded that each of the Continued Agreements should be continued through December 31, 2008.
Certain Matters Relating to Julius Baer International Stock Portfolio (formerly known as the FI International Stock Portfolio) (the “International Stock Portfolio”). At the November 15, 2007 Board meeting, the Board approved a change of subadviser for the International Stock Portfolio from Fidelity Management & Research Company (“FMR”) to Julius Baer Investment Management LLC (“Julius Baer”).
In making the determination to approve the change in subadviser for the International Stock Portfolio, the Board carefully considered those factors described above with respect to the continuation of the Continued Agreements, as relevant to both the existing Subadvisory Agreement with FMR and the proposed Subadvisory Agreement with Julius Baer. In addition to these factors, the Board also considered as relevant:
| | • | | the experience, investment style and investment performance history of Julius Baer as portfolio manager; |
| | • | | that the form of the proposed Subadvisory Agreement with Julius Baer was substantially similar to the International Stock Portfolio’s existing Subadvisory Agreement with FMR; |
| | • | | that the subadvisory fee schedule for Julius Baer set forth in the proposed Subadvisory Agreement was lower than the fee schedule in the existing Subadvisory Agreement and that MetLife Advisers had agreed to reduce its advisory fee, through a contractual fee waiver, by an amount corresponding to such savings; |
| | • | | the expected transition costs of the change of subadviser; and |
| | • | | that the preferred date of the change of subadviser was January 7, 2008 and the desirability, in order to facilitate an orderly transition of subadvising functions, of extending the existing Subadvisory Agreement with FMR from its scheduled expiration date of December 31, 2007 until January 7, 2008. |
Following such consideration, and assisted by the advice of independent counsel, the Directors, including the Independent Directors, unanimously voted to approve the continuation of the existing Subadvisory Agreement relating to the International Stock Portfolio through January 7, 2008 and to approve the proposed Subadvisory Agreement relating to such Portfolio with Julius Baer, effective January 7, 2008 through January 6, 2010.
MSF-19
A description of the policies and procedures that the Fund uses to determine how to vote proxies relating to portfolio securities is available (i) without charge, upon request, by calling (800) 638-7732 and (ii) on the Securities and Exchange Commission’s (the “SEC”) website at http://www.sec.gov.
Information regarding how the Fund voted proxies relating to portfolio securities during the most recent twelve-month period ended December 31, 2007 is available (i) without charge, upon request, by calling (800) 638-7732 and (ii) on the SEC’s website at http://www.sec.gov.
The Fund files with the SEC a complete schedule of its portfolio holdings, as of the close of the first and third quarters of its fiscal year, on “Form N-Q”. These filings are available on the SEC’s website at www.sec.gov and may be reviewed and copied at the SEC’s Public Reference Room in Washington, DC. (Call 1-800-SEC-0330 for information on the operation of the Public Reference Room.)
MSF-20
| | |
Metropolitan Series Fund, Inc. MetLife Moderate to Aggressive Allocation Portfolio Annual Report | | December 31, 2007 |
Letter from the President
February 1, 2008
Letter to Policy Holders:
2007 was a tumultuous year in the financial markets driven by concerns in the credit markets surrounding sub-prime mortgages and fears of recession in the U.S. Economy. The broad markets were mixed, with the Dow Jones Industrial Average up 8.9% and the MSCI EAFE Index, which measures the performance of international equities, up 11.2% for the year, while the Russell 2000 Index, which measures the performance of small capitalization stocks, was down 1.6%.
In the fixed income markets, credit spreads increased as a result of the pressure from sub-prime mortgage crisis and the Federal Reserve lowered interest rates by a total of 1% during the year. The Lehman Brothers Aggregate Bond Index posted a 7.0% return for the year.
On the following pages, you will find a complete review of your Portfolio and its investment performance.
MetLife is committed to building your financial freedom. We appreciate your trust and will continue to focus our efforts on meeting your investment needs.
Sincerely,
Elizabeth Forget
President, Metropolitan Series Fund, Inc.
Metropolitan Series Fund, Inc.
MetLife Moderate to Aggressive Allocation Portfolio
Managed by MetLife Advisers, LLC
Portfolio Manager Commentary*
PORTFOLIO PERFORMANCE
For the year ended December 31, 2007, the Class A shares of the MetLife Moderate to Aggressive Allocation Portfolio returned 4.1% compared to the 5.7% return of the Wilshire 5000 Index1 and the 6.5% return of the Lehman Brothers U.S. Universal Bond Index2. Considering that no single index or benchmark can accurately capture the multiple asset class design of the Portfolio, we have created a blended benchmark comprised of several indices for use in portfolio design and evaluation purposes. Specifically, the blended benchmark for the MetLife Moderate to Aggressive Allocation Portfolio consists of a 4% allocation to the Lehman Brothers 1 to 3 Year Government Bond Index3, a 16% allocation to the Lehman Brothers U.S. Universal Bond Index, a 64% allocation to the Wilshire 5000 Index, and a 16% allocation to the Morgan Stanley Capital International EAFE Index4. During the twelve-month period ended December 31, 2007, the blended benchmark returned 6.9%.
PORTFOLIO REVIEW
Concerns about subprime mortgages and the strength of the overall economy initially surfaced in the first half of 2007, but they were mostly brushed off. It was not until the second half of the year that those concerns intensified. Most economic statistics at the end of 2007 indicated a weakening economy: a sharp decrease in New and Existing Home Sales, a drop in Consumer Confidence, a rise in the Unemployment Rate, and a decline in the Purchasing Managers Index.
During 2007, large cap stocks, as measured by the Standard & Poor’s 500 Index5 return of 5.5%, did better than small cap stocks, as measured by the -1.6% return of the Russell 2000 Index6. Growth style stocks generally held up better than value style stocks. There was a wide dispersion among the various sectors of the S&P 500 Index: Energy and Materials were up 34% and 22% respectively, while Financials (-19%) and Consumer Discretionary (-13%) were down sharply. On a local basis, foreign stocks were also up modestly for the year, but U.S. based investors benefited from a weak dollar to receive an 11.2% return as measured by the MSCI EAFE Index4.
Investment grade bonds, as measured by the Lehman Brothers Aggregate Bond Index7, posted a 7.0% return in response to a decline in interest rates across the yield curve. Below investment grade bonds, while still eking out a positive return for the year, were adversely impacted by credit concerns brought about by the subprime mortgage crisis. Treasuries and Treasury Inflation Protected Securities (TIPS) were the best performing investment grade sectors, while the credit based sectors lagged.
The MetLife Moderate to Aggressive Allocation Portfolio is a “fund of funds” that invests in other Portfolios of the Metropolitan Series Fund, Inc. and the Met Investors Series Trust. The Portfolio’s initial target allocations were 80% in equity investments and 20% in fixed income investments. The MetLife Moderate to Aggressive Allocation Portfolio is considered the second most aggressive of the five Asset Allocation Portfolios as measured by it potential risk.
The only change in the Portfolio during the period was a slight adjustment for the underlying Portfolios as of May 1, 2007. We also rebalanced the Portfolio on a quarterly basis to bring it back into line with the underlying Portfolio targets and the desired risk level.
Collectively, the performance of the underlying fixed income Portfolios essentially matched that of the Lehman Brothers U.S. Universal Bond Index. The PIMCO Total Return Portfolio and the PIMCO Inflation Protected Bond Portfolio beat the Index, but this good performance was offset by the Western Asset Strategic Bond Opportunities and Western Asset U.S. Government Portfolios, which lagged the Index due to exposure to holdings of spread product, which includes mortgage backed securities and corporate bonds.
The largest source of underperformance over the past year was poor security selection within several of the underlying equity Portfolios. This impact was intensified by the large (80%) weighting to equities in general. These Portfolios did not perform as well as we would have expected given their asset allocation among the segments of the capital markets. Detracting the most from performance were the Harris Oakmark International Portfolio, which was down 1% for the year compared to an 11% return of foreign stocks overall, as measured by the MSCI EAFE Index, and the Legg Mason Value Equity Portfolio, which fell nearly 6% compared to the 5.5% return of the S&P 500 Index. Although its position was relatively small (2%) and its performance was in line with the real estate indices, the Neuberger Berman Real Estate Portfolio was down sharply for the year (-14.8%) relative to the broad equity market. This had an adverse impact on the Portfolio’s performance.
Among the underlying Portfolios that had positive security selection and added to relative performance were the Met/AIM Small Cap Growth Portfolio, the Jennison Growth Portfolio, the PIMCO Total Return Portfolio, and the T. Rowe Price Large Cap Growth Portfolio. Among the equity funds, growth oriented funds like these performed better than the broad equity market and added relative value to the Portfolio’s performance.
* The views expressed above are those of the advisory firm as of December 31, 2007 and are subject to change based on market and other conditions. Information about the Portfolio’s holdings, asset allocation, industry allocation, or country diversification is historical and is not an indication of future Portfolio composition, which will vary. The performance of any index mentioned in this commentary has not been adjusted for ongoing management, distribution and operating expenses, and sales charges applicable to mutual fund investments. Direct investment in the Index is not possible.
1 The Wilshire 5000 Index measures the performance of all U.S. headquartered equity securities with readily available price data.
2 The Lehman Brothers U.S. Universal Bond Index represents the union of the U.S. Aggregate Index, the U.S. High-Yield Corporate Index, the 144A Index, the Eurodollar Index, the Emerging Markets Index, the non-EIRSA portion of the Commercial Mortgage Backed Securities Index and the Commercial Mortgage Backed Securities High Yield Index.
3 The Lehman Brothers 1 to 3 Year Government Bond Index includes most obligations of the U.S Treasury, agencies and quasi-federal corporations having maturities between one to three years.
4 The Morgan Stanley Capital International Europe, Australasia and Far East Index (“MSCI EAFE Index”) is an unmanaged free float-adjusted market capitalization index that is designed to measure developed market equity performance, excluding the U.S. & Canada.
5 The Standard & Poor’s (S&P) 500® Stock Index is an unmanaged index representing the performance of 500 major companies, most of which are listed on the New York Stock Exchange.
6 The Russell 2000® Index is an unmanaged measure of performance of the 2,000 smallest companies in the Russell 3000® Index.
7 Lehman Brothers® Aggregate Bond Index includes most obligations of the U.S. Treasury, agencies and quasi-federal corporations, most publicly issued investment grade corporate bonds and most bonds backed by mortgage pools of GNMA, FNMA and FHLMC.
MSF-2
Metropolitan Series Fund, Inc.
MetLife Moderate to Aggressive Allocation Portfolio
A $10,000 INVESTMENT COMPARED TO
THE WILSHIRE 5000 STOCK INDEX AND THE LEHMAN BROTHERS
UNIVERSAL BOND INDEX
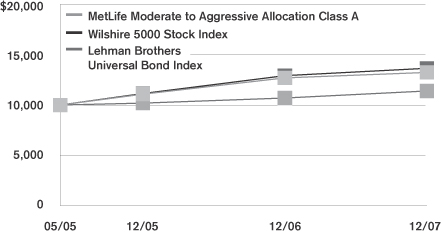
Average Annual Returns as of December 31, 2007
| | | | | | | | | | | | |
| | | MetLife Moderate
to Aggressive
Allocation Portfolio | | | Wilshire 5000
Stock Index | | | Lehman Brothers
Universal Bond Index | |
| | | Class A | | | Class B | | | |
| 1 Year | | 4.1 | % | | 3.9 | % | | 5.7 | % | | 6.5 | % |
| Since Inception | | 11.1 | | | 10.8 | | | 12.4 | | | 5.1 | |
Performance numbers are net of all Portfolio expenses but do not include any insurance, sales, or administrative charges of variable annuity or life insurance contracts. If these charges were included, the returns would be lower.
Inception date of the Class A and Class B shares is 5/2/05. Index since inception return is based on the Portfolio’s inception date.
This information represents past performance and is not indicative of future results. Investment return and principal value may fluctuate so that shares, upon redemption, may be worth more or less than the original cost.
PORTFOLIO COMPOSITION
as of December 31, 2007
Top Holdings
| | |
| | | % of Total
Net Assets |
Met Investor Series Trust—PIMCO Total Return Portfolio, (Class A) | | 13.1% |
Metropolitan Series Fund, Inc.—Davis Venture Value Portfolio, (Class A) | | 10.0% |
Metropolitan Series Fund, Inc.—Neuberger Berman Mid Cap Value Portfolio, (Class A) | | 7.2% |
Metropolitan Series Fund, Inc.—T. Rowe Price Large Cap Growth Portfolio, (Class A) | | 7.1% |
Met Investor Series Trust—Harris Oakmark International Portfolio, (Class A) | | 6.9% |
Metropolitan Series Fund, Inc.—Julius Baer International Stock Portfolio, (Class A) | | 6.9% |
Metropolitan Series Fund, Inc.—BlackRock Large Cap Value Portfolio, (Class A) | | 6.1% |
Met Investor Series Trust—Legg Mason Value Equity Portfolio, (Class A) | | 5.9% |
Metropolitan Series Fund, Inc.—Western Asset Mgt. Strategic Bond Opportunities Portfolio, (Class A) | | 5.0% |
Met Investor Series Trust—Lazard Mid-Cap Portfolio, (Class A) | | 4.8% |
MSF-3
Metropolitan Series Fund, Inc.
Shareholder Expense Example
As a shareholder of the Fund, you incur ongoing costs, including management fees; distribution and service (12b-1) fees; and other fund expenses. This example is intended to help you understand your ongoing costs (in dollars) (referred to as “expenses”) of investing in the Portfolio and compare these costs with the ongoing costs of investing in other mutual funds. The example is based on an investment of $1,000 invested at the beginning of the period and held for the entire period, July 1, 2007 through December 31, 2007.
Actual Expenses
The first line for each share class of the Portfolio in the table below provides information about actual account values and actual expenses. You may use the information in this line, together with the amount you invested in the particular share class of the Portfolio, to estimate the expenses that you paid over the period. Simply divide your account value by $1,000 (for example, an $8,600 account value divided by $1,000=8.6), then multiply the result by the number in the first line under the heading entitled “Expenses Paid During Period” to estimate the expenses you paid on your account during this period.
Hypothetical Example for Comparison Purposes
The second line for each share class of the Portfolio in the table below provides information about hypothetical account values and hypothetical expenses based on the Portfolio’s actual expense ratio and an assumed rate of return of 5% per year before expenses, which is not the Portfolio’s actual return. The hypothetical account values and expenses may not be used to estimate the actual ending account balance or expenses you paid for the period. You may use this information to compare the ongoing costs of investing in the Portfolio and other funds. To do so, compare this 5% hypothetical example with the 5% hypothetical examples that appear in the shareholder reports of the other funds.
Please note that the expenses shown in the table are meant to highlight your ongoing costs only and do not reflect any fees or charges of your variable insurance product or any additional expenses that participants in certain eligible qualified plans may bear relating to the operations of their plan. Therefore, the second line for each share class in the table is useful in comparing ongoing costs only, and will not help you determine the relative total costs of owning different funds. In addition, if these other costs were included, your costs would have been higher.
| | | | | | | | | | | | | | |
Portfolio | | | | Annualized
Expense
Ratio | | | Beginning
Account Value
July 1,
2007 | | Ending
Account Value
December 31,
2007 | | Expenses paid
during period*
July 1, 2007
to
December 31,
2007 |
MetLife Moderate to Aggressive Allocation—Class A(a)(b) | | Actual | | 0.81 | % | | $ | 1,000.00 | | $ | 978.00 | | $ | 4.04 |
| | Hypothetical | | 0.81 | % | | $ | 1,000.00 | | $ | 1,021.08 | | $ | 4.13 |
| | | | | |
MetLife Moderate to Aggressive Allocation—Class B(a)(b) | | Actual | | 1.06 | % | | $ | 1,000.00 | | $ | 976.30 | | $ | 5.28 |
| | Hypothetical | | 1.06 | % | | $ | 1,000.00 | | $ | 1,019.80 | | $ | 5.40 |
* Expenses paid are equal to the Portfolio’s annualized expense ratio for the most recent six month period, as shown above, multiplied by the average account value over the period, multiplied by the number of days in the most recent fiscal half-year, divided by 365 (to reflect the one-half year period).
(a) The annualized expense ratio shown reflects an expense agreement between MetLife Advisers, LLC and the Portfolio as described under Expense Agreement in Note 4 to the Financial Statements.
(b) The annualized expense ratio reflects the expenses of both the Portfolio and the underlying Portfolios in which it invests.
MSF-4
Metropolitan Series Fund, Inc.
MetLife Moderate to Aggressive Allocation Portfolio
Schedule of Investments as of December 31, 2007
Mutual Funds—100.0%
| | | | | | |
| Security Description | | Shares | | Value* | |
|
Affiliated Investment Companies—100.0% | |
Met Investors Series Trust—BlackRock Large Cap Core Portfolio, (Class A) | | 8,731,788 | | $ | 97,272,116 | |
Met Investors Series Trust—Dreman Small Cap Value Portfolio, (Class A) | | 6,807,033 | | | 92,371,436 | |
Met Investors Series Trust—Harris Oakmark International Portfolio, (Class A) | | 9,526,664 | | | 164,525,481 | |
Met Investors Series Trust—Lazard Mid-Cap Portfolio, (Class A) | | 9,408,702 | | | 114,503,905 | |
Met Investors Series Trust—Legg Mason Value Equity Portfolio, (Class A) | | 13,315,850 | | | 139,816,422 | |
Met Investors Series Trust—Lord Abbett Bond Debenture Portfolio, (Class A) | | 1,863,824 | | | 23,540,097 | |
Met Investors Series Trust—Met/AIM Small Cap Growth Portfolio, (Class A) | | 4,744,382 | | | 70,501,522 | |
Met Investors Series Trust—Neuberger Berman Real Estate Portfolio, (Class A) | | 3,226,467 | | | 45,428,655 | |
Met Investors Series Trust—PIMCO Total Return Portfolio, (Class A) | | 25,217,908 | | | 309,928,085 | |
Metropolitan Series Fund, Inc.—BlackRock Large Cap Value Portfolio, (Class A) | | 10,656,161 | | | 145,030,347 | |
Metropolitan Series Fund, Inc.—Davis Venture Value Portfolio, (Class A) | | 6,545,574 | | | 238,520,723 | |
Metropolitan Series Fund, Inc.—Julius Baer International Stock Portfolio, (Class A) | | 10,245,374 | | | 164,335,797 | |
Metropolitan Series Fund, Inc.—FI Mid Cap Opportunities Portfolio, (Class A) | | 3,300,219 | | | 69,766,639 | |
Metropolitan Series Fund, Inc.—Jennison Growth Portfolio, (Class A) | | 7,141,902 | | | 97,272,709 | |
Metropolitan Series Fund, Inc.—MetLife Stock Index Portfolio, (Class A) | | 2,586,957 | | | 95,717,417 | |
Metropolitan Series Fund, Inc.—Neuberger Berman Mid Cap Value Portfolio, (Class A) | | 8,041,241 | | | 170,956,777 | |
Metropolitan Series Fund, Inc.—Russell 2000 Index Portfolio, (Class A) | | 3,308,763 | | | 46,918,261 | |
Metropolitan Series Fund, Inc.—T. Rowe Price Large Cap Growth Portfolio, (Class A) | | 10,232,141 | | | 168,625,679 | |
Metropolitan Series Fund, Inc.—Western Asset Mgt. Strategic Bond Opportunities Portfolio, (Class A) | | 9,244,507 | | | 117,590,128 | |
| | | | | | |
Total Mutual Funds
(Identified Cost $2,361,195,319) | | | | | 2,372,622,196 | |
| | | | | | |
Total Investments—100.0%
(Identified Cost $2,361,195,319) (a) | | | | | 2,372,622,196 | |
Liabilities in excess of other assets | | | | | (711,532 | ) |
| | | | | | |
| Total Net Assets—100% | | | | $ | 2,371,910,664 | |
| | | | | | |
| (a) | The aggregate cost of investments for federal income tax purposes as of December 31, 2007 was $2,361,576,205 and the composition of unrealized appreciation and depreciation of investment securities was $46,087,606 and $(35,041,615), respectively. |
*See accompanying notes to financial statements.
MSF-5
Metropolitan Series Fund, Inc.
MetLife Moderate to Aggressive Allocation Portfolio
Statement of Assets & Liabilities
December 31, 2007
| | | | | | |
Assets | | | | | | |
Investments at value (a) | | | | | $ | 2,372,622,196 |
Receivable for: | | | | | | |
Fund shares sold | | | | | | 3,322,481 |
| | | | | | |
Total Assets | | | | | | 2,375,944,677 |
Liabilities | | | | | | |
Payable for: | | | | | | |
Securities purchased | | $ | 2,665,167 | | | |
Fund shares redeemed | | | 657,315 | | | |
Due to custodian bank | | | 12 | | | |
Accrued expenses: | | | | | | |
Management fees | | | 219,862 | | | |
Service and distribution fees | | | 460,666 | | | |
Other expenses | | | 30,991 | | | |
| | | | | | |
Total Liabilities | | | | | | 4,034,013 |
| | | | | | |
Net Assets | | | | | $ | 2,371,910,664 |
| | | | | | |
Net assets consists of: | | | | | | |
Capital paid in | | | | | $ | 2,309,702,893 |
Undistributed net investment income | | | | | | 13,891,653 |
Accumulated net realized gains | | | | | | 36,889,241 |
Unrealized appreciation on investments | | | | | | 11,426,877 |
| | | | | | |
Net Assets | | | | | $ | 2,371,910,664 |
| | | | | | |
| Computation of offering price: | | | | | | |
Class A | | | | | | |
Net asset value and redemption price per share ($155,393,413 divided by 12,501,978 shares outstanding) | | | | | $ | 12.43 |
| | | | | | |
Class B | | | | | | |
Net asset value and redemption price per share ($2,216,517,251 divided by 178,965,564 shares outstanding) | | | | | $ | 12.39 |
| | | | | | |
(a) Identified cost of investments | | | | | $ | 2,361,195,319 |
| | | | | | |
Statement of Operations
For the Year Ended December 31, 2007
| | | | | | | |
Investment Income | | | | | | | |
Dividends from Underlying Portfolios | | | | | $ | 12,555,051 | |
| | | | | | | |
Expenses | | | | | | | |
Management fees | | $ | 1,055,570 | | | | |
Deferred expense reimbursement | | | 89,298 | | | | |
Service and distribution fees—Class B | | | 3,138,546 | | | | |
Directors’ fees and expenses | | | 811 | | | | |
Custodian | | | 28,091 | | | | |
Audit and tax services | | | 18,574 | | | | |
Legal | | | 18,833 | | | | |
Miscellaneous | | | 10,161 | | | | |
| | | | | | | |
Total expenses | | | | | | 4,359,884 | |
| | | | | | | |
Net Investment Income | | | | | | 8,195,167 | |
| | | | | | | |
Realized and Unrealized Gain (Loss) | | | | | | | |
| Realized gain on: | | | | | | | |
Investments—net | | | 15,901,622 | | | | |
Capital gains distributions from Underlying Portfolios | | | 27,165,860 | | | 43,067,482 | |
| | | | | | | |
| Change in unrealized depreciation on: | | | | | | | |
Investments—net | | | | | | (28,789,722 | ) |
| | | | | | | |
Net gain | | | | | | 14,277,760 | |
| | | | | | | |
Net Increase in Net Assets From Operations | | | | | $ | 22,472,927 | |
| | | | | | | |
See accompanying notes to financial statements.
MSF-6
Metropolitan Series Fund, Inc.
MetLife Moderate to Aggressive Allocation Portfolio
Statements of Changes in Net Assets
| | | | | | | | |
| | | Year ended
December 31,
2007 | | | Year ended
December 31,
2006 | |
From Operations | | | | | | | | |
Net investment income | | $ | 8,195,167 | | | $ | 1,963,732 | |
Net realized gain | | | 43,067,482 | | | | 8,757,473 | |
Unrealized appreciation (depreciation) | | | (28,789,722 | ) | | | 40,246,323 | |
| | | | | | | | |
Increase in net assets from operations | | | 22,472,927 | | | | 50,967,528 | |
| | | | | | | | |
From Distributions to Shareholders | | | | | | | | |
Net investment income | | | | | | | | |
Class A | | | (253,328 | ) | | | (475,092 | ) |
Class B | | | (312,864 | ) | | | (2,199,740 | ) |
| | | | | | | | |
| | | (566,192 | ) | | | (2,674,832 | ) |
| | | | | | | | |
Net realized gain | | | | | | | | |
Class A | | | (144,759 | ) | | | (1,209,082 | ) |
Class B | | | (1,251,456 | ) | | | (5,827,381 | ) |
| | | | | | | | |
| | | (1,396,215 | ) | | | (7,036,463 | ) |
| | | | | | | | |
Total distributions | | | (1,962,407 | ) | | | (9,711,295 | ) |
| | | | | | | | |
Increase in net assets from capital share transactions | | | 1,631,789,973 | | | | 590,067,543 | |
| | | | | | | | |
Total increase in net assets | | | 1,652,300,493 | | | | 631,323,776 | |
| | |
Net Assets | | | | | | | | |
Beginning of the period | | | 719,610,171 | | | | 88,286,395 | |
| | | | | | | | |
End of the period | | $ | 2,371,910,664 | | | $ | 719,610,171 | |
| | | | | | | | |
Undistributed Net Investment Income | | | | | | | | |
End of the period | | $ | 13,891,653 | | | $ | 536,324 | |
| | | | | | | | |
Other Information:
Capital Shares
Transactions in capital shares were as follows:
| | | | | | | | | | | | | | |
| | | Year ended
December 31, 2007 | | | Year ended
December 31, 2006 | |
| | | Shares | | | $ | | | Shares | | | $ | |
Class A | | | | | | | | | | | | | | |
Sales | | 8,175,240 | | | $ | 102,020,544 | | | 6,446,557 | | | $ | 72,782,346 | |
Reinvestments | | 31,644 | | | | 398,087 | | | 151,047 | | | | 1,684,174 | |
Redemptions | | (2,444,633 | ) | | | (30,451,289 | ) | | (1,069,236 | ) | | | (11,995,850 | ) |
| | | | | | | | | | | | | | |
Net increase | | 5,762,251 | | | $ | 71,967,342 | | | 5,528,368 | | | $ | 62,470,670 | |
| | | | | | | | | | | | | | |
Class B | | | | | | | | | | | | | | |
Sales | | 135,533,113 | | | $ | 1,684,958,265 | | | 45,666,047 | | | $ | 515,977,589 | |
Shares issued through acquisition | | 0 | | | | 0 | | | 3,452,195 | | | | 38,561,018 | |
Reinvestments | | 124,547 | | | | 1,564,320 | | | 721,215 | | | | 8,027,121 | |
Redemptions | | (10,185,495 | ) | | | (126,699,954 | ) | | (3,128,609 | ) | | | (34,968,855 | ) |
| | | | | | | | | | | | | | |
Net increase | | 125,472,165 | | | $ | 1,559,822,631 | | | 46,710,848 | | | $ | 527,596,873 | |
| | | | | | | | | �� | | | | | |
Increase derived from capital share transactions | | | | | $ | 1,631,789,973 | | | | | | $ | 590,067,543 | |
| | | | | | | | | | | | | | |
See accompanying notes to financial statements.
MSF-7
Metropolitan Series Fund, Inc.
MetLife Moderate to Aggressive Allocation Portfolio
Financial Highlights
| | | | | | | | | | | | |
| | | Class A | |
| | | Year ended December 31, | |
| | | 2007 | | | 2006 | | | 2005(a) | |
Net Asset Value, Beginning of Period | | $ | 11.98 | | | $ | 11.05 | | | $ | 10.00 | |
| | | | | | | | | | | | |
Income From Investment Operations | | | | | | | | | | | | |
Net investment income | | | 0.12 | (b) | | | 0.17 | | | | 0.04 | |
Net realized and unrealized gain on investments | | | 0.38 | | | | 1.39 | | | | 1.05 | |
| | | | | | | | | | | | |
Total from investment operations | | | 0.50 | | | | 1.56 | | | | 1.09 | |
| | | | | | | | | | | | |
Less Distributions | | | | | | | | | | | | |
Distributions from net investment income | | | (0.03 | ) | | | (0.18 | ) | | | (0.04 | ) |
Distributions from net realized capital gains | | | (0.02 | ) | | | (0.45 | ) | | | 0.00 | |
| | | | | | | | | | | | |
Total distributions | | | (0.05 | ) | | | (0.63 | ) | | | (0.04 | ) |
| | | | | | | | | | | | |
Net Asset Value, End of Period | | $ | 12.43 | | | $ | 11.98 | | | $ | 11.05 | |
| | | | | | | | | | | | |
Total Return (%) | | | 4.1 | | | | 14.6 | | | | 10.9 | (c) |
Ratio of operating expenses to average net assets (%) (d) | | | 0.09 | | | | 0.10 | | | | 0.10 | (e) |
Ratio of operating expenses to average net assets without giving effect to the contractual expense agreement would have been (%) (h) | | | 0.09 | | | | 0.11 | | | | 0.34 | (e) |
Ratio of net investment income to average net assets (%) (f) | | | 0.95 | | | | 1.07 | | | | 1.34 | (e) |
Portfolio turnover rate (%) | | | 14 | | | | 23 | | | | 2 | (e) |
Net assets, end of period (000) | | $ | 155,393 | | | $ | 80,728 | | | $ | 13,388 | |
| | | | | | | | | | | | |
| | | Class B | |
| | | Year ended December 31, | |
| | | 2007 | | | 2006 | | | 2005(a) | |
Net Asset Value, Beginning of Period | | $ | 11.94 | | | $ | 11.04 | | | $ | 10.00 | |
| | | | | | | | | | | | |
Income From Investment Operations | | | | | | | | | | | | |
Net investment income | | | 0.07 | (b) | | | 0.16 | | | | 0.04 | |
Net realized and unrealized gain on investments | | | 0.40 | | | | 1.36 | | | | 1.05 | |
| | | | | | | | | | | | |
Total from investment operations | | | 0.47 | | | | 1.52 | | | | 1.08 | |
| | | | | | | | | | | | |
Less Distributions | | | | | | | | | | | | |
Distributions from net investment income | | | (0.00 | ) (g) | | | (0.17 | ) | | | (0.04 | ) |
Distributions from net realized capital gains | | | (0.02 | ) | | | (0.45 | ) | | | 0.00 | |
| | | | | | | | | | | | |
Total distributions | | | (0.02 | ) | | | (0.62 | ) | | | (0.04 | ) |
| | | | | | | | | | | | |
Net Asset Value, End of Period | | $ | 12.39 | | | $ | 11.94 | | | $ | 11.04 | |
| | | | | | | | | | | | |
Total Return (%) | | | 3.9 | | | | 14.2 | | | | 10.8 | (c) |
Ratio of operating expenses to average net assets (%) (d) | | | 0.34 | | | | 0.35 | | | | 0.35 | (e) |
Ratio of operating expenses to average net assets without giving effect to the contractual expense agreement would have been (%) (h) | | | 0.34 | | | | 0.36 | | | | 0.59 | (e) |
Ratio of net investment income to average net assets (%) (f) | | | 0.56 | | | | 0.54 | | | | 1.33 | (e) |
Portfolio turnover rate (%) | | | 14 | | | | 23 | | | | 2 | (e) |
Net assets, end of period (000) | | $ | 2,216,517 | | | $ | 638,882 | | | $ | 74,899 | |
| (a) | Commencement of operations was May 2, 2005. |
| (b) | Per share amount is based on average shares outstanding during the period. |
| (c) | Periods less than one year are not computed on an annualized basis. |
| (d) | The ratio of operating expenses to average net assets does not include expenses of investment companies in which the Portfolio invests. |
| (e) | Computed on an annualized basis. |
| (f) | Recognition of net investment income by the Portfolio is affected by the timing of the declaration of dividends by the underlying Portfolios in which it invests. |
| (g) | Distributions for the period were less than $0.01. |
| (h) | See Note 4 in the Notes to Financial Statements. |
See accompanying notes to financial statements.
MSF-8
Metropolitan Series Fund, Inc.
MetLife Moderate to Aggressive Allocation Portfolio
Notes to Financial Statements—December 31, 2007
Metropolitan Series Fund, Inc. (the “Fund”) is organized as a corporation under the laws of Maryland pursuant to Articles of Incorporation filed on November 23, 1982, as amended, and registered under the Investment Company Act of 1940, as amended (the “1940 Act”), as an open-end investment company. The Fund is a “series” type of mutual fund, which issues separate series of stock. Each series represents an interest in a separate portfolio of Fund investments. The MetLife Moderate to Aggressive Allocation Portfolio (the “Asset Allocation Portfolio”) is a non-diversified series of the fund. The Asset Allocation Portfolio operates under a “fund of funds” structure, investing substantially all of its assets in other Portfolios advised by MetLife Advisers, LLC (“MetLife Advisers”) or its affiliates (each, an “Underlying Portfolio,” and, collectively, the “Underlying Portfolios”). Shares in the Fund are not offered directly to the general public and are currently available only to separate accounts established by Metropolitan Life Insurance Company (“MetLife”), New England Life Insurance Company, General American Life Insurance Company (“General American”), The MetLife Investors Group of Insurance Companies, MetLife Insurance Company of Connecticut and other affiliated insurance companies (collectively, the “Insurance Companies”), as an investment vehicle for variable life insurance, group annuity or variable annuity products, although not all Portfolios are available to all such separate accounts. The Asset Allocation Portfolio’s shares may be divided into different classes. Currently, the classes being offered by the Asset Allocation Portfolio are named Class A and Class B. The classes of the Asset Allocation Portfolio’s shares are identical, except that certain additional charges (Rule 12b-1 fees) are made against Class B shares. Investment income, realized and unrealized capital gains and losses, the common expenses of the Asset Allocation Portfolio and certain Portfolio-level expense reductions, if any, are allocated on a pro rata basis to each class based on the relative net assets of each class to the total net assets of the Asset Allocation Portfolio.
| 2. | SIGNIFICANT ACCOUNTING POLICIES: |
The preparation of financial statements in conformity with accounting principles generally accepted in the United States of America (“GAAP”) requires management to make estimates and assumptions that affect the reported amounts of assets and liabilities and disclosure of contingent assets and liabilities as of the date of the financial statements and the reported amounts of income and expenses during the reporting period. Actual results could differ from those estimates.
The following is a summary of significant accounting policies consistently followed by the Asset Allocation Portfolio in the preparation of its financial statements. The policies are in conformity with GAAP.
Investment Valuation:
The net asset value of the Asset Allocation Portfolio is calculated based on the net asset values of the Underlying Portfolios in which the Asset Allocation Portfolio invests. The Underlying Portfolios that are series of the Fund will use fair value pricing in the circumstances and manner described below. For more information about the use of fair value pricing by the Underlying Portfolios that are series of Met Investors Series Trust (“MIST”), please refer to the prospectus for such Underlying Portfolios.
The Underlying Portfolios that are series of the Fund are valued as follows:
Debt securities (other than short term obligations with a remaining maturity of sixty days or less) are valued on the basis of valuations furnished by independent pricing services selected by the relevant subadviser pursuant to authorization of the Board of Directors of the Fund (the “Board of Directors”). Short term obligations with a remaining maturity of sixty days or less are valued at amortized cost which approximates fair market value.
Equity securities traded on a national securities exchange or exchanges are valued at their last sale price on the principal trading market. Equity securities traded on the NASDAQ National Market System are valued at the NASDAQ Official Closing Price (the “NOCP”). The NOCP is the last sale price if it falls between the spread of the last reported bid and asked prices. If the last reported bid and asked prices are above the last reported sale price, the NOCP will be the last reported bid price. If the last reported bid and asked prices are below the last reported sale price, the NOCP will be the last reported asked price. Equity securities traded on a national securities exchange or exchanges or on the NASDAQ National Market System for which there is no reported sale during the day are valued at the last reported bid price. A security that is listed or traded on more than one exchange is valued at the quotation on the exchange determined to be the primary market for that security by the Board or its delegates. If no closing price is available, then such securities are valued by using the last reported bid price. Equity securities traded over-the-counter are valued at the last reported sales price.
MSF-9
Metropolitan Series Fund, Inc.
MetLife Moderate to Aggressive Allocation Portfolio
Notes to Financial Statements—December 31, 2007—(Continued)
If no current market value quotation is readily available or reliable for a portfolio security, fair value will be determined in accordance with procedures established by and under the general supervision of the Board. When an Underlying Portfolio uses fair value pricing, it may take into account any factors it deems appropriate. The value of securities used by the Fund to calculate its net asset value may differ from quoted or published prices for the same securities. Fair value pricing involves subjective judgments and the fair value determined for a security may be materially different than the value that could be realized upon the sale of that security.
The Underlying Portfolios expect to use fair value pricing for securities primarily traded on U.S. exchanges only under very limited circumstances. For example, the Underlying Portfolios may use fair value pricing if the exchange on which a security is traded closes early or trading in the security is suspended.
Securities traded primarily on an exchange outside of the United States which closes before the close of the New York Stock Exchange will be valued at the last sales price on that non-U.S. exchange. Securities traded primarily on an exchange outside of the United States for which there is no reported sale during the day are valued at the mean between the last reported bid and asked prices. However, because most foreign markets close well before the Underlying Portfolio values its securities (typically at 4 p.m. Eastern Time), the earlier close of these foreign markets gives rise to the possibility that significant events, including broad market moves, may have occurred after these foreign markets close but before the Underlying Portfolio values its securities. For example, foreign security values may be affected by activity that occurs after the close of foreign securities markets. To account for this, the Underlying Portfolio may frequently value many of the its foreign equity securities using fair value prices based on third party vendor modeling tools.
Forward foreign currency exchange contracts are valued based on the mean between closing bid and asked prices of the forward currency contract rates in the London foreign exchange markets on a daily basis as provided by a reliable bank or dealer.
Options, whether on securities, indices, futures contracts, or otherwise, are valued at the last sales price available as of the close of business on the day of valuation or, if there is no such sale price available, at the mean between the bid and asked prices. Options on currencies are valued at the spot price each day.
The value of futures contracts will be the sum of the margin deposit plus or minus the difference between the value of the futures contract on each day the net asset value is calculated and the value on the date the futures contract originated, value being that established on a recognized commodity exchange, or by reference to other customary sources, with gain or loss being realized when the futures contract closes or expires.
Subject to the Board’s oversight, the Board has delegated day-to-day responsibility for valuing assets to MetLife Advisers, LLC (“MetLife Advisers” or the “Adviser”) or the subadviser of the Underlying Portfolio, as applicable, who values such assets as described above and operates under procedures approved by the Board.
Investment Transactions and Related Investment Income:
Portfolio security transactions are recorded on the trade date. Dividend income is recorded on the ex-dividend date. Interest income is recorded on the accrual basis. Realized gains and losses on investments and unrealized appreciation and depreciation are determined on the identified cost basis, which is the same basis used for income tax purposes.
Federal Income Taxes:
It is the Fund’s policy to comply with the requirements of the Internal Revenue Code of 1986, as amended, and regulations thereunder, applicable to regulated investment companies and to distribute all of its taxable income to shareholders. Therefore, no federal income tax provision is required.
As of December 31, 2007, the Asset Allocation Portfolio had no capital loss carryovers.
The tax character of distributions paid for the periods ended December 31, 2007 and 2006 was as follows:
| | | | | | | | | | | | | | | | | | | | | |
Ordinary Income | | Long Term Gain | | Return of Capital | | Total |
2007 | | 2006 | | 2007 | | 2006 | | 2007 | | 2006 | | 2007 | | 2006 |
| $1,962,407 | | $ | 4,201,348 | | $ | — | | $ | 5,509,947 | | $ | — | | $ | — | | $ | 1,962,407 | | $ | 9,711,295 |
MSF-10
Metropolitan Series Fund, Inc.
MetLife Moderate to Aggressive Allocation Portfolio
Notes to Financial Statements—December 31, 2007—(Continued)
As of December 31, 2007, the components of distributable earnings (accumulated losses) on a federal income tax basis were as follows:
| | | | | | | | | | | | |
Undistributed
Ordinary
Income | | Undistributed
Long Term
Gain | | Unrealized
Appreciation | | Loss
Carryforwards | | Total |
| $20,838,854 | | $ | 30,322,926 | | $ | 11,045,991 | | $ | — | | $ | 62,207,771 |
Dividends and Distributions to Shareholders:
The Asset Allocation Portfolio records dividends and distributions on the ex-dividend date. Net realized gains from security transactions (if any) are generally distributed annually to shareholders. The timing and characterization of certain income and capital gains distributions are determined in accordance with federal tax regulations that may differ from GAAP. Permanent book and tax basis differences relating to shareholder distributions will result in reclassification between under/over distributed net investment income, accumulated net realized gains/losses and paid in capital.
| 3. | INVESTMENT TRANSACTIONS: |
For the year ended December 31, 2007, purchases and sales of Underlying Portfolios by the Asset Allocation Portfolio were $1,857,504,019 and $191,799,253, respectively.
| 4. | INVESTMENT MANAGEMENT FEES AND OTHER TRANSACTIONS WITH AFFILIATES: |
Investment Management Agreement:
MetLife Advisers, LLC (“MetLife Advisers”) is the investment adviser to the Asset Allocation Portfolio. The Fund has entered into an investment management agreement with MetLife Advisers with respect to the Portfolio. For providing investment management services to the Portfolio, MetLife Advisers receives monthly compensation at the following annual rates:
| | | | | | |
| | | Management
Fees earned by
MetLife Advisers
for the year ended
December 31, 2007 | | Annual
percentage
rates paid to
MetLife Advisers | | Based on Portfolios
average daily net asset levels |
| | $1,055,570 | | 0.100% | | Of the first $500 million |
| | | | 0.075% | | Of the next $500 million |
| | | | 0.050% | | On amounts in excess of $1 billion |
In addition to the above Management Fee paid to MetLife Advisers, the Asset Allocation Portfolio indirectly pays MetLife Advisers an investment advisory fee through its investments in certain Underlying Portfolios.
Certain officers and directors of the Fund may also be officers of MetLife Advisers; however, such officers and directors receive no compensation from the Fund.
Service and Distribution Fees:
The Fund has adopted a Distribution and Service Plan under Rule 12b-1 of the 1940 Act for the Asset Allocation Portfolio’s B shares. Under the Distribution and Service plan, the Class B shares of the Asset Allocation Portfolio pay a fee to compensate the Insurance Companies (or other affiliates) and other broker-dealers and financial Intermediaries involved in the offer and sale of Portfolio shares for promoting or selling and servicing, the Class B shares of the Asset Allocation Portfolio. The fees under the Distribution and Service Plan for each class of the Asset Allocation Portfolio’s shares are calculated as percentage of the Asset Allocation Portfolio’s average daily net assets that are attribute to that class. Currently, the fee is 0.25% per year for Class B shares. Amounts paid by the Asset Allocation Portfolio for the year ended December 31, 2007 are shown as Service and Distribution fees in the Statement of Operations.
MSF-11
Metropolitan Series Fund, Inc.
MetLife Moderate to Aggressive Allocation Portfolio
Notes to Financial Statements—December 31, 2007—(Continued)
Expense Agreement:
Pursuant to an expense agreement relating to each class of the Asset Allocation Portfolio, MetLife Advisers has agreed, from May 1, 2007 to April 30, 2008, to waive a portion of its advisory fees or pay a portion of the other operating expenses (not including brokerage costs, interest, taxes, or extraordinary expenses) to the extent total operating expenses exceed stated annual expense limits (based on the Asset Allocation Portfolio’s then current fiscal year). For the Asset Allocation Portfolio, this subsidy, and similar subsidies in effect in earlier periods, are subject to the obligation of each class of the Asset Allocation Portfolio to repay MetLife Advisers in future years, if any, when a class’ expenses fall below the stated expense limit pertaining to that class that was in effect at the time of the subsidy in question. Such deferred expenses may be charged to a class in a subsequent year to the extent that the charge does not cause the total expenses in such subsequent year to exceed the class’ stated expense limit that was in effect at the time of the subsidy in question; provided, however, that no class of the Asset Allocation Portfolio is obligated to repay any expense paid by MetLife Advisers more than five years after the end of the fiscal year in which such expense was incurred.
The expense limits (annual rates as a percentage of each class of the Asset Allocation Portfolio’s net average daily net assets) in effect from May 1, 2007 to April 30, 2008 are 0.10% and 0.35% for Class A and B, respectively.
For the year ended December 31, 2007, MetLife Advisers recovered $89,298 in deferred expenses. As of December 31, 2007, there are no expenses deferred in prior years that are subject to repayment by the Portfolio.
As previously reported, in May 2004, General American received a Wells Notice stating that the SEC staff was considering recommending that the SEC bring a civil action alleging violations of the U.S. securities laws against General American with respect to market timing and late trading in a limited number of privately-placed variable insurance contracts that were sold through General American. General American responded to the SEC staff and cooperated with the investigation. On August 9, 2007, the SEC announced that it had settled an enforcement action regarding late trading against General American with, among other things, General American agreeing to pay a civil penalty and to comply with certain undertakings. General American consented to the SEC’s order without admitting or denying the findings. MetLife Advisers has also advised the Fund’s Board of Directors that, while certain exceptions to the Fund’s policies have been noted, no situations have been identified that would have a material impact on the financial position of the Fund.
| 6. | RECENT ACCOUNTING PRONOUNCEMENTS: |
Effective June 29, 2007, the Fund implemented Financial Accounting Standards Board (“FASB”) Interpretation No. 48, “Accounting for Uncertainty in Income Taxes—an interpretation of FASB Statement No. 109” (“FIN 48”). FIN 48 prescribes the minimum recognition threshold a tax position must meet in connection with accounting for uncertainties in income tax positions taken or expected to be taken by an entity, including investment companies, before being measured and recognized in the financial statements. Management has evaluated the application of FIN 48 to the Fund, and has determined that the adoption of FIN 48 does not have a material impact on the Fund’s financial statements. The Fund files U.S. tax returns. No income tax returns are currently under examination. The statute of limitations on the Fund’s tax returns remains open for the years ended December 31, 2004 through December 31, 2006.
In September 2006, Statement of Financial Accounting Standards No. 157, Fair Value Measurements (SFAS 157) was issued and is effective for fiscal years beginning after November 15, 2007. SFAS 157 defines fair value, establishes a framework for measuring fair value and expands disclosures about fair value measurements. Management is currently evaluating the impact the adoption of SFAS 157 will have on the Portfolio’s financial statement disclosures.
MSF-12
Metropolitan Series Fund, Inc.
MetLife Moderate to Aggressive Allocation Portfolio
Notes to Financial Statements—December 31, 2007—(Continued)
| 7. | TRANSACTIONS IN SECURITIES OF AFFILIATED ISSUERS: |
The Asset Allocation Portfolio does not invest in the Underlying Portfolios for the purpose of exercising management or control; however, investments by the Asset Allocation Portfolio within its principal investment strategies may represent a significant portion of the Underlying Portfolio’s net assets. Transactions in the Underlying Portfolios during the year ended December 31, 2007 in which the Asset Allocation Portfolio had ownership of at least 5% of the outstanding voting securities at the end of the period are as follows:
| | | | | | | | |
Underlying Portfolio (Class A) | | Beginning Shares
as of
12/31/2006 | | Shares
Purchased
during Period | | Shares Sold
during Period | | Ending Shares
as of
12/31/2007 |
MIST—BlackRock Large Cap Core | | 0 | | 8,733,012 | | 1,224 | | 8,731,788 |
MIST—Dreman Small Cap Value | | 2,136,262 | | 4,686,147 | | 15,376 | | 6,807,033 |
MIST—Harris Oakmark International | | 3,081,183 | | 7,188,214 | | 742,733 | | 9,526,664 |
MIST—Lazard Mid-Cap | | 2,641,455 | | 6,856,995 | | 89,748 | | 9,408,702 |
MIST—Legg Mason Value Equity | | 3,902,120 | | 9,415,552 | | 1,822 | | 13,315,850 |
MIST—Met/AIM Small Cap Growth | | 0 | | 4,836,271 | | 91,889 | | 4,744,382 |
MIST—PIMCO Total Return | | 7,661,127 | | 18,855,797 | | 1,299,016 | | 25,217,908 |
MSF—BlackRock Large Cap Value | | 0 | | 10,657,631 | | 1,470 | | 10,656,161 |
MSF—Julius Baer International Stock | | 3,750,720 | | 7,550,875 | | 1,056,221 | | 10,245,374 |
MSF—FI Mid Cap Opportunities | | 1,118,002 | | 2,277,256 | | 95,039 | | 3,300,219 |
MSF—Jennison Growth | | 2,248,482 | | 5,116,893 | | 223,473 | | 7,141,902 |
MSF—Neuberger Berman Mid Cap Value | | 2,416,879 | | 5,767,254 | | 142,892 | | 8,041,241 |
MSF—Russell 2000 Index | | 921,258 | | 2,395,699 | | 8,194 | | 3,308,763 |
MSF—T. Rowe Price Large Cap Growth | | 3,312,333 | | 7,022,692 | | 102,884 | | 10,232,141 |
MSF—Western Asset Mgmt. Strategic Bond Opportunities | | 2,775,893 | | 6,807,807 | | 339,193 | | 9,244,507 |
| | | | | | | | | | | | | |
Underlying Portfolio (Class A) | | Realized Gain/
(Loss)
during Period | | | Capital Gains
Distributions
during Period | | Dividend Income
during Period | | Ending Value
as of
12/31/2007 |
MIST—BlackRock Large Cap Core | | $ | (553 | ) | | $ | 0 | | $ | 0 | | $ | 97,272,116 |
MIST—Dreman Small Cap Value | | | 13,828 | | | | 212,376 | | | 0 | | | 92,371,436 |
MIST—Harris Oakmark International | | | 1,634,430 | | | | 6,876,701 | | | 801,444 | | | 164,525,481 |
MIST—Lazard Mid-Cap | | | (50,945 | ) | | | 4,740,021 | | | 345,857 | | | 114,503,905 |
MIST—Legg Mason Value Equity | | | 488 | | | | 71,745 | | | 2,128 | | | 139,816,422 |
MIST—Met/AIM Small Cap Growth | | | 2,885 | | | | 0 | | | 0 | | | 70,501,522 |
MIST—PIMCO Total Return | | | 412,921 | | | | 0 | | | 4,961,673 | | | 309,928,085 |
MSF—BlackRock Large Cap Value | | | (1,228 | ) | | | 0 | | | 0 | | | 145,030,347 |
MSF—Julius Baer International Stock | | | 2,351,743 | | | | 4,581,804 | | | 943,155 | | | 164,335,797 |
MSF—FI Mid Cap Opportunities | | | 195,100 | | | | 0 | | | 44,032 | | | 69,766,639 |
MSF—Jennison Growth | | | 121,607 | | | | 1,568,376 | | | 187,024 | | | 97,272,709 |
MSF—Neuberger Berman Mid Cap Value | | | 348,444 | | | | 2,227,181 | | | 413,812 | | | 170,956,777 |
MSF—Russell 2000 Index | | | 16,116 | | | | 1,585,139 | | | 193,695 | | | 46,918,261 |
MSF—T. Rowe Price Large Cap Growth | | | 235,227 | | | | 683,624 | | | 344,202 | | | 168,625,679 |
MSF—Western Asset Mgmt. Strategic Bond Opportunities | | | (29,394 | ) | | | 50,657 | | | 1,469,053 | | | 117,590,128 |
MSF-13
Metropolitan Series Fund, Inc.
MetLife Moderate to Aggressive Allocation Portfolio
Report of Independent Registered Public Accounting Firm
To the Shareholders and Board of Directors of the Metropolitan Series Fund, Inc.:
We have audited the accompanying statement of assets and liabilities, including the schedule of investments, of the MetLife Moderate to Aggressive Portfolio, one of the portfolios constituting the Metropolitan Series Fund, Inc. (the “Fund”) as of December 31, 2007, and the related statement of operations for the year then ended, the statements of changes in net assets for each of the two years in the period then ended and the financial highlights for each of the two years ended December 31, 2007 and for the period from May 2, 2005 (commencement of operations) through December 31, 2005. These financial statements and financial highlights are the responsibility of the Fund’s management. Our responsibility is to express an opinion on these financial statements and financial highlights based on our audits.
We conducted our audits in accordance with the standards of the Public Company Accounting Oversight Board (United States). Those standards require that we plan and perform the audit to obtain reasonable assurance about whether the financial statements and financial highlights are free of material misstatement. The Fund is not required to have, nor were we engaged to perform, an audit of its internal control over financial reporting. Our audits included consideration of internal control over financial reporting as a basis for designing audit procedures that are appropriate in the circumstances, but not for the purpose of expressing an opinion on the effectiveness of the Fund’s internal control over financial reporting. Accordingly, we express no such opinion. An audit also includes examining, on a test basis, evidence supporting the amounts and disclosures in the financial statements, assessing the accounting principles used and significant estimates made by management, as well as evaluating the overall financial statement presentation. Our procedures included confirmation of securities owned as of December 31, 2007, by correspondence with the custodian and transfer agent. We believe that our audits provide a reasonable basis for our opinion.
In our opinion, the financial statements and financial highlights referred to above present fairly, in all material respects, the financial position of the MetLife Moderate to Aggressive Portfolio of the Metropolitan Series Fund, Inc. as of December 31, 2007, the results of its operations for the year then ended, the changes in its net assets for each of the two years in the period then ended, and the financial highlights for each of the two years ended December 31, 2007 and for the period from May 2, 2005 (commencement of operations) through December 31, 2005, in conformity with accounting principles generally accepted in the United States of America.
Deloitte & Touche LLP
Boston, Massachusetts
February 21, 2008
MSF-14
Metropolitan Series Fund, Inc.
Directors and Officers
The Fund’s Directors review actions of the Fund’s investment adviser and subadvisers, and decide upon matters of general policy. The Fund’s officers supervise the daily business operations of the Fund. The Board of Directors and the Fund’s officers are listed below. Each Director is responsible for overseeing all 36 Portfolios of the Fund. There is no limit to the term a Director may serve. Directors serve until their resignation, retirement or removal in accordance with the Fund’s organizational documents and policies adopted by the Board from time to time. Officers hold office at the pleasure of the Board or until the election or appointment and the qualification of a successor. The address of the directors and officers is c/o Metropolitan Series Fund, Inc., 501 Boylston Street, Boston, MA 02116.
Interested Directors(1)
Each Director below is an “interested person” (as defined by the 1940 Act) with respect to the Fund in that Ms. Forget is an employee of MetLife and Mr. Typermass is a former employee of MetLife and owns securities issued by MetLife, Inc., the ultimate parent company of MetLife Advisers.
| | | | | | | | |
Name, Address and Age | | Current
position(s)
with Fund | | Position(s)
held since | | Principal occupations
over past five years, including other directorships(2) | | Number of
Portfolios in
Fund Complex
Overseen by
Director(3) |
Elizabeth M. Forget Age: 41 | | Director, Chairman of the Board, President and Chief Executive Officer | | 2006 | | Senior Vice President (since 2007), MetLife, Inc.; President, Met Investors Advisory, LLC (“MIA”); Trustee and President, Met Investors Series Trust (“MIST”); Executive Vice President, MetLife Investors Group, Inc.; President (since 2006), MetLife Advisers. | | 81 |
| | | | |
Arthur G. Typermass Age: 70 | | Director | | 1998 | | Formerly, Senior Vice President and Treasurer, MetLife. | | 37 |
Non-Interested Directors(1)
Each Director below is not an “interested person” (as defined by the 1940 Act) with respect to the Fund (collectively, the “Independent Directors”).
| | | | | | | | |
Name, Address and Age | | Current
position(s)
with Fund | | Position(s)
held since | | Principal occupations
over past five years, including other directorships(2) | | Number of
Portfolios in
Fund Complex
Overseen by
Director(3) |
Steve A. Garban† Age: 70 | | Director | | 1985 | | Formerly, Chief Financial Officer, Senior Vice President Finance and Operations and Treasurer (Emeritus), The Pennsylvania State University. | | 37 |
| | | | |
Linda B. Strumpf Age: 60 | | Director | | 2000 | | Vice President and Chief Investment Officer, Ford Foundation. | | 37 |
| | | | |
Michael S. Scott Morton† Age: 70 | | Director | | 1993 | | Jay W. Forrester Professor of Management (Emeritus) at Sloan School of Management, MIT. | | 37 |
| | | | |
H. Jesse Arnelle Age: 74 | | Director | | 2001 | | Formerly, Counsel, Womble Carlyle Sandrie & Rice; Director, Textron Inc. (global multi-industry company)*; formerly, Director, Gannet Co. Inc. (diversified news and information company)*; formerly, Director, Eastman Chemical Company (global chemical company)*; formerly, Director, Waste Management, Inc.*; formerly, Director, Armstrong Holdings Inc. (parent company of floor and ceiling products business)*; formerly, Director, FPL Group Inc. (public utility holding company)*; Director, URS Corporation (engineering design services firm)*. | | 37 |
| | | | |
Nancy Hawthorne Age: 56 | | Director | | 2003 | | Director, Avid Technologies (computer software company)*; formerly, Chairman of the Board of Avid Technologies; formerly, Board of Advisors, L. Knife & Sons, Inc. (beverage distributor); Chief Executive Officer, Clerestory LLC (corporate financial advisor); formerly, Trustee, New England Zenith Fund (“Zenith Fund”)**; formerly, Chief Executive Officer and Managing Partner, Hawthorne, Krauss and Associates (corporate financial advisor); formerly, Chief Financial Officer and Executive Vice President, Continental Cablevision, subsequently renamed MediaOne (cable television company); formerly, Director, Life F/X, Inc.; formerly, Chairman of the Board, WorldClinic (distance medicine company); formerly, Director, Perini Corporation (construction company)*; formerly, Director, CGU (property and casualty insurance company); formerly, Director, Beacon Power Corporation (energy company )*. | | 37 |
MSF-15
Metropolitan Series Fund, Inc.
Directors and Officers—(Continued)
| | | | | | | | |
Name, Address and Age | | Current
position(s)
with Fund | | Position(s)
held since | | Principal occupations
over past five years, including other directorships(2) | | Number of
Portfolios in
Fund Complex
Overseen by
Director(3) |
John T. Ludes Age: 71 | | Director | | 2003 | | President, LFP Properties (consulting firm); Formerly, Trustee, Zenith Fund**; formerly, Vice Chairman, President and Chief Operating Officer, Fortune Brands/American Brands (global conglomerate); formerly, President and CEO, Acushnet Company (athletic equipment company). | | 37 |
Officers(1)
| | | | | | | | |
Name and address | | Age | | Current
position(s)
with Fund | | Position(s)
held since | | Principal occupations over past five years(2) |
| Jeffrey P. Halperin | | 40 | | Chief Compliance Officer | | 2006 | | Vice President (since 2006), Corporate Ethics and Compliance Department, MetLife, Inc.; Chief Compliance Officer (since 2006), MetLife Advisers, MIA and MIST. |
| | | | |
| John F. Guthrie, Jr. | | 64 | | Senior Vice President | | 2002 | | Manager and Senior Vice President, MetLife Advisers; Vice President, MetLife; Vice President (since 2003), MetLife Group, Inc.; Vice President, NELICO; Vice President (since 2005), MIA; formerly, Senior Vice President, Zenith Fund**. |
| | | | |
| Alan C. Leland | | 55 | | Senior Vice President | | 2005 | | Treasurer and Chief Financial Officer, MetLife Advisers, LLC; Treasurer (since 2005), Met Investors Advisory, LLC; Vice President (since 2004), MIA; Vice President (since 2003), MetLife Group, Inc.; Vice President, MetLife; Senior Vice President, NELICO |
| | | | |
| Peter Duffy | | 52 | | Vice President and Treasurer | | 2000 | | Senior Vice President, MetLife Advisers (since 1998); Second Vice President (since 2003), NELICO; Vice President, MetLife (since 2004); Vice President (since 2004), MetLife Group, Inc.; formerly, Vice President and Treasurer, Zenith Fund**. |
| | | | |
| Thomas M. Lenz | | 49 | | Vice President and Secretary | | 2002 | | General Counsel and Secretary, MetLife Advisers; Assistant General Counsel, MetLife; formerly, Vice President and Secretary, Zenith Fund**. |
| * | Indicates a directorship with a registered investment company or a company subject to the reporting requirements of the Securities Exchange Act of 1934, as amended. |
| ** | The Zenith Fund deregistered with the Securities and Exchange Commission (“SEC”) in 2004. |
| (†) | Served as a trustee, director and/or officer of one or more of the following companies, each of which had a direct or indirect advisory relationship with MetLife Advisers or its affiliates prior to January 31, 2005: State Street Research Financial Trust, State Street Research Income Trust, State Street Research Money Market Trust, State Street Research Institutional Funds, State Street Research Capital Trust, State Street Research Master Investment Trust, State Street Research Equity Trust, State Street Research Securities Trust and State Street Research Exchange Trust (collectively, the “State Street Research Funds”). |
| (1) | Each Director of the Fund also serves as trustee of Metropolitan Series Fund II (“Met Series Fund II”), a registered investment company advised by MetLife Advisers. Each officer of the Fund serves in the same position with Met Series Fund II, which consists of one portfolio. |
| (2) | Previous positions during the past five years with the Fund, MIST, MetLife, MetLife Advisers, MIA, Zenith Fund, NELICO or New England Securities Corporation are omitted if not materially different. |
| (3) | The Fund Complex includes the Fund (36 portfolios), Met Series Fund II (1 portfolio) and MIST (44 portfolios) |
MSF-16
Metropolitan Series Fund, Inc.
MetLife Moderate to Aggressive Allocation Portfolio
Board Approval of Advisory and Subadvisory Agreements
The Fund’s Contract Review Committees of the Board of Directors (the “Board”) typically meet in early fall to review the Portfolios’ advisory agreements (the “Advisory Agreements”) and subadvisory agreements (collectively, the “Subadvisory Agreements,” and, together with the Advisory Agreements, the “Agreements”) and determine whether to recommend that the full Board approve the continuation of the Agreements for an additional one-year period. (Following the initial approval of an Agreement for a new Portfolio or with a new adviser or subadviser, such annual reviews are not required until 2 years following the execution of such Agreement.) After each Committee has made its recommendations, the full Board, including the Independent Directors, determines whether to approve the continuation of each of the Agreements. In addition, the Board, including the Independent Directors, considers matters bearing on the Agreements at most of its other meetings throughout the year and regularly interviews various individuals at MetLife Advisers responsible for the management of the Portfolios. The Directors also interview selected investment managers and other professionals at the subadvisers at various times throughout the year.
The Directors receive all materials that they or MetLife Advisers, the Fund’s investment adviser, and the subadvisers believe to be reasonably necessary for the Directors to evaluate the Agreements and determine whether to approve the continuation of the Agreements. These materials generally include, among other items, (i) information on the investment performance of the Portfolios and the performance of peer groups of funds and the Portfolios’ performance benchmarks, (ii) information on the Portfolios’ advisory and subadvisory fees and other expenses, including information comparing the Portfolios’ expenses to those of peer groups of funds and information about any applicable expense caps and fee “breakpoints,” (iii) sales and redemption data, (iv) information related to the profitability of the Agreements to MetLife Advisers and the subadvisers, and potential “fall-out” or ancillary benefits that MetLife Advisers, the subadvisers or their affiliates may receive as a result of their relationships with the Fund and (v) information obtained through the subadvisers’ responses to certain requests from MetLife Advisers and the Directors and MetLife Advisers’ responses to requests from the Directors. The Directors may also consider other information such as (vi) MetLife Advisers’ and the subadvisers’ financial results and condition, (vii) each Portfolio’s investment objectives and strategies and the size, education and experience of the investment staffs of MetLife Advisers and the relevant subadvisers and their use of technology and external research, (viii) the allocation of the Portfolios’ brokerage, if any, including allocations to brokers affiliated with the subadvisers and the use of “soft” commission dollars to pay Portfolio expenses and to pay for research and other similar services, (ix) the resources devoted to, and the record of compliance with, the Portfolios’ investment policies and restrictions, policies on personal securities transactions and other compliance policies, (x) the responses of MetLife Advisers, the subadvisers and/or their affiliates to certain legal and regulatory proceedings and (xi) the economic outlook generally and for the mutual fund industry in particular. Throughout the process, the Directors have the opportunity to ask questions of and request additional materials from MetLife Advisers and the subadvisers.
Following meetings of each Contract Review Committee on September 12, 2007, the Board, at its November 15, 2007 meeting, approved the continuation through December 31, 2008 of the Advisory Agreements for each Portfolio of the Fund and the Subadvisory Agreements for each Portfolio of the Fund. The Agreements approved for continuation are referred to below as the “Continued Agreements.”
In considering whether to approve the continuation of the Continued Agreements, the Directors, including the Independent Directors, did not identify any single factor as determinative, and each weighed the various factors as he or she deemed appropriate. The Directors considered the following matters in connection with their approval of the Continued Agreements:
The nature, extent and quality of the services provided to the relevant Portfolios under the Continued Agreements. The Directors considered the nature, extent and quality of the services provided by MetLife Advisers, the relevant subadvisers (if any) and their affiliates (each, an “Adviser,” and, collectively, the “Advisers”) to the relevant Portfolios pursuant to the Continued Agreements and the resources dedicated to these Portfolios by the Advisers. In particular, the Directors considered the Advisers’ abilities to attract and retain highly qualified investment professionals. With respect to MetLife Advisers, the Directors considered (for each Portfolio other than Zenith Equity and the Asset Allocation Portfolios) that MetLife Advisers is (i) ultimately responsible for the performance of such Portfolios; (ii) ultimately responsible for the establishment of the investment strategies of each such Portfolio, primarily through its recommendations to the Board regarding the hiring and selection of subadvisers; (iii) responsible for the hiring and selection, subject to Board approval, of subadvisers; and (iv) responsible for maintaining a program of Subadviser oversight reasonably designed to ensure that the subadvisers have reasonable compliance policies and procedures in place. The Directors also considered that MetLife Advisers provides a full range of day-to-day administrative services for the Portfolios involving all aspects of such Portfolios’ day-to-day operations (other than portfolio management). With respect to Zenith Equity and the Asset Allocation Portfolios, the Directors considered both the portfolio management services and the administrative services provided by MetLife Advisers. After reviewing these and related factors, the Directors concluded, within the context of their overall conclusions regarding each of the Continued Agreements, that the nature, extent and quality of services provided supported the renewal of these Agreements.
MSF-17
Metropolitan Series Fund, Inc.
MetLife Moderate to Aggressive Allocation Portfolio
Board Approval of Advisory and Subadvisory Agreements—(Continued)
Investment performance of the relevant Portfolios. The Directors reviewed information about the performance of the relevant Portfolios over various time periods, including information prepared by an independent third party that compared the performance of the Portfolios to the performance of peer groups of funds and performance benchmarks. The Directors also reviewed a description of the third party’s methodology for identifying a Portfolio’s peer group(s) for purposes of performance and expense comparisons.
In the case of each relevant Portfolio that had performance that lagged its peer group(s) for certain periods, the Directors concluded that other factors relevant to performance were sufficient, in light of other considerations, to warrant renewal of the Continued Agreements relating to such Portfolio. These factors varied from Portfolio to Portfolio, but included one or more of the following: (i) that such Portfolio’s performance, although lagging in certain recent periods, was stronger over the longer term; (ii) that the underperformance was attributable, to a significant extent, to investment decisions that were reasonable and consistent with the Portfolio’s investment objective(s) and policies and that the Portfolio was performing within the range of reasonable expectations, given market conditions and the Portfolio’s investment objective(s) and policies; (iii) that the Portfolio’s performance was competitive when compared to other relevant performance benchmarks or peer groups; and (iv) that MetLife Advisers and/or the relevant subadviser (if any) had taken or was taking steps designed to help improve the Portfolio’s investment performance.
The Directors also considered the investment performance of the Advisers and their reputations generally, the historical responsiveness of the Advisers to Director concerns about performance and the willingness of the Advisers to take steps intended to improve performance.
After reviewing these and related factors, the Directors concluded, within the context of their overall conclusions regarding each of the Continued Agreements, that the investment performance of each relevant Portfolio and Adviser was sufficient, in light of other considerations, to warrant the renewal of the Continued Agreements.
The costs of the services to be provided and profits to be realized by the Advisers and their affiliates from their relationships with the Portfolios. The Directors considered the fees charged by MetLife Advisers to the Portfolios for advisory services and, with respect to the subadvised Portfolios, by such subadvisers to MetLife Advisers for subadvisory services (such advisory and subadvisory fees (if any), collectively, “Fees”), as well as the total expense levels of the Portfolios. This information included comparisons (provided by an independent third party) of the Portfolios’ advisory fees and total expense levels to those of their peer groups. In evaluating Fees for the relevant Portfolios, the Directors also took into account the demands, complexity and quality of the investment management services provided to each Portfolio. The Directors considered MetLife Advisers’ recommendations regarding reductions in Fee rates, implementation of Fee breakpoints and institution of Fee waivers and expense caps.
The Directors also considered the compensation directly or indirectly received by the Advisers and their affiliates from their relationships with the relevant Portfolios. The Directors reviewed information relating to the profits received by MetLife Advisers, certain of the subadvisers and their affiliates as a result of their relationships with the relevant Portfolios, and information about the allocation of expenses used to calculate profitability. When reviewing profitability, the Directors also considered the performance of the relevant Portfolios, the expense levels of such Portfolios and whether the relevant Advisers had implemented breakpoints, fee waivers and/or expense caps with respect to such Portfolios.
After reviewing these and related factors, the Directors concluded, within the context of their overall conclusions regarding each of the Continued Agreements, that the Fees charged to each of the relevant Portfolios were fair and reasonable, and that the information provided regarding costs of these services generally, and the related profitability (if known) to the relevant Advisers of their relationships with the relevant Portfolios, supported the renewal of the Continued Agreements.
Economies of Scale. The Directors considered the existence of any economies of scale in the provision of services by the Advisers and whether those economies were shared with the relevant Portfolios through breakpoints in their advisory fees or other means, such as expense caps, fee waivers or relatively low levels of fees. The Directors noted that most of the relevant Portfolios benefited or will benefit from breakpoints, expense caps and/or fee waivers with respect to their advisory fees. In considering these issues, the Directors also took into consideration information relating to the costs of the services provided and the profitability to MetLife Advisers, the relevant subadvisers (if any) and each of their affiliates of their relationships with the relevant Portfolios, as discussed above.
After reviewing these and related factors, the Directors concluded, within the context of their overall conclusions regarding each of the Continued Agreements, that the extent to which economies of scale were shared with the relevant Portfolios supported the renewal of such Agreements.
MSF-18
Metropolitan Series Fund, Inc.
MetLife Moderate to Aggressive Allocation Portfolio
Board Approval of Advisory and Subadvisory Agreements—(Continued)
Other Factors. The Directors also considered other factors, which included but were not limited to the following:
| | • | | the extent to which each relevant Portfolio operated in accordance with its investment objective, and its record of compliance with its investment restrictions and the compliance programs of the Fund and the Advisers. They also considered the compliance-related resources the Advisers and their affiliates provide to the relevant Portfolios; |
| | • | | the nature, quality, cost and extent of administrative and shareholder services performed by MetLife Advisers and its affiliates under the Advisory Agreements; and |
| | • | | so-called “fall-out benefits” to the Advisers, such as the engagement of their affiliates to provide distribution, brokerage and transfer agency services to the Portfolios, and the benefits of research made available to the relevant Advisers by reason of brokerage commissions generated by the relevant Portfolios’ securities transactions. The Directors also considered the possible conflicts of interest associated with these fall-out and other benefits, and the reporting and other processes in place to disclose and monitor these possible conflicts of interest. |
Based on their evaluation of all factors that they deemed to be material, including those factors described above, and assisted by the advice of independent counsel, the Directors, including the Independent Directors, concluded that each of the Continued Agreements should be continued through December 31, 2008.
Certain Matters Relating to Julius Baer International Stock Portfolio (formerly known as the FI International Stock Portfolio) (the “International Stock Portfolio”). At the November 15, 2007 Board meeting, the Board approved a change of subadviser for the International Stock Portfolio from Fidelity Management & Research Company (“FMR”) to Julius Baer Investment Management LLC (“Julius Baer”).
In making the determination to approve the change in subadviser for the International Stock Portfolio, the Board carefully considered those factors described above with respect to the continuation of the Continued Agreements, as relevant to both the existing Subadvisory Agreement with FMR and the proposed Subadvisory Agreement with Julius Baer. In addition to these factors, the Board also considered as relevant:
| | • | | the experience, investment style and investment performance history of Julius Baer as portfolio manager; |
| | • | | that the form of the proposed Subadvisory Agreement with Julius Baer was substantially similar to the International Stock Portfolio’s existing Subadvisory Agreement with FMR; |
| | • | | that the subadvisory fee schedule for Julius Baer set forth in the proposed Subadvisory Agreement was lower than the fee schedule in the existing Subadvisory Agreement and that MetLife Advisers had agreed to reduce its advisory fee, through a contractual fee waiver, by an amount corresponding to such savings; |
| | • | | the expected transition costs of the change of subadviser; and |
| | • | | that the preferred date of the change of subadviser was January 7, 2008 and the desirability, in order to facilitate an orderly transition of subadvising functions, of extending the existing Subadvisory Agreement with FMR from its scheduled expiration date of December 31, 2007 until January 7, 2008. |
Following such consideration, and assisted by the advice of independent counsel, the Directors, including the Independent Directors, unanimously voted to approve the continuation of the existing Subadvisory Agreement relating to the International Stock Portfolio through January 7, 2008 and to approve the proposed Subadvisory Agreement relating to such Portfolio with Julius Baer, effective January 7, 2008 through January 6, 2010.
MSF-19
A description of the policies and procedures that the Fund uses to determine how to vote proxies relating to portfolio securities is available (i) without charge, upon request, by calling (800) 638-7732 and (ii) on the Securities and Exchange Commission’s (the “SEC”) website at http://www.sec.gov.
Information regarding how the Fund voted proxies relating to portfolio securities during the most recent twelve-month period ended December 31, 2007 is available (i) without charge, upon request, by calling (800) 638-7732 and (ii) on the SEC’s website at http://www.sec.gov.
The Fund files with the SEC a complete schedule of its portfolio holdings, as of the close of the first and third quarters of its fiscal year, on “Form N-Q”. These filings are available on the SEC’s website at www.sec.gov and may be reviewed and copied at the SEC’s Public Reference Room in Washington, DC. (Call 1-800-SEC-0330 for information on the operation of the Public Reference Room.)
MSF-20
| | |
Metropolitan Series Fund, Inc. MetLife Stock Index Portfolio Annual Report | | December 31, 2007 |
Letter from the President
February 1, 2008
Letter to Policy Holders:
2007 was a tumultuous year in the financial markets driven by concerns in the credit markets surrounding sub-prime mortgages and fears of recession in the U.S. Economy. The broad markets were mixed, with the Dow Jones Industrial Average up 8.9% and the MSCI EAFE Index, which measures the performance of international equities, up 11.2% for the year, while the Russell 2000 Index, which measures the performance of small capitalization stocks, was down 1.6%.
In the fixed income markets, credit spreads increased as a result of the pressure from sub-prime mortgage crisis and the Federal Reserve lowered interest rates by a total of 1% during the year. The Lehman Brothers Aggregate Bond Index posted a 7.0% return for the year.
On the following pages, you will find a complete review of your Portfolio and its investment performance.
MetLife is committed to building your financial freedom. We appreciate your trust and will continue to focus our efforts on meeting your investment needs.
Sincerely,
Elizabeth Forget
President, Metropolitan Series Fund, Inc.
Metropolitan Series Fund, Inc.
MetLife Stock Index Portfolio
Managed by MetLife Investment Advisors Company, LLC
Portfolio Manager Commentary*
PORTFOLIO PERFORMANCE
For the year ended December 31, 2007, the Class A shares of the MetLife Stock Index Portfolio returned 5.2%, compared to its benchmark, the Standard & Poor’s 500 Index1, which returned 5.5%. The average return of its peer group, the Lipper Variable Insurance Products S&P 500 Index Funds Universe2, was 5.1% over the same period.
PORTFOLIO REVIEW
The S&P 500 Index had a positive annual return for the fifth consecutive year. Over the five-year period ending December 31, 2007, the S&P 500 Index returned 12.8% annualized. During the first half of 2007, the S&P 500 returned 7.0% despite mixed earnings and macroeconomic reports. However, during the second half of 2007, the S&P 500 returned -1.4%. This second half decline was largely attributable to the subprime mortgage crisis. The subprime contagion contributed to the weakening housing market, a liquidity crisis, lender bankruptcies, and large write-downs at several major financial institutions. During the first half of 2007, the Federal Reserve maintained the Fed Funds Rate at 5.25%. However, during the second half of 2007, the Federal Reserve began lowering the Fed Funds Rate, dropping the target by 100 basis points to 4.25% at year-end. The Federal Reserve lowered the Fed Funds Rate primarily due to concerns that the risk of slower economic growth outweighed the risk of inflation. The price of oil surged from $61 to $96 per barrel through December, up 57% from the beginning of the year. Increasing global demand, weakness in refinery utilization, and global geopolitical unrest contributed to supply concerns, increasing oil prices over the period. Some of the factors driving the equity markets included geopolitical concerns, energy prices, Federal Reserve interest rate policy, corporate earnings, and unemployment rates.
Eight of the ten sectors comprising the S&P 500 Index experienced positive returns for the year. The Energy sector, which had a beginning-of-year weight of 9.9%, was the best-performing sector, up 34.4%, and had the largest positive impact on the benchmark return. The next best-performing sectors were Materials (3.0% beginning weight), Utilities (3.5% beginning weight), and Information Technology (15.1% beginning weight) returning 22.5%, 19.4% and 16.3%, respectively. The two sectors with negative returns this year were Financials (the largest sector with a beginning weight of 22.2%) and Consumer Discretionary (10.6% beginning weight), down 18.6% and 13.3%, respectively.
The stocks with the largest positive impact on the benchmark return for the year were Apple, up 133.5%; Google, up 50.2%; and Exxon Mobil, up 24.3%. The best performing stock on an absolute basis was National-Oilwell Varco, up 140.1%, but the impact was small due to its small size. The stocks with the largest negative impact were Citigroup, down 44.7%; Merrill Lynch, down 41.3%; and Bank of America, down 18.9%. The worst performing stock was E*Trade Financial, down 84.2%. There were forty-one additions and forty-one deletions to the benchmark in 2007, compared to thirty-three additions and thirty-three deletions in 2006.
* The views expressed above are those of the subadvisory firm as of December 31, 2007 and are subject to change based on market and other conditions. Information about the Portfolio’s holdings, asset allocation, industry allocation, or country diversification is historical and is not an indication of future Portfolio composition, which will vary. The performance of any index mentioned in this commentary has not been adjusted for ongoing management, distribution and operating expenses, and sales charges applicable to mutual fund investments. Direct investment in the Index is not possible.
1 The Standard & Poor’s (S&P) 500® Index is an unmanaged index representing the performance of 500 major companies, most of which are listed on the New York Stock Exchange.
2 The Lipper Variable Insurance Products Fund Average is an average of the total return performance (calculated on the basis of net asset value) of variable product funds with similar investment objectives to those of the subject Portfolio as calculated by Lipper Analytical Services, an independent mutual fund ranking service.
MSF-2
Metropolitan Series Fund, Inc.
MetLife Stock Index Portfolio
A $10,000 INVESTMENT COMPARED TO
THE S&P 500 INDEX
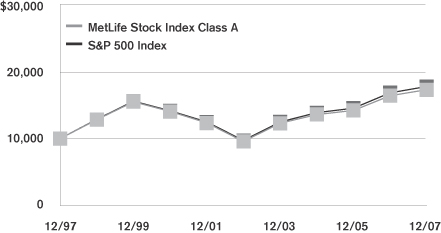
Average Annual Returns as of December 31, 2007
| | | | | | | | | | | | |
| | | MetLife Stock Index Portfolio | | | S&P 500
Index | |
| | | Class A | | | Class B | | | Class E | | |
| 1 Year | | 5.2 | % | | 5.0 | % | | 5.1 | % | | 5.5 | % |
| 5 Year | | 12.5 | | | 12.2 | | | 12.3 | | | 12.8 | |
| 10 Year | | 5.6 | | | — | | | — | | | 5.9 | |
| Since Inception | | — | | | 3.2 | | | 3.6 | | | — | |
Performance numbers are net of all Portfolio expenses but do not include any insurance, sales, or administrative charges of variable annuity or life insurance contracts. If these charges were included, the returns would be lower.
Inception dates of the Class A, Class B and Class E shares are: 5/1/90, 1/2/01 and 5/1/01, respectively.
This information represents past performance and is not indicative of future results. Investment return and principal value may fluctuate so that shares, upon redemption, may be worth more or less than the original cost.
PORTFOLIO COMPOSITION
as of December 31, 2007
Top Holdings
| | |
| | | % of Total
Net Assets |
Exxon Mobil Corp. | | 3.9% |
General Electric Co. | | 2.9% |
Microsoft Corp. | | 2.2% |
AT&T, Inc. | | 1.9% |
Procter & Gamble Co. | | 1.8% |
Chevron Corp. | | 1.5% |
Johnson & Johnson | | 1.5% |
Bank of America Corp. | | 1.4% |
Apple, Inc. | | 1.3% |
Cisco Systems, Inc. | | 1.3% |
Top Sectors
| | |
| | | % of Equity
Market Value |
Financials | | 17.6% |
Information Technology | | 16.8% |
Energy | | 12.9% |
Health Care | | 12.0% |
Industrials | | 11.5% |
Consumer Staples | | 10.2% |
Consumer Discretionary | | 8.5% |
Telecomm Services | | 3.6% |
Utilities | | 3.6% |
Materials | | 3.3% |
MSF-3
Metropolitan Series Fund, Inc.
Shareholder Expense Example
As a shareholder of the Portfolio, you incur ongoing costs, including management fees; distribution and service (12b-1) fees; and other Portfolio expenses. This example is intended to help you understand your ongoing costs (in dollars) (referred to as “expenses”) of investing in the Portfolio and compare these costs with the ongoing costs of investing in other mutual funds. The example is based on an investment of $1,000 invested at the beginning of the period and held for the entire period, July 1, 2007 through December 31, 2007.
Actual Expenses
The first line for each share class of the Portfolio in the table below provides information about actual account values and actual expenses. You may use the information in this line, together with the amount you invested in the particular share class of the Portfolio, to estimate the expenses that you paid over the period. Simply divide your account value by $1,000 (for example, an $8,600 account value divided by $1,000=8.6), then multiply the result by the number in the first line under the heading entitled “Expenses Paid During Period” to estimate the expenses you paid on your account during this period.
Hypothetical Example for Comparison Purposes
The second line for each share class of the Portfolio in the table below provides information about hypothetical account values and hypothetical expenses based on the Portfolio’s actual expense ratio and an assumed rate of return of 5% per year before expenses, which is not the Portfolio’s actual return. The hypothetical account values and expenses may not be used to estimate the actual ending account balance or expenses you paid for the period. You may use this information to compare the ongoing costs of investing in the Portfolio and other funds. To do so, compare this 5% hypothetical example with the 5% hypothetical examples that appear in the shareholder reports of the other funds.
Please note that the expenses shown in the table are meant to highlight your ongoing costs only and do not reflect any fees or charges of your variable insurance product or any additional expenses that participants in certain eligible qualified plans may bear relating to the operations of their plan. Therefore, the second line for each share class in the table is useful in comparing ongoing costs only, and will not help you determine the relative total costs of owning different funds. In addition, if these other costs were included, your costs would have been higher.
| | | | | | | | | | | | | | |
Portfolio | | | | Annualized
Expense
Ratio | | | Beginning
Account Value
July 1,
2007 | | Ending
Account Value
December 31,
2007 | | Expenses Paid
During Period*
July 1, 2007
to
December 31,
2007 |
MetLife Stock Index—Class A(a) | | Actual | | 0.28 | % | | $ | 1,000.00 | | $ | 985.10 | | $ | 1.40 |
| | Hypothetical | | 0.28 | % | | $ | 1,000.00 | | $ | 1,023.78 | | $ | 1.43 |
| | | | | |
MetLife Stock Index—Class B(a) | | Actual | | 0.53 | % | | $ | 1,000.00 | | $ | 984.20 | | $ | 2.65 |
| | Hypothetical | | 0.53 | % | | $ | 1,000.00 | | $ | 1,022.50 | | $ | 2.70 |
| | | | | |
MetLife Stock Index—Class E(a) | | Actual | | 0.43 | % | | $ | 1,000.00 | | $ | 984.20 | | $ | 2.15 |
| | Hypothetical | | 0.43 | % | | $ | 1,000.00 | | $ | 1,023.02 | | $ | 2.19 |
* Expenses paid are equal to the Portfolio’s annualized expense ratio for the most recent six month period, as shown above, multiplied by the average account value over the period, multiplied by the number of days in the most recent fiscal half-year, divided by 365 (to reflect the one-half year period).
(a) The annualized expense ratio shown reflects the impact of the management fee waiver as described in Note 4 to the Financial Statements.
MSF-4
Metropolitan Series Fund, Inc.
MetLife Stock Index Portfolio
Schedule of Investments as of December 31, 2007
Common Stock—99.6% of Total Net Assets
| | | | | |
| Security Description | | Shares | | Value* |
| | | | | |
| | | | | |
| | |
Aerospace & Defense—2.8% | | | | | |
Boeing Co. | | 365,531 | | $ | 31,969,341 |
General Dynamics Corp. | | 189,763 | | | 16,887,009 |
Goodrich Corp. | | 58,914 | | | 4,159,917 |
Honeywell International, Inc. | | 352,187 | | | 21,684,154 |
L-3 Communications Holdings, Inc. | | 59,315 | | | 6,283,831 |
Lockheed Martin Corp. | | 163,672 | | | 17,228,115 |
Northrop Grumman Corp. | | 159,576 | | | 12,549,057 |
Precision Castparts Corp. | | 65,142 | | | 9,035,195 |
Raytheon Co. | | 202,467 | | | 12,289,747 |
Rockwell Collins, Inc. | | 76,834 | | | 5,529,743 |
United Technologies Corp. | | 466,194 | | | 35,682,489 |
| | | | | |
| | | | | 173,298,598 |
| | | | | |
| | |
Air Freight & Logistics—0.9% | | | | | |
C. H. Robinson Worldwide, Inc. | | 80,057 | | | 4,332,685 |
Expeditors International of Washington, Inc. | | 100,506 | | | 4,490,608 |
FedEx Corp. | | 145,854 | | | 13,005,801 |
United Parcel Service, Inc. (Class B) | | 495,592 | | | 35,048,266 |
| | | | | |
| | | | | 56,877,360 |
| | | | | |
| | |
Airlines—0.1% | | | | | |
Southwest Airlines Co. | | 346,182 | | | 4,223,420 |
| | | | | |
| | |
Auto Components—0.2% | | | | | |
Johnson Controls, Inc. | | 280,051 | | | 10,093,038 |
The Goodyear Tire & Rubber Co. (a) | | 113,111 | | | 3,191,992 |
| | | | | |
| | | | | 13,285,030 |
| | | | | |
| | |
Automobiles—0.3% | | | | | |
Ford Motor Co. (a) (b) | | 995,202 | | | 6,697,709 |
General Motors Corp. (a) | | 266,930 | | | 6,643,888 |
Harley-Davidson, Inc. (a) | | 113,877 | | | 5,319,195 |
| | | | | |
| | | | | 18,660,792 |
| | | | | |
| | |
Beverages—2.4% | | | | | |
Anheuser-Busch Cos., Inc. | | 346,088 | | | 18,114,246 |
Brown-Forman Corp. (Class B) | | 40,747 | | | 3,019,760 |
Coca-Cola Enterprises, Inc. | | 134,970 | | | 3,513,269 |
Constellation Brands, Inc. (a) (b) | | 91,437 | | | 2,161,571 |
Molson Coors Brewing Co. | | 64,452 | | | 3,327,012 |
Pepsi Bottling Group, Inc. | | 65,406 | | | 2,580,921 |
PepsiCo, Inc. | | 759,158 | | | 57,620,092 |
The Coca-Cola Co. | | 937,304 | | | 57,522,347 |
| | | | | |
| | | | | 147,859,218 |
| | | | | |
| | |
Biotechnology—1.1% | | | | | |
Amgen, Inc. (b) | | 512,947 | | | 23,821,259 |
Biogen Idec, Inc. (b) | | 138,357 | | | 7,875,280 |
Celgene Corp. (b) | | 181,977 | | | 8,409,157 |
Genzyme Corp. (b) | | 125,438 | | | 9,337,605 |
Gilead Sciences, Inc. (b) | | 438,965 | | | 20,196,780 |
| | | | | |
| | | | | 69,640,081 |
| | | | | |
| | | | | |
| Security Description | | Shares | | Value* |
| | | | | |
| | |
Building Products—0.1% | | | | | |
Masco Corp. | | 173,931 | | $ | 3,758,649 |
Trane, Inc. | | 80,839 | | | 3,775,990 |
| | | | | |
| | | | | 7,534,639 |
| | | | | |
| | |
Capital Markets—3.3% | | | | | |
American Capital Strategies, Ltd. (a) | | 90,421 | | | 2,980,276 |
Ameriprise Financial, Inc. | | 109,366 | | | 6,027,160 |
E*TRADE Financial Corp. (a) (b) | | 199,848 | | | 709,460 |
Federated Investors, Inc. (Class B) | | 40,781 | | | 1,678,546 |
Franklin Resources, Inc. | | 76,265 | | | 8,727,004 |
Janus Capital Group, Inc. (a) | | 72,355 | | | 2,376,862 |
Legg Mason, Inc. | | 63,327 | | | 4,632,370 |
Lehman Brothers Holdings, Inc. | | 249,974 | | | 16,358,299 |
Merrill Lynch & Co., Inc. | | 403,716 | | | 21,671,475 |
Morgan Stanley | | 500,490 | | | 26,581,024 |
Northern Trust Corp. | | 90,243 | | | 6,910,809 |
State Street Corp. | | 182,140 | | | 14,789,768 |
T. Rowe Price Group, Inc. | | 124,532 | | | 7,581,508 |
The Bank of New York Mellon Corp. | | 537,018 | | | 26,184,998 |
The Bear Stearns Co., Inc. (a) | | 54,453 | | | 4,805,477 |
The Charles Schwab Corp. | | 441,769 | | | 11,287,198 |
The Goldman Sachs Group, Inc. | | 187,549 | | | 40,332,412 |
| | | | | |
| | | | | 203,634,646 |
| | | | | |
| | |
Chemicals—1.8% | | | | | |
Air Products & Chemicals, Inc. | | 101,580 | | | 10,018,835 |
Ashland, Inc. | | 26,418 | | | 1,253,006 |
E. I. du Pont de Nemours & Co. | | 424,003 | | | 18,694,292 |
Eastman Chemical Co. | | 38,214 | | | 2,334,493 |
Ecolab, Inc. | | 82,378 | | | 4,218,577 |
Hercules, Inc. | | 54,533 | | | 1,055,214 |
International Flavors & Fragrances, Inc. | | 38,358 | | | 1,846,171 |
Monsanto Co. | | 257,884 | | | 28,803,064 |
PPG Industries, Inc. | | 77,224 | | | 5,423,442 |
Praxair, Inc. | | 148,988 | | | 13,216,725 |
Rohm & Haas Co. (a) | | 59,099 | | | 3,136,384 |
Sigma-Aldrich Corp. | | 61,320 | | | 3,348,072 |
The Dow Chemical Co. | | 445,391 | | | 17,557,313 |
| | | | | |
| | | | | 110,905,588 |
| | | | | |
| | |
Commercial Banks—3.0% | | | | | |
BB&T Corp. (a) | | 259,131 | | | 7,947,548 |
Comerica, Inc. | | 71,222 | | | 3,100,294 |
Commerce Bancorp, Inc. | | 91,884 | | | 3,504,456 |
Fifth Third Bancorp | | 251,205 | | | 6,312,782 |
First Horizon National Corp. (a) | | 59,606 | | | 1,081,849 |
Huntington Bancshares, Inc. (a) | | 172,562 | | | 2,547,015 |
KeyCorp. | | 183,348 | | | 4,299,511 |
M&T Bank Corp. | | 35,242 | | | 2,874,690 |
Marshall & Ilsley Corp. (a) | | 121,349 | | | 3,213,322 |
National City Corp. (a) | | 298,816 | | | 4,918,511 |
PNC Financial Services Group, Inc. | | 164,859 | | | 10,822,993 |
Regions Financial Corp. (a) | | 327,816 | | | 7,752,848 |
SunTrust Banks, Inc. | | 164,711 | | | 10,292,790 |
U.S. Bancorp | | 814,317 | | | 25,846,422 |
*See accompanying notes to financial statements.
MSF-5
Metropolitan Series Fund, Inc.
MetLife Stock Index Portfolio
Schedule of Investments as of December 31, 2007
Common Stock—(Continued)
| | | | | |
| Security Description | | Shares | | Value* |
| | | | | |
| | |
Commercial Banks—(Continued) | | | | | |
Wachovia Corp. | | 931,642 | | $ | 35,430,345 |
Wells Fargo & Co. | | 1,591,402 | | | 48,044,426 |
Zions Bancorp | | 50,950 | | | 2,378,855 |
| | | | | |
| | | | | 180,368,657 |
| | | | | |
| | |
Commercial Services & Supplies—0.5% | | | | | |
Allied Waste Industries, Inc. (b) | | 136,549 | | | 1,504,770 |
Avery Dennison Corp. | | 50,218 | | | 2,668,584 |
Cintas Corp. | | 63,684 | | | 2,141,056 |
Equifax, Inc. (a) | | 62,177 | | | 2,260,756 |
Monster Worldwide, Inc. (b) | | 60,329 | | | 1,954,660 |
Pitney Bowes, Inc. | | 102,287 | | | 3,890,997 |
R.R. Donnelley & Sons Co. | | 101,208 | | | 3,819,590 |
Robert Half International, Inc. | | 75,959 | | | 2,053,931 |
Waste Management, Inc. | | 239,743 | | | 7,832,404 |
| | | | | |
| | | | | 28,126,748 |
| | | | | |
| | |
Communications Equipment—2.5% | | | | | |
Ciena Corp. (a) (b) | | 40,542 | | | 1,382,888 |
Cisco Systems, Inc. (b) | | 2,861,265 | | | 77,454,443 |
Corning, Inc. (b) | | 743,185 | | | 17,829,008 |
JDS Uniphase Corp. (a) (b) | | 103,505 | | | 1,376,616 |
Juniper Networks, Inc. (b) | | 245,993 | | | 8,166,968 |
Motorola, Inc. | | 1,077,317 | | | 17,280,165 |
QUALCOMM, Inc. | | 771,790 | | | 30,369,936 |
Tellabs, Inc. (a) (b) | | 207,116 | | | 1,354,539 |
| | | | | |
| | | | | 155,214,563 |
| | | | | |
| | |
Computers & Peripherals—4.5% | | | | | |
Apple, Inc. (b) | | 412,917 | | | 81,790,599 |
Dell, Inc. (b) | | 1,056,880 | | | 25,904,129 |
EMC Corp. (b) | | 989,552 | | | 18,336,399 |
Hewlett-Packard Co. | | 1,215,850 | | | 61,376,108 |
International Business Machines Corp. | | 649,863 | | | 70,250,190 |
Lexmark International, Inc. (Class A) (a) (b) | | 44,672 | | | 1,557,266 |
Network Appliance, Inc. (b) | | 162,325 | | | 4,051,632 |
QLogic Corp. (b) | | 64,556 | | | 916,695 |
SanDisk Corp. (a) (b) | | 107,628 | | | 3,570,021 |
Sun Microsystems, Inc. (b) | | 390,770 | | | 7,084,660 |
Teradata Corp. (b) | | 85,362 | | | 2,339,772 |
| | | | | |
| | | | | 277,177,471 |
| | | | | |
| | |
Construction & Engineering—0.2% | | | | | |
Fluor Corp. | | 41,703 | | | 6,076,961 |
Jacobs Engineering Group, Inc. | | 56,983 | | | 5,448,145 |
| | | | | |
| | | | | 11,525,106 |
| | | | | |
| | |
Construction Materials—0.1% | | | | | |
Vulcan Materials Co. (a) | | 51,027 | | | 4,035,725 |
| | | | | |
| | |
Consumer Finance—0.8% | | | | | |
American Express Co. | | 551,517 | | | 28,689,914 |
Capital One Financial Corp. | | 184,307 | | | 8,710,349 |
Discover Financial Services | | 225,221 | | | 3,396,333 |
| | | | | |
| Security Description | | Shares | | Value* |
| | | | | |
| | |
Consumer Finance—(Continued) | | | | | |
SLM Corp. | | 243,248 | | $ | 4,899,015 |
| | | | | |
| | | | | 45,695,611 |
| | | | | |
| | |
Containers & Packaging—0.1% | | | | | |
Ball Corp. | | 47,397 | | | 2,132,865 |
Bemis Co., Inc. (a) | | 47,405 | | | 1,297,949 |
Pactiv Corp. (b) | | 61,537 | | | 1,638,730 |
Sealed Air Corp. | | 76,176 | | | 1,762,713 |
| | | | | |
| | | | | 6,832,257 |
| | | | | |
| | |
Distributors—0.1% | | | | | |
Genuine Parts Co. | | 79,184 | | | 3,666,219 |
| | | | | |
| | |
Diversified Consumer Services—0.1% | | | | | |
Apollo Group, Inc. (Class A) (b) | | 64,501 | | | 4,524,745 |
H&R Block, Inc. | | 153,290 | | | 2,846,595 |
| | | | | |
| | | | | 7,371,340 |
| | | | | |
|
Diversified Financial Services—4.4% |
Bank of America Corp. | | 2,093,172 | | | 86,364,277 |
CIT Group, Inc. | | 89,431 | | | 2,149,027 |
Citigroup, Inc. | | 2,354,439 | | | 69,314,684 |
CME Group, Inc. | | 25,829 | | | 17,718,694 |
IntercontinentalExchange, Inc. (b) | | 32,807 | | | 6,315,347 |
JPMorgan Chase & Co. | | 1,584,172 | | | 69,149,108 |
Leucadia National Corp. (a) | | 79,748 | | | 3,756,131 |
Moody’s Corp. (a) | | 101,148 | | | 3,610,984 |
NYSE Euronext | | 124,978 | | | 10,969,319 |
| | | | | |
| | | | | 269,347,571 |
| | | | | |
|
Diversified Telecommunication Services—3.2% |
AT&T, Inc. | | 2,860,224 | | | 118,870,909 |
CenturyTel, Inc. | | 52,058 | | | 2,158,325 |
Citizens Communications Co. (a) | | 154,583 | | | 1,967,842 |
Embarq Corp. | | 72,067 | | | 3,569,479 |
Qwest Communications International, Inc. (a) | | 740,538 | | | 5,191,171 |
Verizon Communications, Inc. | | 1,363,118 | | | 59,554,625 |
Windstream Corp. | | 225,011 | | | 2,929,643 |
| | | | | |
| | | | | 194,241,994 |
| | | | | |
|
Electric Utilities—1.9% |
Allegheny Energy, Inc. (b) | | 78,400 | | | 4,987,024 |
American Electric Power Co., Inc. | | 188,648 | | | 8,783,451 |
Edison International | | 153,657 | | | 8,200,674 |
Entergy Corp. | | 91,671 | | | 10,956,518 |
Exelon Corp. | | 311,250 | | | 25,410,450 |
FirstEnergy Corp. | | 143,765 | | | 10,399,960 |
FPL Group, Inc. | | 191,984 | | | 13,012,676 |
Pepco Holdings, Inc. | | 94,449 | | | 2,770,189 |
Pinnacle West Capital Corp. | | 47,343 | | | 2,007,817 |
PPL Corp. | | 175,533 | | | 9,143,514 |
Progress Energy, Inc. | | 122,243 | | | 5,920,228 |
The Southern Co. | | 358,181 | | | 13,879,514 |
| | | | | |
| | | | | 115,472,015 |
| | | | | |
*See accompanying notes to financial statements.
MSF-6
Metropolitan Series Fund, Inc.
MetLife Stock Index Portfolio
Schedule of Investments as of December 31, 2007
Common Stock—(Continued)
| | | | | |
| Security Description | | Shares | | Value* |
| | | | | |
|
Electrical Equipment—0.5% |
Cooper Industries, Ltd. (Class A) | | 84,924 | | $ | 4,490,781 |
Emerson Electric Co. | | 371,268 | | | 21,036,045 |
Rockwell Automation, Inc. | | 70,377 | | | 4,853,198 |
| | | | | |
| | | | | 30,380,024 |
| | | | | |
|
Electronic Equipment & Instruments—0.3% |
Agilent Technologies, Inc. (b) | | 182,301 | | | 6,697,738 |
Jabil Circuit, Inc. | | 98,129 | | | 1,498,430 |
Molex, Inc. | | 66,763 | | | 1,822,630 |
Tyco Electronics, Ltd. | | 234,483 | | | 8,706,354 |
| | | | | |
| | | | | 18,725,152 |
| | | | | |
|
Energy Equipment & Services—2.5% |
Baker Hughes, Inc. | | 150,061 | | | 12,169,947 |
BJ Services Co. | | 138,100 | | | 3,350,306 |
ENSCO International, Inc. (a) | | 68,322 | | | 4,073,358 |
Halliburton Co. | | 415,564 | | | 15,754,031 |
Nabors Industries, Ltd. (b) | | 133,570 | | | 3,658,483 |
National Oilwell Varco, Inc. (b) | | 168,207 | | | 12,356,486 |
Noble Corp. | | 126,414 | | | 7,143,655 |
Rowan Cos., Inc. (a) (b) | | 52,483 | | | 2,070,979 |
Schlumberger, Ltd. | | 563,988 | | | 55,479,500 |
Smith International, Inc. (b) | | 94,472 | | | 6,976,757 |
Transocean, Inc. | | 149,974 | | | 21,468,717 |
Weatherford International, Ltd. (b) | | 159,067 | | | 10,911,996 |
| | | | | |
| | | | | 155,414,215 |
| | | | | |
|
Food & Staples Retailing—2.4% |
Costco Wholesale Corp. | | 204,720 | | | 14,281,267 |
CVS Caremark Corp. | | 696,522 | | | 27,686,749 |
Safeway, Inc. | | 208,642 | | | 7,137,643 |
Supervalu, Inc. | | 99,701 | | | 3,740,782 |
Sysco Corp. | | 286,816 | | | 8,951,527 |
The Kroger Co. | | 321,249 | | | 8,580,561 |
Wal-Mart Stores, Inc. | | 1,114,347 | | | 52,964,913 |
Walgreen Co. | | 467,660 | | | 17,808,493 |
Whole Foods Market, Inc. (a) | | 65,721 | | | 2,681,417 |
| | | | | |
| | | | | 143,833,352 |
| | | | | |
|
Food Products—1.5% |
Archer-Daniels-Midland Co. | | 303,196 | | | 14,077,390 |
Campbell Soup Co. | | 104,928 | | | 3,749,077 |
ConAgra Foods, Inc. | | 229,796 | | | 5,466,847 |
Dean Foods Co. (a) (b) | | 62,067 | | | 1,605,053 |
General Mills, Inc. | | 159,239 | | | 9,076,623 |
H.J. Heinz Co. | | 149,463 | | | 6,976,933 |
Hershey Co. (a) | | 79,239 | | | 3,122,017 |
Kellogg Co. | | 124,468 | | | 6,525,857 |
Kraft Foods, Inc. (Class A) | | 729,678 | | | 23,809,393 |
McCormick & Co., Inc. | | 60,247 | | | 2,283,964 |
Sara Lee Corp. | | 341,538 | | | 5,485,100 |
Tyson Foods, Inc. (Class A) | | 129,142 | | | 1,979,747 |
Wm. Wrigley Jr., Co. | | 102,735 | | | 6,015,134 |
| | | | | |
| | | | | 90,173,135 |
| | | | | |
| | | | | |
| Security Description | | Shares | | Value* |
| | | | | |
|
Gas Utilities—0.1% |
Nicor, Inc. (a) | | 21,281 | | $ | 901,250 |
Questar Corp. | | 81,469 | | | 4,407,473 |
| | | | | |
| | | | | 5,308,723 |
| | | | | |
|
Health Care Equipment & Supplies—1.8% |
Applera Corp.—Applied Biosystems Group | | 79,318 | | | 2,690,467 |
Baxter International, Inc. | | 299,038 | | | 17,359,156 |
Becton, Dickinson & Co. | | 115,027 | | | 9,613,957 |
Boston Scientific Corp. (b) | | 632,767 | | | 7,359,080 |
C.R. Bard, Inc. | | 48,056 | | | 4,555,709 |
Covidien, Ltd. | | 234,812 | | | 10,399,823 |
Hospira, Inc. (b) | | 74,306 | | | 3,168,408 |
Medtronic, Inc. (a) | | 533,234 | | | 26,805,673 |
St. Jude Medical, Inc. (b) | | 161,459 | | | 6,561,694 |
Stryker Corp. | | 112,282 | | | 8,389,711 |
Varian Medical Systems, Inc. (b) | | 59,007 | | | 3,077,805 |
Zimmer Holdings, Inc. (b) | | 110,700 | | | 7,322,805 |
| | | | | |
| | | | | 107,304,288 |
| | | | | |
|
Health Care Providers & Services—2.4% |
Aetna, Inc. | | 235,996 | | | 13,624,049 |
AmerisourceBergen Corp. | | 79,213 | | | 3,554,287 |
Cardinal Health, Inc. | | 170,518 | | | 9,847,415 |
CIGNA Corp. | | 131,657 | | | 7,073,931 |
Coventry Health Care, Inc. (b) | | 73,044 | | | 4,327,857 |
Express Scripts, Inc. (b) | | 118,868 | | | 8,677,364 |
Humana, Inc. (b) | | 79,907 | | | 6,017,796 |
Laboratory Corp. of America Holdings (b) | | 54,330 | | | 4,103,545 |
McKesson Corp. | | 136,479 | | | 8,940,739 |
Medco Health Solutions, Inc. (b) | | 126,139 | | | 12,790,495 |
Patterson Cos., Inc. (b) | | 65,942 | | | 2,238,731 |
Quest Diagnostics, Inc. (a) | | 73,958 | | | 3,912,378 |
Tenet Healthcare Corp. (a) (b) | | 223,591 | | | 1,135,842 |
UnitedHealth Group, Inc. | | 609,402 | | | 35,467,197 |
WellPoint, Inc. (b) | | 269,447 | | | 23,638,585 |
| | | | | |
| | | | | 145,350,211 |
| | | | | |
|
Health Care Technology—0.0% |
IMS Health, Inc. | | 91,489 | | | 2,107,907 |
| | | | | |
|
Hotels, Restaurants & Leisure—1.4% |
Carnival Corp. | | 206,000 | | | 9,164,940 |
Darden Restaurants, Inc. | | 66,919 | | | 1,854,325 |
Harrah’s Entertainment, Inc. | | 88,465 | | | 7,851,269 |
International Game Technology | | 148,747 | | | 6,534,456 |
Marriott International, Inc. | | 147,425 | | | 5,038,986 |
McDonald’s Corp. | | 557,805 | | | 32,860,292 |
Starbucks Corp. (b) | | 344,466 | | | 7,051,219 |
Starwood Hotels & Resorts Worldwide, Inc. (b) | | 93,919 | | | 4,135,254 |
Wendy’s International, Inc. | | 41,216 | | | 1,065,021 |
Wyndham Worldwide Corp. | | 83,910 | | | 1,976,920 |
Yum! Brands, Inc. | | 239,866 | | | 9,179,672 |
| | | | | |
| | | | | 86,712,354 |
| | | | | |
*See accompanying notes to financial statements.
MSF-7
Metropolitan Series Fund, Inc.
MetLife Stock Index Portfolio
Schedule of Investments as of December 31, 2007
Common Stock—(Continued)
| | | | | |
| Security Description | | Shares | | Value* |
| | | | | |
|
Household Durables—0.4% |
Black & Decker Corp. (a) | | 29,493 | | $ | 2,054,188 |
Centex Corp. (a) | | 57,330 | | | 1,448,156 |
D.R. Horton, Inc. (a) | | 130,726 | | | 1,721,661 |
Fortune Brands, Inc. | | 72,042 | | | 5,212,959 |
Harman International Industries, Inc. | | 28,521 | | | 2,102,283 |
KB Home (a) | | 36,326 | | | 784,642 |
Leggett & Platt, Inc. (a) | | 80,226 | | | 1,399,141 |
Lennar Corp. (Class A) (a) | | 65,732 | | | 1,175,946 |
Newell Rubbermaid, Inc. | | 131,721 | | | 3,408,940 |
Pulte Homes, Inc. (a) | | 100,219 | | | 1,056,308 |
Snap-On, Inc. | | 27,171 | | | 1,310,729 |
The Stanley Works (a) | | 38,757 | | | 1,878,939 |
Whirlpool Corp. (a) | | 36,453 | | | 2,975,658 |
| | | | | |
| | | | | 26,529,550 |
| | | | | |
|
Household Products—2.4% |
Colgate-Palmolive Co. | | 240,411 | | | 18,742,441 |
Kimberly-Clark Corp. | | 199,546 | | | 13,836,520 |
Procter & Gamble Co. | | 1,464,662 | | | 107,535,484 |
The Clorox Co. | | 65,321 | | | 4,256,970 |
| | | | | |
| | | | | 144,371,415 |
| | | | | |
|
Independent Power Producers & Energy Traders—0.3% |
Constellation Energy Group | | 85,199 | | | 8,735,454 |
Dynegy, Inc. (b) | | 233,810 | | | 1,669,403 |
The AES Corp. (b) | | 315,630 | | | 6,751,326 |
| | | | | |
| | | | | 17,156,183 |
| | | | | |
|
Industrial Conglomerates—3.7% |
3M Co. | | 336,369 | | | 28,362,634 |
General Electric Co. | | 4,766,228 | | | 176,684,072 |
Textron, Inc. | | 117,550 | | | 8,381,315 |
Tyco International, Ltd. | | 233,362 | | | 9,252,803 |
| | | | | |
| | | | | 222,680,824 |
| | | | | |
|
Insurance—4.3% |
ACE, Ltd. | | 155,437 | | | 9,602,898 |
Aflac, Inc. | | 230,060 | | | 14,408,658 |
AMBAC Financial Group, Inc. (a) | | 47,892 | | | 1,234,177 |
American International Group, Inc. | | 1,196,125 | | | 69,734,087 |
Aon Corp. | | 138,471 | | | 6,603,682 |
Assurant, Inc. (a) | | 45,042 | | | 3,013,310 |
Cincinnati Financial Corp. | | 78,287 | | | 3,095,468 |
Genworth Financial, Inc. (Class A) | | 206,870 | | | 5,264,842 |
Lincoln National Corp. | | 126,971 | | | 7,392,252 |
Loews Corp. | | 207,306 | | | 10,435,784 |
Marsh & McLennan Cos., Inc. | | 245,309 | | | 6,493,329 |
MBIA, Inc. (a) | | 59,226 | | | 1,103,380 |
MetLife, Inc. (c) | | 349,275 | | | 21,522,325 |
Principal Financial Group, Inc. | | 123,372 | | | 8,492,928 |
Prudential Financial, Inc. | | 214,113 | | | 19,921,074 |
SAFECO Corp. | | 44,591 | | | 2,482,827 |
The Allstate Corp. | | 269,158 | | | 14,058,122 |
The Chubb Corp. | | 180,997 | | | 9,878,816 |
The Hartford Financial Services Group, Inc. | | 148,014 | | | 12,905,341 |
| | | | | |
| Security Description | | Shares | | Value* |
| | | | | |
|
Insurance—(Continued) |
The Progressive Corp. | | 329,233 | | $ | 6,308,104 |
The Travelers Cos., Inc. | | 304,167 | | | 16,364,185 |
Torchmark Corp. | | 43,473 | | | 2,631,421 |
UnumProvident Corp. | | 170,172 | | | 4,048,392 |
XL Capital, Ltd. (Class A) | | 84,066 | | | 4,229,360 |
| | | | | |
| | | | | 261,224,762 |
| | | | | |
|
Internet & Catalog Retail—0.3% |
Amazon.com, Inc. (a) (b) | | 144,895 | | | 13,423,073 |
Expedia, Inc. (a) (b) | | 97,947 | | | 3,097,084 |
IAC/InterActiveCorp (b) | | 86,948 | | | 2,340,640 |
| | | | | |
| | | | | 18,860,797 |
| | | | | |
|
Internet Software & Services—1.9% |
Akamai Technologies, Inc. (a) (b) | | 78,365 | | | 2,711,429 |
eBay, Inc. (b) | | 536,208 | | | 17,796,744 |
Google, Inc. (Class A) (b) | | 109,180 | | | 75,495,786 |
VeriSign, Inc. (a) (b) | | 104,204 | | | 3,919,112 |
Yahoo!, Inc. (b) | | 630,285 | | | 14,660,429 |
| | | | | |
| | | | | 114,583,500 |
| | | | | |
|
IT Services—0.9% |
Affiliated Computer Services, Inc.
(Class A) (b) | | 47,392 | | | 2,137,379 |
Automatic Data Processing, Inc. | | 248,158 | | | 11,050,476 |
Cognizant Technology Solutions Corp. (Class A) (b) | | 136,938 | | | 4,647,676 |
Computer Sciences Corp. (a) (b) | | 82,057 | | | 4,059,360 |
Convergys Corp. (b) | | 61,422 | | | 1,011,006 |
Electronic Data Systems Corp. | | 241,509 | | | 5,006,481 |
Fidelity National Information Services, Inc. | | 80,499 | | | 3,347,953 |
Fiserv, Inc. (b) | | 77,645 | | | 4,308,521 |
Paychex, Inc. | | 157,282 | | | 5,696,754 |
The Western Union Co. | | 354,142 | | | 8,598,568 |
Total Systems Services, Inc. | | 93,338 | | | 2,613,464 |
Unisys Corp. (a) (b) | | 164,005 | | | 775,744 |
| | | | | |
| | | | | 53,253,382 |
| | | | | |
|
Leisure Equipment & Products—0.1% |
Brunswick Corp. (a) | | 41,471 | | | 707,081 |
Eastman Kodak Co. (a) | | 135,813 | | | 2,970,230 |
Hasbro, Inc. | | 69,361 | | | 1,774,255 |
Mattel, Inc. | | 173,009 | | | 3,294,091 |
| | | | | |
| | | | | 8,745,657 |
| | | | | |
|
Life Sciences Tools & Services—0.3% |
Millipore Corp. (a) (b) | | 25,739 | | | 1,883,580 |
PerkinElmer, Inc. | | 55,903 | | | 1,454,596 |
Thermo Fisher Scientific, Inc. (b) | | 198,988 | | | 11,477,628 |
Waters Corp. (b) | | 47,362 | | | 3,744,913 |
| | | | | |
| | | | | 18,560,717 |
| | | | | |
*See accompanying notes to financial statements.
MSF-8
Metropolitan Series Fund, Inc.
MetLife Stock Index Portfolio
Schedule of Investments as of December 31, 2007
Common Stock—(Continued)
| | | | | |
| Security Description | | Shares | | Value* |
| | | | | |
|
Machinery—1.9% |
Caterpillar, Inc. | | 299,928 | | $ | 21,762,776 |
Cummins, Inc. | | 48,165 | | | 6,134,776 |
Danaher Corp. | | 119,398 | | | 10,475,980 |
Deere & Co. | | 209,282 | | | 19,488,340 |
Dover Corp. | | 93,717 | | | 4,319,417 |
Eaton Corp. | | 69,092 | | | 6,698,469 |
Illinois Tool Works, Inc. | | 194,968 | | | 10,438,587 |
Ingersoll-Rand Co., Ltd. (Class A) | | 128,481 | | | 5,970,512 |
ITT Industries, Inc. | | 85,508 | | | 5,646,948 |
Paccar, Inc. (a) | | 173,706 | | | 9,463,503 |
Pall Corp. | | 57,819 | | | 2,331,262 |
Parker-Hannifin Corp. | | 79,335 | | | 5,974,719 |
Terex Corp. | | 48,388 | | | 3,172,801 |
The Manitowoc Co., Inc. | | 61,228 | | | 2,989,763 |
| | | | | |
| | | | | 114,867,853 |
| | | | | |
| | |
Media—2.8% | | | | | |
CBS Corp. (Class B) | | 323,075 | | | 8,803,794 |
Clear Channel Communications, Inc. | | 234,826 | | | 8,106,193 |
Comcast Corp. (Class A) (b) | | 1,449,350 | | | 26,465,131 |
E.W. Scripps Co. (Class A) (a) | | 42,252 | | | 1,901,763 |
Gannett Co., Inc. | | 109,481 | | | 4,269,759 |
Interpublic Group of Cos., Inc. (a) | | 222,309 | | | 1,802,926 |
Meredith Corp. | | 17,901 | | | 984,197 |
News Corp. (Class A) | | 1,090,957 | | | 22,353,709 |
Omnicom Group, Inc. | | 154,170 | | | 7,327,700 |
The DIRECTV Group, Inc. (b) | | 338,574 | | | 7,827,831 |
The McGraw-Hill Cos., Inc. | | 155,161 | | | 6,797,603 |
The New York Times Co. (Class A) (a) | | 67,842 | | | 1,189,270 |
The Walt Disney Co. | | 897,710 | | | 28,978,079 |
The Washington Post Co. (Class B) | | 2,735 | | | 2,164,561 |
Time Warner, Inc. | | 1,704,693 | | | 28,144,481 |
Viacom, Inc. (Class B) (b) | | 309,492 | | | 13,592,889 |
| | | | | |
| | | | | 170,709,886 |
| | | | | |
| | |
Metals & Mining—1.0% | | | | | |
Alcoa, Inc. | | 399,998 | | | 14,619,927 |
Allegheny Technologies, Inc. | | 48,227 | | | 4,166,813 |
Freeport-McMoRan Copper & Gold, Inc. | | 180,120 | | | 18,451,493 |
Newmont Mining Corp. | | 213,097 | | | 10,405,527 |
Nucor Corp. | | 135,790 | | | 8,041,484 |
Titanium Metals Corp. (a) | | 41,305 | | | 1,092,517 |
United States Steel Corp. | | 55,706 | | | 6,735,412 |
| | | | | |
| | | | | 63,513,173 |
| | | | | |
| | |
Multi-Utilities—1.3% | | | | | |
Ameren Corp. | | 98,100 | | | 5,318,001 |
CenterPoint Energy, Inc. | | 151,507 | | | 2,595,315 |
CMS Energy Corp. (a) | | 106,156 | | | 1,844,991 |
Consolidated Edison, Inc. (a) | | 128,051 | | | 6,255,291 |
Dominion Resources, Inc. | | 275,816 | | | 13,087,469 |
DTE Energy Co. | | 77,210 | | | 3,394,152 |
Duke Energy Holding Corp. | | 594,714 | | | 11,995,382 |
Integrys Energy Group, Inc. | | 35,967 | | | 1,859,134 |
NiSource, Inc. | | 129,303 | | | 2,442,534 |
PG&E Corp. | | 166,976 | | | 7,194,996 |
| | | | | |
| Security Description | | Shares | | Value* |
| | | | | |
| | |
Multi-Utilities—(Continued) | | | | | |
Public Service Enterprise Group, Inc. | | 119,938 | | $ | 11,782,709 |
Sempra Energy | | 123,285 | | | 7,628,876 |
TECO Energy, Inc. | | 99,358 | | | 1,709,951 |
Xcel Energy, Inc. (a) | | 198,044 | | | 4,469,853 |
| | | | | |
| | | | | 81,578,654 |
| | | | | |
| | |
Multiline Retail—0.7% | | | | | |
Big Lots, Inc. (a) (b) | | 42,637 | | | 681,766 |
Dillard’s, Inc. (Class A) (a) | | 26,941 | | | 505,952 |
Family Dollar Stores, Inc. (a) | | 66,249 | | | 1,273,968 |
J.C. Penney Co., Inc. | | 104,564 | | | 4,599,770 |
Kohl’s Corp. (b) | | 147,931 | | | 6,775,240 |
Macy’s, Inc. | | 204,203 | | | 5,282,732 |
Nordstrom, Inc. (a) | | 88,658 | | | 3,256,408 |
Sears Holdings Corp. (a) (b) | | 34,403 | | | 3,510,826 |
Target Corp. | | 391,838 | | | 19,591,900 |
| | | | | |
| | | | | 45,478,562 |
| | | | | |
| | |
Mutual Funds—0.2% | | | | | |
SPDR Trust | | 94,500 | | | 13,816,845 |
| | | | | |
| | |
Office Electronics—0.1% | | | | | |
Xerox Corp. | | 435,972 | | | 7,058,387 |
| | | | | |
| | |
Oil, Gas & Consumable Fuels—10.2% | | | | | |
Anadarko Petroleum Corp. | | 219,941 | | | 14,447,924 |
Apache Corp. | | 156,180 | | | 16,795,597 |
Chesapeake Energy Corp. (a) | | 214,215 | | | 8,397,228 |
Chevron Corp. | | 995,786 | | | 92,936,708 |
ConocoPhillips | | 754,373 | | | 66,611,136 |
Consol Energy, Inc. | | 85,573 | | | 6,120,181 |
Devon Energy Corp. | | 209,849 | | | 18,657,675 |
El Paso Corp. | | 330,358 | | | 5,695,372 |
EOG Resources, Inc. | | 116,013 | | | 10,354,160 |
Exxon Mobil Corp. | | 2,576,722 | | | 241,413,085 |
Hess Corp. | | 131,071 | | | 13,219,821 |
Marathon Oil Corp. | | 334,978 | | | 20,386,761 |
Murphy Oil Corp. | | 88,723 | | | 7,527,260 |
Noble Energy, Inc. | | 80,959 | | | 6,437,860 |
Occidental Petroleum Corp. | | 390,777 | | | 30,085,921 |
Peabody Energy Corp. | | 124,883 | | | 7,697,788 |
Range Resources Corp. | | 70,362 | | | 3,613,792 |
Spectra Energy Corp. | | 298,200 | | | 7,699,524 |
Sunoco, Inc. | | 55,453 | | | 4,017,015 |
Tesoro Corp. | | 64,603 | | | 3,081,563 |
The Williams Cos., Inc. | | 279,915 | | | 10,015,359 |
Valero Energy Corp. | | 259,593 | | | 18,179,298 |
XTO Energy, Inc. | | 228,048 | | | 11,712,545 |
| | | | | |
| | | | | 625,103,573 |
| | | | | |
| | |
Paper & Forest Products—0.3% | | | | | |
International Paper Co. (a) | | 201,915 | | | 6,538,008 |
MeadWestvaco Corp. (a) | | 87,128 | | | 2,727,106 |
Weyerhaeuser Co. | | 98,819 | | | 7,286,913 |
| | | | | |
| | | | | 16,552,027 |
| | | | | |
*See accompanying notes to financial statements.
MSF-9
Metropolitan Series Fund, Inc.
MetLife Stock Index Portfolio
Schedule of Investments as of December 31, 2007
Common Stock—(Continued)
| | | | | |
| Security Description | | Shares | | Value* |
| | | | | |
| | |
Personal Products—0.2% | | | | | |
Avon Products, Inc. | | 202,352 | | $ | 7,998,975 |
The Estee Lauder Cos., Inc. (Class A) | | 53,702 | | | 2,341,944 |
| | | | | |
| | | | | 10,340,919 |
| | | | | |
| | |
Pharmaceuticals—6.3% | | | | | |
Abbott Laboratories | | 728,772 | | | 40,920,548 |
Allergan, Inc. | | 144,772 | | | 9,300,153 |
Barr Pharmaceuticals, Inc. (b) | | 50,817 | | | 2,698,383 |
Bristol-Myers Squibb Co. | | 933,093 | | | 24,745,626 |
Eli Lilly & Co. | | 465,413 | | | 24,848,400 |
Forest Laboratories, Inc. (b) | | 147,076 | | | 5,360,920 |
Johnson & Johnson | | 1,349,641 | | | 90,021,054 |
King Pharmaceuticals, Inc. (b) | | 115,278 | | | 1,180,447 |
Merck & Co., Inc. | | 1,026,499 | | | 59,649,857 |
Mylan Laboratories, Inc. (a) | | 142,612 | | | 2,005,125 |
Pfizer, Inc. | | 3,221,030 | | | 73,214,012 |
Schering-Plough Corp. | | 763,883 | | | 20,349,843 |
Watson Pharmaceuticals, Inc. (b) | | 48,872 | | | 1,326,386 |
Wyeth | | 631,557 | | | 27,908,504 |
| | | | | |
| | | | | 383,529,258 |
| | | | | |
| | |
Real Estate Investment Trusts—1.0% | | | | | |
Apartment Investment & Management Co.
(Class A) (a) | | 45,078 | | | 1,565,559 |
AvalonBay Communities, Inc. | | 37,141 | | | 3,496,454 |
Boston Properties, Inc. | | 56,247 | | | 5,164,037 |
Developers Diversified Realty Corp. | | 57,942 | | | 2,218,599 |
Equity Residential | | 127,836 | | | 4,662,179 |
General Growth Properties, Inc. | | 114,985 | | | 4,735,082 |
Host Hotels & Resorts, Inc. | | 246,369 | | | 4,198,128 |
Kimco Realty Corp. (a) | | 119,181 | | | 4,338,188 |
Plum Creek Timber Co., Inc. | | 81,248 | | | 3,740,658 |
ProLogis | | 121,454 | | | 7,697,755 |
Public Storage, Inc. (a) | | 58,720 | | | 4,310,635 |
Simon Property Group, Inc. | | 105,173 | | | 9,135,327 |
Vornado Realty Trust | | 63,193 | | | 5,557,824 |
| | | | | |
| | | | | 60,820,425 |
| | | | | |
| |
Real Estate Management & Development—0.0% | | | |
CB Richard Ellis Group, Inc. (a) (b) | | 93,339 | | | 2,011,455 |
| | | | | |
| | |
Road & Rail—0.8% | | | | | |
Burlington Northern Santa Fe Corp. | | 140,558 | | | 11,698,642 |
CSX Corp. | | 198,278 | | | 8,720,267 |
Norfolk Southern Corp. | | 182,628 | | | 9,211,756 |
Ryder System, Inc. | | 27,367 | | | 1,286,523 |
Union Pacific Corp. | | 123,857 | | | 15,558,916 |
| | | | | |
| | | | | 46,476,104 |
| | | | | |
| |
Semiconductors & Semiconductor Equipment—2.7% | | | |
Advanced Micro Devices, Inc. (a) (b) | | 284,686 | | | 2,135,145 |
Altera Corp. (b) | | 158,399 | | | 3,060,269 |
Analog Devices, Inc. | | 143,066 | | | 4,535,192 |
Applied Materials, Inc. | | 649,933 | | | 11,542,810 |
Broadcom Corp. (b) | | 221,892 | | | 5,800,257 |
| | | | | |
| Security Description | | Shares | | Value* |
| | | | | |
|
Semiconductors & Semiconductor Equipment—(Continued) |
Intel Corp. | | 2,757,526 | | $ | 73,515,643 |
KLA-Tencor Corp. (a) | | 85,903 | | | 4,137,089 |
Linear Technology Corp. (a) | | 105,395 | | | 3,354,723 |
LSI Logic Corp. (a) (b) | | 332,923 | | | 1,767,821 |
MEMC Electronic Materials, Inc. (b) | | 108,053 | | | 9,561,610 |
Microchip Technology, Inc. (a) | | 101,039 | | | 3,174,646 |
Micron Technology, Inc. (a) (b) | | 358,621 | | | 2,600,002 |
National Semiconductor Corp. | | 110,813 | | | 2,508,806 |
Novellus Systems, Inc. (a) (b) | | 54,775 | | | 1,510,147 |
NVIDIA Corp. (b) | | 262,014 | | | 8,913,716 |
Teradyne, Inc. (b) | | 81,891 | | | 846,753 |
Texas Instruments, Inc. | | 659,413 | | | 22,024,394 |
Xilinx, Inc. | | 138,652 | | | 3,032,319 |
| | | | | |
| | | | | 164,021,342 |
| | | | | |
| | |
Software—3.7% | | | | | |
Adobe Systems, Inc. (b) | | 270,606 | | | 11,562,994 |
Autodesk, Inc. | | 108,896 | | | 5,418,665 |
BMC Software, Inc. (b) | | 92,346 | | | 3,291,211 |
CA, Inc. (a) | | 184,807 | | | 4,610,935 |
Citrix Systems, Inc. (b) | | 89,467 | | | 3,400,641 |
Compuware Corp. (b) | | 134,977 | | | 1,198,596 |
Electronic Arts, Inc. (b) | | 148,546 | | | 8,676,572 |
Intuit, Inc. (b) | | 156,914 | | | 4,960,051 |
Microsoft Corp. | | 3,794,453 | | | 135,082,527 |
Novell, Inc. (b) | | 164,995 | | | 1,133,516 |
Oracle Corp. (b) | | 1,859,766 | | | 41,993,516 |
Symantec Corp. (b) | | 409,020 | | | 6,601,583 |
| | | | | |
| | | | | 227,930,807 |
| | | | | |
| | |
Specialty Retail—1.5% | | | | | |
Abercrombie & Fitch Co. (Class A) | | 40,631 | | | 3,249,261 |
AutoNation, Inc. (a) (b) | | 65,069 | | | 1,018,981 |
AutoZone, Inc. (b) | | 20,818 | | | 2,496,286 |
Bed Bath & Beyond, Inc. (a) (b) | | 124,893 | | | 3,670,605 |
Best Buy Co., Inc. (a) | | 165,505 | | | 8,713,838 |
Circuit City Stores, Inc. (a) | | 79,495 | | | 333,879 |
GameStop Corp. (Class A) (b) | | 75,006 | | | 4,658,623 |
Limited Brands, Inc. | | 146,561 | | | 2,774,400 |
Lowe’s Cos., Inc. | | 689,783 | | | 15,602,891 |
Office Depot, Inc. (b) | | 128,716 | | | 1,790,440 |
OfficeMax, Inc. | | 35,558 | | | 734,628 |
RadioShack Corp. (a) | | 61,822 | | | 1,042,319 |
Staples, Inc. | | 333,479 | | | 7,693,360 |
The Gap, Inc. | | 219,652 | | | 4,674,195 |
The Home Depot, Inc. | | 795,903 | | | 21,441,627 |
The Sherwin-Williams Co. (a) | | 49,171 | | | 2,853,885 |
Tiffany & Co. | | 63,971 | | | 2,944,585 |
TJX Cos., Inc. | | 206,103 | | | 5,921,339 |
| | | | | |
| | | | | 91,615,142 |
| | | | | |
| |
Textiles, Apparel & Luxury Goods—0.4% | | | |
Coach, Inc. (b) | | 173,618 | | | 5,309,238 |
Jones Apparel Group, Inc. (a) | | 40,209 | | | 642,942 |
Liz Claiborne, Inc. (a) | | 46,917 | | | 954,761 |
*See accompanying notes to financial statements.
MSF-10
Metropolitan Series Fund, Inc.
MetLife Stock Index Portfolio
Schedule of Investments as of December 31, 2007
Common Stock—(Continued)
| | | | | |
| Security Description | |
Shares | | Value* |
| | | | | |
| |
Textiles, Apparel & Luxury Goods—(Continued) | | | |
Nike, Inc. | | 181,114 | | $ | 11,634,763 |
Polo Ralph Lauren Corp. | | 27,772 | | | 1,716,032 |
VF Corp. | | 41,519 | | | 2,850,695 |
| | | | | |
| | | | | 23,108,431 |
| | | | | |
| | |
Thrifts & Mortgage Finance—0.7% | | | | | |
Countrywide Financial Corp. (a) | | 272,922 | | | 2,439,923 |
Federal Home Loan Mortgage Corp. | | 311,998 | | | 10,629,772 |
Federal National Mortgage Association | | 461,317 | | | 18,443,454 |
Hudson City Bancorp, Inc. (a) | | 245,439 | | | 3,686,494 |
MGIC Investment Corp. (a) | | 38,574 | | | 865,215 |
Sovereign Bancorp, Inc. | | 169,979 | | | 1,937,760 |
Washington Mutual, Inc. (a) | | 409,701 | | | 5,576,030 |
| | | | | |
| | | | | 43,578,648 |
| | | | | |
| | |
Tobacco—1.4% | | | | | |
Altria Group, Inc. | | 993,370 | | | 75,078,905 |
Reynolds American, Inc. (a) | | 80,693 | | | 5,322,510 |
UST, Inc. (a) | | 73,878 | | | 4,048,514 |
| | | | | |
| | | | | 84,449,929 |
| | | | | |
| |
Trading Companies & Distributors—0.1% | | | |
W.W. Grainger, Inc. (a) | | 31,767 | | | 2,780,248 |
| | | | | |
| |
Wireless Telecommunication Services—0.4% | | | |
American Tower Corp. (Class A) (b) | | 190,881 | | | 8,131,531 |
Sprint Nextel Corp. (a) | | 1,341,317 | | | 17,611,492 |
| | | | | |
| | | | | 25,743,023 |
| | | | | |
Total Common Stock
(Identified Cost $4,751,493,866) | | | | | 6,081,355,488 |
| | | | | |
| | | | | | | |
| |
| Short Term Investments—3.5% | | | | |
| Security Description | | Face
Amount/Shares | | Value* | |
| | | | | | | |
| | |
Discount Notes—0.4% | | | | | | | |
Federal Home Loan Bank
4.15%, 01/14/08 | | $ | 25,200,000 | | $ | 25,170,425 | |
| | | | | | | |
| | |
Mutual Funds—3.1% | | | | | | | |
State Street Navigator Securities
Lending Prime Portfolio (d) | | | 188,534,748 | | | 188,534,748 | |
| | | | | | | |
Total Short Term Investments
(Identified Cost $213,705,173) | | | | | | 213,705,173 | |
| | | | | | | |
Total Investments—103.1%
(Identified Cost $4,965,199,039) (e) | | | | | | 6,295,060,661 | |
Liabilities in excess of other assets | | | | | | (188,846,332 | ) |
| | | | | | | |
| Total Net Assets—100% | | | | | $ | 6,106,214,329 | |
| | | | | | | |
| (a) | A portion or all of the security was held on loan. As of December 31, 2007, the market value of securities loaned was $207,060,986 and the collateral received consisted of cash in the amount of $188,534,748 and non cash collateral with a value of $24,433,751. The cash collateral is invested in a money market fund managed by an affiliate of the custodian. The non cash collateral received consists primarily of government securities and bank letters of credit, and are held for the benefit of the Portfolio at the Portfolio’s custodian. |
| (c) | Affiliated Issuer. See below. |
| (d) | Represents investment of cash collateral received from securities lending transactions. |
| (e) | The aggregate cost of investments for federal income tax purposes as of December 31, 2007 was $4,987,627,880 and the composition of unrealized appreciation and depreciation of investment securities was $1,728,369,108 and $(420,936,327), respectively. |
Futures Contracts
| | | | | | | | | | | | | | |
Futures Contracts—Long | | Expiration Date | | Number of
Contracts | | Contract
Amount | | Valuation as of
12/31/2007 | | Net Unrealized
Depreciation | |
S&P 500 Index Futures | | 3/19/2008 | | 38 | | $ | 14,525,690 | | $ | 14,033,400 | | ($ | 492,290 | ) |
| | | | | | | | | | | | | | |
Affliliated Issuer
| | | | | | | | | | | | | | | |
Security Description | | Number of Shares
Held at 12/31/2006 | | Shares Purchased
Since 12/31/2006 | | Shares Sold
Since 12/31/2006 | | | Number of Shares
Held on 12/31/2007 | | Realized Gain
on Shares Sold | | Income For
Year Ended
12/31/2007 |
MetLife, Inc. | | 320,806 | | 45,946 | | (17,477 | ) | | 349,275 | | $ | 569,551 | | $ | 250,706 |
*See accompanying notes to financial statements.
MSF-11
Metropolitan Series Fund, Inc.
MetLife Stock Index Portfolio
Statement of Assets & Liabilities
December 31, 2007
| | | | | | |
Assets | | | | | | |
Investments at value (a) (b) | | | | | $ | 6,295,060,661 |
Cash | | | | | | 115,054 |
Receivable for: | | | | | | |
Securities sold | | | | | | 5,234,142 |
Fund shares sold | | | | | | 2,329,250 |
Accrued interest and dividends | | | | | | 8,932,800 |
| | | | | | |
Total Assets | | | | | | 6,311,671,907 |
Liabilities | | | | | | |
Payable for: | | | | | | |
Securities purchased | | $ | 12,166,020 | | | |
Fund shares redeemed | | | 3,058,929 | | | |
Futures variation margin | | | 78,850 | | | |
Collateral for securities loaned | | | 188,534,748 | | | |
Accrued expenses: | | | | | | |
Management fees | | | 1,271,051 | | | |
Service and distribution fees | | | 269,265 | | | |
Other expenses | | | 78,715 | | | |
| | | | | | |
Total Liabilities | | | | | | 205,457,578 |
| | | | | | |
Net Assets | | | | | $ | 6,106,214,329 |
| | | | | | |
Net assets consists of: | | | | | | |
Capital paid in | | | | | $ | 4,492,369,532 |
Undistributed net investment income | | | | | | 95,281,650 |
Accumulated net realized gains | | | | | | 189,193,815 |
Unrealized appreciation on investments and futures contracts | | | | | | 1,329,369,332 |
| | | | | | |
Net Assets | | | | | $ | 6,106,214,329 |
| | | | | | |
| Computation of offering price: | | | | | | |
Class A | | | | | | |
Net asset value and redemption price per share ($4,733,145,211 divided by 127,921,688 shares outstanding) | | | | | $ | 37.00 |
| | | | | | |
Class B | | | | | | |
Net asset value and redemption price per share ($1,092,993,291 divided by 30,306,108 shares outstanding) | | | | | $ | 36.07 |
| | | | | | |
Class E | | | | | | |
Net asset value and redemption price per share ($280,075,827 divided by 7,608,261 shares outstanding) | | | | | $ | 36.81 |
| | | | | | |
(a) Identified cost of investments | | | | | $ | 4,965,199,039 |
| | | | | | |
| (b) | Includes cash collateral for securities loaned of $188,534,748. |
Statement of Operations
For the Year Ended December 31, 2007
| | | | | | | | |
Investment Income | | | | | | | | |
Dividends | | | | | | $ | 115,239,516 | |
Interest | | | | | | | 1,049,250 | (a) |
| | | | | | | | |
| | | | | | | 116,288,766 | |
Expenses | | | | | | | | |
Management fees | | $ | 14,763,665 | | | | | |
Service and distribution fees—Class B | | | 2,669,744 | | | | | |
Service and distribution fees—Class E | | | 437,624 | | | | | |
Directors’ fees and expenses | | | 23,668 | | | | | |
Custodian | | | 432,712 | | | | | |
Audit and tax services | | | 31,737 | | | | | |
Legal | | | 65,480 | | | | | |
Printing | | | 1,577,204 | | | | | |
Insurance | | | 62,521 | | | | | |
Miscellaneous | | | 86,516 | | | | | |
| | | | | | | | |
Total expenses | | | 20,150,871 | | | | | |
Management fee waivers | | | (413,383 | ) | | | 19,737,488 | |
| | | | | | | | |
Net Investment Income | | | | | | | 96,551,278 | |
| | | | | | | | |
Realized and Unrealized Gain (Loss) | | | | | | | | |
| Realized gain on: | | | | | | | | |
Investments—net | | | 200,037,930 | | | | | |
Futures contracts—net | | | 822,487 | | | | 200,860,417 | |
| | | | | | | | |
| Change in unrealized depreciation on: | | | | | | | | |
Investments—net | | | (16,494,506 | ) | | | | |
Futures contracts—net | | | (522,463 | ) | | | (17,016,969 | ) |
| | | | | | | | |
Net gain | | | | | | | 183,843,448 | |
| | | | | | | | |
Net Increase in Net Assets From Operations | | | | | | $ | 280,394,726 | |
| | | | | | | | |
| (a) | Includes net income on securities loaned of $509,083. |
See accompanying notes to financial statements.
MSF-12
Metropolitan Series Fund, Inc.
MetLife Stock Index Portfolio
Statements of Changes in Net Assets
| | | | | | | | |
| | | Year ended
December 31,
2007 | | | Year ended
December 31,
2006 | |
From Operations | | | | | | | | |
Net investment income | | $ | 96,551,278 | | | $ | 80,719,566 | |
Net realized gain | | | 200,860,417 | | | | 172,963,623 | |
Unrealized appreciation (depreciation) | | | (17,016,969 | ) | | | 485,911,309 | |
| | | | | | | | |
Increase in net assets from operations | | | 280,394,726 | | | | 739,594,498 | |
| | | | | | | | |
From Distributions to Shareholders | | | | | | | | |
Net investment income | | | | | | | | |
Class A | | | (43,678,879 | ) | | | (80,522,773 | ) |
Class B | | | (8,803,969 | ) | | | (14,529,078 | ) |
Class E | | | (2,690,749 | ) | | | (5,220,974 | ) |
| | | | | | | | |
| | | (55,173,597 | ) | | | (100,272,825 | ) |
| | | | | | | | |
Net realized gain | | | | | | | | |
Class A | | | (84,906,392 | ) | | | (137,410,085 | ) |
Class B | | | (21,923,608 | ) | | | (29,305,249 | ) |
Class E | | | (6,012,759 | ) | | | (9,828,692 | ) |
| | | | | | | | |
| | | (112,842,759 | ) | | | (176,544,026 | ) |
| | | | | | | | |
Total distributions | | | (168,016,356 | ) | | | (276,816,851 | ) |
| | | | | | | | |
Increase (decrease) in net assets from capital share transactions | | | 585,539,125 | | | | (49,958,395 | ) |
| | | | | | | | |
Total increase in net assets | | | 697,917,495 | | | | 412,819,252 | |
Net Assets | | | | | | | | |
Beginning of the period | | | 5,408,296,834 | | | | 4,995,477,582 | |
| | | | | | | | |
End of the period | | $ | 6,106,214,329 | | | $ | 5,408,296,834 | |
| | | | | | | | |
Undistributed Net Investment Income | | | | | | | | |
End of the period | | $ | 95,281,650 | | | $ | 55,170,891 | |
| | | | | | | | |
Other Information:
Capital Shares
Transactions in capital shares were as follows:
| | | | | | | | | | | | | | |
| | | Year ended
December 31, 2007 | | | Year ended
December 31, 2006 | |
| | | Shares | | | $ | | | Shares | | | $ | |
Class A | | | | | | | | | | | | | | |
Sales | | 34,990,203 | | | $ | 1,297,764,619 | | | 14,718,341 | | | $ | 499,114,494 | |
Shares issued through acquisition | | 0 | | | | 0 | | | 94,991 | | | | 3,147,991 | |
Reinvestments | | 3,487,531 | | | | 128,585,271 | | | 6,624,099 | | | | 217,932,858 | |
Redemptions | | (24,307,503 | ) | | | (904,992,455 | ) | | (26,428,343 | ) | | | (892,484,688 | ) |
| | | | | | | | | | | | | | |
Net increase (decrease) | | 14,170,231 | | | $ | 521,357,435 | | | (4,990,912 | ) | | $ | (172,289,345 | ) |
| | | | | | | | | | | | | | |
Class B | | | | | | | | | | | | | | |
Sales | | 8,914,415 | | | $ | 322,546,020 | | | 11,622,143 | | | $ | 381,456,330 | |
Reinvestments | | 853,544 | | | | 30,727,577 | | | 1,363,008 | | | | 43,834,327 | |
Redemptions | | (7,494,071 | ) | | | (271,598,959 | ) | | (8,569,124 | ) | | | (281,262,304 | ) |
| | | | | | | | | | | | | | |
Net increase | | 2,273,888 | | | $ | 81,674,638 | | | 4,416,027 | | | $ | 144,028,353 | |
| | | | | | | | | | | | | | |
Class E | | | | | | | | | | | | | | |
Sales | | 593,708 | | | $ | 21,859,230 | | | 792,149 | | | $ | 26,626,818 | |
Reinvestments | | 237,024 | | | | 8,703,508 | | | 459,111 | | | | 15,049,666 | |
Redemptions | | (1,297,297 | ) | | | (48,055,686 | ) | | (1,881,032 | ) | | | (63,373,887 | ) |
| | | | | | | | | | | | | | |
Net decrease | | (466,565 | ) | | $ | (17,492,948 | ) | | (629,772 | ) | | $ | (21,697,403 | ) |
| | | | | | | | | | | | | | |
Increase (decrease) derived from capital share transactions | | | | | $ | 585,539,125 | | | | | | $ | (49,958,395 | ) |
| | | | | | | | | | | | | | |
See accompanying notes to financial statements.
MSF-13
Metropolitan Series Fund, Inc.
MetLife Stock Index Portfolio
Financial Highlights
| | | | | | | | | | | | | | | | | | | | |
| | | Class A | |
| | | Year ended December 31, | |
| | | 2007 | | | 2006 | | | 2005 | | | 2004 | | | 2003 | |
Net Asset Value, Beginning of Period | | $ | 36.26 | | | $ | 33.20 | | | $ | 32.27 | | | $ | 29.45 | | | $ | 23.41 | |
| | | | | | | | | | | | | | | | | | | | |
Income From Investment Operations | | | | | | | | | | | | | | | | | | | | |
Net investment income | | | 0.63 | (a) | | | 0.58 | | | | 0.55 | | | | 0.54 | | | | 0.38 | |
Net realized and unrealized gain on investments | | | 1.26 | | | | 4.37 | | | | 0.90 | | | | 2.54 | | | | 6.11 | |
| | | | | | | | | | | | | | | | | | | | |
Total from investment operations | | | 1.89 | | | | 4.95 | | | | 1.45 | | | | 3.08 | | | | 6.49 | |
| | | | | | | | | | | | | | | | | | | | |
Less Distributions | | | | | | | | | | | | | | | | | | | | |
Distributions from net investment income | | | (0.39 | ) | | | (0.70 | ) | | | (0.52 | ) | | | (0.26 | ) | | | (0.45 | ) |
Distributions from net realized capital gains | | | (0.76 | ) | | | (1.19 | ) | | | 0.00 | | | | 0.00 | | | | 0.00 | |
| | | | | | | | | | | | | | | | | | | | |
Total distributions | | | (1.15 | ) | | | (1.89 | ) | | | (0.52 | ) | | | (0.26 | ) | | | (0.45 | ) |
| | | | | | | | | | | | | | | | | | | | |
Net Asset Value, End of Period | | $ | 37.00 | | | $ | 36.26 | | | $ | 33.20 | | | $ | 32.27 | | | $ | 29.45 | |
| | | | | | | | | | | | | | | | | | | | |
Total Return (%) | | | 5.2 | | | | 15.5 | | | | 4.6 | | | | 10.5 | | | | 28.2 | |
Ratio of operating expenses to average net assets (%) | | | 0.28 | | | | 0.30 | | | | 0.29 | | | | 0.30 | | | | 0.31 | |
Ratio of operating expenses to average net assets without giving effect to the contractual expense agreement would have been (%) (b) | | | 0.29 | | | | 0.31 | | | | 0.29 | | | | N/A | | | | N/A | |
Ratio of net investment income to average net assets (%) | | | 1.69 | | | | 1.63 | | | | 1.59 | | | | 1.73 | | | | 1.48 | |
Portfolio turnover rate (%) | | | 12 | | | | 9 | | | | 8 | | | | 3 | | | | 1 | |
Net assets, end of period (000) | | $ | 4,733,145 | | | $ | 4,125,102 | | | $ | 3,942,484 | | | $ | 4,139,893 | | | $ | 3,931,839 | |
| |
| | | Class B | |
| | | Year ended December 31, | |
| | | 2007 | | | 2006 | | | 2005 | | | 2004 | | | 2003 | |
Net Asset Value, Beginning of Period | | $ | 35.38 | | | $ | 32.41 | | | $ | 31.52 | | | $ | 28.80 | | | $ | 22.92 | |
| | | | | | | | | | | | | | | | | | | | |
Income From Investment Operations | | | | | | | | | | | | | | | | | | | | |
Net investment income | | | 0.52 | (a) | | | 0.47 | | | | 0.39 | | | | 0.41 | | | | 0.34 | |
Net realized and unrealized gain on investments | | | 1.24 | | | | 4.28 | | | | 0.95 | | | | 2.53 | | | | 5.95 | |
| | | | | | | | | | | | | | | | | | | | |
Total from investment operations | | | 1.76 | | | | 4.75 | | | | 1.34 | | | | 2.94 | | | | 6.29 | |
| | | | | | | | | | | | | | | | | | | | |
Less Distributions | | | | | | | | | | | | | | | | | | | | |
Distributions from net investment income | | | (0.31 | ) | | | (0.59 | ) | | | (0.45 | ) | | | (0.22 | ) | | | (0.41 | ) |
Distributions from net realized capital gains | | | (0.76 | ) | | | (1.19 | ) | | | 0.00 | | | | 0.00 | | | | 0.00 | |
| | | | | | | | | | | | | | | | | | | | |
Total distributions | | | (1.07 | ) | | | (1.78 | ) | | | (0.45 | ) | | | (0.22 | ) | | | (0.41 | ) |
| | | | | | | | | | | | | | | | | | | | |
Net Asset Value, End of Period | | $ | 36.07 | | | $ | 35.38 | | | $ | 32.41 | | | $ | 31.52 | | | $ | 28.80 | |
| | | | | | | | | | | | | | | | | | | | |
Total Return (%) | | | 5.0 | | | | 15.2 | | | | 4.4 | | | | 10.3 | | | | 27.9 | |
Ratio of operating expenses to average net assets (%) | | | 0.53 | | | | 0.55 | | | | 0.54 | | | | 0.55 | | | | 0.56 | |
Ratio of operating expenses to average net assets without giving effect to the contractual expense agreement would have been (%) (b) | | | 0.54 | | | | 0.56 | | | | 0.54 | | | | N/A | | | | N/A | |
Ratio of net investment income to average net assets (%) | | | 1.43 | | | | 1.38 | | | | 1.36 | | | | 1.59 | | | | 1.24 | |
Portfolio turnover rate (%) | | | 12 | | | | 9 | | | | 8 | | | | 3 | | | | 1 | |
Net assets, end of period (000) | | $ | 1,092,993 | | | $ | 991,777 | | | $ | 765,425 | | | $ | 508,908 | | | $ | 251,793 | |
| (a) | Per share amount is based on average shares outstanding during the period. |
| (b) | See Note 4 in the Notes to Financial Statements. |
See accompanying notes to financial statements.
MSF-14
Metropolitan Series Fund, Inc.
MetLife Stock Index Portfolio
Financial Highlights
| | | | | | | | | | | | | | | | | | | | |
| | | Class E | |
| | | Year ended December 31, | |
| | | 2007 | | | 2006 | | | 2005 | | | 2004 | | | 2003 | |
Net Asset Value, Beginning of Period | | $ | 36.09 | | | $ | 33.04 | | | $ | 32.11 | | | $ | 29.33 | | | $ | 23.34 | |
| | | | | | | | | | | | | | | | | | | | |
Income From Investment Operations | | | | | | | | | | | | | | | | | | | | |
Net investment income | | | 0.57 | (a) | | | 0.52 | | | | 0.47 | | | | 0.47 | | | | 0.40 | |
Net realized and unrealized gain on investments | | | 1.25 | | | | 4.35 | | | | 0.93 | | | | 2.56 | | | | 6.02 | |
| | | | | | | | | | | | | | | | | | | | |
Total from investment operations | | | 1.82 | | | | 4.87 | | | | 1.40 | | | | 3.03 | | | | 6.42 | |
| | | | | | | | | | | | | | | | | | | | |
Less Distributions | | | | | | | | | | | | | | | | | | | | |
Distributions from net investment income | | | (0.34 | ) | | | (0.63 | ) | | | (0.47 | ) | | | (0.25 | ) | | | (0.43 | ) |
Distributions from net realized capital gains | | | (0.76 | ) | | | (1.19 | ) | | | 0.00 | | | | 0.00 | | | | 0.00 | |
| | | | | | | | | | | | | | | | | | | | |
Total distributions | | | (1.10 | ) | | | (1.82 | ) | | | (0.47 | ) | | | (0.25 | ) | | | (0.43 | ) |
| | | | | | | | | | | | | | | | | | | | |
Net Asset Value, End of Period | | $ | 36.81 | | | $ | 36.09 | | | $ | 33.04 | | | $ | 32.11 | | | $ | 29.33 | |
| | | | | | | | | | | | | | | | | | | | |
Total Return (%) | | | 5.1 | | | | 15.3 | | | | 4.5 | | | | 10.4 | | | | 28.0 | |
Ratio of operating expenses to average net assets (%) | | | 0.43 | | | | 0.45 | | | | 0.44 | | | | 0.45 | | | | 0.46 | |
Ratio of operating expenses to average net assets without giving effect to the contractual expense agreement would have been (%) (b) | | | 0.44 | | | | 0.46 | | | | 0.44 | | | | N/A | | | | N/A | |
Ratio of net investment income to average net assets (%) | | | 1.53 | | | | 1.48 | | | | 1.44 | | | | 1.67 | | | | 1.34 | |
Portfolio turnover rate (%) | | | 12 | | | | 9 | | | | 8 | | | | 3 | | | | 1 | |
Net assets, end of period (000) | | $ | 280,076 | | | $ | 291,417 | | | $ | 287,568 | | | $ | 293,266 | | | $ | 142,284 | |
| (a) | Per share amount is based on average shares outstanding during the period. |
| (b) | See Note 4 in the Notes to Financial Statements. |
See accompanying notes to financial statements.
MSF-15
Metropolitan Series Fund, Inc.
MetLife Stock Index Portfolio
Notes to Financial Statements—December 31, 2007
Metropolitan Series Fund, Inc. (the “Fund”) is organized as a corporation under the laws of Maryland pursuant to Articles of Incorporation filed on November 23, 1982, as amended, and registered under the Investment Company Act of 1940, as amended (the “1940 Act”), as an open-end investment company. The Fund is a “series” type of mutual fund, which issues separate series of stock. Each series represents an interest in a separate portfolio of Fund investments. The MetLife Stock Index Portfolio (the “Portfolio”) is a diversified series of the Fund. Shares in the Fund are not offered directly to the general public and are currently available only to separate accounts established by Metropolitan Life Insurance Company (“MetLife”), New England Life Insurance Company, General American Life Insurance Company (“General American”), The MetLife Investors Group of Insurance Companies, MetLife Insurance Company of Connecticut and other affiliated insurance companies (collectively, the “Insurance Companies”), as an investment vehicle for variable life insurance, group annuity or variable annuity products, although the Portfolio is not available to all such separate accounts. The Portfolio’s shares may be divided into different classes. Currently, the classes being offered by the Portfolio are named Class A, Class B and Class E. The classes of the Portfolio’s shares are identical, except that certain additional charges (Rule 12b-1 fees) are made against Class B and Class E shares. Investment income, realized and unrealized capital gains and losses, the common expenses of the Portfolio and certain Portfolio-level expense reductions, if any, are allocated on a pro rata basis to each class based on the relative net assets of each class to the total net assets of the Portfolio.
| 2. | SIGNIFICANT ACCOUNTING POLICIES: |
The preparation of financial statements in conformity with accounting principles generally accepted in the United States of America (“GAAP”) requires management to make estimates and assumptions that affect the reported amounts of assets and liabilities and disclosure of contingent assets and liabilities as of the date of the financial statements and the reported amounts of income and expenses during the reporting period. Actual results could differ from those estimates.
The following is a summary of significant accounting policies consistently followed by the Portfolio in the preparation of its financial statements. The policies are in conformity with GAAP.
Investment Valuation:
Debt securities (other than short term obligations with a remaining maturity of sixty days or less) are valued by independent pricing services selected by the relevant subadviser pursuant to authorization of the Board of Directors of the Fund (the “Board” or “Directors”). Short term obligations with a remaining maturity of sixty days or less are valued at amortized cost which approximates fair market value.
Equity securities traded on a national securities exchange or exchanges are valued at their last sale price on the principal trading market. Equity securities traded on the NASDAQ National Market System are valued at the NASDAQ Official Closing Price (the “NOCP”). The NOCP is the last sale price if it falls between the spread of the last reported bid and asked prices. If the last reported bid and asked prices are above the last reported sale price, the NOCP will be the last reported bid price. If the last reported bid and asked prices are below the last reported sale price, the NOCP will be the last reported asked price. Equity securities traded on a national securities exchange or exchanges or on the NASDAQ National Market System for which there is no reported sale during the day are valued at the last reported bid price. A security that is listed or traded on more than one exchange is valued at the quotation on the exchange determined to be the primary market for that security by the Board or its delegates. If no closing price is available, then such securities are valued by using the last reported bid price. Equity securities traded over-the-counter are valued at the last reported sales price.
If no current market value quotation is readily available or reliable for a portfolio security, fair value will be determined in accordance with procedures established by and under the general supervision of the Board. When the Portfolio uses fair value pricing, it may take into account any factors it deems appropriate. The value of securities used by the Portfolio to calculate its net asset value may differ from quoted or published prices for the same securities. Fair value pricing involves subjective judgments and the fair value determined for a security may be materially different than the value that could be realized upon the sale of that security.
The Portfolio expects to use fair value pricing for securities primarily traded on U.S. exchanges only under very limited circumstances. For example, the Portfolio may use fair value pricing if the exchange on which a security is traded closes early or trading in the security is suspended.
MSF-16
Metropolitan Series Fund, Inc.
MetLife Stock Index Portfolio
Notes to Financial Statements—December 31, 2007—(Continued)
Securities traded primarily on an exchange outside of the United States which closes before the close of the New York Stock Exchange will be valued at the last sales price on that non-U.S. exchange. Securities traded primarily on an exchange outside of the United States for which there is no reported sale during the day are valued at the mean between the last reported bid and asked prices. However, because most foreign markets close well before the Portfolio values its securities (typically at 4 p.m. Eastern Time), the earlier close of these foreign markets gives rise to the possibility that significant events, including broad market moves, may have occurred after these foreign markets close but before the Portfolio values its securities. To account for this, the Portfolio may frequently value many of its foreign equity securities using fair value prices based on third party vendor modeling tools.
Options, whether on securities, indices, futures contracts, or otherwise, are valued at the last sales price available as of the close of business on the day of valuation or, if there is no such sale price available, at the mean between the bid and asked prices. Options on currencies are valued at the spot price each day.
The value of futures contracts will be the sum of the margin deposit plus or minus the difference between the value of the futures contract on each day the net asset value is calculated and the value on the date the futures contract originated, value being that established on a recognized commodity exchange, or by reference to other customary sources, with gain or loss being realized when the futures contract closes or expires.
Subject to the Board’s oversight, the Board has delegated day-to-day responsibility for valuing Portfolio assets to the subadviser of the Portfolio, who values such assets as described above and operates under procedures approved by the Board.
Investment Transactions and Related Investment Income:
Portfolio security transactions are recorded on the trade date. Dividend income is recorded on the ex-dividend date or, for certain foreign securities, when notified. Interest income, which includes amortization of premium and accretion of discount on debt securities, is recorded on the accrual basis. Realized gains and losses on investments and unrealized appreciation and depreciation are determined on the identified cost basis, which is the same basis used for federal income tax purposes.
Repurchase Agreements:
The Portfolio, through the custodian or a subcustodian, receives delivery of the underlying securities collateralizing repurchase agreements. The Portfolio requires the custodian to take possession, to have legally segregated in the Federal Reserve Book Entry System, or to have segregated within the custodian’s vault, all securities held as collateral for repurchase agreements. It is the Portfolio’s policy that the market value of the collateral be at least equal to 100% of the repurchase price in the case of a repurchase agreement of one-day duration and 102% on all other repurchase agreements. The Portfolio’s subadviser is responsible for determining that the value of the collateral is at all times at least equal to the repurchase price. In connection with transactions in repurchase agreements, if the seller defaults and the value of the collateral declines or if the seller enters an insolvency proceeding, realization of the collateral by the Portfolio may be delayed, limited or wholly denied.
Futures Contracts:
The Portfolio may buy and sell futures contracts (on recognized exchanges) as a hedge or to enhance return. Futures contracts are agreements to buy or sell a security, or deliver a final cash settlement price in connection with an index, interest rate, currency, or other contracts not calling for physical delivery, for a set price in the future. The Portfolio must post an amount equal to a portion of the total market value of the futures contract as futures variation margin, which is returned when the Portfolio’s obligations under the contract have been satisfied. From time to time thereafter, the Portfolio may have to post variation margin to maintain this amount as the market value of the contract fluctuates. Risks of entering into futures contracts (and related options) include the possibility that there may be an illiquid market and that a change in the value of the contract or option may not correlate with changes in the value of the underlying securities.
Options:
The Portfolio may use options to hedge against changes in values of securities the Portfolio owns or expects to purchase. Writing puts or buying calls tends to increase the Portfolio’s exposure to the underlying instrument and writing calls or buying puts tends to decrease the Portfolio’s exposure to the underlying instrument, and can be used to hedge other Portfolio investments. For options purchased to hedge the Portfolio’s investments, the potential risk to the Portfolio is that the change in value of options
MSF-17
Metropolitan Series Fund, Inc.
MetLife Stock Index Portfolio
Notes to Financial Statements—December 31, 2007—(Continued)
contracts may not correspond to the change in value of the hedged instruments. In addition, losses may arise from changes in the value of the underlying instruments, if there is an illiquid secondary market, or if the counterparty is unable to perform. The maximum loss for purchased options is limited to the premium initially paid for the option. For options written by the Portfolio, the maximum loss is not limited to the premium initially received for the option.
The main risk associated with purchasing an option is that the option expires without being exercised. In this case, the option expires worthless and the premium paid for the option is considered the loss. The risk associated with writing a call option is that the Portfolio may forgo the opportunity for a profit if the market value of the underlying position increases and the option is exercised. The risk in writing a put option is that the Portfolio may incur a loss if the market value of the underlying position decreases and the option is exercised. In addition, the Portfolio risks not being able to enter into a closing transaction for the written option as the result of an illiquid market.
“When-Issued” Securities:
Purchasing securities “when-issued” is a forward commitment by the Portfolio to buy a security. The estimated amount of the Portfolio’s payment obligation and the security’s interest rate are determined when the commitment is made, even though no interest accrues until the security is issued, which is generally 15 to 120 days later. The Portfolio will segregate liquid assets with its custodian sufficient at all times to satisfy these commitments. If the value of the security is less when delivered than when the commitment was made, the Portfolio will suffer a loss.
Federal Income Taxes:
It is the Portfolio’s policy to comply with the requirements of the Internal Revenue Code of 1986, as amended, and regulations thereunder, applicable to regulated investment companies and to distribute all of its taxable income to shareholders. Therefore, no federal income tax provision is required.
As of December 31, 2007, the Portfolio had no capital loss carryovers.
The tax character of distributions paid for the periods ended December 31, 2007 and 2006 was as follows:
| | | | | | | | | | | | | | | | | | | | | |
Ordinary Income | | Long Term Gain | | Return of Capital | | Total |
2007 | | 2006 | | 2007 | | 2006 | | 2007 | | 2006 | | 2007 | | 2006 |
| $57,542,999 | | $ | 103,997,904 | | $ | 110,473,357 | | $ | 172,818,947 | | $ | — | | $ | — | | $ | 168,016,356 | | $ | 276,816,851 |
As of December 31, 2007, the components of distributable earnings (accumulated losses) on a federal income tax basis were as follows:
| | | | | | | | | | | | |
Undistributed
Ordinary
Income | | Undistributed
Long Term
Gain | | Unrealized
Appreciation | | Loss
Carryforwards | | Total |
$97,037,207 | | $ | 209,114,940 | | $ | 1,307,432,781 | | $ | — | | $ | 1,613,584,928 |
Dividends and Distributions to Shareholders:
The Portfolio records dividends and distributions on the ex-dividend date. Net realized gains from security transactions (if any) are generally distributed annually to shareholders. The timing and characterization of certain income and capital gains distributions are determined in accordance with federal tax regulations that may differ from GAAP. Permanent book and tax basis differences relating to shareholder distributions will result in reclassification between under/over distributed net investment income, accumulated net realized gains/losses and paid in capital.
| 3. | INVESTMENT TRANSACTIONS: |
For the year ended December 31, 2007, purchases and sales of securities (excluding short term investments) for the Portfolio were as follows:
| | | | | | | | | |
Purchases | | Sales |
U.S. Government | | Other | | U.S. Government | | Other |
$0 | | $ | 1,084,052,120 | | $ | 0 | | $ | 736,019,865 |
MSF-18
Metropolitan Series Fund, Inc.
MetLife Stock Index Portfolio
Notes to Financial Statements—December 31, 2007—(Continued)
| 4. | INVESTMENT MANAGEMENT FEES AND OTHER TRANSACTIONS WITH AFFILIATES: |
Investment Management Agreement:
MetLife Advisers, LLC (“MetLife Advisers”) is the investment adviser to the Portfolio. The Fund has entered into an investment management agreement with MetLife Advisers with respect to the Portfolio. For providing investment management services to the Portfolio, MetLife Advisers receives monthly compensation at the annual rate of 0.25% of average daily net assets. Fees earned by MetLife Advisers with respect to the Portfolio for the year ended December 31, 2007 were $14,763,665.
Certain officers and directors of the Fund may also be officers of MetLife Advisers; however, such officers and directors receive no compensation from the Fund.
Effective April 30, 2007, MetLife Advisers entered into an investment subadvisory agreement with MetLife Investment Advisors, LLC (“MLIAC”) with respect to the Portfolio. MetLife Advisers pays MLIAC an investment subadvisory fee for the Portfolio equal to the costs incurred by MLIAC in providing subadvisory services to the Portfolio. Fees earned by MLIAC with respect to the Portfolio for the period ended December 31, 2007 were $946,783. Prior to April 30, 2007, MetLife served as the subadviser to the Portfolio and for the period January 1, 2007 through April 30, 2007, fees earned by MetLife were $411,474.
Management Fee Waivers:
Pursuant to an expense agreement, MetLife Advisers has agreed, for the period May 1, 2007 to April 30, 2008, to reduce its advisory fees set out above under “Investment Management Agreement” for each class of the Portfolio at the annual rate of 0.007% of average daily net assets. Amounts waived for the year ended December 31, 2007 are shown as management fee waivers in the Statement of Operations.
Service and Distribution Fees:
The Fund has adopted a Distribution and Service Plan under Rule 12b-1 of the 1940 Act for the Portfolio’s Class B and E shares. Under the Distribution and Service Plan, the Class B and E shares of the Portfolio pay a fee to compensate the Insurance Companies (or their affiliates) and other broker-dealers and financial intermediaries involved in the offer and sale of Portfolio shares for promoting or selling and servicing, the Class B and E shares. The fees under the Distribution and Service Plan for each class of the Portfolio’s shares are calculated as a percentage of the Portfolio’s average daily net assets that are attributable to that Class. Currently, the fee is 0.25% per year for Class B shares and 0.15% per year for Class E shares. Amounts paid by the Portfolio for the year ended December 31, 2007 are shown as Service and Distribution fees in the Statement of Operations.
Substitution:
On November 9, 2007, the MetLife Stock Index Portfolio received and recorded a share subscription for 4,653,274 shares of Class A amounting to $169,984,087 from various shareholder accounts previously invested in the MetLife Investment Funds, Inc. (“MLIF”), an affiliated investment company of the Fund. A portion of the assets received from MLIF were investment securities with a market value of $157,388,958, and transferred in-kind pursuant to a substitution order received from the Securities and Exchange Commission. The balance of the assets was paid in cash. This transaction resulted from the planned liquidation of MLIF, pursuant to a Plan of Liquidation approved by the MLIF Board of Directors on August 16, 2007. The securities received were recorded at value and have been excluded from the calculation of portfolio turnover reported in the Portfolio’s financial highlights. The shares issued in this transaction are included in Sales in the Capital Shares schedule on the Statements of Changes in Net Assets.
The Fund has entered into a securities lending arrangement with the Fund’s custodian, State Street Bank and Trust Company (the “custodian”). Under the agreement, the custodian is authorized to loan securities on the Portfolios’ behalf. In exchange, the Portfolio receives either cash or securities as collateral against the loaned securities. The Portfolio receives collateral at least equal to 102% of the market value of the loaned securities (105% for foreign securities), at each loan’s inception. Collateral must be maintained at least at 100% of the market value of the loaned securities for the duration of the loan. The cash collateral is invested in the Navigator Securities Lending Prime Portfolio, an affiliate of the custodian, which invests in a variety of high quality U.S. dollar-denominated instruments. If the market value of the collateral at the close of trading on a business day is less than 100% of the market value of the loaned securities at the close of trading on that day, the borrower shall be required to
MSF-19
Metropolitan Series Fund, Inc.
MetLife Stock Index Portfolio
Notes to Financial Statements—December 31, 2007—(Continued)
deliver, by the close of business on the following business day, an additional amount of collateral, equal to at least 100% of the market value of all the loaned securities as of such preceding day. The Portfolio receives 80% of the annual net income from securities lending transactions, which is included in interest income of the Portfolio. The remaining 20% is paid to the custodian as compensation for its securities lending services. The Portfolio bears the risk of any deficiency in the amount of collateral available for return to a borrower due to a loss in an approved investment. Any outstanding loans by the Portfolio at December 31, 2007 are footnoted in the Schedule of Investments.
As previously reported, in May 2004, General American received a Wells Notice stating that the SEC staff was considering recommending that the SEC bring a civil action alleging violations of the U.S. securities laws against General American with respect to market timing and late trading in a limited number of privately-placed variable insurance contracts that were sold through General American. General American responded to the SEC staff and cooperated with the investigation. On August 9, 2007, the SEC announced that it had settled an enforcement action regarding late trading against General American with, among other things, General American agreeing to pay a civil penalty and to comply with certain undertakings. General American consented to the SEC’s order without admitting or denying the findings. MetLife Advisers has also advised the Fund’s Board of Directors that, while certain exceptions to the Fund’s policies have been noted, no situations have been identified that would have a material impact on the financial position of the Fund.
| 7. | RECENT ACCOUNTING PRONOUNCEMENTS: |
Effective June 29, 2007, the Fund implemented Financial Accounting Standards Board (“FASB”) Interpretation No. 48, “Accounting for Uncertainty in Income Taxes—an interpretation of FASB Statement No. 109” (“FIN 48”). FIN 48 prescribes the minimum recognition threshold a tax position must meet in connection with accounting for uncertainties in income tax positions taken or expected to be taken by an entity, including investment companies, before being measured and recognized in the financial statements. Management has evaluated the application of FIN 48 to the Fund, and has determined that the adoption of FIN 48 does not have a material impact on the Fund’s financial statements. The Fund files U.S. tax returns. No income tax returns are currently under examination. The statute of limitations on the Fund’s tax returns remains open for the years ended December 31, 2004 through December 31, 2006.
In September 2006, Statement of Financial Accounting Standards No. 157, Fair Value Measurements (SFAS 157) was issued and is effective for fiscal years beginning after November 15, 2007. SFAS 157 defines fair value, establishes a framework for measuring fair value and expands disclosures about fair value measurements. Management is currently evaluating the impact the adoption of SFAS 157 will have on the Portfolio’s financial statement disclosures.
MSF-20
Metropolitan Series Fund, Inc.
MetLife Stock Index Portfolio
Report of Independent Registered Public Accounting Firm
To the Shareholders and Board of Directors of the Metropolitan Series Fund, Inc.:
We have audited the accompanying statement of assets and liabilities, including the schedule of investments, of the MetLife Stock Index Portfolio, one of the portfolios constituting the Metropolitan Series Fund, Inc. (the “Fund”) as of December 31, 2007, and the related statement of operations for the year then ended, and the statements of changes in net assets for each of the two years in the period then ended, the financial highlights for each of the five years in the period then ended. These financial statements and financial highlights are the responsibility of the Fund’s management. Our responsibility is to express an opinion on these financial statements and financial highlights based on our audits.
We conducted our audits in accordance with the standards of the Public Company Accounting Oversight Board (United States). Those standards require that we plan and perform the audit to obtain reasonable assurance about whether the financial statements and financial highlights are free of material misstatement. The Fund is not required to have, nor were we engaged to perform, an audit of its internal control over financial reporting. Our audits included consideration of internal control over financial reporting as a basis for designing audit procedures that are appropriate in the circumstances, but not for the purpose of expressing an opinion on the effectiveness of the Fund’s internal control over financial reporting. Accordingly, we express no such opinion. An audit also includes examining, on a test basis, evidence supporting the amounts and disclosures in the financial statements, assessing the accounting principles used and significant estimates made by management, as well as evaluating the overall financial statement presentation. Our procedures included confirmation of securities owned as of December 31, 2007, by correspondence with the custodian and brokers; where replies were not received from brokers, we performed other auditing procedures. We believe that our audits provide a reasonable basis for our opinion.
In our opinion, the financial statements and financial highlights referred to above present fairly, in all material respects, the financial position of the MetLife Stock Index Portfolio of the Metropolitan Series Fund, Inc. as of December 31, 2007, the results of its operations for the year then ended, the changes in its net assets for each of the two years in the period then ended, and the financial highlights for each of the five years in the period then ended, in conformity with accounting principles generally accepted in the United States of America.
Deloitte & Touche LLP
Boston, Massachusetts
February 21, 2008
MSF-21
Metropolitan Series Fund, Inc.
Directors and Officers
The Fund’s Directors review actions of the Fund’s investment adviser and subadvisers, and decide upon matters of general policy. The Fund’s officers supervise the daily business operations of the Fund. The Board of Directors and the Fund’s officers are listed below. Each Director is responsible for overseeing all 36 Portfolios of the Fund. There is no limit to the term a Director may serve. Directors serve until their resignation, retirement or removal in accordance with the Fund’s organizational documents and policies adopted by the Board from time to time. Officers hold office at the pleasure of the Board or until the election or appointment and the qualification of a successor. The address of the directors and officers is c/o Metropolitan Series Fund, Inc., 501 Boylston Street, Boston, MA 02116.
Interested Directors(1)
Each Director below is an “interested person” (as defined by the 1940 Act) with respect to the Fund in that Ms. Forget is an employee of MetLife and Mr. Typermass is a former employee of MetLife and owns securities issued by MetLife, Inc., the ultimate parent company of MetLife Advisers.
| | | | | | | | |
Name, Address and Age | | Current
position(s)
with Fund | | Position(s)
held since | | Principal occupations
over past five years, including other directorships(2) | | Number of
Portfolios in
Fund Complex
Overseen by
Director(3) |
Elizabeth M. Forget Age: 41 | | Director, Chairman of the Board, President and Chief Executive Officer | | 2006 | | Senior Vice President (since 2007), MetLife, Inc.; President, Met Investors Advisory, LLC (“MIA”); Trustee and President, Met Investors Series Trust (“MIST”); Executive Vice President, MetLife Investors Group, Inc.; President (since 2006), MetLife Advisers. | | 81 |
| | | | |
Arthur G. Typermass Age: 70 | | Director | | 1998 | | Formerly, Senior Vice President and Treasurer, MetLife. | | 37 |
Non-Interested Directors(1)
Each Director below is not an “interested person” (as defined by the 1940 Act) with respect to the Fund (collectively, the “Independent Directors”).
| | | | | | | | |
Name, Address and Age | | Current
position(s)
with Fund | | Position(s)
held since | | Principal occupations
over past five years, including other directorships(2) | | Number of
Portfolios in
Fund Complex
Overseen by
Director(3) |
Steve A. Garban† Age: 70 | | Director | | 1985 | | Formerly, Chief Financial Officer, Senior Vice President Finance and Operations and Treasurer (Emeritus), The Pennsylvania State University. | | 37 |
| | | | |
Linda B. Strumpf Age: 60 | | Director | | 2000 | | Vice President and Chief Investment Officer, Ford Foundation. | | 37 |
| | | | |
Michael S. Scott Morton† Age: 70 | | Director | | 1993 | | Jay W. Forrester Professor of Management (Emeritus) at Sloan School of Management, MIT. | | 37 |
| | | | |
H. Jesse Arnelle Age: 74 | | Director | | 2001 | | Formerly, Counsel, Womble Carlyle Sandrie & Rice; Director, Textron Inc. (global multi-industry company)*; formerly, Director, Gannet Co. Inc. (diversified news and information company)*; formerly, Director, Eastman Chemical Company (global chemical company)*; formerly, Director, Waste Management, Inc.*; formerly, Director, Armstrong Holdings Inc. (parent company of floor and ceiling products business)*; formerly, Director, FPL Group Inc. (public utility holding company)*; Director, URS Corporation (engineering design services firm)*. | | 37 |
| | | | |
Nancy Hawthorne Age: 56 | | Director | | 2003 | | Director, Avid Technologies (computer software company)*; formerly, Chairman of the Board of Avid Technologies; formerly, Board of Advisors, L. Knife & Sons, Inc. (beverage distributor); Chief Executive Officer, Clerestory LLC (corporate financial advisor); formerly, Trustee, New England Zenith Fund (“Zenith Fund”)**; formerly, Chief Executive Officer and Managing Partner, Hawthorne, Krauss and Associates (corporate financial advisor); formerly, Chief Financial Officer and Executive Vice President, Continental Cablevision, subsequently renamed MediaOne (cable television company); formerly, Director, Life F/X, Inc.; formerly, Chairman of the Board, WorldClinic (distance medicine company); formerly, Director, Perini Corporation (construction company)*; formerly, Director, CGU (property and casualty insurance company); formerly, Director, Beacon Power Corporation (energy company )*. | | 37 |
MSF-22
Metropolitan Series Fund, Inc.
Directors and Officers—(Continued)
| | | | | | | | |
Name, Address and Age | | Current
position(s)
with Fund | | Position(s)
held since | | Principal occupations
over past five years, including other directorships(2) | | Number of
Portfolios in
Fund Complex
Overseen by
Director(3) |
John T. Ludes Age: 71 | | Director | | 2003 | | President, LFP Properties (consulting firm); Formerly, Trustee, Zenith Fund**; formerly, Vice Chairman, President and Chief Operating Officer, Fortune Brands/American Brands (global conglomerate); formerly, President and CEO, Acushnet Company (athletic equipment company). | | 37 |
Officers(1)
| | | | | | | | |
Name and address | | Age | | Current
position(s)
with Fund | | Position(s)
held since | | Principal occupations over past five years(2) |
| Jeffrey P. Halperin | | 40 | | Chief Compliance Officer | | 2006 | | Vice President (since 2006), Corporate Ethics and Compliance Department, MetLife, Inc.; Chief Compliance Officer (since 2006), MetLife Advisers, MIA and MIST. |
| | | | |
| John F. Guthrie, Jr. | | 64 | | Senior Vice President | | 2002 | | Manager and Senior Vice President, MetLife Advisers; Vice President, MetLife; Vice President (since 2003), MetLife Group, Inc.; Vice President, NELICO; Vice President (since 2005), MIA; formerly, Senior Vice President, Zenith Fund**. |
| | | | |
| Alan C. Leland | | 55 | | Senior Vice President | | 2005 | | Treasurer and Chief Financial Officer, MetLife Advisers, LLC; Treasurer (since 2005), Met Investors Advisory, LLC; Vice President (since 2004), MIA; Vice President (since 2003), MetLife Group, Inc.; Vice President, MetLife; Senior Vice President, NELICO |
| | | | |
| Peter Duffy | | 52 | | Vice President and Treasurer | | 2000 | | Senior Vice President, MetLife Advisers (since 1998); Second Vice President (since 2003), NELICO; Vice President, MetLife (since 2004); Vice President (since 2004), MetLife Group, Inc.; formerly, Vice President and Treasurer, Zenith Fund**. |
| | | | |
| Thomas M. Lenz | | 49 | | Vice President and Secretary | | 2002 | | General Counsel and Secretary, MetLife Advisers; Assistant General Counsel, MetLife; formerly, Vice President and Secretary, Zenith Fund**. |
| * | Indicates a directorship with a registered investment company or a company subject to the reporting requirements of the Securities Exchange Act of 1934, as amended. |
| ** | The Zenith Fund deregistered with the Securities and Exchange Commission (“SEC”) in 2004. |
| (†) | Served as a trustee, director and/or officer of one or more of the following companies, each of which had a direct or indirect advisory relationship with MetLife Advisers or its affiliates prior to January 31, 2005: State Street Research Financial Trust, State Street Research Income Trust, State Street Research Money Market Trust, State Street Research Institutional Funds, State Street Research Capital Trust, State Street Research Master Investment Trust, State Street Research Equity Trust, State Street Research Securities Trust and State Street Research Exchange Trust (collectively, the “State Street Research Funds”). |
| (1) | Each Director of the Fund also serves as trustee of Metropolitan Series Fund II (“Met Series Fund II”), a registered investment company advised by MetLife Advisers. Each officer of the Fund serves in the same position with Met Series Fund II, which consists of one portfolio. |
| (2) | Previous positions during the past five years with the Fund, MIST, MetLife, MetLife Advisers, MIA, Zenith Fund, NELICO or New England Securities Corporation are omitted if not materially different. |
| (3) | The Fund Complex includes the Fund (36 portfolios), Met Series Fund II (1 portfolio) and MIST (44 portfolios) |
MSF-23
Metropolitan Series Fund, Inc.
MetLife Stock Index Portfolio
Board Approval of Advisory and Subadvisory Agreements
The Fund’s Contract Review Committees of the Board of Directors (the “Board”) typically meet in early fall to review the Portfolios’ advisory agreements (the “Advisory Agreements”) and subadvisory agreements (collectively, the “Subadvisory Agreements,” and, together with the Advisory Agreements, the “Agreements”) and determine whether to recommend that the full Board approve the continuation of the Agreements for an additional one-year period. (Following the initial approval of an Agreement for a new Portfolio or with a new adviser or subadviser, such annual reviews are not required until 2 years following the execution of such Agreement.) After each Committee has made its recommendations, the full Board, including the Independent Directors, determines whether to approve the continuation of each of the Agreements. In addition, the Board, including the Independent Directors, considers matters bearing on the Agreements at most of its other meetings throughout the year and regularly interviews various individuals at MetLife Advisers responsible for the management of the Portfolios. The Directors also interview selected investment managers and other professionals at the subadvisers at various times throughout the year.
The Directors receive all materials that they or MetLife Advisers, the Fund’s investment adviser, and the subadvisers believe to be reasonably necessary for the Directors to evaluate the Agreements and determine whether to approve the continuation of the Agreements. These materials generally include, among other items, (i) information on the investment performance of the Portfolios and the performance of peer groups of funds and the Portfolios’ performance benchmarks, (ii) information on the Portfolios’ advisory and subadvisory fees and other expenses, including information comparing the Portfolios’ expenses to those of peer groups of funds and information about any applicable expense caps and fee “breakpoints,” (iii) sales and redemption data, (iv) information related to the profitability of the Agreements to MetLife Advisers and the subadvisers, and potential “fall-out” or ancillary benefits that MetLife Advisers, the subadvisers or their affiliates may receive as a result of their relationships with the Fund and (v) information obtained through the subadvisers’ responses to certain requests from MetLife Advisers and the Directors and MetLife Advisers’ responses to requests from the Directors. The Directors may also consider other information such as (vi) MetLife Advisers’ and the subadvisers’ financial results and condition, (vii) each Portfolio’s investment objectives and strategies and the size, education and experience of the investment staffs of MetLife Advisers and the relevant subadvisers and their use of technology and external research, (viii) the allocation of the Portfolios’ brokerage, if any, including allocations to brokers affiliated with the subadvisers and the use of “soft” commission dollars to pay Portfolio expenses and to pay for research and other similar services, (ix) the resources devoted to, and the record of compliance with, the Portfolios’ investment policies and restrictions, policies on personal securities transactions and other compliance policies, (x) the responses of MetLife Advisers, the subadvisers and/or their affiliates to certain legal and regulatory proceedings and (xi) the economic outlook generally and for the mutual fund industry in particular. Throughout the process, the Directors have the opportunity to ask questions of and request additional materials from MetLife Advisers and the subadvisers.
Following meetings of each Contract Review Committee on September 12, 2007, the Board, at its November 15, 2007 meeting, approved the continuation through December 31, 2008 of the Advisory Agreements for each Portfolio of the Fund and the Subadvisory Agreements for each Portfolio of the Fund. The Agreements approved for continuation are referred to below as the “Continued Agreements.”
In considering whether to approve the continuation of the Continued Agreements, the Directors, including the Independent Directors, did not identify any single factor as determinative, and each weighed the various factors as he or she deemed appropriate. The Directors considered the following matters in connection with their approval of the Continued Agreements:
The nature, extent and quality of the services provided to the relevant Portfolios under the Continued Agreements. The Directors considered the nature, extent and quality of the services provided by MetLife Advisers, the relevant subadvisers (if any) and their affiliates (each, an “Adviser,” and, collectively, the “Advisers”) to the relevant Portfolios pursuant to the Continued Agreements and the resources dedicated to these Portfolios by the Advisers. In particular, the Directors considered the Advisers’ abilities to attract and retain highly qualified investment professionals. With respect to MetLife Advisers, the Directors considered that MetLife Advisers is (i) ultimately responsible for the performance of such Portfolios; (ii) ultimately responsible for the establishment of the investment strategies of each such Portfolio, primarily through its recommendations to the Board regarding the hiring and selection of subadvisers; (iii) responsible for the hiring and selection, subject to Board approval, of subadvisers; and (iv) responsible for maintaining a program of Subadviser oversight reasonably designed to ensure that the subadvisers have reasonable compliance policies and procedures in place. The Directors also considered that MetLife Advisers provides a full range of day-to-day administrative services for the Portfolios involving all aspects of such Portfolios’ day-to-day operations (other than portfolio management). After reviewing these and related factors, the Directors concluded, within the context of their overall conclusions regarding each of the Continued Agreements, that the nature, extent and quality of services provided supported the renewal of these Agreements.
Investment performance of the relevant Portfolios. The Directors reviewed information about the performance of the relevant Portfolios over various time periods, including information prepared by an independent third party that compared the performance of
MSF-24
Metropolitan Series Fund, Inc.
MetLife Stock Index Portfolio
Board Approval of Advisory and Subadvisory Agreements—(Continued)
the Portfolios to the performance of peer groups of funds and performance benchmarks. The Directors also reviewed a description of the third party’s methodology for identifying a Portfolio’s peer group(s) for purposes of performance and expense comparisons.
In the case of each relevant Portfolio that had performance that lagged its peer group(s) for certain periods, the Directors concluded that other factors relevant to performance were sufficient, in light of other considerations, to warrant renewal of the Continued Agreements relating to such Portfolio. These factors varied from Portfolio to Portfolio, but included one or more of the following: (i) that such Portfolio’s performance, although lagging in certain recent periods, was stronger over the longer term; (ii) that the underperformance was attributable, to a significant extent, to investment decisions that were reasonable and consistent with the Portfolio’s investment objective(s) and policies and that the Portfolio was performing within the range of reasonable expectations, given market conditions and the Portfolio’s investment objective(s) and policies; (iii) that the Portfolio’s performance was competitive when compared to other relevant performance benchmarks or peer groups; and (iv) that MetLife Advisers and/or the relevant subadviser (if any) had taken or was taking steps designed to help improve the Portfolio’s investment performance.
The Directors also considered the investment performance of the Advisers and their reputations generally, the historical responsiveness of the Advisers to Director concerns about performance and the willingness of the Advisers to take steps intended to improve performance.
After reviewing these and related factors, the Directors concluded, within the context of their overall conclusions regarding each of the Continued Agreements, that the investment performance of each relevant Portfolio and Adviser was sufficient, in light of other considerations, to warrant the renewal of the Continued Agreements.
The costs of the services to be provided and profits to be realized by the Advisers and their affiliates from their relationships with the Portfolios. The Directors considered the fees charged by MetLife Advisers to the Portfolios for advisory services and, with respect to the subadvised Portfolios, by such subadvisers to MetLife Advisers for subadvisory services (such advisory and subadvisory fees (if any), collectively, “Fees”), as well as the total expense levels of the Portfolios. This information included comparisons (provided by an independent third party) of the Portfolios’ advisory fees and total expense levels to those of their peer groups. In evaluating Fees for the relevant Portfolios, the Directors also took into account the demands, complexity and quality of the investment management services provided to each Portfolio. The Directors considered MetLife Advisers’ recommendations regarding reductions in Fee rates, implementation of Fee breakpoints and institution of Fee waivers and expense caps.
The Directors also considered the compensation directly or indirectly received by the Advisers and their affiliates from their relationships with the relevant Portfolios. The Directors reviewed information relating to the profits received by MetLife Advisers, certain of the subadvisers and their affiliates as a result of their relationships with the relevant Portfolios, and information about the allocation of expenses used to calculate profitability. When reviewing profitability, the Directors also considered the performance of the relevant Portfolios, the expense levels of such Portfolios and whether the relevant Advisers had implemented breakpoints, fee waivers and/or expense caps with respect to such Portfolios.
After reviewing these and related factors, the Directors concluded, within the context of their overall conclusions regarding each of the Continued Agreements, that the Fees charged to each of the relevant Portfolios were fair and reasonable, and that the information provided regarding costs of these services generally, and the related profitability (if known) to the relevant Advisers of their relationships with the relevant Portfolios, supported the renewal of the Continued Agreements.
Economies of Scale. The Directors considered the existence of any economies of scale in the provision of services by the Advisers and whether those economies were shared with the relevant Portfolios through breakpoints in their advisory fees or other means, such as expense caps, fee waivers or relatively low levels of fees. The Directors noted that most of the relevant Portfolios benefited or will benefit from breakpoints, expense caps and/or fee waivers with respect to their advisory fees. In considering these issues, the Directors also took into consideration information relating to the costs of the services provided and the profitability to MetLife Advisers, the relevant subadvisers (if any) and each of their affiliates of their relationships with the relevant Portfolios, as discussed above.
After reviewing these and related factors, the Directors concluded, within the context of their overall conclusions regarding each of the Continued Agreements, that the extent to which economies of scale were shared with the relevant Portfolios supported the renewal of such Agreements.
Other Factors. The Directors also considered other factors, which included but were not limited to the following:
| | • | | the extent to which each relevant Portfolio operated in accordance with its investment objective, and its record of compliance with its investment restrictions and the compliance programs of the Fund and the Advisers. They also considered the compliance-related resources the Advisers and their affiliates provide to the relevant Portfolios; |
MSF-25
Metropolitan Series Fund, Inc.
MetLife Stock Index Portfolio
Board Approval of Advisory and Subadvisory Agreements—(Continued)
| | • | | the nature, quality, cost and extent of administrative and shareholder services performed by MetLife Advisers and its affiliates under the Advisory Agreements; and |
| | • | | so-called “fall-out benefits” to the Advisers, such as the engagement of their affiliates to provide distribution, brokerage and transfer agency services to the Portfolios, and the benefits of research made available to the relevant Advisers by reason of brokerage commissions generated by the relevant Portfolios’ securities transactions. The Directors also considered the possible conflicts of interest associated with these fall-out and other benefits, and the reporting and other processes in place to disclose and monitor these possible conflicts of interest. |
Based on their evaluation of all factors that they deemed to be material, including those factors described above, and assisted by the advice of independent counsel, the Directors, including the Independent Directors, concluded that each of the Continued Agreements should be continued through December 31, 2008.
MSF-26
A description of the policies and procedures that the Fund uses to determine how to vote proxies relating to portfolio securities is available (i) without charge, upon request, by calling (800) 638-7732 and (ii) on the Securities and Exchange Commission’s (the “SEC”) website at http://www.sec.gov.
Information regarding how the Fund voted proxies relating to portfolio securities during the most recent twelve-month period ended December 31, 2007 is available (i) without charge, upon request, by calling (800) 638-7732 and (ii) on the SEC’s website at http://www.sec.gov.
The Fund files with the SEC a complete schedule of its portfolio holdings, as of the close of the first and third quarters of its fiscal year, on “Form N-Q”. These filings are available on the SEC’s website at www.sec.gov and may be reviewed and copied at the SEC’s Public Reference Room in Washington, DC. (Call 1-800-SEC-0330 for information on the operation of the Public Reference Room.)
MSF-27
| | |
Metropolitan Series Fund, Inc. MFS Total Return Portfolio Annual Report | | December 31, 2007 |
Letter from the President
February 1, 2008
Letter to Policy Holders:
2007 was a tumultuous year in the financial markets driven by concerns in the credit markets surrounding sub-prime mortgages and fears of recession in the U.S. Economy. The broad markets were mixed, with the Dow Jones Industrial Average up 8.9% and the MSCI EAFE Index, which measures the performance of international equities, up 11.2% for the year, while the Russell 2000 Index, which measures the performance of small capitalization stocks, was down 1.6%.
In the fixed income markets, credit spreads increased as a result of the pressure from sub-prime mortgage crisis and the Federal Reserve lowered interest rates by a total of 1% during the year. The Lehman Brothers Aggregate Bond Index posted a 7.0% return for the year.
On the following pages, you will find a complete review of your Portfolio and its investment performance.
MetLife is committed to building your financial freedom. We appreciate your trust and will continue to focus our efforts on meeting your investment needs.
Sincerely,
Elizabeth Forget
President, Metropolitan Series Fund, Inc.
Metropolitan Series Fund, Inc.
MFS Total Return Portfolio
Managed by Massachusetts Financial Services Company
Portfolio Manager Commentary*
PORTFOLIO PERFORMANCE
For the year ended December 31, 2007, the Class A shares of the MFS Total Return Portfolio returned 4.4%, compared to its benchmark, a blend of the Standard & Poor’s 500 Index1 (60%) and the Lehman Brothers Aggregate Bond Index2 (40%), which returned 6.2%. The average return of its peer group, the Lipper Variable Insurance Products Mixed-Asset Target Allocation Moderate Funds Universe3, was 6.2% over the same period.
PORTFOLIO REVIEW
As 2007 drew to a close, global financial markets were enmeshed in another period of volatility driven by the ongoing credit crisis and the uncertainty about the effect that the slowing of the U.S. economy could have on the global economies. The crisis in the U.S. subprime market was in full force by year-end. The crisis erupted in the third quarter as rising interest rates spurred defaults on U.S. subprime loans. Fears of more bad loans, combined with the slowing in the U.S. housing market, sparked a global liquidity crunch. In response, central banks around the world injected billions of dollars to keep financial systems liquid and help ease investor worries. Investor fears were heightened in November as the severity of the credit crisis became more apparent as did the toll it had wrought on banks’ balance sheets. Globally, banks were hit by losses from mortgage bets gone bad, and some of the world’s largest banks, such as Citigroup and UBS, agreed to capital infusions from sovereign wealth funds in the Middle East.
In mid-December several of the world’s central banks announced a joint plan to ease the liquidity squeeze in global markets by broadening the range of collateral against which banks can borrow. As part of the plan, the U.S. Federal Reserve Board introduced a monetary tool, the “term-auction facility,” and temporary swap lines with the European Central Bank and the Swiss National Bank. Investor fears and the ensuing volatility have also been driven by the possibility of an impending recession in the United States and the effect such a drastic slowdown could have on the rest of the world. Exporting countries have become especially concerned that a decline in U.S. consumer demand will cut into their own growth. In its annual report, the International Monetary Fund said that the risk of a severe global slowdown is stronger than at any time since the 2001 terror attacks in the United States. Recession concerns have been exacerbated by the high cost of oil, bad mortgage bets, and a glut of empty homes. Retail sales have stalled, corporate earnings likely have peaked, and consumer confidence is falling. In line with slowing in the United States, we have begun to see signs that other developed markets have entered a slowing phase as the financial crisis spreads to real economies. Housing demand is falling in the United Kingdom, retail sales have slowed in the eurozone, and, globally, industrial production has retreated.
At the same time, some measures of consumer inflation are being nudged upward in line with higher oil and food prices. These higher prices have created a conflict for central bankers, who also are confronting the pressures of slowing growth and financial market turmoil. Overall, expectations have risen that global monetary policies will remain on hold or loosen until the credit crunch passes. Meanwhile, central banks have assured markets that they are ready to inject liquidity should the banking system need it.
Within the equity portion of the Portfolio, an overweighted position in the poor-performing financial services sector held back performance relative to the Standard & Poor’s 500 Stock Index (S&P 500 Index). Insurance companies, Genworth Financial, Conseco, and Allstate, and mortgage lending firm Countrywide Financial (which was sold during the year) were among the Portfolio’s top detractors.
Stock selection and an underweighted position in the technology sector also dampened relative performance. Telecommunications equipment manufacturer Nortel Networks was a top detractor. We believe Nortel’s weaker-than-expected fundamentals and management’s inability to turn the business around contributed to the decline of the company’s stock price. Not holding strong-performing computer company Apple also hurt investment results. Security selection in the health care sector detracted from relative performance. However, no individual securities within the health care sector were among the Portfolio’s top detractors for the year. Elsewhere, retailer Macy’s, home improvement products maker Masco, media titan The New York Times, and newsprint maker AbitibiBowater held back relative performance. Masco’s shares were hurt by the deterioration of the housing markets and the company’s pessimistic guidance that cited decreased housing starts.
Within the fixed income portion of the Portfolio, our exposure to bonds in the financial sector and to structured products, particularly commercial mortgage-backed securities (CMBS) and asset-backed securities (ABS), held back performance relative to the Lehman Brothers Aggregate Bond Index (Lehman Index) as these securities suffered from the recent turmoil in the subprime market. Credit quality, particularly holdings of lower-quality “BBB”(s) rated securities, detracted from performance as credit spreads widened over the reporting period.
Within the equity portion of the Portfolio, stock selection and an overweighted position in the strong-performing energy sector boosted relative performance. Global integrated energy company Hess, and oil and gas producers, Anadarko Petroleum, Devon Energy, and Apache, were all strong contributors over the reporting period. The surge of Hess’s shares in recent months was due largely to hopes that an oil field discovery off the coast of Brazil could nearly double Hess reserves.
A strong showing in the basic materials sector was principally due to positive stock selection. Packaging manufacturer Owens-Illinois was a top contributor within this sector. The company reported quarterly earnings that exceeded consensus expectations. The firm attributed the positive results to better operating performance in its glass factories and improved pricing and product sales mix.
Elsewhere, agricultural equipment manufacturer Deere & Co. and global financial services provider Bank of New York Mellon were top contributors. Deere & Co’s stock price gain was driven by strong capital management and better-than-expected results throughout the period, which pushed its shares up in excess of the market. Not holding poor-performing benchmark constituents, financial services firm Wachovia and cable services provider Comcast, benefited results, while our small, underweight positioning in insurance company American International Group, which struggled during the reporting period, also helped.
Within the fixed income portion of the Portfolio, our defensive positioning in shorter duration corporate bond holdings, relative to the Lehman Index, and our positioning in U.S. Treasury securities, boosted relative performance as credit spreads widened. The Portfolio’s fixed income segment generated a higher level of income than the index over the reporting period, which also benefited relative results.
* The views expressed above are those of the subadvisory firm as of December 31, 2007 and are subject to change based on market and other conditions. Information about the Portfolio’s holdings, asset allocation, industry allocation, or country diversification is historical and is not an indication of future Portfolio composition, which will vary. The performance of any index mentioned in this commentary has not been adjusted for ongoing management, distribution and operating expenses, and sales charges applicable to mutual fund investments. Direct investment in the Index is not possible.
1 The Standard & Poor’s (S&P) 500® Stock Index is an unmanaged index representing the performance of 500 major companies, most of which are listed on the New York Stock Exchange.
2 Lehman Brothers® Aggregate Bond Index includes most obligations of the U.S. Treasury, agencies and quasi-federal corporations, most publicly issued investment grade corporate bonds and most bonds backed by mortgage pools of GNMA, FNMA and FHLMC.
3 The Lipper Variable Insurance Products Fund Average is an average of the total return performance (calculated on the basis of net asset value) of variable product funds with similar investment objectives to those of the subject Portfolio as calculated by Lipper Analytical Services, an independent mutual fund ranking service.
MSF-2
Metropolitan Series Fund, Inc.
MFS Total Return Portfolio
A $10,000 INVESTMENT COMPARED TO
THE S&P 500 INDEX AND THE LEHMAN BROTHERS
AGGREGATE BOND INDEX
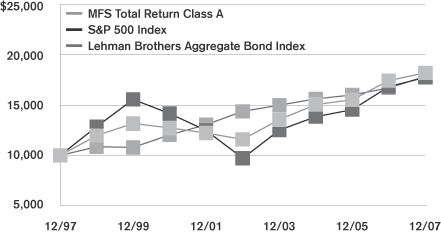
Average Annual Returns as of December 31, 2007
| | | | | | | | | | | | | | | | | | |
| | | MFS Total Return Portfolio | | | Lehman Brothers
Aggregate Bond Index | | | S&P 500
Index | |
| | | Class A | | | Class B | | | Class E | | | Class F | | | |
| 1 Year | | 4.4 | % | | 4.1 | % | | 4.2 | % | | 4.2 | % | | 7.0 | % | | 5.5 | % |
| 5 Year | | 9.5 | | | 9.2 | | | — | | | — | | | 4.4 | | | 12.8 | |
| 10 Year | | 6.2 | | | — | | | — | | | — | | | 6.0 | | | 5.9 | |
| Since Inception | | — | | | 6.5 | | | 7.5 | | | 7.3 | | | — | | | — | |
Performance numbers are net of all Portfolio expenses but do not include any insurance, sales, or administrative charges of variable annuity or life insurance contracts. If these charges were included, the returns would be lower.
Inception dates of the Class A, Class B, Class E and Class F shares are: 5/1/87, 5/1/02, 4/26/04 and 5/2/06, respectively.
This information represents past performance and is not indicative of future results. Investment return and principal value may fluctuate so that shares, upon redemption, may be worth more or less than the original cost.
PORTFOLIO COMPOSITION
as of December 31, 2007
Top Holdings
| | |
| | | % of Total
Net Assets |
Federal National Mortgage Association | | 12.1% |
U.S. Treasury Notes | | 10.1% |
Federal Home Loan Mortgage Corp. | | 4.2% |
General Electric Co. | | 2.1% |
Exxon Mobil Corp. | | 2.0% |
Altria Group, Inc. | | 1.8% |
JPMorgan Chase Commercial Mortgage Securities Corp. | | 1.6% |
Lockheed Martin Corp. | | 1.5% |
Bank of America Corp. | | 1.3% |
The Allstate Corp. | | 1.2% |
Top Equity Sectors
| | |
| | | % of Equity
Market Value |
Financials | | 25.2% |
Energy | | 14.9% |
Consumer Staples | | 11.8% |
Industrials | | 10.7% |
Health Care | | 9.7% |
|
| Top Fixed Income Sectors |
| | | % of Fixed Income
Market Value |
Mortgage-Backed | | 37.4% |
U.S. Treasury | | 25.2% |
High Grade Corporates | | 22.6% |
Commercial Mortgage-Backed | | 5.3% |
U.S. Government Agencies | | 4.0% |
MSF-3
Metropolitan Series Fund, Inc.
Shareholder Expense Example
As a shareholder of the Portfolio, you incur ongoing costs, including management fees; distribution and service (12b-1) fees; and other Portfolio expenses. This example is intended to help you understand your ongoing costs (in dollars) (referred to as “expenses”) of investing in the Portfolio and compare these costs with the ongoing costs of investing in other mutual funds. The example is based on an investment of $1,000 invested at the beginning of the period and held for the entire period, July 1, 2007 through December 31, 2007.
Actual Expenses
The first line for each share class of the Portfolio in the table below provides information about actual account values and actual expenses. You may use the information in this line, together with the amount you invested in the particular share class of the Portfolio, to estimate the expenses that you paid over the period. Simply divide your account value by $1,000 (for example, an $8,600 account value divided by $1,000=8.6), then multiply the result by the number in the first line under the heading entitled “Expenses Paid During Period” to estimate the expenses you paid on your account during this period.
Hypothetical Example for Comparison Purposes
The second line for each share class of the Portfolio in the table below provides information about hypothetical account values and hypothetical expenses based on the Portfolio’s actual expense ratio and an assumed rate of return of 5% per year before expenses, which is not the Portfolio’s actual return. The hypothetical account values and expenses may not be used to estimate the actual ending account balance or expenses you paid for the period. You may use this information to compare the ongoing costs of investing in the Portfolio and other funds. To do so, compare this 5% hypothetical example with the 5% hypothetical examples that appear in the shareholder reports of the other funds.
Please note that the expenses shown in the table are meant to highlight your ongoing costs only and do not reflect any fees or charges of your variable insurance product or any additional expenses that participants in certain eligible qualified plans may bear relating to the operations of their plan. Therefore, the second line for each share class in the table is useful in comparing ongoing costs only, and will not help you determine the relative total costs of owning different funds. In addition, if these other costs were included, your costs would have been higher.
| | | | | | | | | | | | | | |
Portfolio | | | | Annualized
Expense
Ratio | | | Beginning
Account Value
July 1,
2007 | | Ending
Account Value
December 31,
2007 | | Expenses Paid
During Period*
July 1, 2007
to
December 31,
2007 |
MFS Total Return—Class A | | Actual | | 0.59 | % | | $ | 1,000.00 | | $ | 985.10 | | $ | 2.95 |
| | Hypothetical | | 0.59 | % | | $ | 1,000.00 | | $ | 1,022.20 | | $ | 3.01 |
| | | | | |
MFS Total Return—Class B | | Actual | | 0.84 | % | | $ | 1,000.00 | | $ | 983.80 | | $ | 4.20 |
| | Hypothetical | | 0.84 | % | | $ | 1,000.00 | | $ | 1,020.92 | | $ | 4.28 |
| | | | | |
MFS Total Return—Class E | | Actual | | 0.74 | % | | $ | 1,000.00 | | $ | 984.30 | | $ | 3.70 |
| | Hypothetical | | 0.74 | % | | $ | 1,000.00 | | $ | 1,021.43 | | $ | 3.77 |
| | | | | |
MFS Total Return—Class F | | Actual | | 0.79 | % | | $ | 1,000.00 | | $ | 984.10 | | $ | 3.95 |
| | Hypothetical | | 0.79 | % | | $ | 1,000.00 | | $ | 1,021.18 | | $ | 4.02 |
* Expenses paid are equal to the Portfolio’s annualized expense ratio for the most recent six month period, as shown above, multiplied by the average account value over the period, multiplied by the number of days in the most recent fiscal half-year, divided by 365 (to reflect the one-half year period).
MSF-4
Metropolitan Series Fund, Inc.
MFS Total Return Portfolio
Schedule of Investments as of December 31, 2007
Common Stock—58.7% of Total Net Assets
| | | | | |
| Security Description | | Shares | | Value* |
| | | | | |
|
Aerospace & Defense—2.7% |
Lockheed Martin Corp. | | 268,939 | | $ | 28,308,519 |
Northrop Grumman Corp. | | 79,706 | | | 6,268,080 |
Raytheon Co. | | 15,340 | | | 931,138 |
United Technologies Corp. | | 200,700 | | | 15,361,578 |
| | | | | |
| | | | | 50,869,315 |
| | | | | |
|
Air Freight & Logistics—0.2% |
United Parcel Service, Inc. (Class B) | | 53,170 | | | 3,760,182 |
| | | | | |
|
Auto Components—0.4% |
Johnson Controls, Inc. | | 212,770 | | | 7,668,231 |
| | | | | |
|
Automobiles—0.2% |
Bayerische Motoren Werke AG(EUR) | | 30,170 | | | 1,860,291 |
Harley-Davidson, Inc. (a) | | 57,850 | | | 2,702,174 |
| | | | | |
| | | | | 4,562,465 |
| | | | | |
|
Beverages—1.0% |
Diageo, Plc.(GBP) | | 510,946 | | | 10,904,063 |
PepsiCo, Inc. | | 102,735 | | | 7,797,586 |
| | | | | |
| | | | | 18,701,649 |
| | | | | |
|
Biotechnology—0.4% |
Amgen, Inc. (b) | | 77,820 | | | 3,613,961 |
Genzyme Corp. (b) | | 54,740 | | | 4,074,845 |
| | | | | |
| | | | | 7,688,806 |
| | | | | |
|
Building Products—0.3% |
Masco Corp. (a) | | 267,050 | | | 5,770,950 |
| | | | | |
|
Capital Markets—4.9% |
E*TRADE Financial Corp. (a) (b) | | 451,670 | | | 1,603,429 |
Franklin Resources, Inc. | | 63,050 | | | 7,214,811 |
Legg Mason, Inc. | | 38,640 | | | 2,826,516 |
Lehman Brothers Holdings, Inc. | | 154,340 | | | 10,100,010 |
Merrill Lynch & Co., Inc. | | 128,026 | | | 6,872,436 |
State Street Corp. | | 97,140 | | | 7,887,768 |
The Bank of New York Mellon Corp. | | 443,734 | | | 21,636,470 |
The Bear Stearns Co., Inc. (a) | | 88,500 | | | 7,810,125 |
The Goldman Sachs Group, Inc. | | 68,310 | | | 14,690,065 |
UBS AG(CHF) | | 129,142 | | | 5,992,250 |
UBS AG | | 102,080 | | | 4,695,680 |
| | | | | |
| | | | | 91,329,560 |
| | | | | |
|
Chemicals—1.2% |
Air Products & Chemicals, Inc. | | 68,904 | | | 6,796,002 |
PPG Industries, Inc. | | 156,610 | | | 10,998,720 |
Praxair, Inc. | | 22,510 | | | 1,996,862 |
Syngenta AG(CHF) | | 4,187 | | | 1,061,457 |
The Dow Chemical Co. | | 31,048 | | | 1,223,912 |
| | | | | |
| | | | | 22,076,953 |
| | | | | |
|
Commercial Banks—1.2% |
Huntington Bancshares, Inc. (a) | | 107,310 | | | 1,583,896 |
PNC Financial Services Group, Inc. | | 146,230 | | | 9,599,999 |
| | | | | |
| Security Description | | Shares | | Value* |
| | | | | |
|
Commercial Banks—(Continued) |
SunTrust Banks, Inc. | | 163,180 | | $ | 10,197,118 |
| | | | | |
| | | | | 21,381,013 |
| | | | | |
|
Communications Equipment—0.2% |
Motorola, Inc. | | 100,160 | | | 1,606,567 |
Nortel Networks Corp. (a) (b) | | 88,236 | | | 1,331,481 |
| | | | | |
| | | | | 2,938,048 |
| | | | | |
|
Computers & Peripherals—1.3% |
Hewlett-Packard Co. | | 181,090 | | | 9,141,423 |
International Business Machines Corp. | | 138,770 | | | 15,001,037 |
| | | | | |
| | | | | 24,142,460 |
| | | | | |
|
Consumer Finance—0.4% |
American Express Co. | | 140,490 | | | 7,308,290 |
| | | | | |
|
Containers & Packaging—0.0% |
Smurfit-Stone Container Corp. (b) | | 57,905 | | | 611,477 |
| | | | | |
|
Diversified Financial Services—3.0% |
Bank of America Corp. | | 521,304 | | | 21,509,003 |
Citigroup, Inc. | | 518,288 | | | 15,258,399 |
JPMorgan Chase & Co. | | 391,360 | | | 17,082,864 |
KKR Private Equity Investors, L.P. (b) | | 40,863 | | | 743,513 |
KKR Private Equity Investors, L.P. (RDU) (b) | | 65,160 | | | 1,166,364 |
| | | | | |
| | | | | 55,760,143 |
| | | | | |
|
Diversified Telecommunication Services—2.7% |
AT&T, Inc. | | 445,894 | | | 18,531,355 |
Embarq Corp. | | 222,085 | | | 10,999,870 |
Qwest Communications International, Inc. (a) | | 1,425,110 | | | 9,990,021 |
Telus Corp.(CAD) | | 55,270 | | | 2,765,738 |
Telus Corp.(Non-Voting Shares)(CAD) | | 72,462 | | | 3,521,154 |
Verizon Communications, Inc. | | 92,977 | | | 4,062,165 |
| | | | | |
| | | | | 49,870,303 |
| | | | | |
|
Electric Utilities—1.4% |
American Electric Power Co., Inc. | | 88,670 | | | 4,128,475 |
DPL, Inc. (a) | | 133,810 | | | 3,967,467 |
Entergy Corp. | | 26,368 | | | 3,151,503 |
FPL Group, Inc. | | 172,560 | | | 11,696,117 |
Pepco Holdings, Inc. | | 78,860 | | | 2,312,964 |
PPL Corp. | | 24,256 | | | 1,263,495 |
| | | | | |
| | | | | 26,520,021 |
| | | | | |
|
Electrical Equipment—0.1% |
Rockwell Automation, Inc. (a) | | 36,510 | | | 2,517,730 |
| | | | | |
|
Electronic Equipment & Instruments—0.3% |
Flextronics International, Ltd. (b) | | 249,590 | | | 3,010,055 |
Samsung Electronics Co., Ltd. (U.S. Traded Shares) (144A) (GDR) | | 6,064 | | | 1,775,236 |
| | | | | |
| | | | | 4,785,291 |
| | | | | |
*See accompanying notes to financial statements.
MSF-5
Metropolitan Series Fund, Inc.
MFS Total Return Portfolio
Schedule of Investments as of December 31, 2007
Common Stock—(Continued)
| | | | | |
| Security Description | | Shares | | Value* |
| | | | | |
|
Energy Equipment & Services—0.2% |
Halliburton Co. | | 50,550 | | $ | 1,916,351 |
Noble Corp. | | 44,220 | | | 2,498,872 |
| | | | | |
| | | | | 4,415,223 |
| | | | | |
|
Food & Staples Retailing—1.4% |
CVS Caremark Corp. | | 267,993 | | | 10,652,722 |
Safeway, Inc. | | 173,390 | | | 5,931,672 |
The Kroger Co. | | 105,890 | | | 2,828,322 |
Wal-Mart Stores, Inc. | | 73,760 | | | 3,505,813 |
Walgreen Co. | | 91,840 | | | 3,497,267 |
| | | | | |
| | | | | 26,415,796 |
| | | | | |
|
Food Products—1.7% |
General Mills, Inc. | | 187,560 | | | 10,690,920 |
Kellogg Co. | | 130,550 | | | 6,844,736 |
Nestle S.A.(CHF) | | 28,687 | | | 13,133,754 |
| | | | | |
| | | | | 30,669,410 |
| | | | | |
|
Health Care Equipment & Supplies—0.4% |
Advanced Medical Optics, Inc. (a) (b) | | 77,500 | | | 1,901,075 |
Boston Scientific Corp. (b) | | 310,220 | | | 3,607,859 |
The Cooper Cos., Inc. (a) | | 34,050 | | | 1,293,900 |
| | | | | |
| | | | | 6,802,834 |
| | | | | |
|
Health Care Providers & Services—1.3% |
DaVita, Inc. (b) | | 32,300 | | | 1,820,105 |
Omnicare, Inc. (a) | | 40,310 | | | 919,471 |
UnitedHealth Group, Inc. | | 120,380 | | | 7,006,116 |
WellPoint, Inc. (b) | | 165,790 | | | 14,544,757 |
| | | | | |
| | | | | 24,290,449 |
| | | | | |
|
Hotels, Restaurants & Leisure—0.6% |
Royal Caribbean Cruises, Ltd. (a) | | 270,900 | | | 11,496,996 |
| | | | | |
|
Household Durables—0.7% |
D.R. Horton, Inc. (a) | | 278,570 | | | 3,668,767 |
Jarden Corp. (a) (b) | | 110,880 | | | 2,617,877 |
Toll Brothers, Inc. (a) (b) | | 212,260 | | | 4,257,935 |
Whirlpool Corp. (a) | | 22,460 | | | 1,833,410 |
| | | | | |
| | | | | 12,377,989 |
| | | | | |
|
Household Products—1.1% |
Procter & Gamble Co. | | 204,590 | | | 15,020,998 |
The Clorox Co. | | 83,150 | | | 5,418,885 |
| | | | | |
| | | | | 20,439,883 |
| | | | | |
|
Independent Power Producers & Energy Traders—0.3% |
NRG Energy, Inc. (a) (b) | | 127,950 | | | 5,545,353 |
| | | | | |
|
Industrial Conglomerates—0.9% |
3M Co. | | 48,240 | | | 4,067,597 |
General Electric Co. | | 362,265 | | | 13,429,163 |
| | | | | |
| | | | | 17,496,760 |
| | | | | |
| | | | | |
| Security Description | | Shares | | Value* |
| | | | | |
|
Insurance—4.2% |
AMBAC Financial Group, Inc. (a) | | 63,320 | | $ | 1,631,756 |
American International Group, Inc. | | 40,590 | | | 2,366,397 |
Conseco, Inc. (a) (b) | | 313,360 | | | 3,935,801 |
Genworth Financial, Inc. (Class A) | | 669,240 | | | 17,032,158 |
Max Capital Group, Ltd. | | 105,080 | | | 2,941,189 |
MBIA, Inc. (a) | | 52,490 | | | 977,889 |
Principal Financial Group, Inc. | | 29,470 | | | 2,028,715 |
Prudential Financial, Inc. | | 29,800 | | | 2,772,592 |
The Allstate Corp. | | 428,016 | | | 22,355,276 |
The Chubb Corp. | | 57,500 | | | 3,138,350 |
The Hartford Financial Services Group, Inc. | | 168,577 | | | 14,698,229 |
The Travelers Cos., Inc. | | 89,290 | | | 4,803,802 |
| | | | | |
| | | | | 78,682,154 |
| | | | | |
|
Internet Software & Services—0.1% |
Yahoo!, Inc. (b) | | 37,930 | | | 882,252 |
| | | | | |
|
IT Services—0.4% |
Accenture, Ltd. (Class A) | | 120,149 | | | 4,328,968 |
Automatic Data Processing, Inc. | | 24,160 | | | 1,075,845 |
Fidelity National Information Services, Inc. | | 63,200 | | | 2,628,488 |
| | | | | |
| | | | | 8,033,301 |
| | | | | |
|
Leisure Equipment & Products—0.1% |
Polaris Industries, Inc. (a) | | 40,290 | | | 1,924,653 |
| | | | | |
|
Machinery—0.9% |
Deere & Co. | | 50,740 | | | 4,724,909 |
Eaton Corp. | | 12,850 | | | 1,245,808 |
Kennametal, Inc. | | 47,980 | | | 1,816,523 |
Pall Corp. | | 59,170 | | | 2,385,734 |
Timkin Co. | | 184,530 | | | 6,061,810 |
| | | | | |
| | | | | 16,234,784 |
| | | | | |
|
Media—1.0% |
Citadel Broadcasting Corp. (a) | | 4,163 | | | 8,576 |
E.W. Scripps Co. (Class A) (a) | | 74,040 | | | 3,332,540 |
Omnicom Group, Inc. | | 109,490 | | | 5,204,060 |
The New York Times Co. (Class A) (a) | | 86,910 | | | 1,523,532 |
The Walt Disney Co. | | 87,290 | | | 2,817,721 |
Time Warner Cable, Inc. (Class A) (a) (b) | | 180,840 | | | 4,991,184 |
WPP Group, Plc.(GBP) | | 121,170 | | | 1,546,628 |
| | | | | |
| | | | | 19,424,241 |
| | | | | |
|
Metals & Mining—0.3% |
Allegheny Technologies, Inc. | | 21,630 | | | 1,868,832 |
BHP Billiton, Plc.(GBP) | | 79,120 | | | 2,429,703 |
Century Aluminum Co. (a) (b) | | 35,220 | | | 1,899,767 |
| | | | | |
| | | | | 6,198,302 |
| | | | | |
|
Multi-Utilities—1.4% |
Dominion Resources, Inc. | | 96,272 | | | 4,568,106 |
PG&E Corp. | | 123,400 | | | 5,317,306 |
Public Service Enterprise Group, Inc. | | 101,440 | | | 9,965,466 |
Sempra Energy | | 105,300 | | | 6,515,964 |
| | | | | |
| | | | | 26,366,842 |
| | | | | |
*See accompanying notes to financial statements.
MSF-6
Metropolitan Series Fund, Inc.
MFS Total Return Portfolio
Schedule of Investments as of December 31, 2007
Common Stock—(Continued)
| | | | | |
| Security Description | | Shares | | Value* |
| | | | | |
|
Multiline Retail—0.8% |
Macy’s, Inc. | | 552,970 | | $ | 14,305,334 |
| | | | | |
|
Oil, Gas & Consumable Fuels—8.5% |
Anadarko Petroleum Corp. | | 128,240 | | | 8,424,086 |
Apache Corp. | | 136,450 | | | 14,673,833 |
Chevron Corp. | | 70,006 | | | 6,533,660 |
ConocoPhillips | | 58,910 | | | 5,201,753 |
Consol Energy, Inc. | | 14,500 | | | 1,037,040 |
Devon Energy Corp. | | 142,740 | | | 12,691,013 |
EOG Resources, Inc. | | 34,880 | | | 3,113,040 |
Exxon Mobil Corp. | | 406,044 | | | 38,042,262 |
Hess Corp. | | 219,740 | | | 22,162,977 |
Marathon Oil Corp. | | 139,510 | | | 8,490,579 |
Royal Dutch Shell, Plc. (ADR) (A Shares) | | 25,720 | | | 2,165,624 |
Sunoco, Inc. | | 50,580 | | | 3,664,015 |
The Williams Cos., Inc. | | 231,640 | | | 8,288,079 |
Total S.A. (ADR) | | 271,340 | | | 22,412,684 |
Ultra Petroleum Corp. (b) | | 25,380 | | | 1,814,670 |
| | | | | |
| | | | | 158,715,315 |
| | | | | |
|
Paper & Forest Products—0.3% |
AbitibiBowater, Inc. (a) | | 57,567 | | | 1,186,456 |
MeadWestvaco Corp. (a) | | 110,880 | | | 3,470,544 |
| | | | | |
| | | | | 4,657,000 |
| | | | | |
|
Pharmaceuticals—3.6% |
Abbott Laboratories | | 42,078 | | | 2,362,680 |
Eli Lilly & Co. | | 54,540 | | | 2,911,891 |
GlaxoSmithKline, Plc.(GBP) | | 76,960 | | | 1,947,113 |
Johnson & Johnson | | 284,548 | | | 18,979,352 |
Merck & Co., Inc. | | 251,073 | | | 14,589,852 |
Merck KGaA(EUR) | | 23,790 | | | 3,051,552 |
Pfizer, Inc. | | 77,290 | | | 1,756,802 |
Warner Chilcott, Ltd. | | 82,890 | | | 1,469,640 |
Wyeth | | 440,340 | | | 19,458,624 |
| | | | | |
| | | | | 66,527,506 |
| | | | | |
|
Road & Rail—0.5% |
Burlington Northern Santa Fe Corp. | | 65,925 | | | 5,486,938 |
Norfolk Southern Corp. | | 62,410 | | | 3,147,960 |
| | | | | |
| | | | | 8,634,898 |
| | | | | |
|
Semiconductors & Semiconductor Equipment—0.6% |
Intel Corp. | | 409,410 | | | 10,914,871 |
| | | | | |
|
Software—0.5% |
Oracle Corp. (b) | | 423,420 | | | 9,560,824 |
| | | | | |
|
Specialty Retail—0.6% |
Advance Auto Parts, Inc. | | 21,050 | | | 799,690 |
Lowe’s Cos., Inc. | | 23,950 | | | 541,749 |
Staples, Inc. | | 354,600 | | | 8,180,622 |
The Sherwin-Williams Co. | | 27,310 | | | 1,585,072 |
| | | | | |
| | | | | 11,107,133 |
| | | | | |
| | | | | | |
| Security Description | | Shares | | Value* |
| | | | | | |
|
Textiles, Apparel & Luxury Goods—0.6% |
Nike, Inc. | | | 162,110 | | $ | 10,413,946 |
| | | | | | |
|
Thrifts & Mortgage Finance—1.1% |
Federal Home Loan Mortgage Corp. | | | 87,750 | | | 2,989,643 |
Federal National Mortgage Association | | | 277,528 | | | 11,095,569 |
New York Community Bancorp, Inc. (a) | | | 381,200 | | | 6,701,496 |
| | | | | | |
| | | | | | 20,786,708 |
| | | | | | |
|
Tobacco—1.8% |
Altria Group, Inc. | | | 433,580 | | | 32,769,976 |
| | | | | | |
|
Trading Companies & Distributors—0.6% |
W.W. Grainger, Inc. (a) | | | 80,360 | | | 7,033,107 |
WESCO International, Inc. (a) | | | 102,490 | | | 4,062,704 |
| | | | | | |
| | | | | | 11,095,811 |
| | | | | | |
|
Wireless Telecommunication Services—0.3% |
Sprint Nextel Corp. | | | 172,555 | | | 2,265,647 |
Vodafone Group, Plc. (ADR) | | | 107,863 | | | 4,025,447 |
| | | | | | |
| | | | | | 6,291,094 |
| | | | | | |
Total Common Stock
(Identified Cost $1,009,971,428) | | | | | | 1,091,740,525 |
| | | | | | |
| | |
| Fixed Income—39.8% | | | | | | |
| Security Description | | Face
Amount | | Value* |
|
Aerospace & Defense—0.1% |
BAE Systems Holdings, Inc. (144A)
5.200%, 08/15/15 | | $ | 1,718,000 | | | 1,668,221 |
| | | | | | |
|
Asset Backed—0.4% |
AESOP Funding, LLC (144A)
2.860%, 08/20/09 | | | 220,000 | | | 218,219 |
Bayview Financial (144A)
5.655%, 12/28/40 (c) | | | 1,510,000 | | | 1,208,000 |
Capital Trust, Ltd.
5.160%, 06/25/35 | | | 1,600,000 | | | 1,503,750 |
Connecticut RRB Special Purpose Trust
6.210%, 12/30/11 (c) | | | 300,000 | | | 314,211 |
Countrywide Asset-Backed Certificates
4.575%, 07/25/35 | | | 5,677 | | | 5,637 |
4.823%, 08/25/35 | | | 60,107 | | | 59,714 |
5.689%, 10/25/36 | | | 930,000 | | | 867,133 |
GMAC Mortgage Corp. Loan Trust
5.805%, 10/25/36 (c) | | | 1,077,000 | | | 878,243 |
Jet Equipment Trust (144A)
11.440%, 11/01/14 (d) (e) (f) | | | 300,000 | | | 0 |
Residential Asset Mortgage Products, Inc.
4.109%, 01/25/29 | | | 103,126 | | | 102,274 |
4.971%, 09/25/34 | | | 752,000 | | | 718,904 |
Residential Funding Mortgage Securities II, Inc.
5.320%, 12/25/35 | | | 1,190,000 | | | 1,092,308 |
| | | | | | |
| | | | | | 6,968,393 |
| | | | | | |
*See accompanying notes to financial statements.
MSF-7
Metropolitan Series Fund, Inc.
MFS Total Return Portfolio
Schedule of Investments as of December 31, 2007
Fixed Income—(Continued)
| | | | | | |
| Security Description | | Face
Amount | | Value* |
| | | | | | |
|
Auto Components—0.1% |
Johnson Controls, Inc.
5.500%, 01/15/16 | | $ | 1,408,000 | | $ | 1,387,356 |
| | | | | | |
|
Beverages—0.4% |
Diageo, Plc.
5.500%, 04/01/13 | | | 2,140,000 | | | 2,171,131 |
Miller Brewing Co. (144A)
5.500%, 08/15/13 | | | 2,921,000 | | | 2,959,843 |
The Coca-Cola Co.
5.350%, 11/15/17 | | | 1,730,000 | | | 1,772,458 |
| | | | | | |
| | | | | | 6,903,432 |
| | | | | | |
|
Capital Markets—0.5% |
Lehman Brothers Holdings, Inc.
6.500%, 07/19/17 | | | 1,960,000 | | | 1,983,240 |
Merrill Lynch & Co., Inc.
6.050%, 05/16/16 | | | 1,384,000 | | | 1,359,878 |
6.110%, 01/29/37 | | | 1,270,000 | | | 1,121,651 |
Morgan Stanley
5.750%, 10/18/16 | | | 1,156,000 | | | 1,140,703 |
6.750%, 04/15/11 | | | 1,180,000 | | | 1,236,807 |
The Goldman Sachs Group, Inc.
5.625%, 01/15/17 | | | 1,972,000 | | | 1,925,808 |
| | | | | | |
| | | | | | 8,768,087 |
| | | | | | |
|
Commercial Banks—0.8% |
Bank One Corp.
8.000%, 04/29/27 | | | 100,000 | | | 116,845 |
HSBC Finance Corp.
5.250%, 01/14/11 | | | 1,300,000 | | | 1,299,561 |
Nordea Bank (144A)
5.424%, 12/29/49 (c) | | | 610,000 | | | 551,506 |
Royal Bank of Scotland Group, Plc. (144A)
6.990%, 10/29/49 (c) | | | 690,000 | | | 687,924 |
U.S. Bancorp
7.500%, 06/01/26 | | | 400,000 | | | 456,007 |
Unicredito Italiano Capital Trust (144A)
9.200%, 10/05/49 (c) | | | 1,412,000 | | | 1,538,751 |
Wachovia Corp. 5.250%,
08/01/14 | | | 3,334,000 | | | 3,259,772 |
Wells Fargo Bank, N.A.
4.750%, 02/09/15 | | | 1,950,000 | | | 1,862,476 |
5.750%, 05/16/16 | | | 2,430,000 | | | 2,465,441 |
WOORI Bank
6.125%, 05/03/16 (c) | | | 2,620,000 | | | 2,633,485 |
| | | | | | |
| | | | | | 14,871,768 |
| | | | | | |
|
Commercial Mortgage-Backed Securities—2.3% |
Banc of America Commercial Mortgage, Inc.
5.482%, 01/15/17 (c) | | | 272,233 | | | 268,406 |
BlackRock Capital Finance, L.P.
7.750%, 09/25/26 | | | 102,546 | | | 96,496 |
Bruce Mansfield Unit
6.850%, 06/01/34 | | | 2,390,000 | | | 2,461,987 |
| | | | | | |
| Security Description | | Face
Amount | | Value* |
| | | | | | |
|
Commercial Mortgage-Backed Securities—(Continued) |
Chase Commercial Mortgage Securities Corp.
7.543%, 07/15/32 | | $ | 116,362 | | $ | 117,523 |
Countrywide Commercial Mortgage Trust
5.478%, 02/12/39 (c) | | | 560,000 | | | 557,264 |
Credit Suisse Mortgage Capital Certificates
5.343%, 12/15/39 | | | 880,078 | | | 854,801 |
Criimi Mae Commercial Mortgage Trust (144A)
7.000%, 06/02/33 | | | 235,951 | | | 235,361 |
Falcon Franchise Loan, LLC (144A)
7.382%, 05/05/10 | | | 35,317 | | | 34,932 |
GE Capital Commercial Mortgage Corp.
5.339%, 03/10/44 (c) | | | 1,000,000 | | | 985,260 |
General Electric Capital Assurance Co. (144A)
5.743%, 05/12/35 | | | 35,000 | | | 36,865 |
Greenwich Capital Commercial Funding Corp.
4.305%, 08/10/42 | | | 326,945 | | | 322,889 |
4.915%, 01/05/36 (c) | | | 500,000 | | | 499,359 |
5.317%, 06/10/36 (c) | | | 1,341,434 | | | 1,365,140 |
5.475%, 02/10/17 | | | 3,025,000 | | | 2,971,864 |
JPMorgan Chase Commercial Mortgage Securities Corp.
4.780%, 07/15/42 | | | 1,384,000 | | | 1,302,438 |
4.948%, 09/12/37 (c) | | | 1,400,000 | | | 1,333,638 |
5.038%, 03/15/46 | | | 480,060 | | | 466,570 |
5.210%, 05/15/41 (c) | | | 1,292,933 | | | 1,313,999 |
5.475%, 04/15/43 (c) | | | 2,260,000 | | | 2,285,436 |
5.532%, 06/12/47 (c) | | | 867,919 | | | 713,484 |
5.552%, 05/12/45 | | | 949,000 | | | 962,916 |
5.855%, 06/12/43 (c) | | | 2,170,000 | | | 2,196,505 |
5.875%, 04/15/45 (c) | | | 2,260,000 | | | 2,351,445 |
Merrill Lynch Mortgage Trust
5.829%, 07/12/17 (c) | | | 929,000 | | | 832,567 |
Merrill Lynch/Countrywide Commercial Mortgage Trust
5.378%, 01/12/17 (c) | | | 5,800,000 | | | 5,801,079 |
Morgan Stanley Capital I, Inc.
5.150%, 06/13/41 | | | 250,000 | | | 252,246 |
5.168%, 01/14/42 | | | 199,571 | | | 195,740 |
Morgan Stanley Capital I, Inc. (144A)
0.523%, 11/15/30 (c) (g) | | | 29,703,217 | | | 251,378 |
Multi-Family Capital Access One, Inc.
6.650%, 01/15/24 | | | 161,198 | | | 161,710 |
Spirit Master Funding, LLC (144A)
5.050%, 07/20/23 | | | 1,337,492 | | | 1,312,106 |
Structured Asset Securities Corp.
4.670%, 03/25/35 | | | 504,972 | | | 504,244 |
The Bear Stearns Commercial Mortgage Securities, Inc.
4.680%, 08/13/39 | | | 150,000 | | | 148,094 |
Wachovia Bank Commercial Mortgage Trust
4.847%, 10/15/41 | | | 2,245,000 | | | 2,164,269 |
5.083%, 03/15/42 (c) | | | 1,748,241 | | | 1,707,991 |
5.466%, 01/15/45 (c) | | | 2,039,000 | | | 2,014,787 |
5.513%, 12/15/43 (c) | | | 612,500 | | | 534,871 |
5.777%, 04/15/47 (c) | | | 1,098,000 | | | 909,345 |
*See accompanying notes to financial statements.
MSF-8
Metropolitan Series Fund, Inc.
MFS Total Return Portfolio
Schedule of Investments as of December 31, 2007
Fixed Income—(Continued)
| | | | | | |
| Security Description | | Face
Amount | | Value* |
| | | | | | |
|
Commercial Mortgage-Backed Securities—(Continued) |
Wachovia Bank Commercial Mortgage Trust
5. 795%, 07/15/45 (c) | | $ | 1,360,000 | | $ | 1,365,433 |
5.962%, 06/15/45 (c) | | | 1,530,000 | | | 1,567,198 |
| | | | | | |
| | | | | | 43,457,636 |
| | | | | | |
|
Commercial Services & Supplies—0.2% |
The Western Union Co.
5.400%, 11/17/11 | | | 2,140,000 | | | 2,156,373 |
Waste Management, Inc.
7.375%, 08/01/10 | | | 1,061,000 | | | 1,120,732 |
| | | | | | |
| | | | | | 3,277,105 |
| | | | | | |
|
Construction & Engineering—0.1% |
CRH America, Inc.
6.950%, 03/15/12 | | | 1,409,000 | | | 1,489,894 |
| | | | | | |
|
Consumer Finance—0.2% |
American Express Co.
5.500%, 09/12/16 | | | 2,170,000 | | | 2,157,238 |
Capital One Financial Corp.
6.150%, 09/01/16 | | | 1,330,000 | | | 1,180,176 |
Dean Witter Discover & Co.
6.750%, 01/01/16 | | | 260,000 | | | 271,561 |
| | | | | | |
| | | | | | 3,608,975 |
| | | | | | |
|
Diversified Financial Services—1.7% |
Bank of America Corp.
5.300%, 03/15/17 | | | 1,300,000 | | | 1,264,089 |
Bank of America Corp. (144A)
5.490%, 03/15/19 | | | 696,000 | | | 665,079 |
Capmark Financial Group, Inc.
5.875%, 05/10/12 | | | 1,760,000 | | | 1,393,153 |
CIT Group, Inc.
6.100%, 03/15/67 (c) | | | 180,000 | | | 130,698 |
Citigroup, Inc.
5.000%, 09/15/14 | | | 1,105,000 | | | 1,052,893 |
Covidien International Finance S.A.
6.000%, 10/15/17 | | | 630,000 | | | 651,882 |
6.550%, 10/15/37 | | | 380,000 | | | 394,644 |
DBS Capital Funding Corp. (144A)
7.657%, 03/31/49 (c) | | | 1,190,000 | | | 1,271,580 |
Deutsche Telekom International Finance BV
5.750%, 03/23/16 | | | 1,949,000 | | | 1,950,826 |
Duke Capital, LLC
8.000%, 10/01/19 | | | 1,253,000 | | | 1,443,499 |
Enel Finance International S.A.
6.250%, 09/15/17 | | | 1,920,000 | | | 1,942,875 |
ERP Operating, L.P.
5.750%, 06/15/17 | | | 1,900,000 | | | 1,809,284 |
General Electric Capital Corp.
5.250%, 12/06/17 | | | 660,000 | | | 658,592 |
5.375%, 10/20/16 (a) | | | 685,000 | | | 693,741 |
5.450%, 01/15/13 | | | 572,000 | | | 589,543 |
8.500%, 07/24/08 | | | 553,000 | | | 563,679 |
| | | | | | |
| Security Description | | Face
Amount | | Value* |
| | | | | | |
|
Diversified Financial Services—(Continued) |
MidAmerican Funding, LLC
6.927%, 03/01/29 | | $ | 699,000 | | $ | 770,649 |
Mizuho, Ltd. (144A)
6.686%, 03/31/49 (c) | | | 2,240,000 | | | 2,095,811 |
MUFG Capital Finance
6.346%, 07/29/49 (c) | | | 1,711,000 | | | 1,620,546 |
Natexis AMBS Company, LLC (144A)
8.440%, 12/29/49 (c) | | | 280,000 | | | 285,700 |
ORIX Corp.
5.480%, 11/22/11 | | | 2,170,000 | | | 2,169,931 |
PNC Funding Corp.
5.625%, 02/01/17 | | | 1,080,000 | | | 1,051,115 |
Telecom Italia Capital S.A.
5.250%, 11/15/13 | | | 753,000 | | | 744,212 |
UBS Preferred Funding Trust V
6.243%, 05/12/49 (c) | | | 1,930,000 | | | 1,858,318 |
UFJ Finance Aruba AEC
6.750%, 07/15/13 | | | 1,320,000 | | | 1,434,008 |
Unicredit Luxembourg Finance S.A.
6.000%, 10/31/17 | | | 1,520,000 | | | 1,504,981 |
ZFS Finance USA Trust I (144A)
5.875%, 05/09/32 (c) | | | 500,000 | | | 466,065 |
6.500%, 05/09/37 (c) | | | 1,950,000 | | | 1,800,217 |
| | | | | | |
| | | | | | 32,277,610 |
| | | | | | |
|
Diversified Telecommunication Services—0.4% |
AT&T, Inc.
6.500%, 09/01/37 | | | 1,507,000 | | | 1,575,837 |
BellSouth Corp.
6.550%, 06/15/34 | | | 1,212,000 | | | 1,253,576 |
Telus Corp.
8.000%, 06/01/11 | | | 1,918,000 | | | 2,078,093 |
Verizon New York, Inc.
6.875%, 04/01/12 | | | 3,102,000 | | | 3,291,244 |
| | | | | | |
| | | | | | 8,198,750 |
| | | | | | |
|
Electric Utilities—0.8% |
Entergy Louisiana, LLC
8.090%, 01/02/17 | | | 699,383 | | | 699,656 |
Exelon Generation Co., LLC
6.200%, 10/01/17 | | | 860,000 | | | 854,693 |
6.950%, 06/15/11 | | | 2,478,000 | | | 2,585,468 |
FirstEnergy Corp.
6.450%, 11/15/11 | | | 1,926,000 | | | 1,988,819 |
Hydro-Quebec
6.300%, 05/11/11 | | | 1,600,000 | | | 1,713,312 |
MidAmerican Energy Holdings Co.
3.500%, 05/15/08 | | | 694,000 | | | 689,440 |
5.875%, 10/01/12 | | | 768,000 | | | 796,022 |
6.125%, 04/01/36 | | | 602,000 | | | 600,566 |
Oncor Electric Delivery Co.
7.000%, 09/01/22 | | | 1,825,000 | | | 1,890,596 |
PPL Energy Supply, LLC
6.400%, 11/01/11 | | | 100,000 | | | 102,369 |
*See accompanying notes to financial statements.
MSF-9
Metropolitan Series Fund, Inc.
MFS Total Return Portfolio
Schedule of Investments as of December 31, 2007
Fixed Income—(Continued)
| | | | | | |
| Security Description | | Face
Amount | | Value* |
| | | | | | |
|
Electric Utilities—(Continued) |
PSE&G Power, LLC
5.500%, 12/01/15 | | $ | 977,000 | | $ | 956,504 |
6.950%, 06/01/12 | | | 560,000 | | | 597,020 |
System Energy Resources, Inc. (144A)
5.129%, 01/15/14 | | | 692,781 | | | 709,518 |
United Energy Distribution Holdings, Ltd. (144A)
5.450%, 04/15/16 | | | 50,000 | | | 51,254 |
| | | | | | |
| | | | | | 14,235,237 |
| | | | | | |
|
Electronic Equipment & Instruments—0.1% |
Tyco Electronics Group S.A.
6.550%, 10/01/17 | | | 1,385,000 | | | 1,424,571 |
| | | | | | |
|
Energy Equipment & Services—0.1% |
Kinder Morgan Energy Partners, L.P.
5.125%, 11/15/14 | | | 412,000 | | | 401,432 |
6.750%, 03/15/11 | | | 1,202,000 | | | 1,260,963 |
7.750%, 03/15/32 | | | 625,000 | | | 698,115 |
| | | | | | |
| | | | | | 2,360,510 |
| | | | | | |
|
Federal Agencies—16.4% |
Federal Home Loan Mortgage Corp.
3.900%, 02/25/08 | | | 1,025,000 | | | 1,023,901 |
4.125%, 11/18/09 | | | 3,100,000 | | | 3,130,656 |
4.125%, 07/12/10 (a) | | | 787,000 | | | 796,690 |
4.500%, 05/01/18 | | | 431,650 | | | 424,452 |
4.500%, 08/01/18 | | | 694,689 | | | 683,105 |
4.500%, 11/01/18 | | | 661,715 | | | 650,680 |
4.500%, 01/01/19 | | | 1,196,944 | | | 1,176,984 |
4.500%, 08/01/19 | | | 65,744 | | | 64,620 |
4.500%, 02/01/20 | | | 1,090,264 | | | 1,071,620 |
4.500%, 04/01/35 | | | 1,301,254 | | | 1,231,142 |
5.000%, 12/01/17 | | | 30,159 | | | 30,233 |
5.000%, 05/01/18 | | | 295,020 | | | 295,744 |
5.000%, 06/01/18 | | | 43,742 | | | 43,849 |
5.000%, 09/01/18 | | | 659,892 | | | 661,517 |
5.000%, 12/01/18 | | | 98,312 | | | 98,554 |
5.000%, 02/01/19 | | | 790,392 | | | 791,830 |
5.000%, 05/01/19 | | | 567,628 | | | 568,889 |
5.000%, 06/01/19 | | | 318,683 | | | 319,262 |
5.000%, 09/01/33 | | | 3,067,066 | | | 2,997,113 |
5.000%, 11/01/33 | | | 1,440,346 | | | 1,407,495 |
5.000%, 03/01/34 | | | 427,950 | | | 418,017 |
5.000%, 04/01/34 | | | 457,345 | | | 446,730 |
5.000%, 05/01/35 | | | 550,977 | | | 537,937 |
5.000%, 07/01/35 | | | 1,363,252 | | | 1,330,987 |
5.000%, 08/01/35 | | | 1,415,588 | | | 1,382,084 |
5.000%, 09/01/35 | | | 819,429 | | | 800,036 |
5.000%, 10/01/35 | | | 4,848,180 | | | 4,733,437 |
5.500%, 08/23/17 | | | 7,900,000 | | | 8,476,487 |
5.500%, 01/01/19 | | | 134,261 | | | 136,010 |
5.500%, 04/01/19 | | | 73,349 | | | 74,362 |
5.500%, 06/01/19 | | | 50,536 | | | 51,194 |
5.500%, 07/01/19 | | | 205,825 | | | 208,506 |
5.500%, 08/01/19 | | | 67,916 | | | 68,800 |
| | | | | | |
| Security Description | | Face
Amount | | Value* |
| | | | | | |
|
Federal Agencies—(Continued) |
5.500%, 12/01/19 | | $ | 77,817 | | $ | 78,831 |
5.500%, 02/01/20 | | | 31,814 | | | 32,207 |
5.500%, 12/01/20 | | | 125,133 | | | 126,678 |
5.500%, 10/01/24 | | | 723,314 | | | 726,671 |
5.500%, 06/01/25 | | | 1,275,028 | | | 1,280,405 |
5.500%, 07/01/25 | | | 555,214 | | | 557,555 |
5.500%, 08/01/25 | | | 856,381 | | | 859,992 |
5.500%, 09/01/25 | | | 766,736 | | | 769,969 |
5.500%, 05/01/33 | | | 2,917,679 | | | 2,916,844 |
5.500%, 12/01/33 | | | 1,971,657 | | | 1,971,093 |
5.500%, 01/01/34 | | | 1,969,448 | | | 1,968,885 |
5.500%, 04/01/34 | | | 299,487 | | | 299,220 |
5.500%, 10/01/34 | | | 181,589 | | | 181,427 |
5.500%, 11/01/34 | | | 246,689 | | | 246,469 |
5.500%, 12/01/34 | | | 366,766 | | | 366,439 |
5.500%, 05/01/35 | | | 165,919 | | | 165,641 |
5.500%, 07/01/35 | | | 1,033,427 | | | 1,031,694 |
5.500%, 09/01/35 | | | 442,884 | | | 442,141 |
5.500%, 10/01/35 | | | 678,484 | | | 677,347 |
6.000%, 04/01/16 | | | 120,422 | | | 123,352 |
6.000%, 04/01/17 | | | 205,813 | | | 210,764 |
6.000%, 07/01/17 | | | 103,514 | | | 106,004 |
6.000%, 10/01/17 | | | 149,425 | | | 153,019 |
6.000%, 08/01/19 | | | 847,464 | | | 866,576 |
6.000%, 09/01/19 | | | 276,831 | | | 283,074 |
6.000%, 11/01/19 | | | 138,890 | | | 142,047 |
6.000%, 05/01/21 | | | 486,467 | | | 497,657 |
6.000%, 10/01/21 | | | 684,812 | | | 700,564 |
6.000%, 02/01/23 | | | 849,039 | | | 866,777 |
6.000%, 12/01/25 | | | 373,046 | | | 379,889 |
6.000%, 02/01/26 | | | 391,386 | | | 398,566 |
6.000%, 04/01/34 | | | 182,892 | | | 185,903 |
6.000%, 07/01/34 | | | 739,701 | | | 751,878 |
6.000%, 08/01/34 | | | 4,208,747 | | | 4,278,036 |
6.000%, 09/01/34 | | | 89,307 | | | 90,777 |
6.000%, 07/01/35 | | | 397,400 | | | 403,632 |
6.000%, 08/01/35 | | | 489,777 | | | 497,457 |
6.000%, 11/01/35 | | | 1,210,184 | | | 1,229,161 |
6.000%, 03/01/36 | | | 581,407 | | | 590,149 |
6.000%, 10/01/36 | | | 866,523 | | | 880,789 |
6.000%, 11/01/36 | | | 1,379,989 | | | 1,400,739 |
6.000%, 01/01/37 | | | 889,495 | | | 902,869 |
6.000%, 03/01/37 | | | 741,762 | | | 752,839 |
6.000%, 05/01/37 | | | 1,864,843 | | | 1,892,693 |
6.000%, 06/01/37 | | | 1,383,974 | | | 1,404,642 |
6.500%, 05/01/34 | | | 168,574 | | | 173,740 |
6.500%, 06/01/34 | | | 224,417 | | | 231,297 |
6.500%, 08/01/34 | | | 858,168 | | | 884,473 |
6.500%, 10/01/34 | | | 812,542 | | | 840,031 |
6.500%, 11/01/34 | | | 465,500 | | | 479,769 |
6.500%, 05/01/37 | | | 470,568 | | | 483,713 |
6.500%, 07/01/37 | | | 1,961,802 | | | 2,016,606 |
Federal National Mortgage Association
4.010%, 08/01/13 (c) | | | 149,214 | | | 144,901 |
4.019%, 08/01/13 (c) | | | 675,459 | | | 657,674 |
4.500%, 04/01/18 | | | 537,332 | | | 528,693 |
*See accompanying notes to financial statements.
MSF-10
Metropolitan Series Fund, Inc.
MFS Total Return Portfolio
Schedule of Investments as of December 31, 2007
Fixed Income—(Continued)
| | | | | | |
| Security Description | | Face
Amount | | Value* |
| | | | | | |
|
Federal Agencies—(Continued) |
Federal National Mortgage Association
4.500%, 06/01/18 | | $ | 1,165,996 | | $ | 1,147,250 |
4.500%, 07/01/18 | | | 1,473,076 | | | 1,449,393 |
4.500%, 03/01/19 | | | 758,636 | | | 746,143 |
4.500%, 06/01/19 | | | 2,698,553 | | | 2,654,114 |
4.500%, 04/01/20 | | | 632,191 | | | 621,780 |
4.500%, 05/01/20 | | | 260,444 | | | 256,085 |
4.500%, 07/01/20 | | | 341,277 | | | 335,657 |
4.500%, 11/01/20 | | | 787,970 | | | 774,783 |
4.500%, 02/01/35 | | | 491,956 | | | 465,828 |
4.500%, 03/01/35 | | | 2,016,316 | | | 1,909,387 |
4.500%, 09/01/35 | | | 751,843 | | | 711,972 |
4.548%, 05/01/14 (c) | | | 981,572 | | | 974,739 |
4.630%, 04/01/14 | | | 370,236 | | | 368,734 |
4.700%, 03/01/15 | | | 619,329 | | | 615,774 |
4.751%, 04/01/13 (c) | | | 79,635 | | | 80,164 |
4.839%, 08/01/14 (c) | | | 1,002,125 | | | 1,008,765 |
4.845%, 06/01/13 | | | 93,205 | | | 94,064 |
4.871%, 02/01/14 (c) | | | 662,836 | | | 668,590 |
4.880%, 03/01/20 | | | 470,125 | | | 472,115 |
4.926%, 04/01/15 (c) | | | 2,346,478 | | | 2,364,331 |
4.940%, 08/01/15 | | | 50,000 | | | 50,768 |
5.000%, 11/01/17 | | | 801,341 | | | 803,270 |
5.000%, 02/01/18 | | | 3,165,843 | | | 3,173,468 |
5.000%, 11/01/18 | | | 60,187 | | | 60,338 |
5.000%, 12/01/18 | | | 2,015,929 | | | 2,020,969 |
5.000%, 06/01/19 | | | 1,433,330 | | | 1,435,973 |
5.000%, 07/01/19 | | | 1,293,937 | | | 1,296,324 |
5.000%, 09/01/19 | | | 854,383 | | | 855,959 |
5.000%, 11/01/19 | | | 221,407 | | | 221,815 |
5.000%, 12/01/19 | | | 64,526 | | | 64,645 |
5.000%, 01/01/20 | | | 71,037 | | | 71,107 |
5.000%, 03/01/20 | | | 309,705 | | | 310,008 |
5.000%, 05/01/20 | | | 556,390 | | | 556,936 |
5.000%, 07/01/20 | | | 1,754,631 | | | 1,756,353 |
5.000%, 08/01/20 | | | 375,999 | | | 376,368 |
5.000%, 11/01/33 | | | 1,506,446 | | | 1,472,105 |
5.000%, 03/01/34 | | | 1,468,953 | | | 1,435,311 |
5.000%, 04/01/34 | | | 460,685 | | | 450,003 |
5.000%, 05/01/34 | | | 466,689 | | | 455,869 |
5.000%, 06/01/34 | | | 461,517 | | | 450,817 |
5.000%, 08/01/34 | | | 509,364 | | | 497,554 |
5.000%, 09/01/34 | | | 1,776,821 | | | 1,735,626 |
5.000%, 11/01/34 | | | 296,560 | | | 289,685 |
5.000%, 12/01/34 | | | 215,928 | | | 210,922 |
5.000%, 03/01/35 | | | 822,392 | | | 803,791 |
5.000%, 06/01/35 | | | 2,179,435 | | | 2,127,722 |
5.000%, 07/01/35 | | | 8,365,369 | | | 8,166,879 |
5.000%, 08/01/35 | | | 2,765,893 | | | 2,700,264 |
5.000%, 08/01/36 | | | 537,780 | | | 525,020 |
5.370%, 02/01/13 (c) | | | 386,635 | | | 398,690 |
5.471%, 11/01/15 (c) | | | 448,358 | | | 464,751 |
5.500%, 11/01/17 | | | 1,262,188 | | | 1,281,272 |
5.500%, 12/01/17 | | | 218,948 | | | 222,258 |
5.500%, 01/01/18 | | | 813,935 | | | 826,241 |
5.500%, 02/01/18 | | | 689,739 | | | 699,990 |
5.500%, 12/01/18 | | | 310,277 | | | 314,888 |
| | | | | | |
| Security Description | | Face
Amount | | Value* |
| | | | | | |
|
Federal Agencies—(Continued) |
5.500%, 06/01/19 | | $ | 1,194,659 | | $ | 1,211,383 |
5.500%, 07/01/19 | | | 1,516,530 | | | 1,537,760 |
5.500%, 08/01/19 | | | 429,973 | | | 435,993 |
5.500%, 09/01/19 | | | 976,006 | | | 989,669 |
5.500%, 11/01/19 | | | 190,499 | | | 193,165 |
5.500%, 12/01/19 | | | 218,847 | | | 221,911 |
5.500%, 01/01/21 | | | 579,702 | | | 587,437 |
5.500%, 03/01/21 | | | 833,432 | | | 844,340 |
5.500%, 05/01/22 | | | 466,750 | | | 472,806 |
5.500%, 05/01/25 | | | 721,958 | | | 725,420 |
5.500%, 06/01/25 | | | 494,263 | | | 496,633 |
5.500%, 02/01/33 | | | 715,188 | | | 715,718 |
5.500%, 04/01/33 | | | 257,514 | | | 257,705 |
5.500%, 05/01/33 | | | 60,540 | | | 60,585 |
5.500%, 06/01/33 | | | 4,508,794 | | | 4,512,138 |
5.500%, 07/01/33 | | | 2,771,640 | | | 2,773,694 |
5.500%, 11/01/33 | | | 1,688,206 | | | 1,689,459 |
5.500%, 12/01/33 | | | 335,597 | | | 335,846 |
5.500%, 01/01/34 (c) | | | 486,278 | | | 486,638 |
5.500%, 01/01/34 | | | 736,897 | | | 737,443 |
5.500%, 02/01/34 | | | 1,814,585 | | | 1,815,652 |
5.500%, 03/01/34 | | | 214,262 | | | 214,348 |
5.500%, 04/01/34 | | | 625,847 | | | 625,939 |
5.500%, 05/01/34 | | | 2,459,670 | | | 2,459,806 |
5.500%, 06/01/34 | | | 3,289,718 | | | 3,289,900 |
5.500%, 07/01/34 | | | 2,865,139 | | | 2,865,299 |
5.500%, 08/01/34 | | | 1,235,262 | | | 1,235,331 |
5.500%, 09/01/34 | | | 6,480,917 | | | 6,481,276 |
5.500%, 10/01/34 | | | 5,360,937 | | | 5,361,234 |
5.500%, 11/01/34 | | | 9,058,418 | | | 9,058,918 |
5.500%, 12/01/34 | | | 4,438,770 | | | 4,439,015 |
5.500%, 01/01/35 | | | 7,298,705 | | | 7,299,568 |
5.500%, 02/01/35 | | | 2,107,721 | | | 2,107,043 |
5.500%, 03/01/35 | | | 4,328,343 | | | 4,325,703 |
5.500%, 04/01/35 | | | 2,033,856 | | | 2,032,615 |
5.500%, 05/01/35 | | | 121,655 | | | 121,581 |
5.500%, 07/01/35 | | | 993,768 | | | 993,162 |
5.500%, 08/01/35 | | | 3,524,768 | | | 3,523,440 |
5.500%, 09/01/35 (c) | | | 1,647,785 | | | 1,646,779 |
5.500%, 09/01/35 | | | 805,320 | | | 804,830 |
5.500%, 10/01/35 | | | 276,713 | | | 276,544 |
5.500%, 12/01/35 | | | 2,430,385 | | | 2,428,902 |
5.500%, 04/01/36 | | | 1,636,683 | | | 1,635,685 |
5.500%, 10/01/36 | | | 478,234 | | | 477,717 |
5.500%, 11/01/36 | | | 395,482 | | | 395,054 |
5.500%, 03/01/37 | | | 676,033 | | | 675,303 |
6.000%, 05/15/08 | | | 4,179,000 | | | 4,200,167 |
6.000%, 05/15/11 (a) | | | 1,473,000 | | | 1,580,685 |
6.000%, 07/01/16 | | | 435,835 | | | 446,702 |
6.000%, 01/01/17 | | | 558,117 | | | 572,138 |
6.000%, 02/01/17 (c) | | | 499,921 | | | 512,386 |
6.000%, 07/01/17 | | | 773,013 | | | 792,288 |
6.000%, 08/01/17 | | | 83,728 | | | 85,831 |
6.000%, 09/01/17 | | | 419,227 | | | 429,758 |
6.000%, 03/01/18 | | | 68,511 | | | 70,232 |
6.000%, 11/01/18 | | | 423,460 | | | 434,019 |
*See accompanying notes to financial statements.
MSF-11
Metropolitan Series Fund, Inc.
MFS Total Return Portfolio
Schedule of Investments as of December 31, 2007
Fixed Income—(Continued)
| | | | | | |
| Security Description | | Face
Amount | | Value* |
| | | | | | |
|
Federal Agencies—(Continued) |
Federal National Mortgage Association
6.000%, 01/01/21 | | $ | 537,335 | | $ | 550,220 |
6.000%, 02/01/21 | | | 697,738 | | | 714,470 |
6.000%, 05/01/21 | | | 914,233 | | | 936,156 |
6.000%, 01/01/23 | | | 94,963 | | | 96,995 |
6.000%, 11/01/25 | | | 618,629 | | | 630,386 |
6.000%, 02/01/32 | | | 1,605,830 | | | 1,637,929 |
6.000%, 03/01/34 | | | 124,462 | | | 126,787 |
6.000%, 04/01/34 | | | 2,120,267 | | | 2,156,351 |
6.000%, 05/01/34 | | | 191,781 | | | 195,013 |
6.000%, 06/01/34 | | | 2,221,701 | | | 2,259,152 |
6.000%, 07/01/34 | | | 2,543,426 | | | 2,586,300 |
6.000%, 08/01/34 | | | 6,005,475 | | | 6,106,711 |
6.000%, 10/01/34 | | | 2,164,926 | | | 2,201,421 |
6.000%, 11/01/34 | | | 280,709 | | | 285,442 |
6.000%, 12/01/34 | | | 148,500 | | | 151,003 |
6.000%, 04/01/35 | | | 75,623 | | | 76,838 |
6.000%, 08/01/35 | | | 450,696 | | | 457,932 |
6.000%, 09/01/35 (c) | | | 627,510 | | | 638,848 |
6.000%, 10/01/35 | | | 854,899 | | | 868,626 |
6.000%, 11/01/35 | | | 383,770 | | | 389,931 |
6.000%, 12/01/35 | | | 1,253,166 | | | 1,273,286 |
6.000%, 02/01/36 | | | 2,017,342 | | | 2,049,542 |
6.000%, 03/01/36 | | | 1,107,549 | | | 1,124,930 |
6.000%, 04/01/36 | | | 2,569,314 | | | 2,609,635 |
6.000%, 06/01/36 | | | 676,225 | | | 686,995 |
6.000%, 07/01/36 | | | 1,212,199 | | | 1,231,223 |
6.000%, 08/01/36 | | | 555,468 | | | 564,185 |
6.000%, 12/01/36 | | | 729,646 | | | 741,096 |
6.000%, 01/01/37 | | | 2,062,351 | | | 2,094,671 |
6.000%, 02/01/37 | | | 1,088,294 | | | 1,105,227 |
6.000%, 03/01/37 | | | 771,321 | | | 783,322 |
6.000%, 04/01/37 | | | 1,166,896 | | | 1,185,051 |
6.000%, 05/01/37 | | | 1,131,579 | | | 1,149,185 |
6.000%, 06/01/37 | | | 1,513,356 | | | 1,536,903 |
6.000%, 07/01/37 | | | 2,698,739 | | | 2,740,728 |
6.330%, 03/01/11 (c) | | | 170,550 | | | 178,250 |
6.500%, 06/01/31 | | | 404,419 | | | 418,204 |
6.500%, 07/01/31 | | | 185,746 | | | 192,077 |
6.500%, 08/01/31 | | | 103,592 | | | 107,123 |
6.500%, 09/01/31 | | | 553,546 | | | 572,413 |
6.500%, 02/01/32 | | | 528,541 | | | 546,555 |
6.500%, 05/01/32 | | | 181,418 | | | 187,551 |
6.500%, 07/01/32 | | | 936,667 | | | 968,605 |
6.500%, 08/01/32 | | | 834,955 | | | 863,184 |
6.500%, 01/01/33 | | | 364,730 | | | 377,061 |
6.500%, 04/01/34 | | | 748,203 | | | 772,322 |
6.500%, 06/01/34 | | | 195,780 | | | 201,789 |
6.500%, 08/01/34 | | | 256,110 | | | 263,970 |
6.500%, 03/01/36 | | | 895,663 | | | 920,780 |
6.500%, 04/01/36 | | | 413,838 | | | 425,443 |
6.500%, 05/01/36 | | | 620,399 | | | 637,797 |
6.500%, 01/01/37 | | | 535,753 | | | 550,777 |
6.500%, 02/01/37 | | | 2,409,750 | | | 2,477,123 |
6.500%, 04/01/37 | | | 608,060 | | | 625,047 |
6.500%, 05/01/37 | | | 807,847 | | | 830,415 |
6.500%, 06/01/37 | | | 554,848 | | | 570,348 |
| | | | | | |
| Security Description | | Face
Amount | | Value* |
| | | | | | |
|
Federal Agencies—(Continued) |
6.500%, 07/01/37 | | $ | 798,211 | | $ | 820,510 |
6.625%, 09/15/09 (a) | | | 3,886,000 | | | 4,078,532 |
7.500%, 10/01/29 | | | 87,490 | | | 93,527 |
7.500%, 02/01/30 | | | 60,622 | | | 64,847 |
7.500%, 11/01/31 | | | 203,949 | | | 217,506 |
7.500%, 02/01/32 | | | 60,775 | | | 64,814 |
Government National Mortgage Association 4.500%, 07/20/33 | | | 141,049 | | | 133,801 |
4.500%, 09/15/33 | | | 574,374 | | | 550,063 |
4.500%, 09/20/33 | | | 72,171 | | | 68,462 |
4.500%, 12/20/34 | | | 73,169 | | | 69,404 |
4.500%, 03/20/35 | | | 357,112 | | | 338,795 |
5.000%, 07/20/33 | | | 276,937 | | | 270,547 |
5.000%, 03/15/34 | | | 263,282 | | | 259,519 |
5.000%, 06/15/34 | | | 438,154 | | | 431,891 |
5.000%, 12/15/34 | | | 269,704 | | | 265,849 |
5.000%, 06/15/35 | | | 95,692 | | | 94,321 |
5.500%, 11/15/32 | | | 808,959 | | | 815,786 |
5.500%, 08/15/33 | | | 3,184,608 | | | 3,209,489 |
5.500%, 12/15/33 | | | 1,160,530 | | | 1,169,717 |
5.500%, 09/15/34 | | | 1,061,272 | | | 1,069,338 |
5.500%, 02/15/35 | | | 98,156 | | | 98,903 |
5.500%, 10/15/35 | | | 597,351 | | | 601,899 |
6.000%, 12/15/28 | | | 203,891 | | | 209,501 |
6.000%, 12/15/31 | | | 209,100 | | | 214,585 |
6.000%, 03/15/32 | | | 11,345 | | | 11,636 |
6.000%, 10/15/32 | | | 841,579 | | | 863,170 |
6.000%, 01/15/33 | | | 145,784 | | | 149,439 |
6.000%, 02/15/33 | | | 6,739 | | | 6,908 |
6.000%, 04/15/33 | | | 822,602 | | | 843,224 |
6.000%, 08/15/33 | | | 8,498 | | | 8,711 |
6.000%, 07/15/34 | | | 625,567 | | | 641,105 |
6.000%, 09/15/34 | | | 518,484 | | | 531,362 |
6.000%, 01/20/35 | | | 449,333 | | | 458,807 |
6.000%, 02/20/35 | | | 506,041 | | | 516,711 |
6.000%, 04/20/35 | | | 276,839 | | | 282,676 |
6.500%, 11/20/35 | | | 400,286 | | | 413,935 |
6.500%, 02/20/36 | | | 268,942 | | | 277,733 |
| | | | | | |
| | | | | | 305,413,748 |
| | | | | | |
|
Food & Staples Retailing—0.2% |
CVS Corp.
5.750%, 06/01/17 | | | 790,000 | | | 795,084 |
6.125%, 08/15/16 | | | 1,080,000 | | | 1,108,604 |
Wal-Mart Stores, Inc.
5.250%, 09/01/35 | | | 1,830,000 | | | 1,623,236 |
| | | | | | |
| | | | | | 3,526,924 |
| | | | | | |
|
Food Products—0.0% |
The Kroger Co.
6.400%, 08/15/17 | | | 340,000 | | | 355,610 |
| | | | | | |
|
Foreign Government—0.2% |
Egypt Government AID Bond
4.450%, 09/15/15 | | | 403,000 | | | 400,901 |
*See accompanying notes to financial statements.
MSF-12
Metropolitan Series Fund, Inc.
MFS Total Return Portfolio
Schedule of Investments as of December 31, 2007
Fixed Income—(Continued)
| | | | | | |
| Security Description | | Face
Amount | | Value* |
| | | | | | |
|
Foreign Government—(Continued) |
Israel Government International AID Bond
4.625%, 06/15/13 | | $ | 1,095,000 | | $ | 1,078,980 |
Province of Ontario Canada
5.000%, 10/18/11 | | | 2,170,000 | | | 2,242,456 |
| | | | | | |
| | | | | | 3,722,337 |
| | | | | | |
|
Government Agency—0.4% |
Financing Corp.
9.650%, 11/02/18 | | | 430,000 | | | 612,497 |
Massachusetts Bay Transportation Authority (MBTA)
5.250%, 07/01/17 | | | 1,430,000 | | | 1,599,970 |
Small Business Administration Participation Certificates
4.350%, 07/01/23 (c) | | | 1,553,633 | | | 1,516,926 |
4.770%, 04/01/24 | | | 79,740 | | | 79,349 |
4.950%, 03/01/25 (c) | | | 496,826 | | | 488,811 |
4.990%, 09/01/24 (c) | | | 268,613 | | | 270,047 |
5.090%, 10/01/25 (c) | | | 594,476 | | | 598,948 |
5.110%, 08/01/25 (c) | | | 662,893 | | | 669,045 |
5.180%, 05/01/24 (c) | | | 129,506 | | | 131,275 |
5.390%, 12/01/25 (c) | | | 819,472 | | | 836,225 |
5.520%, 06/01/24 (c) | | | 430,451 | | | 442,372 |
U.S. Department of Housing & Urban Development
7.498%, 08/01/11 | | | 98,000 | | | 103,828 |
| | | | | | |
| | | | | | 7,349,293 |
| | | | | | |
|
Health Care Equipment & Supplies—0.1% |
Baxter International, Inc.
5.900%, 09/01/16 | | | 1,496,000 | | | 1,554,402 |
| | | | | | |
|
Health Care Providers & Services—0.0% |
HCA, Inc.
8.750%, 09/01/10 | | | 294,000 | | | 296,572 |
| | | | | | |
|
Hotels, Restaurants & Leisure—0.1% |
Marriott International, Inc.
6.375%, 06/15/17 | | | 1,760,000 | | | 1,805,719 |
Wyndham Worldwide Corp.
6.000%, 12/01/16 | | | 1,077,000 | | | 1,021,427 |
| | | | | | |
| | | | | | 2,827,146 |
| | | | | | |
|
Household Durables—0.1% |
Fortune Brands, Inc.
5.125%, 01/15/11 | | | 1,435,000 | | | 1,432,088 |
| | | | | | |
|
Insurance—0.4% |
American International Group, Inc.
6.250%, 03/15/37 | | | 1,510,000 | | | 1,350,573 |
Chubb Corp.
6.375%, 03/29/67 (c) | | | 2,110,000 | | | 2,058,119 |
Everest Reinsurance Holdings, Inc.
8.750%, 03/15/10 | | | 100,000 | | | 109,438 |
| | | | | | |
| Security Description | | Face
Amount | | Value* |
| | | | | | |
|
Insurance—(Continued) |
Fund American Cos., Inc.
5.875%, 05/15/13 | | $ | 735,000 | | $ | 736,586 |
ING Groep NV
5.775%, 12/29/49 (c) | | | 2,310,000 | | | 2,135,586 |
The Allstate Corp.
5.550%, 05/09/35 | | | 1,326,000 | | | 1,179,562 |
| | | | | | |
| | | | | | 7,569,864 |
| | | | | | |
|
Machinery—0.1% |
Kennametal, Inc.
7.200%, 06/15/12 | | | 1,284,000 | | | 1,395,346 |
| | | | | | |
|
Media—0.3% |
CBS Corp.
6.625%, 05/15/11 | | | 1,485,000 | | | 1,540,285 |
Cox Communications, Inc.
4.625%, 06/01/13 | | | 1,473,000 | | | 1,409,234 |
Hearst-Argyle Television, Inc.
7.500%, 11/15/27 | | | 200,000 | | | 208,860 |
News America Holdings, Inc.
8.500%, 02/23/25 | | | 722,000 | | | 860,397 |
News America, Inc.
6.200%, 12/15/34 | | | 938,000 | | | 924,671 |
Time Warner Entertainment Co., L.P.
8.375%, 07/15/33 | | | 1,240,000 | | | 1,493,714 |
| | | | | | |
| | | | | | 6,437,161 |
| | | | | | |
|
Metals & Mining—0.1% |
Vale Overseas, Ltd.
6.250%, 01/23/17 | | | 1,560,000 | | | 1,564,844 |
| | | | | | |
|
Multi-Utilities—0.2% |
Centerpoint Energy Resources Corp.
7.875%, 04/01/13 | | | 1,293,000 | | | 1,419,697 |
Dominion Resources, Inc.
5.150%, 07/15/15 | | | 1,756,000 | | | 1,699,162 |
Pacific Gas & Electric Co.
4.800%, 03/01/14 | | | 397,000 | | | 385,968 |
| | | | | | |
| | | | | | 3,504,827 |
| | | | | | |
|
Office Electronics—0.1% |
Xerox Corp.
5.500%, 05/15/12 | | | 820,000 | | | 833,626 |
6.400%, 03/15/16 | | | 440,000 | | | 450,244 |
| | | | | | |
| | | | | | 1,283,870 |
| | | | | | |
|
Oil, Gas & Consumable Fuels—0.4% |
Ocean Energy, Inc.
7.250%, 10/01/11 | | | 2,215,000 | | | 2,407,269 |
Pemex Project Funding Master Trust
9.125%, 10/13/10 | | | 35,000 | | | 38,675 |
Ras Laffan Liquefied Natural Gas Co., Ltd. III 5.832%, 09/30/16 | | | 970,000 | | | 985,695 |
*See accompanying notes to financial statements.
MSF-13
Metropolitan Series Fund, Inc.
MFS Total Return Portfolio
Schedule of Investments as of December 31, 2007
Fixed Income—(Continued)
| | | | | | |
| Security Description | | Face
Amount | | Value* |
| | | | | | |
|
Oil, Gas & Consumable Fuels—(Continued) |
Valero Energy Corp.
6.875%, 04/15/12 | | $ | 2,023,000 | | $ | 2,158,648 |
Weatherford International, Inc.
6.350%, 06/15/17 | | | 480,000 | | | 496,155 |
XTO Energy, Inc.
5.650%, 04/01/16 | | | 1,830,000 | | | 1,843,000 |
| | | | | | |
| | | | | | 7,929,442 |
| | | | | | |
|
Paper & Forest Products—0.0% |
MeadWestvaco Corp.
6.800%, 11/15/32 | | | 607,000 | | | 571,683 |
6.850%, 04/01/12 | | | 35,000 | | | 36,968 |
| | | | | | |
| | | | | | 608,651 |
| | | | | | |
|
Pharmaceuticals—0.2% |
Allergen, Inc.
5.750%, 04/01/16 | | | 1,430,000 | | | 1,464,715 |
Cardinal Health, Inc. (144A)
6.300%, 10/15/16 (c) | | | 793,000 | | | 812,770 |
Hospira, Inc.
5.550%, 03/30/12 | | | 530,000 | | | 538,943 |
6.050%, 03/30/17 (c) | | | 1,847,000 | | | 1,855,871 |
| | | | | | |
| | | | | | 4,672,299 |
| | | | | | |
|
Real Estate Investment Trusts—0.4% |
Boston Properties, Inc.
5.000%, 06/01/15 | | | 200,000 | | | 185,277 |
HRPT Properties Trust
6.250%, 08/15/16 | | | 1,776,000 | | | 1,688,280 |
Kimco Realty Corp.
5.783%, 03/15/16 | | | 1,040,000 | | | 1,004,072 |
Prologis
5.750%, 04/01/16 (a) | | | 1,743,000 | | | 1,636,050 |
Simon Property Group, L.P.
5.100%, 06/15/15 | | | 2,102,000 | | | 1,976,277 |
5.875%, 03/01/17 | | | 1,328,000 | | | 1,273,018 |
Vornado Realty, L.P.
4.750%, 12/01/10 | | | 530,000 | | | 528,817 |
| | | | | | |
| | | | | | 8,291,791 |
| | | | | | |
|
Road & Rail—0.1% |
CSX Corp.
6.750%, 03/15/11 | | | 574,000 | | | 602,330 |
7.900%, 05/01/17 | | | 1,120,000 | | | 1,254,849 |
Norfolk Southern Corp.
7.050%, 05/01/37 | | | 360,000 | | | 390,147 |
| | | | | | |
| | | | | | 2,247,326 |
| | | | | | |
|
Specialty Retail—0.1% |
Federated Retail Holdings, Inc.
5.350%, 03/15/12 | | | 480,000 | | | 467,662 |
Home Depot, Inc.
5.875%, 12/16/36 | | | 1,310,000 | | | 1,105,510 |
| | | | | | |
| Security Description | | Face
Amount | | Value* |
| | | | | | |
|
Specialty Retail—(Continued) |
Limited Brands, Inc.
5.250%, 11/01/14 | | $ | 1,377,000 | | $ | 1,235,958 |
| | | | | | |
| | | | | | 2,809,130 |
| | | | | | |
|
Thrifts & Mortgage Finance—0.1% |
Countrywide Financial Corp.
6.250%, 05/15/16 (a) | | | 1,648,000 | | | 948,536 |
| | | | | | |
|
U.S. Treasury—10.1% |
U.S. Treasury Bonds
4.500%, 02/15/36 (a) | | | 5,612,000 | | | 5,640,498 |
5.375%, 02/15/31 (a) | | | 12,741,000 | | | 14,354,533 |
6.000%, 02/15/26 (a) | | | 5,369,000 | | | 6,353,879 |
6.250%, 08/15/23 (a) | | | 3,748,000 | | | 4,487,353 |
6.750%, 08/15/26 (a) | | | 10,508,000 | | | 13,450,240 |
U.S. Treasury Notes
3.875%, 02/15/13 (a) | | | 9,213,000 | | | 9,397,260 |
4.000%, 06/15/09 (a) | | | 203,000 | | | 205,649 |
4.000%, 11/15/12 (a) | | | 3,625,000 | | | 3,722,705 |
4.250%, 08/15/13 (a) | | | 9,273,000 | | | 9,611,316 |
4.500%, 03/31/09 (a) | | | 3,276,000 | | | 3,330,771 |
4.750%, 11/15/08 (a) | | | 10,722,000 | | | 10,842,622 |
4.875%, 08/15/09 (a) | | | 6,716,000 | | | 6,901,738 |
4.875%, 08/15/16 (a) | | | 6,300,000 | | | 6,708,517 |
5.125%, 06/30/11 (a) | | | 3,496,000 | | | 3,714,227 |
5.500%, 02/15/08 | | | 753,000 | | | 754,941 |
5.625%, 05/15/08 (a) | | | 53,503,000 | | | 53,933,539 |
6.500%, 02/15/10 (a) | | | 31,404,000 | | | 33,580,203 |
| | | | | | |
| | | | | | 186,989,991 |
| | | | | | |
|
Wireless Telecommunication Services—0.3% |
Cingular Wireless, LLC
6.500%, 12/15/11 | | | 900,000 | | | 947,490 |
France Telecom S.A.
7.750%, 03/01/11 (c) | | | 346,000 | | | 371,889 |
Nextel Communications, Inc.
5.950%, 03/15/14 | | | 1,915,000 | | | 1,800,041 |
Telefonica Emisiones, S.A.U.
7.045%, 06/20/36 | | | 1,120,000 | | | 1,251,920 |
Telefonica Europe
7.750%, 09/15/10 | | | 650,000 | | | 695,730 |
| | | | | | |
| | | | | | 5,067,070 |
| | | | | | |
|
Yankee—1.2% |
Atlas Copco AB
5.600%, 05/22/17 | | | 1,580,000 | | | 1,580,577 |
BNP Paribas (144A)
7.195%, 12/31/49 (c) | | | 1,300,000 | | | 1,281,683 |
Commonwealth Bank of Australia (144A)
5.000%, 11/06/12 (a) | | | 2,580,000 | | | 2,633,009 |
Consumers International, Inc.
10.250%, 04/01/49 (d) (e) (f) | | | 50,000 | | | 0 |
EDP Finance BV
6.000%, 02/02/18 | | | 1,930,000 | | | 1,882,398 |
*See accompanying notes to financial statements.
MSF-14
Metropolitan Series Fund, Inc.
MFS Total Return Portfolio
Schedule of Investments as of December 31, 2007
Fixed Income—(Continued)
| | | | | | | |
| Security Description | | Face
Amount | | Value* | |
| | | | | | | |
|
Yankee—(Continued) | |
European Investment Bank
5.125%, 05/30/17 | | $ | 9,325,549 | | $ | 10,576,438 | |
Nexen, Inc.
5.875%, 03/10/35 | | | 1,550,000 | | | 1,460,425 | |
Norsk Hydro A/S
7.750%, 06/15/23 | | | 100,000 | | | 118,444 | |
Vodafone Group, Plc.
5.625%, 02/27/17 | | | 1,961,000 | | | 1,952,674 | |
| | | | | | | |
| | | | | | 21,485,648 | |
| | | | | | | |
Total Fixed Income
(Identified Cost $738,817,139) | | | | | | 740,181,461 | |
| | | | | | | |
|
| Short Term Investments—15.0% | |
| Security Description | | Face Amount/
Shares | | Value* | |
|
Commercial Paper—1.2% | |
General Electric Capital Corp.
4.150%, 01/02/08 | | $ | 22,039,000 | | | 22,036,460 | |
| | | | | | | |
|
Mutual Funds—13.8% | |
State Street Navigator Securities Lending Prime Portfolio (h) | | | 255,664,311 | | | 255,664,311 | |
| | | | | | | |
Total Short Term Investments
(Identified Cost $277,700,771) | | | | | | 277,700,771 | |
| | | | | | | |
Total Investments—113.5%
(Identified Cost $2,026,489,338) (i) | | | | | | 2,109,622,757 | |
Liabilities in excess of other assets | | | | | | (250,456,999 | ) |
| | | | | | | |
| Total Net Assets—100% | | | | | $ | 1,859,165,758 | |
| | | | | | | |
| (a) | A portion or all of the security was held on loan. As of December 31, 2007, the market value of securities loaned was $276,880,325 and the collateral received consisted of cash in the amount of $255,664,311 and non cash collateral with a value of $26,960,818. The cash collateral is invested in a money market fund managed by an affiliate of the custodian. The non cash collateral received consists primarily of government securities and bank letters of credit, and are held for the benefit of the Portfolio at the Portfolio’s custodian. |
| (c) | Variable or Floating Rate Security. Rate disclosed is as of December 31, 2007. |
| (d) | Non-Income Producing; Defaulted Bond. |
| (e) | Security was valued in good faith under procedures established by the Board of Directors. |
| (g) | Interest Only Certificate. This security receives monthly interest payments but is not entitled to principal payments. |
| (h) | Represents investment of cash collateral received from securities lending transactions. |
| (i) | The aggregate cost of investments for federal income tax purposes as of December 31, 2007 was $2,043,480,152 and the composition of unrealized appreciation and depreciation of investment securities was $133,741,508 and $(67,598,903), respectively. |
| (144A)— | Securities exempt from registration under Rule 144A of the Securities Act of 1933. These securities may be resold in transactions exempt from registration, normally to qualified institutional buyers. As of December 31, 2007, the market value of 144A securities was $24,551,028, which is 1.3% of total net assets. |
| (ADR)— | An American Depositary Receipt is a certificate issued by a custodian bank representing the right to receive securities of the foreign issuer described. Trading on exchanges not located in the United States or Canada significantly influences the value of ADRs. |
| (GDR)— | Global Depository Receipt. |
| (RDU)— | Restricted Depository Unit. Each restricted depository unit represents the right to receive one common unit that has been deposited with the depository bank, and any other securities, cash or property that the depository bank receives in respect of the common unit. |
*See accompanying notes to financial statements.
MSF-15
Metropolitan Series Fund, Inc.
MFS Total Return Portfolio
Statement of Assets & Liabilities
December 31, 2007
| | | | | | | |
Assets | | | | | | | |
Investments at value (a) (c) | | | | | $ | 2,109,622,757 | |
Cash | | | | | | 42,468 | |
Foreign cash at value (b) | | | | | | (192 | ) |
Receivable for: | | | | | | | |
Securities sold | | | | | | 1,377,437 | |
Fund shares sold | | | | | | 349,397 | |
Accrued interest and dividends | | | | | | 8,954,053 | |
Foreign taxes | | | | | | 43,360 | |
| | | | | | | |
Total Assets | | | | | | 2,120,389,280 | |
Liabilities | | | | | | | |
Payable for: | | | | | | | |
Securities purchased | | $ | 1,490,106 | | | | |
Fund shares redeemed | | | 2,800,355 | | | | |
Withholding taxes | | | 8,967 | | | | |
Collateral for securities loaned | | | 255,664,311 | | | | |
Accrued expenses: | | | | | | | |
Management fees | | | 837,419 | | | | |
Service and distribution fees | | | 279,623 | | | | |
Deferred directors’ fees | | | 60,054 | | | | |
Other expenses | | | 82,687 | | | | |
| | | | | | | |
Total Liabilities | | | | | | 261,223,522 | |
| | | | | | | |
Net Assets | | | | | $ | 1,859,165,758 | |
| | | | | | | |
Net assets consists of: | | | | | | | |
Capital paid in | | | | | $ | 1,647,739,362 | |
Undistributed net investment income | | | | | | 54,123,170 | |
Accumulated net realized gains | | | | | | 74,169,942 | |
Unrealized appreciation on investments and foreign currency | | | | | | 83,133,284 | |
| | | | | | | |
Net Assets | | | | | $ | 1,859,165,758 | |
| | | | | | | |
| Computation of offering price: | | | | | | | |
Class A | | | | | | | |
Net asset value and redemption price per share ($264,375,897 divided by 1,710,856 shares outstanding) | | | | | $ | 154.53 | |
| | | | | | | |
Class B | | | | | | | |
Net asset value and redemption price per share ($233,742,177 divided by 1,527,271 shares outstanding) | | | | | $ | 153.05 | |
| | | | | | | |
Class E | | | | | | | |
Net asset value and redemption price per share ($73,556,952 divided by 478,094 shares outstanding) | | | | | $ | 153.85 | |
| | | | | | | |
Class F | | | | | | | |
Net asset value and redemption price per share ($1,287,490,732 divided by 8,389,598 shares outstanding) | | | | | $ | 153.46 | |
| | | | | | | |
(a) Identified cost of investments | | | | | $ | 2,026,489,338 | |
| | | | | | | |
(b) Identified cost of foreign cash | | | | | $ | (191 | ) |
| | | | | | | |
| (c) | Includes cash collateral for securities loaned of $255,664,311. |
Statement of Operations
For the Year Ended December 31, 2007
| | | | | | | | |
Investment Income | | | | | | | | |
Dividends | | | | | | $ | 23,388,290 | (a) |
Interest | | | | | | | 42,821,611 | (b) |
| | | | | | | | |
| | | | | | | 66,209,901 | |
Expenses | | | | | | | | |
Management fees | | $ | 10,307,018 | | | | | |
Service and distribution fees—Class B | | | 569,398 | | | | | |
Service and distribution fees—Class E | | | 126,086 | | | | | |
Service and distribution fees—Class F | | | 2,743,930 | | | | | |
Directors’ fees and expenses | | | 26,188 | | | | | |
Custodian | | | 321,149 | | | | | |
Audit and tax services | | | 36,237 | | | | | |
Legal | | | 1,558 | | | | | |
Printing | | | 617,819 | | | | | |
Insurance | | | 21,980 | | | | | |
Miscellaneous | | | 22,495 | | | | | |
| | | | | | | | |
Total expenses | | | 14,793,858 | | | | | |
Expense reductions | | | (146,755 | ) | | | 14,647,103 | |
| | | | | | | | |
Net Investment Income | | | | | | | 51,562,798 | |
| | | | | | | | |
Realized and Unrealized Gain (Loss) | | | | | | | | |
| Realized gain (loss) on: | | | | | | | | |
Investments—net | | | 109,964,869 | | | | | |
Foreign currency transactions—net | | | (128,993 | ) | | | 109,835,876 | |
| | | | | | | | |
| Change in unrealized depreciation on: | | | | | | | | |
Investments—net | | | (78,817,633 | ) | | | | |
Foreign currency transactions—net | | | (744 | ) | | | (78,818,377 | ) |
| | | | | | | | |
Net gain | | | | | | | 31,017,499 | |
| | | | | | | | |
Net Increase in Net Assets From Operations | | | | | | $ | 82,580,297 | |
| | | | | | | | |
| (a) | Net of foreign taxes of $216,870. |
| (b) | Includes net income on securities loaned of $840,177. |
See accompanying notes to financial statements.
MSF-16
Metropolitan Series Fund, Inc.
MFS Total Return Portfolio
Statements of Changes in Net Assets
| | | | | | | | |
| | | Year ended
December 31,
2007 | | | Year ended
December 31,
2006 | |
From Operations | | | | | | | | |
Net investment income | | $ | 51,562,798 | | | $ | 38,340,404 | |
Net realized gain | | | 109,835,876 | | | | 77,104,353 | |
Unrealized appreciation (depreciation) | | | (78,818,377 | ) | | | 51,628,241 | |
| | | | | | | | |
Increase in net assets from operations | | | 82,580,297 | | | | 167,072,998 | |
| | | | | | | | |
From Distributions to Shareholders | | | | | | | | |
Net investment income | | | | | | | | |
Class A | | | (6,077,127 | ) | | | (9,353,948 | ) |
Class B | | | (4,271,221 | ) | | | (5,663,220 | ) |
Class E | | | (1,741,399 | ) | | | (3,000,726 | ) |
Class F | | | (27,365,987 | ) | | | 0 | |
| | | | | | | | |
| | | (39,455,734 | ) | | | (18,017,894 | ) |
| | | | | | | | |
Net realized gain | | | | | | | | |
Class A | | | (9,194,580 | ) | | | (5,851,759 | ) |
Class B | | | (7,330,189 | ) | | | (3,895,024 | ) |
Class E | | | (2,813,723 | ) | | | (1,986,975 | ) |
Class F | | | (46,173,029 | ) | | | 0 | |
| | | | | | | | |
| | | (65,511,521 | ) | | | (11,733,758 | ) |
| | | | | | | | |
Total distributions | | | (104,967,255 | ) | | | (29,751,652 | ) |
| | | | | | | | |
Increase (decrease) in net assets from capital share transactions | | | (92,438,567 | ) | | | 1,325,851,593 | |
| | | | | | | | |
Total increase (decrease) in net assets | | | (114,825,525 | ) | | | 1,463,172,939 | |
| | |
Net Assets | | | | | | | | |
Beginning of the period | | | 1,973,991,283 | | | | 510,818,344 | |
| | | | | | | | |
End of the period | | $ | 1,859,165,758 | | | $ | 1,973,991,283 | |
| | | | | | | | |
Undistributed Net Investment Income | | | | | | | | |
End of the period | | $ | 54,123,170 | | | $ | 39,299,175 | |
| | | | | | | | |
Other Information:
Capital Shares
Transactions in capital shares were as follows:
| | | | | | | | | | | | | | |
| | | Year ended
December 31, 2007 | | | Year ended
December 31, 2006 | |
| | | Shares | | | $ | | | Shares | | | $ | |
Class A | | | | | | | | | | | | | | |
Sales | | 285,406 | | | $ | 44,679,626 | | | 350,649 | | | $ | 51,588,250 | |
Reinvestments | | 98,527 | | | | 15,271,707 | | | 105,911 | | | | 15,205,707 | |
Redemptions | | (460,811 | ) | | | (72,109,670 | ) | | (436,903 | ) | | | (64,820,987 | ) |
| | | | | | | | | | | | | | |
Net increase (decrease) | | (76,878 | ) | | $ | (12,158,337 | ) | | 19,657 | | | $ | 1,972,970 | |
| | | | | | | | | | | | | | |
Class B | | | | | | | | | | | | | | |
Sales | | 536,030 | | | $ | 83,546,125 | | | 448,718 | | | $ | 65,767,442 | |
Reinvestments | | 75,442 | | | | 11,601,410 | | | 67,075 | | | | 9,558,244 | |
Redemptions | | (442,313 | ) | | | (68,803,892 | ) | | (239,167 | ) | | | (35,203,038 | ) |
| | | | | | | | | | | | | | |
Net increase | | 169,159 | | | $ | 26,343,643 | | | 276,626 | | | $ | 40,122,648 | |
| | | | | | | | | | | | | | |
Class E | | | | | | | | | | | | | | |
Sales | | 191,657 | | | $ | 30,163,464 | | | 106,458 | | | $ | 15,712,560 | |
Reinvestments | | 29,485 | | | | 4,555,122 | | | 34,840 | | | | 4,987,701 | |
Redemptions | | (290,620 | ) | | | (45,525,263 | ) | | (208,798 | ) | | | (30,778,276 | ) |
| | | | | | | | | | | | | | |
Net decrease | | (69,478 | ) | | $ | (10,806,677 | ) | | (67,500 | ) | | $ | (10,078,015 | ) |
| | | | | | | | | | | | | | |
Class F | | | | | | | | | | | | | | |
Sales | | 529,936 | | | $ | 82,534,533 | | | 1,418,148 | | | $ | 206,416,218 | |
Shares issued through acquisition | | 0 | | | | 0 | | | 8,939,065 | | | | 1,285,437,558 | |
Reinvestments | | 477,092 | | | | 73,539,016 | | | 0 | | | | 0 | |
Redemptions | | (1,617,157 | ) | | | (251,890,745 | ) | | (1,357,486 | ) | | | (198,019,786 | ) |
| | | | | | | | | | | | | | |
Net increase (decrease) | | (610,129 | ) | | $ | (95,817,196 | ) | | 8,999,727 | | | $ | 1,293,833,990 | |
| | | | | | | | | | | | | | |
Increase (decrease) derived from capital share transactions | | | | | $ | (92,438,567 | ) | | | | | $ | 1,325,851,593 | |
| | | | | | | | | | | | | | |
See accompanying notes to financial statements.
MSF-17
Metropolitan Series Fund, Inc.
MFS Total Return Portfolio
Financial Highlights
| | | | | | | | | | | | | | | | | | | | |
| | | Class A | |
| | | Year ended December 31, | |
| | | 2007 | | | 2006 | | | 2005 | | | 2004 | | | 2003 | |
Net Asset Value, Beginning of Period | | $ | 156.45 | | | $ | 147.99 | | | $ | 147.96 | | | $ | 138.13 | | | $ | 119.83 | |
| | | | | | | | | | | | | | | | | | | | |
Income From Investment Operations | | | | | | | | | | | | | | | | | | | | |
Net investment income | | | 4.40 | (a) | | | 4.32 | | | | 3.84 | | | | 3.60 | | | | 3.30 | |
Net realized and unrealized gain on investments | | | 2.49 | | | | 13.06 | | | | 0.46 | | | | 11.53 | | | | 16.79 | |
| | | | | | | | | | | | | | | | | | | | |
Total from investment operations | | | 6.89 | | | | 17.38 | | | | 4.30 | | | | 15.13 | | | | 20.09 | |
| | | | | | | | | | | | | | | | | | | | |
Less Distributions | | | | | | | | | | | | | | | | | | | | |
Distributions from net investment income | | | (3.51 | ) | | | (5.49 | ) | | | (2.61 | ) | | | (4.52 | ) | | | (1.79 | ) |
Distributions from net realized capital gains | | | (5.30 | ) | | | (3.43 | ) | | | (1.66 | ) | | | (0.78 | ) | | | 0.00 | |
| | | | | | | | | | | | | | | | | | | | |
Total distributions | | | (8.81 | ) | | | (8.92 | ) | | | (4.27 | ) | | | (5.30 | ) | | | (1.79 | ) |
| | | | | | | | | | | | | | | | | | | | |
Net Asset Value, End of Period | | $ | 154.53 | | | $ | 156.45 | | | $ | 147.99 | | | $ | 147.96 | | | $ | 138.13 | |
| | | | | | | | | | | | | | | | | | | | |
Total Return (%) | | | 4.4 | | | | 12.2 | | | | 3.1 | | | | 11.3 | | | | 17.0 | |
Ratio of operating expenses to average net assets before expense reductions (%) | | | 0.58 | | | | 0.59 | | | | 0.66 | | | | 0.64 | | | | 0.69 | |
Ratio of operating expenses to average net assets after expense reductions (%) (b) | | | 0.57 | | | | 0.58 | | | | 0.65 | | | | 0.63 | | | | 0.69 | |
Ratio of net investment income to average net assets (%) | | | 2.80 | | | | 2.74 | | | | 2.53 | | | | 2.60 | | | | 2.55 | |
Portfolio turnover rate (%) | | | 58 | | | | 55 | | | | 47 | | | | 89 | | | | 62 | |
Net assets, end of period (000) | | $ | 264,376 | | | $ | 279,698 | | | $ | 261,653 | | | $ | 268,870 | | | $ | 148,601 | |
| | | | | | | | | | | | | | | | | | | | |
| | | Class B | |
| | | Year ended December 31, | |
| | | 2007 | | | 2006 | | | 2005 | | | 2004 | | | 2003 | |
Net Asset Value, Beginning of Period | | $ | 155.02 | | | $ | 146.58 | | | $ | 146.59 | | | $ | 136.93 | | | $ | 119.01 | |
| | | | | | | | | | | | | | | | | | | | |
Income From Investment Operations | | | | | | | | | | | | | | | | | | | | |
Net investment income | | | 3.97 | (a) | | | 3.71 | | | | 2.75 | | | | 3.64 | | | | 2.53 | |
Net realized and unrealized gain on investments | | | 2.45 | | | | 13.15 | | | | 1.16 | | | | 11.01 | | | | 17.11 | |
| | | | | | | | | | | | | | | | | | | | |
Total from Investment operations | | | 6.42 | | | | 16.86 | | | | 3.91 | | | | 14.65 | | | | 19.64 | |
| | | | | | | | | | | | | | | | | | | | |
Less Distributions | | | | | | | | | | | | | | | | | | | | |
Distributions from net investment income | | | (3.09 | ) | | | (4.99 | ) | | | (2.26 | ) | | | (4.21 | ) | | | (1.72 | ) |
Distributions from net realized capital gains | | | (5.30 | ) | | | (3.43 | ) | | | (1.66 | ) | | | (0.78 | ) | | | 0.00 | |
| | | | | | | | | | | | | | | | | | | | |
Total distributions | | | (8.39 | ) | | | (8.42 | ) | | | (3.92 | ) | | | (4.99 | ) | | | (1.72 | ) |
| | | | | | | | | | | | | | | | | | | | |
Net Asset Value, End of Period | | $ | 153.05 | | | $ | 155.02 | | | $ | 146.58 | | | $ | 146.59 | | | $ | 136.93 | |
| | | | | | | | | | | | | | | | | | | | |
Total Return (%) | | | 4.1 | | | | 11.9 | | | | 2.9 | | | | 11.0 | | | | 16.7 | |
Ratio of operating expenses to average net assets before expense reductions (%) | | | 0.83 | | | | 0.84 | | | | 0.91 | | | | 0.89 | | | | 0.94 | |
Ratio of operating expenses to average net assets after expense reductions (%) (b) | | | 0.82 | | | | 0.83 | | | | 0.90 | | | | 0.88 | | | | 0.94 | |
Ratio of net investment income to average net assets (%) | | | 2.56 | | | | 2.50 | | | | 2.29 | | | | 2.39 | | | | 2.30 | |
Portfolio turnover rate (%) | | | 58 | | | | 55 | | | | 47 | | | | 89 | | | | 62 | |
Net assets, end of period (000) | | $ | 233,742 | | | $ | 210,529 | | | $ | 158,528 | | | $ | 103,373 | | | $ | 29,582 | |
| (a) | Per share amount is based on average shares outstanding during the period. |
| (b) | The Portfolio has entered into arrangements with certain brokers who paid a portion of the Portfolio’s expenses. |
| (c) | Commencement of operations was April 26, 2004 and May 2, 2006 for Classes E and F, respectively. |
| (d) | Periods less than one year are not computed on an annualized basis. |
| (e) | Computed on an annualized basis. |
See accompanying notes to financial statements.
MSF-18
Metropolitan Series Fund, Inc.
MFS Total Return Portfolio
Financial Highlights
| | | | | | | | | | | | | | | | |
| | | Class E | |
| | | Year ended December 31, | |
| | | 2007 | | | 2006 | | | 2005 | | | 2004(c) | |
Net Asset Value, Beginning of Period | | $ | 155.83 | | | $ | 147.36 | | | $ | 147.29 | | | $ | 135.61 | |
| | | | | | | | | | | | | | | | |
Income From Investment Operations | | | | | | | | | | | | | | | | |
Net investment income | | | 4.14 | (a) | | | 4.27 | | | | 3.46 | | | | 2.33 | |
Net realized and unrealized gain on investments | | | 2.46 | | | | 12.81 | | | | 0.60 | | | | 9.35 | |
| | | | | | | | | | | | | | | | |
Total from investment operations | | | 6.60 | | | | 17.08 | | | | 4.06 | | | | 11.68 | |
| | | | | | | | | | | | | | | | |
Less Distributions | | | | | | | | | | | | | | | | |
Distributions from net investment income | | | (3.28 | ) | | | (5.18 | ) | | | (2.33 | ) | | | 0.00 | |
Distributions from net realized capital gains | | | (5.30 | ) | | | (3.43 | ) | | | (1.66 | ) | | | 0.00 | |
| | | | | | | | | | | | | | | | |
Total distributions | | | (8.58 | ) | | | (8.61 | ) | | | (3.99 | ) | | | 0.00 | |
| | | | | | | | | | | | | | | | |
Net Asset Value, End of Period | | $ | 153.85 | | | $ | 155.83 | | | $ | 147.36 | | | $ | 147.29 | |
| | | | | | | | | | | | | | | | |
Total Return (%) | | | 4.2 | | | | 12.0 | | | | 3.0 | | | | 8.6 | (d) |
Ratio of operating expenses to average net assets before expense reductions (%) | | | 0.73 | | | | 0.74 | | | | 0.81 | | | | 0.79 | (e) |
Ratio of operating expenses to average net assets after expense reductions (%) (b) | | | 0.72 | | | | 0.73 | | | | 0.80 | | | | 0.78 | (e) |
Ratio of net investment income to average net assets (%) | | | 2.65 | | | | 2.57 | | | | 2.38 | | | | 2.57 | (e) |
Portfolio turnover rate (%) | | | 58 | | | | 55 | | | | 47 | | | | 89 | |
Net assets, end of period (000) | | $ | 73,557 | | | $ | 85,327 | | | $ | 90,637 | | | $ | 89,519 | |
| | | | | | | | |
| | | Class F | |
| | | Year ended December 31, | |
| | | 2007 | | | 2006(c) | |
Net Asset Value, Beginning of Period | | $ | 155.39 | | | $ | 143.80 | |
| | | | | | | | |
Income From Investment Operations | | | | | | | | |
Net investment income | | | 4.08 | (a) | | | 2.69 | |
Net realized and unrealized gain on investments | | | 2.43 | | | | 8.90 | |
| | | | | | | | |
Total from investment operations | | | 6.51 | | | | 11.59 | |
| | | | | | | | |
Less Distributions | | | | | | | | |
Distributions from net investment income | | | (3.14 | ) | | | 0.00 | |
Distributions from net realized capital gains | | | (5.30 | ) | | | 0.00 | |
| | | | | | | | |
Total distributions | | | (8.44 | ) | | | 0.00 | |
| | | | | | | | |
Net Asset Value, End of Period | | $ | 153.46 | | | $ | 155.39 | |
| | | | | | | | |
Total Return (%) | | | 4.2 | | | | 8.1 | (d) |
Ratio of operating expenses to average net assets before expense reductions (%) | | | 0.78 | | | | 0.79 | (e) |
Ratio of operating expenses to average net assets after expense reductions (%) (b) | | | 0.77 | | | | 0.78 | (e) |
Ratio of net investment income to average net assets (%) | | | 2.60 | | | | 2.67 | (e) |
Portfolio turnover rate (%) | | | 58 | | | | 55 | |
Net assets, end of period (000) | | $ | 1,287,491 | | | $ | 1,398,437 | |
| (a) | Per share amount is based on average shares outstanding during the period. |
| (b) | The Portfolio has entered into arrangements with certain brokers who paid a portion of the Portfolio’s expenses. |
| (c) | Commencement of operations was April 26, 2004 and May 2, 2006 for Classes E and F, respectively. |
| (d) | Periods less than one year are not computed on an annualized basis. |
| (e) | Computed on an annualized basis. |
See accompanying notes to financial statements.
MSF-19
Metropolitan Series Fund, Inc.
MFS Total Return Portfolio
Notes to Financial Statements—December 31, 2007
Metropolitan Series Fund, Inc. (the “Fund”) is organized as a corporation under the laws of Maryland pursuant to Articles of Incorporation filed on November 23, 1982, as amended, and registered under the Investment Company Act of 1940, as amended (the “1940 Act”), as an open-end investment company. The Fund is a “series” type of mutual fund, which issues separate series of stock. Each series represents an interest in a separate portfolio of Fund investments. The MFS Total Return Portfolio (the “Portfolio”) is a diversified series of the Fund. Shares in the Fund are not offered directly to the general public and are currently available only to separate accounts established by Metropolitan Life Insurance Company (“MetLife”), New England Life Insurance Company, General American Life Insurance Company (“General American”), The MetLife Investors Group of Insurance Companies, MetLife Insurance Company of Connecticut and other affiliated insurance companies (collectively, the “Insurance Companies”), as an investment vehicle for variable life insurance, group annuity or variable annuity products, although the Portfolio is not available to all such separate accounts. The Portfolio’s shares may be divided into different classes. Currently, the classes being offered by the Portfolio are named Class A, Class B, Class E and Class F. The classes of the Portfolio’s shares are identical, except that certain additional charges (Rule 12b-1 fees) are made against Class B, Class E and Class F shares. Investment income, realized and unrealized capital gains and losses, the common expenses of the Portfolio and certain Portfolio-level expense reductions, if any, are allocated on a pro rata basis to each class based on the relative net assets of each class to the total net assets of the Portfolio.
| 2. | SIGNIFICANT ACCOUNTING POLICIES: |
The preparation of financial statements in conformity with accounting principles generally accepted in the United States of America (“GAAP”) requires management to make estimates and assumptions that affect the reported amounts of assets and liabilities and disclosure of contingent assets and liabilities as of the date of the financial statements and the reported amounts of income and expenses during the reporting period. Actual results could differ from those estimates.
The following is a summary of significant accounting policies consistently followed by the Portfolio in the preparation of its financial statements. The policies are in conformity with GAAP.
Investment Valuation:
Debt securities (other than short term obligations with a remaining maturity of sixty days or less) are valued by independent pricing services selected by the relevant subadviser pursuant to authorization of the Board of Directors of the Fund (the “Board” or “Directors”). Short term obligations with a remaining maturity of sixty days or less are valued at amortized cost which approximates fair market value.
Equity securities traded on a national securities exchange or exchanges are valued at their last sale price on the principal trading market. Equity securities traded on the NASDAQ National Market System are valued at the NASDAQ Official Closing Price (the “NOCP”). The NOCP is the last sale price if it falls between the spread of the last reported bid and asked prices. If the last reported bid and asked prices are above the last reported sale price, the NOCP will be the last reported bid price. If the last reported bid and asked prices are below the last reported sale price, the NOCP will be the last reported asked price. Equity securities traded on a national securities exchange or exchanges or on the NASDAQ National Market System for which there is no reported sale during the day are valued at the last reported bid price. A security that is listed or traded on more than one exchange is valued at the quotation on the exchange determined to be the primary market for that security by the Board or its delegates. If no closing price is available, then such securities are valued by using the last reported bid price. Equity securities traded over-the-counter are valued at the last reported sales price.
If no current market value quotation is readily available or reliable for a portfolio security, fair value will be determined in accordance with procedures established by and under the general supervision of the Board. When the Portfolio uses fair value pricing, it may take into account any factors it deems appropriate. The value of securities used by the Portfolio to calculate its net asset value may differ from quoted or published prices for the same securities. Fair value pricing involves subjective judgments and the fair value determined for a security may be materially different than the value that could be realized upon the sale of that security.
The Portfolio expects to use fair value pricing for securities primarily traded on U.S. exchanges only under very limited circumstances. For example, the Portfolio may use fair value pricing if the exchange on which a security is traded closes early or trading in the security is suspended.
MSF-20
Metropolitan Series Fund, Inc.
MFS Total Return Portfolio
Notes to Financial Statements—December 31, 2007—(Continued)
Securities traded primarily on an exchange outside of the United States which closes before the close of the New York Stock Exchange will be valued at the last sales price on that non-U.S. exchange. Securities traded primarily on an exchange outside of the United States for which there is no reported sale during the day are valued at the mean between the last reported bid and asked prices. However, because most foreign markets close well before the Portfolio values its securities (typically at 4 p.m. Eastern Time), the earlier close of these foreign markets gives rise to the possibility that significant events, including broad market moves, may have occurred after these foreign markets close but before the Portfolio values its securities. To account for this, the Portfolio may frequently value many of its foreign equity securities using fair value prices based on third party vendor modeling tools.
Forward foreign currency exchange contracts are valued based on the mean between closing bid and asked prices of the forward currency contract rates in the London foreign exchange markets on a daily basis as provided by a reliable bank or dealer.
Options, whether on securities, indices, futures contracts, or otherwise, are valued at the last sales price available as of the close of business on the day of valuation or, if there is no such sale price available, at the mean between the bid and asked prices. Options on currencies are valued at the spot price each day.
The value of futures contracts will be the sum of the margin deposit plus or minus the difference between the value of the futures contract on each day the net asset value is calculated and the value on the date the futures contract originated, value being that established on a recognized commodity exchange, or by reference to other customary sources, with gain or loss being realized when the futures contract closes or expires.
Subject to the Board’s oversight, the Board has delegated day-to-day responsibility for valuing Portfolio assets to MetLife Advisers, LLC (“MetLife Advisers” or the “Adviser”) who values such assets as described above and operates under procedures approved by the Board.
Investment Transactions and Related Investment Income:
Portfolio security transactions are recorded on the trade date. Dividend income is recorded on the ex-dividend date or, for certain foreign securities, when notified. Interest income, which includes amortization of premium and accretion of discount on debt securities, is recorded on the accrual basis. Realized gains and losses on investments and unrealized appreciation and depreciation are determined on the identified cost basis, which is the same basis used for federal income tax purposes.
Repurchase Agreements:
The Portfolio, through the custodian or a subcustodian, receives delivery of the underlying securities collateralizing repurchase agreements. The Portfolio requires the custodian to take possession, to have legally segregated in the Federal Reserve Book Entry System, or to have segregated within the custodian’s vault, all securities held as collateral for repurchase agreements. It is the Portfolio’s policy that the market value of the collateral be at least equal to 100% of the repurchase price in the case of a repurchase agreement of one-day duration and 102% on all other repurchase agreements. The Portfolio’s subadviser is responsible for determining that the value of the collateral is at all times at least equal to the repurchase price. In connection with transactions in repurchase agreements, if the seller defaults and the value of the collateral declines or if the seller enters an insolvency proceeding, realization of the collateral by the Portfolio may be delayed, limited or wholly denied.
Foreign Currency Translation:
The books and records of the Portfolio are maintained in U.S. dollars. The values of securities, currencies and other assets and liabilities denominated in currencies other than U.S. dollars are translated into U.S. dollars based upon foreign exchange rates prevailing at the end of the period. Purchases and sales of investment securities, income and expenses are translated on the respective dates of such transactions. Since the values of investment securities are presented at the foreign exchange rates prevailing at the end of the period, it is not practical to isolate that portion of the results of operations arising from changes in exchange rates from that portion of the results of operations reflecting fluctuations arising from changes in market prices of the investment securities. Such fluctuations are included in the net realized and unrealized gain or loss on investments.
Net realized foreign exchange gains or losses arise from sales of foreign currency, currency gains or losses realized between the trade and settlement dates on securities transactions, and the difference between the amounts of dividends, interest, and foreign
MSF-21
Metropolitan Series Fund, Inc.
MFS Total Return Portfolio
Notes to Financial Statements—December 31, 2007—(Continued)
withholding taxes recorded by the Portfolio and the U.S. dollar equivalent of the amounts actually received or paid by the Portfolio. Net unrealized foreign exchange gains and losses arise from changes in the value of assets and liabilities, other than investment securities, resulting from changes in the exchange rate.
Forward Foreign Currency Exchange Contracts:
The Portfolio may enter into forward foreign currency exchange contracts primarily to hedge against foreign currency exchange rate risks on its non-U.S. dollar denominated investment securities. When entering into a forward currency contract, the Portfolio agrees to receive or deliver a fixed quantity of foreign currency for an agreed-upon price on an agreed future date. These contracts are valued daily and the Portfolio’s net equity therein, representing unrealized gain or loss on the contracts as measured by the difference between the foreign exchange rates at the dates of entry into the contracts and the forward rates at the settlement date, is included in the Statement of Assets and Liabilities. Realized and unrealized gains and losses are included in the Statement of Operations. These instruments involve market and/or credit risk in excess of the amount recognized in the Statement of Assets and Liabilities. Risks arise from the possible inability of counterparties to meet the terms of their contracts and from movement in currency and securities values and interest rates.
Futures Contracts:
The Portfolio may buy and sell futures contracts (on recognized exchanges) as a hedge or to enhance return. Futures contracts are agreements to buy or sell a security, or deliver a final cash settlement price in connection with an index, interest rate, currency, or other contracts not calling for physical delivery, for a set price in the future. The Portfolio must post an amount equal to a portion of the total market value of the futures contract as futures variation margin, which is returned when the Portfolio’s obligations under the contract have been satisfied. From time to time thereafter, the Portfolio may have to post variation margin to maintain this amount as the market value of the contract fluctuates. Risks of entering into futures contracts (and related options) include the possibility that there may be an illiquid market and that a change in the value of the contract or option may not correlate with changes in the value of the underlying securities.
Options:
The Portfolio may use options to hedge against changes in values of securities the Portfolio owns or expects to purchase. Writing puts or buying calls tends to increase the Portfolio’s exposure to the underlying instrument and writing calls or buying puts tends to decrease the Portfolio’s exposure to the underlying instrument, and can be used to hedge other Portfolio investments. For options purchased to hedge the Portfolio’s investments, the potential risk to the Portfolio is that the change in value of options contracts may not correspond to the change in value of the hedged instruments. In addition, losses may arise from changes in the value of the underlying instruments, if there is an illiquid secondary market, or if the counterparty is unable to perform. The maximum loss for purchased options is limited to the premium initially paid for the option. For options written by the Portfolio, the maximum loss is not limited to the premium initially received for the option.
The main risk associated with purchasing an option is that the option expires without being exercised. In this case, the option expires worthless and the premium paid for the option is considered the loss. The risk associated with writing a call option is that the Portfolio may forgo the opportunity for a profit if the market value of the underlying position increases and the option is exercised. The risk in writing a put option is that the Portfolio may incur a loss if the market value of the underlying position decreases and the option is exercised. In addition, the Portfolio risks not being able to enter into a closing transaction for the written option as the result of an illiquid market.
“When-Issued” Securities:
Purchasing securities “when-issued” is a forward commitment by the Portfolio to buy a security. The estimated amount of the Portfolio’s payment obligation and the security’s interest rate are determined when the commitment is made, even though no interest accrues until the security is issued, which is generally 15 to 120 days later. The Portfolio will segregate liquid assets with its custodian sufficient at all times to satisfy these commitments. If the value of the security is less when delivered than when the commitment was made, the Portfolio will suffer a loss.
MSF-22
Metropolitan Series Fund, Inc.
MFS Total Return Portfolio
Notes to Financial Statements—December 31, 2007—(Continued)
Credit and Market Risk:
The Portfolio may invest in high yield instruments that are subject to certain credit and market risks. The yields of high yield instruments reflect, among other things, perceived credit risk. The Portfolio’s investments in securities rated below investment grade typically involve risks not associated with higher rated securities including, among others, greater risk related to timely and ultimate payment of interest and principal, greater market price volatility and less liquid secondary market trading.
Federal Income Taxes:
It is the Portfolio’s policy to comply with the requirements of the Internal Revenue Code of 1986, as amended, and regulations thereunder, applicable to regulated investment companies and to distribute all of its taxable income to shareholders. Therefore, no federal income tax provision is required.
As of December 31, 2007, the Portfolio had capital loss carryovers as follows:
| | | | |
Expiring
12/31/09 | | Total |
| $ | 10,856,151 | | $ | 10,856,151 |
The utilization of the capital loss carryforward acquired as part of a merger may be limited under Section 382 of the Internal Revenue Code.
The tax character of distributions paid for the periods ended December 31, 2007 and 2006 was as follows:
| | | | | | | | | | | | | | | | | | | | | |
| Ordinary Income | | Long Term Gain | | Return of Capital | | Total |
| 2007 | | 2006 | | 2007 | | 2006 | | 2007 | | 2006 | | 2007 | | 2006 |
| $41,790,578 | | $ | 18,017,894 | | $ | 63,176,677 | | $ | 11,733,758 | | $ | — | | $ | — | | $ | 104,967,255 | | $ | 29,751,652 |
As of December 31, 2007, the components of distributable earnings (accumulated losses) on a federal income tax basis were as follows:
| | | | | | | | | | | | | |
Undistributed
Ordinary
Income | | Undistributed
Long Term
Gain | | Unrealized
Appreciation | | Loss
Carryforwards | | | Total |
| $70,071,514 | | $ | 108,490,971 | | $ | 66,142,470 | | $ | (10,856,151 | ) | | $ | 233,848,804 |
Dividends and Distributions to Shareholders:
The Portfolio records dividends and distributions on the ex-dividend date. Net realized gains from security transactions (if any) are generally distributed annually to shareholders. The timing and characterization of certain income and capital gains distributions are determined in accordance with federal tax regulations that may differ from GAAP. Permanent book and tax basis differences relating to shareholder distributions will result in reclassification between under/over distributed net investment income, accumulated net realized gains/losses and paid in capital.
Expense Reductions:
Certain Portfolio trades are directed to brokers who paid a portion of the Portfolio’s expenses. Amounts paid for the Portfolio are shown as expense reductions in the Statement of Operations.
| 3. | INVESTMENT TRANSACTIONS: |
For the year ended December 31, 2007, purchases and sales of securities (excluding short term investments) for the Portfolio were as follows:
| | | | | | | | | |
| Purchases | | Sales |
U.S. Government | | Other | | U.S. Government | | Other |
| $168,788,560 | | $ | 955,646,633 | | $ | 134,591,668 | | $ | 1,054,699,913 |
MSF-23
Metropolitan Series Fund, Inc.
MFS Total Return Portfolio
Notes to Financial Statements—December 31, 2007—(Continued)
| 4. | INVESTMENT MANAGEMENT FEES AND OTHER TRANSACTIONS WITH AFFILIATES: |
Investment Management Agreement:
MetLife Advisers, LLC (“MetLife Advisers”) is the investment adviser to the Portfolio. The Fund has entered into an investment management agreement with MetLife Advisers with respect to the Portfolio. For providing investment management services to the Portfolio, MetLife Advisers receives monthly compensation at the following annual rates:
| | | | | | | |
| | | Management
Fees earned by
MetLife Advisers
for the year ended
December 31, 2007 | | Annual
percentage
rates paid to
MetLife Advisers | | Based on Portfolios
average daily net asset levels |
| | $ | 10,307,018 | | 0.600% | | Of the first $250 million |
| | | | | 0.550% | | Of the next $500 million |
| | | | | 0.500% | | On amounts in excess of $750 million |
Certain officers and directors of the Fund may also be officers of MetLife Advisers; however, such officers and directors receive no compensation from the Fund.
MetLife Advisers has entered into an investment subadvisory agreement with respect to the Portfolio. Massachusetts Financial Services Co. is compensated by MetLife Advisers to provide subadvisory services for the Portfolio.
Service and Distribution Fees:
The Fund has adopted a Distribution and Service Plan under Rule 12b-1 of the 1940 Act for the Portfolio’s Class B, E and F shares. Under the Distribution and Service Plan, the Class B, E and F shares of the Portfolio pay a fee to compensate the Insurance Companies (or their affiliates) and other broker-dealers and financial intermediaries involved in the offer and sale of Portfolio shares for promoting or selling and servicing, the Class B, E and F shares. The fees under the Distribution and Service Plan for each applicable class of the Portfolio’s shares are calculated as a percentage of the Portfolio’s average daily net assets that are attributable to that Class. Currently, the fee is 0.25% per year for Class B shares, 0.15% per year for Class E shares and 0.20% per year for Class F shares. Amounts paid by the Portfolio for the year ended December 31, 2007 are shown as Service and Distribution fees in the Statement of Operations.
The Fund has entered into a securities lending arrangement with the Fund’s custodian, State Street Bank and Trust Company (the “custodian”). Under the agreement, the custodian is authorized to loan securities on the Portfolios’ behalf. In exchange, the Portfolio receives either cash or securities as collateral against the loaned securities. The Portfolio receives collateral at least equal to 102% of the market value of the loaned securities (105% for foreign securities), at each loan’s inception. Collateral must be maintained at least at 100% of the market value of the loaned securities for the duration of the loan. The cash collateral is invested in the Navigator Securities Lending Prime Portfolio, an affiliate of the custodian, which invests in a variety of high quality U.S. dollar-denominated instruments. If the market value of the collateral at the close of trading on a business day is less than 100% of the market value of the loaned securities at the close of trading on that day, the borrower shall be required to deliver, by the close of business on the following business day, an additional amount of collateral, equal to at least 100% of the market value of all the loaned securities as of such preceding day. The Portfolio receives 80% of the annual net income from securities lending transactions, which is included in interest income of the Portfolio. The remaining 20% is paid to the custodian as compensation for its securities lending services. The Portfolio bears the risk of any deficiency in the amount of collateral available for return to a borrower due to a loss in an approved investment. Any outstanding loans by the Portfolio at December 31, 2007 are footnoted in the Schedule of Investments.
As previously reported, in May 2004, General American received a Wells Notice stating that the SEC staff was considering recommending that the SEC bring a civil action alleging violations of the U.S. securities laws against General American with respect to market timing and late trading in a limited number of privately-placed variable insurance contracts that were sold through General American. General American responded to the SEC staff and cooperated with the investigation. On August 9,
MSF-24
Metropolitan Series Fund, Inc.
MFS Total Return Portfolio
Notes to Financial Statements—December 31, 2007—(Continued)
2007, the SEC announced that it had settled an enforcement action regarding late trading against General American with, among other things, General American agreeing to pay a civil penalty and to comply with certain undertakings. General American consented to the SEC’s order without admitting or denying the findings. MetLife Advisers has also advised the Fund’s Board of Directors that, while certain exceptions to the Fund’s policies have been noted, no situations have been identified that would have a material impact on the financial position of the Fund.
| 7. | RECENT ACCOUNTING PRONOUNCEMENTS: |
Effective June 29, 2007, the Fund implemented Financial Accounting Standards Board (“FASB”) Interpretation No. 48, “Accounting for Uncertainty in Income Taxes— an interpretation of FASB Statement No. 109” (“FIN 48”). FIN 48 prescribes the minimum recognition threshold a tax position must meet in connection with accounting for uncertainties in income tax positions taken or expected to be taken by an entity, including investment companies, before being measured and recognized in the financial statements. Management has evaluated the application of FIN 48 to the Fund, and has determined that the adoption of FIN 48 does not have a material impact on the Fund’s financial statements. The Fund files U.S. tax returns. No income tax returns are currently under examination. The statute of limitations on the Fund’s tax returns remains open for the years ended December 31, 2004 through December 31, 2006.
In September 2006, Statement of Financial Accounting Standards No. 157, Fair Value Measurements (SFAS 157) was issued and is effective for fiscal years beginning after November 15, 2007. SFAS 157 defines fair value, establishes a framework for measuring fair value and expands disclosures about fair value measurements. Management is currently evaluating the impact the adoption of SFAS 157 will have on the Portfolio’s financial statement disclosures.
MSF-25
Metropolitan Series Fund, Inc.
MFS Total Return Portfolio
Report of Independent Registered Public Accounting Firm
To the Shareholders and Board of Directors of the Metropolitan Series Fund, Inc.:
We have audited the accompanying statement of assets and liabilities, including the schedule of investments, of the MFS Total Return Portfolio, one of the portfolios constituting the Metropolitan Series Fund, Inc. (the “Fund”) as of December 31, 2007, and the related statement of operations for the year then ended, the statements of changes in net assets for each of the two years in the period then ended, and the financial highlights for each of the five years in the period then ended. These financial statements and financial highlights are the responsibility of the Fund’s management. Our responsibility is to express an opinion on these financial statements and financial highlights based on our audits.
We conducted our audits in accordance with the standards of the Public Company Accounting Oversight Board (United States). Those standards require that we plan and perform the audit to obtain reasonable assurance about whether the financial statements and financial highlights are free of material misstatement. The Fund is not required to have, nor were we engaged to perform, an audit of its internal control over financial reporting. Our audits included consideration of internal control over financial reporting as a basis for designing audit procedures that are appropriate in the circumstances, but not for the purpose of expressing an opinion on the effectiveness of the Fund’s internal control over financial reporting. Accordingly, we express no such opinion. An audit also includes examining, on a test basis, evidence supporting the amounts and disclosures in the financial statements, assessing the accounting principles used and significant estimates made by management, as well as evaluating the overall financial statement presentation. Our procedures included confirmation of securities owned as of December 31, 2007, by correspondence with the custodian and brokers; where replies were not received from brokers, we performed other auditing procedures. We believe that our audits provide a reasonable basis for our opinion.
In our opinion, the financial statements and financial highlights referred to above present fairly, in all material respects, the financial position of the MFS Total Return Portfolio of the Metropolitan Series Fund, Inc. as of December 31, 2007, the results of its operations for the year then ended, the changes in its net assets for each of the two years in the period then ended, and the financial highlights for each of the five years in the period then ended, in conformity with accounting principles generally accepted in the United States of America.
Deloitte & Touche LLP
Boston, Massachusetts
February 28, 2008
MSF-26
Metropolitan Series Fund, Inc.
Directors and Officers
The Fund’s Directors review actions of the Fund’s investment adviser and subadvisers, and decide upon matters of general policy. The Fund’s officers supervise the daily business operations of the Fund. The Board of Directors and the Fund’s officers are listed below. Each Director is responsible for overseeing all 36 Portfolios of the Fund. There is no limit to the term a Director may serve. Directors serve until their resignation, retirement or removal in accordance with the Fund’s organizational documents and policies adopted by the Board from time to time. Officers hold office at the pleasure of the Board or until the election or appointment and the qualification of a successor. The address of the directors and officers is c/o Metropolitan Series Fund, Inc., 501 Boylston Street, Boston, MA 02116.
Interested Directors(1)
Each Director below is an “interested person” (as defined by the 1940 Act) with respect to the Fund in that Ms. Forget is an employee of MetLife and Mr. Typermass is a former employee of MetLife and owns securities issued by MetLife, Inc., the ultimate parent company of MetLife Advisers.
| | | | | | | | |
Name, Address and Age | | Current
position(s)
with Fund | | Position(s)
held since | | Principal occupations
over past five years, including other directorships(2) | | Number of
Portfolios in
Fund Complex
Overseen by
Director(3) |
Elizabeth M. Forget Age: 41 | | Director, Chairman of the Board, President and Chief Executive Officer | | 2006 | | Senior Vice President (since 2007), MetLife, Inc.; President, Met Investors Advisory, LLC (“MIA”); Trustee and President, Met Investors Series Trust (“MIST”); Executive Vice President, MetLife Investors Group, Inc.; President (since 2006), MetLife Advisers. | | 81 |
| | | | |
Arthur G. Typermass Age: 70 | | Director | | 1998 | | Formerly, Senior Vice President and Treasurer, MetLife. | | 37 |
Non-Interested Directors(1)
Each Director below is not an “interested person” (as defined by the 1940 Act) with respect to the Fund (collectively, the “Independent Directors”).
| | | | | | | | |
Name, Address and Age | | Current
position(s)
with Fund | | Position(s)
held since | | Principal occupations
over past five years, including other directorships(2) | | Number of
Portfolios in
Fund Complex
Overseen by
Director(3) |
Steve A. Garban† Age: 70 | | Director | | 1985 | | Formerly, Chief Financial Officer, Senior Vice President Finance and Operations and Treasurer (Emeritus), The Pennsylvania State University. | | 37 |
| | | | |
Linda B. Strumpf Age: 60 | | Director | | 2000 | | Vice President and Chief Investment Officer, Ford Foundation. | | 37 |
| | | | |
Michael S. Scott Morton† Age: 70 | | Director | | 1993 | | Jay W. Forrester Professor of Management (Emeritus) at Sloan School of Management, MIT. | | 37 |
| | | | |
H. Jesse Arnelle Age: 74 | | Director | | 2001 | | Formerly, Counsel, Womble Carlyle Sandrie & Rice; Director, Textron Inc. (global multi-industry company)*; formerly, Director, Gannet Co. Inc. (diversified news and information company)*; formerly, Director, Eastman Chemical Company (global chemical company)*; formerly, Director, Waste Management, Inc.*; formerly, Director, Armstrong Holdings Inc. (parent company of floor and ceiling products business)*; formerly, Director, FPL Group Inc. (public utility holding company)*; Director, URS Corporation (engineering design services firm)*. | | 37 |
| | | | |
Nancy Hawthorne Age: 56 | | Director | | 2003 | | Director, Avid Technologies (computer software company)*; formerly, Chairman of the Board of Avid Technologies; formerly, Board of Advisors, L. Knife & Sons, Inc. (beverage distributor); Chief Executive Officer, Clerestory LLC (corporate financial advisor); formerly, Trustee, New England Zenith Fund (“Zenith Fund”)**; formerly, Chief Executive Officer and Managing Partner, Hawthorne, Krauss and Associates (corporate financial advisor); formerly, Chief Financial Officer and Executive Vice President, Continental Cablevision, subsequently renamed MediaOne (cable television company); formerly, Director, Life F/X, Inc.; formerly, Chairman of the Board, WorldClinic (distance medicine company); formerly, Director, Perini Corporation (construction company)*; formerly, Director, CGU (property and casualty insurance company); formerly, Director, Beacon Power Corporation (energy company )*. | | 37 |
MSF-27
Metropolitan Series Fund, Inc.
Directors and Officers—(Continued)
| | | | | | | | |
Name, Address and Age | | Current
position(s)
with Fund | | Position(s)
held since | | Principal occupations
over past five years, including other directorships(2) | | Number of
Portfolios in
Fund Complex
Overseen by
Director(3) |
John T. Ludes Age: 71 | | Director | | 2003 | | President, LFP Properties (consulting firm); Formerly, Trustee, Zenith Fund**; formerly, Vice Chairman, President and Chief Operating Officer, Fortune Brands/American Brands (global conglomerate); formerly, President and CEO, Acushnet Company (athletic equipment company). | | 37 |
Officers(1)
| | | | | | | | |
Name and address | | Age | | Current
position(s)
with Fund | | Position(s)
held since | | Principal occupations over past five years(2) |
| Jeffrey P. Halperin | | 40 | | Chief Compliance Officer | | 2006 | | Vice President (since 2006), Corporate Ethics and Compliance Department, MetLife, Inc.; Chief Compliance Officer (since 2006), MetLife Advisers, MIA and MIST. |
| | | | |
| John F. Guthrie, Jr. | | 64 | | Senior Vice President | | 2002 | | Manager and Senior Vice President, MetLife Advisers; Vice President, MetLife; Vice President (since 2003), MetLife Group, Inc.; Vice President, NELICO; Vice President (since 2005), MIA; formerly, Senior Vice President, Zenith Fund**. |
| | | | |
| Alan C. Leland | | 55 | | Senior Vice President | | 2005 | | Treasurer and Chief Financial Officer, MetLife Advisers, LLC; Treasurer (since 2005), Met Investors Advisory, LLC; Vice President (since 2004), MIA; Vice President (since 2003), MetLife Group, Inc.; Vice President, MetLife; Senior Vice President, NELICO |
| | | | |
| Peter Duffy | | 52 | | Vice President and Treasurer | | 2000 | | Senior Vice President, MetLife Advisers (since 1998); Second Vice President (since 2003), NELICO; Vice President, MetLife (since 2004); Vice President (since 2004), MetLife Group, Inc.; formerly, Vice President and Treasurer, Zenith Fund**. |
| | | | |
| Thomas M. Lenz | | 49 | | Vice President and Secretary | | 2002 | | General Counsel and Secretary, MetLife Advisers; Assistant General Counsel, MetLife; formerly, Vice President and Secretary, Zenith Fund**. |
| * | Indicates a directorship with a registered investment company or a company subject to the reporting requirements of the Securities Exchange Act of 1934, as amended. |
| ** | The Zenith Fund deregistered with the Securities and Exchange Commission (“SEC”) in 2004. |
| (†) | Served as a trustee, director and/or officer of one or more of the following companies, each of which had a direct or indirect advisory relationship with MetLife Advisers or its affiliates prior to January 31, 2005: State Street Research Financial Trust, State Street Research Income Trust, State Street Research Money Market Trust, State Street Research Institutional Funds, State Street Research Capital Trust, State Street Research Master Investment Trust, State Street Research Equity Trust, State Street Research Securities Trust and State Street Research Exchange Trust (collectively, the “State Street Research Funds”). |
| (1) | Each Director of the Fund also serves as trustee of Metropolitan Series Fund II (“Met Series Fund II”), a registered investment company advised by MetLife Advisers. Each officer of the Fund serves in the same position with Met Series Fund II, which consists of one portfolio. |
| (2) | Previous positions during the past five years with the Fund, MIST, MetLife, MetLife Advisers, MIA, Zenith Fund, NELICO or New England Securities Corporation are omitted if not materially different. |
| (3) | The Fund Complex includes the Fund (36 portfolios), Met Series Fund II (1 portfolio) and MIST (44 portfolios) |
MSF-28
Metropolitan Series Fund, Inc.
MFS Total Return Portfolio
Board Approval of Advisory and Subadvisory Agreements
The Fund’s Contract Review Committees of the Board of Directors (the “Board”) typically meet in early fall to review the Portfolios’ advisory agreements (the “Advisory Agreements”) and subadvisory agreements (collectively, the “Subadvisory Agreements,” and, together with the Advisory Agreements, the “Agreements”) and determine whether to recommend that the full Board approve the continuation of the Agreements for an additional one-year period. (Following the initial approval of an Agreement for a new Portfolio or with a new adviser or subadviser, such annual reviews are not required until 2 years following the execution of such Agreement.) After each Committee has made its recommendations, the full Board, including the Independent Directors, determines whether to approve the continuation of each of the Agreements. In addition, the Board, including the Independent Directors, considers matters bearing on the Agreements at most of its other meetings throughout the year and regularly interviews various individuals at MetLife Advisers responsible for the management of the Portfolios. The Directors also interview selected investment managers and other professionals at the subadvisers at various times throughout the year.
The Directors receive all materials that they or MetLife Advisers, the Fund’s investment adviser, and the subadvisers believe to be reasonably necessary for the Directors to evaluate the Agreements and determine whether to approve the continuation of the Agreements. These materials generally include, among other items, (i) information on the investment performance of the Portfolios and the performance of peer groups of funds and the Portfolios’ performance benchmarks, (ii) information on the Portfolios’ advisory and subadvisory fees and other expenses, including information comparing the Portfolios’ expenses to those of peer groups of funds and information about any applicable expense caps and fee “breakpoints,” (iii) sales and redemption data, (iv) information related to the profitability of the Agreements to MetLife Advisers and the subadvisers, and potential “fall-out” or ancillary benefits that MetLife Advisers, the subadvisers or their affiliates may receive as a result of their relationships with the Fund and (v) information obtained through the subadvisers’ responses to certain requests from MetLife Advisers and the Directors and MetLife Advisers’ responses to requests from the Directors. The Directors may also consider other information such as (vi) MetLife Advisers’ and the subadvisers’ financial results and condition, (vii) each Portfolio’s investment objectives and strategies and the size, education and experience of the investment staffs of MetLife Advisers and the relevant subadvisers and their use of technology and external research, (viii) the allocation of the Portfolios’ brokerage, if any, including allocations to brokers affiliated with the subadvisers and the use of “soft” commission dollars to pay Portfolio expenses and to pay for research and other similar services, (ix) the resources devoted to, and the record of compliance with, the Portfolios’ investment policies and restrictions, policies on personal securities transactions and other compliance policies, (x) the responses of MetLife Advisers, the subadvisers and/or their affiliates to certain legal and regulatory proceedings and (xi) the economic outlook generally and for the mutual fund industry in particular. Throughout the process, the Directors have the opportunity to ask questions of and request additional materials from MetLife Advisers and the subadvisers.
Following meetings of each Contract Review Committee on September 12, 2007, the Board, at its November 15, 2007 meeting, approved the continuation through December 31, 2008 of the Advisory Agreements for each Portfolio of the Fund and the Subadvisory Agreements for each Portfolio of the Fund. The Agreements approved for continuation are referred to below as the “Continued Agreements.”
In considering whether to approve the continuation of the Continued Agreements, the Directors, including the Independent Directors, did not identify any single factor as determinative, and each weighed the various factors as he or she deemed appropriate. The Directors considered the following matters in connection with their approval of the Continued Agreements:
The nature, extent and quality of the services provided to the relevant Portfolios under the Continued Agreements. The Directors considered the nature, extent and quality of the services provided by MetLife Advisers, the relevant subadvisers (if any) and their affiliates (each, an “Adviser,” and, collectively, the “Advisers”) to the relevant Portfolios pursuant to the Continued Agreements and the resources dedicated to these Portfolios by the Advisers. In particular, the Directors considered the Advisers’ abilities to attract and retain highly qualified investment professionals. With respect to MetLife Advisers, the Directors considered that MetLife Advisers is (i) ultimately responsible for the performance of such Portfolios; (ii) ultimately responsible for the establishment of the investment strategies of each such Portfolio, primarily through its recommendations to the Board regarding the hiring and selection of subadvisers; (iii) responsible for the hiring and selection, subject to Board approval, of subadvisers; and (iv) responsible for maintaining a program of Subadviser oversight reasonably designed to ensure that the subadvisers have reasonable compliance policies and procedures in place. The Directors also considered that MetLife Advisers provides a full range of day-to-day administrative services for the Portfolios involving all aspects of such Portfolios’ day-to-day operations (other than portfolio management). After reviewing these and related factors, the Directors concluded, within the context of their overall conclusions regarding each of the Continued Agreements, that the nature, extent and quality of services provided supported the renewal of these Agreements.
Investment performance of the relevant Portfolios. The Directors reviewed information about the performance of the relevant Portfolios over various time periods, including information prepared by an independent third party that compared the performance of
MSF-29
Metropolitan Series Fund, Inc.
MFS Total Return Portfolio
Board Approval of Advisory and Subadvisory Agreements—(Continued)
the Portfolios to the performance of peer groups of funds and performance benchmarks. The Directors also reviewed a description of the third party’s methodology for identifying a Portfolio’s peer group(s) for purposes of performance and expense comparisons.
In the case of each relevant Portfolio that had performance that lagged its peer group(s) for certain periods, the Directors concluded that other factors relevant to performance were sufficient, in light of other considerations, to warrant renewal of the Continued Agreements relating to such Portfolio. These factors varied from Portfolio to Portfolio, but included one or more of the following: (i) that such Portfolio’s performance, although lagging in certain recent periods, was stronger over the longer term; (ii) that the underperformance was attributable, to a significant extent, to investment decisions that were reasonable and consistent with the Portfolio’s investment objective(s) and policies and that the Portfolio was performing within the range of reasonable expectations, given market conditions and the Portfolio’s investment objective(s) and policies; (iii) that the Portfolio’s performance was competitive when compared to other relevant performance benchmarks or peer groups; and (iv) that MetLife Advisers and/or the relevant subadviser (if any) had taken or was taking steps designed to help improve the Portfolio’s investment performance.
The Directors also considered the investment performance of the Advisers and their reputations generally, the historical responsiveness of the Advisers to Director concerns about performance and the willingness of the Advisers to take steps intended to improve performance.
After reviewing these and related factors, the Directors concluded, within the context of their overall conclusions regarding each of the Continued Agreements, that the investment performance of each relevant Portfolio and Adviser was sufficient, in light of other considerations, to warrant the renewal of the Continued Agreements.
The costs of the services to be provided and profits to be realized by the Advisers and their affiliates from their relationships with the Portfolios. The Directors considered the fees charged by MetLife Advisers to the Portfolios for advisory services and, with respect to the subadvised Portfolios, by such subadvisers to MetLife Advisers for subadvisory services (such advisory and subadvisory fees (if any), collectively, “Fees”), as well as the total expense levels of the Portfolios. This information included comparisons (provided by an independent third party) of the Portfolios’ advisory fees and total expense levels to those of their peer groups. In evaluating Fees for the relevant Portfolios, the Directors also took into account the demands, complexity and quality of the investment management services provided to each Portfolio. The Directors considered MetLife Advisers’ recommendations regarding reductions in Fee rates, implementation of Fee breakpoints and institution of Fee waivers and expense caps.
The Directors also considered the compensation directly or indirectly received by the Advisers and their affiliates from their relationships with the relevant Portfolios. The Directors reviewed information relating to the profits received by MetLife Advisers, certain of the subadvisers and their affiliates as a result of their relationships with the relevant Portfolios, and information about the allocation of expenses used to calculate profitability. When reviewing profitability, the Directors also considered the performance of the relevant Portfolios, the expense levels of such Portfolios and whether the relevant Advisers had implemented breakpoints, fee waivers and/or expense caps with respect to such Portfolios.
After reviewing these and related factors, the Directors concluded, within the context of their overall conclusions regarding each of the Continued Agreements, that the Fees charged to each of the relevant Portfolios were fair and reasonable, and that the information provided regarding costs of these services generally, and the related profitability (if known) to the relevant Advisers of their relationships with the relevant Portfolios, supported the renewal of the Continued Agreements.
Economies of Scale. The Directors considered the existence of any economies of scale in the provision of services by the Advisers and whether those economies were shared with the relevant Portfolios through breakpoints in their advisory fees or other means, such as expense caps, fee waivers or relatively low levels of fees. The Directors noted that most of the relevant Portfolios benefited or will benefit from breakpoints, expense caps and/or fee waivers with respect to their advisory fees. In considering these issues, the Directors also took into consideration information relating to the costs of the services provided and the profitability to MetLife Advisers, the relevant subadvisers (if any) and each of their affiliates of their relationships with the relevant Portfolios, as discussed above.
After reviewing these and related factors, the Directors concluded, within the context of their overall conclusions regarding each of the Continued Agreements, that the extent to which economies of scale were shared with the relevant Portfolios supported the renewal of such Agreements.
Other Factors. The Directors also considered other factors, which included but were not limited to the following:
| | • | | the extent to which each relevant Portfolio operated in accordance with its investment objective, and its record of compliance with its investment restrictions and the compliance programs of the Fund and the Advisers. They also considered the compliance-related resources the Advisers and their affiliates provide to the relevant Portfolios; |
MSF-30
Metropolitan Series Fund, Inc.
MFS Total Return Portfolio
Board Approval of Advisory and Subadvisory Agreements—(Continued)
| | • | | the nature, quality, cost and extent of administrative and shareholder services performed by MetLife Advisers and its affiliates under the Advisory Agreements; and |
| | • | | so-called “fall-out benefits” to the Advisers, such as the engagement of their affiliates to provide distribution, brokerage and transfer agency services to the Portfolios, and the benefits of research made available to the relevant Advisers by reason of brokerage commissions generated by the relevant Portfolios’ securities transactions. The Directors also considered the possible conflicts of interest associated with these fall-out and other benefits, and the reporting and other processes in place to disclose and monitor these possible conflicts of interest. |
Based on their evaluation of all factors that they deemed to be material, including those factors described above, and assisted by the advice of independent counsel, the Directors, including the Independent Directors, concluded that each of the Continued Agreements should be continued through December 31, 2008.
MSF-31
A description of the policies and procedures that the Fund uses to determine how to vote proxies relating to portfolio securities is available (i) without charge, upon request, by calling (800) 638-7732 and (ii) on the Securities and Exchange Commission’s (the “SEC”) website at http://www.sec.gov.
Information regarding how the Fund voted proxies relating to portfolio securities during the most recent twelve-month period ended December 31, 2007 is available (i) without charge, upon request, by calling (800) 638-7732 and (ii) on the SEC’s website at http://www.sec.gov.
The Fund files with the SEC a complete schedule of its portfolio holdings, as of the close of the first and third quarters of its fiscal year, on “Form N-Q”. These filings are available on the SEC’s website at www.sec.gov and may be reviewed and copied at the SEC’s Public Reference Room in Washington, DC. (Call 1-800-SEC-0330 for information on the operation of the Public Reference Room.)
MSF-32
| | |
Metropolitan Series Fund, Inc. MFS Value Portfolio
(formerly Harris Oakmark Large Cap Value Portfolio) Annual Report | | December 31, 2007 |
Letter from the President
February 1, 2008
Letter to Policy Holders:
2007 was a tumultuous year in the financial markets driven by concerns in the credit markets surrounding sub-prime mortgages and fears of recession in the U.S. Economy. The broad markets were mixed, with the Dow Jones Industrial Average up 8.9% and the MSCI EAFE Index, which measures the performance of international equities, up 11.2% for the year, while the Russell 2000 Index, which measures the performance of small capitalization stocks, was down 1.6%.
In the fixed income markets, credit spreads increased as a result of the pressure from sub-prime mortgage crisis and the Federal Reserve lowered interest rates by a total of 1% during the year. The Lehman Brothers Aggregate Bond Index posted a 7.0% return for the year.
On the following pages, you will find a complete review of your Portfolio and its investment performance.
MetLife is committed to building your financial freedom. We appreciate your trust and will continue to focus our efforts on meeting your investment needs.
Sincerely,
Elizabeth Forget
President, Metropolitan Series Fund, Inc.
Metropolitan Series Fund, Inc.
MFS Value Portfolio (formerly Harris Oakmark Large Cap Value Portfolio)
Currently managed by Massachusetts Financial Services Company
Formerly managed by Harris Associates, L.P.*
Portfolio Manager Commentary*
Harris Associates L.P. (“Harris”), the Portfolio’s subadviser prior to January 7, 2008, prepared this commentary, which addresses the Portfolio’s performance for the one year period ended December 31, 2007. On January 7, 2008, Massachusetts Financial Services Company (“MFS”) succeeded Harris as the subadviser to the Portfolio and the name of the Portfolio was changed from the Harris Oakmark Large Cap Value Portfolio to the MFS Value Portfolio. This commentary and performance does not reflect the management of MFS.
PORTFOLIO PERFORMANCE
For the year ended December 31, 2007, the Class A shares of the Portfolio returned -3.8%, compared to its benchmark, the Russell 1000 Value Index1, which returned -0.2%. The average return of its peer group, the Lipper Variable Insurance Products Large Cap Value Funds Universe2, was 1.7% over the same period.
PORTFOLIO REVIEW
The S&P 500 gained 5.5% in 2007, but a single number fails to describe the increasing divergence between the market’s winners and losers (the statistical performance spread between the top and bottom performers widened substantially in the past six months, frustrating value-minded investors who expect valuation excesses to eventually correct).
As of December 31, 2007, the Portfolio held 52 securities across a variety of industries. During the year, we initiated positions in Best Buy, Capital One Financial, FedEx Corporation, and Sprint Nextel Corporation. Other changes in the Portfolio during the year include Bank of New York’s acquisition of Mellon Financial. The resulting firm is now known as Bank of New York Mellon Corporation. Additionally, conglomerate holding Tyco International Ltd. spun off two business units. As a result the Portfolio now holds Covidien (formerly Tyco Healthcare Group) and Tyco Electronics. Tyco International, which retained its fire and security and engineered products and services businesses, also remains in the Portfolio. We eliminated several positions during the year: Coca-Cola, DIRECTV Group, EchoStar Communications, First Data, Gannett, Gap, Mattel, and MGIC Investment Corporation.
McDonald’s, Yum! Brands, and Intel Corporation had the most positive impact on performance during the period. McDonald’s produced solid earnings as it continued to successfully execute its strategy for operational improvements. The big drivers of future earnings will be menu-driven in the U.S. and kitchen-driven in Europe. In the U.S., the company will be rolling out its premium beverages along with new menu items, while in Europe the focus will be on kitchen remodels required for premium chicken products.
Yum! Brands continued to show strong international growth, especially in China. Management expects to increase franchise ownership in the U.S. to over 90% by 2010, which we think should increase overall growth for the company.
Intel delivered solid positive performance throughout the year. The firm consistently reported better than expected earnings during 2007, and in the most recent quarter reported strong quarterly earnings (up 41%) with gross margins expected to be around 52% for the full year. We believe Intel will benefit from the explosion of processor power needed at the client and the Internet service level. The trend toward mobile computing should also be a positive for the company.
Washington Mutual, Pulte, and Citigroup had the most negative impact on performance during the period. The deterioration in the housing market, coupled with significant loan write-offs, has injured Washington Mutual’s earnings power. While fundamentals have been hurt in this environment, we continue to feel that its retail banking franchise and mortgage business still have the potential to add value. We feel the sell off has been overdone and the stock looks very cheap, trading at just 4 times 2009 expected earnings.
The environment for home-builders remains challenging. Pulte has been forced to take write-offs, as business fundamentals weaken. However, with its stock trading at a significant discount to book value, we feel that the bad news is already factored into the share price.
Like other large financial institutions, Citigroup took a large write-down this past quarter relating to its Collateralized Debt Obligations (CDO) portfolio. Since then, the company has raised capital, replaced its Chief Executive Officer, and is making good progress in reducing Structured Investment Vehicle (SIV) exposure.
* The views expressed above are those of the subadvisory firm as of December 31, 2007 and are subject to change based on market and other conditions. Information about the Portfolio’s holdings, asset allocation, industry allocation, or country diversification is historical and is not an indication of future Portfolio composition, which will vary. The performance of any index mentioned in this commentary has not been adjusted for ongoing management, distribution and operating expenses, and sales charges applicable to mutual fund investments. Direct investment in the Index is not possible.
1 The Russell 1000® Value Index is an unmanaged measure of the largest capitalized U.S. domiciled companies with a less than average growth orientation. Companies in this Index generally have a low price-to-book and price-to-earnings ratio, higher divided yields and lower forecasted growth values.
2 The Lipper Variable Insurance Products Fund Average is an average of the total return performance (calculated on the basis of net asset value) of variable product funds with similar investment objectives to those of the subject Portfolio as calculated by Lipper Analytical Services, an independent mutual fund ranking service.
MSF-2
Metropolitan Series Fund, Inc.
MFS Value Portfolio (formerly Harris Oakmark Large Cap Value Portfolio)
A $10,000 INVESTMENT COMPARED TO
THE RUSSELL 1000 VALUE INDEX
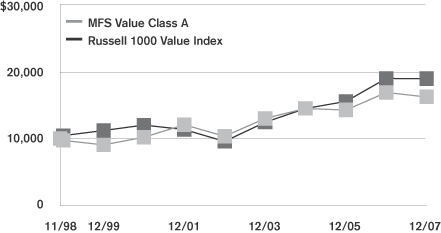
Average Annual Returns as of December 31, 2007
| | | | | | | | | | | | |
| | | MFS Value Portfolio | | | Russell 1000
Value Index | |
| | | Class A | | | Class B | | | Class E | | |
| 1 Year | | -3.8 | % | | -4.0 | % | | -3.9 | % | | -0.2 | % |
| 5 Year | | 9.4 | | | 9.1 | | | 9.3 | | | 14.6 | |
| Since Inception | | 5.4 | | | 7.7 | | | 5.2 | | | 7.2 | |
Performance numbers are net of all Portfolio expenses but do not include any insurance, sales, or administrative charges of variable annuity or life insurance contracts. If these charges were included, the returns would be lower.
Inception dates of the Class A, Class B and Class E shares are: 11/9/98, 7/30/02 and 5/1/01, respectively. Index since inception return is based on the Class A inception date.
This information represents past performance and is not indicative of future results. Investment return and principal value may fluctuate so that shares, upon redemption, may be worth more or less than the original cost.
PORTFOLIO COMPOSITION as of December 31, 2007
Top Holdings
| | |
| | | % of Total
Net Assets |
Yum! Brands, Inc. | | 3.3% |
Viacom, Inc. (Class B) | | 2.9% |
Texas Instruments, Inc. | | 2.8% |
Intel Corp. | | 2.5% |
Abbott Laboratories | | 2.4% |
McDonald’s Corp. | | 2.4% |
Best Buy Co., Inc. | | 2.4% |
Time Warner, Inc. | | 2.3% |
InBev NV | | 2.3% |
Bristol-Myers Squibb Co. | | 2.3% |
Top Sectors
| | |
| | | % of Equity
Market Value |
Consumer Discretionary | | 35.6% |
Information Technology | | 14.8% |
Financials | | 14.1% |
Consumer Staples | | 13.7% |
Health Care | | 11.5% |
Industrials | | 7.0% |
Energy | | 1.7% |
Telecommunication Services | | 1.6% |
MSF-3
Metropolitan Series Fund, Inc.
Shareholder Expense Example
As a shareholder of the Portfolio, you incur ongoing costs, including management fees; distribution and service (12b-1) fees; and other Portfolio expenses. This example is intended to help you understand your ongoing costs (in dollars) (referred to as “expenses”) of investing in the Portfolio and compare these costs with the ongoing costs of investing in other mutual funds. The example is based on an investment of $1,000 invested at the beginning of the period and held for the entire period, July 1, 2007 through December 31, 2007.
Actual Expenses
The first line for each share class of the Portfolio in the table below provides information about actual account values and actual expenses. You may use the information in this line, together with the amount you invested in the particular share class of the Portfolio, to estimate the expenses that you paid over the period. Simply divide your account value by $1,000 (for example, an $8,600 account value divided by $1,000=8.6), then multiply the result by the number in the first line under the heading entitled “Expenses Paid During Period” to estimate the expenses you paid on your account during this period.
Hypothetical Example for Comparison Purposes
The second line for each share class of the Portfolio in the table below provides information about hypothetical account values and hypothetical expenses based on the Portfolio’s actual expense ratio and an assumed rate of return of 5% per year before expenses, which is not the Portfolio’s actual return. The hypothetical account values and expenses may not be used to estimate the actual ending account balance or expenses you paid for the period. You may use this information to compare the ongoing costs of investing in the Portfolio and other funds. To do so, compare this 5% hypothetical example with the 5% hypothetical examples that appear in the shareholder reports of the other funds.
Please note that the expenses shown in the table are meant to highlight your ongoing costs only and do not reflect any fees or charges of your variable insurance product or any additional expenses that participants in certain eligible qualified plans may bear relating to the operations of their plan. Therefore, the second line for each share class in the table is useful in comparing ongoing costs only, and will not help you determine the relative total costs of owning different funds. In addition, if these other costs were included, your costs would have been higher.
| | | | | | | | | | | | | | |
Portfolio | | | | Annualized
Expense
Ratio | | | Beginning
Account Value
July 1,
2007 | | Ending
Account Value
December 31,
2007 | | Expenses Paid
During Period*
July 1, 2007
to
December 31,
2007 |
MFS Value—Class A(a) | | Actual | | 0.76 | % | | $ | 1,000.00 | | $ | 912.30 | | $ | 3.66 |
| | Hypothetical | | 0.76 | % | | $ | 1,000.00 | | $ | 1,021.33 | | $ | 3.87 |
| | | | | |
MFS Value—Class B(a) | | Actual | | 1.01 | % | | $ | 1,000.00 | | $ | 911.30 | | $ | 4.87 |
| | Hypothetical | | 1.01 | % | | $ | 1,000.00 | | $ | 1,020.05 | | $ | 5.14 |
| | | | | |
MFS Value—Class E(a) | | Actual | | 0.91 | % | | $ | 1,000.00 | | $ | 911.40 | | $ | 4.38 |
| | Hypothetical | | 0.91 | % | | $ | 1,000.00 | | $ | 1,020.56 | | $ | 4.63 |
* Expenses paid are equal to the Portfolio’s annualized expense ratio for the most recent six month period, as shown above, multiplied by the average account value over the period, multiplied by the number of days in the most recent fiscal half-year, divided by 365 (to reflect the one-half year period).
(a) The annualized expense ratio shown reflects the impact of the management fee waiver as described in Note 4 to the Financial Statements.
MSF-4
Metropolitan Series Fund, Inc.
MFS Value Portfolio (formerly Harris Oakmark Large Cap Value Portfolio)
Schedule of Investments as of December 31, 2007
Common Stock—93.2% of Total Net Assets
| | | | | |
| Security Description | | Shares | | Value* |
| | | | | |
| | | | | |
|
Aerospace & Defense—3.4% |
Honeywell International, Inc. | | 146,350 | | $ | 9,010,770 |
Raytheon Co. | | 172,300 | | | 10,458,610 |
| | | | | |
| | | | | 19,469,380 |
| | | | | |
|
Air Freight & Logistics—1.3% |
FedEx Corp. | | 80,800 | | | 7,204,936 |
| | | | | |
|
Automobiles—1.8% |
Harley-Davidson, Inc. | | 217,100 | | | 10,140,741 |
| | | | | |
|
Beverages—6.6% |
Anheuser-Busch Cos., Inc. | | 244,300 | | | 12,786,662 |
Diageo, Plc. (ADR) | | 138,000 | | | 11,844,540 |
InBev NV (EUR) | | 161,400 | | | 13,295,615 |
| | | | | |
| | | | | 37,926,817 |
| | | | | |
|
Building Products—1.4% |
Masco Corp. | | 372,800 | | | 8,056,208 |
| | | | | |
|
Capital Markets—1.7% |
The Bank of New York Mellon Corp. | | 199,717 | | | 9,738,201 |
| | | | | |
|
Commercial Banks—2.1% |
U.S. Bancorp | | 374,600 | | | 11,889,804 |
| | | | | |
|
Computers & Peripherals—5.2% |
Dell, Inc. (a) | | 455,200 | | | 11,156,952 |
Hewlett-Packard Co. | | 242,100 | | | 12,221,208 |
Sun Microsystems, Inc. (a) | | 365,275 | | | 6,622,436 |
| | | | | |
| | | | | 30,000,596 |
| | | | | |
|
Consumer Finance—2.2% |
Capital One Financial Corp. | | 263,200 | | | 12,438,832 |
| | | | | |
|
Diversified Consumer Services—1.4% |
H&R Block, Inc. | | 447,000 | | | 8,300,790 |
| | | | | |
|
Diversified Financial Services—3.6% |
Citigroup, Inc. | | 260,600 | | | 7,672,064 |
JPMorgan Chase & Co. | | 293,100 | | | 12,793,815 |
| | | | | |
| | | | | 20,465,879 |
| | | | | |
|
Electronic Equipment & Instruments—0.4% |
Tyco Electronics, Ltd. | | 69,425 | | | 2,577,750 |
| | | | | |
|
Food & Staples Retailing—2.2% |
Wal-Mart Stores, Inc. | | 271,400 | | | 12,899,642 |
| | | | | |
|
Food Products—3.9% |
General Mills, Inc. | | 190,600 | | | 10,864,200 |
H.J. Heinz Co. | | 244,250 | | | 11,401,590 |
| | | | | |
| | | | | 22,265,790 |
| | | | | |
| | | | | |
| Security Description | | Shares | | Value* |
| | | | | |
| | | | | |
|
Health Care Equipment & Supplies—3.9% |
Baxter International, Inc. | | 162,700 | | $ | 9,444,735 |
Covidien, Ltd. | | 69,425 | | | 3,074,833 |
Medtronic, Inc. | | 200,800 | | | 10,094,216 |
| | | | | |
| | | | | 22,613,784 |
| | | | | |
|
Hotels, Restaurants & Leisure—5.7% |
McDonald’s Corp. | | 233,700 | | | 13,767,267 |
Yum! Brands, Inc. | | 488,800 | | | 18,706,376 |
| | | | | |
| | | | | 32,473,643 |
| | | | | |
|
Household Durables—4.5% |
Black & Decker Corp. | | 152,000 | | | 10,586,800 |
Fortune Brands, Inc. | | 152,000 | | | 10,998,720 |
Pulte Homes, Inc. | | 380,000 | | | 4,005,200 |
| | | | | |
| | | | | 25,590,720 |
| | | | | |
|
Industrial Conglomerates—0.5% |
Tyco International, Ltd. | | 69,425 | | | 2,752,701 |
| | | | | |
|
Insurance—1.8% |
Aflac, Inc. | | 168,300 | | | 10,540,629 |
| | | | | |
|
Internet & Catalog Retail—1.3% |
Liberty Media Interactive (Class A) (a) | | 401,725 | | | 7,664,913 |
| | | | | |
|
IT Services—1.2% |
The Western Union Co. | | 279,600 | | | 6,788,688 |
| | | | | |
|
Media—11.3% |
Comcast Corp. (Special Class A) (a) | | 392,500 | | | 7,112,100 |
Discovery Holding Co. (Class A) (a) | | 129,100 | | | 3,245,574 |
Liberty Media Capital (Series A) (a) | | 108,545 | | | 12,644,407 |
The Walt Disney Co. | | 358,300 | | | 11,565,924 |
Time Warner, Inc. | | 808,600 | | | 13,349,986 |
Viacom, Inc. (Class B) (a) | | 383,000 | | | 16,821,360 |
| | | | | |
| | | | | 64,739,351 |
| | | | | |
| | | | | |
|
Multiline Retail—1.8% |
Kohl’s Corp. (a) | | 221,900 | | | 10,163,020 |
| | | | | |
|
Office Electronics—1.6% |
Xerox Corp. | | 572,500 | | | 9,268,775 |
| | | | | |
|
Oil, Gas & Consumable Fuels—1.6% |
ConocoPhillips | | 103,387 | | | 9,129,072 |
| | | | | |
|
Pharmaceuticals—6.8% |
Abbott Laboratories | | 248,300 | | | 13,942,045 |
Bristol-Myers Squibb Co. | | 488,600 | | | 12,957,672 |
Schering-Plough Corp. | | 450,000 | | | 11,988,000 |
| | | | | |
| | | | | 38,887,717 |
| | | | | |
|
Semiconductors & Semiconductor Equipment—5.3% |
Intel Corp. | | 541,800 | | | 14,444,388 |
Texas Instruments, Inc. | | 477,700 | | | 15,955,180 |
| | | | | |
| | | | | 30,399,568 |
| | | | | |
*See accompanying notes to financial statements.
MSF-5
Metropolitan Series Fund, Inc.
MFS Value Portfolio (formerly Harris Oakmark Large Cap Value Portfolio)
Schedule of Investments as of December 31, 2007
Common Stock—(Continued)
| | | | | | |
| Security Description | | Shares | | Value* |
| | | | | | |
|
Specialty Retail—5.4% |
Best Buy Co., Inc. | | | 260,600 | | $ | 13,720,590 |
Limited Brands, Inc. | | | 430,200 | | | 8,143,686 |
The Home Depot, Inc. | | | 345,400 | | | 9,305,076 |
| | | | | | |
| | | | | | 31,169,352 |
| | | | | | |
|
Thrifts & Mortgage Finance—1.8% |
Washington Mutual, Inc. | | | 743,900 | | | 10,124,479 |
| | | | | | |
|
Wireless Telecommunication Services—1.5% |
Sprint Nextel Corp. | | | 636,600 | | | 8,358,558 |
| | | | | | |
Total Common Stock
(Identified Cost $458,960,215) | | | | | | 534,040,336 |
| | | | | | |
|
| Short Term Investments—6.6% |
| Security Description | | Face
Amount | | Value* |
|
Repurchase Agreement—6.6% |
State Street Repurchase Agreement dated 12/31/07 at 1.200% to be repurchased at $37,829,522 on 1/02/08, collateralized by $31,235,000 U.S. Treasury Bond
7.500% due 11/15/16 with a value of $38,965,663. | | $ | 37,827,000 | | | 37,827,000 |
| | | | | | |
Total Short Term Investments
(Identified Cost $37,827,000) | | | | | | 37,827,000 |
| | | | | | |
Total Investments—99.8%
(Identified Cost $496,787,215) (b) | | | | | | 571,867,336 |
Other assets less liabilities | | | | | | 901,848 |
| | | | | | |
| Total Net Assets—100% | | | | | $ | 572,769,184 |
| | | | | | |
| (b) | The aggregate cost of investments for federal income tax purposes as of December 31, 2007 was $496,808,535 and the composition of unrealized appreciation and depreciation of investment securities was $115,314,878 and $(40,256,077), respectively. |
| (ADR)— | An American Depositary Receipt is a certificate issued by a custodian bank representing the right to receive securities of the foreign issuer described. Trading on exchanges not located in the United States or Canada significantly influences the value of ADRs. |
*See accompanying notes to financial statements.
MSF-6
Metropolitan Series Fund, Inc.
MFS Value Portfolio (formerly Harris Oakmark Large Cap Value Portfolio)
Statement of Assets & Liabilities
December 31, 2007
| | | | | | |
Assets | | | | | | |
Investments at value (a) | | | | | $ | 571,867,336 |
Cash | | | | | | 89,208 |
Receivable for: | | | | | | |
Fund shares sold | | | | | | 964,027 |
Accrued interest and dividends | | | | | | 666,747 |
| | | | | | |
Total Assets | | | | | | 573,587,318 |
Liabilities | | | | | | |
Payable for: | | | | | | |
Securities purchased | | $ | 128,002 | | | |
Fund shares redeemed | | | 251,727 | | | |
Accrued expenses: | | | | | | |
Management fees | | | 351,385 | | | |
Service and distribution fees | | | 48,840 | | | |
Other expenses | | | 38,180 | | | |
| | | | | | |
Total Liabilities | | | | | | 818,134 |
| | | | | | |
Net Assets | | | | | $ | 572,769,184 |
| | | | | | |
Net assets consists of: | | | | | | |
Capital paid in | | | | | $ | 431,943,111 |
Undistributed net investment income | | | | | | 6,159,427 |
Accumulated net realized gains | | | | | | 59,586,525 |
Unrealized appreciation on investments and foreign currency | | | | | | 75,080,121 |
| | | | | | |
Net Assets | | | | | $ | 572,769,184 |
| | | | | | |
| Computation of offering price: | | | | | | |
Class A | | | | | | |
Net asset value and redemption price per share ($302,334,537 divided by 21,198,242 shares outstanding) | | | | | $ | 14.26 |
| | | | | | |
Class B | | | | | | |
Net asset value and redemption price per share ($158,515,628 divided by 11,178,333 shares outstanding) | | | | | $ | 14.18 |
| | | | | | |
Class E | | | | | | |
Net asset value and redemption price per share ($111,919,019 divided by 7,881,311 shares outstanding) | | | | | $ | 14.20 |
| | | | | | |
(a) Identified cost of investments | | | | | $ | 496,787,215 |
| | | | | | |
Statement of Operations
For the Year Ended December 31, 2007
| | | | | | | | |
Investment Income | | | | | | | | |
Dividends | | | | | | $ | 11,237,826 | (a) |
Interest | | | | | | | 660,214 | |
| | | | | | | | |
| | | | | | | 11,898,040 | |
Expenses | | | | | | | | |
Management fees | | $ | 4,792,627 | | | | | |
Service and distribution fees—Class B | | | 413,448 | | | | | |
Service and distribution fees—Class E | | | 192,470 | | | | | |
Directors’ fees and expenses | | | 23,669 | | | | | |
Custodian | | | 63,562 | | | | | |
Audit and tax services | | | 31,738 | | | | | |
Legal | | | 7,466 | | | | | |
Printing | | | 195,486 | | | | | |
Insurance | | | 7,095 | | | | | |
Miscellaneous | | | 15,347 | | | | | |
| | | | | | | | |
Total expenses | | | 5,742,908 | | | | | |
Expense reductions | | | (7,024 | ) | | | | |
Management fee waivers | | | (90,371 | ) | | | 5,645,513 | |
| | | | | | | | |
Net Investment Income | | | | | | | 6,252,527 | |
| | | | | | | | |
Realized and Unrealized Gain (Loss) | | | | | | | | |
| Realized gain (loss) on: | | | | | | | | |
Investments—net | | | 59,787,295 | | | | | |
Foreign currency transactions—net | | | (4,679 | ) | | | 59,782,616 | |
| | | | | | | | |
| Change in unrealized depreciation on: | | | | | | | | |
Investments—net | | | (81,695,518 | ) | | | | |
Foreign currency transactions—net | | | (717 | ) | | | (81,696,235 | ) |
| | | | | | | | |
Net loss | | | | | | | (21,913,619 | ) |
| | | | | | | | |
Net Decrease in Net Assets From Operations | | | | | | $ | (15,661,092 | ) |
| | | | | | | | |
| (a) | Net of foreign taxes of $29,194. |
See accompanying notes to financial statements.
MSF-7
Metropolitan Series Fund, Inc.
MFS Value Portfolio (formerly Harris Oakmark Large Cap Value Portfolio)
Statements of Changes in Net Assets
| | | | | | | | |
| | | Year ended
December 31,
2007 | | | Year ended
December 31,
2006 | |
From Operations | | | | | | | | |
Net investment income | | $ | 6,252,527 | | | $ | 5,337,455 | |
Net realized gain | | | 59,782,616 | | | | 22,785,696 | |
Unrealized appreciation (depreciation) | | | (81,696,235 | ) | | | 79,532,999 | |
| | | | | | | | |
Increase (decrease) in net assets from operations | | | (15,661,092 | ) | | | 107,656,150 | |
| | | | | | | | |
From Distributions to Shareholders | | | | | | | | |
Net investment income | | | | | | | | |
Class A | | | (3,589,303 | ) | | | (2,908,650 | ) |
Class B | | | (913,050 | ) | | | (650,225 | ) |
Class E | | | (861,644 | ) | | | (857,581 | ) |
| | | | | | | | |
| | | (5,363,997 | ) | | | (4,416,456 | ) |
| | | | | | | | |
Net realized gain | | | | | | | | |
Class A | | | (12,547,728 | ) | | | 0 | |
Class B | | | (4,490,931 | ) | | | 0 | |
Class E | | | (3,608,668 | ) | | | 0 | |
| | | | | | | | |
| | | (20,647,327 | ) | | | 0 | |
| | | | | | | | |
Total distributions | | | (26,011,324 | ) | | | (4,416,456 | ) |
| | | | | | | | |
Increase (decrease) in net assets from capital share transactions | | | (103,575,641 | ) | | | 13,117,750 | |
| | | | | | | | |
Total increase (decrease) in net assets | | | (145,248,057 | ) | | | 116,357,444 | |
| | |
Net Assets | | | | | | | | |
Beginning of the period | | | 718,017,241 | | | | 601,659,797 | |
| | | | | | | | |
End of the period | | $ | 572,769,184 | | | $ | 718,017,241 | |
| | | | | | | | |
Undistributed Net Investment Income | | | | | | | | |
End of the period | | $ | 6,159,427 | | | $ | 5,282,600 | |
| | | | | | | | |
Other Information:
Capital Shares
Transactions in capital shares were as follows:
| | | | | | | | | | | | | | |
| | | Year ended
December 31, 2007 | | | Year ended
December 31, 2006 | |
| | | Shares | | | $ | | | Shares | | | $ | |
Class A | | | | | | | | | | | | | | |
Sales | | 6,983,800 | | | $ | 106,401,516 | | | 8,376,893 | | | $ | 116,488,433 | |
Reinvestments | | 1,037,084 | | | | 16,137,031 | | | 214,502 | | | | 2,908,650 | |
Redemptions | | (14,734,597 | ) | | | (227,584,457 | ) | | (7,853,759 | ) | | | (108,053,619 | ) |
| | | | | | | | | | | | | | |
Net increase (decrease) | | (6,713,713 | ) | | $ | (105,045,910 | ) | | 737,636 | | | $ | 11,343,464 | |
| | | | | | | | | | | | | | |
Class B | | | | | | | | | | | | | | |
Sales | | 2,571,664 | | | $ | 39,258,516 | | | 3,398,940 | | | $ | 46,799,383 | |
Reinvestments | | 348,644 | | | | 5,403,981 | | | 48,094 | | | | 650,225 | |
Redemptions | | (1,855,533 | ) | | | (28,197,343 | ) | | (1,644,391 | ) | | | (22,600,352 | ) |
| | | | | | | | | | | | | | |
Net increase | | 1,064,775 | | | $ | 16,465,154 | | | 1,802,643 | | | $ | 24,849,256 | |
| | | | | | | | | | | | | | |
Class E | | | | | | | | | | | | | | |
Sales | | 719,712 | | | $ | 10,903,913 | | | 719,505 | | | $ | 9,911,834 | |
Reinvestments | | 288,221 | | | | 4,470,312 | | | 63,431 | | | | 857,581 | |
Redemptions | | (1,993,418 | ) | | | (30,369,110 | ) | | (2,480,095 | ) | | | (33,844,385 | ) |
| | | | | | | | | | | | | | |
Net decrease | | (985,485 | ) | | $ | (14,994,885 | ) | | (1,697,159 | ) | | $ | (23,074,970 | ) |
| | | | | | | | | | | | | | |
Increase (decrease) derived from capital share transactions | | | | | $ | (103,575,641 | ) | | | | | $ | 13,117,750 | |
| | | | | | | | | | | | | | |
See accompanying notes to financial statements.
MSF-8
Metropolitan Series Fund, Inc.
MFS Value Portfolio (formerly Harris Oakmark Large Cap Value Portfolio)
Financial Highlights
| | | | | | | | | | | | | | | | | | | |
| | | Class A |
| | | Year ended December 31, |
| | | 2007 | | | 2006 | | | 2005 | | | 2004 | | | 2003 |
Net Asset Value, Beginning of Period | | $ | 15.34 | | | $ | 13.09 | | | $ | 13.37 | | | $ | 12.06 | | | $ | 9.61 |
| | | | | | | | | | | | | | | | | | | |
Income From Investment Operations | | | | | | | | | | | | | | | | | | | |
Net investment income | | | 0.16 | (a) | | | 0.12 | | | | 0.11 | | | | 0.10 | | | | 0.07 |
Net realized and unrealized gain (loss) of investments | | | (0.70 | ) | | | 2.24 | | | | (0.30 | ) | | | 1.27 | | | | 2.38 |
| | | | | | | | | | | | | | | | | | | |
Total from investment operations | | | (0.54 | ) | | | 2.36 | | | | (0.19 | ) | | | 1.37 | | | | 2.45 |
| | | | | | | | | | | | | | | | | | | |
Less Distributions | | | | | | | | | | | | | | | | | | | |
Distributions from net investment income | | | (0.12 | ) | | | (0.11 | ) | | | (0.09 | ) | | | (0.06 | ) | | | 0.00 |
Distributions from net realized capital gains | | | (0.42 | ) | | | 0.00 | | | | 0.00 | | | | 0.00 | | | | 0.00 |
| | | | | | | | | | | | | | | | | | | |
Total distributions | | | (0.54 | ) | | | (0.11 | ) | | | (0.09 | ) | | | (0.06 | ) | | | 0.00 |
| | | | | | | | | | | | | | | | | | | |
Net Asset Value, End of Period | | $ | 14.26 | | | $ | 15.34 | | | $ | 13.09 | | | $ | 13.37 | | | $ | 12.06 |
| | | | | | | | | | | | | | | | | | | |
Total Return (%) | | | (3.8 | ) | | | 18.1 | | | | (1.4 | ) | | | 11.4 | | | | 25.5 |
Ratio of operating expenses to average net assets before expense reductions (%) | | | 0.76 | | | | 0.79 | | | | 0.78 | | | | 0.79 | | | | 0.83 |
Ratio of operating expenses to average net assets after expense reductions (%) (b) | | | 0.76 | | | | 0.79 | | | | 0.78 | | | | 0.78 | | | | 0.81 |
Ratio of operating expenses to average net assets without giving effect to the management fee waiver would have been (%) (c) | | | 0.77 | | | | N/A | | | | N/A | | | | N/A | | | | N/A |
Ratio of net investment income to average net assets (%) | | | 1.03 | | | | 0.93 | | | | 0.86 | | | | 0.80 | | | | 0.70 |
Portfolio turnover rate (%) | | | 16 | | | | 14 | | | | 13 | | | | 16 | | | | 13 |
Net assets, end of period (000) | | $ | 302,335 | | | $ | 428,203 | | | $ | 355,707 | | | $ | 341,632 | | | $ | 296,728 |
| | | | | | | | | | | | | | | | | | | |
| | | Class B |
| | | Year ended December 31, |
| | | 2007 | | | 2006 | | | 2005 | | | 2004 | | | 2003 |
Net Asset Value, Beginning of Period | | $ | 15.26 | | | $ | 13.02 | | | $ | 13.31 | | | $ | 12.01 | | | $ | 9.59 |
| | | | | | | | | | | | | | | | | | | |
Income From Investment Operations | | | | | | | | | | | | | | | | | | | |
Net investment income | | | 0.12 | (a) | | | 0.09 | | | | 0.06 | | | | 0.05 | | | | 0.02 |
Net realized and unrealized gain (loss) of investments | | | (0.69 | ) | | | 2.22 | | | | (0.28 | ) | | | 1.29 | | | | 2.40 |
| | | | | | | | | | | | | | | | | | | |
Total from investment operations | | | (0.57 | ) | | | 2.31 | | | | (0.22 | ) | | | 1.34 | | | | 2.42 |
| | | | | | | | | | | | | | | | | | | |
Less Distributions | | | | | | | | | | | | | | | | | | | |
Distributions from net investment income | | | (0.09 | ) | | | (0.07 | ) | | | (0.07 | ) | | | (0.04 | ) | | | 0.00 |
Distributions from net realized capital gains | | | (0.42 | ) | | | 0.00 | | | | 0.00 | | | | 0.00 | | | | 0.00 |
| | | | | | | | | | | | | | | | | | | |
Total distributions | | | (0.51 | ) | | | (0.07 | ) | | | (0.07 | ) | | | (0.04 | ) | | | 0.00 |
| | | | | | | | | | | | | | | | | | | |
Net Asset Value, End of Period | | $ | 14.18 | | | $ | 15.26 | | | $ | 13.02 | | | $ | 13.31 | | | $ | 12.01 |
| | | | | | | | | | | | | | | | | | | |
Total Return (%) | | | (4.0 | ) | | | 17.8 | | | | (1.7 | ) | | | 11.2 | | | | 25.2 |
Ratio of operating expenses to average net assets before expense reductions (%) | | | 1.01 | | | | 1.04 | | | | 1.03 | | | | 1.04 | | | | 1.08 |
Ratio of operating expenses to average net assets after expense reductions (%) (b) | | | 1.01 | | | | 1.04 | | | | 1.03 | | | | 1.03 | | | | 1.06 |
Ratio of operating expenses to average net assets without giving effect to the management fee waiver would have been (%) (c) | | | 1.02 | | | | N/A | | | | N/A | | | | N/A | | | | N/A |
Ratio of net investment income to average net assets (%) | | | 0.78 | | | | 0.68 | | | | 0.66 | | | | 1.07 | | | | 0.55 |
Portfolio turnover rate (%) | | | 16 | | | | 14 | | | | 13 | | | | 16 | | | | 13 |
Net assets, end of period (000) | | $ | 158,516 | | | $ | 154,330 | | | $ | 108,214 | | | $ | 43,136 | | | $ | 1,138 |
| (a) | Per share amount is based on average shares outstanding during the period. |
| (b) | The Portfolio has entered into arrangements with certain brokers who paid a portion of the Portfolio’s expenses. |
| (c) | See Note 4 in the Notes to Financial Statements. |
See accompanying notes to financial statements.
MSF-9
Metropolitan Series Fund, Inc.
MFS Value Portfolio (formerly Harris Oakmark Large Cap Value Portfolio)
Financial Highlights
| | | | | | | | | | | | | | | | | | | |
| | | Class E |
| | | Year ended December 31, |
| | | 2007 | | | 2006 | | | 2005 | | | 2004 | | | 2003 |
Net Asset Value, Beginning of Period | | $ | 15.28 | | | $ | 13.04 | | | $ | 13.32 | | | $ | 12.02 | | | $ | 9.59 |
| | | | | | | | | | | | | | | | | | | |
Income From Investment Operations | | | | | | | | | | | | | | | | | | | |
Net investment income | | | 0.13 | (a) | | | 0.12 | | | | 0.09 | | | | 0.07 | | | | 0.04 |
Net realized and unrealized gain (loss) of investments | | | (0.69 | ) | | | 2.21 | | | | (0.30 | ) | | | 1.28 | | | | 2.39 |
| | | | | | | | | | | | | | | | | | | |
Total from investment operations | | | (0.56 | ) | | | 2.33 | | | | (0.21 | ) | | | 1.35 | | | | 2.43 |
| | | | | | | | | | | | | | | | | | | |
Less Distributions | | | | | | | | | | | | | | | | | | | |
Distributions from net investment income | | | (0.10 | ) | | | (0.09 | ) | | | (0.07 | ) | | | (0.05 | ) | | | 0.00 |
Distributions from net realized capital gains | | | (0.42 | ) | | | 0.00 | | | | 0.00 | | | | 0.00 | | | | 0.00 |
| | | | | | | | | | | | | | | | | | | |
Total distributions | | | (0.52 | ) | | | (0.09 | ) | | | (0.07 | ) | | | (0.05 | ) | | | 0.00 |
| | | | | | | | | | | | | | | | | | | |
Net Asset Value, End of Period | | $ | 14.20 | | | $ | 15.28 | | | $ | 13.04 | | | $ | 13.32 | | | $ | 12.02 |
| | | | | | | | | | | | | | | | | | | |
Total Return (%) | | | (3.9 | ) | | | 17.9 | | | | (1.5 | ) | | | 11.3 | | | | 25.3 |
Ratio of operating expenses to average net assets before expense reductions (%) | | | 0.91 | | | | 0.94 | | | | 0.93 | | | | 0.94 | | | | 0.98 |
Ratio of operating expenses to average net assets after expense reductions (%) (b) | | | 0.91 | | | | 0.94 | | | | 0.93 | | | | 0.93 | | | | 0.96 |
Ratio of operating expenses to average net assets without giving effect to the management fee waiver would have been (%) (c) | | | 0.92 | | | | N/A | | | | N/A | | | | N/A | | | | N/A |
Ratio of net investment income to average net assets (%) | | | 0.87 | | | | 0.77 | | | | 0.70 | | | | 0.68 | | | | 0.60 |
Portfolio turnover rate (%) | | | 16 | | | | 14 | | | | 13 | | | | 16 | | | | 13 |
Net assets, end of period (000) | | $ | 111,919 | | | $ | 135,484 | | | $ | 137,739 | | | $ | 147,376 | | | $ | 99,196 |
| (a) | Per share amount is based on average shares outstanding during the period. |
| (b) | The Portfolio has entered into arrangements with certain brokers who paid a portion of the Portfolio’s expenses. |
| (c) | See Note 4 in the Notes to Financial Statements. |
See accompanying notes to financial statements.
MSF-10
Metropolitan Series Fund, Inc.
MFS Value Portfolio (formerly Harris Oakmark Large Cap Value Portfolio)
Notes to Financial Statements—December 31, 2007
Metropolitan Series Fund, Inc. (the “Fund”) is organized as a corporation under the laws of Maryland pursuant to Articles of Incorporation filed on November 23, 1982, as amended, and registered under the Investment Company Act of 1940, as amended (the “1940 Act”), as an open-end investment company. The Fund is a “series” type of mutual fund, which issues separate series of stock. Each series represents an interest in a separate portfolio of Fund investments. The MFS Value Portfolio (the “Portfolio”) is a diversified series of the Fund. Shares in the Fund are not offered directly to the general public and are currently available only to separate accounts established by Metropolitan Life Insurance Company (“MetLife”), New England Life Insurance Company, General American Life Insurance Company (“General American”), The MetLife Investors Group of Insurance Companies, MetLife Insurance Company of Connecticut and other affiliated insurance companies (collectively, the “Insurance Companies”), as an investment vehicle for variable life insurance, group annuity or variable annuity products, although the Portfolio is not available to all such separate accounts. The Portfolio’s shares may be divided into different classes. Currently, the classes being offered by the Portfolio are named Class A, Class B and Class E. The classes of the Portfolio’s shares are identical, except that certain additional charges (Rule 12b-1 fees) are made against Class B and Class E shares. Investment income, realized and unrealized capital gains and losses, the common expenses of the Portfolio and certain Portfolio-level expense reductions, if any, are allocated on a pro rata basis to each class based on the relative net assets of each class to the total net assets of the Portfolio.
| 2. | SIGNIFICANT ACCOUNTING POLICIES: |
The preparation of financial statements in conformity with accounting principles generally accepted in the United States of America (“GAAP”) requires management to make estimates and assumptions that affect the reported amounts of assets and liabilities and disclosure of contingent assets and liabilities as of the date of the financial statements and the reported amounts of income and expenses during the reporting period. Actual results could differ from those estimates.
The following is a summary of significant accounting policies consistently followed by the Portfolio in the preparation of its financial statements. The policies are in conformity with GAAP.
Investment Valuation:
Debt securities (other than short term obligations with a remaining maturity of sixty days or less) are valued by independent pricing services selected by the relevant subadviser pursuant to authorization of the Board of Directors of the Fund (the “Board” or “Directors”). Short term obligations with a remaining maturity of sixty days or less are valued at amortized cost which approximates fair market value.
Equity securities traded on a national securities exchange or exchanges are valued at their last sale price on the principal trading market. Equity securities traded on the NASDAQ National Market System are valued at the NASDAQ Official Closing Price (the “NOCP”). The NOCP is the last sale price if it falls between the spread of the last reported bid and asked prices. If the last reported bid and asked prices are above the last reported sale price, the NOCP will be the last reported bid price. If the last reported bid and asked prices are below the last reported sale price, the NOCP will be the last reported asked price. Equity securities traded on a national securities exchange or exchanges or on the NASDAQ National Market System for which there is no reported sale during the day are valued at the last reported bid price. A security that is listed or traded on more than one exchange is valued at the quotation on the exchange determined to be the primary market for that security by the Board or its delegates. If no closing price is available, then such securities are valued by using the last reported bid price. Equity securities traded over-the-counter are valued at the last reported sales price.
If no current market value quotation is readily available or reliable for a portfolio security, fair value will be determined in accordance with procedures established by and under the general supervision of the Board. When the Portfolio uses fair value pricing, it may take into account any factors it deems appropriate. The value of securities used by the Portfolio to calculate its net asset value may differ from quoted or published prices for the same securities. Fair value pricing involves subjective judgments and the fair value determined for a security may be materially different than the value that could be realized upon the sale of that security.
The Portfolio expects to use fair value pricing for securities primarily traded on U.S. exchanges only under very limited circumstances. For example, the Portfolio may use fair value pricing if the exchange on which a security is traded closes early or trading in the security is suspended.
MSF-11
Metropolitan Series Fund, Inc.
MFS Value Portfolio (formerly Harris Oakmark Large Cap Value Portfolio)
Notes to Financial Statements—December 31, 2007—(Continued)
Securities traded primarily on an exchange outside of the United States which closes before the close of the New York Stock Exchange will be valued at the last sales price on that non-U.S. exchange. Securities traded primarily on an exchange outside of the United States for which there is no reported sale during the day are valued at the mean between the last reported bid and asked prices. However, because most foreign markets close well before the Portfolio values its securities (typically at 4 p.m. Eastern Time), the earlier close of these foreign markets gives rise to the possibility that significant events, including broad market moves, may have occurred after these foreign markets close but before the Portfolio values its securities. To account for this, the Portfolio may frequently value many of its foreign equity securities using fair value prices based on third party vendor modeling tools.
Forward foreign currency exchange contracts are valued based on the mean between closing bid and asked prices of the forward currency contract rates in the London foreign exchange markets on a daily basis as provided by a reliable bank or dealer.
Options, whether on securities, indices, futures contracts, or otherwise, are valued at the last sales price available as of the close of business on the day of valuation or, if there is no such sale price available, at the mean between the bid and asked prices. Options on currencies are valued at the spot price each day.
The value of futures contracts will be the sum of the margin deposit plus or minus the difference between the value of the futures contract on each day the net asset value is calculated and the value on the date the futures contract originated, value being that established on a recognized commodity exchange, or by reference to other customary sources, with gain or loss being realized when the futures contract closes or expires.
Subject to the Board’s oversight, the Board has delegated day-to-day responsibility for valuing Portfolio assets to the subadviser of the Portfolio, who values such assets as described above and operates under procedures approved by the Board.
Investment Transactions and Related Investment Income:
Portfolio security transactions are recorded on the trade date. Dividend income is recorded on the ex-dividend date or, for certain foreign securities, when notified. Interest income, which includes amortization of premium and accretion of discount on debt securities, is recorded on the accrual basis. Realized gains and losses on investments and unrealized appreciation and depreciation are determined on the identified cost basis, which is the same basis used for federal income tax purposes.
Repurchase Agreements:
The Portfolio, through the custodian or a subcustodian, receives delivery of the underlying securities collateralizing repurchase agreements. The Portfolio requires the custodian to take possession, to have legally segregated in the Federal Reserve Book Entry System, or to have segregated within the custodian’s vault, all securities held as collateral for repurchase agreements. It is the Portfolio’s policy that the market value of the collateral be at least equal to 100% of the repurchase price in the case of a repurchase agreement of one-day duration and 102% on all other repurchase agreements. The Portfolio’s subadviser is responsible for determining that the value of the collateral is at all times at least equal to the repurchase price. In connection with transactions in repurchase agreements, if the seller defaults and the value of the collateral declines or if the seller enters an insolvency proceeding, realization of the collateral by the Portfolio may be delayed, limited or wholly denied.
Foreign Currency Translation:
The books and records of the Portfolio are maintained in U.S. dollars. The values of securities, currencies and other assets and liabilities denominated in currencies other than U.S. dollars are translated into U.S. dollars based upon foreign exchange rates prevailing at the end of the period. Purchases and sales of investment securities, income and expenses are translated on the respective dates of such transactions. Since the values of investment securities are presented at the foreign exchange rates prevailing at the end of the period, it is not practical to isolate that portion of the results of operations arising from changes in exchange rates from that portion of the results of operations reflecting fluctuations arising from changes in market prices of the investment securities. Such fluctuations are included in the net realized and unrealized gain or loss on investments.
Net realized foreign exchange gains or losses arise from sales of foreign currency, currency gains or losses realized between the trade and settlement dates on securities transactions, and the difference between the amounts of dividends, interest, and foreign withholding taxes recorded by the Portfolio and the U.S. dollar equivalent of the amounts actually received or paid by the Portfolio. Net unrealized foreign exchange gains and losses arise from changes in the value of assets and liabilities, other than investment securities, resulting from changes in the exchange rate.
MSF-12
Metropolitan Series Fund, Inc.
MFS Value Portfolio (formerly Harris Oakmark Large Cap Value Portfolio)
Notes to Financial Statements—December 31, 2007—(Continued)
Forward Foreign Currency Exchange Contracts:
The Portfolio may enter into forward foreign currency exchange contracts primarily to hedge against foreign currency exchange rate risks on its non-U.S. dollar denominated investment securities. When entering into a forward currency contract, the Portfolio agrees to receive or deliver a fixed quantity of foreign currency for an agreed-upon price on an agreed future date. These contracts are valued daily and the Portfolio’s net equity therein, representing unrealized gain or loss on the contracts as measured by the difference between the foreign exchange rates at the dates of entry into the contracts and the forward rates at the settlement date, is included in the Statement of Assets and Liabilities. Realized and unrealized gains and losses are included in the Statement of Operations. These instruments involve market and/or credit risk in excess of the amount recognized in the Statement of Assets and Liabilities. Risks arise from the possible inability of counterparties to meet the terms of their contracts and from movement in currency and securities values and interest rates.
Futures Contracts:
The Portfolio may buy and sell futures contracts (on recognized exchanges) as a hedge or to enhance return. Futures contracts are agreements to buy or sell a security, or deliver a final cash settlement price in connection with an index, interest rate, currency, or other contracts not calling for physical delivery, for a set price in the future. The Portfolio must post an amount equal to a portion of the total market value of the futures contract as futures variation margin, which is returned when the Portfolio’s obligations under the contract have been satisfied. From time to time thereafter, the Portfolio may have to post variation margin to maintain this amount as the market value of the contract fluctuates. Risks of entering into futures contracts (and related options) include the possibility that there may be an illiquid market and that a change in the value of the contract or option may not correlate with changes in the value of the underlying securities.
Options:
The Portfolio may use options to hedge against changes in values of securities the Portfolio owns or expects to purchase. Writing puts or buying calls tends to increase the Portfolio’s exposure to the underlying instrument and writing calls or buying puts tends to decrease the Portfolio’s exposure to the underlying instrument, and can be used to hedge other Portfolio investments. For options purchased to hedge the Portfolio’s investments, the potential risk to the Portfolio is that the change in value of options contracts may not correspond to the change in value of the hedged instruments. In addition, losses may arise from changes in the value of the underlying instruments, if there is an illiquid secondary market, or if the counterparty is unable to perform. The maximum loss for purchased options is limited to the premium initially paid for the option. For options written by the Portfolio, the maximum loss is not limited to the premium initially received for the option.
The main risk associated with purchasing an option is that the option expires without being exercised. In this case, the option expires worthless and the premium paid for the option is considered the loss. The risk associated with writing a call option is that the Portfolio may forgo the opportunity for a profit if the market value of the underlying position increases and the option is exercised. The risk in writing a put option is that the Portfolio may incur a loss if the market value of the underlying position decreases and the option is exercised. In addition, the Portfolio risks not being able to enter into a closing transaction for the written option as the result of an illiquid market.
“When-Issued” Securities:
Purchasing securities “when-issued” is a forward commitment by the Portfolio to buy a security. The estimated amount of the Portfolio’s payment obligation and the security’s interest rate are determined when the commitment is made, even though no interest accrues until the security is issued, which is generally 15 to 120 days later. The Portfolio will segregate liquid assets with its custodian sufficient at all times to satisfy these commitments. If the value of the security is less when delivered than when the commitment was made, the Portfolio will suffer a loss.
Federal Income Taxes:
It is the Portfolio’s policy to comply with the requirements of the Internal Revenue Code of 1986, as amended, and regulations thereunder, applicable to regulated investment companies and to distribute all of its taxable income to shareholders. Therefore, no federal income tax provision is required.
As of December 31, 2007, the Portfolio had no capital loss carryovers.
MSF-13
Metropolitan Series Fund, Inc.
MFS Value Portfolio (formerly Harris Oakmark Large Cap Value Portfolio)
Notes to Financial Statements—December 31, 2007—(Continued)
The tax character of distributions paid for the periods ended December 31, 2007 and 2006 was as follows:
| | | | | | | | | | | | | | | | | | | | | |
| Ordinary Income | | Long Term Gain | | Return of Capital | | Total |
2007 | | 2006 | | 2007 | | 2006 | | 2007 | | 2006 | | 2007 | | 2006 |
| $5,363,997 | | $ | 4,416,456 | | $ | 20,647,327 | | $ | — | | $ | — | | $ | — | | $ | 26,011,324 | | $ | 4,416,456 |
As of December 31, 2007, the components of distributable earnings (accumulated losses) on a federal income tax basis were as follows:
| | | | | | | | | | | | |
Undistributed
Ordinary
Income | | Undistributed
Long Term
Gain | | Unrealized
Appreciation | | Loss
Carryforwards | | Total |
| $7,024,384 | | $ | 58,742,888 | | $ | 75,058,801 | | $ | — | | $ | 140,826,073 |
Dividends and Distributions to Shareholders:
The Portfolio records dividends and distributions on the ex-dividend date. Net realized gains from security transactions (if any) are generally distributed annually to shareholders. The timing and characterization of certain income and capital gains distributions are determined in accordance with federal tax regulations that may differ from GAAP. Permanent book and tax basis differences relating to shareholder distributions will result in reclassification between under/over distributed net investment income, accumulated net realized gains/losses and paid in capital.
Expense Reductions:
Certain Portfolio trades are directed to brokers who paid a portion of the Portfolio’s expenses. Amounts paid for the Portfolio are shown as expense reductions in the Statement of Operations.
| 3. | INVESTMENT TRANSACTIONS: |
For the year ended December 31, 2007, purchases and sales of securities (excluding short term investments) for the Portfolio were as follows:
| | | | | | | | | |
| Purchases | | Sales |
U.S. Government | | Other | | U.S. Government | | Other |
| $0 | | $ | 101,697,547 | | $ | 0 | | $ | 197,923,364 |
| 4. | INVESTMENT MANAGEMENT FEES AND OTHER TRANSACTIONS WITH AFFILIATES: |
Investment Management Agreement:
MetLife Advisers, LLC (“MetLife Advisers”) is the investment adviser to the Portfolio. The Fund has entered into an investment management agreement with MetLife Advisers with respect to the Portfolio. For providing investment management services to the Portfolio, MetLife Advisers receives monthly compensation at the following annual rates:
| | | | | | | |
| | | Management
Fees earned by
MetLife Advisers
for the year ended
December 31, 2007 | | Annual
percentage
rates paid to
MetLife Advisers | | Based on Portfolios
average daily net asset levels |
| | $ | 4,792,627 | | 0.750% | | Of the first $250 million |
| | | | | 0.700% | | Of the next $2.25 billion |
| | | | | 0.675% | | Of the next $2.5 billion |
| | | | | 0.650% | | On amounts in excess of $5 billion |
Certain officers and directors of the Fund may also be officers of MetLife Advisers; however, such officers and directors receive no compensation from the Fund.
Management Fee Waivers:
Effective January 1, 2007 to January 6, 2008, a new subadvisory fee schedule was adopted for the Portfolio, under which the subadvisory fee for the Portfolio is calculated based on the combined average daily net assets for the Portfolio and the Harris
MSF-14
Metropolitan Series Fund, Inc.
MFS Value Portfolio (formerly Harris Oakmark Large Cap Value Portfolio)
Notes to Financial Statements—December 31, 2007—(Continued)
Oakmark Focused Value Portfolio (collectively, the “Harris Portfolios”). In connection with this change in the subadvisory fee schedule, MetLife Advisers agreed, pursuant to an expense agreement effective January 1, 2007 to January 6, 2008, to reduce its advisory fees set out above under “Investment Management Agreement” for each class of the Portfolio by the following amount: the difference between (i) the subadvisory fee that MetLife Advisers actually pays Harris Associates, L.P. with respect to such class of the Portfolio; and (ii) the subadvisory fee that MetLife Advisers would pay Harris Associates, L.P. with respect to such class of the Portfolio after applying the new subadvisory fee schedule for the Portfolio that took effect January 1, 2007 but without combining the assets of the Harris Portfolios for purposes of calculating such fee. This combined fee schedule and corresponding fee waiver were discontinued effective January 7, 2008.
Amounts waived for the year ended December 31, 2007 are shown as management fee waivers in the Statement of Operations.
Service and Distribution Fees:
The Fund has adopted a Distribution and Service Plan under Rule 12b-1 of the 1940 Act for the Portfolio’s Class B and E shares. Under the Distribution and Service Plan, the Class B and E shares of the Portfolio pay a fee to compensate the Insurance Companies (or their affiliates) and other broker-dealers and financial intermediaries involved in the offer and sale of Portfolio shares for promoting or selling and servicing, the Class B and E shares. The fees under the Distribution and Service Plan for each class of the Portfolio’s shares are calculated as a percentage of the Portfolio’s average daily net assets that are attributable to that Class. Currently, the fee is 0.25% per year for Class B shares and 0.15% per year for Class E shares. Amounts paid by the Portfolio for the year ended December 31, 2007 are shown as Service and Distribution fees in the Statement of Operations.
As previously reported, in May 2004, General American received a Wells Notice stating that the SEC staff was considering recommending that the SEC bring a civil action alleging violations of the U.S. securities laws against General American with respect to market timing and late trading in a limited number of privately-placed variable insurance contracts that were sold through General American. General American responded to the SEC staff and cooperated with the investigation. On August 9, 2007, the SEC announced that it had settled an enforcement action regarding late trading against General American with, among other things, General American agreeing to pay a civil penalty and to comply with certain undertakings. General American consented to the SEC’s order without admitting or denying the findings. MetLife Advisers has also advised the Fund’s Board of Directors that, while certain exceptions to the Fund’s policies have been noted, no situations have been identified that would have a material impact on the financial position of the Fund.
| 6. | RECENT ACCOUNTING PRONOUNCEMENTS: |
Effective June 29, 2007, the Fund implemented Financial Accounting Standards Board (“FASB”) Interpretation No. 48, “Accounting for Uncertainty in Income Taxes—an interpretation of FASB Statement No. 109” (“FIN 48”). FIN 48 prescribes the minimum recognition threshold a tax position must meet in connection with accounting for uncertainties in income tax positions taken or expected to be taken by an entity, including investment companies, before being measured and recognized in the financial statements. Management has evaluated the application of FIN 48 to the Fund, and has determined that the adoption of FIN 48 does not have a material impact on the Fund’s financial statements. The Fund files U.S. tax returns. No income tax returns are currently under examination. The statute of limitations on the Fund’s tax returns remains open for the years ended December 31, 2004 through December 31, 2006.
In September 2006, Statement of Financial Accounting Standards No. 157, Fair Value Measurements (SFAS 157) was issued and is effective for fiscal years beginning after November 15, 2007. SFAS 157 defines fair value, establishes a framework for measuring fair value and expands disclosures about fair value measurements. Management is currently evaluating the impact the adoption of SFAS 157 will have on the Portfolio’s financial statement disclosures.
On November 15, 2007, the Board of Directors of the Fund approved a new Subadvisory Agreement (the “Agreement”) with respect to the Portfolio between MetLife Advisers and Massachusetts Financial Services Company (“MFS”). The Agreement was not subject to shareholder approval and became effective January 7, 2008. The Advisory Agreement between the Fund, with respect to the Portfolio, and MetLife Advisers will remain in effect and fees payable thereunder to MetLife Advisers will not
MSF-15
Metropolitan Series Fund, Inc.
MFS Value Portfolio (formerly Harris Oakmark Large Cap Value Portfolio)
Notes to Financial Statements—December 31, 2007—(Continued)
change. Under the Agreement, MFS became subadviser to the Portfolio, succeeding Harris Associates, L.P., and became responsible for the day-to-day management of the Portfolio’s investment operations under the oversight of MetLife Advisers and the Board. The name of the Harris Oakmark Large Cap Value Portfolio was changed to the MFS Value Portfolio at the time the Agreement took effect.
On November 15, 2007, the Board approved the acquisition of the Met Investors Series Trust MFS Value Portfolio (“MIST MFS Value Portfolio”) by the Portfolio, subject to the approval of shareholders of MIST MFS Value Portfolio. On or about February 28, 2008, the shareholders of MIST MFS Value Portfolio will consider the approval of a proposed Agreement and Plan of Reorganization providing for the acquisition of all the assets of MIST MFS Value Portfolio by the Portfolio in exchange for shares of the Portfolio and the assumption by the Portfolio of the liabilities of MIST MFS Value Portfolio. If approved by shareholders, the reorganization will close on or about April 28, 2008.
MSF-16
Metropolitan Series Fund, Inc.
MFS Value Portfolio (formerly Harris Oakmark Large Cap Value Portfolio)
Report of Independent Registered Public Accounting Firm
To the Shareholders and Board of Directors of the Metropolitan Series Fund, Inc.:
We have audited the accompanying statement of assets and liabilities, including the schedule of investments, of the MFS Value Portfolio (formerly Harris Oakmark Large Cap Value Portfolio), one of the portfolios constituting the Metropolitan Series Fund, Inc. (the “Fund”) as of December 31, 2007, and the related statement of operations for the year then ended, the statements of changes in net assets for each of the two years in the period then ended, and the financial highlights for each of the five years in the period then ended. These financial statements and financial highlights are the responsibility of the Fund’s management. Our responsibility is to express an opinion on these financial statements and financial highlights based on our audits.
We conducted our audits in accordance with the standards of the Public Company Accounting Oversight Board (United States). Those standards require that we plan and perform the audit to obtain reasonable assurance about whether the financial statements and financial highlights are free of material misstatement. The Fund is not required to have, nor were we engaged to perform, an audit of its internal control over financial reporting. Our audits included consideration of internal control over financial reporting as a basis for designing audit procedures that are appropriate in the circumstances, but not for the purpose of expressing an opinion on the effectiveness of the Fund’s internal control over financial reporting. Accordingly, we express no such opinion. An audit also includes examining, on a test basis, evidence supporting the amounts and disclosures in the financial statements, assessing the accounting principles used and significant estimates made by management, as well as evaluating the overall financial statement presentation. Our procedures included confirmation of securities owned as of December 31, 2007, by correspondence with the custodian and brokers; where replies were not received from brokers, we performed other auditing procedures. We believe that our audits provide a reasonable basis for our opinion.
In our opinion, the financial statements and financial highlights referred to above present fairly, in all material respects, the financial position of the MFS Value Portfolio (formerly Harris Oakmark Large Cap Value Portfolio) of the Metropolitan Series Fund, Inc. as of December 31, 2007, the results of its operations for the year then ended, the changes in its net assets for each of the two years in the period then ended, and the financial highlights for each of the five years in the period then ended, in conformity with accounting principles generally accepted in the United States of America.
Deloitte & Touche LLP
Boston, Massachusetts
February 21, 2008
MSF-17
Metropolitan Series Fund, Inc.
Directors and Officers
The Fund’s Directors review actions of the Fund’s investment adviser and subadvisers, and decide upon matters of general policy. The Fund’s officers supervise the daily business operations of the Fund. The Board of Directors and the Fund’s officers are listed below. Each Director is responsible for overseeing all 36 Portfolios of the Fund. There is no limit to the term a Director may serve. Directors serve until their resignation, retirement or removal in accordance with the Fund’s organizational documents and policies adopted by the Board from time to time. Officers hold office at the pleasure of the Board or until the election or appointment and the qualification of a successor. The address of the directors and officers is c/o Metropolitan Series Fund, Inc., 501 Boylston Street, Boston, MA 02116.
Interested Directors(1)
Each Director below is an “interested person” (as defined by the 1940 Act) with respect to the Fund in that Ms. Forget is an employee of MetLife and Mr. Typermass is a former employee of MetLife and owns securities issued by MetLife, Inc., the ultimate parent company of MetLife Advisers.
| | | | | | | | |
Name, Address and Age | | Current
position(s)
with Fund | | Position(s)
held since | | Principal occupations
over past five years, including other directorships(2) | | Number of
Portfolios in
Fund Complex
Overseen by
Director(3) |
Elizabeth M. Forget Age: 41 | | Director, Chairman of the Board, President and Chief Executive Officer | | 2006 | | Senior Vice President (since 2007), MetLife, Inc.; President, Met Investors Advisory, LLC (“MIA”); Trustee and President, Met Investors Series Trust (“MIST”); Executive Vice President, MetLife Investors Group, Inc.; President (since 2006), MetLife Advisers. | | 81 |
| | | | |
Arthur G. Typermass Age: 70 | | Director | | 1998 | | Formerly, Senior Vice President and Treasurer, MetLife. | | 37 |
Non-Interested Directors(1)
Each Director below is not an “interested person” (as defined by the 1940 Act) with respect to the Fund (collectively, the “Independent Directors”).
| | | | | | | | |
Name, Address and Age | | Current
position(s)
with Fund | | Position(s)
held since | | Principal occupations
over past five years, including other directorships(2) | | Number of
Portfolios in
Fund Complex
Overseen by
Director(3) |
Steve A. Garban† Age: 70 | | Director | | 1985 | | Formerly, Chief Financial Officer, Senior Vice President Finance and Operations and Treasurer (Emeritus), The Pennsylvania State University. | | 37 |
| | | | |
Linda B. Strumpf Age: 60 | | Director | | 2000 | | Vice President and Chief Investment Officer, Ford Foundation. | | 37 |
| | | | |
Michael S. Scott Morton† Age: 70 | | Director | | 1993 | | Jay W. Forrester Professor of Management (Emeritus) at Sloan School of Management, MIT. | | 37 |
| | | | |
H. Jesse Arnelle Age: 74 | | Director | | 2001 | | Formerly, Counsel, Womble Carlyle Sandrie & Rice; Director, Textron Inc. (global multi-industry company)*; formerly, Director, Gannet Co. Inc. (diversified news and information company)*; formerly, Director, Eastman Chemical Company (global chemical company)*; formerly, Director, Waste Management, Inc.*; formerly, Director, Armstrong Holdings Inc. (parent company of floor and ceiling products business)*; formerly, Director, FPL Group Inc. (public utility holding company)*; Director, URS Corporation (engineering design services firm)*. | | 37 |
| | | | |
Nancy Hawthorne Age: 56 | | Director | | 2003 | | Director, Avid Technologies (computer software company)*; formerly, Chairman of the Board of Avid Technologies; formerly, Board of Advisors, L. Knife & Sons, Inc. (beverage distributor); Chief Executive Officer, Clerestory LLC (corporate financial advisor); formerly, Trustee, New England Zenith Fund (“Zenith Fund”)**; formerly, Chief Executive Officer and Managing Partner, Hawthorne, Krauss and Associates (corporate financial advisor); formerly, Chief Financial Officer and Executive Vice President, Continental Cablevision, subsequently renamed MediaOne (cable television company); formerly, Director, Life F/X, Inc.; formerly, Chairman of the Board, WorldClinic (distance medicine company); formerly, Director, Perini Corporation (construction company)*; formerly, Director, CGU (property and casualty insurance company); formerly, Director, Beacon Power Corporation (energy company )*. | | 37 |
MSF-18
Metropolitan Series Fund, Inc.
Directors and Officers—(Continued)
| | | | | | | | |
Name, Address and Age | | Current
position(s)
with Fund | | Position(s)
held since | | Principal occupations
over past five years, including other directorships(2) | | Number of
Portfolios in
Fund Complex
Overseen by
Director(3) |
John T. Ludes Age: 71 | | Director | | 2003 | | President, LFP Properties (consulting firm); Formerly, Trustee, Zenith Fund**; formerly, Vice Chairman, President and Chief Operating Officer, Fortune Brands/American Brands (global conglomerate); formerly, President and CEO, Acushnet Company (athletic equipment company). | | 37 |
Officers(1)
| | | | | | | | |
Name and address | | Age | | Current
position(s)
with Fund | | Position(s)
held since | | Principal occupations over past five years(2) |
| Jeffrey P. Halperin | | 40 | | Chief Compliance Officer | | 2006 | | Vice President (since 2006), Corporate Ethics and Compliance Department, MetLife, Inc.; Chief Compliance Officer (since 2006), MetLife Advisers, MIA and MIST. |
| | | | |
| John F. Guthrie, Jr. | | 64 | | Senior Vice President | | 2002 | | Manager and Senior Vice President, MetLife Advisers; Vice President, MetLife; Vice President (since 2003), MetLife Group, Inc.; Vice President, NELICO; Vice President (since 2005), MIA; formerly, Senior Vice President, Zenith Fund**. |
| | | | |
| Alan C. Leland | | 55 | | Senior Vice President | | 2005 | | Treasurer and Chief Financial Officer, MetLife Advisers, LLC; Treasurer (since 2005), Met Investors Advisory, LLC; Vice President (since 2004), MIA; Vice President (since 2003), MetLife Group, Inc.; Vice President, MetLife; Senior Vice President, NELICO |
| | | | |
| Peter Duffy | | 52 | | Vice President and Treasurer | | 2000 | | Senior Vice President, MetLife Advisers (since 1998); Second Vice President (since 2003), NELICO; Vice President, MetLife (since 2004); Vice President (since 2004), MetLife Group, Inc.; formerly, Vice President and Treasurer, Zenith Fund**. |
| | | | |
| Thomas M. Lenz | | 49 | | Vice President and Secretary | | 2002 | | General Counsel and Secretary, MetLife Advisers; Assistant General Counsel, MetLife; formerly, Vice President and Secretary, Zenith Fund**. |
| * | Indicates a directorship with a registered investment company or a company subject to the reporting requirements of the Securities Exchange Act of 1934, as amended. |
| ** | The Zenith Fund deregistered with the Securities and Exchange Commission (“SEC”) in 2004. |
| (†) | Served as a trustee, director and/or officer of one or more of the following companies, each of which had a direct or indirect advisory relationship with MetLife Advisers or its affiliates prior to January 31, 2005: State Street Research Financial Trust, State Street Research Income Trust, State Street Research Money Market Trust, State Street Research Institutional Funds, State Street Research Capital Trust, State Street Research Master Investment Trust, State Street Research Equity Trust, State Street Research Securities Trust and State Street Research Exchange Trust (collectively, the “State Street Research Funds”). |
| (1) | Each Director of the Fund also serves as trustee of Metropolitan Series Fund II (“Met Series Fund II”), a registered investment company advised by MetLife Advisers. Each officer of the Fund serves in the same position with Met Series Fund II, which consists of one portfolio. |
| (2) | Previous positions during the past five years with the Fund, MIST, MetLife, MetLife Advisers, MIA, Zenith Fund, NELICO or New England Securities Corporation are omitted if not materially different. |
| (3) | The Fund Complex includes the Fund (36 portfolios), Met Series Fund II (1 portfolio) and MIST (44 portfolios) |
MSF-19
Metropolitan Series Fund, Inc.
MFS Value Portfolio (formerly Harris Oakmark Large Cap Value Portfolio)
Board Approval of Advisory and Subadvisory Agreements
The Fund’s Contract Review Committees of the Board of Directors (the “Board”) typically meet in early fall to review the Portfolios’ advisory agreements (the “Advisory Agreements”) and subadvisory agreements (collectively, the “Subadvisory Agreements,” and, together with the Advisory Agreements, the “Agreements”) and determine whether to recommend that the full Board approve the continuation of the Agreements for an additional one-year period. (Following the initial approval of an Agreement for a new Portfolio or with a new adviser or subadviser, such annual reviews are not required until 2 years following the execution of such Agreement.) After each Committee has made its recommendations, the full Board, including the Independent Directors, determines whether to approve the continuation of each of the Agreements. In addition, the Board, including the Independent Directors, considers matters bearing on the Agreements at most of its other meetings throughout the year and regularly interviews various individuals at MetLife Advisers responsible for the management of the Portfolios. The Directors also interview selected investment managers and other professionals at the subadvisers at various times throughout the year.
The Directors receive all materials that they or MetLife Advisers, the Fund’s investment adviser, and the subadvisers believe to be reasonably necessary for the Directors to evaluate the Agreements and determine whether to approve the continuation of the Agreements. These materials generally include, among other items, (i) information on the investment performance of the Portfolios and the performance of peer groups of funds and the Portfolios’ performance benchmarks, (ii) information on the Portfolios’ advisory and subadvisory fees and other expenses, including information comparing the Portfolios’ expenses to those of peer groups of funds and information about any applicable expense caps and fee “breakpoints,” (iii) sales and redemption data, (iv) information related to the profitability of the Agreements to MetLife Advisers and the subadvisers, and potential “fall-out” or ancillary benefits that MetLife Advisers, the subadvisers or their affiliates may receive as a result of their relationships with the Fund and (v) information obtained through the subadvisers’ responses to certain requests from MetLife Advisers and the Directors and MetLife Advisers’ responses to requests from the Directors. The Directors may also consider other information such as (vi) MetLife Advisers’ and the subadvisers’ financial results and condition, (vii) each Portfolio’s investment objectives and strategies and the size, education and experience of the investment staffs of MetLife Advisers and the relevant subadvisers and their use of technology and external research, (viii) the allocation of the Portfolios’ brokerage, if any, including allocations to brokers affiliated with the subadvisers and the use of “soft” commission dollars to pay Portfolio expenses and to pay for research and other similar services, (ix) the resources devoted to, and the record of compliance with, the Portfolios’ investment policies and restrictions, policies on personal securities transactions and other compliance policies, (x) the responses of MetLife Advisers, the subadvisers and/or their affiliates to certain legal and regulatory proceedings and (xi) the economic outlook generally and for the mutual fund industry in particular. Throughout the process, the Directors have the opportunity to ask questions of and request additional materials from MetLife Advisers and the subadvisers.
Following meetings of each Contract Review Committee on September 12, 2007, the Board, at its November 15, 2007 meeting, approved the continuation through December 31, 2008 of the Advisory Agreements for each Portfolio of the Fund and the Subadvisory Agreements for each Portfolio of the Fund, other than the MFS Value Portfolio (formerly known as the Harris Oakmark Large Cap Value Portfolio). The Agreements approved for continuation are referred to below as the “Continued Agreements.”
In considering whether to approve the continuation of the Continued Agreements, the Directors, including the Independent Directors, did not identify any single factor as determinative, and each weighed the various factors as he or she deemed appropriate. The Directors considered the following matters in connection with their approval of the Continued Agreements:
The nature, extent and quality of the services provided to the relevant Portfolios under the Continued Agreements. The Directors considered the nature, extent and quality of the services provided by MetLife Advisers, the relevant subadvisers (if any) and their affiliates (each, an “Adviser,” and, collectively, the “Advisers”) to the relevant Portfolios pursuant to the Continued Agreements and the resources dedicated to these Portfolios by the Advisers. In particular, the Directors considered the Advisers’ abilities to attract and retain highly qualified investment professionals. With respect to MetLife Advisers, the Directors considered that MetLife Advisers is (i) ultimately responsible for the performance of such Portfolios; (ii) ultimately responsible for the establishment of the investment strategies of each such Portfolio, primarily through its recommendations to the Board regarding the hiring and selection of subadvisers; (iii) responsible for the hiring and selection, subject to Board approval, of subadvisers; and (iv) responsible for maintaining a program of Subadviser oversight reasonably designed to ensure that the subadvisers have reasonable compliance policies and procedures in place. The Directors also considered that MetLife Advisers provides a full range of day-to-day administrative services for the Portfolios involving all aspects of such Portfolios’ day-to-day operations (other than portfolio management). After reviewing these and related factors, the Directors concluded, within the context of their overall conclusions regarding each of the Continued Agreements, that the nature, extent and quality of services provided supported the renewal of these Agreements.
Investment performance of the relevant Portfolios. The Directors reviewed information about the performance of the relevant Portfolios over various time periods, including information prepared by an independent third party that compared the performance of
MSF-20
Metropolitan Series Fund, Inc.
MFS Value Portfolio (formerly Harris Oakmark Large Cap Value Portfolio)
Board Approval of Advisory and Subadvisory Agreements—(Continued)
the Portfolios to the performance of peer groups of funds and performance benchmarks. The Directors also reviewed a description of the third party’s methodology for identifying a Portfolio’s peer group(s) for purposes of performance and expense comparisons.
In the case of each relevant Portfolio that had performance that lagged its peer group(s) for certain periods, the Directors concluded that other factors relevant to performance were sufficient, in light of other considerations, to warrant renewal of the Continued Agreements relating to such Portfolio. These factors varied from Portfolio to Portfolio, but included one or more of the following: (i) that such Portfolio’s performance, although lagging in certain recent periods, was stronger over the longer term; (ii) that the underperformance was attributable, to a significant extent, to investment decisions that were reasonable and consistent with the Portfolio’s investment objective(s) and policies and that the Portfolio was performing within the range of reasonable expectations, given market conditions and the Portfolio’s investment objective(s) and policies; (iii) that the Portfolio’s performance was competitive when compared to other relevant performance benchmarks or peer groups; and (iv) that MetLife Advisers and/or the relevant subadviser (if any) had taken or was taking steps designed to help improve the Portfolio’s investment performance.
The Directors also considered the investment performance of the Advisers and their reputations generally, the historical responsiveness of the Advisers to Director concerns about performance and the willingness of the Advisers to take steps intended to improve performance.
After reviewing these and related factors, the Directors concluded, within the context of their overall conclusions regarding each of the Continued Agreements, that the investment performance of each relevant Portfolio and Adviser was sufficient, in light of other considerations, to warrant the renewal of the Continued Agreements.
The costs of the services to be provided and profits to be realized by the Advisers and their affiliates from their relationships with the Portfolios. The Directors considered the fees charged by MetLife Advisers to the Portfolios for advisory services and, with respect to the subadvised Portfolios, by such subadvisers to MetLife Advisers for subadvisory services (such advisory and subadvisory fees (if any), collectively, “Fees”), as well as the total expense levels of the Portfolios. This information included comparisons (provided by an independent third party) of the Portfolios’ advisory fees and total expense levels to those of their peer groups. In evaluating Fees for the relevant Portfolios, the Directors also took into account the demands, complexity and quality of the investment management services provided to each Portfolio. The Directors considered MetLife Advisers’ recommendations regarding reductions in Fee rates, implementation of Fee breakpoints and institution of Fee waivers and expense caps.
The Directors also considered the compensation directly or indirectly received by the Advisers and their affiliates from their relationships with the relevant Portfolios. The Directors reviewed information relating to the profits received by MetLife Advisers, certain of the subadvisers and their affiliates as a result of their relationships with the relevant Portfolios, and information about the allocation of expenses used to calculate profitability. When reviewing profitability, the Directors also considered the performance of the relevant Portfolios, the expense levels of such Portfolios and whether the relevant Advisers had implemented breakpoints, fee waivers and/or expense caps with respect to such Portfolios.
After reviewing these and related factors, the Directors concluded, within the context of their overall conclusions regarding each of the Continued Agreements, that the Fees charged to each of the relevant Portfolios were fair and reasonable, and that the information provided regarding costs of these services generally, and the related profitability (if known) to the relevant Advisers of their relationships with the relevant Portfolios, supported the renewal of the Continued Agreements.
Economies of Scale. The Directors considered the existence of any economies of scale in the provision of services by the Advisers and whether those economies were shared with the relevant Portfolios through breakpoints in their advisory fees or other means, such as expense caps, fee waivers or relatively low levels of fees. The Directors noted that most of the relevant Portfolios benefited or will benefit from breakpoints, expense caps and/or fee waivers with respect to their advisory fees. In considering these issues, the Directors also took into consideration information relating to the costs of the services provided and the profitability to MetLife Advisers, the relevant subadvisers (if any) and each of their affiliates of their relationships with the relevant Portfolios, as discussed above.
After reviewing these and related factors, the Directors concluded, within the context of their overall conclusions regarding each of the Continued Agreements, that the extent to which economies of scale were shared with the relevant Portfolios supported the renewal of such Agreements.
Other Factors. The Directors also considered other factors, which included but were not limited to the following:
| | • | | the extent to which each relevant Portfolio operated in accordance with its investment objective, and its record of compliance with its investment restrictions and the compliance programs of the Fund and the Advisers. They also considered the compliance-related resources the Advisers and their affiliates provide to the relevant Portfolios; |
MSF-21
Metropolitan Series Fund, Inc.
MFS Value Portfolio (formerly Harris Oakmark Large Cap Value Portfolio)
Board Approval of Advisory and Subadvisory Agreements—(Continued)
| | • | | the nature, quality, cost and extent of administrative and shareholder services performed by MetLife Advisers and its affiliates under the Advisory Agreements; and |
| | • | | so-called “fall-out benefits” to the Advisers, such as the engagement of their affiliates to provide distribution, brokerage and transfer agency services to the Portfolios, and the benefits of research made available to the relevant Advisers by reason of brokerage commissions generated by the relevant Portfolios’ securities transactions. The Directors also considered the possible conflicts of interest associated with these fall-out and other benefits, and the reporting and other processes in place to disclose and monitor these possible conflicts of interest. |
Based on their evaluation of all factors that they deemed to be material, including those factors described above, and assisted by the advice of independent counsel, the Directors, including the Independent Directors, concluded that each of the Continued Agreements should be continued through December 31, 2008.
Certain Matters Relating to MFS Value Portfolio (formerly known as Harris Oakmark Large Cap Value Portfolio) (the “Value Portfolio”) and Harris Oakmark Focused Value Portfolio (the “Focused Value Portfolio”). At the November 15, 2007 Board meeting, the Board approved a change of subadviser for the Value Portfolio from Harris Associates L.P. (“Harris”) to Massachusetts Financial Services Company (“MFS”) and an amendment to the Subadvisory Agreement relating to the Focused Value Portfolio, each to be effective on January 7, 2008. The Board also approved a merger of the Value Portfolio with the MFS Value Portfolio, a series of the Met Investors Series Trust (“MIST”), to be effective on April 28, 2008 (the “Merger).
In making the determination to approve the change in subadviser for the Value Portfolio, the Board carefully considered those factors described above with respect to the continuation of the Continued Agreements, as relevant to both the existing Subadvisory Agreement with Harris and the proposed Subadvisory Agreement with MFS. In addition to these factors, the Board also considered as relevant:
| | • | | the experience, investment style and investment performance history of MFS as portfolio manager; |
| | • | | that the form of the proposed Subadvisory Agreement with MFS was substantially similar to the Value Portfolio’s existing Subadvisory Agreement with Harris; |
| | • | | that the subadvisory fee schedule for MFS set forth in the proposed Subadvisory Agreement was lower than the fee schedule in the existing Subadvisory Agreement and that MetLife Advisers had agreed to reduce its advisory fee, through a contractual fee waiver, by an amount corresponding to such savings; |
| | • | | the expected transition costs of the change of subadviser and the fact that MetLife Advisers had agreed to pay a portion of those costs; |
| | • | | the impact of the Merger on the Value Portfolio, including any potential costs savings; |
| | • | | that the preferred date of the change of subadviser for the Value Portfolio was January 7, 2008 and the desirability, in order to facilitate an orderly transition of subadvising functions, of extending the existing Subadvisory Agreement with Harris from its scheduled expiration date of December 31, 2007 until January 7, 2008; |
| | • | | that the existing Subadvisory Agreement with Harris for the Focused Value Portfolio contained a subadvisory fee schedule based on the combined average daily net assets for the Value Portfolio and the Focused Value Portfolio and that, as a result of the subadviser change for the Value Portfolio, the subadvisory fees for the Focused Value Portfolio may increase slightly; and |
| | • | | that MetLife Adviser’s voluntary advisory fee waiver currently in effect with respect to the Focused Value Portfolio would be discontinued following the subadviser change and that, as a result, the advisory fees for the Focused Value Portfolio may increase slightly. |
Following such consideration, and assisted by the advice of independent counsel, the Directors, including the Independent Directors, unanimously voted to approve (i) the continuation of the existing Subadvisory Agreement relating to the Value Portfolio through January 7, 2008 (ii) an amendment to the Subadvisory Agreement relating to the Focused Value Portfolio, effective January 7, 2008, and (iii) the proposed Subadvisory Agreement relating to the Value Portfolio with MFS, effective January 7, 2008 through January 6, 2010.
MSF-22
A description of the policies and procedures that the Fund uses to determine how to vote proxies relating to portfolio securities is available (i) without charge, upon request, by calling (800) 638-7732 and (ii) on the Securities and Exchange Commission’s (the “SEC”) website at http://www.sec.gov.
Information regarding how the Fund voted proxies relating to portfolio securities during the most recent twelve-month period ended December 31, 2007 is available (i) without charge, upon request, by calling (800) 638-7732 and (ii) on the SEC’s website at http://www.sec.gov.
The Fund files with the SEC a complete schedule of its portfolio holdings, as of the close of the first and third quarters of its fiscal year, on “Form N-Q”. These filings are available on the SEC’s website at www.sec.gov and may be reviewed and copied at the SEC’s Public Reference Room in Washington, DC. (Call 1-800-SEC-0330 for information on the operation of the Public Reference Room.)
MSF-23
| | |
Metropolitan Series Fund, Inc. Morgan Stanley EAFE Index Portfolio Annual Report | | December 31, 2007 |
Letter from the President
February 1, 2008
Letter to Policy Holders:
2007 was a tumultuous year in the financial markets driven by concerns in the credit markets surrounding sub-prime mortgages and fears of recession in the U.S. Economy. The broad markets were mixed, with the Dow Jones Industrial Average up 8.9% and the MSCI EAFE Index, which measures the performance of international equities, up 11.2% for the year, while the Russell 2000 Index, which measures the performance of small capitalization stocks, was down 1.6%.
In the fixed income markets, credit spreads increased as a result of the pressure from sub-prime mortgage crisis and the Federal Reserve lowered interest rates by a total of 1% during the year. The Lehman Brothers Aggregate Bond Index posted a 7.0% return for the year.
On the following pages, you will find a complete review of your Portfolio and its investment performance.
MetLife is committed to building your financial freedom. We appreciate your trust and will continue to focus our efforts on meeting your investment needs.
Sincerely,
Elizabeth Forget
President, Metropolitan Series Fund, Inc.
Metropolitan Series Fund, Inc.
Morgan Stanley EAFE Index Portfolio
Managed by MetLife Investment Advisors Company, LLC
Portfolio Manager Commentary*
PORTFOLIO PERFORMANCE
For the year ended December 31, 2007, the Class A shares of the Morgan Stanley EAFE Index Portfolio returned 10.8%, compared to its benchmark, the Morgan Stanley Capital International (MSCI) EAFE Index1, which returned 11.2%. Dividend income accounted for 2.5% of this year’s total return. The Portfolio’s performance cannot exactly duplicate the MSCI EAFE Index’s return because of differences that primarily result from sampling, pricing, and transaction costs.
PORTFOLIO REVIEW
The MSCI EAFE Index began the year with six positive monthly returns in a row, up 10.7% through the month of June. However, four of the six months in the second half of 2007 had negative returns, resulting in a second half return of only 0.4%. The MSCI EAFE Index outperformed its U.S. domestic counterpart (the S&P 500 Index2) by 5.7%. The weakening U.S. Dollar positively impacted the U.S. investors’ MSCI EAFE Index return versus the local currency return by approximately 7%. The price of oil surged from $61 to $96 per barrel through December, up 57% from the beginning of the year. Increasing global demand, weakness in refinery utilization, and global geopolitical unrest contributed to supply concerns, increasing oil prices over the period. Some of the factors driving the foreign equity markets included geopolitical concerns, energy prices, foreign exchange rates, corporate earnings, and unemployment rates.
Eighteen of the twenty-one countries that comprise the MSCI EAFE Index had positive returns in 2007. Germany (7.4% beginning-of-year weight, up 36.0%) and United Kingdom (23.7% beginning weight, up 8.4%) had the largest positive impacts on the benchmark return. The best performing countries were; Finland (1.4% beginning weight, up 50.1%) and Hong Kong (1.8% beginning weight, up 41.3%). Japan (22.6% beginning weight, down 4.1%) had the largest negative impact on the benchmark return. The worst performing country was Ireland (0.9% beginning weight), down 19.2%.
The stocks with the largest positive impact on the benchmark return for the year were Rio Tinto, up 102.9%; Nokia Oyj, up 94.3%; and Vodafone Group, up 40.7%. The best performing stock was Leighton Holdings, up 246.8%, but the overall impact was negligible due to the company’s small size. The stocks with the largest negative impact were Royal Bank of Scotland Group, down 28.6%; UBS AG, down 21.5%; and Toyota Motor Corp, down 17.7%. The worst performing stock was Centro Properties Group, down 87.3%.
* The views expressed above are those of the subadvisory firm as of December 31, 2007 and are subject to change based on market and other conditions. Information about the Portfolio’s holdings, asset allocation, industry allocation, or country diversification is historical and is not an indication of future Portfolio composition, which will vary. The performance of any index mentioned in this commentary has not been adjusted for ongoing management, distribution and operating expenses, and sales charges applicable to mutual fund investments. Direct investment in the Index is not possible.
1 The Morgan Stanley Capital International Europe, Australasia and Far East Index (“MSCI EAFE Index”) is an unmanaged free float-adjusted market capitalization index that is designed to measure developed market equity performance, excluding the U.S. & Canada.
2 The Standard & Poor’s (S&P) 500® Stock Index is an unmanaged index representing the performance of 500 major companies, most of which are listed on the New York Stock Exchange.
MSF-2
Metropolitan Series Fund, Inc.
Morgan Stanley EAFE Index Portfolio
A $10,000 INVESTMENT COMPARED TO
THE MSCI EAFE INDEX
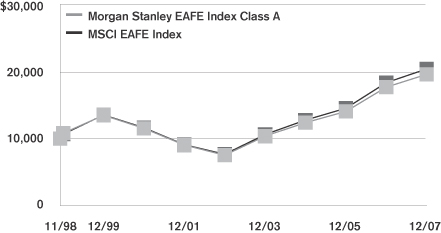
Average Annual Returns as of December 31, 2007
| | | | | | | | | | | | |
| | | Morgan Stanley
EAFE Index Portfolio | | | MSCI EAFE
Index | |
| | | Class A | | | Class B | | | Class E | | |
| 1 Year | | 10.8 | % | | 10.5 | % | | 10.6 | % | | 11.2 | % |
| 5 Year | | 21.0 | | | 20.7 | | | 20.8 | | | 21.6 | |
| Since Inception | | 7.6 | | | 7.6 | | | 9.2 | | | 8.1 | |
Performance numbers are net of all Portfolio expenses but do not include any insurance, sales, or administrative charges of variable annuity or life insurance contracts. If these charges were included, the returns would be lower.
Inception dates of the Class A, Class B and Class E shares are: 11/9/98, 1/2/01 and 5/1/01, respectively. Index since inception return is based on the Class A inception date.
This information represents past performance and is not indicative of future results. Investment return and principal value may fluctuate so that shares, upon redemption, may be worth more or less than the original cost.
PORTFOLIO COMPOSITION
as of December 31, 2007
Top Holdings
| | |
| | | % of Total
Net Assets |
iShares MSCI EAFE Index Fund | | 2.0% |
BP, Plc. | | 1.6% |
Vodafone Group, Plc. | | 1.4% |
HSBC Holdings, Plc. | | 1.4% |
Nestle S.A. | | 1.3% |
Total S.A. | | 1.3% |
Royal Dutch Shell, Plc. (Class A) | | 1.1% |
Nokia Oyj | | 1.1% |
Toyota Motor Corp. | | 1.0% |
GlaxoSmithKline, Plc. | | 1.0% |
Top Countries
| | |
| | | % of Total
Net Assets |
United Kingdom | | 21.6% |
Japan | | 19.3% |
France | | 9.7% |
Germany | | 9.1% |
Switzerland | | 6.5% |
Australia | | 6.2% |
Spain | | 4.3% |
Italy | | 3.8% |
Netherlands | | 2.9% |
Hong Kong | | 1.9% |
MSF-3
Metropolitan Series Fund, Inc.
Shareholder Expense Example
As a shareholder of the Portfolio, you incur ongoing costs, including management fees; distribution and service (12b-1) fees; and other Portfolio expenses. This example is intended to help you understand your ongoing costs (in dollars) (referred to as “expenses”) of investing in the Portfolio and compare these costs with the ongoing costs of investing in other mutual funds. The example is based on an investment of $1,000 invested at the beginning of the period and held for the entire period, July 1, 2007 through December 31, 2007.
Actual Expenses
The first line for each share class of the Portfolio in the table below provides information about actual account values and actual expenses. You may use the information in this line, together with the amount you invested in the particular share class of the Portfolio, to estimate the expenses that you paid over the period. Simply divide your account value by $1,000 (for example, an $8,600 account value divided by $1,000=8.6), then multiply the result by the number in the first line under the heading entitled “Expenses Paid During Period” to estimate the expenses you paid on your account during this period.
Hypothetical Example for Comparison Purposes
The second line for each share class of the Portfolio in the table below provides information about hypothetical account values and hypothetical expenses based on the Portfolio’s actual expense ratio and an assumed rate of return of 5% per year before expenses, which is not the Portfolio’s actual return. The hypothetical account values and expenses may not be used to estimate the actual ending account balance or expenses you paid for the period. You may use this information to compare the ongoing costs of investing in the Portfolio and other funds. To do so, compare this 5% hypothetical example with the 5% hypothetical examples that appear in the shareholder reports of the other funds.
Please note that the expenses shown in the table are meant to highlight your ongoing costs only and do not reflect any fees or charges of your variable insurance product or any additional expenses that participants in certain eligible qualified plans may bear relating to the operations of their plan. Therefore, the second line for each share class in the table is useful in comparing ongoing costs only, and will not help you determine the relative total costs of owning different funds. In addition, if these other costs were included, your costs would have been higher.
| | | | | | | | | | | | | | |
Portfolio | | | | Annualized
Expense
Ratio | | | Beginning
Account Value
July 1,
2007 | | Ending
Account Value
December 31,
2007 | | Expenses Paid
During Period*
July 1, 2007
to
December 31,
2007 |
Morgan Stanley EAFE Index—Class A(a) | | Actual | | 0.41 | % | | $ | 1,000.00 | | $ | 1,004.10 | | $ | 2.07 |
| | Hypothetical | | 0.41 | % | | $ | 1,000.00 | | $ | 1,023.12 | | $ | 2.09 |
| | | | | |
Morgan Stanley EAFE Index—Class B(a) | | Actual | | 0.66 | % | | $ | 1,000.00 | | $ | 1,003.00 | | $ | 3.33 |
| | Hypothetical | | 0.66 | % | | $ | 1,000.00 | | $ | 1,021.84 | | $ | 3.36 |
| | | | | |
Morgan Stanley EAFE Index—Class E(a) | | Actual | | 0.56 | % | | $ | 1,000.00 | | $ | 1,002.90 | | $ | 2.83 |
| | Hypothetical | | 0.56 | % | | $ | 1,000.00 | | $ | 1,022.35 | | $ | 2.85 |
* Expenses paid are equal to the Portfolio’s annualized expense ratio for the most recent six month period, as shown above, multiplied by the average account value over the period, multiplied by the number of days in the most recent fiscal half-year, divided by 365 (to reflect the one-half year period).
(a) The annualized expense ratio shown reflects the impact of the management fee waiver as described in Note 4 to the Financial Statements.
MSF-4
Metropolitan Series Fund, Inc.
Morgan Stanley EAFE Index Portfolio
Schedule of Investments as of December 31, 2007
Common Stock—98.1% of Total Net Assets
| | | | | |
| Security Description | | Shares | | Value* |
| | | | | |
|
Australia—6.0% |
AGL Energy, Ltd. (a) | | 27,513 | | $ | 321,247 |
Alumina, Ltd. (a) | | 77,975 | | | 431,974 |
Amcor, Ltd. | | 57,157 | | | 345,792 |
AMP, Ltd. | | 121,108 | | | 1,053,879 |
Ansell, Ltd. | | 1 | | | 11 |
Aristocrat Leisure, Ltd. (a) | | 23,455 | | | 230,732 |
Asciano Group, Ltd. (b) | | 33,157 | | | 202,958 |
ASX, Ltd. | | 11,184 | | | 591,357 |
Australia & New Zealand Banking Group, Ltd. | | 115,675 | | | 2,773,783 |
AXA Asia Pacific Holdings, Ltd. | | 50,272 | | | 324,045 |
Babcock & Brown, Ltd. (a) | | 14,021 | | | 330,713 |
Bendigo Bank, Ltd. (a) | | 16,859 | | | 256,241 |
BHP Billiton, Ltd. (a) | | 209,376 | | | 7,342,436 |
Billabong International, Ltd. (a) | | 11,340 | | | 149,257 |
BlueScope Steel, Ltd. | | 55,000 | | | 463,214 |
Boart Longyear Group (b) | | 89,441 | | | 189,266 |
Boral, Ltd. (a) | | 33,631 | | | 180,082 |
Brambles Ltd. | | 89,667 | | | 903,681 |
Caltex Australia, Ltd. | | 8,471 | | | 143,216 |
Coca-Cola Amatil, Ltd. | | 30,998 | | | 256,945 |
Cochlear, Ltd. | | 2,939 | | | 192,947 |
Commonwealth Bank of Australia | | 82,153 | | | 4,243,327 |
Computershare, Ltd. | | 29,681 | | | 257,168 |
Crown, Ltd. (a) | | 29,464 | | | 347,963 |
CSL, Ltd. | | 34,643 | | | 1,100,992 |
CSR, Ltd. (a) | | 79,151 | | | 214,823 |
DB RREEF Trust (REIT) (a) | | 188,026 | | | 328,932 |
Fairfax Media, Ltd. (a) | | 84,531 | | | 346,300 |
Fortescue Metals Group, Ltd. | | 82,630 | | | 537,555 |
Foster’s Group, Ltd. | | 137,610 | | | 789,708 |
Futuris Corp., Ltd. | | 1 | | | 2 |
Goodman Group (REIT) (a) | | 93,428 | | | 402,070 |
Harvey Norman Holdings, Ltd. (a) | | 38,269 | | | 227,565 |
Insurance Australia Group, Ltd. (a) | | 111,884 | | | 403,055 |
Leighton Holdings, Ltd. (a) | | 9,786 | | | 521,710 |
Lend Lease Corp., Ltd. | | 20,464 | | | 309,845 |
Lion Nathan, Ltd. (a) | | 21,432 | | | 180,347 |
Macquarie Airports | | 49,626 | | | 175,825 |
Macquarie Group, Ltd. (a) | | 17,263 | | | 1,144,185 |
Mirvac Group (REIT) (a) | | 76,884 | | | 404,225 |
National Australia Bank, Ltd. | | 101,103 | | | 3,335,360 |
Newcrest Mining, Ltd. | | 28,699 | | | 827,130 |
OneSteel, Ltd. (a) | | 41,427 | | | 222,761 |
Orica, Ltd. (a) | | 21,486 | | | 596,654 |
Origin Energy, Ltd. | | 51,589 | | | 399,706 |
Oxiana, Ltd. (a) | | 90,420 | | | 312,016 |
Paladin Resources Ltd. (a) | | 29,852 | | | 175,447 |
Perpetual Trustees Australia, Ltd. (a) | | 2,121 | | | 123,514 |
Qantas Airways, Ltd. | | 58,796 | | | 279,718 |
QBE Insurance Group, Ltd. | | 56,197 | | | 1,637,528 |
Rio Tinto, Ltd. (a) | | 17,460 | | | 2,038,455 |
Santos, Ltd. | | 36,830 | | | 457,105 |
Sonic Healthcare, Ltd. (a) | | 16,937 | | | 247,719 |
St. George Bank, Ltd. (a) | | 17,044 | | | 540,703 |
Suncorp-Metway, Ltd. | | 59,372 | | | 878,972 |
TABCORP Holdings, Ltd. (a) | | 29,263 | | | 378,843 |
Tattersall’s, Ltd. (a) | | 76,330 | | | 266,718 |
| | | | | |
| Security Description | | Shares | | Value* |
| | | | | |
|
Australia—(Continued) |
Telstra Corp., Ltd. (a) | | 182,880 | | $ | 750,492 |
Telstra Corp., Ltd. (Receipt) (a) | | 103,969 | | | 288,039 |
Toll Holdings, Ltd. (a) | | 33,157 | | | 332,078 |
Transurban Group (a) | | 68,623 | | | 410,632 |
Wesfarmers, Ltd. (a) | | 32,926 | | | 1,166,660 |
Wesfarmers, Ltd. (Price Protected Shares) (b) | | 11,090 | | | 396,319 |
Westfield Group (REIT) (a) | | 113,589 | | | 2,081,281 |
Westpac Banking Corp. | | 114,691 | | | 2,794,647 |
Woodside Petroleum, Ltd. | | 31,206 | | | 1,372,444 |
Woolworths, Ltd. | | 75,638 | | | 2,245,142 |
WorleyParsoms, Ltd. | | 10,634 | | | 482,602 |
Zinifex, Ltd. (a) | | 31,103 | | | 335,372 |
| | | | | |
| | | | | 53,993,430 |
| | | | | |
| | |
Austria—0.6% | | | | | |
Andritz AG | | 2,729 | | | 163,600 |
Erste Bank der oesterreichischen Sparkassen AG | | 12,016 | | | 854,036 |
Immoeast AG | | 28,570 | | | 305,131 |
IMMOFINANZ AG | | 26,048 | | | 262,480 |
Meinl European Land, Ltd. | | 22,315 | | | 308,275 |
OMV AG | | 11,202 | | | 901,374 |
Raiffeisen International Bank Holding AG (a) | | 2,179 | | | 328,298 |
Telekom Austria AG | | 23,294 | | | 645,540 |
Verbund-Oesterreichische Elektrizitaetswirtschafts AG (Class A) (a) | | 4,650 | | | 323,845 |
Voestalpine AG | | 7,335 | | | 525,148 |
Wiener Staedtische Versicherung AG | | 2,014 | | | 162,110 |
Wienerberger AG | | 4,887 | | | 269,958 |
| | | | | |
| | | | | 5,049,795 |
| | | | | |
|
Belgium—1.2% |
Belgacom S.A. (a) | | 10,680 | | | 523,870 |
Colruyt S.A. (a) | | 1,086 | | | 254,325 |
Delhaize Group | | 6,756 | | | 590,743 |
Dexia S.A. | | 37,577 | | | 944,433 |
Fortis | | 130,740 | | | 3,397,569 |
Fortis Bank S.A. (b) (c) (d) | | 5 | | | 0 |
Groupe Bruxelles Lambert S.A. | | 5,565 | | | 710,739 |
InBev NV | | 12,607 | | | 1,040,053 |
KBC Groep NV | | 11,188 | | | 1,562,581 |
Mobistar S.A. | | 2,918 | | | 264,450 |
Solvay S.A. | | 4,372 | | | 608,856 |
UCB S.A. | | 6,793 | | | 306,369 |
Umicore S.A. | | 1,777 | | | 438,247 |
| | | | | |
| | | | | 10,642,235 |
| | | | | |
|
Bermuda—0.3% |
Esprit Holdings, Ltd. (HKD) | | 65,100 | | | 964,192 |
Kerry Properties, Ltd. (HKD) | | 46,500 | | | 372,916 |
Li & Fung, Ltd. (HKD) | | 150,800 | | | 601,651 |
Pacific Basin Shipping, Ltd. (HKD) | | 108,000 | | | 221,612 |
SeaDrill, Ltd. (NOK) | | 18,268 | | | 439,839 |
Shangri-La Asia, Ltd. (HKD) | | 101,114 | | | 317,248 |
| | | | | |
| | | | | 2,917,458 |
| | | | | |
*See accompanying notes to financial statements.
MSF-5
Metropolitan Series Fund, Inc.
Morgan Stanley EAFE Index Portfolio
Schedule of Investments as of December 31, 2007
Common Stock—(Continued)
| | | | | |
| Security Description | | Shares | | Value* |
| | | | | |
|
Cayman Islands—0.2% |
Belle International Holdings, Ltd. (HKD) | | 172,483 | | $ | 258,628 |
Foxconn International Holdings, Ltd. (HKD) (a) | | 141,000 | | | 314,970 |
Kingboard Chemical Holdings, Ltd. (HKD) | | 45,000 | | | 262,982 |
Shui On Land, Ltd. (HKD) | | 163,000 | | | 200,682 |
Tencent Holdings, Ltd. (HKD) | | 68,000 | | | 514,611 |
Tingyi Cayman Islands Holding Corp. (HKD) (a) | | 143,840 | | | 227,521 |
| | | | | |
| | | | | 1,779,394 |
| | | | | |
|
Cyprus—0.0% |
ProSafe SE (a) | | 13,770 | | | 237,406 |
| | | | | |
|
Denmark—0.9% |
AP Moller-Maersk A/S (Series A) | | 19 | | | 200,053 |
AP Moller-Maersk A/S (Series B) | | 72 | | | 763,033 |
Carlsberg A/S (Class B) | | 1,953 | | | 234,948 |
Coloplast A/S (a) | | 2,044 | | | 175,447 |
Danisco A/S (a) | | 3,322 | | | 234,734 |
Danske Bank A/S | | 30,405 | | | 1,178,679 |
DSV A/S (a) | | 14,053 | | | 305,460 |
FLSmidth & Co. A/S | | 3,194 | | | 323,677 |
Jyske Bank A/S | | 3,993 | | | 312,353 |
Novo Nordisk A/S | | 29,900 | | | 1,951,784 |
Novozymes A/S (Series B) (a) | | 3,213 | | | 362,634 |
Sydbank A/S | | 4,663 | | | 198,133 |
Topdanmark A/S (a) | | 1,150 | | | 163,988 |
TrygVesta A/S (a) | | 2,044 | | | 154,290 |
Vestas Wind Systems A/S | | 11,881 | | | 1,270,097 |
William Demant Holding (a) | | 2,044 | | | 187,457 |
| | | | | |
| | | | | 8,016,767 |
| | | | | |
|
Finland—1.8% |
Elisa Oyj | | 11,157 | | | 340,425 |
Fortum Oyj | | 27,597 | | | 1,235,391 |
Kesko Oyj | | 4,472 | | | 245,387 |
Kone Oyj | | 5,140 | | | 357,196 |
Metso Oyj | | 8,217 | | | 443,461 |
Neste Oil Oyj | | 7,224 | | | 253,326 |
Nokia Oyj | | 246,457 | | | 9,489,690 |
Nokian Renkaat Oyj | | 8,240 | | | 287,041 |
Orion Oyj | | 6,644 | | | 154,933 |
Outokumpu Oyj | | 9,016 | | | 274,854 |
Rautaruukki Oyj | | 5,366 | | | 228,375 |
Sampo Oyj | | 27,863 | | | 728,717 |
Sanoma-WSOY Oyj | | 5,778 | | | 164,735 |
Stora Enso Oyj (a) | | 40,497 | | | 601,003 |
UPM-Kymmene Oyj | | 35,770 | | | 716,672 |
Wartsila Oyj | | 4,154 | | | 314,138 |
YIT Oyj | | 9,481 | | | 204,889 |
| | | | | |
| | | | | 16,040,233 |
| | | | | |
|
France—9.7% |
Accor S.A. | | 12,073 | | | 957,574 |
Aeroports de Paris (a) | | 2,209 | | | 224,706 |
Air France-KLM | | 7,711 | | | 268,878 |
Air Liquide (a) | | 14,827 | | | 2,196,879 |
| | | | | |
| Security Description | | Shares | | Value* |
| | | | | |
|
France—(Continued) |
Alcatel-Lucent | | 146,253 | | $ | 1,063,264 |
Alstom | | 6,487 | | | 1,378,522 |
Atos Origin S.A. | | 3,727 | | | 191,116 |
AXA S.A. | | 98,691 | | | 3,929,514 |
BNP Paribas | | 53,053 | | | 5,702,931 |
Bouygues | | 13,864 | | | 1,149,498 |
Business Objects S.A. | | 5,473 | | | 333,726 |
Cap Gemini S.A. | | 9,532 | | | 592,340 |
Carrefour S.A. | | 36,744 | | | 2,848,683 |
Casino Guichard-Perrachon S.A. (a) | | 3,089 | | | 336,143 |
Christian Dior S.A. | | 1,765 | | | 230,855 |
Cie de Saint-Gobain | | 17,609 | | | 1,668,969 |
Cie Generale d’Optique Essilor International S.A. | | 12,229 | | | 778,273 |
Cie Generale de Geophysique-Veritas (b) | | 1,654 | | | 465,207 |
CNP Assurances (a) | | 2,630 | | | 341,007 |
Compagnie Générale des Etablissements Michelin (Class B) | | 9,437 | | | 1,081,896 |
Credit Agricole S.A. | | 40,631 | | | 1,362,997 |
Dassault Systemes S.A. (a) | | 4,077 | | | 240,114 |
Eiffage S.A. | | 1,236 | | | 120,944 |
Electricite de France | | 6,327 | | | 749,779 |
France Telecom S.A. | | 114,777 | | | 4,118,986 |
Gaz de France S.A. (a) | | 11,430 | | | 665,570 |
Gecina S.A. (REIT) | | 826 | | | 129,499 |
Groupe Danone | | 26,776 | | | 2,392,227 |
Hermes International (a) | | 4,408 | | | 561,248 |
ICADE | | 1,080 | | | 161,001 |
Imerys S.A. (a) | | 2,590 | | | 212,090 |
JC Decaux S.A. | | 4,355 | | | 170,635 |
Klepierre (REIT) | | 4,415 | | | 224,164 |
L’Oreal S.A. (a) | | 15,708 | | | 2,242,320 |
Lafarge S.A. | | 9,367 | | | 1,695,590 |
Lagardere S.C.A. | | 8,303 | | | 619,112 |
LVMH Moet Hennessy Louis Vuitton S.A. | | 15,517 | | | 1,864,994 |
Natixis (a) | | 11,841 | | | 231,220 |
Neopost S.A. | | 2,613 | | | 268,314 |
PagesJaunes Groupe S.A. (a) | | 6,661 | | | 133,068 |
Pernod-Ricard S.A. | | 5,601 | | | 1,289,996 |
Peugoet S.A. (a) | | 10,412 | | | 782,773 |
Pinault-Printemps-Redoute S.A. | | 4,886 | | | 781,167 |
Publicis Groupe | | 7,880 | | | 306,448 |
Renault S.A. | | 11,630 | | | 1,631,844 |
Safran S.A. (a) | | 14,320 | | | 291,633 |
Sanofi-Aventis (a) | | 64,536 | | | 5,898,621 |
Schneider Electric S.A. | | 14,039 | | | 1,877,181 |
Scor SE | | 11,686 | | | 296,891 |
Societe Des Autoroutes Paris-Rhin-Rhone (a) | | 1,450 | | | 141,784 |
Societe Television Francaise 1 | | 9,194 | | | 244,877 |
Société Générale | | 23,082 | | | 3,298,762 |
Sodexho Alliance S.A. | | 6,815 | | | 417,790 |
Suez S.A. (a) | | 64,124 | | | 4,346,656 |
Technip S.A. | | 6,217 | | | 491,705 |
Thales S.A. | | 5,108 | | | 302,445 |
Thomson | | 13,742 | | | 194,211 |
Total S.A. (a) | | 134,679 | | | 11,176,957 |
Unibail-Rodamco (REIT) | | 4,107 | | | 893,985 |
*See accompanying notes to financial statements.
MSF-6
Metropolitan Series Fund, Inc.
Morgan Stanley EAFE Index Portfolio
Schedule of Investments as of December 31, 2007
Common Stock—(Continued)
| | | | | |
| Security Description | | Shares | | Value* |
| | | | | |
|
France—(Continued) |
Valeo S.A. (a) | | 3,767 | | $ | 154,261 |
Vallourec | | 3,026 | | | 814,612 |
Veolia Environnement S.A. | | 22,418 | | | 2,035,977 |
Vinci S.A. (a) | | 25,227 | | | 1,853,111 |
Vivendi | | 71,792 | | | 3,271,371 |
Wendel | | 1,074 | | | 154,566 |
Zodiac S.A. (a) | | 3,563 | | | 226,592 |
| | | | | |
| | | | | 87,080,069 |
| | | | | |
| | |
Germany—8.7% | | | | | |
Adidas AG | | 12,448 | | | 926,837 |
Allianz SE | | 28,170 | | | 6,025,301 |
BASF AG | | 30,515 | | | 4,509,784 |
Bayer AG | | 44,970 | | | 4,100,118 |
Bayerische Motoren Werke AG | | 10,765 | | | 655,213 |
Beiersdorf AG | | 5,572 | | | 430,010 |
Bilfinger Berger AG | | 2,232 | | | 169,360 |
Celesio AG | | 5,284 | | | 325,877 |
Commerzbank AG | | 38,831 | | | 1,469,768 |
Continental AG | | 9,787 | | | 1,269,161 |
Daimler AG | | 59,628 | | | 5,775,707 |
Deutche Postbank AG | | 5,103 | | | 451,155 |
Deutsche Bank AG | | 32,093 | | | 4,151,247 |
Deutsche Boerse AG | | 13,005 | | | 2,566,939 |
Deutsche Lufthansa AG | | 17,254 | | | 456,911 |
Deutsche Post AG | | 51,998 | | | 1,777,194 |
Deutsche Telekom AG | | 179,266 | | | 3,920,792 |
E.ON AG | | 38,832 | | | 8,245,037 |
Fresenius Medical Care AG | | 13,721 | | | 733,943 |
GEA Group AG | | 10,696 | | | 385,635 |
Henkel KGaA | | 6,949 | | | 354,698 |
Hochtief AG | | 3,344 | | | 445,006 |
Hypo Real Estate Holding AG | | 12,973 | | | 674,905 |
Infineon Technologies AG (b) | | 48,636 | | | 568,692 |
IVG Immobilen AG | | 7,318 | | | 247,675 |
K&S AG | | 2,457 | | | 493,684 |
Linde AG | | 7,552 | | | 994,642 |
MAN AG | | 7,218 | | | 1,187,710 |
Merck KGaA | | 4,173 | | | 536,060 |
Metro AG | | 10,019 | | | 836,208 |
Müenchener Rüeckversicherungs AG | | 13,269 | | | 2,565,045 |
Puma AG Rudolf Dassler Sport | | 444 | | | 176,456 |
Q-Cells AG (b) | | 3,158 | | | 443,108 |
Rheinmetall AG | | 2,165 | | | 169,759 |
RWE AG | | 27,981 | | | 3,920,958 |
Salzgitter AG | | 2,440 | | | 359,233 |
SAP AG | | 55,251 | | | 2,854,640 |
Siemens AG | | 53,964 | | | 8,471,771 |
SolarWorld AG | | 4,671 | | | 280,354 |
ThyssenKrupp AG | | 22,242 | | | 1,241,369 |
TUI AG | | 13,050 | | | 362,429 |
Volkswagen AG (a) | | 10,188 | | | 2,317,727 |
| | | | | |
| | | | | 77,848,118 |
| | | | | |
|
Greece—0.8% |
Alpha Bank A.E. | | 25,417 | | | 927,989 |
Coca-Cola Hellenic Bottling Co. S.A. | | 11,079 | | | 477,962 |
| | | | | |
| Security Description | | Shares | | Value* |
| | | | | |
|
Greece—(Continued) |
EFG Eurobank Ergasias S.A. | | 21,566 | | $ | 761,323 |
Hellenic Telecommunications Organization S.A. | | 19,354 | | | 711,287 |
National Bank of Greece S.A. | | 24,871 | | | 1,713,294 |
OPAP S.A. | | 15,100 | | | 602,866 |
Piraeus Bank S.A. | | 22,128 | | | 861,961 |
Public Power Corp. S.A. | | 7,286 | | | 382,363 |
Titan Cement Co. S.A. | | 3,910 | | | 177,732 |
| | | | | |
| | | | | 6,616,777 |
| | | | | |
|
Hong Kong—1.9% |
Bank of East Asia, Ltd. | | 101,200 | | | 684,528 |
BOC Hong Kong Holdings, Ltd. | | 253,965 | | | 701,854 |
Cathay Pacific Airways, Ltd. (a) | | 87,000 | | | 226,071 |
Cheung Kong Holdings, Ltd. | | 100,000 | | | 1,823,405 |
CLP Holdings, Ltd. | | 90,877 | | | 617,884 |
Hang Lung Group, Ltd. | | 37,000 | | | 210,686 |
Hang Lung Properties, Ltd. | | 160,000 | | | 733,674 |
Hang Seng Bank, Ltd. | | 49,400 | | | 1,009,469 |
Henderson Land Development Co., Ltd. (a) | | 63,000 | | | 584,772 |
Hong Kong & China Gas Co. (a) | | 257,450 | | | 784,772 |
Hong Kong Exchanges & Clearing, Ltd. | | 67,500 | | | 1,894,926 |
HongKong Electric Holdings | | 93,049 | | | 535,061 |
Hopewell Holdings | | 50,000 | | | 229,885 |
Hutchison Whampoa, Ltd. | | 141,000 | | | 1,586,705 |
MTR Corp. (a) | | 107,500 | | | 391,784 |
New World Development, Ltd. | | 174,354 | | | 614,198 |
PCCW, Ltd. | | 345,794 | | | 204,552 |
Sino Land Co. (a) | | 104,000 | | | 363,482 |
Sun Hung Kai Properties, Ltd. | | 91,000 | | | 1,912,090 |
Swire Pacific, Ltd. | | 58,317 | | | 799,190 |
The Link (REIT) | | 148,141 | | | 321,045 |
Wharf Holdings, Ltd. (a) | | 75,433 | | | 389,337 |
| | | | | |
| | | | | 16,619,370 |
| | | | | |
|
Ireland—0.6% |
Allied Irish Banks, Plc. | | 60,464 | | | 1,389,413 |
Anglo Irish Bank Corp., Plc. | | 26,064 | | | 413,136 |
Bank of Ireland | | 71,813 | | | 1,064,638 |
CRH, Plc. | | 34,755 | | | 1,206,716 |
Elan Corp., Plc. | | 32,780 | | | 708,602 |
Kerry Group, Plc. | | 13,480 | | | 426,062 |
Kingspan Group, Plc. | | 14,152 | | | 213,286 |
| | | | | |
| | | | | 5,421,853 |
| | | | | |
|
Italy—3.8% |
Alleanza Assicurazioni S.p.A. (a) | | 25,301 | | | 325,137 |
Assicuraziono Generali S.p.A. | | 67,450 | | | 3,023,682 |
Atlantia S.p.A. | | 16,870 | | | 637,956 |
Banca Monte dei Paschi di Siena S.p.A. (a) | | 75,717 | | | 400,158 |
Banca Popolare di Milano Scarl | | 27,586 | | | 372,895 |
Banco Popolare Scarl | | 42,175 | | | 927,052 |
Bulgari S.p.A. | | 11,847 | | | 164,832 |
Enel S.p.A. | | 271,529 | | | 3,204,874 |
Eni S.p.A. | | 163,906 | | | 5,972,181 |
FIAT S.p.A. (a) | | 45,156 | | | 1,160,586 |
*See accompanying notes to financial statements.
MSF-7
Metropolitan Series Fund, Inc.
Morgan Stanley EAFE Index Portfolio
Schedule of Investments as of December 31, 2007
Common Stock—(Continued)
| | | | | |
| Security Description | | Shares | | Value* |
| | | | | |
|
Italy—(Continued) |
Finmeccanica S.p.A. (a) | | 21,168 | | $ | 670,948 |
Fondiaria-Sai S.p.A. | | 4,556 | | | 188,135 |
Intesa Sanpaolo S.p.A. | | 484,200 | | | 3,797,572 |
Intesa Sanpaolo S.p.A.—RNC | | 56,998 | | | 410,761 |
Italcementi S.p.A. | | 1 | | | 21 |
Lottomatica S.p.A. (a) (b) | | 3,732 | | | 135,342 |
Luxottica Group S.p.A. (a) | | 9,343 | | | 295,617 |
Mediaset S.p.A. | | 51,298 | | | 515,781 |
Mediobanca S.p.A. | | 36,157 | | | 741,879 |
Parmalat S.p.A. (a) (b) | | 100,163 | | | 387,222 |
Pirelli & Co. S.p.A. | | 175,429 | | | 192,332 |
Prysmian S.p.A. (b) | | 9,888 | | | 242,119 |
Saipem S.p.A. | | 9,129 | | | 363,222 |
Snam Rete Gas S.p.A. | | 75,100 | | | 476,874 |
Telecom Italia S.p.A. | | 678,837 | | | 2,101,870 |
Telecom Italia S.p.A.—RNC | | 396,854 | | | 932,864 |
Terna Rete Elettrica Nazionale S.p.A. (a) | | 106,289 | | | 426,351 |
UniCredito Italiano S.p.A. | | 587,857 | | | 4,892,410 |
Unione di Banche Italiane SCPA (a) | | 42,560 | | | 1,171,531 |
| | | | | |
| | | | | 34,132,204 |
| | | | | |
|
Japan—19.3% |
Advantest Corp. (a) | | 11,800 | | | 332,422 |
Aeon Co., Ltd. | | 40,400 | | | 589,713 |
Aisin Seiki Co., Ltd. | | 11,400 | | | 473,993 |
Ajinomoto Co., Inc. | | 46,000 | | | 520,693 |
All Nippon Airways Co., Ltd. | | 40,000 | | | 147,439 |
Alps Electric Co., Ltd. | | 13,600 | | | 175,909 |
Amada Co., Ltd. | | 27,000 | | | 237,947 |
Asahi Breweries, Ltd. (a) | | 27,900 | | | 472,768 |
Asahi Glass Co., Ltd. (a) | | 60,000 | | | 795,657 |
Asahi Kasei Corp. | | 79,000 | | | 526,593 |
Asics Corp. | | 13,000 | | | 186,605 |
Astellas Pharma, Inc. | | 31,600 | | | 1,378,617 |
Benesse Corp. | | 5,000 | | | 212,541 |
Bridgestone Corp. (a) | | 38,000 | | | 669,272 |
Canon, Inc. | | 67,300 | | | 3,074,958 |
Casio Computer Co., Ltd. | | 18,100 | | | 210,657 |
Central Japan Railway Co. | | 105 | | | 893,201 |
Chubu Electric Power Co., Inc. | | 43,800 | | | 1,143,665 |
Chugai Pharmaceutical Co., Ltd. (a) | | 22,400 | | | 319,996 |
Chuo Mitsui Trust Holdings, Inc. | | 60,262 | | | 467,071 |
Citizen Holdings Co., Ltd. (a) | | 26,900 | | | 261,524 |
Cosmo Oil Co., Ltd. | | 43,000 | | | 160,841 |
Credit Saison Co., Ltd. | | 10,500 | | | 286,510 |
Dai Nippon Printing Co., Ltd. | | 40,000 | | | 582,690 |
Daido Steel Co., Ltd. (a) | | 25,893 | | | 193,646 |
Daiichi Sankyo Co., Ltd. | | 44,700 | | | 1,373,347 |
Daikin Industries, Ltd. | | 16,800 | | | 937,948 |
Dainippon Ink & Chemicals, Inc. | | 52,000 | | | 259,817 |
Daito Trust Construction Co., Ltd. | | 6,400 | | | 355,102 |
Daiwa House Industry Co., Ltd. | | 40,000 | | | 514,558 |
Daiwa Securities Group, Inc. | | 87,000 | | | 801,593 |
Denki Kagaku Kogyo K.K. | | 38,000 | | | 164,068 |
Denso Corp. | | 30,100 | | | 1,223,305 |
Dentsu, Inc. | | 142 | | | 372,898 |
| | | | | |
| Security Description | | Shares | | Value* |
| | | | | |
|
Japan—(Continued) |
East Japan Railway Co. | | 210 | | $ | 1,724,446 |
Eisai Co., Ltd. | | 16,600 | | | 654,554 |
Electric Power Development Co., Ltd. | | 12,200 | | | 452,701 |
Elpida Memory, Inc. (a) | | 6,300 | | | 217,455 |
Fanuc, Ltd. | | 12,600 | | | 1,229,214 |
Fast Retailing Co., Ltd. | | 4,500 | | | 320,152 |
FUJIFILM Holdings Corp. | | 32,600 | | | 1,381,851 |
Fujitsu, Ltd. | | 131,000 | | | 876,644 |
Fukuoka Financial Group, Inc. | | 53,000 | | | 316,112 |
Hankyu Hanshin Holdings, Inc. | | 76,000 | | | 327,890 |
Haseko Corp. | | 83,500 | | | 143,388 |
Hirose Electric Co., Ltd. (a) | | 2,200 | | | 254,883 |
Hitachi Chemical Co., Ltd. | | 8,000 | | | 183,675 |
Hitachi Construction Machinary Co., Ltd. | | 6,400 | | | 190,851 |
Hitachi, Ltd. | | 214,000 | | | 1,567,882 |
Hokkaido Electric Power Co., Inc. | | 13,800 | | | 299,145 |
Hokuhoku Financial Group, Inc. | | 76,000 | | | 218,279 |
Honda Motor Co., Ltd. | | 98,800 | | | 3,266,466 |
Hoya Corp. | | 26,300 | | | 839,367 |
Ibiden Co., Ltd. | | 8,100 | | | 559,480 |
Idemitsu Kosan Co., Ltd. | | 1,600 | | | 168,876 |
Ihi Corp. (a) | | 99,000 | | | 205,597 |
Inpex Holdings, Inc. | | 53 | | | 570,112 |
Isetan Co., Ltd. (a) | | 13,200 | | | 178,528 |
Isuzu Motors, Ltd. | | 54,000 | | | 241,478 |
Itochu Corp. | | 101,000 | | | 981,421 |
J Front Retailing Co., Ltd. | | 30,400 | | | 267,032 |
Japan Airlines Corp. | | 71,000 | | | 160,961 |
Japan Petroleum Exploration Co. | | 2,200 | | | 159,952 |
Japan Prime Realty Investment Corp. (REIT) (a) | | 44 | | | 175,338 |
Japan Real Estate Investment Corp. (REIT) (a) | | 27 | | | 333,715 |
Japan Retail Fund Investment Corp. (REIT) (a) | | 23 | | | 161,941 |
Japan Tobacco, Inc. | | 287 | | | 1,701,741 |
JFE Holding, Inc. | | 36,300 | | | 1,829,180 |
JGC Corp. | | 13,000 | | | 223,260 |
JS Group Corp. | | 22,100 | | | 353,917 |
JSR Corp. | | 11,300 | | | 292,314 |
JTEKT Corp. | | 12,600 | | | 225,770 |
Kajima Corp. | | 74,000 | | | 242,328 |
Kaneka Corp. | | 20,000 | | | 166,009 |
Kao Corp. | | 33,000 | | | 992,980 |
Kawasaki Heavy Industries, Ltd. (a) | | 80,000 | | | 235,756 |
Kawasaki Kisen Kaisha, Ltd. (a) | | 41,000 | | | 400,888 |
KDDI Corp. | | 165 | | | 1,225,169 |
Keihin Electric Express Railway Co., Ltd. (a) | | 25,000 | | | 152,964 |
Keio Corp. | | 32,000 | | | 194,429 |
Keyence Corp. | | 2,100 | | | 514,460 |
Kintetsu Corp. (a) | | 102,120 | | | 316,764 |
Kirin Holdings Co., Ltd. (a) | | 54,000 | | | 791,382 |
Kobe Steel, Ltd. | | 177,000 | | | 573,675 |
Komatsu, Ltd. | | 57,100 | | | 1,543,871 |
Konami Corp. | | 8,300 | | | 270,978 |
Konica Minolta Holdings, Inc. | | 35,000 | | | 616,033 |
Kubota Corp. | | 75,000 | | | 513,401 |
Kuraray Co., Ltd. | | 24,500 | | | 295,774 |
Kurita Water Industries, Ltd. (a) | | 7,100 | | | 215,922 |
Kyocera Corp. | | 11,300 | | | 988,726 |
*See accompanying notes to financial statements.
MSF-8
Metropolitan Series Fund, Inc.
Morgan Stanley EAFE Index Portfolio
Schedule of Investments as of December 31, 2007
Common Stock—(Continued)
| | | | | |
| Security Description | | Shares | | Value* |
| | | | | |
|
Japan—(Continued) |
Kyowa Hakko Kogyo Co., Ltd. (a) | | 20,000 | | $ | 213,103 |
Kyushu Electric Power Co., Inc. | | 25,800 | | | 635,790 |
Lawson, Inc. | | 4,900 | | | 173,485 |
Leopalace21 Corp. | | 8,500 | | | 227,970 |
Makita Corp. | | 9,400 | | | 392,786 |
Marubeni Corp. | | 112,000 | | | 786,666 |
Marui Group Co., Ltd. (a) | | 27,500 | | | 271,913 |
Matsushita Electric Industrial Co., Ltd. | | 127,000 | | | 2,598,213 |
Matsushita Electric Works, Ltd. | | 24,000 | | | 266,092 |
Mazda Motor Corp. | | 36,000 | | | 180,257 |
Millea Holdings, Inc. (d) | | 48,800 | | | 1,649,378 |
Minebea Co., Ltd. | | 28,000 | | | 179,003 |
Mitsubishi Chemical Holdings Corp. | | 88,000 | | | 674,514 |
Mitsubishi Corp. | | 85,900 | | | 2,339,837 |
Mitsubishi Electric Corp. | | 122,000 | | | 1,259,998 |
Mitsubishi Estate Co., Ltd. | | 75,000 | | | 1,797,817 |
Mitsubishi Gas & Chemical Co., Inc. | | 26,000 | | | 253,307 |
Mitsubishi Heavy Industries, Ltd. | | 204,000 | | | 873,013 |
Mitsubishi Materials Corp. | | 65,000 | | | 276,453 |
Mitsubishi Motors Corp. (a) (b) | | 132,000 | | | 223,720 |
Mitsubishi Rayon Co., Ltd. | | 44,000 | | | 212,988 |
Mitsubishi UFJ Financial Group, Inc. | | 546,868 | | | 5,090,147 |
Mitsui & Co., Ltd. | | 106,317 | | | 2,255,627 |
Mitsui Chemicals, Inc. | | 52,000 | | | 340,367 |
Mitsui Engineering & Shipbuilding Co., Ltd. (a) | | 54,000 | | | 209,409 |
Mitsui Fudosan Co., Ltd. | | 56,000 | | | 1,210,268 |
Mitsui Mining & Smelting Co., Ltd. | | 38,000 | | | 151,937 |
Mitsui OSK Lines, Ltd. | | 75,000 | | | 952,719 |
Mitsui Sumitomo Insurance Co., Ltd. | | 83,000 | | | 810,116 |
Mitsumi Electric Co., Ltd. | | 5,700 | | | 190,228 |
Mizuho Financial Group, Inc. | | 621 | | | 2,946,053 |
Murata Manufacturing Co., Ltd. | | 14,100 | | | 820,021 |
Namco Bandai Holdings, Inc. | | 12,500 | | | 197,963 |
NEC Corp. | | 144,000 | | | 665,238 |
NGK Insulators, Ltd. | | 17,000 | | | 458,691 |
NGK Spark Plug Co., Ltd. (a) | | 10,000 | | | 174,574 |
Nidec Corp. | | 7,100 | | | 527,084 |
Nikko Cordial Corp. (a) | | 27,500 | | | 412,355 |
Nikon Corp. (a) | | 23,000 | | | 784,585 |
Nintendo Co., Ltd. | | 6,200 | | | 3,764,316 |
Nippon Building Fund, Inc. (REIT) | | 29 | | | 405,992 |
Nippon Electric Glass Co., Ltd. | | 23,000 | | | 373,563 |
Nippon Express Co., Ltd. | | 48,000 | | | 245,434 |
Nippon Mining Holdings, Inc. | | 71,000 | | | 456,103 |
Nippon Oil Corp. | | 90,000 | | | 733,207 |
Nippon Paper Group, Inc. | | 63 | | | 189,308 |
Nippon Sheet Glass Co., Ltd. | | 35,000 | | | 176,098 |
Nippon Steel Corp. | | 368,000 | | | 2,266,230 |
Nippon Telephone & Telegraph Corp. | | 345 | | | 1,707,390 |
Nippon Yusen K.K. | | 75,000 | | | 597,148 |
NIPPONKOA Insurance Co., Ltd. | | 26,000 | | | 235,746 |
Nissan Motor Co., Ltd. | | 146,500 | | | 1,586,203 |
Nisshin Steel Co., Ltd. (a) | | 68,000 | | | 238,011 |
Nissin Food Products Co., Ltd. (a) | | 6,400 | | | 206,833 |
Nitto Denko Corp. (a) | | 10,100 | | | 533,252 |
NOK Corp. | | 8,900 | | | 187,603 |
Nomura Holdings, Inc. | | 109,200 | | | 1,825,456 |
| | | | | |
| Security Description | | Shares | | Value* |
| | | | | |
|
Japan—(Continued) |
Nomura Real Estate Office Fund, Inc. (REIT) | | 18 | | $ | 169,287 |
Nomura Research Institute, Ltd. | | 9,600 | | | 315,229 |
NSK, Ltd. | | 37,000 | | | 384,040 |
NTN Corp. (a) | | 25,000 | | | 216,747 |
NTT Data Corp. (a) | | 80 | | | 356,447 |
NTT DoCoMo, Inc. | | 990 | | | 1,640,304 |
NTT Urban Development Corp. | | 89 | | | 141,761 |
Obayashi Corp. (a) | | 51,000 | | | 256,983 |
Odakyu Electric Railway Co., Ltd. (a) | | 51,000 | | | 325,048 |
OJI Paper Co., Ltd. | | 63,000 | | | 309,316 |
Olympus Corp. | | 16,000 | | | 655,542 |
Omron Corp. | | 13,600 | | | 321,904 |
Ono Pharmaceutical Co., Ltd. | | 3,700 | | | 173,058 |
Oriental Land Co., Ltd. (a) | | 3,400 | | | 205,228 |
ORIX Corp. | | 5,960 | | | 996,666 |
Osaka Gas Co., Ltd. | | 134,000 | | | 528,126 |
Rakuten, Inc. (a) | | 385 | | | 187,190 |
Resona Holdings, Inc. (a) | | 377 | | | 689,694 |
Ricoh Co., Ltd. | | 45,000 | | | 827,639 |
Rohm Co., Ltd. | | 7,200 | | | 626,677 |
Sankyo Co., Ltd. | | 3,600 | | | 166,902 |
Sanyo Electric Co., Ltd. (a) | | 110,000 | | | 151,935 |
Sapporo Hokuyo Holdings, Inc. | | 20 | | | 179,643 |
SBI Holdings, Inc. (a) | | 686 | | | 186,525 |
Secom Co., Ltd. | | 13,500 | | | 739,083 |
Sega Sammy Holdings, Inc. (a) | | 14,600 | | | 182,267 |
Seiko Epson Corp. (a) | | 8,600 | | | 186,976 |
Sekisui Chemical Co., Ltd. | | 38,000 | | | 256,466 |
Sekisui House, Ltd. | | 38,000 | | | 411,598 |
Seven & I Holdings Co., Ltd. | | 54,600 | | | 1,587,793 |
Sharp Corp. (a) | | 65,000 | | | 1,164,480 |
Shikoku Electric Power Co., Inc. | | 7,000 | | | 187,329 |
Shimamura Co., Ltd. (a) | | 1,700 | | | 143,630 |
Shimano, Inc. (a) | | 5,500 | | | 198,019 |
Shimizu Corp. | | 37,000 | | | 161,059 |
Shin-Etsu Chemical Co., Ltd. | | 26,300 | | | 1,644,346 |
Shinko Securities Co., Ltd. | | 37,000 | | | 153,383 |
Shinsei Bank, Ltd. (a) | | 100,000 | | | 367,645 |
Shionogi & Co., Ltd. | | 19,000 | | | 335,036 |
Shiseido Co., Ltd. | | 21,000 | | | 497,530 |
Showa Denko K.K. (a) | | 65,000 | | | 233,110 |
Showa Shell Sekiyu K.K. (a) | | 12,600 | | | 140,343 |
SMC Corp. | | 4,000 | | | 476,070 |
Softbank Corp. (a) | | 48,100 | | | 990,058 |
Sojitz Corp. | | 70,500 | | | 253,928 |
Sompo Japan Insurance, Inc. | | 64,000 | | | 576,550 |
Sony Corp. | | 63,000 | | | 3,418,889 |
Sony Financial Holdings, Inc. | | 64 | | | 243,245 |
Stanley Electric Co., Ltd. | | 11,800 | | | 293,882 |
Sumco Corp. | | 8,200 | | | 234,768 |
Sumitomo Chemical Co., Ltd. | | 100,000 | | | 889,346 |
Sumitomo Corp. | | 67,700 | | | 964,001 |
Sumitomo Electric Industries, Ltd. | | 51,134 | | | 814,518 |
Sumitomo Heavy Industries, Ltd. | | 46,000 | | | 422,642 |
Sumitomo Metal Industries, Ltd. | | 264,000 | | | 1,219,103 |
Sumitomo Metal Mining Co., Ltd. | | 34,000 | | | 582,235 |
Sumitomo Mitsui Financial Group, Inc. (a) | | 414 | | | 3,080,625 |
*See accompanying notes to financial statements.
MSF-9
Metropolitan Series Fund, Inc.
Morgan Stanley EAFE Index Portfolio
Schedule of Investments as of December 31, 2007
Common Stock—(Continued)
| | | | | |
| Security Description | | Shares | | Value* |
| | | | | |
|
Japan—(Continued) |
Sumitomo Realty & Development Co., Ltd. | | 25,000 | | $ | 614,908 |
Suzuken Co., Ltd. | | 5,574 | | | 198,622 |
Suzuki Motor Corp. | | 12,200 | | | 366,924 |
T&D Holdings, Inc. | | 12,400 | | | 641,831 |
Taisei Corp. | | 79,000 | | | 212,926 |
Taisho Pharmaceutical Co., Ltd. | | 10,000 | | | 192,581 |
Taiyo Nippon Sanso Corp. | | 18,000 | | | 168,184 |
Takashimaya Co., Ltd. (a) | | 17,000 | | | 204,854 |
Takeda Pharmaceutical Co., Ltd. | | 54,400 | | | 3,180,079 |
Takefuji Corp. | | 7,440 | | | 178,627 |
TDK Corp. | | 9,100 | | | 674,905 |
Teijin, Ltd. | | 66,000 | | | 282,113 |
Terumo Corp. | | 11,900 | | | 626,914 |
The 77 Bank, Ltd. | | 20,000 | | | 124,804 |
The Bank of Kyoto, Ltd. | | 22,000 | | | 259,946 |
The Bank of Yokohama, Ltd. | | 83,000 | | | 586,918 |
The Chiba Bank, Ltd. | | 47,000 | | | 380,789 |
The Chugoku Electric Power Co., Inc. (a) | | 10,300 | | | 200,224 |
The Furukawa Electric Co., Ltd. | | 38,000 | | | 146,919 |
The Gunma Bank, Ltd. | | 26,000 | | | 174,027 |
The Hachijuni Bank, Ltd. | | 30,000 | | | 201,730 |
The Hiroshima Bank, Ltd. | | 38,000 | | | 205,360 |
The Japan Steel Works, Ltd. | | 21,000 | | | 307,610 |
The Joyo Bank, Ltd. | | 40,000 | | | 223,016 |
The Kansai Electric Power Co., Inc. | | 51,500 | | | 1,201,576 |
The Shizuoka Bank, Ltd. | | 41,000 | | | 451,063 |
The Sumitomo Trust & Banking Co., Ltd. | | 81,000 | | | 539,303 |
The Suruga Bank, Ltd. (a) | | 17,000 | | | 184,459 |
The Tokyo Electric Power Co., Inc. | | 77,400 | | | 2,004,951 |
THK Co., Ltd. | | 7,700 | | | 155,599 |
Tobu Railway Co., Ltd. (a) | | 52,000 | | | 243,241 |
Toho Co., Ltd. (a) | | 9,467 | | | 212,073 |
Tohoku Electric Power Co., Inc. | | 26,200 | | | 590,454 |
Tokuyama Corp. (a) | | 22,000 | | | 220,112 |
Tokyo Electron, Ltd. | | 11,400 | | | 696,356 |
Tokyo Gas Co., Ltd. | | 150,000 | | | 700,330 |
Tokyo Tatemono Co., Ltd. (a) | | 19,000 | | | 178,853 |
Tokyu Corp. | | 76,000 | | | 500,908 |
Tokyu Land Corp. | | 29,000 | | | 248,182 |
TonenGeneral Sekiyu K.K. (a) | | 27,000 | | | 266,128 |
Toppan Printing Co., Ltd. | | 42,000 | | | 413,726 |
Toray Industries, Inc. (a) | | 83,000 | | | 644,857 |
Toshiba Corp. (a) | | 198,000 | | | 1,476,480 |
Tosoh Corp. | | 34,000 | | | 145,915 |
Toyo Seikan Kaisha, Ltd. | | 10,200 | | | 180,584 |
Toyoda Gosei Co., Ltd. | | 5,100 | | | 179,694 |
Toyota Industries Corp. | | 12,600 | | | 513,831 |
Toyota Motor Corp. | | 169,800 | | | 9,139,506 |
Toyota Tsusho Corp. (a) | | 14,200 | | | 383,690 |
Trend Micro, Inc. | | 9,000 | | | 322,622 |
Ube Industries, Ltd. | | 53,000 | | | 180,164 |
Unicharm Corp. | | 3,100 | | | 195,187 |
Urban Corp. | | 12,900 | | | 171,614 |
Ushio, Inc. | | 8,700 | | | 190,948 |
West Japan Railway Co. | | 126 | | | 621,200 |
Yahoo! Japan Corp. (a) | | 900 | | | 401,646 |
Yakult Honsha Co., Ltd. (a) | | 9,000 | | | 207,615 |
| | | | | |
| Security Description | | Shares | | Value* |
| | | | | |
|
Japan—(Continued) |
Yamada Denki Co., Ltd. (a) | | 6,020 | | $ | 685,214 |
Yamaha Corp. | | 11,500 | | | 262,424 |
Yamaha Motor Co., Ltd. (a) | | 13,100 | | | 317,793 |
Yamato Holdings Co., Ltd. | | 27,000 | | | 389,749 |
Yaskawa Electric Corp. | | 17,000 | | | 229,112 |
Yokogawa Electric Corp. (a) | | 14,600 | | | 160,130 |
| | | | | |
| | | | | 172,460,163 |
| | | | | |
| | |
Luxembourg—0.6% | | | | | |
Acergy S.A. (a) | | 12,330 | | | 271,640 |
ArcelorMittal | | 57,095 | | | 4,390,089 |
Millicom International Cellular S.A. (SEK) (b) | | 2,100 | | | 239,123 |
SES (FDR) | | 9,743 | | | 255,481 |
| | | | | |
| | | | | 5,156,333 |
| | | | | |
| | |
Netherlands—2.9% | | | | | |
Aegon NV | | 94,540 | | | 1,658,649 |
Akzo Nobel NV | | 17,317 | | | 1,379,025 |
ASML Holding NV (b) | | 24,137 | | | 758,506 |
Corio NV (REIT) | | 3,133 | | | 252,182 |
European Aeronautic Defense & Space Co. NV (a) | | 21,349 | | | 677,745 |
Fugro NV | | 3,571 | | | 273,721 |
Heineken Holding NV | | 3,702 | | | 208,572 |
Heineken NV | | 16,152 | | | 1,040,267 |
ING Groep NV | | 118,498 | | | 4,625,281 |
James Hardie Industries NV (AUD) (a) | | 34,811 | | | 196,099 |
Koninklijke Ahold NV | | 81,255 | | | 1,128,237 |
Koninklijke DSM NV | | 10,570 | | | 494,171 |
Koninklijke Philips Electronics NV | | 70,981 | | | 3,076,164 |
Randstad Holding NV (a) | | 3,422 | | | 135,876 |
Reed Elsevier NV (a) | | 45,759 | | | 907,780 |
Royal KPN NV | | 118,971 | | | 2,151,640 |
SBM Offshore NV | | 9,817 | | | 307,929 |
STMicroelectronics NV (a) | | 44,693 | | | 636,241 |
TNT NV (b) | | 24,488 | | | 1,019,009 |
TomTom NV (b) | | 3,347 | | | 250,143 |
Unilever NV | | 105,906 | | | 3,877,498 |
Vedior NV | | 11,155 | | | 278,474 |
Wolters Kluwer NV | | 17,885 | | | 584,330 |
| | | | | |
| | | | | 25,917,539 |
| | | | | |
| | |
New Zealand—0.1% | | | | | |
Auckland International Airport, Ltd. (a) | | 114,386 | | | 255,350 |
Fletcher Building, Ltd. (a) | | 50,819 | | | 448,964 |
Telecom Corp. of New Zealand, Ltd. (a) | | 138,544 | | | 462,336 |
| | | | | |
| | | | | 1,166,650 |
| | | | | |
|
Norway—0.9% |
Aker Kvaerner ASA | | 10,348 | | | 272,917 |
DnB NOR ASA | | 48,456 | | | 734,884 |
Lighthouse Caledonia ASA (a) (b) | | 700 | | | 665 |
Norsk Hydro ASA | | 45,479 | | | 642,958 |
Orkla ASA | | 54,230 | | | 1,044,691 |
Petroleum Geo-Services ASA (a) | | 12,801 | | | 368,097 |
Renewable Energy Corp. ASA (a) (b) | | 11,753 | | | 587,548 |
*See accompanying notes to financial statements.
MSF-10
Metropolitan Series Fund, Inc.
Morgan Stanley EAFE Index Portfolio
Schedule of Investments as of December 31, 2007
Common Stock—(Continued)
| | | | | |
| Security Description | | Shares | | Value* |
| | | | | |
|
Norway—(Continued) |
StatoilHydro ASA | | 79,549 | | $ | 2,459,592 |
Storebrand ASA (a) | | 29,064 | | | 300,994 |
Telenor ASA | | 56,338 | | | 1,331,775 |
Yara International ASA | | 12,775 | | | 586,626 |
| | | | | |
| | | | | 8,330,747 |
| | | | | |
|
Portugal—0.4% |
Banco Comercial Portugues S.A. (a) | | 122,688 | | | 520,921 |
Banco Espirito Santo S.A. (a) | | 13,155 | | | 287,241 |
Brisa-Auto Estradas de Portugal S.A. (a) | | 24,915 | | | 364,653 |
Energias de Portugal S.A. | | 142,218 | | | 924,502 |
Portugal Telecom, SGPS, S.A. | | 52,727 | | | 684,744 |
PT Multimedia Servicos de Telecomunicacoes e Multimedia, SGPS, S.A. | | 17,901 | | | 249,182 |
Sonae, SGPS, S.A. | | 37,542 | | | 107,982 |
| | | | | |
| | | | | 3,139,225 |
| | | | | |
|
Singapore—1.1% |
CapitaLand, Ltd. | | 116,000 | | | 498,754 |
CapitaMall Trust (REIT) (a) | | 98,000 | | | 233,038 |
City Developments, Ltd. | | 40,000 | | | 389,501 |
ComfortDelGro Corp., Ltd. | | 184,000 | | | 231,508 |
Cosco Corp Singapore, Ltd. | | 71,517 | | | 281,379 |
DBS Group Holdings, Ltd. | | 74,978 | | | 1,062,563 |
Fraser & Neave, Ltd. | | 58,000 | | | 234,851 |
Keppel Corp., Ltd. | | 79,000 | | | 707,186 |
Oversea-Chinese Banking Corp. | | 170,880 | | | 986,070 |
SembCorp Industries, Ltd. | | 89,000 | | | 355,524 |
Sembcorp Marine | | 79,685 | | | 222,175 |
Singapore Airlines, Ltd. | | 40,940 | | | 490,029 |
Singapore Exchange, Ltd. (a) | | 54,000 | | | 493,614 |
Singapore Press Holdings, Ltd. | | 117,250 | | | 365,564 |
Singapore Technologies Engineering, Ltd. | | 135,000 | | | 349,722 |
Singapore Telecommunications, Ltd. | | 546,820 | | | 1,500,586 |
United Overseas Bank, Ltd. | | 83,392 | | | 1,154,273 |
| | | | | |
| | | | | 9,556,337 |
| | | | | |
|
Spain—4.2% |
Abertis Infraestructuras S.A. (a) | | 16,853 | | | 539,908 |
Acciona S.A. | | 1,646 | | | 517,355 |
Acerinox S.A. (a) | | 12,363 | | | 302,079 |
ACS Actividades de Construccion y Servicios S.A. | | 13,005 | | | 766,091 |
Altadis S.A. | | 15,935 | | | 1,157,945 |
Banco Bilbao Vizcaya Argentaria S.A. | | 234,707 | | | 5,764,681 |
Banco de Sabadell S.A. (a) | | 31,632 | | | 340,737 |
Banco Popular Espanol S.A. (a) | | 54,939 | | | 927,014 |
Banco Santander S.A. | | 390,782 | | | 8,442,540 |
Bankinter S.A. (a) | | 9,284 | | | 168,729 |
Cintra Concesiones de Infraestructuras de Transporte S.A. (a) | | 13,160 | | | 197,411 |
Fomento de Construcciones y Contratas S.A. (a) | | 3,072 | | | 228,948 |
Gamesa Corp. Tecnologica S.A. | | 10,521 | | | 486,774 |
Gas Natural SDG S.A. | | 7,593 | | | 442,213 |
Gestevision Telecino S.A. (a) | | 7,207 | | | 182,301 |
Grupo Ferrovial S.A. (a) | | 4,336 | | | 302,757 |
| | | | | |
| Security Description | | Shares | | Value* |
| | | | | |
|
Spain—(Continued) |
Iberdrola S.A. (a) (b) | | 236,442 | | $ | 3,579,279 |
Iberia Lineas Aereas de Espana | | 35,252 | | | 152,596 |
Inditex S.A. (a) | | 13,792 | | | 838,581 |
Indra Sistemas S.A. (a) | | 9,459 | | | 254,140 |
Mapfre S.A. (a) | | 30,960 | | | 135,449 |
Red Electrica de Espana | | 6,962 | | | 437,533 |
Repsol YPF S.A. | | 48,301 | | | 1,722,294 |
Sacyr Vallehermoso S.A. (a) | | 5,904 | | | 227,117 |
Sociedad General de Aguas de Barcelona S.A. (a) | | 4,432 | | | 178,131 |
Telefonica S.A. | | 268,833 | | | 8,687,932 |
Union Fenosa S.A. | | 6,520 | | | 437,310 |
Zardoya Otis S.A. (a) | | 7,249 | | | 204,121 |
| | | | | |
| | | | | 37,621,966 |
| | | | | |
|
Sweden—2.2% |
Alfa Laval AB | | 6,515 | | | 362,423 |
Assa Abloy AB (Series B) | | 20,057 | | | 399,033 |
Atlas Copco AB (Series A) | | 45,479 | | | 671,423 |
Atlas Copco AB (Series B) | | 26,061 | | | 351,792 |
Boliden AB | | 18,652 | | | 231,020 |
Electrolux AB | | 17,118 | | | 285,244 |
Getinge AB (Class B) | | 12,136 | | | 324,109 |
Hennes & Mauritz AB (Series B) | | 30,251 | | | 1,828,352 |
Husqvarna AB | | 17,118 | | | 202,037 |
Investor AB | | 15,800 | | | 355,549 |
Lundin Petroleum AB (a) | | 16,352 | | | 169,094 |
Modern Times Group AB | | 3,130 | | | 218,437 |
Nordea Bank AB | | 131,570 | | | 2,182,596 |
Sandvik AB | | 61,232 | | | 1,040,764 |
Scania AB | | 26,572 | | | 628,097 |
Securitas AB | | 21,462 | | | 296,676 |
Skandinaviska Enskilda Banken AB | | 29,510 | | | 746,317 |
Skanska AB | | 25,167 | | | 470,037 |
SKF AB | | 28,872 | | | 483,680 |
SSAB Svenskt Stal AB (Series A) | | 11,498 | | | 308,639 |
Svenska Cellulosa AB | | 34,876 | | | 613,323 |
Svenska Handelsbanken AB | | 35,259 | | | 1,118,372 |
Swedbank AB | | 12,400 | | | 347,402 |
Swedish Match AB | | 18,278 | | | 434,914 |
Tele2 AB | | 23,123 | | | 459,915 |
Telefonaktiebolaget LM Ericsson (Class B) | | 940,902 | | | 2,199,787 |
TeliaSonera AB | | 147,300 | | | 1,369,908 |
Volvo AB (Series A) | | 32,832 | | | 540,571 |
Volvo AB (Series B) | | 69,624 | | | 1,153,877 |
| | | | | |
| | | | | 19,793,388 |
| | | | | |
|
Switzerland—6.2% |
ABB, Ltd. | | 136,348 | | | 3,931,178 |
Actelion, Ltd. (a) (b) | | 6,285 | | | 278,402 |
Adecco S.A. | | 8,604 | | | 461,373 |
Ciba Specialty Chemicals AG | | 4,529 | | | 208,539 |
Credit Suisse Group | | 65,575 | | | 3,942,854 |
Geberit AG | | 2,351 | | | 320,522 |
Givaudan AG | | 405 | | | 389,123 |
Holcim, Ltd. | | 13,815 | | | 1,467,900 |
Julius Baer Holding AG | | 6,779 | | | 573,025 |
*See accompanying notes to financial statements.
MSF-11
Metropolitan Series Fund, Inc.
Morgan Stanley EAFE Index Portfolio
Schedule of Investments as of December 31, 2007
Common Stock—(Continued)
| | | | | |
| Security Description | | Shares | | Value* |
| | | | | |
|
Switzerland—(Continued) |
Kuehne & Nagel International AG | | 3,252 | | $ | 310,041 |
Lindt & Spruengli AG | | 55 | | | 182,661 |
Logitech International S.A. | | 10,725 | | | 389,404 |
Lonza Group AG (a) | | 2,935 | | | 353,027 |
Nestle S.A. | | 24,590 | | | 11,267,473 |
Nobel Biocare Holding AG | | 1,606 | | | 424,847 |
Novartis AG | | 144,728 | | | 7,884,526 |
Roche Holding AG | | 43,848 | | | 7,552,878 |
SGS S.A. | | 302 | | | 355,787 |
Sonova Holding AG | | 2,594 | | | 290,165 |
Straumann Holding AG | | 534 | | | 150,934 |
Sulzer AG | | 196 | | | 284,553 |
Swatch Group AG (Class A) | | 4,566 | | | 266,943 |
Swatch Group AG (Class B) | | 2,093 | | | 627,502 |
Swiss Life Holding | | 2,159 | | | 534,482 |
Swiss Reinsurance | | 22,569 | | | 1,583,159 |
Swisscom AG | | 1,500 | | | 582,731 |
Syngenta AG | | 6,723 | | | 1,705,795 |
UBS AG | | 129,760 | | | 6,025,978 |
Unaxis Holdings AG | | 425 | | | 194,828 |
Zurich Financial Services AG | | 8,914 | | | 2,623,261 |
| | | | | |
| | | | | 55,163,891 |
| | | | | |
|
United Kingdom—21.6% |
3i Group, Plc. | | 28,037 | | | 557,209 |
Alliance & Leicester, Plc. | | 12,993 | | | 165,486 |
AMEC, Plc. | | 25,228 | | | 418,473 |
Anglo American, Plc. | | 83,031 | | | 5,032,001 |
Antofagasta, Plc. | | 13,127 | | | 185,529 |
ARM Holdings, Plc. (a) | | 70,619 | | | 173,123 |
Associated British Foods, Plc. | | 11,767 | | | 209,505 |
AstraZeneca, Plc. | | 91,973 | | | 3,951,943 |
Aviva, Plc. | | 165,050 | | | 2,192,222 |
BAE Systems, Plc. | | 218,107 | | | 2,136,063 |
Balfour Beatty, Plc. | | 30,333 | | | 297,402 |
Barclays, Plc. | | 427,844 | | | 4,333,863 |
Barratt Developments, Plc. | | 18,894 | | | 172,696 |
BG Group, Plc. | | 213,112 | | | 4,906,566 |
BHP Billiton, Plc. | | 144,308 | | | 4,444,967 |
BP, Plc. | | 1,192,234 | | | 14,580,523 |
British Airways, Plc. | | 41,370 | | | 252,653 |
British America Tobacco, Plc. | | 95,291 | | | 3,752,272 |
British Energy Group, Plc. | | 64,769 | | | 702,990 |
British Land Co., Plc. (REIT) | | 36,770 | | | 685,386 |
British Sky Broadcasting, Plc. | | 73,950 | | | 906,506 |
BT Group, Plc. | | 504,528 | | | 2,722,539 |
Bunzl, Plc. | | 22,401 | | | 314,057 |
Burberry Group, Plc. | | 26,876 | | | 302,554 |
Cable & Wireless, Plc. | | 157,710 | | | 581,940 |
Cadbury Schweppes, Plc. | | 135,855 | | | 1,693,492 |
Capita Group, Plc. | | 39,413 | | | 551,123 |
Carnival, Plc. | | 11,804 | | | 518,174 |
Centrica, Plc. | | 226,177 | | | 1,607,361 |
Cobham, Plc. | | 90,123 | | | 372,434 |
Compass Group, Plc. | | 128,562 | | | 783,877 |
Daily Mail & General Trust | | 23,944 | | | 234,564 |
| | | | | |
| Security Description | | Shares | | Value* |
| | | | | |
|
United Kingdom—(Continued) |
Diageo, Plc. | | 164,623 | | $ | 3,523,831 |
DSG International, Plc. | | 124,943 | | | 243,851 |
EMAP, Plc. (a) | | 17,862 | | | 324,681 |
Enterprise Inns, Plc. | | 31,243 | | | 300,962 |
Experian Group, Ltd. | | 59,983 | | | 476,715 |
FirstGroup, Plc. | | 30,753 | | | 496,355 |
Friends Provident, Plc. | | 122,735 | | | 396,790 |
G4S, Plc. | | 83,089 | | | 401,373 |
GKN, Plc. | | 50,689 | | | 282,350 |
GlaxoSmithKline, Plc. | | 353,125 | | | 8,961,193 |
Hammerson, Plc. (REIT) | | 17,590 | | | 357,796 |
Hays, Plc. | | 89,608 | | | 204,835 |
HBOS, Plc. | | 235,004 | | | 3,407,722 |
Home Retail Group, Plc. (b) | | 67,711 | | | 435,241 |
HSBC Holdings, Plc. | | 733,916 | | | 12,311,110 |
ICAP, Plc. | | 36,213 | | | 521,212 |
IMI, Plc. | | 24,507 | | | 190,280 |
Imperial Chemical Industries, Plc. | | 75,167 | | | 1,002,504 |
Imperial Tobacco Group, Plc. | | 43,373 | | | 2,361,414 |
Inchcape, Plc. | | 34,970 | | | 261,294 |
Intercontinental Hotels Group, Plc. | | 21,687 | | | 378,532 |
International Power, Plc. | | 93,731 | | | 841,397 |
Invensys, Plc. | | 47,928 | | | 213,710 |
Investec, Plc. | | 26,347 | | | 239,901 |
J. Sainsbury Co. | | 101,545 | | | 854,609 |
Johnson Matthey, Plc. | | 14,556 | | | 542,101 |
Kazakhmys, Plc. | | 6,841 | | | 184,769 |
Kelda Group, Plc. | | 18,730 | | | 403,061 |
Kesa Electricals, Plc. | | 35,058 | | | 161,570 |
Kingfisher, Plc. | | 152,400 | | | 438,848 |
Ladbrokes, Plc. | | 47,638 | | | 304,246 |
Land Securities Group, Plc. (REIT) | | 28,545 | | | 848,842 |
Legal & General Group, Plc. | | 409,084 | | | 1,058,300 |
Liberty International, Plc. (REIT) | | 16,665 | | | 354,662 |
Lloyds TSB Group, Plc. | | 351,482 | | | 3,277,344 |
LogicaCMG, Plc. | | 90,803 | | | 211,717 |
London Stock Exchange Group, Plc. | | 11,107 | | | 435,577 |
Lonmin, Plc. | | 5,054 | | | 311,814 |
Man Group, Plc. | | 100,310 | | | 1,153,820 |
Marks & Spencer Group, Plc. | | 113,023 | | | 1,251,936 |
Meggitt, Plc. | | 42,619 | | | 280,512 |
Mitchells & Butlers, Plc. | | 20,913 | | | 175,187 |
Mondi, Plc. | | 23,534 | | | 197,434 |
National Express Group, Plc. | | 7,087 | | | 173,093 |
National Grid, Plc. | | 167,651 | | | 2,771,809 |
Next, Plc. | | 13,648 | | | 437,762 |
Old Mutual, Plc. | | 340,234 | | | 1,128,073 |
Pearson, Plc. | | 55,668 | | | 808,961 |
Persimmon, Plc. | | 19,800 | | | 315,314 |
Prudential, Plc. | | 151,315 | | | 2,126,940 |
Punch Taverns, Plc. | | 19,122 | | | 289,451 |
Reckitt Benckiser Group, Plc. | | 37,679 | | | 2,176,675 |
Reed Elsevier, Plc. | | 80,370 | | | 1,081,364 |
Rentokil Initial, Plc. | | 138,654 | | | 331,140 |
Resolution, Plc. | | 42,579 | | | 602,480 |
Reuters Group, Plc. | | 79,333 | | | 1,000,904 |
Rexam, Plc. | | 42,308 | | | 350,052 |
*See accompanying notes to financial statements.
MSF-12
Metropolitan Series Fund, Inc.
Morgan Stanley EAFE Index Portfolio
Schedule of Investments as of December 31, 2007
Common Stock—(Continued)
| | | | | |
| Security Description | | Shares | | Value* |
| | | | | |
|
United Kingdom—(Continued) |
Rio Tinto, Plc. | | 62,082 | | $ | 6,504,184 |
Rolls-Royce Group, Plc. | | 114,239 | | | 1,234,779 |
Royal Bank of Scotland Group, Plc. (a) | | 631,583 | | | 5,678,015 |
Royal Dutch Shell, Plc. (Class A) (a) | | 227,319 | | | 9,576,469 |
Royal Dutch Shell, Plc. (Class B) | | 171,621 | | | 7,177,792 |
SABMiller, Plc. | | 57,485 | | | 1,617,398 |
Sage Group, Ltd. | | 78,702 | | | 358,414 |
Schroders, Plc. | | 5,949 | | | 153,075 |
Scottish & Newcastle, Plc. | | 48,226 | | | 710,508 |
Scottish & Southern Energy, Plc. | | 54,779 | | | 1,779,371 |
Segro, Plc. (REIT) | | 25,798 | | | 239,551 |
Serco Group, Plc. | | 34,317 | | | 313,693 |
Severn Trent, Plc. | | 14,349 | | | 433,938 |
Shire, Plc. | | 17,927 | | | 411,855 |
Signet Group, Plc. | | 115,653 | | | 159,202 |
Smith & Nephew, Plc. | | 56,488 | | | 649,441 |
Smiths Group, Plc. | | 25,680 | | | 514,780 |
Stagecoach Group, Plc. | | 36,523 | | | 204,762 |
Standard Chartered, Plc. | | 41,969 | | | 1,524,177 |
Standard Life, Plc. | | 141,054 | | | 717,343 |
Tate & Lyle, Plc. | | 33,442 | | | 293,476 |
Taylor Wimpey, Plc. | | 76,505 | | | 305,811 |
Tesco, Plc. | | 495,654 | | | 4,680,308 |
The Carphone Warehouse, Plc. (a) | | 23,467 | | | 160,077 |
Thomas Cook Group, Plc. | | 33,377 | | | 186,055 |
Tomkins, Plc. | | 54,938 | | | 194,218 |
Travis Perkins, Plc. | | 9,603 | | | 228,577 |
TUI Travel, Plc. | | 44,767 | | | 259,494 |
Tullow Oil, Plc. | | 45,822 | | | 591,226 |
Unilever, Plc. | | 82,194 | | | 3,082,429 |
United Business Media, Plc. | | 20,280 | | | 260,026 |
United Utilities, Plc. | | 60,703 | | | 908,883 |
Vendeta Resources, Plc. | | 4,774 | | | 192,207 |
Vodafone Group, Plc. | | 3,314,325 | | | 12,352,526 |
Whitbread, Plc. | | 14,040 | | | 389,123 |
William Hill, Plc. | | 21,132 | | | 219,165 |
WM Morrison Supermarkets, Plc. | | 77,336 | | | 498,825 |
Wolseley, Plc. | | 43,462 | | | 637,254 |
WPP Group, Plc. | | 74,431 | | | 952,918 |
Xstrata, Plc. | | 39,366 | | | 2,772,011 |
Yell Group, Plc. | | 44,982 | | | 356,616 |
| | | | | |
| | | | | 193,394,881 |
| | | | | |
|
United States—2.1% |
iShares MSCI EAFE Index Fund (a) | | 234,400 | | | 18,400,400 |
Synthes, Inc. (CHF) (b) | | 3,629 | | | 448,564 |
| | | | | |
| | | | | 18,848,964 |
| | | | | |
Total Common Stock
(Identified Cost $645,759,682) | | | | | 876,945,193 |
| | | | | |
| | | | | |
|
| Preferred Stock—0.5% |
| Security Description | | Shares | | Value* |
| | | | | |
| | |
Australia—0.1% | | | | | |
GPT Group (REIT) | | 121,164 | | $ | 427,755 |
Macquarie Infrastructure Group (a) | | 183,237 | | | 485,516 |
| | | | | |
| | | | | 913,271 |
| | | | | |
| | |
Germany—0.4% | | | | | |
Fresenius SE | | 2,720 | | | 224,688 |
Henkel KGaA | | 10,747 | | | 602,426 |
Porsche AG | | 561 | | | 1,130,525 |
RWE AG | | 2,982 | | | 361,443 |
Volkswagen AG | | 6,775 | | | 983,936 |
| | | | | |
| | | | | 3,303,018 |
| | | | | |
| | |
Italy—0.0% | | | | | |
Unipol Gruppo Finanziario S.p.A. | | 57,044 | | | 179,581 |
| | | | | |
| | |
Switzerland—0.0% | | | | | |
Schindler Holding AG | | 4,477 | | | 286,185 |
| | | | | |
Total Preferred Stock
(Identified Cost $2,987,518) | | | | | 4,682,055 |
| | | | | |
| | |
| Units—0.4% | | | | | |
| | |
Australia—0.1% | | | | | |
Centro Properties Group (REIT) (a) | | 62,280 | | | 54,761 |
CFS Retail Property Trust (REIT) (a) | | 65,218 | | | 133,613 |
Macquarie Office Trust (REIT) (a) | | 135,057 | | | 166,312 |
Stockland (REIT) (a) | | 92,213 | | | 678,767 |
| | | | | |
| | | | | 1,033,453 |
| | | | | |
| | |
Switzerland—0.3% | | | | | |
Compagnie Financière Richemont S.A. | | 32,172 | | | 2,194,915 |
| | | | | |
| | |
United Kingdom—0.0% | | | | | |
Berkeley Group Holdings, Plc. | | 5,136 | | | 139,154 |
| | | | | |
Total Units
(Identified Cost $2,193,567) | | | | | 3,367,522 |
| | | | | |
| | |
| Rights—0.0% | | | | | |
| | |
Hong Kong—0.0% | | | | | |
Wharf Holdings, Ltd. (a) | | 9,429 | | | 12,940 |
| | | | | |
| | |
Japan—0.0% | | | | | |
Dowa Mining Co., Ltd. | | 16,000 | | | 5,607 |
| | | | | |
Total Rights
(Identified Cost $0) | | | | | 18,547 |
| | | | | |
*See accompanying notes to financial statements.
MSF-13
Metropolitan Series Fund, Inc.
Morgan Stanley EAFE Index Portfolio
Schedule of Investments as of December 31, 2007
Short Term Investments—10.8%
| | | | | | | |
| Security Description | | Face
Amount/Shares | | Value* | |
| | |
United States—10.8% | | | | | | | |
Federal Home Loan Bank
4.150%, 01/14/08 | | $ | 1,850,000 | | $ | 1,847,829 | |
State Street Navigator Securities
Lending Prime Portfolio (e) | | | 95,025,043 | | | 95,025,043 | |
| | | | | | | |
Total Short Term Investments
(Identified Cost $96,872,872) | | | | | | 96,872,872 | |
| | | | | | | |
Total Investments—109.8%
(Identified Cost $747,813,639) (f) | | | | | | 981,886,189 | |
Liabilities in excess of other assets | | | | | | (87,785,534 | ) |
| | | | | | | |
| Total Net Assets—100% | | | | | $ | 894,100,655 | |
| | | | | | | |
| (a) | A portion or all of the security was held on loan. As of December 31, 2007, the market value of securities loaned was $94,313,789 and the collateral received consisted of cash in the amount of $95,025,043 and non cash collateral with a value of $3,427,179. The cash collateral is invested in a money market fund managed by an affiliate of the custodian. The non cash collateral received consists primarily of government securities and bank letters of credit, and are held for the benefit of the Portfolio at the Portfolio’s custodian. |
| (d) | Security was valued in good faith under procedures established by the Board of Directors. |
| (e) | Represents investment of cash collateral received from securities lending transactions. |
| (f) | The aggregate cost of investments for federal income tax purposes as of December 31, 2007 was $757,006,731 and the composition of unrealized appreciation and depreciation of investment securities was $234,793,406 and $(9,913,948), respectively. |
| (FDR)— | Fudiciary Depository Receipt |
| (REIT)— | A Real Estate Investment Trust is a pooled investment vehicle that invests primarily in income-producing real estate or real estate related loans or interest. |
| | |
Ten Largest Industries as of
December 31, 2007 | | Percentage of
Total Net Assets |
Commercial Banks | | 14.7% |
Oil, Gas & Consumable Fuels | | 7.4% |
Metals & Mining | | 5.4% |
Pharmaceuticals | | 5.2% |
Insurance | | 4.6% |
Diversified Telecommunication Services | | 4.1% |
Automobiles | | 3.3% |
Electric Utilities | | 3.3% |
Food Products | | 2.9% |
Chemicals | | 2.9% |
*See accompanying notes to financial statements.
MSF-14
Metropolitan Series Fund, Inc.
Morgan Stanley EAFE Index Portfolio
Statement of Assets & Liabilities
December 31, 2007
| | | | | | |
Assets | | | | | | |
Investments at value (a) (c) | | | | | $ | 981,886,189 |
Cash | | | | | | 130,192 |
Foreign cash at value (b) | | | | | | 7,439,103 |
Receivable for: | | | | | | |
Securities sold | | | | | | 116,917 |
Fund shares sold | | | | | | 698,208 |
Accrued interest and dividends | | | | | | 2,424,017 |
Foreign taxes | | | | | | 69,548 |
| | | | | | |
Total Assets | | | | | | 992,764,174 |
Liabilities | | | | | | |
Payable for: | | | | | | |
Securities purchased | | $ | 1,785,967 | | | |
Fund shares redeemed | | | 1,282,732 | | | |
Withholding taxes | | | 118,212 | | | |
Collateral for securities loaned | | | 95,025,043 | | | |
Accrued expenses: | | | | | | |
Management fees | | | 223,959 | | | |
Service and distribution fees | | | 74,163 | | | |
Other expenses | | | 153,443 | | | |
| | | | | | |
Total Liabilities | | | | | | 98,663,519 |
| | | | | | |
Net Assets | | | | | $ | 894,100,655 |
| | | | | | |
Net assets consists of: | | | | | | |
Capital paid in | | | | | $ | 619,160,962 |
Undistributed net investment income | | | | | | 16,995,755 |
Accumulated net realized gains | | | | | | 23,872,672 |
Unrealized appreciation on investments and foreign currency | | | | | | 234,071,266 |
| | | | | | |
Net Assets | | | | | $ | 894,100,655 |
| | | | | | |
| Computation of offering price: | | | | | | |
Class A | | | | | | |
Net asset value and redemption price per share ($511,802,825 divided by 29,774,343 shares outstanding) | | | | | $ | 17.19 |
| | | | | | |
Class B | | | | | | |
Net asset value and redemption price per share ($297,897,580 divided by 17,604,286 shares outstanding) | | | | | $ | 16.92 |
| | | | | | |
Class E | | | | | | |
Net asset value and redemption price per share ($84,400,250 divided by 4,933,628 shares outstanding) | | | | | $ | 17.11 |
| | | | | | |
(a) Identified cost of investments | | | | | $ | 747,813,639 |
| | | | | | |
(b) Identified cost of foreign cash | | | | | $ | 7,462,828 |
| | | | | | |
| (c) | Includes cash collateral for securities loaned of $95,025,043. |
Statement of Operations
For the Year Ended December 31, 2007
| | | | | | | | |
Investment Income | | | | | | | | |
Dividends | | | | | | $ | 21,705,320 | (a) |
Interest | | | | | | | 824,701 | (b) |
| | | | | | | | |
| | | | | | | 22,530,021 | |
Expenses | | | | | | | | |
Management fees | | $ | 2,173,284 | | | | | |
Service and distribution fees—Class B | | | 671,301 | | | | | |
Service and distribution fees—Class E | | | 128,126 | | | | | |
Directors’ fees and expenses | | | 23,669 | | | | | |
Custodian | | | 537,287 | | | | | |
Audit and tax services | | | 36,237 | | | | | |
Legal | | | 8,407 | | | | | |
Printing | | | 201,864 | | | | | |
Insurance | | | 7,048 | | | | | |
Miscellaneous | | | 14,951 | | | | | |
| | | | | | | | |
Total expenses | | | 3,802,174 | | | | | |
Management fee waivers | | | (50,710 | ) | | | 3,751,464 | |
| | | | | | | | |
Net Investment Income | | | | | | | 18,778,557 | |
| | | | | | | | |
Realized and Unrealized Gain | | | | | | | | |
| Realized gain on: | | | | | | | | |
Investments—net | | | 27,166,461 | | | | | |
Reimbursement received from affiliate | | | 149,126 | | | | | |
Foreign currency transactions—net | | | 80,827 | | | | 27,396,414 | |
| | | | | | | | |
Change in unrealized appreciation (depreciation) on: | | | | | | | | |
Investments—net | | | 19,832,270 | | | | | |
Foreign currency transactions—net | | | (17,539 | ) | | | 19,814,731 | |
| | | | | | | | |
Net gain | | | | | | | 47,211,145 | |
| | | | | | | | |
Net Increase in Net Assets From Operations | | | | | | $ | 65,989,702 | |
| | | | | | | | |
| (a) | Net of foreign taxes of $1,721,129. |
| (b) | Includes net income on securities loaned of $731,604. |
See accompanying notes to financial statements.
MSF-15
Metropolitan Series Fund, Inc.
Morgan Stanley EAFE Index Portfolio
Statements of Changes in Net Assets
| | | | | | | | |
| | | Year ended
December 31,
2007 | | | Year ended
December 31,
2006 | |
From Operations | | | | | | | | |
Net investment income | | $ | 18,778,557 | | | $ | 12,612,701 | |
Net realized gain | | | 27,396,414 | | | | 8,969,491 | |
Unrealized appreciation | | | 19,814,731 | | | | 101,925,592 | |
| | | | | | | | |
Increase in net assets from operations | | | 65,989,702 | | | | 123,507,784 | |
| | | | | | | | |
From Distributions to Shareholders | | | | | | | | |
Net investment income | | | | | | | | |
Class A | | | (6,957,555 | ) | | | (4,873,215 | ) |
Class B | | | (4,654,053 | ) | | | (2,705,444 | ) |
Class E | | | (1,623,651 | ) | | | (1,274,235 | ) |
| | | | | | | | |
| | | (13,235,259 | ) | | | (8,852,894 | ) |
| | | | | | | | |
Net realized gain | | | | | | | | |
Class A | | | (3,710,696 | ) | | | 0 | |
Class B | | | (2,816,927 | ) | | | 0 | |
Class E | | | (930,691 | ) | | | 0 | |
| | | | | | | | |
| | | (7,458,314 | ) | | | 0 | |
| | | | | | | | |
Total distributions | | | (20,693,573 | ) | | | (8,852,894 | ) |
| | | | | | | | |
Increase in net assets from capital share transactions | | | 214,083,082 | | | | 57,877,999 | |
| | | | | | | | |
Total increase in net assets | | | 259,379,211 | | | | 172,532,889 | |
| | |
Net Assets | | | | | | | | |
Beginning of the period | | | 634,721,444 | | | | 462,188,555 | |
| | | | | | | | |
End of the period | | $ | 894,100,655 | | | $ | 634,721,444 | |
| | | | | | | | |
Undistributed Net Investment Income | | | | | | | | |
End of the period | | $ | 16,995,755 | | | $ | 11,063,229 | |
| | | | | | | | |
Other Information:
Capital Shares
Transactions in capital shares were as follows:
| | | | | | | | | | | | | | |
| | | Year ended
December 31, 2007 | | | Year ended
December 31, 2006 | |
| | | Shares | | | $ | | | Shares | | | $ | |
Class A | | | | | | | | | | | | | | |
Sales | | 14,171,371 | | | $ | 244,141,099 | | | 5,399,575 | | | $ | 77,553,018 | |
Reinvestments | | 634,637 | | | | 10,668,251 | | | 337,714 | | | | 4,873,215 | |
Redemptions | | (5,081,003 | ) | | | (85,752,377 | ) | | (4,423,246 | ) | | | (63,386,502 | ) |
| | | | | | | | | | | | | | |
Net increase | | 9,725,005 | | | $ | 169,056,973 | | | 1,314,043 | | | $ | 19,039,731 | |
| | | | | | | | | | | | | | |
Class B | | | | | | | | | | | | | | |
Sales | | 6,004,028 | | | $ | 99,957,475 | | | 6,399,548 | | | $ | 90,433,197 | |
Reinvestments | | 450,602 | | | | 7,470,980 | | | 189,989 | | | | 2,705,444 | |
Redemptions | | (3,507,476 | ) | | | (57,974,664 | ) | | (3,298,139 | ) | | | (46,325,751 | ) |
| | | | | | | | | | | | | | |
Net increase | | 2,947,154 | | | $ | 49,453,791 | | | 3,291,398 | | | $ | 46,812,890 | |
| | | | | | | | | | | | | | |
Class E | | | | | | | | | | | | | | |
Sales | | 743,690 | | | $ | 12,495,190 | | | 777,439 | | | $ | 11,099,892 | |
Reinvestments | | 152,498 | | | | 2,554,342 | | | 88,612 | | | | 1,274,235 | |
Redemptions | | (1,162,298 | ) | | | (19,477,214 | ) | | (1,442,564 | ) | | | (20,348,749 | ) |
| | | | | | | | | | | | | | |
Net decrease | | (266,110 | ) | | $ | (4,427,682 | ) | | (576,513 | ) | | $ | (7,974,622 | ) |
| | | | | | | | | | | | | | |
Increase derived from capital share transactions | | | | | $ | 214,083,082 | | | | | | $ | 57,877,999 | |
| | | | | | | | | | | | | | |
See accompanying notes to financial statements.
MSF-16
Metropolitan Series Fund, Inc.
Morgan Stanley EAFE Index Portfolio
Financial Highlights
| | | | | | | | | | | | | | | | | | | | |
| | | Class A | |
| | | Year ended December 31, | |
| | | 2007 | | | 2006 | | | 2005 | | | 2004 | | | 2003 | |
Net Asset Value, Beginning of Period | | $ | 16.00 | | | $ | 12.95 | | | $ | 11.64 | | | $ | 9.80 | | | $ | 7.26 | |
| | | | | | | | | | | | | | | | | | | | |
Income From Investment Operations | | | | | | | | | | | | | | | | | | | | |
Net investment income | | | 0.46 | (a) | | | 0.35 | (a) | | | 0.25 | | | | 0.21 | | | | 0.14 | |
Net realized and unrealized gain on investments | | | 1.26 | | | | 2.95 | | | | 1.26 | | | | 1.70 | | | | 2.54 | |
| | | | | | | | | | | | | | | | | | | | |
Total from investment operations | | | 1.72 | | | | 3.30 | | | | 1.51 | | | | 1.91 | | | | 2.68 | |
| | | | | | | | | | | | | | | | | | | | |
Less Distributions | | | | | | | | | | | | | | | | | | | | |
Distributions from net investment income | | | (0.35 | ) | | | (0.25 | ) | | | (0.20 | ) | | | (0.07 | ) | | | (0.14 | ) |
Distributions from net realized capital gains | | | (0.18 | ) | | | 0.00 | | | | 0.00 | | | | 0.00 | | | | 0.00 | |
| | | | | | | | | | | | | | | | | | | | |
Total distributions | | | (0.53 | ) | | | (0.25 | ) | | | (0.20 | ) | | | (0.07 | ) | | | (0.14 | ) |
| | | | | | | | | | | | | | | | | | | | |
Net Asset Value, End of Period | | $ | 17.19 | | | $ | 16.00 | | | $ | 12.95 | | | $ | 11.64 | | | $ | 9.80 | |
| | | | | | | | | | | | | | | | | | | | |
Total Return (%) | | | 10.8 | | | | 25.7 | | | | 13.2 | | | | 19.6 | | | | 37.6 | |
Ratio of operating expenses to average net assets (%) | | | 0.41 | | | | 0.49 | | | | 0.51 | | | | 0.59 | | | | 0.71 | |
Ratio of operating expenses to average net assets without giving effect to the contractual expense agreement would have been (%) (b) | | | 0.41 | | | | 0.50 | | | | 0.51 | | | | N/A | | | | N/A | |
Ratio of net investment income to average net assets (%) | | | 2.69 | | | | 2.46 | | | | 2.19 | | | | 2.01 | | | | 1.85 | |
Portfolio turnover rate (%) | | | 24 | | | | 18 | | | | 22 | | | | 38 | | | | 43 | |
Net assets, end of period (000) | | $ | 511,803 | | | $ | 320,845 | | | $ | 242,623 | | | $ | 210,034 | | | $ | 176,835 | |
| | | | | | | | | | | | | | | | | | | | |
| | | Class B | |
| | | Year ended December 31, | |
| | | 2007 | | | 2006 | | | 2005 | | | 2004 | | | 2003 | |
Net Asset Value, Beginning of Period | | $ | 15.76 | | | $ | 12.76 | | | $ | 11.48 | | | $ | 9.68 | | | $ | 7.18 | |
| | | | | | | | | | | | | | | | | | | | |
Income From Investment Operations | | | | | | | | | | | | | | | | | | | | |
Net investment income | | | 0.41 | (a) | | | 0.31 | (a) | | | 0.19 | | | | 0.12 | | | | 0.11 | |
Net realized and unrealized gain on investments | | | 1.23 | | | | 2.91 | | | | 1.27 | | | | 1.74 | | | | 2.51 | |
| | | | | | | | | | | | | | | | | | | | |
Total from investment operations | | | 1.64 | | | | 3.22 | | | | 1.46 | | | | 1.86 | | | | 2.62 | |
| | | | | | | | | | | | | | | | | | | | |
Less Distributions | | | | | | | | | | | | | | | | | | | | |
Distributions from net investment income | | | (0.30 | ) | | | (0.22 | ) | | | (0.18 | ) | | | (0.06 | ) | | | (0.12 | ) |
Distributions from net realized capital gains | | | (0.18 | ) | | | 0.00 | | | | 0.00 | | | | 0.00 | | | | 0.00 | |
| | | | | | | | | | | | | | | | | | | | |
Total distributions | | | (0.48 | ) | | | (0.22 | ) | | | (0.18 | ) | | | (0.06 | ) | | | (0.12 | ) |
| | | | | | | | | | | | | | | | | | | | |
Net Asset Value, End of Period | | $ | 16.92 | | | $ | 15.76 | | | $ | 12.76 | | | $ | 11.48 | | | $ | 9.68 | |
| | | | | | | | | | | | | | | | | | | | |
Total Return (%) | | | 10.5 | | | | 25.5 | | | | 12.9 | | | | 19.3 | | | | 37.2 | |
Ratio of operating expenses to average net assets (%) | | | 0.66 | | | | 0.74 | | | | 0.76 | | | | 0.84 | | | | 0.96 | |
Ratio of operating expenses to average net assets without giving effect to the contractual expense agreement would have been (%) (b) | | | 0.66 | | | | 0.75 | | | | 0.76 | | | | N/A | | | | N/A | |
Ratio of net investment income to average net assets (%) | | | 2.46 | | | | 2.18 | | | | 1.86 | | | | 1.60 | | | | 1.45 | |
Portfolio turnover rate (%) | | | 24 | | | | 18 | | | | 22 | | | | 38 | | | | 43 | |
Net assets, end of period (000) | | $ | 297,898 | | | $ | 231,042 | | | $ | 145,077 | | | $ | 73,707 | | | $ | 27,933 | |
| (a) | Per share amount is based on average shares outstanding during the period. |
| (b) | See Note 4 in the Notes to Financial Statements. |
See accompanying notes to financial statements.
MSF-17
Metropolitan Series Fund, Inc.
Morgan Stanley EAFE Index Portfolio
Financial Highlights
| | | | | | | | | | | | | | | | | | | | |
| | | Class E | |
| | | Year ended December 31, | |
| | | 2007 | | | 2006 | | | 2005 | | | 2004 | | | 2003 | |
Net Asset Value, Beginning of Period | | $ | 15.93 | | | $ | 12.90 | | | $ | 11.59 | | | $ | 9.77 | | | $ | 7.25 | |
| | | | | | | | | | | | | | | | | | | | |
Income From Investment Operations | | | | | | | | | | | | | | | | | | | | |
Net investment income | | | 0.43 | (a) | | | 0.33 | (a) | | | 0.26 | | | | 0.19 | | | | 0.13 | |
Net realized and unrealized gain on investments | | | 1.25 | | | | 2.94 | | | | 1.23 | | | | 1.70 | | | | 2.52 | |
| | | | | | | | | | | | | | | | | | | | |
Total from investment operations | | | 1.68 | | | | 3.27 | | | | 1.49 | | | | 1.89 | | | | 2.65 | |
| | | | | | | | | | | | | | | | | | | | |
Less Distributions | | | | | | | | | | | | | | | | | | | | |
Distributions from net investment income | | | (0.32 | ) | | | (0.24 | ) | | | (0.18 | ) | | | (0.07 | ) | | | (0.13 | ) |
Distributions from net realized capital gains | | | (0.18 | ) | | | 0.00 | | | | 0.00 | | | | 0.00 | | | | 0.00 | |
| | | | | | | | | | | | | | | | | | | | |
Total distributions | | | (0.50 | ) | | | (0.24 | ) | | | (0.18 | ) | | | (0.07 | ) | | | (0.13 | ) |
| | | | | | | | | | | | | | | | | | | | |
Net Asset Value, End of Period | | $ | 17.11 | | | $ | 15.93 | | | $ | 12.90 | | | $ | 11.59 | | | $ | 9.77 | |
| | | | | | | | | | | | | | | | | | | | |
Total Return (%) | | | 10.6 | | | | 25.6 | | | | 13.0 | | | | 19.4 | | | | 37.3 | |
Ratio of operating expenses to average net assets (%) | | | 0.56 | | | | 0.64 | | | | 0.66 | | | | 0.74 | | | | 0.86 | |
Ratio of operating expenses to average net assets without giving effect to the contractual expense agreement would have been (%) (b) | | | 0.56 | | | | 0.65 | | | | 0.66 | | | | N/A | | | | N/A | |
Ratio of net investment income to average net assets (%) | | | 2.57 | | | | 2.32 | | | | 2.05 | | | | 1.91 | | | | 1.42 | |
Portfolio turnover rate (%) | | | 24 | | | | 18 | | | | 22 | | | | 38 | | | | 43 | |
Net assets, end of period (000) | | $ | 84,400 | | | $ | 82,835 | | | $ | 74,489 | | | $ | 73,449 | | | $ | 54,269 | |
| (a) | Per share amount is based on average shares outstanding during the period. |
| (b) | See Note 4 in the Notes to Financial Statements. |
See accompanying notes to financial statements.
MSF-18
Metropolitan Series Fund, Inc.
Morgan Stanley EAFE Index Portfolio
Notes to Financial Statements—December 31, 2007
Metropolitan Series Fund, Inc. (the “Fund”) is organized as a corporation under the laws of Maryland pursuant to Articles of Incorporation filed on November 23, 1982, as amended, and registered under the Investment Company Act of 1940, as amended (the “1940 Act”), as an open-end investment company. The Fund is a “series” type of mutual fund, which issues separate series of stock. Each series represents an interest in a separate portfolio of Fund investments. The Morgan Stanley EAFE Index Portfolio (the “Portfolio”) is a diversified series of the Fund. Shares in the Fund are not offered directly to the general public and are currently available only to separate accounts established by Metropolitan Life Insurance Company (“MetLife”), New England Life Insurance Company, General American Life Insurance Company (“General American”), The MetLife Investors Group of Insurance Companies, MetLife Insurance Company of Connecticut and other affiliated insurance companies (collectively, the “Insurance Companies”), as an investment vehicle for variable life insurance, group annuity or variable annuity products, although the Portfolio is not available to all such separate accounts. The Portfolio’s shares may be divided into different classes. Currently, the classes being offered by the Portfolio are named Class A, Class B and Class E. The classes of the Portfolio’s shares are identical, except that certain additional charges (Rule 12b-1 fees) are made against Class B and Class E shares. Investment income, realized and unrealized capital gains and losses, the common expenses of the Portfolio and certain Portfolio-level expense reductions, if any, are allocated on a pro rata basis to each class based on the relative net assets of each class to the total net assets of the Portfolio.
| 2. | SIGNIFICANT ACCOUNTING POLICIES: |
The preparation of financial statements in conformity with accounting principles generally accepted in the United States of America (“GAAP”) requires management to make estimates and assumptions that affect the reported amounts of assets and liabilities and disclosure of contingent assets and liabilities as of the date of the financial statements and the reported amounts of income and expenses during the reporting period. Actual results could differ from those estimates.
The following is a summary of significant accounting policies consistently followed by the Portfolio in the preparation of its financial statements. The policies are in conformity with GAAP.
Investment Valuation:
Debt securities (other than short term obligations with a remaining maturity of sixty days or less) are valued by independent pricing services selected by the relevant subadviser pursuant to authorization of the Board of Directors of the Fund (the “Board” or “Directors”). Short term obligations with a remaining maturity of sixty days or less are valued at amortized cost which approximates fair market value.
Equity securities traded on a national securities exchange or exchanges are valued at their last sale price on the principal trading market. Equity securities traded on the NASDAQ National Market System are valued at the NASDAQ Official Closing Price (the “NOCP”). The NOCP is the last sale price if it falls between the spread of the last reported bid and asked prices. If the last reported bid and asked prices are above the last reported sale price, the NOCP will be the last reported bid price. If the last reported bid and asked prices are below the last reported sale price, the NOCP will be the last reported asked price. Equity securities traded on a national securities exchange or exchanges or on the NASDAQ National Market System for which there is no reported sale during the day are valued at the last reported bid price. A security that is listed or traded on more than one exchange is valued at the quotation on the exchange determined to be the primary market for that security by the Board or its delegates. If no closing price is available, then such securities are valued by using the last reported bid price. Equity securities traded over-the-counter are valued at the last reported sales price.
If no current market value quotation is readily available or reliable for a portfolio security, fair value will be determined in accordance with procedures established by and under the general supervision of the Board. When the Portfolio uses fair value pricing, it may take into account any factors it deems appropriate. The value of securities used by the Portfolio to calculate its net asset value may differ from quoted or published prices for the same securities. Fair value pricing involves subjective judgments and the fair value determined for a security may be materially different than the value that could be realized upon the sale of that security.
The Portfolio expects to use fair value pricing for securities primarily traded on U.S. exchanges only under very limited circumstances. For example, the Portfolio may use fair value pricing if the exchange on which a security is traded closes early or trading in the security is suspended.
MSF-19
Metropolitan Series Fund, Inc.
Morgan Stanley EAFE Index Portfolio
Notes to Financial Statements—December 31, 2007—(Continued)
Securities traded primarily on an exchange outside of the United States which closes before the close of the New York Stock Exchange will be valued at the last sales price on that non-U.S. exchange. Securities traded primarily on an exchange outside of the United States for which there is no reported sale during the day are valued at the mean between the last reported bid and asked prices. However, because most foreign markets close well before the Portfolio values its securities (typically at 4 p.m. Eastern Time), the earlier close of these foreign markets gives rise to the possibility that significant events, including broad market moves, may have occurred after these foreign markets close but before the Portfolio values its securities. To account for this, the Portfolio may frequently value many of its foreign equity securities using fair value prices based on third party vendor modeling tools.
Forward foreign currency exchange contracts are valued based on the mean between closing bid and asked prices of the forward currency contract rates in the London foreign exchange markets on a daily basis as provided by a reliable bank or dealer.
Options, whether on securities, indices, futures contracts, or otherwise, are valued at the last sales price available as of the close of business on the day of valuation or, if there is no such sale price available, at the mean between the bid and asked prices. Options on currencies are valued at the spot price each day.
The value of futures contracts will be the sum of the margin deposit plus or minus the difference between the value of the futures contract on each day the net asset value is calculated and the value on the date the futures contract originated, value being that established on a recognized commodity exchange, or by reference to other customary sources, with gain or loss being realized when the futures contract closes or expires.
Subject to the Board’s oversight, the Board has delegated day-to-day responsibility for valuing Portfolio assets to the subadviser of the Portfolio, who values such assets as described above and operates under procedures approved by the Board.
Investment Transactions and Related Investment Income:
Portfolio security transactions are recorded on the trade date. Dividend income is recorded on the ex-dividend date or, for certain foreign securities, when notified. Interest income, which includes amortization of premium and accretion of discount on debt securities, is recorded on the accrual basis. Realized gains and losses on investments and unrealized appreciation and depreciation are determined on the identified cost basis, which is the same basis used for federal income tax purposes.
Repurchase Agreements:
The Portfolio, through the custodian or a subcustodian, receives delivery of the underlying securities collateralizing repurchase agreements. The Portfolio requires the custodian to take possession, to have legally segregated in the Federal Reserve Book Entry System, or to have segregated within the custodian’s vault, all securities held as collateral for repurchase agreements. It is the Portfolio’s policy that the market value of the collateral be at least equal to 100% of the repurchase price in the case of a repurchase agreement of one-day duration and 102% on all other repurchase agreements. The Portfolio’s subadviser is responsible for determining that the value of the collateral is at all times at least equal to the repurchase price. In connection with transactions in repurchase agreements, if the seller defaults and the value of the collateral declines or if the seller enters an insolvency proceeding, realization of the collateral by the Portfolio may be delayed, limited or wholly denied.
Foreign Currency Translation:
The books and records of the Portfolio are maintained in U.S. dollars. The values of securities, currencies and other assets and liabilities denominated in currencies other than U.S. dollars are translated into U.S. dollars based upon foreign exchange rates prevailing at the end of the period. Purchases and sales of investment securities, income and expenses are translated on the respective dates of such transactions. Since the values of investment securities are presented at the foreign exchange rates prevailing at the end of the period, it is not practical to isolate that portion of the results of operations arising from changes in exchange rates from that portion of the results of operations reflecting fluctuations arising from changes in market prices of the investment securities. Such fluctuations are included in the net realized and unrealized gain or loss on investments.
Net realized foreign exchange gains or losses arise from sales of foreign currency, currency gains or losses realized between the trade and settlement dates on securities transactions, and the difference between the amounts of dividends, interest, and foreign withholding taxes recorded by the Portfolio and the U.S. dollar equivalent of the amounts actually received or paid by the Portfolio. Net unrealized foreign exchange gains and losses arise from changes in the value of assets and liabilities, other than investment securities, resulting from changes in the exchange rate.
MSF-20
Metropolitan Series Fund, Inc.
Morgan Stanley EAFE Index Portfolio
Notes to Financial Statements—December 31, 2007—(Continued)
Forward Foreign Currency Exchange Contracts:
The Portfolio may enter into forward foreign currency exchange contracts primarily to hedge against foreign currency exchange rate risks on their non-U.S. dollar denominated investment securities. When entering into a forward currency contract, the Portfolio agrees to receive or deliver a fixed quantity of foreign currency for an agreed-upon price on an agreed future date. These contracts are valued daily and the Portfolio’s net equity therein, representing unrealized gain or loss on the contracts as measured by the difference between the foreign exchange rates at the dates of entry into the contracts and the forward rates at the settlement date, is included in the Statement of Assets and Liabilities. Realized and unrealized gains and losses are included in the Statement of Operations. These instruments involve market and/or credit risk in excess of the amount recognized in the Statement of Assets and Liabilities. Risks arise from the possible inability of counterparties to meet the terms of their contracts and from movement in currency and securities values and interest rates.
Futures Contracts:
The Portfolio may buy and sell futures contracts (on recognized exchanges) as a hedge or to enhance return. Futures contracts are agreements to buy or sell a security, or deliver a final cash settlement price in connection with an index, interest rate, currency, or other contracts not calling for physical delivery, for a set price in the future. The Portfolio must post an amount equal to a portion of the total market value of the futures contract as futures variation margin, which is returned when the Portfolio’s obligations under the contract have been satisfied. From time to time thereafter, the Portfolio may have to post variation margin to maintain this amount as the market value of the contract fluctuates. Risks of entering into futures contracts (and related options) include the possibility that there may be an illiquid market and that a change in the value of the contract or option may not correlate with changes in the value of the underlying securities.
Options:
The Portfolio may use options to hedge against changes in values of securities the Portfolio owns or expects to purchase. Writing puts or buying calls tends to increase the Portfolio’s exposure to the underlying instrument and writing calls or buying puts tends to decrease the Portfolio’s exposure to the underlying instrument, or hedge other Portfolio investments. For options purchased to hedge the Portfolio’s investments, the potential risk to the Portfolio is that the change in value of options contracts may not correspond to the change in value of the hedged instruments. In addition, losses may arise from changes in the value of the underlying instruments, if there is an illiquid secondary market, or if the counterparty is unable to perform. The maximum loss for purchased options is limited to the premium initially paid for the option. For options written by the Portfolio, the maximum loss is not limited to the premium initially received for the option.
The main risk associated with purchasing options is that the option expires without being exercised. In this case, the option expires worthless and the premium paid for the option is considered the loss. The risk associated with writing a call option is that the Portfolio may forgo the opportunity for a profit if the market value of the underlying position increases and the option is exercised. The risk in writing put options is that the Portfolio may incur a loss if the market value of the underlying position decreases and the option is exercised. In addition, the Portfolio risks not being able to enter into a closing transaction for the written option as the result of an illiquid market.
“When-Issued” Securities:
Purchasing securities “when-issued” is a forward commitment by the Portfolio to buy a security. The estimated amount of the Portfolio’s payment obligation and the security’s interest rate are determined when the commitment is made, even though no interest accrues until the security is issued, which is generally 15 to 120 days later. The Portfolio will segregate liquid assets with its custodian sufficient at all times to satisfy these commitments. If the value of the security is less when delivered than when the commitment was made, the Portfolio will suffer a loss.
Fund Concentration:
The investments by the Portfolio in foreign securities may involve risks not present in domestic investments. Since securities may be denominated in foreign currencies and may require settlement in foreign currencies and pay interest or dividends in foreign currencies, changes in the relationship of these foreign currencies to the U.S. dollar can significantly affect the value of the investments and earnings of the Portfolio. Foreign investments may also subject the Portfolio to foreign government exchange restrictions, expropriation, taxation or other political, social or economic developments, all of which could affect the market
MSF-21
Metropolitan Series Fund, Inc.
Morgan Stanley EAFE Index Portfolio
Notes to Financial Statements—December 31, 2007—(Continued)
and/or credit risk of the investments. In addition to the risks described above, risks may arise from forward foreign currency contracts with respect to the potential inability of counterparties to meet the terms of their contracts.
Federal Income Taxes:
It is the Portfolio’s policy to comply with the requirements of the Internal Revenue Code of 1986, as amended, and regulations thereunder, applicable to regulated investment companies and to distribute all of its taxable income to shareholders. Therefore, no federal income tax provision is required.
As of December 31, 2007, the Portfolio had no capital loss carryovers.
The tax character of distributions paid for the periods ended December 31, 2007 and 2006 was as follows:
| | | | | | | | | | | | | | | | | | | | | |
Ordinary Income | | Long Term Gain | | Return of Capital | | Total |
2007 | | 2006 | | 2007 | | 2006 | | 2007 | | 2006 | | 2007 | | 2006 |
$14,775,563 | | $ | 8,852,894 | | $ | 5,918,010 | | $ | — | | $ | — | | $ | — | | $ | 20,693,573 | | $ | 8,852,894 |
As of December 31, 2006, the components of distributable earnings (accumulated losses) on a federal income tax basis were as follows:
| | | | | | | | | | | | |
Undistributed
Ordinary
Income | | Undistributed
Long Term
Gain | | Unrealized
Appreciation | | Loss
Carryforwards | | Total |
| $23,873,802 | | $ | 26,187,716 | | $ | 224,878,174 | | $ | — | | $ | 274,939,692 |
Dividends and Distributions to Shareholders:
The Portfolio records dividends and distributions on the ex-dividend date. Net realized gains from security transactions (if any) are generally distributed annually to shareholders. The timing and characterization of certain income and capital gains distributions are determined in accordance with federal tax regulations that may differ from GAAP. Permanent book and tax basis differences relating to shareholder distributions will result in reclassification between under/over distributed net investment income, accumulated net realized gains/losses and paid in capital.
| 3. | INVESTMENT TRANSACTIONS: |
For the year ended December 31, 2007, purchases and sales of securities (excluding short term investments) for the Portfolio were as follows:
| | | | | | | | | |
| Purchases | | Sales |
| U.S. Government | | Other | | U.S. Government | | Other |
| $0 | | $ | 294,805,000 | | $ | 0 | | $ | 173,615,029 |
| 4. | INVESTMENT MANAGEMENT FEES AND OTHER TRANSACTIONS WITH AFFILIATES: |
Investment Management Agreement:
MetLife Advisers, LLC (“MetLife Advisers”) is the investment adviser to the Portfolio. The Fund has entered into an investment management agreement with MetLife Advisers with respect to the Portfolio. For providing investment management services to the Portfolio, MetLife Advisers receives monthly compensation at the annual rate of 0.30% of average daily net assets. Fees earned by MetLife Advisers with respect to the Portfolio for the year ended December 31, 2007 were $2,173,284.
Certain officers and directors of the Fund may also be officers of MetLife Advisers; however, such officers and directors receive no compensation from the Fund.
Effective April 30, 2007, MetLife Advisers entered into an investment subadvisory agreement with MetLife Investment Advisors, LLC (“MLIAC”) with respect to the Portfolio. MetLife Advisers pays MLIAC an investment subadvisory fee for the Portfolio equal to the costs incurred by MLIAC in providing subadvisory services to the Portfolio. Fees earned by MLIAC with respect to the Portfolio for the period ended December 31, 2007 were $116,765. Prior to April 30, 2007, MetLife served as the subadviser to the Portfolio and for the period January 1, 2007 through April 30, 2007, fees earned by MetLife were $49,854.
MSF-22
Metropolitan Series Fund, Inc.
Morgan Stanley EAFE Index Portfolio
Notes to Financial Statements—December 31, 2007—(Continued)
Management Fee Waivers:
Pursuant to an expense agreement, MetLife Advisers has agreed, for the period May 1, 2007 to April 30, 2008, to reduce its advisory fees set out above under “Investment Management Agreement” for each class of the Portfolio at the annual rate of 0.007% of average daily net assets. Amounts waived for the year ended December 31, 2007 are shown as management fee waivers in the Statement of Operations.
Service and Distribution Fees:
The Fund has adopted a Distribution and Service Plan under Rule 12b-1 of the 1940 Act for the Portfolio’s Class B and E shares. Under the Distribution and Service Plan, the Class B and E shares of the Portfolio pay a fee to compensate the Insurance Companies (or their affiliates) and other broker-dealers and financial intermediaries involved in the offer and sale of Portfolio shares for promoting or selling and servicing, the Class B and E shares. The fees under the Distribution and Service Plan for each class of the Portfolio’s shares are calculated as a percentage of the Portfolio’s average daily net assets that are attributable to that Class. Currently, the fee is 0.25% per year for Class B shares and 0.15% per year for Class E shares. Amounts paid by the Portfolio for the year ended December 31, 2007 are shown as Service and Distribution fees in the Statement of Operations.
Substitution:
On November 9, 2007, the Morgan Stanley EAFE Index Portfolio received and recorded a share subscription for 9,043,463 shares of Class A amounting to $157,446,695 from various shareholder accounts previously invested in the MetLife Investment Funds, Inc. (“MLIF”), an affiliated investment company of the Fund. A portion of the assets received from MLIF were investment securities with a market value of $82,605,776, and transferred in-kind pursuant to a substitution order received from the Securities and Exchange Commission. The balance of the assets was paid in cash. This transaction resulted from the planned liquidation of MLIF, pursuant to a Plan of Liquidation approved by the MLIF Board of Directors on August 16, 2007. The securities received were recorded at value and have been excluded from the calculation of portfolio turnover reported in the Portfolio’s financial highlights. The shares issued in this transaction are included in Sales in the Capital Shares schedule on the Statements of Changes in Net Assets.
The Fund has entered into a securities lending arrangement with the Fund’s custodian, State Street Bank and Trust Company (the “custodian”). Under the agreement, the custodian is authorized to loan securities on the Portfolios’ behalf. In exchange, the Portfolio receives either cash or securities as collateral against the loaned securities. The Portfolio receives collateral at least equal to 102% of the market value of the loaned securities (105% for foreign securities), at each loan’s inception. Collateral must be maintained at least at 100% of the market value of the loaned securities for the duration of the loan. The cash collateral is invested in the Navigator Securities Lending Prime Portfolio, an affiliate of the custodian, which invests in a variety of high quality U.S. dollar-denominated instruments. If the market value of the collateral at the close of trading on a business day is less than 100% of the market value of the loaned securities at the close of trading on that day, the borrower shall be required to deliver, by the close of business on the following business day, an additional amount of collateral, equal to at least 100% of the market value of all the loaned securities as of such preceding day. The Portfolio receives 80% of the annual net income from securities lending transactions, which is included in interest income of the Portfolio. The remaining 20% is paid to the custodian as compensation for its securities lending services. The Portfolio bears the risk of any deficiency in the amount of collateral available for return to a borrower due to a loss in an approved investment. Any outstanding loans by the Portfolio at December 31, 2007 are footnoted in the Schedule of Investments.
As previously reported, in May 2004, General American received a Wells Notice stating that the SEC staff was considering recommending that the SEC bring a civil action alleging violations of the U.S. securities laws against General American with respect to market timing and late trading in a limited number of privately-placed variable insurance contracts that were sold through General American. General American responded to the SEC staff and cooperated with the investigation. On August 9, 2007, the SEC announced that it had settled an enforcement action regarding late trading against General American with, among other things, General American agreeing to pay a civil penalty and to comply with certain undertakings. General American consented to the SEC’s order without admitting or denying the findings. MetLife Advisers has also advised the Fund’s Board of
MSF-23
Metropolitan Series Fund, Inc.
Morgan Stanley EAFE Index Portfolio
Notes to Financial Statements—December 31, 2007—(Continued)
Directors that, while certain exceptions to the Fund’s policies have been noted, no situations have been identified that would have a material impact on the financial position of the Fund.
| 7. | RECENT ACCOUNTING PRONOUNCEMENTS: |
Effective June 29, 2007, the Fund implemented Financial Accounting Standards Board (“FASB”) Interpretation No. 48, “Accounting for Uncertainty in Income Taxes—an interpretation of FASB Statement No. 109” (“FIN 48”). FIN 48 prescribes the minimum recognition threshold a tax position must meet in connection with accounting for uncertainties in income tax positions taken or expected to be taken by an entity, including investment companies, before being measured and recognized in the financial statements. Management has evaluated the application of FIN 48 to the Fund, and has determined that the adoption of FIN 48 does not have a material impact on the Fund’s financial statements. The Fund files U.S. tax returns. No income tax returns are currently under examination. The statute of limitations on the Fund’s tax returns remains open for the years ended December 31, 2004 through December 31, 2006.
In September 2006, Statement of Financial Accounting Standards No. 157, Fair Value Measurements (SFAS 157) was issued and is effective for fiscal years beginning after November 15, 2007. SFAS 157 defines fair value, establishes a framework for measuring fair value and expands disclosures about fair value measurements. Management is currently evaluating the impact the adoption of SFAS 157 will have on the Portfolio’s financial statement disclosures.
MSF-24
Metropolitan Series Fund, Inc.
Morgan Stanley EAFE Index Portfolio
Report of Independent Registered Public Accounting Firm
To the Shareholders and Board of Directors of the Metropolitan Series Fund, Inc.:
We have audited the accompanying statement of assets and liabilities, including the schedule of investments, of the Morgan Stanley EAFE Index Portfolio, one of the portfolios constituting the Metropolitan Series Fund, Inc. (the “Fund”) as of December 31, 2007, and the related statement of operations for the year then ended, the statements of changes in net assets for each of the two years in the period then ended, and the financial highlights for each of the five years in the period then ended. These financial statements and financial highlights are the responsibility of the Fund’s management. Our responsibility is to express an opinion on these financial statements and financial highlights based on our audits.
We conducted our audits in accordance with the standards of the Public Company Accounting Oversight Board (United States). Those standards require that we plan and perform the audit to obtain reasonable assurance about whether the financial statements and financial highlights are free of material misstatement. The Fund is not required to have, nor were we engaged to perform, an audit of its internal control over financial reporting. Our audits included consideration of internal control over financial reporting as a basis for designing audit procedures that are appropriate in the circumstances, but not for the purpose of expressing an opinion on the effectiveness of the Fund’s internal control over financial reporting. Accordingly, we express no such opinion. An audit also includes examining, on a test basis, evidence supporting the amounts and disclosures in the financial statements, assessing the accounting principles used and significant estimates made by management, as well as evaluating the overall financial statement presentation. Our procedures included confirmation of securities owned as of December 31, 2007, by correspondence with the custodian and brokers; where replies were not received from brokers, we performed other auditing procedures. We believe that our audits provide a reasonable basis for our opinion.
In our opinion, the financial statements and financial highlights referred to above present fairly, in all material respects, the financial position of the Morgan Stanley EAFE Index Portfolio of the Metropolitan Series Fund, Inc. as of December 31, 2007, the results of its operations for the year then ended, the changes in its net assets for each of the two years in the period then ended, and the financial highlights for each of the five years in the period then ended, in conformity with accounting principles generally accepted in the United States of America.
Deloitte & Touche LLP
Boston, Massachusetts
February 21, 2008
MSF-25
Metropolitan Series Fund, Inc.
Directors and Officers
The Fund’s Directors review actions of the Fund’s investment adviser and subadvisers, and decide upon matters of general policy. The Fund’s officers supervise the daily business operations of the Fund. The Board of Directors and the Fund’s officers are listed below. Each Director is responsible for overseeing all 36 Portfolios of the Fund. There is no limit to the term a Director may serve. Directors serve until their resignation, retirement or removal in accordance with the Fund’s organizational documents and policies adopted by the Board from time to time. Officers hold office at the pleasure of the Board or until the election or appointment and the qualification of a successor. The address of the directors and officers is c/o Metropolitan Series Fund, Inc., 501 Boylston Street, Boston, MA 02116.
Interested Directors(1)
Each Director below is an “interested person” (as defined by the 1940 Act) with respect to the Fund in that Ms. Forget is an employee of MetLife and Mr. Typermass is a former employee of MetLife and owns securities issued by MetLife, Inc., the ultimate parent company of MetLife Advisers.
| | | | | | | | |
Name, Address and Age | | Current
position(s)
with Fund | | Position(s)
held since | | Principal occupations
over past five years, including other directorships(2) | | Number of
Portfolios in
Fund Complex
Overseen by
Director(3) |
Elizabeth M. Forget Age: 41 | | Director, Chairman of the Board, President and Chief Executive Officer | | 2006 | | Senior Vice President (since 2007), MetLife, Inc.; President, Met Investors Advisory, LLC (“MIA”); Trustee and President, Met Investors Series Trust (“MIST”); Executive Vice President, MetLife Investors Group, Inc.; President (since 2006), MetLife Advisers. | | 81 |
| | | | |
Arthur G. Typermass Age: 70 | | Director | | 1998 | | Formerly, Senior Vice President and Treasurer, MetLife. | | 37 |
Non-Interested Directors(1)
Each Director below is not an “interested person” (as defined by the 1940 Act) with respect to the Fund (collectively, the “Independent Directors”).
| | | | | | | | |
Name, Address and Age | | Current
position(s)
with Fund | | Position(s)
held since | | Principal occupations
over past five years, including other directorships(2) | | Number of
Portfolios in
Fund Complex
Overseen by
Director(3) |
Steve A. Garban† Age: 70 | | Director | | 1985 | | Formerly, Chief Financial Officer, Senior Vice President Finance and Operations and Treasurer (Emeritus), The Pennsylvania State University. | | 37 |
| | | | |
Linda B. Strumpf Age: 60 | | Director | | 2000 | | Vice President and Chief Investment Officer, Ford Foundation. | | 37 |
| | | | |
Michael S. Scott Morton† Age: 70 | | Director | | 1993 | | Jay W. Forrester Professor of Management (Emeritus) at Sloan School of Management, MIT. | | 37 |
| | | | |
H. Jesse Arnelle Age: 74 | | Director | | 2001 | | Formerly, Counsel, Womble Carlyle Sandrie & Rice; Director, Textron Inc. (global multi-industry company)*; formerly, Director, Gannet Co. Inc. (diversified news and information company)*; formerly, Director, Eastman Chemical Company (global chemical company)*; formerly, Director, Waste Management, Inc.*; formerly, Director, Armstrong Holdings Inc. (parent company of floor and ceiling products business)*; formerly, Director, FPL Group Inc. (public utility holding company)*; Director, URS Corporation (engineering design services firm)*. | | 37 |
| | | | |
Nancy Hawthorne Age: 56 | | Director | | 2003 | | Director, Avid Technologies (computer software company)*; formerly, Chairman of the Board of Avid Technologies; formerly, Board of Advisors, L. Knife & Sons, Inc. (beverage distributor); Chief Executive Officer, Clerestory LLC (corporate financial advisor); formerly, Trustee, New England Zenith Fund (“Zenith Fund”)**; formerly, Chief Executive Officer and Managing Partner, Hawthorne, Krauss and Associates (corporate financial advisor); formerly, Chief Financial Officer and Executive Vice President, Continental Cablevision, subsequently renamed MediaOne (cable television company); formerly, Director, Life F/X, Inc.; formerly, Chairman of the Board, WorldClinic (distance medicine company); formerly, Director, Perini Corporation (construction company)*; formerly, Director, CGU (property and casualty insurance company); formerly, Director, Beacon Power Corporation (energy company )*. | | 37 |
MSF-26
Metropolitan Series Fund, Inc.
Directors and Officers—(Continued)
| | | | | | | | |
Name, Address and Age | | Current
position(s)
with Fund | | Position(s)
held since | | Principal occupations
over past five years, including other directorships(2) | | Number of
Portfolios in
Fund Complex
Overseen by
Director(3) |
John T. Ludes Age: 71 | | Director | | 2003 | | President, LFP Properties (consulting firm); Formerly, Trustee, Zenith Fund**; formerly, Vice Chairman, President and Chief Operating Officer, Fortune Brands/American Brands (global conglomerate); formerly, President and CEO, Acushnet Company (athletic equipment company). | | 37 |
Officers(1)
| | | | | | | | |
Name and address | | Age | | Current
position(s)
with Fund | | Position(s)
held since | | Principal occupations over past five years(2) |
| Jeffrey P. Halperin | | 40 | | Chief Compliance Officer | | 2006 | | Vice President (since 2006), Corporate Ethics and Compliance Department, MetLife, Inc.; Chief Compliance Officer (since 2006), MetLife Advisers, MIA and MIST. |
| | | | |
| John F. Guthrie, Jr. | | 64 | | Senior Vice President | | 2002 | | Manager and Senior Vice President, MetLife Advisers; Vice President, MetLife; Vice President (since 2003), MetLife Group, Inc.; Vice President, NELICO; Vice President (since 2005), MIA; formerly, Senior Vice President, Zenith Fund**. |
| | | | |
| Alan C. Leland | | 55 | | Senior Vice President | | 2005 | | Treasurer and Chief Financial Officer, MetLife Advisers, LLC; Treasurer (since 2005), Met Investors Advisory, LLC; Vice President (since 2004), MIA; Vice President (since 2003), MetLife Group, Inc.; Vice President, MetLife; Senior Vice President, NELICO |
| | | | |
| Peter Duffy | | 52 | | Vice President and Treasurer | | 2000 | | Senior Vice President, MetLife Advisers (since 1998); Second Vice President (since 2003), NELICO; Vice President, MetLife (since 2004); Vice President (since 2004), MetLife Group, Inc.; formerly, Vice President and Treasurer, Zenith Fund**. |
| | | | |
| Thomas M. Lenz | | 49 | | Vice President and Secretary | | 2002 | | General Counsel and Secretary, MetLife Advisers; Assistant General Counsel, MetLife; formerly, Vice President and Secretary, Zenith Fund**. |
| * | Indicates a directorship with a registered investment company or a company subject to the reporting requirements of the Securities Exchange Act of 1934, as amended. |
| ** | The Zenith Fund deregistered with the Securities and Exchange Commission (“SEC”) in 2004. |
| (†) | Served as a trustee, director and/or officer of one or more of the following companies, each of which had a direct or indirect advisory relationship with MetLife Advisers or its affiliates prior to January 31, 2005: State Street Research Financial Trust, State Street Research Income Trust, State Street Research Money Market Trust, State Street Research Institutional Funds, State Street Research Capital Trust, State Street Research Master Investment Trust, State Street Research Equity Trust, State Street Research Securities Trust and State Street Research Exchange Trust (collectively, the “State Street Research Funds”). |
| (1) | Each Director of the Fund also serves as trustee of Metropolitan Series Fund II (“Met Series Fund II”), a registered investment company advised by MetLife Advisers. Each officer of the Fund serves in the same position with Met Series Fund II, which consists of one portfolio. |
| (2) | Previous positions during the past five years with the Fund, MIST, MetLife, MetLife Advisers, MIA, Zenith Fund, NELICO or New England Securities Corporation are omitted if not materially different. |
| (3) | The Fund Complex includes the Fund (36 portfolios), Met Series Fund II (1 portfolio) and MIST (44 portfolios) |
MSF-27
Metropolitan Series Fund, Inc.
Morgan Stanley EAFE Index Portfolio
Board Approval of Advisory and Subadvisory Agreements
The Fund’s Contract Review Committees of the Board of Directors (the “Board”) typically meet in early fall to review the Portfolios’ advisory agreements (the “Advisory Agreements”) and subadvisory agreements (collectively, the “Subadvisory Agreements,” and, together with the Advisory Agreements, the “Agreements”) and determine whether to recommend that the full Board approve the continuation of the Agreements for an additional one-year period. (Following the initial approval of an Agreement for a new Portfolio or with a new adviser or subadviser, such annual reviews are not required until 2 years following the execution of such Agreement.) After each Committee has made its recommendations, the full Board, including the Independent Directors, determines whether to approve the continuation of each of the Agreements. In addition, the Board, including the Independent Directors, considers matters bearing on the Agreements at most of its other meetings throughout the year and regularly interviews various individuals at MetLife Advisers responsible for the management of the Portfolios. The Directors also interview selected investment managers and other professionals at the subadvisers at various times throughout the year.
The Directors receive all materials that they or MetLife Advisers, the Fund’s investment adviser, and the subadvisers believe to be reasonably necessary for the Directors to evaluate the Agreements and determine whether to approve the continuation of the Agreements. These materials generally include, among other items, (i) information on the investment performance of the Portfolios and the performance of peer groups of funds and the Portfolios’ performance benchmarks, (ii) information on the Portfolios’ advisory and subadvisory fees and other expenses, including information comparing the Portfolios’ expenses to those of peer groups of funds and information about any applicable expense caps and fee “breakpoints,” (iii) sales and redemption data, (iv) information related to the profitability of the Agreements to MetLife Advisers and the subadvisers, and potential “fall-out” or ancillary benefits that MetLife Advisers, the subadvisers or their affiliates may receive as a result of their relationships with the Fund and (v) information obtained through the subadvisers’ responses to certain requests from MetLife Advisers and the Directors and MetLife Advisers’ responses to requests from the Directors. The Directors may also consider other information such as (vi) MetLife Advisers’ and the subadvisers’ financial results and condition, (vii) each Portfolio’s investment objectives and strategies and the size, education and experience of the investment staffs of MetLife Advisers and the relevant subadvisers and their use of technology and external research, (viii) the allocation of the Portfolios’ brokerage, if any, including allocations to brokers affiliated with the subadvisers and the use of “soft” commission dollars to pay Portfolio expenses and to pay for research and other similar services, (ix) the resources devoted to, and the record of compliance with, the Portfolios’ investment policies and restrictions, policies on personal securities transactions and other compliance policies, (x) the responses of MetLife Advisers, the subadvisers and/or their affiliates to certain legal and regulatory proceedings and (xi) the economic outlook generally and for the mutual fund industry in particular. Throughout the process, the Directors have the opportunity to ask questions of and request additional materials from MetLife Advisers and the subadvisers.
Following meetings of each Contract Review Committee on September 12, 2007, the Board, at its November 15, 2007 meeting, approved the continuation through December 31, 2008 of the Advisory Agreements for each Portfolio of the Fund and the Subadvisory Agreements for each Portfolio of the Fund. The Agreements approved for continuation are referred to below as the “Continued Agreements.”
In considering whether to approve the continuation of the Continued Agreements, the Directors, including the Independent Directors, did not identify any single factor as determinative, and each weighed the various factors as he or she deemed appropriate. The Directors considered the following matters in connection with their approval of the Continued Agreements:
The nature, extent and quality of the services provided to the relevant Portfolios under the Continued Agreements. The Directors considered the nature, extent and quality of the services provided by MetLife Advisers, the relevant subadvisers (if any) and their affiliates (each, an “Adviser,” and, collectively, the “Advisers”) to the relevant Portfolios pursuant to the Continued Agreements and the resources dedicated to these Portfolios by the Advisers. In particular, the Directors considered the Advisers’ abilities to attract and retain highly qualified investment professionals. With respect to MetLife Advisers, the Directors considered that MetLife Advisers is (i) ultimately responsible for the performance of such Portfolios; (ii) ultimately responsible for the establishment of the investment strategies of each such Portfolio, primarily through its recommendations to the Board regarding the hiring and selection of subadvisers; (iii) responsible for the hiring and selection, subject to Board approval, of subadvisers; and (iv) responsible for maintaining a program of Subadviser oversight reasonably designed to ensure that the subadvisers have reasonable compliance policies and procedures in place. The Directors also considered that MetLife Advisers provides a full range of day-to-day administrative services for the Portfolios involving all aspects of such Portfolios’ day-to-day operations (other than portfolio management). After reviewing these and related factors, the Directors concluded, within the context of their overall conclusions regarding each of the Continued Agreements, that the nature, extent and quality of services provided supported the renewal of these Agreements.
MSF-28
Metropolitan Series Fund, Inc.
Morgan Stanley EAFE Index Portfolio
Board Approval of Advisory and Subadvisory Agreements—(Continued)
Investment performance of the relevant Portfolios. The Directors reviewed information about the performance of the relevant Portfolios over various time periods, including information prepared by an independent third party that compared the performance of the Portfolios to the performance of peer groups of funds and performance benchmarks. The Directors also reviewed a description of the third party’s methodology for identifying a Portfolio’s peer group(s) for purposes of performance and expense comparisons.
In the case of each relevant Portfolio that had performance that lagged its peer group(s) for certain periods, the Directors concluded that other factors relevant to performance were sufficient, in light of other considerations, to warrant renewal of the Continued Agreements relating to such Portfolio. These factors varied from Portfolio to Portfolio, but included one or more of the following: (i) that such Portfolio’s performance, although lagging in certain recent periods, was stronger over the longer term; (ii) that the underperformance was attributable, to a significant extent, to investment decisions that were reasonable and consistent with the Portfolio’s investment objective(s) and policies and that the Portfolio was performing within the range of reasonable expectations, given market conditions and the Portfolio’s investment objective(s) and policies; (iii) that the Portfolio’s performance was competitive when compared to other relevant performance benchmarks or peer groups; and (iv) that MetLife Advisers and/or the relevant subadviser (if any) had taken or was taking steps designed to help improve the Portfolio’s investment performance.
The Directors also considered the investment performance of the Advisers and their reputations generally, the historical responsiveness of the Advisers to Director concerns about performance and the willingness of the Advisers to take steps intended to improve performance.
After reviewing these and related factors, the Directors concluded, within the context of their overall conclusions regarding each of the Continued Agreements, that the investment performance of each relevant Portfolio and Adviser was sufficient, in light of other considerations, to warrant the renewal of the Continued Agreements.
The costs of the services to be provided and profits to be realized by the Advisers and their affiliates from their relationships with the Portfolios. The Directors considered the fees charged by MetLife Advisers to the Portfolios for advisory services and, with respect to the subadvised Portfolios, by such subadvisers to MetLife Advisers for subadvisory services (such advisory and subadvisory fees (if any), collectively, “Fees”), as well as the total expense levels of the Portfolios. This information included comparisons (provided by an independent third party) of the Portfolios’ advisory fees and total expense levels to those of their peer groups. In evaluating Fees for the relevant Portfolios, the Directors also took into account the demands, complexity and quality of the investment management services provided to each Portfolio. The Directors considered MetLife Advisers’ recommendations regarding reductions in Fee rates, implementation of Fee breakpoints and institution of Fee waivers and expense caps.
The Directors also considered the compensation directly or indirectly received by the Advisers and their affiliates from their relationships with the relevant Portfolios. The Directors reviewed information relating to the profits received by MetLife Advisers, certain of the subadvisers and their affiliates as a result of their relationships with the relevant Portfolios, and information about the allocation of expenses used to calculate profitability. When reviewing profitability, the Directors also considered the performance of the relevant Portfolios, the expense levels of such Portfolios and whether the relevant Advisers had implemented breakpoints, fee waivers and/or expense caps with respect to such Portfolios.
After reviewing these and related factors, the Directors concluded, within the context of their overall conclusions regarding each of the Continued Agreements, that the Fees charged to each of the relevant Portfolios were fair and reasonable, and that the information provided regarding costs of these services generally, and the related profitability (if known) to the relevant Advisers of their relationships with the relevant Portfolios, supported the renewal of the Continued Agreements.
Economies of Scale. The Directors considered the existence of any economies of scale in the provision of services by the Advisers and whether those economies were shared with the relevant Portfolios through breakpoints in their advisory fees or other means, such as expense caps, fee waivers or relatively low levels of fees. The Directors noted that most of the relevant Portfolios benefited or will benefit from breakpoints, expense caps and/or fee waivers with respect to their advisory fees. In considering these issues, the Directors also took into consideration information relating to the costs of the services provided and the profitability to MetLife Advisers, the relevant subadvisers (if any) and each of their affiliates of their relationships with the relevant Portfolios, as discussed above.
After reviewing these and related factors, the Directors concluded, within the context of their overall conclusions regarding each of the Continued Agreements, that the extent to which economies of scale were shared with the relevant Portfolios supported the renewal of such Agreements.
MSF-29
Metropolitan Series Fund, Inc.
Morgan Stanley EAFE Index Portfolio
Board Approval of Advisory and Subadvisory Agreements—(Continued)
Other Factors. The Directors also considered other factors, which included but were not limited to the following:
| | • | | the extent to which each relevant Portfolio operated in accordance with its investment objective, and its record of compliance with its investment restrictions and the compliance programs of the Fund and the Advisers. They also considered the compliance-related resources the Advisers and their affiliates provide to the relevant Portfolios; |
| | • | | the nature, quality, cost and extent of administrative and shareholder services performed by MetLife Advisers and its affiliates under the Advisory Agreements; and |
| | • | | so-called “fall-out benefits” to the Advisers, such as the engagement of their affiliates to provide distribution, brokerage and transfer agency services to the Portfolios, and the benefits of research made available to the relevant Advisers by reason of brokerage commissions generated by the relevant Portfolios’ securities transactions. The Directors also considered the possible conflicts of interest associated with these fall-out and other benefits, and the reporting and other processes in place to disclose and monitor these possible conflicts of interest. |
Based on their evaluation of all factors that they deemed to be material, including those factors described above, and assisted by the advice of independent counsel, the Directors, including the Independent Directors, concluded that each of the Continued Agreements should be continued through December 31, 2008.
MSF-30
A description of the policies and procedures that the Fund uses to determine how to vote proxies relating to portfolio securities is available (i) without charge, upon request, by calling (800) 638-7732 and (ii) on the Securities and Exchange Commission’s (the “SEC”) website at http://www.sec.gov.
Information regarding how the Fund voted proxies relating to portfolio securities during the most recent twelve-month period ended December 31, 2007 is available (i) without charge, upon request, by calling (800) 638-7732 and (ii) on the SEC’s website at http://www.sec.gov.
The Fund files with the SEC a complete schedule of its portfolio holdings, as of the close of the first and third quarters of its fiscal year, on “Form N-Q”. These filings are available on the SEC’s website at www.sec.gov and may be reviewed and copied at the SEC’s Public Reference Room in Washington, DC. (Call 1-800-SEC-0330 for information on the operation of the Public Reference Room.)
MSF-31
| | |
Metropolitan Series Fund, Inc. Neuberger Berman Mid Cap Value Portfolio Annual Report | | December 31, 2007 |
Letter from the President
February 1, 2008
Letter to Policy Holders:
2007 was a tumultuous year in the financial markets driven by concerns in the credit markets surrounding sub-prime mortgages and fears of recession in the U.S. Economy. The broad markets were mixed, with the Dow Jones Industrial Average up 8.9% and the MSCI EAFE Index, which measures the performance of international equities, up 11.2% for the year, while the Russell 2000 Index, which measures the performance of small capitalization stocks, was down 1.6%.
In the fixed income markets, credit spreads increased as a result of the pressure from sub-prime mortgage crisis and the Federal Reserve lowered interest rates by a total of 1% during the year. The Lehman Brothers Aggregate Bond Index posted a 7.0% return for the year.
On the following pages, you will find a complete review of your Portfolio and its investment performance.
MetLife is committed to building your financial freedom. We appreciate your trust and will continue to focus our efforts on meeting your investment needs.
Sincerely,
Elizabeth Forget
President, Metropolitan Series Fund, Inc.
Metropolitan Series Fund, Inc.
Neuberger Berman Mid Cap Value Portfolio
Managed by Neuberger Berman Management, Inc.
Portfolio Manager Commentary*
PORTFOLIO PERFORMANCE
For the year ended December 31, 2007, the Class A shares of the Neuberger Berman Mid Cap Value Portfolio returned 3.4%, compared to its benchmark, the Russell Midcap Value Index1, which returned -1.4%. The average return of the Portfolio’s peer group, the Lipper Variable Insurance Products Mid-Cap Value Funds Universe2, was 2.8% over the same period.
PORTFOLIO REVIEW
The year 2007 was volatile for the equity markets, but most major indices advanced. In the first half, the strength of earnings and stable interest rate policy lifted stocks, but during the summer concern over the impact of subprime mortgage defaults spread to the credit markets, causing a liquidity crunch and dampening enthusiasm for equities. The Federal Reserve stepped in to ease monetary conditions, which helped revive stocks in the fall. However, concern about economic weakness, reflected in slowing retail sales, caused pessimism and stock declines in the fourth quarter. For the year, large-cap issues finished modestly ahead of mid-caps, while small-caps declined. Within the Russell Midcap Value Index, the Energy sector provided the most substantial gains, followed distantly by Materials and Utilities. Financials and Consumer Discretionary suffered substantial losses.
For the year, the Portfolio posted a positive return, outperforming the Russell Midcap Value Index. Energy had the most favorable impact on total return, followed by Materials and Industrials. Consumer Discretionary was the worst laggard, followed by Financials. Relative to the Index, the Portfolio’s overweight in Energy provided the most favorable impact. Stock selection in Materials and Industrials were also considerable positives, with overweights in these sectors also contributing to results, but more modestly.
Our assessment of the credit crunch led us to the view that the recovery in housing was likely to be more protracted than we had anticipated. As such, in the third quarter, we made the decision to exit the bulk of our homebuilding (in Consumer Discretionary) and mortgage-related stocks (in Financials), reinvesting the proceeds in Retail, Energy and Industrials. By the fourth quarter, this change paid significant dividends as we limited our exposure to continued trauma in these areas. However, for the year, Consumer Discretionary and Financials had the worst impact on relative results.
Over the course of the year, problems in the housing and subprime mortgage markets morphed from seemingly narrow issues to factors affecting the broad financial markets and the economy as a whole. Now, it’s clear from a variety of metrics that economic growth has decelerated substantially. Although the Federal Reserve was slow to grasp the breadth and depth of the current problem, it has taken a number of steps to ease credit conditions.
* The views expressed above are those of the subadvisory firm as of December 31, 2007 and are subject to change based on market and other conditions. Information about the Portfolio’s holdings, asset allocation, industry allocation, or country diversification is historical and is not an indication of future Portfolio composition, which will vary. The performance of any index mentioned in this commentary has not been adjusted for ongoing management, distribution and operating expenses, and sales charges applicable to mutual fund investments. Direct investment in the Index is not possible.
1 The Russell Midcap® Value Index is an unmanaged measure of performance of those Russell Midcap companies (the 800 smallest companies in the Russell 1000 Index) with lower price-to-book ratios and higher forecasted growth values.
2 The Lipper Variable Insurance Products Fund Average is an average of the total return performance (calculated on the basis of net asset value) of variable product funds with similar investment objectives to those of the subject Portfolio as calculated by Lipper Analytical Services, an independent mutual fund ranking service.
MSF-2
Metropolitan Series Fund, Inc.
Neuberger Berman Mid Cap Value Portfolio
A $10,000 INVESTMENT COMPARED TO
THE RUSSELL MIDCAP VALUE INDEX
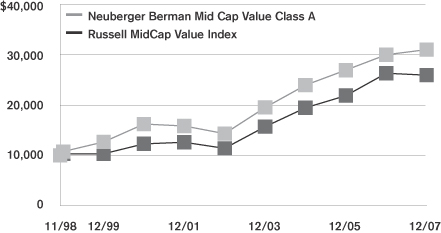
Average Annual Returns as of December 31, 2007
| | | | | | | | | | | | |
| | | Neuberger Berman
Mid Cap Value Portfolio | | | Russell
MidCap
Value Index | |
| | | Class A | | | Class B | | | Class E | | |
| 1 Year | | 3.4 | % | | 3.2 | % | | 3.3 | % | | -1.4 | % |
| 5 Year | | 16.8 | | | 16.5 | | | 16.6 | | | 17.9 | |
| Since Inception | | 13.1 | | | 10.1 | | | 10.3 | | | 11.0 | |
Performance numbers are net of all Portfolio expenses but do not include any insurance, sales, or administrative charges of variable annuity or life insurance contracts. If these charges were included, the returns would be lower.
Inception dates of the Class A, Class B and Class E shares are: 11/9/98, 5/1/01 and 5/1/01, respectively. Index since inception return is based on the Class A inception date.
This information represents past performance and is not indicative of future results. Investment return and principal value may fluctuate so that shares, upon redemption, may be worth more or less than the original cost.
PORTFOLIO COMPOSITION
as of December 31, 2007
Top Holdings
| | |
| | | % of Total
Net Assets |
Chicago Bridge & Iron Co., NV | | 2.9% |
Terex Corp. | | 2.4% |
Freeport-McMoRan Copper & Gold, Inc. | | 2.4% |
Canadian Natural Resources, Ltd. | | 2.3% |
Noble Corp. | | 2.2% |
FirstEnergy Corp. | | 2.2% |
DPL, Inc. | | 2.1% |
Assurant, Inc. | | 2.1% |
Constellation Energy Group | | 2.1% |
United States Steel Corp. | | 2.0% |
Top Sectors
| | |
| | | % of Total
Market Value |
Industrials | | 16.4% |
Energy | | 13.1% |
Financials | | 13.1% |
Consumer Discretionary | | 12.9% |
Utilities | | 10.6% |
Information Technology | | 9.2% |
Materials | | 8.6% |
Health Care | | 8.2% |
Consumer Staples | | 6.5% |
Cash | | 1.5% |
MSF-3
Metropolitan Series Fund, Inc.
Shareholder Expense Example
As a shareholder of the Portfolio, you incur ongoing costs, including management fees; distribution and service (12b-1) fees; and other Portfolio expenses. This example is intended to help you understand your ongoing costs (in dollars) (referred to as “expenses”) of investing in the Portfolio and compare these costs with the ongoing costs of investing in other mutual funds. The example is based on an investment of $1,000 invested at the beginning of the period and held for the entire period, July 1, 2007 through December 31, 2007.
Actual Expenses
The first line for each share class of the Portfolio in the table below provides information about actual account values and actual expenses. You may use the information in this line, together with the amount you invested in the particular share class of the Portfolio, to estimate the expenses that you paid over the period. Simply divide your account value by $1,000 (for example, an $8,600 account value divided by $1,000=8.6), then multiply the result by the number in the first line under the heading entitled “Expenses Paid During Period” to estimate the expenses you paid on your account during this period.
Hypothetical Example for Comparison Purposes
The second line for each share class of the Portfolio in the table below provides information about hypothetical account values and hypothetical expenses based on the Portfolio’s actual expense ratio and an assumed rate of return of 5% per year before expenses, which is not the Portfolio’s actual return. The hypothetical account values and expenses may not be used to estimate the actual ending account balance or expenses you paid for the period. You may use this information to compare the ongoing costs of investing in the Portfolio and other funds. To do so, compare this 5% hypothetical example with the 5% hypothetical examples that appear in the shareholder reports of the other funds.
Please note that the expenses shown in the table are meant to highlight your ongoing costs only and do not reflect any fees or charges of your variable insurance product or any additional expenses that participants in certain eligible qualified plans may bear relating to the operations of their plan. Therefore, the second line for each share class in the table is useful in comparing ongoing costs only, and will not help you determine the relative total costs of owning different funds. In addition, if these other costs were included, your costs would have been higher.
| | | | | | | | | | | | | | |
Portfolio | | | | Annualized
Expense
Ratio | | | Beginning
Account Value
July 1,
2007 | | Ending
Account Value
December 31,
2007 | | Expenses Paid
During Period*
July 1, 2007
to
December 31,
2007 |
Neuberger Berman Mid Cap Value—Class A | | Actual | | 0.69 | % | | $ | 1,000.00 | | $ | 945.30 | | $ | 3.38 |
| | Hypothetical | | 0.69 | % | | $ | 1,000.00 | | $ | 1,021.69 | | $ | 3.52 |
| | | | | |
Neuberger Berman Mid Cap Value—Class B | | Actual | | 0.94 | % | | $ | 1,000.00 | | $ | 943.90 | | $ | 4.61 |
| | Hypothetical | | 0.94 | % | | $ | 1,000.00 | | $ | 1,020.41 | | $ | 4.79 |
| | | | | |
Neuberger Berman Mid Cap Value—Class E | | Actual | | 0.84 | % | | $ | 1,000.00 | | $ | 944.20 | | $ | 4.12 |
| | Hypothetical | | 0.84 | % | | $ | 1,000.00 | | $ | 1,020.92 | | $ | 4.28 |
* Expenses paid are equal to the Portfolio’s annualized expense ratio for the most recent six month period, as shown above, multiplied by the average account value over the period, multiplied by the number of days in the most recent fiscal half-year, divided by 365 (to reflect the one-half year period).
MSF-4
Metropolitan Series Fund, Inc.
Neuberger Berman Mid Cap Value Portfolio
Schedule of Investments as of December 31, 2007
Common Stock—96.9% of Total Net Assets
| | | | | |
| Security Description | | Shares | | Value* |
| | | | | |
|
Aerospace & Defense—3.3% |
L-3 Communications Holdings, Inc. | | 185,400 | | $ | 19,641,276 |
Spirit Aerosystems Holdings, Inc. | | 690,100 | | | 23,808,450 |
| | | | | |
| | | | | 43,449,726 |
| | | | | |
|
Auto Components—1.2% |
WABCO Holdings, Inc. | | 321,200 | | | 16,088,908 |
| | | | | |
|
Automobiles—1.2% |
Harley-Davidson, Inc. | | 333,800 | | | 15,591,798 |
| | | | | |
|
Beverages—1.8% |
Constellation Brands, Inc. (a) (b) | | 996,000 | | | 23,545,440 |
| | | | | |
|
Capital Markets—5.2% |
Jefferies Group, Inc. | | 821,500 | | | 18,935,575 |
Legg Mason, Inc. | | 92,000 | | | 6,729,800 |
Morgan Stanley | | 405,800 | | | 21,552,038 |
The Bear Stearns Co., Inc. (a) | | 242,000 | | | 21,356,500 |
| | | | | |
| | | | | 68,573,913 |
| | | | | |
|
Communications Equipment—1.0% |
Arris Group, Inc. (b) | | 1,328,700 | | | 13,260,426 |
| | | | | |
|
Construction & Engineering—3.3% |
Chicago Bridge & Iron Co., NV | | 623,800 | | | 37,702,471 |
The Shaw Group, Inc. (b) | | 92,000 | | | 5,560,480 |
| | | | | |
| | | | | 43,262,951 |
| | | | | |
|
Electric Utilities—6.0% |
DPL, Inc. (a) | | 940,200 | | | 27,876,930 |
FirstEnergy Corp. | | 395,600 | | | 28,617,704 |
PPL Corp. | | 433,100 | | | 22,560,179 |
| | | | | |
| | | | | 79,054,813 |
| | | | | |
|
Electronic Equipment & Instruments—1.5% |
Avnet, Inc. | | 555,000 | | | 19,408,350 |
| | | | | |
|
Energy Equipment & Services—5.5% |
National Oilwell Varco, Inc. (b) | | 363,300 | | | 26,688,018 |
Noble Corp. | | 517,700 | | | 29,255,227 |
Oceaneering International, Inc. (b) | | 247,900 | | | 16,696,065 |
| | | | | |
| | | | | 72,639,310 |
| | | | | |
|
Food Products—3.1% |
ConAgra Foods, Inc. | | 908,200 | | | 21,606,078 |
Smithfield Foods, Inc. (a) (b) | | 639,500 | | | 18,494,340 |
| | | | | |
| | | | | 40,100,418 |
| | | | | |
|
Health Care Equipment & Supplies—0.7% |
Covidien, Ltd. | | 211,400 | | | 9,362,906 |
| | | | | |
|
Health Care Providers & Services—4.4% |
Aetna, Inc. | | 404,800 | | | 23,369,104 |
CIGNA Corp. | | 401,800 | | | 21,588,714 |
| | | | | |
| Security Description | | Shares | | Value* |
| | | | | |
|
Health Care Providers & Services—(Continued) |
Coventry Health Care, Inc. (b) | | 224,850 | | $ | 13,322,362 |
| | | | | |
| | | | | 58,280,180 |
| | | | | |
|
Household Durables—3.0% |
NVR, Inc. (a) (b) | | 46,200 | | | 24,208,800 |
Whirlpool Corp. (a) | | 191,200 | | | 15,607,656 |
| | | | | |
| | | | | 39,816,456 |
| | | | | |
|
Independent Power Producers & Energy Traders—4.6% |
Constellation Energy Group | | 265,500 | | | 27,221,715 |
Mirant Corp. (b) | | 365,200 | | | 14,235,496 |
NRG Energy, Inc. (a) (b) | | 444,000 | | | 19,242,960 |
| | | | | |
| | | | | 60,700,171 |
| | | | | |
|
Industrial Conglomerates—1.9% |
McDermott International, Inc. (b) | | 433,800 | | | 25,607,214 |
| | | | | |
|
Insurance—3.9% |
Assurant, Inc. (a) | | 410,160 | | | 27,439,704 |
Endurance Specialty Holdings, Ltd. (a) | | 183,300 | | | 7,649,109 |
StanCorp Financial Group, Inc. | | 314,800 | | | 15,859,624 |
| | | | | |
| | | | | 50,948,437 |
| | | | | |
|
IT Services—1.7% |
Affiliated Computer Services, Inc. (Class A) (b) | | 496,000 | | | 22,369,600 |
| | | | | |
|
Machinery—5.3% |
Eaton Corp. | | 223,600 | | | 21,678,020 |
Joy Global, Inc. | | 255,700 | | | 16,830,174 |
Terex Corp. | | 480,400 | | | 31,499,828 |
| | | | | |
| | | | | 70,008,022 |
| | | | | |
|
Marine—1.1% |
Eagle Bulk Shipping, Inc. (a) | | 543,300 | | | 14,424,615 |
| | | | | |
|
Media—1.3% |
The McGraw-Hill Cos., Inc. | | 382,900 | | | 16,774,849 |
| | | | | |
|
Metals & Mining—8.6% |
Cleveland-Cliffs, Inc. (a) | | 195,400 | | | 19,696,320 |
Freeport-McMoRan Copper & Gold, Inc. | | 302,200 | | | 30,957,369 |
Sterlite Industries India, Ltd. (ADR) (a) (b) | | 572,900 | | | 14,935,503 |
Teck Cominco, Ltd. (Class B) (CAD) | | 570,100 | | | 20,358,271 |
United States Steel Corp. | | 221,100 | | | 26,733,201 |
| | | | | |
| | | | | 112,680,664 |
| | | | | |
|
Multiline Retail—3.1% |
J.C. Penney Co., Inc. | | 430,400 | | | 18,933,296 |
Macy’s, Inc. | | 589,813 | | | 15,258,462 |
Saks, Inc. (a) (b) | | 306,400 | | | 6,360,864 |
| | | | | |
| | | | | 40,552,622 |
| | | | | |
*See accompanying notes to financial statements.
MSF-5
Metropolitan Series Fund, Inc.
Neuberger Berman Mid Cap Value Portfolio
Schedule of Investments as of December 31, 2007
Common Stock—(Continued)
| | | | | |
| Security Description | |
Shares | | Value* |
| | | | | |
|
Oil, Gas & Consumable Fuels—7.5% |
Canadian Natural Resources, Ltd. | | 407,700 | | $ | 29,819,178 |
Denbury Resources, Inc. (b) | | 705,000 | | | 20,973,750 |
Ship Finance International, Ltd. (a) | | 482,013 | | | 13,356,580 |
Southwestern Energy Co. (b) | | 252,000 | | | 14,041,440 |
Talisman Energy, Inc. | | 504,615 | | | 9,345,470 |
XTO Energy, Inc. | | 216,010 | | | 11,094,274 |
| | | | | |
| | | | | 98,630,692 |
| | | | | |
|
Personal Products—1.6% |
NBTY, Inc. (b) | | 774,015 | | | 21,208,011 |
| | | | | |
|
Pharmaceuticals—3.0% |
Endo Pharmaceuticals Holdings, Inc. (b) | | 674,600 | | | 17,991,582 |
Shire, Plc. (ADR) | | 319,700 | | | 22,043,315 |
| | | | | |
| | | | | 40,034,897 |
| | | | | |
|
Real Estate Investment Trusts—4.0% |
Annaly Capital Management, Inc. | | 719,120 | | | 13,073,602 |
Developers Diversified Realty Corp. | | 187,600 | | | 7,183,204 |
First Industrial Realty Trust, Inc. (a) | | 224,100 | | | 7,753,860 |
iStar Financial, Inc. (a) | | 424,700 | | | 11,063,435 |
Ventas, Inc. | | 286,000 | | | 12,941,500 |
| | | | | |
| | | | | 52,015,601 |
| | | | | |
|
Semiconductors & Semiconductor Equipment—1.6% |
International Rectifier Corp. (a) (b) | | 604,700 | | | 20,541,659 |
| | | | | |
|
Software—3.4% |
Activision, Inc. (b) | | 346,900 | | | 10,302,930 |
Check Point Software Technologies, Ltd. (b) | | 519,106 | | | 11,399,568 |
Take-Two Interactive Software, Inc. (a) (b) | | 1,255,500 | | | 23,163,975 |
| | | | | |
| | | | | 44,866,473 |
| | | | | |
|
Specialty Retail—2.3% |
Abercrombie & Fitch Co. (Class A) | | 113,900 | | | 9,108,583 |
Aeropostale, Inc. (b) | | 247,000 | | | 6,545,500 |
TJX Cos., Inc. | | 510,300 | | | 14,660,919 |
| | | | | |
| | | | | 30,315,002 |
| | | | | |
|
Textiles, Apparel & Luxury Goods—0.8% |
Liz Claiborne, Inc. (a) | | 495,800 | | | 10,089,530 |
| | | | | |
Total Common Stock
(Identified Cost $1,125,785,908) | | | | | 1,274,203,654 |
| | | | | |
|
| Preferred Stock—1.3% |
|
Aerospace & Defense—1.3% |
Empresa Brasileira de Aeronautica S.A. (ADR) | | 372,500 | | | 16,982,275 |
| | | | | |
Total Preferred Stock
(Identified Cost $14,998,533) | | | | | 16,982,275 |
| | | | | |
| | | | | | | |
|
| Short Term Investments—14.9% | |
| Security Description | | Shares/
Face Amount | | Value* | |
| | | | | | | |
| | |
Mutual Funds—12.9% | | | | | | | |
State Street Navigator Securities Lending Prime Portfolio (c) | | | 168,835,271 | | $ | 168,835,271 | |
| | | | | | | |
| | |
Repurchase Agreement—2.0% | | | | | | | |
State Street Corp. Repurchase Agreement dated 12/31/07 at 1.20% to be repurchased at $26,794,786 on 1/02/08, collateralized by $23,440,000 U.S. Treasury Bond 6.00% due 2/15/26 with a value of $27,600,600. | | $ | 26,793,000 | | | 26,793,000 | |
| | | | | | | |
Total Short Term Investments
(Identified Cost $195,628,271) | | | | | | 195,628,271 | |
| | | | | | | |
Total Investments—113.1%
(Identified Cost $1,336,412,712) (d) | | | | | | 1,486,814,200 | |
Liabilities in excess of other assets | | | | | | (171,907,482 | ) |
| | | | | | | |
| Total Net Assets—100% | | | | | $ | 1,314,906,718 | |
| | | | | | | |
| (a) | A portion or all of the security was held on loan. As of December 31, 2007, the market value of securities loaned was $206,801,017 and the collateral received consisted of cash in the amount of $168,835,271 and non cash collateral with a value of $43,499,632. The cash collateral is invested in a money market fund managed by an affiliate of the custodian. The non cash collateral received consists primarily of government securities and bank letters of credit, and are held for the benefit of the Portfolio at the Portfolio’s custodian. |
| (c) | Represents investment of cash collateral received from securities lending transactions. |
| (d) | The aggregate cost of investments for federal income tax purposes as of December 31, 2007 was $1,336,188,518 and the composition of unrealized appreciation and depreciation of investment securities was $220,810,654 and $(70,184,972), respectively. |
| (ADR)— | An American Depositary Receipt is a certificate issued by a custodian bank representing the right to receive securities of the foreign issuer described. Trading on exchanges not located in the United States or Canada significantly influences the value of ADRs. |
*See accompanying notes to financial statements.
MSF-6
Metropolitan Series Fund, Inc.
Neuberger Berman Mid Cap Value Portfolio
Statement of Assets & Liabilities
December 31, 2007
| | | | | | | |
Assets | | | | | | | |
Investments at value (a) (b) | | | | | $ | 1,486,814,200 | |
Cash | | | | | | 31 | |
Receivable for: | | | | | | | |
Securities sold | | | | | | 1,301,094 | |
Fund shares sold | | | | | | 655,954 | |
Accrued interest and dividends | | | | | | 1,436,120 | |
Foreign taxes | | | | | | 160 | |
| | | | | | | |
Total Assets | | | | | | 1,490,207,559 | |
Liabilities | | | | | | | |
Payable for: | | | | | | | |
Securities purchased | | $ | 4,547,933 | | | | |
Fund shares redeemed | | | 1,009,448 | | | | |
Withholding taxes | | | 68,877 | | | | |
Collateral for securities loaned | | | 168,835,271 | | | | |
Accrued expenses: | | | | | | | |
Management fees | | | 708,130 | | | | |
Service and distribution fees | | | 86,961 | | | | |
Other expenses | | | 44,221 | | | | |
| | | | | | | |
Total Liabilities | | | | | | 175,300,841 | |
| | | | | | | |
Net Assets | | | | | $ | 1,314,906,718 | |
| | | | | | | |
Net assets consists of: | | | | | | | |
Capital paid in | | | | | $ | 1,161,542,036 | |
Undistributed net investment income | | | | | | 9,312,085 | |
Accumulated net realized losses | | | | | | (6,354,786 | ) |
Unrealized appreciation on investments and foreign currency | | | | | | 150,407,383 | |
| | | | | | | |
Net Assets | | | | | $ | 1,314,906,718 | |
| | | | | | | |
| Computation of offering price: | | | | | | | |
Class A | | | | | | | |
Net asset value and redemption price per share ($871,569,426 divided by 40,994,300 shares outstanding) | | | | | $ | 21.26 | |
| | | | | | | |
Class B | | | | | | | |
Net asset value and redemption price per share ($361,252,039 divided by 17,177,459 shares outstanding) | | | | | $ | 21.03 | |
| | | | | | | |
Class E | | | | | | | |
Net asset value and redemption price per share ($82,085,253 divided by 3,876,450 shares outstanding) | | | | | $ | 21.18 | |
| | | | | | | |
(a) Identified cost of investments | | | | | $ | 1,336,412,712 | |
| | | | | | | |
| (b) | Includes cash collateral for securities loaned of $168,835,271. |
Statement of Operations
For the Year Ended December 31, 2007
| | | | | | | | |
Investment Income | | | | | | | | |
Dividends | | | | | | $ | 20,356,136 | (a) |
Interest | | | | | | | 1,751,939 | (b) |
| | | | | | | | |
| | | | | | | 22,108,075 | |
Expenses | | | | | | | | |
Management fees | | $ | 7,500,564 | | | | | |
Service and distribution fees—Class B | | | 881,384 | | | | | |
Service and distribution fees—Class E | | | 133,977 | | | | | |
Directors’ fees and expenses | | | 23,669 | | | | | |
Custodian | | | 98,096 | | | | | |
Audit and tax services | | | 31,737 | | | | | |
Legal | | | 13,405 | | | | | |
Printing | | | 317,355 | | | | | |
Insurance | | | 11,226 | | | | | |
Miscellaneous | | | 16,291 | | | | | |
| | | | | | | | |
Total expenses | | | 9,027,704 | | | | | |
Expense reductions | | | (248,309 | ) | | | 8,779,395 | |
| | | | | | | | |
Net Investment Income | | | | | | | 13,328,680 | |
| | | | | | | | |
Realized and Unrealized Gain (Loss) | | | | | | | | |
| Realized loss on: | | | | | | | | |
Investments—net | | | (10,328,331 | ) | | | | |
Futures contracts—net | | | (178,304 | ) | | | | |
Foreign currency transactions—net | | | (1,975 | ) | | | (10,508,610 | ) |
| | | | | | | | |
| Change in unrealized appreciation on: | | | | | | | | |
Investments—net | | | 23,260,412 | | | | | |
Foreign currency transactions—net | | | 6,041 | | | | 23,266,453 | |
| | | | | | | | |
Net gain | | | | | | | 12,757,843 | |
| | | | | | | | |
Net Increase in Net Assets From Operations | | | | | | $ | 26,086,523 | |
| | | | | | | | |
| (a) | Net of foreign taxes of $176,635. |
| (b) | Includes net income on securities loaned of $1,173,368. |
See accompanying notes to financial statements.
MSF-7
Metropolitan Series Fund, Inc.
Neuberger Berman Mid Cap Value Portfolio
Statements of Changes in Net Assets
| | | | | | | | |
| | | Year ended
December 31,
2007 | | | Year ended
December 31,
2006 | |
From Operations | | | | | | | | |
Net investment income | | $ | 13,328,680 | | | $ | 6,365,226 | |
Net realized gain (loss) | | | (10,508,610 | ) | | | 31,895,557 | |
Unrealized appreciation | | | 23,266,453 | | | | 52,306,093 | |
| | | | | | | | |
Increase in net assets from operations | | | 26,086,523 | | | | 90,566,876 | |
| | | | | | | | |
From Distributions to Shareholders | | | | | | | | |
Net investment income | | | | | | | | |
Class A | | | (3,653,118 | ) | | | (2,278,227 | ) |
Class B | | | (1,085,328 | ) | | | (662,115 | ) |
Class E | | | (369,343 | ) | | | (335,325 | ) |
| | | | | | | | |
| | | (5,107,789 | ) | | | (3,275,667 | ) |
| | | | | | | | |
Net realized gain | | | | | | | | |
Class A | | | (19,661,495 | ) | | | (41,155,752 | ) |
Class B | | | (10,264,105 | ) | | | (22,662,908 | ) |
Class E | | | (2,686,871 | ) | | | (8,496,351 | ) |
| | | | | | | | |
| | | (32,612,471 | ) | | | (72,315,011 | ) |
| | | | | | | | |
Total distributions | | | (37,720,260 | ) | | | (75,590,678 | ) |
| | | | | | | | |
Increase in net assets from capital share transactions | | | 381,397,860 | | | | 199,126,077 | |
| | | | | | | | |
Total increase in net assets | | | 369,764,123 | | | | 214,102,275 | |
| | |
Net Assets | | | | | | | | |
Beginning of the period | | | 945,142,595 | | | | 731,040,320 | |
| | | | | | | | |
End of the period | | $ | 1,314,906,718 | | | $ | 945,142,595 | |
| | | | | | | | |
| | |
Undistributed Net Investment Income | | | | | | | | |
End of the period | | $ | 9,312,085 | | | $ | 5,438,013 | |
| | | | | | | | |
Other Information:
Capital Shares
Transactions in capital shares were as follows:
| | | | | | | | | | | | | | |
| | | Year ended
December 31, 2007 | | | Year ended
December 31, 2006 | |
| | | Shares | | | $ | | | Shares | | | $ | |
Class A | | | | | | | | | | | | | | |
Sales | | 20,952,460 | | | $ | 455,646,071 | | | 9,832,182 | | | $ | 200,950,338 | |
Reinvestments | | 1,038,513 | | | | 23,314,613 | | | 2,095,223 | | | | 43,433,979 | |
Redemptions | | (6,570,813 | ) | | | (142,938,314 | ) | | (6,802,398 | ) | | | (138,222,422 | ) |
| | | | | | | | | | | | | | |
Net increase | | 15,420,160 | | | $ | 336,022,370 | | | 5,125,007 | | | $ | 106,161,895 | |
| | | | | | | | | | | | | | |
Class B | | | | | | | | | | | | | | |
Sales | | 4,778,926 | | | $ | 103,820,476 | | | 6,271,533 | | | $ | 127,421,240 | |
Reinvestments | | 510,087 | | | | 11,349,433 | | | 1,135,038 | | | | 23,325,023 | |
Redemptions | | (2,939,477 | ) | | | (63,331,566 | ) | | (2,658,825 | ) | | | (53,486,709 | ) |
| | | | | | | | | | | | | | |
Net increase | | 2,349,536 | | | $ | 51,838,343 | | | 4,747,746 | | | $ | 97,259,554 | |
| | | | | | | | | | | | | | |
Class E | | | | | | | | | | | | | | |
Sales | | 612,491 | | | $ | 13,516,410 | | | 801,181 | | | $ | 16,648,526 | |
Reinvestments | | 136,560 | | | | 3,056,214 | | | 427,270 | | | | 8,831,676 | |
Redemptions | | (1,066,379 | ) | | | (23,035,477 | ) | | (1,469,228 | ) | | | (29,775,574 | ) |
| | | | | | | | | | | | | | |
Net decrease | | (317,328 | ) | | $ | (6,462,853 | ) | | (240,777 | ) | | $ | (4,295,372 | ) |
| | | | | | | | | | | | | | |
Increase derived from capital share transactions | | | | | $ | 381,397,860 | | | | | | $ | 199,126,077 | |
| | | | | | | | | | | | | | |
See accompanying notes to financial statements.
MSF-8
Metropolitan Series Fund, Inc.
Neuberger Berman Mid Cap Value Portfolio
Financial Highlights
| | | | | | | | | | | | | | | | | | | | |
| | | Class A | |
| | | Year ended December 31, | |
| | | 2007 | | | 2006 | | | 2005 | | | 2004 | | | 2003 | |
Net Asset Value, Beginning of Period | | $ | 21.27 | | | $ | 20.97 | | | $ | 20.67 | | | $ | 17.35 | | | $ | 12.76 | |
| | | | | | | | | | | | | | | | | | | | |
Income From Investment Operations | | | | | | | | | | | | | | | | | | | | |
Net investment income | | | 0.27 | (a) | | | 0.18 | (a) | | | 0.12 | | | | 0.07 | | | | 0.06 | |
Net realized and unrealized gain on investments | | | 0.50 | | | | 2.18 | | | | 2.08 | | | | 3.82 | | | | 4.58 | |
| | | | | | | | | | | | | | | | | | | | |
Total from investment operations | | | 0.77 | | | | 2.36 | | | | 2.20 | | | | 3.89 | | | | 4.64 | |
| | | | | | | | | | | | | | | | | | | | |
Less Distributions | | | | | | | | | | | | | | | | | | | | |
Distributions from net investment income | | | (0.12 | ) | | | (0.11 | ) | | | (0.06 | ) | | | (0.05 | ) | | | (0.05 | ) |
Distributions from net realized capital gains | | | (0.66 | ) | | | (1.95 | ) | | | (1.84 | ) | | | (0.52 | ) | | | 0.00 | |
| | | | | | | | | | | | | | | | | | | | |
Total distributions | | | (0.78 | ) | | | (2.06 | ) | | | (1.90 | ) | | | (0.57 | ) | | | (0.05 | ) |
| | | | | | | | | | | | | | | | | | | | |
Net Asset Value, End of Period | | $ | 21.26 | | | $ | 21.27 | | | $ | 20.97 | | | $ | 20.67 | | | $ | 17.35 | |
| | | | | | | | | | | | | | | | | | | | |
Total Return (%) | | | 3.4 | | | | 11.5 | | | | 12.3 | | | | 22.9 | | | | 36.5 | |
Ratio of operating expenses to average net assets before expense reductions (%) | | | 0.69 | | | | 0.73 | | | | 0.76 | | | | 0.76 | | | | 0.80 | |
Ratio of operating expenses to average net assets after expense reductions (%) (b) | | | 0.67 | | | | 0.70 | | | | 0.75 | | | | 0.73 | | | | 0.77 | |
Ratio of net investment income to average net assets (%) | | | 1.24 | | | | 0.86 | | | | 0.67 | | | | 0.43 | | | | 0.41 | |
Portfolio turnover rate (%) | | | 60 | | | | 47 | | | | 90 | | | | 55 | | | | 61 | |
Net assets, end of period (000) | | $ | 871,569 | | | $ | 544,070 | | | $ | 428,897 | | | $ | 327,782 | | | $ | 222,050 | |
| | | | | | | | | | | | | | | | | | | | |
| | | Class B | |
| | | Year ended December 31, | |
| | | 2007 | | | 2006 | | | 2005 | | | 2004 | | | 2003 | |
Net Asset Value, Beginning of Period | | $ | 21.05 | | | $ | 20.78 | | | $ | 20.51 | | | $ | 17.23 | | | $ | 12.69 | |
| | | | | | | | | | | | | | | | | | | | |
Income From Investment Operations | | | | | | | | | | | | | | | | | | | | |
Net investment income | | | 0.21 | (a) | | | 0.12 | (a) | | | 0.07 | | | | 0.03 | | | | 0.03 | |
Net realized and unrealized gain on investments | | | 0.50 | | | | 2.16 | | | | 2.06 | | | | 3.79 | | | | 4.55 | |
| | | | | | | | | | | | | | | | | | | | |
Total from investment operations | | | 0.71 | | | | 2.28 | | | | 2.13 | | | | 3.82 | | | | 4.58 | |
| | | | | | | | | | | | | | | | | | | | |
Less Distributions | | | | | | | | | | | | | | | | | | | | |
Distributions from net investment income | | | (0.07 | ) | | | (0.06 | ) | | | (0.02 | ) | | | (0.02 | ) | | | (0.04 | ) |
Distributions from net realized capital gains | | | (0.66 | ) | | | (1.95 | ) | | | (1.84 | ) | | | (0.52 | ) | | | 0.00 | |
| | | | | | | | | | | | | | | | | | | | |
Total distributions | | | (0.73 | ) | | | (2.01 | ) | | | (1.86 | ) | | | (0.54 | ) | | | (0.04 | ) |
| | | | | | | | | | | | | | | | | | | | |
Net Asset Value, End of Period | | $ | 21.03 | | | $ | 21.05 | | | $ | 20.78 | | | $ | 20.51 | | | $ | 17.23 | |
| | | | | | | | | | | | | | | | | | | | |
Total Return (%) | | | 3.2 | | | | 11.2 | | | | 11.9 | | | | 22.7 | | | | 36.2 | |
Ratio of operating expenses to average net assets before expense reductions (%) | | | 0.94 | | | | 0.98 | | | | 1.01 | | | | 1.01 | | | | 1.05 | |
Ratio of operating expenses to average net assets after expense reductions (%) (b) | | | 0.92 | | | | 0.95 | | | | 0.99 | | | | 0.98 | | | | 1.02 | |
Ratio of net investment income to average net assets (%) | | | 0.97 | | | | 0.61 | | | | 0.46 | | | | 0.17 | | | | 0.18 | |
Portfolio turnover rate (%) | | | 60 | | | | 47 | | | | 90 | | | | 55 | | | | 61 | |
Net assets, end of period (000) | | $ | 361,252 | | | $ | 312,192 | | | $ | 209,448 | | | $ | 93,366 | | | $ | 27,173 | |
| (a) | Per share amount is based on average shares outstanding during the period. |
| (b) | The Portfolio has entered into arrangements with certain brokers who paid a portion of the Portfolio’s expenses. |
See accompanying notes to financial statements.
MSF-9
Metropolitan Series Fund, Inc.
Neuberger Berman Mid Cap Value Portfolio
Financial Highlights
| | | | | | | | | | | | | | | | | | | | |
| | | Class E | |
| | | Year ended December 31, | |
| | | 2007 | | | 2006 | | | 2005 | | | 2004 | | | 2003 | |
Net Asset Value, Beginning of Period | | $ | 21.19 | | | $ | 20.90 | | | $ | 20.61 | | | $ | 17.31 | | | $ | 12.74 | |
| | | | | | | | | | | | | | | | | | | | |
Income From Investment Operations | | | | | | | | | | | | | | | | | | | | |
Net investment income | | | 0.23 | (a) | | | 0.15 | (a) | | | 0.10 | | | | 0.05 | | | | 0.05 | |
Net realized and unrealized gain on investments | | | 0.51 | | | | 2.17 | | | | 2.06 | | | | 3.81 | | | | 4.57 | |
| | | | | | | | | | | | | | | | | | | | |
Total from investment operations | | | 0.74 | | | | 2.32 | | | | 2.16 | | | | 3.86 | | | | 4.62 | |
| | | | | | | | | | | | | | | | | | | | |
Less Distributions | | | | | | | | | | | | | | | | | | | | |
Distributions from net investment income | | | (0.09 | ) | | | (0.08 | ) | | | (0.03 | ) | | | (0.04 | ) | | | (0.05 | ) |
Distributions from net realized capital gains | | | (0.66 | ) | | | (1.95 | ) | | | (1.84 | ) | | | (0.52 | ) | | | 0.00 | |
| | | | | | | | | | | | | | | | | | | | |
Total distributions | | | (0.75 | ) | | | (2.03 | ) | | | (1.87 | ) | | | (0.56 | ) | | | (0.05 | ) |
| | | | | | | | | | | | | | | | | | | | |
Net Asset Value, End of Period | | $ | 21.18 | | | $ | 21.19 | | | $ | 20.90 | | | $ | 20.61 | | | $ | 17.31 | |
| | | | | | | | | | | | | | | | | | | | |
Total Return (%) | | | 3.3 | | | | 11.3 | | | | 12.1 | | | | 22.8 | | | | 36.4 | |
Ratio of operating expenses to average net assets before expense reductions (%) | | | 0.84 | | | | 0.88 | | | | 0.91 | | | | 0.91 | | | | 0.95 | |
Ratio of operating expenses to average net assets after expense reductions (%) (b) | | | 0.82 | | | | 0.85 | | | | 0.90 | | | | 0.88 | | | | 0.92 | |
Ratio of net investment income to average net assets (%) | | | 1.06 | | | | 0.72 | | | | 0.52 | | | | 0.28 | | | | 0.29 | |
Portfolio turnover rate (%) | | | 60 | | | | 47 | | | | 90 | | | | 55 | | | | 61 | |
Net assets, end of period (000) | | $ | 82,085 | | | $ | 88,880 | | | $ | 92,695 | | | $ | 72,652 | | | $ | 28,400 | |
| (a) | Per share amount is based on average shares outstanding during the period. |
| (b) | The Portfolio has entered into arrangements with certain brokers who paid a portion of the Portfolio’s expenses. |
See accompanying notes to financial statements.
MSF-10
Metropolitan Series Fund, Inc.
Neuberger Berman Mid Cap Value Portfolio
Notes to Financial Statements—December 31, 2007
Metropolitan Series Fund, Inc. (the “Fund”) is organized as a corporation under the laws of Maryland pursuant to Articles of Incorporation filed on November 23, 1982, as amended, and registered under the Investment Company Act of 1940, as amended (the “1940 Act”), as an open-end investment company. The Fund is a “series” type of mutual fund, which issues separate series of stock. Each series represents an interest in a separate portfolio of Fund investments. The Neuberger Berman Mid Cap Value Portfolio (the “Portfolio”) is a diversified series of the Fund. Shares in the Fund are not offered directly to the general public and are currently available only to separate accounts established by Metropolitan Life Insurance Company (“MetLife”), New England Life Insurance Company, General American Life Insurance Company (“General American”), The MetLife Investors Group of Insurance Companies, MetLife Insurance Company of Connecticut and other affiliated insurance companies (collectively, the “Insurance Companies”), as an investment vehicle for variable life insurance, group annuity or variable annuity products, although the Portfolio is not available to all such separate accounts. The Portfolio’s shares may be divided into different classes. Currently, the classes being offered by the Portfolio are named Class A, Class B and Class E. The classes of the Portfolio’s shares are identical, except that certain additional charges (Rule 12b-1 fees) are made against Class B and Class E shares. Investment income, realized and unrealized capital gains and losses, the common expenses of the Portfolio and certain Portfolio-level expense reductions, if any, are allocated on a pro rata basis to each class based on the relative net assets of each class to the total net assets of the Portfolio.
| 2. | SIGNIFICANT ACCOUNTING POLICIES: |
The preparation of financial statements in conformity with accounting principles generally accepted in the United States of America (“GAAP”) requires management to make estimates and assumptions that affect the reported amounts of assets and liabilities and disclosure of contingent assets and liabilities as of the date of the financial statements and the reported amounts of income and expenses during the reporting period. Actual results could differ from those estimates.
The following is a summary of significant accounting policies consistently followed by the Portfolio in the preparation of its financial statements. The policies are in conformity with GAAP.
Investment Valuation:
Debt securities (other than short term obligations with a remaining maturity of sixty days or less) are valued by independent pricing services selected by the relevant subadviser pursuant to authorization of the Board of Directors of the Fund (the “Board” or “Directors”). Short term obligations with a remaining maturity of sixty days or less are valued at amortized cost which approximates fair market value.
Equity securities traded on a national securities exchange or exchanges are valued at their last sale price on the principal trading market. Equity securities traded on the NASDAQ National Market System are valued at the NASDAQ Official Closing Price (the “NOCP”). The NOCP is the last sale price if it falls between the spread of the last reported bid and asked prices. If the last reported bid and asked prices are above the last reported sale price, the NOCP will be the last reported bid price. If the last reported bid and asked prices are below the last reported sale price, the NOCP will be the last reported asked price. Equity securities traded on a national securities exchange or exchanges or on the NASDAQ National Market System for which there is no reported sale during the day are valued at the last reported bid price. A security that is listed or traded on more than one exchange is valued at the quotation on the exchange determined to be the primary market for that security by the Board or its delegates. If no closing price is available, then such securities are valued by using the last reported bid price. Equity securities traded over-the-counter are valued at the last reported sales price.
If no current market value quotation is readily available or reliable for a portfolio security, fair value will be determined in accordance with procedures established by and under the general supervision of the Board. When the Portfolio uses fair value pricing, it may take into account any factors it deems appropriate. The value of securities used by the Portfolio to calculate its net asset value may differ from quoted or published prices for the same securities. Fair value pricing involves subjective judgments and the fair value determined for a security may be materially different than the value that could be realized upon the sale of that security.
The Portfolio expects to use fair value pricing for securities primarily traded on U.S. exchanges only under very limited circumstances. For example, the Portfolio may use fair value pricing if the exchange on which a security is traded closes early or trading in the security is suspended.
MSF-11
Metropolitan Series Fund, Inc.
Neuberger Berman Mid Cap Value Portfolio
Notes to Financial Statements—December 31, 2007—(Continued)
Securities traded primarily on an exchange outside of the United States which closes before the close of the New York Stock Exchange will be valued at the last sales price on that non-U.S. exchange. Securities traded primarily on an exchange outside of the United States for which there is no reported sale during the day are valued at the mean between the last reported bid and asked prices. However, because most foreign markets close well before the Portfolio values its securities (typically at 4 p.m. Eastern Time), the earlier close of these foreign markets gives rise to the possibility that significant events, including broad market moves, may have occurred after these foreign markets close but before the Portfolio values its securities. To account for this, the Portfolio may frequently value many of its foreign equity securities using fair value prices based on third party vendor modeling tools.
Forward foreign currency exchange contracts are valued based on the mean between closing bid and asked prices of the forward currency contract rates in the London foreign exchange markets on a daily basis as provided by a reliable bank or dealer.
Subject to the Board’s oversight, the Board has delegated day-to-day responsibility for valuing Portfolio assets to the subadviser of the Portfolio, who values such assets as described above and operates under procedures approved by the Board.
Investment Transactions and Related Investment Income:
Portfolio security transactions are recorded on the trade date. Dividend income is recorded on the ex-dividend date or, for certain foreign securities, when notified. Interest income, which includes amortization of premium and accretion of discount on debt securities, is recorded on the accrual basis. Realized gains and losses on investments and unrealized appreciation and depreciation are determined on the identified cost basis, which is the same basis used for federal income tax purposes.
Repurchase Agreements:
The Portfolio, through the custodian or a subcustodian, receives delivery of the underlying securities collateralizing repurchase agreements. The Portfolio requires the custodian to take possession, to have legally segregated in the Federal Reserve Book Entry System, or to have segregated within the custodian’s vault, all securities held as collateral for repurchase agreements. It is the Portfolio’s policy that the market value of the collateral be at least equal to 100% of the repurchase price in the case of a repurchase agreement of one-day duration and 102% on all other repurchase agreements. The Portfolio’s subadviser is responsible for determining that the value of the collateral is at all times at least equal to the repurchase price. In connection with transactions in repurchase agreements, if the seller defaults and the value of the collateral declines or if the seller enters an insolvency proceeding, realization of the collateral by the Portfolio may be delayed, limited or wholly denied.
Foreign Currency Translation:
The books and records of the Portfolio are maintained in U.S. dollars. The values of securities, currencies and other assets and liabilities denominated in currencies other than U.S. dollars are translated into U.S. dollars based upon foreign exchange rates prevailing at the end of the period. Purchases and sales of investment securities, income and expenses are translated on the respective dates of such transactions. Since the values of investment securities are presented at the foreign exchange rates prevailing at the end of the period, it is not practical to isolate that portion of the results of operations arising from changes in exchange rates from that portion of the results of operations reflecting fluctuations arising from changes in market prices of the investment securities. Such fluctuations are included in the net realized and unrealized gain or loss on investments.
Net realized foreign exchange gains or losses arise from sales of foreign currency, currency gains or losses realized between the trade and settlement dates on securities transactions, and the difference between the amounts of dividends, interest, and foreign withholding taxes recorded by the Portfolio and the U.S. dollar equivalent of the amounts actually received or paid by the Portfolio. Net unrealized foreign exchange gains and losses arise from changes in the value of assets and liabilities, other than investment securities, resulting from changes in the exchange rate.
Forward Foreign Currency Exchange Contracts:
The Portfolio may enter into forward foreign currency exchange contracts primarily to hedge against foreign currency exchange rate risks on its non-U.S. dollar denominated investment securities. When entering into a forward currency contract, the Portfolio agrees to receive or deliver a fixed quantity of foreign currency for an agreed-upon price on an agreed future date. These contracts are valued daily and the Portfolio’s net equity therein, representing unrealized gain or loss on the contracts as measured by the difference between the foreign exchange rates at the dates of entry into the contracts and the forward rates at
MSF-12
Metropolitan Series Fund, Inc.
Neuberger Berman Mid Cap Value Portfolio
Notes to Financial Statements—December 31, 2007—(Continued)
the settlement date, is included in the Statement of Assets and Liabilities. Realized and unrealized gains and losses are included in the Statement of Operations. These instruments involve market and/or credit risk in excess of the amount recognized in the Statement of Assets and Liabilities. Risks arise from the possible inability of counterparties to meet the terms of their contracts and from movement in currency and securities values and interest rates.
“When-Issued” Securities:
Purchasing securities “when-issued” is a forward commitment by the Portfolio to buy a security. The estimated amount of the Portfolio’s payment obligation and the security’s interest rate are determined when the commitment is made, even though no interest accrues until the security is issued, which is generally 15 to 120 days later. The Portfolio will segregate liquid assets with its custodian sufficient at all times to satisfy these commitments. If the value of the security is less when delivered than when the commitment was made, the Portfolio will suffer a loss.
Federal Income Taxes:
It is the Portfolio’s policy to comply with the requirements of the Internal Revenue Code of 1986, as amended, and regulations thereunder, applicable to regulated investment companies and to distribute all of its taxable income to shareholders. Therefore, no federal income tax provision is required.
As of December 31, 2007, the Portfolio had no capital loss carryovers.
The tax character of distributions paid for the periods ended December 31, 2007 and 2006 was as follows:
| | | | | | | | | | | | | | | | | | | | | |
| Ordinary Income | | Long Term Gain | | Return of Capital | | Total |
| 2007 | | 2006 | | 2007 | | 2006 | | 2007 | | 2006 | | 2007 | | 2006 |
| $10,970,152 | | $ | 10,651,798 | | $ | 26,750,108 | | $ | 64,938,880 | | $ | — | | $ | — | | $ | 37,720,260 | | $ | 75,590,678 |
As of December 31, 2007, the components of distributable earnings (accumulated losses) on a federal income tax basis were as follows:
| | | | | | | | | | | | |
Undistributed
Ordinary
Income | | Undistributed
Long Term
Gain | | Unrealized
Appreciation | | Loss
Carryforwards | | Total |
| $8,556,613 | | $ | 12,894,163 | | $ | 150,631,577 | | $ | — | | $ | 172,082,353 |
Dividends and Distributions to Shareholders:
The Portfolio records dividends and distributions on the ex-dividend date. Net realized gains from security transactions (if any) are generally distributed annually to shareholders. The timing and characterization of certain income and capital gains distributions are determined in accordance with federal tax regulations that may differ from GAAP. Permanent book and tax basis differences relating to shareholder distributions will result in reclassification between under/over distributed net investment income, accumulated net realized gains/losses and paid in capital.
Expense Reductions:
Certain Portfolio trades are directed to brokers who paid a portion of the Portfolio’s expenses. Amounts paid for the Portfolio are shown as expense reductions in the Statement of Operations.
| 3. | INVESTMENT TRANSACTIONS: |
For the year ended December 31, 2007, purchases and sales of securities (excluding short term investments) for the Portfolio were as follows:
| | | | | | | | | |
Purchases | | Sales |
U.S. Government | | Other | | U.S. Government | | Other |
$0 | | $ | 1,031,778,078 | | $ | 0 | | $ | 673,215,138 |
MSF-13
Metropolitan Series Fund, Inc.
Neuberger Berman Mid Cap Value Portfolio
Notes to Financial Statements—December 31, 2007—(Continued)
| 4. | INVESTMENT MANAGEMENT FEES AND OTHER TRANSACTIONS WITH AFFILIATES: |
Investment Management Agreement:
MetLife Advisers, LLC (“MetLife Advisers”) is the investment adviser to the Portfolio. The Fund has entered into an investment management agreement with MetLife Advisers with respect to the Portfolio. For providing investment management services to the Portfolio, MetLife Advisers receives monthly compensation at the following annual rates:
| | | | | | |
| | | Management
Fees earned by
MetLife Advisers
for the year ended
December 31, 2007 | | Annual
percentage
rates paid to
MetLife Advisers | | Based on Portfolios
average daily net asset levels |
| | $7,500,564 | | 0.650% | | Of the first $1.0 billion |
| | | | 0.600% | | On amounts in excess of $1.0 billion |
Certain officers and directors of the Fund may also be officers of MetLife Advisers; however, such officers and directors receive no compensation from the Fund.
MetLife Advisers has entered into an investment subadvisory agreement with respect to the Portfolio. Neuberger Berman Management, Inc. is compensated by MetLife Advisers to provide subadvisory services for the Portfolio.
Service and Distribution Fees:
The Fund has adopted a Distribution and Service Plan under Rule 12b-1 of the 1940 Act for the Portfolio’s Class B and E shares. Under the Distribution and Service Plan, the Class B and E shares of the Portfolio pay a fee to compensate the Insurance Companies (or their affiliates) and other broker-dealers and financial intermediaries involved in the offer and sale of Portfolio shares for promoting or selling and servicing, the Class B and E shares. The fees under the Distribution and Service Plan for each class of the Portfolio’s shares are calculated as a percentage of the Portfolio’s average daily net assets that are attributable to that Class. Currently, the fee is 0.25% per year for Class B shares and 0.15% per year for Class E shares. Amounts paid by the Portfolio for the year ended December 31, 2007 are shown as Service and Distribution fees in the Statement of Operations.
The Fund has entered into a securities lending arrangement with the Fund’s custodian, State Street Bank and Trust Company (the “custodian”). Under the agreement, the custodian is authorized to loan securities on the Portfolios’ behalf. In exchange, the Portfolio receives either cash or securities as collateral against the loaned securities. The Portfolio receives collateral at least equal to 102% of the market value of the loaned securities (105% for foreign securities), at each loan’s inception. Collateral must be maintained at least at 100% of the market value of the loaned securities for the duration of the loan. The cash collateral is invested in the Navigator Securities Lending Prime Portfolio, an affiliate of the custodian, which invests in a variety of high quality U.S. dollar-denominated instruments. If the market value of the collateral at the close of trading on a business day is less than 100% of the market value of the loaned securities at the close of trading on that day, the borrower shall be required to deliver, by the close of business on the following business day, an additional amount of collateral, equal to at least 100% of the market value of all the loaned securities as of such preceding day. The Portfolio receives 80% of the annual net income from securities lending transactions, which is included in interest income of the Portfolio. The remaining 20% is paid to the custodian as compensation for its securities lending services. The Portfolio bears the risk of any deficiency in the amount of collateral available for return to a borrower due to a loss in an approved investment. The Portfolio’s outstanding loans at December 31, 2007 are footnoted in the Schedule of Investments.
As previously reported, in May 2004, General American received a Wells Notice stating that the SEC staff was considering recommending that the SEC bring a civil action alleging violations of the U.S. securities laws against General American with respect to market timing and late trading in a limited number of privately-placed variable insurance contracts that were sold through General American. General American responded to the SEC staff and cooperated with the investigation. On August 9, 2007, the SEC announced that it had settled an enforcement action regarding late trading against General American with, among other things, General American agreeing to pay a civil penalty and to comply with certain undertakings. General American
MSF-14
Metropolitan Series Fund, Inc.
Neuberger Berman Mid Cap Value Portfolio
Notes to Financial Statements—December 31, 2007—(Continued)
consented to the SEC’s order without admitting or denying the findings. MetLife Advisers has also advised the Fund’s Board of Directors that, while certain exceptions to the Fund’s policies have been noted, no situations have been identified that would have a material impact on the financial position of the Fund.
| 7. | RECENT ACCOUNTING PRONOUNCEMENTS: |
Effective June 29, 2007, the Fund implemented Financial Accounting Standards Board (“FASB”) Interpretation No. 48, “Accounting for Uncertainty in Income Taxes—an interpretation of FASB Statement No. 109” (“FIN 48”). FIN 48 prescribes the minimum recognition threshold a tax position must meet in connection with accounting for uncertainties in income tax positions taken or expected to be taken by an entity, including investment companies, before being measured and recognized in the financial statements. Management has evaluated the application of FIN 48 to the Fund, and has determined that the adoption of FIN 48 does not have a material impact on the Fund’s financial statements. The Fund files U.S. tax returns. No income tax returns are currently under examination. The statute of limitations on the Fund’s tax returns remains open for the years ended December 31, 2004 through December 31, 2006.
In September 2006, Statement of Financial Accounting Standards No. 157, Fair Value Measurements (SFAS 157) was issued and is effective for fiscal years beginning after November 15, 2007. SFAS 157 defines fair value, establishes a framework for measuring fair value and expands disclosures about fair value measurements. Management is currently evaluating the impact the adoption of SFAS 157 will have on the Portfolio’s financial statement disclosures.
MSF-15
Metropolitan Series Fund, Inc.
Neuberger Berman Mid Cap Value Portfolio
Report of Independent Registered Public Accounting Firm
To the Shareholders and Board of Directors of the Metropolitan Series Fund, Inc.:
We have audited the accompanying statement of assets and liabilities, including the schedule of investments, of the Neuberger Berman Mid Cap Value Portfolio, one of the portfolios constituting the Metropolitan Series Fund, Inc. (the “Fund”) as of December 31, 2007, and the related statement of operations for the year then ended, the statements of changes in net assets for each of the two years in the period then ended, and the financial highlights for each of the five years in the period then ended. These financial statements and financial highlights are the responsibility of the Fund’s management. Our responsibility is to express an opinion on these financial statements and financial highlights based on our audits.
We conducted our audits in accordance with the standards of the Public Company Accounting Oversight Board (United States). Those standards require that we plan and perform the audit to obtain reasonable assurance about whether the financial statements and financial highlights are free of material misstatement. The Fund is not required to have, nor were we engaged to perform, an audit of its internal control over financial reporting. Our audits included consideration of internal control over financial reporting as a basis for designing audit procedures that are appropriate in the circumstances, but not for the purpose of expressing an opinion on the effectiveness of the Fund’s internal control over financial reporting. Accordingly, we express no such opinion. An audit also includes examining, on a test basis, evidence supporting the amounts and disclosures in the financial statements, assessing the accounting principles used and significant estimates made by management, as well as evaluating the overall financial statement presentation. Our procedures included confirmation of securities owned as of December 31, 2007, by correspondence with the custodian and brokers; where replies were not received from brokers, we performed other auditing procedures. We believe that our audits provide a reasonable basis for our opinion.
In our opinion, the financial statements and financial highlights referred to above present fairly, in all material respects, the financial position of the Neuberger Berman Mid Cap Value Portfolio of the Metropolitan Series Fund, Inc. as of December 31, 2007, the results of its operations for the year then ended, the changes in its net assets for each of the two years in the period then ended, and the financial highlights for each of the five years in the period then ended, in conformity with accounting principles generally accepted in the United States of America.
Deloitte & Touche LLP
Boston, Massachusetts
February 21, 2008
MSF-16
Metropolitan Series Fund, Inc.
Directors and Officers
The Fund’s Directors review actions of the Fund’s investment adviser and subadvisers, and decide upon matters of general policy. The Fund’s officers supervise the daily business operations of the Fund. The Board of Directors and the Fund’s officers are listed below. Each Director is responsible for overseeing all 36 Portfolios of the Fund. There is no limit to the term a Director may serve. Directors serve until their resignation, retirement or removal in accordance with the Fund’s organizational documents and policies adopted by the Board from time to time. Officers hold office at the pleasure of the Board or until the election or appointment and the qualification of a successor. The address of the directors and officers is c/o Metropolitan Series Fund, Inc., 501 Boylston Street, Boston, MA 02116.
Interested Directors(1)
Each Director below is an “interested person” (as defined by the 1940 Act) with respect to the Fund in that Ms. Forget is an employee of MetLife and Mr. Typermass is a former employee of MetLife and owns securities issued by MetLife, Inc., the ultimate parent company of MetLife Advisers.
| | | | | | | | |
Name, Address and Age | | Current
position(s)
with Fund | | Position(s)
held since | | Principal occupations
over past five years, including other directorships(2) | | Number of
Portfolios in
Fund Complex
Overseen by
Director(3) |
Elizabeth M. Forget Age: 41 | | Director, Chairman of the Board, President and Chief Executive Officer | | 2006 | | Senior Vice President (since 2007), MetLife, Inc.; President, Met Investors Advisory, LLC (“MIA”); Trustee and President, Met Investors Series Trust (“MIST”); Executive Vice President, MetLife Investors Group, Inc.; President (since 2006), MetLife Advisers. | | 81 |
| | | | |
Arthur G. Typermass Age: 70 | | Director | | 1998 | | Formerly, Senior Vice President and Treasurer, MetLife. | | 37 |
Non-Interested Directors(1)
Each Director below is not an “interested person” (as defined by the 1940 Act) with respect to the Fund (collectively, the “Independent Directors”).
| | | | | | | | |
Name, Address and Age | | Current
position(s)
with Fund | | Position(s)
held since | | Principal occupations
over past five years, including other directorships(2) | | Number of
Portfolios in
Fund Complex
Overseen by
Director(3) |
Steve A. Garban† Age: 70 | | Director | | 1985 | | Formerly, Chief Financial Officer, Senior Vice President Finance and Operations and Treasurer (Emeritus), The Pennsylvania State University. | | 37 |
| | | | |
Linda B. Strumpf Age: 60 | | Director | | 2000 | | Vice President and Chief Investment Officer, Ford Foundation. | | 37 |
| | | | |
Michael S. Scott Morton† Age: 70 | | Director | | 1993 | | Jay W. Forrester Professor of Management (Emeritus) at Sloan School of Management, MIT. | | 37 |
| | | | |
H. Jesse Arnelle Age: 74 | | Director | | 2001 | | Formerly, Counsel, Womble Carlyle Sandrie & Rice; Director, Textron Inc. (global multi-industry company)*; formerly, Director, Gannet Co. Inc. (diversified news and information company)*; formerly, Director, Eastman Chemical Company (global chemical company)*; formerly, Director, Waste Management, Inc.*; formerly, Director, Armstrong Holdings Inc. (parent company of floor and ceiling products business)*; formerly, Director, FPL Group Inc. (public utility holding company)*; Director, URS Corporation (engineering design services firm)*. | | 37 |
| | | | |
Nancy Hawthorne Age: 56 | | Director | | 2003 | | Director, Avid Technologies (computer software company)*; formerly, Chairman of the Board of Avid Technologies; formerly, Board of Advisors, L. Knife & Sons, Inc. (beverage distributor); Chief Executive Officer, Clerestory LLC (corporate financial advisor); formerly, Trustee, New England Zenith Fund (“Zenith Fund”)**; formerly, Chief Executive Officer and Managing Partner, Hawthorne, Krauss and Associates (corporate financial advisor); formerly, Chief Financial Officer and Executive Vice President, Continental Cablevision, subsequently renamed MediaOne (cable television company); formerly, Director, Life F/X, Inc.; formerly, Chairman of the Board, WorldClinic (distance medicine company); formerly, Director, Perini Corporation (construction company)*; formerly, Director, CGU (property and casualty insurance company); formerly, Director, Beacon Power Corporation (energy company )*. | | 37 |
MSF-17
Metropolitan Series Fund, Inc.
Directors and Officers—(Continued)
| | | | | | | | |
Name, Address and Age | | Current
position(s)
with Fund | | Position(s)
held since | | Principal occupations
over past five years, including other directorships(2) | | Number of
Portfolios in
Fund Complex
Overseen by
Director(3) |
John T. Ludes Age: 71 | | Director | | 2003 | | President, LFP Properties (consulting firm); Formerly, Trustee, Zenith Fund**; formerly, Vice Chairman, President and Chief Operating Officer, Fortune Brands/American Brands (global conglomerate); formerly, President and CEO, Acushnet Company (athletic equipment company). | | 37 |
Officers(1)
| | | | | | | | |
Name and address | | Age | | Current
position(s)
with Fund | | Position(s)
held since | | Principal occupations over past five years(2) |
| Jeffrey P. Halperin | | 40 | | Chief Compliance Officer | | 2006 | | Vice President (since 2006), Corporate Ethics and Compliance Department, MetLife, Inc.; Chief Compliance Officer (since 2006), MetLife Advisers, MIA and MIST. |
| | | | |
| John F. Guthrie, Jr. | | 64 | | Senior Vice President | | 2002 | | Manager and Senior Vice President, MetLife Advisers; Vice President, MetLife; Vice President (since 2003), MetLife Group, Inc.; Vice President, NELICO; Vice President (since 2005), MIA; formerly, Senior Vice President, Zenith Fund**. |
| | | | |
| Alan C. Leland | | 55 | | Senior Vice President | | 2005 | | Treasurer and Chief Financial Officer, MetLife Advisers, LLC; Treasurer (since 2005), Met Investors Advisory, LLC; Vice President (since 2004), MIA; Vice President (since 2003), MetLife Group, Inc.; Vice President, MetLife; Senior Vice President, NELICO |
| | | | |
| Peter Duffy | | 52 | | Vice President and Treasurer | | 2000 | | Senior Vice President, MetLife Advisers (since 1998); Second Vice President (since 2003), NELICO; Vice President, MetLife (since 2004); Vice President (since 2004), MetLife Group, Inc.; formerly, Vice President and Treasurer, Zenith Fund**. |
| | | | |
| Thomas M. Lenz | | 49 | | Vice President and Secretary | | 2002 | | General Counsel and Secretary, MetLife Advisers; Assistant General Counsel, MetLife; formerly, Vice President and Secretary, Zenith Fund**. |
| * | Indicates a directorship with a registered investment company or a company subject to the reporting requirements of the Securities Exchange Act of 1934, as amended. |
| ** | The Zenith Fund deregistered with the Securities and Exchange Commission (“SEC”) in 2004. |
| (†) | Served as a trustee, director and/or officer of one or more of the following companies, each of which had a direct or indirect advisory relationship with MetLife Advisers or its affiliates prior to January 31, 2005: State Street Research Financial Trust, State Street Research Income Trust, State Street Research Money Market Trust, State Street Research Institutional Funds, State Street Research Capital Trust, State Street Research Master Investment Trust, State Street Research Equity Trust, State Street Research Securities Trust and State Street Research Exchange Trust (collectively, the “State Street Research Funds”). |
| (1) | Each Director of the Fund also serves as trustee of Metropolitan Series Fund II (“Met Series Fund II”), a registered investment company advised by MetLife Advisers. Each officer of the Fund serves in the same position with Met Series Fund II, which consists of one portfolio. |
| (2) | Previous positions during the past five years with the Fund, MIST, MetLife, MetLife Advisers, MIA, Zenith Fund, NELICO or New England Securities Corporation are omitted if not materially different. |
| (3) | The Fund Complex includes the Fund (36 portfolios), Met Series Fund II (1 portfolio) and MIST (44 portfolios) |
MSF-18
Metropolitan Series Fund, Inc.
Neuberger Berman Mid Cap Value Portfolio
Board Approval of Advisory and Subadvisory Agreements
The Fund’s Contract Review Committees of the Board of Directors (the “Board”) typically meet in early fall to review the Portfolios’ advisory agreements (the “Advisory Agreements”) and subadvisory agreements (collectively, the “Subadvisory Agreements,” and, together with the Advisory Agreements, the “Agreements”) and determine whether to recommend that the full Board approve the continuation of the Agreements for an additional one-year period. (Following the initial approval of an Agreement for a new Portfolio or with a new adviser or subadviser, such annual reviews are not required until 2 years following the execution of such Agreement.) After each Committee has made its recommendations, the full Board, including the Independent Directors, determines whether to approve the continuation of each of the Agreements. In addition, the Board, including the Independent Directors, considers matters bearing on the Agreements at most of its other meetings throughout the year and regularly interviews various individuals at MetLife Advisers responsible for the management of the Portfolios. The Directors also interview selected investment managers and other professionals at the subadvisers at various times throughout the year.
The Directors receive all materials that they or MetLife Advisers, the Fund’s investment adviser, and the subadvisers believe to be reasonably necessary for the Directors to evaluate the Agreements and determine whether to approve the continuation of the Agreements. These materials generally include, among other items, (i) information on the investment performance of the Portfolios and the performance of peer groups of funds and the Portfolios’ performance benchmarks, (ii) information on the Portfolios’ advisory and subadvisory fees and other expenses, including information comparing the Portfolios’ expenses to those of peer groups of funds and information about any applicable expense caps and fee “breakpoints,” (iii) sales and redemption data, (iv) information related to the profitability of the Agreements to MetLife Advisers and the subadvisers, and potential “fall-out” or ancillary benefits that MetLife Advisers, the subadvisers or their affiliates may receive as a result of their relationships with the Fund and (v) information obtained through the subadvisers’ responses to certain requests from MetLife Advisers and the Directors and MetLife Advisers’ responses to requests from the Directors. The Directors may also consider other information such as (vi) MetLife Advisers’ and the subadvisers’ financial results and condition, (vii) each Portfolio’s investment objectives and strategies and the size, education and experience of the investment staffs of MetLife Advisers and the relevant subadvisers and their use of technology and external research, (viii) the allocation of the Portfolios’ brokerage, if any, including allocations to brokers affiliated with the subadvisers and the use of “soft” commission dollars to pay Portfolio expenses and to pay for research and other similar services, (ix) the resources devoted to, and the record of compliance with, the Portfolios’ investment policies and restrictions, policies on personal securities transactions and other compliance policies, (x) the responses of MetLife Advisers, the subadvisers and/or their affiliates to certain legal and regulatory proceedings and (xi) the economic outlook generally and for the mutual fund industry in particular. Throughout the process, the Directors have the opportunity to ask questions of and request additional materials from MetLife Advisers and the subadvisers.
Following meetings of each Contract Review Committee on September 12, 2007, the Board, at its November 15, 2007 meeting, approved the continuation through December 31, 2008 of the Advisory Agreements for each Portfolio of the Fund and the Subadvisory Agreements for each Portfolio of the Fund. The Agreements approved for continuation are referred to below as the “Continued Agreements.”
In considering whether to approve the continuation of the Continued Agreements, the Directors, including the Independent Directors, did not identify any single factor as determinative, and each weighed the various factors as he or she deemed appropriate. The Directors considered the following matters in connection with their approval of the Continued Agreements:
The nature, extent and quality of the services provided to the relevant Portfolios under the Continued Agreements. The Directors considered the nature, extent and quality of the services provided by MetLife Advisers, the relevant subadvisers (if any) and their affiliates (each, an “Adviser,” and, collectively, the “Advisers”) to the relevant Portfolios pursuant to the Continued Agreements and the resources dedicated to these Portfolios by the Advisers. In particular, the Directors considered the Advisers’ abilities to attract and retain highly qualified investment professionals. With respect to MetLife Advisers, the Directors considered that MetLife Advisers is (i) ultimately responsible for the performance of such Portfolios; (ii) ultimately responsible for the establishment of the investment strategies of each such Portfolio, primarily through its recommendations to the Board regarding the hiring and selection of subadvisers; (iii) responsible for the hiring and selection, subject to Board approval, of subadvisers; and (iv) responsible for maintaining a program of Subadviser oversight reasonably designed to ensure that the subadvisers have reasonable compliance policies and procedures in place. The Directors also considered that MetLife Advisers provides a full range of day-to-day administrative services for the Portfolios involving all aspects of such Portfolios’ day-to-day operations (other than portfolio management). After reviewing these and related factors, the Directors concluded, within the context of their overall conclusions regarding each of the Continued Agreements, that the nature, extent and quality of services provided supported the renewal of these Agreements.
Investment performance of the relevant Portfolios. The Directors reviewed information about the performance of the relevant Portfolios over various time periods, including information prepared by an independent third party that compared the performance of
MSF-19
Metropolitan Series Fund, Inc.
Neuberger Berman Mid Cap Value Portfolio
Board Approval of Advisory and Subadvisory Agreements—(Continued)
the Portfolios to the performance of peer groups of funds and performance benchmarks. The Directors also reviewed a description of the third party’s methodology for identifying a Portfolio’s peer group(s) for purposes of performance and expense comparisons.
In the case of each relevant Portfolio that had performance that lagged its peer group(s) for certain periods, the Directors concluded that other factors relevant to performance were sufficient, in light of other considerations, to warrant renewal of the Continued Agreements relating to such Portfolio. These factors varied from Portfolio to Portfolio, but included one or more of the following: (i) that such Portfolio’s performance, although lagging in certain recent periods, was stronger over the longer term; (ii) that the underperformance was attributable, to a significant extent, to investment decisions that were reasonable and consistent with the Portfolio’s investment objective(s) and policies and that the Portfolio was performing within the range of reasonable expectations, given market conditions and the Portfolio’s investment objective(s) and policies; (iii) that the Portfolio’s performance was competitive when compared to other relevant performance benchmarks or peer groups; and (iv) that MetLife Advisers and/or the relevant subadviser (if any) had taken or was taking steps designed to help improve the Portfolio’s investment performance.
The Directors also considered the investment performance of the Advisers and their reputations generally, the historical responsiveness of the Advisers to Director concerns about performance and the willingness of the Advisers to take steps intended to improve performance.
After reviewing these and related factors, the Directors concluded, within the context of their overall conclusions regarding each of the Continued Agreements, that the investment performance of each relevant Portfolio and Adviser was sufficient, in light of other considerations, to warrant the renewal of the Continued Agreements.
The costs of the services to be provided and profits to be realized by the Advisers and their affiliates from their relationships with the Portfolios. The Directors considered the fees charged by MetLife Advisers to the Portfolios for advisory services and, with respect to the subadvised Portfolios, by such subadvisers to MetLife Advisers for subadvisory services (such advisory and subadvisory fees (if any), collectively, “Fees”), as well as the total expense levels of the Portfolios. This information included comparisons (provided by an independent third party) of the Portfolios’ advisory fees and total expense levels to those of their peer groups. In evaluating Fees for the relevant Portfolios, the Directors also took into account the demands, complexity and quality of the investment management services provided to each Portfolio. The Directors considered MetLife Advisers’ recommendations regarding reductions in Fee rates, implementation of Fee breakpoints and institution of Fee waivers and expense caps.
The Directors also considered the compensation directly or indirectly received by the Advisers and their affiliates from their relationships with the relevant Portfolios. The Directors reviewed information relating to the profits received by MetLife Advisers, certain of the subadvisers and their affiliates as a result of their relationships with the relevant Portfolios, and information about the allocation of expenses used to calculate profitability. When reviewing profitability, the Directors also considered the performance of the relevant Portfolios, the expense levels of such Portfolios and whether the relevant Advisers had implemented breakpoints, fee waivers and/or expense caps with respect to such Portfolios.
After reviewing these and related factors, the Directors concluded, within the context of their overall conclusions regarding each of the Continued Agreements, that the Fees charged to each of the relevant Portfolios were fair and reasonable, and that the information provided regarding costs of these services generally, and the related profitability (if known) to the relevant Advisers of their relationships with the relevant Portfolios, supported the renewal of the Continued Agreements.
Economies of Scale. The Directors considered the existence of any economies of scale in the provision of services by the Advisers and whether those economies were shared with the relevant Portfolios through breakpoints in their advisory fees or other means, such as expense caps, fee waivers or relatively low levels of fees. The Directors noted that most of the relevant Portfolios benefited or will benefit from breakpoints, expense caps and/or fee waivers with respect to their advisory fees. In considering these issues, the Directors also took into consideration information relating to the costs of the services provided and the profitability to MetLife Advisers, the relevant subadvisers (if any) and each of their affiliates of their relationships with the relevant Portfolios, as discussed above.
After reviewing these and related factors, the Directors concluded, within the context of their overall conclusions regarding each of the Continued Agreements, that the extent to which economies of scale were shared with the relevant Portfolios supported the renewal of such Agreements.
Other Factors. The Directors also considered other factors, which included but were not limited to the following:
| | • | | the extent to which each relevant Portfolio operated in accordance with its investment objective, and its record of compliance with its investment restrictions and the compliance programs of the Fund and the Advisers. They also considered the compliance-related resources the Advisers and their affiliates provide to the relevant Portfolios; |
MSF-20
Metropolitan Series Fund, Inc.
Neuberger Berman Mid Cap Value Portfolio
Board Approval of Advisory and Subadvisory Agreements—(Continued)
| | • | | the nature, quality, cost and extent of administrative and shareholder services performed by MetLife Advisers and its affiliates under the Advisory Agreements; and |
| | • | | so-called “fall-out benefits” to the Advisers, such as the engagement of their affiliates to provide distribution, brokerage and transfer agency services to the Portfolios, and the benefits of research made available to the relevant Advisers by reason of brokerage commissions generated by the relevant Portfolios’ securities transactions. The Directors also considered the possible conflicts of interest associated with these fall-out and other benefits, and the reporting and other processes in place to disclose and monitor these possible conflicts of interest. |
Based on their evaluation of all factors that they deemed to be material, including those factors described above, and assisted by the advice of independent counsel, the Directors, including the Independent Directors, concluded that each of the Continued Agreements should be continued through December 31, 2008.
MSF-21
A description of the policies and procedures that the Fund uses to determine how to vote proxies relating to portfolio securities is available (i) without charge, upon request, by calling (800) 638-7732 and (ii) on the Securities and Exchange Commission’s (the “SEC”) website at http://www.sec.gov.
Information regarding how the Fund voted proxies relating to portfolio securities during the most recent twelve-month period ended December 31, 2007 is available (i) without charge, upon request, by calling (800) 638-7732 and (ii) on the SEC’s website at http://www.sec.gov.
The Fund files with the SEC a complete schedule of its portfolio holdings, as of the close of the first and third quarters of its fiscal year, on “Form N-Q”. These filings are available on the SEC’s website at www.sec.gov and may be reviewed and copied at the SEC’s Public Reference Room in Washington, DC. (Call 1-800-SEC-0330 for information on the operation of the Public Reference Room.)
MSF-22
| | |
Metropolitan Series Fund, Inc. Oppenheimer Global Equity Portfolio Annual Report | | December 31, 2007 |
Letter from the President
February 1, 2008
Letter to Policy Holders:
2007 was a tumultuous year in the financial markets driven by concerns in the credit markets surrounding sub-prime mortgages and fears of recession in the U.S. Economy. The broad markets were mixed, with the Dow Jones Industrial Average up 8.9% and the MSCI EAFE Index, which measures the performance of international equities, up 11.2% for the year, while the Russell 2000 Index, which measures the performance of small capitalization stocks, was down 1.6%.
In the fixed income markets, credit spreads increased as a result of the pressure from sub-prime mortgage crisis and the Federal Reserve lowered interest rates by a total of 1% during the year. The Lehman Brothers Aggregate Bond Index posted a 7.0% return for the year.
On the following pages, you will find a complete review of your Portfolio and its investment performance.
MetLife is committed to building your financial freedom. We appreciate your trust and will continue to focus our efforts on meeting your investment needs.
Sincerely,
Elizabeth Forget
President, Metropolitan Series Fund, Inc.
Metropolitan Series Fund, Inc.
Oppenheimer Global Equity Portfolio
Managed by OppenheimerFunds, Inc.
Portfolio Manager Commentary*
PORTFOLIO PERFORMANCE
For the year ended December 31, 2007, the Class A shares of the Oppenheimer Global Equity Portfolio returned 6.5%, compared to its benchmark, the Morgan Stanley Capital International (MSCI) World Index1, which returned 9.0%. The average return of its peer group, the Lipper Variable Insurance Products Global Growth Funds Universe2, was 13.2% over the same period.
PORTFOLIO REVIEW
Global markets were highly volatile during the year, as market fears about continued fall-out from the turmoil in the credit markets, the rising price of oil and the falling dollar were somewhat offset by the easing of the U.S. monetary policy. The past year has in fact been a period of unprecedented high oil prices and very high prices of commodities, both hard and soft, especially compared to the last twenty years. The U.S. housing market has been tumultuous, with significant concerns in the sub-prime and near-prime mortgage markets leading to a substantial tightening of credit and a consequential decline in housing prices. Inflation, while relatively subdued in much of the world, also began to show incipient signs of creeping back in a number of countries.
The most significant contribution to the underperformance of the Portfolio was the Portfolio’s lack of holdings of metals and materials stocks and its relative underweight in energy and utilities stocks. Its substantial position in technology stocks hurt its relative performance too. Our relative underweight in stocks in the financial sector, especially U.S.-based companies, helped returns, as we partially anticipated a more difficult economic environment for financial stocks.
Given the strategic orientation of the Portfolio, which focuses on long-term sustainable competitive advantage and away from commodities, the past year’s environment was somewhat unfavorable for our long-term strategy. We had some success in the past year from our investments in our second-largest holding Siemens AG, the German conglomerate, where restructuring continues to deliver value. Also, Nintendo Co. Ltd., which had a blockbuster release of its new Wii gaming platform and continued its dominance of the handheld electronic games business, more than doubled in the past year. Juniper Networks, Inc., one of the world’s leading network equipment providers, gained as evidence of the need to increase network capacity in telecom networks mounted. Among our long-term holdings, Vodafone Group, Plc, our third-largest holding, and Porsche AG, also had good years. Our lack of oil orientation notwithstanding, our investments in the increased complexity of the oil business also proved to be excellent investments. Transocean, Inc., the world’s largest driller and Hyundai Heavy Industries, the world’s largest shipbuilder (whose stock we sold and took profits), both had stellar years.
Our largest holding as of December 31, 2007, Telefonaktiebolaget LM Ericsson, the leading wireless network equipment producer in the world had a terrible year, falling considerably, as order shortfalls played havoc with the stock price. We believed that its world leading technology, significant barriers to entry, and a compelling valuation presage excellent long term prospects for the company. Japan was the location of many of our poor performers. The lack of growth in the Japanese domestic economy hurt our holdings of Japanese banks. A dramatic reduction in the maximum interest chargeable by finance companies in Japan through a change in regulation hurt our holding in Credit Saison Co., Ltd. Regulatory changes in gaming laws affected the sales of pachinko and pachislot machines which substantially reduced Sega Sammy Holdings, Inc.’s profit and stock price. One of our most trying holdings has been Advanced Micro Devices, Inc., which declined sharply as a result of missteps and delays.
* The views expressed above are those of the subadvisory firm as of December 31, 2007 and are subject to change based on market and other conditions. Information about the Portfolio’s holdings, asset allocation, industry allocation, or country diversification is historical and is not an indication of future Portfolio composition, which will vary. The performance of any index mentioned in this commentary has not been adjusted for ongoing management, distribution and operating expenses, and sales charges applicable to mutual fund investments. Direct investment in the Index is not possible.
1 The Morgan Stanley Capital International (MSCI) World® Index is a capitalization weighted index that measures performance of stocks from around the world.
2 The Lipper Variable Insurance Products Fund Average is an average of the total return performance (calculated on the basis of net asset value) of variable product funds with similar investment objectives to those of the subject Portfolio as calculated by Lipper Analytical Services, an independent mutual fund ranking service.
MSF-2
Metropolitan Series Fund, Inc.
Oppenheimer Global Equity Portfolio
A $10,000 INVESTMENT COMPARED TO
THE MSCI WORLD INDEX
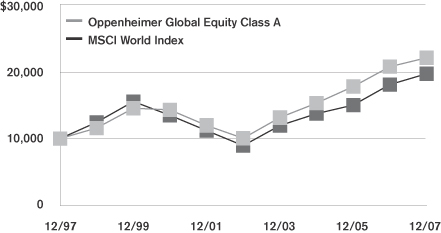
Average Annual Returns as of December 31, 2007
| | | | | | | | | | | | |
| | | Oppenheimer Global
Equity Portfolio | | | MSCI World Index | |
| | | Class A | | | Class B | | | Class E | | |
| 1 Year | | 6.5 | % | | 6.3 | % | | 6.3 | % | | 9.0 | % |
| 5 Year | | 17.0 | | | — | | | 16.8 | | | 17.0 | |
| 10 Year | | 8.2 | | | — | | | — | | | 7.0 | |
| Since Inception | | — | | | 13.9 | | | 7.5 | | | — | |
Performance numbers are net of all Portfolio expenses but do not include any insurance, sales, or administrative charges of variable
annuity or life insurance contracts. If these charges were included, the returns would be lower.
Inception dates of the Class A, Class B and Class E shares are: 3/3/97, 4/26/04 and 5/1/01, respectively.
This information represents past performance and is not indicative of future results. Investment return and principal value may fluctuate so that shares, upon redemption, may be worth more or less than the original cost.
PORTFOLIO COMPOSITION
as of December 31, 2007
Top Holdings
| | |
| | | % of Total
Net Assets |
Telefonaktiebolaget LM Ericsson | | 2.8% |
Siemens AG | | 2.5% |
Vodafone Group, Plc. | | 2.4% |
Microsoft Corp. | | 1.9% |
Hennes & Mauritz AB (Series B) | | 1.8% |
Juniper Networks, Inc. | | 1.8% |
Sony Corp. | | 1.7% |
eBay, Inc. | | 1.6% |
LVMH Moet Hennessy Louis Vuitton S.A. | | 1.5% |
Credit Suisse Group | | 1.4% |
Top Countries
| | |
| | | % of Total
Net Assets |
United States | | 40.9% |
United Kingdom | | 12.3% |
Japan | | 11.3% |
Germany | | 7.2% |
Sweden | | 6.5% |
France | | 5.6% |
India | | 3.1% |
Netherlands | | 2.9% |
Mexico | | 2.8% |
Switzerland | | 2.8% |
MSF-3
Metropolitan Series Fund, Inc.
Shareholder Expense Example
As a shareholder of the Portfolio, you incur ongoing costs, including management fees; distribution and service (12b-1) fees; and other Portfolio expenses. This example is intended to help you understand your ongoing costs (in dollars) (referred to as “expenses”) of investing in the Portfolio and compare these costs with the ongoing costs of investing in other mutual funds. The example is based on an investment of $1,000 invested at the beginning of the period and held for the entire period, July 1, 2007 through December 31, 2007.
Actual Expenses
The first line for each share class of the Portfolio in the table below provides information about actual account values and actual expenses. You may use the information in this line, together with the amount you invested in the particular share class of the Portfolio, to estimate the expenses that you paid over the period. Simply divide your account value by $1,000 (for example, an $8,600 account value divided by $1,000=8.6), then multiply the result by the number in the first line under the heading entitled “Expenses Paid During Period” to estimate the expenses you paid on your account during this period.
Hypothetical Example for Comparison Purposes
The second line for each share class of the Portfolio in the table below provides information about hypothetical account values and hypothetical expenses based on the Portfolio’s actual expense ratio and an assumed rate of return of 5% per year before expenses, which is not the Portfolio’s actual return. The hypothetical account values and expenses may not be used to estimate the actual ending account balance or expenses you paid for the period. You may use this information to compare the ongoing costs of investing in the Portfolio and other funds. To do so, compare this 5% hypothetical example with the 5% hypothetical examples that appear in the shareholder reports of the other funds.
Please note that the expenses shown in the table are meant to highlight your ongoing costs only and do not reflect any fees or charges of your variable insurance product or any additional expenses that participants in certain eligible qualified plans may bear relating to the operations of their plan. Therefore, the second line for each share class in the table is useful in comparing ongoing costs only, and will not help you determine the relative total costs of owning different funds. In addition, if these other costs were included, your costs would have been higher.
| | | | | | | | | | | | | | |
Portfolio | | | | Annualized
Expense
Ratio | | | Beginning
Account Value
July 1,
2007 | | Ending
Account Value
December 31,
2007 | | Expenses Paid
During Period*
July 1, 2007
to
December 31,
2007 |
Oppenheimer Global Equity—Class A | | Actual | | 0.61 | % | | $ | 1,000.00 | | $ | 980.40 | | $ | 3.04 |
| | Hypothetical | | 0.61 | % | | $ | 1,000.00 | | $ | 1,022.10 | | $ | 3.11 |
| | | | | |
Oppenheimer Global Equity—Class B | | Actual | | 0.86 | % | | $ | 1,000.00 | | $ | 979.20 | | $ | 4.29 |
| | Hypothetical | | 0.86 | % | | $ | 1,000.00 | | $ | 1,020.82 | | $ | 4.38 |
| | | | | |
Oppenheimer Global Equity—Class E | | Actual | | 0.76 | % | | $ | 1,000.00 | | $ | 979.80 | | $ | 3.79 |
| | Hypothetical | | 0.76 | % | | $ | 1,000.00 | | $ | 1,021.33 | | $ | 3.87 |
* Expenses paid are equal to the Portfolio’s annualized expense ratio for the most recent six month period, as shown above, multiplied by the average account value over the period, multiplied by the number of days in the most recent fiscal half-year, divided by 365 (to reflect the one-half year period).
MSF-4
Metropolitan Series Fund, Inc.
Oppenheimer Global Equity Portfolio
Schedule of Investments as of December 31, 2007
Common Stock—95.9% of Total Net Assets
| | | | | |
| Security Description | | Shares | | Value* |
| | | | | |
| | |
Australia—0.0% | | | | | |
Aristocrat Leisure, Ltd. (a) | | 49,000 | | $ | 481,667 |
| | | | | |
| | |
Canada—1.3% | | | | | |
Husky Energy, Inc. | | 281,800 | | | 12,718,079 |
| | | | | |
| | |
Cayman Islands—2.4% | | | | | |
ACE, Ltd. | | 100,970 | | | 6,237,926 |
Transocean, Inc. | | 88,758 | | | 12,705,708 |
XL Capital, Ltd. (Class A) (a) | | 82,810 | | | 4,166,171 |
| | | | | |
| | | | | 23,109,805 |
| | | | | |
| | |
Finland—1.0% | | | | | |
Fortum Oyj | | 210,680 | | | 9,417,310 |
| | | | | |
| | |
France—5.6% | | | | | |
BNP Paribas (a) | | 32,510 | | | 3,489,524 |
LVMH Moet Hennessy Louis Vuitton S.A. (a) | | 119,561 | | | 14,348,957 |
NicOx S.A. (a) (b) | | 51,405 | | | 817,238 |
Sanofi-Aventis | | 115,482 | | | 10,539,592 |
Société Générale | | 57,449 | | | 8,198,250 |
Technip S.A. | | 129,570 | | | 10,232,670 |
Total S.A. | | 72,158 | | | 5,979,560 |
| | | | | |
| | | | | 53,605,791 |
| | | | | |
| | |
Germany—6.1% | | | | | |
Allianz SE | | 59,420 | | | 12,690,701 |
Bayerische Motoren Werke AG | | 159,535 | | | 9,836,977 |
SAP AG | | 229,360 | | | 11,832,866 |
Siemens AG | | 156,468 | | | 24,527,690 |
| | | | | |
| | | | | 58,888,234 |
| | | | | |
| | |
India—3.1% | | | | | |
Dish TV India, Ltd. (b) | | 597,114 | | | 1,538,627 |
Hindustan Lever, Ltd. | | 1,028,800 | | | 5,550,841 |
ICICI Bank, Ltd. (ADR) | | 58,630 | | | 3,605,745 |
Infosys Technologies, Ltd. | | 261,126 | | | 11,662,222 |
Wire & Wireless India, Ltd. (b) | | 556,330 | | | 1,402,399 |
Zee Telefilms, Ltd. | | 731,560 | | | 6,100,212 |
| | | | | |
| | | | | 29,860,046 |
| | | | | |
| | |
Italy—0.9% | | | | | |
Bulgari S.p.A. | | 335,700 | | | 4,663,850 |
Tod’s S.p.A. (a) | | 60,600 | | | 4,219,444 |
| | | | | |
| | | | | 8,883,294 |
| | | | | |
| | |
Japan—11.3% | | | | | |
Chugai Pharmaceutical Co., Ltd. (a) | | 166,100 | | | 2,372,618 |
Credit Saison Co., Ltd. | | 176,200 | | | 4,807,474 |
Fanuc, Ltd. | | 27,300 | | | 2,663,058 |
Hoya Corp. | | 214,800 | | | 6,854,753 |
KDDI Corp. | | 1,376 | | | 10,216,256 |
Keyence Corp. | | 20,900 | | | 5,119,639 |
Kyocera Corp. | | 52,200 | | | 4,566,981 |
Mitsubishi Electric Corp. | | 368,000 | | | 3,800,310 |
| | | | | |
| Security Description | | Shares | | Value* |
| | | | | |
| | |
Japan—(Continued) | | | | | |
Murata Manufacturing Co., Ltd. | | 130,300 | | $ | 7,577,248 |
Nidec Corp. | | 36,000 | | | 2,672,302 |
Nintendo Co., Ltd. | | 9,800 | | | 5,949,515 |
Secom Co., Ltd. | | 105,000 | | | 5,747,909 |
Sega Sammy Holdings, Inc. (a) | | 131,700 | | | 1,644,001 |
Seven & I Holdings Co., Ltd. | | 108,891 | | | 3,166,317 |
Shionogi & Co., Ltd. | | 436,000 | | | 7,687,517 |
Sony Corp. | | 301,628 | | | 16,367,307 |
Sony Financial Holdings, Inc. | | 390 | | | 1,482,143 |
Square Enix Co., Ltd. (a) | | 140,400 | | | 4,302,649 |
Sumitomo Mitsui Financial Group, Inc. (a) | | 755 | | | 5,617,544 |
Toyota Motor Corp. | | 115,200 | | | 6,200,099 |
| | | | | |
| | | | | 108,815,640 |
| | | | | |
| | |
Mexico—2.1% | | | | | |
Fomento Economico Mexicano S.A. de C.V. (a) | | 1,876,860 | | | 7,177,935 |
Grupo Modelo S.A. de C.V. (a) | | 864,910 | | | 4,118,110 |
Grupo Televisa S.A. (ADR) | | 388,870 | | | 9,243,440 |
| | | | | |
| | | | | 20,539,485 |
| | | | | |
| | |
Netherlands—2.9% | | | | | |
European Aeronautic Defense & Space Co. NV (a) | | 312,957 | | | 9,920,526 |
Koninklijke Philips Electronics NV | | 287,048 | | | 12,421,753 |
TNT NV (b) | | 124,000 | | | 5,152,373 |
| | | | | |
| | | | | 27,494,652 |
| | | | | |
| | |
Norway—0.5% | | | | | |
Tandberg ASA | | 255,970 | | | 5,270,135 |
| | | | | |
| | |
Panama—1.2% | | | | | |
Carnival Corp. (a) | | 262,370 | | | 11,672,841 |
| | | | | |
| | |
South Korea—1.5% | | | | | |
Samsung Electronics Co., Ltd. | | 8,471 | | | 4,979,189 |
SK Telecom Co., Ltd. (ADR) (a) | | 310,340 | | | 9,260,546 |
| | | | | |
| | | | | 14,239,735 |
| | | | | |
| | |
Spain—1.0% | | | | | |
Inditex S.A. (a) | | 154,790 | | | 9,397,698 |
| | | | | |
| | |
Sweden—6.5% | | | | | |
Assa Abloy AB (Series B) | | 518,300 | | | 10,317,464 |
Hennes & Mauritz AB (Series B) | | 289,110 | | | 17,483,637 |
Investor AB | | 328,957 | | | 7,406,781 |
Telefonaktiebolaget LM Ericsson (Class B) | | 11,700,680 | | | 27,371,335 |
| | | | | |
| | | | | 62,579,217 |
| | | | | |
| | |
Switzerland—2.8% | | | | | |
Basilea Pharmaceuticals | | 5,416 | | | 1,047,582 |
Credit Suisse Group | | 230,719 | | | 13,860,903 |
Roche Holding AG (b) | | 67,758 | | | 11,661,622 |
| | | | | |
| | | | | 26,570,107 |
| | | | | |
*See accompanying notes to financial statements.
MSF-5
Metropolitan Series Fund, Inc.
Oppenheimer Global Equity Portfolio
Schedule of Investments as of December 31, 2007
Common Stock—(Continued)
| | | | | |
| Security Description | | Shares | | Value* |
| | | | | |
| | |
Taiwan—1.8% | | | | | |
MediaTek, Inc. | | 717,455 | | $ | 9,232,584 |
Taiwan Semiconductor Manufacturing Co., Ltd. | | 2,921,217 | | | 5,555,782 |
Taiwan Semiconductor Manufacturing Co., Ltd. (ADR) | | 236,676 | | | 2,357,293 |
| | | | | |
| | | | | 17,145,659 |
| | | | | |
| | |
United Kingdom—12.3% | | | | | |
3i Group, Plc. | | 116,230 | | | 2,302,998 |
BP, Plc. (ADR) | | 111,250 | | | 8,140,163 |
Burberry Group, Plc. | | 338,803 | | | 3,802,542 |
Cadbury Schweppes, Plc. | | 798,931 | | | 9,929,004 |
Diageo, Plc. | | 237,532 | | | 5,069,154 |
Experian Group, Ltd. | | 308,498 | | | 2,444,398 |
HSBC Holdings, Plc. | | 530,857 | | | 8,875,246 |
Pearson, Plc. | | 275,262 | | | 3,988,020 |
Prudential, Plc. | | 625,772 | | | 8,769,567 |
Reckitt Benckiser Group, Plc. | | 220,388 | | | 12,693,193 |
Royal Bank of Scotland Group, Plc. | | 1,213,716 | | | 10,878,574 |
RT Group, Plc. (c) (d) (e) | | 282,264 | | | 0 |
Smith & Nephew, Plc. | | 421,628 | | | 4,832,830 |
Tesco, Plc. | | 1,011,829 | | | 9,525,587 |
Vodafone Group, Plc. | | 6,232,941 | | | 23,160,210 |
WPP Group, Plc. | | 350,345 | | | 4,471,843 |
| | | | | |
| | | | | 118,883,329 |
| | | | | |
| | |
United States—31.6% | | | | | |
3M Co. | | 117,070 | | | 9,871,342 |
Acadia Pharmaceuticals, Inc. (a) (b) | | 75,300 | | | 833,571 |
Adobe Systems, Inc. (b) | | 277,370 | | | 11,852,020 |
Advanced Micro Devices, Inc. (a) (b) | | 601,610 | | | 4,512,075 |
Aflac, Inc. | | 120,600 | | | 7,553,178 |
Altera Corp. (b) | | 302,230 | | | 5,839,084 |
American International Group, Inc. | | 159,400 | | | 9,293,020 |
Automatic Data Processing, Inc. | | 249,010 | | | 11,088,415 |
Boeing Co. | | 52,760 | | | 4,614,390 |
Chevron Corp. | | 90,070 | | | 8,406,233 |
Cisco Systems, Inc. (b) | | 160,410 | | | 4,342,299 |
Coach, Inc. (b) | | 74,680 | | | 2,283,714 |
Colgate-Palmolive Co. | | 112,800 | | | 8,793,888 |
Corning, Inc. (b) | | 466,610 | | | 11,193,974 |
Cree, Inc. (a) (b) | | 201,140 | | | 5,525,316 |
eBay, Inc. (b) | | 464,030 | | | 15,401,156 |
Emerson Electric Co. | | 217,500 | | | 12,323,550 |
Genentech, Inc. (b) | | 48,540 | | | 3,255,578 |
Gilead Sciences, Inc. (b) | | 209,360 | | | 9,632,654 |
Hospira, Inc. (b) | | 25,800 | | | 1,100,112 |
InterMune, Inc. (a) (b) | | 68,300 | | | 910,439 |
International Game Technology | | 143,670 | | | 6,311,423 |
Intuit, Inc. (b) | | 348,220 | | | 11,007,234 |
Johnson & Johnson | | 36,950 | | | 2,464,565 |
Juniper Networks, Inc. (b) | | 518,800 | | | 17,224,160 |
Linear Technology Corp. (a) | | 124,910 | | | 3,975,885 |
Lockheed Martin Corp. | | 58,980 | | | 6,208,235 |
Maxim Integrated Products, Inc. | | 278,590 | | | 7,377,063 |
McDonald’s Corp. | | 140,500 | | | 8,276,855 |
Microsoft Corp. | | 511,360 | | | 18,204,416 |
| | | | | |
| Security Description | | Shares | | Value* |
| | | | | |
| | |
United States—(Continued) | | | | | |
Nektar Therapeutics (a) (b) | | 68,770 | | $ | 461,447 |
Northern Trust Corp. | | 147,360 | | | 11,284,829 |
Northrop Grumman Corp. | | 65,430 | | | 5,145,415 |
Pharmion Corp. (b) | | 22,500 | | | 1,414,350 |
Praxair, Inc. | | 37,600 | | | 3,335,496 |
Raytheon Co. | | 108,150 | | | 6,564,705 |
Regeneron Pharmaceuticals, Inc. (a) (b) | | 43,890 | | | 1,059,943 |
Seattle Genetics, Inc. (a) (b) | | 104,026 | | | 1,185,896 |
Shuffle Master, Inc. (a) (b) | | 72,900 | | | 874,071 |
Sirius Satellite Radio, Inc. (a) (b) | | 2,356,460 | | | 7,140,074 |
The Walt Disney Co. (a) | | 304,760 | | | 9,837,653 |
Theravance, Inc. (a) (b) | | 104,580 | | | 2,039,310 |
Tiffany & Co. (a) | | 196,500 | | | 9,044,895 |
United Parcel Service, Inc. (Class B) | | 32,800 | | | 2,319,616 |
Wal-Mart Stores, Inc. | | 188,910 | | | 8,978,892 |
Xilinx, Inc. (a) | | 201,990 | | | 4,417,521 |
| | | | | |
| | | | | 304,779,957 |
| | | | | |
Total Common Stock
(Identified Cost $819,351,970) | | | | | 924,352,681 |
| | | | | |
| | |
| Preferred Stock—2.8% | | | | | |
| | |
Brazil—1.0% | | | | | |
Empresa Brasileira de Aeronautica S.A. (ADR) | | 209,410 | | | 9,547,002 |
| | | | | |
| | |
Germany—1.1% | | | | | |
Bayerische Motoren Werke AG | | 50,509 | | | 2,666,881 |
Porsche AG | | 3,712 | | | 7,469,410 |
| | | | | |
| | | | | 10,136,291 |
| | | | | |
| | |
Mexico—0.7% | | | | | |
Companhia de Bebidas das Americas (ADR) | | 100,150 | | | 7,113,655 |
| | | | | |
Total Preferred Stock
(Identified Cost $18,181,751) | | | | | 26,796,948 |
| | | | | |
*See accompanying notes to financial statements.
MSF-6
Metropolitan Series Fund, Inc.
Oppenheimer Global Equity Portfolio
Schedule of Investments as of December 31, 2007
Short Term Investments—9.3%
| | | | | | | |
| Security Description | | Shares/
Face Amount | | Value* | |
| | |
United States—9.3% | | | | | | | |
State Street Navigator Securities Lending Prime Portfolio (f) | | | 78,969,766 | | $ | 78,969,766 | |
State Street Corp. Repurchase Agreement dated 12/31/07 at 1.20% to be repurchased at $10,555,704 on 1/02/08, collateralized by $7,700,000 U.S. Treasury Bond 8.50% due 2/15/20 with a value of $10,770,375. | | $ | 10,555,000 | | | 10,555,000 | |
| | | | | | | |
Total Short Term Investments
(Identified Cost $89,524,766) | | | | | | 89,524,766 | |
| | | | | | | |
Total Investments—108.0%
(Identified Cost $927,058,487) (g) | | | | | | 1,040,674,395 | |
Liabilities in excess of other assets | | | | | | (76,854,060 | ) |
| | | | | | | |
| Total Net Assets—100% | | | | | $ | 963,820,335 | |
| | | | | | | |
| (a) | A portion or all of the security was held on loan. As of December 31, 2007, the market value of securities loaned was $108,743,276 and the collateral received consisted of cash in the amount of $ 78,969,766 and non cash collateral with a value of $34,210,119. The cash collateral is invested in a money market fund managed by an affiliate of the custodian. The non cash collateral received consists primarily of government securities and bank letters of credit, and are held for the benefit of the Portfolio at the Portfolio’s custodian. |
| (c) | Non-Income Producing; issuer filed under Chapter 11 of the Federal Bankruptcy Code. |
| (e) | Security was valued in good faith under procedures established by the Board of Directors. |
| (f) | Represents investment of cash collateral received from securities lending transactions. |
| (g) | The aggregate cost of investments for federal income tax purposes as of December 31, 2007 was $931,361,273 and the composition of unrealized appreciation and depreciation of investment securities was $161,183,416 and $(51,870,294), respectively. |
| (ADR)— | An American Depositary Receipt is a certificate issued by a custodian bank representing the right to receive securities of the foreign issuer described. Trading on exchanges not located in the United States or Canada significantly influences the value of ADRs. |
| | |
Ten Largest Industries as of
December 31, 2007 | | Percentage of
Total Net Assets |
Software | | 6.7% |
Communications Equipment | | 6.2% |
Semiconductors & Semiconductor Equipment | | 5.6% |
Insurance | | 5.2% |
Oil, Gas & Consumable Fuels | | 4.6% |
Media | | 4.5% |
Wireless Telecommunication Services | | 4.4% |
Aerospace & Defense | | 4.4% |
Commercial Banks | | 4.2% |
Specialty Retail | | 3.7% |
*See accompanying notes to financial statements.
MSF-7
Metropolitan Series Fund, Inc.
Oppenheimer Global Equity Portfolio
Statement of Assets & Liabilities
December 31, 2007
| | | | | | |
Assets | | | | | | |
Investments at value (a) (c) | | | | | $ | 1,040,674,395 |
Cash | | | | | | 741 |
Foreign cash at value (b) | | | | | | 2,008,180 |
Receivable for: | | | | | | |
Fund shares sold | | | | | | 193,307 |
Accrued interest and dividends | | | | | | 966,467 |
Foreign taxes | | | | | | 43,874 |
| | | | | | |
Total Assets | | | | | | 1,043,886,964 |
Liabilities | | | | | | |
Payable for: | | | | | | |
Fund shares redeemed | | $ | 363,626 | | | |
Withholding taxes | | | 142,573 | | | |
Collateral for securities loaned | | | 78,969,766 | | | |
Accrued expenses: | | | | | | |
Management fees | | | 421,595 | | | |
Service and distribution fees | | | 64,055 | | | |
Other expenses | | | 105,014 | | | |
| | | | | | |
Total Liabilities | | | | | | 80,066,629 |
| | | | | | |
Net Assets | | | | | $ | 963,820,335 |
| | | | | | |
Net assets consists of: | | | | | | |
Capital paid in | | | | | $ | 810,630,194 |
Undistributed net investment income | | | | | | 12,317,160 |
Accumulated net realized gains | | | | | | 27,369,848 |
Unrealized appreciation on investments and foreign currency | | | | | | 113,503,133 |
| | | | | | |
Net Assets | | | | | $ | 963,820,335 |
| | | | | | |
| Computation of offering price: | | | | | | |
Class A | | | | | | |
Net asset value and redemption price per share ($653,909,844 divided by 37,361,082 shares outstanding) | | | | | $ | 17.50 |
| | | | | | |
Class B | | | | | | |
Net asset value and redemption price per share ($285,117,715 divided by 16,348,494 shares outstanding) | | | | | $ | 17.44 |
| | | | | | |
Class E | | | | | | |
Net asset value and redemption price per share ($24,792,776 divided by 1,421,356 shares outstanding) | | | | | $ | 17.44 |
| | | | | | |
(a) Identified cost of investments | | | | | $ | 927,058,487 |
| | | | | | |
(b) Identified cost of foreign cash | | | | | $ | 1,995,763 |
| | | | | | |
| (c) | Includes cash collateral for securities loaned of $78,969,766. |
Statement of Operations
For the Year Ended December 31, 2007
| | | | | | | | |
Investment Income | | | | | | | | |
Dividends | | | | | | $ | 16,638,794 | (a) |
Interest | | | | | | | 973,134 | (b) |
| | | | | | | | |
| | | | | | | 17,611,928 | |
Expenses | | | | | | | | |
Management fees | | $ | 5,003,683 | | | | | |
Service and distribution fees—Class B | | | 701,610 | | | | | |
Service and distribution fees—Class E | | | 37,285 | | | | | |
Directors’ fees and expenses | | | 23,669 | | | | | |
Custodian | | | 492,043 | | | | | |
Audit and tax services | | | 36,237 | | | | | |
Legal | | | 11,128 | | | | | |
Printing | | | 339,813 | | | | | |
Insurance | | | 10,032 | | | | | |
Miscellaneous | | | 16,653 | | | | | |
| | | | | | | | |
Total expenses | | | | | | | 6,672,153 | |
| | | | | | | | |
Net Investment Income | | | | | | | 10,939,775 | |
| | | | | | | | |
Realized and Unrealized Gain | | | | | | | | |
| Realized gain on: | | | | | | | | |
Investments—net | | | 28,799,323 | | | | | |
Foreign currency transactions—net | | | 2,735,522 | | | | 31,534,845 | |
| | | | | | | | |
Change in unrealized appreciation (depreciation) on: | | | | | | | | |
Investments—net | | | 16,715,818 | | | | | |
Foreign currency transactions—net | | | (22,791 | ) | | | 16,693,027 | |
| | | | | | | | |
Net gain | | | | | | | 48,227,872 | |
| | | | | | | | |
Net Increase in Net Assets From Operations | | | | | | $ | 59,167,647 | |
| | | | | | | | |
| (a) | Net of foreign taxes of $1,300,013. |
| (b) | Includes net income on securities loaned of $912,585. |
See accompanying notes to financial statements.
MSF-8
Metropolitan Series Fund, Inc.
Oppenheimer Global Equity Portfolio
Statements of Changes in Net Assets
| | | | | | | | |
| | | Year ended
December 31,
2007 | | | Year ended
December 31,
2006 | |
From Operations | | | | | | | | |
Net investment income | | $ | 10,939,775 | | | $ | 8,353,873 | |
Net realized gain | | | 31,534,845 | | | | 13,346,068 | |
Unrealized appreciation | | | 16,693,027 | | | | 61,071,625 | |
| | | | | | | | |
Increase in net assets from operations | | | 59,167,647 | | | | 82,771,566 | |
| | | | | | | | |
From Distributions to Shareholders | | | | | | | | |
Net investment income | | | | | | | | |
Class A | | | (7,335,264 | ) | | | (6,101,747 | ) |
Class B | | | (2,440,729 | ) | | | (1,075,045 | ) |
Class E | | | (241,497 | ) | | | (559,487 | ) |
| | | | | | | | |
| | | (10,017,490 | ) | | | (7,736,279 | ) |
| | | | | | | | |
Net realized gain | | | | | | | | |
Class A | | | (9,569,355 | ) | | | (4,715,671 | ) |
Class B | | | (4,046,887 | ) | | | (926,967 | ) |
Class E | | | (358,756 | ) | | | (454,856 | ) |
| | | | | | | | |
| | | (13,974,998 | ) | | | (6,097,494 | ) |
| | | | | | | | |
Total distributions | | | (23,992,488 | ) | | | (13,833,773 | ) |
| | | | | | | | |
Increase (decrease) in net assets from capital share transactions | | | (4,231,804 | ) | | | 589,438,114 | |
| | | | | | | | |
Total increase in net assets | | | 30,943,355 | | | | 658,375,907 | |
| | |
Net Assets | | | | | | | | |
Beginning of the period | | | 932,876,980 | | | | 274,501,073 | |
| | | | | | | | |
End of the period | | $ | 963,820,335 | | | $ | 932,876,980 | |
| | | | | | | | |
Undistributed Net Investment Income | | | | | | | | |
End of the period | | $ | 12,317,160 | | | $ | 8,353,803 | |
| | | | | | | | |
Other Information:
Capital Shares
Transactions in capital shares were as follows:
| | | | | | | | | | | | | | |
| | | Year ended
December 31, 2007 | | | Year ended
December 31, 2006 | |
| | | Shares | | | $ | | | Shares | | | $ | |
Class A | | | | | | | | | | | | | | |
Sales | | 4,194,704 | | | $ | 73,742,074 | | | 28,196,746 | | | $ | 445,346,815 | |
Reinvestments | | 967,637 | | | | 16,904,619 | | | 687,257 | | | | 10,817,418 | |
Redemptions | | (6,228,657 | ) | | | (109,336,843 | ) | | (5,417,003 | ) | | | (83,897,755 | ) |
| | | | | | | | | | | | | | |
Net increase (decrease) | | (1,066,316 | ) | | $ | (18,690,150 | ) | | 23,467,000 | | | $ | 372,266,478 | |
| | | | | | | | | | | | | | |
Class B | | | | | | | | | | | | | | |
Sales | | 3,442,632 | | | $ | 60,341,810 | | | 15,166,597 | | | $ | 239,200,993 | |
Reinvestments | | 371,996 | | | | 6,487,616 | | | 127,354 | | | | 2,002,012 | |
Redemptions | | (2,968,518 | ) | | | (52,002,112 | ) | | (1,637,262 | ) | | | (25,211,269 | ) |
| | | | | | | | | | | | | | |
Net increase | | 846,110 | | | $ | 14,827,314 | | | 13,656,689 | | | $ | 215,991,736 | |
| | | | | | | | | | | | | | |
Class E | | | | | | | | | | | | | | |
Sales | | 267,137 | | | $ | 4,723,139 | | | 421,002 | | | $ | 6,535,337 | |
Reinvestments | | 34,438 | | | | 600,253 | | | 64,608 | | | | 1,014,343 | |
Redemptions | | (326,485 | ) | | | (5,692,360 | ) | | (412,215 | ) | | | (6,369,780 | ) |
| | | | | | | | | | | | | | |
Net increase (decrease) | | (24,910 | ) | | $ | (368,968 | ) | | 73,395 | | | $ | 1,179,900 | |
| | | | | | | | | | | | | | |
Increase (decrease) derived from capital share transactions | | | | | $ | (4,231,804 | ) | | | | | $ | 589,438,114 | |
| | | | | | | | | | | | | | |
See accompanying notes to financial statements.
MSF-9
Metropolitan Series Fund, Inc.
Oppenheimer Global Equity Portfolio
Financial Highlights
| | | | | | | | | | | | | | | | | | | | |
| | | Class A | |
| | | Year ended December 31, | |
| | | 2007 | | | 2006 | | | 2005 | | | 2004 | | | 2003 | |
Net Asset Value, Beginning of Period | | $ | 16.86 | | | $ | 15.11 | | | $ | 13.09 | | | $ | 11.43 | | | $ | 8.98 | |
| | | | | | | | | | | | | | | | | | | | |
Income From Investment Operations | | | | | | | | | | | | | | | | | | | | |
Net investment income | | | 0.21 | (a) | | | 0.21 | (a) | | | 0.12 | | | | 0.11 | | | | 0.14 | |
Net realized and unrealized gain on investments | | | 0.89 | | | | 2.26 | | | | 1.98 | | | | 1.74 | | | | 2.52 | |
| | | | | | | | | | | | | | | | | | | | |
Total from investment operations | | | 1.10 | | | | 2.47 | | | | 2.10 | | | | 1.85 | | | | 2.66 | |
| | | | | | | | | | | | | | | | | | | | |
Less Distributions | | | | | | | | | | | | | | | | | | | | |
Distributions from net investment income | | | (0.20 | ) | | | (0.41 | ) | | | (0.08 | ) | | | (0.19 | ) | | | (0.21 | ) |
Distributions from net realized capital gains | | | (0.26 | ) | | | (0.31 | ) | | | 0.00 | | | | 0.00 | | | | 0.00 | |
| | | | | | | | | | | | | | | | | | | | |
Total distributions | | | (0.46 | ) | | | (0.72 | ) | | | (0.08 | ) | | | (0.19 | ) | | | (0.21 | ) |
| | | | | | | | | | | | | | | | | | | | |
Net Asset Value, End of Period | | $ | 17.50 | | | $ | 16.86 | | | $ | 15.11 | | | $ | 13.09 | | | $ | 11.43 | |
| | | | | | | | | | | | | | | | | | | | |
Total Return (%) | | | 6.5 | | | | 16.6 | | | | 16.2 | | | | 16.4 | | | | 30.5 | |
Ratio of operating expenses to average net assets (%) | | | 0.61 | | | | 0.66 | | | | 0.93 | | | | 0.81 | | | | 0.84 | |
Ratio of net investment income to average net assets (%) | | | 1.19 | | | | 1.37 | | | | 0.87 | | | | 0.95 | | | | 1.35 | |
Portfolio turnover rate (%) | | | 17 | | | | 73 | | | | 115 | | | | 79 | | | | 65 | |
Net assets, end of period (000) | | $ | 653,910 | | | $ | 648,024 | | | $ | 226,037 | | | $ | 195,181 | | | $ | 179,334 | |
| | | | | | | | | | | | | | | | |
| | | Class B | |
| | | Year ended December 31, | |
| | | 2007 | | | 2006 | | | 2005 | | | 2004(b) | |
Net Asset Value, Beginning of Period | | $ | 16.81 | | | $ | 15.06 | | | $ | 13.04 | | | $ | 11.59 | |
| | | | | | | | | | | | | | | | |
Income From Investment Operations | | | | | | | | | | | | | | | | |
Net investment income | | | 0.16 | (a) | | | 0.17 | (a) | | | 0.05 | | | | 0.02 | |
Net realized and unrealized gain on investments | | | 0.89 | | | | 2.25 | | | | 2.02 | | | | 1.43 | |
| | | | | | | | | | | | | | | | |
Total from investment operations | | | 1.05 | | | | 2.42 | | | | 2.07 | | | | 1.45 | |
| | | | | | | | | | | | | | | | |
Less Distributions | | | | | | | | | | | | | | | | |
Distributions from net investment income | | | (0.16 | ) | | | (0.36 | ) | | | (0.05 | ) | | | 0.00 | |
Distributions from net realized capital gains | | | (0.26 | ) | | | (0.31 | ) | | | 0.00 | | | | 0.00 | |
| | | | | | | | | | | | | | | | |
Total distributions | | | (0.42 | ) | | | (0.67 | ) | | | (0.05 | ) | | | 0.00 | |
| | | | | | | | | | | | | | | | |
Net Asset Value, End of Period | | $ | 17.44 | | | $ | 16.81 | | | $ | 15.06 | | | $ | 13.04 | |
| | | | | | | | | | | | | | | | |
Total Return (%) | | | 6.3 | | | | 16.4 | | | | 16.0 | | | | 12.5 | (c) |
Ratio of operating expenses to average net assets (%) | | | 0.86 | | | | 0.91 | | | | 1.18 | | | | 1.06 | (d) |
Ratio of net investment income to average net assets (%) | | | 0.94 | | | | 1.09 | | | | 0.53 | | | | 0.54 | (d) |
Portfolio turnover rate (%) | | | 17 | | | | 73 | | | | 115 | | | | 79 | |
Net assets, end of period (000) | | $ | 285,118 | | | $ | 260,542 | | | $ | 27,790 | | | $ | 3,646 | |
| (a) | Per share amount is based on average shares outstanding during the period. |
| (b) | Commencement of operations was April 26, 2004 for Class B. |
| (c) | Periods less than one year are not computed on an annualized basis. |
| (d) | Computed on an annualized basis. |
See accompanying notes to financial statements.
MSF-10
Metropolitan Series Fund, Inc.
Oppenheimer Global Equity Portfolio
Financial Highlights
| | | | | | | | | | | | | | | | | | | | |
| | | Class E | |
| | | Year ended December 31, | |
| | | 2007 | | | 2006 | | | 2005 | | | 2004 | | | 2003 | |
Net Asset Value, Beginning of Period | | $ | 16.81 | | | $ | 15.06 | | | $ | 13.04 | | | $ | 11.40 | | | $ | 8.96 | |
| | | | | | | | | | | | | | | | | | | | |
Income From Investment Operations | | | | | | | | | | | | | | | | | | | | |
Net investment income | | | 0.18 | (a) | | | 0.18 | (a) | | | 0.11 | | | | 0.11 | | | | 0.13 | |
Net realized and unrealized gain on investments | | | 0.88 | | | | 2.27 | | | | 1.97 | | | | 1.71 | | | | 2.52 | |
| | | | | | | | | | | | | | | | | | | | |
Total from investment operations | | | 1.06 | | | | 2.45 | | | | 2.08 | | | | 1.82 | | | | 2.65 | |
| | | | | | | | | | | | | | | | | | | | |
Less Distributions | | | | | | | | | | | | | | | | | | | | |
Distributions from net investment income | | | (0.17 | ) | | | (0.39 | ) | | | (0.06 | ) | | | (0.18 | ) | | | (0.21 | ) |
Distributions from net realized capital gains | | | (0.26 | ) | | | (0.31 | ) | | | 0.00 | | | | 0.00 | | | | 0.00 | |
| | | | | | | | | | | | | | | | | | | | |
Total distributions | | | (0.43 | ) | | | (0.70 | ) | | | (0.06 | ) | | | (0.18 | ) | | | (0.21 | ) |
| | | | | | | | | | | | | | | | | | | | |
Net Asset Value, End of Period | | $ | 17.44 | | | $ | 16.81 | | | $ | 15.06 | | | $ | 13.04 | | | $ | 11.40 | |
| | | | | | | | | | | | | | | | | | | | |
Total Return (%) | | | 6.3 | | | | 16.5 | | | | 16.1 | | | | 16.1 | | | | 30.4 | |
Ratio of operating expenses to average net assets (%) | | | 0.76 | | | | 0.81 | | | | 1.08 | | | | 0.96 | | | | 0.99 | |
Ratio of net investment income to average net assets (%) | | | 1.04 | | | | 1.13 | | | | 0.71 | | | | 0.81 | | | | 1.08 | |
Portfolio turnover rate (%) | | | 17 | | | | 73 | | | | 115 | | | | 79 | | | | 65 | |
Net assets, end of period (000) | | $ | 24,793 | | | $ | 24,311 | | | $ | 20,674 | | | $ | 15,303 | | | $ | 10,515 | |
| (a) | Per share amount is based on average shares outstanding during the period. |
| (b) | Commencement of operations was April 26, 2004 for Class B. |
| (c) | Periods less than one year are not computed on an annualized basis. |
| (d) | Computed on an annualized basis. |
See accompanying notes to financial statements.
MSF-11
Metropolitan Series Fund, Inc.
Oppenheimer Global Equity Portfolio
Notes to Financial Statements—December 31, 2007
Metropolitan Series Fund, Inc. (the “Fund”) is organized as a corporation under the laws of Maryland pursuant to Articles of Incorporation filed on November 23, 1982, as amended, and registered under the Investment Company Act of 1940, as amended (the “1940 Act”), as an open-end investment company. The Fund is a “series” type of mutual fund, which issues separate series of stock. Each series represents an interest in a separate portfolio of Fund investments. The Oppenheimer Global Equity Portfolio (the “Portfolio”) is a diversified series of the Fund. Shares in the Fund are not offered directly to the general public and are currently available only to separate accounts established by Metropolitan Life Insurance Company (“MetLife”), New England Life Insurance Company, General American Life Insurance Company (“General American”), The MetLife Investors Group of Insurance Companies, MetLife Insurance Company of Connecticut and other affiliated insurance companies (collectively, the “Insurance Companies”), as an investment vehicle for variable life insurance, group annuity or variable annuity products, although the Portfolio is not available to all such separate accounts. The Portfolio’s shares may be divided into different classes. Currently, the classes being offered by the Portfolio are named Class A, Class B and Class E. The classes of the Portfolio’s shares are identical, except that certain additional charges (Rule 12b-1 fees) are made against Class B and Class E shares. Investment income, realized and unrealized capital gains and losses, the common expenses of the Portfolio and certain Portfolio-level expense reductions, if any, are allocated on a pro rata basis to each class based on the relative net assets of each class to the total net assets of the Portfolio.
| 2. | SIGNIFICANT ACCOUNTING POLICIES: |
The preparation of financial statements in conformity with accounting principles generally accepted in the United States of America (“GAAP”) requires management to make estimates and assumptions that affect the reported amounts of assets and liabilities and disclosure of contingent assets and liabilities as of the date of the financial statements and the reported amounts of income and expenses during the reporting period. Actual results could differ from those estimates.
The following is a summary of significant accounting policies consistently followed by the Portfolio in the preparation of its financial statements. The policies are in conformity with GAAP.
Investment Valuation:
Debt securities (other than short term obligations with a remaining maturity of sixty days or less) are valued by independent pricing services selected by the relevant subadviser pursuant to authorization of the Board of Directors of the Fund (the “Board” or “Directors”). Short term obligations with a remaining maturity of sixty days or less are valued at amortized cost which approximates fair market value.
Equity securities traded on a national securities exchange or exchanges are valued at their last sale price on the principal trading market. Equity securities traded on the NASDAQ National Market System are valued at the NASDAQ Official Closing Price (the “NOCP”). The NOCP is the last sale price if it falls between the spread of the last reported bid and asked prices. If the last reported bid and asked prices are above the last reported sale price, the NOCP will be the last reported bid price. If the last reported bid and asked prices are below the last reported sale price, the NOCP will be the last reported asked price. Equity securities traded on a national securities exchange or exchanges or on the NASDAQ National Market System for which there is no reported sale during the day are valued at the last reported bid price. A security that is listed or traded on more than one exchange is valued at the quotation on the exchange determined to be the primary market for that security by the Board or its delegates. If no closing price is available, then such securities are valued by using the last reported bid price. Equity securities traded over-the-counter are valued at the last reported sales price.
If no current market value quotation is readily available or reliable for a portfolio security, fair value will be determined in accordance with procedures established by and under the general supervision of the Board. When the Portfolio uses fair value pricing, it may take into account any factors it deems appropriate. The value of securities used by the Portfolio to calculate its net asset value may differ from quoted or published prices for the same securities. Fair value pricing involves subjective judgments and the fair value determined for a security may be materially different than the value that could be realized upon the sale of that security.
The Portfolio expects to use fair value pricing for securities primarily traded on U.S. exchanges only under very limited circumstances. For example, the Portfolio may use fair value pricing if the exchange on which a security is traded closes early or trading in the security is suspended.
MSF-12
Metropolitan Series Fund, Inc.
Oppenheimer Global Equity Portfolio
Notes to Financial Statements—December 31, 2007—(Continued)
Securities traded primarily on an exchange outside of the United States which closes before the close of the New York Stock Exchange will be valued at the last sales price on that non-U.S. exchange. Securities traded primarily on an exchange outside of the United States for which there is no reported sale during the day are valued at the mean between the last reported bid and asked prices. However, because most foreign markets close well before the Portfolio values its securities (typically at 4 p.m. Eastern Time), the earlier close of these foreign markets gives rise to the possibility that significant events, including broad market moves, may have occurred after these foreign markets close but before the Portfolio values its securities. To account for this, the Portfolio may frequently value many of its foreign equity securities using fair value prices based on third party vendor modeling tools.
Forward foreign currency exchange contracts are valued based on the mean between closing bid and asked prices of the forward currency contract rates in the London foreign exchange markets on a daily basis as provided by a reliable bank or dealer.
Options, whether on securities, indices, futures contracts, or otherwise, are valued at the last sales price available as of the close of business on the day of valuation or, if there is no such sale price available, at the mean between the bid and asked prices. Options on currencies are valued at the spot price each day.
The value of futures contracts will be the sum of the margin deposit plus or minus the difference between the value of the futures contract on each day the net asset value is calculated and the value on the date the futures contract originated, value being that established on a recognized commodity exchange, or by reference to other customary sources, with gain or loss being realized when the futures contract closes or expires.
Subject to the Board’s oversight, the Board has delegated day-to-day responsibility for valuing Portfolio assets to MetLife Advisers, LLC (“MetLife Advisers” or the “Adviser”) who values such assets as described above and operates under procedures approved by the Board.
Investment Transactions and Related Investment Income:
Portfolio security transactions are recorded on the trade date. Dividend income is recorded on the ex-dividend date or, for certain foreign securities, when notified. Interest income, which includes amortization of premium and accretion of discount on debt securities, is recorded on the accrual basis. Realized gains and losses on investments and unrealized appreciation and depreciation are determined on the identified cost basis, which is the same basis used for federal income tax purposes.
Repurchase Agreements:
The Portfolio, through the custodian or a subcustodian, receives delivery of the underlying securities collateralizing repurchase agreements. The Portfolio requires the custodian to take possession, to have legally segregated in the Federal Reserve Book Entry System, or to have segregated within the custodian’s vault, all securities held as collateral for repurchase agreements. It is the Portfolio’s policy that the market value of the collateral be at least equal to 100% of the repurchase price in the case of a repurchase agreement of one-day duration and 102% on all other repurchase agreements. The Portfolio’s subadviser is responsible for determining that the value of the collateral is at all times at least equal to the repurchase price. In connection with transactions in repurchase agreements, if the seller defaults and the value of the collateral declines or if the seller enters an insolvency proceeding, realization of the collateral by the Portfolio may be delayed, limited or wholly denied.
Foreign Currency Translation:
The books and records of the Portfolio are maintained in U.S. dollars. The values of securities, currencies and other assets and liabilities denominated in currencies other than U.S. dollars are translated into U.S. dollars based upon foreign exchange rates prevailing at the end of the period. Purchases and sales of investment securities, income and expenses are translated on the respective dates of such transactions. Since the values of investment securities are presented at the foreign exchange rates prevailing at the end of the period, it is not practical to isolate that portion of the results of operations arising from changes in exchange rates from that portion of the results of operations reflecting fluctuations arising from changes in market prices of the investment securities. Such fluctuations are included in the net realized and unrealized gain or loss on investments.
Net realized foreign exchange gains or losses arise from sales of foreign currency, currency gains or losses realized between the trade and settlement dates on securities transactions, and the difference between the amounts of dividends, interest, and foreign withholding taxes recorded by the Portfolio and the U.S. dollar equivalent of the amounts actually received or paid by the Portfolio. Net unrealized foreign exchange gains and losses arise from changes in the value of assets and liabilities, other than investment securities, resulting from changes in the exchange rate.
MSF-13
Metropolitan Series Fund, Inc.
Oppenheimer Global Equity Portfolio
Notes to Financial Statements—December 31, 2007—(Continued)
Forward Foreign Currency Exchange Contracts:
The Portfolio may enter into forward foreign currency exchange contracts primarily to hedge against foreign currency exchange rate risks on its non-U.S. dollar denominated investment securities. When entering into a forward currency contract, the Portfolio agrees to receive or deliver a fixed quantity of foreign currency for an agreed-upon price on an agreed future date. These contracts are valued daily and the Portfolio’s net equity therein, representing unrealized gain or loss on the contracts as measured by the difference between the foreign exchange rates at the dates of entry into the contracts and the forward rates at the settlement date, is included in the Statement of Assets and Liabilities. Realized and unrealized gains and losses are included in the Statement of Operations. These instruments involve market and/or credit risk in excess of the amount recognized in the Statement of Assets and Liabilities. Risks arise from the possible inability of counterparties to meet the terms of their contracts and from movement in currency and securities values and interest rates.
Futures Contracts:
The Portfolio may buy and sell futures contracts (on recognized exchanges) as a hedge or to enhance return. Futures contracts are agreements to buy or sell a security, or deliver a final cash settlement price in connection with an index, interest rate, currency, or other contracts not calling for physical delivery, for a set price in the future. The Portfolio must post an amount equal to a portion of the total market value of the futures contract as futures variation margin, which is returned when the Portfolio’s obligations under the contract have been satisfied. From time to time thereafter, the Portfolio may have to post variation margin to maintain this amount as the market value of the contract fluctuates. Risks of entering into futures contracts (and related options) include the possibility that there may be an illiquid market and that a change in the value of the contract or option may not correlate with changes in the value of the underlying securities.
Options:
The Portfolio may use options to hedge against changes in values of securities the Portfolio owns or expects to purchase. Writing puts or buying calls tends to increase the Portfolio’s exposure to the underlying instrument and writing calls or buying puts tends to decrease the Portfolio’s exposure to the underlying instrument, and can be used to hedge other Portfolio investments. For options purchased to hedge the Portfolio’s investments, the potential risk to the Portfolio is that the change in value of options contracts may not correspond to the change in value of the hedged instruments. In addition, losses may arise from changes in the value of the underlying instruments, if there is an illiquid secondary market, or if the counterparty is unable to perform. The maximum loss for purchased options is limited to the premium initially paid for the option. For options written by the Portfolio, the maximum loss is not limited to the premium initially received for the option.
The main risk associated with purchasing an option is that the option expires without being exercised. In this case, the option expires worthless and the premium paid for the option is considered the loss. The risk associated with writing a call option is that the Portfolio may forgo the opportunity for a profit if the market value of the underlying position increases and the option is exercised. The risk in writing a put option is that the Portfolio may incur a loss if the market value of the underlying position decreases and the option is exercised. In addition, the Portfolio risks not being able to enter into a closing transaction for the written option as the result of an illiquid market.
“When-Issued” Securities:
Purchasing securities “when-issued” is a forward commitment by the Portfolio to buy a security. The estimated amount of the Portfolio’s payment obligation and the security’s interest rate are determined when the commitment is made, even though no interest accrues until the security is issued, which is generally 15 to 120 days later. The Portfolio will segregate liquid assets with its custodian sufficient at all times to satisfy these commitments. If the value of the security is less when delivered than when the commitment was made, the Portfolio will suffer a loss.
Fund Concentration:
The investments by the Portfolio in foreign securities may involve risks not present in domestic investments. Since securities may be denominated in foreign currencies and may require settlement in foreign currencies and pay interest or dividends in foreign currencies, changes in the relationship of these foreign currencies to the U.S. dollar can significantly affect the value of the investments and earnings of the Portfolio. Foreign investments may also subject the Portfolio to foreign government exchange restrictions, expropriation, taxation or other political, social or economic developments, all of which could affect the market
MSF-14
Metropolitan Series Fund, Inc.
Oppenheimer Global Equity Portfolio
Notes to Financial Statements—December 31, 2007—(Continued)
and/or credit risk of the investments. In addition to the risks described above, risks may arise from forward foreign currency contracts with respect to the potential inability of counterparties to meet the terms of their contracts.
Federal Income Taxes:
It is the Portfolio’s policy to comply with the requirements of the Internal Revenue Code of 1986, as amended, and regulations thereunder, applicable to regulated investment companies and to distribute all of its taxable income to shareholders. Therefore, no federal income tax provision is required.
As of December 31, 2007, the Portfolio had no capital loss carryovers.
The tax character of distributions paid for the periods ended December 31, 2007 and 2006 was as follows:
| | | | | | | | | | | | | | | | | | | | | |
| Ordinary Income | | Long Term Gain | | Return of Capital | | Total |
| 2007 | | 2006 | | 2007 | | 2006 | | 2007 | | 2006 | | 2007 | | 2006 |
| $13,497,645 | | $ | 7,736,279 | | $ | 10,494,843 | | $ | 6,097,494 | | $ | — | | $ | — | | $ | 23,992,488 | | $ | 13,833,773 |
As of December 31, 2007, the components of distributable earnings (accumulated losses) on a federal income tax basis were as follows:
| | | | | | | | | | | | |
Undistributed
Ordinary
Income | | Undistributed
Long Term
Gain | | Unrealized
Appreciation | | Loss
Carryforwards | | Total |
| $16,214,234 | | $ | 27,775,562 | | $ | 109,200,347 | | $ | — | | $ | 153,190,143 |
Dividends and Distributions to Shareholders:
The Portfolio records dividends and distributions on the ex-dividend date. Net realized gains from security transactions (if any) are generally distributed annually to shareholders. The timing and characterization of certain income and capital gains distributions are determined in accordance with federal tax regulations that may differ from GAAP. Permanent book and tax basis differences relating to shareholder distributions will result in reclassification between under/over distributed net investment income, accumulated net realized gains/losses and paid in capital.
| 3. | INVESTMENT TRANSACTIONS: |
For the year ended December 31, 2007, purchases and sales of securities (excluding short term investments) for the Portfolio were as follows:
| | | | | | | | | |
| Purchases | | Sales |
| U.S. Government | | Other | | U.S. Government | | Other |
| $0 | | $ | 164,029,531 | | $ | 0 | | $ | 187,618,220 |
| 4. | INVESTMENT MANAGEMENT FEES AND OTHER TRANSACTIONS WITH AFFILIATES: |
Investment Management Agreement:
MetLife Advisers, LLC (“MetLife Advisers”) is the investment adviser to the Portfolio. The Fund has entered into an investment management agreement with MetLife Advisers with respect to the Portfolio. For providing investment management services to the Portfolio, MetLife Advisers receives monthly compensation at the following annual rates:
| | | | | | | |
| | | Management
Fees earned by
MetLife Advisers
for the year ended
December 31, 2007 | | Annual
percentage
rates paid to
MetLife Advisers | | Based on Portfolios
average daily net asset levels |
| | $ | 5,003,683 | | 0.900% | | Of the first $ 50 million |
| | | | | 0.550% | | Of the next $50 million |
| | | | | 0.500% | | Of the next $400 million |
| | | | | 0.475% | | On amounts in excess of $500 million |
Certain officers and directors of the Fund may also be officers of MetLife Advisers; however, such officers and directors receive no compensation from the Fund.
MSF-15
Metropolitan Series Fund, Inc.
Oppenheimer Global Equity Portfolio
Notes to Financial Statements—December 31, 2007—(Continued)
MetLife Advisers has entered into an investment subadvisory agreement with respect to the Portfolio. OppenheimerFunds, Inc. is compensated by MetLife Advisers to provide subadvisory services for the Portfolio.
Service and Distribution Fees:
The Fund has adopted a Distribution and Service Plan under Rule 12b-1 of the 1940 Act for the Portfolio’s Class B and E shares. Under the Distribution and Service Plan, the Class B and E shares of the Portfolio pay a fee to compensate the Insurance Companies (or their affiliates) and other broker-dealers and financial intermediaries involved in the offer and sale of Portfolio shares for promoting or selling and servicing, the Class B and E shares. The fees under the Distribution and Service Plan for each class of the Portfolio’s shares are calculated as a percentage of the Portfolio’s average daily net assets that are attributable to that Class. Currently, the fee is 0.25% per year for Class B shares and 0.15% per year for Class E shares. Amounts paid by the Portfolio for the year ended December 31, 2007 are shown as Service and Distribution fees in the Statement of Operations.
The Fund has entered into a securities lending arrangement with the Fund’s custodian, State Street Bank and Trust Company (the “custodian”). Under the agreement, the custodian is authorized to loan securities on the Portfolios’ behalf. In exchange, the Portfolio receives either cash or securities as collateral against the loaned securities. The Portfolio receives collateral at least equal to 102% of the market value of the loaned securities (105% for foreign securities), at each loan’s inception. Collateral must be maintained at least at 100% of the market value of the loaned securities for the duration of the loan. The cash collateral is invested in the Navigator Securities Lending Prime Portfolio, an affiliate of the custodian, which invests in a variety of high quality U.S. dollar-denominated instruments. If the market value of the collateral at the close of trading on a business day is less than 100% of the market value of the loaned securities at the close of trading on that day, the borrower shall be required to deliver, by the close of business on the following business day, an additional amount of collateral, equal to at least 100% of the market value of all the loaned securities as of such preceding day. The Portfolio receives 80% of the annual net income from securities lending transactions, which is included in interest income of the Portfolio. The remaining 20% is paid to the custodian as compensation for its securities lending services. The Portfolio bears the risk of any deficiency in the amount of collateral available for return to a borrower due to a loss in an approved investment. Any outstanding loans by the Portfolio at December 31, 2007 are footnoted in the Schedule of Investments.
As previously reported, in May 2004, General American received a Wells Notice stating that the SEC staff was considering recommending that the SEC bring a civil action alleging violations of the U.S. securities laws against General American with respect to market timing and late trading in a limited number of privately-placed variable insurance contracts that were sold through General American. General American responded to the SEC staff and cooperated with the investigation. On August 9, 2007, the SEC announced that it had settled an enforcement action regarding late trading against General American with, among other things, General American agreeing to pay a civil penalty and to comply with certain undertakings. General American consented to the SEC’s order without admitting or denying the findings. MetLife Advisers has also advised the Fund’s Board of Directors that, while certain exceptions to the Fund’s policies have been noted, no situations have been identified that would have a material impact on the financial position of the Fund.
| 7. | RECENT ACCOUNTING PRONOUNCEMENTS: |
Effective June 29, 2007, the Fund implemented Financial Accounting Standards Board (“FASB”) Interpretation No. 48, “Accounting for Uncertainty in Income Taxes—an interpretation of FASB Statement No. 109” (“FIN 48”). FIN 48 prescribes the minimum recognition threshold a tax position must meet in connection with accounting for uncertainties in income tax positions taken or expected to be taken by an entity, including investment companies, before being measured and recognized in the financial statements. Management has evaluated the application of FIN 48 to the Fund, and has determined that the adoption of FIN 48 does not have a material impact on the Fund’s financial statements. The Fund files U.S. tax returns. No income tax returns are currently under examination. The statute of limitations on the Fund’s tax returns remains open for the years ended December 31, 2004 through December 31, 2006.
In September 2006, Statement of Financial Accounting Standards No. 157, Fair Value Measurements (SFAS 157) was issued and is effective for fiscal years beginning after November 15, 2007. SFAS 157 defines fair value, establishes a framework for measuring fair value and expands disclosures about fair value measurements. Management is currently evaluating the impact the adoption of SFAS 157 will have on the Portfolio’s financial statement disclosures.
MSF-16
Metropolitan Series Fund, Inc.
Oppenheimer Global Equity Portfolio
Report of Independent Registered Public Accounting Firm
To the Shareholders and Board of Directors of the Metropolitan Series Fund, Inc.:
We have audited the accompanying statement of assets and liabilities, including the schedule of investments, of the Oppenheimer Global Equity Portfolio, one of the portfolios constituting the Metropolitan Series Fund, Inc. (the “Fund”) as of December 31, 2007, and the related statement of operations for the year then ended, the statements of changes in net assets for each of the two years in the period then ended, and the financial highlights for each of the five years in the period then ended. These financial statements and financial highlights are the responsibility of the Fund’s management. Our responsibility is to express an opinion on these financial statements and financial highlights based on our audits.
We conducted our audits in accordance with the standards of the Public Company Accounting Oversight Board (United States). Those standards require that we plan and perform the audit to obtain reasonable assurance about whether the financial statements and financial highlights are free of material misstatement. The Fund is not required to have, nor were we engaged to perform, an audit of its internal control over financial reporting. Our audits included consideration of internal control over financial reporting as a basis for designing audit procedures that are appropriate in the circumstances, but not for the purpose of expressing an opinion on the effectiveness of the Fund’s internal control over financial reporting. Accordingly, we express no such opinion. An audit also includes examining, on a test basis, evidence supporting the amounts and disclosures in the financial statements, assessing the accounting principles used and significant estimates made by management, as well as evaluating the overall financial statement presentation. Our procedures included confirmation of securities owned as of December 31, 2007, by correspondence with the custodian and brokers; where replies were not received from brokers, we performed other auditing procedures. We believe that our audits provide a reasonable basis for our opinion.
In our opinion, the financial statements and financial highlights referred to above present fairly, in all material respects, the financial position of the Oppenheimer Global Equity Portfolio of the Metropolitan Series Fund, Inc. as of December 31, 2007, the results of its operations for the year then ended, the changes in its net assets for each of the two years in the period then ended, and the financial highlights for each of the five years in the period then ended, in conformity with accounting principles generally accepted in the United States of America.
Deloitte & Touche LLP
Boston, Massachusetts
February 21, 2008
MSF-17
Metropolitan Series Fund, Inc.
Directors and Officers
The Fund’s Directors review actions of the Fund’s investment adviser and subadvisers, and decide upon matters of general policy. The Fund’s officers supervise the daily business operations of the Fund. The Board of Directors and the Fund’s officers are listed below. Each Director is responsible for overseeing all 36 Portfolios of the Fund. There is no limit to the term a Director may serve. Directors serve until their resignation, retirement or removal in accordance with the Fund’s organizational documents and policies adopted by the Board from time to time. Officers hold office at the pleasure of the Board or until the election or appointment and the qualification of a successor. The address of the directors and officers is c/o Metropolitan Series Fund, Inc., 501 Boylston Street, Boston, MA 02116.
Interested Directors(1)
Each Director below is an “interested person” (as defined by the 1940 Act) with respect to the Fund in that Ms. Forget is an employee of MetLife and Mr. Typermass is a former employee of MetLife and owns securities issued by MetLife, Inc., the ultimate parent company of MetLife Advisers.
| | | | | | | | |
Name, Address and Age | | Current
position(s)
with Fund | | Position(s)
held since | | Principal occupations
over past five years, including other directorships(2) | | Number of
Portfolios in
Fund Complex
Overseen by
Director(3) |
Elizabeth M. Forget Age: 41 | | Director, Chairman of the Board, President and Chief Executive Officer | | 2006 | | Senior Vice President (since 2007), MetLife, Inc.; President, Met Investors Advisory, LLC (“MIA”); Trustee and President, Met Investors Series Trust (“MIST”); Executive Vice President, MetLife Investors Group, Inc.; President (since 2006), MetLife Advisers. | | 81 |
| | | | |
Arthur G. Typermass Age: 70 | | Director | | 1998 | | Formerly, Senior Vice President and Treasurer, MetLife. | | 37 |
Non-Interested Directors(1)
Each Director below is not an “interested person” (as defined by the 1940 Act) with respect to the Fund (collectively, the “Independent Directors”).
| | | | | | | | |
Name, Address and Age | | Current
position(s)
with Fund | | Position(s)
held since | | Principal occupations
over past five years, including other directorships(2) | | Number of
Portfolios in
Fund Complex
Overseen by
Director(3) |
Steve A. Garban† Age: 70 | | Director | | 1985 | | Formerly, Chief Financial Officer, Senior Vice President Finance and Operations and Treasurer (Emeritus), The Pennsylvania State University. | | 37 |
| | | | |
Linda B. Strumpf Age: 60 | | Director | | 2000 | | Vice President and Chief Investment Officer, Ford Foundation. | | 37 |
| | | | |
Michael S. Scott Morton† Age: 70 | | Director | | 1993 | | Jay W. Forrester Professor of Management (Emeritus) at Sloan School of Management, MIT. | | 37 |
| | | | |
H. Jesse Arnelle Age: 74 | | Director | | 2001 | | Formerly, Counsel, Womble Carlyle Sandrie & Rice; Director, Textron Inc. (global multi-industry company)*; formerly, Director, Gannet Co. Inc. (diversified news and information company)*; formerly, Director, Eastman Chemical Company (global chemical company)*; formerly, Director, Waste Management, Inc.*; formerly, Director, Armstrong Holdings Inc. (parent company of floor and ceiling products business)*; formerly, Director, FPL Group Inc. (public utility holding company)*; Director, URS Corporation (engineering design services firm)*. | | 37 |
| | | | |
Nancy Hawthorne Age: 56 | | Director | | 2003 | | Director, Avid Technologies (computer software company)*; formerly, Chairman of the Board of Avid Technologies; formerly, Board of Advisors, L. Knife & Sons, Inc. (beverage distributor); Chief Executive Officer, Clerestory LLC (corporate financial advisor); formerly, Trustee, New England Zenith Fund (“Zenith Fund”)**; formerly, Chief Executive Officer and Managing Partner, Hawthorne, Krauss and Associates (corporate financial advisor); formerly, Chief Financial Officer and Executive Vice President, Continental Cablevision, subsequently renamed MediaOne (cable television company); formerly, Director, Life F/X, Inc.; formerly, Chairman of the Board, WorldClinic (distance medicine company); formerly, Director, Perini Corporation (construction company)*; formerly, Director, CGU (property and casualty insurance company); formerly, Director, Beacon Power Corporation (energy company )*. | | 37 |
MSF-18
Metropolitan Series Fund, Inc.
Directors and Officers—(Continued)
| | | | | | | | |
Name, Address and Age | | Current
position(s)
with Fund | | Position(s)
held since | | Principal occupations
over past five years, including other directorships(2) | | Number of
Portfolios in
Fund Complex
Overseen by
Director(3) |
John T. Ludes Age: 71 | | Director | | 2003 | | President, LFP Properties (consulting firm); Formerly, Trustee, Zenith Fund**; formerly, Vice Chairman, President and Chief Operating Officer, Fortune Brands/American Brands (global conglomerate); formerly, President and CEO, Acushnet Company (athletic equipment company). | | 37 |
Officers(1)
| | | | | | | | |
Name and address | | Age | | Current
position(s)
with Fund | | Position(s)
held since | | Principal occupations over past five years(2) |
| Jeffrey P. Halperin | | 40 | | Chief Compliance Officer | | 2006 | | Vice President (since 2006), Corporate Ethics and Compliance Department, MetLife, Inc.; Chief Compliance Officer (since 2006), MetLife Advisers, MIA and MIST. |
| | | | |
| John F. Guthrie, Jr. | | 64 | | Senior Vice President | | 2002 | | Manager and Senior Vice President, MetLife Advisers; Vice President, MetLife; Vice President (since 2003), MetLife Group, Inc.; Vice President, NELICO; Vice President (since 2005), MIA; formerly, Senior Vice President, Zenith Fund**. |
| | | | |
| Alan C. Leland | | 55 | | Senior Vice President | | 2005 | | Treasurer and Chief Financial Officer, MetLife Advisers, LLC; Treasurer (since 2005), Met Investors Advisory, LLC; Vice President (since 2004), MIA; Vice President (since 2003), MetLife Group, Inc.; Vice President, MetLife; Senior Vice President, NELICO |
| | | | |
| Peter Duffy | | 52 | | Vice President and Treasurer | | 2000 | | Senior Vice President, MetLife Advisers (since 1998); Second Vice President (since 2003), NELICO; Vice President, MetLife (since 2004); Vice President (since 2004), MetLife Group, Inc.; formerly, Vice President and Treasurer, Zenith Fund**. |
| | | | |
| Thomas M. Lenz | | 49 | | Vice President and Secretary | | 2002 | | General Counsel and Secretary, MetLife Advisers; Assistant General Counsel, MetLife; formerly, Vice President and Secretary, Zenith Fund**. |
| * | Indicates a directorship with a registered investment company or a company subject to the reporting requirements of the Securities Exchange Act of 1934, as amended. |
| ** | The Zenith Fund deregistered with the Securities and Exchange Commission (“SEC”) in 2004. |
| (†) | Served as a trustee, director and/or officer of one or more of the following companies, each of which had a direct or indirect advisory relationship with MetLife Advisers or its affiliates prior to January 31, 2005: State Street Research Financial Trust, State Street Research Income Trust, State Street Research Money Market Trust, State Street Research Institutional Funds, State Street Research Capital Trust, State Street Research Master Investment Trust, State Street Research Equity Trust, State Street Research Securities Trust and State Street Research Exchange Trust (collectively, the “State Street Research Funds”). |
| (1) | Each Director of the Fund also serves as trustee of Metropolitan Series Fund II (“Met Series Fund II”), a registered investment company advised by MetLife Advisers. Each officer of the Fund serves in the same position with Met Series Fund II, which consists of one portfolio. |
| (2) | Previous positions during the past five years with the Fund, MIST, MetLife, MetLife Advisers, MIA, Zenith Fund, NELICO or New England Securities Corporation are omitted if not materially different. |
| (3) | The Fund Complex includes the Fund (36 portfolios), Met Series Fund II (1 portfolio) and MIST (44 portfolios) |
MSF-19
Metropolitan Series Fund, Inc.
Oppenheimer Global Equity Portfolio
Board Approval of Advisory and Subadvisory Agreements
The Fund’s Contract Review Committees of the Board of Directors (the “Board”) typically meet in early fall to review the Portfolios’ advisory agreements (the “Advisory Agreements”) and subadvisory agreements (collectively, the “Subadvisory Agreements,” and, together with the Advisory Agreements, the “Agreements”) and determine whether to recommend that the full Board approve the continuation of the Agreements for an additional one-year period. (Following the initial approval of an Agreement for a new Portfolio or with a new adviser or subadviser, such annual reviews are not required until 2 years following the execution of such Agreement.) After each Committee has made its recommendations, the full Board, including the Independent Directors, determines whether to approve the continuation of each of the Agreements. In addition, the Board, including the Independent Directors, considers matters bearing on the Agreements at most of its other meetings throughout the year and regularly interviews various individuals at MetLife Advisers responsible for the management of the Portfolios. The Directors also interview selected investment managers and other professionals at the subadvisers at various times throughout the year.
The Directors receive all materials that they or MetLife Advisers, the Fund’s investment adviser, and the subadvisers believe to be reasonably necessary for the Directors to evaluate the Agreements and determine whether to approve the continuation of the Agreements. These materials generally include, among other items, (i) information on the investment performance of the Portfolios and the performance of peer groups of funds and the Portfolios’ performance benchmarks, (ii) information on the Portfolios’ advisory and subadvisory fees and other expenses, including information comparing the Portfolios’ expenses to those of peer groups of funds and information about any applicable expense caps and fee “breakpoints,” (iii) sales and redemption data, (iv) information related to the profitability of the Agreements to MetLife Advisers and the subadvisers, and potential “fall-out” or ancillary benefits that MetLife Advisers, the subadvisers or their affiliates may receive as a result of their relationships with the Fund and (v) information obtained through the subadvisers’ responses to certain requests from MetLife Advisers and the Directors and MetLife Advisers’ responses to requests from the Directors. The Directors may also consider other information such as (vi) MetLife Advisers’ and the subadvisers’ financial results and condition, (vii) each Portfolio’s investment objectives and strategies and the size, education and experience of the investment staffs of MetLife Advisers and the relevant subadvisers and their use of technology and external research, (viii) the allocation of the Portfolios’ brokerage, if any, including allocations to brokers affiliated with the subadvisers and the use of “soft” commission dollars to pay Portfolio expenses and to pay for research and other similar services, (ix) the resources devoted to, and the record of compliance with, the Portfolios’ investment policies and restrictions, policies on personal securities transactions and other compliance policies, (x) the responses of MetLife Advisers, the subadvisers and/or their affiliates to certain legal and regulatory proceedings and (xi) the economic outlook generally and for the mutual fund industry in particular. Throughout the process, the Directors have the opportunity to ask questions of and request additional materials from MetLife Advisers and the subadvisers.
Following meetings of each Contract Review Committee on September 12, 2007, the Board, at its November 15, 2007 meeting, approved the continuation through December 31, 2008 of the Advisory Agreements for each Portfolio of the Fund and the Subadvisory Agreements for each Portfolio of the Fund. The Agreements approved for continuation are referred to below as the “Continued Agreements.”
In considering whether to approve the continuation of the Continued Agreements, the Directors, including the Independent Directors, did not identify any single factor as determinative, and each weighed the various factors as he or she deemed appropriate. The Directors considered the following matters in connection with their approval of the Continued Agreements:
The nature, extent and quality of the services provided to the relevant Portfolios under the Continued Agreements. The Directors considered the nature, extent and quality of the services provided by MetLife Advisers, the relevant subadvisers (if any) and their affiliates (each, an “Adviser,” and, collectively, the “Advisers”) to the relevant Portfolios pursuant to the Continued Agreements and the resources dedicated to these Portfolios by the Advisers. In particular, the Directors considered the Advisers’ abilities to attract and retain highly qualified investment professionals. With respect to MetLife Advisers, the Directors considered that MetLife Advisers is (i) ultimately responsible for the performance of such Portfolios; (ii) ultimately responsible for the establishment of the investment strategies of each such Portfolio, primarily through its recommendations to the Board regarding the hiring and selection of subadvisers; (iii) responsible for the hiring and selection, subject to Board approval, of subadvisers; and (iv) responsible for maintaining a program of Subadviser oversight reasonably designed to ensure that the subadvisers have reasonable compliance policies and procedures in place. The Directors also considered that MetLife Advisers provides a full range of day-to-day administrative services for the Portfolios involving all aspects of such Portfolios’ day-to-day operations (other than portfolio management). After reviewing these and related factors, the Directors concluded, within the context of their overall conclusions regarding each of the Continued Agreements, that the nature, extent and quality of services provided supported the renewal of these Agreements.
Investment performance of the relevant Portfolios. The Directors reviewed information about the performance of the relevant Portfolios over various time periods, including information prepared by an independent third party that compared the performance of
MSF-20
Metropolitan Series Fund, Inc.
Oppenheimer Global Equity Portfolio
Board Approval of Advisory and Subadvisory Agreements—(Continued)
the Portfolios to the performance of peer groups of funds and performance benchmarks. The Directors also reviewed a description of the third party’s methodology for identifying a Portfolio’s peer group(s) for purposes of performance and expense comparisons.
In the case of each relevant Portfolio that had performance that lagged its peer group(s) for certain periods, the Directors concluded that other factors relevant to performance were sufficient, in light of other considerations, to warrant renewal of the Continued Agreements relating to such Portfolio. These factors varied from Portfolio to Portfolio, but included one or more of the following: (i) that such Portfolio’s performance, although lagging in certain recent periods, was stronger over the longer term; (ii) that the underperformance was attributable, to a significant extent, to investment decisions that were reasonable and consistent with the Portfolio’s investment objective(s) and policies and that the Portfolio was performing within the range of reasonable expectations, given market conditions and the Portfolio’s investment objective(s) and policies; (iii) that the Portfolio’s performance was competitive when compared to other relevant performance benchmarks or peer groups; and (iv) that MetLife Advisers and/or the relevant subadviser (if any) had taken or was taking steps designed to help improve the Portfolio’s investment performance.
The Directors also considered the investment performance of the Advisers and their reputations generally, the historical responsiveness of the Advisers to Director concerns about performance and the willingness of the Advisers to take steps intended to improve performance.
After reviewing these and related factors, the Directors concluded, within the context of their overall conclusions regarding each of the Continued Agreements, that the investment performance of each relevant Portfolio and Adviser was sufficient, in light of other considerations, to warrant the renewal of the Continued Agreements.
The costs of the services to be provided and profits to be realized by the Advisers and their affiliates from their relationships with the Portfolios. The Directors considered the fees charged by MetLife Advisers to the Portfolios for advisory services and, with respect to the subadvised Portfolios, by such subadvisers to MetLife Advisers for subadvisory services (such advisory and subadvisory fees (if any), collectively, “Fees”), as well as the total expense levels of the Portfolios. This information included comparisons (provided by an independent third party) of the Portfolios’ advisory fees and total expense levels to those of their peer groups. In evaluating Fees for the relevant Portfolios, the Directors also took into account the demands, complexity and quality of the investment management services provided to each Portfolio. The Directors considered MetLife Advisers’ recommendations regarding reductions in Fee rates, implementation of Fee breakpoints and institution of Fee waivers and expense caps.
The Directors also considered the compensation directly or indirectly received by the Advisers and their affiliates from their relationships with the relevant Portfolios. The Directors reviewed information relating to the profits received by MetLife Advisers, certain of the subadvisers and their affiliates as a result of their relationships with the relevant Portfolios, and information about the allocation of expenses used to calculate profitability. When reviewing profitability, the Directors also considered the performance of the relevant Portfolios, the expense levels of such Portfolios and whether the relevant Advisers had implemented breakpoints, fee waivers and/or expense caps with respect to such Portfolios.
After reviewing these and related factors, the Directors concluded, within the context of their overall conclusions regarding each of the Continued Agreements, that the Fees charged to each of the relevant Portfolios were fair and reasonable, and that the information provided regarding costs of these services generally, and the related profitability (if known) to the relevant Advisers of their relationships with the relevant Portfolios, supported the renewal of the Continued Agreements.
Economies of Scale. The Directors considered the existence of any economies of scale in the provision of services by the Advisers and whether those economies were shared with the relevant Portfolios through breakpoints in their advisory fees or other means, such as expense caps, fee waivers or relatively low levels of fees. The Directors noted that most of the relevant Portfolios benefited or will benefit from breakpoints, expense caps and/or fee waivers with respect to their advisory fees. In considering these issues, the Directors also took into consideration information relating to the costs of the services provided and the profitability to MetLife Advisers, the relevant subadvisers (if any) and each of their affiliates of their relationships with the relevant Portfolios, as discussed above.
After reviewing these and related factors, the Directors concluded, within the context of their overall conclusions regarding each of the Continued Agreements, that the extent to which economies of scale were shared with the relevant Portfolios supported the renewal of such Agreements.
Other Factors. The Directors also considered other factors, which included but were not limited to the following:
| | • | | the extent to which each relevant Portfolio operated in accordance with its investment objective, and its record of compliance with its investment restrictions and the compliance programs of the Fund and the Advisers. They also considered the compliance-related resources the Advisers and their affiliates provide to the relevant Portfolios; |
MSF-21
Metropolitan Series Fund, Inc.
Oppenheimer Global Equity Portfolio
Board Approval of Advisory and Subadvisory Agreements—(Continued)
| | • | | the nature, quality, cost and extent of administrative and shareholder services performed by MetLife Advisers and its affiliates under the Advisory Agreements; and |
| | • | | so-called “fall-out benefits” to the Advisers, such as the engagement of their affiliates to provide distribution, brokerage and transfer agency services to the Portfolios, and the benefits of research made available to the relevant Advisers by reason of brokerage commissions generated by the relevant Portfolios’ securities transactions. The Directors also considered the possible conflicts of interest associated with these fall-out and other benefits, and the reporting and other processes in place to disclose and monitor these possible conflicts of interest. |
Based on their evaluation of all factors that they deemed to be material, including those factors described above, and assisted by the advice of independent counsel, the Directors, including the Independent Directors, concluded that each of the Continued Agreements should be continued through December 31, 2008.
MSF-22
A description of the policies and procedures that the Fund uses to determine how to vote proxies relating to portfolio securities is available (i) without charge, upon request, by calling (800) 638-7732 and (ii) on the Securities and Exchange Commission’s (the “SEC”) website at http://www.sec.gov.
Information regarding how the Fund voted proxies relating to portfolio securities during the most recent twelve-month period ended December 31, 2007 is available (i) without charge, upon request, by calling (800) 638-7732 and (ii) on the SEC’s website at http://www.sec.gov.
The Fund files with the SEC a complete schedule of its portfolio holdings, as of the close of the first and third quarters of its fiscal year, on “Form N-Q”. These filings are available on the SEC’s website at www.sec.gov and may be reviewed and copied at the SEC’s Public Reference Room in Washington, DC. (Call 1-800-SEC-0330 for information on the operation of the Public Reference Room.)
MSF-23
| | |
Metropolitan Series Fund, Inc. Russell 2000 Index Portfolio Annual Report | | December 31, 2007 |
Letter from the President
February 1, 2008
Letter to Policy Holders:
2007 was a tumultuous year in the financial markets driven by concerns in the credit markets surrounding sub-prime mortgages and fears of recession in the U.S. Economy. The broad markets were mixed, with the Dow Jones Industrial Average up 8.9% and the MSCI EAFE Index, which measures the performance of international equities, up 11.2% for the year, while the Russell 2000 Index, which measures the performance of small capitalization stocks, was down 1.6%.
In the fixed income markets, credit spreads increased as a result of the pressure from sub-prime mortgage crisis and the Federal Reserve lowered interest rates by a total of 1% during the year. The Lehman Brothers Aggregate Bond Index posted a 7.0% return for the year.
On the following pages, you will find a complete review of your Portfolio and its investment performance.
MetLife is committed to building your financial freedom. We appreciate your trust and will continue to focus our efforts on meeting your investment needs.
Sincerely,
Elizabeth Forget
President, Metropolitan Series Fund, Inc.
Metropolitan Series Fund, Inc.
Russell 2000 Index Portfolio
Managed by MetLife Investment Advisors Company, LLC
Portfolio Manager Commentary*
PORTFOLIO PERFORMANCE
For the year ended December 31, 2007, the Class A shares of the Russell 2000 Index Portfolio returned -1.6%, compared to its benchmark, the Russell 2000 Index1, which returned -1.6%. The Portfolio’s performance cannot exactly duplicate the Russell 2000 Index’s return because of differences that primarily result from sampling, pricing, and transaction costs.
PORTFOLIO REVIEW
The Russell 2000 small capitalization benchmark had a negative annual return for the first time in five years. During the first half of 2007, the Russell 2000 Index returned positive 6.4% despite mixed earnings and macroeconomic reports. However, during the second half of the year, the Russell 2000 Index returned -7.5%. This second half decline was largely attributable to the subprime mortgage crisis. The subprime contagion contributed to the weakening housing market, a liquidity crisis, lender bankruptcies, and large write-downs at several major financial institutions. During the first half of 2007, the Federal Reserve maintained the Fed Funds Rate at 5.25%. However, during the second half of 2007, the Federal Reserve began lowering the Fed Funds Rate, dropping the target by 100 basis points to 4.25% at year-end. The Federal Reserve lowered the Fed Funds Rate primarily due to concerns that the risk of slower economic growth outweighed the risk of inflation. The price of oil surged from $61 to $96 per barrel through December, up 57% from the beginning of the year. Increasing global demand, weakness in refinery utilization, and global geopolitical unrest contributed to supply concerns, increasing oil prices over the period. Some of the factors driving the equity markets included geopolitical concerns, energy prices, Federal Reserve interest rate policy, corporate earnings, employment data, and the U.S. Dollar.
Eight of the twelve sectors comprising the Russell 2000 Index experienced positive returns for the year. Health Care, which had a beginning-of-year weight of 11.3%, up 13.7%, had the largest positive impact on the benchmark return. The best-performing sectors were Other Energy (4.6% beginning weight, up 17.9%), Materials & Processing (9.3% beginning weight, up 13.1%), and Consumer Staples (2.1% beginning weight, up 7.7%). Financial Services (the largest sector with a beginning weight of 24.0%), down 16.7%, was the worst-performing sector and had the largest negative impact on the benchmark return.
The stocks with the largest positive impact on the benchmark return for the year were CF Industries Holdings, up 330.0%; Terra Industries, up 298.7%; and Aquantive (acquired during the year by Microsoft), up 156.5%. The stocks with the largest negative impact were American Home Mortgage Investment Corp, down 98.9%; RAIT Investment Trust, down 70.8%; and JetBlue Airways Corp, down 58.5%.
On June 29, 2007 Frank Russell underwent their annual reconstitution. In total, 235 companies were added to the Russell 2000 Index and 191 were deleted. The difference of 44 names is due to attrition throughout the period between annual reconstitutions. The annual Russell 2000 reconstitution generated approximately 19% turnover.
* The views expressed above are those of the subadvisory firm as of December 31, 2007 and are subject to change based on market and other conditions. Information about the Portfolio’s holdings, asset allocation, industry allocation, or country diversification is historical and is not an indication of future Portfolio composition, which will vary. The performance of any index mentioned in this commentary has not been adjusted for ongoing management, distribution and operating expenses, and sales charges applicable to mutual fund investments. Direct investment in the Index is not possible.
1 The Russell 2000® Index is an unmanaged measure of performance of the 2,000 smallest companies in the Russell 3000® Index.
MSF-2
Metropolitan Series Fund, Inc.
Russell 2000 Index Portfolio
A $10,000 INVESTMENT COMPARED TO
THE RUSSELL 2000 INDEX
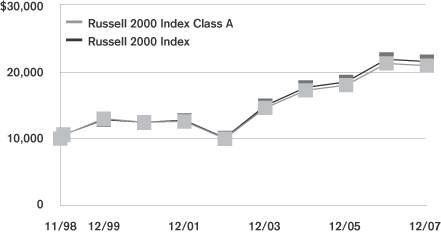
Average Annual Returns as of December 31, 2007
| | | | | | | | | | | | |
| | | Russell 2000 Index Portfolio | | | Russell 2000
Index | |
| | | Class A | | | Class B | | | Class E | | |
| 1 Year | | -1.6 | % | | -1.8 | % | | -1.7 | % | | -1.6 | % |
| 5 Year | | 15.9 | | | 15.5 | | | 15.7 | | | 16.2 | |
| Since Inception | | 8.4 | | | 8.1 | | | 7.7 | | | 8.7 | |
Performance numbers are net of all Portfolio expenses but do not include any insurance, sales, or administrative charges of variable annuity or life insurance contracts. If these charges were included, the returns would be lower.
Inception dates of the Class A, Class B and Class E shares are: 11/9/98, 1/2/01 and 5/1/01, respectively. Index since inception return is based on the Class A inception date.
This information represents past performance and is not indicative of future results. Investment return and principal value may fluctuate so that shares, upon redemption, may be worth more or less than the original cost.
PORTFOLIO COMPOSITION
as of December 31, 2007
Top Holdings
| | |
| | | % of Total
Net Assets |
iShares Russell 2000 Index Fund | | 2.1% |
Hologic, Inc. | | 0.6% |
CF Industries Holdings, Inc. | | 0.5% |
Exterran Holdings, Inc. | | 0.4% |
Terra Industries, Inc. | | 0.4% |
Priceline.com, Inc. | | 0.3% |
FLIR Systems, Inc. | | 0.3% |
Chipotle Mexican Grill, Inc. | | 0.3% |
Bucyrus International, Inc. | | 0.3% |
BioMarin Pharmaceutical, Inc. | | 0.3% |
Top Sectors
| | |
| | | % of Equity
Market Value |
Financial Services | | 20.4% |
Consumer Discretionary | | 17.4% |
Technology | | 14.2% |
Health Care | | 13.9% |
Materials & Processing | | 9.9% |
Producer Durables | | 7.6% |
Other Energy | | 5.8% |
Utilities | | 4.3% |
Auto & Transportation | | 3.6% |
Consumer Staples | | 2.2% |
MSF-3
Metropolitan Series Fund, Inc.
Shareholder Expense Example
As a shareholder of the Portfolio, you incur ongoing costs, including management fees; distribution and service (12b-1) fees; and other Portfolio expenses. This example is intended to help you understand your ongoing costs (in dollars) (referred to as “expenses”) of investing in the Portfolio and compare these costs with the ongoing costs of investing in other mutual funds. The example is based on an investment of $1,000 invested at the beginning of the period and held for the entire period, July 1, 2007 through December 31, 2007.
Actual Expenses
The first line for each share class of the Portfolio in the table below provides information about actual account values and actual expenses. You may use the information in this line, together with the amount you invested in the particular share class of the Portfolio, to estimate the expenses that you paid over the period. Simply divide your account value by $1,000 (for example, an $8,600 account value divided by $1,000=8.6), then multiply the result by the number in the first line under the heading entitled “Expenses Paid During Period” to estimate the expenses you paid on your account during this period.
Hypothetical Example for Comparison Purposes
The second line for each share class of the Portfolio in the table below provides information about hypothetical account values and hypothetical expenses based on the Portfolio’s actual expense ratio and an assumed rate of return of 5% per year before expenses, which is not the Portfolio’s actual return. The hypothetical account values and expenses may not be used to estimate the actual ending account balance or expenses you paid for the period. You may use this information to compare the ongoing costs of investing in the Portfolio and other funds. To do so, compare this 5% hypothetical example with the 5% hypothetical examples that appear in the shareholder reports of the other funds.
Please note that the expenses shown in the table are meant to highlight your ongoing costs only and do not reflect any fees or charges of your variable insurance product or any additional expenses that participants in certain eligible qualified plans may bear relating to the operations of their plan. Therefore, the second line for each share class in the table is useful in comparing ongoing costs only, and will not help you determine the relative total costs of owning different funds. In addition, if these other costs were included, your costs would have been higher.
| | | | | | | | | | | | | | |
Portfolio | | | | Annualized
Expense
Ratio | | | Beginning
Account Value
July 1,
2007 | | Ending
Account Value
December 31,
2007 | | Expenses Paid
During Period*
July 1, 2007
to
December 31,
2007 |
Russell 2000 Index—Class A(a) | | Actual | | 0.32 | % | | $ | 1,000.00 | | $ | 925.00 | | $ | 1.55 |
| | Hypothetical | | 0.32 | % | | $ | 1,000.00 | | $ | 1,023.58 | | $ | 1.63 |
| | | | | |
Russell 2000 Index—Class B(a) | | Actual | | 0.57 | % | | $ | 1,000.00 | | $ | 923.80 | | $ | 2.76 |
| | Hypothetical | | 0.57 | % | | $ | 1,000.00 | | $ | 1,022.30 | | $ | 2.91 |
| | | | | |
Russell 2000 Index—Class E(a) | | Actual | | 0.47 | % | | $ | 1,000.00 | | $ | 924.00 | | $ | 2.28 |
| | Hypothetical | | 0.47 | % | | $ | 1,000.00 | | $ | 1,022.81 | | $ | 2.40 |
* Expenses paid are equal to the Portfolio’s annualized expense ratio for the most recent six month period, as shown above, multiplied by the average account value over the period, multiplied by the number of days in the most recent fiscal half-year, divided by 365 (to reflect the one-half year period).
(a) The annualized expense ratio shown reflects the impact of the management fee waiver as described in Note 4 to the Financial Statements.
MSF-4
Metropolitan Series Fund, Inc.
Russell 2000 Index Portfolio
Schedule of Investments as of December 31, 2007
Common Stock—96.6% of Total Net Assets
| | | | | |
| Security Description | | Shares | | Value* |
| | | | | |
|
Aerospace & Defense—1.6% |
AAR Corp. (a) (b) | | 21,637 | | $ | 822,855 |
American Science & Engineering, Inc. (a) | | 5,154 | | | 292,490 |
Argon, Inc. (a) (b) | | 6,788 | | | 125,985 |
Ceradyne, Inc. (a) (b) | | 16,320 | | | 765,898 |
Cubic Corp. | | 9,190 | | | 360,248 |
Curtiss Wright Corp. | | 28,142 | | | 1,412,728 |
DynCorp. International, Inc. (b) | | 15,363 | | | 412,957 |
Esterline Technologies Corp. (b) | | 17,279 | | | 894,188 |
GenCorp, Inc. (a) (b) | | 39,139 | | | 456,361 |
HEICO Corp. (Class A) | | 371 | | | 15,805 |
HEICO Corp. (Class B) (a) | | 15,158 | | | 825,808 |
Hexcel Corp. (b) | | 59,259 | | | 1,438,809 |
Innovative Solutions & Support (a) (b) | | 8,015 | | | 77,665 |
Ladish, Inc. (a) (b) | | 8,706 | | | 376,012 |
Moog, Inc. (b) | | 22,893 | | | 1,048,728 |
Orbital Sciences Corp. (b) | | 36,263 | | | 889,169 |
Taser International, Inc. (a) (b) | | 44,282 | | | 637,218 |
Teledyne Technologies, Inc. (b) | | 20,430 | | | 1,089,532 |
TransDigm Group, Inc. (b) | | 5,892 | | | 266,142 |
Triumph Group, Inc. (a) | | 10,004 | | | 823,829 |
| | | | | |
| | | | | 13,032,427 |
| | | | | |
|
Air Freight & Logistics—0.3% |
ABX Air, Inc. (a) (b) | | 31,360 | | | 131,085 |
Atlas Air Worldwide Holdings, Inc. (a) (b) | | 8,084 | | | 438,315 |
Dynamex, Inc. (a) (b) | | 6,006 | | | 162,522 |
Forward Air Corp. (a) | | 18,684 | | | 582,380 |
HUB Group, Inc. (Class A) (b) | | 25,072 | | | 666,414 |
Pacer International, Inc. (a) | | 22,347 | | | 326,266 |
| | | | | |
| | | | | 2,306,982 |
| | | | | |
|
Airlines—0.4% |
AirTran Holdings, Inc. (a) (b) | | 59,266 | | | 424,344 |
Alaska Air Group, Inc. (a) (b) | | 23,300 | | | 582,733 |
ExpressJet Holdings, Inc. (a) (b) | | 39,869 | | | 98,875 |
JetBlue Airways Corp. (a) (b) | | 112,271 | | | 662,399 |
Midwest Air Group, Inc. (a) (b) | | 15,135 | | | 223,998 |
Pinnacle Airlines Corp. (a) (b) | | 12,112 | | | 184,708 |
Republic Airways Holdings, Inc. (b) | | 23,593 | | | 462,187 |
SkyWest, Inc. | | 38,881 | | | 1,043,955 |
| | | | | |
| | | | | 3,683,199 |
| | | | | |
|
Auto Components—0.9% |
Aftermarket Technology Corp. (b) | | 13,111 | | | 357,406 |
American Axle & Manufacturing Holdings, Inc. | | 31,250 | | | 581,875 |
Amerigon, Inc. (a) (b) | | 13,318 | | | 281,542 |
ArvinMeritor, Inc. (a) | | 40,778 | | | 478,326 |
Cooper Tire & Rubber Co. | | 36,658 | | | 607,790 |
Drew Industries, Inc. (a) (b) | | 10,890 | | | 298,386 |
Exide Technologies (a) (b) | | 44,313 | | | 354,504 |
GenTek, Inc. (a) (b) | | 5,631 | | | 164,819 |
Hayes Lemmerz International, Inc. (a) (b) | | 57,979 | | | 264,964 |
Lear Corp. (b) | | 49,919 | | | 1,380,759 |
Modine Manufacturing Co. (a) | | 20,814 | | | 343,639 |
Noble International, Ltd. (a) | | 7,044 | | | 114,888 |
| | | | | |
| Security Description | | Shares | | Value* |
| | | | | |
|
Auto Components—(Continued) |
Raser Technologies, Inc. (a) (b) | | 9,432 | | $ | 140,065 |
Sauer-Danfoss, Inc. | | 7,791 | | | 195,165 |
Spartan Motors, Inc. (a) | | 19,530 | | | 149,209 |
Standard Motor Products, Inc. | | 16,871 | | | 137,667 |
Superior Industries International, Inc. (a) | | 13,180 | | | 239,481 |
Tenneco, Inc. (b) | | 28,545 | | | 744,168 |
Visteon Corp. (a) (b) | | 75,405 | | | 331,028 |
| | | | | |
| | | | | 7,165,681 |
| | | | | |
|
Automobiles—0.1% |
Fleetwood Enterprises, Inc. (a) (b) | | 35,502 | | | 212,302 |
Monaco Coach Corp. (a) | | 17,964 | | | 159,521 |
Winnebago Industries, Inc. (a) | | 20,312 | | | 426,958 |
| | | | | |
| | | | | 798,781 |
| | | | | |
|
Beverages—0.2% |
Boston Beer, Inc. (a) (b) | | 7,145 | | | 269,009 |
Central European Distribution Corp. (a) (b) | | 21,208 | | | 1,231,761 |
Coca-Cola Bottling Co. | | 3,137 | | | 184,707 |
Jones Soda Co. (a) (b) | | 13,932 | | | 103,654 |
| | | | | |
| | | | | 1,789,131 |
| | | | | |
|
Biotechnology—3.6% |
Acadia Pharmaceuticals, Inc. (a) (b) | | 19,354 | | | 214,249 |
Acorda Therapeutics, Inc. (a) (b) | | 13,375 | | | 293,715 |
Alexion Pharmaceuticals, Inc. (a) (b) | | 23,760 | | | 1,782,713 |
Alkermes, Inc. (b) | | 60,343 | | | 940,747 |
Allos Therapeutics, Inc. (a) (b) | | 27,209 | | | 171,145 |
Alnylam Pharmaceuticals, Inc. (a) (b) | | 21,839 | | | 635,078 |
Altus Pharmaceuticals, Inc. (a) (b) | | 13,707 | | | 71,002 |
Applera Corp.—Celera Genomics (b) | | 46,793 | | | 742,605 |
Arena Pharmaceuticals, Inc. (b) | | 35,841 | | | 280,635 |
Ariad Pharmaceuticals, Inc. (a) (b) | | 35,921 | | | 152,664 |
Arqule, Inc. (a) (b) | | 21,164 | | | 122,751 |
Array Biopharma, Inc. (a) (b) | | 31,105 | | | 261,904 |
BioMarin Pharmaceutical, Inc. (b) | | 63,670 | | | 2,253,918 |
Cell Genesys, Inc. (a) (b) | | 38,976 | | | 89,645 |
Cepheid, Inc. (a) (b) | | 33,061 | | | 871,157 |
Cubist Pharmaceuticals, Inc. (b) | | 35,783 | | | 733,909 |
CV Therapeutics, Inc. (b) | | 35,967 | | | 325,501 |
CytRx Corp. (a) (b) | | 55,366 | | | 157,239 |
Dendreon Corp. (a) (b) | | 66,216 | | | 411,864 |
Enzon Pharmaceuticals, Inc. (a) (b) | | 24,485 | | | 233,342 |
Genomic Health, Inc. (a) (b) | | 7,389 | | | 167,287 |
Geron Corp. (a) (b) | | 45,239 | | | 256,958 |
GTx, Inc. (a) (b) | | 10,111 | | | 145,093 |
Halozyme Therapeutics, Inc. (a) (b) | | 39,723 | | | 282,431 |
Human Genome Sciences, Inc. (a) (b) | | 81,158 | | | 847,290 |
Immunomedics, Inc. (a) (b) | | 55,067 | | | 127,755 |
Incyte Corp. (a) (b) | | 59,640 | | | 599,382 |
Indevus Pharmaceuticals, Inc. (a) (b) | | 36,580 | | | 254,231 |
InterMune, Inc. (a) (b) | | 17,950 | | | 239,273 |
Isis Pharmaceuticals, Inc. (a) (b) | | 52,045 | | | 819,709 |
Keryx Biopharmaceuticals, Inc. (a) (b) | | 25,445 | | | 213,738 |
Kosan Biosciences, Inc. (a) (b) | | 27,535 | | | 99,126 |
*See accompanying notes to financial statements.
MSF-5
Metropolitan Series Fund, Inc.
Russell 2000 Index Portfolio
Schedule of Investments as of December 31, 2007
Common Stock—(Continued)
| | | | | |
| Security Description | | Shares | | Value* |
| | | | | |
|
Biotechnology—(Continued) |
Lifecell Corp. (a) (b) | | 19,808 | | $ | 853,923 |
Ligand Pharmaceuticals, Inc. (a) (b) | | 55,630 | | | 268,693 |
MannKind Corp. (a) (b) | | 25,880 | | | 206,005 |
Martek Biosciences Corp. (b) | | 19,372 | | | 573,024 |
Medarex, Inc. (a) (b) | | 74,829 | | | 779,718 |
Metabolix, Inc. (a) (b) | | 9,209 | | | 219,174 |
Momenta Pharmaceuticals, Inc. (a) (b) | | 13,287 | | | 94,869 |
Myriad Genetics, Inc. (a) (b) | | 25,833 | | | 1,199,168 |
Nabi Biopharmaceuticals (a) (b) | | 32,116 | | | 115,939 |
Neurocrine Biosciences, Inc. (a) (b) | | 21,044 | | | 95,540 |
Neurogen Corp. (a) (b) | | 29,096 | | | 100,381 |
Omrix Biopharmaceuticals, Inc. (a) (b) | | 8,576 | | | 297,930 |
Onyx Pharmaceuticals, Inc. (b) | | 32,330 | | | 1,798,195 |
OSI Pharmaceuticals, Inc. (b) | | 36,987 | | | 1,794,239 |
Pharmion Corp. (b) | | 16,848 | | | 1,059,065 |
Progenics Pharmaceuticals, Inc. (a) (b) | | 15,213 | | | 274,899 |
Protalix Bio Therapeutics, Inc. (b) | | 1,183 | | | 4,022 |
Regeneron Pharmaceuticals, Inc. (a) (b) | | 38,704 | | | 934,702 |
Rigel Pharmaceuticals, Inc. (a) (b) | | 15,241 | | | 386,969 |
Savient Pharmaceuticals, Inc. (a) (b) | | 33,200 | | | 762,604 |
Seattle Genetics, Inc. (a) (b) | | 29,265 | | | 333,621 |
Senomyx, Inc. (a) (b) | | 17,202 | | | 128,843 |
United Therapeutics Corp. (b) | | 13,840 | | | 1,351,476 |
Vanda Pharmaceuticals, Inc. (a) (b) | | 16,466 | | | 113,286 |
XOMA, Ltd. (b) | | 82,412 | | | 279,377 |
Zymogenetics, Inc. (a) (b) | | 26,358 | | | 307,598 |
| | | | | |
| | | | | 29,131,316 |
| | | | | |
|
Building Products—0.5% |
AAON, Inc. | | 7,694 | | | 152,495 |
American Woodmark Corp. (a) | | 8,732 | | | 158,748 |
Ameron International Corp. | | 5,465 | | | 503,600 |
Apogee Enterprises, Inc. | | 17,370 | | | 297,201 |
Builders Firstsource, Inc. (a) (b) | | 16,682 | | | 120,444 |
Gibraltar Industries, Inc. (a) | | 13,753 | | | 212,071 |
Goodman Global, Inc. (b) | | 22,982 | | | 563,978 |
Griffon Corp. (a) (b) | | 18,603 | | | 231,607 |
Insteel Industries, Inc. (a) | | 8,244 | | | 96,702 |
NCI Building Systems, Inc. (b) | | 12,366 | | | 356,017 |
Simpson Manufacturing Co. , Inc. (a) | | 24,267 | | | 645,260 |
Trex Co., Inc. (a) (b) | | 12,252 | | | 104,265 |
Universal Forest Products, Inc. (a) | | 10,348 | | | 304,852 |
| | | | | |
| | | | | 3,747,240 |
| | | | | |
|
Capital Markets—1.7% |
Apollo Investment Corp. (a) | | 66,511 | | | 1,134,013 |
Ares Capital Corp. (a) | | 42,109 | | | 616,055 |
Calamos Asset Management, Inc. | | 15,750 | | | 469,035 |
Capital Southwest Corp. (a) | | 1,881 | | | 222,710 |
Cohen & Steers, Inc. (a) | | 10,675 | | | 319,930 |
Cowen Group, Inc. (a) (b) | | 10,041 | | | 95,490 |
Evercore Partners, Inc. (a) | | 5,609 | | | 120,874 |
FBR Capital Markets Corp. (b) | | 18,665 | | | 178,811 |
FCStone Group, Inc. (b) | | 5,535 | | | 254,776 |
GAMCO Investors, Inc. (a) | | 3,447 | | | 238,532 |
GFI Group, Inc. (a) (b) | | 9,719 | | | 930,303 |
| | | | | |
| Security Description | | Shares | | Value* |
| | | | | |
|
Capital Markets—(Continued) |
Gladstone Capital Corp. (a) | | 8,551 | | $ | 145,367 |
GLG Partners, Inc. (b) | | 2,000 | | | 27,200 |
Greenhill & Co., Inc. (a) | | 11,430 | | | 759,866 |
Hercules Technology Growth Capital, Inc. (a) | | 18,966 | | | 235,558 |
HFF, Inc. (b) | | 10,010 | | | 77,477 |
KBW, Inc. (a) (b) | | 17,828 | | | 456,218 |
Knight Capital Group, Inc. (b) | | 61,855 | | | 890,712 |
Kohlberg Capital Corp. | | 9,110 | | | 109,320 |
LaBranche & Co., Inc. (a) (b) | | 36,996 | | | 186,460 |
Ladenburg Thalmann Financial Services, Inc. (a) (b) | | 62,538 | | | 132,581 |
MCG Capital Corp. | | 37,963 | | | 439,991 |
MVC Capital, Inc. | | 15,052 | | | 242,939 |
optionsXpress Holdings, Inc. (a) | | 26,495 | | | 896,061 |
Patriot Capital Funding, Inc. (a) | | 11,637 | | | 117,417 |
PennantPark Investment Corp. (a) | | 12,678 | | | 127,034 |
Penson Worldwide, Inc. (b) | | 9,106 | | | 130,671 |
Piper Jaffray Co. (b) | | 12,145 | | | 562,556 |
Prospect Capital Corp. (a) | | 12,494 | | | 163,047 |
Sanders Morris Harris Group, Inc. (a) | | 11,996 | | | 122,959 |
Stifel Financial Corp. (a) | | 8,833 | | | 464,351 |
SWS Group, Inc. | | 16,924 | | | 214,427 |
Thomas Weisel Partners Group, Inc. (a) (b) | | 13,512 | | | 185,520 |
TICC Capital Corp. (a) | | 13,071 | | | 120,645 |
TradeStation Group, Inc. (a) (b) | | 14,831 | | | 210,748 |
U.S. Global Investors, Inc. (a) | | 7,498 | | | 124,917 |
Waddell & Reed Financial, Inc. (Class A) | | 55,373 | | | 1,998,412 |
WP Stewart & Co., Ltd. | | 14,158 | | | 72,347 |
| | | | | |
| | | | | 13,795,330 |
| | | | | |
|
Chemicals—2.6% |
A. Schulman, Inc. | | 16,618 | | | 358,118 |
American Vanguard Corp. | | 13,990 | | | 242,726 |
Arch Chemicals, Inc. | | 14,370 | | | 528,097 |
Balchem Corp. (a) | | 10,704 | | | 239,556 |
Calgon Carbon Corp. (a) (b) | | 24,329 | | | 386,588 |
CF Industries Holdings, Inc. | | 35,824 | | | 3,942,789 |
Ferro Corp. | | 27,506 | | | 570,199 |
Flotek Industries, Inc. (a) (b) | | 11,318 | | | 407,901 |
Georgia Gulf Corp. (a) | | 22,956 | | | 151,969 |
H.B. Fuller Co. | | 36,393 | | | 817,023 |
Hercules, Inc. | | 76,861 | | | 1,487,260 |
Innophos Holdings, Inc. (a) | | 13,189 | | | 196,252 |
Innospec, Inc. | | 17,009 | | | 291,874 |
Koppers Holdings, Inc. | | 10,804 | | | 467,165 |
Landec Corp. (b) | | 13,828 | | | 185,295 |
LSB Industries, Inc. (a) (b) | | 9,300 | | | 262,446 |
Minerals Technologies, Inc. | | 11,572 | | | 774,745 |
NewMarket Corp. | | 11,150 | | | 620,943 |
Olin Corp. | | 44,757 | | | 865,153 |
OM Group, Inc. (b) | | 17,381 | | | 1,000,103 |
PolyOne Corp. (b) | | 55,802 | | | 367,177 |
Rockwood Holdings, Inc. (b) | | 20,873 | | | 693,401 |
Sensient Technologies Corp. | | 28,200 | | | 797,496 |
Spartech Corp. | | 20,427 | | | 288,021 |
Symyx Technologies, Inc. (a) (b) | | 18,026 | | | 138,440 |
Terra Industries, Inc. (b) | | 61,135 | | | 2,919,808 |
*See accompanying notes to financial statements.
MSF-6
Metropolitan Series Fund, Inc.
Russell 2000 Index Portfolio
Schedule of Investments as of December 31, 2007
Common Stock—(Continued)
| | | | | |
| Security Description | | Shares | | Value* |
| | | | | |
|
Chemicals—(Continued) |
Tronox, Inc. | | 21,926 | | $ | 189,660 |
W.R. Grace & Co. (a) (c) | | 44,416 | | | 1,162,811 |
ZEP, Inc. (b) | | 14,264 | | | 197,842 |
Zoltek Companies, Inc. (a) (b) | | 14,802 | | | 634,562 |
| | | | | |
| | | | | 21,185,420 |
| | | | | |
|
Commercial Banks—5.1% |
1st Source Corp. | | 6,693 | | | 115,856 |
Alabama National Bancorp (a) | | 11,115 | | | 864,858 |
Amcore Financial, Inc. (a) | | 13,549 | | | 307,562 |
Americanwest Bancorp (a) | | 10,312 | | | 181,801 |
Ameris Bancorp (a) | | 8,404 | | | 141,607 |
Bancfirst Corp. (a) | | 5,056 | | | 216,650 |
Banco Latinoamericano de Exportaciones S.A. | | 16,812 | | | 274,204 |
Bank of the Ozarks, Inc. (a) | | 7,390 | | | 193,618 |
BankFinancial Corp. (a) | | 11,879 | | | 187,926 |
Banner Corp. (a) | | 9,004 | | | 258,685 |
Boston Private Financial Holdings, Inc. | | 21,774 | | | 589,640 |
Capital City Bank Group, Inc. (a) | | 7,854 | | | 221,640 |
Capital Corp. of the West (a) | | 6,934 | | | 134,728 |
Capitol Bancorp, Ltd. (a) | | 7,793 | | | 156,795 |
Cascade Bancorp. (a) | | 13,690 | | | 190,565 |
Cathay General Bancorp (a) | | 31,566 | | | 836,183 |
Centennial Bank Holdings, Inc. (a) (b) | | 31,105 | | | 179,787 |
Central Pacific Financial Corp. (a) | | 19,720 | | | 364,031 |
Chemical Financial Corp. (a) | | 17,023 | | | 404,977 |
Citizens Banking Corp. (a) | | 46,095 | | | 668,838 |
City Bank (a) | | 8,842 | | | 198,238 |
City Holdings Co. | | 9,914 | | | 335,490 |
Cobiz, Inc. (a) | | 11,639 | | | 173,072 |
Columbia Banking Systems, Inc. | | 10,169 | | | 302,324 |
Community Bancorp (a) (b) | | 7,584 | | | 131,734 |
Community Bank Systems, Inc. (a) | | 16,595 | | | 329,743 |
Community Trust Bancorp, Inc. (a) | | 9,791 | | | 269,546 |
CVB Financial Corp. (a) | | 38,519 | | | 398,286 |
Enterprise Financial Services Corp. (a) | | 4,811 | | | 114,550 |
F.N.B. Corp. (a) | | 35,581 | | | 523,041 |
First Bancorp (a) | | 6,830 | | | 129,019 |
First Bancorp (Puerto Rico) | | 54,770 | | | 399,273 |
First Charter Corp. (a) | | 21,094 | | | 629,867 |
First Commonwealth Financial Corp. (a) | | 47,267 | | | 503,394 |
First Community Bancorp, Inc. (a) | | 15,528 | | | 640,375 |
First Community Bancshares, Inc. (a) | | 6,026 | | | 192,169 |
First Financial Bancorp (a) | | 17,408 | | | 198,451 |
First Financial Bankshares, Inc. (a) | | 13,236 | | | 498,335 |
First Financial Corp. (a) | | 6,809 | | | 192,967 |
First Indiana Corp. | | 8,521 | | | 272,672 |
First Merchants Corp. | | 11,118 | | | 242,817 |
First Midwest Bancorp, Inc. | | 31,239 | | | 955,913 |
First South BanCorp, Inc. (a) | | 4,540 | | | 100,743 |
First State Bancorp | | 12,708 | | | 176,641 |
FirstMerit Corp. (a) | | 46,811 | | | 936,688 |
Frontier Financial Corp. (a) | | 25,853 | | | 480,090 |
Glacier Bancorp, Inc. (a) | | 32,876 | | | 616,096 |
Great Southern Bancorp, Inc. (a) | | 7,749 | | | 170,168 |
Greene County Bancshares, Inc. (a) | | 6,640 | | | 127,488 |
| | | | | |
| Security Description | | Shares | | Value* |
| | | | | |
|
Commercial Banks—(Continued) |
Hancock Holding Co. (a) | | 17,503 | | $ | 668,615 |
Hanmi Financial Corp. (a) | | 27,683 | | | 238,627 |
Harleysville National Corp. (a) | | 15,148 | | | 220,706 |
Heartland Financial USA, Inc. (a) | | 7,703 | | | 143,045 |
Heritage Commerce Corp. | | 8,026 | | | 147,598 |
Home Bancshares, Inc. (a) | | 6,644 | | | 139,325 |
Horizon Financial Corp. (a) | | 7,025 | | | 122,516 |
IBERIABANK Corp. | | 6,673 | | | 311,963 |
Independent Bank Corp. (a) | | 12,902 | | | 122,569 |
Independent Bank Corp. (Massachusetts) | | 10,279 | | | 279,794 |
Integra Bank Corp. (a) | | 12,892 | | | 181,906 |
International Bancshares Corp. | | 30,207 | | | 632,535 |
Investors Bancorp, Inc. (b) | | 34,761 | | | 491,521 |
Irwin Financial Corp. (a) | | 14,305 | | | 105,142 |
Lakeland Bancorp, Inc. (a) | | 12,623 | | | 146,301 |
Lakeland Financial Corp. (a) | | 7,109 | | | 148,578 |
Macatawa Bank Corp. (a) | | 8,564 | | | 73,565 |
Mainsource Financial Group, Inc. (a) | | 9,884 | | | 153,795 |
MB Financial, Inc. (a) | | 22,095 | | | 681,189 |
Midwest Banc Holdings, Inc. (a) | | 9,773 | | | 121,381 |
Nara Bancorp, Inc. (a) | | 15,312 | | | 178,691 |
National Penn Bancshares, Inc. (a) | | 27,387 | | | 414,639 |
NBT Bancorp, Inc. (a) | | 20,656 | | | 471,370 |
Old National Bancorp (a) | | 43,737 | | | 654,305 |
Old Second Bancorp, Inc. (a) | | 7,369 | | | 197,415 |
Omega Financial Corp. (a) | | 8,619 | | | 252,192 |
Oriental Financial Group, Inc. | | 14,047 | | | 188,370 |
Pacific Capital Bancorp | | 29,016 | | | 584,092 |
Park National Corp. (a) | | 6,924 | | | 446,598 |
People’s Bancorp, Inc. | | 5,816 | | | 144,760 |
Pinnacle Financial Partners, Inc. (a) (b) | | 9,322 | | | 236,965 |
Preferred Bank (Los Angeles, CA) (a) | | 5,780 | | | 150,396 |
PrivateBancorp, Inc. (a) | | 10,384 | | | 339,038 |
Prosperity Bancshares, Inc. | | 22,146 | | | 650,871 |
Provident Bankshares Corp. | | 19,334 | | | 413,554 |
Renasant Corp. (a) | | 12,711 | | | 274,176 |
S&T Bancorp, Inc. (a) | | 16,636 | | | 459,819 |
S.Y. Bancorp, Inc. (a) | | 7,249 | | | 173,541 |
Sandy Spring Bancorp, Inc. (a) | | 9,035 | | | 251,354 |
SCBT Financial Corp. | | 5,080 | | | 160,884 |
Seacoast Banking Corp. (a) | | 10,259 | | | 105,463 |
Security Bank Corp. (a) | | 10,720 | | | 97,981 |
Signature Bank (b) | | 19,686 | | | 664,402 |
Simmons First National Corp. (a) | | 8,478 | | | 224,667 |
Southside Bancshares, Inc. (a) | | 5,529 | | | 113,123 |
Southwest Bancorp, Inc. (Oklahoma) | | 10,385 | | | 190,357 |
Sterling Bancorp (a) | | 13,033 | | | 177,770 |
Sterling Bancshares, Inc. | | 42,923 | | | 479,021 |
Sterling Financial Corp. (Pennsylvania) (a) (b) | | 16,721 | | | 274,559 |
Sterling Financial Corp. (Washington) | | 29,125 | | | 489,009 |
Suffolk Bancorp (a) | | 5,413 | | | 166,233 |
Sun Bancorp, Inc. (New Jersey) (a) (b) | | 7,876 | | | 124,283 |
Superior Bancorp (a) | | 21,831 | | | 117,232 |
Susquehanna Bancshares, Inc. (a) | | 53,865 | | | 993,271 |
SVB Financial Group (a) (b) | | 22,783 | | | 1,148,263 |
Texas Capital Bancshares, Inc. (b) | | 13,432 | | | 245,134 |
The Bancorp, Inc. (b) | | 5,606 | | | 75,457 |
*See accompanying notes to financial statements.
MSF-7
Metropolitan Series Fund, Inc.
Russell 2000 Index Portfolio
Schedule of Investments as of December 31, 2007
Common Stock—(Continued)
| | | | | |
| Security Description | | Shares | | Value* |
| | | | | |
|
Commercial Banks—(Continued) |
The South Financial Group, Inc. (a) | | 44,741 | | $ | 699,302 |
Tompkins Trustco, Inc. (a) | | 4,886 | | | 189,577 |
TriCo Bancshares (a) | | 7,390 | | | 142,627 |
Trustmark Corp. (a) | | 31,258 | | | 792,703 |
UCBH Holdings, Inc. (a) | | 60,126 | | | 851,384 |
UMB Financial Corp. (a) | | 21,357 | | | 819,254 |
Umpqua Holdings Corp. (a) | | 37,028 | | | 568,009 |
Union Bankshares Corp. (a) | | 7,036 | | | 148,741 |
United Bankshares, Inc. | | 24,546 | | | 687,779 |
United Community Bank, Inc. (a) | | 24,941 | | | 394,068 |
Univest Corp. (a) | | 7,788 | | | 164,405 |
Virginia Commerce Bancorp (a) (b) | | 11,846 | | | 138,954 |
W Holding Co., Inc. (a) | | 70,473 | | | 85,272 |
Washington Trust Bancorp, Inc. (a) | | 6,459 | | | 162,961 |
WesBanco, Inc. (a) | | 11,956 | | | 246,294 |
West Coast Bancorp | | 9,015 | | | 166,777 |
WestAmerica Bancorp (a) | | 18,288 | | | 814,730 |
Western Alliance BanCorp (a) (b) | | 10,257 | | | 192,524 |
Wintrust Financial Corp. (a) | | 16,617 | | | 550,521 |
| | | | | |
| | | | | 42,004,949 |
| | | | | |
|
Commercial Services & Supplies—4.3% |
ABM Industries, Inc. | | 27,860 | | | 568,065 |
Acco Brands Corp. (a) (b) | | 32,678 | | | 524,155 |
Administaff, Inc. | | 14,105 | | | 398,889 |
American Ecology Corp. | | 10,910 | | | 256,167 |
American Reprographics Co. (a) (b) | | 18,156 | | | 299,211 |
Bowne & Co., Inc. | | 20,659 | | | 363,598 |
Brady Corp. | | 30,399 | | | 1,066,701 |
Casella Waste Systems, Inc. (b) | | 15,671 | | | 204,350 |
CBIZ, Inc. (a) (b) | | 32,679 | | | 320,581 |
CDI Corp. (a) | | 7,746 | | | 187,918 |
Cenveo, Inc. (a) (b) | | 31,208 | | | 545,204 |
Clean Harbors, Inc. (b) | | 10,307 | | | 532,872 |
Comfort Systems USA, Inc. | | 24,012 | | | 306,873 |
COMSYS IT Partners, Inc. (b) | | 9,602 | | | 151,520 |
Consolidated Graphics, Inc. (b) | | 7,858 | | | 375,770 |
Cornell Companies, Inc. (a) (b) | | 7,626 | | | 177,838 |
CoStar Group, Inc. (a) (b) | | 11,684 | | | 552,069 |
CRA International, Inc. (a) (b) | | 6,375 | | | 303,514 |
Deluxe Corp. | | 36,692 | | | 1,206,800 |
Diamond Management & Technology, Inc. | | 16,170 | | | 117,556 |
EnergySolutions, Inc. | | 14,500 | | | 391,355 |
Ennis, Inc. | | 15,615 | | | 281,070 |
Exponent, Inc. (b) | | 12,020 | | | 325,021 |
FTI Consulting, Inc. (b) | | 28,177 | | | 1,736,830 |
Fuel Tech, Inc. (a) (b) | | 10,672 | | | 241,721 |
G&K Services, Inc. | | 12,200 | | | 457,744 |
GeoEye, Inc. (b) | | 10,978 | | | 369,410 |
Healthcare Services Group, Inc. (a) | | 28,064 | | | 594,395 |
Heidrick & Struggles International, Inc. | | 11,860 | | | 440,125 |
Herman Miller, Inc. | | 41,240 | | | 1,335,764 |
Hudson Highland Group, Inc. (b) | | 14,268 | | | 119,994 |
Huron Consulting Group, Inc. (b) | | 11,643 | | | 938,775 |
IHS, Inc. (b) | | 19,044 | | | 1,153,305 |
IKON Office Solutions, Inc. (a) | | 66,461 | | | 865,322 |
| | | | | |
| Security Description | | Shares | | Value* |
| | | | | |
|
Commercial Services & Supplies—(Continued) |
Innerworkings, Inc. (a) (b) | | 14,610 | | $ | 252,169 |
Interface, Inc. | | 33,244 | | | 542,542 |
Kelly Services, Inc. (Class A) | | 14,642 | | | 273,220 |
Kenexa Corp. (a) (b) | | 15,403 | | | 299,126 |
Kforce, Inc. (b) | | 18,129 | | | 176,758 |
Knoll, Inc. | | 30,139 | | | 495,184 |
Korn/Ferry International (b) | | 26,919 | | | 506,616 |
Layne Christensen Co. (b) | | 9,885 | | | 486,441 |
LECG Corp. (b) | | 14,501 | | | 218,385 |
M&F Worldwide Corp. (a) (b) | | 8,341 | | | 449,163 |
McGrath Rentcorp (a) | | 15,045 | | | 387,409 |
Mine Safety Appliances Co. (a) | | 18,278 | | | 948,080 |
Mobile Mini, Inc. (b) | | 23,164 | | | 429,460 |
Navigant Consulting, Inc. (a) (b) | | 35,278 | | | 482,250 |
Odyssey Marine Exploration, Inc. (a) (b) | | 25,579 | | | 158,334 |
On Assignment, Inc. (b) | | 20,637 | | | 144,665 |
PeopleSupport, Inc. (a) (b) | | 13,989 | | | 191,369 |
PHH Corp. (b) | | 34,498 | | | 608,545 |
Pike Electric Corp. (a) (b) | | 10,661 | | | 178,678 |
Resources Connection, Inc. (b) | | 30,533 | | | 554,479 |
Rollins, Inc. | | 24,760 | | | 475,392 |
RSC Holdings, Inc. (a) (b) | | 20,756 | | | 260,488 |
Schawk, Inc. (a) | | 10,309 | | | 159,996 |
School Specialty, Inc. (a) (b) | | 13,686 | | | 472,851 |
Spherion Corp. (b) | | 36,226 | | | 263,725 |
Team, Inc. (a) | | 8,561 | | | 313,161 |
TeleTech Holdings, Inc. (b) | | 25,316 | | | 538,471 |
Tetra Technologies, Inc. (b) | | 34,691 | | | 745,856 |
The Advisory Board Co. (b) | | 11,952 | | | 767,199 |
The Geo Group, Inc. (a) (b) | | 30,521 | | | 854,588 |
TrueBlue, Inc. (b) | | 30,139 | | | 436,413 |
United Stationers, Inc. (b) | | 16,799 | | | 776,282 |
Viad Corp. | | 14,216 | | | 448,941 |
Volt Information Sciences, Inc. (b) | | 7,738 | | | 141,296 |
Waste Connections, Inc. (b) | | 45,821 | | | 1,415,869 |
Watson Wyatt & Co. Holdings | | 28,868 | | | 1,339,764 |
| | | | | |
| | | | | 34,903,647 |
| | | | | |
|
Communications Equipment—2.4% |
3Com Corp. (b) | | 237,144 | | | 1,071,891 |
Acme Packet, Inc. (a) (b) | | 15,723 | | | 197,953 |
Adtran, Inc. | | 35,649 | | | 762,176 |
Anaren, Inc. (b) | | 13,662 | | | 225,286 |
Arris Group, Inc. (b) | | 94,592 | | | 944,028 |
Avanex Corp. (a) (b) | | 116,708 | | | 116,708 |
Avocent Corp. (b) | | 31,883 | | | 743,193 |
Bel Fuse, Inc. (Class B) (a) | | 7,133 | | | 208,783 |
Black Box Corp. | | 12,292 | | | 444,602 |
Blue Coat Systems, Inc. (b) | | 17,843 | | | 586,499 |
Comtech Group, Inc. (a) (b) | | 10,935 | | | 176,163 |
Comtech Telecommunications Corp. (b) | | 14,811 | | | 799,942 |
Digi International, Inc. (b) | | 18,330 | | | 260,103 |
Ditech Networks, Inc. (a) (b) | | 23,945 | | | 83,089 |
Dycom Industries, Inc. (b) | | 26,092 | | | 695,352 |
EMS Technologies, Inc. (b) | | 8,296 | | | 250,871 |
Extreme Networks, Inc. (b) | | 65,514 | | | 231,920 |
*See accompanying notes to financial statements.
MSF-8
Metropolitan Series Fund, Inc.
Russell 2000 Index Portfolio
Schedule of Investments as of December 31, 2007
Common Stock—(Continued)
| | | | | |
| Security Description | | Shares | | Value* |
| | | | | |
|
Communications Equipment—(Continued) |
Finisar Corp. (a) (b) | | 163,124 | | $ | 236,530 |
Foundry Networks, Inc. (b) | | 93,327 | | | 1,635,089 |
Harmonic, Inc. (b) | | 50,535 | | | 529,607 |
Harris Stratex Networks, Inc. (a) (b) | | 13,458 | | | 224,749 |
Hughes Communications, Inc. (a) (b) | | 4,058 | | | 221,607 |
InterDigital, Inc. (a) (b) | | 30,258 | | | 705,919 |
Ixia (b) | | 26,295 | | | 249,277 |
Loral Space & Communications, Inc. (a) (b) | | 6,397 | | | 219,097 |
MasTec, Inc. (b) | | 25,880 | | | 263,200 |
MRV Communications, Inc. (a) (b) | | 90,098 | | | 209,027 |
Netgear, Inc. (b) | | 21,529 | | | 767,939 |
Network Equipment Technologies, Inc. (b) | | 16,985 | | | 143,014 |
Nextwave Wireless, Inc. (a) (b) | | 17,365 | | | 93,424 |
Oplink Communications, Inc. (b) | | 14,091 | | | 216,297 |
OpNext, Inc. (b) | | 18,542 | | | 164,097 |
Orbcomm, Inc. (a) (b) | | 16,019 | | | 100,759 |
Packeteer, Inc. (a) (b) | | 25,147 | | | 154,905 |
Plantronics, Inc. | | 29,185 | | | 758,810 |
Polycom, Inc. (b) | | 61,112 | | | 1,697,691 |
Powerwave Technologies, Inc. (a) (b) | | 73,012 | | | 294,238 |
Sonus Networks, Inc. (a) (b) | | 159,961 | | | 932,573 |
Sycamore Networks, Inc. (b) | | 115,462 | | | 443,374 |
Symmetricom, Inc. (a) (b) | | 28,539 | | | 134,419 |
Tekelec, Inc. (b) | | 37,743 | | | 471,787 |
UTStarcom, Inc. (a) (b) | | 77,850 | | | 214,087 |
ViaSat, Inc. (b) | | 14,912 | | | 513,420 |
| | | | | |
| | | | | 19,393,495 |
| | | | | |
| | |
Computers & Peripherals—0.9% | | | | | |
Adaptec, Inc. (b) | | 71,017 | | | 240,037 |
Avid Technology, Inc. (a) (b) | | 24,962 | | | 707,423 |
Cray, Inc. (b) | | 20,991 | | | 125,736 |
Electronics for Imaging, Inc. (b) | | 33,985 | | | 763,983 |
Emulex Corp. (b) | | 51,645 | | | 842,846 |
Hutchinson Technology, Inc. (a) (b) | | 16,128 | | | 424,489 |
Hypercom Corp. (a) (b) | | 27,716 | | | 138,026 |
Imation Corp. (a) | | 21,384 | | | 449,064 |
Immersion Corp. (a) (b) | | 16,446 | | | 212,976 |
Intermec, Inc. (a) (b) | | 36,682 | | | 745,011 |
Intevac, Inc. (b) | | 14,334 | | | 208,416 |
Novatel Wireless, Inc. (a) (b) | | 18,653 | | | 302,179 |
Palm, Inc. (a) (b) | | 62,480 | | | 396,123 |
Quantum Corp. (b) | | 116,270 | | | 312,766 |
Rackable Systems, Inc. (a) (b) | | 18,071 | | | 180,710 |
Rimage Corp. (b) | | 6,386 | | | 165,717 |
Stratasys, Inc. (a) (b) | | 11,733 | | | 303,181 |
Synaptics, Inc. (a) (b) | | 15,310 | | | 630,160 |
| | | | | |
| | | | | 7,148,843 |
| | | | | |
| | |
Construction & Engineering—0.5% | | | | | |
Aecom Technology Corp. (a) (b) | | 25,729 | | | 735,078 |
EMCOR Group, Inc. (b) | | 38,577 | | | 911,574 |
Granite Construction, Inc. | | 21,617 | | | 782,103 |
Insituform Technologies, Inc. (a) (b) | | 18,179 | | | 269,049 |
Integrated Electrical Services, Inc. (a) (b) | | 8,328 | | | 156,483 |
Michael Baker Corp. (b) | | 4,608 | | | 189,389 |
| | | | |
| Security Description | | Shares | | Value* |
| | | | |
| | |
Construction & Engineering—(Continued) | | | | |
Northwest Pipe Co. (a) (b) | | 5,677 | | 222,198 |
Perini Corp. (b) | | 16,122 | | 667,773 |
| | | | |
| | | | 3,933,647 |
| | | | |
| | |
Construction Materials—0.2% | | | | |
Headwaters, Inc. (a) (b) | | 23,430 | | 275,068 |
Texas Industries, Inc. (a) | | 16,438 | | 1,152,304 |
U.S. Concrete, Inc. (a) (b) | | 19,458 | | 64,795 |
| | | | |
| | | | 1,492,167 |
| | | | |
| | |
Consumer Finance—0.3% | | | | |
Advance America Cash Advance Centers, Inc. | | 43,274 | | 439,664 |
Advanta Corp. (Class B) | | 22,458 | | 181,236 |
Cash America International, Inc. | | 17,989 | | 581,045 |
CompuCredit Corp. (a) (b) | | 11,875 | | 118,512 |
Dollar Financial Corp. (b) | | 9,938 | | 304,997 |
EzCorp., Inc. (b) | | 20,427 | | 230,621 |
First Cash Financial Services (b) | | 15,881 | | 233,133 |
Nelnet, Inc. (a) | | 10,868 | | 138,132 |
World Acceptance Corp. (a) (b) | | 12,260 | | 330,775 |
| | | | |
| | | | 2,558,115 |
| | | | |
| | |
Containers & Packaging—0.6% | | | | |
AEP Industries, Inc. (b) | | 4,294 | | 137,451 |
AptarGroup, Inc. | | 45,183 | | 1,848,436 |
Chesapeake Corp. (b) | | 14,739 | | 76,495 |
Graphic Packaging Corp. (a) (b) | | 41,742 | | 154,028 |
Greif, Inc. | | 19,842 | | 1,297,072 |
Myers Industries, Inc. | | 18,955 | | 274,279 |
Rock Tennessee Co. | | 20,366 | | 517,500 |
Silgan Holdings, Inc. | | 14,320 | | 743,781 |
| | | | |
| | | | 5,049,042 |
| | | | |
| | |
Distributors—0.2% | | | | |
Building Materials Holdings Corp. (a) | | 17,215 | | 95,199 |
Core-Mark Holding Co., Inc. (a) (b) | | 5,639 | | 161,952 |
LKQ Corp. (b) | | 70,158 | | 1,474,721 |
| | | | |
| | | | 1,731,872 |
| | | | |
| | |
Diversified Consumer Services—1.5% | | | | |
Bright Horizons Family Solutions, Inc. (b) | | 17,548 | | 606,108 |
Capella Education Co. (b) | | 6,686 | | 437,666 |
Coinstar, Inc. (a) (b) | | 16,369 | | 460,787 |
Corinthian Colleges, Inc. (a) (b) | | 50,281 | | 774,327 |
CPI Corp. | | 3,276 | | 77,150 |
DeVry, Inc. | | 40,323 | | 2,095,183 |
INVESTools, Inc. (a) (b) | | 39,002 | | 691,895 |
Jackson Hewitt Tax Service, Inc. (a) | | 21,669 | | 687,991 |
Matthews International Corp. | | 20,673 | | 968,944 |
PrePaid Legal Services, Inc. | | 4,860 | | 269,001 |
Regis Corp. | | 29,631 | | 828,483 |
Sotheby’s Holdings, Inc. (Class A) (a) | | 45,005 | | 1,714,690 |
Steiner Leisure, Ltd. (b) | | 10,437 | | 460,898 |
Stewart Enterprises, Inc. (a) | | 70,035 | | 623,311 |
*See accompanying notes to financial statements.
MSF-9
Metropolitan Series Fund, Inc.
Russell 2000 Index Portfolio
Schedule of Investments as of December 31, 2007
Common Stock—(Continued)
| | | | | |
| Security Description | | Shares | | Value* |
| | | | | |
| | |
Diversified Consumer Services—(Continued) | | | | | |
Strayer Education, Inc. | | 9,629 | | $ | 1,642,515 |
Universal Technical Institute, Inc. (a) (b) | | 14,118 | | | 240,006 |
| | | | | |
| | | | | 12,578,955 |
| | | | | |
| | |
Diversified Financial Services—0.5% | | | | | |
Aldabra 2 Acquisition Corp. (a) | | 12,563 | | | 122,364 |
Alternative Asset Management Aquisition Corp. | | 12,563 | | | 115,077 |
Asset Acceptence Capital Corp. (a) (b) | | 15,616 | | | 162,563 |
ASTA Funding, Inc. (a) | | 6,497 | | | 171,781 |
Compass Diversified Trust (a) | | 14,166 | | | 211,073 |
Financial Federal Corp. (a) | | 16,143 | | | 359,827 |
Heckmann Corp. (b) | | 26,000 | | | 191,100 |
Hicks Acquisition Co. I, Inc. (a) (b) | | 26,700 | | | 245,373 |
Interactive Brokers Group, Inc. (a) (b) | | 24,288 | | | 784,988 |
Marathon Aquisition Corp. (a) (b) | | 44,481 | | | 346,062 |
MarketAxess Holdings, Inc. (a) (b) | | 22,737 | | | 291,716 |
NRDC Acquisition Corp. (b) | | 20,000 | | | 183,400 |
Pico Holdings, Inc. (a) (b) | | 9,148 | | | 307,556 |
Portfolio Recovery Associates, Inc. (a) (b) | | 10,501 | | | 416,575 |
Primus Guaranty, Ltd. (a) (b) | | 27,878 | | | 195,425 |
Resource America, Inc. (a) | | 8,256 | | | 121,115 |
Triplecrown Acquisition Corp. (b) | | 23,200 | | | 212,048 |
| | | | | |
| | | | | 4,438,043 |
| | | | | |
| |
Diversified Telecommunication Services—1.1% | | | |
Alaska Communication Systems, Inc. | | 23,688 | | | 355,320 |
Atlantic Tele-Network, Inc. | | 5,823 | | | 196,701 |
Cbeyond, Inc. (a) (b) | | 12,633 | | | 492,561 |
Cincinnati Bell, Inc. (b) | | 150,258 | | | 713,726 |
Cogent Communications Group, Inc. (b) | | 30,249 | | | 717,204 |
Consolidated Communications Holdings, Inc. | | 12,371 | | | 246,183 |
Fairpoint Communications, Inc. (a) | | 21,144 | | | 275,295 |
General Communication, Inc. (b) | | 33,319 | | | 291,541 |
Global Crossing, Ltd. (a) (b) | | 14,700 | | | 324,135 |
Golden Telecom, Inc. | | 9,502 | | | 959,227 |
IDT Corp. (Class B) (a) | | 29,001 | | | 245,059 |
Iowa Telecommunications Services, Inc. (a) | | 19,030 | | | 309,428 |
North Pittsburgh Systems, Inc. (a) | | 8,876 | | | 201,396 |
NTELOS Holdings Corp. | | 16,786 | | | 498,376 |
PAETEC Holding Corp. (a) (b) | | 42,483 | | | 414,209 |
Premiere Global Services, Inc. (b) | | 37,778 | | | 561,003 |
Shenandoah Telecommunications Co. (a) | | 14,453 | | | 346,583 |
SureWest Communications (a) | | 9,472 | | | 161,971 |
Time Warner Telecom, Inc. (Class A) (a) (b) | | 92,349 | | | 1,873,761 |
| | | | | |
| | | | | 9,183,679 |
| | | | | |
| | |
Electric Utilities—1.2% | | | | | |
Allete, Inc. | | 16,309 | | | 645,510 |
Central Vermont Public Service | | 6,238 | | | 192,380 |
Cleco Corp. | | 35,817 | | | 995,713 |
El Paso Electric Co. (b) | | 30,498 | | | 779,834 |
Empire District Electric Co. | | 18,221 | | | 415,074 |
IDACORP, Inc. (a) (b) | | 26,307 | | | 926,532 |
ITC Holdings Corp. | | 28,013 | | | 1,580,493 |
MGE Energy, Inc. (a) | | 12,048 | | | 427,343 |
| | | | | |
| Security Description | | Shares | | Value* |
| | | | | |
| | |
Electric Utilities—(Continued) | | | | | |
Otter Tail Corp. (a) | | 17,338 | | $ | 599,895 |
Portland General Electric Co. | | 18,293 | | | 508,180 |
UIL Holdings Corp. (a) | | 14,601 | | | 539,507 |
Unisource Energy Corp. | | 21,167 | | | 667,819 |
Westar Energy, Inc. | | 63,101 | | | 1,636,840 |
| | | | | |
| | | | | 9,915,120 |
| | | | | |
| | |
Electrical Equipment—1.8% | | | | | |
A.O. Smith Corp. (a) | | 13,278 | | | 465,394 |
Acuity Brands, Inc. | | 28,529 | | | 1,283,805 |
American Superconductor Corp. (a) (b) | | 23,917 | | | 653,891 |
AZZ, Inc. (a) (b) | | 7,338 | | | 208,032 |
Baldor Electric Co. | | 27,117 | | | 912,758 |
Belden, Inc. (a) | | 29,488 | | | 1,312,216 |
Coleman Cable, Inc. (a) (b) | | 8,447 | | | 79,824 |
Encore Wire Corp. (a) | | 12,689 | | | 202,009 |
Energy Conversion Devices, Inc. (a) (b) | | 23,146 | | | 778,863 |
EnerSys (b) | | 13,372 | | | 333,765 |
Evergreen Solar, Inc. (a) (b) | | 57,975 | | | 1,001,228 |
Franklin Electric, Inc. (a) | | 12,359 | | | 472,979 |
FuelCell Energy, Inc. (a) (b) | | 41,421 | | | 410,896 |
GrafTech International, Ltd. (b) | | 65,425 | | | 1,161,294 |
II-VI, Inc. (b) | | 16,368 | | | 500,043 |
LSI Industries, Inc. (a) | | 16,398 | | | 298,444 |
Medis Technologies, Ltd. (a) (b) | | 11,847 | | | 182,799 |
Powell Industries, Inc. (b) | | 4,404 | | | 194,084 |
Power-One, Inc. (a) (b) | | 46,502 | | | 185,543 |
Regal Beloit Corp. | | 19,177 | | | 862,006 |
Superior Essex, Inc. (a) (b) | | 12,255 | | | 294,120 |
The Genlyte Group, Inc. (b) | | 17,069 | | | 1,624,969 |
Vicor Corp. (a) | | 15,700 | | | 244,763 |
Woodward Governor Co. | | 18,675 | | | 1,268,966 |
| | | | | |
| | | | | 14,932,691 |
| | | | | |
| | |
Electronic Equipment & Instruments—2.6% | | | | | |
Acacia Research Corp. (a) (b) | | 16,062 | | | 144,237 |
Agilysys, Inc. | | 20,665 | | | 312,455 |
Anixter International, Inc. (a) (b) | | 20,208 | | | 1,258,352 |
Benchmark Electronics, Inc. (b) | | 43,585 | | | 772,762 |
Brightpoint, Inc. (b) | | 30,518 | | | 468,756 |
Checkpoint Systems, Inc. (b) | | 26,372 | | | 685,145 |
Cogent, Inc. (a) (b) | | 24,218 | | | 270,031 |
Cognex Corp. | | 27,796 | | | 560,089 |
CTS Corp. (a) | | 24,167 | | | 239,978 |
Daktronics, Inc. (a) | | 24,015 | | | 542,019 |
DTS, Inc. (a) (b) | | 13,103 | | | 335,044 |
Echelon Corp. (a) (b) | | 22,668 | | | 467,867 |
Electro Scientific Industries, Inc. (b) | | 17,241 | | | 342,234 |
Excel Technology, Inc. (b) | | 6,734 | | | 182,491 |
FARO Technologies, Inc. (a) (b) | | 9,100 | | | 247,338 |
FLIR Systems, Inc. (a) (b) | | 84,398 | | | 2,641,657 |
Gerber Scientific, Inc. (a) (b) | | 12,272 | | | 132,538 |
Insight Enterprises, Inc. (b) | | 31,718 | | | 578,536 |
Itron, Inc. (a) (b) | | 19,429 | | | 1,864,601 |
Kemet Corp. (b) | | 47,399 | | | 314,255 |
L-1 Identity Solutions, Inc. (a) (b) | | 39,104 | | | 701,917 |
*See accompanying notes to financial statements.
MSF-10
Metropolitan Series Fund, Inc.
Russell 2000 Index Portfolio
Schedule of Investments as of December 31, 2007
Common Stock—(Continued)
| | | | | |
| Security Description | | Shares | | Value* |
| | | | | |
| |
Electronic Equipment & Instruments—(Continued) | | | |
Littelfuse, Inc. (b) | | 13,779 | | $ | 454,156 |
LoJack Corp. (a) (b) | | 15,167 | | | 254,957 |
Measurement Specialties, Inc. (a) (b) | | 10,016 | | | 221,354 |
Mercury Computer Systems, Inc. (b) | | 12,071 | | | 194,464 |
Methode Electronics, Inc. | | 22,249 | | | 365,774 |
MTS Systems Corp. | | 11,959 | | | 510,291 |
Newport Corp. (a) (b) | | 26,749 | | | 342,120 |
OSI Systems, Inc. (a) (b) | | 10,131 | | | 268,168 |
OYO Geospace Corp. (a) (b) | | 2,297 | | | 173,102 |
Park Electrochemical Corp. | | 12,787 | | | 361,105 |
Plexus Corp. (b) | | 31,220 | | | 819,837 |
RadiSys Corp. (a) (b) | | 14,648 | | | 196,283 |
Rofin-Sinar Technologies, Inc. (b) | | 19,918 | | | 958,255 |
Rogers Corp. (a) (b) | | 11,170 | | | 484,443 |
ScanSource, Inc. (a) (b) | | 16,538 | | | 535,004 |
Smart Modular Technologies, Inc. (b) | | 30,764 | | | 313,177 |
SYNNEX Corp. (b) | | 9,776 | | | 191,610 |
Technitrol, Inc. | | 27,072 | | | 773,718 |
TTM Technologies, Inc. (b) | | 26,267 | | | 306,273 |
Universal Display Corp. (a) (b) | | 15,842 | | | 327,454 |
X-Rite, Inc. (b) | | 15,649 | | | 181,841 |
Zygo Corp. (a) (b) | | 9,717 | | | 121,074 |
| | | | | |
| | | | | 21,416,762 |
| | | | | |
| | |
Energy Equipment & Services—2.4% | | | | | |
Allis-Chalmers Energy, Inc. (a) (b) | | 16,875 | | | 248,906 |
Atwood Oceanics, Inc. (b) | | 17,041 | | | 1,708,190 |
Basic Energy Services, Inc. (a) (b) | | 24,942 | | | 547,477 |
Bristow Group, Inc. (a) | | 14,137 | | | 800,861 |
Bronco Drilling Co., Inc. (a) (b) | | 16,422 | | | 243,867 |
Cal Dive International, Inc. (a) (b) | | 26,651 | | | 352,859 |
CARBO Ceramics, Inc. (a) | | 12,789 | | | 475,751 |
Complete Production Services, Inc. (a) (b) | | 26,058 | | | 468,262 |
Dawson Geophysical Co. (a) (b) | | 4,314 | | | 308,279 |
Dril-Quip, Inc. (b) | | 16,221 | | | 902,861 |
Exterran Holdings, Inc. (a) (b) | | 37,973 | | | 3,106,191 |
Grey Wolf, Inc. (a) (b) | | 111,714 | | | 595,436 |
Gulf Island Fabrication, Inc. | | 6,921 | | | 219,465 |
Gulfmark Offshore, Inc. (b) | | 13,789 | | | 645,187 |
Hercules Offshore, Inc. (b) | | 55,077 | | | 1,309,731 |
Hornbeck Offshore Services, Inc. (a) (b) | | 15,736 | | | 707,333 |
ION Geophysical Corp. (a) (b) | | 44,587 | | | 703,583 |
Lufkin Industries, Inc. | | 8,679 | | | 497,220 |
Matrix Service Co. (b) | | 18,598 | | | 405,808 |
NATCO Group, Inc. (b) | | 10,702 | | | 579,513 |
Newpark Resources, Inc. (b) | | 50,255 | | | 273,890 |
Oil States International, Inc. (b) | | 32,934 | | | 1,123,708 |
Parker Drilling Co. (a) (b) | | 67,944 | | | 512,977 |
PHI, Inc. (a) (b) | | 7,353 | | | 228,090 |
Pioneer Drilling Co. (b) | | 30,616 | | | 363,718 |
RPC, Inc. (a) | | 23,695 | | | 277,469 |
Superior Well Services, Inc. (a) (b) | | 10,288 | | | 218,311 |
Trico Marine Services, Inc. (a) (b) | | 6,649 | | | 246,146 |
W-H Energy Services, Inc. (b) | | 19,242 | | | 1,081,593 |
Willbros Group, Inc. (b) | | 17,359 | | | 664,676 |
| | | | | |
| | | | | 19,817,358 |
| | | | | |
| | | | | |
| Security Description | | Shares | | Value* |
| | | | | |
| | |
Food & Staples Retailing—0.9% | | | | | |
Casey’s General Stores, Inc. | | 29,357 | | $ | 869,261 |
Great Atlantic & Pacific Tea Co., Inc. (a) (b) | | 15,655 | | | 490,471 |
Ingles Markets, Inc. (a) | | 7,334 | | | 186,210 |
Longs Drug Stores Corp. | | 22,066 | | | 1,037,102 |
Nash Finch Co. (a) | | 9,613 | | | 339,147 |
Performance Food Group Co. (b) | | 21,973 | | | 590,414 |
Pricesmart, Inc. (a) | | 8,493 | | | 255,300 |
Ruddick Corp. | | 25,820 | | | 895,179 |
Spartan Stores, Inc. | | 12,461 | | | 284,734 |
The Andersons, Inc. | | 10,048 | | | 450,150 |
The Pantry, Inc. (a) (b) | | 14,653 | | | 382,883 |
United Natural Foods, Inc. (a) (b) | | 26,341 | | | 835,536 |
Weis Markets, Inc. | | 7,822 | | | 312,411 |
Winn-Dixie Stores, Inc. (a) (b) | | 21,026 | | | 354,709 |
| | | | | |
| | | | | 7,283,507 |
| | | | | |
| | |
Food Products—1.1% | | | | | |
Chiquita Brands International, Inc. (a) | | 24,548 | | | 451,438 |
Darling International, Inc. (b) | | 48,525 | | | 560,949 |
Flowers Foods, Inc. | | 52,138 | | | 1,220,550 |
Fresh Del Monte Produce, Inc. (a) (b) | | 17,433 | | | 585,400 |
Green Mountain Coffee Roasters, Inc. (a) (b) | | 10,328 | | | 420,350 |
Hain Celestial Group, Inc. (a) (b) | | 24,296 | | | 777,472 |
Imperial Sugar Co. (a) | | 6,849 | | | 128,556 |
J&J Snack Foods Corp. | | 7,714 | | | 241,294 |
Lancaster Colony Corp. | | 17,199 | | | 682,800 |
Lance, Inc. | | 19,320 | | | 394,514 |
Pilgrim’s Pride Corp. (a) | | 24,334 | | | 704,469 |
Ralcorp Holdings, Inc. (b) | | 15,749 | | | 957,382 |
Reddy Ice Holdings, Inc. (a) | | 13,615 | | | 344,596 |
Sanderson Farms, Inc. (a) | | 9,546 | | | 322,464 |
Seabord Corp. | | 219 | | | 321,930 |
Tootsie Roll Industries, Inc. (a) | | 22,736 | | | 623,421 |
Treehouse Foods, Inc. (b) | | 18,656 | | | 428,901 |
| | | | | |
| | | | | 9,166,486 |
| | | | | |
| | |
Gas Utilities—0.9% | | | | | |
Energysouth, Inc. (a) | | 4,257 | | | 246,906 |
Laclede Group, Inc. (a) | | 12,890 | | | 441,354 |
New Jersey Resources Corp. (a) | | 16,619 | | | 831,282 |
Nicor, Inc. (a) | | 28,093 | | | 1,189,739 |
Northwest Natural Gas Co. (a) | | 16,676 | | | 811,454 |
Piedmont Natural Gas Co. (a) | | 50,197 | | | 1,313,153 |
South Jersey Industries, Inc. (a) | | 18,897 | | | 681,993 |
Southwest Gas Corp. | | 24,831 | | | 739,219 |
WGL Holdings, Inc. | | 29,240 | | | 957,902 |
| | | | | |
| | | | | 7,213,002 |
| | | | | |
| | |
Health Care Equipment & Supplies—3.6% | | | | | |
Abaxis, Inc. (b) | | 12,540 | | | 449,684 |
ABIOMED, Inc. (a) (b) | | 19,560 | | | 303,962 |
Accuray, Inc. (b) | | 9,517 | | | 144,849 |
Align Technology, Inc. (a) (b) | | 35,857 | | | 598,095 |
American Medical Systems Holdings, Inc. (a) (b) | | 40,831 | | | 590,416 |
Analogic Corp. | | 9,258 | | | 626,952 |
*See accompanying notes to financial statements.
MSF-11
Metropolitan Series Fund, Inc.
Russell 2000 Index Portfolio
Schedule of Investments as of December 31, 2007
Common Stock—(Continued)
| | | | | |
| Security Description | | Shares | | Value* |
| | | | | |
|
Health Care Equipment & Supplies—(Continued) |
Angiodynamics, Inc. (b) | | 12,607 | | $ | 240,037 |
ArthroCare Corp. (a) (b) | | 17,369 | | | 834,580 |
Aspect Medical Systems, Inc. (a) (b) | | 9,240 | | | 129,360 |
Conceptus, Inc. (a) (b) | | 18,228 | | | 350,707 |
Conmed Corp. (b) | | 16,200 | | | 374,382 |
Cutera, Inc. (a) (b) | | 8,601 | | | 135,036 |
Cyberonics, Inc. (a) (b) | | 16,539 | | | 217,653 |
Cynosure, Inc. (a) (b) | | 4,867 | | | 128,781 |
Datascope Corp. | | 9,172 | | | 333,861 |
ev3, Inc. (a) (b) | | 33,522 | | | 426,065 |
Greatbatch, Inc. (a) (b) | | 14,650 | | | 292,853 |
Haemonetics Corp. (b) | | 17,070 | | | 1,075,751 |
Hologic, Inc. (a) (b) | | 71,228 | | | 4,889,090 |
I Flow Corp. (a) (b) | | 19,111 | | | 301,572 |
ICU Medical, Inc. (a) (b) | | 9,981 | | | 359,416 |
Immucor, Inc. (b) | | 48,668 | | | 1,654,225 |
Integra LifeSciences Holdings (a) (b) | | 11,261 | | | 472,174 |
Invacare Corp. (a) | | 18,340 | | | 462,168 |
Inverness Medical Innovations, Inc. (b) | | 36,370 | | | 2,043,267 |
Kensey Nash Corp. (b) | | 8,837 | | | 264,403 |
Masimo Corp. (a) (b) | | 4,159 | | | 164,073 |
Medical Action Industries, Inc. (b) | | 8,826 | | | 184,022 |
Mentor Corp. (a) | | 22,570 | | | 882,487 |
Meridian Bioscience, Inc. | | 24,310 | | | 731,245 |
Merit Medical Systems, Inc. (b) | | 18,475 | | | 256,802 |
Micrus Endovascular Corp. (a) (b) | | 9,469 | | | 186,350 |
Minrad International, Inc. (a) (b) | | 30,250 | | | 98,312 |
Natus Medical, Inc. (a) (b) | | 11,359 | | | 219,797 |
Northstar Neuroscience, Inc. (a) (b) | | 12,720 | | | 118,296 |
NuVasive, Inc. (b) | | 20,591 | | | 813,756 |
NxStage Medical, Inc. (a) (b) | | 13,074 | | | 198,333 |
OraSure Technologies, Inc. (a) (b) | | 34,671 | | | 308,225 |
Orthofix International NV (b) | | 10,154 | | | 588,627 |
Palomar Medical Technologies, Inc. (a) (b) | | 11,206 | | | 171,676 |
Quidel Corp. (a) (b) | | 19,051 | | | 370,923 |
Regeneration Technologies, Inc. (b) | | 18,890 | | | 163,965 |
Sirona Dental Systems, Inc. (a) (b) | | 10,033 | | | 335,905 |
Sonic Innovations, Inc. (a) (b) | | 17,151 | | | 132,406 |
SonoSite, Inc. (b) | | 10,253 | | | 345,218 |
Spectranetics Corp. (a) (b) | | 19,194 | | | 294,244 |
Stereotaxis, Inc. (a) (b) | | 20,830 | | | 254,543 |
STERIS Corp. | | 39,327 | | | 1,134,191 |
SurModics, Inc. (a) (b) | | 9,719 | | | 527,450 |
Symmetry Medical, Inc. (b) | | 19,457 | | | 339,135 |
Thoratec Corp. (a) (b) | | 34,557 | | | 628,592 |
TomoTherapy, Inc. (a) (b) | | 7,004 | | | 136,998 |
Vital Signs, Inc. | | 6,688 | | | 341,891 |
Volcano Corp. (b) | | 17,311 | | | 216,561 |
West Pharmaceutical Services, Inc. (a) | | 19,799 | | | 803,641 |
Wright Medical Group, Inc. (b) | | 22,902 | | | 668,051 |
Zoll Medical Corp. (b) | | 11,101 | | | 296,619 |
| | | | | |
| | | | | 29,611,673 |
| | | | | |
| | |
Health Care Providers & Services—2.7% | | | | | |
Air Methods Corp. (b) | | 6,724 | | | 333,981 |
Alliance Imaging, Inc. (b) | | 16,629 | | | 159,971 |
| | | | | |
| Security Description | | Shares | | Value* |
| | | | | |
| |
Health Care Providers & Services—(Continued) | | | |
Amedisys, Inc. (a) (b) | | 14,858 | | $ | 720,910 |
American Dental Partners, Inc. (a) (b) | | 7,963 | | | 79,869 |
AMERIGROUP Corp. (b) | | 31,664 | | | 1,154,153 |
AMN Healthcare Services, Inc. (b) | | 21,359 | | | 366,734 |
AmSurg Corp. (b) | | 20,671 | | | 559,357 |
Apria Healthcare Group, Inc. (b) | | 26,027 | | | 561,402 |
Assisted Living Concepts, Inc. (b) | | 51,522 | | | 386,415 |
athenahealth, Inc. (b) | | 3,400 | | | 122,400 |
BIO-Reference Laboratories, Inc. (a) (b) | | 6,543 | | | 213,825 |
Capital Senior Living Corp. (b) | | 17,540 | | | 174,172 |
Centene Corp. (b) | | 26,172 | | | 718,160 |
Chemed Corp. | | 15,280 | | | 853,846 |
Cross Country Healthcare, Inc. (b) | | 22,155 | | | 315,487 |
CryoLife, Inc. (b) | | 14,371 | | | 114,249 |
Emergency Medical Services Corp. (a) (b) | | 5,882 | | | 172,225 |
Gentiva Health Services, Inc. (b) | | 18,854 | | | 358,980 |
HealthExtras, Inc. (a) (b) | | 18,671 | | | 486,940 |
Healthsouth Corp. (a) (b) | | 47,674 | | | 1,001,154 |
Healthspring, Inc. (b) | | 29,248 | | | 557,174 |
Healthways, Inc. (a) (b) | | 21,297 | | | 1,244,597 |
HMS Holdings Corp. (b) | | 13,181 | | | 437,741 |
Hythiam, Inc. (a) (b) | | 26,423 | | | 77,419 |
inVentiv Health, Inc. (b) | | 18,678 | | | 578,271 |
Kindred Healthcare, Inc. (b) | | 18,529 | | | 462,854 |
Landauer, Inc. | | 5,855 | | | 303,582 |
LCA-Vision, Inc. (a) | | 12,447 | | | 248,567 |
LHC Group, Inc. (a) (b) | | 8,704 | | | 217,426 |
Magellan Health Services, Inc. (b) | | 24,247 | | | 1,130,638 |
Matria Healthcare, Inc. (b) | | 12,568 | | | 298,741 |
MedCath Corp. (b) | | 5,739 | | | 140,950 |
Molina Healthcare, Inc. (a) (b) | | 8,197 | | | 317,224 |
MWI Veterinary Supply, Inc. (b) | | 5,393 | | | 215,720 |
National Healthcare Corp. (a) | | 3,588 | | | 185,500 |
Nighthawk Radiology Holdings, Inc. (a) (b) | | 13,278 | | | 279,502 |
Odyssey Healthcare, Inc. (b) | | 25,972 | | | 287,250 |
Owens & Minor, Inc. | | 24,307 | | | 1,031,346 |
PharMerica Corp. (a) (b) | | 16,146 | | | 224,107 |
Providence Service Corp. (a) (b) | | 9,010 | | | 253,541 |
PSS World Medical, Inc. (b) | | 42,327 | | | 828,339 |
Psychiatric Solutions, Inc. (b) | | 37,105 | | | 1,205,913 |
Radiation Therapy Services, Inc. (a) (b) | | 8,837 | | | 273,152 |
RehabCare Group, Inc. (b) | | 10,778 | | | 243,152 |
Res-Care, Inc. (b) | | 14,684 | | | 369,449 |
Skilled Healthcare Group, Inc. (b) | | 14,177 | | | 207,410 |
Sun Healthcare Group, Inc. (b) | | 26,563 | | | 456,087 |
Sunrise Senior Living, Inc. (a) (b) | | 28,803 | | | 883,676 |
| | | | | |
| | | | | 21,813,558 |
| | | | | |
| | |
Health Care Technology—0.4% | | | | | |
Allscripts Heathcare Solutions, Inc. (a) (b) | | 33,557 | | | 651,677 |
Computer Programs & Systems, Inc. (a) | | 5,856 | | | 133,165 |
Eclipsys Corp. (b) | | 29,942 | | | 757,832 |
Omnicell, Inc. (b) | | 20,699 | | | 557,424 |
Phase Forward, Inc. (b) | | 25,352 | | | 551,406 |
The TriZetto Group, Inc. (b) | | 28,410 | | | 493,482 |
Vital Images, Inc. (a) (b) | | 10,111 | | | 182,706 |
| | | | | |
| | | | | 3,327,692 |
| | | | | |
*See accompanying notes to financial statements.
MSF-12
Metropolitan Series Fund, Inc.
Russell 2000 Index Portfolio
Schedule of Investments as of December 31, 2007
Common Stock—(Continued)
| | | | | |
| Security Description | | Shares | | Value* |
| | | | | |
| | |
Hotels, Restaurants & Leisure—2.7% | | | | | |
AFC Enterprises, Inc. (b) | | 19,632 | | $ | 222,234 |
Ambassadors Group, Inc. (a) | | 11,473 | | | 210,071 |
Ambassadors Intenational, Inc. (a) | | 6,497 | | | 94,726 |
Ameristar Casinos, Inc. | | 16,928 | | | 466,197 |
Bally Technologies, Inc. (a) (b) | | 32,474 | | | 1,614,607 |
BJ’s Restaurants, Inc. (a) (b) | | 10,206 | | | 165,950 |
Bluegreen Corp. (a) (b) | | 14,301 | | | 102,824 |
Bob Evans Farms, Inc. | | 23,317 | | | 627,927 |
Buffalo Wild Wings, Inc. (a) (b) | | 11,369 | | | 263,988 |
California Pizza Kitchen, Inc. (a) (b) | | 16,897 | | | 263,086 |
CBRL Group, Inc. | | 14,976 | | | 485,073 |
CEC Entertainment, Inc. (b) | | 19,645 | | | 509,984 |
Chipotle Mexican Grill, Inc. (a) (b) | | 20,951 | | | 2,578,021 |
Churchill Downs, Inc. | | 5,549 | | | 299,480 |
CKE Restaurants, Inc. (a) | | 41,454 | | | 547,193 |
Denny’s Corp. (b) | | 67,630 | | | 253,613 |
Domino’s Pizza, Inc. (a) (b) | | 26,291 | | | 347,830 |
Gaylord Entertainment Co. (a) (b) | | 26,984 | | | 1,092,042 |
Great Wolf Resorts, Inc. (a) (b) | | 18,410 | | | 180,602 |
IHOP Corp. (a) | | 10,820 | | | 395,796 |
Isle of Capri Casinos, Inc. (a) (b) | | 8,638 | | | 118,945 |
Jack in the Box, Inc. (b) | | 41,664 | | | 1,073,681 |
Jamba, Inc. (a) (b) | | 32,282 | | | 119,443 |
Krispy Kreme Doughnuts, Inc. (a) (b) | | 38,377 | | | 121,271 |
Landry’s Restaurants, Inc. (a) | | 8,548 | | | 168,396 |
Life Time Fitness, Inc. (a) (b) | | 19,048 | | | 946,305 |
Lodgian, Inc. (b) | | 12,497 | | | 140,716 |
Marcus Corp. (a) | | 11,284 | | | 174,338 |
McCormick & Schmick’s Seafood Restaurants, Inc. (b) | | 8,788 | | | 104,841 |
Monarch Casino & Resort, Inc. (a) (b) | | 6,371 | | | 153,414 |
Morgans Hotel Group Co. (b) | | 13,254 | | | 255,537 |
MTR Gaming Group, Inc. (a) (b) | | 13,571 | | | 92,147 |
Multimedia Games, Inc. (a) (b) | | 17,111 | | | 142,706 |
O’Charleys, Inc. (a) | | 16,600 | | | 248,668 |
P.F. Chang’s China Bistro, Inc. (a) (b) | | 16,111 | | | 367,975 |
Papa John’s International, Inc. (b) | | 13,676 | | | 310,445 |
Peet’s Coffee & Tea, Inc. (a) (b) | | 8,820 | | | 256,397 |
Pinnacle Entertainment, Inc. (b) | | 36,031 | | | 848,890 |
Premier Exhibitions, Inc. (a) (b) | | 18,145 | | | 198,506 |
Red Robin Gourmet Burgers, Inc. (b) | | 9,999 | | | 319,868 |
Riviera Holdings Corp. (a) (b) | | 6,475 | | | 199,430 |
Ruby Tuesday, Inc. (a) | | 35,010 | | | 341,348 |
Ruth’s Chris Steak House, Inc. (a) (b) | | 10,533 | | | 94,165 |
Shuffle Master, Inc. (a) (b) | | 20,839 | | | 249,860 |
Six Flags, Inc. (a) (b) | | 53,836 | | | 109,287 |
Sonic Corp. (a) (b) | | 41,985 | | | 919,471 |
Speedway Motorsports, Inc. | | 8,883 | | | 276,084 |
Texas Roadhouse, Inc. (a) (b) | | 31,607 | | | 349,573 |
The Steak N Shake Co. (a) (b) | | 15,973 | | | 174,106 |
Town Sports International Holdings, Inc. (a) (b) | | 10,287 | | | 98,344 |
Triarc Cos., Inc. (a) | | 38,211 | | | 334,728 |
Trump Entertainment Resorts, Inc. (a) (b) | | 17,059 | | | 73,354 |
Vail Resorts, Inc. (a) (b) | | 21,308 | | | 1,146,583 |
WMS Industries, Inc. (a) (b) | | 23,739 | | | 869,797 |
| | | | | |
| | | | | 22,119,863 |
| | | | | |
| | | | | |
| Security Description | | Shares | | Value* |
| | | | | |
|
Household Durables—1.1% |
American Greetings Corp. (Class A) | | 32,419 | | $ | 658,106 |
Avatar Holding, Inc. (a) (b) | | 3,358 | | | 140,432 |
Beazer Homes USA, Inc. (a) | | 23,725 | | | 176,277 |
Blyth, Inc. | | 18,566 | | | 407,338 |
Brookfield Homes Corp. (a) | | 8,314 | | | 131,361 |
Champion Enterprises, Inc. (a) (b) | | 51,174 | | | 482,059 |
CSS Industries, Inc. (a) | | 4,704 | | | 172,637 |
Ethan Allen Interiors, Inc. (a) | | 17,544 | | | 500,004 |
Furniture Brands International, Inc. (a) | | 29,013 | | | 291,871 |
Helen of Troy, Ltd. (b) | | 18,491 | | | 316,936 |
Hooker Furniture Corp. (a) | | 7,384 | | | 148,418 |
Hovnanian Enterprises, Inc. (Class A) (a) (b) | | 22,223 | | | 159,339 |
iRobot Corp. (a) (b) | | 12,683 | | | 229,309 |
Kimball International, Inc. (Class B) (a) | | 17,331 | | | 237,435 |
La-Z-Boy, Inc. (a) | | 32,284 | | | 256,012 |
Libbey, Inc. | | 9,115 | | | 144,382 |
M/I Schottenstein Homes, Inc. (a) | | 14,145 | | | 148,522 |
Meritage Homes Corp. (a) (b) | | 14,229 | | | 207,316 |
National Presto Industries, Inc. | | 2,609 | | | 137,390 |
Russ Berrie & Co., Inc. (a) | | 10,539 | | | 172,418 |
Sealy Corp. (a) | | 27,397 | | | 306,572 |
Standard-Pacific Corp. (a) | | 39,264 | | | 131,534 |
Syntax-Brillian Corp. (a) (b) | | 36,580 | | | 112,666 |
Tempur-Pedic International, Inc. (a) | | 53,514 | | | 1,389,759 |
Tupperware Corp. | | 37,995 | | | 1,254,975 |
Universal Electronics, Inc. (b) | | 10,896 | | | 364,362 |
WCI Communities, Inc. (a) (b) | | 20,664 | | | 78,110 |
| | | | | |
| | | | | 8,755,540 |
| | | | | |
|
Household Products—0.1% |
Central Garden and Pet Co. (a) (b) | | 43,733 | | | 234,409 |
Spectrum Brands, Inc. (a) (b) | | 34,225 | | | 182,419 |
WD-40 Co. | | 10,145 | | | 385,206 |
| | | | | |
| | | | | 802,034 |
| | | | | |
|
Independent Power Producers & Energy Traders—0.1% |
Ormat Technologies, Inc. (a) | | 8,116 | | | 446,461 |
| | | | | |
|
Industrial Conglomerates—0.2% |
Raven Industries, Inc. (a) | | 9,918 | | | 380,752 |
Standex International Corp. | | 6,527 | | | 113,896 |
Tredegar Industries, Inc. (a) | | 22,277 | | | 358,214 |
Walter Industries, Inc. | | 33,396 | | | 1,199,919 |
| | | | | |
| | | | | 2,052,781 |
| | | | | |
|
Insurance—3.5% |
Alfa Corp. | | 17,983 | | | 389,692 |
American Equity Investment Life Holding Co. (a) | | 36,575 | | | 303,207 |
American Physicians Capital, Inc. | | 6,414 | | | 265,924 |
Amerisafe, Inc. (b) | | 11,822 | | | 183,359 |
Amtrust Financial Services, Inc. (a) | | 15,935 | | | 219,425 |
Argo Group International Holdings, Ltd. | | 16,949 | | | 714,061 |
Aspen Insurance Holdings, Ltd. | | 57,655 | | | 1,662,770 |
Assured Guaranty, Ltd. | | 48,852 | | | 1,296,532 |
Citizens, Inc. (a) (b) | | 22,172 | | | 122,611 |
*See accompanying notes to financial statements.
MSF-13
Metropolitan Series Fund, Inc.
Russell 2000 Index Portfolio
Schedule of Investments as of December 31, 2007
Common Stock—(Continued)
| | | | | |
| Security Description | | Shares | | Value* |
| | | | | |
|
Insurance—(Continued) |
CNA Surety Corp. (a) (b) | | 9,923 | | $ | 196,376 |
Commerce Group, Inc. | | 33,605 | | | 1,209,108 |
Delphi Financial Group, Inc. | | 25,658 | | | 905,214 |
eHealth, Inc. (b) | | 8,024 | | | 257,651 |
Employers Holdings, Inc. | | 33,650 | | | 562,292 |
Enstar Group, Ltd. (a) (b) | | 4,274 | | | 523,223 |
FBL Financial Group, Inc. | | 8,813 | | | 304,313 |
First Mercury Financial Corp. (b) | | 6,912 | | | 168,653 |
FPIC Insurance Group, Inc. (a) (b) | | 5,920 | | | 254,442 |
Harleysville Group, Inc. | | 9,700 | | | 343,186 |
Hilb, Rogal & Hamilton Co. | | 21,750 | | | 882,398 |
Horace Mann Educators Corp. | | 26,595 | | | 503,709 |
Infinity Property & Casualty Corp. | | 13,290 | | | 480,168 |
IPC Holdings, Ltd. | | 38,356 | | | 1,107,338 |
Landamerica Financial Group, Inc. (a) | | 11,411 | | | 381,698 |
Max Capital Group, Ltd. | | 36,394 | | | 1,018,668 |
Meadowbrook Insurance Group, Inc. (b) | | 19,234 | | | 180,992 |
Midland Co. | | 6,919 | | | 447,590 |
Montpelier Re Holdings, Ltd. | | 67,329 | | | 1,145,266 |
National Financial Partners Corp. (a) | | 22,215 | | | 1,013,226 |
National Western Life Insurance Co. | | 1,512 | | | 313,543 |
NYMAGIC, Inc. | | 4,986 | | | 115,326 |
Odyssey Re Holdings Corp. | | 17,162 | | | 630,017 |
Phoenix Cos., Inc. | | 69,794 | | | 828,455 |
Platinum Underwriters Holdings, Ltd. | | 39,512 | | | 1,405,047 |
PMA Capital Corp. (b) | | 17,258 | | | 141,861 |
Presidential Life Corp. | | 15,310 | | | 268,078 |
ProAssurance Corp. (b) | | 23,170 | | | 1,272,496 |
RAM Holdings, Ltd. (a) (b) | | 11,524 | | | 56,929 |
RLI Corp. | | 12,921 | | | 733,784 |
Safety Insurance Group, Inc. | | 10,092 | | | 369,569 |
Scottish Re Group, Ltd. (b) | | 42,773 | | | 31,010 |
SeaBright Insurance Holdings, Inc. (b) | | 12,481 | | | 188,213 |
Security Capital Assurance, Ltd. (a) | | 14,591 | | | 56,759 |
Selective Insurance Group, Inc. | | 35,452 | | | 815,041 |
State Auto Financial Corp. | | 9,434 | | | 248,114 |
Stewart Information Services Corp. | | 11,597 | | | 302,566 |
The Navigators Group, Inc. (b) | | 8,311 | | | 540,215 |
Tower Group, Inc. | | 12,792 | | | 427,253 |
United America Indemity, Ltd. (b) | | 15,178 | | | 302,346 |
United Fire & Casualty Co. | | 14,209 | | | 413,340 |
Universal American Financial Corp. (b) | | 28,541 | | | 730,364 |
Validus Holdings, Ltd. (b) | | 4,797 | | | 124,626 |
Zenith National Insurance Corp. | | 23,688 | | | 1,059,564 |
| | | | | |
| | | | | 28,417,608 |
| | | | | |
|
Internet & Catalog Retail—0.7% |
Blue Nile, Inc. (a) (b) | | 7,985 | | | 543,459 |
FTD Group, Inc. | | 11,480 | | | 147,862 |
Gaiam, Inc. (a) (b) | | 9,847 | | | 292,259 |
GSI Commerce, Inc. (b) | | 12,450 | | | 242,775 |
Netflix, Inc. (a) (b) | | 29,185 | | | 776,905 |
Orbitz Worldwide, Inc. (b) | | 20,423 | | | 173,595 |
Overstock.com, Inc. (a) (b) | | 10,438 | | | 162,102 |
PetMed Express, Inc. (a) (b) | | 11,525 | | | 139,453 |
Priceline.com, Inc. (a) (b) | | 24,176 | | | 2,776,855 |
| | | | | |
| Security Description | | Shares | | Value* |
| | | | | |
|
Internet & Catalog Retail—(Continued) |
Shutterfly, Inc. (b) | | 9,219 | | $ | 236,191 |
Stamps.com, Inc. (a) (b) | | 10,227 | | | 124,565 |
ValueVision Media, Inc. (a) (b) | | 21,714 | | | 136,581 |
| | | | | |
| | | | | 5,752,602 |
| | | | | |
|
Internet Software & Services—2.5% |
Ariba, Inc. (a) (b) | | 51,204 | | | 570,925 |
Art Technology Group, Inc. (a) (b) | | 76,761 | | | 331,608 |
Asiainfo Holdings, Inc. (a) (b) | | 20,202 | | | 222,222 |
Bankrate, Inc. (a) (b) | | 7,602 | | | 365,580 |
Chordiant Software, Inc. (b) | | 17,666 | | | 151,044 |
CMGI, Inc. (b) | | 29,234 | | | 382,673 |
CNET Networks, Inc. (a) (b) | | 92,673 | | | 847,031 |
DealerTrack Holdings, Inc. (b) | | 20,263 | | | 678,203 |
Digital River, Inc. (a) (b) | | 24,214 | | | 800,757 |
DivX, Inc. (b) | | 14,635 | | | 204,890 |
EarthLink, Inc. (a) (b) | | 77,790 | | | 549,975 |
Equinix, Inc. (a) (b) | | 21,465 | | | 2,169,468 |
Greenfield Online, Inc. (b) | | 13,708 | | | 200,274 |
iBasis, Inc. (a) (b) | | 20,983 | | | 107,643 |
Imergent, Inc. (a) | | 7,829 | | | 82,909 |
InfoSpace, Inc. (a) (b) | | 18,952 | | | 356,298 |
Internap Network Services Corp. (a) (b) | | 30,035 | | | 250,192 |
Internet Capital Group, Inc. (a) (b) | | 29,139 | | | 342,092 |
Interwoven, Inc. (b) | | 24,116 | | | 342,929 |
iPass, Inc. (a) (b) | | 32,314 | | | 131,195 |
j2 Global Communications, Inc. (b) | | 29,625 | | | 627,161 |
Keynote Systems, Inc. (b) | | 10,145 | | | 142,537 |
LivePerson, Inc. (b) | | 23,764 | | | 126,900 |
LoopNet, Inc. (a) (b) | | 16,690 | | | 234,494 |
Marchex, Inc. (a) | | 16,789 | | | 182,329 |
Mercadolibre, Inc. (b) | | 9,665 | | | 714,050 |
NIC, Inc. (a) (b) | | 24,542 | | | 207,134 |
Omniture, Inc. (b) | | 19,205 | | | 639,334 |
On2 Technologies, Inc. (a) (b) | | 111,400 | | | 113,628 |
Online Resources Corp. (a) (b) | | 13,918 | | | 165,903 |
Openwave Systems, Inc. (a) (b) | | 55,156 | | | 143,406 |
Perficient, Inc. (b) | | 18,068 | | | 284,390 |
RealNetworks, Inc. (a) (b) | | 66,317 | | | 403,871 |
S1 Corp. (b) | | 34,158 | | | 249,353 |
SAVVIS, Inc. (a) (b) | | 16,648 | | | 464,646 |
Sohu.com, Inc. (a) (b) | | 16,791 | | | 915,445 |
SonicWall, Inc. (b) | | 35,830 | | | 384,098 |
Terremark Worldwide, Inc. (a) (b) | | 29,552 | | | 192,088 |
The Knot, Inc. (a) (b) | | 17,057 | | | 271,889 |
TheStreet.com, Inc. (a) | | 13,342 | | | 212,405 |
United Online, Inc. | | 40,507 | | | 478,793 |
ValueClick, Inc. (b) | | 69,016 | | | 1,511,450 |
Vignette Corp. (b) | | 18,591 | | | 271,614 |
VistaPrint, Ltd. (a) (b) | | 26,050 | | | 1,116,242 |
Visual Sciences, Inc. (b) | | 11,535 | | | 213,167 |
Vocus, Inc. (b) | | 8,193 | | | 282,904 |
Websense, Inc. (b) | | 26,527 | | | 450,428 |
| | | | | |
| | | | | 20,087,567 |
| | | | | |
*See accompanying notes to financial statements.
MSF-14
Metropolitan Series Fund, Inc.
Russell 2000 Index Portfolio
Schedule of Investments as of December 31, 2007
Common Stock—(Continued)
| | | | | |
| Security Description | | Shares | | Value* |
| | | | | |
|
IT Services—1.7% |
BearingPoint, Inc. (a) (b) | | 121,992 | | $ | 345,237 |
CACI International, Inc. (Class A) (b) | | 18,545 | | | 830,260 |
Ciber, Inc. (b) | | 32,578 | | | 199,052 |
CSG Systems International, Inc. (b) | | 30,519 | | | 449,240 |
Cybersource Corp. (a) (b) | | 37,634 | | | 668,756 |
Euronet Worldwide, Inc. (a) (b) | | 27,740 | | | 832,200 |
ExlService Holdings, Inc. (a) (b) | | 14,049 | | | 324,251 |
Forrester Research, Inc. (b) | | 8,982 | | | 251,676 |
Gartner, Inc. (Class A) (b) | | 41,669 | | | 731,708 |
Gevity HR, Inc. (a) | | 14,918 | | | 114,719 |
Global Cash Access, Inc. (a) (b) | | 27,053 | | | 163,941 |
Heartland Payment Systems, Inc. (a) | | 10,165 | | | 272,422 |
Information Services Group, Inc. (b) | | 19,555 | | | 133,952 |
InfoUSA, Inc. | | 24,161 | | | 215,758 |
Integral Systems, Inc. (a) | | 6,666 | | | 155,051 |
Lionbridge Technologies, Inc. (a) (b) | | 44,502 | | | 157,982 |
Mantech International Corp. (b) | | 12,046 | | | 527,856 |
MAXIMUS, Inc. (a) | | 14,829 | | | 572,548 |
MPS Group, Inc. (b) | | 63,807 | | | 698,048 |
Ness Technologies, Inc. (a) (b) | | 20,490 | | | 189,123 |
Perot Systems Corp. (Class A) (b) | | 52,731 | | | 711,868 |
RightNow Technologies, Inc. (b) | | 10,146 | | | 160,814 |
Safeguard Scientifics, Inc. (a) (b) | | 66,647 | | | 119,965 |
SAIC, Inc. (a) (b) | | 99,730 | | | 2,006,568 |
Sapient Corp. (b) | | 48,288 | | | 425,417 |
SI International, Inc. (b) | | 9,254 | | | 254,207 |
SRA International, Inc. (b) | | 24,074 | | | 708,979 |
Sykes Enterprises, Inc. (b) | | 20,294 | | | 365,292 |
Syntel, Inc. (a) | | 7,885 | | | 303,730 |
TNS, Inc. (b) | | 13,033 | | | 231,336 |
Wright Express Corp. (b) | | 24,854 | | | 882,068 |
| | | | | |
| | | | | 14,004,024 |
| | | | | |
|
Leisure Equipment & Products—0.4% |
Arctic Cat, Inc. (a) | | 8,298 | | | 99,078 |
Callaway Golf Co. | | 48,207 | | | 840,248 |
JAKKS Pacific, Inc. (a) (b) | | 16,889 | | | 398,749 |
Leapfrog Enterprises, Inc. (b) | | 17,489 | | | 117,701 |
MarineMax, Inc. (a) (b) | | 9,671 | | | 149,901 |
Nautilus Group, Inc. (a) | | 20,664 | | | 100,220 |
Polaris Industries, Inc. (a) | | 21,479 | | | 1,026,052 |
RC2 Corp. (b) | | 14,177 | | | 397,948 |
Smith & Wesson Holding Corp. (a) (b) | | 16,594 | | | 101,224 |
Steinway Musical Instruments, Inc. (b) | | 4,118 | | | 113,533 |
Sturm Ruger & Co., Inc. (a) (b) | | 14,288 | | | 118,305 |
| | | | | |
| | | | | 3,462,959 |
| | | | | |
|
Life Sciences Tools & Services —1.6% |
Affymetrix, Inc. (a) (b) | | 42,415 | | | 981,483 |
Albany Molecular Research, Inc. (b) | | 13,735 | | | 197,509 |
AMAG Pharmaceuticals, Inc. (b) | | 9,916 | | | 596,249 |
Bio-Rad Laboratories, Inc. (b) | | 10,911 | | | 1,130,598 |
Bruker Biosciences Corp. (b) | | 40,189 | | | 534,514 |
Cambrex Corp. | | 14,910 | | | 124,946 |
Dionex Corp. (b) | | 12,610 | | | 1,044,865 |
Enzo Biochem, Inc. (a) (b) | | 17,301 | | | 220,415 |
| | | | | |
| Security Description | | Shares | | Value* |
| | | | | |
|
Life Sciences Tools & Services—(Continued) |
eResearch Technology, Inc. (a) (b) | | 26,533 | | $ | 313,620 |
Exelixis, Inc. (b) | | 61,683 | | | 532,324 |
Illumina, Inc. (a) (b) | | 36,156 | | | 2,142,605 |
Kendle International, Inc. (b) | | 7,432 | | | 363,573 |
Luminex Corp. (a) (b) | | 21,359 | | | 346,870 |
Medivation, Inc. (a) | | 13,412 | | | 193,133 |
Nektar Therapeutics (a) (b) | | 54,733 | | | 367,258 |
Parexel International Corp. (b) | | 17,516 | | | 846,023 |
Pharmanet Development Group, Inc. (b) | | 11,199 | | | 439,113 |
Varian, Inc. (b) | | 19,748 | | | 1,289,544 |
Ventana Medical Systems, Inc. (b) | | 18,644 | | | 1,626,316 |
| | | | | |
| | | | | 13,290,958 |
| | | | | |
|
Machinery—3.0% |
3D Systems Corp. (a) (b) | | 11,338 | | | 175,059 |
Accuride Corp. (b) | | 12,273 | | | 96,466 |
Actuant Corp. (a) | | 34,670 | | | 1,179,127 |
Albany International Corp. (Class A) (a) | | 17,773 | | | 659,378 |
American Railcar Industries, Inc. (a) | | 5,293 | | | 101,890 |
AMPCO Pittsburgh Corp. | | 4,198 | | | 160,070 |
Astec Industries, Inc. (b) | | 11,497 | | | 427,573 |
ASV, Inc. (a) (b) | | 11,690 | | | 161,907 |
Badger Meter, Inc. (a) | | 9,649 | | | 433,723 |
Barnes Group, Inc. | | 27,847 | | | 929,811 |
Blount International, Inc. (b) | | 20,226 | | | 248,982 |
Briggs & Stratton Corp. (a) | | 28,901 | | | 654,897 |
Bucyrus International, Inc. | | 24,253 | | | 2,410,506 |
Cascade Corp. (a) | | 8,261 | | | 383,806 |
Chart Industries, Inc. (b) | | 8,169 | | | 252,422 |
Circor International, Inc. | | 9,447 | | | 437,963 |
CLARCOR, Inc. | | 31,113 | | | 1,181,361 |
Columbus McKinnon Corp. (b) | | 11,301 | | | 368,639 |
Commercial Vehicle Group, Inc. (b) | | 11,473 | | | 166,358 |
Dynamic Materials Corp. (a) | | 7,259 | | | 427,555 |
Enpro Industries, Inc. (b) | | 12,182 | | | 373,378 |
ESCO Technologies, Inc. (a) (b) | | 16,183 | | | 646,349 |
Federal Signal Corp. (a) | | 27,166 | | | 304,803 |
Flow International Corp. (b) | | 23,138 | | | 215,646 |
Force Protection, Inc. (a) (b) | | 41,101 | | | 192,353 |
FreightCar America, Inc. (a) | | 7,047 | | | 246,645 |
Gehl Co. (a) (b) | | 5,715 | | | 91,669 |
Gorman-Rupp Co. (a) | | 9,576 | | | 298,771 |
Hardinge, Inc. | | 6,954 | | | 116,688 |
Hurco Cos., Inc. | | 3,576 | | | 156,092 |
Kadant, Inc. (b) | | 8,363 | | | 248,130 |
Kaydon Corp. (a) | | 17,350 | | | 946,269 |
LB Foster Co. (a) (b) | | 6,186 | | | 320,002 |
Lindsay Manufacturing Co. (a) | | 6,983 | | | 493,628 |
Miller Industries, Inc. (b) | | 9,123 | | | 124,894 |
Mueller Industries, Inc. | | 22,661 | | | 656,942 |
Mueller Water Products, Inc. (a) | | 69,188 | | | 658,670 |
NACCO Industries, Inc. | | 3,492 | | | 348,117 |
Nordson Corp. | | 20,342 | | | 1,179,022 |
RBC Bearings, Inc. (b) | | 12,744 | | | 553,854 |
Robbins & Myers, Inc. | | 8,450 | | | 639,073 |
Sun Hydraulics Corp. | | 7,039 | | | 177,594 |
*See accompanying notes to financial statements.
MSF-15
Metropolitan Series Fund, Inc.
Russell 2000 Index Portfolio
Schedule of Investments as of December 31, 2007
Common Stock—(Continued)
| | | | | |
| Security Description | | Shares | | Value* |
| | | | | |
|
Machinery—(Continued) |
Tennant Co. | | 10,316 | | $ | 456,896 |
The Greenbrier Cos., Inc. (a) | | 9,593 | | | 213,540 |
The Middleby Corp. (a) | | 8,794 | | | 673,796 |
Titan International, Inc. (a) | | 14,345 | | | 448,425 |
Turbochef Technologies, Inc. (a) (b) | | 11,797 | | | 194,650 |
Twin Disc, Inc. | | 2,881 | | | 203,888 |
Valmont Industries, Inc. (a) | | 11,905 | | | 1,060,974 |
Wabash National Corp. (a) | | 17,632 | | | 135,590 |
Wabtec Corp. | | 33,052 | | | 1,138,311 |
Watts Industries, Inc. (a) | | 19,051 | | | 567,720 |
| | | | | |
| | | | | 24,939,872 |
| | | | | |
|
Marine—0.3% |
American Commercial Lines, Inc. (a) (b) | | 36,170 | | | 587,401 |
Eagle Bulk Shipping, Inc. (a) | | 27,758 | | | 736,975 |
Genco Shipping & Trading, Ltd. (a) | | 10,777 | | | 590,148 |
Horizon Lines, Inc. (a) | | 20,292 | | | 378,243 |
Ultrapetrol Bahamas, Ltd. (a) (b) | | 16,410 | | | 279,134 |
| | | | | |
| | | | | 2,571,901 |
| | | | | |
|
Media—1.7% |
Arbitron, Inc. (a) | | 18,068 | | | 751,087 |
Belo Corp. (Class A) | | 51,102 | | | 891,219 |
Carmike Cinemas, Inc. (a) | | 6,657 | | | 48,330 |
Charter Communications, Inc. (a) (b) | | 245,494 | | | 287,228 |
Cinemark Holdings, Inc. (a) | | 17,343 | | | 294,831 |
Citadel Broadcasting Corp. (a) | | 117,847 | | | 242,765 |
CKX, Inc. (a) (b) | | 27,632 | | | 331,584 |
Courier Corp. | | 5,405 | | | 178,419 |
Cox Radio, Inc. (Class A) (a) (b) | | 24,285 | | | 295,063 |
Cumulus Media, Inc. (a) (b) | | 29,033 | | | 233,425 |
DG FastChannel, Inc. (b) | | 8,430 | | | 216,145 |
Emmis Communications Corp. (Class A) (a) (b) | | 17,821 | | | 68,611 |
Entercom Communications Corp. (a) | | 18,287 | | | 250,349 |
Entravision Communications Corp. (Class A) (b) | | 38,327 | | | 300,100 |
Fisher Communications, Inc. (b) | | 3,926 | | | 149,031 |
GateHouse Media, Inc. (a) | | 13,401 | | | 117,661 |
Gemstar-TV Guide International, Inc. (a) (b) | | 147,815 | | | 703,599 |
Global Sources, Ltd. (a) (b) | | 10,947 | | | 308,930 |
Gray Television, Inc. (a) | | 22,092 | | | 177,178 |
Harris Interactive, Inc. (b) | | 29,643 | | | 126,279 |
Interactive Data Corp. | | 23,903 | | | 789,038 |
Journal Communications, Inc. | | 28,263 | | | 252,671 |
Knology, Inc. (a) (b) | | 16,245 | | | 207,611 |
Lee Enterprises, Inc. (a) | | 28,447 | | | 416,749 |
LIN TV Corp. (a) (b) | | 16,477 | | | 200,525 |
Live Nation, Inc. (a) (b) | | 39,075 | | | 567,369 |
LodgeNet Entertainment Corp. (a) (b) | | 12,212 | | | 212,977 |
Martha Stewart Living Omnimedia, Inc. (a) (b) | | 17,104 | | | 158,554 |
Marvel Entertainment, Inc. (a) (b) | | 32,800 | | | 876,088 |
Media General, Inc. (a) | | 12,942 | | | 275,018 |
Mediacom Communications Corp. (a) (b) | | 34,201 | | | 156,983 |
Morningstar, Inc. (a) (b) | | 7,761 | | | 603,418 |
National CineMedia, Inc. | | 24,826 | | | 625,863 |
Playboy Enterprises, Inc. (Class B) (a) (b) | | 13,665 | | | 124,625 |
Primedia, Inc. (a) (b) | | 26,996 | | | 229,466 |
| | | | | |
| Security Description | | Shares | | Value* |
| | | | | |
|
Media—(Continued) |
Radio One, Inc. (Class D) (b) | | 43,485 | | $ | 103,059 |
RCN Corp. (a) (b) | | 18,924 | | | 295,025 |
Scholastic Corp. (a) (b) | | 20,130 | | | 702,336 |
Sinclair Broadcast Group, Inc. (a) | | 27,921 | | | 229,231 |
Sun Times Media Croup, Inc. (a) (b) | | 41,861 | | | 92,094 |
TiVo, Inc. (a) (b) | | 61,206 | | | 510,458 |
Valassis Communications, Inc. (a) (b) | | 28,156 | | | 329,144 |
Westwood One, Inc. (a) (b) | | 73,299 | | | 145,865 |
World Wrestling Entertainment, Inc. | | 13,534 | | | 199,762 |
| | | | | |
| | | | | 14,275,763 |
| | | | | |
|
Metals & Mining—1.6% |
A.M. Castle & Co. | | 8,171 | | | 222,169 |
AMCOL International Corp. (a) | | 15,760 | | | 567,833 |
Apex Silver Mines, Ltd. (b) | | 35,539 | | | 541,614 |
Brush Engineered Material, Inc. (a) (b) | | 12,873 | | | 476,558 |
Century Aluminum Co. (b) | | 17,432 | | | 940,282 |
Coeur D’Alene Mines Corp. (a) | | 268,852 | | | 1,328,129 |
Compass Minerals International, Inc. (a) | | 21,163 | | | 867,683 |
Esmark, Inc. (a) (b) | | 6,594 | | | 93,173 |
General Moly, Inc. (a) (b) | | 30,689 | | | 358,141 |
Haynes International, Inc. (b) | | 7,082 | | | 492,199 |
Hecla Mining Co. (a) (b) | | 72,011 | | | 673,303 |
Kaiser Aluminum Corp. | | 9,158 | | | 727,878 |
Metal Management, Inc. | | 16,920 | | | 770,368 |
Olympic Steel, Inc. | | 5,096 | | | 161,594 |
Quanex Corp. (a) | | 22,520 | | | 1,168,788 |
Royal Gold, Inc. (a) | | 14,314 | | | 436,863 |
RTI International Metals, Inc. (b) | | 14,086 | | | 970,948 |
Schnitzer Steel Industries, Inc. | | 13,177 | | | 910,926 |
Stillwater Mining Co. (a) (b) | | 29,045 | | | 280,575 |
U.S. Gold Corp. (b) | | 29,552 | | | 87,474 |
Universal Stainless & Alloy (b) | | 4,250 | | | 151,172 |
Worthington Industries, Inc. (a) | | 43,979 | | | 786,345 |
| | | | | |
| | | | | 13,014,015 |
| | | | | |
|
Multi-Utilities—0.6% |
Aquila, Inc. (b) | | 224,670 | | | 838,019 |
Avista Corp. | | 30,935 | | | 666,340 |
Black Hills Corp. (a) | | 22,635 | | | 998,204 |
CH Energy Group, Inc. (a) | | 9,850 | | | 438,719 |
NorthWestern Corp. | | 21,562 | | | 636,079 |
PNM Resources, Inc. | | 50,750 | | | 1,088,587 |
| | | | | |
| | | | | 4,665,948 |
| | | | | |
|
Multiline Retail—0.1% |
99 Cents Only Stores (a) (b) | | 27,759 | | | 220,962 |
Fred’s, Inc. (a) | | 22,728 | | | 218,871 |
Retail Ventures, Inc. (a) (b) | | 17,215 | | | 87,624 |
The Bon-Ton Stores, Inc. (a) | | 6,370 | | | 60,451 |
Tuesday Morning Corp. (a) | | 18,418 | | | 93,379 |
| | | | | |
| | | | | 681,287 |
| | | | | |
|
Mutual Funds—2.1% |
iShares Russell 2000 Index Fund (a) | | 223,800 | | | 16,990,896 |
| | | | | |
*See accompanying notes to financial statements.
MSF-16
Metropolitan Series Fund, Inc.
Russell 2000 Index Portfolio
Schedule of Investments as of December 31, 2007
Common Stock—(Continued)
| | | | | |
| Security Description | | Shares | | Value* |
| | | | | |
|
Oil, Gas & Consumable Fuels—3.8% |
Alon USA Energy, Inc. (a) | | 8,071 | | $ | 219,370 |
Alpha Natural Resources, Inc. (a) (b) | | 39,880 | | | 1,295,302 |
Arena Resources, Inc. (b) | | 18,278 | | | 762,375 |
Arlington Tankers, Ltd. (a) | | 8,166 | | | 180,714 |
Atlas America, Inc. | | 13,915 | | | 823,490 |
ATP Oil & Gas Corp. (b) | | 13,166 | | | 665,410 |
Aventine Renewable Energy Holdings, Inc. (a) (b) | | 16,611 | | | 211,956 |
Berry Petroleum Co. (a) | | 23,954 | | | 1,064,755 |
Bill Barrett Corp. (a) (b) | | 18,955 | | | 793,646 |
Bois d’Arc Energy, Inc. (a) (b) | | 10,923 | | | 216,821 |
BPZ Energy, Inc. (a) (b) | | 29,482 | | | 329,609 |
Brigham Exploration Co. (b) | | 27,172 | | | 204,333 |
Callon Petroleum Co. (b) | | 10,848 | | | 178,450 |
Carrizo Oil & Gas, Inc. (b) | | 14,570 | | | 797,707 |
Comstock Resources, Inc. (b) | | 26,648 | | | 906,032 |
Concho Resources, Inc. (b) | | 6,996 | | | 144,188 |
Contango Oil & Gas Co. (b) | | 8,216 | | | 418,112 |
Crosstex Energy, Inc. (a) | | 22,126 | | | 823,972 |
CVR Energy, Inc. (b) | | 9,700 | | | 241,918 |
Delek U.S. Holdings, Inc. | | 7,579 | | | 153,323 |
Delta Petroleum Corp. (a) (b) | | 39,218 | | | 739,259 |
Double Hull Tankers, Inc. (a) | | 13,136 | | | 160,785 |
Edge Petroleum Corp. (b) | | 17,960 | | | 106,503 |
Encore Aquisition Co. (b) | | 33,227 | | | 1,108,785 |
Energy Partners, Ltd. (b) | | 21,596 | | | 255,049 |
Evergreen Energy, Inc. (a) (b) | | 49,607 | | | 110,624 |
EXCO Resources, Inc. (b) | | 37,568 | | | 581,553 |
FX Energy, Inc. (a) (b) | | 22,765 | | | 129,305 |
General Maritime Corp. (a) | | 17,335 | | | 423,841 |
GMX Resources, Inc. (a) (b) | | 6,752 | | | 217,954 |
Golar LNG, Ltd. (a) | | 21,224 | | | 469,475 |
Goodrich Petroleum Corp. (a) (b) | | 8,943 | | | 202,291 |
Gulfport Energy Corp. (a) (b) | | 12,572 | | | 229,565 |
Harvest Natural Resources, Inc. (a) (b) | | 22,532 | | | 281,650 |
International Coal Group, Inc. (a) (b) | | 80,605 | | | 432,043 |
Kayne Anderson Energy Development Co. | | 6,396 | | | 146,532 |
Knightbridge Tankers, Ltd. (a) | | 10,435 | | | 252,005 |
Mariner Energy, Inc. (b) | | 52,599 | | | 1,203,465 |
Markwest Hydrocarbon, Inc. | | 3,821 | | | 239,386 |
McMoran Exploration Co. (a) (b) | | 17,241 | | | 225,685 |
Meridian Resource Corp. (a) (b) | | 42,979 | | | 77,792 |
NGP Capital Resources Co. (a) | | 10,468 | | | 163,615 |
Nordic American Tanker Shipping (a) | | 17,812 | | | 584,590 |
Oilsands Quest, Inc. (a) (b) | | 69,900 | | | 285,192 |
Pacific Ethanol, Inc. (a) (b) | | 22,411 | | | 183,994 |
Parallel Petroleum Corp. (a) (b) | | 22,143 | | | 390,381 |
Penn Virginia Corp. | | 22,558 | | | 984,205 |
PetroHawk Energy Corp. (a) (b) | | 109,569 | | | 1,896,639 |
Petroleum Development Corp. (a) (b) | | 8,492 | | | 502,132 |
PetroQuest Energy, Inc. (a) (b) | | 28,823 | | | 412,169 |
Rentech, Inc. (a) (b) | | 133,219 | | | 241,126 |
Rosetta Resources, Inc. (b) | | 32,454 | | | 643,563 |
Ship Finance International, Ltd. (a) | | 19,039 | | | 527,571 |
Stone Energy Corp. (b) | | 16,789 | | | 787,572 |
Swift Energy Co. (b) | | 17,689 | | | 778,847 |
Toreador Resources Corp. (a) (b) | | 10,538 | | | 73,661 |
TXCO Resources, Inc. (a) (b) | | 20,226 | | | 243,925 |
| | | | | |
| Security Description | | Shares | | Value* |
| | | | | |
|
Oil, Gas & Consumable Fuels—(Continued) |
Uranium Resources, Inc. (a) (b) | | 32,142 | | $ | 401,132 |
USEC, Inc. (a) (b) | | 63,645 | | | 572,805 |
Vaalco Energy, Inc. (a) (b) | | 34,324 | | | 159,607 |
Venoco, Inc. (a) (b) | | 8,154 | | | 162,509 |
VeraSun Energy Corp. (a) (b) | | 20,803 | | | 317,870 |
Warren Resources, Inc. (b) | | 34,497 | | | 487,443 |
Whiting Petroleum Corp. (b) | | 25,051 | | | 1,444,441 |
World Fuel Services Corp. | | 17,110 | | | 496,703 |
| | | | | |
| | | | | 30,766,722 |
| | | | | |
| | |
Paper & Forest Products—0.3% | | | | | |
AbitibiBowater, Inc. (a) | | 31,843 | | | 656,284 |
Buckeye Technologies, Inc. (b) | | 26,263 | | | 328,287 |
Deltic Timber Corp. | | 6,297 | | | 324,233 |
Glatfelter | | 26,773 | | | 409,895 |
Mercer International, Inc. (a) (b) | | 19,123 | | | 149,733 |
Neenah Paper, Inc. (a) | | 10,748 | | | 313,304 |
Schweitzer-Mauduit International, Inc. | | 12,493 | | | 323,694 |
Wausau-Mosinee Paper Corp. | | 26,829 | | | 241,193 |
| | | | | |
| | | | | 2,746,623 |
| | | | | |
| | |
Personal Products—0.3% | | | | | |
American Oriental Bioengineering, Inc. (b) | | 31,524 | | | 349,286 |
Chattem, Inc. (b) | | 11,061 | | | 835,548 |
Elizabeth Arden, Inc. (b) | | 14,516 | | | 295,400 |
Mannatech, Inc. (a) | | 21,927 | | | 138,579 |
NU Skin Enterprises, Inc. | | 33,522 | | | 550,766 |
Prestige Brands Holdings, Inc. (a) (b) | | 23,318 | | | 174,419 |
Revlon, Inc. (a) (b) | | 120,243 | | | 141,887 |
USANA Health Sciences, Inc. (a) (b) | | 5,737 | | | 212,728 |
| | | | | |
| | | | | 2,698,613 |
| | | | | |
| | |
Pharmaceuticals—1.7% | | | | | |
Adams Respiratory Therapeutics, Inc. (a) (b) | | 21,574 | | | 1,288,831 |
Akorn, Inc. (a) (b) | | 33,037 | | | 242,492 |
Alpharma, Inc. (b) | | 27,114 | | | 546,347 |
Auxilium Pharmaceuticals, Inc. (a) (b) | | 20,238 | | | 606,938 |
Beijing Med-Pharm Corp. (a) (b) | | 17,491 | | | 192,051 |
Bentley Pharmaceuticals, Inc. (b) | | 12,414 | | | 187,327 |
Bradley Pharmaceuticals, Inc. (a) (b) | | 8,703 | | | 171,449 |
Cypress Biosciences, Inc. (b) | | 22,201 | | | 244,877 |
Discovery Laboratories, Inc. (a) (b) | | 54,214 | | | 116,560 |
Durect Corp., Inc. (a) (b) | | 41,647 | | | 267,790 |
Javelin Pharmaceuticals, Inc. (a) (b) | | 27,296 | | | 102,087 |
KV Pharmaceutical Co. (a) (b) | | 25,617 | | | 731,109 |
Medicis Pharmaceutical Corp. (a) (b) | | 33,392 | | | 867,190 |
MGI Pharma, Inc. (b) | | 48,053 | | | 1,947,588 |
Nastech Pharmaceutical, Inc. (a) (b) | | 17,753 | | | 67,461 |
Noven Pharmaceuticals, Inc. (a) (b) | | 17,432 | | | 241,956 |
Pain Therapeutics, Inc. (a) (b) | | 19,603 | | | 207,792 |
Par Pharmaceutical Companies, Inc. (a) (b) | | 19,985 | | | 479,640 |
Penwest Pharmaceuticals Co. (a) (b) | | 14,685 | | | 85,907 |
Perrigo Co. | | 48,543 | | | 1,699,491 |
Pozen, Inc. (a) (b) | | 15,141 | | | 181,692 |
Salix Pharmaceuticals, Ltd. (a) (b) | | 27,105 | | | 213,587 |
*See accompanying notes to financial statements.
MSF-17
Metropolitan Series Fund, Inc.
Russell 2000 Index Portfolio
Schedule of Investments as of December 31, 2007
Common Stock—(Continued)
| | | | | |
| Security Description | | Shares | | Value* |
| | | | | |
| | |
Pharmaceuticals—(Continued) | | | | | |
Santarus, Inc. (a) (b) | | 43,882 | | $ | 120,676 |
Sciele Pharma, Inc. (b) | | 21,586 | | | 441,434 |
Supergen, Inc. (a) (b) | | 30,336 | | | 110,726 |
The Medicines Co. (a) (b) | | 30,908 | | | 592,197 |
Valeant Pharmaceuticals International, Inc. | | 57,024 | | | 682,577 |
ViroPharma, Inc. (a) (b) | | 44,265 | | | 351,464 |
Vivus, Inc. (b) | | 37,397 | | | 193,717 |
Xenoport, Inc. (a) (b) | | 12,803 | | | 715,432 |
| | | | | |
| | | | | 13,898,385 |
| | | | | |
|
Real Estate Investment Trusts—5.5% |
Acadia Realty Trust | | 18,744 | | | 480,034 |
Agree Realty Corp. (a) | | 4,326 | | | 130,213 |
Alesco Financial, Inc. (a) | | 34,321 | | | 112,573 |
Alexander’s, Inc. (a) (b) | | 1,300 | | | 459,225 |
Alexandria Real Estate Equities, Inc. | | 18,979 | | | 1,929,595 |
American Campus Communities, Inc. | | 15,926 | | | 427,613 |
American Financial Realty Trust | | 77,553 | | | 621,975 |
American Home Mortgage Investment Corp. (a) (c) | | 22,105 | | | 376 |
Anthracite Capital, Inc. (a) | | 39,169 | | | 283,584 |
Anworth Mortgage Asset Corp. | | 27,885 | | | 230,330 |
Arbor Realty Trust, Inc. (a) | | 7,348 | | | 118,376 |
Ashford Hospitality Trust, Inc. | | 64,189 | | | 461,519 |
Associated Estates Realty Corp. | | 10,121 | | | 95,542 |
BioMed Realty Trust, Inc. | | 42,940 | | | 994,920 |
Capital Lease Funding, Inc. (a) | | 26,965 | | | 227,045 |
Capital Trust, Inc. (a) | | 7,775 | | | 238,304 |
CBRE Realty Finance, Inc. (a) | | 29,225 | | | 156,062 |
Cedar Shopping Centers, Inc. | | 28,436 | | | 290,900 |
Chimera Investment Corp. | | 16,100 | | | 287,868 |
Corporate Office Properties Trust | | 23,558 | | | 742,077 |
Cousins Properties, Inc. (a) | | 24,120 | | | 533,052 |
Crystal River Capital, Inc. (a) | | 15,330 | | | 221,365 |
DCT Industrial Realty Trust, Inc. | | 105,805 | | | 985,045 |
Deerfield Capital Corp. (a) | | 33,570 | | | 268,560 |
Diamondrock Hospitality Co. | | 57,049 | | | 854,594 |
Digital Realty Trust, Inc. | | 35,419 | | | 1,359,027 |
DuPont Fabros Technology, Inc. | | 16,900 | | | 331,240 |
EastGroup Properties, Inc. | | 13,883 | | | 581,004 |
Education Realty Trust, Inc. | | 15,360 | | | 172,646 |
Entertainment Properties Trust | | 16,641 | | | 782,127 |
Equity Lifestyle Properties, Inc. | | 12,948 | | | 591,335 |
Equity One, Inc. (a) | | 24,905 | | | 573,562 |
Extra Space Storage, Inc. | | 37,255 | | | 532,374 |
FelCor Lodging Trust, Inc. | | 36,854 | | | 574,554 |
First Industrial Realty Trust, Inc. (a) | | 27,374 | | | 947,140 |
First Potomac Realty Trust | | 16,284 | | | 281,550 |
Franklin Street Properties Corp. (a) | | 36,824 | | | 544,995 |
Friedman Billings Ramsey Group, Inc. (a) | | 98,047 | | | 307,868 |
Getty Realty Corp. | | 9,654 | | | 257,569 |
Glimcher Realty Trust (a) | | 22,979 | | | 328,370 |
GMH Communities Trust (a) | | 20,937 | | | 115,572 |
Gramercy Capital Corp. (a) | | 13,048 | | | 317,197 |
Healthcare Realty Trust, Inc. (a) | | 30,414 | | | 772,211 |
Hersha Hospitality Trust | | 25,342 | | | 240,749 |
Highwoods Properties, Inc. | | 40,416 | | | 1,187,422 |
Home Properties of New York, Inc. | | 20,060 | | | 899,691 |
| | | | | |
| Security Description | | Shares | | Value* |
| | | | | |
|
Real Estate Investment Trusts—(Continued) |
IMPAC Mortage Holdings, Inc. (a) (b) | | 80,057 | | $ | 44,832 |
Inland Real Estate Corp. (a) | | 36,358 | | | 514,829 |
Investors Real Estate Trust | | 26,423 | | | 237,014 |
JER Investors Trust, Inc. (a) | | 13,786 | | | 148,475 |
Kite Realty Group Trust | | 14,565 | | | 222,408 |
LaSalle Hotel Properties | | 24,950 | | | 795,905 |
Lexington Corporate Properties Trust | | 43,043 | | | 625,845 |
LTC Properties, Inc. | | 15,049 | | | 376,977 |
Luminent Mortgage Capital, Inc. (a) (b) | | 101,272 | | | 78,992 |
Maguire Properties, Inc. (a) | | 22,799 | | | 671,887 |
Medical Properties Trust, Inc. (a) | | 30,496 | | | 310,754 |
MFA Mortgage Investment, Inc. | | 60,506 | | | 559,681 |
Mid-America Apartment Communities, Inc. | | 15,879 | | | 678,827 |
Mission West Properties | | 12,528 | | | 119,141 |
National Health Investors, Inc. (a) | | 13,381 | | | 373,330 |
National Retail Properties, Inc. | | 42,663 | | | 997,461 |
Nationwide Health Properties, Inc. | | 58,078 | | | 1,821,907 |
Newcastle Investment Corp. (a) | | 25,148 | | | 325,918 |
NorthStar Realty Finance Corp. (a) | | 35,021 | | | 312,387 |
Omega Healthcare Investors, Inc. | | 40,810 | | | 655,000 |
Parkway Properties, Inc. (a) | | 9,472 | | | 350,275 |
Pennsylvania Real Estate Investment Trust | | 19,441 | | | 577,009 |
Post Properties, Inc. (a) | | 26,881 | | | 944,061 |
Potlatch Corp. | | 23,039 | | | 1,023,853 |
PS Business Parks, Inc. | | 9,502 | | | 499,330 |
RAIT Investment Trust (a) | | 39,676 | | | 342,007 |
Ramco-Gershenson Property Trust | | 11,167 | | | 238,639 |
Realty Income Corp. (a) | | 65,128 | | | 1,759,759 |
Redwood Trust, Inc. (a) | | 11,590 | | | 396,842 |
Resource Capital Corp. (a) | | 13,847 | | | 128,916 |
Saul Centers, Inc. | | 7,327 | | | 391,482 |
Senior Housing Properties Trust | | 50,455 | | | 1,144,319 |
Sovran Self Storage, Inc. | | 12,354 | | | 495,395 |
Strategic Hotel Capital, Inc. | | 44,618 | | | 746,459 |
Sun Communities, Inc. | | 12,799 | | | 269,675 |
Sunstone Hotel Investors, Inc. | | 37,671 | | | 689,003 |
Tanger Factory Outlet Centers, Inc. (a) | | 18,763 | | | 707,553 |
U-Store-It Trust | | 31,251 | | | 286,259 |
Universal Health Realty Income Trust, Inc. (a) | | 8,355 | | | 296,101 |
Urstadt Biddle Properties, Inc. | | 12,686 | | | 196,633 |
Washington Real Estate Investment Trust (a) | | 28,245 | | | 887,175 |
Winthrop Realty Trust | | 31,903 | | | 168,767 |
| | | | | |
| | | | | 45,260,032 |
| | | | | |
|
Real Estate Management & Development—0.1% |
Consolidated Tomoka Land Co. (a) | | 3,138 | | | 196,690 |
Hilltop Holdings, Inc. (a) (b) | | 28,463 | | | 310,816 |
Meruelo Maddux Properties, Inc. (b) | | 28,654 | | | 114,616 |
Move, Inc. (a) (b) | | 69,308 | | | 169,804 |
Tejon Ranch Co. (a) (b) | | 5,919 | | | 241,791 |
Thomas Properties Group, Inc. | | 14,851 | | | 160,094 |
| | | | | |
| | | | | 1,193,811 |
| | | | | |
|
Road & Rail—0.5% |
Amerco, Inc. (a) (b) | | 6,294 | | | 413,390 |
Arkansas Best Corp. (a) | | 15,099 | | | 331,272 |
*See accompanying notes to financial statements.
MSF-18
Metropolitan Series Fund, Inc.
Russell 2000 Index Portfolio
Schedule of Investments as of December 31, 2007
Common Stock—(Continued)
| | | | | |
| Security Description | | Shares | | Value* |
| | | | | |
|
Road & Rail—(Continued) |
Celadon Group, Inc. (b) | | 13,384 | | $ | 122,598 |
Dollar Thrifty Automotive Group, Inc. (b) | | 15,896 | | | 376,417 |
Genesee & Wyoming, Inc. (b) | | 22,578 | | | 545,710 |
Heartland Express, Inc. (a) | | 37,668 | | | 534,132 |
Knight Transportation, Inc. (a) | | 34,955 | | | 517,684 |
Marten Transport, Ltd. (a) (b) | | 7,808 | | | 108,922 |
Old Dominion Freight Line, Inc. (a) (b) | | 19,138 | | | 442,279 |
Saia, Inc. (b) | | 8,130 | | | 108,129 |
Werner Enterprises, Inc. (a) | | 33,940 | | | 577,998 |
| | | | | |
| | | | | 4,078,531 |
| | | | | |
|
Semiconductors & Semiconductor Equipment—3.5% |
Actel Corp. (b) | | 13,736 | | | 187,634 |
Advanced Analogic Technologies, Inc. (a) (b) | | 24,209 | | | 273,078 |
Advanced Energy Industries, Inc. (b) | | 23,757 | | | 310,742 |
AMIS Holdings, Inc. (b) | | 40,861 | | | 409,427 |
Amkor Technology, Inc. (a) (b) | | 64,880 | | | 553,426 |
Anadigics, Inc. (a) (b) | | 36,036 | | | 416,936 |
Applied Micro Circuits Corp. (b) | | 42,638 | | | 372,656 |
Asyst Technologies, Inc. (b) | | 26,557 | | | 86,576 |
Atheros Communications, Inc. (b) | | 32,346 | | | 987,847 |
ATMI, Inc. (b) | | 22,055 | | | 711,274 |
Axcelis Technologies, Inc. (b) | | 55,347 | | | 254,596 |
Brooks Automation, Inc. (b) | | 47,372 | | | 625,784 |
Cabot Microelectronics Corp. (a) (b) | | 14,624 | | | 525,148 |
Cirrus Logic, Inc. (b) | | 52,948 | | | 279,565 |
Cohu, Inc. (a) | | 16,023 | | | 245,152 |
Conexant Systems, Inc. (a) (b) | | 293,509 | | | 243,612 |
Credence Systems Corp. (b) | | 75,148 | | | 181,858 |
Cymer, Inc. (a) (b) | | 23,064 | | | 897,881 |
Diodes, Inc. (a) (b) | | 20,159 | | | 606,181 |
DSP Group, Inc. (b) | | 17,234 | | | 210,255 |
Entegris, Inc. (a) (b) | | 80,270 | | | 692,730 |
Exar Corp. (a) (b) | | 26,962 | | | 214,887 |
FEI Co. (a) (b) | | 23,419 | | | 581,494 |
Formfactor, Inc. (b) | | 32,888 | | | 1,088,593 |
Genesis Microchip, Inc. (a) (b) | | 19,110 | | | 163,773 |
Hittite Microwave Corp. (b) | | 10,071 | | | 480,991 |
IXYS Corp. (a) (b) | | 21,409 | | | 171,700 |
Kulicke & Soffa Industries, Inc. (a) (b) | | 32,332 | | | 221,798 |
Lattice Semiconductor Corp. (a) (b) | | 63,675 | | | 206,944 |
LTX Corp. (a) (b) | | 33,422 | | | 106,282 |
Mattson Technology, Inc. (b) | | 29,202 | | | 249,969 |
Micrel, Inc. (a) | | 45,136 | | | 381,399 |
Microsemi Corp. (a) (b) | | 44,890 | | | 993,865 |
Microtune, Inc. (a) (b) | | 32,159 | | | 209,998 |
MIPS Technologies, Inc. (a) (b) | | 33,240 | | | 164,870 |
MKS Instruments, Inc. (b) | | 30,616 | | | 585,990 |
Monolithic Power Systems (a) (b) | | 17,526 | | | 376,283 |
NetLogic Microsystems, Inc. (a) (b) | | 9,879 | | | 318,104 |
OmniVision Technologies, Inc. (a) (b) | | 33,553 | | | 525,104 |
ON Semiconductor Corp. (a) (b) | | 156,175 | | | 1,386,834 |
PDF Solutions, Inc. (a) (b) | | 13,806 | | | 124,392 |
Pericom Semiconductor Corp. (b) | | 16,354 | | | 305,820 |
Photronics, Inc. (b) | | 26,378 | | | 328,934 |
PLX Technology, Inc. (b) | | 14,095 | | | 131,083 |
| | | | | |
| Security Description | | Shares | | Value* |
| | | | | |
|
Semiconductors & Semiconductor Equipment—(Continued) |
PMC-Sierra, Inc. (a) (b) | | 129,140 | | $ | 844,576 |
RF Micro Devices, Inc. (a) (b) | | 162,114 | | | 925,671 |
Rudolph Technologies, Inc. (b) | | 18,029 | | | 204,088 |
Semtech Corp. (b) | | 42,758 | | | 663,604 |
Sigma Designs, Inc. (a) (b) | | 16,526 | | | 912,235 |
Silicon Image, Inc. (b) | | 51,588 | | | 233,178 |
Silicon Storage Technology, Inc. (b) | | 66,738 | | | 199,547 |
SiRF Technology Holdings, Inc. (a) (b) | | 30,930 | | | 777,271 |
Skyworks Solutions, Inc. (b) | | 97,006 | | | 824,551 |
Spansion, Inc. (Class A) (a) (b) | | 54,773 | | | 215,258 |
Standard Microsystems Corp. (b) | | 14,611 | | | 570,852 |
Supertex, Inc. (a) (b) | | 6,854 | | | 214,462 |
Tessera Technologies, Inc. (b) | | 28,758 | | | 1,196,333 |
Trident Microsystems, Inc. (a) (b) | | 33,467 | | | 219,544 |
TriQuint Semiconductor, Inc. (b) | | 86,708 | | | 574,874 |
Ultra Clean Holdings (b) | | 12,131 | | | 147,998 |
Ultratech Stepper, Inc. (a) (b) | | 12,277 | | | 139,221 |
Veeco Instruments, Inc. (a) (b) | | 18,697 | | | 312,240 |
Volterra Semiconductor Corp. (a) (b) | | 12,770 | | | 140,853 |
Zoran Corp. (b) | | 29,361 | | | 660,916 |
| | | | | |
| | | | | 28,368,737 |
| | | | | |
|
Software—3.9% |
ACI Worldwide, Inc. (a) (b) | | 22,537 | | | 429,104 |
Actuate Corp. (b) | | 36,338 | | | 282,346 |
Advent Software, Inc. (a) (b) | | 12,161 | | | 657,910 |
Ansoft Corp. (b) | | 12,283 | | | 317,516 |
ANSYS, Inc. (b) | | 50,372 | | | 2,088,423 |
Aspen Technology, Inc. (b) | | 53,444 | | | 866,862 |
Blackbaud, Inc. | | 27,827 | | | 780,269 |
Blackboard, Inc. (b) | | 16,794 | | | 675,959 |
Borland Software Corp. (a) (b) | | 47,333 | | | 142,472 |
Bottomline Technologies, Inc. (b) | | 12,369 | | | 173,166 |
Commvault Systems, Inc. (b) | | 21,874 | | | 463,291 |
Concur Technologies, Inc. (b) | | 25,154 | | | 910,826 |
Epicor Software Corp. (b) | | 37,761 | | | 444,825 |
EPIQ System, Inc. (b) | | 16,229 | | | 282,547 |
FalconStor Software, Inc. (a) (b) | | 30,124 | | | 339,196 |
i2 Technologies, Inc. (a) (b) | | 8,649 | | | 108,977 |
Informatica Corp. (b) | | 50,800 | | | 915,416 |
Interactive Intelligence, Inc. (b) | | 8,397 | | | 221,261 |
Intervoice, Inc. (b) | | 23,310 | | | 186,247 |
Jack Henry & Associates, Inc. | | 54,675 | | | 1,330,790 |
JDA Software Group, Inc. (b) | | 21,699 | | | 443,962 |
Lawson Software, Inc. (b) | | 74,434 | | | 762,204 |
Macrovision Corp. (b) | | 32,000 | | | 586,560 |
Magma Design Automation, Inc. (b) | | 24,388 | | | 297,777 |
Manhattan Associates, Inc. (b) | | 15,513 | | | 408,923 |
Mentor Graphics Corp. (b) | | 53,271 | | | 574,261 |
MICROS Systems, Inc. (b) | | 26,633 | | | 1,868,571 |
MicroStrategy, Inc. (Class A) (b) | | 6,205 | | | 590,096 |
MSC.Software Corp. (b) | | 27,127 | | | 352,380 |
Net 1 UEPS Technologies, Inc. (a) (b) | | 29,781 | | | 874,370 |
Nuance Communications, Inc. (a) (b) | | 97,610 | | | 1,823,355 |
Parametric Technology Corp. (b) | | 67,494 | | | 1,204,768 |
Progress Software Corp. (b) | | 26,687 | | | 898,818 |
*See accompanying notes to financial statements.
MSF-19
Metropolitan Series Fund, Inc.
Russell 2000 Index Portfolio
Schedule of Investments as of December 31, 2007
Common Stock—(Continued)
| | | | | |
| Security Description | | Shares | | Value* |
| | | | | |
|
Software—(Continued) |
Quality Systems, Inc. (a) | | 9,392 | | $ | 286,362 |
Quest Software, Inc. (b) | | 40,243 | | | 742,081 |
Radiant Systems, Inc. (a) (b) | | 15,752 | | | 271,407 |
Secure Computing Corp. (a) (b) | | 39,694 | | | 381,062 |
Smith Micro Software, Inc. (a) (b) | | 18,686 | | | 158,270 |
Solera Holdings, Inc. (b) | | 16,246 | | | 402,576 |
Sonic Solutions (a) (b) | | 16,198 | | | 168,297 |
SourceForge, Inc. (a) (b) | | 75,477 | | | 184,919 |
SPSS, Inc. (a) (b) | | 10,624 | | | 381,508 |
Sybase, Inc. (b) | | 60,313 | | | 1,573,566 |
Synchronoss Technologies, Inc. (a) (b) | | 11,423 | | | 404,831 |
Take-Two Interactive Software, Inc. (a) (b) | | 44,011 | | | 812,003 |
Taleo Corp. (b) | | 10,434 | | | 310,725 |
The Ultimate Software Group, Inc. (b) | | 16,554 | | | 520,954 |
THQ, Inc. (b) | | 42,100 | | | 1,186,799 |
TIBCO Software, Inc. (b) | | 125,508 | | | 1,012,850 |
Tyler Technologies, Inc. (a) | | 23,370 | | | 301,239 |
Vasco Data Security International, Inc. (b) | | 14,994 | | | 418,632 |
Wind River Systems, Inc. (b) | | 48,121 | | | 429,721 |
| | | | | |
| | | | | 32,251,250 |
| | | | | |
|
Specialty Retail—2.2% |
A.C. Moore Arts & Crafts, Inc. (a) (b) | | 12,632 | | | 173,690 |
Aaron Rents, Inc. (Class B) (a) | | 27,193 | | | 523,193 |
Aeropostale, Inc. (b) | | 46,697 | | | 1,237,470 |
Asbury Automotive Group, Inc. | | 15,742 | | | 236,917 |
Bebe Stores, Inc. (a) | | 14,075 | | | 181,005 |
Big 5 Sporting Goods Corp. (a) | | 15,464 | | | 222,991 |
Blockbuster, Inc. (a) (b) | | 121,924 | | | 475,504 |
Books-A-Million, Inc. (a) | | 8,899 | | | 106,076 |
Borders Group, Inc. (a) | | 37,348 | | | 397,756 |
Buckle, Inc. | | 8,427 | | | 278,091 |
Build-A-Bear-Workshop, Inc. (b) | | 8,177 | | | 114,069 |
Cabelas, Inc. (a) (b) | | 23,327 | | | 351,538 |
Casual Male Retail Group, Inc. (a) (b) | | 22,096 | | | 114,457 |
Cato Corp. | | 20,861 | | | 326,683 |
Charlotte Russe Holding, Inc. (b) | | 15,539 | | | 250,955 |
Charming Shoppes, Inc. (a) (b) | | 74,119 | | | 400,984 |
Christopher & Banks Corp. (a) | | 19,581 | | | 224,202 |
Citi Trends, Inc. (a) (b) | | 8,551 | | | 132,027 |
Collective Brands, Inc. (b) | | 39,343 | | | 684,175 |
Conn’s, Inc. (a) (b) | | 7,311 | | | 125,091 |
CSK Auto Corp. (a) (b) | | 26,489 | | | 132,710 |
DSW, Inc. (Class A) (a) (b) | | 9,118 | | | 171,054 |
Eddie Bauer Holdings, Inc. (a) (b) | | 19,007 | | | 120,694 |
Genesco, Inc. (a) (b) | | 13,502 | | | 510,376 |
Group 1 Automotive, Inc. (a) | | 15,023 | | | 356,796 |
Haverty Furniture Cos., Inc. (a) | | 14,903 | | | 133,978 |
Hibbett Sports, Inc. (a) (b) | | 20,742 | | | 414,425 |
Hot Topic, Inc. (b) | | 28,681 | | | 166,923 |
J. Crew Group, Inc. (a) (b) | | 23,470 | | | 1,131,489 |
Jo-Ann Stores, Inc. (a) (b) | | 17,237 | | | 225,460 |
JoS. A. Bank Clothiers, Inc. (a) (b) | | 10,071 | | | 286,520 |
Lithia Motors, Inc. (a) | | 10,432 | | | 143,231 |
Midas, Inc. (b) | | 12,016 | | | 176,155 |
Monro Muffler Brake, Inc. | | 11,587 | | | 225,831 |
| | | | | |
| Security Description | | Shares | | Value* |
| | | | | |
|
Specialty Retail—(Continued) |
New York & Co., Inc. (b) | | 27,444 | | $ | 175,093 |
Pacific Sunwear of California, Inc. (b) | | 41,245 | | | 581,967 |
Pep Boys-Manny Moe & Jack (a) | | 25,683 | | | 294,841 |
Pier 1 Imports, Inc. (a) (b) | | 55,682 | | | 291,217 |
Rent-A-Center, Inc. (a) (b) | | 43,057 | | | 625,188 |
Sally Beauty Holdings, Inc. (a) (b) | | 57,066 | | | 516,447 |
Select Comfort Corp. (a) (b) | | 32,528 | | | 228,021 |
Shoe Carnival, Inc. (a) (b) | | 8,573 | | | 120,965 |
Sonic Automotive, Inc. | | 19,007 | | | 367,976 |
Stage Stores, Inc. (a) | | 24,947 | | | 369,216 |
Stein Mart, Inc. (a) | | 15,704 | | | 74,437 |
The Children’s Place Retail Stores, Inc. (a) (b) | | 13,501 | | | 350,081 |
The Dress Barn, Inc. (b) | | 30,389 | | | 380,166 |
The Finish Line, Inc. (Class A) (b) | | 29,843 | | | 72,220 |
The Gymboree Corp. (b) | | 19,498 | | | 593,909 |
The Men’s Wearhouse, Inc. | | 35,036 | | | 945,271 |
The Talbots, Inc. (a) | | 15,495 | | | 183,151 |
Tween Brands, Inc. (b) | | 18,948 | | | 501,743 |
Wet Seal, Inc. (a) (b) | | 49,181 | | | 114,592 |
Zale Corp. (a) (b) | | 28,025 | | | 450,082 |
Zumiez, Inc. (a) (b) | | 10,595 | | | 258,094 |
| | | | | |
| | | | | 18,247,193 |
| | | | | |
| | |
Textiles, Apparel & Luxury Goods—1.4% | | | | | |
Brown Shoe Co., Inc. | | 26,195 | | | 397,378 |
Carter’s, Inc. (b) | | 35,318 | | | 683,403 |
Cherokee, Inc. (a) | | 3,788 | | | 122,239 |
Columbia Sportswear Co. (a) | | 8,790 | | | 387,551 |
Deckers Outdoor Corp. (a) (b) | | 7,496 | | | 1,162,330 |
Fossil, Inc. (b) | | 26,121 | | | 1,096,560 |
Iconix Brand Group, Inc. (b) | | 30,427 | | | 598,195 |
K-Swiss, Inc. (a) | | 14,921 | | | 270,070 |
Kellwood Co. (a) | | 14,012 | | | 233,160 |
Kenneth Cole Productions, Inc. (a) | | 5,987 | | | 104,713 |
Luluemon Athletica, Inc. (a) (b) | | 10,951 | | | 518,749 |
Maidenform Brands, Inc. (a) (b) | | 14,280 | | | 193,208 |
Movado Group, Inc. | | 10,013 | | | 253,229 |
Oxford Industries, Inc. (a) | | 8,566 | | | 220,746 |
Perry Ellis International, Inc. (b) | | 6,720 | | | 103,354 |
Quiksilver, Inc. (a) (b) | | 72,330 | | | 620,591 |
Skechers U. S. A., Inc. (b) | | 12,549 | | | 244,831 |
Steven Madden, Ltd. (b) | | 13,172 | | | 263,440 |
The Warnaco Group, Inc. (b) | | 27,189 | | | 946,177 |
Timberland Co. (Class A) (b) | | 28,756 | | | 519,908 |
True Religion Apparel, Inc. (a) (b) | | 8,724 | | | 186,257 |
Under Armour, Inc. (a) (b) | | 14,724 | | | 642,997 |
UniFirst Corp. (a) | | 8,591 | | | 326,458 |
Volcom, Inc. (a) (b) | | 7,844 | | | 172,803 |
Wolverine World Wide, Inc. | | 35,799 | | | 877,792 |
| | | | | |
| | | | | 11,146,139 |
| | | | | |
| | |
Thrifts & Mortgage Finance—1.1% | | | | | |
Anchor Bancorp Wisconsin, Inc. (a) | | 13,639 | | | 320,789 |
Bank Mutual Corp. | | 43,000 | | | 454,510 |
BankAtlantic Bancorp, Inc. (Class A) (a) | | 30,322 | | | 124,320 |
BankUnited Financial Corp. (a) | | 18,035 | | | 124,442 |
*See accompanying notes to financial statements.
MSF-20
Metropolitan Series Fund, Inc.
Russell 2000 Index Portfolio
Schedule of Investments as of December 31, 2007
Common Stock—(Continued)
| | | | | |
| Security Description | | Shares | | Value* |
| | | | | |
| | |
Thrifts & Mortgage Finance—(Continued) | | | | | |
Berkshire Hill Bancorp, Inc. (a) | | 4,386 | | $ | 114,036 |
Brookline Bancorp, Inc. | | 41,732 | | | 423,997 |
Centerline Holding Co. (a) | | 32,116 | | | 244,724 |
Corus Bankshares, Inc. (a) | | 22,730 | | | 242,529 |
Dime Community Bancorp, Inc. (a) | | 17,298 | | | 220,895 |
Downey Financial Corp. (a) | | 12,930 | | | 402,252 |
Federal Agricultural Mortage Corp. (a) | | 7,740 | | | 203,717 |
First Busey Corp. (a) | | 14,750 | | | 292,935 |
First Financial Holdings, Inc. (a) | | 6,397 | | | 175,406 |
First Niagara Financial Group, Inc. | | 65,452 | | | 788,042 |
First Place Financial Corp. (a) | | 9,007 | | | 126,008 |
FirstFed Financial Corp. (a) (b) | | 9,423 | | | 337,532 |
Flagstar Bancorp, Inc. (a) | | 23,560 | | | 164,213 |
Flushing Financial Corp. | | 12,920 | | | 207,366 |
Franklin Bank Corp. (a) (b) | | 13,649 | | | 58,827 |
Fremont General Corp. (a) | | 41,423 | | | 144,981 |
Imperial Capital Bancorp, Inc. | | 4,760 | | | 87,108 |
Kearny Financial Corp. (a) | | 11,434 | | | 136,179 |
KNBT Bancorp. (a) | | 14,978 | | | 230,961 |
NewAlliance Bancshares, Inc. (a) | | 70,024 | | | 806,677 |
NexCen Brands, Inc. (a) (b) | | 26,031 | | | 125,990 |
Northwest Bancorp, Inc. (a) | | 11,002 | | | 292,323 |
Novastar Financial, Inc. (a) (b) | | 10,253 | | | 29,631 |
Ocwen Financial Corp. (a) (b) | | 21,044 | | | 116,584 |
PFF Bancorp, Inc. (a) | | 16,606 | | | 199,936 |
Provident Bancorp, Inc. (a) | | 23,182 | | | 299,511 |
Provident Financial Services, Inc. | | 37,874 | | | 546,143 |
TierOne Corp. | | 11,318 | | | 250,694 |
Triad Guaranty, Inc. (a) (b) | | 6,298 | | | 61,720 |
TrustCo Bank Corp. (a) | | 45,076 | | | 447,154 |
United Community Financial Corp. (a) | | 15,799 | | | 87,211 |
WSFS Financial Corp. | | 3,267 | | | 164,003 |
| | | | | |
| | | | | 9,053,346 |
| | | | | |
| | |
Tobacco—0.2% | | | | | |
Alliance One International, Inc. (b) | | 57,683 | | | 234,770 |
Universal Corp. (a) | | 16,420 | | | 841,032 |
Vector Group, Ltd. (a) | | 25,754 | | | 516,625 |
| | | | | |
| | | | | 1,592,427 |
| | | | | |
| | |
Trading Companies & Distributors—0.6% | | | | | |
Applied Industrial Technologies, Inc. | | 27,967 | | | 811,602 |
Beacon Roofing Supply, Inc. (a) (b) | | 29,180 | | | 245,696 |
Electro Rent Corp. (a) | | 8,653 | | | 128,497 |
H&E Equipment Services, Inc. (b) | | 11,032 | | | 208,284 |
Houston Wire & Cable Co. (a) | | 10,450 | | | 147,763 |
Interline Brands, Inc. (b) | | 16,945 | | | 371,265 |
Kaman Corp. | | 14,481 | | | 533,046 |
NuCo2, Inc. (a) (b) | | 8,604 | | | 214,240 |
Rush Enterprises, Inc. (a) (b) | | 19,917 | | | 362,091 |
TAL International Group, Inc. | | 8,589 | | | 195,571 |
UAP Holdings Corp. (a) | | 32,146 | | | 1,240,836 |
Watsco, Inc. (a) | | 13,865 | | | 509,677 |
| | | | | |
| | | | | 4,968,568 |
| | | | | |
| | | | | | | |
| Security Description | | Shares | | Value* | |
| | | | | | | |
| | |
Water Utilities—0.2% | | | | | | | |
American State Water Co. | | | 10,318 | | $ | 388,782 | |
Cadiz, Inc. (a) (b) | | | 7,581 | | | 159,201 | |
California Water Service Group (a) | | | 11,744 | | | 434,763 | |
Consolidated Water Co., Inc. (a) | | | 8,783 | | | 221,244 | |
SJW Corp. (a) | | | 10,058 | | | 348,711 | |
Southwest Water Co. (a) | | | 15,204 | | | 190,354 | |
| | | | | | | |
| | | | | | 1,743,055 | |
| | | | | | | |
| |
Wireless Telecommunication Services—0.2% | | | | |
Fibertower Corp. (a) (b) | | | 64,566 | | | 147,211 | |
ICO Global Communications Holdings (a) (b) | | | 62,811 | | | 199,739 | |
iPCS, Inc. (b) | | | 11,024 | | | 396,754 | |
Rural Cellular Corp. (b) | | | 7,433 | | | 327,721 | |
Syniverse Holdings, Inc. (b) | | | 16,623 | | | 258,986 | |
USA Mobility, Inc. (b) | | | 15,317 | | | 219,033 | |
| | | | | | | |
| | | | | | 1,549,444 | |
| | | | | | | |
Total Common Stock
(Identified Cost $747,600,727) | | | | | | 791,444,765 | |
| | | | | | | |
| | |
| Rights—0.0% | | | | | | | |
| | |
Electrical Equipment—0.0% | | | | | | | |
Medis Technologies, Ltd. (a) | | | 1,184 | | | 18,269 | |
| | | | | | | |
| | |
Thrifts & Mortgage Finance—0.0% | | | | | | | |
BankUnited Financial Corp. (d) (e) | | | 4,713 | | | 0 | |
| | | | | | | |
Total Rights
(Identified Cost $1,603) | | | | | | 18,269 | |
| | | | | | | |
| | |
| Short Term Investments—28.5% | | | | | | | |
| Security Description | | Face
Amount/ Shares | | Value* | |
| | |
Discount Notes—3.2% | | | | | | | |
Federal Home Loan Bank
4.15%, 01/14/08 | | $ | 26,125,000 | | | 26,094,339 | |
| | |
Mutual Funds—25.3% | | | | | | | |
State Street Navigator Securities Lending Prime Portfolio (f) | | | 207,333,953 | | | 207,333,953 | |
| | | | | | | |
Total Short Term Investments
(Identified Cost $233,428,292) | | | | | | 233,428,292 | |
| | | | | | | |
Total Investments—125.1%
(Identified Cost $981,030,622) (g) | | | | | | 1,024,891,326 | |
Liabilities in excess of other assets | | | | | | (206,337,429 | ) |
| | | | | | | |
| Total Net Assets—100% | | | | | $ | 818,553,897 | |
| | | | | | | |
*See accompanying notes to financial statements.
MSF-21
Metropolitan Series Fund, Inc.
Russell 2000 Index Portfolio
Schedule of Investments as of December 31, 2007
| (a) | A portion or all of the security was held on loan. As of December 31, 2007, the market value of securities loaned was $200,363,820 and the collateral received consisted of cash in the amount of $207,333,953 and non cash collateral with a value of $358,212. The cash collateral is invested in a money market fund managed by an affiliate of the custodian. The non cash collateral received consists primarily of government securities and bank letters of credit, and are held for the benefit of the Portfolio at the Portfolio’s custodian. |
| (c) | Non-Income Producing; issuer filed under Chapter 11 of the Federal Bankruptcy Code. |
| (e) | Security was valued in good faith under procedures established by the Board of Directors. |
| (f) | Represents investment of cash collateral received from securities lending transactions. |
| (g) | The aggregate cost of investments for federal income tax purposes as of December 31, 2007 was $981,166,569 and the composition of unrealized appreciation and depreciation of investment securities was $126,535,147 and $(82,810,390), respectively. |
Futures Contracts
| | | | | | | | | | | | | | |
Futures Contracts—Long | | Expiration Date | | Number of
Contracts | | Contract
Amount | | Valuation as of
12/31/2007 | | Net
Unrealized
Depreciation | |
Russell 2000 Index Futures | | 3/19/2008 | | 65 | | $ | 25,949,950 | | $ | 25,096,500 | | $ | (853,450 | ) |
| | | | | | | | | | | | | | |
*See accompanying notes to financial statements.
MSF-22
Metropolitan Series Fund, Inc.
Russell 2000 Index Portfolio
Statement of Assets & Liabilities
December 31, 2007
| | | | | | |
Assets | | | | | | |
Investments at value (a) (b) | | | | | $ | 1,024,891,326 |
Cash | | | | | | 888,568 |
Receivable for: | | | | | | |
Securities sold | | | | | | 3,187,009 |
Fund shares sold | | | | | | 1,021,934 |
Accrued interest and dividends | | | | | | 1,123,918 |
| | | | | | |
Total Assets | | | | | | 1,031,112,755 |
Liabilities | | | | | | |
Payable for: | | | | | | |
Securities purchased | | $ | 4,396,924 | | | |
Fund shares redeemed | | | 525,492 | | | |
Futures variation margin | | | 35,750 | | | |
Withholding taxes | | | 308 | | | |
Collateral for securities loaned | | | 207,333,953 | | | |
Accrued expenses: | | | | | | |
Management fees | | | 170,299 | | | |
Service and distribution fees | | | 40,423 | | | |
Other expenses | | | 55,709 | | | |
| | | | | | |
Total Liabilities | | | | | | 212,558,858 |
| | | | | | |
Net Assets | | | | | $ | 818,553,897 |
| | | | | | |
Net assets consists of: | | | | | | |
Capital paid in | | | | | $ | 732,125,321 |
Undistributed net investment income | | | | | | 8,346,869 |
Accumulated net realized gains | | | | | | 35,074,453 |
Unrealized appreciation on investments and futures contracts | | | | | | 43,007,254 |
| | | | | | |
Net Assets | | | | | $ | 818,553,897 |
| | | | | | |
| Computation of offering price: | | | | | | |
Class A | | | | | | |
Net asset value and redemption price per share ($610,844,182 divided by 43,115,686 shares outstanding) | | | | | $ | 14.17 |
| | | | | | |
Class B | | | | | | |
Net asset value and redemption price per share ($160,848,896 divided by 11,543,541 shares outstanding) | | | | | $ | 13.93 |
| | | | | | |
Class E | | | | | | |
Net asset value and redemption price per share ($46,860,819 divided by 3,323,553 shares outstanding) | | | | | $ | 14.10 |
| | | | | | |
(a) Identified cost of investments | | | | | $ | 981,030,622 |
| | | | | | |
| (b) | Includes cash collateral for securities loaned of $207,333,953. |
Statement of Operations
For the Year Ended December 31, 2007
| | | | | | | | |
Investment Income | | | | | | | | |
Dividends | | | | | | $ | 9,188,161 | (a) |
Interest | | | | | | | 2,454,150 | (b) |
| | | | | | | | |
| | | | | | | 11,642,311 | |
Expenses | | | | | | | | |
Management fees | | $ | 1,645,583 | | | | | |
Service and distribution fees—Class B | | | 421,001 | | | | | |
Service and distribution fees—Class E | | | 80,137 | | | | | |
Directors’ fees and expenses | | | 23,669 | | | | | |
Custodian | | | 112,697 | | | | | |
Audit and tax services | | | 31,737 | | | | | |
Legal | | | 7,468 | | | | | |
Printing | | | 251,498 | | | | | |
Insurance | | | 6,242 | | | | | |
Miscellaneous | | | 20,908 | | | | | |
| | | | | | | | |
Total expenses | | | 2,600,940 | | | | | |
Management fee waivers | | | (46,076 | ) | | | 2,554,864 | |
| | | | | | | | |
Net Investment Income | | | | | | | 9,087,447 | |
| | | | | | | | |
Realized and Unrealized Gain (Loss) | | | | | | | | |
| Realized gain (loss) on: | | | | | | | | |
Investments—net | | | 35,143,945 | | | | | |
Futures contracts—net | | | (852,105 | ) | | | 34,291,840 | |
| | | | | | | | |
| Change in unrealized depreciation on: | | | | | | | | |
Investments—net | | | (59,890,953 | ) | | | | |
Futures contracts—net | | | (708,270 | ) | | | (60,599,223 | ) |
| | | | | | | | |
Net loss | | | | | | | (26,307,383 | ) |
| | | | | | | | |
Net Decrease in Net Assets From Operations | | | | | | $ | (17,219,936 | ) |
| | | | | | | | |
| (a) | Net of foreign taxes of $2,696. |
| (b) | Includes net income on securities loaned of $1,138,452. |
See accompanying notes to financial statements.
MSF-23
Metropolitan Series Fund, Inc.
Russell 2000 Index Portfolio
Statements of Changes in Net Assets
| | | | | | | | |
| | | Year ended
December 31,
2007 | | | Year ended
December 31,
2006 | |
From Operations | | | | | | | | |
Net investment income | | $ | 9,087,447 | | | $ | 5,426,129 | |
Net realized gain | | | 34,291,840 | | | | 42,312,347 | |
Unrealized appreciation (depreciation) | | | (60,599,223 | ) | | | 31,029,317 | |
| | | | | | | | |
Increase (decrease) in net assets from operations | | | (17,219,936 | ) | | | 78,767,793 | |
| | | | | | | | |
From Distributions to Shareholders | | | | | | | | |
Net investment income | | | | | | | | |
Class A | | | (3,188,576 | ) | | | (2,492,950 | ) |
Class B | | | (1,196,833 | ) | | | (779,273 | ) |
Class E | | | (431,556 | ) | | | (362,193 | ) |
| | | | | | | | |
| | | (4,816,965 | ) | | | (3,634,416 | ) |
| | | | | | | | |
Net realized gain | | | | | | | | |
Class A | | | (26,094,268 | ) | | | (11,542,164 | ) |
Class B | | | (12,971,085 | ) | | | (4,927,018 | ) |
Class E | | | (4,153,294 | ) | | | (2,009,144 | ) |
| | | | | | | | |
| | | (43,218,647 | ) | | | (18,478,326 | ) |
| | | | | | | | |
Total distributions | | | (48,035,612 | ) | | | (22,112,742 | ) |
| | | | | | | | |
Increase in net assets from capital share transactions | | | 338,031,175 | | | | 64,478,331 | |
| | | | | | | | |
Total increase in net assets | | | 272,775,627 | | | | 121,133,382 | |
| | |
Net Assets | | | | | | | | |
Beginning of the period | | | 545,778,270 | | | | 424,644,888 | |
| | | | | | | | |
End of the period | | $ | 818,553,897 | | | $ | 545,778,270 | |
| | | | | | | | |
Undistributed Net Investment Income | | | | | | | | |
End of the period | | $ | 8,346,869 | | | $ | 4,790,491 | |
| | | | | | | | |
Other Information:
Capital Shares
Transactions in capital shares were as follows:
| | | | | | | | | | | | | | |
| | | Year ended
December 31, 2007 | | | Year ended
December 31, 2006 | |
| | Shares | | | $ | | | Shares | | | $ | |
Class A | | | | | | | | | | | | | | |
Sales | | 26,866,189 | | | $ | 396,007,191 | | | 7,058,753 | | | $ | 104,860,923 | |
Reinvestments | | 1,931,586 | | | | 29,282,844 | | | 927,022 | | | | 14,035,114 | |
Redemptions | | (6,831,606 | ) | | | (103,249,575 | ) | | (5,975,413 | ) | | | (88,805,816 | ) |
| | | | | | | | | | | | | | |
Net increase | | 21,966,169 | | | $ | 322,040,460 | | | 2,010,362 | | | $ | 30,090,221 | |
| | | | | | | | | | | | | | |
Class B | | | | | | | | | | | | | | |
Sales | | 3,050,121 | | | $ | 45,954,278 | | | 4,054,683 | | | $ | 59,147,033 | |
Reinvestments | | 948,321 | | | | 14,167,918 | | | 381,947 | | | | 5,706,291 | |
Redemptions | | (2,751,410 | ) | | | (41,002,941 | ) | | (2,058,160 | ) | | | (30,081,414 | ) |
| | | | | | | | | | | | | | |
Net increase | | 1,247,032 | | | $ | 19,119,255 | | | 2,378,470 | | | $ | 34,771,910 | |
| | | | | | | | | | | | | | |
Class E | | | | | | | | | | | | | | |
Sales | | 479,620 | | | $ | 7,307,786 | | | 719,276 | | | $ | 10,559,339 | |
Reinvestments | | 303,632 | | | | 4,584,850 | | | 157,042 | | | | 2,371,337 | |
Redemptions | | (996,313 | ) | | | (15,021,176 | ) | | (908,461 | ) | | | (13,314,476 | ) |
| | | | | | | | | | | | | | |
Net decrease | | (213,061 | ) | | $ | (3,128,540 | ) | | (32,143 | ) | | $ | (383,800 | ) |
| | | | | | | | | | | | | | |
Increase derived from capital share transactions | | | | | $ | 338,031,175 | | | | | | $ | 64,478,331 | |
| | | | | | | | | | | | | | |
See accompanying notes to financial statements.
MSF-24
Metropolitan Series Fund, Inc.
Russell 2000 Index Portfolio
Financial Highlights
| | | | | | | | | | | | | | | | | | | | |
| | | Class A | |
| | | Year ended December 31, | |
| | | 2007 | | | 2006 | | | 2005 | | | 2004 | | | 2003 | |
Net Asset Value, Beginning of Period | | $ | 15.68 | | | $ | 13.92 | | | $ | 14.01 | | | $ | 11.95 | | | $ | 8.25 | |
| | | | | | | | | | | | | | | | | | | | |
Income From Investment Operations | | | | | | | | | | | | | | | | | | | | |
Net investment income | | | 0.22 | (a) | | | 0.18 | (a) | | | 0.14 | | | | 0.12 | | | | 0.08 | |
Net realized and unrealized gain (loss) of investments | | | (0.38 | ) | | | 2.30 | | | | 0.40 | | | | 2.00 | | | | 3.69 | |
| | | | | | | | | | | | | | | | | | | | |
Total from investment operations | | | (0.16 | ) | | | 2.48 | | | | 0.54 | | | | 2.12 | | | | 3.77 | |
| | | | | | | | | | | | | | | | | | | | |
Less Distributions | | | | | | | | | | | | | | | | | | | | |
Distributions from net investment income | | | (0.15 | ) | | | (0.13 | ) | | | (0.11 | ) | | | (0.06 | ) | | | (0.07 | ) |
Distributions from net realized capital gains | | | (1.20 | ) | | | (0.59 | ) | | | (0.52 | ) | | | 0.00 | | | | 0.00 | |
| | | | | | | | | | | | | | | | | | | | |
Total distributions | | | (1.35 | ) | | | (0.72 | ) | | | (0.63 | ) | | | (0.06 | ) | | | (0.07 | ) |
| | | | | | | | | | | | | | | | | | | | |
Net Asset Value, End of Period | | $ | 14.17 | | | $ | 15.68 | | | $ | 13.92 | | | $ | 14.01 | | | $ | 11.95 | |
| | | | | | | | | | | | | | | | | | | | |
Total Return (%) | | | (1.6 | ) | | | 18.0 | | | | 4.5 | | | | 17.8 | | | | 46.1 | |
Ratio of operating expenses to average net assets (%) | | | 0.31 | | | | 0.35 | | | | 0.35 | | | | 0.37 | | | | 0.47 | |
Ratio of operating expenses to average net assets without giving effect to the contractual expense agreement would have been (%) (b) | | | 0.32 | | | | 0.36 | | | | 0.36 | | | | N/A | | | | N/A | |
Ratio of net investment income to average net assets (%) | | | 1.47 | | | | 1.21 | | | | 1.10 | | | | 0.97 | | | | 0.89 | |
Portfolio turnover rate (%) | | | 37 | | | | 44 | | | | 39 | | | | 39 | | | | 42 | |
Net assets, end of period (000) | | $ | 610,844 | | | $ | 331,568 | | | $ | 266,467 | | | $ | 254,898 | | | $ | 216,744 | |
| | | | | | | | | | | | | | | | | | | | |
| | | Class B | |
| | | Year ended December 31, | |
| | | 2007 | | | 2006 | | | 2005 | | | 2004 | | | 2003 | |
Net Asset Value, Beginning of Period | | $ | 15.44 | | | $ | 13.73 | | | $ | 13.82 | | | $ | 11.80 | | | $ | 8.16 | |
| | | | | | | | | | | | | | | | | | | | |
Income From Investment Operations | | | | | | | | | | | | | | | | | | | | |
Net investment income | | | 0.18 | (a) | | | 0.14 | (a) | | | 0.10 | | | | 0.08 | | | | 0.05 | |
Net realized and unrealized gain (loss) of investments | | | (0.38 | ) | | | 2.25 | | | | 0.41 | | | | 1.98 | | | | 3.65 | |
| | | | | | | | | | | | | | | | | | | | |
Total from investment operations | | | (0.20 | ) | | | 2.39 | | | | 0.51 | | | | 2.06 | | | | 3.70 | |
| | | | | | | | | | | | | | | | | | | | |
Less Distributions | | | | | | | | | | | | | | | | | | | | |
Distributions from net investment income | | | (0.11 | ) | | | (0.09 | ) | | | (0.08 | ) | | | (0.04 | ) | | | (0.06 | ) |
Distributions from net realized capital gains | | | (1.20 | ) | | | (0.59 | ) | | | (0.52 | ) | | | 0.00 | | | | 0.00 | |
| | | | | | | | | | | | | | | | | | | | |
Total distributions | | | (1.31 | ) | | | (0.68 | ) | | | (0.60 | ) | | | (0.04 | ) | | | (0.06 | ) |
| | | | | | | | | | | | | | | | | | | | |
Net Asset Value, End of Period | | $ | 13.93 | | | $ | 15.44 | | | $ | 13.73 | | | $ | 13.82 | | | $ | 11.80 | |
| | | | | | | | | | | | | | | | | | | | |
Total Return (%) | | | (1.8 | ) | | | 17.6 | | | | 4.3 | | | | 17.4 | | | | 45.7 | |
Ratio of operating expenses to average net assets (%) | | | 0.56 | | | | 0.60 | | | | 0.60 | | | | 0.62 | | | | 0.72 | |
Ratio of operating expenses to average net assets without giving effect to the contractual expense agreement would have been (%) (b) | | | 0.57 | | | | 0.61 | | | | 0.61 | | | | N/A | | | | N/A | |
Ratio of net investment income to average net assets (%) | | | 1.17 | | | | 0.97 | | | | 0.87 | | | | 0.77 | | | | 0.64 | |
Portfolio turnover rate (%) | | | 37 | | | | 44 | | | | 39 | | | | 39 | | | | 42 | |
Net assets, end of period (000) | | $ | 160,849 | | | $ | 159,003 | | | $ | 108,689 | | | $ | 76,322 | | | $ | 39,911 | |
| (a) | Per share amount is based on average shares outstanding during the period. |
| (b) | See Note 4 in the Notes to Financial Statements. |
See accompanying notes to financial statements.
MSF-25
Metropolitan Series Fund, Inc.
Russell 2000 Index Portfolio
Financial Highlights
| | | | | | | | | | | | | | | | | | | | |
| | | Class E | |
| | | Year ended December 31, | |
| | | 2007 | | | 2006 | | | 2005 | | | 2004 | | | 2003 | |
Net Asset Value, Beginning of Period | | $ | 15.61 | | | $ | 13.87 | | | $ | 13.95 | | | $ | 11.92 | | | $ | 8.23 | |
| | | | | | | | | | | | | | | | | | | | |
Income From Investment Operations | | | | | | | | | | | | | | | | | | | | |
Net investment income | | | 0.19 | (a) | | | 0.16 | (a) | | | 0.13 | | | | 0.09 | | | | 0.07 | |
Net realized and unrealized gain (loss) of investments | | | (0.37 | ) | | | 2.28 | | | | 0.40 | | | | 1.99 | | | | 3.69 | |
| | | | | | | | | | | | | | | | | | | | |
Total from investment operations | | | (0.18 | ) | | | 2.44 | | | | 0.53 | | | | 2.08 | | | | 3.76 | |
| | | | | | | | | | | | | | | | | | | | |
Less Distributions | | | | | | | | | | | | | | | | | | | | |
Distributions from net investment income | | | (0.13 | ) | | | (0.11 | ) | | | (0.09 | ) | | | (0.05 | ) | | | (0.07 | ) |
Distributions from net realized capital gains | | | (1.20 | ) | | | (0.59 | ) | | | (0.52 | ) | | | 0.00 | | | | 0.00 | |
| | | | | | | | | | | | | | | | | | | | |
Total distributions | | | (1.33 | ) | | | (0.70 | ) | | | (0.61 | ) | | | (0.05 | ) | | | (0.07 | ) |
| | | | | | | | | | | | | | | | | | | | |
Net Asset Value, End of Period | | $ | 14.10 | | | $ | 15.61 | | | $ | 13.87 | | | $ | 13.95 | | | $ | 11.92 | |
| | | | | | | | | | | | | | | | | | | | |
Total Return (%) | | | (1.7 | ) | | | 17.7 | | | | 4.4 | | | | 17.5 | | | | 46.0 | |
Ratio of operating expenses to average net assets (%) | | | 0.46 | | | | 0.50 | | | | 0.50 | | | | 0.52 | | | | 0.62 | |
Ratio of operating expenses to average net assets without giving effect to the contractual expense agreement would have been (%) (b) | | | 0.47 | | | | 0.51 | | | | 0.51 | | | | N/A | | | | N/A | |
Ratio of net investment income to average net assets (%) | | | 1.27 | | | | 1.05 | | | | 0.95 | | | | 0.82 | | | | 0.74 | |
Portfolio turnover rate (%) | | | 37 | | | | 44 | | | | 39 | | | | 39 | | | | 42 | |
Net assets, end of period (000) | | $ | 46,861 | | | $ | 55,208 | | | $ | 49,489 | | | $ | 51,061 | | | $ | 38,059 | |
| (a) | Per share amount is based on average shares outstanding during the period. |
| (b) | See Note 4 in the Notes to Financial Statements. |
See accompanying notes to financial statements.
MSF-26
Metropolitan Series Fund, Inc.
Russell 2000 Index Portfolio
Notes to Financial Statements—December 31, 2007
Metropolitan Series Fund, Inc. (the “Fund”) is organized as a corporation under the laws of Maryland pursuant to Articles of Incorporation filed on November 23, 1982, as amended, and registered under the Investment Company Act of 1940, as amended (the “1940 Act”), as an open-end investment company. The Fund is a “series” type of mutual fund, which issues separate series of stock. Each series represents an interest in a separate portfolio of Fund investments. The Russell 2000 Index Portfolio (the “Portfolio”) is a diversified series of the Fund. Shares in the Fund are not offered directly to the general public and are currently available only to separate accounts established by Metropolitan Life Insurance Company (“MetLife”), New England Life Insurance Company, General American Life Insurance Company (“General American”), The MetLife Investors Group of Insurance Companies, MetLife Insurance Company of Connecticut and other affiliated insurance companies (collectively, the “Insurance Companies”), as an investment vehicle for variable life insurance, group annuity or variable annuity products, although the Portfolio is not available to all such separate accounts. The Portfolio’s shares may be divided into different classes. Currently, the classes being offered by the Portfolio are named Class A, Class B and Class E. The classes of the Portfolio’s shares are identical, except that certain additional charges (Rule 12b-1 fees) are made against Class B and Class E shares. Investment income, realized and unrealized capital gains and losses, the common expenses of the Portfolio and certain Portfolio-level expense reductions, if any, are allocated on a pro rata basis to each class based on the relative net assets of each class to the total net assets of the Portfolio.
| 2. | SIGNIFICANT ACCOUNTING POLICIES: |
The preparation of financial statements in conformity with accounting principles generally accepted in the United States of America (“GAAP”) requires management to make estimates and assumptions that affect the reported amounts of assets and liabilities and disclosure of contingent assets and liabilities as of the date of the financial statements and the reported amounts of income and expenses during the reporting period. Actual results could differ from those estimates.
The following is a summary of significant accounting policies consistently followed by the Portfolio in the preparation of its financial statements. The policies are in conformity with GAAP.
Investment Valuation:
Debt securities (other than short term obligations with a remaining maturity of sixty days or less) are valued by independent pricing services selected by the relevant subadviser pursuant to authorization of the Board of Directors of the Fund (the “Board” or “Directors”). Short term obligations with a remaining maturity of sixty days or less are valued at amortized cost which approximates fair market value.
Equity securities traded on a national securities exchange or exchanges are valued at their last sale price on the principal trading market. Equity securities traded on the NASDAQ National Market System are valued at the NASDAQ Official Closing Price (the “NOCP”). The NOCP is the last sale price if it falls between the spread of the last reported bid and asked prices. If the last reported bid and asked prices are above the last reported sale price, the NOCP will be the last reported bid price. If the last reported bid and asked prices are below the last reported sale price, the NOCP will be the last reported asked price. Equity securities traded on a national securities exchange or exchanges or on the NASDAQ National Market System for which there is no reported sale during the day are valued at the last reported bid price. A security that is listed or traded on more than one exchange is valued at the quotation on the exchange determined to be the primary market for that security by the Board or its delegates. If no closing price is available, then such securities are valued by using the last reported bid price. Equity securities traded over-the-counter are valued at the last reported sales price.
If no current market value quotation is readily available or reliable for a portfolio security, fair value will be determined in accordance with procedures established by and under the general supervision of the Board. When the Portfolio uses fair value pricing, it may take into account any factors it deems appropriate. The value of securities used by the Portfolio to calculate its net asset value may differ from quoted or published prices for the same securities. Fair value pricing involves subjective judgments and the fair value determined for a security may be materially different than the value that could be realized upon the sale of that security.
The Portfolio expects to use fair value pricing for securities primarily traded on U.S. exchanges only under very limited circumstances. For example, the Portfolio may use fair value pricing if the exchange on which a security is traded closes early or trading in the security is suspended.
MSF-27
Metropolitan Series Fund, Inc.
Russell 2000 Index Portfolio
Notes to Financial Statements—December 31, 2007—(Continued)
Securities traded primarily on an exchange outside of the United States which closes before the close of the New York Stock Exchange will be valued at the last sales price on that non-U.S. exchange. Securities traded primarily on an exchange outside of the United States for which there is no reported sale during the day are valued at the mean between the last reported bid and asked prices. However, because most foreign markets close well before the Portfolio values its securities (typically at 4 p.m. Eastern Time), the earlier close of these foreign markets gives rise to the possibility that significant events, including broad market moves, may have occurred after these foreign markets close but before the Portfolio values its securities. To account for this, the Portfolio may frequently value many of its foreign equity securities using fair value prices based on third party vendor modeling tools.
Options, whether on securities, indices, futures contracts, or otherwise, are valued at the last sales price available as of the close of business on the day of valuation or, if there is no such sale price available, at the mean between the bid and asked prices. Options on currencies are valued at the spot price each day.
The value of futures contracts will be the sum of the margin deposit plus or minus the difference between the value of the futures contract on each day the net asset value is calculated and the value on the date the futures contract originated, value being that established on a recognized commodity exchange, or by reference to other customary sources, with gain or loss being realized when the futures contract closes or expires.
Subject to the Board’s oversight, the Board has delegated day-to-day responsibility for valuing Portfolio assets to the subadviser of the Portfolio, who values such assets as described above and operates under procedures approved by the Board.
Investment Transactions and Related Investment Income:
Portfolio security transactions are recorded on the trade date. Dividend income is recorded on the ex-dividend date or, for certain foreign securities, when notified. Interest income, which includes amortization of premium and accretion of discount on debt securities, is recorded on the accrual basis. Realized gains and losses on investments and unrealized appreciation and depreciation are determined on the identified cost basis, which is the same basis used for federal income tax purposes.
Repurchase Agreements:
The Portfolio, through the custodian or a subcustodian, receives delivery of the underlying securities collateralizing repurchase agreements. The Portfolio requires the custodian to take possession, to have legally segregated in the Federal Reserve Book Entry System, or to have segregated within the custodian’s vault, all securities held as collateral for repurchase agreements. It is the Portfolio’s policy that the market value of the collateral be at least equal to 100% of the repurchase price in the case of a repurchase agreement of one-day duration and 102% on all other repurchase agreements. The Portfolio’s subadviser is responsible for determining that the value of the collateral is at all times at least equal to the repurchase price. In connection with transactions in repurchase agreements, if the seller defaults and the value of the collateral declines or if the seller enters an insolvency proceeding, realization of the collateral by the Portfolio may be delayed, limited or wholly denied.
Futures Contracts:
The Portfolio may buy and sell futures contracts (on recognized exchanges) as a hedge or to enhance return. Futures contracts are agreements to buy or sell a security, or deliver a final cash settlement price in connection with an index, interest rate, currency, or other contracts not calling for physical delivery, for a set price in the future. The Portfolio must post an amount equal to a portion of the total market value of the futures contract as futures variation margin, which is returned when the Portfolio’s obligations under the contract have been satisfied. From time to time thereafter, the Portfolio may have to post variation margin to maintain this amount as the market value of the contract fluctuates. Risks of entering into futures contracts (and related options) include the possibility that there may be an illiquid market and that a change in the value of the contract or option may not correlate with changes in the value of the underlying securities.
Options:
The Portfolio may use options to hedge against changes in values of securities the Portfolio owns or expects to purchase. Writing puts or buying calls tends to increase the Portfolio’s exposure to the underlying instrument and writing calls or buying puts tends to decrease the Portfolio’s exposure to the underlying instrument, and can be used to hedge other Portfolio investments. For options purchased to hedge the Portfolio’s investments, the potential risk to the Portfolio is that the change in value of options
MSF-28
Metropolitan Series Fund, Inc.
Russell 2000 Index Portfolio
Notes to Financial Statements—December 31, 2007—(Continued)
contracts may not correspond to the change in value of the hedged instruments. In addition, losses may arise from changes in the value of the underlying instruments, if there is an illiquid secondary market, or if the counterparty is unable to perform. The maximum loss for purchased options is limited to the premium initially paid for the option. For options written by the Portfolio, the maximum loss is not limited to the premium initially received for the option.
The main risk associated with purchasing an option is that the option expires without being exercised. In this case, the option expires worthless and the premium paid for the option is considered the loss. The risk associated with writing a call option is that the Portfolio may forgo the opportunity for a profit if the market value of the underlying position increases and the option is exercised. The risk in writing a put option is that the Portfolio may incur a loss if the market value of the underlying position decreases and the option is exercised. In addition, the Portfolio risks not being able to enter into a closing transaction for the written option as the result of an illiquid market.
“When-Issued” Securities:
Purchasing securities “when-issued” is a forward commitment by the Portfolio to buy a security. The estimated amount of the Portfolio’s payment obligation and the security’s interest rate are determined when the commitment is made, even though no interest accrues until the security is issued, which is generally 15 to 120 days later. The Portfolio will segregate liquid assets with its custodian sufficient at all times to satisfy these commitments. If the value of the security is less when delivered than when the commitment was made, the Portfolio will suffer a loss.
Federal Income Taxes:
It is the Portfolio’s policy to comply with the requirements of the Internal Revenue Code of 1986, as amended, and regulations thereunder, applicable to regulated investment companies and to distribute all of its taxable income to shareholders. Therefore, no federal income tax provision is required.
As of December 31, 2007, the Portfolio had no capital loss carryovers.
The tax character of distributions paid for the periods ended December 31, 2007 and 2006 was as follows:
| | | | | | | | | | | | | | | | | | | | | |
Ordinary Income | | Long Term Gain | | Return of Capital | | Total |
2007 | | 2006 | | 2007 | | 2006 | | 2007 | | 2006 | | 2007 | | 2006 |
$8,404,113 | | $ | 4,357,208 | | $ | 39,631,499 | | $ | 17,755,534 | | $ | — | | $ | — | | $ | 48,035,612 | | $ | 22,112,742 |
As of December 31, 2007, the components of distributable earnings (accumulated losses) on a federal income tax basis were as follows:
| | | | | | | | | | | | |
Undistributed
Ordinary
Income | | Undistributed
Long Term
Gain | | Unrealized
Appreciation | | Loss
Carryforwards | | Total |
| $14,859,478 | | $ | 27,844,341 | | $ | 43,724,757 | | $ | — | | $ | 86,428,576 |
Dividends and Distributions to Shareholders:
The Portfolio records dividends and distributions on the ex-dividend date. Net realized gains from security transactions (if any) are generally distributed annually to shareholders. The timing and characterization of certain income and capital gains distributions are determined in accordance with federal tax regulations that may differ from GAAP. Permanent book and tax basis differences relating to shareholder distributions will result in reclassification between under/over distributed net investment income, accumulated net realized gains/losses and paid in capital.
| 3. | INVESTMENT TRANSACTIONS: |
For the year ended December 31, 2007, purchases and sales of securities (excluding short term investments) for the Portfolio were as follows:
| | | | | | | | | |
Purchases | | Sales |
U.S. Government | | Other | | U.S. Government | | Other |
$0 | | $ | 474,245,166 | | $ | 0 | | $ | 234,616,202 |
MSF-29
Metropolitan Series Fund, Inc.
Russell 2000 Index Portfolio
Notes to Financial Statements—December 31, 2007—(Continued)
| 4. | INVESTMENT MANAGEMENT FEES AND OTHER TRANSACTIONS WITH AFFILIATES: |
Investment Management Agreement:
MetLife Advisers, LLC (“MetLife Advisers”) is the investment adviser to the Portfolio. The Fund has entered into an investment management agreement with MetLife Advisers with respect to the Portfolio. For providing investment management services to the Portfolio, MetLife Advisers receives monthly compensation at the annual rate of 0.25% of average daily net assets. Fees earned by MetLife Advisers with respect to the Portfolio for the year ended December 31, 2007 were $1,645,583.
Certain officers and directors of the Fund may also be officers of MetLife Advisers; however, such officers and directors receive no compensation from the Fund.
Effective April 30, 2007, MetLife Advisers entered into an investment subadvisory agreement with MetLife Investment Advisors, LLC (“MLIAC”) with respect to the Portfolio. MetLife Advisers pays MLIAC an investment subadvisory fee for the Portfolio equal to the costs incurred by MLIAC in providing subadvisory services to the Portfolio. Fees earned by MLIAC with respect to the Portfolio for the period ended December 31, 2007 were $108,696. Prior to April 30, 2007, MetLife served as the subadviser to the Portfolio and for the period January 1, 2007 through April 30, 2007, fees earned by MetLife were $42,698.
Management Fee Waivers:
Pursuant to an expense agreement, MetLife Advisers has agreed, for the period May 1, 2007 to April 30, 2008, to reduce its advisory fees set out above under “Investment Management Agreement” for each class of the Portfolio at the annual rate of 0.007% of average daily net assets. Amounts waived for the year ended December 31, 2007 are shown as management fee waivers in the Statement of Operations.
Service and Distribution Fees:
The Fund has adopted a Distribution and Service Plan under Rule 12b-1 of the 1940 Act for the Portfolio’s Class B and E shares. Under the Distribution and Service Plan, the Class B and E shares of the Portfolio pay a fee to compensate the Insurance Companies (or their affiliates) and other broker-dealers and financial intermediaries involved in the offer and sale of Portfolio shares for promoting or selling and servicing, the Class B and E shares of the Portfolio. The fees under the Distribution and Service Plan for each class of the Portfolio’s shares are calculated as a percentage of the Portfolio’s average daily net assets that are attributable to that Class. Currently, the fee is 0.25% per year for Class B shares and 0.15% per year for Class E shares. Amounts paid by the Portfolio for the year ended December 31, 2007 are shown as Service and Distribution fees in the Statement of Operations.
Substitution:
On November 9, 2007, the Russell 2000 Index Portfolio received and recorded a share subscription for 11,343,919 shares of Class A amounting to $161,764,288 from various shareholder accounts previously invested in the MetLife Investment Funds, Inc. (“MLIF”), an affiliated investment company of the Fund. A portion of the assets received from MLIF were investment securities with a market value of $57,343,367, and transferred in-kind pursuant to a substitution order received from the Securities and Exchange Commission. The balance of the assets was paid in cash. This transaction resulted from the planned liquidation of MLIF, pursuant to a Plan of Liquidation approved by the MLIF Board of Directors on August 16, 2007. The securities received were recorded at value and have been excluded from the calculation of portfolio turnover reported in the Portfolio’s financial highlights. The shares issued in this transaction are included in Sales in the Capital Shares schedule on the Statements of Changes in Net Assets.
The Fund has entered into a securities lending arrangement with the Fund’s custodian, State Street Bank and Trust Company (the “custodian”). Under the agreement, the custodian is authorized to loan securities on the Portfolios’ behalf. In exchange, the Portfolio receives either cash or securities as collateral against the loaned securities. The Portfolio receives collateral at least equal to 102% of the market value of the loaned securities (105% for foreign securities), at each loan’s inception. Collateral must be maintained at least at 100% of the market value of the loaned securities for the duration of the loan. The cash collateral is invested in the Navigator Securities Lending Prime Portfolio, an affiliate of the custodian, which invests in a variety of high quality U.S. dollar-denominated instruments. If the market value of the collateral at the close of trading on a business day is less
MSF-30
Metropolitan Series Fund, Inc.
Russell 2000 Index Portfolio
Notes to Financial Statements—December 31, 2007—(Continued)
than 100% of the market value of the loaned securities at the close of trading on that day, the borrower shall be required to deliver, by the close of business on the following business day, an additional amount of collateral, equal to at least 100% of the market value of all the loaned securities as of such preceding day. The Portfolio receives 80% of the annual net income from securities lending transactions, which is included in interest income of the Portfolio. The remaining 20% is paid to the custodian as compensation for its securities lending services. The Portfolio bears the risk of any deficiency in the amount of collateral available for return to a borrower due to a loss in an approved investment. Any outstanding loans by the Portfolio at December 31, 2007 are footnoted in the Schedule of Investments.
As previously reported, in May 2004, General American received a Wells Notice stating that the SEC staff was considering recommending that the SEC bring a civil action alleging violations of the U.S. securities laws against General American with respect to market timing and late trading in a limited number of privately-placed variable insurance contracts that were sold through General American. General American responded to the SEC staff and cooperated with the investigation. On August 9, 2007, the SEC announced that it had settled an enforcement action regarding late trading against General American with, among other things, General American agreeing to pay a civil penalty and to comply with certain undertakings. General American consented to the SEC’s order without admitting or denying the findings. MetLife Advisers has also advised the Fund’s Board of Directors that, while certain exceptions to the Fund’s policies have been noted, no situations have been identified that would have a material impact on the financial position of the Fund.
| 7. | RECENT ACCOUNTING PRONOUNCEMENTS: |
Effective June 29, 2007, the Fund implemented Financial Accounting Standards Board (“FASB”) Interpretation No. 48, “Accounting for Uncertainty in Income Taxes—an interpretation of FASB Statement No. 109” (“FIN 48”). FIN 48 prescribes the minimum recognition threshold a tax position must meet in connection with accounting for uncertainties in income tax positions taken or expected to be taken by an entity, including investment companies, before being measured and recognized in the financial statements. Management has evaluated the application of FIN 48 to the Fund, and has determined that the adoption of FIN 48 does not have a material impact on the Fund’s financial statements. The Fund files U.S. tax returns. No income tax returns are currently under examination. The statute of limitations on the Fund’s tax returns remains open for the years ended December 31, 2004 through December 31, 2006.
In September 2006, Statement of Financial Accounting Standards No. 157, Fair Value Measurements (SFAS 157) was issued and is effective for fiscal years beginning after November 15, 2007. SFAS 157 defines fair value, establishes a framework for measuring fair value and expands disclosures about fair value measurements. Management is currently evaluating the impact the adoption of SFAS 157 will have on the Portfolio’s financial statement disclosures.
MSF-31
Metropolitan Series Fund, Inc.
Russell 2000 Index Portfolio
Report of Independent Registered Public Accounting Firm
To the Shareholders and Board of Directors of the Metropolitan Series Fund, Inc.:
We have audited the accompanying statement of assets and liabilities, including the schedule of investments, of the Russell 2000 Index Portfolio, one of the portfolios constituting the Metropolitan Series Fund, Inc. (the “Fund”) as of December 31, 2007, and the related statement of operations for the year then ended, the statements of changes in net assets for each of the two years in the period then ended, and the financial highlights for each of the five years in the period then ended. These financial statements and financial highlights are the responsibility of the Fund’s management. Our responsibility is to express an opinion on these financial statements and financial highlights based on our audits.
We conducted our audits in accordance with the standards of the Public Company Accounting Oversight Board (United States). Those standards require that we plan and perform the audit to obtain reasonable assurance about whether the financial statements and financial highlights are free of material misstatement. The Fund is not required to have, nor were we engaged to perform, an audit of its internal control over financial reporting. Our audits included consideration of internal control over financial reporting as a basis for designing audit procedures that are appropriate in the circumstances, but not for the purpose of expressing an opinion on the effectiveness of the Fund’s internal control over financial reporting. Accordingly, we express no such opinion. An audit also includes examining, on a test basis, evidence supporting the amounts and disclosures in the financial statements, assessing the accounting principles used and significant estimates made by management, as well as evaluating the overall financial statement presentation. Our procedures included confirmation of securities owned as of December 31, 2007, by correspondence with the custodian and brokers; where replies were not received from brokers, we performed other auditing procedures. We believe that our audits provide a reasonable basis for our opinion.
In our opinion, the financial statements and financial highlights referred to above present fairly, in all material respects, the financial position of the Russell 2000 Index Portfolio of the Metropolitan Series Fund, Inc. as of December 31, 2007, the results of its operations for the year then ended, the changes in its net assets for each of the two years in the period then ended, and the financial highlights for each of the five years in the period then ended, in conformity with accounting principles generally accepted in the United States of America.
Deloitte & Touche LLP
Boston, Massachusetts
February 21, 2008
MSF-32
Metropolitan Series Fund, Inc.
Directors and Officers
The Fund’s Directors review actions of the Fund’s investment adviser and subadvisers, and decide upon matters of general policy. The Fund’s officers supervise the daily business operations of the Fund. The Board of Directors and the Fund’s officers are listed below. Each Director is responsible for overseeing all 36 Portfolios of the Fund. There is no limit to the term a Director may serve. Directors serve until their resignation, retirement or removal in accordance with the Fund’s organizational documents and policies adopted by the Board from time to time. Officers hold office at the pleasure of the Board or until the election or appointment and the qualification of a successor. The address of the directors and officers is c/o Metropolitan Series Fund, Inc., 501 Boylston Street, Boston, MA 02116.
Interested Directors(1)
Each Director below is an “interested person” (as defined by the 1940 Act) with respect to the Fund in that Ms. Forget is an employee of MetLife and Mr. Typermass is a former employee of MetLife and owns securities issued by MetLife, Inc., the ultimate parent company of MetLife Advisers.
| | | | | | | | |
Name, Address and Age | | Current
position(s)
with Fund | | Position(s)
held since | | Principal occupations
over past five years, including other directorships(2) | | Number of
Portfolios in
Fund Complex
Overseen by
Director(3) |
Elizabeth M. Forget Age: 41 | | Director, Chairman of the Board, President and Chief Executive Officer | | 2006 | | Senior Vice President (since 2007), MetLife, Inc.; President, Met Investors Advisory, LLC (“MIA”); Trustee and President, Met Investors Series Trust (“MIST”); Executive Vice President, MetLife Investors Group, Inc.; President (since 2006), MetLife Advisers. | | 81 |
| | | | |
Arthur G. Typermass Age: 70 | | Director | | 1998 | | Formerly, Senior Vice President and Treasurer, MetLife. | | 37 |
Non-Interested Directors(1)
Each Director below is not an “interested person” (as defined by the 1940 Act) with respect to the Fund (collectively, the “Independent Directors”).
| | | | | | | | |
Name, Address and Age | | Current
position(s)
with Fund | | Position(s)
held since | | Principal occupations
over past five years, including other directorships(2) | | Number of
Portfolios in
Fund Complex
Overseen by
Director(3) |
Steve A. Garban† Age: 70 | | Director | | 1985 | | Formerly, Chief Financial Officer, Senior Vice President Finance and Operations and Treasurer (Emeritus), The Pennsylvania State University. | | 37 |
| | | | |
Linda B. Strumpf Age: 60 | | Director | | 2000 | | Vice President and Chief Investment Officer, Ford Foundation. | | 37 |
| | | | |
Michael S. Scott Morton† Age: 70 | | Director | | 1993 | | Jay W. Forrester Professor of Management (Emeritus) at Sloan School of Management, MIT. | | 37 |
| | | | |
H. Jesse Arnelle Age: 74 | | Director | | 2001 | | Formerly, Counsel, Womble Carlyle Sandrie & Rice; Director, Textron Inc. (global multi-industry company)*; formerly, Director, Gannet Co. Inc. (diversified news and information company)*; formerly, Director, Eastman Chemical Company (global chemical company)*; formerly, Director, Waste Management, Inc.*; formerly, Director, Armstrong Holdings Inc. (parent company of floor and ceiling products business)*; formerly, Director, FPL Group Inc. (public utility holding company)*; Director, URS Corporation (engineering design services firm)*. | | 37 |
| | | | |
Nancy Hawthorne Age: 56 | | Director | | 2003 | | Director, Avid Technologies (computer software company)*; formerly, Chairman of the Board of Avid Technologies; formerly, Board of Advisors, L. Knife & Sons, Inc. (beverage distributor); Chief Executive Officer, Clerestory LLC (corporate financial advisor); formerly, Trustee, New England Zenith Fund (“Zenith Fund”)**; formerly, Chief Executive Officer and Managing Partner, Hawthorne, Krauss and Associates (corporate financial advisor); formerly, Chief Financial Officer and Executive Vice President, Continental Cablevision, subsequently renamed MediaOne (cable television company); formerly, Director, Life F/X, Inc.; formerly, Chairman of the Board, WorldClinic (distance medicine company); formerly, Director, Perini Corporation (construction company)*; formerly, Director, CGU (property and casualty insurance company); formerly, Director, Beacon Power Corporation (energy company )*. | | 37 |
MSF-33
Metropolitan Series Fund, Inc.
Directors and Officers—(Continued)
| | | | | | | | |
Name, Address and Age | | Current
position(s)
with Fund | | Position(s)
held since | | Principal occupations
over past five years, including other directorships(2) | | Number of
Portfolios in
Fund Complex
Overseen by
Director(3) |
John T. Ludes Age: 71 | | Director | | 2003 | | President, LFP Properties (consulting firm); Formerly, Trustee, Zenith Fund**; formerly, Vice Chairman, President and Chief Operating Officer, Fortune Brands/American Brands (global conglomerate); formerly, President and CEO, Acushnet Company (athletic equipment company). | | 37 |
Officers(1)
| | | | | | | | |
Name and address | | Age | | Current
position(s)
with Fund | | Position(s)
held since | | Principal occupations over past five years(2) |
| Jeffrey P. Halperin | | 40 | | Chief Compliance Officer | | 2006 | | Vice President (since 2006), Corporate Ethics and Compliance Department, MetLife, Inc.; Chief Compliance Officer (since 2006), MetLife Advisers, MIA and MIST. |
| | | | |
| John F. Guthrie, Jr. | | 64 | | Senior Vice President | | 2002 | | Manager and Senior Vice President, MetLife Advisers; Vice President, MetLife; Vice President (since 2003), MetLife Group, Inc.; Vice President, NELICO; Vice President (since 2005), MIA; formerly, Senior Vice President, Zenith Fund**. |
| | | | |
| Alan C. Leland | | 55 | | Senior Vice President | | 2005 | | Treasurer and Chief Financial Officer, MetLife Advisers, LLC; Treasurer (since 2005), Met Investors Advisory, LLC; Vice President (since 2004), MIA; Vice President (since 2003), MetLife Group, Inc.; Vice President, MetLife; Senior Vice President, NELICO |
| | | | |
| Peter Duffy | | 52 | | Vice President and Treasurer | | 2000 | | Senior Vice President, MetLife Advisers (since 1998); Second Vice President (since 2003), NELICO; Vice President, MetLife (since 2004); Vice President (since 2004), MetLife Group, Inc.; formerly, Vice President and Treasurer, Zenith Fund**. |
| | | | |
| Thomas M. Lenz | | 49 | | Vice President and Secretary | | 2002 | | General Counsel and Secretary, MetLife Advisers; Assistant General Counsel, MetLife; formerly, Vice President and Secretary, Zenith Fund**. |
| * | Indicates a directorship with a registered investment company or a company subject to the reporting requirements of the Securities Exchange Act of 1934, as amended. |
| ** | The Zenith Fund deregistered with the Securities and Exchange Commission (“SEC”) in 2004. |
| (†) | Served as a trustee, director and/or officer of one or more of the following companies, each of which had a direct or indirect advisory relationship with MetLife Advisers or its affiliates prior to January 31, 2005: State Street Research Financial Trust, State Street Research Income Trust, State Street Research Money Market Trust, State Street Research Institutional Funds, State Street Research Capital Trust, State Street Research Master Investment Trust, State Street Research Equity Trust, State Street Research Securities Trust and State Street Research Exchange Trust (collectively, the “State Street Research Funds”). |
| (1) | Each Director of the Fund also serves as trustee of Metropolitan Series Fund II (“Met Series Fund II”), a registered investment company advised by MetLife Advisers. Each officer of the Fund serves in the same position with Met Series Fund II, which consists of one portfolio. |
| (2) | Previous positions during the past five years with the Fund, MIST, MetLife, MetLife Advisers, MIA, Zenith Fund, NELICO or New England Securities Corporation are omitted if not materially different. |
| (3) | The Fund Complex includes the Fund (36 portfolios), Met Series Fund II (1 portfolio) and MIST (44 portfolios) |
MSF-34
Metropolitan Series Fund, Inc.
Russell 2000 Index Portfolio
Board Approval of Advisory and Subadvisory Agreements
The Fund’s Contract Review Committees of the Board of Directors (the “Board”) typically meet in early fall to review the Portfolios’ advisory agreements (the “Advisory Agreements”) and subadvisory agreements (collectively, the “Subadvisory Agreements,” and, together with the Advisory Agreements, the “Agreements”) and determine whether to recommend that the full Board approve the continuation of the Agreements for an additional one-year period. (Following the initial approval of an Agreement for a new Portfolio or with a new adviser or subadviser, such annual reviews are not required until 2 years following the execution of such Agreement.) After each Committee has made its recommendations, the full Board, including the Independent Directors, determines whether to approve the continuation of each of the Agreements. In addition, the Board, including the Independent Directors, considers matters bearing on the Agreements at most of its other meetings throughout the year and regularly interviews various individuals at MetLife Advisers responsible for the management of the Portfolios. The Directors also interview selected investment managers and other professionals at the subadvisers at various times throughout the year.
The Directors receive all materials that they or MetLife Advisers, the Fund’s investment adviser, and the subadvisers believe to be reasonably necessary for the Directors to evaluate the Agreements and determine whether to approve the continuation of the Agreements. These materials generally include, among other items, (i) information on the investment performance of the Portfolios and the performance of peer groups of funds and the Portfolios’ performance benchmarks, (ii) information on the Portfolios’ advisory and subadvisory fees and other expenses, including information comparing the Portfolios’ expenses to those of peer groups of funds and information about any applicable expense caps and fee “breakpoints,” (iii) sales and redemption data, (iv) information related to the profitability of the Agreements to MetLife Advisers and the subadvisers, and potential “fall-out” or ancillary benefits that MetLife Advisers, the subadvisers or their affiliates may receive as a result of their relationships with the Fund and (v) information obtained through the subadvisers’ responses to certain requests from MetLife Advisers and the Directors and MetLife Advisers’ responses to requests from the Directors. The Directors may also consider other information such as (vi) MetLife Advisers’ and the subadvisers’ financial results and condition, (vii) each Portfolio’s investment objectives and strategies and the size, education and experience of the investment staffs of MetLife Advisers and the relevant subadvisers and their use of technology and external research, (viii) the allocation of the Portfolios’ brokerage, if any, including allocations to brokers affiliated with the subadvisers and the use of “soft” commission dollars to pay Portfolio expenses and to pay for research and other similar services, (ix) the resources devoted to, and the record of compliance with, the Portfolios’ investment policies and restrictions, policies on personal securities transactions and other compliance policies, (x) the responses of MetLife Advisers, the subadvisers and/or their affiliates to certain legal and regulatory proceedings and (xi) the economic outlook generally and for the mutual fund industry in particular. Throughout the process, the Directors have the opportunity to ask questions of and request additional materials from MetLife Advisers and the subadvisers.
Following meetings of each Contract Review Committee on September 12, 2007, the Board, at its November 15, 2007 meeting, approved the continuation through December 31, 2008 of the Advisory Agreements for each Portfolio of the Fund and the Subadvisory Agreements for each Portfolio of the Fund. The Agreements approved for continuation are referred to below as the “Continued Agreements.”
In considering whether to approve the continuation of the Continued Agreements, the Directors, including the Independent Directors, did not identify any single factor as determinative, and each weighed the various factors as he or she deemed appropriate. The Directors considered the following matters in connection with their approval of the Continued Agreements:
The nature, extent and quality of the services provided to the relevant Portfolios under the Continued Agreements. The Directors considered the nature, extent and quality of the services provided by MetLife Advisers, the relevant subadvisers (if any) and their affiliates (each, an “Adviser,” and, collectively, the “Advisers”) to the relevant Portfolios pursuant to the Continued Agreements and the resources dedicated to these Portfolios by the Advisers. In particular, the Directors considered the Advisers’ abilities to attract and retain highly qualified investment professionals. With respect to MetLife Advisers, the Directors considered that MetLife Advisers is (i) ultimately responsible for the performance of such Portfolios; (ii) ultimately responsible for the establishment of the investment strategies of each such Portfolio, primarily through its recommendations to the Board regarding the hiring and selection of subadvisers; (iii) responsible for the hiring and selection, subject to Board approval, of subadvisers; and (iv) responsible for maintaining a program of Subadviser oversight reasonably designed to ensure that the subadvisers have reasonable compliance policies and procedures in place. The Directors also considered that MetLife Advisers provides a full range of day-to-day administrative services for the Portfolios involving all aspects of such Portfolios’ day-to-day operations (other than portfolio management). After reviewing these and related factors, the Directors concluded, within the context of their overall conclusions regarding each of the Continued Agreements, that the nature, extent and quality of services provided supported the renewal of these Agreements.
Investment performance of the relevant Portfolios. The Directors reviewed information about the performance of the relevant Portfolios over various time periods, including information prepared by an independent third party that compared the performance of
MSF-35
Metropolitan Series Fund, Inc.
Russell 2000 Index Portfolio
Board Approval of Advisory and Subadvisory Agreements—(Continued)
the Portfolios to the performance of peer groups of funds and performance benchmarks. The Directors also reviewed a description of the third party’s methodology for identifying a Portfolio’s peer group(s) for purposes of performance and expense comparisons.
In the case of each relevant Portfolio that had performance that lagged its peer group(s) for certain periods, the Directors concluded that other factors relevant to performance were sufficient, in light of other considerations, to warrant renewal of the Continued Agreements relating to such Portfolio. These factors varied from Portfolio to Portfolio, but included one or more of the following: (i) that such Portfolio’s performance, although lagging in certain recent periods, was stronger over the longer term; (ii) that the underperformance was attributable, to a significant extent, to investment decisions that were reasonable and consistent with the Portfolio’s investment objective(s) and policies and that the Portfolio was performing within the range of reasonable expectations, given market conditions and the Portfolio’s investment objective(s) and policies; (iii) that the Portfolio’s performance was competitive when compared to other relevant performance benchmarks or peer groups; and (iv) that MetLife Advisers and/or the relevant subadviser (if any) had taken or was taking steps designed to help improve the Portfolio’s investment performance.
The Directors also considered the investment performance of the Advisers and their reputations generally, the historical responsiveness of the Advisers to Director concerns about performance and the willingness of the Advisers to take steps intended to improve performance.
After reviewing these and related factors, the Directors concluded, within the context of their overall conclusions regarding each of the Continued Agreements, that the investment performance of each relevant Portfolio and Adviser was sufficient, in light of other considerations, to warrant the renewal of the Continued Agreements.
The costs of the services to be provided and profits to be realized by the Advisers and their affiliates from their relationships with the Portfolios. The Directors considered the fees charged by MetLife Advisers to the Portfolios for advisory services and, with respect to the subadvised Portfolios, by such subadvisers to MetLife Advisers for subadvisory services (such advisory and subadvisory fees (if any), collectively, “Fees”), as well as the total expense levels of the Portfolios. This information included comparisons (provided by an independent third party) of the Portfolios’ advisory fees and total expense levels to those of their peer groups. In evaluating Fees for the relevant Portfolios, the Directors also took into account the demands, complexity and quality of the investment management services provided to each Portfolio. The Directors considered MetLife Advisers’ recommendations regarding reductions in Fee rates, implementation of Fee breakpoints and institution of Fee waivers and expense caps.
The Directors also considered the compensation directly or indirectly received by the Advisers and their affiliates from their relationships with the relevant Portfolios. The Directors reviewed information relating to the profits received by MetLife Advisers, certain of the subadvisers and their affiliates as a result of their relationships with the relevant Portfolios, and information about the allocation of expenses used to calculate profitability. When reviewing profitability, the Directors also considered the performance of the relevant Portfolios, the expense levels of such Portfolios and whether the relevant Advisers had implemented breakpoints, fee waivers and/or expense caps with respect to such Portfolios.
After reviewing these and related factors, the Directors concluded, within the context of their overall conclusions regarding each of the Continued Agreements, that the Fees charged to each of the relevant Portfolios were fair and reasonable, and that the information provided regarding costs of these services generally, and the related profitability (if known) to the relevant Advisers of their relationships with the relevant Portfolios, supported the renewal of the Continued Agreements.
Economies of Scale. The Directors considered the existence of any economies of scale in the provision of services by the Advisers and whether those economies were shared with the relevant Portfolios through breakpoints in their advisory fees or other means, such as expense caps, fee waivers or relatively low levels of fees. The Directors noted that most of the relevant Portfolios benefited or will benefit from breakpoints, expense caps and/or fee waivers with respect to their advisory fees. In considering these issues, the Directors also took into consideration information relating to the costs of the services provided and the profitability to MetLife Advisers, the relevant subadvisers (if any) and each of their affiliates of their relationships with the relevant Portfolios, as discussed above.
After reviewing these and related factors, the Directors concluded, within the context of their overall conclusions regarding each of the Continued Agreements, that the extent to which economies of scale were shared with the relevant Portfolios supported the renewal of such Agreements.
Other Factors. The Directors also considered other factors, which included but were not limited to the following:
| | • | | the extent to which each relevant Portfolio operated in accordance with its investment objective, and its record of compliance with its investment restrictions and the compliance programs of the Fund and the Advisers. They also considered the compliance-related resources the Advisers and their affiliates provide to the relevant Portfolios; |
MSF-36
Metropolitan Series Fund, Inc.
Russell 2000 Index Portfolio
Board Approval of Advisory and Subadvisory Agreements—(Continued)
| | • | | the nature, quality, cost and extent of administrative and shareholder services performed by MetLife Advisers and its affiliates under the Advisory Agreements; and |
| | • | | so-called “fall-out benefits” to the Advisers, such as the engagement of their affiliates to provide distribution, brokerage and transfer agency services to the Portfolios, and the benefits of research made available to the relevant Advisers by reason of brokerage commissions generated by the relevant Portfolios’ securities transactions. The Directors also considered the possible conflicts of interest associated with these fall-out and other benefits, and the reporting and other processes in place to disclose and monitor these possible conflicts of interest. |
Based on their evaluation of all factors that they deemed to be material, including those factors described above, and assisted by the advice of independent counsel, the Directors, including the Independent Directors, concluded that each of the Continued Agreements should be continued through December 31, 2008.
MSF-37
A description of the policies and procedures that the Fund uses to determine how to vote proxies relating to portfolio securities is available (i) without charge, upon request, by calling (800) 638-7732 and (ii) on the Securities and Exchange Commission’s (the “SEC”) website at http://www.sec.gov.
Information regarding how the Fund voted proxies relating to portfolio securities during the most recent twelve-month period ended December 31, 2007 is available (i) without charge, upon request, by calling (800) 638-7732 and (ii) on the SEC’s website at http://www.sec.gov.
The Fund files with the SEC a complete schedule of its portfolio holdings, as of the close of the first and third quarters of its fiscal year, on “Form N-Q”. These filings are available on the SEC’s website at www.sec.gov and may be reviewed and copied at the SEC’s Public Reference Room in Washington, DC. (Call 1-800-SEC-0330 for information on the operation of the Public Reference Room.)
MSF-38
| | |
Metropolitan Series Fund, Inc. T. Rowe Price Large Cap Growth Portfolio Annual Report | | December 31, 2007 |
Letter from the President
February 1, 2008
Letter to Policy Holders:
2007 was a tumultuous year in the financial markets driven by concerns in the credit markets surrounding sub-prime mortgages and fears of recession in the U.S. Economy. The broad markets were mixed, with the Dow Jones Industrial Average up 8.9% and the MSCI EAFE Index, which measures the performance of international equities, up 11.2% for the year, while the Russell 2000 Index, which measures the performance of small capitalization stocks, was down 1.6%.
In the fixed income markets, credit spreads increased as a result of the pressure from sub-prime mortgage crisis and the Federal Reserve lowered interest rates by a total of 1% during the year. The Lehman Brothers Aggregate Bond Index posted a 7.0% return for the year.
On the following pages, you will find a complete review of your Portfolio and its investment performance.
MetLife is committed to building your financial freedom. We appreciate your trust and will continue to focus our efforts on meeting your investment needs.
Sincerely,
Elizabeth Forget
President, Metropolitan Series Fund, Inc.
Metropolitan Series Fund, Inc.
T. Rowe Price Large Cap Growth Portfolio
Managed by T. Rowe Price Associates, Inc.
Portfolio Manager Commentary*
PORTFOLIO PERFORMANCE
For the year ended December 31, 2007, the Class A shares of the T. Rowe Price Large Cap Growth Portfolio returned 9.4%, compared to its benchmark, the Standard & Poor’s 500 Index1, which returned 5.5%. The average return of its peer group, the Lipper Variable Insurance Products Large-Cap Growth Funds Universe2, was 12.8% over the same period.
PORTFOLIO REVIEW
The Portfolio delivered solid returns and soundly outperformed the benchmark Standard & Poor’s 500 Index for the 12-month period, primarily behind good stock selection. Financials, information technology, and telecommunication services sectors were the leading sources of relative outperformance. The energy and utilities sectors were major detractors from relative results for the year.
U.S. stocks generally delivered positive returns for the period, amid extreme volatility in the second half of 2007. The S&P 500 was led by the energy sector on higher oil prices and materials on global commodity demand. Financials was the worst performing sector along with consumer discretionary, as the ripple effects of the subprime lending fallout spread widely and crimped the credit markets, while dampening consumer spending optimism. Among major market indexes, growth stocks substantially outpaced value stocks for the period, and large-caps surpassed small-caps, which sustained their first annual loss since 2002.
Although financials was the worst performing sector in the benchmark during 2007, it was the Portfolio’s strongest relative outperformer, lifted by stock selection and a beneficial underweight. Stock selection in the capital markets holdings made a strong contribution. State Street Corp., a leader in trust services and asset management, continued to perform well despite fallout from the subprime mortgage contraction. Charles Schwab, the brokerage and financials services firm, saw an increase in client assets despite notable market volatility. Northern Trust, a provider of banking and asset management to wealthier clients, was able to avoid much of the credit crunch issues due to higher quality credit ratings of clients. While overweight in capital markets stocks, the Portfolio eliminated several positions with credit concerns.
The telecommunication services sector delivered outperformance based on stock selection and a significant overweight relative to the benchmark. The major driver was stock selection in the wireless telecommunication industry. America Movil (Mexico) continues to grow on increased subscriber bases in Latin America, market share gains, and higher average user revenues. Rogers Communications (Canada) also demonstrated growth in market share and average user revenues, increasing free cash flow that is being used to repurchase shares.
Information technology was the Portfolio’s largest absolute sector as of December 31, 2007 and the largest relative overweight. Results benefited from the notable overweight and from stock selection in the Internet software and services industry and the communications equipment industry. Google, the global targeted-advertising and Internet search company, further increased its market share at a remarkable rate, led by domestic revenue acceleration and strong international growth. Shares of Juniper Networks surged after a strong earnings report by the maker of service provider and enterprise networking equipment.
The Portfolio’s overall underweight in energy was the largest detractor from relative performance. The Portfolio concentration in energy equipment and services was the major source of weakness. Baker Hughes slumped amid unexpected international startup costs, but we believe the oilfield services firm should gain from new contracts in countries where it did not previously have a presence. Total, a leading multinational energy company, slid as it reduced production targets and increased its longer-term pricing assumptions.
A considerable underweight position to utilities also detracted from relative performance. The Portfolio is typically underweight in this sector, but the climate of economic uncertainty made utilities attractive for worried investors. Improving fundamentals and credit ratings buoyed the sector. Our holding in AES, one of the world’s largest power companies, was hurt by accounting issues, although we believe it exhibits good free cash flow and offers significant global growth opportunities.
* The views expressed above are those of the subadvisory firm as of December 31, 2007 and are subject to change based on market and other conditions. Information about the Portfolio’s holdings, asset allocation, industry allocation, or country diversification is historical and is not an indication of future Portfolio composition, which will vary. The performance of any index mentioned in this commentary has not been adjusted for ongoing management, distribution and operating expenses, and sales charges applicable to mutual fund investments. Direct investment in the Index is not possible.
1 The Standard & Poor’s (S&P) 500® Stock Index is an unmanaged index representing the performance of 500 major companies, most of which are listed on the New York Stock Exchange.
2 The Lipper Variable Insurance Products Fund Average is an average of the total return performance (calculated on the basis of net asset value) of variable product funds with similar investment objectives to those of the subject Portfolio as calculated by Lipper Analytical Services, an independent mutual fund ranking service.
MSF-2
Metropolitan Series Fund, Inc.
T. Rowe Price Large Cap Growth Portfolio
A $10,000 INVESTMENT COMPARED TO
THE S&P 500 INDEX
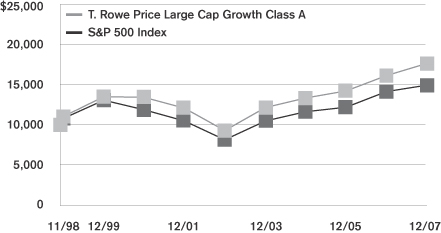
Average Annual Returns as of December 31, 2007
| | | | | | | | | | | | |
| | | T. Rowe Price
Large Cap Growth Portfolio | | | S&P 500
Index | |
| | | Class A | | | Class B | | | Class E | | |
| 1 Year | | 9.4 | % | | 9.2 | % | | 9.3 | % | | 5.5 | % |
| 5 Year | | 13.7 | | | 13.5 | | | 13.5 | | | 12.8 | |
| Since Inception | | 6.4 | | | 12.2 | | | 4.8 | | | 4.5 | |
Performance numbers are net of all Portfolio expenses but do not include any insurance, sales, or administrative charges of variable
annuity or life insurance contracts. If these charges were included, the returns would be lower.
Inception dates of the Class A, Class B and Class E shares are: 11/9/98, 7/30/02 and 5/1/01, respectively. Index since inception return is based on the Class A inception date.
This information represents past performance and is not indicative of future results. Investment return and principal value may fluctuate so that shares, upon redemption, may be worth more or less than the original cost.
PORTFOLIO COMPOSITION
as of December 31, 2007
Top Holdings
| | |
| | | % of Total
Net Assets |
General Electric Co. | | 3.8% |
Google, Inc. (Class A) | | 3.2% |
Microsoft Corp. | | 2.7% |
Schlumberger, Ltd. | | 2.6% |
Apple, Inc. | | 2.5% |
CVS Caremark Corp. | | 2.4% |
Danaher Corp. | | 2.0% |
WellPoint, Inc. | | 1.8% |
Nintendo Co., Ltd. | | 1.7% |
State Street Corp. | | 1.6% |
Top Sectors
| | |
| | | % of Total
Market Value |
Information Technology | | 23.4% |
Health Care | | 16.1% |
Industrials & Business Services | | 11.7% |
Financials | | 10.5% |
Consumer Discretionary | | 10.2% |
Consumer Staples | | 8.7% |
Energy | | 7.4% |
Telecommunication Services | | 5.4% |
Materials | | 3.3% |
Utilities | | 0.7% |
MSF-3
Metropolitan Series Fund, Inc.
Shareholder Expense Example
As a shareholder of the Portfolio, you incur ongoing costs, including management fees; distribution and service (12b-1) fees; and other Portfolio expenses. This example is intended to help you understand your ongoing costs (in dollars) (referred to as “expenses”) of investing in the Portfolio and compare these costs with the ongoing costs of investing in other mutual funds. The example is based on an investment of $1,000 invested at the beginning of the period and held for the entire period, July 1, 2007 through December 31, 2007.
Actual Expenses
The first line for each share class of the Portfolio in the table below provides information about actual account values and actual expenses. You may use the information in this line, together with the amount you invested in the particular share class of the Portfolio, to estimate the expenses that you paid over the period. Simply divide your account value by $1,000 (for example, an $8,600 account value divided by $1,000=8.6), then multiply the result by the number in the first line under the heading entitled “Expenses Paid During Period” to estimate the expenses you paid on your account during this period.
Hypothetical Example for Comparison Purposes
The second line for each share class of the Portfolio in the table below provides information about hypothetical account values and hypothetical expenses based on the Portfolio’s actual expense ratio and an assumed rate of return of 5% per year before expenses, which is not the Portfolio’s actual return. The hypothetical account values and expenses may not be used to estimate the actual ending account balance or expenses you paid for the period. You may use this information to compare the ongoing costs of investing in the Portfolio and other funds. To do so, compare this 5% hypothetical example with the 5% hypothetical examples that appear in the shareholder reports of the other funds.
Please note that the expenses shown in the table are meant to highlight your ongoing costs only and do not reflect any fees or charges of your variable insurance product or any additional expenses that participants in certain eligible qualified plans may bear relating to the operations of their plan. Therefore, the second line for each share class in the table is useful in comparing ongoing costs only, and will not help you determine the relative total costs of owning different funds. In addition, if these other costs were included, your costs would have been higher.
| | | | | | | | | | | | | | |
Portfolio | | | | Annualized
Expense
Ratio | | | Beginning
Account Value
July 1,
2007 | | Ending
Account Value
December 31,
2007 | | Expenses Paid
During Period*
July 1, 2007
to
December 31,
2007 |
T. Rowe Price Large Cap Growth—Class A | | Actual | | 0.67 | % | | $ | 1,000.00 | | $ | 1,008.00 | | $ | 3.39 |
| | Hypothetical | | 0.67 | % | | $ | 1,000.00 | | $ | 1,021.79 | | $ | 3.41 |
| | | | | |
T. Rowe Price Large Cap Growth—Class B | | Actual | | 0.92 | % | | $ | 1,000.00 | | $ | 1,006.80 | | $ | 4.65 |
| | Hypothetical | | 0.92 | % | | $ | 1,000.00 | | $ | 1,020.51 | | $ | 4.69 |
| | | | | |
T. Rowe Price Large Cap Growth—Class E | | Actual | | 0.82 | % | | $ | 1,000.00 | | $ | 1,007.40 | | $ | 4.15 |
| | Hypothetical | | 0.82 | % | | $ | 1,000.00 | | $ | 1,021.02 | | $ | 4.18 |
* Expenses paid are equal to the Portfolio’s annualized expense ratio for the most recent six month period, as shown above, multiplied by the average account value over the period, multiplied by the number of days in the most recent fiscal half-year, divided by 365 (to reflect the one-half year period).
(a) The annualized expense ratio shown reflects the impact of the management fee waiver as described in Note 4 to the Financial Statements.
MSF-4
Metropolitan Series Fund, Inc.
T. Rowe Price Large Cap Growth Portfolio
Schedule of Investments as of December 31, 2007
Common Stock—97.3% of Total Net Assets
| | | | | |
| Security Description | | Shares | | Value* |
| | | | | |
|
Aerospace & Defense—0.9% |
General Dynamics Corp. | | 92,900 | | $ | 8,267,171 |
| | | | | |
|
Air Freight & Logistics—0.5% |
Expeditors International of Washington, Inc. | | 106,200 | | | 4,745,016 |
| | | | | |
|
Airlines—0.7% |
Southwest Airlines Co. | | 535,900 | | | 6,537,980 |
| | | | | |
|
Beverages—1.3% |
InBev NV (EUR) | | 52,200 | | | 4,300,069 |
PepsiCo, Inc. | | 93,800 | | | 7,119,420 |
| | | | | |
| | | | | 11,419,489 |
| | | | | |
|
Biotechnology—2.6% |
Celgene Corp. (a) | | 49,200 | | | 2,273,532 |
Genentech, Inc. (a) | | 134,400 | | | 9,014,208 |
Gilead Sciences, Inc. (a) | | 240,200 | | | 11,051,602 |
| | | | | |
| | | | | 22,339,342 |
| | | | | |
|
Capital Markets—5.4% |
BlackRock, Inc. (b) | | 19,600 | | | 4,249,280 |
Franklin Resources, Inc. | | 70,500 | | | 8,067,315 |
Morgan Stanley | | 52,600 | | | 2,793,586 |
Northern Trust Corp. | | 66,600 | | | 5,100,228 |
State Street Corp. | | 174,900 | | | 14,201,880 |
The Charles Schwab Corp. | | 292,000 | | | 7,460,600 |
The Goldman Sachs Group, Inc. | | 25,500 | | | 5,483,775 |
| | | | | |
| | | | | 47,356,664 |
| | | | | |
|
Chemicals—1.4% |
Monsanto Co. | | 77,000 | | | 8,600,130 |
Praxair, Inc. | | 45,800 | | | 4,062,918 |
| | | | | |
| | | | | 12,663,048 |
| | | | | |
|
Commercial Banks—0.6% |
Erste Bank der oesterreichischen
Sparkassen AG (EUR) | | 68,400 | | | 4,854,374 |
| | | | | |
|
Communications Equipment—3.9% |
Cisco Systems, Inc. (a) | | 407,000 | | | 11,017,490 |
Corning, Inc. (a) | | 350,800 | | | 8,415,692 |
Juniper Networks, Inc. (a) | | 214,300 | | | 7,114,760 |
QUALCOMM, Inc. | | 195,500 | | | 7,692,925 |
| | | | | |
| | | | | 34,240,867 |
| | | | | |
|
Computers & Peripherals—3.6% |
Apple, Inc. (a) | | 112,100 | | | 22,204,768 |
Dell, Inc. (a) | | 194,700 | | | 4,772,097 |
EMC Corp. (a) | | 254,600 | | | 4,717,738 |
| | | | | |
| | | | | 31,694,603 |
| | | | | |
|
Construction & Engineering—1.2% |
Foster Wheeler, Ltd. | | 66,000 | | | 10,231,320 |
| | | | | |
| | | | | |
| Security Description | | Shares | | Value* |
| | | | | |
|
Consumer Finance—0.5% |
American Express Co. | | 79,100 | | $ | 4,114,782 |
| | | | | |
|
Diversified Financial Services—2.7% |
Bovespa Holding S.A. (BRL) (a) | | 477,500 | | | 9,201,264 |
CME Group, Inc. | | 9,700 | | | 6,654,200 |
Moody’s Corp. (b) | | 217,447 | | | 7,762,858 |
| | | | | |
| | | | | 23,618,322 |
| | | | | |
|
Electrical Equipment—0.9% |
Schneider Electric S.A. (EUR) | | 58,200 | | | 7,770,591 |
| | | | | |
|
Electronic Equipment & Instruments—0.7% |
Hon Hai Precision Industry Co., Ltd. (GDR) | | 26,900 | | | 333,560 |
Hon Hai Precision Industry Co., Ltd. (GDR)
(London Traded Shares) | | 451,660 | | | 5,568,358 |
| | | | | |
| | | | | 5,901,918 |
| | | | | |
|
Energy Equipment & Services—3.8% |
Baker Hughes, Inc. | | 126,900 | | | 10,291,590 |
Schlumberger, Ltd. | | 231,200 | | | 22,743,144 |
| | | | | |
| | | | | 33,034,734 |
| | | | | |
|
Food & Staples Retailing—5.4% |
Costco Wholesale Corp. | | 126,100 | | | 8,796,736 |
CVS Caremark Corp. | | 518,290 | | | 20,602,028 |
Sysco Corp. | | 192,400 | | | 6,004,804 |
Walgreen Co. | | 165,400 | | | 6,298,432 |
Whole Foods Market, Inc. (b) | | 135,700 | | | 5,536,560 |
| | | | | |
| | | | | 47,238,560 |
| | | | | |
|
Food Products—0.4% |
Groupe Danone (EUR) | | 39,700 | | | 3,541,672 |
| | | | | |
|
Health Care Equipment & Supplies—4.7% |
Alcon, Inc. | | 37,100 | | | 5,306,784 |
Becton, Dickinson & Co. | | 70,600 | | | 5,900,748 |
Covidien, Ltd. | | 134,950 | | | 5,976,936 |
Medtronic, Inc. | | 220,000 | | | 11,059,400 |
St. Jude Medical, Inc. (a) | | 91,100 | | | 3,702,304 |
Stryker Corp. | | 71,300 | | | 5,327,536 |
Zimmer Holdings, Inc. (a) | | 62,000 | | | 4,101,300 |
| | | | | |
| | | | | 41,375,008 |
| | | | | |
|
Health Care Providers & Services—6.5% |
Aetna, Inc. | | 217,200 | | | 12,538,956 |
CIGNA Corp. | | 97,200 | | | 5,222,556 |
Humana, Inc. (a) | | 60,700 | | | 4,571,317 |
Laboratory Corp. of America Holdings (a) | | 97,100 | | | 7,333,963 |
McKesson Corp. | | 74,300 | | | 4,867,393 |
Medco Health Solutions, Inc. (a) | | 67,600 | | | 6,854,640 |
WellPoint, Inc. (a) | | 180,700 | | | 15,852,811 |
| | | | | |
| | | | | 57,241,636 |
| | | | | |
*See accompanying notes to financial statements.
MSF-5
Metropolitan Series Fund, Inc.
T. Rowe Price Large Cap Growth Portfolio
Schedule of Investments as of December 31, 2007
Common Stock—(Continued)
| | | | | |
| Security Description | | Shares | | Value* |
| | | | | |
|
Hotels, Restaurants & Leisure—3.0% |
International Game Technology | | 149,600 | | $ | 6,571,928 |
Las Vegas Sands Corp. (a) | | 49,900 | | | 5,142,195 |
Marriott International, Inc. | | 118,660 | | | 4,055,799 |
MGM Mirage (a) | | 16,600 | | | 1,394,732 |
Yum! Brands, Inc. | | 236,000 | | | 9,031,720 |
| | | | | |
| | | | | 26,196,374 |
| | | | | |
|
Household Durables—0.9% |
Harman International Industries, Inc. | | 39,000 | | | 2,874,690 |
TomTom NV (EUR) (a) | | 68,435 | | | 5,107,075 |
| | | | | |
| | | | | 7,981,765 |
| | | | | |
|
Household Products—1.6% |
Procter & Gamble Co. | | 153,105 | | | 11,240,969 |
Reckitt Benckiser Group, Plc. (GBP) | | 51,200 | | | 2,948,852 |
| | | | | |
| | | | | 14,189,821 |
| | | | | |
|
Independent Power Producers & Energy Traders—0.7% |
The AES Corp. (a) | | 282,300 | | | 6,038,397 |
| | | | | |
|
Industrial Conglomerates—4.3% |
General Electric Co. | | 903,900 | | | 33,507,573 |
McDermott International, Inc. (a) | | 77,100 | | | 4,551,213 |
| | | | | |
| | | | | 38,058,786 |
| | | | | |
|
Insurance—1.4% |
Assurant, Inc. | | 66,600 | | | 4,455,540 |
Prudential Financial, Inc. | | 79,900 | | | 7,433,896 |
| | | | | |
| | | | | 11,889,436 |
| | | | | |
|
Internet & Catalog Retail—2.0% |
Amazon.com, Inc. (a) | | 102,500 | | | 9,495,600 |
B2W Companhia Global do Varejo (BRL) | | 53,900 | | | 2,132,009 |
Expedia, Inc. (a) | | 198,345 | | | 6,271,669 |
| | | | | |
| | | | | 17,899,278 |
| | | | | |
|
Internet Software & Services—4.8% |
Google, Inc. (Class A) (a) | | 40,900 | | | 28,281,532 |
VeriSign, Inc. (a) (b) | | 281,500 | | | 10,587,215 |
Yahoo!, Inc. (a) | | 123,300 | | | 2,867,958 |
| | | | | |
| | | | | 41,736,705 |
| | | | | |
|
IT Services—2.9% |
Accenture, Ltd. (Class A) | | 262,200 | | | 9,447,066 |
Automatic Data Processing, Inc. | | 205,400 | | | 9,146,462 |
Infosys Technologies Ltd. (ADR) (b) | | 99,100 | | | 4,495,176 |
Redecard S.A. (BRL) | | 141,200 | | | 2,260,699 |
| | | | | |
| | | | | 25,349,403 |
| | | | | |
|
Machinery—2.8% |
Danaher Corp. | | 201,500 | | | 17,679,610 |
Deere & Co. | | 43,400 | | | 4,041,408 |
Joy Global, Inc. | | 43,800 | | | 2,882,916 |
| | | | | |
| | | | | 24,603,934 |
| | | | | |
| | | | | |
| Security Description | | Shares | | Value* |
| | | | | |
|
Media—2.7% |
EchoStar Communications Corp. (Class A) (a) | | 59,500 | | $ | 2,244,340 |
Naspers, Ltd. (ZAR) | | 233,400 | | | 5,471,876 |
Shaw Communications, Inc. | | 195,800 | | | 4,636,544 |
The McGraw-Hill Cos., Inc. | | 264,400 | | | 11,583,364 |
| | | | | |
| | | | | 23,936,124 |
| | | | | |
|
Metals & Mining—1.8% |
BHP Billiton, Ltd. (AUD) | | 299,000 | | | 10,477,622 |
Freeport-McMoRan Copper & Gold, Inc. | | 55,500 | | | 5,685,420 |
| | | | | |
| | | | | 16,163,042 |
| | | | | |
|
Multiline Retail—1.2% |
Kohl’s Corp. (a) | | 110,100 | | | 5,042,580 |
Lojas Renner S.A. (BRL) | | 112,500 | | | 2,251,509 |
Target Corp. | | 60,300 | | | 3,015,000 |
| | | | | |
| | | | | 10,309,089 |
| | | | | |
|
Oil, Gas & Consumable Fuels—3.6% |
EOG Resources, Inc. | | 71,800 | | | 6,408,150 |
Exxon Mobil Corp. | | 95,316 | | | 8,930,156 |
Murphy Oil Corp. | | 52,200 | | | 4,428,648 |
Total S.A. (EUR) | | 146,300 | | | 12,123,530 |
| | | | | |
| | | | | 31,890,484 |
| | | | | |
|
Pharmaceuticals—2.4% |
Allergan, Inc. | | 127,600 | | | 8,197,024 |
Merck & Co., Inc. | | 74,100 | | | 4,305,951 |
Roche Holding AG (CHF) | | 21,100 | | | 3,631,456 |
Schering-Plough Corp. | | 169,100 | | | 4,504,824 |
| | | | | |
| | | | | 20,639,255 |
| | | | | |
|
Semiconductors & Semiconductor Equipment—1.5% |
Intel Corp. | | 179,100 | | | 4,774,806 |
Marvell Technology Group, Ltd. (a) | | 409,500 | | | 5,724,810 |
Maxim Integrated Products, Inc. | | 89,600 | | | 2,372,608 |
| | | | | |
| | | | | 12,872,224 |
| | | | | |
|
Software—6.1% |
Amdocs, Ltd. (a) | | 161,300 | | | 5,560,011 |
Electronic Arts, Inc. (a) | | 146,005 | | | 8,528,152 |
Microsoft Corp. | | 675,200 | | | 24,037,120 |
Nintendo Co., Ltd. (JPY) | | 24,800 | | | 15,055,914 |
| | | | | |
| | | | | 53,181,197 |
| | | | | |
|
Specialty Retail—0.3% |
Bed Bath & Beyond, Inc. (a) | | 95,200 | | | 2,797,928 |
| | | | | |
|
Trading Companies & Distributors—0.2% |
Fastenal Co. (b) | | 49,400 | | | 1,996,748 |
| | | | | |
|
Wireless Telecommunication Services—5.4% |
American Tower Corp. (Class A) (a) | | 241,700 | | | 10,296,420 |
América Movil S.A. de C.V. (ADR) | | 202,800 | | | 12,449,892 |
Crown Castle International Corp. (a) | | 272,000 | | | 11,315,200 |
*See accompanying notes to financial statements.
MSF-6
Metropolitan Series Fund, Inc.
T. Rowe Price Large Cap Growth Portfolio
Schedule of Investments as of December 31, 2007
Common Stock—(Continued)
| | | | | | |
| Security Description | | Shares | | Value* | |
| | | | | | |
|
Wireless Telecommunication Services—(Continued) | |
Leap Wireless International, Inc. (a) (b) | | 41,900 | | $ | 1,954,216 | |
MetroPCS Communications, Inc. (a) | | 81,700 | | | 1,589,065 | |
Rogers Communications, Inc. (Class B) | | 210,800 | | | 9,538,700 | |
| | | | | | |
| | | | | 47,143,493 | |
| | | | | | |
Total Common Stock
(Identified Cost $748,898,921) | | | | | 853,060,580 | |
| | | | | | |
|
| Short Term Investments—6.0% | |
|
Mutual Funds—6.0% | |
State Street Navigator Securities Lending
Prime Portfolio (c) | | 27,150,483 | | | 27,150,483 | |
T. Rowe Price Reserve Investment Fund (d) | | 25,468,225 | | | 25,468,225 | |
| | | | | | |
Total Short Term Investments
(Identified Cost $52,618,708) | | | | | 52,618,708 | |
| | | | | | |
Total Investments—103.3%
(Identified Cost $801,517,629) (e) | | | | | 905,679,288 | |
Liabilities in excess of other assets | | | | | (29,050,736 | ) |
| | | | | | |
| Total Net Assets—100% | | | | $ | 876,628,552 | |
| | | | | | |
| (b) | A portion or all of the security was held on loan. As of December 31, 2007, the market value of securities loaned was $26,312,259 and the collateral received consisted of cash in the amount of $27,150,483. The cash collateral is invested in a money market fund managed by an affiliate of the custodian. |
| (c) | Represents investment of cash collateral received from securities lending transactions. |
| (d) | Affiliated Issuer. See below. |
| (e) | The aggregate cost of investments for federal income tax purposes as of December 31, 2007 was $804,710,197 and the composition of unrealized appreciation and depreciation of investment securities was $126,211,577 and $(25,242,486), respectively. |
| (ADR)— | An American Depositary Receipt is a certificate issued by a custodian bank representing the right to receive securities of the foreign issuer described. Trading on exchanges not located in the United States or Canada significantly influences the value of ADRs. |
| (GDR)— | Global Depository Receipt. |
Affiliated Issuer
| | | | | | | | | | | | | | | |
Security Description | | Number of
Shares
Held at
12/31/2006 | | Shares
Purchased
Since
12/31/2006 | | Shares Sold
Since
12/31/2006 | | | Number of
Shares
Held at
12/31/2007 | | Realized
Gain/Loss on
Shares Sold | | Income for
Year Ended
12/31/2007 |
T. Rowe Price Reserve Investment Fund | | 27,238,060 | | 228,049,800 | | (229,819,635 | ) | | 25,468,225 | | $ | 0 | | $ | 1,209,686 |
*See accompanying notes to financial statements.
MSF-7
Metropolitan Series Fund, Inc.
T. Rowe Price Large Cap Growth Portfolio
Statement of Assets & Liabilities
December 31, 2007
| | | | | | |
Assets | | | | | | |
Investments at value (a) (c) | | | | | $ | 905,679,288 |
Cash | | | | | | 10,192 |
Foreign cash at value (b) | | | | | | 762,204 |
Receivable for: | | | | | | |
Securities sold | | | | | | 1,568,140 |
Fund shares sold | | | | | | 489,634 |
Accrued interest and dividends | | | | | | 821,018 |
Foreign taxes | | | | | | 14,815 |
| | | | | | |
Total Assets | | | | | | 909,345,291 |
Liabilities | | | | | | |
Payable for: | | | | | | |
Securities purchased | | $ | 4,533,468 | | | |
Fund shares redeemed | | | 456,228 | | | |
Withholding taxes | | | 6,988 | | | |
Collateral for securities loaned | | | 27,150,483 | | | |
Accrued expenses: | | | | | | |
Management fees | | | 434,978 | | | |
Service and distribution fees | | | 66,317 | | | |
Other expenses | | | 68,277 | | | |
| | | | | | |
Total Liabilities | | | | | | 32,716,739 |
| | | | | | |
Net Assets | | | | | $ | 876,628,552 |
| | | | | | |
Net assets consists of: | | | | | | |
Capital paid in | | | | | $ | 731,464,896 |
Undistributed net investment income | | | | | | 3,618,628 |
Accumulated net realized gains | | | | | | 37,375,223 |
Unrealized appreciation on investments and foreign currency | | | | | | 104,169,805 |
| | | | | | |
Net Assets | | | | | $ | 876,628,552 |
| | | | | | |
| Computation of offering price: | | | | | | |
Class A | | | | | | |
Net asset value and redemption price per share ($552,460,460 divided by 33,530,794 shares outstanding) | | | | | $ | 16.48 |
| | | | | | |
Class B | | | | | | |
Net asset value and redemption price per share ($292,019,053 divided by 17,808,072 shares outstanding) | | | | | $ | 16.40 |
| | | | | | |
Class E | | | | | | |
Net asset value and redemption price per share ($32,149,039 divided by 1,957,953 shares outstanding) | | | | | $ | 16.42 |
| | | | | | |
(a) Identified cost of investments | | | | | $ | 801,517,629 |
| | | | | | |
(b) Identified cost of foreign cash | | | | | $ | 755,575 |
| | | | | | |
| (c) | Includes cash collateral for securities loaned of $27,150,483. |
Statement of Operations
For the Year Ended December 31, 2007
| | | | | | | | |
Investment Income | | | | | | | | |
Dividends | | | | | | $ | 8,897,574 | (a) |
Interest | | | | | | | 1,240,281 | (b) |
| | | | | | | | |
| | | | | | | 10,137,855 | |
Expenses | | | | | | | | |
Management fees | | $ | 4,714,924 | | | | | |
Service and distribution fees—Class B | | | 713,660 | | | | | |
Service and distribution fees—Class E | | | 47,110 | | | | | |
Directors’ fees and expenses | | | 23,669 | | | | | |
Custodian | | | 201,484 | | | | | |
Audit and tax services | | | 31,737 | | | | | |
Legal | | | 8,920 | | | | | |
Printing | | | 265,686 | | | | | |
Insurance | | | 7,814 | | | | | |
Miscellaneous | | | 14,433 | | | | | |
| | | | | | | | |
Total expenses | | | 6,029,437 | | | | | |
Expense reductions | | | (26,866 | ) | | | | |
Management fee waivers | | | (131,936 | ) | | | 5,870,635 | |
| | | | | | | | |
Net Investment Income | | | | | | | 4,267,220 | |
| | | | | | | | |
Realized and Unrealized Gain | | | | | | | | |
| Realized gain (loss) on: | | | | | | | | |
Investments—net | | | 40,004,302 | | | | | |
Futures contracts—net | | | 550,621 | | | | | |
Foreign currency transactions—net | | | (362,900 | ) | | | 40,192,023 | |
| | | | | | | | |
| Change in unrealized appreciation on: | | | | | | | | |
Investments—net | | | 21,451,180 | | | | | |
Foreign currency transactions—net | | | 4,982 | | | | 21,456,162 | |
| | | | | | | | |
Net gain | | | | | | | 61,648,185 | |
| | | | | | | | |
Net Increase in Net Assets From Operations | | | | | | $ | 65,915,405 | |
| | | | | | | | |
| (a) | Net of foreign taxes of $256,557. |
| (b) | Includes net income on securities loaned of $32,640. |
See accompanying notes to financial statements.
MSF-8
Metropolitan Series Fund, Inc.
T. Rowe Price Large Cap Growth Portfolio
Statements of Changes in Net Assets
| | | | | | | | |
| | | Year ended
December 31,
2007 | | | Year ended
December 31,
2006 | |
From Operations | | | | | | | | |
Net investment income | | $ | 4,267,220 | | | $ | 2,730,623 | |
Net realized gain | | | 40,192,023 | | | | 29,235,537 | |
Unrealized appreciation | | | 21,456,162 | | | | 36,515,240 | |
| | | | | | | | |
Increase in net assets from operations | | | 65,915,405 | | | | 68,481,400 | |
| | | | | | | | |
From Distributions to Shareholders | | | | | | | | |
Net investment income | | | | | | | | |
Class A | | | (2,029,262 | ) | | | (937,824 | ) |
Class B | | | (535,551 | ) | | | (122,146 | ) |
Class E | | | (92,499 | ) | | | (58,204 | ) |
| | | | | | | | |
| | | (2,657,312 | ) | | | (1,118,174 | ) |
| | | | | | | | |
Net realized gain | | | | | | | | |
Class A | | | (4,030,340 | ) | | | 0 | |
Class B | | | (2,470,445 | ) | | | 0 | |
Class E | | | (275,570 | ) | | | 0 | |
| | | | | | | | |
| | | (6,776,355 | ) | | | 0 | |
| | | | | | | | |
Total distributions | | | (9,433,667 | ) | | | (1,118,174 | ) |
| | | | | | | | |
Increase in net assets from capital share transactions | | | 136,440,858 | | | | 245,680,812 | |
| | | | | | | | |
Total increase in net assets | | | 192,922,596 | | | | 313,044,038 | |
| | |
Net Assets | | | | | | | | |
Beginning of the period | | | 683,705,956 | | | | 370,661,918 | |
| | | | | | | | |
End of the period | | $ | 876,628,552 | | | $ | 683,705,956 | |
| | | | | | | | |
Undistributed Net Investment Income | | | | | | | | |
End of the period | | $ | 3,618,628 | | | $ | 2,611,080 | |
| | | | | | | | |
Other Information:
Capital Shares
Transactions in capital shares were as follows:
| | | | | | | | | | | | | | |
| | | Year ended
December 31, 2007 | | | Year ended
December 31, 2006 | |
| | | Shares | | | $ | | | Shares | | | $ | |
Class A | | | | | | | | | | | | | | |
Sales | | 18,615,964 | | | $ | 299,429,944 | | | 12,750,061 | | | $ | 182,472,112 | |
Reinvestments | | 381,587 | | | | 6,059,602 | | | 66,797 | | | | 937,824 | |
Redemptions | | (8,709,171 | ) | | | (140,654,691 | ) | | (6,976,649 | ) | | | (98,380,759 | ) |
| | | | | | | | | | | | | | |
Net increase | | 10,288,380 | | | $ | 164,834,855 | | | 5,840,209 | | | $ | 85,029,177 | |
| | | | | | | | | | | | | | |
Class B | | | | | | | | | | | | | | |
Sales | | 4,092,070 | | | $ | 65,765,107 | | | 19,382,686 | | | $ | 271,687,508 | |
Reinvestments | | 189,773 | | | | 3,005,996 | | | 8,725 | | | | 122,146 | |
Redemptions | | (6,126,259 | ) | | | (96,631,962 | ) | | (7,620,165 | ) | | | (109,090,213 | ) |
| | | | | | | | | | | | | | |
Net increase (decrease) | | (1,844,416 | ) | | $ | (27,860,859 | ) | | 11,771,246 | | | $ | 162,719,441 | |
| | | | | | | | | | | | | | |
Class E | | | | | | | | | | | | | | |
Sales | | 620,754 | | | $ | 10,039,787 | | | 470,996 | | | $ | 6,622,128 | |
Reinvestments | | 23,222 | | | | 368,069 | | | 4,157 | | | | 58,204 | |
Redemptions | | (679,344 | ) | | | (10,940,994 | ) | | (629,144 | ) | | | (8,748,138 | ) |
| | | | | | | | | | | | | | |
Net decrease | | (35,368 | ) | | $ | (533,138 | ) | | (153,991 | ) | | $ | (2,067,806 | ) |
| | | | | | | | | | | | | | |
Increase derived from capital share transactions | | | | | $ | 136,440,858 | | | | | | $ | 245,680,812 | |
| | | | | | | | | | | | | | |
See accompanying notes to financial statements.
MSF-9
Metropolitan Series Fund, Inc.
T. Rowe Price Large Cap Growth Portfolio
Financial Highlights
| | | | | | | | | | | | | | | | | | | | |
| | | Class A | |
| | | Year ended December 31, | |
| | | 2007 | | | 2006 | | | 2005 | | | 2004 | | | 2003 | |
Net Asset Value, Beginning of Period | | $ | 15.27 | | | $ | 13.53 | | | $ | 12.77 | | | $ | 11.64 | | | $ | 8.91 | |
| | | | | | | | | | | | | | | | | | | | |
Income From Investment Operations | | | | | | | | | | | | | | | | | | | | |
Net investment income | | | 0.10 | (a) | | | 0.09 | (a) | | | 0.05 | | | | 0.08 | | | | 0.03 | |
Net realized and unrealized gain on investments | | | 1.32 | | | | 1.70 | | | | 0.78 | | | | 1.07 | | | | 2.71 | |
| | | | | | | | | | | | | | | | | | | | |
Total from investment operations | | | 1.42 | | | | 1.79 | | | | 0.83 | | | | 1.15 | | | | 2.74 | |
| | | | | | | | | | | | | | | | | | | | |
Less Distributions | | | | | | | | | | | | | | | | | | | | |
Distributions from net investment income | | | (0.07 | ) | | | (0.05 | ) | | | (0.07 | ) | | | (0.02 | ) | | | (0.01 | ) |
Distributions from net realized capital gains | | | (0.14 | ) | | | 0.00 | | | | 0.00 | | | | 0.00 | | | | 0.00 | |
| | | | | | | | | | | | | | | | | | | | |
Total distributions | | | (0.21 | ) | | | (0.05 | ) | | | (0.07 | ) | | | (0.02 | ) | | | (0.01 | ) |
| | | | | | | | | | | | | | | | | | | | |
Net Asset Value, End of Period | | $ | 16.48 | | | $ | 15.27 | | | $ | 13.53 | | | $ | 12.77 | | | $ | 11.64 | |
| | | | | | | | | | | | | | | | | | | | |
Total Return (%) | | | 9.4 | | | | 13.2 | | | | 6.6 | | | | 9.9 | | | | 30.8 | |
Ratio of operating expenses to average net assets before expense reductions (%) | | | 0.66 | | | | 0.68 | | | | 0.71 | | | | 0.74 | | | | 0.79 | |
Ratio of operating expenses to average net assets after expense reductions (%) (b) | | | 0.65 | | | | 0.68 | | | | 0.70 | | | | 0.73 | | | | 0.77 | |
Ratio of operating expenses to average net assets without giving effect to the management fee waiver would have been (%) (c) | | | 0.67 | | | | 0.70 | | | | N/A | | | | N/A | | | | N/A | |
Ratio of net investment income to average net assets (%) | | | 0.64 | | | | 0.65 | | | | 0.44 | | | | 0.68 | | | | 0.28 | |
Portfolio turnover rate (%) | | | 61 | | | | 55 | | | | 35 | | | | 37 | | | | 37 | |
Net assets, end of period (000) | | $ | 552,460 | | | $ | 354,798 | | | $ | 235,513 | | | $ | 198,913 | | | $ | 172,315 | |
| | | | | | | | | | | | | | | | | | | | |
| | | Class B | |
| | | Year ended December 31, | |
| | | 2007 | | | 2006 | | | 2005 | | | 2004 | | | 2003 | |
Net Asset Value, Beginning of Period | | $ | 15.19 | | | $ | 13.47 | | | $ | 12.72 | | | $ | 11.60 | | | $ | 8.88 | |
| | | | | | | | | | | | | | | | | | | | |
Income From Investment Operations | | | | | | | | | | | | | | | | | | | | |
Net investment income | | | 0.06 | (a) | | | 0.05 | (a) | | | 0.01 | | | | 0.05 | | | | 0.01 | |
Net realized and unrealized gain on investments | | | 1.32 | | | | 1.68 | | | | 0.79 | | | | 1.08 | | | | 2.72 | |
| | | | | | | | | | | | | | | | | | | | |
Total from investment operations | | | 1.38 | | | | 1.73 | | | | 0.80 | | | | 1.13 | | | | 2.73 | |
| | | | | | | | | | | | | | | | | | | | |
Less Distributions | | | | | | | | | | | | | | | | | | | | |
Distributions from net investment income | | | (0.03 | ) | | | (0.01 | ) | | | (0.05 | ) | | | (0.01 | ) | | | (0.01 | ) |
Distributions from net realized capital gains | | | (0.14 | ) | | | 0.00 | | | | 0.00 | | | | 0.00 | | | | 0.00 | |
| | | | | | | | | | | | | | | | | | | | |
Total distributions | | | (0.17 | ) | | | (0.01 | ) | | | (0.05 | ) | | | (0.01 | ) | | | (0.01 | ) |
| | | | | | | | | | | | | | | | | | | | |
Net Asset Value, End of Period | | $ | 16.40 | | | $ | 15.19 | | | $ | 13.47 | | | $ | 12.72 | | | $ | 11.60 | |
| | | | | | | | | | | | | | | | | | | | |
Total Return (%) | | | 9.2 | | | | 12.9 | | | | 6.3 | | | | 9.7 | | | | 30.8 | |
Ratio of operating expenses to average net assets before expense reductions (%) | | | 0.91 | | | | 0.93 | | | | 0.96 | | | | 0.99 | | | | 1.04 | |
Ratio of operating expenses to average net assets after expense reductions (%) (b) | | | 0.90 | | | | 0.93 | | | | 0.95 | | | | 0.98 | | | | 1.02 | |
Ratio of operating expenses to average net assets without giving effect to the management fee waiver would have been (%) (c) | | | 0.92 | | | | 0.95 | | | | N/A | | | | N/A | | | | N/A | |
Ratio of net investment income to average net assets (%) | | | 0.39 | | | | 0.34 | | | | 0.20 | | | | 0.93 | | | | 0.06 | |
Portfolio turnover rate (%) | | | 61 | | | | 55 | | | | 35 | | | | 37 | | | | 37 | |
Net assets, end of period (000) | | $ | 292,019 | | | $ | 298,582 | | | $ | 106,181 | | | $ | 48,955 | | | $ | 325 | |
| (a) | Per share amount is based on average shares outstanding during the period. |
| (b) | The Portfolio has entered into arrangements with certain brokers who paid a portion of the Portfolio’s expenses. |
| (c) | See Note 4 in the Notes to Financial Statements. |
See accompanying notes to financial statements.
MSF-10
Metropolitan Series Fund, Inc.
T. Rowe Price Large Cap Growth Portfolio
Financial Highlights
| | | | | | | | | | | | | | | | | | | | |
| | | Class E | |
| | | Year ended December 31, | |
| | | 2007 | | | 2006 | | | 2005 | | | 2004 | | | 2003 | |
Net Asset Value, Beginning of Period | | $ | 15.21 | | | $ | 13.49 | | | $ | 12.73 | | | $ | 11.61 | | | $ | 8.90 | |
| | | | | | | | | | | | | | | | | | | | |
Income From Investment Operations | | | | | | | | | | | | | | | | | | | | |
Net investment income | | | 0.08 | (a) | | | 0.07 | (a) | | | 0.04 | | | | 0.06 | | | | 0.01 | |
Net realized and unrealized gain on investments | | | 1.32 | | | | 1.68 | | | | 0.77 | | | | 1.08 | | | | 2.71 | |
| | | | | | | | | | | | | | | | | | | | |
Total from investment operations | | | 1.40 | | | | 1.75 | | | | 0.81 | | | | 1.14 | | | | 2.72 | |
| | | | | | | | | | | | | | | | | | | | |
Less Distributions | | | | | | | | | | | | | | | | | | | | |
Distributions from net investment income | | | (0.05 | ) | | | (0.03 | ) | | | (0.05 | ) | | | (0.02 | ) | | | (0.01 | ) |
Distributions from net realized capital gains | | | (0.14 | ) | | | 0.00 | | | | 0.00 | | | | 0.00 | | | | 0.00 | |
| | | | | | | | | | | | | | | | | | | | |
Total distributions | | | (0.19 | ) | | | (0.03 | ) | | | (0.05 | ) | | | (0.02 | ) | | | (0.01 | ) |
| | | | | | | | | | | | | | | | | | | | |
Net Asset Value, End of Period | | $ | 16.42 | | | $ | 15.21 | | | $ | 13.49 | | | $ | 12.73 | | | $ | 11.61 | |
| | | | | | | | | | | | | | | | | | | | |
Total Return (%) | | | 9.3 | | | | 13.0 | | | | 6.4 | | | | 9.8 | | | | 30.6 | |
Ratio of operating expenses to average net assets before expense reductions (%) | | | 0.81 | | | | 0.83 | | | | 0.86 | | | | 0.89 | | | | 0.94 | |
Ratio of operating expenses to average net assets after expense reductions (%) (b) | | | 0.80 | | | | 0.83 | | | | 0.85 | | | | 0.88 | | | | 0.92 | |
Ratio of operating expenses to average net assets without giving effect to the management fee waiver would have been (%) (c) | | | 0.82 | | | | 0.85 | | | | N/A | | | | N/A | | | | N/A | |
Ratio of net investment income to average net assets (%) | | | 0.50 | | | | 0.51 | | | | 0.29 | | | | 0.56 | | | | 0.14 | |
Portfolio turnover rate (%) | | | 61 | | | | 55 | | | | 35 | | | | 37 | | | | 37 | |
Net assets, end of period (000) | | $ | 32,149 | | | $ | 30,325 | | | $ | 28,968 | | | $ | 27,341 | | | $ | 16,646 | |
| (a) | Per share amount is based on average shares outstanding during the period. |
| (b) | The Portfolio has entered into arrangements with certain brokers who paid a portion of the Portfolio’s expenses. |
| (c) | See Note 4 in the Notes to Financial Statements. |
See accompanying notes to financial statements.
MSF-11
Metropolitan Series Fund, Inc.
T. Rowe Price Large Cap Growth Portfolio
Notes to Financial Statements—December 31, 2007
Metropolitan Series Fund, Inc. (the “Fund”) is organized as a corporation under the laws of Maryland pursuant to Articles of Incorporation filed on November 23, 1982, as amended, and registered under the Investment Company Act of 1940, as amended (the “1940 Act”), as an open-end investment company. The Fund is a “series” type of mutual fund, which issues separate series of stock. Each series represents an interest in a separate portfolio of Fund investments. The T. Rowe Price Large Cap Growth Portfolio (the “Portfolio”) is a diversified series of the Fund. Shares in the Fund are not offered directly to the general public and are currently available only to separate accounts established by Metropolitan Life Insurance Company (“MetLife”), New England Life Insurance Company, General American Life Insurance Company (“General American”), The MetLife Investors Group of Insurance Companies, MetLife Insurance Company of Connecticut and other affiliated insurance companies (collectively, the “Insurance Companies”), as an investment vehicle for variable life insurance, group annuity or variable annuity products, although the Portfolio is not available to all such separate accounts. The Portfolio’s shares may be divided into different classes. Currently, the classes being offered by the Portfolio are named Class A, Class B and Class E. The classes of the Portfolio’s shares are identical, except that certain additional charges (Rule 12b-1 fees) are made against Class B and Class E shares. Investment income, realized and unrealized capital gains and losses, the common expenses of the Portfolio and certain Portfolio-level expense reductions, if any, are allocated on a pro rata basis to each class based on the relative net assets of each class to the total net assets of the Portfolio.
| 2. | SIGNIFICANT ACCOUNTING POLICIES: |
The preparation of financial statements in conformity with accounting principles generally accepted in the United States of America (“GAAP”) requires management to make estimates and assumptions that affect the reported amounts of assets and liabilities and disclosure of contingent assets and liabilities as of the date of the financial statements and the reported amounts of income and expenses during the reporting period. Actual results could differ from those estimates.
The following is a summary of significant accounting policies consistently followed by the Portfolio in the preparation of its financial statements. The policies are in conformity with GAAP.
Investment Valuation:
Debt securities (other than short term obligations with a remaining maturity of sixty days or less) are valued by independent pricing services selected by the relevant subadviser pursuant to authorization of the Board of Directors of the Fund (the “Board” or “Directors”). Short term obligations with a remaining maturity of sixty days or less are valued at amortized cost which approximates fair market value.
Equity securities traded on a national securities exchange or exchanges are valued at their last sale price on the principal trading market. Equity securities traded on the NASDAQ National Market System are valued at the NASDAQ Official Closing Price (the “NOCP”). The NOCP is the last sale price if it falls between the spread of the last reported bid and asked prices. If the last reported bid and asked prices are above the last reported sale price, the NOCP will be the last reported bid price. If the last reported bid and asked prices are below the last reported sale price, the NOCP will be the last reported asked price. Equity securities traded on a national securities exchange or exchanges or on the NASDAQ National Market System for which there is no reported sale during the day are valued at the last reported bid price. A security that is listed or traded on more than one exchange is valued at the quotation on the exchange determined to be the primary market for that security by the Board or its delegates. If no closing price is available, then such securities are valued by using the last reported bid price. Equity securities traded over-the-counter are valued at the last reported sales price.
If no current market value quotation is readily available or reliable for a portfolio security, fair value will be determined in accordance with procedures established by and under the general supervision of the Board. When the Portfolio uses fair value pricing, it may take into account any factors it deems appropriate. The value of securities used by the Portfolio to calculate its net asset value may differ from quoted or published prices for the same securities. Fair value pricing involves subjective judgments and the fair value determined for a security may be materially different than the value that could be realized upon the sale of that security.
The Portfolio expects to use fair value pricing for securities primarily traded on U.S. exchanges only under very limited circumstances. For example, the Portfolio may use fair value pricing if the exchange on which a security is traded closes early or trading in the security is suspended.
MSF-12
Metropolitan Series Fund, Inc.
T. Rowe Price Large Cap Growth Portfolio
Notes to Financial Statements—December 31, 2007—(Continued)
Securities traded primarily on an exchange outside of the United States which closes before the close of the New York Stock Exchange will be valued at the last sales price on that non-U.S. exchange. Securities traded primarily on an exchange outside of the United States for which there is no reported sale during the day are valued at the mean between the last reported bid and asked prices. However, because most foreign markets close well before the Portfolio values its securities (typically at 4 p.m. Eastern Time), the earlier close of these foreign markets gives rise to the possibility that significant events, including broad market moves, may have occurred after these foreign markets close but before the Portfolio values its securities. To account for this, the Portfolio may frequently value many of its foreign equity securities using fair value prices based on third party vendor modeling tools.
Forward foreign currency exchange contracts are valued based on the mean between closing bid and asked prices of the forward currency contract rates in the London foreign exchange markets on a daily basis as provided by a reliable bank or dealer.
Options, whether on securities, indices, futures contracts, or otherwise, are valued at the last sales price available as of the close of business on the day of valuation or, if there is no such sale price available, at the mean between the bid and asked prices. Options on currencies are valued at the spot price each day.
The value of futures contracts will be the sum of the margin deposit plus or minus the difference between the value of the futures contract on each day the net asset value is calculated and the value on the date the futures contract originated, value being that established on a recognized commodity exchange, or by reference to other customary sources, with gain or loss being realized when the futures contract closes or expires.
Subject to the Board’s oversight, the Board has delegated day-to-day responsibility for valuing Portfolio assets to the subadviser of the Portfolio, who values such assets as described above and operates under procedures approved by the Board.
Investment Transactions and Related Investment Income:
Portfolio security transactions are recorded on the trade date. Dividend income is recorded on the ex-dividend date or, for certain foreign securities, when notified. Interest income, which includes amortization of premium and accretion of discount on debt securities, is recorded on the accrual basis. Realized gains and losses on investments and unrealized appreciation and depreciation are determined on the identified cost basis, which is the same basis used for federal income tax purposes.
Repurchase Agreements:
The Portfolio, through the custodian or a subcustodian, receives delivery of the underlying securities collateralizing repurchase agreements. The Portfolio requires the custodian to take possession, to have legally segregated in the Federal Reserve Book Entry System, or to have segregated within the custodian’s vault, all securities held as collateral for repurchase agreements. It is the Portfolio’s policy that the market value of the collateral be at least equal to 100% of the repurchase price in the case of a repurchase agreement of one-day duration and 102% on all other repurchase agreements. The Portfolio’s subadviser is responsible for determining that the value of the collateral is at all times at least equal to the repurchase price. In connection with transactions in repurchase agreements, if the seller defaults and the value of the collateral declines or if the seller enters an insolvency proceeding, realization of the collateral by the Portfolio may be delayed, limited or wholly denied.
Foreign Currency Translation:
The books and records of the Portfolio are maintained in U.S. dollars. The values of securities, currencies and other assets and liabilities denominated in currencies other than U.S. dollars are translated into U.S. dollars based upon foreign exchange rates prevailing at the end of the period. Purchases and sales of investment securities, income and expenses are translated on the respective dates of such transactions. Since the values of investment securities are presented at the foreign exchange rates prevailing at the end of the period, it is not practical to isolate that portion of the results of operations arising from changes in exchange rates from that portion of the results of operations reflecting fluctuations arising from changes in market prices of the investment securities. Such fluctuations are included in the net realized and unrealized gain or loss on investments.
Net realized foreign exchange gains or losses arise from sales of foreign currency, currency gains or losses realized between the trade and settlement dates on securities transactions, and the difference between the amounts of dividends, interest, and foreign withholding taxes recorded by the Portfolio and the U.S. dollar equivalent of the amounts actually received or paid by the Portfolio. Net unrealized foreign exchange gains and losses arise from changes in the value of assets and liabilities, other than investment securities, resulting from changes in the exchange rate.
MSF-13
Metropolitan Series Fund, Inc.
T. Rowe Price Large Cap Growth Portfolio
Notes to Financial Statements—December 31, 2007—(Continued)
Forward Foreign Currency Exchange Contracts:
The Portfolio may enter into forward foreign currency exchange contracts primarily to hedge against foreign currency exchange rate risks on its non-U.S. dollar denominated investment securities. When entering into a forward currency contract, the Portfolio agrees to receive or deliver a fixed quantity of foreign currency for an agreed-upon price on an agreed future date. These contracts are valued daily and the Portfolio’s net equity therein, representing unrealized gain or loss on the contracts as measured by the difference between the foreign exchange rates at the dates of entry into the contracts and the forward rates at the settlement date, is included in the Statement of Assets and Liabilities. Realized and unrealized gains and losses are included in the Statement of Operations. These instruments involve market and/or credit risk in excess of the amount recognized in the Statement of Assets and Liabilities. Risks arise from the possible inability of counterparties to meet the terms of their contracts and from movement in currency and securities values and interest rates.
Futures Contracts:
The Portfolio may buy and sell futures contracts (on recognized exchanges) as a hedge or to enhance return. Futures contracts are agreements to buy or sell a security, or deliver a final cash settlement price in connection with an index, interest rate, currency, or other contracts not calling for physical delivery, for a set price in the future. The Portfolio must post an amount equal to a portion of the total market value of the futures contract as futures variation margin, which is returned when the Portfolio’s obligations under the contract have been satisfied. From time to time thereafter, the Portfolio may have to post variation margin to maintain this amount as the market value of the contract fluctuates. Risks of entering into futures contracts (and related options) include the possibility that there may be an illiquid market and that a change in the value of the contract or option may not correlate with changes in the value of the underlying securities.
Options:
The Portfolio may use options to hedge against changes in values of securities the Portfolio owns or expects to purchase. Writing puts or buying calls tends to increase the Portfolio’s exposure to the underlying instrument and writing calls or buying puts tends to decrease the Portfolio’s exposure to the underlying instrument, and can be used to hedge other Portfolio investments. For options purchased to hedge the Portfolio’s investments, the potential risk to the Portfolio is that the change in value of options contracts may not correspond to the change in value of the hedged instruments. In addition, losses may arise from changes in the value of the underlying instruments, if there is an illiquid secondary market, or if the counterparty is unable to perform. The maximum loss for purchased options is limited to the premium initially paid for the option. For options written by the Portfolio, the maximum loss is not limited to the premium initially received for the option.
The main risk associated with purchasing an option is that the option expires without being exercised. In this case, the option expires worthless and the premium paid for the option is considered the loss. The risk associated with writing a call option is that the Portfolio may forgo the opportunity for a profit if the market value of the underlying position increases and the option is exercised. The risk in writing a put option is that the Portfolio may incur a loss if the market value of the underlying position decreases and the option is exercised. In addition, the Portfolio risks not being able to enter into a closing transaction for the written option as the result of an illiquid market.
“When-Issued” Securities:
Purchasing securities “when-issued” is a forward commitment by the Portfolio to buy a security. The estimated amount of the Portfolio’s payment obligation and the security’s interest rate are determined when the commitment is made, even though no interest accrues until the security is issued, which is generally 15 to 120 days later. The Portfolio will segregate liquid assets with its custodian sufficient at all times to satisfy these commitments. If the value of the security is less when delivered than when the commitment was made, the Portfolio will suffer a loss.
Federal Income Taxes:
It is the Portfolio’s policy to comply with the requirements of the Internal Revenue Code of 1986, as amended, and regulations thereunder, applicable to regulated investment companies and to distribute all of its taxable income to shareholders. Therefore, no federal income tax provision is required.
As of December 31, 2007, the Portfolio had no capital loss carryovers.
MSF-14
Metropolitan Series Fund, Inc.
T. Rowe Price Large Cap Growth Portfolio
Notes to Financial Statements—December 31, 2007—(Continued)
The tax character of distributions paid for the periods ended December 31, 2007 and 2006 was as follows:
| | | | | | | | | | | | | | | | | | | | | |
| Ordinary Income | | Long Term Gain | | Return of Capital | | Total |
| 2007 | | 2006 | | 2007 | | 2006 | | 2007 | | 2006 | | 2007 | | 2006 |
| $2,657,312 | | $ | 1,118,174 | | $ | 6,776,355 | | $ | — | | $ | — | | $ | — | | $ | 9,433,667 | | $ | 1,118,174 |
As of December 31, 2007, the components of distributable earnings (accumulated losses) on a federal income tax basis were as follows:
| | | | | | | | | | | | |
Undistributed
Ordinary
Income | | Undistributed
Long Term
Gain | | Unrealized
Appreciation | | Loss
Carryforwards | | Total |
| $11,906,813 | | $ | 34,021,160 | | $ | 100,977,239 | | $ | — | | $ | 146,905,212 |
Dividends and Distributions to Shareholders:
The Portfolio records dividends and distributions on the ex-dividend date. Net realized gains from security transactions (if any) are generally distributed annually to shareholders. The timing and characterization of certain income and capital gains distributions are determined in accordance with federal tax regulations that may differ from GAAP. Permanent book and tax basis differences relating to shareholder distributions will result in reclassification between under/over distributed net investment income, accumulated net realized gains/losses and paid in capital.
Expense Reductions:
Certain Portfolio trades are directed to brokers who paid a portion of the Portfolio’s expenses. Amounts paid for the Portfolio are shown as expense reductions in the Statement of Operations.
| 3. | INVESTMENT TRANSACTIONS: |
For the year ended December 31, 2007, purchases and sales of securities (excluding short term investments) for the Portfolio were as follows:
| | | | | | | | | |
| Purchases | | Sales |
U.S. Government | | Other | | U.S. Government | | Other |
| $0 | | $ | 589,657,084 | | $ | 0 | | $ | 461,803,132 |
| 4. | INVESTMENT MANAGEMENT FEES AND OTHER TRANSACTIONS WITH AFFILIATES: |
Investment Management Agreement:
MetLife Advisers, LLC (“MetLife Advisers”) is the investment adviser to the Portfolio. The Fund has entered into an investment management agreement with MetLife Advisers with respect to the Portfolio. For providing investment management services to the Portfolio, MetLife Advisers receives monthly compensation at the following annual rates:
| | | | | | |
| | | Management
Fees earned by
MetLife Advisers
for the year ended
December 31, 2007 | | Annual
percentage
rates paid to
MetLife Advisers | | Based on Portfolios
average daily net asset levels |
| | $4,714,924 | | 0.650% | | Of the first $50 million |
| | | | 0.600% | | On amounts in excess of $50 million |
Certain officers and directors of the Fund may also be officers of MetLife Advisers; however, such officers and directors receive no compensation from the Fund.
MetLife Advisers has entered into an investment subadvisory agreement with respect to the Portfolio. T. Rowe Price Associates, Inc. (“T. Rowe Price”) is compensated by MetLife Advisers to provide subadvisory services for the Portfolio.
MSF-15
Metropolitan Series Fund, Inc.
T. Rowe Price Large Cap Growth Portfolio
Notes to Financial Statements—December 31, 2007—(Continued)
Management Fee Waivers:
Pursuant to an expense agreement, MetLife Advisers has agreed, for the period May 1, 2007 to April 30, 2008, to reduce its advisory fees set out above under “Investment Management Agreement” for each class of the Portfolio at the annual rate of 0.015% of the first $50 million of the Portfolio’s average daily net assets. Amounts waived for the year ended December 31, 2007 are shown as management fee waivers in the Statement of Operations.
Effective February 17, 2005, T. Rowe Price agreed to a voluntary subadvisory fee waiver that applies if (i) assets under management by T. Rowe Price for the Fund and Met Investor Series Trust (“MIST”), in the aggregate, exceed $750,000,000, (ii) T. Rowe Price subadvises three or more portfolios of the Fund and MIST in the aggregate, and (iii) at least one of those portfolios is a large cap domestic equity portfolio.
If the aforementioned conditions are met, T. Rowe Price will waive its subadvisory fee paid by MetLife Advisers by 5% for combined Fund and MIST average daily net assets over $750,000,000, 7.5% for the next $1,500,000,000 of combined assets, and 10% for amounts over $3,000,000,000. Any amounts waived pursuant to this subadvisory fee waiver will be allocated with respect to the Fund and MIST portfolios in proportion to such portfolios’ net assets. MetLife Advisers has voluntarily agreed to reduce its advisory fee for T. Rowe Price Large Cap Growth and T. Rowe Price Small Cap Growth by the amount waived (if any) by T. Rowe Price for the relevant Portfolio(s) pursuant to this voluntary subadvisory fee waiver. Because these fee waivers are voluntary, and not contractual, they may be discontinued by T. Rowe Price and MetLife Advisers at any time. Amounts waived for the year ended December 31, 2007 are shown as management fee waivers in the Statement of Operations of the respective Portfolios.
Service and Distribution Fees:
The Fund has adopted a Distribution and Service Plan under Rule 12b-1 of the 1940 Act for the Portfolio’s Class B and E shares. Under the Distribution and Service Plan, the Class B and E shares of the Portfolio pay a fee to compensate the Insurance Companies (or their affiliates) and other broker-dealers and financial intermediaries involved in the offer and sale of Portfolio shares for promoting or selling and servicing, the Class B and E shares. The fees under the Distribution and Service Plan for each class of the Portfolio’s shares are calculated as a percentage of the Portfolio’s average daily net assets that are attributable to that Class. Currently, the fee is 0.25% per year for Class B shares and 0.15% per year for Class E shares. Amounts paid by the Portfolio for the year ended December 31, 2007 are shown as Service and Distribution fees in the Statement of Operations.
The Fund has entered into a securities lending arrangement with the Fund’s custodian, State Street Bank and Trust Company (the “custodian”). Under the agreement, the custodian is authorized to loan securities on the Portfolios’ behalf. In exchange, the Portfolio receives either cash or securities as collateral against the loaned securities. The Portfolio receives collateral at least equal to 102% of the market value of the loaned securities (105% for foreign securities), at each loan’s inception. Collateral must be maintained at least at 100% of the market value of the loaned securities for the duration of the loan. The cash collateral is invested in the Navigator Securities Lending Prime Portfolio, an affiliate of the custodian, which invests in a variety of high quality U.S. dollar-denominated instruments. If the market value of the collateral at the close of trading on a business day is less than 100% of the market value of the loaned securities at the close of trading on that day, the borrower shall be required to deliver, by the close of business on the following business day, an additional amount of collateral, equal to at least 100% of the market value of all the loaned securities as of such preceding day. The Portfolio receives 80% of the annual net income from securities lending transactions, which is included in interest income of the Portfolio. The remaining 20% is paid to the custodian as compensation for its securities lending services. The Portfolio bears the risk of any deficiency in the amount of collateral available for return to a borrower due to a loss in an approved investment. Any outstanding loans by the Portfolio at December 31, 2007 are footnoted in the Schedule of Investments.
As previously reported, in May 2004, General American received a Wells Notice stating that the SEC staff was considering recommending that the SEC bring a civil action alleging violations of the U.S. securities laws against General American with respect to market timing and late trading in a limited number of privately-placed variable insurance contracts that were sold through General American. General American responded to the SEC staff and cooperated with the investigation. On August 9, 2007, the SEC announced that it had settled an enforcement action regarding late trading against General American with, among other things, General American agreeing to pay a civil penalty and to comply with certain undertakings. General American
MSF-16
Metropolitan Series Fund, Inc.
T. Rowe Price Large Cap Growth Portfolio
Notes to Financial Statements—December 31, 2007—(Continued)
consented to the SEC’s order without admitting or denying the findings. MetLife Advisers has also advised the Fund’s Board of Directors that, while certain exceptions to the Fund’s policies have been noted, no situations have been identified that would have a material impact on the financial position of the Fund.
| 7. | RECENT ACCOUNTING PRONOUNCEMENTS: |
Effective June 29, 2007, the Fund implemented Financial Accounting Standards Board (“FASB”) Interpretation No. 48, “Accounting for Uncertainty in Income Taxes—an interpretation of FASB Statement No. 109” (“FIN 48”). FIN 48 prescribes the minimum recognition threshold a tax position must meet in connection with accounting for uncertainties in income tax positions taken or expected to be taken by an entity, including investment companies, before being measured and recognized in the financial statements. Management has evaluated the application of FIN 48 to the Fund, and has determined that the adoption of FIN 48 does not have a material impact on the Fund’s financial statements. The Fund files U.S. tax returns. No income tax returns are currently under examination. The statute of limitations on the Fund’s tax returns remains open for the years ended December 31, 2004 through December 31, 2006.
In September 2006, Statement of Financial Accounting Standards No. 157, Fair Value Measurements (SFAS 157) was issued and is effective for fiscal years beginning after November 15, 2007. SFAS 157 defines fair value, establishes a framework for measuring fair value and expands disclosures about fair value measurements. Management is currently evaluating the impact the adoption of SFAS 157 will have on the Portfolio’s financial statement disclosures.
MSF-17
Metropolitan Series Fund, Inc.
T. Rowe Price Large Cap Growth Portfolio
Report of Independent Registered Public Accounting Firm
To the Shareholders and Board of Directors of the Metropolitan Series Fund, Inc.:
We have audited the accompanying statement of assets and liabilities, including the schedule of investments, of the T. Rowe Price Large Cap Growth Portfolio, one of the portfolios constituting the Metropolitan Series Fund, Inc. (the “Fund”) as of December 31, 2007, and the related statement of operations for the year then ended, the statements of changes in net assets for each of the two years in the period then ended, and the financial highlights for each of the five years in the period then ended. These financial statements and financial highlights are the responsibility of the Fund’s management. Our responsibility is to express an opinion on these financial statements and financial highlights based on our audits.
We conducted our audits in accordance with the standards of the Public Company Accounting Oversight Board (United States). Those standards require that we plan and perform the audit to obtain reasonable assurance about whether the financial statements and financial highlights are free of material misstatement. The Fund is not required to have, nor were we engaged to perform, an audit of its internal control over financial reporting. Our audits included consideration of internal control over financial reporting as a basis for designing audit procedures that are appropriate in the circumstances, but not for the purpose of expressing an opinion on the effectiveness of the Fund’s internal control over financial reporting. Accordingly, we express no such opinion. An audit also includes examining, on a test basis, evidence supporting the amounts and disclosures in the financial statements, assessing the accounting principles used and significant estimates made by management, as well as evaluating the overall financial statement presentation. Our procedures included confirmation of securities owned as of December 31, 2007, by correspondence with the custodian and brokers; where replies were not received from brokers, we performed other auditing procedures. We believe that our audits provide a reasonable basis for our opinion.
In our opinion, the financial statements and financial highlights referred to above present fairly, in all material respects, the financial position of the T. Rowe Price Large Cap Growth Portfolio of the Metropolitan Series Fund, Inc. as of December 31, 2007, the results of its operations for the year then ended, the changes in its net assets for each of the two years in the period then ended, and the financial highlights for each of the five years in the period then ended, in conformity with accounting principles generally accepted in the United States of America.
Deloitte & Touche LLP
Boston, Massachusetts
February 21, 2008
MSF-18
Metropolitan Series Fund, Inc.
Directors and Officers
The Fund’s Directors review actions of the Fund’s investment adviser and subadvisers, and decide upon matters of general policy. The Fund’s officers supervise the daily business operations of the Fund. The Board of Directors and the Fund’s officers are listed below. Each Director is responsible for overseeing all 36 Portfolios of the Fund. There is no limit to the term a Director may serve. Directors serve until their resignation, retirement or removal in accordance with the Fund’s organizational documents and policies adopted by the Board from time to time. Officers hold office at the pleasure of the Board or until the election or appointment and the qualification of a successor. The address of the directors and officers is c/o Metropolitan Series Fund, Inc., 501 Boylston Street, Boston, MA 02116.
Interested Directors(1)
Each Director below is an “interested person” (as defined by the 1940 Act) with respect to the Fund in that Ms. Forget is an employee of MetLife and Mr. Typermass is a former employee of MetLife and owns securities issued by MetLife, Inc., the ultimate parent company of MetLife Advisers.
| | | | | | | | |
Name, Address and Age | | Current
position(s)
with Fund | | Position(s)
held since | | Principal occupations
over past five years, including other directorships(2) | | Number of
Portfolios in
Fund Complex
Overseen by
Director(3) |
Elizabeth M. Forget Age: 41 | | Director, Chairman of the Board, President and Chief Executive Officer | | 2006 | | Senior Vice President (since 2007), MetLife, Inc.; President, Met Investors Advisory, LLC (“MIA”); Trustee and President, Met Investors Series Trust (“MIST”); Executive Vice President, MetLife Investors Group, Inc.; President (since 2006), MetLife Advisers. | | 81 |
| | | | |
Arthur G. Typermass Age: 70 | | Director | | 1998 | | Formerly, Senior Vice President and Treasurer, MetLife. | | 37 |
Non-Interested Directors(1)
Each Director below is not an “interested person” (as defined by the 1940 Act) with respect to the Fund (collectively, the “Independent Directors”).
| | | | | | | | |
Name, Address and Age | | Current
position(s)
with Fund | | Position(s)
held since | | Principal occupations
over past five years, including other directorships(2) | | Number of
Portfolios in
Fund Complex
Overseen by
Director(3) |
Steve A. Garban† Age: 70 | | Director | | 1985 | | Formerly, Chief Financial Officer, Senior Vice President Finance and Operations and Treasurer (Emeritus), The Pennsylvania State University. | | 37 |
| | | | |
Linda B. Strumpf Age: 60 | | Director | | 2000 | | Vice President and Chief Investment Officer, Ford Foundation. | | 37 |
| | | | |
Michael S. Scott Morton† Age: 70 | | Director | | 1993 | | Jay W. Forrester Professor of Management (Emeritus) at Sloan School of Management, MIT. | | 37 |
| | | | |
H. Jesse Arnelle Age: 74 | | Director | | 2001 | | Formerly, Counsel, Womble Carlyle Sandrie & Rice; Director, Textron Inc. (global multi-industry company)*; formerly, Director, Gannet Co. Inc. (diversified news and information company)*; formerly, Director, Eastman Chemical Company (global chemical company)*; formerly, Director, Waste Management, Inc.*; formerly, Director, Armstrong Holdings Inc. (parent company of floor and ceiling products business)*; formerly, Director, FPL Group Inc. (public utility holding company)*; Director, URS Corporation (engineering design services firm)*. | | 37 |
| | | | |
Nancy Hawthorne Age: 56 | | Director | | 2003 | | Director, Avid Technologies (computer software company)*; formerly, Chairman of the Board of Avid Technologies; formerly, Board of Advisors, L. Knife & Sons, Inc. (beverage distributor); Chief Executive Officer, Clerestory LLC (corporate financial advisor); formerly, Trustee, New England Zenith Fund (“Zenith Fund”)**; formerly, Chief Executive Officer and Managing Partner, Hawthorne, Krauss and Associates (corporate financial advisor); formerly, Chief Financial Officer and Executive Vice President, Continental Cablevision, subsequently renamed MediaOne (cable television company); formerly, Director, Life F/X, Inc.; formerly, Chairman of the Board, WorldClinic (distance medicine company); formerly, Director, Perini Corporation (construction company)*; formerly, Director, CGU (property and casualty insurance company); formerly, Director, Beacon Power Corporation (energy company )*. | | 37 |
MSF-19
Metropolitan Series Fund, Inc.
Directors and Officers—(Continued)
| | | | | | | | |
Name, Address and Age | | Current
position(s)
with Fund | | Position(s)
held since | | Principal occupations
over past five years, including other directorships(2) | | Number of
Portfolios in
Fund Complex
Overseen by
Director(3) |
John T. Ludes Age: 71 | | Director | | 2003 | | President, LFP Properties (consulting firm); Formerly, Trustee, Zenith Fund**; formerly, Vice Chairman, President and Chief Operating Officer, Fortune Brands/American Brands (global conglomerate); formerly, President and CEO, Acushnet Company (athletic equipment company). | | 37 |
Officers(1)
| | | | | | | | |
Name and address | | Age | | Current
position(s)
with Fund | | Position(s)
held since | | Principal occupations over past five years(2) |
| Jeffrey P. Halperin | | 40 | | Chief Compliance Officer | | 2006 | | Vice President (since 2006), Corporate Ethics and Compliance Department, MetLife, Inc.; Chief Compliance Officer (since 2006), MetLife Advisers, MIA and MIST. |
| | | | |
| John F. Guthrie, Jr. | | 64 | | Senior Vice President | | 2002 | | Manager and Senior Vice President, MetLife Advisers; Vice President, MetLife; Vice President (since 2003), MetLife Group, Inc.; Vice President, NELICO; Vice President (since 2005), MIA; formerly, Senior Vice President, Zenith Fund**. |
| | | | |
| Alan C. Leland | | 55 | | Senior Vice President | | 2005 | | Treasurer and Chief Financial Officer, MetLife Advisers, LLC; Treasurer (since 2005), Met Investors Advisory, LLC; Vice President (since 2004), MIA; Vice President (since 2003), MetLife Group, Inc.; Vice President, MetLife; Senior Vice President, NELICO |
| | | | |
| Peter Duffy | | 52 | | Vice President and Treasurer | | 2000 | | Senior Vice President, MetLife Advisers (since 1998); Second Vice President (since 2003), NELICO; Vice President, MetLife (since 2004); Vice President (since 2004), MetLife Group, Inc.; formerly, Vice President and Treasurer, Zenith Fund**. |
| | | | |
| Thomas M. Lenz | | 49 | | Vice President and Secretary | | 2002 | | General Counsel and Secretary, MetLife Advisers; Assistant General Counsel, MetLife; formerly, Vice President and Secretary, Zenith Fund**. |
| * | Indicates a directorship with a registered investment company or a company subject to the reporting requirements of the Securities Exchange Act of 1934, as amended. |
| ** | The Zenith Fund deregistered with the Securities and Exchange Commission (“SEC”) in 2004. |
| (†) | Served as a trustee, director and/or officer of one or more of the following companies, each of which had a direct or indirect advisory relationship with MetLife Advisers or its affiliates prior to January 31, 2005: State Street Research Financial Trust, State Street Research Income Trust, State Street Research Money Market Trust, State Street Research Institutional Funds, State Street Research Capital Trust, State Street Research Master Investment Trust, State Street Research Equity Trust, State Street Research Securities Trust and State Street Research Exchange Trust (collectively, the “State Street Research Funds”). |
| (1) | Each Director of the Fund also serves as trustee of Metropolitan Series Fund II (“Met Series Fund II”), a registered investment company advised by MetLife Advisers. Each officer of the Fund serves in the same position with Met Series Fund II, which consists of one portfolio. |
| (2) | Previous positions during the past five years with the Fund, MIST, MetLife, MetLife Advisers, MIA, Zenith Fund, NELICO or New England Securities Corporation are omitted if not materially different. |
| (3) | The Fund Complex includes the Fund (36 portfolios), Met Series Fund II (1 portfolio) and MIST (44 portfolios) |
MSF-20
Metropolitan Series Fund, Inc.
T. Rowe Price Large Cap Growth Portfolio
Board Approval of Advisory and Subadvisory Agreements
The Fund’s Contract Review Committees of the Board of Directors (the “Board”) typically meet in early fall to review the Portfolios’ advisory agreements (the “Advisory Agreements”) and subadvisory agreements (collectively, the “Subadvisory Agreements,” and, together with the Advisory Agreements, the “Agreements”) and determine whether to recommend that the full Board approve the continuation of the Agreements for an additional one-year period. (Following the initial approval of an Agreement for a new Portfolio or with a new adviser or subadviser, such annual reviews are not required until 2 years following the execution of such Agreement.) After each Committee has made its recommendations, the full Board, including the Independent Directors, determines whether to approve the continuation of each of the Agreements. In addition, the Board, including the Independent Directors, considers matters bearing on the Agreements at most of its other meetings throughout the year and regularly interviews various individuals at MetLife Advisers responsible for the management of the Portfolios. The Directors also interview selected investment managers and other professionals at the subadvisers at various times throughout the year.
The Directors receive all materials that they or MetLife Advisers, the Fund’s investment adviser, and the subadvisers believe to be reasonably necessary for the Directors to evaluate the Agreements and determine whether to approve the continuation of the Agreements. These materials generally include, among other items, (i) information on the investment performance of the Portfolios and the performance of peer groups of funds and the Portfolios’ performance benchmarks, (ii) information on the Portfolios’ advisory and subadvisory fees and other expenses, including information comparing the Portfolios’ expenses to those of peer groups of funds and information about any applicable expense caps and fee “breakpoints,” (iii) sales and redemption data, (iv) information related to the profitability of the Agreements to MetLife Advisers and the subadvisers, and potential “fall-out” or ancillary benefits that MetLife Advisers, the subadvisers or their affiliates may receive as a result of their relationships with the Fund and (v) information obtained through the subadvisers’ responses to certain requests from MetLife Advisers and the Directors and MetLife Advisers’ responses to requests from the Directors. The Directors may also consider other information such as (vi) MetLife Advisers’ and the subadvisers’ financial results and condition, (vii) each Portfolio’s investment objectives and strategies and the size, education and experience of the investment staffs of MetLife Advisers and the relevant subadvisers and their use of technology and external research, (viii) the allocation of the Portfolios’ brokerage, if any, including allocations to brokers affiliated with the subadvisers and the use of “soft” commission dollars to pay Portfolio expenses and to pay for research and other similar services, (ix) the resources devoted to, and the record of compliance with, the Portfolios’ investment policies and restrictions, policies on personal securities transactions and other compliance policies, (x) the responses of MetLife Advisers, the subadvisers and/or their affiliates to certain legal and regulatory proceedings and (xi) the economic outlook generally and for the mutual fund industry in particular. Throughout the process, the Directors have the opportunity to ask questions of and request additional materials from MetLife Advisers and the subadvisers.
Following meetings of each Contract Review Committee on September 12, 2007, the Board, at its November 15, 2007 meeting, approved the continuation through December 31, 2008 of the Advisory Agreements for each Portfolio of the Fund and the Subadvisory Agreements for each Portfolio of the Fund. The Agreements approved for continuation are referred to below as the “Continued Agreements.”
In considering whether to approve the continuation of the Continued Agreements, the Directors, including the Independent Directors, did not identify any single factor as determinative, and each weighed the various factors as he or she deemed appropriate. The Directors considered the following matters in connection with their approval of the Continued Agreements:
The nature, extent and quality of the services provided to the relevant Portfolios under the Continued Agreements. The Directors considered the nature, extent and quality of the services provided by MetLife Advisers, the relevant subadvisers (if any) and their affiliates (each, an “Adviser,” and, collectively, the “Advisers”) to the relevant Portfolios pursuant to the Continued Agreements and the resources dedicated to these Portfolios by the Advisers. In particular, the Directors considered the Advisers’ abilities to attract and retain highly qualified investment professionals. With respect to MetLife Advisers, the Directors considered that MetLife Advisers is (i) ultimately responsible for the performance of such Portfolios; (ii) ultimately responsible for the establishment of the investment strategies of each such Portfolio, primarily through its recommendations to the Board regarding the hiring and selection of subadvisers; (iii) responsible for the hiring and selection, subject to Board approval, of subadvisers; and (iv) responsible for maintaining a program of Subadviser oversight reasonably designed to ensure that the subadvisers have reasonable compliance policies and procedures in place. The Directors also considered that MetLife Advisers provides a full range of day-to-day administrative services for the Portfolios involving all aspects of such Portfolios’ day-to-day operations (other than portfolio management). After reviewing these and related factors, the Directors concluded, within the context of their overall conclusions regarding each of the Continued Agreements, that the nature, extent and quality of services provided supported the renewal of these Agreements.
Investment performance of the relevant Portfolios. The Directors reviewed information about the performance of the relevant Portfolios over various time periods, including information prepared by an independent third party that compared the performance of
MSF-21
Metropolitan Series Fund, Inc.
T. Rowe Price Large Cap Growth Portfolio
Board Approval of Advisory and Subadvisory Agreements—(Continued)
the Portfolios to the performance of peer groups of funds and performance benchmarks. The Directors also reviewed a description of the third party’s methodology for identifying a Portfolio’s peer group(s) for purposes of performance and expense comparisons.
In the case of each relevant Portfolio that had performance that lagged its peer group(s) for certain periods, the Directors concluded that other factors relevant to performance were sufficient, in light of other considerations, to warrant renewal of the Continued Agreements relating to such Portfolio. These factors varied from Portfolio to Portfolio, but included one or more of the following: (i) that such Portfolio’s performance, although lagging in certain recent periods, was stronger over the longer term; (ii) that the underperformance was attributable, to a significant extent, to investment decisions that were reasonable and consistent with the Portfolio’s investment objective(s) and policies and that the Portfolio was performing within the range of reasonable expectations, given market conditions and the Portfolio’s investment objective(s) and policies; (iii) that the Portfolio’s performance was competitive when compared to other relevant performance benchmarks or peer groups; and (iv) that MetLife Advisers and/or the relevant subadviser (if any) had taken or was taking steps designed to help improve the Portfolio’s investment performance.
The Directors also considered the investment performance of the Advisers and their reputations generally, the historical responsiveness of the Advisers to Director concerns about performance and the willingness of the Advisers to take steps intended to improve performance.
After reviewing these and related factors, the Directors concluded, within the context of their overall conclusions regarding each of the Continued Agreements, that the investment performance of each relevant Portfolio and Adviser was sufficient, in light of other considerations, to warrant the renewal of the Continued Agreements.
The costs of the services to be provided and profits to be realized by the Advisers and their affiliates from their relationships with the Portfolios. The Directors considered the fees charged by MetLife Advisers to the Portfolios for advisory services and, with respect to the subadvised Portfolios, by such subadvisers to MetLife Advisers for subadvisory services (such advisory and subadvisory fees (if any), collectively, “Fees”), as well as the total expense levels of the Portfolios. This information included comparisons (provided by an independent third party) of the Portfolios’ advisory fees and total expense levels to those of their peer groups. In evaluating Fees for the relevant Portfolios, the Directors also took into account the demands, complexity and quality of the investment management services provided to each Portfolio. The Directors considered MetLife Advisers’ recommendations regarding reductions in Fee rates, implementation of Fee breakpoints and institution of Fee waivers and expense caps.
The Directors also considered the compensation directly or indirectly received by the Advisers and their affiliates from their relationships with the relevant Portfolios. The Directors reviewed information relating to the profits received by MetLife Advisers, certain of the subadvisers and their affiliates as a result of their relationships with the relevant Portfolios, and information about the allocation of expenses used to calculate profitability. When reviewing profitability, the Directors also considered the performance of the relevant Portfolios, the expense levels of such Portfolios and whether the relevant Advisers had implemented breakpoints, fee waivers and/or expense caps with respect to such Portfolios.
After reviewing these and related factors, the Directors concluded, within the context of their overall conclusions regarding each of the Continued Agreements, that the Fees charged to each of the relevant Portfolios were fair and reasonable, and that the information provided regarding costs of these services generally, and the related profitability (if known) to the relevant Advisers of their relationships with the relevant Portfolios, supported the renewal of the Continued Agreements.
Economies of Scale. The Directors considered the existence of any economies of scale in the provision of services by the Advisers and whether those economies were shared with the relevant Portfolios through breakpoints in their advisory fees or other means, such as expense caps, fee waivers or relatively low levels of fees. The Directors noted that most of the relevant Portfolios benefited or will benefit from breakpoints, expense caps and/or fee waivers with respect to their advisory fees. In considering these issues, the Directors also took into consideration information relating to the costs of the services provided and the profitability to MetLife Advisers, the relevant subadvisers (if any) and each of their affiliates of their relationships with the relevant Portfolios, as discussed above.
After reviewing these and related factors, the Directors concluded, within the context of their overall conclusions regarding each of the Continued Agreements, that the extent to which economies of scale were shared with the relevant Portfolios supported the renewal of such Agreements.
Other Factors. The Directors also considered other factors, which included but were not limited to the following:
| | • | | the extent to which each relevant Portfolio operated in accordance with its investment objective, and its record of compliance with its investment restrictions and the compliance programs of the Fund and the Advisers. They also considered the compliance-related resources the Advisers and their affiliates provide to the relevant Portfolios; |
MSF-22
Metropolitan Series Fund, Inc.
T. Rowe Price Large Cap Growth Portfolio
Board Approval of Advisory and Subadvisory Agreements—(Continued)
| | • | | the nature, quality, cost and extent of administrative and shareholder services performed by MetLife Advisers and its affiliates under the Advisory Agreements; and |
| | • | | so-called “fall-out benefits” to the Advisers, such as the engagement of their affiliates to provide distribution, brokerage and transfer agency services to the Portfolios, and the benefits of research made available to the relevant Advisers by reason of brokerage commissions generated by the relevant Portfolios’ securities transactions. The Directors also considered the possible conflicts of interest associated with these fall-out and other benefits, and the reporting and other processes in place to disclose and monitor these possible conflicts of interest. |
Based on their evaluation of all factors that they deemed to be material, including those factors described above, and assisted by the advice of independent counsel, the Directors, including the Independent Directors, concluded that each of the Continued Agreements should be continued through December 31, 2008.
MSF-23
A description of the policies and procedures that the Fund uses to determine how to vote proxies relating to portfolio securities is available (i) without charge, upon request, by calling (800) 638-7732 and (ii) on the Securities and Exchange Commission’s (the “SEC”) website at http://www.sec.gov.
Information regarding how the Fund voted proxies relating to portfolio securities during the most recent twelve-month period ended December 31, 2007 is available (i) without charge, upon request, by calling (800) 638-7732 and (ii) on the SEC’s website at http://www.sec.gov.
The Fund files with the SEC a complete schedule of its portfolio holdings, as of the close of the first and third quarters of its fiscal year, on “Form N-Q”. These filings are available on the SEC’s website at www.sec.gov and may be reviewed and copied at the SEC’s Public Reference Room in Washington, DC. (Call 1-800-SEC-0330 for information on the operation of the Public Reference Room.)
MSF-24
| | |
Metropolitan Series Fund, Inc. T. Rowe Price Small Cap Growth Portfolio Annual Report | | December 31, 2007 |
Letter from the President
February 1, 2008
Letter to Policy Holders:
2007 was a tumultuous year in the financial markets driven by concerns in the credit markets surrounding sub-prime mortgages and fears of recession in the U.S. Economy. The broad markets were mixed, with the Dow Jones Industrial Average up 8.9% and the MSCI EAFE Index, which measures the performance of international equities, up 11.2% for the year, while the Russell 2000 Index, which measures the performance of small capitalization stocks, was down 1.6%.
In the fixed income markets, credit spreads increased as a result of the pressure from sub-prime mortgage crisis and the Federal Reserve lowered interest rates by a total of 1% during the year. The Lehman Brothers Aggregate Bond Index posted a 7.0% return for the year.
On the following pages, you will find a complete review of your Portfolio and its investment performance.
MetLife is committed to building your financial freedom. We appreciate your trust and will continue to focus our efforts on meeting your investment needs.
Sincerely,
Elizabeth Forget
President, Metropolitan Series Fund, Inc.
Metropolitan Series Fund, Inc.
T. Rowe Price Small Cap Growth Portfolio
Managed by T. Rowe Price Associates, Inc.
Portfolio Manager Commentary*
PORTFOLIO PERFORMANCE
For the year ended December 31, 2007, the Class A shares of the T. Rowe Price Small Cap Growth Portfolio returned 9.9%, compared to its benchmark, the Morgan Stanley Capital International (MSCI) Small Cap Growth Index1, which returned 9.7%. The average return of its peer group, the Lipper Variable Insurance Products Small-Cap Growth Funds Universe2, was 9.1% over the same period.
PORTFOLIO REVIEW
The Portfolio modestly outperformed the MSCI Small Cap Growth Index in 2007. Relative to the index, outperformance was largely a result of stock selection among financial shares; information technology, healthcare, and consumer discretionary shares were other notable contributors. Stock selection in the industrials and business services sector was by far the leading detractor from relative results.
Stocks hit record highs during 2007, before the housing, credit, and liquidity crises ultimately brought the market rally to a halt. For the year, small-cap stocks generally produced negative returns and lagged large and mid-cap stocks, while growth beat value across all capitalization ranges. In the MSCI Small Cap Growth Index, the materials sector performed best (up 39%), followed by energy (up 28%). Utilities also put up excellent returns (gaining 23%), but since it makes up less than 1% of the index, its impact was small. The financial sector (down 14%) was by far the worst performer for the year. Consumer discretionary (down about 4%) was the only other sector to have negative returns.
Stock selection among financials shares was the key source of strength for the Portfolio, led by holdings in diversified financial services firms and commercial banks. In addition, it helped to be underweight in consumer finance and real estate investment trusts. The leading contributors in this area were asset manager Affiliated Managers Group and energy trader IntercontinentalExchange. These stocks benefited from the gains and volatility of 2007 in financial and commodity markets, respectively.
Good stock selection drove relative results in the information technology sector, led by holdings in the IT services and electronic equipment industry segments. In IT services, electronic payments processor CyberSource was a leading contributor as a result of soaring revenues, a positive outlook, and the expected divestiture of an underperforming business unit. That said, the largest contributor in the sector was in the electronic equipment segment. Here FLIR Systems, a maker of infrared camera equipment used by the military, beat estimates and provided a positive outlook. Software firm Taleo was another notable contributor, reporting rapid growth and profit gains in its corporate recruiting and tracking software business.
In the consumer discretionary sector, stock picks helped most in the specialty retail, internet & catalog retail and media segments. A leading contributor in this space was priceline.com, which enjoyed growth in its international business and acquired overseas assets. Electronic game retailer GameStop was the overall top contributor on the strength of an increase in sales driven by new hardware and software gaming cycles.
Within the industrials and business services sector; stock picks in the commercial services and supplies and airfreight and logistics industries were leading sources of weakness. In the commercial services industry, overweight positions in Corporate Executive Board, Resources Connection and Kenexa detracted because slower economic growth and a more difficult business environment took the wind out of the sails of corporate consulting firms. These stocks were the largest detractors for the entire Portfolio for the year. In addition, freight logistics company UTi Worldwide saw its stock fall to a three-year low late in 2007 after losing Wal-Mart as a customer. UTi was the number-two detractor for the year.
An underweight position in materials stocks, the best-performing segment of the benchmark, also detracted from relative returns. Telecommunication services was the only other sector to detract from relative results, due to stock selection. In this sector, Leap Wireless International was the leading detractor from relative performance after restating earnings and giving poor guidance, while rejecting the buyout offer of MetroPCS.
* The views expressed above are those of the subadvisory firm as of December 31, 2007 and are subject to change based on market and other conditions. Information about the Portfolio’s holdings, asset allocation, industry allocation, or country diversification is historical and is not an indication of future Portfolio composition, which will vary. The performance of any index mentioned in this commentary has not been adjusted for ongoing management, distribution and operating expenses, and sales charges applicable to mutual fund investments. Direct investment in the Index is not possible.
1 The Morgan Stanley Capital International (MSCI) Small Cap Growth Index represents the growth companies of the MSCI Small Cap 1750 Index. (The MSCI US Small Cap 1750 Index represents the universe of small capitalization companies in the US equity market).
2 The Lipper Variable Insurance Products Fund Average is an average of the total return performance (calculated on the basis of net asset value) of variable product funds with similar investment objectives to those of the subject Portfolio as calculated by Lipper Analytical Services, an independent mutual fund ranking service.
MSF-2
Metropolitan Series Fund, Inc.
T. Rowe Price Small Cap Growth Portfolio
A $10,000 INVESTMENT COMPARED TO
THE MSCI SMALL CAP GROWTH INDEX
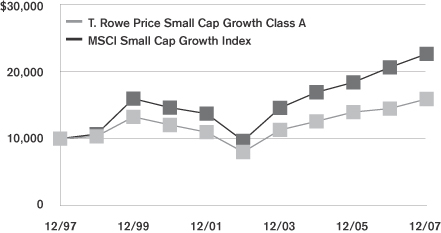
Average Annual Returns as of December 31, 2007
| | | | | | | | | | | | |
| | | T. Rowe Price
Small Cap Growth Portfolio | | | MSCI Small Cap
Growth Index | |
| | | Class A | | | Class B | | | Class E | | |
| 1 Year | | 9.9 | % | | 9.5 | % | | 9.7 | % | | 9.7 | % |
| 5 Year | | 14.7 | | | 14.5 | | | 14.5 | | | 18.5 | |
| 10 Year | | 4.8 | | | — | | | — | | | 8.5 | |
| Since Inception | | — | | | 13.1 | | | 5.1 | | | — | |
Performance numbers are net of all Portfolio expenses but do not include any insurance, sales, or administrative charges of variable annuity or life insurance contracts. If these charges were included, the returns would be lower.
Inception dates of the Class A, Class B and Class E shares are: 3/3/97, 7/30/02 and 5/1/01, respectively.
This information represents past performance and is not indicative of future results. Investment return and principal value may fluctuate so that shares, upon redemption, may be worth more or less than the original cost.
PORTFOLIO COMPOSITION
as of December 31, 2007
Top Holdings
| | |
| | | % of Total
Net Assets |
FLIR Systems, Inc. | | 1.1% |
Actuant Corp. | | 1.1% |
Stericycle, Inc. | | 1.0% |
Affiliated Managers Group, Inc. | | 1.0% |
Respironics, Inc. | | 0.9% |
SBA Communications Corp. | | 0.8% |
Priceline.com, Inc. | | 0.8% |
Informatica Corp. | | 0.8% |
Mettler-Toledo International, Inc. | | 0.8% |
Cabot Oil & Gas Corp. | | 0.7% |
Top Sectors
| | |
| | | % of Total
Market Value |
Information Technology | | 24.6% |
Health Care | | 19.1% |
Industrials & Business Services | | 16.0% |
Consumer Discretionary | | 14.0% |
Energy | | 10.5% |
Materials | | 5.0% |
Financials | | 4.9% |
Consumer Staples | | 2.8% |
Telecommunication Services | | 2.1% |
Cash/Other | | 1.0% |
MSF-3
Metropolitan Series Fund, Inc.
Shareholder Expense Example
As a shareholder of the Portfolio, you incur ongoing costs, including management fees; distribution and service (12b-1) fees; and other Portfolio expenses. This example is intended to help you understand your ongoing costs (in dollars) (referred to as “expenses”) of investing in the Portfolio and compare these costs with the ongoing costs of investing in other mutual funds. The example is based on an investment of $1,000 invested at the beginning of the period and held for the entire period, July 1, 2007 through December 31, 2007.
Actual Expenses
The first line for each share class of the Portfolio in the table below provides information about actual account values and actual expenses. You may use the information in this line, together with the amount you invested in the particular share class of the Portfolio, to estimate the expenses that you paid over the period. Simply divide your account value by $1,000 (for example, an $8,600 account value divided by $1,000=8.6), then multiply the result by the number in the first line under the heading entitled “Expenses Paid During Period” to estimate the expenses you paid on your account during this period.
Hypothetical Example for Comparison Purposes
The second line for each share class of the Portfolio in the table below provides information about hypothetical account values and hypothetical expenses based on the Portfolio’s actual expense ratio and an assumed rate of return of 5% per year before expenses, which is not the Portfolio’s actual return. The hypothetical account values and expenses may not be used to estimate the actual ending account balance or expenses you paid for the period. You may use this information to compare the ongoing costs of investing in the Portfolio and other funds. To do so, compare this 5% hypothetical example with the 5% hypothetical examples that appear in the shareholder reports of the other funds.
Please note that the expenses shown in the table are meant to highlight your ongoing costs only and do not reflect any fees or charges of your variable insurance product or any additional expenses that participants in certain eligible qualified plans may bear relating to the operations of their plan. Therefore, the second line for each share class in the table is useful in comparing ongoing costs only, and will not help you determine the relative total costs of owning different funds. In addition, if these other costs were included, your costs would have been higher.
| | | | | | | | | | | | | | |
Portfolio | | | | Annualized
Expense
Ratio | | | Beginning
Account Value
July 1,
2007 | | Ending
Account Value
December 31,
2007 | | Expenses Paid
During Period*
July 1, 2007
to
December 31,
2007 |
T. Rowe Price Small Cap Growth—Class A | | Actual | | 0.59 | % | | $ | 1,000.00 | | $ | 980.70 | | $ | 2.95 |
| | Hypothetical | | 0.59 | % | | $ | 1,000.00 | | $ | 1,022.20 | | $ | 3.01 |
| | | | | |
T. Rowe Price Small Cap Growth—Class B | | Actual | | 0.84 | % | | $ | 1,000.00 | | $ | 979.10 | | $ | 4.19 |
| | Hypothetical | | 0.84 | % | | $ | 1,000.00 | | $ | 1,020.92 | | $ | 4.28 |
| | | | | |
T. Rowe Price Small Cap Growth—Class E | | Actual | | 0.74 | % | | $ | 1,000.00 | | $ | 979.80 | | $ | 3.69 |
| | Hypothetical | | 0.74 | % | | $ | 1,000.00 | | $ | 1,021.43 | | $ | 3.77 |
* Expenses paid are equal to the Portfolio’s annualized expense ratio for the most recent six month period, as shown above, multiplied by the average account value over the period, multiplied by the number of days in the most recent fiscal half-year, divided by 365 (to reflect the one-half year period).
(a) The annualized expense ratio shown reflects the impact of the management fee waiver as described in Note 4 to the Financial Statements.
MSF-4
Metropolitan Series Fund, Inc.
T. Rowe Price Small Cap Growth Portfolio
Schedule of Investments as of December 31, 2007
Common Stock—99.0% of Total Net Assets
| | | | | |
| Security Description | | Shares | | Value* |
| | | | | |
| | |
Aerospace & Defense—2.0% | | | | | |
Alliant Techsystems, Inc. (a) | | 13,300 | | $ | 1,513,008 |
BE Aerospace, Inc. (a) | | 19,500 | | | 1,031,550 |
Ceradyne, Inc. (a) (b) | | 37,800 | | | 1,773,954 |
DRS Technologies, Inc. | | 17,079 | | | 926,877 |
Teledyne Technologies, Inc. (a) | | 28,200 | | | 1,503,906 |
TransDigm Group, Inc. (a) | | 15,800 | | | 713,686 |
| | | | | |
| | | | | 7,462,981 |
| | | | | |
| | |
Air Freight & Logistics—0.8% | | | | | |
HUB Group, Inc. (Class A) (a) | | 26,300 | | | 699,054 |
UTi Worldwide, Inc. | | 116,200 | | | 2,277,520 |
| | | | | |
| | | | | 2,976,574 |
| | | | | |
| | |
Airlines—0.2% | | | | | |
SkyWest, Inc. | | 27,400 | | | 735,690 |
| | | | | |
| | |
Auto Components—0.4% | | | | | |
Drew Industries, Inc. (a) (b) | | 19,100 | | | 523,340 |
Gentex Corp. (b) | | 56,100 | | | 996,897 |
| | | | | |
| | | | | 1,520,237 |
| | | | | |
| | |
Automobiles—0.4% | | | | | |
Thor Industries, Inc. (b) | | 34,900 | | | 1,326,549 |
| | | | | |
| | |
Beverages—0.6% | | | | | |
Boston Beer, Inc. (a) (b) | | 31,900 | | | 1,201,035 |
Hansen Natural Corp. (a) (b) | | 26,400 | | | 1,169,256 |
| | | | | |
| | | | | 2,370,291 |
| | | | | |
| | |
Biotechnology—4.8% | | | | | |
Acadia Pharmaceuticals, Inc. (a) (b) | | 14,900 | | | 164,943 |
Alexion Pharmaceuticals, Inc. (a) (b) | | 21,000 | | | 1,575,630 |
Alkermes, Inc. (a) | | 50,800 | | | 791,972 |
Alnylam Pharmaceuticals, Inc. (a) (b) | | 7,900 | | | 229,732 |
Array Biopharma, Inc. (a) (b) | | 16,200 | | | 136,404 |
BioMarin Pharmaceutical, Inc. (a) | | 62,400 | | | 2,208,960 |
Cubist Pharmaceuticals, Inc. (a) | | 19,500 | | | 399,945 |
deCODE genetics, Inc. (a) (b) | | 72,600 | | | 267,168 |
Human Genome Sciences, Inc. (a) (b) | | 52,200 | | | 544,968 |
Incyte Corp. (a) (b) | | 88,000 | | | 884,400 |
Isis Pharmaceuticals, Inc. (a) (b) | | 10,800 | | | 170,100 |
Lexicon Pharmaceuticals, Inc. (a) | | 44,400 | | | 134,532 |
Lifecell Corp. (a) (b) | | 9,500 | | | 409,545 |
Martek Biosciences Corp. (a) (b) | | 10,200 | | | 301,716 |
Medarex, Inc. (a) (b) | | 49,400 | | | 514,748 |
Myriad Genetics, Inc. (a) (b) | | 20,200 | | | 937,684 |
Onyx Pharmaceuticals, Inc. (a) | | 23,800 | | | 1,323,756 |
OSI Pharmaceuticals, Inc. (a) (b) | | 22,300 | | | 1,081,773 |
PDL BioPharma, Inc. (a) | | 81,800 | | | 1,433,136 |
Pharmion Corp. (a) | | 13,900 | | | 873,754 |
Regeneron Pharmaceuticals, Inc. (a) (b) | | 25,800 | | | 623,070 |
Rigel Pharmaceuticals, Inc. (a) (b) | | 29,500 | | | 749,005 |
Seattle Genetics, Inc. (a) (b) | | 25,300 | | | 288,420 |
Senomyx, Inc. (a) (b) | | 58,200 | | | 435,918 |
| | | | | |
| Security Description | | Shares | | Value* |
| | | | | |
| | |
Biotechnology—(Continued) | | | | | |
Theravance, Inc. (a) (b) | | 17,300 | | $ | 337,350 |
United Therapeutics Corp. (a) | | 8,400 | | | 820,260 |
| | | | | |
| | | | | 17,638,889 |
| | | | | |
| | |
Capital Markets—2.3% | | | | | |
Affiliated Managers Group, Inc. (a) (b) | | 32,249 | | | 3,787,968 |
Cohen & Steers, Inc. (b) | | 9,500 | | | 284,715 |
GFI Group, Inc. (a) (b) | | 9,100 | | | 871,052 |
Greenhill & Co., Inc. (b) | | 32,600 | | | 2,167,248 |
Knight Capital Group, Inc. (a) | | 26,600 | | | 383,040 |
optionsXpress Holdings, Inc. (b) | | 23,800 | | | 804,916 |
Penson Worldwide, Inc. (a) | | 15,400 | | | 220,990 |
| | | | | |
| | | | | 8,519,929 |
| | | | | |
| | |
Chemicals—2.9% | | | | | |
Airgas, Inc. | | 35,200 | | | 1,834,272 |
CF Industries Holdings, Inc. | | 17,000 | | | 1,871,020 |
Hercules, Inc. | | 44,500 | | | 861,075 |
Koppers Holdings, Inc. | | 19,900 | | | 860,476 |
Nalco Holding Co. | | 86,100 | | | 2,081,898 |
Terra Industries, Inc. (a) | | 42,500 | | | 2,029,800 |
The Scotts Miracle-Gro Co. | | 25,300 | | | 946,726 |
| | | | | |
| | | | | 10,485,267 |
| | | | | |
| | |
Commercial Banks—0.8% | | | | | |
Boston Private Financial Holdings, Inc. | | 28,100 | | | 760,948 |
Pinnacle Financial Partners, Inc. (a) (b) | | 11,000 | | | 279,620 |
SVB Financial Group (a) (b) | | 13,900 | | | 700,560 |
UCBH Holdings, Inc. (b) | | 71,800 | | | 1,016,688 |
| | | | | |
| | | | | 2,757,816 |
| | | | | |
| | |
Commercial Services & Supplies—4.6% | | | | | |
Administaff, Inc. (b) | | 21,000 | | | 593,880 |
ChoicePoint, Inc. (a) | | 29,633 | | | 1,079,234 |
Heidrick & Struggles International, Inc. | | 17,800 | | | 660,558 |
Huron Consulting Group, Inc. (a) | | 6,700 | | | 540,221 |
IHS, Inc. (a) | | 17,700 | | | 1,071,912 |
Kenexa Corp. (a) (b) | | 37,800 | | | 734,076 |
Knoll, Inc. | | 15,500 | | | 254,665 |
Korn/Ferry International (a) | | 25,600 | | | 481,792 |
Navigant Consulting, Inc. (a) (b) | | 22,700 | | | 310,309 |
Resources Connection, Inc. (a) | | 81,600 | | | 1,481,856 |
Stericycle, Inc. (a) | | 64,200 | | | 3,813,480 |
The Advisory Board Co. (a) (b) | | 35,400 | | | 2,272,326 |
The Corporate Executive Board Co. (b) | | 30,300 | | | 1,821,030 |
Waste Connections, Inc. (a) | | 57,300 | | | 1,770,570 |
| | | | | |
| | | | | 16,885,909 |
| | | | | |
|
Communications Equipment—3.3% |
Adtran, Inc. | | 43,100 | | | 921,478 |
Avocent Corp. (a) | | 19,025 | | | 443,473 |
Blue Coat Systems, Inc. (a) | | 18,300 | | | 601,521 |
CommScope, Inc. (a) | | 38,600 | | | 1,899,506 |
Comtech Telecommunications Corp. (a) | | 37,000 | | | 1,998,370 |
*See accompanying notes to financial statements.
MSF-5
Metropolitan Series Fund, Inc.
T. Rowe Price Small Cap Growth Portfolio
Schedule of Investments as of December 31, 2007
Common Stock—(Continued)
| | | | | |
| Security Description | | Shares | | Value* |
| | | | | |
|
Communications Equipment—(Continued) |
Dycom Industries, Inc. (a) (b) | | 22,300 | | $ | 594,295 |
F5 Networks, Inc. (a) | | 69,700 | | | 1,987,844 |
Foundry Networks, Inc. (a) | | 66,700 | | | 1,168,584 |
Netgear, Inc. (a) (a) | | 18,300 | | | 652,761 |
Plantronics, Inc. (b) | | 25,700 | | | 668,200 |
Polycom, Inc. (a) | | 41,493 | | | 1,152,675 |
| | | | | |
| | | | | 12,088,707 |
| | | | | |
|
Computers & Peripherals—0.2% |
Intermec, Inc. (a) (b) | | 13,800 | | | 280,278 |
Palm, Inc. (a) (b) | | 84,000 | | | 532,560 |
| | | | | |
| | | | | 812,838 |
| | | | | |
|
Construction & Engineering—1.0% |
Foster Wheeler, Ltd. | | 10,400 | | | 1,612,208 |
Perini Corp. (a) | | 11,400 | | | 472,188 |
Quanta Services, Inc. (a) (b) | | 59,224 | | | 1,554,038 |
| | | | | |
| | | | | 3,638,434 |
| | | | | |
|
Construction Materials—0.2% |
Eagle Materials, Inc. (b) | | 17,200 | | | 610,256 |
| | | | | |
|
Containers & Packaging—0.7% |
Crown Holdings, Inc. | | 68,400 | | | 1,754,460 |
Greif, Inc. | | 12,500 | | | 817,125 |
| | | | | |
| | | | | 2,571,585 |
| | | | | |
|
Diversified Consumer Services—2.5% |
Bright Horizons Family Solutions, Inc. (a) | | 45,000 | | | 1,554,300 |
DeVry, Inc. | | 45,200 | | | 2,348,592 |
ITT Educational Services, Inc. (a) | | 27,400 | | | 2,336,398 |
Matthews International Corp. | | 22,600 | | | 1,059,262 |
Sotheby’s Holdings, Inc. (Class A) (b) | | 30,200 | | | 1,150,620 |
Steiner Leisure, Ltd. (a) (b) | | 12,700 | | | 560,832 |
| | | | | |
| | | | | 9,010,004 |
| | | | | |
|
Diversified Financial Services—0.1% |
MSCI, Inc. (a) | | 8,800 | | | 337,920 |
| | | | | |
|
Diversified Telecommunication Services—0.7% |
Cbeyond, Inc. (a) | | 23,900 | | | 931,861 |
Cogent Communications Group, Inc. (a) | | 22,700 | | | 538,217 |
Time Warner Telecom, Inc. (Class A) (a) (b) | | 60,600 | | | 1,229,574 |
| | | | | |
| | | | | 2,699,652 |
| | | | | |
|
Electrical Equipment—1.9% |
Ametek, Inc. (a) | | 44,100 | | | 2,065,644 |
General Cable Corp. (b) | | 26,100 | | | 1,912,608 |
II-VI, Inc. (a) (b) | | 43,300 | | | 1,322,815 |
Thomas & Betts Corp. (a) | | 30,300 | | | 1,485,912 |
| | | | | |
| | | | | 6,786,979 |
| | | | | |
| | | | | |
| Security Description | | Shares | | Value* |
| | | | | |
|
Electronic Equipment & Instruments—4.0% |
CyberOptics Corp. (a) (b) | | 103,937 | | $ | 1,247,244 |
Dolby Laboratories, Inc. (Class A) (a) | | 43,600 | | | 2,167,792 |
FLIR Systems, Inc. (a) (b) | | 130,000 | | | 4,069,000 |
Itron, Inc. (a) (b) | | 13,500 | | | 1,295,595 |
Mettler-Toledo International, Inc. (a) | | 25,700 | | | 2,924,660 |
Orbotech, Ltd. (a) | | 31,900 | | | 559,845 |
Rofin-Sinar Technologies, Inc. (a) | | 17,600 | | | 846,736 |
Trimble Navigation, Ltd. (a) | | 23,100 | | | 698,544 |
TTM Technologies, Inc. (a) | | 57,400 | | | 669,284 |
| | | | | |
| | | | | 14,478,700 |
| | | | | |
|
Energy Equipment & Services—6.3% |
Atwood Oceanics, Inc. (a) | | 14,800 | | | 1,483,552 |
Core Laboratories NV (a) (b) | | 21,500 | | | 2,681,480 |
Dresser-Rand Group, Inc. (a) | | 41,900 | | | 1,636,195 |
Global Industries, Inc. (a) | | 90,500 | | | 1,938,510 |
Helix Energy Solutions Group, Inc. (a) (b) | | 56,300 | | | 2,336,450 |
Helmerich & Payne, Inc. | | 48,600 | | | 1,947,402 |
ION Geophysical Corp. (a) (b) | | 49,200 | | | 776,376 |
NATCO Group, Inc. (a) | | 18,700 | | | 1,012,605 |
Oceaneering International, Inc. (a) | | 22,800 | | | 1,535,580 |
Oil States International, Inc. (a) | | 67,900 | | | 2,316,748 |
SEACOR Holdings, Inc. (a) (b) | | 9,000 | | | 834,660 |
Superior Energy Services, Inc. (a) | | 42,800 | | | 1,473,176 |
Tetra Technologies, Inc. (a) (b) | | 60,600 | | | 943,542 |
Unit Corp. (a) | | 16,000 | | | 740,000 |
W-H Energy Services, Inc. (a) | | 26,700 | | | 1,500,807 |
| | | | | |
| | | | | 23,157,083 |
| | | | | |
|
Food & Staples Retailing—0.2% |
The Pantry, Inc. (a) (b) | | 21,200 | | | 553,956 |
| | | | | |
|
Food Products—0.3% |
Ralcorp Holdings, Inc. (a) | | 9,600 | | | 583,584 |
SunOpta, Inc. (a) (b) | | 39,400 | | | 525,990 |
| | | | | |
| | | | | 1,109,574 |
| | | | | |
|
Health Care Equipment & Supplies—5.7% |
American Medical Systems Holdings, Inc. (a) (b) | | 28,500 | | | 412,110 |
ArthroCare Corp. (a) (b) | | 23,200 | | | 1,114,760 |
Edwards Lifesciences Corp. (a) | | 31,300 | | | 1,439,487 |
Gen-Probe, Inc. (a) | | 40,900 | | | 2,573,837 |
Hologic, Inc. (a) | | 22,220 | | | 1,525,181 |
IDEXX Laboratories, Inc. (a) | | 29,400 | | | 1,723,722 |
Immucor, Inc. (a) | | 60,650 | | | 2,061,493 |
Integra LifeSciences Holdings (a) (b) | | 8,500 | | | 356,405 |
Mentor Corp. (b) | | 11,200 | | | 437,920 |
Meridian Bioscience, Inc. | | 70,200 | | | 2,111,616 |
ResMed, Inc. (b) | | 31,000 | | | 1,628,430 |
Respironics, Inc. (a) | | 50,300 | | | 3,293,644 |
Stereotaxis, Inc. (a) (b) | | 26,000 | | | 317,720 |
STERIS Corp. | | 29,700 | | | 856,548 |
Thoratec Corp. (a) (b) | | 48,300 | | | 878,577 |
| | | | | |
| | | | | 20,731,450 |
| | | | | |
*See accompanying notes to financial statements.
MSF-6
Metropolitan Series Fund, Inc.
T. Rowe Price Small Cap Growth Portfolio
Schedule of Investments as of December 31, 2007
Common Stock—(Continued)
| | | | | |
| Security Description | | Shares | | Value* |
| | | | | |
|
Health Care Providers & Services—4.0% |
Air Methods Corp. (a) | | 14,500 | | $ | 720,215 |
Amedisys, Inc. (a) (b) | | 19,033 | | | 923,481 |
Centene Corp. (a) | | 43,700 | | | 1,199,128 |
Chemed Corp. | | 26,300 | | | 1,469,644 |
Gentiva Health Services, Inc. (a) | | 35,500 | | | 675,920 |
HealthExtras, Inc. (a) | | 36,500 | | | 951,920 |
Healthspring, Inc. (a) | | 33,900 | | | 645,795 |
Healthways, Inc. (a) (b) | | 10,200 | | | 596,088 |
inVentiv Health, Inc. (a) | | 23,900 | | | 739,944 |
LCA-Vision, Inc. (b) | | 7,800 | | | 155,766 |
LifePoint Hospitals, Inc. (a) | | 21,900 | | | 651,306 |
Pediatrix Medical Group, Inc. (a) | | 28,300 | | | 1,928,645 |
PSS World Medical, Inc. (a) | | 35,400 | | | 692,778 |
Psychiatric Solutions, Inc. (a) (b) | | 31,700 | | | 1,030,250 |
Sunrise Senior Living, Inc. (a) (b) | | 19,100 | | | 585,988 |
VCA Antech, Inc. (a) | | 37,700 | | | 1,667,471 |
| | | | | |
| | | | | 14,634,339 |
| | | | | |
|
Health Care Technology—0.6% |
Cerner Corp. (a) | | 22,000 | | | 1,240,800 |
Computer Programs & Systems, Inc. (b) | | 17,900 | | | 407,046 |
Phase Forward, Inc. (a) | | 20,300 | | | 441,525 |
| | | | | |
| | | | | 2,089,371 |
| | | | | |
|
Hotels, Restaurants & Leisure—2.7% |
BJ’s Restaurants, Inc. (a) (b) | | 59,500 | | | 967,470 |
Burger King Holdings, Inc. | | 41,900 | | | 1,194,569 |
Chipotle Mexican Grill, Inc. (a) (b) | | 14,100 | | | 1,735,005 |
Choice Hotels International, Inc. | | 18,600 | | | 617,520 |
Monarch Casino & Resort, Inc. (a) (b) | | 19,000 | | | 457,520 |
Orient-Express Hotels, Ltd. (Class A) | | 16,800 | | | 966,336 |
Sonic Corp. (a) (b) | | 67,162 | | | 1,470,848 |
WMS Industries, Inc. (a) (b) | | 66,750 | | | 2,445,720 |
| | | | | |
| | | | | 9,854,988 |
| | | | | |
|
Household Durables—0.6% |
iRobot Corp. (a) (b) | | 13,300 | | | 240,464 |
Jarden Corp. (a) (b) | | 37,800 | | | 892,458 |
Tempur-Pedic International, Inc. (b) | | 39,500 | | | 1,025,815 |
| | | | | |
| | | | | 2,158,737 |
| | | | | |
|
Household Products—0.5% |
Church & Dwight Co., Inc. | | 35,000 | | | 1,892,450 |
| | | | | |
|
Insurance—1.5% |
HCC Insurance Holdings, Inc. | | 48,900 | | | 1,402,452 |
Max Capital Group, Ltd. | | 25,900 | | | 724,941 |
Philadelphia Consolidated Holding Corp. (a) | | 34,800 | | | 1,369,380 |
StanCorp Financial Group, Inc. | | 36,600 | | | 1,843,908 |
| | | | | |
| | | | | 5,340,681 |
| | | | | |
|
Internet & Catalog Retail—1.2% |
Blue Nile, Inc. (a) (b) | | 15,700 | | | 1,068,542 |
Nutri/System, Inc. (a) (b) | | 16,800 | | | 453,264 |
priceline.com, Inc. (a) (b) | | 26,100 | | | 2,997,846 |
| | | | | |
| | | | | 4,519,652 |
| | | | | |
| | | | | |
| Security Description | | Shares | | Value* |
| | | | | |
|
Internet Software & Services—2.2% |
CNET Networks, Inc. (a) (b) | | 139,400 | | $ | 1,274,116 |
DealerTrack Holdings, Inc. (a) | | 27,700 | | | 927,119 |
Digital River, Inc. (a) (b) | | 22,500 | | | 744,075 |
j2 Global Communications, Inc. (a) (b) | | 43,200 | | | 914,544 |
SINA Corp. (a) (b) | | 26,700 | | | 1,183,077 |
ValueClick, Inc. (a) | | 55,700 | | | 1,219,830 |
Visual Sciences, Inc. (a) (b) | | 45,000 | | | 831,600 |
Websense, Inc. (a) (b) | | 63,500 | | | 1,078,230 |
| | | | | |
| | | | | 8,172,591 |
| | | | | |
|
IT Services—3.4% |
CACI International, Inc. (Class A) (a) | | 30,000 | | | 1,343,100 |
Cybersource Corp. (a) (b) | | 100,200 | | | 1,780,554 |
Global Payments, Inc. | | 40,320 | | | 1,875,686 |
Heartland Payment Systems, Inc. (b) | | 44,500 | | | 1,192,600 |
NCI, Inc. (Class A) (a) | | 105,200 | | | 1,799,972 |
NeuStar, Inc. (Class A) (a) | | 26,500 | | | 760,020 |
Perot Systems Corp. (Class A) (a) | | 83,200 | | | 1,123,200 |
RightNow Technologies, Inc. (a) (b) | | 76,100 | | | 1,206,185 |
SRA International, Inc. (a) | | 48,700 | | | 1,434,215 |
| | | | | |
| | | | | 12,515,532 |
| | | | | |
|
Leisure Equipment & Products—0.5% |
Polaris Industries, Inc. (b) | | 28,600 | | | 1,366,222 |
Pool Corp. (b) | | 20,625 | | | 408,994 |
| | | | | |
| | | | | 1,775,216 |
| | | | | |
|
Life Sciences Tools & Services—2.6% |
Affymetrix, Inc. (a) | | 28,100 | | | 650,234 |
Dionex Corp. (a) (b) | | 5,900 | | | 488,874 |
Exelixis, Inc. (a) (b) | | 62,700 | | | 541,101 |
Illumina, Inc. (a) (b) | | 24,500 | | | 1,451,870 |
Invitrogen Corp. (a) | | 25,100 | | | 2,344,591 |
Parexel International Corp. (a) | | 26,600 | | | 1,284,780 |
Techne Corp. (a) | | 23,600 | | | 1,558,780 |
Varian, Inc. (a) | | 18,300 | | | 1,194,990 |
| | | | | |
| | | | | 9,515,220 |
| | | | | |
|
Machinery—4.7% |
Actuant Corp. (b) | | 113,600 | | | 3,863,536 |
Bucyrus International, Inc. | | 15,800 | | | 1,570,362 |
Chart Industries, Inc. (a) | | 16,200 | | | 500,580 |
Gardner Denver, Inc. (a) | | 19,200 | | | 633,600 |
Graco, Inc. | | 26,000 | | | 968,760 |
Kaydon Corp. (b) | | 33,800 | | | 1,843,452 |
Kennametal, Inc. | | 22,200 | | | 840,492 |
RBC Bearings, Inc. (a) | | 27,100 | | | 1,177,766 |
The Manitowoc Co., Inc. | | 39,800 | | | 1,943,434 |
The Middleby Corp. (b) | | 12,200 | | | 934,764 |
The Toro Co. (b) | | 34,900 | | | 1,899,956 |
Wabtec Corp. | | 25,600 | | | 881,664 |
| | | | | |
| | | | | 17,058,366 |
| | | | | |
|
Marine—0.1% |
Horizon Lines, Inc. (b) | | 23,000 | | | 428,720 |
| | | | | |
*See accompanying notes to financial statements.
MSF-7
Metropolitan Series Fund, Inc.
T. Rowe Price Small Cap Growth Portfolio
Schedule of Investments as of December 31, 2007
Common Stock—(Continued)
| | | | | |
| Security Description | | Shares | | Value* |
| | | | | |
|
Media—0.7% |
Interactive Data Corp. | | 23,800 | | $ | 785,638 |
John Wiley & Sons, Inc. | | 21,800 | | | 933,912 |
Marvel Entertainment, Inc. (a) (b) | | 30,300 | | | 809,313 |
| | | | | |
| | | | | 2,528,863 |
| | | | | |
|
Metals & Mining—1.2% |
Carpenter Technology Corp. | | 22,400 | | | 1,683,808 |
Cleveland-Cliffs, Inc. (b) | | 24,100 | | | 2,429,280 |
Steel Dynamics, Inc. | | 6,600 | | | 393,162 |
| | | | | |
| | | | | 4,506,250 |
| | | | | |
|
Multiline Retail—0.5% |
Big Lots, Inc. (a) (b) | | 48,300 | | | 772,317 |
Saks, Inc. (a) (b) | | 44,400 | | | 921,744 |
| | | | | |
| | | | | 1,694,061 |
| | | | | |
|
Oil, Gas & Consumable Fuels—4.2% |
Bill Barrett Corp. (a) (b) | | 23,700 | | | 992,319 |
Cabot Oil & Gas Corp. | | 66,900 | | | 2,700,753 |
Denbury Resources, Inc. (a) | | 40,600 | | | 1,207,850 |
Foundation Coal Holdings, Inc. | | 36,100 | | | 1,895,250 |
Frontier Oil Corp. | | 43,500 | | | 1,765,230 |
Mariner Energy, Inc. (a) (b) | | 51,336 | | | 1,174,568 |
Penn Virginia Corp. | | 37,800 | | | 1,649,214 |
PetroHawk Energy Corp. (a) | | 63,400 | | | 1,097,454 |
Plains Exploration & Production Co. (a) | | 26,400 | | | 1,425,600 |
St. Mary Land & Exploration Co. | | 33,200 | | | 1,281,852 |
| | | | | |
| | | | | 15,190,090 |
| | | | | |
|
Personal Products—1.2% |
Alberto-Culver Co. | | 54,200 | | | 1,330,068 |
Chattem, Inc. (a) (b) | | 14,300 | | | 1,080,222 |
Herbalife, Ltd. | | 24,800 | | | 998,944 |
NBTY, Inc. (a) | | 30,800 | | | 843,920 |
| | | | | |
| | | | | 4,253,154 |
| | | | | |
|
Pharmaceuticals—1.4% |
Medicis Pharmaceutical Corp. (a) (b) | | 55,500 | | | 1,441,335 |
MGI Pharma, Inc. (a) | | 27,300 | | | 1,106,469 |
Sciele Pharma, Inc. (a) | | 16,800 | | | 343,560 |
The Medicines Co. (a) | | 20,300 | | | 388,948 |
Valeant Pharmaceuticals International, Inc. | | 52,800 | | | 632,016 |
ViroPharma, Inc. (a) (b) | | 23,300 | | | 185,002 |
Xenoport, Inc. (a) | | 16,600 | | | 927,608 |
| | | | | |
| | | | | 5,024,938 |
| | | | | |
|
Real Estate Investment Trusts—0.0% |
PS Business Parks, Inc. | | 2,800 | | | 147,140 |
| | | | | |
|
Real Estate Management & Development—0.3% |
Jones Lang LaSalle, Inc. | | 14,000 | | | 996,240 |
| | | | | |
| | |
Road & Rail—0.4% | | | | | |
Landstar System, Inc. | | 31,500 | | | 1,327,725 |
| | | | | |
| | | | | |
| Security Description | | Shares | | Value* |
| | | | | |
|
Semiconductors & Semiconductor Equipment—5.0% |
Advanced Energy Industries, Inc. (a) | | 80,400 | | $ | 1,051,632 |
ATMI, Inc. (a) | | 33,500 | | | 1,080,375 |
Cabot Microelectronics Corp. (a) (b) | | 13,400 | | | 481,194 |
Cohu, Inc. (b) | | 40,000 | | | 612,000 |
Cymer, Inc. (a) (b) | | 42,700 | | | 1,662,311 |
Diodes, Inc. (a) (b) | | 25,700 | | | 772,799 |
Entegris, Inc. (a) | | 94,600 | | | 816,398 |
Exar Corp. (a) (b) | | 38,700 | | | 308,439 |
Integrated Device Technology, Inc. (a) | | 95,350 | | | 1,078,408 |
Intersil Corp. | | 41,064 | | | 1,005,247 |
Micrel, Inc. (b) | | 69,600 | | | 588,120 |
ON Semiconductor Corp. (a) (b) | | 272,600 | | | 2,420,688 |
Pericom Semiconductor Corp. (a) | | 27,400 | | | 512,380 |
PMC-Sierra, Inc. (a) (b) | | 99,900 | | | 653,346 |
Semtech Corp. (a) | | 70,800 | | | 1,098,816 |
Standard Microsystems Corp. (a) | | 12,200 | | | 476,654 |
Varian Semiconductor Equipment Associates, Inc. (a) | | 62,250 | | | 2,303,250 |
Verigy, Ltd. (a) | | 38,200 | | | 1,037,894 |
Virage Logic Corp. (a) | | 57,900 | | | 483,465 |
| | | | | |
| | | | | 18,443,416 |
| | | | | |
|
Software—6.4% |
Actuate Corp. (a) | | 136,800 | | | 1,062,936 |
Ansoft Corp. (a) | | 34,300 | | | 886,655 |
ANSYS, Inc. (a) | | 49,400 | | | 2,048,124 |
Blackboard, Inc. (a) | | 24,000 | | | 966,000 |
Epicor Software Corp. (a) (b) | | 51,200 | | | 603,136 |
FactSet Research Systems, Inc. | | 33,900 | | | 1,888,230 |
Fair Isaac Corp. (b) | | 37,419 | | | 1,203,021 |
Informatica Corp. (a) | | 165,700 | | | 2,985,914 |
Jack Henry & Associates, Inc. | | 34,000 | | | 827,560 |
Lawson Software, Inc. (a) | | 64,600 | | | 661,504 |
Macrovision Corp. (a) (b) | | 46,400 | | | 850,512 |
MICROS Systems, Inc. (a) | | 18,000 | | | 1,262,880 |
MicroStrategy, Inc. (Class A) (a) | | 6,300 | | | 599,130 |
Parametric Technology Corp. (a) | | 26,100 | | | 465,885 |
Progress Software Corp. (a) | | 19,800 | | | 666,864 |
Quest Software, Inc. (a) | | 45,600 | | | 840,864 |
SPSS, Inc. (a) (b) | | 22,500 | | | 807,975 |
Synopsys, Inc. (a) | | 32,300 | | | 837,539 |
Taleo Corp. (a) | | 62,400 | | | 1,858,272 |
THQ, Inc. (a) (b) | | 41,100 | | | 1,158,609 |
TIBCO Software, Inc. (a) | | 70,600 | | | 569,742 |
Wind River Systems, Inc. (a) | | 46,200 | | | 412,566 |
| | | | | |
| | | | | 23,463,918 |
| | | | | |
|
Specialty Retail—2.9% |
A.C. Moore Arts & Crafts, Inc. (a) (b) | | 74,350 | | | 1,022,312 |
Aeropostale, Inc. (a) | | 37,650 | | | 997,725 |
GameStop Corp. (Class A) (a) | | 23,700 | | | 1,472,007 |
Guess?, Inc. | | 20,100 | | | 761,589 |
Hibbett Sports, Inc. (a) (b) | | 43,250 | | | 864,135 |
J. Crew Group, Inc. (a) | | 20,200 | | | 973,842 |
JoS. A. Bank Clothiers, Inc. (a) (b) | | 12,600 | | | 358,470 |
The Dress Barn, Inc. (a) | | 26,600 | | | 332,766 |
*See accompanying notes to financial statements.
MSF-8
Metropolitan Series Fund, Inc.
T. Rowe Price Small Cap Growth Portfolio
Schedule of Investments as of December 31, 2007
Common Stock—(Continued)
| | | | | |
| Security Description | | Shares | | Value* |
| | | | | |
|
Specialty Retail—(Continued) |
The Gymboree Corp. (a) | | 52,100 | | $ | 1,586,966 |
Tractor Supply Co. (a) (b) | | 26,600 | | | 956,004 |
Zumiez, Inc. (a) (b) | | 56,800 | | | 1,383,648 |
| | | | | |
| | | | | 10,709,464 |
| | | | | |
| | |
Textiles, Apparel & Luxury Goods—1.7% | | | | | |
Deckers Outdoor Corp. (a) (b) | | 8,800 | | | 1,364,528 |
Fossil, Inc. (a) | | 34,749 | | | 1,458,763 |
Hanesbrands, Inc. (a) | | 44,100 | | | 1,198,197 |
Iconix Brand Group, Inc. (a) | | 49,800 | | | 979,068 |
The Warnaco Group, Inc. (a) | | 33,200 | | | 1,155,360 |
| | | | | |
| | | | | 6,155,916 |
| | | | | |
| | |
Trading Companies & Distributors—0.3% | | | | | |
Beacon Roofing Supply, Inc. (a) (b) | | 28,200 | | | 237,444 |
MSC Industrial Direct Co., Inc. (Class A) | | 24,200 | | | 979,374 |
| | | | | |
| | | | | 1,216,818 |
| | | | | |
| | |
Wireless Telecommunication Services—1.3% | | | | | |
Leap Wireless International, Inc. (a) (b) | | 29,000 | | | 1,352,560 |
SBA Communications Corp. (a) | | 90,700 | | | 3,069,288 |
Syniverse Holdings, Inc. (a) | | 31,300 | | | 487,654 |
| | | | | |
| | | | | 4,909,502 |
| | | | | |
Total Common Stock
(Identified Cost $308,596,772) | | | | | 361,790,628 |
| | | | | |
| | | | | | |
| | |
| Short Term Investments—24.0% | | | | | | |
| Security Description | | Shares | | Value* | |
| | |
Mutual Funds—24.0% | | | | | | |
State Street Navigator Securities Lending
Prime Portfolio (c) | | 83,992,756 | | $ | 83,992,756 | |
T. Rowe Price Reserve Investment Fund (d) | | 3,756,232 | | | 3,756,232 | |
| | | | | | |
Total Short Term Investments
(Identified Cost $87,748,988) | | | | | 87,748,988 | |
| | | | | | |
Total Investments—123.0%
(Identified Cost $396,345,760) (e) | | | | | 449,539,616 | |
Liabilities in excess of other assets | | | | | (84,067,744 | ) |
| | | | | | |
| Total Net Assets—100% | | | | $ | 365,471,872 | |
| | | | | | |
| (b) | A portion or all of the security was held on loan. As of December 31, 2007, the market value of securities loaned was $ 85,139,164 and the collateral received consisted of cash in the amount of $83,992,756 and non cash collateral with a value of $4,168,255. The cash collateral is invested in a money market fund managed by an affiliate of the custodian. The non cash collateral received consists primarily of government securities and bank letters of credit, and are held for the benefit of the Portfolio at the Portfolio’s custodian. |
| (c) | Represents investment of cash collateral received from securities lending transactions. |
| (d) | Affiliated Issuer. See below. |
| (e) | The aggregate cost of investments for federal income tax purposes as of December 31, 2007 was $396,562,614 and the composition of unrealized appreciation and depreciation of investment securities was $77,245,576 and $(24,268,574), respectively. |
Affiliated Issuer
| | | | | | | | | | | | | | | |
Security Description | | Number of
Shares Held
at
12/31/2006 | | Shares
Purchased
Since
12/31/2006 | | Shares
Sold Since
12/31/2006 | | | Number of
Shares Held
at
12/31/2007 | | Realized
Gain/Loss
on
Shares Sold | | Income
For Year
Ended
12/31/2007 |
T. Rowe Price Reserve Investment Fund | | 7,589,435 | | 96,639,712 | | (100,472,915 | ) | | 3,756,232 | | $ | 0 | | $ | 220,729 |
*See accompanying notes to financial statements.
MSF-9
Metropolitan Series Fund, Inc.
T. Rowe Price Small Cap Growth Portfolio
Statement of Assets & Liabilities
December 31, 2007
| | | | | | |
Assets | | | | | | |
Investments at value (a) (b) | | | | | $ | 449,539,616 |
Receivable for: | | | | | | |
Fund shares sold | | | | | | 244,489 |
Accrued interest and dividends | | | | | | 64,991 |
| | | | | | |
Total Assets | | | | | | 449,849,096 |
Liabilities | | | | | | |
Payable for: | | | | | | |
Fund shares redeemed | | $ | 177,578 | | | |
Collateral for securities loaned | | | 83,992,756 | | | |
Accrued expenses: | | | | | | |
Management fees | | | 154,725 | | | |
Service and distribution fees | | | 13,643 | | | |
Other expenses | | | 38,522 | | | |
| | | | | | |
Total Liabilities | | | | | | 84,377,224 |
| | | | | | |
Net Assets | | | | | $ | 365,471,872 |
| | | | | | |
Net assets consists of: | | | | | | |
Capital paid in | | | | | $ | 252,459,069 |
Accumulated net realized gains | | | | | | 59,818,947 |
Unrealized appreciation on investments | | | | | | 53,193,856 |
| | | | | | |
Net Assets | | | | | $ | 365,471,872 |
| | | | | | |
| Computation of offering price: | | | | | | |
Class A | | | | | | |
Net asset value and redemption price per share ($294,458,426 divided by 17,055,492 shares outstanding) | | | | | $ | 17.26 |
| | | | | | |
Class B | | | | | | |
Net asset value and redemption price per share ($54,366,087 divided by 3,218,276 shares outstanding) | | | | | $ | 16.89 |
| | | | | | |
Class E | | | | | | |
Net asset value and redemption price per share ($16,647,359 divided by
979,287 shares outstanding) | | | | | $ | 17.00 |
| | | | | | |
(a) Identified cost of investments | | | | | $ | 396,345,760 |
| | | | | | |
| (b) | Includes cash collateral for securities loaned of $83,992,756. |
Statement of Operations
For the Year Ended December 31, 2007
| | | | | | | | |
Investment Income | | | | | | | | |
Dividends | | | | | | $ | 1,195,394 | |
Interest | | | | | | | 600,932 | (a) |
| | | | | | | | |
| | | | | | | 1,796,326 | |
Expenses | | | | | | | | |
Management fees | | $ | 2,017,686 | | | | | |
Service and distribution fees—Class B | | | 125,842 | | | | | |
Service and distribution fees—Class E | | | 26,759 | | | | | |
Directors’ fees and expenses | | | 23,669 | | | | | |
Custodian | | | 70,375 | | | | | |
Audit and tax services | | | 31,738 | | | | | |
Legal | | | 4,400 | | | | | |
Printing | | | 163,244 | | | | | |
Insurance | | | 5,758 | | | | | |
Miscellaneous | | | 14,065 | | | | | |
| | | | | | | | |
Total expenses | | | 2,483,536 | | | | | |
Expense reductions | | | (2,988 | ) | | | | |
Management fee waivers | | | (66,136 | ) | | | 2,414,412 | |
| | | | | | | | |
Net Investment Loss | | | | | | | (618,086 | ) |
| | | | | | | | |
Realized and Unrealized Gain (Loss) | | | | | | | | |
| Realized gain on: | | | | | | | | |
Investments—net | | | 71,699,895 | | | | | |
Futures contracts—net | | | 86,360 | | | | 71,786,255 | |
| | | | | | | | |
| Change in unrealized depreciation on: | | | | | | | | |
Investments—net | | | | | | | (31,913,290 | ) |
| | | | | | | | |
Net gain | | | | | | | 39,872,965 | |
| | | | | | | | |
Net Increase in Net Assets From Operations | | | | | | $ | 39,254,879 | |
| | | | | | | | |
| (a) | Includes net income on securities loaned of $377,817. |
See accompanying notes to financial statements.
MSF-10
Metropolitan Series Fund, Inc.
T. Rowe Price Small Cap Growth Portfolio
Statements of Changes in Net Assets
| | | | | | | | |
| | | Year ended
December 31,
2007 | | | Year ended
December 31,
2006 | |
From Operations | | | | | | | | |
Net investment loss | | $ | (618,086 | ) | | $ | (897,570 | ) |
Net realized gain | | | 71,786,255 | | | | 17,806,736 | |
Unrealized depreciation | | | (31,913,290 | ) | | | (3,516,615 | ) |
| | | | | | | | |
Increase in net assets from operations | | | 39,254,879 | | | | 13,392,551 | |
| | | | | | | | |
Increase (decrease) in net assets from capital share transactions | | | (86,751,199 | ) | | | 30,463,297 | |
| | | | | | | | |
Total increase (decrease) in net assets | | | (47,496,320 | ) | | | 43,855,848 | |
| | |
Net Assets | | | | | | | | |
Beginning of the period | | | 412,968,192 | | | | 369,112,344 | |
| | | | | | | | |
End of the period | | $ | 365,471,872 | | | $ | 412,968,192 | |
| | | | | | | | |
Other Information:
Capital Shares
Transactions in capital shares were as follows:
| | | | | | | | | | | | | | |
| | | Year ended
December 31, 2007 | | | Year ended
December 31, 2006 | |
| | | Shares | | | $ | | | Shares | | | $ | |
Class A | | | | | | | | | | | | | | |
Sales | | 2,902,264 | | | $ | 48,368,155 | | | 5,525,628 | | | $ | 86,189,244 | |
Redemptions | | (8,064,495 | ) | | | (136,495,142 | ) | | (4,375,585 | ) | | | (67,461,408 | ) |
| | | | | | | | | | | | | | |
Net increase (decrease) | | (5,162,231 | ) | | $ | (88,126,987 | ) | | 1,150,043 | | | $ | 18,727,836 | |
| | | | | | | | | | | | | | |
Class B | | | | | | | | | | | | | | |
Sales | | 995,536 | | | $ | 16,637,781 | | | 1,667,737 | | | $ | 25,431,636 | |
Redemptions | | (709,679 | ) | | | (11,749,801 | ) | | (775,310 | ) | | | (11,646,238 | ) |
| | | | | | | | | | | | | | |
Net increase | | 285,857 | | | $ | 4,887,980 | | | 892,427 | | | $ | 13,785,398 | |
| | | | | | | | | | | | | | |
Class E | | | | | | | | | | | | | | |
Sales | | 148,888 | | | $ | 2,517,344 | | | 334,736 | | | $ | 5,152,126 | |
Redemptions | | (362,938 | ) | | | (6,029,536 | ) | | (473,521 | ) | | | (7,202,063 | ) |
| | | | | | | | | | | | | | |
Net decrease | | (214,050 | ) | | $ | (3,512,192 | ) | | (138,785 | ) | | $ | (2,049,937 | ) |
| | | | | | | | | | | | | | |
Increase (decrease) derived from capital share transactions | | | | | $ | (86,751,199 | ) | | | | | $ | 30,463,297 | |
| | | | | | | | | | | | | | |
See accompanying notes to financial statements.
MSF-11
Metropolitan Series Fund, Inc.
T. Rowe Price Small Cap Growth Portfolio
Financial Highlights
| | | | | | | | | | | | | | | | | | | | |
| | | Class A | |
| | | Year ended December 31, | |
| | | 2007 | | | 2006 | | | 2005 | | | 2004 | | | 2003 | |
Net Asset Value, Beginning of Period | | $ | 15.72 | | | $ | 15.13 | | | $ | 13.63 | | | $ | 12.27 | | | $ | 8.71 | |
| | | | | | | | | | | | | | | | | | | | |
Income From Investment Operations | | | | | | | | | | | | | | | | | | | | |
Net investment loss | | | (0.02 | )(a) | | | (0.03 | ) | | | (0.02 | ) | | | (0.04 | ) | | | (0.04 | ) |
Net realized and unrealized gain on investments | | | 1.56 | | | | 0.62 | | | | 1.52 | | | | 1.40 | | | | 3.60 | |
| | | | | | | | | | | | | | | | | | | | |
Total from investment operations | | | 1.54 | | | | 0.59 | | | | 1.50 | | | | 1.36 | | | | 3.56 | |
| | | | | | | | | | | | | | | | | | | | |
Net Asset Value, End of Period | | $ | 17.26 | | | $ | 15.72 | | | $ | 15.13 | | | $ | 13.63 | | | $ | 12.27 | |
| | | | | | | | | | | | | | | | | | | | |
Total Return (%) | | | 9.9 | | | | 3.9 | | | | 11.0 | | | | 11.1 | | | | 40.9 | |
Ratio of operating expenses to average net assets before expense reductions (%) | | | 0.57 | | | | 0.59 | | | | 0.60 | | | | 0.60 | | | | 0.63 | |
Ratio of operating expenses to average net assets after expense reductions (%) (b) | | | 0.57 | | | | 0.59 | | | | 0.59 | | | | 0.60 | | | | 0.63 | |
Ratio of operating expenses to average net assets without giving effect to the management fee waiver would have been (%) (c) | | | 0.59 | | | | 0.60 | | | | N/A | | | | N/A | | | | N/A | |
Ratio of net investment loss to average net assets (%) | | | (0.12 | ) | | | (0.19 | ) | | | (0.14 | ) | | | (0.31 | ) | | | (0.39 | ) |
Portfolio turnover rate (%) | | | 51 | | | | 38 | | | | 31 | | | | 28 | | | | 25 | |
Net assets, end of period (000) | | $ | 294,458 | | | $ | 349,258 | | | $ | 318,845 | | | $ | 312,834 | | | $ | 297,728 | |
| | | | | | | | | | | | | | | | | | | | |
| | | Class B | |
| | | Year ended December 31, | |
| | | 2007 | | | 2006 | | | 2005 | | | 2004 | | | 2003 | |
Net Asset Value, Beginning of Period | | $ | 15.42 | | | $ | 14.88 | | | $ | 13.44 | | | $ | 12.11 | | | $ | 8.59 | |
| | | | | | | | | | | | | | | | | | | | |
Income From Investment Operations | | | | | | | | | | | | | | | | | | | | |
Net investment loss | | | (0.06 | )(a) | | | (0.05 | ) | | | (0.04 | ) | | | (0.03 | ) | | | (0.01 | ) |
Net realized and unrealized gain on investments | | | 1.53 | | | | 0.59 | | | | 1.48 | | | | 1.36 | | | | 3.53 | |
| | | | | | | | | | | | | | | | | | | | |
Total from investment operations | | | 1.47 | | | | 0.54 | | | | 1.44 | | | | 1.33 | | | | 3.52 | |
| | | | | | | | | | | | | | | | | | | | |
Net Asset Value, End of Period | | $ | 16.89 | | | $ | 15.42 | | | $ | 14.88 | | | $ | 13.44 | | | $ | 12.11 | |
| | | | | | | | | | | | | | | | | | | | |
Total Return (%) | | | 9.5 | | | | 3.6 | | | | 10.7 | | | | 11.0 | | | | 41.0 | |
Ratio of operating expenses to average net assets before expense reductions (%) | | | 0.82 | | | | 0.84 | | | | 0.84 | | | | 0.85 | | | | 0.88 | |
Ratio of operating expenses to average net assets after expense reductions (%) (b) | | | 0.82 | | | | 0.84 | | | | 0.84 | | | | 0.85 | | | | 0.88 | |
Ratio of operating expenses to average net assets without giving effect to the management fee waiver would have been (%) (c) | | | 0.84 | | | | 0.85 | | | | N/A | | | | N/A | | | | N/A | |
Ratio of net investment loss to average net assets (%) | | | (0.36 | ) | | | (0.44 | ) | | | (0.40 | ) | | | (0.52 | ) | | | (0.59 | ) |
Portfolio turnover rate (%) | | | 51 | | | | 38 | | | | 31 | | | | 28 | | | | 25 | |
Net assets, end of period (000) | | $ | 54,366 | | | $ | 45,213 | | | $ | 30,357 | | | $ | 15,516 | | | $ | 152 | |
| (a) | Per share amount is based on average shares outstanding during the period. |
| (b) | The Portfolio has entered into arrangements with certain brokers who paid a portion of the Portfolio’s expenses. |
| (c) | See Note 4 in the Notes to Financial Statements. |
See accompanying notes to financial statements.
MSF-12
Metropolitan Series Fund, Inc.
T. Rowe Price Small Cap Growth Portfolio
Financial Highlights
| | | | | | | | | | | | | | | | | | | | |
| | | Class E | |
| | | Year ended December 31, | |
| | | 2007 | | | 2006 | | | 2005 | | | 2004 | | | 2003 | |
Net Asset Value, Beginning of Period | | $ | 15.50 | | | $ | 14.95 | | | $ | 13.49 | | | $ | 12.15 | | | $ | 8.64 | |
| | | | | | | | | | | | | | | | | | | | |
Income From Investment Operations | | | | | | | | | | | | | | | | | | | | |
Net investment loss | | | (0.04 | )(a) | | | (0.06 | ) | | | (0.04 | ) | | | (0.05 | ) | | | (0.03 | ) |
Net realized and unrealized gain on investments | | | 1.54 | | | | 0.61 | | | | 1.50 | | | | 1.39 | | | | 3.54 | |
| | | | | | | | | | | | | | | | | | | | |
Total from investment operations | | | 1.50 | | | | 0.55 | | | | 1.46 | | | | 1.34 | | | | 3.51 | |
| | | | | | | | | | | | | | | | | | | | |
Net Asset Value, End of Period | | $ | 17.00 | | | $ | 15.50 | | | $ | 14.95 | | | $ | 13.49 | | | $ | 12.15 | |
| | | | | | | | | | | | | | | | | | | | |
Total Return (%) | | | 9.7 | | | | 3.7 | | | | 10.8 | | | | 11.0 | | | | 40.6 | |
Ratio of operating expenses to average net assets before expense reductions (%) | | | 0.72 | | | | 0.74 | | | | 0.74 | | | | 0.75 | | | | 0.78 | |
Ratio of operating expenses to average net assets after expense reductions (%) (b) | | | 0.72 | | | | 0.74 | | | | 0.74 | | | | 0.75 | | | | 0.78 | |
Ratio of operating expenses to average net assets without giving effect to the management fee waiver would have been (%) (c) | | | 0.74 | | | | 0.75 | | | | N/A | | | | N/A | | | | N/A | |
Ratio of net investment loss to average net assets (%) | | | (0.26 | ) | | | (0.35 | ) | | | (0.30 | ) | | | (0.45 | ) | | | (0.52 | ) |
Portfolio turnover rate (%) | | | 51 | | | | 38 | | | | 31 | | | | 28 | | | | 25 | |
Net assets, end of period (000) | | $ | 16,647 | | | $ | 18,497 | | | $ | 19,910 | | | $ | 18,321 | | | $ | 11,353 | |
| (a) | Per share amount is based on average shares outstanding during the period. |
| (b) | The Portfolio has entered into arrangements with certain brokers who paid a portion of the Portfolio’s expenses. |
| (c) | See Note 4 in the Notes to Financial Statements. |
See accompanying notes to financial statements.
MSF-13
Metropolitan Series Fund, Inc.
T. Rowe Price Small Cap Growth Portfolio
Notes to Financial Statements—December 31, 2007
Metropolitan Series Fund, Inc. (the “Fund”) is organized as a corporation under the laws of Maryland pursuant to Articles of Incorporation filed on November 23, 1982, as amended, and registered under the Investment Company Act of 1940, as amended (the “1940 Act”), as an open-end investment company. The Fund is a “series” type of mutual fund, which issues separate series of stock. Each series represents an interest in a separate portfolio of Fund investments. The T. Rowe Price Small Cap Growth Portfolio (the “Portfolio”) is a diversified series of the Fund. Shares in the Fund are not offered directly to the general public and are currently available only to separate accounts established by Metropolitan Life Insurance Company (“MetLife”), New England Life Insurance Company, General American Life Insurance Company (“General American”), The MetLife Investors Group of Insurance Companies, MetLife Insurance Company of Connecticut and other affiliated insurance companies (collectively, the “Insurance Companies”), as an investment vehicle for variable life insurance, group annuity or variable annuity products, although the Portfolio is not available to all such separate accounts. The Portfolio’s shares may be divided into different classes. Currently, the classes being offered by the Portfolio are named Class A, Class B and Class E. The classes of the Portfolio’s shares are identical, except that certain additional charges (Rule 12b-1 fees) are made against Class B and Class E shares. Investment income, realized and unrealized capital gains and losses, the common expenses of the Portfolio and certain Portfolio-level expense reductions, if any, are allocated on a pro rata basis to each class based on the relative net assets of each class to the total net assets of the Portfolio.
| 2. | SIGNIFICANT ACCOUNTING POLICIES: |
The preparation of financial statements in conformity with accounting principles generally accepted in the United States of America (“GAAP”) requires management to make estimates and assumptions that affect the reported amounts of assets and liabilities and disclosure of contingent assets and liabilities as of the date of the financial statements and the reported amounts of income and expenses during the reporting period. Actual results could differ from those estimates.
The following is a summary of significant accounting policies consistently followed by the Portfolio in the preparation of its financial statements. The policies are in conformity with GAAP.
Investment Valuation:
Debt securities (other than short term obligations with a remaining maturity of sixty days or less) are valued by independent pricing services selected by the relevant subadviser pursuant to authorization of the Board of Directors of the Fund (the “Board” or “Directors”). Short term obligations with a remaining maturity of sixty days or less are valued at amortized cost which approximates fair market value.
Equity securities traded on a national securities exchange or exchanges are valued at their last sale price on the principal trading market. Equity securities traded on the NASDAQ National Market System are valued at the NASDAQ Official Closing Price (the “NOCP”). The NOCP is the last sale price if it falls between the spread of the last reported bid and asked prices. If the last reported bid and asked prices are above the last reported sale price, the NOCP will be the last reported bid price. If the last reported bid and asked prices are below the last reported sale price, the NOCP will be the last reported asked price. Equity securities traded on a national securities exchange or exchanges or on the NASDAQ National Market System for which there is no reported sale during the day are valued at the last reported bid price. A security that is listed or traded on more than one exchange is valued at the quotation on the exchange determined to be the primary market for that security by the Board or its delegates. If no closing price is available, then such securities are valued by using the last reported bid price. Equity securities traded over-the-counter are valued at the last reported sales price.
If no current market value quotation is readily available or reliable for a portfolio security, fair value will be determined in accordance with procedures established by and under the general supervision of the Board. When the Portfolio uses fair value pricing, it may take into account any factors it deems appropriate. The value of securities used by the Portfolio to calculate its net asset value may differ from quoted or published prices for the same securities. Fair value pricing involves subjective judgments and the fair value determined for a security may be materially different than the value that could be realized upon the sale of that security.
The Portfolio expects to use fair value pricing for securities primarily traded on U.S. exchanges only under very limited circumstances. For example, the Portfolio may use fair value pricing if the exchange on which a security is traded closes early or trading in the security is suspended.
MSF-14
Metropolitan Series Fund, Inc.
T. Rowe Price Small Cap Growth Portfolio
Notes to Financial Statements—December 31, 2007—(Continued)
Securities traded primarily on an exchange outside of the United States which closes before the close of the New York Stock Exchange will be valued at the last sales price on that non-U.S. exchange. Securities traded primarily on an exchange outside of the United States for which there is no reported sale during the day are valued at the mean between the last reported bid and asked prices. However, because most foreign markets close well before the Portfolio values its securities (typically at 4 p.m. Eastern Time), the earlier close of these foreign markets gives rise to the possibility that significant events, including broad market moves, may have occurred after these foreign markets close but before the Portfolio values its securities. To account for this, the Portfolio may frequently value many of its foreign equity securities using fair value prices based on third party vendor modeling tools.
Forward foreign currency exchange contracts are valued based on the mean between closing bid and asked prices of the forward currency contract rates in the London foreign exchange markets on a daily basis as provided by a reliable bank or dealer.
Options, whether on securities, indices, futures contracts, or otherwise, are valued at the last sales price available as of the close of business on the day of valuation or, if there is no such sale price available, at the mean between the bid and asked prices. Options on currencies are valued at the spot price each day.
The value of futures contracts will be the sum of the margin deposit plus or minus the difference between the value of the futures contract on each day the net asset value is calculated and the value on the date the futures contract originated, value being that established on a recognized commodity exchange, or by reference to other customary sources, with gain or loss being realized when the futures contract closes or expires.
Subject to the Board’s oversight, the Board has delegated day-to-day responsibility for valuing Portfolio assets to the subadviser of the Portfolio, who values such assets as described above and operates under procedures approved by the Board.
Investment Transactions and Related Investment Income:
Portfolio security transactions are recorded on the trade date. Dividend income is recorded on the ex-dividend date or, for certain foreign securities, when notified. Interest income, which includes amortization of premium and accretion of discount on debt securities, is recorded on the accrual basis. Realized gains and losses on investments and unrealized appreciation and depreciation are determined on the identified cost basis, which is the same basis used for federal income tax purposes.
Repurchase Agreements:
The Portfolio, through the custodian or a subcustodian, receives delivery of the underlying securities collateralizing repurchase agreements. The Portfolio requires the custodian to take possession, to have legally segregated in the Federal Reserve Book Entry System, or to have segregated within the custodian’s vault, all securities held as collateral for repurchase agreements. It is the Portfolio’s policy that the market value of the collateral be at least equal to 100% of the repurchase price in the case of a repurchase agreement of one-day duration and 102% on all other repurchase agreements. The Portfolio’s subadviser is responsible for determining that the value of the collateral is at all times at least equal to the repurchase price. In connection with transactions in repurchase agreements, if the seller defaults and the value of the collateral declines or if the seller enters an insolvency proceeding, realization of the collateral by the Portfolio may be delayed, limited or wholly denied.
Foreign Currency Translation:
The books and records of the Portfolio are maintained in U.S. dollars. The values of securities, currencies and other assets and liabilities denominated in currencies other than U.S. dollars are translated into U.S. dollars based upon foreign exchange rates prevailing at the end of the period. Purchases and sales of investment securities, income and expenses are translated on the respective dates of such transactions. Since the values of investment securities are presented at the foreign exchange rates prevailing at the end of the period, it is not practical to isolate that portion of the results of operations arising from changes in exchange rates from that portion of the results of operations reflecting fluctuations arising from changes in market prices of the investment securities. Such fluctuations are included in the net realized and unrealized gain or loss on investments.
Net realized foreign exchange gains or losses arise from sales of foreign currency, currency gains or losses realized between the trade and settlement dates on securities transactions, and the difference between the amounts of dividends, interest, and foreign withholding taxes recorded by the Portfolio and the U.S. dollar equivalent of the amounts actually received or paid by the Portfolio. Net unrealized foreign exchange gains and losses arise from changes in the value of assets and liabilities, other than investment securities, resulting from changes in the exchange rate.
MSF-15
Metropolitan Series Fund, Inc.
T. Rowe Price Small Cap Growth Portfolio
Notes to Financial Statements—December 31, 2007—(Continued)
Forward Foreign Currency Exchange Contracts:
The Portfolio may enter into forward foreign currency exchange contracts primarily to hedge against foreign currency exchange rate risks on its non-U.S. dollar denominated investment securities. When entering into a forward currency contract, the Portfolio agrees to receive or deliver a fixed quantity of foreign currency for an agreed-upon price on an agreed future date. These contracts are valued daily and the Portfolio’s net equity therein, representing unrealized gain or loss on the contracts as measured by the difference between the foreign exchange rates at the dates of entry into the contracts and the forward rates at the settlement date, is included in the Statement of Assets and Liabilities. Realized and unrealized gains and losses are included in the Statement of Operations. These instruments involve market and/or credit risk in excess of the amount recognized in the Statement of Assets and Liabilities. Risks arise from the possible inability of counterparties to meet the terms of their contracts and from movement in currency and securities values and interest rates.
Futures Contracts:
The Portfolio may buy and sell futures contracts (on recognized exchanges) as a hedge or to enhance return. Futures contracts are agreements to buy or sell a security, or deliver a final cash settlement price in connection with an index, interest rate, currency, or other contracts not calling for physical delivery, for a set price in the future. The Portfolio must post an amount equal to a portion of the total market value of the futures contract as futures variation margin, which is returned when the Portfolio’s obligations under the contract have been satisfied. From time to time thereafter, the Portfolio may have to post variation margin to maintain this amount as the market value of the contract fluctuates. Risks of entering into futures contracts (and related options) include the possibility that there may be an illiquid market and that a change in the value of the contract or option may not correlate with changes in the value of the underlying securities.
Options:
The Portfolio may use options to hedge against changes in values of securities the Portfolio owns or expects to purchase. Writing puts or buying calls tends to increase the Portfolio’s exposure to the underlying instrument and writing calls or buying puts tends to decrease the Portfolio’s exposure to the underlying instrument, and can be used to hedge other Portfolio investments. For options purchased to hedge the Portfolio’s investments, the potential risk to the Portfolio is that the change in value of options contracts may not correspond to the change in value of the hedged instruments. In addition, losses may arise from changes in the value of the underlying instruments, if there is an illiquid secondary market, or if the counterparty is unable to perform. The maximum loss for purchased options is limited to the premium initially paid for the option. For options written by the Portfolio, the maximum loss is not limited to the premium initially received for the option.
The main risk is associated with purchasing an option is that the option expires without being exercised. In this case, the option expires worthless and the premium paid for the option is considered the loss. The risk associated with writing a call option is that the Portfolio may forgo the opportunity for a profit if the market value of the underlying position increases and the option is exercised. The risk in writing a put option is that the Portfolio may incur a loss if the market value of the underlying position decreases and the option is exercised. In addition, the Portfolio risks not being able to enter into a closing transaction for the written option as the result of an illiquid market.
“When-Issued” Securities:
Purchasing securities “when-issued” is a forward commitment by the Portfolio to buy a security. The estimated amount of the Portfolio’s payment obligation and the security’s interest rate are determined when the commitment is made, even though no interest accrues until the security is issued, which is generally 15 to 120 days later. The Portfolio will segregate liquid assets with its custodian sufficient at all times to satisfy these commitments. If the value of the security is less when delivered than when the commitment was made, the Portfolio will suffer a loss.
Federal Income Taxes:
It is the Portfolio’s policy to comply with the requirements of the Internal Revenue Code of 1986, as amended, and regulations thereunder, applicable to regulated investment companies and to distribute all of its taxable income to shareholders. Therefore, no federal income tax provision is required.
MSF-16
Metropolitan Series Fund, Inc.
T. Rowe Price Small Cap Growth Portfolio
Notes to Financial Statements—December 31, 2007—(Continued)
As of December 31, 2007, the Portfolio had no capital loss carryovers.
As of December 31, 2007, the components of distributable earnings (accumulated losses) on a federal income tax basis were as follows:
| | | | | | | | | | | | |
Undistributed
Ordinary
Income | | Undistributed
Long Term
Gain | | Unrealized
Appreciation | | Loss
Carryforwards | | Total |
| $— | | $ | 60,035,800 | | $ | 52,977,002 | | $ | — | | $ | 113,012,802 |
Dividends and Distributions to Shareholders:
The Portfolio records dividends and distributions on the ex-dividend date. Net realized gains from security transactions (if any) are generally distributed annually to shareholders. The timing and characterization of certain income and capital gains distributions are determined in accordance with federal tax regulations that may differ from GAAP. Permanent book and tax basis differences relating to shareholder distributions will result in reclassification between under/over distributed net investment income, accumulated net realized gains/losses and paid in capital.
Expense Reductions:
Certain Portfolio trades are directed to brokers who paid a portion of the Portfolio’s expenses. Amounts paid for the Portfolio are shown as expense reductions in the Statement of Operations.
| 3. | INVESTMENT TRANSACTIONS: |
For the year ended December 31, 2007, purchases and sales of securities (excluding short term investments) for the Portfolio were as follows:
| | | | | | | | | |
| Purchases | | Sales |
U.S. Government | | Other | | U.S. Government | | Other |
| $0 | | $ | 196,617,561 | | $ | 0 | | $ | 280,832,013 |
| 4. | INVESTMENT MANAGEMENT FEES AND OTHER TRANSACTIONS WITH AFFILIATES: |
Investment Management Agreement:
MetLife Advisers, LLC (“MetLife Advisers”) is the investment adviser to the Portfolio. The Fund has entered into an investment management agreement with MetLife Advisers with respect to the Portfolio. For providing investment management services to the Portfolio, MetLife Advisers receives monthly compensation at the following annual rates:
| | | | | | | |
| | | Management
Fees earned by
MetLife Advisers
for the year ended
December 31, 2007 | | Annual
percentage
rates paid to
MetLife Advisers | | Based on Portfolios
average daily net asset levels |
| | $ | 2,017,686 | | 0.550% | | Of the first $100 million |
| | | | | 0.500% | | Of the next $300 million |
| | | | | 0.450% | | On amounts in excess of $400 million |
| | | | | | | |
Certain officers and directors of the Fund may also be officers of MetLife Advisers; however, such officers and directors receive no compensation from the Fund.
MetLife Advisers has entered into an investment subadvisory agreement with respect to the Portfolio. T. Rowe Price Associates, Inc. (“T. Rowe Price”) is compensated by MetLife Advisers to provide subadvisory services for the Portfolio.
MSF-17
Metropolitan Series Fund, Inc.
T. Rowe Price Small Cap Growth Portfolio
Notes to Financial Statements—December 31, 2007—(Continued)
Management Fee Waivers:
Effective February 17, 2005, T. Rowe Price agreed to a voluntary subadvisory fee waiver that applies if (i) assets under management by T. Rowe Price for the Fund and Met Investor Series Trust (“MIST”), in the aggregate, exceed $750,000,000, (ii) T. Rowe Price subadvises three or more portfolios of the Fund and MIST in the aggregate, and (iii) at least one of those portfolios is a large cap domestic equity portfolio.
If the aforementioned conditions are met, T. Rowe Price will waive its subadvisory fee paid by MetLife Advisers by 5% for combined Fund and MIST average daily net assets over $750,000,000, 7.5% for the next $1,500,000,000 of combined assets, and 10% for amounts over $3,000,000,000. Any amounts waived pursuant to this subadvisory fee waiver will be allocated with respect to the Fund and MIST portfolios in proportion to such portfolios’ net assets. MetLife Advisers has voluntarily agreed to reduce its advisory fee for T. Rowe Price Large Cap Growth and T. Rowe Price Small Cap Growth by the amount waived (if any) by T. Rowe Price for the relevant Portfolio(s) pursuant to this voluntary subadvisory fee waiver. Because these fee waivers are voluntary, and not contractual, they may be discontinued by T. Rowe Price and MetLife Advisers at any time. Amounts waived for the year ended December 31, 2007 are shown as management fee waivers in the Statement of Operations of the respective Portfolios.
Service and Distribution Fees:
The Fund has adopted a Distribution and Service Plan under Rule 12b-1 of the 1940 Act for the Portfolio’s Class B and E shares. Under the Distribution and Service Plan, the Class B and E shares of the Portfolio pay a fee to compensate the Insurance Companies (or their affiliates) and other broker-dealers and financial intermediaries involved in the offer and sale of Portfolio shares for promoting or selling and servicing, the Class B and E shares. The fees under the Distribution and Service Plan for each class of the Portfolio’s shares are calculated as a percentage of the Portfolio’s average daily net assets that are attributable to that Class. Currently, the fee is 0.25% per year for Class B shares and 0.15% per year for Class E shares. Amounts paid by the Portfolio for the year ended December 31, 2007 are shown as Service and Distribution fees in the Statement of Operations.
The Fund has entered into a securities lending arrangement with the Fund’s custodian, State Street Bank and Trust Company (the “custodian”). Under the agreement, the custodian is authorized to loan securities on the Portfolios’ behalf. In exchange, the Portfolio receives either cash or securities as collateral against the loaned securities. The Portfolio receives collateral at least equal to 102% of the market value of the loaned securities (105% for foreign securities), at each loan’s inception. Collateral must be maintained at least at 100% of the market value of the loaned securities for the duration of the loan. The cash collateral is invested in the Navigator Securities Lending Prime Portfolio, an affiliate of the custodian, which invests in a variety of high quality U.S. dollar-denominated instruments. If the market value of the collateral at the close of trading on a business day is less than 100% of the market value of the loaned securities at the close of trading on that day, the borrower shall be required to deliver, by the close of business on the following business day, an additional amount of collateral, equal to at least 100% of the market value of all the loaned securities as of such preceding day. The Portfolio receives 80% of the annual net income from securities lending transactions, which is included in interest income of the Portfolio. The remaining 20% is paid to the custodian as compensation for its securities lending services. The Portfolio bears the risk of any deficiency in the amount of collateral available for return to a borrower due to a loss in an approved investment. Any outstanding loans by the Portfolio at June 30, 2007 are footnoted in the Schedule of Investments.
As previously reported, in May 2004, General American received a Wells Notice stating that the SEC staff was considering recommending that the SEC bring a civil action alleging violations of the U.S. securities laws against General American with respect to market timing and late trading in a limited number of privately-placed variable insurance contracts that were sold through General American. General American responded to the SEC staff and cooperated with the investigation. On August 9, 2007, the SEC announced that it had settled an enforcement action regarding late trading against General American with, among other things, General American agreeing to pay a civil penalty and to comply with certain undertakings. General American consented to the SEC’s order without admitting or denying the findings. MetLife Advisers has also advised the Fund’s Board of Directors that, while certain exceptions to the Fund’s policies have been noted, no situations have been identified that would have a material impact on the financial position of the Fund.
MSF-18
Metropolitan Series Fund, Inc.
T. Rowe Price Small Cap Growth Portfolio
Notes to Financial Statements—December 31, 2007—(Continued)
| 7. | RECENT ACCOUNTING PRONOUNCEMENTS: |
Effective June 29, 2007, the Fund implemented Financial Accounting Standards Board (“FASB”) Interpretation No. 48, “Accounting for Uncertainty in Income Taxes—an interpretation of FASB Statement No. 109” (“FIN 48”). FIN 48 prescribes the minimum recognition threshold a tax position must meet in connection with accounting for uncertainties in income tax positions taken or expected to be taken by an entity, including investment companies, before being measured and recognized in the financial statements. Management has evaluated the application of FIN 48 to the Fund, and has determined that the adoption of FIN 48 does not have a material impact on the Fund’s financial statements. The Fund files U.S. tax returns. No income tax returns are currently under examination. The statute of limitations on the Fund’s tax returns remains open for the years ended December 31, 2004 through December 31, 2006.
In September 2006, Statement of Financial Accounting Standards No. 157, Fair Value Measurements (SFAS 157) was issued and is effective for fiscal years beginning after November 15, 2007. SFAS 157 defines fair value, establishes a framework for measuring fair value and expands disclosures about fair value measurements. Management is currently evaluating the impact the adoption of SFAS 157 will have on the Portfolio’s financial statement disclosures.
MSF-19
Metropolitan Series Fund, Inc.
T. Rowe Price Small Cap Growth Portfolio
Report of Independent Registered Public Accounting Firm
To the Shareholders and Board of Directors of the Metropolitan Series Fund, Inc.:
We have audited the accompanying statement of assets and liabilities, including the schedule of investments, of the T. Rowe Price Small Cap Growth Portfolio, one of the portfolios constituting the Metropolitan Series Fund, Inc. (the “Fund”) as of December 31, 2007, and the related statement of operations for the year then ended, the statements of changes in net assets for each of the two years in the period then ended, and the financial highlights for each of the five years in the period then ended. These financial statements and financial highlights are the responsibility of the Fund’s management. Our responsibility is to express an opinion on these financial statements and financial highlights based on our audits.
We conducted our audits in accordance with the standards of the Public Company Accounting Oversight Board (United States). Those standards require that we plan and perform the audit to obtain reasonable assurance about whether the financial statements and financial highlights are free of material misstatement. The Fund is not required to have, nor were we engaged to perform, an audit of its internal control over financial reporting. Our audits included consideration of internal control over financial reporting as a basis for designing audit procedures that are appropriate in the circumstances, but not for the purpose of expressing an opinion on the effectiveness of the Fund’s internal control over financial reporting. Accordingly, we express no such opinion. An audit also includes examining, on a test basis, evidence supporting the amounts and disclosures in the financial statements, assessing the accounting principles used and significant estimates made by management, as well as evaluating the overall financial statement presentation. Our procedures included confirmation of securities owned as of December 31, 2007, by correspondence with the custodian and brokers; where replies were not received from brokers, we performed other auditing procedures. We believe that our audits provide a reasonable basis for our opinion.
In our opinion, the financial statements and financial highlights referred to above present fairly, in all material respects, the financial position of the T. Rowe Price Small Cap Growth Portfolio of the Metropolitan Series Fund, Inc. as of December 31, 2007, the results of its operations for the year then ended, the changes in its net assets for each of the two years in the period then ended, and the financial highlights for each of the five years in the period then ended, in conformity with accounting principles generally accepted in the United States of America.
Deloitte & Touche LLP
Boston, Massachusetts
February 21, 2008
MSF-20
Metropolitan Series Fund, Inc.
Directors and Officers
The Fund’s Directors review actions of the Fund’s investment adviser and subadvisers, and decide upon matters of general policy. The Fund’s officers supervise the daily business operations of the Fund. The Board of Directors and the Fund’s officers are listed below. Each Director is responsible for overseeing all 36 Portfolios of the Fund. There is no limit to the term a Director may serve. Directors serve until their resignation, retirement or removal in accordance with the Fund’s organizational documents and policies adopted by the Board from time to time. Officers hold office at the pleasure of the Board or until the election or appointment and the qualification of a successor. The address of the directors and officers is c/o Metropolitan Series Fund, Inc., 501 Boylston Street, Boston, MA 02116.
Interested Directors(1)
Each Director below is an “interested person” (as defined by the 1940 Act) with respect to the Fund in that Ms. Forget is an employee of MetLife and Mr. Typermass is a former employee of MetLife and owns securities issued by MetLife, Inc., the ultimate parent company of MetLife Advisers.
| | | | | | | | |
Name, Address and Age | | Current
position(s)
with Fund | | Position(s)
held since | | Principal occupations
over past five years, including other directorships(2) | | Number of
Portfolios in
Fund Complex
Overseen by
Director(3) |
Elizabeth M. Forget Age: 41 | | Director, Chairman of the Board, President and Chief Executive Officer | | 2006 | | Senior Vice President (since 2007), MetLife, Inc.; President, Met Investors Advisory, LLC (“MIA”); Trustee and President, Met Investors Series Trust (“MIST”); Executive Vice President, MetLife Investors Group, Inc.; President (since 2006), MetLife Advisers. | | 81 |
| | | | |
Arthur G. Typermass Age: 70 | | Director | | 1998 | | Formerly, Senior Vice President and Treasurer, MetLife. | | 37 |
Non-Interested Directors(1)
Each Director below is not an “interested person” (as defined by the 1940 Act) with respect to the Fund (collectively, the “Independent Directors”).
| | | | | | | | |
Name, Address and Age | | Current
position(s)
with Fund | | Position(s)
held since | | Principal occupations
over past five years, including other directorships(2) | | Number of
Portfolios in
Fund Complex
Overseen by
Director(3) |
Steve A. Garban† Age: 70 | | Director | | 1985 | | Formerly, Chief Financial Officer, Senior Vice President Finance and Operations and Treasurer (Emeritus), The Pennsylvania State University. | | 37 |
| | | | |
Linda B. Strumpf Age: 60 | | Director | | 2000 | | Vice President and Chief Investment Officer, Ford Foundation. | | 37 |
| | | | |
Michael S. Scott Morton† Age: 70 | | Director | | 1993 | | Jay W. Forrester Professor of Management (Emeritus) at Sloan School of Management, MIT. | | 37 |
| | | | |
H. Jesse Arnelle Age: 74 | | Director | | 2001 | | Formerly, Counsel, Womble Carlyle Sandrie & Rice; Director, Textron Inc. (global multi-industry company)*; formerly, Director, Gannet Co. Inc. (diversified news and information company)*; formerly, Director, Eastman Chemical Company (global chemical company)*; formerly, Director, Waste Management, Inc.*; formerly, Director, Armstrong Holdings Inc. (parent company of floor and ceiling products business)*; formerly, Director, FPL Group Inc. (public utility holding company)*; Director, URS Corporation (engineering design services firm)*. | | 37 |
| | | | |
Nancy Hawthorne Age: 56 | | Director | | 2003 | | Director, Avid Technologies (computer software company)*; formerly, Chairman of the Board of Avid Technologies; formerly, Board of Advisors, L. Knife & Sons, Inc. (beverage distributor); Chief Executive Officer, Clerestory LLC (corporate financial advisor); formerly, Trustee, New England Zenith Fund (“Zenith Fund”)**; formerly, Chief Executive Officer and Managing Partner, Hawthorne, Krauss and Associates (corporate financial advisor); formerly, Chief Financial Officer and Executive Vice President, Continental Cablevision, subsequently renamed MediaOne (cable television company); formerly, Director, Life F/X, Inc.; formerly, Chairman of the Board, WorldClinic (distance medicine company); formerly, Director, Perini Corporation (construction company)*; formerly, Director, CGU (property and casualty insurance company); formerly, Director, Beacon Power Corporation (energy company )*. | | 37 |
MSF-21
Metropolitan Series Fund, Inc.
Directors and Officers—(Continued)
| | | | | | | | |
Name, Address and Age | | Current
position(s)
with Fund | | Position(s)
held since | | Principal occupations
over past five years, including other directorships(2) | | Number of
Portfolios in
Fund Complex
Overseen by
Director(3) |
John T. Ludes Age: 71 | | Director | | 2003 | | President, LFP Properties (consulting firm); Formerly, Trustee, Zenith Fund**; formerly, Vice Chairman, President and Chief Operating Officer, Fortune Brands/American Brands (global conglomerate); formerly, President and CEO, Acushnet Company (athletic equipment company). | | 37 |
Officers(1)
| | | | | | | | |
Name and address | | Age | | Current
position(s)
with Fund | | Position(s)
held since | | Principal occupations over past five years(2) |
| Jeffrey P. Halperin | | 40 | | Chief Compliance Officer | | 2006 | | Vice President (since 2006), Corporate Ethics and Compliance Department, MetLife, Inc.; Chief Compliance Officer (since 2006), MetLife Advisers, MIA and MIST. |
| | | | |
| John F. Guthrie, Jr. | | 64 | | Senior Vice President | | 2002 | | Manager and Senior Vice President, MetLife Advisers; Vice President, MetLife; Vice President (since 2003), MetLife Group, Inc.; Vice President, NELICO; Vice President (since 2005), MIA; formerly, Senior Vice President, Zenith Fund**. |
| | | | |
| Alan C. Leland | | 55 | | Senior Vice President | | 2005 | | Treasurer and Chief Financial Officer, MetLife Advisers, LLC; Treasurer (since 2005), Met Investors Advisory, LLC; Vice President (since 2004), MIA; Vice President (since 2003), MetLife Group, Inc.; Vice President, MetLife; Senior Vice President, NELICO |
| | | | |
| Peter Duffy | | 52 | | Vice President and Treasurer | | 2000 | | Senior Vice President, MetLife Advisers (since 1998); Second Vice President (since 2003), NELICO; Vice President, MetLife (since 2004); Vice President (since 2004), MetLife Group, Inc.; formerly, Vice President and Treasurer, Zenith Fund**. |
| | | | |
| Thomas M. Lenz | | 49 | | Vice President and Secretary | | 2002 | | General Counsel and Secretary, MetLife Advisers; Assistant General Counsel, MetLife; formerly, Vice President and Secretary, Zenith Fund**. |
| * | Indicates a directorship with a registered investment company or a company subject to the reporting requirements of the Securities Exchange Act of 1934, as amended. |
| ** | The Zenith Fund deregistered with the Securities and Exchange Commission (“SEC”) in 2004. |
| (†) | Served as a trustee, director and/or officer of one or more of the following companies, each of which had a direct or indirect advisory relationship with MetLife Advisers or its affiliates prior to January 31, 2005: State Street Research Financial Trust, State Street Research Income Trust, State Street Research Money Market Trust, State Street Research Institutional Funds, State Street Research Capital Trust, State Street Research Master Investment Trust, State Street Research Equity Trust, State Street Research Securities Trust and State Street Research Exchange Trust (collectively, the “State Street Research Funds”). |
| (1) | Each Director of the Fund also serves as trustee of Metropolitan Series Fund II (“Met Series Fund II”), a registered investment company advised by MetLife Advisers. Each officer of the Fund serves in the same position with Met Series Fund II, which consists of one portfolio. |
| (2) | Previous positions during the past five years with the Fund, MIST, MetLife, MetLife Advisers, MIA, Zenith Fund, NELICO or New England Securities Corporation are omitted if not materially different. |
| (3) | The Fund Complex includes the Fund (36 portfolios), Met Series Fund II (1 portfolio) and MIST (44 portfolios) |
MSF-22
Metropolitan Series Fund, Inc.
T. Rowe Price Small Cap Growth Portfolio
Board Approval of Advisory and Subadvisory Agreements
The Fund’s Contract Review Committees of the Board of Directors (the “Board”) typically meet in early fall to review the Portfolios’ advisory agreements (the “Advisory Agreements”) and subadvisory agreements (collectively, the “Subadvisory Agreements,” and, together with the Advisory Agreements, the “Agreements”) and determine whether to recommend that the full Board approve the continuation of the Agreements for an additional one-year period. (Following the initial approval of an Agreement for a new Portfolio or with a new adviser or subadviser, such annual reviews are not required until 2 years following the execution of such Agreement.) After each Committee has made its recommendations, the full Board, including the Independent Directors, determines whether to approve the continuation of each of the Agreements. In addition, the Board, including the Independent Directors, considers matters bearing on the Agreements at most of its other meetings throughout the year and regularly interviews various individuals at MetLife Advisers responsible for the management of the Portfolios. The Directors also interview selected investment managers and other professionals at the subadvisers at various times throughout the year.
The Directors receive all materials that they or MetLife Advisers, the Fund’s investment adviser, and the subadvisers believe to be reasonably necessary for the Directors to evaluate the Agreements and determine whether to approve the continuation of the Agreements. These materials generally include, among other items, (i) information on the investment performance of the Portfolios and the performance of peer groups of funds and the Portfolios’ performance benchmarks, (ii) information on the Portfolios’ advisory and subadvisory fees and other expenses, including information comparing the Portfolios’ expenses to those of peer groups of funds and information about any applicable expense caps and fee “breakpoints,” (iii) sales and redemption data, (iv) information related to the profitability of the Agreements to MetLife Advisers and the subadvisers, and potential “fall-out” or ancillary benefits that MetLife Advisers, the subadvisers or their affiliates may receive as a result of their relationships with the Fund and (v) information obtained through the subadvisers’ responses to certain requests from MetLife Advisers and the Directors and MetLife Advisers’ responses to requests from the Directors. The Directors may also consider other information such as (vi) MetLife Advisers’ and the subadvisers’ financial results and condition, (vii) each Portfolio’s investment objectives and strategies and the size, education and experience of the investment staffs of MetLife Advisers and the relevant subadvisers and their use of technology and external research, (viii) the allocation of the Portfolios’ brokerage, if any, including allocations to brokers affiliated with the subadvisers and the use of “soft” commission dollars to pay Portfolio expenses and to pay for research and other similar services, (ix) the resources devoted to, and the record of compliance with, the Portfolios’ investment policies and restrictions, policies on personal securities transactions and other compliance policies, (x) the responses of MetLife Advisers, the subadvisers and/or their affiliates to certain legal and regulatory proceedings and (xi) the economic outlook generally and for the mutual fund industry in particular. Throughout the process, the Directors have the opportunity to ask questions of and request additional materials from MetLife Advisers and the subadvisers.
Following meetings of each Contract Review Committee on September 12, 2007, the Board, at its November 15, 2007 meeting, approved the continuation through December 31, 2008 of the Advisory Agreements for each Portfolio of the Fund and the Subadvisory Agreements for each Portfolio of the Fund. The Agreements approved for continuation are referred to below as the “Continued Agreements.”
In considering whether to approve the continuation of the Continued Agreements, the Directors, including the Independent Directors, did not identify any single factor as determinative, and each weighed the various factors as he or she deemed appropriate. The Directors considered the following matters in connection with their approval of the Continued Agreements:
The nature, extent and quality of the services provided to the relevant Portfolios under the Continued Agreements. The Directors considered the nature, extent and quality of the services provided by MetLife Advisers, the relevant subadvisers (if any) and their affiliates (each, an “Adviser,” and, collectively, the “Advisers”) to the relevant Portfolios pursuant to the Continued Agreements and the resources dedicated to these Portfolios by the Advisers. In particular, the Directors considered the Advisers’ abilities to attract and retain highly qualified investment professionals. With respect to MetLife Advisers, the Directors considered that MetLife Advisers is (i) ultimately responsible for the performance of such Portfolios; (ii) ultimately responsible for the establishment of the investment strategies of each such Portfolio, primarily through its recommendations to the Board regarding the hiring and selection of subadvisers; (iii) responsible for the hiring and selection, subject to Board approval, of subadvisers; and (iv) responsible for maintaining a program of Subadviser oversight reasonably designed to ensure that the subadvisers have reasonable compliance policies and procedures in place. The Directors also considered that MetLife Advisers provides a full range of day-to-day administrative services for the Portfolios involving all aspects of such Portfolios’ day-to-day operations (other than portfolio management). After reviewing these and related factors, the Directors concluded, within the context of their overall conclusions regarding each of the Continued Agreements, that the nature, extent and quality of services provided supported the renewal of these Agreements.
Investment performance of the relevant Portfolios. The Directors reviewed information about the performance of the relevant Portfolios over various time periods, including information prepared by an independent third party that compared the performance of
MSF-23
Metropolitan Series Fund, Inc.
T. Rowe Price Small Cap Growth Portfolio
Board Approval of Advisory and Subadvisory Agreements—(Continued)
the Portfolios to the performance of peer groups of funds and performance benchmarks. The Directors also reviewed a description of the third party’s methodology for identifying a Portfolio’s peer group(s) for purposes of performance and expense comparisons.
In the case of each relevant Portfolio that had performance that lagged its peer group(s) for certain periods, the Directors concluded that other factors relevant to performance were sufficient, in light of other considerations, to warrant renewal of the Continued Agreements relating to such Portfolio. These factors varied from Portfolio to Portfolio, but included one or more of the following: (i) that such Portfolio’s performance, although lagging in certain recent periods, was stronger over the longer term; (ii) that the underperformance was attributable, to a significant extent, to investment decisions that were reasonable and consistent with the Portfolio’s investment objective(s) and policies and that the Portfolio was performing within the range of reasonable expectations, given market conditions and the Portfolio’s investment objective(s) and policies; (iii) that the Portfolio’s performance was competitive when compared to other relevant performance benchmarks or peer groups; and (iv) that MetLife Advisers and/or the relevant subadviser (if any) had taken or was taking steps designed to help improve the Portfolio’s investment performance.
The Directors also considered the investment performance of the Advisers and their reputations generally, the historical responsiveness of the Advisers to Director concerns about performance and the willingness of the Advisers to take steps intended to improve performance.
After reviewing these and related factors, the Directors concluded, within the context of their overall conclusions regarding each of the Continued Agreements, that the investment performance of each relevant Portfolio and Adviser was sufficient, in light of other considerations, to warrant the renewal of the Continued Agreements.
The costs of the services to be provided and profits to be realized by the Advisers and their affiliates from their relationships with the Portfolios. The Directors considered the fees charged by MetLife Advisers to the Portfolios for advisory services and, with respect to the subadvised Portfolios, by such subadvisers to MetLife Advisers for subadvisory services (such advisory and subadvisory fees (if any), collectively, “Fees”), as well as the total expense levels of the Portfolios. This information included comparisons (provided by an independent third party) of the Portfolios’ advisory fees and total expense levels to those of their peer groups. In evaluating Fees for the relevant Portfolios, the Directors also took into account the demands, complexity and quality of the investment management services provided to each Portfolio. The Directors considered MetLife Advisers’ recommendations regarding reductions in Fee rates, implementation of Fee breakpoints and institution of Fee waivers and expense caps.
The Directors also considered the compensation directly or indirectly received by the Advisers and their affiliates from their relationships with the relevant Portfolios. The Directors reviewed information relating to the profits received by MetLife Advisers, certain of the subadvisers and their affiliates as a result of their relationships with the relevant Portfolios, and information about the allocation of expenses used to calculate profitability. When reviewing profitability, the Directors also considered the performance of the relevant Portfolios, the expense levels of such Portfolios and whether the relevant Advisers had implemented breakpoints, fee waivers and/or expense caps with respect to such Portfolios.
After reviewing these and related factors, the Directors concluded, within the context of their overall conclusions regarding each of the Continued Agreements, that the Fees charged to each of the relevant Portfolios were fair and reasonable, and that the information provided regarding costs of these services generally, and the related profitability (if known) to the relevant Advisers of their relationships with the relevant Portfolios, supported the renewal of the Continued Agreements.
Economies of Scale. The Directors considered the existence of any economies of scale in the provision of services by the Advisers and whether those economies were shared with the relevant Portfolios through breakpoints in their advisory fees or other means, such as expense caps, fee waivers or relatively low levels of fees. The Directors noted that most of the relevant Portfolios benefited or will benefit from breakpoints, expense caps and/or fee waivers with respect to their advisory fees. In considering these issues, the Directors also took into consideration information relating to the costs of the services provided and the profitability to MetLife Advisers, the relevant subadvisers (if any) and each of their affiliates of their relationships with the relevant Portfolios, as discussed above.
After reviewing these and related factors, the Directors concluded, within the context of their overall conclusions regarding each of the Continued Agreements, that the extent to which economies of scale were shared with the relevant Portfolios supported the renewal of such Agreements.
Other Factors. The Directors also considered other factors, which included but were not limited to the following:
| | • | | the extent to which each relevant Portfolio operated in accordance with its investment objective, and its record of compliance with its investment restrictions and the compliance programs of the Fund and the Advisers. They also considered the compliance-related resources the Advisers and their affiliates provide to the relevant Portfolios; |
MSF-24
Metropolitan Series Fund, Inc.
T. Rowe Price Small Cap Growth Portfolio
Board Approval of Advisory and Subadvisory Agreements—(Continued)
| | • | | the nature, quality, cost and extent of administrative and shareholder services performed by MetLife Advisers and its affiliates under the Advisory Agreements; and |
| | • | | so-called “fall-out benefits” to the Advisers, such as the engagement of their affiliates to provide distribution, brokerage and transfer agency services to the Portfolios, and the benefits of research made available to the relevant Advisers by reason of brokerage commissions generated by the relevant Portfolios’ securities transactions. The Directors also considered the possible conflicts of interest associated with these fall-out and other benefits, and the reporting and other processes in place to disclose and monitor these possible conflicts of interest. |
Based on their evaluation of all factors that they deemed to be material, including those factors described above, and assisted by the advice of independent counsel, the Directors, including the Independent Directors, concluded that each of the Continued Agreements should be continued through December 31, 2008.
MSF-25
A description of the policies and procedures that the Fund uses to determine how to vote proxies relating to portfolio securities is available (i) without charge, upon request, by calling (800) 638-7732 and (ii) on the Securities and Exchange Commission’s (the “SEC”) website at http://www.sec.gov.
Information regarding how the Fund voted proxies relating to portfolio securities during the most recent twelve-month period ended December 31, 2007 is available (i) without charge, upon request, by calling (800) 638-7732 and (ii) on the SEC’s website at http://www.sec.gov.
The Fund files with the SEC a complete schedule of its portfolio holdings, as of the close of the first and third quarters of its fiscal year, on “Form N-Q”. These filings are available on the SEC’s website at www.sec.gov and may be reviewed and copied at the SEC’s Public Reference Room in Washington, DC. (Call 1-800-SEC-0330 for information on the operation of the Public Reference Room.)
MSF-26
| | |
Metropolitan Series Fund, Inc. Western Asset Management Strategic Bond Opportunities Portfolio Annual Report | | December 31, 2007 |
Letter from the President
February 1, 2008
Letter to Policy Holders:
2007 was a tumultuous year in the financial markets driven by concerns in the credit markets surrounding sub-prime mortgages and fears of recession in the U.S. Economy. The broad markets were mixed, with the Dow Jones Industrial Average up 8.9% and the MSCI EAFE Index, which measures the performance of international equities, up 11.2% for the year, while the Russell 2000 Index, which measures the performance of small capitalization stocks, was down 1.6%.
In the fixed income markets, credit spreads increased as a result of the pressure from sub-prime mortgage crisis and the Federal Reserve lowered interest rates by a total of 1% during the year. The Lehman Brothers Aggregate Bond Index posted a 7.0% return for the year.
On the following pages, you will find a complete review of your Portfolio and its investment performance.
MetLife is committed to building your financial freedom. We appreciate your trust and will continue to focus our efforts on meeting your investment needs.
Sincerely,
Elizabeth Forget
President, Metropolitan Series Fund, Inc.
Metropolitan Series Fund, Inc.
Western Asset Management Strategic Bond Opportunities Portfolio
Managed by Western Asset Management Company
Portfolio Manager Commentary*
PORTFOLIO PERFORMANCE
For the year ended December 31, 2007, the Class A shares of the Western Asset Management Strategic Bond Opportunities Portfolio returned 4.0%, compared to its benchmark, the Lehman Brothers Aggregate Bond Index1, which returned 7.0%. The average return of its peer group, the Lipper Variable Insurance Products General Bond Funds Universe2, was 5.5% over the same period.
PORTFOLIO REVIEW
The last six months of 2007 largely defined the year as a whole: crisis in the fixed-income markets. The TED spread, a measure of systemic risk, rose four-fold. Since June 30, the yield on the two-year Treasury declined 181 basis points (1.81%), driving a powerful rally in the Treasury market. Investors began to suspect that the Federal Reserve had reached the end of its tightening cycle and would need to begin easing (lowering) interest rates. These expectations were subsequently validated by the Fed’s decision to cut the funds rate by a total of 100 basis points, or 1.00%, at the final three FOMC meetings of the year. Short-term interest rates fell especially sharply—partly a result of the flight to quality—though long-term rates declined as well. Core inflation measures were tame, but the Fed showed signs of hesitation in the use of monetary stimulus as headline measures of prices such as the Consumer Price Index (CPI) remained uncomfortably high. Home prices declined and housing market indicators deteriorated markedly as the year progressed. Despite the ongoing weakness in residential construction and the collapse of the subprime lending market, economic growth picked up in the second and third quarters, thanks largely to a boom in nonresidential construction and net exports. Credit spreads widened significantly with most of the losses coming in the second half of the year. Rising uncertainty over the degree of subprime losses forced swap spreads sharply higher, negatively affecting mortgage-backed securities. Treasury Inflation Protected Securities, or TIPS, outperformed their nominal counterparts on strong CPI accretion and a decline in real yields.
In 2007, the Portfolio trailed its benchmark, the Lehman Brothers Aggregate Bond Index. Overweight exposure to the mortgage-backed sector detracted significantly from relative returns as spreads widened and volatility surged. An emphasis on lower quality credits was also a large negative factor as spreads spiked higher in the wake of the subprime lending crisis. A modest exposure to U.S. dollar-denominated emerging market debt subtracted from returns as spreads widened. Non-U.S. dollar bond markets exposure generally underperformed relative to their domestic counterparts. On the positive side, a tactically driven duration posture contributed modestly to returns as bond yields oscillated in a relatively flat trend during the period. A curve-steepening strategy had a positive impact on performance as the spread between the two- and ten-year yields widened in the latter part of the period.
* The views expressed above are those of the subadvisory firm as of December 31, 2007 and are subject to change based on market and other conditions. Information about the Portfolio’s holdings, asset allocation, industry allocation, or country diversification is historical and is not an indication of future Portfolio composition, which will vary. The performance of any index mentioned in this commentary has not been adjusted for ongoing management, distribution and operating expenses, and sales charges applicable to mutual fund investments. Direct investment in the Index is not possible.
1 Lehman Brothers® Aggregate Bond Index includes most obligations of the U.S. Treasury, agencies and quasi-federal corporations, most publicly issued investment grade corporate bonds and most bonds backed by mortgage pools of GNMA, FNMA and FHLMC.
2 The Lipper Variable Insurance Products Fund Average is an average of the total return performance (calculated on the basis of net asset value) of variable product funds with similar investment objectives to those of the subject Portfolio as calculated by Lipper Analytical Services, an independent mutual fund ranking service.
MSF-2
Metropolitan Series Fund, Inc.
Western Asset Management Strategic Bond Opportunities Portfolio
A $10,000 INVESTMENT COMPARED TO
THE LEHMAN BROTHERS AGGREGATE BOND INDEX
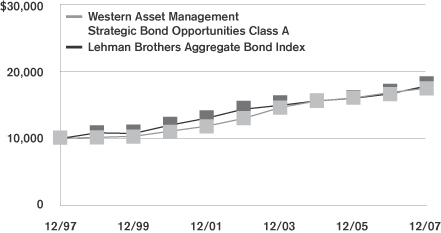
Average Annual Returns as of December 31, 2007
| | | | | | | | | | | | |
| | | Western Asset Management
Strategic Bond
Opportunities Portfolio | | | Lehman Brothers
Aggregate
Bond Index | |
| | | Class A | | | Class B | | | Class E | | |
| 1 Year | | 4.0 | % | | 3.7 | % | | 3.9 | % | | 7.0 | % |
| 5 Year | | 6.2 | | | 5.9 | | | 6.0 | | | 4.4 | |
| 10 Year | | 5.8 | | | — | | | — | | | 6.0 | |
| Since Inception | | — | | | 7.2 | | | 6.5 | | | — | |
Performance numbers are net of all Portfolio expenses but do not include any insurance, sales, or administrative charges of variable annuity or life insurance contracts. If these charges were included, the returns would be lower.
Inception dates of the Class A, Class B and Class E shares are: 10/31/94, 7/30/02 and 5/1/01, respectively.
This information represents past performance and is not indicative of future results. Investment return and principal value may fluctuate so that shares, upon redemption, may be worth more or less than the original cost.
PORTFOLIO COMPOSITION
as of December 31, 2007
Top Holdings
| | |
| | | % of Total
Net Assets |
Federal National Mortgage Association | | 20.8% |
U.S. Treasury Notes | | 6.9% |
Federal Home Loan Bank | | 6.4% |
Government National Mortgage Association | | 6.2% |
Federal Home Loan Mortgage Corp. | | 4.7% |
WaMu Mortgage Pass-Through Certificates | | 2.5% |
Prime Mortgage Trust | | 1.7% |
Harborview Mortgage Loan Trust | | 1.6% |
Bear Stearns Asset Backed Securities Trust | | 1.5% |
U.S. Treasury Inflation Indexed Bonds | | 1.1% |
Top Sectors
| | |
| | | % of Total
Market Value |
Residential Mortgage-Backed | | 45.9% |
Short Term Investments | | 16.7% |
Investment Grade | | 16.0% |
Government | | 8.2% |
High Yield | | 7.8% |
Commercial Mortgage-Backed | | 2.9% |
Index-Linked | | 2.4% |
Asset Backed | | 0.1% |
MSF-3
Metropolitan Series Fund, Inc.
Shareholder Expense Example
As a shareholder of the Portfolio, you incur ongoing costs, including management fees; distribution and service (12b-1) fees; and other Portfolio expenses. This example is intended to help you understand your ongoing costs (in dollars) (referred to as “expenses”) of investing in the Portfolio and compare these costs with the ongoing costs of investing in other mutual funds. The example is based on an investment of $1,000 invested at the beginning of the period and held for the entire period, July 1, 2007 through December 31, 2007.
Actual Expenses
The first line for each share class of the Portfolio in the table below provides information about actual account values and actual expenses. You may use the information in this line, together with the amount you invested in the particular share class of the Portfolio, to estimate the expenses that you paid over the period. Simply divide your account value by $1,000 (for example, an $8,600 account value divided by $1,000=8.6), then multiply the result by the number in the first line under the heading entitled “Expenses Paid During Period” to estimate the expenses you paid on your account during this period.
Hypothetical Example for Comparison Purposes
The second line for each share class of the Portfolio in the table below provides information about hypothetical account values and hypothetical expenses based on the Portfolio’s actual expense ratio and an assumed rate of return of 5% per year before expenses, which is not the Portfolio’s actual return. The hypothetical account values and expenses may not be used to estimate the actual ending account balance or expenses you paid for the period. You may use this information to compare the ongoing costs of investing in the Portfolio and other funds. To do so, compare this 5% hypothetical example with the 5% hypothetical examples that appear in the shareholder reports of the other funds.
Please note that the expenses shown in the table are meant to highlight your ongoing costs only and do not reflect any fees or charges of your variable insurance product or any additional expenses that participants in certain eligible qualified plans may bear relating to the operations of their plan. Therefore, the second line for each share class in the table is useful in comparing ongoing costs only, and will not help you determine the relative total costs of owning different funds. In addition, if these other costs were included, your costs would have been higher.
| | | | | | | | | | | | | | |
Portfolio | | | | Annualized
Expense
Ratio | | | Beginning
Account Value
July 1,
2007 | | Ending
Account Value
December 31,
2007 | | Expenses Paid
During Period*
July 1, 2007
to
December 31,
2007 |
Western Asset Mgt. Strategic Bond Opportunities—Class A | | Actual | | 0.66 | % | | $ | 1,000.00 | | $ | 1,036.70 | | $ | 3.39 |
| | Hypothetical | | 0.66 | % | | $ | 1,000.00 | | $ | 1,021.84 | | $ | 3.36 |
| | | | | |
Western Asset Mgt. Strategic Bond Opportunities—Class B | | Actual | | 0.91 | % | | $ | 1,000.00 | | $ | 1,035.20 | | $ | 4.67 |
| | Hypothetical | | 0.91 | % | | $ | 1,000.00 | | $ | 1,020.56 | | $ | 4.63 |
| | | | | |
Western Asset Mgt. Strategic Bond Opportunities—Class E | | Actual | | 0.81 | % | | $ | 1,000.00 | | $ | 1,035.90 | | $ | 4.16 |
| | Hypothetical | | 0.81 | % | | $ | 1,000.00 | | $ | 1,021.08 | | $ | 4.13 |
* Expenses paid are equal to the Portfolio’s annualized expense ratio for the most recent six month period, as shown above, multiplied by the average account value over the period, multiplied by the number of days in the most recent fiscal half-year, divided by 365 (to reflect the one-half year period).
MSF-4
Metropolitan Series Fund, Inc.
Western Asset Management Strategic Bond Opportunities Portfolio
Schedule of Investments as of December 31, 2007
Fixed Income—97.3% of Total Net Assets
| | | | | | |
| Security Description | | Face
Amount | | Value* |
| | | | | | |
|
Aerospace & Defense—0.1% |
DRS Technologies, Inc.
6.875%, 11/01/13 | | $ | 375,000 | | $ | 373,125 |
L-3 Communications Corp.
6.375%, 10/15/15 | | | 250,000 | | | 246,250 |
7.625%, 06/15/12 | | | 400,000 | | | 409,500 |
| | | | | | |
| | | | | | 1,028,875 |
| | | | | | |
|
Airlines—0.3% |
Continental Airlines, Inc.
6.541%, 09/15/08 | | | 11,456 | | | 11,370 |
Delta Air Lines, Inc. (144A)
6.821%, 08/10/22 | | | 1,000,000 | | | 990,000 |
Northwest Airlines, Inc.
5.699%, 05/20/14 (a) | | | 2,142,705 | | | 2,103,536 |
| | | | | | |
| | | | | | 3,104,906 |
| | | | | | |
|
Asset Backed—7.2% |
ACE Securities Corp.
4.995%, 02/25/31 (a) | | | 3,101,222 | | | 2,981,785 |
Amortizing Residential Collateral Trust
6.065%, 08/25/32 (a) | | | 119,242 | | | 21,791 |
Argent Securities, Inc.
4.925%, 05/25/36 (a) | | | 444,683 | | | 443,514 |
Asset Backed Securities Corp.
7.878%, 04/15/33 (a) | | | 65,574 | | | 61,343 |
Bear Stearns Asset Backed Securities Trust
5.235%, 01/25/34 (a) | | | 101,022 | | | 96,835 |
6.000%, 10/25/36 | | | 6,188,723 | | | 5,918,276 |
6.115%, 08/25/37 (a) | | | 4,166,170 | | | 4,065,182 |
6.500%, 10/25/36 | | | 6,171,598 | | | 6,208,627 |
Countrywide Asset Backed Certificates
6.068%, 06/25/34 (a) | | | 610,989 | | | 495,139 |
Countrywide Home Equity Loan Trust
5.168%, 12/25/31 (a) | | | 3,388,533 | | | 3,216,750 |
Ellington Loan Acquisition Trust (144A)
5.865%, 05/25/37 (a) | | | 4,259,451 | | | 4,131,156 |
6.115%, 05/25/37 (a) | | | 4,400,000 | | | 3,959,516 |
First Franklin Mortgage Loan Asset Backed Cettificates
5.265%, 12/25/32 (a) | | | 18,702 | | | 18,680 |
GMAC Mortgage Corp. Loan Trust
5.075%, 11/25/36 (a) | | | 10,955,837 | | | 9,602,011 |
Green Tree Financial Corp.
7.070%, 01/15/29 | | | 409,783 | | | 429,526 |
GSAMP Trust
4.955%, 07/05/36 (a) | | | 1,669,605 | | | 1,345,052 |
GSAMP Trust (144A)
4.975%, 05/25/36 (a) | | | 3,543,475 | | | 2,984,917 |
GSRPM Mortgage Loan Trust (144A)
5.165%, 03/25/35 (a) | | | 2,617,075 | | | 2,335,661 |
Indymac Seconds Asset Backed Trust
4.995%, 06/25/36 (a) | | | 3,176,827 | | | 1,667,547 |
Lehman XS Trust
4.909%, 06/25/37 (a) | | | 2,643,616 | | | 2,634,230 |
4.995%, 06/25/37 (a) | | | 7,055,719 | | | 7,015,606 |
| | | | | | |
| Security Description | | Face
Amount | | Value* |
| | | | | | |
| | |
Asset Backed—(Continued) | | | | | | |
Long Beach Mortgage Loan Trust
5.005%, 11/25/35 (a) | | $ | 1,655,233 | | $ | 1,645,132 |
5.452%, 01/21/31 (a) | | | 56,947 | | | 54,134 |
Merrill Lynch Mortgage Investors NIM Trust (144A)
5.000%, 09/25/35 | | | 6,965 | | | 6,776 |
Mid-State Trust
7.340%, 07/01/35 | | | 554,464 | | | 593,186 |
Morgan Stanley IXIS Real Estate Capital Trust
4.895%, 07/25/36 (a) | | | 1,632,001 | | | 1,616,644 |
RAAC Series (144A)
5.115%, 08/25/35 (a) | | | 3,053,927 | | | 2,799,565 |
SACO I Trust
4.995%, 06/25/36 (a) | | | 2,942,829 | | | 1,213,635 |
Sail Net Interest Margin Notes (144A)
5.500%, 03/27/34 | | | 35,690 | | | 2,363 |
7.750%, 04/27/33 | | | 783 | | | 56 |
SLM Student Loan Trust
5.074%, 07/25/17 (a) | | | 3,634,301 | | | 3,633,469 |
5.084%, 04/25/18 (a) | | | 480,281 | | | 480,286 |
Structured Asset Securities Corp. (144A)
4.975%, 02/25/36 (a) | | | 3,273,995 | | | 1,168,317 |
Varick Structured Asset Fund, Ltd. (144A)
6.291%, 11/01/35 (b) (c) (d) | | | 1,202,498 | | | 0 |
Washington Mutual Master Note Trust (144A)
5.058%, 09/16/13 (a) | | | 4,150,000 | | | 4,102,721 |
| | | | | | |
| | | | | | 76,949,428 |
| | | | | | |
|
Auto Components—0.0% |
Visteon Corp.
8.250%, 08/01/10 (e) | | | 280,000 | | | 247,800 |
| | | | | | |
|
Automobiles—0.4% |
DaimlerChrysler North America Holdings Corp.
4.050%, 06/04/08 | | | 2,053,000 | | | 2,045,096 |
Ford Motor Co.
6.625%, 10/01/28 | | | 135,000 | | | 89,775 |
7.450%, 07/16/31 (e) | | | 2,045,000 | | | 1,518,412 |
8.900%, 01/15/32 | | | 105,000 | | | 81,375 |
General Motors Corp.
8.250%, 07/15/23 (e) | | | 685,000 | | | 544,575 |
8.375%, 07/15/33 (e) | | | 35,000 | | | 28,175 |
| | | | | | |
| | | | | | 4,307,408 |
| | | | | | |
|
Building Products—0.0% |
Norcraft Holdings, L.P.
0/9.750%, 09/01/12 (f) | | | 225,000 | | | 202,500 |
| | | | | | |
|
Capital Markets—1.4% |
JPMorgan Chase & Co.
5.125%, 09/15/14 | | | 2,740,000 | | | 2,685,690 |
5.150%, 10/01/15 | | | 1,430,000 | | | 1,379,224 |
6.625%, 03/15/12 | | | 70,000 | | | 73,813 |
*See accompanying notes to financial statements.
MSF-5
Metropolitan Series Fund, Inc.
Western Asset Management Strategic Bond Opportunities Portfolio
Schedule of Investments as of December 31, 2007
Fixed Income—(Continued)
| | | | | | |
| Security Description | | Face
Amount | | Value* |
| | | | | | |
| | |
Capital Markets—(Continued) | | | | | | |
Lehman Brothers Holdings Capital Trust V
5.857%, 11/29/49 (a) | | $ | 3,780,000 | | $ | 3,368,925 |
Lehman Brothers Holdings, Inc.
4.500%, 07/26/10 | | | 3,050,000 | | | 3,015,834 |
Morgan Stanley
3.625%, 04/01/08 | | | 365,000 | | | 363,455 |
5.625%, 01/09/12 | | | 1,290,000 | | | 1,312,249 |
5.659%, 10/18/16 (a) | | | 490,000 | | | 457,168 |
The Bear Stearns Cos., Inc.
5.550%, 01/22/17 (e) | | | 1,130,000 | | | 1,012,721 |
The Goldman Sachs Group, L.P.
4.500%, 06/15/10 | | | 1,110,000 | | | 1,106,349 |
| | | | | | |
| | | | | | 14,775,428 |
| | | | | | |
|
Chemicals—0.0% |
Georgia Gulf Corp.
9.500%, 10/15/14 (e) | | | 100,000 | | | 79,750 |
Key Plastics, LLC (144A)
10.250%, 03/15/17 | | | 250,000 | | | 250 |
| | | | | | |
| | | | | | 80,000 |
| | | | | | |
|
Commercial Banks—2.3% |
BAC Capital Trust XIV
5.630%, 12/31/49 (a) | | | 2,520,000 | | | 2,236,273 |
Bank of America Corp.
5.420%, 03/15/17 | | | 1,700,000 | | | 1,642,710 |
Capital One Bank
5.750%, 09/15/10 | | | 50,000 | | | 50,012 |
Glitnir Banki Hf (144A)
6.330%, 07/28/11 | | | 720,000 | | | 703,876 |
6.693%, 06/15/16 (a) | | | 1,400,000 | | | 1,410,339 |
HSBC Finance Corp.
4.625%, 01/15/08 | | | 2,700,000 | | | 2,699,560 |
ICICI Bank, Ltd.
6.375%, 04/30/22 (a) | | | 939,000 | | | 839,812 |
ICICI Bank, Ltd. (144A)
6.375%, 04/30/22 (a) | | | 844,000 | | | 764,003 |
Kaupthing Bank Hf (144A)
5.750%, 10/04/11 | | | 350,000 | | | 329,175 |
5.938%, 04/12/11 (a) | | | 2,040,000 | | | 1,989,973 |
7.125%, 05/19/16 | | | 450,000 | | | 412,539 |
Landsbanki Islands Hf (144A)
6.100%, 08/25/11 | | | 2,000,000 | | | 1,971,118 |
Royal Bank of Scotland Group, Plc.
7.640%, 03/31/49 (a) | | | 500,000 | | | 514,047 |
Royal Bank of Scotland Group, Plc. (144A)
6.990%, 10/29/49 (a) | | | 790,000 | | | 787,624 |
Santander Issuances S.A. Unipersonal (144A)
5.805%, 06/20/16 (a) | | | 1,180,000 | | | 1,204,225 |
Shinsei Finance Cayman, Ltd. (144A)
6.418%, 01/29/49 (a) | | | 1,100,000 | | | 933,915 |
TuranAlem Finance BV
8.250%, 01/22/37 | | | 1,620,000 | | | 1,381,050 |
TuranAlem Finance BV (144A)
8.250%, 01/22/37 | | | 1,870,000 | | | 1,598,850 |
| | | | | | |
| Security Description | | Face
Amount | | Value* |
| | | | | | |
| | |
Commercial Banks—(Continued) | | | | | | |
Wachovia Corp.
5.250%, 08/01/14 | | $ | 3,110,000 | | $ | 3,040,759 |
| | | | | | |
| | | | | | 24,509,860 |
| | | | | | |
|
Commercial Mortgage-Backed Securities—18.8% |
American Home Mortgage Investment Trust
5.294%, 06/25/45 | | | 4,082,105 | | | 4,072,667 |
Banc of America Funding Corp.
5.119%, 05/20/36 (a) | | | 1,840,140 | | | 1,763,800 |
Banc of America Mortgage Securities, Inc.
4.802%, 09/25/35 (a) | | | 4,838,476 | | | 4,801,872 |
Bear Stearns Structured Products, Inc. (144A)
6.021%, 09/25/37 (a) | | | 8,959,132 | | | 8,778,874 |
Bear Sterns Adjustable Rate Mortgage Trust
4.650%, 10/25/35 (a) | | | 2,700,000 | | | 2,670,690 |
Citigroup Mortgage Loan Trust, Inc.
5.671%, 12/25/35 (a) | | | 6,742,704 | | | 6,755,015 |
Commercial Mortgage Asset Trust
7.350%, 01/17/32 | | | 475,000 | | | 531,060 |
Commercial Mortgage Pass-Through Certificates (144A)
5.447%, 07/16/34 | | | 640,440 | | | 651,502 |
Countrywide Alternative Loan Trust
5.065%, 05/25/36 (a) | | | 2,980,683 | | | 2,823,170 |
5.118%, 11/20/35 (a) | | | 5,220,068 | | | 4,881,105 |
5.149%, 07/25/36 (a) | | | 4,055,641 | | | 3,666,617 |
Credit Suisse Mortgage Capital Certificates
5.555%, 02/15/39 (a) | | | 3,270,000 | | | 3,319,561 |
Crusade Global Trust
5.156%, 09/18/34 (a) | | | 613,497 | | | 612,379 |
EMC Mortgage Loan Trust (144A)
5.770%, 05/25/43 | | | 3,490,370 | | | 3,001,858 |
6.020%, 01/25/41 | | | 700,000 | | | 589,225 |
First Union National Bank Commercial Mortgage
0.530%, 05/17/32 (a) (g) | | | 10,912,908 | | | 193,018 |
Greenpoint Mortgage Funding Trust
4.945%, 03/25/37 (a) | | | 6,449,627 | | | 6,237,870 |
GSMPS Mortgage Loan Trust (144A)
5.246%, 01/25/35 (a) | | | 1,766,585 | | | 1,744,738 |
GSR Mortgage Loan Trust
4.986%, 10/25/35 (a) | | | 1,233,100 | | | 1,241,058 |
5.180%, 01/25/36 (a) | | | 4,118,424 | | | 4,102,555 |
Harborview Mortgage Loan Trust
5.185%, 06/25/37 (a) | | | 7,792,199 | | | 7,347,721 |
5.215%, 01/19/36 (a) | | | 2,601,632 | | | 2,483,322 |
5.873%, 08/19/37 (a) | | | 7,777,851 | | | 7,685,606 |
Impac Secured Assets CMN Owner Trust
5.185%, 03/25/36 (a) | | | 3,214,450 | | | 3,063,593 |
Indymac INDA Mortgage Loan Trust
6.287%, 11/25/37 (a) | | | 4,437,764 | | | 4,466,520 |
Indymac Index Mortgage Loan Trust
5.225%, 01/25/35 (a) | | | 2,236,181 | | | 2,090,028 |
5.339%, 03/25/35 (a) | | | 2,056,377 | | | 2,039,207 |
*See accompanying notes to financial statements.
MSF-6
Metropolitan Series Fund, Inc.
Western Asset Management Strategic Bond Opportunities Portfolio
Schedule of Investments as of December 31, 2007
Fixed Income—(Continued)
| | | | | | |
| Security Description | | Face
Amount | | Value* |
| | | | | | |
|
Commercial Mortgage-Backed Securities—(Continued) |
JPMorgan Chase Commercial Mortgage
Securities Corp.
5.814%, 06/12/43 | | $ | 4,960,000 | | $ | 5,127,621 |
LB-UBS Commercial Mortgage Trust
5.430%, 02/15/40 | | | 7,970,000 | | | 8,005,122 |
Luminent Mortgage Trust
5.055%, 05/25/46 (a) | | | 3,553,784 | | | 3,344,277 |
Mastr Seasoned Securities Trust
6.755%, 10/25/32 (a) | | | 971,552 | | | 970,551 |
Merit Securities Corp. (144A)
6.355%, 09/28/32 (a) | | | 887,867 | | | 818,535 |
Merrill Lynch Mortgage Investors, Inc.
5.028%, 05/25/34 (a) | | | 1,274,053 | | | 1,243,280 |
Merrill Lynch Mortgage Trust
5.659%, 05/12/39 (a) | | | 1,890,000 | | | 1,945,978 |
Merrill Lynch/Countrywide Commercial Mortgage Trust
5.485%, 03/12/51 (a) | | | 2,070,000 | | | 2,083,236 |
5.750%, 06/12/50 (a) | | | 6,940,000 | | | 7,129,801 |
Morgan Stanley Capital I
5.692%, 04/15/49 | | | 2,240,000 | | | 2,283,187 |
Morgan Stanley Mortgage Loan Trust
5.015%, 03/25/36 (a) | | | 2,183,815 | | | 1,736,732 |
5.467%, 06/26/36 (a) | | | 3,969,563 | | | 3,917,125 |
Novastar Mortgage-Backed Notes
5.055%, 06/25/36 (a) | | | 3,327,462 | | | 3,167,057 |
Prime Mortgage Trust (144A)
6.000%, 05/25/35 | | | 1,474,632 | | | 1,479,956 |
6.000%, 11/25/36 | | | 5,710,874 | | | 5,698,367 |
Prime Mortgage Trust (Class 1) (144A)
5.500%, 05/25/35 | | | 3,344,823 | | | 3,283,679 |
Prime Mortgage Trust (Class 2) (144A)
5.500%, 05/25/35 | | | 7,980,645 | | | 7,920,790 |
Structured Adjustable Rate Mortgage Loan Trust
5.198%, 01/25/35 (a) | | | 2,115,756 | | | 2,125,222 |
Structured Asset Mortgage Investments, Inc.
7.568%, 08/25/35 (a) | | | 403,661 | | | 406,402 |
Thornburg Mortgage Securities Trust
5.065%, 12/25/35 (a) | | | 7,068,277 | | | 7,053,883 |
5.095%, 12/25/35 (a) | | | 2,180,872 | | | 2,175,635 |
WaMu Mortgage Pass-Through Certificates
5.135%, 12/25/45 (a) | | | 5,305,264 | | | 5,001,678 |
5.145%, 11/25/45 (a) | | | 3,719,056 | | | 3,488,454 |
5.155%, 07/25/45 (a) | | | 75,610 | | | 71,572 |
5.155%, 10/25/45 (a) | | | 2,175,435 | | | 2,044,060 |
5.358%, 08/25/36 | | | 7,321,087 | | | 7,287,337 |
5.503%, 04/25/37 (a) | | | 3,009,957 | | | 3,029,025 |
5.670%, 03/25/37 (a) | | | 3,489,508 | | | 3,504,341 |
5.943%, 09/25/36 (a) | | | 1,945,018 | | | 1,965,342 |
Wells Fargo Mortgage Backed Securities Trust
4.527%, 06/25/35 (a) | | | 627,136 | | | 620,925 |
4.540%, 02/25/35 (a) | | | 5,715,017 | | | 5,674,899 |
5.241%, 05/25/36 (a) | | | 1,461,230 | | | 1,457,933 |
| | | | | | |
| Security Description | | Face
Amount | | Value* |
| | | | | | |
|
Commercial Mortgage-Backed Securities—(Continued) |
Zuni Mortgage Loan Trust
4.995%, 06/25/36 (a) | | $ | 2,640,654 | | $ | 2,524,942 |
| | | | | | |
| | | | | | 200,201,575 |
| | | | | | |
|
Commercial Services & Supplies—0.3% |
Allied Waste North America, Inc.
6.375%, 04/15/11 | | | 100,000 | | | 99,000 |
7.250%, 03/15/15 | | | 275,000 | | | 273,625 |
7.875%, 04/15/13 | | | 75,000 | | | 76,687 |
Corrections Corp. of America
6.250%, 03/15/13 | | | 150,000 | | | 147,750 |
6.750%, 01/31/14 | | | 275,000 | | | 276,031 |
Hertz Corp.
8.875%, 01/01/14 | | | 205,000 | | | 207,819 |
10.500%, 01/01/16 (e) | | | 115,000 | | | 119,025 |
Interface, Inc.
10.375%, 02/01/10 | | | 150,000 | | | 157,125 |
Safety-Kleen Services, Inc.
9.250%, 06/01/08 (c) | | | 250,000 | | | 250 |
Service Corp. International
7.500%, 04/01/27 | | | 330,000 | | | 303,600 |
7.625%, 10/01/18 | | | 125,000 | | | 125,625 |
Waste Management, Inc.
6.375%, 11/15/12 | | | 1,290,000 | | | 1,363,942 |
| | | | | | |
| | | | | | 3,150,479 |
| | | | | | |
|
Communications Equipment—0.0% |
Intelsat Corp.
9.000%, 08/15/14 | | | 81,000 | | | 81,405 |
9.000%, 06/15/16 | | | 155,000 | | | 156,163 |
| | | | | | |
| | | | | | 237,568 |
| | | | | | |
|
Consumer Finance—0.8% |
American Express Co.
6.800%, 09/01/66 (a) | | | 3,550,000 | | | 3,599,572 |
SLM Corp.
5.000%, 10/01/13 | | | 1,565,000 | | | 1,371,735 |
5.000%, 04/15/15 | | | 60,000 | | | 51,169 |
5.050%, 11/14/14 | | | 310,000 | | | 267,947 |
5.375%, 05/15/14 | | | 2,955,000 | | | 2,627,211 |
5.625%, 08/01/33 | | | 295,000 | | | 228,016 |
| | | | | | |
| | | | | | 8,145,650 |
| | | | | | |
|
Containers & Packaging—0.1% |
Graham Packaging Co., Inc.
8.500%, 10/15/12 | | | 280,000 | | | 261,800 |
9.875%, 10/15/14 (e) | | | 120,000 | | | 110,400 |
Graphic Packaging International Corp.
9.500%, 08/15/13 | | | 300,000 | | | 296,250 |
Owens-Illinois, Inc.
7.350%, 05/15/08 | | | 275,000 | | | 275,687 |
Plastipak Holdings, Inc. (144A)
8.500%, 12/15/15 | | | 200,000 | | | 200,000 |
*See accompanying notes to financial statements.
MSF-7
Metropolitan Series Fund, Inc.
Western Asset Management Strategic Bond Opportunities Portfolio
Schedule of Investments as of December 31, 2007
Fixed Income—(Continued)
| | | | | | |
| Security Description | | Face
Amount | | Value* |
| | | | | | |
|
Containers & Packaging—(Continued) |
Radnor Holdings Corp.
11.000%, 03/15/10 (c) | | $ | 175,000 | | $ | 1,313 |
| | | | | | |
| | | | | | 1,145,450 |
| | | | | | |
|
Diversified Financial Services—5.4% |
AGFC Capital Trust I (144A)
6.000%, 01/15/67 (a) | | | 815,000 | | | 739,086 |
Aiful Corp. (144A)
5.000%, 08/10/10 | | | 800,000 | | | 785,126 |
Airplane Pass Through Trust
10.875%, 03/15/19 (b) (c) (d) | | | 246,925 | | | 0 |
American General Finance Corp.
6.900%, 12/15/17 | | | 610,000 | | | 610,610 |
Anadarko Finance Co.
7.500%, 05/01/31 | | | 1,500,000 | | | 1,686,475 |
Basell AF SCA (144A)
8.375%, 08/15/15 | | | 230,000 | | | 185,725 |
Chukchansi Economic Development Authority (144A)
8.000%, 11/15/13 | | | 100,000 | | | 97,500 |
Credit Suisse Guernsey, Ltd.
5.860%, 05/29/49 (a) | | | 500,000 | | | 447,599 |
Deutsche Telekom International Finance BV
5.750%, 03/23/16 (e) | | | 820,000 | | | 820,768 |
Devon Financing Corp., U.L.C.
6.875%, 09/30/11 | | | 3,680,000 | | | 3,940,879 |
El Paso Performance-Linked Trust (144A)
7.750%, 07/15/11 | | | 1,940,000 | | | 1,990,886 |
European Investment Bank
3.500%, 03/21/12 (e) | | | 870,000 | | | 890,880 |
FMC Finance III S.A. (144A)
6.875%, 07/15/17 | | | 750,000 | | | 750,000 |
Ford Motor Credit Co.
7.375%, 10/28/09 | | | 5,150,000 | | | 4,847,417 |
7.875%, 06/15/10 | | | 1,975,000 | | | 1,822,267 |
10.241%, 06/15/11 (a) (e) | | | 904,000 | | | 857,025 |
General Electric Capital Corp.
6.375%, 11/15/67 (a) | | | 6,110,000 | | | 6,308,465 |
GMAC, LLC
5.125%, 05/09/08 (e) | | | 260,000 | | | 257,127 |
5.625%, 05/15/09 | | | 1,410,000 | | | 1,330,287 |
5.850%, 01/14/09 | | | 370,000 | | | 353,844 |
6.625%, 05/15/12 | | | 5,090,000 | | | 4,231,407 |
6.750%, 12/01/14 | | | 670,000 | | | 540,388 |
6.875%, 09/15/11 | | | 1,325,000 | | | 1,133,530 |
7.250%, 03/02/11 | | | 40,000 | | | 35,062 |
8.000%, 11/01/31 (e) | | | 1,650,000 | | | 1,384,144 |
Goldman Sachs Capital II
5.793%, 12/29/49 (a) | | | 3,880,000 | | | 3,454,461 |
HSBC Finance Capital Trust IX
5.911%, 11/30/35 (a) | | | 50,000 | | | 46,264 |
ILFC E-Capital Trust II (144A)
6.250%, 12/21/65 (a) | | | 330,000 | | | 315,382 |
| | | | | | |
| Security Description | | Face
Amount | | Value* |
| | | | | | |
|
Diversified Financial Services—(Continued) |
Intergas Finance BV
6.375%, 05/14/17 | | $ | 2,450,000 | | $ | 2,198,875 |
International Lease Finance Corp.
5.875%, 05/01/13 | | | 50,000 | | | 50,828 |
KAC Aquisition Co. (144A)
Zero Coupon, 04/26/26 (d) | | | 3,316 | | | 0 |
Level 3 Financing, Inc.
9.250%, 11/01/14 (e) | | | 295,000 | | | 266,975 |
NXP Funding, LLC
9.500%, 10/15/15 (e) | | | 205,000 | | | 187,831 |
Petrobras International Finance Co.
6.125%, 10/06/16 | | | 1,190,000 | | | 1,213,800 |
Residential Capital, LLC
6.000%, 02/22/11 | | | 5,030,000 | | | 3,131,175 |
6.500%, 06/01/12 | | | 20,000 | | | 12,300 |
7.615%, 05/22/09 (a) | | | 470,000 | | | 333,700 |
7.814%, 04/17/09 (a) | | | 160,000 | | | 113,600 |
RSHB Capital S.A. for OJSC Russian Agricultural Bank (144A)
6.299%, 05/15/17 | | | 570,000 | | | 540,075 |
Sprint Capital Corp.
6.900%, 05/01/19 | | | 30,000 | | | 29,801 |
8.375%, 03/15/12 | | | 1,725,000 | | | 1,868,216 |
8.750%, 03/15/32 | | | 160,000 | | | 180,352 |
SunTrust Capital VIII
6.100%, 12/01/66 (a) | | | 650,000 | | | 540,944 |
Telecom Italia Capital S.A.
5.250%, 10/01/15 | | | 2,100,000 | | | 2,045,923 |
TNK-BP Finance S.A.
7.500%, 07/18/16 | | | 108,000 | | | 106,865 |
7.875%, 03/13/18 | | | 2,440,000 | | | 2,409,500 |
TNK-BP Finance S.A. (144A)
6.625%, 03/20/17 | | | 670,000 | | | 611,375 |
7.500%, 07/18/16 | | | 1,080,000 | | | 1,046,250 |
Wells Fargo Capital X
5.950%, 12/15/36 (e) | | | 930,000 | | | 867,944 |
| | | | | | |
| | | | | | 57,618,933 |
| | | | | | |
|
Diversified Telecommunication Services—0.9% |
America Movil SAB de C.V.
5.625%, 11/15/17 | | | 880,000 | | | 859,844 |
Citizens Communications Co. | | | | | | |
7.125%, 03/15/19 | | | 165,000 | | | 156,750 |
7.875%, 01/15/27 | | | 250,000 | | | 238,125 |
Embarq Corp.
6.738%, 06/01/13 | | | 3,550,000 | | | 3,672,038 |
Qwest Communications International, Inc. (Series B)
7.500%, 02/15/14 | | | 303,000 | | | 302,242 |
Qwest Corp.
8.875%, 03/15/12 | | | 275,000 | | | 294,250 |
Royal KPN NV
8.000%, 10/01/10 | | | 990,000 | | | 1,061,741 |
Verizon Florida, Inc.
6.125%, 01/15/13 | | | 70,000 | | | 72,258 |
*See accompanying notes to financial statements.
MSF-8
Metropolitan Series Fund, Inc.
Western Asset Management Strategic Bond Opportunities Portfolio
Schedule of Investments as of December 31, 2007
Fixed Income—(Continued)
| | | | | | |
| Security Description | | Face
Amount | | Value* |
| | | | | | |
|
Diversified Telecommunication Services—(Continued) |
Verizon New York, Inc.
6.875%, 04/01/12 (e) | | $ | 1,820,000 | | $ | 1,931,033 |
Windstream Corp.
8.625%, 08/01/16 | | | 450,000 | | | 472,500 |
| | | | | | |
| | | | | | 9,060,781 |
| | | | | | |
|
Electric Utilities—1.9% |
Dominion Resources, Inc.
5.700%, 09/17/12 | | | 1,350,000 | | | 1,386,269 |
Edison Mission Energy
7.000%, 05/15/17 | | | 390,000 | | | 383,175 |
7.200%, 05/15/19 | | | 520,000 | | | 510,900 |
7.625%, 05/15/27 | | | 190,000 | | | 178,600 |
Energy Future Holdings Corp.
10.875%, 11/01/17 | | | 1,560,000 | | | 1,567,800 |
11.250%, 11/01/17 | | | 8,730,000 | | | 8,882,775 |
Exelon Corp.
5.625%, 06/15/35 | | | 595,000 | | | 531,358 |
FirstEnergy Corp.
6.450%, 11/15/11 | | | 770,000 | | | 795,114 |
7.375%, 11/15/31 | | | 1,645,000 | | | 1,804,957 |
Williams Cos., Inc.
7.125%, 09/01/11 | | | 50,000 | | | 52,813 |
7.500%, 01/15/31 | | | 925,000 | | | 994,375 |
7.625%, 07/15/19 | | | 125,000 | | | 135,469 |
7.750%, 06/15/31 | | | 1,410,000 | | | 1,543,950 |
7.875%, 09/01/21 | | | 1,091,000 | | | 1,209,646 |
8.750%, 03/15/32 | | | 455,000 | | | 556,237 |
| | | | | | |
| | | | | | 20,533,438 |
| | | | �� | | |
|
Energy Equipment & Services—0.3% |
Compagnie Generale de Geophysique-Veritas
7.500%, 05/15/15 | | | 115,000 | | | 116,437 |
7.750%, 05/15/17 | | | 480,000 | | | 484,800 |
Kinder Morgan Energy Partners, L.P. 6.000%, 02/01/17 | | | 1,410,000 | | | 1,409,920 |
6.300%, 02/01/09 | | | 200,000 | | | 202,587 |
6.750%, 03/15/11 | | | 870,000 | | | 912,677 |
6.950%, 01/15/38 | | | 50,000 | | | 52,475 |
7.125%, 03/15/12 | | | 20,000 | | | 21,379 |
SemGroup, L.P. (144A)
8.750%, 11/15/15 | | | 75,000 | | | 71,250 |
| | | | | | |
| | | | | | 3,271,525 |
| | | | | | |
|
Federal Agencies—37.8% |
Farmer Mac Guaranteed Notes Trust
5.125%, 04/19/17 | | | 3,400,000 | | | 3,493,126 |
Federal Home Loan Bank
5.000%, 12/21/15 (e) | | | 3,660,000 | | | 3,837,137 |
5.000%, 12/01/34 | | | 145,168 | | | 141,799 |
5.500%, 10/01/35 | | | 1,511,618 | | | 1,509,083 |
| | | | | | |
| Security Description | | Face
Amount | | Value* |
| | | | | | |
|
Federal Agencies—(Continued) |
5.500%, 07/15/36 (e) | | $ | 2,690,000 | | $ | 2,945,364 |
5.500%, 07/01/37 | | | 1,987,109 | | | 1,983,007 |
5.500%, 12/01/37 | | | 4,000,000 | | | 3,991,919 |
5.553%, 11/01/37 (a) | | | 11,140,000 | | | 11,221,779 |
6.000%, 10/01/37 | | | 1,405,421 | | | 1,426,409 |
6.000%, 12/01/37 | | | 40,600,000 | | | 41,206,308 |
Federal Home Loan Mortgage Corp.
5.365%, 02/01/36 (a) | | | 2,576,134 | | | 2,596,720 |
5.500%, 12/01/36 | | | 29,759,960 | | | 29,702,269 |
5.814%, 02/01/37 (a) | | | 1,282,384 | | | 1,304,262 |
5.959%, 05/01/37 (a) | | | 3,472,869 | | | 3,521,019 |
6.000%, 09/01/37 | | | 6,663,350 | | | 6,762,858 |
6.022%, 05/01/37 (a) | | | 2,765,954 | | | 2,810,373 |
11.565%, 06/15/21 (a) (g) | | | 1 | | | 1 |
Federal National Mortgage Association
5.000%, 08/01/34 | | | 344,778 | | | 336,785 |
5.000%, 03/01/35 | | | 297,779 | | | 290,875 |
5.000%, 05/01/35 | | | 774,008 | | | 755,642 |
5.000%, 08/01/35 | | | 240,971 | | | 235,230 |
5.000%, 02/01/36 | | | 16,178,963 | | | 15,795,075 |
5.000%, TBA | | | 88,500,000 | | | 86,342,812 |
5.112%, 10/01/35 (a) | | | 1,211,107 | | | 1,231,044 |
5.500%, 04/01/36 | | | 9,014,709 | | | 8,914,404 |
5.500%, 11/01/36 | | | 4,563,055 | | | 4,558,125 |
5.500%, 01/01/37 | | | 7,420,316 | | | 7,412,299 |
5.500%, 08/01/37 | | | 2,977,490 | | | 2,973,652 |
5.500%, TBA | | | 29,800,000 | | | 30,164,924 |
5.513%, 02/01/37 (a) | | | 7,562,388 | | | 7,654,327 |
6.000%, 10/01/36 | | | 15,482,294 | | | 15,725,267 |
6.000%, 07/01/37 | | | 997,534 | | | 1,013,054 |
6.000%, 12/01/37 | | | 6,000,000 | | | 6,093,352 |
6.000%, TBA | | | 4,900,000 | | | 4,981,279 |
6.500%, 03/01/26 | | | 19,038 | | | 19,780 |
6.500%, 03/01/36 | | | 971,319 | | | 998,557 |
6.500%, 08/01/36 | | | 926,677 | | | 952,663 |
6.500%, 10/01/36 | | | 616,321 | | | 633,604 |
6.500%, 12/01/36 | | | 918,034 | | | 943,778 |
6.500%, 05/01/37 | | | 999,010 | | | 1,026,918 |
6.500%, 07/01/37 | | | 998,614 | | | 1,026,511 |
6.500%, 08/01/37 | | | 499,610 | | | 513,567 |
6.500%, 09/01/37 | | | 2,369,145 | | | 2,435,329 |
6.500%, 10/01/37 | | | 2,969,293 | | | 3,052,243 |
6.500%, TBA | | | 12,540,000 | | | 12,888,762 |
7.000%, 05/01/26 | | | 3,613 | | | 3,786 |
7.500%, 12/01/29 | | | 6,007 | | | 6,353 |
7.500%, 06/01/30 | | | 10,634 | | | 11,236 |
7.500%, 08/01/30 | | | 1,193 | | | 1,261 |
7.500%, 11/01/30 | | | 46,213 | | | 49,326 |
7.500%, 02/01/31 | | | 1,946 | | | 2,077 |
8.000%, 08/01/27 | | | 4,654 | | | 4,987 |
8.000%, 01/01/31 | | | 215,281 | | | 230,920 |
8.500%, 08/01/19 | | | 103,646 | | | 110,858 |
10.400%, 04/25/19 | | | 4,030 | | | 4,374 |
*See accompanying notes to financial statements.
MSF-9
Metropolitan Series Fund, Inc.
Western Asset Management Strategic Bond Opportunities Portfolio
Schedule of Investments as of December 31, 2007
Fixed Income—(Continued)
| | | | | | |
| Security Description | | Face
Amount | | Value* |
| | | | | | |
|
Federal Agencies—(Continued) |
Government National Mortgage Association
5.500%, TBA | | $ | 9,800,000 | | $ | 9,835,219 |
6.000%, TBA | | | 54,700,000 | | | 55,995,219 |
| | | | | | |
| | | | | | 403,678,907 |
| | | | | | |
|
Food & Staples Retailing—0.2% |
CVS Caremark Corp.
6.943%, 01/10/30 | | | 2,130,000 | | | 2,136,305 |
Safeway, Inc.
7.250%, 02/01/31 | | | 50,000 | | | 54,195 |
| | | | | | |
| | | | | | 2,190,500 |
| | | | | | |
|
Food Products—0.0% |
Dole Food Co., Inc.
7.250%, 06/15/10 | | | 285,000 | | | 259,350 |
8.750%, 07/15/13 (a) (e) | | | 125,000 | | | 115,000 |
8.875%, 03/15/11 | | | 150,000 | | | 138,750 |
| | | | | | |
| | | | | | 513,100 |
| | | | | | |
|
Foreign Government—0.5% |
Mexico Government International Bond
5.625%, 01/15/17 | | | 1,260,000 | | | 1,277,010 |
5.875%, 01/15/14 (e) | | | 760,000 | | | 790,400 |
6.750%, 09/27/34 | | | 851,000 | | | 939,930 |
10.375%, 02/17/09 | | | 238,000 | | | 252,994 |
Region of Lombardy Italy
5.804%, 10/25/32 | | | 925,000 | | | 993,930 |
Russian Federation
7.500%, 03/31/30 (a) | | | 31,680 | | | 36,293 |
11.000%, 07/24/18 | | | 950,000 | | | 1,362,157 |
| | | | | | |
| | | | | | 5,652,714 |
| | | | | | |
|
Gas Utilities—0.1% |
El Paso Natural Gas Co.
8.375%, 06/15/32 | | | 590,000 | | | 691,125 |
| | | | | | |
|
Government Agency—0.7% |
Tennessee Valley Authority
5.980%, 04/01/36 | | | 2,320,000 | | | 2,637,984 |
Virginia Housing Development Authority
6.000%, 06/25/34 | | | 4,470,411 | | | 4,470,858 |
| | | | | | |
| | | | | | 7,108,842 |
| | | | | | |
|
Health Care Providers & Services—0.4% |
Community Health Systems, Inc.
8.875%, 07/15/15 | | | 500,000 | | | 509,375 |
DaVita, Inc.
6.625%, 03/15/13 | | | 405,000 | | | 402,975 |
HCA, Inc.
6.250%, 02/15/13 | | | 543,000 | | | 475,125 |
6.375%, 01/15/15 | | | 275,000 | | | 232,375 |
6.500%, 02/15/16 (e) | | | 494,000 | | | 417,430 |
| | | | | | |
| Security Description | | Face
Amount | | Value* |
| | | | | | |
|
Health Care Providers & Services—(Continued) |
HCA, Inc. | | | | | | |
9.125%, 11/15/14 | | $ | 90,000 | | $ | 93,600 |
9.250%, 11/15/16 | | | 690,000 | | | 724,500 |
9.625%, 11/15/16 | | | 132,000 | | | 139,590 |
IASIS Healthcare, LLC
8.750%, 06/15/14 | | | 350,000 | | | 350,000 |
Tenet Healthcare Corp.
6.875%, 11/15/31 | | | 95,000 | | | 70,775 |
7.375%, 02/01/13 | | | 325,000 | | | 284,375 |
Vanguard Health Holdings Co. I, LLC
0/11.250%, 10/01/15 (e) (f) | | | 210,000 | | | 155,400 |
Vanguard Health Holdings Co. II, LLC
9.000%, 10/01/14 | | | 580,000 | | | 558,250 |
WellPoint, Inc.
5.875%, 06/15/17 | | | 130,000 | | | 130,884 |
| | | | | | |
| | | | | | 4,544,654 |
| | | | | | |
|
Hotels, Restaurants & Leisure—0.2% |
Boyd Gaming Corp.
6.750%, 04/15/14 | | | 100,000 | | | 95,250 |
Caesars Entertainment, Inc.
8.125%, 05/15/11 (e) | | | 50,000 | | | 46,500 |
Carrols Corp.
9.000%, 01/15/13 | | | 205,000 | | | 186,550 |
Inn of the Mountain Gods Resort & Casino
12.000%, 11/15/10 (e) | | | 110,000 | | | 114,400 |
Las Vegas Sands Corp.
6.375%, 02/15/15 | | | 225,000 | | | 211,500 |
MGM Mirage
6.750%, 09/01/12 | | | 320,000 | | | 311,600 |
7.625%, 01/15/17 (e) | | | 435,000 | | | 429,563 |
Station Casinos, Inc.
6.500%, 02/01/14 | | | 125,000 | | | 93,750 |
7.750%, 08/15/16 | | | 500,000 | | | 451,250 |
Turning Stone Casino Resort Enterprise (144A)
9.125%, 12/15/10 | | | 275,000 | | | 277,750 |
| | | | | | |
| | | | | | 2,218,113 |
| | | | | | |
|
Independent Power Producers & Energy Traders—0.6% |
Duke Energy Corp.
4.200%, 10/01/08 | | | 50,000 | | | 49,686 |
5.625%, 11/30/12 | | | 370,000 | | | 384,017 |
NRG Energy, Inc.
7.250%, 02/01/14 | | | 155,000 | | | 151,125 |
7.375%, 02/01/16 | | | 715,000 | | | 697,125 |
The AES Corp.
7.750%, 03/01/14 | | | 35,000 | | | 35,263 |
7.750%, 10/15/15 | | | 520,000 | | | 527,800 |
8.000%, 10/15/17 | | | 2,850,000 | | | 2,914,125 |
8.875%, 02/15/11 (e) | | | 150,000 | | | 156,375 |
9.375%, 09/15/10 | | | 403,000 | | | 423,150 |
9.500%, 06/01/09 | | | 100,000 | | | 103,500 |
*See accompanying notes to financial statements.
MSF-10
Metropolitan Series Fund, Inc.
Western Asset Management Strategic Bond Opportunities Portfolio
Schedule of Investments as of December 31, 2007
Fixed Income—(Continued)
| | | | | | |
| Security Description | | Face
Amount | | Value* |
| | | | | | |
|
Independent Power Producers & Energy Traders—(Continued) |
TXU Corp.
5.550%, 11/15/14 | | $ | 420,000 | | $ | 335,237 |
6.500%, 11/15/24 | | | 490,000 | | | 357,411 |
6.550%, 11/15/34 | | | 1,040,000 | | | 752,656 |
| | | | | | |
| | | | | | 6,887,470 |
| | | | | | |
| | |
Industrial Conglomerates—0.6% | | | | | | |
Corporacion Andina de Fomento
6.875%, 03/15/12 | | | 2,900,000 | | | 3,094,370 |
Tyco International Group S.A.
6.000%, 11/15/13 | | | 2,660,000 | | | 2,734,054 |
6.125%, 11/01/08 | | | 50,000 | | | 50,430 |
| | | | | | |
| | | | | | 5,878,854 |
| | | | | | |
| | |
Insurance—0.5% | | | | | | |
American International Group, Inc.
5.850%, 01/16/18 | | | 350,000 | | | 352,292 |
6.250%, 03/15/37 | | | 760,000 | | | 679,758 |
The Travelers Cos., Inc.
6.250%, 03/15/67 (a) | | | 4,400,000 | | | 4,126,263 |
| | | | | | |
| | | | | | 5,158,313 |
| | | | | | |
| | |
IT Services—0.2% | | | | | | |
Electronic Data Systems Corp.
7.125%, 10/15/09 | | | 1,270,000 | | | 1,311,053 |
SunGard Data Systems, Inc.
9.125%, 08/15/13 | | | 280,000 | | | 284,900 |
| | | | | | |
| | | | | | 1,595,953 |
| | | | | | |
| | |
Leisure Equipment & Products—0.1% | | | | | | |
Herbst Gaming, Inc.
8.125%, 06/01/12 | | | 225,000 | | | 146,813 |
Pinnacle Entertainment, Inc.
8.750%, 10/01/13 | | | 375,000 | | | 381,562 |
Seneca Gaming Corp.
7.250%, 05/01/12 | | | 225,000 | | | 226,688 |
| | | | | | |
| | | | | | 755,063 |
| | | | | | |
| | |
Machinery—0.0% | | | | | | |
Terex Corp.
8.000%, 11/15/17 (e) | | | 170,000 | | | 172,125 |
| | | | | | |
| | |
Media—1.5% | | | | | | |
CCH I Holdings, LLC
11.000%, 10/01/15 (e) | | | 984,000 | | | 801,960 |
Clear Channel Communications, Inc.
6.250%, 03/15/11 | | | 1,130,000 | | | 1,022,650 |
Comcast Cable Communications Holdings, Inc.
8.375%, 03/15/13 | | | 50,000 | | | 56,094 |
8.875%, 05/01/17 | | | 600,000 | | | 715,393 |
Comcast Corp.
5.875%, 02/15/18 | | | 170,000 | | | 169,488 |
6.500%, 01/15/15 | | | 1,890,000 | | | 1,972,759 |
6.500%, 01/15/17 | | | 130,000 | | | 135,545 |
| | | | | | |
| Security Description | | Face
Amount | | Value* |
| | | | | | |
|
Media—(Continued) |
CSC Holdings, Inc.
6.750%, 04/15/12 | | $ | 350,000 | | $ | 334,687 |
8.125%, 08/15/09 | | | 200,000 | | | 203,500 |
Dex Media West, LLC
9.875%, 08/15/13 | | | 267,000 | | | 277,680 |
Dex Media, Inc.
0/9.000%, 11/15/13 (e) (f) | | | 295,000 | | | 268,450 |
DirecTV Holdings, LLC
8.375%, 03/15/13 | | | 162,000 | | | 168,480 |
EchoStar DBS Corp.
6.625%, 10/01/14 | | | 845,000 | | | 840,775 |
Idearc, Inc.
8.000%, 11/15/16 | | | 580,000 | | | 532,150 |
Lamar Media Corp.
6.625%, 08/15/15 | | | 455,000 | | | 442,487 |
Liberty Media, LLC
7.875%, 07/15/09 | | | 2,540,000 | | | 2,578,710 |
News America, Inc.
6.650%, 11/15/37 | | | 100,000 | | | 103,148 |
R.H. Donnelley Corp.
6.875%, 01/15/13 | | | 225,000 | | | 201,375 |
8.875%, 01/15/16 | | | 225,000 | | | 210,375 |
Time Warner Cable, Inc.
5.850%, 05/01/17 | | | 2,650,000 | | | 2,656,540 |
Time Warner Entertainment Co., L.P.
8.375%, 07/15/33 | | | 510,000 | | | 614,350 |
Time Warner, Inc.
6.875%, 05/01/12 | | | 1,270,000 | | | 1,337,321 |
7.625%, 04/15/31 | | | 50,000 | | | 55,331 |
7.700%, 05/01/32 | | | 120,000 | | | 133,327 |
TL Acquisitions, Inc. (144A)
10.500%, 01/15/15 | | | 220,000 | | | 211,475 |
Videotron Ltee
6.375%, 12/15/15 | | | 250,000 | | | 234,688 |
| | | | | | |
| | | | | | 16,278,738 |
| | | | | | |
|
Metals & Mining—0.4% |
Freeport-McMoRan Copper & Gold, Inc.
8.375%, 04/01/17 | | | 630,000 | | | 675,675 |
Steel Dynamics, Inc.
7.375%, 11/01/12 | | | 180,000 | | | 180,900 |
Steel Dynamics, Inc. (144A)
6.750%, 04/01/15 | | | 370,000 | | | 357,050 |
Vale Overseas, Ltd.
6.875%, 11/21/36 | | | 2,740,000 | | | 2,771,814 |
8.250%, 01/17/34 | | | 60,000 | | | 69,470 |
| | | | | | |
| | | | | | 4,054,909 |
| | | | | | |
|
Multi-Utilities—0.3% |
Dynegy Holdings, Inc.
7.125%, 05/15/18 | | | 115,000 | | | 101,775 |
7.750%, 06/01/19 | | | 585,000 | | | 539,663 |
Pacific Gas & Electric Co.
5.625%, 11/30/17 | | | 1,480,000 | | | 1,484,481 |
5.800%, 03/01/37 | | | 430,000 | | | 414,633 |
6.050%, 03/01/34 | | | 770,000 | | | 768,720 |
| | | | | | |
| | | | | | 3,309,272 |
| | | | | | |
*See accompanying notes to financial statements.
MSF-11
Metropolitan Series Fund, Inc.
Western Asset Management Strategic Bond Opportunities Portfolio
Schedule of Investments as of December 31, 2007
Fixed Income—(Continued)
| | | | | | |
| Security Description | | Face
Amount | | Value* |
| | | | | | |
|
Multiline Retail—0.0% |
The Neiman Marcus Group, Inc.
10.375%, 10/15/15 (e) | | $ | 155,000 | | $ | 161,394 |
| | | | | | |
|
Office Electronics—0.0% |
Xerox Corp.
6.400%, 03/15/16 | | | 360,000 | | | 368,382 |
| | | | | | |
|
Oil, Gas & Consumable Fuels—2.5% |
Anadarko Petroleum Corp.
6.450%, 09/15/36 | | | 1,140,000 | | | 1,160,903 |
Apache Corp.
5.250%, 04/15/13 | | | 1,000,000 | | | 1,023,553 |
5.625%, 01/15/17 (e) | | | 2,620,000 | | | 2,669,138 |
Chesapeake Energy Corp.
6.250%, 01/15/18 | | | 25,000 | | | 24,000 |
6.375%, 06/15/15 | | | 425,000 | | | 411,188 |
6.500%, 08/15/17 | | | 450,000 | | | 434,250 |
ConocoPhillips Holding Co.
6.950%, 04/15/29 | | | 1,230,000 | | | 1,404,776 |
El Paso Corp.
7.000%, 06/15/17 | | | 2,410,000 | | | 2,412,499 |
7.375%, 12/15/12 | | | 50,000 | | | 51,190 |
7.750%, 01/15/32 | | | 179,000 | | | 181,699 |
7.800%, 08/01/31 | | | 45,000 | | | 45,669 |
7.875%, 06/15/12 (e) | | | 575,000 | | | 597,257 |
Exco Resources, Inc.
7.250%, 01/15/11 | | | 465,000 | | | 447,562 |
Gaz Capital for Gazprom (144A)
6.212%, 11/22/16 | | | 1,880,000 | | | 1,803,672 |
6.510%, 03/07/22 | | | 1,220,000 | | | 1,159,854 |
8.625%, 04/28/34 | | | 800,000 | | | 1,000,000 |
Hess Corp.
6.650%, 08/15/11 | | | 2,330,000 | | | 2,459,168 |
7.300%, 08/15/31 | | | 1,060,000 | | | 1,190,667 |
7.875%, 10/01/29 | | | 140,000 | | | 165,706 |
Kerr-McGee Corp.
6.950%, 07/01/24 | | | 500,000 | | | 534,099 |
7.875%, 09/15/31 | | | 2,270,000 | | | 2,706,673 |
OPTI Canada, Inc.
7.875%, 12/15/14 | | | 430,000 | | | 420,325 |
OPTI Canada, Inc. (144A)
8.250%, 12/15/14 | | | 310,000 | | | 306,900 |
Peabody Energy Corp.
6.875%, 03/15/13 | | | 120,000 | | | 120,600 |
Pemex Project Funding Master Trust
6.625%, 06/15/35 (e) | | | 260,000 | | | 274,049 |
6.625%, 06/15/35 | | | 150,000 | | | 158,105 |
Quicksilver Resources, Inc.
7.125%, 04/01/16 | | | 250,000 | | | 245,625 |
Valero Energy Corp.
4.750%, 06/15/13 | | | 50,000 | | | 48,479 |
Whiting Peteroleum Corp.
7.000%, 02/01/14 | | | 205,000 | | | 202,950 |
7.250%, 05/01/12 | | | 50,000 | | | 49,250 |
| | | | | | |
| Security Description | | Face
Amount | | Value* |
| | | | | | |
|
Oil, Gas & Consumable Fuels—(Continued) |
XTO Energy, Inc.
5.650%, 04/01/16 | | $ | 2,190,000 | | $ | 2,205,558 |
6.250%, 08/01/17 | | | 20,000 | | | 20,982 |
7.500%, 04/15/12 | | | 390,000 | | | 426,327 |
| | | | | | |
| | | | | | 26,362,673 |
| | | | | | |
|
Paper & Forest Products—0.1% |
Appleton Papers, Inc.
9.750%, 06/15/14 | | | 150,000 | | | 148,500 |
Weyerhaeuser Co.
6.750%, 03/15/12 | | | 680,000 | | | 714,095 |
| | | | | | |
| | | | | | 862,595 |
| | | | | | |
|
Pharmaceuticals—0.4% |
Abbott Laboratories
5.600%, 11/30/17 | | | 3,150,000 | | | 3,236,376 |
Wyeth
5.500%, 03/15/13 (a) | | | 50,000 | | | 51,426 |
5.950%, 04/01/37 | | | 1,190,000 | | | 1,193,157 |
| | | | | | |
| | | | | | 4,480,959 |
| | | | | | |
|
Real Estate Investment Trusts—0.1% |
Boston Properties, L.P.
6.250%, 01/15/13 | | | 65,000 | | | 65,286 |
Host Marriott, L.P.
6.375%, 03/15/15 | | | 350,000 | | | 341,250 |
iStar Financial, Inc.
5.150%, 03/01/12 (e) | | | 50,000 | | | 43,211 |
Realogy Corp. (144A)
12.375%, 04/15/15 (e) | | | 1,400,000 | | | 882,000 |
| | | | | | |
| | | | | | 1,331,747 |
| | | | | | |
|
Semiconductors & Semiconductor Equipment—0.0% |
Freescale Semiconductor, Inc.
8.875%, 12/15/14 | | | 120,000 | | | 107,100 |
| | | | | | |
|
Specialty Retail—0.0% |
NEBCO Evans Holdings Co.
12.375%, 07/15/07 (b) (c) (d) | | | 350,000 | | | 0 |
The Limited, Inc.
6.950%, 03/01/33 | | | 60,000 | | | 52,570 |
| | | | | | |
| | | | | | 52,570 |
| | | | | | |
|
Textiles, Apparel & Luxury Goods—0.0% |
Oxford Industries, Inc.
8.875%, 06/01/11 | | | 120,000 | | | 119,400 |
| | | | | | |
|
Thrifts & Mortgage Finance—0.1% |
Countrywide Financial Corp.
5.076%, 06/18/08 (a) | | | 570,000 | | | 504,218 |
5.384%, 01/05/09 (a) | | | 460,000 | | | 364,442 |
Countrywide Home Loans, Inc.
4.000%, 03/22/11 (e) | | | 75,000 | | | 54,154 |
| | | | | | |
| | | | | | 922,814 |
| | | | | | |
*See accompanying notes to financial statements.
MSF-12
Metropolitan Series Fund, Inc.
Western Asset Management Strategic Bond Opportunities Portfolio
Schedule of Investments as of December 31, 2007
Fixed Income—(Continued)
| | | | | | |
| Security Description | | Face
Amount | | Value* |
| | | | | | |
|
Tobacco—0.2% |
Altria Group, Inc.
7.000%, 11/04/13 | | $ | 1,100,000 | | $ | 1,230,170 |
Reynolds American, Inc.
6.750%, 06/15/17 | | | 575,000 | | | 585,651 |
| | | | | | |
| | | | | | 1,815,821 |
| | | | | | |
|
Trading Companies & Distributors—0.0% |
The Holt Group, Inc.
9.750%, 01/15/49 (b) (c) (d) | | | 200,000 | | | 0 |
| | | | | | |
|
U.S. Treasury—9.3% |
U.S. Treasury Bonds
4.750%, 02/15/37 (e) | | | 370,000 | | | 387,228 |
5.500%, 08/15/28 | | | 500,000 | | | 566,172 |
6.125%, 11/15/27 | | | 200,000 | | | 242,203 |
8.875%, 08/15/17(e) | | | 340,000 | | | 467,819 |
U.S. Treasury Inflation Indexed Bonds (TII)
2.000%, 01/15/26 (e) | | | 1,484,194 | | | 1,478,165 |
2.375%, 01/15/27 (e) | | | 4,232,019 | | | 4,475,360 |
2.500%, 07/15/16 (e) | | | 693,122 | | | 739,149 |
2.625%, 07/15/17 (e) | | | 10,937,126 | | | 11,800,983 |
U.S. Treasury Inflation Indexed Notes (TII)
0.875%, 04/15/10 (e) | | | 584,489 | | | 582,526 |
2.000%, 01/15/16 (e) | | | 4,305,217 | | | 4,418,229 |
2.375%, 04/15/11 (e) | | | 778,902 | | | 811,884 |
U.S. Treasury Notes
2.375%, 01/15/17 (e) | | | 507,635 | | | 535,674 |
3.500%, 02/15/10 (e) | | | 6,930,000 | | | 6,990,097 |
4.000%, 04/15/10 (e) | | | 12,500,000 | | | 12,753,900 |
4.125%, 08/31/12 (e) | | | 39,690,000 | | | 40,865,181 |
4.500%, 03/31/09 (e) | | | 6,560,000 | | | 6,669,677 |
4.500%, 03/31/12 (e) | | | 670,000 | | | 700,255 |
4.625%, 10/31/11 (e) | | | 130,000 | | | 136,236 |
4.625%, 07/31/12 (e) | | | 1,890,000 | | | 1,984,500 |
4.750%, 08/15/17 (e) | | | 40,000 | | | 42,247 |
4.875%, 05/31/11 (e) | | | 2,890,000 | | | 3,045,788 |
| | | | | | |
| | | | | | 99,693,273 |
| | | | | | |
|
Wireless Telecommunication Services—0.2% |
American Tower Corp.
7.500%, 05/01/12 | | | 150,000 | | | 154,500 |
Cingular Wireless Services, Inc.
8.750%, 03/01/31 | | | 50,000 | | | 64,799 |
Nextel Communications, Inc. | | | | | | |
6.875%, 10/31/13 | | | 1,295,000 | | | 1,275,733 |
7.375%, 08/01/15 | | | 800,000 | | | 787,695 |
| | | | | | |
| | | | | | 2,282,727 |
| | | | | | |
|
Yankee—0.1% |
Methanex Corp.
8.750%, 08/15/12 | | | 225,000 | | | 241,313 |
Morgan Stanley Bank AG for OAO Gazprom
9.625%, 03/01/13 | | | 170,000 | | | 192,668 |
| | | | | | |
| Security Description | | Face
Amount | | Value* |
| | | | | | |
|
Yankee—(Continued) |
Rogers Cable, Inc.
8.750%, 05/01/32 | | $ | 375,000 | | $ | 471,279 |
Smurfit Capital Funding, Plc.
7.500%, 11/20/25 | | | 275,000 | | | 259,875 |
| | | | | | |
| | | | | | 1,165,135 |
| | | | | | |
Total Fixed Income
(Identified Cost $1,054,130,073) | | | | | | 1,038,986,846 |
| | | | | | |
|
| Preferred Stock—0.7% |
| Security Description | | Shares | | Value* |
|
Diversified Financial Services—0.1% |
Resona Preferred Global Securities Cayman, Ltd. (144A) (a) | | | 770,000 | | | 764,023 |
TCR Holdings (Class B) (d) (h) | | | 840 | | | 1 |
TCR Holdings (Class C) (b) (d) (h) | | | 462 | | | 0 |
TCR Holdings (Class D) (d) (h) | | | 1,219 | | | 1 |
TCR Holdings (Class E) (d) (h) | | | 2,521 | | | 3 |
| | | | | | |
| | | | | | 764,028 |
| | | | | | |
|
Thrifts & Mortgage Finance—0.6% |
Federal Home Loan Mortgage Corp. | | | 135,000 | | | 3,530,250 |
Federal National Mortgage Association (e) | | | 95,000 | | | 2,446,250 |
Federal National Mortgage Association (144A) | | | 3,400 | | | 156,719 |
| | | | | | |
| | | | | | 6,133,219 |
| | | | | | |
Total Preferred Stock
(Identified Cost $6,727,306) | | | | | | 6,897,247 |
| | | | | | |
|
| Term Loans—0.2% |
| Security Description | | Face
Amount | | Value* |
|
IT Services—0.2% |
First Data Corp.
7.960%, 09/24/14 (a) | | $ | 2,400,000 | | | 2,279,455 |
| | | | | | |
Total Term Loans
(Identified Cost $2,304,000) | | | | | | 2,279,455 |
| | | | | | |
|
| Common Stock—0.0% |
| Security Description | | Shares | | Value* |
|
Chemicals—0.0% |
Applied Extrusion Technologies, Inc.
(Class B) (h) | | | 2,424 | | | 16,968 |
| | | | | | |
|
Diversified Financial Services—0.0% |
ContiFinancial Corp. (Liquidating Unit Trust) (i) | | | 234,073 | | | 73 |
| | | | | | |
*See accompanying notes to financial statements.
MSF-13
Metropolitan Series Fund, Inc.
Western Asset Management Strategic Bond Opportunities Portfolio
Schedule of Investments as of December 31, 2007
Common Stock—(Continued)
| | | | | | |
| Security Description | |
Shares | | Value* |
| | | | | | |
|
Household Products—0.0% |
Home Interiors & Gifts, Inc. (Restricted Shares) (d) (h) | | | 674,618 | | $ | 6,746 |
| | | | | | |
Total Common Stock
(Identified Cost $364,358) | | | | | | 23,787 |
| | | | | | |
|
| Escrow Shares—0.0% |
|
Textiles, Apparel & Luxury Goods—0.0% |
Pillowtex Corp. (b) (d) (h) | | | 250,000 | | | 0 |
| | | | | | |
Total Escrow Shares
(Identified Cost $0) | | | | | | 0 |
| | | | | | |
|
| Warrants—0.0% |
|
Foreign Government—0.0% |
Republic of Venezuela (d) (h) | | | 3,750 | | | 140,625 |
| | | | | | |
|
Household Durables—0.0% |
Winsloew Furniture, Inc. (144A) (d) (h) | | | 200 | | | 2 |
| | | | | | |
|
Textiles, Apparel & Luxury Goods—0.0% |
Pillowtex Corp. (b) (d) (h) | | | 1,701 | | | 0 |
| | | | | | |
|
Wireless Telecommunication Services—0.0% |
Leap Wireless International,
Inc. (144A) (b) (d) (h) | | | 125 | | | 0 |
| | | | | | |
Total Warrants
(Identified Cost $43,682) | | | | | | 140,627 |
| | | | | | |
|
| Fixed Income—Convertible—0.0% |
| Security Description | | Face
Amount | | Value* |
|
Automobiles—0.0% |
Ford Motor Co.
4.250%, 12/15/36 (e) | | $ | 170,000 | | | 168,937 |
| | | | | | |
Total Fixed Income—Convertible
(Identified Cost $170,000) | | | | | | 168,937 |
| | | | | | |
|
| Short Term Investments—30.6% |
|
Discount Notes—19.6% |
Federal Home Loan Bank
3.250%, 01/02/08 | | | 205,900,000 | | | 205,879,410 |
Federal National Mortgage Association
5.000%, 03/17/08 | | | 3,500,000 | | | 3,462,982 |
| | | | | | |
| | | | | | 209,342,392 |
| | | | | | |
|
Mutual Funds—10.8% |
State Street Navigator Securities Lending
Prime Portfolio (j) | | | 115,277,525 | | | 115,277,525 |
| | | | | | |
| | | | | | | |
| Security Description | | Face
Amount | | Value* | |
| | | | | | | |
|
Repurchase Agreement—0.2% | |
Merrill Lynch Repurchase Agreement dated 12/31/07 at 4.050% to be repurchased at $2,400,540 on 1/02/08 collateralized by $1,895,000 Tennessee Valley Authority 7.125% due 5/01/30 with a value of $2,448,000. | | $ | 2,400,000 | | $ | 2,400,000 | |
| | | | | | | |
Total Short Term Investments
(Identified Cost $327,019,917) | | | | | | 327,019,917 | |
| | | | | | | |
Total Investments—128.8%
(Identified Cost $1,390,759,336) (k) | | | | | | 1,375,516,816 | |
Liabilities in excess of other assets | | | | | | (308,747,481 | ) |
| | | | | | | |
| Total Net Assets—100% | | | | | $ | 1,066,769,335 | |
| | | | | | | |
| (a) | Variable or Floating Rate Security. Rate disclosed is as of December 31, 2007. |
| (c) | Non-Income Producing; Defaulted Bond. |
| (d) | Security was valued in good faith under procedures established by the Board of Directors. |
| (e) | A portion or all of the security was held on loan. As of December 31, 2007, the market value of securities loaned was $116,484,026 and the collateral received consisted of cash in the amount of $115,277,525 and non cash collateral with a value of $3,010,504. The cash collateral is invested in a money market fund managed by an affiliate of the custodian. The non cash collateral received consists primarily of government securities and bank letters of credit, and are held for the benefit of the Portfolio at the Portfolio’s custodian. |
| (f) | Step Bond: Coupon rate is set for an initial period and then increased to a higher coupon rate at a specified date. |
| (g) | Interest Only Certificate. This security receives monthly interest payments but is not entitled to principal payments. |
| (i) | Non-Income Producing; issuer filed under Chapter 11 of the Federal Bankruptcy Code. |
| (j) | Represents investment of cash collateral received from securities lending transactions. |
| (k) | The aggregate cost of investments for federal income tax purposes as of December 31, 2007 was $1,391,773,445 and the composition of unrealized appreciation and depreciation of investment securities was $10,658,386 and $(26,915,015), respectively. |
| (144A)— | Securities exempt from registration under Rule 144A of the Securities Act of 1933. These securities may be resold in transactions exempt from registration, normally to qualified institutional buyers. As of December 31, 2007, the market value of 144A securities was $82,806,562, which is 7.8% of total net assets. |
| (TBA)— | A contract for the purchase or sale of a Mortgage Backed Security to be delivered at a future date but does not include a specified pool or precise amount to be delivered. |
| (TII)— | A Treasury Inflation Index is a security with a fixed interest rate and the principal is adjusted for inflation. At maturity, the security will be redeemed at the greater of the inflation adjusted principal or par amount at original issue. |
*See accompanying notes to financial statements.
MSF-14
Metropolitan Series Fund, Inc.
Western Asset Management Strategic Bond Opportunities Portfolio
Schedule of Investments as of December 31, 2007
Futures Contracts
| | | | | | | | | | | | | | | | | |
Futures Contracts—Long | | Expiration Date | | Number of
Contracts | | | Contract
Amount | | | Valuation as of
12/31/2007 | | | Unrealized
Appreciation/
Depreciation | |
Euribor Futures | | 6/16/2008 | | 262 | | | $ | 91,614,016 | | | $ | 91,387,388 | | | $ | (226,628 | ) |
Eurodollar Futures | | 3/17/2008 | | 125 | | | | 29,880,675 | | | | 29,926,562 | | | | 45,887 | |
Eurodollar Futures | | 6/16/2008 | | 109 | | | | 25,843,933 | | | | 26,229,488 | | | | 385,555 | |
Eurodollar Futures | | 9/15/2008 | | 204 | | | | 49,154,695 | | | | 49,220,100 | | | | 65,405 | |
Eurodollar Futures | | 12/15/2008 | | 10 | | | | 2,407,450 | | | | 2,415,750 | | | | 8,300 | |
Eurodollar Futures | | 3/16/2009 | | 10 | | | | 2,405,945 | | | | 2,415,750 | | | | 9,805 | |
Eurodollar Futures | | 6/15/2009 | | 10 | | | | 2,402,700 | | | | 2,412,750 | | | | 10,050 | |
Eurodollar Futures | | 9/14/2009 | | 10 | | | | 2,399,325 | | | | 2,408,750 | | | | 9,425 | |
German Treasury Bonds 10 Year Futures | | 3/6/2008 | | 236 | | | | 39,858,973 | | | | 38,970,536 | | | | (888,437 | ) |
U.S. Treasury Bond Futures | | 3/19/2008 | | 451 | | | | 53,019,605 | | | | 52,485,125 | | | | (534,480 | ) |
U.S. Treasury Notes 2 Year Futures | | 3/31/2008 | | 22 | | | | 4,624,860 | | | | 4,625,500 | | | | 640 | |
U.S. Treasury Notes 5 Year Futures | | 3/31/2008 | | 743 | | | | 81,596,793 | | | | 81,938,969 | | | | 342,176 | |
| | | | | |
Futures Contracts—Short | | | | | | | | | | | | | | |
U.S. Treasury Notes 10 Year Futures | | 3/19/2008 | | (489 | ) | | | (55,535,165 | ) | | | (55,448,016 | ) | | | 87,149 | |
| | | | | | | | | | | | | | | | | |
Net Unrealized Depreciation | | | $ | (685,153 | ) |
| | | | | | | | | | | | | | | | | |
Options Written
| | | | | | | | | | | | | | | | | |
Options Written—Calls | | Expiration Date | | Number of
Contracts | | | Premiums
Received | | | Valuation as of
12/31/2007 | | | Unrealized
Appreciation/
Depreciation | |
U.S. Treasury Note 10 Year Futures 111 Call | | 2/22/2008 | | (332 | ) | | $ | (231,059 | ) | | $ | (944,125 | ) | | $ | (713,066 | ) |
U.S. Treasury Note 10 Year Futures 112 Call | | 2/22/2008 | | (44 | ) | | | (39,655 | ) | | | (94,188 | ) | | | (54,533 | ) |
| | | | | |
Options Written—Puts | | | | | | | | | | | | | | |
U.S. Treasury Note 10 Year Futures 107 Put | | 2/22/2008 | | (105 | ) | | | (88,256 | ) | | | (4,922 | ) | | | 83,334 | |
U.S. Treasury Note 10 Year Futures 112 Put | | 2/22/2008 | | (220 | ) | | | (177,650 | ) | | | (165,000 | ) | | | 12,650 | |
| | | | | | | | | | | | | | | | | |
Net Unrealized Depreciation | | | $ | (671,615 | ) |
| | | | | | | | | | | | | | | | | |
*See accompanying notes to financial statements.
MSF-15
Metropolitan Series Fund, Inc.
Western Asset Management Strategic Bond Opportunities Portfolio
Statement of Assets & Liabilities
December 31, 2007
| | | | | | | |
Assets | | | | | | | |
Investments at value (a) (c) | | | | | $ | 1,375,516,816 | |
Receivable for: | | | | | | | |
Securities sold | | | | | | 28,696,896 | |
Fund shares sold | | | | | | 804,130 | |
Accrued interest and dividends | | | | | | 7,583,588 | |
Foreign taxes | | | | | | 4,683 | |
Futures variation margin | | | | | | 1,098,644 | |
| | | | | | | |
Total Assets | | | | | | 1,413,704,757 | |
Liabilities | | | | | | | |
Payable for: | | | | | | | |
Securities purchased | | $ | 228,155,268 | | | | |
Fund shares redeemed | | | 781,612 | | | | |
Withholding taxes | | | 1,988 | | | | |
Collateral for securities loaned | | | 115,277,525 | | | | |
Due to custodian bank | | | 839,451 | | | | |
Options written, at fair value (b) | | | 1,208,235 | | | | |
Accrued expenses: | | | | | | | |
Management fees | | | 535,214 | | | | |
Service and distribution fees | | | 67,342 | | | | |
Deferred directors’ fees | | | 13,321 | | | | |
Other expenses | | | 55,466 | | | | |
| | | | | | | |
Total Liabilities | | | | | | 346,935,422 | |
| | | | | | | |
Net Assets | | | | | $ | 1,066,769,335 | |
| | | | | | | |
Net assets consists of: | | | | | | | |
Capital paid in | | | | | $ | 1,036,895,443 | |
Undistributed net investment income | | | | | | 41,173,287 | |
Accumulated net realized gains | | | | | | 5,299,893 | |
Unrealized depreciation on investments, futures contracts, foreign currency and options | | | | | | (16,599,288 | ) |
| | | | | | | |
Net Assets | | | | | $ | 1,066,769,335 | |
| | | | | | | |
| Computation of offering price: | | | | | | | |
Class A | | | | | | | |
Net asset value and redemption price per share ($696,191,155 divided by 54,797,568 shares outstanding) | | | | | $ | 12.70 | |
| | | | | | | |
Class B | | | | | | | |
Net asset value and redemption price per share ($241,183,886 divided by 19,064,111 shares outstanding) | | | | | $ | 12.65 | |
| | | | | | | |
Class E | | | | | | | |
Net asset value and redemption price per share ($129,394,294 divided by 10,213,106 shares outstanding) | | | | | $ | 12.67 | |
| | | | | | | |
(a) Identified cost of investments | | | | | $ | 1,390,759,336 | |
| | | | | | | |
(b) Premiums received on written
options | | | | | $ | (536,620) | |
| | | | | | | |
| (c) | Includes cash collateral for securities on loan of $115,277,525. |
Statement of Operations
For the Year Ended December 31, 2007
| | | | | | | | |
Investment Income | | | | | | | | |
Dividends | | | | | | $ | 29,621 | |
Interest | | | | | | | 48,708,149 | (a) |
| | | | | | | | |
| | | | | | | 48,737,770 | |
Expenses | | | | | | | | |
Management fees | | $ | 5,212,322 | | | | | |
Service and distribution fees—Class B | | | 550,386 | | | | | |
Service and distribution fees—Class E | | | 200,421 | | | | | |
Directors’ fees and expenses | | | 24,185 | | | | | |
Custodian | | | 129,273 | | | | | |
Audit and tax services | | | 36,237 | | | | | |
Legal | | | 11,112 | | | | | |
Printing | | | 217,805 | | | | | |
Insurance | | | 8,379 | | | | | |
Miscellaneous | | | 15,156 | | | | | |
| | | | | | | | |
Total expenses | | | | | | | 6,405,276 | |
| | | | | | | | |
Net Investment Income | | | | | | | 42,332,494 | |
| | | | | | | | |
Realized and Unrealized Gain (Loss) | | | | | | | | |
| Realized gain on: | | | | | | | | |
Investments—net | | | 4,459,583 | | | | | |
Futures contracts—net | | | 553,329 | | | | | |
Foreign currency transactions—net | | | 23,401 | | | | | |
Options—net | | | 790,540 | | | | 5,826,853 | |
| | | | | | | | |
| Change in unrealized appreciation (depreciation) on: | | | | | | | | |
Investments—net | | | (14,233,546 | ) | | | | |
Futures contracts—net | | | (431,056 | ) | | | | |
Foreign currency transactions—net | | | 127,854 | | | | | |
Options—net | | | (690,897 | ) | | | (15,227,645 | ) |
| | | | | | | | |
Net loss | | | | | | | (9,400,792 | ) |
| | | | | | | | |
Net Increase in Net Assets From Operations | | | | | | $ | 32,931,702 | |
| | | | | | | | |
| (a) | Includes income on securities loaned of $185,863. |
See accompanying notes to financial statements.
MSF-16
Metropolitan Series Fund, Inc.
Western Asset Management Strategic Bond Opportunities Portfolio
Statements of Changes in Net Assets
| | | | | | | | |
| | | Year ended
December 31,
2007 | | | Year ended
December 31,
2006 | |
From Operations | | | | | | | | |
Net investment income | | $ | 42,332,494 | | | $ | 28,294,830 | |
Net realized gain | | | 5,826,853 | | | | 2,721,118 | |
Unrealized depreciation | | | (15,227,645 | ) | | | (695,446 | ) |
| | | | | | | | |
Increase in net assets from operations | | | 32,931,702 | | | | 30,320,502 | |
| | | | | | | | |
From Distributions to Shareholders | | | | | | | | |
Net investment income | | | | | | | | |
Class A | | | (12,132,873 | ) | | | (12,580,267 | ) |
Class B | | | (5,326,759 | ) | | | (7,306,479 | ) |
Class E | | | (3,551,481 | ) | | | (7,255,957 | ) |
| | | | | | | | |
| | | (21,011,113 | ) | | | (27,142,703 | ) |
| | | | | | | | |
Net realized gain | | | | | | | | |
Class A | | | (418,375 | ) | | | (2,004,980 | ) |
Class B | | | (202,282 | ) | | | (1,240,035 | ) |
Class E | | | (129,537 | ) | | | (1,203,427 | ) |
| | | | | | | | |
| | | (750,194 | ) | | | (4,448,442 | ) |
| | | | | | | | |
Total distributions | | | (21,761,307 | ) | | | (31,591,145 | ) |
| | | | | | | | |
Increase in net assets from capital share transactions | | | 352,934,887 | | | | 217,558,252 | |
| | | | | | | | |
Total increase in net assets | | | 364,105,282 | | | | 216,287,609 | |
| | |
Net Assets | | | | | | | | |
Beginning of the period | | | 702,664,053 | | | | 486,376,444 | |
| | | | | | | | |
End of the period | | $ | 1,066,769,335 | | | $ | 702,664,053 | |
| | | | | | | | |
Undistributed Net Investment Income | | | | | | | | |
End of the period | | $ | 42,183,643 | | | $ | 20,862,262 | |
| | | | | | | | |
Other Information:
Capital Shares
Transactions in capital shares were as follows:
| | | | | | | | | | | | | | |
| | | Year ended
December 31, 2007 | | | Year ended
December 31, 2006 | |
| | | Shares | | | $ | | | Shares | | | $ | |
Class A | | | | | | | | | | | | | | |
Sales | | 32,064,594 | | | $ | 402,583,204 | | | 15,850,028 | | | $ | 196,471,815 | |
Shares issued through acquisition | | 0 | | | | 0 | | | 984,206 | | | | 11,895,886 | |
Reinvestments | | 1,006,516 | | | | 12,551,248 | | | 1,223,595 | | | | 14,585,247 | |
Redemptions | | (7,446,566 | ) | | | (93,255,284 | ) | | (5,706,228 | ) | | | (70,429,737 | ) |
| | | | | | | | | | | | | | |
Net increase | | 25,624,544 | | | $ | 321,879,168 | | | 12,351,601 | | | $ | 152,523,211 | |
| | | | | | | | | | | | | | |
Class B | | | | | | | | | | | | | | |
Sales | | 6,040,423 | | | $ | 75,317,405 | | | 7,929,484 | | | $ | 98,102,344 | |
Reinvestments | | 444,814 | | | | 5,529,041 | | | 718,798 | | | | 8,546,514 | |
Redemptions | | (3,276,505 | ) | | | (40,875,803 | ) | | (2,319,695 | ) | | | (28,470,172 | ) |
| | | | | | | | | | | | | | |
Net increase | | 3,208,732 | | | $ | 39,970,643 | | | 6,328,587 | | | $ | 78,178,686 | |
| | | | | | | | | | | | | | |
Class E | | | | | | | | | | | | | | |
Sales | | 1,544,488 | | | $ | 19,309,344 | | | 1,629,882 | | | $ | 20,205,861 | |
Reinvestments | | 295,902 | | | | 3,681,018 | | | 710,873 | | | | 8,459,384 | |
Redemptions | | (2,551,275 | ) | | | (31,905,286 | ) | | (3,397,895 | ) | | | (41,808,890 | ) |
| | | | | | | | | | | | | | |
Net decrease | | (710,885 | ) | | $ | (8,914,924 | ) | | (1,057,140 | ) | | $ | (13,143,645 | ) |
| | | | | | | | | | | | | | |
Increase derived from capital share transactions | | | | | $ | 352,934,887 | | | | | | $ | 217,558,252 | |
| | | | | | | | | | | | | | |
See accompanying notes to financial statements.
MSF-17
Metropolitan Series Fund, Inc.
Western Asset Management Strategic Bond Opportunities Portfolio
Financial Highlights
| | | | | | | | | | | | | | | | | | | | |
| | | Class A | |
| | | Year ended December 31, | |
| | | 2007 | | | 2006 | | | 2005 | | | 2004 | | | 2003 | |
Net Asset Value, Beginning of Period | | $ | 12.58 | | | $ | 12.72 | | | $ | 13.04 | | | $ | 12.61 | | | $ | 11.44 | |
| | | | | | | | | | | | | | | | | | | | |
Income From Investment Operations | | | | | | | | | | | | | | | | | | | | |
Net investment income | | | 0.63 | (a) | | | 0.38 | | | | 0.36 | | | | 0.46 | | | | 0.51 | |
Net realized and unrealized gain (loss) of investments | | | (0.15 | ) | | | 0.22 | | | | (0.01 | ) | | | 0.35 | | | | 0.92 | |
| | | | | | | | | | | | | | | | | | | | |
Total from investment operations | | | 0.48 | | | | 0.60 | | | | 0.35 | | | | 0.81 | | | | 1.43 | |
| | | | | | | | | | | | | | | | | | | | |
Less Distributions | | | | | | | | | | | | | | | | | | | | |
Distributions from net investment income | | | (0.35 | ) | | | (0.64 | ) | | | (0.41 | ) | | | (0.38 | ) | | | (0.26 | ) |
Distributions from net realized capital gains | | | (0.01 | ) | | | (0.10 | ) | | | (0.26 | ) | | | 0.00 | | | | 0.00 | |
| | | | | | | | | | | | | | | | | | | | |
Total distributions | | | (0.36 | ) | | | (0.74 | ) | | | (0.67 | ) | | | (0.38 | ) | | | (0.26 | ) |
| | | | | | | | | | | | | | | | | | | | |
Net Asset Value, End of Period | | $ | 12.70 | | | $ | 12.58 | | | $ | 12.72 | | | $ | 13.04 | | | $ | 12.61 | |
| | | | | | | | | | | | | | | | | | | | |
Total Return (%) | | | 4.0 | | | | 5.1 | | | | 2.8 | | | | 6.6 | | | | 12.6 | |
Ratio of operating expenses to average net assets (%) | | | 0.66 | | | | 0.72 | | | | 0.75 | | | | 0.77 | | | | 0.81 | |
Ratio of net investment income to average net assets (%) | | | 5.03 | | | | 4.91 | | | | 4.11 | | | | 3.79 | | | | 4.66 | |
Portfolio turnover rate (%) | | | 504 | | | | 700 | | | | 507 | | | | 393 | | | | 329 | |
Net assets, end of period (000) | | $ | 696,191 | | | $ | 366,984 | | | $ | 213,906 | | | $ | 164,213 | | | $ | 153,549 | |
| |
| | | Class B | |
| | | Year ended December 31, | |
| | | 2007 | | | 2006 | | | 2005 | | | 2004 | | | 2003 | |
Net Asset Value, Beginning of Period | | $ | 12.53 | | | $ | 12.66 | | | $ | 12.99 | | | $ | 12.58 | | | $ | 11.41 | |
| | | | | | | | | | | | | | | | | | | | |
Income From Investment Operations | | | | | | | | | | | | | | | | | | | | |
Net investment income | | | 0.59 | (a) | | | 0.54 | | | | 0.40 | | | | 0.39 | | | | 0.23 | |
Net realized and unrealized gain (loss) of investments | | | (0.14 | ) | | | 0.03 | | | | (0.08 | ) | | | 0.38 | | | | 1.19 | |
| | | | | | | | | | | | | | | | | | | | |
Total from investment operations | | | 0.45 | | | | 0.57 | | | | 0.32 | | | | 0.77 | | | | 1.42 | |
| | | | | | | | | | | | | | | | | | | | |
Less Distributions | | | | | | | | | | | | | | | | | | | | |
Distributions from net investment income | | | (0.32 | ) | | | (0.60 | ) | | | (0.39 | ) | | | (0.36 | ) | | | (0.25 | ) |
Distributions from net realized capital gains | | | (0.01 | ) | | | (0.10 | ) | | | (0.26 | ) | | | 0.00 | | | | 0.00 | |
| | | | | | | | | | | | | | | | | | | | |
Total distributions | | | (0.33 | ) | | | (0.70 | ) | | | (0.65 | ) | | | (0.36 | ) | | | (0.25 | ) |
| | | | | | | | | | | | | | | | | | | | |
Net Asset Value, End of Period | | $ | 12.65 | | | $ | 12.53 | | | $ | 12.66 | | | $ | 12.99 | | | $ | 12.58 | |
| | | | | | | | | | | | | | | | | | | | |
Total Return (%) | | | 3.7 | | | | 4.8 | | | | 2.6 | | | | 6.3 | | | | 12.6 | |
Ratio of operating expenses to average net assets (%) | | | 0.91 | | | | 0.97 | | | | 1.00 | | | | 1.02 | | | | 1.06 | |
Ratio of net investment income to average net assets (%) | | | 4.77 | | | | 4.66 | | | | 3.92 | | | | 3.66 | | | | 3.95 | |
Portfolio turnover rate (%) | | | 504 | | | | 700 | | | | 507 | | | | 393 | | | | 329 | |
Net assets, end of period (000) | | $ | 241,184 | | | $ | 198,632 | | | $ | 120,590 | | | $ | 36,346 | | | $ | 268 | |
| (a) | Per share amount is based on average shares outstanding during the period. |
See accompanying notes to financial statements.
MSF-18
Metropolitan Series Fund, Inc.
Western Asset Management Strategic Bond Opportunities Portfolio
Financial Highlights
| | | | | | | | | | | | | | | | | | | | |
| | | Class E | |
| | | Year ended December 31, | |
| | | 2007 | | | 2006 | | | 2005 | | | 2004 | | | 2003 | |
Net Asset Value, Beginning of Period | | $ | 12.55 | | | $ | 12.68 | | | $ | 13.00 | | | $ | 12.58 | | | $ | 11.42 | |
| | | | | | | | | | | | | | | | | | | | |
Income From Investment Operations | | | | | | | | | | | | | | | | | | | | |
Net investment income | | | 0.61 | (a) | | | 0.62 | | | | 0.50 | | | | 0.38 | | | | 0.42 | |
Net realized and unrealized gain (loss) of investments | | | (0.15 | ) | | | (0.03 | ) | | | (0.17 | ) | | | 0.41 | | | | 0.99 | |
| | | | | | | | | | | | | | | | | | | | |
Total from investment operations | | | 0.46 | | | | 0.59 | | | | 0.33 | | | | 0.79 | | | | 1.41 | |
| | | | | | | | | | | | | | | | | | | | |
Less Distributions | | | | | | | | | | | | | | | | | | | | |
Distributions from net investment income | | | (0.33 | ) | | | (0.62 | ) | | | (0.39 | ) | | | (0.37 | ) | | | (0.25 | ) |
Distributions from net realized capital gains | | | (0.01 | ) | | | (0.10 | ) | | | (0.26 | ) | | | 0.00 | | | | 0.00 | |
| | | | | | | | | | | | | | | | | | | | |
Total distributions | | | (0.34 | ) | | | (0.72 | ) | | | (0.65 | ) | | | (0.37 | ) | | | (0.25 | ) |
| | | | | | | | | | | | | | | | | | | | |
Net Asset Value, End of Period | | $ | 12.67 | | | $ | 12.55 | | | $ | 12.68 | | | $ | 13.00 | | | $ | 12.58 | |
| | | | | | | | | | | | | | | | | | | | |
Total Return (%) | | | 3.9 | | | | 4.9 | | | | 2.7 | | | | 6.5 | | | | 12.5 | |
Ratio of operating expenses to average net assets (%) | | | 0.81 | | | | 0.87 | | | | 0.90 | | | | 0.92 | | | | 0.96 | |
Ratio of net investment income to average net assets (%) | | | 4.87 | | | | 4.75 | | | | 3.95 | | | | 3.64 | | | | 4.34 | |
Portfolio turnover rate (%) | | | 504 | | | | 700 | | | | 507 | | | | 393 | | | | 329 | |
Net assets, end of period (000) | | $ | 129,394 | | | $ | 137,048 | | | $ | 151,881 | | | $ | 144,605 | | | $ | 96,026 | |
| (a) | Per share amount is based on average shares outstanding during the period. |
See accompanying notes to financial statements.
MSF-19
Metropolitan Series Fund, Inc.
Western Asset Management Strategic Bond Opportunities Portfolio
Notes to Financial Statements—December 31, 2007
Metropolitan Series Fund, Inc. (the “Fund”) is organized as a corporation under the laws of Maryland pursuant to Articles of Incorporation filed on November 23, 1982, as amended, and registered under the Investment Company Act of 1940, as amended (the “1940 Act”), as an open-end investment company. The Fund is a “series” type of mutual fund, which issues separate series of stock. Each series represents an interest in a separate portfolio of Fund investments. The Western Asset Management Strategic Bond Opportunities Portfolio (the “Portfolio”) is a diversified series of the Fund. Shares in the Fund are not offered directly to the general public and are currently available only to separate accounts established by Metropolitan Life Insurance Company (“MetLife”), New England Life Insurance Company, General American Life Insurance Company (“General American”), The MetLife Investors Group of Insurance Companies, MetLife Insurance Company of Connecticut and other affiliated insurance companies (collectively, the “Insurance Companies”), as an investment vehicle for variable life insurance, group annuity or variable annuity products, although the Portfolio is not available to all such separate accounts. The Portfolio’s shares may be divided into different classes. Currently, the classes being offered by the Portfolio are named Class A, Class B and Class E. The classes of the Portfolio’s shares are identical, except that certain additional charges (Rule 12b-1 fees) are made against Class B and Class E shares. Investment income, realized and unrealized capital gains and losses, the common expenses of the Portfolio and certain Portfolio-level expense reductions, if any, are allocated on a pro rata basis to each class based on the relative net assets of each class to the total net assets of the Portfolio.
| 2. | SIGNIFICANT ACCOUNTING POLICIES: |
The preparation of financial statements in conformity with accounting principles generally accepted in the United States of America (“GAAP”) requires management to make estimates and assumptions that affect the reported amounts of assets and liabilities and disclosure of contingent assets and liabilities as of the date of the financial statements and the reported amounts of income and expenses during the reporting period. Actual results could differ from those estimates.
The following is a summary of significant accounting policies consistently followed by the Portfolio in the preparation of its financial statements. The policies are in conformity with GAAP.
Investment Valuation:
Debt securities (other than short term obligations with a remaining maturity of sixty days or less) are valued by independent pricing services selected by the relevant subadviser pursuant to authorization of the Board of Directors of the Fund (the “Board” or “Directors”). Short term obligations with a remaining maturity of sixty days or less are valued at amortized cost which approximates fair market value.
Equity securities traded on a national securities exchange or exchanges are valued at their last sale price on the principal trading market. Equity securities traded on the NASDAQ National Market System are valued at the NASDAQ Official Closing Price (the “NOCP”). The NOCP is the last sale price if it falls between the spread of the last reported bid and asked prices. If the last reported bid and asked prices are above the last reported sale price, the NOCP will be the last reported bid price. If the last reported bid and asked prices are below the last reported sale price, the NOCP will be the last reported asked price. Equity securities traded on a national securities exchange or exchanges or on the NASDAQ National Market System for which there is no reported sale during the day are valued at the last reported bid price. A security that is listed or traded on more than one exchange is valued at the quotation on the exchange determined to be the primary market for that security by the Board or its delegates. If no closing price is available, then such securities are valued by using the last reported bid price. Equity securities traded over-the-counter are valued at the last reported sales price.
If no current market value quotation is readily available or reliable for a portfolio security, fair value will be determined in accordance with procedures established by and under the general supervision of the Board. When the Portfolio uses fair value pricing, it may take into account any factors it deems appropriate. The value of securities used by the Portfolio to calculate its net asset value may differ from quoted or published prices for the same securities. Fair value pricing involves subjective judgments and the fair value determined for a security may be materially different than the value that could be realized upon the sale of that security.
The Portfolio expects to use fair value pricing for securities primarily traded on U.S. exchanges only under very limited circumstances. For example, the Portfolio may use fair value pricing if the exchange on which a security is traded closes early or trading in the security is suspended.
MSF-20
Metropolitan Series Fund, Inc.
Western Asset Management Strategic Bond Opportunities Portfolio
Notes to Financial Statements—December 31, 2007—(Continued)
Securities traded primarily on an exchange outside of the United States which closes before the close of the New York Stock Exchange will be valued at the last sales price on that non-U.S. exchange. Securities traded primarily on an exchange outside of the United States for which there is no reported sale during the day are valued at the mean between the last reported bid and asked prices. However, because most foreign markets close well before the Portfolio values its securities (typically at 4 p.m. Eastern Time), the earlier close of these foreign markets gives rise to the possibility that significant events, including broad market moves, may have occurred after these foreign markets close but before the Portfolio values its securities. To account for this, the Portfolio may frequently value many of its foreign equity securities using fair value prices based on third party vendor modeling tools.
Forward foreign currency exchange contracts are valued based on the mean between closing bid and asked prices of the forward currency contract rates in the London foreign exchange markets on a daily basis as provided by a reliable bank or dealer.
Options, whether on securities, indices, futures contracts, or otherwise, are valued at the last sales price available as of the close of business on the day of valuation or, if there is no such sale price available, at the mean between the bid and asked prices. Options on currencies are valued at the spot price each day.
The value of futures contracts will be the sum of the margin deposit plus or minus the difference between the value of the futures contract on each day the net asset value is calculated and the value on the date the futures contract originated, value being that established on a recognized commodity exchange, or by reference to other customary sources, with gain or loss being realized when the futures contract closes or expires.
Subject to the Board’s oversight, the Board has delegated day-to-day responsibility for valuing Portfolio assets to the subadviser of the Portfolio, who values such assets as described above and operates under procedures approved by the Board.
Investment Transactions and Related Investment Income:
Portfolio security transactions are recorded on the trade date. Dividend income is recorded on the ex-dividend date or, for certain foreign securities, when notified. Interest income, which includes amortization of premium and accretion of discount on debt securities, is recorded on the accrual basis. Realized gains and losses on investments and unrealized appreciation and depreciation are determined on the identified cost basis, which is the same basis used for federal income tax purposes.
Repurchase Agreements:
The Portfolio, through the custodian or a subcustodian, receives delivery of the underlying securities collateralizing repurchase agreements. The Portfolio requires the custodian to take possession, to have legally segregated in the Federal Reserve Book Entry System, or to have segregated within the custodian’s vault, all securities held as collateral for repurchase agreements. It is the Portfolio’s policy that the market value of the collateral be at least equal to 100% of the repurchase price in the case of a repurchase agreement of one-day duration and 102% on all other repurchase agreements. The Portfolio’s subadviser is responsible for determining that the value of the collateral is at all times at least equal to the repurchase price. In connection with transactions in repurchase agreements, if the seller defaults and the value of the collateral declines or if the seller enters an insolvency proceeding, realization of the collateral by the Portfolio may be delayed, limited or wholly denied.
Foreign Currency Translation:
The books and records of the Portfolio are maintained in U.S. dollars. The values of securities, currencies and other assets and liabilities denominated in currencies other than U.S. dollars are translated into U.S. dollars based upon foreign exchange rates prevailing at the end of the period. Purchases and sales of investment securities, income and expenses are translated on the respective dates of such transactions. Since the values of investment securities are presented at the foreign exchange rates prevailing at the end of the period, it is not practical to isolate that portion of the results of operations arising from changes in exchange rates from that portion of the results of operations reflecting fluctuations arising from changes in market prices of the investment securities. Such fluctuations are included in the net realized and unrealized gain or loss on investments.
Net realized foreign exchange gains or losses arise from sales of foreign currency, currency gains or losses realized between the trade and settlement dates on securities transactions, and the difference between the amounts of dividends, interest, and foreign withholding taxes recorded by the Portfolio and the U.S. dollar equivalent of the amounts actually received or paid by the Portfolio. Net unrealized foreign exchange gains and losses arise from changes in the value of assets and liabilities, other than investment securities, resulting from changes in the exchange rate.
MSF-21
Metropolitan Series Fund, Inc.
Western Asset Management Strategic Bond Opportunities Portfolio
Notes to Financial Statements—December 31, 2007—(Continued)
Forward Foreign Currency Exchange Contracts:
The Portfolio may enter into forward foreign currency exchange contracts primarily to hedge against foreign currency exchange rate risks on its non-U.S. dollar denominated investment securities. When entering into a forward currency contract, the Portfolio agrees to receive or deliver a fixed quantity of foreign currency for an agreed-upon price on an agreed future date. These contracts are valued daily and the Portfolio’s net equity therein, representing unrealized gain or loss on the contracts as measured by the difference between the foreign exchange rates at the dates of entry into the contracts and the forward rates at the settlement date, is included in the Statement of Assets and Liabilities. Realized and unrealized gains and losses are included in the Statement of Operations. These instruments involve market and/or credit risk in excess of the amount recognized in the Statement of Assets and Liabilities. Risks arise from the possible inability of counterparties to meet the terms of their contracts and from movement in currency and securities values and interest rates.
Futures Contracts:
The Portfolio may buy and sell futures contracts (on recognized exchanges) as a hedge or to enhance return. Futures contracts are agreements to buy or sell a security, or deliver a final cash settlement price in connection with an index, interest rate, currency, or other contracts not calling for physical delivery, for a set price in the future. The Portfolio must post an amount equal to a portion of the total market value of the futures contract as futures variation margin, which is returned when the Portfolio’s obligations under the contract have been satisfied. From time to time thereafter, the Portfolio may have to post variation margin to maintain this amount as the market value of the contract fluctuates. Risks of entering into futures contracts (and related options) include the possibility that there may be an illiquid market and that a change in the value of the contract or option may not correlate with changes in the value of the underlying securities.
Options:
The Portfolio may use options to hedge against changes in values of securities the Portfolio owns or expects to purchase. Writing puts or buying calls tends to increase the Portfolio’s exposure to the underlying instrument and writing calls or buying puts tends to decrease the Portfolio’s exposure to the underlying instrument, and can be used to hedge other Portfolio investments. For options purchased to hedge the Portfolio’s investments, the potential risk to the Portfolio is that the change in value of options contracts may not correspond to the change in value of the hedged instruments. In addition, losses may arise from changes in the value of the underlying instruments, if there is an illiquid secondary market, or if the counterparty is unable to perform. The maximum loss for purchased options is limited to the premium initially paid for the option. For options written by the Portfolio, the maximum loss is not limited to the premium initially received for the option.
The main risk associated with purchasing an option is that the option expires without being exercised. In this case, the option expires worthless and the premium paid for the option is considered the loss. The risk associated with writing a call option is that the Portfolio may forgo the opportunity for a profit if the market value of the underlying position increases and the option is exercised. The risk in writing a put option is that the Portfolio may incur a loss if the market value of the underlying position decreases and the option is exercised. In addition, the Portfolio risks not being able to enter into a closing transaction for the written option as the result of an illiquid market.
Mortgage Dollar Rolls:
The Portfolio may enter into mortgage “dollar rolls” in which a Portfolio sells mortgage-backed securities for delivery in the current month and simultaneously contracts to repurchase substantially similar (same type, coupon and maturity) securities on a specified future date. Dollar rolls are accounted for as purchase and sale transactions; gain/loss is recognized at the end of the term of the dollar roll. The average monthly balance of dollar rolls outstanding during the year ended December 31, 2007 was $643,425,694 for the Portfolio.
A Portfolio that enters into mortgage dollar rolls is subject to the risk that the market value of the securities the Portfolio is obligated to repurchase under the agreement may decline below the repurchase price. In the event the buyer of securities under a mortgage dollar roll files for bankruptcy or becomes insolvent, the Portfolio’s use of proceeds from the dollar roll may be restricted pending a court determination, a determination by the other party, or its trustee or receiver, whether to enforce the Portfolio’s obligation to repurchase the securities.
MSF-22
Metropolitan Series Fund, Inc.
Western Asset Management Strategic Bond Opportunities Portfolio
Notes to Financial Statements—December 31, 2007—(Continued)
“When-Issued” Securities:
Purchasing securities “when-issued” is a forward commitment by the Portfolio to buy a security. The estimated amount of the Portfolio’s payment obligation and the security’s interest rate are determined when the commitment is made, even though no interest accrues until the security is issued, which is generally 15 to 120 days later. The Portfolio will segregate liquid assets with its custodian sufficient at all times to satisfy these commitments. If the value of the security is less when delivered than when the commitment was made, the Portfolio will suffer a loss.
Credit and Market Risk:
The Portfolio may invest in high yield instruments that are subject to certain credit and market risks. The yields of high yield instruments reflect, among other things, perceived credit risk. The Portfolio’s investments in securities rated below investment grade typically involve risks not associated with higher rated securities including, among others, greater risk related to timely and ultimate payment of interest and principal, greater market price volatility and less liquid secondary market trading.
Credit Risk:
The Portfolio invests a significant portion of its assets in securities of issuers that hold mortgage and asset backed securities and direct investments in securities backed by commercial and residential mortgage loans and other financial assets. The value and related income of these securities are sensitive to changes in economic conditions, including delinquencies and/or defaults. Continuing shifts in the market’s perception of credit quality on securities backed by commercial and residential mortgage loans and other financial assets may result in increased volatility of market price and periods of illiquidity that can negatively impact the valuation of certain issuers held by the Portfolio. At December 31, 2007, the Portfolio held securities of issuers that hold mortgage and asset backed securities and direct investments in mortgage and asset backed securities with an aggregate value of $277,151,003 (representing 26.0% of the Portfolio’s total assets).
Federal Income Taxes:
It is the Portfolio’s policy to comply with the requirements of the Internal Revenue Code of 1986, as amended, and regulations thereunder, applicable to regulated investment companies and to distribute all of its taxable income to shareholders. Therefore, no federal income tax provision is required.
As of December 31, 2007, the Portfolio had no capital loss carryovers.
The tax character of distributions paid for the periods ended December 31, 2007 and 2006 was as follows:
| | | | | | | | | | | | | | | |
| Ordinary Income | | Long Term Gain | | Return of Capital | | Total |
| 2007 | | 2006 | | 2007 | | 2006 | | 2007 | | 2006 | | 2007 | | 2006 |
| $21,761,307 | | $ | 29,358,699 | | $— | | $2,232,446 | | $— | | $— | | $21,761,307 | | $31,591,145 |
As of December 31, 2007, the components of distributable earnings (accumulated losses) on a federal income tax basis were as follows:
| | | | | | | | | | | | | |
Undistributed
Ordinary
Income | | Undistributed
Long Term
Gain | | Unrealized
Depreciation | | | Loss
Carryforwards | | Total |
| $45,540,754 | | $ | 1,845,715 | | $ | (17,371,693 | ) | | $ | — | | $ | 30,014,776 |
Dividends and Distributions to Shareholders:
The Portfolio records dividends and distributions on the ex-dividend date. Net realized gains from security transactions (if any) are generally distributed annually to shareholders. The timing and characterization of certain income and capital gains distributions are determined in accordance with federal tax regulations that may differ from GAAP. Permanent book and tax basis differences relating to shareholder distributions will result in reclassification between under/over distributed net investment income, accumulated net realized gains/losses and paid in capital.
MSF-23
Metropolitan Series Fund, Inc.
Western Asset Management Strategic Bond Opportunities Portfolio
Notes to Financial Statements—December 31, 2007—(Continued)
| 3. | INVESTMENT TRANSACTIONS: |
For the year ended December 31, 2007, purchases and sales of securities (excluding short term investments) for the Portfolio were as follows:
| | | | | | | | | |
| Purchases | | Sales |
U.S. Government | | Other | | U.S. Government | | Other |
| $4,683,594,092 | | $ | 301,311,308 | | $ | 4,572,499,566 | | $ | 72,425,291 |
Options Written:
The Portfolio transactions in options written during the year ended December 31, 2007 were as follows:
| | | | | | | |
Call Options | | Number of
contracts | | | Premiums
received | |
Options outstanding December 31, 2006 | | 177 | | | $ | 47,662 | |
Options written | | 1,155 | | | | 492,607 | |
Options closed | | (431 | ) | | | (104,907 | ) |
Options expired | | (525 | ) | | | (164,648 | ) |
| | | | | | | |
Options outstanding December 31, 2007 | | 376 | | | $ | 270,714 | |
| | | | | | | |
| | | | | | | |
Put Options | | Number of
contracts | | | Premiums
received | |
Options outstanding December 31, 2006 | | 351 | | | $ | 105,964 | |
Options written | | 1,757 | | | | 841,183 | |
Options closed | | (1,783 | ) | | | (681,241 | ) |
Options expired | | 0 | | | | 0 | |
| | | | | | | |
Options outstanding December 31, 2007 | | 325 | | | $ | 265,906 | |
| | | | | | | |
| 4. | INVESTMENT MANAGEMENT FEES AND OTHER TRANSACTIONS WITH AFFILIATES: |
Investment Management Agreement:
MetLife Advisers, LLC (“MetLife Advisers”) is the investment adviser to the Portfolio. The Fund has entered into an investment management agreement with MetLife Advisers with respect to the Portfolio. For providing investment management services to the Portfolio, MetLife Advisers receives monthly compensation at the following annual rates:
| | | | | | |
| | | Management
Fees earned by
MetLife Advisers
for the year ended
December 31, 2007 | | Annual
percentage
rates paid to
MetLife Advisers | | Based on Portfolios
average daily net asset levels |
| | $5,212,322 | | 0.650% | | Of the first $500 million |
| | | | 0.550% | | On amounts in excess of $500 million |
Certain officers and directors of the Fund may also be officers of MetLife Advisers; however, such officers and directors receive no compensation from the Fund.
MetLife Advisers has entered into an investment subadvisory agreement with respect to the Portfolio. Western Asset Management Co. is compensated by MetLife Advisers to provide subadvisory services for the Portfolio.
Service and Distribution Fees:
The Fund has adopted a Distribution and Service Plan under Rule 12b-1 of the 1940 Act for the Portfolio’s Class B and E shares. Under the Distribution and Service Plan, the Class B and E shares of the Portfolio pay a fee to compensate the Insurance Companies (or their affiliates) and other broker-dealers and financial intermediaries involved in the offer and sale of Portfolio shares for promoting or selling and servicing, the Class B and E shares. The fees under the Distribution and Service Plan for each class of the Portfolio’s shares are calculated as a percentage of the Portfolio’s average daily net assets that are attributable to
MSF-24
Metropolitan Series Fund, Inc.
Western Asset Management Strategic Bond Opportunities Portfolio
Notes to Financial Statements—December 31, 2007—(Continued)
that Class. Currently, the fee is 0.25% per year for Class B shares and 0.15% per year for Class E shares. Amounts paid by the Portfolio for the year ended December 31, 2007 are shown as Service and Distribution fees in the Statement of Operations.
The Fund has entered into a securities lending arrangement with the Fund’s custodian, State Street Bank and Trust Company (the “custodian”). Under the agreement, the custodian is authorized to loan securities on the Portfolios’ behalf. In exchange, the Portfolio receives either cash or securities as collateral against the loaned securities. The Portfolio receives collateral at least equal to 102% of the market value of the loaned securities (105% for foreign securities), at each loan’s inception. Collateral must be maintained at least at 100% of the market value of the loaned securities for the duration of the loan. The cash collateral is invested in the Navigator Securities Lending Prime Portfolio, an affiliate of the custodian, which invests in a variety of high quality U.S. dollar-denominated instruments. If the market value of the collateral at the close of trading on a business day is less than 100% of the market value of the loaned securities at the close of trading on that day, the borrower shall be required to deliver, by the close of business on the following business day, an additional amount of collateral, equal to at least 100% of the market value of all the loaned securities as of such preceding day. The Portfolio receives 80% of the annual net income from securities lending transactions, which is included in interest income of the Portfolio. The remaining 20% is paid to the custodian as compensation for its securities lending services. The Portfolio bears the risk of any deficiency in the amount of collateral available for return to a borrower due to a loss in an approved investment. Any outstanding loans by the Portfolio at December 31, 2007 are footnoted in the Schedule of Investments.
As previously reported, in May 2004, General American received a Wells Notice stating that the SEC staff was considering recommending that the SEC bring a civil action alleging violations of the U.S. securities laws against General American with respect to market timing and late trading in a limited number of privately-placed variable insurance contracts that were sold through General American. General American responded to the SEC staff and cooperated with the investigation. On August 9, 2007, the SEC announced that it had settled an enforcement action regarding late trading against General American with, among other things, General American agreeing to pay a civil penalty and to comply with certain undertakings. General American consented to the SEC’s order without admitting or denying the findings. MetLife Advisers has also advised the Fund’s Board of Directors that, while certain exceptions to the Fund’s policies have been noted, no situations have been identified that would have a material impact on the financial position of the Fund.
| 7. | RECENT ACCOUNTING PRONOUNCEMENTS: |
Effective June 29, 2007, the Fund implemented Financial Accounting Standards Board (“FASB”) Interpretation No. 48, “Accounting for Uncertainty in Income Taxes - an interpretation of FASB Statement No. 109” (“FIN 48”). FIN 48 prescribes the minimum recognition threshold a tax position must meet in connection with accounting for uncertainties in income tax positions taken or expected to be taken by an entity, including investment companies, before being measured and recognized in the financial statements. Management has evaluated the application of FIN 48 to the Fund, and has determined that the adoption of FIN 48 does not have a material impact on the Fund’s financial statements. The Fund files U.S. tax returns. No income tax returns are currently under examination. The statute of limitations on the Fund’s tax returns remains open for the years ended December 31, 2004 through December 31, 2006.
In September 2006, Statement of Financial Accounting Standards No. 157, Fair Value Measurements (SFAS 157) was issued and is effective for fiscal years beginning after November 15, 2007. SFAS 157 defines fair value, establishes a framework for measuring fair value and expands disclosures about fair value measurements. Management is currently evaluating the impact the adoption of SFAS 157 will have on the Portfolio’s financial statement disclosures.
MSF-25
Metropolitan Series Fund, Inc.
Western Asset Management Strategic Bond Opportunities Portfolio
Report of Independent Registered Public Accounting Firm
To the Shareholders and Board of Directors of the Metropolitan Series Fund, Inc.:
We have audited the accompanying statement of assets and liabilities, including the schedule of investments, of the Western Asset Management Strategic Bond Opportunities Portfolio, one of the portfolios constituting the Metropolitan Series Fund, Inc. (the “Fund”) as of December 31, 2007, and the related statement of operations for the year then ended, the statements of changes in net assets for each of the two years in the period then ended, and the financial highlights for each of the five years in the period then ended. These financial statements and financial highlights are the responsibility of the Fund’s management. Our responsibility is to express an opinion on these financial statements and financial highlights based on our audits.
We conducted our audits in accordance with the standards of the Public Company Accounting Oversight Board (United States). Those standards require that we plan and perform the audit to obtain reasonable assurance about whether the financial statements and financial highlights are free of material misstatement. The Fund is not required to have, nor were we engaged to perform, an audit of its internal control over financial reporting. Our audits included consideration of internal control over financial reporting as a basis for designing audit procedures that are appropriate in the circumstances, but not for the purpose of expressing an opinion on the effectiveness of the Fund’s internal control over financial reporting. Accordingly, we express no such opinion. An audit also includes examining, on a test basis, evidence supporting the amounts and disclosures in the financial statements, assessing the accounting principles used and significant estimates made by management, as well as evaluating the overall financial statement presentation. Our procedures included confirmation of securities owned as of December 31, 2007, by correspondence with the custodian and brokers; where replies were not received from brokers, we performed other auditing procedures. We believe that our audits provide a reasonable basis for our opinion.
In our opinion, the financial statements and financial highlights referred to above present fairly, in all material respects, the financial position of the Western Asset Management Strategic Bond Opportunities Portfolio of the Metropolitan Series Fund, Inc. as of December 31, 2007, the results of its operations for the year then ended, the changes in its net assets for each of the two years in the period then ended, and the financial highlights for each of the five years in the period then ended, in conformity with accounting principles generally accepted in the United States of America.
Deloitte & Touche LLP
Boston, Massachusetts
February 28, 2008
MSF-26
Metropolitan Series Fund, Inc.
Directors and Officers
The Fund’s Directors review actions of the Fund’s investment adviser and subadvisers, and decide upon matters of general policy. The Fund’s officers supervise the daily business operations of the Fund. The Board of Directors and the Fund’s officers are listed below. Each Director is responsible for overseeing all 36 Portfolios of the Fund. There is no limit to the term a Director may serve. Directors serve until their resignation, retirement or removal in accordance with the Fund’s organizational documents and policies adopted by the Board from time to time. Officers hold office at the pleasure of the Board or until the election or appointment and the qualification of a successor. The address of the directors and officers is c/o Metropolitan Series Fund, Inc., 501 Boylston Street, Boston, MA 02116.
Interested Directors(1)
Each Director below is an “interested person” (as defined by the 1940 Act) with respect to the Fund in that Ms. Forget is an employee of MetLife and Mr. Typermass is a former employee of MetLife and owns securities issued by MetLife, Inc., the ultimate parent company of MetLife Advisers.
| | | | | | | | |
Name, Address and Age | | Current
position(s)
with Fund | | Position(s)
held since | | Principal occupations
over past five years, including other directorships(2) | | Number of
Portfolios in
Fund Complex
Overseen by
Director(3) |
Elizabeth M. Forget Age: 41 | | Director, Chairman of the Board, President and Chief Executive Officer | | 2006 | | Senior Vice President (since 2007), MetLife, Inc.; President, Met Investors Advisory, LLC (“MIA”); Trustee and President, Met Investors Series Trust (“MIST”); Executive Vice President, MetLife Investors Group, Inc.; President (since 2006), MetLife Advisers. | | 81 |
| | | | |
Arthur G. Typermass Age: 70 | | Director | | 1998 | | Formerly, Senior Vice President and Treasurer, MetLife. | | 37 |
Non-Interested Directors(1)
Each Director below is not an “interested person” (as defined by the 1940 Act) with respect to the Fund (collectively, the “Independent Directors”).
| | | | | | | | |
Name, Address and Age | | Current
position(s)
with Fund | | Position(s)
held since | | Principal occupations
over past five years, including other directorships(2) | | Number of
Portfolios in
Fund Complex
Overseen by
Director(3) |
Steve A. Garban† Age: 70 | | Director | | 1985 | | Formerly, Chief Financial Officer, Senior Vice President Finance and Operations and Treasurer (Emeritus), The Pennsylvania State University. | | 37 |
| | | | |
Linda B. Strumpf Age: 60 | | Director | | 2000 | | Vice President and Chief Investment Officer, Ford Foundation. | | 37 |
| | | | |
Michael S. Scott Morton† Age: 70 | | Director | | 1993 | | Jay W. Forrester Professor of Management (Emeritus) at Sloan School of Management, MIT. | | 37 |
| | | | |
H. Jesse Arnelle Age: 74 | | Director | | 2001 | | Formerly, Counsel, Womble Carlyle Sandrie & Rice; Director, Textron Inc. (global multi-industry company)*; formerly, Director, Gannet Co. Inc. (diversified news and information company)*; formerly, Director, Eastman Chemical Company (global chemical company)*; formerly, Director, Waste Management, Inc.*; formerly, Director, Armstrong Holdings Inc. (parent company of floor and ceiling products business)*; formerly, Director, FPL Group Inc. (public utility holding company)*; Director, URS Corporation (engineering design services firm)*. | | 37 |
| | | | |
Nancy Hawthorne Age: 56 | | Director | | 2003 | | Director, Avid Technologies (computer software company)*; formerly, Chairman of the Board of Avid Technologies; formerly, Board of Advisors, L. Knife & Sons, Inc. (beverage distributor); Chief Executive Officer, Clerestory LLC (corporate financial advisor); formerly, Trustee, New England Zenith Fund (“Zenith Fund”)**; formerly, Chief Executive Officer and Managing Partner, Hawthorne, Krauss and Associates (corporate financial advisor); formerly, Chief Financial Officer and Executive Vice President, Continental Cablevision, subsequently renamed MediaOne (cable television company); formerly, Director, Life F/X, Inc.; formerly, Chairman of the Board, WorldClinic (distance medicine company); formerly, Director, Perini Corporation (construction company)*; formerly, Director, CGU (property and casualty insurance company); formerly, Director, Beacon Power Corporation (energy company )*. | | 37 |
MSF-27
Metropolitan Series Fund, Inc.
Directors and Officers—(Continued)
| | | | | | | | |
Name, Address and Age | | Current
position(s)
with Fund | | Position(s)
held since | | Principal occupations
over past five years, including other directorships(2) | | Number of
Portfolios in
Fund Complex
Overseen by
Director(3) |
John T. Ludes Age: 71 | | Director | | 2003 | | President, LFP Properties (consulting firm); Formerly, Trustee, Zenith Fund**; formerly, Vice Chairman, President and Chief Operating Officer, Fortune Brands/American Brands (global conglomerate); formerly, President and CEO, Acushnet Company (athletic equipment company). | | 37 |
Officers(1)
| | | | | | | | |
Name and address | | Age | | Current
position(s)
with Fund | | Position(s)
held since | | Principal occupations over past five years(2) |
| Jeffrey P. Halperin | | 40 | | Chief Compliance Officer | | 2006 | | Vice President (since 2006), Corporate Ethics and Compliance Department, MetLife, Inc.; Chief Compliance Officer (since 2006), MetLife Advisers, MIA and MIST. |
| | | | |
| John F. Guthrie, Jr. | | 64 | | Senior Vice President | | 2002 | | Manager and Senior Vice President, MetLife Advisers; Vice President, MetLife; Vice President (since 2003), MetLife Group, Inc.; Vice President, NELICO; Vice President (since 2005), MIA; formerly, Senior Vice President, Zenith Fund**. |
| | | | |
| Alan C. Leland | | 55 | | Senior Vice President | | 2005 | | Treasurer and Chief Financial Officer, MetLife Advisers, LLC; Treasurer (since 2005), Met Investors Advisory, LLC; Vice President (since 2004), MIA; Vice President (since 2003), MetLife Group, Inc.; Vice President, MetLife; Senior Vice President, NELICO |
| | | | |
| Peter Duffy | | 52 | | Vice President and Treasurer | | 2000 | | Senior Vice President, MetLife Advisers (since 1998); Second Vice President (since 2003), NELICO; Vice President, MetLife (since 2004); Vice President (since 2004), MetLife Group, Inc.; formerly, Vice President and Treasurer, Zenith Fund**. |
| | | | |
| Thomas M. Lenz | | 49 | | Vice President and Secretary | | 2002 | | General Counsel and Secretary, MetLife Advisers; Assistant General Counsel, MetLife; formerly, Vice President and Secretary, Zenith Fund**. |
| * | Indicates a directorship with a registered investment company or a company subject to the reporting requirements of the Securities Exchange Act of 1934, as amended. |
| ** | The Zenith Fund deregistered with the Securities and Exchange Commission (“SEC”) in 2004. |
| (†) | Served as a trustee, director and/or officer of one or more of the following companies, each of which had a direct or indirect advisory relationship with MetLife Advisers or its affiliates prior to January 31, 2005: State Street Research Financial Trust, State Street Research Income Trust, State Street Research Money Market Trust, State Street Research Institutional Funds, State Street Research Capital Trust, State Street Research Master Investment Trust, State Street Research Equity Trust, State Street Research Securities Trust and State Street Research Exchange Trust (collectively, the “State Street Research Funds”). |
| (1) | Each Director of the Fund also serves as trustee of Metropolitan Series Fund II (“Met Series Fund II”), a registered investment company advised by MetLife Advisers. Each officer of the Fund serves in the same position with Met Series Fund II, which consists of one portfolio. |
| (2) | Previous positions during the past five years with the Fund, MIST, MetLife, MetLife Advisers, MIA, Zenith Fund, NELICO or New England Securities Corporation are omitted if not materially different. |
| (3) | The Fund Complex includes the Fund (36 portfolios), Met Series Fund II (1 portfolio) and MIST (44 portfolios) |
MSF-28
Metropolitan Series Fund, Inc.
Western Asset Management Strategic Bond Opportunities Portfolio
Board Approval of Advisory and Subadvisory Agreements
The Fund’s Contract Review Committees of the Board of Directors (the “Board”) typically meet in early fall to review the Portfolios’ advisory agreements (the “Advisory Agreements”) and subadvisory agreements (collectively, the “Subadvisory Agreements,” and, together with the Advisory Agreements, the “Agreements”) and determine whether to recommend that the full Board approve the continuation of the Agreements for an additional one-year period. (Following the initial approval of an Agreement for a new Portfolio or with a new adviser or subadviser, such annual reviews are not required until 2 years following the execution of such Agreement.) After each Committee has made its recommendations, the full Board, including the Independent Directors, determines whether to approve the continuation of each of the Agreements. In addition, the Board, including the Independent Directors, considers matters bearing on the Agreements at most of its other meetings throughout the year and regularly interviews various individuals at MetLife Advisers responsible for the management of the Portfolios. The Directors also interview selected investment managers and other professionals at the subadvisers at various times throughout the year.
The Directors receive all materials that they or MetLife Advisers, the Fund’s investment adviser, and the subadvisers believe to be reasonably necessary for the Directors to evaluate the Agreements and determine whether to approve the continuation of the Agreements. These materials generally include, among other items, (i) information on the investment performance of the Portfolios and the performance of peer groups of funds and the Portfolios’ performance benchmarks, (ii) information on the Portfolios’ advisory and subadvisory fees and other expenses, including information comparing the Portfolios’ expenses to those of peer groups of funds and information about any applicable expense caps and fee “breakpoints,” (iii) sales and redemption data, (iv) information related to the profitability of the Agreements to MetLife Advisers and the subadvisers, and potential “fall-out” or ancillary benefits that MetLife Advisers, the subadvisers or their affiliates may receive as a result of their relationships with the Fund and (v) information obtained through the subadvisers’ responses to certain requests from MetLife Advisers and the Directors and MetLife Advisers’ responses to requests from the Directors. The Directors may also consider other information such as (vi) MetLife Advisers’ and the subadvisers’ financial results and condition, (vii) each Portfolio’s investment objectives and strategies and the size, education and experience of the investment staffs of MetLife Advisers and the relevant subadvisers and their use of technology and external research, (viii) the allocation of the Portfolios’ brokerage, if any, including allocations to brokers affiliated with the subadvisers and the use of “soft” commission dollars to pay Portfolio expenses and to pay for research and other similar services, (ix) the resources devoted to, and the record of compliance with, the Portfolios’ investment policies and restrictions, policies on personal securities transactions and other compliance policies, (x) the responses of MetLife Advisers, the subadvisers and/or their affiliates to certain legal and regulatory proceedings and (xi) the economic outlook generally and for the mutual fund industry in particular. Throughout the process, the Directors have the opportunity to ask questions of and request additional materials from MetLife Advisers and the subadvisers.
Following meetings of each Contract Review Committee on September 12, 2007, the Board, at its November 15, 2007 meeting, approved the continuation through December 31, 2008 of the Advisory Agreements for each Portfolio of the Fund and the Subadvisory Agreements for each Portfolio of the Fund. The Agreements approved for continuation are referred to below as the “Continued Agreements.”
In considering whether to approve the continuation of the Continued Agreements, the Directors, including the Independent Directors, did not identify any single factor as determinative, and each weighed the various factors as he or she deemed appropriate. The Directors considered the following matters in connection with their approval of the Continued Agreements:
The nature, extent and quality of the services provided to the relevant Portfolios under the Continued Agreements. The Directors considered the nature, extent and quality of the services provided by MetLife Advisers, the relevant subadvisers (if any) and their affiliates (each, an “Adviser,” and, collectively, the “Advisers”) to the relevant Portfolios pursuant to the Continued Agreements and the resources dedicated to these Portfolios by the Advisers. In particular, the Directors considered the Advisers’ abilities to attract and retain highly qualified investment professionals. With respect to MetLife Advisers, the Directors considered that MetLife Advisers is (i) ultimately responsible for the performance of such Portfolios; (ii) ultimately responsible for the establishment of the investment strategies of each such Portfolio, primarily through its recommendations to the Board regarding the hiring and selection of subadvisers; (iii) responsible for the hiring and selection, subject to Board approval, of subadvisers; and (iv) responsible for maintaining a program of Subadviser oversight reasonably designed to ensure that the subadvisers have reasonable compliance policies and procedures in place. The Directors also considered that MetLife Advisers provides a full range of day-to-day administrative services for the Portfolios involving all aspects of such Portfolios’ day-to-day operations (other than portfolio management). After reviewing these and related factors, the Directors concluded, within the context of their overall conclusions regarding each of the Continued Agreements, that the nature, extent and quality of services provided supported the renewal of these Agreements.
Investment performance of the relevant Portfolios. The Directors reviewed information about the performance of the relevant Portfolios over various time periods, including information prepared by an independent third party that compared the performance of
MSF-29
Metropolitan Series Fund, Inc.
Western Asset Management Strategic Bond Opportunities Portfolio
Board Approval of Advisory and Subadvisory Agreements—(Continued)
the Portfolios to the performance of peer groups of funds and performance benchmarks. The Directors also reviewed a description of the third party’s methodology for identifying a Portfolio’s peer group(s) for purposes of performance and expense comparisons.
In the case of each relevant Portfolio that had performance that lagged its peer group(s) for certain periods, the Directors concluded that other factors relevant to performance were sufficient, in light of other considerations, to warrant renewal of the Continued Agreements relating to such Portfolio. These factors varied from Portfolio to Portfolio, but included one or more of the following: (i) that such Portfolio’s performance, although lagging in certain recent periods, was stronger over the longer term; (ii) that the underperformance was attributable, to a significant extent, to investment decisions that were reasonable and consistent with the Portfolio’s investment objective(s) and policies and that the Portfolio was performing within the range of reasonable expectations, given market conditions and the Portfolio’s investment objective(s) and policies; (iii) that the Portfolio’s performance was competitive when compared to other relevant performance benchmarks or peer groups; and (iv) that MetLife Advisers and/or the relevant subadviser (if any) had taken or was taking steps designed to help improve the Portfolio’s investment performance.
The Directors also considered the investment performance of the Advisers and their reputations generally, the historical responsiveness of the Advisers to Director concerns about performance and the willingness of the Advisers to take steps intended to improve performance.
After reviewing these and related factors, the Directors concluded, within the context of their overall conclusions regarding each of the Continued Agreements, that the investment performance of each relevant Portfolio and Adviser was sufficient, in light of other considerations, to warrant the renewal of the Continued Agreements.
The costs of the services to be provided and profits to be realized by the Advisers and their affiliates from their relationships with the Portfolios. The Directors considered the fees charged by MetLife Advisers to the Portfolios for advisory services and, with respect to the subadvised Portfolios, by such subadvisers to MetLife Advisers for subadvisory services (such advisory and subadvisory fees (if any), collectively, “Fees”), as well as the total expense levels of the Portfolios. This information included comparisons (provided by an independent third party) of the Portfolios’ advisory fees and total expense levels to those of their peer groups. In evaluating Fees for the relevant Portfolios, the Directors also took into account the demands, complexity and quality of the investment management services provided to each Portfolio. The Directors considered MetLife Advisers’ recommendations regarding reductions in Fee rates, implementation of Fee breakpoints and institution of Fee waivers and expense caps.
The Directors also considered the compensation directly or indirectly received by the Advisers and their affiliates from their relationships with the relevant Portfolios. The Directors reviewed information relating to the profits received by MetLife Advisers, certain of the subadvisers and their affiliates as a result of their relationships with the relevant Portfolios, and information about the allocation of expenses used to calculate profitability. When reviewing profitability, the Directors also considered the performance of the relevant Portfolios, the expense levels of such Portfolios and whether the relevant Advisers had implemented breakpoints, fee waivers and/or expense caps with respect to such Portfolios.
After reviewing these and related factors, the Directors concluded, within the context of their overall conclusions regarding each of the Continued Agreements, that the Fees charged to each of the relevant Portfolios were fair and reasonable, and that the information provided regarding costs of these services generally, and the related profitability (if known) to the relevant Advisers of their relationships with the relevant Portfolios, supported the renewal of the Continued Agreements.
Economies of Scale. The Directors considered the existence of any economies of scale in the provision of services by the Advisers and whether those economies were shared with the relevant Portfolios through breakpoints in their advisory fees or other means, such as expense caps, fee waivers or relatively low levels of fees. The Directors noted that most of the relevant Portfolios benefited or will benefit from breakpoints, expense caps and/or fee waivers with respect to their advisory fees. In considering these issues, the Directors also took into consideration information relating to the costs of the services provided and the profitability to MetLife Advisers, the relevant subadvisers (if any) and each of their affiliates of their relationships with the relevant Portfolios, as discussed above.
After reviewing these and related factors, the Directors concluded, within the context of their overall conclusions regarding each of the Continued Agreements, that the extent to which economies of scale were shared with the relevant Portfolios supported the renewal of such Agreements.
Other Factors. The Directors also considered other factors, which included but were not limited to the following:
| | • | | the extent to which each relevant Portfolio operated in accordance with its investment objective, and its record of compliance with its investment restrictions and the compliance programs of the Fund and the Advisers. They also considered the compliance-related resources the Advisers and their affiliates provide to the relevant Portfolios; |
MSF-30
Metropolitan Series Fund, Inc.
Western Asset Management Strategic Bond Opportunities Portfolio
Board Approval of Advisory and Subadvisory Agreements—(Continued)
| | • | | the nature, quality, cost and extent of administrative and shareholder services performed by MetLife Advisers and its affiliates under the Advisory Agreements; and |
| | • | | so-called “fall-out benefits” to the Advisers, such as the engagement of their affiliates to provide distribution, brokerage and transfer agency services to the Portfolios, and the benefits of research made available to the relevant Advisers by reason of brokerage commissions generated by the relevant Portfolios’ securities transactions. The Directors also considered the possible conflicts of interest associated with these fall-out and other benefits, and the reporting and other processes in place to disclose and monitor these possible conflicts of interest. |
Based on their evaluation of all factors that they deemed to be material, including those factors described above, and assisted by the advice of independent counsel, the Directors, including the Independent Directors, concluded that each of the Continued Agreements should be continued through December 31, 2008.
MSF-31
A description of the policies and procedures that the Fund uses to determine how to vote proxies relating to portfolio securities is available (i) without charge, upon request, by calling (800) 638-7732 and (ii) on the Securities and Exchange Commission’s (the “SEC”) website at http://www.sec.gov.
Information regarding how the Fund voted proxies relating to portfolio securities during the most recent twelve-month period ended December 31, 2007 is available (i) without charge, upon request, by calling (800) 638-7732 and (ii) on the SEC’s website at http://www.sec.gov.
The Fund files with the SEC a complete schedule of its portfolio holdings, as of the close of the first and third quarters of its fiscal year, on “Form N-Q”. These filings are available on the SEC’s website at www.sec.gov and may be reviewed and copied at the SEC’s Public Reference Room in Washington, DC. (Call 1-800-SEC-0330 for information on the operation of the Public Reference Room.)
MSF-32
| | |
Metropolitan Series Fund, Inc. Western Asset Management U.S.
Government Portfolio Annual Report | | December 31, 2007 |
Letter from the President
February 1, 2008
Letter to Policy Holders:
2007 was a tumultuous year in the financial markets driven by concerns in the credit markets surrounding sub-prime mortgages and fears of recession in the U.S. Economy. The broad markets were mixed, with the Dow Jones Industrial Average up 8.9% and the MSCI EAFE Index, which measures the performance of international equities, up 11.2% for the year, while the Russell 2000 Index, which measures the performance of small capitalization stocks, was down 1.6%.
In the fixed income markets, credit spreads increased as a result of the pressure from sub-prime mortgage crisis and the Federal Reserve lowered interest rates by a total of 1% during the year. The Lehman Brothers Aggregate Bond Index posted a 7.0% return for the year.
On the following pages, you will find a complete review of your Portfolio and its investment performance.
MetLife is committed to building your financial freedom. We appreciate your trust and will continue to focus our efforts on meeting your investment needs.
Sincerely,
Elizabeth Forget
President, Metropolitan Series Fund, Inc.
Metropolitan Series Fund, Inc.
Western Asset Management U.S. Government Portfolio
Managed by Western Asset Management Company
Portfolio Manager Commentary*
PORTFOLIO PERFORMANCE
For the year ended December 31, 2007, the Class A shares of the Western Asset Management U.S. Government Portfolio returned 4.4%, compared to its benchmark, the Lehman Brothers Intermediate Government Bond Index1, which returned 8.5%. The average return of its peer group, a universe of short-term and intermediate term government bond funds (mutual and variable) tracked by Morningstar, was 6.0% over the same period.
PORTFOLIO REVIEW
The last six months of 2007 largely defined the year as a whole: crisis in the fixed-income markets. The TED spread, a measure of systemic risk, rose four-fold. Since June 30, the yield on the two-year Treasury declined 181 basis points (1.81%), driving a powerful rally in the Treasury market. Investors began to suspect that the Federal Reserve had reached the end of its tightening cycle and would need to begin easing (lowering) interest rates. These expectations were subsequently validated by the Fed’s decision to cut the funds rate by a total of 100 basis points, or 1.00%, at the final three FOMC meetings of the year. Short-term interest rates fell especially sharply—partly a result of the flight to quality—though long-term rates declined as well. Core inflation measures were tame, but the Fed showed signs of hesitation in the use of monetary stimulus as headline measures of prices such as the Consumer Price Index (CPI) remained uncomfortably high. Home prices declined and housing market indicators deteriorated markedly as the year progressed. Despite the ongoing weakness in residential construction and the collapse of the subprime lending market, economic growth picked up in the second and third quarters, thanks largely to a boom in nonresidential construction and net exports. Credit spreads widened significantly with most of the losses coming in the second half of the year. Rising uncertainty over the degree of subprime losses forced swap spreads sharply higher, negatively affecting mortgage-backed securities. Treasury Inflation Protected Securities or TIPS outperformed their nominal counterparts on strong CPI accretion and a decline in real yields.
In 2007, the Portfolio trailed its benchmark, the Lehman Brothers Intermediate Government Bond Index. Overweight exposure to the agency mortgage-backed sector detracted significantly from returns as spreads widened and volatility surged. More importantly, non-agency mortgage-backed securities traded poorly given fears of higher delinquencies and losses on the part of homeowners. On the positive side, a tactically driven duration posture contributed modestly to returns as bond yields oscillated in a relatively flat trend during the period. A curve-steepening strategy had a positive impact on performance as the spread between the two- and ten-year yields widened in the latter part of the period.
* The views expressed above are those of the subadvisory firm as of December 31, 2007 and are subject to change based on market and other conditions. Information about the Portfolio’s holdings, asset allocation, industry allocation, or country diversification is historical and is not an indication of future Portfolio composition, which will vary. The performance of any index mentioned in this commentary has not been adjusted for ongoing management, distribution and operating expenses, and sales charges applicable to mutual fund investments. Direct investment in the Index is not possible.
1 The Lehman Brothers Intermediate Government Bond Index® includes most obligations of the U.S. Treasury, agencies and quasi-federal corporations having maturities between one to ten years.
MSF-2
Metropolitan Series Fund, Inc.
Western Asset Management U.S. Government Portfolio
A $10,000 INVESTMENT COMPARED TO
THE LEHMAN BROTHERS INTERMEDIATE
U.S. GOVERNMENT BOND INDEX
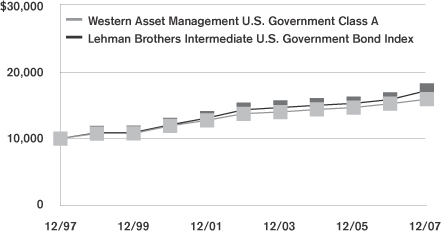
Average Annual Returns as of December 31, 2007
| | | | | | | | | | | | |
| | | Western Asset Management
U.S. Government Portfolio | | | Lehman Brothers
Intermediate U.S.
Government Bond Index | |
| | | Class A | | | Class B | | | Class E | | |
| 1 Year | | 4.4 | % | | 4.0 | % | | 4.1 | % | | 8.5 | % |
| 5 Year | | 3.0 | | | 2.7 | | | 2.8 | | | 3.7 | |
| 10 Year | | 4.7 | | | — | | | — | | | 5.5 | |
| Since Inception | | — | | | 3.2 | | | 3.9 | | | — | |
Performance numbers are net of all Portfolio expenses but do not include any insurance, sales, or administrative charges of variable annuity or life insurance contracts. If these charges were included, the returns would be lower.
Inception dates of the Class A, Class B and Class E shares are: 10/31/94, 7/30/02 and 5/1/01, respectively.
This information represents past performance and is not indicative of future results. Investment return and principal value may fluctuate so that shares, upon redemption, may be worth more or less than the original cost.
PORTFOLIO COMPOSITION
as of December 31, 2007
Top Holdings
| | |
| | | % of Total
Net Assets |
Federal National Mortgage Association | | 41.9% |
Federal Home Loan Bank | | 13.6% |
U.S. Treasury Notes | | 11.4% |
Government National Mortgage Association | | 2.1% |
U.S. Treasury Bonds | | 1.8% |
U.S. Treasury Inflation Indexed Bonds (TII) | | 1.6% |
Federal Home Loan Mortgage Corp. | | 1.2% |
Master Adjustable Rate Mortgages Trust | | 1.2% |
JPMorgan Chase Commercial Mortgage Securities Corp. | | 0.9% |
Countrywide Alternative Loan Trust | | 0.8% |
Top Sectors
| | |
| | | % of Total
Market Value |
Residential Mortgage-Backed | | 73.2% |
Government | | 19.0% |
Commercial Mortgage-Backed | | 3.0% |
Short Term Investments | | 2.1% |
Index-Linked | | 2.1% |
Investment Grade | | 0.6% |
MSF-3
Metropolitan Series Fund, Inc.
Shareholder Expense Example
As a shareholder of the Portfolio, you incur ongoing costs, including management fees; distribution and service (12b-1) fees; and other Portfolio expenses. This example is intended to help you understand your ongoing costs (in dollars) (referred to as “expenses”) of investing in the Portfolio and compare these costs with the ongoing costs of investing in other mutual funds. The example is based on an investment of $1,000 invested at the beginning of the period and held for the entire period, July 1, 2007 through December 31, 2007.
Actual Expenses
The first line for each share class of the Portfolio in the table below provides information about actual account values and actual expenses. You may use the information in this line, together with the amount you invested in the particular share class of the Portfolio, to estimate the expenses that you paid over the period. Simply divide your account value by $1,000 (for example, an $8,600 account value divided by $1,000=8.6), then multiply the result by the number in the first line under the heading entitled “Expenses Paid During Period” to estimate the expenses you paid on your account during this period.
Hypothetical Example for Comparison Purposes
The second line for each share class of the Portfolio in the table below provides information about hypothetical account values and hypothetical expenses based on the Portfolio’s actual expense ratio and an assumed rate of return of 5% per year before expenses, which is not the Portfolio’s actual return. The hypothetical account values and expenses may not be used to estimate the actual ending account balance or expenses you paid for the period. You may use this information to compare the ongoing costs of investing in the Portfolio and other funds. To do so, compare this 5% hypothetical example with the 5% hypothetical examples that appear in the shareholder reports of the other funds.
Please note that the expenses shown in the table are meant to highlight your ongoing costs only and do not reflect any fees or charges of your variable insurance product or any additional expenses that participants in certain eligible qualified plans may bear relating to the operations of their plan. Therefore, the second line for each share class in the table is useful in comparing ongoing costs only, and will not help you determine the relative total costs of owning different funds. In addition, if these other costs were included, your costs would have been higher.
| | | | | | | | | | | | | | |
Portfolio | | | | Annualized
Expense
Ratio | | | Beginning
Account Value
July 1,
2007 | | Ending
Account Value
December 31,
2007 | | Expenses Paid
During Period*
July 1, 2007
to
December 31,
2007 |
Western Asset Mgt. U.S. Government—Class A | | Actual | | 0.54 | % | | $ | 1,000.00 | | $ | 1,037.40 | | $ | 2.77 |
| | Hypothetical | | 0.54 | % | | $ | 1,000.00 | | $ | 1,022.45 | | $ | 2.75 |
| | | | | |
Western Asset Mgt. U.S. Government—Class B | | Actual | | 0.79 | % | | $ | 1,000.00 | | $ | 1,035.80 | | $ | 4.05 |
| | Hypothetical | | 0.79 | % | | $ | 1,000.00 | | $ | 1,021.18 | | $ | 4.02 |
| | | | | |
Western Asset Mgt. U.S. Government—Class E | | Actual | | 0.69 | % | | $ | 1,000.00 | | $ | 1,035.80 | | $ | 3.54 |
| | Hypothetical | | 0.69 | % | | $ | 1,000.00 | | $ | 1,021.69 | | $ | 3.52 |
* Expenses paid are equal to the Portfolio’s annualized expense ratio for the most recent six month period, as shown above, multiplied by the average account value over the period, multiplied by the number of days in the most recent fiscal half-year, divided by 365 (to reflect the one-half year period).
MSF-4
Metropolitan Series Fund, Inc.
Western Asset Management U.S. Government Portfolio
Schedule of Investments as of December 31, 2007
Fixed Income—116.3% of Total Net Assets
| | | | | | |
| Security Description | | Face
Amount | | Value* |
| | | | | | |
|
Asset Backed—4.3% |
AAMES Mortgage Investment Trust (144A)
5.015%, 08/25/35 (a) | | $ | 205,887 | | $ | 201,904 |
ACE Securities Corp.
4.995%, 02/25/31 (a) | | | 5,453,874 | | | 5,243,829 |
Bayview Financial Aquisition Trust
5.012%, 08/28/44 (a) | | | 74,319 | | | 73,557 |
Bayview Financial Asset Trust (144A)
5.465%, 12/25/39 (a) | | | 916,334 | | | 851,925 |
Bear Stearns Asset Backed Securities, Inc.
4.975%, 10/25/36 (a) | | | 1,837,168 | | | 1,804,661 |
Compucredit Aquired Portfolio Voltage Master Trust (144A)
5.198%, 09/15/18 (a) | | | 5,036,234 | | | 4,934,048 |
Countrywide Home Equity Loan Trust
5.168%, 12/25/31 (a) | | | 6,017,567 | | | 5,712,505 |
5.398%, 12/15/28 (a) | | | 721,535 | | | 705,860 |
EMC Mortgage Loan Trust (144A)
5.315%, 12/25/42 (a) | | | 248,978 | | | 219,168 |
GMAC Mortgage Corp. Loan Trust
4.935%, 07/25/36 (a) | | | 800,000 | | | 795,385 |
5.075%, 11/25/36 (a) | | | 9,898,694 | | | 8,675,501 |
GSAMP Trust
4.955%, 07/05/36 (a) | | | 2,570,662 | | | 2,070,953 |
GSR Mortgage Loan Trust
5.135%, 11/25/30 (a) | | | 2,000,000 | | | 1,810,820 |
Indymac Seconds Asset Backed Trust
4.995%, 06/25/36 (a) | | | 5,629,115 | | | 2,954,777 |
Lehman XS Trust
4.909%, 06/25/37 (a) | | | 2,114,893 | | | 2,107,384 |
4.955%, 02/25/37 (a) | | | 3,588,530 | | | 3,409,722 |
Morgan Stanley IXIS Real Estate Capital Trust
4.895%, 07/25/36 (a) | | | 2,926,346 | | | 2,898,810 |
Option One Mortgage Loan Trust
5.155%, 06/25/33 (a) | | | 251,993 | | | 237,528 |
SACO I Trust
4.995%, 06/25/36 (a) | | | 5,214,486 | | | 2,150,475 |
5.015%, 04/25/36 (a) | | | 1,318,548 | | | 814,451 |
5.115%, 07/25/35 (a) | | | 179,834 | | | 178,559 |
5.125%, 06/25/36 (a) | | | 79,671 | | | 73,504 |
SLM Student Loan Trust
5.074%, 07/25/17 (a) | | | 6,454,016 | | | 6,452,539 |
5.094%, 10/25/17 (a) | | | 1,623,890 | | | 1,624,433 |
Structured Asset Securities Corp. (144A)
4.975%, 02/25/36 (a) | | | 5,193,234 | | | 1,853,193 |
| | | | | | |
| | | | | | 57,855,491 |
| | | | | | |
|
Commercial Mortgage-Backed Securities—13.3% |
American Home Mortgage Assets
5.055%, 11/25/36 (a) | | | 9,688,515 | | | 9,143,345 |
Banc of America Funding Corp.
5.791%, 10/25/36 (a) | | | 322,764 | | | 323,395 |
Banc of America Mortgage Securities
5.012%, 07/25/35 (a) | | | 529,279 | | | 527,402 |
Bear Stearns Mortgage Funding Trust
5.025%, 12/25/36 (a) | | | 766,618 | | | 728,198 |
| | | | | | |
| Security Description | | Face
Amount | | Value* |
| | | | | | |
|
Commercial Mortgage-Backed Securities—(Continued) |
Bear Stearns Structured Products, Inc. (144A) 5.139%, 12/31/37 (a) | | $ | 11,909,952 | | $ | 11,818,841 |
Countrywide Alternative Loan Trust
5.149%, 07/25/36 (a) | | | 7,284,345 | | | 6,278,357 |
5.149%, 07/25/36 (a) | | | 7,507,132 | | | 6,787,035 |
5.179%, 07/20/35 (a) | | | 2,103,720 | | | 1,983,966 |
Credit Suisse Mortgage Capital Certificates 5.311%, 12/15/39 | | | 10,200,000 | | | 10,164,527 |
CS First Boston Mortgage Securities Corp.
4.889%, 11/15/37 (a) | | | 4,280,000 | | | 4,004,651 |
GE Capital Commercial Mortgage Corp.
5.333%, 11/10/45 (a) | | | 3,000,000 | | | 3,014,036 |
GMAC Mortgage Corp. Loan Trust
5.016%, 11/19/35 (a) | | | 2,405,768 | | | 2,391,057 |
Granite Mortgages, Plc.
5.370%, 01/20/20 (a) | | | 42,213 | | | 41,976 |
Impac Secured Assets CMN Owner Trust
5.185%, 03/25/36 (a) | | | 5,652,998 | | | 5,387,697 |
JPMorgan Chase Commercial Mortgage Securities Corp.
4.951%, 01/12/37 (a) | | | 4,950,000 | | | 4,656,337 |
4.999%, 10/15/42 (a) | | | 3,100,000 | | | 2,963,814 |
5.420%, 01/15/49 | | | 1,280,000 | | | 1,281,186 |
5.429%, 12/12/43 | | | 9,530,000 | | | 9,582,911 |
LB-UBS Commercial Mortgage Trust
4.858%, 12/15/39 (a) | | | 5,500,000 | | | 5,149,747 |
Luminent Mortgage Trust
5.055%, 05/25/46 (a) | | | 6,249,758 | | | 5,881,314 |
Master Adjustable Rate Mortgages Trust
5.065%, 05/25/47 (a) | | | 11,971,093 | | | 11,339,030 |
5.733%, 12/25/46 (a) | | | 10,726,343 | | | 10,074,825 |
Morgan Stanley Mortgage Loan Trust
4.935%, 06/25/36 (a) | | | 4,486,520 | | | 4,438,804 |
4.985%, 10/25/36 (a) | | | 4,485,697 | | | 4,461,640 |
5.015%, 03/25/36 (a) | | | 3,840,502 | | | 3,054,252 |
5.469%, 06/26/36 (a) | | | 7,005,110 | | | 6,912,573 |
Novastar Mortgage-Backed Notes
5.055%, 06/25/36 (a) | | | 5,851,744 | | | 5,569,652 |
Ownit Mortgage Loan Asset Backed Certificates
5.290%, 12/25/36 (a) | | | 3,400,000 | | | 3,307,608 |
Provident Funding Mortgage Loan Trust
4.146%, 05/25/35 (a) | | | 8,936,952 | | | 8,876,675 |
4.345%, 10/25/35 (a) | | | 916,995 | | | 909,756 |
Residential Accredit Loans, Inc.
4.955%, 10/25/46 (a) | | | 8,181,826 | | | 7,894,394 |
Residential Funding Mortgage Securities I, Inc.
4.750%, 12/25/18 | | | 4,094,004 | | | 4,036,434 |
Thornburg Mortgage Securities Trust
4.975%, 06/25/36 (a) | | | 4,675,094 | | | 4,648,990 |
5.035%, 01/25/36 (a) | | | 86,601 | | | 83,771 |
5.115%, 07/25/45 (a) | | | 7,029,578 | | | 7,027,492 |
WaMu Mortgage Pass-Through Certificates 5.135%, 12/25/45 (a) | | | 4,822,505 | | | 4,566,058 |
Zuni Mortgage Loan Trust
4.995%, 08/25/36 (a) | | | 364,228 | | | 348,268 |
| | | | | | |
| | | | | | 179,660,014 |
| | | | | | |
*See accompanying notes to financial statements.
MSF-5
Metropolitan Series Fund, Inc.
Western Asset Management U.S. Government Portfolio
Schedule of Investments as of December 31, 2007
Fixed Income—(Continued)
| | | | | | |
| Security Description | | Face
Amount | | Value* |
| | | | | | |
|
Federal Agencies—77.2% |
Federal Home Loan Bank
5.000%, 12/01/34 | | $ | 362,920 | | $ | 354,497 |
5.250%, 12/11/20 (b) | | | 12,000,000 | | | 12,602,220 |
5.500%, 10/01/35 | | | 7,784,831 | | | 7,771,778 |
5.500%, 07/01/37 | | | 3,984,007 | | | 3,975,783 |
5.500%, 12/01/37 | | | 133,300,000 | | | 133,030,805 |
6.000%, 10/01/37 | | | 7,286,262 | | | 7,395,073 |
6.000%, 12/01/37 | | | 76,300,000 | | | 77,439,441 |
Federal Home Loan Mortgage Corp.
4.000%, 05/01/19 | | | 153,116 | | | 146,997 |
4.500%, 04/15/32 | | | 182,747 | | | 165,857 |
4.500%, 04/01/33 | | | 2,036,293 | | | 1,926,802 |
4.500%, 04/01/35 | | | 1,610,663 | | | 1,523,369 |
5.000%, 12/01/18 | | | 1,583,961 | | | 1,587,863 |
5.000%, 08/01/19 | | | 2,319,424 | | | 2,323,644 |
5.000%, 10/01/35 | | | 8,819,153 | | | 8,610,428 |
5.500%, 01/15/23 (c) | | | 490,878 | | | 4,193 |
5.500%, 07/01/35 | | | 2,265,126 | | | 2,261,328 |
5.881%, 01/01/37 (a) | | | 2,333,393 | | | 2,379,067 |
6.000%, 10/01/10 | | | 180 | | | 183 |
6.000%, 10/01/28 | | | 78,058 | | | 79,773 |
6.000%, 11/01/28 | | | 98,145 | | | 100,301 |
6.500%, 08/01/13 | | | 15,956 | | | 16,410 |
6.500%, 03/01/26 | | | 2,069 | | | 2,150 |
6.500%, 07/01/26 | | | 41,860 | | | 43,493 |
7.000%, 07/01/11 | | | 6,847 | | | 7,080 |
7.500%, 05/01/32 | | | 241,618 | | | 257,364 |
8.000%, 12/01/19 | | | 11,649 | | | 12,228 |
8.000%, 07/01/20 | | | 29,934 | | | 31,572 |
8.000%, 09/01/30 | | | 20,750 | | | 22,222 |
8.500%, 06/15/21 | | | 172,895 | | | 172,563 |
9.000%, 10/01/17 | | | 5,017 | | | 5,093 |
Federal National Mortgage Association
3.895%, 02/17/09 (a) (b) | | | 2,000,000 | | | 1,986,040 |
4.000%, 08/01/19 | | | 99,941 | | | 95,862 |
4.000%, 08/01/20 | | | 1,155,894 | | | 1,106,906 |
4.000%, 05/01/33 | | | 901,088 | | | 831,743 |
4.500%, 05/01/19 | | | 1,196,356 | | | 1,176,654 |
4.500%, 09/01/19 | | | 2,725,504 | | | 2,680,621 |
4.500%, 03/01/20 | | | 482,351 | | | 474,278 |
4.500%, 04/01/20 | | | 19,496 | | | 19,169 |
4.750%, 11/19/12 (b) | | | 25,450,000 | | | 26,337,340 |
4.875%, 01/11/08 | | | 12,300,000 | | | 12,300,615 |
5.000%, 10/01/17 | | | 2,716,545 | | | 2,723,085 |
5.000%, 12/01/17 | | | 14,508,126 | | | 14,543,054 |
5.000%, 02/01/18 | | | 3,071,160 | | | 3,078,674 |
5.000%, 03/01/18 | | | 2,534,268 | | | 2,540,625 |
5.000%, 04/01/18 | | | 3,837,040 | | | 3,846,632 |
5.000%, 05/01/18 | | | 1,112,640 | | | 1,115,421 |
5.000%, 06/01/18 | | | 3,480,243 | | | 3,488,943 |
5.000%, 11/01/18 | | | 3,887,134 | | | 3,896,852 |
5.000%, 10/01/20 | | | 2,139,895 | | | 2,141,994 |
5.000%, 11/01/33 | | | 10,238,986 | | | 10,005,578 |
5.000%, 08/01/34 | | | 1,103,290 | | | 1,077,711 |
5.000%, 03/01/35 | | | 818,893 | | | 799,907 |
| | | | | | |
| Security Description | | Face
Amount | | Value* |
| | | | | | |
|
Federal Agencies—(Continued) |
5.000%, 08/01/35 | | $ | 8,174,619 | | $ | 7,980,590 |
5.000%, 09/01/35 | | | 3,367,911 | | | 3,287,999 |
5.000%, 11/01/36 | | | 2,727,454 | | | 2,662,738 |
5.000%, TBA | | | 241,200,000 | | | 235,194,277 |
5.500%, 09/01/24 | | | 3,412,547 | | | 3,431,289 |
5.500%, 04/01/35 | | | 3,376,598 | | | 3,374,539 |
5.500%, 09/01/35 | | | 10,914,714 | | | 10,908,056 |
5.500%, 12/01/35 | | | 880,829 | | | 880,292 |
5.500%, 11/01/36 | | | 23,820,236 | | | 23,794,499 |
5.500%, 08/01/37 | | | 14,887,449 | | | 14,868,258 |
5.500%, TBA | | | 97,210,000 | | | 97,887,209 |
5.770%, 08/01/37 (a) | | | 12,204,193 | | | 12,427,522 |
6.000%, 04/01/35 | | | 7,907,728 | | | 8,044,094 |
6.000%, 10/01/36 | | | 13,850,796 | | | 14,068,165 |
6.000%, 11/01/36 | | | 12,855,340 | | | 13,057,087 |
6.000%, 10/01/37 | | | 27,328,112 | | | 27,753,302 |
6.000%, 11/01/37 | | | 73,437,673 | | | 74,580,269 |
6.000%, TBA | | | 1,400,000 | | | 1,432,375 |
6.354%, 07/01/37 (a) | | | 17,190,210 | | | 17,748,723 |
6.363%, 01/25/43 (a) | | | 950,906 | | | 961,130 |
6.500%, 06/01/08 | | | 1,071 | | | 1,078 |
6.500%, 12/01/10 | | | 2,389 | | | 2,441 |
6.500%, 04/01/13 | | | 49,620 | | | 51,082 |
6.500%, 07/01/13 | | | 28,621 | | | 29,662 |
6.500%, 06/01/17 | | | 564,492 | | | 583,948 |
6.500%, 03/01/26 | | | 5,472 | | | 5,685 |
6.500%, 12/01/27 | | | 55,725 | | | 57,895 |
6.500%, 04/01/29 | | | 261,822 | | | 270,973 |
6.500%, 05/01/32 | | | 489,791 | | | 502,760 |
6.500%, 07/01/32 | | | 2,852,359 | | | 2,972,891 |
6.500%, TBA | | | 62,800,000 | | | 64,546,594 |
7.000%, 12/01/14 | | | 28,187 | | | 29,356 |
7.000%, 07/01/15 | | | 5,276 | | | 5,493 |
7.000%, 11/01/23 | | | 5,397 | | | 5,654 |
7.000%, 02/01/28 | | | 19,652 | | | 20,654 |
7.000%, 10/01/28 | | | 130,533 | | | 137,335 |
7.000%, 11/01/28 | | | 8,732 | | | 9,186 |
7.000%, 02/01/29 | | | 35,002 | | | 36,866 |
7.000%, 01/01/30 | | | 13,317 | | | 14,046 |
7.000%, 01/01/34 | | | 729,592 | | | 765,474 |
7.500%, 02/01/16 | | | 88,408 | | | 92,041 |
7.500%, 11/01/29 | | | 69,717 | | | 74,527 |
7.500%, 11/01/30 | | | 34,660 | | | 36,995 |
7.500%, 01/01/31 | | | 13,538 | | | 14,450 |
8.000%, 05/01/28 | | | 11,071 | | | 11,872 |
8.000%, 07/01/30 | | | 842 | | | 899 |
8.000%, 08/01/30 | | | 10,105 | | | 10,788 |
8.000%, 10/01/30 | | | 12,773 | | | 13,637 |
8.000%, 02/01/31 | | | 294,160 | | | 315,542 |
8.000%, 07/01/32 | | | 1,382 | | | 1,476 |
11.500%, 09/01/19 | | | 611 | | | 689 |
12.000%, 10/01/15 | | | 37,698 | | | 43,643 |
12.000%, 01/15/16 | | | 1,857 | | | 2,161 |
12.500%, 09/20/15 | | | 2,942 | | | 3,364 |
12.500%, 01/15/16 | | | 22,998 | | | 26,229 |
*See accompanying notes to financial statements.
MSF-6
Metropolitan Series Fund, Inc.
Western Asset Management U.S. Government Portfolio
Schedule of Investments as of December 31, 2007
Fixed Income—(Continued)
| | | | | | |
| Security Description | | Face
Amount | | Value* |
| | | | | | |
|
Federal Agencies—(Continued) |
Government National Mortgage Association
5.500%, 09/15/34 | | $ | 2,229,073 | | $ | 2,246,015 |
5.500%, 06/15/35 | | | 720,395 | | | 725,880 |
5.500%, 12/15/35 | | | 5,125,557 | | | 5,164,582 |
6.000%, TBA | | | 27,800,000 | | | 28,452,438 |
6.500%, 08/15/34 | | | 696,640 | | | 721,182 |
7.500%, 01/15/29 | | | 14,299 | | | 15,259 |
7.500%, 09/15/29 | | | 14,646 | | | 15,630 |
7.500%, 02/15/30 | | | 19,516 | | | 20,693 |
7.500%, 04/15/30 | | | 30,675 | | | 32,525 |
7.500%, 05/15/30 | | | 13,494 | | | 14,395 |
7.500%, 09/15/30 | | | 27,264 | | | 29,085 |
8.500%, 05/15/18 | | | 24,047 | | | 26,082 |
8.500%, 06/15/25 | | | 132,510 | | | 144,555 |
9.000%, 08/15/08 | | | 426 | | | 432 |
9.000%, 09/15/08 | | | 1,021 | | | 1,034 |
9.000%, 10/15/08 | | | 6,096 | | | 6,175 |
9.000%, 12/15/08 | | | 4,052 | | | 4,104 |
9.000%, 01/15/09 | | | 6,062 | | | 6,236 |
9.000%, 02/15/09 | | | 741 | | | 763 |
9.000%, 03/15/09 | | | 2,729 | | | 2,808 |
9.000%, 04/15/09 | | | 8,702 | | | 8,934 |
9.000%, 05/15/09 | | | 3,584 | | | 3,688 |
9.000%, 09/15/09 | | | 5,020 | | | 5,165 |
9.000%, 12/15/16 | | | 11,267 | | | 12,128 |
| | | | | | |
| | | | | | 1,043,216,868 |
| | | | | | |
| | |
Government Agency—1.4% | | | | | | |
Financing Corp. (FICO) Strips
Zero Coupon, 06/27/11 | | | 13,949,000 | | | 12,378,342 |
National Archives Facility Trust
8.500%, 09/01/19 | | | 4,995,704 | | | 6,182,784 |
| | | | | | |
| | | | | | 18,561,126 |
| | | | | | |
| | |
U.S. Treasury—20.1% | | | | | | |
U.S. Treasury Bond Strips
Zero Coupon, 11/15/09 | | | 7,500,000 | | | 7,087,433 |
U.S. Treasury Bonds
7.125%, 02/15/23 (b) | | | 25,600,000 | | | 33,036,006 |
U.S. Treasury Inflation Indexed Bonds (TII) 2.000%, 01/15/26 (b) | | | 17,831,383 | | | 17,758,952 |
2.375%, 01/15/27 (b) | | | 9,986,944 | | | 10,561,193 |
U.S. Treasury Notes | | | | | | |
4.000%, 08/31/09 (b) | | | 14,790,000 | | | 15,007,236 |
4.000%, 04/15/10 (b) | | | 112,360,000 | | | 114,642,256 |
4.625%, 07/31/12 (b) | | | 26,220,000 | | | 27,531,000 |
4.750%, 08/15/17 (b) | | | 20,000 | | | 21,123 |
5.000%, 07/31/08 (b) | | | 45,300,000 | | | 45,696,375 |
| | | | | | |
| | | | | | 271,341,574 |
| | | | | | |
Total Fixed Income
(Identified Cost $1,576,721,179) | | | | | | 1,570,635,073 |
| | | | | | |
| | | | | | | |
| | |
| Preferred Stock—0.6% | | | | | | | |
| Security Description | | Shares | | Value* | |
| | |
Thrifts & Mortgage Finance—0.6% | | | | | | | |
Federal Home Loan Mortgage Corp. (b) | | | 173,000 | | $ | 4,523,950 | |
Federal National Mortgage Association (b) | | | 122,000 | | | 3,141,500 | |
| | | | | | | |
Total Preferred Stock
(Identified Cost $7,375,000) | | | | | | 7,665,450 | |
| | | | | | | |
|
| Short Term Investments—36.8% | |
| Security Description | | Face Amount/
Shares | | Value* | |
| | |
Discount Notes—0.3% | | | | | | | |
Federal Home Loan Bank
4.18%, 03/14/08 | | $ | 1,000,000 | | | 991,483 | |
Federal National Mortgage Association
5.15%, 03/17/08 | | | 2,295,000 | | | 2,270,994 | |
4.50%, 03/19/08 | | | 600,000 | | | 594,169 | |
| | | | | | | |
| | | | | | 3,856,646 | |
| | | | | | | |
| | |
Mutual Funds—22.4% | | | | | | | |
State Street Navigator Securities Lending
Prime Portfolio (d) | | | 302,820,054 | | | 302,820,054 | |
| | | | | | | |
| | |
Repurchase Agreement—14.1% | | | | | | | |
Deutsche Bank Repurchase Agreement dated 12/31/07 at 4.15% to be repurchased at $191,044,036 on 1/02/08, collateralized by $191,579,000 Federal National Mortgage Association 5.15% due 3/08/12 with a value of $194,819,942. | | | 191,000,000 | | | 191,000,000 | |
| | | | | | | |
Total Short Term Investments
(Identified Cost $497,676,700) | | | | | | 497,676,700 | |
| | | | | | | |
Total Investments—153.7%
(Identified Cost $2,081,772,879) (e) | | | | | | 2,075,977,223 | |
Liabilities in excess of other assets | | | | | | (725,593,485 | ) |
| | | | | | | |
| Total Net Assets—100% | | | | | $ | 1,350,383,738 | |
| | | | | | | |
| (a) | Variable or Floating Rate Security. Rate disclosed is as of December 31, 2007. |
| (b) | A portion or all of the security was held on loan. As of December 31, 2007, the market value of securities loaned was $313,046,373 and the collateral received consisted of cash in the amount of $302,820,054 and non cash collateral with a value of $15,402,233. The cash collateral is invested in a money market fund managed by an affiliate of the custodian. The non cash collateral received consists primarily of government securities and bank letters of credit, and are held for the benefit of the Portfolio at the Portfolio’s custodian. |
| (c) | Interest Only Certificate. This security receives monthly interest payments but is not entitled to principal payments. |
| (d) | Represents investment of cash collateral received from securities lending transactions. |
*See accompanying notes to financial statements.
MSF-7
Metropolitan Series Fund, Inc.
Western Asset Management U.S. Government Portfolio
Schedule of Investments as of December 31, 2007
| (e) | The aggregate cost of investments for federal income tax purposes as of December 31, 2007 was $2,084,523,326 and the composition of unrealized appreciation and depreciation of investment securities was $15,535,080 and $(24,081,183), respectively. |
| (144A)— | Securities exempt from registration under Rule 144A of the Securities Act of 1933. These securities may be resold in transactions exempt from registration, normally to qualified institutional buyers. As of December 31, 2007, the market value of 144A securities was $19,879,079, which is 1.5% of total net assets. |
| (TBA)— | A contract for the purchase or sale of a Mortgage Backed Security to be delivered at a future date but does not include a specified pool or precise amount to be delivered. |
| (TII)— | A Treasury Inflation Index is a security with a fixed interest rate and the principal is adjusted for inflation. At maturity, the security will be redeemed at the greater of the inflation adjusted principal or par amount at original issue. |
Futures Contracts
| | | | | | | | | | | | | | | | | |
Futures Contracts—Long | | Expiration Date | | Number of
Contracts | | | Contract
Amount | | | Valuation as of
12/31/2007 | | | Unrealized
Appreciation/
Depreciation | |
Eurodollar Futures | | 3/17/2008 | | 2,765 | | | $ | 660,522,538 | | | $ | 661,975,563 | | | $ | 1,453,025 | |
U.S. Treasury Notes 2 Year Futures | | 3/31/2008 | | 173 | | | | 36,326,459 | | | | 36,373,250 | | | | 46,791 | |
U.S. Treasury Notes 10 Year Futures | | 3/19/2008 | | 425 | | | | 48,203,766 | | | | 48,191,016 | | | | (12,750 | ) |
| | | | | |
Futures Contracts—Short | | | | | | | | | | | | | | |
Eurodollar Futures | | 12/15/2008 | | (352 | ) | | | (84,421,040 | ) | | | (85,034,400 | ) | | | (613,360 | ) |
U.S. Treasury Bond Futures | | 3/19/2008 | | (8 | ) | | | (936,968 | ) | | | (931,000 | ) | | | 5,968 | |
U.S. Treasury Notes 5 Year Futures | | 3/31/2008 | | (1,884 | ) | | | (207,235,783 | ) | | | (207,769,875 | ) | | | (534,092 | ) |
| | | | | | | | | | | | | | | | | |
Net Unrealized Appreciation | | | $ | 345,582 | |
| | | | | | | | | | | | | | | | | |
Options Written
| | | | | | | | | | | | | | | | |
Options Written—Calls | | Expiration Date | | Number of
Contracts | | | Premiums
Received | | | Valuation as of
12/31/2007 | | | Unrealized
Appreciation |
U.S. Treasury Note 10 Year Futures 114.5 Call | | 1/25/2008 | | (758 | ) | | $ | (542,085 | ) | | $ | (426,375 | ) | | $ | 115,710 |
| | | | | |
Options Written—Puts | | | | | | | | | | | | | |
U.S. Treasury Note 10 Year Futures 109.5 Put | | 1/25/2008 | | (758 | ) | | | (375,210 | ) | | | (35,531 | ) | | | 339,679 |
| | | | | | | | | | | | | | | | |
Net Unrealized Appreciation | | | $ | 455,389 |
| | | | | | | | | | | | | | | | |
*See accompanying notes to financial statements.
MSF-8
Metropolitan Series Fund, Inc.
Western Asset Management U.S. Government Portfolio
Statement of Assets & Liabilities
December 31, 2007
| | | | | | | |
Assets | | | | | | | |
Investments at value (a) (d) | | | | | $ | 1,884,977,223 | |
Repurchase agreements at value (c) | | | | | | 191,000,000 | |
Cash | | | | | | 309,000 | |
Receivable for: | | | | | | | |
Fund shares sold | | | | | | 805,094 | |
Accrued interest | | | | | | 7,489,741 | |
| | | | | | | |
Total Assets | | | | | | 2,084,581,058 | |
Liabilities | | | | | | | |
Payable for: | | | | | | | |
Securities purchased | | $ | 428,584,025 | | | | |
Fund shares redeemed | | | 1,473,102 | | | | |
Futures variation margin | | | 179,028 | | | | |
Collateral for securities loaned | | | 302,820,054 | | | | |
Options written, at fair value (b) | | | 461,906 | | | | |
Accrued expenses: | | | | | | | |
Management fees | | | 555,197 | | | | |
Service and distribution fees | | | 59,608 | | | | |
Deferred directors’ fees | | | 10,943 | | | | |
Other expenses | | | 53,457 | | | | |
| | | | | | | |
Total Liabilities | | | | | | 734,197,320 | |
| | | | | | | |
Net Assets | | | | | $ | 1,350,383,738 | |
| | | | | | | |
Net assets consists of: | | | | | | | |
Capital paid in | | | | | $ | 1,312,641,926 | |
Undistributed net investment income | | | | | | 58,910,311 | |
Accumulated net realized losses | | | | | | (16,173,814 | ) |
Unrealized depreciation on investments, futures contracts and options | | | | | | (4,994,685 | ) |
| | | | | | | |
Net Assets | | | | | $ | 1,350,383,738 | |
| | | | | | | |
| Computation of offering price: | | | | | | | |
Class A | | | | | | | |
Net asset value and redemption price per share ($1,032,046,921 divided by 82,665,780 shares outstanding) | | | | | $ | 12.48 | |
| | | | | | | |
Class B | | | | | | | |
Net asset value and redemption price per share ($226,693,352 divided by 18,238,190 shares outstanding) | | | | | $ | 12.43 | |
| | | | | | | |
Class E | | | | | | | |
Net asset value and redemption price per share ($91,643,465 divided by 7,366,492 shares outstanding) | | | | | $ | 12.44 | |
| | | | | | | |
(a) Identified cost of investments | | | | | $ | 1,890,772,879 | |
| | | | | | | |
(b) Premiums received on written
options | | | | | $ | (917,295 | ) |
| | | | | | | |
(c) Amortized cost of repurchase agreements | | | | | $ | 191,000,000 | |
| | | | | | | |
| (d) | Includes cash collateral for securities loaned of $302,820,054. |
Statement of Operations
For the Year Ended December 31, 2007
| | | | | | | | |
Investment Income | | | | | | | | |
Interest | | | | | | $ | 65,566,682 | (a) |
| | | | | | | | |
Expenses | | | | | | | | |
Management fees | | $ | 6,179,307 | | | | | |
Service and distribution fees—Class B | | | 526,878 | | | | | |
Service and distribution fees—Class E | | | 146,242 | | | | | |
Directors’ fees and expenses | | | 24,125 | | | | | |
Custodian | | | 130,040 | | | | | |
Audit and tax services | | | 36,237 | | | | | |
Legal | | | 4,660 | | | | | |
Printing | | | 364,005 | | | | | |
Insurance | | | 13,424 | | | | | |
Miscellaneous | | | 18,474 | | | | | |
| | | | | | | | |
Total expenses | | | | | | | 7,443,392 | |
| | | | | | | | |
Net Investment Income | | | | | | | 58,123,290 | |
| | | | | | | | |
Realized and Unrealized Gain (Loss) | | | | | | | | |
| Realized gain (loss) on: | | | | | | | | |
Investments—net | | | 11,243,830 | | | | | |
Futures contracts—net | | | (16,883,583 | ) | | | | |
Options—net | | | 376,069 | | | | (5,263,684 | ) |
| | | | | | | | |
Change in unrealized appreciation (depreciation) on: | | | | | | | | |
Investments—net | | | (475,497 | ) | | | | |
Futures contracts—net | | | 797,478 | | | | | |
Options—net | | | 455,389 | | | | 777,370 | |
| | | | | | | | |
Net loss | | | | | | | (4,486,314 | ) |
| | | | | | | | |
Net Increase in Net Assets From Operations | | | | | | $ | 53,636,976 | |
| | | | | | | | |
| (a) | Includes net income on securities loaned of $566,441. |
See accompanying notes to financial statements.
MSF-9
Metropolitan Series Fund, Inc.
Western Asset Management U.S. Government Portfolio
Statements of Changes in Net Assets
| | | | | | | | |
| | | Year ended
December 31,
2007 | | | Year ended
December 31,
2006 | |
From Operations | | | | | | | | |
Net investment income | | $ | 58,123,290 | | | $ | 41,804,080 | |
Net realized gain (loss) | | | (5,263,684 | ) | | | 1,889,513 | |
Unrealized appreciation | | | 777,370 | | | | 581,436 | |
| | | | | | | | |
Increase in net assets from operations | | | 53,636,976 | | | | 44,275,029 | |
| | | | | | | | |
From Distributions to Shareholders | | | | | | | | |
Net investment income | | | | | | | | |
Class A | | | (25,701,258 | ) | | | (17,449,874 | ) |
Class B | | | (5,038,642 | ) | | | (4,169,148 | ) |
Class E | | | (2,574,347 | ) | | | (3,561,866 | ) |
| | | | | | | | |
Total distributions | | | (33,314,247 | ) | | | (25,180,888 | ) |
| | | | | | | | |
Increase in net assets from capital share transactions | | | 158,560,156 | | | | 446,036,846 | |
| | | | | | | | |
Total increase in net assets | | | 178,882,885 | | | | 465,130,987 | |
| | |
Net Assets | | | | | | | | |
Beginning of the period | | | 1,171,500,853 | | | | 706,369,866 | |
| | | | | | | | |
End of the period | | $ | 1,350,383,738 | | | $ | 1,171,500,853 | |
| | | | | | | | |
Undistributed Net Investment Income | | | | | | | | |
End of the period | | $ | 58,910,311 | | | $ | 32,927,922 | |
| | | | | | | | |
Other Information:
Capital Shares
Transactions in capital shares were as follows:
| | | | | | | | | | | | | | |
| | | Year ended
December 31, 2007 | | | Year ended
December 31, 2006 | |
| | | Shares | | | $ | | | Shares | | | $ | |
Class A | | | | | | | | | | | | | | |
Sales | | 25,944,586 | | | $ | 318,487,141 | | | 24,941,485 | | | $ | 300,895,828 | |
Shares issued through acquisition | | 0 | | | | 0 | | | 20,242,397 | | | | 238,253,010 | |
Reinvestments | | 2,110,120 | | | | 25,701,258 | | | 1,486,361 | | | | 17,449,874 | |
Redemptions | | (17,495,862 | ) | | | (214,420,714 | ) | | (13,148,680 | ) | | | (158,120,192 | ) |
| | | | | | | | | | | | | | |
Net increase | | 10,558,844 | | | $ | 129,767,685 | | | 33,521,563 | | | $ | 398,478,520 | |
| | | | | | | | | | | | | | |
Class B | | | | | | | | | | | | | | |
Sales | | 7,713,101 | | | $ | 94,310,450 | | | 7,693,574 | | | $ | 92,633,136 | |
Reinvestments | | 414,703 | | | | 5,038,642 | | | 356,033 | | | | 4,169,148 | |
Redemptions | | (4,789,601 | ) | | | (58,633,913 | ) | | (2,789,188 | ) | | | (33,543,923 | ) |
| | | | | | | | | | | | | | |
Net increase | | 3,338,203 | | | $ | 40,715,179 | | | 5,260,419 | | | $ | 63,258,361 | |
| | | | | | | | | | | | | | |
Class E | | | | | | | | | | | | | | |
Sales | | 1,092,215 | | | $ | 13,418,398 | | | 1,027,782 | | | $ | 12,399,242 | |
Reinvestments | | 211,880 | | | | 2,574,347 | | | 304,173 | | | | 3,561,866 | |
Redemptions | | (2,277,527 | ) | | | (27,915,453 | ) | | (2,629,747 | ) | | | (31,661,143 | ) |
| | | | | | | | | | | | | | |
Net decrease | | (973,432 | ) | | $ | (11,922,708 | ) | | (1,297,792 | ) | | $ | (15,700,035 | ) |
| | | | | | | | | | | | | | |
Increase derived from capital share transactions | | | | | $ | 158,560,156 | | | | | | $ | 446,036,846 | |
| | | | | | | | | | | | | | |
See accompanying notes to financial statements.
MSF-10
Metropolitan Series Fund, Inc.
Western Asset Management U.S. Government Portfolio
Financial Highlights
| | | | | | | | | | | | | | | | | | | | |
| | | Class A | |
| | | Year ended December 31, | |
| | | 2007 | | | 2006 | | | 2005 | | | 2004 | | | 2003 | |
Net Asset Value, Beginning of Period | | $ | 12.30 | | | $ | 12.22 | | | $ | 12.43 | | | $ | 12.34 | | | $ | 12.34 | |
| | | | | | | | | | | | | | | | | | | | |
Income From Investment Operations | | | | | | | | | | | | | | | | | | | | |
Net investment income | | | 0.57 | (a) | | | 0.46 | | | | 0.19 | | | | 0.20 | | | | 0.18 | |
Net realized and unrealized gain (loss) of investments | | | (0.05 | ) | | | 0.03 | | | | 0.01 | | | | 0.18 | | | | 0.02 | |
| | | | | | | | | | | | | | | | | | | | |
Total from investment operations | | | 0.52 | | | | 0.49 | | | | 0.20 | | | | 0.38 | | | | 0.20 | |
| | | | | | | | | | | | | | | | | | | | |
Less Distributions | | | | | | | | | | | | | | | | | | | | |
Distributions from net investment income | | | (0.34 | ) | | | (0.41 | ) | | | (0.17 | ) | | | (0.16 | ) | | | (0.08 | ) |
Distributions from net realized capital gains | | | 0.00 | | | | 0.00 | | | | (0.24 | ) | | | (0.13 | ) | | | (0.12 | ) |
| | | | | | | | | | | | | | | | | | | | |
Total distributions | | | (0.34 | ) | | | (0.41 | ) | | | (0.41 | ) | | | (0.29 | ) | | | (0.20 | ) |
| | | | | | | | | | | | | | | | | | | | |
Net Asset Value, End of Period | | $ | 12.48 | | | $ | 12.30 | | | $ | 12.22 | | | $ | 12.43 | | | $ | 12.34 | |
| | | | | | | | | | | | | | | | | | | | |
Total Return (%) | | | 4.4 | | | | 4.2 | | | | 1.7 | | | | 3.0 | | | | 1.7 | |
Ratio of operating expenses to average net assets (%) | | | 0.54 | | | | 0.58 | | | | 0.61 | | | | 0.64 | | | | 0.65 | |
Ratio of operating expenses to average net assets without giving effect to the contractual expense agreement would have been (%) | | | N/A | | | | N/A | | | | N/A | | | | 0.64 | | | | 0.65 | |
Ratio of net investment income to average net assets (%) | | | 4.66 | | | | 4.36 | | | | 3.00 | | | | 1.56 | | | | 1.22 | |
Portfolio turnover rate (%) | | | 685 | | | | 835 | | | | 964 | | | | 977 | | | | 882 | |
Net assets, end of period (000) | | $ | 1,032,047 | | | $ | 886,805 | | | $ | 471,703 | | | $ | 148,047 | | | $ | 154,010 | |
| |
| | | Class B | |
| | | Year ended December 31, | |
| | | 2007 | | | 2006 | | | 2005 | | | 2004 | | | 2003 | |
Net Asset Value, Beginning of Period | | $ | 12.25 | | | $ | 12.16 | | | $ | 12.38 | | | $ | 12.31 | | | $ | 12.31 | |
| | | | | | | | | | | | | | | | | | | | |
Income From Investment Operations | | | | | | | | | | | | | | | | | | | | |
Net investment income | | | 0.54 | (a) | | | 0.44 | | | | 0.25 | | | | 0.16 | | | | 0.06 | |
Net realized and unrealized gain (loss) of investments | | | (0.05 | ) | | | 0.02 | | | | (0.08 | ) | | | 0.17 | | | | 0.14 | |
| | | | | | | | | | | | | | | | | | | | |
Total from investment operations | | | 0.49 | | | | 0.46 | | | | 0.17 | | | | 0.33 | | | | 0.20 | |
| | | | | | | | | | | | | | | | | | | | |
Less Distributions | | | | | | | | | | | | | | | | | | | | |
Distributions from net investment income | | | (0.31 | ) | | | (0.37 | ) | | | (0.15 | ) | | | (0.13 | ) | | | (0.08 | ) |
Distributions from net realized capital gains | | | 0.00 | | | | 0.00 | | | | (0.24 | ) | | | (0.13 | ) | | | (0.12 | ) |
| | | | | | | | | | | | | | | | | | | | |
Total distributions | | | (0.31 | ) | | | (0.37 | ) | | | (0.39 | ) | | | (0.26 | ) | | | (0.20 | ) |
| | | | | | | | | | | | | | | | | | | | |
Net Asset Value, End of Period | | $ | 12.43 | | | $ | 12.25 | | | $ | 12.16 | | | $ | 12.38 | | | $ | 12.31 | |
| | | | | | | | | | | | | | | | | | | | |
Total Return (%) | | | 4.0 | | | | 3.9 | | | | 1.4 | | | | 2.7 | | | | 1.6 | |
Ratio of operating expenses to average net assets (%) | | | 0.79 | | | | 0.83 | | | | 0.86 | | | | 0.89 | | | | 0.90 | |
Ratio of operating expenses to average net assets without giving effect to the contractual expense agreement would have been (%) | | | N/A | | | | N/A | | | | N/A | | | | 0.89 | | | | 0.90 | |
Ratio of net investment income to average net assets (%) | | | 4.41 | | | | 4.08 | | | | 2.76 | | | | 1.81 | | | | 0.79 | |
Portfolio turnover rate (%) | | | 685 | | | | 835 | | | | 964 | | | | 977 | | | | 882 | |
Net assets, end of period (000) | | $ | 226,693 | | | $ | 182,472 | | | $ | 117,258 | | | $ | 35,073 | | | $ | 347 | |
| (a) | Per share amount is based on average shares outstanding during the period. |
See accompanying notes to financial statements.
MSF-11
Metropolitan Series Fund, Inc.
Western Asset Management U.S. Government Portfolio
Financial Highlights
| | | | | | | | | | | | | | | | | | | | |
| | | Class E | |
| | | Year ended December 31, | |
| | | 2007 | | | 2006 | | | 2005 | | | 2004 | | | 2003 | |
Net Asset Value, Beginning of Period | | $ | 12.26 | | | $ | 12.18 | | | $ | 12.38 | | | $ | 12.31 | | | $ | 12.32 | |
| | | | | | | | | | | | | | | | | | | | |
Income From Investment Operations | | | | | | | | | | | | | | | | | | | | |
Net investment income | | | 0.55 | (a) | | | 0.54 | | | | 0.34 | | | | 0.17 | | | | 0.12 | |
Net realized and unrealized gain (loss) of investments | | | (0.05 | ) | | | (0.07 | ) | | | (0.15 | ) | | | 0.17 | | | | 0.07 | |
| | | | | | | | | | | | | | | | | | | | |
Total from investment operations | | | 0.50 | | | | 0.47 | | | | 0.19 | | | | 0.34 | | | | 0.19 | |
| | | | | | | | | | | | | | | | | | | | |
Less Distributions | | | | | | | | | | | | | | | | | | | | |
Distributions from net investment income | | | (0.32 | ) | | | (0.39 | ) | | | (0.15 | ) | | | (0.14 | ) | | | (0.08 | ) |
Distributions from net realized capital gains | | | 0.00 | | | | 0.00 | | | | (0.24 | ) | | | (0.13 | ) | | | (0.12 | ) |
| | | | | | | | | | | | | | | | | | | | |
Total distributions | | | (0.32 | ) | | | (0.39 | ) | | | (0.39 | ) | | | (0.27 | ) | | | (0.20 | ) |
| | | | | | | | | | | | | | | | | | | | |
Net Asset Value, End of Period | | $ | 12.44 | | | $ | 12.26 | | | $ | 12.18 | | | $ | 12.38 | | | $ | 12.31 | |
| | | | | | | | | | | | | | | | | | | | |
Total Return (%) | | | 4.1 | | | | 4.0 | | | | 1.6 | | | | 2.8 | | | | 1.5 | |
Ratio of operating expenses to average net assets (%) | | | 0.69 | | | | 0.73 | | | | 0.76 | | | | 0.79 | | | | 0.80 | |
Ratio of operating expenses to average net assets without giving effect to the contractual expense agreement would have been (%) | | | N/A | | | | N/A | | | | N/A | | | | 0.79 | | | | 0.80 | |
Ratio of net investment income to average net assets (%) | | | 4.51 | | | | 4.13 | | | | 2.74 | | | | 1.42 | | | | 1.03 | |
Portfolio turnover rate (%) | | | 685 | | | | 835 | | | | 964 | | | | 977 | | | | 882 | |
Net assets, end of period (000) | | $ | 91,643 | | | $ | 102,223 | | | $ | 117,409 | | | $ | 123,455 | | | $ | 114,450 | |
| (a) | Per share amount is based on average shares outstanding during the period. |
See accompanying notes to financial statements.
MSF-12
Metropolitan Series Fund, Inc.
Western Asset Management U.S. Government Portfolio
Notes to Financial Statements—December 31, 2007
Metropolitan Series Fund, Inc. (the “Fund”) is organized as a corporation under the laws of Maryland pursuant to Articles of Incorporation filed on November 23, 1982, as amended, and registered under the Investment Company Act of 1940, as amended (the “1940 Act”), as an open-end investment company. The Fund is a “series” type of mutual fund, which issues separate series of stock. Each series represents an interest in a separate portfolio of Fund investments. The Western Asset Management U.S. Government Portfolio (the “Portfolio”) is a diversified series of the Fund. Shares in the Fund are not offered directly to the general public and are currently available only to separate accounts established by Metropolitan Life Insurance Company (“MetLife”), New England Life Insurance Company, General American Life Insurance Company (“General American”), The MetLife Investors Group of Insurance Companies, MetLife Insurance Company of Connecticut and other affiliated insurance companies (collectively, the “Insurance Companies”), as an investment vehicle for variable life insurance, group annuity or variable annuity products, although the Portfolio is not available to all such separate accounts. The Portfolio’s shares may be divided into different classes. Currently, the classes being offered by the Portfolio are named Class A, Class B and Class E. The classes of the Portfolio’s shares are identical, except that certain additional charges (Rule 12b-1 fees) are made against Class B and Class E shares. Investment income, realized and unrealized capital gains and losses, the common expenses of the Portfolio and certain Portfolio-level expense reductions, if any, are allocated on a pro rata basis to each class based on the relative net assets of each class to the total net assets of the Portfolio.
| 2. | SIGNIFICANT ACCOUNTING POLICIES: |
The preparation of financial statements in conformity with accounting principles generally accepted in the United States of America (“GAAP”) requires management to make estimates and assumptions that affect the reported amounts of assets and liabilities and disclosure of contingent assets and liabilities as of the date of the financial statements and the reported amounts of income and expenses during the reporting period. Actual results could differ from those estimates.
The following is a summary of significant accounting policies consistently followed by the Portfolio in the preparation of its financial statements. The policies are in conformity with GAAP.
Investment Valuation:
Debt securities (other than short term obligations with a remaining maturity of sixty days or less) are valued by independent pricing services selected by the relevant subadviser pursuant to authorization of the Board of Directors of the Fund (the “Board” or “Directors”). Short term obligations with a remaining maturity of sixty days or less are valued at amortized cost which approximates fair market value.
Equity securities traded on a national securities exchange or exchanges are valued at their last sale price on the principal trading market. Equity securities traded on the NASDAQ National Market System are valued at the NASDAQ Official Closing Price (the “NOCP”). The NOCP is the last sale price if it falls between the spread of the last reported bid and asked prices. If the last reported bid and asked prices are above the last reported sale price, the NOCP will be the last reported bid price. If the last reported bid and asked prices are below the last reported sale price, the NOCP will be the last reported asked price. Equity securities traded on a national securities exchange or exchanges or on the NASDAQ National Market System for which there is no reported sale during the day are valued at the last reported bid price. A security that is listed or traded on more than one exchange is valued at the quotation on the exchange determined to be the primary market for that security by the Board or its delegates. If no closing price is available, then such securities are valued by using the last reported bid price. Equity securities traded over-the-counter are valued at the last reported sales price.
If no current market value quotation is readily available or reliable for a portfolio security, fair value will be determined in accordance with procedures established by and under the general supervision of the Board. When the Portfolio uses fair value pricing, it may take into account any factors it deems appropriate. The value of securities used by the Portfolio to calculate its net asset value may differ from quoted or published prices for the same securities. Fair value pricing involves subjective judgments and the fair value determined for a security may be materially different than the value that could be realized upon the sale of that security.
The Portfolio expects to use fair value pricing for securities primarily traded on U.S. exchanges only under very limited circumstances. For example, the Portfolio may use fair value pricing if the exchange on which a security is traded closes early or trading in the security is suspended.
MSF-13
Metropolitan Series Fund, Inc.
Western Asset Management U.S. Government Portfolio
Notes to Financial Statements—December 31, 2007—(Continued)
Securities traded primarily on an exchange outside of the United States which closes before the close of the New York Stock Exchange will be valued at the last sales price on that non-U.S. exchange. Securities traded primarily on an exchange outside of the United States for which there is no reported sale during the day are valued at the mean between the last reported bid and asked prices. However, because most foreign markets close well before the Portfolio values its securities (typically at 4 p.m. Eastern Time), the earlier close of these foreign markets gives rise to the possibility that significant events, including broad market moves, may have occurred after these foreign markets close but before the Portfolio values its securities. To account for this, the Portfolio may frequently value many of its foreign equity securities using fair value prices based on third party vendor modeling tools.
Forward foreign currency exchange contracts are valued based on the mean between closing bid and asked prices of the forward currency contract rates in the London foreign exchange markets on a daily basis as provided by a reliable bank or dealer.
Options, whether on securities, indices, futures contracts, or otherwise, are valued at the last sales price available as of the close of business on the day of valuation or, if there is no such sale price available, at the mean between the bid and asked prices. Options on currencies are valued at the spot price each day.
The value of futures contracts will be the sum of the margin deposit plus or minus the difference between the value of the futures contract on each day the net asset value is calculated and the value on the date the futures contract originated, value being that established on a recognized commodity exchange, or by reference to other customary sources, with gain or loss being realized when the futures contract closes or expires.
Subject to the Board’s oversight, the Board has delegated day-to-day responsibility for valuing Portfolio assets to the subadviser of the Portfolio, who values such assets as described above and operates under procedures approved by the Board.
Investment Transactions and Related Investment Income:
Portfolio security transactions are recorded on the trade date. Dividend income is recorded on the ex-dividend date or, for certain foreign securities, when notified. Interest income, which includes amortization of premium and accretion of discount on debt securities, is recorded on the accrual basis. Realized gains and losses on investments and unrealized appreciation and depreciation are determined on the identified cost basis, which is the same basis used for federal income tax purposes.
Repurchase Agreements:
The Portfolio, through the custodian or a subcustodian, receives delivery of the underlying securities collateralizing repurchase agreements. The Portfolio requires the custodian to take possession, to have legally segregated in the Federal Reserve Book Entry System, or to have segregated within the custodian’s vault, all securities held as collateral for repurchase agreements. It is the Portfolio’s policy that the market value of the collateral be at least equal to 100% of the repurchase price in the case of a repurchase agreement of one-day duration and 102% on all other repurchase agreements. The Portfolio’s subadviser is responsible for determining that the value of the collateral is at all times at least equal to the repurchase price. In connection with transactions in repurchase agreements, if the seller defaults and the value of the collateral declines or if the seller enters an insolvency proceeding, realization of the collateral by the Portfolio may be delayed, limited or wholly denied.
Futures Contracts:
The Portfolio may buy and sell futures contracts (on recognized exchanges) as a hedge or to enhance return. Futures contracts are agreements to buy or sell a security, or deliver a final cash settlement price in connection with an index, interest rate, currency, or other contracts not calling for physical delivery, for a set price in the future. The Portfolio must post an amount equal to a portion of the total market value of the futures contract as futures variation margin, which is returned when the Portfolio’s obligations under the contract have been satisfied. From time to time thereafter, the Portfolio may have to post variation margin to maintain this amount as the market value of the contract fluctuates. Risks of entering into futures contracts (and related options) include the possibility that there may be an illiquid market and that a change in the value of the contract or option may not correlate with changes in the value of the underlying securities.
Options:
The Portfolio may use options to hedge against changes in values of securities the Portfolio owns or expects to purchase. Writing puts or buying calls tends to increase the Portfolio’s exposure to the underlying instrument and writing calls or buying puts tends
MSF-14
Metropolitan Series Fund, Inc.
Western Asset Management U.S. Government Portfolio
Notes to Financial Statements—December 31, 2007—(Continued)
to decrease the Portfolio’s exposure to the underlying instrument, and can be used to hedge other Portfolio investments. For options purchased to hedge the Portfolio’s investments, the potential risk to the Portfolio is that the change in value of options contracts may not correspond to the change in value of the hedged instruments. In addition, losses may arise from changes in the value of the underlying instruments, if there is an illiquid secondary market, or if the counterparty is unable to perform. The maximum loss for purchased options is limited to the premium initially paid for the option. For options written by the Portfolio, the maximum loss is not limited to the premium initially received for the option.
The main risk associated with purchasing an option is that the option expires without being exercised. In this case, the option expires worthless and the premium paid for the option is considered the loss. The risk associated with writing a call option is that the Portfolio may forgo the opportunity for a profit if the market value of the underlying position increases and the option is exercised. The risk in writing a put option is that the Portfolio may incur a loss if the market value of the underlying position decreases and the option is exercised. In addition, the Portfolio risks not being able to enter into a closing transaction for the written option as the result of an illiquid market.
Mortgage Dollar Rolls:
The Portfolio may enter into mortgage “dollar rolls” in which a Portfolio sells mortgage-backed securities for delivery in the current month and simultaneously contracts to repurchase substantially similar (same type, coupon and maturity) securities on a specified future date. Dollar rolls are accounted for as purchase and sale transactions; gain/loss is recognized at the end of the term of the dollar roll. The average monthly balance of dollar rolls outstanding during the year ended December 31, 2007 was $662,527,667 for the Portfolio.
A Portfolio that enters into mortgage dollar rolls is subject to the risk that the market value of the securities the Portfolio is obligated to repurchase under the agreement may decline below the repurchase price. In the event the buyer of securities under a mortgage dollar roll files for bankruptcy or becomes insolvent, the Portfolio’s use of proceeds from the dollar roll may be restricted pending a court determination, a determination by the other party, or its trustee or receiver, whether to enforce the Portfolio’s obligation to repurchase the securities.
“When-Issued” Securities:
Purchasing securities “when-issued” is a forward commitment by the Portfolio to buy a security. The estimated amount of the Portfolio’s payment obligation and the security’s interest rate are determined when the commitment is made, even though no interest accrues until the security is issued, which is generally 15 to 120 days later. The Portfolio will segregate liquid assets with its custodian sufficient at all times to satisfy these commitments. If the value of the security is less when delivered than when the commitment was made, the Portfolio will suffer a loss.
Credit Risk:
The Portfolio invests a significant portion of its assets in securities of issuers that hold mortgage and asset backed securities and direct investments in securities backed by commercial and residential mortgage loans and other financial assets. The value and related income of these securities are sensitive to changes in economic conditions, including delinquencies and/or defaults. Continuing shifts in the market’s perception of credit quality on securities backed by commercial and residential mortgage loans and other financial assets may result in increased volatility of market price and periods of illiquidity that can negatively impact the valuation of certain issuers held by the Portfolio. At December 31, 2007, the Portfolio held securities of issuers that hold mortgage and asset backed securities and direct investments in mortgage and asset backed securities with an aggregate value of $237,515,505 (representing 17.6% of the Portfolio’s total assets).
Federal Income Taxes:
It is the Portfolio’s policy to comply with the requirements of the Internal Revenue Code of 1986, as amended, and regulations thereunder, applicable to regulated investment companies and to distribute all of its taxable income to shareholders. Therefore, no federal income tax provision is required.
As of December 31, 2007, the Portfolio had capital loss carryovers as follows:
| | | | | | | | |
Expiring
12/31/15 | | Expiring
12/31/14 | | Expiring
12/31/13 | | Total |
| $1,601,118 | | $2,179,549 | | $ | 5,101,186 | | $ | 8,881,853 |
MSF-15
Metropolitan Series Fund, Inc.
Western Asset Management U.S. Government Portfolio
Notes to Financial Statements—December 31, 2007—(Continued)
The utilization of the capital loss carryforward acquired as part of a merger may be limited under section 382 of the Internal Revenue Code.
The tax character of distributions paid for the periods ended December 31, 2007 and 2006 was as follows:
| | | | | | | | | | | | | | | | | | | | | |
| Ordinary Income | | Long Term Gain | | Return of Capital | | Total |
| 2007 | | 2006 | | 2007 | | 2006 | | 2007 | | 2006 | | 2007 | | 2006 |
| $33,314,247 | | $ | 25,180,888 | | $ | — | | $ | — | | $ | — | | $ | — | | $ | 33,314,247 | | $ | 25,180,888 |
As of December 31, 2007, the components of distributable earnings (accumulated losses) on a federal income tax basis were as follows:
| | | | | | | | | | | | | | |
Undistributed
Ordinary
Income | | Undistributed
Long Term
Gain | | Unrealized
(Depreciation) | | | Loss
Carryforwards | | | Total |
| $58,923,283 | | $ | — | | $ | (8,546,103 | ) | | $ | (8,881,853 | ) | | $ | 41,495,327 |
Dividends and Distributions to Shareholders:
The Portfolio records dividends and distributions on the ex-dividend date. Net realized gains from security transactions (if any) are generally distributed annually to shareholders. The timing and characterization of certain income and capital gains distributions are determined in accordance with federal tax regulations that may differ from GAAP. Permanent book and tax basis differences relating to shareholder distributions will result in reclassification between under/over distributed net investment income, accumulated net realized gains/losses and paid in capital.
| 3. | INVESTMENT TRANSACTIONS: |
For the year ended December 31, 2007, purchases and sales of securities (excluding short term investments) for the Portfolio were as follows:
| | | | | | | | | |
Purchases | | Sales |
U.S. Government | | Other | | U.S. Government | | Other |
$9,636,899,555 | | $ | 105,654,561 | | $ | 9,328,425,057 | | $ | 4,203,487 |
Options Written:
The Portfolio transactions in options written during the year ended December 31, 2007 were as follows:
| | | | | |
Call Options | | Number of
contracts | | Premiums
received |
Options outstanding December 31, 2006 | | 0 | | $ | 0 |
Options written | | 758 | | | 542,085 |
Options closed | | 0 | | | 0 |
Options expired | | 0 | | | 0 |
| | | | | |
Options outstanding December 31, 2007 | | 758 | | $ | 542,085 |
| | | | | |
| | | | | | | |
Put Options | | Number of
contracts | | | Premiums
received | |
Options outstanding December 31, 2006 | | 0 | | | $ | 0 | |
Options written | | 2,398 | | | | 990,104 | |
Options closed | | (1,640 | ) | | | (614,894 | ) |
Options expired | | 0 | | | | 0 | |
| | | | | | | |
Options outstanding December 31, 2007 | | 758 | | | $ | 375,210 | |
| | | | | | | |
MSF-16
Metropolitan Series Fund, Inc.
Western Asset Management U.S. Government Portfolio
Notes to Financial Statements—December 31, 2007—(Continued)
| 4. | INVESTMENT MANAGEMENT FEES AND OTHER TRANSACTIONS WITH AFFILIATES: |
Investment Management Agreement:
MetLife Advisers, LLC (“MetLife Advisers”) is the investment adviser to the Portfolio. The Fund has entered into an investment management agreement with MetLife Advisers with respect to the Portfolio. For providing investment management services to the Portfolio, MetLife Advisers receives monthly compensation at the following annual rates:
| | | | | | |
| | | Management
Fees earned by
MetLife Advisers
for the year ended
December 31, 2007 | | Annual
percentage
rates paid to
MetLife Advisers | | Based on Portfolios
average daily net asset levels |
| | $6,179,307 | | 0.550% | | Of the first $500 million |
| | | | 0.450% | | On amounts in excess of $500 million |
Certain officers and directors of the Fund may also be officers of MetLife Advisers; however, such officers and directors receive no compensation from the Fund.
MetLife Advisers has entered into an investment subadvisory agreement with respect to the Portfolio. Western Asset Management Co. is compensated by MetLife Advisers to provide subadvisory services for the Portfolio.
Service and Distribution Fees:
The Fund has adopted a Distribution and Service Plan under Rule 12b-1 of the 1940 Act for the Portfolio’s Class B and E shares. Under the Distribution and Service Plan, the Class B and E shares of the Portfolio pay a fee to compensate the Insurance Companies (or their affiliates) and other broker-dealers and financial intermediaries involved in the offer and sale of Portfolio shares for promoting or selling and servicing, the Class B and E shares. The fees under the Distribution and Service Plan for each class of the Portfolio’s shares are calculated as a percentage of the Portfolio’s average daily net assets that are attributable to that Class. Currently, the fee is 0.25% per year for Class B shares and 0.15% per year for Class E shares. Amounts paid by the Portfolio for the year ended December 31, 2007 are shown as Service and Distribution fees in the Statement of Operations.
The Fund has entered into a securities lending arrangement with the Fund’s custodian, State Street Bank and Trust Company (the “custodian”). Under the agreement, the custodian is authorized to loan securities on the Portfolios’ behalf. In exchange, the Portfolio receives either cash or securities as collateral against the loaned securities. The Portfolio receives collateral at least equal to 102% of the market value of the loaned securities (105% for foreign securities), at each loan’s inception. Collateral must be maintained at least at 100% of the market value of the loaned securities for the duration of the loan. The cash collateral is invested in the Navigator Securities Lending Prime Portfolio, an affiliate of the custodian, which invests in a variety of high quality U.S. dollar-denominated instruments. If the market value of the collateral at the close of trading on a business day is less than 100% of the market value of the loaned securities at the close of trading on that day, the borrower shall be required to deliver, by the close of business on the following business day, an additional amount of collateral, equal to at least 100% of the market value of all the loaned securities as of such preceding day. The Portfolio receives 80% of the annual net income from securities lending transactions, which is included in interest income of the Portfolio. The remaining 20% is paid to the custodian as compensation for its securities lending services. The Portfolio bears the risk of any deficiency in the amount of collateral available for return to a borrower due to a loss in an approved investment. Any outstanding loans by the Portfolio at December 31, 2007 are footnoted in the Schedule of Investments.
As previously reported, in May 2004, General American received a Wells Notice stating that the SEC staff was considering recommending that the SEC bring a civil action alleging violations of the U.S. securities laws against General American with respect to market timing and late trading in a limited number of privately-placed variable insurance contracts that were sold through General American. General American responded to the SEC staff and cooperated with the investigation. On August 9, 2007, the SEC announced that it had settled an enforcement action regarding late trading against General American with, among other things, General American agreeing to pay a civil penalty and to comply with certain undertakings. General American
MSF-17
Metropolitan Series Fund, Inc.
Western Asset Management U.S. Government Portfolio
Notes to Financial Statements—December 31, 2007—(Continued)
consented to the SEC’s order without admitting or denying the findings. MetLife Advisers has also advised the Fund’s Board of Directors that, while certain exceptions to the Fund’s policies have been noted, no situations have been identified that would have a material impact on the financial position of the Fund.
| 7. | RECENT ACCOUNTING PRONOUNCEMENTS: |
Effective June 29, 2007, the Fund implemented Financial Accounting Standards Board (“FASB”) Interpretation No. 48, “Accounting for Uncertainty in Income Taxes—an interpretation of FASB Statement No. 109” (“FIN 48”). FIN 48 prescribes the minimum recognition threshold a tax position must meet in connection with accounting for uncertainties in income tax positions taken or expected to be taken by an entity, including investment companies, before being measured and recognized in the financial statements. Management has evaluated the application of FIN 48 to the Fund, and has determined that the adoption of FIN 48 does not have a material impact on the Fund’s financial statements. The Fund files U.S. tax returns. No income tax returns are currently under examination. The statute of limitations on the Fund’s tax returns remains open for the years ended December 31, 2004 through December 31, 2006.
In September 2006, Statement of Financial Accounting Standards No. 157, Fair Value Measurements (SFAS 157) was issued and is effective for fiscal years beginning after November 15, 2007. SFAS 157 defines fair value, establishes a framework for measuring fair value and expands disclosures about fair value measurements. Management is currently evaluating the impact the adoption of SFAS 157 will have on the Portfolio’s financial statement disclosures.
MSF-18
Metropolitan Series Fund, Inc.
Western Asset Management U.S. Government Portfolio
Report of Independent Registered Public Accounting Firm
To the Shareholders and Board of Directors of the Metropolitan Series Fund, Inc.:
We have audited the accompanying statement of assets and liabilities, including the schedule of investments, of the Western Asset Management U.S. Government Portfolio, one of the portfolios constituting the Metropolitan Series Fund, Inc. (the “Fund”) as of December 31, 2007, and the related statement of operations for the year then ended, the statements of changes in net assets for each of the two years in the period then ended, and the financial highlights for each of the five years in the period then ended. These financial statements and financial highlights are the responsibility of the Fund’s management. Our responsibility is to express an opinion on these financial statements and financial highlights based on our audits.
We conducted our audits in accordance with the standards of the Public Company Accounting Oversight Board (United States). Those standards require that we plan and perform the audit to obtain reasonable assurance about whether the financial statements and financial highlights are free of material misstatement. The Fund is not required to have, nor were we engaged to perform, an audit of its internal control over financial reporting. Our audits included consideration of internal control over financial reporting as a basis for designing audit procedures that are appropriate in the circumstances, but not for the purpose of expressing an opinion on the effectiveness of the Fund’s internal control over financial reporting. Accordingly, we express no such opinion. An audit also includes examining, on a test basis, evidence supporting the amounts and disclosures in the financial statements, assessing the accounting principles used and significant estimates made by management, as well as evaluating the overall financial statement presentation. Our procedures included confirmation of securities owned as of December 31, 2007, by correspondence with the custodian and brokers; where replies were not received from brokers, we performed other auditing procedures. We believe that our audits provide a reasonable basis for our opinion.
In our opinion, the financial statements and financial highlights referred to above present fairly, in all material respects, the financial position of the Western Asset Management U.S. Government Portfolio of the Metropolitan Series Fund, Inc. as of December 31, 2007, the results of its operations for the year then ended, the changes in its net assets for each of the two years in the period then ended, and the financial highlights for each of the five years in the period then ended, in conformity with accounting principles generally accepted in the United States of America.
Deloitte & Touche LLP
Boston, Massachusetts
February 28, 2008
MSF-19
Metropolitan Series Fund, Inc.
Directors and Officers
The Fund’s Directors review actions of the Fund’s investment adviser and subadvisers, and decide upon matters of general policy. The Fund’s officers supervise the daily business operations of the Fund. The Board of Directors and the Fund’s officers are listed below. Each Director is responsible for overseeing all 36 Portfolios of the Fund. There is no limit to the term a Director may serve. Directors serve until their resignation, retirement or removal in accordance with the Fund’s organizational documents and policies adopted by the Board from time to time. Officers hold office at the pleasure of the Board or until the election or appointment and the qualification of a successor. The address of the directors and officers is c/o Metropolitan Series Fund, Inc., 501 Boylston Street, Boston, MA 02116.
Interested Directors(1)
Each Director below is an “interested person” (as defined by the 1940 Act) with respect to the Fund in that Ms. Forget is an employee of MetLife and Mr. Typermass is a former employee of MetLife and owns securities issued by MetLife, Inc., the ultimate parent company of MetLife Advisers.
| | | | | | | | |
Name, Address and Age | | Current
position(s)
with Fund | | Position(s)
held since | | Principal occupations
over past five years, including other directorships(2) | | Number of
Portfolios in
Fund Complex
Overseen by
Director(3) |
Elizabeth M. Forget Age: 41 | | Director, Chairman of the Board, President and Chief Executive Officer | | 2006 | | Senior Vice President (since 2007), MetLife, Inc.; President, Met Investors Advisory, LLC (“MIA”); Trustee and President, Met Investors Series Trust (“MIST”); Executive Vice President, MetLife Investors Group, Inc.; President (since 2006), MetLife Advisers. | | 81 |
| | | | |
Arthur G. Typermass Age: 70 | | Director | | 1998 | | Formerly, Senior Vice President and Treasurer, MetLife. | | 37 |
Non-Interested Directors(1)
Each Director below is not an “interested person” (as defined by the 1940 Act) with respect to the Fund (collectively, the “Independent Directors”).
| | | | | | | | |
Name, Address and Age | | Current
position(s)
with Fund | | Position(s)
held since | | Principal occupations
over past five years, including other directorships(2) | | Number of
Portfolios in
Fund Complex
Overseen by
Director(3) |
Steve A. Garban† Age: 70 | | Director | | 1985 | | Formerly, Chief Financial Officer, Senior Vice President Finance and Operations and Treasurer (Emeritus), The Pennsylvania State University. | | 37 |
| | | | |
Linda B. Strumpf Age: 60 | | Director | | 2000 | | Vice President and Chief Investment Officer, Ford Foundation. | | 37 |
| | | | |
Michael S. Scott Morton† Age: 70 | | Director | | 1993 | | Jay W. Forrester Professor of Management (Emeritus) at Sloan School of Management, MIT. | | 37 |
| | | | |
H. Jesse Arnelle Age: 74 | | Director | | 2001 | | Formerly, Counsel, Womble Carlyle Sandrie & Rice; Director, Textron Inc. (global multi-industry company)*; formerly, Director, Gannet Co. Inc. (diversified news and information company)*; formerly, Director, Eastman Chemical Company (global chemical company)*; formerly, Director, Waste Management, Inc.*; formerly, Director, Armstrong Holdings Inc. (parent company of floor and ceiling products business)*; formerly, Director, FPL Group Inc. (public utility holding company)*; Director, URS Corporation (engineering design services firm)*. | | 37 |
| | | | |
Nancy Hawthorne Age: 56 | | Director | | 2003 | | Director, Avid Technologies (computer software company)*; formerly, Chairman of the Board of Avid Technologies; formerly, Board of Advisors, L. Knife & Sons, Inc. (beverage distributor); Chief Executive Officer, Clerestory LLC (corporate financial advisor); formerly, Trustee, New England Zenith Fund (“Zenith Fund”)**; formerly, Chief Executive Officer and Managing Partner, Hawthorne, Krauss and Associates (corporate financial advisor); formerly, Chief Financial Officer and Executive Vice President, Continental Cablevision, subsequently renamed MediaOne (cable television company); formerly, Director, Life F/X, Inc.; formerly, Chairman of the Board, WorldClinic (distance medicine company); formerly, Director, Perini Corporation (construction company)*; formerly, Director, CGU (property and casualty insurance company); formerly, Director, Beacon Power Corporation (energy company )*. | | 37 |
MSF-20
Metropolitan Series Fund, Inc.
Directors and Officers—(Continued)
| | | | | | | | |
Name, Address and Age | | Current
position(s)
with Fund | | Position(s)
held since | | Principal occupations
over past five years, including other directorships(2) | | Number of
Portfolios in
Fund Complex
Overseen by
Director(3) |
John T. Ludes Age: 71 | | Director | | 2003 | | President, LFP Properties (consulting firm); Formerly, Trustee, Zenith Fund**; formerly, Vice Chairman, President and Chief Operating Officer, Fortune Brands/American Brands (global conglomerate); formerly, President and CEO, Acushnet Company (athletic equipment company). | | 37 |
Officers(1)
| | | | | | | | |
Name and address | | Age | | Current
position(s)
with Fund | | Position(s)
held since | | Principal occupations over past five years(2) |
| Jeffrey P. Halperin | | 40 | | Chief Compliance Officer | | 2006 | | Vice President (since 2006), Corporate Ethics and Compliance Department, MetLife, Inc.; Chief Compliance Officer (since 2006), MetLife Advisers, MIA and MIST. |
| | | | |
| John F. Guthrie, Jr. | | 64 | | Senior Vice President | | 2002 | | Manager and Senior Vice President, MetLife Advisers; Vice President, MetLife; Vice President (since 2003), MetLife Group, Inc.; Vice President, NELICO; Vice President (since 2005), MIA; formerly, Senior Vice President, Zenith Fund**. |
| | | | |
| Alan C. Leland | | 55 | | Senior Vice President | | 2005 | | Treasurer and Chief Financial Officer, MetLife Advisers, LLC; Treasurer (since 2005), Met Investors Advisory, LLC; Vice President (since 2004), MIA; Vice President (since 2003), MetLife Group, Inc.; Vice President, MetLife; Senior Vice President, NELICO |
| | | | |
| Peter Duffy | | 52 | | Vice President and Treasurer | | 2000 | | Senior Vice President, MetLife Advisers (since 1998); Second Vice President (since 2003), NELICO; Vice President, MetLife (since 2004); Vice President (since 2004), MetLife Group, Inc.; formerly, Vice President and Treasurer, Zenith Fund**. |
| | | | |
| Thomas M. Lenz | | 49 | | Vice President and Secretary | | 2002 | | General Counsel and Secretary, MetLife Advisers; Assistant General Counsel, MetLife; formerly, Vice President and Secretary, Zenith Fund**. |
| * | Indicates a directorship with a registered investment company or a company subject to the reporting requirements of the Securities Exchange Act of 1934, as amended. |
| ** | The Zenith Fund deregistered with the Securities and Exchange Commission (“SEC”) in 2004. |
| (†) | Served as a trustee, director and/or officer of one or more of the following companies, each of which had a direct or indirect advisory relationship with MetLife Advisers or its affiliates prior to January 31, 2005: State Street Research Financial Trust, State Street Research Income Trust, State Street Research Money Market Trust, State Street Research Institutional Funds, State Street Research Capital Trust, State Street Research Master Investment Trust, State Street Research Equity Trust, State Street Research Securities Trust and State Street Research Exchange Trust (collectively, the “State Street Research Funds”). |
| (1) | Each Director of the Fund also serves as trustee of Metropolitan Series Fund II (“Met Series Fund II”), a registered investment company advised by MetLife Advisers. Each officer of the Fund serves in the same position with Met Series Fund II, which consists of one portfolio. |
| (2) | Previous positions during the past five years with the Fund, MIST, MetLife, MetLife Advisers, MIA, Zenith Fund, NELICO or New England Securities Corporation are omitted if not materially different. |
| (3) | The Fund Complex includes the Fund (36 portfolios), Met Series Fund II (1 portfolio) and MIST (44 portfolios) |
MSF-21
Metropolitan Series Fund, Inc.
Western Asset Management U.S. Government Portfolio
Board Approval of Advisory and Subadvisory Agreements
The Fund’s Contract Review Committees of the Board of Directors (the “Board”) typically meet in early fall to review the Portfolios’ advisory agreements (the “Advisory Agreements”) and subadvisory agreements (collectively, the “Subadvisory Agreements,” and, together with the Advisory Agreements, the “Agreements”) and determine whether to recommend that the full Board approve the continuation of the Agreements for an additional one-year period. (Following the initial approval of an Agreement for a new Portfolio or with a new adviser or subadviser, such annual reviews are not required until 2 years following the execution of such Agreement.) After each Committee has made its recommendations, the full Board, including the Independent Directors, determines whether to approve the continuation of each of the Agreements. In addition, the Board, including the Independent Directors, considers matters bearing on the Agreements at most of its other meetings throughout the year and regularly interviews various individuals at MetLife Advisers responsible for the management of the Portfolios. The Directors also interview selected investment managers and other professionals at the subadvisers at various times throughout the year.
The Directors receive all materials that they or MetLife Advisers, the Fund’s investment adviser, and the subadvisers believe to be reasonably necessary for the Directors to evaluate the Agreements and determine whether to approve the continuation of the Agreements. These materials generally include, among other items, (i) information on the investment performance of the Portfolios and the performance of peer groups of funds and the Portfolios’ performance benchmarks, (ii) information on the Portfolios’ advisory and subadvisory fees and other expenses, including information comparing the Portfolios’ expenses to those of peer groups of funds and information about any applicable expense caps and fee “breakpoints,” (iii) sales and redemption data, (iv) information related to the profitability of the Agreements to MetLife Advisers and the subadvisers, and potential “fall-out” or ancillary benefits that MetLife Advisers, the subadvisers or their affiliates may receive as a result of their relationships with the Fund and (v) information obtained through the subadvisers’ responses to certain requests from MetLife Advisers and the Directors and MetLife Advisers’ responses to requests from the Directors. The Directors may also consider other information such as (vi) MetLife Advisers’ and the subadvisers’ financial results and condition, (vii) each Portfolio’s investment objectives and strategies and the size, education and experience of the investment staffs of MetLife Advisers and the relevant subadvisers and their use of technology and external research, (viii) the allocation of the Portfolios’ brokerage, if any, including allocations to brokers affiliated with the subadvisers and the use of “soft” commission dollars to pay Portfolio expenses and to pay for research and other similar services, (ix) the resources devoted to, and the record of compliance with, the Portfolios’ investment policies and restrictions, policies on personal securities transactions and other compliance policies, (x) the responses of MetLife Advisers, the subadvisers and/or their affiliates to certain legal and regulatory proceedings and (xi) the economic outlook generally and for the mutual fund industry in particular. Throughout the process, the Directors have the opportunity to ask questions of and request additional materials from MetLife Advisers and the subadvisers.
Following meetings of each Contract Review Committee on September 12, 2007, the Board, at its November 15, 2007 meeting, approved the continuation through December 31, 2008 of the Advisory Agreements for each Portfolio of the Fund and the Subadvisory Agreements for each Portfolio of the Fund. The Agreements approved for continuation are referred to below as the “Continued Agreements.”
In considering whether to approve the continuation of the Continued Agreements, the Directors, including the Independent Directors, did not identify any single factor as determinative, and each weighed the various factors as he or she deemed appropriate. The Directors considered the following matters in connection with their approval of the Continued Agreements:
The nature, extent and quality of the services provided to the relevant Portfolios under the Continued Agreements. The Directors considered the nature, extent and quality of the services provided by MetLife Advisers, the relevant subadvisers (if any) and their affiliates (each, an “Adviser,” and, collectively, the “Advisers”) to the relevant Portfolios pursuant to the Continued Agreements and the resources dedicated to these Portfolios by the Advisers. In particular, the Directors considered the Advisers’ abilities to attract and retain highly qualified investment professionals. With respect to MetLife Advisers, the Directors considered that MetLife Advisers is (i) ultimately responsible for the performance of such Portfolios; (ii) ultimately responsible for the establishment of the investment strategies of each such Portfolio, primarily through its recommendations to the Board regarding the hiring and selection of subadvisers; (iii) responsible for the hiring and selection, subject to Board approval, of subadvisers; and (iv) responsible for maintaining a program of Subadviser oversight reasonably designed to ensure that the subadvisers have reasonable compliance policies and procedures in place. The Directors also considered that MetLife Advisers provides a full range of day-to-day administrative services for the Portfolios involving all aspects of such Portfolios’ day-to-day operations (other than portfolio management). After reviewing these and related factors, the Directors concluded, within the context of their overall conclusions regarding each of the Continued Agreements, that the nature, extent and quality of services provided supported the renewal of these Agreements.
Investment performance of the relevant Portfolios. The Directors reviewed information about the performance of the relevant Portfolios over various time periods, including information prepared by an independent third party that compared the performance of
MSF-22
Metropolitan Series Fund, Inc.
Western Asset Management U.S. Government Portfolio
Board Approval of Advisory and Subadvisory Agreements—(Continued)
the Portfolios to the performance of peer groups of funds and performance benchmarks. The Directors also reviewed a description of the third party’s methodology for identifying a Portfolio’s peer group(s) for purposes of performance and expense comparisons.
In the case of each relevant Portfolio that had performance that lagged its peer group(s) for certain periods, the Directors concluded that other factors relevant to performance were sufficient, in light of other considerations, to warrant renewal of the Continued Agreements relating to such Portfolio. These factors varied from Portfolio to Portfolio, but included one or more of the following: (i) that such Portfolio’s performance, although lagging in certain recent periods, was stronger over the longer term; (ii) that the underperformance was attributable, to a significant extent, to investment decisions that were reasonable and consistent with the Portfolio’s investment objective(s) and policies and that the Portfolio was performing within the range of reasonable expectations, given market conditions and the Portfolio’s investment objective(s) and policies; (iii) that the Portfolio’s performance was competitive when compared to other relevant performance benchmarks or peer groups; and (iv) that MetLife Advisers and/or the relevant subadviser (if any) had taken or was taking steps designed to help improve the Portfolio’s investment performance.
The Directors also considered the investment performance of the Advisers and their reputations generally, the historical responsiveness of the Advisers to Director concerns about performance and the willingness of the Advisers to take steps intended to improve performance.
After reviewing these and related factors, the Directors concluded, within the context of their overall conclusions regarding each of the Continued Agreements, that the investment performance of each relevant Portfolio and Adviser was sufficient, in light of other considerations, to warrant the renewal of the Continued Agreements.
The costs of the services to be provided and profits to be realized by the Advisers and their affiliates from their relationships with the Portfolios. The Directors considered the fees charged by MetLife Advisers to the Portfolios for advisory services and, with respect to the subadvised Portfolios, by such subadvisers to MetLife Advisers for subadvisory services (such advisory and subadvisory fees (if any), collectively, “Fees”), as well as the total expense levels of the Portfolios. This information included comparisons (provided by an independent third party) of the Portfolios’ advisory fees and total expense levels to those of their peer groups. In evaluating Fees for the relevant Portfolios, the Directors also took into account the demands, complexity and quality of the investment management services provided to each Portfolio. The Directors considered MetLife Advisers’ recommendations regarding reductions in Fee rates, implementation of Fee breakpoints and institution of Fee waivers and expense caps.
The Directors also considered the compensation directly or indirectly received by the Advisers and their affiliates from their relationships with the relevant Portfolios. The Directors reviewed information relating to the profits received by MetLife Advisers, certain of the subadvisers and their affiliates as a result of their relationships with the relevant Portfolios, and information about the allocation of expenses used to calculate profitability. When reviewing profitability, the Directors also considered the performance of the relevant Portfolios, the expense levels of such Portfolios and whether the relevant Advisers had implemented breakpoints, fee waivers and/or expense caps with respect to such Portfolios.
After reviewing these and related factors, the Directors concluded, within the context of their overall conclusions regarding each of the Continued Agreements, that the Fees charged to each of the relevant Portfolios were fair and reasonable, and that the information provided regarding costs of these services generally, and the related profitability (if known) to the relevant Advisers of their relationships with the relevant Portfolios, supported the renewal of the Continued Agreements.
Economies of Scale. The Directors considered the existence of any economies of scale in the provision of services by the Advisers and whether those economies were shared with the relevant Portfolios through breakpoints in their advisory fees or other means, such as expense caps, fee waivers or relatively low levels of fees. The Directors noted that most of the relevant Portfolios benefited or will benefit from breakpoints, expense caps and/or fee waivers with respect to their advisory fees. In considering these issues, the Directors also took into consideration information relating to the costs of the services provided and the profitability to MetLife Advisers, the relevant subadvisers (if any) and each of their affiliates of their relationships with the relevant Portfolios, as discussed above.
After reviewing these and related factors, the Directors concluded, within the context of their overall conclusions regarding each of the Continued Agreements, that the extent to which economies of scale were shared with the relevant Portfolios supported the renewal of such Agreements.
Other Factors. The Directors also considered other factors, which included but were not limited to the following:
| | • | | the extent to which each relevant Portfolio operated in accordance with its investment objective, and its record of compliance with its investment restrictions and the compliance programs of the Fund and the Advisers. They also considered the compliance-related resources the Advisers and their affiliates provide to the relevant Portfolios; |
MSF-23
Metropolitan Series Fund, Inc.
Western Asset Management U.S. Government Portfolio
Board Approval of Advisory and Subadvisory Agreements—(Continued)
| | • | | the nature, quality, cost and extent of administrative and shareholder services performed by MetLife Advisers and its affiliates under the Advisory Agreements; and |
| | • | | so-called “fall-out benefits” to the Advisers, such as the engagement of their affiliates to provide distribution, brokerage and transfer agency services to the Portfolios, and the benefits of research made available to the relevant Advisers by reason of brokerage commissions generated by the relevant Portfolios’ securities transactions. The Directors also considered the possible conflicts of interest associated with these fall-out and other benefits, and the reporting and other processes in place to disclose and monitor these possible conflicts of interest. |
Based on their evaluation of all factors that they deemed to be material, including those factors described above, and assisted by the advice of independent counsel, the Directors, including the Independent Directors, concluded that each of the Continued Agreements should be continued through December 31, 2008.
MSF-24
A description of the policies and procedures that the Fund uses to determine how to vote proxies relating to portfolio securities is available (i) without charge, upon request, by calling (800) 638-7732 and (ii) on the Securities and Exchange Commission’s (the “SEC”) website at http://www.sec.gov.
Information regarding how the Fund voted proxies relating to portfolio securities during the most recent twelve-month period ended December 31, 2007 is available (i) without charge, upon request, by calling (800) 638-7732 and (ii) on the SEC’s website at http://www.sec.gov.
The Fund files with the SEC a complete schedule of its portfolio holdings, as of the close of the first and third quarters of its fiscal year, on “Form N-Q”. These filings are available on the SEC’s website at www.sec.gov and may be reviewed and copied at the SEC’s Public Reference Room in Washington, DC. (Call 1-800-SEC-0330 for information on the operation of the Public Reference Room.)
MSF-25
| | |
Metropolitan Series Fund, Inc. Zenith Equity Portfolio Annual Report | | December 31, 2007 |
Letter from the President
February 1, 2008
Letter to Policy Holders:
2007 was a tumultuous year in the financial markets driven by concerns in the credit markets surrounding sub-prime mortgages and fears of recession in the U.S. Economy. The broad markets were mixed, with the Dow Jones Industrial Average up 8.9% and the MSCI EAFE Index, which measures the performance of international equities, up 11.2% for the year, while the Russell 2000 Index, which measures the performance of small capitalization stocks, was down 1.6%.
In the fixed income markets, credit spreads increased as a result of the pressure from sub-prime mortgage crisis and the Federal Reserve lowered interest rates by a total of 1% during the year. The Lehman Brothers Aggregate Bond Index posted a 7.0% return for the year.
On the following pages, you will find a complete review of your Portfolio and its investment performance.
MetLife is committed to building your financial freedom. We appreciate your trust and will continue to focus our efforts on meeting your investment needs.
Sincerely,
Elizabeth Forget
President, Metropolitan Series Fund, Inc.
Metropolitan Series Fund, Inc.
Zenith Equity Portfolio
Managed by MetLife Advisers, LLC
Portfolio Manager Commentary*
PORTFOLIO PERFORMANCE
For the year ended December 31, 2007, the Class A shares of the Zenith Equity Portfolio returned 5.3%, compared to its benchmark, the Standard & Poor’s 500 Index1, which returned 5.5%. The average return of its peer group, the Lipper Variable Insurance Products Large-Cap Core Funds Universe2, was 5.8% over the same period.
PORTFOLIO REVIEW
Concerns about subprime mortgages and the strength of the overall economy initially surfaced in the first half of 2007, but they were mostly brushed off. It was not until the second half of the year that those concerns intensified. Most economic statistics at the end of 2007 indicated a weakening economy: a sharp decrease in New and Existing Home Sales, a drop in Consumer Confidence, a rise in the Unemployment Rate, and a decline in the Purchasing Managers Index.
During 2007, large cap stocks, as measured by the Standard & Poor’s 500 Index return of 5.5%, did better than small cap stocks, as measured by the -1.6% return of the Russell 2000 Index3. Growth style stocks generally held up better than value style stocks. There was a wide dispersion among the various sectors of the S&P 500 Index: Energy and Materials were up 34% and 22% respectively, while Financials (-19%) and Consumer Discretionary (-13%) were down sharply. On a local basis, foreign stocks were also up modestly for the year, but US based investors benefited from a weak dollar to receive an 11.2% return as measured by the MSCI EAFE Index4.
The Zenith Equity Portfolio is a “fund of funds” that invests in other Portfolios of the Metropolitan Series Fund, Inc. Currently, MetLife Advisers invests the assets of Zenith Equity Portfolio equally among the Capital Guardian U.S. Equity Portfolio, the FI Value Leaders Portfolio, and the Jennison Growth Portfolio (the Underlying Portfolios). Of its three Underlying Portfolios, Capital Guardian was the weakest performer with a -0.1% return for the year ending December 31, 2007; the FI Value Leaders component returned 4.2%; and Jennison, in line with the large cap growth indices, returned 11.7%.
For more information on the Underlying Portfolios, please see the individual report pertaining to each of the Underlying Portfolios.
* The views expressed above are those of the advisory firm as of December 31, 2007 and are subject to change based on market and other conditions. Information about the Portfolio’s holdings, asset allocation, industry allocation, or country diversification is historical and is not an indication of future Portfolio composition, which will vary. The performance of any index mentioned in this commentary has not been adjusted for ongoing management, distribution and operating expenses, and sales charges applicable to mutual fund investments. Direct investment in the Index is not possible.
1 The Standard & Poor’s (S&P) 500® Stock Index is an unmanaged index representing the performance of 500 major companies, most of which are listed on the New York Stock Exchange.
2 The Lipper Variable Insurance Products Fund Average is an average of the total return performance (calculated on the basis of net asset value) of variable product funds with similar investment objectives to those of the subject Portfolio as calculated by Lipper Analytical Services, an independent mutual fund ranking service.
3The Russell 2000® Index is an unmanaged measure of performance of the 2,000 smallest companies in the Russell 3000® Index.
4The Morgan Stanley Capital International Europe, Australasia and Far East Index (“MSCI EAFE Index”) is an unmanaged free float-adjusted market capitalization index that is designed to measure developed market equity performance, excluding the U.S. & Canada.
MSF-2
Metropolitan Series Fund, Inc.
Zenith Equity Portfolio
A $10,000 INVESTMENT COMPARED TO
THE S&P 500 INDEX
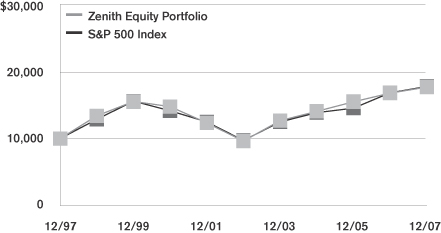
Average Annual Returns as of December 31, 2007
| | | | | | |
| | | Zenith Equity
Portfolio | | | S&P 500
Index | |
| 1 Year | | 5.3 | % | | 5.5 | % |
| 5 Year | | 12.9 | | | 12.8 | |
| 10 Year | | 5.9 | | | 5.9 | |
Performance numbers are net of all Portfolio expenses but do not include any insurance, sales, or administrative charges of variable annuity or life insurance contracts. If these charges were included, the returns would be lower.
This information represents past performance and is not indicative of future results. Investment return and principal value may fluctuate so that shares, upon redemption, may be worth more or less than the original cost.
PORTFOLIO COMPOSITION
as of December 31, 2007
Top Holdings
| | |
| | | % of Total
Net Assets |
Metropolitan Series Fund, Inc.—Jennison Growth Portfolio, (Class A) | | 34.0% |
Metropolitan Series Fund, Inc.—FI Value Leaders Portfolio, (Class A) | | 33.7% |
Metropolitan Series Fund, Inc.—Capital Guardian U.S. Equity Portfolio, (Class A) | | 32.3% |
MSF-3
Metropolitan Series Fund, Inc.
Shareholder Expense Example
As a shareholder of the Portfolio, you incur ongoing costs, including management fees; distribution and service (12b-1) fees; and other Portfolio expenses. This example is intended to help you understand your ongoing costs (in dollars) (referred to as “expenses”) of investing in the Portfolio and compare these costs with the ongoing costs of investing in other mutual funds. The example is based on an investment of $1,000 invested at the beginning of the period and held for the entire period, July 1, 2007 through December 31, 2007.
Actual Expenses
The first line for each share class of the Portfolio in the table below provides information about actual account values and actual expenses. You may use the information in this line, together with the amount you invested in the particular share class of the Portfolio, to estimate the expenses that you paid over the period. Simply divide your account value by $1,000 (for example, an $8,600 account value divided by $1,000=8.6), then multiply the result by the number in the first line under the heading entitled “Expenses Paid During Period” to estimate the expenses you paid on your account during this period.
Hypothetical Example for Comparison Purposes
The second line for each share class of the Portfolio in the table below provides information about hypothetical account values and hypothetical expenses based on the Portfolio’s actual expense ratio and an assumed rate of return of 5% per year before expenses, which is not the Portfolio’s actual return. The hypothetical account values and expenses may not be used to estimate the actual ending account balance or expenses you paid for the period. You may use this information to compare the ongoing costs of investing in the Portfolio and other funds. To do so, compare this 5% hypothetical example with the 5% hypothetical examples that appear in the shareholder reports of the other funds.
Please note that the expenses shown in the table are meant to highlight your ongoing costs only and do not reflect any fees or charges of your variable insurance product or any additional expenses that participants in certain eligible qualified plans may bear relating to the operations of their plan. Therefore, the second line for each share class in the table is useful in comparing ongoing costs only, and will not help you determine the relative total costs of owning different funds. In addition, if these other costs were included, your costs would have been higher.
| | | | | | | | | | | | | | |
Portfolio | | | | Annualized
Expense
Ratio | | | Beginning
Account Value
July 1,
2007 | | Ending
Account Value
December 31,
2007 | | Expenses Paid
During Period*
July 1, 2007
to
December 31,
2007 |
Zenith Equity(a) | | Actual | | 0.71 | % | | $ | 1,000.00 | | $ | 987.00 | | $ | 3.56 |
| | Hypothetical | | 0.71 | % | | $ | 1,000.00 | | $ | 1,021.59 | | $ | 3.62 |
* Expenses paid are equal to the Portfolio’s annualized expense ratio for the most recent six month period, as shown above, multiplied by the average account value over the period, multiplied by the number of days in the most recent fiscal half-year, divided by 365 (to reflect the one-half year period).
(a) The annualized expense ratio reflects the expenses of both the Zenith Equity Portfolio and the underlying Portfolios in which it invests.
MSF-4
Metropolitan Series Fund, Inc.
Zenith Equity Portfolio
Schedule of Investments as of December 31, 2007
Mutual Funds—100.0%
| | | | | | |
| Security Description | | Shares | | Value* | |
| | | | | | |
| | |
Affiliated Investment Companies—100.0% | | | | | | |
Metropolitan Series Fund, Inc.—Capital Guardian U.S. Equity Portfolio, (Class A) | | 22,154,374 | | $ | 275,600,413 | |
Metropolitan Series Fund, Inc.—FI Value Leaders Portfolio, (Class A) | | 1,467,259 | | | 287,832,240 | |
Metropolitan Series Fund, Inc.—Jennison Growth Portfolio, (Class A) | | 21,266,895 | | | 289,655,114 | |
Total Mutual Funds
(Identified Cost $680,664,772) | | | | | 853,087,767 | |
| | | | | | |
Total Investments—100.0%
(Identified Cost $680,664,772) (a) | | | | | 853,087,767 | |
Liabilities less other assets | | | | | (110,648 | ) |
| | | | | | |
| Total Net Assets—100% | | | | $ | 852,977,119 | |
| | | | | | |
| (a) | The aggregate cost of investments for federal income tax purposes as of December 31, 2007 was $688,446,175 and the unrealized appreciation on investment securities was $164,641,592. |
*See accompanying notes to financial statements.
MSF-5
Metropolitan Series Fund, Inc.
Zenith Equity Portfolio
Statement of Assets & Liabilities
December 31, 2007
| | | | | | | |
Assets | | | | | | | |
Investments at value (a) | | | | | $ | 853,087,767 | |
Receivable for: | | | | | | | |
Securities sold | | | | | | 863,893 | |
Fund shares sold | | | | | | 22,090 | |
| | | | | | | |
Total Assets | | | | | | 853,973,750 | |
Liabilities | | | | | | | |
Payable for: | | | | | | | |
Fund shares redeemed | | $ | 885,983 | | | | |
Due to custodian bank | | | 825 | | | | |
Accrued expenses: | | | | | | | |
Deferred directors’ fees | | | 85,267 | | | | |
Other expenses | | | 24,556 | | | | |
| | | | | | | |
Total Liabilities | | | | | | 996,631 | |
| | | | | | | |
Net Assets | | | | | $ | 852,977,119 | |
| | | | | | | |
Net assets consists of: | | | | | | | |
Capital paid in | | | | | $ | 665,618,544 | |
Undistributed net investment income | | | | | | 18,091,157 | |
Accumulated net realized losses | | | | | | (3,155,577 | ) |
Unrealized appreciation on investments | | | | | | 172,422,995 | |
| | | | | | | |
Net Assets | | | | | $ | 852,977,119 | |
| | | | | | | |
| Computation of offering price: | | | | | | | |
Class A | | | | | | | |
Net asset value and redemption price per share ($852,977,119 divided by 1,818,970 shares outstanding) | | | | | $ | 468.93 | |
| | | | | | | |
(a) Identified cost of investments | | | | | $ | 680,664,772 | |
| | | | | | | |
Statement of Operations
For the Year Ended December 31, 2007
| | | | | | |
Investment Income | | | | | | |
Dividends from Underlying Portfolios | | | | $ | 5,755,477 | |
Interest | | | | | 111 | |
| | | | | | |
| | | | | 5,755,588 | |
Expenses | | | | | | |
Directors’ fees and expenses | | 4,798 | | | | |
Custodian | | 32,123 | | | | |
Audit and tax services | | 18,574 | | | | |
Legal | | 9,971 | | | | |
Miscellaneous | | 9,538 | | | | |
| | | | | | |
Total expenses | | | | | 75,004 | |
| | | | | | |
Net Investment Income | | | | | 5,680,584 | |
| | | | | | |
Realized and Unrealized Gain (Loss) | | | | | | |
| Realized gain on: | | | | | | |
Investments—net | | 41,679,353 | | | | |
Capital gain distributions from Underlying Portfolios | | 57,453,234 | | | 99,132,587 | |
| | | | | | |
| Change in unrealized depreciation on: | | | | | | |
Investments—net | | | | | (55,905,944 | ) |
| | | | | | |
Net gain | | | | | 43,226,643 | |
| | | | | | |
Net Increase in Net Assets From Operations | | | | $ | 48,907,227 | |
| | | | | | |
See accompanying notes to financial statements.
MSF-6
Metropolitan Series Fund, Inc.
Zenith Equity Portfolio
Statements of Changes in Net Assets
| | | | | | | | |
| | | Year ended
December 31,
2007 | | | Year ended
December 31,
2006 | |
From Operations | | | | | | | | |
Net investment income | | $ | 5,680,584 | | | $ | 6,930,597 | |
Net realized gain | | | 99,132,587 | | | | 49,310,064 | |
Unrealized appreciation (depreciation) | | | (55,905,944 | ) | | | 19,077,888 | |
| | | | | | | | |
Increase in net assets from operations | | | 48,907,227 | | | | 75,318,549 | |
| | | | | | | | |
From Distributions to Shareholders | | | | | | | | |
Net Investment Income | | | (6,947,399 | ) | | | (5,148,684 | ) |
| | | | | | | | |
Total distributions | | | (6,947,399 | ) | | | (5,148,684 | ) |
| | | | | | | | |
Decrease in net assets from capital share transactions | | | (126,957,251 | ) | | | (129,049,996 | ) |
| | | | | | | | |
Total decrease in net assets | | | (84,997,423 | ) | | | (58,880,131 | ) |
| | | | | | | | |
| | |
Net Assets | | | | | | | | |
Beginning of the period | | | 937,974,542 | | | | 996,854,673 | |
| | | | | | | | |
End of the period | | $ | 852,977,119 | | | $ | 937,974,542 | |
| | | | | | | | |
Undistributed Net Investment Income | | | | | | | | |
End of the period | | $ | 18,091,157 | | | $ | 6,875,406 | |
| | | | | | | | |
Other Information:
Capital Shares
Transactions in capital shares were as follows:
| | | | | | | | | | | | | | |
| | | Year ended
December 31, 2007 | | | Year ended
December 31, 2006 | |
| | | Shares | | | $ | | | Shares | | | $ | |
Sales | | 186,558 | | | $ | 87,294,647 | | | 239,084 | | | $ | 101,838,553 | |
Reinvestments | | 14,827 | | | | 6,947,399 | | | 11,885 | | | | 5,148,684 | |
Redemptions | | (472,139 | ) | | | (221,199,297 | ) | | (553,641 | ) | | | (236,037,233 | ) |
| | | | | | | | | | | | | | |
Net decrease | | (270,754 | ) | | $ | (126,957,251 | ) | | (302,672 | ) | | $ | (129,049,996 | ) |
| | | | | | | | | | | | | | |
See accompanying notes to financial statements.
MSF-7
Metropolitan Series Fund, Inc.
Zenith Equity Portfolio
Financial Highlights
| | | | | | | | | | | | | | | | | | | | |
| | | Year ended December 31, | |
| | | 2007 | | | 2006 | | | 2005 | | | 2004 | | | 2003 | |
Net Asset Value, Beginning of Period | | $ | 448.85 | | | $ | 416.68 | | | $ | 381.97 | | | $ | 345.68 | | | $ | 263.54 | |
| | | | | | | | | | | | | | | | | | | | |
Income From Investment Operations | | | | | | | | | | | | | | | | | | | | |
Net investment income | | | 2.91 | (a) | | | 3.40 | | | | 2.29 | | | | 3.44 | | | | 1.57 | |
Net realized and unrealized gain on investments | | | 20.66 | | | | 31.01 | | | | 35.94 | | | | 34.45 | | | | 81.36 | |
| | | | | | | | | | | | | | | | | | | | |
Total from investment operations | | | 23.57 | | | | 34.41 | | | | 38.23 | | | | 37.89 | | | | 82.93 | |
| | | | | | | | | | | | | | | | | | | | |
Less Distributions | | | | | | | | | | | | | | | | | | | | |
Distributions from net investment income | | | (3.49 | ) | | | (2.24 | ) | | | (3.52 | ) | | | (1.60 | ) | | | (0.79 | ) |
| | | | | | | | | | | | | | | | | | | | |
Total distributions | | | (3.49 | ) | | | (2.24 | ) | | �� | (3.52 | ) | | | (1.60 | ) | | | (0.79 | ) |
| | | | | | | | | | | | | | | | | | | | |
Net Asset Value, End of Period | | $ | 468.93 | | | $ | 448.85 | | | $ | 416.68 | | | $ | 381.97 | | | $ | 345.68 | |
| | | | | | | | | | | | | | | | | | | | |
Total Return (%) | | | 5.3 | | | | 8.3 | | | | 10.2 | | | | 11.0 | | | | 31.5 | |
Ratio of operating expenses to average net assets (%) | | | 0.01 | (b) | | | 0.01 | (b) | | | 0.01 | (b) | | | 0.01 | (b) | | | 0.01 | (b) |
Ratio of net investment income to average net assets (%) | | | 0.62 | | | | 0.72 | | | | 0.52 | | | | 0.91 | | | | 0.50 | |
Portfolio turnover rate (%) | | | 11 | | | | 6 | | | | 5 | | | | 4 | | | | 6 | |
Net assets, end of period (000) | | $ | 852,977 | | | $ | 937,975 | | | $ | 996,855 | | | $ | 1,029,383 | | | $ | 1,042,983 | |
| (a) | Per share amount is based on average shares outstanding during the period. |
| (b) | The ratio of operating expenses to average net assets does not include expenses of investment companies in which the Portfolio invests. |
See accompanying notes to financial statements.
MSF-8
Metropolitan Series Fund, Inc.
Zenith Equity Portfolio
Notes to Financial Statements—December 31, 2007
Metropolitan Series Fund, Inc. (the “Fund”) is organized as a corporation under the laws of Maryland pursuant to Articles of Incorporation filed on November 23, 1982, as amended, and registered under the Investment Company Act of 1940, as amended (the “1940 Act”), as an open-end investment company. The Fund is a “series” type of mutual fund, which issues separate series of stock. Each series represents an interest in a separate portfolio of Fund investments. The Zenith Equity Portfolio (the “Asset Allocation Portfolio”) is a non-diversified series of the fund. The Asset Allocation Portfolio operates under a “fund of funds” structure, investing substantially all of its assets in other Portfolios advised by MetLife Advisers, LLC (“MetLife Advisers”) or its affiliates (each, an “Underlying Portfolio,” and, collectively, the “Underlying Portfolios”). Shares in the Fund are not offered directly to the general public and are currently available only to separate accounts established by Metropolitan Life Insurance Company (“MetLife”), New England Life Insurance Company, General American Life Insurance Company (“General American”), The MetLife Investors Group of Insurance Companies, MetLife Insurance Company of Connecticut and other affiliated insurance companies (collectively, the “Insurance Companies”), as an investment vehicle for variable life insurance, group annuity or variable annuity products, although not all Portfolios are available to all such separate accounts.
| 2. | SIGNIFICANT ACCOUNTING POLICIES: |
The preparation of financial statements in conformity with accounting principles generally accepted in the United States of America (“GAAP”) requires management to make estimates and assumptions that affect the reported amounts of assets and liabilities and disclosure of contingent assets and liabilities as of the date of the financial statements and the reported amounts of income and expenses during the reporting period. Actual results could differ from those estimates.
The following is a summary of significant accounting policies consistently followed by the Asset Allocation Portfolio in the preparation of its financial statements. The policies are in conformity with GAAP.
Investment Valuation:
The net asset value of the Asset Allocation Portfolio is calculated based on the net asset values of the Underlying Portfolios in which the Asset Allocation Portfolio invests. The Underlying Portfolios that are Series of the Fund will use fair value pricing in the circumstances and manner described below.
The Underlying Portfolios are valued as follows:
Debt securities (other than short term obligations with a remaining maturity of sixty days or less) are valued by independent pricing services selected by the relevant subadviser pursuant to authorization of the Board of Directors of the Fund (the “Board” or “Directors”). Short term obligations with a remaining maturity of sixty days or less are valued at amortized cost which approximates fair market value.
Equity securities traded on a national securities exchange or exchanges are valued at their last sale price on the principal trading market. Equity securities traded on the NASDAQ National Market System are valued at the NASDAQ Official Closing Price (the “NOCP”). The NOCP is the last sale price if it falls between the spread of the last reported bid and asked prices. If the last reported bid and asked prices are above the last reported sale price, the NOCP will be the last reported bid price. If the last reported bid and asked prices are below the last reported sale price, the NOCP will be the last reported asked price. Equity securities traded on a national securities exchange or exchanges or on the NASDAQ National Market System for which there is no reported sale during the day are valued at the last reported bid price. A security that is listed or traded on more than one exchange is valued at the quotation on the exchange determined to be the primary market for that security by the Board or its delegates. If no closing price is available, then such securities are valued by using the last reported bid price. Equity securities traded over-the-counter are valued at the last reported sales price.
If no current market value quotation is readily available or reliable for a portfolio security, fair value will be determined in accordance with procedures established by and under the general supervision of the Board. When an Underlying Portfolio uses fair value pricing, it may take into account any factors it deems appropriate. The value of securities used by the Portfolio to calculate its net asset value may differ from quoted or published prices for the same securities. Fair value pricing involves subjective judgments and the fair value determined for a security may be materially different than the value that could be realized upon the sale of that security.
MSF-9
Metropolitan Series Fund, Inc.
Zenith Equity Portfolio
Notes to Financial Statements—December 31, 2007—(Continued)
The Underlying Portfolios expect to use fair value pricing for securities primarily traded on U.S. exchanges only under very limited circumstances. For example, the Underlying Portfolios may use fair value pricing if the exchange on which a security is traded closes early or trading in the security is suspended.
Securities traded primarily on an exchange outside of the United States which closes before the close of the New York Stock Exchange will be valued at the last sales price on that non-U.S. exchange. Securities traded primarily on an exchange outside of the United States for which there is no reported sale during the day are valued at the mean between the last reported bid and asked prices. However, because most foreign markets close well before the Underlying Portfolios value their securities (typically at 4 p.m. Eastern Time), the earlier close of these foreign markets gives rise to the possibility that significant events, including broad market moves, may have occurred after these foreign markets close but before the Underlying Portfolios value their securities. To account for this, the Underlying Portfolios may frequently value many of the Underlying Portfolios’ foreign equity securities using fair value prices based on third party vendor modeling tools.
Forward foreign currency exchange contracts are valued based on the mean between closing bid and asked prices of the forward currency contract rates in the London foreign exchange markets on a daily basis as provided by a reliable bank or dealer.
Options, whether on securities, indices, futures contracts, or otherwise, are valued at the last sales price available as of the close of business on the day of valuation or, if there is no such sale price available, at the mean between the bid and asked prices. Options on currencies are valued at the spot price each day.
The value of futures contracts will be the sum of the margin deposit plus or minus the difference between the value of the futures contract on each day the net asset value is calculated and the value on the date the futures contract originated, value being that established on a recognized commodity exchange, or by reference to other customary sources, with gain or loss being realized when the futures contract closes or expires.
Subject to the Board’s oversight, the Board has delegated day-to-day responsibility for valuing Underlying Portfolio assets to MetLife Advisers, LLC (“MetLife Advisers” or the “Adviser”), who values such assets as described above and operates under procedures approved by the Board.
Investment Transactions and Related Investment Income:
Portfolio security transactions are recorded on the trade date. Dividend income is recorded on the ex-dividend date. Interest income is recorded on the accrual basis. Realized gains and losses on investments and unrealized appreciation and depreciation are determined on the identified cost basis, which is the same basis used for federal income tax purposes.
Federal Income Taxes:
It is the Fund’s policy to comply with the requirements of the Internal Revenue Code of 1986, as amended, and regulations thereunder, applicable to regulated investment companies and to distribute all of its taxable income to shareholders. Therefore, no federal income tax provision is required.
As of December 31, 2007, the Asset Allocation Portfolio had no capital loss carryovers.
| | | | | | | | | | | | | | | | | | | | | |
Ordinary Income | | Long Term Gain | | Return of Capital | | Total |
2007 | | 2006 | | 2007 | | 2006 | | 2007 | | 2006 | | 2007 | | 2006 |
$6,947,399 | | $ | 5,148,684 | | $ | — | | $ | — | | $ | — | | $ | — | | $ | 6,947,399 | | $ | 5,148,684 |
As of December 31, 2007, the components of distributable earnings (accumulated losses) on a federal income tax basis were as follows:
| | | | | | | | | |
Undistributed
Ordinary
Income | | Undistributed
Long Term
Gain | | Unrealized
Appreciation | | Total |
$18,151,802 | | $ | 4,625,826 | | $ | 164,641,592 | | $ | 187,419,220 |
MSF-10
Metropolitan Series Fund, Inc.
Zenith Equity Portfolio
Notes to Financial Statements—December 31, 2007—(Continued)
Dividends and Distributions to Shareholders:
The Asset Allocation Portfolio records dividends and distributions on the ex-dividend date. Net realized gains from security transactions (if any) are generally distributed annually to shareholders. The timing and characterization of certain income and capital gains distributions are determined in accordance with federal tax regulations that may differ from GAAP. Permanent book and tax basis differences relating to shareholder distributions will result in reclassification between under/over distributed net investment income, accumulated net realized gains/losses and paid in capital.
| 3. | INVESTMENT TRANSACTIONS: |
For the year ended December 31, 2007, purchases and sales of Underlying Portfolios by the Zenith Equity Portfolio were $98,428,721 and $169,210,977, respectively.
| 4. | INVESTMENT MANAGEMENT FEES AND OTHER TRANSACTIONS WITH AFFILIATES: |
Investment Management Agreement:
MetLife Advisers, LLC (“MetLife Advisers”) is the investment adviser to the Asset Allocation Portfolio. The Asset Allocation Portfolio does not directly pay MetLife Advisers an investment advisory fee for its services, but indirectly pays MetLife Advisers an investment advisory fee through its investments in the Underlying Portfolios.
Certain officers and directors of the Fund may also be officers of MetLife Advisers; however, such officers and directors receive no compensation from the Fund.
As previously reported, in May 2004, General American received a Wells Notice stating that the SEC staff was considering recommending that the SEC bring a civil action alleging violations of the U.S. securities laws against General American with respect to market timing and late trading in a limited number of privately-placed variable insurance contracts that were sold through General American. General American responded to the SEC staff and cooperated with the investigation. On August 9, 2007, the SEC announced that it had settled an enforcement action regarding late trading against General American with, among other things, General American agreeing to pay a civil penalty and to comply with certain undertakings. General American consented to the SEC’s order without admitting or denying the findings. MetLife Advisers has also advised the Fund’s Board of Directors that, while certain exceptions to the Fund’s policies have been noted, no situations have been identified that would have a material impact on the financial position of the Fund.
| 6. | RECENT ACCOUNTING PRONOUNCEMENTS: |
Effective June 29, 2007, the Fund implemented Financial Accounting Standards Board (“FASB”) Interpretation No. 48, “Accounting for Uncertainty in Income Taxes—an interpretation of FASB Statement No. 109” (“FIN 48”). FIN 48 prescribes the minimum recognition threshold a tax position must meet in connection with accounting for uncertainties in income tax positions taken or expected to be taken by an entity, including investment companies, before being measured and recognized in the financial statements. Management has evaluated the application of FIN 48 to the Fund, and has determined that the adoption of FIN 48 does not have a material impact on the Fund’s financial statements. The Fund files U.S. tax returns. No income tax returns are currently under examination. The statute of limitations on the Fund’s tax returns remains open for the years ended December 31, 2004 through December 31, 2006.
In September 2006, Statement of Financial Accounting Standards No. 157, Fair Value Measurements (SFAS 157) was issued and is effective for fiscal years beginning after November 15, 2007. SFAS 157 defines fair value, establishes a framework for measuring fair value and expands disclosures about fair value measurements. Management is currently evaluating the impact the adoption of SFAS 157 will have on the Portfolio’s financial statement disclosures.
MSF-11
Metropolitan Series Fund, Inc.
Zenith Equity Portfolio
Notes to Financial Statements—December 31, 2007—(Continued)
The Asset Allocation Portfolio does not invest in the Underlying Portfolios for the purpose of exercising management or control; however, investments by the Asset Allocation Portfolio within its principal investment strategies may represent a significant portion of the Underlying Portfolio’s net assets. Transactions in the Underlying Portfolios during the year ended December 31, 2007 in which the Asset Allocation Portfolio had ownership of at least 5% of the outstanding voting securities during the period are as follows:
| | | | | | | | | | | | |
Underlying Portfolio (Class A) | | Beginning Shares
as of 12/31/2006 | | Shares
Purchased
during Period | | Shares Sold
during Period | | Ending Shares
as of 12/31/2007 |
Metropolitan Series Fund, Inc.—Capital Guardian U.S. Equity | | | 23,400,657 | | | 2,457,379 | | | 3,703,662 | | | 22,154,374 |
Metropolitan Series Fund, Inc.—FI Value Leaders | | | 1,506,632 | | | 231,327 | | | 270,700 | | | 1,467,259 |
Metropolitan Series Fund, Inc.—Jennison Growth | | | 24,622,035 | | | 1,622,223 | | | 4,977,363 | | | 21,266,895 |
| | | | |
Underlying Portfolio (Class A) | | Realized Gain
during Period | | Capital Gains
Distributions
during Period | | Dividend
Income during
Period | | Ending Value
as of 12/31/2007 |
Metropolitan Series Fund, Inc.—Capital Guardian U.S. Equity | | $ | 11,982,101 | | $ | 18,464,868 | | $ | 1,484,386 | | $ | 275,600,414 |
Metropolitan Series Fund, Inc.—FI Value Leaders | | | 14,652,256 | | | 27,767,396 | | | 2,933,025 | | | 287,832,240 |
Metropolitan Series Fund, Inc.—Jennison Growth | | | 15,044,913 | | | 11,220,971 | | | 1,338,066 | | | 289,655,114 |
MSF-12
Metropolitan Series Fund, Inc.
Zenith Equity Portfolio
Report of Independent Registered Public Accounting Firm
To the Shareholders and Board of Directors of the Metropolitan Series Fund, Inc.:
We have audited the accompanying statement of assets and liabilities, including the schedule of investments, of the Zenith Equity Portfolio, one of the portfolios constituting the Metropolitan Series Fund, Inc. (the “Fund”) as of December 31, 2007, and the related statement of operations for the year then ended, the statements of changes in net assets for each of the two years in the period then ended, and the financial highlights for each of the five years in the period then ended. These financial statements and financial highlights are the responsibility of the Fund’s management. Our responsibility is to express an opinion on these financial statements and financial highlights based on our audits.
We conducted our audits in accordance with the standards of the Public Company Accounting Oversight Board (United States). Those standards require that we plan and perform the audit to obtain reasonable assurance about whether the financial statements and financial highlights are free of material misstatement. The Fund is not required to have, nor were we engaged to perform, an audit of its internal control over financial reporting. Our audits included consideration of internal control over financial reporting as a basis for designing audit procedures that are appropriate in the circumstances, but not for the purpose of expressing an opinion on the effectiveness of the Fund’s internal control over financial reporting. Accordingly, we express no such opinion. An audit also includes examining, on a test basis, evidence supporting the amounts and disclosures in the financial statements, assessing the accounting principles used and significant estimates made by management, as well as evaluating the overall financial statement presentation. Our procedures included confirmation of securities owned as of December 31, 2007, by correspondence with the custodian and transfer agent; where replies were not received from the transfer agent, we performed other auditing procedures. We believe that our audits provide a reasonable basis for our opinion.
In our opinion, the financial statements and financial highlights referred to above present fairly, in all material respects, the financial position of the Zenith Equity Portfolio of the Metropolitan Series Fund, Inc. as of December 31, 2007, the results of its operations for the year then ended, the changes in its net assets for each of the two years in the period then ended, and the financial highlights for each of the five years in the period then ended, in conformity with accounting principles generally accepted in the United States of America.
Deloitte & Touche LLP
Boston, Massachusetts
February 21, 2008
MSF-13
Metropolitan Series Fund, Inc.
Directors and Officers
The Fund’s Directors review actions of the Fund’s investment adviser and subadvisers, and decide upon matters of general policy. The Fund’s officers supervise the daily business operations of the Fund. The Board of Directors and the Fund’s officers are listed below. Each Director is responsible for overseeing all 36 Portfolios of the Fund. There is no limit to the term a Director may serve. Directors serve until their resignation, retirement or removal in accordance with the Fund’s organizational documents and policies adopted by the Board from time to time. Officers hold office at the pleasure of the Board or until the election or appointment and the qualification of a successor. The address of the directors and officers is c/o Metropolitan Series Fund, Inc., 501 Boylston Street, Boston, MA 02116.
Interested Directors(1)
Each Director below is an “interested person” (as defined by the 1940 Act) with respect to the Fund in that Ms. Forget is an employee of MetLife and Mr. Typermass is a former employee of MetLife and owns securities issued by MetLife, Inc., the ultimate parent company of MetLife Advisers.
| | | | | | | | |
Name, Address and Age | | Current
position(s)
with Fund | | Position(s)
held since | | Principal occupations
over past five years, including other directorships(2) | | Number of
Portfolios in
Fund Complex
Overseen by
Director(3) |
Elizabeth M. Forget Age: 41 | | Director, Chairman of the Board, President and Chief Executive Officer | | 2006 | | Senior Vice President (since 2007), MetLife, Inc.; President, Met Investors Advisory, LLC (“MIA”); Trustee and President, Met Investors Series Trust (“MIST”); Executive Vice President, MetLife Investors Group, Inc.; President (since 2006), MetLife Advisers. | | 81 |
| | | | |
Arthur G. Typermass Age: 70 | | Director | | 1998 | | Formerly, Senior Vice President and Treasurer, MetLife. | | 37 |
Non-Interested Directors(1)
Each Director below is not an “interested person” (as defined by the 1940 Act) with respect to the Fund (collectively, the “Independent Directors”).
| | | | | | | | |
Name, Address and Age | | Current
position(s)
with Fund | | Position(s)
held since | | Principal occupations
over past five years, including other directorships(2) | | Number of
Portfolios in
Fund Complex
Overseen by
Director(3) |
Steve A. Garban† Age: 70 | | Director | | 1985 | | Formerly, Chief Financial Officer, Senior Vice President Finance and Operations and Treasurer (Emeritus), The Pennsylvania State University. | | 37 |
| | | | |
Linda B. Strumpf Age: 60 | | Director | | 2000 | | Vice President and Chief Investment Officer, Ford Foundation. | | 37 |
| | | | |
Michael S. Scott Morton† Age: 70 | | Director | | 1993 | | Jay W. Forrester Professor of Management (Emeritus) at Sloan School of Management, MIT. | | 37 |
| | | | |
H. Jesse Arnelle Age: 74 | | Director | | 2001 | | Formerly, Counsel, Womble Carlyle Sandrie & Rice; Director, Textron Inc. (global multi-industry company)*; formerly, Director, Gannet Co. Inc. (diversified news and information company)*; formerly, Director, Eastman Chemical Company (global chemical company)*; formerly, Director, Waste Management, Inc.*; formerly, Director, Armstrong Holdings Inc. (parent company of floor and ceiling products business)*; formerly, Director, FPL Group Inc. (public utility holding company)*; Director, URS Corporation (engineering design services firm)*. | | 37 |
| | | | |
Nancy Hawthorne Age: 56 | | Director | | 2003 | | Director, Avid Technologies (computer software company)*; formerly, Chairman of the Board of Avid Technologies; formerly, Board of Advisors, L. Knife & Sons, Inc. (beverage distributor); Chief Executive Officer, Clerestory LLC (corporate financial advisor); formerly, Trustee, New England Zenith Fund (“Zenith Fund”)**; formerly, Chief Executive Officer and Managing Partner, Hawthorne, Krauss and Associates (corporate financial advisor); formerly, Chief Financial Officer and Executive Vice President, Continental Cablevision, subsequently renamed MediaOne (cable television company); formerly, Director, Life F/X, Inc.; formerly, Chairman of the Board, WorldClinic (distance medicine company); formerly, Director, Perini Corporation (construction company)*; formerly, Director, CGU (property and casualty insurance company); formerly, Director, Beacon Power Corporation (energy company )*. | | 37 |
MSF-14
Metropolitan Series Fund, Inc.
Directors and Officers—(Continued)
| | | | | | | | |
Name, Address and Age | | Current
position(s)
with Fund | | Position(s)
held since | | Principal occupations
over past five years, including other directorships(2) | | Number of
Portfolios in
Fund Complex
Overseen by
Director(3) |
John T. Ludes Age: 71 | | Director | | 2003 | | President, LFP Properties (consulting firm); Formerly, Trustee, Zenith Fund**; formerly, Vice Chairman, President and Chief Operating Officer, Fortune Brands/American Brands (global conglomerate); formerly, President and CEO, Acushnet Company (athletic equipment company). | | 37 |
Officers(1)
| | | | | | | | |
Name and address | | Age | | Current
position(s)
with Fund | | Position(s)
held since | | Principal occupations over past five years(2) |
| Jeffrey P. Halperin | | 40 | | Chief Compliance Officer | | 2006 | | Vice President (since 2006), Corporate Ethics and Compliance Department, MetLife, Inc.; Chief Compliance Officer (since 2006), MetLife Advisers, MIA and MIST. |
| | | | |
| John F. Guthrie, Jr. | | 64 | | Senior Vice President | | 2002 | | Manager and Senior Vice President, MetLife Advisers; Vice President, MetLife; Vice President (since 2003), MetLife Group, Inc.; Vice President, NELICO; Vice President (since 2005), MIA; formerly, Senior Vice President, Zenith Fund**. |
| | | | |
| Alan C. Leland | | 55 | | Senior Vice President | | 2005 | | Treasurer and Chief Financial Officer, MetLife Advisers, LLC; Treasurer (since 2005), Met Investors Advisory, LLC; Vice President (since 2004), MIA; Vice President (since 2003), MetLife Group, Inc.; Vice President, MetLife; Senior Vice President, NELICO |
| | | | |
| Peter Duffy | | 52 | | Vice President and Treasurer | | 2000 | | Senior Vice President, MetLife Advisers (since 1998); Second Vice President (since 2003), NELICO; Vice President, MetLife (since 2004); Vice President (since 2004), MetLife Group, Inc.; formerly, Vice President and Treasurer, Zenith Fund**. |
| | | | |
| Thomas M. Lenz | | 49 | | Vice President and Secretary | | 2002 | | General Counsel and Secretary, MetLife Advisers; Assistant General Counsel, MetLife; formerly, Vice President and Secretary, Zenith Fund**. |
| * | Indicates a directorship with a registered investment company or a company subject to the reporting requirements of the Securities Exchange Act of 1934, as amended. |
| ** | The Zenith Fund deregistered with the Securities and Exchange Commission (“SEC”) in 2004. |
| (†) | Served as a trustee, director and/or officer of one or more of the following companies, each of which had a direct or indirect advisory relationship with MetLife Advisers or its affiliates prior to January 31, 2005: State Street Research Financial Trust, State Street Research Income Trust, State Street Research Money Market Trust, State Street Research Institutional Funds, State Street Research Capital Trust, State Street Research Master Investment Trust, State Street Research Equity Trust, State Street Research Securities Trust and State Street Research Exchange Trust (collectively, the “State Street Research Funds”). |
| (1) | Each Director of the Fund also serves as trustee of Metropolitan Series Fund II (“Met Series Fund II”), a registered investment company advised by MetLife Advisers. Each officer of the Fund serves in the same position with Met Series Fund II, which consists of one portfolio. |
| (2) | Previous positions during the past five years with the Fund, MIST, MetLife, MetLife Advisers, MIA, Zenith Fund, NELICO or New England Securities Corporation are omitted if not materially different. |
| (3) | The Fund Complex includes the Fund (36 portfolios), Met Series Fund II (1 portfolio) and MIST (44 portfolios) |
MSF-15
Metropolitan Series Fund, Inc.
Zenith Equity Portfolio
Board Approval of Advisory and Subadvisory Agreements
The Fund’s Contract Review Committees of the Board of Directors (the “Board”) typically meet in early fall to review the Portfolios’ advisory agreements (the “Advisory Agreements”) and subadvisory agreements (collectively, the “Subadvisory Agreements,” and, together with the Advisory Agreements, the “Agreements”) and determine whether to recommend that the full Board approve the continuation of the Agreements for an additional one-year period. (Following the initial approval of an Agreement for a new Portfolio or with a new adviser or subadviser, such annual reviews are not required until 2 years following the execution of such Agreement.) After each Committee has made its recommendations, the full Board, including the Independent Directors, determines whether to approve the continuation of each of the Agreements. In addition, the Board, including the Independent Directors, considers matters bearing on the Agreements at most of its other meetings throughout the year and regularly interviews various individuals at MetLife Advisers responsible for the management of the Portfolios. The Directors also interview selected investment managers and other professionals at the subadvisers at various times throughout the year.
The Directors receive all materials that they or MetLife Advisers, the Fund’s investment adviser, and the subadvisers believe to be reasonably necessary for the Directors to evaluate the Agreements and determine whether to approve the continuation of the Agreements. These materials generally include, among other items, (i) information on the investment performance of the Portfolios and the performance of peer groups of funds and the Portfolios’ performance benchmarks, (ii) information on the Portfolios’ advisory and subadvisory fees and other expenses, including information comparing the Portfolios’ expenses to those of peer groups of funds and information about any applicable expense caps and fee “breakpoints,” (iii) sales and redemption data, (iv) information related to the profitability of the Agreements to MetLife Advisers and the subadvisers, and potential “fall-out” or ancillary benefits that MetLife Advisers, the subadvisers or their affiliates may receive as a result of their relationships with the Fund and (v) information obtained through the subadvisers’ responses to certain requests from MetLife Advisers and the Directors and MetLife Advisers’ responses to requests from the Directors. The Directors may also consider other information such as (vi) MetLife Advisers’ and the subadvisers’ financial results and condition, (vii) each Portfolio’s investment objectives and strategies and the size, education and experience of the investment staffs of MetLife Advisers and the relevant subadvisers and their use of technology and external research, (viii) the allocation of the Portfolios’ brokerage, if any, including allocations to brokers affiliated with the subadvisers and the use of “soft” commission dollars to pay Portfolio expenses and to pay for research and other similar services, (ix) the resources devoted to, and the record of compliance with, the Portfolios’ investment policies and restrictions, policies on personal securities transactions and other compliance policies, (x) the responses of MetLife Advisers, the subadvisers and/or their affiliates to certain legal and regulatory proceedings and (xi) the economic outlook generally and for the mutual fund industry in particular. Throughout the process, the Directors have the opportunity to ask questions of and request additional materials from MetLife Advisers and the subadvisers.
Following meetings of each Contract Review Committee on September 12, 2007, the Board, at its November 15, 2007 meeting, approved the continuation through December 31, 2008 of the Advisory Agreements for each Portfolio of the Fund and the Subadvisory Agreements for each Portfolio other than the Zenith Equity Portfolio (which does not have a subadviser). The Agreements approved for continuation are referred to below as the “Continued Agreements.”
In considering whether to approve the continuation of the Continued Agreements, the Directors, including the Independent Directors, did not identify any single factor as determinative, and each weighed the various factors as he or she deemed appropriate. The Directors considered the following matters in connection with their approval of the Continued Agreements:
The nature, extent and quality of the services provided to the relevant Portfolios under the Continued Agreements. The Directors considered the nature, extent and quality of the services provided by MetLife Advisers, the relevant subadvisers (if any) and their affiliates (each, an “Adviser,” and, collectively, the “Advisers”) to the relevant Portfolios pursuant to the Continued Agreements and the resources dedicated to these Portfolios by the Advisers. In particular, the Directors considered the Advisers’ abilities to attract and retain highly qualified investment professionals. With respect to MetLife Advisers, the Directors considered (for each Portfolio other than Zenith Equity) that MetLife Advisers is (i) ultimately responsible for the performance of such Portfolios; (ii) ultimately responsible for the establishment of the investment strategies of each such Portfolio, primarily through its recommendations to the Board regarding the hiring and selection of subadvisers; (iii) responsible for the hiring and selection, subject to Board approval, of subadvisers; and (iv) responsible for maintaining a program of Subadviser oversight reasonably designed to ensure that the subadvisers have reasonable compliance policies and procedures in place. The Directors also considered that MetLife Advisers provides a full range of day-to-day administrative services for the Portfolios involving all aspects of such Portfolios’ day-to-day operations (other than portfolio management). With respect to Zenith Equity, the Directors considered both the portfolio management services and the administrative services provided by MetLife Advisers. After reviewing these and related factors, the Directors concluded, within the context of their overall conclusions regarding each of the Continued Agreements, that the nature, extent and quality of services provided supported the renewal of these Agreements.
MSF-16
Metropolitan Series Fund, Inc.
Zenith Equity Portfolio
Board Approval of Advisory and Subadvisory Agreements—(Continued)
Investment performance of the relevant Portfolios. The Directors reviewed information about the performance of the relevant Portfolios over various time periods, including information prepared by an independent third party that compared the performance of the Portfolios to the performance of peer groups of funds and performance benchmarks. The Directors also reviewed a description of the third party’s methodology for identifying a Portfolio’s peer group(s) for purposes of performance and expense comparisons.
In the case of each relevant Portfolio that had performance that lagged its peer group(s) for certain periods, the Directors concluded that other factors relevant to performance were sufficient, in light of other considerations, to warrant renewal of the Continued Agreements relating to such Portfolio. These factors varied from Portfolio to Portfolio, but included one or more of the following: (i) that such Portfolio’s performance, although lagging in certain recent periods, was stronger over the longer term; (ii) that the underperformance was attributable, to a significant extent, to investment decisions that were reasonable and consistent with the Portfolio’s investment objective(s) and policies and that the Portfolio was performing within the range of reasonable expectations, given market conditions and the Portfolio’s investment objective(s) and policies; (iii) that the Portfolio’s performance was competitive when compared to other relevant performance benchmarks or peer groups; and (iv) that MetLife Advisers and/or the relevant subadviser (if any) had taken or was taking steps designed to help improve the Portfolio’s investment performance.
The Directors also considered the investment performance of the Advisers and their reputations generally, the historical responsiveness of the Advisers to Director concerns about performance and the willingness of the Advisers to take steps intended to improve performance.
After reviewing these and related factors, the Directors concluded, within the context of their overall conclusions regarding each of the Continued Agreements, that the investment performance of each relevant Portfolio and Adviser was sufficient, in light of other considerations, to warrant the renewal of the Continued Agreements.
The costs of the services to be provided and profits to be realized by the Advisers and their affiliates from their relationships with the Portfolios. The Directors considered the fees charged by MetLife Advisers to the Portfolios for advisory services and, with respect to the subadvised Portfolios, by such subadvisers to MetLife Advisers for subadvisory services (such advisory and subadvisory fees (if any), collectively, “Fees”), as well as the total expense levels of the Portfolios. This information included comparisons (provided by an independent third party) of the Portfolios’ advisory fees and total expense levels to those of their peer groups. In evaluating Fees for the relevant Portfolios, the Directors also took into account the demands, complexity and quality of the investment management services provided to each Portfolio. The Directors considered MetLife Advisers’ recommendations regarding reductions in Fee rates, implementation of Fee breakpoints and institution of Fee waivers and expense caps.
The Directors also considered the compensation directly or indirectly received by the Advisers and their affiliates from their relationships with the relevant Portfolios. The Directors reviewed information relating to the profits received by MetLife Advisers, certain of the subadvisers and their affiliates as a result of their relationships with the relevant Portfolios, and information about the allocation of expenses used to calculate profitability. When reviewing profitability, the Directors also considered the performance of the relevant Portfolios, the expense levels of such Portfolios and whether the relevant Advisers had implemented breakpoints, fee waivers and/or expense caps with respect to such Portfolios.
After reviewing these and related factors, the Directors concluded, within the context of their overall conclusions regarding each of the Continued Agreements, that the Fees charged to each of the relevant Portfolios were fair and reasonable, and that the information provided regarding costs of these services generally, and the related profitability (if known) to the relevant Advisers of their relationships with the relevant Portfolios, supported the renewal of the Continued Agreements.
Economies of Scale. The Directors considered the existence of any economies of scale in the provision of services by the Advisers and whether those economies were shared with the relevant Portfolios through breakpoints in their advisory fees or other means, such as expense caps, fee waivers or relatively low levels of fees. The Directors noted that most of the relevant Portfolios benefited or will benefit from breakpoints, expense caps and/or fee waivers with respect to their advisory fees. In considering these issues, the Directors also took into consideration information relating to the costs of the services provided and the profitability to MetLife Advisers, the relevant subadvisers (if any) and each of their affiliates of their relationships with the relevant Portfolios, as discussed above.
After reviewing these and related factors, the Directors concluded, within the context of their overall conclusions regarding each of the Continued Agreements, that the extent to which economies of scale were shared with the relevant Portfolios supported the renewal of such Agreements.
MSF-17
Metropolitan Series Fund, Inc.
Zenith Equity Portfolio
Board Approval of Advisory and Subadvisory Agreements—(Continued)
Other Factors. The Directors also considered other factors, which included but were not limited to the following:
| | • | | the extent to which each relevant Portfolio operated in accordance with its investment objective, and its record of compliance with its investment restrictions and the compliance programs of the Fund and the Advisers. They also considered the compliance-related resources the Advisers and their affiliates provide to the relevant Portfolios; |
| | • | | the nature, quality, cost and extent of administrative and shareholder services performed by MetLife Advisers and its affiliates under the Advisory Agreements; and |
| | • | | so-called “fall-out benefits” to the Advisers, such as the engagement of their affiliates to provide distribution, brokerage and transfer agency services to the Portfolios, and the benefits of research made available to the relevant Advisers by reason of brokerage commissions generated by the relevant Portfolios’ securities transactions. The Directors also considered the possible conflicts of interest associated with these fall-out and other benefits, and the reporting and other processes in place to disclose and monitor these possible conflicts of interest. |
Based on their evaluation of all factors that they deemed to be material, including those factors described above, and assisted by the advice of independent counsel, the Directors, including the Independent Directors, concluded that each of the Continued Agreements should be continued through December 31, 2008.
MSF-18
A description of the policies and procedures that the Fund uses to determine how to vote proxies relating to portfolio securities is available (i) without charge, upon request, by calling (800) 638-7732 and (ii) on the Securities and Exchange Commission’s (the “SEC”) website at http://www.sec.gov.
Information regarding how the Fund voted proxies relating to portfolio securities during the most recent twelve-month period ended December 31, 2007 is available (i) without charge, upon request, by calling (800) 638-7732 and (ii) on the SEC’s website at http://www.sec.gov.
The Fund files with the SEC a complete schedule of its portfolio holdings, as of the close of the first and third quarters of its fiscal year, on “Form N-Q”. These filings are available on the SEC’s website at www.sec.gov and may be reviewed and copied at the SEC’s Public Reference Room in Washington, DC. (Call 1-800-SEC-0330 for information on the operation of the Public Reference Room.)
MSF-19
Item 2. Code of Ethics.
As of December 31, 2007 the registrant has adopted a “code of ethics” (as such term is defined in the instructions to Item 2 of Form N-CSR) that applies to the registrant’s principal executive officer and principal financial and accounting officer. There were no substantive amendments or waivers to this code of ethics during the period covered by this report.
Item 3. Audit Committee Financial Expert.
The registrant’s Board of Directors has determined that Steve A. Garban, John T. Ludes and Linda B. Strumpf are “audit committee financial experts” (as such term is defined in the instructions to Item 3 of Form N-CSR). Each of these individuals is “independent” for purposes of Item 3 of Form N-CSR.
Item 4. Principal Accountant Fees and Services.
Fees for Services Rendered to the Registrant
| | | | | | | | | | | | |
Fiscal Year | | Audit Fees | | Audit-Related Fees | | Tax Fees | | All Other Fees |
2006 | | $ | 859,460 | | $ | 83,026 | | $ | 114,000 | | $ | 0 |
2007 | | $ | 902,800 | | $ | 36,000 | | $ | 111,000 | | $ | 0 |
Audit-Related Fees represent fees for services rendered to the registrant (i) for security valuation testing in connection with the registrant’s semi-annual report for the periods ended June 30, 2006 and June 30, 2007 respectively; and (ii) related to reorganizations involving certain portfolios of the registrant (in the case of (ii), such fees were paid by the registrant’s investment adviser).
Tax Fees represent fees for services rendered to the registrant for tax return preparation and review of and participation in determining required income and capital gains distributions.
There were no fees required to be approved pursuant to paragraph (c)(7)(ii) of Rule 2-01 of Regulation S-X.
(e)(1) The registrant’s Audit Committee has established pre-approval procedures pursuant to paragraph (c)(7)(i)(B) of Rule 2-01 of Regulation S-X, which include regular pre-approval procedures and interim pre-approval procedures. Under the regular pre-approval procedures, the Audit Committee pre-approves at its regularly scheduled meetings audit and non-audit services that are required to be pre-approved under paragraph (c)(7) of Rule 2-01 of Regulation S-X. Under the interim pre-approval procedures, any member of the Audit Committee who is an independent Director is authorized to pre-approve proposed services that arise between regularly scheduled Audit Committee meetings and that need to commence prior to the next regularly scheduled Audit Committee meeting. Such Audit Committee member must report to the Audit Committee at its next regularly scheduled meeting on the pre-approval decision.
(e)(2) Not applicable.
(f) Not applicable.
(g)
| | | |
Fiscal Year | | Aggregate Non-Audit Fees |
2006 | | $ | 7,800,000 |
2007 | | $ | 4,700,000 |
The amounts set out above represent the aggregate non-audit fees billed by the registrant’s accountant to MetLife, Inc., and include, among other non-audit fees, non-audit fees for services rendered to the registrant and rendered to the registrant’s investment adviser (not including any subadviser whose role is primarily portfolio management and is subcontracted with or overseen by another investment adviser) and any entity controlling, controlled by, or under common control with the adviser that provides ongoing services to the registrant.
(h) The Audit Committee of the registrant’s Board of Directors considered the provision of non-audit services that were rendered to the registrant’s investment adviser (not including any subadviser whose role is primarily portfolio management and is subcontracted with or overseen by another investment adviser), and any entity controlling, controlled by or under common control with the investment adviser that provides ongoing services to the registrant that were not pre-approved pursuant to paragraph (c)(7)(ii) of Rule 2-01 of Regulation S-X and concluded that such services are compatible with maintaining the principal accountant’s independence.
Item 5. Audit Committee of Listed Registrants
Not applicable.
Item 6. Schedule of Investments.
Included in reports to stockholders under Item 1.
Item 7. Disclosure of Proxy Voting Policies and Procedures for Closed-End Management Investment Companies.
Not applicable.
Item 8. Portfolio Managers of Closed-End Management Investment Companies.
Not applicable.
Item 9. Purchases of Equity Securities by Closed-End Management Investment Company and Affiliated Purchasers.
Not applicable.
Item 10. Submission of Matters to a Vote of Security Holders.
There have been no material changes to the procedures by which shareholders may recommend nominees to the Board of Directors since the registrant last provided disclosure in response to this Item.
Item 11. Controls and Procedures.
(a) The President and Treasurer of the registrant have concluded, based on their evaluation of the effectiveness of the registrant’s disclosure controls and procedures (as defined in Rule 30a-3(c) under the Act) as of a date within 90 days of the filing date of this report on Form N-CSR, that the design and operation of such procedures provide reasonable assurance that information required to be disclosed by the registrant in this report on Form N-CSR is recorded, processed, summarized, and reported within the time periods specified in the Securities and Exchange Commission’s rules and forms.
(b) There has been no change in the registrant’s internal controls over financial reporting (as defined in Rule 30a-3(d) under the Act) that occurred during the second fiscal quarter of the period covered by this report that has materially affected, or is reasonably likely to materially affect, the registrant’s internal control over financial reporting.
Item 12. Exhibits.
| (a) | (1) Code of Ethics (as defined in Item 2(b) of Form N-CSR). |
(2) Certifications required by Rule 30a-2(a) under the Act.
(3) Not applicable.
| (b) | Certification required by Rule 30a-2(b) under the Act. |
SIGNATURES
Pursuant to the requirements of the Securities Exchange Act of 1934 and the Investment Company Act of 1940, the registrant has duly caused this report to be signed on its behalf by the undersigned, thereunto duly authorized.
METROPOLITAN SERIES FUND, INC.
| | | | |
| | |
| | By: | | /s/ Elizabeth Forget |
| | Name: | | Elizabeth Forget |
| | Title: | | President |
| | Date: | | February 28, 2008 |
Pursuant to the requirements of the Securities Exchange Act of 1934 and the Investment Company Act of 1940, this report has been signed below by the following persons on behalf of the registrant and in the capacities and on the dates indicated.
| | | | |
| | |
| | By: | | /s/ Elizabeth Forget |
| | Name: | | Elizabeth Forget |
| | Title: | | President |
| | Date: | | February 28, 2008 |
| | | | |
| | |
| | By: | | /s/ Peter H. Duffy |
| | Name: | | Peter H. Duffy |
| | Title: | | Treasurer |
| | Date: | | February 28, 2008 |
EXHIBIT LIST
| | |
| |
Exhibit 12(a)(1): | | Code of Ethics |
| |
Exhibit 12(a)(2)(a): | | Certification of the Principal Executive Officer required by Rule 30a-2(a) under the Act |
| |
Exhibit 12(a)(2)(b): | | Certification of the Principal Financial Officer required by Rule 30a-2(a) under the Act |
| |
Exhibit 12(b): | | Certification required by Rule 30a-2(b) under the Act |